Self-Organization of the Ternary Didecyldimethylammonium Bromide/Octyl-β- d -glucopyranoside/Water...
10
Self-Organization of the Ternary Didecyldimethylammonium Bromide/ Octyl--D-glucopyranoside/Water System Elena Junquera, Patricia del Burgo, Jasminka Boskovic, ‡ and Emilio Aicart* , Departamento de Quı ´mica Fı ´sica I, Facultad de Ciencias Quı ´micas, Universidad Complutense de Madrid, 28040-Madrid, Spain, and Centro de Investigaciones Biolo ´ gicas, CSIC, Ramiro de Maeztu 9, 28040-Madrid, Spain Received March 16, 2005. In Final Form: June 2, 2005 The spontaneous and thermodynamically stable mixed vesicles constituted by a double-chain cationic surfactant with 10 carbon atoms hydrophobic tail, didecyldimethylammonium bromide (di-C10DMAB), and a nonionic single-chain surfactant, octyl--D-glucopyranoside (OBG), have been characterized in aqueous media by means of a series of experimental techniques, as well as a theoretical approach. Conductivity data allow for the determination of the concentrations at which the monomer-to-vesicle (CVC*) and/or vesicle-to-micelle (CMC*) transitions occur. Electrophoretic mobilities, obtained from laser-doppler- electrophoresis experiments, permit the determination of œ-potentials and, from them, the surface charge density of the vesicle aggregates. Cryogenic transmission electron microscopy (cryo-TEM) provides pictures of the vesicles, their size and shape being, thus, determined. Finally, the sensitivity of the emission spectra of some fluorescent probes, such as the cationic TNS and the nonionic PRODAN, to the polarity of the environment, allow for a complete study of different pre- and post-vesicle microdomains, of variable rigidity and micropolarity. This, in turn, yield interesting information about the vesicle surface and bilayer, as well as, about the existence of clusters and/or nanoaggregates prior to the formation of vesicles, as was proposed by us in a previous paper. I. Introduction The mixture of a single-chain surfactant and a double- chain surfactant, within the appropriate concentration range, is well-known to form spontaneous and thermo- dynamically stable mixed vesicles. 1-6 This kind of vesicle offers advantages with respect to phospholipid vesicles, since their preparation and their conservation over long periods of time are easier. In addition, it is worth mentioning their potential practical applications, as drug delivery systems, active substances in cosmetics and/or food industries, etc., and their no less interesting uses as simplified models to analyze the behavior of biological membranes. 1,7-10 Also important is the fact that the interaction of alkyl surfactants with vesicles may drive, at certain concentrations, the disruption of vesicle struc- tures, which points to these mixed aggregated systems as suitable models to mimic the solubilization and recon- stitution processes of lipidic bilayers. 11-22 Didecyldimethylammonium bromide (di-C 10 DMAB; see Chart 1) is a commercial double-chain cationic surfactant of the quaternary alkylammonium salt series also used in a wide variety of applications, such as fungicidal and bactericidal, wood preservative, disinfectant, and so on. 23,24 The phase behavior of this surfactant in water was characterized many years ago. 25 Funasaki et al. studied the formation of inclusion complexes of this double-chain surfactant with cyclodextrins, from emf measurements with ion-selective electrodes. 26 However, non studies have been reported on the formation of di-C 10 DMAB vesicles in the absence and/or presence of a single-chain surfactant. Recently, we have investigated the behavior of mixed ternary cationic-cationic and cationic-nonionic systems in aqueous solution, in the diluted region. 5,6 These works * To whom correspondence should be addressed. Fax: 34- 913944135. E-mail: [email protected]. Web site: http:// www.ucm.es/info/coloidal/index.html. Universidad Complutense de Madrid. ‡ CSIC. (1) Rosoff, M. Vesicles; Marcel Dekker: New York, 1996. (2) Barreleiro, P. C. A.; Olofsson, G.; Brown, W.; Edwards, K.; Bonassi, N. M.; Feitosa, E. Langmuir 2002, 18, 1024. (3) Viseu, M. I.; Edwards, K.; Campos, C. S.; Costa, S. M. B. Langmuir 2000, 16, 2105. (4) Viseu, M. I.; Velazquez, M. M.; Campos, C. S.; Garcia-Mateos, I.; Costa, S. M. B. Langmuir 2000, 16, 4882. (5) Junquera, E.; Arranz, R.; Aicart, E. Langmuir 2004, 20, 6619. (6) Junquera, E.; del Burgo, P.; Arranz, R.; Llorca, O.; Aicart, E. Langmuir 2005, 21, 1795. (7) Fendler, J. H. Membrane Mimetic Chemistry; John Wiley & Sons: New York, 1982. (8) Christian, S. D.; Scamehorn, J. F. Solubilization in Surfactant Aggregates; Marcel Dekker: New York, 1995; Vol. 55. (9) Barenholz, Y. Curr. Opin. Colloid Interface Sci. 2001, 6, 66. (10) Somasundaran, P.; Hubbard, A. Encyclopedia of Surface and Colloid Science.; Marcel Dekker: Santa Barbara, CA, 2002. (11) Lichtenberg, D. Biochim. Biophys. Acta 1985, 821, 470. (12) Dennis, E. A. Adv. Colloid Interface Sci. 1986, 26, 155. (13) Engberts, J. B. F. N.; Kevelam, J. Curr. Opin. Colloid Interface Sci. 1996, 1, 779. (14) Ribosa, I.; Sanchez-Leal, J.; Comelles, F.; Garcia, M. T. J. Colloid Interface Sci. 1997, 187, 443. (15) Lopez, O.; Cocera, M.; Coderch, L.; Parra, J. L.; Barsukov, L.; de la Maza, A. J. Phys. Chem. B 2001, 105, 9879. (16) Ollivon, M.; Lesieur, S.; Grabielle-Madelmont, C.; Paternostre, M. Biochim. Biophys. Acta 2000, 1508, 34. (17) Deo, N.; Somasundaran, P. Colloids Surf. A-Physicochem. Eng. Aspects 2001, 186, 33. (18) Deo, N.; Somasundaran, P. Langmuir 2003, 19, 7271. (19) Fontana, A.; De Maria, P.; Siani, G.; Robinson, B. H. Colloids Surf. B-Biointerfaces 2003, 32, 365. (20) Majhi, P. R.; Blume, A. J. Phys. Chem. B 2002, 106, 10753. (21) Kawasaki, H.; Imahayashi, R.; Tanaka, S.; Almgren, M.; Karlsson, G.; Maeda, H. J. Phys. Chem. B 2003, 107, 8661. (22) Tan, A. M.; Ziegler, A.; Steinbauer, B.; Seelig, J. Biophys. J. 2002, 83, 1547. (23) Argy, G.; Bricout, F.; d’Hermies, F.; Cheymol, A. C. R. Acad. Sci., Ser. III 1999, 322, 863. (24) Budavari, S. The Merck Index; Merck & Co., Inc.: Whitehouse Station, 1996. (25) Warr, G. G.; Sen, R.; Fennell-Evans, D.; Trend, J. E. J. Phys. Chem. 1988, 92, 774. (26) Funasaki, N.; Neya, S. Langmuir 2000, 16, 5343. 7143 Langmuir 2005, 21, 7143-7152 10.1021/la050701f CCC: $30.25 © 2005 American Chemical Society Published on Web 06/25/2005
-
Upload
independent -
Category
Documents
-
view
2 -
download
0
Transcript of Self-Organization of the Ternary Didecyldimethylammonium Bromide/Octyl-β- d -glucopyranoside/Water...

Self-Organization of the TernaryDidecyldimethylammonium Bromide/
Octyl-â-D-glucopyranoside/Water System
Elena Junquera,† Patricia del Burgo,† Jasminka Boskovic,‡ and Emilio Aicart*,†
Departamento de Quımica Fısica I, Facultad de Ciencias Quımicas, Universidad Complutensede Madrid, 28040-Madrid, Spain, and Centro de Investigaciones Biologicas, CSIC,
Ramiro de Maeztu 9, 28040-Madrid, Spain
Received March 16, 2005. In Final Form: June 2, 2005
The spontaneous and thermodynamically stable mixed vesicles constituted by a double-chain cationicsurfactant with 10 carbon atoms hydrophobic tail, didecyldimethylammonium bromide (di-C10DMAB),and a nonionic single-chain surfactant, octyl-â-D-glucopyranoside (OBG), have been characterized in aqueousmedia by means of a series of experimental techniques, as well as a theoretical approach. Conductivitydata allow for the determination of the concentrations at which the monomer-to-vesicle (CVC*) and/orvesicle-to-micelle (CMC*) transitions occur. Electrophoretic mobilities, obtained from laser-doppler-electrophoresis experiments, permit the determination of ú-potentials and, from them, the surface chargedensity of the vesicle aggregates. Cryogenic transmission electron microscopy (cryo-TEM) provides picturesof the vesicles, their size and shape being, thus, determined. Finally, the sensitivity of the emission spectraof some fluorescent probes, such as the cationic TNS and the nonionic PRODAN, to the polarity of theenvironment, allow for a complete study of different pre- and post-vesicle microdomains, of variable rigidityand micropolarity. This, in turn, yield interesting information about the vesicle surface and bilayer, aswell as, about the existence of clusters and/or nanoaggregates prior to the formation of vesicles, as wasproposed by us in a previous paper.
I. Introduction
The mixture of a single-chain surfactant and a double-chain surfactant, within the appropriate concentrationrange, is well-known to form spontaneous and thermo-dynamically stable mixed vesicles.1-6 This kind of vesicleoffers advantages with respect to phospholipid vesicles,since their preparation and their conservation over longperiods of time are easier. In addition, it is worthmentioning their potential practical applications, as drugdelivery systems, active substances in cosmetics and/orfood industries, etc., and their no less interesting uses assimplified models to analyze the behavior of biologicalmembranes.1,7-10 Also important is the fact that theinteraction of alkyl surfactants with vesicles may drive,at certain concentrations, the disruption of vesicle struc-tures, which points to these mixed aggregated systems assuitable models to mimic the solubilization and recon-stitution processes of lipidic bilayers.11-22
Didecyldimethylammonium bromide (di-C10DMAB; seeChart 1) is a commercial double-chain cationic surfactantof the quaternary alkylammonium salt series also usedin a wide variety of applications, such as fungicidal andbactericidal, wood preservative, disinfectant, and so on.23,24
The phase behavior of this surfactant in water wascharacterized many years ago.25 Funasaki et al. studiedthe formation of inclusion complexes of this double-chainsurfactant with cyclodextrins, from emf measurementswith ion-selective electrodes.26 However, non studies havebeen reported on the formation of di-C10DMAB vesicles inthe absence and/or presence of a single-chain surfactant.Recently, we have investigated the behavior of mixedternary cationic-cationic and cationic-nonionic systemsin aqueous solution, in the diluted region.5,6 These works
* To whom correspondence should be addressed. Fax: 34-913944135. E-mail: [email protected]. Web site: http://www.ucm.es/info/coloidal/index.html.
† Universidad Complutense de Madrid.‡ CSIC.(1) Rosoff, M. Vesicles; Marcel Dekker: New York, 1996.(2) Barreleiro, P. C. A.; Olofsson, G.; Brown, W.; Edwards, K.; Bonassi,
N. M.; Feitosa, E. Langmuir 2002, 18, 1024.(3) Viseu, M. I.; Edwards, K.; Campos, C. S.; Costa, S. M. B. Langmuir
2000, 16, 2105.(4) Viseu, M. I.; Velazquez, M. M.; Campos, C. S.; Garcia-Mateos, I.;
Costa, S. M. B. Langmuir 2000, 16, 4882.(5) Junquera, E.; Arranz, R.; Aicart, E. Langmuir 2004, 20, 6619.(6) Junquera, E.; del Burgo, P.; Arranz, R.; Llorca, O.; Aicart, E.
Langmuir 2005, 21, 1795.(7) Fendler, J. H. Membrane Mimetic Chemistry; John Wiley & Sons:
New York, 1982.(8) Christian, S. D.; Scamehorn, J. F. Solubilization in Surfactant
Aggregates; Marcel Dekker: New York, 1995; Vol. 55.(9) Barenholz, Y. Curr. Opin. Colloid Interface Sci. 2001, 6, 66.(10) Somasundaran, P.; Hubbard, A. Encyclopedia of Surface and
Colloid Science.; Marcel Dekker: Santa Barbara, CA, 2002.
(11) Lichtenberg, D. Biochim. Biophys. Acta 1985, 821, 470.(12) Dennis, E. A. Adv. Colloid Interface Sci. 1986, 26, 155.(13) Engberts, J. B. F. N.; Kevelam, J. Curr. Opin. Colloid Interface
Sci. 1996, 1, 779.(14) Ribosa, I.; Sanchez-Leal, J.; Comelles, F.; Garcia, M. T. J. Colloid
Interface Sci. 1997, 187, 443.(15) Lopez, O.; Cocera, M.; Coderch, L.; Parra, J. L.; Barsukov, L.;
de la Maza, A. J. Phys. Chem. B 2001, 105, 9879.(16) Ollivon, M.; Lesieur, S.; Grabielle-Madelmont, C.; Paternostre,
M. Biochim. Biophys. Acta 2000, 1508, 34.(17) Deo, N.; Somasundaran, P. Colloids Surf. A-Physicochem. Eng.
Aspects 2001, 186, 33.(18) Deo, N.; Somasundaran, P. Langmuir 2003, 19, 7271.(19) Fontana, A.; De Maria, P.; Siani, G.; Robinson, B. H. Colloids
Surf. B-Biointerfaces 2003, 32, 365.(20) Majhi, P. R.; Blume, A. J. Phys. Chem. B 2002, 106, 10753.(21) Kawasaki, H.; Imahayashi, R.; Tanaka, S.; Almgren, M.;
Karlsson, G.; Maeda, H. J. Phys. Chem. B 2003, 107, 8661.(22) Tan, A. M.; Ziegler, A.; Steinbauer, B.; Seelig, J. Biophys. J.
2002, 83, 1547.(23) Argy, G.; Bricout, F.; d’Hermies, F.; Cheymol, A. C. R. Acad.
Sci., Ser. III 1999, 322, 863.(24) Budavari, S. The Merck Index; Merck & Co., Inc.: Whitehouse
Station, 1996.(25) Warr, G. G.; Sen, R.; Fennell-Evans, D.; Trend, J. E. J. Phys.
Chem. 1988, 92, 774.(26) Funasaki, N.; Neya, S. Langmuir 2000, 16, 5343.
7143Langmuir 2005, 21, 7143-7152
10.1021/la050701f CCC: $30.25 © 2005 American Chemical SocietyPublished on Web 06/25/2005

were mainly aimed at studying the effect of a secondhydrophobic chain and the ionic or nonionic character ofits polar head on the structure and properties of themonomeric and aggregated phases, as well as to analyzethe ionic-nonionic interactions in the vesicle surface. Withthis background, we face in the present work a physicalchemistry study of the aqueous solutions of cationic-nonionic mixed vesicles constituted by a cationic double-chainsurfactant (di-C10DMAB)andanonionic single-chainsurfactant, widely used in the crystallization and solu-bilization of membrane proteins,27-31 the n-octyl-â-D-glucopyranoside (OBG; see Chart 1). Both surfactants havehydrophobic chains of comparable length but differ on thecharge of their polar heads. The parameters that deter-mine and characterize the formation of mixed di-C10-DMAB/OBG vesicles in diluted aqueous solutions, suchas, the concentration domain, the packing features, theshape, the size, and the charge of the resulting vesicleshave been evaluated by means of a variety of highlyaccurate experimental techniques, as well as, theoreticalcalculations. The critical vesicle concentrations of the pure,CVC, and mixed, CVC*, vesicles defined as the concen-tration corresponding to the monomer-to-vesicles transi-tion,havebeendetermined from conductivityexperiments.This method has been also used to determine the criticalmicellar concentration, CMC*, or concentration at whichmixed micelles start to form (vesicles-to-micelles transi-tion). The solubilization process of the vesicles is generallydescribed by using a “three stage model”11,32 which defines(a) stage I, where the surfactant monomers partitionbetween the bulk and the bilayer, (b) stage II, where mixedvesicles and micelles coexist, and (c) stage III, where alldouble-chain surfactants are present in solution as mixedmicelles. The structure and morphology of these ag-gregates have been analyzed by using cryogenic trans-mission electron microscopy (cryo-TEM), a technique
which has been revealed as a powerful tool to analyzevesicles of small and medium size, in conjunction withsome theoretical calculations based on the effectivepacking parameter of the mixed system.33 The vesicle/solution interface has been also studied by means ofelectrophoretic mobility data. This method permits thezeta potential of the aggregate surface from the experi-mental electrophoretic mobility to be obtained, by usingthe Henry equation if the particle size is known. We usein this work the equation proposed by Ohshima34 tocalculate the Henry function, f(κDa), as a function of κDainstead of the normally used expressions,35 once demon-strated that the validity limits of these equations aretotally wrong for κDa falling within the range 0.5 < κDa< 25, which is the usual experimental range of mostreported studies, the present one included. Additionally,steady-state fluorescence spectroscopy experiments havebeen carried out with the aim of further characterizingthe mixed aggregates herein studied. The interactionbetween fluorophore molecules and auto-aggregated sur-factant systems to analyze questions of the structure,interactions, and dynamics of the system is well docu-mented in the literature.36-42 The basis for these studiesis the characteristic sensitivity of the photophysicalproperties of many fluorophores to their immediatemicroenvironment; the interaction between the fluoro-phore molecules and the solvent or the auto-aggregatedsystem has a direct effect on the energy difference betweenthe ground and excited states of the fluorophore, affectingthe maximum emission wavelength and the fluorescencequantum yield. The anionic probe 2-(p-toluidino)naph-thalene-6-sulfonic acid (TNS), and the nonionic probe6-propionyl-2-dimethylaminonaphthalene (PRODAN) be-long to this type of compounds with an electron donor-acceptor moiety linked by a single bond to an aromaticring (see Chart 1). This arrangement confers the moleculescharacteristic properties, which have been widely ex-plained in the literature.36-46 In fact, the use of TNS and/orPRODANisquiteadvantageous inanalyzing thesurfaceand interior of mixed aggregates constituted by cationicand nonionic components. We do expect that theseelectrochemical, microscopic, and spectroscopic results willshed light to a better understanding of the parametersthat govern the spontaneous self-organization processesof mixed aggregates.
(27) Garavito, R. M.; Rosenbush, J. P. J. Cell. Biol. 1980, 86, 327.(28) Michel, H.; Oesterhelt, D. Proc. Nat. Acad. Sci. U.S.A. 1980, 77,
1283.(29) Baron, C.; Thompson, T. E. Biochim. Biophys. Acta 1975, 382,
276.(30) Stubbs, G. W.; Gilbert, S. H.; Litman, B. J. Biochim. Biophys.
Acta 1976, 425, 45.(31) Korsaric, N. Biosurfactants: Production. Properties. Aplications;
Marcel Dekker: New York, 1993; Vol. 48.(32) Lichtenberg, D.; Robson; Dennis, E. A. Biochim. Biophys. Acta
1983, 737, 285.
(33) Israelachvili, J. Intermolecular and Surfaces Forces with Ap-plication to Colloidal and Biological Systems; Academic Press: London,1985.
(34) Ohshima, H.; Furusawa, K. Electrical Phenomena at Interfaces.Fundamentals, Measurements, and Applications; Marcel Dekker: NewYork, 1998.
(35) Henry, D. C. Proc. R. Soc. London, Ser. A 1931, 133, 106.(36) Lakowicz, J. R. Principle of Flourescence Spectroscopy; Kluwer
Acad./Plenum Pubs.: New York, 1999.(37) Niu, S.; Gopidas, K. R.; Turro, N. J.; Gabor, G. Langmuir 1992,
8, 1271.(38) Krishnamoorthy, G.; Dogra, S. K. J. Colloid Interface Sci. 2000,
228, 335.(39) Zhong, D.; Kumar-Pal, S.; Zewail, A. H. ChemPhysChem 2001,
2, 219.(40) Karukstis, K. K. Encapsulation of fluorophores in multiple
microenvironments in surfactant-based supramolecular assemblies;Academic Press: London, 2001; Vol. 3: Nanostructured Materials,Micelles and Colloids.
(41) Karukstis, K. K.; Zieleniuk, C. A.; Fox, M. J. Langmuir 2003,19, 10054.
(42) Karukstis, K. K.; McCormack, S. A.; McQueen, T. M.; Goto, K.F. Langmuir 2004, 20, 64.
(43) Kosower, E. M. Acc. Chem. Res. 1982, 15, 259.(44) Wang, Y.; Eisenthal, K. B. J. Chem. Phys. 1982, 77, 6076.(45) Parusel, A. B.; Nowak, W.; Grimme, S.; Kohler, G. J. Phys. Chem.
1998, 102, 7149.(46) Lobo, B. C.; Abelt, C. J. J. Phys. Chem. 2003, 107, 10938.
Chart 1. (a) Di-C10DMAB, (b) OBG, (c) TNS, and (d)PRODAN Molecules
7144 Langmuir, Vol. 21, No. 16, 2005 Junquera et al.

II. Experimental Section
A. Materials. di-C10DMAB, with purities of 99% or greater,and OBG, with purity of 98% or greater, were purchased fromAldrich Co. The potassium salt of 2-(p-toluidino)naphthalene-6-sulfonic acid (TNS) is from Sigma, and 6-propionyl-2-dim-ethylaminonaphthalene (PRODAN) is from Molecular Probes.All were used without further purification. OBG was stored ina dark place at 278 K. Double-distilled water was deionized usinga Super Q Millipore system (with a conductivity lower than 18µS cm-1) and finally was also degassed with a vacuum pumpprior to the preparation of the solutions.
B. Preparation of the Samples. Appropriate amounts ofboth components of the ternary system, di-C10DMAB and OBG,were weighted and dissolved simultaneously in water to preparea solution of a given total surfactant concentration at the desiredmolar fraction. These initial solutions, after sonicated for 2 h inan ultrasonic bath, were homogeneous and totally clear in visible-scale. Their long term thermodynamic stability was checked byconfirming that conductivity, κ, and zeta potential, ú, resultsremained unchanged four months later, within the experimentaluncertainty.
C.ConductometricMeasurements. Conductivity data werecollected at 298.15 K ((1 mK) with a Hewlett-Packard 4263ALCR Meter. The whole equipment, the preparation of mixturesand the fully computerized procedure was widely describedpreviously.47 The accuracy on the specific conductivity κ, obtainedas an average of 2400 measurements for each concentration, isbetter than 0.03%. The conductivity measurements were madeas a function of total surfactant concentration, [S]tot () [di-C10-DMAB] + [OBG]), at several constant values of the molar fraction,R1.
D. ú-potential Measurements. A laser Doppler electro-phoresis (LDE) technique (Zetamaster 2000, Malvern Instru-ments Ltd.), previously described,5 was used to measure elec-trophoretic mobilities at 298.15 ( 0.01 K. The cell used is aZetasizer 2000 Standard Quartz rectangular capillary electro-phoresis cell of 5 × 2 × 50 mm, which is calibrated with a zetapotential transfer standard of ú ) (-50 ( 5) mV. ú-Potentialswere calculated from the electrophoretic mobility measurementsmade at the molar fractions studied on conductivity experiments.Each electrophoretic mobility data is taken as an average over10 independent measurements.
E. cryo-TEM Measurements. Samples for cryogenic trans-mission electron microscopy were vitrified according to themethod devised by Dubochet et al.48 and also described in Llorcaet al.49 Briefly, 5 µL aliquots of the different samples were appliedto glow-discharged carbon coated grids for 1 min, blotted for 5s, and frozen rapidly in liquid ethane at -180 °C and kept at thistemperature throughout the whole procedure. Observations wereconducted at a JEOL 1230 microscope operated at 100 kV.Micrographs were recorded on Kodak 4489 film at zero degreestilt and a nominal magnification of 30 000×. Selected micrographswere digitalized in a Dimage Scan Multi Pro scanner (Minolta)with a sampling window of 7 Å/pixel at the specimen.
F. Fluorescence Measurements. Steady-state fluorescenceexperiments were carried out with a Perkin-Elmer LS-50BLuminescence Spectrometer,50 connected to a PC computer. A10 mm stoppered rectangular silica cell was placed in a stirredcuvette holder whose temperature was kept constant at 298.15( 0.01 K with a recirculating water circuit. The aqueoussurfactant solutions previously prepared for conductivity andú-potential experiments were also used on fluorescence mea-surements. An aqueous stock solution of TNS at a concentrationof 10.08 µM and an ethanol stock solution of PRODAN at aconcentration of 97.22 µM were prepared. An aliquot of 10 µL ofTNS stock solution was mixed with 3.85 mL of the surfactantsolution, while an aliquot of 155 µL of the PRODAN stock solutionwas mixed with 3.00 mL of the surfactant solution, the ethanol
being previously evaporated with nitrogen in this case. As a result,probes concentrations are kept constant at [TNS] ) 2.07 µMand/or [PRODAN] ) 5.02 µM, and surfactant concentrationsrange from pre- to post-vesicle values, at each molar fraction ofthe ternary system. All surfactant/probe solutions thus preparedwere first stirred for 2-3 h, and subsequently allowed toequilibrate more than 60 h, prior to running the spectra.Excitation wavelengths of 330 and 340 nm were chosen, andemission wavelengths were varied from 340 to 600 nm and from350 to 650 nm, to record the fluorescent emission of TNS andPRODAN, respectively. In all of the cases, excitation and emissionband slits were fixed at 2.5 nm and the scan rate selected at 240nm/min.
III. Results and Discussion
Vesicle Concentration Domain. Conductivity ex-periments were run to determine the concentration atwhich mixed di-C10DMAB (1)/OBG (2) vesicles are formedin aqueous solutions, the so-called mixed critical vesicleconcentration, CVC*. Figure 1 shows the experimentalspecific conductivities, κ, as a function of total surfactantconcentration, [S]tot, at several constant values of molarfraction, R1, through the whole composition range. Thethird derivative method51 (∂κ3/∂c3 ) 0) was used to calculateCVC* at each molar fraction. The inset at the top of Figure1 shows a third derivative plot for R1 ) 0.502, as anexample. The CVC* thus determined are plotted as afunction of the molar fraction R1 in Figure 2. As can beobserved, CVC* decreases with the molar fraction R1,which means that vesicles tend to form at lower concen-trations as long as the total content on double-chainsurfactant increases. It is worth noting that CVC* valuesare of the same order of magnitude than those previouslyreported for di-C12DMAB + OBG, whereas the CVC forthe pure di-C10DMAB vesicles ()1.325 mM) is almost 1order of magnitude higher than that of di-C12DMAB()0.165 mM).5 It seems that the qualitative rule that statesthat the CMC is divided per 2 when the chain is enlarged
(47) Junquera, E.; Aicart, E. Rev. Sci. Instrum. 1994, 65, 2672.(48) Dubochet, J.; Adrian, M.; Chang, J. J.; Homo, J. C.; Lepault, J.;
McDowall, A. W.; Schultz, P. Q. Rev. Biophys. 1988, 21, 129.(49) Llorca, O.; McCormack, E.; Hynes, G.; Grantham, J.; Cordell,
J.; Carrascosa, J. L.; Willison, K. R.; Fernandez, J. J.; Valpuesta, J. M.Nature 1999, 402, 693.
(50) Junquera, E.; Pena, L.; Aicart, E. Langmuir 1997, 13, 219. (51) Phillips, J. N. Trans. Faraday Soc. 1955, 51, 561.
Figure 1. Specific conductivity, κ, as a function of totalsurfactant concentration, [S]tot, in the very diluted range, at298.15 K, at constant molar fraction, R1, for the mixed systemdi-C10DMAB (1) + OBG (2). The inset at the top shows the thirdderivative of conductivity with respect to concentration for R1)0. 502.
di-C10DMAB/OBG/H2O System Langmuir, Vol. 21, No. 16, 2005 7145

by a -CH2- group for single -Cn- chain surfactants52
can be also applied to double chain surfactants; thus, itcan be observed how CVC divides by 8 on going from di-C10DMAB to di-C12DMAB (a total of 4 -CH2- groups havebeen added).
Vesicle concentration domain is limited by CVC*, onthe monomers-to-mixed vesicle transition, and by theconcentration at which the mixed vesicle are disruptedand solubilized by mixed micelles, CMCtot
/ . Accordingwith the three stages model,11,32 accepted by the groupsworking on this field, we do believe that prior to this totalmixed vesicle-to-mixed micelle transition there exists aconcentration at which mixed micelles start to form, theso-called CMC*, and coexist with mixed vesicles up toCMCtot
/ . The conductivity experiments were repeated ina more concentrated range (0 < [S]tot < around 25 mM),to estimate the CMC*. The change on specific conductivityat this CMC* (vesicles-to-micelles) is expected to be small,and, consequently, more difficult to detect than CVC*(monomers-to-vesicles). Figure 3 shows the results at R1) 0.501, as an example, together with those obtained inthe highly diluted region, at R1 ) 0.502. The extremelygood agreement between the experiments done in bothranges is remarkable, confirming the reproducibility ofthe technique. Although very small, a break onκwas found(following the third derivative method previously ex-plained) at CMC* ) 12.3 mM, in agreement with CMC*found in the literature for similar ternary systems.4,5 Itseems that the presence of the double-chain surfactant,irrespective of its length, halves the CMC* with respectto the value previously obtained for pure OBG (CMC* )25.24 mM), by using different experimental techniques.53-55
This fact means that the solubilization of the cationic-nonionic vesicles, studied herein and previously,6 due tomixed micelles formation is clearly favored, reinforcingone of the well-known applications of OBG on thesolubilization and reconstitution processes of membranes.
It is also worth noting that the specific conductivity isclearly higher for either mixed vesicles or mixed micellesof di-C10DMAB/OBG than for those of di-C12DMAB/OBG,6at a given R1. This feature could be pointing to the factthat di-C10DMAB/OBG mixed aggregates show highermobilities, although other factors, such as the differenceson size and dissociation of the aggregates can affect, aswill be discussed later.
Vesicle Size and Shape. Cryo-TEM experiments wererun on a sample with pure di-C10DMAB vesicles and onsamples with mixed di-C10DMAB/OBG vesicles within aconcentration range where only mixed vesicles are present,i.e., CVC* < [S]tot < CMC*. Figures 4-6 show, as anexample, some of the micrographs obtained for the vitrifiedsamples mentioned above. As can be observed, all of themicrographs show the presence of vesicles. Pure di-C10-DMAB vesicles (Figure 4) are spherical and unilamellar,with an average diameter of about 36 nm, quite similarto pure di-C12DMAB vesicles previously reported.5 It seemsthat two C atoms per hydrocarbon surfactant chain donot affect the overall size and shape of the aggregates.Mixed di-C10DMAB/OBG vesicles (Figures 5 and 6) appearto be also spherical and mainly unilamellar, although itis noticeable a certain contribution of vesicles withonionskin structures. The averaged diameters are around90 nm at R1 ) 0.501 and [S]tot ) 8.980 mM, and around103 nm at R1 ) 0.848, [S]tot ) 2.992 mM, clearly higherthan those of vesicles consisting of pure double-chainsurfactant. However, a clear effect of R1 on the size ofmixed vesicles is not apparent. It is worth noticing thatat a given molar fraction the sizes of di-C10DMAB/OBGmixed vesicles are comparable in magnitude with thoseof di-C12DMAB/OBG mixed vesicles, but clearly smallerthan those of di-C12DMAB/C12EDMAB.5,6 Given that thesize and shape of pure vesicles consisting of double-chainsurfactants of the dialkyldimethylammonium salt seriesseems to be unaffected by the length of the surfactant,these differences on the size of mixed vesicles can only beattributed to the cationic (C12EDMAB) or nonionic (OBG)character of the counterpart. Thus, a nonionic single-chain
(52) Attwood, D.; Florence, A. T. Surfactant Systems: Their Chem-istry, Pharmacy and Biology; Chapman and Hall: London, 1983.
(53) Pastor, O.; Junquera, E.; Aicart, E. Langmuir 1998, 14, 2950.(54) del Burgo, P.; Junquera, E.; Aicart, E. Langmuir 2004, 20, 1587.(55) Lainez, A.; del Burgo, P.; Junquera, E.; Aicart, E. Langmuir
2004, 20, 5745.
Figure 2. CVC* as a function of the molar fraction, R1, for themixed system di-C10DMAB (1) + OBG (2).
Figure 3. Specific conductivity, κ, as a function of totalsurfactant concentration, [S]tot, in both the very diluted range(solid symbols, R1 ) 0.502), and the moderately diluted range(crossed symbols, R1 ) 0.501), at 298.15 K, for the mixed systemdi-C10DMAB (1) + OBG (2).
7146 Langmuir, Vol. 21, No. 16, 2005 Junquera et al.

surfactant, as OBG, decreases the electrostatic repulsionbetween the cationic polar heads of a cationic double-chain surfactant than does a cationic single-chain sur-factant, as C12EDMAB.
With respect to the shape of the aggregates, both thecontribution of the repulsive electrostatic interactionsbetween the positive charged quaternary ammoniumheads of di-C10DMAB, shielded by nonionic OBG head,and the molecular packing properties, coming from thehydrocarbon tails, must be considered. The packingparameter, P ()v/aolc), proposed by Israelachvili,33 relatesthe molecular characteristics of a surfactant molecule.The volume, ν, and the critical chain length, lc, of thehydrophobic tail, obtained according with the Tanford’smodel,56-58 the optimal headgroup area,ao, estimated fromthe aggregation number of the single-chain surfactantassuming spherical micelles,50 and P are 593.4 Å3, 14.15Å, 75 Å2, and 0.56, respectively, for di-C10DMAB. Thecorresponding parameters for OBG have been previouslyreported.6 Comparing this P with that of di-C12DMAB()0.56 in both cases),5 it can be concluded that the decreaseon the length of the tail of the double-chain surfactant (2carbon atoms per chain, on going from di-C12DMAB todi-C10DMAB) does not affect to the packing parameter,that is compatible with a vesicle, as the optimal aggregate.On the other hand, the globular shape of pure OBGmicelles6 is consistent with a P ) 0.35 for OBG. Thesetheoretical results are in agreement with the cryo-TEMexperiments reported herein and with fluorescence datareported in a previous paper.53 An effective packing
parameter can be defined as follows, in the case of mixedaggregates:
where Xiagg is the molar fraction in the aggregate.
Effective packing parameters, calculated with eq 1, showa gradual decrease from 0.56 of the pure di-C10DMABvesicles to 0.35 of the pure OBG globular micelles, as wouldbe expected. The presence of only mixed vesicles, or onlymixed micelles, or coexistence of both, depends very muchon both R1 and [S]tot. For example, at R1 ) 0.5, Peffectiveresults 0.54 at [S]tot ) 15 mM, 0.51 at [S]tot ) 26 mM, 0.49at [S]tot ) 36 mM, and 0.48 at [S]tot ) 46 mM. Consideringthat CVC* ) 2.426 mM and CMC* ) 12.3 mM at R1 ) 0.5,and keeping in mind the characteristic values of P forglobular micelles (0.33 < P < 0.50) and/or vesicles (0.50< P < 1), the resulting Peffective indicate that there existsa concentration range, above CMC*, within mixed vesiclesand mixed micelles coexist prior to the total disruptionand solubilization of the vesicles at higher concentrations,as proposed in a former section (see Figure 3). In addition,it is worth noting the gradual change of Peffective, as [S]totincreases, justifying the gradual change on the specificconductivity found in this region of coexistence of bothtypes of aggregates (see Figure 3). However, at higher R1,for example R1 ) 0.85, the resulting Peffective are all higherthan 0.50, independently of [S]tot and even at high [S]totconcentrations (for example, Peffective ) 0.55 at [S]tot ) 40mM and even Peffective ) 0.54 at [S]tot ) 100 mM), which
(56) Tanford, C. J. Phys. Chem. 1972, 76, 3020.(57) Tanford, C. J. Phys. Chem. 1974, 78, 2469.(58) Tanford, C. The Hydrophobic Effect: Formation of Micelles and
Biological Membranes; Wiley & Sons: New York, 1980.
Figure 4. cryo-TEM photographies of a di-C10DMAB solution containing pure vesicles (R1 ) 1) at [S]tot ) 2.935 mM.
Figure 5. cryo-TEM photographies of a di-C10DMAB/OBG solution containing mixed vesicles at R1 ) 0.501 and [S]tot ) 8.980 mM.
Figure 6. cryo-TEM photographies of a di-C10DMAB/OBG solution containing mixed vesicles at R1 ) 0.848 and [S]tot ) 2.992 mM.
Peffective ) ( v
aolc)
effective
)
∑i
viXiagg
∑i
ao,iXiagg∑
i
lc,iXiagg
(1)
di-C10DMAB/OBG/H2O System Langmuir, Vol. 21, No. 16, 2005 7147

means that for high contents of the double-chain surfac-tants, mixed vesicles are always present. This featurereveals that, up to moderate concentrations, the existenceof the four concentration domains: i) mixture of monomers([S]tot < CVC*), ii) mixed vesicles (CVC* < [S]tot < CMC*),iii) mixed vesicles + mixed micelles (CMC* < [S]tot <CMCtot
/ ), and iv) mixed micelles ([S]tot > CMCtot/ ), is very
much dependent on R1.These results are in agreement with the mixed ag-
gregation behavior experimentally found in this work inthe vesicle domain. Furthermore, a cryo-TEM experimentwas run in the expected micelles domain, for a solutionof di-C10DMAB/OBG at R1 ) 0.502 and [S]tot ) 38 mM,well above the CMC*. Mixed vesicles could not bevisualized in any of the micrographs, confirming that atsuch concentration all of the vesicles have been solubilizedby the mixed micelles, in concordance with the theoreticalpredictions (Peffective ) 0.49).
Vesicle Surface. The charged outer surface of pureand mixed vesicles has been studied via electrophoreticmobility measurements. Figure 7 shows, as an example,the electrophoretic spectrum for a vesicle solution at R1) 0.848 and [S]tot ) 9.772 mM (CVC* ) 1.511 mM); theexperimental peaks, with an optimum and uniform width,lead an average electrophoretic mobility of (5.42 ( 0.05)× 10-8 m2 s-1 V-1. ú-Potentials can be obtained from theseexperimental electrophoretic mobilities, µE, by using theHenry equation.35,59 The Henry function, f(κDa), whichappears in this equation, is usually calculated for sphericalparticles by using the approximations given by34,60
where κD and a are the Debye length reciprocal and theparticle radius, respectively.
Figure 8 shows a plot of f(κDa) values61 vs (κDa), togetherwith those calculated with eqs 2 and 3 for (κDa < 1) and(8 < κDa < 30), respectively. It is worth noticing that (i)the abovementioned validity limits of eqs 2 and 3 areincorrect; eq 2 can be applied with a reasonably accuracyonly for κDa < 0.5 and eq 3 would be valid only for κDa >25; and (ii) neither eq 2 nor eq 3 can be used for sphericalparticles for which κDa falls within the range 0.5 < κDa< 25. However, in most published studies, as is also thecase of the vesicle aqueous solutions studied herein, thisis, in fact, the experimental κDa range. This feature wasalready pointed out by Henry,34 who recommended to usean interpolation formula, given that there is a hiatus inthe course of calculations of f(κDa).
At this respect, we have used in this work the expressionderived by Ohshima34 for the Henry function, f(κDa),(relative errors less than 1%) to improve the calculationsof zeta potentials from electrophoretic mobilities (dashedline in Figure 8)
The Ohshima fit gives very good results in the full κDarange, and specially, as can be observed in the figure, for0 < κDa < 25, which is the range of ionic strength and sizeof our vesicle solutions. Table 1 reports κDa, f(κDa) andú-potential calculated at several molar fractions, R1, forsolutions that contain mixed di-C10DMAB/OBG vesicles.In these calculations, a values were taken from cryo-TEMdata. Notice that ú-potential is almost constant with R1,around (80 ( 5) mV, within the experimental error,although a slight decrease could be pointed as long as thecontent of the ionic double-chain surfactant, di-C10DMAB,increases.
(59) Delgado, A. V. Interfacial Electrokinetics and Electrophoresis;Marcel Dekker: New York, 2002; Vol. 106.
(60) Hunter, R. J. Zeta Potential in Colloids Science. Principles andApplications; Academic Presss: London, 1981.
(61) Abramson, H. A.; Moyer, L. S.; Gorin, M. H. Electrophoresis ofProteins; Reinhold: New York, 1942.
Figure 7. Intensities vs electrophoretic mobility for a vesiclesolution of the mixed system di-C10DMAB (1) + OBG (2), at R1) 0.878 and [S]tot ) 9.772 mM
f(κDa) ) 1 +(κDa)2
16- 5
(κDa)3
48-
(κDa)4
96(for spheres with κDa < 1) (2)
f(κDa) ) 32
- 92(κDa)
+ 752(κDa)2
- 330(κDa)3
(for spheres with κDa > 1) (3)
Figure 8. Henry function f(κDa) vs κDa: 0, tabulated values;b, data from eq 2; 2, data from eq 3; and dashed line accordingto eq 4.
f(κa) ) 23[1 + 1
2(1 + 2.5κa(1 + 2e-κa))3] (4)
7148 Langmuir, Vol. 21, No. 16, 2005 Junquera et al.

The surface charge density enclosed by the shear plane,σú, can be calculated, assuming a Gouy-Chapman doublelayer, by using the equation62
where e is the elemental charge, z is the valence of the ion,kB is the Boltzmann constant, and T is the absolutetemperature. Figure 9 shows σú, calculated with eq 5, asa function of R1, together with σú for di-C12DMAB/OBGvesicles,6 whose ú-potential have been also corrected byeq 4. An average value of (19 ( 4) × 10-3 C m-2 has beenobtained, almost constant with R1 within the experimentaluncertainty of ú-potential measurements. A comparableresult ((14 ( 4) × 10-3 C m-2) has been found for di-C12-DMAB/OBG vesicles. Comparing these σú with thosereported for the cationic-cationic system di-C12DMAB +C12EDMAB,5 also corrected, (σú ) (9 ( 2) × 10-3 C m-2),it can be concluded that nonionic OBG molecules shieldthe electrostatic repulsion between the cationic quaternaryammonium heads, thus stabilizing the aggregates, in-creasing the counterion dissociation degree, and, accord-ingly, ú-potential and σú. This fact would also explain (i)
the slight decrease on zeta potential as long as R1 increases,observed in Table 1; and (ii) the higher conductivitiesobserved at a certain R1 for the system studied in thiswork, compared with those of previous works.
Aggregates Microenvironments. The structure andmorphology of di-C10DMAB/OBG mixed aggregates hasbeen analyzed by measuring the fluorescent emission oftwo probes: one anionic, such as TNS, and the other onenonionic, such as PRODAN. Both emit weakly in waterbut exhibit intense fluorescence upon binding to amacromolecule or membrane surface.36,40 The net chargeof the surface assembly is a key factor on the emissionfeatures; thus, in the case of positively charged surfaces,as the di-C10DMAB/OBG system of this work, anionic TNSis not repelled and surfactant-TNS interactions allowthe probe to be located in a more water-restrictedenvironment, thus enhancing the fluorescence quantumyield. On the other hand, the nonionic character ofPRODAN allows for supplying information either of ionicor nonionic aggregates.
It is known36 that the ground states of the fluorescentprobes used in this work, which are characterized bypossessing a naphthalene ring and a phenyl ring (TNS)or a dimethylamino moiety (PRODAN) in their molecules,yield, upon excitation, a locally excited state (LE) (via πf π* electronic transition). However, there exists muchcontroversy in the past decade regarding the existence ofother excited states, and the mechanism by which theseexcited states are formed and deactivated. Some groupspropose that an intramolecular charge-transfer excitedstate is formed, characterized by the coplanar orientationof the rings (ICT state),46,63-68 whereas others point to anintramolecular charge-transfer excited state (TICTstate),45,69-71 with a characteristic twist around the NHmoiety to achieve a perpendicular configuration betweenthe naphthalene ring and phenyl ring (TNS) or dimethy-lamino moiety (PRODAN). In either case, the transfer ofnitrogen lone pair to the sulfonate (TNS) or acetylsubstituents (PRODAN) of the naphthyl ring, is stabilizedin polar media.36,40 Recently, an TICT state has beenproposed by Zewail et al.,39 from femtosecond studies, forthe emission of TNS in water, whereas only the classic LEstate is found for TNS immersed in supramolecularassemblies, such as CTAB micelles.
This photophysical scheme, however, has been ques-tioned, mainly in supramolecular assemblies.41,42,72-74 Inanother approach, the emission band of this type offluorescent probes is believed to consist of different peaksor emission components at different wavelength that canbe attributed to a series of microenvironments where theprobe may be housed, each microenvironment having
(62) Loeb, A. L.; Overbeek, J. T. G.; Wiersema, P. H. The ElectricalDouble Layer Around a Spherical Colloid Particle; MIT Press: Cam-bridge, MA, 1961.
(63) Zachariasse, K. A.; van der Haar, T.; Hebecker, A.; Leinhos, U.;Kiihnle, W. Pure Appl. Chem. 1993, 65, 1745.
(64) Zachariasse, K. A.; Grobys, M.; van der Haar, T.; Hebecker, A.;Il’ichev, Y. V.; Morawski, O.; Riicker, I.; Kiihnle, W. J. Photochem.Photobiol. A: Chem. 1997, 105, 373.
(65) Kawski, A. Z. Naturforsch. 1999, 54, 379.(66) Il’ichev, Y. V.; Kuhnle, W.; Zachariasse, K. A. J. Phys. Chem. A
1998, 102, 5670.(67) Zachariasse, K. A. Chem. Phys. Lett. 2000, 320, 8.(68) Zachariasse, K. A.; Druzhinin, S. I.; Bosch, W.; Machinek, R. J.
Am. Chem. Soc. 2004, 126, 1705.(69) Grabowski, Z. R.; Rotkiewicz, K.; Siemiarexuk, A.; Cowley, D.
J.; Baumann, W. Nouv. J. Chim. 1979, 3, 443.(70) Rettig, W.; Bliss, B.; Dirnberger, K. Chem. Phys. Lett. 1999, 317,
187.(71) Jodicke, C. J.; Luthi, H. P. J. Am. Chem. Soc. 2002, 125, 252.(72) Asakawa, T.; Mouri, M.; Miyagishi, S.; Nishida, M. Langmuir
1989, 5, 343.(73) Manoj, K. M.; Jayakumar, R.; Rakshit, S. K. Langmuir 1996,
12, 4068.(74) Mandal, D.; Pal, S. K.; Datta, A.; Bhattacharyya, K. Anal. Sci.
1998, 14, 199.
Table 1. Values of CVC*, KDa, f(KDa) and ú at SeveralMolar Fractions, r1, and Total Surfactant Concentration,
[S]tot, of the Mixed System di-C10DMAB (1) + OBG (2)
R1
[S]tot(mM)
CVC*(mM)
[S]1(mM) κDa f(κDa)
úa
(mV)
0.401 6.076 2.807 2.434 7.0 1.19 860.649 7.890 1.885 5.124 11.2 1.26 800.749 9.788 1.735 7.331 13.9 1.30 830.749 6.116 1.735 4.581 11.0 1.26 810.848 9.772 1.511 8.284 15.4 1.31 761.000 2.427 1.325 2.427 2.9 1.09 73
a Error is estimated to be 6%.
Figure 9. Surface charge density, σú, as a function of molarfraction, R1, for various [S]tot concentrations of the mixedsystems: open squares, di-C10DMAB (1) + OBG (2), and solidsquares, di-C12DMAB (1) + OBG (2).
σú )2ε0εrκDkBT
ze [sinh ( zeú2kBT) + 2
κDatanh ( zeú
4kBT)] (5)
di-C10DMAB/OBG/H2O System Langmuir, Vol. 21, No. 16, 2005 7149
different hydrophobicity, microviscosity, rigidity, and/orsolvation characteristics. Accordingly, this approachinterprets the overall emission of the probe by deconvo-luting the band into the optimum number of reproducibleoverlapping curves, and assigning them to different probemicroenvironments, this assignment being based on theirexpected and/or known properties. This is, in fact, ourapproach in the present work.
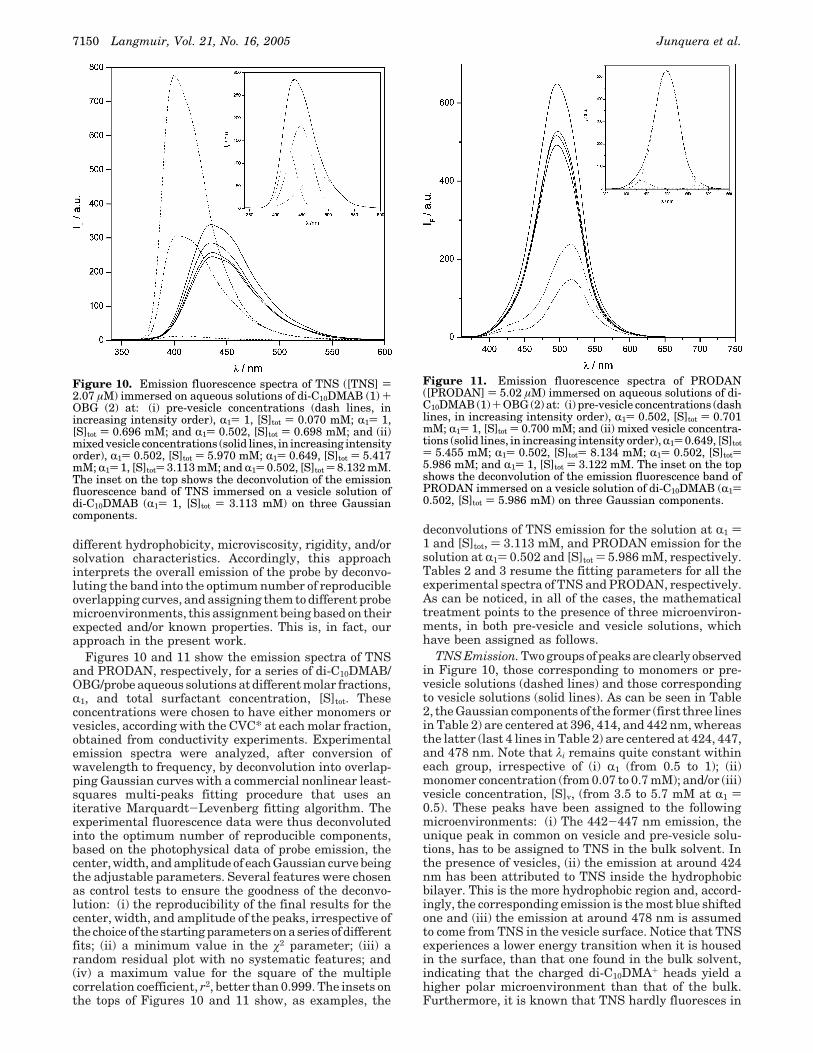
Figures 10 and 11 show the emission spectra of TNSand PRODAN, respectively, for a series of di-C10DMAB/OBG/probe aqueous solutions at different molar fractions,R1, and total surfactant concentration, [S]tot. Theseconcentrations were chosen to have either monomers orvesicles, according with the CVC* at each molar fraction,obtained from conductivity experiments. Experimentalemission spectra were analyzed, after conversion ofwavelength to frequency, by deconvolution into overlap-ping Gaussian curves with a commercial nonlinear least-squares multi-peaks fitting procedure that uses aniterative Marquardt-Levenberg fitting algorithm. Theexperimental fluorescence data were thus deconvolutedinto the optimum number of reproducible components,based on the photophysical data of probe emission, thecenter, width, and amplitude of each Gaussian curve beingthe adjustable parameters. Several features were chosenas control tests to ensure the goodness of the deconvo-lution: (i) the reproducibility of the final results for thecenter, width, and amplitude of the peaks, irrespective ofthe choice of the starting parameters on a series of differentfits; (ii) a minimum value in the ø2 parameter; (iii) arandom residual plot with no systematic features; and(iv) a maximum value for the square of the multiplecorrelation coefficient, r2, better than 0.999. The insets onthe tops of Figures 10 and 11 show, as examples, the
deconvolutions of TNS emission for the solution at R1 )1 and [S]tot, ) 3.113 mM, and PRODAN emission for thesolution at R1) 0.502 and [S]tot ) 5.986 mM, respectively.Tables 2 and 3 resume the fitting parameters for all theexperimental spectra of TNS and PRODAN, respectively.As can be noticed, in all of the cases, the mathematicaltreatment points to the presence of three microenviron-ments, in both pre-vesicle and vesicle solutions, whichhave been assigned as follows.
TNS Emission. Two groups of peaks are clearly observedin Figure 10, those corresponding to monomers or pre-vesicle solutions (dashed lines) and those correspondingto vesicle solutions (solid lines). As can be seen in Table2, the Gaussian components of the former (first three linesin Table 2) are centered at 396, 414, and 442 nm, whereasthe latter (last 4 lines in Table 2) are centered at 424, 447,and 478 nm. Note that λi remains quite constant withineach group, irrespective of (i) R1 (from 0.5 to 1); (ii)monomer concentration (from 0.07 to 0.7 mM); and/or (iii)vesicle concentration, [S]v, (from 3.5 to 5.7 mM at R1 )0.5). These peaks have been assigned to the followingmicroenvironments: (i) The 442-447 nm emission, theunique peak in common on vesicle and pre-vesicle solu-tions, has to be assigned to TNS in the bulk solvent. Inthe presence of vesicles, (ii) the emission at around 424nm has been attributed to TNS inside the hydrophobicbilayer. This is the more hydrophobic region and, accord-ingly, the corresponding emission is the most blue shiftedone and (iii) the emission at around 478 nm is assumedto come from TNS in the vesicle surface. Notice that TNSexperiences a lower energy transition when it is housedin the surface, than that one found in the bulk solvent,indicating that the charged di-C10DMA+ heads yield ahigher polar microenvironment than that of the bulk.Furthermore, it is known that TNS hardly fluoresces in
Figure 10. Emission fluorescence spectra of TNS ([TNS] )2.07 µM) immersed on aqueous solutions of di-C10DMAB (1) +OBG (2) at: (i) pre-vesicle concentrations (dash lines, inincreasing intensity order), R1) 1, [S]tot ) 0.070 mM; R1) 1,[S]tot ) 0.696 mM; and R1) 0.502, [S]tot ) 0.698 mM; and (ii)mixed vesicle concentrations (solid lines, in increasing intensityorder), R1) 0.502, [S]tot ) 5.970 mM; R1) 0.649, [S]tot ) 5.417mM; R1) 1, [S]tot) 3.113 mM; and R1) 0.502, [S]tot ) 8.132 mM.The inset on the top shows the deconvolution of the emissionfluorescence band of TNS immersed on a vesicle solution ofdi-C10DMAB (R1) 1, [S]tot ) 3.113 mM) on three Gaussiancomponents.
Figure 11. Emission fluorescence spectra of PRODAN([PRODAN] ) 5.02 µM) immersed on aqueous solutions of di-C10DMAB (1) + OBG (2) at: (i) pre-vesicle concentrations (dashlines, in increasing intensity order), R1) 0.502, [S]tot ) 0.701mM; R1) 1, [S]tot ) 0.700 mM; and (ii) mixed vesicle concentra-tions (solid lines, in increasing intensity order), R1) 0.649, [S]tot) 5.455 mM; R1) 0.502, [S]tot) 8.134 mM; R1) 0.502, [S]tot)5.986 mM; and R1) 1, [S]tot ) 3.122 mM. The inset on the topshows the deconvolution of the emission fluorescence band ofPRODAN immersed on a vesicle solution of di-C10DMAB (R1)0.502, [S]tot ) 5.986 mM) on three Gaussian components.
7150 Langmuir, Vol. 21, No. 16, 2005 Junquera et al.

water, but it does in aqueous solutions with small amountsof surfactant (below CVC or CMC).37 It means that inpre-vesicle solutions, part of TNS must be within envi-ronments with less polarity than water. Based on that,the other two peaks on the spectra for pre-vesicle solutionshave been assigned as follows: (iv) the emission at around396 nm could be attributed to TNS housed within clustersformed by the di-C10DMA+ and OBG monomers. Theseclusters should be characterized by a rigid hydrophobiccavity, which would result in an intense blue shiftedtransition with respect to that found in the bulk.37 (v) Wesuggest two possibilities for the peak at around 414 nm:the formation of ion-pair complexes, as suggested by someother authors,75 or the presence of certain microdomainsin the solution, that must be more loose than the previouscommented hydrophobic cavity, since this microenviron-ment should be more polar than that rigid hydrophobiccavity but less polar than the bulk solvent. Actually, wereported in a previous work the formation of nanoaggre-gates, prior to the CVC*,6 in a similar mixed surfactantsystem. Accordingly, other authors37,75 suggest that theassociation of the fluorescent probe with, for example,monomers or clusters of surfactant in aqueous media couldbe the responsible for the emission observed at concentra-tions below the CMC.
The previous λi assignment is consistent with the nextfeatures also resumed in Table 2: (i) at constant R1, Imaxincreases with [S]tot in pre-vesicle solutions (R1 ) 1), andwith [S]v in vesicles solutions (R1 ) 0.502), indicating that,as surfactant concentration increases, the probe is locatedin less polar environments; (ii) Imax remains constant atdifferent R1 () 0.502 and 0.649) and constant [S]v () 3.5mM), confirming that vesicle concentration is the factorthat mainly governs the intensity of the peak; (iii) in theabsence of vesicles, when the surfactant concentration isextremely low, Imax also results the lowest, but increasesdramatically with surfactant concentration. Furthermore,at constant [S]tot ) 0.7 mM (below CVC*), Imax decreaseswith R1, which clearly indicates that OBG has a partici-pation in the microenvironments by creating, togetherwith di-C10DMA+, a more hydrophobic region than thatformed by di-C10DMA+ alone. In conclusion, the micropo-larity that TNS experiments within the microdomainsbelow CVC* is lower than that one found within the
vesicles, this fact producing a blue shift of the spectrawith respect to the spectra obtained when vesicles arepresent. These features, not expected to be found in thepre-vesicle region, in principle, are in agreement withprevious results obtained by other authors37 for TNS insurfactant solutions of C16TAB.
PRODAN Emission. Accordingly, two groups of peakscan be also observed in Figure 11, where emission spectraof PRODAN in aqueous solutions of the di-C10DMAB/OBGsystem are shown: those corresponding to pre-vesiclesolutions (dashed lines) and those corresponding to vesiclesolutions (solid lines). The Gaussian components obtainedfor pre-vesicle solutions (first 2 lines in Table 3) arecentered at 460, 515, and 576 nm, whereas those for vesiclesolutions (last 4 lines in Table 3) are centered at 434, 498,and 578 nm. Again, λi remains quite constant within eachgroup of spectra, irrespective of the composition, R1, of thesystem (from 0.5 to 1) and/or vesicle concentration, [S]v,(from 3.5 to 5.7 mM at R1 ) 0.502). The peaks of PRODANhave been assigned as follows: (i) the emission at around578 nm, the unique peak in common on vesicle and pre-vesicle solutions, has been assigned to PRODAN in thebulk solvent. In the presence of vesicles: (ii) the emissionat around 434 nm has been attributed to PRODAN insidethe hydrophobic bilayer; and (iii) the emission at around498 nm is assumed to come from PRODAN in the vesiclesurface. It is worth noticing that the emission of PRODANfrom the vesicle surface is blue shifted with respect tothat from the bulk, in contrast with the behavior previouslypresented for TNS. It can only be due to the characteristicsof the probe, since the vesicle surface is the same,irrespective of the probe. In pre-vesicle solutions, theassignment of the other two peaks is similar to thatproposed for TNS: (iv) the emission at around 460 nmhas been also attributed to PRODAN immersed withinclusters formed by the di-C10DMA+ and OBG monomersand (v) the peak at around 515 nm has been attributedto the loose microdomains previously referred for TNS,since the formation of ion-pair complexes is not possiblein this case, given the nonionic character of PRODAN.
The previous λi assignment is consistent with the nextfeatures also resumed in Table 3: (i) at constant R1, Imaxremains roughly constant with increasing [S]v in thevesicles domain, which can be explained if the probe isalmost totally immersed in the vesicle; (ii) at constant[S]v () 3.6 mM), Imax decreases with R1 varying from 0.502and 0.649; (iii) in the absence of vesicles, Imax is lower
(75) Karukstis, K. K.; Savin, D. A.; Loftus, C. T.; D’Angelo, N. D. J.Colloid Interface Sci. 1998, 203, 157.
Table 2. Parameters of the Deconvoluted Gaussian Components of the TNS Fluorescence Emission Spectra at VariousMolar Fractions, r1, and Total Surfactant Concentrations, [S]tot of the Mixed System di-C10DMAB (1) + OBG (2):
Wavelength λι, Width Wi, and Area Ai in Terms of % Contribution to the Overall Fluorescence Emission Area
R1 [S]tot (mM) CVC* (mM) [S]v (mM) λmax (nm) Imax λ1 (nm) A1 % W1 λ2 (nm) A2 % W2 λ3 (nm) A3 % W3 r2
0.502 0.698 2.426 396.0 802.6 395.4 22.4 16 412.3 45.9 28 436.9 31.7 47 0.99931 0.070 1.325 416.1 11.5 397.1 17.7 20 414.5 49.4 33 445.3 32.8 59 0.99861 0.696 1.325 401.5 314.1 396.3 17.3 17 415.1 42.5 31 443.9 40.2 54 0.99850.502 5.970 2.426 3.544 436.0 257.9 424.4 15.3 29 445.5 49.3 45 476.3 35.4 73 0.99980.502 8.132 2.426 5.706 433.0 352.1 423.8 21.7 30 447.2 46.4 43 478.8 31.8 67 0.99990.649 5.417 1.885 3.532 435.1 263.1 424.3 24.9 31 448.4 43.2 42 479.2 31.9 66 0.99991 3.113 1.325 1.788 436.5 292.9 424.0 23.6 31 447.4 47.2 43 479.7 29.2 66 0.9999
Table 3. Parameters of the Deconvoluted Gaussian Components of the PRODAN Fluorescence Emission Spectra atVarious Molar Fractions, r1, and Total Surfactant Concentrations, [S]tot of the Mixed System di-C10DMAB (1) + OBG (2):
Wavelength λι, Width Wi, and Area Ai in Terms of % Contribution to the Overall Fluorescence Emission Area
R1 [S]tot (mM) CVC* (mM) [S]v (mM) λmax (nm) Imax λ1 (nm) A1 % W1 λ2 (nm) A2 % W2 λ3 (nm) A3 % W3 r2
0.502 0.701 2.426 515.9 151.6 459.8 10.2 54 514.9 85.0 50 576.6 4.8 35 0.99921 0.700 1.325 514.5 247.0 459.6 20.0 66 514.7 75.5 49 576.0 4.6 36 0.99930.502 5.986 2.426 3.560 494.6 538.2 433.6 4.8 43 498.8 93.5 58 577.4 1.7 31 0.99970.502 8.134 2.426 5.708 493.4 525.6 432.0 5.1 40 497.8 93.3 59 578.6 1.5 30 0.99970.649 5.455 1.885 3.570 497.9 502.3 432.8 4.9 42 497.8 93.6 59 578.0 1.5 30 0.99971 3.123 1.325 1.796 495.1 664.8 440.2 6.8 51 498.7 91.6 59 578.9 1.6 30 0.9996
di-C10DMAB/OBG/H2O System Langmuir, Vol. 21, No. 16, 2005 7151

than that in its presence, irrespective of R1, whereas atconstant [S]tot ) 0.7 mM (below CVC*), Imax increases withR1, which indicates that, in contrast with what we havefound for TNS, in the case of PRODAN, the OBG is notthe main responsible of the hidrophobicity of the micro-domains. In conclusion, the micropolarity that PRODANexperiments in the microdomains below CVC* is slightlyhigher than that felt within the vesicles, this fact producinga red shift of the spectra compared with those obtainedin the presence of vesicles.
The global picture of results obtained from the emissionspectra of TNS and PRODAN indicates that both probesare predominantly solubilized within the vesicles (noticein Tables 2 and 3 that (A1 + A3) > A2 for TNS and (A1 +A2) > A3 for PRODAN, where Ai are the areas of thedeconvoluted bands in terms of % contribution to theoverall fluorescence emission area). Nevertheless, theanionic TNS remains within the bulk solvent up toconsiderable extent (A2 is about 45% of the total fluores-cence), whereas the nonionic PRODAN are almost totallyhoused within the vesicles (A3 is very low). Anotherinteresting aspect is that both probes are solubilizedmainly within the vesicle surface (A3 > A1 for TNS andA2 > A1 for PRODAN). In fact, in the case of PRODAN,it seems that almost all of the probe is solubilized in thepalisade layer of the vesicle, since A2 is around 93% of thetotal fluorescence (A2 . A1 + A3). This fact, usually foundfor both vesicle and micelles aggregates,8,36,76 confirmsthat the solubilization of fluorescent probes, which areusually globular molecules, within the hydrophobic coreof the aggregate may be sterically hindered.
Once the Gaussian components of the emission spectraof TNS and PRODAN have been assigned to different
vesicle (hydrophobic core and/or surface) and pre-vesicle(clusters and/or nanoaggregates) microenvironments ofdifferent polarity, and using the reported λmax of bothprobes in a series of pure solvents of known dielectricconstant,40,77 several conclusions can be remarked: (i) theresults obtained in the case of TNS indicate that thehydrophobic core (λ1 ) 424 nm) presents a polarity similarto that of n-propanol (ε ) 21), whereas the vesicle surface(λ1 ) 478 nm) resembles an ethylenglycol environment (ε) 41.4); and (ii) the results obtained from PRODAN spectrareveal an hydrophobic core similar to THF (ε ) 7.4) orCHCl3 (ε ) 4.8) environments and a palisade with apolarity similar to that of ethanol (ε ) 24). Given that thevesicles are the same in both cases, these results point tothe fact that PRODAN is located deeper in the hydrophobiccore than TNS, and furthermore, it selects zones of vesiclesurface richer on nonionic OBG than its anionic coun-terpart (TNS) does. However, conclusions regarding theeffect of the composition of the system, R1, on the polarityof the different microenvironments are speculative, sincethe spectroscopic parameters within each microenviron-ment do not change almost with R1. This feature isconsistent with the facts that size, zeta potential, andcharge density do not seem to be affected by the composi-tion.
Acknowledgment. The authors thank the SpanishMinistry of Education, Project No. BQU2002-586. J.B.thanks MEC of Spain (Project No. SAF2002-01715) forsupporting cryo-TEM measurements. The authors alsothank to O. Llorca for assistance on cryo-TEM experi-ments.
LA050701F
(76) Zana, R. Surfactant Solutions: New Methods of Investigation;Marcel Dekker Inc.: New York, 1987.
(77) Lide, D. R. CRC Handbook of Chemistry and Physics; CRCPress: Boca Raton, FL, 2004.
7152 Langmuir, Vol. 21, No. 16, 2005 Junquera et al.