Selecting the Best of Us? Politician Quality in Village Councils ...
65
Chaudhuri, Ananish; Iversen, Vegard; Jensenius, Francesca R.; Maitra, Pushkar Working Paper Selecting the Best of Us? Politician Quality in Village Councils in West Bengal, India CESifo Working Paper, No. 8597 Provided in Cooperation with: Ifo Institute – Leibniz Institute for Economic Research at the University of Munich Suggested Citation: Chaudhuri, Ananish; Iversen, Vegard; Jensenius, Francesca R.; Maitra, Pushkar (2020) : Selecting the Best of Us? Politician Quality in Village Councils in West Bengal, India, CESifo Working Paper, No. 8597, Center for Economic Studies and Ifo Institute (CESifo), Munich This Version is available at: http://hdl.handle.net/10419/226299 Standard-Nutzungsbedingungen: Die Dokumente auf EconStor dürfen zu eigenen wissenschaftlichen Zwecken und zum Privatgebrauch gespeichert und kopiert werden. Sie dürfen die Dokumente nicht für öffentliche oder kommerzielle Zwecke vervielfältigen, öffentlich ausstellen, öffentlich zugänglich machen, vertreiben oder anderweitig nutzen. Sofern die Verfasser die Dokumente unter Open-Content-Lizenzen (insbesondere CC-Lizenzen) zur Verfügung gestellt haben sollten, gelten abweichend von diesen Nutzungsbedingungen die in der dort genannten Lizenz gewährten Nutzungsrechte. Terms of use: Documents in EconStor may be saved and copied for your personal and scholarly purposes. You are not to copy documents for public or commercial purposes, to exhibit the documents publicly, to make them publicly available on the internet, or to distribute or otherwise use the documents in public. If the documents have been made available under an Open Content Licence (especially Creative Commons Licences), you may exercise further usage rights as specified in the indicated licence.
-
Upload
khangminh22 -
Category
Documents
-
view
5 -
download
0
Transcript of Selecting the Best of Us? Politician Quality in Village Councils ...

Chaudhuri, Ananish; Iversen, Vegard; Jensenius, Francesca R.; Maitra,Pushkar
Working Paper
Selecting the Best of Us? Politician Quality in VillageCouncils in West Bengal, India
CESifo Working Paper, No. 8597
Provided in Cooperation with:Ifo Institute – Leibniz Institute for Economic Research at the University of Munich
Suggested Citation: Chaudhuri, Ananish; Iversen, Vegard; Jensenius, Francesca R.; Maitra,Pushkar (2020) : Selecting the Best of Us? Politician Quality in Village Councils in West Bengal,India, CESifo Working Paper, No. 8597, Center for Economic Studies and Ifo Institute (CESifo),Munich
This Version is available at:http://hdl.handle.net/10419/226299
Standard-Nutzungsbedingungen:
Die Dokumente auf EconStor dürfen zu eigenen wissenschaftlichenZwecken und zum Privatgebrauch gespeichert und kopiert werden.
Sie dürfen die Dokumente nicht für öffentliche oder kommerzielleZwecke vervielfältigen, öffentlich ausstellen, öffentlich zugänglichmachen, vertreiben oder anderweitig nutzen.
Sofern die Verfasser die Dokumente unter Open-Content-Lizenzen(insbesondere CC-Lizenzen) zur Verfügung gestellt haben sollten,gelten abweichend von diesen Nutzungsbedingungen die in der dortgenannten Lizenz gewährten Nutzungsrechte.
Terms of use:
Documents in EconStor may be saved and copied for yourpersonal and scholarly purposes.
You are not to copy documents for public or commercialpurposes, to exhibit the documents publicly, to make thempublicly available on the internet, or to distribute or otherwiseuse the documents in public.
If the documents have been made available under an OpenContent Licence (especially Creative Commons Licences), youmay exercise further usage rights as specified in the indicatedlicence.
8597 2020
September 2020
Selecting the Best of Us? Politician Quality in Village Councils in West Bengal, India Ananish Chaudhuri, Vegard Iversen, Francesca R. Jensenius, Pushkar Maitra
Impressum:
CESifo Working Papers ISSN 2364-1428 (electronic version) Publisher and distributor: Munich Society for the Promotion of Economic Research - CESifo GmbH The international platform of Ludwigs-Maximilians University’s Center for Economic Studies and the ifo Institute Poschingerstr. 5, 81679 Munich, Germany Telephone +49 (0)89 2180-2740, Telefax +49 (0)89 2180-17845, email [email protected] Editor: Clemens Fuest https://www.cesifo.org/en/wp An electronic version of the paper may be downloaded · from the SSRN website: www.SSRN.com · from the RePEc website: www.RePEc.org · from the CESifo website: https://www.cesifo.org/en/wp

CESifo Working Paper No. 8597
Selecting the Best of Us? Politician Quality in Village Councils in West Bengal, India
Abstract
Who gets elected to political office? The negative selection hypothesis posits that the inherently dishonest run for office, expecting to earn political rent. Alternatively, the positive selection hypothesis suggests that individuals join politics to make a difference. Developing country politicians are frequently stereotyped as embodiments of the negative selection hypothesis. Using survey and experimental data covering village councils in rural West Bengal, we find that inexperienced village council politicians are less dishonest and more pro-social than ordinary citizens. Our findings also suggest that this idealism wears off with time.
JEL-Codes: C930, O120, O530, Z180.
Keywords: selection into politics, politician quality, corruption, experiments, behavioural games.
Ananish Chaudhuri
University of Auckland / New Zealand [email protected]
Vegard Iversen Natural Resources Institute (NRI)
University of Greenwich / United Kingdom [email protected]
Francesca R. Jensenius
University of Oslo / Norway [email protected]
Pushkar Maitra
Monash University / Australia [email protected]
October 2020 We gratefully acknowledge funding from the University of Auckland (Project No. 3714801), the Department Research Scheme, Monash University, and the Norwegian Research Council (Project No. 250753). IRB clearance was obtained from the University of Auckland (Approval number 019938). We wish to thank the field staff at Outline India for conducting the surveys and experiments reported here. We would also like to thank participants at numerous seminars and conferences for their excellent feedback. A non-exhaustive list includes seminars at Bangladesh Institute of Development Studies, Harvard Kennedy School, HKUST Webinar Series on Growth and Development in India, Indian Statistical Institute Kolkata, University of Massachusetts Amherst and University of Queensland as well as presentations at ESA Annual Meetings in Vancouver, Canada, ESA European Meetings in Dijon France, Australia New Zealand Workshop in Experimental Economics at Monash University, 2019, and the 29th Annual Conference on Contemporary Issues in Economic Development at Jadavpur University. We are responsible for any remaining errors.
“Politics is the last resort of scoundrels.” – George Bernard Shaw (1856–1950)
“Power tends to corrupt, and absolute power corrupts absolutely.” – Lord Acton (1834–1902)
1. Introduction
These two quotes, generally attributed to the playwright George Bernard Shaw and the
British historian, statesman, and writer John Emerich Edward Dalberg-Acton (Lord
Acton), respectively, feature prominently in popular political discourse. Yet, we often
do not pause to reflect that Shaw and Lord Acton convey two quite different perceptions
of politicians. Shaw’s view, which might be thought of as a negative selection
hypothesis, is more cynical and suggests that inherently dishonest personalities
(compared to other members of the citizenry) gravitate towards a political career—most
likely in the hopes of reaping rents from holding office. Here, socialization within
political institutions plays only a limited role. Acton’s view is more charitable, and may
be thought of as a positive selection hypothesis, where those who seek office are not
more dishonest than others (and may well be less corrupt). For him, it is the exposure to
politics that makes politicians corrupt.6
While study of corruption may be the sine qua non of much research on politics
and politicians, more recent work has addressed the broader issue of politician quality.
How do the attributes, attitudes, and behavior of those who enter politics differ from
6 Lord Acton does not specifically say that politicians are more honest than citizens, merely that they are not more dishonest. In that sense, this is a null hypothesis. Acton’s view is that socialization within politics may render dishonest even those initially committed to making a difference. To keep things simple, we take the liberty of labelling Shaw’s view the negative selection hypothesis and refer to the Actonian perspective as positive selection to contrast the latter with the former, with the caveat that positive selection implies that politicians are either no different from ordinary citizens or initially more honest. The positive selection hypothesis also does not rule out the fact that not everyone may be corrupted by the powers of office. Individual preferences and motivations for joining politics have been extensively studied in the political science literature. See, for example, Wittman (1983) and Calvert (1985).
3
those of ordinary citizens? In a review of the literature on selection into politics in
industrial countries, Dal Bó et al. (2019) suggest that data on the quality of politicians
have been wanting, and are often limited to information about education and income.
This is even more true of studies in the developing world.
We address the issue of politician quality using data from surveys and lab-in-
the-field experiments conducted in the state of West Bengal in India. Our participants
are drawn from three distinct groups: (i) inexperienced politicians who are newly (first-
time) elected to village councils known locally as Gram Panchayats (henceforth GP);
(ii) experienced politicians who have served on the village councils for at least one five-
year term in the past (these include outgoing and re-elected councilors), and (iii) regular
citizens from the same catchment area, but with no prior political experience or overt
political connections.
In addition to survey data on individual characteristics such as sex, age,
education, occupation, asset ownership, caste/religion, and family ties to politics, we
collect data from a series of incentivized experimental tasks designed to capture
preferences for altruism, fairness, trust, trustworthiness and cooperation, attitudes
towards risk, and measures of dishonesty. In our survey, we also collect data on self-
esteem and self-efficacy, to capture politicians’ self-perceived effectiveness;
perceptions of and attitudes towards politics and political institutions; and Raven’s
progressive matrices test scores, which capture cognitive ability.
To the best of our knowledge, ours is the first study to collect both extensive
survey and experimental data on the preferences, beliefs, attitudes and behavior of
actual politicians and members of the public in the same location. This allows us to
obtain a rich understanding of what sets politicians apart from the rest of the local
4
population, including any propensity towards corruption. Our study also provides an
important reference point and external validity check for prior studies on dishonesty and
corruption that rely either on naturally occurring data or on data from survey responses
and/or experimental tasks where subjects are university students and/or ordinary
citizens.
We find strong evidence in favor of the positive selection hypothesis. Compared
to ordinary citizens, inexperienced politicians (those elected to office for the first time)
emerge as not only more honest in our experimental tasks, but also more pro-social,
better educated, better-off, have higher self-esteem, higher self-efficacy, and greater
trust that political institutions do the right thing. This is consistent with findings from
Swedish politics (as discussed in Dal Bó et al. (2019)). Our data also provide evidence
to support Lord Acton’s dictum that power corrupts. Compared to inexperienced
politicians, experienced politicians emerge as more cynical about political institutions,
less pro-social, and more dishonest.
2. Literature on politician quality
The quality and behavior of politicians is of interest to economists as well as political
scientists. Much of the research in this area has operated with the implicit theoretical
assumption that office-holding is predicated on substantial monetary and non-monetary
rewards. Caselli and Morelli (2001), for example, explain how low-quality citizens have
a comparative advantage for pursuing elected office because their wages are lower than
that of high-quality citizens. A primary pull of office-holding is thus the lower
opportunity cost for the less-able candidates and the greater potential to extract rents
from being in such positions.
5
Fisman et al. (2014) analyze wealth accumulation among politicians in Indian
states purposively selected for high levels of corruption (Bihar, Madhya Pradesh,
Rajasthan, and Uttar Pradesh). Taking advantage of the public disclosure of personal
assets that is now mandatory for all candidates running for higher office in India, they
find that the average annual asset growth rate of those who won elections is
significantly higher than for those who came in second. They argue that their findings
are consistent with a rent-seeking explanation, where the scope for rent extraction
increases as politicians rise in the hierarchy. While there are pecuniary benefits to being
an office-holder, Fisman et al. (2014) are unable to say whether it is the more dishonest
persons who get elected, as there is no relevant control group of ordinary citizens.
A related set of studies has explored whether raising the salary of politicians will
attract higher-quality candidates. Besley (2004) provides weak evidence in favor of this
hypothesis, using data for U.S. governors. Drawing on data from Italian municipalities
between 1993 and 2001, Gagliarducci and Nannicini (2013) find that better-paid
politicians reduce the overall size of the government machinery by improving
efficiency. Further, they indicate that most of this gain is driven by the more competent
politicians attracted by higher wages. However, Kotakorpi and Poutvaara (2011) report
slightly different findings. They take advantage of a natural experiment where the
salaries of Finnish Members of Parliament were increased by 35% in 2000, intended to
make their salaries more competitive. Using a difference-in-differences design, with
candidates in municipal elections as control group, the salary increase was found to
increase the share of candidates with higher education—but only among female
candidates: there was no significant change for male candidates.
6
Dal Bó et al. (2019), using a rich data-set from Sweden, compared ordinary
citizens and politicians standing for municipal and parliamentary elections between
1991 and 2010. Swedish MPs (Members of Parliament) were found to have more
formal education, with higher pre-election earnings and higher cognitive ability and
leadership scores (as recorded from military enlistment tests for males, at age 18) than
the candidates who win in municipal elections—who, in turn, had more formal
education, with higher earnings and higher scores than ordinary citizens. This is
consistent with strong positive selection into office when moving from the lowest
(municipal) to the highest tier of political representation.
The Dal Bó et al. (2019) findings give rise to several questions. First, are the
drivers of selection among persons elected to office in developing countries differ
systematically from those in developed countries; second, are these drivers differ for
lower and upper tiers of political representation; and third, if yes, how can such
differences be explained.
Vaishnav (2017) argues that electoral success in India is affected less by
politician quality as defined in developed countries; rather by voter perceptions as to
how effective the candidate is. Central in the Indian context is “muscle”—whether legal
or not—and capacity to maneuver bureaucratic and other hurdles and get things done.
Vaishnav (2017) uses this concept of “effectiveness” to explain why many politicians,
perceived as corrupt and with often serious criminal records, continue to win elections
in India. Banerjee et al. (2020) theorize along similar lines as to why, in developing
country settings, persons less concerned about their moral stature are more likely to join
politics.
7
To summarize, Dal Bó et al. (2019) demonstrate the intensification of selection
on quality as one moves up the political status ladder in Sweden. In the Indian context,
Fisman et al. (2014) and Vaishnav (2017) find evidence of significant corruption among
high-level politicians. However, these studies fail to provide evidence on selection into
politics or information about the attributes and qualities of politicians at any level of
politics.
3. Study Design and procedures
We study politicians and citizens in the district of North 24 Parganas in the state of
West Bengal in eastern India. Specifically, we collected data from 31 randomly selected
GPs across 11 randomly selected blocks (sub-districts) in the district.7 Each village
council (GP) in West Bengal covers between 5 and 15 villages and is headed by a
Pradhan (village council head). GPs are responsible for identifying beneficiaries for
government anti-poverty programs, for the upkeep of local public goods, and
implementation of various developmental programs. They have little revenue-raising
capacity and are funded mainly through national and state grants. Members of the GP
are elected through universal adult franchise. A candidate for a GP seat may be
nominated by a political party or stand as an independent candidate, but must be a
resident of one of the villages within the GP that he/she represents.
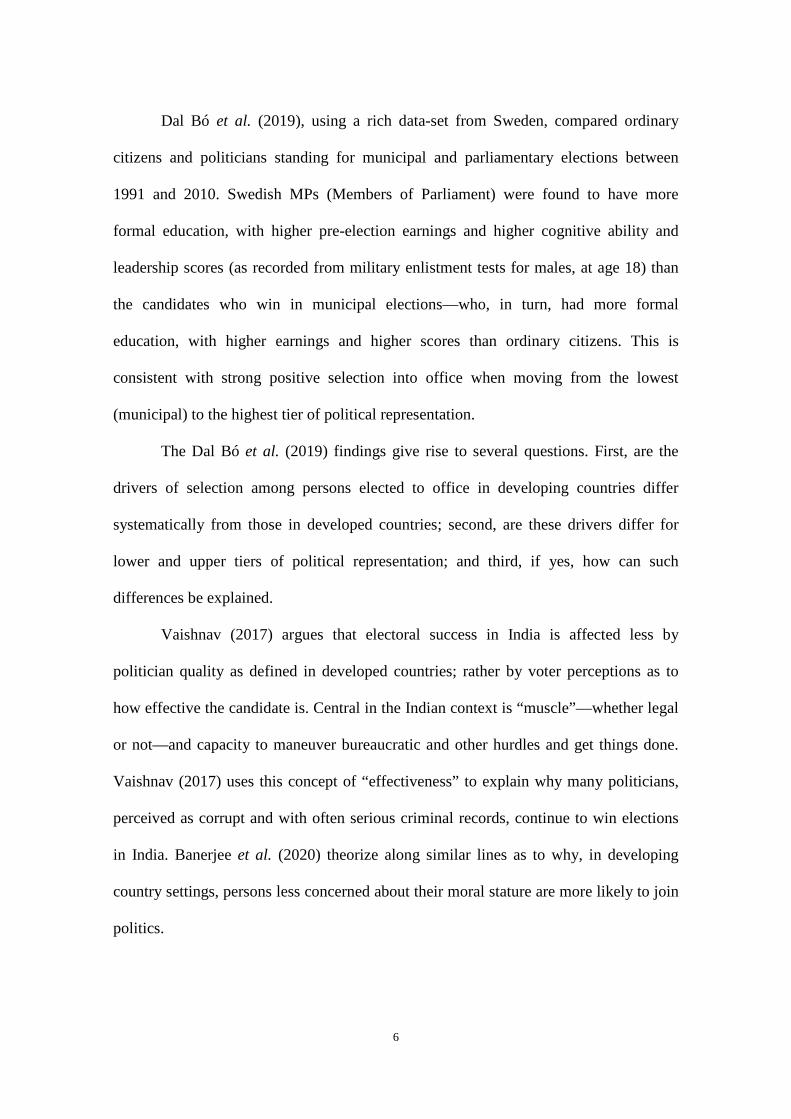
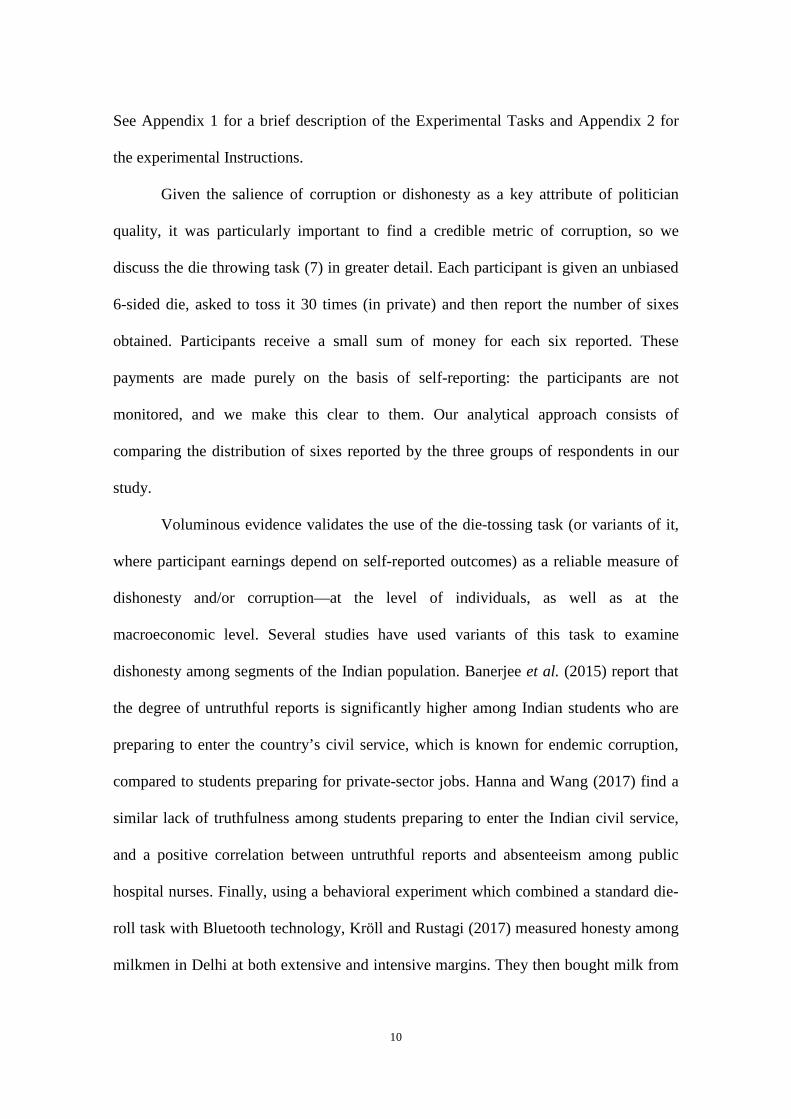
7 Figure 1 shows the location of West Bengal in India as well as the district where our fieldwork was conducted. The 11 blocks canvassed for this study are Amdanga (1), Barasat–I (1), Barasat–II (2), Basirhat–I (5), Basirhat–II (7), Deganga (2), Gaighata (5), Habra–I (3), Habra–II (2), Hingalganj (2) and Sandeshkhali–I (1). The numbers in parentheses indicate the number of GPs canvassed within each of those 11 blocks. GPs form the lowest level of the three-tiered local government system in rural India, the other two being the Panchayat Samity (block or sub-district level) and the Zila Parishad (district level). West Bengal has a population of approx. 90 million, out of which approximately 11 million persons live in North 24 Parganas, one of 23 districts that make up the state.
8
GP elections were conducted in the State of West Bengal for the first time in
1978, soon after the Left Front coalition led by the Communist Party of India (Marxist)
came to power in the State Assembly in 1977. Elections have been conducted every five
years since.8 Following the 73rd Amendment to the Indian Constitution (ratified in April
1993), seats have been reserved for the Scheduled Castes (SC) and Scheduled Tribes
(ST) according to the proportion of SCs and STs in the district and also for women.9
3.1 Design
Our sample consists of 400 elected members and 100 ordinary citizens who are
residents of the 30 GPs. To be able to compare politicians with more and less
experience, while controlling for as many other factors as possible, we sampled both
incoming and outgoing politicians in the same locations. Of the 400 politicians we
interviewed, 195 were inexperienced (elected for the first time, had never held office
before); the other 205 had prior experience with public office (44 re-elected and 161
outgoing). We call these experienced. The list of politicians to be interviewed from each
panchayat was generated randomly from data available from the Election Commission
of India. Contact with the selected politicians was established by either contacting the
Pradhan of the GP, or via the Block Development Office, which is the chief
administrative body with authority over the functioning of the GP.
8 Recently, the state of West Bengal has witnessed intense political competition between two rival political blocks: the Left Front led by the Communist Party of India (Marxist) and the All India Trinamool Congress (AITC). The Left Front held power in the West Bengal state legislature and village councils continuously from 1977 until 2011. In the state legislative assembly elections in 2011, the Left Front lost its majority, and AITC formed the state government. A similar pattern followed for the village council elections as well: up until 2013, the Left Front controlled the majority of village councils in the state. After the 2013 village council elections, most village councils have an AITC majority. 9 33% of seats were reserved for women in the 1993, 1998, 2003, and 2008 GP elections. This proportion increased to 50% in the 2013 election and remained at this level in 2018. Reservation for women was orthogonal to the caste-based reservation. We discuss the issue of reservations and how they correlate with observed outcomes in Section 4.3.3.
9
Once the list of respondents had been finalized, fieldworkers approached the
respondents and set up an appointment. Respondents could choose the time and place.
Typically, meetings with elected politicians were held in the local GP office; ordinary
citizens were usually interviewed in their homes or at another location such as a shop,
for those who ran small businesses.
West Bengal held GP elections in June 2018, but the results were not declared
until September 2018. The new councils officially took over the governance roles (and
the new Pradhan was elected from the set of elected members) in October 2018. Our
surveys and experimental sessions were conducted in September–October 2018, after
the results had been announced but before the new council had officially taken charge.
Thus, for the purposes of the current study, the inexperienced (first time elected)
politicians were truly inexperienced and had not been socialized into politics.
3.2.1 Experimental Tasks
Each session with the sampled politicians and members of the public started with the
respondents participating in a series of incentivized experiments, in order: (1) the
dictator game, which we use as a measure of generosity (Forsythe et al. (1994); (2) an
ultimatum game, which measures respondents’ notions of fairness (Güth et al. (1982));
(3) a trust game, designed to measure trust and trustworthiness (Berg et al. (1995)); (4)
a public goods games with a punishment option, to capture cooperation and norm
enforcement (Ledyard (1995), Chaudhuri (2011)); (5) an investment decision task, to
shed light on risk attitudes (Gneezy and Potters (1997)); (7) a die throwing task
designed to test for dishonesty and corruption (Fischbacher and Föllmi-Heusi (2013)).
10
See Appendix 1 for a brief description of the Experimental Tasks and Appendix 2 for
the experimental Instructions.
Given the salience of corruption or dishonesty as a key attribute of politician
quality, it was particularly important to find a credible metric of corruption, so we
discuss the die throwing task (7) in greater detail. Each participant is given an unbiased
6-sided die, asked to toss it 30 times (in private) and then report the number of sixes
obtained. Participants receive a small sum of money for each six reported. These
payments are made purely on the basis of self-reporting: the participants are not
monitored, and we make this clear to them. Our analytical approach consists of
comparing the distribution of sixes reported by the three groups of respondents in our
study.
Voluminous evidence validates the use of the die-tossing task (or variants of it,
where participant earnings depend on self-reported outcomes) as a reliable measure of
dishonesty and/or corruption—at the level of individuals, as well as at the
macroeconomic level. Several studies have used variants of this task to examine
dishonesty among segments of the Indian population. Banerjee et al. (2015) report that
the degree of untruthful reports is significantly higher among Indian students who are
preparing to enter the country’s civil service, which is known for endemic corruption,
compared to students preparing for private-sector jobs. Hanna and Wang (2017) find a
similar lack of truthfulness among students preparing to enter the Indian civil service,
and a positive correlation between untruthful reports and absenteeism among public
hospital nurses. Finally, using a behavioral experiment which combined a standard die-
roll task with Bluetooth technology, Kröll and Rustagi (2017) measured honesty among
milkmen in Delhi at both extensive and intensive margins. They then bought milk from
11
the same milkmen, and found that cheating in the field, measured by the amount of
water added to milk, was significantly and positively correlated with the milkman’s
degree of dishonesty.10
With the exception of the investment decision task and the die-throwing task
(which are individual decision-making tasks), in all the other tasks, participants play
both roles of first mover and second mover.11 For all of the paired games, we rely on the
strategy method for eliciting responses. This implies that all interactions are carried out
on a one-on-one basis between the enumerator and the participant. Once all responses
have been recorded, we match participants ex-post. We first decide, by a coin toss,
whether a given participant will be paid for the first mover role or the second mover
role. We then match the set of first movers with the set of second movers, to determine
cash payments. Participants do not know whom they will be matched with: a politician
could be matched with another politician or with an ordinary citizen. Respondents are
matched across GPs; participants are not informed about their earnings in-between
tasks, to ensure that there are no potential wealth effects. On average, the participants
earned Rs. 800.12
10 For similar evidence connecting behavior in the die-tossing task (or variants thereof) with other measures of corruption/dishonesty in other countries, see Dai et al. (2017), Cohn et al. (2014), Cohn et al. (2015), Cohn and Maréchal (2019). Gächter and Schulz (2016) and Olsen et al. (2019) have conducted cross-sectional studies to examine how behaviour in the die-tossing task is correlated with country-level measures of corruption such as the Corruptions Perceptions Index. They find that citizens of more (less) corrupt countries tend to be less (more) truthful in reporting their die-tossing task. 11 In the dictator game, whereas the second mover has no decision to make, there is one pairing where the participant makes the allocation decision, while in another pairing the participant is the passive recipient. 12 This is equivalent to approx. USD $37 using the PPP exchange rate available at https://data.oecd.org/conversion/purchasing-power-parities-ppp.htm. As of 2018, elected GP members in West Bengal are paid a monthly stipend of Rs. 1000. For the GP councillors who participated in our experimental sessions, earnings were therefore close to a month’s regular stipend.
12
3.2.2 Our survey data
Upon completion of the experimental part, we administered an extensive post-
experiment survey to elicit information on (i) demographic and socio-economic
characteristics of the participants and their households; (ii) self-efficacy; (iii) self-
esteem (or self-confidence);13 (iv) political aspirations; (v) degree of trust in political
institutions; and (vi) attitudes towards nepotism and corruption.14 Finally, to measure
cognitive ability, each participant took part in a Raven’s Progressive Matrices test
(Appendix 3).15 An average session lasted for 90 minutes, including the experimental
tasks and the survey.
4. Results
Our primary interest lies in understanding selection and who gets elected to political
office in local-level politics. If the negative selection hypothesis holds, we expect those
who are already corrupt to gravitate towards political office. In that case, we expect
neophyte politicians to be more dishonest and less pro-social than ordinary citizens.
Exposure to political office should play a limited role, so we would not expect to find a
sharp difference between inexperienced and experienced politicians. By contrast, if
selection is driven by the Actonian positive selection hypothesis, we would expect those
who choose to run for office to be more honest and less corrupt than members of the
public, or that there are no differences. For the broader interpretation of positive
13 Our self-esteem and self-efficacy measures are abridged and modified variants of the Rosenberg Self-esteem Scale (Rosenberg (1965)) and of Rotter's Locus of Control Questionnaire (Rotter (1966)). 14 This is done using vignettes (see Truex (2011)). For details, see Section 4.3.2. 15 Raven progressive matrices tests are well-suited for measuring cognitive ability in low-income settings, as they capture ‘the capacity to think logically and solve problems in novel situations, independent of acquired knowledge’ (Mani et al. (2013)) and their claimed neutrality to variation in educational experience. In implementing Raven’s tests, we closely followed the protocol used by Mani et al. (2013).
13
selection, first-time politicians should, in addition, outperform ordinary citizens on
positive attributes and other indicators of individual quality covered by our data. For
pro-social preferences and other qualities, we expect some of this to deteriorate with
time in office and greater exposure to the workings of political institutions. We thus
expect inexperienced politicians to be more honest and pro-social than experienced
politicians.
4.1 Selection
A comparison of Columns 2 and 3 in Table 1 shows that, relative to ordinary citizens,
inexperienced politicians are richer (they own more land), more educated (are less likely
to have left school at the primary level (23 % vs. 10.8 %)) and are more likely to have
political leaders in the family or extended family. Surprisingly, however, the average
number of matrices correctly completed in the Raven’s Progressive Matrices test was
significantly lower for inexperienced politicians, relative to ordinary citizens.16
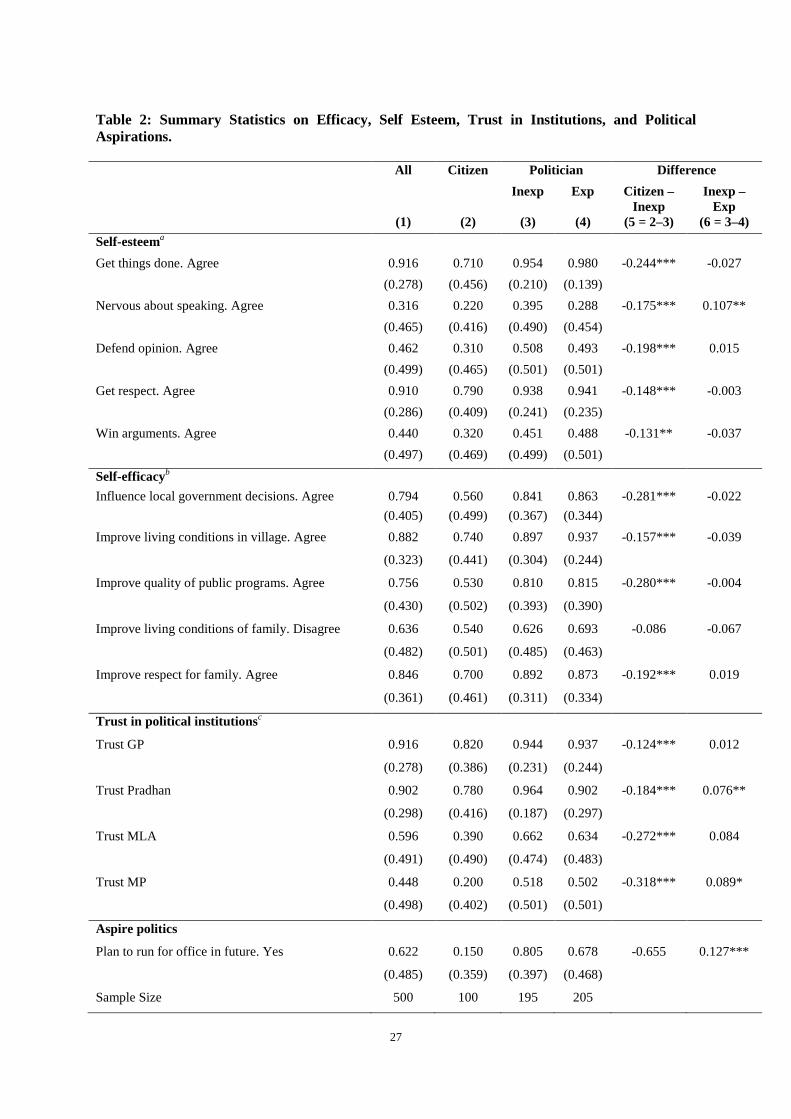
Table 2 shows that there are notable differences between inexperienced
politicians and members of the public with respect to self-esteem. Inexperienced
politicians are more likely to agree or strongly agree that they can get things done; they
can defend an opinion; they get respect and can win an argument. Table 2 also suggests
that inexperienced politicians are significantly more likely to agree or strongly agree
with the statement that they are able to influence local government decisions and
improve living conditions and the quality of public programs in the village. Relative to
ordinary citizens, inexperienced politicians exhibit significantly greater trust in political
institutions and leaders (including the Pradhan, the local MLA, and the local MP). 16 This result is in contrast to those in Dal Bó et al. (2019), who find that the cognitive ability of politicians is higher than that of non-politicians.
14
Finally, inexperienced politicians are significantly more likely to exhibit future political
aspirations.
Table 3 presents summary statistics on choices made in the experimental tasks.
We first discuss results for the die-tossing task, which is the key metric for dishonesty
and corruption in our study. Recall that in the die-tossing task, participants are given an
unbiased die, asked to retire to a private corner, roll the die 30 times and then report the
number of sixes obtained. Participants are paid Rs 5 for each six reported. That there is
no monitoring is an incentive to misreport in order to maximize earnings. As
participants are tossing an unbiased die, over thirty rolls we would expect an average of
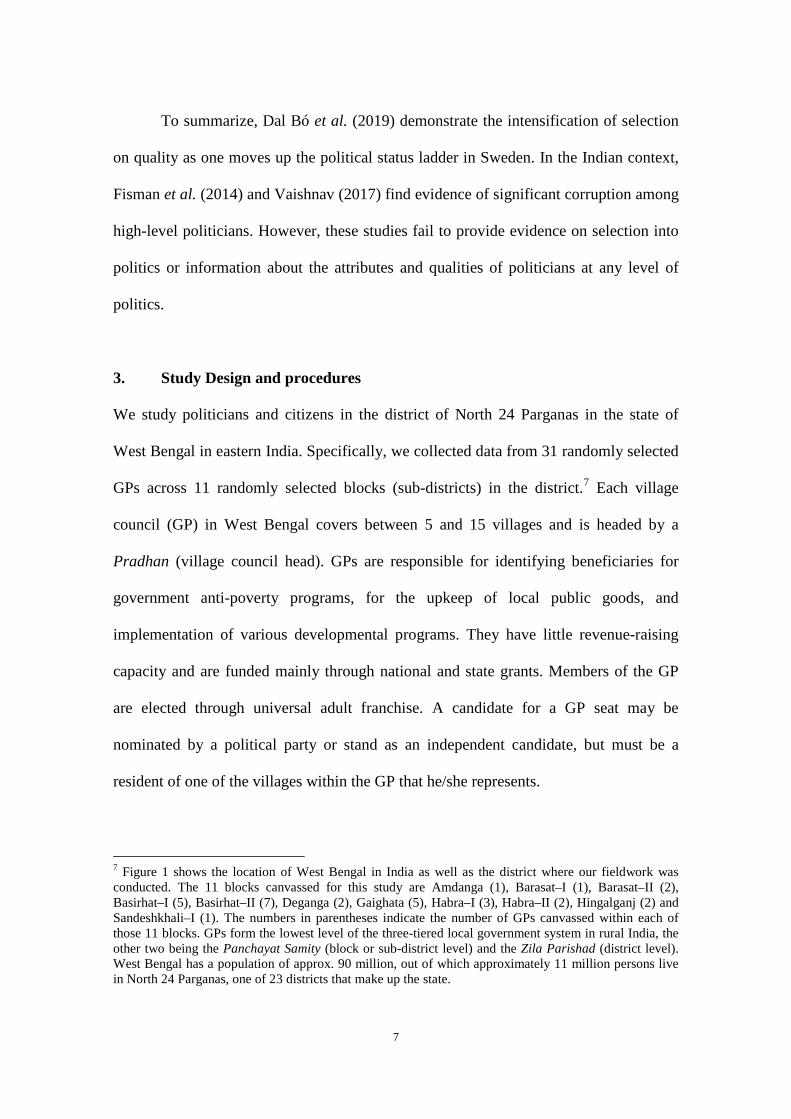
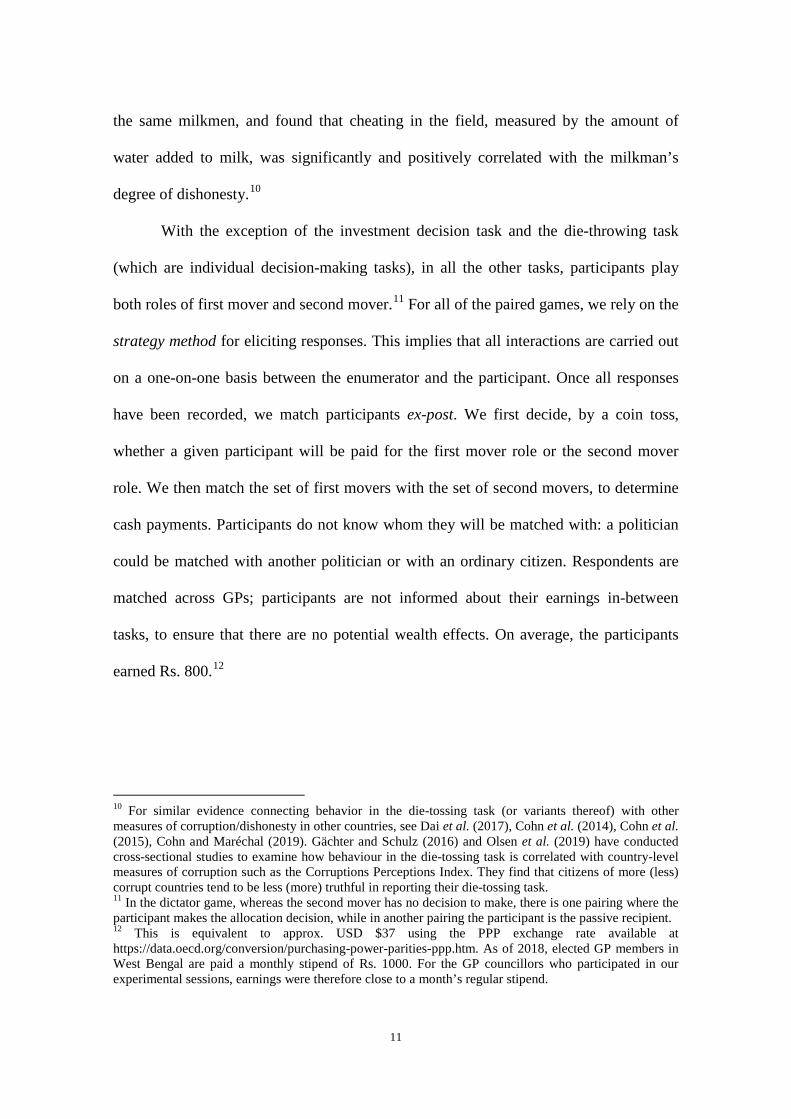
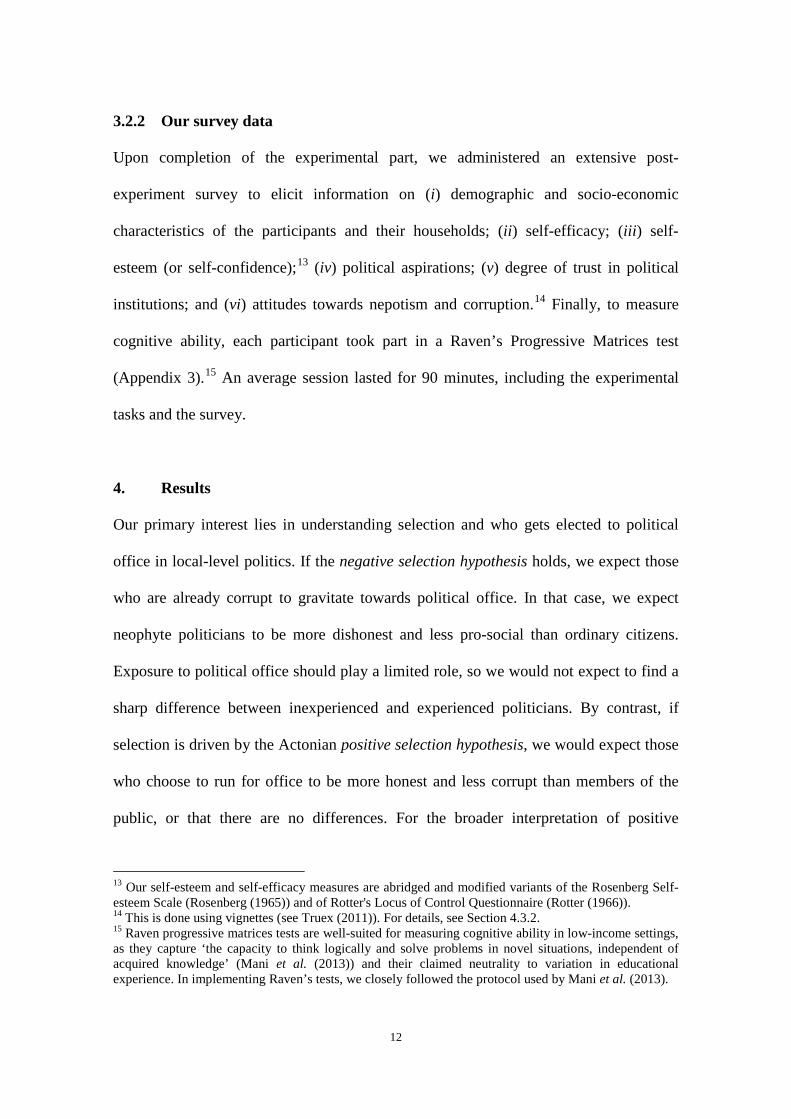
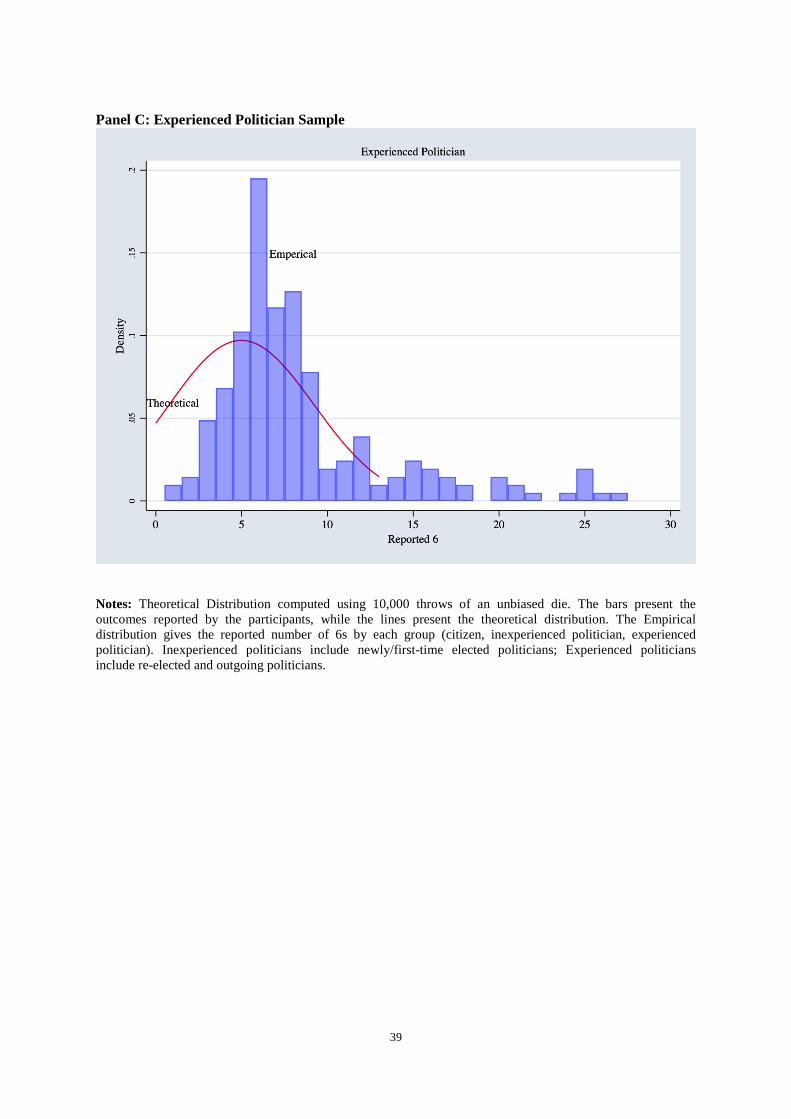
five sixes. Figure 2 presents the distribution of the reported number of sixes by our three
groups of interest.17 On average, the reported number of sixes are 10.2 for ordinary
citizens, 7.7 for inexperienced politicians and 8.5 for experienced politicians. The
difference between the reported sixes of inexperienced politicians and citizens is highly
significant (p < 0.01).18
In addition, relative to ordinary citizens, inexperienced politicians express a
stronger preference for fairness (the minimum acceptable offer in the ultimatum game is
significantly higher for inexperienced politicians). They are more trustworthy (in terms
of returning money in the trust game as the second mover) and are more cooperative
(they are more likely to contribute to the public good).
These descriptive statistics therefore support not only the Actonian positive
selection hypothesis in terms of lower corruption on the part of inexperienced
17 We also present in Figure 2, a theoretical distribution of the draws of sixes from a simulation of 10,000 draws of an unbiased die. 18 Using the non-parametric Wilcoxon rank sum test, the number of sixes reported by inexperienced politicians is significantly smaller than that reported by citizens (|z| = 5.196; p < 0.01).

15
politicians, but also that in terms of human capital, wealth, self-esteem, self-efficacy,
aspirations, and pro-social preferences.
4.2 The role of experience
We next look at the effect of experience. Here, for each of Tables 1–3, we focus on
Columns 3 and 4, which represent inexperienced and experienced politicians,
respectively. Table 1 shows that, relative to inexperienced politicians, experienced
politicians are significantly more likely to belong to Hindu general castes and are less
likely to be non-Hindus. Inexperienced politicians are significantly more likely to be
affiliated to AITC. Further, inexperienced politicians are significantly more likely than
experienced politicians to have completed middle school, and are more likely to be
female; on the other hand, they are significantly less likely to have completed secondary
school or to have been a resident of the village for fewer years; they are younger and
have lower cognitive ability as measured by the number of correct answers in the
Raven’s Test.
Table 2 indicates that, compared to experienced politicians, inexperienced
politicians display greater trust in the Gram Pradhan and the local MP. Not surprisingly,
they are more likely to be nervous when speaking at village council meetings; they also
express greater political aspirations in terms of seeking public office in the future.
Finally, from the results presented in Table 3 we see that there is evidence that
inexperienced politicians make difference choices compared to the experienced
politicians in the experimental tasks.19
19 While using a t-test the difference in the number of reported 6’s in the die throwing task is not significantly different between inexperienced and experienced politicians, using the non-parametric
16
4.3 Regression Analysis
We now turn to formal regression analysis to check for the robustness of our non-
parametric test results.
4.3.1 The selection issue: Do newly elected politicians differ from ordinary
citizens?
To examine the selection question, we restrict the sample to ordinary citizens and
inexperienced politicians. As noted, the inexperienced politicians (those elected for the
first time in 2018) had not yet taken up office, and had thus not yet been socialized into
politics. Therefore, comparing ordinary citizens and inexperienced politicians informs
us about selection into politics. The estimating equation takes the following form:
𝑦𝑦𝑖𝑖𝑖𝑖 = 𝛼𝛼0 + 𝛼𝛼1X𝑖𝑖𝑖𝑖 + 𝜀𝜀𝑖𝑖𝑖𝑖 (1)
The dependent variable takes the value of 1 if the individual is an inexperienced
politician, and the value 0 if not. We present results corresponding to different
specifications. In Column 1, we include only socio-economic and demographic
characteristics: age, gender, highest level of education attained (the reference category
is “less than primary schooling”), caste and religion (with “Muslim” as reference
category), land ownership, primary occupation, number of political leaders in the
extended family, cognitive ability (measured using the Raven’s Test) and party
affiliation.20 In Column 2, we add variables that capture efficacy, self-esteem, trust in
political institutions, and future political aspirations. In Column 3, we include Wilcoxon rank sum test, the number of sixes reported by inexperienced politicians is significantly lower than that reported by experienced politicians (|z| = 2.182; p < 0.03). 20 For ordinary citizens, we use self-reported party affiliation. For politicians, we use the party that nominated them. In West Bengal, unlike in many other parts of India, parties contest GP elections.
17
behavioral characteristics (proportion sent in the Dictator Game, the Ultimatum Game,
and the Trust Game, minimum acceptable offer in the Ultimatum Game, average
trustworthiness, contribution to the public good, proportion invested in the risky asset in
the Investment Game, and, finally, the reported number of sixes in the die-throwing
task).21
The regression results generally corroborate the differences in means reported in
Tables 1–3. While not all the regressors are significant in every specification, the
evidence indicates that inexperienced politicians are marginally more likely to own
more land, have more political activists in their families, and have lower scores on the
Raven’s test. They believe that they can get things done and influence local government
decisions. These effects are considerable: around 25 percentage points for the former
(get things done) with differences of around 16–21 percentage points for the latter
(influence government decisions). Inexperienced politicians are marginally more likely
to trust the Gram Pradhan and significantly more likely to trust the local MP (almost 20
percentage points more than among ordinary citizens). Not surprisingly, inexperienced
politicians are 32–34 percentage points more likely to express future political
aspirations, i.e. exhibit a significantly greater desire to run for office in the future.
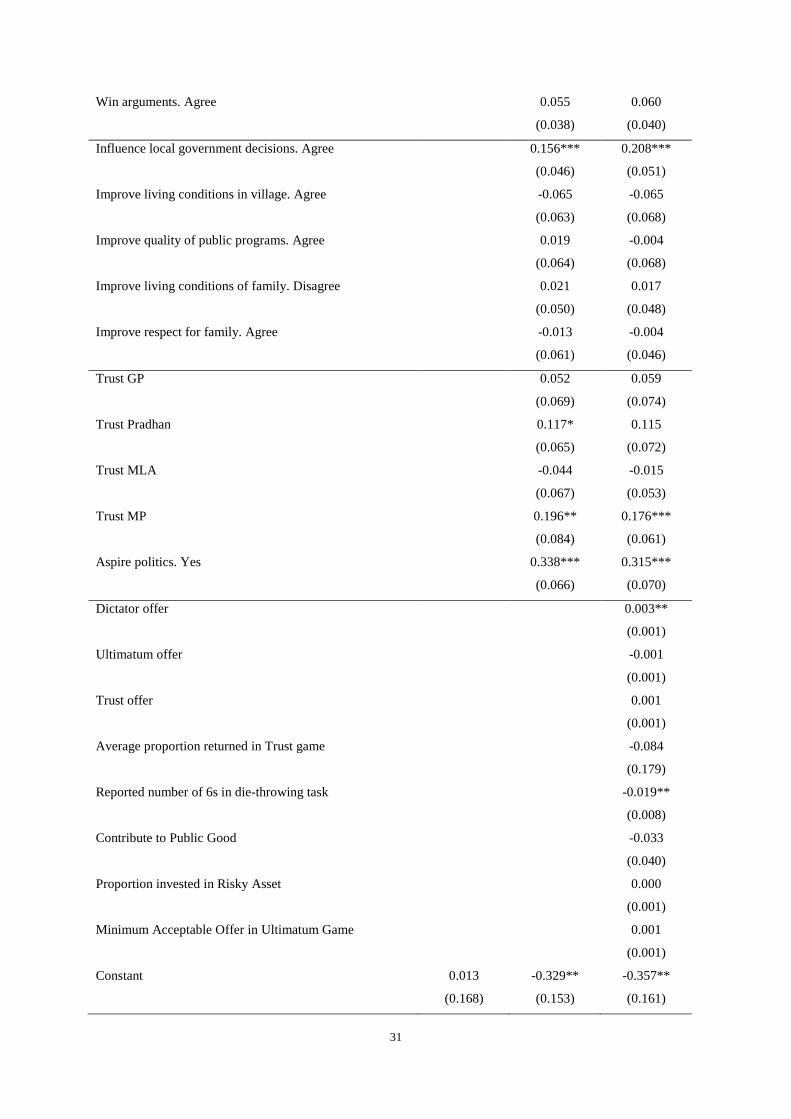
Turning to the experimental tasks, inexperienced politicians, on average, report
significantly fewer sixes compared to citizens in the die-tossing task, and make more
generous offers in the dictator game.22 The evidence here also reinforces the impression
21 In the results presented in Table 4, standard errors are clustered at the GP level. The results remain unaffected if instead we use Wild cluster bootstrapped standard errors. These results are available on request. The within block estimates (regressions with block fixed effects) are qualitatively similar to those presented in Table 3 (of course different in terms of the actual magnitudes). The estimated effect of the reported # of 6’s is, however, now only marginally significant. These results are also available on request. 22 The difference in minimum acceptable offers in the ultimatum game and contribution to the public good lose their statistical significance when we control for co-variates.
18
from Section 4.1 in favor of the positive selection hypothesis. On a range of measures,
inexperienced politicians appear to be more pro-social and more trusting of institutions
than ordinary citizens.
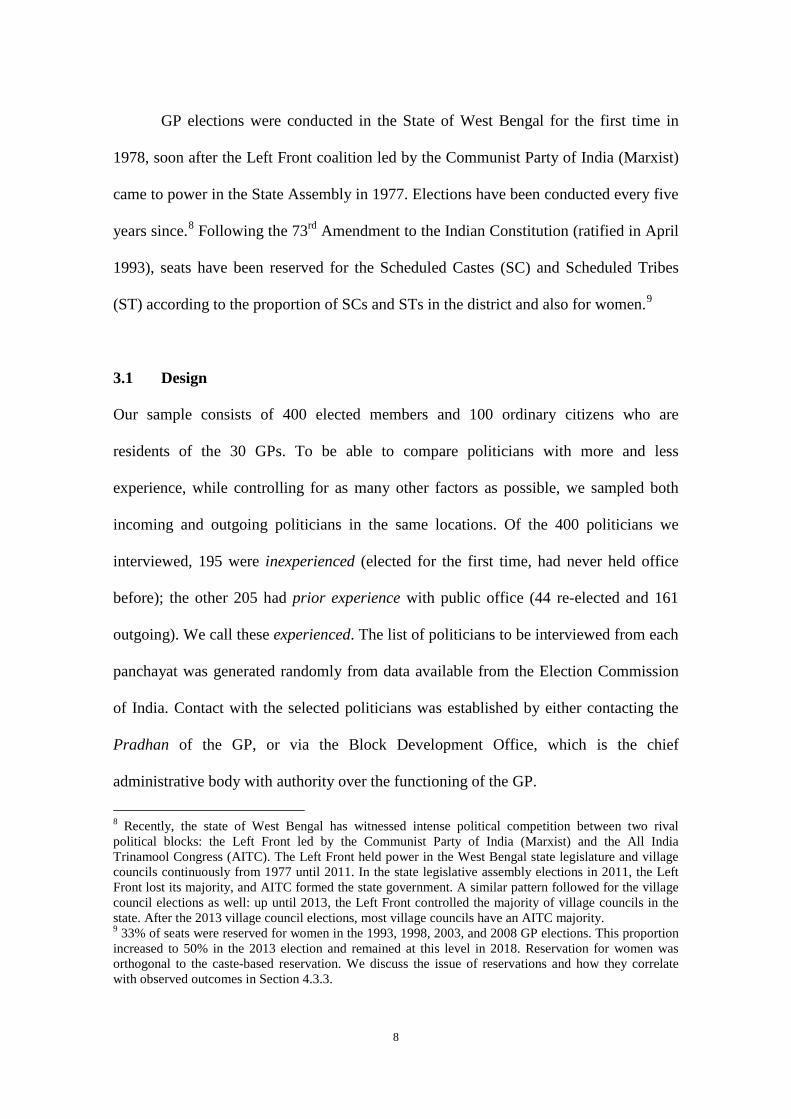
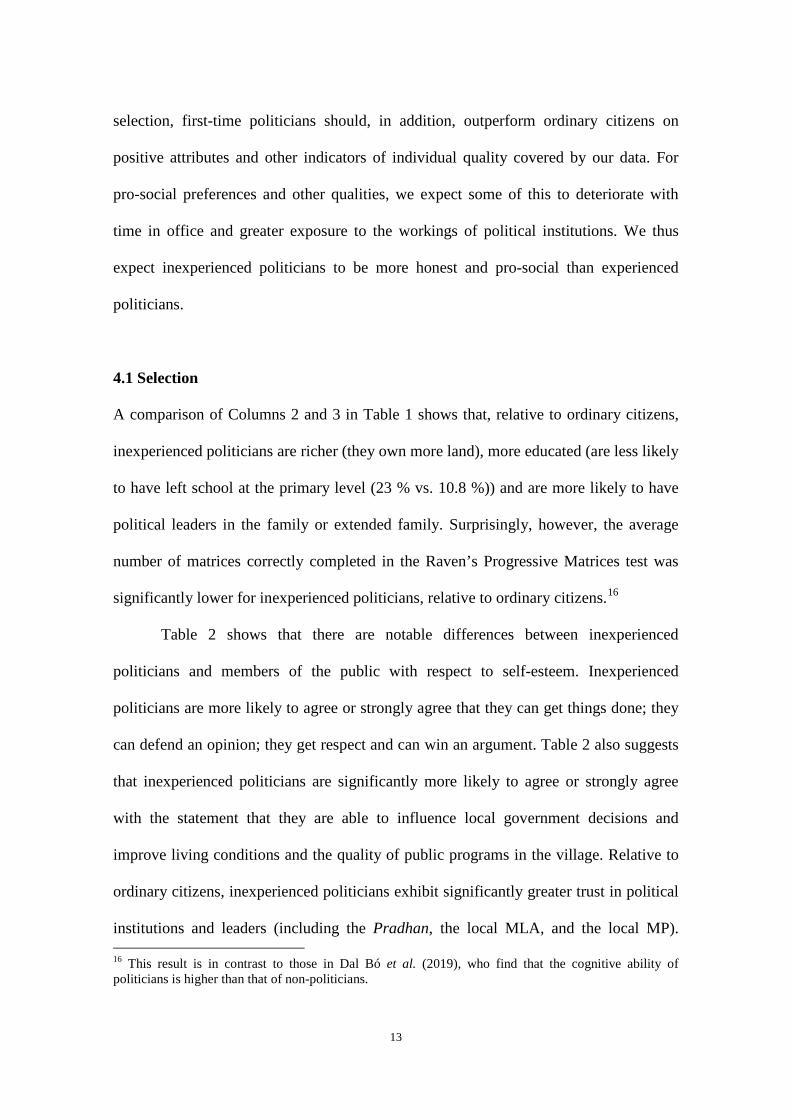
The female dummy is statistically significant in the regression results presented
in Table 4. To see whether the selection patterns differ between males and females, we
estimate equation (1) separately for males and females. The estimated coefficients and
90% confidence intervals are presented in Figure 3. The different characteristics do not
differentially affect the likelihood of selecting into politics for men and women.
4.3.2 The role of experience
In Table 5, we present results concerning the question of experience. Here, we examine
whether time in office (experience) changes politicians’ behaviour, their attitudes
towards corruption and nepotism, trust in institutions, self-esteem, efficacy, and
aspirations. Our regression specification takes the following form:
𝑦𝑦𝑖𝑖𝑖𝑖 = 𝛽𝛽0 + 𝛽𝛽1Experienced + 𝛾𝛾X𝑖𝑖𝑖𝑖 + 𝜀𝜀𝑖𝑖𝑖𝑖 (2)
Here 𝑦𝑦𝑖𝑖𝑖𝑖 is the outcome variable of interest for politician 𝑖𝑖 in village council (GP) 𝑖𝑖;
Experienced is a dummy variable that takes the value of 1 if the politician is
experienced. X𝑖𝑖𝑖𝑖 denotes a vector of individual characteristics of each politician. These
are gender, age, educational attainment (reference category: not above primary
schooling), caste/religion (reference category: Muslim), land ownership, primary
occupation, total number of political leaders in the family and whether the politician
was elected to a reserved seat.
In Panel A of Table 5, we compare experienced and inexperienced politicians in
terms of pro-sociality as measured by behavior in the experimental tasks. The results
19
indicate that while time in office does not have a significant effect on any of the
measures of pro-sociality, experienced politicians emerge as significantly more
dishonest relative to inexperienced politicians. Specifically, experienced politicians
report on average one more six in 30 draws of the unbiased dice (see column 4 in Panel
A of Table 5).
In Panel B of Table 5, we examine whether the observed results on dishonesty
are consistent with self-reported attitudes towards nepotism and corruption between
experienced and inexperienced politicians. Our survey facilitates an examination of
these attitudes. Specifically, participants were asked to respond on a 5-point Likert scale
(ranging from strongly disagree to strongly agree) to each of the following vignettes:
1. It is acceptable for a shopkeeper to offer a politician a small gift to help keep the tax
auditor away; 2. It is acceptable for a businessman to give a job in a family firm to a family member
even though other applicants are more qualified; 3. It is acceptable for a government employee to give a government job to a family
member even though other applicants are more qualified; 4. It is acceptable for a male politician to give a government job to a family member
even though other applicants are more qualified; 5. It is acceptable for a female politician to give a government job to a family member
even though other applicants are more qualified; 6. It is acceptable for a government employee to ask a schoolteacher for a small gift in
exchange for approving his BPL card without proper documentation; 7. It is acceptable for a politician to ask a schoolteacher for a small gift in exchange for
approving his BPL card without proper documentation.
We estimate a version of equation (2) where the outcome variables (𝑦𝑦𝑖𝑖𝑖𝑖) are
dummy variables that take the value 1 if the participant “strongly disagrees” or
“disagrees” with the statement in the vignette. The regression results are presented in
Panel B of Table 5. We find no systematic pattern in how experience affects attitudes
towards corruption and nepotism: the experienced politician dummy is never
20
statistically significant. This suggests that, while there is a significant difference as to
corrupt behavior (as measured by the number of sixes reported in the die-tossing game)
there are no significant differences in professed attitudes towards corruption and
nepotism between experienced and inexperienced politicians.23
Attitudes towards corruption may be shaped by (and shape) the trust that
politicians express towards political institutions and other politicians. To explore trust in
local political institutions (GP and head of the village council), and in the local
representatives in the state legislative assembly (MLA) and parliament (MP), we re-
estimate equation (2) using responses to the questions that measure trust in local
political institutions as outcome variables. The relevant dependent variables in columns
1 through 4 of Panel C in Table 5 are dummies that take the value 1 if the participant
responds by saying “almost always” or “most of the time”. There is no evidence of
significant differences in trust in political institutions between experienced and
inexperienced politicians. Additionally, as the results in column 3 of Panel A of Table 5
show, there is no evidence that time in office has an effect on generalized trust, captured
by the amount sent in the trust task.24 Taken together, the descriptive statistics presented
in Section 4.2 and the regression results presented in this section indicate that, compared
to inexperienced politicians, experienced politicians are more dishonest (report more
sixes in the die-tossing game) and express less trust in political institutions and leaders.
23 Such cognitive dissonance between professed attitudes and actual behavior is well-established (see, for example, Chaudhuri (2009)). 24 In Chaudhuri et al. (2020), we examine whether and how a gender gap in dishonesty among elected representatives change with time in office. While we find little evidence of a gender gap in the attitudes of inexperienced politicians, lower faith in political institutions and greater disapproval of corruption can be seen among experienced politicians, particularly women. However, this apparent hardening of attitudes among female politicians also coincides with more dishonest behavior in our experiments.
21
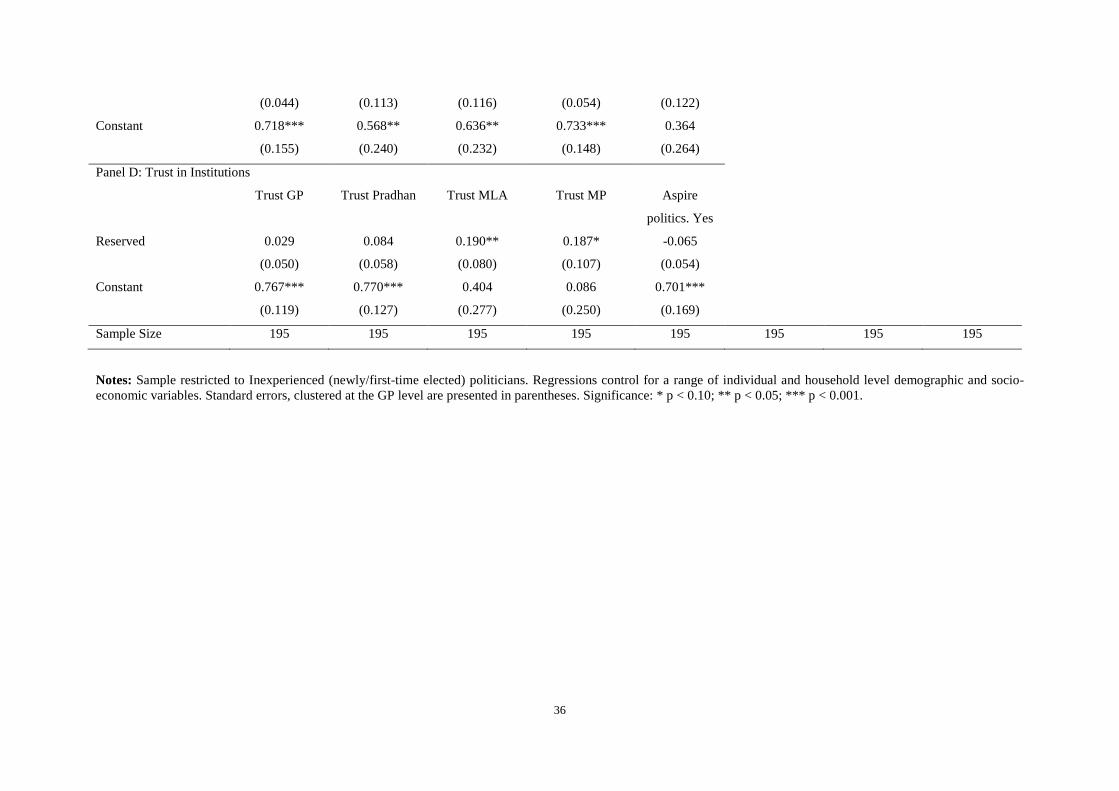
4.3.3 Reservations: a possible channel to explain our results
One important result, of strong positive selection, stands out. Overall, politicians,
particularly inexperienced ones, emerge as more pro-social and honest than the ordinary
citizens in our sample. It is our conjecture that these more favorable characteristics
among politicians may be connected to the high turnover in these positions, perhaps
reflecting the low remuneration for holding positions in village politics combined with
the rotation of reserved seats, which often bars incumbents from running for re-election
(see Jensenius (2017), Maitra (2020)). This could indicate that, at lower levels of
politics in India, a new and different breed of politicians is (regularly) getting elected.
To examine this, we ask whether politicians elected to reserved seats are different in
terms of their behavioral characteristics, trust in institutions, self-esteem, efficacy, and
aspirations. We consider the following regression:
𝑦𝑦𝑖𝑖𝑖𝑖 = 𝛼𝛼0 + 𝛼𝛼1Reserved + 𝛿𝛿X𝑖𝑖𝑖𝑖 + 𝜀𝜀𝑖𝑖𝑖𝑖 (3)
Here 𝑦𝑦𝑖𝑖𝑖𝑖 is the outcome variable of interest for politician 𝑖𝑖 in village council (GP) 𝑖𝑖;
Reserved is a dummy variable that takes the value 1 if the politician is elected to a
reserved seat. X𝑖𝑖𝑖𝑖 denotes a vector of individual characteristics for each politician.
These are gender, age, educational attainment (reference category: no more than
primary schooling), caste/religion (reference category: Muslim), land ownership,
primary occupation and total number of political leaders in the family.
The regression results are presented in Table 6. Candidates elected to reserved
seats are more pro-social. They have a greater predisposition to fairness: the minimum
acceptable offer in the ultimatum game is higher, as is the average amount sent in the
dictator game. They also exhibit greater trust in political institutions (local MLA and
22
local MP) to do the right thing compared to candidates elected to open seats.25
Politicians in reserved seats also have somewhat higher Raven scores than those in
unreserved constituencies, though the difference is not statistically significant. These
findings indicate that political reservations contribute to the positive selection results
reported in this study.
5. Concluding remarks
This study was motivated by the wish to understand the attitudes and motivations of
those who are elected to political office, particularly for the first time. By and large, we
find evidence in favor of what we call the positive selection hypothesis. Compared to
both ordinary citizens and experienced politicians, persons who enter political office for
the first time are more honest, generous, and cooperative; they have a greater sense of
fairness, greater confidence in their ability to make a difference, and greater trust in
political institutions and leaders. However, we also find evidence indicating that this
optimism gradually wears off, so that experienced politicians are less honest than
neophytes. Of course, this result must be treated with caution, as our data are not
longitudinal; while we are comparing a group of recently elected inexperienced
politicians with a different group of experienced politicians, our results are robust to
controlling for a wide range of possible confounds.
Our evidence indicates that those who are elected into local-level politics are
more honest than the citizenry at large. While this goes beyond the findings of Dal Bó et
25 Using more detailed measures of reservation (gender reserved (UR (W)), caste reserved (SC, ST, OBC), and caste and gender reserved (SC (W), ST (W), OBC (W)), we find that gender reserved candidates are significantly less dishonest compared to unreserved candidates, whereas caste and gender reserved candidates are significantly more pro-social than are unreserved inexperienced candidates. These results are available on request from the authors.
23
al. (2019), our other results are consistent with their overall findings and provide a
fairly optimistic portrayal of Indian politicians. It is difficult to compare our results
directly with the findings of Fisman et al. (2014) and Vaishnav (2017), as they work
with different types of data and with politicians at higher levels of elected office.
Additionally, they do not have a citizen sample to compare and are thus silent on the
selection question.
Specifically, we find evidence that inexperienced politicians elected from
reserved seats are more positively selected than their unreserved counterparts. It thus
appears that seat reservations at this level of Indian politics generate results in the
selection of candidates who are less entrenched in existing political networks and
therefore tend to be more pro-social. Bills have been introduced to implement
reservation for women at the higher tiers, in addition to the reserved seats for SCs and
STs, but these have not been enacted into law. Although we do not mean to suggest that
reservations can be a panacea, our evidence seems to indicate that, at least in the Indian
context, seat reservation may lead to positive selection of candidates—a topic we hope
that future research will examine in greater detail.
References
BANERJEE, P., V. IVERSEN, S. MITRA, A. NICOLO, AND K. SEN (2020): "Moral Reputation and
Political Selection in a Decentralized Democracy: Theory and Evidence from India," UNU WIDER Working Paper 2020/26.
BANERJEE, R., T. BAUL, AND T. ROSENBLAT (2015): "On Self-Selection of the Corrupt into the Public Sector," Economics Letters, 127, 43 - 46.
BERG, J., J. DICKHAUT, AND K. MCCABE (1995): "Trust, Reciprocity, and Social-History," Games and Economic Behavior, 10, 122-142.
BESLEY, T. (2004): " Paying Politicians: Theory and Evidence," Journal of the European Economic Association, 2, 193 - 215.
CALVERT, R. (1985): "Robustness of the Multidimensional Voting Model: Candidate Motivations, Uncertainty, and Convergence," American Journal of Political Science, 29, 69 - 95.
CASELLI, F., AND M. MORELLI (2001): "Bad Politicians," Journal of Public Economics, 88, 759 - 782.
24
CHAUDHURI, A. (2009): Experiments in Economics: Playing Fair with Money. London and New York: Routledge. .
— (2011): "Sustaining Cooperation in Laboratory Public Goods Experiments: A Selective Survey of the Literature," Experimental Economics, 14, 47 - 83.
CHAUDHURI, A., V. IVERSEN, F. R. JENSENIUS, AND P. MAITRA (2020): "Time in Office and the Changing Gender Gap in Dishonesty," Working Paper 8217. CESifo, Munich, Germany.
COHN, A., AND M. MARÉCHAL (2019): "Laboratory Measure of Cheating Predicts School Misconduct," Economic Journal, 128, 2743 - 2754.
COHN, A., M. MARECHAL, AND E. FEHR (2014): "Business Culture and Dishonesty in the Banking Industry," Nature, 516, 86 - 89.
COHN, A., M. MARÉCHAL, AND T. NOLL (2015): "Bad Boys: How Criminal Identity Salience Affects Rule Violation," Review of Economic Studies, 82.
DAI, Z., F. GALEOTTI, AND M.-C. VILLEVAL (2017): "Cheating in the Lab Predicts Fraud in the Field: An Experiment in Public Transportation," Management Science, 64, 1081 - 1100.
DAL BÓ, E., F. FINAN, O. FOLKE, T. PERSSON, AND J. RICKNE (2019): "Who Becomes a Politician? ," Quarterly Journal of Economics, 132, 1877 - 1914.
FISCHBACHER, U., AND F. FÖLLMI-HEUSI (2013): "Lies in Disguise- an Experimental Study on Cheating," Journal of the European Economic Association, 11, 525 - 547.
FISMAN, R., F. SCHULZ, AND V. VIG (2014): "The Private Returns to Public Office," Journal of Political Economy, 122, 806 - 862.
FORSYTHE, R., J. L. HOROWITZ, N. E. SAVIN, AND M. SEFTON (1994): "Fairness in Simple Bargaining Experiments," Games and Economic Behavior,, 6, 347 0 369.
GÄCHTER, S., AND J. F. SCHULZ (2016): "Intrinsic Honesty and the Prevalence of Rule Violations across Societies," Nature, 531.
GAGLIARDUCCI, S., AND T. NANNICINI (2013): "Do Better Paid Politicians Perform Better? Disentangling Incentives from Selection," Journal of the European Economic Association,, 11, 369 - 398.
GNEEZY, U., AND J. POTTERS (1997): "An Experiment on Risk Taking and Evaluation Periods," Quarterly Journal of Economics, 112, 631 -- 645.
GÜTH, W., R. SCHMITTBERGER, AND B. SCHWARZE (1982): "An Experimental Analysis of Ultimatum Bargaining," Journal of Economic Behavior & Organization, 3, 367 - 388.
HANNA, R., AND S. Y. WANG (2017): " Dishonesty and Selection into Public Service: Evidence from India," American Economic Journal: Economic Policy, 9, 262 - 290.
JENSENIUS, F. R. (2017): Social Justice through Inclusion: The Consequences of Electoral Quotas in India. Oxford University Press.
KOTAKORPI, K., AND P. POUTVAARA (2011): "Pay for Politicians and Candidate Selection: An Empirical Analysis," Journal of Public Economics, 95, 877 - 885.
LEDYARD, J. O. (1995): "Public Goods: A Survey of Experimental Research," in The Handbook of Experimental Economics. Princeton University Press, Princeton, 111 - 194.
MAITRA, P. (2020): "Removing Affirmative Action: Evidence from Local Politics in India," Mimeo, Monash University.
MANI, A., S. MULLAINATHAN, E. SHAFIR, AND J. ZHAO (2013): "Poverty Impedes Cognitive Function," Science, 341, 976 - 980.
OLSEN, A. L., F. HJORTH, N. HARMON, AND S. BARFORT. (2019): "Behavioral Dishonesty in the Public Sector," Journal of Public Administration Research and Theory,, 572 - 590.
ROSENBERG, M. (1965): Society and the Adolescent Self-Image. Princeton, NJ: Princeton University Press.
ROTTER, J. B. (1966): "Generalized Expectancies for Internal Versus External Control of Reinforcement," Psychological Monographs: General and Applied., 80, 1-28.
TRUEX, R. (2011): "Corruption, Attitudes, and Education: Survey Evidence from Nepal," World Development, 39, 1133 - 1142.
25
VAISHNAV, M. (2017): When Crime Pays: Money and Muscle in Indian Politics. New Haven: Yale University Press.
WITTMAN, D. (1983): "Candidate Motivation: A Synthesis of Alternative Theories’. , 77(1): 142–57.," American Political Science Review, 77, 142 - 157.

Table 1: Demographic and Socioeconomic Characteristics
Politician Difference
All Citizen Inexp Exp Citizen – Inexp Inexp – Exp
(1) (2) (3) (4) (5 = 2 – 3) (6 = 4 – 3)
Hindu General Caste 0.128 0.100 0.103 0.166 -0.003 -0.063*
(0.334) (0.302) (0.304) (0.373)
Hindu OBC 0.098 0.080 0.097 0.107 -0.017 -0.010 (0.298) (0.273) (0.297) (0.310) Hindu ST 0.012 0.000 0.021 0.010 -0.021 0.011 (0.109) (0.000) (0.142) (0.099) Hindu SC 0.334 0.390 0.297 0.341 0.093 -0.044 (0.472) (0.490) (0.458) (0.475) Non-Hindu 0.428 0.430 0.482 0.376 -0.052 0.106** (0.495) (0.498) (0.501) (0.485) Landowner 28.528 15.350 27.928 35.527 -12.578* -7.599 (59.072) (47.287) (63.146) (59.361) AITC 0.928 0.707 0.221*** (0.259) (0.456) Reserved 0.815 0.795 0.020
(0.389) (0.405) Leaders in family 0.158 0.030 0.205 0.176 -0.175*** 0.030 (0.416) (0.171) (0.496) (0.406) Leaders in extended family 0.136 0.040 0.169 0.151 -0.129** 0.018 (0.504) (0.197) (0.563) (0.544) Primary schooling or less 0.114 0.230 0.108 0.063 0.122*** 0.044 (0.318) (0.423) (0.311) (0.244) Completed middle school 0.508 0.490 0.564 0.463 -0.074 0.101** (0.500) (0.502) (0.497) (0.500) Completed secondary school 0.378 0.280 0.328 0.473 -0.048 -0.145*** (0.485) (0.451) (0.471) (0.501) Years resident in village 31.086 28.870 27.882 35.215 0.988 -7.333*** (16.234) (14.767) (15.804) (16.491) Age 40.844 37.280 38.662 44.659 -1.382 -5.997*** (11.017) (12.738) (9.527) (10.318) Female 0.502 0.500 0.569 0.439 -0.069 0.130*** (0.500) (0.503) (0.496) (0.497) Number correct in Raven's Test 4.144 4.530 3.631 4.444 0.899*** -0.813*** (2.121) (2.307) (1.991) (2.059)
Sample size 500 100 195 205
Notes: Figures in parenthesis are standard deviations. Inexperienced politicians include newly/first time elected politicians; Experienced politicians include re-elected and outgoing politicians. Significance: * p < 0.10; ** p < 0.05; *** p < 0.001.
27
Table 2: Summary Statistics on Efficacy, Self Esteem, Trust in Institutions, and Political Aspirations. All Citizen Politician Difference Inexp Exp Citizen –
Inexp Inexp –
Exp (1) (2) (3) (4) (5 = 2–3) (6 = 3–4) Self-esteema Get things done. Agree 0.916 0.710 0.954 0.980 -0.244*** -0.027 (0.278) (0.456) (0.210) (0.139) Nervous about speaking. Agree 0.316 0.220 0.395 0.288 -0.175*** 0.107** (0.465) (0.416) (0.490) (0.454) Defend opinion. Agree 0.462 0.310 0.508 0.493 -0.198*** 0.015 (0.499) (0.465) (0.501) (0.501) Get respect. Agree 0.910 0.790 0.938 0.941 -0.148*** -0.003 (0.286) (0.409) (0.241) (0.235) Win arguments. Agree 0.440 0.320 0.451 0.488 -0.131** -0.037 (0.497) (0.469) (0.499) (0.501)
Self-efficacyb Influence local government decisions. Agree 0.794 0.560 0.841 0.863 -0.281*** -0.022 (0.405) (0.499) (0.367) (0.344) Improve living conditions in village. Agree 0.882 0.740 0.897 0.937 -0.157*** -0.039
(0.323) (0.441) (0.304) (0.244)
Improve quality of public programs. Agree 0.756 0.530 0.810 0.815 -0.280*** -0.004
(0.430) (0.502) (0.393) (0.390)
Improve living conditions of family. Disagree 0.636 0.540 0.626 0.693 -0.086 -0.067
(0.482) (0.501) (0.485) (0.463)
Improve respect for family. Agree 0.846 0.700 0.892 0.873 -0.192*** 0.019
(0.361) (0.461) (0.311) (0.334)
Trust in political institutionsc
Trust GP 0.916 0.820 0.944 0.937 -0.124*** 0.012
(0.278) (0.386) (0.231) (0.244)
Trust Pradhan 0.902 0.780 0.964 0.902 -0.184*** 0.076**
(0.298) (0.416) (0.187) (0.297)
Trust MLA 0.596 0.390 0.662 0.634 -0.272*** 0.084
(0.491) (0.490) (0.474) (0.483)
Trust MP 0.448 0.200 0.518 0.502 -0.318*** 0.089*
(0.498) (0.402) (0.501) (0.501)
Aspire politics
Plan to run for office in future. Yes 0.622 0.150 0.805 0.678 -0.655 0.127***
(0.485) (0.359) (0.397) (0.468)
Sample Size 500 100 195 205
28
Notes: Figures in parentheses are standard deviations. Inexperienced politicians include newly/first-time elected politicians; Experienced politicians include re-elected and outgoing politicians. a: Respondents were asked to answer on a 5-point Likert scale (a lot, a moderate amount, a little, none at all, don’t know). b: Respondents were asked to answer on a 5-point Likert scale (strongly disagree, disagree, neutral, agree, strongly agree). c: Respondents were asked to answer on a 5-point Likert scale (almost always, most of the time, only some of the time, almost never, don’t know). Significance *** p<0.01, ** p<0.05, * p<0.1
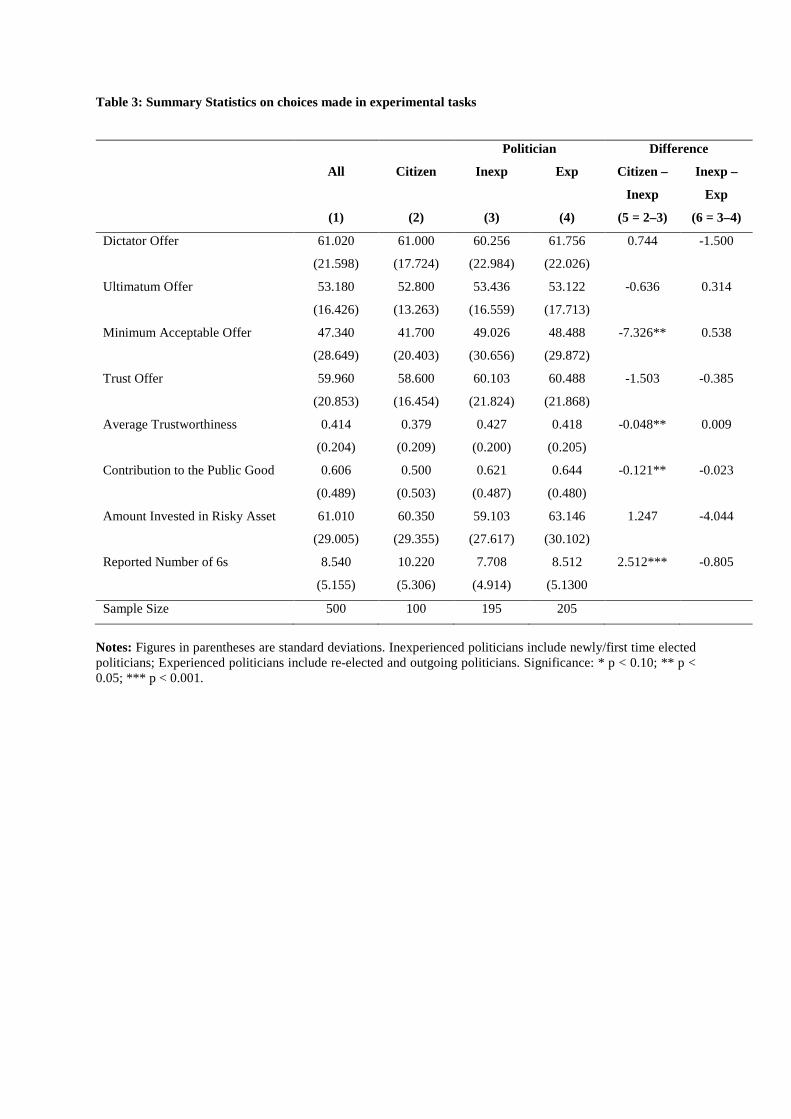
Table 3: Summary Statistics on choices made in experimental tasks
Politician Difference
All Citizen Inexp Exp Citizen –
Inexp
Inexp –
Exp
(1) (2) (3) (4) (5 = 2–3) (6 = 3–4)
Dictator Offer 61.020 61.000 60.256 61.756 0.744 -1.500
(21.598) (17.724) (22.984) (22.026)
Ultimatum Offer 53.180 52.800 53.436 53.122 -0.636 0.314
(16.426) (13.263) (16.559) (17.713)
Minimum Acceptable Offer 47.340 41.700 49.026 48.488 -7.326** 0.538
(28.649) (20.403) (30.656) (29.872)
Trust Offer 59.960 58.600 60.103 60.488 -1.503 -0.385
(20.853) (16.454) (21.824) (21.868)
Average Trustworthiness 0.414 0.379 0.427 0.418 -0.048** 0.009
(0.204) (0.209) (0.200) (0.205)
Contribution to the Public Good 0.606 0.500 0.621 0.644 -0.121** -0.023
(0.489) (0.503) (0.487) (0.480)
Amount Invested in Risky Asset 61.010 60.350 59.103 63.146 1.247 -4.044
(29.005) (29.355) (27.617) (30.102)
Reported Number of 6s 8.540 10.220 7.708 8.512 2.512*** -0.805
(5.155) (5.306) (4.914) (5.1300
Sample Size 500 100 195 205
Notes: Figures in parentheses are standard deviations. Inexperienced politicians include newly/first time elected politicians; Experienced politicians include re-elected and outgoing politicians. Significance: * p < 0.10; ** p < 0.05; *** p < 0.001.
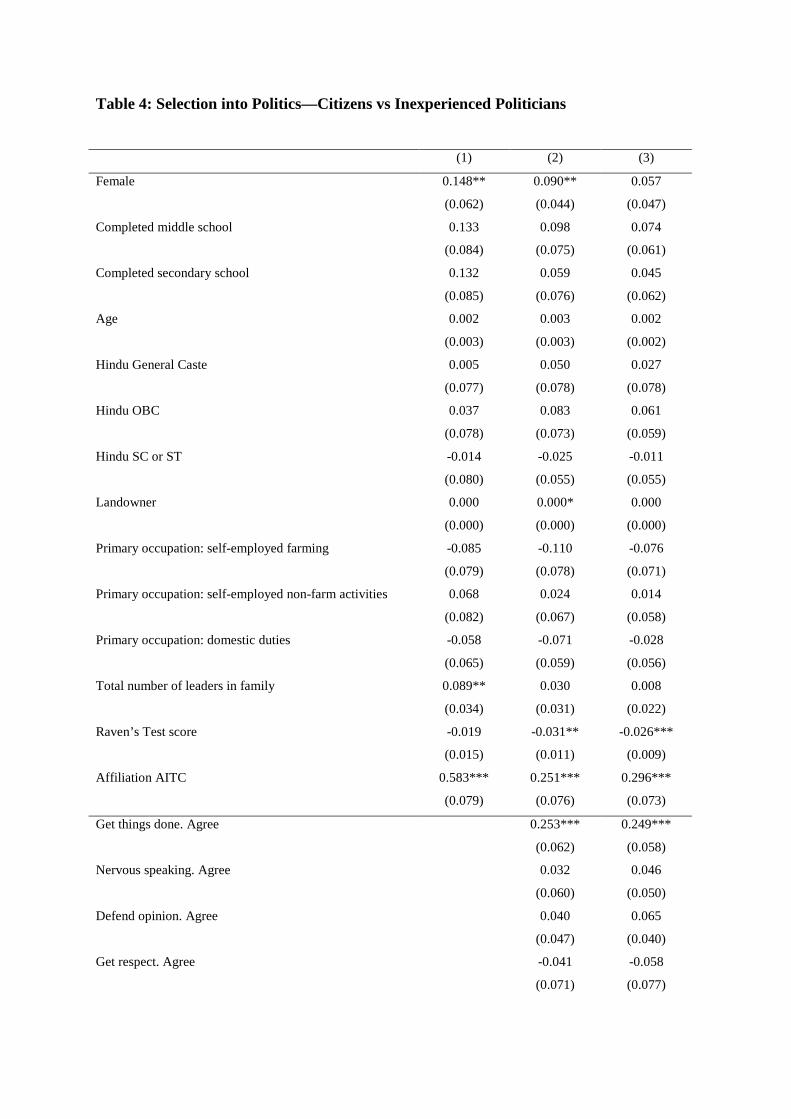
Table 4: Selection into Politics—Citizens vs Inexperienced Politicians
(1) (2) (3)
Female 0.148** 0.090** 0.057
(0.062) (0.044) (0.047)
Completed middle school 0.133 0.098 0.074
(0.084) (0.075) (0.061)
Completed secondary school 0.132 0.059 0.045
(0.085) (0.076) (0.062)
Age 0.002 0.003 0.002
(0.003) (0.003) (0.002)
Hindu General Caste 0.005 0.050 0.027
(0.077) (0.078) (0.078)
Hindu OBC 0.037 0.083 0.061
(0.078) (0.073) (0.059)
Hindu SC or ST -0.014 -0.025 -0.011
(0.080) (0.055) (0.055)
Landowner 0.000 0.000* 0.000
(0.000) (0.000) (0.000)
Primary occupation: self-employed farming -0.085 -0.110 -0.076
(0.079) (0.078) (0.071)
Primary occupation: self-employed non-farm activities 0.068 0.024 0.014
(0.082) (0.067) (0.058)
Primary occupation: domestic duties -0.058 -0.071 -0.028
(0.065) (0.059) (0.056)
Total number of leaders in family 0.089** 0.030 0.008
(0.034) (0.031) (0.022)
Raven’s Test score -0.019 -0.031** -0.026***
(0.015) (0.011) (0.009)
Affiliation AITC 0.583*** 0.251*** 0.296***
(0.079) (0.076) (0.073)
Get things done. Agree 0.253*** 0.249***
(0.062) (0.058)
Nervous speaking. Agree 0.032 0.046
(0.060) (0.050)
Defend opinion. Agree 0.040 0.065
(0.047) (0.040)
Get respect. Agree -0.041 -0.058
(0.071) (0.077)
31
Win arguments. Agree 0.055 0.060
(0.038) (0.040)
Influence local government decisions. Agree 0.156*** 0.208***
(0.046) (0.051)
Improve living conditions in village. Agree -0.065 -0.065
(0.063) (0.068)
Improve quality of public programs. Agree 0.019 -0.004
(0.064) (0.068)
Improve living conditions of family. Disagree 0.021 0.017
(0.050) (0.048)
Improve respect for family. Agree -0.013 -0.004
(0.061) (0.046)
Trust GP 0.052 0.059
(0.069) (0.074)
Trust Pradhan 0.117* 0.115
(0.065) (0.072)
Trust MLA -0.044 -0.015
(0.067) (0.053)
Trust MP 0.196** 0.176***
(0.084) (0.061)
Aspire politics. Yes 0.338*** 0.315***
(0.066) (0.070)
Dictator offer 0.003**
(0.001)
Ultimatum offer -0.001
(0.001)
Trust offer 0.001
(0.001)
Average proportion returned in Trust game -0.084
(0.179)
Reported number of 6s in die-throwing task -0.019**
(0.008)
Contribute to Public Good -0.033
(0.040)
Proportion invested in Risky Asset
0.000
(0.001)
Minimum Acceptable Offer in Ultimatum Game 0.001
(0.001)
Constant 0.013 -0.329** -0.357**
(0.168) (0.153) (0.161)

32
Sample Size 295 295 295
Notes: Dependent variable = 1 if the individual was elected to office for the first time, 0 otherwise. Sample includes citizens and inexperienced (newly/first-time elected) politicians. Standard errors, clustered at the GP level are presented in parentheses. Significance: * p < 0.10; ** p < 0.05; *** p < 0.001.
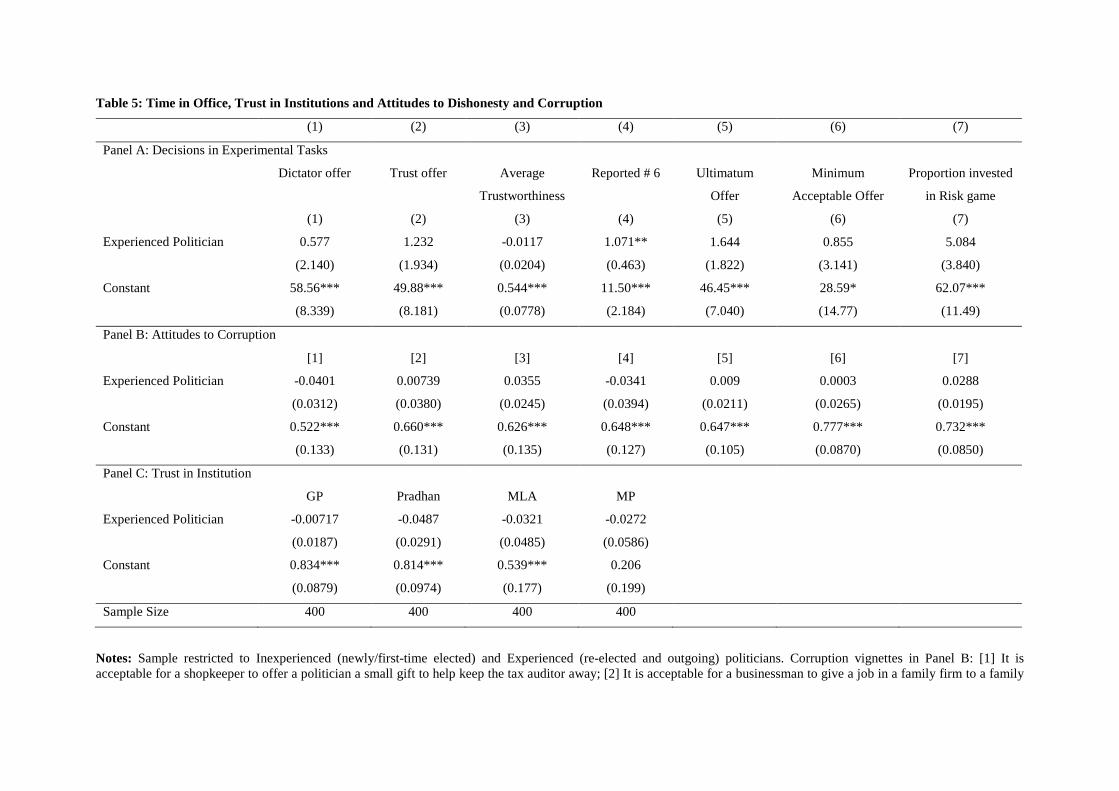
Table 5: Time in Office, Trust in Institutions and Attitudes to Dishonesty and Corruption
(1) (2) (3) (4) (5) (6) (7)
Panel A: Decisions in Experimental Tasks
Dictator offer Trust offer Average
Trustworthiness
Reported # 6 Ultimatum
Offer
Minimum
Acceptable Offer
Proportion invested
in Risk game
(1) (2) (3) (4) (5) (6) (7)
Experienced Politician 0.577 1.232 -0.0117 1.071** 1.644 0.855 5.084
(2.140) (1.934) (0.0204) (0.463) (1.822) (3.141) (3.840)
Constant 58.56*** 49.88*** 0.544*** 11.50*** 46.45*** 28.59* 62.07***
(8.339) (8.181) (0.0778) (2.184) (7.040) (14.77) (11.49)
Panel B: Attitudes to Corruption
[1] [2] [3] [4] [5] [6] [7]
Experienced Politician -0.0401 0.00739 0.0355 -0.0341 0.009 0.0003 0.0288
(0.0312) (0.0380) (0.0245) (0.0394) (0.0211) (0.0265) (0.0195)
Constant 0.522*** 0.660*** 0.626*** 0.648*** 0.647*** 0.777*** 0.732***
(0.133) (0.131) (0.135) (0.127) (0.105) (0.0870) (0.0850)
Panel C: Trust in Institution
GP Pradhan MLA MP
Experienced Politician -0.00717 -0.0487 -0.0321 -0.0272
(0.0187) (0.0291) (0.0485) (0.0586)
Constant 0.834*** 0.814*** 0.539*** 0.206
(0.0879) (0.0974) (0.177) (0.199)
Sample Size 400 400 400 400
Notes: Sample restricted to Inexperienced (newly/first-time elected) and Experienced (re-elected and outgoing) politicians. Corruption vignettes in Panel B: [1] It is acceptable for a shopkeeper to offer a politician a small gift to help keep the tax auditor away; [2] It is acceptable for a businessman to give a job in a family firm to a family

34
member even though other applicants are more qualified; [3] It is acceptable for a government employee to give a government job to a family member even though other applicants are more qualified; [4] It is acceptable for a male politician to give a government job to a family member even though other applicants are more qualified; [5] It is ok for a female politician to give a government job to a family member even though other applicants are more qualified; [6] It is acceptable for a government employee to ask a schoolteacher for a small gift in exchange for approving his BPL card without proper documentation; [7] It is acceptable for a politician to ask a schoolteacher for a small gift in exchange for approving his BPL card without proper documentation. Standard errors, clustered at the GP level are presented in parentheses. Significance: * p < 0.10; ** p < 0.05; *** p < 0.001.
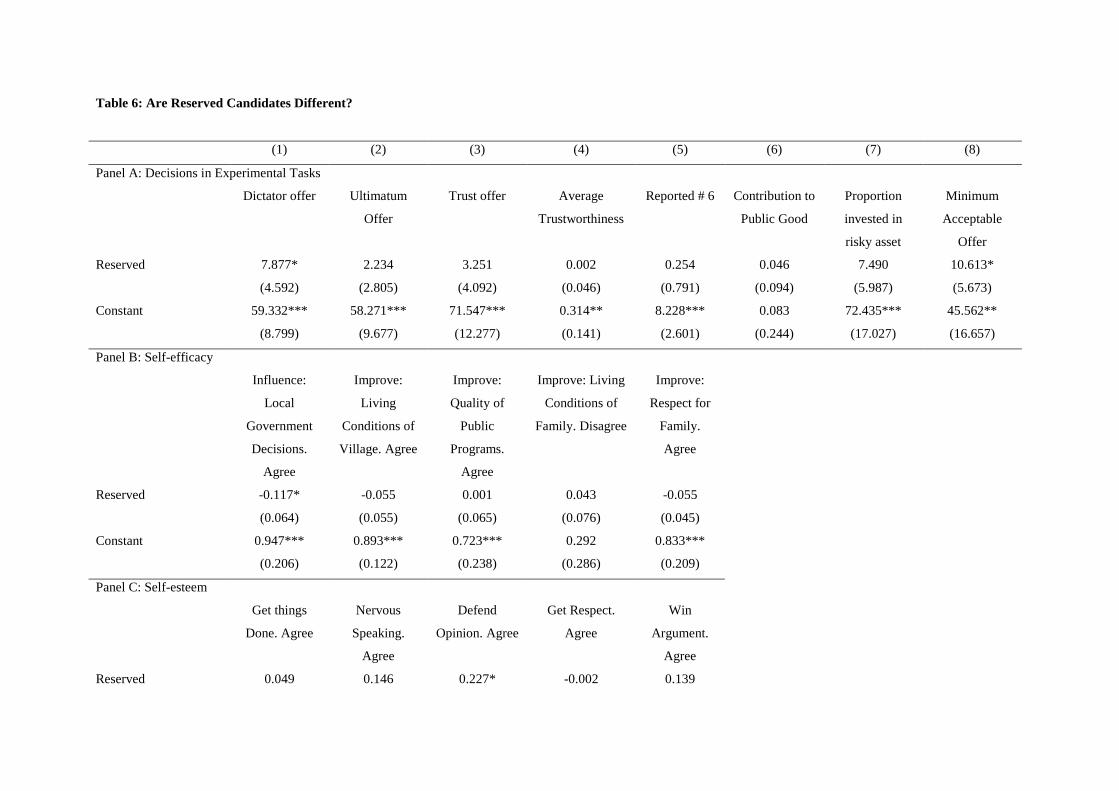
Table 6: Are Reserved Candidates Different?
(1) (2) (3) (4) (5) (6) (7) (8)
Panel A: Decisions in Experimental Tasks
Dictator offer Ultimatum
Offer
Trust offer Average
Trustworthiness
Reported # 6 Contribution to
Public Good
Proportion
invested in
risky asset
Minimum
Acceptable
Offer
Reserved 7.877* 2.234 3.251 0.002 0.254 0.046 7.490 10.613*
(4.592) (2.805) (4.092) (0.046) (0.791) (0.094) (5.987) (5.673)
Constant 59.332*** 58.271*** 71.547*** 0.314** 8.228*** 0.083 72.435*** 45.562**
(8.799) (9.677) (12.277) (0.141) (2.601) (0.244) (17.027) (16.657)
Panel B: Self-efficacy
Influence:
Local
Government
Decisions.
Agree
Improve:
Living
Conditions of
Village. Agree
Improve:
Quality of
Public
Programs.
Agree
Improve: Living
Conditions of
Family. Disagree
Improve:
Respect for
Family.
Agree
Reserved -0.117* -0.055 0.001 0.043 -0.055
(0.064) (0.055) (0.065) (0.076) (0.045)
Constant 0.947*** 0.893*** 0.723*** 0.292 0.833***
(0.206) (0.122) (0.238) (0.286) (0.209)
Panel C: Self-esteem
Get things
Done. Agree
Nervous
Speaking.
Agree
Defend
Opinion. Agree
Get Respect.
Agree
Win
Argument.
Agree
Reserved 0.049 0.146 0.227* -0.002 0.139
36
(0.044) (0.113) (0.116) (0.054) (0.122)
Constant 0.718*** 0.568** 0.636** 0.733*** 0.364
(0.155) (0.240) (0.232) (0.148) (0.264)
Panel D: Trust in Institutions
Trust GP Trust Pradhan Trust MLA Trust MP Aspire
politics. Yes
Reserved 0.029 0.084 0.190** 0.187* -0.065
(0.050) (0.058) (0.080) (0.107) (0.054)
Constant 0.767*** 0.770*** 0.404 0.086 0.701***
(0.119) (0.127) (0.277) (0.250) (0.169)
Sample Size 195 195 195 195 195 195 195 195
Notes: Sample restricted to Inexperienced (newly/first-time elected) politicians. Regressions control for a range of individual and household level demographic and socio-economic variables. Standard errors, clustered at the GP level are presented in parentheses. Significance: * p < 0.10; ** p < 0.05; *** p < 0.001.
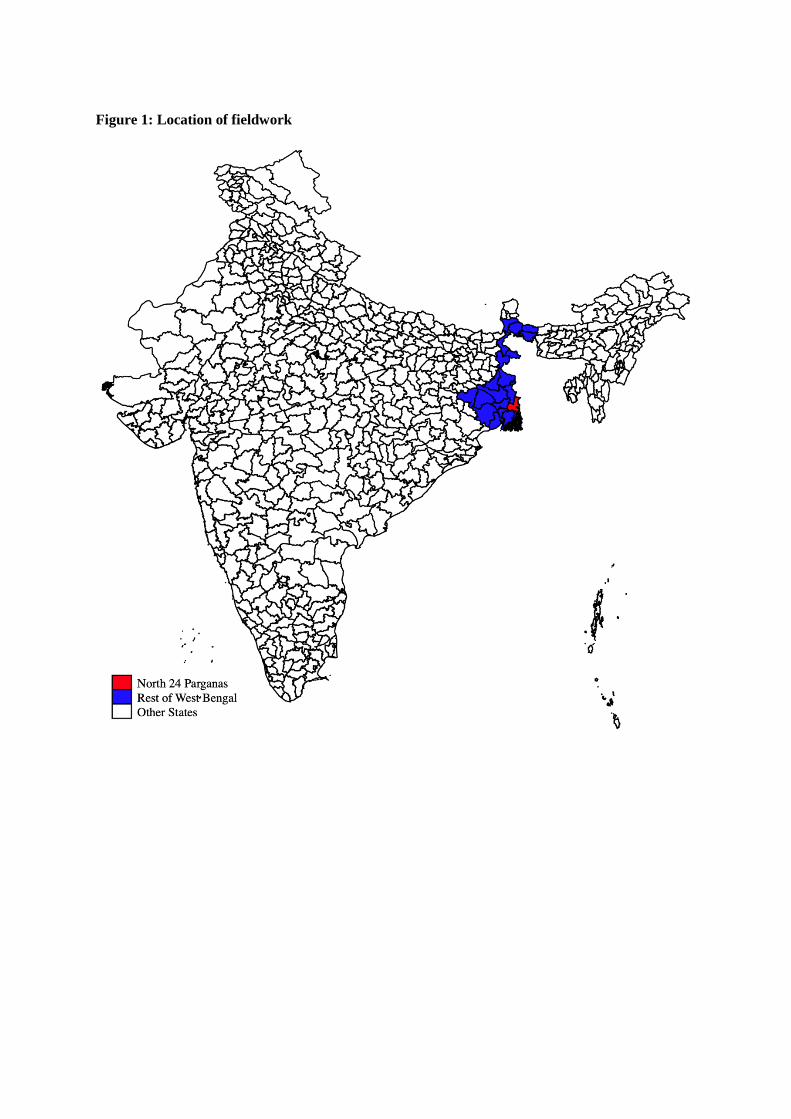
Figure 1: Location of fieldwork
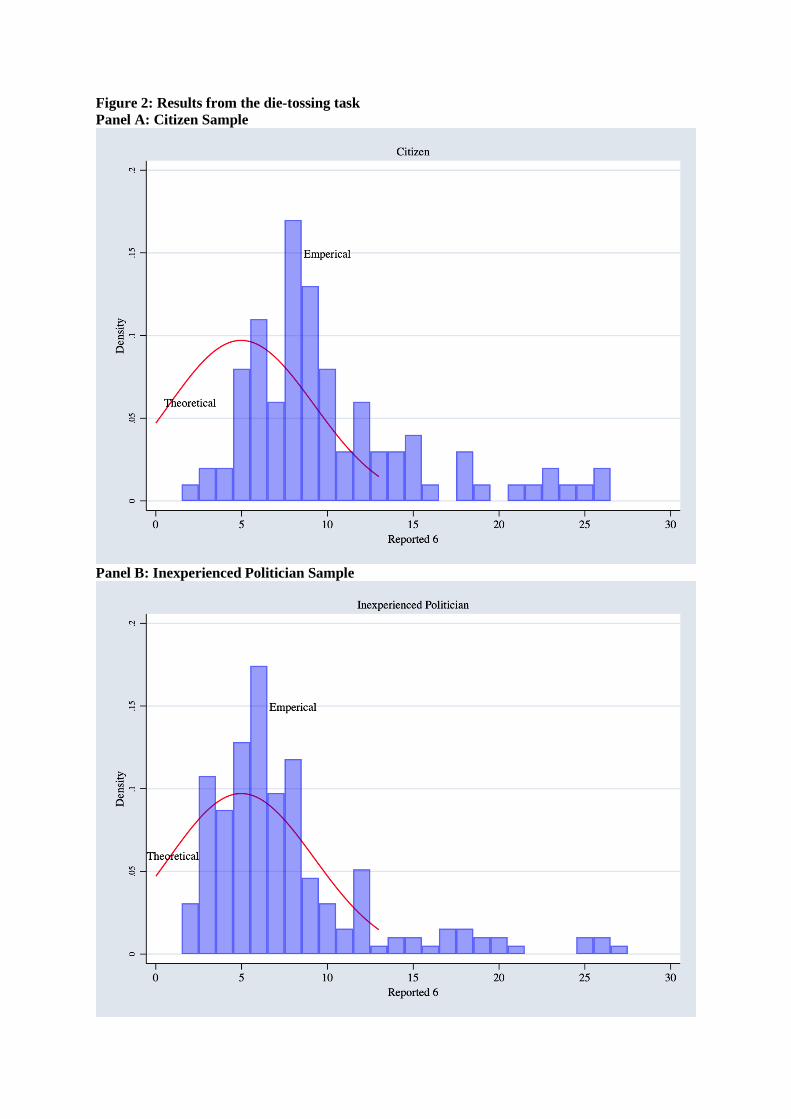
Figure 2: Results from the die-tossing task Panel A: Citizen Sample
Panel B: Inexperienced Politician Sample
39
Panel C: Experienced Politician Sample
Notes: Theoretical Distribution computed using 10,000 throws of an unbiased die. The bars present the outcomes reported by the participants, while the lines present the theoretical distribution. The Empirical distribution gives the reported number of 6s by each group (citizen, inexperienced politician, experienced politician). Inexperienced politicians include newly/first-time elected politicians; Experienced politicians include re-elected and outgoing politicians.
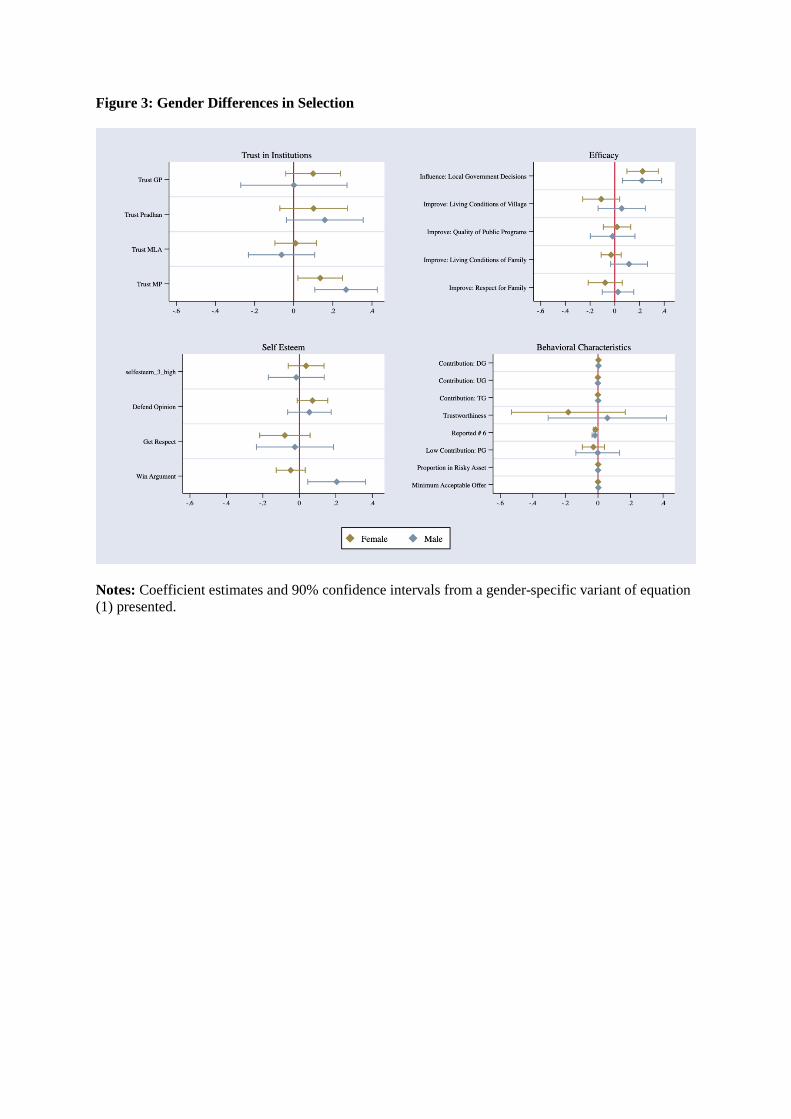
Figure 3: Gender Differences in Selection
Notes: Coefficient estimates and 90% confidence intervals from a gender-specific variant of equation (1) presented.
41
For Online Publication
Appendix 1: Brief Description of Experimental Tasks
Dictator Game: This is a paired task. First mover has an endowment of Rs. 100; second
mover has no initial endowment. First mover decides how much of this Rs. 100 (x) to send to
the second mover. Second mover has no decision to make. Payoff of the two players is given
by the split chosen by the first mover (100−x, x). Amount sent by first mover is considered a
measure of first mover’s level of generosity/altruism.
Ultimatum Game: This is a paired task. First mover has an endowment Rs. 100; second
mover has no initial endowment. First mover decides on a split of the initial endowment of
Rs. 100 (100−x, x) The second mover can either accept or reject the offer. If second mover
accepts, then each gets the split offered by first mover (first mover 100−x, second mover gets
x). However, if second mover rejects, then both get 0. This game (and the second mover’s
decision to reject small offers) is often used a measure of notions of fairness.
Trust Game: This is a paired task. First mover has an endowment of Rs. 100; second mover
has no initial endowment. First mover can choose to send x ∈ [0, 100] to second mover. The
amount sent (x) sent is multiplied by 3 and this tripled amount (3x) is given to second mover.
Second mover then decides whether to send anything back y (∈ [0, 3𝑥𝑥])to first mover. This
latter amount is not multiplied. The payoff of the first mover is 100−x+y and the payoff of the
second mover is 3𝑥𝑥 −y. Amount sent by first mover is considered a measure of trust; the
proportion returned by second mover is considered a measure of trustworthiness/reciprocity.
Public Goods Game with Punishment: This is a paired task. Each player has an endowment
of Rs. 100. Each player has a binary decision to make: contribute 0 or the entire endowment
to a common pool. Contributions to the common pool are multiplied by 1.5 and then re-
distributed equally among the two players. The decision to contribute is used as a measure of
a player’s cooperative tendencies. There is a second, punishment, stage. Each player is given
an additional endowment Rs. 25 and asked whether he/she wishes to use any or all of this in
order to punish the other player. For every rupee given up in punishment, the other player is
penalized by Rs. 3. So, if a player wishes to use Rs. x for punishment, then he/she is left with
42
20−x, while the other player loses 3x out of his/her pay-off from the first stage. The amount
foregone in punishment is used as a measure of a player’s willingness to punish a violator of
the cooperative norm.
Investment Task: This is an individual decision-making task. Each player is given an
endowment of Rs. 100 and has the option of investing any amount x ∈ [0, 100] into a project.
The remaining amount 100−x goes into a safe private account. The project is risky. With
probability 0.5, the project will be a success and return 3x; with probability 0.5, the project
will fail and return 0. Thus, the expected payoff is 0.5(3x + (100−x)) + 0.5(100−x). There is a
50% chance that the project will succeed, and a 50% chance that the project will fail. Given
that investments are multiplied by 3, a risk-neutral person would invest the entire Rs. 100 in
the project. The actual amount invested is used to show each player’s degree of risk aversion:
the higher (lower) the amount investment, the less (more) risk averse that player is.
Die-throwing Task: This is an individual decision-making task. Each participant is given an
unbiased die and is asked to roll the die 30 times in private, and then report how many 6s
were obtained in those 30 rolls of the die. Participants are paid Rs. 5 for each 6 they report;
there is no monitoring. The number of 6s reported in this task is our primary measure of
dishonesty.
Appendix 2: Instructions for experimental games
Instructions
This is a study about market decision making. We are a group of university professors
running the study and we are not connected to the government in any way. The results are
for research purposes only, and neither government officials nor anyone else will have
access to the material that we collect. You can think of the decisions you will be asked to
make as a series of games where you are playing against another person. The instructions
are simple. If you follow them closely and make appropriate decisions, you may earn a
considerable amount of money. These earnings will be paid to you in rupees at the end of
this session.
We will now ask you to make a series of decisions. There are others like you taking part.
For most of these decisions, you will be paired with another person. We will call the
players Player 1 and Player 2. We will not tell you who the person you are playing with
is. In most of the games below, we will ask you to play once as Player 1 and once as
Player 2. We will explain as we go along.
As you play this game, there is another person in a different location who is also
answering the same questions with another researcher. Based on the decisions that both
of you have made, we will determine your earnings from the game.
For each game, we will ask you to make a decision once as Player 1 and once as Player
2. In order to calculate your earnings, we will count your decision either as Player 1 or
as Player 2. We will decide this by tossing a coin after the experiment is over. If as a
result of the coin toss you are Player 1 you will be paid as Player 1 for all the games.
Please understand that there is no special advantage to being either Player 1 or Player 2.
The money you make depends on your decisions and the decisions made by the other
player. Sometimes, Player 1 may make more; at other times, Player 2 may make more.
44
If you are ready, we will now proceed. You can stop me and ask questions at any time.
You can also discontinue the study at any time, without providing an explanation.
45
Game 1
This game has two players: Player 1 and Player 2. We will ask you to make one decision
as Player 1 and a second decision as Player 2.
Part 1:
You are Player 1. You are paired with Player 2, whom you do not know. Player 2 will be
in a different location and will be answering the same set of questions.
You have Rs. 100.00
You can choose to keep the entire Rs. 100.00. Or, if you wish, you can split this with
Player 2. For example, if you wish to give Rs. 50.00 to Player 2, then Player 2 will get
Rs. 50.00, and you will get Rs. 50.00.
Please indicate your choice and I will fill in the form appropriately. You are welcome to
look at the form while I do so. Please correct me if anything is entered wrongly.
Form for Recording Decisions for Game #1
Your choice
(Choose only one)
Amount you wish
to keep
(in Rs)
Amount you wish
to send to Player
2
(in Rs)
Total Amount
(in Rs)
0 100 100
10 90 100
20 80 100
30 70 100

46
40 60 100
50 50 100
60 40 100
70 30 100
80 20 100
90 10 100
100 0 100
47
Part 2:
You are Player 2. You are paired with Player 1, whom you do not know. Player 1 will be
in a different location and will be answering the same set of questions.
Player 1 has Rs. 100.00
Player 1 can keep the entire Rs. 100.00. Or, if he/she wishes, then he/she can split this
with you. For example, if Player 1 wishes to give you Rs. 40.00, then Player 1 will get
Rs. 60.00 and you will get Rs. 40.00.
You have no decision to make.
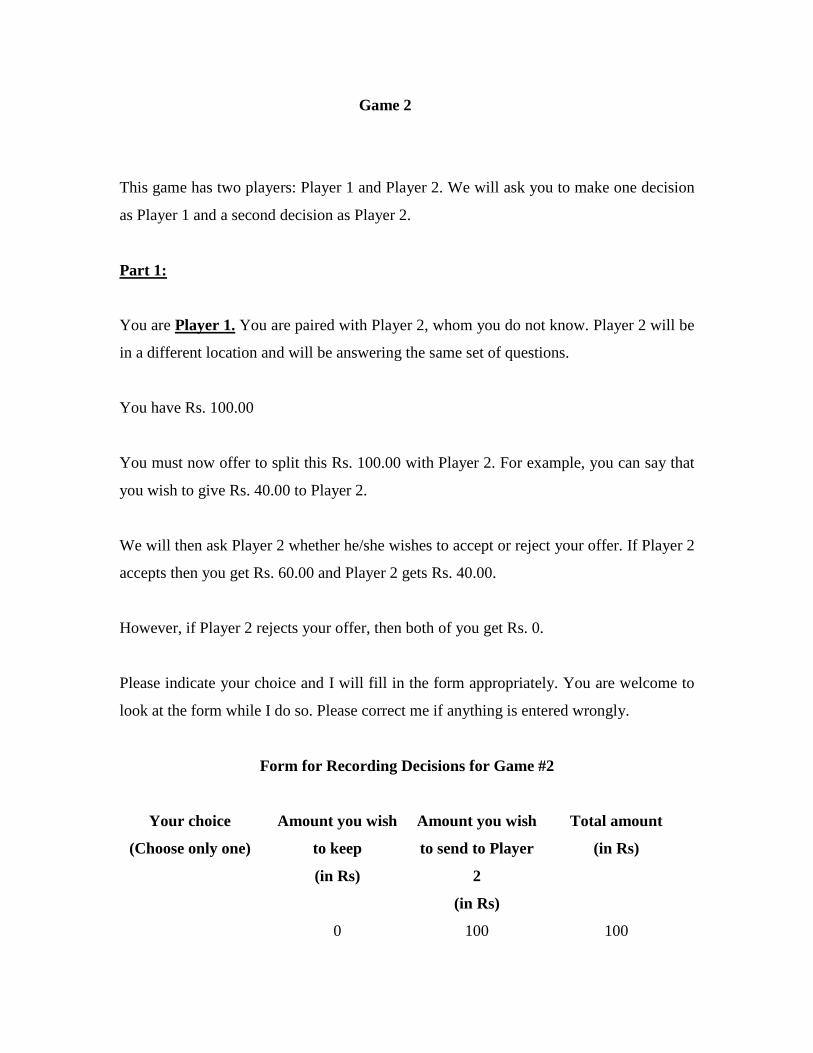
Game 2
This game has two players: Player 1 and Player 2. We will ask you to make one decision
as Player 1 and a second decision as Player 2.
Part 1:
You are Player 1. You are paired with Player 2, whom you do not know. Player 2 will be
in a different location and will be answering the same set of questions.
You have Rs. 100.00
You must now offer to split this Rs. 100.00 with Player 2. For example, you can say that
you wish to give Rs. 40.00 to Player 2.
We will then ask Player 2 whether he/she wishes to accept or reject your offer. If Player 2
accepts then you get Rs. 60.00 and Player 2 gets Rs. 40.00.
However, if Player 2 rejects your offer, then both of you get Rs. 0.
Please indicate your choice and I will fill in the form appropriately. You are welcome to
look at the form while I do so. Please correct me if anything is entered wrongly.
Form for Recording Decisions for Game #2
Your choice
(Choose only one)
Amount you wish
to keep
(in Rs)
Amount you wish
to send to Player
2
(in Rs)
Total amount
(in Rs)
0 100 100
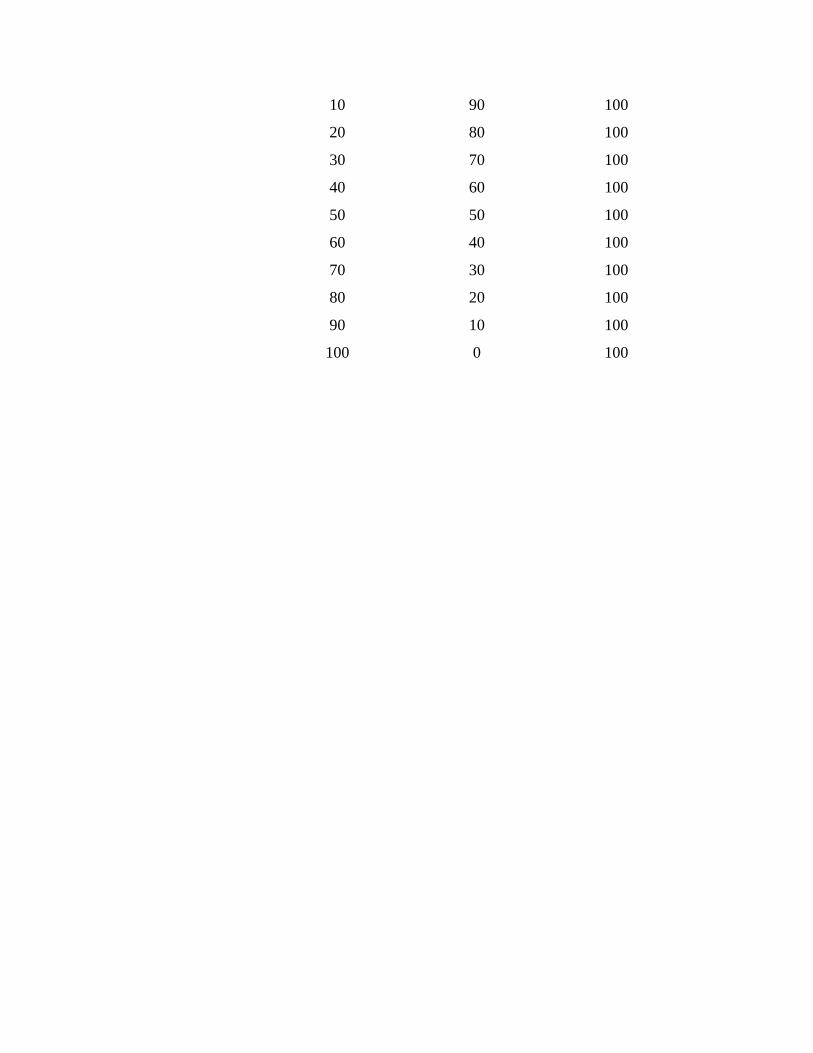
10 90 100
20 80 100
30 70 100
40 60 100
50 50 100
60 40 100
70 30 100
80 20 100
90 10 100
100 0 100
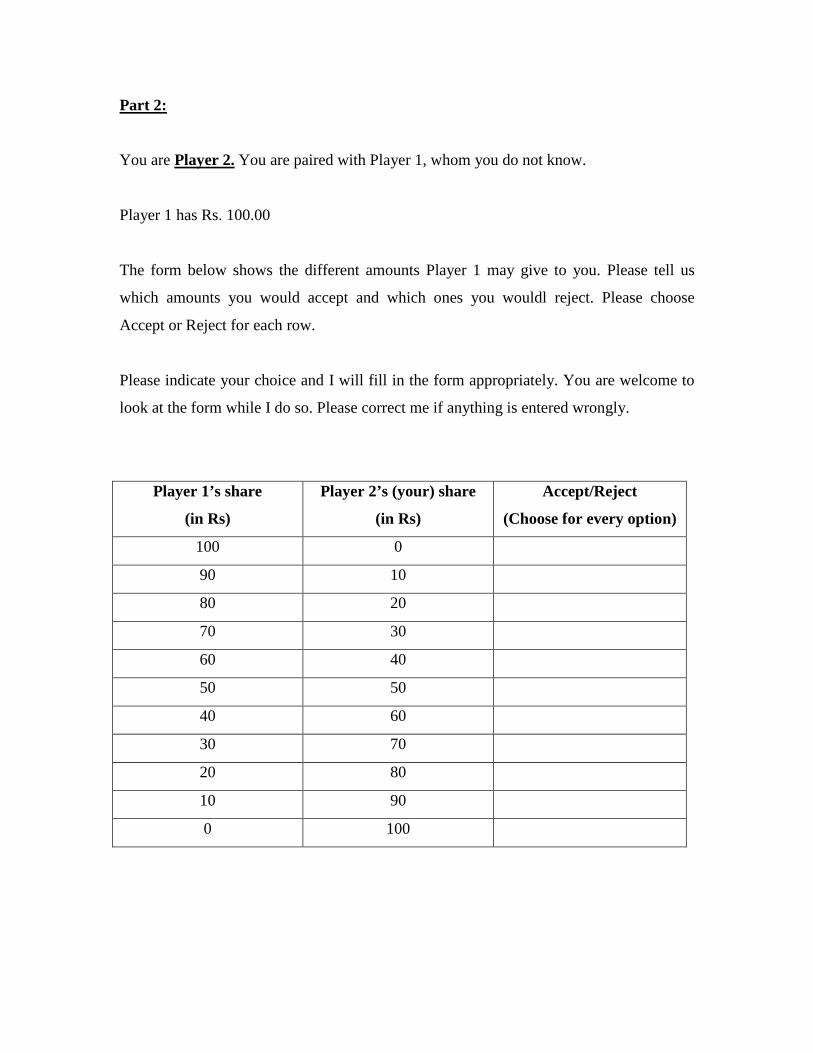
Part 2:
You are Player 2. You are paired with Player 1, whom you do not know.
Player 1 has Rs. 100.00
The form below shows the different amounts Player 1 may give to you. Please tell us
which amounts you would accept and which ones you wouldl reject. Please choose
Accept or Reject for each row.
Please indicate your choice and I will fill in the form appropriately. You are welcome to
look at the form while I do so. Please correct me if anything is entered wrongly.
Player 1’s share
(in Rs)
Player 2’s (your) share
(in Rs)
Accept/Reject
(Choose for every option)
100 0
90 10
80 20
70 30
60 40
50 50
40 60
30 70
20 80
10 90
0 100
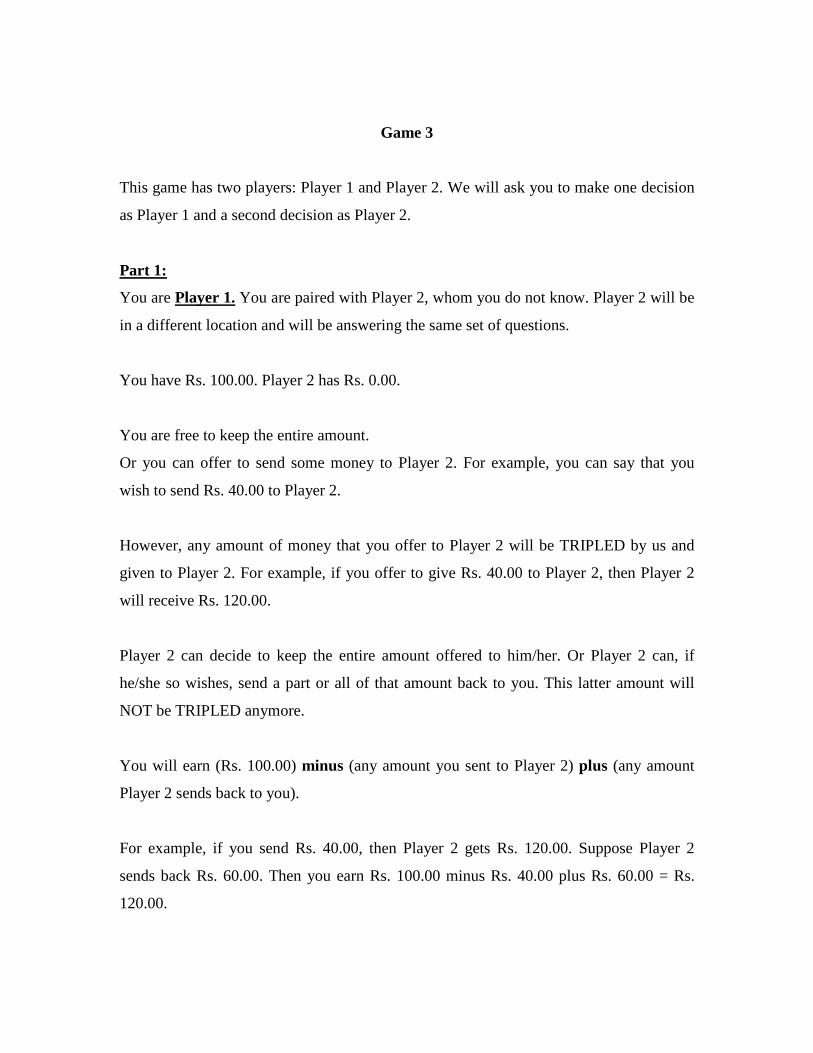
Game 3
This game has two players: Player 1 and Player 2. We will ask you to make one decision
as Player 1 and a second decision as Player 2.
Part 1:
You are Player 1. You are paired with Player 2, whom you do not know. Player 2 will be
in a different location and will be answering the same set of questions.
You have Rs. 100.00. Player 2 has Rs. 0.00.
You are free to keep the entire amount.
Or you can offer to send some money to Player 2. For example, you can say that you
wish to send Rs. 40.00 to Player 2.
However, any amount of money that you offer to Player 2 will be TRIPLED by us and
given to Player 2. For example, if you offer to give Rs. 40.00 to Player 2, then Player 2
will receive Rs. 120.00.
Player 2 can decide to keep the entire amount offered to him/her. Or Player 2 can, if
he/she so wishes, send a part or all of that amount back to you. This latter amount will
NOT be TRIPLED anymore.
You will earn (Rs. 100.00) minus (any amount you sent to Player 2) plus (any amount
Player 2 sends back to you).
For example, if you send Rs. 40.00, then Player 2 gets Rs. 120.00. Suppose Player 2
sends back Rs. 60.00. Then you earn Rs. 100.00 minus Rs. 40.00 plus Rs. 60.00 = Rs.
120.00.

Player 2 earns Rs. 120.00 minus Rs. 60.00 = Rs. 60.00.

Task 1:
Please indicate your choice and I will fill in the form appropriately. You are welcome to
look at the form while I do so. Please correct me if anything is entered wrongly.
Your choice
(Choose only one)
Amount you wish
to keep
(in Rs)
Amount you wish
to send to Player
2
(in Rs)
Player 2 will then
get
(in Rs)
0 100 300
10 90 270
20 80 240
30 70 210
40 60 180
50 50 150
60 40 120
70 30 90
80 20 60
90 10 30
100 0 0

Task 2:
If you chose to send any amount to Player 2:
1. Are you expecting to get any money back? ____ YES ____ NO
2. How much money are you expecting to get back from Player 2? Rs. _____
Keep in mind the amount of money that you sent to Player 2 and the amount Player 2
received as shown above.
Please indicate your choice and I will fill in the form appropriately. You are welcome to
look at the form while I do so. Please correct me if anything is entered wrongly.
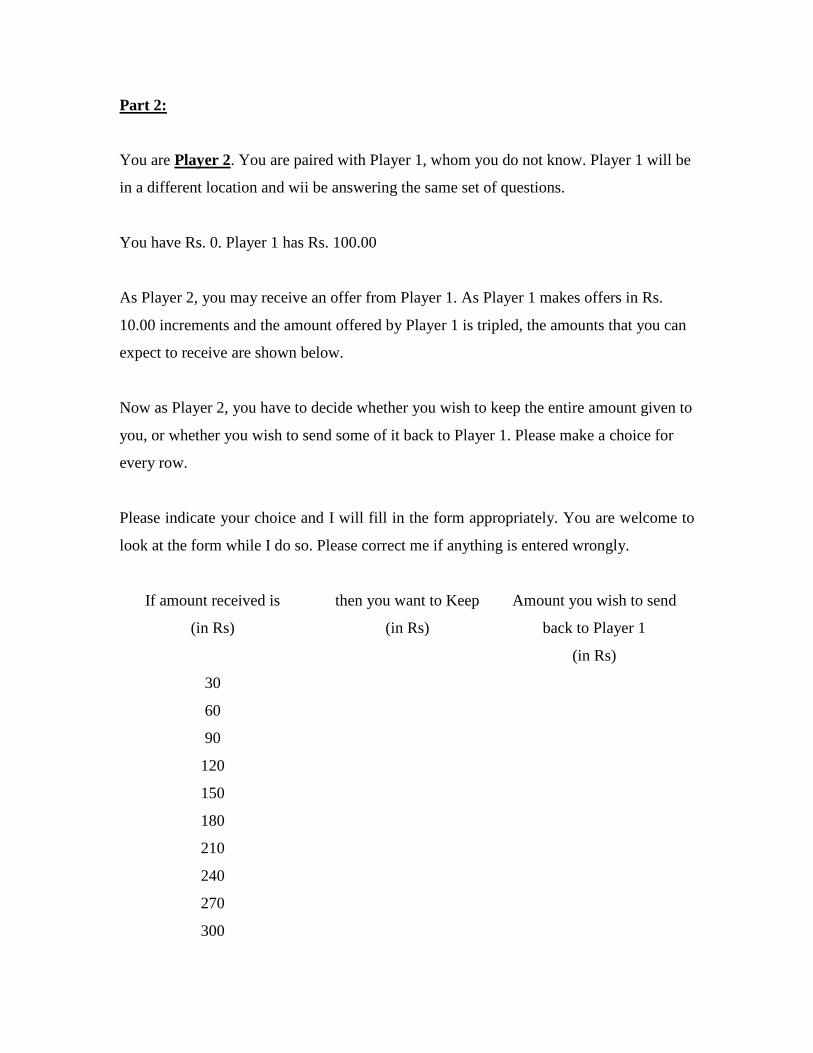
Part 2:
You are Player 2. You are paired with Player 1, whom you do not know. Player 1 will be
in a different location and wii be answering the same set of questions.
You have Rs. 0. Player 1 has Rs. 100.00
As Player 2, you may receive an offer from Player 1. As Player 1 makes offers in Rs.
10.00 increments and the amount offered by Player 1 is tripled, the amounts that you can
expect to receive are shown below.
Now as Player 2, you have to decide whether you wish to keep the entire amount given to
you, or whether you wish to send some of it back to Player 1. Please make a choice for
every row.
Please indicate your choice and I will fill in the form appropriately. You are welcome to
look at the form while I do so. Please correct me if anything is entered wrongly.
If amount received is
(in Rs)
then you want to Keep
(in Rs)
Amount you wish to send
back to Player 1
(in Rs)
30
60
90
120
150
180
210
240
270
300
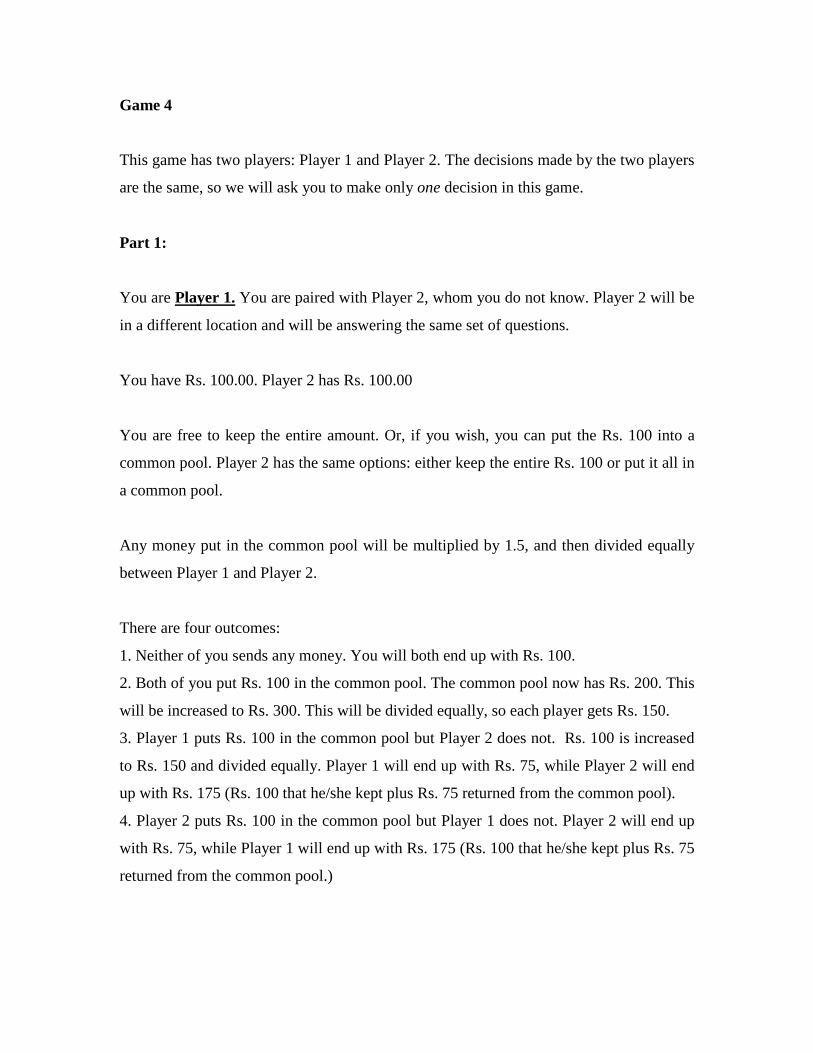
Game 4
This game has two players: Player 1 and Player 2. The decisions made by the two players
are the same, so we will ask you to make only one decision in this game.
Part 1:
You are Player 1. You are paired with Player 2, whom you do not know. Player 2 will be
in a different location and will be answering the same set of questions.
You have Rs. 100.00. Player 2 has Rs. 100.00
You are free to keep the entire amount. Or, if you wish, you can put the Rs. 100 into a
common pool. Player 2 has the same options: either keep the entire Rs. 100 or put it all in
a common pool.
Any money put in the common pool will be multiplied by 1.5, and then divided equally
between Player 1 and Player 2.
There are four outcomes:
1. Neither of you sends any money. You will both end up with Rs. 100.
2. Both of you put Rs. 100 in the common pool. The common pool now has Rs. 200. This
will be increased to Rs. 300. This will be divided equally, so each player gets Rs. 150.
3. Player 1 puts Rs. 100 in the common pool but Player 2 does not. Rs. 100 is increased
to Rs. 150 and divided equally. Player 1 will end up with Rs. 75, while Player 2 will end
up with Rs. 175 (Rs. 100 that he/she kept plus Rs. 75 returned from the common pool).
4. Player 2 puts Rs. 100 in the common pool but Player 1 does not. Player 2 will end up
with Rs. 75, while Player 1 will end up with Rs. 175 (Rs. 100 that he/she kept plus Rs. 75
returned from the common pool.)
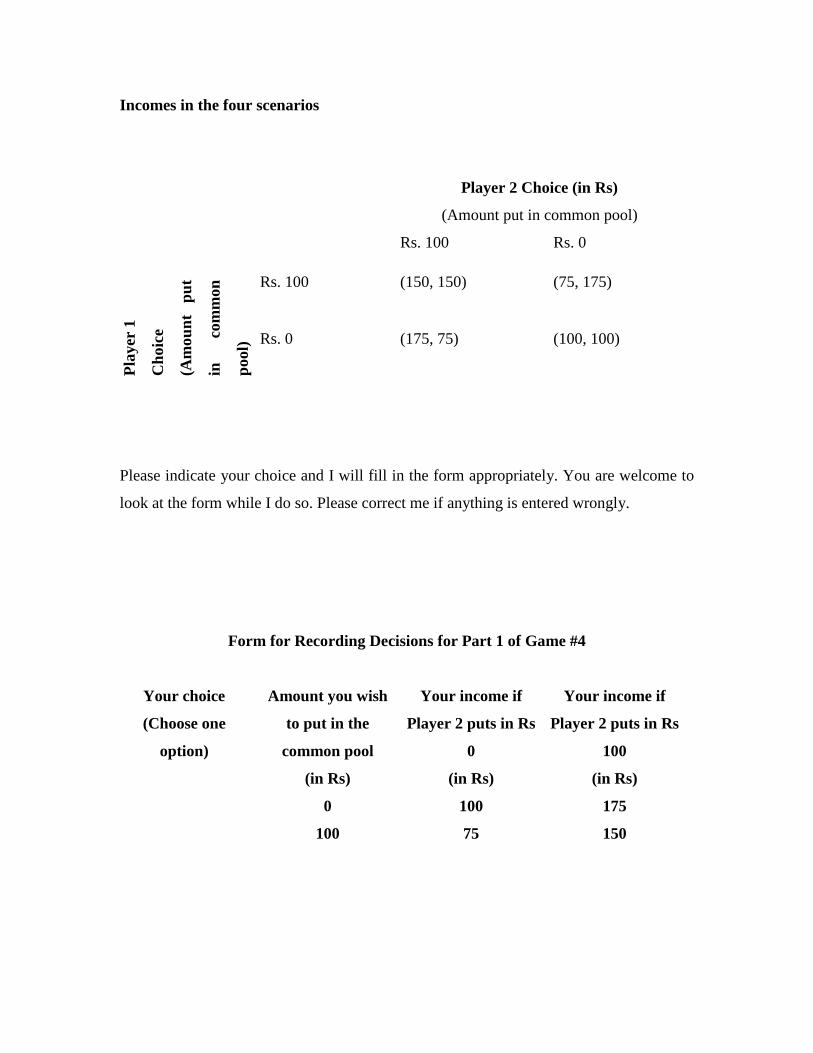
Incomes in the four scenarios
Player 2 Choice (in Rs)
(Amount put in common pool)
Rs. 100 Rs. 0
Play
er 1
Cho
ice
(Am
ount
pu
t
in
com
mon
pool
)
Rs. 100 (150, 150) (75, 175)
Rs. 0 (175, 75) (100, 100)
Please indicate your choice and I will fill in the form appropriately. You are welcome to
look at the form while I do so. Please correct me if anything is entered wrongly.
Form for Recording Decisions for Part 1 of Game #4
Your choice
(Choose one
option)
Amount you wish
to put in the
common pool
(in Rs)
Your income if
Player 2 puts in Rs
0
(in Rs)
Your income if
Player 2 puts in Rs
100
(in Rs)
0 100 175
100 75 150

Part 2:
Answer this only if you put Rs. 100 in the common pool.
Suppose Player 2 did not put any money into the common pool. This means that you now
have Rs. 75 and Player 2 has Rs. 175.
We will give you an additional Rs. 25. You can keep this Rs. 25, so that you will have
Rs. 100.
But if you want to you can give up some or all of this Rs. 25. But for every rupee that you
give up, we will take away Rs. 3 from Player 2. So, for example, if you give up Rs. 10,
then we will take away Rs. 30 from Player 2. If you give up Rs. 25, then we will take
away Rs. 75 from Player 2.
Please indicate your choice and I will fill in the form appropriately. You are welcome to
look at the form while I do so. Please correct me if anything is entered wrongly.
Form for Recording Decisions for Part 2 Game #4
Do you wish to give up money? YES/NO
If yes, how much are you willing to give
up?
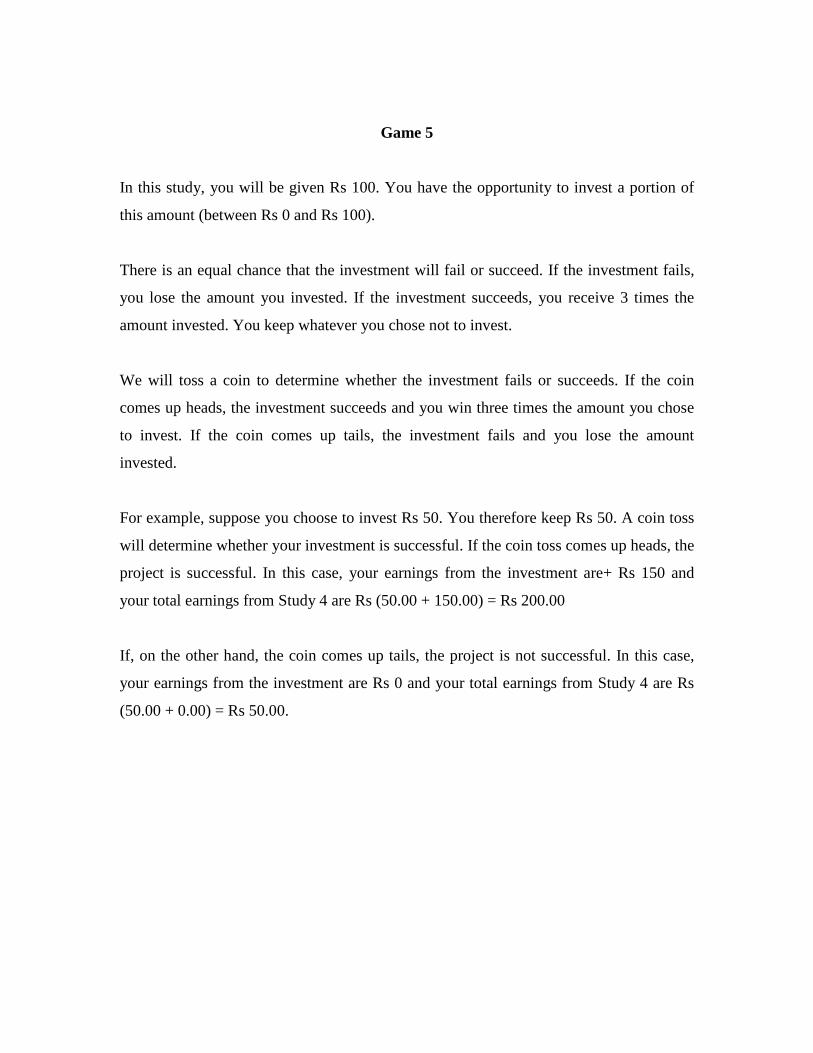
Game 5
In this study, you will be given Rs 100. You have the opportunity to invest a portion of
this amount (between Rs 0 and Rs 100).
There is an equal chance that the investment will fail or succeed. If the investment fails,
you lose the amount you invested. If the investment succeeds, you receive 3 times the
amount invested. You keep whatever you chose not to invest.
We will toss a coin to determine whether the investment fails or succeeds. If the coin
comes up heads, the investment succeeds and you win three times the amount you chose
to invest. If the coin comes up tails, the investment fails and you lose the amount
invested.
For example, suppose you choose to invest Rs 50. You therefore keep Rs 50. A coin toss
will determine whether your investment is successful. If the coin toss comes up heads, the
project is successful. In this case, your earnings from the investment are+ Rs 150 and
your total earnings from Study 4 are Rs (50.00 + 150.00) = Rs 200.00
If, on the other hand, the coin comes up tails, the project is not successful. In this case,
your earnings from the investment are Rs 0 and your total earnings from Study 4 are Rs
(50.00 + 0.00) = Rs 50.00.
Form for Recording Decisions for Game 5
Total Amount Rs 100
Amount you wish to keep (in Rs)
Amount you wish to invest (in Rs)
Result of coin toss Successful ( ) Unsuccessful ( )
Game 6
Here is a standard 6-sided die. Please go to the booth in the corner. Roll the die 30 times
and then tell us the number of times you received a 6. You will get Rs 5 for each 6 you
receive in the process.
Form for Recording Decisions for Game 6
Total Number of 6s received
Amount earned (in Rs)
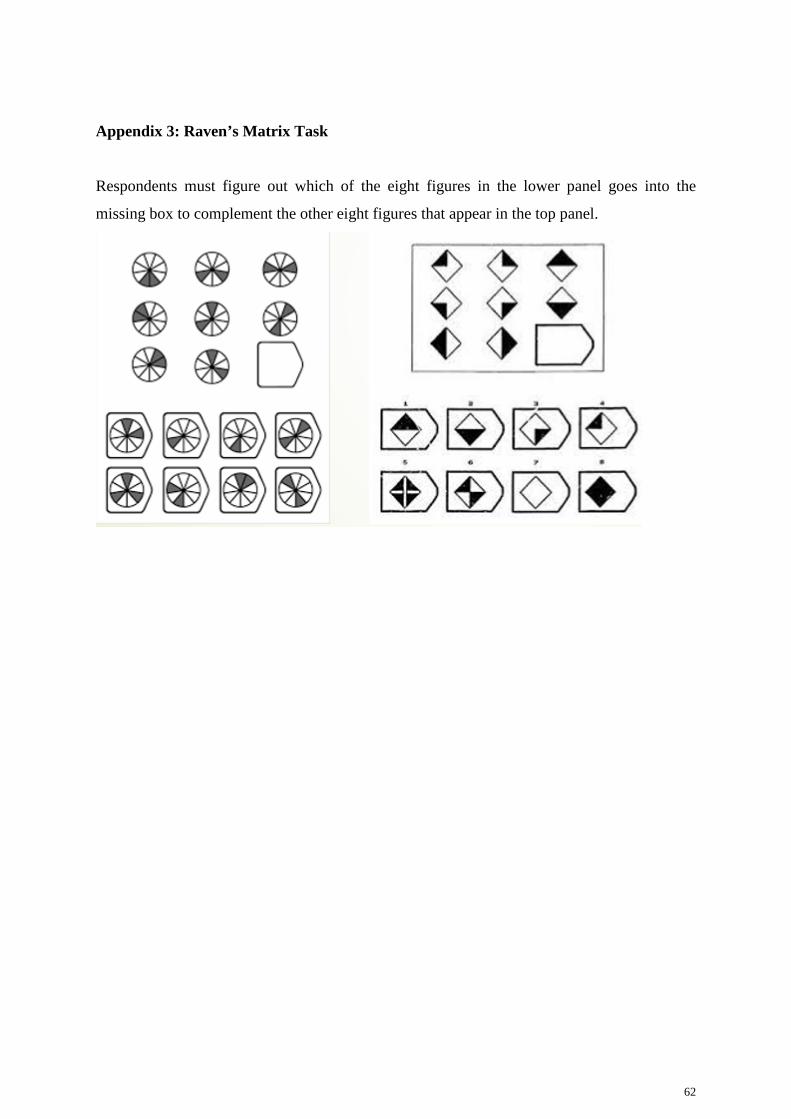
62
Appendix 3: Raven’s Matrix Task
Respondents must figure out which of the eight figures in the lower panel goes into the
missing box to complement the other eight figures that appear in the top panel.