Seeing things in the clouds: the effect of visual features on tag cloud selections
10
Seeing Things in the Clouds: The Effect of Visual Features on Tag Cloud Selections Scott Bateman, Carl Gutwin, and Miguel Nacenta Department of Computer Science, University of Saskatchewan Saskatoon, Saskatchewan, Canada +1 306 966 4886 {scott.bateman, carl.gutwin, miguel.nacenta}@usask.ca ABSTRACT Tag clouds are a popular method for visualizing and linking socially-organized information on websites. Tag clouds represent variables of interest (such as popularity) in the visual appearance of the keywords themselves – using text properties such as font size, weight, or colour. Although tag clouds are becoming common, there is still little information about which visual features of tags draw the attention of viewers. As tag clouds attempt to represent a wider range of variables with a wider range of visual properties, it becomes difficult to predict what will appear visually important to a viewer. To investigate this issue, we carried out an exploratory study that asked users to select tags from clouds that manipulated nine visual properties. Our results show that font size and font weight have stronger effects than intensity, number of characters, or tag area; but when several visual properties are manipulated at once, there is no one property that stands out above the others. This study adds to the understanding of how visual properties of text capture the attention of users, indicates general guidelines for designers of tag clouds, and provides a study paradigm and starting points for future studies. In addition, our findings may be applied more generally to the visual presentation of textual hyperlinks as a way to provide more information to web navigators. Categories and Subject Descriptors H.5.4 Hypertext/Hypermedia: User issues. General Terms Human Factors, Experimentation, Design. Keywords Visualization of text, tag clouds, visual properties, social linking. 1. INTRODUCTION Tag clouds are visualizations of the tags used in a website or other repository of information. The basic representation for the visualization is the tag words themselves; variables of interest, such as tag popularity or importance, are represented by manipulating visual features of the words such as font size, colour, or weight (Figure 1). Figure 1. Example tag cloud from amazon.com/tags Tag clouds have emerged along with the rise of collaborative tagging, which is now common on social software websites for photo sharing (e.g., flickr), bookmark sharing (e.g., del.icio.us), and blog searching (e.g., Technorati). On these websites, simple keywords called tags are used to categorize the information on the site (such as the photos or bookmarks), and tag clouds are frequently used as a way to give an overview of this human- created metadata. Most often the tags are hyperlinks, and clicking on a tag will lead users to the resources in the social website that have been labeled with the tag. Clouds have been shown to help people get a high-level understanding of the data, and to help people in casual exploration [15]. Unlike other information visualizations, tag clouds do not use additional artifacts (such as the bars in a bar chart) to represent variables of interest. Instead, tag clouds merge the data variable with the data label (the tag word itself). Variables of interest are conveyed by manipulations to the visual properties of the text. The most common approach currently used is to map the popularity of a tag (its frequency of use) to the font size of the word in the cloud. However, many other possibilities exist, both in terms of possible input variables and possible visual manipulations. Tag clouds are not exclusively used on social websites; they have now been incorporated in many commercial websites as well (such as www.amazon.com/tags). However, very little is known about how visual cues influence users to look at and follow particular links in tag clouds. There is a general understanding, in the field of psychology, that words with very different visual characteristics will ‘pop out’ from the rest of the cloud [20], but less is known about how people are influenced by tags in clouds, where the differences are less dramatic and more widespread. In addition, it is not known whether there are interactions between different visual features: for example, in the tag cloud of Figure 1, ‘dvd’ is the word with the largest font size, but out pilot study suggests that its length and position make it less noticeable than other tags. In general, as tag clouds attempt to represent a wider Permission to make digital or hard copies of all or part of this work for personal or classroom use is granted without fee provided that copies are not made or distributed for profit or commercial advantage and that copies bear this notice and the full citation on the first page. To copy otherwise, or republish, to post on servers or to redistribute to lists, requires prior specific permission and/or a fee. HT’08, June 19–21, 2008, Pittsburgh, Pennsylvania, USA. Copyright 2008 ACM 978-1-59593-985-2/08/06...$5.00.
-
Upload
newbrunswick -
Category
Documents
-
view
4 -
download
0
Transcript of Seeing things in the clouds: the effect of visual features on tag cloud selections

Seeing Things in the Clouds: The Effect of Visual Features on Tag Cloud Selections
Scott Bateman, Carl Gutwin, and Miguel Nacenta Department of Computer Science, University of Saskatchewan
Saskatoon, Saskatchewan, Canada +1 306 966 4886
{scott.bateman, carl.gutwin, miguel.nacenta}@usask.ca
ABSTRACT Tag clouds are a popular method for visualizing and linking socially-organized information on websites. Tag clouds represent variables of interest (such as popularity) in the visual appearance of the keywords themselves – using text properties such as font size, weight, or colour. Although tag clouds are becoming common, there is still little information about which visual features of tags draw the attention of viewers. As tag clouds attempt to represent a wider range of variables with a wider range of visual properties, it becomes difficult to predict what will appear visually important to a viewer. To investigate this issue, we carried out an exploratory study that asked users to select tags from clouds that manipulated nine visual properties. Our results show that font size and font weight have stronger effects than intensity, number of characters, or tag area; but when several visual properties are manipulated at once, there is no one property that stands out above the others. This study adds to the understanding of how visual properties of text capture the attention of users, indicates general guidelines for designers of tag clouds, and provides a study paradigm and starting points for future studies. In addition, our findings may be applied more generally to the visual presentation of textual hyperlinks as a way to provide more information to web navigators.
Categories and Subject Descriptors H.5.4 Hypertext/Hypermedia: User issues.
General Terms Human Factors, Experimentation, Design.
Keywords Visualization of text, tag clouds, visual properties, social linking.
1. INTRODUCTION Tag clouds are visualizations of the tags used in a website or other repository of information. The basic representation for the visualization is the tag words themselves; variables of interest, such as tag popularity or importance, are represented by manipulating visual features of the words such as font size, colour, or weight (Figure 1).
Figure 1. Example tag cloud from amazon.com/tags
Tag clouds have emerged along with the rise of collaborative tagging, which is now common on social software websites for photo sharing (e.g., flickr), bookmark sharing (e.g., del.icio.us), and blog searching (e.g., Technorati). On these websites, simple keywords called tags are used to categorize the information on the site (such as the photos or bookmarks), and tag clouds are frequently used as a way to give an overview of this human-created metadata. Most often the tags are hyperlinks, and clicking on a tag will lead users to the resources in the social website that have been labeled with the tag. Clouds have been shown to help people get a high-level understanding of the data, and to help people in casual exploration [15]. Unlike other information visualizations, tag clouds do not use additional artifacts (such as the bars in a bar chart) to represent variables of interest. Instead, tag clouds merge the data variable with the data label (the tag word itself). Variables of interest are conveyed by manipulations to the visual properties of the text. The most common approach currently used is to map the popularity of a tag (its frequency of use) to the font size of the word in the cloud. However, many other possibilities exist, both in terms of possible input variables and possible visual manipulations. Tag clouds are not exclusively used on social websites; they have now been incorporated in many commercial websites as well (such as www.amazon.com/tags). However, very little is known about how visual cues influence users to look at and follow particular links in tag clouds. There is a general understanding, in the field of psychology, that words with very different visual characteristics will ‘pop out’ from the rest of the cloud [20], but less is known about how people are influenced by tags in clouds, where the differences are less dramatic and more widespread. In addition, it is not known whether there are interactions between different visual features: for example, in the tag cloud of Figure 1, ‘dvd’ is the word with the largest font size, but out pilot study suggests that its length and position make it less noticeable than other tags. In general, as tag clouds attempt to represent a wider
Permission to make digital or hard copies of all or part of this work for personal or classroom use is granted without fee provided that copies are not made or distributed for profit or commercial advantage and that copies bear this notice and the full citation on the first page. To copy otherwise, or republish, to post on servers or to redistribute to lists, requires prior specific permission and/or a fee. HT’08, June 19–21, 2008, Pittsburgh, Pennsylvania, USA. Copyright 2008 ACM 978-1-59593-985-2/08/06...$5.00.

range of variables with a wider range of visual manipulations, it becomes difficult to predict what will appear visually important to a viewer. So, how do text properties exert visual influence on a viewer, and, therefore, lead them to read a particular tag? Studying the visual influence of tags is important for two reasons. First, we know that people scan rather than read tag clouds (as indicated by Halvey and Keane [9]). Second, people generally do not look at all of the tags in the cloud, just as they do not take the time to consider all of the hyperlinks that are presented on a web page [21]. Thus, it is important to determine what people will look at based on visual influence. We define ‘visual influence’ as the visual characteristics of the tag that draw a user’s attention. We can further refine this definition by saying that the visual influence of tags does not include the semantics of the word itself, since once a tag is read, the meaning of the tag word has a strong influence on whether or not that tag is chosen. To find out more about which visual properties influence people viewing tag clouds, we carried out a broad exploratory study. Although there have been previous studies of information retrieval using tag clouds, our study explicitly looks at the interrelated visual properties of tags and how they lead a user to read and consider a tag for selection. We created several sets of tag clouds that manipulated different visual properties (font size, tag area, number of characters, tag width, font weight, colour, intensity, and number of pixels). We asked participants to choose tags from these clouds that they felt were the most ‘visually important’, and used the results to determine which visual properties had consistent and strong effects of capturing peoples’ attention. Our study showed several substantial differences in the degree that different properties influenced people, and these results can be used to improve the design of future tag clouds, and social visualizations using text (such as individual hyperlinks). Further, we have empirically confirmed several intuitions about the use of font size and position in tag clouds. However, we also found that when several visual properties are manipulated at once, the results become less clear, providing several interesting questions with regards to how many visual properties can be usefully combined. In the remainder of the paper, we provide background on tag clouds, related work, and possible interpretation problems in tag clouds, and then introduce the visual properties that we studied. We then report on our exploratory study results, and discuss how our findings can be used by designers and researchers, and generalized for more general purposes.
2. ABOUT CLOUDS The first use of a tag-cloud-like visualization was in Douglas Coupland's 1995 novel Microserfs [6]. In 1997, Jim Flanagan developed a software module to provide tag cloud functionality for blogs, and this system likely inspired photo sharing site flickr.com. It was flickr, perhaps more than any other site or person, that has popularized the widespread use of clouds [2].
2.1 Clouds on the Web Tag clouds, in the most common form found on the Web, manipulate text by changing the font size of individual tags to reflect the popularity of the given tag (that is, how often a tag has been used). However, several different mappings of a variable of interest to a text property have also been seen: for example, Amazon encodes the recency of a tag’s use with colour intensity
(the older tags fade away), and del.icio.us shows shared tags in red rather than the normal blue. Swivel (swivel.com) uses the cloud as a general purpose visualization for any available data set; such clouds are more generally called data clouds, since they do not display collaborative tagging data. The chainofthoughts website (chainofthoughts.com) provides an image cloud, where images grow as they receive more clicks.
2.2 What Tag Clouds are Used For Tag clouds are simple and need little explanation; most tag clouds on the Web provide little or no clues as to how they should be interpreted or used. For example, flickr simply presents the heading “All time most popular tags” above the tag cloud (flickr.com/photos/tags), and follows with a description of what tags are, but gives no directions on how to interpret the different text sizes. What is surprising given their simplicity is that tag clouds intrinsically support multiple uses. Rivadeneira and colleagues [15] introduce four distinct tasks that can be accomplished using clouds: Search: Locating (or determining the absence of) a specific target or alternative target. This is often as a means to get more detailed information about the target. Browsing: Casually exploring the cloud without a specific target or purpose, often drilling down on multiple discovered targets as they pique the user’s interest. Impression Formation and Impression Presentation: The cloud can be scanned to get a general idea about a subject. Visually prominent items may carry more weight in this initial impression, but other less prominent items also serve to enrich the impression. Recognition or Matching: Recognizing the entire cloud as data which describes a subject.
2.3 Relationship to Social Navigation There is a large body of related work in social navigation and adaptive navigation support for hypertext systems. Social navigation was defined by Dourish and Chalmers as “moving towards clusters of people”, or in other words, to provide the most popular paths in information spaces [7]. Similarly, adaptive navigation support was described by Brusilovsky as “[helping] users to find their paths in hyperspace by adapting the way of presenting links to goals” [2]. With the popularity of social web applications on the rise, social navigation support, in general, is still not readily available on most websites. Tag clouds seem to fit in this niche, by providing a simple, effective and evolving visual representation to guide information seekers in a variety of tasks.
2.4 Research in Tag Clouds While tag clouds and data clouds are becoming increasingly prevalent most of their evaluation has appeared not in scientific literature, but rather in the blogosphere [1]. Critics of note include information architects Jefferey Zeldman, and Thomas Van der Wal (known for coining the term folksonomy, an individual’s personal tag set) [19]. Despite several blog-based critiques of the tag cloud as a fad, Zeldman concedes, “[tag clouds] are smart, which is why so many have flocked to use them” [22]. Related work in published literature does exist, however, and concerns topics such as improving tag clouds for information retrieval tasks, through semantic clustering of tags [10], or altering tag placements and visual properties for more efficient spatial display [11]. Neither of these studies evaluated effects on

users; below we present three relevant studies published on the nature and effectiveness of tag clouds. Halvey and Keane studied the effectiveness of clouds for finding specific targets. They found that both vertical and horizontal lists outperformed tag clouds for finding a predetermined target. However, they noted that targets with significantly larger font size (they used only 3 font sizes, the largest of which was 250% larger than the smallest) were found more quickly. They also concluded that tag clouds were scanned rather than read sequentially, indicated by decreased target location times for tags in central positions [9]. Rivadeneira et al. report on two experiments. The first examined the effects of font size, location, and proximity to the largest tag, on recall for sparsely populated clouds (clouds of 13 tags). They found the effect of font size was strong on recall, while proximity to the largest tag had no effect. A position effect was found, where the upper-left hand quadrant was strongest, but they attributed this to the sparseness of the clouds studied. The second experiment examined impression formation and recognition by varying the font size and layout of tags. Font size had a strong effect on recognition. They found no effect of layout on recognition, but found that it affected accuracy of impression formation. They found that a simple ordered list performed slightly, but significantly, better than tag cloud layouts [15]. Sinclair and Cardew-Hall examined the opinions and actions of participants who were given both a traditional search interface and a tag cloud for information retrieval. They found that for specific information retrieval tasks, users preferred the search interface. For more open-ended tasks, users preferred the tag cloud. They concluded that a tag cloud is not sufficient as a replacement for search in information retrieval tasks, but could be used to augment the user’s search process. The advantage of the tag cloud interface was summed up by one participant who said, “The tags [in the tag cloud] invoked ideas immediately in my mind, making access easier” [16]. While these studies have provided interesting first steps for understanding the nature of tag clouds, they have failed to study the most important purpose of a tag cloud. As the participant described in the Sinclair and Cardew-Hall study, tag clouds are best used in browsing scenarios where a specific target has not been identified. Often referred to as serendipity [14], browsing tags allows the discovery of terms that a user may not have known or would not have thought of. This is the important niche in which tagging data fits, and is something search engines overlook. Our study is the first to examine browsing behaviour in tag clouds, by examining what influences people to read certain tags.
2.5 Pre-attentive Processing Pre-attentive processing theory proposes that altering certain visual properties such as colour or shape will make objects ‘pop out’ to viewers. Pre-attentive processing theoretically occurs before viewers allocate conscious attention. Ware categorizes what can be pre-attentively processed into four major categories: form, colour, motion and spatial position. All, with the exception of motion, are related to the visual features of tags in clouds [20]. Pre-attentive features allow for extremely fast processing – for example, a single red dot easily pops out in a grid of blue dots. However, the case becomes more complicated as the number of visual features increases and as the number of encoded values increases; because of this complexity, we are without a general
theory of visual prominence. Tag clouds always have more than one visual feature used at a time (that is, they always use at least position and font size), and it is not clear how different features will affect the user. In addition, we hypothesize that people are very much “attentive” in selecting tags in a cloud. Although certain tags may pre-attentively pop out because of large visual differences, there will often still be an attentive period of reading, reasoning, and deliberation before a tag is selected.
2.6 The Complexity of Visual Influence in Tag Clouds The visual influence of different aspects of text tags is a complex issue. To illustrate the problem, consider the tag cloud from Amazon.com shown in Figure 1. We informally asked 10 people what was the most visually important word in the cloud, and why they chose that word. Of the 10 people, three chose “music”, three chose “science fiction”, three chose ”fantasy” and one chose “history.” When asked why they had made those choices, everyone made comments relating to size and colour intensity. Through examining the source code of the cloud, however, we found the largest tag to be ‘dvd’, which no one had selected. When told that ‘dvd’ was the largest tag, several people said that they had not even considered it. Two other people attributed their oversight to the fact that “it’s shorter.” A second issue involves the basic visibility of the tags that have been manipulated. The Amazon cloud uses intensity to encode how recently a tag has been used; the older tags are faded. The World Wide Web Consortium (W3C) provides contrast guidelines for information encoded by colour [5]; it is known that the higher the level of detail required, the greater the amount of contrast needed to convey the information, and that sensitivity to contrast decreases with age [20]. We used a Colour Contrast Analyzer (juicystudio.com/services/colourcontrast.php) to test the contrast of the Amazon tag cloud using the methods suggested by the W3C. The tool showed that roughly 30% of the tags in the Amazon cloud did not provide enough difference in brightness, and did not provide sufficient difference between the background and font colour to be reliably seen by all viewers. While we know tag clouds do work in general, we cannot be sure that visual properties of tags are seen by everyone in the same way, or in the way the designer intended.
3. VISUAL COMPOSITION OF CLOUDS 3.1 Visual Text and Font Properties The W3C has defined a comprehensive array of properties in the text, font and colour modules in the Cascading Style Sheet Level 3 (CSS3) working draft [4],[17]. Newer and more advanced properties, such as text embossing, remain largely unimplemented in today's browsers, but define what will be possible in the near future. When this large list of visual text properties is available natively in web browsers, many new avenues for textual encoding of information will exist. We have investigated a selection of common visual text and font properties that are available in modern graphical web browsers: text decoration (underline, over-line, line-through), text style (italics), text size (font size), text weight (bold), text colour, text intensity (contrast or saturation), text alignment (justification: full, left, right, center), character width variability (variable or mono-spaced), and word spacing (spacing between individual words).

3.2 Visual Properties of Words in Clouds In addition to properties relating to font and text, there are complex relationships between the visual properties of a tag in a cloud and the tags around it. These arise from the shape and visual features of characters as they make up a word, and how the words are arranged in a cloud. Such visual characteristics are: word length (in pixels), number of characters (in a word), number of pixels in a word (i.e. the pixels contained in all characters of a word), area of the word (as words have different lengths), position in cloud, and effects of proximity [15] (i.e. the visual effect of smaller tags being clustered around a dramatically larger tag).
4. A STUDY OF VISUAL INFLUENCE To explore the effects of these various properties and characteristics of text, and to find out more about how people are influenced to read tags in tag clouds, we carried out a broad exploratory study. In the following sections we first present an overview of the goals and approach of the study, and then report specific methods, results, and interpretation.
4.1 Overview of the Study Our goal in this evaluation was to explore the effects of several different visual characteristics of tag text, in several combinations – with different numbers of interacting characteristics manipulated at a time. Therefore, the study was designed around testing multiple clouds with multiple manipulations. We identified ten configurations of the visual characteristics described below, and generated ten clouds for each of the ten configurations. The configurations were chosen because they best covered the selected properties, while providing the most realistic conditions, given the constraints of testing each property (as described in 5.2). In each configuration any characteristics that were not under study were held constant (see Table 1). Our main measure in the study was the degree to which users selected tags that had a given visual property. Since people might select some of these tags at random, we compared people’s selection rate to the expected value (the rate that would be expected if people chose tags at random). We then could test whether the difference between people’s selection rates were significantly different from the expected (random) rate. For example, if people chose 8 of 10 tags that were bold, and if only 20% of the tags in the cloud were bold, then we would have evidence that bold was used as a selection criteria. This meant that for each tag cloud, we pre-identified a ‘goal set’ of tags that had each of the visual properties in which we were interested. We then used this set to score people’s actual responses, and calculate selection rates for each property. In cloud sets where there was more than one manipulation, it is possible that a single tag could have several properties of interest; in these cases, we tested against multiple goal sets (the interdependence between properties was recognized, and is taken into account in our interpretations below).
5. STUDY METHODS 5.1 Independent Variables: Visual properties Based on the visual properties of tags coupled with the font and text properties already described, we determined a list of interesting visual properties for study. For each property, the study investigated whether the property is chosen more often when people select ‘visually important’ tags.
1. Font Size The most common manipulation in existing tag clouds is font size; so, it is likely that font size is an effective means to capture viewer attention. However, we do not know how the other properties relate to size, and it is not clear whether size always has the most visual influence.
2. Font Weight Changing the thickness of letter strokes, by using bold type, is a common way people make words stand out in typography. Are bold tags more obvious than non-bold tags?
3. Colour In information visualization, colour is a frequently-used visual feature for encoding data [20]. Tufte suggests that we can detect even a single pixel that differs in colour on a high resolution display [18]. Although colour is clearly pre-attentive for small numbers of items, we are interested in what happens when many of the tags in the cloud are coloured – how does this more even distribution of colour influence visual attention?
4. Intensity The tag clouds at Amazon.com couple font size with intensity; the W3C indicates that the higher the contrast, the better for reading clarity [5]. We were interested in whether tags with higher intensity are more likely to be read.
5. Number of Pixels Letters have individual characteristics that may make them more visually prominent. Some letters take considerably more ink than others. For instance, the letter ‘m’ contains more pixels and is more visible than the letter ‘i’. Do words with higher numbers of pixels appear more visually important?
6. Tag Width Words, even if they have the same number of letters, are of different widths. For example, the word ‘illicit’ takes up less horizontal space than the word ‘snoozes’ in a variable-spaced font, although both have 7 letters. Given that we recognize each individual letter when reading, perhaps wider letters and words are more visually important.
7. Number of Characters When we read, we recognize a word’s component letters, and then use that visual information to help recognize words [13]. We were interested in the question of whether words with more or fewer letters attract our attention.
8. Tag Area Previous work by Kasser and Lemire has proposed using packing algorithms for more efficient display of tag clouds [11]. In order to manipulate tags in such a way to fit in the smallest area possible, they exchange the font size mapping with that of the area of the tag. This type of mapping only works if area is at least as effective as font size for conveying information.
9. Position If clouds are organized alphabetically, a tag’s position does not indicate anything about its importance. However, people often start reading in a particular place in a document (e.g., the top left for English speakers). Are users therefore biased towards selecting tags that are in certain areas of the cloud? Do certain areas of a tag cloud get overlooked?

5.2 Interdependencies of Visual Tag Features The nine visual properties outlined above are difficult, or sometimes impossible, to study individually because of their interdependencies. Figure 2 shows the relationships of the visual features examined. The direction of the arrows show the other properties affected when a given property is changed. We, therefore, designed a series of cloud sets based on providing the best coverage of visual features, given the constraints imposed by the independencies (described in 5.7).
Figure 2. The interdependencies of the selected visual features.
5.3 Dependent Variable Our study is focused on how much visual influence is exerted by different visual features on viewers, and lead viewers to read and select certain tags in clouds. Our dependent variable in the study, therefore, is the degree to which people were influenced by each visual property. As described above, what we actually measured in the study was people’s selection rate of tags with particular properties, and compared these rates to the expected values (the rate that would occur if people chose tags at random).
5.4 Participants We recruited 12 participants (8 men, 4 women) from a local university. Participants ranged in age from 18 to 30 years (mean 24). All used computers at least 28 hours per week (mean 46). All participants had normal or corrected to normal vision and could distinguish between all colours used in the experiment. Of the 12 participants 5 reported knowing what a tag cloud is, and 4 said they have used tag clouds before. We also asked of those people who were familiar with tag clouds to rate their level of familiarity on a 10 point scale (10 being “very familiar”). For our participants, familiarity ratings ranged from 1 to 8 (mean 3.25).
5.5 Apparatus A custom study system was built in Java, which hid the underlying operating system (windows, taskbar, etc.) from view. The system presented a series of tag clouds (see Figure 3), and recorded unique tag selections only. Participants were informed of their progress through the trials via a counter below the tag cloud. The study was conducted on a Pentium 4 based computer, running Ubuntu Linux and using an Apple one button mouse for input. The display was a 19-inch LCD screen at 1280x1024 resolution.
5.6 Tasks The study presented a series of 100 tag clouds that were randomly generated before the study (139 to 147 tags per cloud). Each trial started with a blank screen that required the participant to click a button to load a tag cloud. The participant was instructed to “click on 10 tags that you find the most important in the cloud. ‘Most important’ means the most visually important in relation to the other tags in the cloud. Please choose the tags based on how they look to you rather than the semantic meaning of the word.” The term ‘important’ was left as an open-ended concept in the study, to avoid influencing participants in their selections, and to allow them to focus on the visual influence of tags. (Our use of
importance should not be confused with algorithmically determined notions of ‘interesting’ tags [8]). We also found through our preliminary piloting that people needed very little other direction when the term ‘important’ was used to describe which tags should be selected. They naturally selected tags based on their visual properties rather than their semantic meanings.
Figure 3. A tag cloud in the testing system.
The system registered only the first 10 unique clicks (a tag could only be clicked once in a trial) and the participants were then required to finish the trial by clicking a button outside the cloud. There were 10 tag selections required for each of the 100 total trials (10 trials x 10 cloud sets). All participants saw the same clouds, but the ordering was varied.
5.7 Cloud Sets We tested 10 cloud sets – a group of tag clouds containing the same independent variables. Each of our cloud sets contained 10 clouds, and manipulated a different set of visual properties (see Table 1); due to the interdependencies between properties, some properties could not be tested alone. All other visual features were fixed for each group. Tag positions were random over all trials, and were explored only in secondary analysis. Table 1 shows the independent variables for each cloud set.
Tag Cloud Set
Visual Property 1 2 3 4 5 6 7 8 9 10
Font Size X X X X
Tag Area X X X X
Num. of Characters X X X X
Tag Width X X X X X X
Font Weight X X X
Colour X X
Intensity X X X X
Num. of Pixels X X X X X
Table 1. Visual properties manipulated for each cloud set.

The cloud sets can be organized into three main groups: those with one manipulation (cloud sets 1-2), with two manipulations (cloud sets 3-6), and real-world-style clouds with several manipulations at once (cloud sets 7-10). Cloud set 7 was a basic multiple-manipulation cloud with equivalent tags; cloud set 8 was based on flickr and del.icio.us; cloud set 9 was based on Amazon, and cloud set 10 manipulated all variables excluding pixels.
Visual Property Value Range Font Size 26-36 pt.; 31 pt.
Tag Area Dependent on font size and number of characters, and the use of variable or fixed fonts.; 2625 px.
Num. of Characters 3-7 characters; 5 characters
Tag Width Dependent on font size, spacing, # of characters, and the use of variable or fixed fonts.; 75px.
Font Weight bold or normal; normal Colour blue or red; blue
Intensity 100%, 87.5%, 75%,62.5%,50%; 100%
Num. of Pixels tags varied over a 300 pixel range; varied over 10 pixel range
Table 2. Value ranges for independent variables. Italicized values show the variable when not varied.
When visual text features were not being examined in a given experiment, their values were not visibly different. Table 2 shows the range of values used for each visual feature when used as an independent variable. The ranges of variables selected were somewhat smaller than what is typically found in tag clouds; this was done in order to avoid extreme pop-out effects. For example, tag cloud 1 was constructed by fixing all variables (to the italic values shown in Table 2) with the exception of tag width. In order to generate different tag widths, given the requirement of a fixed number of characters, we used a variable spaced font – when this manipulation type was not required, we used a mono-spaced font.
5.8 Tag Corpus For the study we opted for an artificial, rather than real, tag corpus. This was done for several reasons. First, we needed to maintain semantic consistency in the tag corpus. Since the goal was to have the study participants focus on visual rather than semantic information, we did not want to have the corpus contain words that were overly interesting to the users. For instance, words relating to the computer field might have been of high interest to our study group given their frequent computer use. In addition, a very large set of tags was needed to be able to satisfy the constraints placed by the ranges and values of the manipulated properties. For instance, in cloud set 2 (as shown in Table 1) pixels were the only manipulated property, which means 10 sets of 150 words needed to be found, all with 5 characters and which contained differences in the range of 300 pixels. To find a consistent set of words for this manipulation, a large set of candidates was required. Following the design of Rivadeneira et al., we selected tag words from the Kucera-Francis list [12], via the MRC Psycholinguistic Database (www.psy.uwa.edu.au/mrcdatabase/mrc2.html). We took advantage of the frequency count of words contained in the list; the count represents how many times the word had been found in written form. This value ranged from 0 to 69971. We selected words with a frequency count of less than 100, which represents less frequently used words. Thus, we hoped to provide
participants with words that would consistently be unfamiliar and less likely to be contained in a domain of interest.
5.9 Procedure Participants were introduced to the study, given a demographics questionnaire, and randomly assigned to one of the ten ordering groups (which varied the presentation of cloud sets). Before starting, the participants were also shown three example tag clouds from prominent websites, but were not given any instruction on how they should be interpreted. After each of the first three trials in each condition, users were asked to state their selection strategy – that is, explain why they had made those particular tag selections, via a popup text dialog.
6. RESULTS Two aspects of the data were of interest – reliability and strength – and we discuss each of our findings below in terms of these two qualities. The reliability of a particular visual feature’s effect was tested using a statistical analysis that compared the participants’ selection rates to the expected rate (note that since our data was not normally distributed, we converted rates to ranks, and carried out a non-parametric test). The strength of an effect was examined as a post-hoc investigation of the original means – for those properties that showed reliable differences, we inspected the means to determine the size of the difference between actual selection rate and expected rate. For example, a hypothetical cloud may provide 150 total tags, of which 30 are candidate targets for a particular visual property. If the participants selected tags randomly, they would choose on average two of the target tags for every ten selections. If the participants actually selected seven target tags on average, we conclude that the visual property has shown a strong effect, since the actual selection rate was 350% higher than the expected (random) rate. The study system gathered 10 tag selections for each cloud. There were 10 clouds in each of the 10 cloud sets (10 selections x 10 clouds x 10 cloud sets = 1000 selection per participant). Despite, there being 1000 selections by each user, fatigue was not an issue; most participants completed the study within 40 minutes and did not report any difficulties when asked.
Strength of Effect Reliability (Wilcoxon)
Tag Visual Properties
Mean Selected
Mean Expected
Difference Z p
Font Size 8.6 2.0 6.6 -5.88 < .001 Tag Area 2.0 0.8 1.2 -5.11 <.001 Num. of
Characters 2.7 3.6 - 0.9 -5.12 <.001
Tag Width 2.5 2.4 0.1 -1.97 <.05 Font Weight 8.2 3.3 4.9 -5.51 <.001
Colour (blue before red)
5.2 4.9 0.3 -0.37 >.05
Colour (red before blue)
4.8 5.1 - 0.3 -0.37 >.05
Intensity 6.0 4.0 2.0 -6.07 <.001 Num. of Pixels 1.3 0.7 0.6 -6.29 <.001 Table 3. Effects of visual properties on selection rates. (All
relevant tag cloud sets are grouped for each visual property) Selection rates for each property of interest for a particular cloud set were converted to rank data, and compared against the expected value using a Wilcoxon Signed Rank test. A summary of reliability and strength results are shown in Table 3. Each row

represents a visual property of interest, and the columns represent the reliability and strength results for that property. Each property was considered over all tag sets where it was a variable of interest (see Table 1 for this mapping).
6.1 Participant strategy results Responses to the free-form text field which appeared after each of the first 30 tag clouds are shown in Table 4. Each cell represents the count of cited visual properties in the participant responses, for each cloud set. If the participant stated that they chose at random, or they used some other strategy that could not be reasonably mapped to an applicable visual property, we added to the count of the ‘Other’ row. Visual properties that were neither varied nor cited in a cloud set have been grayed out. Those properties that were varied, but not cited have been marked as a zero. It should be noted that the any given property could be sited a maximum of 36 times per cloud set (12 users x 3 trials, for each cloud set). However, the total number of cited properties for each cloud set could be higher than 36. This is because often users would cite two or more properties in their responses. For instance, “the larger and darker tags”, would be a single response but generate an additional citation count for both font size and intensity.
Tag Cloud Sets Tag Visual Properties 1 2 3 4 5 6 7 8 9 10
Font Size 25 24 24 10Tag Area 0 0 0 0
Num. of Characters 3 0 0 0 Tag Width 1 3 0 0 0 1
Font Weight 27 24 15Colour 22 16
Intensity 8 14 10 6 Number of Pixels 0 0 0 0 0
Position 7 1 5 4 2 2 2 6 5 2 Other 25 28 25 6 7 5 7 7 1 1
Table 4. Visual properties and number of participants stating that they used that property in making their selection.
6.2 Interpretation of Results 1. Font Size Larger font sizes were chosen reliably and with the strongest effect among any of the visual features. These results show that even over small changes of, for instance, a font size point or two, users can see differences in tags with a relatively high accuracy. However, in cloud set 10 the rate of selecting large tags was lower: mean 5.9 selections (this is not reported in Table 3, which combines results from all cloud sets), as opposed to 8.6 over all cloud sets. This affects both the strength of the effect and the reliability scores, and it can be attributed to a couple of factors. First, reviewing the responses of the participants collected on reasoning for selections revealed that size was used only 10 times (of 30 total) as a basis for selections in set 10. While font weight (bold) was cited 15 times and colour 16 times for set 10. This fact is coupled with the composition of the set 10 clouds, in which the number of pixels in each tag was fixed. This resulted in bold words tending to be in smaller font sizes, as the words with a larger font size tended not to be in bold type. This is a potential confound for the results of set 10, since the distribution of visual
features was uneven. However, it also shows that users were more likely to select tags with higher font weight and tags based on colour rather than font size, when all features were manipulated. Overall, size appeared to exert the most visual influence on selection when it was used, except in cloud set 10, where font weight and colour were more important factors.
2. Font Weight Font weight (bold tags) had a reliable and strong visual effect. One cloud set highlighted the fact that people could easily identify font weight; cloud set 4 varied only font weight and the number of pixels in tags (see Table 1), based on participant responses (25 of 30 responses cited font weight). This being said, one participant did not seem to notice or attribute importance to bold tags at all; this person did not cite it as a factor, and selected bold tags just slightly more frequently than random. All other participants, however, selected bold tags at a high rate. Font weight was the second most frequently-selected property, and participant responses agreed with the selection data. However, in cloud set 10 (where both font size and weight were used), font size had a mean selection rate of only 5.9 per cloud, while font weight had a rate of 6.2 times per cloud, which is higher than any other visual property. These numbers are supported in the participant’s responses: font weight was cited 15 times as the basis for tag selection compared to 10 times for font size. This indicates that participants tended to choose bold tags before tags with large font sizes.
3. Colour In calculating results for colour we used two orderings for our analysis; one that targeted blue tags, and one that targeted red tags. Two orderings were used because when colour was varied, half the tags were blue and half were red, and we did not know which users would choose. Neither ordering was selected reliably when considering all participants. However, we can see in both our data and the participant responses that there was a strong effect by individual; but there was almost an even split between those who chose blue and those who chose red. Colour was cited as being just as important as font size, although the reasons people made colour-based choices differed greatly: some chose red because “red stood out,” while another said they avoided red tags because “red burns the eye.” The use of both colour and intensity together also caused a visual interaction. We thought participants would always choose the darker (or high intensity) colours. However, some participants said they selected the “pinker” tags over either red or blue tags with high intensity; however, pink tags were actually red tags with low intensity. While we continue to believe that colour is an important visual property, our open-ended task of selecting the most visually important tags did not lead to consensus in our population over what colour (blue or red) was most influential, when both colours are used in the tag cloud.
4. Intensity Intensity had a reliable but weak effect. When intensity was cited by participants, it was usually in relation to darker words, although a few people also indicated that they chose lighter words or pinker (red low-intensity) words. It appears that people had no difficulty in noticing the intensity differences. We provided 5 levels of intensity between 50% and 100%. Although people often said they chose darker tags, we do not know if they set some

arbitrary level of intensity for their selections (i.e., that a certain level as ‘dark enough’). We believe that higher values of intensity are fairly reliable in drawing the attention of participants. However, we have shown evidence that in some situations lower intensities can also be the basis of selection; this may be due to the fact that low-intensity red appeared to be a different colour.
5. Number of Pixels Pixel count had a reliable effect on selection, but the strength of this effect was small – the selection rate was only slightly higher than the random case. It is also possible that the results for number of pixels are due to correlation with other visual features, such as font weight and font size. Had there been a visual influence of increased pixel count alone, we would have seen it in cloud set 2, which varied only the number of pixels in a word (the different features of the font and characters dictated the variance in pixels). While some participants said some words “seemed to stand out,” their selections were not correlated to the number of pixels in the words (Z = -1.081, p > .05). Therefore, we believe that the influence of pixels is actually due to the correlation with more prominent visual features.
6. Tag Width Tag width did not have either a reliable or a strong effect, and therefore does not appear to exert much visual influence on tag selection. However, this result is limited only to small differences in width. Cloud set 1 and 7 varied tag width, but maintained all tags to length 4. with equal word lengths to obtain varying tag widths; the restriction of equal number of characters in the words, however, allowed for only small differences in width. The maximum difference in width was only 27 pixels (about the size of an ‘m’ in 30-point font). Under these conditions, tag width was mentioned only once as the basis for selections, suggesting that that small differences in width have limited influence.
7. Number of Characters Tags with a larger number of characters were reliably selected less often than the random case, which was surprising. However, there is evidence to suggest that there is not, in fact, a negative influence of number of characters. First, cloud set 3 manipulated only the number of characters, but only three participants mentioned character count as a reason for selecting tags, suggesting that people simply did not look at this feature. Second, cloud set 10 saw bold tags selected at the highest rate, and bold words tended to be shorter (see discussion of font size above); this interaction with bold type may have resulted in the negative effect of number of characters. Overall, it appeared that people took little notice of small differences of character counts. However, in our informal experience suggests that larger difference may have more influence: we have seen several cases where differences of three or more characters appeared to be a deciding factor in tag selections. One example of this situation is our informal study of the Amazon tag cloud (Figure 1), where some users said they did not see ‘dvd’ because of its length. These differences are much larger than what was studied (e.g., ‘dvd’ with 3 letters is substantially smaller than tags such as ‘science fiction’ with 14 characters).
8. Tag Area Tags with large areas had both a reliable and strong effect of visual influence. We attribute this not to the strength of the effect it has but because it is correlated to other more prominent visual
tag features. For example, changing either font size or the number of characters, would change the area of the tag. While some participants stated that they simply chose tags that were “bigger,” in some cases this appeared to be shorthand for ‘bigger font sizes.’ Since small differences in tag widths went unnoticed, we suggest that this occurred to tag areas as well. This is supported by the participants’ responses: no person cited tag area a single time as a basis for selection.
6.3 Analysis of Position 9. Position We present position as a secondary result, as it was not directly studied in our design. We used clickmap visualizations to display all the tag selections in order to get a qualitative view of position and its relationship to the tags in the different cloud sets. The clickmaps were normalized over all individuals for each tag cloud group. Figure 4 shows two of the clickmaps from two of the cloud sets (lighter areas indicate more clicks than darker areas). The image labeled ‘cloud set 2’ represents the 10 clouds where only the pixels counts were varied. This resulted in a tag cloud where all the tags were relatively similar. For these clouds, the dominant feature of the clickmap is the central tendency of the clicks. In contrast, cloud set 10 varied seven different visual features, including several features with stronger visual effects (font size, font weight and intensity). The corresponding clickmap (‘clickmap 10’) does not show the same central tendency as was seen in the other map. The informal analysis of the clickmaps suggests two general trends that should be studied further. First, the central tendency of clicks seems to dissipate as the strength and number of visual features increases. Second, the top and bottom areas of the cloud (see the top and bottom rows of the ‘cloud set 10’ clickmap) were underused by our participants. In participants’ response data (see Table 4), at least some of the participants cited tag position as a reason for selection, in every cloud set, but this reason was not given frequently. There is no obvious correlation between the different cloud sets and the number of times position was cited.
Cloud Set 2 Cloud Set 10
Figure 4. Clickmaps displaying the concentration of clicks for the clouds in two tag cloud sets. Lighter areas indicate more
clicks than darker areas. In addition, these results also lend some empirical evidence to the hypothesis that people scan tag clouds rather than reading them. Rivadeneira et al. [15] suggested that sparsely populated clouds enforce left-to-right reading; however, sparse clouds are not common on the Web. Halvey and Keane [9] indicated that people may scan clouds, based on the timings of user results; tags that were situated towards the outside edges of their clouds took longer for participants to locate. Our results support this conclusion, but also suggest that the influence of a central position
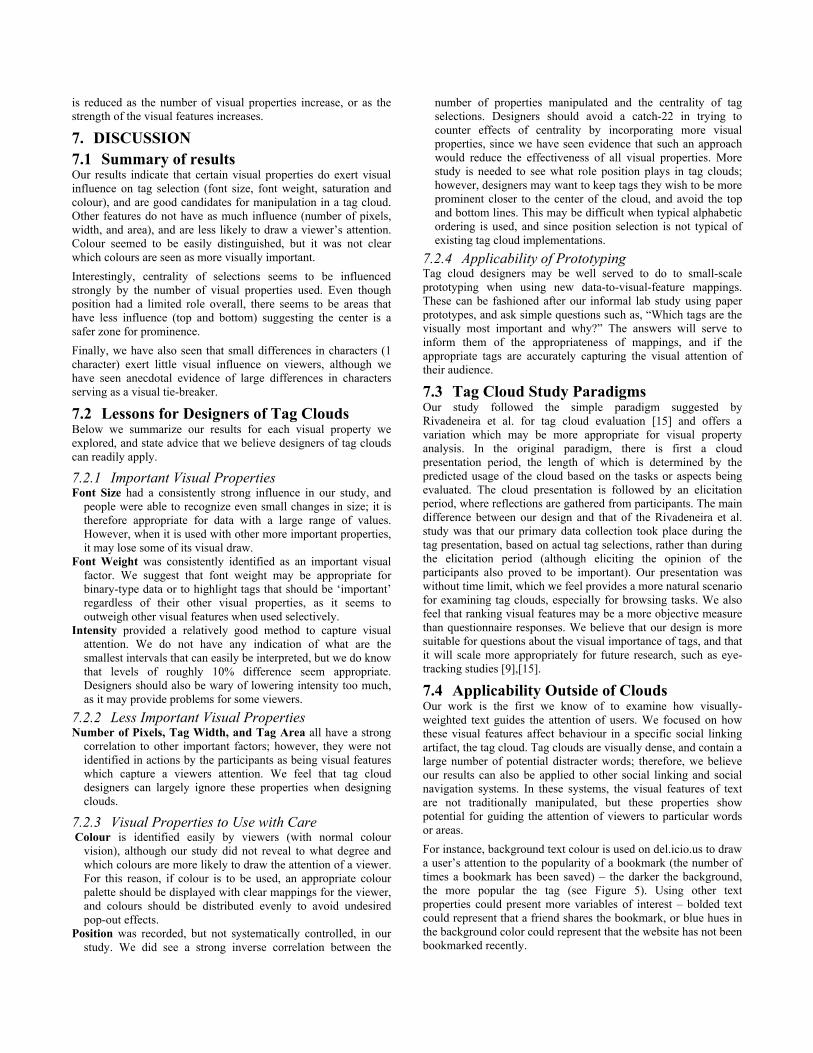
is reduced as the number of visual properties increase, or as the strength of the visual features increases.
7. DISCUSSION 7.1 Summary of results Our results indicate that certain visual properties do exert visual influence on tag selection (font size, font weight, saturation and colour), and are good candidates for manipulation in a tag cloud. Other features do not have as much influence (number of pixels, width, and area), and are less likely to draw a viewer’s attention. Colour seemed to be easily distinguished, but it was not clear which colours are seen as more visually important. Interestingly, centrality of selections seems to be influenced strongly by the number of visual properties used. Even though position had a limited role overall, there seems to be areas that have less influence (top and bottom) suggesting the center is a safer zone for prominence. Finally, we have also seen that small differences in characters (1 character) exert little visual influence on viewers, although we have seen anecdotal evidence of large differences in characters serving as a visual tie-breaker.
7.2 Lessons for Designers of Tag Clouds Below we summarize our results for each visual property we explored, and state advice that we believe designers of tag clouds can readily apply.
7.2.1 Important Visual Properties Font Size had a consistently strong influence in our study, and
people were able to recognize even small changes in size; it is therefore appropriate for data with a large range of values. However, when it is used with other more important properties, it may lose some of its visual draw.
Font Weight was consistently identified as an important visual factor. We suggest that font weight may be appropriate for binary-type data or to highlight tags that should be ‘important’ regardless of their other visual properties, as it seems to outweigh other visual features when used selectively.
Intensity provided a relatively good method to capture visual attention. We do not have any indication of what are the smallest intervals that can easily be interpreted, but we do know that levels of roughly 10% difference seem appropriate. Designers should also be wary of lowering intensity too much, as it may provide problems for some viewers.
7.2.2 Less Important Visual Properties Number of Pixels, Tag Width, and Tag Area all have a strong
correlation to other important factors; however, they were not identified in actions by the participants as being visual features which capture a viewers attention. We feel that tag cloud designers can largely ignore these properties when designing clouds.
7.2.3 Visual Properties to Use with Care Colour is identified easily by viewers (with normal colour
vision), although our study did not reveal to what degree and which colours are more likely to draw the attention of a viewer. For this reason, if colour is to be used, an appropriate colour palette should be displayed with clear mappings for the viewer, and colours should be distributed evenly to avoid undesired pop-out effects.
Position was recorded, but not systematically controlled, in our study. We did see a strong inverse correlation between the
number of properties manipulated and the centrality of tag selections. Designers should avoid a catch-22 in trying to counter effects of centrality by incorporating more visual properties, since we have seen evidence that such an approach would reduce the effectiveness of all visual properties. More study is needed to see what role position plays in tag clouds; however, designers may want to keep tags they wish to be more prominent closer to the center of the cloud, and avoid the top and bottom lines. This may be difficult when typical alphabetic ordering is used, and since position selection is not typical of existing tag cloud implementations.
7.2.4 Applicability of Prototyping Tag cloud designers may be well served to do to small-scale prototyping when using new data-to-visual-feature mappings. These can be fashioned after our informal lab study using paper prototypes, and ask simple questions such as, “Which tags are the visually most important and why?” The answers will serve to inform them of the appropriateness of mappings, and if the appropriate tags are accurately capturing the visual attention of their audience.
7.3 Tag Cloud Study Paradigms Our study followed the simple paradigm suggested by Rivadeneira et al. for tag cloud evaluation [15] and offers a variation which may be more appropriate for visual property analysis. In the original paradigm, there is first a cloud presentation period, the length of which is determined by the predicted usage of the cloud based on the tasks or aspects being evaluated. The cloud presentation is followed by an elicitation period, where reflections are gathered from participants. The main difference between our design and that of the Rivadeneira et al. study was that our primary data collection took place during the tag presentation, based on actual tag selections, rather than during the elicitation period (although eliciting the opinion of the participants also proved to be important). Our presentation was without time limit, which we feel provides a more natural scenario for examining tag clouds, especially for browsing tasks. We also feel that ranking visual features may be a more objective measure than questionnaire responses. We believe that our design is more suitable for questions about the visual importance of tags, and that it will scale more appropriately for future research, such as eye-tracking studies [9],[15].
7.4 Applicability Outside of Clouds Our work is the first we know of to examine how visually-weighted text guides the attention of users. We focused on how these visual features affect behaviour in a specific social linking artifact, the tag cloud. Tag clouds are visually dense, and contain a large number of potential distracter words; therefore, we believe our results can also be applied to other social linking and social navigation systems. In these systems, the visual features of text are not traditionally manipulated, but these properties show potential for guiding the attention of viewers to particular words or areas. For instance, background text colour is used on del.icio.us to draw a user’s attention to the popularity of a bookmark (the number of times a bookmark has been saved) – the darker the background, the more popular the tag (see Figure 5). Using other text properties could present more variables of interest – bolded text could represent that a friend shares the bookmark, or blue hues in the background color could represent that the website has not been bookmarked recently.

Figure 5. Colour is used on del.icio.us to give users a quick
indication of how popular a bookmark is. Other text properties could be used to present more variables of interest.
8. CONCLUSION AND FUTURE WORK Although intuitions exist about the visual features of text that can be used in tag clouds, our study is the first to provide empirical evidence of which features draw the attention of viewers, and which features have little effect. The results of our study suggest recommendations to the designers of tag clouds, and provide a basis for future research into the ways that clouds can be more effectively displayed. We have also described an extended study paradigm to better suit questions about visual tag characteristics. Finally, we have identified how our results can be generalized for other social linking systems. Our future work will look more closely at the visual features that our study suggests are the most important. We plan to use an eye tracking system to answer immediate number of additional questions about the effects of colour and position. In addition, we will explore the effects of larger differences in the variables that we studied, to see whether other features are more useful in situations with greater contrast. We also plan to extend our results into situations where users are carrying out realistic tasks with tag clouds. Finally, we will explore the issues raised here in systems outside of tag clouds, by using weighted text as a general purpose method of visualizing social activities and paths for improved Web navigation.
9. ACKNOWLEDGEMENTS This research is supported by the Natural Sciences and Engineering Research Council of Canada.
10. REFERENCES [1] Brooks, C. H., & Montanez, N. Improved Annotation of the
Blogosphere via Autotagging and Hierarchical Clustering. Proc. WWW ’06. 625-631.
[2] Brusilovsky, P. Methods and Techniques of Adaptive Hypermedia. User Modeling and User-Adapted Interaction. 6 (2-3), 87-129. 1996.
[3] Bumgardner, J. Building Tag Clouds in Perl and PHP. O’Reilly Media, 2006.
[4] Celik, T., Sawicki, M., Suignard, M., & Zilles, S. CSS3 module: Fonts W3C Working Draft 2 August 2002 http://www.w3.org/TR/2002/WD-css3-fonts-20020802
[5] Chisholm, W., Vanderheiden, G., and Jacobs, I. Web Content Accessibility Guidelines 1.0 W3C Recommendation 5-May-1999. http://www.w3.org/TR /1999/WAI-WEBCONTENT-19990505
[6] Coupland, D. Microserfs. HarperCollins, Toronto, 1995. [7] Dourish, P., and Chalmers, M. Running out of Space: Models
of Information Navigation, in Proc. of HCI '94. [8] Dubinko, M., Kumar, R., Magnani, J., Novak, J., Raghavan,
P., and Tomkins, A. Visualizing tags over time. Proc. WWW '06, 193-202.
[9] Halvey, K., and Keane, M. T. An Assessment of Tag Presentation Techniques. Proc. WWW ’07. 1313-1314.
[10] Hassan-Montero, Y., & Herrero-Solana, V. Improving tag-clouds as visual information retrieval interfaces. Proc. InfoSciT2006. 6 pages. Available at http://www.nosolousabilidad.com/hassan/ improving_tagclouds.pdf
[11] Kasser, O., & Lemire, D. Tag-Cloud Drawing: Algorithms for Cloud Visualization. Proc. Tagging and Metadata for Social Information Organization Workshop. In conjunction with WWW ’07. 10 pages. Available at www2007.org/workshops/paper_12.pdf
[12] Kucera, H., & Francis, W. N. Computational Analysis of Present Day American English. Brown University Press, Providence, 1967.
[13] Larson, K. The Science of Word Recognition or how I learned to stop worrying and love the bouma. Accessed Sept. 8, 2007. http://www.microsoft.com/typography/ ctfonts/WordRecognition.aspx
[14] Mathes, A. Folksonomies – Cooperative Classification and Communication Through Shared Metadata. Technical Report. http://www.adammathes.com/academic/computer-mediated-communication/folksonomies.html Dec, 2004.
[15] Rivadeneira, A.W., Gruen, D.M., Muller, M.J., and Millen, D.R. Getting our head in the clouds: toward evaluation studies of tagclouds. Proc. CHI ’07. 995-998.
[16] Sinclair, J., and Cardew-Hall, M. The folksonomy tag cloud: when is it useful? Journal of Information Science. 6 (1), 15-23. Feb 1, 2008.
[17] Suignar, M. CSS Text Level 3 W3C Working Draft 6 March 2007, http://www.w3.org/TR/2007/WD-css3-text-20070306/
[18] Tufte, E., R. The Visual Display of Quantitative Information. Graphics Press, Cheshire, Conn., 2001.
[19] Van der Wal, T. Folksonomy. Accessed Sept. 8, 2007. http://www.vanderwal.net/folksonomy.html
[20] Ware, C. Information Visualization: perception for design. Academic Press, London, 2000.
[21] Weinreich, H., Obendorf, H., Herder, E., and Mayer, M. Off the Beaten Tracks: Exploring Three Aspects of Web Navigation, Proc. WWW ‘06, ACM Press, pp. 133-142.
[22] Zeldman, J. Tag clouds are the new mullets. Accessed Sept. 8, 2007. http://www.zeldman.com/daily/0405d.shtml