SECURITIES AND EXCHANGE COMMISSION FORM 11-K ...
29
SECURITIES AND EXCHANGE COMMISSION Washington, D.C. 20549 FORM 11-K (Mark One) ☒ ANNUAL REPORT PURSUANT TO SECTION 15(d) OF THE SECURITIES EXCHANGE ACT OF 1934 [NO FEE REQUIRED] For the fiscal year ended December 31, 2006 OR o TRANSITION REPORT PURSUANT TO SECTION 15(d) OF THE SECURITIES EXCHANGE ACT OF 1934 [NO FEE REQUIRED] For the transition period from to Commission File Number 1-6049 A. Full title of the plan and address of the plan, if different from that of the issuer named below: Target Corporation 401(k) Plan. B. Name of issuer of the securities held pursuant to the plan and the address of its principal executive office: TARGET CORPORATION 1000 Nicollet Mall Minneapolis, Minnesota 55403 AUDITED FINANCIAL STATEMENTS AND SCHEDULES Target Corporation 401(k) Plan Years Ended December 31, 2006 and 2005 With Report of Independent Registered Public Accounting Firm Target Corporation 401(k) Plan Audited Financial Statements and Schedules Years Ended December 31, 2006 and 2005 Contents Report of Independent Registered Public Accounting Firm 1 Audited Financial Statements Statements of Net Assets Available for Benefits 3 Statements of Changes in Net Assets Available for Benefits 4 Notes to Financial Statements 5 Schedules Schedule H, Line 4i – Schedule of Assets (Held at End of Year) 14 Schedule H, Line 4j – Schedule of Reportable Transactions 67 Report of Independent Registered Public Accounting Firm The Board of Directors and Plan Participants Target Corporation We have audited the accompanying statements of net assets available for benefits of the Target Corporation 401(k) Plan (the Plan) as of December 31, 2006 and 2005, and the related statements of changes in net assets available for benefits for the years then ended. These financial statements are the responsibility
-
Upload
khangminh22 -
Category
Documents
-
view
2 -
download
0
Transcript of SECURITIES AND EXCHANGE COMMISSION FORM 11-K ...

SECURITIES AND EXCHANGE COMMISSIONWashington, D.C. 20549
FORM 11-K
(Mark One) ☒
ANNUAL REPORT PURSUANT TO SECTION 15(d) OF THE SECURITIES EXCHANGE ACT OF 1934 [NO FEE REQUIRED]
For the fiscal year ended December 31, 2006
OR o
TRANSITION REPORT PURSUANT TO SECTION 15(d) OF THE SECURITIES EXCHANGE ACT OF 1934 [NO FEE REQUIRED]
For the transition period from to
Commission File Number 1-6049
A. Full title of the plan and address of the plan, if different from that of the issuer named below: Target Corporation 401(k) Plan.
B. Name of issuer of the securities held pursuant to the plan and the address of its principal executive office:
TARGET CORPORATION
1000 Nicollet MallMinneapolis, Minnesota 55403
AUDITED FINANCIAL STATEMENTS AND SCHEDULES Target Corporation 401(k) PlanYears Ended December 31, 2006 and 2005With Report of Independent Registered Public Accounting Firm
Target Corporation 401(k) Plan
Audited Financial Statements and Schedules
Years Ended December 31, 2006 and 2005
Contents Report of Independent Registered Public Accounting Firm 1 Audited Financial Statements
Statements of Net Assets Available for Benefits 3Statements of Changes in Net Assets Available for Benefits 4Notes to Financial Statements 5 Schedules
Schedule H, Line 4i – Schedule of Assets (Held at End of Year) 14Schedule H, Line 4j – Schedule of Reportable Transactions 67
Report of Independent Registered Public Accounting Firm
The Board of Directors and Plan ParticipantsTarget Corporation We have audited the accompanying statements of net assets available for benefits of the Target Corporation 401(k) Plan (the Plan) as of December 31, 2006and 2005, and the related statements of changes in net assets available for benefits for the years then ended. These financial statements are the responsibility

of the Plan’s management. Our responsibility is to express an opinion on these financial statements based on our audits. We conducted our audits in accordance with the standards of the Public Company Accounting Oversight Board (United States). Those standards require thatwe plan and perform the audit to obtain reasonable assurance about whether the financial statements are free of material misstatement. We were not engagedto perform an audit of the Plan’s internal control over financial reporting. Our audits included consideration of internal control over financial reporting as abasis for designing audit procedures that are appropriate in the circumstances, but not for the purpose of expressing an opinion on the effectiveness of thePlan’s internal control over financial reporting. Accordingly, we express no such opinion. An audit also includes examining, on a test basis, evidencesupporting the amounts and disclosures in the financial statements, assessing the accounting principles used and significant estimates made by management,and evaluating the overall financial statement presentation. We believe that our audits provide a reasonable basis for our opinion. In our opinion, the financial statements referred to above present fairly, in all material respects, the net assets available for benefits of the Plan atDecember 31, 2006 and 2005, and the changes in its net assets available for benefits for the years then ended, in conformity with U.S. generally acceptedaccounting principles. As discussed in Note 4 to the financial statements, in 2006 the Plan adopted FSP AAG INV-1 and SOP 94-4-1, Reporting of Fully Benefit-ResponsiveInvestment Contracts Held by Certain Investment Companies Subject to the AICPA Investment Company Guide and Defined-Contribution Health and Welfareand Pension Plans. Our audits were performed for the purpose of forming an opinion on the financial statements taken as a whole. The accompanying supplemental schedules ofassets (held at end of year) as of December 31, 2006, and reportable transactions for the year then ended are presented for purposes of additional analysis andare not a required part of the financial statements but are supplementary information required by the Department of Labor’s Rules and Regulations forReporting and Disclosure under the Employee Retirement Income Security Act of 1974. These
1
supplemental schedules are the responsibility of the Plan’s management. The supplemental schedules have been subjected to the auditing procedures appliedin our audit of the financial statements and, in our opinion, are fairly stated in all material respects in relation to the financial statements taken as a whole. Minneapolis, Minnesota
/s/ Ernst & Young
June 22, 2007
2
Target Corporation 401(k) Plan
Statements of Net Assets Available for Benefits
(In Thousands)
December 31
2006
2005
Assets
Investments
$ 4,859,089
$ 4,678,798
Wrapper contracts
464
486
Receivables:
Participant contributions
4,826
4,135
Employer contribution
3,120
2,678
Interest
2,858
2,822
Total receivables
10,804
9,635
Total assets
4,870,357
4,688,919
Liabilities
Expenses payable
2,574
66
Total liabilities
2,574
66
Net assets reflecting all investments at fair value
4,867,783
4,688,853
Adjustment from fair value to contract value for fully benefit-responsive investment contracts
752
(5,122)Net assets available for benefits
$ 4,868,535
$ 4,683,731
See accompanying notes.
3
Target Corporation 401(k) Plan
Statements of Changes in Net Assets Available for Benefits
(In Thousands)
Year Ended December 31
2006
2005
Additions to net assets attributed to:
Participant contributions
$ 216,676
$ 192,289

Employer contributions 135,339 116,959Investment income:
Interest and dividends
56,507
52,264
Net realized and unrealized appreciation in fair value of investments
277,941
231,541
Total additions
686,463
593,053
Deductions from net assets attributed to:
Benefits paid to participants
488,042
431,912
Trustee fees
1,206
1,326
Administration fees
12,411
9,705
Total deductions
501,659
442,943
Net increase
184,804
150,110
Net assets available for benefits:
Beginning of year
4,683,731
4,533,621
End of year
$ 4,868,535
$ 4,683,731
See accompanying notes.
4
Target Corporation 401(k) Plan
Notes to Financial Statements
December 31, 2006
1. Description of the Plan Employees of Target Corporation (the Company) who meet certain eligibility requirements of age and hours worked can participate in the Target Corporation401(k) Plan (the Plan). Under the terms of the Plan, participants can invest up to 80% of their current gross cash compensation in the Plan, within EmployeeRetirement Income Security Act (ERISA) limits, in any combination of before-tax and/or after-tax contributions. Participants become vested in the Company’s matching deposits over time, beginning with the day they become eligible to participate in the Plan:
Years
VestedPercentage
Upon Eligibility
20%1
40
2
70
3
100
Beginning January 1, 2007, participants immediately become vested in the Company’s matching deposits. Participant contributions are fully vested at all times. Participants who leave the Plan forfeit unvested company contributions, which are then used to reducefuture company contributions. For the years ended December 31, 2006 and 2005, forfeitures were $4,763,000 and $4,370,000, respectively. Highly compensated participants, as defined by Internal Revenue Code (the Code) Section 414(q), are subject to limitations on the amount and type ofcontributions that they may make to the Plan. Such participants’ contributions are limited to pre-tax contributions of no more than 5% of the first $220,000 ofannual gross cash compensation earned. In connection with the vesting change described above, highly compensated participants will be able to make contributions up to the annual pre-taxcontribution limits established by the Internal Revenue Service (IRS), ($15,500 starting January 1, 2007).
5
Target Corporation 401(k) Plan
Notes to Financial Statements (continued)
1. Description of the Plan (continued) Participants may receive benefits upon termination, death, disability, or retirement as either a lump-sum amount equal to the vested value of their account orin installments, subject to certain restrictions. Participants may also withdraw some or all of their account balances prior to termination, subject to certainrestrictions Expenses paid by the Plan include the following: fund management fees (which are netted against investment interest income), trustee fees, monthlyprocessing costs (including record-keeping fees), quarterly participant account statement preparation and distribution, and other third-party administrativeexpenses. The Plan allows for two types of loans, one for the purchase of a primary residence and the other a general purpose loan, both subject to certain restrictions asdefined in the Plan. Participants may have one of each type of loan outstanding at any given time. Repayment of loans, including interest, is allocated toparticipants’ investment accounts in accordance with each participant’s investment election in effect at the time of the repayment.

Although it has not expressed any intent to do so, the Company has the right under the Plan to discontinue its contributions at any time and to terminate thePlan subject to the provisions of the ERISA. In the event of plan termination, participants will become 100% vested in their accounts. For more detailed information regarding the Plan, participants may refer to the Summary Plan Description available from the Company. 2. Accounting Policies Accounting Method All investments are carried at fair market value except for fully benefit-responsive investment contracts which are adjusted from fair value to contract value.Contract value represents contributions made under the contract, plus interest at the contract rate, less funds used to pay plan benefits. Common stock isvalued at the quoted market price on the last business day of the plan year. Collective investment fund values are based on the fair value of the underlyingsecurities (as determined by quoted market prices) as of the last business day of the plan year. Participant loans are valued at the unpaid principal balance,which approximates fair value.
6
Target Corporation 401(k) Plan
Notes to Financial Statements (continued)
2. Accounting Policies (continued) Use of Estimates The preparation of financial statements in conformity with accounting principles generally accepted in the United States requires management to makeestimates and assumptions that affect the amounts reported in the financial statements and accompanying notes. Actual results may differ significantly fromthose estimates. Reclassifications Certain prior year amounts have been reclassified to conform to current year presentations. Fully Benefit-Responsive Investment Contracts In December 2005, the Financial Accounting Standards Board (FASB) issued FASB Staff Position AAG INV-1 and Statement of Position (SOP) 94-4-1,Reporting of Fully Benefit-Responsive Investment Contracts Held by Certain Investment Companies Subject to the AICPA Investment Company Guide andDefined-Contribution Health and Welfare and Pension Plans (the FSP). The FSP defines the circumstances in which an investment contract is consideredfully benefit responsive and provides certain reporting and disclosure requirements for fully benefit responsive investment contracts in defined contributionhealth and welfare and pension plans. The financial statement presentation and disclosure provisions of the FSP are effective for financial statements issuedfor annual periods ending after December 15, 2006, and are required to be applied retroactively to all prior periods presented for comparative purposes. ThePlan has adopted the provisions of the FSP at December 31, 2006. As required by the FSP, investments in the accompanying statements of net assets available for benefits include fully benefit responsive investment contractsrecognized at fair value. American Institute of Certified Public Accountants SOP 94-4-1, Reporting of Investment Contracts Held by Health and WelfareBenefit Plans and Defined Contribution Pension Plans, as amended, requires fully benefit responsive investment contracts to be reported at fair value in thePlan’s statement of net assets available for benefits with a corresponding adjustment to reflect these investments at contract value. The requirements of theFSP have been applied retroactively to the statement of net assets available for benefits as of December 31, 2005, presented for comparative purposes.Adoption of the FSP had no effect on the statement of changes in net assets available for benefits for any period presented.
7
Target Corporation 401(k) Plan
Notes to Financial Statements (continued)
3. Investments At December 31, 2006, the Plan allowed participants to choose from among 13 investment funds. Participants may change their investment elections forexisting account balances for past and future contributions on a daily basis. The Plan’s investments are held by State Street Bank, the trustee. The Plan’s investments, including investments bought and sold, as well as investments heldduring the year, appreciated in fair value as follows:
NetAppreciationin Fair ValueDuring Year
(In Thousands)
Year ended December 31, 2006:
Collective investment funds
$ 175,473
Target Corporation common stock
102,468
$ 277,941

Year ended December 31, 2005:Collective investment funds
$ 62,546
Target Corporation common stock
168,995
$ 231,541
8
Target Corporation 401(k) Plan
Notes to Financial Statements (continued)
3. Investments (continued) The fair values of individual investments representing 5% or more of the Plan’s net assets are as follows:
December 31
2006
2005
(In Thousands)
Target Corporation common stock*
$ 2,794,425
$ 2,938,272
State Street Bank & Trust Co. S&P 500 Flagship Fund Class A*
282,403
253,003
AIG Financial Products Group Annuity Contract No. 130221
290,459
303,776
Pacific Mutual Life Insurance Co. Group Annuity Contract No. 26255
290,459
303,776
*Indicates issuer is a party in interest to the Plan.
4. The Stable Value Fund One of the Plan’s investment options is the Stable Value Fund (the Fund). Contributions to this fund are invested in a portfolio of high-quality short- andintermediate-term U.S. bonds, including U.S. government treasuries, corporate debt securities, and other high-credit-quality asset-backed securities.Additionally, the Fund has entered into two insurance contracts with insurance companies under which the insurance companies provide guarantees withrespect to the availability of funds to make distributions from this investment option. These insurance contracts are carried at contract value in theparticipants’ accounts. The contract value represents contributions made under the contract, plus earnings, less withdrawals and administrative expenses. Thefair value of the Fund’s assets includes the value of the underlying securities and the value of the insurance contracts. The fair value of the insurance contractsprovided by the insurance companies is the replacement cost, and it is based on the insurance contract fees. The underlying portfolio of assets and theadjustments to contract value are shown in aggregate on the statements of net assets available for benefits and by contract on the schedule of assets (held atend of year). Under the contracts, the issuers do not guarantee payment of withdrawals at contract value as a result of premature termination of the contractsby the Plan or upon plan termination. The plan sponsor has not expressed any intention to take either of these actions.
9
Target Corporation 401(k) Plan
Notes to Financial Statements (continued)
4. The Stable Value Fund (continued) Participant accounts in the Fund are credited with interest at a fixed rate that is reset quarterly. The primary variables impacting the future crediting ratesinclude (1) the current yield of the assets underlying the contract, (2) the duration of the assets underlying the contracts, (3) the existing difference betweenthe fair value of the securities and contract value of the assets within the insurance contract. The crediting rate of security-backed contracts will track currentmarket yields on a trailing basis. The rate reset allows the contract value to converge with the fair value of the underlying portfolio over time, assuming theportfolio continues to earn the current yield for a period of time equal to the current portfolio duration. To the extent that the underlying portfolio has unrealized and/or realized losses, a positive adjustment is made to the adjustment from fair value to contractvalue under contract value accounting. As a result, the future crediting rate may be lower over time than the current market rates. Similarly, if the underlyingportfolio generates unrealized and/or realized gains, a negative adjustment is made to the adjustment from fair value to contract value, and in the future thecrediting rate may be higher than the current market rates. The insurance contracts cannot credit an interest rate that is less than zero percent. The yield earned by the Fund at December 31, 2006 and 2005, was 5.42% and 4.94%, respectively. This represents the annualized earnings of all investmentsin the Fund, divided by the fair value of all investments in the Fund at December 31, 2006 and 2005. The yield earned by the Fund with an adjustment to reflect the actual interest rate credited to participants in the Fund at December 31, 2006 and 2005, was4.62% and 4.53%, respectively. This represents the annualized earnings credited to participants in the Fund divided by the fair value of all investments in theFund at December 31, 2006 and 2005.
10
Target Corporation 401(k) Plan
Notes to Financial Statements (continued)

5. Nonparticipant-Directed Investments The Company matches 100% of participants’ before- and after-tax contributions up to 5% of each participant’s gross cash compensation, except for highlycompensated employees as described in Note 1. The Company’s contributions to the Plan are initially invested in the Target Corporation Common StockFund. Participants are allowed to diversify the investment of employer match funds to other plan investment options once they are 100% vested in theemployer match contributions. At December 31, 2006 and 2005, approximately $69 million and $60 million, respectively, in investments of the Company’sstock could not be directed to other investment options because full vesting had not yet been achieved. For the years ended December 31, 2006 and 2005,employer contributions of nonparticipant-directed funds were $38 million and $36 million, respectively. As of January 1, 2007, all actively employedparticipants become fully vested in their employer match contributions. As a result, participants can immediately diversify the investments of all employermatched contributions. 6. Transactions With Parties in Interest During the plan year 2006 and 2005, the Plan engaged in the following exempt party-in-interest transactions related to the Company’s common stock:
2006
2005
(In Thousands)
Number of common shares purchased
2,444
4,540
Cost of common shares purchased
$ 128,615
$ 237,075
Number of common shares sold
6,432
6,616
Market value of common shares sold
$ 349,323
$ 351,245
Cost of common shares sold
$ 160,034
$ 152,044
Number of common shares distributed to plan participants
483
511
Market value of common shares distributed to plan participants
$ 25,608
$ 26,641
Cost of common shares distributed to plan participants
$ 11,977
$ 11,727
Dividends received
$ 21,650
$ 19,688
During 2006 and 2005, the Plan received match-related dividends of $14,153,000 and $12,196,000, respectively, on the Company’s common stock.
11
Target Corporation 401(k) Plan
Notes to Financial Statements (continued)
7. Reconciliation of Financial Statements to Form 5500 The following is a reconciliation of net assets available for benefits per the financial statements to the Form 5500:
December 31
2006
2005
(In Thousands)
Net assets available for benefits per the financial statements
$ 4,868,535
$ 4,683,731
Amounts payable to terminating participants
(2,105) (2,267)Net assets available for benefits per the Form 5500
$ 4,866,430
$ 4,681,464
The following is a reconciliation of benefits paid to participants per the financial statements to the Form 5500:
December 31
2006
2005
(In Thousands)
Benefits paid to participants per the financial statements
$ 488,042
$ 431,912
Amounts payable to terminating participants at December 31, 2005
(2,267) (1,026)Amounts payable to terminating participants at December 31, 2006
2,105
2,267
Benefits paid to participants per the Form 5500
$ 487,880
$ 433,153
8. Income Tax Status The Plan has received a determination letter from the IRS dated September 12, 2001, stating that the Plan is qualified under Section 401(a) of the Code, andtherefore, the related trust is exempt from taxation. Subsequent to the issuance of this determination letter, the Plan was amended. Once qualified, the Plan isrequired to operate in conformity with the Code to maintain its qualification. The plan administrator believes that the Plan is being operated in compliancewith the applicable requirements of the Code and, therefore, believes the Plan, as amended, is qualified and the related trust is tax-exempt.
12
Target Corporation 401(k) Plan

Notes to Financial Statements (continued)
9. Risks and Uncertainties The Plan invests in various investment securities. Investment securities are exposed to various risks, such as interest rate, market, and credit risks. Due to thelevel of risk associated with certain investment securities, it is at least reasonably possible that changes in the values of investment securities will occur in thenear term and that such changes could materially affect the amounts reported in the financial statements.
13
Schedules
Target Corporation 401(k) Plan
EIN: 41-0215170
Plan #002
Schedule H, Line 4i – Schedule of Assets (Held at End of Year)
December 31, 2006
Face AmountAmount orNumber of
Shares/Units
Identity of Issue andDescription of Investment
ContractIssuer
Moody’s/S&P Rating
Cost
Investmentsat FairValue
WrapperContract atFair Value
Adjustmentto Contract
Value
ContractValue
CASH EQUIVALENTS
32,485,435
*State Street Bank & Trust Co.
$ 32,485,435
$ 32,485,435
$ –
$ –
$ –
COMINGLED INVESTMENT FUNDS
327,149
Barclays Global Investors
US Real Estate Index Fund
64,656,897
80,710,907
–
–
–
9,231,291
Barclays Global Investors
BGI S&P 500 Growth
94,449,424
116,318,648
–
–
–
8,568,362
*State Street Bank & Trust Co.
Bond Market Index Fund
146,201,533
162,678,913
–
–
–
2,513,867
*State Street Bank & Trust Co.
Daily EAFE
30,413,290
44,814,712
–
–
–
17,763,126
*State Street Bank & Trust Co.
Russell 3000 Fund
167,836,740
213,015,410
–
–
–
14
Target Corporation 401(k) Plan
EIN: 41-0215170
Plan #002
Schedule H, Line 4i – Schedule of Assets (Held at End of Year) (continued)
Face Amount
Contract
Amount or
Issuer
Investments
Wrapper
Adjustment
Number of
Identity of Issue and
Moody’s/
at Fair
Contract at
to Contract
Contract
Shares/Units
Description of Investment
S&P Rating
Cost
Value
Fair Value
Value
Value
COMINGLED INVESTMENT FUNDS (continued)
1,731,389
Galliard Capital Management
Managed Synthetic Fund
$ 20,000,000
$ 29,133,569
$ –
$ –
$ –
1,983,467
Galliard Capital Management
Stable Return Fund
80,316,707
80,977,045
–
–
–
5,223,410
*State Street Bank & Trust Co.
Daily Emerging Markets Index Fund
85,856,452
109,482,679
–
–
–
1,307,663
*State Street Bank & Trust Co.
20,540,667
21,038,996
–
–
–
Treasury Inflation Protected
1,050,435
*State Street Bank & Trust Co.
184,626,774
282,403,163
–
–
–
Flagship FD Series A
5,082,265
*State Street Bank & Trust Co.
76,002,551
107,769,429
–
–
–
EAFE Series T
5,346,195
*State Street Bank & Trust Co.
Russell 2000 Fund
95,654,934
137,012,283
–
–
–
TOTAL COMINGLED INVESTMENT FUNDS
1,066,555,969
1,385,355,754
–
–
–
15

Target Corporation 401(k) Plan
EIN: 41-0215170 Plan #002
Schedule H, Line 4i – Schedule of Assets (Held at End of Year) (continued)
Face Amount
Contract
Amount or
Issuer
Investments
Wrapper
Adjustment
Number of
Identity of Issue and
Moody’s/
at Fair
Contract at
to Contract
Contract
Shares/Units
Description of Investment
S&P Rating
Cost
Value
Fair Value
Value
Value
SYNTHETIC GUARANTEED INVESTMENT CONTRACTS
American International Life Group (AIG)
Products Group Annuity Contract
No. 130221, 5.05%
Aa2/AA
$ –
$ –
$ 232,182
$ 376,016
$ 290,835,019
Pacific Mutual Life Insurance Co.
Group Annuity Contract
No. 26255, 5.05%
Aa3/AA
–
–
232,181
376,013
290,835,018
7,451,149
*State Street Bank & Trust Co
7,451,149
7,451,149
–
–
–
9,000,000
Federal Home Ln Bks
9,095,718
9,118,088
–
–
–
2,000,000
Federal Farm Cr Bks
1,990,240
1,932,757
–
–
–
76,778
IMC Home Equity Ln Tr
79,261
76,549
–
–
–
415,086
CWABS Inc
415,572
415,540
–
–
–
1,092,414
Centex Home Equity Ln Tr
1,092,414
1,092,585
–
–
–
71,684
Fremont Home Ln Tr
71,684
71,695
–
–
–
1,026,137
Impac Cmb Tr
1,026,137
1,027,395
–
–
–
355,839
Morgan Stanley Abs Cap I Inc T
356,395
356,674
–
–
–
599,474
Revolving Home Equity Ln Tr
599,474
600,598
–
–
–
5,000,000
SLM Student Ln Tr
4,998,647
4,898,200
–
–
–
590,982
Structured Asset Sec Corp
596,799
585,608
–
–
–
1,427,621
Structured Asset Secs Corp
1,426,728
1,431,859
–
–
–
16
Target Corporation 401(k) Plan
EIN: 41-0215170
Plan #002
Schedule H, Line 4i – Schedule of Assets (Held at End of Year) (continued)
Face Amount
Contract
Amount or
Issuer
Investments
Wrapper
Adjustment
Number of
Identity of Issue and
Moody’s/
at Fair
Contract at
to Contract
Contract
Shares/Units
Description of Investment
S&P Rating
Cost
Value
Fair Value
Value
Value
SYNTHETIC GUARANTEED INVESTMENT CONTRACTS (continued)
1,863,974
Wamu Mtg Pass Through Ctfs
$ 16,694
$ 13,167
$ –
$ –
$ –
1,436,696
Wells Fargo Mtg Bkd Secs
1,441,780
1,428,163
–
–
–
2,731,542
Wells Fargo Mtg
2,713,190
2,708,286
–
–
–
3,896,820
Credit Suisse First Boston
4,003,701
3,920,091
–
–
–
1,500,000
GMAC Coml Mtg Sec Inc
1,572,188
1,559,919
–
–
–
904,638
Mortgage Cap Fdg Inc
935,805
911,452
–
–
–
35,357
Federal Home Ln Mtg Pc Gtd
31,247
34,254
–
–
–
386,973
Federal Home Ln Mtg Pc Gtd
355,136
380,104
–
–
–
1,000,129
Federal Natl Mtg Assn Stripped
740,223
754,082
–
–
–
2,000,000
Banc Amer Coml Mtg Inc
1,972,188
1,968,050
–
–
–
2,000,000
Banc Amer Coml Mtg Inc
1,993,125
1,986,011
–
–
–
1,000,000
Banc Amer Coml Mtg Tr
1,005,055
1,019,286
–
–
–
1,000,000
Banc Amer Coml Mtg Tr
1,005,048
1,003,192
–
–
–
1,000,000
Citigroup/Deutsche Bk Comm Mor
959,883
1,002,973
–
–
–
1,127,473
Cwalt Inc
1,127,426
1,128,878
–
–
–
714,393
Cwalt Inc
715,286
715,820
–
–
–
752,251
Cwalt Inc
752,251
753,686
–
–
–
1,218,446
Cwalt Inc
1,218,446
1,218,446
–
–
–
798,878
Cwalt Inc
798,878
801,054
–
–
–
1,171,214
Cwalt Inc
1,171,196
1,171,830
–
–
–
17
Target Corporation 401(k) Plan
EIN: 41-0215170
Plan #002
Schedule H, Line 4i – Schedule of Assets (Held at End of Year) (continued)
Face Amount
Contract
Amount or
Issuer
Investments
Wrapper
Adjustment
Number of
Identity of Issue and
Moody’s/
at Fair
Contract at
to Contract
Contract
Shares/Units
Description of Investment
S&P Rating
Cost
Value
Fair Value
Value
Value
SYNTHETIC GUARANTEED INVESTMENT CONTRACTS (continued)
1,748,795
Cwalt Alt Ln Tr
$ 1,748,795
$ 1,745,673
$ –
$ –
$ –
1,250,000
Comm Mtg Tr
1,256,225
1,243,955
–
–
–
604,029
Credit Suisse First Boston Mtg
622,527
604,081
–
–
–
233,167
Credit Suisse First Boston Mtg
238,449
232,109
–
–
–
67,857
Credit Suisse First Boston Mtg
3,350
2,895
–
–
–
64,312
Credit Suisse First Boston Mtg
4,341
2,902
–
–
–
62,242
Credit Suisse First Boston Mtg
4,746
3,525
–
–
–

705,928 Credit Suisse First Boston 99,051 91,642 – – –2,000,000
Credit Suisse Coml Mtg Tr
2,010,000
1,991,629
–
–
–
1,149,529
Dsla Mtg Ln Tr
1,149,529
1,152,347
–
–
–
2,000,000
Ge Coml Mtg Corp
2,007,422
2,008,749
–
–
–
63,767
Government Natl Mtg Assn
72,771
71,517
–
–
–
76,193
Government Natl Mtg Assn
88,024
87,544
–
–
–
95,614
Government Natl Mtg Assn
108,885
107,239
–
–
–
18,757
Government Natl Mtg
20,749
20,938
–
–
–
1,998,839
Harborview Mtg Ln Tr
1,998,839
2,005,216
–
–
–
1,164,591
IMPAC Secd Assets Corp
1,164,591
1,166,410
–
–
–
1,000,000
JP Morgan Chase
1,004,993
1,003,538
–
–
–
1,500,000
LB UBS Coml Mtg Tr
1,507,441
1,480,734
–
–
–
18
Target Corporation 401(k) Plan
EIN: 41-0215170
Plan #002
Schedule H, Line 4i – Schedule of Assets (Held at End of Year) (continued)
Face Amount
Contract
Amount or
Issuer
Investments
Wrapper
Adjustment
Number of
Identity of Issue and
Moody’s/
at Fair
Contract at
to Contract
Contract
Shares/Units
Description of Investment
S&P Rating
Cost
Value
Fair Value
Value
Value
SYNTHETIC GUARANTEED INVESTMENT CONTRACTS (continued)
1,608,653
Lehman Xs Tr
$ 1,608,653
$ 1,612,424
$ –
$ –
$ –
1,711,751
Lehman Xs Tr
1,711,751
1,715,227
–
–
–
992,714
Mastr Adj Rate Mtg Tr
992,249
992,249
–
–
–
235,687
Mastr Adj Rate Mtgs Tr
238,634
231,798
–
–
–
1,200,792
Structured Asset Mtg Invts II
1,200,792
1,201,634
–
–
–
844,058
Structured Asset Mtg Invts II
844,058
844,511
–
–
–
1,819,347
Structured Asset Mtg Invts
1,818,779
1,819,417
–
–
–
1,000,000
Wamu Mtg Pass Through Ctfs
979,961
980,538
–
–
–
1,117,472
Wamu Mtg
1,117,472
1,117,040
–
–
–
775,046
Wamu Mtg
12,352
7,839
–
–
–
1,286,164
Wamu Mtg Pass Through Ctfs
1,286,164
1,288,443
–
–
–
964,437
Washington Mutual
964,437
967,205
–
–
–
2,000,000
Wachovia Bk Coml Mtg Tr
1,986,094
1,990,399
–
–
–
940,351
Wamu Mtg
940,351
941,828
–
–
–
971,645
Wamu Mtg
971,645
974,745
–
–
–
1,983,203
Washington Mut Mtg Pass Thru C
1,983,203
1,983,203
–
–
–
877,170
Washington Mut Mtg Pass
877,170
879,687
–
–
–
450,000
Midamerican Energy Hldgs Co N
454,005
455,070
–
–
–
1,150,000
Anz Cap Tr I
1,150,000
1,117,697
–
–
–
19
Target Corporation 401(k) Plan
EIN: 41-0215170
Plan #002
Schedule H, Line 4i – Schedule of Assets (Held at End of Year) (continued)
Face Amount
Contract
Amount or
Issuer
Investments
Wrapper
Adjustment
Number of
Identity of Issue and
Moody’s/
at Fair
Contract at
to Contract
Contract
Shares/Units
Description of Investment
S&P Rating
Cost
Value
Fair Value
Value
Value
SYNTHETIC GUARANTEED INVESTMENT CONTRACTS (continued)
1,000,000
Ace Ltd
$ 1,035,093
$ 1,000,882
$ –
$ –
$ –
225,000
Aspen Ins Hldgs Ltd
212,963
221,932
–
–
–
100,000
Bank Utd Corp
117,669
101,175
–
–
–
550,000
Capital One Finl Corp
549,736
556,856
–
–
–
1,200,000
Credit Suisse First Boston USA
1,190,045
1,161,159
–
–
–
950,000
Credit Suisse First Boston USA
882,037
916,070
–
–
–
400,000
Den Danske Bk Aktieselskab
454,800
403,744
–
–
–
450,000
Eop Oper Ltd Part
523,868
487,505
–
–
–
1,200,000
Fleet Boston Corp
1,336,142
1,268,803
–
–
–
350,000
Hartford Finl Svcs Group Inc.
406,763
378,319
–
–
–
325,000
Huntington Natl Bk Columbus OH
313,719
315,364
–
–
–
550,000
Istar Finl Inc
549,758
550,469
–
–
–
270,000
Nelnet Inc
269,465
264,442
–
–
–
450,000
Nordbanken Ab
523,346
488,552
–
–
–
750,000
Pnc Fdg Corp
850,688
755,604
–
–
–
250,000
Phoenix Life Ins Co
257,760
259,380
–
–
–
400,000
Popular North Amer Inc
407,104
393,565
–
–
–
125,000
Popular North Amer Inc
124,860
125,447
–
–
–
450,000
Principal Finl Group Australia
513,966
479,656
–
–
–
500,000
Prudential Fdg Corp Mtn 144a
562,440
507,313
–
–
–
20
Target Corporation 401(k) Plan
EIN: 41-0215170
Plan #002

Schedule H, Line 4i – Schedule of Assets (Held at End of Year) (continued)
Face Amount
Contract
Amount or
Issuer
Investments
Wrapper
Adjustment
Number of
Identity of Issue and
Moody’s/
at Fair
Contract at
to Contract
Contract
Shares/Units
Description of Investment
S&P Rating
Cost
Value
Fair Value
Value
Value
SYNTHETIC GUARANTEED INVESTMENT CONTRACTS (continued)
400,000
Reinsurance Group Amer Inc
$ 404,684
$ 415,958
$ –
$ –
$ –
300,000
Sb Treas Co LLC
333,957
315,756
–
–
–
800,000
Safeco Corp
906,912
805,591
–
–
–
275,000
Simon Debartolo Group L P
296,551
281,066
–
–
–
700,000
Sovereign Bk Fsb Wyomissing PA
699,335
689,896
–
–
–
200,000
Tokai Pfd Cap LLC
221,576
212,106
–
–
–
500,000
Union Planters
548,117
499,299
–
–
–
250,000
Washington Mut Inc
279,787
270,129
–
–
–
850,000
Zurich Cap Trust
911,663
890,945
–
–
–
300,000
AT&T Broadband Corp
415,314
387,196
–
–
–
100,000
Altria Group Inc
111,900
108,628
–
–
–
275,000
Boardwalk Pipelines LLC
274,387
274,144
–
–
–
125,000
CSX Corp
137,215
125,855
–
–
–
250,000
CSX Corp
271,898
253,625
–
–
–
350,000
Daimlerchrysler North Amer Hld
349,888
359,464
–
–
–
300,000
Enbridge Energy Partners Lp
300,108
293,718
–
–
–
325,000
FUJI JGB Invt LLC
365,002
344,406
–
–
–
336,000
Kern Riv Fdg Corp
336,000
322,350
–
–
–
1,000,000
Nabsico Inc
1,113,668
1,008,425
–
–
–
21
Target Corporation 401(k) Plan
EIN: 41-0215170
Plan #002
Schedule H, Line 4i – Schedule of Assets (Held at End of Year) (continued)
Face Amount
Contract
Amount or
Issuer
Investments
Wrapper
Adjustment
Number of
Identity of Issue and
Moody’s/
at Fair
Contract at
to Contract
Contract
Shares/Units
Description of Investment
S&P Rating
Cost
Value
Fair Value
Value
Value
SYNTHETIC GUARANTEED INVESTMENT CONTRACTS (continued)
200,000
Oneok Partners Lp
$ 207,942
$ 204,696
$ –
$ –
$ –
500,000
Oracle Corp / Ozark Hldg Inc
498,185
493,370
–
–
–
300,000
PHH Corp
324,045
300,156
–
–
–
250,000
PHH Corp
253,696
253,547
–
–
–
75,000
Phillip Morris Co Inc
83,925
90,681
–
–
–
75,000
Phillip Morris Cos Inc
78,534
75,123
–
–
–
775,000
QBE Ins Group Ltd
722,825
752,060
–
–
–
1,275,000
Sprint Cap Corp
1,411,451
1,364,547
–
–
–
175,000
Telefonica Europe Bv
186,585
187,710
–
–
–
750,000
Time Warner Entmt Co Lp
853,770
768,385
–
–
–
175,000
Wyndham Worldwide Corp
174,197
170,921
–
–
–
750,000
AT&T Wireless Svcs Inc
865,545
816,948
–
–
–
1,056,317
CWHEQ Inc
1,056,317
1,054,668
–
–
–
6,766
Fed Hm Ln Pc Pool G30052
6,933
7,116
–
–
–
3,883
Fed Hm Ln Pc Pool E81885
3,967
3,968
–
–
–
65,978
Fed Hm Ln Pc Pool E85959
67,722
67,416
–
–
–
73,562
Fed Hm Ln Pc Pool E86369
75,507
75,165
–
–
–
404,015
Fed Hm Ln Pc Pool E88017
420,113
404,804
–
–
–
939,846
Federal Home Ln Mtg Corpfedera
692,206
706,427
–
–
–
131,866
Fed Hm Ln Pc Pool E96057
127,271
127,364
–
–
–
22
Target Corporation 401(k) Plan
EIN: 41-0215170
Plan #002
Schedule H, Line 4i – Schedule of Assets (Held at End of Year) (continued)
Face Amount
Contract
Amount or
Issuer
Investments
Wrapper
Adjustment
Number of
Identity of Issue and
Moody’s/
at Fair
Contract at
to Contract
Contract
Shares/Units
Description of Investment
S&P Rating
Cost
Value
Fair Value
Value
Value
SYNTHETIC GUARANTEED INVESTMENT CONTRACTS (continued)
45,262
Fed Hm Ln Pc Pool E96247
$ 43,685
$ 43,717
$ –
$ –
$ –
45,325
Fed Hm Ln Pc Pool E96248
43,746
43,777
–
–
–
52,668
Fed Hm Ln Pc Pool E97034
50,833
50,870
–
–
–
19,932
Fed Hm Ln Pc Pool E99763
19,238
19,252
–
–
–
19,129
Fed Hm Ln Pc Pool E99764
18,462
18,476
–
–
–
14,712
Fed Hm Ln Pc Pool E99765
14,200
14,210
–
–
–
87,964
Fed Hm Ln Pc Pool E99768
84,899
84,960
–
–
–
43,425
Fed Hm Ln Pc Pool E99769
41,912
41,942
–
–
–
27,451
Fed Hm Ln Pc Pool E99770
26,495
26,514
–
–
–
1,598,220
Fed Hm Ln Pc Pool G12093
1,517,934
1,543,656
–
–
–
1,427,693
Fed Hm Ln Pc Pool G12094
1,355,527
1,378,951
–
–
–
2,811,174
Fed Hm Ln Pc Pool G12251
2,604,289
2,651,947
–
–
–
1,608,882
Fed Hm Ln Pc Pool 1h2524
1,604,609
1,588,188
–
–
–
480,270
Fed Hm Ln Pc Pool G01604
500,494
491,320
–
–
–
1,000,237
Fed Hm Ln Pc Pool G01731
1,052,672
1,027,001
–
–
–

44,542 Fed Hm Ln Pc Pool G10994 45,496 46,167 – – –58,315
Fed Hm Ln Pc Pool G11526
56,283
56,287
–
–
–
621,336
Fed Hm Ln Pc Pool P60084
641,141
619,540
–
–
–
66,808
Fed Hm Ln Pc Pool E01087
68,575
68,264
–
–
–
52,964
Fed Hm Ln Pc Pool E01481
51,118
51,155
–
–
–
23
Target Corporation 401(k) Plan
EIN: 41-0215170
Plan #002
Schedule H, Line 4i – Schedule of Assets (Held at End of Year) (continued)
Face Amount
Contract
Amount or
Issuer
Investments
Wrapper
Adjustment
Number of
Identity of Issue and
Moody’s/
at Fair
Contract at
to Contract
Contract
Shares/Units
Description of Investment
S&P Rating
Cost
Value
Fair Value
Value
Value
SYNTHETIC GUARANTEED INVESTMENT CONTRACTS (continued)
106,434
Fed Hm Ln Pc Pool E01489
$ 102,726
$ 102,801
$ –
$ –
$ –
57,138
Fed Hm Ln Pc Pool E01602
55,147
55,152
–
–
–
48,343
Fed Hm Ln Pc Pool B10170
46,659
46,693
–
–
–
53,788
Fed Hm Ln Pc Pool B10207
51,914
51,952
–
–
–
473,566
Fed Hm Ln Pc Pool B10569
454,771
457,398
–
–
–
53,364
Fed Hm Ln Pc Pool B10931
51,505
51,542
–
–
–
58,313
Fed Hm Ln Pc Pool B11801
56,282
56,323
–
–
–
471,292
Fed Hm Ln Pc Pool B12928
452,588
454,908
–
–
–
307,238
Fed Hm Ln Pc Pool C90227
320,103
316,626
–
–
–
722,878
Fed Hm Ln Pc Pool C90230
753,148
744,872
–
–
–
243,385
Fed Hm Ln Pc Pool C90247
253,576
251,048
–
–
–
1,686,250
Fed Hm Ln Pc Pool 780447
1,670,441
1,682,458
–
–
–
458,920
Federal Home Ln Mtg Corp
478,424
459,018
–
–
–
590,472
Federal Home Ln Mtg Corp
70,857
58,554
–
–
–
27,754
FNMA Pool 252717
28,302
28,813
–
–
–
280,263
FNMA Pool 254107
292,525
287,502
–
–
–
367,519
FNMA Pool 254360
377,855
377,287
–
–
–
826,866
FNMA Pool 254631
816,401
815,561
–
–
–
566,809
FNMA Pool 254681
554,941
552,899
–
–
–
137,761
FNMA Pool 254720
133,252
133,177
–
–
–
24
Target Corporation 401(k) Plan
EIN: 41-0215170
Plan #002
Schedule H, Line 4i – Schedule of Assets (Held at End of Year) (continued)
Face Amount
Contract
Amount or
Issuer
Investments
Wrapper
Adjustment
Number of
Identity of Issue and
Moody’s/
at Fair
Contract at
to Contract
Contract
Shares/Units
Description of Investment
S&P Rating
Cost
Value
Fair Value
Value
Value
SYNTHETIC GUARANTEED INVESTMENT CONTRACTS (continued)
255,725
FNMA Pool 254756
$ 250,370
$ 249,357
$ –
$ –
$ –
533,454
FNMA Pool 254758
522,285
520,074
–
–
–
278,036
FNMA Pool 254806
272,040
271,010
–
–
–
110,901
FNMA Pool 254817
107,088
106,662
–
–
–
147,936
FNMA Pool 254845
142,851
142,283
–
–
–
205,358
FNMA Pool 254863
198,299
197,451
–
–
–
131,170
FNMA Pool 254864
128,342
127,834
–
–
–
68,673
FNMA Pool 254865
66,082
66,388
–
–
–
1,795,028
FNMA Pool 254880
1,722,105
1,700,719
–
–
–
131,925
FNMA Pool 254909
127,390
126,807
–
–
–
684,612
FNMA Pool 254914
670,019
667,085
–
–
–
229,599
FNMA Pool 254957
221,706
220,617
–
–
–
169,734
FNMA Pool 357348
166,657
167,413
–
–
–
227,031
FNMA Pool 535874
234,986
239,834
–
–
–
697,344
FNMA Pool 545454
727,525
715,052
–
–
–
930,736
FNMA Pool 656333
931,500
918,012
–
–
–
2,371,718
FNMA Pool 668357
2,375,424
2,339,292
–
–
–
393,727
FNMA Pool 673002
394,050
388,344
–
–
–
534,175
FNMA Pool 673011
534,613
526,872
–
–
–
262,613
FNMA Pool 673032
262,829
259,023
–
–
–
25
Target Corporation 401(k) Plan
EIN: 41-0215170
Plan #002
Schedule H, Line 4i – Schedule of Assets (Held at End of Year) (continued)
Face Amount
Contract
Amount or
Issuer
Investments
Wrapper
Adjustment
Number of
Identity of Issue and
Moody’s/
at Fair
Contract at
to Contract
Contract

Shares/Units Description of Investment S&P Rating Cost Value Fair Value Value Value SYNTHETIC GUARANTEED INVESTMENT CONTRACTS (continued)
281,775
FNMA Pool 674438
$ 282,006
$ 278,187
$ –
$ –
$ –
571,109
Federal National Mtg Assn Gtd Remi
596,095
571,895
–
–
–
781,765
Federal Natl Mtg Assn
36,645
27,674
–
–
–
376,304
Federal Natl Mtg Assn Gtd Remi
18,933
14,527
–
–
–
713,349
Federal Natl Mtg Assn
37,451
18,152
–
–
–
44,340
FNMA Pool 687485
42,888
42,864
–
–
–
131,856
FNMA Pool 687532
126,881
127,468
–
–
–
152,689
FNMA Pool 689082
149,921
150,601
–
–
–
107,279
FNMA Pool 689085
103,768
103,709
–
–
–
90,913
FNMA Pool 694900
87,937
87,887
–
–
–
171,919
FNMA Pool 695826
168,655
169,569
–
–
–
52,919
FNMA Pool 695854
51,186
51,157
–
–
–
105,252
FNMA Pool 695863
101,807
101,749
–
–
–
50,796
FNMA Pool 695893
49,133
49,106
–
–
–
168,334
FNMA Pool 695945
161,982
162,732
–
–
–
76,052
FNMA Pool 696450
78,322
75,929
–
–
–
216,906
FNMA Pool 697602
209,806
209,687
–
–
–
75,279
FNMA Pool 699653
72,439
72,774
–
–
–
48,916
FNMA Pool 701379
47,315
47,288
–
–
–
46,185
FNMA Pool 702326
44,673
44,648
–
–
–
26
Target Corporation 401(k) Plan
EIN: 41-0215170
Plan #002
Schedule H, Line 4i – Schedule of Assets (Held at End of Year) (continued)
Face Amount
Contract
Amount or
Issuer
Investments
Wrapper
Adjustment
Number of
Identity of Issue and
Moody’s/
at Fair
Contract at
to Contract
Contract
Shares/Units
Description of Investment
S&P Rating
Cost
Value
Fair Value
Value
Value
SYNTHETIC GUARANTEED INVESTMENT CONTRACTS (continued)
118,668
FNMA Pool 703445
$ 116,517
$ 117,045
$ –
$ –
$ –
140,931
FNMA Pool 703710
138,376
139,004
–
–
–
207,092
FNMA Pool 707774
200,313
200,199
–
–
–
154,065
FNMA Pool 709192
151,273
151,959
–
–
–
108,751
FNMA Pool 709817
105,191
105,132
–
–
–
817,387
FNMA Pool 712203
800,528
806,212
–
–
–
103,543
FNMA Pool 720307
100,153
100,097
–
–
–
57,977
FNMA Pool 720309
56,079
56,047
–
–
–
54,422
FNMA Pool 720321
52,640
52,610
–
–
–
287,493
FNMA Pool 720364
278,083
277,925
–
–
–
53,657
FNMA Pool 720370
51,901
51,872
–
–
–
123,352
FNMA Pool 720718
119,314
119,247
–
–
–
49,664
FNMA Pool 721346
48,039
48,011
–
–
–
959,964
FNMA Pool 727369
918,715
928,015
–
–
–
717,381
FNMA Pool 729214
714,747
706,128
–
–
–
575,112
FNMA Pool 730338
589,220
566,890
–
–
–
201,927
FNMA Pool 730721
194,307
195,206
–
–
–
1,861,872
FNMA Pool 734788
1,721,068
1,758,742
–
–
–
153,390
FNMA Pool 735010
150,610
150,910
–
–
–
5,192,464
FNMA Pool 735028
5,461,012
5,353,587
–
–
–
27
Target Corporation 401(k) Plan
EIN: 41-0215170
Plan #002
Schedule H, Line 4i – Schedule of Assets (Held at End of Year) (continued)
Face Amount
Contract
Amount or
Issuer
Investments
Wrapper
Adjustment
Number of
Identity of Issue and
Moody’s/
at Fair
Contract at
to Contract
Contract
Shares/Units
Description of Investment
S&P Rating
Cost
Value
Fair Value
Value
Value
SYNTHETIC GUARANTEED INVESTMENT CONTRACTS (continued)
967,555
FNMA Pool 745387
$ 949,588
$ 953,117
$ –
$ –
$ –
586,771
FNMA Pool 745388
575,631
578,749
–
–
–
148,810
FNMA Pool 752685
143,195
143,764
–
–
–
859,015
FNMA Pool 754089
840,694
846,197
–
–
–
909,631
FNMA Pool 758905
922,706
900,547
–
–
–
188,664
FNMA Pool 759975
181,545
182,385
–
–
–
69,341
FNMA Pool 761404
68,084
68,306
–
–
–
1,393,417
FNMA Pool 779574
1,390,913
1,379,593
–
–
–
1,176,828
FNMA Pool 802783
1,168,737
1,169,030
–
–
–
624,445
FNMA Pool 806642
626,299
617,697
–
–
–
829,831
FNMA Pool 879906
813,137
818,152
–
–
–
383,349
Small Business Admin
385,000
393,531
–
–
–
575,000
Bellsouth Telecoms
619,781
582,245
–
–
–
439,496
United States Treas Nts
422,346
424,649
–
–
–
214,116
United States Treas Nts
209,573
207,853
–
–
–
835,654
United States Treas Nts
804,560
801,016
–
–
–
2,500,000
United States Treas Nts
2,574,512
2,575,391
–
–
–
1,200,000
United States Treas Nts
1,204,125
1,200,563
–
–
–
2,600,000
United States Treas Bd
869,194
985,794
–
–
–
150,000
Canadian Natl Resource
152,754
149,787
–
–
–

28
Target Corporation 401(k) Plan
EIN: 41-0215170
Plan #002
Schedule H, Line 4i – Schedule of Assets (Held at End of Year) (continued)
Face Amount
Contract
Amount or
Issuer
Investments
Wrapper
Adjustment
Number of
Identity of Issue and
Moody’s/
at Fair
Contract at
to Contract
Contract
Shares/Units
Description of Investment
S&P Rating
Cost
Value
Fair Value
Value
Value
SYNTHETIC GUARANTEED INVESTMENT CONTRACTS (continued)
500,000
Mufg Capital Finance 1 Limited
$ 500,767
$ 507,445
$ –
$ –
$ –
1,100,000
British Telecommunications Plc
1,176,948
1,221,857
–
–
–
400,000
Deutsche Telekom Intl Fin Bv
498,952
489,149
–
–
–
375,000
Endurance Specialty Hldgs Ltd
373,646
372,047
–
–
–
550,000
France Telecom Sa
602,234
598,056
–
–
–
1,250,000
HSBC Cap Fdg Dlr 2 L P
1,222,415
1,164,149
–
–
–
125,000
Telecom Italia Cap
117,378
118,995
–
–
–
500,000
Telecom Italia Cap
491,942
462,323
–
–
–
175,000
Telecom Italia Cap
167,795
169,725
–
–
–
285,000
Bank Of New York
284,901
284,901
–
–
–
2,309,027
State Street Bank & Trust Co
2,309,027
2,309,027
–
–
–
300,000
Federal Home Ln Mtg
293,458
296,687
–
–
–
530,000
Federal Home Ln Bks
524,918
522,781
–
–
–
1,165,000
Federal Home Ln Bks
1,163,741
1,164,688
–
–
–
685,000
Federal Home Lona Bank
682,411
682,205
–
–
–
555,000
Federal Natl Mtg Assn
548,132
544,453
–
–
–
2,395,000
Federal Natl Mtg Assn
2,544,736
2,546,797
–
–
–
730,000
Federal Natl Mtg Assn
725,292
726,291
–
–
–
2,555,000
Federal Natl Mtg Assn
2,552,752
2,553,150
–
–
–
195,000
Federal Home Ln Mtg Corp
195,731
196,639
–
–
–
29
Target Corporation 401(k) Plan
EIN: 41-0215170
Plan #002
Schedule H, Line 4i – Schedule of Assets (Held at End of Year) (continued)
Face Amount
Contract
Amount or
Issuer
Investments
Wrapper
Adjustment
Number of
Identity of Issue and
Moody’s/
at Fair
Contract at
to Contract
Contract
Shares/Units
Description of Investment
S&P Rating
Cost
Value
Fair Value
Value
Value
SYNTHETIC GUARANTEED INVESTMENT CONTRACTS (continued)
110,000
United Mexican Sts Mtn
$ 110,549
$ 110,165
$ –
$ –
$ –
3,274
BMW Veh Owner Tr
3,274
3,269
–
–
–
870,000
Daimlerchrysler Auto Tr
869,807
867,417
–
–
–
715,000
Daimlerchrysler Auto Tr
714,795
711,760
–
–
–
865,000
Nissan Auto Lease Tr
864,946
864,459
–
–
–
405,000
American Express Cr Account
397,849
398,925
–
–
–
605,000
Capital One Multi Asset Execut
591,198
590,442
–
–
–
830,000
Citibank Cr Card Issuance Tr
832,690
834,021
–
–
–
355,000
GE Cap Cr Card Master Nt Tr
354,931
355,721
–
–
–
550,000
MBNA Cr Card Master Nt Tr
532,061
538,313
–
–
–
260,000
MBNA Cr Card Master Nt Tr
259,933
256,709
–
–
–
340,000
MBNA Cr Card Master Nt Tr
339,986
335,431
–
–
–
325,000
Advanta Business Card Master
324,384
326,016
–
–
–
1,100,000
Bank One Issurance Tr
1,072,414
1,071,297
–
–
–
359,740
California Infra + Economic
372,668
361,819
–
–
–
1,115,000
Citibank Cr Card Issuance Tr
1,111,902
1,109,425
–
–
–
155,000
FNANB Cr Card Master Tr
155,872
155,194
–
–
–
895,000
HSBC Cr Card Master Nt Tr
894,866
897,238
–
–
–
650,000
MBNA Cr Card Master Nt Tr
634,156
631,820
–
–
–
565,000
Nissan Auto Lease Tr
564,994
564,912
–
–
–
30
Target Corporation 401(k) Plan
EIN: 41-0215170
Plan #002
Schedule H, Line 4i – Schedule of Assets (Held at End of Year) (continued)
Face Amount
Contract
Amount or
Issuer
Investments
Wrapper
Adjustment
Number of
Identity of Issue and
Moody’s/
at Fair
Contract at
to Contract
Contract
Shares/Units
Description of Investment
S&P Rating
Cost
Value
Fair Value
Value
Value
SYNTHETIC GUARANTEED INVESTMENT CONTRACTS (continued)
405,000
Morgan Stanley Cap Inc.
$ 400,729
$ 400,034
$ –
$ –
$ –

535,000 Fannie Mae 527,602 530,305 – – –325,000
Federal Home Loan Mortgage Corp.
329,570
322,899
–
–
–
581,328
Federal Home Loan Mortgage Corp.
575,613
577,380
–
–
–
405,000
Federal Home Loan Mortgage Corp.
409,556
408,144
–
–
–
570,000
Federal Home Loan Mortgage Corp.
576,079
575,192
–
–
–
396,382
Federal Home Loan Mortgage Corp.
398,364
401,456
–
–
–
1,000,000
Banc Amer Coml Mtg Inc
992,502
992,787
–
–
–
1,025,000
Bear Stearns Coml Mtg Secs
1,030,626
1,018,796
–
–
–
470,000
Bear Stearns Coml Mtg Secs
472,583
465,001
–
–
–
810,000
Chase Issuance Tr
788,167
790,636
–
–
–
505,000
Credit Suisse First Boston Mtg
493,440
489,977
–
–
–
725,000
Credit Suisse First Boston Mtg
693,423
710,086
–
–
–
475,000
J P Morgan Mtg Tr
477,189
481,395
–
–
–
413,972
J P Morgan Chase Coml Mtg Sec
414,971
413,348
–
–
–
595,000
J P Morgan Chase Coml Mtg Secs
589,023
585,225
–
–
–
515,000
ML CFC Coml Mtg
517,799
507,516
–
–
–
530,000
Morgan Stanley Cap I Inc
532,909
525,668
–
–
–
970,000
Morgan Stanley Cap I Tr
975,313
994,628
–
–
–
520,000
Morgan Stanley Cap I Tr
520,917
540,410
–
–
–
31
Target Corporation 401(k) Plan
EIN: 41-0215170
Plan #002
Schedule H, Line 4i – Schedule of Assets (Held at End of Year) (continued)
Face Amount
Contract
Amount or
Issuer
Investments
Wrapper
Adjustment
Number of
Identity of Issue and
Moody’s/
at Fair
Contract at
to Contract
Contract
Shares/Units
Description of Investment
S&P Rating
Cost
Value
Fair Value
Value
Value
SYNTHETIC GUARANTEED INVESTMENT CONTRACTS (continued)
685,000
New York Mtg Tr
$ 681,592
$ 689,368
$ –
$ –
$ –
575,000
1345 Ave Of The Amers Tr
623,658
617,368
–
–
–
265,000
Baltimore Gas + Elec Co
264,375
264,628
–
–
–
90,000
Carolina Pwr + Lt Co
89,175
87,994
–
–
–
315,000
Consolidated Nat Gas Co
293,033
301,128
–
–
–
75,000
Duke Energy Field Svcs LLLC
88,458
80,968
–
–
–
170,000
Duke Energy Co
171,125
166,940
–
–
–
235,000
Energy East Corp
260,622
245,367
–
–
–
90,000
Indiana Mi Pwr Co
89,672
86,171
–
–
–
120,000
Union Elec Co
117,066
116,735
–
–
–
130,000
Allied Cap Corp
129,891
128,131
–
–
–
255,000
American Gen Fin Corp Mtn
248,724
247,279
–
–
–
590,000
American Intl Group Inc
589,794
589,447
–
–
–
110,000
Assurant Inc
112,373
109,171
–
–
–
205,000
Bae Sys Hldgs Inc
190,941
195,271
–
–
–
200,000
Bank Amer Corp
199,504
198,451
–
–
–
80,000
Bankamerica Corp
92,237
86,295
–
–
–
180,000
CIT Group Inc
177,177
178,482
–
–
–
125,000
Capital One Finl Corp
125,158
126,558
–
–
–
295,000
Comerica Bk Detroit Mich
294,292
294,723
–
–
–
32
Target Corporation 401(k) Plan
EIN: 41-0215170
Plan #002
Schedule H, Line 4i – Schedule of Assets (Held at End of Year) (continued)
Face Amount
Contract
Amount or
Issuer
Investments
Wrapper
Adjustment
Number of
Identity of Issue and
Moody’s/
at Fair
Contract at
to Contract
Contract
Shares/Units
Description of Investment
S&P Rating
Cost
Value
Fair Value
Value
Value
SYNTHETIC GUARANTEED INVESTMENT CONTRACTS (continued)
255,000
Commerce Group Inc Mass
$ 262,141
$ 252,762
$ –
$ –
$ –
135,000
Deere John Cap Corp Mtn Bk Ent
133,742
133,844
–
–
–
455,000
General Elec Cap Corp Mtn
467,857
467,347
–
–
–
830,000
General Elec Cap Corp Mtn
868,844
858,203
–
–
–
120,000
Goldman Sachs Group Inc
116,929
115,411
–
–
–
210,000
Goldman Sachs Group Inc
209,857
212,935
–
–
–
115,000
Hrpt Pptys Tr
117,339
119,311
–
–
–
255,000
Hrpt Pptys Tr
254,232
255,392
–
–
–
200,000
Hartford Finl Svcs Group Inc
200,657
201,476
–
–
–
470,000
Keycorp Mtn Book Entry
463,523
463,814
–
–
–
300,000
M + I Marshall + Ilsley Bk Mil
299,925
296,188
–
–
–
130,000
Massmutual Global Fgd II Mtn
124,045
124,587
–
–
–
345,000
Morgan Stanley
349,549
349,325
–
–
–
630,000
Nationwide Bldg Soc
624,876
610,886
–
–
–
415,000
PNC Fdg Corp
414,462
408,995
–
–
–
105,000
Popular North Amer Inc
104,882
105,375
–
–
–
105,000
Realogy Corp
109,022
107,289
–
–
–
285,000
Regions Finl Corp New
284,684
281,569
–
–
–
140,000
Simon Ppty Group Inc New
134,722
135,565
–
–
–
190,000
UFJ Fin Aruba A E C
209,286
202,762
–
–
–
33
Target Corporation 401(k) Plan
EIN: 41-0215170Plan #002
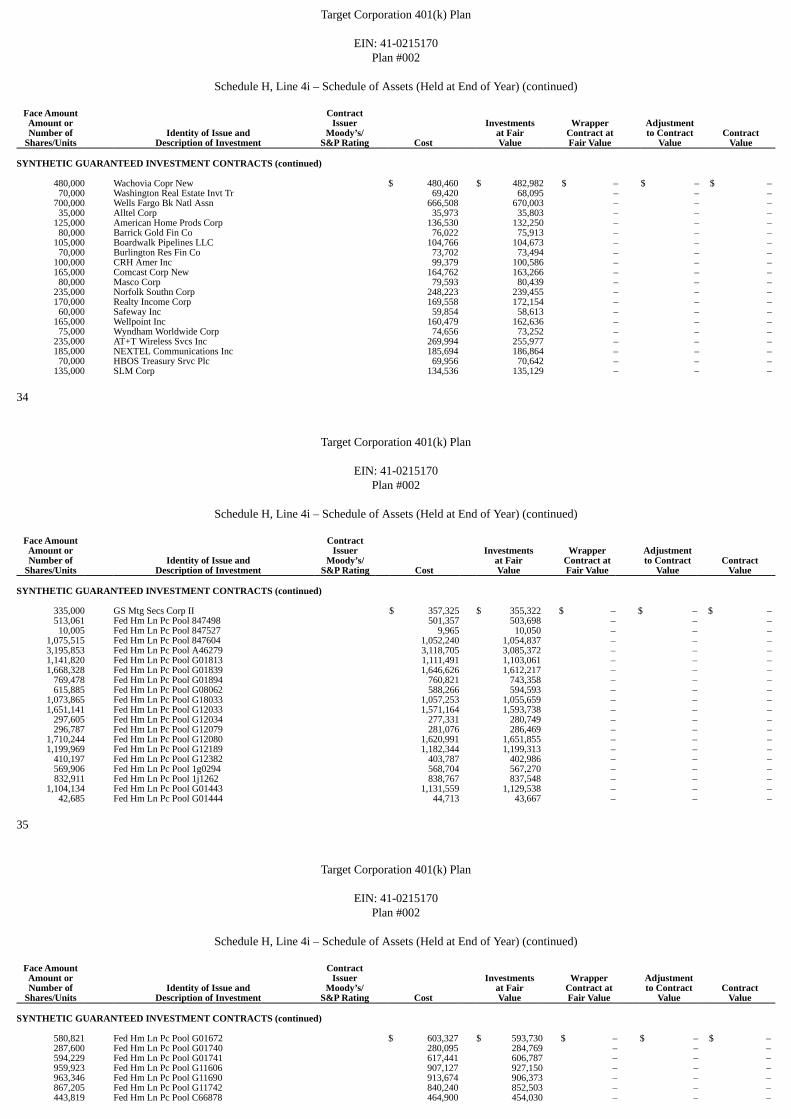
Schedule H, Line 4i – Schedule of Assets (Held at End of Year) (continued)
Face Amount
Contract
Amount or
Issuer
Investments
Wrapper
Adjustment
Number of
Identity of Issue and
Moody’s/
at Fair
Contract at
to Contract
Contract
Shares/Units
Description of Investment
S&P Rating
Cost
Value
Fair Value
Value
Value
SYNTHETIC GUARANTEED INVESTMENT CONTRACTS (continued)
480,000
Wachovia Copr New
$ 480,460
$ 482,982
$ –
$ –
$ –
70,000
Washington Real Estate Invt Tr
69,420
68,095
–
–
–
700,000
Wells Fargo Bk Natl Assn
666,508
670,003
–
–
–
35,000
Alltel Corp
35,973
35,803
–
–
–
125,000
American Home Prods Corp
136,530
132,250
–
–
–
80,000
Barrick Gold Fin Co
76,022
75,913
–
–
–
105,000
Boardwalk Pipelines LLC
104,766
104,673
–
–
–
70,000
Burlington Res Fin Co
73,702
73,494
–
–
–
100,000
CRH Amer Inc
99,379
100,586
–
–
–
165,000
Comcast Corp New
164,762
163,266
–
–
–
80,000
Masco Corp
79,593
80,439
–
–
–
235,000
Norfolk Southn Corp
248,223
239,455
–
–
–
170,000
Realty Income Corp
169,558
172,154
–
–
–
60,000
Safeway Inc
59,854
58,613
–
–
–
165,000
Wellpoint Inc
160,479
162,636
–
–
–
75,000
Wyndham Worldwide Corp
74,656
73,252
–
–
–
235,000
AT+T Wireless Svcs Inc
269,994
255,977
–
–
–
185,000
NEXTEL Communications Inc
185,694
186,864
–
–
–
70,000
HBOS Treasury Srvc Plc
69,956
70,642
–
–
–
135,000
SLM Corp
134,536
135,129
–
–
–
34
Target Corporation 401(k) Plan
EIN: 41-0215170
Plan #002
Schedule H, Line 4i – Schedule of Assets (Held at End of Year) (continued)
Face Amount
Contract
Amount or
Issuer
Investments
Wrapper
Adjustment
Number of
Identity of Issue and
Moody’s/
at Fair
Contract at
to Contract
Contract
Shares/Units
Description of Investment
S&P Rating
Cost
Value
Fair Value
Value
Value
SYNTHETIC GUARANTEED INVESTMENT CONTRACTS (continued)
335,000
GS Mtg Secs Corp II
$ 357,325
$ 355,322
$ –
$ –
$ –
513,061
Fed Hm Ln Pc Pool 847498
501,357
503,698
–
–
–
10,005
Fed Hm Ln Pc Pool 847527
9,965
10,050
–
–
–
1,075,515
Fed Hm Ln Pc Pool 847604
1,052,240
1,054,837
–
–
–
3,195,853
Fed Hm Ln Pc Pool A46279
3,118,705
3,085,372
–
–
–
1,141,820
Fed Hm Ln Pc Pool G01813
1,111,491
1,103,061
–
–
–
1,668,328
Fed Hm Ln Pc Pool G01839
1,646,626
1,612,217
–
–
–
769,478
Fed Hm Ln Pc Pool G01894
760,821
743,358
–
–
–
615,885
Fed Hm Ln Pc Pool G08062
588,266
594,593
–
–
–
1,073,865
Fed Hm Ln Pc Pool G18033
1,057,253
1,055,659
–
–
–
1,651,141
Fed Hm Ln Pc Pool G12033
1,571,164
1,593,738
–
–
–
297,605
Fed Hm Ln Pc Pool G12034
277,331
280,749
–
–
–
296,787
Fed Hm Ln Pc Pool G12079
281,076
286,469
–
–
–
1,710,244
Fed Hm Ln Pc Pool G12080
1,620,991
1,651,855
–
–
–
1,199,969
Fed Hm Ln Pc Pool G12189
1,182,344
1,199,313
–
–
–
410,197
Fed Hm Ln Pc Pool G12382
403,787
402,986
–
–
–
569,906
Fed Hm Ln Pc Pool 1g0294
568,704
567,270
–
–
–
832,911
Fed Hm Ln Pc Pool 1j1262
838,767
837,548
–
–
–
1,104,134
Fed Hm Ln Pc Pool G01443
1,131,559
1,129,538
–
–
–
42,685
Fed Hm Ln Pc Pool G01444
44,713
43,667
–
–
–
35
Target Corporation 401(k) Plan
EIN: 41-0215170
Plan #002
Schedule H, Line 4i – Schedule of Assets (Held at End of Year) (continued)
Face Amount
Contract
Amount or
Issuer
Investments
Wrapper
Adjustment
Number of
Identity of Issue and
Moody’s/
at Fair
Contract at
to Contract
Contract
Shares/Units
Description of Investment
S&P Rating
Cost
Value
Fair Value
Value
Value
SYNTHETIC GUARANTEED INVESTMENT CONTRACTS (continued)
580,821
Fed Hm Ln Pc Pool G01672
$ 603,327
$ 593,730
$ –
$ –
$ –
287,600
Fed Hm Ln Pc Pool G01740
280,095
284,769
–
–
–
594,229
Fed Hm Ln Pc Pool G01741
617,441
606,787
–
–
–
959,923
Fed Hm Ln Pc Pool G11606
907,127
927,150
–
–
–
963,346
Fed Hm Ln Pc Pool G11690
913,674
906,373
–
–
–
867,205
Fed Hm Ln Pc Pool G11742
840,240
852,503
–
–
–
443,819
Fed Hm Ln Pc Pool C66878
464,900
454,030
–
–
–

592,710 Fed Hm Ln Pc Pool C01585 567,520 573,517 – – –240,054
Fed Hm Ln Pc Pool C01645
243,973
245,127
–
–
–
6,855
Fed Hm Ln Pc Pool A16908
7,181
7,000
–
–
–
123,804
Fed Hm Ln Pc Pool A36230
123,049
119,524
–
–
–
960,556
Fed Hm Ln Pc Pool B17430
913,954
926,262
–
–
–
1,327,895
Fed Hm Ln Pc Pool 972234
1,338,114
1,340,555
–
–
–
445,000
Federal Natl Mtg Assn
439,820
437,640
–
–
–
725,000
Federal Home Ln Mtg
711,293
709,006
–
–
–
730,000
Federal Home Ln Mtg Corp
739,182
737,163
–
–
–
590,000
Federal Home Ln Mtg Corp
596,753
595,533
–
–
–
907,788
FNMA Pool 254918
884,809
852,363
–
–
–
591,115
FNMA Pool 545759
605,985
604,900
–
–
–
951,602
FNMA Pool 545817
975,987
973,794
–
–
–
36
Target Corporation 401(k) Plan
EIN: 41-0215170
Plan #002
Schedule H, Line 4i – Schedule of Assets (Held at End of Year) (continued)
Face Amount
Contract
Amount or
Issuer
Investments
Wrapper
Adjustment
Number of
Identity of Issue and
Moody’s/
at Fair
Contract at
to Contract
Contract
Shares/Units
Description of Investment
S&P Rating
Cost
Value
Fair Value
Value
Value
SYNTHETIC GUARANTEED INVESTMENT CONTRACTS (continued)
439,256
FNMA Pool 555880
$ 439,050
$ 435,275
$ –
$ –
$ –
1,400,779
FNMA Pool 555967
1,415,309
1,388,085
–
–
–
118,321
FNMA Pool 609077
123,904
120,992
–
–
–
125,535
FNMA Pool 625094
134,127
129,816
–
–
–
617,280
FNMA Pool 670385
632,519
631,675
–
–
–
1,125,000
Federal Natl Mtg Assn
1,171,713
1,147,705
–
–
–
360,000
Federal Natl Mtg Assn Gtd Remi
356,723
356,701
–
–
–
470,000
Federal Natl Mtg Assn
460,747
460,893
–
–
–
1,060,966
FNMA Pool 725424
1,060,635
1,051,351
–
–
–
380,743
FNMA Pool 735224
381,695
376,816
–
–
–
1,500,292
FNMA Pool 735871
1,504,278
1,484,821
–
–
–
2,189,670
FNMA Pool 740228
2,210,370
2,169,826
–
–
–
425,897
FNMA Pool 745810
418,976
420,232
–
–
–
195,325
FNMA Pool 745852
199,109
200,368
–
–
–
165,107
FNMA Pool 758938
168,526
163,405
–
–
–
1,942,803
FNMA Pool 759230
1,905,161
1,922,768
–
–
–
133,719
FNMA Pool 765438
140,029
136,738
–
–
–
322,067
FNMA Pool 776486
318,028
317,814
–
–
–
87,332
FNMA Pool 836018
87,237
86,336
–
–
–
328,894
FNMA Pool 836284
328,894
325,142
–
–
–
37
Target Corporation 401(k) Plan
EIN: 41-0215170
Plan #002
Schedule H, Line 4i – Schedule of Assets (Held at End of Year) (continued)
Face Amount
Contract
Amount or
Issuer
Investments
Wrapper
Adjustment
Number of
Identity of Issue and
Moody’s/
at Fair
Contract at
to Contract
Contract
Shares/Units
Description of Investment
S&P Rating
Cost
Value
Fair Value
Value
Value
SYNTHETIC GUARANTEED INVESTMENT CONTRACTS (continued)
1,719,442
FNMA Pool 844809
$ 1,644,351
$ 1,660,807
$ –
$ –
$ –
835,706
FNMA Pool 881959
839,754
840,876
–
–
–
2,743,935
FNMA Pool 896032
2,737,289
2,762,799
–
–
–
774,213
FNMA Pool 901506
781,593
779,903
–
–
–
54,630
GNMA Pool 595148
58,233
56,504
–
–
–
2,318,183
FNMA II Pool 003624
2,225,093
2,305,234
–
–
–
747,161
GNMA II Pool 003774
736,070
742,170
–
–
–
895,000
New York NY
1,003,528
920,561
–
–
–
140,000
Wisconsin St Gen Rev
143,892
137,407
–
–
–
605,000
United States Treas Bds
822,999
827,432
–
–
–
2,155,000
United States Treas Nts
2,268,247
2,264,433
–
–
–
1,330,000
United States Treas Nts
1,308,969
1,295,088
–
–
–
1,600,000
United States Treas Nts
1,505,209
1,532,000
–
–
–
1,085,000
United States Treas Nts
1,057,960
1,050,077
–
–
–
1,135,000
United States Treas Nts
1,125,984
1,127,552
–
–
–
315,000
United States Treas Nts
311,554
310,078
–
–
–
725,000
United States Treas Nts
729,050
726,189
–
–
–
875,000
United States Treas Nts
878,349
877,598
–
–
–
1,770,000
United States Treas Nts
1,762,256
1,754,651
–
–
–
435,000
United States Treas Nts
436,070
435,204
–
–
–
38
Target Corporation 401(k) Plan
EIN: 41-0215170
Plan #002

Schedule H, Line 4i – Schedule of Assets (Held at End of Year) (continued)
Face Amount
Contract
Amount or
Issuer
Investments
Wrapper
Adjustment
Number of
Identity of Issue and
Moody’s/
at Fair
Contract at
to Contract
Contract
Shares/Units
Description of Investment
S&P Rating
Cost
Value
Fair Value
Value
Value
SYNTHETIC GUARANTEED INVESTMENT CONTRACTS (continued)
1,290,000
United States Treas Nts
$ 1,292,619
$ 1,285,465
$ –
$ –
$ –
450,000
United States Treas Nts
451,310
448,594
–
–
–
2,235,000
United States Treas Nts
2,253,191
2,220,682
–
–
–
30,000
Encana Hldgs Fin Corp
29,890
30,061
–
–
–
305,000
Ontario Prov Cda
304,253
304,653
–
–
–
205,000
Quebec Prov Cda
204,176
202,856
–
–
–
270,000
Transalta Corp
266,615
271,021
–
–
–
165,000
Allied World Assurn Co Hldgs
164,517
177,023
–
–
–
125,000
Diageo Cap Plc
124,676
123,155
–
–
–
655,000
HBOS Treasury Srvc Plc Covrd Bd
654,659
653,211
–
–
–
160,000
Italty Rep
165,539
165,134
–
–
–
125,000
Kaupthing Bk Hf Medium Term Sr
125,158
125,795
–
–
–
180,000
Landeskreditbank Baden
179,136
179,791
–
–
–
785,000
Quebec Prov Cda
847,641
814,449
–
–
–
70,000
Sabmiller Plc
69,950
71,383
–
–
–
405,000
Telecom Italia Cap
369,490
374,481
–
–
–
165,000
Telefonica Emisiones S A U
165,000
170,240
–
–
–
100,000
African Dev Bk
110,504
112,107
–
–
–
8,070,538
State Street Bank & Trust Co
8,070,538
8,070,538
–
–
–
400,000
United States Treas Bills
397,029
398,051
–
–
–
39
Target Corporation 401(k) Plan
EIN: 41-0215170
Plan #002
Schedule H, Line 4i – Schedule of Assets (Held at End of Year) (continued)
Face Amount
Contract
Amount or
Issuer
Investments
Wrapper
Adjustment
Number of
Identity of Issue and
Moody’s/
at Fair
Contract at
to Contract
Contract
Shares/Units
Description of Investment
S&P Rating
Cost
Value
Fair Value
Value
Value
SYNTHETIC GUARANTEED INVESTMENT CONTRACTS (continued)
20,000
Merrill Lynch & Co Inc
$ 186,372
$ 194,400
$ –
$ –
$ –
38,500
Merrill Lynch & Co Inc
348,272
368,445
–
–
–
2,500
Morgan Stanley Bridges
22,175
24,950
–
–
–
500,000
Federal Home Ln Bks
491,815
496,693
–
–
–
500,000
Federal Home Ln Bks
490,584
495,537
–
–
–
108,477
Federal Home Ln Mtg Corp
108,477
108,061
–
–
–
81,054
USAA Auto Owner Tr
80,167
80,838
–
–
–
222,209
Centex Home Equity Ln Tr
222,730
220,022
–
–
–
595,653
Centex Home Equity Ln Tr
585,509
583,833
–
–
–
92,044
Chase Fdg Mtg Ln
90,951
91,426
–
–
–
277,831
Federal Natl Mtg Assn
277,483
275,226
–
–
–
780,229
Saxon Asset Secs Tr
798,150
778,279
–
–
–
235,800
Argent Secs Inc
236,058
234,128
–
–
–
28,489
CWABS Inc
28,551
28,493
–
–
–
500,000
CWABS Inc
494,375
491,953
–
–
–
412,095
Chase Fdg Tr
431,358
411,580
–
–
–
69,544
Citifinancial Mtg Secs Inc
69,805
68,066
–
–
–
712,920
Credit Suisse First Boston Mtg
714,925
713,143
–
–
–
1,230,000
Popular Abs Inc
1,210,941
1,200,788
–
–
–
221,866
Renaissance Home Equity Ln Tr
221,589
220,757
–
–
–
40
Target Corporation 401(k) Plan
EIN: 41-0215170
Plan #002
Schedule H, Line 4i – Schedule of Assets (Held at End of Year) (continued)
Face Amount
Contract
Amount or
Issuer
Investments
Wrapper
Adjustment
Number of
Identity of Issue and
Moody’s/
at Fair
Contract at
to Contract
Contract
Shares/Units
Description of Investment
S&P Rating
Cost
Value
Fair Value
Value
Value
SYNTHETIC GUARANTEED INVESTMENT CONTRACTS (continued)
155,904
SLM Private Cr Student Ln Tr
$ 156,123
$ 156,221
$ –
$ –
$ –
28,797
Washington Mut Mtg Secs Corp
29,274
28,823
–
–
–
500,000
Asset Securitization Corp
516,406
507,275
–
–
–
500,000
Credit Suisse First Boston Mtg
502,871
500,945
–
–
–
353,164
Credit Suisse First Boston Mtg
357,896
357,937
–
–
–
826,090
DLJ Coml Mtg Corp
837,352
831,225
–
–
–
161,009
DLJ Coml Mtg Corp
162,318
161,463
–
–
–
415,000
GS Mtg Secs Corp II
417,399
415,721
–
–
–
58,994
GS Mtg Secs Corp II
63,262
59,082
–
–
–
16,519
LB Coml Conduit Mtg Tr
17,610
16,552
–
–
–
539,510
LB UBS Comm Mtg Tr
547,265
547,106
–
–
–
152,050
Morgan JP Coml Mtg Fin Corp
156,065
151,999
–
–
–
500,000
Morgan Stanley Cap I Inc
509,453
509,418
–
–
–

700,000 Mortgage Cap Fdg Inc 712,688 699,382 – – –635,562
Nationslink Fdg Corp
650,682
649,732
–
–
–
2,770
PNC Mtg Accep Corp
2,825
2,772
–
–
–
457,479
Prudential Secs Secd Fing Corp
473,134
471,617
–
–
–
374,884
Federal Home Ln Mtg Corp Multi
376,876
375,133
–
–
–
242,839
Federal Home Ln Mtg Pc Gtd
244,699
247,520
–
–
–
69,493
Federal Home Ln Mtg Pc Gtd
69,949
69,219
–
–
–
41
Target Corporation 401(k) Plan
EIN: 41-0215170
Plan #002
Schedule H, Line 4i – Schedule of Assets (Held at End of Year) (continued)
Face Amount
Contract
Amount or
Issuer
Investments
Wrapper
Adjustment
Number of
Identity of Issue and
Moody’s/
at Fair
Contract at
to Contract
Contract
Shares/Units
Description of Investment
S&P Rating
Cost
Value
Fair Value
Value
Value
SYNTHETIC GUARANTEED INVESTMENT CONTRACTS (continued)
23,332
Federal Natl Mtg Assn Remic
$ 24,039
$ 23,280
$ –
$ –
$ –
86,948
Federal Natl Mtg Assn Remic
90,751
87,102
–
–
–
15,648
Federal Natl Mtg Assn Remic Tr
16,233
15,624
–
–
–
370,326
Federal Natl Mtg Assn
369,458
369,420
–
–
–
374,420
Federal Natl Mtg Assn Gtd
375,590
373,060
–
–
–
638,399
Federal Home Ln Mtg Corp
644,783
642,269
–
–
–
295,349
Federal Natl Mtg Assn
296,780
295,058
–
–
–
374,786
Federal Natl Mtg Assn Remic
372,443
371,129
–
–
–
35,021
Federal Home Ln Mtg Corp
35,448
34,911
–
–
–
346,508
Federal Natl Mtg Assn
344,776
343,359
–
–
–
268,528
Federal Home Ln Mtg Corp
262,570
264,133
–
–
–
626,673
Federal Home Ln Mtg Corp
629,023
627,193
–
–
–
473,569
Federal Home Ln Mtg Corp
475,789
473,916
–
–
–
381,920
First Horizon Mtg Passthru Tr
385,143
380,224
–
–
–
356,717
ABN Amro Mtg Corp
359,727
354,059
–
–
–
92,360
Banc Amer Mtg Secs Inc
92,518
91,559
–
–
–
500,000
Banc Amer Mtg Secs Inc
498,516
494,919
–
–
–
344,767
Banc Amer Mtg Secs Inc
346,922
342,183
–
–
–
142,020
CWALT Inc
141,398
142,020
–
–
–
275,429
CWALT Inc
276,806
273,511
–
–
–
42
Target Corporation 401(k) Plan
EIN: 41-0215170
Plan #002
Schedule H, Line 4i – Schedule of Assets (Held at End of Year) (continued)
Face Amount
Contract
Amount or
Issuer
Investments
Wrapper
Adjustment
Number of
Identity of Issue and
Moody’s/
at Fair
Contract at
to Contract
Contract
Shares/Units
Description of Investment
S&P Rating
Cost
Value
Fair Value
Value
Value
SYNTHETIC GUARANTEED INVESTMENT CONTRACTS (continued)
242,732
CWALT Inc
$ 245,235
$ 242,070
$ –
$ –
$ –
445,375
CWALT Inc
436,328
436,450
–
–
–
5,471
CWMBS Inc
5,500
5,453
–
–
–
500,000
CWMBS Inc
503,359
499,662
–
–
–
494,228
CWMBS Inc
486,738
488,473
–
–
–
145,148
Citicorp Mtg Secs Inc
147,054
144,770
–
–
–
499,963
Citicorp Mtg Secs Inc
495,744
493,178
–
–
–
5,437
Citicorp Mtg Secs Inc
5,294
5,346
–
–
–
401,781
Citigroup Mtg Ln Tr
398,265
398,678
–
–
–
48,683
Credit Suisse First Boston Sec
49,490
48,619
–
–
–
321,130
Credit Suisse First Boston Mtg
322,736
319,189
–
–
–
104,989
GMACM Mtg Ln Tr
107,449
104,021
–
–
–
374,652
GMACM Home Equity Ln Tr
369,852
370,555
–
–
–
283,903
GS Mtg Secs Corp
281,596
278,435
–
–
–
330,000
GSR Mtg Ln Tr
336,712
330,047
–
–
–
231,923
GSR Mtg Ln Tr
239,062
232,973
–
–
–
190,385
GS Mtg Secs Corp
189,433
188,213
–
–
–
500,000
GS Mtg Secs Corp
498,047
493,125
–
–
–
672,626
Government Ntl Mtg Assn Gtd
660,645
665,364
–
–
–
289,690
Indymac MBS Inc
283,489
283,726
–
–
–
43
Target Corporation 401(k) Plan
EIN: 41-0215170
Plan #002
Schedule H, Line 4i – Schedule of Assets (Held at End of Year) (continued)
Face Amount
Contract

Amount or Issuer Investments Wrapper AdjustmentNumber of
Identity of Issue and
Moody’s/
at Fair
Contract at
to Contract
Contract
Shares/Units
Description of Investment
S&P Rating
Cost
Value
Fair Value
Value
Value
SYNTHETIC GUARANTEED INVESTMENT CONTRACTS (continued)
504,700
Indymac MBS Inc
$ 509,393
$ 500,294
$ –
$ –
$ –
212,884
Indymac MBS Inc
213,383
211,930
–
–
–
320,160
Mastr Asset Securitization Tr
318,259
319,501
–
–
–
250,822
Mastr Alternative Ln Tr
249,802
245,303
–
–
–
261,073
Merrill Lynch Mtg Invs Inc
258,136
259,119
–
–
–
752,670
Morgan Stanley Mtge Ln Trust
748,588
744,217
–
–
–
550,000
Popular ABS Inc
539,430
544,156
–
–
–
182,047
Residential Accredit Lns Inc
184,067
181,595
–
–
–
662,593
Residential Accredit Lns Inc
668,650
657,941
–
–
–
289,241
Residential Accredit Lns Inc
290,913
285,816
–
–
–
281,010
Sequoia Mtg Tr
286,367
281,010
–
–
–
358,572
Structured Asset Secs Corp
359,356
358,000
–
–
–
54,492
Structured Asset Secs Corp
54,713
54,244
–
–
–
384,001
Structured Asset Secs Corp
385,321
381,425
–
–
–
232,673
Structured Asset Secs Corp
231,037
231,473
–
–
–
243,205
WAMU Mtg Pass Through Ctfs
239,709
241,590
–
–
–
355,235
WAMU Mtg Pass Through Ctfs
354,791
352,840
–
–
–
274,370
WAMU Mtg
275,870
273,097
–
–
–
47,928
WAMU Mtg Pass Through Ctfs
48,774
47,717
–
–
–
316,332
WAMU Mtg Pass Through Ctfs
314,453
311,593
–
–
–
44
Target Corporation 401(k) Plan
EIN: 41-0215170
Plan #002
Schedule H, Line 4i – Schedule of Assets (Held at End of Year) (continued)
Face Amount
Contract
Amount or
Issuer
Investments
Wrapper
Adjustment
Number of
Identity of Issue and
Moody’s/
at Fair
Contract at
to Contract
Contract
Shares/Units
Description of Investment
S&P Rating
Cost
Value
Fair Value
Value
Value
SYNTHETIC GUARANTEED INVESTMENT CONTRACTS (continued)
162,207
Wells Fargo Mtg Backed Secs
$ 162,461
$ 161,635
$ –
$ –
$ –
339,000
SLM Corp Medium Term NTS
343,129
329,566
–
–
–
37,732
CWMBS Inc
37,767
37,632
–
–
–
284,344
Fed Hm Ln Pc Pool 1B1793
287,721
284,024
–
–
–
288,276
Fed Hm Ln Pc Pool 1B2023
291,519
287,632
–
–
–
344,792
Fed Hm Ln Pc Pool 847375
354,058
345,960
–
–
–
399,183
Fed Hm Ln Pc Pool 847527
397,686
400,980
–
–
–
158,816
Fed Hm Ln Pc Pool M80739
163,530
159,634
–
–
–
284,838
Federal Home Ln Mtg Corp
286,529
284,934
–
–
–
468,246
Federal Home Ln Mtg Corp
473,148
470,382
–
–
–
466,238
Federal Home Ln Mtg Corp
467,185
468,387
–
–
–
85,407
Federal Home Ln Mtg Corp
86,648
85,486
–
–
–
20,498
Federal Home Ln Mtg Corp
20,690
20,461
–
–
–
85,835
Fed Hm Ln Pc Pool 780369
86,774
87,140
–
–
–
367,966
Fed Hm Ln Pc Pool 420045
372,336
367,159
–
–
–
250,111
Fed Hm Ln Pc Pool 780967
249,173
250,824
–
–
–
373,206
Federal Natl Mtg Assn
378,046
375,960
–
–
–
323,011
Federal Home Ln Mtg Corp
323,163
321,462
–
–
–
151,189
Federal Home Ln Mtg Corp
151,661
150,912
–
–
–
644,147
Federal Home Ln Mtg Corp
641,191
639,877
–
–
–
45
Target Corporation 401(k) Plan
EIN: 41-0215170
Plan #002
Schedule H, Line 4i – Schedule of Assets (Held at End of Year) (continued)
Face Amount
Contract
Amount or
Issuer
Investments
Wrapper
Adjustment
Number of
Identity of Issue and
Moody’s/
at Fair
Contract at
to Contract
Contract
Shares/Units
Description of Investment
S&P Rating
Cost
Value
Fair Value
Value
Value
SYNTHETIC GUARANTEED INVESTMENT CONTRACTS (continued)
355,269
Federal Home Ln Mtg Corp
$ 354,047
$ 353,345
$ –
$ –
$ –
60,625
Federal Home Ln Mtg Corp Multi
61,250
59,883
–
–
–
135,362
Federal Home Ln Mtg Corp
136,335
134,440
–
–
–
116,973
Federal Home Ln Mtg Corp
117,485
115,796
–
–
–
27,255
Federal Home Ln Mtg Corp
27,715
27,017
–
–
–
183,951
Federal Home Ln Mtg Corp
184,612
182,899
–
–
–
554,887
Federal Home Ln Mtg Corp
539,107
533,980
–
–
–
325,867
Federal Home Ln Mtg Corp
323,728
320,791
–
–
–
197,139
Federal Home Ln Mtg Corp
197,640
196,459
–
–
–
30,798
Federal Home Ln Mtg Corp
31,001
30,704
–
–
–
84,502
Federal Home Ln Mtg Corp
84,225
84,234
–
–
–
200,859
Federal Home Ln Mtg Corp
202,962
198,124
–
–
–
402,803
Federal Home Ln Mtg Corp
400,286
398,013
–
–
–
52,164
Federal Home Ln Mtg Corp
51,642
51,952
–
–
–
200,340
Federal Home Ln Mtg Corp
205,035
198,841
–
–
–
475,000
Federal Home Ln Mtg Corp
466,613
467,758
–
–
–
600,000
Federal Home Ln Mtg Corp
589,125
589,498
–
–
–
255,273
Federal Home Ln Mtg Corp
251,842
253,798
–
–
–
503,877
Federal Home Ln Mtg Corp Multi
503,877
499,901
–
–
–

512,498 Federal Home Ln Mtg Corp 498,164 498,323 – – –
46
Target Corporation 401(k) Plan
EIN: 41-0215170
Plan #002
Schedule H, Line 4i – Schedule of Assets (Held at End of Year) (continued)
Face Amount
Contract
Amount or
Issuer
Investments
Wrapper
Adjustment
Number of
Identity of Issue and
Moody’s/
at Fair
Contract at
to Contract
Contract
Shares/Units
Description of Investment
S&P Rating
Cost
Value
Fair Value
Value
Value
SYNTHETIC GUARANTEED INVESTMENT CONTRACTS (continued)
601,199
Federal Home Ln Mtg Corp
$ 591,054
$ 592,145
$ –
$ –
$ –
151,307
Federal Home Ln Mtg Corp
152,678
151,256
–
–
–
121,796
Federal Natl Mtg Assn Gtd
122,253
121,290
–
–
–
135,566
FNMA Pool 066181
136,413
135,190
–
–
–
261,531
FNMA Pool 142407
267,742
262,323
–
–
–
225,523
FNMA Pool 198164
229,469
223,042
–
–
–
318,477
FNMA Pool 338457
317,432
318,402
–
–
–
136,644
FNMA Pool 594233
140,529
139,495
–
–
–
130,242
FNMA Pool 604921
133,946
130,900
–
–
–
184,815
FNMA Pool 609912
190,475
186,171
–
–
–
567,449
FNMA Pool 657210
570,020
578,229
–
–
–
145,778
FNMA Pool 6665084
150,562
148,277
–
–
–
184,518
Federal Natl Mtg Assn Gtd
188,208
184,961
–
–
–
388,060
Federal Natl Mtg Assn
388,666
383,813
–
–
–
279,085
Federal Natl Mtg Assn
277,516
275,652
–
–
–
390,720
Federal Natl Mtg Assn
389,865
388,221
–
–
–
443,096
Federal Natl Mtg Assn
441,988
438,332
–
–
–
234,806
Federal Natl Mtg Assn
232,971
231,100
–
–
–
477,228
Federal Natl Mtg Assn
479,241
477,735
–
–
–
218,172
Federal Natl Mtg Assn Remic
221,990
218,314
–
–
–
47
Target Corporation 401(k) Plan
EIN: 41-0215170
Plan #002
Schedule H, Line 4i – Schedule of Assets (Held at End of Year) (continued)
Face Amount
Contract
Amount or
Issuer
Investments
Wrapper
Adjustment
Number of
Identity of Issue and
Moody’s/
at Fair
Contract at
to Contract
Contract
Shares/Units
Description of Investment
S&P Rating
Cost
Value
Fair Value
Value
Value
SYNTHETIC GUARANTEED INVESTMENT CONTRACTS (continued)
596,283
FNMA Remic Trust
$ 592,090
$ 587,952
$ –
$ –
$ –
964,664
FNMA Remic Trust
965,482
965,944
–
–
–
253,767
Federal Natl Mtg Assn Gtd
254,402
252,398
–
–
–
192,610
Federal Natl Mortgage Assoc
193,536
190,573
–
–
–
673,263
Federal Natl Mtg Assn
655,169
660,344
–
–
–
435,000
Federal Natl Mtg Assn Gtd Remi
432,213
429,614
–
–
–
405,143
Federal Natl Mtg Assn
391,596
397,179
–
–
–
317,554
Federal Natl Mtg Assn
315,570
312,667
–
–
–
440,724
Federal Natl Mtg Assn
439,347
440,315
–
–
–
377,801
Fed Ntl Mtg Assn Gtd Remic Pas
378,509
378,032
–
–
–
381,662
Federal Natl Mtg Assn
383,690
383,947
–
–
–
63,751
FNMA Pool 711466
64,707
65,611
–
–
–
187,130
FNMA Pool 723661
190,143
189,919
–
–
–
139,974
FNMA Pool 725054
144,129
142,485
–
–
–
183,470
FNMA Pool 725741
187,828
185,184
–
–
–
401,454
FNMA Pool 735785
403,085
402,550
–
–
–
395,855
FNMA Pool 745481
398,205
400,874
–
–
–
83,853
FNMA Pool 763194
86,657
85,456
–
–
–
328,813
Government Natl Mtg Assn Gtd
328,659
324,040
–
–
–
562,562
Government Natl Mtg Assn Gtd
565,023
561,255
–
–
–
48
Target Corporation 401(k) Plan
EIN: 41-0215170
Plan #002
Schedule H, Line 4i – Schedule of Assets (Held at End of Year) (continued)
Face Amount
Contract
Amount or
Issuer
Investments
Wrapper
Adjustment
Number of
Identity of Issue and
Moody’s/
at Fair
Contract at
to Contract
Contract
Shares/Units
Description of Investment
S&P Rating
Cost
Value
Fair Value
Value
Value
SYNTHETIC GUARANTEED INVESTMENT CONTRACTS (continued)

410,499 General Natl Mtg Assn $ 398,954 $ 400,123 $ – $ – $ –270,712
General Natl Mtg Assn
263,944
262,550
–
–
–
257,522
Government Natl Mtg Assn Gtd
254,866
254,706
–
–
–
179,014
Nationslink Fdg Corp
182,930
179,705
–
–
–
6,843,873
State Street Bank & Trust Co
6,843,873
6,843,873
–
–
–
235,000
Suntrust Bk Atlanta GA
235,000
235,000
–
–
–
475,000
Deutsche Bk Ag
475,000
475,000
–
–
–
1,750,000
HSBC Bk USA Instl
1,750,000
1,750,000
–
–
–
410,000
Federal Natl Mtg Assn
401,355
412,344
–
–
–
2,175,000
Federal Natl Mtg Assn Mtn
2,152,091
2,170,324
–
–
–
955,062
Small Business Admin Partn Ctf
955,062
929,696
–
–
–
1,975,000
BMW Veh Owner Tr 2006 A
1,974,967
1,973,149
–
–
–
1,425,000
Ford Cr Auto Owner Tr
1,418,821
1,422,106
–
–
–
1,900,000
Ford Cr Auto Owner Tr
1,899,636
1,899,407
–
–
–
2,175,000
Citibank Cr Card Issuance Tr
2,170,389
2,108,051
–
–
–
1,725,000
MBNA Cr Card Master Nt Tr
1,723,539
1,712,602
–
–
–
759,357
Ace Secs Corp Home Equity Ln T
759,446
759,357
–
–
–
1,117,762
Ameriquest Mtg Secs Inc
1,120,556
1,119,683
–
–
–
2,150,000
BA Cr Card Tr
2,149,947
2,125,477
–
–
–
568,708
CWABS Inc
568,708
568,797
–
–
–
49
Target Corporation 401(k) Plan
EIN: 41-0215170
Plan #002
Schedule H, Line 4i – Schedule of Assets (Held at End of Year) (continued)
Face Amount
Contract
Amount or
Issuer
Investments
Wrapper
Adjustment
Number of
Identity of Issue and
Moody’s/
at Fair
Contract at
to Contract
Contract
Shares/Units
Description of Investment
S&P Rating
Cost
Value
Fair Value
Value
Value
SYNTHETIC GUARANTEED INVESTMENT CONTRACTS (continued)
1,625,000
Chase Issuance Tr
$ 1,624,716
$ 1,599,102
$ –
$ –
$ –
2,000,000
Citibank Cr Card Issuance Tr
1,999,440
1,997,500
–
–
–
1,925,000
Citibank Cr Card Issuance Tr
1,923,903
1,898,832
–
–
–
1,700,000
Citibank Cr Card Issuance Tr
1,699,524
1,691,500
–
–
–
615,524
Massachusetts Rrb Spl Purp Tr
624,134
619,275
–
–
–
179,031
Money Store SBA Loan Backed Tr
179,002
177,898
–
–
–
106,386
Money Store Buis Ln Bckd Ctfs
106,386
106,505
–
–
–
662,055
Morgan Stanley Abs Cap I
662,158
662,158
–
–
–
616,655
Peco Energy Trans Tr
643,368
617,441
–
–
–
1,080,854
Residential Asset Mtg Prods
1,080,854
1,081,023
–
–
–
318,245
Residential Asset Mtg Prods
318,245
318,245
–
–
–
717,922
SLM Student Ln Tr
717,922
718,034
–
–
–
1,675,000
SLM Student Ln Tr
1,675,000
1,675,524
–
–
–
590,653
Structured Asset Secs Corp
564,756
544,139
–
–
–
847,058
Structured Asset Secs Corp
841,929
776,726
–
–
–
1,500,000
Wachovia Auto Owner Trust
1,499,952
1,500,000
–
–
–
1,619,711
Wells Fargo Tr
1,585,229
1,583,278
–
–
–
1,275,000
Banc Amer Coml Mtg Inc
1,316,438
1,284,102
–
–
–
1,835,000
Banc Amer Coml Mtg Inc
1,832,420
1,822,323
–
–
–
65,869
Capco Amer Securitization Corp
66,366
65,807
–
–
–
50
Target Corporation 401(k) Plan
EIN: 41-0215170
Plan #002
Schedule H, Line 4i – Schedule of Assets (Held at End of Year) (continued)
Face Amount
Contract
Amount or
Issuer
Investments
Wrapper
Adjustment
Number of
Identity of Issue and
Moody’s/
at Fair
Contract at
to Contract
Contract
Shares/Units
Description of Investment
S&P Rating
Cost
Value
Fair Value
Value
Value
SYNTHETIC GUARANTEED INVESTMENT CONTRACTS (continued)
1,367,589
Comm
$ 1,471,334
$ 1,436,226
$ –
$ –
$ –
669,786
Commerical Mtg Accep Corp
700,188
672,339
–
–
–
1,255,000
Credit Suisse First Boston Mtg
1,300,690
1,316,166
–
–
–
1,280,000
Credit Suisse First Boston Mtg
1,267,700
1,297,084
–
–
–
1,440,000
Credit Suise First Boston Mtg
1,410,750
1,431,160
–
–
–
1,540,000
Credit Suisse First Boston Mtg
1,541,444
1,511,794
–
–
–
854,863
DLJ Coml Mtg Corp
965,026
898,901
–
–
–
1,750,000
First Un Natl Bk Coml Mtg Tr
1,890,137
1,821,777
–
–
–
1,640,488
First Un Natl Bk Chase
1,760,962
1,677,741
–
–
–
518,840
GMAC Coml Mtg Sec Inc
596,058
534,199
–
–
–
846,045
GMAC Coml Mtg Sec Inc
946,579
877,964
–
–
–
995,094
GMAC Coml Mtg Sec Inc
1,142,648
1,053,247
–
–
–
880,000
GMAC Coml Mtg Sec Inc
1,003,406
928,196
–
–
–
1,384,244
GS Mtg Secs Corp II
1,469,570
1,391,390
–
–
–
1,425,379
J P Morgan Chase Coml Mtg Secs
1,593,918
1,469,455
–
–
–
1,210,000
J P Morgan Chase Coml Mtg Secs
1,277,921
1,237,999
–
–
–
1,050,000
J P Morgan Chase Coml Mtg Secs
1,140,357
1,099,996
–
–
–
44,876
LB Coml Conduit Mtg Tr
48,900
44,966
–
–
–
1,085,000
LN Coml Conduit Mtg Tr
1,243,130
1,128,761
–
–
–
1,030,000
LB UBS Coml Mtg Tr
1,056,917
1,005,225
–
–
–
51

Target Corporation 401(k) Plan
EIN: 41-0215170
Plan #002
Schedule H, Line 4i – Schedule of Assets (Held at End of Year) (continued)
Face Amount
Contract
Amount or
Issuer
Investments
Wrapper
Adjustment
Number of
Identity of Issue and
Moody’s/
at Fair
Contract at
to Contract
Contract
Shares/Units
Description of Investment
S&P Rating
Cost
Value
Fair Value
Value
Value
SYNTHETIC GUARANTEED INVESTMENT CONTRACTS (continued)
2,475,000
Federal National Mortgage Asso
$ 550,301
$ 591,575
$ –
$ –
$ –
1,122,779
Banc Of America Comm Mtg Inc
1,246,373
1,166,061
–
–
–
1,180,000
Banc Amer Coml Mtg Inc
1,151,238
1,138,859
–
–
–
424,960
Banc Amer Alternative Ln Tr
428,346
418,926
–
–
–
537,407
Banc Amer Alternative Ln Tr
537,743
524,946
–
–
–
1,497,706
Bear Stearns Arm Tr
1,486,474
1,463,202
–
–
–
997,101
Bear Stearns Alt A Tr
997,101
999,731
–
–
–
22,767
CWABS Inc
22,767
22,765
–
–
–
339,434
CWMBS Inc
339,434
339,842
–
–
–
371,346
Citigroup Coml Mtg Tr
370,012
364,624
–
–
–
1,525,000
Daimlerchrysler Auto Tr
1,524,788
1,526,191
–
–
–
26,600,194
GS Mtg Secs Corp II
1,240,650
460,037
–
–
–
575,000
GS Mtg Secs Corp II
580,711
552,910
–
–
–
1,060,000
GS Mtg Secs Tr
1,065,300
1,074,623
–
–
–
375,000
Greenwich Cap Coml Fdg Corp
376,863
369,629
–
–
–
1,939,508
J P Morgan Mtg Tr
1,886,384
1,896,412
–
–
–
1,130,000
LB UBS
1,134,739
1,130,599
–
–
–
1,439,536
LB UBS Coml Mtg Tr
1,410,295
1,387,735
–
–
–
1,160,000
Morgan Stanley Cap I Tr
1,166,297
1,156,794
–
–
–
1,224,447
Opteum Mtg Accep Corp
1,224,202
1,224,542
–
–
–
52
Target Corporation 401(k) Plan
EIN: 41-0215170
Plan #002
Schedule H, Line 4i – Schedule of Assets (Held at End of Year) (continued)
Face Amount
Contract
Amount or
Issuer
Investments
Wrapper
Adjustment
Number of
Identity of Issue and
Moody’s/
at Fair
Contract at
to Contract
Contract
Shares/Units
Description of Investment
S&P Rating
Cost
Value
Fair Value
Value
Value
SYNTHETIC GUARANTEED INVESTMENT CONTRACTS (continued)
311,593
Structured Adj Rate Mtg Ln Tr
$ 311,155
$ 311,934
$ –
$ –
$ –
863,941
Structured Asset Investment Lo
863,941
863,941
–
–
–
1,530,000
Teachers Ins & Annuity Assn Am
1,581,757
1,574,663
–
–
–
1,975,000
USAA Auto Owner Tr
1,974,979
1,976,853
–
–
–
1,100,000
Wachovia Bk Coml Mtg Tr
1,105,498
1,115,279
–
–
–
1,275,000
Wachovia Bk Coml Mtg Tr
1,281,307
1,267,977
–
–
–
250,000
American Elec Pwr Inc
251,835
248,693
–
–
–
325,000
DTE Energy Co
330,272
325,030
–
–
–
95,000
Dominion Res Inc Del
110,794
104,246
–
–
–
25,000
Dominion Res Inc Del
24,888
24,818
–
–
–
550,000
Nisource Fin Corp
550,000
550,165
–
–
–
570,000
Oneok Inc New
573,317
569,540
–
–
–
325,000
SP Powerassets Ltd Global
324,854
314,943
–
–
–
575,000
Scottish Power Plc
575,227
565,105
–
–
–
355,000
Virginia Elec & Pwr Co Mtn
389,254
357,542
–
–
–
45,000
ASIF Global Fing XXIII
45,522
43,864
–
–
–
325,000
Allstate Finl Global Fdg LLC
331,279
325,025
–
–
–
220,000
Archstone Smith Tr
219,347
219,275
–
–
–
280,000
ASIF Global Fing XVIII
279,644
275,975
–
–
–
50,000
BAC Cap Tr XI
49,926
53,839
–
–
–
53
Target Corporation 401(k) Plan
EIN: 41-0215170
Plan #002
Schedule H, Line 4i – Schedule of Assets (Held at End of Year) (continued)
Face Amount
Contract
Amount or
Issuer
Investments
Wrapper
Adjustment
Number of
Identity of Issue and
Moody’s/
at Fair
Contract at
to Contract
Contract
Shares/Units
Description of Investment
S&P Rating
Cost
Value
Fair Value
Value
Value
SYNTHETIC GUARANTEED INVESTMENT CONTRACTS (continued)
210,000
Bank Of America
$ 245,659
$ 225,611
$ –
$ –
$ –
500,000
Bank Amer Corp
498,183
488,464
–
–
–
250,000
Bank New York N Y
248,598
246,029
–
–
–
200,000
Bank One N A Chicago IL Mtn
199,556
196,752
–
–
–
525,000
Bear Stearns Cos Inc
502,677
503,112
–
–
–
610,000
Berkshire Hathaway Fin Corp
609,231
591,089
–
–
–

675,000 Chubb Corp 679,259 672,075 – – –440,000
Citigroup Inc
481,061
448,914
–
–
–
185,000
Citigroup Inc
190,321
181,653
–
–
–
995,000
Citigroup Inc
987,433
963,004
–
–
–
390,000
Citicorp Mtg Secs Inc
390,371
398,096
–
–
–
1,095,000
Eksportfinans A Sa Mtn
1,091,857
1,075,272
–
–
–
700,000
General Elec Cap Corp Mtn
699,587
692,254
–
–
–
150,000
General Elec Cap Corp Mtn
149,852
148,550
–
–
–
590,000
General Elec Cap Corp Mtn
577,291
566,100
–
–
–
2,015,000
General Elec Cap Corp Mtn
2,014,704
2,017,639
–
–
–
835,000
General Elec Cap Corp Mtn
835,785
824,442
–
–
–
535,000
General Elec Cap Corp Mtn
533,898
529,438
–
–
–
75,000
Household Fin Corp
83,326
75,032
–
–
–
875,000
Landeskreditbank Baden
873,443
851,828
–
–
–
54
Target Corporation 401(k) Plan
EIN: 41-0215170
Plan #002
Schedule H, Line 4i – Schedule of Assets (Held at End of Year) (continued)
Face Amount
Contract
Amount or
Issuer
Investments
Wrapper
Adjustment
Number of
Identity of Issue and
Moody’s/
at Fair
Contract at
to Contract
Contract
Shares/Units
Description of Investment
S&P Rating
Cost
Value
Fair Value
Value
Value
SYNTHETIC GUARANTEED INVESTMENT CONTRACTS (continued)
450,000
Lehman Brothers Hldgs Inc
$ 449,384
$ 452,654
$ –
$ –
$ –
450,000
Lehman Brothers Hldgs Inc
448,691
457,749
–
–
–
350,000
Massmutual Global Fgd II Mtn
335,776
335,426
–
–
–
190,000
Metropolitan Life Global Mtn
189,905
185,405
–
–
–
350,000
Morgan J P & Co Inc
359,765
362,648
–
–
–
100,000
Morgan Stanley Group Inc
106,957
105,225
–
–
–
1,990,000
Morgan Stanley Group Inc
1,990,000
1,991,087
–
–
–
200,000
Morgan Stanley
199,596
202,116
–
–
–
415,000
Morgan Stanley
413,509
410,385
–
–
–
500,000
Nationwide Bldg Soc Mt Sr 144A
499,145
494,217
–
–
–
470,000
New York Life Global Fdg Mtn
476,345
459,067
–
–
–
195,000
Principal Life Global Fdg I Gl
194,571
190,256
–
–
–
750,000
Prudential Fdg Corp Mtn 144A
749,130
760,970
–
–
–
200,000
Salomon Inc
222,584
202,709
–
–
–
320,000
Suntrust Bks Inc
319,446
315,753
–
–
–
215,000
Suntrust Bks Inc
216,950
210,449
–
–
–
135,000
TIAA Global Mkts Inc
133,983
132,821
–
–
–
375,000
US Bk Natl Assn Cincinnati
368,344
374,234
–
–
–
605,000
US Bk Natl Assn Cincinnati OH
606,095
601,598
–
–
–
475,000
U S Cent Cr Un
469,617
459,297
–
–
–
55
Target Corporation 401(k) Plan
EIN: 41-0215170
Plan #002
Schedule H, Line 4i – Schedule of Assets (Held at End of Year) (continued)
Face Amount
Contract
Amount or
Issuer
Investments
Wrapper
Adjustment
Number of
Identity of Issue and
Moody’s/
at Fair
Contract at
to Contract
Contract
Shares/Units
Description of Investment
S&P Rating
Cost
Value
Fair Value
Value
Value
SYNTHETIC GUARANTEED INVESTMENT CONTRACTS (continued)
35,000
U S Bancorp Mtn Bk Ent
$ 34,978
$ 34,699
$ –
$ –
$ –
10,000
Wachovia Bk Natl Assn Medium
9,971
9,872
–
–
–
150,000
Wells Fargo & Co New
147,546
145,868
–
–
–
490,000
Wells Fargo & Co New
489,069
480,786
–
–
–
180,000
Wells Fargo & Co New
179,905
177,836
–
–
–
10,000
AOL Time Warner Inc
10,986
10,448
–
–
–
800,000
AT&T Broadband Corp
959,375
910,925
–
–
–
460,000
Abbott Labs
459,701
466,780
–
–
–
500,000
Anadarko Pete Corp
497,885
499,302
–
–
–
425,000
Cable & Wireless Optus Fin
420,580
458,229
–
–
–
245,000
Comcast Cable Communications
266,611
255,968
–
–
–
700,000
Daimlerchrysler Nth Amer Hldg
695,079
697,500
–
–
–
275,000
Daimler Chrysler North Amer Hl
276,045
272,173
–
–
–
90,000
Federated Dept Stores Inc Del
97,294
91,194
–
–
–
550,000
Federated Retail Hldgs Inc
549,626
547,968
–
–
–
275,000
Halliburton Co
281,353
276,781
–
–
–
475,000
Jones Intercable Inc
529,896
487,528
–
–
–
270,000
Merck & Co Inc
263,488
268,206
–
–
–
950,000
Oracle Corp / Ozark Hldg Inc
946,552
937,403
–
–
–
15,000
SBC Communications Inc
15,990
15,284
–
–
–
56
Target Corporation 401(k) Plan
EIN: 41-0215170

Plan #002
Schedule H, Line 4i – Schedule of Assets (Held at End of Year) (continued)
Face Amount
Contract
Amount or
Issuer
Investments
Wrapper
Adjustment
Number of
Identity of Issue and
Moody’s/
at Fair
Contract at
to Contract
Contract
Shares/Units
Description of Investment
S&P Rating
Cost
Value
Fair Value
Value
Value
SYNTHETIC GUARANTEED INVESTMENT CONTRACTS (continued)
205,000
TCI Communications Inc
$ 263,310
$ 239,672
$ –
$ –
$ –
50,000
Tele Communications Inc
57,732
54,893
–
–
–
65,000
Telefonica Europe Bv
77,381
69,721
–
–
–
145,000
Turner Broadcasting Sys Inc
133,400
165,598
–
–
–
415,000
Tyco Intl Group S A
428,530
433,360
–
–
–
325,000
Union Pac Corp
341,036
329,393
–
–
–
700,000
United Health Group Inc
698,880
695,574
–
–
–
765,000
Verizon New Jersey Inc
831,616
769,897
–
–
–
675,000
Vodafone Airtouch Plc
770,960
719,326
–
–
–
30,000
Vodafone Group Plc
29,303
28,871
–
–
–
475,000
Wellpoint Inc
474,207
468,193
–
–
–
600,000
SBC Communications Inc
597,443
596,730
–
–
–
900,000
Vodafone Group Plc New
899,298
900,092
–
–
–
(800,000) FHLMC TBA Jan 15 Gold Single
(776,938) (770,875) –
–
–
5,300,000
FHLMC TBA Jan 15 Gold Single
5,238,512
5,205,594
–
–
–
5,000,000
FHLMC TBA Jan 30 Gold Single
4,896,875
4,824,219
–
–
–
1,000,000
FHLMC TBA Jan 30 Gold Single
997,266
988,828
–
–
–
1,000,000
FHLMC TBA Jan 30 Gold Single
1,012,031
1,007,188
–
–
–
8,812
Fed Hm Ln Pc Pool E75562
8,959
8,928
–
–
–
16,102
Fed Hm Ln Pc Pool E75957
16,371
16,315
–
–
–
57
Target Corporation 401(k) Plan
EIN: 41-0215170
Plan #002
Schedule H, Line 4i – Schedule of Assets (Held at End of Year) (continued)
Face Amount
Contract
Amount or
Issuer
Investments
Wrapper
Adjustment
Number of
Identity of Issue and
Moody’s/
at Fair
Contract at
to Contract
Contract
Shares/Units
Description of Investment
S&P Rating
Cost
Value
Fair Value
Value
Value
SYNTHETIC GUARANTEED INVESTMENT CONTRACTS (continued)
10,514
Fed Hm Ln Pc Pool E7599
$ 10,690
$ 10,654
$ –
$ –
$ –
25,593
Fed Hm Ln Pc Pool E76081
26,021
25,932
–
–
–
7,349
Fed Hm Ln Pc Pool E76089
7,472
7,447
–
–
–
2,735
Fed Hm Ln Pc Pool E84024
2,721
2,776
–
–
–
211,574
Fed Hm Ln Pc Pool E88189
219,706
214,772
–
–
–
220,473
Fed Hm Ln Pc Pool E89360
228,947
223,668
–
–
–
69,515
Fed Hm Ln Pc Pool E90215
72,187
70,523
–
–
–
262,604
Fed Hm Ln Pc Pool E90239
267,835
266,574
–
–
–
39,779
Fed Hm Ln Pc Pool E90563
41,308
40,355
–
–
–
217,779
Fed Hm Ln Pc Pool E92215
224,338
218,068
–
–
–
12,288
Fed Hm Ln Pc Pool E73202
12,012
12,330
–
–
–
183,728
Fed Hm Ln Pc Pool E73259
179,594
184,384
–
–
–
49,706
Fed Hm Ln Pc Pool E95510
51,027
49,772
–
–
–
44,495
Fed Hm Ln Pc Pool E98590
45,273
42,975
–
–
–
894,897
Fed Hm Ln Pc Pool 1B1580
912,900
875,564
–
–
–
384,049
Fed Hm Ln Pc Pool G18047
379,128
370,337
–
–
–
1,551,760
Fed Hm Ln Pc Pool 1L1302
1,540,849
1,546,814
–
–
–
42,361
Fed Hm Ln Pc Pool G01324
44,432
43,787
–
–
–
171,469
Fed Hm Ln Pc Pool G01391
179,788
177,028
–
–
–
203,408
Fed Hm Ln Pc Pool G01564
210,202
205,919
–
–
–
58
Target Corporation 401(k) Plan
EIN: 41-0215170
Plan #002
Schedule H, Line 4i – Schedule of Assets (Held at End of Year) (continued)
Face Amount
Contract
Amount or
Issuer
Investments
Wrapper
Adjustment
Number of
Identity of Issue and
Moody’s/
at Fair
Contract at
to Contract
Contract
Shares/Units
Description of Investment
S&P Rating
Cost
Value
Fair Value
Value
Value
SYNTHETIC GUARANTEED INVESTMENT CONTRACTS (continued)
249,542
Fed Hm Ln Pc Pool G11720
$ 245,955
$ 240,633
$ –
$ –
$ –
477,087
Fed Hm Ln Pc Pool G11742
480,591
468,999
–
–
–
168,459
Fed Hm Ln Pc Pool C66817
177,408
173,710
–
–
–
55,806
Fed Hm Ln Pc Pool C67714
58,514
57,546
–
–
–
294,948
Fed Hm Ln Pc Pool C00665
300,017
299,142
–
–
–
251,797
Fed Hm Ln Pc Pool C00680
256,125
255,377
–
–
–
546,156
Fed Hm Ln Pc Pool C01598
534,892
528,470
–
–
–
75,189
Fed Hm Ln Pc Pool E01157
77,045
76,279
–
–
–
172,435
Fed Hm Ln Pc Pool E01606
167,356
166,440
–
–
–
161,031
Fed Hm Ln Pc Pool E01641
159,170
155,433
–
–
–
534,736
Fed Hm Ln Pc Pool B13801
518,987
516,146
–
–
–
321,658
Fed Hm Ln Pc Pool B13870
312,184
310,475
–
–
–

375,701 Fed Hm Ln Pc Pool B15067 364,635 362,639 – – –289,378
Fed Hm Ln Pc Pool B17445
285,783
279,046
–
–
–
90,874
Fed Hm Ln Pc Pool B17949
89,653
87,629
–
–
–
770,112
Fed Hm Ln Pc Pool 781523
739,548
746,590
–
–
–
1,352,504
Federal Home Ln Mtg Corp
1,324,186
1,323,995
–
–
–
1,409,750
Federal Home Ln Mtg Corp
1,469,003
1,409,209
–
–
–
1,017,695
Federal Home Ln Mtg Corp
1,055,859
1,017,761
–
–
–
1,350,000
GHLMC
1,322,947
1,296,421
–
–
–
59
Target Corporation 401(k) Plan
EIN: 41-0215170
Plan #002
Schedule H, Line 4i – Schedule of Assets (Held at End of Year) (continued)
Face Amount
Contract
Amount or
Issuer
Investments
Wrapper
Adjustment
Number of
Identity of Issue and
Moody’s/
at Fair
Contract at
to Contract
Contract
Shares/Units
Description of Investment
S&P Rating
Cost
Value
Fair Value
Value
Value
SYNTHETIC GUARANTEED INVESTMENT CONTRACTS (continued)
2,212,480
Federal Home Ln Mtg Corp
$ 2,220,777
$ 2,215,359
$ –
$ –
$ –
4,004,196
Federal Home Ln Mtg Corp
3,970,724
3,986,579
–
–
–
1,000,000
FNMA TBA Jan 15 Single Fam
971,875
964,453
–
–
–
1,100,000
FNMA TBA Jan 30 Single Fam
1,044,484
1,030,219
–
–
–
(1,000,000) FNMA TBA Jan 30 Single Fam
(977,422) (965,313) –
–
–
14,600,000
FNMA TBA Jan 15 Single Fam
14,665,039
14,595,438
–
–
–
(13,000,000) FNMA TBA Jan 30 Single Fam
(12,904,063) (12,848,672) –
–
–
5,000,000
FNMA TBA Jan 30 Single Fam
4,969,844
4,941,797
–
–
–
2,000,000
FNMA TBA Jan 15 Single Fam
2,036,055
2,027,500
–
–
–
9,000,000
FNMA TBA Jan 30 Single Fam
9,095,625
9,060,469
–
–
–
1,700,000
FNMA TBA Jan 30 Single Fam
1,735,328
1,731,742
–
–
–
1,774,946
Federal Natl Mtg Assn
454,969
406,019
–
–
–
2,188,631
Federal Natl Mtg Assn
534,505
515,696
–
–
–
2,222,179
Federal Natl Mtg Assn
546,170
522,906
–
–
–
31,790
FNMA Pool 124676
31,586
31,954
–
–
–
52,272
FNMA Pool 252342
48,752
53,688
–
–
–
132,202
FNMA Pool 254371
135,486
132,584
–
–
–
564,400
FNMA Pool 254402
584,044
566,032
–
–
–
541,630
FNMA Pool 254836
530,459
514,570
–
–
–
231,431
FNMA Pool 255225
233,456
229,045
–
–
–
60
Target Corporation 401(k) Plan
EIN: 41-0215170
Plan #002
Schedule H, Line 4i – Schedule of Assets (Held at End of Year) (continued)
Face Amount
Contract
Amount or
Issuer
Investments
Wrapper
Adjustment
Number of
Identity of Issue and
Moody’s/
at Fair
Contract at
to Contract
Contract
Shares/Units
Description of Investment
S&P Rating
Cost
Value
Fair Value
Value
Value
SYNTHETIC GUARANTEED INVESTMENT CONTRACTS (continued)
193,174
FNMA Pool 256394
$ 196,706
$ 196,834
$ –
$ –
$ –
4,461
FNMA Pool 294334
4,414
4,503
–
–
–
5,945
FNMA Pool 300809
5,882
6,058
–
–
–
93,111
FNMA Pool 303906
92,122
94,841
–
–
–
43,980
FNMA Pool 323331
44,866
45,000
–
–
–
5,583
FNMA Pool 325041
5,523
5,684
–
–
–
3,195
FNMA Pool 327130
3,162
3,250
–
–
–
375,807
FNMA Pool 357327
376,453
370,669
–
–
–
34,644
FNMA Pool 449769
33,453
35,121
–
–
–
80,927
FNMA Pool 480538
77,564
81,107
–
–
–
18,974
FNMA Pool 516232
19,427
19,087
–
–
–
692
FNMA Pool 518113
710
717
–
–
–
50,436
FNMA Pool 535685
53,699
51,607
–
–
–
3,556
FNMA Pool 540042
3,509
3,685
–
–
–
51,650
FNMA Pool 545556
54,366
53,349
–
–
–
48,242
FNMA Pool 545762
50,573
49,367
–
–
–
283,052
FNMA Pool 545899
290,969
283,871
–
–
–
1,844
FNMA Pool 547432
1,820
1,911
–
–
–
32,709
FNMA Pool 555010
34,825
33,448
–
–
–
2,873,975
FNMA Pool 555531
2,852,870
2,847,930
–
–
–
61
Target Corporation 401(k) Plan
EIN: 41-0215170
Plan #002
Schedule H, Line 4i – Schedule of Assets (Held at End of Year) (continued)

Face Amount ContractAmount or
Issuer
Investments
Wrapper
Adjustment
Number of
Identity of Issue and
Moody’s/
at Fair
Contract at
to Contract
Contract
Shares/Units
Description of Investment
S&P Rating
Cost
Value
Fair Value
Value
Value
SYNTHETIC GUARANTEED INVESTMENT CONTRACTS (continued)
1,335,075
FNMA Pool 555745
$ 1,299,404
$ 1,290,642
$ –
$ –
$ –
357,534
FNMA Pool 555880
364,489
354,294
–
–
–
305,195
FNMA Pool 619195
324,937
312,276
–
–
–
261,453
FNMA Pool 625178
268,766
262,209
–
–
–
61,455
FNMA Pool 633410
61,359
62,888
–
–
–
130,217
FNMA Pool 637870
138,640
133,157
–
–
–
21,733
FNMA Pool 641781
21,689
21,796
–
–
–
3,063
FNMA Pool 643858
3,063
3,135
–
–
–
75,855
FNMA Pool 657776
80,596
77,568
–
–
–
274,205
FNMA Pool 673488
281,875
274,827
–
–
–
288,934
Federal Natl Mtg Assn
263,653
266,925
–
–
–
700,212
Federal Natl Mtg Assn
701,032
685,534
–
–
–
861,205
Federal Natl Mtg Assn
888,925
860,264
–
–
–
1,256,648
Federal Natl Mtg Assn
1,285,119
1,251,702
–
–
–
795,986
Federal Natl Mtg Assn
820,861
794,599
–
–
–
1,345,178
Federal Natl Mtg Assn Gtd Remi
1,335,510
1,329,925
–
–
–
77,443
FNMA Pool 684248
79,609
77,618
–
–
–
48,870
FNMA Pool 685106
50,237
48,927
–
–
–
304,153
FNMA Pool 695861
312,660
304,842
–
–
–
1,212,798
FNMA Pool 725162
1,238,333
1,224,168
–
–
–
62
Target Corporation 401(k) Plan
EIN: 41-0215170
Plan #002
Schedule H, Line 4i – Schedule of Assets (Held at End of Year) (continued)
Face Amount
Contract
Amount or
Issuer
Investments
Wrapper
Adjustment
Number of
Identity of Issue and
Moody’s/
at Fair
Contract at
to Contract
Contract
Shares/Units
Description of Investment
S&P Rating
Cost
Value
Fair Value
Value
Value
SYNTHETIC GUARANTEED INVESTMENT CONTRACTS (continued)
2,255,411
FNMA Pool 725206
$ 2,264,574
$ 2,234,971
$ –
$ –
$ –
967,888
FNMA Pool 725519
965,242
970,081
–
–
–
1,878,279
FNMA Pool 725709
1,728,311
1,771,893
–
–
–
1,491,035
FNMA Pool 725946
1,472,863
1,475,659
–
–
–
414,875
FNMA Pool 731512
412,282
408,944
–
–
–
486,072
FNMA Pool 735611
497,958
487,173
–
–
–
2,723,400
FNMA Pool 735649
2,731,166
2,752,336
–
–
–
3,555,970
FNMA Pool 735989
3,555,970
3,523,744
–
–
–
1,263,591
FNMA Pool 737493
1,218,181
1,232,738
–
–
–
1,729,574
FNMA Pool 745140
1,672,552
1,671,133
–
–
–
966,167
FNMA Pool 745193
963,525
968,356
–
–
–
2,755,167
FNMA Pool 745412
2,711,579
2,726,754
–
–
–
1,673,752
FNMA Pool 745734
1,618,374
1,649,822
–
–
–
1,037,394
FNMA Pool 745813
1,018,267
1,021,915
–
–
–
2,463,405
FNMA Pool 745832
2,483,420
2,501,030
–
–
–
631,140
FNMA Pool 746280
613,895
610,135
–
–
–
842,600
FNMA Pool 748088
806,789
820,286
–
–
–
33,315
FNMA Pool 751726
34,475
33,391
–
–
–
29,417
FNMA Pool 754198
30,441
29,484
–
–
–
174,618
FNMA Pool 766088
171,781
172,818
–
–
–
63
Target Corporation 401(k) Plan
EIN: 41-0215170
Plan #002
Schedule H, Line 4i – Schedule of Assets (Held at End of Year) (continued)
Face Amount
Contract
Amount or
Issuer
Investments
Wrapper
Adjustment
Number of
Identity of Issue and
Moody’s/
at Fair
Contract at
to Contract
Contract
Shares/Units
Description of Investment
S&P Rating
Cost
Value
Fair Value
Value
Value
SYNTHETIC GUARANTEED INVESTMENT CONTRACTS (continued)
1,070,674
FNMA Pool 766924
$ 1,082,009
$ 1,050,901
$ –
$ –
$ –
189,279
FNMA Pool 779270
186,056
187,327
–
–
–
257,058
FNMA Pool 828346
249,467
248,292
–
–
–
986,120
FNMA Pool 831735
1,002,068
1,004,803
–
–
–
928,594
FNMA Pool 893628
945,570
946,186
–
–
–
1,000,000
GNMA II TBA Jan 30 Single Fam
1,014,453
1,014,453
–
–
–
11,025
GNMA Pool 599756
11,671
11,403
–
–
–
210,960
GNMA Pool 604791
214,273
210,441
–
–
–
85,734
GNMA Pool 569326
88,708
87,265
–
–
–
3,274
GNMA Pool 445964
3,383
3,339
–
–
–
12,210
GNMA Pool 552620
12,924
12,648
–
–
–
8,375
GNMA Pool 781328
8,866
8,686
–
–
–
1,856
GNMA Pool 781548
1,956
1,923
–
–
–
115,425
GNMA Pool 781584
122,038
119,709
–
–
–
198,209
GS Mtg Secs Corp
198,209
198,457
–
–
–
30,953
Small Business Admin Partn Ctf
30,953
31,234
–
–
–
950,000
Port Auth NY NJ
949,098
937,175
–
–
–

290,000 Sales Tax Asset Receivable 290000 290,000 282,428 – – –510,000
Texas St Pub Fin Auth Rev
508,118
505,048
–
–
–
455,000
Wisconsin St Gen Rev
453,444
444,544
–
–
–
64
Target Corporation 401(k) Plan
EIN: 41-0215170
Plan #002
Schedule H, Line 4i – Schedule of Assets (Held at End of Year) (continued)
Face Amount
Contract
Amount or
Issuer
Investments
Wrapper
Adjustment
Number of
Identity of Issue and
Moody’s/
at Fair
Contract at
to Contract
Contract
Shares/Units
Description of Investment
S&P Rating
Cost
Value
Fair Value
Value
Value
SYNTHETIC GUARANTEED INVESTMENT CONTRACTS (continued)
1,303,407
United States Treas Bds
$ 1,252,197
$ 1,225,814
$ –
$ –
$ –
30,000
United States Treas Bds
29,109
28,542
–
–
–
1,418,935
United States Treas Nts
1,438,539
1,429,737
–
–
–
2,350,000
United States Treas Nts
2,336,588
2,334,945
–
–
–
1,495,000
United States Tres Bd Strp Prn
665,590
719,747
–
–
–
385,000
Canadian Natl Ry Co
382,840
376,231
–
–
–
35,000
Encana Hldgs Fin Corp
36,491
35,072
–
–
–
325,000
Barclays Bk Plc
374,439
350,997
–
–
–
1,300,000
Depfa Acs Bk
1,297,998
1,265,205
–
–
–
305,000
HBOS Plc Medium Term Sr Nts
306,348
297,292
–
–
–
1,530,000
HBOS Treas Svca Plc Covrd Bd
1,529,204
1,525,821
–
–
–
1,500,000
Swedish Expt Cr Corp
1,498,935
1,474,116
–
–
–
240,000
Telecom Italia Cap
243,914
228,654
–
–
–
250,000
Telecom Italia Cap
223,978
232,627
–
–
–
500,000
Telefonica Emisiones S A U
500,000
515,878
–
–
–
42
(US Treas Notes 10 yr Feb07 106 Put)
23,702
23,702
–
–
–
Cash on deposit with bankers
–
645,471
–
–
–
Accrued interest receivable
–
4,164,951
–
–
–
Other receivables
–
8,646
–
–
–
65
Target Corporation 401(k) Plan
EIN: 41-0215170
Plan #002
Schedule H, Line 4i – Schedule of Assets (Held at End of Year) (continued)
Face Amount
Contract
Amount or
Issuer
Investments
Wrapper
Adjustment
Number of
Identity of Issue and
Moody’s/
at Fair
Contract at
to Contract
Contract
Shares/Units
Description of Investment
S&P Rating
Cost
Value
Fair Value
Value
Value
SYNTHETIC GUARANTEED INVESTMENT CONTRACTS (continued)
Receivable for investment securities sold
$ –
$ 28,314,865
$ –
$ –
$ –
Payable for investment securities purchased
–
(65,630,786) –
–
–
Other payables
–
(141,052) –
–
–
TOTAL SYNTHETIC GUARANTEEDINVESTMENT CONTRACTS
618,896,528
580,453,645
464,363
752,029
581,670,037
COMMON STOCK
48,982,032
*Target Corporation
1,249,977,414
2,794,424,926
–
–
–
PARTICIPANT LOANS
66,369,562
Participant loans, interest rates ranging from4.99% - 10.52%
66,369,562
66,369,562
–
–
–
TOTAL ASSETS HELD FOR INVESTMENTPURPOSES AT END OF YEAR
$ 3,034,284,908
$ 4,859,089,322
$ 464,363
$ 752,029
$ 581,670,037
*Indicates a party in interest to the Plan.
66
Target Corporation 401(k) Plan
EIN: 41-0215170
Plan #002
Schedule H, Line 4j – Schedule of Reportable Transactions
Year Ended December 31, 2006
Current Value
Purchase
Selling
Cost of
of Asset on
Identity of Party Involved
Description of Asset
Price
Price
Asset
Transaction Date
Net Gain
Category (iii) – Series of transactions in excess of 5% of plan assets

Wells Fargo Bank
Stable Value Fund
$ 498,138,530
$ –
$ 498,138,530
$ 498,138,530
$ –
Wells Fargo Bank
Stable Value Fund
–
483,008,816
480,627,429
483,008,816
2,381,387
Target Corporation*
Common Stock
723,239,933
–
723,239,933
723,239,933
–
Target Corporation*
Common Stock
–
971,049,889
768,130,161
971,049,889
202,919,728
There were no category (i), (ii), or (iv) transactions for the year ended December 31, 2006. *Includes both nonparticipant- and participant-directed transactions.
67
SIGNATURES
Pursuant to the requirements of the Securities Exchange Act of 1934, the trustees (or other persons who administer the employee benefit plan) have dulycaused this annual report to be signed on their behalf by the undersigned hereunto duly authorized.
TARGET CORPORATION 401(K) PLANDate: June 22, 2007
By
/s/ Douglas A. Scovanner
Douglas A. Scovanner
Chief Financial Officer,
On behalf of Target Corporation as PlanAdministrator

Consent of Independent Registered Public Accounting Firm
We consent to the incorporation by reference in the following Registration Statements (Form S-8 Nos. 33-66050, 333-27435, 333-103920, and 333-131083)pertaining to the Target Corporation 401(k) Plan of our report dated June 22, 2007, with respect to the financial statements and schedules of the TargetCorporation 401(k) Plan included in this Annual Report (Form 11-K) for the year ended December 31, 2006.
/s/ ERNST & YOUNG LLP
Minneapolis, MinnesotaJune 22, 2007