Section 202 and 811 Operating Costs Needs - HUD User
148
Section 202 and 811 Operating Costs Needs U.S. Department of Housing and Urban Development Office of Policy Development and Research
-
Upload
khangminh22 -
Category
Documents
-
view
1 -
download
0
Transcript of Section 202 and 811 Operating Costs Needs - HUD User

Section 202 and 811Operating Costs Needs
U.S. Department of Housing and Urban DevelopmentOffice of Policy Development and Research

Section 202 and 811 Operating Costs Needs Final Report Prepared for U.S. Department of Housing and Urban Development Office of Policy Development and Research Prepared by Ken Lam Jill Khadduri Abt Associates Inc. Judy Weber VIVA Consulting, LLC March 14, 2007

Acknowledgements
This study has been made possible with the help of numerous persons and organizations. In addition to the report authors, several staff members from Abt Associates were instrumental. In particular, Meryl Finkel, as Project Quality Advisor, has provided thoughtful comments on the report. Missy Robinson and Isabel Cancel provided production support throughout the project. At HUD’s Office of Policy Development and Research, we are grateful to the Government Technical Representative, Michael T. Morse, and the Government Technical Monitor, Brent D. Mast, for their guidance, assistance, and support throughout the study. Various staff members at HUD, including Kevin J. Neary, Willie Spearmon, Judith V. May, Robert W. Gray, and Joseph P. Riley, have provided valuable feedback on early versions of this report. The report benefited greatly from their insights. We also would like to thank the owners and managers of the Section 202 and 811 projects who participated in the field testing phase of the study. The contents of this report are the views of the contractor and do not necessarily reflect the views or policies of the U.S. Department of Housing and Urban Development or the U.S. Government.

Table of Contents iii
Table of Contents
Executive Summary ........................................................................................................................... vii
Chapter One – Introduction ................................................................................................................ 1
Chapter Two – Data Sources and Study Properties .......................................................................... 5 Sources of Data ............................................................................................................................ 5
Annual Financial Statements (AFS) .................................................................................. 5 Real Estate Management System (REMS) data ................................................................ 6
PRAC Properties and Potential Benchmark Properties ............................................................... 6 Summary .................................................................................................................................... 12
Chapter Three – Levels and Patterns of Operating Expenses ....................................................... 13 Level of Operating Expenses ..................................................................................................... 13 Operating Expenses and Property Characteristics ..................................................................... 19 Additional Expense Items .......................................................................................................... 21 Summary .................................................................................................................................... 23
Chapter Four – Cost Model Development ....................................................................................... 25 Technical Approach to Cost Benchmarking .............................................................................. 25 Proposed Cost Models ............................................................................................................... 27 Implications of Applying the Cost Models to the PRAC Housing Stock .................................. 32
Chapter Five – Field Testing ............................................................................................................. 41 Technical Approach to Field Testing ......................................................................................... 41 Description of the Properties for Field Testing .......................................................................... 43 Findings...................................................................................................................................... 45 Summary .................................................................................................................................... 49
Chapter Six – Policy Recommendations ........................................................................................... 51
Appendix A – Definition of Census Geography ............................................................................... 55
Appendix B – Summary Statistics of Additional Expense Items ................................................... 57
Appendix C – Definition of HUD Regions ........................................................................................ 67
Appendix D – Field Test Reports ...................................................................................................... 61 AHEPA 113 Apartments ............................................................................................................ 62 Seton London ............................................................................................................................. 68 Mission Springs ......................................................................................................................... 74 Nate Smith House ...................................................................................................................... 79 Blue Ledge Cooperative Apartments ......................................................................................... 86 Jireh Villa ................................................................................................................................... 93 Network Housing 92 ................................................................................................................ 100 Prebleway II ............................................................................................................................. 106 Marshfield Group Home .......................................................................................................... 112 Prospect Street Apartments ...................................................................................................... 118

Table of Contents iv

List of Exhibits v
List of Exhibits
Exhibit 2-1: Distribution of Study Properties and Units by HUD Program Type ......................... 8
Exhibit 2-2: Comparison of Property and Location Characteristics ............................................. 10
Exhibit 3-1: Summary Statistics of Per-unit-month Non-utility Operating Costs ....................... 14
Exhibit 3-2: Kernel Density Plots: PRAC 202s vs. PRAC 811s ...................................................... 16
Exhibit 3-3: Kernel Density Plots: PRAC 202s vs. Benchmark Properties ................................... 17
Exhibit 3-4: Kernel Density Plots: PRAC 811s vs. Benchmark Properties ................................... 18
Exhibit 3-5: Comparison of Median Per-unit-month Non-utility Operating Costs ..................... 20
Exhibit 4-1: Coefficient Estimates of Operating Cost Models for the PRAC 202 and 811 Housing Stock ..................................................................................................................................... 28
Exhibit 4-2: Summary Statistics of Project-level Current and Model Non-Utility Expenses (Per Unit Month) ......................................................................................................................................... 33
Exhibit 4-3: Summary Statistics of Project-level Current and Model Utility Expenses (Per Unit Month) ................................................................................................................................................. 34
Exhibit 4-4: Summary Statistics of Project-level Current and Model Total Expenses (Per Unit Month) ................................................................................................................................................. 35
Exhibit 4-5: Distribution of Differences Between Current and Model Total Expenses (Per Unit Month) PRAC 202 .............................................................................................................................. 36
Exhibit 4-6: Distribution of Differences Between Current and Model Total Expenses (Per Unit Month) PRAC 811 .............................................................................................................................. 36
Exhibit 4-7: Distribution of Differences Between Current and Model Total Expenses (Per Unit Month) PRAC 202 and PRAC811 Combined .................................................................................. 36
Exhibit 4-8: Comparison of Current and Model Total Expenses (Per Unit Month), by HUD Region PRAC 202 ............................................................................................................................... 37
Exhibit 4-9: Comparison of Current and Model Total Expenses (Per Unit Month), by HUD Region PRAC 811 ............................................................................................................................... 38
Exhibit 4-10: Comparison of Current and Model Total Expenses (Per Unit Month), by HUD Region PRAC 202 and PRAC 811 Combined .................................................................................. 38
Exhibit 4-11: Comparison of Current and Model Total Expenses (Per Unit Month), by Metropolitan Location PRAC 202 .................................................................................................... 39

List of Exhibits vi
Exhibit 4-12: Comparison of Current and Model Total Expenses (Per Unit Month), by Metropolitan Location PRAC 811 .................................................................................................... 39
Exhibit 4-13: Comparison of Current and Model Total Expenses (Per Unit Month), by Metropolitan Location PRAC 202 and PRAC 811 Combined ....................................................... 39
Exhibit 5-1: Properties Selected for Field Testing .......................................................................... 44
Exhibit 5-2: Comparison of Field Tester’s Operating Budget Estimates and Model Expenses, Per Unit Month ................................................................................................................................... 46
Exhibit A-1: Definition of Census Geography ................................................................................. 55
Exhibit B-1: Summary Statistics of Per-unit-month Utility Expenses .......................................... 57
Exhibit B-2: Comparison of Median Per-unit-month Utility Expenses ........................................ 58
Exhibit B-3: Summary Statistics of Per-unit-month Deposits to Replacement Reserve .............. 60
Exhibit B-4: Comparison of Median Per-unit-month Deposits to Replacement Reserve ............ 61
Exhibit B-5: Summary Statistics of Per-unit-month Service Expenses ......................................... 63
Exhibit B-6: Comparison of Median Per-unit-month Service Expenses ....................................... 64
Exhibit C-1: Definition of HUD Regions .......................................................................................... 67

Executive Summary vii
Executive Summary
HUD funds the operating costs of housing produced under the current Section 202 program for the elderly and the Section 811 program for persons with disabilities through a Project Rental Assistance Contract or PRAC. Created by the National Affordable Housing Act of 1990, these programs provide capital advances for non-profit developers to finance the construction and rehabilitation of supportive housing for the elderly and persons with disabilities. Thus, the properties have no debt, and the PRAC pays the difference between rental revenues and HUD-approved operating expense levels. Each PRAC has a three-year term and is renewable subject to the availability of federal funds. Before 1990, federal housing assistance for the elderly and persons with disabilities was provided through the Section 202 Direct Loan Program for Housing for the Elderly or Handicapped, which offered direct loans to non-profit sponsors. Instead of PRAC, the federal operating subsidy for these developments was provided as part of project-based Section 8 rental assistance. (These projects are henceforth referred to as Section 8 202s, while projects with operating subsidies provided by PRAC are called PRAC 202s and PRAC 811s.)1
Under the Section 8 202 program, a contract rent agreed to at the time of the development of the housing and subsequently adjusted for inflation covered both repayment of the Section 202 loan and operating expenses. Congress changed the structure of the program—from a repayable loan plus a rent subsidy to a grant plus an operating subsidy—in order to reduce the budget authority that had to be appropriated to support the program. In effect, the government was appropriating funds to repay itself, which the legislators who enacted the National Affordable Housing Act decided made the program appear to cost more than it really did and made it harder for the program to compete for funds each year within the federal budget.
The introduction of an operating subsidy meant that HUD needed to establish standards against which to assess property owners’ operating budgets, both at the time the housing development is first occupied and each year thereafter. Allocations of PRAC contract authority for the first 3 years of project operations are based on Operating Cost Standards (OCS) published annually by HUD for each of the FHA field offices.2
The OCS vary by broad geographical area, but not by the individual characteristics of each development beyond the number of units or “residential spaces” in the development. Once established by HUD, the OCS have been adjusted annually based on the National Consumer Price Index (CPI).
The OCS used by HUD program administrators are not formula amounts that determine automatically the operating expenses allocated each year to each PRAC 202 or PRAC 811 development. Rather, they are benchmarks against which HUD staff review the operating budgets proposed by property owners on the basis of the actual costs incurred during the first full year of operations and increases in
1 In HUD’s database system, the Section 8 202s are referred to as Section 202/8 while projects with PRAC
202 are called Section 202/PRAC. 2 It is unclear how the OCS were originally developed in the early 1990s. Interim Notice 92-10, issued July
30, 1992, says: “Originally developed for use with the Section 162 program, Housing for the Handicapped, experience reflects that Operating Cost Standards serve as an accurate measure for reserving PRAC funds in both the Section 202 and 811 Supportive Housing Programs.”

Executive Summary viii
costs they believe they will incur each year.3
In this sense, they are different from the cost standards that control the non-utility operating funds allocated for public housing developments, which are allocated to public housing authorities (PHAs) through a formula, with very little room for appeals.
There is some variation in the way in which HUD field staff responsible for determining the PRAC operating expense levels use the OCS after the original allocation of PRAC contract authority. In some cases, the standards provide general guidance for staff review of proposed increases in annual operating budgets. In other cases, they continue to form the expected level, and it is difficult for owners to obtain a higher amount. For some developments, HUD staff review requests for increases on the basis of their own knowledge of local real estate practice, with no reference to the OCS. 4
This study explores whether it is possible to develop improved benchmarks for PRAC operating expense levels that would be more finely tuned to the locations and individual characteristics of properties in the PRAC 202 and PRAC 811 stock. There are at least three potential uses of such benchmarks:
• As an alternative to the current OCS for determining the first year’s operating expenses and the allocation of contract authority to each project.
• As guidance for HUD field staff when they review requests for operating budget increases after the first year of operations.
• As support for HUD budget requests for PRAC made each year to the Office of Management and Budget (OMB) and Congress.
Research Design
A recent study conducted by the Harvard University Graduate School of Design (GSD) developed benchmarks for the operating expenses of the public housing stock using expense data of rental properties insured by HUD's FHA mortgage insurance. This study follows the same approach as the GSD study, using analysis of data on the operating expenses of a reference group of multifamily properties that also serve elderly residents and persons with disabilities but are outside the PRAC 202 and PRAC 811 programs. The GSD cost study focused exclusively on benchmarking non-utility expenses, because funding for the utility expenses and capital needs of the public housing stock are provided by separate HUD funding streams. The benchmark estimates developed for the PRAC 202 and 811 properties, however, need to include utility expenses and contributions to a replacement reserve for future capital needs, because these costs are included in the PRAC operating subsidy. The PRAC 202 subsidy also
3 HUD Notice 06-06, published June 8, 2006 reinstated a policy under which PRAC reservations may be
increased prior to occupancy if supported by operating expense estimates agreed to at the time the project is underwritten.
4 Based on interviews with HUD staff and on the field work conducted for this study and reported in Chapter 5 and Appendix D.

Executive Summary ix
covers expenses for services, capped at $15 per unit month. The PRAC subsidy can be used to pay for the cost of a service coordinator as long as the project is principally serving the frail elderly. Thus, the components of operating costs reimbursed by PRAC are:
• Non-utility operating expenses
• Utility expenses
• Contributions to replacement reserves
• Services and service coordination (for PRAC 202 projects)
The research design for this study included the following components.
• Identification of the benchmark properties and an analysis of the characteristics of these properties in relation to the PRAC projects.
• A review of the levels and patterns of the historical operating expenses of the PRAC projects and their benchmarks.
• Development of a preliminary cost model that can be used to benchmark the operating expenses of the PRAC projects.
• An examination of the implications of applying the benchmark estimates produced by the cost model to the existing PRAC housing stock.
• Field tests of the cost model estimates on a purposive sample of 10 PRAC developments located in two major metropolitan areas.
The inventories of HUD-assisted multifamily properties included in this study were:
1. PRAC 202 – Section 202 projects funded since 1990. They serve the elderly. Rental assistance is provided by PRAC.
2. Section 8 202 Elderly – Section 202 projects funded before 1990 that are designated to serve the elderly. Rental subsidy is provided by project-based Section 8.
3. Newer Assisted Section 8 Elderly – Projects funded by Section 8 New Construction/Substantial Rehabilitation (NC/SR) that are designated to serve the elderly.
4. PRAC 811 – Section 811 projects with PRAC subsidy. They serve persons with disabilities.
5. Section 8 202 Disability – Section 202 projects funded before 1990 that are designated to serve persons with disabilities. Rental subsidy is provided by project-based Section 8.
6. Newer Assisted Section 8 Disability – Projects funded by Section 8 NC/SR that are designated to serve persons with disabilities.

Executive Summary x
The study team explored using property categories 2 and 3 as benchmarks for the PRAC 202s, and categories 5 and 6 as benchmarks for the PRAC 811s. Our analysis indicated that the costs of these HUD-assisted properties for the elderly and people with disabilities could serve as good benchmarks for the operating costs of the PRAC properties, for several reasons. First, the benchmarks projects were built to serve populations similar to those of the PRAC properties and have similar programmatic and operating environments. Second, the geographic distributions and property characteristics of the PRAC projects and benchmark properties are similar. Building age is an exception, but it appears that age is not a significant cost driver for these developments. The PRAC 811 projects typically are smaller than the benchmark properties, with fewer units. However, we found a sufficient number of small-size developments in the HUD-assisted multifamily housing stock for the elderly and people with disabilities to make benchmarking possible. To examine the operating expense levels and patterns of these properties, we used financial information reported in Annual Financial Statements from recent years. The vast majority of the study properties are required to submit expenses information to HUD annually in electronic format. Property and location characteristics of the properties are derived from information collected in HUD’s Real Estate Management System (REMS). Level and Patterns of Operating Expenses
The study team conducted a thorough examination of the levels and patterns of the non-utility operating expenses for PRAC and benchmark properties, using expense data from recent years (2002-2004). Non-utility operating expenses are defined as the sum of the following three line items reported in the Annual Financial Statement:
• Total administrative expenses (line item 6200/6300)
• Total operating and maintenance expenses (line item 6500)
• Total taxes and insurance expenses (line item 6700)
Our key observations on non-utility expenses are:
• The average and median expense levels for the PRAC 202 housing stock were $286 and $271 per unit month (PUM) in 2004 dollars.
• Without controlling for locations and housing characteristics, the benchmark properties had higher costs than the PRAC 202s, both average costs ($300 for Newer Assisted Section 8 Elderly and $310 for Section 8 202 Elderly) and median costs ($273 and $291).
• The average expense level PUM for the PRAC 811 properties was $316, and the median was $262.
• The median expense level of the PRAC 811s was $262, only $9 lower than the median for the PRAC 202s. However, the average expense level for the PRAC 811s ($316) was substantially higher than the median, and substantially higher than the average expense

Executive Summary xi
level for the PRAC 202s. This is an indication that the PRAC 811 properties’ cost distribution was uneven and skewed to the high end.
• The PRAC 811s’ principal benchmark properties, Section 8 202 Disability, generally had lower expense levels, as indicated by both the average and the median. For example, the median expense level of the Section 8 202 Disability properties ($241) was $21 lower than the PRAC 811s’ median.
Our key findings with respect to the relationship between cost levels and property characteristics include:
• The relationship between geography and operating expenses is strong. Location is the strongest predictor of operating expenses.
• The effect of development size on expense level is apparent and strong. Across the six categories of properties examined, there appears to be a distinct “U” shape relationship between a project’s development size and per unit expense level. As development size increases, operating expenses per unit first decline gradually, apparently due to the “economies of scale” effect, and then rise steadily.
• As expected, projects with a larger unit size have higher operating costs per unit.
• Across all program types, properties classified as high-rise or elevator building type cost more to operate.
• The correlation between operating expenses and building age are weak for these properties.
• Among projects that allow both non-profit and profit-motivated sponsors (Newer Assisted Section 8), those with profit-motivated sponsors have lower expenses.
• Projects located in non-metropolitan areas are the least expensive to run, compared to projects located in the suburbs and central cities.
To explore the feasibility of benchmarking utility expenses, contributions to replacement reserves, and expenses for services using the same database, we analyzed these expense components reported for the benchmark properties over the same time period. We found that the utility expense levels of the PRACs and their benchmark properties conform to general expectations. Cost variations for utilities are associated with property characteristics in ways that make sense, as is the case for non-utility expenses (for example, per unit utility costs are higher for high-rise buildings and for very old buildings, and they decrease with property size). In contrast, there is no apparent pattern for the contributions to replacement reserves or for the services expenses reported in the Annual Financial Statements. Moreover, only a portion of the elderly projects reported any expenses for services in the cost database. This is an indication that the Annual Financial Statements may not be the suitable source of data for benchmarking these two expense components. Contributions to a replacement reserve and service expenses should each be treated as an out-of-model adjustment. That is, separate estimates for the replacement reserve contribution and service expenses should be added to the operating cost estimates produced by the

Executive Summary xii
model as part of the application of the model results as benchmarks for the initial operating costs of PRAC properties. Preliminary Cost Model
Because expense levels are correlated with property characteristics and locations, an attempt to develop benchmark cost estimates for the PRAC projects must control for the differences in these factors between the PRACs and their benchmark properties. Using expense data from 2002-2004 for the benchmark properties and a statistical technique called multiple regression analysis, the study team developed a preliminary cost model that can be used to benchmark the operating costs of the PRAC projects. Multiple regression analysis allows an outcome measure to be expressed as the result of the combination of characteristics that affect it multiplied by their respective regression coefficients. The property characteristics that we found significant in the cost model include:
• Development size • Unit size • Building type • Building age • Ownership type • Geographic/metropolitan location • Neighborhood poverty rate • Tenant clientele
Consistent with findings from the Harvard GSD study, geographic variables in the model account for the largest share of the cost variations. We applied the cost model to the existing PRAC housing stock and then compared the model estimates with the spending level reported in recent years. The application also allowed us to assess the potential impact on individual properties and on the HUD budget of using such benchmarks in the administration of the PRAC-based program. The major findings are:
• Overall, the actual expense levels are fairly close to the benchmarks. On average, the model produces operating expense estimates that are 9 percent higher than the current expense levels for PRAC 202 projects and estimates that are 4 percent lower for PRAC 811 projects.
• For any particular property, however, the model-based benchmark cost may be substantially higher or lower than the current expense level for that project. This is to be expected, as the current expenses may simply represent “spending what you get” and may be higher or lower than the amount needed to operate the property.

Executive Summary xiii
• For example, 9 percent of the PRAC 202 projects (with 7 percent of the total units) have benchmarked costs at least 20 percent lower than their current expenses, while 33 percent of the projects (and units) have costs estimated by the model at least 20 percent higher than their current expenses.
• For PRAC 811, 19 percent of projects (18 percent of units) have costs estimated by the model at least 20 percent lower than current expenses, while 30 percent of the projects (31 percent of units) have benchmarked costs at least 20 percent higher than their current expenses.
Field Tests
To investigate whether the model produces benchmarks cost estimates that would make it feasible to operate PRAC 202 and 811 housing developments, the study team field tested the proposed benchmarks in ten PRAC 202 and 811 projects in two metropolitan areas (and their nearby rural areas). Field test projects were deliberately selected to represent a mix of projects in each MSA with current expenses that are substantially above and substantially below the cost benchmarks. Test projects were also chosen to represent a mix of central city, suburban and rural locations in areas of the country with high and low housing costs. With limited resources for field testing, we decided to focus the effort on properties that have very different actual current expenses than those predicted by the model. Therefore, the results of the field tests do not tell us whether the model is, on average, producing estimates consistent with reasonable expense levels. Instead, the field testing was intended to identify issues that might need to be addressed if these cost benchmarks were used in the administration of the PRAC programs. The field work included a one-day site visit to each of the properties. The field tester’s task was to determine whether the model-based expense levels are reasonable to operate the selected PRAC 202 or 811 properties in these markets, assuming efficiency of operation as well as compliance with all regulatory requirements regarding leasing and occupancy, reporting, physical standards, and financial management. Key findings from the field tests include:
• Most of the property owners and managers reported that their current PRAC subsidies were insufficient to sustain the properties for the long haul.
• The smaller, service-enriched PRAC 811s are more vulnerable to per-unit-cost fluctuations, than the larger PRAC 202s.
• The cost model estimates align well with the operating budgets recommended by the field tester. However, some properties have property-specific conditions that the model does not account for.

Executive Summary xiv
The special project characteristics identified in the field tests include:
• Real estate taxes. Non-profit owners negotiate their treatment of Payment-in-Lieu-of-Tax (PILOT) with the local government. Payments can vary greatly across locales and have a large impact on expenses.
• Whether a PRAC 811 property is operated as a group home (with on-site full-time support staff funded by the local or state government who, in effect, provide some of the housing management functions for the property) or an independent living project (without on-site full-time support staff). Properties with a full-time on-site staff tend to have lower expenses.
• Whether the property is eligible to self-certify or is required to submit an audit on its annual financial statements. Currently, this option is available only to the PRAC 811s. Properties that can self-certify have lower operating expenses.
• Whether a majority of the operating and maintenance functions are performed by project staff or are contracted out. If project staff perform some of the operating and maintenance functions, expenses can be reduced.
• Whether some of the housing management functions are performed by volunteers, which can reduce operating expenses
• Whether the project contains a very small number of units. A very small number of units increases per-unit operating expenses due to the fixed nature of some costs.
• Whether the project is located in a lower-cost area within the larger geographical area on which the model’s cost estimates are based, such as the fringe of a larger metropolitan region.
Policy Recommendations
Overall, results from the field tests and model applications indicate that it is feasible to benchmark the operating expenses of the PRAC developments using operating costs of other HUD-assisted properties that serve similar tenant populations. While the benchmarks produced by the cost model could be improved, they may already be superior to the current Operating Cost Standards as a basis for reviewing operating budgets during HUD’s firm commitment processing (i.e., underwriting) of the project and for calculating reservations of PRAC funds. They may also be superior to the reference points currently used by HUD field staff during their review of requests for operating budget increases made by owners of PRAC properties already in operation. Therefore, we recommend that HUD consider moving immediately to using operating cost standards based on this type of model. We do not recommend that model-produced standards be applied to PRAC 202s and PRAC 811s without further review of the operating budgets of each property during firm commitment processing and when owners ask for annual increases. Rather, they should serve as expected per-unit operating expense levels. HUD staff would then make adjustments—up or down—

Executive Summary xv
based on such special property characteristics such as those identified in the field tests conducted for this study. A first step might be to engage HUD field staff responsible for administering the PRAC programs and industry groups in a discussion of whether such an approach would be an improvement on the current system and whether the benchmarks produced by the current version of the model make sense. In addition to achieving “buy in” from those most affected, those discussions could identify additional special project conditions that HUD staff might take into account when applying the results of the model and additional local factors and project characteristics that might be incorporated into future version of the model. If operating cost standards based on this type of model were used as guidance for reviewing operating budgets, at some point in the future the model also could be used in support of HUD budget requests for PRAC. Should HUD decide to proceed with using cost model benchmarks or to consider this approach further, the study team has the following recommendations for additional work on the cost benchmarks.
• Additional Field Testing of the Current Model Estimates. We recommend additional field testing as a necessary step for developing the guidance needed by HUD staff for using the model’s cost estimates as benchmarks. Future test samples should include a greater number of geographic areas and should not be dominated by outlier cases.
The main purpose of the additional field testing would be the further identification of special development characteristics to be taken into account by HUD staff when reviewing operating budgets. At the same time, the results of the field tests could also help guide improvements to the model. For example, the field tests could suggest alternative ways of grouping geographic areas for the model’s geographic identifiers. There may also be development characteristics captured by HUD’s database or another readily available dataset that were overlooked in the current version of the model.
Information collected from a larger sample of field tests might also be used to set ceilings and floors to be used in the application of the overall cost benchmarks.
• Refinements to the Model. We have already identified additional work on the model that could proceed at the same time as further field testing. This includes:
– Fine-tuning the geographic groupings in the cost model.
– Exploring whether it is possible to find a variable in REMS or another readily available dataset to proxy group homes or developments with on-site staff supported by another funding stream.
– Determining if it is feasible to adjust the data used to create and apply the model of utility costs to account for tenant-paid utilities.
– Testing additional specifications and functional forms for the model.
• Costs Not Covered by the Model. We have identified two components of the operating costs of PRAC properties that cannot be benchmarked using other properties in the HUD

Executive Summary xvi
assisted stock: contributions to replacement reserves and services costs. It would be desirable to provide HUD staff with additional guidance on how to assess these components of operating budgets.
Research on industry standards for contributions to replacement reserves and their applicability to PRAC properties could be undertaken to develop guidance for HUD staff in reviewing this important component of operating expenses. The field testing undertaken for this study confirmed what we already suspected: that the amount of contribution to replacement reserves currently is more a function of whether the property is amply funded or squeezed, than of a realistic assessment of the property’s long-term capital needs.
Services costs are a very difficult area for which to create benchmarks, as they vary with the characteristics of the residents (age and type of disability) and, in particular, with the local and state services environment and availability of other funding streams. Nonetheless, it would be possible to collect data on the services costs of PRAC 202 and PRAC 811 properties—and who pays for them—to determine whether the $15 PUM current limit on services is reasonable and also to develop per-unit cost benchmarks for services coordination.

Chapter 1. Introduction 1
Chapter One Introduction
HUD funds the operating costs of housing produced under the current Section 202 program for the elderly and the Section 811 program for persons with disabilities through a Project Rental Assistance Contract or PRAC. Created by the National Affordable Housing Act of 1990, these programs provide capital advances for non-profit developers to finance the construction and rehabilitation of supportive housing for the elderly and persons with disabilities. Thus, the properties have no debt, and the PRAC pays the difference between rental revenues and HUD-approved operating expense levels. Each PRAC has a three-year term and is renewable subject to the availability of federal funds. Before 1990, federal housing assistance for the elderly and persons with disabilities was provided through the Section 202 Direct Loan Program for Housing for the Elderly or Handicapped, which offered direct loans to non-profit sponsors. Instead of PRAC, the federal operating subsidy for these developments was provided as part of project-based Section 8 rental assistance. (These projects are henceforth referred to as Section 8 202s, while projects with operating subsidies provided by PRAC are called PRAC 202s and PRAC 811s.)5
Under the Section 8 202 program, a contract rent agreed to at the time of the development of the housing and subsequently adjusted for inflation covered both repayment of the Section 202 loan and operating expenses. Congress changed the structure of the program—from a repayable loan plus a rent subsidy to a grant plus an operating subsidy—in order to reduce the budget authority that had to be appropriated to support the program. In effect, the government was appropriating funds to repay itself, which the legislators who enacted the National Affordable Housing Act decided made the program appear to cost more than it really did and made it harder for the program to compete for funds each year within the federal budget.
The introduction of an operating subsidy meant that HUD needed to establish standards against which to assess property owners’ operating budgets, both at the time the housing development is first occupied and each year thereafter. Allocations of PRAC contract authority for the first 3 years of project operations are based on Operating Cost Standards (OCS) published annually by HUD for each of the FHA field offices.6
5 In HUD’s database system, the Section 8 202s are referred to as Section 202/8, while projects with PRAC
202s are called Section 202/PRAC.
The OCS vary by broad geographical area, but not by the individual characteristics of each development beyond the number of units or “residential spaces” in the
6 It is unclear how the OCS were originally developed in the early 1990s. Interim Notice 92-10, issued July 30, 1992, says: “Originally developed for use with the Section 162 program, Housing for the Handicapped, experience reflects that Operating Cost Standards serve as an accurate measure for reserving PRAC funds in both the Section 202 and 811 Supportive Housing Programs.”

Chapter 1. Introduction 2
development.7
The OCS have been adjusted annually based on the National Consumer Price Index (CPI).
The OCS used by HUD program administrators are not formula amounts that determine automatically the operating expenses allocated each year to each PRAC 202 or PRAC 811 development. Rather, they are benchmarks against which HUD staff review the operating budgets proposed by property owners on the basis of the actual costs incurred during the first full year of operations and increases in costs they believe they will incur each year.8
In this sense, they are different from the cost standards that control the non-utility operating funds allocated for public housing developments, which are allocated to public housing authorities (PHAs) through a formula, with very little room for appeals.
There is some variation in the way in which HUD field staff responsible for determining the PRAC operating expense levels use the OCS after the original allocation of PRAC contract authority. In some cases, the standards provide general guidance for staff review of proposed increases in annual operating budgets. In other cases they continue to form the expected level, and it is difficult for owners to obtain a higher amount. For some developments, HUD staff review requests for increases on the basis of their own knowledge of local real estate practice, with no reference to the OCS. 9
This study explores whether it is possible to develop improved benchmarks for PRAC operating expense levels that would be more finely tuned to the locations and individual characteristics of properties in the PRAC 202 and PRAC 811 stock. There are at least three potential uses of such benchmarks:
• As an alternative to the current OCS for determining the first year’s operating expenses and the allocation of contract authority to each project.
• As guidance for HUD field staff when they review requests for operating budget increases after the first year of operations.
• As support for HUD budget requests for PRAC made each year to the Office of Management and Budget (OMB) and Congress.
A recent study conducted by the Harvard University Graduate School of Design (GSD) developed benchmarks for the operating expenses of the public housing stock using expense data of rental properties insured by HUD's FHA mortgage insurance.10
7 For example, the FY 2004 OCS is $5,866 (per-unit-year) for the Section 202 and 811 projects located in the
Boston field office area and $4,645 for projects located in the Washington, DC, field office area. HUD Housing Notice H 2004-12.
This study follows the same approach as
8 HUD Notice 06-06, published June 8, 2006 reinstated a policy under which PRAC reservations may be increased prior to occupancy if supported by operating expense estimates agreed to at the time the project is underwritten,
9 Based on interviews with HUD staff and on the field work conducted for this study and reported in Chapter 5 and Appendix D.
10 Abt Associates was part of the Harvard GSD research team. See Public Housing Operating Cost Study. Final Report prepared for HUD by Harvard University Graduate School of Design (GSD), June 2003.

Chapter 1. Introduction 3
the GSD study, using analysis of data on the operating expenses of a reference group of multifamily properties that also serve elderly residents and persons with disabilities but are outside the PRAC 202 and PRAC 811 programs The remainder of the report is organized as follows:
• Chapter Two identifies the sources of administrative data used for the study. It presents our findings on the availability of the benchmark developments and on their project characteristics and geographic distribution in comparison to the PRAC 202s and PRAC 811s.
• Chapter Three presents a descriptive analysis of the levels and patterns of operating expenses for the PRACs and their benchmark projects from recent years, separately for the analytic categories of properties we identified in chapter two.
• Chapter Four describes the development of a cost model that can be used to benchmark the operating cost of the PRAC 202s and PRAC 811s. The chapter discusses the implications of applying the benchmark costs produced by the model, by inspecting the summary statistics on the differences between the cost model estimates and the current expense levels of the existing PRAC housing stock.
• Chapter Five presents the findings of field tests conducted on a purposive sample of PRAC 202 and 811 developments. To investigate the reasonableness of the cost model, the study team field tested the model estimates on a total of ten housing developments located in two major metropolitan areas.
• Chapter Six offers recommendations for the next steps, including ways in which the model might be applied and further analysis that could improve the accuracy of the benchmarks.
• Appendix A provides definitions of the census geography.
• Appendix B includes summary statistics and cross tabulations on utility expenses, deposits to replacement reserves, and service expenses.
• Appendix C provides definitions of HUD regions.
• Appendix D contains the field test reports for each of the ten selected developments.

Chapter 1. Introduction 4

Chapter 2. Data Sources and Study Properties 5
Chapter Two Data Sources and Study Properties
This chapter identifies the study properties and provides a descriptive analysis of their project, program, and location characteristics. It is organized as follows. The first section reviews the sources of administrative data used for this study. The second section identifies the PRAC 202 and 811 developments and their potential benchmark properties in the HUD-assisted housing stock. The third section explores the overlap of these developments in term of the project, program, and location characteristics. Sources of Data
Two sources of HUD administrative data are used for this study: Annual Financial Statements (AFS) and the Real Estate Management System (REMS) data. Below we provide brief descriptions of these data and identify how they are used in the study. Annual Financial Statements (AFS)
Annual Financial Statements are full financial statements (including Statement of Financial Position, Statement of Profit and Loss, Statement of Cash Flows, and various supplemental schedules required by HUD) prepared under Generally Accepted Accounting Principles, submitted by the property owner after the end of the property’s fiscal year. Most owners receiving HUD subsidy are required to submit AFS that have been audited by an Independent Public Accountant before the data are submitted to HUD; the remaining owners are required to have a subsequent audit and reflect any adjustments in the next year’s AFS. Beginning with AFS for the fiscal year ending 12/31/98, owners have been required to submit AFS electronically to HUD’s Real Estate Assessment Center (REAC). Previously, AFS were submitted in hard copy and entered into an electronic database by a HUD contractor. AFS data are subjected to extensive quality control checks by REAC, as they are used to determine whether a property is financially troubled or at risk of becoming financially troubled. Because more recent data are more complete and have been subjected to more rigorous quality controls, the expense data analyzed in this study are based on a December 2005 extract provided by HUD. The extract includes audited AFS data for the entire HUD multifamily housing stock for the period 2002 to 2004. Our analysis focused on financial information reported in the Statement of Profit and Loss. We converted all the reported expense levels to per-unit-month amounts and to 2004 dollars, using the Consumer Price Index (CIP) published by the Bureau of Labor Statistics.

Chapter 2. Data Sources and Study Properties 6
Real Estate Management System (REMS) data
Property and location characteristics of the properties are derived from an extract of the Real Estate Management System (REMS) data obtained from HUD in late 2004. The REMS database contains a wealth of useful information at the development level. For example, it includes variables on the number of units in each property, the distribution of units by bedroom size (one-bedroom, two-bedroom, etc.), building type (high-rise, garden, townhouse, etc.), mortgage sponsor type (for-profit, non-profit, limited dividend), occupancy type (family, elderly/disabled), HUD program type (section of the act for FHA programs), and the location of the property. We linked the REMS data elements to the AFS expense variables using a unique property identifier created by HUD. PRAC Properties and Potential Benchmark Properties
A key objective of this study is to explore the feasibility of using the operating expenses of developments in the HUD multi-family stock as benchmark data for the cost of operating the PRAC 202s and PRAC 811s. Potential candidates are other HUD-assisted projects that serve similar tenant types: the elderly and persons with disabilities. These include the Section 8 202 projects and an array of developments that are assisted by either a mortgage interest reduction program or a rental assistance program. The non-Section 202 HUD-assisted stock is commonly divided into “older assisted” and “newer assisted” properties. The older assisted properties are those developed under the Section 221(d)(3) Below Market Interest Rate (BMIR) and Section 236 (mortgage interest reduction) programs. These were not rental assistance programs, although most of these units either originally had Rent Supplement (RS) or Rental Assistance Payment (RAP) subsidies (later converted to project-based Section 8) or have since received project-based Section 8 assistance. The newer assisted properties are those developed under the Section 8 New Construction/Substantial Rehabilitation (NC/SR) and Moderate Rehabilitation programs; many of these projects were not financed by FHA mortgages.11 Some of the projects in both the older and the newer assisted stock were constructed to serve the low-income elderly and persons with disabilities.12
A key challenge of using the older assisted stock as a benchmark in this analysis is that many of these properties have budget-based rents that were negotiated between the owners and HUD. As a result, operating expenses of these projects may be systematically constrained. Another consideration is that these properties are significantly older than the PRAC 202 and PRAC 811 stock. Therefore, they do not appear to be appropriate benchmarks.
11 Many of these developments were originally financed by state housing finance agencies (HFAs). 12 There is a data element in the REMS database that explicitly identifies whether a development is
designated to serve the elderly, persons with disabilities, or families. The REMS data, however, do not contain a variable that would allow us to further disaggregate the “persons with disabilities” category into persons with developmental disabilities, physical disabilities, and chronic mental illness.

Chapter 2. Data Sources and Study Properties 7
We have identified the following project types as potential benchmarks:
• Section 202 projects that were developed in the 1970s and 1980s (Section 8 202s). These projects are assisted by project-based Section 8 rental assistance and do not receive PRAC subsidy. The operating environments of these properties should be comparable to the PRAC 202 and PRAC 811 projects in many respects.
• Newer assisted (non-202) Section 8 developments that serve the elderly or persons with disabilities. Assisted by project-based Section 8, these properties are not regulated by budget-based rents. Therefore, the operating expenses of these projects can be used in the benchmarking.
The universe of study properties thus covers a total of six analytic categories. They are:
1. PRAC 202 – Section 202 projects funded since 1990. They serve the elderly. Rental assistance is provided by PRAC.
2. Section 8 202 Elderly – Section 202 projects funded before 1990 that are designated to serve the elderly. Rental subsidy is provided by project-based Section 8.
3. Newer Assisted Section 8 Elderly – Projects funded by Section 8 NC/SR that are designated to serve the elderly.
4. PRAC 811 – Section 811 projects with PRAC subsidy. They serve persons with disabilities.
5. Section 8 202 Disability – Section 202 projects funded before 1990 that are designated to serve persons with disabilities. Rental subsidy is provided by project-based Section 8.
6. Newer Assisted Section 8 Disability – Projects funded by Section 8 NC/SR that are designated to serve persons with disabilities.
Categories 2 and 3 are benchmarks for the PRAC 202s, while categories 5 and 6 can be used to benchmark the PRAC 811s. Exhibit 2-1 presents the distribution of the study properties across the six analytic categories. The first two columns show the project counts and unit counts based on the REMS data, with the remaining columns in the exhibit indicating the portion of projects with complete cost data. As of the end of 2004, there are a total of 1,685 PRAC 202 developments, accounting for more than 76,000 units. The number of developments funded by the PRAC 811 program is slightly higher (1,897 projects) for the same time period. They, however, only represent a total of 23,039 units. On average, the PRAC 811 developments are much smaller in scale than the PRAC 202s. Operating expense data are available for well over 90 percent of these two categories of projects.13
13 Operating expense levels for the first full year of operations of new projects generally are constrained by
the Operating Cost Standards (OCSs) published annually by HUD for each of the FHA field offices. In the cost analysis, therefore, we excluded any AFS cost data reported for a PRAC 202 or PRAC 811 project’s first two years of operation.

Chapter 2. D
ata Sources and Study Properties 8
Exhibit 2-1: Distribution of Study Properties and Units by HUD Program Type
Total Number of Projects
Total Number of
Units
Number of Projects Included in the Cost Analysisa
Number of Units Included in the Cost Analysisa
Pct. of Units Included in the Cost Analysisa
PRAC 202 1,685 76,107 1,559 71,830 94%
Section 8 202 Elderly 2,681 187,527 2,653 185,718 99%
Newer Assisted Section 8 Elderly 4,354 329,792 1,639 149,268 45%
PRAC 811 1,897 23,039 1,667 20,732 90%
Section 8 202 Disability 1,680 27,656 1,632 26,681 96%
Newer Assisted Section 8 Disability 161 8,310 78 5,798 70%
All 12,458 652,431 9,228 460,027 71%
Notes: a Excluded projects with no operating cost data.

Chapter 2. Data Sources and Study Properties 9
More than 7,000 projects in the HUD assisted stock could potentially serve as benchmarks for the PRAC 202s. However, cost data are not available for a portion of the Newer Assisted Section 8 stock that serve the elderly, because these projects were not financed by FHA mortgages and the owners thus are not required to submit AFS data to HUD. Overall, cost data are available for 4,292 projects for the Section 8 202 Elderly and Newer Assisted Section 8 Elderly combined. On average, there are 2.8 benchmark properties with complete cost data for every PRAC 202 development. Selecting benchmark projects for the PRAC 811 developments poses the same missing data problem. Nonetheless, we were able to find complete cost data for a total of 1,710 projects for the Section 8 202 Disability and Newer Assisted Section 8 Disability combined. This translates into a ratio of at least one benchmark property for every PRAC 811 development. Aside from sample size, a key analytic issue is whether the potential benchmark properties are comparable to the PRAC 202s and PRAC 811s in terms of project characteristics and geographic locations. If the degree of overlap is small between the PRAC 202s/811s and their benchmark properties on project characteristics that turn out to be key cost drivers, the reliability of the final benchmark estimates may be questionable. To address this issue, Exhibit 2-2 examines, separately for the six groups of projects, the distribution of the study properties along the following eight dimensions:
• Development size (total number of units)
• Unit size (average number of bedrooms per unit)14
• Building type
• Building age15
• Sponsor ownership type
• Scattered-site development type
• Census division
• Metropolitan location
We found that the PRAC 202 and PRAC 811 developments are comparable to their potential benchmark projects for most of the characteristics we examined.
14 A 0-bedroom or efficiency unit is counted as half a bedroom in this calculation. 15 The REMS database does not contain a data element for a development’s construction date. Instead, to
calculate building age, we used occupancy date as a proxy for construction date. We discovered that in the data there are a handful of Newer Assisted and Section 8 202 projects with occupancy dates in the post-1990 period. This may be the result of coding errors in the HUD database, as both programs had ceased to finance any new projects in that time period. This is especially the case for the Newer Assisted projects. For the Section 8 202s, there typically was a three-year time lag between the loans made for the projects and their occupancy dates; therefore, records of Section 8 202 projects with an occupancy date in the early 1990s may indeed be valid. We re-coded the Newer Assisted records with an occupancy date of 1993 or later to 1989 for the purpose of this analysis.

Chapter 2. Data Sources and Study Properties 10
Exhibit 2-2: Comparison of Property and Location Characteristics
PRAC 202
Section 8 202
Elderly
Newer Assisted Section 8
Elderly PRAC 811
Section 8 202
Disability
Newer Assisted Section 8 Disability All
Number of projects 1,559 2,653 1,639 1,667 1,632 78 9,228 Number of units 71,830 185,718 149,268 20,732 26,681 5,798 460,027 Development Size
1-4 units 0% 0% 0% 3% 0% 0% 0% 5-9 units 0% 0% 0% 19% 15% 1% 2% 10-19 units 3% 1% 0% 40% 30% 1% 4% 20-29 units 8% 3% 1% 30% 20% 0% 5% 30-49 units 29% 14% 7% 5% 18% 9% 14% 50-99 units 53% 34% 29% 2% 9% 32% 33% 100+ units 7% 48% 62% 0% 7% 56% 42% Total 100% 100% 100% 100% 100% 100% 100%
Unit Size (Average Number of Bedrooms Per Unit) <= 1 69% 67% 48% 64% 67% 30% 60% > 1 31% 33% 52% 36% 33% 70% 40% Total 100% 100% 100% 100% 100% 100% 100%
Building Type High-rise or elevator 53% 72% 64% 10% 18% 43% 61% Others 47% 28% 36% 90% 82% 57% 39% Total 100% 100% 100% 100% 100% 100% 100%
Building Age Less than 5 years 22% 0% 0% 18% 0% 0% 4% 5-10 years 52% 0% 0% 49% 0% 0% 9% 10-15 years 26% 11% 0% 33% 21% 0% 11% 15-25 years 0% 65% 38% 0% 75% 67% 44% 25+ years 0% 24% 62% 0% 5% 33% 32% Total 100% 100% 100% 100% 100% 100% 100%
Sponsor Ownership Type Non-profit 100% 100% 11% 100% 100% 9% 68% Profit motivated 0% 0% 70% 0% 0% 62% 25% Limited dividend 0% 0% 19% 0% 0% 28% 7% Total 100% 100% 100% 100% 100% 100% 100%
Scattered-site Development Yes 0% 1% 2% 15% 17% 1% 3% No 100% 99% 98% 85% 83% 99% 97% Total 100% 100% 100% 100% 100% 100% 100%
Census Division New England 8% 8% 10% 6% 7% 2% 8% Mid Atlantic 19% 19% 13% 12% 10% 6% 16% East North Central 16% 18% 21% 15% 17% 25% 19% West North Central 7% 7% 11% 8% 15% 7% 9% South Atlantic 17% 16% 16% 25% 17% 14% 17% East South Central 6% 7% 10% 7% 7% 13% 8% West South Central 9% 9% 4% 10% 11% 25% 8% Mountain 4% 4% 5% 5% 5% 7% 5% Pacific 14% 11% 10% 12% 11% 1% 11% Total 100% 100% 100% 100% 100% 100% 100%
Metro Location Central city 48% 49% 49% 46% 48% 54% 49% Suburb 35% 34% 30% 30% 26% 24% 32% Non-metro 17% 16% 21% 24% 26% 22% 19% Total 100% 100% 100% 100% 100% 100% 100%

Chapter 2. Data Sources and Study Properties 11
Below we highlight some of the similarities and differences.
• Development size. The PRAC 811s are small-scale developments; the vast majority have 30 or fewer units. Projects in the Section 8 202 Disability group are their principal benchmark properties. They have a similar development size distribution, although their share of projects with 30+ units is slightly higher than that of the PRAC 811s. The PRAC 202s and their benchmark projects are much larger developments. While 60 percent of the PRAC 202 projects have 50 or more units, none has fewer than 10 units. Their benchmark projects, the Section 202 Elderly and Newer Assisted Section 8 Elderly, tend to have development sizes that are slightly larger. In particular, they have more projects in the category of 100+ units. Overall, however, their distributions are sufficiently comparable.
• Unit size. To serve a non-family clientele, these developments have predominately small-size units (0- and 1-bedroom units). Unit size distributions are almost identical across the PRAC properties and their potential benchmarks, except for the Newer Assisted Section 8 projects which tend to have a larger proportion of units with more than one bedroom.
• Building type. High-rise or elevator building type is featured prominently (from 53 to 72 percent) in all three categories of projects that serve the elderly. The share of high-rise projects is comparable between the PRAC 202s and their potential benchmarks. The PRAC 811s have much fewer (10 percent) high-rise projects, but their principal potential benchmarks, Section 8 202 Disability, also have a small share of high-rises, 18 percent of such developments.
• Building age. Not surprisingly, since they were produced under programs active at different time periods, the degree of overlap between the PRAC projects and their potential benchmark groups is small in terms of building age. The vast majority of the PRAC 202s were placed in service within the last 15 years, while most of the Section 8 202s and Newer Assisted Section 8 projects are older than 15 years. The only overlapping category is for projects that were placed in service in the last 10-15 years. The same is observed for the PRAC 811s and their benchmark developments. Whether this is a cause for concern depends on the effect that building age has on operating costs.
• Sponsor type. By statute, all PRAC 202, PRAC 811, and Section 8 202 developments must have non-profit sponsors. In contrast, only about 10 percent of the Newer Assisted Section 8 properties selected as potential benchmarks are associated with non-profit sponsors.
• Scattered sites. The scattered-site development type is extremely rare (1 to 2 percent) among the three categories of properties that serve the elderly. Scattered-site developments are more prevalent among projects that serve persons with disabilities. The share of such projects is almost identical for the PRAC 811s (15 percent) and their principal benchmark group (17 percent).
• Census division. The majority (58 percent) of the PRAC 202s funded to date are located on the two coasts of the nation: New England, Mid Atlantic, South Atlantic, and

Chapter 2. Data Sources and Study Properties 12
Pacific.16
• Metropolitan location. The PRAC 202s track their benchmark properties well in terms of distribution over metropolitan locations. The same is true for the PRAC 811s and their potential benchmarks. Across the six categories of developments, those located in the central city portions of MSAs account for the largest share (approximately 50 percent) of the total, followed by those located in the suburbs (24 to 35 percent).
The geographic distribution of the potential benchmarks tracks the PRAC 202s extremely well, as can be seen in the exhibit. Similarly, a majority (55 percent) of the PRAC 811 units are located on the two coasts. The PRAC 811s’ principal benchmarks follow a similar geographic distribution, but with a somewhat smaller percentage in the South Atlantic region.
Summary
We found a sufficiently large number of housing developments in the HUD-assisted multifamily stock with complete cost data reported in Annual Financial Statements that can be used to create benchmarks for the costs of operating PRAC 202 and PRAC 811 projects. We explored using the following properties as benchmarks:
• For PRAC 202s: Section 8/202 elderly projects and Newer Assisted Section 8 Elderly projects.
• For PRAC 811s: Section 8/202 projects for people with disabilities and Newer Assisted Section 8 Disabilities projects.
Our analysis suggests that the costs of these properties can potentially serve as good benchmarks for the operating costs of the PRAC properties, for a number of reasons. First, the benchmarks projects were built to serve populations similar to those of the PRAC properties. They have very similar programmatic and operating environments. Second, the geographic distributions and property characteristics of the PRAC projects and benchmark properties are similar. Building age is an exception, but it appears that age is not a significant cost driver. The PRAC 811 projects typically are smaller than the benchmark properties, with fewer units. However, we found a sufficient number of small-size developments in the HUD-assisted multifamily housing stock for the elderly and people with disabilities to make benchmarking possible.
16 Definitions for the census geography are shown in Exhibit A-1 of Appendix A.

Chapter 3. Levels and Patterns of Operating Expenses 13
Chapter Three Levels and Patterns of Operating Expenses
This chapter presents a descriptive analysis of the historical operating expenses of the Section 202 and 811 developments receiving PRAC subsidies, and their benchmark properties. It is organized as follows. The first section examines the distribution of the per-unit-month expenses using summary statistics, separately for the analytic categories of properties identified in the previous chapter. The second section investigates the cost patterns and correlation between the expense levels and key project, program and location characteristics of the properties. Additional expense items are examined in the third section. A summary of the findings is provided in the last section of the chapter. Level of Operating Expenses
Following the approach developed in the Harvard GSD cost study, this analysis focuses on the non-utility component of the operating expenses. The operating expense level for a property is defined as the sum of the following three line items reported in the Annual Financial Statement:
• Total administrative expenses (line item 6200/6300)17
• Total operating and maintenance expenses (line item 6500)
• Total taxes and insurance expenses (line item 6700) In general, non-utility expenses account for the lion’s share of a property’s overall operating expenses. To smooth out any year-to-year cost variations that represent non-recurring and idiosyncratic expenses, we used a simple average of the total expense levels from the three years (2002-2004) as our analysis variable. Exhibit 3-1 shows, separately for the six groups of properties, key summary statistics on the 2002-2004 non-utility expense levels. All figures are in 2004 dollars and converted to per-unit-month (PUM) measures. The summary statistics are:
• Mean • Median • Standard deviation • Percentile statistics (10th, 25th, 75th, and 90th percentiles) • Number of projects with expense level less than $100 • Number of projects with expense level more than $900
17 The line item for bad debts (6370) can be considered either as an expense or a (negative) revenue item.
Consistent with the Harvard Cost study, we kept bad debts as part of the total administrative expenses. The vast majority of these HUD-assisted properties have zero bad debts.

Chapter 3. Levels and Patterns of O
perating Expenses
14
Exhibit 3-1: Summary Statistics of Per-unit-month Non-utility Operating Costs
2002-2004 Reported in 2004 Dollars
PRAC 202 Section 8
202 Elderly
Newer Assisted Section 8 Elderly PRAC 811
Section 8 202
Disability
Newer Assisted Section 8 Disability All
Number of projects 1,559 2,653 1,639 1,667 1,632 78 9,228
Number of units 71,830 185,718 149,268 20,732 26,681 5,798 460,027
Mean $286 $310 $300 $316 $309 $307 $305
Median $271 $291 $273 $262 $241 $271 $274
Standard Deviation $104 $109 $109 $253 $363 $136 $206
Percentile Statistics
10th Percentile $175 $193 $204 $150 $129 $195 $163
25th Percentile $217 $237 $233 $196 $162 $229 $215
75th Percentile $340 $357 $334 $362 $352 $339 $348
90th Percentile $415 $456 $438 $508 $520 $497 $462
Number of Records with Cost Less than $100 10 6 2 24 59 0 101
Number of Records with Cost More than $900 1 2 6 32 35 0 76

Chapter 3. Levels and Patterns of Operating Expenses 15
For the PRAC 202 housing stock, the mean ($286) and median ($271) expense levels are reasonably close, with a standard deviation of $104 for the entire cost distribution. The standard deviation measures how spread out a distribution is. In terms of extreme values,18
we found a small number of projects (10) with expenses less than $100. They most likely are the result of reporting errors in the financial statements/REMS and were, therefore, excluded from subsequent analysis. Similarly, expense levels above $900 are too extreme and were not used in the analysis. We found only one such PRAC 202 project.
The benchmark properties have consistently higher costs than the PRAC 202s, in terms of the mean, median, and percentile statistics. Standard deviations are almost identical for the PRAC 202s’ ($104) and their benchmark properties’ ($109) cost distributions. The PRAC 811s have a median expense level of $262, which differs from the PRAC 202s’ median by just $9. The mean expense level ($316), on the other hand, is substantially higher than the median, an indication either that the PRAC 811s’ cost distribution is uneven and skewed to the right or that there are a handful of projects with extremely high expense levels. Our review of the cost records supports the latter hypothesis. As shown in the bottom panel of Exhibit 3-1, there are 32 projects with expenses over $900; a closer examination reveals that over half of these projects reported an expense level of $2,000 or more. At the other end of the spectrum, there are 24 PRAC 811 projects with an expense level under $100. All these extreme cost values are excluded from the subsequent analyses. The standard deviation for the PRAC 811s’ cost distribution is $253, which is more than 2 times the level for the PRAC 202s. This is an indication that the PRAC 811 cost distribution is more spread out. The PRAC 811s’ principal benchmarks, Section 8 202 Disability, generally have lower expense levels, as indicated by their mean, median, and most of the percentile statistics. Exhibits 3-2 to 3-4 compare the cost distributions of these properties using kernel density plots. Kernel density plots are a smooth version of histograms.19
They are a useful descriptive tool for comparing the shape of distributions from different populations. Exhibit 3-2 compares the PRAC 202s with PRAC 811s, while Exhibits 3-3 and 3-4 put the PRAC 202s and PRAC 811s side by side with their own benchmark properties.
18 Our speculation is that the extremely low and high per-unit-month figures found in the AFS data are most
likely the result of erroneous unit counts reported in REMS. 19 Like histograms, the area under a kernel density curve adds up to one. The Y-axis shows the probability
density.

Chapter 3. Levels and Patterns of Operating Expenses 16
Exhibit 3-2: Kernel Density Plots: PRAC 202s vs. PRAC 811s
2002-2004 Reported in 2004 Dollars
0.
000
0.00
10.
002
0.00
30.
004
0.00
5D
ensi
ty
0 100 200 300 400 500 600 700 800 900 1000Per-unit-month Expense Level
PRAC 202 PRAC 811
Distribution of Operating Expenses

Chapter 3. Levels and Patterns of Operating Expenses 17
Exhibit 3-3: Kernel Density Plots: PRAC 202s vs. Benchmark Properties
2002-2004 Reported in 2004 Dollars
0.
000
0.00
10.
002
0.00
30.
004
0.00
5D
ensi
ty
0 100 200 300 400 500 600 700 800 900 1000Per-unit-month Expense Level
PRAC 202 Benchmark Properties
Distribution of Operating Expenses

Chapter 3. Levels and Patterns of Operating Expenses 18
Exhibit 3-4: Kernel Density Plots: PRAC 811s vs. Benchmark Properties
2002-2004 Reported in 2004 Dollars
0.
000
0.00
10.
002
0.00
30.
004
0.00
5D
ensi
ty
0 100 200 300 400 500 600 700 800 900 1000Per-unit-month Expense Level
PRAC 811 Benchmark Properties
Distribution of Operating Expenses

Chapter 3. Levels and Patterns of Operating Expenses 19
Operating Expenses and Property Characteristics
We next investigated how operating expenses are correlated with project characteristics and geographic locations. Exhibit 3-5 presents, separately for the six categories of developments, cross tabulations of the median expense level by the property and location characteristics we examined in the previous chapter.20
Most of the cost patterns conform to our general expectations. For example, we found that high-rise buildings and projects with large-size units tend to cost more to operate. Projects located in the Midwest/South and non-metropolitan areas have lower operating expenses.
Below we summarize our observations.
• The effect of development size on expense level is apparent and strong. Across the six categories of properties examined, there appears to be a distinct “U” shape relationship between a project’s development size and expense level. As development size increases from 1-4 units to 30 units, operating expenses decline gradually, apparently due to the “economies of scale” effect. However, after hitting the 30-unit and especially the 50-unit threshold, operating costs begin to rise steadily as development size goes up. This cost pattern indicates that properties with 30 to 50 units appear to be the optimal development size in terms of cost effectiveness.
• Unit size (measured in terms of average number of bedrooms per unit) is correlated with costs. As expected, projects with a larger unit size have higher operating costs. This is consistent across the six groups.
• Building type matters. Across all program types, projects classified as high-rise or elevator building type cost more to operate.
• Contrary to our expectations, the correlation between operating expenses and building age appears to be weak for these properties. For the PRAC 202s, expenses are weakly correlated with age. Projects that are placed in service within the last five years are the least expensive to operate. As building age rises, the expense level climbs. For the other five categories of properties, however, no discernable patterns between costs and age are observed. If the multivariate analysis confirms that building age is an insignificant cost driver, this observation has important implications for the validity of our benchmarking approach. It means that reliable cost benchmarks can be obtained, even though the degree of overlap is small between the PRAC developments and their benchmark properties in terms of age.
• As expected, for projects that allow both non-profit and profit-motivated sponsors (Newer Assisted Section 8), those with profit-motivated sponsors have the smallest median operating expenses.
20 Medians, rather than averages, are used in this analysis to mitigate the impact of any remaining extreme
cost values in the data. The extreme values identified in Exhibits 3 have already been excluded.

Chapter 3. Levels and Patterns of Operating Expenses 20
Exhibit 3-5: Comparison of Median Per-unit-month Non-utility Operating Costs 2002-2004 Reported in 2004 Dollars
PRAC 202
Section 8 202
Elderly
Newer Assisted Section 8
Elderly PRAC 811
Section 8 202
Disability
Newer Assisted Section 8 Disability All
Number of projects 1,559 2,653 1,639 1,667 1,632 78 9,228 Number of units 71,830 185,718 149,268 20,732 26,681 5,798 460,027 Development Size
1-4 units $379 $274 $330 $589 $293 5-9 units $299 $262 $289 $248 $188 $287 $229 10-19 units $226 $255 $252 $256 $242 $121 $247 20-29 units $236 $243 $251 $271 $269 $254 30-49 units $263 $277 $251 $303 $315 $235 $271 50-99 units $295 $298 $266 $262 $299 $270 $288 100+ units $306 $309 $291 $348 $289 $302 All $271 $291 $273 $262 $241 $271 $274
Unit Size (Average Number of Bedrooms Per Unit) <= 1 $266 $289 $263 $242 $221 $268 $265 > 1 $281 $293 $285 $300 $306 $275 $289 All $271 $291 $273 $262 $241 $271 $274
Building Type High-rise or elevator $307 $311 $283 $417 $366 $272 $305 Others $251 $263 $259 $248 $235 $271 $252 All $271 $291 $273 $262 $241 $271 $274
Building Age Less than 5 years $240 $274 $252 5-10 years $277 $268 $273 10-15 years $281 $303 $245 $248 $271 15-25 years $274 $286 $288 $308 $239 $274 $277 25+ years $299 $261 $372 $265 $270 All $271 $291 $273 $262 $241 $271 $274
Sponsor Ownership Type Non-profit $271 $291 $278 $262 $241 $275 $274 Profit motivated $264 $271 $264 Limited dividend $322 $296 $322 All $271 $291 $273 $262 $241 $271 $274
Scattered-site Development Yes $283 $265 $326 $252 $209 $213 $241 No $271 $291 $272 $265 $249 $273 $275 All $271 $291 $273 $262 $241 $271 $274
Census Division New England $341 $367 $453 $353 $359 $737 $367 Mid Atlantic $341 $349 $354 $358 $317 $478 $347 East North Central $272 $281 $278 $256 $275 $270 $276 West North Central $247 $240 $229 $244 $194 $454 $231 South Atlantic $260 $283 $271 $212 $164 $319 $241 East South Central $212 $247 $240 $207 $208 $250 $231 West South Central $209 $246 $243 $245 $242 $256 $237 Mountain $236 $275 $263 $228 $234 $268 $257 Pacific $300 $320 $309 $389 $346 $397 $323 All $271 $291 $273 $262 $241 $271 $274
Metro Location Central city $284 $308 $291 $273 $274 $328 $291 Suburb $285 $302 $296 $291 $285 $278 $293 Non-metro $236 $244 $240 $204 $174 $233 $229 All $271 $291 $273 $262 $241 $271 $274

Chapter 3. Levels and Patterns of Operating Expenses 21
• Although our general expectation is that scattered-site developments should incur higher
operating expenses, only data from the PRAC 202s and Newer Assisted Section 8 Elderly group provide supportive evidence. For the other four groups, the opposite is observed.
• The relationship between geography and operating expenses is strong. Consistent with our expectations, developments located on the two coasts are the most expensive to operate, while projects located in the Midwest and South are associated with lower costs. This cost pattern is clear and consistent across the six categories of properties. For example, for the PRAC 202 projects, those located in the New England ($341) and Mid Atlantic ($341) regions cost more than 60 percent to operate than those located in the West South Central ($209) region. The median expense level of the PRAC 811s located in the West North Central region ($244) is about two-thirds of the cost level of projects located in the Pacific region ($389).
• Projects located in non-metropolitan areas are the least expensive to run, compared to projects located in the suburbs and central cities. This observation is consistent across the board.
• Within metropolitan areas, there appears to be no coherent cost relationship between central cities and suburbs across the six groups of properties we examined. For the Section 8 202 Elderly and Newer Assisted Section 8 Disability categories, projects located in central cities are more expensive to operate. For the other four groups of properties, however, the direction of the cost differentials reverses.
It is important to stress that, although cross-tabulations are a useful descriptive tool for exploring cost patterns, they may lead to incorrect inferences because they focus on only one variable at a time. For example, since Exhibit 3-5 indicates that the PRAC 811s located in the suburbs tend to have the highest expense levels, one may conclude that projects located in the suburbs are expensive to operate in general. This cost relationship, however, may disappear once we control for other influences, such as regional location, development size, and unit size. Therefore, using a multivariate approach (i.e., multiple regressions) is imperative if we want to study the determinants of operating expenses. Multiple regressions allow us to look at the impact of each factor on costs, while holding all other variables constant. Additional Expense Items
The Harvard GSD cost study focused exclusively on benchmarking non-utility expenses, because funding for the utility expenses and capital needs of the public housing stock are provided by separate HUD funding streams. Unlike the benchmarks produced by the Harvard GSD cost study, however, the benchmark cost estimates developed for the PRAC 202 and 811 properties need to include utility expenses and contributions to a replacement reserve for future capital needs, because these costs are included in the PRAC operating subsidy. The PRAC 202 subsidy also covers expenses for services, capped at $15 per unit month. The PRAC subsidy can be used to pay for the cost of a service coordinator as long as the project is principally serving the frail elderly.

Chapter 3. Levels and Patterns of Operating Expenses 22
Thus, the components of operating costs reimbursed by PRAC are:
• Non-utility operating expenses
• Utility expenses
• Contributions to replacement reserves
• Services and service coordination (for PRAC 202 projects)
To explore the feasibility of benchmarking the utility expenses, contributions to replacement reserve, and expenses for services using the FHA data, the study team analyzed these expense components reported in the Annual Financial Statements of the PRAC and benchmark properties over the 2002-2004 period. The line items for these three cost components reported in the Annual Financial Statement are:
• Total utility expenses (line item 6400)21
• Elderly service expenses (line item 6900)
• Replacement reserve deposits required by the regulatory agreement (line item S1000-020)
Descriptive statistics of the expense levels for these items are shown in Exhibits B-1, B-3, and B-5 of Appendix B, while cross tabulations of the expenses by project and location characteristics are presented in Exhibits B-2, B-4, and B-6. We found that the utility expense levels of both sets of properties conform to general expectations. Cost variations for utilities are associated with property characteristics in ways that make sense, as is the case for non-utility expenses. In contrast, there is no apparent pattern for the contributions to replacement reserves or for the services expenses reported in the Annual Financial Statements.22
Moreover, only a portion of the elderly projects (26 percent of the PRAC 202s, 35 percent of the Section 8/202 Elderly, and 10 percent of the Newer Assisted Section 8 Elderly) reported any expenses for services in our cost database. This is an indication that the Annual Financial Statements may not be the suitable source of data for benchmarking these two expense components.
21 It is not possible to identify whether the utility expenses reported in the Annual Financial Statements
include renter-paid utilities. 22 Some operators of multifamily assisted housing may incur services coordination expenses, but not report
them separately in Annual Financial Statements. Instead, they may be included in line item 6263 – total administrative expenses.

Chapter 3. Levels and Patterns of Operating Expenses 23
Summary
Overall, we found a sufficiently large number of housing developments in the HUD-assisted multifamily stock with complete cost data that can serve as benchmarks for the cost of operating the PRAC 202s and PRAC 811s. Our analysis suggests that these developments are ideal benchmarks for a number of reasons. First, constructed to serve similar tenant populations, these developments appear to have programmatic and operating environments that are comparable to the PRAC projects. Second, our examination of the property characteristics and geographic distribution indicates that the degree of overlap is large between the PRAC projects and their benchmark developments. A noticeable difference is building age. However, our exploratory analysis of operating cost patterns indicates that age is an insignificant cost driver for this type of properties. In addition, the age factor can potentially be adjusted (or controlled for) in the multivariate analysis. Our review of the historical data shows that the levels and patterns of non-utility expenses of both sets of properties – the benchmark properties and PRAC properties – conform to general expectations. The prevalence of extreme values in the cost database is modest. The same is true for the utility expenses of these properties. One of our key findings is that, for both the benchmark projects and PRAC developments, operating costs are correlated with project characteristics. Project characteristics we examined that appear to affect operating costs include geographic location, development size, unit size, building type, and ownership type. Without controlling for any of these project characteristics, we found that the PRAC 202s tend to have a lower expense level than the benchmark properties, while the PRAC 811s generally are slightly more expensive to run than the benchmark properties. There is no apparent pattern for expenses related to contributions to replacement reserves or for service expenses reported in the Annual Financial Statements. In addition, the reporting of expenses for services is sparse in our cost database.

Chapter 3. Levels and Patterns of Operating Expenses 24

Chapter 4. Cost Model Development 25
Chapter Four Cost Model Development
This chapter describes the development of a cost model that can be used to benchmark the operating costs of the Section 202 and Section 811 projects that have PRAC operating subsidies. It also contains an analysis of the implications of applying the benchmark costs produced by the model to the existing PRAC housing stock. Summary statistics are presented to show the differences between the model cost estimates and current expense levels of the PRAC developments. Technical Approach to Cost Benchmarking
Because expense levels are correlated with property characteristics and locations, an attempt to develop benchmark cost estimates for the PRAC projects must control for the differences in these factors between the PRAC projects and their benchmark properties. There are two benchmarking approaches: developing a cost model through multiple regression analysis, or using a cell-based approach. Multiple regression analysis is a statistical technique that allows an outcome measure (also called the dependent variable, in this case per-unit-month operating expenses) to be expressed as the result of the combination of characteristics that affect it (also called the independent variables) multiplied by their respective regression coefficients. This approach permits us to measure both whether a particular characteristic drives operating expenses and the extent to which that characteristic drives operating expenses. A cell-based approach would sort the benchmark properties into a matrix of property types, based on several property characteristics – for example, medium-sized projects for the elderly in high-rise buildings in non-metropolitan areas of the Northeast – and use the average or median expense level for the properties in each cell as the benchmarks. This approach is inferior to a multiple regression approach for a number of reasons.23
First, to control for all of the relevant property and location characteristics, the number of the properties in many of the cells would be very small or zero. Idiosyncrasies in the operating costs of those individual properties would make the benchmarks less reliable than benchmarks created by a multiple regression approach, which permits controlling for a large number of property characteristics simultaneously without losing sample size. Multiple regression analysis overcomes the problem that there may be no properties in the database that have all of the characteristics necessary to create a cell with a very detailed definition, or too few such properties for their average operating costs to be a useful benchmark.
23 A multiple regression model with only dummy variables is equivalent to a cell-based approach if the
number of variables is small. However, as the number of variables increases, the number of cells will increase exponentially; the average number of observations per cell will in turn become very small. The cost model contains a large number of dummy variables for property characteristics, plus indicators for the projects' geographic locations.

Chapter 4. Cost Model Development 26
Second, the selection of cells for a cell-based approach would be based on expert judgment as to what drives operating costs, but a cell-based approach would not establish whether the expert judgment was correct. The development of a model based on the multiple regression approach will permit us to identify those factors that have a statistically significant impact on costs, rather than simply relying on conventional wisdom. For example, if development size affects operating costs, we will be able to examine the cost model’s coefficients and their level of statistical significance to test which size category has the greatest impact on the expense level, everything else being equal. Does occupancy by people with disabilities affect operating costs? Should neighborhood characteristics be included as part of the cost model? A recent study conducted by the Harvard University Graduate School of Design (GSD) also used the multiple regression approach to develop benchmarks for the operating costs of the public housing stock. 24
Benchmark properties were assisted and unassisted multifamily developments with FHA mortgage insurance. That study focused exclusively on benchmarking non-utility expenses, because funding for the utility expenses and capital needs of the public housing stock are provided by separate HUD funding streams.
Unlike the benchmarks produced by the GSD study, the benchmark cost estimates developed for the PRAC 202 and 811 properties need to include utility expenses and contributions to a replacement reserve for future capital needs, because these costs are included in the PRAC operating subsidy. The PRAC 202 subsidy also covers expenses for services, capped at $15 per unit month. Thus, the components of operating costs reimbursed by PRAC are:
• Non-utility operating expenses
• Utility expenses
• Contributions to replacement reserves
• Services and service coordination (for PRAC 202 projects)
Based on findings reported in the previous chapter, the study team concluded that both the non-utility expenses and utility expenses could be included in a model of operating costs based on benchmark properties, but contributions to a replacement reserve and services expenses should each be treated as an out-of-model adjustment. That is, separate estimates for the replacement reserve contribution and services expenses should be added to the operating cost estimates produced by the model as part of the application of the model results as benchmarks for the initial operating costs of PRAC properties. The determination of the appropriate level for these out-of-model adjustments is beyond the scope of this study.
24 Abt Associates was part of the GSD research team responsible for the cost model development. See Public
Housing Operating Cost Study. Final Report prepared for HUD by Harvard University Graduate School of Design (GSD), June 2003.

Chapter 4. Cost Model Development 27
Proposed Cost Models
To develop the cost model for the PRAC properties, we used expense data from 2002-2004 for the benchmark projects. The study team experimented with alternative specifications of a regression model that fits the data and yields coefficient estimates that conform to general expectations. Variations in the models tested included which cost drivers to include as independent variables and the form taken by particular variables. The search process was informed by the descriptive analysis presented in the previous chapter. The initial list of cost drivers included those shown to be highly correlated with expense levels in the cross tabulations. Among the alternatives we tested were different ways of grouping building types and different ways of grouping unit sizes. We chose the form of these variables that made the most intuitive sense and produced the most robust model coefficient estimates. To smooth out any year-to-year cost variations that represent non-recurring and idiosyncratic expenses, we used the logarithm (log) scale of a simple average of the per-unit-month expense level from the three years (2002-2004) as the dependent (or outcome) variable. The log specification has a number of appealing characteristics. First, the estimated model coefficients can be interpreted as percentage changes in the dependent variable. Second, it implies non-linearity and joint determination of the expense level by all the cost drivers in the model. Third, the specification mitigates a common form of heteroskedasticity in the model’s error term.25
The study team tested both models that combine non-utility and utility expenses and separate models for each type of expense. We concluded that the cost estimates produced by separate models should be more precise, because the vast majority of regression coefficients from the non-utility model are significantly different from those of the utility model. Using a combined model would implicitly force the coefficients to be the same. In contrast, we did not develop separate models for the operating costs of properties serving the elderly and properties serving people with disabilities. This would have reduced greatly the sample size of the properties on which the model was based. We concluded that there were few systematic differences in the costs of operating these properties, after controlling for other property characteristics, and that including the type of population served as an independent variable was superior to developing separate models. The proposed models are presented in Exhibit 4-1, separately for non-utility expenses (Model 1) and utility expense (Model 2). Most of the model coefficients, estimated using ordinary least squares (OLS), are statistically significant.26,27
25 In econometrics, heteroskedasticity refers to the fact that the error term in a regression model has different
variances across subgroups of the observations. Standard errors and t-statistics of coefficients estimated from a model with heteroskedasticity are biased. Wooldridge, Jeffrey M. Econometric Analysis of Cross Section and Panel Data. The MIT Press, October 2001.
Overall, the size and sign (or direction) of the coefficient estimates conform to our general expectations.
26 In Exhibit 4-1, the asterisks indicate the levels of statistical significance. For example, in Model 1, the coefficient estimate for the development size category of 10-19 units is significant at the 1 percent level. This means that there is strong evidence that, controlling for other project characteristics, expense levels for

Chapter 4. Cost Model Development 28
Exhibit 4-1: Coefficient Estimates of Operating Cost Models for the PRAC 202 and 811 Housing Stock Model (1) Model (2) Dependent Variable
Log (Per-unit-month Non-utility Expenses)
Log (Per-unit-month Utility Expenses)
Cost Variable Development Size
Less than 10 units Reference 10-19 units 0.065*** -0.054* (3.51) (1.95) 20-29 units 0.087*** -0.193*** (4.17) (6.10) 30-49 units 0.156*** -0.207*** (7.37) (6.47) 50-99 units 0.126*** -0.330*** (5.49) (9.56) 100+ units 0.099*** -0.288*** (3.98) (7.71)
Unit Size Avg. Number of bedrooms = 1 Reference Avg. Number of bedrooms < 1 -0.019* -0.025
(1.82) (1.60) Avg. Number of bedrooms > 1 0.054*** 0.013
(5.34) (0.85) Building Type
Detached/Semi-detached -0.024* 0.012 (1.90) (0.62)
High-rise/Elevator 0.010 0.252*** (0.76) (12.95)
Other building types Reference Building Age
Less than 15 yr Reference 15-25 yr 0.018 0.018 (1.45) (0.98) 25+ yr 0.006 0.075*** (0.38) (3.13)
Ownership Type Non-profit -0.016 0.122***
(1.49) (7.47)
projects with 10-19 units are significantly different from those of projects with 10 or fewer units (reference category); the probability that this finding is due to chance or artifacts in the data is 1 percent.
27 The ordinary least squares (OLS) estimator estimates operating expense level at the mean. Future research should explore the feasibility and implications of using alternative estimators, such as the stochastic frontiers estimator, and median regressions.

Chapter 4. Cost Model Development 29
Model (1) Model (2) Dependent Variable
Log (Per-unit-month Non-utility Expenses)
Log (Per-unit-month Utility Expenses)
Cost Variable Metropolitan Location
Central City 0.042*** 0.071*** (3.93) (4.51)
Neighborhood Poverty Rate Less than 30% Reference 30%+ 0.044*** 0.011 (2.61) (0.43)
Clientele Serving People with Disabilities -0.020 0.121*** (1.38) (5.46) Serving the Elderly Reference
Geographic Dummies (59) Coefficients omitted for brevity
Coefficients omitted for brevity
Constant Term 5.556*** 4.519*** (112.14) (61.15) Number of Observations† 5,399 5,399
R-squared statistic 0.43 0.29
Notes: †Benchmark properties are: Section 8 202 Elderly, Newer Assisted Section 8 Elderly, Section 8 202 Disability, and Newer Assisted Section 8 Disability. Absolute value of t-statistics in parentheses. * Significant at the 10% level; ** significant at the 5% level; *** significant at the 1% level Below we summarize our observations.
• The R-squared statistics, which measure the proportion of variations of the dependent variable explained by the regression model, are .43 and .29 for the two models and are typical for this type of model based on cross-sectional data.28
• The higher R-squared statistic from the non-utility expense model implies that utility expenses are not as correlated with project characteristics as are non-utility expenses.
For example, the public housing cost model developed by the GSD team has an R-squared statistic of .53. The GSD model has a higher R-squared because it is based on a larger cost database with a richer set of geographic control variables.
28 The study team tested for the influence of outliers in the benchmark properties using statistics such as the
Cook’s Distance and Welsch Distance. Only a handful of observations were identified as problematic. Removing these observations yielded regression coefficient estimates and cost benchmarks that are very close to those reported.

Chapter 4. Cost Model Development 30
• Among the variables used to explain variations in cost, geographic variables account for the largest share. In other words, the most important cost driver for these two models, as well as other operating cost models, is the area of the country in which the property is located. It is not possible to provide a separate coefficient estimate for each metropolitan area and non-metropolitan county in the US, because the large number of these separate geographical entities would mean that estimates for many areas would be based on very few benchmark properties. In creating the geographic groupings for this study, we applied the same rule of thumb derived from our work on the GSD operating cost model for public housing, grouping areas so that no unit of geography has fewer than 25 benchmark properties.29
• In addition to the area of the country in which the property is located, we found that one of the largest cost drivers for utility expenses for this type of housing is development size. There are substantial economies of scale when the building type (whether the building has an elevator, for example) is controlled for in the model. For instance, a property with 10-19 units on average has per-unit-month utility expenses 5.4 percent lower than a comparable property with fewer than 10 units (the reference category), as shown in Model 2.
Each of our cost models includes a total of 59 geographic dummy variables.
30
• In contrast, Model 1 shows that there is “no economies of scale” effect for non-utility expenses. Non-utility expenses climb monotonically as development size increases, everything else being equal. In other words, larger projects cost more to run on a per-unit-month basis. For instance, a property with 50-99 units has non-utility expenses 12.6 percent higher than a similar property with 10 or fewer units (the reference category). The cost study conducted by the Harvard GSD also found almost no evidence of “economies of scale” effect for non-utility expenses. The study found that a project with 100 plus units has per-unit non-utility expenses just 1 percent lower than comparable projects with fewer units.
• Unit size (measured in terms of average number of bedrooms per unit) matters for non-utility expenses. As expected, projects with a larger unit size tend to have a higher non-utility expense level, controlling for all other property and location characteristics. Relative to the reference category (average number of bedrooms equals 1), projects with an average number of bedrooms greater than 1 have a cost add-on of 5.4 percent. Coefficient estimates of the unit size variables for the utility expense model have the correct size/direction, although they are not statistically significant.
• Building type also matters a great deal for utility expenses, although its impact on the non-utility expense level appears to be marginal. The cost model separates the projects into three major building type categories: (1) high-rise/elevator, (2) detached/semi-
29 Projects located in metropolitan areas with fewer than 25 observations are grouped together under their
respective Census Divisions. Following our practice for the GSD study, we grouped all projects located in non-metropolitan areas by Census Divisions.
30 Future research could explore the implications of using alternative development size categories as the reference category.

Chapter 4. Cost Model Development 31
detached, and (3) all other building types lumped together as the reference category.31
• Building age has no impact on the non-utility expense level. In contrast, buildings that are very old (25 or more years) have a utility cost add-on of 7.5 percent.
All else being equal, a high-rise/elevator project costs about 25 percent more to operate in terms of utility expenses, compared with the reference category of “other building types.” Consistent with conventional wisdom, detached and semi-detached projects on average cost 2.4 percent less to run than the reference category in terms of non-utility expenses.
• Projects operated by non-profit owners tend to incur a 12.2 percent cost add-on for their utility expenses, controlling for other project and location characteristics. There are a number of possible explanations for this cost differential. First, by design, many of the non-profit properties may have more common areas in the buildings. Second, there may be a correlation between ownership type and project location. Many of the for-profit benchmark properties are located in the suburbs, whereas non-profit projects typically are built in central city locations. Third, properties operated by non-profits may be less likely than those operated by for-profits to have tenants pay some of the utility expenses and have their rent contributions adjusted accordingly.32
• As expected, projects located in central cities on average have higher non-utility (4.2 percent) and utility expenses (7.1 percent).
It is not possible to identify whether the utility expenses reported in the Annual Financial Statements include renter-paid utilities.
• Neighborhood locations have an impact on a project’s operating expenses. Everything else being equal, projects located in neighborhoods with a poverty rate of 30 percent or more have non-utility expenses 4.4 percent greater than projects located in neighborhoods with a lower poverty rate.
• Once all the property and location factors are controlled for, the type of tenant clientele served (elderly vs. people with disabilities) does not have an appreciable impact on a project’s non-utility expense level. In contrast, compared to projects with similar characteristics, projects serving people with disabilities on average have a 12.1 percent cost add-on for their utility expenses.
31 HUD’s REMS database includes a data element that identifies a project’s building type – high-rise/elevator,
garden/walk-up, row-house, townhouse, or detached/semi-detached. Because a project often contains multiple building types, we further restricted the definition of high-rise/elevator projects to those with at least 50 units in the development. Only high-rise/elevator and detached/semi-detached building types are separately identified in the cost model because they show the strongest impact on expense levels, compared to the other building types.
32 For example, to have separate metering of electricity in each unit, with the tenant billed directly by the provider.

Chapter 4. Cost Model Development 32
Implications of Applying the Cost Models to the PRAC Housing Stock
This section examines the implications of applying the proposed cost models to the PRAC housing stock placed in service by the end of 2004. We applied the proposed cost models for non-utility operating expenses and utility expenses to the PRAC 202 and PRAC 811 projects by starting with the average per-unit-month operating expenses of the benchmark projects with the baseline characteristics.33 Next, for each project, we used the model coefficients to derive a model expense estimate that reflects that project’s specific property characteristics and geographic location.34 In particular, since all the PRAC properties are developed by non-profit sponsors, they all receive the 12.2 percent add-on for its utility expenses from the cost model in the application process. As another example, a high-rise PRAC project located in Boston will also receive the 7.1 percent “central city” add-on and 25.2 percent “high-rise” add-on for its utility expenses (in addition to the 12.2 percent non-profit add-on).35
Exhibits 4-2 through 4-4 compare the model estimates to the most recent (average 2002-2004) operating expenses reported in the Annual Financial Statements of the PRAC 202 and PRAC 811 properties. We did not include properties that had been in operation for two years or less, because we wanted to compare the model expense estimates to stable costs, and first/second year or part-year operating expenses often reflect atypical expenses. It is important to remember that the current expenses of PRAC 202 and PRAC 811 properties may simply represent “spending what you get.” To a very large extent, the historical expense levels are determined by HUD’s Operating Cost Standards (OCS) when the projects were originally funded. Constrained by the amounts established in the original reservations of PRAC contract authority, owners and managers may have tailored their operating expenses both to meet those levels and not to exceed them. Decisions on management practices then persist beyond the first years of operations. Therefore, we do not expect the cost estimates produced by the model to match the current expense levels reported by the PRAC projects. Instead, the objective of this analysis is to examine, using the cost benchmarks, whether the current, administratively determined, PRAC subsidy levels are reasonable, based on comparison with external benchmarks and to assess the potential impact on individual properties and the HUD budget of using such benchmarks in the administration of the PRAC-based programs. Exhibit 4-2 summarizes the implications of using the non-utility expense levels predicted by the cost model as benchmarks for the operating costs of PRAC projects, assuming that the projects for which
33 This is equivalent to setting all the cost variables in the model to their reference categories. 34 Consistent with our approach used in the Harvard GSD study, when applying the cost models to the PRAC
housing stock, we included the cost coefficients that are not statistically significant at the 10 percent level. Most of these coefficients have the correct sign/direction and their magnitude is small relative to the other key coefficients.
35 In the model application process, we applied an adjustment factor that corrects for the prediction bias in the log-linear model. For details, see the technical appendix in the final report for the Harvard GSD cost study.

Chapter 4. Cost Model Development 33
costs are to be benchmarked will be the projects already in the PRAC 202 and PRAC 811 stock or similar projects added to the stock. Exhibit 4-2: Summary Statistics of Project-level Current and Model Non-Utility Expenses (Per Unit Month)
2002-2004 Reported in 2004 Dollars
Number of projects PRAC 202 PRAC 811 All
1,559 1,667 3,226 Number of units 71,830 20,732 92,562
Current Expense
Level
Model Expense Estimate
Current Expense
Level
Model Expense Estimate
Current Expense
Level
Model Expense Estimate
Mean $287 $315 $296 $273 $291 $293 Median $272 $292 $262 $255 $267 $274 Standard Deviation $99 $82 $139 $71 $121 $79 Percentile Statistics
10th Percentile $177 $223 $154 $194 $164 $207 25th Percentile $219 $259 $197 $224 $207 $236 75th Percentile $340 $358 $358 $310 $347 $335 90th Percentile $415 $448 $490 $380 $447 $408

Chapter 4. Cost Model Development 34
On average, the model produces per-unit-month expense estimates for the non-utility costs of projects for the elderly that are almost 10 percent higher than the operating expenses of current PRAC 202 projects ($315 vs. $287). The model produces expense estimates for the non-utility costs of projects for people with disabilities that are almost 8 percent lower ($273 vs. $296). The current PRAC 811 projects that are most costly to operate have operating expenses substantially higher than those produced by the model, as shown by the 90th percentile per-unit-month figures. Exhibit 4-3 presents similar information, comparing the utility expenses estimated by the model to the utility expenses of the current PRAC 202 and PRAC 811 stock. The average is the same for the model estimate and the expenses of the current PRAC 202 stock; the model estimate for the utility cost of housing for people with disabilities is slightly higher on average than the current expense level of PRAC 811 projects. Exhibit 4-3: Summary Statistics of Project-level Current and Model Utility Expenses (Per Unit Month)
2002-2004 Reported in 2004 Dollars
Number of projects
PRAC 202 PRAC 811 All 1,559 1,667 3,226
Number of units 71,830 20,732 92,562
Current Expense
Level
Model Expense Estimate
Current Expense
Level
Model Expense Estimate
Current Expense
Level
Model Expense Estimate
Mean $62 $62 $73 $76 $67 $69 Median $59 $58 $71 $70 $65 $65 Standard Deviation $28 $16 $30 $19 $29 $19 Percentile Statistics
10th Percentile $28 $45 $35 $57 $32 $49 25th Percentile $41 $51 $50 $64 $45 $56 75th Percentile $80 $70 $93 $85 $87 $78 90th Percentile $99 $86 $113 $104 $108 $98

Chapter 4. Cost Model Development 35
Exhibit 4-4 shows the result of adding the utility and non-utility model estimates for each project and comparing them to current expense levels. On average, the model estimates for housing for the elderly remain higher than the current expense levels of PRAC 202 projects, by about 9 percent. The model estimates for housing for people with disabilities remain lower on average, by just over 4 percent. Exhibit 4-4: Summary Statistics of Project-level Current and Model Total Expenses (Per Unit Month)
2002-2004 Reported in 2004 Dollars
Number of projects
PRAC 202 PRAC 811 All 1,559 1,667 3,226
Number of units 71,830 20,732 92,562
Current Expense
Level
Model Expense Estimate
Current Expense
Level
Model Expense Estimate
Current Expense
Level
Model Expense Estimate
Mean $347 $377 $365 $349 $356 $362 Median $329 $346 $330 $326 $329 $338 Standard Deviation $113 $93 $147 $83 $132 $89 Percentile Statistics
10th Percentile $218 $272 $212 $260 $215 $265 25th Percentile $269 $313 $261 $290 $266 $301 75th Percentile $409 $431 $434 $396 $421 $411 90th Percentile $498 $516 $567 $477 $530 $495
For any particular project, the model-based benchmark cost may be higher or lower than the current expense level for that project. Exhibits 4-5 to 4-7 show the range of these differences for the PRAC 202 stock (Exhibit 4-5), the PRAC 811 stock (Exhibit 4-6), and the PRAC 202 and 811 stock as a whole (Exhibit 4-7). For example, the first row of Exhibit 4-5 shows that 9 percent of the current PRAC 202 projects, which contain 7 percent of the total units, have benchmark costs at least 20 percent lower than their current expenses, while 33 percent of the projects (and units) have costs estimated by the benchmark model at least 20 percent higher than their current expenses.

Chapter 4. Cost Model Development 36
Exhibit 4-5: Distribution of Differences Between Current and Model Total Expenses (Per Unit Month) PRAC 202
Model Expense Estimate Differs From Current Expense Level by
Number of Projects
Pct. of Projects
Number of Units
Pct. of Units
-20% or more 138 9% 5,121 7% -10% to -20% 169 11% 7,176 10% -10% to 0% 205 13% 9,697 14% 0% to 10% 288 18% 13,878 19% 10% to 20% 248 16% 12,470 17% 20% or more 511 33% 23,488 33%
All 1,559 100% 71,830 100% Exhibit 4-6: Distribution of Differences Between Current and Model Total Expenses (Per Unit Month) PRAC 811
Model Expense Estimate Differs From Current Expense Level by
Number of Projects
Pct. of Projects
Number of Units
Pct. of Units
-20% or more 319 19% 3,717 18% -10% to -20% 222 13% 3,002 14% -10% to 0% 212 13% 2,701 13% 0% to 10% 202 12% 2,444 12% 10% to 20% 217 13% 2,772 13% 20% or more 494 30% 6,097 29%
All 1,667 100% 20,734 100% Exhibit 4-7: Distribution of Differences Between Current and Model Total Expenses (Per Unit Month) PRAC 202 and PRAC811 Combined
Model Expense Estimate Differs From Current Expense Level by
Number of Projects
Pct. of Projects
Number of Units
Pct. of Units
-20% or more 452 14% 9,256 10% -10% to -20% 387 12% 10,182 11% -10% to 0% 419 13% 12,033 13% 0% to 10% 484 15% 16,661 18% 10% to 20% 452 14% 14,810 16% 20% or more 1000 31% 29,620 32%
All 3,226 100% 92,562 100%

Chapter 4. Cost Model Development 37
Exhibits 4-8 to 4-10 compare, by HUD Region, the total expense estimates (non-utility expenses plus utility expenses) produced by the model with the current expense levels, weighted by the number of units. Definitions of the ten HUD Regions are shown in Exhibit C-1 of Appendix C. For the PRAC 202 projects, nine of the ten regions show model cost estimates that are above the current spending level. In other words, the cost model indicates that, on average, a higher expense level is required to operate the projects in these regions, given the specific property and locational characteristics of the projects. The model produces the highest estimates compared to current expense levels in the Southwest (HUD Region VI) and Northwest (HUD Region X), and the lowest in the Great Plains (HUD Region VII). The percent increases for the Southwest and Northwest regions are substantial because, on average, the current expense levels for these two regions appear to be substantially lower than the other regions. The model expenses for the two regions are largely in line with the other regions. In aggregate, the benchmarks suggest that expense levels for these properties should be 8 percent higher than the current level. For the PRAC 811 projects, our application of the cost benchmarks indicates that overall expense levels should be reduced by 1 percent in aggregate. Only two (Mid Atlantic and Northwest) of the ten regions have model cost estimates above the current expense levels. Exhibit 4-8: Comparison of Current and Model Total Expenses (Per Unit Month), by HUD Region PRAC 202
HUD Region Number of Projects
Number of Units
Current Expense
Level
Model Expense Estimate % Diff.
I. New England 119 5,036 $453 $522 15% II. New York/New Jersey 157 9,901 $474 $516 9% III. Mid Atlantic 150 7,365 $403 $418 4% IV. South/Caribbean 288 13,695 $304 $327 7% V. Midwest 295 12,559 $382 $387 1% VI. Southwest 173 6,516 $274 $323 18% VII. Great Plains 84 3,392 $310 $306 -1% VIII. Rocky Mountain 36 1,468 $329 $350 6% IX. Pacific 170 8,859 $377 $423 12% X. Northwest 75 2,648 $295 $353 20% Total 1,547 71,439 $367 $397 8%

Chapter 4. Cost Model Development 38
Exhibit 4-9: Comparison of Current and Model Total Expenses (Per Unit Month), by HUD Region PRAC 811
HUD Region Number of Projects
Number of Units
Current Expense
Level
Model Expense Estimate % Diff.
I. New England 123 1,116 $499 $508 2% II. New York/New Jersey 159 1,638 $477 $446 -7% III. Mid Atlantic 195 2,237 $366 $385 5% IV. South/Caribbean 455 5,006 $302 $300 -1% V. Midwest 246 3,663 $371 $365 -2% VI. Southwest 127 2,079 $313 $296 -5% VII. Great Plains 69 966 $286 $287 0% VIII. Rocky Mountain 31 418 $317 $331 4% IX. Pacific 148 2,315 $420 $405 -4% X. Northwest 56 743 $312 $340 9% Total 1,609 20,180 $358 $356 -1%
Exhibit 4-10: Comparison of Current and Model Total Expenses (Per Unit Month), by HUD Region PRAC 202 and PRAC 811 Combined
HUD Region Number of Projects
Number of Units
Current Expense
Level
Model Expense Estimate % Diff.
I. New England 242 6,152 $462 $519 12% II. New York/New Jersey 316 11,538 $474 $508 7% III. Mid Atlantic 345 9,602 $395 $411 4% IV. South/Caribbean 743 18,702 $304 $319 5% V. Midwest 541 16,222 $379 $381 1% VI. Southwest 300 8,595 $284 $316 11% VII. Great Plains 153 4,357 $304 $301 -1% VIII. Rocky Mountain 67 1,886 $326 $344 6% IX. Pacific 318 11,174 $386 $419 9% X. Northwest 131 3,391 $299 $351 17% Total 3,156 91,619 $365 $388 6%
Exhibits 4-11 to 4-13 present the comparisons by metropolitan location (central city, suburb, and non-metropolitan). They indicate that, for the PRAC 202s, projects located in central cities and suburbs are most likely to have current expense levels below the model cost estimates. Across metropolitan locations, the current expense levels and model cost estimates on average remain very close for the PRAC 811 projects.

Chapter 4. Cost Model Development 39
Exhibit 4-11: Comparison of Current and Model Total Expenses (Per Unit Month), by Metropolitan Location PRAC 202
Metro Location Number of Projects
Number of Units
Current Expense
Level
Model Expense Estimate % Diff.
Central City 622 34,291 $389 $428 10% Suburb 465 25,004 $361 $390 8% Non-metro 460 12,145 $309 $314 2% All 1,547 71,439 $367 $397 8%
Exhibit 4-12: Comparison of Current and Model Total Expenses (Per Unit Month), by Metropolitan Location PRAC 811
Metro Location Number of Projects
Number of Units
Current Expense
Level
Model Expense Estimate % Diff.
Central City 686 9,262 $377 $375 0% Suburb 508 6,000 $382 $374 -2% Non-metro 415 4,918 $286 $288 1% All 1,609 20,180 $358 $356 -1%
Exhibit 4-13: Comparison of Current and Model Total Expenses (Per Unit Month), by Metropolitan Location PRAC 202 and PRAC 811 Combined
Metro Location Number of Projects
Number of Units
Current Expense
Level
Model Expense Estimate % Diff.
Central City 1,308 43,553 $387 $416 8% Suburb 972 31,003 $365 $387 6% Non-metro 876 17,063 $302 $306 1% All 3,156 91,619 $365 $388 6%
To summarize, we found that PRAC 202 projects located in many parts of the country appear to require an operating expense level higher than their current expense levels, according to the cost models we developed. This is particularly the case for projects located in the New England, Southwest, and Northwest regions, and those serving the central cities and suburbs. In contrast, PRAC 811 projects in most of the regions are on average operating at an expense level above or at the amount predicted by the cost models.

Chapter 4. Cost Model Development 40

Chapter 5. Field Testing 41
Chapter Five Field Testing
This chapter presents findings from the field testing component of the study. To examine the reasonableness of the cost model estimates, the study team has field tested the results on a purposive sample of Section 202 and 811 developments receiving PRAC subsidies. A key objective of the field tests was to identify local factors and project-specific circumstances that may explain the differences between a project’s cost model estimate and its expense level determined by the field tester. The chapter is organized as follows. The first section presents our technical approach to the field tests. The second section discusses the characteristics of the sample properties. Findings from the field tests are discussed in the third section. The last section provides a summary. Technical Approach to Field Testing
To investigate whether the recommended model is producing cost benchmarks that make it feasible to operate PRAC 202 and 811 housing developments, the study team field tested the proposed benchmarks in a total of ten PRAC 202 and 811 projects from two metropolitan areas (MSAs) (and their nearby rural areas). Field test projects were deliberately selected to represent a mix in each MSA of projects with current (i.e., recent historical) operating expenses that are substantially above and substantially below the cost benchmarks. Test projects were also chosen to represent a mix of central city, suburban and rural locations in areas of the country with high and low housing costs. With limited resources for field testing, we decided, in consultation with HUD, to focus the field testing effort on properties that have very different actual current expenses than those predicted by the model. Therefore, the results of the field tests do not tell us whether the model is, on average, producing estimates consistent with reasonable expense levels. Instead, the field testing was intended to suggest some of the issues that might need to be addressed if these cost benchmarks were used in the administration of the PRAC programs.
Judy Weber, a nationally recognized expert on the management of affordable rental housing, conducted the field tests.36
36 Ms. Weber, a real estate practitioner for more than 25 years, has managed several large portfolios of
multifamily developments, many of which were originally financed by the Section 202 and 811 programs. She was the task leader in charge of the field testing component of the Harvard GSD cost study.
The field work included a one-day site visit to each of the properties. Prior to the site visit, the field tester was given, for each property, the model-based expense level as well as line-item level expenses reported to HUD from the past four years (2001-2004). Also available were metropolitan-level cost databases such as those published annually by the Institute of Real Estate Management (IREM) and other industry groups. The field tester’s task was to determine whether the model-based expense levels are reasonable to operate the selected PRAC 202 or 811 properties in these markets, assuming efficiency of operation as well as compliance with all regulatory requirements regarding leasing and occupancy, reporting, physical standards, and financial

Chapter 5. Field Testing 42
management. Reasonableness is further defined as what is normal and customary in the local housing market. Below is a summary of the steps for conducting the field tests.
• The owner of each sample property was contacted in the summer of 2006. In addition to the one-day site visit, the field tester requested from the owner copies of the 2005 audited Annual Financial Statement and the 2006 budget.
• During the site visit, the field tester conferred with owner and/or management agent staff to learn about the operation of the development.
• The field tester took photographs of the neighborhood, buildings, common areas, and sample units.
• Based on information collected at the study site, the field tester put together a detailed operating budget using HUD Form 92410 for all the sub-accounts included in:
– Total administrative expense (Line 6200/6300)
– Total utility expense (Line 6400)
– Total operating and maintenance expenses (Line 6500)
– Total taxes and insurance (Line 6700)
– Total Service Expenses (Line 6900)
– Replacement Reserve deposits required by the regulatory requirement (S1000-020)
• The budget prepared by the field tester included a staffing plan for the development by position title and salary. Any resident services staffing is included in the Total Services Expense line item.
• In preparing the budget, the field tester used her professional experience in determining the staffing and compensation, service level, and contract costs.
• In the budget shells, a narrative of justification is provided for each sub-account or line item.
• The budget year was January 1 to December 31, 2006.37
• After the site visit, a narrative case study report was written for each of the study sites, summarizing the project characteristics, management responsibilities, staffing, and spending levels from recent years. In addition, the report comments on the adequacy of the cost model estimate, given the local factors and any special circumstances of the property. Because deferred capital improvements may affect operating expense level, where warranted, the case study report also discusses the effect of these unfunded capital needs on costs.
The site visits were conducted during the months of October and November 2006.
37 When the model cost estimates were compared to the field testing budgets, the Consumer Price Index (CPI)
was used to adjust the model estimates to 2006 dollars.

Chapter 5. Field Testing 43
Description of the Properties for Field Testing
Based on property characteristic data reported in HUD’s REMS system, the study team selected the Boston, MA-NH MSA and the Columbus and Dayton, OH MSAs as the sites for the field testing work. Boston is a high-cost area located on the East Coast, and Ohio is a low-cost housing market located in the Midwest. Both areas have a sufficiently large number of PRAC properties to make it possible to select a mix of projects. Exhibit 5-1 presents the 10 study properties, with information on the key project characteristics.38, 39
The criteria for selecting these developments included:
• Sites that represent an equal number of PRAC 202 and PRAC 811 properties. Half (5) of the sites were PRAC 202s and half (5) were PRAC 811 projects.
• Half (5) of the sites were to be in the greater Boston area and half (5) were to be in the Columbus and Dayton areas of Ohio.
• A mixture of central city (4), suburban (5) and nearby rural (1) locations.
• Sites with current expense levels that varied significantly from the model-predicted levels, either higher or lower. Current expenses are based on a 3-year average of information reported in the Annual Financial Statements by the owners.
The model produces higher costs estimates than current expenses for 6 of the field testing developments and lower costs for 4 developments. Overall, the model predicts higher costs for the PRAC 202s than the properties have experienced, as discussed in the previous chapter. Therefore, to more thoroughly investigate the model’s reliability, a larger number of PRAC 202 properties (4) were selected for which the model predicts higher than actual current costs rather than lower costs. The one PRAC 202 property for which the model predicts lower costs was field tested in the lower-cost Dayton, OH MSA.
• Properties representing different owners and management agents.
38 HUD’s REMS system reports that there are 58 units in the AHEPA 113 Apartments. Our site visit,
however, indicates that the project has 57 units. Similarly, based on information provided by the property owners, the unit counts for Network Housing 92 and Prospect Street Apartments should be 12 and 8, rather than 18 and 7 reported in the REMS database. The study team assumed that this unit count information provided by the owners is more accurate.
39 The Blue Ledge Cooperative Apartments is also known as Roslindale Senior Non-Profit Housing in the HUD database.

Chapter 5. Field Testing
44
Exhibit 5-1: Properties Selected for Field Testing
PRAC Type
Property Name City/State
Location Type
Current Expense (in 2004 dollars)
Model Expense (in 2004 dollars) % Diff. Units Owner Management Agent
202 AHEPA 113 Apartments
Dayton, OH Suburb $440 $344 -22% 57 AHEPA 113, Inc. AHEPA Management Co.
202 Seton London Columbus, OH Suburb $260 $356 37% 50 Seton London, Inc. BRC Properties, Inc.
202 Mission Springs
Holliston, MA Suburb $402 $589 47% 75 Mission Springs Housing for the Elderly, Inc.
The Community Builders, Inc.
202 Nate Smith House
Jamaica Plain, MA
Central City $495 $644 45% 45 Nate Smith Housing Corp.
Maloney Properties
202 Blue Ledge Coop. Apts.
Roslindale, MA Central City 481$ $651 35% 80 Roslindale Senior Nonprofit Housing, Inc.
CSI Support and Development Services
811 Jireh Villa Columbus, OH Central City $554 $370 -33% 6 Jirah Villa, Inc. Jirah Services
811 Network Housing 92
Columbus, Oh Central city $245 $381 56% 12 Network Housing 92, Inc.
Community Housing Network
811 Prebleway II Eaton, OH Non-metro $396 $309 -22% 5 Prebleway II, Inc. Eastway Corporation
811 Marshfield Group Home
Marshfield, MA Suburb $377 $541 44% 8 South Shore Group Home III, Inc.
South Shore Housing Dev.
811 Prospect Street Apts.
Marlborough, MA
Suburb $834 $565 -32% 8 Advocates Properties, Inc.
Advocates Properties, Inc.
Data: HUD REMS and Annual Financial Statement data.
Notes: Unit information is based on updated counts reported by the owners during the site visits. Current expenses are based on a simple average of data from the past three years reported in the Annual Financial Statements by the owners. Expense levels are in per-unit-month basis.

Chapter 5. Field Testing 45
Findings
Case study reports for the 10 study sites are included in Appendix D. Exhibit 5-2 compares the cost model estimates with the field tester’s operating budget estimates. Both estimates are in 2006 dollars for ease of comparison. It also contains breakdowns of the field tester budgets by the four sub-accounts, as well as expenses on resident services and deposits to the replacement reserve account. Below we present our observations across the field test sites. 1. Most of the property owners and managers reported that their current PRAC subsidies were
insufficient to sustain the properties for the long haul. Some are operating at chronic deficits, reportedly resulting from reasons such as not seeking routine rent increases to large increases in fixed costs (such as property taxes or utility rates) that outstrip budget estimates.
• The vast majority of property owners and managers we interviewed (9) indicated that the current level of PRAC subsidy is inadequate or barely adequate, particularly when funding the replacement reserves at adequate levels is considered.
• While all owners make deposits to the replacement reserve account each year, the deposit amounts (and reserve balances) are generally inadequate to meet future capital needs. Six of the ten properties had annual deposits to the replacement reserves between $15 and $23. This level of deposits is below current underwriting standards recommended in the industry. Consequently, many of these properties have deferred maintenance items associated with reductions in maintenance staff, and growing accounts payable.
• Some of the owners/managers of properties experiencing chronic cash-flow deficits or inadequate subsidy levels did not routinely submit requests to the HUD field office for an increase of their HUD contract rents.
2. The cost model estimates align well with the operating budgets recommended by the field
tester. However, some properties have property-specific and local conditions that the model does not appear to account for well.
• Across the 10 field test developments, 6 properties (4 PRAC 202s and 2 PRAC 811s) have cost model estimates that are equal to or higher than the field testing results. In other words, the field tester determined that the cost benchmarks produced by the model would be sufficient to operate these properties. For two of the projects (Seton London and Network Housing 92), the model estimates are within 6 to 7 percent of the field testing results – an indication that the cost model is accurate in predicting the desirable operating expense level in these cases.

Chapter 5. Field Testing
46
Exhibit 5-2: Comparison of Field Tester’s Operating Budget Estimates and Model Expenses, Per Unit Month
PRAC Project Type 202 202 202 202 202 811 811 811 811 811
Property Name AHEPA
113 Seton
London Mission Springs
Nate Smith House
Blue Ledge Coop. Apts. Jireh Villa
Network Housing
92 Preble-way II
Marsh-field
Prospect Street
Metropolitan Location Dayton Columbus Boston Boston Boston Columbus Columbus Dayton Boston Boston Number of Units 57 50 75 45 80 6 12 5 8 8
Model Expense (in 2006 Dollars) $369 $382 $633 $692 $698 $398 $409 $332 $581 $607
% Diff. From Field Tester Estimate -25% 6% 25% 27% 24% -26% 7% -25% 60% -16%
Field Tester's Operating Budget Estimate (in 2006 Dollars)
Administrative Expenses $129 $108 $125 $155 $131 $171 $135 $117 $98 $322 Utilities Expenses $91 $85 $167 $148 $153 $118 $106 $89 $122 $102 Operating & Maintenance Expenses $93 $91 $140 $130 $177 $101 $109 $143 $92 $193 Taxes & Insurance $180 $77 $75 $112 $101 $147 $31 $92 $50 $106
Total Operating Expense (Field Tester's Budget Estimate) $493 $361 $507 $545 $562 $537 $381 $441 $362 $723
Resident Services* $45 $24 $65 $36 $33 $0 $17 $0 $0 $0 Replacement Reserve Deposit* $20 $19 $32 $34 $78 $47 $16 $17 $15 $23
Total Operating Expense Including Resident Services and Replacement Reserve Deposit $558 $404 $604 $615 $673 $584 $414 $458 $379 $745 HUD Contract Rent $543 $348 $569 $649 $555 $705 $368 $430 $316 $952 Notes: * Expenses for resident services and replacement reserve deposits are based on the spending levels from the most recent year reported by the owners.

Chapter 5. Field Testing 47
• Among the 4 projects with a large (positive) difference between the model’s cost estimate and the field tester’s recommended budget, the field tester found that the model cost estimates for 3 projects are still in the reasonable range. The higher-than-current expense levels that the model would permit are prudent, because they would help position these properties to meet their future capital needs and cash flow challenges. A case in point is Mission Springs, a PRAC 202 development located in a suburban portion of the Boston metropolitan area. The property is well maintained and well run. However, because its HUD contract rent has been less than the overall operating expenses, the property operates at a chronic, albeit modest, cash flow deficit. The greatest cost increase over the past 5 years has been in utilities, particularly natural gas, for which costs have gone up 88 percent over the period. At the same time, the replacement reserve is being depleted at an increasing rate because the project routinely seeks reimbursement from the replacement reserve account for allowable reserve items, but the replacement reserves are not being funded at levels consistent with the capital needs assessment. Given this background, a model-produced expense level higher than the field testing estimate could better position the property.
• There are 4 properties – 1 PRAC 202 and 3 PRAC 811s – with model cost estimates below the budget recommended by the field tester. Property-specific circumstances that could not always be controlled by the property owner or manager play a large role in explaining these cases. For example, real estate taxes varied greatly across locations and years for the Ohio properties, ranging from $0 to $118 on a per-unit-month basis for the 5 field test properties in 2005. AHEPA 113, a PRAC 202 project located in Dayton, OH, had an increase in real estate taxes from $66 per-unit-month in 2002 to $118 per-unit-month in 2005, an exceptionally high amount. As a comparison, the other Ohio PRAC 202 (Seton London) in the study paid real estate taxes of $36 PUM in 2005. The AHEPA project also had higher than average administrative expenses because it contributed to the staff’s 403(b) plan, an unusual, but not unheard of, benefit. In the absence of these two unusual expense items, the field tester estimated that the model cost would be sufficient to cover the routine operating costs.
3. The smaller, service-enriched PRAC 811s are more vulnerable to per-unit-cost fluctuations,
than the larger PRAC 202s.
• Development size is another factor contributing to differences between the cost predicted by the model and the field tester’s budget. When properties have a very small number of units, there are only a small number of units over which to spread fixed costs or costs related to an unusual feature of the property. This is especially pertinent for the PRAC 811 projects, which have a very small number of units by design. The Jireh Villa property is an example. Located in Columbus, OH, Jireh Villa is a PRAC 811 group homes with 2 sets of 3-bedroom units. Together they are counted as 6 units. While there are only 6 units, each group home is unusually spacious (over 2,500 square feet each), and the bedrooms for the residents are large. As a result, expenses on items such as landscaping services ($27 PUM in 2005) and property insurance ($51 PUM in 2005) were higher than the industry norm considered on a per unit month basis, but not out of line with the property’s needs, in the field tester’s view. Costs for training ($25 PUM) and audit ($31 PUM) also are expensive for this property, because there were only 6 units

Chapter 5. Field Testing 48
to spread the burden of such administrative items. While the field tester’s budget accepted these amounts, she believes it would be feasible to trim them to accommodate the amounts suggested by the model cost estimates. For instance, since it is such a small development, the owner could self-certify – rather than hiring an outside party to audit their annual revenues and expenses.
• Prospect Street Apartments is another case where the field tester’s budget is above the cost estimate predicted by the model. Located at the edge of the Boston metropolitan area, the property is a small (2 one-bedroom and 3 two-bedroom, counted as 8 units) independent living project serving 8 individuals with mental disabilities. The project has a history of exceptionally high administrative expenses and operating and maintenance expenses. In the field tester’s 2006 budget estimate, the total administrative expenses and operating and maintenance expenses amounted to $322 PUM and $193 PUM. They were the highest among the 10 study sites. There are a number of contributing factors. First, unlike a group home setting where there is a presence of on-site 24-hour personnel (usually funded by the state’s mental health system) to assist the tenants, this project has been handling the vast majority of its operating and maintenance functions on an “on-call” basis without the presence of on-site staff. Where the service component is administered on-site, the service staff can often perform incidental property operating functions (for example, changing a light bulb, unclogging a toilet) that in this situation would require an after-hours maintenance call. Therefore, it is expensive to serve tenants with mental disabilities in an arrangement such as the Prospect Street Apartments.
• In contrast, the Marshfield Group Home, another PRAC 811 property in the Boston area serving a similar tenant population, is staffed with on-site 24-hour personnel with funding provided by the state’s Department of Mental Health. Because the on-site staff member often performs a lot of the administrative and operating functions, this helps to keep the overall administrative and operating costs down for the property’s operating budget. According to the field tester’s estimate, the total administrative expenses and operating and maintenance expenses were $98 PUM and $92 PUM. This explains why the model cost estimate for this property is substantially higher than the field tester’s budget. The project also benefits from a relatively low cost of operation in part because it is located at the fringe of the Boston metropolitan area.
• Prebleway II, a 5-unit PRAC 811 located in Dayton, OH, is a similar case but it also has some cost features that are unique to the property that were accepted by the field tester in her budget estimate but could be reduced, as they are above the industry norm. . Individual budget line items with significant expenditures that create costs above the model estimate include landscaping services ($39 PUM) and management fees ($47). In addition, the property has chosen to handle all of its maintenance requirements through outside contractors.
4. The cost model generally produces higher estimates than the field tester’s budget in the
Boston metropolitan area.
• Four out of five Boston projects have higher model cost estimates than the field tester’s budget. This most likely is the result of the lumpiness of the geographic groupings in the cost model specification.

Chapter 5. Field Testing 49
Summary
The study team deliberately chose PRAC 202 and PRAC 811 field test developments with a benchmark produced by the cost model that is either substantially higher or substantially lower than their current expense levels. Given the total number of study sites involved and the purposive nature of the sample, the field tests are not designed to provide statistical evidence on the robustness and reliability of the cost model estimates in general. Rather, field testing is a tool for identifying the local factors and project characteristics that shape some of these outlier cases. Nonetheless, results from the field tests indicate that, among the projects we examined, the cost benchmarks are generally credible and reasonable. At the same time, for some properties, local factors and unique project characteristics unaccounted for by the model can have a significant effect on the cost levels. This is especially the case for the PRAC 811s, for which project size tends to be very small. The special project characteristics identified in the field testing include:
• Real estate taxes. Non-profit owners negotiate their treatment of Payment-in-Lieu-of-Tax (PILOT) with the local government. Payments can vary greatly across locales and time.
• Whether a PRAC 811 property is operated as a group home (with on-site full-time support staff funded by the local or state government who, in effect, provide some of the housing management functions for the property) or an independent living project (without on-site full-time support staff).
• Whether the property is eligible to self-certify or is required to submit an audit on its annual financial statements. Currently, this option is available only to the PRAC 811s.
• Whether a majority of the operating and maintenance functions are performed by the project staff or are contracted out.
• Whether some of the housing management functions are performed by volunteers.
• Whether the project contains a very small number of units.
• Whether the project is located in a lower-cost area within the larger geographical area on which the model’s cost estimates are based, such as the fringe of a larger metropolitan region.

Chapter 5. Field Testing 50

Chapter 6. Policy Recommendations 51
Chapter Six Policy Recommendations
This chapter provides recommendations for the potential use of the cost model estimates by HUD and identifies directions for further analysis of the operating costs of the PRAC 202 and PRAC 811 properties. Overall, results from the field tests and model applications indicate that it is feasible to benchmark the operating expenses of the PRAC developments using operating costs of other HUD-assisted properties that serve similar tenant populations. While the benchmarks produced by the cost model could be improved, they may already be superior to the current Operating Cost Standards as a basis for reviewing operating budgets during HUD’s firm commitment processing (i.e., underwriting) of the project and for calculating reservations of PRAC funds. They may also be superior to the reference points currently used by HUD field staff during their review of requests for operating budget increases made by owners of PRAC properties already in operation. Therefore, we recommend that HUD consider moving immediately to the use of operating cost standards based on this type of model. We do not recommend that model-produced standards be applied to PRAC 202s and PRAC 811s without further review of the operating budgets of each property during firm commitment processing and when owners ask for annual increases. Rather, they should serve as expected per unit operating expense levels. HUD staff would then make adjustments—up or down—based on such special property characteristics as those identified in the field testing conducted for this study. A first step might be to engage HUD field staff responsible for administering the PRAC programs and industry groups in a discussion of whether such an approach would be an improvement on the current system and whether the benchmarks produced by the current version of the model make sense. In addition to achieving “buy in” from those most affected, those discussions could identify additional special project conditions that HUD staff might take into account when applying the results of the model and additional local factors and project characteristics that might be incorporated into future versions of the model. If operating cost standards based on this type of model were used as guidance for reviewing operating budgets, at some point in the future the model also could be used in support of HUD budget requests for PRAC. Should HUD decide to proceed with using cost model benchmarks or to consider this approach further, the study team has the following recommendations for additional work on the cost benchmarks. This work could proceed at the same time as discussions with HUD staff and industry representatives. The recommendations for additional study and analysis fall into three categories:
• Additional field testing
• Refinements to the model

Chapter 6. Policy Recommendations 52
• Benchmarks for costs not covered by the model: replacement reserves and services Additional Field Testing of the Current Model Estimates. We recommend additional field testing as a necessary step for developing the guidance needed by HUD staff for using the model’s cost estimates as bench marks. The Harvard GSD cost study, for example, conducted field tests on more than 100 properties. Future test samples should include a greater number of geographic areas and should not be dominated by outlier cases. The main purpose of the additional field testing would be the further identification of special development characteristics to be taken into account by HUD staff when reviewing operating budgets. At the same time, the results of the field tests could also help guide improvements to the model. For example, the field tests could suggest alternative ways of grouping geographic areas for the model’s geographic dummies. There may also be development characteristics captured by HUD’s data system or another readily available dataset that we overlooked in the current version of the model. Information collected from a larger sample of field tests might also be used to set ceilings and floors to be used in the application of the overall cost benchmarks. Refinements to the Model. We have already identified additional work on the model that could proceed at the same time as further field testing. This includes:
• Fine-tuning the geographic groupings in the cost model. Specifically, groupings for large metropolitan areas – such as the New York and Boston Consolidated Metropolitan Statistical Areas (CMSA) – can be subdivided into housing markets so that the model can produce separate estimates for different regions of the same metropolitan area.
• Exploring whether it is possible to find a variable in REMs or another readily available dataset to proxy group homes or developments with on-site staff supported by another funding stream.
• Determining if it is feasible to adjust the data used to create and apply the model of utility costs to account for tenant-paid utilities. For example, it might be possible to use the data from the household-level HUD-Form 50059 to identify the types of properties most likely to have tenant-paid utilities and to develop proxies for those amounts.
• Testing additional specifications and functional forms for the model. For example, one of the reviewers of the draft version of this report suggested that changing the reference categories for some of the variables might produce different results. Another reviewer suggested that we conduct sensitivity testing on the models using a median regression approach.
Costs Not Covered by the Model. We have identified two components of the operating costs of PRAC properties that cannot be benchmarked using other properties in the HUD assisted stock: contributions to replacement reserves and services costs. It would be desirable to provide HUD staff with additional guidance on how to assess these components of operating budgets.

Chapter 6. Policy Recommendations 53
Research on industry standards for contributions to replacement reserves and their applicability to PRAC properties could be undertaken to develop guidance for HUD staff in reviewing this important component of operating expenses. The field testing undertaken for this study confirmed what we already suspected: that the amount of contribution to replacement reserves currently is more a function of whether the property is amply funded or squeezed than of a realistic assessment of the property’s needs. Services costs are a very difficult area for which to create benchmarks, as they vary with the characteristics of the residents (age and type of disability) and, in particular, with the local and state services environment and availability of other funding streams. Nonetheless, it would be possible to collect data on the services costs of PRAC 202 and PRAC 811 properties—and who pays for them--to determine whether the $15 PUM current limit on services is reasonable and also to develop per unit cost benchmarks for services coordination.

Chapter 6. Policy Recommendations 54

Appendix A. Definition of Census Geography 55
Appendix A Definition of Census Geography
Exhibit A-1: Definition of Census Geography
Census Division State
New England Connecticut, Massachusetts, Maine, New Hampshire, Rhode Island, Vermont
Mid Atlantic New Jersey, New York, Pennsylvania
East North Central Illinois, Indiana, Michigan, Ohio, Wisconsin
West North Central Iowa, Kansas, Minnesota, Missouri, North Dakota, Nebraska, South Dakota
South Atlantic District of Columbia, Delaware, Florida, Georgia, Maryland, North Carolina, South Carolina, Virginia, West Virginia
East South Central Alabama, Kentucky, Mississippi, Tennessee
West South Central Arkansas, Louisiana, Oklahoma, Texas
Mountain Arizona, Colorado, Idaho, Montana, New Mexico, Nevada, Utah, Wyoming
Pacific Alaska, California, Fed State of Micronesia, Guam, Hawaii, Northern Mariana Islands, Oregon, Palau, Virgin Islands, Washington

Appendix A. Definition of Census Geography 56

Appendix B. Summary Statistics of Additional Expense Items 57
Appendix B Summary Statistics of Additional Expense Items
Exhibit B-1: Summary Statistics of Per-unit-month Utility Expenses
2002-2004 Reported in 2004 Dollars
PRAC
202
Section 8 202
Elderly
Newer Assisted
Section 8 Elderly
PRAC 811
Section 8 202
Disability
Newer Assisted
Section 8 Disability All
Number of projects 1,559 2,653 1,639 1,667 1,632 78 9,228 Number of units 71,830 185,718 149,268 20,732 26,681 5,798 460,027 % of projects reporting utility expenses 99.8% 100.0% 100.0% 99.1% 99.3% 100.0% 99.7% Mean $62 $64 $58 $76 $75 $56 $67 Median $59 $61 $55 $71 $70 $54 $63 Standard Deviation $30 $31 $30 $37 $33 $27 $32 Percentile Statistics 10th Percentile $28 $28 $23 $34 $41 $27 $29 25th Percentile $40 $40 $35 $50 $53 $33 $42 75th Percentile $80 $84 $76 $95 $90 $72 $85 90th Percentile $100 $105 $97 $120 $116 $86 $108 Number of projects with expenses less than $10
12 23 21 14 2 0 72
Number of Projects with expenses more than $160
10 11 6 46 40 1 114

Appendix B. Summary Statistics of Additional Expense Items 58
Exhibit B-2: Comparison of Median Per-unit-month Utility Expenses
2002-2004 Reported in 2004 Dollars
PRAC
202
Section 8 202
Elderly
Newer Assisted
Section 8 Elderly
PRAC 811
Section 8 202
Disability
Newer Assisted
Section 8 Disability All
Number of projects 1,559 2,653 1,639 1,667 1,632 78 9,228 Number of units 71,830 185,718 149,268 20,732 26,681 5,798 460,027
Development Size 1-4 units $37 $84 $76 $85 $84 5-9 units $82 $84 $64 $68 $67 $59 $68 10-19 units $59 $69 $38 $73 $72 $63 $71 20-29 units $55 $53 $49 $63 $66 $60 30-49 units $58 $52 $54 $51 $64 $57 $55 50-99 units $60 $59 $53 $56 $60 $37 $57 100+ units $74 $75 $59 $47 $47 $66 All $59 $61 $55 $70 $69 $54 $63
Unit Size (Average Number of Bedrooms Per Unit) < 1 $72 $58 $69 $59 $61 $114 $61 1 $57 $61 $55 $75 $72 $59 $64 > 1 $60 $68 $52 $64 $72 $46 $61 All $59 $61 $55 $70 $69 $54 $63
Building Type High-rise or elevator $65 $68 $64 $80 $68 $66 $66 Others $55 $49 $39 $69 $69 $46 $60 All $59 $61 $55 $70 $69 $54 $63
Building Age Less than 5 years $57 $71 $63 5-10 years $61 $72 $66 10-15 years $57 $60 $67 $67 $63 15-25 years $76 $57 $55 $67 $69 $46 $62 25+ years $76 $55 $71 $57 $61 All $59 $61 $55 $70 $69 $54 $63
Sponsor Ownership Type Non-profit $59 $61 $63 $70 $69 $65 $65 Profit-motivated $52 $40 $52 Limited dividend $60 $59 $60 All $59 $61 $55 $70 $69 $54 $63
Scattered-site Development Yes $68 $80 $57 $77 $70 $39 $75 No $59 $61 $55 $69 $68 $54 $62 All $59 $61 $55 $70 $69 $54 $63

Appendix B. Summary Statistics of Additional Expense Items 59
PRAC
202
Section 8 202
Elderly
Newer Assisted
Section 8 Elderly
PRAC 811
Section 8 202
Disability
Newer Assisted
Section 8 Disability All
Number of projects 1,559 2,653 1,639 1,667 1,632 78 9,228 Number of units 71,830 185,718 149,268 20,732 26,681 5,798 460,027
Census Division New England $92 $85 $96 $100 $97 $80 $94 Mid Atlantic $83 $77 $63 $87 $95 $103 $81 East North Central $64 $66 $63 $74 $76 $55 $68 West North Central $52 $53 $57 $69 $69 $72 $59 South Atlantic $41 $47 $41 $65 $63 $38 $55 East South Central $63 $72 $37 $63 $63 $57 $60 West South Central $35 $42 $41 $51 $59 $33 $44 Mountain $63 $63 $59 $72 $68 $63 $64 Pacific $53 $53 $50 $58 $60 $60 $55 All $59 $61 $55 $70 $69 $54 $63
Metro Location Central city $63 $68 $59 $68 $71 $64 $66 Suburb $59 $57 $57 $75 $69 $40 $62 Non-metro $59 $56 $51 $69 $65 $52 $59 All $59 $61 $55 $70 $69 $54 $63

Appendix B. Summary Statistics of Additional Expense Items 60
Exhibit B-3: Summary Statistics of Per-unit-month Deposits to Replacement Reserve
2002-2004 Reported in 2004 Dollars
PRAC
202
Section 8 202
Elderly
Newer Assisted
Section 8 Elderly
PRAC 811
Section 8 202
Disability
Newer Assisted
Section 8 Disability All
Number of projects 1,559 2,653 1,639 1,667 1,632 78 9,228 Number of units 71,830 185,718 149,268 20,732 26,681 5,798 460,027 % of projects reporting replacement reserve deposits 99.2% 99.1% 98.2% 98.5% 99.0% 100.0% 98.8% Mean $28 $33 $23 $28 $37 $24 $30 Median $24 $26 $18 $23 $27 $19 $23 Standard Deviation $17 $26 $20 $18 $31 $20 $24 Percentile Statistics 10th Percentile $15 $12 $9 $13 $10 $11 $11 25th Percentile $19 $17 $13 $17 $15 $13 $16 75th Percentile $31 $42 $27 $33 $48 $25 $36 90th Percentile $43 $60 $39 $48 $75 $51 $54 Number of projects with expenses less than $5
3 8 9 13 3 0 36
Number of projects with expenses more than $120
7 41 17 9 40 1 115

Appendix B. Summary Statistics of Additional Expense Items 61
Exhibit B-4: Comparison of Median Per-unit-month Deposits to Replacement Reserve
2002-2004 Reported in 2004 Dollars
PRAC
202
Section 8 202
Elderly
Newer Assisted
Section 8 Elderly
PRAC 811
Section 8 202
Disability
Newer Assisted
Section 8 Disability All
Number of projects 1,559 2,653 1,639 1,667 1,632 78 9,228 Number of units 71,830 185,718 149,268 20,732 26,681 5,798 460,027
Development Size 1-4 units $59 $28 $43 $51 $28 5-9 units $22 $35 $14 $24 $42 $13 $30 10-19 units $21 $22 $23 $21 $20 $20 $21 20-29 units $22 $24 $14 $24 $23 $22 30-49 units $24 $28 $18 $21 $23 $17 $24 50-99 units $26 $26 $18 $31 $20 $19 $23 100+ units $25 $24 $20 $23 $20 $22 All $24 $26 $18 $23 $26 $19 $23
Unit Size (Average Number of Bedrooms Per Unit) < 1 $29 $26 $20 $27 $24 $17 $26 1 $24 $26 $17 $21 $28 $18 $22 > 1 $25 $24 $20 $25 $25 $20 $23 All $24 $26 $18 $23 $26 $19 $23
Building Type High-rise or
elevator $27 $27 $19 $34 $27 $19 $25 Others $21 $24 $17 $22 $26 $19 $22 All $24 $26 $18 $23 $26 $19 $23
Building Age Less than 5 years $25 $25 $25 5-10 years $24 $22 $23 10-15 years $21 $26 $23 $22 $23 15-25 years $26 $26 $21 $31 $27 $21 $24 25+ years $24 $17 $41 $12 $18 All $24 $26 $18 $23 $26 $19 $23
Sponsor Ownership Type Non-profit $24 $26 $20 $23 $26 $21 $24 Profit-motivated $18 $16 $18 Limited dividend $19 $21 $20 All $24 $26 $18 $23 $26 $19 $23
Scattered-site Development Yes $21 $32 $22 $22 $18 $29 $21 No $24 $26 $18 $23 $28 $19 $23 All $24 $26 $18 $23 $26 $19 $23
Census Division New England $27 $37 $26 $30 $32 $25 $30 Mid Atlantic $32 $30 $23 $30 $26 $25 $29 East North Central $23 $22 $17 $21 $21 $13 $21 West North Central $24 $21 $16 $22 $19 $25 $20

Appendix B. Summary Statistics of Additional Expense Items 62
PRAC
202
Section 8 202
Elderly
Newer Assisted
Section 8 Elderly
PRAC 811
Section 8 202
Disability
Newer Assisted
Section 8 Disability All
Number of projects 1,559 2,653 1,639 1,667 1,632 78 9,228 Number of units 71,830 185,718 149,268 20,732 26,681 5,798 460,027
South Atlantic $21 $26 $16 $22 $45 $22 $23 East South Central $19 $21 $22 $17 $12 $18 $18 West South Central $17 $21 $17 $17 $14 $20 $17 Mountain $21 $31 $16 $21 $28 $23 $22 Pacific $30 $30 $19 $31 $39 $19 $30 All $24 $26 $18 $23 $26 $19 $23
Metro Location Central city $25 $27 $19 $22 $25 $20 $24 Suburb $25 $27 $17 $25 $32 $17 $24 Non-metro $21 $24 $19 $21 $23 $19 $21 All $24 $26 $18 $23 $26 $19 $23

Appendix B. Summary Statistics of Additional Expense Items 63
Exhibit B-5: Summary Statistics of Per-unit-month Service Expenses
2002-2004 Reported in 2004 Dollars
PRAC 202 Section 8
202 Elderly
Newer Assisted Section 8
Elderly Number of projects 1,559 2,653 1,639 Number of units 71,830 185,718 149,268 % of projects reporting service expenses 26.4% 34.8% 10.1% Mean $28 $42 $45 Median $19 $25 $18 Standard Deviation $90 $75 $80 Percentile Statistics 10th Percentile $1 $4 $0 25th Percentile $6 $13 $4 75th Percentile $30 $40 $37 90th Percentile $47 $72 $145 Number of projects with service expenses less than $1
32 43 22
Number of projects with service expenses more than $200
3 33 10

Appendix B. Summary Statistics of Additional Expense Items 64
Exhibit B-6: Comparison of Median Per-unit-month Service Expenses
2002-2004 Reported in 2004 Dollars
PRAC 202
Section 8 202
Elderly
Newer Assisted Section 8
Elderly Number of projects 1,559 2,653 1,639 Number of units 71,830 185,718 149,268 Development Size
1-4 units 5-9 units $32 $4 10-19 units $11 $21 20-29 units $9 $31 $19 30-49 units $20 $28 $28 50-99 units $20 $26 $19 100+ units $23 $23 $21 All $19 $25 $21
Unit Size (Average Number of Bedrooms Per Unit) < 1 $29 $25 $19 1 $19 $24 $27 > 1 $20 $28 $14 All $19 $25 $21
Building Type High-rise or elevator $22 $25 $20 Others $19 $25 $21 All $19 $25 $21
Building Age Less than 5 years $14 5-10 years $21 10-15 years $25 $26 15-25 years $9 $25 $18 25+ years $25 $23 All $19 $25 $21
Sponsor Ownership Type Non-profit $19 $25 $21 Profit-motivated $21 Limited dividend $18 All $19 $25 $21
Scattered-site Development Yes $21 $25 No $19 $25 $21 All $19 $25 $21

Appendix B. Summary Statistics of Additional Expense Items 65
PRAC 202
Section 8 202
Elderly
Newer Assisted Section 8
Elderly Number of projects 1,559 2,653 1,639 Number of units 71,830 185,718 149,268 Census Division
New England $25 $22 $18 Mid Atlantic $25 $23 $16 East North Central $23 $28 $24 West North Central $18 $26 $28 South Atlantic $22 $27 $21 East South Central $7 $19 $6 West South Central $11 $22 $18 Mountain $13 $25 $16 Pacific $23 $31 $50 All $19 $25 $21
Metro Location Central city $20 $24 $21 Suburb $21 $26 $27 Non-metro $20 $27 $19 All $19 $25 $21

Appendix B. Summary Statistics of Additional Expense Items 66

Appendix C. Definition of HUD Regions 67
Appendix C Definition of HUD Regions
Exhibit C-1: Definition of HUD Regions
HUD Region State
I. New England Connecticut, Maine, Massachusetts, New Hampshire, Rhode Island, Vermont
II. New York/New Jersey New York, New Jersey
III. Mid Atlantic Delaware, District of Columbia, Maryland, Pennsylvania, Virginia, West Virginia
IV. South/Caribbean Alabama, Florida, Georgia, Kentucky, Mississippi, North Carolina, South Carolina, Tennessee, Puerto Rico
V. Midwest Illinois, Indiana, Michigan, Minnesota, Ohio, Wisconsin
VI. Southwest Arkansas, Louisiana, New Mexico, Oklahoma, Texas
VII. Great Plains Iowa, Kansas, Missouri, Nebraska
VIII. Rocky Mountain Colorado, Montana, North Dakota, South Dakota, Utah, Wyoming
IX. Pacific Arizona, California, Hawaii, Nevada
X. Northwest Alaska, Idaho, Oregon, Washington

Appendix C. Definition of HUD Regions 68

Appendix D: Field Test Reports 61
Appendix D Field Test Reports
This appendix presents the field test report assembled for each of the ten study sites selected for the field testing component of the study. The study sites are:
• AHEPA 113 Apartments (a PRAC 202 development located in Dayton, OH)
• Seton London (a PRAC 202 development located in Columbus, OH)
• Mission Springs (a PRAC 202 development located in Holliston, MA)
• Nate Smith House (a PRAC 202 development located in Jamaica Plain, MA)
• Blue Ledge Cooperative Apartments (a PRAC 202 development located in Roslindale, MA)
• Jireh Villa (a PRAC 811 development located in Columbus, OH)
• Network Housing 92 (a PRAC 811 development located in Columbus, OH)
• Prebleway II (a PRAC 811 development located in Eaton, OH)
• Marshfield Group Home (a PRAC 811 development located in Marshfield, MA)
• Prospect Street Apartments (a PRAC 811 development located in Marlborough, MA)

Appendix D: Field Test Reports 62
AHEPA 113 Apartments 2300 County Line Road Beavercreek, OH 45430
PRAC 202 Project ID No: 800061262
Property Overview AHEPA 113 Apartments is a 57-unit PRAC 202 development located in Beavercreek, OH, an affluent suburban city on the eastern side of the Dayton metropolitan area. The 2000 Census reports a population of 37,984, a median household income of $68,801, and a poverty rate of 4.5 percent. Beavercreek is over 95 percent white, with German, Irish and English ancestries predominating. The property is owned by AHEPA 113 Inc. The board president of AHEPA 113 Inc. is a member of the board of directors of the AHEPA (American Hellenic Educational Progressive Association) National Housing Corporation (ANHC), a non-profit corporation founded in 1983 to develop and operate housing for the elderly and people with disabilities. ANHC currently owns and operates 78 projects in 21 states totaling 4,262 apartments. AHEPA is an American-based, Greek heritage grassroots membership organization.
The 2-story elevator building opened in 1999 and is located on busy County Line Road, next door to a condominium development and across the street from Reynolds and Reynolds, a large software company that services the automotive industry. The property is located in the unincorporated part of Beavercreek.

Appendix D: Field Test Reports 63
There are 57 one-bedroom apartments that average 540 square feet. There is one large multi-purpose room with a full kitchen that opens onto a large patio at the rear of the building, a library, expansive and furnished lobbies on each floor, an exercise/computer room, and an attractive laundry room. Wallpaper is used extensively in the hallways, which gives the building a welcoming feel. Common areas comprise about one-third of the total building square footage40
and they are all very nicely furnished and appointed. The property is popular and currently has a waiting list of 56.
There are two large and separate administrative offices: one for the site manager and one for the resident services coordinator. There is ample maintenance storage. There are 52 parking spaces at the front and side of the building, of which 12 are for those with mobility impairments.
Management Responsibilities The property has been continuously managed by AHEPA Management Company Inc. (AMC) of Indianapolis, IN since the property opened seven years ago. AMC currently manages all ANHC properties.
40 The building has 48,187 square feet.

Appendix D: Field Test Reports 64
AMC is responsible for all day-to-day property management functions including resident selection, resident income certification and recertification, marketing, rent collection, purchasing/contracting, paying vendors, maintenance, inspections, budgeting and budget monitoring, capital planning, management staffing/payroll, reporting, TRACS and replacement reserve requisitioning, placing insurance and the like. The property routinely performs very well on its HUD REAC physical inspections. Its most recent score was reported to be in the high 90s. The property has a part-time resident services coordinator who coordinates service programming at the property and provides some individual counseling assistance. Staffing AHEPA 113 has a total of 3 staff, which appears to be appropriate for this property. There has been a recent turnover in both the site manager and resident services coordinator positions. Both are replacing staff persons who were originally in those positions.
Position Number Full Time Equivalent (FTE)
Allocation Site Manager (40 hours/week) 1 1.00
Maintenance Technician (40 hours/week) 1 1.00
Resident Services Coordinator (20 hrs/week) 1 .50
TOTAL 3 2.50 Operating Expenses, Including Service Expenses and Replacement Reserve Deposits The average of all operating costs for 2005 (7/1/04 - 6/30/05) was $544 per-unit-month (PUM), including replacement reserve deposits and resident services. The total revenue for the same period was $564,41
creating a positive bottom line of $20 PUM. While it is always possible to debate the reasonableness of any operating expenses, AHEPA 113 has two in particular that are unusually high. The first and by far the greatest is the expense for real estate taxes. This amount has ballooned from $66 PUM ($792 per unit per year) to $118 PUM ($1,416 per unit per year) from FY 2002 to FY 2006. This amount is exceptionally high by the industry’s standard. In fact, it is the highest among the 10 study sites. As a comparison, the other Ohio PRAC 202 property in this study (Seton London in London, OH) currently pays real estate taxes of only $36 PUM. During the site visit, staff indicated that Ohio communities could be quite variable in the amounts they assess for payments in lieu of taxes (PILOTs) compared to other states. Due to their non-profit status, PRACs are typically assessed either no or a very modest real estate tax amount.
41 The HUD contract rent is $543 for this property and has been that amount for a couple of years.

Appendix D: Field Test Reports 65
Second, AHEPA has somewhat higher than average administrative expenses, although not unreasonably so. In particular, the property contributes to the staff’s 403(b) plan ($7 PUM), an unusual, but not unheard of, staff benefit.
The following table summarizes the operating costs of the property over the past 4 years on a PUM basis:
Operating Expenses 6/30/02 6/30/03 6/30/04 6/30/05
Administrative 110 144 128 129
Utilities 75 85 80 91
Operating and Maintenance 75 85 94 96
Taxes and Insurance 125 151 157 176
TOTAL OPERATING COSTS 385 465 459 492
Service Expense 2 26 33 32
Replacement Reserve Deposits 20 58 25 20
TOTAL ALL COSTS 407 549 517 544

Appendix D: Field Test Reports 66
The field tester’s budget estimate for FY 2006 is summarized below. It is based on the information collected from the site visit and the field tester’s professional judgment on how the project should be staffed and operated.
Operating Expenses FY 2006
Administrative 129
Utilities 91
Operating and Maintenance 93
Taxes and Insurance 180
TOTAL OPERATING COSTS 493
Service Expense 45
Replacement Reserve Deposits 20
TOTAL ALL COSTS 558

Appendix D: Field Test Reports 67
Adequacy of the Cost Model Estimate The benchmark produced by the cost model is $369 PUM for this property (excluding deposits to replacement reserves and service expenses).42
This amount is below the field tester’s estimate for the portion of the expenses that excludes deposits to replacement reserves and service expenses ($493 PUM). The cost model estimate would be sufficient to cover the routine operating costs of the property if the property did not have the two unusual cost items mentioned above: its exceptionally high real estate taxes and its contribution to the staff’s 403(b) plan. In other words, if these special cost factors did not exist, the cost model estimate would be very close to the field tester’s estimate, as illustrated in the table below.
Aligning the field tester’s estimate with the cost model estimate
Field Tester’s 2006 Budget
Estimate
(Deduct Excessive Real Estate Taxes)
(Deduct 403(b) plan expenses)
2006 Budget Estimate
Adjusted for Project-specific
expenses 2006 Cost
Model Estimate 493 (118) (7) 368 369
42 Model estimate in 2006 dollars.

Appendix D: Field Test Reports 68
Seton London 350 Cambridge Drive London, OH 43140
PRAC 202 Project ID No: 800017232
Property Overview Seton London is a 50-unit PRAC 202 development located in London, Ohio, a small city 32 miles west of Columbus. The 2000 Census reports a population of 22,135, a median household income of $45,226 and a poverty rate of 12.4 percent. London’s ethnic/racial mix is 87 percent white, 11 percent African American, and the remaining 2 percent a mix of Asian, American Indian and other races. The property is owned by Seton London Inc., a non-profit corporation. Its sponsor is the Roman Catholic Diocese of Columbus, Ohio, also a non-profit corporation. Most of the residents are widows who were married to local farmers.

Appendix D: Field Test Reports 69
The 2-story elevator building opened in 1995 and is located on Cambridge Drive, two blocks from Route 42, the major thoroughfare through the city. The property abuts a shopping area that includes a CVS pharmacy, a Kroger’s supermarket and a large discount store. The property is two miles outside London’s downtown area, but is within a quarter mile of a number of big box stores like Wal-Mart and Best Buy as well as a number of fast food and family-style restaurants. The amount of residential development has also grown in the area and includes a large condominium development and a senior living community within half a mile. There are 50 one-bedroom apartments that average 574 square feet. There is one large multi-purpose room (see photo below) that opens onto a large patio at the rear of the building. This community room also has a full kitchen. There are a laundry room, an exercise/computer room, and a meditation room on the second floor. A pastor visits weekly and leads residents in nondenominational prayer. There is also access to two balconies. There are two separate administrative offices: one for the manager (staffed Monday through Thursday, 25 hours per week) and one for the resident services coordinator (15 hours per week). The resident services coordinator position is new for this property. The HUD contract rent was raised recently to the current level of $348 PUM to support this position. Residents here, like others at many of the Section 202 properties, decorate the door of their apartments, which give the hallways a welcoming feel. There are over 100 parking spaces. While there is more than ample parking for residents and guests, everyone would like the spaces closest to the building entrance.

Appendix D: Field Test Reports 70
Management Responsibilities The property has been continuously managed by BRC Properties Inc., of Columbus, OH, since the property opened 11 years ago. BRC currently manages only properties affiliated with the Roman Catholic Diocese of Columbus, OH. BRC is responsible for all the property’s day-to-day management functions, including resident selection, resident income certification and recertification, marketing, rent collection, purchasing/contracting, paying vendors, maintenance, inspections, budgeting and budget monitoring, capital planning, management staffing/payroll, reporting, TRACS and replacement reserve requisitioning, placing insurance and the like. The property routinely receives excellent inspection scores from HUD REAC. BRC reported that the last two REAC scores were in the 90s, although they were anticipating a somewhat lower score on the most recent inspection because of a heightened interest in door closures of which they were unaware. The property has recently begun to provide resident services. The resident service coordinator works 15 hours per week at Seton London, sharing her work week with a nearby property. The staff person has a Master of Social Work degree. She provides counseling to the residents. At the same time, she also arranges for services for the residents.
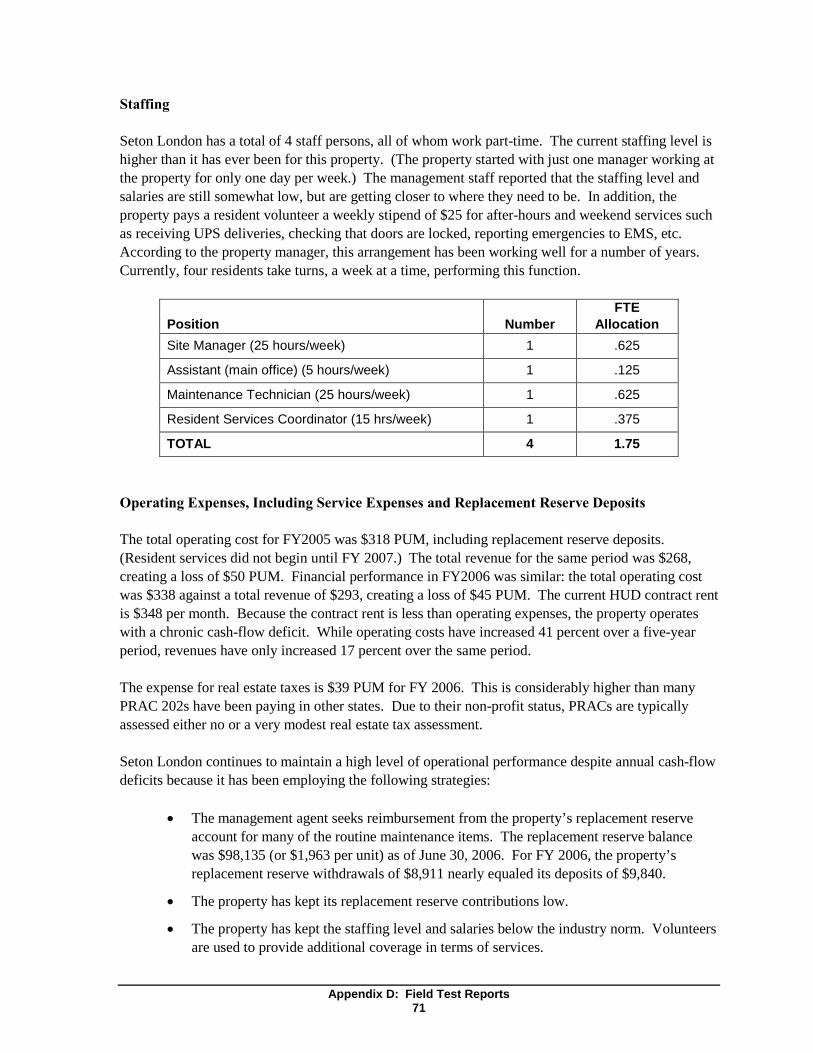
Appendix D: Field Test Reports 71
Staffing Seton London has a total of 4 staff persons, all of whom work part-time. The current staffing level is higher than it has ever been for this property. (The property started with just one manager working at the property for only one day per week.) The management staff reported that the staffing level and salaries are still somewhat low, but are getting closer to where they need to be. In addition, the property pays a resident volunteer a weekly stipend of $25 for after-hours and weekend services such as receiving UPS deliveries, checking that doors are locked, reporting emergencies to EMS, etc. According to the property manager, this arrangement has been working well for a number of years. Currently, four residents take turns, a week at a time, performing this function.
Position Number FTE
Allocation Site Manager (25 hours/week) 1 .625
Assistant (main office) (5 hours/week) 1 .125
Maintenance Technician (25 hours/week) 1 .625
Resident Services Coordinator (15 hrs/week) 1 .375
TOTAL 4 1.75 Operating Expenses, Including Service Expenses and Replacement Reserve Deposits The total operating cost for FY2005 was $318 PUM, including replacement reserve deposits. (Resident services did not begin until FY 2007.) The total revenue for the same period was $268, creating a loss of $50 PUM. Financial performance in FY2006 was similar: the total operating cost was $338 against a total revenue of $293, creating a loss of $45 PUM. The current HUD contract rent is $348 per month. Because the contract rent is less than operating expenses, the property operates with a chronic cash-flow deficit. While operating costs have increased 41 percent over a five-year period, revenues have only increased 17 percent over the same period. The expense for real estate taxes is $39 PUM for FY 2006. This is considerably higher than many PRAC 202s have been paying in other states. Due to their non-profit status, PRACs are typically assessed either no or a very modest real estate tax assessment. Seton London continues to maintain a high level of operational performance despite annual cash-flow deficits because it has been employing the following strategies:
• The management agent seeks reimbursement from the property’s replacement reserve account for many of the routine maintenance items. The replacement reserve balance was $98,135 (or $1,963 per unit) as of June 30, 2006. For FY 2006, the property’s replacement reserve withdrawals of $8,911 nearly equaled its deposits of $9,840.
• The property has kept its replacement reserve contributions low.
• The property has kept the staffing level and salaries below the industry norm. Volunteers are used to provide additional coverage in terms of services.

Appendix D: Field Test Reports 72
• The project has increased the size of its payables, including those due to the management agent BRC.
While these are all reasonable short-term strategies, many of them are not prudent measures for the long-term physical and financial health of the property. For example, the current level of contributions to the replacement reserve account would not be sufficient to cover the property’s growing capital needs. During the site visit, the property manager indicated that the parking lot is in need of an immediate repair that would cost approximately $30,000. Over the next 5 to 10 years, about $100,000 to $200,000 will be required to address repair and replacement for the common area, unit flooring, appliances, and roof. The following table summarizes the project’s operating expenses over the past 5 years:
Operating Expenses 6/30/02 6/30/03 6/30/04 6/30/05 6/30/06
Administrative 63 71 79 89 92
Utilities 64 71 73 78 85
Operating and Maintenance 56 70 69 81 80
Taxes and Insurance 46 49 49 55 65
TOTAL OPERATING COSTS 229 261 270 303 322
Financial Expense 0 1 1 0 0
Service Expense 0 0 0 0 0
Replacement Reserve Deposits 15 15 15 15 16
TOTAL ALL COSTS 244 277 286 318 338 The field tester’s budget estimate for FY 2006 is summarized below. It is based on the information collected from the site visit and the field tester’s professional judgment on how the project should be staffed and operated. In particular, the staffing level has been raised and the budget assumes a higher level of spending on the maintenance items.
Operating Expenses FY 2006 Administrative 108 Utilities 85 Operating and Maintenance 91 Taxes and Insurance 77 TOTAL OPERATING COSTS 361 Service Expense 24 Replacement Reserve Deposits 19 TOTAL ALL COSTS 404

Appendix D: Field Test Reports 73
Adequacy of the Cost Model Estimate The benchmark produced by the cost model is $382 PUM for this property (excluding deposits to replacement reserves and service expenses).43
The amount differs only by 5.8 percent from the field tester’s estimate for the portion of the expenses that excludes deposits to replacement reserves and service expenses ($361). Therefore, the cost model amount is more than enough to cover the routine operation of the project. Given the chronic cash-flow deficits and physical needs of the property, an expense level higher than the field tester’s estimate could better position the property.
Aligning the field tester’s estimate with the cost model estimate
Field Tester’s Budget Estimate
Cost Model Estimate
Variance Amount
Variance Percentage
361 382 21 5.8 percent
43 Model estimate in 2006 dollars.

Appendix D: Field Test Reports 74
Mission Springs 100 Summer Street
Holliston, MA 01746 PRAC 202
Project ID No: 800008703 Property Overview Mission Springs is a 75-unit PRAC 202 development located in Holliston, MA, a semi-rural bedroom community in Boston’s metro-west Middlesex County where the 2000 Census reports a population of 13,824 and a median household income of $78,092. It is owned by Mission Springs Housing for the Elderly Inc., a non-profit Massachusetts corporation. The non-profit co-developers are The Community Builders Inc. (headquartered in Boston) and BayPath Elder Services Inc. (headquartered in Framingham, MA).
The 4-story, 64,500 square foot building was built in 1997 on the former Xaverian Foreign Mission Society site. It is across the street from the Fatima Shrine Mission Center. The property is connected to ten acres of local recreational and Charles River Watershed conservation land. Residents are a short walk from playing fields where they can observe baseball and basketball games or enjoy the walking trails on six acres of conservation land.

Appendix D: Field Test Reports 75
There are 75 one-bedroom apartments whose average size is 528 square feet. There is a laundry room on each of the four residential floors. There are two community rooms, one each on the first and ground floors. One contains a computer providing residents with Internet access. There are separate administrative and resident services offices. Elevator lobbies are attractively furnished with upholstered furniture. There is a landscaped rear patio with umbrella tables, a screened gazebo, and a community garden in which residents grow seasonal vegetables and flowers. There are 72 parking spaces: 52 for residents and 25 for visitors. The property and grounds are in excellent condition. The property has been continuously managed by The Community Builders Inc. and resident services have been continuously provided by BayPath Elder Services Inc. since the property opened nine years ago. BayPath reports that at least half of the residents need assistance in three or more daily living activities such as meal preparation, bathing and dressing.
Management Responsibilities The Community Builders Inc. is responsible for all day-to-day property management functions, including resident selection, resident income certification and recertification, marketing, rent collection, purchasing/contracting, paying vendors, maintenance, inspections, budgeting and budget monitoring, capital planning, management staffing/payroll, reporting, TRACS and replacement reserve requisitioning, placing insurance and the like.

Appendix D: Field Test Reports 76
The property routinely receives excellent REAC inspection scores. Its most recent score of 80b received in July 2006 was unusually low. The deficiencies identified were almost exclusively focused on doors not closing as designed. The management attributed this condition to the 100-degree heat on the day of the inspection and the situation was remedied immediately. BayPath Elder Services Inc. provides resident services that include counseling, arranging assistance for daily living activities, social programming, and arranging services as a courtesy or for a minimal charge. Such services include weekly bus service to a local grocery store, monthly podiatrist visits, monthly blood pressure clinic, twice-a-month luncheons, monthly hair stylist visits, and weekly BINGO nights. Staffing Mission Springs has a total staff of 5, although only one, the maintenance supervisor, works full time. The maintenance technician’s hours have recently been increased from 25 to 30 hours per week as the building’s age has started to create more work orders. Maintenance staff also perform all custodial and landscaping work at the property. The management staff reported that the staffing levels are adequate and they appear to be so, according to the field tester’s determination.
Position Number FTE
Allocation Senior Manager (2 days/week) 1 .400
Assistant Manager (5 hrs/day) 1 .625
Maintenance Supervisor 1 1.000
Maintenance Technician (6 hrs/day) 1 .750
Resident Services Coordinator (30 hrs/week) 1 .750
TOTAL 5 3.525 Operating Expenses, Including Service Expenses and Replacement Reserve Deposits The average of all operating costs for 2005 (9/1/04 - 8/31/05) was $537 PUM, including replacement reserve deposits and resident services costs. The un-audited costs for 2006 (9/1/05 - 8/31/06) are $604 PUM. Because the HUD contract rent is less than the costs, the property operates at a modest, albeit chronic, cash flow deficit.44
The greatest cost increases over the past 5 years have been in utilities, particularly natural gas, which have gone up 88 percent in this period.
Mission Springs continues to maintain a high level of operational performance in service delivery, the condition of the grounds, building and units, and overall property management services despite its growing cash-flow problem. The management is able to do so because of the following measures:
44 The HUD contract rent effective September 1, 2006 is $569 per month.

Appendix D: Field Test Reports 77
• The property routinely seeks reimbursement from its replacement reserves for routine maintenance items.
• Mission Springs manages its payables well. While payables have grown to 45 days in some instances, they always pay something and stay in touch with their vendors.
The project’s replacement reserve balance was $58,835 (or $784 per unit) as of August 31, 2005. In 2006, Mission Springs’ replacement withdrawals of $27,651 nearly equaled its deposits of $28,762. The capital needs assessment estimates that the property’s annual replacement reserve needs are in the $100,000 range in the near future. It appears that the property is ill-prepared to meet that challenge. The following table summarizes the operating costs over the past 6 years on a PUM basis:
Operating Expenses 8/31/02 8/31/03 8/31/04 8/31/05 8/31/06
Administrative 109 117 132 118 125
Utilities 86 89 86 104 167
Operating and Maintenance 104 126 116 142 140
Taxes and Insurance 63 72 76 84 75
TOTAL OPERATING COSTS 362 404 410 448 507
Service Expense 55 59 58 59 65
Replacement Reserve Deposits 29 29 30 31 32
TOTAL ALL COSTS 446 492 498 538 604 The field tester’s budget estimate for FY 2006 is summarized below. It is based on the information collected from the site visit and the field tester’s professional judgment on how the project should be staffed and operated.
Operating Expenses FY 2006
Administrative 125
Utilities 167
Operating and Maintenance 140
Taxes and Insurance 75
TOTAL OPERATING COSTS 507
Service Expense 65
Replacement Reserve Deposits 32
TOTAL ALL COSTS 604

Appendix D: Field Test Reports 78
Adequacy of the Cost Model Estimate The benchmark produced by the cost model is $633 PUM for this property (excluding deposits to replacement reserves and service expenses). 45
The amount is more than adequate to cover the routine operation of the property. However, as noted above, the property’s replacement reserves account is being depleted at an increasing rate. Soon, the property will be unable to address major capital needs, particularly as the property ages. Therefore, an expense level higher than the field tester’s estimate would position the property to meet its physical challenges and to address its cash-flow problem. Against this backdrop, the cost model estimate is still in the reasonable range.
Aligning the field tester’s estimate with the cost model estimate
Field Tester’s Budget Estimate
Cost Model Estimate
Variance Amount
Variance Percentage
507 633 126 24.8 percent
45 Model estimate in 2006 dollars.

Appendix D: Field Test Reports 79
Nate Smith House 155 Lamartine Street
Jamaica Plain, MA 02130 PRAC 202
Project ID No: 800008945 Property Overview Nate Smith House is a 45-unit PRAC 202 development located in Jamaica Plain, MA, a modest residential neighborhood on Boston’s southern boundary, four miles from downtown. It is within walking distance of the neighborhood’s busy Centre Street where shopping is plentiful. It is owned by Nate Smith Housing Corporation, a 501(c)(3) Massachusetts non-profit corporation. The 2000 Census reports a population of 36,293, a median household income of $46,592, and a poverty rate of 13.8 percent for Jamaica Plain. Jamaica Plain’s ethnic/racial mix is 52 percent white, 25 percent Hispanic, 16 percent African American, 5 percent Asian and 2 percent other. The majority of the residents are Hispanic.
The 4-story elevator building opened in 1998 and was the culmination of a 15-year neighborhood battle. The Nate Smith House is located on the site of one of the most notorious and hotly contested properties in Boston during the 1980s. The “Carroll Building” was so decrepit that the slumlord who owned it was sentenced to house arrest until sanitary code violations were remedied. The project’s

Appendix D: Field Test Reports 80
sponsor, the Jamaica Plain Neighborhood Development Corporation (JPNDC), acquired the property from a bankruptcy trustee in 1993, thanks to the persistent struggle of the building’s tenants, neighbors and other neighborhood organizations. The building is named in honor of the late Nate Smith, a local resident who demonstrated a heartfelt and unyielding commitment to the rights of seniors and affordable housing. There are 44 one-bedroom apartments for residents and one two-bedroom caretaker apartment. There is an expansive front lobby with additional common area space on the first floor. The property includes a laundry facility, a multipurpose room with a large kitchen, a library, and a small office for medical examinations/treatments. There is a two-room office for the manager and a separate office for the resident services coordinator. There is a patio with benches at the rear end of the building. A communal garden for the residents is located at the rear of the other side of the building. There are 15 parking spaces and the property is within one block of the Stony Brook public transportation station.
The property has been continuously managed by Maloney Properties, a third-party management company that specializes in managing affordable housing for non-profits. It also manages other developments within a few miles of the property.

Appendix D: Field Test Reports 81
Management Responsibilities Maloney Properties, based in Wellesley, MA, is responsible for all day-to-day property management functions including resident selection, resident income certification and recertification, marketing, rent collection, purchasing/contracting, paying vendors, maintenance, inspections, budgeting and budget monitoring, capital planning, management staffing/payroll, reporting, TRACS and replacement reserve requisitioning, placing insurance and the like. The property routinely receives excellent REAC inspection scores. Its most recent score of 91b was received in October 2004. The property is maintained in good condition. The resident services coordinator coordinates services that include counseling, arranging assistance for daily living activities, social programming, and arranging services such as podiatrist visits and blood pressure readings as a courtesy or for a minimal charge. Staffing Nate Smith House has a total staff of 5, 3 of whom work nearly full-time at this property. In addition, a cleaning company is used for common area cleaning and custodial work. The management staff reported that the staffing levels are adequate. They appear to be so, if not a bit high, according to the field tester’s determination. Maloney Properties employs a live-in responder who stays in the two-bedroom caretaker apartment. The staff person is available from 5 pm to 8 am, Monday through Friday and 24 hours on weekends and holidays to respond to any emergency at the property. She also responds to incidents such as resident lock-outs, and sets up/cleans up the community room when it is used by the residents.
Position Number FTE
Allocation Property Manager 1 .07
Assistant Property Manager 1 .75
Residents Services Coordinator 1 .75
Maintenance superintendent 1 .50
Live-in responder 1 1.00
TOTAL 5 3.07

Appendix D: Field Test Reports 82
Current payroll expenses (exclusive of taxes and benefits) on an annual basis are: Administrative $29,050 Resident Services Coordinator $24,050 Maintenance Superintendent $17,035 $70,135

Appendix D: Field Test Reports 83
Operating Expenses, Including Service Expenses and Replacement Reserve Deposits The average of all operating costs for FY 2005 (1/1 – 12/31/05) was $666 PUM, including replacement reserve deposits and resident services costs. These costs would have been $6381
if not for a one-time increase in the management fee. The current HUD contract rent is $649 PUM for the 44 residential units (no revenue is received on the live-in responder unit). In essence, the property has spent what it has received.
The property had a replacement reserve balance of $132,715 ($2,949 per unit or $246 PUM) at the end of 2005. The reserve balance should be sufficient to address the property’s capital needs. Some of the repair items identified by the manager include:
• Hallway carpet replacement • Appliance replacement • Elevator upgrades (battery back-up)
A modest amount of cash (less than one half of a month’s contract rent) was on hand, which should be sufficient to cover current obligations. The management agent has not used the property’s reserves at any significant level. The following table summarizes operating costs over the past 4 years on a PUM basis:
Operating Expenses 12/31/02 12/31/03 12/31/04 12/31/05
Administrative 140 163 170 188
Utilities 106 87 111 130
Operating and Maintenance 103 142 131 169
Taxes and Insurance 86 111 97 107
TOTAL OPERATING COSTS 435 503 509 594
Financial Expenses 39 41 41 0
Service Expense 52 48 44 43
Replacement Reserve Deposits 29 29 29 29
TOTAL ALL COSTS 555 621 623 666
1 The management fee was approximately $28 PUM higher than usual because of a one-time adjustment
increase in recorded revenue attributable to the forgiveness of interest on a third mortgage note payable.

Appendix D: Field Test Reports 84
The field tester’s budget estimate for FY 2006 is summarized below. It is based on the information collected from the site visit and the field tester’s professional judgment on how the project should be staffed and operated. In particular, it includes a less generous staffing plan than the property currently utilizes. A total of $15 PUM was deducted from the cleaning contract and $15 PUM was deducted from the resident services staffing currently employed at the property.
Operating Expenses FY 2006
Administrative 155
Utilities 148
Operating and Maintenance 130
Taxes and Insurance 112
TOTAL OPERATING COSTS 545
Service Expense 36
Replacement Reserve Deposits 34
TOTAL ALL COSTS 615

Appendix D: Field Test Reports 85
Adequacy of the Cost Model Estimate The benchmark produced by the cost model is $692 PUM for this property (excluding deposits to replacement reserves and service expenses). 47
The amount is more than adequate to cover the routine operating costs of the property. There do not appear to be any imminent capital needs at the property that cannot be covered by the replacement reserve account, which is funded at a level comparable to similar properties. Unlike many other urban properties, Nate Smith House does not use, nor does it appear to require at this time, any manned security, an expense that often has a high impact on the operating costs. Nearby public housing elderly properties are required to have manned security, which is the result of a City of Boston ordinance. However, the ordinance is limited to public housing properties for the elderly and disabled.
Aligning the field tester’s estimate with the cost model estimate
Field Tester’s Budget Estimate
Cost Model Estimate
Variance Amount
Variance Percentage
545 692 147 26.9 percent
47 Model estimate in 2006 dollars.

Appendix D: Field Test Reports 86
Blue Ledge Cooperative Apartments (Also known as Roslindale Senior Non-Profit Housing)
15 Blue Ledge Drive Roslindale, MA 02131
PRAC 202 Project ID No: 800008845
Property Overview The Blue Ledge Cooperative Apartments is an 80-unit PRAC 202 development located in Roslindale, MA, a modest residential neighborhood in Boston’s southwest corner, six miles from downtown. The 2000 Census reports a population of 34,618, a median household income of $34,211 and a poverty rate of 10.9 percent. Roslindale’s ethnic/racial mix is 56 percent white, 20 percent Hispanic, 16 percent African American, 4 percent Asian and 3 percent multi-racial. This ethnic/racial mix is represented in the residents of the property. It is owned by Roslindale Senior Non-Profit Housing Inc., which is organized on a non-stock basis by Cooperative Services Inc. (CSI), a Michigan non-profit cooperative.
The 6-story building opened in 1994 and is at the corner of Blue Ledge Drive and Washington Street, the neighborhood’s main artery where residents can find easily accessible public transportation. The property abuts the 540-unit High Point Village townhouse rental community, which is in the process of being converted to a market-rate gated community. This change will eliminate the currently

Appendix D: Field Test Reports 87
available Blue Ledge Drive street parking that visitors, guests and medical/home care providers have routinely used. There are 80 one-bedroom apartments. There is one main laundry room on the first floor. There are two community rooms on the main floor: one large multi-purpose room with a large kitchen and a smaller community space used to provide once weekly hair stylist appointments for the residents, weekly movies, crafts projects and the like. There is also a library that also serves as a meeting room, providing residents with a computer and Internet access. There are two separate administrative offices: one for the resident volunteers (staffed Monday through Friday from 8 am to 1 pm) and one for administrative functions such as performing resident income certification and recertification (as scheduled). There are expansive sitting areas off each elevator lobby. There are only 20 parking spaces, but this has not been a problem since few residents have cars and those who visit and provide services have been able to find ample parking on Blue Ledge Drive.
The property has been continuously managed by CSI Support and Development Services, an affiliate of CSI, since the property opened 12 years ago. Its Massachusetts office is located in Malden, MA, less than 20 miles away from the property. Management Responsibilities Residents are active participants in the management of the property, which is operated as a consumer cooperative. Through building operating by-laws, a resident council, floor representatives and

Appendix D: Field Test Reports 88
committees carry out several day-to-day management activities under the auspices of CSI Support and Development Services. These activities, which are provided on a voluntary basis, include maintaining the waiting list and interviewing applicants in accordance with the building’s approved Tenant Selection Plan, overseeing the renovation of vacant units, assisting in marketing, welcoming new residents, processing move-out documents, preparing certain parts of the annual operating budget, reviewing and approving maintenance contracts, selecting and supervising site maintenance staff, reviewing procedures for building expenditures, inspecting common areas for cleanliness, conducting semi-annual apartment inspections, overseeing grounds maintenance, and enforcing parking rules. CSI Support and Development Services is responsible for all resident income certification and recertification, rent collection, paying vendors, systems maintenance and inspections, overall budgeting and budget monitoring, capital planning, management reporting, TRACS, replacement reserve requisitioning, placing insurance, and real estate tax appeals. The property does not provide direct resident services. Rather, it maintains a Family and Community Resource Committee (FCRC) whose resident members have the responsibility of providing and maintaining a list of available services in the community. The committee meets with the residents and their family members on matters relating to these resources. Overall, there is an extensive array of resident activities that are coordinated by the residents.

Appendix D: Field Test Reports 89
Staffing Blue Ledge Co-op has a very unique staffing plan. It relies heavily on tenant volunteers who carry out a large number of functions. The tenant volunteers select the maintenance staff who, in this case, is a maintenance vendor (Sunshine Janitorial). Sunshine Janitorial has been providing the same 40-hour-per-week staff person for the property for the past several years. The tenants like using this vendor because it provides a replacement when the regular maintenance person goes on vacation or is sick. CSI Support and Development Services assigns a property manager to the property, who works 13 hours per week. The staff person visits the property 2 to 3 days a week and plays a largely coordinating role with the tenant volunteers. Major administrative functions (such as collecting rent, paying bills, submitting TRACs, certifying income, submitting reports, and completing new applicant paperwork) are performed at the Malden office rather than on-site. CSI Support and Development Services employs an emergency responder who lives in one of the apartments. The staff person is available from 7 pm to 7 am, Monday through Friday and 24 hours on weekends to respond to any emergency at the property. The following table provides a summary of the current staffing plan.
Position Number FTE
Allocation Tenant volunteers (25 hours/week: office only) 5 .625
CSI Property Manager (13 hrs/week) 1 .333
CSI COS Specialist 3 .250
CSI Certification Assistant 1 .100
Sunshine Janitorial Maintenance Tech/Cleaner 1 1.000
CSI Emergency Responder (weekends/nights) 1 .250 Tenant volunteers (council meetings, inspections, committees, etc.)
20
1.50
TOTAL 32 4.058 The project’s operating budget covers the expenses of the 1.93 FTEs. The balance of 2.125 FTEs in staff is covered by volunteers. Without the active participation of the tenant volunteers, it is not likely that the property could offer the level of services with its current paid staffing level. Operating Expenses, Including Service Expenses and Replacement Reserve Deposits The operating costs for FY 2006 (7/1/05 - 6/30/06) totaled $597 PUM, including replacement reserve deposits. There are no recorded resident services costs. The HUD contract rent was $555 for FY 2006. The property was able to break even financially because it earned $30 PUM from laundry

Appendix D: Field Test Reports 90
income and the rental of roof space for a cellular tower. The greatest cost increases over the past 5 years have been in utilities, particularly natural gas, which have gone up 49 percent over that period. The property has been able to operate with a low HUD contract rent so far. However, it faces challenges in the near future. These include:
• The replacement reserve balance was $515,009 ($6,438 per unit) at the end of June 2006. The management indicated that it is not adequate to meet property’s coming capital needs, which include, but are not limited to:
– Paying for $150,000 of repainting and waterproofing work on the building; – The need to create additional parking space for visitors and care givers when the Blue
Ledge Drive is no longer available for parking (estimated to occur within the next several months);
– Additional work on membrane materials on balcony roofs; – Replacement of common hallway carpets, which are 12 years old; – Replacement of the fire alarm panel; – Replacement of the hot water storage tank; – Replacement of gas-fired burners; and – Repainting of all common area hallways.
• The resident population is aging. It is not certain that the level of volunteerism can be sustained indefinitely. Therefore, additional staffing expenses are expected.
• The rear of the property receives no landscaping or annual clearing. Expenses for tree trimming and brush clearing can thus be expected.
• Although a primarily custodial service contract has been sufficient for the property’s maintenance function so far, it is anticipated that a higher staffing/skill level will be required soon as the building continues to age.
• The roof rental contract for the cellular tower has not been renewed. This will reduce the property’s revenue by as much as $27,000 a year.
The following table summarizes the operating costs over the past 5 years on a PUM basis:
Operating Expenses 6/30/02 6/30/03 6/30/04 6/30/05 6/30/06
Administrative 132 125 126 135 115
Utilities 103 111 119 135 153
Operating and Maintenance 186 168 127 155 166
Taxes and Insurance 62 65 79 75 86
TOTAL OPERATING COSTS 483 469 451 500 520
Service Expense 0 0 0 0 0
Replacement Reserve Deposits 31 78 78 78 78
TOTAL ALL COSTS 514 547 529 578 598

Appendix D: Field Test Reports 91
The field tester’s budget estimate for FY 2006 is summarized below. It is based on the information collected from the site visit and the field tester’s professional judgment on how the project should be staffed and operated. In particular, its staffing level is raised from the current level. While the use of volunteers has made the property possible to operate on the funds available, it is not prudent to anticipate that the level of volunteer involvement will continue as the population ages.
Operating Expenses FY 2006
Administrative 131
Utilities 153
Operating and Maintenance 177
Taxes and Insurance 101
TOTAL OPERATING COSTS 562
Service Expense 33
Replacement Reserve Deposits 78
TOTAL ALL COSTS 673

Appendix D: Field Test Reports 92
Adequacy of the Cost Model Estimate The benchmark produced by the cost model is $698 PUM for this property (excluding deposits to replacement reserves and service expenses).48
The amount is more than adequate to cover the routine operation of the property. But given the property’s acute capital needs challenge, the cost model estimate is still in the reasonable range. An expense level higher than the field tester’s estimate would position the property to meet its future physical needs challenge.
Aligning the field tester’s estimate with the cost model estimate
Field Tester’s Budget Estimate
Cost Model Estimate
Variance Amount
Variance Percentage
562 698 136 24.2 percent
48 Model estimate in 2006 dollars.

Appendix D: Field Test Reports 93
Jireh Villa 485 South Weyant Avenue Columbus, OH 43213
2328 Ward Road Columbus, OH 43224
PRAC 811 Project ID No: 800211428
Property Overview Jireh Villa is a PRAC 811 that contains 2 three-bedroom group homes located nine miles apart in the eastern (485 South Weyant Avenue) and northeastern (2328 Ward Road) sections of Columbus, OH. Columbus, the state’s capitol, is a city of 711,470 with a median household income of $37,897. The property’s two residential neighborhoods are:
Characteristic South Weyant zip code Ward Road zip code Population 30,723 40,983 Median household income $35,269 $31,548
Predominant races White: 69 percent African American: 24 percent
White: 59 percent African American: 32
percent Poverty rate 9.8 percent 11.8 percent
485 South Weyant Avenue

Appendix D: Field Test Reports 94
Jireh Villa is owned by Jireh Villa Inc., an Ohio non-profit corporation established to provide housing facilities for people with disabilities in Franklin County. The property’s sponsor is the non-profit Jireh Services Inc., also located in Franklin County. Jireh Services was formed in 1994 and is the evolution of the Simmons House, a residential facility opened in 1979 for people with mental retardation and developmental disabilities. The two one-story, wood-frame, brick and stucco sided houses are very similar and are both situated on residential streets within established neighborhoods. They were built in 2001 and sit on quarter acre lots. They are among the largest, newest and most attractive homes in their neighborhoods. Each group home is spacious (over 2500 square feet each) and the three bedrooms for the three residents in each are large. (See photo on the next page.) The group homes include an eat-in dining area, full kitchen, laundry area, two baths, a large common living room, laundry closet, office for staff, attached garage, and rear patio. Minamyer Residential (Weyant Avenue) and Consumer Support Services (Ward Road) provide on-site 24-hour 7-day a week supportive services. The services are funded by the Franklin County Board of Mental Retardation/Developmental Disabilities (FCBMR/DD). Management Responsibilities JSI provides all routine property management services from its 3509 Refugee Road headquarters, also located in Franklin County. JSI currently operates a small portfolio of six legal entities that have a total of 9 buildings and 31 units. The property manager, under the supervision of JSI’s CEO, is responsible for initial certifications, recertifications, approving bills for payment, recording rents, performing light maintenance and supervising the maintenance technician. JSI’s one maintenance technician is deployed from the Refugee Road office to handle work orders. Landscaping is contracted out as are fire and security alarm systems. Property management accounting, TRACS payments, budget preparation and monitoring and audit preparation are conducted by JSI’s staff accountant. The biggest property management challenges for this property are filling vacancies and conducting timely recertifications. Management is dependent on the FCBMR/DD to fill vacancies. Many aspects of the recertification process are often handled through the county providers rather than by the residents themselves. This process is cumbersome and creates delays. As a result, timely tenant placement is rare. (Vacancy cost was $73 PUM and $64 PUM in FY 2003 and FY 2004 for the project.)

Appendix D: Field Test Reports 95
Staffing Staffing is allocated among a number of staff persons and is summarized below:
Position Number FTE
Allocation Site Manager (13 hours/week) 1 .33
Chief Executive Officer (4 hours/week) 1 .10
Property management accounting (3.2 hours/wk) 1 .08
Maintenance technician (4.6 hrs/week) 1 .11
TOTAL 4 .62 Compared to the industry norm, this staffing allocation appears to be high given the number of units involved, and the age of the buildings. Based on the field tester’s estimate, a more efficient staffing allocation would be the maintenance technician at 5.3 hours per week (.1325 FTE) between the two addresses and a total administrative staffing level at no more than 4 hours per week (.10 FTE). This would result in a total of .2325 FTEs for the 6 units.

Appendix D: Field Test Reports 96
Operating Expenses, Including Service Expenses and Replacement Reserve Deposits The current HUD contract rent is $705, which should be adequate to operate the property at breakeven. The property had a lower HUD contract rent in the earlier years and incurred routine losses and cash-flow problems. This was largely because the project’s staffing was higher than the industry norm. The property had an outstanding payable of $16,191 to Jireh Services at the end of December 2005. Deposits to the replacement reserves are at $47 PUM, reflecting the practice of higher deposits in most of the newer HUD properties. The replacement reserves balance was $8,933 (1,489 per unit) as of the end of December 2005 and reflects little, if any, withdrawals from the replacement reserves by the management. This is expected for a property of its age.
The property also has a real estate taxes obligation that was not reflected on its audited Annual Financial Statement until 2005. It is projected to be a $67 PUM expense.

Appendix D: Field Test Reports 97
The following table summarizes the operating costs over the past 4 years on a PUM basis:
Operating Expenses 12/31/02 12/31/03 12/31/05 12/31/06
Administrative 225 273 311 247
Utilities 91 122 113 111
Operating and Maintenance 115 97 91 98
Taxes and Insurance 55 62 338 134
TOTAL OPERATING COSTS 486 554 852 590
Service Expense 0 0 0 0
Replacement Reserve Deposits 26 40 47 47
TOTAL ALL COSTS 512 594 899 637

Appendix D: Field Test Reports 98
The field tester’s budget estimate for FY 2006 is summarized below. It is based on the information collected from the site visit and the field tester’s professional judgment on how the project should be staffed and operated. In particular, the staffing level is reduced and the expense for real estate taxes is based on a “normalized” estimate (because the project showed no such expense for two years and then its FY 2005 expense reflected a “catch up”).
Operating Expenses FY2006
Administrative 171
Utilities 118
Operating and Maintenance 101
Taxes and Insurance 147
TOTAL OPERATING COSTS 537
Service Expense 0
Replacement Reserve Deposits 47
TOTAL ALL COSTS 584 Adequacy of the Cost Model Estimate The benchmark produced by the cost model is $398 PUM for this property (excluding deposits to replacement reserves and service expenses). That is below the field tester’s estimate for the portion of the expenses that excludes deposits to replacement reserves and service expenses ($537). The cost model estimate would be sufficient to cover the routine operating costs of the property if it did not have a number of unique cost factors and project characteristics. First, many of the cost items are magnified because the project contains such a small number of units (6). There are only 6 units to spread many of the routine costs. For example, expense for real estate taxes reaches $67 PUM. Training carries a cost of $25 PUM and the audit cost is $31 PUM. Compared to the industry norm, these are considered high on a PUM basis. The field tester indicated that the audit expense can potentially be eliminated if the owner could self-certify their financial statements. Another factor is that because the two group homes are so far apart, maintenance staff have to travel 9 miles to go from one building to another. This adds travel costs to the overall operating expenses. Finally, the group homes are exceptionally large for the number of units involved. As a result, expenses for landscaping ($27 PUM) and property insurance ($51 PUM) are higher than the average for similar properties.

Appendix D: Field Test Reports 99
Aligning the field tester’s estimate with the cost model estimate
Field Tester’s 2006 Budget
Estimate
(Deduct training and audit expenses)
(Deduct half of the following cost
items: real estate taxes,
landscaping, and property
insurance)
2006 Budget Estimate
Adjusted for Project-specific
expenses 2006 Cost
Model Estimate 537 (56) (73) 408 398
Although vacancy loss is not counted as part of the operating expense in this study, it is a real concern for the operation of many of the PRAC 811 developments because of its implication on the cash flow. Vacancy loss can be significant, albeit unpredictable, when the service provider is not timely in filling the vacant units.

Appendix D: Field Test Reports 100
Network Housing 92 3743 - 3774 Ashton Road
Columbus, OH 43227 PRAC 811
Project ID No: 800016246 Property Overview Network Housing 92 is a PRAC 811 that contains 12 one-bedroom apartments and is located in the southeastern section of Columbus, OH. Columbus, the state’s capital, is a city of 711,470 with a median household income of $37,897. The property’s zip code neighborhood is four miles square and is a modest area of small one-story single-family homes. The neighborhood has a population of 23,131, a median household income of $35,256, and a poverty rate of 9.5 percent. The neighborhood’s population is 51 percent African American and 41 percent white, with the remaining 8 percent divided among a number of racial and ethnic groups.
The property is owned by Network Housing Inc., a non-profit Ohio corporation established to provide housing facilities to low-income persons with mental disabilities. The property’s sponsor is the non-profit Community Housing Network (CHN), also located in Columbus. CHN was created in 1987 at

Appendix D: Field Test Reports 101
the request of a committee of the Franklin County Mental Health Board when Franklin County was selected to participate in a Robert Wood Johnson Foundation (RWJF) Program on Chronic Mental Illness. CHN’s role was to develop and operate the housing component of the RWJF Project. CHN has now developed and managed over 850 apartments for people with long-term mental illness. CHN has been the property management agent since the inception of the project. The six one-story, wood-frame, vinyl-sided buildings (two apartments side-by-side in each) were built in 1994. They are situated at the end of Ashton Street, with three buildings on each side of this quiet, residential dead-end street. The six buildings sit on approximately two acres. The apartments are small (500 square feet or less) and have modest galley-style kitchens. There is a small patio next to each entrance door. There is ample parking with 24 spaces and generous yards at the rear of the buildings. Landscaping is modest and there are no other amenities on site. Management Responsibilities CHN provides all routine property management services from its East Broad Street office, about 15 minutes away from the property. CHN operates a portfolio of 987 units that represent a mix of Section 8 Section 202s, PRAC 202s and PRAC 811s, Low-Income Housing Tax Credit units, and HUD’s Supportive Housing Program (SHP) properties. CHN also owns some properties it subsidizes internally.

Appendix D: Field Test Reports 102
Property management staff are responsible for leasing, certifications, recertifications, and supervising the maintenance staff. The maintenance staff are deployed from the Broad Street office. Landscaping is contracted out. Residents take their trash to the curb weekly themselves, using the large containers provided for each unit. Property management accounting (including accounts receivable and payable), TRACS payments, budget preparation and monitoring as well as audit preparation are conducted by the fiscal department under the supervision of the CFO at the Broad Street office. CHN has retention specialists who work directly with residents to assure their success as independent residents. Functioning as resident advocates, the retention specialists provide ongoing support and assistance to the residents. They also work with residents when there are issues such as lease violations. CHN relies on local case managers from various service agencies to refer applicants for the property. Vacancies have usually been filled quickly. At the time of this site visit, there was a vacancy at a modified unit for a mobility-impaired person. The unit had been vacant for a few months. The property performs well on its physical inspections and scored a 93 on its September 2006 REAC physical inspection. Staffing The property’s current staffing allocations are summarized below:
Position Number FTE
Allocation Site Manager (1.6 hours/week) 1 .04
Maintenance Technician (5.6 hours/week) 1 .14
Property management accounting (4 hrs/wk) 2 .10
Retention specialist (2.75 hrs/week) 1 .07
TOTAL 5 .35 These allocations are considered appropriate by the CHN. The field tester determined that the allocation for maintenance is low. According to the industry norm, the project should be charged for the services of the retention specialist. Otherwise, the administrative staffing level appears to be appropriate. Operating Expenses, Including Service Expenses and Replacement Reserve Deposits The HUD contract rent has been $368 PUM for several years and has generally been sufficient to cover all expenses including deposits to the replacement reserves. Nonetheless, the property has run into problems of cash-flow deficits before. For the past five years, it has had three positive and two negative financial performances. Whenever there is a revenue shortfall, CHN pays itself last. As of

Appendix D: Field Test Reports 103
June 2006, the property owed CHN $2,329 for operating expenses, management fees, and payroll expenses. Unlike the other four Ohio PRAC properties included in the sample, Network Housing 92 does not have any real estate tax obligation. Deposits to the replacement reserves have remained steady at $16 PUM in recent years. The replacement reserve balance was $27,406 (or $2,284 per unit) as of the end of June 2006. The property is in its 12th year of operation. A facilities director has recently been hired to assess the project’s capital needs. It is anticipated that the current level of replacement reserves will be not be sufficient to meet the property’s future physical needs.

Appendix D: Field Test Reports 104
The following table summarizes the operating costs over the past 5 years on a PUM basis:
Operating Expenses 6/30/02 6/30/03 6/30/04 6/30/05 6/30/06
Administrative 134 114 116 121 125
Utilities 96 94 96 99 106
Operating and Maintenance 101 94 94 112 86
Taxes and Insurance 33 35 36 30 23
TOTAL OPERATING COSTS 364 337 342 362 340
Service Expense 0 0 0 0 0
Replacement Reserve Deposits 16 16 16 16 16
TOTAL ALL COSTS 380 353 358 378 356

Appendix D: Field Test Reports 105
The field tester’s budget estimate for FY 2006 is summarized below. It is based on the information collected from the site visit and the field tester’s professional judgment on how the project should be staffed and operated. In particular, the staffing level is raised. A few expense items (e.g., insurance cost and some of the maintenance expenses) are brought in line with the industry standard. The field tester’s budget also assumes that services from the retention specialist should be paid for as a service expense.
Operating Expenses FY 2006
Administrative 135
Utilities 106
Operating and Maintenance 109
Taxes and Insurance 31
TOTAL OPERATING COSTS 381
Service Expense 17
Replacement Reserve Deposits 16
TOTAL ALL COSTS 414 Adequacy of the Cost Model Estimate The benchmark produced by the cost model is $409 PUM for this property (excluding deposits to replacement reserves and service expenses). The amount differs only by 7.3 percent from the field tester’s estimate for the portion of the expenses that excludes deposits to replacement reserves and service expenses ($381). Therefore, the cost model amount is more than enough to cover the routine operation of the project. In light of the property’s tight cash flow and its capital needs challenges, an expense level slightly higher than the field tester’s estimate would still be considered reasonable. Aligning the field tester’s estimate with the cost model estimate
Field Tester’s Budget Estimate
Cost Model Estimate
Variance Amount
Variance Percentage
381 409 28 7.3 percent

Appendix D: Field Test Reports 106
Prebleway II 729-745 High Street Eaton, OH 45320
PRAC 811 Project ID No: 800061400
Property Overview Prebleway II is a PRAC 811 that contains 5 one-bedroom apartments and is located in Eaton, OH, a small city of 8,133 in Preble County, 20 miles west of Dayton and 15 miles southeast of Richmond, IN. According to the 2000 Census, Eaton’s median household income is $37,231 and it has a family poverty rate of 5.8 percent. The city’s population is 98 percent white with German, English and Irish ancestries predominating. Much of the local economy is agriculture-based.
The property is owned by Prebleway II Inc., a non-profit Ohio corporation established to provide housing facilities to low-income persons with mental disabilities. The property’s sponsor is the non-profit Eastway Corporation, headquartered in Dayton, OH. Eastway was created in 1957 and is the largest, private, non-profit provider of behavioral healthcare, housing and employment services in the Miami Valley area, serving some 7,500 children and adults annually. Eastway is the sponsor/owner

Appendix D: Field Test Reports 107
of 6 HUD properties (two Section 811s and six Section 202s) and 7 non-HUD properties that total approximately 100 units. The one-story, 5-unit, wood-frame, brick and wood-sided building was built in 1996 on a half-acre lot. It is located at the end of High Street which dead-ends across from a high school. (See photo below taken from Prebleway II’s parking lot.) Prebleway II’s neighbors are other small-scale rental properties.
The apartments are typical in size (550 square feet) and layout. There is a small front patio next to each entrance door. There are seven parking spaces and a generous yard at the rear of the building (see photo on the next page). Landscaping is modest with some shrubs and mulch at the front of the building. There are no other amenities on site. Management Responsibilities Eastway provides all routine property management services from its Clayton, OH, property management office, 23 miles from Prebleway II. The office manages all of Eastway’s HUD-assisted properties. Management accounting is also performed from Eastway’s Dayton office. The property provides owner-certified Annual Financial Statements to HUD.

Appendix D: Field Test Reports 108
Property management staff are responsible for leasing, certifications, recertifications and supervising the maintenance staff. About a year ago, the management agent closed its in-house maintenance company. In its place, it has been using two new local contract maintenance vendors. The manager reported that the current system is much more effective and responsive. Eastway works closely with the Preble County Counseling Center to obtain housing referrals and supportive services for the residents. Eastway reported that the counselors have been very good at keeping in touch with the residents. In general, there is very little turnover at the property. As a result, there are few vacancies. There was a rather prolonged period of vacancy in 2005, but that was considered unusual. Eastway is currently involved in a dispute with a resident over lease violations that may require legal intervention as a last resort. The property performs exceptionally well on its REAC physical inspections and scored a 98 in the 2006 round of the inspection.

Appendix D: Field Test Reports 109
Staffing Currently, the only staffing allocation charged to the property is that of the property manager at 4 hours per week (.10 FTE). All other administrative costs are covered by the management fees and bookkeeping fees. All maintenance functions are contracted out. During the site visit, the property manager indicated she would like to have 6 to 8 hours per week (.15 to .2 FTE) in order to do “a more complete job” since travel time between the properties and office work tends to take up a lot of the allocated time. Operating Expenses, Including Service Expenses and Replacement Reserve Deposits The HUD contract rent has been $430 PUM for a few years. It has been sufficient to cover all costs including replacement reserve deposits. Maintenance costs have been exceptionally low in part because the property manager received only minor work orders so far and in part because the Eastway maintenance crew did not get to Prebleway II as frequently as they might have. It is expected that maintenance spending will return to a more standard level now that the new contractors are in place. Real estate taxes were $58 PUM for the past fiscal year. Replacement reserve deposits have remained steady at $17 PUM. The balance was $9.372 (or $1,874 per unit) as of the end of June 2005. The property is in its 10th year of operation. The current funding level of the replacement reserves will not be sufficient to meet future capital needs.

Appendix D: Field Test Reports 110
The following table summarizes the operating costs over the past 4 years on a PUM basis:
Operating Expenses 12/31/02 12/31/03 12/31/04 12/31/05
Administrative 132 166 162 102
Utilities 84 80 84 82
Operating and Maintenance 80 56 45 68
Taxes and Insurance 88 92 88 92
TOTAL OPERATING COSTS 384 394 379 344
Service Expense 0 0 0 0
Replacement Reserve Deposits 17 17 17 17
TOTAL ALL COSTS 401 811 396 361 The field tester’s budget estimate for FY 2006 is summarized below. It is based on the information collected from the site visit and the field tester’s professional judgment on how the project should be staffed and operated. In particular, maintenance expenses are raised to align with the new maintenance approach and the property’s routine maintenance needs. It also assumes that the property will continues to pay real estate taxes at $58 PUM.
Operating Expenses FY 2006
Administrative 117
Utilities 89
Operating and Maintenance 143
Taxes and Insurance 92
TOTAL OPERATING COSTS 441
Service Expense 0
Replacement Reserve Deposits 17
TOTAL ALL COSTS 458

Appendix D: Field Test Reports 111
Adequacy of the Cost Model Estimate The benchmark produced by the cost model is $332 PUM for this property (exclusive of any replacement reserve or services expenses). That is below the field tester’s estimate for the portion of the expenses that excludes deposits to replacement reserves and service expenses ($441). The cost model estimate would still be insufficient to cover the routine operating costs of the property if it did not have some of its unusual cost items. The unusual cost items are:
• Real estate taxes at $58 PUM
• Landscaping services at $39 PUM
• Management fee at $47 PUM (about $10 PUM higher than the other Ohio PRACs in the study)
Another anomaly is that while the property is located in a rural location, its expense levels appear to be more in line with prices in metropolitan areas. Aligning the field tester’s estimate with the cost model estimate
Field Tester’s 2006 Budget
Estimate
(Deduct landscaping
and half of the real estate
taxes)
(Deduct for higher than
average management
fees)
2006 Budget Estimate
Adjusted for Project-specific
expenses 2006 Cost
Model Estimate 441 (68) (10) 363 332

Appendix D: Field Test Reports 112
Marshfield Group Home 1254 Main Street
Marshfield, MA 02050 PRAC 811
Project ID No: 800008657
Property Overview Marshfield Group Home is a PRAC 811 that contains 2 apartments with four bedrooms each in a supportive living group home setting in Marshfield, MA. Marshfield is a small city of 24,324, 30 miles south of Boston in Plymouth County. It is an upscale community where the average household income is $66,508 and 69 percent of the housing units are owner-occupied. The population is 97 percent white, with Irish, English and Italian ancestries predominating.
The property is owned by South Shore Group Home III Inc., a non-profit Massachusetts corporation established to provide low-income persons with disabilities with housing and services specifically designed to meet their needs. The property’s sponsor is the non-profit South Shore Housing, located in nearby Kingston, MA. South Shore Housing was created in 1970. The organization develops and manages affordable housing for families, the elderly, and people with disabilities throughout

Appendix D: Field Test Reports 113
Massachusetts’ south shore communities. South Shore Housing has also been the property’s management agent since its inception. The two-story, wood-frame, vinyl-sided house was built in 1995. It is situated on a 1.5-acre site along a residential portion of Route 3A, a main artery through Marshfield. Each of the two, four-bedroom apartments has a large communal kitchen, one bath and a sitting room. There is a laundry room with a washer and dryer for the residents’ use. There is a patio with chairs and an outdoor grill at the side of the house. There are seven parking spaces. There is also an office that is staffed 24 hours a day, 7 days a week by Vinfen, a private, non-profit human services organization. Vinfen is under contract with the Massachusetts Department of Mental Health (DMH) to provide on-site 24-hour support services to the 8 residents of the property. Management Responsibilities South Shore Housing provides routine property management services although it has not been able to reimburse itself for payroll or management fees on a consistent basis. Because the property’s HUD contract rent is so low, its maintenance services have been cut back from 2 hours per day to 2 hours per week. Most of the maintenance functions are reactive (in response to emergencies or work order requests) rather than planned. The property is clean. Routine custodial work is the responsibility of the residents under the supervision of Vinfen. As a result, this does not represent a cost item for the property.

Appendix D: Field Test Reports 114
South Shore Housing operates primarily small apartment communities and group homes scattered throughout Boston’s south shore suburbs. Its maintenance crew includes one maintenance superintendent, eight maintenance technicians, and one landscaper. They are responsible for 350 units across 31 different locations. The maintenance staff are assigned to the projects as needed, because none of the properties is large enough for one dedicated staff member. A hiring freeze was instituted two years ago. South Shore Housing is currently operating its properties with one supervisor, three technicians, and one clerk less than previously. South Shore Housing has a good working relationship with both DMH and Vinfen. It relies on Vinfen for resident referrals when there is a vacancy. There have been almost no vacancy losses over the past five years. Staffing Because the property is so small, and it has been experiencing significant operating losses for the past several years, its staffing allocations grew smaller and smaller over the past few years. The FY2006 audited financial statement indicated the following allocations: Office salaries $ 812 = .031 FTE Maintenance payroll $ 2,014 = .065 FTE TOTAL $ 2,826 = .096 FTE These allocations are at about half the allocation rate one would expect for similar properties. In particular, one would expect an allocation of 0.06 to 0.08 FTEs on the office salaries and 0.08 to 0.11 FTEs on the maintenance payroll. Operating Expenses, Including Service Expenses and Replacement Reserve Deposits The following table summarizes the operating costs over the past 6 years on a PUM basis49
:
Operating Expenses 6/30/02 6/30/03 6/30/04 6/30/05 6/30/06
Administrative 128 124 119 111 86
Utilities 83 91 102 112 122
Operating and Maintenance 85 121 90 123 58
Taxes and Insurance 51 54 53 49 32
Total OPERATING COSTS 347 390 364 395 298
Service Expense 0 0 0 0 0
Replacement Reserve Deposits 15 15 15 15 15
TOTAL ALL COSTS 362 405 379 410 313
49 Operating costs are calculated based on 8 units.

Appendix D: Field Test Reports 115
Expense levels fluctuated widely over the years. The HUD contract rent was $315 PUM in FY 2006 for this property, which nearly equaled its $314 PUM total operating costs (including replacement reserve deposits). Staffing levels were reduced to a bare bones level to balance the budget. The project has been experiencing operating losses for several years. It owed South Shore Housing $55,747 in unpaid management fees and payroll costs as of June 2006. A recent change in the CFO function has placed new emphasis on reducing costs while requesting HUD rent increases. Replacement reserve deposits have remained steady at $15 PUM. The replacement reserve balance was $25,249 (or $3,156 per unit) as of the end of June 2006. The property is approaching its 12th year of operation. It has a list of unattended capital projects. A partial list includes:
• Replacing the patio sliding door • Replacing the flooring in community areas and bedrooms • Upgrading the bathroom vanities • Replacing the rotted corner boards • Replacing the heating system (currently underway) • Replacing the second-floor toilet
The Marshfield Group Home has managed to get by with such a low HUD contract rent level in large measure because the property has an on-site 24-hour supportive service staff provided by Vinfen. The staff person handles all minor matters (such as changing a light bulb or settling a dispute with a neighbor) that could be a costly emergency after-hours call in a PRAC 811 property that does not have a full-time on-site staff person. The field tester’s budget estimate for FY 2006 is summarized below. It is based on the information collected from the site visit and the field tester’s professional judgment on how the project should be staffed and operated. In particular, the staffing level is raised and the maintenance spending is increased to a higher level.
Operating Expenses FY 2006
Administrative 98
Utilities 122
Operating and Maintenance 92
Taxes and Insurance 50
TOTAL OPERATING COSTS 362
Service Expense 0
Replacement Reserve Deposits 15
TOTAL ALL COSTS 377

Appendix D: Field Test Reports 116

Appendix D: Field Test Reports 117
Adequacy of the Cost Model Estimate The benchmark produced by the cost model is $581 PUM for this property (excluding deposits to replacement reserves and service expenses). This amount is more than adequate to cover the routine operating expenses estimated by the field tester. However, the property is beginning to suffer from a list of deferred maintenance items and the replacement reserves will soon be inadequate to fund the property’s future capital needs. The property thus could easily use the additional funds to address its capital needs and chronic operating losses. Aligning the field tester’s estimate with the cost model estimate
Field Tester’s Budget Estimate
Cost Model Estimate
Variance Amount
Variance Percentage
362 581 219 60.5 percent The property has been able to maintain such a low expense level for a number of reasons. First, it is staffed (with outside funding) with an on-site 24-hour employee to serve the residents. Second, the project functions in many ways like two apartments (with a common kitchen, one bath, and a sitting room) rather than 8 separate units. Third, the property is located in a low-cost portion of the Boston metropolitan area.

Appendix D: Field Test Reports 118
Prospect Street Apartments 120 Prospect Street
Marlborough, MA 01752 PRAC 811
Project ID No: 800008793
Property Overview Prospect Street Apartments is a PRAC 811 that contains 2 one-bedroom and 3 two-bedroom supportive living apartments located in Marlborough, MA. Marlborough is a small city of 36,000 in Boston’s metro-west Middlesex County. The property is owned by Advocates Properties Inc., a non-profit Massachusetts corporation established to provide housing to clients of Advocates Inc., a related non-profit organization. Advocates Inc. has been providing integrated, multi-disciplinary support services for people with disabilities since 1975. Through its Supported Housing division, the organization provides supportive housing services to the residents through a contract with the Massachusetts Department of Mental Health (DMH). Through its Real Estate division, the organization provides property management services to the property.

Appendix D: Field Test Reports 119
The 2-story, 100-year-old farmhouse was renovated in 1995. It is situated on a three-quarter acre parcel on a quiet residential street within walking distance of Marlborough’s downtown. There is a washer and dryer, as well as some storage space, in the basement of the property. One of the apartments has a private porch, while the others share a long open porch at the rear of the building. One of the two-bedroom apartments is accessible for people with physical disabilities. There are 10 parking spaces. The property has been continuously managed and supportive services have been continuously provided by Advocates Inc. since the property opened 11 years ago. While the residents live independently, they nonetheless require frequent contact with staff of Advocates Inc. for both their clinical and housing needs. Management Responsibilities Advocates Inc. is in the process of re-organizing its property management operations. There is a Supported Housing division located in Marlborough, a few miles from the property. Residents typically contact the department to hand in monthly rent payments, request repairs, etc. The Supported Housing staff visit the residents several times a week. They contact one of the property maintenance crew when there is a maintenance issue at the property. They may also arrange for contracted services such as landscaping and snow removal.

Appendix D: Field Test Reports 120
Advocates Inc. operates primarily small apartment communities and group homes scattered throughout Boston’s western and southern suburbs. Its small crew of maintenance staff is assigned to projects as needed because none of the properties is large enough for a dedicated staff member. Considerable time is spent preparing properties for the DMH inspections, which are considered more rigorous than the REAC inspection. Advocates Inc. has a good track record with DMH. Heretofore, the Real Estate division has been handling a great deal of the administrative functions, including processing the TRACs payments, preparing budgets, paying bills, and the like. Advocates Inc. relies on the Department of Mental Health for resident referrals when there is a vacancy. When the processing time extends for several months, as happened recently (one of the units was vacant for 8 months), the financial impact on the property can be considerable. Staffing Because the property is so small, it receives a staffing allocation, rather than a specific assignment of one or two staff persons to the project. The current staffing level is as follows: Occupancy Specialist .031125 FTE Occupancy Specialist .100000 FTE Maintenance Personnel .225000 FTE Program/Project Staff .175000 FTE Facilities Manager .050000 FTE TOTAL .581125 FTEs The average salary for these 5 staff is $50,747. This is higher than the industry norm for site-related activities. Operating Expenses, Including Service Expenses and Replacement Reserve Deposits The current HUD contract rent is $952 for the one-bedroom unit and $1,904 for the two-bedroom unit. Rent for the two-bedroom unit is exactly two times the rent for the one-bedroom unit because HUD assumes that the property is providing housing for eight qualified individuals. Therefore, our calculation on operating expenses is based on 8 rather than 5 units.50
The average expense level was $854 for FY 2005 (including replacement reserve deposits). The un-audited expenses for FY 2006 were $875, including deposits to replacement reserves. The property has been incurring regular cash-flow deficits due to three factors:
• Vacancy losses;
• Higher administrative costs; and
• High maintenance costs, which are in turn influenced by the following factors: 50 HUD records indicate 8 units, but the Rent Schedule, Low Rent Housing (form HUD-92458) shows 2 1-
bedroom units at $952 and 3 2-bedroom units at $1,904.

Appendix D: Field Test Reports 121
– Absence of on-site personnel to respond to maintenance matters as simple as changing a light bulb for the residents. Albeit simple, such matters have to be handled immediately to ensure the residents’ safety.
– Near-emergency nature of otherwise more routine matters requires costly overtime staffing.
– The dispersed nature of Advocates’ housing portfolio makes it difficult to manage the properties’ maintenance needs. The owner estimated that about one-third to half of payroll costs is attributable to travel time.
Unlike the PRAC 811 group homes, which often have a 24-hour on-site staff presence (funded by the state’s public health system) to respond to the residents’ needs, Prospect Street Apartments does not have such an on-site staff person. Instead, requests from the residents are handled through an “on call” approach. This is a costly approach, creating exceptionally high operating and maintenance expenses for the property. In fact, its line item for total operating and maintenance expenses is the highest among the 10 study sites.

Appendix D: Field Test Reports 122
The following table summarizes the operating costs over the past 6 years on a PUM basis:
Operating Expenses 6/30/02 6/30/03 6/30/04 6/30/05 6/30/06
Administrative 148 231 197 208 290
Utilities 76 84 91 106 102
Operating and Maintenance 163 457 431 391 354
Taxes and Insurance 47 120 98 130 106
TOTAL OPERATING COSTS 434 892 817 835 852
Service Expense 0 0 0 0 0
Replacement Reserve Deposits 19 19 19 19 23
TOTAL ALL COSTS 453 911 836 854 875 The field tester’s budget estimate for FY 2006 is summarized below. It is based on the information collected from the site visit and the field tester’s professional judgment on how the project should be staffed and operated. In particular, it assumes a lower level of staff salary. The staffing level is higher than one would find at a property with 24-hour staff coverage funded by the state’s public health system, yet less than is currently provided.
Operating Expenses FY 2006 Administrative 322 Utilities 102 Operating and Maintenance 193 Taxes and Insurance 106 TOTAL OPERATING COSTS 723 Service Expense 0 Replacement Reserve Deposits 23 TOTAL ALL COSTS 746
Adequacy of the Cost Model Estimate The benchmark produced by the cost model is $607 PUM for this property (excluding deposits to replacement reserves and service expenses). This amount is below the field tester’s estimate for the portion of the expenses that excludes deposits to replacement reserves and service expenses ($723). The cost model estimate would be sufficient to cover the routine operation if the property did not have exceptionally high operating and maintenance costs. The unique factor for this property is that it tries to ensure the ability of its residents to live independently by providing a very responsive level of maintenance service that is beyond the level found at other PRAC 811s without on-site service staff.

Appendix D: Field Test Reports 123
Aligning the field tester’s estimate with the cost model estimate
Field Tester’s Budget Estimate
(Deduct for staffing level)
Field Tester’s Budget Estimate Adjusted for
Project-specific expenses Cost Model Estimate
723 (116) 607 607