Secondary / ESL Lesson Plan Template -- 2021-2022 Academic ...
14
Secondary / ESL Lesson Plan Template -- 2021-2022 Academic Year Name: Nora Evans Lesson Topic: Introduction to Quadratics Functions Content Area: Mathematics/Algebra II Grade Level(s): 10-12 Lesson Content Background Information/ Relevance/ Context/ Rationale (Purpose) – Please be clear about how this particular lesson is situated within the current instructional sequence (i.e., unit), why this content is important for students to learn, and how you will convey the relevance and significance of this lesson to students. This is the first lesson in the Quadratic Functions unit. Students are introduced to the uses of quadratic functions and the basic definitions, with a focus on the graphical representation and the algebraic properties that can be learned from it. The lesson connects with prior knowledge about quadratics and polynomials from Algebra I, parabolas from Geometry, and with the previous units on absolute value and linear functions. One of the main goals of the Algebra II course is to help students recognize the general shape of function families and investigate and analyze their algebraic properties. The Quadratic Functions unit, and this lesson in particular, focuses on the quadratic function family. In this lesson, the students will practice analysis of the graphical representation skills learned in the previous units on absolute value and linear function. VSOLs/CCSSs Addressed: AII.7 The student will investigate and analyze linear, quadratic, absolute value, square root, cube root, rational, polynomial, exponential, and logarithmic func- tion families algebraically and graphically. Key concepts include: a) domain, range, and continuity; b) intervals in which a function is increasing or decreasing; c) extrema; d) zeros; e) intercepts; f) values of a function for elements in its domain; g) connections between and among multiple representations of functions using verbal descriptions, tables, equations, and graphs; h) end behavior; i) vertical and horizontal asymptotes; j) inverse of a function; and k) composition of functions algebraically and graphically. AII.8 The student will investigate and describe the relationships among solutions of an equation, zeros of a function, x-intercepts of a graph, and factors of a polynomial expression.
-
Upload
khangminh22 -
Category
Documents
-
view
0 -
download
0
Transcript of Secondary / ESL Lesson Plan Template -- 2021-2022 Academic ...

Secondary / ESL Lesson Plan Template -- 2021-2022 Academic Year
Name: Nora Evans Lesson Topic: Introduction to Quadratics Functions
Content Area: Mathematics/Algebra II Grade Level(s): 10-12
Lesson Content
Background Information/ Relevance/ Context/ Rationale (Purpose) – Please be clear about how this particular lesson is situated within the current instructional sequence (i.e.,
unit), why this content is important for students to learn, and how you will convey the relevance and significance of this lesson to students.
This is the first lesson in the Quadratic Functions unit. Students are introduced to the uses of quadratic functions and the basic definitions, with a focus on the graphical representation and the algebraic properties that can be learned from it. The lesson connects with prior knowledge about quadratics and polynomials from Algebra I, parabolas from Geometry, and with the previous units on absolute value and linear functions. One of the main goals of the Algebra II course is to help students recognize the general shape of function families and investigate and analyze their algebraic properties. The Quadratic Functions unit, and this lesson in particular, focuses on the quadratic function family. In this lesson, the students will practice analysis of the graphical representation skills learned in the previous units on absolute value and linear function.
VSOLs/CCSSs Addressed: AII.7 The student will investigate and analyze linear, quadratic, absolute value, square root, cube root, rational, polynomial, exponential, and logarithmic func-tion families algebraically and graphically. Key concepts include: a) domain, range, and continuity; b) intervals in which a function is increasing or decreasing; c) extrema; d) zeros; e) intercepts; f) values of a function for elements in its domain; g) connections between and among multiple representations of functions using verbal descriptions, tables, equations, and graphs; h) end behavior; i) vertical and horizontal asymptotes; j) inverse of a function; and k) composition of functions algebraically and graphically. AII.8 The student will investigate and describe the relationships among solutions of an equation, zeros of a function, x-intercepts of a graph, and factors of a polynomial expression.

Learning Targets As a result of this lesson, students will...
Explore the following ESSENTIAL QUESTIONS…
(EQ1) Is a picture worth a thousand words? How do successful
mathematicians use graphical representations to understand and solve
problems?
UNDERSTAND THAT…
(U1) Students will understand that the graph of a function is a succinct and
powerful representation of the function’s algebraic properties and that it is a
useful tool to solve a variety of problems.
KNOW…
(K1.1) Students will know the standard and vertex form of the quadratic
function.
(K1.2) Students will know that a parabola has
• an axis of symmetry and a vertex
• a global extremum (minimum or maximum)
BE ABLE TO (DO)...
(D1.1) Students will be able to use the graph or the equation of a quadratic
function to determine:
• global extremes
• Intercepts
• Zeros
• Value of the function at points in the domain
(D1.2) Students will be able to transform a quadratic equation in standard form to a quadratic equation in vertex form.

Plan for Assessment As you plan your lesson, think about what evidence you will gather to determine if students have mastered the lesson’s learning targets. Develop a plan for assessing the degree to which your
students have mastered the learning targets in this lesson. Your plan should include at least one formative assessment at a minimum, and may also include diagnostic/pre-assessment or
summative assessments depending on the nature of the learning targets and the placement of the lesson within the context of the unit. Please add/remove tables as needed.
Assessment #1
Learning target(s) for which you will collect data (write out):
(D1.1) Students will be able to use the graph or the equation of a quadratic function to determine:
• Global extremes
• Intercepts
• Zeros
• Value of the function at points in the domain
Type of Assessment (choose and highlight one):
⚫ Diagnostic Assessment or Pre-Assessment (before the lesson)
⚫ Formative Assessment (during the lesson)
⚫ Summative Assessment (after the lesson)
Possible Options: ⚫ Previous class work ⚫ Graphic organizer ⚫ Journal entry ⚫ Think/Pair/Share ⚫ 1-minute essay
⚫ Problem set ⚫ Strategic questioning ⚫ Learning/response log ⚫ Exit ticket ⚫ 3-2-1 countdown ⚫ Other (DO NOW)
Specific Plan (What does the assessment entail, and what evidence will help you determine students’ progress towards the learning target(s)?): The students are asked to solve a warm-up exercise before the lesson starts. The warm-up exercise has a dual purpose. First, it activates prior knowledge of evaluating an algebraic expression at a point. Second, it is a recall practice of simplifying algebraic expressions. Both skills are needed in the unit and are encompassed in the VSOL. If some students struggle to solve the activity, the teacher solves the one exercise in detail and mentioning the algebraic properties used. The teacher checks in with these students more often during the practice time. If some students are able to solve some of the exercises correctly, the teacher asks them to write up their solution on the whiteboard.
Assessment #2

Learning target(s) for which you will collect data (write out):
(K1.1) Students will know the standard and vertex form of the quadratic function.
(K1.2) Students will know that a parabola has
• an axis of symmetry and a vertex
• a global extremum (minimum or maximum)
(D1.1) Students will be able to use the graph or the equation of a quadratic function to determine:
• global extremes
• Intercepts
• Zeros
• Value of the function at points in the domain (D1.2) Students will be able to transform a quadratic equation in standard form to a quadratic equation in vertex form.
Type of Assessment (choose and highlight one):
⚫ Diagnostic Assessment or Pre-Assessment (before the lesson)
⚫ Formative Assessment (during the lesson)
⚫ Summative Assessment (after the lesson)
Possible Options: ⚫ Previous class work ⚫ Graphic organizer ⚫ Journal entry ⚫ Think/Pair/Share ⚫ 1-minute essay
⚫ Problem set ⚫ Strategic questioning ⚫ Learning/response log ⚫ Exit ticket ⚫ 3-2-1 countdown ⚫ Other (DO NOW)
Specific Plan (What does the assessment entail, and what evidence will help you determine students’ progress towards the learning target(s)?): After the lecture part of the lesson in which I introduce the main concepts and definitions, the students will practice the concepts using a Desmos activity. The Desmos activity will check the student’s recall of the key vocabulary and their ability to identify the properties of quadratic functions on their graphs. While the students are working, I will move around the classroom to help students stay on task and answer questions. After class, I will check the students’ answers carefully in Desmos, add feedback in writing, and make note of what questions were most difficult. In successive lessons, I will include warm-up questions to scaffold the questions missed in the assessment, and I will refer back to these concepts more often. Link to the Desmos activity: https://teacher.desmos.com/activitybuilder/custom/616c926786ea6156095ee31d

Steps in the Lesson (including Modalities & Resources) Planning for Learner Diversity / Instructional Scaffolds ⚫ You should identify specific ways you plan to ensure equity and
inclusion by building on learners’ diversity. ⚫ Guiding questions:
How can you leverage students’ prior experiences and assets in this step of the lesson?
How does this step address and build on learner diversity to ensure equity?
What challenges/ opportunities/barriers might exist for individuals or groups of learners in accessing content and learning activities in this step of the lesson?
How will you utilize Universal Design for Learning (UDL) and/or differentiation so that all students can access the content and learning activities?
What feedback can you provide to acknowledge and value each student’s contributions?
Steps in the Lesson (including Timing and Modalities & Resources Utilized) Planning for Student Diversity / Instructional Scaffolds
STEP 1: Warm-Up / Accessing Prior Knowledge (~10 minutes total) I will greet the class and have them begin working on the Warm-Up, which is posted on the screen (See attached PowerPoint; Slide 1). The Warm-Up contains three algebraic expressions that must be simplified and evaluated at a point. The students recall the distributive property, the meaning of squaring, and order of operations. As students are working, I will circulate and informally check answers on students’ papers and answer questions. I will ask some students to write their solutions on the whiteboard. After 6-7 minutes, I will ask the class to check their work against the solutions written by their peers on the whiteboard. For each exercise, I will point the important steps and ask if there are other solutions.
The students are familiar with this type of exercise and most students should be able to do the work independently. As I am circulating and checking students’ answers, I will quietly ask specific students to write their solution on the whiteboard. If I will notice errors, I will gently guide the students toward the correct solution.
STEP 2: Introduction (~5 minutes) I will tell the class: (PowerPoint; Slide 2) Today, we start the study of quadratic functions. (PowerPoint; Slide 3) We start with a lesson in which we learn about the standard and vertex form of quadratic equations, and some important properties of quadratic function. In the
This segment is accessible to students of all abilities.

second part of the class, you will work individually or together on a Desmos activity. If you do not finish the activity in class, you must complete it at home before the next class. (PowerPoint; Slide 4) These are the learning targets for today. When you review the material, use them as a guide of what I expect you to know or be able to do on the summative assessment. (PowerPoint; Slide 5) Play the hook video (2.5 min). (PowerPoint; Slide 6) The video showed us how often we encounter parabolas in real life. Here is the equation for the parabola you can see in the central part of the Golden Gate Bridge. If you dream about building bridges, then this is the class to pay attention to. However, I know that most of you do not dream of building bridges or worry about the equation of the ball trajectory when you kick it. We study math in high school to make us better thinkers and problem solvers.
STEP 3: Lesson (~40 minutes) I will hand out the note taking sheet, referred as Notes in the rest of this plan. I will tell the class: I would like you to take notes on the papers I am handing you now. (PowerPoint; Slide 7) In the linear functions unit we learned about the standard form of a linear equation is 𝑎𝑥 + 𝑏𝑦 = 0. The standard of a quadratic functions is similar and has an extra quadratic term. Please write this in your notes. The term 𝑎𝑥^2 is called quadratic term, 𝑏𝑥 is called linear, and 𝑐 is called the constant term. Notice that we have the condition 𝑎 ≠ 0. (PowerPoint; Slide 8) Please take half of minute to think what is the formula of f if a equals zero. Write down the answer in your notes. After 30 seconds. What formula did you come up with? What type of functions is that? I will wait for the students to say if they were able to find the formula. (PowerPoint; Slide 9) Indeed, when a is equal to zero, the quadratic term disappears and we are left with only the linear and constant terms. How did we call this type of function before? At least one student should be able to remember that this is a linear function.
I am framing this lesson within the context of students’ larger work on studying functions by making connections with previous units. The notetaking sheet has been designed as a form of UDL to help support students who may struggle to take notes independently and highlights key aspects of the lesson they should remember. The students in this class struggle with organization and note taking. I noticed in the previous units that they have difficulty locating where they took their notes notebook/handout. Throughout this unit, I will use page numbers and consistent numbering of lessons.

Yes, this is a linear function. Please write this in your notes. You can see here the graph of the linear function which is clearly not a parabola. (PowerPoint; Slide 10) Here is how the graph of a quadratic function looks like. If 𝑎 > 0, think of the suspension bridge. We say the parabola opens up. If 𝑎 < 0, think of the ball trajectory. In this case, we say the parabola opens down. Please make sure you complete the blanks in your note sheet. What do you notice about these graphs? Is there a point that seems more special than the rest? Yes, the bottom or top. We call that point a vertex. How does the function look on the left and right of that vertex? Yes, the function is symmetric with respect to a vertical line going through the vertex. (PowerPoint; Slide 11) Please mark in your notes the vertex and line of symmetry. Wait about 10-20 seconds. If we only have the equation for the quadratic function, we can calculate the vertex
algebraically. The x-coordinate of the vertex is −𝑏
2𝑎. The y-coordinate is simply the value of f
at −𝑏
2𝑎. The axis of symmetry has equation 𝑥 = −
𝑏
2𝑎. Note that we use x here, not y, because
the line is vertical and not horizontal. (PowerPoint; Slide 12) (I do.)
𝑓(𝑥) = 2𝑥2 + 4𝑥 − 6 𝑎 = 2, 𝑏 = 4, 𝑐 = −6
The vertex has x-coordinate 4
2∙2= 1. The y-coordinate is 𝑓(1) = 2 + 4 − 6 =0. Thus, the
vertex is the point (1,0). The axis of symmetry has equation 𝑥 = 1. (We do it together.) Take 2 minutes to try out the exercise independently. After 2 minutes, we will solve it together. Walk around to check the student’s work. After 2 minutes, call everyone’s attention back to the white board. Recall, the first step is to write the values of a, b, and c. What do you think they are? The next step is to write the formula for the x-coordinate and replace a and b with the values we determined in step 1. What is the x-coordinate? The last step is to calculate the value of the function at x=5/6.

In conclusion, the vertex is (5/6, f(5/6)). Please make sure you have the correct answer in your notes. (PowerPoint; Slide 13) Break time! The students will throw balls around to see parabolas in action. (About 3 minutes) (PowerPoint; Slide 14) Because the vertex is so special for quadratic functions, we have a vertex form of the equation such that we can write the equation when we know a and the vertex. Let’s practice writing the vertex form. Please take 30 seconds to think and write down the equation. After 30 seconds. We just need to replace a with 1. What is h if the vertex is (1,4)? Some student will say 1. Why is it 1? Wait for answers. Yes, h is the x-coordinate of the vertex, which is the first number of the pair. What is y? I write on the slide the equation. Please make sure you have the correct answer in your notes. (PowerPoint; Slide 15) In the last part of the lesson, we discuss properties of the extremum, zeros and x-intercepts. (PowerPoint; Slide 16) An extremum can be a minimum or a maximum. What is a minimum? You can think of a minimum as the bottom of a valley. Does any of these functions have a minimum? What is a maximum? Can you see one? You can think of a maximum as the tippy top of a mountain. Please write in your notes the type of extremum for a<0 and a>0.

Next, we discuss zeros and x-intercepts, which can be 0, 1, or 2. (PowerPoint; Slide 17) Here is an example of a quadratic function with two zeros. Please make sure you complete in the notes the number of zeros, zeros, and x-intercepts for this graph. Remember that zeros are numbers, and x-intercepts are coordinate pairs. (PowerPoint; Slide 18) Here is an example of a quadratic function with one zero (repeated). What is the zero of this function? The zero of the function is x= 1. What is the x-intercept? It is (1,0). Please write the answers in your notes. (PowerPoint; Slide 19) Here is an example of a quadratic function with no zeros. Please write in your notes no zeros for the graph you see on the whiteboard. (PowerPoint; Slide 20) Now, I would like you to use the link in Schoology to access the Desmos activity. Work in class and complete it at home before the next class. Before the next class, please check my feedback on your work. You may work alone, or in groups but you must complete your own activity.
STEP 4: Practice (You Do It Together/Independently) Screen 1: Card sort to recall the definition of standard form.
Screen 2: Card sort to practice differentiation between the previously learned functions and quadratic functions.
The Desmos activity is accessible to all students.

Screen 3. Multiple choice question to recall that the graph of a quadratic function is called a parabola. Screens 4, 5. Identify the vertex on a graph. The values typed by the students are shown on the graph.
Screens 6, 7. Identify the axis of symmetry. The values typed by the students are shown on the graph.
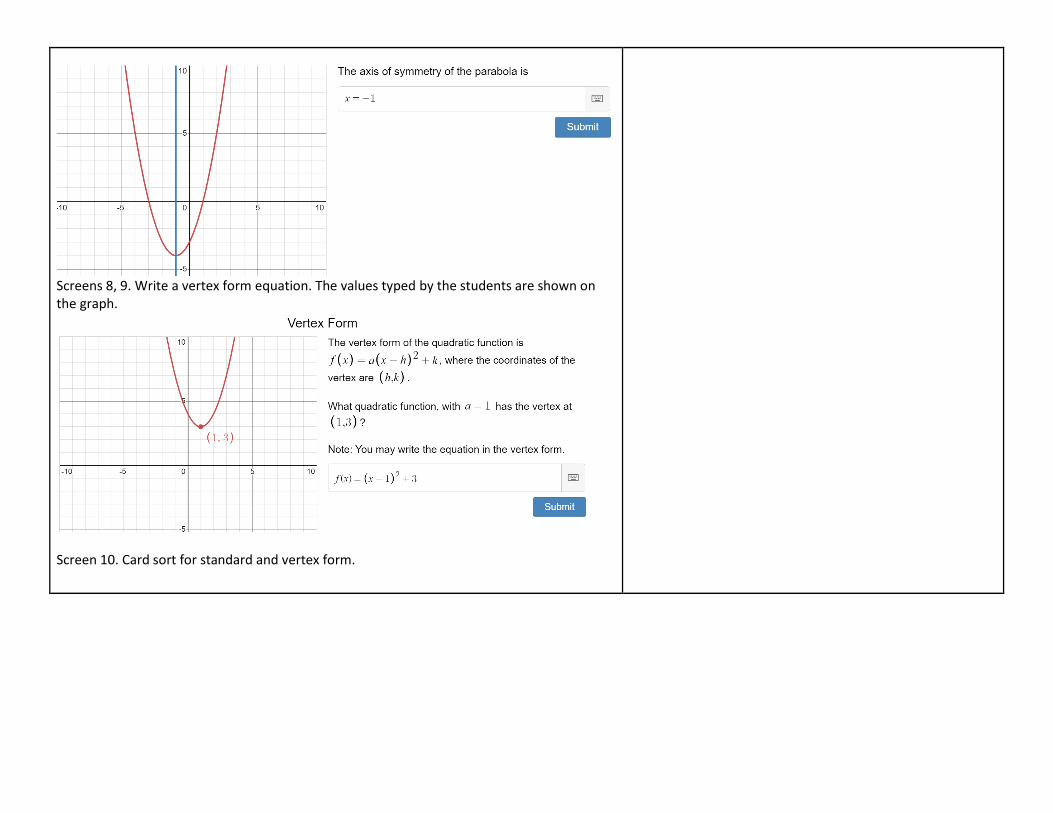
Screens 8, 9. Write a vertex form equation. The values typed by the students are shown on the graph.
Screen 10. Card sort for standard and vertex form.

Screen 11. Card sort to match graphs with opens up/down behavior.
Screen 12. Card sort to match graph with number of x-intercepts

Screen 13. Multiple choice asking how many x-intercepts can a quadratic function have. Screen 14. Multiple choice asking how many y-intercepts can a quadratic function have. Screen 15. Write the y-intercept formula. Screen 16. Extrema of a parabola that opens up. Screen 17. Extrema of a parabola that opens down. Screen 18. Practical application. (screen modified from https://teacher.desmos.com/activitybuilder/custom/616c9e57279ba348f21afa83)
Screen 19. Another application. (screen copied from the same source as the previous one).

Screen 20. Connection between vertex and extremum. Screen 21. Extremum type.
STEP 5: Wrap-Up Please remember to complete the Desmos activity and to check my feedback in Desmos. Do not forget to work on your graded Delta Math assessments.
Materials/ Supplies/ Sources/ Digital and Interactive Instructional Technology (if appropriate): – Please list all necessary instructional supplies, materials, and sources.
Make sure that these are clearly labeled and referenced throughout the lesson plan to enhance clarity.
Desmos activity: https://teacher.desmos.com/activitybuilder/custom/616c926786ea6156095ee31d Notes file attached. PowerPoint attached.