Secondary Cities of the European Union: EU-Accession Process and Regional Development in Turkey
19
Customs Union: An Account of 15 Years (1996-2011), Ankara: Ankara Üniversitesi Avrupa Toplulukları Araştırma ve Uygulama Merkezi, 2013, p. 73-102 1 SECONDARY CITIES OF THE EUROPEAN UNION: EU-ACCESSION PROCESS AND REGIONAL DEVELOPMENT IN TURKEY 1 INTRODUCTION Turkey has been going through a major transformation concerning the composition of its domestic output since the early 1980s. The increasing interconnectedness with global markets particularly in its manufacturing sectors stands out as a major factor that accounted for this transformation. In this context, Turkey‘s relations with the European Union (EU) played a crucial role in the way international connections of Turkish enterprises are established. Particularly after the accession negotiations were started, not only an export boom in capital-intensive manufacturing industries reshaped the composition of the country‘s exports, but also a major geographical redistribution of industrial activities took place in a way that it reshaped the character of regional disparities across the country. This paper will provide a preliminary analysis of this geographical redistribution process in the context of Turkey‘s accession to the European Union. The goal is to pursue a debate on what this transformation signifies for Turkey and the EU. For the inquiry, the aim will be to outline some of the related characteristics of three cities that outperformed many others of a similar economic stature in terms of their export performance after the initiation of accession negotiations with the EU. The argument is that regional development patterns in Turkey become gradually synchronized with those of the EU since the early 2000s. Accordingly, the rise of what I call secondary cities in Turkey as new localities alternative to traditional industrial centers are reflective of EU-wide trends of regional and urban growth. This argument has two repercussions. First, the recent growth performance of these cities in Turkey should be contextualized within this larger framework of EU-related dynamics, rather than unspecified endogenous or global dynamics, if the question is how accession reshaped the context for regional disparities in Turkey. Second, the synchrony between Turkey and Europe in terms of urban-industrial patterns is a heuristic phenomenon that helps to lead the policy choices in response to the ongoing financial crisis in Europe. The argument will be presented as follows: first, the recent trends with regard to the regional disparities in Turkey after the accession process will be presented. This section illustrates that regional disparities in the 2000s took a new shape because of the surprising performance of some cities with outstanding growth capacities. The second section of the paper will focus on the industrial dynamics of three of such outstanding cities of this sort: namely Denizli, Gaziantep and Kayseri. The data at hand reveals the scope of integration of industrial enterprises with the global economy during the accession period. The volume and diversity of exports by these provinces witnessed significant increase in the last decade, even though foreign direct investment played a negligible role in the process. In this period, nominal trade figures with EU have been on the rise, even though trade with EU countries relative to the rest of the world decreased. Accession not only integrated these cities to the EU economic zone, but also bolstered extra-EU connections for individual enterprises in these cities. 1 This research was supported by a Marie Curie FP7 Integration Grant within the 7th European Union Framework Programme.
Transcript of Secondary Cities of the European Union: EU-Accession Process and Regional Development in Turkey

Customs Union: An Account of 15 Years (1996-2011), Ankara: Ankara Üniversitesi Avrupa Toplulukları Araştırma
ve Uygulama Merkezi, 2013, p. 73-102
1
SECONDARY CITIES OF THE EUROPEAN UNION:
EU-ACCESSION PROCESS AND REGIONAL DEVELOPMENT IN TURKEY1
INTRODUCTION
Turkey has been going through a major transformation concerning the composition of its
domestic output since the early 1980s. The increasing interconnectedness with global markets
particularly in its manufacturing sectors stands out as a major factor that accounted for this
transformation. In this context, Turkey‘s relations with the European Union (EU) played a crucial
role in the way international connections of Turkish enterprises are established. Particularly after
the accession negotiations were started, not only an export boom in capital-intensive
manufacturing industries reshaped the composition of the country‘s exports, but also a major
geographical redistribution of industrial activities took place in a way that it reshaped the
character of regional disparities across the country.
This paper will provide a preliminary analysis of this geographical redistribution process
in the context of Turkey‘s accession to the European Union. The goal is to pursue a debate on
what this transformation signifies for Turkey and the EU. For the inquiry, the aim will be to
outline some of the related characteristics of three cities that outperformed many others of a
similar economic stature in terms of their export performance after the initiation of accession
negotiations with the EU.
The argument is that regional development patterns in Turkey become gradually
synchronized with those of the EU since the early 2000s. Accordingly, the rise of what I call
secondary cities in Turkey as new localities alternative to traditional industrial centers are
reflective of EU-wide trends of regional and urban growth. This argument has two repercussions.
First, the recent growth performance of these cities in Turkey should be contextualized
within this larger framework of EU-related dynamics, rather than unspecified endogenous or
global dynamics, if the question is how accession reshaped the context for regional disparities in
Turkey. Second, the synchrony between Turkey and Europe in terms of urban-industrial patterns
is a heuristic phenomenon that helps to lead the policy choices in response to the ongoing
financial crisis in Europe.
The argument will be presented as follows: first, the recent trends with regard to the
regional disparities in Turkey after the accession process will be presented. This section
illustrates that regional disparities in the 2000s took a new shape because of the surprising
performance of some cities with outstanding growth capacities.
The second section of the paper will focus on the industrial dynamics of three of such
outstanding cities of this sort: namely Denizli, Gaziantep and Kayseri. The data at hand reveals
the scope of integration of industrial enterprises with the global economy during the accession
period. The volume and diversity of exports by these provinces witnessed significant increase in
the last decade, even though foreign direct investment played a negligible role in the process. In
this period, nominal trade figures with EU have been on the rise, even though trade with EU
countries relative to the rest of the world decreased. Accession not only integrated these cities to
the EU economic zone, but also bolstered extra-EU connections for individual enterprises in
these cities. 1 This research was supported by a Marie Curie FP7 Integration Grant within the 7th European Union Framework Programme.

Customs Union: An Account of 15 Years (1996-2011), Ankara: Ankara Üniversitesi Avrupa Toplulukları Araştırma
ve Uygulama Merkezi, 2013, p. 73-102
2
Third, data on the urban dynamics in the Union illustrates that secondary cities are not a
phenomenon just pertinent to Turkey. In fact, the working hypothesis, which this paper proposes
for further inquiry, is that mid-size cities across Europe benefit from intra-EU integration more
than large metropolises just as the Turkish cities, since integration means the formation of a
network composed of cities of a similar size. In other words, what we see here is not a mere
change in the conditions of regional development (that is, a mere shift from country-oriented
development to Union-oriented development), but the emergence of a new intra-urban network
across the Continent. That Turkey is still not a formal member and its cities walk on a similar
path to European cities of a similar size further renders this hypothesis a valuable starting point
for prospective research.
REGIONAL DEVELOPMENT AND TURKISH EXPORTS IN THE LAST DECADE
The value of Turkey‘s exports rose from $ 13 billion in 1990 to $ 134 billion in 2011. In
the meantime, volume of the industrial exports reached $ 125 billion and accounted for 95
percent of all Turkish exports (Turkish Statistical Institute 2008). The coup d‘etat in 1980
established the institutional basis for export-oriented growth (ELG) policies (Keyder 1987),
while, as the chart below illustrates, manufacturing exports accounted for an increasingly larger
share of total exports particularly after Turkey and European Union (EU) ratified the Customs
Union Agreement in 1995. In fact, an analysis of the Turkish manufacturing industries has the
potential to give a holistic picture of Turkey‘s export-oriented dynamics. Unsurprisingly, the EU
has been the largest importer of the Turkish manufactures within this period (Undersecretariat of
the Prime Ministry for Foreign Trade 2011): the accession process since 1995 has been shaping
the industrial trends in the Turkish economy.
Table 1: Manufacturing Exports, 1999-2012
Manufacturing Exports
(in million USD)
Total Exports
(in 1000 USD)
Manufacturing
Exports/Total Exports
2012 82 048 87 212 94, 08
2011 125 962 134 906 93, 37
2010 105 466 113 883 92, 61
2009 95 449 102 142 93, 45
2008 125 187 132 027 94, 82
2007 101 081 107 271 94, 23
2006 80 246 85 534 93, 82
2005- Accession negotiations begin. 68 813 73 476 93, 65
2002 33 701 36 059 93, 46
1999- Turkey is granted EU candidacy. 23 957 26 587 90, 11
Source: Turkish Statistical Institute; http://www.tuik.gov.tr/VeriBilgi.do?alt_id=12 , accessed on 9.1.2012.
Customs Union: An Account of 15 Years (1996-2011), Ankara: Ankara Üniversitesi Avrupa Toplulukları Araştırma
ve Uygulama Merkezi, 2013, p. 73-102
3
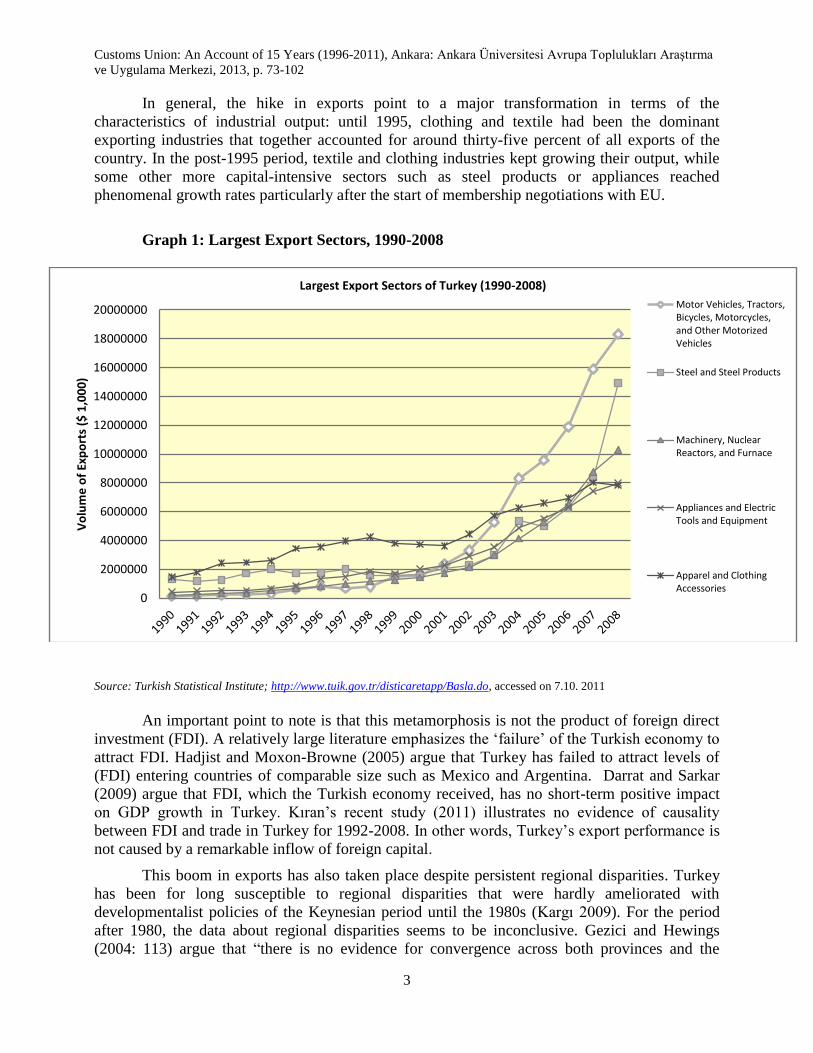
In general, the hike in exports point to a major transformation in terms of the
characteristics of industrial output: until 1995, clothing and textile had been the dominant
exporting industries that together accounted for around thirty-five percent of all exports of the
country. In the post-1995 period, textile and clothing industries kept growing their output, while
some other more capital-intensive sectors such as steel products or appliances reached
phenomenal growth rates particularly after the start of membership negotiations with EU.
Graph 1: Largest Export Sectors, 1990-2008
Source: Turkish Statistical Institute; http://www.tuik.gov.tr/disticaretapp/Basla.do, accessed on 7.10. 2011
An important point to note is that this metamorphosis is not the product of foreign direct
investment (FDI). A relatively large literature emphasizes the ‗failure‘ of the Turkish economy to
attract FDI. Hadjist and Moxon-Browne (2005) argue that Turkey has failed to attract levels of
(FDI) entering countries of comparable size such as Mexico and Argentina. Darrat and Sarkar
(2009) argue that FDI, which the Turkish economy received, has no short-term positive impact
on GDP growth in Turkey. Kıran‘s recent study (2011) illustrates no evidence of causality
between FDI and trade in Turkey for 1992-2008. In other words, Turkey‘s export performance is
not caused by a remarkable inflow of foreign capital.
This boom in exports has also taken place despite persistent regional disparities. Turkey
has been for long susceptible to regional disparities that were hardly ameliorated with
developmentalist policies of the Keynesian period until the 1980s (Kargı 2009). For the period
after 1980, the data about regional disparities seems to be inconclusive. Gezici and Hewings
(2004: 113) argue that ―there is no evidence for convergence across both provinces and the
0
2000000
4000000
6000000
8000000
10000000
12000000
14000000
16000000
18000000
20000000
Vo
lum
e o
f Ex
po
rts
($ 1
,00
0)
Largest Export Sectors of Turkey (1990-2008)
Motor Vehicles, Tractors,Bicycles, Motorcycles,and Other MotorizedVehicles
Steel and Steel Products
Machinery, NuclearReactors, and Furnace
Appliances and ElectricTools and Equipment
Apparel and ClothingAccessories
Customs Union: An Account of 15 Years (1996-2011), Ankara: Ankara Üniversitesi Avrupa Toplulukları Araştırma
ve Uygulama Merkezi, 2013, p. 73-102
4
functional regions in Turkey from 1980 to 1997. Moreover, a high level of the spatial dependence
was revealed‖. Kalyoncu and Kaplan (2010), on the other hand, look at the period between 1975
and 2001 and fail to find any significant result for persistent regional inequality. Disagreements
continue concerning wage and income differentials across the regions. While Elveren (2010)
argues for a hike in regional inequality for wages between 1980 and 2001, Yıldırım and Ocal‘s
analysis on income (2006) argue for convergence at the national level. Baypınar and Erkut (2010)
conclude that, even though conditional (regional) convergence takes place in Turkey, it will take
more than three decades in order for the gap between Western and Eastern regions of the country
to vanish if the convergence rates are sustained at the current level. Altogether, these mixed
results prevent us from presenting a conclusive assessment of the connection between the
ongoing trends in exports and regional disparities in Turkey. Nevertheless, we can argue that
regional disparities in terms of export volume per province have been ameliorating since the early
2000s.
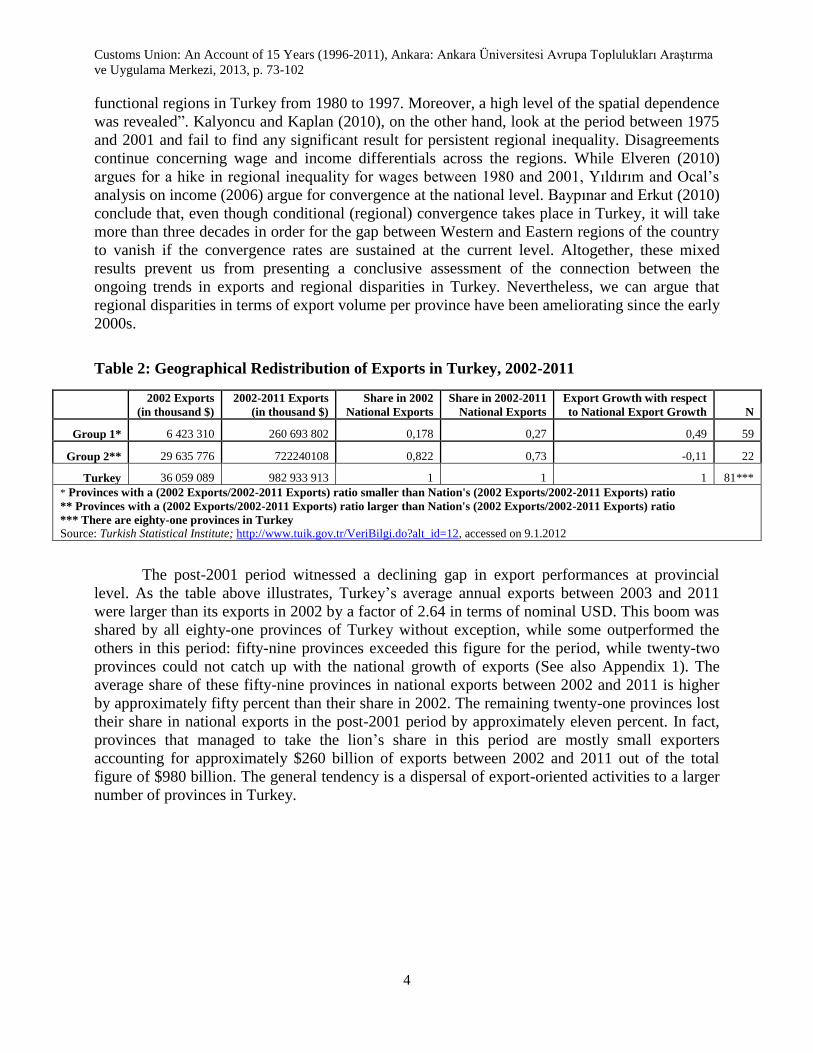
Table 2: Geographical Redistribution of Exports in Turkey, 2002-2011
2002 Exports
(in thousand $)
2002-2011 Exports
(in thousand $)
Share in 2002
National Exports
Share in 2002-2011
National Exports
Export Growth with respect
to National Export Growth N
Group 1* 6 423 310 260 693 802 0,178 0,27 0,49 59
Group 2** 29 635 776 722240108 0,822 0,73 -0,11 22
Turkey 36 059 089 982 933 913 1 1 1 81***
* Provinces with a (2002 Exports/2002-2011 Exports) ratio smaller than Nation's (2002 Exports/2002-2011 Exports) ratio
** Provinces with a (2002 Exports/2002-2011 Exports) ratio larger than Nation's (2002 Exports/2002-2011 Exports) ratio
*** There are eighty-one provinces in Turkey
Source: Turkish Statistical Institute; http://www.tuik.gov.tr/VeriBilgi.do?alt_id=12, accessed on 9.1.2012
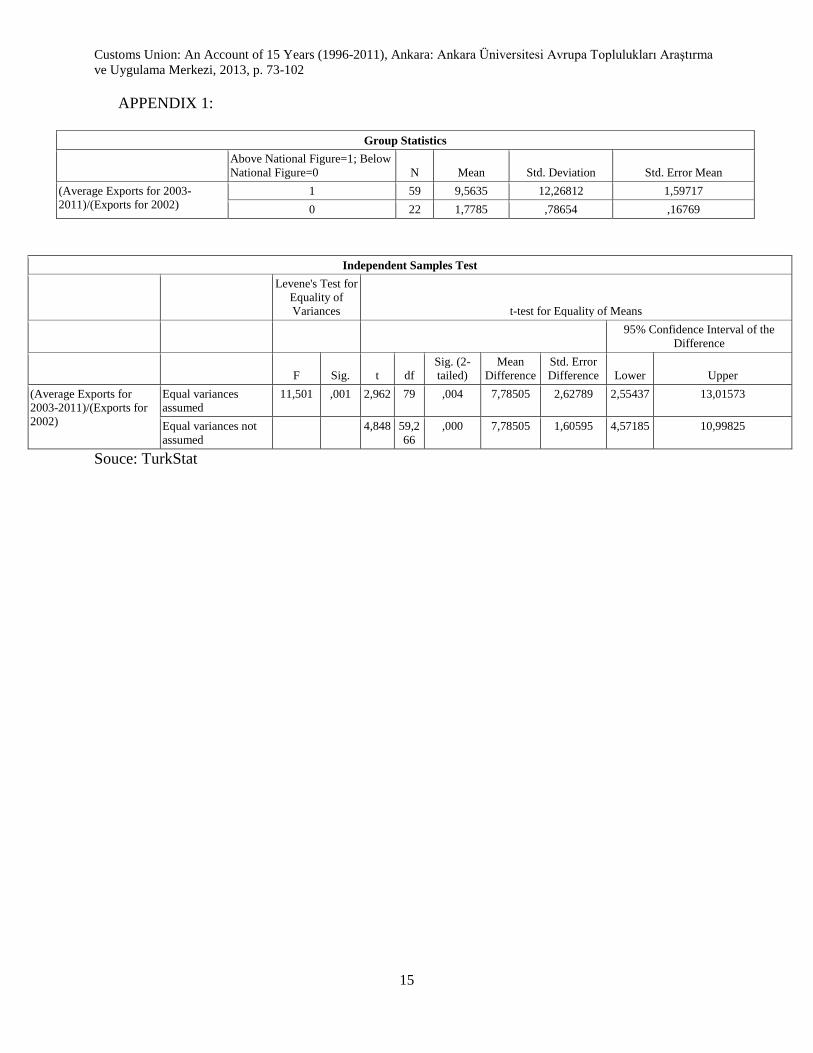
The post-2001 period witnessed a declining gap in export performances at provincial
level. As the table above illustrates, Turkey‘s average annual exports between 2003 and 2011
were larger than its exports in 2002 by a factor of 2.64 in terms of nominal USD. This boom was
shared by all eighty-one provinces of Turkey without exception, while some outperformed the
others in this period: fifty-nine provinces exceeded this figure for the period, while twenty-two
provinces could not catch up with the national growth of exports (See also Appendix 1). The
average share of these fifty-nine provinces in national exports between 2002 and 2011 is higher
by approximately fifty percent than their share in 2002. The remaining twenty-one provinces lost
their share in national exports in the post-2001 period by approximately eleven percent. In fact,
provinces that managed to take the lion‘s share in this period are mostly small exporters
accounting for approximately $260 billion of exports between 2002 and 2011 out of the total
figure of $980 billion. The general tendency is a dispersal of export-oriented activities to a larger
number of provinces in Turkey.
Customs Union: An Account of 15 Years (1996-2011), Ankara: Ankara Üniversitesi Avrupa Toplulukları Araştırma
ve Uygulama Merkezi, 2013, p. 73-102
5
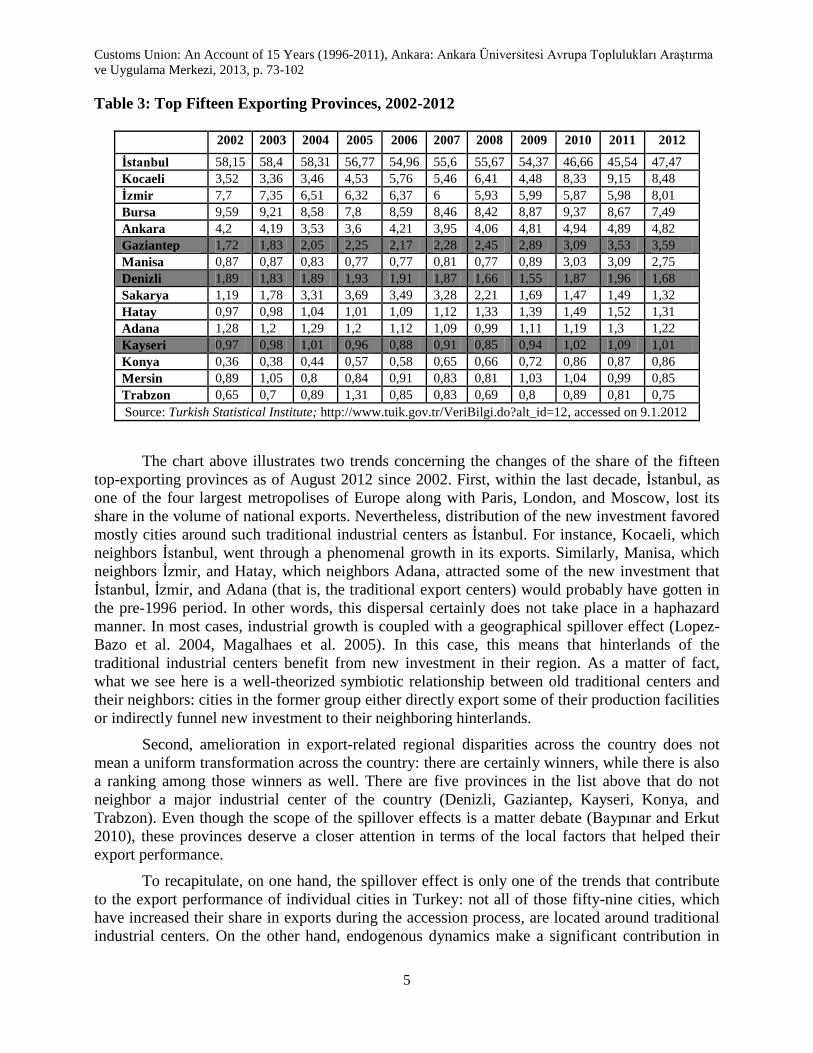
Table 3: Top Fifteen Exporting Provinces, 2002-2012
2002 2003 2004 2005 2006 2007 2008 2009 2010 2011 2012
İstanbul 58,15 58,4 58,31 56,77 54,96 55,6 55,67 54,37 46,66 45,54 47,47
Kocaeli 3,52 3,36 3,46 4,53 5,76 5,46 6,41 4,48 8,33 9,15 8,48
İzmir 7,7 7,35 6,51 6,32 6,37 6 5,93 5,99 5,87 5,98 8,01
Bursa 9,59 9,21 8,58 7,8 8,59 8,46 8,42 8,87 9,37 8,67 7,49
Ankara 4,2 4,19 3,53 3,6 4,21 3,95 4,06 4,81 4,94 4,89 4,82
Gaziantep 1,72 1,83 2,05 2,25 2,17 2,28 2,45 2,89 3,09 3,53 3,59
Manisa 0,87 0,87 0,83 0,77 0,77 0,81 0,77 0,89 3,03 3,09 2,75
Denizli 1,89 1,83 1,89 1,93 1,91 1,87 1,66 1,55 1,87 1,96 1,68
Sakarya 1,19 1,78 3,31 3,69 3,49 3,28 2,21 1,69 1,47 1,49 1,32
Hatay 0,97 0,98 1,04 1,01 1,09 1,12 1,33 1,39 1,49 1,52 1,31
Adana 1,28 1,2 1,29 1,2 1,12 1,09 0,99 1,11 1,19 1,3 1,22
Kayseri 0,97 0,98 1,01 0,96 0,88 0,91 0,85 0,94 1,02 1,09 1,01
Konya 0,36 0,38 0,44 0,57 0,58 0,65 0,66 0,72 0,86 0,87 0,86
Mersin 0,89 1,05 0,8 0,84 0,91 0,83 0,81 1,03 1,04 0,99 0,85
Trabzon 0,65 0,7 0,89 1,31 0,85 0,83 0,69 0,8 0,89 0,81 0,75
Source: Turkish Statistical Institute; http://www.tuik.gov.tr/VeriBilgi.do?alt_id=12, accessed on 9.1.2012
The chart above illustrates two trends concerning the changes of the share of the fifteen
top-exporting provinces as of August 2012 since 2002. First, within the last decade, İstanbul, as
one of the four largest metropolises of Europe along with Paris, London, and Moscow, lost its
share in the volume of national exports. Nevertheless, distribution of the new investment favored
mostly cities around such traditional industrial centers as İstanbul. For instance, Kocaeli, which
neighbors İstanbul, went through a phenomenal growth in its exports. Similarly, Manisa, which
neighbors İzmir, and Hatay, which neighbors Adana, attracted some of the new investment that
İstanbul, İzmir, and Adana (that is, the traditional export centers) would probably have gotten in
the pre-1996 period. In other words, this dispersal certainly does not take place in a haphazard
manner. In most cases, industrial growth is coupled with a geographical spillover effect (Lopez-
Bazo et al. 2004, Magalhaes et al. 2005). In this case, this means that hinterlands of the
traditional industrial centers benefit from new investment in their region. As a matter of fact,
what we see here is a well-theorized symbiotic relationship between old traditional centers and
their neighbors: cities in the former group either directly export some of their production facilities
or indirectly funnel new investment to their neighboring hinterlands.
Second, amelioration in export-related regional disparities across the country does not
mean a uniform transformation across the country: there are certainly winners, while there is also
a ranking among those winners as well. There are five provinces in the list above that do not
neighbor a major industrial center of the country (Denizli, Gaziantep, Kayseri, Konya, and
Trabzon). Even though the scope of the spillover effects is a matter debate (Baypınar and Erkut
2010), these provinces deserve a closer attention in terms of the local factors that helped their
export performance.
To recapitulate, on one hand, the spillover effect is only one of the trends that contribute
to the export performance of individual cities in Turkey: not all of those fifty-nine cities, which
have increased their share in exports during the accession process, are located around traditional
industrial centers. On the other hand, endogenous dynamics make a significant contribution in
Customs Union: An Account of 15 Years (1996-2011), Ankara: Ankara Üniversitesi Avrupa Toplulukları Araştırma
ve Uygulama Merkezi, 2013, p. 73-102
6
some of those fifty-nine cities that put them in the list of top-exporters. In fact, some cities in this
category recently stood out as growth machines. Accordingly, their new position in the country‘s
industrial landscape indirectly reshaped the dynamics concerning regional disparities. The riddle
is rather about these newly emerging cities in Anatolia that do not enjoy the same advantages as
hinterland provinces such as Manisa or Kocaeli.
In this regard, FDI patterns in Turkey fail to account for the performance of the cities that
do not benefit from the above-mentioned spillover effects: Yavan and Kara (2003) argue that FDI
is heavily located in the western part of the country as the traditional industrial centers, while
there is a parallelism between the geographical distribution of industrial activities and the
foreign-oriented companies. Moreover, Diechman, Karidis, and Sayek (2003) argue that public
investment in Turkey has no significant impact on FDI‘s (already uneven) regional distribution.
Yavan (2010) argues that agglomeration economies and information costs are the most important
determinants of FDI location in Turkey for 1996-2003, but not the other way around. In other
words, location choices by foreign companies do not lead to gains in agglomeration economies
and information costs. As noted above, Turkey does not receive as much FDI as other countries
of comparable size. And when it does, foreign capital entering the domestic economy acts in a
similar manner as the local capital, even when some counter-measures are taken by the
government through public investment in order to attract foreign capital to regions outside
traditional industrial centers. Thus, as with regard to the export performance by Turkey, FDI
cannot be taken as an independent factor to account for the ongoing trends in regional
development in Turkey. Thus, a closer focus on the outperformers is needed to illustrate the
factors that render some of the cities ‗the outperformers‘.
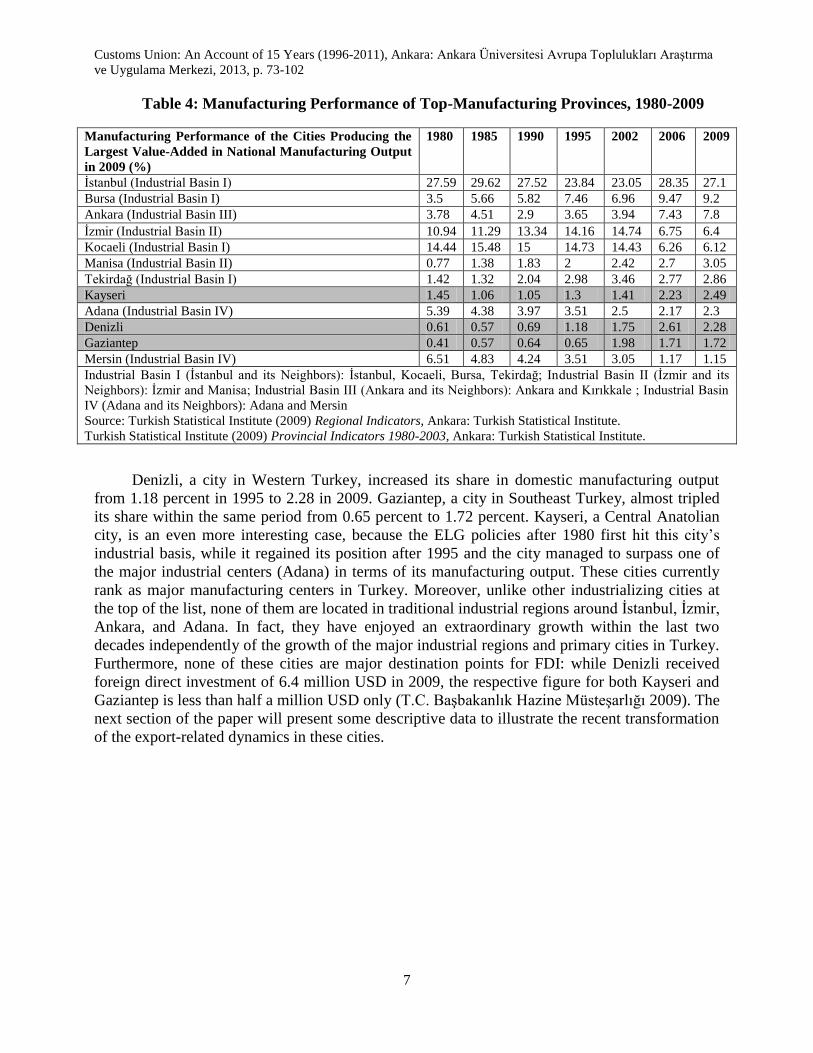
In order to pick the cities that mostly account for the above-mentioned trends in the
2000s, we can use the chart below that illustrates the manufacturing performance of the cities
producing the largest value-added in national manufacturing output in 2009 between 1980 and
2009. Manufacturing performance of individual provinces may serve as a better indicator to
picture this changing industrial topography of Turkey, given that the manufacturing output is not
directly reflected onto their export record, as many of these developing cities are not port cities.
Three cities had an outstanding performance for this period
Customs Union: An Account of 15 Years (1996-2011), Ankara: Ankara Üniversitesi Avrupa Toplulukları Araştırma
ve Uygulama Merkezi, 2013, p. 73-102
7
Table 4: Manufacturing Performance of Top-Manufacturing Provinces, 1980-2009
Manufacturing Performance of the Cities Producing the
Largest Value-Added in National Manufacturing Output
in 2009 (%)
1980 1985 1990 1995 2002 2006 2009
İstanbul (Industrial Basin I) 27.59 29.62 27.52 23.84 23.05 28.35 27.1
Bursa (Industrial Basin I) 3.5 5.66 5.82 7.46 6.96 9.47 9.2
Ankara (Industrial Basin III) 3.78 4.51 2.9 3.65 3.94 7.43 7.8
İzmir (Industrial Basin II) 10.94 11.29 13.34 14.16 14.74 6.75 6.4
Kocaeli (Industrial Basin I) 14.44 15.48 15 14.73 14.43 6.26 6.12
Manisa (Industrial Basin II) 0.77 1.38 1.83 2 2.42 2.7 3.05
Tekirdağ (Industrial Basin I) 1.42 1.32 2.04 2.98 3.46 2.77 2.86
Kayseri 1.45 1.06 1.05 1.3 1.41 2.23 2.49
Adana (Industrial Basin IV) 5.39 4.38 3.97 3.51 2.5 2.17 2.3
Denizli 0.61 0.57 0.69 1.18 1.75 2.61 2.28
Gaziantep 0.41 0.57 0.64 0.65 1.98 1.71 1.72
Mersin (Industrial Basin IV) 6.51 4.83 4.24 3.51 3.05 1.17 1.15
Industrial Basin I (İstanbul and its Neighbors): İstanbul, Kocaeli, Bursa, Tekirdağ; Industrial Basin II (İzmir and its
Neighbors): İzmir and Manisa; Industrial Basin III (Ankara and its Neighbors): Ankara and Kırıkkale ; Industrial Basin
IV (Adana and its Neighbors): Adana and Mersin
Source: Turkish Statistical Institute (2009) Regional Indicators, Ankara: Turkish Statistical Institute.
Turkish Statistical Institute (2009) Provincial Indicators 1980-2003, Ankara: Turkish Statistical Institute.
Denizli, a city in Western Turkey, increased its share in domestic manufacturing output
from 1.18 percent in 1995 to 2.28 in 2009. Gaziantep, a city in Southeast Turkey, almost tripled
its share within the same period from 0.65 percent to 1.72 percent. Kayseri, a Central Anatolian
city, is an even more interesting case, because the ELG policies after 1980 first hit this city‘s
industrial basis, while it regained its position after 1995 and the city managed to surpass one of
the major industrial centers (Adana) in terms of its manufacturing output. These cities currently
rank as major manufacturing centers in Turkey. Moreover, unlike other industrializing cities at
the top of the list, none of them are located in traditional industrial regions around İstanbul, İzmir,
Ankara, and Adana. In fact, they have enjoyed an extraordinary growth within the last two
decades independently of the growth of the major industrial regions and primary cities in Turkey.
Furthermore, none of these cities are major destination points for FDI: while Denizli received
foreign direct investment of 6.4 million USD in 2009, the respective figure for both Kayseri and
Gaziantep is less than half a million USD only (T.C. Başbakanlık Hazine Müsteşarlığı 2009). The
next section of the paper will present some descriptive data to illustrate the recent transformation
of the export-related dynamics in these cities.
Customs Union: An Account of 15 Years (1996-2011), Ankara: Ankara Üniversitesi Avrupa Toplulukları Araştırma
ve Uygulama Merkezi, 2013, p. 73-102
8
SECONDARY CITIES IN THE NEW INDUSTRIAL TOPOGRAPHY OF TURKEY
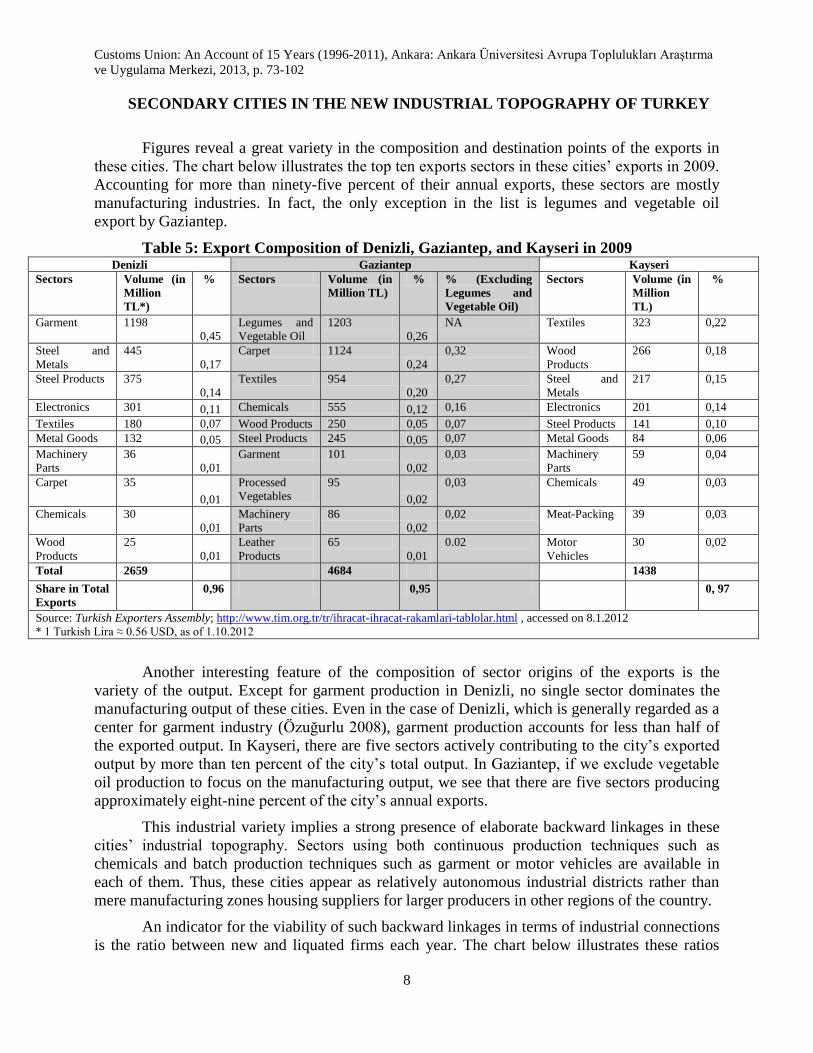
Figures reveal a great variety in the composition and destination points of the exports in
these cities. The chart below illustrates the top ten exports sectors in these cities‘ exports in 2009.
Accounting for more than ninety-five percent of their annual exports, these sectors are mostly
manufacturing industries. In fact, the only exception in the list is legumes and vegetable oil
export by Gaziantep.
Table 5: Export Composition of Denizli, Gaziantep, and Kayseri in 2009 Denizli Gaziantep Kayseri
Sectors Volume (in
Million
TL*)
% Sectors Volume (in
Million TL)
% % (Excluding
Legumes and
Vegetable Oil)
Sectors Volume (in
Million
TL)
%
Garment 1198
0,45
Legumes and
Vegetable Oil
1203
0,26
NA Textiles 323 0,22
Steel and
Metals
445
0,17
Carpet 1124
0,24
0,32 Wood
Products
266 0,18
Steel Products 375
0,14
Textiles 954
0,20
0,27 Steel and
Metals
217 0,15
Electronics 301 0,11 Chemicals 555 0,12 0,16 Electronics 201 0,14
Textiles 180 0,07 Wood Products 250 0,05 0,07 Steel Products 141 0,10
Metal Goods 132 0,05 Steel Products 245 0,05 0,07 Metal Goods 84 0,06
Machinery
Parts
36
0,01
Garment 101
0,02
0,03 Machinery
Parts
59 0,04
Carpet 35
0,01
Processed
Vegetables
95
0,02
0,03 Chemicals 49 0,03
Chemicals 30
0,01
Machinery
Parts
86
0,02
0,02 Meat-Packing 39 0,03
Wood
Products
25
0,01
Leather
Products
65
0,01
0.02 Motor
Vehicles
30 0,02
Total 2659 4684 1438
Share in Total
Exports
0,96 0,95 0, 97
Source: Turkish Exporters Assembly; http://www.tim.org.tr/tr/ihracat-ihracat-rakamlari-tablolar.html , accessed on 8.1.2012
* 1 Turkish Lira ≈ 0.56 USD, as of 1.10.2012
Another interesting feature of the composition of sector origins of the exports is the
variety of the output. Except for garment production in Denizli, no single sector dominates the
manufacturing output of these cities. Even in the case of Denizli, which is generally regarded as a
center for garment industry (Özuğurlu 2008), garment production accounts for less than half of
the exported output. In Kayseri, there are five sectors actively contributing to the city‘s exported
output by more than ten percent of the city‘s total output. In Gaziantep, if we exclude vegetable
oil production to focus on the manufacturing output, we see that there are five sectors producing
approximately eight-nine percent of the city‘s annual exports.
This industrial variety implies a strong presence of elaborate backward linkages in these
cities‘ industrial topography. Sectors using both continuous production techniques such as
chemicals and batch production techniques such as garment or motor vehicles are available in
each of them. Thus, these cities appear as relatively autonomous industrial districts rather than
mere manufacturing zones housing suppliers for larger producers in other regions of the country.
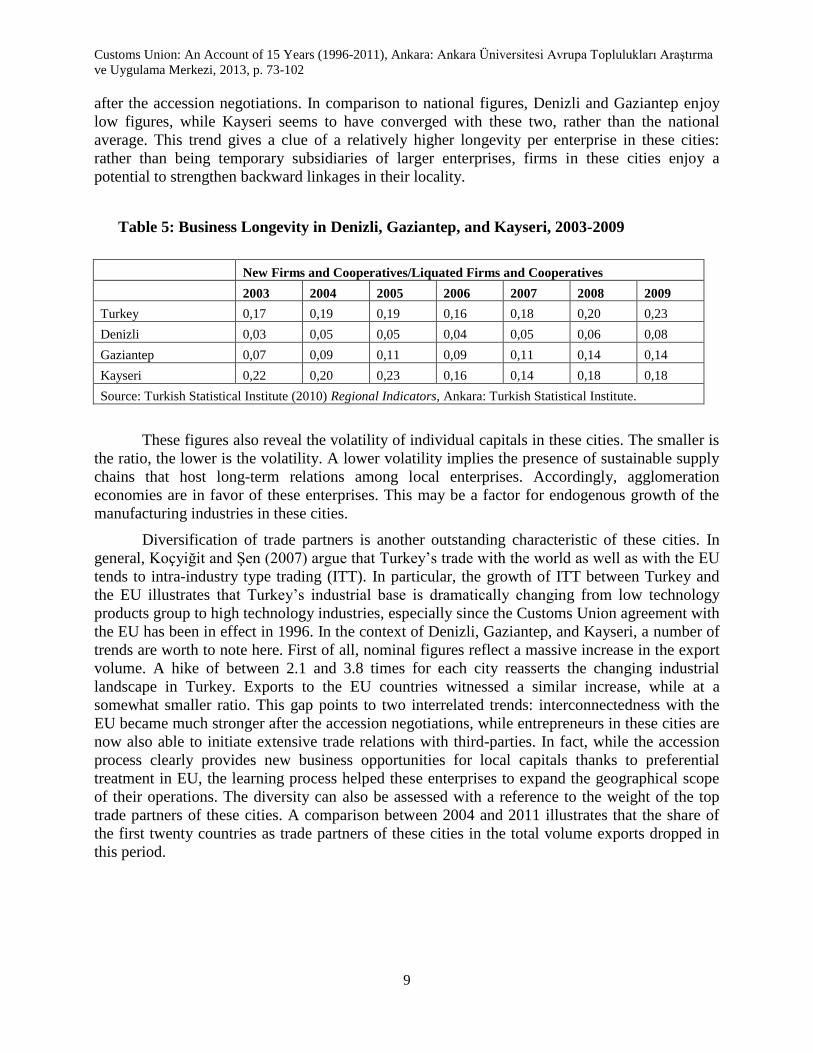
An indicator for the viability of such backward linkages in terms of industrial connections
is the ratio between new and liquated firms each year. The chart below illustrates these ratios
Customs Union: An Account of 15 Years (1996-2011), Ankara: Ankara Üniversitesi Avrupa Toplulukları Araştırma
ve Uygulama Merkezi, 2013, p. 73-102
9
after the accession negotiations. In comparison to national figures, Denizli and Gaziantep enjoy
low figures, while Kayseri seems to have converged with these two, rather than the national
average. This trend gives a clue of a relatively higher longevity per enterprise in these cities:
rather than being temporary subsidiaries of larger enterprises, firms in these cities enjoy a
potential to strengthen backward linkages in their locality.
Table 5: Business Longevity in Denizli, Gaziantep, and Kayseri, 2003-2009
New Firms and Cooperatives/Liquated Firms and Cooperatives
2003 2004 2005 2006 2007 2008 2009
Turkey 0,17 0,19 0,19 0,16 0,18 0,20 0,23
Denizli 0,03 0,05 0,05 0,04 0,05 0,06 0,08
Gaziantep 0,07 0,09 0,11 0,09 0,11 0,14 0,14
Kayseri 0,22 0,20 0,23 0,16 0,14 0,18 0,18
Source: Turkish Statistical Institute (2010) Regional Indicators, Ankara: Turkish Statistical Institute.
These figures also reveal the volatility of individual capitals in these cities. The smaller is
the ratio, the lower is the volatility. A lower volatility implies the presence of sustainable supply
chains that host long-term relations among local enterprises. Accordingly, agglomeration
economies are in favor of these enterprises. This may be a factor for endogenous growth of the
manufacturing industries in these cities.
Diversification of trade partners is another outstanding characteristic of these cities. In
general, Koçyiğit and Şen (2007) argue that Turkey‘s trade with the world as well as with the EU
tends to intra-industry type trading (ITT). In particular, the growth of ITT between Turkey and
the EU illustrates that Turkey‘s industrial base is dramatically changing from low technology
products group to high technology industries, especially since the Customs Union agreement with
the EU has been in effect in 1996. In the context of Denizli, Gaziantep, and Kayseri, a number of
trends are worth to note here. First of all, nominal figures reflect a massive increase in the export
volume. A hike of between 2.1 and 3.8 times for each city reasserts the changing industrial
landscape in Turkey. Exports to the EU countries witnessed a similar increase, while at a
somewhat smaller ratio. This gap points to two interrelated trends: interconnectedness with the
EU became much stronger after the accession negotiations, while entrepreneurs in these cities are
now also able to initiate extensive trade relations with third-parties. In fact, while the accession
process clearly provides new business opportunities for local capitals thanks to preferential
treatment in EU, the learning process helped these enterprises to expand the geographical scope
of their operations. The diversity can also be assessed with a reference to the weight of the top
trade partners of these cities. A comparison between 2004 and 2011 illustrates that the share of
the first twenty countries as trade partners of these cities in the total volume exports dropped in
this period.
Customs Union: An Account of 15 Years (1996-2011), Ankara: Ankara Üniversitesi Avrupa Toplulukları Araştırma
ve Uygulama Merkezi, 2013, p. 73-102
10
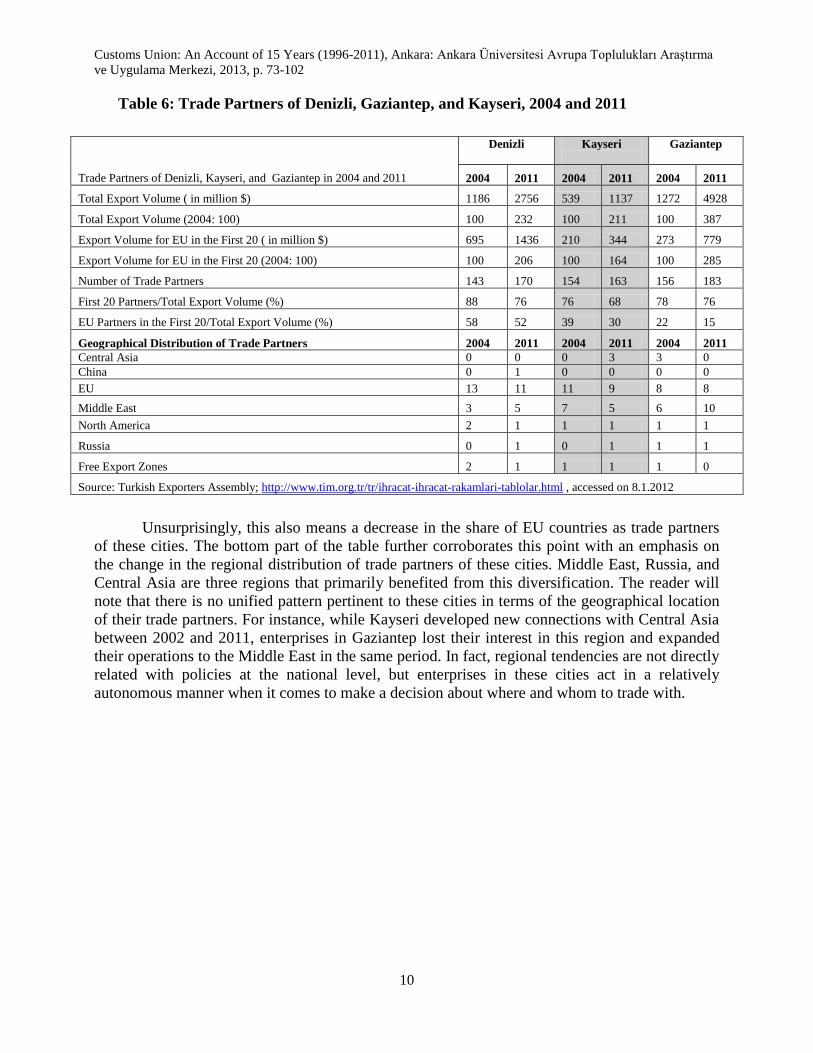
Table 6: Trade Partners of Denizli, Gaziantep, and Kayseri, 2004 and 2011
Trade Partners of Denizli, Kayseri, and Gaziantep in 2004 and 2011
Denizli
Kayseri
Gaziantep
2004 2011 2004 2011 2004 2011
Total Export Volume ( in million $) 1186 2756 539 1137 1272 4928
Total Export Volume (2004: 100) 100 232 100 211 100 387
Export Volume for EU in the First 20 ( in million $) 695 1436 210 344 273 779
Export Volume for EU in the First 20 (2004: 100) 100 206 100 164 100 285
Number of Trade Partners 143 170 154 163 156 183
First 20 Partners/Total Export Volume (%) 88 76 76 68 78 76
EU Partners in the First 20/Total Export Volume (%) 58 52 39 30 22 15
Geographical Distribution of Trade Partners 2004 2011 2004 2011 2004 2011
Central Asia 0 0 0 3 3 0
China 0 1 0 0 0 0
EU 13 11 11 9 8 8
Middle East 3 5 7 5 6 10
North America 2 1 1 1 1 1
Russia 0 1 0 1 1 1
Free Export Zones 2 1 1 1 1 0
Source: Turkish Exporters Assembly; http://www.tim.org.tr/tr/ihracat-ihracat-rakamlari-tablolar.html , accessed on 8.1.2012
Unsurprisingly, this also means a decrease in the share of EU countries as trade partners
of these cities. The bottom part of the table further corroborates this point with an emphasis on
the change in the regional distribution of trade partners of these cities. Middle East, Russia, and
Central Asia are three regions that primarily benefited from this diversification. The reader will
note that there is no unified pattern pertinent to these cities in terms of the geographical location
of their trade partners. For instance, while Kayseri developed new connections with Central Asia
between 2002 and 2011, enterprises in Gaziantep lost their interest in this region and expanded
their operations to the Middle East in the same period. In fact, regional tendencies are not directly
related with policies at the national level, but enterprises in these cities act in a relatively
autonomous manner when it comes to make a decision about where and whom to trade with.
Customs Union: An Account of 15 Years (1996-2011), Ankara: Ankara Üniversitesi Avrupa Toplulukları Araştırma
ve Uygulama Merkezi, 2013, p. 73-102
11
EUROPE OF REGIONS:
THE RISE OF A NETWORK OF SECONDARY CITIES?
The above-mentioned trends are not uniquely pertinent to Turkey. When we look at some
of the basic parameters of regional development, we see that NUTS2 regions with a population
smaller than one million outperform larger regions with regard to the basic manufacturing-related
parameters provided by EuroStat since 2000. Local units in manufacturing have increased only
within this segment of NUTS regions. Investment in tangible goods has increased by twelve
times faster than the EU average. Unlike larger ones, these regions managed to provide more jobs
in manufacturing and wages increased faster than the average and all other regions as well. These
figures had a strong impact on the growth of population and regional GDP as well. Population
growth reached those of regions that have metropolitan areas, while regional GDP growth catches
the average.
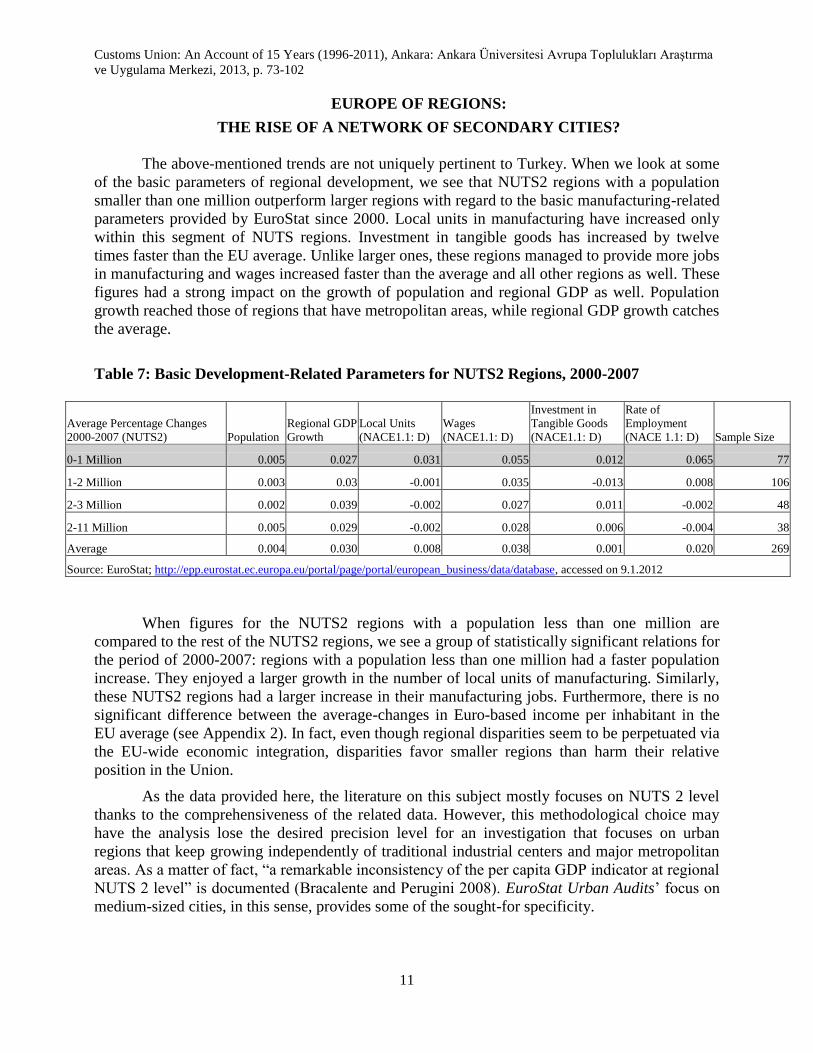
Table 7: Basic Development-Related Parameters for NUTS2 Regions, 2000-2007
Average Percentage Changes
2000-2007 (NUTS2) Population
Regional GDP
Growth
Local Units
(NACE1.1: D)
Wages
(NACE1.1: D)
Investment in
Tangible Goods
(NACE1.1: D)
Rate of
Employment
(NACE 1.1: D) Sample Size
0-1 Million 0.005 0.027 0.031 0.055 0.012 0.065 77
1-2 Million 0.003 0.03 -0.001 0.035 -0.013 0.008 106
2-3 Million 0.002 0.039 -0.002 0.027 0.011 -0.002 48
2-11 Million 0.005 0.029 -0.002 0.028 0.006 -0.004 38
Average 0.004 0.030 0.008 0.038 0.001 0.020 269
Source: EuroStat; http://epp.eurostat.ec.europa.eu/portal/page/portal/european_business/data/database, accessed on 9.1.2012
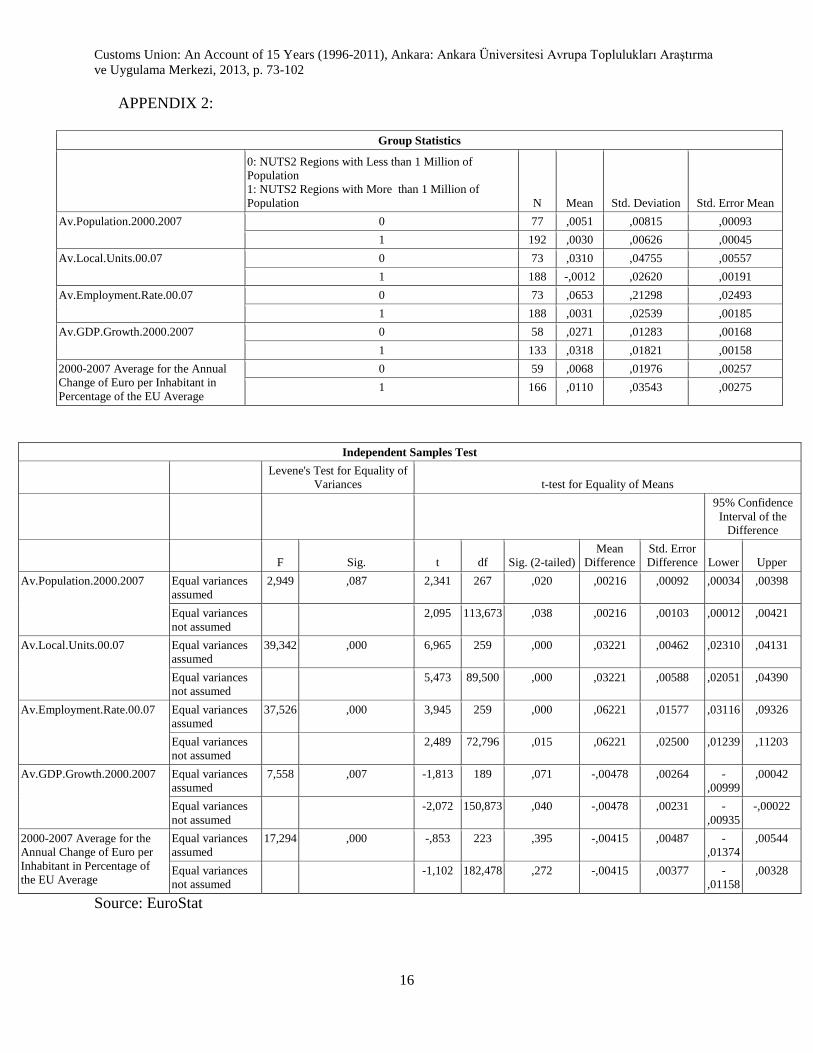
When figures for the NUTS2 regions with a population less than one million are
compared to the rest of the NUTS2 regions, we see a group of statistically significant relations for
the period of 2000-2007: regions with a population less than one million had a faster population
increase. They enjoyed a larger growth in the number of local units of manufacturing. Similarly,
these NUTS2 regions had a larger increase in their manufacturing jobs. Furthermore, there is no
significant difference between the average-changes in Euro-based income per inhabitant in the
EU average (see Appendix 2). In fact, even though regional disparities seem to be perpetuated via
the EU-wide economic integration, disparities favor smaller regions than harm their relative
position in the Union.
As the data provided here, the literature on this subject mostly focuses on NUTS 2 level
thanks to the comprehensiveness of the related data. However, this methodological choice may
have the analysis lose the desired precision level for an investigation that focuses on urban
regions that keep growing independently of traditional industrial centers and major metropolitan
areas. As a matter of fact, ―a remarkable inconsistency of the per capita GDP indicator at regional
NUTS 2 level‖ is documented (Bracalente and Perugini 2008). EuroStat Urban Audits‘ focus on
medium-sized cities, in this sense, provides some of the sought-for specificity.
Customs Union: An Account of 15 Years (1996-2011), Ankara: Ankara Üniversitesi Avrupa Toplulukları Araştırma
ve Uygulama Merkezi, 2013, p. 73-102
12
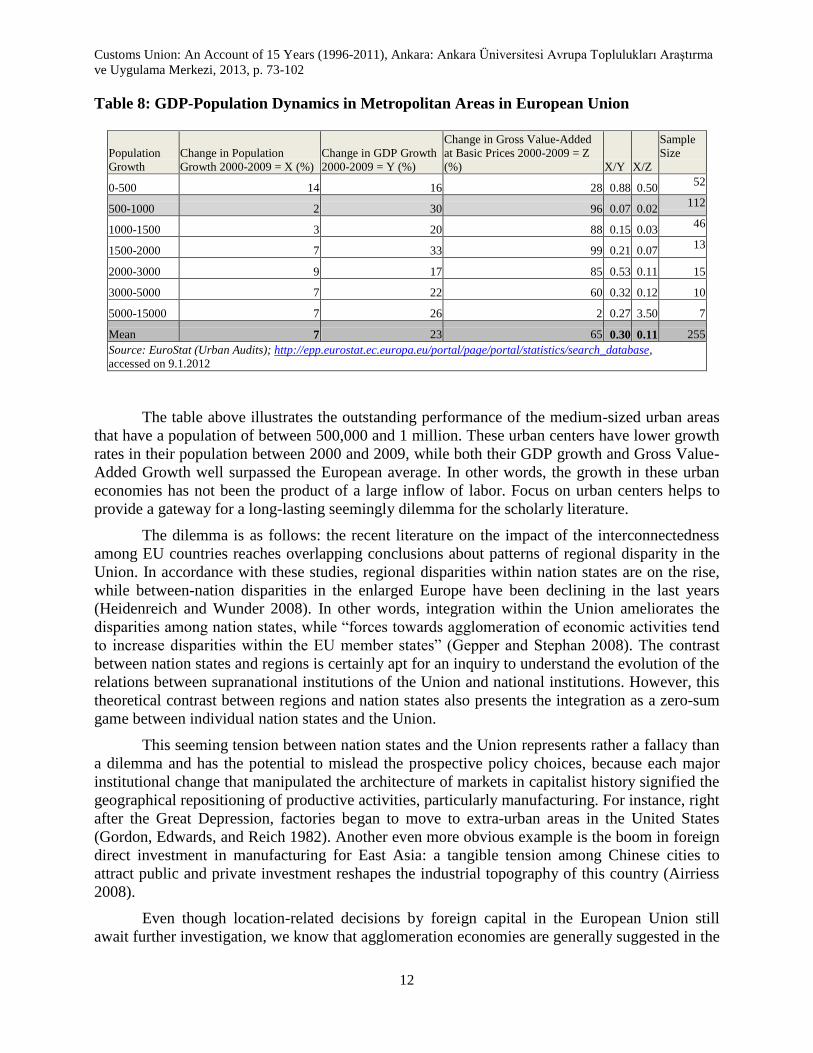
Table 8: GDP-Population Dynamics in Metropolitan Areas in European Union
Population
Growth
Change in Population
Growth 2000-2009 = X (%)
Change in GDP Growth
2000-2009 = Y (%)
Change in Gross Value-Added
at Basic Prices 2000-2009 = Z
(%) X/Y X/Z
Sample
Size
0-500 14 16 28 0.88 0.50 52
500-1000 2 30 96 0.07 0.02 112
1000-1500 3 20 88 0.15 0.03 46
1500-2000 7 33 99 0.21 0.07 13
2000-3000 9 17 85 0.53 0.11 15
3000-5000 7 22 60 0.32 0.12 10
5000-15000 7 26 2 0.27 3.50 7
Mean 7 23 65 0.30 0.11 255
Source: EuroStat (Urban Audits); http://epp.eurostat.ec.europa.eu/portal/page/portal/statistics/search_database,
accessed on 9.1.2012
The table above illustrates the outstanding performance of the medium-sized urban areas
that have a population of between 500,000 and 1 million. These urban centers have lower growth
rates in their population between 2000 and 2009, while both their GDP growth and Gross Value-
Added Growth well surpassed the European average. In other words, the growth in these urban
economies has not been the product of a large inflow of labor. Focus on urban centers helps to
provide a gateway for a long-lasting seemingly dilemma for the scholarly literature.
The dilemma is as follows: the recent literature on the impact of the interconnectedness
among EU countries reaches overlapping conclusions about patterns of regional disparity in the
Union. In accordance with these studies, regional disparities within nation states are on the rise,
while between-nation disparities in the enlarged Europe have been declining in the last years
(Heidenreich and Wunder 2008). In other words, integration within the Union ameliorates the
disparities among nation states, while ―forces towards agglomeration of economic activities tend
to increase disparities within the EU member states‖ (Gepper and Stephan 2008). The contrast
between nation states and regions is certainly apt for an inquiry to understand the evolution of the
relations between supranational institutions of the Union and national institutions. However, this
theoretical contrast between regions and nation states also presents the integration as a zero-sum
game between individual nation states and the Union.
This seeming tension between nation states and the Union represents rather a fallacy than
a dilemma and has the potential to mislead the prospective policy choices, because each major
institutional change that manipulated the architecture of markets in capitalist history signified the
geographical repositioning of productive activities, particularly manufacturing. For instance, right
after the Great Depression, factories began to move to extra-urban areas in the United States
(Gordon, Edwards, and Reich 1982). Another even more obvious example is the boom in foreign
direct investment in manufacturing for East Asia: a tangible tension among Chinese cities to
attract public and private investment reshapes the industrial topography of this country (Airriess
2008).
Even though location-related decisions by foreign capital in the European Union still
await further investigation, we know that agglomeration economies are generally suggested in the
Customs Union: An Account of 15 Years (1996-2011), Ankara: Ankara Üniversitesi Avrupa Toplulukları Araştırma
ve Uygulama Merkezi, 2013, p. 73-102
13
literature as a key factor to explain the FDI location within the Union (Hill and Munday 1992,
Taylor 2003, Basile 2004, Crozet 2004, Barrios et al. 2006). From this perspective, medium-sized
cities do not have a generic ‗competitive advantage‘ than those that have larger populations and
bigger population growth rates, if not a disadvantage. Given that these cities account for the
largest chunk of the metropolitan areas by population size, the scale question needs to be
reframed as well: what we see here may be the emergence of a new urban form that has the
potential to replace the existing urban network in EU, rather than an unspecified amelioration of
the regional disparities within the Union at the expense of the perpetuation or worsening of intra-
nation state disparities.
Accordingly, medium-sized cities of Europe not only had a similar trajectory with those
in Turkey, but also this trajectory needs to be analyzed with great care. Overall, if we turn back to
the primary subject of this paper, this presentation bolsters the argument that the recent
performance of medium-sized Turkish cities has similar characteristics of European cities of a
similar size. This synchronization in urban/manufacturing trends further justifies the possibility
for the emergence of a hitherto ignored network of relations that makes this synchrony possible.
CONCLUSION
Embarking on this data and literature, it is possible to conclude that three major dynamics
characterized the regional industrial patterns in Turkey after 1995. First, manufacturing growth of
some of the recently industrialized cities surpassed the national average within the last fifteen
years. In fact, recent manufacturing growth signifies a geographical redistribution of industries
that has given rise to new industrial cities and de-industrializing cities in Turkey (Akgüngör,
Kumral, and Lenger 2003).
Second, even though Turkey has been in a customs union with the EU, Turkish economy
did not attract levels of foreign direct investment comparable to countries of comparable size
such as Mexico or Argentina (World Bank 2011): investment by the domestic enterprises, rather
than foreign companies, played a major role in this regional redistribution of manufacturing
activities (Hadjita and Moxon-Brownea 2005, Loewendahl and Ertugal- Loewendahl 2001). In
general, there is no convincing data that supports the arguments that FDI ameliorated regional
disparities, improved exports, accelerated the GDP growth, or contributed to regional
agglomeration economies, while there is an expanding literature arguing otherwise.
Third, Turkey‘s manufacturing industry developed a tendency for regional specialization
within the last two decades (Falcıoğlu and Akgüngör 2008). In fact, the recently industrialized
cities in Turkey become relatively autonomous zones of industrial clustering. Following the
second dynamic, investment decisions seem to be made within local business networks: local
business culture and labor-management relations characterize industrial development patterns of
these cities.
In the context of these dynamics, an unspecified emphasis on international business
relations will be unsatisfactory to explain the ongoing processes, given the poor FDI performance
of the Turkish economy. Endogenous factors should not be regarded as a ‗magical element‘,
either, if the question is why some cities outperform traditional industrial centers and their
hinterland rather than others. In fact, the following question still lingers: how did some certain
cities become ‗Anatolian Tigers‘, as some call them, while others remained as mere housecats.
Customs Union: An Account of 15 Years (1996-2011), Ankara: Ankara Üniversitesi Avrupa Toplulukları Araştırma
ve Uygulama Merkezi, 2013, p. 73-102
14
Which endogenous factors are more important than the other in reshaping the global connections
of the enterprises in these cities?
Given the obvious impact of the accession process on the recent performance of Turkish
manufacturing industries, more specificity can be called for with a reference to the recent trends
in urban economies of Europe in order to make sense of the high performance of Denizli,
Gaziantep, and Kayseri. When we look at these trends in Europe, the experience of these three
cities begins to appear nothing but extraordinary: they rather begin look as representative
examples for what can be called secondary cities as a European-wide phenomenon.
While acknowledging the significance of such local and global factors, this paper aims to
illustrate that the ongoing regional development patterns in Turkey are harmonious with similar
trends in European Union. As a matter of fact, the accession process since 1995 both initiated
new regional development patterns in Turkey and harmonized those patterns with the economic
evolution of the Union. A related pattern is the recent performance of medium-sized cities in the
European economic zone. The paper first illustrated macro-level growth dynamics in Turkey that
ameliorated regional disparities in the country. Thus, Turkish case does not support the argument
that European integration necessarily perpetuates regional disparities within nation states.
Second, three of the outstanding medium-sized cities, which benefitted from the ongoing
accession in Turkey, were put on spot for a preliminary analysis: these cities not only increased
their export volume in manufacturing but also enlarged the geographical scope of business
operations. Accordingly, integration with the Union yielded new business opportunities and
capacities for the local capitals in these cities. The growth came with diversification in
manufacturing sectors with the possible establishment of backward linkages.
Third, EuroStat data was used to illustrate the overlapping trends in European Union and
Turkey. Even though the NUTS classification system provides limited information for the
analysis, EuroStat Urban Audit complements the existing data and reveals that medium-sized
cities in the Union has outperformed major metropolitan areas on different grounds. When
analyzed through the prism of these success stories in Turkey, the EuroStat data provides an
informed story about the integration-regional disparity dilemma: it may be true that regional
disparities may be on the rise within nation states in recent years, yet the reason for this may not
be merely the integration as such. In fact, the surprising performance of particular medium-sized
cities may signify a relatively invisible process: the emergence of a new inter-urban network
across the Union.
In fact, the strikingly successful medium-sized cities of Europe appear as a new urban
category that needs a conceptual intervention. Rather than neutral concepts such as medium-sized
cities, these urban centers‘ tense relationship with traditional industrial centers (primary cities of
the pre-EU period) should be emphasized. Accordingly, what we see may be the emergence of a
new network composed of secondary cities. A hitherto unstudied aspect of this new urban
phenomenon is the alternative EU-wide network of enterprises located in these cities. As the
hitherto analyses focus on the performance of individual regions and the contrast between
successful and less successful regions, connections among outperformers are missed, since the
question is framed as a ‗yeah or nay‘ question between nation states and regions. In this regard,
analysis of the interactions among the secondary cities may answer the question how they
surpassed the EU growth rates despite their obvious disadvantages such as below-average
population growth.
Customs Union: An Account of 15 Years (1996-2011), Ankara: Ankara Üniversitesi Avrupa Toplulukları Araştırma
ve Uygulama Merkezi, 2013, p. 73-102
15
APPENDIX 1:
Group Statistics
Above National Figure=1; Below
National Figure=0 N Mean Std. Deviation Std. Error Mean
(Average Exports for 2003-
2011)/(Exports for 2002)
1 59 9,5635 12,26812 1,59717
0 22 1,7785 ,78654 ,16769
Independent Samples Test
Levene's Test for
Equality of
Variances t-test for Equality of Means
95% Confidence Interval of the
Difference
F Sig. t df
Sig. (2-
tailed)
Mean
Difference
Std. Error
Difference Lower Upper
(Average Exports for
2003-2011)/(Exports for
2002)
Equal variances
assumed
11,501 ,001 2,962 79 ,004 7,78505 2,62789 2,55437 13,01573
Equal variances not
assumed
4,848 59,2
66
,000 7,78505 1,60595 4,57185 10,99825
Souce: TurkStat
Customs Union: An Account of 15 Years (1996-2011), Ankara: Ankara Üniversitesi Avrupa Toplulukları Araştırma
ve Uygulama Merkezi, 2013, p. 73-102
16
APPENDIX 2:
Group Statistics
0: NUTS2 Regions with Less than 1 Million of
Population
1: NUTS2 Regions with More than 1 Million of
Population N Mean Std. Deviation Std. Error Mean
Av.Population.2000.2007 0 77 ,0051 ,00815 ,00093
1 192 ,0030 ,00626 ,00045
Av.Local.Units.00.07 0 73 ,0310 ,04755 ,00557
1 188 -,0012 ,02620 ,00191
Av.Employment.Rate.00.07 0 73 ,0653 ,21298 ,02493
1 188 ,0031 ,02539 ,00185
Av.GDP.Growth.2000.2007 0 58 ,0271 ,01283 ,00168
1 133 ,0318 ,01821 ,00158
2000-2007 Average for the Annual
Change of Euro per Inhabitant in
Percentage of the EU Average
0 59 ,0068 ,01976 ,00257
1 166 ,0110 ,03543 ,00275
Independent Samples Test
Levene's Test for Equality of
Variances t-test for Equality of Means
95% Confidence
Interval of the
Difference
F Sig. t df Sig. (2-tailed)
Mean
Difference
Std. Error
Difference Lower Upper
Av.Population.2000.2007 Equal variances
assumed
2,949 ,087 2,341 267 ,020 ,00216 ,00092 ,00034 ,00398
Equal variances
not assumed
2,095 113,673 ,038 ,00216 ,00103 ,00012 ,00421
Av.Local.Units.00.07 Equal variances
assumed
39,342 ,000 6,965 259 ,000 ,03221 ,00462 ,02310 ,04131
Equal variances
not assumed
5,473 89,500 ,000 ,03221 ,00588 ,02051 ,04390
Av.Employment.Rate.00.07 Equal variances
assumed
37,526 ,000 3,945 259 ,000 ,06221 ,01577 ,03116 ,09326
Equal variances
not assumed
2,489 72,796 ,015 ,06221 ,02500 ,01239 ,11203
Av.GDP.Growth.2000.2007 Equal variances
assumed
7,558 ,007 -1,813 189 ,071 -,00478 ,00264 -
,00999
,00042
Equal variances
not assumed
-2,072 150,873 ,040 -,00478 ,00231 -
,00935
-,00022
2000-2007 Average for the
Annual Change of Euro per
Inhabitant in Percentage of
the EU Average
Equal variances
assumed
17,294 ,000 -,853 223 ,395 -,00415 ,00487 -
,01374
,00544
Equal variances
not assumed
-1,102 182,478 ,272 -,00415 ,00377 -
,01158
,00328
Source: EuroStat

Customs Union: An Account of 15 Years (1996-2011), Ankara: Ankara Üniversitesi Avrupa Toplulukları Araştırma
ve Uygulama Merkezi, 2013, p. 73-102
17
REFERENCE:
Airriess, Christopher. ―The Geographies of Secondary City Growth in a Globalized China
Comparing Dongguan and Suzhou.‖ Journal of Urban History 35, no. 1 (November 1,
2008): 134–149.
Akgüngör, Sedef, Neşe Kumral, and Aykut Lenger. ―National Industry Clusters and Regional
Specializations in Turkey.‖ European Planning Studies 11, no. 6 (September 2003): 647–
669.
Barrios, Salvador, Holger Görg, and Eric Strobl. ―Multinationals‘ Location Choice,
Agglomeration Economies, and Public Incentives.‖ International Regional Science
Review 29, no. 1 (January 1, 2006): 81–107.
Basile, Roberto. ―Acquisition Versus Greenfield Investment: The Location of Foreign
Manufacturers in Italy.‖ Regional Science and Urban Economics 34, no. 1 (2004): 3–25.
Baypınar, Mete Başar, and Gülden Erkut. ―Ekonomik Küreselleşme Ve Türkiye‘de Bölgesel
Üretkenlik Düzeylerinde Yakınsama.‖ İTÜ Dergisi/A 10, no. 1 (March 2011): 61–70.
Bracalente, Bruno, and Cristiano Perugini. ―The Components of Regional Disparities in Europe.‖
Annals of Regional Science 44, no. 3 (June 2010): 621–645.
Crozet, Matthieu, Thierry Mayer, and Jean-Louis Mucchielli. ―How Do Firms Agglomerate? A
Study of FDI in France.‖ Regional Science and Urban Economics 34, no. 1 (2004): 27–
54.
Darrat, Ali F., and Jayanta Sarkar. ―Growth Consequences of Foreign Direct Investment: Some
Results for Turkey.‖ Journal of Economic Development 34, no. 2 (December 2009): 85–
96.
Deichmann, Joel, Socrates Karidis, and Selin Sayek. ―Foreign Direct Investment in Turkey:
Regional Determinants.‖ Applied Economics 35 (2003): 1767–1778.
Elveren, Adem Yavuz. ―Wage Inequality in Turkey: Decomposition by Statistical Regions, 1980-
2001.‖ Review of Urban and Regional Development Studies 22, no. 1 (March 2010): 55–
72.
Geppert, Kurt, Michael Happich, and Andreas Stephan. Regional Disparities in the European
Union: Convergence and Agglomeration. Discussion Papers of DIW Berlin. DIW Berlin,
German Institute for Economic Research, 2005.
http://ideas.repec.org/p/diw/diwwpp/dp525.html.
Gezici, Ferhan, and Geoffrey J. D. Hewings. ―Regional Convergence and the Economic
Performance of Peripheral Areas in Turkey.‖ Review of Urban & Regional Development
Studies 16, no. 2 (July 2004): 113–132.
Gordon, David M., Richard Edwards, and Michael Reich. Segmented Work, Divided Workers:
The Historical Transformation of Labor in the United States. Cambridge
[Cambridgeshire] ; New York: Cambridge University Press, 1982.
Hadjit, Assia, and Edward Moxon‐ Browne. ―Foreign Direct Investment in Turkey: The
Implications of EU Accession.‖ Turkish Studies 6, no. 3 (2005): 321–340.
Heidenreich, Martin, and Christoph Wunder. ―Patterns of Regional Inequality in the Enlarged
Europe.‖ European Sociological Review 24, no. 1 (February 2008): 19–36.
Hill, Stephen, and Max Munday. ―The UK Regional Distribution of Foreign Direct Investment:
Analysis and Determinants.‖ Regional Studies 26, no. 6 (1992): 535–544.
Kalyoncu, Hüseyin, and Muhittin Kaplan. ―Convergence of Per Capita GDP in Turkish
Provinces.‖ Empirical Economics Letters 10, no. 1 (January 2011): 27–33.

Customs Union: An Account of 15 Years (1996-2011), Ankara: Ankara Üniversitesi Avrupa Toplulukları Araştırma
ve Uygulama Merkezi, 2013, p. 73-102
18
Kargı, Nihal. ―Bölgesel Kalkınma Yaklaşımlarındaki Gelişmeler Ve AB Perspektifi Altında
Türkiye‘nin Bölgesel Politika Analizi.‖ Uluslararası İktisadi Ve İdari İncelemeler Dergisi
1, no. 3 (2009): 19–40.
Keyder, Çağlar. State and Class in Turkey: A Study in Capitalist Development. New York: Verso,
1987.
Kıran, Burcu. ―Causal Links Between Foreign Direct Investment and Trade in Turkey.‖
International Journal of Economics & Finance 3, no. 2 (May 2011): 150–158.
Koçyiğit, Ali, and Ali Şen. ―The Extent of Intra-Industry Trade Between Turkey and the
European Union: The Impact of Customs Union.‖ Journal of Economic & Social
Research 9, no. 2 (July 2007): 61–84.
Loewendahl, Henry, and Ebru Ertuğal-Loewendahl. Turkey’s Performance in Attracting Foreign
Direct Investment: Implications of EU Enlargement. Economics Working Paper.
European Network of Economic Policy Research Institutes, September 2001.
http://econpapers.repec.org/paper/eprenepwp/008.htm.
López-Bazo, Enrique, Esther Vayá, and Manuel Artís. ―Regional Externalities And Growth:
Evidence From European Regions.‖ Journal of Regional Science 44, no. 1 (2004): 43–73.
Magalhães, André, Geoffrey J. D. Hewings, Carlos Roberto Azzoni, André Magalhães, Geoffrey
J. D. Hewings, and Carlos R. Azzoni. Spatial Dependence and Regional Convergence in
Brazil, 2000.
Özuğurlu, Metin. Anadolu’da Küresel Fabrikanın Doğuşu: Yeni İşçilik Örüntülerinin Sosyolojisi.
Ankara: Kalkedon, 2008.
Taylor, Jim. ―An Analysis of the Factors Determining the Geographical Distribution of Japanese
Manufacturing Investment in the UK, 1984-91.‖ Urban Studies 30, no. 7 (August 1,
1993): 1209–1224.
Turkish Statistical Institute. Provincial Indicators 1980-2003. Ankara: Turkish Statistical
Institute, 2009.
———. Regional Indicators. Ankara: Turkish Statistical Institute, 2009.
———. Statistical Indicators 1923-2008. Ankara: Turkish Statistical Institute, 2008.
Yavan, Nuri, and Hamdi Kara. ―Türkiye‘de Doğrudan Yabancı Sermaye Yatırımları Ve Bölgesel
Dağılışı.‖ Coğrafi Bilimler Dergisi 1, no. 1 (2003): 19–42.
Yavan, Nuri. ―The Location Choice of Foreign Direct Investment Within Turkey: An Empirical
Analysis.‖ European Planning Studies 18, no. 10 (October 2010): 1675–1705.
Yıldırım, Jülide, and Nadir Ocal. ―Income Inequality and Economic Convergence in Turkey.‖
Transition Studies Review 13, no. 3 (2006): 559–568.
Customs Union: An Account of 15 Years (1996-2011), Ankara: Ankara Üniversitesi Avrupa Toplulukları Araştırma
ve Uygulama Merkezi, 2013, p. 73-102
19
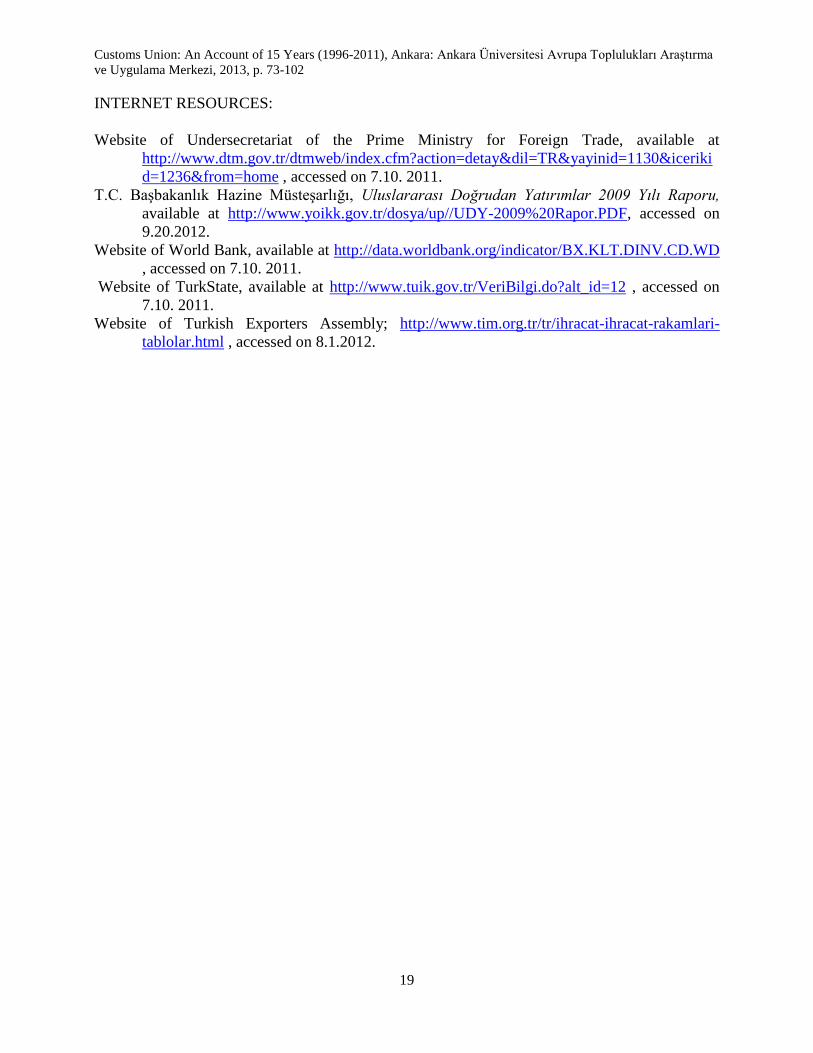
INTERNET RESOURCES:
Website of Undersecretariat of the Prime Ministry for Foreign Trade, available at
http://www.dtm.gov.tr/dtmweb/index.cfm?action=detay&dil=TR&yayinid=1130&iceriki
d=1236&from=home , accessed on 7.10. 2011.
T.C. Başbakanlık Hazine Müsteşarlığı, Uluslararası Doğrudan Yatırımlar 2009 Yılı Raporu,
available at http://www.yoikk.gov.tr/dosya/up//UDY-2009%20Rapor.PDF, accessed on
9.20.2012.
Website of World Bank, available at http://data.worldbank.org/indicator/BX.KLT.DINV.CD.WD
, accessed on 7.10. 2011.
Website of TurkState, available at http://www.tuik.gov.tr/VeriBilgi.do?alt_id=12 , accessed on
7.10. 2011.
Website of Turkish Exporters Assembly; http://www.tim.org.tr/tr/ihracat-ihracat-rakamlari-
tablolar.html , accessed on 8.1.2012.