Seasonal changes of abiotic and biotic gradients downstream a multiple use reservoir in a...
15
SEASONAL CHANGES OF ABIOTIC AND BIOTIC GRADIENTS DOWNSTREAM A MULTIPLE USE RESERVOIR IN A MEDITERRANEAN RIVER L. LUCADAMO, a * A. MEZZOTERO, a N. J. VOELZ b and L. GALLO a a Laboratorio di Ecologia Generale ed Applicata, Dipartimento di Ecologia, Universita ` della Calabria, Cubo 6b, via Pietro Bucci, Arcavacata di Rende, 87036 (CS), Italy b Biology/WSB 262, St. Cloud State University, 720 4th Ave S, St. Cloud, MN 56301, USA ABSTRACT The effect of regulated flow regimentation on hydrogeomorphological variables, autochthonous and allochthonous trophic sources and macroinvertebrates communities of the Mucone River, Calabria (Italy) were studied in May, August and November 2005 at three study sites. The first site (M1) was located close to the impoundment, the second one (M2) immediately upstream from the first permanent tributary (Cerreto stream) and the third one (M3) about 1 km downstream from the Cerreto confluence. Our results suggest that hydrogeomorphological gradients already exist in spring but their strongest development, with major consequences for the lotic biota, take place only with the beginning and ending of the dry season. Reduction of river width, shading due to well preserved riparian alder trees and marked sand deposition in November, were the variables negatively affecting epilithic microalgae biomass at site M1. These factors partially relieved at M2 site and became much less important at M3 resulting in the highest levels of autotrophic periphyton production. Coarse particulate organic matter accumulation exhibited an opposite trend due to the lack of discharge peaks at M1, whereas in November, litter fall removed most differences between stations. In May macrozoobenthic communities of the three stations were relatively similar (reophilous gatherer and scraper taxa). In November sand accumulation reduced spatial heterogeneity and habitats density close to the Cecita dam promoting settlement of shredder sand tolerant taxa (Plecoptera: Leuctridae) and a drop of community biodiversity. Flow reactivation, especially after Cerreto confluence, hindered sand accumulation, favoured autochthonous primary production and increased energy sources for macro- invertebrates. Copyright # 2010 John Wiley & Sons, Ltd. key words: reservoir; seasonal changes; hydrogeomorphological alterations; macrozoobenthic community; trophic sources Received 15 January 2010; Revised 23 June 2010; Accepted 7 July 2010 INTRODUCTION Fluvial environments are characterized from source to mouth by the presence of abiotic gradients (Illies and Botosaneanu, 1963; Vannote et al., 1980) with concomitant modifications of the biotic communities. The main longitudinal abiotic changes include flow (Gore, 1994; Lake et al., 1986; Statzner and Higler, 1986), substratum (Schumm, 1977, 1985; Selby, 1985), form and size of the riverbed (Rosgen, 1994, 1996) as well as temperature (Illies, 1961, 1962; Vannote and Sweeney, 1980). Modifications also occur in the sources and amounts of allochthonous and autochthonous primary production (Vannote et al., 1980; Giller and Malmqvist, 1998). The construction of reservoirs and the subsequent flow regulation alter the natural longitudinal variation of lotic ecosystems (Ward and Stanford, 1983, 1995) and modify the characteristics of river environments. The type and extent of those impacts on biotic communities depend mainly on the use of reservoirs (potable water source, irrigation, industrial, hydroelectric, fisheries), the frequency with which the water releases occur downstream from the dam and whether water is released from the epilimnion or hypolimnion (Perry and Perry, 1986; Gore et al., 1989; Allan, 1996; Rosenberg et al., 2000). Some of the most important downstream consequences produced by modified releases from an impoundment include flow below minimum acceptable levels (Stanford and Ward, 1984) and the deposition of fine sediments (Poff and Ward, 1989; Kondolf and Wilcock, 1996; Wilcock et al., 1996). The latter represents a process that may have serious negative effects on lotic communities (Wagener and LaPerriere, 1985; Ryan, 1991; Davies-Colley et al., 1992; Wood and Armitage, 1997). River basins in Calabria (Italy) often have a steep altitudinal gradient because of the region’s orographic RIVER RESEARCH AND APPLICATIONS River Res. Applic. 28: 103–117 (2012) Published online 23 August 2010 in Wiley Online Library (wileyonlinelibrary.com) DOI: 10.1002/rra.1440 *Correspondence to: L. Lucadamo, Laboratorio di Ecologia Generale ed Applicata, Dipartimento di Ecologia, Universita ` della Calabria, Cubo 6b, via Pietro Bucci, Arcavacata di Rende, 87036 (CS), Italy. E-mail: [email protected] Copyright # 2010 John Wiley & Sons, Ltd.
-
Upload
independent -
Category
Documents
-
view
1 -
download
0
Transcript of Seasonal changes of abiotic and biotic gradients downstream a multiple use reservoir in a...

RIVER RESEARCH AND APPLICATIONS
River Res. Applic. 28: 103–117 (2012)
Published online 23 August 2010 in Wiley Online Library(wileyonlinelibrary.com) DOI: 10.1002/rra.1440
SEASONAL CHANGES OF ABIOTIC AND BIOTIC GRADIENTS DOWNSTREAM AMULTIPLE USE RESERVOIR IN A MEDITERRANEAN RIVER
L. LUCADAMO,a* A. MEZZOTERO,a N. J. VOELZb and L. GALLOa
a Laboratorio di Ecologia Generale ed Applicata, Dipartimento di Ecologia, Universita della Calabria, Cubo 6b, via Pietro Bucci, Arcavacata di Rende,
87036 (CS), Italyb Biology/WSB 262, St. Cloud State University, 720 4th Ave S, St. Cloud, MN 56301, USA
ABSTRACT
The effect of regulated flow regimentation on hydrogeomorphological variables, autochthonous and allochthonous trophic sources andmacroinvertebrates communities of the Mucone River, Calabria (Italy) were studied inMay, August and November 2005 at three studysites.The first site (M1) was located close to the impoundment, the second one (M2) immediately upstream from the first permanent
tributary (Cerreto stream) and the third one (M3) about 1 km downstream from the Cerreto confluence.Our results suggest that hydrogeomorphological gradients already exist in spring but their strongest development, with major
consequences for the lotic biota, take place only with the beginning and ending of the dry season.Reduction of river width, shading due to well preserved riparian alder trees and marked sand deposition in November, were the
variables negatively affecting epilithic microalgae biomass at siteM1. These factors partially relieved at M2 site and becamemuch lessimportant at M3 resulting in the highest levels of autotrophic periphyton production.Coarse particulate organic matter accumulation exhibited an opposite trend due to the lack of discharge peaks at M1, whereas in
November, litter fall removed most differences between stations.In May macrozoobenthic communities of the three stations were relatively similar (reophilous gatherer and scraper taxa). In
November sand accumulation reduced spatial heterogeneity and habitats density close to the Cecita dam promoting settlement ofshredder sand tolerant taxa (Plecoptera: Leuctridae) and a drop of community biodiversity. Flow reactivation, especially after Cerretoconfluence, hindered sand accumulation, favoured autochthonous primary production and increased energy sources for macro-invertebrates. Copyright # 2010 John Wiley & Sons, Ltd.
key words: reservoir; seasonal changes; hydrogeomorphological alterations; macrozoobenthic community; trophic sources
Received 15 January 2010; Revised 23 June 2010; Accepted 7 July 2010
INTRODUCTION
Fluvial environments are characterized from source to
mouth by the presence of abiotic gradients (Illies and
Botosaneanu, 1963; Vannote et al., 1980) with concomitant
modifications of the biotic communities. The main
longitudinal abiotic changes include flow (Gore, 1994;
Lake et al., 1986; Statzner and Higler, 1986), substratum
(Schumm, 1977, 1985; Selby, 1985), form and size of the
riverbed (Rosgen, 1994, 1996) as well as temperature (Illies,
1961, 1962; Vannote and Sweeney, 1980). Modifications
also occur in the sources and amounts of allochthonous and
autochthonous primary production (Vannote et al., 1980;
Giller and Malmqvist, 1998).
The construction of reservoirs and the subsequent flow
regulation alter the natural longitudinal variation of lotic
*Correspondence to: L. Lucadamo, Laboratorio di Ecologia Generale edApplicata, Dipartimento di Ecologia, Universita della Calabria, Cubo 6b,via Pietro Bucci, Arcavacata di Rende, 87036 (CS), Italy.E-mail: [email protected]
Copyright # 2010 John Wiley & Sons, Ltd.
ecosystems (Ward and Stanford, 1983, 1995) and modify the
characteristics of river environments. The type and extent of
those impacts on biotic communities depend mainly on the
use of reservoirs (potable water source, irrigation, industrial,
hydroelectric, fisheries), the frequency with which the water
releases occur downstream from the dam and whether water
is released from the epilimnion or hypolimnion (Perry and
Perry, 1986; Gore et al., 1989; Allan, 1996; Rosenberg et al.,
2000).
Some of the most important downstream consequences
produced by modified releases from an impoundment
include flow below minimum acceptable levels (Stanford
and Ward, 1984) and the deposition of fine sediments (Poff
andWard, 1989; Kondolf andWilcock, 1996; Wilcock et al.,
1996). The latter represents a process that may have serious
negative effects on lotic communities (Wagener and
LaPerriere, 1985; Ryan, 1991; Davies-Colley et al., 1992;
Wood and Armitage, 1997).
River basins in Calabria (Italy) often have a steep
altitudinal gradient because of the region’s orographic
104 L. LUCADAMO ET AL.
characteristics, and the water courses are often regimented
by the presence of dikes and reservoirs. The latter often have
multiple uses (Viceconte, 2004), while a few serve
exclusively for irrigation or electric power production. In
the present research the physical, chemical and biological
characteristics of the Mucone River have been studied in a
stretch downstream from the Cecita Reservoir. Water flow
from the reservoir to the river includes only a very small
leakage from the dam, while more appreciable water
releases occur rarely (generally one or two times per year)
and serve to check the functioning of dam floodgates.
More specifically the goals of this research were, on a
seasonal basis, to: (a) examine any differences for flow or
current velocity and substratum values between a segment
near the dam and others farther downstream (also after the
first permanent tributary); (b) verify whether hydrological
and geomorphological modifications occur together with
changes in the allochthonous and autochthonous primary
production input and (c) study the macrobenthic community
responses, which are associated with those regulated
gradients of abiotic and trophic parameters.
METHODS
Study site
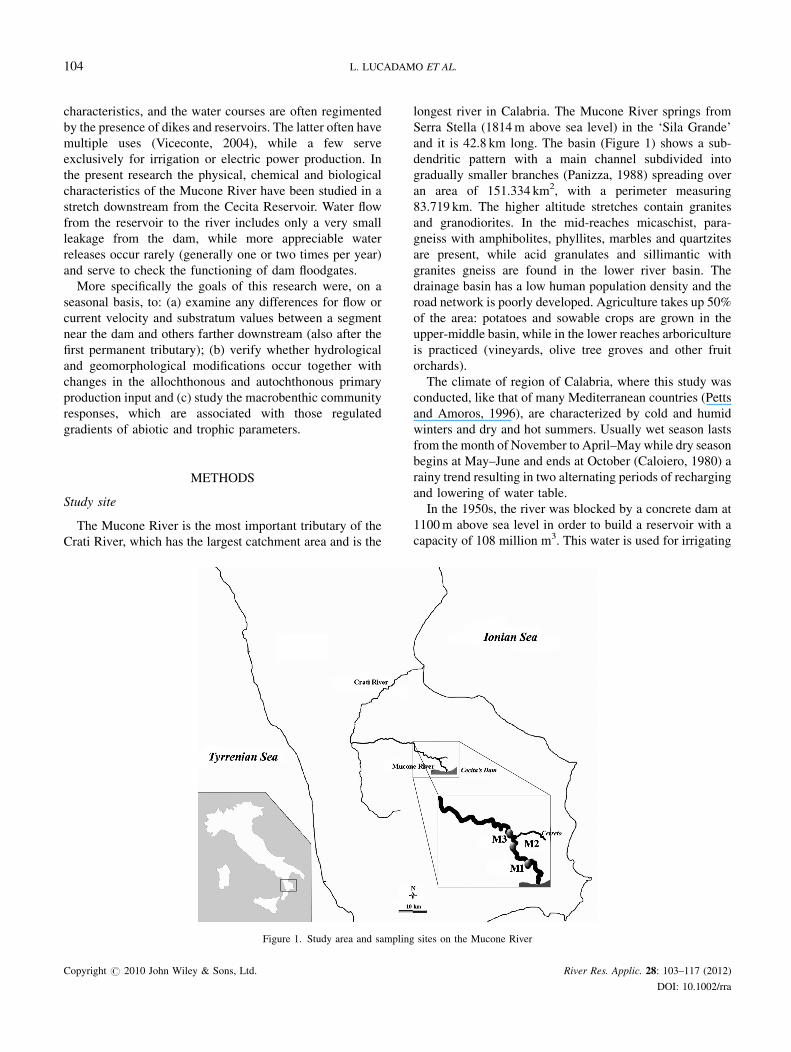
The Mucone River is the most important tributary of the
Crati River, which has the largest catchment area and is the
Figure 1. Study area and sampling
Copyright # 2010 John Wiley & Sons, Ltd.
longest river in Calabria. The Mucone River springs from
Serra Stella (1814m above sea level) in the ‘Sila Grande’
and it is 42.8 km long. The basin (Figure 1) shows a sub-
dendritic pattern with a main channel subdivided into
gradually smaller branches (Panizza, 1988) spreading over
an area of 151.334 km2, with a perimeter measuring
83.719 km. The higher altitude stretches contain granites
and granodiorites. In the mid-reaches micaschist, para-
gneiss with amphibolites, phyllites, marbles and quartzites
are present, while acid granulates and sillimantic with
granites gneiss are found in the lower river basin. The
drainage basin has a low human population density and the
road network is poorly developed. Agriculture takes up 50%
of the area: potatoes and sowable crops are grown in the
upper-middle basin, while in the lower reaches arboriculture
is practiced (vineyards, olive tree groves and other fruit
orchards).
The climate of region of Calabria, where this study was
conducted, like that of many Mediterranean countries (Petts
and Amoros, 1996), are characterized by cold and humid
winters and dry and hot summers. Usually wet season lasts
from the month of November to April–May while dry season
begins at May–June and ends at October (Caloiero, 1980) a
rainy trend resulting in two alternating periods of recharging
and lowering of water table.
In the 1950s, the river was blocked by a concrete dam at
1100m above sea level in order to build a reservoir with a
capacity of 108 million m3. This water is used for irrigating
sites on the Mucone River
River Res. Applic. 28: 103–117 (2012)
DOI: 10.1002/rra

ABIOTIC AND BIOTIC GRADIENTS DOWNSTREAM A RIVER 105
adjacent potato and cereal crop land, as well as the
production of hydro-electric power. With regard to the latter
water is directed into pipes and flows around the study area
to generators located respectively at heights of 480 and
198m above sea level. Only an extremely reduced release
of water consistently originates from the dam (below
minimum acceptable flow) while larger releases occur
once or twice per year to check for proper functioning of
the floodgates. Therefore, most of the flow found down-
stream of the dam comes from groundwater input and
seasonal rains. Apart from the drastic interruption in
ecological connectivity because of the existing dam, the
water course in the stretch immediately downstream from
the reservoir is strongly regulated with development of a
marked deposition process that lasts until flow is once
again reactivated by the progressive inflow. This process is
especially influenced by the first permanent tributary, the
Cerreto, which joins the Mucone River approximately
3.2 km downstream from the impoundment (between
the second and third sampling stations). Vegetation on
the steep slopes consists predominantly of pine trees,
while riparian vegetation are primarily alder trees (Alnus
glutinosa).
Sampling procedures
Three sampling stations (M1, M2 and M3), each with a
length of 90m, were established downstream from the
Cecita Reservoir (Figure 1). All stations have a rhithron
physiognomy, and range in altitude from 1097m a.s.l. (M1)
to 960m a.s.l. (M3). The sampling stations were located 0.9,
3.1 and 4.0 km downstream from the impoundment,
respectively. It was not feasible to place more stations
between M1 and M2 because of the steep sides. However,
the number of sites was considered sufficient for the study of
the regulated gradient.
Physical–chemical parameters were measured at each
site in May, August and November 2005. Current velocity
was measured at a distance of three cm from the riverbed
using a flow meter (Mod. 2030R, General Oceanics).
Discharge was calculated for each riffle using current
velocity, water depth and channel width data. Two litre
samples of water were obtained and brought back to the
laboratory to measure concentrations of ammonium,
nitrite, nitrate, phosphate and suspended solids (APAT-
CNR, 2003). The pH, temperature, conductivity and
dissolved oxygen were measured in the field using
portable probes (Mods. HI 991300 and HI 9143, Hanna
Instruments).
Three substratum replicates were taken also at all sites
each month by means of a cylindrical metallic core
measuring 40 cm in height and 26 cm in diameter.
Substratum was gathered in the core to a depth of 10 cm
Copyright # 2010 John Wiley & Sons, Ltd.
either by hand or by digging with a small shovel, then it was
washed through a series of three sieves (0.063–2.00–
16.0mm; Endecotts Limited). After removing the benthic
substratum, 10 L of water was removed from the core with a
pump to obtain suspended inorganic substratum. This water
was poured through the sieves and gathered in a bucket. A
250ml subsample was taken from the bucket for measuring
the silt–clay fraction. Pebble and cobble sample weights
were measured in the field (using a balance) while the
weights of gravel, sand, and siltþ clay were determined in
the laboratory using an analytic balance (Mod. R200D,
Sartorius) after drying at 1058C for 12 h. Substratum
fractions were expressed in percentage composition, and the
following ratios (weight/weight) were calculated: Pebble-
sþCobbles/Sand [(PþC)/S], PebblesþCobbles/Gravel
[(PþC)/G], Gravel/Sand (G/S), PebblesþCobbles/SiltþClay [(PþC)/(SiþCi)] and Gravel/SiltþClay [G/
(SiþCl)].
Macroinvertebrate, epibenthic microalgal biomass and
coarse particulate organic matter (CPOM) samples were
collected at the same time of hydrogeomorphological and
water-column parameters measurements.
Benthic macroinvertebrates were obtained using a
Surber-type sampler, Mod. N. 12.200 (Scubla, Udine,
Italy), having a 25 cm vertical opening and a sub-
trapezoidal shaped frame with an area of 0.0752m2.
The gathering net used was 60 cm long with a 250mm
mesh. Organisms were separated from substratum in
the field, preserved in 70% alcohol and identified in
the laboratory to family level according to Tachet et al.
(2000) and Sansoni (1988), using a Leica stereomicro-
scope. The following macroinvertebrate parameters
were calculated: type and number of taxa gathered,
relative abundance, dominance—meaning the three
most numerous taxa in the community, percentage
Ephemeroptera, Plecoptera and Trichoptera taxa
(% EPT), the ratio DipteraþOligocheta/the rest of the
community, and Simpson and Shannon indexes.
In order to assess epibenthic microalgal biomass, one
cobble was removed from each riffle and placed in a 5 L
dark plastic bottle with a wide neck containing river water.
The sample was kept in a cooler and then transferred to the
laboratory where epilithic chlorophyll a was measured
(Steinmann and Lamberti, 1996). Three CPOM replicates
were taken at each station using the same core for substrate
collection. The macroscopic vegetable debris (MVD)
(woodþ leaves) was gathered by hand from the core,
while the surface and interstitial smaller organic debris
was sampled by first taking out the substratum contained
in the core with a small shovel, and second by removing
the suspended material with a hand pump. All material
removed from the core was then poured through a 1mm
mesh sieve (Endecotts Limited). The micro detritus
River Res. Applic. 28: 103–117 (2012)
DOI: 10.1002/rra
106 L. LUCADAMO ET AL.
sample was added to the respective macroscopic
component, and both were placed in aluminium foil
that was then folded and placed in numbered plastic
bags. In the laboratory, CPOM samples were dried
at 1108C for 12 h and then ashed in a muffle furnace
(Mod ZB/1, CarloErba Reagents) for 6 h. Dry weights were
determined by using a analytic balance (Mod. R200D,
Sartorius).
Data analysis
All data were normalized prior to statistical analyses
using logarithm transformations (Ln (xþ 1)) except
for CPOM (exponential X0.01) and percentages (arcsin-
rootsquare). Parametric one-way ANOVA, post hoc Tukey
test, Principal Component Analysis (PCA), Detrended
Correspondence Analysis (DCA) and Multiple Response
Permutation Procedured (MRPP) were obtained using either
MINITAB Release 13.2 or PC-ORD 4.
Table I. Average chemical–physical variables values of water-column (
M1
NHþ4 (mgL�1) 32.520 (112.3%)
NO�2 (mgL�1) 2.4 (67.05%)
NO�3 (mgL�1) 138.0 (59.16%)
PO3�4 (mgL�1) 8.2 (33.41%)
% O2 saturation 86.30% (13.49%)pH 7.4 (2.36%)Conductivity (mS cm�1) 171.9 (13.09%)Temperature (8C) 9.8 (59.12%)Average riverbed width (m) 2.42
Table II. Seasonal changes of hydrogeomorphological variables betwee
Dis. Vel. % PþC % Gr % Sa % SþCl (
M1M 0.12 0.40 64.7 23.0 12.1 2� 10�3
A 0.01 0.13 47.4 22.7 29.8 5� 10�3
N 0.03 0.20 14.8 38.7 46.3 14� 10�2
Average 0.05 0.24 42.3 28.1 29.4 7.6� 10�3
M2M 0.35 0.72 60.8 24.5 14.6 18� 10�3
A 0.20 0.52 68.2 20.4 11.3 27� 10�3
N 0.17 0.49 61.8 26.7 11.4 5� 10�3
Average 0.24 0.57 63.6 23.8 12.4 3.1� 10�3
M3M 0.67 0.65 72.2 20.9 6.76 12� 10�3
A 0.38 0.55 67.5 24.9 7.53 75� 10�4
N 0.56 0.71 81.5 13.3 4.81 16� 10�3
Average 0.53 0.63 73.73 19.7 6.36 1.2� 10�3
M, May; A, August; N, November. Dis, Discharge (m3 s�1); Vel (m s�1), Current
Copyright # 2010 John Wiley & Sons, Ltd.
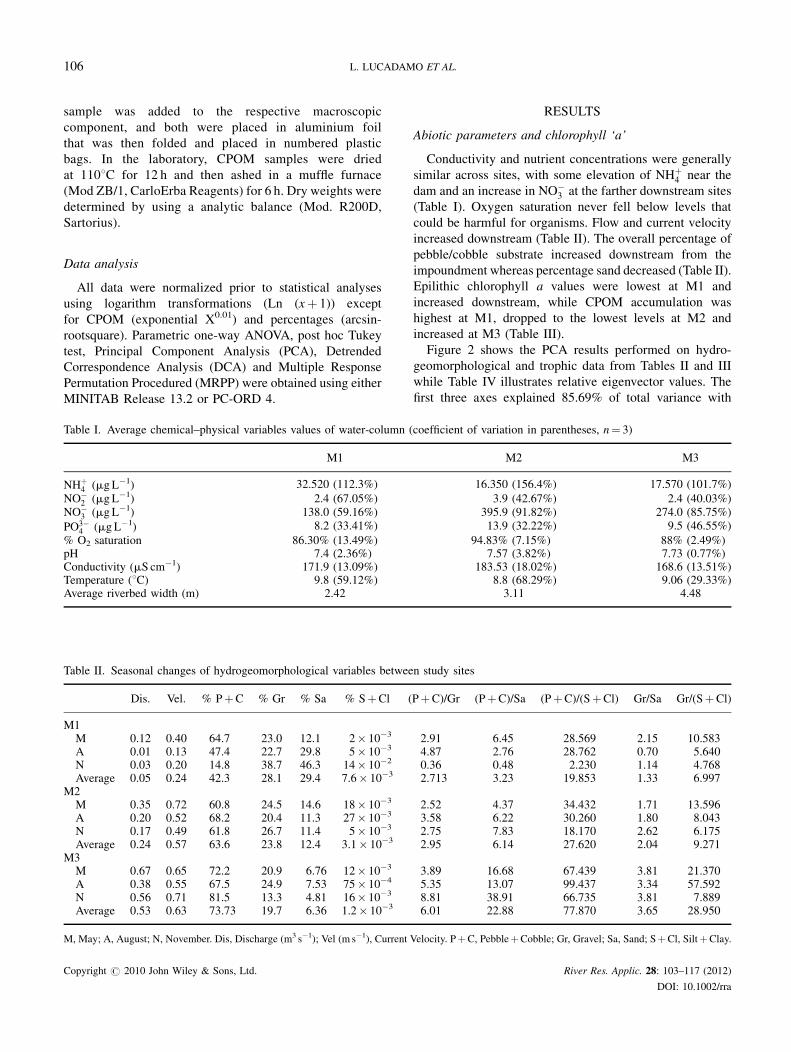
RESULTS
Abiotic parameters and chlorophyll ‘a’
Conductivity and nutrient concentrations were generally
similar across sites, with some elevation of NHþ4 near the
dam and an increase in NO�3 at the farther downstream sites
(Table I). Oxygen saturation never fell below levels that
could be harmful for organisms. Flow and current velocity
increased downstream (Table II). The overall percentage of
pebble/cobble substrate increased downstream from the
impoundment whereas percentage sand decreased (Table II).
Epilithic chlorophyll a values were lowest at M1 and
increased downstream, while CPOM accumulation was
highest at M1, dropped to the lowest levels at M2 and
increased at M3 (Table III).
Figure 2 shows the PCA results performed on hydro-
geomorphological and trophic data from Tables II and III
while Table IV illustrates relative eigenvector values. The
first three axes explained 85.69% of total variance with
coefficient of variation in parentheses, n¼ 3)
M2 M3
16.350 (156.4%) 17.570 (101.7%)
3.9 (42.67%) 2.4 (40.03%)395.9 (91.82%) 274.0 (85.75%)13.9 (32.22%) 9.5 (46.55%)
94.83% (7.15%) 88% (2.49%)7.57 (3.82%) 7.73 (0.77%)
183.53 (18.02%) 168.6 (13.51%)8.8 (68.29%) 9.06 (29.33%)3.11 4.48
n study sites
PþC)/Gr (PþC)/Sa (PþC)/(SþCl) Gr/Sa Gr/(SþCl)
2.91 6.45 28.569 2.15 10.5834.87 2.76 28.762 0.70 5.6400.36 0.48 2.230 1.14 4.7682.713 3.23 19.853 1.33 6.997
2.52 4.37 34.432 1.71 13.5963.58 6.22 30.260 1.80 8.0432.75 7.83 18.170 2.62 6.1752.95 6.14 27.620 2.04 9.271
3.89 16.68 67.439 3.81 21.3705.35 13.07 99.437 3.34 57.5928.81 38.91 66.735 3.81 7.8896.01 22.88 77.870 3.65 28.950
Velocity. PþC, PebbleþCobble; Gr, Gravel; Sa, Sand; SþCl, SiltþClay.
River Res. Applic. 28: 103–117 (2012)
DOI: 10.1002/rra
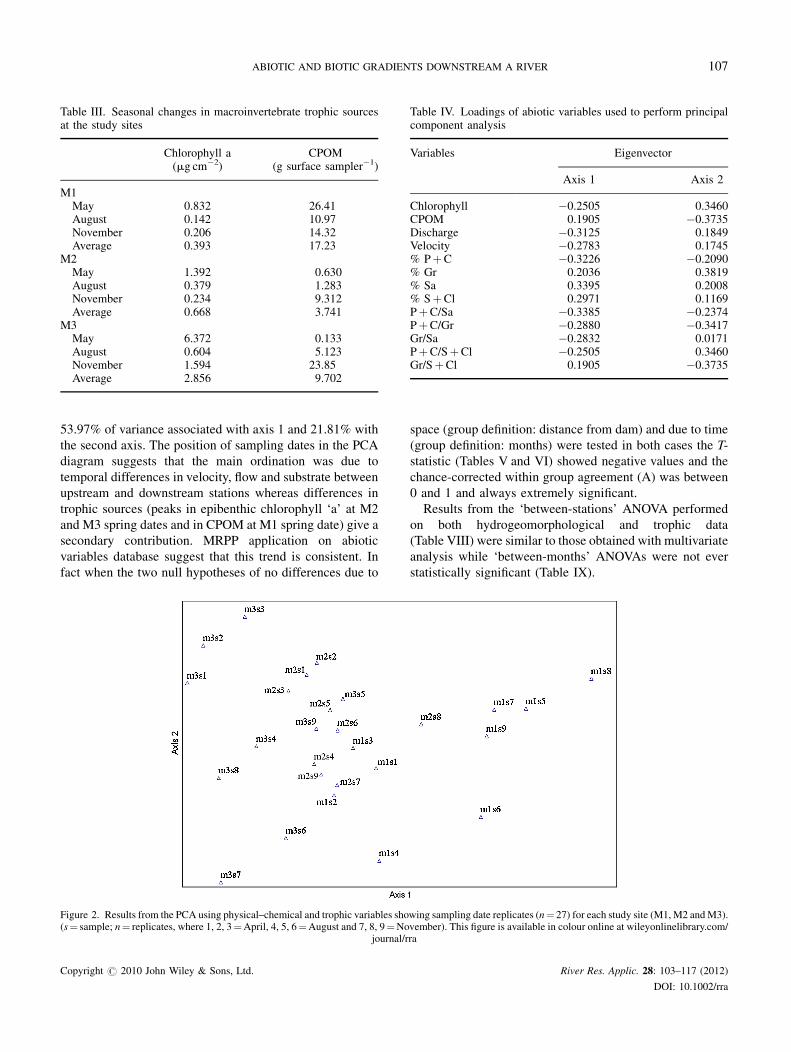
Table III. Seasonal changes in macroinvertebrate trophic sourcesat the study sites
Chlorophyll a(mg cm�2)
CPOM(g surface sampler�1)
M1May 0.832 26.41August 0.142 10.97November 0.206 14.32Average 0.393 17.23
M2May 1.392 0.630August 0.379 1.283November 0.234 9.312Average 0.668 3.741
M3May 6.372 0.133August 0.604 5.123November 1.594 23.85Average 2.856 9.702
Table IV. Loadings of abiotic variables used to perform principalcomponent analysis
Variables Eigenvector
Axis 1 Axis 2
Chlorophyll �0.2505 0.3460CPOM 0.1905 �0.3735Discharge �0.3125 0.1849Velocity �0.2783 0.1745% PþC �0.3226 �0.2090% Gr 0.2036 0.3819% Sa 0.3395 0.2008% SþCl 0.2971 0.1169PþC/Sa �0.3385 �0.2374PþC/Gr �0.2880 �0.3417Gr/Sa �0.2832 0.0171PþC/SþCl �0.2505 0.3460Gr/SþCl 0.1905 �0.3735
ABIOTIC AND BIOTIC GRADIENTS DOWNSTREAM A RIVER 107
53.97% of variance associated with axis 1 and 21.81% with
the second axis. The position of sampling dates in the PCA
diagram suggests that the main ordination was due to
temporal differences in velocity, flow and substrate between
upstream and downstream stations whereas differences in
trophic sources (peaks in epibenthic chlorophyll ‘a’ at M2
and M3 spring dates and in CPOM at M1 spring date) give a
secondary contribution. MRPP application on abiotic
variables database suggest that this trend is consistent. In
fact when the two null hypotheses of no differences due to
Figure 2. Results from the PCA using physical–chemical and trophic variables sho(s¼ sample; n¼ replicates, where 1, 2, 3¼April, 4, 5, 6¼August and 7, 8, 9¼No
journal/r
Copyright # 2010 John Wiley & Sons, Ltd.
space (group definition: distance from dam) and due to time
(group definition: months) were tested in both cases the T-
statistic (Tables V and VI) showed negative values and the
chance-corrected within group agreement (A) was between
0 and 1 and always extremely significant.
Results from the ‘between-stations’ ANOVA performed
on both hydrogeomorphological and trophic data
(Table VIII) were similar to those obtained with multivariate
analysis while ‘between-months’ ANOVAs were not ever
statistically significant (Table IX).
wing sampling date replicates (n¼ 27) for each study site (M1, M2 andM3).vember). This figure is available in colour online at wileyonlinelibrary.com/ra
River Res. Applic. 28: 103–117 (2012)
DOI: 10.1002/rra
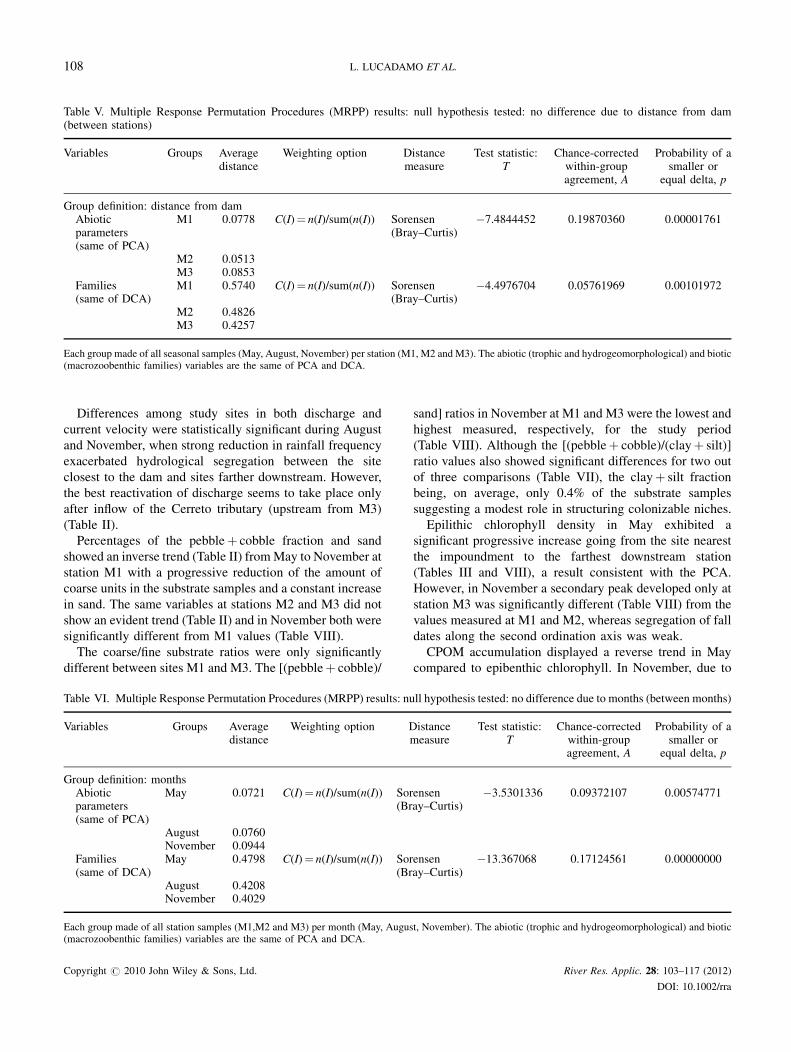
Table V. Multiple Response Permutation Procedures (MRPP) results: null hypothesis tested: no difference due to distance from dam(between stations)
Variables Groups Averagedistance
Weighting option Distancemeasure
Test statistic:T
Chance-correctedwithin-groupagreement, A
Probability of asmaller or
equal delta, p
Group definition: distance from damAbioticparameters(same of PCA)
M1 0.0778 C(I)¼ n(I)/sum(n(I)) Sorensen(Bray–Curtis)
�7.4844452 0.19870360 0.00001761
M2 0.0513M3 0.0853
Families(same of DCA)
M1 0.5740 C(I)¼ n(I)/sum(n(I)) Sorensen(Bray–Curtis)
�4.4976704 0.05761969 0.00101972
M2 0.4826M3 0.4257
Each group made of all seasonal samples (May, August, November) per station (M1, M2 and M3). The abiotic (trophic and hydrogeomorphological) and biotic(macrozoobenthic families) variables are the same of PCA and DCA.
108 L. LUCADAMO ET AL.
Differences among study sites in both discharge and
current velocity were statistically significant during August
and November, when strong reduction in rainfall frequency
exacerbated hydrological segregation between the site
closest to the dam and sites farther downstream. However,
the best reactivation of discharge seems to take place only
after inflow of the Cerreto tributary (upstream from M3)
(Table II).
Percentages of the pebbleþ cobble fraction and sand
showed an inverse trend (Table II) fromMay to November at
station M1 with a progressive reduction of the amount of
coarse units in the substrate samples and a constant increase
in sand. The same variables at stations M2 and M3 did not
show an evident trend (Table II) and in November both were
significantly different from M1 values (Table VIII).
The coarse/fine substrate ratios were only significantly
different between sites M1 and M3. The [(pebbleþ cobble)/
Table VI. Multiple Response Permutation Procedures (MRPP) results: nu
Variables Groups Averagedistance
Weighting option D
Group definition: monthsAbioticparameters(same of PCA)
May 0.0721 C(I)¼ n(I)/sum(n(I)) Sor(Br
August 0.0760November 0.0944
Families(same of DCA)
May 0.4798 C(I)¼ n(I)/sum(n(I)) Sor(Br
August 0.4208November 0.4029
Each group made of all station samples (M1,M2 and M3) per month (May, Augus(macrozoobenthic families) variables are the same of PCA and DCA.
Copyright # 2010 John Wiley & Sons, Ltd.
sand] ratios in November at M1 and M3 were the lowest and
highest measured, respectively, for the study period
(Table VIII). Although the [(pebbleþ cobble)/(clayþ silt)]
ratio values also showed significant differences for two out
of three comparisons (Table VII), the clayþ silt fraction
being, on average, only 0.4% of the substrate samples
suggesting a modest role in structuring colonizable niches.
Epilithic chlorophyll density in May exhibited a
significant progressive increase going from the site nearest
the impoundment to the farthest downstream station
(Tables III and VIII), a result consistent with the PCA.
However, in November a secondary peak developed only at
station M3 was significantly different (Table VIII) from the
values measured at M1 and M2, whereas segregation of fall
dates along the second ordination axis was weak.
CPOM accumulation displayed a reverse trend in May
compared to epibenthic chlorophyll. In November, due to
ll hypothesis tested: no difference due to months (between months)
istancemeasure
Test statistic:T
Chance-correctedwithin-groupagreement, A
Probability of asmaller or
equal delta, p
ensenay–Curtis)
�3.5301336 0.09372107 0.00574771
ensenay–Curtis)
�13.367068 0.17124561 0.00000000
t, November). The abiotic (trophic and hydrogeomorphological) and biotic
River Res. Applic. 28: 103–117 (2012)
DOI: 10.1002/rra
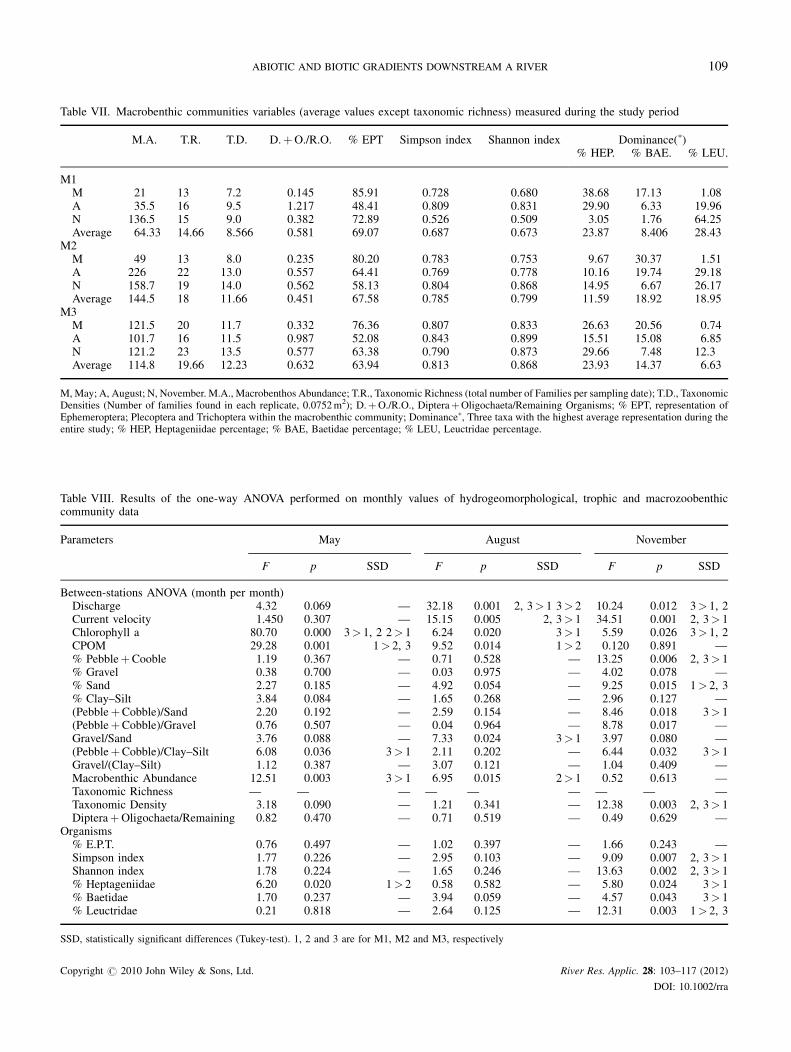
Table VII. Macrobenthic communities variables (average values except taxonomic richness) measured during the study period
M.A. T.R. T.D. D.þO./R.O. % EPT Simpson index Shannon index Dominance(�)% HEP. % BAE. % LEU.
M1M 21 13 7.2 0.145 85.91 0.728 0.680 38.68 17.13 1.08A 35.5 16 9.5 1.217 48.41 0.809 0.831 29.90 6.33 19.96N 136.5 15 9.0 0.382 72.89 0.526 0.509 3.05 1.76 64.25Average 64.33 14.66 8.566 0.581 69.07 0.687 0.673 23.87 8.406 28.43
M2M 49 13 8.0 0.235 80.20 0.783 0.753 9.67 30.37 1.51A 226 22 13.0 0.557 64.41 0.769 0.778 10.16 19.74 29.18N 158.7 19 14.0 0.562 58.13 0.804 0.868 14.95 6.67 26.17Average 144.5 18 11.66 0.451 67.58 0.785 0.799 11.59 18.92 18.95
M3M 121.5 20 11.7 0.332 76.36 0.807 0.833 26.63 20.56 0.74A 101.7 16 11.5 0.987 52.08 0.843 0.899 15.51 15.08 6.85N 121.2 23 13.5 0.577 63.38 0.790 0.873 29.66 7.48 12.3Average 114.8 19.66 12.23 0.632 63.94 0.813 0.868 23.93 14.37 6.63
M, May; A, August; N, November. M.A., Macrobenthos Abundance; T.R., Taxonomic Richness (total number of Families per sampling date); T.D., TaxonomicDensities (Number of families found in each replicate, 0.0752m2); D.þO./R.O., DipteraþOligochaeta/Remaining Organisms; % EPT, representation ofEphemeroptera; Plecoptera and Trichoptera within the macrobenthic community; Dominance�, Three taxa with the highest average representation during theentire study; % HEP, Heptageniidae percentage; % BAE, Baetidae percentage; % LEU, Leuctridae percentage.
Table VIII. Results of the one-way ANOVA performed on monthly values of hydrogeomorphological, trophic and macrozoobenthiccommunity data
Parameters May August November
F p SSD F p SSD F p SSD
Between-stations ANOVA (month per month)Discharge 4.32 0.069 — 32.18 0.001 2, 3> 1 3> 2 10.24 0.012 3> 1, 2Current velocity 1.450 0.307 — 15.15 0.005 2, 3> 1 34.51 0.001 2, 3> 1Chlorophyll a 80.70 0.000 3> 1, 2 2> 1 6.24 0.020 3> 1 5.59 0.026 3> 1, 2CPOM 29.28 0.001 1> 2, 3 9.52 0.014 1> 2 0.120 0.891 —% PebbleþCooble 1.19 0.367 — 0.71 0.528 — 13.25 0.006 2, 3> 1% Gravel 0.38 0.700 — 0.03 0.975 — 4.02 0.078 —% Sand 2.27 0.185 — 4.92 0.054 — 9.25 0.015 1> 2, 3% Clay–Silt 3.84 0.084 — 1.65 0.268 — 2.96 0.127 —(PebbleþCobble)/Sand 2.20 0.192 — 2.59 0.154 — 8.46 0.018 3> 1(PebbleþCobble)/Gravel 0.76 0.507 — 0.04 0.964 — 8.78 0.017 —Gravel/Sand 3.76 0.088 — 7.33 0.024 3> 1 3.97 0.080 —(PebbleþCobble)/Clay–Silt 6.08 0.036 3> 1 2.11 0.202 — 6.44 0.032 3> 1Gravel/(Clay–Silt) 1.12 0.387 — 3.07 0.121 — 1.04 0.409 —Macrobenthic Abundance 12.51 0.003 3> 1 6.95 0.015 2> 1 0.52 0.613 —Taxonomic Richness — — — — — — — — —Taxonomic Density 3.18 0.090 — 1.21 0.341 — 12.38 0.003 2, 3> 1DipteraþOligochaeta/Remaining
Organisms0.82 0.470 — 0.71 0.519 — 0.49 0.629 —
% E.P.T. 0.76 0.497 — 1.02 0.397 — 1.66 0.243 —Simpson index 1.77 0.226 — 2.95 0.103 — 9.09 0.007 2, 3> 1Shannon index 1.78 0.224 — 1.65 0.246 — 13.63 0.002 2, 3> 1% Heptageniidae 6.20 0.020 1> 2 0.58 0.582 — 5.80 0.024 3> 1% Baetidae 1.70 0.237 — 3.94 0.059 — 4.57 0.043 3> 1% Leuctridae 0.21 0.818 — 2.64 0.125 — 12.31 0.003 1> 2, 3
SSD, statistically significant differences (Tukey-test). 1, 2 and 3 are for M1, M2 and M3, respectively
Copyright # 2010 John Wiley & Sons, Ltd. River Res. Applic. 28: 103–117 (2012)
DOI: 10.1002/rra
ABIOTIC AND BIOTIC GRADIENTS DOWNSTREAM A RIVER 109
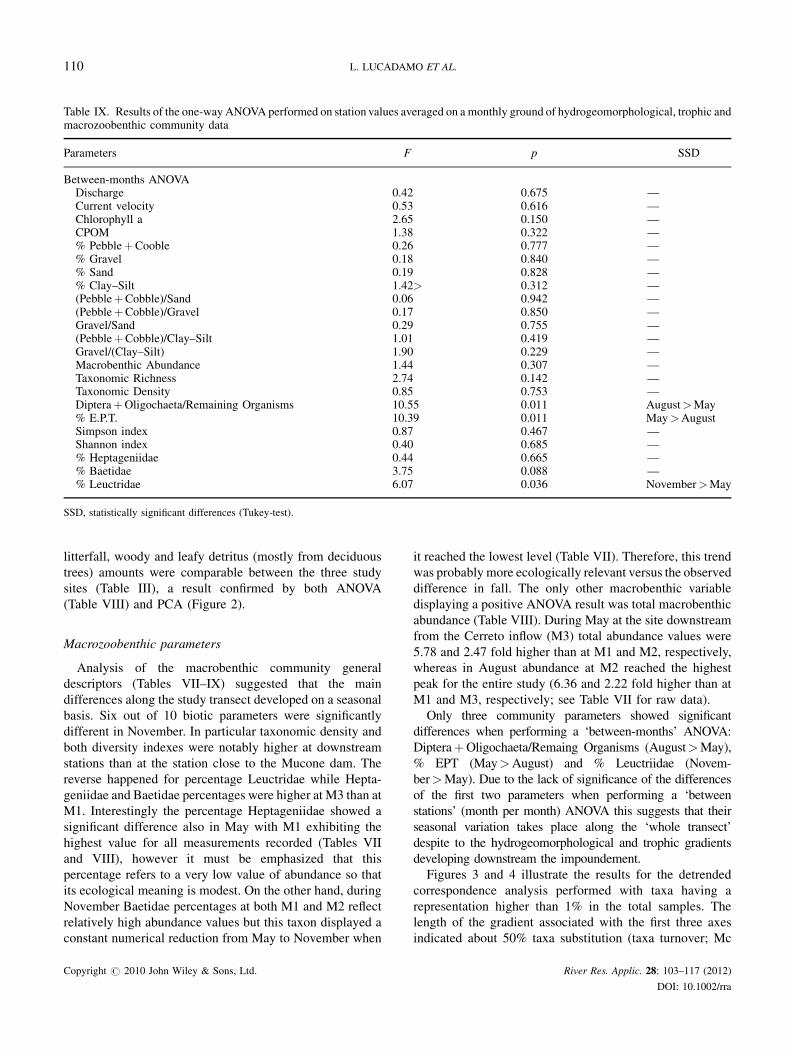
Table IX. Results of the one-way ANOVA performed on station values averaged on a monthly ground of hydrogeomorphological, trophic andmacrozoobenthic community data
Parameters F p SSD
Between-months ANOVADischarge 0.42 0.675 —Current velocity 0.53 0.616 —Chlorophyll a 2.65 0.150 —CPOM 1.38 0.322 —% PebbleþCooble 0.26 0.777 —% Gravel 0.18 0.840 —% Sand 0.19 0.828 —% Clay–Silt 1.42> 0.312 —(PebbleþCobble)/Sand 0.06 0.942 —(PebbleþCobble)/Gravel 0.17 0.850 —Gravel/Sand 0.29 0.755 —(PebbleþCobble)/Clay–Silt 1.01 0.419 —Gravel/(Clay–Silt) 1.90 0.229 —Macrobenthic Abundance 1.44 0.307 —Taxonomic Richness 2.74 0.142 —Taxonomic Density 0.85 0.753 —DipteraþOligochaeta/Remaining Organisms 10.55 0.011 August>May% E.P.T. 10.39 0.011 May>AugustSimpson index 0.87 0.467 —Shannon index 0.40 0.685 —% Heptageniidae 0.44 0.665 —% Baetidae 3.75 0.088 —% Leuctridae 6.07 0.036 November>May
SSD, statistically significant differences (Tukey-test).
110 L. LUCADAMO ET AL.
litterfall, woody and leafy detritus (mostly from deciduous
trees) amounts were comparable between the three study
sites (Table III), a result confirmed by both ANOVA
(Table VIII) and PCA (Figure 2).
Macrozoobenthic parameters
Analysis of the macrobenthic community general
descriptors (Tables VII–IX) suggested that the main
differences along the study transect developed on a seasonal
basis. Six out of 10 biotic parameters were significantly
different in November. In particular taxonomic density and
both diversity indexes were notably higher at downstream
stations than at the station close to the Mucone dam. The
reverse happened for percentage Leuctridae while Hepta-
geniidae and Baetidae percentages were higher at M3 than at
M1. Interestingly the percentage Heptageniidae showed a
significant difference also in May with M1 exhibiting the
highest value for all measurements recorded (Tables VII
and VIII), however it must be emphasized that this
percentage refers to a very low value of abundance so that
its ecological meaning is modest. On the other hand, during
November Baetidae percentages at both M1 and M2 reflect
relatively high abundance values but this taxon displayed a
constant numerical reduction from May to November when
Copyright # 2010 John Wiley & Sons, Ltd.
it reached the lowest level (Table VII). Therefore, this trend
was probably more ecologically relevant versus the observed
difference in fall. The only other macrobenthic variable
displaying a positive ANOVA result was total macrobenthic
abundance (Table VIII). During May at the site downstream
from the Cerreto inflow (M3) total abundance values were
5.78 and 2.47 fold higher than at M1 and M2, respectively,
whereas in August abundance at M2 reached the highest
peak for the entire study (6.36 and 2.22 fold higher than at
M1 and M3, respectively; see Table VII for raw data).
Only three community parameters showed significant
differences when performing a ‘between-months’ ANOVA:
DipteraþOligochaeta/Remaing Organisms (August>May),
% EPT (May>August) and % Leuctriidae (Novem-
ber>May). Due to the lack of significance of the differences
of the first two parameters when performing a ‘between
stations’ (month per month) ANOVA this suggests that their
seasonal variation takes place along the ‘whole transect’
despite to the hydrogeomorphological and trophic gradients
developing downstream the impoundement.
Figures 3 and 4 illustrate the results for the detrended
correspondence analysis performed with taxa having a
representation higher than 1% in the total samples. The
length of the gradient associated with the first three axes
indicated about 50% taxa substitution (taxa turnover; Mc
River Res. Applic. 28: 103–117 (2012)
DOI: 10.1002/rra
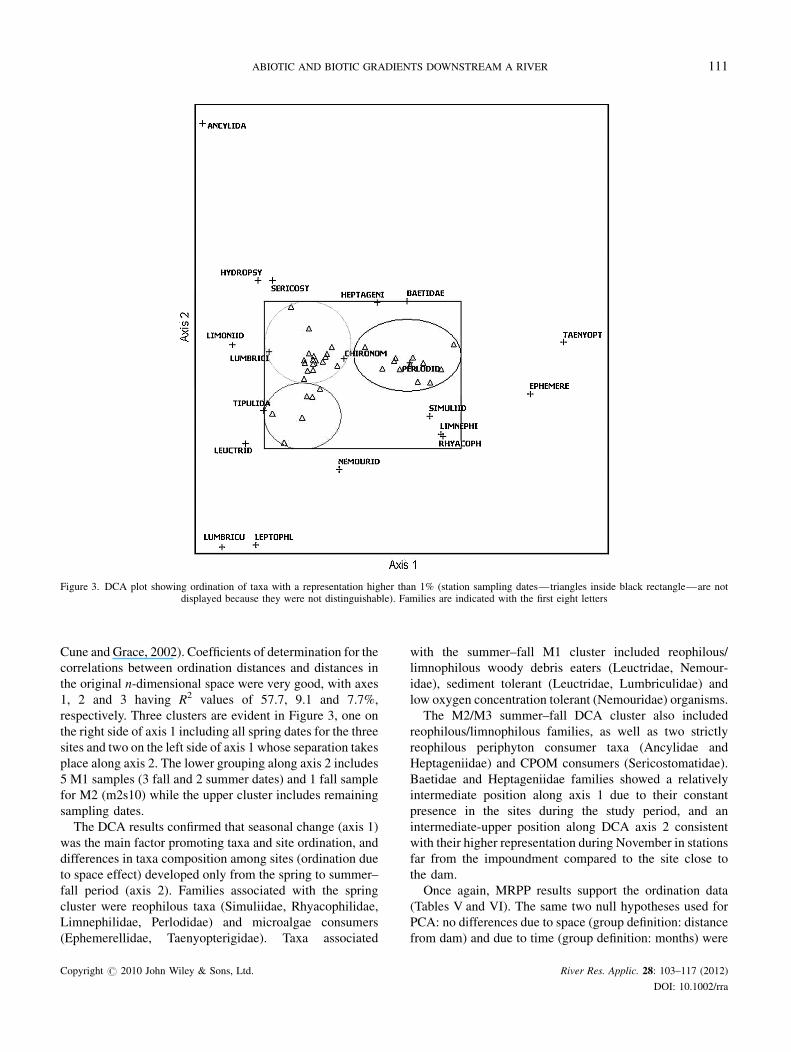
Figure 3. DCA plot showing ordination of taxa with a representation higher than 1% (station sampling dates—triangles inside black rectangle—are notdisplayed because they were not distinguishable). Families are indicated with the first eight letters
ABIOTIC AND BIOTIC GRADIENTS DOWNSTREAM A RIVER 111
Cune and Grace, 2002). Coefficients of determination for the
correlations between ordination distances and distances in
the original n-dimensional space were very good, with axes
1, 2 and 3 having R2 values of 57.7, 9.1 and 7.7%,
respectively. Three clusters are evident in Figure 3, one on
the right side of axis 1 including all spring dates for the three
sites and two on the left side of axis 1 whose separation takes
place along axis 2. The lower grouping along axis 2 includes
5 M1 samples (3 fall and 2 summer dates) and 1 fall sample
for M2 (m2s10) while the upper cluster includes remaining
sampling dates.
The DCA results confirmed that seasonal change (axis 1)
was the main factor promoting taxa and site ordination, and
differences in taxa composition among sites (ordination due
to space effect) developed only from the spring to summer–
fall period (axis 2). Families associated with the spring
cluster were reophilous taxa (Simuliidae, Rhyacophilidae,
Limnephilidae, Perlodidae) and microalgae consumers
(Ephemerellidae, Taenyopterigidae). Taxa associated
Copyright # 2010 John Wiley & Sons, Ltd.
with the summer–fall M1 cluster included reophilous/
limnophilous woody debris eaters (Leuctridae, Nemour-
idae), sediment tolerant (Leuctridae, Lumbriculidae) and
low oxygen concentration tolerant (Nemouridae) organisms.
The M2/M3 summer–fall DCA cluster also included
reophilous/limnophilous families, as well as two strictly
reophilous periphyton consumer taxa (Ancylidae and
Heptageniidae) and CPOM consumers (Sericostomatidae).
Baetidae and Heptageniidae families showed a relatively
intermediate position along axis 1 due to their constant
presence in the sites during the study period, and an
intermediate-upper position along DCA axis 2 consistent
with their higher representation during November in stations
far from the impoundment compared to the site close to
the dam.
Once again, MRPP results support the ordination data
(Tables V and VI). The same two null hypotheses used for
PCA: no differences due to space (group definition: distance
from dam) and due to time (group definition: months) were
River Res. Applic. 28: 103–117 (2012)
DOI: 10.1002/rra
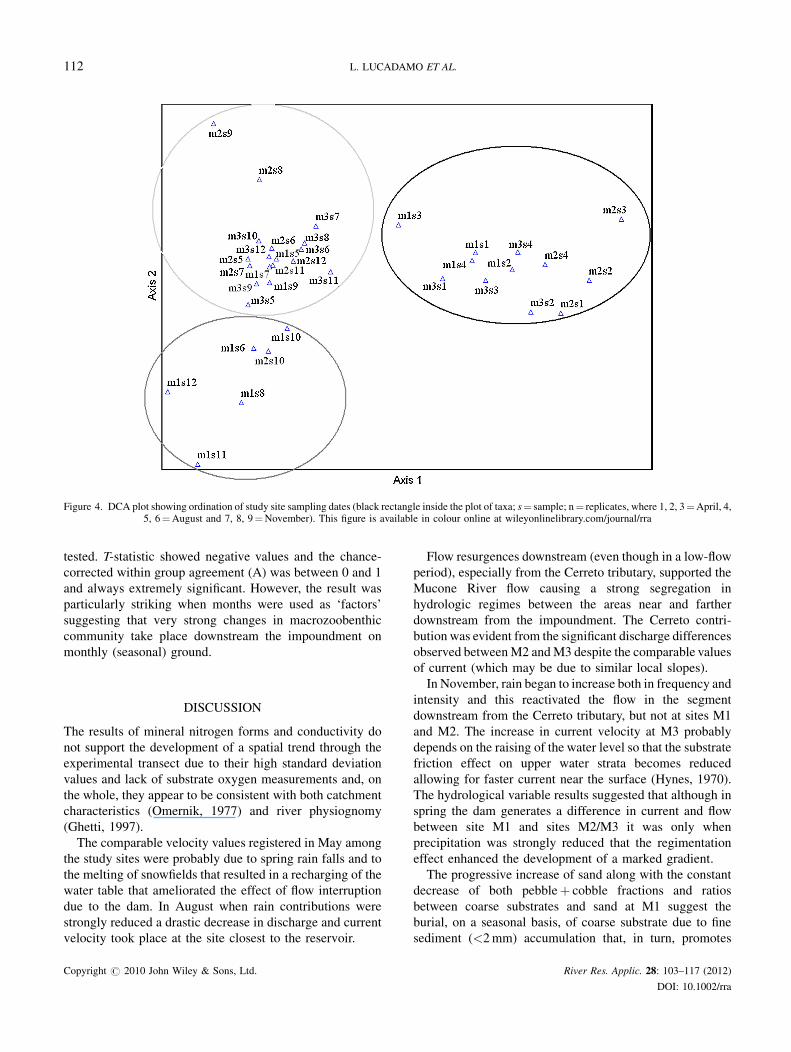
Figure 4. DCA plot showing ordination of study site sampling dates (black rectangle inside the plot of taxa; s¼ sample; n¼ replicates, where 1, 2, 3¼April, 4,5, 6¼August and 7, 8, 9¼November). This figure is available in colour online at wileyonlinelibrary.com/journal/rra
112 L. LUCADAMO ET AL.
tested. T-statistic showed negative values and the chance-
corrected within group agreement (A) was between 0 and 1
and always extremely significant. However, the result was
particularly striking when months were used as ‘factors’
suggesting that very strong changes in macrozoobenthic
community take place downstream the impoundment on
monthly (seasonal) ground.
DISCUSSION
The results of mineral nitrogen forms and conductivity do
not support the development of a spatial trend through the
experimental transect due to their high standard deviation
values and lack of substrate oxygen measurements and, on
the whole, they appear to be consistent with both catchment
characteristics (Omernik, 1977) and river physiognomy
(Ghetti, 1997).
The comparable velocity values registered in May among
the study sites were probably due to spring rain falls and to
the melting of snowfields that resulted in a recharging of the
water table that ameliorated the effect of flow interruption
due to the dam. In August when rain contributions were
strongly reduced a drastic decrease in discharge and current
velocity took place at the site closest to the reservoir.
Copyright # 2010 John Wiley & Sons, Ltd.
Flow resurgences downstream (even though in a low-flow
period), especially from the Cerreto tributary, supported the
Mucone River flow causing a strong segregation in
hydrologic regimes between the areas near and farther
downstream from the impoundment. The Cerreto contri-
bution was evident from the significant discharge differences
observed betweenM2 andM3 despite the comparable values
of current (which may be due to similar local slopes).
In November, rain began to increase both in frequency and
intensity and this reactivated the flow in the segment
downstream from the Cerreto tributary, but not at sites M1
and M2. The increase in current velocity at M3 probably
depends on the raising of the water level so that the substrate
friction effect on upper water strata becomes reduced
allowing for faster current near the surface (Hynes, 1970).
The hydrological variable results suggested that although in
spring the dam generates a difference in current and flow
between site M1 and sites M2/M3 it was only when
precipitation was strongly reduced that the regimentation
effect enhanced the development of a marked gradient.
The progressive increase of sand along with the constant
decrease of both pebbleþ cobble fractions and ratios
between coarse substrates and sand at M1 suggest the
burial, on a seasonal basis, of coarse substrate due to fine
sediment (<2mm) accumulation that, in turn, promotes
River Res. Applic. 28: 103–117 (2012)
DOI: 10.1002/rra
ABIOTIC AND BIOTIC GRADIENTS DOWNSTREAM A RIVER 113
embeddedness of the riverbed. This is a phenomenon well
known for depressing biological colonization (Lenat et al.,
1981; Gordon et al., 2004). Differences in substrate
variables between the site close to the dam (M1) and the
site with the best flow reactivation (M3) became striking
in November, when flow and current velocity segregation
persisted from August. The site immediately upstream from
the Cerreto inflow (M2) seemed to occupy an intermediate
position as indicated by the [(pebbleþ cobble)/sand] ratio
that was not significantly different from either M1 or M3.
Such a result may be due to both weaker discharge values
and the physiognomy of M2 which has a tight succession of
small falls that could break flow, increase turbulence and
promote deposition of small particles like sand (Stevenson,
1983). The seasonal trends for substrate corresponded well
with the hydrological trends strongly supporting the idea
that interaction between local climate and the regimentation
effect of the dam results, on a scale of kilometres as for our
work, in a reversal of the natural substrate gradient on a
catchment scale, according to the hypothesis developed
by Ward and Stanford (1983) about one of the effects of
impoundments on lotic ecosystems.
The shading produced by the well-preserved riparian
canopy (Lowe et al., 1986; Hill and Knight, 1988), together
with the average phosphorous values typical of oligotrophic
environments (Dodds et al., 2002), resulted in modest micro-
algal accrual values, except for the peak reached inMay atM3
(Biggs, 1996). Station M3 showed the highest average values
for chlorophyll a (Table III) probably due to a concurrence
between a greater substratum stability (pebbles and cobbles)
favouring colonization and epi-benthic micro-algae perma-
nence (Allan, 1996), and a greater average channel width,
which allowed a better irradiation of the riverbed (Tank and
Dodds, 2003; Ambrose andWilzbach, 2004). The differences
shown in the trimester confirms and strengthens such an
interpretation. In May, before canopy closure, chlorophyll a
showed progressively increasing values going from M1 to
M3, likely resulting from an irradiation gradient. In August, a
generalized reduction of chlorophyll a levels was evident.
These results were likely due to the high shading effect from
canopy closure and perhaps fine sediment accumulation that
could cover the algal microlayer (Brookes, 1986; Graham,
1990; Yamada and Nakamura, 2002), likely hindering light
penetration or making nutrient and gas exchanges more
difficult. In November, defoliation allowed for increased
riverbed irradiation which could potentially stimulate
epibenthic algal growth (Sumner and Fisher, 1979). A result,
however, that was only registered at M3. The high sand
deposition presumably depressed algal development at M1,
while at M2 the combined effect of sand deposition (though
less than at M1) along with a marked increase in cloudy days
compared to spring (ARPACAL, 2009) would hinder growth
of epilithic microalgae.
Copyright # 2010 John Wiley & Sons, Ltd.
Deciduous leaf and wood debris accumulation was higher
near the impoundment whereas lower quantities were
collected at both downstream stations (Table III). It is
reasonable to speculate that the large CPOM differences
detected in May (Table VII) were due to flow abatement
caused by the dam that eliminated discharge peaks, a process
that together with riverbed width reduction promoted CPOM
accumulation close to the reservoir. Studies by Stanford and
Ward (1984) and D’Ercole (1989) concur with our study
while others found increasing CPOM levels with greater
downstream distance from impoundments (Voelz and Ward,
1990; Cortes et al., 1998). These differences are probably
ascribable to the different ways of operating the reservoirs or
different placement of sampling stations (e.g. closer to the
reservoir so that building of the dam could have altered
the riparian environment).
CPOM quantities collected at M1 in August were
considerably lower than those collected in May. It is
difficult to associate this reduction completely with
decomposition (Spanhoff and Meyer, 2004) especially
because in our work no distinction was made between
woody and leafy litter. However, most CPOM consisted of
deciduous leaves and because Alder leaves (a common tree
along the study reach) have a low C:N ratio (Haeckel et al.,
1973), a chemical property that strongly promotes plant
tissue decomposition, while wood has a much higher C:N
ratio (200�>1000:1), we may suppose that microbial
decomposition of CPOMwas appreciable and contributed to
the negative recovery trend between May and August.
In November, when litter fall occurs, the CPOM amounts
collected at the three stations were comparable (Table VII).
However, despite flow reactivation the largest quantities
were observed at M3, probably due to the higher retention
capacity of the river segment as suggested by the greater
pebbleþ cobble sediment fraction (Naiman, 1982).
In addition, the macrobenthic invertebrate community
characteristics appeared to result from the hydrological
regimentation caused by the dam and were further
influenced by the seasonal change of climate. In May,
when flow was still activated primarily by rainfall, drift was
presumably the main factor driving colonization of the
riverbed (Waters, 1972). However, site M1 (mostly) and site
M2 to a lesser extent likely could not rely on this process,
due to dam barrier (Nichols et al. 2006), whereas M3 was
influenced by macroinvertebrate sources ensured by the
Cerreto tributary. Also in August the Cerreto could play a
key-role in determining the abundance of macroinverte-
brates at M3. In fact the highest macroinvertebrate
abundance for the entire study period was observed at
M2, the station nearest to the Cerreto confluence. Many lotic
insects in Italian and other European rivers emerge around
that time of the year (Cummins, 1974; Cattaneo et al., 2006;
Sporka et al., 2006). Due to different placements and
River Res. Applic. 28: 103–117 (2012)
DOI: 10.1002/rra
114 L. LUCADAMO ET AL.
distances of M2 and M3 with respect to the Cerreto inflow,
we may presume that aerial dispersal of adults (Gray and
Fisher, 1981; Cushing and Gaines, 1989) coming mainly
from the Cerreto, enhances the colonization of the Mucone
River at both M2 and M3, with drift processes taking a
secondary role at M2. In November when the flow
reactivates, drift should again be a critical process in
determining composition and abundance of macrobenthos
but we found no differences among the three sites.
Looking at the structure of macrobenthic communities
and especially the timing of dominance by the Leuctridae
across the stations, we may hypothesize that this family
probably colonizes site M1 partly by upstream movement of
the larvae (Williams and Hynes, 1976; Erman, 1986;
Delucchi, 1989; Freilich, 1991). Such a process could
counterbalance drift eliminating differences in abundance
between sites. Autumn litter deposition presumably pro-
motes Leuctridae colonization also at M2 andM3 (Table IX)
as indicated by their increase in abundance from May to
November.
The abundance of the other dominant taxon, the
Heptageniidae, exhibited a trend that matched the seasonal
variation of epibenthic microalgae biomass at M3 (Merritt
and Cummins, 1996) but not at M2 probably due to the lower
level of epilithic primary production. The percentage of
Heptageniidae in the macrobenthic community suffered the
strongest reduction at M1 in November probably as a
consequence of their intolerance to fine sediment deposition
(Relyea et al., 2000) and depressed level of autotrophic
periphyton.
In all three sites the representation of Baetidae
progressively reduced going from May to November. This
trend suggests that other factors not taken into account in
this work, rather than the hydrogeomorphological gradient,
controlled their seasonal variation along the study transect.
Differences in taxonomic richness among stations were
not particularly high suggesting that the total number of
niches per site was not greatly affected by the flow
regimentation (Cortes et al. 2002) and subsequent sand
accumulation, perhaps because of high total spatial
heterogeneity. On the contrary the density of niches, that
is the spatial diversity measured at a microscale (the surface
of the sampler), not only was consistently lower at M1 than
at M2 or M3 (perhaps due to interruption of ecological
connectivity) but also showed a significant difference in
November between the upstream and downstream sites,
when sand became the dominant component of the riverbed
at M1. It is well know that pebbles and cobbles separately as
well as in mixture enhance the richness of macrobenthic
communities (Mackay and Kalff, 1969; Tolkamp, 1980;
Reice, 1980; Minshall, 1984) whereas sand deposition and
its filling of crevices depresses invertebrate colonization
both reducing space available (Waters, 1995) and lowering
Copyright # 2010 John Wiley & Sons, Ltd.
substrate oxygenation especially when high levels of organic
substrate are present (Ryan, 1991), as in the case of site M1
due to CPOM accumulation. Invertebrate responses consist
of increased drift activity (Culp et al., 1986) of non-tolerant
taxa while covering of substrate with fine sediments
hinders colonization by upstream movements (Luedtke
and Brusven, 1976).
Consistent with the extreme dominance of only one
family (Leuctridae) at site M1 in November and con-
comitant with the low taxonomic density, both promoted by
impairment of the physical–chemical characteristics of the
lotic environment and accumulation of CPOM, biological
diversity (measured by Simpson and Shannon indexes) was
greatly reduced, a result common to other studies on
damming effects (Pardo et al., 1998; Sagawa et al., 2004;
Takao et al., 2008). Data existing in the literature indicate
different fine sediment deposition thresholds above which
biodiversity alteration in the macrobenthic community takes
place. A study by Relyea et al. (2000) sets this sediment
deposition threshold around 25–30%, while Spindler (2004)
suggested between 40 and 50%. Our work seems to be in
accordance with the latter, in as much as when the sand
percentage in August at M1 reached a value of about 30% no
differences in biodiversity levels were detected between
upstream and downstream stations. In November when
the sand percentage at M1 equalled 45% a statistically
significant difference was observed between M1 and sites
M2/M3 for biodiversity indexes and dominance. Many
studies support the idea that deposition of fine sediment
changes macrobenthic community structure from one
dominated by EPT (Ephmeroptera, Plecoptera, Trichoptera)
taxa to another dominated by burrowing organisms (e.g.
Nuttal, 1972; Soluk, 1985; Wood and Armitage, 1997;
Chester and Norris, 2006). Our work suggests only a weak
concordance with this idea. In fact, although it is evident that
in May the most common and abundant taxa were members
of the Ephemeroptera and Trichoptera orders (Figure 3,
Table IX), and between August and November Diptera and
Oligochaeta reached appreciable percentages at M1 (Figure
3, Table IX), fine sediment-low oxygen tolerant Plecoptera
were the main component of the community close to the dam
in autumn. It seems that burrower organisms became a
dominant component just when sand quantities increased in
August, but quite surprisingly not when sand accumulation
further increased (Choy, 2004), a result that may be due to
the litter fall processes that influenced a dominance switch
from burrowers to shredders organisms.
CONCLUSION
The Mucone River below the Cecita Reservoir is a typical
metarhithron environment where pebbles and cobbles
River Res. Applic. 28: 103–117 (2012)
DOI: 10.1002/rra
ABIOTIC AND BIOTIC GRADIENTS DOWNSTREAM A RIVER 115
prevail, the riverbed shows an high degree of microscale
and mesoscale spatial heterogeneity and autochthonous
primary production adds to allochthonous primary pro-
duction in channelling energy through macrobenthic
communities. The damming of the Mucone River, with
water restitution only a few kilometres downstream,
results in an interruption of ecological connectivity and
hydrological regimentation that is exacerbated during
the dry season. This produces a discontinuity in hydro-
geomorphological characteristics and trophic input sources
that in turn modifies the macroinvertebrate community
structure. The area close to the dam remains constantly
heterotrophic due to the narrowing of the river width and
fine sediment deposition that depress epibenthic micro-
algae growth, whereas when flow reactivates (after the
Cerreto tributary inflow) river width about doubles
and better irradiation enhances authocthonous primary
production. Lack of drift colonization below the dam
could be compensated by upstream larval migration
with the Cerreto tributary acting as a permanent source.
Density of niches, dominance and biodiversity levels
suffer due to strong seasonal sand deposition in the
area close to the dam but despite literature data such
geomorphological alteration promotes burrower taxa
colonization only temporally while the most successful
organisms were the CPOM consumer-fine sediment
tolerant Plecoptera that rely on high accumulation
of woody–leafy detritus favoured by the dam flow
regimentation effect.
REFERENCES
Allan JD. 1996. Stream Ecology – Structure and Function of Running
Waters. Chapman and Hall: London.
Ambrose HE, Wilzbach MA. 2004. Periphyton response to increased light
and salmon carcass introduction in northern California streams. Journal
of North America Benthology Society 23(4): 701–712.
APAT-CNR/IRSA. 2003.Metodi Analitici per le Acque, Voll. I, II. Quaderni
APAT 29/200: Roma.
ARPACAL. 2009. Centro Funzionale Meteoidrologico della Regione
Calabria. http://www.cfcalabria.it/index.php?option=com_wrapperand-
view=wrapper%Itemid=41
Biggs BJF. 1996. Patterns in benthic algae of streams. In Algal Ecology, RJ,
Stevenson ML, Bothwell RL Lowe (eds). Academic Press: San Diego;
31–56.
Brookes A. 1986. Response of aquatic vegetation to sedimentation down-
stream from river channellisation works in England and Wales.
Biological Conservation 38: 352–367.
Caloiero D. 1980. Le precipitazioni in Calabria nel cinquantennio 1921-
1980 e la carta delle isoiete alla scala 1: 500,000. – CNR-IRPI, GEO-
DATA 2.
Cattaneo A, Salmoiraghi G, Gazzera S. 2006. The rivers of Italy. In River
and Stream Ecosystems of the World, CE, Cushing KW, Cummins GW
Minshall (eds). University of California Press Ltd: London; 479–505.
Copyright # 2010 John Wiley & Sons, Ltd.
Chester H, Norris R. 2006. Dams and flow in the Cotter river, Australia:
effects on instream trophic structure and benthic metabolism. Hydro-
biologia 572: 275–286.
Choy ML. 2004. A comparison of the effects of regulated and not regulated
hydrologic regimes on fine sediment deposition and benthic macroin-
vertebrate distributions. http://ist-socrates.berkeley.edu/es196/project/
2004final/choi.pdf
Cortes RMV, Ferreira MT, Oliveira SV, Godinho F. 1998. Contrasting
impacts of small dams on the macroinvertebrates of two Iberian mountain
rivers. Hydrobiologia 389: 51–61.
Cortes RMV, Ferreira M-T, Oliveira SV, Oliveira D. 2002. Macroinverte-
brate community in a regulated river segment with different flow
conditions. River Research and Applications 367: 367–382.
Culp JM, Wrona FJ, Davies RW. 1986. Response of stream benthos and
drift to fine sediment deposition versus transport. Canadian Journal of
Zoology 64: 1345–1351.
Cummins KW. 1974. Structure and function of stream ecosystem.
Bioscience 24: 631–641.
Cushing CE, Gaines WL. 1989. Thoughts on recolonization of endorheic
cold desert spring-streams. Journal of North America Benthology Society
8: 277–287.
Davies-Colley RJ, Hickey CW, Quinn JM, Ryan PA. 1992. Effects of clay
discharges on streams. 1. Optical properties and epilithon.Hydrobiologia
248: 215–234.
Delucchi CM. 1989. Movement patterns of invetebrates in temporary and
permanent streams. Oecologia 78: 199–207.
D’Ercole L. 1989. Indagine sul Chimismo delle Acque e Stima della Densita
e Biomassa degli Organismi Macrozoobentonici dei Torrenti Brasiamone
e Limentra di Treppio. Dissertation, Universita di Bologna.
Dodds WK, Smith VH, Lohman K. 2002. Nitrogen and phosphorus
relationships to benthic algal biomass in temperate. Canadian Journal
of Fisheries and Aquatic Science 59: 865–874.
Erman NE. 1986. Movement of self-marked caddisfly larvae, Chyranda
centralis (Tricoptera: Limnephilidae) in a sierran spring stream, Cali-
fornia, USA. Freshwater Biology 16: 455–464.
Freilich JE. 1991. Movement patterns and ecology of Pteronarcys nymphs
(Plecoptera): observations of marked individuals in a Rocky Mountains
stream. Freshwater Biology 25: 379–394.
Ghetti PF. 1997. Indice Biotico Esteso – I macroinvertebrati nel controllo
della qualita degli ambienti di acque correnti. Provincia Autonoma di
Trento: Trento.
Giller PS, Malmqvist B. 1998. The Biology of Streams and Rivers. Oxford
University Press: Oxford.
Gordon ND, McMahon TA, Finlayson BL, Gippel CJ, Nathan RJ. 2004.
Stream Hydrology-An introduction for Ecologists (2nd edn). J. Wiley and
Sons Ltd: Chichester.
Gore JA, Nestler JM, Kayzer JB. 1989. Instream flow predictions and
management options for biota affected by peaking-power hydroelectric
operations. Regulation River 3: 35–48.
Gore JA. 1994. Hydrological Change. In The Rivers Handbook, Vol. 2, P,
Calow GE Petts (eds). Blackwell Science: Cambridge; 33–54.
Graham AA. 1990. Siltation of stone-surface periphyton in rivers by clay-
sized particles from low concentrations in suspension. Hydrobiologia
199: 107–115.
Gray LJ, Fisher SG. 1981. Post flood recolonization pathways of macro-
invertebrates in a lowland Sonoran desert stream. American Midland
Naturalist 106: 249–257.
Haeckel JW, Meijering MPD, Rasutzeki H. 1973. Gammarus Fossarum
Koch als Fallaubzersetzer in Waldbachen. Freshwater Biology 3:
241–249.
Hill WR, Knight AW. 1988. Nutrient and light limitation of algae in two
northern California streams. Journal of Phycology 24: 125–132.
River Res. Applic. 28: 103–117 (2012)
DOI: 10.1002/rra
116 L. LUCADAMO ET AL.
Hynes HBN. 1970. The Ecology of Running Waters. University of Toronto
Press: Toronto.
Illies J. 1961. Versuch einer allgemein biozonotischen Gleiderung der
Fliesagewasser. Internationale Revue Gesamten. Hydrobiologie 46:
205–213.
Illies J. 1962. Oberrheinisches Grundgebirge and Rheingraben.Geologische
Rundschau 52: 317–332.
Illies J, Botosaneanu L. 1963. Problemes et methods de la classification et de
la zonation ecologique des eaux courantes, considerees surtout du poin de
vue faunistique. Int. Ver. The 12: 1–57.
Kondolf GM, Wilcock PR. 1996. The flushing flow problem: defining and
evaluating objectives. Water Resource Research 32(8): 2589–2599.
Lake PS, Barmuta LA, Boulton AJ, Campbell IC, St Clair RM. 1986.
Australia streams and Northern Hemisphere stream ecology:
comparisons and problems. Proceedings of Ecology Society of Australia
14: 61–82.
Lenat DR, Penrose DL, Eagleson KW. 1981. Variable effects of sediment
addition on stream benthos. Hydrobiologia 79: 187–194.
Lowe RL, Gollady SW, Webster JR. 1986. Periphyton response to
nutrient manipulation in streams draining clearcut and forested water-
sheds. Journal of North America Benthology Society 5: 221–229.
Luedtke RJ, Brusven MA. 1976. Effects of sand sedimentation on coloniza-
tion of stream insects. Journal of the Fisheries Research Board of Canada
33: 1881–1886.
Mackay RJ, Kalff J. 1969. Seasonal variation in standing crop and species
diversity of insect communities in a small Quebec stream. Ecology 50:
101–109.
Mc Cune B, Grace JB. 2002. Analysis of Ecological Communities. MjM
Software Design: Gleneden Beach.
Merritt RW, Cummins KW. 1996. An Introduction to the Aquatic
Insect of North America, (3rd edn). Kendall/Hunt Publishing Company:
Iowa.
Minshall GW. 1984. Aquatic insect-substratum relationships. In The
Ecology of Aquatic Insects, VH, Resh DM Rosenberg (eds). Praeger
Scientific: New York; 358–400.
Naiman RJ. 1982. Characteristics of sediment and organic carbon export
from pristine boreal forest watersheds. Canadian Journal of Fisheries
and Aquatic Science 39: 1699–1718.
Nichols S, Norris R, Maher W, Thomas M. 2006. Ecological effects of
serial impoundment on the Cotter River, Australia. Hydrobiologia 572:
255–273.
Nuttal PM. 1972. The effects of sand deposition upon the macroinvertebrate
fauna of the river Camel, Corwall. Freshwater Biology 2: 181–186.
Omernik JM. 1977. Nonpoint source-stream nutrient level relationships: a
nationwide study. EPA-600/3-77-105.
Panizza M. 1988. Geomorfologia Applicata. Nuova Italia Scientifica:
Roma.
Pardo J, Canmebell IC, Brittain JE. 1998. Influence of dam operation on
mayfly assemblage structure and file histories in two southeastern
Australia streams. Regulation River 14: 285–295.
Perry SA, Perry WB. 1986. Effects of experimental flow regulation
on invertebrate drift on invertebrate drift and stranding in the
Flathead and Kootenaai Rivers, Montana. U.S.A. Hydrobiologia 134:
171–182.
Petts GE, Amoros C. 1996. Fluvial Hydrosystems. Chapman and Hall:
London.
Poff NL, Ward JV. 1989. Implications of streamflow variability and pre-
dictability for lotic community structure: a regional analysis of stream-
flow patters. Canadian Journal of Fisheries and Aquatic Science 46:
1805–1818.
Reice SR. 1980. The role of substratum in benthic macroinvertebrates
microdistribution and litter decomposition in awoodland stream. Ecology
61: 580–590.
Copyright # 2010 John Wiley & Sons, Ltd.
Relyea CD, Minshall GW, Danehy RJ. 2000. Stream Insects as Bioindi-
cators of Fine Sediment. Boise Cascade Corp and Water Environment
Federation. Idaho State University: Pocatello, ID.
Rosenberg DM, McCully P, Pringle CM. 2000. Global-scale environ-
mental effects of hydrological alterations: introduction. BioScience 50:
746–752.
Rosgen DL. 1994. A classification of natural rivers. Catena 22: 169–199.
Rosgen DL. 1996. Applied River Morphology. Wildland Hydrology Books:
Pagosa Springs.
Ryan PA. 1991. Environmental effects of sediment on New Zealand
streams: a review. New Zealand Journal of Marine Fresh 25: 207–221.
Sagawa S, Nakamori T, Akiba K, Chou Y, Kondou S, Watanabe T. 2004.
Influences of Takasito dam operation on physical environment
and aquatic animals in downstream. Ecology and Civil Engineering 7:
65–80.
Sansoni G. 1988. Atlante per il Riconoscimento dei Macroinvertebrati
dei Corsi d’Acqua Italiani. – Trento, Prov. Aut. Trento, Centro It. Studi
Biol. Amb.
Schumm SA. 1977. The Fluvial System. John Wiley: New York.
Schumm SA. 1985. Patterns of alluvial rivers. Annual Review of Earth Pl.
Science 13: 5–27.
Selby MJ. 1985. Earth’s Changing Surface: An Introduction to Geomor-
phology. Oxford University Press: Oxford.
Soluk DA. 1985. Macroinvertebrate abundance and production
of psammophilus Chironomidae in shifting sand areas of a
lowland river. Canadian Journal of Fisheries and Aquatic Science
42: 1296–1302.
Spanhoff B, Meyer EI. 2004. Breakdown rates of wood in streams. Journal
of North America Benthology Society 23(2): 189–197.
Spindler P. 2004. Stream Channel Morphology and Benthic Macroinverte-
brate Community Associations in the San Pedro River and Verde River
Basino, 1999–2002. Arizona Department of Environmental Quality,
Water Quality Division, Hydrologic Support and Assessment Section,
Surface Water Monitoring and Standard Unit, St., Phoenix. Open
File Report 04–01. http://www.azdeq.gov/environ/water/assessment/
download/corr.pdf.
Sporka F, Vlek HE, Bulankova E, Krno I. 2006. Influence of seasonal
variation on bioassesment of streams using macroinvertebrates. Hydro-
biologia 566: 543–555.
Stanford JA, Ward JV. 1984. The effects of regulation on the limnology
of the Gunnison River: a North American case history. In Regulated
Rivers, A, Lillehammer SJ Saltveit (eds). Oslo: Universitetsforlaget AS;
467–480.
Statzner B, Higler B. 1986. Stream hydraulics as a major determinant of
benthic invertebrate zonation patterns. Freshwater Biology 16: 127–139.
Steinmann AD, Lamberti GA. 1996. Biomass and pigments of benthic
algae. In Methods in Stream Ecology, FR, Hauer GA Lamberti (eds).
Academic Press: San Diego; 295–313.
Stevenson RJ. 1983. Effects of current and conditions simulating auto-
genically changing microhabitats on benthic diatom immigration.
Ecology 64: 151–1524.
Sumner WT, Fisher SG. 1979. Periphyton production in Fort River,
Massachusetts. Freshwater Biology 9: 205–212.
Tachet H, Richoux P, Bournaud M, Usseglio-Polatera P. 2000. Invertebres
d’eau douce-Systematique, biologie, ecologie. CNRS: Paris.
Takao A, Kawaguchi Y, Minagawa T, Kayaba Y, Morimoto Y. 2008. The
relationships between benthic macroinvertebrates and biotic and abiotic
environmental characteristics downstream of the Yahagi dam, central
Japan, and the state change caused by inflow from a tributary. River
Research and Applications 24: 580–597.
Tank JL, Dodds WK. 2003. Nutrient limitation of epilithic and
epixylic biofilms in 10 North American streams. Freshwater Biology
48: 1031–1049.
River Res. Applic. 28: 103–117 (2012)
DOI: 10.1002/rra
ABIOTIC AND BIOTIC GRADIENTS DOWNSTREAM A RIVER 117
Tolkamp HH. 1980. Organism-substrate relationships in lowland streams.
Agricultural Research Report, 907. Agricultural University, Wageningen,
The Netherlands.
Vannote RL, Sweeney BW. 1980. Geographic analysis of thermal equilibria:
a conceptual model for evaluating the effect of natural and modified
thermal regimes on aquatic insect communities. American Naturalist
115: 667–695.
Vannote RL, Minshall GW, Cummins KW, Sedell JR, Cushing CE. 1980.
The river continuum concept.Canadian Journal of Fisheries and Aquatic
Science 37: 130–137.
Viceconte G. 2004. Calabria – Il sistema idrico. Quaderno n.7. Quadro
Comunitario di Sostegno per le Regioni Italiane dell’Obiettivo 1.
Programma Operativo Nazionale di Assistenza Tecnica e di Sistema
(PONATAS) 2000-2006 . Progetto operativo ‘‘Risorse idriche’’ II stralcio
funzionale.
Voelz NJ, Ward JV. 1990. Macroinvertebrate responses along a complex
regulated stream environmental gradient. Regulation River 5: 365–374.
Wagener SM, LaPerriere JD. 1985. Effects of placer mining on the
invertebrate communities of the interior Alaska streams. Freshwater
Biology 4(4): 208–214.
Copyright # 2010 John Wiley & Sons, Ltd.
Ward JV, Stanford JA. 1983. The serial discontinuity concept of lotic
ecosystems. In Dynamics of Lotic Ecosystems, TD, Fontaine SM
Bartell (eds). Ann Arbor Science Publ: Ann Arbor; 29–42.
Ward JV, Stanford JA. 1995. Ecological connectivity in alluvial river
ecosystems and its disruption by flow regulation. Regulation River 10:
159–168.
Waters TF. 1972. The drift of stream insects. Annual Review of Entomology
17: 253–272.
Waters TF. 1995. Sediment in Streams, Sources, Biological Effects and
Control. Monograph: American Fisheries Society: Bethesda.
Wilcock PR, Kondolf GM, Matthews WVG, Barta AF. 1996. Specification
of sediment maintenance flows for large gravel-bed river.Water Resource
Research 32(9): 2911–2921.
Williams DD, Hynes HBN. 1976. The recolonization mechanisms of stream
benthos. Oikos 27: 265–272.
Wood PJ, Armitage PD. 1997. Biological effects of fine sediment in the lotic
environment. Environment Management 21(2): 203–217.
Yamada H, Nakamura F. 2002. Effect of fine sediment deposition
and channel works on periphyton biomass in the Makomanai River,
Northern Japan. River Research and Applications 18(5): 449–481.
River Res. Applic. 28: 103–117 (2012)
DOI: 10.1002/rra