Searching for the Holy Grail
33
1 Searching for the Holy Grail? Making FDI Work for Sustainable Development Lyuba Zarsky Kevin Gallagher March, 2003 * * This paper was prepared for a WWF-UK Workshop on International Investment Frameworks for Sustainable Development: Framing the Debate, London, March 10, 2003. Lyuba Zarsky is a consultant and Senior Research Fellow and Kevin Gallagher is Research Associate at the Global Development and Environment Institute at Tufts University in Boston, Massachusetts.
Transcript of Searching for the Holy Grail

1
Searching for theHoly Grail?Making FDI Work forSustainable Development
Lyuba ZarskyKevin GallagherMarch, 2003
*
* This paper was prepared for a WWF-UK Workshop on International Investment Frameworks for Sustainable
Development: Framing the Debate, London, March 10, 2003.
Lyuba Zarsky is a consultant and Senior Research Fellow and Kevin Gallagher is Research Associate at the Global
Development and Environment Institute at Tufts University in Boston, Massachusetts.

2
Contents
I. Introduction 3
II. The Promise of FDI 51. Global FDI Trends 52. Does FDI Promote Economic Development? Yes, No, Maybe 83. FDI and the Environment 114. Mixed Record: The Mexican Experience 155. Indicators for “Sustainable FDI”? 16
III. Pointing in the Right Direction: Case Studies 181. Promoting Productive Capacities 182. Improving Environmental Performance 21
IV. Making FDI Work for Sustainable Development 26

3
I. Introduction
Foreign direct investment (FDI) is potentially a powerful engine to promote—or undermine—prospects for sustainable development. Both the investment decisions of multinationalcorporations and the rules that govern FDI can have significant impacts on production andconsumption patterns, as well as the social and institutional milieu in which environmental andeconomic objectives are set and problems are addressed.
The starting point in charting a course towards “sustainable FDI” is typically the assumption thatFDI promotes economic growth, income, employment, and technology transfer. If so, theobjective of sustainable development advocates is to work to reduce negative environmental andsocial impacts while increasing the quantity of FDI flows, especially to the poorest countries andcommunities.
There is increasing evidence, however, that FDI may not consistently deliver on its core promiseof economic benefits. In developed countries, case studies reveal that large subsidies to attractFDI may impoverish a community, especially in comparison to alternative development paths. Inmany larger developing and transition economies, FDI has worked generally to boost economicgrowth, though short-term gains may be vulnerable to reversals. And for many other developingcountries, including the poorest, FDI inflows have correlated with decreases in national economicgrowth.
In this framework, advocates of sustainable development have a more daunting task: to search forprojects, policies and global rules which improve both the development and environmentperformance of FDI. An understanding of the conditions and components--at the level of localand national government, the corporation, and the global regime--which are likely to generate aconsistently positive relationship between FDI flows and sustainable development is largelyuncharted territory.
This paper attempts to take a small step in that direction. The focus is on FDI flows intodeveloping countries, both to make the topic more tractable in a short treatment and to promoteglobal strategic conversation. Moreover, FDI plays a far greater role in the gross domesticproduct (GDP) of developing than developed countries. Given the extreme poverty in the poorestcountries, the stakes are high in getting the policy framework right. Whether in bilateral orregional investment agreements or, potentially, at the WTO, developing countries are beingpressed to open further to foreign investment, often with little scrutiny of environmental, social oreven economic impacts.
Part Two describes and evaluates the “promise” of FDI in sustainable development. It describesFDI trends in developing countries; outlines arguments and evaluates evidence on the promiseand perils of FDI for economic development and for environmental performance; and develops abroad set of indicators for what constitutes “sustainable investment”.

4
Part Three presents summaries of five case studies of private sector-driven projects and industryinitiatives which “point in the right direction” in terms of promoting local productive capacitiesand/or improving environmental performance. One key issue is that there is no consensus aboutthe objective: for some, the goal is to promote FDI in new, sustainable products and processes;for others, it is to “green” established industries by reducing negative impacts. The case studiespresent examples of both.
Part Four draws some lessons from the case studies and review of the evidence about“sustainable FDI”. In each case, the “triggering mechanism” was different, ranging from localpro-development policies to MNC embrace of best practice to industry-UNEP partnership.
Overall, the case studies and review of the evidence point to the conclusion that making FDIwork for sustainable development requires a high level of initiative and commitment by manyplayers, local and global. It will not be achieved simply through greater liberalization, even if itpromotes more FDI flows to the poorest countries. The conclusion provides four pointers towardswhat is needed to make FDI work for sustainable development: • a coherent national development strategy and effective policies to promote it; • the willingness of MNCs to set high internal standards throughout their global operations and
to cooperate with local partners in achieving sustainable development goals; • the need for global, mandatory “corporate citizenship standards”; • the need to design investment rules which not only promote common principles but, crucially,
allow for policy and institutional diversity at the local level.

5
II. The Promise of FDI
The promise of FDI as an engine for economic development has gained momentum over the lasttwenty years. In the 1970s, many developing countries were mistrustful of multinationalcorporations (MNCs), fearing a loss of sovereignty and preferring to borrow from banks tofinance development projects. After the debt crisis of the 1980s, FDI became highly sought after,especially with the widespread embrace of export-oriented development strategies in the 1990s.
Competition for FDI, among both developing and developed countries, is intense. To attract it,developing countries were told in the 1980s to “get the prices right,” that is, to eliminate micropolicies, such as energy and food subsidies, which create a cleavage between domestic and globalprices. In the 1990s, the prescription proffered by the IMF was to “get the policies right”:developing countries should embrace macro-economic policies, especially the deregulation offinancial markets, which promote global integration.
Currently, the focus is on fashioning the right “enabling environment” for FDI: the legal,regulatory and political institutions which provide transparency, protection and stability to foreign(and domestic) investors; and social infrastructure, such as education, which increases the skillsof the local workforce. Developing countries which have such an “enabling environment” are,indeed, quite successful in attracting FDI, though usually with high attendant environmentalcosts. Most developing countries, however, especially the poorest, do not have one.
The promise of FDI for sustainable development is precisely that it could be a useful tool increating an enabling environment for ecologically sound economic and social development. Thepotential of FDI, in other words, is to help nurture local conditions and capacities—productive,social, regulatory and institutional. This section outlines trends in global FDI flows and exploreslinks between FDI and economic development and FDI and the environment. The final sectionconsiders indicators for “sustainable FDI”.
1. GLOBAL FDI TRENDS
Global foreign direct investment inflows soared to unprecedented levels during the late 1990s.From 1970 to 1990, average annual global FDI inflows amounted to $58 billion, or less than onehalf of one percent of global GDP. In 2000, global FDI inflows reached a total of $1.5 trillion, or4 percent of global GDP (Figure 1).
In the 1990s, annual global flows of multi-lateral and bilateral development aid (ODA) remainedstagnant at $54 billion. Many analysts began to hope that FDI would “dwarf” or replace ODA asthe primary source of development capital. However, only a small part of global FDI inflows—about 30 percent on average between 1990 and 2001--went to developing countries. Indeed, thedeveloping country share fell off sharply between 1997 and 2000, falling from 39 to 16 percent.

6
Source: *2002 data calculated by author based on a 0.85% estimated decline by World Bank Global EconomicProspects, 2002
*China figures include Hong KongSource: UNCTAD, World Investment Report, 2002
Figure 1: FDI Inflows in the World Economy, 1990 to 2002
0
200,000
400,000
600,000
800,000
1,000,000
1,200,000
1,400,000
1,600,000
1990 1991 1992 1993 1994 1995 1996 1997 1998 1999 2000 2001 2002*
Inflo
ws
($U
S m
illio
ns)
WorldDeveloped CountriesDeveloping Countries
Table 1. 10 Largest Developing Country Recipients of FDI inflows
Top 10 (1990-2000) Top 10 2001ave
China* 43,428 China* 69,680Brazil 12,000 Mexico 24,731Mexico 10,149 Brazil 22,457Argentina 7,181 Bermuda 9,859Singapore 7,058 Poland 8,830Malaysia 4,722 Singapore 8,609Bermuda 4,722 Chile 5,508Poland 3,705 Czech Republic 4,916Chile 3,307 Taiwan 4,109South Korea 3,188 Thailand 3,759
Top 10 total: 99,460 162,458Total For Developing Countries: 130,893 200,891Top 10 share: 76% 81%
($US millions)

7
FDI inflows are highly concentrated in ten, mostly large developing countries, led by China,Brazil, and Mexico. Between 1990 and 2000, the “top ten” garnered 76 percent of the total FDIflowing into developing countries. The trend towards concentration seems to be intensifying: in2001, the top ten share rose to 81 percent (Table 1).
Even though they are a small part of the world’s total, FDI inflows to developing countries maycomprise a large part of total national investment and/or GDP in a particular country. Between1996 and 1999, for example, FDI comprised about 10 percent of GDP in Bolivia, 26 percent inLesotho, and 26 percent in Thailand.1
The promise of FDI as a replacement for ODA, however, largely remains to be fulfilled. For 55 ofthe world’s 70 poorest countries, ODA flows outstripped FDI in the late 1990s. For 42 poorcountries, ODA flows were twice the size of FDI. Indeed, FDI “dwarfed” ODA in only seven ofthe poorest countries.2
Most troubling, the dramatic global FDI surge of the past decade may itself prove to beunsustainable. Between 2000-2001, global FDI inflows declined sharply, falling by nearly 51percent.3 Data for 2002 suggest that this trend will persist. While steady growth in global FDIflows is a reasonable expectation, the FDI surge of the late 1990s increasingly appears to be abubble.
Composition and Determinants of FDIFDI inflows to developing countries increasingly target the tertiary (service) sector. In 1999,services accounted for 37.3 per cent of FDI inflows, up from 20.7 per cent in 1988. Themanufacturing sector, though shrinking in relative terms in all regions except Africa, continues toaccount for the largest share (Table 2). In most regions, the share of FDI in the “primary”,mostly agriculture and mining, sector decreased in the 1990s. The exception is Latin America,where agriculture and mining received 9.6 percent of FDI in 1988, but 12 percent in 1999(primarily in the mining sector).
The central players in FDI are multinational corporations (MNCs). Why does an MNC locateproduction in a particular developing country, either by purchasing an existing, company(“mergers and acquisitions”) or by building new plant and equipment (“greenfield investment”)?
Studies have found that the most unambiguous and consistent “pull” factor is the market size ofthe host economy. For the most part, MNCs invest in order to get access to large markets. Thereis also close to a consensus that macroeconomic stability is needed to attract FDI. Countries withvolatile exchange rates and high and growing trade deficits tend to be negatively correlated withFDI.
Evidence on whether low (or high) labor costs attract FDI, on the other hand, is ambiguous. Areview of sixteen studies found that, in six studies, low wages attracted FDI, while four studiesfound FDI to be correlated with higher wages and six found labor costs to be insignificant.4

8
Table 2. Sectoral Composition of FDI Inflows to Developing Countries
Primary Secondary Tertiary (percent of total inflows)
1988 13.7 65.0 20.7 1999 5.4 54.5 37.3
1988 51.8 20.8 27.41999 13.6 43.4 42.9
1988 13.1 68.9 17.1 1999 3.5 60.2 33.6
1988 9.6 65.8 24.6 1999 12.0 32.8 52.2
1988 n.a. n.a. n.a.1999 2.5 43.5 50.1
All DevelopingCountries
Africa
Asia
Latin America
C. and E. Europe
World1988 10.7 42.4 43.91999 5.5 41.6 50.3
Source: UNCTAD, World Investment Report, 2000
There has been much debate in recent years about the role of environmental factors, especiallydifferences in enforced standards, in attracting or repelling FDI. No consistent statistical evidencehas been found that differences in standards affect MNC location decisions, presumably because,in most industries, environmental costs are a small component of total costs. However, casestudies have found that in certain “dirty” industries, such as leather tanning, more stringentstandards in OECD countries propelled companies to shift production to countries with lowerstandards.5
2. DOES FDI PROMOTE ECONOMIC DEVELOPMENT? YES, NO, MAYBE
FDI can potentially bring substantial two broad kinds of economic benefits to developingcountries and communities:• Economic growth
- increase in income;- increase in local employment;- increase in foreign exchange;- improvements in income distribution;
• Productive capacities
- transfer of technology and management practices; - spillovers (stimulation of local suppliers and subcontractors);- externalities, including through agglomeration effects;

9
- stimulation of domestic investment; - increases in productivity of domestic firms; - increased integration in global markets- decreased costs/increased rates of R&D and innovation.
FDI can also bring risks to host developing countries. Operating without global and ofteninadequate local regulatory oversight, MNCs have been the target of criticism for inflicting“direct harms”— pollution and natural resource degradation, toleration of worker abuse bysubcontractors, inadequate protection of worker health and safety, and complicity in the violationof human rights.6
But there is also the risk that FDI will thwart the economic development process itself. In a studyfor the International Institute for Economics, Theodore Moran cautions that “the possibility thatFDI might lead to fundamental economic distortion and pervasive damage to the developmentprospects of the country is ever present.”7
Risks stem from the possibility that FDI will lower, rather than raise, domestic savings andinvestment, including via profit repatriation; “crowd out” domestic companies from capitalmarkets; increase demands for foreign exchange; support local oligopolies and be anti-competitive; distort local politics and thwart regulation; and create instability through increasingfinancial volatility. Moreover, MNCs may seek to protect technology rents rather than transfertechnology, reducing or eliminating hoped-for spillovers and externalities.
What is the more likely “face” of FDI? A host of studies over the past decade have examined thenature of economic benefits and the conditions under which they are—or are not—captured.Moran reports on the findings of three separate “net assessments” of the impact of FDI covering183 projects in some 30 countries over the past 15 years. Two studies found that FDI had apositive impact in 55 to 75 percent of the projects they studied. But one study found that FDIhad “a clearly negative impact on the economic welfare of the host” in an astonishing 75 percentof the projects studied.8
Macroeconomic country studies generally have found a positive impact of FDI. For example, astudy by the Brookings Institution covering 58 countries in Latin America and Asia, as well asAfrica, found that a dollar provided by FDI generates another dollar in domestic investment.9 AnIMF study found evidence of positive effects, including productivity increases throughtechnology transfer, to be “overwhelming”.10 Several firm level studies, on the other hand, foundunequivocally that FDI did not accelerate economic growth or promote positive spillovers fromforeign to domestic firms.11
Many studies find that the impacts of FDI in developing countries may be positive or negative,depending on a variety of variables, mostly having to do with host country policies. One studyfound that the impact of FDI is significantly positive in “open” economies, and significantlynegative in “closed” economies. Others have found that positive impacts depend on theeffectiveness of domestic industry policies; and on tax, financial or macroeconomic policies AWorld Bank study found that the impacts of FDI depend on the industry, as well as host countrypolicies (see Table Three).
10
Several studies suggest that, to capture the benefits of FDI, a country must already have reachedsome kind of “development threshold”. One found that FDI raises growth only in countrieswhere the labor force has achieved a minimum level of education (Borensztein et al, 1998).Another found that “the positive impact of FDI on growth…vanishes when limited to lower-income developing countries. ”12 In its recent report on the role of FDI in development, theOECD concluded that the overall benefits, while “well-documented”, depend on “the appropriatehost-country policies and a basic level of development”.13
What the “right policies” are, however, is a matter of some contention, as well as investigation.While it is slowly changing, the conventional wisdom is that developing countries shouldundertake policies which promote global integration, protect foreign investors, and minimizegovernment intervention.
Table Three Does FDI Promote Economic Growth?
Study Author(s) Year Yes, No, Maybe Key Variables
Carkovic & Levine 2002 No Doesn’t generate spillovers
Lensink & Morrissey 2001 Yes Reduces costs of R&D and promotes innovation
Loungani & Razin 2001 Yes but… Risks
Hanson 2001 No Doesn’t generate spillovers
Willem te Velde 2001 Maybe Depends on industrial & macroeconomic policies
Lim 2001 Maybe Depends on tax incentives, regulatory & legalimpediments, macroeconomic instability
Marino 2000 Yes if… Open trade and investment policies
Aitken & Harrison 1999 No Reduces productivity of domestic firms; doesn’tgenerate spillovers
Mallampally & Sauvant 1999 Maybe Human resource development; information and otherinfrastructure
Markussen & Venables 1999 Yes Raises productivity and exports of domestic firms;generates spillovers
Moran 1998 Maybe Depends on policy variables controlled by hostauthorities
Borensztein et al 1998 Maybe Depends on education level of workforce
de Melo 1999 Maybe Depends on open-economy performance anddomestic policy
Blomstrom & Kokko 1996 Maybe Impacts depend on industry and host country policies
Graham 1995 Yes but … MNC’s market power can generate negative impacts
Conventional or not, this policy basket may have little to do either with attracting FDI or utilizingit wisely to promote sustainable development. Moran found, for example, that while domestic

11
content policies were not effective in promoting technology transfer, export performancerequirements were very effective.14 And there is little evidence that bilateral investmentagreements have had much impact on MNC location decisions.15
In a sweeping study of the industrialization process in twelve emerging developing countries inthe 1960s-1990s, Alice Amsden argues that monitored performance requirements linked toindustry subsidies—for both domestic and foreign firms—were the key to the rapid growth oflocal manufacturing capacities.16 Rather than “buy” foreign know-how, their developmentstrategy aimed to “make” it, including through the strategic use of FDI. To do so, governments“opted en masse for an interventionist, institutional” approach.17 With free market normsincreasingly institutionalized in the WTO and investment agreements, this kind of developmentmodel is today more constrained.
3. FDI AND THE ENVIRONMENT
In the last decade, a surge of regional and bilateral investment agreements have promoted theliberalization of investment regimes. These agreements expand the rights of foreign investors but,with few exceptions, articulate no environmental or social responsibilities of either investors orgovernments. Many in the sustainable development community are concerned that, without anenvironmental framework, liberalization will accelerate environmental degradation.18
The impacts of FDI on the environment can be traced through three routes:• Environmental performance of MNCS;• Impacts of economic growth, including on local production and consumption
patterns; • Impacts on national and global environmental regulation.
Performance of MNCsTwo key strategic and management decisions of MNCs affect their environmental performance.First is the choice of technology, viz, whether to invest in newer, cleaner “best available” or to“dump” older, dirtier technologies. In most industries, a range of technologies are in use.Efficiency and “clean-ness” may be a function as much of industry sector as of company choice:some industries are more technologically dynamic than others.
The second decision has to do with management practice, viz, whether the corporate parent hasembraced a strong EMS (environment management system) and enforced it throughout itsoverseas subsidiaries and supply chains. NGO advocacy campaigns have increasingly andeffectively prodded companies into compliance with existing environmental regulation, and toadopt “voluntary initiatives” to go “beyond compliance” in global operations. Efforts to harnessconsumer power, such as the Fair Trade movement, have been especially effective.
One of the promises of FDI for sustainable development is that MNCs, especially from theOECD, will help to drive up standards in developing countries by transferring both cleanertechnology and better environmental management practices.

12
Empirical studies, however, have failed to find evidence for such a trend. In statistical studies ofMexico (manufacturing) and Asia (pulp and paper), foreign firms and plants performed no betterthan domestic companies. Instead, environmental performance was found to depend on 1) thescale of the plant (bigger is better); and 2) the strength of local regulation, both government and“informal”.19
Many developing countries lack the capacity and/or political will to enforce environmentaloversight of industry. In this context, MNCs are able to “self-regulate” and have one of threechoices: 1) follow local practice and norms; 2) adopt internal, company-wide standards, either anaverage or the highest of relevant home country standards; or 3) adopt international standards or“best practice” norms for corporate social responsibility.
In the petroleum and mineral sector, a host of case studies suggest that, on average, MNCs havetended to follow—or even to worsen--local practice.20 In all parts of the world, mining operationshave generated severe environmental degradation and pollution, including the discharge of toxicsubstances into river systems, large volume waste disposal, the inadequate disposal of hazardouswastes, and the long run impacts of poorly planned mine closure.21 Multinational oil companieshave been the target of protest and criticism for widespread pollution and human rights violationsin the Amazon region, Nigeria, Indonesia and, increasingly, the Caspian region.22
In the high tech sector, American and European MNCs tend to adopt either company-widestandards or international “best practice” for environmental management and communityconsultation. Within the industry, however, there are “leaders” and “laggards”. The USchipmaker Intel, for example, adopts the highest relevant standard as the company-wide standard,including for subsidiaries. National Semiconductor, on the other hand, adopts an average USstandard for its newer plants, and follows local practice for its older plants.23 The evidence suggests that, overall, MNCs perform no better than domestic companies. Theenvironmental performance of a particular MNC in a particular locale depends on: 1) the strengthof local regulation; 2) the industry it is in; and 3) the particular company culture with respect toenvironmental commitment and corporate social responsibility.
Economic Growth and the EnvironmentOne of the potential benefits of FDI is that stimulates economic growth. Without adequate globaland national regulation, however, economic growth is likely to accelerate environmentaldegradation—even if MNCs are good performers--through scale effects. The experience of EastAsia, often described as an “economic success story,” provides a tragic example. According tothe Asian Development Bank, resource degradation and environmental pollution in both East andSouth Asia is so “pervasive, accelerating, and unabated” that it risks human health andlivelihood.24
The scale impacts of economic growth on the environment derive largely from unsustainableproduction and consumption patterns. If FDI targets sustainably produced and sustainablytransported goods and services, then the overall impact--even of rapid and high growth--on theenvironment would presumably be neutral or low. To date, however, rapid growth, in developingand developed countries, has tended to be associated with an increase in unsustainable productionand consumption patterns.

13
While acknowledging that environmental impacts can worsen with an increase in the rate ofgrowth, some economists argue that, over time, economic growth generates environmentalimprovements. The “Environmental Kuznets Curve” posits that environmental quality firstworsens and then improves as per capita income (GDP) rises.25 Reasons include the substitutionof less polluting consumer goods; changes in the structure of industry; and greater politicaldemands for environmental regulation. Early studies put the “turning point” at between US$3000and US$5000.
If true, the EKC suggests that, to a large extent, the pursuit of economic growth is itself asustainable development strategy. One major concern, however, is that the environmental andresource degradation at lower levels of income often results in irreversible losses. Examplesinclude loss of biological and genetic diversity and potable water due to degradation ordestruction of “old growth” forests; depletion or destruction of fish stocks due to coastaldegradation; and human deaths resulting from severe air pollution. Given the number of peopleon the planet living today at very low levels of per capita income, the potential environmentallosses which must be endured before the global “turnaround” are staggering.
Another concern is that a positive relationship between income and environmental quality in onecountry or region might mask a relocation of dirty industry to another country or region, resultingin an overall neutral or even negative global environmental impact. Many East Asian studies inthe 1980s and 1990s, for example, documented the correlation between improved environmentalquality in Japan and the relocation of Japan’s pollution-intensive industries to South East Asia.26
A number of studies question the validity of the EKC hypothesis for developing countries on fivecounts:27 • Evidence for an EKC is limited to a small number of localized pollutants, primarily sulfur
and particulate matter;• Evidence for the EKC relies mostly on data from developed nations. • The handful of studies which rely on data from developing nations have found that evidence
for an “inverted-U” relationship is ambiguous;• The “turning point” is significantly higher than original estimates and may recur.• Recent studies have found turning points of $14,730 and $22,675 for sulfur, $9800 for
particulate matter, and $35,000 for carbon dioxide. In one study, a second wave ofenvironmental degradation occurred when per capita income reached $10-15,000.
• Factors other than income important drivers of environmental quality. • Many studies have found that political freedom and democracy, population density, industry
structure, and historical events (such as the oil price shocks of the 1970s) are as or moreimportant than income in determining environmental quality.
• No evidence for the EKC has been found in historical studies. • Most EKC studies utilize cross-sectional or panel data to estimate an average curve. A
historical study of Malaysia found no evidence of an inverted-U shaped curve for six air andwater pollutants.
Environmental Regulation: Stuck in the Mud?Environmental and resource management is largely the preserve of nation-states. How does FDIaffect national (and-sub-national) environmental regulation? There is evidence that MNCs
14
themselves, wielding their substantial bargaining power, can help to drive local standards up—ordown. In Chile in the 1970s and 1980s, foreign mining companies pressed for more coherentenvironmental regulation (see Case Study Seven, below). In the Russian Far East, on the otherhand, oil MNCs involved in obtaining leases for exploration and drilling off of Sakhalin Island inthe 1990s flouted and undermined Russia’s fledgling environmental laws.28
The asymmetric bargaining power of MNCs is most troublesome in the context of the intensecompetition for FDI in both developed and developing countries. Given the absence of globalenvironmental standards, would-be host governments seeking to attract FDI are reluctant to makehigher-than-average environmental demands on individual MNCs. They may even be tempted tooffer lower-than-average environmental demands to enhance the attractiveness of an overallpackage.
Dubbed the “stuck in the mud” problem, the impact of intense global competition for FDI—absent common environmental norms--is thus to inhibit the rise of environmental standards.29 Theproblem afflicts both developed and developing countries: efforts in the 1990s to put a modest taxon carbon were roundly defeated in both the US and Australia by worries that investment wouldmove offshore.
There is some evidence that, despite regulators’ fears, high environmental standards do not, in fact,deter investors and in some cases, are even preferred by investors. Moreover, with the rise of theglobal corporate social responsibility movement, MNC and host-government expectations may bechanging. There is little evidence, however, about the rate of change. The practice in government-MNC negotiations over environmental management, apparently, is to not rock the boat.
Overall, an examination of all three of the channels linking FDI and the environment suggeststhere is no determinate trend: FDI can improve, worsen or have no impact on environmentalquality. Other factors—government regulation, the rate of economic growth, company culture,the particular industry in which the FDI takes place, the rules that govern FDI—are key variables.
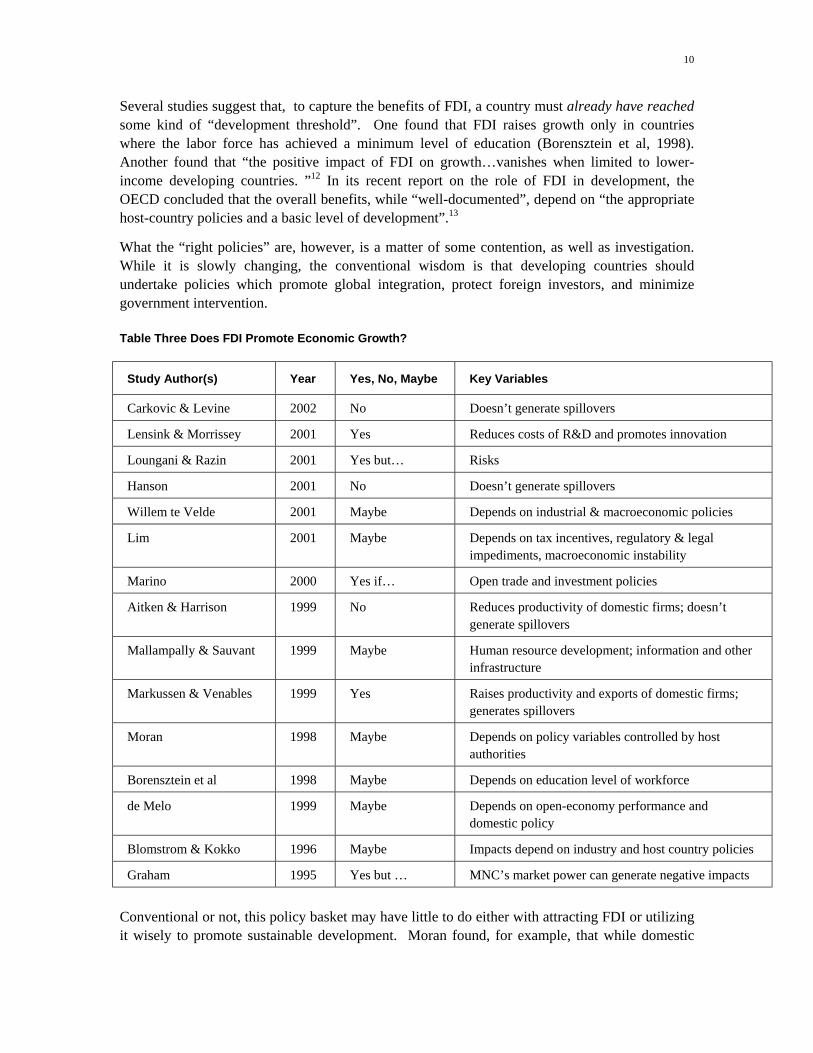
One way to gain insight about a consistent relationship between FDI and environmental quality isto conduct a statistical analysis. Unfortunately, indices of environmental quality, especially at acountry level, are poor and/or partial. An attempt by the World Economic Forum to create acomprehensive index, the Environmental Sustainability Index, ranks nations on a scale of 1 (best)to 100 based on 20 “core” indicators and 68 underlying variables. Many are social andinstitutional variables and require qualitative judgments. The environmental variables, however,are based on performance data.30
We regressed FDI as a percentage of GDP on a subset of environmental variables for 130developed and developing countries in the Environmental Sustainability Index (Table 3). Thescatter plot shows that there is no consistent relationship: high levels of FDI are correlated withpoor, good, or medium ranges in the ESI index. Given the multiplicity and complexity ofchannels by which FDI can affect environmental quality, it is unlikely that better data will reveala consistent relationship.
Table 3 Variables in Environmental Quality Index

15
Air Quality Urban SO2 concentration
Urban NO2 concentration
Urban TSP concentration
Water Quantity Water availability per capita
Water inflow availability per capita
Water Quality Dissolved Oxygen concentration
Phosphorus concentration
Suspended solids
Electrical conductivity
Biodiversity Percentage of mammals threatened
Source: World Economic Forum, 2001.
4. MIXED RECORD: THE MEXICAN EXPERIENCE
For Mexico, FDI was the prize of the NAFTA integration process.31 The hope was that FDIinflows would greatly increase, stimulating economic growth and bringing social andenvironmental benefits by absorbing rural migrants—displaced from by agricultural liberalization- into new, higher paying urban-based jobs, and by transferring cleaner technologies and betterenvironmental management practices.
Figure 4. FDI and the Environment
0.0
10.0
20.0
30.0
40.0
50.0
60.0
70.0
80.0
90.0
100.0
-4 -2 0 2 4 6 8 10 12 14
FDI/GDP
Envi
ronm
enta
l Qua
lity
Series1
16
In the event, the results have been mixed. US FDI into Mexico has increased by a factor of tensince 1985, reaching $24 billion in 2001, contributing to a massive influx of internal migrants tourban areas. Between 1980 and 2000, population more than doubled in FDI-laden areas, whilethe population of Mexico as a whole grew by less than forty percent.
What is less clear is whether the lives of Mexico’s working and poor people have substantiallyimproved. According to the OECD, the swollen urban population far exceeds the infrastructurecapacity of host communities to manage sewage and waste, provide sufficient water, and protectair quality. Wages in foreign firms are lower than the mean wage in Mexican manufacturing as awhole--and have fallen in real terms by more than 10% since 1987.
Moreover, the large FDI inflows of the last decade may not be sustainable. From the middle of2001 through the end of 2002, foreign-owned firms dismissed 287,000 workers (or one in five ofall such workers).32 Mexican analysts worry that US (and other foreign) firms are shying awayfrom Mexico because of sluggish growth in the US--and because of emerging opportunities inChina. The environmental benefits of FDI have also been elusive. A World Bank study found nocorrelation between foreign-ownership and firm-level environmental performance in Mexicanindustry. Rather, the key variable was the strength of state regulation.33
These trends mask some “best practices” that can serve as models for a more comprehensivesustainable investment strategy. Some foreign firms, including Dutch steel companies and U.S.chemical firms, have offered higher wages, better working conditions and/or better environmentalstandards. Some have also negotiated relationships with host communities for publicinfrastructure and social services.34
Unfortunately, these sustainable development success stories are an exception rather than therule. Between 1985 and 1999, rural soil erosion grew by 89 percent, municipal solid waste by108 percent, and urban air pollution by 97 percent.35 The Mexican government estimates that theeconomic costs of environmental degradation have amounted to a staggering 10 percent of annualGDP, or $36 billion per year. These costs dwarf economic growth, which amounted to only 2.6percent on an annual basis.
Unless economic integration is coupled with strong environmental regulation and enforcement,pollution is likely to worsen. Since NAFTA took effect, however, real spending on theenvironment and has declined 45 percent, and plant-level environmental inspections have showna similar drop.36
5. INDICATORS FOR “SUSTAINABLE FDI”?
Fulfilling the promise of FDI for sustainable development will not come as a result of simplyincreasing FDI flows alone, whether through “openness” or other means. It will require theincorporation of social values by MNCs, effective development policies at national and globallevels, and the explicit embrace of environmental and social obligations in investment regimes.
A comprehensive framework to guide and evaluate FDI projects and government policies has notyet been developed. In broad terms, “sustainable FDI” projects and policies in developingcountries should: • Enhance local productive capacities;

17
• Strengthen social resilience and solidarity, including by reducing inequality; • Improve environmental performance, both directly and by increasing capacities for
regulation. The aim is to develop projects and policies which produce positive results for all three goals, or atleast do not retard one at the expense of another. The creation of measurable indicators would be ahelpful step in promoting “sustainable FDI”. A Briefing Paper for the Earth Summit produced aninitial set of indicators, which could be the starting point for discussion and elaboration (Table 4).37
Other efforts to provide guidance to business can usefully inform sustainable FDI indicator,especially the sustainability reporting framework of the Global Reporting Initiative; and theOECD Guidelines for Multinational Enterprises. However, while the GRI has developed anextensive environmental and social reporting framework, benchmarks and indicators for MNCcontributions to economic development are rudimentary at best. Indeed, a recent survey ofcorporate sustainability reporters found that economic indicators were the least developed.38
Table 4 Examples of Indicators for FDI and Sustainability
Type Example of Indicator
Investment andProductivity
Net Foreign Direct Investment (FDI)Net Foreign Direct Investment (FDI) as % of GDP and of GFCPNet change in FDI global share Net resource transferRatio of aggregate Net Resource Transfers (long-term) to GNP(%)Local R & D expenditure from FDI Per cent of FDI in greenfield investments
Economic
Other Financial Factors Ratio of Total Official Development Assistance (ODA) to GNP Ratio of external debt to GNP Ratio of debt service to exports of goods and services, includingworker's remittancesPer capita domestic saving and investment
Labour standards andemployment
Adoption of ILO labour standards and indicatorsPer cent employment in host economy created(directly/indirectly) by FDISocial
Education Enrolment ratios by level of education, public/private expenditureon education/training, expected number of years of formalschooling
Environmental BestPractice
Adoption of environmental management system, environmentalreporting, energy efficiencyGreen accounting e.g. “green" net national product (green NNP),genuine savings etc.
Environmental
EnvironmentalProtection
Per cent of FDI into environmentally sensitive sectorsRatio of environmental protection expenditures to GDPDegree of implementation of Multi-lateral EnvironmentalAgreements
Source: Earth Summit (2002) , Table 3.

18
III. Pointing in the Right Direction: Case Studies
The role of private FDI in promoting sustainable development is a new field of study. Moreimportantly, however, it is a new and active field of practice. A myriad of initiatives areunderway, many involving public-private partnerships. Some are aimed at generating new,sustainable industries and distribution systems. Most, however, are aimed at improving thedevelopment and environment performance of existing industries.
This section reviews five case studies involving private direct investment in developing countries.All except one (Beijing Bergey) are drawn from published sources. Produced at different timeswith different data, methodologies and formats, the case studies do not necessarily reflect “bestpractice” in integrating all of the indicators developed above Rather, they are organized tohighlight good practice along two axes: 1) promoting local productive capacities; and 2)improving environmental performance.
1. PROMOTING PRODUCTIVE CAPACITIES
From an economic development perspective, the most important potential benefit of FDI is tonurture the growth of local productive capacities. Routes to do so include increasing workforceskills and competencies; putting in place new technologies; stimulating local business throughsupplier relationships; and encouraging local innovation through new knowledge and marketopportunities.
For FDI to promote productive capacities, much more is needed than simply the transfer oftechnological hardware. “While policy documents still coin it technology “transfer”, emphasizesBjorn Stigson, President of the World Business Council for Sustainable Development, “thisprocess only succeeds through a cooperation between provider and receiving communities”39
According to Carlos Magarinos, Director-General of UNIDO, “A successful technologycooperation process includes elements such as needs assessment, clear national priorities fortechnology development, identification of appropriate forms of cooperation, an enablingenvironment and capacity building.”40
The WBCSD and UNIDO recently published ten case studies of technology cooperation indeveloping countries.41 Two of the case studies are summarized below. The third case study(Beijing Bergey) is unpublished and was developed by the authors.
Case Study One: DaimlerChrysler-- Sisal Fiber Project South AfricaBased in East London, DaimlerChrysler South Africa manufacturers cars and vehicle componentsfor domestic and international markets. With nearly 4000 employees and a state-of the-artmanufacturing facility, DaimlerChrysler is one of the biggest employers in the Eastern Caperegion. The subsidiary is wholly-owned by DaimlerChrysler Germany, making the corporationone of the largest German investors in South Africa.
19
DaimlerChrsyler SA is spearheading a project to “green” its supply chain by switching to naturalfibers in vehicle components. Early in the 1990s, DaimlerChrysler (then Mercedez-Benz)declared a commitment to environmental sustainability, including by improving its products andprocesses. Company research identified a number of natural fibers—flax, hemp, coconut, cottonand sisal—as best in meeting both environmental and manufacturing requirements. A Germanfirm, Johann Borgers GMBH & Co (Borgers), who developed the technology to process andmanufacture flax and cotton fibers.
DaimlerChrysler SA’s objective, however, was not to import natural fibers processed andmanufactured in Germany, but to establish an entire local supply chain based on sisal. The SouthAfrican supply chain would include:
• Sisal farming• Processing of sisal fibers• Manufacture of sisal components• Release to DaimlerChrysler SA.
The “produce locally” decision was driven by South Africa’s local content policies, which place aduty on imported components used in local manufacture of vehicles. Local content in exports ofvehicles and components, on the other hand, earns credits which offset import duties. “Localcontent,” states the WBCSD case study, “is therefore critical to the business in South Africa, andhas spurred the active involvement in technology transfer projects that promote the use of SouthAfrican resources”.42
The multifaceted project required multiple partners, initiatives, and agreements. DaimlerChrysleroversaw the technology transfer part of the project. Two well-established South African firms,Brits Textiles and NCI, were identified as recipients of the technology owned by Borgers.. Britsgave Borgers a one-time payment of $80,000 for the processing and manufacture technology.NCI—which already had a technology agreement with Borgers--agreed to a 2 percent royalty onrevenue generated to retain their technological support.
The technology transfer was successful, despite some bumps stemming from differences inbusiness styles and communication cultures. For example, DaimlerChrysler’s procurement teamhad to work with one supplier to “ensure that they would not continue to cut corners to saveproduction costs”.43 The first sisal component was released for inclusion in the Mercedes-Benz C-Class vehicles in October 2001 and sisal-cotton mixtures are now used substantively in localproduction.
Both of the local South African companies have been strengthened as a result of the technologytransfer. Thirty new jobs have been added. Brits textiles has entered a new business field anddeveloped new industry contacts and opportunities. NCI has had an increase in turnover and agreater international exposure as a supplier in natural fibers. There have also been spin-offbusinesses from the initial project, including applications in buildings and civil engineeringprojects.

20
Less successful has been the effort to develop a reliable local supply of sisal. South African farmsproduce only 500 tons a year, leaving an import requirement of about 2,500 tons. There are 23state-owned and one operating commercial sisal farms. Two other commercial farms ceasedoperations due to labor problems.
The problem is that the productivity of the state-owned farms is very low. DaimlerChryslercontracted with the Council for Scientific and Industrial Research to examine options forprivatization, as well as additional markets and applications for sisal fibers. However, as of 2002,local sisal harvesting remains the sticking point in the local supply chain. “As long as the farmsunder perform, and cannot supply reliable amounts,” concludes the study, “the success of theproject is in jeopardy”.44
Case Study Two: Beijing Bergey Windpower Co.Beijing Bergey Windpower Company is a small wind turbine manufacturing venture solelyowned and operated by the US company Bergey Windpower Co. (BWC). Headquartered inNorman, Oklahoma, BWC manufactures a range of small wind turbines, including 1.0 and 1.5kW units for off-grid, remote power applications; and larger 10Kw for on-grid utility billreduction and off-grid applications such as village electrification, community water supply, andtelecommunications. In the size range up to 10kW, BWC is the leading supplier in the world.
In 1997, CEO Mike Bergey saw a commercial opportunity when the Chinese State DevelopmentPlanning Commission (SDPC)45 announced “Brightness Engineering,” a large-scale initiative toelectrify 8 million people in villages in China’s western provinces. More than 80 million peoplewho live in the highlands, deserts and other remote areas of China are not connected to the utilitygrid.
Bergey’s pursuit of the SDPC led to the creation of a joint venture in 1998 between BWC (51percent) and Xiangtan Electric Manufacturing Group Corporation, a state-run enterprise. Basednear the city of Changsha in Hunan Province, the joint venture ramped up to produce 10kW windturbines for village electrification, with investment capital provided by BWC.
The joint venture partnership was challenging. Work culture was very different in the twocompanies. According to Mike Bergey, manufacturing the turbines requires a high level ofprecision but, in China, the prevailing management style tends to be to “cut costs—andcorners”.46
Another issue of contention involved technology transfer in the licensing agreement. The SPDCand Bergey’s joint-venture partner wanted access to the design considerations and process inorder to “reverse engineer” the technology. China has domestic manufacturers of wind powerunits but the technology is weak and they are not very reliable. BWC was happy to providetraining and to source nearly all components from China--but wanted to protect its intellectualproperty in the design of the technology.
Despite these tensions, a technology agreement was worked out and the joint venture was primedto start manufacturing. However, the SDPC market did not materialize, largely due to internalbureaucratic maneuvering, and no tenders for small scale windpower units were put forward. The

21
“Brightness Engineering” project funding was delayed for four years and when it finally wentforward in 2002 the projects favored solar technology. Unable to find sufficient private sectorbuyers in the four year hiatus, the joint venture continued to lose money and was dissolved in2001.
With a strong belief in the applicability of the small wind power units in the Chinese countryside,and the potential of China as a low-cost manufacturing site, BWC persisted in trying to establishmanufacturing capacity in China. However, a second joint venture failed. In preparation foraccession to the WTO, China liberalized FDI rules in 2000, including the rule that a foreigncompany had to be in a joint venture in order to sell at a retail level. Bergey set up a newmanufacturing effort in Beijing, this time as a sole venture.
In its second year of operation, Beijing Bergey Windpower Co sold over 400 units, both 10kWand 1kW, employed 21 people, and generated a profit . The 10kW units were primarily sold toChina’s “Alleviate Poorness” Ministry to electrify newly established villages in Xinjiang andInner Mongolia and other nomadic regions.
The 1kW units are mostly exported to the United States, and then re-exported to Brazil, Mexicoand other developing countries. Like much larger multinationals, Bergey has found that low wagecosts make China an attractive manufacturing site. To attract quality employees, Beijing Bergeyoffers employees higher than average wages, and seeks out older, skilled employees who havebeen forced out of their government jobs by mandatory retirement laws.
BWC sources nearly all its inputs from China—except for the design components—and investedheavily in training its Chinese workforce. BWC is eager to promote manufacturing capacity indeveloping countries, and believes that “local manufacturing, under license or through a jointventure, is necessary if widespread utilization is to be pursued.”
On the other hand, BWC is a private sector company. Its core business competency--what it hasto sell--is the proprietary design technology that it has developed and keeps improving. While herecognizes the tension, Mike Bergey feels that a “nexus” can be found which accommodates theinterests of both the developing country government seeking to acquire proprietary technologyand private companies who wish to protect it. BWC continually invests in research anddevelopment to improve existing products and develop new ones.
2. IMPROVING ENVIRONMENTAL PERFORMANCE
One of the potential benefits of FDI to sustainable development is the transmission and diffusionto developing countries of higher environmental and safety management standards in industry.MNCs from OECD countries are typically subject to more intense NGO scrutiny and higherstandards in their home countries.
Drawing from a case study undertaken for Canada’s International Development Research Center,Case Study Three examines the role that higher MNC standards played in promoting betterenvironmental performance in Chile’s mining sector.47

22
One of the ways that companies based in OECD countries can work to promote betterenvironmental and social practice is via supply chain management. In 2000, a group of touroperators, in partnership with the World Tourism Organization, UNESCO and UNEP launchedthe Tour Operators Initiative for Sustainable Tourism (TOI) to raise the environmentalperformance of suppliers and contractors to operators of tour packages, as well as the facilitiesowned by tour operators.
Tourism is one of the world’s largest and fastest-growing industries. In 2001, internationaltourism receipts totaled $462 billion, making it one of the largest categories of internationaltrade.48 Moreover, international tourism is of increasing economic importance to developingcountries. For the poorest countries, tourism receipts more than doubled between 1992 and 1998and, except for three LDCs with oil exports, constitute the largest source of foreign exchange, faroutstripping second-place raw cotton and third-place textiles.49
The local environmental, cultural and social impacts of tourism can be widespread anddevastating. Moreover, no matter how “sustainable” and “socially responsible” at the local level,”global tourism can have major global environmental impacts arising from the air travel on whichit depends. According to its Statement of Commitment, members of the TOI “recognize andaccept our responsibility to operate in ways that reduce environmental impacts, benefit hostcommunities, safeguard the future livelihood of local people, and ensure the protection ofdestinations for future generations.”50
The aim of the TOI is to develop and implement management tools for good practice in four keyareas: sustainability reporting; cooperation with destinations; supply chain management; andinternal management. The TOI currently has 26 members, including high-volume companies specializing in packagetours and small companies specializing in eco-tours.51 Members are involved in Working Groupson the four issue areas. In addition, TOI collaborated with the Global Reporting Initiative (GRI)to produce supplementary guidelines for sustainability reporting in the tourism sector.52 The TOIwebsite has seventeen case studies, two of which are summarized below in Case Studies Four andFive.
Case Study Three: Foreign Companies in ChileMining is central to Chile’s economy. During the 1990s, mining accounted for about 50 percentof Chilean exports and foreign investment, and 5-7 percent of its GNP. Copper, Chile’s primarymineral export, accounts for over 30 percent of global production. Many foreign companies became active in Chile in the 1900s, joining state-owned companies inmining, smelting and processing activities. In the early 1970s, however, all foreign miningcompanies were nationalized as part of the social revolution that swept social democrat SalvadorAllende to power. Foreign mining companies were widely perceived in Chile, especially by tradeunion and center and left political organizations, to be taking out of the country a disproportionateand unfair share of mineral rents.

23
After the assassination of Allende, the military government of General Augosto Pinochet easedforeign investment restrictions. Foreign companies purchased two Chilean mining companies.Disputada, one of Chile’s oldest cooper companies, was purchased by Exxon Minerals Chile in1978 from ENAMI, a state-owned company.53 One of Chile’s oldest mining companies,Disputada had (and has today) two mines, two processing plants, four tailings damns, and onesmelter.
El Indio, which mines gold with copper as a by-product, was purchased by the US St. Joe GoldCompany in 1975, and sold in 1981 to the Fluor Company.54 The El Indio deposit wasdiscovered—at an altitude of 4000 meters--in 1960. In addition to both underground and open pitmines, the company includes a processing plant.
The mining companies began operations in a political context involving three key features. First,due to the prior history, the Chilean public was strongly biased against foreign companies ingeneral and mining companies in particular. Second, Chile’s environmental regulations werelargely undeveloped and “lacked a coherent structure”.55 Neither of the two largest state-ownedcompanies, ENAMI and CODELCO, had an environmental department or policy.
Following its parent, Exxon Minerals Chile, Disputada introduced an environmental policyframework, and an environmental management body to put it into practice, as soon as it beganoperations. The framework called on the company to “comply with environmental regulations or,if such regulations do not exist, to apply responsible standards.” In practice, this meant thatDisputada would comply with foreign standards. The framework also called for research onenvironmental impacts, an environmental audit—and for the company to “promote thedevelopment of appropriate environmental laws and regulations.”56 El Indio likewise followedthe expertise of its US parent, and put in place a code of environmental ethics.
The foreign companies were subjected to higher environmental scrutiny than the domestic, state-owned companies. To some extent, this bias persists. Environmental organizations and the publichave questioned the environmental impact statements of foreign companies, while not extendingsuch scrutiny to domestic companies. Moreover, Disputada, whose smelter is located within 100km of Santiago, Chile’s capital, was willing to engage the public.
The bias against foreign companies also was evident in different regulations. In 1985, a specialdecree required Disputada’s Chagre smelter to comply with air-quality regulations. The five othersmelters belonging to state-owned companies, did not have to comply with any environmentalregulation.
Both Disputada and El Indio undertook significant additional investment beyond the cost ofinitial acquisition, including to upgrade technology and to protect the environment. About 20percent of El Indio’s total investment in mining activities between 1981-91 was related toenvironmental protection and industrial hygiene. There is no evidence that the additionalinvestments reduced company competitiveness or market share. Indeed, given that the state-owned companies eventually adopted similar practices—though not until the 1990s—the foreigncompanies may have had “first mover” advantages.

24
Case Study Four: British Airways HolidaysBritish Airways Holidays (BAH), the airline’s wholly-owned subsidiary, sells holidays in morethan 75 countries around the world. Starting in 1993, BAH began assessing environmentalimpacts in the destinations of its holiday products. In the 1990s, the company undertook a LifeCycle Assessment (LCA) of tourism products in two of its major destinations, the Seychelles andSt. Lucia. A second LCA is planned in St. Lucia in 2003.
Undertaking an LCA of a destination requires an extensive and intensive company commitment.BAH hired an external consultant, the UK Centre for Economic Development, and engaged thesupport of local tourist boards. The LCA had four steps: 1) identification of products; 2)quantification of inputs and outputs associated with the products; 3) review of environmentalimpacts; and 4) identification and evaluation of opportunities to reduce environmental impacts.
In St Lucia, the LCA showed that the greatest environmental impacts from tourism—includinghabitat loss, destruction of coral reefs, ecosystem disturbance, and water pollution--came frominfrastructure development and inadequate waste management. The LCA results andrecommendations were published and presented widely to organizations and hoteliers in St. Luciaand stimulated new national policies on waste management using funds from a tourism tax. Newtypes of tourism such as nature and heritage tourism have also been developed.
The LCA recommended that BAH review the environmental performance of its suppliers,especially hotels. BAH is now developing a project to review procurement policy in touroperating.
There were significant challenges in implementing the LCA, including “convincing stakeholdersthat it really was needed even though it was not required by legislation.” Moreover, the studysuffered from data gaps, especially data required to compare transport impacts from differenttourism packages.
Case Study Five: Finnair Travel Services Finnair Travel, a registered tour operator in Finland, sells package tours to about 300,000 Finnishtourists each year to destinations in Europe and the Mediterranean, Asia, the Americas andAfrica. Finnair has developed a Policy and an Environmental Programme for SustainableTourism. With no hotels or transport companies of its own, the Programme aims to “provideincentives to contract partners to improve their environmental performance, primarily byintroducing environmental criteria into their contracts.”
The company developed its own environmental classification system, using a star rating format.To obtain a contract with Finnair, a supplier must have at least “one star,” obtained bydemonstrating that it has undertaken water and energy-saving measures and wastewatertreatment. “Two stars” adds reliance on renewable energy sources and waste avoidance andrecycling. “Three stars” adds the use of local, organic and fair trade products, biodegradabledetergents, biological pest control, re-use of gray water and composting. Specific criteria differfor obtaining the classification differ in each destination depending on local conditions and laws.

25
Finnair says that environmental criteria “will be integrated into all new contracts made in 2001.”Moreover, Aurinkomarkat-Suntours and Top Club, who sell Finnair tourism packages, will soonintroduce the environmental classification for their hotels and holiday apartments.
Finnair says the next steps are to integrate indicators for socio-cultural and economicsustainability, and to develop environmental criteria for transport companies. The companycautions, however, that “some of the legal aspects of using environmental criteria in contracts andespecially using environmental classifications for accommodation suppliers still need closeinvestigation.”

26
IV. Making FDI Work for Sustainable Development
Making FDI work for sustainable development is no small task, either in design or execution.There are multiple goals, multiple players—and multiple obstacles. To move in the direction of“sustainable FDI” requires not only more research but a high degree of commitment, open-mindedness, a willingness to cooperate, and a degree of humility. Perhaps the most perniciousobstacle would be to think that it is not difficult.
One thing that stands out from the case studies is that the “triggering mechanisms” for asuccessful FDI sustainable development project differed. In the DaimlerChrysler case, it wasdomestic industry policy—local content—in conjunction with a “best practice” MNC. In theBergey case, it was the persistence of a small, technologically dynamic company, along with thepromise of commercial opportunities provided by the Chinese government. In Chile, it wasgovernment policy requiring better performance of foreign companies. And in the tourism casestudies, it is the partnership between private sector companies and international organizations.
Some of these mechanisms, especially those relating to government industry and environmentalpolicy, face scrutiny in investment agreements, especially if negotiated in the rubric of the WTO.Requiring higher standards of foreign than domestic companies, for example, may run foul of“non-discrimination” clauses in investment agreements, even if the intent was to discriminate noton the basis of ownership (foreign versus domestic) but on the basis of environmental impacts(age of technology, management requirements, etc.) With the exception of the European Union,domestic and international institutions to determine whether discrimination is justified onenvironmental and social grounds are lacking.57
Several insights can be teased out of the case studies, as well as the examination of trends andevidence in Part Two. These insights can be grouped into implications for policyrecommendations for national governments and MNCs, as well as for the design of investmentrules.
National Governments: The Centrality of a Sustainable Development StrategyA coherent development strategy and effective policies to promote it are central in utilizing FDIto promote sustainable development. Economic “openness” and the liberalization of investment,even with efforts to create “an enabling environment” and strong protections for foreigninvestors, do not guarantee either that FDI will materialize or that it will promote development orenvironment goals.
Moreover, developing countries differ widely in the way they can utilize FDI for sustainabledevelopment. In most of Africa, argues John Mugabe, founder of the African Centre forTechnology Studies, FDI is not and will not be a leading driver. Instead, development strategiesshould aim to develop local scientific, social and financial capacities--and be aimed at expandinglocal markets. What is important is to harness FDI to these goals.58

27
Even with a coherent development strategy, numerous obstacles exist to successful technologycooperation. Some of these obstacles are bureaucratic and policy-driven, while others derivefrom the desire of MNCs to protect proprietary technologies and the rents they provide. Nationalgovernments need to examine carefully and seek to reduce disincentives to technology transferand capacity-building.
The imperative to create a policy and governance framework to promote sustainable FDI is new.No country, developed or developing, can yet be said to have figured it out. The recognition thatsuch a framework is needed is an important starting point.
MNCs: Development Cooperation and Good PracticeIn each of the case studies, the company worked in close partnership with a variety of partners:municipal and regional governments; national governments; local businesses; research institutes;and multilateral ODA organizations. In many of them, the company defined its commercialopportunity by fitting in with development objectives set by governments or government-ODApartnerships. In others, the company helped to define the development or environment objective.
This willingness to “fit in” with a development program, and to cooperate with others is adifferent slant than defining investment options solely from the perspective of global sourcing ormarketing strategies.
Bilateral and multilateral ODA organizations play a key role in sustainable developmentpartnerships, especially in the poorest developing countries. Understanding how to align withODA partners is an important skill for MNCs—and vice versa. As the Overseas DevelopmentInstitute argues, the goal is to improve development performance “through company-ledstrategies” which align “business core competencies with those of potential partners frominternational donors, government and civil society”.59
MNCs can play an important role in diffusing good practice in environmental and socialmanagement. To do so, companies need to embrace international “best practice” standardsthroughout their global operations and invest in training local workforces to enforce and monitorthem.
Global Investment Rules: Corporate Citizenship Standards and Policy “Elbow RoomThere is substantial scope for voluntary initiatives by business to promote sustainabledevelopment through their internal governance and their willingness to cooperate with developingcountry governments. It is unlikely, however, that such efforts will go to scale without “raisingthe bar” for all MNCs through mandatory global standards for “good corporate citizenship”.
Mandatory standards would alleviate the “stuck in the mud” problem by establishing a set ofcommon norms throughout the global economy. Potentially modeled on the OECD Guidelinesfor MNEs, these standards could embrace minimum environmental management principles, suchas the requirement to have an EMS and a community consultation process, to provide publicinformation, and to assess impacts over product and process life-cycles. They could also
28
establish wider principles of transparency, good corporate governance, worker protections, andcontributions to local economic development.
Investment agreements, bilateral, regional or global, could be an arena in which to insertmandatory corporate citizenship standards. The specific requirement for implementation ofmandatory global corporate standards could vary by locale. Given lack of capacities, enforcementobligations could fall largely on home country governments, rather than host countries.
A second implication for investment rules is that it is important to maintain the space for policyexperimentation and diversity at the national level, especially in developing countries. Theeconomic literature and the case studies surveyed highlight the complexity, subtlety, and varietyof experience in developing countries in channeling FDI toward increases in local productivecapacities, as well as improvements in environmental performance.
“One size doesn’t fit all” is an important starting point for the design of global or regionalinvestment rules which promote sustainable development. Developing countries need “elbowroom”—the freedom and flexibility to regulate and direct FDI in ways that dovetail with andbuild on local economic, social and cultural realities. Constraining development and industrypolicies in the name of protecting investor rights will make it much harder for nationalgovernments to define and embrace a sustainable development framework. Indeed, it will likelysimply perpetuate the current pattern of global investment—viz, the exclusion of the poorestcountries from global capital markets. Need for More Research This paper is one of only a handful which have begun to explore what constitutes “sustainableFDI” and how to promote it. There is need for much more investigation, especially on three keyissues: 1 what constitutes “best practice” by national and municipal governments in negotiating with
and cooperating with MNCs to promote sustainable development; 2 what obstacles MNCs face in technology cooperation with developing countries; 3 how investment rules can articulate broad common principles while allowing for policy
diversity and institutional innovation at the national level.

29
Endnotes 1 Overseas Development Institute (2002), Figure 92 Vietnam, Angola, Lesotho, Ecuador, Turkmenistan, Azerbaijan and China.3 For developed countries, the drop-off was 49 percent; for developing countries, it was 82 percent.4 Chakrabarti (2001)5 See Mabey and McNally (1999), pp. 33-34. See also Zarsky (1999)6 See CAP (2002) and Zarsky (2002b)7 Moran (1998), p. 2.8 Moran (1998) p. 39 Bosworth and Collins (1999)10 Graham (1995).11 Carkovic and Levine (2002); Aitken and Harrison (1999)12 Blomstrom et al (1994); quoted in OECD (2002)13 OECD (2002) p. 914 Moran (1998)15 See Peterson (2003) p. 216 Amsden (2001) The twelve countries are China, India, Indonesia, South Korea, Malaysia, Taiwan andThailand, Turkey, Argentina, Brazil, Chile and Mexico.17 Amsden (2001) p. 8.18 Mabey and McNally (1999); Zarsky and Buffett (2003)19 Dasgupta et al (1998); Hettige et al (1996)20 See International Right To Know Campaign (2003)21 Sandbrook and Mehta (2002)22 CAP (2002) Chapter Two23 CAP (2002) Chapter Three24 Asian Development Bank (2001) p. 225 A landmark article by Simon Kuznets in 1955 posited that inequality first rises, then falls with increasesin per capita income. Development policymakers evoked the theory for decades to argue that inequalitycould be ignored in the short term. More recently, empirical evidence has faded, leading economists toconclude “there is no empirical tendency whatsoever in the inequality-development relationship” (Fields,1995).26 See for example Mani and Wheeler (1997) , Chapter 427 All studies in this section referred to in this section are summarized by Stern (1998)28 Rosenberg and Mischenko (2002)29 Zarsky (2002a)30 For a critique of the Environmental Sustainability Index see Wackernagel (2001)31 This section draws from Gallagher (2003).32 INEGI (2002)33 Dasgupta et al (1998)34 Gentry (1998); Mercardo (2000); Garcia-Johnson (2000)35 Gallagher (2003)36 INEGI (2002)37 Notably missing, with the exception of the adoption of ILO labor standards, is the protection of humanrights by host governments as well as MNCs. See CAP (2002) and Zarsky (2002b).38 SustainAbility and UNEP (2003)
30
39 WBCSD and UNIDO (2002) p. 3.40 WBCSD and UNIDO (2002), p. 2.41 WBCSD and UNIDO (2002).42 WBCSD and UNIDO (2002) p. 2743 WBCSD and UNIDO (2002) p. 3244 Ibid.45 Then the State Planning Commission.46 Interview with Lyuba Zarsky, February 11, 2003.47See Lagos and Valesco (1999); summarized by Von Moltke (2002)48 Frangialli (2002). Depending on the year, the volume of receipts from international tourism equals oroutstrips the value of exports of oil and petroleum products, as well exports of cars and transportequipment.49 Frangialli (2002)50 Tour Operators Initiative, p.251 An effort is also underway to develop and implement standards specifically for ecotourism . The WorldTourism Organization and UNCTAD also recently launched the Sustainable Tourism-Eliminating Poverty(ST-EP) initiative (ST-EP 2003).52 GRI (2002)53 The full name is Compania Minera Disputada de las Condes.54 Fluor sold El Indio in 1987 to the Alan Bond Group, who sold it in 1989 to the current owner, CanadianLac Minerals Ltd.55 Lagos and Valesco (1999) p. 1256 Lagos and Valesco (1999)57 Von Moltke (2003)58 Mugabe (2002)59 Overseas Development Institute (2002) p. 15 _____________________________________
References
Aitken, Brian and Ann Harrison (1999) “Do Domestic Firms Benefit from Foreign Direct Investment?”American Economic Review, 89 (3), pp. 605-18, June.
Amsden, Alice (2001), The Rise of “The Rest”, Challenges to the West From Late-IndustrializingEconomies, New York: Oxford University Press.
Asian Development Bank (2001) Asian Environment Outlook, Manila: ADB.
Blomstrom, Magnus and Ari Kokko (1996) “The Impact of Foreign Investment on Host Countries: AReview of the Empirical Evidence,” World Bank Policy Research Working Paper, 1745.
Blomstrom, Magnus, Ari Kokko and M. Zejan (1994) “Host Country Competition, Labour Skills, andTechnology Transfer by Multinationals, ” Weltwirtschaftliches Archiv, Vol 130, No. 3, pp 521-533.
Borensztein, E., J. de Gregorio, J-W. Lee (1998) “How does foreign direct investment affect economicgrowth? Journal of International Economics Vol 45. pp. 115-135.

31
Bosworth Barry P. and Susan M. Collins (1999) “Capital Flows to Developing Economies: Implications forSavings and Investment,” Brookings Papers on Economic Activity: 1, Brookings Institution, pp. 143-69.
BuildingGreen (1998) “Appendix A, CO2 Emissions from Cement Production,” Concrete, Flyash and theEnvironment – Proceedings, forum held December 8, EHDD Architecture and Pacific Energy Center,www.buildinggreen.com/features/flyash/appendixa.html.
CAP (2002) California Global Corporate Accountability Project, Beyond Good Deeds: Case Studies and aNew Policy Agenda for Corporate Accountability, Natural Heritage Institute, Nautilus Institute, and HumanRights Advocates, http://www.nautilus.org/enviro/.Carkovic, Maria and Ross Levine (2002) “Does FDI Accelerate Economic Growth?” University ofMinnesota, May.
Chakrabati, Avik (2001), “The Determinants of FDI: Sensitivity Analyses and Cross CountryRegressions,” Kyklos, 54 (1), pp. 89-113.
Dasgupta, S., H. Hettige, and D. Wheeler (2000) “What Improves Environmental Compliance? Evidencefrom Mexican Industry, “ Journal of Environmental Economics and Management, vol. 39, no. 1, January2000, pp. 39-66.
DeMelo, Luiz R. (1999) “FDI_Led Growth: Evidence From Time Series and Panel Data,” OxfordEconomic Papers 51.
De Velde, Willem (2001) “Policies Towards Foreign Direct Investment in Developing Countries: EmergingBest Practices and Outstanding Issues,” Overseas Development Institute, London, March.
Earth Summit (2002) “Foreign Direct Investment: A Lead Driver for Sustainable Development?”http://www.earthsummit2002.org/es/issues/FDI/fdi.htm.
Franigalli, Francesco (2002) Secretary-General of the World Tourism Organization, “World TourismOrganization”, statement at World Summit on Sustainable Development, August,http://www.un.org/events/wssd/statement/wtoE.htm.
Gallagher, Kevin (2003) “NACEC and Environmental Quality: Assessing the Mexican Experience,” inJohn Knox and David Markel (eds.) Greening NAFTA (Stanford: Stanford University Press (forthcoming).
Gentry, Brad (1998) Private Capital Flows and the Environment, Lessons from Latin America,Cheltenham:Edward Elgar.
Global Reporting Initiative (2002) Tour Operators Sector Supplement, November, available on-line athttp://www.toinitiative.org/reporting/reporting.htm.
Graham, Edward H. (1995) “FDI in the World Economy,” IMF Working Paper, wp/95/59, WashingtonD.C.
Hanson, Gordon H. (2001) “Should Countries Promote Foreign Direct Investment?” G-24 DiscussionPaper 9, UNCTAD, February.
INEGI (2000) Instituto Nacional de Estadistica Geografia e Informatica, “Sistema de CuentasEconomicas y Ecologicas de Mexico, 1993-1999” (“Determining the Economic Costs of EcologicalDegradation in Mexico”), Mexico City: INEGI, www.inegi.gob.mx
International Right to Know Campaign (2003) International Right to Know: Empowering CommunitiesThrough Corporate Transparency, January, http://www.irtk.org/irtkreport.pdf.

32
Lagos, Gustavo and Patricio Velasco (1999) “Environmental Policies and Practices in Chilean Mining,” inAlyson Warhurst (ed.), Mining and the Environment, Case Studies from the Americas, Ottawa:International Development Research Centre, Chapter 3. Available on-line athttp://www.idrc.ca/books/focus/828/chapter3.html
Lensink, Robert and Oliver Morissey (2001) “Foreign Direct Investment: Flows, Volatility and Growth,”paper presented at the Development Economic Study Group Conference, University of Nottingham, April5-7.
Lim, Ewe-Ghee (2001), “Determinants of and the Relation Between Foreign Direct Investment andGrowth: A Summary of the Recent Literature,” Working Paper 01/75, IMF, November.
Lougani, Prakash and Assaf Razin (2001) “How Beneficial is Foreign Direct Investment for DevelopingCountries?” Finance and Development, 38 (2), International Monetary Fund, June.
Mabey, Nick and Richard McNally (1999), “Foreign Direct Investment and the Environment, FromPollution Havens to Sustainable Development, WWF-UK Report, August.
Malampally, Padma and Karl P. Sauvant (1999), “Foreign Direct Investment in Developing Countries,”Finance and Development 36 (1), IMF, March.Marino, Andrea (2000) “The Impact on FDI on Developing Countries Growth: Trade Policy Matters,”ISTAT-CEMAFI, France.
Mani, Mathukumara and David Wheeler (1997) “In Search of Pollution Havens? Dirty Industry in theWorld Economy,” PRDEI, Poverty, Environment and Growth, World Bank, April.
Markusen, James R. and Anthony J. Venables (1999) “Foreign Direct Investment as a Catalyst forIndustrial Development,” European Economic Review, 43, pp. 335-356.
Moran, Theodore H. (1998) Foreign Direct Investment and Development, The New Policy Agenda forDeveloping Countries and Economies in Transition, Washington D.C.: Institute for InternationalEconomics.
Mugabe, John (2002), “The Keys to Africa’s Sustainable Development, Science, Technology andInvestment,” paper presented to the Global Financial Governance Initiative Working Group, North-SouthInstitute, May 1-2, www.nsi-ins./ca/.
OECD Global Forum on International Investment (2002) New Horizons for Foreign Direct Investment,Paris: OECD.
Overseas Development Institute (2002), Optimising the Development Performance of CorporateInvestment, The ODPCI Program, Discussion Paper, August, available on-line athttp://www.odi.org.uk/pppg/activities/country_level/odpci/index.html.
Peterson, Luke (2003) “All Roads Lead Out of Rome: Divergent Paths of Dispute Settlement in BilateralInvestment Treaties,” International Sustainable and Ethical Investment Rules Project,http://www.nautilus.org/enviro/partners.html.
Rosenberg, Erika and Vera Mischenko (2002), “Conflicts Over Transnational Oil and Gas DevelopmentOff Sakhalin Island in the Russian Far East: A David and Goliath Story,” in Lyuba Zarsky (ed.) HumanRights and the Environment: Conflicts and Norms in a Globalizing World, London: Earthscan.
Sandbrooke, Richard and Pradeep Mehta (2002) “Rapporteurs’ Report,” in OECD, Foreign DirectInvestment and the Environment, Lessons from the Mining Sector, pp. 9-16.

33
ST-EP (2003), Sustainable Tourism-Eliminating Poverty, http://www.world-tourism.org/step/menu.html.
Stern, David, (1998). “Progress on the Environmental Kuznets Curve?” Journal of Economic Developmentand the Environment, 3, 173-196.
SustainAbility and UNEP (2003) Trust Us, The Global Reporters 2002 Survey of Corporate SustainabilityReporting, London: SustainAbility, www.sustainabilility.com
Tour Operators Initiative (2002) Work in Progress, Tour Operators Initiative for Sustainable TourismDevelopment, March 12, 2000 – March 12, 2002,http://www.toinitiative.org/members_area/documents/TOI_documents/TOI_Activity_Report.pdf
Von Moltke, Konrad (2003) “The Environment and Non-Discrimination in Investment Regimes:International and Domestic Institutions,” International Sustainable and Ethical Investment Rules Project,http://www.nautilus.org/enviro/partners.html.
Von Moltke, Konrad (2002) “FDI in Mining: Discrimination and Non-Discrimination,” in Foreign DirectInvestment and the Environment, Lessons from the Mining Sector, Paris: OECD, pp. 141-154.
Wackernagel, Mathis (2001) “Shortcoming of the Environmental Sustainability Index,” RefiningProgress, www.anti-lomborg.com/ESI%20critique.rtf.
WBCSD and UNIDO (2002), Developing Countries and Technology Cooperation, Vol 2, Ten BusinessCases, World Business Council for Sustainable Development and United Nations Industrial DevelopmentOrganization, available on-line at www.wbcsd.org/casestud/index.htm
World Bank (2003) Global Economic Prospects and the Developing Countries 2003, Washington: WorldBank, available on http://www.worldbank.org/prospects/gep2003/.
Zarsky, Lyuba and Sandy Buffett (eds.), (2003) Rules, Rights and Regimes: Development, Sustainability,and International Investment, Earthscan, forthcoming.
Zarsky, Lyuba (2002a), “Stuck in the Mud? Nation-States, Globalization, and the Environment,” in KevinP. Gallagher and Jacob Werksman (eds), International Trade and Sustainable Development, London:Earthscan, pp. 19-44.
Zarsky, Lyuba (2002b), (ed.) Human Rights and the Environment, Conflicts and Norms in a GlobalizingWorld, London: Earthscan.
Zarsky, Lyuba (1999), “Havens, Halos and Spaghetti: Untangling the Relationship Between FDI and theEnvironment,” in Foreign Direct Investment and the Environment, Paris: OECD, pp. 47-73.