SCN News No 29 - unscn
76
A A PERIODIC C REVIEW W OF F DEVELOPMENTS S IN N INTERNATIONAL L NUTRITION N UNITED NATIONS SYSTEM STANDING G COMMITTEE E ON N NUTRITION Number 29 Late 2004-Early 2005 ISSN 1564-3743
-
Upload
khangminh22 -
Category
Documents
-
view
3 -
download
0
Transcript of SCN News No 29 - unscn
STANDING COMMITTEE ON NUTRITION
AA P
ER
IOD
ICC R
EV
IEWW
OFF
DE
VE
LO
PM
EN
TSS
INN IN
TE
RN
AT
ION
ALL
NU
TR
ITIO
N N
UNITED NATIONS SYSTEM
STANDINGG COMMITTEEE ONN NUTRITION
A P
ER
IOD
IC R
EV
IEW
OF
DE
VE
LO
PM
EN
TS
IN IN
TE
RN
AT
ION
AL
NU
TR
ITIO
N
STANDING COMMITTEE ON NUTRITION
Number 29 Late 2004-Early 2005 ISSN 1564-3743
A P
ER
IOD
IC R
EV
IEW
OF
DE
VE
LO
PM
EN
TS
IN IN
TE
RN
AT
ION
AL
NU
TR
ITIO
N
SCN NEWS provides information on issues of importance and sharing of experiences in the field of international nutrition. All manuscripts submitted for consideration are peer-reviewed, although publication is not guaranteed. Overall editorial control is retained by the SCN Secretariat. Every effort is made to ascertain the validity of the information contained in SCN publications. Contributing authors are responsible for the accuracy of references. Manuscript guidelines are available at www.unsystem.org/scn Items published by the SCN Secretariat do not imply endorsement of views given, nor necessarily the official positions taken by the SCN and its member agencies. The status of quotes and other material is generally indicated in the text and/or sources.
SCN NEWS is issued twice a year by the United Nations System SCN. Your contributions to future issues are most welcome; please send these to [email protected]
Readers are encouraged to review, abstract, reproduce or translate this document in part or in whole—but please attribute to the SCN. If you wish to receive additional copies of SCN NEWS, or would like to suggest other names to be added to our distribution list, please write to us or visit our website at www.unsystem.org/scn This issue of SCN NEWS was edited by Andrea D Moreira, MPS ID. Cover illustration by Marc Standing.
SCN NEWS is printed by the
Lavenham Press United Kingdom
ISSN 1564-3743
Inside this Issue
Chair’s Round Up……………………………………..1
Overweight and Obesity: A New Nutrition Emergency?........…………..3
Programme News…………………………………..45 Australia•FAO•INACG•IVACG•OHCHR•WHO
World Vision Canada
Speakers’ Corner………………………………….55
Publications………………………………………….61
Bulletin Board…………………………………..…70 Conferences•New Resources•Courses
Specials SCN Spotlight………………………………….…………....2 Clive E West Obituary……………………………….…44 Yongyuth Kachondham Obituary………………..60
2005
We gratefully acknowledge funding assistance from the Government of the Nether lands
• Chizuru Nishida & Patricia Macavele
• Josef Schmidhuber & Prakash Shetty
• Corinna Hawkes, Cara Eckhardt, Marie Ruel & Nicholas Minot
• Miriam Labbok
• Mercedes des Onis
• Tim Lobstein
• W Philip T James
Chair’s Roundup 1
SCN News #29
Chair’s Round Up
This festive end of year season was horribly marred by the Tsunami disaster that struck thousands of communities across the rim of the Indian Ocean on Boxing Day. We hope that out of the chaos that is left in the wake of the big wave, the survivors of the devas-tated communities are aided by the massive humanitarian effort now being mounted. We at the SCN extend our heartfelt sympathies and regrets to all those families, and es-pecially those of our colleagues, that have been affected by this terrible catastrophe. This issue of SCN News has a special focus on another sort of emergency that is brew-ing for all nations in the not too distant future, namely obesity. The six articles compiled by Dr Chizuru Nishida from WHO and the editorial comments by Professor Philip James are especially sobering and point to the complexity of nutritional issues that con-front us in this modern world. Some half a million people in North America and West-ern Europe die from obesity related diseases (coronary heart disease, stroke, and diabe-tes mellitus) every year. Despite the incredible economic development that the globe has seen in the 30 years since the first World Food Conference and the creation of the SCN, the nutritional problems facing the nations of the world are still far from being resolved. The co-existence of underweight and overweight in an increasing number of developing country settings widens the scope of nutrition problems and poses one of the greatest challenges to nutritionists, health workers, and national policy-makers globally in this new millennium. This issue of SCN News continues the special series of interviews, but this time with the SCN Distinguished Nutrition Advocate (DNA), Dom Mauro Morelli. Dom Mauro was appointed DNA at the 30th Session in Chennai. In his article, Dom Mauro talks about his experience in mobilizing support to end hunger in Brazil during the last dec-ade or more. Dom Mauro’s interview is fitting considering that the 32nd Session will be held in Brasilia this March. We look forward to meeting him again then. In that regard the 32nd Session of the SCN to be held in Brasilia, 14-18 March, looks very promising. The focus of the week's discussions will be on how realizing the human right to adequate food will help governments achieve the MDGs. The recent approval of the Voluntary Guidelines, elaborated by an Intergovernmental Working Group, is another concrete step towards solving the global problems of hunger and malnutrition. The SCN looks forward to discussing how to take forward this whole area of work and accelerate the realization of the right to adequate food and to be free of hunger and mal-nutrition. Lastly, I am very pleased to welcome Dr Lena Davidsson, IAEA, to the SCN network. Dr Davidsson takes over from Dr Venkatesh Iyengar who retired last year. Other move-ments include Dr Meera Shekar replacing Dr Milla McLachlan as World Bank represen-tative to the SCN’s Steering Committee; and Dr Ted Greiner having changed affiliation to join PATH as Senior Nutritionist—Dr Greiner was previously a bilateral partner from Sweden.
Catherine Bertini Chair SCN
2 Chair’s Roundup
SCN News #29
SCN Spotlight
Bishop Dom Mauro Morelli is the SCN’s second Distinguished Nutrition Advocate (DNA), continuing the work begun by Professor MS Swaminathan. He was appointed DNA at the SCN’s 30th Session held in Chennai, India and has since worked throughout Latin America and around the world to promote the right to adequate food on behalf of the SCN. In December 2004, Dom Mauro provided the following inter-view for SCN News. SCN News: What inspired you to dedicate your life’s work to issues of food security and the promotion of the right to adequate food?
Dom Mauro: My whole pastoral life (40 years as a priest, of which 30 as a bishop) has been a constant struggle for a life with dignity and hope for our people. Human rights and citizen-ship have been the foundation of my work. I started my pastoral life less than two years after the dictatorship in Brazil. Since then I’ve been committed to democracy which in-cludes not just political freedom, but real opportunities to live and grow as active human beings. Therefore, housing, education, food, health and work are fundamental issues to de-mocracy. Since the end of the dictatorship in Brazil, I have focused on social inclusion and access to adequate food for a healthy life. For the last 30 years I’ve spent my time in the outskirts of São Paulo and Rio de Janeiro working and living with poor people, migrants from all over Brazil and people of African descent. It is blasphemous that such a rich country as Brazil, a very large food producer, has such a significant part of its population suffering from the consequences of food insecurity. Since 1993, I have been committed to the political processes that deals with hunger as a political question and as a priority for families, society and governments. It also pains me to see undernourished children there-fore, maternal and infant nutrition is a driving force behind my work, especially after recov-ering from a terrible car accident that kept me in an intensive care unit for about 40 days.
You have been named president of the State Food Security Council for São Paulo, can you tell us more about some of your activities?
Since 1993, as president of the then National Food Security Council, and even after the Council was abolished in 1995, my mission has been to press governments for public policies to recognize food as a basic human right. During the last five years, I worked in the State of Minas Gerais as president of the State Food Security Council. I witnessed and participated in a good partnership between civil society and the government—over 20 regional commissions are working with the special food security pro-gramme. I am doing similar work in the State of São Paulo. In July the Governor of the State of São Paulo signed and sent to the State Congress a Food Security Law to be voted on. This means that pub-lic policies and food security planning will be mandatory in that State. This year I will also be setting up 32 regional commissions to implement food security policies—it’s a very promising year!
In March the SCN’s 32nd Session will present case studies focusing on achieving the MDGs within a context of the right to adequate food in Brazil, Angola, Mozambique and Bolivia. We expect a strong Brazilian civil society presence. What outcomes do you foresee from this an-nual meeting in Brasilia?
I hope that this year’s SCN annual meeting in Brasilia will go a long way in promoting adequate food as a basic human right. The presence of the SCN might serve as a catalyst to establish a national system to evaluate children’s growth and development. The case studies may also become a starting point for a solidarity movement between Brazil, Bolivia, Mozambique and Angola. As part of my mandate as DNA I plan to visit these other countries this year.
I am quite convinced that no democracy can continue progressing when millions of its children are undernourished and without adequate living conditions. I hope that other DNAs will be chosen with mandates to work for such a sacred and noble cause. In the meantime, I hope that another bishop will be appointed to my diocese, so I´ll be free to totally commit to the promotion of the right to adequate food and nutrition, especially for children and the elderly. Dom Mauro can be contacted through the SCN Secretariat ([email protected]) or at [email protected]
The SCN’s Distinguished
Nutrition Advocate,
Dom Mauro Morelli
Features 3
SCN News #29
Introduction by Chizuru Nishida
Department of Nutrition for Health and Development, WHO
This issue of SCN News highlights the global challenge involved in effectively addressing the increas-ing public health problem of overweight and obesity. Our goal is to update readers and raise aware-ness of the issues related to overweight and obesity from a broad perspective and highlight recent global efforts and actions for their prevention and control. Our article introduces the development of the WHO Global Database on Body Mass Index (BMI) as a global interactive surveillance tool to monitor nutrition transition and provides some initial analyses based on the available adult BMI data. We highlight the lack of nationally representative cross-sectional data, particularly for the countries in Africa, as an obstacle in monitoring the magnitude of current and future nutrition problems worldwide. Schmidhuber and Shetty’s article demonstrates a very complex, but very valuable, aspect of the increasing problems of overweight and obesity, reviewed from the food and agricultural development perspective. Hawkes et al, further address a dual burden of under- and overnutrition being faced, particularly in developing countries from the perspective of food policy. They emphasize the need for more food policy research to redirect the nutrition transi-tion towards optimal diets and good health. Yet another complex aspect of overweight and obesity problems is described by Labbok in her review of recent studies related to breastfeeding and development of obesity later in life. This emphasizes the fact that, like undernutrition and nutritional deficiencies, the problems of overweight and obesity need to be addressed in the context of the life course. Adapting the life cycle causal links for undernutrition described in the report to the ACC/SCN by the Commission on the Nutrition Challenges of the 21st Century,1 Darnton-Hill, Nishida and James2 proposed a lifecourse approach to diet, nutrition and the prevention of chronic diseases in order to review the processes and environmental and societal influ-ences that cause the risks of various chronic diseases. This lifecourse approach was then adopted by the joint WHO/FAO Expert Consultation3 when reviewing the changes in dietary and health patterns worldwide and examining their relationship to emergence of chronic diseases, particularly obesity, type 2 diabetes, hypertension and cardiovascular diseases, cancer, dental disease, and osteoporosis. The articles by de Onis and Lobstein highlight the emerging problem of overweight and obesity among children, which can no longer be ignored. In 1997, the WHO Expert Consultation4 identified increas-ing overweight and obesity in childhood as emerging childhood health problems which need urgent public health attention. Unfortunately, not much action has been taken so far to address the over-weight and obesity problems among children. One of the difficulties identified by the Consultation was a lack of agreement on the classification of overweight and obesity in children and adolescents. There has been confusion both in terms of a globally applicable reference population and in the selec-tion of appropriate cut-off points for designating a child as obese. However, with the completion of the WHO Multicentre Growth Reference Study and construction of a new WHO growth reference, WHO may now be in a position to propose a recommendation for cut-off points for school-age chil-dren and adolescents to be used globally for monitoring childhood overweight and obesity. Further-more, there has been increasing recognition among the global public health community as well as by WHO Member States for the need to develop effective strategies for preventing childhood overweight and obesity in many parts of the world. In response to this growing concern, WHO will organize an expert consultation on childhood obesity from 20-24 June 2005. The objectives of the Consultation are to: 1) review the prevalence and magnitude of childhood overweight and obesity; 2) review the rec-ommendation for cut-off points for school-age children and adolescents to be used for monitoring childhood overweight and obesity; 3) review and assess the impact of on-going undernutrition inter-vention programmes on increasing overweight and obesity in children in countries; 4) review the out-come of the updated Cochrane systematic review on the prevention of childhood obesity and lessons learned from countries that have implemented prevention strategies; 5) identify and define types of strategies, and the possible obstacles for their implementation; and 6) identify further research needs.
Overweight and Obesity A New Nutrition Emergency?
4 Features
SCN News #29
The Consultation is expected to i) develop a guide for countries to strengthen their national nutrition monitoring and surveillance system for school-age children and adolescents, and ii) develop and im-plement effective strategies for addressing the increasing public health problem of childhood obesity. The editorial of James, who served as a reviewer for these six papers, also highlights the complexity of the social, cultural and economic context in which the problem of overweight and obesity needs to be addressed. He further emphasizes the need for a new perspective and a fundamental rethinking of approaches in addressing the ever complex problems of malnutrition, whether it is undernutrition or overweight and obesity.
Much has changed in the international context of macro-policy on food and nutrition since the 1974 World Food Conference. Each decade had its solemn government pledges to eliminate hunger and reduce all forms of malnutrition. World declarations and governments’ commitments in these matters have increased in scope, detail and en-dorsement, allowing the development of multiple global strategies and goals for the millennium. However, we repeatedly learn that making commitments is one thing, but that being able to deliver and implement those commitments has proven more prob-lematic. The experience of WHO, in close collaboration with FAO and other partner agencies, in supporting countries to develop, strengthen and implement national inter-sectoral food and nutrition plans and policies demonstrates that even when political commitment exists, there is very little “buy-in” from senior officials even in the health and agriculture sectors. Furthermore, significant capacity gaps exist at all levels in un-derstanding the required intersectoral responses to the increasing complexity of food and nutrition policy-making for addressing the whole spectrum of nutrition problems. To overcome these gaps, the combined efforts of SCN members are needed to form a revolutionary interaction and collaboration among all stakeholders.
References
1. ACC/SCN. Ending malnutrition by 2020: an agenda for change in the millennium. Final report to the ACC/SCN by the Commission on the Nutrition Challenges of the 21st Century. Food and Nutri-tion Bulletin, 2000, 21(3): 3-88. 2. Darnton-Hill I, Nishida C, WPT James. A life course approach to diet, nutrition and the preven-tion of chronic diseases. Public Health Nutrition, 2004, 7(1A): 101-121. 3. WHO/FAO. Diet, nutrition and the prevention of chronic diseases. Report of a joint WHO/FAO expert con-sultation. WHO Technical Report Series 916. Geneva, World Health Organization, 2003. 4. WHO. Obesity: preventing and managing the global epidemic. Report of a WHO Consultation. WHO Techni-cal Report Series 894. Geneva: World Health Organization, 2000.
...we repeatedly learn that making commitments is
one thing, but that being able to deliver and
implement those commitments has
proven more problematic.
Features 5
SCN News #29
Monitoring the rapidly emerging public health
problem of overweight and obesity:
the WHO Global Database on Body Mass Index
Chizuru Nishida and Patricia Mucavele
World Health Organization
Background
In 1997, the WHO Expert Consultation on Obesity (Geneva, 3-5 June 1997)1 warned the global com-munity of an escalating epidemic of overweight and obesity that was affecting many countries world-wide. The Consultation also forewarned that if action was not taken to stem the pandemic, millions of people in both developed and developing countries would be at risk of developing various noncommu-nicable diseases (NCDs) and other related health disorders. The Consultation identified the lack of na-tionally representative cross-sectional data as an obstacle for monitoring the magnitude of the current and future obesity problem and recommended a systematic collation of national and sub-national adult overweight and obesity data to provide a more accurate insight into the dimensions of the epidemic. In response to this recommendation, as well as to facilitate international comparisons of adulthood over-weight and obesity rates, and the monitoring and evaluation of the effectiveness of intervention strate-gies, the WHO Department of Nutrition for Health and Development (NHD) initiated the develop-ment of a Global Database on Body Mass Index (BMI). During the last four years, the database has evolved, in close collaboration with the Food and Agricul-ture Organization of the United Nations (FAO), as a global interactive surveillance tool to monitor nu-trition transition, covering and reporting on the entire spectrum of adult nutritional status. Currently, efforts are being made to undertake a systematic collection of nationally representative studies that also include underweight. This unique surveillance system also incorporates both food availability and food aid data from the FAO Statistical Database (FAOSTAT), allowing the user to simultaneously display the BMI and food availability data on maps and in charts. The integration of these datasets provides a dynamic surveillance tool that can be used to monitor food insecurity and vulnerability as well as nutri-tion transition, thereby providing an invaluable contribution to the on-going efforts of the Inter-Agency Working Group on Food Insecurity and Vulnerability Information and Mapping Systems (IAWG-FIVIMS) as follow-up to the World Food Summit held in Rome in 1996. This paper deals with BMI data only. Details of data sources, inclusion criteria and standardization methods applied to the data prior to inclusion into the database are presented. Also included are exam-ples of how the compiled BMI information can be used for monitoring the global overweight and obe-sity problems, in particular, for identifying the location and demographic profile of vulnerable popula-tion groups. Methods DATA SOURCES Survey data for inclusion in the database are identified primarily from two principle sources. One is from a literature search that continuously applies an established search history, providing timely up-dates. Each periodical abstract is reviewed in relation to stringent inclusion criteria. The full article is sourced if the study conforms to the criteria and is simultaneously entered into an electronic reference bank with the corresponding URLs leading to relevant abstracts to enable users to directly download on-line versions of each abstract from PubMed. Another source is from a wide network of collabora-tors including the six WHO Regional Offices, the unit on Surveillance for Information and Policy (SIP) in the WHO Department of Chronic Disease and Health Promotion (CHP), Ministries of Health, other national or academic institutions and individual researchers. A total of 281 bibliographic citations are included in the reference system. Eighty-three peer-reviewed journals have been consulted and cited; journal publications contribute nearly three-quarters (72.2%) of all sources. The publication dates span two decades (1983-2004). Just under half (46.3%) of all refer-ences cited have been published since 2000, clearly demonstrating the increasing attention focused on overweight and obesity issues in the public health and nutrition research agenda.
6 Features
SCN News #29
CRITERIA FOR INCLUSION AND DATA STANDARDIZATION There is considerable variation in the types of studies that have been undertaken to assess the over-weight and obesity problems. Some are national samples, while others are sub-national from single or multiple regions, or single or multiple cities, villages or communities. National samples cover both rural and urban areas while at sub-national level the surveys may be urban, rural or both urban and rural. However, all the surveys had to meet specific criteria, including: 1) a clearly defined population-based sampling frame, allowing inferences to be drawn about an entire population; and 2) a probabilistic sam-pling procedure involving at least 100 adults (allowing for an estimation of prevalence with a 95% confi-dence interval). For those surveys where results are presented using different BMI cut-off points, the principal investigators are contacted and encouraged to re-analyze their data following the WHO recom-mended procedure for reporting BMI data or otherwise, provide the raw data to NHD for re-analysis. A valuable feature of the database is the collection of data in a standard format using the WHO BMI cut-off points for overweight (≥25 kg/m2), pre-obese (25-29.99 kg/m2) and obesity (≥30 kg/m2)1,2 as well as the means and standard deviations, where available, for adult males, females and combined sexes. BMI provides the most useful, though crude, population-level measure of overweight and obesity. It can be used to estimate the prevalence of overweight and obesity within a population and the risks asso-ciated with them. It should be noted, however, that BMI does not account for the wide variation in body fat distribution, and may not correspond to the same degree of fatness or associated health risk in different individuals and populations. BMI CUT-OFF POINTS FOR DIFFERENT ETHNIC GROUPS In recent years, there has been a growing debate on whether there is a possible need for developing dif-ferent BMI cut-off points for different ethnic groups, in particular for Asian populations. This is due to the increasing evidence that the associations between BMI, percentage of body fat, and body fat distri-bution differ across populations and therefore, the health risks increase below the cut-off point of 25 kg/m2 that defines overweight in the current WHO classification. There have been two previous attempts to interpret the BMI cut-off points in Asian and Pacific popula-tions,3,4 both of which contributed to the growing debate. To investigate these questions further, WHO held the Expert Consultation on BMI in Asian populations (Singapore, 8-11 July 2002).5 The Consulta-tion concluded that the proportion of Asian people with a high risk of type 2 diabetes and cardiovascu-lar disease is substantial at BMI's lower than the existing WHO cut-off point for overweight (≥ 25 kg/m2). However, the cut-off point for observed risk varies from 22 kg/m2 to 25 kg/m2 in different Asian populations and for high risk, it varies from 26 kg/m2 to 31 kg/m2. The Consultation, therefore, recom-mended that the current WHO BMI cut-off points should be retained as the international classification, however, the cut-off points of 23, 27.5, 32.5 and 37.5 kg/m2 are to be added for public health action points. This recommendation stated that countries should use all BMI categories (ie, 18.5, 23, 25, 27.5, 30, 32.5 kg/m2, and in many populations, 35, 37.5, and 40 kg/m2) for reporting purposes, with a view to facilitating international comparisons. In addition, an expert working group was formed by the WHO Expert Consultation, and is currently undertaking a further review and assessment of available data on the relationship between waist circumference and morbidity and the interaction between BMI, waist circumference, and health risk. It is anticipated that this analysis will be completed by October 2005. Description of the BMI data
The collation of survey information is an on-going dynamic process. To date (November 2004), the da-tabase has compiled data from a total of 97 countries and territories covering approximately 86% of the adult population worldwide. These include data from 350 separate surveys conducted over a span of six decades (1942-2002), of which 156 (44.6%) are national surveys from 66 countries and 194 (55.4%) are sub-national surveys from 75 countries. The majority of nationally representative surveys cover both urban and rural areas, with the exception of two, namely Mexico (1992-93) and Uruguay (1998), both of which were conducted in urban settings only. In contrast, at the sub-national level, the surveys may have been carried out in urban (76, 39.2%) or rural (28, 14.4%) areas only or both urban and rural settings (90, 46.4%). Worldwide and regional variation in overweight and obesity
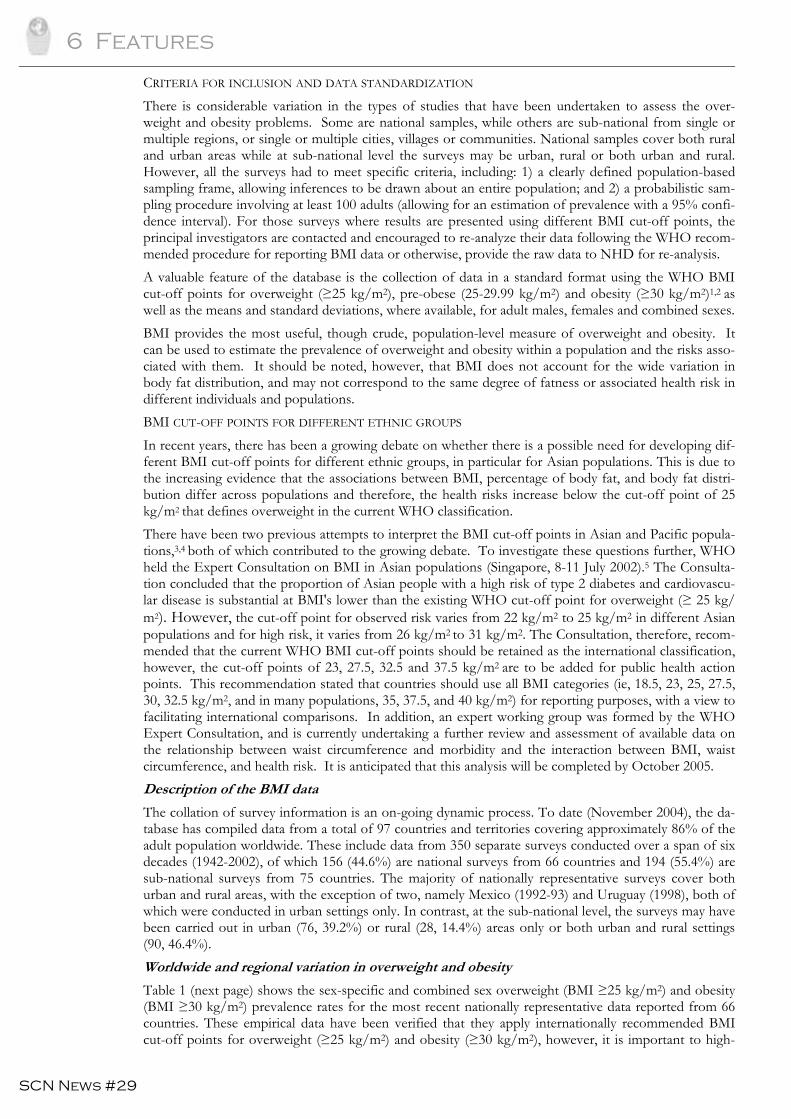
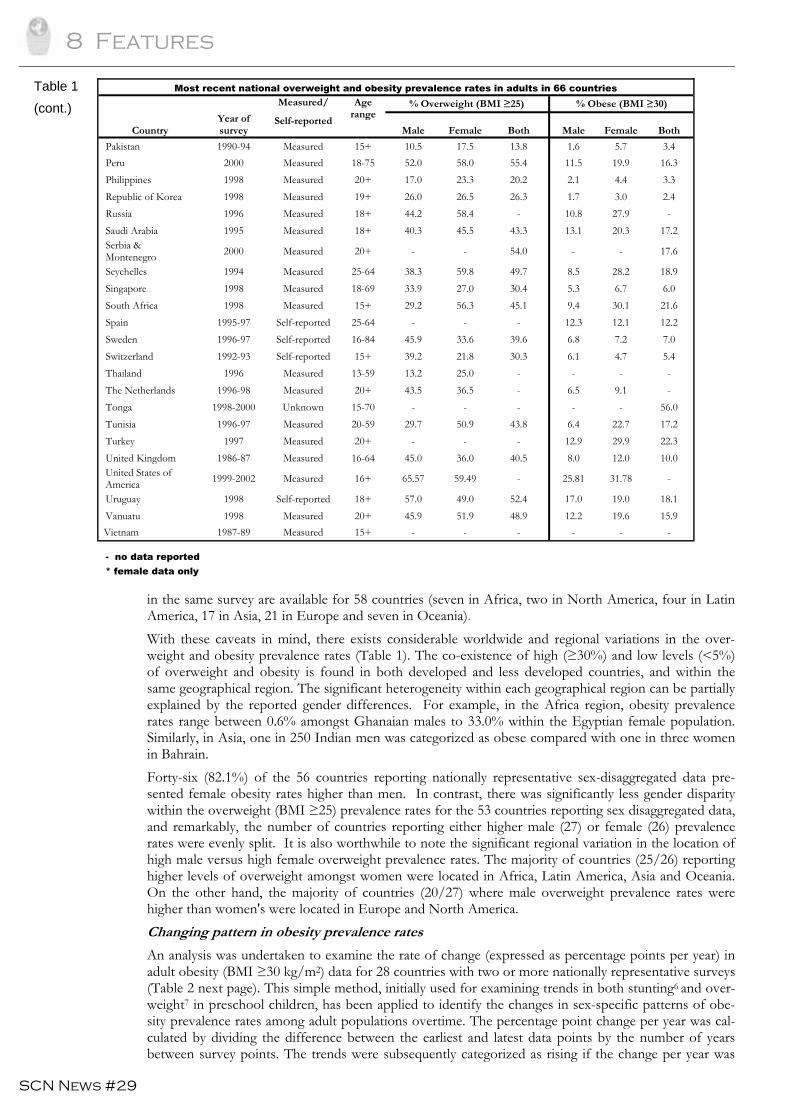
Table 1 (next page) shows the sex-specific and combined sex overweight (BMI ≥25 kg/m2) and obesity (BMI ≥30 kg/m2) prevalence rates for the most recent nationally representative data reported from 66 countries. These empirical data have been verified that they apply internationally recommended BMI cut-off points for overweight (≥25 kg/m2) and obesity (≥30 kg/m2), however, it is important to high-
Features 7
SCN News #29
light that the data presented vary considerably in terms of sampling procedures, age ranges, and the period of observation. Six of the surveys included were conducted prior to 1990, 20 were carried out during the early 1990's, 31 were administered between 1996-1999, and the remaining nine surveys were conducted between 2000-2002. Over three-quarter's (77.3%) of these 66 surveys measured the height and weight while 11 were self-reported and four provided no information as to how height and weight was obtained. Likewise there are considerable differences in reported sample sizes, varying between 286 (Cook Islands) and 239,972 (China) with a median sample size of 5,816. National data in which both male and female overweight and/or obesity prevalence data have been collected and reported separately
Most recent national overweight and obesity prevalence rates in adults in 66 countries
Country Year of survey
Measured/ Self-reported
Age range
% Overweight (BMI ≥25) % Obese (BMI ≥30) Male Female Both
sexes Male Female Both sexes
Australia 1995 Measured 19+ 64.3 47.3 55.3 18.7 18.4 18.6 Austria 1991 Unknown 20+ - - - 8.3 9.0 8.5 Bahrain 1998-99 Measured 19+ 59.9 62.4 61.2 23.3 34.1 28.9 Belgium 1979-84 Measured 25-74 58.6 53.6 56.2 12.1 18.4 15.1 Brazil 1989 Measured 25-64 27.3 38.1 32.8 4.8 11.7 8.3 Canada 2000-2001 Self-reported 20-64 55.6 39.2 47.4 16.0 13.9 14.9 China 1990-2000 Measured 20+ 22.4 26.3 24.5 2.0 3.9 3.0 Cook Islands 1998 Unknown 17+ 76.6 81.0 77.6 40.6 50.0 43.0 Croatia 1995-97 Measured 18-65 79.2 49.9 64.4 31.1 15.2 23.1 Cuba 1982 Measured 20-59 31.5 39.4 36.4 - - - Cyprus 1993-94 Measured Adults - - - 16.0 19.0 - Czech Republic 2002 Self-reported 16+ 56.7 47.4 51.7 13.7 16.3 15.1 Denmark 1994 Self-reported 16+ 44.2 28.0 35.8 8.2 7.0 7.6 Egypt 1998-99 Measured 18-60 48.9 71.1 62.1 12.6 33.0 24.7 Estonia 1997 Measured 19-64 41.9 29.9 35.4 9.9 6.0 7.8 Fiji 1993 Measured 18+ 32.4 50.4 41.7 7.3 20.5 14.1 Finland 1999 Self-reported 15-64 50.1 36.0 42.4 9.7 10.5 10.1 France 1991-92 Self-reported 20+ 40.8 28.9 35.0 6.4 7.8 6.9 French Polynesia 1995 Unknown 16+ 75.2 72.5 73.7 36.3 44.3 40.9 Gambia 1995 Measured 15+ - - 10.4 - - 2.3 Germany 1998 Measured 18-79 66.7 53.8 60.0 19.2 22.3 20.8 Ghana 1987-89 Measured 20-65 5.3 18.1 11.2 0.6 6.1 3.1 Greece 1997 Measured 30-82 - - - - - - Hungary 1992-94 Measured 18+ 62.9 49.1 55.4 21.0 21.2 21.1 India 1998 Measured 18+ 4.3 4.5 4.4 0.3 0.5 0.5 Iran 1999 Measured 15+ 29.3 38.6 34.4 5.6 14.2 10.3 Ireland 1997-99 Measured 18-64 66.4 48.4 56.8 20.1 15.9 17.8 Italy 1994 Self-reported 15+ 46.0 31.4 38.4 6.5 6.3 6.4 Japan 2001 Measured 15+ 26.8 20.7 23.4 2.9 3.3 3.1 Kuwait 1998-2000 Measured 18+ 65.8 62.6 64.2 27.5 29.8 28.8 Kyrgyzstan 1993 Measured 18-59 31.5 38.1 35.0 4.8 12.1 8.7 Lao People's Democratic Republic 1994 Measured 18+ 6.8 11.4 9.3 0.7 1.4 1.1 Latvia 1997 Measured 19-64 50.5 50.4 50.4 9.5 17.4 13.7 Lesotho * 1993 Measured 20-65 - 50.1 - - 23.0 - Lithuania 1997 Measured 19-65 53.3 51.0 52.0 11.4 18.3 15.1 Malaysia 1996 Measured 20+ 24.1 29.0 26.5 4.0 7.6 5.8 Mauritius 1998 Measured 20+ 41.0 54.0 48.1 8.0 20.0 14.4 Mexico * 1999 Measured 18-49 - 59.6 - - 24.4 - Morocco 1998-99 Measured 18+ 25.4 45.0 35.5 4.3 16.0 10.3 Nauru 1994 Measured 25-69 - - - 80.2 78.6 79.4 New Caledonia * 1992-94 Measured 30-59 - 70.4 - - - - New Zealand 1996-97 Measured 15+ 41.0 29.8 34.6 12.6 16.7 14.9 Norway 1994 Self-reported 16-79 42.0 26.4 34.0 5.0 5.9 5.4
Continued on page 8
Table 1
8 Features
SCN News #29
in the same survey are available for 58 countries (seven in Africa, two in North America, four in Latin America, 17 in Asia, 21 in Europe and seven in Oceania). With these caveats in mind, there exists considerable worldwide and regional variations in the over-weight and obesity prevalence rates (Table 1). The co-existence of high (≥30%) and low levels (<5%) of overweight and obesity is found in both developed and less developed countries, and within the same geographical region. The significant heterogeneity within each geographical region can be partially explained by the reported gender differences. For example, in the Africa region, obesity prevalence rates range between 0.6% amongst Ghanaian males to 33.0% within the Egyptian female population. Similarly, in Asia, one in 250 Indian men was categorized as obese compared with one in three women in Bahrain. Forty-six (82.1%) of the 56 countries reporting nationally representative sex-disaggregated data pre-sented female obesity rates higher than men. In contrast, there was significantly less gender disparity within the overweight (BMI ≥25) prevalence rates for the 53 countries reporting sex disaggregated data, and remarkably, the number of countries reporting either higher male (27) or female (26) prevalence rates were evenly split. It is also worthwhile to note the significant regional variation in the location of high male versus high female overweight prevalence rates. The majority of countries (25/26) reporting higher levels of overweight amongst women were located in Africa, Latin America, Asia and Oceania. On the other hand, the majority of countries (20/27) where male overweight prevalence rates were higher than women's were located in Europe and North America. Changing pattern in obesity prevalence rates
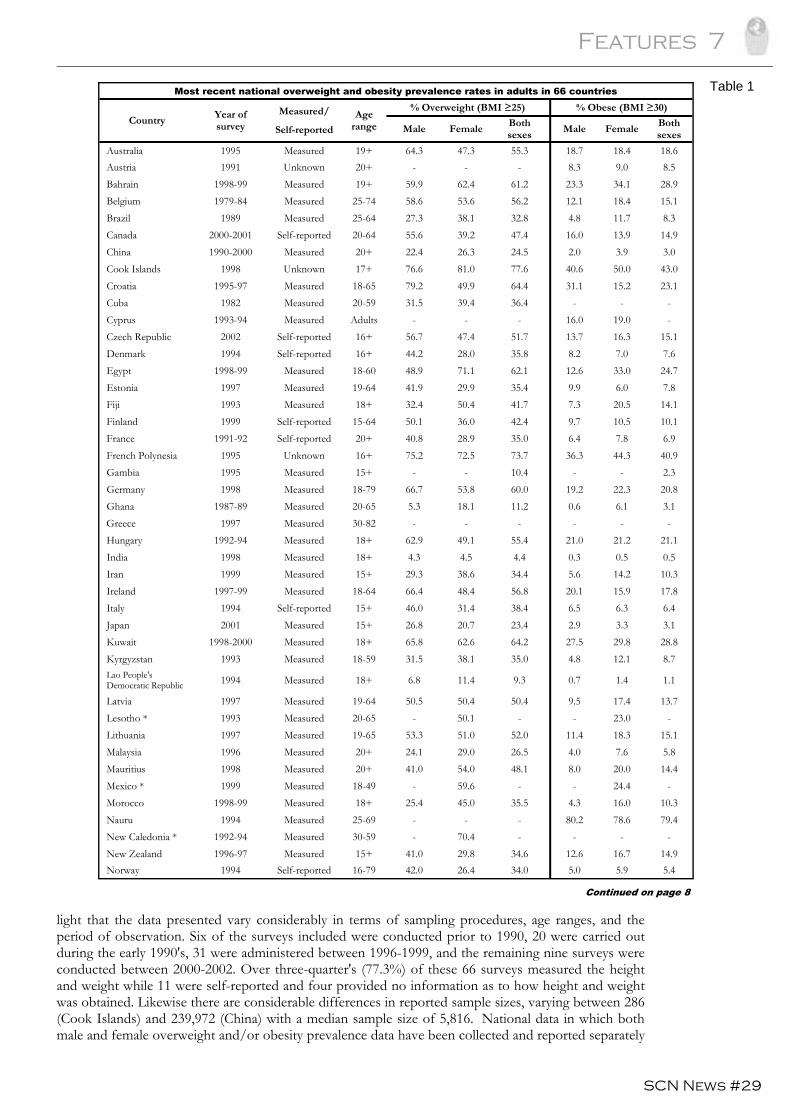
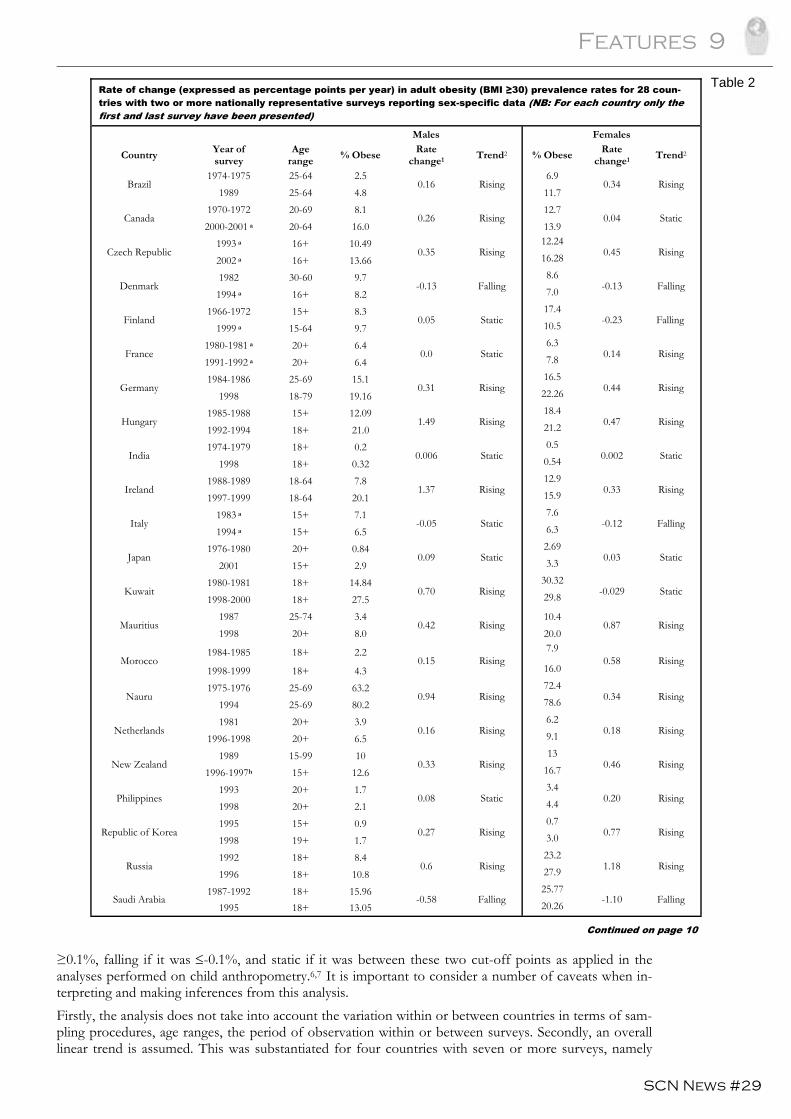
An analysis was undertaken to examine the rate of change (expressed as percentage points per year) in adult obesity (BMI ≥30 kg/m2) data for 28 countries with two or more nationally representative surveys (Table 2 next page). This simple method, initially used for examining trends in both stunting6 and over-weight7 in preschool children, has been applied to identify the changes in sex-specific patterns of obe-sity prevalence rates among adult populations overtime. The percentage point change per year was cal-culated by dividing the difference between the earliest and latest data points by the number of years between survey points. The trends were subsequently categorized as rising if the change per year was
Most recent national overweight and obesity prevalence rates in adults in 66 countries
Country Year of survey
Measured/ Self-reported
Age range
% Overweight (BMI ≥25) % Obese (BMI ≥30)
Male Female Both Male Female Both
Pakistan 1990-94 Measured 15+ 10.5 17.5 13.8 1.6 5.7 3.4 Peru 2000 Measured 18-75 52.0 58.0 55.4 11.5 19.9 16.3 Philippines 1998 Measured 20+ 17.0 23.3 20.2 2.1 4.4 3.3 Republic of Korea 1998 Measured 19+ 26.0 26.5 26.3 1.7 3.0 2.4 Russia 1996 Measured 18+ 44.2 58.4 - 10.8 27.9 - Saudi Arabia 1995 Measured 18+ 40.3 45.5 43.3 13.1 20.3 17.2 Serbia & Montenegro 2000 Measured 20+ - - 54.0 - - 17.6 Seychelles 1994 Measured 25-64 38.3 59.8 49.7 8.5 28.2 18.9 Singapore 1998 Measured 18-69 33.9 27.0 30.4 5.3 6.7 6.0 South Africa 1998 Measured 15+ 29.2 56.3 45.1 9.4 30.1 21.6 Spain 1995-97 Self-reported 25-64 - - - 12.3 12.1 12.2 Sweden 1996-97 Self-reported 16-84 45.9 33.6 39.6 6.8 7.2 7.0 Switzerland 1992-93 Self-reported 15+ 39.2 21.8 30.3 6.1 4.7 5.4 Thailand 1996 Measured 13-59 13.2 25.0 - - - - The Netherlands 1996-98 Measured 20+ 43.5 36.5 - 6.5 9.1 - Tonga 1998-2000 Unknown 15-70 - - - - - 56.0 Tunisia 1996-97 Measured 20-59 29.7 50.9 43.8 6.4 22.7 17.2 Turkey 1997 Measured 20+ - - - 12.9 29.9 22.3 United Kingdom 1986-87 Measured 16-64 45.0 36.0 40.5 8.0 12.0 10.0 United States of America 1999-2002 Measured 16+ 65.57 59.49 - 25.81 31.78 - Uruguay 1998 Self-reported 18+ 57.0 49.0 52.4 17.0 19.0 18.1 Vanuatu 1998 Measured 20+ 45.9 51.9 48.9 12.2 19.6 15.9
Vietnam 1987-89 Measured 15+ - - - - - -
- no data reported * female data only
Table 1 (cont.)
Features 9
SCN News #29
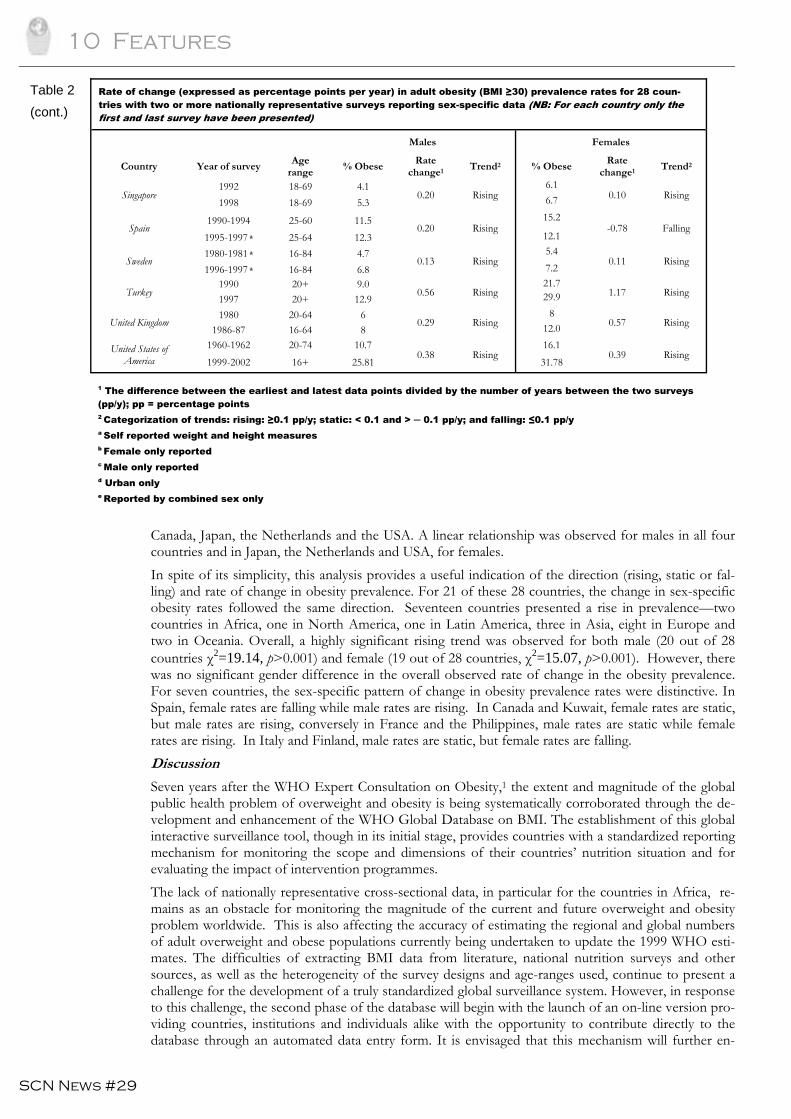
≥0.1%, falling if it was ≤-0.1%, and static if it was between these two cut-off points as applied in the analyses performed on child anthropometry.6,7 It is important to consider a number of caveats when in-terpreting and making inferences from this analysis. Firstly, the analysis does not take into account the variation within or between countries in terms of sam-pling procedures, age ranges, the period of observation within or between surveys. Secondly, an overall linear trend is assumed. This was substantiated for four countries with seven or more surveys, namely
Rate of change (expressed as percentage points per year) in adult obesity (BMI ≥30) prevalence rates for 28 coun-tries with two or more nationally representative surveys reporting sex-specific data (NB: For each country only the first and last survey have been presented)
Males Females
Country Year of survey
Age range % Obese Rate
change1 Trend2 % Obese Rate change1 Trend2
Brazil 1974-1975 25-64 2.5
0.16 Rising 6.9
0.34 Rising 1989 25-64 4.8 11.7
Canada 1970-1972 20-69 8.1
0.26 Rising 12.7
0.04 Static 2000-2001 a 20-64 16.0 13.9
Czech Republic 1993 a 16+ 10.49
0.35 Rising 12.24
0.45 Rising 2002 a 16+ 13.66 16.28
Denmark 1982 30-60 9.7
-0.13 Falling 8.6
-0.13 Falling 1994 a 16+ 8.2 7.0
Finland 1966-1972 15+ 8.3
0.05 Static 17.4
-0.23 Falling 1999 a 15-64 9.7 10.5
France 1980-1981 a 20+ 6.4
0.0 Static 6.3
0.14 Rising 1991-1992 a 20+ 6.4 7.8
Germany 1984-1986 25-69 15.1
0.31 Rising 16.5
0.44 Rising 1998 18-79 19.16 22.26
Hungary 1985-1988 15+ 12.09
1.49 Rising 18.4
0.47 Rising 1992-1994 18+ 21.0 21.2
India 1974-1979 18+ 0.2
0.006 Static 0.5
0.002 Static 1998 18+ 0.32 0.54
Ireland 1988-1989 18-64 7.8
1.37 Rising 12.9
0.33 Rising 1997-1999 18-64 20.1 15.9
Italy 1983 a 15+ 7.1
-0.05 Static 7.6
-0.12 Falling 1994 a 15+ 6.5 6.3
Japan 1976-1980 20+ 0.84
0.09 Static 2.69
0.03 Static 2001 15+ 2.9 3.3
Kuwait 1980-1981 18+ 14.84
0.70 Rising 30.32
-0.029 Static 1998-2000 18+ 27.5 29.8
Mauritius 1987 25-74 3.4
0.42 Rising 10.4
0.87 Rising 1998 20+ 8.0 20.0
Morocco 1984-1985 18+ 2.2
0.15 Rising 7.9
0.58 Rising 1998-1999 18+ 4.3 16.0
Nauru 1975-1976 25-69 63.2
0.94 Rising 72.4
0.34 Rising 1994 25-69 80.2 78.6
Netherlands 1981 20+ 3.9
0.16 Rising 6.2
0.18 Rising 1996-1998 20+ 6.5 9.1
New Zealand 1989 15-99 10
0.33 Rising 13
0.46 Rising 1996-1997h 15+ 12.6 16.7
Philippines 1993 20+ 1.7
0.08 Static 3.4
0.20 Rising 1998 20+ 2.1 4.4
Republic of Korea 1995 15+ 0.9
0.27 Rising 0.7
0.77 Rising 1998 19+ 1.7 3.0
Russia 1992 18+ 8.4
0.6 Rising 23.2
1.18 Rising 1996 18+ 10.8 27.9
Saudi Arabia 1987-1992 18+ 15.96
-0.58 Falling 25.77
-1.10 Falling 1995 18+ 13.05 20.26
Continued on page 10
Table 2
10 Features
SCN News #29
Canada, Japan, the Netherlands and the USA. A linear relationship was observed for males in all four countries and in Japan, the Netherlands and USA, for females. In spite of its simplicity, this analysis provides a useful indication of the direction (rising, static or fal-ling) and rate of change in obesity prevalence. For 21 of these 28 countries, the change in sex-specific obesity rates followed the same direction. Seventeen countries presented a rise in prevalence—two countries in Africa, one in North America, one in Latin America, three in Asia, eight in Europe and two in Oceania. Overall, a highly significant rising trend was observed for both male (20 out of 28 countries χ2=19.14, p>0.001) and female (19 out of 28 countries, χ2=15.07, p>0.001). However, there was no significant gender difference in the overall observed rate of change in the obesity prevalence. For seven countries, the sex-specific pattern of change in obesity prevalence rates were distinctive. In Spain, female rates are falling while male rates are rising. In Canada and Kuwait, female rates are static, but male rates are rising, conversely in France and the Philippines, male rates are static while female rates are rising. In Italy and Finland, male rates are static, but female rates are falling. Discussion
Seven years after the WHO Expert Consultation on Obesity,1 the extent and magnitude of the global public health problem of overweight and obesity is being systematically corroborated through the de-velopment and enhancement of the WHO Global Database on BMI. The establishment of this global interactive surveillance tool, though in its initial stage, provides countries with a standardized reporting mechanism for monitoring the scope and dimensions of their countries’ nutrition situation and for evaluating the impact of intervention programmes. The lack of nationally representative cross-sectional data, in particular for the countries in Africa, re-mains as an obstacle for monitoring the magnitude of the current and future overweight and obesity problem worldwide. This is also affecting the accuracy of estimating the regional and global numbers of adult overweight and obese populations currently being undertaken to update the 1999 WHO esti-mates. The difficulties of extracting BMI data from literature, national nutrition surveys and other sources, as well as the heterogeneity of the survey designs and age-ranges used, continue to present a challenge for the development of a truly standardized global surveillance system. However, in response to this challenge, the second phase of the database will begin with the launch of an on-line version pro-viding countries, institutions and individuals alike with the opportunity to contribute directly to the database through an automated data entry form. It is envisaged that this mechanism will further en-
Rate of change (expressed as percentage points per year) in adult obesity (BMI ≥30) prevalence rates for 28 coun-tries with two or more nationally representative surveys reporting sex-specific data (NB: For each country only the first and last survey have been presented)
Males Females
Country Year of survey Age range % Obese Rate
change1 Trend2 % Obese Rate change1 Trend2
Singapore 1992 18-69 4.1
0.20 Rising 6.1
0.10 Rising 1998 18-69 5.3 6.7
Spain 1990-1994 25-60 11.5
0.20 Rising 15.2
-0.78 Falling 1995-1997 a 25-64 12.3 12.1
Sweden 1980-1981 a 16-84 4.7
0.13 Rising 5.4
0.11 Rising 1996-1997 a 16-84 6.8 7.2
Turkey 1990 20+ 9.0
0.56 Rising 21.7
1.17 Rising 1997 20+ 12.9 29.9
United Kingdom 1980 20-64 6
0.29 Rising 8
0.57 Rising 1986-87 16-64 8 12.0
United States of America
1960-1962 20-74 10.7 0.38 Rising
16.1 0.39 Rising
1999-2002 16+ 25.81 31.78
1 The difference between the earliest and latest data points divided by the number of years between the two surveys (pp/y); pp = percentage points 2 Categorization of trends: rising: ≥0.1 pp/y; static: < 0.1 and > ─ 0.1 pp/y; and falling: ≤0.1 pp/y a Self reported weight and height measures b Female only reported c Male only reported d Urban only e Reported by combined sex only
Table 2 (cont.)
Features 11
SCN News #29
hance the comprehensiveness and coverage of the database and eventually allow a more precise target-ing and identification of the demographic profile (age and gender) and locations (urban/rural) of adult underweight, overweight and obese populations. One of the unique features of the database is the concurrent inclusion of food availability data ex-tracted from FAOSTAT, allowing the user to simultaneously explore and elucidate possible associa-tions between BMI data and changing patterns of food commodities. In the future, it is envisaged that the database will be enhanced further with the inclusion of available dietary intake survey data, allowing the user to explore the relationship between BMI and changing dietary patterns, that are usually attrib-uted to rapid socioeconomic transition,8-10 in particular the excessive consumption of various nutrients and dietary components (eg, fats and oils, sugar) on the one hand and low levels of intake of other nu-trients (eg, complex carbohydrates and fibre) on the other. Dramatic changes in socioeconomic conditions in various countries are expected to continue in the future, accompanied by continued changes in the behaviours and life-styles of communities.1,9-11 The co-existence of underweight and overweight within and between countries throughout the world, widens the scope of nutrition problems and poses one of the greatest challenges to national policy-makers, as well as to nutri-tionists and other health workers. It is, therefore, of the utmost importance to strengthen national nutrition monitoring and surveillance systems and mechanisms in all countries. The WHO Global Database on BMI can serve as a model that takes full advantage of the internet communication era, allowing data to be shared and compared, and subsequently used to support the formulation of evidence-based policies and pro-grammes. Acknowledgements
We are grateful to a number of people who have contributed to the development of the WHO Global Database on BMI. These include Masanobu Takahashi, Akiko Amamoto, Sarah Nalty, Anne-Marie Campbell, and Rowena Imperial Laue, for undertaking literature reviews, extracting data for review and their compilation; Francesco Branca from the National Institute for Research on Food & Nutrition, Rome, Italy; Katherine Flegal from the National Center for Health Statistics, Centers for Disease Con-trol & Prevention, Atlanta, USA; Ruth Bonita, Kate Strong and Jackie Lippe from the unit on Surveil-lance for Information and Policy in the WHO Department of Chronic Diseases and Health Promotion(CHP/SIP), for reviewing the data in an earlier version of the database and providing their valuable advice for its improvement; Boyd Swinburn and Helen La Fontaine from Deakin University, Mel-bourne, Australia; Joanna Broad from the University of Auckland, Auckland, New Zealand, and WPT James and others from the International Obesity Task Force (IOTF), for sharing the data they had collected for their projects. We would like to express our deep appreciation to Nick Masie-Taylor from the Department of Bio-logical Anthropology, University of Cambridge, Cambridge, UK, for his invaluable help and support in reviewing and enhancing the database, as well as for providing expert advice and support for data analysis. Special thanks are also due to Karl Morteo and Kurt Vertucci from the FAO Information Systems and Technology Division, Rome, Italy, for supporting the development and designing of the web-based database system. Finally, we would like to especially thank the countries and researchers who have kindly shared their data for inclusion in the WHO Global Database on BMI, and the WHO Regional Nutrition Advisers who supported this collection process. References
1. WHO. Obesity: preventing and managing the global epidemic. Report of a WHO Consultation. Geneva, World Health Organization, 2000 (WHO Technical Report Series No. 894). 2. WHO. Physical status: the use and interpretation of anthropometry. Report of a WHO Expert Committee. Ge-neva, World Health Organization, 1995 (WHO Technical Report Series No. 854). 3. WHO/IASO/IOTF. The Asia-Pacific perspective: redefining obesity and its treatment. Melbourne, Health Communications Australia, 2000. 4. James WPT, Chen C, Inoue S. Appropriate Asian body mass indices? Obesity Reviews, 2002; 3:139. 5. WHO. Appropriate body mass index for Asian populations and its implications for policy and inter-vention strategies. The Lancet, 2004; 363: 157-163
The co-existence of underweight and over-
weight within and between countries
throughout the world, widens the scope of
nutrition problems and poses one of the great-
est challenges to national policy-
makers….
12 Features
SCN News #29
6. de Onis M, Frongillo EA, Blössner M. Is malnutrition declining? An analysis of changes in levels of child malnutrition since 1980. Bulletin of the World Health Organization, 2000; 78:1222-1233. 7. de Onis M, Blössner M. Prevalence and trends of overweight among preschool children in developing countries. American Journal of Clinical Nutrition, 2000; 72: 1032-1039. 8. Popkin BM. The nutrition transition and obesity in the developing world. Journal of Nutrition, 2001; 131: 871S-873S. 9. Swinburn BA et al. Diet, nutrition and the prevention of excess weight gain and obesity. Public Health Nutrition, 2004; 7(1A): 123-146. 10. WHO. Diet, nutrition and the prevention of chronic diseases. Report of a joint WHO/FAO Ex-pert Consultation. Geneva, World Health Organization, 2003 (Technical Report Series No. 916) 11. Popkin BM. An overview on the nutrition transition and its health implications: the Bellagio meet-ing. Public Health Nutrition, 2002; 5(1A): 93-103. Contacts: Chizuru Nishida ([email protected]) and Patricia Mucavele ([email protected])
Features 13
SCN News #29
Nutrition transition, obesity & noncommunicable diseases:
drivers, outlook and concerns
Josef Schmidhuber and Prakash Shettya
Food and Agriculture Organization of the UN
Introduction Food and nutrition issues are perceived in developing societies as those relating to inadequate food or nutrient deficiency diseases. Now, however, diet and nutrition along with life-style changes are recog-nized as the principal environmental component affecting a wide range of diseases of public health importance in developing countries. The emerging epidemic of noncommunicable diseases (NCDs) is adding to the burden of malnutrition and, unlike what was previously believed, are no longer a prob-lem restricted to affluent, industrialized countries but increasingly also affect developing countries. Thus in developing societies, diseases caused by caloric inadequacy and deficiency continue to persist, but co-exist with the growing presence of diet related chronic diseases among adults; hence contribut-ing to the ‘double burden’ of malnutrition. Many of these NCDs are the result of changes in diet and life-styles that characterize the ‘nutrition transition’ which accompanies economic development, the increasing urbanization of societies and the globalization of food systems. NCDs take an enormous toll in lives (33 million premature deaths worldwide) and account for about 59% of premature deaths due to heart disease, stroke, cancer, diabetes and obesity. NCDs account for at least 40% of all deaths in developing countries and represent an even greater proportion of loss of disability adjusted life years (DALYs); they constitute an immense and growing global health problem imposing additional economic and health burden on developing countries. NCDs are largely prevent-able and require committed policies and targeted action by all stakeholders, public and private, national and international. Strategies that are aimed at promoting healthy diets and lifestyles will affect all sec-tors of society from food and agriculture, to transport and leisure sectors, not just the health sector. They require inter-sectoral dialogue and action and may affect the growth of several sectors that con-tribute to the economies of societies. Hence the relative costs and the consequences of both the emerging burden and the preventive solutions offered need to be considered if developing societies want to succeed in tackling this rising epidemic of NCDs. The ‘double burden’ of global malnutrition is a challenge that needs to be addressed by the food and nutrition community both in developed and developing societies, and must be addressed together. Drivers of the nutrition transition in developing countriesb
RAPID PRODUCTIVITY GROWTH IN AGRICULTURE AND FALLING REAL PRICES FOR FOOD The last two centuries have seen a fundamental transformation of diets in all affluent countries. At the beginning of this transformation was the agro-industrial revolution of the 19th century which brought about both the know-how to produce more and the income to consume more food. The moderniza-tion of agriculture has played a pivotal role in bringing about change. The rigorous application of scien-tific advances to traditional agriculture, mechanization, genetic improvements and the development of fertilizers and pesticides allowed a doubling and redoubling of food production within a few decades. In fact, productivity growth was so strong that growth in production comfortably exceeded growth in demand and afforded a rapidly growing population more and better food at declining real prices. Agri-cultural productivity growth also promoted the industrialization of the then largely agrarian societies. It helped accumulate capital, free up labour and provide ever more nutritious food. Eventually, produc-tivity growth, rising incomes and better nutrition became mutually supportive and thus spurred overall economic development.c These developments remained, however, largely limited to industrial coun-tries, at least for much of the 19th century. It took more than a century before the agro-industrial revolution started to reach developing countries. With the beginning of the 60s, the same factors that had initiated the agro-industrial revolution in the
aThe views expressed by the authors do not necessarily represent those of FAO. bSection 1 and 2 of this paper are largely based on Schmidhuber J (2003) “A long term outlook for long term changes in food consumption patterns: Concerns and policy options,” paper presented at the FAO Scientific Workshop.” cFogel1 estimates that half of the overall economic growth in France and England in the 19th century was a re-sult of better nutrition.
14 Features
SCN News #29
developed world helped transform the food and agricultural sectors of parts of the developing world. The combination of modern varieties, expansion of irrigation, more and improved input supplies and the widespread mechanization of production brought about an overall boost in food production in developing countries. Since the early 60s, the average caloric availability in the developing world has increased from about 1,950 to 2,680 kcals/person/day while protein availability nearly doubled from about 40 to 70 g/person/day. The prevalence of undernourishment declined from 37% in 1970 to 17% in 2000 and, while more than 840 million of people2 are still food insecure, this is more often the result of adverse local production conditions, such as war and civil strife, lack of income and of access to food rather than the inability of the world as a whole to produce and provide enough food. As in the industrial world of the 19th century, consumers in developing countries have benefited most from advances in agricultural productivity. In real terms, food prices have declined to the lowest levels in history and, together with gains in broader economic growth, have enabled consumers today to eat better while spending less of their budget on food. However, not all countries and regions have bene-fited from these advances. In parts of the developing world, notably in Sub-Saharan Africa, these ad-vances have not yielded a meaningful impact. But in many developing countries, the progress in access to more, better and cheaper food has been impressive. The rapid decline in real food prices has al-lowed consumers in developing countries to embark on food consumption patterns that were reserved for consumers in industrialized countries at much higher per capita gross domestic product (GDP) levels. Today, a consumer in a developing country can purchase more calories than ever before and more than consumers in industrialized countries ever could previously at comparable income levels. In China, for instance, consumers today have about 3000 kcals/day and 50 kg of meat per year (FAOSTAT, 2004) at their disposal—at less than US$ 1000 income per year.3 DEMOGRAPHIC CHANGES AND POPULATION GROWTH The latest UN population projections4 suggest a marked slow-down in population growth over the next decades. World population growth is forecast to slow to less than 0.8% by 2030, less than 0.5% by 2050 and may come to a complete halt by around 2070. The slow-down in population growth should allow to maintain and even increase food production per person in the future. The FAO out-look to 20305 predicts that the average dietary energy availability could increase from 2800 to 3050 kcals/person/day globally over the next 30 years; in developing countries the increase will even be more pronounced with an increase from 2680 to 2980 kcals/person/day. But the results of this study also suggest that there will be vast differences between countries and regions as well as within coun-tries. Another aspect of the demographic change in populations that will influence food availability and con-sumption, is the shift in the demographic pyramids of countries in the developing world. One of the most dramatic changes of the 20th century in developing countries is not merely the demographic tran-sition that has contributed to the rapid increase in population size and density but also the contribution of improvements in public health that impacts on the age structure of the population and of families. This process, can either help or handicap the escape from poverty. Early in the transition—with many more children than adults (ie, a high dependency ratio) and rapid population growth—the demo-graphic structure handicaps poverty reduction. The situation reverses later in the transition, when the age structure is less heavily weighted towards the very young. Countries in the later stages of the transi-tion have succeeded most in bringing down mass poverty. Developing countries like India and China are in the phase of a rapid demographic transition. Life expectancy is increasing while birth rates are on the decline. The share of population above the age of 60 is growing at a rapid rate and those who cross the age of 60 today are expected to live up to or over the age of 75 years. These changes in the demo-graphic profiles of developing countries will impact both on the food needs and consumption patterns but also on the related health burden of these societies. A crucial driver of the income growth in developing countries is the shift in the population structure. A large portion of the overall population will be economically active, earning incomes that are being spent on a rapidly shrinking number of children. In Asia, for instance, buying more food is often seen as a first ‘investment’ in the younger generation which is increasingly suffering from overweight and child obesity. The problem has become particularly acute in urban China, where 20 years of a strict one-child policy and a booming economy have meant that growing incomes are often spent on the family's only child. The result is a sharp rise in child obesity for a whole generation of “little emper-ors”. The Shanghai Preventive Medical Association, for instance, found that nearly 30% of city’s chil-dren were overweight with almost half of them obese.6
Features 15
SCN News #29
Urbanization, global outlook and regional differences
Africa and Asia are just beginning the urbanization process
Urbanization rates and share of urban population: 1999/01
M iddle East-North Africa
South Asia
East Asia
sub-Saharan Africa
Latin America and Caribbean
High Income Countries
Europe and Central Asia-1
0
1
2
3
4
5
20 30 40 50 60 70 80 90 100
Urban population, share of totalU
rban
pop
ulat
ion ,
gro
wth
% p
.a.
Source: World Bank, World Development Indicators, 2003
Urbanization to accelerate over the next 30 yearsUrban-rural population, World, 1950-2030
0
1
2
3
4
5
1950 1960 1970 1980 1990 2000 2010 2020 2030
billi
on p
eopl
e
Rural
Urban
Source, FAO, FAOSTAT, 2003
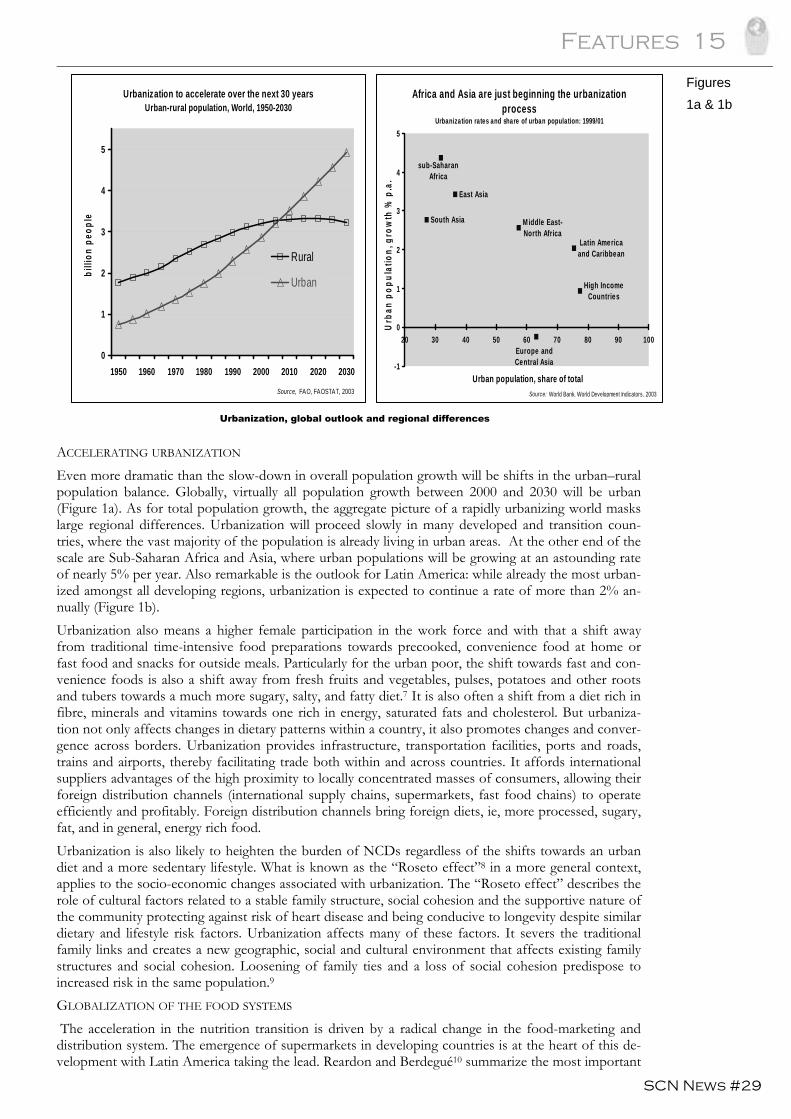
ACCELERATING URBANIZATION Even more dramatic than the slow-down in overall population growth will be shifts in the urban–rural population balance. Globally, virtually all population growth between 2000 and 2030 will be urban (Figure 1a). As for total population growth, the aggregate picture of a rapidly urbanizing world masks large regional differences. Urbanization will proceed slowly in many developed and transition coun-tries, where the vast majority of the population is already living in urban areas. At the other end of the scale are Sub-Saharan Africa and Asia, where urban populations will be growing at an astounding rate of nearly 5% per year. Also remarkable is the outlook for Latin America: while already the most urban-ized amongst all developing regions, urbanization is expected to continue a rate of more than 2% an-nually (Figure 1b). Urbanization also means a higher female participation in the work force and with that a shift away from traditional time-intensive food preparations towards precooked, convenience food at home or fast food and snacks for outside meals. Particularly for the urban poor, the shift towards fast and con-venience foods is also a shift away from fresh fruits and vegetables, pulses, potatoes and other roots and tubers towards a much more sugary, salty, and fatty diet.7 It is also often a shift from a diet rich in fibre, minerals and vitamins towards one rich in energy, saturated fats and cholesterol. But urbaniza-tion not only affects changes in dietary patterns within a country, it also promotes changes and conver-gence across borders. Urbanization provides infrastructure, transportation facilities, ports and roads, trains and airports, thereby facilitating trade both within and across countries. It affords international suppliers advantages of the high proximity to locally concentrated masses of consumers, allowing their foreign distribution channels (international supply chains, supermarkets, fast food chains) to operate efficiently and profitably. Foreign distribution channels bring foreign diets, ie, more processed, sugary, fat, and in general, energy rich food. Urbanization is also likely to heighten the burden of NCDs regardless of the shifts towards an urban diet and a more sedentary lifestyle. What is known as the “Roseto effect”8 in a more general context, applies to the socio-economic changes associated with urbanization. The “Roseto effect” describes the role of cultural factors related to a stable family structure, social cohesion and the supportive nature of the community protecting against risk of heart disease and being conducive to longevity despite similar dietary and lifestyle risk factors. Urbanization affects many of these factors. It severs the traditional family links and creates a new geographic, social and cultural environment that affects existing family structures and social cohesion. Loosening of family ties and a loss of social cohesion predispose to increased risk in the same population.9 GLOBALIZATION OF THE FOOD SYSTEMS The acceleration in the nutrition transition is driven by a radical change in the food-marketing and distribution system. The emergence of supermarkets in developing countries is at the heart of this de-velopment with Latin America taking the lead. Reardon and Berdegué10 summarize the most important
Figures 1a & 1b
16 Features
SCN News #29
changes for the region. They find that, over the 90s, supermarkets have been taking over much of food retailing in Latin America. In 2000 they had roughly 60% on average of the national retail sectors in South America and Mexico, up from 15% in 1990. This rapid expansion was only possible as super-markets moved far beyond their original niches, expanded from large to small and poor countries, from metropolitan areas to rural towns and expanded the customers from the upper/middle to the working class. Reardon and Berdequé10 also venture into the likely developments for other regions. They suggest that East and South East Asia as well as Eastern and Central Europe are only five to seven years behind the developments in Latin America and expect that the transition will even be faster in these regions. Even South and East Africa are seen as catching-up to Latin America over the next decade, albeit at a slower pace. Where supermarkets have made such massive inroads into the food retailing system, they affect the entire food economy. In Brazil for instance, supermarkets have provided a boost to milk consump-tion, which was driven by a rapid increase in yoghurt and UHT milk (Ultra High Temperature). Here the expansion of supermarkets created a very positive outcome making safe and cheap milk available to the poor. But Reardon and Berdegué10 also find that supermarkets are often also distribution chan-nels for cheaper, unhealthy snacks and provide the platforms for fast food chains and junk food. ROLE OF THE FOOD INDUSTRY Urbanization also means more frequent eating outside of the home, often under time and budgetary constraints. The fast food industry has catered to these constraints providing fast access to cheap meals, take away services and home delivery services. The fast food meals also cater to other needs, most importantly the desire to eat a salt-, sugar- and fat-rich diet, an old, evolutionary craving to bene-fit from access to these formerly scarce resources.7 The growing processing of foodstuffs itself has an increasing influence on food consumption patterns. Vegetal oils, for instance, are important sources of essential fatty acids, but are as such not readily useable as ingredients for many sophisticated food products. Hydrogenation allows to convert fluid oils into spreadable margarine but the same process can turn valuable unsaturated fatty acids into harmful trans-fatty acids. Likewise, the almost universal shift to refined grain flour has a direct impact on the nutrient intakes, particularly where wheat and maize are staple foods. Modern milling procedures produce refined flour which has better digestibility but destroys its texture, structure and valuable fibre and decimates minerals and vitamins.7 Changes in dietary consumption patterns
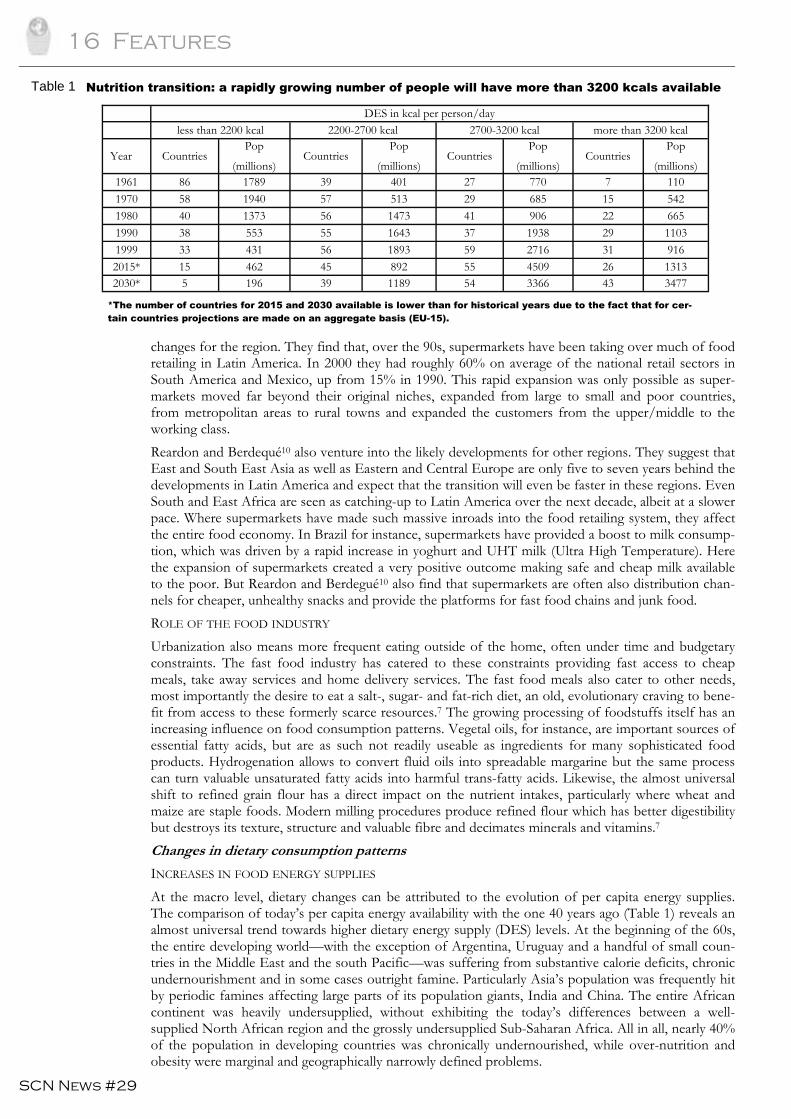
INCREASES IN FOOD ENERGY SUPPLIES At the macro level, dietary changes can be attributed to the evolution of per capita energy supplies. The comparison of today’s per capita energy availability with the one 40 years ago (Table 1) reveals an almost universal trend towards higher dietary energy supply (DES) levels. At the beginning of the 60s, the entire developing world—with the exception of Argentina, Uruguay and a handful of small coun-tries in the Middle East and the south Pacific—was suffering from substantive calorie deficits, chronic undernourishment and in some cases outright famine. Particularly Asia’s population was frequently hit by periodic famines affecting large parts of its population giants, India and China. The entire African continent was heavily undersupplied, without exhibiting the today’s differences between a well-supplied North African region and the grossly undersupplied Sub-Saharan Africa. All in all, nearly 40% of the population in developing countries was chronically undernourished, while over-nutrition and obesity were marginal and geographically narrowly defined problems.
*The number of countries for 2015 and 2030 available is lower than for historical years due to the fact that for cer-tain countries projections are made on an aggregate basis (EU-15).
DES in kcal per person/day less than 2200 kcal 2200-2700 kcal 2700-3200 kcal more than 3200 kcal
Year Countries Pop
(millions) Countries
Pop (millions)
Countries Pop
(millions) Countries
Pop (millions)
1961 86 1789 39 401 27 770 7 110 1970 58 1940 57 513 29 685 15 542 1980 40 1373 56 1473 41 906 22 665 1990 38 553 55 1643 37 1938 29 1103 1999 33 431 56 1893 59 2716 31 916 2015* 15 462 45 892 55 4509 26 1313 2030* 5 196 39 1189 54 3366 43 3477
Table 1 Nutrition transition: a rapidly growing number of people will have more than 3200 kcals available
Features 17
SCN News #29
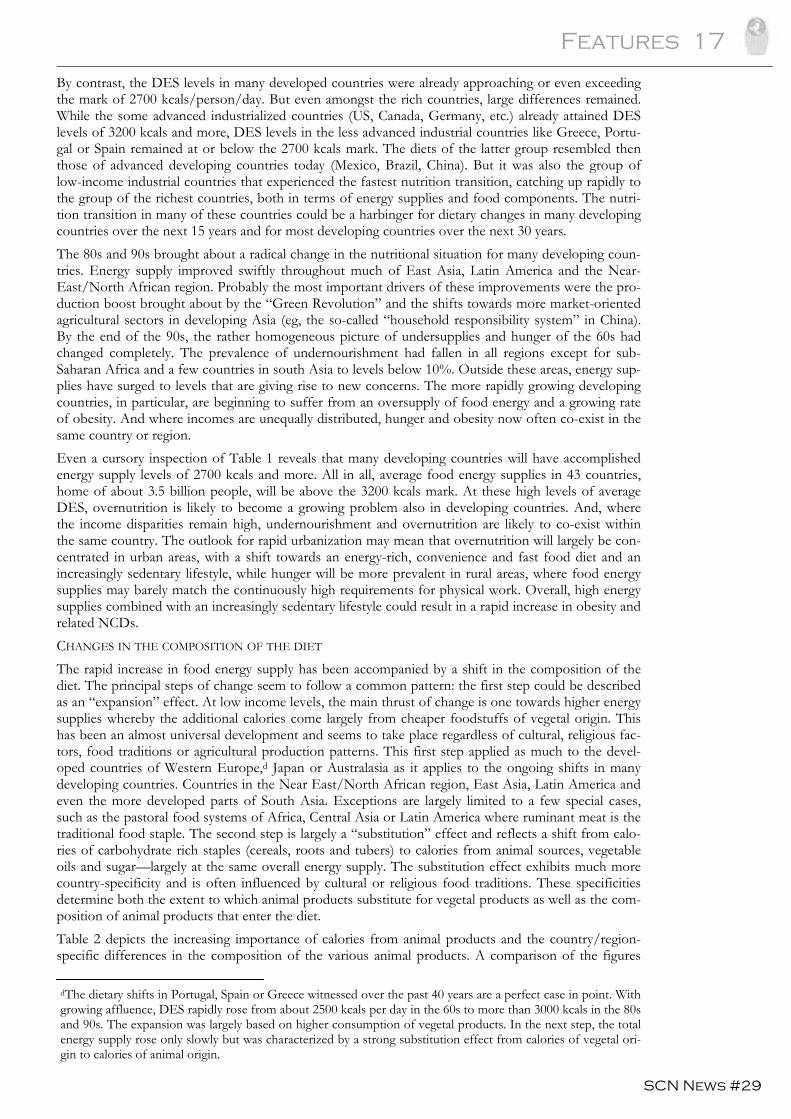
By contrast, the DES levels in many developed countries were already approaching or even exceeding the mark of 2700 kcals/person/day. But even amongst the rich countries, large differences remained. While the some advanced industrialized countries (US, Canada, Germany, etc.) already attained DES levels of 3200 kcals and more, DES levels in the less advanced industrial countries like Greece, Portu-gal or Spain remained at or below the 2700 kcals mark. The diets of the latter group resembled then those of advanced developing countries today (Mexico, Brazil, China). But it was also the group of low-income industrial countries that experienced the fastest nutrition transition, catching up rapidly to the group of the richest countries, both in terms of energy supplies and food components. The nutri-tion transition in many of these countries could be a harbinger for dietary changes in many developing countries over the next 15 years and for most developing countries over the next 30 years. The 80s and 90s brought about a radical change in the nutritional situation for many developing coun-tries. Energy supply improved swiftly throughout much of East Asia, Latin America and the Near-East/North African region. Probably the most important drivers of these improvements were the pro-duction boost brought about by the “Green Revolution” and the shifts towards more market-oriented agricultural sectors in developing Asia (eg, the so-called “household responsibility system” in China). By the end of the 90s, the rather homogeneous picture of undersupplies and hunger of the 60s had changed completely. The prevalence of undernourishment had fallen in all regions except for sub-Saharan Africa and a few countries in south Asia to levels below 10%. Outside these areas, energy sup-plies have surged to levels that are giving rise to new concerns. The more rapidly growing developing countries, in particular, are beginning to suffer from an oversupply of food energy and a growing rate of obesity. And where incomes are unequally distributed, hunger and obesity now often co-exist in the same country or region. Even a cursory inspection of Table 1 reveals that many developing countries will have accomplished energy supply levels of 2700 kcals and more. All in all, average food energy supplies in 43 countries, home of about 3.5 billion people, will be above the 3200 kcals mark. At these high levels of average DES, overnutrition is likely to become a growing problem also in developing countries. And, where the income disparities remain high, undernourishment and overnutrition are likely to co-exist within the same country. The outlook for rapid urbanization may mean that overnutrition will largely be con-centrated in urban areas, with a shift towards an energy-rich, convenience and fast food diet and an increasingly sedentary lifestyle, while hunger will be more prevalent in rural areas, where food energy supplies may barely match the continuously high requirements for physical work. Overall, high energy supplies combined with an increasingly sedentary lifestyle could result in a rapid increase in obesity and related NCDs. CHANGES IN THE COMPOSITION OF THE DIET The rapid increase in food energy supply has been accompanied by a shift in the composition of the diet. The principal steps of change seem to follow a common pattern: the first step could be described as an “expansion” effect. At low income levels, the main thrust of change is one towards higher energy supplies whereby the additional calories come largely from cheaper foodstuffs of vegetal origin. This has been an almost universal development and seems to take place regardless of cultural, religious fac-tors, food traditions or agricultural production patterns. This first step applied as much to the devel-oped countries of Western Europe,d Japan or Australasia as it applies to the ongoing shifts in many developing countries. Countries in the Near East/North African region, East Asia, Latin America and even the more developed parts of South Asia. Exceptions are largely limited to a few special cases, such as the pastoral food systems of Africa, Central Asia or Latin America where ruminant meat is the traditional food staple. The second step is largely a “substitution” effect and reflects a shift from calo-ries of carbohydrate rich staples (cereals, roots and tubers) to calories from animal sources, vegetable oils and sugar—largely at the same overall energy supply. The substitution effect exhibits much more country-specificity and is often influenced by cultural or religious food traditions. These specificities determine both the extent to which animal products substitute for vegetal products as well as the com-position of animal products that enter the diet. Table 2 depicts the increasing importance of calories from animal products and the country/region-specific differences in the composition of the various animal products. A comparison of the figures
dThe dietary shifts in Portugal, Spain or Greece witnessed over the past 40 years are a perfect case in point. With growing affluence, DES rapidly rose from about 2500 kcals per day in the 60s to more than 3000 kcals in the 80s and 90s. The expansion was largely based on higher consumption of vegetal products. In the next step, the total energy supply rose only slowly but was characterized by a strong substitution effect from calories of vegetal ori-gin to calories of animal origin.
18 Features
SCN News #29
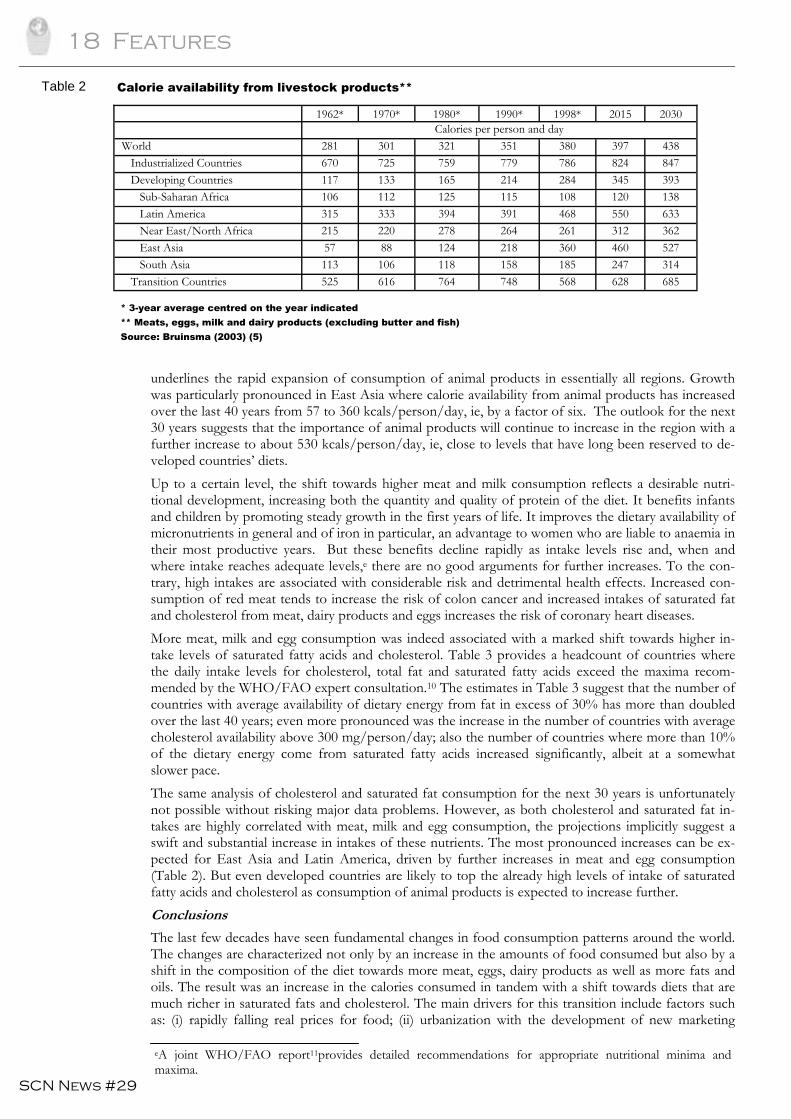
underlines the rapid expansion of consumption of animal products in essentially all regions. Growth was particularly pronounced in East Asia where calorie availability from animal products has increased over the last 40 years from 57 to 360 kcals/person/day, ie, by a factor of six. The outlook for the next 30 years suggests that the importance of animal products will continue to increase in the region with a further increase to about 530 kcals/person/day, ie, close to levels that have long been reserved to de-veloped countries’ diets. Up to a certain level, the shift towards higher meat and milk consumption reflects a desirable nutri-tional development, increasing both the quantity and quality of protein of the diet. It benefits infants and children by promoting steady growth in the first years of life. It improves the dietary availability of micronutrients in general and of iron in particular, an advantage to women who are liable to anaemia in their most productive years. But these benefits decline rapidly as intake levels rise and, when and where intake reaches adequate levels,e there are no good arguments for further increases. To the con-trary, high intakes are associated with considerable risk and detrimental health effects. Increased con-sumption of red meat tends to increase the risk of colon cancer and increased intakes of saturated fat and cholesterol from meat, dairy products and eggs increases the risk of coronary heart diseases. More meat, milk and egg consumption was indeed associated with a marked shift towards higher in-take levels of saturated fatty acids and cholesterol. Table 3 provides a headcount of countries where the daily intake levels for cholesterol, total fat and saturated fatty acids exceed the maxima recom-mended by the WHO/FAO expert consultation.10 The estimates in Table 3 suggest that the number of countries with average availability of dietary energy from fat in excess of 30% has more than doubled over the last 40 years; even more pronounced was the increase in the number of countries with average cholesterol availability above 300 mg/person/day; also the number of countries where more than 10% of the dietary energy come from saturated fatty acids increased significantly, albeit at a somewhat slower pace. The same analysis of cholesterol and saturated fat consumption for the next 30 years is unfortunately not possible without risking major data problems. However, as both cholesterol and saturated fat in-takes are highly correlated with meat, milk and egg consumption, the projections implicitly suggest a swift and substantial increase in intakes of these nutrients. The most pronounced increases can be ex-pected for East Asia and Latin America, driven by further increases in meat and egg consumption (Table 2). But even developed countries are likely to top the already high levels of intake of saturated fatty acids and cholesterol as consumption of animal products is expected to increase further. Conclusions
The last few decades have seen fundamental changes in food consumption patterns around the world. The changes are characterized not only by an increase in the amounts of food consumed but also by a shift in the composition of the diet towards more meat, eggs, dairy products as well as more fats and oils. The result was an increase in the calories consumed in tandem with a shift towards diets that are much richer in saturated fats and cholesterol. The main drivers for this transition include factors such as: (i) rapidly falling real prices for food; (ii) urbanization with the development of new marketing
1962* 1970* 1980* 1990* 1998* 2015 2030 Calories per person and day World 281 301 321 351 380 397 438 Industrialized Countries 670 725 759 779 786 824 847 Developing Countries 117 133 165 214 284 345 393 Sub-Saharan Africa 106 112 125 115 108 120 138 Latin America 315 333 394 391 468 550 633 Near East/North Africa 215 220 278 264 261 312 362 East Asia 57 88 124 218 360 460 527 South Asia 113 106 118 158 185 247 314 Transition Countries 525 616 764 748 568 628 685
* 3-year average centred on the year indicated ** Meats, eggs, milk and dairy products (excluding butter and fish) Source: Bruinsma (2003) (5)
Table 2 Calorie availability from livestock products**
eA joint WHO/FAO report11provides detailed recommendations for appropriate nutritional minima and maxima.
Features 19
SCN News #29
channels and the spread of supermarkets into developing countries; (iii) and freer trade and globaliza-tion with the emergence of large, transnationally operating food companies. This diet transition also brought about a rapid increase in the prevalence of overweight, obesity and related NCDs. Initially, these problems were limited to developed countries, but more recently a growing number of develop-ing countries is experiencing a similar transformation process. The growing health concerns have also given rise to a intense debate about possible remedies to stop and reverse the obesity epidemic in developed countries, and, perhaps even more importantly, to pre-vent similar developments in developing countries. Some of these policy options have been examined in this paper. While much of the policy analysis was limited to a discussion of conceptual issues and problems, it allowed to identify the principal strengths and weaknesses of the various policy measures that are currently being discussed and considered for implementation. Perhaps most importantly, the discussion underlined that more empirical work is required before recommendations for a particular or a combination of policy measures to address the growing obesity problem can be made. Given the speed of growth of the obesity/NCD problem, this lack of knowledge needs to be addressed urgently. References
1. Fogel R. “Economic growth, population theory and physiology: the bearing of long-term processes on the making of economic policy”, American Economic Review, 1994, 84(3):369-95. 2. FAO. The State of Food Insecurity in the World 2003. Rome, FAO, 2003. 3. World Bank. World Development Indicators. Washington, DC, World Bank, 2002, data available on CD. 4. UN Population Division of the Department of Economic and Social Affairs. World Population Pros-pects: The 2002 Revision. New York, United Nations, 2003. 5. Bruinsma (ed). World agriculture: towards 2015/2030, An FAO Perspective. FAO, Rome and Earthscan, London, 2003. 6. Sheng Hongguang. L’obésité, “épidémie globale” du nouveau siècle. IOTF, http://forums.transnationale.org/ accessed August 2003. 7. Smil V. Feeding the World: A Challenge for the Twenty-First Century. The MIT Press, Cambridge, Massa-chusetts and London, England, 2000. 8. Egolf B, Lasker J, Wolf S, and Potvin L. The Roseto Effect: A 50-year Comparison of Mortality Rates. American Journal of Public Health, 1992, 82(8): 1089-92. 9. Shetty PS. “Diet, Lifestyle and Chronic Disease: Lessons from Contrasting Worlds”, in Diet, Nutri-tion & Chronic Disease, Lessons from Contrasting Worlds. Shetty PS and McPherson K (eds.), Wiley, 1997. 10. Reardon T and Berdegué JA. The Rapid Rise of Supermarkets in Latin America: Challenges and Opportunities for Development. Development Policy Review, 2002, 20 (4): 371-388. 11. WHO/FAO. Diet, Nutrition and the Prevention of Chronic Diseases. Report of a Joint WHO/FAO Expert Consultation. WHO Technical Report Series 916, Geneva, WHO, 2003. Contact: Prakash Shetty ([email protected]) or Josef Schmidhuber ([email protected])
1961/63 1969/71 1979/81 1989/91 1999/01
Limits(a) Number of countries
No of countries (b,c) 158 158 158 158 178 Total fat > 30% 28 31 43 54 61 Saturated fatty acids > 10% 47 49 50 55 62 Cholesterol > 300 mg/day 26 30 41 44 64
Table 3
Notes: (a) All results are based on total availability rather than actual intake. This can result in a misclassification of coun-tries, particularly where recommendations are defined in absolute terms. (b) Limited to countries for which FAO produces Supply-Utilization Accounts (SUAs). (c) The disintegration of the Former Soviet Union and other countries in Eastern Europe increased the number of countries for which FAO provided SUAs in the 90s to 178.
Fats and cholesterol availability in excess of recommended levels
20 Features
SCN News #29
Diet quality, poverty and food policy:
a new research agenda for obesity prevention in
developing countries
Corinna Hawkes, Cara Eckhardt, Marie Ruel
and Nicholas Minot
International Food Policy Research Institute
It is the best of times; it is the worst of times. Globally, the percentage of people who are underweight has fallen from 32% to 28% in the last decade. Proportionally, more children now have enough to eat. Yet malnutrition in Sub-Saharan Africa is increasing and the Millennium Development Goal to cut hunger in half by 2015 seems far away. On top of this, more and more people in the developing world are becoming overweight or obese. Significant increases in the prevalence of obesity are being reported from numerous developing countries. Worldwide, over 10% of children are already overweight or obese. It is a tale of two malnutritions. A dual burden of malnutrition
In a low-income community in northeast Brazil, 10% of children are underweight, and 11% of adoles-cents and 25% of adults are stunted. Yet over 5% of girls and 25% of adults are overweight. Over-weight and undernutrition co-exist in 30% of households. In a suburb in northern India, 16% of peo-ple are too thin while 28% are overweight. Obesity is growing in the shanty towns of both countries. Ever since the co-existence of underweight and overweight in the same households was first identified in China, Brazil and Russia,1 more and more examples of the close proximity of the two types of mal-nutrition have been emerging. Overweight and obesity are becoming problems of the poor. In one of Latin America’s poorest countries, Bolivia, more than one quarter of infants are stunted. But between 1994 and 1998 the number of overweight women increased nine percentage points, with the greatest increases seen among women with less education. In Jamaica, overweight in adolescents ap-proaches levels found in the US, while 10% are underweight. In Egypt, over 10% of households con-tain a stunted child and an overweight mother. In developed countries, obesity has been concentrated among the poor for decades. But in developing countries, obesity has traditionally been associated with wealth—until now. Although poverty still con-fers protection from obesity in the lowest income nations, it is now associated with obesity in the eco-nomically more advanced developing countries, especially in urban areas and more developed regions.2 Overweight and obesity among the poor severely compromise public health gains in developing coun-tries. The conditions increase the risk of developing chronic diseases, notably heart disease, diabetes and some cancers. Diet-related chronic diseases are already a burden in poor countries: 80% of all deaths from cardiovascular disease occur in low- and middle-income nations. As overweight and obe-sity increase among the poor, so will the burden of chronic disease. The result will be not just an en-demic double burden of malnutrition, but a entrenched double burden of disease. In the US, obesity is also associated with household food insecurity. The correlation is likewise emerg-ing in some developing economies. In the Republic of Korea, for example, food insecure children are more likely to be overweight than food secure children. Evidence is also emerging that infant undernutrition increases the likelihood of overnutrition later in life. Childhood stunting may be a risk factor for the development of obesity.3 There may also be links between overweight and micronutrient deficiency. In rural Mexico, obesity rates increased 78% between 1980 and 1998, and diabetes by 62%. Meanwhile, more than 20% of women have anaemia. This might well be linked with the declining consumption of fruits and vegeta-bles and increasing intake of high-cholesterol foods in the country. The issue is clearly not just a ques-tion of excess or deficiency, but of poor quality diets. An issue of diet quality
High-quality diets benefit everyone at risk from under- or overnutrition. In poorer countries, diet qual-ity has traditionally been equated with sufficient intake of energy and essential nutrients. But with die-tary patterns undergoing radical transformations—becoming more concentrated in sugars, saturated
Features 21
SCN News #29
fats and salt while being low in fruits, vegetables and whole grain cereals—it needs to be recognized that malnutrition is not simply caused by a lack of food overall, but by a lack of high-quality foods. Given the rapid spread of this so-called “nutrition transition”, the definition of diet quality now needs to account for both deficiency and excess intake of certain nutrients and foods. A healthy, high quality diet leading to optimal nutrition should contain sufficient energy and nutrients, but also limit the amount of saturated fats, transfats, cholesterol, sodium and added sugars, and include many servings of fruits, vegetables and wholegrain products. Nutritional research to promote better diets
Researchers have begun to call for public health programmes that simultaneously address problems of underweight and overweight. Yet how can we intervene to control overweight when we are trying, at the same time, to increase the body mass index of the underweight? And how can we best intervene to improve underweight without moving too far towards overweight and obesity? Given the emerging burden on the poor, this challenge needs to be confronted and integrated inter-ventions developed to address both over- and undernutrition. Such interventions are needed immedi-ately. But to improve our responses over the longer term, we need a coherent research agenda to help better understand the dynamics behind the coexistence of under- and overnutrition. The nutrition transition has been clearly identified in many countries through an examination of food availability statistics. What is less evident is how this changing supply of basic commodities is affecting dietary patterns across different types of households and among different household members. What shifts in food consumption patterns lead to overweight and obesity in developing countries? How can dietary quality improve without leading to excess energy intake? Does increasing energy intake auto-matically lead to elimination of micronutrient deficiency or do obesity and micronutrient malnutrition coexist as a result of poor diet quality? How do household income and food prices affect diet quality and obesity? These are the questions we need to address in order to target nutrition and public health interventions more effectively. A food policy approach
To integrate responses to under- and overnutrition most effectively, we also need to go beyond the traditional approach to nutrition interventions and take a closer look at broader food policy. There are many factors fuelling changes in diets: the globalization of trade, finance, information, and culture; technological changes in food production, processing and distribution; higher incomes; demographic shifts; and urban growth. These determinants of dietary change are all influenced by public policy, and by food policy in particular. A food policy approach allows us to place under- and overnutrition in the same frame and consider the tradeoffs between them. How to ensure improved diet quality through consumption of micronu-trient-rich meat while not encouraging excess intake of saturated fats? A food policy approach allows us to think more broadly about the need to address health, poverty and environmental concerns. Take fish. How to increase global demand for fish consumption while ensuring rising prices do not push fish out of the reach of the poor and that fishing activities do not damage the environment?4 Food policy research can help us identify positive solutions. Fruits and vegetables are an essential part of a healthy diet, rich in micronutrients and protective against chronic diseases. There is also some evidence that eating fruits and vegetables helps control energy intake. Research conducted at the Inter-national Food Policy Research Institute provides insight into the constraints to higher consumption among the poor.5 In most developing countries, there is an enormous gap between mean intake of fruits and vegetables and the WHO recommendation of 400 grams per capita per day. In Sub-Saharan Africa, low-income households are more sensitive to price than higher-income households. Fruit and vegetable consumption increases steadily as income increases, but as income grows, consumption of fruits and vegetables increases at a slower pace. The policy implication is clear: income growth will contribute to greater consumption of fruits and vegetables but economic growth alone is unlikely to help developing countries reach recommended levels. Food policies are needed to alleviate price and availability constraints that prevent poor households from consuming more fruits and vegetables, and to encourage all households to eat more. The approach would address poor diet quality among the underweight and overweight alike. A food policy research agenda
In 2004, the 192 Member States of the World Health Organization called for action on the nutrition transition. The Global Strategy on Diet, Physical Activity and Health requests countries to implement poli-cies promoting healthier diets alongside malnutrition reduction. To facilitate the development of such
22 Features
SCN News #29
policies, the Strategy calls for more research on the production, availability, processing and consump-tion of food and the policies that affect them. The lack of research is hampering efforts to develop food policy recommendations to redirect the nu-trition transition towards optimal diets and good health. This is especially pressing given concerns ex-pressed by the G77 countries that WHO Strategy recommendations would negatively affect their agri-cultural economies and small farmers. While the tactics of certain special interests against the Strategy have rightly outraged public health campaigners, there is a legitimate concern: developing countries need to continue to develop their agricultural economies and support the livelihoods of small produc-ers. This is another advantage of a food policy approach: it allows us to place both the food economy and food consumption in the same frame. To move forward, two research questions are vital. First, how is the globalization of food systems driv-ing diet change? We need to identify how agricultural production, international trade, food processing, and new patterns of food retailing are affecting the price and availability of food, and how this in turn is shaping diets. Second, what are the “win-win” solutions for both agriculture and diet quality? We need to find policies and programmes to move rural development and healthy diets forward hand-in-hand. Farmers need markets for high-value food products like fruits and vegetables, and those at risk from under- and overnutrition need their products. A closer examination of pricing policies would be one place to start. As pointed out by Gillespie and Haddad,6 governments engage in numerous direct and indirect methods to affect food prices, from direct subsidies that lower the purchase price, to subsidies and taxes on various inputs. We need to review how food prices are affecting dietary patterns and then identify how food price policies could be reoriented to encourage the consumption of healthier foods. Another area in need of attention is food retailing. The rapid emergence of supermarkets is having a more profound effect on the market for fruit and vegetables in many developing countries than inter-national trade. Supermarkets are also major channels for the sales of highly-processed foods.7 Under-standing how the concentrated procurement systems associated with large chains affect small farmers is critical; likewise, we need to identify the impact of supermarkets on food consumption habits and examine if supermarkets could be a vehicle to improve diet quality. Trade and finance liberalization is also having an important impact. Changing trade patterns in the edi-ble oils market is affecting national economies; we now need to examine how these emerging trade patterns are affecting the mix of more and less healthy oils in the global marketplace. Armed with this information, we could better identify policies needed reorient the food system towards healthier out-comes. We now have an opportunity to confront a real threat to sustainable economic development: poor quality diets associated with obesity, chronic diseases and premature death. Well-targeted research is one mechanism to help prevent these problems becoming an even more severe burden on poor coun-tries and poor people. References
1. Doak CM, Adair LS, Monteiro C, Popkin BM. Overweight and underweight coexist within house-holds in Brazil, China and Russia. Journal of Nutrition, 2000, 130:2965-2971. 2. Monteiro C, Conde WL, Lu B, et al. Obesity and inequities in health in the developing world. Interna-tional Journal Of Obesity, 2004, 28 (9): 1181-1186. 3. Popkin BM, Richards M, Montiero CA. Stunting is associated with overweight in children of four nations that are undergoing the nutrition transition. Journal of Nutrition, 1996, 126:3009-3016. 4. Delgado CL, Wada N, Rosegrant MW et al. Fish to 2020. Washington DC, IFPRI, 2003. 5. Ruel MT, Minot N, Smith L. Patterns and determinants of fruit and vegetable consumption in Sub-Saharan Af-rica: a multi-country comparison. Draft paper prepared for the Joint WHO/FAO Workshop on Fruit and Vegetables for Health Kobe, Japan, September 1-3, 2004. WHO, in press. 6. Gillespie S, Haddad L. Attacking the Double Burden of Malnutrition in Asia. Manila, Asian Development Bank, 2001. 7. Reardon T, Timmer CP, Barrett CB, Berdegué J. The rise of supermarkets in Africa, Asia and Latin America. American Journal of Agricultural Economics, 2003, 85(5):1140-1146. For more information about the diet quality research programme at IFPRI, please contact Corinna Hawkes at [email protected]
Features 23
SCN News #29
Infant Feeding and Obesity
Miriam Labbok
UNICEF Introduction
Increasing prevalence of obesity is a major and growing concern in both developing and industrialized countries. Obesity is associated with increases in nearly all chronic diseases, morbidity and mortality. It has long been recognized that genetic and behavioural predisposition, excess caloric intake and insuffi-cient exercise are directly associated with obesity. There are conflicting views, however, as to whether early childhood practices could have any lasting impact on body composition in later childhood and adulthood. More light is being shed on this issue thanks to recent research. This review includes recent studies that help define and clarify the relationship between infant feeding practices and later obesity in child-hood and beyond. This review will not include the literature that demonstrates that maternal obesity at the time of pregnancy and lactation is negatively associated with breastfeeding success. Is there an association of infant feeding patterns and obesity?
One of the largest and most recent studies on obesity in the US1 asked, “Does breastfeeding protect against paediatric overweight?” While findings for the larger population did not achieve significance, the study found that the duration of breastfeeding showed a dose-response protective relationship against the risk of overweight in non-Hispanic white four year old children. This finding confirmed the similar results of a meta-analysis which concluded that, among 11 studies that examined prevalence of overweight in children older than three years of age and that had a sample size of ≥100 per feeding group, eight showed a lower risk of overweight in children who had been breastfed, after controlling for potential confounders. The three "negative" studies lacked information on the exclusivity of breast-feeding. A dose-response relationship with duration of breastfeeding was observed in some, but not all, of the "positive" studies.2 Does this association hold at different ages and in different settings? A study in Scotland of 32,200 children assessed at ages 39-42 months found the odds ratio (OR) for BMI ≥98 percentile to be 0.70 (95% CI 0.61-0.80) for breastfed children.3 In a German study of 9,206 children five to six years old,4 the prevalence of obesity in never breastfed children was 4.5% when compared to 2.8% in those ever breastfed children. A clear dose-response effect for the duration of breast-feeding on the prevalence of obesity was found to be 3.8%, 2.3%, 1.7% and 0.8% for exclusive breastfeeding in children 2, 3-5, 6-12 and >12 months, respectively. The results for overweight were very similar. The protective effect of breastfeeding on overweight and obe-sity could not be explained by differences in social class or lifestyle. The adjusted OR of breastfeeding for any length of time was 0.71 (95% CI, 0.56-0.90) for obesity and 0.77 (95% CI, 0.66-0.88) for over-weight. A Czech study of 33,768 school-children aged 6-14 years included multiple logistic regression analyses to assess the association between breastfeeding and BMI.5 They found that the overall prevalence of overweight was lower in breastfed children. The effect of breastfeeding on overweight and obesity did not diminish with age in children 6-14 years old, controlling for parental education, parental obesity, maternal smoking, high birthweight, watching television, number of siblings, and physical activity. Ad-justed OR for breastfeeding were for overweight 0.80 (95% CI, 0.71-0.90) and for obesity 0.80 (95% CI, 0.66-0.96). In another study in two German cities,6 9-14 year olds were observed to have a markedly lower over-weight prevalence among children who were breastfed than those non-breastfed. Controlling for age, sex and city, breastfed children were substantially less likely to be overweight at 9-10 years of age (OR 0.55, 95% CI 0.41-0.74). Results were slightly attenuated after adjustment for nationality, socioeco-nomic status, number of siblings, parental smoking (OR 0.66, 95% CI, 0.52-0.87)). A longer overall duration of exclusive breastfeeding was associated significantly with decreasing prevalence of over-weight. Finally, a study in the US (Gillman) assessed more than 15,000 children aged 9-14 years by their breast-feeding pattern in the first six months of life. Among subjects who had been only or mostly breastfed compared with those only or mostly formulafed, the OR for being overweight was 0.78 (95% CI, 0.66-
24 Features
SCN News #29
0.91), after adjustment for age, sex, sexual maturity, energy intake, time watching television, physical activity, mother's body mass index, and other variables reflecting social, economic, and lifestyle factors. These OR across age groups and countries are quite similar, reflecting about a 20% reduction in over-weight and obesity with breastfeeding. Not all studies looking at the impact of infant feeding on obesity in childhood8 or adults9 achieved sig-nificance, and others found only some parameters to achieve significance—such as a Brazilian study that found significance only in medium durations of breastfeeding and a linear decreasing trend in obe-sity with increasing duration of predominant breastfeeding (p=0.03).10 Those studies with outcomes measured during 4-8 months of life often found the expected slower growth with breastfeeding during this period, although all report that there is catch-up growth during early childhood.11 Lack of breast-feeding during that period (after 3 months) in fact may be associated with later obesity.12 Most studies, whether achieving significance or not, showed a trend towards protection by breastfeeding. Two recent literature reviews concur the probability that breastfeeding is associated with less obesity. One review by physical activity and nutrition researchers in Melbourne concluded that protective fac-tors against obesity included: regular physical activity (convincing); a high intake of dietary non-starch polysaccharides/fibre (convincing); supportive home and school environments for children (probable); and breastfeeding (probable).13 A second review noted inconsistent findings. The author postulated that this might be due to common issues in the study of breastfeeding,14 including inability to blind or randomize, retrospective recall, inconsistent definitions of breastfeeding patterns, insufficient sample size in prospective studies, statistical methodology, varying controls, and variable outcome measures. The reviewer concludes with the comment that “the possibility remains that even if the effect of breastfeeding on future obesity is small the public health impact can be tremendous,” and calls for in-creased public funding for research in this area.
Is there any biological rationale for the association?
Thorsdottir and colleagues15 in Iceland considered whether birthweight might contrib-ute to obesity. In a study of 120 children, a longer duration of breastfeeding was related to higher HDL-cholesterol (good cholesterol) in six year old girls, and lower BMI in six year old boys. No association was seen with birthweight. Since both high BMI and low HDLs are associated with heart disease, this may begin to shed some light on how breastfeeding might have a lifetime influence on heart health. Singhal et al,16 explored some biological markers more in-depth. These researchers ex-amined the issue of breastfeeding and lower cholesterol levels later in life by assigning preterm infants to breastmilk or standard formula, along with preterm formula in both groups. At age 13-15 years, those with a greater proportion of human milk intake had better LDL/HDL ratios, independent of gestation and potential confounding variables, as well as better apolipoprotein ratios.
As exclusive breastfeeding seemed to be associated with less obesity in some studies, it is interesting that Brazilian researchers examined energy intake in exclusively and partially breastfed infants.17 They found a significant difference in human milk intake between exclusively and partially breastfed infants, but those who received cow or formula milk in addition to human milk tended to have an energy in-take 20% above the latest recommendations (1996) for breastfed and 9% above those for formulafed infants. The authors postulate that if high intakes are maintained, this may result in obesity later in life. The only study that found a significant positive association of breastfeeding and obesity was of breast-fed children of diabetic mothers.18 Although no explanation was offered in the article, future work might consider whether this outlier finding is the result of the high sugar content or other differences in diabetic human milk. Conclusions
The findings of this set of studies, which included subjects from age four to adulthood, were consis-tent: the more breastfeeding and human milk provided—the less overweight. Even when studies did not achieve statistical significance, this increasing body of evidence showing a protective effect of breastfeeding against obesity adds yet another indication of the risks of not breastfeeding—ie, negative impacts on health and survival in infancy and childhood,19 lack of immune protection in infancy and beyond,20 reduced cognitive and neurological development,21 and increased incidence of cancers in children and their mothers who breastfed.22, 23 If the child is not breastfed, this list of risks now should include the lifelong consequences of overweight and an increased incidence of the many diseases that result from obesity and cardiac risk.
...risks (of not breastfeeding)
should now include the lifelong
consequences of overweight and an
increased incidence of the many
diseases that result from obesity and
cardiac risk.
Features 25
SCN News #29
References
1. Grummer-Strawn L, Mei Z. Does breastfeeding protect against pediatric overweight? Analysis of longitudinal data from the Centers for Disease Control and Prevention Paediatric Nutrition Surveil-lance System. Pediatrics. 2004, 113(2):e81-6. 2. Dewey KG. Is breastfeeding protective against child obesity? Journal of Human Lactation. 2003, 19(1):9-18. 3. Armstrong J, Reilly JJ (Child Health Information Team). Breastfeeding and lowering the risk of childhood obesity. The Lancet. 2002, 8; 359(9322):2003-4. 4. von Kries R, Koletzko B, Sauerwald T, von Mutius E. Does breast-feeding protect against child-hood obesity? Advances in Experimental Medicine and Biology, 2000, 478:29-39. 5. Toschke AM, Vignerova J, Lhotska L, Osancova K, Koletzko B, Von Kries R. Overweight and obe-sity in 6- to 14-year-old Czech children in 1991: protective effect of breast-feeding. Journal of Pediatrics, 2002, 141(6):764-9. 6. Liese AD, Hirsch T, von Mutius E, Keil U, Leupold W, Weiland SK. Inverse association of over-weight and breastfeeding in 9 to 10 year old children in Germany. International Journal of Obesity Related Metabolic Disorders, 2001, 25 (11): 1644-50. 7. Gillman MW, Rifas-Shiman SL, Camargo CA Jr, Berkey CS, Frazier AL, Rockett HR, Field AE, Colditz GA. Risk of overweight among adolescents who were breastfed as infants. JAMA. 2001, 16; 285(19):2461-7. 8. Li L, Parsons TJ, Power C. Breast feeding and obesity in childhood: cross sectional study. British Medical Journal, 2003, 18;327(7420):904-5. 9. Parsons TJ, Power C, Manor O. Infant feeding and obesity through the lifecourse. Archives of Diseases in Childhood, 2003, 88(9):793-4. 10. Victora CG, Barros F, Lima RC, Horta BL, Wells J. Anthropometry and body composition of 18 year old men according to duration of breast feeding: birth cohort study from Brazil. British Medical Journal, 2003, 18; 327(7420):901. 11. Hediger ML, Overpeck MD, Kuczmarski RJ, Ruan WJ. Association between infant breastfeeding and overweight in young children. JAMA, 2001, 16;285(19):2453-60. 12. Bergmann KE, Bergmann RL, Von Kries R, Bohm O, Richter R, Dudenhausen JW, Wahn U. Early determinants of childhood overweight and adiposity in a birth cohort study: role of breast-feeding. International Journal of Obesity Related Metabolic Disorders, 2003, 27(2):162-72. 13. Swinburn BA, Caterson I, Seidell JC, James WP Diet, nutrition and the prevention of excess weight gain and obesity. Public Health Nutrition, 2004, 7(1A):123-46. 14. Clifford TJ. Breast feeding and obesity. British Medical Journal, 2003, 18; 327(7420):879-80. 15. Thorsdottir I et al. Association of birth weight and breast-feeding with coronary heart disease risk factors at the age of 6 years. Nutrition, Metabolism, and Cardiovascular Diseases, 2003, 13(5):267-72. 16. Singhal A, Cole T et al. Breast milk-feeding and lipoprotein profile in adolescents born preterm: follow-up of a prospective randomised study. The Lancet, 2004, 15; 363(9421):1571-8. 17. Haisma H, Coward WA, Albernaz E, Visser GH, Wells JC, Wright A, Victora CG. Breast milk and energy intake in exclusively, predominantly, and partially breast-fed infants. European Journal of Clinical Nutrition, 2003, 57(12):1633-42. 18. Plagemann A, Harder T, Franke K, Kohlhoff R. Long-term impact of neonatal breast-feeding on body weight and glucose tolerance in children of diabetic mothers. Diabetes Care, 2002, 25(1):16-22. 19. Jones G et al. How many child deaths can we prevent this year? The Lancet, Child Survival Series, 2003, 362:65071. 20. Labbok M, Clark D, Goldman A. Breastfeeding and Immunology: Possible public policy impact, Natural Immunity, July 2004. 21. Golding J, Rogers IS, Emmett PM. Association between breast feeding, child development and behaviour. Early Human Development, 1997, 49 Suppl:S175-84. 22. Davis MK. Breastfeeding and chronic disease in childhood and adolescence. Pediatric Clinics of North America, 2001 Feb;48(1):125-41, ix.

26 Features
SCN News #29
23. Collaborative Group on Hormonal Factors in Breast Cancer. Breast cancer and breastfeeding: col-laborative reanalysis of individual data from 47 epidemiological studies in 30 countries, including 50302 women with breast cancer and 96973 women without the disease. The Lancet, 2002, 360(9328):187-95. Contact: Miriam Labbok ([email protected])
Features 27
SCN News #29
The use of anthropometry in the prevention of childhood
overweight and obesitya
Mercedes de Onis
World Health Organization
Introduction
During the past two decades the prevalence of overweight and obesity in children has increased world-wide. Historically, a fat child meant a healthy child, and the concept of “bigger is better” was widely accepted by paediatricians and caretakers. In recent years, however, this perception has drastically changed as we have learnt that obesity in childhood causes a wide range of serious complications and increases the risk of premature illness and death later in life.1,2 In view of its rapid development in ge-netically stable populations, there is general agreement among experts that the environment, rather than biology, is driving this epidemic.3 The lack of sign that the rapid increase in childhood obesity seen over the past two decades is abating is raising public-health concerns. Fundamental changes in the social environment and family life-styles will be needed to combat this emerging public-health crisis. Although solutions to reverse the adverse environmental factors exist, they are politically difficult to implement. The purpose of this paper is to review concepts and propose measures related to the use of anthropometry for early identification of excessive weight gain. Global epidemic of childhood overweight
The definitions of overweight and obesity in children often differ across studies, making comparisons of cross-sectional prevalence data difficult. Nevertheless, several studies have documented important increases in prevalence over time within populations in developed countries.4-8 Similarly, a recent global analysis showed a rising trend in childhood overweight in 16 out of 38 developing countries with more than one national survey.9 Figure 1 (next page) presents trends in selected developing coun-tries over the past decade based on national surveys included in the WHO Global Database on Child Growth and Malnutrition (accessed March, 2004).10 The comparison of both ends of the weight-for-height distribution suggest a population-wide shift, with overweight replacing wasting as countries un-dergo the nutrition transition.9 Moreover, the distribution of body mass index (BMI) has shifted in a skewed fashion, such that the heaviest children have become even heavier.11 In view of the adverse health consequences1,2 and the economic burden 12 of obesity in childhood and adolescence, greater efforts to identify individuals and populations at risk are needed. Potential measures for early identification of excessive weight gain
MONITOR THE APPROPRIATE ANTHROPOMETRIC INDICATOR Assessing child overweight and obesity is not as straightforward as it may seem, but there is now con-sensus that indicators based on weight and height measurements such as weight-for-height or BMI (ie, weight (kg)/height (m)2), should be used for clinical practice and epidemiological studies to classify child body weight status.13,14 Nevertheless, a recent global survey on child growth monitoring prac-tices15 showed that weight-for-age was the anthropometric indicator universally used (97% of coun-tries), while only 23% of the countries used weight-for-height, with BMI being rarely used. The results from this study indicate that at present only a few countries have in place growth monitoring systems that allow early identification of children at risk of becoming overweight and/or obese. National pro-grammes need to include the routine collection of height measurements (recumbent length up to two years of age and standing height for older children) to allow the monitoring of weight-for-height and/or BMI for the early identification of children at risk of overweight and obesity. MONITOR THE GROWTH OF ALL CHILDREN UP TO 18 YEARS OF AGE The same study demonstrated that less than one third of countries expand growth monitoring activities beyond 6 years of age. Figure 2 (page 29) presents the age coverage of the growth charts collected from 154 countries.15 The majority (55%) of charts were used for infants and young children (0-5 years), 29% covered birth to adolescence (0-18 years), while the rest were applied to variable age spans
a Reprinted by permission from the International Journal on Obesity (de Onis M. The use of anthropometry in the prevention of childhood overweight and obesity. 2004; 28:S81-85), copyright (2004) Macmillan Publishers Ltd.
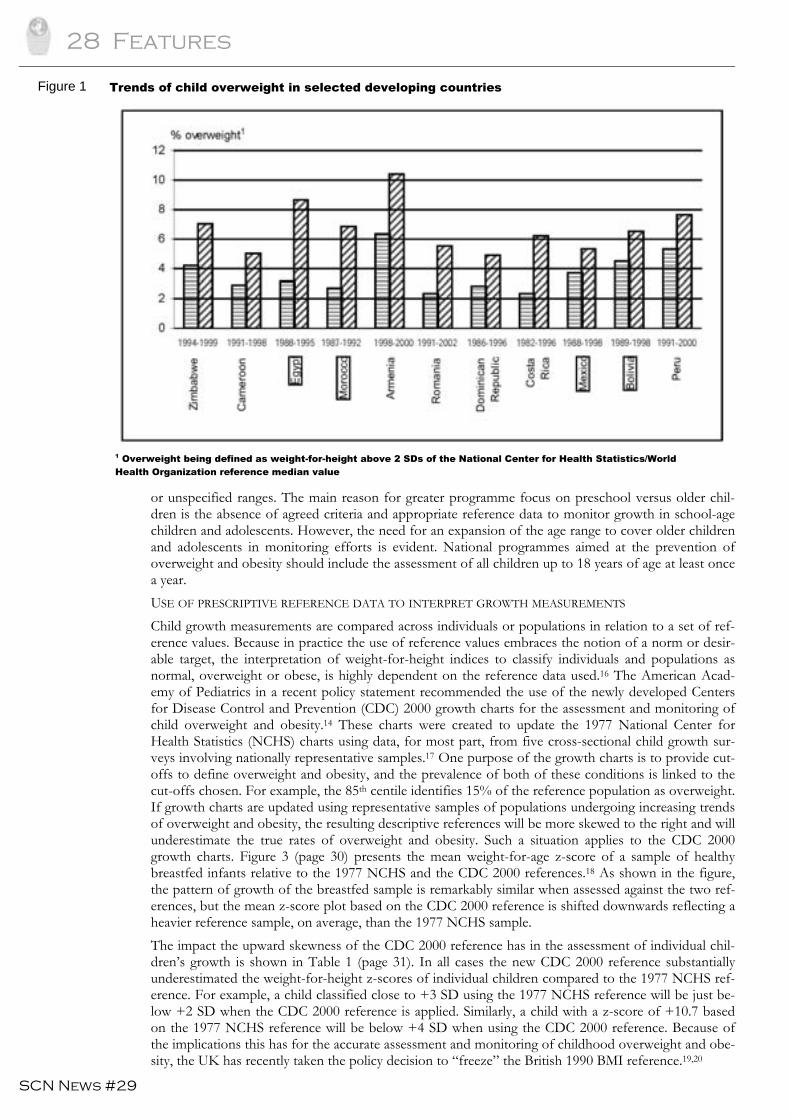
28 Features
SCN News #29
Figure 1
or unspecified ranges. The main reason for greater programme focus on preschool versus older chil-dren is the absence of agreed criteria and appropriate reference data to monitor growth in school-age children and adolescents. However, the need for an expansion of the age range to cover older children and adolescents in monitoring efforts is evident. National programmes aimed at the prevention of overweight and obesity should include the assessment of all children up to 18 years of age at least once a year. USE OF PRESCRIPTIVE REFERENCE DATA TO INTERPRET GROWTH MEASUREMENTS Child growth measurements are compared across individuals or populations in relation to a set of ref-erence values. Because in practice the use of reference values embraces the notion of a norm or desir-able target, the interpretation of weight-for-height indices to classify individuals and populations as normal, overweight or obese, is highly dependent on the reference data used.16 The American Acad-emy of Pediatrics in a recent policy statement recommended the use of the newly developed Centers for Disease Control and Prevention (CDC) 2000 growth charts for the assessment and monitoring of child overweight and obesity.14 These charts were created to update the 1977 National Center for Health Statistics (NCHS) charts using data, for most part, from five cross-sectional child growth sur-veys involving nationally representative samples.17 One purpose of the growth charts is to provide cut-offs to define overweight and obesity, and the prevalence of both of these conditions is linked to the cut-offs chosen. For example, the 85th centile identifies 15% of the reference population as overweight. If growth charts are updated using representative samples of populations undergoing increasing trends of overweight and obesity, the resulting descriptive references will be more skewed to the right and will underestimate the true rates of overweight and obesity. Such a situation applies to the CDC 2000 growth charts. Figure 3 (page 30) presents the mean weight-for-age z-score of a sample of healthy breastfed infants relative to the 1977 NCHS and the CDC 2000 references.18 As shown in the figure, the pattern of growth of the breastfed sample is remarkably similar when assessed against the two ref-erences, but the mean z-score plot based on the CDC 2000 reference is shifted downwards reflecting a heavier reference sample, on average, than the 1977 NCHS sample. The impact the upward skewness of the CDC 2000 reference has in the assessment of individual chil-dren’s growth is shown in Table 1 (page 31). In all cases the new CDC 2000 reference substantially underestimated the weight-for-height z-scores of individual children compared to the 1977 NCHS ref-erence. For example, a child classified close to +3 SD using the 1977 NCHS reference will be just be-low +2 SD when the CDC 2000 reference is applied. Similarly, a child with a z-score of +10.7 based on the 1977 NCHS reference will be below +4 SD when using the CDC 2000 reference. Because of the implications this has for the accurate assessment and monitoring of childhood overweight and obe-sity, the UK has recently taken the policy decision to “freeze” the British 1990 BMI reference.19,20
1 Overweight being defined as weight-for-height above 2 SDs of the National Center for Health Statistics/World Health Organization reference median value
Trends of child overweight in selected developing countries
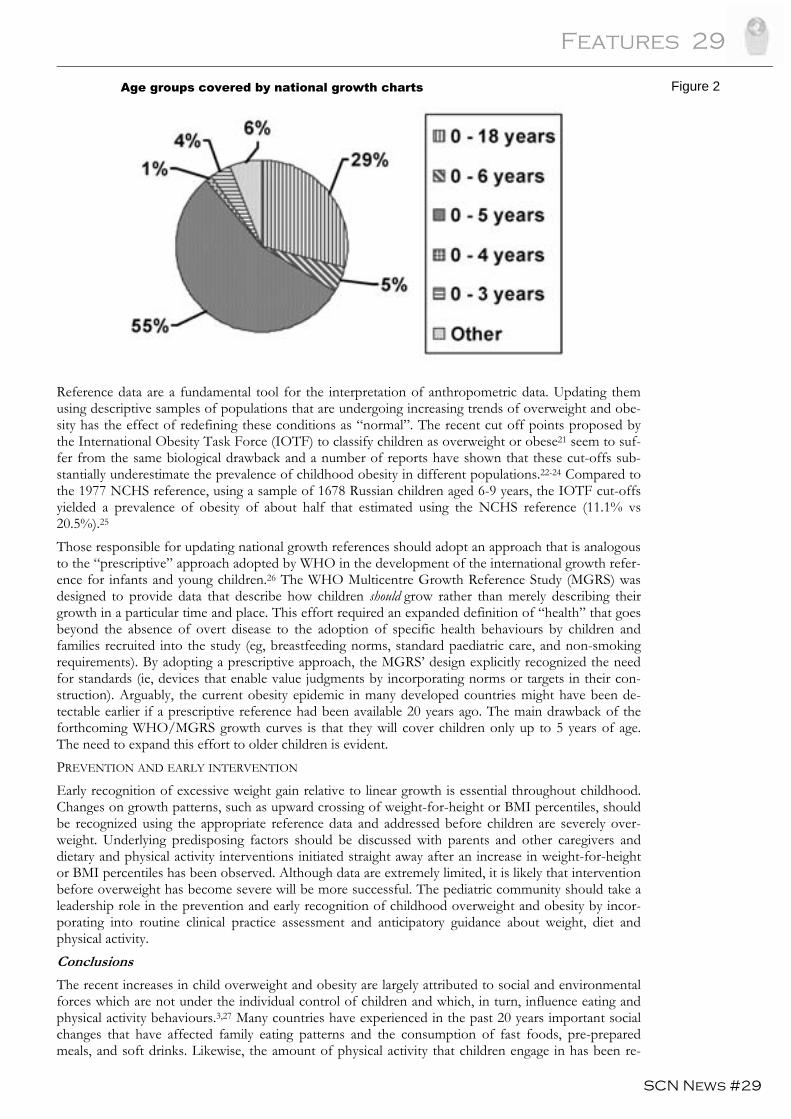
Features 29
SCN News #29
Reference data are a fundamental tool for the interpretation of anthropometric data. Updating them using descriptive samples of populations that are undergoing increasing trends of overweight and obe-sity has the effect of redefining these conditions as “normal”. The recent cut off points proposed by the International Obesity Task Force (IOTF) to classify children as overweight or obese21 seem to suf-fer from the same biological drawback and a number of reports have shown that these cut-offs sub-stantially underestimate the prevalence of childhood obesity in different populations.22-24 Compared to the 1977 NCHS reference, using a sample of 1678 Russian children aged 6-9 years, the IOTF cut-offs yielded a prevalence of obesity of about half that estimated using the NCHS reference (11.1% vs 20.5%).25 Those responsible for updating national growth references should adopt an approach that is analogous to the “prescriptive” approach adopted by WHO in the development of the international growth refer-ence for infants and young children.26 The WHO Multicentre Growth Reference Study (MGRS) was designed to provide data that describe how children should grow rather than merely describing their growth in a particular time and place. This effort required an expanded definition of “health” that goes beyond the absence of overt disease to the adoption of specific health behaviours by children and families recruited into the study (eg, breastfeeding norms, standard paediatric care, and non-smoking requirements). By adopting a prescriptive approach, the MGRS’ design explicitly recognized the need for standards (ie, devices that enable value judgments by incorporating norms or targets in their con-struction). Arguably, the current obesity epidemic in many developed countries might have been de-tectable earlier if a prescriptive reference had been available 20 years ago. The main drawback of the forthcoming WHO/MGRS growth curves is that they will cover children only up to 5 years of age. The need to expand this effort to older children is evident. PREVENTION AND EARLY INTERVENTION Early recognition of excessive weight gain relative to linear growth is essential throughout childhood. Changes on growth patterns, such as upward crossing of weight-for-height or BMI percentiles, should be recognized using the appropriate reference data and addressed before children are severely over-weight. Underlying predisposing factors should be discussed with parents and other caregivers and dietary and physical activity interventions initiated straight away after an increase in weight-for-height or BMI percentiles has been observed. Although data are extremely limited, it is likely that intervention before overweight has become severe will be more successful. The pediatric community should take a leadership role in the prevention and early recognition of childhood overweight and obesity by incor-porating into routine clinical practice assessment and anticipatory guidance about weight, diet and physical activity. Conclusions
The recent increases in child overweight and obesity are largely attributed to social and environmental forces which are not under the individual control of children and which, in turn, influence eating and physical activity behaviours.3,27 Many countries have experienced in the past 20 years important social changes that have affected family eating patterns and the consumption of fast foods, pre-prepared meals, and soft drinks. Likewise, the amount of physical activity that children engage in has been re-
Figure 2 Age groups covered by national growth charts
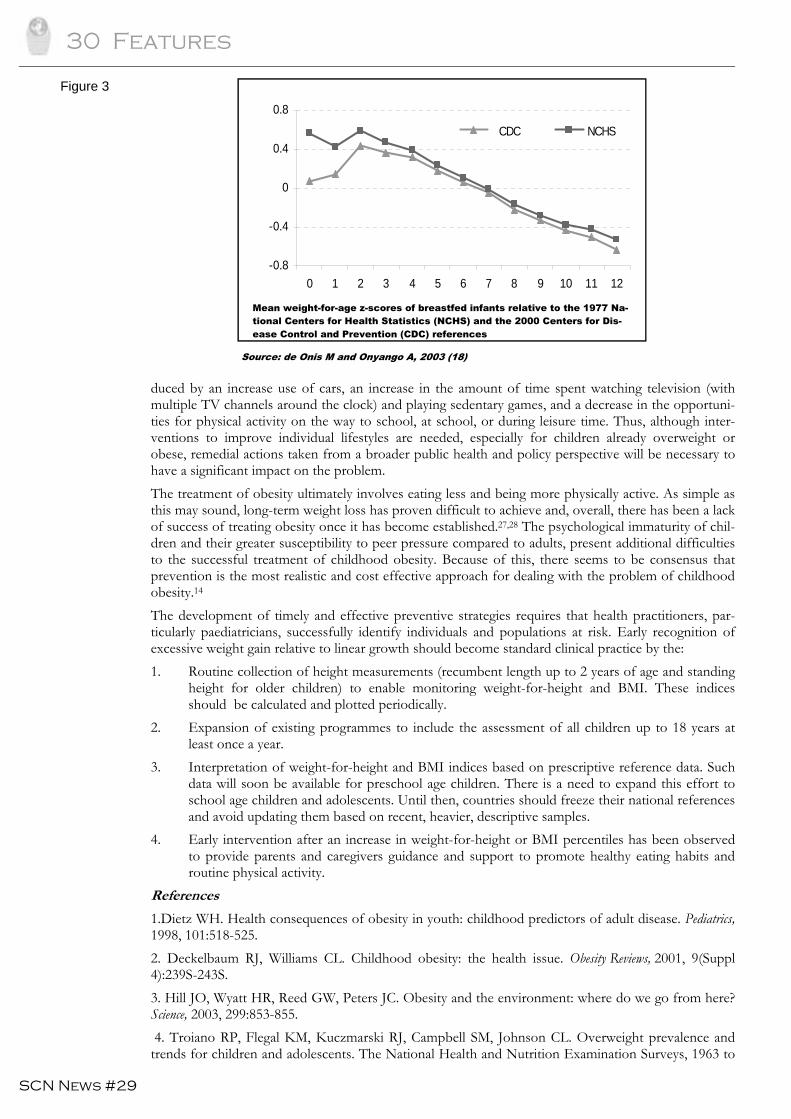
30 Features
SCN News #29
duced by an increase use of cars, an increase in the amount of time spent watching television (with multiple TV channels around the clock) and playing sedentary games, and a decrease in the opportuni-ties for physical activity on the way to school, at school, or during leisure time. Thus, although inter-ventions to improve individual lifestyles are needed, especially for children already overweight or obese, remedial actions taken from a broader public health and policy perspective will be necessary to have a significant impact on the problem. The treatment of obesity ultimately involves eating less and being more physically active. As simple as this may sound, long-term weight loss has proven difficult to achieve and, overall, there has been a lack of success of treating obesity once it has become established.27,28 The psychological immaturity of chil-dren and their greater susceptibility to peer pressure compared to adults, present additional difficulties to the successful treatment of childhood obesity. Because of this, there seems to be consensus that prevention is the most realistic and cost effective approach for dealing with the problem of childhood obesity.14 The development of timely and effective preventive strategies requires that health practitioners, par-ticularly paediatricians, successfully identify individuals and populations at risk. Early recognition of excessive weight gain relative to linear growth should become standard clinical practice by the: 1. Routine collection of height measurements (recumbent length up to 2 years of age and standing
height for older children) to enable monitoring weight-for-height and BMI. These indices should be calculated and plotted periodically.
2. Expansion of existing programmes to include the assessment of all children up to 18 years at least once a year.
3. Interpretation of weight-for-height and BMI indices based on prescriptive reference data. Such data will soon be available for preschool age children. There is a need to expand this effort to school age children and adolescents. Until then, countries should freeze their national references and avoid updating them based on recent, heavier, descriptive samples.
4. Early intervention after an increase in weight-for-height or BMI percentiles has been observed to provide parents and caregivers guidance and support to promote healthy eating habits and routine physical activity.
References
1.Dietz WH. Health consequences of obesity in youth: childhood predictors of adult disease. Pediatrics, 1998, 101:518-525. 2. Deckelbaum RJ, Williams CL. Childhood obesity: the health issue. Obesity Reviews, 2001, 9(Suppl 4):239S-243S. 3. Hill JO, Wyatt HR, Reed GW, Peters JC. Obesity and the environment: where do we go from here? Science, 2003, 299:853-855. 4. Troiano RP, Flegal KM, Kuczmarski RJ, Campbell SM, Johnson CL. Overweight prevalence and trends for children and adolescents. The National Health and Nutrition Examination Surveys, 1963 to
Figure 3
-0.8
-0.4
0
0.4
0.8
0 1 2 3 4 5 6 7 8 9 10 11 12
Age (months)
CDC NCHSCDC NCHS
Mean weight-for-age z-scores of breastfed infants relative to the 1977 Na-tional Centers for Health Statistics (NCHS) and the 2000 Centers for Dis-ease Control and Prevention (CDC) references
Source: de Onis M and Onyango A, 2003 (18)
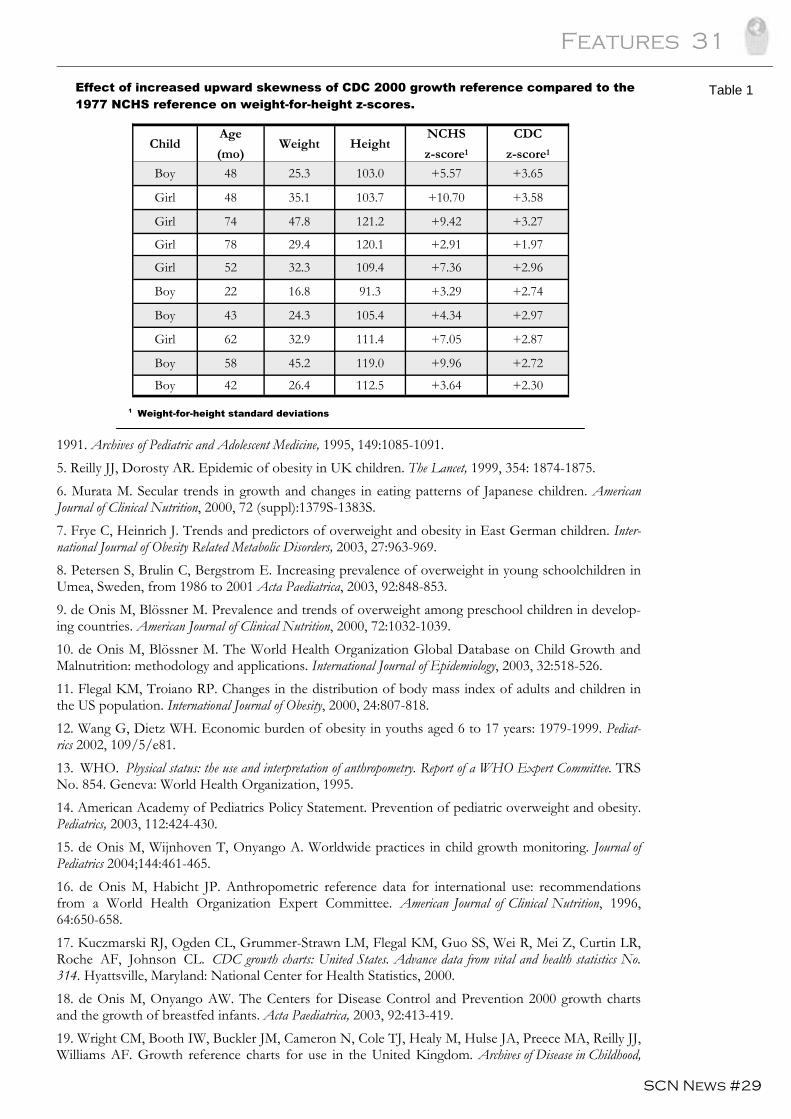
Features 31
SCN News #29
1991. Archives of Pediatric and Adolescent Medicine, 1995, 149:1085-1091. 5. Reilly JJ, Dorosty AR. Epidemic of obesity in UK children. The Lancet, 1999, 354: 1874-1875. 6. Murata M. Secular trends in growth and changes in eating patterns of Japanese children. American Journal of Clinical Nutrition, 2000, 72 (suppl):1379S-1383S. 7. Frye C, Heinrich J. Trends and predictors of overweight and obesity in East German children. Inter-national Journal of Obesity Related Metabolic Disorders, 2003, 27:963-969. 8. Petersen S, Brulin C, Bergstrom E. Increasing prevalence of overweight in young schoolchildren in Umea, Sweden, from 1986 to 2001 Acta Paediatrica, 2003, 92:848-853. 9. de Onis M, Blössner M. Prevalence and trends of overweight among preschool children in develop-ing countries. American Journal of Clinical Nutrition, 2000, 72:1032-1039. 10. de Onis M, Blössner M. The World Health Organization Global Database on Child Growth and Malnutrition: methodology and applications. International Journal of Epidemiology, 2003, 32:518-526. 11. Flegal KM, Troiano RP. Changes in the distribution of body mass index of adults and children in the US population. International Journal of Obesity, 2000, 24:807-818. 12. Wang G, Dietz WH. Economic burden of obesity in youths aged 6 to 17 years: 1979-1999. Pediat-rics 2002, 109/5/e81. 13. WHO. Physical status: the use and interpretation of anthropometry. Report of a WHO Expert Committee. TRS No. 854. Geneva: World Health Organization, 1995. 14. American Academy of Pediatrics Policy Statement. Prevention of pediatric overweight and obesity. Pediatrics, 2003, 112:424-430. 15. de Onis M, Wijnhoven T, Onyango A. Worldwide practices in child growth monitoring. Journal of Pediatrics 2004;144:461-465. 16. de Onis M, Habicht JP. Anthropometric reference data for international use: recommendations from a World Health Organization Expert Committee. American Journal of Clinical Nutrition, 1996, 64:650-658. 17. Kuczmarski RJ, Ogden CL, Grummer-Strawn LM, Flegal KM, Guo SS, Wei R, Mei Z, Curtin LR, Roche AF, Johnson CL. CDC growth charts: United States. Advance data from vital and health statistics No. 314. Hyattsville, Maryland: National Center for Health Statistics, 2000. 18. de Onis M, Onyango AW. The Centers for Disease Control and Prevention 2000 growth charts and the growth of breastfed infants. Acta Paediatrica, 2003, 92:413-419. 19. Wright CM, Booth IW, Buckler JM, Cameron N, Cole TJ, Healy M, Hulse JA, Preece MA, Reilly JJ, Williams AF. Growth reference charts for use in the United Kingdom. Archives of Disease in Childhood,
Effect of increased upward skewness of CDC 2000 growth reference compared to the 1977 NCHS reference on weight-for-height z-scores.
Child Age
(mo) Weight Height
NCHS
z-score1
CDC
z-score1
Boy 48 25.3 103.0 +5.57 +3.65
Girl 48 35.1 103.7 +10.70 +3.58
Girl 74 47.8 121.2 +9.42 +3.27
Girl 78 29.4 120.1 +2.91 +1.97
Girl 52 32.3 109.4 +7.36 +2.96
Boy 22 16.8 91.3 +3.29 +2.74
Boy 43 24.3 105.4 +4.34 +2.97
Girl 62 32.9 111.4 +7.05 +2.87
Boy 58 45.2 119.0 +9.96 +2.72
Boy 42 26.4 112.5 +3.64 +2.30
1 Weight-for-height standard deviations
Table 1
32 Features
SCN News #29
2002, 86:11-14. 20. Cole TJ, Power C, Preece MA. Child obesity and body mass index. The Lancet, 1999, 353:1188. 21. Cole TJ, Bellizzi MC, Flegal KM, Dietz WH. Establishing a standard definition for child overweight and obesity worldwide: international survey. British Medical Journal, 2000, 320:1240-1243. 22. Kain J, Uauy R, Vio F, Albala C. Trends in overweight and obesity prevalence in Chilean children: comparison of three definitions. European Journal of Clinical Nutrition, 2002;56:200-204. 23. Fu WPC, Lee HC, Ng CJ, Tay Y-KD, Kau CY, Seow CJ, Siak JK, Hong CY. Screening for child-hood obesity: international vs population-specific definitions. Which is more appropriate? Internal Jour-nal of Obesity Related Metabalic Disorders, 2003, 27:1121-1126. 24. Vignerová J, Lhotská L, Bláha P. Proposed standard definition for child overweight and obesity. Central European Journal of Public Health, 2001, 9:145-146. 25. Wang Y, Wang JQ. A comparison of international references for the assessment of child and ado-lescent overweight and obesity in different populations. European Journal of Clinical Nutrition, 2002, 56:973-982. 26. de Onis M, Garza C, Victora CG, Onyango AW, Frongillo EA, Martines J, for the WHO Multicen-tre Growth Reference Study Group. The WHO Multicentre Growth Reference Study: planning, study design and methodology. Food and Nutrition Bulletin, 2004, 25(suppl 1):S15-26. 27. Ebbeling CB, Pawlak DB, Ludwig DS. Childhood obesity: public-health crisis, common sense cure. The Lancet, 2002, 360:473-482. 28. Summerbell CD, Ashton V, Campbell KJ, Edmunds L, Kelly S, Waters E. Interventions for treating obesity in children. Cochrane Database Systematic Reviews, 2003, 3:CD001872. Contact: Mercedes de Onis ([email protected])
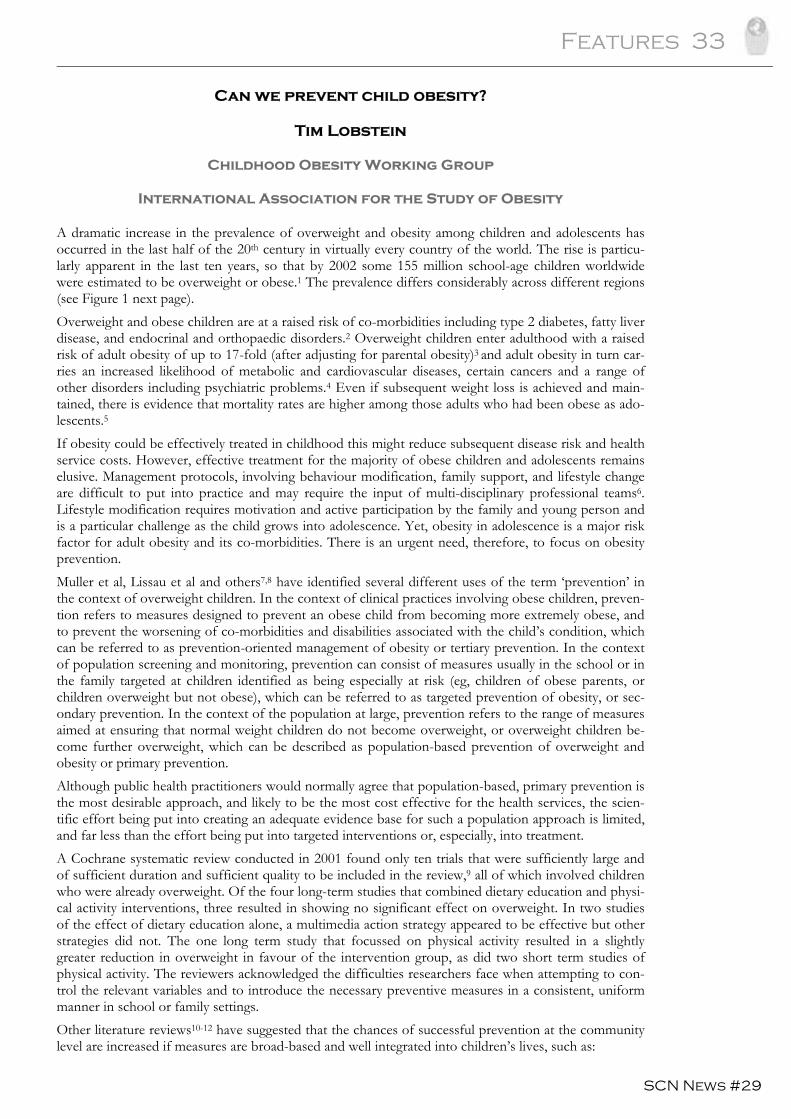
Features 33
SCN News #29
Can we prevent child obesity?
Tim Lobstein
Childhood Obesity Working Group
International Association for the Study of Obesity A dramatic increase in the prevalence of overweight and obesity among children and adolescents has occurred in the last half of the 20th century in virtually every country of the world. The rise is particu-larly apparent in the last ten years, so that by 2002 some 155 million school-age children worldwide were estimated to be overweight or obese.1 The prevalence differs considerably across different regions (see Figure 1 next page). Overweight and obese children are at a raised risk of co-morbidities including type 2 diabetes, fatty liver disease, and endocrinal and orthopaedic disorders.2 Overweight children enter adulthood with a raised risk of adult obesity of up to 17-fold (after adjusting for parental obesity)3 and adult obesity in turn car-ries an increased likelihood of metabolic and cardiovascular diseases, certain cancers and a range of other disorders including psychiatric problems.4 Even if subsequent weight loss is achieved and main-tained, there is evidence that mortality rates are higher among those adults who had been obese as ado-lescents.5 If obesity could be effectively treated in childhood this might reduce subsequent disease risk and health service costs. However, effective treatment for the majority of obese children and adolescents remains elusive. Management protocols, involving behaviour modification, family support, and lifestyle change are difficult to put into practice and may require the input of multi-disciplinary professional teams6. Lifestyle modification requires motivation and active participation by the family and young person and is a particular challenge as the child grows into adolescence. Yet, obesity in adolescence is a major risk factor for adult obesity and its co-morbidities. There is an urgent need, therefore, to focus on obesity prevention. Muller et al, Lissau et al and others7,8 have identified several different uses of the term ‘prevention’ in the context of overweight children. In the context of clinical practices involving obese children, preven-tion refers to measures designed to prevent an obese child from becoming more extremely obese, and to prevent the worsening of co-morbidities and disabilities associated with the child’s condition, which can be referred to as prevention-oriented management of obesity or tertiary prevention. In the context of population screening and monitoring, prevention can consist of measures usually in the school or in the family targeted at children identified as being especially at risk (eg, children of obese parents, or children overweight but not obese), which can be referred to as targeted prevention of obesity, or sec-ondary prevention. In the context of the population at large, prevention refers to the range of measures aimed at ensuring that normal weight children do not become overweight, or overweight children be-come further overweight, which can be described as population-based prevention of overweight and obesity or primary prevention. Although public health practitioners would normally agree that population-based, primary prevention is the most desirable approach, and likely to be the most cost effective for the health services, the scien-tific effort being put into creating an adequate evidence base for such a population approach is limited, and far less than the effort being put into targeted interventions or, especially, into treatment. A Cochrane systematic review conducted in 2001 found only ten trials that were sufficiently large and of sufficient duration and sufficient quality to be included in the review,9 all of which involved children who were already overweight. Of the four long-term studies that combined dietary education and physi-cal activity interventions, three resulted in showing no significant effect on overweight. In two studies of the effect of dietary education alone, a multimedia action strategy appeared to be effective but other strategies did not. The one long term study that focussed on physical activity resulted in a slightly greater reduction in overweight in favour of the intervention group, as did two short term studies of physical activity. The reviewers acknowledged the difficulties researchers face when attempting to con-trol the relevant variables and to introduce the necessary preventive measures in a consistent, uniform manner in school or family settings. Other literature reviews10-12 have suggested that the chances of successful prevention at the community level are increased if measures are broad-based and well integrated into children’s lives, such as:
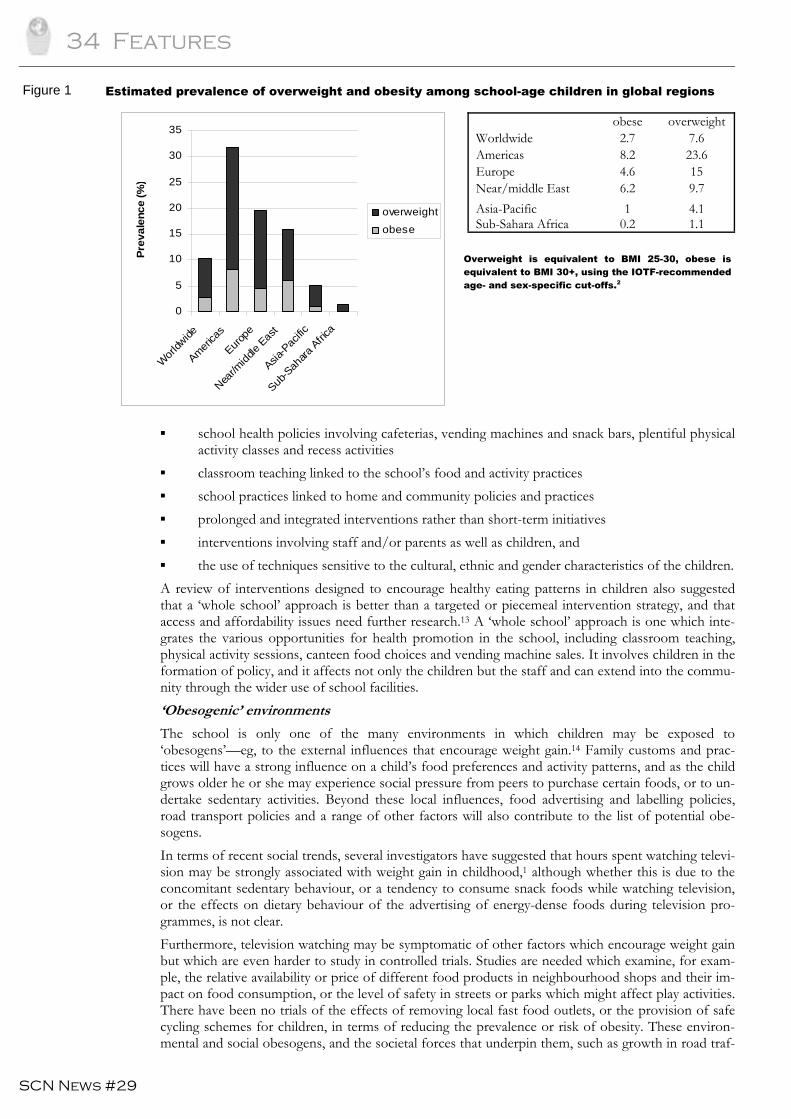
34 Features
SCN News #29
0
5
10
15
20
25
30
35
Wor
ldwide
America
s
Europe
Near/m
iddle
East
Asia-P
acific
Sub-S
ahara
Africa
Prev
alen
ce (%
)
overweight
obese
▪ school health policies involving cafeterias, vending machines and snack bars, plentiful physical activity classes and recess activities
▪ classroom teaching linked to the school’s food and activity practices ▪ school practices linked to home and community policies and practices ▪ prolonged and integrated interventions rather than short-term initiatives ▪ interventions involving staff and/or parents as well as children, and ▪ the use of techniques sensitive to the cultural, ethnic and gender characteristics of the children. A review of interventions designed to encourage healthy eating patterns in children also suggested that a ‘whole school’ approach is better than a targeted or piecemeal intervention strategy, and that access and affordability issues need further research.13 A ‘whole school’ approach is one which inte-grates the various opportunities for health promotion in the school, including classroom teaching, physical activity sessions, canteen food choices and vending machine sales. It involves children in the formation of policy, and it affects not only the children but the staff and can extend into the commu-nity through the wider use of school facilities. ‘Obesogenic’ environments
The school is only one of the many environments in which children may be exposed to ‘obesogens’—eg, to the external influences that encourage weight gain.14 Family customs and prac-tices will have a strong influence on a child’s food preferences and activity patterns, and as the child grows older he or she may experience social pressure from peers to purchase certain foods, or to un-dertake sedentary activities. Beyond these local influences, food advertising and labelling policies, road transport policies and a range of other factors will also contribute to the list of potential obe-sogens. In terms of recent social trends, several investigators have suggested that hours spent watching televi-sion may be strongly associated with weight gain in childhood,1 although whether this is due to the concomitant sedentary behaviour, or a tendency to consume snack foods while watching television, or the effects on dietary behaviour of the advertising of energy-dense foods during television pro-grammes, is not clear. Furthermore, television watching may be symptomatic of other factors which encourage weight gain but which are even harder to study in controlled trials. Studies are needed which examine, for exam-ple, the relative availability or price of different food products in neighbourhood shops and their im-pact on food consumption, or the level of safety in streets or parks which might affect play activities. There have been no trials of the effects of removing local fast food outlets, or the provision of safe cycling schemes for children, in terms of reducing the prevalence or risk of obesity. These environ-mental and social obesogens, and the societal forces that underpin them, such as growth in road traf-
Figure 1 Estimated prevalence of overweight and obesity among school-age children in global regions
obese overweight Worldwide 2.7 7.6 Americas 8.2 23.6 Europe 4.6 15 Near/middle East 6.2 9.7 Asia-Pacific 1 4.1 Sub-Sahara Africa 0.2 1.1
Overweight is equivalent to BMI 25-30, obese is equivalent to BMI 30+, using the IOTF-recommended age- and sex-specific cut-offs.2
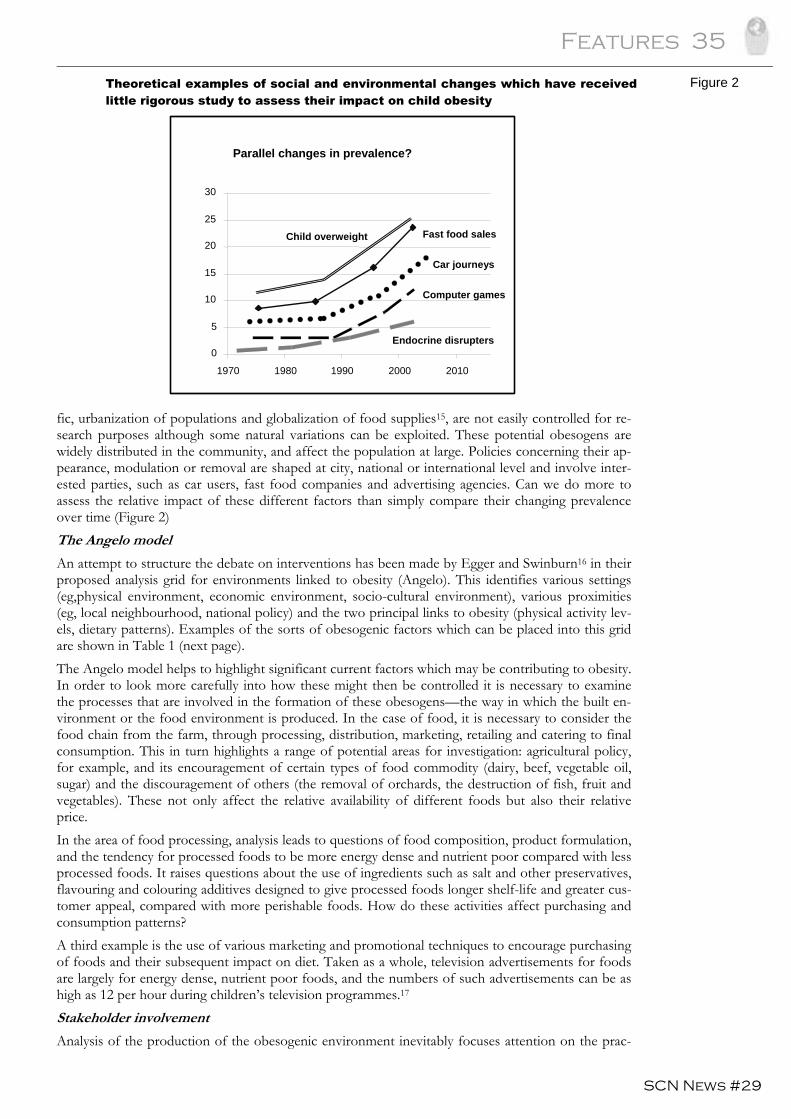
Features 35
SCN News #29
fic, urbanization of populations and globalization of food supplies15, are not easily controlled for re-search purposes although some natural variations can be exploited. These potential obesogens are widely distributed in the community, and affect the population at large. Policies concerning their ap-pearance, modulation or removal are shaped at city, national or international level and involve inter-ested parties, such as car users, fast food companies and advertising agencies. Can we do more to assess the relative impact of these different factors than simply compare their changing prevalence over time (Figure 2) The Angelo model
An attempt to structure the debate on interventions has been made by Egger and Swinburn16 in their proposed analysis grid for environments linked to obesity (Angelo). This identifies various settings (eg,physical environment, economic environment, socio-cultural environment), various proximities (eg, local neighbourhood, national policy) and the two principal links to obesity (physical activity lev-els, dietary patterns). Examples of the sorts of obesogenic factors which can be placed into this grid are shown in Table 1 (next page). The Angelo model helps to highlight significant current factors which may be contributing to obesity. In order to look more carefully into how these might then be controlled it is necessary to examine the processes that are involved in the formation of these obesogens—the way in which the built en-vironment or the food environment is produced. In the case of food, it is necessary to consider the food chain from the farm, through processing, distribution, marketing, retailing and catering to final consumption. This in turn highlights a range of potential areas for investigation: agricultural policy, for example, and its encouragement of certain types of food commodity (dairy, beef, vegetable oil, sugar) and the discouragement of others (the removal of orchards, the destruction of fish, fruit and vegetables). These not only affect the relative availability of different foods but also their relative price. In the area of food processing, analysis leads to questions of food composition, product formulation, and the tendency for processed foods to be more energy dense and nutrient poor compared with less processed foods. It raises questions about the use of ingredients such as salt and other preservatives, flavouring and colouring additives designed to give processed foods longer shelf-life and greater cus-tomer appeal, compared with more perishable foods. How do these activities affect purchasing and consumption patterns? A third example is the use of various marketing and promotional techniques to encourage purchasing of foods and their subsequent impact on diet. Taken as a whole, television advertisements for foods are largely for energy dense, nutrient poor foods, and the numbers of such advertisements can be as high as 12 per hour during children’s television programmes.17 Stakeholder involvement
Analysis of the production of the obesogenic environment inevitably focuses attention on the prac-
Figure 2
IOTF 2004
0
5
10
15
20
25
30
1970 1980 1990 2000 2010
Fast food sales
Car journeys
Computer games
Parallel changes in prevalence?
Endocrine disrupters
Child overweight
Theoretical examples of social and environmental changes which have received little rigorous study to assess their impact on child obesity
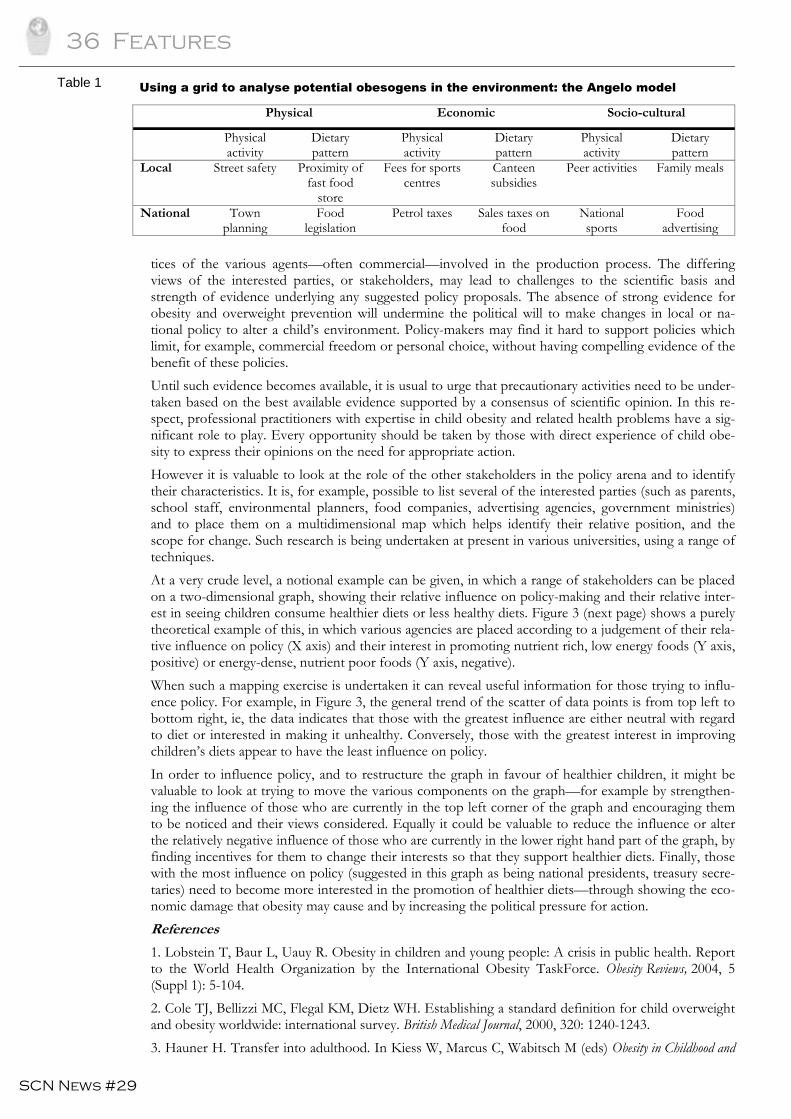
36 Features
SCN News #29
tices of the various agents—often commercial—involved in the production process. The differing views of the interested parties, or stakeholders, may lead to challenges to the scientific basis and strength of evidence underlying any suggested policy proposals. The absence of strong evidence for obesity and overweight prevention will undermine the political will to make changes in local or na-tional policy to alter a child’s environment. Policy-makers may find it hard to support policies which limit, for example, commercial freedom or personal choice, without having compelling evidence of the benefit of these policies. Until such evidence becomes available, it is usual to urge that precautionary activities need to be under-taken based on the best available evidence supported by a consensus of scientific opinion. In this re-spect, professional practitioners with expertise in child obesity and related health problems have a sig-nificant role to play. Every opportunity should be taken by those with direct experience of child obe-sity to express their opinions on the need for appropriate action. However it is valuable to look at the role of the other stakeholders in the policy arena and to identify their characteristics. It is, for example, possible to list several of the interested parties (such as parents, school staff, environmental planners, food companies, advertising agencies, government ministries) and to place them on a multidimensional map which helps identify their relative position, and the scope for change. Such research is being undertaken at present in various universities, using a range of techniques. At a very crude level, a notional example can be given, in which a range of stakeholders can be placed on a two-dimensional graph, showing their relative influence on policy-making and their relative inter-est in seeing children consume healthier diets or less healthy diets. Figure 3 (next page) shows a purely theoretical example of this, in which various agencies are placed according to a judgement of their rela-tive influence on policy (X axis) and their interest in promoting nutrient rich, low energy foods (Y axis, positive) or energy-dense, nutrient poor foods (Y axis, negative). When such a mapping exercise is undertaken it can reveal useful information for those trying to influ-ence policy. For example, in Figure 3, the general trend of the scatter of data points is from top left to bottom right, ie, the data indicates that those with the greatest influence are either neutral with regard to diet or interested in making it unhealthy. Conversely, those with the greatest interest in improving children’s diets appear to have the least influence on policy. In order to influence policy, and to restructure the graph in favour of healthier children, it might be valuable to look at trying to move the various components on the graph—for example by strengthen-ing the influence of those who are currently in the top left corner of the graph and encouraging them to be noticed and their views considered. Equally it could be valuable to reduce the influence or alter the relatively negative influence of those who are currently in the lower right hand part of the graph, by finding incentives for them to change their interests so that they support healthier diets. Finally, those with the most influence on policy (suggested in this graph as being national presidents, treasury secre-taries) need to become more interested in the promotion of healthier diets—through showing the eco-nomic damage that obesity may cause and by increasing the political pressure for action. References
1. Lobstein T, Baur L, Uauy R. Obesity in children and young people: A crisis in public health. Report to the World Health Organization by the International Obesity TaskForce. Obesity Reviews, 2004, 5 (Suppl 1): 5-104. 2. Cole TJ, Bellizzi MC, Flegal KM, Dietz WH. Establishing a standard definition for child overweight and obesity worldwide: international survey. British Medical Journal, 2000, 320: 1240-1243. 3. Hauner H. Transfer into adulthood. In Kiess W, Marcus C, Wabitsch M (eds) Obesity in Childhood and
Table 1
Physical Economic Socio-cultural
Physical activity
Dietary pattern
Physical activity
Dietary pattern
Physical activity
Dietary pattern
Local Street safety Proximity of fast food
store
Fees for sports centres
Canteen subsidies
Peer activities Family meals
National Town planning
Food legislation
Petrol taxes Sales taxes on food
National sports
Food advertising
Using a grid to analyse potential obesogens in the environment: the Angelo model
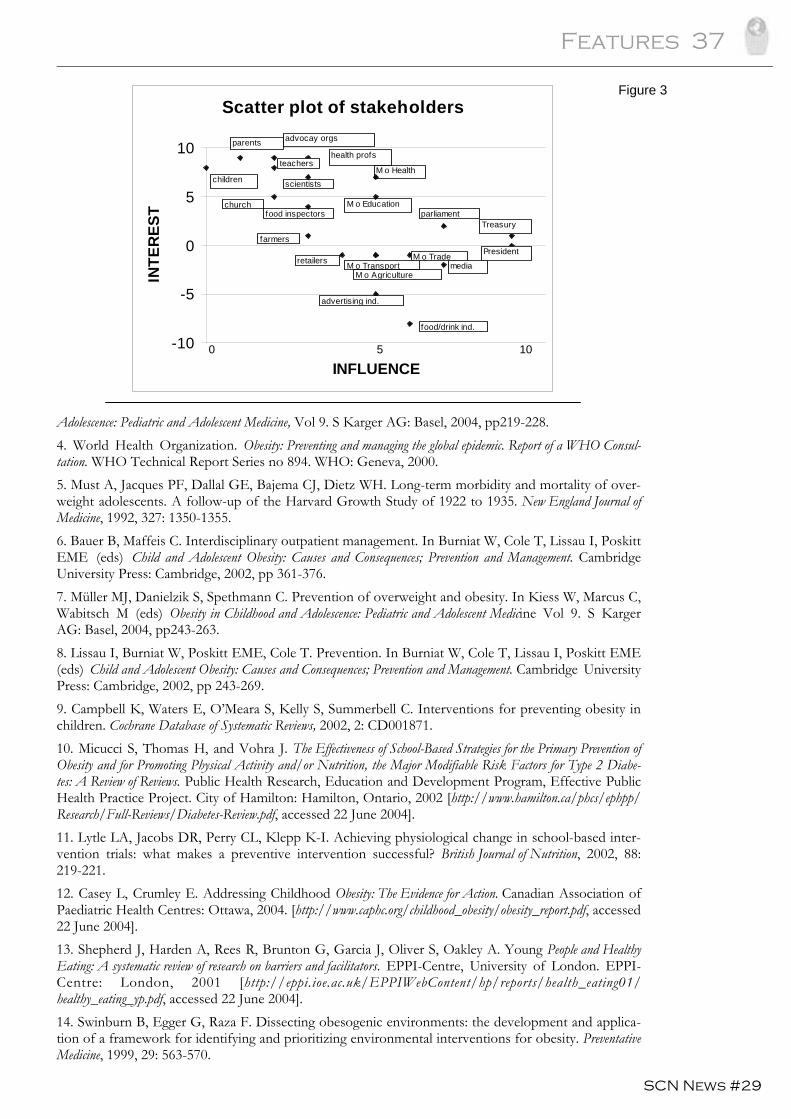
Features 37
SCN News #29
Adolescence: Pediatric and Adolescent Medicine, Vol 9. S Karger AG: Basel, 2004, pp219-228. 4. World Health Organization. Obesity: Preventing and managing the global epidemic. Report of a WHO Consul-tation. WHO Technical Report Series no 894. WHO: Geneva, 2000. 5. Must A, Jacques PF, Dallal GE, Bajema CJ, Dietz WH. Long-term morbidity and mortality of over-weight adolescents. A follow-up of the Harvard Growth Study of 1922 to 1935. New England Journal of Medicine, 1992, 327: 1350-1355. 6. Bauer B, Maffeis C. Interdisciplinary outpatient management. In Burniat W, Cole T, Lissau I, Poskitt EME (eds) Child and Adolescent Obesity: Causes and Consequences; Prevention and Management. Cambridge University Press: Cambridge, 2002, pp 361-376. 7. Müller MJ, Danielzik S, Spethmann C. Prevention of overweight and obesity. In Kiess W, Marcus C, Wabitsch M (eds) Obesity in Childhood and Adolescence: Pediatric and Adolescent Medicine Vol 9. S Karger AG: Basel, 2004, pp243-263. 8. Lissau I, Burniat W, Poskitt EME, Cole T. Prevention. In Burniat W, Cole T, Lissau I, Poskitt EME (eds) Child and Adolescent Obesity: Causes and Consequences; Prevention and Management. Cambridge University Press: Cambridge, 2002, pp 243-269. 9. Campbell K, Waters E, O’Meara S, Kelly S, Summerbell C. Interventions for preventing obesity in children. Cochrane Database of Systematic Reviews, 2002, 2: CD001871. 10. Micucci S, Thomas H, and Vohra J. The Effectiveness of School-Based Strategies for the Primary Prevention of Obesity and for Promoting Physical Activity and/or Nutrition, the Major Modifiable Risk Factors for Type 2 Diabe-tes: A Review of Reviews. Public Health Research, Education and Development Program, Effective Public Health Practice Project. City of Hamilton: Hamilton, Ontario, 2002 [http://www.hamilton.ca/phcs/ephpp/Research/Full-Reviews/Diabetes-Review.pdf, accessed 22 June 2004]. 11. Lytle LA, Jacobs DR, Perry CL, Klepp K-I. Achieving physiological change in school-based inter-vention trials: what makes a preventive intervention successful? British Journal of Nutrition, 2002, 88: 219-221. 12. Casey L, Crumley E. Addressing Childhood Obesity: The Evidence for Action. Canadian Association of Paediatric Health Centres: Ottawa, 2004. [http://www.caphc.org/childhood_obesity/obesity_report.pdf, accessed 22 June 2004]. 13. Shepherd J, Harden A, Rees R, Brunton G, Garcia J, Oliver S, Oakley A. Young People and Healthy Eating: A systematic review of research on barriers and facilitators. EPPI-Centre, University of London. EPPI-Centre: London, 2001 [http://eppi.ioe.ac.uk/EPPIWebContent/hp/reports/health_eating01/healthy_eating_yp.pdf, accessed 22 June 2004]. 14. Swinburn B, Egger G, Raza F. Dissecting obesogenic environments: the development and applica-tion of a framework for identifying and prioritizing environmental interventions for obesity. Preventative Medicine, 1999, 29: 563-570.
Scatter plot of stakeholders
-10
-5
0
5
10
INFLUENCE
INTE
RES
Tchildren
health profs
advocay orgs
scientists
parents
M o Health
parliament
farmers
media
church
M o TransportM o Agriculture
retailers
Treasury
President
advertising ind.
food/drink ind.
M o Trade
food inspectorsM o Education
teachers
0 5 10
Figure 3
38 Features
SCN News #29
15. Kumanyika S, Jeffery RW, Morabia A, Rittenbaugh C, Antipatis VJ. Obesity prevention: the case for action. International Journal on Obesity, 2002, 26: 425-436. 16. Egger G, Swinburn B. An "ecological" approach to the obesity pandemic. British Medical Jour-nal,1997, 315: 477-480. 17. Consumers International. A spoonful of sugar: Television food advertising aimed at children, an international comparative study. Consumers International Programme for Developed Economies: London, 1996. Contact: Tim Lobstein, [email protected]
Features 39
SCN News #29
Editorial
The challenge of obesity and its associated chronic diseases
W Philip T James
International Obesity TaskForce and
the London School of Hygiene and Tropical Medicine The accompanying six articles on obesity pose a new challenge for the SCN and international policy-makers because they present a completely new demand for coping with yet another problem. For some it will be an unnecessary distraction from the priorities of the Millennium Development Goals (MDGs) set out by the UN and G8 only a short time ago; for others, it highlights a problem that could surely be resolved through education enabling the public to comprehend the need for sensible eating and increased physical activity. Why then should we address this problem? Do we run the risk of taking on too many nutrition issues when we are already failing to make sufficient progress with the MDGs, despite the declared commit-ments of governments? For decades we have been concerned with the enormous impact of childhood malnutrition, communi-cable diseases and the scourge of natural disasters and wars on whole populations, especially the vul-nerable groups within society. These problems have been the primary concern of a large number of UN agencies such as FAO, UNHCR, UNICEF, WFP and WHO who, often working with NGOs, have become renowned for their ability to cope with emergencies, as seen in the aftermath of the re-cent Asian Tsunami disaster. Today, policies recognize the crucial importance of food, shelter and the nurturing of children; but it has always been recognized that poverty is a major constraint on progress. FAO, founded by Boyd-Orr who helped transform British food and agricultural policy before, but particularly during, World War II, led the drive to make the global agricultural community self-sufficient in food and capable of coping with the hungry and deprived. Over the last 60 years, governments in Western Europe, the ex-Soviet Union, the US and Japan have spent billions of dollars annually to ensure not only self-sufficiency in food but also improve production efficiency. This enabled even the poor to afford both meat and milk needed for child growth and cereals, butter and sugar for energy sources. After the War these commodities met the needs of millions of malnourished children and adults in Europe and the Middle East. These methods were then taken to the developing world to cope with a plethora of com-municable diseases, poverty, contaminated water supplies, poor sanitation and childhood malnutrition whilst promoting economic development. Recently the benefits of using a free enterprise approach to development have become the principal focus of governments, which today has led us into an intense drive to enhance free trade and liberal economies. Chronic diseases-a major problem for the developing world
Given the progress achieved in the past six decades, why should the problem of obesity assume such prominence? What is its relevance to development, aid and trade issues? The answer is that excess weight gain is now recognized to be of pivotal importance to the development of diabetes and high blood pressure, an increased risk of heart disease, stroke and several major cancers: in short, chronic diseases are already dominating the global burden of ill-health. In the last five years, new WHO analysis highlighting the total burden of disability and premature death in all parts of the world has transformed our thinking. Figure 1 (next page) presents the surpris-ing findings that, although communicable diseases are still dominant in the least developed countries, the numbers of deaths from chronic ailments such as cardiovascular diseases (ie, heart disease and strokes) and cancers are far greater in developing countries than in transitional and economically de-veloped societies. Furthermore, projections over the next 30 years, based on current trends, show that the most common cause of death in the developing world will still be cardiovascular disease, with the epidemic of HIV/AIDS coming in third. The term "Western chronic diseases" or "diseases of afflu-ence" is a misnomer since the greatest burden is borne by the poorer countries in Asia, Latin America and Africa, with these diseases being shown to affect particularly the poor, underprivileged sections of society. So chronic diseases, as well as obesity, affect the poor, especially those who have moved to live in the burgeoning slums of the big cities.
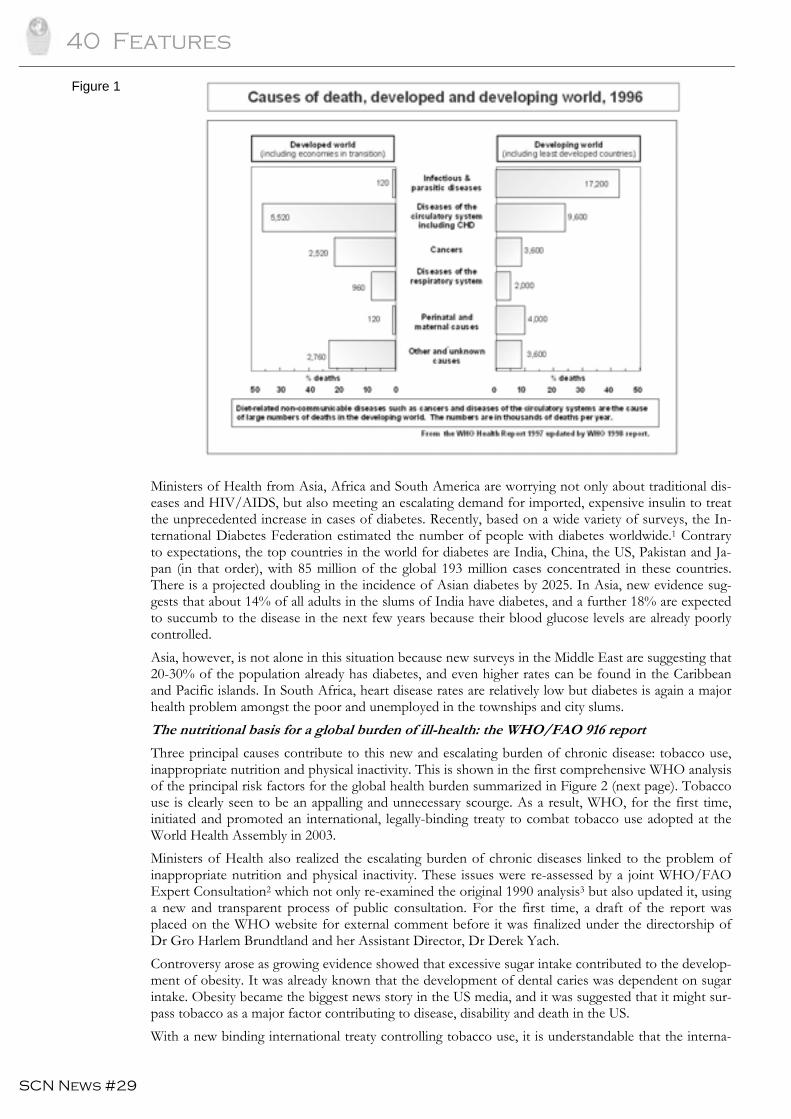
40 Features
SCN News #29
Ministers of Health from Asia, Africa and South America are worrying not only about traditional dis-eases and HIV/AIDS, but also meeting an escalating demand for imported, expensive insulin to treat the unprecedented increase in cases of diabetes. Recently, based on a wide variety of surveys, the In-ternational Diabetes Federation estimated the number of people with diabetes worldwide.1 Contrary to expectations, the top countries in the world for diabetes are India, China, the US, Pakistan and Ja-pan (in that order), with 85 million of the global 193 million cases concentrated in these countries. There is a projected doubling in the incidence of Asian diabetes by 2025. In Asia, new evidence sug-gests that about 14% of all adults in the slums of India have diabetes, and a further 18% are expected to succumb to the disease in the next few years because their blood glucose levels are already poorly controlled. Asia, however, is not alone in this situation because new surveys in the Middle East are suggesting that 20-30% of the population already has diabetes, and even higher rates can be found in the Caribbean and Pacific islands. In South Africa, heart disease rates are relatively low but diabetes is again a major health problem amongst the poor and unemployed in the townships and city slums. The nutritional basis for a global burden of ill-health: the WHO/FAO 916 report
Three principal causes contribute to this new and escalating burden of chronic disease: tobacco use, inappropriate nutrition and physical inactivity. This is shown in the first comprehensive WHO analysis of the principal risk factors for the global health burden summarized in Figure 2 (next page). Tobacco use is clearly seen to be an appalling and unnecessary scourge. As a result, WHO, for the first time, initiated and promoted an international, legally-binding treaty to combat tobacco use adopted at the World Health Assembly in 2003. Ministers of Health also realized the escalating burden of chronic diseases linked to the problem of inappropriate nutrition and physical inactivity. These issues were re-assessed by a joint WHO/FAO Expert Consultation2 which not only re-examined the original 1990 analysis3 but also updated it, using a new and transparent process of public consultation. For the first time, a draft of the report was placed on the WHO website for external comment before it was finalized under the directorship of Dr Gro Harlem Brundtland and her Assistant Director, Dr Derek Yach. Controversy arose as growing evidence showed that excessive sugar intake contributed to the develop-ment of obesity. It was already known that the development of dental caries was dependent on sugar intake. Obesity became the biggest news story in the US media, and it was suggested that it might sur-pass tobacco as a major factor contributing to disease, disability and death in the US. With a new binding international treaty controlling tobacco use, it is understandable that the interna-
Figure 1
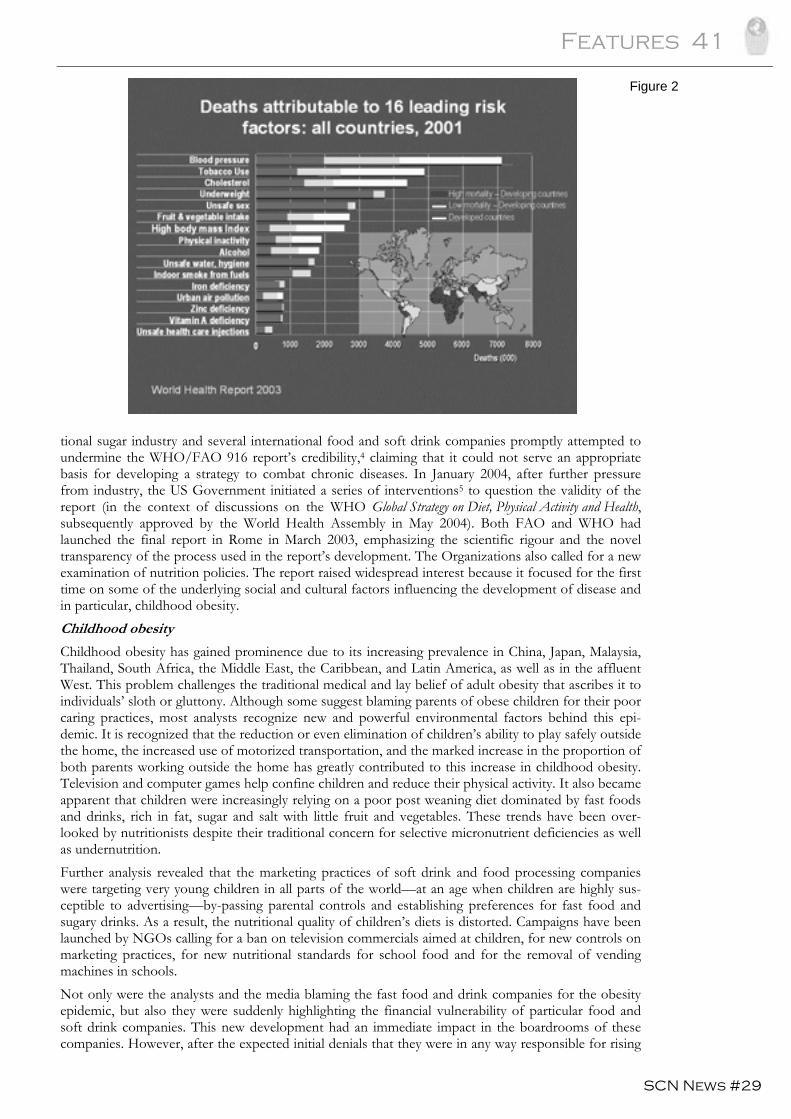
Features 41
SCN News #29
tional sugar industry and several international food and soft drink companies promptly attempted to undermine the WHO/FAO 916 report’s credibility,4 claiming that it could not serve an appropriate basis for developing a strategy to combat chronic diseases. In January 2004, after further pressure from industry, the US Government initiated a series of interventions5 to question the validity of the report (in the context of discussions on the WHO Global Strategy on Diet, Physical Activity and Health, subsequently approved by the World Health Assembly in May 2004). Both FAO and WHO had launched the final report in Rome in March 2003, emphasizing the scientific rigour and the novel transparency of the process used in the report’s development. The Organizations also called for a new examination of nutrition policies. The report raised widespread interest because it focused for the first time on some of the underlying social and cultural factors influencing the development of disease and in particular, childhood obesity. Childhood obesity
Childhood obesity has gained prominence due to its increasing prevalence in China, Japan, Malaysia, Thailand, South Africa, the Middle East, the Caribbean, and Latin America, as well as in the affluent West. This problem challenges the traditional medical and lay belief of adult obesity that ascribes it to individuals’ sloth or gluttony. Although some suggest blaming parents of obese children for their poor caring practices, most analysts recognize new and powerful environmental factors behind this epi-demic. It is recognized that the reduction or even elimination of children’s ability to play safely outside the home, the increased use of motorized transportation, and the marked increase in the proportion of both parents working outside the home has greatly contributed to this increase in childhood obesity. Television and computer games help confine children and reduce their physical activity. It also became apparent that children were increasingly relying on a poor post weaning diet dominated by fast foods and drinks, rich in fat, sugar and salt with little fruit and vegetables. These trends have been over-looked by nutritionists despite their traditional concern for selective micronutrient deficiencies as well as undernutrition. Further analysis revealed that the marketing practices of soft drink and food processing companies were targeting very young children in all parts of the world—at an age when children are highly sus-ceptible to advertising—by-passing parental controls and establishing preferences for fast food and sugary drinks. As a result, the nutritional quality of children’s diets is distorted. Campaigns have been launched by NGOs calling for a ban on television commercials aimed at children, for new controls on marketing practices, for new nutritional standards for school food and for the removal of vending machines in schools. Not only were the analysts and the media blaming the fast food and drink companies for the obesity epidemic, but also they were suddenly highlighting the financial vulnerability of particular food and soft drink companies. This new development had an immediate impact in the boardrooms of these companies. However, after the expected initial denials that they were in any way responsible for rising
Figure 2
42 Features
SCN News #29
childhood obesity, companies began changing their approach with surprising rapidity and sought to become “part of the solution” rather than “part of the problem”. A new global nutrition strategy is needed
This intense international debate formed the background for the development of the 2004 WHO Global Strategy on Diet, Physical Activity and Health aimed at preventing chronic diseases. The Strategy sought to engage other UN agencies, governments and many other actors whilst recognizing that nu-trition and physical inactivity required a different approach from that used for tobacco. Nevertheless, the World Sugar Research Association engaged a UK agricultural economist to produce a carefully constructed partial analysis of sugar producing economies.7 It identified those countries who would theoretically suffer if the 916 report became the reference document for calculating global food needs. Surprisingly the analysis ignored the population of China in calculating global needs and assumed no further growth in the world’s population. It also ignored the World Bank’s estimates that if the $6.4 billion annual subsidies by Western governments to their farmers were eliminated the developing world would benefit from a 40% increase in the world price and the employment of another 1 million farmers. Despite the spurious nature of the objections to the agricultural implications of the 916 report and a well-defined and carefully constructed FAO paper on this issue, the G-77 group of developing coun-tries attempted to undermine the proposal when it was discussed at the FAO’s Committee on Agricul-ture in Rome in February 2004. There the World Bank went further than before by suggesting huge agricultural benefits from implementing the fruit and vegetable goals of the 916 report. This requires, however, that the EU, US and Japan reform their vast agricultural and export subsidies which handi-cap the production of many different crops in the developing world. This remarkable industrial and political involvement provides the background to these six papers on overweight and obesity. We know there are many dietary factors contributing to chronic diseases but the novelty of finding obese children in poor as well as rich families is beginning to dominate the po-litical agenda. These six papers emphasize the importance of monitoring children’s growth and developing new cri-teria for recognizing the currently underestimated problem of childhood obesity. They also supply estimates of the possible prevalence of adult obesity, its rate of increase, and a focus on the value of breastfeeding. The FAO paper highlights the remarkable changes in agriculture and the drivers of change in feeding patterns in association with the emergence of chronic diseases. The paper from IF-PRI sets out the extraordinary speed of change in the delivery and accessibility of Western-style foods in the developing world and finally we have an early perspective on how we might cope with what is increasingly recognized as an “obesogenic toxic environment”. We now need a new perspective on nutrition policy and an examination of why food and nutrition actors may have inadvertently contributed to setting the scene for this new phenomenon. A more daunting challenge is how to best mesh all the nutritional gains that have been made over the last few decades with a nutrition policy for dealing with chronic diseases; how to integrate all other nutrition policies dealing with nutritional issues affecting the life cycle;8 and how to integrate the fun-damental needs and rights of children, young women, mothers and adults to ensure they are protected and supported in an optimum nutritional way without splintering into competing interests. This is the new nutrition emergency and it has huge global implications. References
1. IDF. International Diabetes Federation. Diabetes Atlas. 2nd Edition. World Diabetes Federation, 2003. 2. WHO. Diet, Nutrition and the Prevention of Chronic Diseases. Report of a Joint WHO/FAO Expert Consul-tation. WHO Technical Report Series No. 916. World Health Organization, Geneva, 2003. 3. WHO. Diet, nutrition, and the prevention of chronic diseases. Report of WHO study group. WHO technical series report no 797, Geneva 1990. 4. Sugar Association. Letters from the Sugar Association to then WHO Director General. March 14, April 14 2003 5. Steiger W. Letter to WHO Director General from William Steiger, Special Assistant to the Secretary for Interna-tional Affairs. US Department of Health and Human Services, January 2004. 6. WHO. Global Strategy on Diet, Physical Activity and Health. Resolution WHA57/A57_R17 May 22 2004
Features 43
SCN News #29
7. Irz X. Impact of WHO Dietary Recommendations on World Sugar Consumption, Production and Trade. Dr Xavier Irz Department of Agricultural and Food Economics School of Agriculture, Policy and Devel-opment. The University of Reading, UK April 2003 (unpublished). 8. James WPT, Norum K, Smitasiri S, Swaminathan MS, Tagwirye J, Uauy R, Ul Haq M. Ending Mal-nutrition by 2020: an Agenda for Change in the Millennium. Final Report to the ACC/SCN by the Commis-sion on the Nutrition Challenges of the 21st Century. Supplement to the Food and Nutrition Bulletin, September/October 2000. UNU International Nutrition Foundation, USA. Contact: W Philip T James ([email protected])
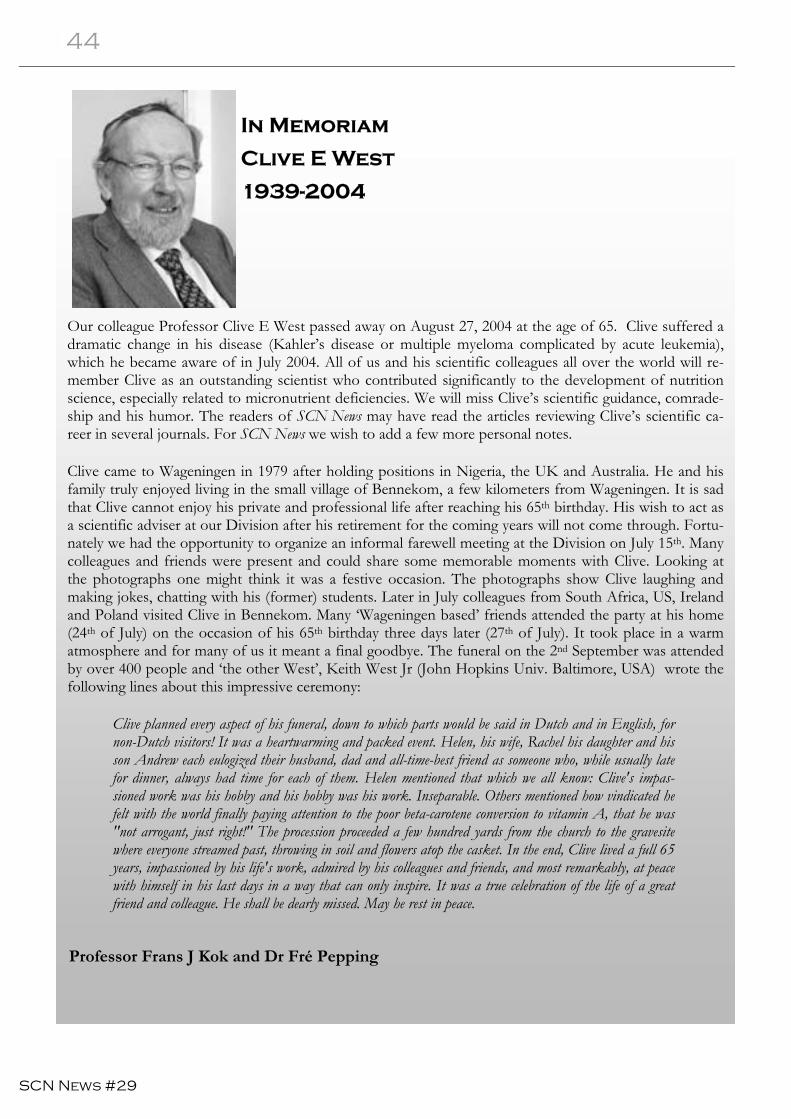
44 Features
SCN News #29
In Memoriam
Clive E West
1939-2004
Our colleague Professor Clive E West passed away on August 27, 2004 at the age of 65. Clive suffered a dramatic change in his disease (Kahler’s disease or multiple myeloma complicated by acute leukemia), which he became aware of in July 2004. All of us and his scientific colleagues all over the world will re-member Clive as an outstanding scientist who contributed significantly to the development of nutrition science, especially related to micronutrient deficiencies. We will miss Clive’s scientific guidance, comrade-ship and his humor. The readers of SCN News may have read the articles reviewing Clive’s scientific ca-reer in several journals. For SCN News we wish to add a few more personal notes.
Clive came to Wageningen in 1979 after holding positions in Nigeria, the UK and Australia. He and his family truly enjoyed living in the small village of Bennekom, a few kilometers from Wageningen. It is sad that Clive cannot enjoy his private and professional life after reaching his 65th birthday. His wish to act as a scientific adviser at our Division after his retirement for the coming years will not come through. Fortu-nately we had the opportunity to organize an informal farewell meeting at the Division on July 15th. Many colleagues and friends were present and could share some memorable moments with Clive. Looking at the photographs one might think it was a festive occasion. The photographs show Clive laughing and making jokes, chatting with his (former) students. Later in July colleagues from South Africa, US, Ireland and Poland visited Clive in Bennekom. Many ‘Wageningen based’ friends attended the party at his home (24th of July) on the occasion of his 65th birthday three days later (27th of July). It took place in a warm atmosphere and for many of us it meant a final goodbye. The funeral on the 2nd September was attended by over 400 people and ‘the other West’, Keith West Jr (John Hopkins Univ. Baltimore, USA) wrote the following lines about this impressive ceremony:
Clive planned every aspect of his funeral, down to which parts would be said in Dutch and in English, for non-Dutch visitors! It was a heartwarming and packed event. Helen, his wife, Rachel his daughter and his son Andrew each eulogized their husband, dad and all-time-best friend as someone who, while usually late for dinner, always had time for each of them. Helen mentioned that which we all know: Clive's impas-sioned work was his hobby and his hobby was his work. Inseparable. Others mentioned how vindicated he felt with the world finally paying attention to the poor beta-carotene conversion to vitamin A, that he was "not arrogant, just right!" The procession proceeded a few hundred yards from the church to the gravesite where everyone streamed past, throwing in soil and flowers atop the casket. In the end, Clive lived a full 65 years, impassioned by his life's work, admired by his colleagues and friends, and most remarkably, at peace with himself in his last days in a way that can only inspire. It was a true celebration of the life of a great friend and colleague. He shall be dearly missed. May he rest in peace.
Professor Frans J Kok and Dr Fré Pepping
SCN News #29
Programme News 45
It is estimated that 67% of adult males and 52% of adult females in Australia were either overweight or obese in 1999-2000.1 Since 1989, the increase in prevalence of obesity for adults is almost 80%.2 Put in perspective, this translates to around 7.5 million Australian adults who are either overweight or obese. The rate of overweight and obesity in Australian children and adolescents has doubled over the last decade, with an estimated 20-25% of children affected.3 The Australian Government considers the promotion of healthy lifestyles among children and young people a high priority. The prevention of obesity in young people has been the initial focus of Austra-lia’s National Obesity Taskforce, established in November 2002, to develop a nationally coordinated, collaborative cross-sector approach to tackle the problem. The November 2003 Taskforce report, Healthy Weight 2008—Australia’s Future—The National Action Agenda for Children and Young People and their Families, recommends actions across a range of settings such as child care, schools, primary care, ma-ternal and infant health care, neighbourhoods, workplaces, food supply, family and community ser-vices, media and marketing. In July 2004, Australian Health Ministers announced a package of national initiatives including: a na-tional information programme to promote increased consumption of fruit and vegetables; a schools resource kit to promote healthy eating and physical activity (presenting examples of quality practice in Australian schools); the promotion of healthy school canteens; the establishment of a community net-work of healthy weight demonstration sites; and new physical recommendations for children and youth. Further information on the Taskforce and other Australian Government initiatives can be found at www.healthyactive.gov.au In addition, Australia was the first country to commit funding to WHO to assist in the implementa-tion of the Global Strategy on Diet, Physical Activity and Health in the Western Pacific region through the development of a ‘template’ to guide implementation. Countries in our region will derive a direct benefit from our investment. Obesity is a complex problem, with no simple solution. It will require effort from all sectors, includ-ing industry, nongovernmental organizations and the community. For its part, the Australian Govern-ment is contributing to tackling overweight and obesity through a number of initiatives. Four of these initiatives are outlined below and a number of Australian guidelines targeting healthy eating, physical activity and overweight and obesity are outlined in the publications section of this issue. Building a healthy active Australia
On 29 June 2004, the Australian Prime Minister, the Hon John Howard MP, launched a AUD 116 million package (over four years) to tackle the growing problem of declining physical activity and poor eating habits of Australian children. This package, Building a Healthy, Active Australia, recognizes that we need a balanced approach to nutrition and physical activity to promote healthy habits for life. Fur-ther information on the full package of initiatives is available at www.healthyactive.gov.au The package includes an AUD 11 million programme to give Australian families practical help on how to make healthy eating and physical activity part of their everyday lives. The funding will support a national information programme on healthy eating, with a particular emphasis on increasing the con-sumption of fruit and vegetables as part of a balanced diet. The package also includes the AUD 15 million Healthy School Communities initiative. The aim of this initiative is to assist schools, families and children throughout Australia to improve their intake of nu-tritious food. A grant of up to AUD 1,500 is available until the end of the 2005 school year to each Australian primary and secondary school, to initiate activities that encourage healthy eating. An infor-mation kit was sent to all schools to assist them with a grant application and the identification of suit-able activities that could be implemented in their school. This kit contains healthy eating publications, healthy eating and physical activity tips for parents, examples of activities that some schools have al-ready tried and found effective, and grant application forms. In response, schools have applied to implement a range of initiatives, including healthy canteen menus, healthy cooking classes, breakfast programmes, curriculum resources and vegetable gardens.
Programme News Australia
46 Programme News
SCN News #29
National Child Nutrition Programme
The three-year National Child Nutrition Programme is a community grants programme, which aims to improve the nutrition and long term eating patterns of children aged 0-12 years and pregnant women in high-need environments. One hundred and nine communities have participated, or are still participating in, the National Child Nutrition Programme across Australia. Projects have been funded within a range of settings including antenatal and postnatal services, childcare services, outside school time care and primary school set-tings. Completed summary reports on each project will be made available on www.health.gov.au/internet/wcms/Publishing.nsf/Content/health-pubhlth-strateg-childnutrition-index.htm. Rural chronic disease initiative
The Rural Chronic Disease Initiative (RCDI) was a four year initiative (2000-2004) undertaken by the Australian Government to develop an evidence base demonstrating the effectiveness of community-driven health promotion and prevention activities in rural areas. Evaluation of this initiative has shown that rural and remote communities can be supported to take responsibility for making their own lifestyle and behaviour changes, in order to reduce the burden of chronic disease. Participants across all RCDI projects engaged in a wide number of activities, which focused essentially on good nutrition and healthy weight and increased levels of physical activity. RCDI projects achieved a range of outcomes including reduction in risk factors; significant weight losses; reduced social isola-tion; improvements in fitness levels and mobility; reduced or improved medication use; and increases in early testing for chronic diseases. An RCDI Building Healthy Communities Guide has been developed to support chronic disease prevention and management projects in small rural communities. The Guide is available, from the Australian Government, Department of Health and Ageing, Rural Primary Health Section, MDP 91, GPO Box 9848, Canberra, ACT, 2601, Australia. Lifestyle prescriptions initiative
The Lifestyle Prescriptions Initiative aims to make it easier for general practitioners (GPs) to encourage their patients to adopt healthier lifestyles. For example, a GP may prescribe that their patient either increase their physical activity, quit smoking, eat a healthier diet, lose weight, reduce their alcohol in-take or a combination of these. In addressing these risk factors, a large proportion of the burden of chronic disease in Australia can be prevented or delayed. A lifestyle prescription is written advice that is given to the patient recommending healthy behaviour change. These lifestyle issues will be addressed through the introduction of a national approach to lifestyle pre-scriptions that is being progressed through the Focus on Prevention Package, announced in the 2003-2004 Federal Budget. The Government has provided AUD 4.3 million over three years to support general practices to assist individuals to adopt healthier lifestyles. There are two aspects to lifestyle prescriptions: ▪ for the patient, the prescription is a written lifestyle advice provided by their GP, and ▪ for GPs (including MDs, Aboriginal Health Workers, practice staff and divisional staff) lifestyle
prescriptions represent a process of assessment, advice, information and/or referral encouraging and supporting the management of behavioural risk factors in a primary care setting.
Implementation of the Lifestyle Prescriptions Initiative is underway and it is anticipated that resources to support general practice will be available in June 2005. Further information on lifestyle prescriptions is available at: www.health.gov.au/pubhlth/strateg/lifescripts/ References
1. A growing problem: Trends and patterns in overweight and obesity among adults in Australia, 1980 to 2001. AIHW, 2003. 2. ibid 3. Magarey AM, Daniels LA & Boulton JC (2001). Prevalance of overweight and obesity in Australian children and adolescents: reassessment of 1985 and 1995 data against new standard international defi-nitions. Medical Journal of Australia 174:561-564. (as referenced in DRAFT AIHW fact sheet, ‘Overweight and obesity in Australian children and adolescents’) 1985 Australian Health and Fitness Survey and 1995 National Nutrition Survey. Contact: Michelle Coad, Australian Government ([email protected])
SCN News #29
Programme News 47
Food and
Agriculture
Organization
Protecting and improving food and nutrition security of orphans and HIV/AIDS affected children in Lesotho and Malawi
Currently, 40 million people live with HIV/AIDS representing a severe development crisis. By far the worst-affected region, Sub-Saharan Africa is now home to 29.4 million people living with HIV/AIDS. The highest levels of HIV/AIDS are found in Southern Africa, with prevalence rates exceeding 25% among the adult population in Botswana, Lesotho, Swaziland and Zimbabwe (WHO/UNAIDS, 2002). In 2001, it was estimated that more than 1.1 million orphans lived alone in Lesotho, Malawi, Swazi-land, and Zambia, and it is expected that this number will increase to more than 1.6 million in these four Southern African countries by 2005. Children on the Brink, published by UNAIDS, UNICEF and USAID in 2004, revealed that in 2003, 180,000 children (19%) in Lesotho were orphaned, and an esti-mated 210,000 children (23%) will be orphaned by 2010. For Malawi, the report states that 1 million children (14%) were orphaned in 2003, and projects that this figure will increase to 1.3 million (15%) by 2010. HIV/AIDS orphans live in a vicious circle of food insecurity, HIV/AIDS and lack of care and educa-tion resulting in malnutrition and high mortality. To break this vicious circle, large scale multi-sectoral efforts are required to address the problem. In Southern Africa it can be expected that without ade-quate policies and programmes, the coming years will see similar widespread crises in other high HIV-prevalence countries and regions. Global efforts are therefore required to address this problem. In re-sponding to the challenges of HIV/AIDS, particularly among orphans and vulnerable children, FAO is, in collaboration with UNICEF and WFP, implementing a project to protect and improve nutrition and food security of orphans and other children affected by HIV/AIDS. The project is funded by the Government of Germany and it will be operational initially in two Southern African countries with high levels of HIV (Lesotho and Malawi). Phase two of the project will include more Southern African countries. The project aims to serve as a start-up phase of a multi-sectoral action programme to promote the im-plementation of an inter-country, inter-agency and multi-donor response to the emerging food security crisis affecting children in HIV/AIDS-affected countries. Lessons learned from this project in terms of feasibility, replicability, and coverage will be widely disseminated and used to advocate for broader ac-tion and resource mobilization at all levels. The project will directly address the underlying causes of child malnutrition through actions to increase the availability of and access to food and improved pub-lic health services. Further, it will use mothers’ and care givers’ influence on the utilization and con-sumption of food by children. The project is based on the recognition that there is a multitude of small-scale and scattered initiatives that provide a valuable experience base for expansion and for achieving coverage at a meaningful scale. It therefore builds upon and strengthens the capacity of local institutions as the primary means for achieving wider replication and greater impact of district and national programmes. Models and methods for taking multi-sectoral food security action relevant for the support of HIV/AIDS affected preschool and school-aged children, both infected individuals as well as their family and community, will be demonstrated and made available to relevant stakeholders. In a second phase, addi-tional resources for the expansion of such activities to other districts will be sought. By the end of the project the household food security and nutrition of orphans, children and their families will be improved. The project will strengthen the capacity of families, communities, commu-nity-based organizations and institutions at local, district and national levels to protect and improve livelihoods, food and nutrition security and education of orphans and HIV/AIDS-affected children. The project will demonstrate and make available to relevant stakeholders feasible models and methods for taking multi-sectoral action to improve the food and nutrition security of HIV/AIDS affected pre-school and school-aged children. Regional African training course on nutrition in emergencies in Kenya
A nutrition in emergencies training course developed for graduate students and field practitioners was undertaken at the University of Nairobi in June 2004. It involved students at the Master’s degree level from both the University of Nairobi and Kenyatta University. The FAO Food Security Assessment Unit for Somalia based in Nairobi contributed substantially to the development of the course with nu-trition, food security and GIS component inputs. Tufts University and other academic institutions have indicated an interest in becoming involved in the further development of this course. Contact: Brian Thompson, FAO ([email protected])
48 Programme News
SCN News #29
INACG
IVACG
Iron deficiency in early life: challenges and progress-2004 INACG Symposium
The International Nutritional Anemia Consultative Group (INACG) held its 4th international sympo-sium in Lima, Peru on 18 November 2004. More than 665 policy-makers, programme managers, plan-ners, and scientists from 79 countries participated in discussions on the benefits of iron supplementa-tion for child development and ways to improve delivery of iron to infants, children and women of childbearing-age at risk of iron deficiency. Dr Frances Davidson (USAID) called attention to INACG’s focus on state of the art research and in-novative programming for the most vulnerable populations—infants, children and pregnant women—during the 2004 Symposium. Data from the Pemba trial in Zanzibar suggest a need to protect children from malaria (insecticide-treated nets and/or presumptive treatment) while providing iron/folic acid supplements. Given evidence that there may be some risk associated with iron supplementation of iron-replete children, further research is needed to evaluate the appropriate recommendations for uni-versal iron/folic acid supplementation in malarious areas and potential strategies for targeting children who are iron-deficient. Studies from Asia and Africa presented at the INACG Symposium demonstrated that fortification of staple foods and condiments with iron salts is a valid approach to reducing iron deficiency anaemia in children and women who are at risk. Deworming and vitamin A supplementation also reduced anae-mia in children in Nepal. Dr Ian Darnton-Hill (UNICEF) stated that he was very optimistic about the emerging strategies to combat anaemia. Two other micronutrient groups, the International Vitamin A Consultative Group and the International Zinc Nutrition Consultative Group took advantage of the broad audience to hold scientific and pro-grammatic discussions on vitamin A and zinc deficiencies. The INACG Steering Committee and the INACG Secretariat organized the meeting collaboratively with the local organizing committee coordinated by the Peruvian Ministry of Health, the Pan American Health Organization, USAID/Peru and nongovernmental organizations in Peru. Additional funding was provided by Task Force SIGHT AND LIFE, The Micronutrient Initiative, and several private sec-tor companies. A complete report of the meeting will be available in mid-2005 from the INACG Secretariat. For more information email [email protected] or visit http://inacg.ilsi.org
Vitamin A and the common agenda for micronutrients: XXII IVACG Meeting
The International Vitamin A Consultative Group (IVACG) held its 22nd meeting in Lima, Peru on 15–17 November 2004. More than 665 participants took part in discussions on ways to improve delivery of vitamin A and other micronutrients to infants, young children and women of childbearing age in developing countries. Dr Pilar Mazzetti Soler, Minister of Health of Peru, opened by acknowledging that the IVACG Meeting provided an opportunity to share the latest scientific findings on ways to reduce “hidden hunger” in women and children worldwide. Vitamin A deficiency, which is only one component of “hidden hun-ger,” affects approximately 127 million preschool children worldwide. Dr Richard Martin (USAID) called reducing vitamin A deficiency an excellent investment for develop-ing countries. He congratulated IVACG for providing a forum to exchange data on effective interven-tions in developing countries and thereby reducing vitamin A deficiency. Dr Gerald Keusch, Associate Dean for Global Health at Boston University’s School of Public Health, urged collaboration, integrity and action as the watchwords for achieving global health in a globalized world. Since micronutrients are only one piece of the public health puzzle, Dr Keusch encouraged partnership across disciplines to achieve public health action. Since nutrition, especially micronutrient status, is a conditioning factor for infectious disease mortality and morbidity, better integration of mi-cronutrient and infectious disease public health programmes is vital to controlling these problems. The fact that populations deficient in vitamin A are likely to be deficient in other micronutrients as well, has been known for a very long time. Results of research that has begun to explore the benefits and complications of combining micronutrients were presented. Clearly a great deal more research and testing needs to be done before optimal solutions are determined. Several presentations highlighted national vitamin A supplementation programmes that successfully replaced the phase out of National Immunization Days (NIDS) with alternative supplementation deliv-
SCN News #29
Programme News 49
Office for the High Commissioner on
Human Rights
ery strategies. Developing these alternative delivery strategies has been a major focus of discussion and planning at the last three IVACG meetings. Dr Alfred Sommer, Chair of the IVACG Steering Committee, closed the three-day meeting saying that it was gratifying to hear that real progress is being made in developing enriched cultivars of traditional foods through traditional breeding and genetically engineered techniques. The IVACG Steering Committee and IVACG Secretariat organized the meeting collaboratively with the local organizing committee coordinated by the Peruvian Ministry of Health, the Pan American Health Organization, USAID/Peru and nongovernmental organizations in Peru. Additional funding was provided by Task Force SIGHT AND LIFE, The Micronutrient Initiative and several private sec-tor companies. A complete report of the meeting will be available in mid-2005 from the IVACG Secretariat. For more information email [email protected] or visit http://ivacg.ilsi.org Voluntary Guidelines
On 24 November 2004, the Council of the Food and Agriculture Organization (FAO) adopted a set of Voluntary Guidelines to support the progressive realization of the right to adequate food in the con-text of national food security, which had been negotiated within an Intergovernmental Working Group and endorsed by the Committee on World Food Security in September 2004. The Inter-Governmental Working Group (IGWG) that negotiated the Voluntary Guidelines was es-tablished by the FAO Council in response to the invitation by the World Food Summit: five years later (2001) with the mandate to elaborate, within two years, a set of voluntary guidelines to support States’ efforts to progressively realize the right to adequate food. The IGWG was open to Member States of the FAO and the United Nations with participation of stakeholders (including United Nations human rights bodies and several human rights NGOs). The adopted text was the result of two years of intense work and negotiations among States, with the active participation of stakeholders. It took three sessions of the IGWG (24-26 March and 27-29 Oc-tober 2003, and 5-9 July 2004), various sessions in the form of open-ended working groups (February 2004 and July 2004), and several meetings of the IGWG Bureau and Friends of the Chair for States to agree on the text of the Guidelines. The text comprises three parts: 1) Preface and Introduction; 2) Guidelines 1-18; and 3) an interna-tional framework. Guidelines 1 to 18 address a wide range of issues relating to the right to food includ-ing the need to adopt national strategies—including poverty reduction strategies—the need to establish adequate institutions, legislation and market systems, the adoption of measures in the fields of access to resources and assets, consumer protection and food safety, nutrition, education and awareness-raising, financial resources, safety nets and emergency preparedness. Guideline 18 establishes a clear link between the international framework that provides an enabling environment and the other Guide-lines. This is the latest step in a process that began with the World Food Summit (1996) Objective 4.7 estab-lishing the need to clarify the rights related to food contained in Article 11 of the International Cove-nant on Economic, Social and Cultural Rights (ICESCR), and invited the High Commissioner for Hu-man Rights to do such clarification taking into account possible development of voluntary guidelines as a way to implement that right. In response to that invitation, the Committee on ESCR had adopted its General Comment 12 (1999) on the right to adequate food as contained in the ICESCR. Contact: Carlos Lopez, Office of the UN High Commissioner for Human Rights ([email protected]) Feeding non-breastfed children 6–24 months of age: report of a WHO meeting held 8–10 March 2004, Geneva
According to current UN recommendations, infants should be exclusively breastfed for the first six months of life, and thereafter should receive appropriate complementary feeding with continued breastfeeding up to two years or beyond. However, there are a number of infants who will not enjoy the benefits of breastfeeding in the early months of life or for whom breastfeeding will not occur or will stop before the recommended duration of two years or beyond. A group that calls for particular attention is the infants of mothers who are known to be HIV positive.
World Health
Organization
50 Programme News
SCN News #29
Recommendations for appropriate feeding of breastfed infants from six months onwards have been summarized by PAHO in the publication Guiding Principles for Complementary Feeding of the Breastfed Child1. Some of these guiding principles are not applicable to non-breastfed children, while others need adap-tation. WHO convened an informal meeting to develop similar guidance for feeding non-breastfed children after six months of age. A summary of the resulting guiding principles for non-breastfed chil-dren is presented in the box. The full report of the meeting is available at: www.who.int/child-adolescent-health/New_Publications/ NUTRITION/FCH_CAH_04.03.pdf Summary of Guiding Principles for feeding non-breastfed children 6–24 months of age 1. AMOUNT OF FOOD NEEDED
Ensure that energy needs are met. These needs are approximately 600 kcal per day at 6-8 months of age, 700 kcal per day at 9-11 months of age, and 900 kcal per day at 12-23 months of age. 2. FOOD CONSISTENCY
Gradually increase food consistency and variety as the infant gets older, adapting to the infant’s re-quirements and abilities. Infants can eat pureed, mashed and semi-solid foods beginning at six months. By eight months most infants can also eat “finger foods” (snacks that can be eaten by chil-dren alone). By 12 months, most children can eat the same types of foods as consumed by the rest of the family (keeping in mind the need for nutrient-dense foods, as explained in #4 below). Avoid foods in a form that may cause choking (ie, items that have a shape and/or consistency that may cause them to become lodged in the trachea, such as nuts, grapes, raw carrots). Such foods should be mashed, pureed or juiced before being fed to young children. 3. MEAL FREQUENCY AND ENERGY DENSITY
For the average healthy infant, meals should be provided 4-5 times per day, with additional nutritious snacks (such as pieces of fruit or bread or chapatti with nut paste) offered 1-2 times per day, as desired. The appropriate number of feedings depends on the energy density of the local foods and the usual amounts consumed at each feeding. If energy density or amount of food per meal is low, more fre-quent meals may be required. 4. NUTRIENT CONTENT OF FOODS
Feed a variety of foods to ensure that nutrient needs are met. ▪ Meat, poultry, fish or eggs should be eaten daily, or as often as possible, because they are rich
sources of many key nutrients such as iron and zinc. Milk products are rich sources of calcium and several other nutrients. Diets that do not contain animal source foods (meat, poultry, fish or eggs, plus milk products) cannot meet all nutrient needs at this age unless fortified products or nutrient supplements are used.
▪ If adequate amounts of other animal source foods are consumed regularly, the amount of milk needed is ~200-400 mL/d; otherwise, the amount of milk needed is ~300-500 mL/d. Accept-able milk sources include full-cream animal milk (cow, goat, buffalo, sheep, camel), Ultra High Temperature (UHT) milk, reconstituted evaporated (but not condensed) milk, fermented milk or yogurt, and expressed breastmilk (heat-treated if HIV-positive).
▪ If milk and other animal source foods are not eaten in adequate amounts, both grains and leg-umes should be consumed daily, if possible within the same meal, to ensure adequate protein quality.
▪ Dairy products are the richest sources of calcium. If dairy products are not consumed in ade-quate amounts, other foods that contain relatively large amounts of calcium, such as small fish that include the bones (dried or fresh, with the bones crushed or otherwise processed so that they are safe to eat) and lime-treated maize tortillas, can fill the gap. Other foods such as soy-beans, cabbage, carrots, squash, papaya, green leafy vegetables, guava and pumpkin are useful additional sources of calcium.
▪ The daily diet should include vitamin A rich foods (eg, dark coloured fruits and vegetables; red palm oil; vitamin A fortified oil or foods); vitamin C rich foods (eg, many fruits, vegetables and potatoes) consumed with meals to enhance iron absorption; and foods rich in the B vitamins including riboflavin (e.g. liver, egg, dairy products, green leafy vegetables, soybeans), vitamin B6 (eg, meat, poultry, fish, banana, green leafy vegetables, potato and other tubers, peanuts) and folate (eg, legumes, green leafy vegetables, orange juice).
▪ Provide diets with adequate fat content. If animal-source foods are not consumed regularly, 10-
SCN News #29
Programme News 51
20 g of added fats or oils are needed unless a fat-rich food is given (such as foods or pastes made from groundnuts, other nuts and seeds). If animal-source foods are consumed, up to 5 g of addi-tional fats or oils may be needed.
▪ Avoid giving drinks with low nutrient value, such as tea, coffee and sugary soft drinks. Limit the amount of juice offered, to avoid displacing more nutrient-rich foods.
5. USE OF VITAMIN-MINERAL SUPPLEMENTS OR FORTIFIED PRODUCTS
As needed, use fortified complementary foods or vitamin-mineral supplements (preferably mixed with or fed with food) that contain iron (8-10 mg/d at 6-12 months, 5-7 mg/d at 12-24 months). If adequate amounts of animal-source foods are not consumed, these fortified foods or supplements should also contain other micronutrients, particularly zinc, calcium and vitamin B12. In countries where vitamin A deficiency is prevalent or where the underfive mortality rate is over 50 per 1000, it is recommended that children 6-24 months old receive a high-dose vitamin A supplement (100,000 IU once for infants 6-12 months old and 200,000 IU bi-annually for young children 12-23 months old). 6. FLUID NEEDS
Non-breastfed infants need at least 400-600 mL/d of extra fluids (in addition to the 200-700 mL/d of water that is estimated to come from milk and other foods) in a temperate climate, and 800-1200 mL/d in a hot climate. Plain, clean (boiled, if necessary) water should be offered several times per day to en-sure that the infant’s thirst is satisfied. 7. SAFE PREPARATION AND STORAGE OF FOODS
Practice good hygiene and proper food handling by a) washing care givers’ and children’s hands with soap before food preparation and eating, b) storing foods safely and serving foods immediately after preparation, c) using clean utensils to prepare and serve food, d) using clean cups and bowls when feed-ing children, and e) avoiding the use of feeding bottles, which are difficult to keep clean (for additional details, see WHO Complementary Feeding: Family foods for breastfed children, 2000 and Five Keys to Safer Food www.who.int/foodsafety/publications/consumer/5keys/en/). 8. RESPONSIVE FEEDING
Practice responsive feeding, applying the principles of psycho-social care. Specifically: a) feed infants directly and assist older children when they feed themselves, being sensitive to their hunger and satiety cues; b) feed slowly and patiently, and encourage children to eat, but do not force them; c) if children refuse many foods, experiment with different food combinations, tastes, textures and methods of en-couragement; e) minimize distractions during meals if the child loses interest easily; f) remember that feeding times are periods of learning and love--talk to children during feeding, with eye to eye contact. 9. FEEDING DURING AND AFTER ILLNESS
Increase fluid intake during illness and encourage the child to eat soft, varied, appetizing, favourite foods. After illness, give food more often than usual and encourage the child to eat more. For more information, contact André Briend ([email protected]) or Peggy Henderson ([email protected]) in WHO's Department of Child and Adolescent Health and Development. References
1. PAHO Guiding Principles for Complementary Feeding of the Breastfed Child. Washington: Pan American Health Organization, World Health Organization, 2003. Indicators to assess dietary adequacy in children 6-23 months of age and older: a joint WHO/IFPRI/FAO meeting, 11-13 October 2004
Dietary diversity is a key component of dietary quality. Evidence from developed countries shows that greater food and food group variety helps ensure adequate intake of essential nutrients. Little is known however about the nature of these relationships in developing countries where diets are typically mo-notonous and rely on a few-plant based foods. WHO, IFPRI and FAO held a technical meeting on Dietary diversity, dietary adequacy and child growth from 11-13 October 2004 in Rome, to review state-of-the-art knowledge in this area and use this information to guide the development of indicators for assessing dietary quality in children 6-23 months of age (ie, the period of complementary feeding and older). Studies in various age-groups, including young infants, indicate that there is a likely correlation between
World Health
Organization
(cont.)
52 Programme News
SCN News #29
dietary diversity and dietary adequacy in resource-poor settings.1 A recent analysis of four sets of data on complementary feeding, carried out by the University of California at Davis and IFPRI with financial support from USAID/FANTA, showed a correlation between dietary diversity and nutrient density in diets of infants aged 6-12 months.2 A protocol describing the methodology used to conduct this analysis has been formulated and will be available for wider application. Additional analyses of data, as they pertain to feeding practices of children 6-23 months of age and older, will begin in the near future in various sites covering all main regions. USAID/FANTA, WHO and FAO will provide funding and IFPRI and the University of California at Davis will provide technical support. The aim is to provide the evidence necessary to enable the global community to reach a consensus on a limited set of universal indicators to assess dietary adequacy. For more information, please contact Mary Arimond at the International Food Research Policy Institute ([email protected]), Bernadette Daelmans in WHO's Department of Child and Adolescent Health and Development ([email protected]), or Gina Kennedy ([email protected]). References
1. Ruel MT. Operationalizing dietary diversity: a review of measurement issues and research priorities. Journal of Nutrition, 2003, 133: 3911S-3926S. 2. Dewey KG, Cohen RJ, Arimond M, Ruel M. Developing and validating indicators of feeding frequency and nutri-ent density of complementary foods for the breastfed child in developing countries. Report submitted to WHO and USAID/FANTA. (draft) WHO Integrated Strategy to promote optimum foetal development
Regional experts in nutrition and reproductive health from 16 WHO South-East Asia and West Pacific Regional countries met in Bangkok in December 2004, to identify region-specific issues related to the proposed strategy in optimizing foetal growth and development. The objective of the consultation was to inform about the strategy, gather comments on its purpose, direction and contents for its development and guidance on implementation issues with other existing related strategies. A 2002 WHO consultation highlighted the need to develop a strategy to reduce low birthweight (LBW). In practice, optimizing foetal development is critical, with size at birth marking one aspect of this proc-ess. A meeting of the experts was held in November 2003, to review the recent knowledge about the impact of earlier life events on neonatal transition, infant development, cognitive development and life-long sequelae. The experts concluded that an integrated strategy was needed which promotes a broader characterization of pregnancy outcomes than birth size alone. The meeting report outlines strategic di-rections to address related actions for countries to take to promote and protect optimal fetal develop-ment. The strategy recognizes two types of interventions: a) public health interventions to make the envi-ronment optimal for the potential mother to nurture her foetus, and b) interventions aimed at maximiz-ing the role of an individual woman as an environment for the foetus—these would tend to be clinical interventions. Because the causes of sub-optimal foetal development are multiple, it is unlikely that inter-ventions focused on addressing only one aspect, for example single nutrient deficiencies, will have large impact on foetal development, whereas packages of interventions are likely to have synergistic effects. The objectives and targets of programme efforts will best relate to immediate causes of the problem in the reality of the local context. The promotion of optimal foetal development will potentiate and ensure the achievement of many of the Millennium Development Goals by 2015. LBW rates are highest in Asian countries, thus concerns about its impact on populations are most press-ing. The participants identified region-specific issues related to the protection of foetal development, identified priority areas for action and defined feasible ways to implement the strategy, along with other global or regional strategies, and identified gaps in knowledge regarding optimal foetal growth and devel-opment that could serve as the basis for research topics necessary for moving the agenda forward. Similar consultations are planned for this year in WHO’s other Regions before finalizing the integrated strategy to promote optimum foetal development. Contact: Sultana Khanum WHO Department of Nutrition for Health and Development ([email protected]) or Jelka Zupan, WHO Reproductive Health and Research ([email protected])
SCN News #29
Programme News 53
World Vision
Canada
Hearth/Positive Deviance: Sharing lessons learned
In 1999, World Vision Canada initiated the Hearth programme in conjunction with its field partners in Honduras and Guatemala. Since 1999, the programme has expanded to include eight countries within the Caribbean, Central and South America regions (Haiti, Mexico, Guatemala, Honduras, Nicaragua, El Salvador, Peru, and Bolivia). More than 38,000 children underfive years are benefiting from the pro-gramme. Using a positive deviant approach, Hearth seeks to empower communities to find local solutions to mal-nutrition. Hearth is built upon the premise that even in communities with high levels of malnutrition, there are individuals whose behaviours and practices enable them to find better ways to prevent malnu-trition than their neighbours, despite facing similar conditions of poverty. Community-appointed health volunteers, are led through a process to discover what these families (positive deviants) do differently and seek to teach these concepts to the mothers of malnourished children. From 21-25 June 2004, a Hearth Regional Experience Sharing Forum was held in Huaraz, Peru. Eight World Vision field offices sent representatives from health, nutrition, economic development and food security sectors to participate in the forum. Each country provided an overview of their Hearth experi-ence, including programme adaptations, lessons learned and key results. In addition to measurable improvements in nutritional status, participants noted several positive results from the Hearth experience: ▪ emergence of community solidarity and leadership focused on addressing malnutrition among
community children ▪ strengthening of the family unit, as men and women are united in a common cause: improving the
care of their children ▪ increased self-confidence of women ▪ participation of the, often excluded, poorest families within a community ▪ other community development activities have a ‘child-focus’ as a result of the Hearth programme ▪ integration of economic development, agriculture and health activities allow families to sustain the
new behaviours they have learned through Hearth ▪ the positive deviant approach can be successfully applied to other community challenges (ie, sani-
tation, prevention of respiratory infections, early child stimulation). On a broader level, World Vision’s positive experience in implementing the Hearth model has been noted by several Government Ministries of Health, notably in Peru and Honduras. Government minis-tries are now taking the lessons learned from hearth and incorporating them into the National Health Strategy. Based upon its experience of positive deviance in Latin America, World Vision Canada is supporting the implementation of this approach in both Asia and Africa regions. For more information please contact: Colleen Emary ([email protected]) Small scale fortification in Malawi and Tanzania
Small scale fortification (SSF) activities have been widely accepted in World Vision (WV) programme areas of Malawi and Tanzania. Funded by the Canadian International Development Agency (CIDA) and implemented through the WV Micronutrient and Health (MICAH) programme, SSF combats micronu-trient deficiencies by fortifying the family’s maize with vitamin A, iron, B vitamins, folic acid, and zinc. Micronutrient malnutrition is highly prevalent in Malawi and Tanzania, particularly among the rural population. In the Malawi 2001 National Micronutrient Survey, 80% of preschool children and 27% of pregnant women were found to be anaemic. The prevalence of stunting was 53% for preschool chil-dren, reflecting chronic undernutrition including poor intake of micronutrients. In addition, more than 50% of women and children were found to suffer from vitamin A deficiency. Similarly undernutrition is a problem in Tanzania where 44% of children underfive are stunted.1 Iron deficiency affects 65% of children underfive and 45% of women of child bearing age.2 These high rates of malnutrition have a significant impact on the health, survival and economic produc-tivity of the people of Malawi and Tanzania.
54 Programme News
SCN News #29
Fortification is an ideal means of improving the micronutrient content of commonly consumed foods. However, the majority of rural-dwellers in Malawi and Tanzania grow and process their own food, and thus are not reached through commercial fortification programmes. This nutritionally vulnerable popu-lation (86% of the total population in Malawi) can instead be reached through fortification at the village level, in local hammermills. Maize, the staple of both the Malawian and Tanzanian diet, is grown by virtually every family, and taken to village hammermills for milling. World Vision Malawi and Tanzania and its partner-agencies in the CIDA-funded MICAH programme, have developed and pilot tested a method for adding micronutrient premix to maize during milling at village hammermills. The pilot project is currently being implemented in 12 mills located throughout Malawi and 23 mills in Tanzania. In both Malawi and Tanzania, SSF is one component of an integrated nutrition and health programme focused on reducing micronutrient malnutrition. Fortifying the family’s staple food, maize, increases the nutrient content of the meal without changing the traditional diet. At first people were apprehensive about adding anything to their flour, but through sensitization, families have realized that the vitamins and minerals did not change the taste, texture or smell of their maize porridge. The success of SSF is due to many factors including the diligence and hard work of the staff in both countries; they listened to the communities and made appropriate changes to make the programme work. In Tanzania the Fortification Committees made it successful through community ownership. In both countries families have seen first hand how the micronutrients have made them healthier, and they share this new information with their neighbours, which expands the acceptance and use of the premix. In Tanzania, preliminary results from a small survey conducted prior to and 18 months into the fortifica-tion process indicated anaemia rates (Hb < 12.0g/dl) in women of childbearing age decreased from 80% to 47% the decrease is likely due, in part, to increased iron intake through SSF. Similarly, for children underfive, rates of anaemia (Hb < 12.0g/dl) changed from 88% at baseline 45% after 18 months. Fur-ther follow-up studies are taking place in both countries at the end of 2004. The small scale fortification method has proven easy to implement, and has been widely accepted by the beneficiary communities. In addition, the Malawi Ministry of Health has named fortification, at both the commercial and hammermill levels, as a priority strategy for combating micronutrient malnutrition in Malawi. Small scale fortification is an effective strategy to address micronutrient deficiencies among women of child bearing age that deserves increased emphasis and resource allocations in these and other countries. For more information on small scale fortification, contact the Nutrition and Health Team at World Vi-sion Canada, at [email protected] References
1. UNICEF. State of the World’s Children 2003. New York, UNICEF, 2003. 2. UNICEF and The Micronutrient Initiative. Vitamin and Mineral Deficiency: A Global Progress Report. UNI-CEF and MI, 2004.
SCN News #29
Speakers’ Corner 55
A Fistful of Rice Harsh Mander
Centre for Equity Studies, New Delhi Barely seven days had passed since his widowed mother Gajalachmi had died, defeated finally by hun-ger. Balachandran, her 13 year old elder son, was still badly shaken. ‘If there was even a little rice in the house, she would force us to eat’, he recalled. When he would press her to also share the food, she would reply, ‘You need food more than me. My life is done. You should eat, become strong, study hard and grow to be good man’.
Gajalachmi was only 32 years old when she lost her battle with unforgiving hunger. Her husband had died two years earlier, of kidney failure. Of the most oppressed Maliga dalit caste of Andhra Pradesh, they owned no land. Even when he was alive, they found work as farm workers only sporadically in their village Gonepally in Medak district of Andhra Pradesh, and wages for agricultural workers were a pittance.
During her husband’s illness, she had borrowed 70,000 thousand rupees from the local moneylender. After his death, she would rise before dawn to collect curry leaves and sell them at the village market. Part of her earnings went to the moneylender, part to the owner of the fields from where she plucked curry leaves. Usually not more than ten rupees were left a day to feed her three small children and mother-in-law.
Some dalit youth were moved by her struggle and helped her by securing admission for Balachandran and his nine year old sister Rajani in government hostels for scheduled caste children. The youngest, Suman, remained with Gajalachmi, along with her husband’s ageing mother, who had nowhere else to go.
Gajalachmi’s strength and spirit slowly ebbed, as she toiled often without food for days at a stretch. During her last months, she could not even rise from her bed. Her teenaged son Balachandran dropped out his school and hostel, to take care of her and feed the family. He would also spend the day gathering and selling curry leaves.
In the neighbouring village of Kasturpalli, we encountered another elderly dalit couple Yalliya and Nar-samma, silently waiting for death, with dignity, but bereft of hope. They had spent thirty years of their lives helping build multi-storeyed skyscrapers in Mumbai, often strapped with ropes at dizzying height for hours. But now they were far too old for such work and their three sons had inherited their vocation in contributing to Mumbai’s unending journey skywards.
Their sons do send their savings to the village from Mumbai but this money is to feed their own wives and children. Their parents tried hard to keep the bitterness out of their voices when they said, ‘Our sons have to look after their own families. How can we expect that they will look after us?’
Almost all able-bodied people have fled their villages in desperate search of work. Left behind are chil-dren, widows, the disabled and old people. Children usually eat at least one meal in fairly efficiently ad-ministered school mid-day meals; for the rest, there is often no recourse except a slow, invisible, unac-knowledged starvation.
Government officials, not just in Andhra Pradesh but also in every part of the country, hotly deny alle-gations of starvation deaths. Most claim that the deaths result from illness, some even quibble that peo-ple were just chronically malnourished, but not starving. I am still unable to tell the difference.
Denials and petty technicalities cannot obscure the abiding shame of hidden hunger deaths recurring in a country that produces considerably more grain than is needed to fully feed every resident of this teem-ing nation. In a highly significant legal battle in the Supreme Court of India, activists are demanding that the right to food, which is an extension of the right to life, should be explicitly recognized as a funda-mental right of all citizens. People should not be dependent on the unreliable and grudging welfare of the government for their survival. The state must be bound, by the highest law of the land, to ensure the nutrition of every citizen.
Hunger lurks unseen in every village and city of our country. Yet it surfaces into public consciousness only transiently, in moments when there are troubling media reports of starvation deaths. What goes
Speakers’ corner
SCN News #29
56 Speakers’ Corner
unrecognized is that death by starvation is only the dramatic manifestation of a much more invisible malaise of pervasive, stubborn, chronic hunger and that there are millions of forgotten people in India who live routinely at the very edge of survival, with hunger as a harrowing way of everyday life.
Among these are entire communities, utterly disenfranchised and assetless, like the Musahaars, a proud but savagely oppressed dalit community in Bihar and Uttar Pradesh who own not even the land on which their tenuous homesteads are built. Many months in a year they scour the harvested fields of the landlords for stray grain that many have fallen, or the undigested grain in the dung of cattle. The Sa-hariyas, classified as a primitive tribal group, have been cheated of 90% of their land, and forests which sustained them in the past are completely felled or degraded, leaving them tragically trapped with no escape paths.
In addition, in all communities, chronic hunger and destitution are endemic in certain perennially vul-nerable social groups, such as old people without care, young children without adult protection, single women headed households, poor families with one or more disabled members, and people who live with stigmatized illnesses like leprosy, mental illness and HIV/AIDS. Traditional community support systems have frayed, often collapsed, and even the meagre state support of the past has vanished as the state retreats under externally driven pressures for fiscal economy and structural adjustment.
In a glittering metropolis like Delhi, more than 3000 people die profoundly lonely anonymous deaths on the streets each year, mounting the cold uncaring official statistics of ‘unclaimed bodies’. Many of these are of destitute people, reduced to begging as the only means of survival, for whom the only official state response is to declare begging a crime and to periodically round them up for incarceration in sub-human beggar’s jails. For an estimated 1.5 million people who are forced to live under the open sky in the capital city of India, the state provides the barest common night shelters to less than 4%, and emergency food support to none.
Even in ordinary times, undernutrition levels in India are among the highest in the world. About half of all Indian children are malnourished, a quarter severely, and half of all adult women suffer from anaemia. In a drought year, of the kind that has con-vulsed large tracts of rural India for three consecutive years, hunger intensifies pitilessly, and threatens the very survival of poor families.
Mounting state and societal indifference to chronic hunger in our midst is all the more unconscionable, because the nation stocks mountains of food-grains in public godowns. Instead of ensuring that grain from these overflowing stores reaches people living with hunger, state policies have resulted in stocks being devoured by rodent or rotting beyond even animal consumption. The state prefers to spend vast resources on storing mountains of decaying food-grain, rather than on feeding its famished multitudes. This, along with the unrepentant state complicity in the massacre of a segment of its people in Gujarat, represents the abyss of the crisis of governance in India today.
The Famine Codes, written in colonial times, codified state responsibilities to prevent starvation in times of famine. Even as recently as the last countrywide scarcity in 1987, employment was guaranteed to every person who sought work with wages in foodgrain, in massive public works in affected districts across the country. There is tragic irony that even colonial standards for protecting vulnerable people from hunger are being abandoned in the dazzling glitter of globalized India today, as central and state governments together claim inability to muster resources for more than at best 3-5 days of work a month for its teeming hungry people.
The situation is even worse for destitute old people, widows, disabled people and children. The cover-age of schemes for these groups is so meagre as to leave huge gaping holes in the social security net, through which large numbers of destitute women and men, girls and boys slip through unseen and un-mourned. In extremely rare times when their deaths come to public notice, it is left to public officials to quibble whether they starved, or were merely malnourished, or succumbed instead to preventable diseases to which they had no resistance. For the rest of the country, they remain people who are ut-terly dispensable.
It is against this background that activists have petitioned the Supreme Court for the right to food for every citizen, through work for all able-bodied people, and as direct food transfers for other vulnerable groups. However, the political feasibility of such a scheme is fiercely contested, despite the fact that its costs are relatively modest, food resources abundant and going waste, and preventing hunger and abject destitution the paramount duty of any welfare state. It is as yet unable to see the light of day only be-cause of the utter powerlessness, invisibility, political irrelevance and lack of organization of people who live with hunger.
There is tragic irony that even
colonial standards for protecting
vulnerable people from hunger are
being abandoned in the dazzling glitter of globalized India
today….
SCN News #29
Speakers’ Corner 57
The right to food has been guaranteed by law to all able-bodied persons seeking work only in one state in India, Maharashtra. Its Employment Guarantee Scheme secures as a legally enforceable right wage employment at survival wages for any able-bodied person willing to labour in a public construction work. District officials are required to keep ready at all times a shelf of labour-intensive public works, which can be opened at short notice whenever even a small contingent of adults demand work.
Activists and academics have long argued that a nationwide guarantee of work on local dispersed public construction projects would ensure the widest and most assured food security for large sections of the population. It is self-selecting, since well-to-do sections would be unwilling to labour at public works, and it would result in the on-going creation of public assets, while firmly keeping hunger at bay from the doorsteps of a majority of households who are most living with poverty. The central government has recently agreed reluctantly to a watered down Employment Guarantee Act, with limited coverage and guarantees, and wages below the prescribed statutory minimum wage.
For able-bodied citizens, the right to food would be realized substantially through a genuine legal right to work. Studies indicate that the public distribution system, however flawed and corrupt, is still a life-line for survival of millions across the country. It needs to be expanded, strengthened, and subjected to much greater people’s scrutiny and control. Almost half the children in India continue to be malnour-ished, stunting their physical and mental growth and survival chances in adulthood. A third element of the right to food therefore relates to children’s nutrition. In this the Supreme Court has been the most progressive, declaring both mid-day school meals and pre-school feeding in Integrated Child Develop-ment Services centres universal entitlements for all children.
However, the most unconscionable neglect in public policy relates to the food security of vulnerable social groups like widows, disabled people and abandoned old people. Even a universal employment guarantee and public distribution system will not ensure their survival, because they lack both the means to work or to purchase even subsidized food. The state must ensure direct food transfers to each of them. Until it does this, people like Gajalachmi, Yaliya and Narsamma will continue to die, dispensable to our glittering world.
It is imperative that the universal coverage of the most vulnerable social groups by these food security schemes must be guaranteed by the law, as part of the fundamental right to life. Other most vulnerable social groups, such as impoverished families with people with disabilities, and single women headed households, must also be food transfers or subsidized grain. There is a special challenge to extend these social security guarantees to cities, and to ensure that street children and homeless old people, women and homeless people with mental illness and leprosy, are ensured not only a roof over their heads but also regular emergency feeding in soup kitchens operated with community support.
The fundamental right to food must no longer be left to the chance of executive discretion. It must be a judiciable legal entitlement, binding of every government, union, state and local. Only then would the enormous injustice, indignity and suffering associated with chronic hunger and destitution be overcome.
It is the custom in the dalit Madiga caste of Andhra Pradesh to tie some grains of rice to the edge of the saree of a woman who dies, before she is buried in an unmarked grave. When Gajalachmi died, there was no rice in the house to bind to her saree. It is considered inauspicious for neighbours to donate grains for funeral rites. So Gajalachmi had to be buried as she had lived, without the solace and dignity of even a fistful of rice.
Contact: Harsh Mander ([email protected])
SCN News #29
58 Speakers’ Corner
Letter to the Editor Dear SCN,
I attentively read all the articles featured in SCN News #28 on Nutrition and the MDGs. There is quite a bit I can agree with, but also quite a bit I find misleading. I wonder if our readers agree with me—anybody for a counter-point?
On the “I could not agree more” side, let me paraphrase the following (author’s comments in italics):
1. We can easily get tempted to overburden the system with high diversity and fragmentation. Instead, limited resources should be used to focus (our actions) on a reduced number of interven-tions….Moreover, adequate nutrition strategies require: the courage to focus, perseverance for consis-tent action, and ability to secure sufficient resources. [R Gross (UNICEF), p 6] A caveat here: is this all adequate strategies require?
2. USD 360 billion in subsidies/yr in the North is a major deterrent to agricultural production in the South. [I Johnson (World Bank), p 9] So, isn’t it time we (all) do something about this basic cause of malnutrition?
3. Basic causes (are those) grounded in economic injustice and poor governance. [F Schiek (USAID), p 14]. Always forcefully enough addressed by major donors and international NGOs?
4. To improve nutrition and health, we must improve the status of women….Empower women and invest in girls and increase the nutritional status of adolescent girls and women….Given the rise in world wealth, and its growing unequal distribution, and the call for wide-spread application of Human Rights principles, the case for making these investments has never been stronger…. (But have these invest-ments been done in the past? Why was the case not made strong enough before? Why is it stronger now?) (It behooves us to) strengthen governance, reduce poverty and make trade liberalization and health sector reform work for the poor….(For that, we have to) forge new connections across unfamiliar divides. If not, nu-trition may be relegated to simply being an indicator of the attainment of the MDGs rather than an es-sential foundation for their attainment. [T Ahmed Obaid (UNFPA), pp 15, 18] Bravo, I could not have said it better.
5. Broader and (more) strategic(ally used) communication of SCN analyses (are very much needed); (we also need to) contribute (much more) to training future leaders in nutrition…. (Yes, but not only ‘nutrition engineers’: rather nutrition activists.) (We also need to more forcefully) promote the Human Rights approach to nutrition. [N Scrimshaw (INU and UNU), pp 20, 22]
6. Doing what donor countries prioritize, ie, funding the victims of acute hunger (that are only 8% of all the malnourished!), will not lead to the end of hunger (by 2015)….Governments must support the self-organization of the poor…We will never achieve the MDGs unless we invest in human capacity. [P Sanchez, (Hunger Task Force), pp 24, 25] The question is which capacities; certainly not only the technical ones—and primarily those of claim holders to struggle for their inalienable rights.
7. (As a priority, we have to) enable the poor to further their education….(Moreover,) women have got to take leadership positions…and programmes need to be more community-based….[S Keino (Horwitz Lecture), pp 30, 32, 33] But to keep saying “the Government should” or “policies are needed” is not good enough for the achievement of MDGs!
On the “no-no” side, here are the excerpts of what I founda:
1. (We are witnesses of a) lack of delivering commitment resources (whatever this mean)….Overcoming poverty requires greater aid from high-income countries to the poor countries…Avoiding the poverty trap requires a change in the scale of effort by high-income countries....Poverty reduction strategies need resources if they are to help the world’s poorest break out of the poverty trap, ie, more donor re-sources. [J Sachs (Millennium Project), pp 5, 6, 8] Do I think this is totally wrong? No (or perhaps??), but it certainly is ‘more of the same’ of what has been said in all global nutrition conferences and summits before. Nothing much is said in this article about the absolute need to tackle the basic causes of ill-health and malnutrition. Will we have to wait another millennium?
2. MDGs are achievable due to the (main) resources we have: human ingenuity and technological pro-gress (sorry Sir, “Give me a break”, will you?)….Let us think about the real underlying causes of malnutri-tion and underdevelopment not just approximate ones. [I Johnson (WB), pp 9, 10] And what about the basic causes? (see my comment immediately above).
a I do hope I did not quote authors out of context; if they think I did, my sincere apologies.
SCN News #29
Speakers’ Corner 59
3. Through the application of the latest developments in agriculture technology the dietary needs (of the many) can be met (to once more offer them what they cannot afford?). Food aid contributes to transformational development. Food aid can be programmed at the community level to change food consciousness and health behavior leading to better young child nutrition. Sir, with all due respect, can you really get away with these statements in 2004? We know a lot already about agricultural technology’s and food aid’s unfulfilled promises of the past. You also really think bio-fortification (by itself and without the needed structural changes) has an important, sustain-able role to play to 2015? Perhaps, as you say, using ‘social marketing nutrition education’ which does a wonderful job in telling people what to do, but not why and for what purpose….Our challenge is to build on these programmes and bring them to scale. [F Schieck (USAID), pp 11, 12, 13] I hope not the programmes that I refer to above.
4. The many failures to achieve global promises is due to a lack of political will…It is actually not a lack of political will. It is a political choice. Internal and external resources allocated have thus remained a pittance, unmatched to the challenge. There is nothing in sight that tells me this will soon change. Political choices can be influenced by targeted and sustained advocacy. [T Ahmed Obaid (UNFPA), p 18] Yes, but only through political means; high-level decision-makers do not particularly always listen to scientific or epidemiological evidence.
5. The MDGs are an example of consensus among nations….Keep in mind that setting these international goals is the result of a process in which public admission of dissent is difficult (these days, being against the MDGs is like being against motherhood). Therefore, countries pledge, but do not really embark or comply. Through advocacy influence private sector organizations to adopt nutritionally sound practices...Given our experiences with the Code of Marketing Breastmilk Substitutes do I need to say anything here? A radical change of behavior of corporations would have to happen for this to work. There is nothing in sight that tells me this will change soon. Persuading internationally recognized leaders to serve as advocates….[N Scrimshaw (International Nutrition. Foundation and UNU), pp 19,20, 23] Who should help us to vigorously pursue the Right to Food and Good Nutrition in the spirit of greater equity?
6. MDGs have given ‘us’ a new sense of urgency and direction….(yes, but have they really given us a ‘new’ sense and, if so, urgency for what, and which direction/for whom? MDGs do NOT speak of processes to launch to get there by 2015) Prevention will result in improved quality of life (only preventive interventions?)....Nutrition is a key component of development (the only, or a major key? no other ‘keys’?) Nutrition empowers individuals, as well as communities and this leads to poverty reduction…. Nutrition, per-se? No, I am sorry of this travesty in the use of the concept of empowerment which I often see. [S Keino (Horwitz Lecture), pp 28, 29, 33, 34].
Contact: Claudio Shuftan,[email protected]
Corrections!
Please note the following corrections to Speakers’ Corner in SCN News #28 (July 2004): ▪ In the Letter to the Editor, page 70, by Emily J Levitt, the first line
should begin, “On 17th of May 1954…,” not, “On 1954 of May 1954….”
▪ Further down in the fourth paragraph, the sentence beginning with, “If we are wrong that investment in our African colleagues…,” should read, “If we believe that investment in our African colleagues….”
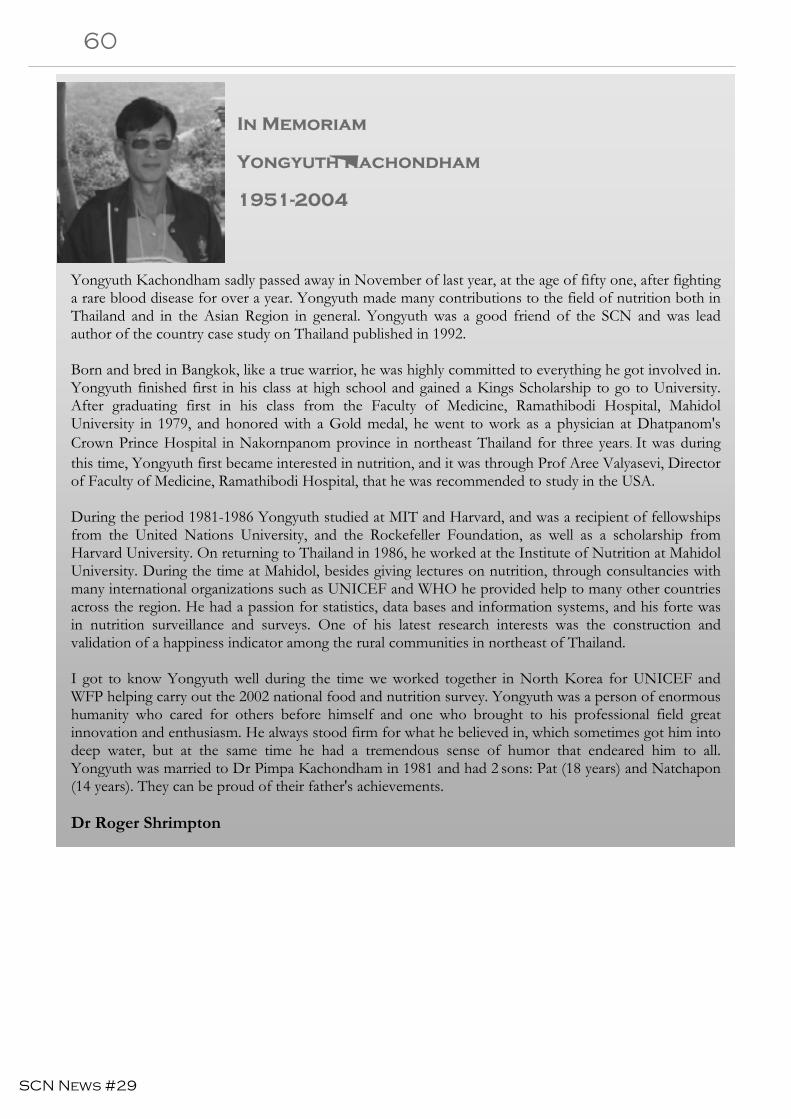
SCN News #29
60 Speakers’ Corner
In Memoriam
Yongyuth Kachondham
1951-2004
Yongyuth Kachondham sadly passed away in November of last year, at the age of fifty one, after fighting a rare blood disease for over a year. Yongyuth made many contributions to the field of nutrition both in Thailand and in the Asian Region in general. Yongyuth was a good friend of the SCN and was lead author of the country case study on Thailand published in 1992. Born and bred in Bangkok, like a true warrior, he was highly committed to everything he got involved in. Yongyuth finished first in his class at high school and gained a Kings Scholarship to go to University. After graduating first in his class from the Faculty of Medicine, Ramathibodi Hospital, Mahidol University in 1979, and honored with a Gold medal, he went to work as a physician at Dhatpanom's Crown Prince Hospital in Nakornpanom province in northeast Thailand for three years. It was during this time, Yongyuth first became interested in nutrition, and it was through Prof Aree Valyasevi, Director of Faculty of Medicine, Ramathibodi Hospital, that he was recommended to study in the USA. During the period 1981-1986 Yongyuth studied at MIT and Harvard, and was a recipient of fellowships from the United Nations University, and the Rockefeller Foundation, as well as a scholarship from Harvard University. On returning to Thailand in 1986, he worked at the Institute of Nutrition at Mahidol University. During the time at Mahidol, besides giving lectures on nutrition, through consultancies with many international organizations such as UNICEF and WHO he provided help to many other countries across the region. He had a passion for statistics, data bases and information systems, and his forte was in nutrition surveillance and surveys. One of his latest research interests was the construction and validation of a happiness indicator among the rural communities in northeast of Thailand. I got to know Yongyuth well during the time we worked together in North Korea for UNICEF and WFP helping carry out the 2002 national food and nutrition survey. Yongyuth was a person of enormous humanity who cared for others before himself and one who brought to his professional field great innovation and enthusiasm. He always stood firm for what he believed in, which sometimes got him into deep water, but at the same time he had a tremendous sense of humor that endeared him to all. Yongyuth was married to Dr Pimpa Kachondham in 1981 and had 2 sons: Pat (18 years) and Natchapon (14 years). They can be proud of their father's achievements.
Dr Roger Shrimpton
SCN News #29
Publications 61
Publications Public-Private Partnerships and International Health Policy-Making How can public interests be safeguarded? Judith Richter Published by the Ministry for Foreign Affairs of Finland 2004, 105 pp Judith Richter is an independent researcher and author who has worked with international health issues since 1980. Much of her work has focused on the interaction between UN agencies, govern-ments, citizen action groups, and transnational corporations (TNC). Considering the complexity of some of today's health issues including nutrition, multi-stakeholder approaches ("partnerships") are probably important to consider, but not at any cost as Dr Richter states in her book. The book contains a thoroughly researched review of the processes behind this "new" policy para-digm with special emphasis on WHO. Using documents, interviews and other sources of informa-tion, Dr Richter manages to give a quasi "investigative" insight into the progressive integration of the public-private partnerships (PPP) model in WHO. This greatly helps the reader to understand the potentially positive and negative consequences the adoption of this model produces. Following a comprehensive definition of PPP's and of the private sector, the book extensively ad-dresses the development of safeguards within WHO. This includes the process by which PPP's were officially introduced in WHO under the strong influence of Dr GH Bruntland (DG of WHO from 1998-2003), how WHO dealt with these partnerships and the problems resulting from them. This is followed by an in-depth analysis of conflict of interest issues. Conflicts of interest are of central con-cern when dealing with the private sector, whether at an institutional or individual level. This chap-ter certainly merits to be read by any health professional having to deal with the private sector in both developing and developed countries. Many challenges exist in the globalizing health sector, both for health providers looking for funding and trans-disciplinary solutions to health problems, or for TNC's seeking control of the decision-making process and accessorily, trying to improve their image. The author manages, throughout this text, to maintain a balanced view whilst still expressing some concern for potential policy distortions created by PPP's in WHO, as well as in the UN system in general through the Global Compact and UNICEF. Protecting the public interest remains the central issue throughout the text. The author concludes with a set of proposals/alternatives that certainly merit close attention and reflection by politicians and health professionals. In conclusion, this book succeeds in providing a carefully reasoned insight into the PPP processes in WHO and to its discernible and potential consequences for the Organization’s mission. PPP's are probably here to stay, but the way they are implemented will be crucial for the credibility of health policy-makers and for public interest. Free copies of this monograph can be ordered by emailing [email protected]. A PDF version is available online at www.global.finland.fi and www.gaspp.org Reviewed by Dr PB Mahler, MPH Service de Santé de la Jeunesse Geneva, Switzerland [email protected]
SCN News #29
62 Publications
Australian Dietary Guidelines
Recommendations for healthy eating in Australia are based on a number of documents including the recently reviewed Dietary Guidelines for Australian Adults (2003), and the Dietary Guidelines for Chil-dren and Adolescents in Australia Incorporating the Infant Feeding Guidelines for Health Workers (2003). Other relevant documents include the Dietary Guidelines for Older Australians (1999), the Australia Guide to Healthy Eating (1998), Recommended Dietary Intake for use in Australia (1991-currently under review), and the Core Food Groups (1995). Launched in June 2003, the revised dietary guidelines have a broad focus that emphasize food groups and life-style patterns, rather than focussing on food and nutrients, in order to make it eas-ier for Australians and nutrition educators to implement the recommendations. This theme is con-sistent with the World Health Organization objectives for dietary guidelines, and has resulted in a more direct relationship with other Australian nutrition recommendations such as the Australian Guide to Healthy Eating. Australia’s revised dietary guidelines are accompanied by consumer resources to provide practical information to families on healthy eating patterns and good nutrition. All resources are available on the internet at www.health.gov.au/internet/wcms/Publishing.nsf/Content/health-pubhlth-strateg-food-recommend.htm Clinical Practice Guidelines for the Management of Overweight and Obesity in Adults, Children and Adolescents
In Australia, more than 50% of patients visiting a doctor are likely to have overweight or obesity as a co-morbidity, if not a primary cause of disease. In response to this, the Australian Government has developed clinical practice guidelines for doctors on the management of overweight and obe-sity in children, adolescents and adults. The Guidelines contain a comprehensive assessment of the current scientific evidence providing detailed, evidenced-based guidance for the management of overweight and obesity through multi-faceted strategies for use by doctors in clinical settings. The Guidelines include a summarized Guide with an assessment form and a flow chart outlining key steps in the management of overweight and obesity. The flow chart has 'quick tips' on the back for handy reference. The Guidelines and Guide form a package. Copies of the Guidelines and Guide can be obtained by contacting 1800 020 103 extension 8654 (in Australia only) toll-free or emailing [email protected] National Physical Activity Recommendations for Children and Youth The Australian Government Department of Health and Ageing has developed national recommen-dations on physical activity for children and youth. The recommendations are a useful tool for policy and programme development, community education and health promotion across a range of settings. They set standards to monitor physical activity participation by children and youth in the future.
A national workshop of key researchers, policy-makers and representatives from community or-ganisations was held in March 2004, where the evidence was reviewed and agreement reached on the amount of physical activity to be promoted for children and youth.
In July 2004, Australian Health Ministers endorsed the recommendations that:
▪ children and youth should participate in at least 60 minutes of moderate- to vigorous- intensity physical activity every day; and
▪ children and youth should not spend more than two hours per day using electronic media for entertainment (eg, computer games, Internet, TV), particularly during daylight hours.
Information resources will be produced to support dissemination of the recommendations to young people, parents, care givers, educators and health professionals. These recommendations can be downloaded from www.health.gov.au/internet/wcms/publishing.nsf/Content/health-pubhlth-strateg-active-recommend.htm
SCN News #29
Publications 63 Complementary Feeding Counselling: A Training Course WHO/UNICEF 2004, 530 pp
Appropriate feeding practices are of fundamental importance for the survival, growth, development, health and nutrition of infants and children. Inadequate knowledge about how to continue breastfeed-ing, the appropriate complementary foods to give and good feeding practices are often a greater deter-minant of malnutrition than the availability of food. Hence, there is a need to train health workers who are in contact with care givers of young children with the skills to support adequate feeding.
Complementary feeding should be timely, adequate, safe and responsively fed. The information pro-vided in this course focuses on when to introduce foods in addition to breast milk, how to enhance home-prepared foods, the use of low-cost processed complementary foods and education to enhance feeding behaviours.
This course aims to provide the knowledge and skills for health workers who work with care givers of young children from 6-24 months of age to enable those health workers to:
▪ have up-to-date knowledge on the nutrition of young children and suitable feeding techniques for this age group
▪ counsel care givers of young children about appropriate and effective complementary feeding practices, and
▪ contribute to the consistency of young child feeding messages and sustainability of activities in their health facility.
This course can be used either to complement existing courses, such as the Integrated Management of Childhood Illness (IMCI), Breastfeeding Counselling, HIV and Infant Feeding Counselling, or locally available courses, or can stand alone.
Course structure The Complementary Feeding Counselling Course is for 16-24 participants, and 4-6 trainers, in groups of 4 participants each with one trainer plus a course director. The course takes about 21 hours, not including meal breaks. It can be conducted intensively over three days or it can be spread out less in-tensively over a longer period.
There are 15 sessions which use a variety of teaching methods, including lectures, demonstrations, and work in smaller groups of four participants with one trainer, with discussion, reading, role-play, practi-cal work and exercises. The sessions are structured around two 2-hour field practice sessions, during which participants practise interpersonal skills with care givers of young children.
Target group The course is for health workers working in primary health care services in the community or attached to hospital health services where one of their activities is the provision of general nutrition information and counselling to care givers of young children. The health workers may include community health nurses, paediatric nurses, health care assistants, community workers and doctors.
It is assumed that the health workers have little or no specific training/experience in nutrition. Course trainers and participants are expected already to have a basic knowledge of breastfeeding counselling, as in the Breastfeeding Counselling: A Training Course or an equivalent level of knowledge and skills. Those who are not familiar with counselling and skills in the support of early initiation and exclusivity of breastfeeding in the first six months will need to acquire this knowledge first. Nutrient Requirements for People Living with HIVAIDS: Report of a Technical Consultation WHO 2004, 31 pp
The HIV/AIDS epidemic is having a devastating impact on health, nutrition, food security and overall socioeconomic development in countries that have been most seriously affected by the disease. There is thus an urgent need for renewed focus on nutrition as a fundamental part of a comprehensive pack-age of care for people living with HIV/AIDS.
The epidemic is occurring mostly in populations where malnutrition is already endemic. As an urgent priority, therefore, greater political, financial and technical support is needed to improve dietary quality to recommended levels. In addition, focused evidence-based nutrition interventions should be part of all national AIDS control and treatment programmes.
Action and investment to improve nutrition needs to be based on sound scientific evidence, and pro-grammatic and clinical experience with the prevention, treatment and management of HIV/AIDS and related infections. Although there are gaps in scientific knowledge, much can be done based on exist-ing information, which is summarized in this report, to improve the health, nutrition and quality of care for people living with HIV/AIDS.
SCN News #29
64 Publications
Nutritional Care and Support for People Living with HIV/AIDS: A Training Course WHO/FAO 2004, 281 pp
Good nutrition is a fundamental part of caring for people living with HIV/AIDS. Good nutrition translated into a balanced diet is a positive way to respond to this illness, and it helps people live better, longer and more comfortably.
This short course, which takes into account recent findings, aims to provide care givers with practical knowl-edge about nutrition care and support for people living with HIV/AIDS. The course also seeks to sharpen care givers' communication skills to enable them to provide appropriate guidance in choosing the right foods, and in preparing them appetizingly and safely for people who are ill or with poor appetite.
The course consists of a package of 11 sessions that take between 10 to 12 hours to complete using a variety of classic teaching methods including lectures, demonstrations, role-play and exercises. In addition to sessions on basic nutrition and communications skills, topics include feeding children living with HIV/AIDS, the role of medicines and myths in nutrition care, and discussions on how to increase access to food.
For further information and to order these publications, please contact: Randa Jarudi Saadeh Scientist, Nutrition for Health and Development World Health Organization Geneva, Switzerland Tel: +41-22-791-3315/3878 Fax: +41-22-791-4156 [email protected]
New from LINKAGES! Maternal Nutrition during Pregnancy and Lactation is a new publication from the LINKAGES Project. This six-page dietary guide was developed with the Child Survival Collaborations and Resources (CORE) Nutrition Working Group to help programmes prepare appropriate protocols and counseling materials on maternal nutrition.
The LINKAGES Project has also produced several publications to help policy makers, programme managers, and health care providers develop infant feeding guidelines for HIV-positive women. Infant Feeding Options in the Context of HIV identifies specific behaviours required of a mother or care giver to act upon the infant feeding recommendations and informed choice policy of WHO, UNICEF, UNAIDS, and UNFPA. Two briefs are also available as part of LINKAGES’ Spotlight series on critical infant and young child feeding is-sues. One focuses on replacement feeding and the other on strategies for reducing the risk of HIV transmis-sion through breastfeeding.
Selected Abstracts on HIV and Infant Feeding is another resource for researchers and programme managers. To facilitate review of the emerging research on HIV and infant feeding, LINKAGES and the Quality Assurance Project prepared for the USAID MTCT Partners Working Group a synthesis of issues found in approxi-mately 90 abstracts developed for oral presentations and poster sessions at the XV International AIDS Con-ference. This resource can be downloaded from both projects’ websites. Luann Martin LINKAGES Project Academy for Educational Development [email protected] www.linkagesproject.org
SCN News #29
Publications 65
FOOD & NUTRITION A HANDBOOK FOR NAMIBIAN
VOLUNTEER LEADERS Ministry of Higher Education,
Training and Employment Creation, Namibia and FAO
Windhoek, Namibia 2003, 113 pp
As part of the Rural Youth Develop-ment Programme of the Namibian Min-istry of Higher Education, Training and Employment Creation, this handbook has been developed in collaboration with FAO [under the technical coopera-tion project Training Youth for Sustain-able Livelihoods in Rural Namibia (TCP/NAM/0066)]. While specifically tailored to suit the needs and situation of Namibia, this handbook can serve as a model of nutrition education material for other countries. The document is designed for use in non-formal settings, such as youth groups. With 27 lesson plans, including a board game, the re-source helps young people learn about the functions of food, the importance of a healthy diet, food safety, child feeding and growth monitoring. Using the expe-riential learning approach, it emphasizes both project skills and life skills, which makes learning more fun and effective. Newly acquired or strengthened life skills will help young people better ad-dress other problems in their lives. With a view to enhancing the effectiveness of Namibia’s broader nutrition education efforts, some learning modules make use of the official Namibian dietary guidelines and related food guide. By doing so, the handbook’s messages are consistent with other diet-related mes-sages disseminated in the country. For information about the handbook, please contact the Director, Food and Nutrition Division, FAO, [email protected]
FAMILY NUTRITION GUIDE Ann Burgess with Peter Glasauer
FAO, 2004
Promoting appropriate diets and healthy lifestyles is widely recognized as an important activity to achieve nutritional well being for all. People need the understanding of what con-stitutes an appropriate diet for achiev-ing health, as well as the skills and motivation to make sound choices about family care and feeding prac-tices. Nutrition education is key to the development of such knowledge, skills, and motivation.
The Family Nutrition Guide is a book that can help in this educational proc-ess. It provides an up-to-date sum-mary of the relevant nutrition infor-mation and gives many suggestions on how to share this information when working with groups of people. The guide is suitable for everyone who wants to improve the feeding and nutritional situation of families in de-veloping countries. It can be individu-als, as well as members of a commu-nity group who want to know more about family feeding. The guide is primarily written for health workers, nutritionists, agricultural extension workers or other development work-ers.
The guide is divided into 11 topics that cover basic nutrition, family food security, meal planning, food hygiene and the special feeding needs of chil-dren, women, men, and of elderly, sick and malnourished people. Each topic is set out in the same way and has two parts: nutrition notes and sharing this information. The Nutrition notes summarize up-to-date technical facts on each topic. Sharing this informa-tion is for people working directly with families and community groups. It describes the steps needed to pre-pare an education session and how to make it more fun and effective.
For information about the Family Nu-trition Guide, contact the Director, Food and Nutrition Division, FAO ([email protected])
EMERGENCY NUTRITION ASSESSMENT: GUIDELINES FOR
FIELD WORKERS Save the Children
2004, 327 pp
Accurate assessment of the nutrition situation in emergencies is key to effec-tive, life-saving responses. These guide-lines offer straightforward, step-by-step guidance on how to carry out a nutrition assessment. This book starts by looking at how to assess potential causes of mal-nutrition in emergencies. It is followed by practical guidance on how to con-duct field surveys of the prevalence of malnutrition and the rate of mortality among underfives, and how to interpret findings and present recommendations. A separate section looks at how to measure feeding programme coverage. Software tools for use in designing sur-veys and analysing finding are included on the accompanying CD-ROM, as well as key supporting texts on nutrition assessment.
Copies can be obtained from www.savethechildren.org.uk
ANEMIA, IRON DEFICIENCY, AND IRON DEFICIENCY ANEMIA
INACG 2002, 6 pp
Now available in Spanish. Anaemia is one of the most widespread public health problems, especially in develop-ing countries, and has important health and welfare, social, and economic con-sequences. Given the magnitude of the problem, greater efforts are needed to develop and implement programmes both to prevent and to control it. In programme development, it is essential to understand the differences between anaemia, iron deficiency, and iron defi-ciency anaemia, and to recognize that anaemia can result both from nutrition-related causes and from inflammatory/infectious disease, as well as from blood loss. This International Nutritional Ane-mia Consultative Group publication, prepared by Drs Penelope Nestel and Lena Davidsson, provides definitions of anaemia, iron deficiency, and iron defi-ciency anaemia and the differences be-tween them.
This publication is available in English, French, Spanish, and Portuguese at http://inacg.ilsi.org
SCN News #29
66 Publications
HIV/AIDS: A GUIDE FOR NUTRITIONAL CARE AND
SUPPORT FANTA
2004, 106 pp
The FANTA Project has updated this guide to assist programme managers and health workers make recommenda-tions on nutritional issues and food management for households with mem-bers who are HIV-infected or living with AIDS. The guide, funded by USAID, can be translated and adapted to meet local needs and serve as a re-source to develop educational materials that are shared with communities and households. The guide contains new information on: revised nutritional re-quirements of people living with HIV/AIDS; nutrition and antiretrovirals; guidelines for breastfeeding infants safely in settings of high HIV preva-lence; multivitamin supplementation and HIV; safe practices for complemen-tary and replacement feeding of infants and young children born to HIV+ women; and uses of food aid to support HIV-affected communities. This guide is available for download from the FANTA website at www.fantaproject.org. Hard copies are also available and can be requested from [email protected]
FOOD WARS THE GLOBAL BATTLE FOR
MOUTHS, MINDS AND MARKETS Tim Lang and Michael Heasman
Earthscan 2004, 365 pp
The emergence of global markets has a far-reaching impact on what we eat and on health, food security, social justice and quality of life. What matters now is not just what we eat, but how and where it has been produced, distributed, and processed, and the assumptions upon which this production is based—a global politics of food and health. Food Wars argues that two conflicting para-digms (one developing food through integrating the ‘life sciences’, the other through integrating ‘ecology’) are bat-tling to replace the dominant industrial-productionist model of the 20th century, both grappling to attract investment, public support and policy legitimacy over the appropriate use of biology and food technologies.
Copies of Food Wars can be ordered from www.earthscan.co.uk
GUIDING PRINCIPLES FOR FEEDING INFANTS AND YOUNG
CHILDREN DURING EMERGENCIES
WHO 2004, 96 pp
The guiding principles presented here are intended to serve as a starting point for organizing sustained prag-matic field interventions that will en-sure appropriate feeding and care for infants and young children at all stages of an organized emergency response. They should be applied flexibly in conjunction with suitable manuals, guidelines, training curricula and other practical field-oriented documentation that treat in detail a variety of interre-lated topics.
Responsible national authorities and concerned international and nongov-ernmental organizations are invited to use these guiding principles as a basis for training personnel responsible for emergency preparedness and re-sponse, and for reacting directly on behalf of needy populations during emergencies.
Meeting the specific nutritional re-quirements of infants and young chil-dren, including promoting and sup-porting optimal feeding practices, should be a routine part of any emer-gency relief response. Indeed, it should be at the centre of efforts to protect the right of affected children to food, life and a productive future.
Copies of this books can be ordered from [email protected]
GUIDELINES FOR THE INPATIENT TREATMENT OF SEVERELY
MALNOURISHED CHILDREN WHO
2004, 48 pp
Severely malnourished children need special care. This book provides simple, practical guidelines for treating these children successfully and takes into ac-count the limited resources of many hospitals and health units in developing countries. It is intended for doctors, nurses, dietitians and other health work-ers with responsibility for the medical and dietary management of severely malnourished children, and for their trainers and supervisors. The guidelines are authoritative and hospitals using
HUMAN RIGHTS AND POVERTY REDUCTION
A CONCEPTUAL FRAMEWORK OHCHR
2004, 36 pp
In 2001, the Chairperson of the UN Committee on Economic, Social and Cultural Rights requested the Office of the United Nations High Commissioner for Human Rights to develop draft guidelines on a human rights approach to poverty reduction strategies. This publication presents these guidelines as a Conceptual Framework. There are two main chapters; the first explores the definition of poverty and suggests that Amartya Sen’s “capability approach” to poverty provides a conceptual bridge between the discourses on poverty and human rights. Chapter 2 outlines the main features of a human rights ap-proach to poverty reduction. This in-cludes empowerment and participation; accountability; and non-discrimination and equality. This Framework presents a clear vision of a human rights ap-proach to poverty reduction, a vision that explicitly encompasses accountabil-ity and empowering people as actors for their own development. Copies can be ordered from www.ohchr.org
them report substantial reductions in mortality. For example, mortality rates of 30-50% have fallen to 5-15%. The instructions are clear, concise, and easy to follow and the information is consistent with other WHO publica-tions. The aim is to help improve the quality of inpatient care and so pre-vent unnecessary deaths.
Copies of this books can be ordered from [email protected]
SCN News #29
Publications 67
NUTRITION IN THE PHILIPPINES
THE PAST FOR ITS TEMPLATE, RED FOR ITS COLOR Cecilia A Florencio
University of the Philippines Press 2004, 179 pp
In this book, Prof Florencio provides an assessment of the Philippine’s nu-trition plan and programmes. The author describes and analyzes the ad-vances and shortfalls in the country’s thinking and efforts to address the long-standing, widespread, and layered problem of malnutrition in infants, children, adolescents, pregnant and lactating women, adults and the eld-erly. She puts forward recommenda-tions for refection and action, on both specific and broad fronts. While rec-ognizing the reality of an increasingly borderless world, she calls for the country to address its nutritional situa-tion with the national interest in mind. The book is also as much about the past as it is of the present and future of nutrition in the Philippines and the nutritional well being of the Filipinos.
This book can be ordered by contact-i n g p r e s s @ u p . e d u . p h o r u p -p r e s s @ u p p r e s s . o r g o r v i s i t i n g www.uppress.org
MANUEL DE NUTRITION POUR L'INTERVENTION HUMANITAIRE
Alain Mourey, CICR 2004, 719 pp
Ce manuel traite des principes de nutri-tion humaine, tels que les besoins nutri-tionnels et les pathologies nutritionnel-les, ainsi que de la mise en place de pro-grammes d'urgence, comme la distribu-
REDUCING MATERNAL DEATHS: EVIDENCE AND ACTION
DFID 2004, 27 pp
Every minute a woman dies in child-birth, more than half a million a year; all but 2,700 of them are in developing countries. This publication presents the UK’s Department for International Development’s (DFID) strategy to re-ducing maternal deaths by setting out the evidence of the scale of the problem and of what needs to be done. It de-scribes DFID’s priority actions in four areas: international and national advo-cacy; improving access to services for maternal and newborn health; address-ing social, cultural and economic barri-ers; and supporting research, monitoring and evaluation. The strategy stresses that a successful effort will require in-creased resources for health systems, increased efficiency in their use and tackling inequity. Above all political will to act and a greater level of ambition is needed if the 5th Millennium Develop-ment Goal—to reduce by three quar-ters, between 1990 and 2015, the mater-nal mortality ratio—is to be achieved.
Copies of DFID’s strategy can be ob-tained by contacting [email protected]
JOINT ASSESSMENT GUIDELINES FIRST EDITION UNHCR/WFP 2004, 338 pp
UNHCR and WFP have worked to-gether in carrying out Joint Assessment Missions in refugee settings around the world since 1994. In July 2002, the Memorandum of Understanding be-tween the two agencies was revised, and production of these guidelines was man-dated-putting increased importance on examining both food and non-food related aspects of food security, as well as opportunities to increase self-reliance. This first edition of the Guidelines is the result of a joint effort to distil ex-perience, institutionalize what has worked well, and to agree on practical approaches in dealing with some issues that have proved to be problematic. It has benefited from inputs form field and headquarters staff of both organiza-tions and consultations with some key partners. It provides guidance on orga-nizing all types of joint assessment ac-tivities, and includes a variety of tools and other resource materials that may be useful for staff and partners partici-pating in assessment activities and in joint monitoring. Towards the end of 2005, the guidelines will be revised, tak-ing into consideration feedback received and lessons learned. Hardcopies of the Guidelines can be ordered from [email protected] or [email protected]
STATE OF FOOD INSECURITY FAO
2004, 40 pp
The FAO 2004 report on the State of Food Insecurity (SOFI), reveals that progress in reducing the numbers of hungry people in the world has stag-nated, with an increase from 800 to 810 million in the last five years. Evi-dence is presented from 30 countries where things are improving, largely based on the priority given to improv-ing the productivity of small farmers
tion alimentaire générale ou la nutri-tion thérapeutique.
Ces aspects techniques de la nutrition sont placés dans une perspective plus large tels que les processus économi-ques, politiques et sociaux qui régis-sent l'accès à la nourriture et la surve-nue des crises, ainsi que dans le cadre de la protection des droits. L'évalua-tion d'une situation et la planification de programmes sont abordées en pre-nant en compte ces différents facteurs et leur rôle au niveau des différents groupes de la société.
La traduction anglaise est en cours. Ce ma-nuel est également disponible en format pdf sur le site www.icrc.org
SCN News #29
68 Publications
THE STATE OF THE WORLD’S CHILDREN 2005
CHILDHOOD UNDER THREAT UNICEF
2004, 152 pp
This year’s SWC focuses on childhood, defined as the state and condition of a child’s life. The Convention of the Rights of the Child, adopted in 1989, offers a new definition of childhood based on human rights. Yet for hundred of millions of children, the promise of childhood already appears broken as poverty, armed conflict and HIV/AIDS threaten their survival and development. The report examines these three key threats, offers a comprehensive action agenda to combat them, and calls on all stakeholders to reaffirm and recommit to their moral and legal responsibilities to children. The report also provides statistical tables on basic indicators, nutrition, health, HIV/AIDS, educa-tion, demographic indicators, women and others that reflect children’s well-being.
Copies of the SWC 2005 can be ob-tained from www.unicef.org
TOWARDS THE GLOBAL ELIMINATION OF BRAIN DAMAGE
DUE TO IODINE DEFICIENCY Basil Hetzel in collaboration with
ICCIDD Oxford University Press
2004, 578 pp
This book, published in collaboration with the International Council for Con-trol of Iodine Deficiency Disorders, provides a comprehensive account of the global effort directed at sustainable elimination of iodine deficiency disor-ders (IDD). This condition is the most common preventable cause of brain damage in the world today with 2 billion people at risk and over 20 million af-fected. The book describes the great progress that has been made since 1990 when the goal of elimination of IDD was unanimously accepted by the UN World Summit for Children and by the World Health Assembly. By the year 2000 approximately 70% of households had access to iodized salt. The book also describes the development, since 1990, of an informal global partnership be-tween the people, the salt industry and sovereign governments of IDD affected countries, with the support of interna-tional agencies such as WHO, UNICEF and the World Bank, bilateral agencies in Australia, Canada, The Netherlands, Belgium, Sweden, and the USA, Kiwanis International, the Gates Foundation (through UNICEF), and technical agen-cies such as ICCIDD and Micronutrient Initiative. The urgent need for coverage of the remaining 30% of households as well as consolidation of the existing achievements depends on sustained po-litical will, which follows community awareness and understanding of the problem by governments and their peo-ple.
To order this book please contact [email protected] or [email protected]
STATE OF THE WORLD POPULATION 2004
THE CAIRO CONSENSUS AT TEN UNFPA
2004, 115 pp
Ten years ago at the International Conference on Population and Devel-opment (ICPD) held in Cairo, 179 countries adopted a forward-looking 20-year plan—the ICPD Programme of Action (PoA)—that seeks to bal-ance the world’s people with its re-sources; ensure universal access to reproductive health care; and improve women’s status by promoting women’s social economic and political participation in issues surrounding population and development. Accord-ing to the United Nations Population Fund’s (UNFPA) new report, in the 10 years since Cairo, a number of countries are making measurable pro-gress in carrying out the ICPD PoA. The report reviews countries’ achieve-ments and constraints in implement-ing the ICPD PoA nearly half way to the 2015 target date. In particular, it examines actions addressing the links between population and poverty; envi-ronmental protection; migration and urbanization; discrimination against women and girls; and key reproduc-tive health issues. The report finds that nearly all developing countries report they have incorporated popula-tion concerns in their development and poverty-reduction strategies; many have established laws and poli-cies to protect women’s and girls’ rights; and many have begun to inte-grate reproductive health services into primary health care. However, the report warns that much more must be done to ensure reproductive health and rights, particularly among adoles-cents; promote safe motherhood; and stem the spread of HIV/AID.
To order copies, contact www.unfpa.org
in ways that enhance food consumption for their families and communities. SOFI includes estimates of the eco-nomic costs of hunger—broadly de-fined to include hidden hunger and un-derweight, and concludes that nutrition related factors account for one half of the burden of disease in developing countries. SOFI estimates that public investments in the order of US$ 24 bil-lion a year in developing countries would lead to a boost in annual GDP amounting to US$ 120 billion a year because of longer and healthier lives. SOFI also points to the importance of protecting foetal and infant growth for preventing chronic degenerative dis-eases in adulthood in these developing countries. The conclusions drawn are that we must and can do better.
Copies of SOFI can be ordered or downloaded from www.fao.org
SCN News #29
Publications 69 OTHER PUBLICATIONS RECEIVED BY THE SCN
SECRETARIAT
Children on the Brink 2004: A joint report of new orphan estimates and a framework for action. UNAIDS/UNICEF/USAID July 2004. www.unicef.org Collective Action and Property Rights for Sustainable Development. Ruth S Meinzen-Dick and Monica Di Gregorio, eds. IFPRI, 2004. www.ifpri.org Equality Matters for a World Fit for Chil-dren: Lessons from the 1990s. Alberto Minujin and Enrique Delamonica. UNI-CEF December 2003. www.unicef.org Flour Fortification with Iron, Folic Acid and Vitamin B12: Regional Meeting Report. (FCH/NU/49-24/04) PAHO/CDC/M O D / U N I C E F / I N T A , 2 0 0 4 . www.paho.org The Least Developed Countries Report 2004: Linking international trade with poverty reduc-tion. UNCTAD, 2004. www.unctad.org Meeting the challenges to food security in the Horn of Africa: Fourth Annual Peter Do-herty Distinguished Lecture. Catherine Ber-tini. International Livestock Research Institute, 2001. www.ilri.org Progress for Children: A child survival report ca rd . Vol 1 . UNICEF, 2004. www.unicef.org Trade and Development Report, 2004. UNCTAD, 2004. www.unctad.org UNICEF Annual Report, 2003. UNI-CEF, 2004. www.unicef.org World Population Monitoring: Reproductive rights and reproductive health. United Na-tions, 2004. www.un.org
WORLD EMPLOYMENT REPORT 2004-05
EMPLOYMENT, PRODUCTIVITY AND POVERTY REDUCTION International Labour Office
2004, pp 253
Today there are 550 million people who work, but still live on less than US$ 1 a day. These “working poor” represent 20% of total world employ-ment. While it is clearly the case that employment is central to poverty re-duction, it is “decent and productive” employment that matters, not employ-ment alone. The centrality of decent employment to reaching the UN’s Millennium Development Goals, par-ticularly in halving the share of those in extreme poverty in the total popula-tion by 2015, is widely accepted and becoming more and more integrated as a component of national policy. Given this backdrop, this Report ex-amines the interrelationship between employment creation, productivity growth, and poverty reduction, explor-ing key issues relevant to the debate. It investigates whether gains in pro-ductivity lead to employment losses and, if so, the conditions under which this might occur. The Report shows that bridging the “global productivity divide”, particularly in parts of the economy where the majority of people work—such as in agriculture, small-scale enterprises or the urban informal economy—is essential for fighting poverty and stimulating growth in both output and “decent and produc-tive” employment.
Copies of the ILO report can be ob-tained from www.ilo.org/publns or [email protected]
WORLD DISASTER REPORT 2004 International Federation of
Red Cross and Red Crescent Societies
2004, 231 pp
This Report highlights the changing nature of disasters and the need for in-ternational humanitarian organizations to be better prepared for them. Not only does the Report cover the devastation caused by natural disasters—such as the earthquake in Bam, Iran—but also the silent emergencies that prove to kill far more people over longer periods of time. In Sub-Saharan Africa last year, 2.2 million people died from HIV/AIDS, while 25 million live with the infection. Disease, drought, malnutrition, poor healthcare and poverty have together created a complex catastrophe, demand-ing a more integrated response than simply food aid or drugs.
The Report also looks at: from risk to resilience—helping communities cope with crisis; heatwaves: the developed world’s hidden disaster; harnessing local capacities in rural India; building com-munity resilience to disaster in the Phil-ippines; surviving in the slums; and dis-aster data: key trends and statistics. The Report stresses three things that need to happen for better response to disasters. First, we must understand what enables people to cope with, recover from and adapt to the risks they face. Second, we must build our responses on the com-munities own priorities, knowledge and resources. Third, we must scale up com-munity responses, by creating new coali-tions with governments and advocating changes in policy and practice at all lev-els.
Copies of this Report can be ordered f r o m w w w . k p b o o k s . c o m o r www.eurospanonline.com
SCN News #29
70 Bulletin Board 2005
1st International Conference of Child-
care in Islam 21-25 November 2005
Kuala Lumpur, Malaysia
The objectives of the conference are to widely disseminate the various aspects of the state and rights of the child in Is-lam; motherhood in the Koran; child upbringing in Islam; child survival and development; and nutrition and its impact on physical and mental growth. If you are inter-ested in attending, please contact the Conference S e c r e t a r i a t a t [email protected] or by visiting www.susuibu.net.my
International Conference on
HIV/AIDS, Food and Nutrition Security
Durban, South Africa 14-16 April 2005
IFPRI and partners are organizing a global con-ference to enhance learn-ing about the interactions between HIV/AIDS, food and nutrition secu-rity and their implications for food-and nutrition-relevant policy. For more information, please con-tact Stuart Gillespie ([email protected]).
The 14th World Con-gress on Disaster and Emergency Medicine is coming to Edinburgh, 16-20 May 2005. Histori-cally, this event has been mainly centred around pre-hospital care, but at the last Congress in Mel-bourne 2003, the roles of humanitarian medicine and public health were very much acknowledged and focused on. There will be some poster space for delegate NGOs to use. Please contact Jane Hay (Jane@concorde-u k . c o m ) o r v i s i t www.wcdem2005.org for more information.
3rd Annual Congress International Academy on Nutrition and Aging
May 6-8, 2005 Saint Louis, USA
This Congress will cover topics ranging from re-search into the precise phys iologica l ag ing mechanisms to broad epidemiological studies of the aging population in various residential set-tings. For more informa-tion contact: Pat Byrne-M u l l i g a n a g i n g s u c [email protected] or visit w w w . b o o m e r e d u . c o m /ianaconference.htm
Technical consultation on nutrition and HIV/AIDS in Africa
Evidence, lessons and recommendations for action Durban, South Africa
11-13 April 2005 This is a major effort to present the science and evi-dence on issues related to nutrition and HIV/AIDS (including consideration of all essential macro- and micronutrients) in adults, pregnant and lactating women, and infants and children and the role(s) such interactions might play in the prevention, care and treatment, includ-ing antiretroviral therapy, of those living with HIV/AIDS. It is an opportunity to discuss with the African community what works in their setting and how best to translate the scientific findings into action-oriented pro-grammes and successful nutrition interventions.
This consultation is being planned to dovetail with the IFRI meeting planned for 14-16 April (see below) with the recommendations from the WHO meeting feeding into the IFPRI meeting, which will focus on the food security/policy/programme-end of the evidence-based policy continuum.
WHO, the Departments of Nutrition for Health and Development and HIV/AIDS are working closely with many partners in planning and holding of this consulta-tion. These include UNICEF, FAO, WFP, UNAIDS, SCN, SADC, CRHCS, WAHO, Office of the US Global AIDS Coordinator, US National Institutes of Health, USAID, CDC and others. For further information, con-tact Randa Jarudi Saadeh ([email protected]).
Conferences
Bulletin Board
The 29th National Nutrient Databank Conference (NNDC) will be held 1 April 2005 in conjunction with Experimental Biology (2-6 April) in San Diego. If you are attending the EB2005 www.faseb.org/meetings/eb2005, plan to arrive a day earlier to attend the NNDC. The conference theme is “Nutrient Data Needs for Studies of Obesity Treatment and Cancer Prevention.” A call for poster abstracts along with the preliminary pro-gramme will be available soon—check our website to learn more, http://health.pbrc.edu/nndc2005 Plan to join us and participate in this interesting and informative conference. There is no admission charge, but registra-tion is required. Watch for further information at the conference website above or at www.nal.usda.gov/fnic/foodcomp/conf/index.html
SCN News #29
Bulletin Board 71 2005
7th International Graduate Course on Production and Use of Food Composition Data in Nutrition
31 October-16 November 2005, Wageningen, The Netherlands
The aim of this course is to show how the quality and usefulness of food composition data is determined by the quality of the production of analytical data for nutrients in foods, and the compilation of these and other data into food composition tables and nutritional data-bases. Please contact [email protected] for more information on how to register.
The SCN’s Nutrition Information in Crisis Situations (NICS) has two new sections on its w e b s i t e a t www.uns y s t em .o r g/s cn/Publications/html/rnis.html. The section "Articles by country" provides all the articles over the ten years RNIS/NICS has been reporting, classified by country. The results of the random sampled nu-trition surveys which have been reported in the RNIS/NICS bulletins are available in the section "Database". They are classified by country and have direct links with the contextual information and the methodology reported in the RNIS/NICS reports. These two sections are updated quarterly.
New Sight and Life CD-ROM!
CD-ROM conta ins books, brochures, and key documents in the fight against vitamin A deficiency. Contact www.sightandlife.org for a copy of the CD-ROM.
A user friendly software for optimizing diets during the complementary feeding period
available on the web
Linear programming is a mathematical method that can give clear answers to very practical questions raised in the field by nutritionists:
• is it possible with locally available food to provide all nutrients needed by a young child? • what quantities of nutrient-rich foods are needed to provide all micronutrients? • if this is possible, using locally available foods, how much will it cost? • what food combination is best adapted to provide all needed nutrients at the lowest cost? • are micronutrient supplements or fortified foods needed to feed a child a balanced diet at low cost?
The principle of this method was presented in a recent issue of SCN News1. However, the lack of a user-friendly software has made the application of the method limited to date. Although it is possible in theory to use the method with a simple Excel spreadsheet, this has proven to be difficult in practice since many data need to be en-tered and this is prone to error. Recently, the linear pro-gramming module of Nutrisurvey was updated and spe-cifically adapted for the design of diets during the com-plementary feeding period by Juergen Erhardt (SEAMEO-TROPMED, RCCN-University of Indonesia, Jakarta) and André Briend (WHO, Department of Child and Adolescent Health and Development, Geneva). The food data base from the World Food Dietary Assessment System has been integrated into the programme along with FAO/WHO recommended nutrient intakes during the complementary feeding period. To learn more about this freely available software and its application, visit www.nutrisurvey.de/lp/lp.htm or contact Dr André Briend (b r i e nda@who . i n t ) o r Ju rgen Erhard t a t ([email protected]).
1. Briend A. Trial and error methods, "expert" guessing or linear programming? Formulating sound nutritional recommendations for complementary feeding. SCN News #27, December 2003, p 36-38.
Breastfeeding Practice and Policy Course 13 June–8 July 2005
Centre for International Child Health, UK in col-
laboration with WHO (Department of Child and Adolescent Health and Development) and
UNICEF (Nutrition Section)
This course aims to de-velop each participant’s capacity to take an active role in protecting, pro-moting and facilitating optimal infant feeding practices, within the con-text of International Ini-tiatives on Mother and Child Health and Devel-opment, and breastfeed-ing as a public health i ssue . Appl ica t ions should be submitted by May 1st and can be ob-t a i n e d f r o m [email protected]
New Resources
Courses
New for 2005! Part 1. Breastfeeding and Pub-lic Health: Essential Knowledge and Skills 13-24 June. Part 2. Breastfeeding and Be-yond: Addressing Chal-lenges to Optimal In-fant and Young Child Feeding. 27 June-8 July. Also available as separate two week modules. Courses can be taken as a Certificate Courses, or to earn MSc/ Diploma credits under 'Taster Programme'. For more information contact: The Breastfeeding Course, Centre for International Child Health, Institute of Child Health, 30 Guilford St, London WC1 1EH. Fax+44 171 404 2062 b f e e d @ i c h . u c l . a c . u k . www. c i ch . i ch .u c l .a c . uk/cich under teaching pro-gramme.
Australian Aid Resource and Training Guide (AARTG)
The AARTG is produced by TorqAid, an Australian overseas aid consultancy specializing in disaster management training, project management and human resource management. It consists of four main sections: advice for those seeking overseas work; useful Australian contacts in the aid field; useful overseas or international contacts related to the aid field, and the main aid-related training courses offered in Australia. For more information, con-tact TorqAid’s Director/CEO, Mr Chris Piper ([email protected]).
SCN News #29
72 Bulletin Board 2005
T h e Nutr i t i on Soc ie ty ha s a ne w In fo rma t i on Shee t (#4 ) on i t s we bs i t e a t www.nutritionsociety.org/careers/studentsinfo.htm. Information Sheet #4 lists email listserves and forums, web-based forums, e-advisory services and sites giving free or low cost access to online journals. The Nutrition Society is planning to reorganize its website in 2005 and the URL for the Information Sheets may change—but they should be easy to find via www.nutritionsociety.org. In case of problems, and to send additions/corrections for any of the Sheets, please email the Nutrition Society ([email protected]) or Ann Burgess ([email protected]). If it is difficult for you to connect to the internet, you can ask Ann Burgess to send a Sheet as an email attachment.
Date Title Type material Authors
Description Distributor Approximate
price Language
1999 Management of severe malnutrition: a manual
for physicians and other senior health
workers
Manual 60 pages. WHO
Internationally agreed guidelines on the man-agement of severe malnutrition in young children (and briefly in adults and adoles-
cents) for health staff working at central and district level.
NHD/WHO US$20.70 or
SwFr 23.00 (16.10)* Eng, Fre, Span,
Port
2000 Management of the child with a serious infection or severe
malnutrition WHO/FCH/
CAH/00.1
Manual with 20-page chapter ‘Severe
Malnutrition’ + ap-pendices.
WHO-IMCI
IMCI guidelines for senior health staff re-sponsible for the care of young children at
the first referral level in developing countries
CAH/WHO SwFr 15.00 (10.50)
*Eng, Fre, Rus TALC
£3.50 +pp Eng
2000 Treatment of severely malnourished children
Slides + notes for facilitator.
Schofield/Ashworth/ Burgess
Set of 24 teaching/learning slides for staff in health centres, hospitals and emergency
feeding programmes.
TALC From £5.50 +pp
Eng
2001 Improving the management of severe
malnutrition
Training modules (300 pages) on
CD-ROM. Ashworth/Schofield (LSHTM) & Puoane/
Sanders (UWC)
Trainers’ Guide for those running training workshops. It tells how to plan a workshop and contains course materials, handouts and transparencies that participants can use to
train their own staff, especially nurses. Clini-cal setting not required.
LSHTM & UWC Free
TALC (see item 7 below)
Eng
2002 Training course on the management of severe
malnutrition WHO/NHD/02.04
Training guides and 7 modules with support material including a
video. WHO
Instructor and Participant Guides (with exer-cises and photos) for 3-day orientation
course for instructors and 6-day training course for senior health workers
NHD/WHO Eng, Span
(Fre/Port under prep.)
2003 Caring for severely malnourished children
Book 82 pages. Ashworth/Burgess
Based on items 1, 2 and 4 and written for nurses and other health professionals work-ing in resource-poor settings. Sets out the 10
steps and briefly explains the rationale for each one. Includes how to involve mothers
in care.
TALC £3.15 +pp
Eng
2003 Caring for severely malnourished children
CD-ROM TALC
Contains items 3, 4, 6 and a list of related websites.
TALC £4.50 +pp
(includes hard copy of item 6 –
CD-ROM not sold separately)
Eng 2003
Guidelines for the in-patient treatment of
severely malnourished children
Handbook 48 pages. Ashworth/Khanum/
Jackson/Schofield NHD/WHO
Practical 10-step treatment guidelines similar to the malnutrition section of item 2. Sup-
port material for item 5.
NHD/WHO US$ 9.00 or
SwFr 10.00 (7.00)*Eng
(Fre/Span under prep.)
Recent materials on the Management of Severe Malnutrition distributed by WHO and TALC
*Prices: where two are given the first is for industrialized and second for developing countries Approximate exchange rates (these change) UK£1 = US$1.77, Swiss Franc (SwFr)1 = US$ 0.77
2005 Call for Nominations
Abraham Horwitz Award for Leadership in Inter-American Health
The Abraham Horwitz Award for Leadership in Inter-American Health is one of five awards presented by the Pan American Health and Education Foundation through its Awards for Excellence in Inter-American Public Health Program, a partnership between the Foundation and the Pan American Health Organization (PAHO). The Award recognizes individuals whose professional achievement in inter-American health stimulates excellence, and has impacted the health of populations across the bor-ders of the Americas. They may be active in their careers, active though in formal retire-ment or retired having demonstrated an outstanding lifetime career. The winner is recognized with a certificate of honour, a cash prize of $5,000 and a paid trip to Washington DC. The deadline for submission is 15 April 2005. To learn more, please visit our website at www.pahef.org, e-mail us at [email protected] or call 202-974-3416.
SCN News needs your help! A readership survey will be available on the SCN’s website (www.unsystem.org/scn/) this April. In order to make SCN News more relevant to you and your organization’s needs, we would appreciate your feedback on how user-friendly you find this publication and what topics you would like addressed in future issues. The last survey was conducted in SCN News #19 (December 1999). The results enabled the Editor to have a better understanding of
readers’ backgrounds and what nutrition-related topics were important to them. This current survey will do the same, and most importantly, will evaluate the changing needs of our readers five years on. We look forward to receiving your responses to our survey and we thank you in ad-vance for all your contributions to SCN News.
UNITED NATIONS SYSTEM
STANDING COMMITTEE ON NUTRITION
The Administrative Committee on Coordination (ACC), which was comprised of the heads of the UN Agencies, recommended the establishment of the Sub-Committee on Nutrition in 1976, following the World Food Conference and with particular reference to Resolution V on food and nutrition. This was approved by the Economic and Social Council of the UN (ECOSOC) by resolution in July 1977. Following the reform of the ACC in 2001, the ACC/SCN was renamed the United Nations System Standing Committee on Nutrition or simply “the SCN”. The SCN reports to the Chief Executives Board of the UN, the successor of the ACC. The UN members of the SCN are ECA, FAO, IAEA, IFAD, ILO, UN, UNAIDS, UNDP, UNEP, UNESCO, UNFPA, UNHCHR, UNHCR, UNICEF, UNRISD, UNU, WFP, WHO and the World Bank. IFPRI and the ADB are also members. From the outset, representatives of bilateral donor agencies have participated actively in SCN activities as do nongovernmental organizations (NGOs). The SCN Secretariat is hosted by WHO in Geneva.
The mandate of the SCN is to serve as the UN focal point for promoting harmonized nutrition policies and strategies throughout the UN system, and to strengthen collaboration with other partners for accelerated and more effective action against malnutrition. The aim of the SCN is to raise awareness of and concern for nutrition problems at global, regional and national levels; to refine the direction, increase the scale and strengthen the coherence and impact of actions against malnutrition worldwide; and to promote cooperation among UN agencies and partner organizations. The SCN’s annual meetings have representation from UN agencies, donor agencies and NGOs; these meetings begin with symposia on subjects of current importance for policy. The SCN brings such matters to the attention of the UN Secretary General and convenes working groups on specialized areas of nutrition. Initiatives are taken to promote coordinated activities—interagency programmes, meetings, publications—aimed at reducing malnutrition, reflecting the shared views of the agencies concerned. Regular reports on the world nutrition situation are issued. Nutrition Policy Papers are produced to summarize current knowledge on selected topics. SCN News is published twice a year, and the NICS (formerly RNIS) is published quarterly. As decided by the SCN, initiatives are taken to promote coordinated activities—interagency programmes, meetings, publications aimed at reducing malnutrition, primarily in developing countries.
Ms Catherine Bertini Chair
Dr Roger Shrimpton
Secretary
UN System SCN c/o World Health Organization
20 Avenue Appia, CH 1211 Geneva 27 Switzerland
Telephone: +41-22 791 04 56 Fax: +41-22 798 88 91
[email protected] www.unsystem.org/scn/