School-based Deworming in Ogun State, Nigeria - GiveWell
32
School-based Deworming in Ogun State, Nigeria Process Monitoring and Coverage Validation Report June 2019
-
Upload
khangminh22 -
Category
Documents
-
view
0 -
download
0
Transcript of School-based Deworming in Ogun State, Nigeria - GiveWell

School-based Deworming in Ogun State, Nigeria Process Monitoring and Coverage Validation Report June 2019

2
Contents Glossary............................................................................................................................... 3
1.0 Executive Summary ...................................................................................................... 4
2.0 Background ................................................................................................................... 5
3.0 Methodology ................................................................................................................. 6
3.1 Process Monitoring ................................................................................................... 6
3.2 Coverage Validation .................................................................................................. 9
3.3 Data Collection, Management, Analysis, and Quality Control ............................. 12
4.0 Results ......................................................................................................................... 12
4.1 Review of teacher training ....................................................................................... 12
4.2 Distribution of materials ........................................................................................ 20
4.3 Community Sensitization ....................................................................................... 22
4.4 Deworming Day ...................................................................................................... 23
4.5 Coverage Validation ................................................................................................ 26
5.0 Recommendations ....................................................................................................... 31

3
Acknowledgement Evidence Action acknowledges the organizational and logistical support provided by Ogun state's Neglected Tropical Diseases (NTD) Unit of the State Ministry of Health, State Ministry of Education, Science, and Technology, and the State Universal Basic Education Board.
The contribution of all other program stakeholders to the generation of this report, including Infotrak Research and Consulting, is highly appreciated.
Glossary FLHF. Frontline health facility FMOH. Federal Ministry of Health LGA. Local government area
MDA. Mass drug administration
NTD. Neglected tropical disease
PC. Preventive chemotherapy
SAE. Severe adverse event
STH. Soil-transmitted helminths
WHO. World Health Organization
4
1.0 Executive Summary In June 2019, Ogun state carried out its first round of school-based deworming for the year, the third year of deworming in Ogun, targeting both enrolled and non-enrolled children, ages 5-14 years. Treatment was given in eleven local government areas (LGAs), with four endemic for both soil-transmitted helminths (STH) and schistosomiasis, five for schistosomiasis only, and two for only STH. The state targeted 2,954 public and private primary and junior secondary schools for deworming.
To identify opportunities for program improvements, Evidence Action assessed the effectiveness of implementation, adherence to implementation protocol, and supply chain effectiveness. Evidence Action recruited an independent firm, Infotrak Research and Consulting, to collect data from a sample of 25 teacher trainings, 30 schools, and 70 parents in communities near schools participating in the MDA.
The survey observed that 83% of schools on Deworming Day had all the required key materials (drugs, posters, and monitoring forms, as well as tablet poles in schistosomiasis-treating schools). However, prior to teacher training, 30% lacked one or more of these key materials and therefore could not use them as aides during the trainings. From field reports, this resulted from trainers being either unable to locate the venue or indicating that the venue was too distant from their duty station. This obstacle should be factored in during planning to ensure timely distribution of all the necessary materials across targeted schools and training venues.
Average attendance during teacher trainings was 74% (from an expected average of 25 teachers per session), with 71% of expected schools represented at the trainings. Delayed communication or non-communication was the most common reason (74%) provided by participants that did not attend the trainings. Monitors found a need for more thorough training; some topics were only covered completely in 20% of trainings. However, post-training interviews revealed that at least 80% of teachers were knowledgeable on key messages about worms, target population, drug administration, recording forms, and roles and responsibilities.
Overall awareness of Deworming Day was higher among parents of enrolled children (93%) than parents of non-enrolled children (44%). There is a need to identify additional strategies to increase awareness of deworming among parents of non-enrolled children. Eighty-nine percent (89%) of parents indicated that they would be sending their children for deworming. Children (70%) and/or teachers (54%) were the main sources of information cited by parents. Teachers’ adherence to key drug administration steps was generally high. Administration of the correct drug dosage

5
(100%), requesting children to chew the mebendazole tablet (100%), and asking the child if they were on medication prior to drug administration (92%) all had high observed adherence. However, the provision of health education messages (57%) prior to treatment is an area for improvement. Non-enrolled children were dewormed in only 13% of monitored schools on Deworming Day.
Coverage validation was conducted in two LGAs (Ikenne Imeko and Afon); both treated for schistosomiasis and Ikenne also treated for STH. Both achieved a program reach (proportion of children offered the drug) of at least 88% for both treatments. However, disaggregation of this figure by enrollment status revealed a low reach for the non-enrolled children for both treatments (56% for STH treatment in Ikenne, and 58% in Ikenne, 41% in Imeko Afon for schistosomiasis). The surveyed coverage (proportion of surveyed children who reported having swallowed the drugs) for STH treatment in Ikenne was 80%, while this figure was 80% in Ikenne and 76% in Imeko Afon for schistosomiasis treatment. All of these surveyed coverage figures are above WHO's threshold of 75%, suggesting a successful MDA.
The reported coverage from both LGAs was outside the confidence bounds of the surveyed coverage; reported coverage for both STH and schistosomiasis in Ikenne was at least 25% lower than surveyed coverage, while reported coverage in Imeko Afon was at least 11% higher than the survey finding. Under- or over-estimations of population denominators could be distorting coverage figures; this remains a challenge that is beyond the program’s scope of influence. However, a data quality assessment may also help to pinpoint issues in the reporting process and could identify opportunities for immediate program improvements.
2.0 Background Globally, about 870 million children in many poor and developing countries are at risk of parasitic worm infections1, a type of Neglected Tropical Diseases (NTDs) - WHO, 2017. The most common infections are from soil-transmitted helminths (STH) and schistosomiasis. Worm infections interfere with nutrient uptake, causing anemia, malnourishment, and impaired mental and physical development. These symptoms threaten a child’s health, education, and economic potential. Infected children are often too sick or tired to concentrate in school, or to attend at all. Parasitic worms pose a massive threat to human capital, hindering schooling and economic development in
1 http://apps.who.int/neglected_diseases/ntddata/sth/sth.html

6
parts of the world that can least afford it. School-age children harbor the highest intensity of infection from STH and schistosomiasis2, and therefore the World Health Organization (WHO) and Nigeria’s Federal Ministry of Health (FMoH) recommend large-scale school-based deworming to control these diseases. WHO estimates that about 46.7 million children in Nigeria (about 5.4% of the global figure) require preventive chemotherapy for STH and 16.8 million for schistosomiasis. Evidence Action provides technical support to several Nigerian state governments working to eliminate the public health problem of worms through school-based deworming.
In June, the first round of its third year of statewide school-based deworming for 2019 took place in eleven out of 20 LGAs in Ogun state which are endemic for STH and schistosomiasis. A total of 534,366 enrolled and non-enrolled children aged 5-14 years were targeted to receive deworming treatment in both public and private primary and junior secondary schools3. Teachers (3,010) were trained to properly administer the safe and effective deworming drugs, mebendazole and praziquantel.
Evidence Action designed data collection tools and a sampling method to observe, review, and measure the quality and success of teacher trainings, community mobilization, sensitization, and Deworming Day activities. Infotrak Research and Consulting was competitively selected to collect the data, which Evidence Action then entered, cleaned, and analyzed. The findings are presented in this report.
3.0 Methodology 3.1 Process Monitoring Process monitoring was conducted in all 11 Ogun state LGAs which conducted deworming. The monitoring adopted a combination of descriptive and qualitative study design to assess the quality of trainings and implementation of deworming in schools. Process monitoring only focused on teacher trainings and deworming days. LGA trainings were not monitored.
A probability proportional to estimated size (PPES) methodology was adopted to select a representative sample of teacher trainings and deworming days to monitor. Samples
2 "WHO data show unprecedented treatment coverage for bilharzia and intestinal worms" 3 This round of deworming targeted a smaller number of children and LGAs due to reduced availability of medicine from the FMOH; the scope was therefore similar to that of a typical “second round” of treatment. Another round in late 2019 was therefore planned to target the full scope of a typical “first round” of treatment.

7
of 25 out of 135 teacher training sessions and 30 out of 2,954 schools that conducted deworming were monitored. The samples were calculated to meet a 90% confidence level and a margin of error of 15%. Using PPES, 26 out of 2,560 primary and 4 out of 394 junior secondary schools were sampled and monitored4. In every teacher training session sampled, the trainer was interviewed. Four participants were selected and interviewed before the training and another set of four participants were interviewed after the training. The pre- and post-training participants were systematically sampled where every third participant to arrive at the meeting venue was interviewed pre-training and every third participant to receive training materials as indicated in the training materials distribution form, was selected for post-training interview.
During Deworming Day, head teachers from each of the 30 sampled schools were interviewed to assess their knowledge of deworming, FLHF engagement, deworming preparedness, mobilization, and availability of deworming materials. Monitors also conducted interviews with one randomly selected teacher who was a member of the deworming team in the school and observed deworming as it took place.
For the student interviews, three students were randomly sampled and interviewed, including two enrolled children based on the class register and one non-enrolled child. The monitor further conducted general school observation to assess school infrastructure including WASH, presence and location of sensitization materials, and where deworming was taking place for different classes.
To assess parents’ awareness on Deworming Day, one parent was randomly sampled and interviewed at each school conducting deworming, totaling 18 parents compared to 30 planned parents, having failed to obtain parents to interview in some schools. In addition, one teacher was purposively selected and interviewed at each school to obtain their feedback on the deworming campaign, from the start of the training to the time of reporting, totaling to 30 teachers. Furthermore, 20 out of 30 planned FLHF staff were interviewed to obtain feedback on Deworming Day as well as on referrals. Some of the FLHF staff were attached to more than one school.
To assess the effectiveness of the community mobilization and sensitization methods adopted to raise awareness of the deworming activity among the community members, two randomly selected households with enrolled children and one household with non-enrolled child(ren) within the target age group around the sampled school were
4 Monitors replaced 20 out of the 30 schools originally primed for monitoring, due to difficulty in locating schools. This was largely due to a shift in monitoring approach, where monitors now visit the schools on Deworming Day rather than a day before like in previous rounds, hence limiting time for school identification given the window for deworming activities is restricted to the morning hours.

8
interviewed using the community survey. This totaled to 70 parents, including 60 parents to enrolled children and 10 parents to non-enrolled children.
Table 1: Targeted and actual sample sizes
Category Monitoring activity Population
Target sample size
Actual sample size
Teacher Training
Total number of teacher training sessions
135 25 25
No. of Teachers interviewed - Pre-training
100 865
No. of Teachers interviewed - Post-training
100 896
Schools Head teachers interviewed
30 30
Total number of schools deworming monitored
2,954 30 30
School type No. of Primary schools 2,954 26 267
No. of Junior secondary schools 394 4 4
Number of primary school child interviews
78 568
Number of junior secondary school child interviews
12 12
5 In some of the trainings, participants arrived after the pre-training interview was administered. The sample of four respondents was therefore not met as monitors were observing other training aspects. 6 Participants left immediately after training in some trainings and therefore monitors failed to meet the target sample of four. 7 One Primary school was doubling as a Junior secondary. 8 There were no non-enrolled children in some of the schools monitored.

9
Parents Parents interviewed on Deworming Day
30 189
Children Enrolled children interviewed on Deworming Day
60 60
Non-enrolled children interviewed on Deworming Day
30 16
FLHF FLHF staff
30 2010
Community Mobilization
Households surveyed - Parents of enrolled children
60 60
Households surveyed - Parents of non-enrolled children
30 1011
3.2 Coverage Validation To compute program treatment coverage, there is a high volume of summarization and transfer of treatment figures from school level, ward level, LGA level until state level which increases the chance of errors. The errors could be made unknowingly through omission of some treatment data when transferring or summing up the figures, or knowingly by officials who may want to inflate the figures for appearance of success. In order to validate coverage of the program as reported by treatment figures and the accuracy of the reporting system, we undertook an impartial coverage evaluation survey in two LGAs within Ogun state (Ikenne and Imeko and Afon), both treating for schistosomiasis, with Ikenne additionally treating for STH.
Coverage validation was undertaken four weeks after mass drug administration (MDA) and mop up day activities. This was intended to achieve three objectives:
1. To measure coverage for the MDA within the LGA
9 In some of the schools visited, there were no parents to interview. 10 Some FLHF staff were attached to more than one school. Others could not be reached on phone. 11 Only 10 monitors were able to find households where all children do not attend school, possibly because these instances are limited.

10
2. To validate the reported coverage numbers as provided by head teachers
3. To identify reasons for non-compliance
Ogun’s coverage evaluation survey adopted both a school-based approach to reach enrolled children as well as a community-based approach to reach the non-enrolled children and enrolled children found at home.
3.2.1 Community-based sampling
As guided by the WHO protocol, we used the PPES sampling approach to select samples of households and schools from two randomly selected survey areas12; Ikenne and Imeko Afon. Because the validation survey was conducted during school hours, part of the target population requiring treatment were attending school. In order to ensure that all school-age children are reached, we conducted interviews both in the community and in sampled schools within the administrative levels at which treatment was conducted.
3.2.2 School-based sampling
The total sample size is multiplied by the average net enrollment rate of 54% (primary and junior secondary schools in Ogun) to determine the number of surveys to be conducted in schools. The 1,952 school surveys were further disaggregated proportionally according to the average age representation for the target population in primary and junior secondary school resulting to 1,268 surveys in primary schools and 684 in junior secondary schools.
After the household’s surveys, the field officer asked the parents and community elders the primary and junior secondary school where most children from the segment attend. Every segment was expected to mention a unique primary school yielding a total of 30 primary schools. However, if upon getting to the mentioned school the monitor finds that it had been sampled by another segment, he was to go to the second most popular school where children from the segment attend. In each of the 30 primary schools identified, the monitor conducted interviews with 21 pupils.
Since junior secondary schools are few, they are shared by multiple segments making it impossible to have unique secondary school for each segment. The monitors asked for the junior secondary school that most children from the ward in which the segment belonged attended school. This was based on the assumption that a given ward was served by at least 1 unique junior secondary school. Sampled segments were distributed across 10 wards in Ikenne and 9 wards in Imeko Afon. This would translate to at least
12 In this context, survey areas were LGAs

11
9 and 10 unique junior secondary school in Imeko Afon and Ikenne respectively. As such, 324 and 360 surveys in junior secondary school would be conducted in Ikenne and Imeko Afon respectively translating to 36 surveys per junior secondary school.
To determine the classes from which children were drawn for interviews in primary schools, the monitor randomly selected four out of six classes in each of the sampled primary schools. In junior secondary school, all three classes were selected. If a selected class had more than one stream, the monitoring team randomly selected only one stream. In each of the sampled streams in primary schools, interviews were conducted with six students using a systematic sampling technique with a sampling interval of six as per the class register. In junior secondary schools, 12 students per class using a skip pattern of three in the class register.
Table 2: Distribution of interviews across community and school-based approach
Category Disaggregation Population
Target sample size
Actual sample size
Total number of surveys Overall sample 80,341 3,616 2,250
Community surveys 36,957 1,664 21713
School surveys 43,384 1,952 2,033
No. of schools sampled
Primary 282 60 60
Junior secondary 51 19 41
No. of School Surveys Primary 2 1,268 1,403
Junior secondary
684 630
13 The true net enrollment rate may have been much higher than the quoted 54% used to generate the sample for community interviews. This could have led to a smaller proportion of children being found in the community than anticipated at the planning stage. Consequently the small number of non-enrolled children interviewed makes it difficult to make any deductions about this population type.

12
3.3 Data Collection, Management, Analysis, and Quality Control Data collection tools were developed and programmed into mobile-based platforms and pre-tested before monitors were trained. After data was collected, it was cleaned to ensure quality before analysis and reporting began. An independent monitoring firm, Infotrak Research and Consulting, responsible for data collection conducted back-checks on 10% of the data for both process monitoring and coverage validation and shared the data with Evidence Action for validation. The results from the back-check resulted in high confidence in the data shared, with no systematic errors in the data.
4.0 Results 4.1 Review of teacher training Monitors were dispatched to 25 teacher training sessions to measure the delivery and effectiveness of the sessions. Of these, 11 (44%) were focused on only schistosomiasis treatment, four (16%) on only STH, and 10 (40%) on both treatments. Only one trainer (in a training focused on schistosomiasis treatment only) had not attended an LGA-level training within 21 days of the teacher training. The majority of participants for the teacher training were invited either by phone call (64%) and/or SMS (52%).
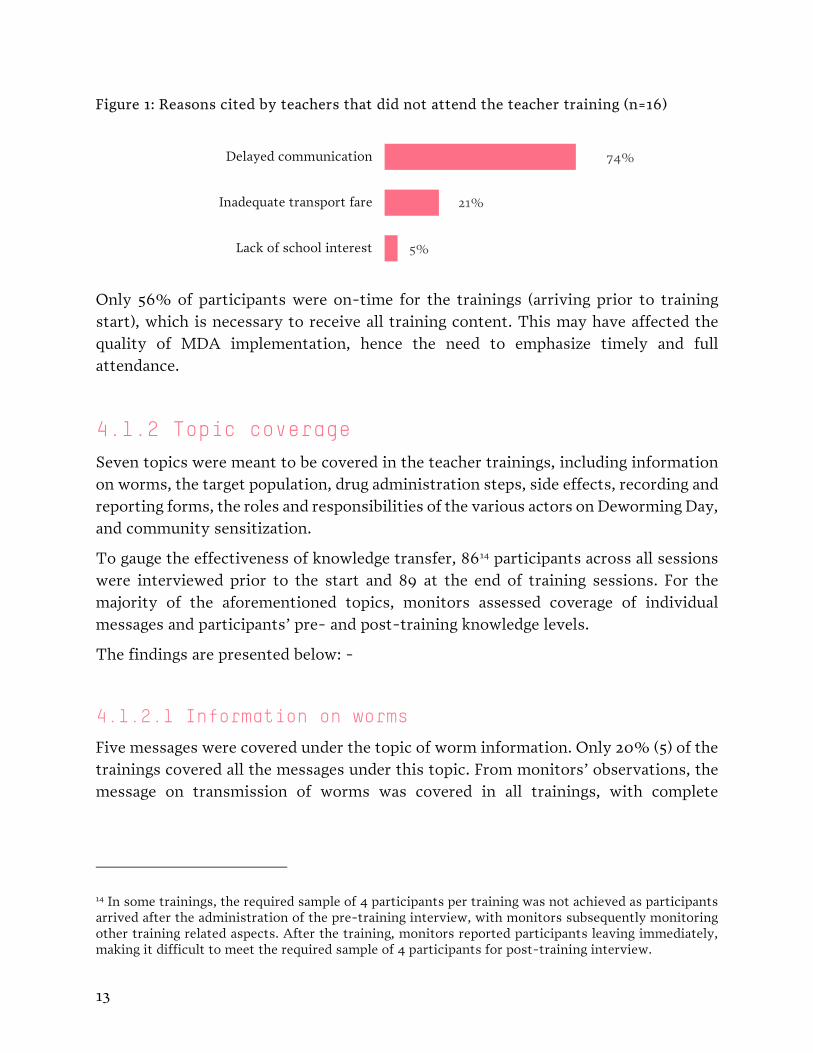
4.1.1. Attendance during trainings An attendance sheet was available in 96% of the trainings monitored, with the average teacher attendance rate at 74% (of an expected average of 25 teachers per training), representing 71% of the expected schools. Delayed communication or non-communication (74%) was the main reason cited by the teachers who did not attend (Figure 1). This was also the case in the previous round of deworming, signifying the need for more timely communication with teachers.
A comparison of the attendance rate for teacher training, computed from the attendance register, to the self-reported rate from head teachers on Deworming Day suggests that actual training attendance may have been 26% lower than the 100% self-
13
Figure 1: Reasons cited by teachers that did not attend the teacher training (n=16)
Only 56% of participants were on-time for the trainings (arriving prior to training start), which is necessary to receive all training content. This may have affected the quality of MDA implementation, hence the need to emphasize timely and full attendance.
4.1.2 Topic coverage Seven topics were meant to be covered in the teacher trainings, including information on worms, the target population, drug administration steps, side effects, recording and reporting forms, the roles and responsibilities of the various actors on Deworming Day, and community sensitization.
To gauge the effectiveness of knowledge transfer, 8614 participants across all sessions were interviewed prior to the start and 89 at the end of training sessions. For the majority of the aforementioned topics, monitors assessed coverage of individual messages and participants’ pre- and post-training knowledge levels.
The findings are presented below: -
4.1.2.1 Information on worms
Five messages were covered under the topic of worm information. Only 20% (5) of the trainings covered all the messages under this topic. From monitors’ observations, the message on transmission of worms was covered in all trainings, with complete
14 In some trainings, the required sample of 4 participants per training was not achieved as participants arrived after the administration of the pre-training interview, with monitors subsequently monitoring other training related aspects. After the training, monitors reported participants leaving immediately, making it difficult to meet the required sample of 4 participants for post-training interview.
5%
21%
74%
Lack of school interest
Inadequate transport fare
Delayed communication

14
coverage15 noted in 86% of trainings and partial coverage in 14% of trainings (Figure
2). Prevention of worm infection and benefits of deworming received less coverage in the trainings with more than a third of trainings not covering them completely. There is need to emphasize comprehensive coverage in the future, to impact knowledge transfer to trainees, and support a high quality Deworming Day.
Figure 2: Messages covered under worms (n=25)
Post-training interviews revealed that all participants could cite at least one way a person can be infected with worms, up from 91% in the pre-training interviews. Also, though 98% of participants in STH treating schools could cite the type of worms being treated, only 86% of participants in schistosomiasis treating schools could cite this after the training.
4.1.2.2 Target population
Critical to the success of the MDA is the proper identification of the target group. To this end, 92% of trainers correctly highlighted that all children (both enrolled and non-enrolled) aged 5-14 years were the target for the MDA.
Equally important is the identification of the non-eligible persons for the MDA. Sick children during Deworming Day (88%) received the highest mentions (Figure 3).
15 The term “completely” means that the trainer covered the prescribed content of the topic according to the training manual and presentations
64%
64%
62%
71%
86%
24%
29%
33%
29%
14%
12%
7%
5%
Benefits of deworming
Prevention of STH infection (n=14)
Prevention of schistosomiasis infection (n=21)
Types of worms
Transmission of worms
Completely covered Partially covered Not Covered

15
Figure 3: Non-eligible persons covered in the trainings (n=25)
The proportion of participants citing the correct age group for deworming increased by 37 percentage points in post-training interviews from 59% pre-training. Six percent of participants said that they would deworm sick children present during the MDA, a finding that needs to be addressed going forward.
4.1.2.3 Drug Administration Steps
A number of key messages under the drug administration topic received high coverage (individual coverage of messages in at least 72% of trainings) with the correct drugs cited in all trainings (100%) and use of the tablet pole for schistosomiasis dosage (95%) among the strongest messages (Table 3). Additional focus should be provided to messages on drug storage, not forcing children to swallow drugs, and hand washing prior to treatment, as these were not emphasized in 24% or more of trainings. Further, given the critical importance of this topic, there is a need to ensure that all key messages are covered, as complete topic coverage was noted in only 20% of trainings.
Table 3: Messages on drug administration covered during the teacher trainings (n=25)
MDA practice Percent
Schistosomiasis drug is praziquantel (n=21) 100%
STH drug is mebendazole (n= 14) 100%
One mebendazole tablet to be given to each child (n= 14) 100%
Register enrolled children prior to and non-enrolled children on, prior to treatment.
100%
Under the program, all drugs are free, safe and effective 96%
The tablet pole will be used to determine praziquantel dosage (n=21) 95%
Ensure that child has eaten before giving praziquantel treatment (n=21) 95%
64%
72%
88%
Any child under 5 years
Children with a history of epilepsy, sicklecell disease
Sick children

16
Under no circumstances should a child be forced to swallow the medicine 76%
Drugs must be stored in a clean, safe, dry and cool location 72%
Facilitate hand washing prior to treatment 72%
From post-training interviews, a large proportion of participants knew the correct drugs and respective dosages (Figure 4), indicative of excellent knowledge retention among participants, which potentially indicates that messages were well conveyed by trainers.
Figure 4: Pre- and post training drug and dosage interview mentions
4.1.2.4 Side effects
Side effects are possible outcomes of any treatment that may or may not be directly related to the treatment being provided. To ensure teachers were prepared to handle any eventualities, trainers were required to communicate messages related to this topic during the trainings. However, only 28% of trainings mentioned all the potential side effects, with abdominal discomfort and vomiting mentioned most frequently (Figure 5).
39%
45%
42%
66%
96%
100%
96%
100%
Praziquantel
Mebendazole
Praziquantel
Mebendazole
Cor
rect
Dru
gC
orre
ct D
osag
e
Post-training (n=75) Pre-training (n=72)

17
Figure 5: Messages on potential side effects covered during trainings
Figure 6: Participants’ pre- and post-interview mentions of potential side effects
The proportion of trainers covering each side effect (Figure 5) was higher than the proportion of teachers able to mention the side effect in post-training interviews (Figure 6). This, together with the low coverage of all side effect information (only 28% of trainings) indicates that this topic needs more emphasis in future trainings.
4.1.2.5 Recording and reporting forms
It is critical that reporting forms are properly filled, as the data enables the program to establish reported coverage- a key program output. While all trainings demonstrated the filling of both the school summary forms and treatment register, complete filling of all sections within the forms was noted in 88% of trainings (Figure 7). Further,
48%
64%
72%
72%
80%
88%
Fainting
Diarrhoea
Nausea
Fatigue
Vomiting
Abdominal discomfort
3%
47%
17%
8%
17%
14%
33%
10%
19%
25%
31%
32%
33%
36%
48%
60%
Diarrhoea
Fainting
Headache
Fatigue
Dizziness
Nausea
Abdominal discomfort
Vomiting
Post-training (n=75) Pre-training (n=72)

18
complete instructions for filling all forms (school summary form, treatment register, and adverse events reporting form) were provided in only 48% of trainings monitored.
Figure 7: Messages covered under recording and reporting forms (n=25)
From post-training interviews, 90% of teachers were aware of their responsibility to fill out the treatment register, while 81% knew that the head teacher is responsible for filling the school summary form.
4.1.2.6 Roles and Responsibilities
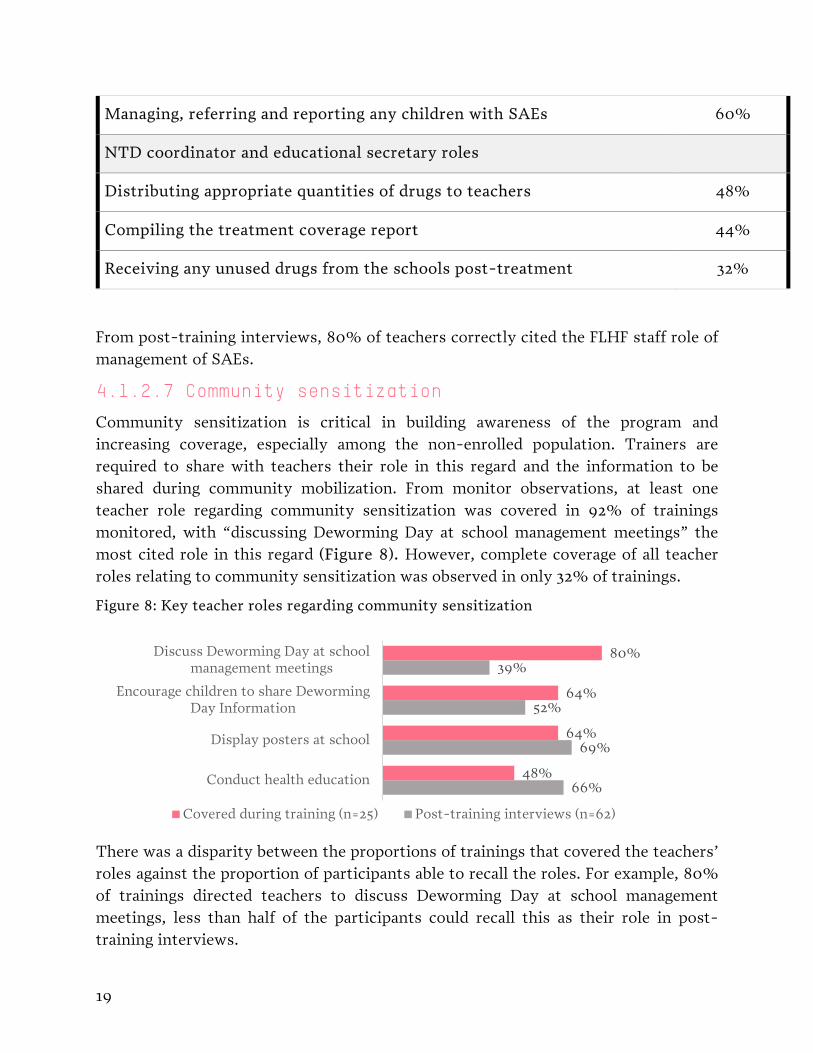
All trainings covered at least one role of the teachers during the MDA and 88% covered at least one of the frontline health facility (FLHF) staff roles. Complete coverage of teacher roles was seen in only 44% of trainings. Further, 40% of trainings covered none of the NTD coordinator and educational secretaries’ roles. All trainings covered the role of drug administration by teachers (100%).
Table 4: Key MDA roles and responsibilities of various actors covered at the trainings (n=25)
Roles and responsibilities Percent
Key teacher roles
Organizing drug administration 100%
Form recording and reporting 88%
Disseminating health education messages to children and parents 72%
Mobilization of non-enrolled children 56%
Key FLHF staff roles
Managing side-effects 76%
56%
88%
88%
28%
12%
12%
16%Filling of adverse events reporting form
Filling of treatment register
Filling of school summary form
Completely covered Partially covered Not Covered
19
Managing, referring and reporting any children with SAEs 60%
NTD coordinator and educational secretary roles
Distributing appropriate quantities of drugs to teachers 48%
Compiling the treatment coverage report 44%
Receiving any unused drugs from the schools post-treatment 32%
From post-training interviews, 80% of teachers correctly cited the FLHF staff role of management of SAEs.
4.1.2.7 Community sensitization
Community sensitization is critical in building awareness of the program and increasing coverage, especially among the non-enrolled population. Trainers are required to share with teachers their role in this regard and the information to be shared during community mobilization. From monitor observations, at least one teacher role regarding community sensitization was covered in 92% of trainings monitored, with “discussing Deworming Day at school management meetings” the most cited role in this regard (Figure 8). However, complete coverage of all teacher roles relating to community sensitization was observed in only 32% of trainings.
Figure 8: Key teacher roles regarding community sensitization
There was a disparity between the proportions of trainings that covered the teachers’ roles against the proportion of participants able to recall the roles. For example, 80% of trainings directed teachers to discuss Deworming Day at school management meetings, less than half of the participants could recall this as their role in post-training interviews.
66%
69%
52%
39%
48%
64%
64%
80%
Conduct health education
Display posters at school
Encourage children to share DewormingDay Information
Discuss Deworming Day at schoolmanagement meetings
Covered during training (n=25) Post-training interviews (n=62)

20
4.1.3 Training Methods Trainers use a variety of methods to keep the participants engaged and to ensure effective information transfer. Group discussions (96%) and lecture based approaches (95%) were the most common training methods, distantly followed by demonstrations (56%). Trainers also allowed for role plays (24%) and group work (12%).
To assess the success of various training methods, a composite score was generated for participants’ knowledge of drugs, dosage, and the target age-group for STH treatment. The most used training method were demonstrations (47% of trainings), and analysis suggested a significant increase in post-training knowledge (p < 0.01) after these training sessions. Other training methods included discussions (33%) and lecture-based approaches (31%), but there was no indication for increased post-training knowledge for these methods.
4.2 Distribution of materials During LGA trainings, teacher trainers were meant to receive key materials (drugs, teacher training handout, reporting forms, tablet poles, and posters) to aid in teacher trainings, as well as to pass onto teachers.
Observations made at the start of teacher trainings indicated that only 70% of trainers had all the aforementioned key materials, while distribution of all these materials was noted in 77% of teacher trainings. On Deworming Day, 83% of the schools had all these key materials (Figure 9). From field reports, the 30% of trainers that did not have all key materials at training start were mostly in trainings with more than one trainer, with the other trainer arriving late because of difficulty locating the venue or the training venue being too distant from their duty station. While the program was able to progressively supply required items, material availability right from the start of the implementation cascade is essential. Addressing this bottleneck at the planning phase is essential for subsequent rounds of deworming training.
Figure 9: Distribution of all KEY materials across the implementation cascade
83%
77%
70%
On Deworming Day (n=30)
After teacher training (n=25)
At the start of teacher training (n=25)

21
4.2.1 Drugs From observations prior to the start of the teacher training sessions, only 76% of trainers had drugs to act as teaching aides as well as distribute to teachers. At the end of 96% of the trainings, drugs were distributed to teachers. On Deworming Day, all monitored schools had drugs, which indicates that the program was able to overcome initial bottlenecks to avail drugs as required. However, future efforts should be channeled towards availing drugs early on in the cascade.
From post-deworming interviews with head teachers, 93% indicated that drugs had been sufficient, with a further 87% of all head teachers interviewed reporting a drug surplus. This surplus was to be used for planned mop-ups before making returns to the LGA in 62% of cases, in line with the program strategy, while 38% were returned to the LGA immediately, presumably since they had no mop-ups planned.
4.2.2 Reporting forms The proportions of trainers with reporting forms prior to the trainings were generally low (Figure 10); only 68% and 76% of trainers had the treatment register and school summary forms, respectively. However, these proportions rose at subsequent cascade stages, with all schools notably found to have the class treatment register on Deworming Day. Post-deworming interviews with head teachers indicated the sufficiency of these forms among 97% of those interviewed. Efforts should however be geared toward ensuring availability of these forms at the cascade start.
Figure 10: Availability of reporting forms across the implementation cascade
4.2.3 Community sensitization materials Posters intended for display within schools were available to 68% of trainers prior to training start. The end of the training sessions saw the distribution of posters in 72%
68%76%
96% 96%100%93%
Class treatment register School Summary Form
Prior to the start of teacher training (n=25) After teacher training (n=25) On Deworming Day (n=30)

22
of sessions, with poster availability on Deworming Day at 93%. Schools monitored on Deworming Day had on average two posters on display.
While 28 of the 30 head teachers (93%) indicated that they received posters, 36% (10 head teachers) did not have them posted, which needs to be addressed in future trainings.
4.2.4 Tablet poles On Deworming Day, 92% of schools reported availability of tablet poles, up from an initial 56% prior to training start. The two schools (8%) that did not have the program-availed tablet poles reportedly used makeshift poles.
4.3 Community Sensitization Community sensitization prior to Deworming Day is an evidence-supported key factor for MDA success. On Deworming Day, monitors held interviews with 70 parents (60 of enrolled children, 10 of non-enrolled children). The key to this interview was to gauge awareness of the MDA, as well as their sources of MDA information.
4.3.1 Implementation of community sensitization When monitors interviewed 30 head teachers on Deworming Day, only half (50%) of them reported sending someone from the school to mobilize children in the community for the MDA; this was either a student (67%) and/or a teacher (60%). This is consistent with the main sources of information cited by parents (Figure 11).
Figure 11: Sources of information cited by parents
2%
2%
4%
5%
12%
14%
21%
54%
70%
Town announcer
Village meeting
PTA meeting
FLHF staff
Posters
Friends/relatives
Radio
Primary school teacher
Child

23
4.3.2 Community knowledge Prior to Deworming Day, 84% of parents – 55 of enrolled children and three of non-enrolled children - were aware of Deworming Day. Knowledge of other deworming aspects was generally low. Only 73% of parents of enrolled children, and 50% of parents of non-enrolled children, were aware of the target age-group. The proportions of parents who knew the types of worms being treated was 51% among parents of enrolled children, and 50% for non-enrolled children. These are clear opportunities to increase sensitisation for parents of non-enrolled children.
At the end of these interviews, 89% of parents indicated that they would be sending their children for deworming, albeit with a higher proportion of enrolled parents (94%) compared to the parents of non-enrolled children (50%). Of the six parents that wouldn’t send their children for deworming, five were not aware of the activity or had not had sufficient preparation, while one needed to inform their spouse.
4.4 Deworming Day Thirty schools were visited on Deworming Day, with 15 treating schistosomiasis and STH, 11 treating schistosomiasis only, and 4 treating STH only. Eighty three percent were primary schools, 13% were junior level, and 4% were both primary and junior level schools. The purpose of the visit was to assess MDA procedures and interview the deworming team to assess knowledge and capability to deliver the MDA.
4.4.1 Preparedness for Deworming Day At sampled schools, monitors found that all head teachers had made plans to conduct deworming. All head teachers reported that either they or a teacher from the school had attended training within a month of the MDA, with 90% of these trainings happening within 2 weeks of the MDA. On a scale of 1 - not useful to 4 - very useful, all teachers rated the training as very useful.
All head teachers in schistosomiasis treating schools indicated that they had requested that children eat something prior to deworming.
Monitors also observed school infrastructure, which revealed that 67% of schools lacked hand washing facilities while 13% of schools visited lacked a toilet facility.
4.4.2 Deworming Day Delivery 4.4.2.1 Adherence to MDA procedures
Monitors observed deworming teams to assess adherence to key drug administration procedures. Drug administration aspects on average recorded high adherence scores,

24
including giving the correct dosage of mebendazole (100%) and using the tablet pole to determine the correct praziquantel dosage (90%) – (Table 5).
Table 5: MDA procedures observed by monitors during drug administration
MDA practice Percent
Pre-deworming preparations
Deworming team comprised of two teachers 87%
Health education messages were given to children prior to treatment 57%
Teachers ensured children washed their hands prior to treatment 17%
Drug Administration
Teachers who gave the correct dosage for mebendazole (1 tablet) 100%
Teacher asked child to chew the mebendazole tablet 100%
A tablet pole was used to determine dosage for praziquantel (schistosomiasis, n=26)
100%
Teacher asked if child was sick or under medication before administering medicine
92%
Teacher asked if the child had eaten prior to administering medicine (schistosomiasis, n=26)
90%
Children were not forced to swallow drugs against their wishes 83%
Recording treatment
All sections of the treatment register were filled out 70%
The treatment register was used to record treatment 70%
The teacher had transferred the names from the class register to treatment register prior to the deworming exercise
57%
However, adherence to protocol in preparations for deworming and completing forms was poor. Notably, 63% of schools of the schools with hand washing facilities did not ensure that children washed their hands prior to treatment In addition, 43% of schools

25
did not provide any health education messages. The treatment register was not used to record treatment in 30% of monitored schools, however all that did use the treatment register completed all sections. Forty-three percent had not taken the initiative to transfer the names from the class register to the treatment register before deworming, which is likely related to the gaps in capturing treatment data. The next round of deworming training should emphasize proper use and completion of forms.
4.4.2.1 Management of side effects and referrals In pre-deworming interviews, 93% of head teachers indicated they would refer any emerging cases of severe adverse events (SAEs) to the FLHF, a 21 percentage point improvement from the last round.
Thirteen side effects were reported in 10 (33%) of the 30 monitored schools. The majority of cases (9) were reported in schools treating both schistosomiasis and STH (Figure 12). Overall, vomiting had the highest frequency (46%), followed by abdominal discomfort (31%). From monitor reports, all cases were routinely managed with no referrals made to FLHF staff. However, only three (30%) of the 10 schools documented these occurrences in the adverse events recording form, indicating a reporting gap.
Figure 12: Side effects noted during deworming (n=13)
4.4.3 Attendance Rate Sixty-three percent (63%) of schools treated all eligible children present on Deworming Day. Disaggregation by school type indicated that 69% of 13 public schools dewormed all eligible children while this proportion stands at 59% of 17 private schools. The primary reasons that all eligible children were not treated in these 11 schools were: refusal by some parents to have children dewormed (36%), illness (36%), not having had breakfast in schistosomiasis treating schools (27%), and refusal by some children (27%). Eighty-one percent (81%) of schools took steps towards planning
1
1
2
2 1
6Schistosomiasis + STH
Schistosomiasis only
Headache Abdominal discomfort Fainting Vomiting

26
for absentees to receive treatment when they returned by recording their names on the treatment register.
From interviews with head teachers before deworming, 10 (33%) of the 30 monitored schools did not have plans to deworm non-enrolled children. Head teachers attributed this to the school management position against deworming of non-enrolled children (5 schools), the fact that non-enrolled children would not come at all (3 schools) and fear of running out of drugs to treat all children (2 schools). Disaggregation of these reasons by school type revealed that of the five head teachers citing school management resistance, four (80%) were from private schools. All three head teachers indicating that non-enrolled children would not come were also from private schools. The two school head teachers voicing fears of possible drug insufficiency were from public schools.
On Deworming Day, only 13% of schools dewormed non-enrolled children, similar to the 15% in the last round, with the same principal reasons (school management position against deworming and non-enrolled children unwilling to come). The program should consider addressing this consistently low proportion observed over time.
4.5 Coverage Validation Coverage validation was conducted in two LGAs within Ogun state, Ikenne and Imeko Afon. Treatment for both STH and schistosomiasis took place in Ikenne, while only schistosomiasis treatment occurred in Imeko Afon. Prior to the MDA, 4% of respondents in Ikenne and 6% in Imeko Afon indicated that they received deworming medicine outside of the MDA, with majority citing receipt from home (Figure 13).
Figure 13: Non-program sources of deworming treatment
1%
5%
0%
94%
1%
4%
2%
93%
Other
Health facility
Chemist/Pharmacy
Home
Imeko Afon (n=121) Ikenne (n=88)

27
A high overall program reach16 (at least 89%) was achieved for both treatments (Table 6 and 7), implying that a large proportion (at least 88%) of the target population was reached.
Table 6: STH Coverage Validation results for Ikenne
Program reach Survey Coverage
Category Mean
(%)
Lower bound (95%
CI)
Upper bound
(95% CI) Mean
(%)
Lower bound
(95% CI)
Upper bound (95%
CI) Reported Coverage
Number of children
interviewed
Overall 93% 91% 94% 80% 78% 83% 55% 1,109
Disaggregation by gender
Male 93% 90% 95% 80% 77% 84% 525
Female 92% 90% 95% 80% 77% 84% 584
Disaggregation by enrolment status
Enrolled 93% 92% 95% 82% 79% 84% 1,084
Non-enrolled 56% 35% 76% 24% 9% 45% 25
Disaggregation by school type
Public 96% 94% 97% 86% 83% 89% 591
Private 92% 89% 94% 78% 73% 82% 430
16 Program reach - proportion of children interviewed who were given the opportunity to receive the drug, regardless of whether the drug was ingested

28
Table 7: Schistosomiasis coverage validation results for Ikenne and Imeko Afon
LGA
Program reach Survey Coverage
Category Mean
(%)
Lower bound (95%
CI)
Upper bound (95%
CI) Mean
(%)
Lower bound (95%
CI)
Upper bound (95%
CI) Reported Coverage
Number of children
interviewed
Overall
Ikenne 93% 91% 94% 80% 78% 83% 53% 1,108
Imeko Afon 88% 86% 90% 76% 73% 78% 87% 1,079
Disaggregation by gender
Ikenne Male 93% 90% 95% 80% 77% 84% 525
Female 93% 91% 95% 80% 77% 83% 583
Imeko Afon Male 88% 85% 90% 76% 72% 79% 564
Female 89% 85% 91% 76% 72% 79% 515
Disaggregation by enrolment status
Ikenne Enrolled 94% 92% 95% 82% 79% 84% 1,084
Non-enrolled 58% 37% 78% 25% 10% 47% 24
Imeko Afon Enrolled 91% 89% 92% 79% 76% 81% 1,020
Non-enrolled 41% 28% 54% 19% 10% 31% 59
Disaggregation by school type
Ikenne Public 96% 94% 97% 86% 83% 89% 591
Private 92% 89% 94% 78% 73% 82% 430
Imeko Afon Public 92% 90% 94% 80% 77% 82% 756
Private 87% 82% 91% 76% 69% 82% 194
The overall surveyed coverage for both treatments exceeds WHO’s recommended 75% therapeutic coverage threshold indicating successful implementation. Disaggregation by gender and school type revealed consistent findings with those noted for the overall program reach and surveyed coverage (Table 6 and 7).
However, the surveyed coverage for private schools was low, with the lower bounds for surveyed coverage in both LGAs lower than the WHO target, implying that the true coverage may be lower than the WHO target. Program reach and surveyed coverage for non-enrolled children are particularly concerning, with neither LGA exceeding a reach

29
of 60% for either type of treatment. This is unsurprising given that monitors reported only 13% of schools dewormed non-enrolled children. Caution should however be exercised in interpreting these results given the small sample sizes.
The reported coverage in Ikenne for both treatments was much lower (at least 25 percentage points) than the surveyed coverage, while that in Imeko Afon is 11 percentage points higher than the surveyed coverage. This suggests that teachers may be incorrectly reporting the ingestion of the drug, or that population denominators may be incorrect. A data quality assessment could help to identify where the reporting may be breaking down, and it may also be useful to re-examine the population denominator for possible overestimation in Ikenne and underestimation in Imeko Afon.
Unavailability of the child on Deworming Day was the major reason provided by those who did not receive drugs across both treatments and LGAs (Figure 14). As per the earlier recommendations for improved community sensitization, heightened parental and community awareness and buy-in to deworming may increase program reach in future rounds.
Figure 14: Reasons drug was not given
Disaggregation of the reasons for not swallowing the drugs revealed lack of parental consent as the main reason across both treatments and LGAs (Figure 15 and 16). This is consistent with monitor observations: on Deworming Day, the same reason was given for not deworming all target children (36%) in some monitored schools.
12%
88%
Distributor didnot come
I was absent
Ikenne (n=82)
Reasons drug not given, disaggregated by LGA(mebendazole)
11%
89%
10%
11%
78%
I was not aware
Distributor did notcome
I was absent
Imeko Afon (n=129)
Reasons drug was not given, disaggregated by LGA (praziquantel)

30
Figure 15: Reasons drug (mebendazole) was not swallowed in Ikenne
Figure 16: Reasons drug (praziquantel) was not swallowed
1%
3%
7%
10%
13%
66%
2%
4%
9%
2%
14%
9%
13%
14%
31%
I was busy
Not enrolled in primary school
Not aware
I am not at risk for this disease
Fear of side effects
I am taking other medications
I didn't bring anything to eat
I was sick
Lack of parental consent
Imeko Afon (n=129) Ikenne (n=79)
Reasons drug (praziquantel) was not swallowed, disaggregated by LGA
2%
3%
7%
10%
12%
66%
13%
25%
63%
I am not at risk for thisdisease
Fear of side effects
I am taking othermedications
I didn't bring anything toeat
I was sick
Lack of parental consent
Non-Enrolled (n=8) Enrolled (n=127)
Reasons drug (mebendazole) was not swallowed, disaggregated by enrolment status (Ikenne)
1%
3%
7%
10%
13%
66%
I am not at risk for thisdisease
Fear of side effects
I am taking othermedications
I didn't bring anything toeat
I was sick
Lack of parental consent
Ikenna (n=135)
Reasons drug (mebendazole) was not swallowed in LGA

31
5.0 Recommendations 5.1 What worked well
1. Large proportions of training participants knew information about worms, target population, drug administration, recording forms, and roles and responsibilities based on interviews. This indicates the effectiveness of training content delivery by trainers, a finding which needs to be maintained going forward.
2. Community sensitization efforts were generally successful, with 84% of parents aware of Deworming Day and 89% of parents indicating that they would send at least one of their children for deworming. Teachers and students were the most common sources of information for parents, and as such the program should continue to leverage on teachers and students as conveyors of information.
3. Key drug administration steps were generally well performed, as exemplified in the excellent scores (100%) for provision of the correct drug dosage (for both mebendazole and praziquantel).
4. All 13 cases of side effects which arose post-treatment were routinely managed with no referrals made, indicating that teachers effectively put into practice their knowledge of side effects and their management.
1%
2%
2%
10%
14%
16%
17%
37%
25%
50%
4%
4%
17%
Not enrolled in primary…
Not aware
I was busy
I am not at risk for this…
I am taking other medications
Fear of side effects
I didn't bring anything to eat
I was sick
Lack of parental consent
Non-Enrolled (n=24) Enrolled (n=115)
Reasons drug (praziquantel) was not swallowed,
2%
3%
7%
10%
12%
66%
13%
25%
63%
I am not at risk for this…
Fear of side effects
I am taking other…
I didn't bring anything to eat
I was sick
Lack of parental consent
Non-Enrolled (n=8) Enrolled (n=127)
Reasons drug (praziquantel) was not swallowed,
32
5. Coverage validation findings indicate a high program reach of at least 90% in both LGAs, each of which exceeded the WHO 75% threshold for the surveyed coverage, indicating MDA implementation success.
4.6.2 What can improve 1. Thorough content coverage during teacher training is an area for improvement,
as only the topic of target population received complete coverage in more than 50% of trainings monitored. Messages under the topic of “worms” were completely covered in only 20% of trainings, the lowest among the prescribed topics. Comprehensive coverage needs to be emphasized in future teacher trainings given the bearing it has on the quality of implementation.
2. Attendance at trainings can be improved: 76% of expected teachers from 71% of the expected schools were in attendance. Attendance, as well as time management for a punctual training start, needs to be improved in subsequent rounds by addressing underlying bottlenecks such as poor or delayed communication to participants.
3. While the program was able to provide all key materials for deworming in the majority of the schools (83%), material availability prior to training start was reported in only 70% of trainings. As the majority of instances related to difficulty in accessing training venue due to either distance from the trainer’s workstation or failure to locate the schools, these should be considered during the planning phase.
4. Participation and coverage for non-enrolled children were generally poor as reflected in the low proportion of schools (13%) that dewormed them, and less than 60% of non-enrolled children reportedly receiving the drug as from post-coverage surveys. While monitors found a number of reasons for low coverage of non-enrolled children, school management teams’ resistance toward deworming them is an issue requiring strategic advocacy. The consistently low proportion of schools deworming non-enrolled children in 2018 and 2019 indicates a need for thorough consideration of this issue.
5. Reported coverage rates for both LGAs were outside the bounds of the surveyed coverage, indicating possible incorrect reporting by teachers or incorrect population denominators. A data quality assessment may help pinpoint areas where reporting may be breaking down, and the state team is encouraged to re-examine the best source of population data.