Scanned by La'o Hamutuk from RDTL State Budget 2011 Book 1
60
Scanned by La’o Hamutuk from RDTL State Budget 2011 Book 1: Budget Overview. For more information on the budget, see http://www.laohamutuk.org/econ/OGE11/10OJE2011.htm Proofed and corrected 27 November 2010.
-
Upload
khangminh22 -
Category
Documents
-
view
1 -
download
0
Transcript of Scanned by La'o Hamutuk from RDTL State Budget 2011 Book 1

Scanned by La’o Hamutuk from RDTL State Budget 2011 Book 1: Budget Overview. For more information on the budget, see
http://www.laohamutuk.org/econ/OGE11/10OJE2011.htm
Proofed and corrected 27 November 2010.
RDTL General State Budget for 2011 as Presented to Parliament 15 November 2010. Scanned, with some parts translated, by La’o Hamutuk. For more information see http://www.laohamutuk.org/econ/OGE11/10OJE2011.htm
Book 1
Table of contents
PART 1. SPEECH OF PRIME MINISTER
(not included)
PART 2. EXECUTIVE SUMMARY...........1
PART 3. ECONOMIC OUTLOOK ............4
1. International Economy
Advanced Economies
Asia
Emerging and Developing Countries
World Prices
2. Domestic Economy
Non-oil GDP
Government Expenditures
Domestic Revenues
Petroleum Revenues
Inflation
Employment
Poverty and MDGs
Medium-Term Prospects (2011-2015)
PART 4. EXPENDITURE..........................14
1. Introduction
2. Expenditure reviews
3. Major initiatives proposed for 2011
CFTL Expenditures
Salaries and Wages
Goods and Services
Public Transfers
Minor Capital
CFTL Capital and Development
4. Infrastructure Fund
5. Human Capital Development Fund
6. Development Partners
PART 5. REVENUES ................................ 20
1. Introduction
2. Domestic Revenues
Taxes
User Fees and Charges
Rice Sales and Interest
Autonomous Agencies
3. Petroleum Revenues
Investment Return
Petroleum Fund
Petroleum Wealth and ESI calculation
Change of Methodology
Oil price forecast
Changes in the ESI from 2010 to 2011
Oil prices
Liquids price differentials
Production
LNG prices
Petroleum fund withdrawals
Kitan
Discount rate
Sensitivity analysis
4. Development Partners
PART 6. FINANCING ............................... 30
ANNEX 1 - ESTIMATED SUSTAINABLE
INCOME CALCULATION 2011 ............. 32
ANNEX 2 - 2011 GENERAL STATE
BUDGET LAW .......................................... 36
(translated by La‟o Hamutuk)
Annex I (Revenues) ............................. 40
Annex II-A (Expenditures) ................ 41
Annex II-B (Infrastructure Fund) ..... 53
Annex II-C (Human Capital Fund) ... 54
Annex III (Autonomous Agencies) .... 55
ANNEX 3 - TRANSFER FROM
PETROLEUM FUND ................................ 56
ANNEX 4 — DELOITTE REPORT ........ 57
RDTL General State Budget for 2011 as Presented to Parliament 15 November 2010. Scanned, with some parts translated, by La’o Hamutuk. For more information see http://www.laohamutuk.org/econ/OGE11/10OJE2011.htm
Figure 3.1: World, Regional and Timor-Leste‟s Output Growth, 2007-2011 (%)
Figure 3.2: Percentage Changes in Consumer Price Index, 2004 – 2010 (%).
Figure 3.3: Real Effective Exchange Rate and Real Exchange Rate Changes with Major Trading
Partners, Jan. 2009 – May 2010
Chart 5.1: Historical Changes and Future Projections in the WTI Oil Price ($ per barrel)
Figure 5.2: Timor-Leste Petroleum Revenues and ESI, 2002-2024
Figure 5.3: Changes in the Estimated Sustainable Income (from Budget 2010 to Budget 2011)
Figure 5.4: Sensitivity Analysis – Estimated Sustainable Income, 2011 ($ million)
Graph 5.4: Development Partners‟ Indicative Commitment, 2010 - 2015 ($ million)
Figure A2: EIA Forecasts and 10 years Historical Average WTI Prices, 2004 – 2025
Table 2.1. Combined Source Budget, 2011 –2015 ($ million, prelim)
Table 2.2. CFTL, by Category, 2011 – 2015 ($ Million, prelim)
Table 3.1: Real Economic Growth in Asian Economies, 2007 – 2011 (%)
Table 3.2: Sectoral share of real non-oil GDP, 2002 - 2009 (%)
Table 3.3: Nominal GDP by sector
Table 3.4: Real GDP Growth Rate (%)
Table 3.5: Whole of Government Expenditures ($ millions), including Auto Agencies.
Table 3.6: Domestic Revenues, 2002-2001 ($millions)
Table 4.1: Combined Source Budget, 2011 – 2015 ($ million, preliminary)
Table 4.2: Expenditures and Fiscal Envelope, 2010 – 2015 ($ million)
Table 4.3: Economic Targets, 2011 – 2015
Table 4.4: CFTL by Category, 2011 – 2015 ($ Million)
Table 4.5: CFTL Capital and Development, 2011 – 2015 ($ Million)
Table 4.6: Special Funds, 2011– 2015
Table 5.1: Total Revenue Projections, 2009-2015 (5‟ million)
Table 5.2: Domestic Revenues, 2009-2015 ($ million)
Table 5.3: Total Tax Revenue Projections, 2009-2015 ($ million)
Table 5.4: User Fees and Charges, 2009-2015 ($ Million)
Table 5.5: Revenues from Autonomous Agencies, 2009-2015 ($ million)
Table 5.6: Estimated Petroleum Revenues, 2009-2015 ($in)
Table 5.7: Oil Price Assumptions, Total Production and Timor-Leste Revenue Forecasts 2002-2024
Table 5.8: Estimated Petroleum Fund Savings 2009-2015 ($m)
Table 5.9: ESI as of 1 January 2011 Onward Compared to Figures in Budget 2010
Table A1. World Oil Price Forecasts, 2015 – 2025

1
RDTL General State Budget for 2011 as Presented to Parliament 15 November 2010. Scanned, with some parts translated, by La’o Hamutuk. For more information see http://www.laohamutuk.org/econ/OGE11/10OJE2011.htm
PART 2. EXECUTIVE SUMMARY
Budget Outlook
The Combined Source Budget for Timor-Leste in 2011 is $1.18 billion comprising the General State Budget in
the amount of $985 million, and $195 million from Development Partners, as shown in Table 2.1.
Table 2.1. Combined Sources Budget 2011 - 2015 ($ million, prelim)
Budget 2010 2011 2012 2013 2014 2015
CFTL 837.9 642.7 653.4 679.6 706.7 734.9
Infrastructure Fund 317.3 597 620.9 645.8 671.6
HCDF 25.0 30 35 40 45
General State Budget 837.9 985.0 1,280.4 1,335.5 1,392.5 1,451.5
Development Partners 256.8 195.0 112.7 75.2 32.7 0
Combined State Budget 1,094.7 1,180 1,393.1 1,410.7 1,425.2 1,451.5
Source: Budget and Aid Effectiveness directorates, Ministry of Finance, 2010
Table 2.2 shows Consolidated Fund of Timor-Leste (CFTL) by categories of expense, divided between
recurrent and capital.
Table 2.2. CFTL by Category, 2011 - 2015 (5 million, prelim)
Budget 2010 2011 2012 2013 2014 2015
Recurrent
Salary and Wages 99.3 115.9 120.6 125.4 130.4 135.6
Goods and Services 260.6 245.5 255.3 265.5 276.1 287.1
Public Transfers 184.4 164.5 171.0 177.9 184.9 192.4
Capital
Minor Capital 39.9 28.2 29.3 30.6 31.8 33.0
Capital & Development 253.7 88.6 77.2 80.2 83.5 86.8
CFTL Total 837.9 642.7 653.4 679.6 706.7 734.9
Source: Budget Directorate, Ministry of Finance, 2010.
Economy
The international economy has begun to recover from the financial crisis that plunged major advanced
economies into recession and impacted adversely on the majority of emerging and developing countries.
Timor-Leste was relatively sheltered from the crisis and its economic growth remained strong throughout, as
result of limited exposure to international trade and no financial industry. Overall real economic growth in
Timor-Leste in 2009 is estimated at 13%, with Public Sector contributing 5.6% of this growth, Agriculture
contributing 3.9% of growth and industry and Services contributing the remaining 3.5%. Going forward, it is
projected that the economy will continue its double digit economic trajectory from 2011 through 2015 driven
primarily by public expenditures.
Since the 2008 financial crisis, oil prices have risen and stabilized at around $70-$80 per barrel. Oil

2
RDTL General State Budget for 2011 as Presented to Parliament 15 November 2010. Scanned, with some parts translated, by La’o Hamutuk. For more information see http://www.laohamutuk.org/econ/OGE11/10OJE2011.htm
demand has risen in the first half of 2010, particularly in China, on the back of a rebound in global
activity. Timor-Leste‟s petroleum revenues, including interest, were $1.84 billion in 2009. It is
estimated that the petroleum revenues will reach $2.02 billion in 2010, primarily due to an increase in
the average oil price from $62 per barrel in 2009 to an estimated average of $76 per barrel in 2010.
Headline inflation year-on-year in 2009 in Timor-Leste and Dili was 0.1% and 0.7% respectively.1 This
represents a drop in inflation rates from 2007 and 2008. Global food prices are expected to rise as a result of bad
weather leading to poor harvests, and consequently inflation is projected to increase to 4%.
Expenditure
For 2011, the Government has determined the following expenditure priorities:
PN1: Infrastructure: electricity, roads and bridges, water and sanitation.
PN2: Rural development: agricultural productivity, livestock, access to microcredit and
environmental protection.
PN3: Accelerated development of human resources:
o Professional and technical training;
o Justice, health and teachers training;
o Specialist training in the finance, management and administration areas.
PN4: Access to justice.
PN5: Delivery of Public Services:
o Assistance to Vulnerable groups, health and education;
o Improve public service and access.
PN6: Good Governance
o Focus in the transparency, accountability, coordination between ministries and user services and
training of inspectors and auditors.
PN7: Public Security and Stability
This year‟s Budget Review Committee, led by the Prime Minister reviewed the budget submissions based on a
careful assessment of prior years budgets, and redirected savings to national priorities identified in the Strategic
Development Plan process.
Expenditure in the Budget is constructed on the framework of the Strategic Development Plan. The SDP has
two main objectives; to transform Timor-Leste:
from a low-income country to an upper-middle income country by 2030, and
by reducing its dependence on oil.
Public investment will constitute a major driver of growth in the immediate phase of this plan and provide a
catalyst for private investment to supplant government expenditure. Two Special Funds, the Infrastructure Fund
(FI) and the Human Capital Development Fund (HCDF), will be established to manage the SDP expenditure
under the stewardship of the Prime Minister and relevant line ministers. The Ministries/Agencies will
implement the projects under the Special Funds.
The Government will create the National Development Agency (ADN) in 2011 to provide technical assistance
for the implementation of the SDP. In addition, a Procurement Commission will manage procurement.
The centralization of decision making of the projects within the Special Funds will ensure projects are better
coordinated between line ministries and integrated within the SDP.
1 National Directorate of Statistics (DNE), Ministry of Finance

3
RDTL General State Budget for 2011 as Presented to Parliament 15 November 2010. Scanned, with some parts translated, by La’o Hamutuk. For more information see http://www.laohamutuk.org/econ/OGE11/10OJE2011.htm
Revenues
In 2010, Domestic Revenues are expected to achieve a milestone when in excess of $100 million is expected to
be received, despite a reduction in revenues from rice. Domestic Revenues will continue its growth trajectory
and reach $163.3 million by 2015. These are conservative estimates as further regulatory reforms, improved tax
administration, and increased compliance may result in additional revenues.
The Petroleum Revenues are expected to remain high in 2011 and 2012 due to stable production and higher
average oil prices. The estimated Petroleum Revenues for 2011 and 2012 are $2.23 billion and $2.4 billion
respectively. The Petroleum Fund balance is expected to be $6.62 billion at the beginning of 2011 representing
an increase of $1.24 billion from year on year.
The Estimated Sustainable Income (ESI) for 2011 is calculated at $734 million. This is an increase of $232
million from ESI 2010, and results basically from a change of methodology for the oil price forecast.
The Government in the last three years has fully implemented its investment strategy, and fully utilized the
scope of the Petroleum Fund Law. The Petroleum Fund now invests not only in US bonds but also in other
foreign Government bonds, and Supranational Organizations. An equity mandate has been added to its portfolio
in October 2010.
The Government‟s strategy to further diversify the Petroleum Fund portfolio will necessitate amendments to the
Petroleum Fund Law and will require approval by Parliament. Diversification will manifest in an increase
exposure to equities.
Development partners will contribute $194.8 million in 2011 to the Combined Source Budget of Timor-Leste.
Development partner‟s contribution will reduce disproportionately from 2010 onwards. This reduction is based
on actual information to date and therefore does not reflect an absence of future international support and
commitment.
Financing
Aside from traditional funding sources, a deficit will arise between desired development and domestic available
resources over the medium and long term. Accordingly, the Government is exploring alternative funding
options to finance strategic public investment.
A Debt Management Unit (DMU) has been established within the Ministry of Finance to ensure effective and
efficient management of public debt should it arise. The Government is assessing the benefits of borrowing as
opposed to relying exclusively on the Petroleum Funds revenue, including the financing options of Private
Public Partnerships (PPP).

4
RDTL General State Budget for 2011 as Presented to Parliament 15 November 2010. Scanned, with some parts translated, by La’o Hamutuk. For more information see http://www.laohamutuk.org/econ/OGE11/10OJE2011.htm
PART 3. ECONOMIC OUTLOOK
1. International Economy
The international economy has begun to recover from the financial crisis that plunged major advanced
economies into recession and impacted adversely on the majority of emerging and developing countries. Over
the first half of 2010 the world economy expanded at just over 5%, on an annual basis, according to the October
2010 IMF World Economic Outlook (WEO). Global output is now expected to rise by 4.8% in 2010 and 4.1% in
2011 and IMF‟s assessment is that the risk of a strong global downturn in economic activity is low. Figure 3,1
shows world output between 2007 and 2011 and the impact of the recession and subsequent recovery.
Timor-Leste was relatively sheltered from the crisis and its economic growth remained strong throughout.
Overall, inflation rates around the world are forecast to stay low due to excess capacity and high levels of
unemployment. Financial markets have begun to return to their pre-crisis level, although in early 2010 financial
market volatility increased and investor confidence dropped. This highlights the fragility of the recovery
process. However, the extent of recovery varies substantially across regions; Asia and Latin America are the
fastest rebounding regions.
Figure 3.1: World, Regional and Timor-Leste’s Output Growth, 2007-2011 (%)
Source: IMF, World Economic Outlook, October 2010.
Advanced Economies
Growth has accelerated in Europe in 2010, but elsewhere in the USA and Japan economic activity slowed in the
second quarter of 2010. Advanced economies are battling with the need to reduce high levels of public and
private debt, while consumption remains low due to a lack of consumer confidence and reduced household
incomes. Advanced economies were hit hardest by the spread of global unemployment and in 2010
unemployment rates in advanced economies have dipped modestly from peak rates. There is also a pressing
need to reform financial sectors, which are still vulnerable to shocks. Growth rates are reportedly slowing as
public sector stimulus eases and IMF projects only 2.7% and 2.2% in output growth for 2010 and 2011
respectively in advanced economies.

5
RDTL General State Budget for 2011 as Presented to Parliament 15 November 2010. Scanned, with some parts translated, by La’o Hamutuk. For more information see http://www.laohamutuk.org/econ/OGE11/10OJE2011.htm
Asia
Economies of advanced Asia (apart from Japan) experienced a strong rebound, with output already exceeding
pre-crisis levels. Large manufacturing sectors in these countries have benefited from renewed levels of
international trade. A strong demand-driven recovery is underway in Asia‟s newly industrialized economies
(NIEs2) and the ASEAN economies
3, with strong domestic activity coupled with healthy regional demand,
particularly from China. Demand for commodities and electronics in particular is benefiting exporting countries
and private investment activity is strong (although in Malaysia investment is not in full swing as in other
countries).
Emerging Asia has also seen capital inflows return after the international crisis; inflows have increased by more
than four times over the four quarters to October 2010. Many of these economies have already adopted prudent
macroeconomic policies to protect against adverse effects from potential volatility of capital flows. Demand
from Asian economies, particularly China, India and Indonesia has spurred growth in emerging Asia as well,
with economic growth averaging 9.5% over the first half of 2010. In most Asian countries the transition from
public sector-driven growth to private sector-driven growth is making good progress. The post-crisis era is a
good time for Timor-Leste to take advantage of strong regional demand by increasing exports. Table 3.1 shows
the extent and timing of the economic recovery in selected Asian countries.
Table 3.1: Real Economic Growth in Asian Economies, 2007 - 2011 (%)
Actual Projection 2007 2008 2009 2010 2011 China 14.2 9.6 9.1 10.5 9.6 Australia 4.8 2.2 1.2 3.0 3.5 Singapore 8.5 1.8 1.3 15.0 4.5 ASEAN-5 6.7 4.6 1.4 6.5 5.3
Indonesia 6.3 6.0 4.5 6.0 6.2 Vietnam 8.5 6.2 5.3 6.5 6.8 Philippines 7.1 3.7 1.1 6.0 4.0 Thailand 4.9 2.5 -2.2 7.5 4.0 Malaysia 6.5 4.7 -1.7 6.7 5.3
Timor-Leste 9.1 12.1 13.0 9.5 11.2 Sources: IMF, World Economic Outlook October 2010; Macroeconomic Directorate. Ministry of Finance (for
Timor-Leste data).
Emerging and Developing Countries
Emerging and Developing countries‟ prudent policies have led the IMF to project significantly improved
medium-term growth compared to previous post-global recession periods; 7.1% growth in 2010 and 6.4% in
2011. As with all regions, recovery has been heterogeneous, with developing and emerging countries growing
significantly faster; Timor-Leste is an example of such a country. Countries that were hit hard by the recession
are straining to sustain economic growth after the crisis; these include many regions in emerging Europe and the
Commonwealth of Independent States.
Noting that developing countries have begun to benefit from the higher post-crisis levels of global trade, which
is contributing to their strong growth, IMF recommends measures to improve developing countries‟ market
access, for example, 100% duty-free and quota-free market access for the least developed countries,
complemented by liberal rules of origin. This should be implemented alongside programs aimed at
strengthening low income countries‟ capacity to trade. Trade facilitation is especially important at a time when
capital is scarcer than before the global recession and developing countries must rely more heavily on domestic
revenues. Policy to supplement traditional forms of financing could include public-private partnerships (PPP)
and South-South investment initiatives.
2 NIEs include Hong Kong SAR, South Korea, Singapore and Taiwan Province of China.
3 Indonesia, Philippines, Malaysia and Thailand

6
RDTL General State Budget for 2011 as Presented to Parliament 15 November 2010. Scanned, with some parts translated, by La’o Hamutuk. For more information see http://www.laohamutuk.org/econ/OGE11/10OJE2011.htm
World Prices
The main impact of world economic activity on Timor-Leste is on oil revenues, through changing prices in oil.
However, through saving the majority of oil revenues and spending via the mechanism of the Estimated
Sustainable Income, Government spending in the domestic economy is protected from oil price fluctuations.
Changing oil prices have no short-term impact on economic growth. In 2008 the world price of oil collapsed
from over $140 per barrel mid-year to just $40 by the end of 2008. Since then, oil prices have risen and
stabilized at around $70-80 a barrel and oil demand became stronger in the first half of 2010, particularly in
China, on the back of strong global activity. Oil demand is projected to rise with economic recovery but
advanced economies‟ slow-paced recovery will counteract much of the expected rise in demand for oil from
emerging and developing countries. Oil prices are projected to rise gently but not exceed $90 per barrel by 2013.
A more detailed description of the impact of oil prices on Timor-Leste‟s oil wealth and projected oil revenue
streams can be found in the Petroleum Sector section below.
Commodities are real assets as well as goods, and accordingly their prices can be affected by changing
expectations over the global economic forecast. The IMF report that rapidly changing expectations in May and
June 2010 resulted in broader financial market volatility spilling over into commodity markets, observed by a
decline in commodity prices, after peaking in early May 2010. Since the decline, most commodity prices are on
the rise again but only food, beverage and agricultural commodity prices have exceeded their peak in May.
Rising food prices are a result of recent supply shocks from bad weather leading to poor harvests. Specifically,
drought and wildfire in Russia and in other major exporters resulted in low wheat harvests with consequent
surges in wheat prices in July and August 2010. The impact of rising global food prices can be seen in markets in
Timor-Leste, mostly in Dili (see the Inflation section below).
Wheat markets are more vulnerable to shocks over this harvest period and the IMF assessment is that any further
shocks to this harvest would probably spill over and impact on other major crop prices. Over the medium-term
commodity prices are forecast to remain relatively high, accompanied by upside risks.
2. Domestic Economy
Non-oil GDP
Table 3.2 shows the evolution of the structure of Non-Oil Domestic Product (GDP) over seven years in
Timor-Leste. The public sector‟s share in economic output increased front 31.6% to 38.4% between 2002 and
2009 while the United Nations‟ share decreased across this period by 61%. This is true despite the increased role
of the United Nations since 2005, which has only partly offset the decline in UN presence in the four years
leading up to the 2006 crisis. After 2003 the economy moved into recovery, driven by moderate growth in
agriculture and public sector production. However, social unrest in 2006 destroyed parts of the economy,
reducing the size of the economy by almost 6% in real terms.
Table 3.2: Sectoral share of real non-oil GDP, 2002 - 2009 (%)
2002 2003 2004 2005 2006 2007 2008 2009
Real Non-oil GDP, Excl. UN 100.0 100.0 100.0 100.0 100.0 100.0 100.0 100.0
Including UN 119.0 113.0 109.4 105.6 108.1 115.2 114.7 111.7
Agriculture 33.5 32.7 33.3 33.2 35.3 30.6 30.9 30.8
Industry and Services 34.9 34.9 34.2 32.9 29.9 31.6 31.3 30.8
Public Sector 31.6 32.4 32.5 33.9 34.9 37.8 37.8 38.4
United Nations 19.0 13.0 9.4 5.6 8.1 15.2 14.7 11.7
Source: Macroeconomic Directorate. Ministry of Finance, 2010
Table 3.4 illustrates that over the years since 2007, the Timor-Leste non-oil economy has continued to expand
rapidly, driven primarily by public sector spending. Government spending has stimulated both the demand and
7
RDTL General State Budget for 2011 as Presented to Parliament 15 November 2010. Scanned, with some parts translated, by La’o Hamutuk. For more information see http://www.laohamutuk.org/econ/OGE11/10OJE2011.htm
supply sides of the domestic economy, contributing to impressive growth rates in many areas of the private
sector. On the demand side, government funds have been allocated to social transfer schemes as well as creating
tens of, thousands of jobs for unskilled labourers through infrastructure spending. Infrastructure developments
and improvements in public services and public utilities have boosted the production capacity of private
businesses. Overall real economic growth in Timor-Leste in 2009 is estimated at 13.0%, with public sector
production contributing 5.6 of the 13 growth percentage points, agriculture contributing 3.9 of the points and
industry and services contributing 3.5 of the percentage points to growth in Non-Oil GDP of Timor-Leste.
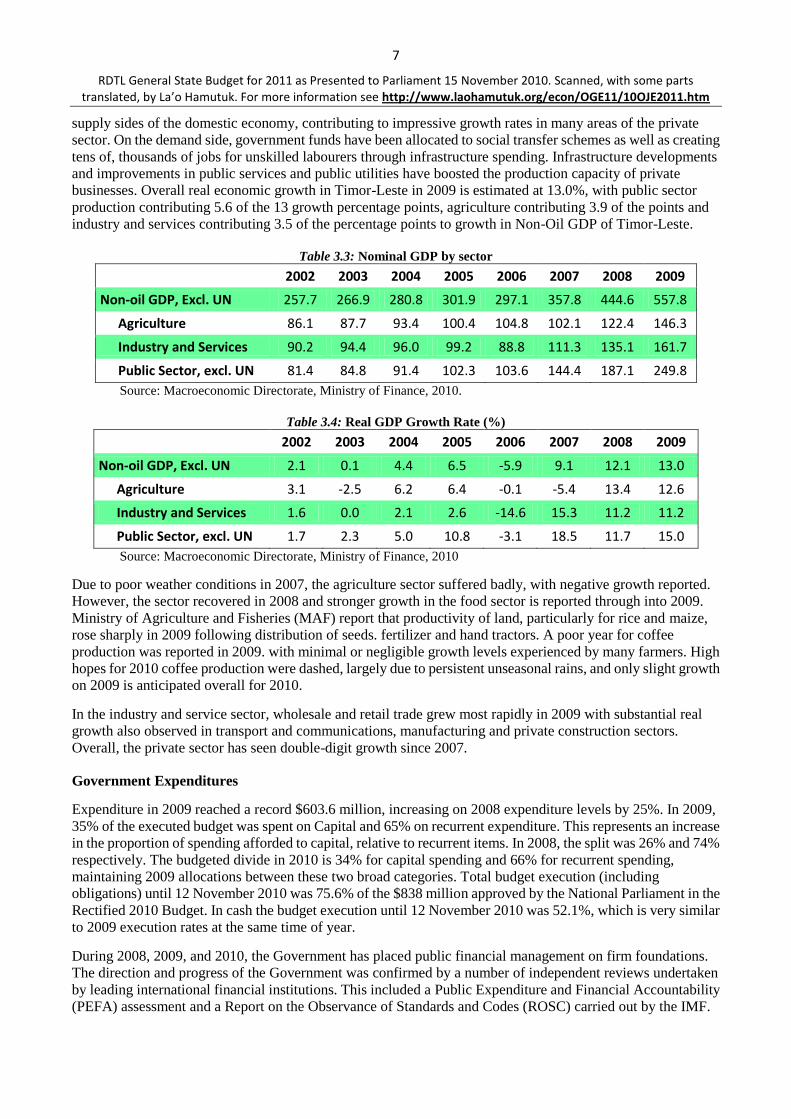
Table 3.3: Nominal GDP by sector
2002 2003 2004 2005 2006 2007 2008 2009
Non-oil GDP, Excl. UN 257.7 266.9 280.8 301.9 297.1 357.8 444.6 557.8
Agriculture 86.1 87.7 93.4 100.4 104.8 102.1 122.4 146.3
Industry and Services 90.2 94.4 96.0 99.2 88.8 111.3 135.1 161.7
Public Sector, excl. UN 81.4 84.8 91.4 102.3 103.6 144.4 187.1 249.8
Source: Macroeconomic Directorate, Ministry of Finance, 2010.
Table 3.4: Real GDP Growth Rate (%)
2002 2003 2004 2005 2006 2007 2008 2009
Non-oil GDP, Excl. UN 2.1 0.1 4.4 6.5 -5.9 9.1 12.1 13.0
Agriculture 3.1 -2.5 6.2 6.4 -0.1 -5.4 13.4 12.6
Industry and Services 1.6 0.0 2.1 2.6 -14.6 15.3 11.2 11.2
Public Sector, excl. UN 1.7 2.3 5.0 10.8 -3.1 18.5 11.7 15.0
Source: Macroeconomic Directorate, Ministry of Finance, 2010
Due to poor weather conditions in 2007, the agriculture sector suffered badly, with negative growth reported.
However, the sector recovered in 2008 and stronger growth in the food sector is reported through into 2009.
Ministry of Agriculture and Fisheries (MAF) report that productivity of land, particularly for rice and maize,
rose sharply in 2009 following distribution of seeds. fertilizer and hand tractors. A poor year for coffee
production was reported in 2009. with minimal or negligible growth levels experienced by many farmers. High
hopes for 2010 coffee production were dashed, largely due to persistent unseasonal rains, and only slight growth
on 2009 is anticipated overall for 2010.
In the industry and service sector, wholesale and retail trade grew most rapidly in 2009 with substantial real
growth also observed in transport and communications, manufacturing and private construction sectors.
Overall, the private sector has seen double-digit growth since 2007.
Government Expenditures
Expenditure in 2009 reached a record $603.6 million, increasing on 2008 expenditure levels by 25%. In 2009,
35% of the executed budget was spent on Capital and 65% on recurrent expenditure. This represents an increase
in the proportion of spending afforded to capital, relative to recurrent items. In 2008, the split was 26% and 74%
respectively. The budgeted divide in 2010 is 34% for capital spending and 66% for recurrent spending,
maintaining 2009 allocations between these two broad categories. Total budget execution (including
obligations) until 12 November 2010 was 75.6% of the $838 million approved by the National Parliament in the
Rectified 2010 Budget. In cash the budget execution until 12 November 2010 was 52.1%, which is very similar
to 2009 execution rates at the same time of year.
During 2008, 2009, and 2010, the Government has placed public financial management on firm foundations.
The direction and progress of the Government was confirmed by a number of independent reviews undertaken
by leading international financial institutions. This included a Public Expenditure and Financial Accountability
(PEFA) assessment and a Report on the Observance of Standards and Codes (ROSC) carried out by the IMF.

8
RDTL General State Budget for 2011 as Presented to Parliament 15 November 2010. Scanned, with some parts translated, by La’o Hamutuk. For more information see http://www.laohamutuk.org/econ/OGE11/10OJE2011.htm
Improved service delivery by decentralisation remains a focus of Government. This related particularly to
increased financial capacity and autonomy in line ministries and decentralisation of procurement. As a result of
visits to the districts by the Prime Minister, local management of smaller projects were envisaged. To achieve
the Government‟s priorities while maintaining fiscal responsibility has required reduced expenditure in areas of
lower priority.
Table 3.5: Whole of Government Expenditures ($; million), including Auto Agencies.
02/03 03/04 04/05 05/06 06/07 2007 2008 2009
12 Nov 2010
Budget 2010
Total expenditures 60.7 70.5 70.2 93.7 170.5 97.2 483.9 603.6 436.6 838.0
Recurrent expenditures 49.9 59.2 59.9 71.2 139.5 63.1 356.0 394.3 342.2 550.7
Wages and Salaries 20.5 23.1 24.8 26.1 33.8 17.4 50.3 87.3 65.8 99.1
Goods and Services 29.4 36.0 35.2 45.1 93.9 37.1 221.4 212.8 182.7 267.0
Transfers 0.0 0.0 0.0 0.0 11.8 8.6 84.3 94.2 93.7 184.6
Capital expenditures 10.9 11.3 10.3 22.5 31.0 34.1 127.9 209.3 94.40 287.3
Minor Capital
Unknown distribution
9.3 0.7 41.4 38.5 11.6 34.5
Development & Major Capital
11.7 0.7 86.5 170.8 82.8 252.8
Capital Transfers 0.5 0.4 0.0 10.9 0.0 0.0 0 0 0.0
Unallocated Capital Carryovers
5.7 7.3 8.4 8.3 10.0 32.7 -- --
Source: Timor-Leste Ministry of Finance, Treasury Department and 2009 Budget for actual values;
Macroeconomic Directorate for 2010 projections.
Note: The amounts in the highlighted column in Table 3.5 ore the cash execution as at 12 November 2010.
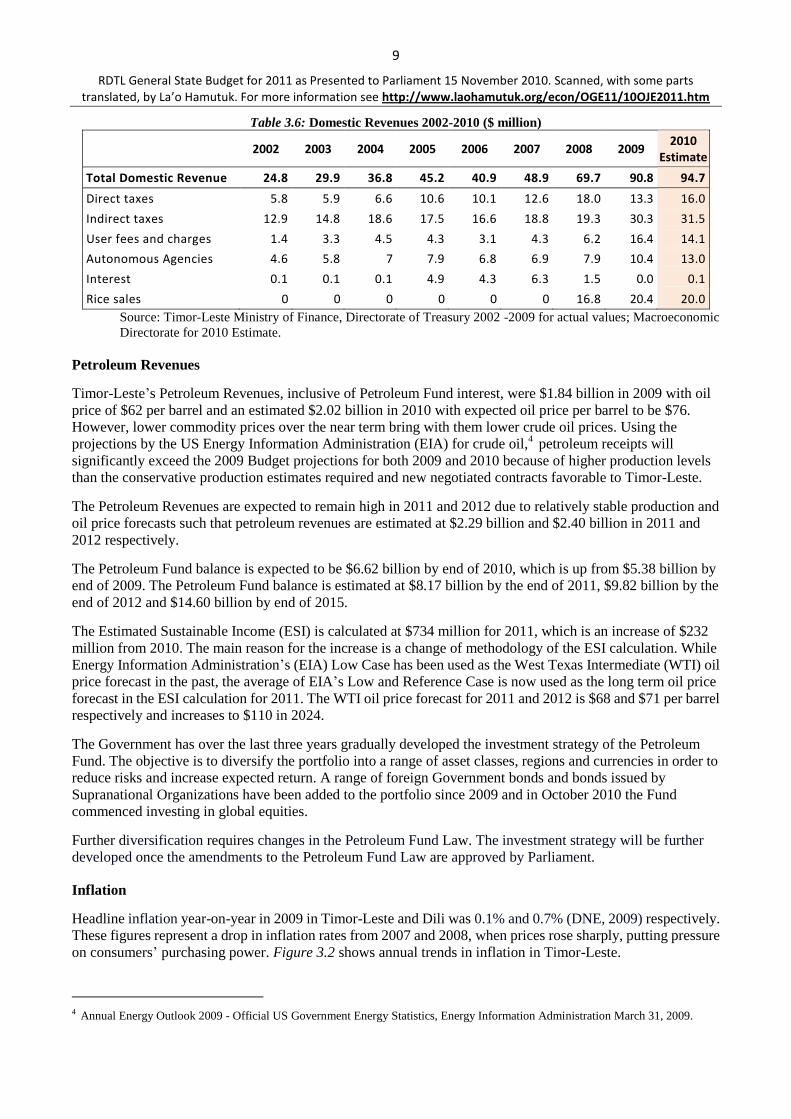
Domestic Revenues
Overall, domestic revenues are estimated to reach $94.7 million in 2010, up from $90.8 million in 2009.
Although this growth rate of 4.3% is significantly slower than the 30.3% achieved last year, it was to be
expected that strong growth would be achieved from the lows of the crisis period. The fall in growth rates also is
accounted for by reductions in rice revenues (subsidy) intended only as a temporary measure.
Government tax revenues increased by 16.7% in 2009 to $43.6 million or up from $37.3 million in 2008. Tax
revenues will continue to increase in 2010 reaching $47.5 million (Table 3.6). Direct Tax revenues performed
better than expected in 2009 in light of the tax reforms of 2008. But the resuming growth in 2010 will bring
revenues from Direct Taxes back to the levels of 2008 ($18 million). It is projected further growth in Direct
Taxes in the coming years as the economy continues to expand. Indirect Tax revenues grew strongly from $19.3
million in 2008 to $30.3 million in 2009 despite Tax Reforms in 2008. It is estimated that Indirect Taxes will be
$31.5 million in 2010 and continue to grow in the years to come.
User Fees and Charges is another area that showed increased growth from 2008 to 2009. The significant
increase from $6.2 million in 2008 to $16.4 million in 2009 is attributable to an extraordinary refund. It is
projected to be $14.1 million in 2010 and $16.2 million in 2011.
Autonomous Agency revenues grew from $7.9 million in 2008 to $10.4 million in 2009. It is estimated at $13.0
million in 2010. This is driven largely by increased revenue performance by EDTL, as their efforts to increase
pay for use and higher tariffs take effect. Rice subsidies were introduced in 2008 to protect the Timorese people
from spikes in international food prices. Revenues flowing from these measures increased from $16.8 million in
2008 to $20.4 million in 2009. It is expected to be $20 million in 2010. However, as world food prices stabilize
and the need for government subsidy is reduced, revenues in this area are estimated to fall to $10.0 million in
2011.
9
RDTL General State Budget for 2011 as Presented to Parliament 15 November 2010. Scanned, with some parts translated, by La’o Hamutuk. For more information see http://www.laohamutuk.org/econ/OGE11/10OJE2011.htm
Table 3.6: Domestic Revenues 2002-2010 ($ million)
2002 2003 2004 2005 2006 2007 2008 2009 2010
Estimate
Total Domestic Revenue 24.8 29.9 36.8 45.2 40.9 48.9 69.7 90.8 94.7
Direct taxes 5.8 5.9 6.6 10.6 10.1 12.6 18.0 13.3 16.0
Indirect taxes 12.9 14.8 18.6 17.5 16.6 18.8 19.3 30.3 31.5
User fees and charges 1.4 3.3 4.5 4.3 3.1 4.3 6.2 16.4 14.1
Autonomous Agencies 4.6 5.8 7 7.9 6.8 6.9 7.9 10.4 13.0
Interest 0.1 0.1 0.1 4.9 4.3 6.3 1.5 0.0 0.1
Rice sales 0 0 0 0 0 0 16.8 20.4 20.0
Source: Timor-Leste Ministry of Finance, Directorate of Treasury 2002 -2009 for actual values; Macroeconomic
Directorate for 2010 Estimate.
Petroleum Revenues
Timor-Leste‟s Petroleum Revenues, inclusive of Petroleum Fund interest, were $1.84 billion in 2009 with oil
price of $62 per barrel and an estimated $2.02 billion in 2010 with expected oil price per barrel to be $76.
However, lower commodity prices over the near term bring with them lower crude oil prices. Using the
projections by the US Energy Information Administration (EIA) for crude oil,4 petroleum receipts will
significantly exceed the 2009 Budget projections for both 2009 and 2010 because of higher production levels
than the conservative production estimates required and new negotiated contracts favorable to Timor-Leste.
The Petroleum Revenues are expected to remain high in 2011 and 2012 due to relatively stable production and
oil price forecasts such that petroleum revenues are estimated at $2.29 billion and $2.40 billion in 2011 and
2012 respectively.
The Petroleum Fund balance is expected to be $6.62 billion by end of 2010, which is up from $5.38 billion by
end of 2009. The Petroleum Fund balance is estimated at $8.17 billion by the end of 2011, $9.82 billion by the
end of 2012 and $14.60 billion by end of 2015.
The Estimated Sustainable Income (ESI) is calculated at $734 million for 2011, which is an increase of $232
million from 2010. The main reason for the increase is a change of methodology of the ESI calculation. While
Energy Information Administration‟s (EIA) Low Case has been used as the West Texas Intermediate (WTI) oil
price forecast in the past, the average of EIA‟s Low and Reference Case is now used as the long term oil price
forecast in the ESI calculation for 2011. The WTI oil price forecast for 2011 and 2012 is $68 and $71 per barrel
respectively and increases to $110 in 2024.
The Government has over the last three years gradually developed the investment strategy of the Petroleum
Fund. The objective is to diversify the portfolio into a range of asset classes, regions and currencies in order to
reduce risks and increase expected return. A range of foreign Government bonds and bonds issued by
Supranational Organizations have been added to the portfolio since 2009 and in October 2010 the Fund
commenced investing in global equities.
Further diversification requires changes in the Petroleum Fund Law. The investment strategy will be further
developed once the amendments to the Petroleum Fund Law are approved by Parliament.
Inflation
Headline inflation year-on-year in 2009 in Timor-Leste and Dili was 0.1% and 0.7% (DNE, 2009) respectively.
These figures represent a drop in inflation rates from 2007 and 2008, when prices rose sharply, putting pressure
on consumers‟ purchasing power. Figure 3.2 shows annual trends in inflation in Timor-Leste.
4 Annual Energy Outlook 2009 - Official US Government Energy Statistics, Energy Information Administration March 31, 2009.

10
RDTL General State Budget for 2011 as Presented to Parliament 15 November 2010. Scanned, with some parts translated, by La’o Hamutuk. For more information see http://www.laohamutuk.org/econ/OGE11/10OJE2011.htm
Figure 3.2: Percentage Changes in Consumer Price Index, 2004 — 2010 (%).
Source: National Directorate of Statistics, Ministry of Finance, 2010.
Relatively low levels of inflation in 2009 and continuing through to 2010, reflect lower inflation of all
categories of goods, but primarily food, which peaked in 2007 and 2008 following the “global food price
crisis”. The second and third quarters of 2009 prices actually fell; or year-on-year deflation over these two
quarters were -2.8% and -1.7% respectively. By the fourth quarter of 2009 prices started to pick up and in
2010 this trend continues; 2010 inflation to date exceeds 2009 inflation but remains well below 2007 and
2008 levels. Year-on-year inflation in the second quarter of 2010 was 2.5%. Headline Inflation in Dili has
steadily increased in the first half of 2010, showing higher rates of inflation than those in Timor-Leste
overall. June 2010 price levels in Dili are 6.6% higher than June 2009. Part of this inflationary pressure, in
Timor-Leste especially Dili comes from price rises for food, in particular cereals, following sharp
international price rises for cereals (see International Economy Section). The year -on-year inflation rate
for „cereals, roots and their products5„ in Dili in June 2010 was 14.1%.
The potential for high inflation remains a concern particularly in the short-term with increased public
spending and rising food prices. However, public spending on core infrastructure, advancement of the
business environment and improving the capacity of the port should improve the efficiency and capacity of
the supply side of Timor-Leste, putting downward pressure on inflation over the medium term. Subsidized
rice protected Timor-Leste from steep rises in the world price of rice in 2008. However, since the price of
rice has declined sharply in international markets after its peak in mid-2008, the need for subsidies has
greatly diminished. Despite signs in mid-2010 of an increased world price of rice the September 2010 Thai
rice price remains at half its peak value of 2008.
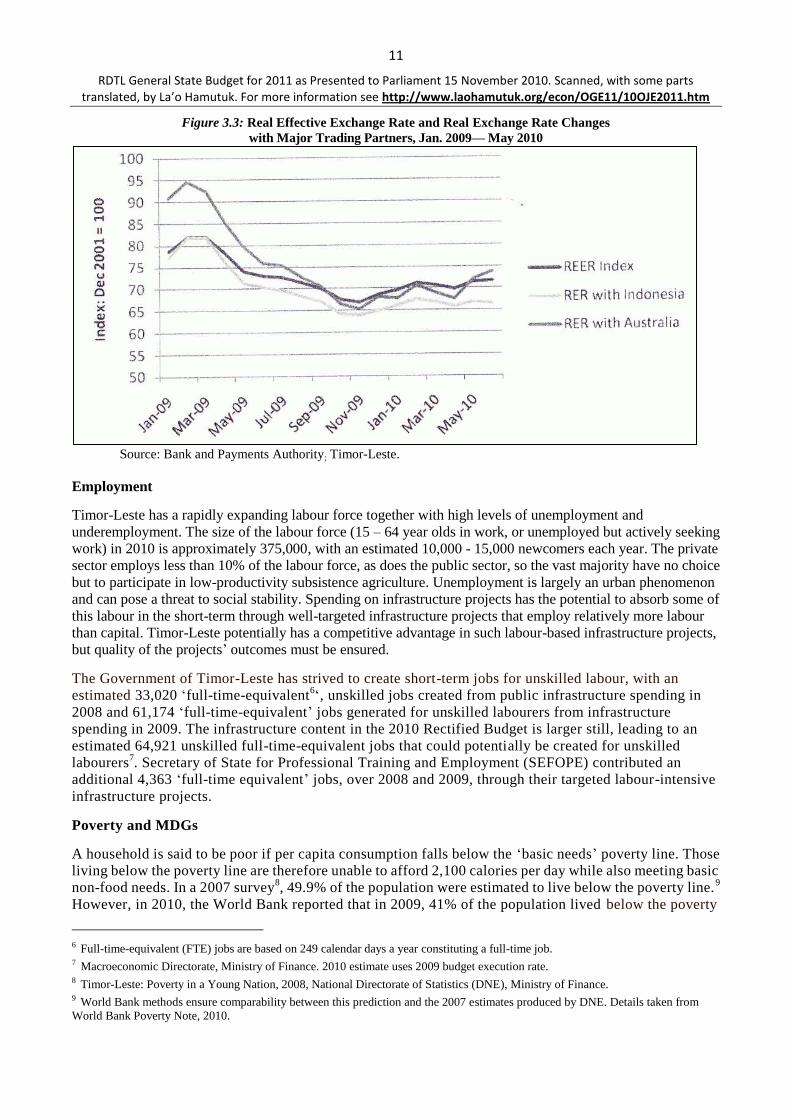
Figure 3.3 shows the evolution of the real effective exchange rate (REER) between the US Dollar and the
currencies of Timor-Leste‟s major trading partners. The real exchange rate between the US Dollar and the
currencies of Australia and Indonesia are also displayed. Over 2009 a real depreciation was observed,
meaning Timor-Leste‟s exports became more competitive in foreign markets. In the first half of 2010 the
REER has started to appreciate, coincidentally with rising inflation.
5 This category includes local rice, imported rice, cassava, wheat flour arid instant noodles.
11
RDTL General State Budget for 2011 as Presented to Parliament 15 November 2010. Scanned, with some parts translated, by La’o Hamutuk. For more information see http://www.laohamutuk.org/econ/OGE11/10OJE2011.htm
Figure 3.3: Real Effective Exchange Rate and Real Exchange Rate Changes
with Major Trading Partners, Jan. 2009— May 2010
Source: Bank and Payments Authority; Timor-Leste.
Employment
Timor-Leste has a rapidly expanding labour force together with high levels of unemployment and
underemployment. The size of the labour force (15 – 64 year olds in work, or unemployed but actively seeking
work) in 2010 is approximately 375,000, with an estimated 10,000 - 15,000 newcomers each year. The private
sector employs less than 10% of the labour force, as does the public sector, so the vast majority have no choice
but to participate in low-productivity subsistence agriculture. Unemployment is largely an urban phenomenon
and can pose a threat to social stability. Spending on infrastructure projects has the potential to absorb some of
this labour in the short-term through well-targeted infrastructure projects that employ relatively more labour
than capital. Timor-Leste potentially has a competitive advantage in such labour-based infrastructure projects,
but quality of the projects‟ outcomes must be ensured.
The Government of Timor-Leste has strived to create short-term jobs for unskilled labour, with an
estimated 33,020 „full-time-equivalent6„, unskilled jobs created from public infrastructure spending in
2008 and 61,174 „full-time-equivalent‟ jobs generated for unskilled labourers from infrastructure
spending in 2009. The infrastructure content in the 2010 Rectified Budget is larger still, leading to an
estimated 64,921 unskilled full-time-equivalent jobs that could potentially be created for unskilled
labourers7. Secretary of State for Professional Training and Employment (SEFOPE) contributed an
additional 4,363 „full-time equivalent‟ jobs, over 2008 and 2009, through their targeted labour-intensive
infrastructure projects.
Poverty and MDGs
A household is said to be poor if per capita consumption falls below the „basic needs‟ poverty line. Those
living below the poverty line are therefore unable to afford 2,100 calories per day while also meeting basic
non-food needs. In a 2007 survey8, 49.9% of the population were estimated to live below the poverty line.
9
However, in 2010, the World Bank reported that in 2009, 41% of the population lived below the poverty
6 Full-time-equivalent (FTE) jobs are based on 249 calendar days a year constituting a full-time job. 7 Macroeconomic Directorate, Ministry of Finance. 2010 estimate uses 2009 budget execution rate. 8 Timor-Leste: Poverty in a Young Nation, 2008, National Directorate of Statistics (DNE), Ministry of Finance. 9 World Bank methods ensure comparability between this prediction and the 2007 estimates produced by DNE. Details taken from
World Bank Poverty Note, 2010.

12
RDTL General State Budget for 2011 as Presented to Parliament 15 November 2010. Scanned, with some parts translated, by La’o Hamutuk. For more information see http://www.laohamutuk.org/econ/OGE11/10OJE2011.htm
line. The fall of almost 9 percentage points is partly because of higher rate of real economic growth since
2007 and social transfer programs such as pensions for elderly, veterans, housing subsidy for IDPs, and
cash for work programs that contributed to increase of private consumption. Low inflation rates since
mid-2008 also increased private consumption levels because of increase in purchasing power.
The UN 2010 Human Development Report recently released, positions Timor-Leste at 120 out of 169
counties, which is an improvement of 14 places. From 2005 to 2010, Timor-Leste‟s HDI value increased
from 0.428 to 0.502, an increase of 17%.
Besides consumption, preliminary analysis of the Demographic Health Survey 2009-2010 (DHS
2009-2010) compared to DHS 2003 and TL-SLS 2007 suggest improvements in living conditions in recent
years. For example, 45% of children are underweight in Timor-Leste, which represents a drop from 48.6%
estimated for 2007 in the TL-SLS. Further, the incidence of wasting fell from 24.5% in 2007 to 19% in
2009. Wasting occurs when children become severely underweight for their height, due to very low energy
intake in the short term, which is closely linked to changes in the level of poverty10
.
In the education sector, the net enrolment rate in primary education has increased from 65.6% in 2007 to
82.7% in 2009. Additionally, the completion rate increased from 47% in 2004 to 56.9% in 2009. This is in
the context of increasing school enrolments, which rose from 65% in 2007 to 83% in 2009/2010.
Timor-Leste has surpassed the MDG target for 2015 for both under-five mortality rate and infant mortality
rate based on targets set in 2004 and also the detection and cure of Tuberculosis with new target being set.
In 2009, the National TB program has achieved the two key global targets for TB control namely, a New
Smear Positive (NSP) case detection rate of 70% (global target 70%) and treatment success rate of 85%
among NSP cases registered in previous year (global target is 85%).
In addressing the need to fast track achievement towards the MDGs, the government has created an
innovative program to be launched in 2011, the MDG Sucos program. This program will provide 11,140
houses in 2,228 aldeias to the most vulnerable families together with power, water, and sanitation,
enabling their participation in the development process.
Medium-Term Prospects (2011-2015)
The Government of Timor-Leste is designing a 20-year Strategic Development Plan (SDP) targeting
double-digit growth over the period of SDP. Timor-Leste will be an upper-middle income country no later
than 2030, with the gap closed with today‟s richer neighbors, such as Indonesia, Thailand, and Malaysia.
The SDP sets out a plan to increase government capital and development spending over the short -term in
a bid to fast-track critical infrastructure development in Timor-Leste. The government will strive towards
this target predominantly through capital and development spending plans on critical infrastructure such as
roads, electricity, housing, water and sanitation that boosts the productive capacity of the private sector.
In the medium-term (2011 – 2015), besides infrastructure, public spending also will be directed to agriculture,
tourism, and hydrocarbon sectors to maintain the double digit growth through 2015 and sustain it beyond that
period en route to middle income country by 2030. Human resources development also is an integral part of the
medium to long-term strategy.
In addition, the government also aims to undertake aggressive policies to improve business environment so that
Timor-Leste can attract foreign direct investment. In a recent international conference organized by the Ministry
of Finance, participants discussed several policy choices that Timor-Leste need to explore to attract investment
both domestic and international. Firstly, improve the conditions of doing business in Timor-Leste, which
includes creating an investment package that allows:
Clear, fast, and ready to go procedures to curtail the current lengthy business registration process.
10 World Bank Poverty Note, 2010

13
RDTL General State Budget for 2011 as Presented to Parliament 15 November 2010. Scanned, with some parts translated, by La’o Hamutuk. For more information see http://www.laohamutuk.org/econ/OGE11/10OJE2011.htm
For land laws and titling processes to provide collateral.
The rule of law.
Timely bankruptcy procedures.
Access to credit.
Clear mechanism for investors to follow including a one-stop shop.
Secondly, explore ways to finance large-projects with the private sector such as Private-Public-Partnership
(PPP) that can contribute to additional investment, efficiency/productivity gains, and improvement in quality of
service. Project financing of large projects is another option within the PPP framework.
Thirdly, revisit Timor-Leste‟s tax regime and possibility of shifting to Value Added-Tax (VAT) to further
attract private investment. Fourthly, invest in infrastructure such as roads, power, telecommunications, and
water and sanitation, which can also be the subject of PPPs.
Finally, special attention must be given to structural bottlenecks that add higher transaction costs to the
economy.
If the renewed post-crisis growth in Asia is maintained and advanced economies continue their recovery,
Timor-Leste could be in a good position to attract foreign investment over the medium term. This will rely on
continued social and political stability in the country as well as realization of infrastructure development plans
and improvements in the business environment. Policy to extend this impressive growth through private sector
participation could include the following:
Address the skills deficit through Vocational Educational Training (VET) and on-the-job training, in
both the agriculture and industry and service sectors.
Update agro-processing machinery along with improved road networks from rural fanning areas to the
port and border crossing with Indonesia, in order to boost export earning potential in agriculture.
Continue efforts in reducing Customs delays and modernizing their procedures.
In short, Timor-Leste requires policies and actions to reduce the skills deficit, secure access to land, improve the
business environment (through institutions that improve service delivery), develop road links (particularly
important trade corridors) and increase the port capacity.

14
RDTL General State Budget for 2011 as Presented to Parliament 15 November 2010. Scanned, with some parts translated, by La’o Hamutuk. For more information see http://www.laohamutuk.org/econ/OGE11/10OJE2011.htm
PART 4. EXPENDITURE
1. Introduction
This part covers expenditures from all funds controlled by the Government: the Consolidated Fund of
Timor-Leste (CFTL) and the new Special Funds. It also covers expenditures from the Government‟s own source
of revenues as well as development partners in the combined source budget. In addition, key expenditure
objectives are outlined in this budget.
Table 4.1 provides Combined Source Budget of $1.18 billion for 2011 with General State Budget at $985
million and $195 million from Development Partners.
Table 4.1: Combined Source Budget, 2011 - 2015 ($ million, preliminary)
Budget 2010 2011 2012 2013 2014 2015
CFTL 837.9 642.7 653.4 679.6 706.7 734.9
Infrastructure Fund - 317.3 597.0 620.9 645.8 671.6
HCDF 25 30 35 40 45
General State Budget 837.9 985.0 1,280.4 1,335.5 1,392.5 1,451.5
Development Partners 256.8 195.0 112.7 75.2 32.7 0
Combined State Budget 1,094.7 1,180.0 1,393.1 1,410.7 1,425.2 1,451.5
Source: Budget Directorate, Ministry of Finance, 2010.
Table 4.2 outlines the medium term fiscal envelope.
Table 4.2. Expenditures and Fiscal Envelope, 2010 - 2015 ($ million)
No Description 2010 2011 2012 2013 2014 2015
1 Expenditures 838 985 1,280.4 1,335.5 1,392.5 1,451.5
2 Fiscal Envelope 597 844 862.4 881.7 903.5 925.4
3
1. Domestic Revenues 95 110 121.4 133.7 148.5 163.4
2. ESI 502 734 741 748 755 762
3. Excess withdrawal of PF 309 0 418 453.8 489 526.1
Note: Domestic Revenues, projected as of November 2010
Source: Budget and Macroeconomic directorates, Ministry of Finance, 2010.
La’o Hamutuk note: the ESI values in table 4.2, which were copied from tables 5.8 or 5.9, are not correct. Those
tables were based on the assumption that the Government would not withdraw more than the ESI in future
years. Since table 4.2 shows that it plans to do so, La’o Hamutuk has recalculated the ESI values and excess
withdrawals required to meet these expenditure levels, as follows:
Revised Table 4.2. Expenditures and Fiscal Envelope, 2010 - 2015 ($ million) (green shaded cells have changed)
No Description 2010 2011 2012 2013 2014 2015
1 Expenditures 838 985 1,280.4 1,335.5 1,392.5 1,451.5
2 Fiscal Envelope 597 844 862.4 868.7 876.5 882.4
3
1. Domestic Revenues 95 110 121.4 133.7 148.5 163.4
2. ESI 502 734 741 735 728 719
3. Excess withdrawal of PF 309 0 418 466.8 516.0 569.1
Source: La’o Hamutuk
15
RDTL General State Budget for 2011 as Presented to Parliament 15 November 2010. Scanned, with some parts translated, by La’o Hamutuk. For more information see http://www.laohamutuk.org/econ/OGE11/10OJE2011.htm
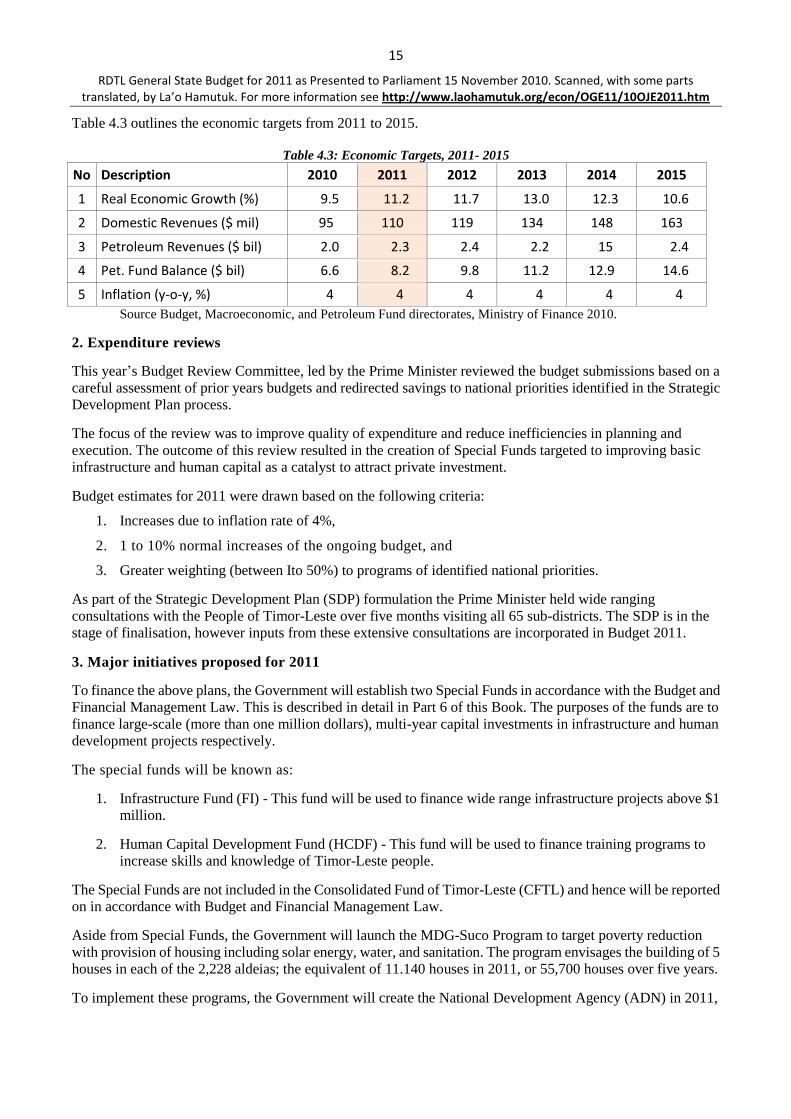
Table 4.3 outlines the economic targets from 2011 to 2015.
Table 4.3: Economic Targets, 2011- 2015
No Description 2010 2011 2012 2013 2014 2015
1 Real Economic Growth (%) 9.5 11.2 11.7 13.0 12.3 10.6
2 Domestic Revenues ($ mil) 95 110 119 134 148 163
3 Petroleum Revenues ($ bil) 2.0 2.3 2.4 2.2 15 2.4
4 Pet. Fund Balance ($ bil) 6.6 8.2 9.8 11.2 12.9 14.6
5 Inflation (y-o-y, %) 4 4 4 4 4 4
Source Budget, Macroeconomic, and Petroleum Fund directorates, Ministry of Finance 2010.
2. Expenditure reviews
This year‟s Budget Review Committee, led by the Prime Minister reviewed the budget submissions based on a
careful assessment of prior years budgets and redirected savings to national priorities identified in the Strategic
Development Plan process.
The focus of the review was to improve quality of expenditure and reduce inefficiencies in planning and
execution. The outcome of this review resulted in the creation of Special Funds targeted to improving basic
infrastructure and human capital as a catalyst to attract private investment.
Budget estimates for 2011 were drawn based on the following criteria:
1. Increases due to inflation rate of 4%,
2. 1 to 10% normal increases of the ongoing budget, and
3. Greater weighting (between Ito 50%) to programs of identified national priorities.
As part of the Strategic Development Plan (SDP) formulation the Prime Minister held wide ranging
consultations with the People of Timor-Leste over five months visiting all 65 sub-districts. The SDP is in the
stage of finalisation, however inputs from these extensive consultations are incorporated in Budget 2011.
3. Major initiatives proposed for 2011
To finance the above plans, the Government will establish two Special Funds in accordance with the Budget and
Financial Management Law. This is described in detail in Part 6 of this Book. The purposes of the funds are to
finance large-scale (more than one million dollars), multi-year capital investments in infrastructure and human
development projects respectively.
The special funds will be known as:
1. Infrastructure Fund (FI) - This fund will be used to finance wide range infrastructure projects above $1
million.
2. Human Capital Development Fund (HCDF) - This fund will be used to finance training programs to
increase skills and knowledge of Timor-Leste people.
The Special Funds are not included in the Consolidated Fund of Timor-Leste (CFTL) and hence will be reported
on in accordance with Budget and Financial Management Law.
Aside from Special Funds, the Government will launch the MDG-Suco Program to target poverty reduction
with provision of housing including solar energy, water, and sanitation. The program envisages the building of 5
houses in each of the 2,228 aldeias; the equivalent of 11.140 houses in 2011, or 55,700 houses over five years.
To implement these programs, the Government will create the National Development Agency (ADN) in 2011,

16
RDTL General State Budget for 2011 as Presented to Parliament 15 November 2010. Scanned, with some parts translated, by La’o Hamutuk. For more information see http://www.laohamutuk.org/econ/OGE11/10OJE2011.htm
with competence to evaluate, monitor, and supervise projects, validate progress reports, and undertake quality
control. The ADN will report to the Council of Ministers and the National Parliament.
ADN is the precursor of the Economic Planning and Investment Agency (EPIA) to be created in 2012. It is
anticipated that EPIA will have broader powers than ADN in planning, implementation, and evaluation.
The ADN oversees implementation of projects financed by the Special Funds, whilst the Ministries/Agencies
will manage the recurrent expenditures, as well as the annual Capital and Development and Minor Capital
expenditures. In addition, a Procurement Commission will manage the procurement process.
CFTL Expenditures
The annual budget is operated from the Consolidated Fund of Timor-Leste (CFTL) comprising five categories
as indicated in Table 4.4.
Table 4.4: CFTL, by Category, 2011 - 2015 ($ million)
Budget 2010 2011 2012 2013 2014 2015
Recurrent
Salary and Wages 99.3 115.9 120.6 125.4 130.4 135.6
Goods and Services 260.6 245.5 255.3 265.5 276.1 287.1
Public Transfers 184.4 164.5 171.0 177.9 184.9 192.4
Capital
Minor Capital 39.9 28.2 29.3 30.6 31.8 33.0
Capital & Development 253.7 88.6 77.2 80.2 83.5 86.8
CFTL 837.9 642.7 653.4 679.6 706.7 734.9
Source: Budget Directorate, Ministry of Finance, 2010.
Salaries and Wages
Key policy decisions in Salaries and Wages include:
Transforming temporary civil servants to permanent staff in 2011.
Freezing new recruitment across all Ministries/Agencies except Civil Service Commission, PNTL
(Police) and F-FDTL (Armed Forces) according to their needs.
$9 million of allowances reallocate from Goods and Services to Salary and Wages.
$7 million for the provision of Career Regime for teachers in Ministry of Education.
Goods and Services
The total budget for this category is $270.5 million including $25 million for the Human Capital Development
Fund. The main expenditures in this category include (amounts are rounded):
$1.2 million to support F-FDTL in Material and Operational Provisions in Ministry of Defence and
Security.
$3.4 million for F-FDTL Operational Readiness Package and maintenance of patrol boats.
$0.5 million for LDC - g7+ in Ministry of Finance.
$2.0 million to target MDG 5 (Maternal Mortality) and support of Specialist in Referral Hospitals of
Baucau and Suai.
$1.6 million for the provision of textbooks in Ministry of Education.
17
RDTL General State Budget for 2011 as Presented to Parliament 15 November 2010. Scanned, with some parts translated, by La’o Hamutuk. For more information see http://www.laohamutuk.org/econ/OGE11/10OJE2011.htm
$1.5 million for Merenda Escolar in Ministry of Education.
$0.15 million for National Institute of Linguistics in the National University of Timor Lorosae (UNTL).
$30 million to $48 million for fuel including EDTL in the Ministry of Infrastructure.
$32 Million for professionals service and technical assistance in the areas of Petroleum, Justice,
Education, Health, Management Banking and Financing, Foreign Affairs. Tourism, Conflict
prevention, and quality control.
$1.0 million dollars for peace initiative in Sudan.
Despite new initiatives in this category the budget for 2011 is lower than 2010 as a result of the expenditure
review.
Public Transfers
Public Transfers expenditures will also decrease in 2011 compared to 2010. The government aims to properly
target public transfers to vulnerable groups and deliver it more efficiently. The government will scale up
payments to elderly, veterans, and scholarships. This will also include programs of conditional cash transfers
and cash for work. Major initiatives in this category include:
$1.1 million for contribution to: Western Sahara ($0.8 million), and Guinea-Bissau Office in New York
($0.3 million), in Ministry of Foreign Affairs.
$3.5 million for capacity building in local administration.
$1 million for the Land Compensation in Ministry of Justice.
$3.0 million for overseas medical treatment in Ministry of Health.
$1.5 million for returning of Medical students from Cuba in Ministry of Health.
$6 million for capital transfers in Ministry of State Administration and Territorial Planning.
$3.4 million for further capitalisation of IMFTL in the Ministry of Economy and Development.
$7.5 million for demobilizing ex-FALINTIL from 1975 – 2000 (Aileu).
$0.8 million for Mortuary (Restus Mortals).
$1.1 million for the Council of Veterans (Concelho Veteranus).
$1.0 million for natural disaster response in Ministry of Social Solidarity.
$11 million allocated to Local Development Programs (PDD1) for retention ($3 million) and
re-budgeting ($8 million).
Minor Capital
Minor Capital expenditures also reduced in 2011 to $28.3 million compared to $39.9 million in 2010. The
principle expenditures in this category are:
$12 million for the purchase of multi-purpose vehicles for Ministry of Health, mobile banking,
education monitoring, and preparation and monitoring of local and national elections, and patrol boats
in Ministry of Defense and Security.
$0.7 million for the handover Package of UNMIT to Timor-Leste of equipments.
$1.1 million for equipment for the Techno-Professional Schools and laboratory in Ministry of
Education.
18
RDTL General State Budget for 2011 as Presented to Parliament 15 November 2010. Scanned, with some parts translated, by La’o Hamutuk. For more information see http://www.laohamutuk.org/econ/OGE11/10OJE2011.htm
CFTL Capital and Development
The Government continued to improve service delivery to the people by increased delivery at district,
subdistrict, and suco level, by use of public transfers with specific purposes, together with accountability
mechanisms. This reflects increased confidence in regional delivery mechanisms.
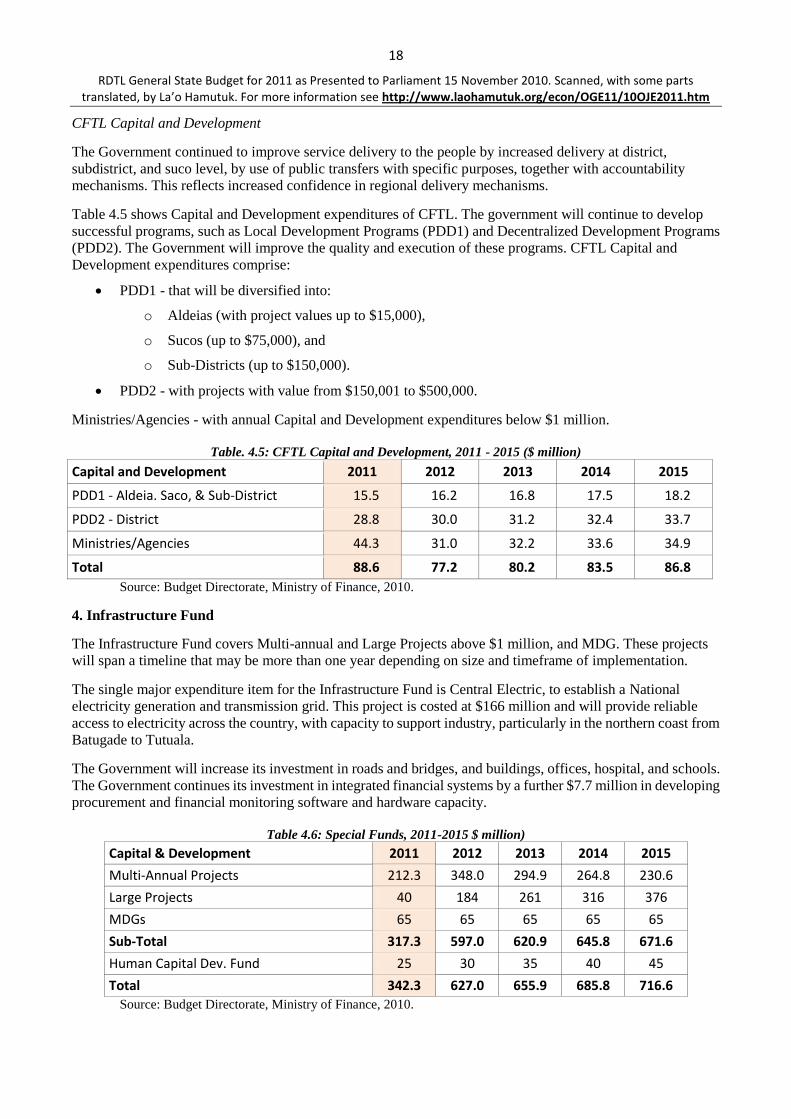
Table 4.5 shows Capital and Development expenditures of CFTL. The government will continue to develop
successful programs, such as Local Development Programs (PDD1) and Decentralized Development Programs
(PDD2). The Government will improve the quality and execution of these programs. CFTL Capital and
Development expenditures comprise:
PDD1 - that will be diversified into:
o Aldeias (with project values up to $15,000),
o Sucos (up to $75,000), and
o Sub-Districts (up to $150,000).
PDD2 - with projects with value from $150,001 to $500,000.
Ministries/Agencies - with annual Capital and Development expenditures below $1 million.
Table. 4.5: CFTL Capital and Development, 2011 - 2015 ($ million)
Capital and Development 2011 2012 2013 2014 2015
PDD1 - Aldeia. Saco, & Sub-District 15.5 16.2 16.8 17.5 18.2
PDD2 - District 28.8 30.0 31.2 32.4 33.7
Ministries/Agencies 44.3 31.0 32.2 33.6 34.9
Total 88.6 77.2 80.2 83.5 86.8
Source: Budget Directorate, Ministry of Finance, 2010.
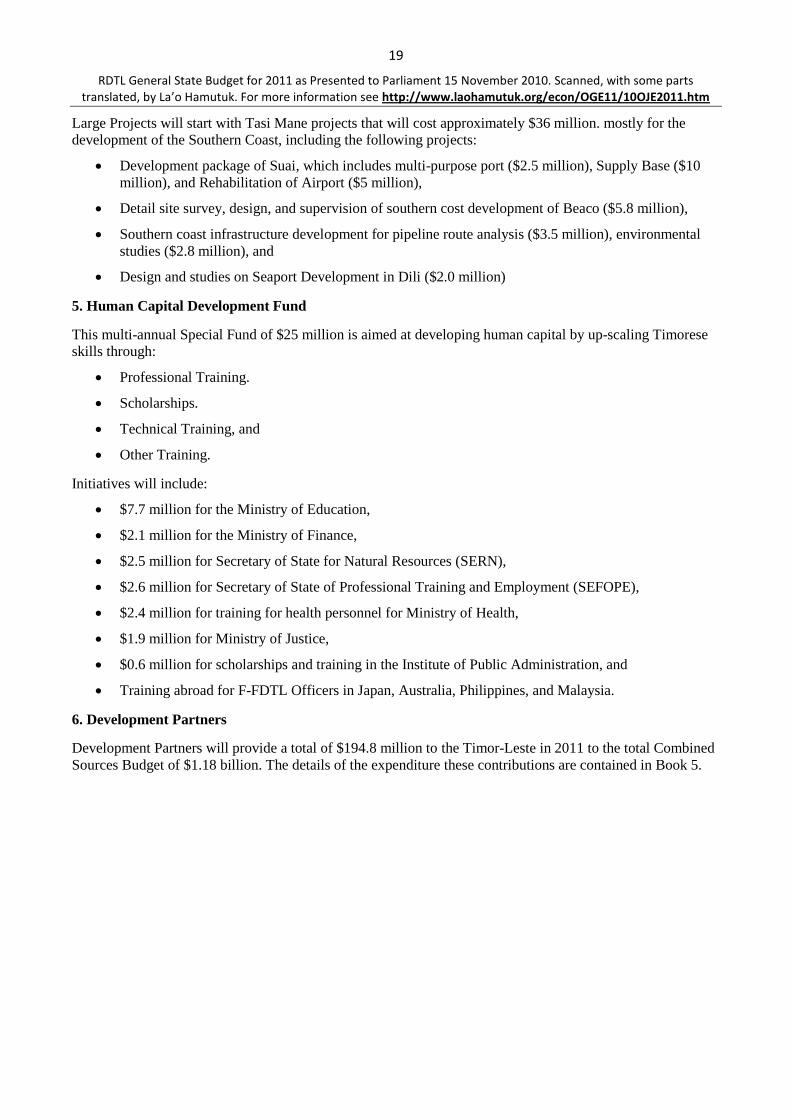
4. Infrastructure Fund
The Infrastructure Fund covers Multi-annual and Large Projects above $1 million, and MDG. These projects
will span a timeline that may be more than one year depending on size and timeframe of implementation.
The single major expenditure item for the Infrastructure Fund is Central Electric, to establish a National
electricity generation and transmission grid. This project is costed at $166 million and will provide reliable
access to electricity across the country, with capacity to support industry, particularly in the northern coast from
Batugade to Tutuala.
The Government will increase its investment in roads and bridges, and buildings, offices, hospital, and schools.
The Government continues its investment in integrated financial systems by a further $7.7 million in developing
procurement and financial monitoring software and hardware capacity.
Table 4.6: Special Funds, 2011-2015 $ million)
Capital & Development 2011 2012 2013 2014 2015
Multi-Annual Projects 212.3 348.0 294.9 264.8 230.6
Large Projects 40 184 261 316 376
MDGs 65 65 65 65 65
Sub-Total 317.3 597.0 620.9 645.8 671.6
Human Capital Dev. Fund 25 30 35 40 45
Total 342.3 627.0 655.9 685.8 716.6
Source: Budget Directorate, Ministry of Finance, 2010.
19
RDTL General State Budget for 2011 as Presented to Parliament 15 November 2010. Scanned, with some parts translated, by La’o Hamutuk. For more information see http://www.laohamutuk.org/econ/OGE11/10OJE2011.htm
Large Projects will start with Tasi Mane projects that will cost approximately $36 million. mostly for the
development of the Southern Coast, including the following projects:
Development package of Suai, which includes multi-purpose port ($2.5 million), Supply Base ($10
million), and Rehabilitation of Airport ($5 million),
Detail site survey, design, and supervision of southern cost development of Beaco ($5.8 million),
Southern coast infrastructure development for pipeline route analysis ($3.5 million), environmental
studies ($2.8 million), and
Design and studies on Seaport Development in Dili ($2.0 million)
5. Human Capital Development Fund
This multi-annual Special Fund of $25 million is aimed at developing human capital by up-scaling Timorese
skills through:
Professional Training.
Scholarships.
Technical Training, and
Other Training.
Initiatives will include:
$7.7 million for the Ministry of Education,
$2.1 million for the Ministry of Finance,
$2.5 million for Secretary of State for Natural Resources (SERN),
$2.6 million for Secretary of State of Professional Training and Employment (SEFOPE),
$2.4 million for training for health personnel for Ministry of Health,
$1.9 million for Ministry of Justice,
$0.6 million for scholarships and training in the Institute of Public Administration, and
Training abroad for F-FDTL Officers in Japan, Australia, Philippines, and Malaysia.
6. Development Partners
Development Partners will provide a total of $194.8 million to the Timor-Leste in 2011 to the total Combined
Sources Budget of $1.18 billion. The details of the expenditure these contributions are contained in Book 5.

20
RDTL General State Budget for 2011 as Presented to Parliament 15 November 2010. Scanned, with some parts translated, by La’o Hamutuk. For more information see http://www.laohamutuk.org/econ/OGE11/10OJE2011.htm
PART 5. REVENUES
1. Introduction
Major revenues of Timor-Leste comes from oil and gas, while Domestic Revenues (taxes, user fees and charges,
autonomous agencies, and others) are a small component of the total revenues (Table 5.1). Total Revenues in
2011 is estimated to be $2.4 billion with the bulk of it ($2.29 billion) being Petroleum Revenues and the
remaining $110 million Domestic Revenues. Going forward, Petroleum Revenues will continue to dominate for
the next five years and beyond. Domestic Revenues show an increasing trend in collections. In 2010, the
projection is for Domestic Revenue of $94.7 million, and in 2011 it is projected to be $110 million. By 2015,
Domestic Revenues are projected to reach $163.3 million. The Government‟s objective is to achieve $200
million before 2015 but this will be dependent on the introduction of significant reforms.
Table 5.1: Total Revenue Projections, 2009-2015 ($ million)
2009 2010 2011 2012 2013 2014 2015
Actual Estimate Projection
Total Revenues 1,918.4 2,111.0 2,398.1 2,520.0 2,293.5 2,609.4 2,606.4
Domestic Revenues 90.8 94.7 110.1 121.4 133.7 148.5 163.4
Petroleum Revenues 1,827.6 2,016.3 2,288.0 2,398.6 2,159.8 2,460.9 2,443.0
2. Domestic Revenues
Domestic Revenues are comprised of Taxes (Direct and Indirect), User Fees and Charges, and revenues from
autonomous agencies. Additionally, revenues also come from the sale of subsidized rice, a measure introduced
by government to ease the hardship caused by the spike of world food prices in 2008.
Table 5.2 shows that taxes, fees and charges, and autonomous agencies continue to increase from 2009 through
2015. These increases off-set the reduction of revenues from rice sales, which will continue to decrease as world
food prices stabilize.
Table 5.2: Domestic Revenues, 2009-2015 ($ million)
2009 2010 2011 2012 2013 2014 2015
Actual Estimate Projection
Direct Taxes 13.3 16.0 22.3 26.9 31.4 35.9 40.4
Indirect Tax 30.3 31.5 42.6 44.5 46.3 50.3 54.4
Fees and Charges 16.4 14.1 16.2 17.5 19.6 21.9 24.2
Rice Sales 20.4 20.0 10.0 9.6 9.6 9.6 9.6
Interest 0.0 0.1 0.1 0.1 0.1 0.1 0.1
Autonomous Agencies 10.4 13.0 18.9 22.8 26.7 30.7 34.6
Total 90.8 94.7 110.1 121.4 133.7 148.5 163.3
Source: Macroeconomic Directorate, Ministry of Finance, 2010
Taxes
Table 5.3 shows revenue projections by category and type of taxes. Direct taxes, adversely affected by the Tax
Reforms of 2008, have recovered and show an upward trend.
Direct taxes are projected to be $22.3 million in 2011. This is due to stronger prospects for economic growth and
the efforts of increasing compliance and improved tax administration. The projection for Indirect Taxes is $42.6
million in 2011, and expected to increase to $54.4 million in 2015.

21
RDTL General State Budget for 2011 as Presented to Parliament 15 November 2010. Scanned, with some parts translated, by La’o Hamutuk. For more information see http://www.laohamutuk.org/econ/OGE11/10OJE2011.htm
Table 5.3: Total Tax Revenue Projections, 2009-2015 ($ million)
2009 2010 2011 2012 2013 2014 2015
Actual Estimate Projections
Direct Taxes 13.4 16.0 22.3 26.9 31.4 35.9 40.4
Income Tax 5.1 6.0 7.1 8.8 10.5 12.2 13.9
Corporate Tax 2.0 2.4 5.7 6.9 8.1 9.3 10.5
Witholding Tax 6.3 7.6 9.5 11.2 12.8 14.4 16.0
Indirect Tax 30.3 31.5 42.6 44.5 46.3 50.3 54.4
Service tax 2.9 3.4 4.0 4.9 5.3 5.9 6.6
Sales Tax 7.3 7.5 11.4 10.7 11.2 12.2 13.1
Excise Tax 13.8 14.2 17.7 20.7 21.6 23.5 25.5
Import Duties 6.3 6.4 9.5 8.2 8.2 8.7 9.2
Source: Macroeconomic Directorate, Ministry of Finance, 2010
User Fees and Charges
Table 5.4 contains the projected income from User Fees and Charges, which are expected to increase to $16.2
million in 2011 from $14.1 million in 2010. There is a core upward trend of growth in User Fees and Charges
which is projected to continue in 2011 and beyond.
Table 5.4: User Fees and Charges, 2009-2015 ($ million)
2009 2010 2011 2012 2013 2014 2015
Actual Estimate Projection
Fees and Charges 16.4 14.1 16.2 17.5 19.6 21.9 24.2
Business Registration Fees 0.2 0.5 0.7 0.9 1.1 1.3 1.5
Postage Fees 0.0 0.0 0.1 0.1 0.1 0.1 0.1
Property Rentals 1.9 2.8 2.4 2.6 2.8 3.1 3.3
Water Fees 0.1 0.1 0.1 0.1 0.1 0.1 0.1
National University Fees 0.4 0.7 0.5 0.5 0.5 0.5 0.6
Vehicle Registration Fees 1.0 0.9 0.9 0.9 1.1 1.1 1.3
Vehicle Inspection Fees 0.0 0.2 0.2 0.0 0.0 0.0 0.0
Drivers Licence Fees 0.0 0.3 0.3 0.0 0.0 0.0 0.0
Other Transport Fees 0.0 0.0 0.0 0.0 0.0 0.0 0.0
ID and Passport 0.4 0.6 0.8 1.0 1.1 1.4 1.6
Visa Fees 1.2 1.8 1.5 1.7 1.9 2.1 2.3
Hospital and Medical Fees 0.1 0.1 0.1 0.1 0.1 0.1 0.1
Dividents, Profits, and Gains 4.6 4.8 7.3 8.1 9.1 10.1 11.2
Mining and Quarrying 0.1 0.0 0.1 0.1 0.1 0.2 0.2
Radio and Television Fees 0.0 0.0 0.0 0.0 0.0 0.0 0.0
Bid Document Receipts 0.1 0.1 0.0 0.1 0.1 0.1 0.1
Auctions 0.0 0.0 0.1 0.1 0.1 0.1 0.1
Other Non-Tax Revenue 6.4 1.2 1.1 1.2 1.4 1.6 1.7
Source: Macroeconomic Directorate, Ministry of Finance, 2010
Rice Sales and Interest
Rice subsidies were introduced to buffer the Timorese people from spikes in world food prices in 2008. The
need for the government to intervene in this market has now subsided with the stabilization of world food prices.
As government intervention reduces, revenues in this area are projected to fall to $10 million in 2011, and
stabilize at $9.6 million.
interest, being monies received on government bank account balances, represents only a small portion of
Domestic Revenues. Interest receipts are projected to be $0.1 million in 2011 and then increase modestly in the

22
RDTL General State Budget for 2011 as Presented to Parliament 15 November 2010. Scanned, with some parts translated, by La’o Hamutuk. For more information see http://www.laohamutuk.org/econ/OGE11/10OJE2011.htm
medium term.
Autonomous Agencies
Revenues from Autonomous Agencies (Equipment Management, Aviation, Port, and EDTL) have improved in
recent times as shown in Table 5.5. The share of total revenues is expected to increase from 12% in 2009 to 14%
for 2010. For 2011, the share of this category of revenue is projected to increase to 17%, being $18.9 million.
The most significant revenue item is EDTL. It outperformed expectations for 2009 ($7million) by 16%. This
growth trend is likely to increase further with continued efforts to increase pay for use among electricity
consumers. This will be complemented by increased tariffs. The current projection for EDTL revenues for 201 I
is $14.5 million. It is anticipated that the customer base will increase and result in additional revenue.
Aviation and Port performance has been strong relative to the 2010 Budget projections, and sustained growth in
revenues is likely to continue.
Table 5.5: Revenues from Autonomous Agencies, 2009-2015 ($ million)
2009 2010 2011 2012 2013 2014 2015
Actual Estimate Projection
Institute of Equipment Management 0.0 0.0 0.0 0.0 0.0 0.0 0.0
Aviation 0.9 1.1 1.3 1.6 1.7 2.0 2.2
Port 1.4 2.5 3.1 3.5 4.0 4.5 5.0
EDTL 8.1 9.4 14.5 17.7 21.0 24.2 27.4
Total 10.4 13.0 18.9 22.8 26.7 30.7 34.6
Source: Macroeconomic Directorate, Ministry of Finance, 2010
3. Petroleum Revenues
The Petroleum Revenues are expected to remain high in 2011 and 2012 due to relatively stable production and
oil price forecasts during this period. This Revenue is estimated at $2.29 billion and $2.4 billion in 2011 and
2012 respectively. This is an increase from $1.84 billion in 2009 and the forecast for 2010 of $2.02 billion,
mainly due to higher expected oil prices. Table 5.6 shows actual revenues in 2009, estimates of 2010 and the
Petroleum Revenue forecast through 2015.
Table 5.6: Estimated Petroleum Revenues, 2009-2015 ($ million)
2009
Actual 2010
Estimate 2011
Budget 2012
Projection 2013
Projection 2014
Projection 2015
Projection
Total Petroleum Revenue 1,828 2,016 2,288 2,399 2,160 2,461 2,443
Royalties 122 136 147 162 137 149 143
Profit oil 871 916 1,057 1,075 946 1,055 1,009
Income Tax 283 368 355 393 296 362 381
Additional Profit Tax 343 341 395 381 327 385 333
Value Added Tax 15 9 6 6 9 7 7
Wages Tax 10 8 8 8 8 9 9
Pipeline Payments 5 6 6 6 6 6 6
Other Payments 1 20 10
Withholding Tax 9 12 8 9 12 9 10
Petroleum Fund Interest Received* 167 200 296 359 419 479 546
*) Actual Cash flow for 2009 Source: Petroleum Fund Directorate, Ministry of Finance, 2010
After the oil price skyrocketed in the first part of 2008, and the West Texas Intermediate (WTI) oil price peaked
at $145 per barrel in June 2008, it dropped to $30 per barrel six months later. Since then the WTI oil price has

23
RDTL General State Budget for 2011 as Presented to Parliament 15 November 2010. Scanned, with some parts translated, by La’o Hamutuk. For more information see http://www.laohamutuk.org/econ/OGE11/10OJE2011.htm
recovered and averaged $62 per barrel in 2009. The average oil price by end of August 2010 was $78 per barrel,
which is $16 per barrel higher than the oil price projection used in the Budget 2010, and the average price for
2010 is estimated at $76 per barrel. The Petroleum Revenue forecast for 2011 and 2012 is based on an oil price
of $68 and $71 per barrel respectively. Chart 5.1 shows the historical WTI oil price and oil price forecast used in
Budget 2011.
A scheduled shut down at Bayu Undan in 2010 has resulted in lower production and revenues from the field in
2010 than otherwise would have been the case. The production in 2010 is estimated at 57 million barrels of oil
equivalents, which is down from 62 million barrels of oil equivalents in 2009. The production at Bayu Undan in
2011 and 2012 is expected to increase to 62 and 60 million of oil equivalents respectively, before it declines
gradually until the production is expected to cease in 2024.
Development Plan for the Kitan field has been approved in 2010 and the production will commence in 2011.
The total production is modest compared to the Bayu Undan field. Kitan‟s Low and Base Production Cases are
23 and 35 million barrels of oil respectively over the life time of the project. The total revenue stream based on
the Low Production Case is equivalent to $145 million.
Chart 5.1: Historical Changes and Future Projections in the WTI Oil Price (S per barrel)
Source: Petroleum Fund Directorate, Ministry of Finance, 2010
The total production from the two fields is estimated at 65 and 68 million of oil equivalents for 2011 and 2012
respectively. Table 5.7 shows the oil price, total production volumes, undiscounted and discounted Petroleum
Revenues for Timor-Leste over the life time of the two projects11
.
11
Includes revenue streams from Bayu Undan and Kitan fields
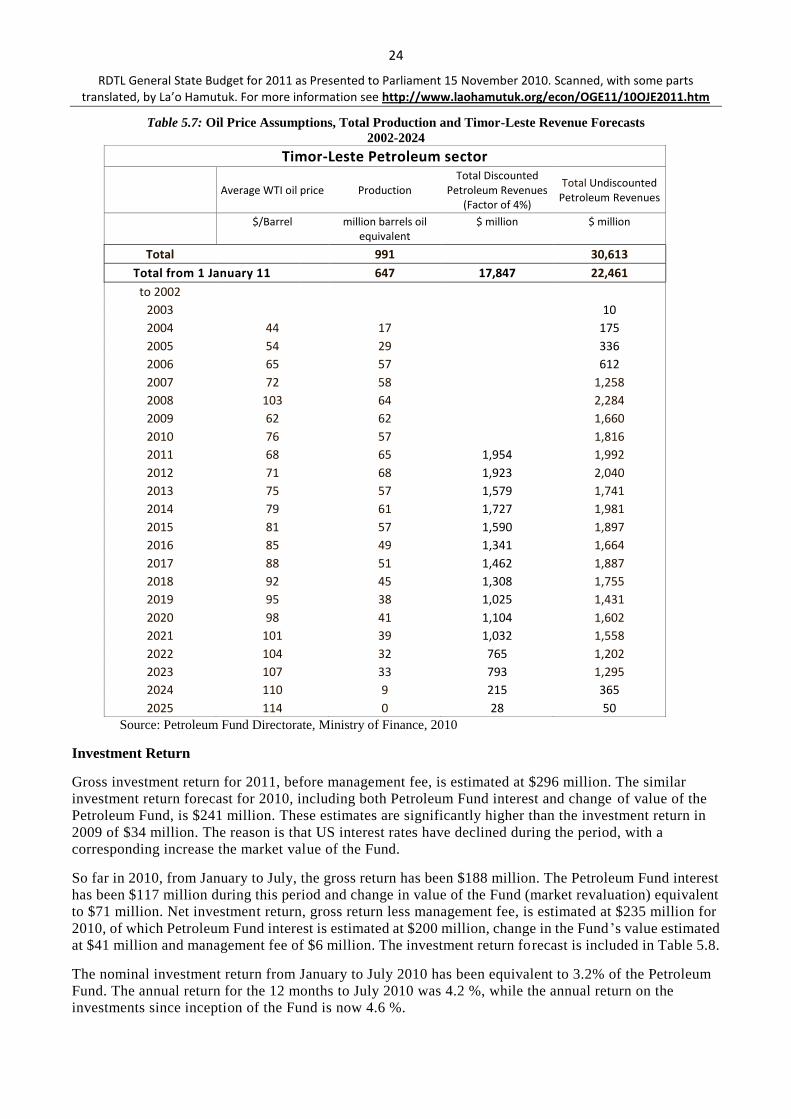
24
RDTL General State Budget for 2011 as Presented to Parliament 15 November 2010. Scanned, with some parts translated, by La’o Hamutuk. For more information see http://www.laohamutuk.org/econ/OGE11/10OJE2011.htm
Table 5.7: Oil Price Assumptions, Total Production and Timor-Leste Revenue Forecasts
2002-2024
Timor-Leste Petroleum sector
Average WTI oil price Production Total Discounted
Petroleum Revenues (Factor of 4%)
Total Undiscounted Petroleum Revenues
$/Barrel million barrels oil equivalent
$ million $ million
Total 991 30,613
Total from 1 January 11 647 17,847 22,461
to 2002
2003 10
2004 44 17 175
2005 54 29 336
2006 65 57 612
2007 72 58 1,258
2008 103 64 2,284
2009 62 62 1,660
2010 76 57 1,816
2011 68 65 1,954 1,992
2012 71 68 1,923 2,040
2013 75 57 1,579 1,741
2014 79 61 1,727 1,981
2015 81 57 1,590 1,897
2016 85 49 1,341 1,664
2017 88 51 1,462 1,887
2018 92 45 1,308 1,755
2019 95 38 1,025 1,431
2020 98 41 1,104 1,602
2021 101 39 1,032 1,558
2022 104 32 765 1,202
2023 107 33 793 1,295
2024 110 9 215 365
2025 114 0 28 50
Source: Petroleum Fund Directorate, Ministry of Finance, 2010
Investment Return
Gross investment return for 2011, before management fee, is estimated at $296 million. The similar
investment return forecast for 2010, including both Petroleum Fund interest and change of value of the
Petroleum Fund, is $241 million. These estimates are significantly higher than the investment return in
2009 of $34 million. The reason is that US interest rates have declined during the period, with a
corresponding increase the market value of the Fund.
So far in 2010, from January to July, the gross return has been $188 million. The Petroleum Fund interest
has been $117 million during this period and change in value of the Fund (market revaluation) equivalent
to $71 million. Net investment return, gross return less management fee, is estimated at $235 million for
2010, of which Petroleum Fund interest is estimated at $200 million, change in the Fund ‟s value estimated
at $41 million and management fee of $6 million. The investment return forecast is included in Table 5.8.
The nominal investment return from January to July 2010 has been equivalent to 3.2% of the Petroleum
Fund. The annual return for the 12 months to July 2010 was 4.2 %, while the annual return on the
investments since inception of the Fund is now 4.6 %.

25
RDTL General State Budget for 2011 as Presented to Parliament 15 November 2010. Scanned, with some parts translated, by La’o Hamutuk. For more information see http://www.laohamutuk.org/econ/OGE11/10OJE2011.htm
Table 5.8: Estimated Petroleum Fund Savings 2009-2015 ($m)
2009
Actual 2010
Estimate
2011 Budget
2012 Projection
2013 Projection
2014 Projection
2015 Projection
Opening Balance 4,197 5,377 6,617 8,165 9,817 11,223 12,923
Petroleum Revenue excluding PF Interest 1,660 1,816 1,992 2,040 1,741 1,981 1,897
Petroleum Fund Interest* 177 200 296 359 419 479 546
Change in Value of the Fund -143 41 0 0 0 0 0
BPA Management fee -3 -6 -6 -6 -6 -6 -6
Withdrawal -512 -811 -734 -741 -748 -755 -762
Closing Balance 5,377 6,617 8,165 9,817 11,223 12,923 14,598
*) includes accrued interest Source: Petroleum Fund Directorate, Ministry of Finance, 2010
La’o Hamutuk note: table 5.8 above assumes that the Government will withdraw only the ESI in future years.
However, table 4.2 in the expenditure part of this book states that the Government will withdrawal of $418-$526
million above the ESI for each year from 2012 to 2015. Recalculating this table with that information reduces
the balance in the Petroleum Fund at the end of 2015 by $2 billion, as follows:
Revised Table 5.8: Estimated Petroleum Fund Savings 2009-2015 ($m) (green shaded cells have changed):
2009
Actual 2010
Estimate
2011 Budget
2012 Projection
2013 Projection
2014 Projection
2015 Projection
Opening Balance 4,197 5,377 6,617 8,165 9,390 10,316 11,480
Petroleum Revenue excluding PF Interest 1,660 1,816 1,992 2,040 1,741 1,981 1,897
Petroleum Fund Interest 177 200 296 350 392 432 477
Change in Value of the Fund -143 41 0 0 0 0 0
BPA Management fee -3 -6 -6 -6 -6 -6 -6
Withdrawal -512 -811 -734 -1,159 -1,202 -1,244 -1,288
Closing Balance 5,377 6,617 8,165 9,390 10,316 11,480 12,559
Source: La’o Hamutuk
Petroleum Fund
The balance of the Petroleum Fund as of 31 July 2010 was $6.45 billion. This is an increase of $1.07
billion during the financial year. The balance is expected to increase only modestly for the rest of the year
as the major part of the withdrawals in 2010 will take place in the second part of 2010. By the end of 2010,
the balance of Petroleum Fund is expected to be $6.62 billion.
The current forecast shows the total value of the Fund to be $8.17 billion by the end of 2011, $9.82 billion
by the end of 2012 and $14.6 billion by end of 2015. The forecasts of the future Petroleum Fund balance
are shown in Table 5.8.
The Government has over the last three years gradually implemented the investment strategy of the
Petroleum Fund. The objective is to diversify, the portfolio into a range of asset classes, regions and
currencies in order to reduce risks and increase expected return, within the limitations of the Petroleum
Fund Law. The first step was taken in 2009 when the Bank for International Settlements (BIS) was
appointed as the Fund‟s first external manager. The BIS is responsible for investing 20 per cent of the
portfolio. Now the portfolio includes Government bonds issued by Australia, Japan, EU and UK as well as
bonds issued by Supranational Organizations, such as the European Investment Bank and the World Bank.
In 2010, the Government appointed the External Manager, Schroeder Investment Management Ltd as the
first Equity Manager and 4% of the portfolio is now allocated to global equities. With the latest allocation
to equities, the flexibility in the current Petroleum Fund Law to diversify the portfolio is now fully
exploited. Further diversification of the portfolio requires changes to the Petroleum Fund Law.
The fund is currently overweighted to bonds and this represents an exposure to financial risk associated
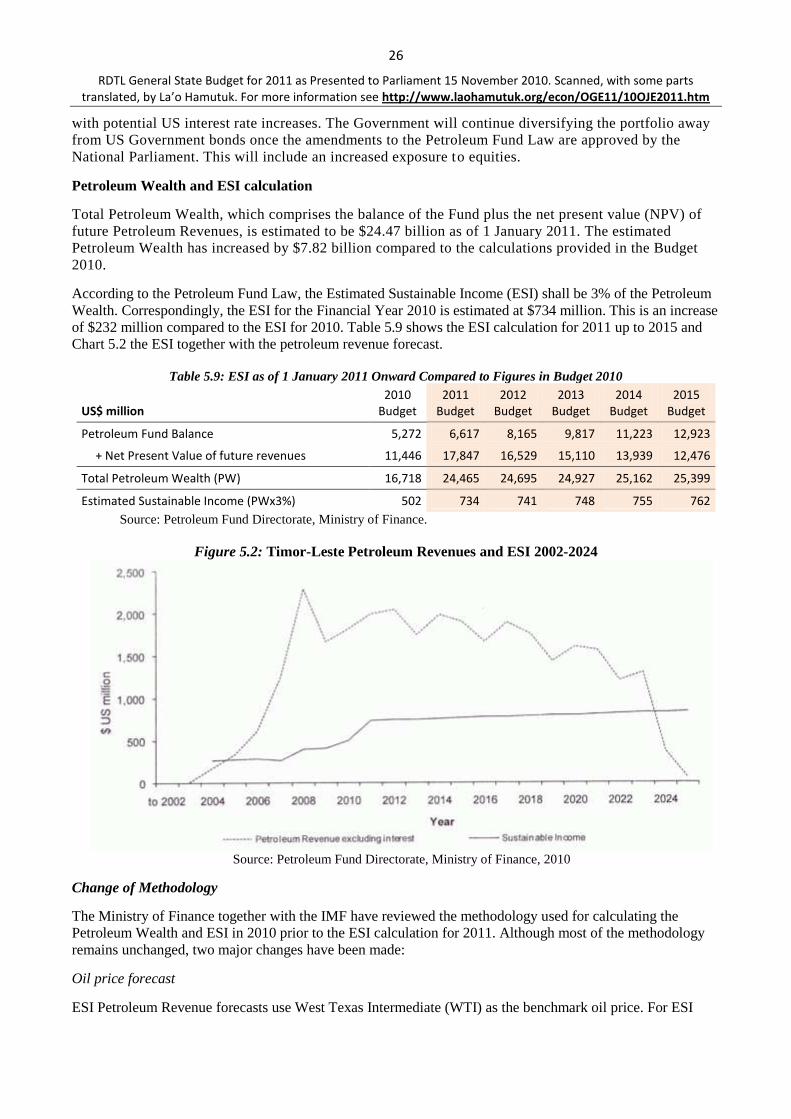
26
RDTL General State Budget for 2011 as Presented to Parliament 15 November 2010. Scanned, with some parts translated, by La’o Hamutuk. For more information see http://www.laohamutuk.org/econ/OGE11/10OJE2011.htm
with potential US interest rate increases. The Government will continue diversifying the portfolio away
from US Government bonds once the amendments to the Petroleum Fund Law are approved by the
National Parliament. This will include an increased exposure to equities.
Petroleum Wealth and ESI calculation
Total Petroleum Wealth, which comprises the balance of the Fund plus the net present value (NPV) of
future Petroleum Revenues, is estimated to be $24.47 billion as of 1 January 2011. The estimated
Petroleum Wealth has increased by $7.82 billion compared to the calculations provided in the Budget
2010.
According to the Petroleum Fund Law, the Estimated Sustainable Income (ESI) shall be 3% of the Petroleum
Wealth. Correspondingly, the ESI for the Financial Year 2010 is estimated at $734 million. This is an increase
of $232 million compared to the ESI for 2010. Table 5.9 shows the ESI calculation for 2011 up to 2015 and
Chart 5.2 the ESI together with the petroleum revenue forecast.
Table 5.9: ESI as of 1 January 2011 Onward Compared to Figures in Budget 2010
US$ million
2010 Budget
2011 Budget
2012 Budget
2013 Budget
2014 Budget
2015 Budget
Petroleum Fund Balance 5,272 6,617 8,165 9,817 11,223 12,923
+ Net Present Value of future revenues 11,446 17,847 16,529 15,110 13,939 12,476
Total Petroleum Wealth (PW) 16,718 24,465 24,695 24,927 25,162 25,399
Estimated Sustainable Income (PWx3%) 502 734 741 748 755 762
Source: Petroleum Fund Directorate, Ministry of Finance.
Figure 5.2: Timor-Leste Petroleum Revenues and ESI 2002-2024
Source: Petroleum Fund Directorate, Ministry of Finance, 2010
Change of Methodology
The Ministry of Finance together with the IMF have reviewed the methodology used for calculating the
Petroleum Wealth and ESI in 2010 prior to the ESI calculation for 2011. Although most of the methodology
remains unchanged, two major changes have been made:
Oil price forecast
ESI Petroleum Revenue forecasts use West Texas Intermediate (WTI) as the benchmark oil price. For ESI

27
RDTL General State Budget for 2011 as Presented to Parliament 15 November 2010. Scanned, with some parts translated, by La’o Hamutuk. For more information see http://www.laohamutuk.org/econ/OGE11/10OJE2011.htm
calculations between 2007 and 2010, WTI has been forecasting deterministically using the Energy Information
Administration (EIA) low case oil price forecast provided in its annual report, Annual Energy Outlook12
. EIA is
an independent organization that applies a consistent and rigorous methodology, and the only such organization
to provide both a low and reference case forecast for WTI oil prices.
Oil prices are inherently difficult to forecast, and there is much academic debate as to their underlying
properties, including whether the market upheaval in 2008 and 2009 signals a permanent shift to a higher
oil price world. The EIA low and reference case forecasts have been reviewed against current futures
prices and other sources to evaluate whether these ESI cases serve as a reasonably p rudent guideline for
sustainable consumption of Timor-Leste‟s petroleum wealth. Based on this assessment, the EIA low case
forecast is felt to be overly prudent and the 2011 ESI calculation will instead use the average of EIA low
and reference case forecasts.
Discount rate
Previous ESI used a single observation of the US government bond yields close to the date of the ESI
calculation, weighted simply according to the proportion of forecast petroleum revenues occurring against
each maturity period. The further liberalisation of US monetary policy following the global financial crisis
has resulted in unusually low bond yields, as reflected in a discount rate of 2.6% for 2010 ESI.
The methodology has been revised to use (1) the 10 year historic average of bond yields for each maturity
date; and (2) a refined calculation of the average discount rate. This results in a discount rate of 4.0 percent
for 2011 ESI.
Changes in the ESI from 2010 to 2011
Several factors have affected the outcome of the ESI calculation for 2011 compared to the calculation in the
previous year:
Oil prices
The forecast WTI oil price for 2010 has increased from $62 to $76 per barrel reflecting the average of
actual oil prices to August 2010 and the EIA forecast for 2010 for the remainder of the year. For years after
2010, the move from ETA low case to the average of EIA low and reference case forecasts involves
moving from long term real prices that converge to $50 per barrel to real prices that increase by around 2
percent per year between 2012 and 2025.
Liquids price differentials
The assumed value of Bayu Undan (BU) condensate and LPG relative to WTI have been slightly revised
consistent with actual average differentials since the start of the project, leading to a modest further
increase in ESI.
Production
The Bayu Undan low case production forecasts provided by Conoco Philips increased for all three product
types. The range of uncertainty around future production volumes has narrowed reflecting revised
reservoir estimates taking into account further production history and data gathered during recent
development drilling. The higher production forecast, when valued using the average of EIA low and
reference case oil prices, adds $61 million to ESI.
LNG prices
LNG contract prices until end of 2009 are now settled and these were largely reflected in 2010 ESI. Prices
for 2010 to 2012 are close to being finalized and have resulted in a modest increase relative to prudent
12 Annual Energy Outlook 2010: http://www.eia.doe.gov/oiaf/aeo/index.html
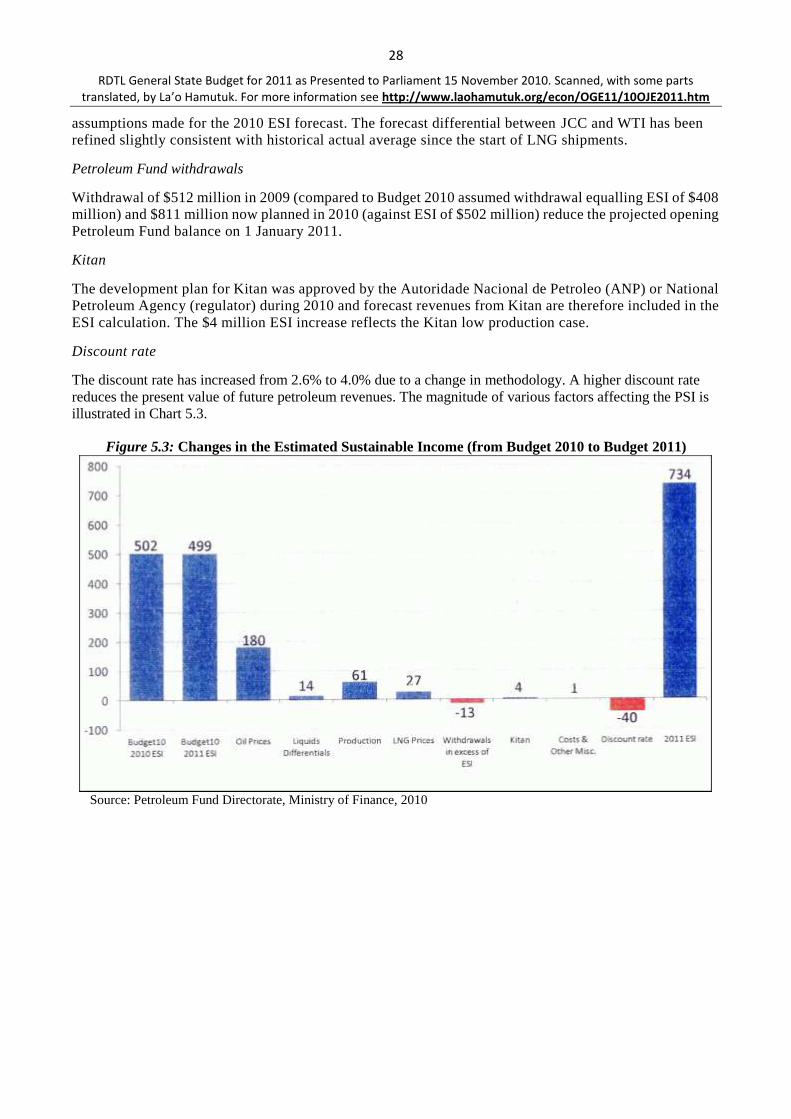
28
RDTL General State Budget for 2011 as Presented to Parliament 15 November 2010. Scanned, with some parts translated, by La’o Hamutuk. For more information see http://www.laohamutuk.org/econ/OGE11/10OJE2011.htm
assumptions made for the 2010 ESI forecast. The forecast differential between JCC and WTI has been
refined slightly consistent with historical actual average since the start of LNG shipments.
Petroleum Fund withdrawals
Withdrawal of $512 million in 2009 (compared to Budget 2010 assumed withdrawal equalling ESI of $408
million) and $811 million now planned in 2010 (against ESI of $502 million) reduce the projected opening
Petroleum Fund balance on 1 January 2011.
Kitan
The development plan for Kitan was approved by the Autoridade Nacional de Petroleo (ANP) or National
Petroleum Agency (regulator) during 2010 and forecast revenues from Kitan are therefore included in the
ESI calculation. The $4 million ESI increase reflects the Kitan low production case.
Discount rate
The discount rate has increased from 2.6% to 4.0% due to a change in methodology. A higher discount rate
reduces the present value of future petroleum revenues. The magnitude of various factors affecting the PSI is
illustrated in Chart 5.3.
Figure 5.3: Changes in the Estimated Sustainable Income (from Budget 2010 to Budget 2011)
Source: Petroleum Fund Directorate, Ministry of Finance, 2010
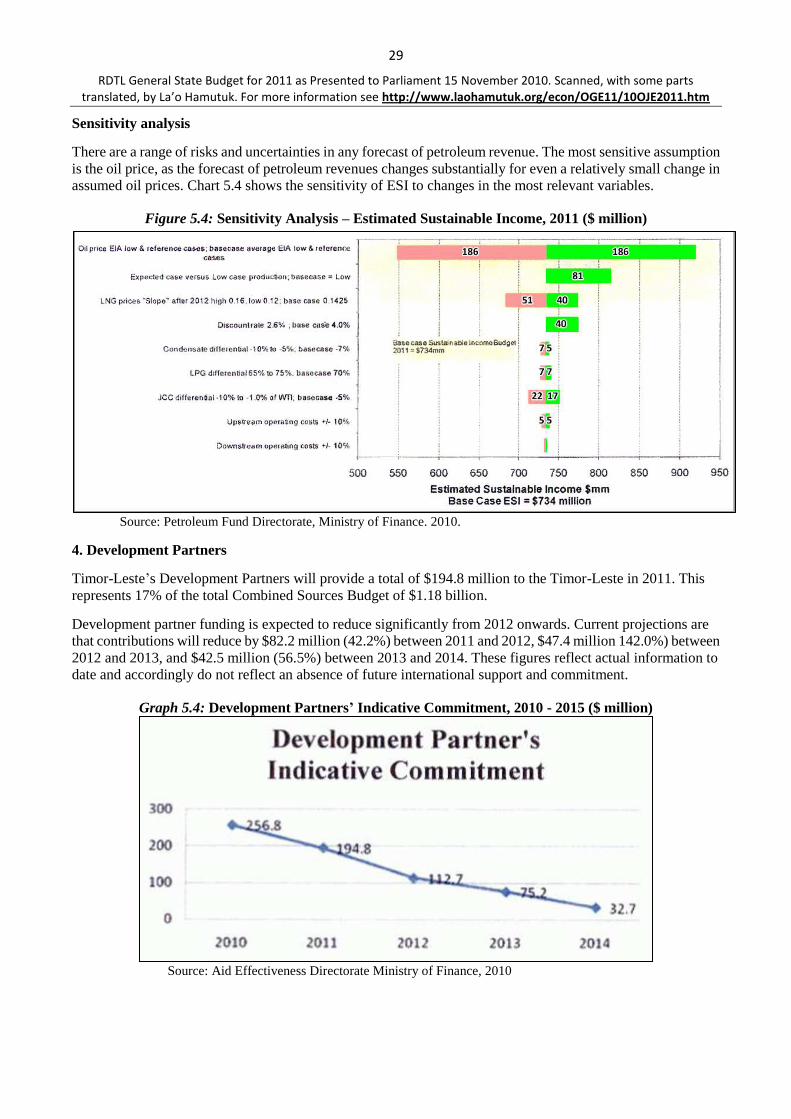
29
RDTL General State Budget for 2011 as Presented to Parliament 15 November 2010. Scanned, with some parts translated, by La’o Hamutuk. For more information see http://www.laohamutuk.org/econ/OGE11/10OJE2011.htm
Sensitivity analysis
There are a range of risks and uncertainties in any forecast of petroleum revenue. The most sensitive assumption
is the oil price, as the forecast of petroleum revenues changes substantially for even a relatively small change in
assumed oil prices. Chart 5.4 shows the sensitivity of ESI to changes in the most relevant variables.
Figure 5.4: Sensitivity Analysis – Estimated Sustainable Income, 2011 ($ million)
Source: Petroleum Fund Directorate, Ministry of Finance. 2010.
4. Development Partners
Timor-Leste‟s Development Partners will provide a total of $194.8 million to the Timor-Leste in 2011. This
represents 17% of the total Combined Sources Budget of $1.18 billion.
Development partner funding is expected to reduce significantly from 2012 onwards. Current projections are
that contributions will reduce by $82.2 million (42.2%) between 2011 and 2012, $47.4 million 142.0%) between
2012 and 2013, and $42.5 million (56.5%) between 2013 and 2014. These figures reflect actual information to
date and accordingly do not reflect an absence of future international support and commitment.
Graph 5.4: Development Partners’ Indicative Commitment, 2010 - 2015 ($ million)
Source: Aid Effectiveness Directorate Ministry of Finance, 2010

30
RDTL General State Budget for 2011 as Presented to Parliament 15 November 2010. Scanned, with some parts translated, by La’o Hamutuk. For more information see http://www.laohamutuk.org/econ/OGE11/10OJE2011.htm
PART 6. FINANCING
Timor-Leste is a developing economy with a nominal non-oil per-capita income of $594.50. 41% of the
population live below the poverty line, down from 49.9% in 2007. The number of people entering the work
force continues to increase at a faster rate than employment creation in public and private sectors. The
challenges of building a sustainable economy, absorbing the increased workforce participation rate, and
reducing poverty, are enormous. The Timor-Leste economy is primarily driven by public investment but
for long term growth and sustainability private investment is critical. The prerequisites for private
investment include security and political stability, basic infrastructure, ski lled labour force, attractive tax
rate, land laws, rule of law, and legal framework. Public investment and regulatory reform are essential to
deliver these prerequisites.
The Government is finalising the Strategic Development Plan (SDP) 2011-2030, which calls for
substantial investment in two fundamental pillars to create the basic conditions to attract private
investment for growth and sustainability. These two pillars are basic infrastructure and human capital.
This budget year marks the beginning of the SDP with an immediate need for funding to operationalise the SDP.
The main source of revenue for Timor-Leste is Petroleum Revenues, which is derived mainly front Bayu
Undan in the Timor Sea. These revenues are deposited in the Petroleum Fund, from which wi thdrawals are
made to finance the State Budget guided by the Estimated Sustainable Income (ESI) benchmark of 3% of
the Petroleum Wealth.
Domestic Revenues and donor funding constitute a small component of the Budget revenues.
Beyond what can be spent from traditional funding sources (ESI and Domestic Revenues), additional
amounts are envisaged to be required in the first five years of the SPD. The Government is, therefore,
exploring other options towards funding strategic public investments. These financing options range from
judicious withdrawals from the Petroleum Fund ensuring long term sustainability, access to concessional
and non-concessional borrowings, and Public Private Partnerships (PPP).
Starting 2011, the Government will establish two Special Funds in accordance with section 32 of Law No.
13/2009 on Budget and Financial Management. The purposes of the funds are to finance large-scale, multi-year
capital investments in infrastructure and human development. The special funds will be known as:
1. Infrastructure Fund (FI), and
2. Human Capital Development Fund (HCDF).
The creation of Special Funds is provided for in section 32 of the Budget and Financial Management Law.
These funds will be financed through the budget and provide a more transparent and effective governance and
reporting mechanism on the use of the money. The Government in accordance with article 115(1)(e) of the
Constitution has the competency to establish the rules and regulations for the Special Funds. Parliamentary
authorisation is required pursuant to article 32 of the Budget and Financial Management Law.
The use of Special Funds will fast track the implementation of the SDP. The Special Funds will be
governed by a board consisting of the Prime Minister and relevant line ministers. One of the benefits of the
Special Funds is the centralisation of decision making, which will ensure projects are coordinated between
line ministries and integrated within the SDP. The board will prioritise and sequence projects, with the
scope to realign projects to accommodate changes arising from factors outside its control. Another benefit
of the Special Funds is that it will provide an avenue to allow donors to participate in the SDP.
A National Development Agency (ADN) will be established under the Prime Minister staffed with
technical expertise to quality control project submissions to ensure specifications and costings are
appropriate. The ADN will also provide supervision and monitoring of the projects including quarterly

31
RDTL General State Budget for 2011 as Presented to Parliament 15 November 2010. Scanned, with some parts translated, by La’o Hamutuk. For more information see http://www.laohamutuk.org/econ/OGE11/10OJE2011.htm
reporting to the National Parliament through the Council of Ministers.
The Minister of Finance is responsible for the management and control of the Special Funds in accordance
with the Budget and Financial Management Law. The purposes of the Special Funds are included in
Article 9 of the State Budget 2011.
Under articles 20 and 21 of the Budget and Financial Management Law the Government has a legal basis
to borrow. The primary goal of external borrowing is to fill the deficit between desired development needs
and domestically available resources over the medium and long-term. A Debt Management Unit (DMU)
has been established within the Ministry of Finance to ensure efficient and effective management of public
debt should it arise. The Government is assessing the benefits of borrowing as opposed to relying
exclusively on the Petroleum Funds revenue.
The Government is considering the financing option of Private Public Partnerships (PPP), which will
enable more infrastructure investments whilst sharing associated risks with other parties.

32
RDTL General State Budget for 2011 as Presented to Parliament 15 November 2010. Scanned, with some parts translated, by La’o Hamutuk. For more information see http://www.laohamutuk.org/econ/OGE11/10OJE2011.htm
ANNEX 1 - Estimated Sustainable Income Calculation 2011
Introduction
According to the Petroleum Fund Law the Estimated Sustainable Income (ESI) the maximum amount that
can be appropriated from the Petroleum Fund in a financial year while leaving sufficient resou rces to
appropriate an amount of equal real value in subsequent years. This means that the ESI is a benchmark
indicating the sustainable level of withdrawal from the Petroleum Fund that does not reduce the real value
of Timor-Leste‟s total petroleum wealth in the long-term.
The Petroleum Fund Law requires that all assumptions underlying the calculation of the ESI be prudent.
reflecting international best practice and be based upon internationally recognized standards. Currently
approximately 2/3 of Timor-Leste‟s Petroleum Wealth included in the ESI calculation is still under the
seabed in Timor Sea, while 1/3 is already in the Petroleum Fund. The future revenues are highly uncertain
and subject to production and oil prices in the future.
Moreover, currently only one field. Bayu Undan, is in operation. The risk, however small, is that an event
on the Bayu Undan field will cause a deferral of the revenue stream to the State of Timor -Leste. Such a
deferral may last for months, years or even indefinitely, depending on the event. Furthermore, oil prices
are very volatile, and it should not be ruled out that oil prices fall to or below the price assumptions used in
the calculations of the Petroleum Fund.
Review of methodology
The Ministry of Finance (MoF) has reviewed the methodology used for the ESI calculation and has broadly
re-confirmed the approach used previously with the exceptions noted below.
Asset recognition policy
The forecast of future petroleum revenues used for ESI includes projects with approved development plans and
firm investment commitment from the oil company. This has been reconfirmed as an appropriate basis for ESI
and revenues from Bayu Undan (BU) and the recently approved small Kitan project are included in the forecast.
Because of significant uncertainty and potential for material delay no revenues are included for the Sunrise
project. Though exploration continues, at this time there have been no other significant petroleum discoveries in
the Joint Petroleum Development area or Timor-Leste exclusive areas.
Petroleum Reserves and Production Forecasts
The operators, ConocoPhillips and Eni, have provided three production scenarios, “high”, “expected” and
“low” production, based on different assumptions of the total petroleum resources available at Bayu Undan and
Kitan fields respectively.
The State Budget estimates production on the basis of the Operators‟ “Low” estimate, which reflects a
90% likelihood that predicted production levels will he achieved. This is considered to be in accordance
with the prudent requirements in the Petroleum Fund Law.
ConocoPhillips update production forecasts annually, taking into account new production data, including
results from 2009 development drilling, There were no major revisions in underlying production plans , but
as the Bayu Undan field matures, the low, base and high case production forecasts are converging,
reflecting the reducing level of uncertainty. The key difference between the three production cases now
lies in the estimated size of the total producible reserves, as reflected in differing cut off points and
production volumes in the final years of the field.
Oil prices
ESI petroleum revenue forecasts use West Texas Intermediate (WTI) as the benchmark oil price. For ESI

33
RDTL General State Budget for 2011 as Presented to Parliament 15 November 2010. Scanned, with some parts translated, by La’o Hamutuk. For more information see http://www.laohamutuk.org/econ/OGE11/10OJE2011.htm
calculations between 2007 and 2010, WTI has been forecast deterministically using the Energy
Information Administration (EIA) low case oil price forecast provided in its annual report, Annual Energy
Outlook13
13. EIA is an independent organization that applies a consistent and rigorous methodology, and
the only such organization to provide both a low and reference case forecast for WTI oil prices.
The 2011 ESI calculation uses the average of the EIA low case and reference case forecasts as the WTI oil price
benchmark for the ESI calculation. The average of the two EIA cases lies well within the 68 percent confidence
interval around average futures prices, and significantly below the average of futures prices, as shown in Chart
A1.
Figure Al: Comparing EIA Oil Price Forecasts to Market Futures Prices
(WTI prices, $ per barrel)
Source: Petroleum Fund Directorate. Ministry of Finance, 2010
Moreover, the average of the EIA low case and reference case is significantly lower than the ETA‟s Reference
Case, and the difference between the two projections increases with the time horizon. The EIA‟s Low,
Reference and average of Low and Reference Case are shown in Chart A2 together with the historical average
WTI prices.
13 Annual Energy Outlook 2010: http://www.eia.doe.gov/oiaf/aeo/index.html

34
RDTL General State Budget for 2011 as Presented to Parliament 15 November 2010. Scanned, with some parts translated, by La’o Hamutuk. For more information see http://www.laohamutuk.org/econ/OGE11/10OJE2011.htm
Figure A2: EIA Forecasts and 10 years Historical Average WTI Prices 2004-2025
Source: Petroleum Fund Directorate, Ministry of Finance, 2010
There are many institutions providing oil price forecasts. Nonetheless, the EIA is the only one, as the Ministry of
Finance is aware, that provides both Low and Reference Price Cases. As shown in Table Al, the oil price
projection used in the ESI calculation is significantly lower than most other oil price forecasts made by other
institutions.
Table A1: World Oil Price Forecasts, 2015 – 2025 ($ million)
World Oil price forecasts, USD/barrel, real 2008 USD 2015 2020 2025
INFORUM 92.5 108.0 109.7
DB 93.2 105.5 114.7
IHSGI 85.1 81.9 74.9
IEA 100.0 115.0
EVA 80.4 84.5 91.0
SEER (Business-as-usual) 79.2 74.3 69.7
SEER (Multi-Dimensional) 99.0 101.5 105.8
EIA Reference Case 94.5 108.3 115.1
EIA: Half way between low & reference 73.6 80.4 84.4
EIA Low Price Case 51.6 51.9 51.7
Source: AEO 2010, EIA
Budget 2010 forecast a WTI oil price of $62 in 2010. For the seven months to the end of July 2010, WTI spot
prices averaged $78.114
. For the remaining five months of 2010, prices are assumed to average the most recent
EIA forecast for WTI in 2010 of $72.4. The weighted average 2010 price is therefore $75.7. Oil price forecasts
for 2011 and 2012 are US$68 and US$71 per barrel.
14
Source: Daily WTI spot prices from Energy Information Administration (EIA)
( http://tonto.eia.doe.gov/dnav/pet/pet_pri_spt_1_d.htm )
35
RDTL General State Budget for 2011 as Presented to Parliament 15 November 2010. Scanned, with some parts translated, by La’o Hamutuk. For more information see http://www.laohamutuk.org/econ/OGE11/10OJE2011.htm
Discount rate
The Petroleum Fund Law stipulates that the discount rate used for calculating the present value of the future
cash flow from the petroleum sector be the nominal yield on a US Government security averaged over the years,
in which the Petroleum Fund receipts are expected.
Previous ESI used a single observation of the US government bond yields close to the date of the ESI
calculation, weighted simply according to the proportion of forecast petroleum revenues occurring against each
maturity period. The unprecedented loosening of US monetary policy following the global financial crisis has
resulted in unusually low bond yields, as reflected in a discount rate of 2.6% for 2010 ESI. The methodology has
been revised to use (1) the 10 year historic average of bond yields for each maturity date; and (2) a refined
calculation of the average discount rate. This results in a discount rate of 4.0 percent for 2011 ESI.
Other assumptions
Actual realized prices for condensate and liquefied petroleum gas (LPG) relative to WTI have been reviewed
and the forecast differential set consistent with average actual percentage differentials since the start of
shipments in 2004.
Liquefied Natural Gas (LNG) prices for 2010-2012 are forecast using the provisional price formula negotiated
between Darwin LNG and Japanese LNG buyers. For 2013 onwards, a prudent assumption has been made for
long term LNG prices relative to oil prices, taking into account advice front Poten & Partners (LNG consultants
advising the ANP). The percentage differential between WTI and the JCC15
is forecast consistent with the
historic actual average.
Operating and capital costs are the operator‟s forecast consistent with base case production. Advice from the
operators is that costs would not be materially different for the low production case, therefore base case costs are
used without adjustment as a prudent estimate of low case production costs.
Certification of the ESI calculation
According to the Petroleum Fund Law Art. 8 no transfer shall be made from the Petroleum Fund in the Fiscal
Year unless the Government has first provided Parliament with reports:
a) specifying the Estimated Sustainable Income for the Fiscal Year for which the transfer is made;
b) specifying the Estimated Sustainable Income for the preceding Fiscal Year; and
c) from the Independent Auditor certifying the amount of the Estimated Sustainable Income in paragraphs
(a) and (b) above.
The reports are attached as Annex 3 and 4.
15 Japanese Crude Cocktail, price index of all oil imported into Japan, reported by Japanese Ministry of Finance

36
RDTL General State Budget for 2011 as Presented to Parliament 15 November 2010. Scanned, with some parts translated, by La’o Hamutuk. For more information see http://www.laohamutuk.org/econ/OGE11/10OJE2011.htm
Annex 2: Budget Law
(unofficial translation by La‟o Hamutuk)
DEMOCRATIC REPUBLIC OF TIMOR-LESTE
IV CONSTITUTIONAL GOVERNMENT
Proposed Law No.
Of ........ of .......
Approves the State Budget of the Democratic Republic of Timor-Leste for 2011
The State Budget for 2011 includes all revenue and expenditure of the State of Timor-Leste.
Annex I to the Law on State Budget for 2011, hereinafter OGE, establishes the estimated total revenue for the
state budget for January to December 2011 derived from all sources of petroleum, not petroleum, funds from
development partners and non-tax revenues . The total estimated revenue from all sources is $ 2.398 billion U.S.
dollars.
Annex II to the Law on State Budget provides all budget allocations, systematized as follows:
1. $ 115.909 million U.S. dollars for Salaries and Wages;
2. $ 270.459 million U.S. dollars for Goods and Services, of which $ 25 million is allocated to the Fund for
Development of Human Capital;
3. $ 164.456 million U.S. dollars for Public Transfers;
4. $ 28.252 million U.S. dollars for Minor Capital, and
5. $ 405.924 million U.S. dollars for Capital Development, of which $ 317.306 million is allocated to the
Infrastructure Fund.
The total budget is thus $ 985 million U.S. dollars, of which $ 317.306 million is allocated to the Infrastructure
Fund and $ 25 for the Fund for Development of Human Capital.
Excluding the autonomous services and funds, total appropriations for the State Budget is $ 934.740 million
U.S. dollars.
The total estimated expenditure for the autonomous funds and services in 2011, is $ 50.261 million U.S. dollars,
of which $ 31.361 million U.S. dollars are transferred from the state budget in order to subsidize their costs
when they exceed the revenues provided.
The total estimated expenditure of the State Budget is $ 985 million U.S. dollars, while the non-petroleum
revenues estimated at $ 110 million U.S. dollars, including revenues from autonomous services and funds. The
non-petroleum fiscal deficit is $ 875 million U.S. dollars, of which $ 734 million U.S. dollars will be paid from
the Petroleum Fund and $ 141 million U.S. dollars from the Consolidated Fund for East Timor.
The Government presents to the National Parliament, under Article 97.1(c) and Article 145.1 of the Constitution
of the Republic, the following Proposed Law:

37
RDTL General State Budget for 2011 as Presented to Parliament 15 November 2010. Scanned, with some parts translated, by La’o Hamutuk. For more information see http://www.laohamutuk.org/econ/OGE11/10OJE2011.htm
Chapter I
Definitions and approval
Article 1.
Definitions
For the purposes of this Act, the following definitions apply:
a) ―Expense Category‖ - the grouping of expenditure under the following five categories: Salaries and
Wages, Goods and Services, Public Transfers, Minor Capital and Development Capital, where:
i) ―Salaries and Wages‖ - The total amount that an organ can spend on wages and salaries for
political office holders and civil servants, temporary and part-time;
ii) ―Goods and Services‖ - The total amount that an organ can spend on purchasing goods and
services;
iii) ―Public Transfers‖ - The total amount that an organ can spend on public subsidies and consigned
payments;
iv) ―Minor Capital‖ - The total amount that an organ can spend on purchasing goods from Minor
Capital;
v) ―Capital Development‖ - The total amount that an organ can spend on projects of Capital
Development.
b) ―Expenses offset by revenues‖ - expenses incurred by own revenues collected by autonomous funds
and services, provided the amount does not exceed the total revenues that were received in the relevant
accounts of the Treasury;
c) ―Appropriation‖ - Maximum OGE entered in favor of an Organ to achieve a given expenditure;
d) ―Organ / Organs‖ - the generic term adopted in the Budget to indicate the general government budget
and subject to discipline, according to the organic classification, can be divided under headings such as:
Office of the President of the Republic, National Parliament, Government (Office of the Prime Minister
at the Presidency of the Council of Ministers, Ministries and Secretaries of State), Courts and the
Attorney General‟s Office.
e) ―Expenditure Lines‖ - The individual expenditure lines within each category of expenditure, based on
the code structure of expenditure accounts maintained by the Treasury.
Article 2
Approval
An Act approving the State Budget for the period from 1 January 2011 and December 31, 2011, as well as:
a) Total revenues by groups including the own revenues of the autonomous funds and services listed in
Annex I to this law, are an integral part;
b) Total expenditure of groupings, including special funds and the funds to be transferred from the State
Budget funds for services to independent in 2011, listed in Annex II to this law, are an integral part;
c) Total expenditure of autonomous funds and services to be financed from its own revenue and grant the
State Budget, in Annex III to this law, made part.
Chapter II
Revenues
Article 3.
Revenues
In 2011, the Government is authorized to collect taxes and other tax duties established by law.
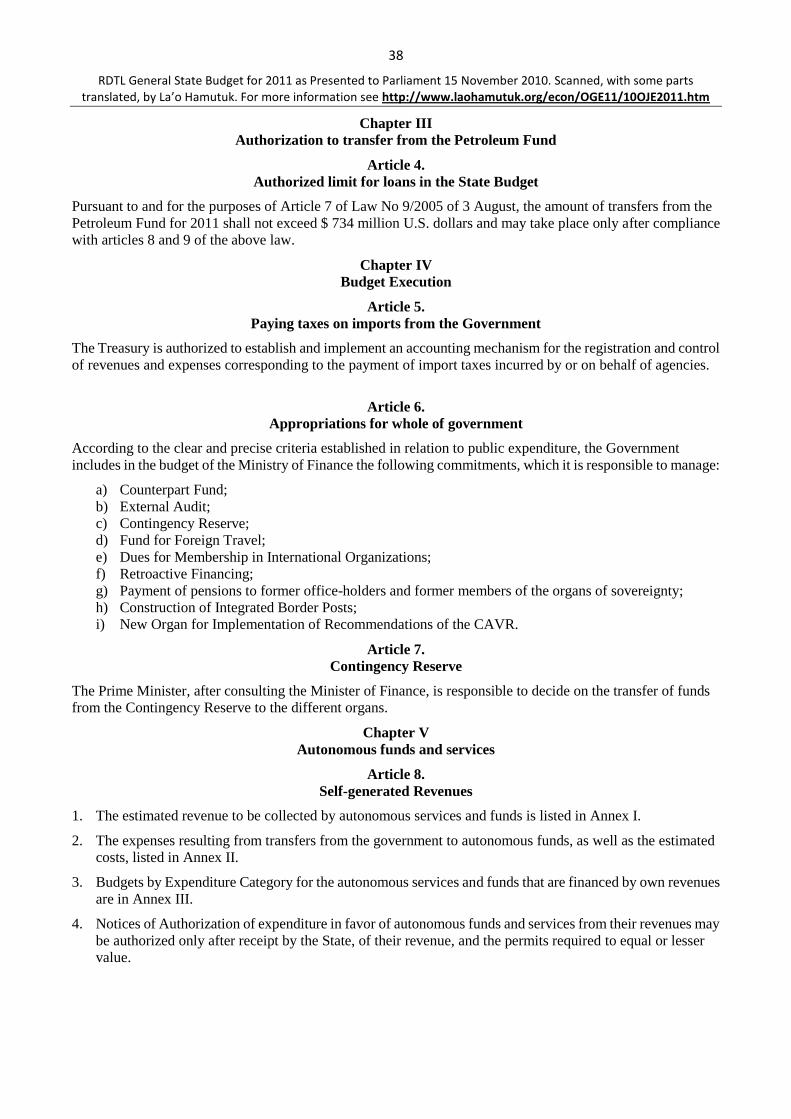
38
RDTL General State Budget for 2011 as Presented to Parliament 15 November 2010. Scanned, with some parts translated, by La’o Hamutuk. For more information see http://www.laohamutuk.org/econ/OGE11/10OJE2011.htm
Chapter III
Authorization to transfer from the Petroleum Fund
Article 4.
Authorized limit for loans in the State Budget
Pursuant to and for the purposes of Article 7 of Law No 9/2005 of 3 August, the amount of transfers from the
Petroleum Fund for 2011 shall not exceed $ 734 million U.S. dollars and may take place only after compliance
with articles 8 and 9 of the above law.
Chapter IV
Budget Execution
Article 5.
Paying taxes on imports from the Government
The Treasury is authorized to establish and implement an accounting mechanism for the registration and control
of revenues and expenses corresponding to the payment of import taxes incurred by or on behalf of agencies.
Article 6.
Appropriations for whole of government
According to the clear and precise criteria established in relation to public expenditure, the Government
includes in the budget of the Ministry of Finance the following commitments, which it is responsible to manage:
a) Counterpart Fund;
b) External Audit;
c) Contingency Reserve;
d) Fund for Foreign Travel;
e) Dues for Membership in International Organizations;
f) Retroactive Financing;
g) Payment of pensions to former office-holders and former members of the organs of sovereignty;
h) Construction of Integrated Border Posts;
i) New Organ for Implementation of Recommendations of the CAVR.
Article 7.
Contingency Reserve
The Prime Minister, after consulting the Minister of Finance, is responsible to decide on the transfer of funds
from the Contingency Reserve to the different organs.
Chapter V
Autonomous funds and services
Article 8.
Self-generated Revenues
1. The estimated revenue to be collected by autonomous services and funds is listed in Annex I.
2. The expenses resulting from transfers from the government to autonomous funds, as well as the estimated
costs, listed in Annex II.
3. Budgets by Expenditure Category for the autonomous services and funds that are financed by own revenues
are in Annex III.
4. Notices of Authorization of expenditure in favor of autonomous funds and services from their revenues may
be authorized only after receipt by the State, of their revenue, and the permits required to equal or lesser
value.
39
RDTL General State Budget for 2011 as Presented to Parliament 15 November 2010. Scanned, with some parts translated, by La’o Hamutuk. For more information see http://www.laohamutuk.org/econ/OGE11/10OJE2011.htm
Chapter VI
Special Funds
Article 9
Fund for Infrastructure and Fund for Development of Human Capital
1. Pursuant to Article 32 of Law No 13/2009, 21 October, Budget and Financial Management, the Government
is authorized to establish the Infrastructure Fund and the Fund for the Development of Human Capital.
2. The Infrastructure Fund is intended to fund projects aimed at strategic acquisitions, construction and
development of:
a) Road infrastructure, including roads, bridges, ports and airports;
b) Power generators and distribution lines;
c) Telecommunications;
d) Infrastructure to promote flood protection;
e) Installations for water treatment and sanitation;
f) Logistic facilities, including storage infrastructure;
g) Government buildings, including health facilities and education;
h) Other infrastructure that promotes the strategic development.
3. The Fund for Human Capital Development is intended to finance projects and programs of training of
human resources, including programs to increase the training of Timorese professionals in key sectors of
development such as justice, health, education, infrastructure, agriculture, tourism, petroleum management
and financial management, among others, which includes activities and actions undertaken in Timor-Leste
and the participation of Timorese citizens in overseas training, including scholarships for undergraduate and
postgraduate level.
4. The Funds mentioned in the preceding paragraphs are regulated by decree-law.
Chapter VII
Final Provisions
Article 10
Financing from Independent Donors
1. Each Authority may enter into agreements with independent donors to provide additional resources or
additional funding to budget allocations contained in this Act, with prior approval by the Minister of
Finance.
2. The management of this funding should be made in accordance with the directives issued by the Ministry of
Finance and donors‟ requirements.
Article 11
Entry into force
This Law shall enter into force on 1 February 2011, effective as of 1 January 2011.
Approved by the Council of Ministers on 11 November 2010.
/ S /
The Prime Minister
Kay Rala Xanana Gusmão
/ S /
The Minister of Finance
Emilia Pires

40
RDTL General State Budget for 2011 as Presented to Parliament 15 November 2010. Scanned, with some parts translated, by La’o Hamutuk. For more information see http://www.laohamutuk.org/econ/OGE11/10OJE2011.htm
Annex I to Budget Law
Estimated revenues to be collected in the State Budget of the
Democratic Republic of Timor-Leste for 201116
(U.S. $ million)
1. Total Revenues 2,398.1
1.1. Petroleum Revenues 2,288.0
1.1.1. Petroleum profits tax 1057.0
1.1.2. Rights in the Timor Sea 147.0
1.1.3. Income tax 355.0
1.1.4. Additional profits tax 395.0
1.1.5. Other Taxes and Petroleum Fees 38.0
1.1.6. Interest on the Petroleum Fund 296.0
1.2. Non-Petroleum Revenues 91.2
1.2.1. Direct taxes 22.3
1.2.2. Indirect taxes 42.6
1.2.3. User fees and other income 26.2
1.2.4. Interest on Treasury Account 0.1
1.3 Donations 0.0
1.4 Revenues of Autonomous Agencies 18.9
16
The values are not rounded, and therefore the sum may not accurately reflect the total costs.

41
RDTL General State Budget for 2011 as Presented to Parliament 15 November 2010. Scanned, with some parts translated, by La’o Hamutuk. For more information see http://www.laohamutuk.org/econ/OGE11/10OJE2011.htm
Annex II-A to Budget Law
Annex 2-A: Budget Expenditures for 2011 ($’000)
Salários e Venci-
mentos
Bens e Serviços
Transfer- ências
Capital Menor
Capital Desenvol- vimento
Total das Despesas
Incluindo Agências Autónomas 115,909 245,459 164,456 28,252 88,618 642,694
Excluindo Agências Autónomas 113,918 198,924 164,456 27,718 87,418 592,434
Presidente de República 500 5,471
300 6,271
Gabinete do Presidente da República 60 2,951
3,011
Administração Presidente República 440 1,235
300
1,975
Assessor Geral Presidente República 1,015
1,015
Secretariado Técnico Post CAVR 270
270
Parlamento Nacional 3,891 7,845
711 12,447
Parlamento Nacional 3,001 1,430
4,431
Gabinete do Presidente do Parlamento 63 475
538
Bancadas Parlamentares
112
112
Secretariado do Parlamento Nacional 827 4,161
694
5,682
Comissão A
142
142
Comissão B
147
147
Comissão C
144
144
Comissão D
117
117
Comissão E
144
144
Comissão F
136
136
Comissão G
141
141
Comissão H
92
92
Comissão I
61
61
Conselho Consultivo do Fundo Petrolifeiro
413
17
430
Grupo Mulheres Parlamentar do Timor Leste
130
130
Primeiro-Ministro e Presidência do Conselho de Ministros
3,008 17,130 21,046 974 29,880 72,038
Primeiro Ministro e Presidência do Conselho de Ministros (CoM)
950 9,767 9,450 481 28,811 49,459
Gabinete do Primeiro Ministro 66
66
Secretariado do Primeiro Ministro 25 831
856
Direcção de Administração e Finanças 78 1,018
121
1,217
Direcção dos Recursos Humanos 93 9
102
Residencia Oficial do Primeiro Ministro
51
51
Gabinete do Director Geral 16 6
22

42
RDTL General State Budget for 2011 as Presented to Parliament 15 November 2010. Scanned, with some parts translated, by La’o Hamutuk. For more information see http://www.laohamutuk.org/econ/OGE11/10OJE2011.htm
Salários e Venci-
mentos
Bens e Serviços
Transfer- ências
Capital Menor
Capital Desenvol- vimento
Total das Despesas
Gabinete dos Vice Primeiros Ministros 186 726 9,450
10,362
Agencia do Desenvolvimento Nacional (ADN)
3,500
28,811 32,311
Commissao Nacional de Aprovisionamento (CNA)
2,000
2,000
Serviço Nacional de Inteligência (SNI) 179 960
270
1,409
Gabinete da inspecção-Geral (IG) 307 666
90
1,063
Secretaria de Estado do Conselho de Ministros 306 3,066 87 3,459
Gabinete do Secretário de Estado 70 689
3
762
Direcção Nacional de Administração e de Apoio ao Conselho do Ministros
91 1,029
1
1,121
Direcção Nacional dos Serviços de Tradução 51 44
30
125
Unidade de Apoio Jurídico 17 534
551
Direcção de Disseminação de informação 35 504
23
562
Centro da Rádio Communltarla 21 56
30
107
Gabinete de Assuntos Parlamentares 21 210
231
Secretaria de Estado da Juventude e do Desporto 373 467 4,338 72 971 6,221
Gabinete do Secretario de Estado 64 45
109
Direcção de Administração e Finanças 146 335 128 72 971 1,652
Direcção Nacional da Juventude 25
375
400
Direcção da Educação Física e Desporto 19 40 3,382
3,441
Direcção da Politica do Desenvolvimento 34
300
334
Direcção Nacional de Arte 26
155
181
Gabinete do Director Geral 9 1
10
Direcção de Communlcação 48 46
94
Secretaria de Estado dos Recursos Naturais 220 1,989 4,300 146 6,655
Gabinete do Secretário da Estado 52 795
847
Direcção Nacional de Administração e Finanças 75 321
146
542
Direcção Nacional de Planeamento de Recursos Naturais
41 90 4,300
4,431
Direcção Nacional de Minerais 52 783
835
Secretaria de Estado para a Política Energética 181 537 1,963 60 2,741
Gabinete do Secretário de Estado 57 64
121
Direcção Nacional de Administração e Finanças 61 123
60
244
Direcção Nacional da Pesquisa r Políticas de Energia Alternativa
30 27
57
Direcção Nacional para Coordenação das Actividades de Energia Renovável
33 30 496
559
Grupo de Acção (Task Force) Para a instalação de Painel Solar
293 1,467
1,760
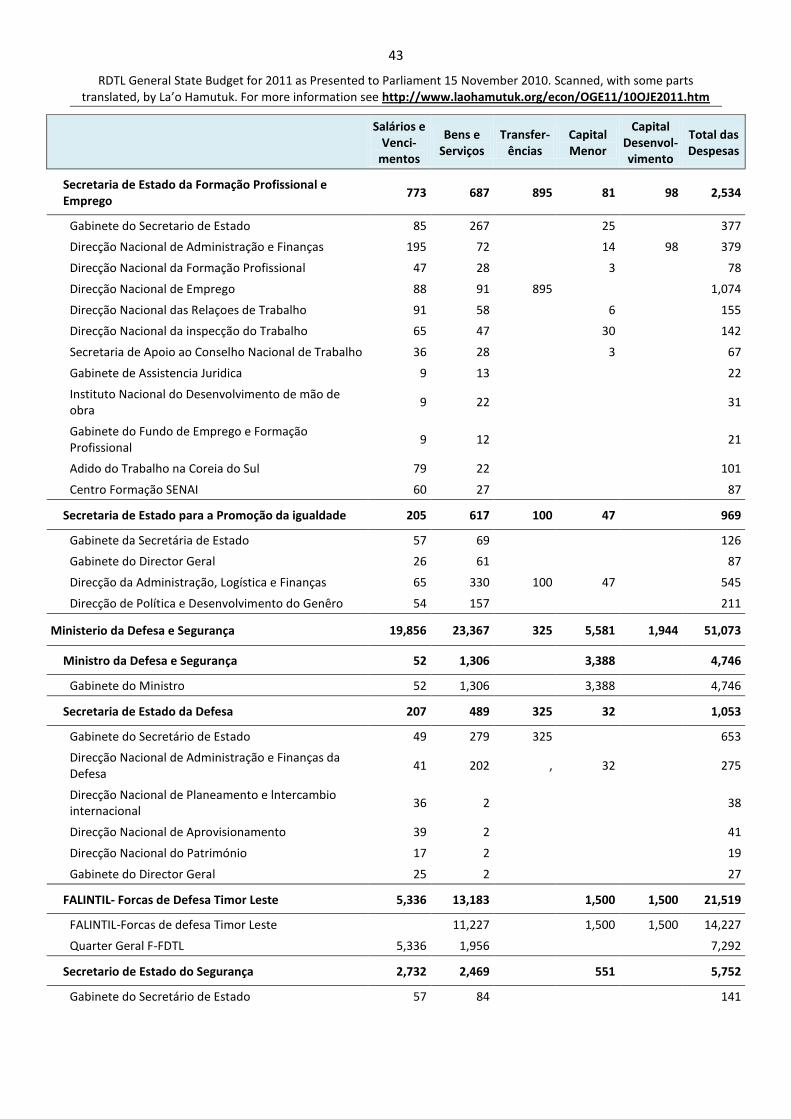
43
RDTL General State Budget for 2011 as Presented to Parliament 15 November 2010. Scanned, with some parts translated, by La’o Hamutuk. For more information see http://www.laohamutuk.org/econ/OGE11/10OJE2011.htm
Salários e Venci-
mentos
Bens e Serviços
Transfer- ências
Capital Menor
Capital Desenvol- vimento
Total das Despesas
Secretaria de Estado da Formação Profissional e Emprego
773 687 895 81 98 2,534
Gabinete do Secretario de Estado 85 267
25
377
Direcção Nacional de Administração e Finanças 195 72
14 98 379
Direcção Nacional da Formação Profissional 47 28
3
78
Direcção Nacional de Emprego 88 91 895
1,074
Direcção Nacional das Relaçoes de Trabalho 91 58
6
155
Direcção Nacional da inspecção do Trabalho 65 47
30
142
Secretaria de Apoio ao Conselho Nacional de Trabalho 36 28
3
67
Gabinete de Assistencia Juridica 9 13
22
Instituto Nacional do Desenvolvimento de mão de obra
9 22
31
Gabinete do Fundo de Emprego e Formação Profissional
9 12
21
Adido do Trabalho na Coreia do Sul 79 22
101
Centro Formação SENAI 60 27
87
Secretaria de Estado para a Promoção da igualdade 205 617 100 47 969
Gabinete da Secretária de Estado 57 69
126
Gabinete do Director Geral 26 61
87
Direcção da Administração, Logística e Finanças 65 330 100 47
545
Direcção de Política e Desenvolvimento do Genêro 54 157
211
Ministerio da Defesa e Segurança 19,856 23,367 325 5,581 1,944 51,073
Ministro da Defesa e Segurança 52 1,306 3,388 4,746
Gabinete do Ministro 52 1,306
3,388
4,746
Secretaria de Estado da Defesa 207 489 325 32 1,053
Gabinete do Secretário de Estado 49 279 325
653
Direcção Nacional de Administração e Finanças da Defesa
41 202 , 32
275
Direcção Nacional de Planeamento e lntercambio internacional
36 2
38
Direcção Nacional de Aprovisionamento 39 2
41
Direcção Nacional do Património 17 2
19
Gabinete do Director Geral 25 2
27
FALINTIL- Forcas de Defesa Timor Leste 5,336 13,183 1,500 1,500 21,519
FALINTIL-Forcas de defesa Timor Leste
11,227
1,500 1,500 14,227
Quarter Geral F-FDTL 5,336 1,956
7,292
Secretario de Estado do Segurança 2,732 2,469 551 5,752
Gabinete do Secretário de Estado 57 84
141

44
RDTL General State Budget for 2011 as Presented to Parliament 15 November 2010. Scanned, with some parts translated, by La’o Hamutuk. For more information see http://www.laohamutuk.org/econ/OGE11/10OJE2011.htm
Salários e Venci-
mentos
Bens e Serviços
Transfer- ências
Capital Menor
Capital Desenvol- vimento
Total das Despesas
Gabinete do Director Geral 31 24
55
Direcção Nacional das Financas 75 28
103
Direcção Nacional de Protecção Civil 718 519
416
1,653
Direcção Nacional de Segurança de Edificlos Publicas 1,565 550
2,115
Gabinete de inspecção e Auditoria 48 26
74
Direcção Nacional de Administração 72 553
40
665
Direcção Nacional Prevenção de Conflitos Comunitarlo
78 65
143
Direcção Nacional de Aprovisionamento 52 31
83
Serviços de Migração-Civil 36 589
95
720
Policia Nacional Timor-Leste 11,529 5,920 110 444 18,003
PNTL-Direcção Nacional de Administração e Financas 951 1,100
110 444 2,605
PNTL-Unidade Especial da Policia 1,523 1,125
2,648
PNTL-Servlcos de Migração 310
310
PNTL-Unida de Patulhamento das Frontreiras 857 504
1,361
PNTL-Unidade Marítima 215 296
511
PNTL-Comando Nacional de Operacoes 982 891
1,873
PNTL-Centro da Formação da Policia 345 769 ,
1,114
Regiao I 2,541 590
3,131
Regiao II 1,874 335
2,209
Regiao III 1,533 249
1,782
Regiao Especial de Oecusse 398 61
459
Ministério dos Negócios Estrangeiros 9,879 5,653 2,050 838 18,420
Gabinete do Ministro , 25
25
Sede no MNEC 9,879 4,281 2,050 625
16,835
Gabinete do Vice Ministro
30 ,
30
Missão Permanente Nova Iorque
40
40
Embaixada - Lisboa
42
42
Embalsado - Jakarta
46
46
Embaixada - Washington .
62
62
Embaixada - Canberra
60
12
72
Embaixada - Kuala Lumpur
33
33
Embaixada - Bruxelas
40
40
Embaixada - Banguecoque , 33
28
61
Embaixada-Tóquio
40
40
Embaixada - Pequim
36
45
81
Embaixada - Maputo
40
40
Consulado - Sidney
26
26
Consulado - Denpasar
28
28
Consulado - Kupang
31
50
81

45
RDTL General State Budget for 2011 as Presented to Parliament 15 November 2010. Scanned, with some parts translated, by La’o Hamutuk. For more information see http://www.laohamutuk.org/econ/OGE11/10OJE2011.htm
Salários e Venci-
mentos
Bens e Serviços
Transfer- ências
Capital Menor
Capital Desenvol- vimento
Total das Despesas
Demarcação da Fronteira Terrestre
210
210
Embaixada - Havana
35
,
35
Embaixada - Manila
33
40
73
Embaixada - Geneva
46
3
49
Visitas Oficiais
200
200
Embaixada - Vaticano
35
35
Embaixada - Brasilia
41
41
Embaixada - Seoul
30
30
Embaixada - CPLP/Unesco
28
28
Embaixada Prataria
20
20
Embaixada Luanda
45
45
Embaixada Singapura
37
35
72
Ministério das Finanças 2,938 7,306 1,707 1,900 13,851
Ministérto das Finanças 177 1,044
1,221
Direcção-Geral dos Serviços Corporativos 223 5,169
1,707 1,900 8,999
Direcção-Geral das Finanças do Estado 851 254
1,105
Direcção-Gerai das Receitas e Alfândegas 1,158 646
1,804
Direcção-Gerai de Analise e Pesquisa 529 193
722
Dotações para todo o Governo 50 34,003 2,700 2,664 3,044 42,461
DTG-Fundos de Contrapartidas
2,600
2,600
DTG-Auditoria Externa
1,500
1,500
DTG-Financiamento Retroactivo
200
200
DTG-Reserva de Contingência
27,000
27,000
DTG-Fundo de Viagens ao Estrangeiro
655
655
DTG-Quotas de Membro de instituições internacionais
845
845
DTG-Pensão aos Ex-Titulares
1,003 2,700 123 344 4,170
Construção de Postos integrado
2,541 2,700 5,241
Novo Organismo Publico para implementação das Recomendacoes do CAVR
50 200
250
Ministério da Justiça 2,513 4,689 667 7,869
Gabinete de Ministra 66 27
93
Gabinete do Director Geral 23 13
1
37
Direcção Nacional de Administração e Financas 379 1,689
307
2,375
Direcção Nacional de Assessoria Jurídica e Legislação 90 78
7
175
Direcção Nacional dos Direitos Humanos da Cidadania 84 119
3
206
Direcção Nacional dos Registos a do Notariado 412 974
194
1,580
Direcção Nacional dos Serviços Prisionais e Reinserção Social
469 652
34
1,155
Centro de Formação Juridica 32 216
23
271

46
RDTL General State Budget for 2011 as Presented to Parliament 15 November 2010. Scanned, with some parts translated, by La’o Hamutuk. For more information see http://www.laohamutuk.org/econ/OGE11/10OJE2011.htm
Salários e Venci-
mentos
Bens e Serviços
Transfer- ências
Capital Menor
Capital Desenvol- vimento
Total das Despesas
Defensoria Pública 432 141
39
612
DN. Terras, Propriedades Cadestr 431 634
29
1,094
Comis.Nac. dos Direitos Crianca 23 80
8
111
Gabinete de inspecção e de Auditorta 16 40
22
78
Gabinete do Vice Ministro 56 26
82
Ministério da Saúde 10,778 15,148 10,345 1,643 37,914
Gabinete do Ministro 68 95
163
Gabinete da Vice Ministra 61 98
159
Laboratório Nacional 228 543 , 22
793
Hospital Nacional Guido Valadares 1,694 2,099 3,125
6,918
Hospital Referencia Baucau 583 1,042
1,625
Hospital Referência Maliana 411 507
918
Hospital Referencia Maubisse 354 500
854
Hospital Referencia Oecusse 383 622
1,005
Hospital Referencia Suai 386 498
884
Serviços Distritais de Saúde de Aileu 308 242
550
Serviços Distritais de Saúde de Ainaro 313 235
548
Serviços Distritais de Saúde de Baucau 450 265
715
Serviços Distritais de Saúde de Bobonaro 343 234
577
Serviços Distritais de Saúde de Covalima 386 281
667
Serviços Distritais de Saúde de Dili 535 323
858
Serviços Distritais de Saúde de Ermera 395 228
623
Serviços Distritais de Saúde de Lautem 390 255
645
Serviços Distritais de Saúde de Liquiça 281 218
499
Serviços Distritais de Saúde de Manatuto 397 249
646
Serviços Distritais de Saúde de Manufahi 346 235
581
Instituto de Ciêncies da Saúde 185 141
12
338
Serviços Distritais de Saúde de Oecusse 294 221
515
Serviços Distritais de Saúde de Viqueque 410 246
656
Director Geral Saude 218 400
4
622
DN-Plano e Finanças 170 3,342 127 139
3,778
DN-Saude Comunitaria 202 324 6,000 2
6,528
DN-Recursos Humanos 409 351 868
1,628
DN-Servicos Hospital 183 780 225
1,188
DN-de Administração,Logist.e Aprovisionamento 229 501
1,450
2,180
Gab-Ins-Fisc.e Auditoria saude 166 73
14
253
Ministério Educação e Cultura 42,579 22,990 3,920 650 70,139
Gabinete do Ministro 67 132
199
Gabinete do Vice Ministro 57 97
154

47
RDTL General State Budget for 2011 as Presented to Parliament 15 November 2010. Scanned, with some parts translated, by La’o Hamutuk. For more information see http://www.laohamutuk.org/econ/OGE11/10OJE2011.htm
Salários e Venci-
mentos
Bens e Serviços
Transfer- ências
Capital Menor
Capital Desenvol- vimento
Total das Despesas
Gabinete do Inspector-Geral 88 212
300
Direcção Nacional de Administração,Finanças,Logistica e Aprovisionamento
241 2,662
1,080
3,983
Direcção Nacional da Politiça,Plano e Desenvolvimento
164 137
301
Universidade Nacional de Timor Leste 3,075 1,840
1,440
6,355
Unidade do infraestruturas
650 650
Gabinete Jurídico 2 100
102
Direcção nacional do Ensino Recorrente 196 1,304
1,500
lel Nacional Formação Professional 420 4,432
4,852
Gabinete de Protocolo e Media 61 282
400
743
Dir Curil Escolar,Materi e Ave 120 2,906
3,026
Direcção Regional-I 422 118
540
Direcção Regonal-III 318 98
416
Direcção Regonal-III 316 101
417
Direcção Reglonal-IV 353 105
458
Direcção Regonal-Oecussi 157 92
249
Direcção Nacional dos Recursos Humanos 174 90
264
Direcção Geral dos Services Corporailvos 91 57
148
Direcção Geral de Administração Escolar, inovação e Desenvolvimento Curricular
15 39
54
Direcção Geral do Ensino Supertor 29 30
59
Direcção Nacional de Aprovisionamento
12
12
Direcção Nacional do Ensino Superior unlversearlo 115 755
870
Direcção Nacional do Ensino Supertor Teceloa 7 7
Direcção Nacional de Desenvolvimenta da Ciencias e Techologias
20
20
Direcção Nacional de Acçao Social Escolar
2,812
2,812
Direcção Nacional de Educação Pre-Escolar
194
194
Direcção Nacional do Ensino Basico 30,331 2,797
33,128
Direcção Nacional do Ensino Secundario Geral 4,278 181
500
4,959
Direcção Nacional do Ensino Secundado Tecnico Vocacional
1,178 151
500
1,829
Agencia Nacional para Avalição e Acreditada Academica (ANAAA)
, 250
250
Servicos Distritais de Educação de Dili
13
13
Servicos Distritais de Educação de Baucau
13
13
Servicos Distritais de Educação de Aileu
13
13
Servicos Distritais de Educação de Ainaro
13
13
Servicos Distritais de Educação de Bobonaro
13
13
Servicos Distritais de Educação de Ermera
13
13
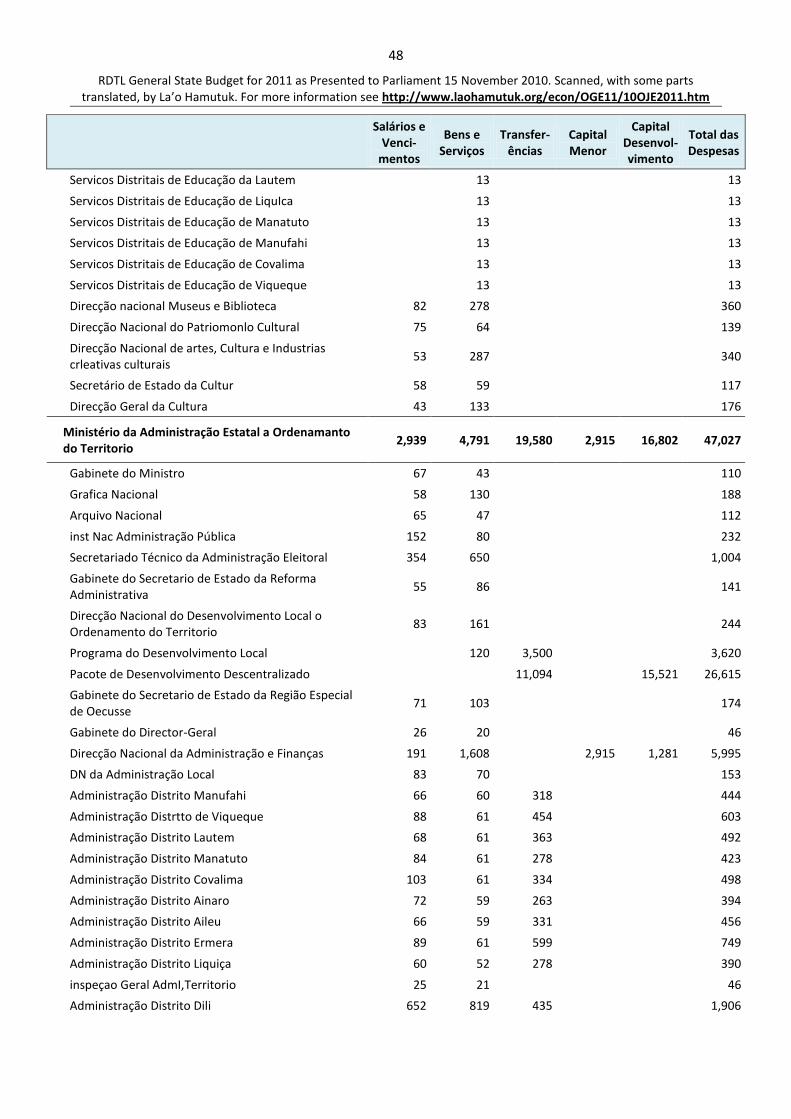
48
RDTL General State Budget for 2011 as Presented to Parliament 15 November 2010. Scanned, with some parts translated, by La’o Hamutuk. For more information see http://www.laohamutuk.org/econ/OGE11/10OJE2011.htm
Salários e Venci-
mentos
Bens e Serviços
Transfer- ências
Capital Menor
Capital Desenvol- vimento
Total das Despesas
Servicos Distritais de Educação da Lautem
13
13
Servicos Distritais de Educação de LiquIca
13
13
Servicos Distritais de Educação de Manatuto
13
13
Servicos Distritais de Educação de Manufahi
13
13
Servicos Distritais de Educação de Covalima
13
13
Servicos Distritais de Educação de Viqueque 13
13
Direcção nacional Museus e Biblioteca 82 278
360
Direcção Nacional do Patriomonlo Cultural 75 64
139
Direcção Nacional de artes, Cultura e Industrias crleativas culturais
53 287
340
Secretário de Estado da Cultur 58 59
117
Direcção Geral da Cultura 43 133
176
Ministério da Administração Estatal a Ordenamanto do Territorio
2,939 4,791 19,580 2,915 16,802 47,027
Gabinete do Ministro 67 43
110
Grafica Nacional 58 130
188
Arquivo Nacional 65 47
112
inst Nac Administração Pública 152 80
232
Secretariado Técnico da Administração Eleitoral 354 650
1,004
Gabinete do Secretario de Estado da Reforma Administrativa
55 86
141
Direcção Nacional do Desenvolvimento Local o Ordenamento do Territorio
83 161
244
Programa do Desenvolvimento Local
120 3,500
3,620
Pacote de Desenvolvimento Descentralizado
11,094
15,521 26,615
Gabinete do Secretario de Estado da Região Especial de Oecusse
71 103 174
Gabinete do Director-Geral 26 20
46
Direcção Nacional da Administração e Finanças 191 1,608
2,915 1,281 5,995
DN da Administração Local 83 70
153
Administração Distrito Manufahi 66 60 318
444
Administração Distrtto de Viqueque 88 61 454
603
Administração Distrito Lautem 68 61 363
492
Administração Distrito Manatuto 84 61 278
423
Administração Distrito Covalima 103 61 334
498
Administração Distrito Ainaro 72 59 263
394
Administração Distrito Aileu 66 59 331
456
Administração Distrito Ermera 89 61 599
749
Administração Distrito Liquiça 60 52 278
390
inspeçao Geral AdmI,Territorio 25 21
46
Administração Distrito Dili 652 819 435
1,906

49
RDTL General State Budget for 2011 as Presented to Parliament 15 November 2010. Scanned, with some parts translated, by La’o Hamutuk. For more information see http://www.laohamutuk.org/econ/OGE11/10OJE2011.htm
Salários e Venci-
mentos
Bens e Serviços
Transfer- ências
Capital Menor
Capital Desenvol- vimento
Total das Despesas
Administração Distrito Bobonaro 104 61 503
668
Administração Distrito Baucau 105 49 654
808
Administração Distrito Oecusse 96 59 174
329
Direcção Nacional de Apoio a Administração de Sucos 56 127
183
Ministério da Economia e Desenvolvimento 1,459 1,592 4,659 334 600 8,644
Gabineta do Ministro 68 61
129
Gabinete do inspecção Auditoria do Ministerlo 33 32
2
67
instituto de Apoio ao Desenvolvimento Empresarial 299 173 158 34
664
instituto para a Promoção de investimento e Exportação
16 342 120 19
497
Gabinete do Vice Ministro 59 36
95
DN Pesquisa Desenvolvi Nacional 58 59
8
125
Gabinete do Secretarto de Estado do Melo Ambiente 54 32
86
DN Servicos Melo Ambiente 221 104 300 87
712
Direcção Nacional para Assuntos Ambientais internacionais
44 45
89
Seio Est Desenvolv Rural e Coop 54 23
77
Direcção Nacional do Desenvolvimento Rural 299 96 300 1 600 1,296
Dir.Nac.dos Cooperativas 125 61 300
486
Gabinete do Director Geral 33 121
154
Economia-Administraçao e Finan 79 385 3,481 181
4,126
Departamento do Aprovisionamento 17 22
2
41
Ministério da Solidariedade Social 1,565 2,991 99,706 416 104,678
Gabinete da Ministra 65 46
111
inspecção e Auditoria Interna 33 65
98
Gabinete do Director Geral 42 33
75
Direcção Nacional da Administração e das Finanças 424 1,148
213
1,785
Gabinete do Secretário de Estado para os Assuntos dos Antigos Combatentes da Libertação Nacional
54 426
480
Direcção Nacional dos Assuntos dos Antigos Combatentes da Libertação Nacional
219 263 67,776 5
68,263
Gabinete do Secretario de Estado da Assistência Social e Desastres Naturais
53 45
98
Direcção Nacional da Assistencia Social 141 390 450 50
1,031
Direcção Nacional de Relnserção Social 263 246 2,362 20
2,891
Direcção Nacional de Gestão de Desastres 111 214 1,000 34
1,359
Secretario do Estado da Segurança Social 53 35
88
Direcção Nacional da Segurança Social 107 80 28,118 94
28,399
Ministério das infra-Estrutura incluindo Agências Autônomas
4,611 55,435 945 1,364 29,783 92,138

50
RDTL General State Budget for 2011 as Presented to Parliament 15 November 2010. Scanned, with some parts translated, by La’o Hamutuk. For more information see http://www.laohamutuk.org/econ/OGE11/10OJE2011.htm
Salários e Venci-
mentos
Bens e Serviços
Transfer- ências
Capital Menor
Capital Desenvol- vimento
Total das Despesas
Ministério das Infra-Estrutura Excluindo Agências Autônomas
2,620 8,901 945 830 28,583 41,879
Gabinete do Ministro 62 40
102
Gabinete do Director Geral 16 11
14
41
Autortdade Reguladora das Comunicações 67 68
11
146
Direcção dos Servicos Transportes Marítimos 54 46
100
Direcção Meteorologia e Geofisica 47 45
92
Direcção Nacional informatica Tecnologia 103 101
20
224
Direcção Nacional Administração e das Finanças 96 762
4
862
Direcção Nacional Transporte Terrestres 276 330
606
Direcção Nacional dos Correios de Timor-Leste 77 376
19
472
Autoridade da Aviação Civil de Timor-Leste 36 233
369
638
Administração de Aeroportos e Navegação Aerea de Timor Leste (Agencia Auto Financiada)
251 271
12
534
Autoridade Portuarla de Umes Leste (Agencia Auto Financiada)
87 163
250
Instituto Publico de Gestão de EquIpmentos (Agencia Auto Financiada)
653 613
52
1,318
Operações do Berlin - Nakroma
1,941
1,941
Gablnete do Secretario de Estado para Eletricidade, Agua e Urbanização
55 21
1
77
Gabinete do Director Geral 4 9
1
14
Direcção Geral dos Servicos Coorporativos 60 3,040 12 3,112
Direcção Nacional de Gestao dos Recursos de Agua 20 38
5
63
Direcção Nacional de Sorvicos de Aguas e Saneamento
538 735 945 43 2,758 5,019
Electricidade de Timor-Leste EDTL (Agencia Auto Financiada)
1,000 45,488
471 1,200 48,159
Tecnicos EDTL para Acompanhamento do Projeto da Central Electriça
7
7
Gabinete do Secretario de Estado das Obres Púbicas 51 20
3
74
Gabinete do Director Geral 21 13
11
45
Pireéção Nacional Administração e das Finanças 111 441
19
571
Direcção Nacional de Edificação,Habitação a Pisneamento Urbano
290 199
36
525
Direcção Nacional de Pesquisa e Desenvolvimento 92 185
187
464
Direcção Nacional de Estradas,Pontes e Controlo de Cheias
488 197
76 25,825 26,586
Gabinete Vice Ministro 57 45
102
Ministério do Turismo, Comercio e Industria 916 22,400 1,600 653 1,640 27,209
Gabinete do Ministro 67 394
461
Gabinete do Auditoris interna 34 29
63
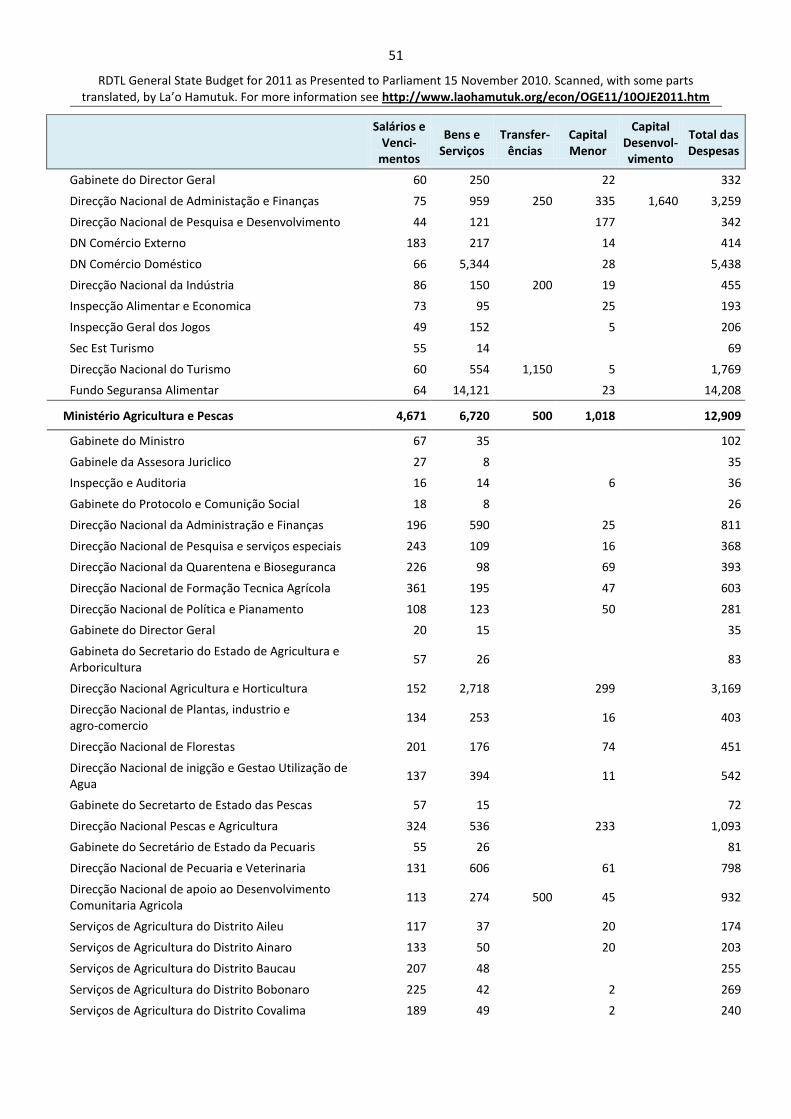
51
RDTL General State Budget for 2011 as Presented to Parliament 15 November 2010. Scanned, with some parts translated, by La’o Hamutuk. For more information see http://www.laohamutuk.org/econ/OGE11/10OJE2011.htm
Salários e Venci-
mentos
Bens e Serviços
Transfer- ências
Capital Menor
Capital Desenvol- vimento
Total das Despesas
Gabinete do Director Geral 60 250
22
332
Direcção Nacional de Administação e Finanças 75 959 250 335 1,640 3,259
Direcção Nacional de Pesquisa e Desenvolvimento 44 121
177
342
DN Comércio Externo 183 217
14
414
DN Comércio Doméstico 66 5,344
28
5,438
Direcção Nacional da Indústria 86 150 200 19
455
Inspecção Alimentar e Economica 73 95
25
193
Inspecção Geral dos Jogos 49 152
5
206
Sec Est Turismo 55 14
69
Direcção Nacional do Turismo 60 554 1,150 5
1,769
Fundo Seguransa Alimentar 64 14,121
23
14,208
Ministério Agricultura e Pescas 4,671 6,720 500 1,018 12,909
Gabinete do Ministro 67 35
102
Gabinele da Assesora Juriclico 27 8
35
Inspecção e Auditoria 16 14
6
36
Gabinete do Protocolo e Comunição Social 18 8
26
Direcção Nacional da Administração e Finanças 196 590
25
811
Direcção Nacional de Pesquisa e serviços especiais 243 109
16
368
Direcção Nacional da Quarentena e Bioseguranca 226 98
69
393
Direcção Nacional de Formação Tecnica Agrícola 361 195 47 603
Direcção Nacional de Política e Pianamento 108 123
50
281
Gabinete do Director Geral 20 15
35
Gabineta do Secretario do Estado de Agricultura e Arboricultura
57 26
83
Direcção Nacional Agricultura e Horticultura 152 2,718
299
3,169
Direcção Nacional de Plantas, industrio e agro-comercio
134 253
16
403
Direcção Nacional de Florestas 201 176
74
451
Direcção Nacional de inigção e Gestao Utilização de Agua
137 394
11
542
Gabinete do Secretarto de Estado das Pescas 57 15
72
Direcção Nacional Pescas e Agricultura 324 536
233
1,093
Gabinete do Secretário de Estado da Pecuaris 55 26
81
Direcção Nacional de Pecuaria e Veterinaria 131 606
61
798
Direcção Nacional de apoio ao Desenvolvimento Comunitaria Agricola
113 274 500 45
932
Serviços de Agricultura do Distrito Aileu 117 37
20
174
Serviços de Agricultura do Distrito Ainaro 133 50
20
203
Serviços de Agricultura do Distrito Baucau 207 48
255
Serviços de Agricultura do Distrito Bobonaro 225 42
2
269
Serviços de Agricultura do Distrito Covalima 189 49
2
240

52
RDTL General State Budget for 2011 as Presented to Parliament 15 November 2010. Scanned, with some parts translated, by La’o Hamutuk. For more information see http://www.laohamutuk.org/econ/OGE11/10OJE2011.htm
Salários e Venci-
mentos
Bens e Serviços
Transfer- ências
Capital Menor
Capital Desenvol- vimento
Total das Despesas
Serviços de Agricultura do Distrito Ermera 141 45
19
205
Serviços de Agricultura do Distrito Liquica 125 32
2
159
Serviços de Agricultura do Distrito Lautem 165 45
2
212
Serviços de Agricultura do Distrito Manatuto 163 35
198
Serviços de Agrtcultura do Distrito Manutahi 173 31
204
Serviços de Agricultura do Distrito Oecusse 203 43
246
Serviços de Agricultura do Distrito Viqueque 187 44
231
Tribunais 590 1,717 249 2,556
Conselho Superior de Magistral 4 8
10
22
Tribunal de Recurso 379 1,540
31
1,950
Tribunais Distritals 207 169
208
584
Procuradoria Geral da República 699 1,349 1,019 2,360 5,427
Procuradoria-Geral da República 571 1,223
1,019 2,360 5,173
Procuradoria Distrital de Bauçau 55 52
107
Procuradoria Distrital de Suai 38 37
75
Procuradoria Distrital de Oecusse 35 37
72
Provedoria dos Direitos Humanos e Justica 414 520 214 1,148
Provedoria de Direitos Humanos 414 520
214
1,148
Servico Publico de Radiodifusão,Televisao de Timor-Leste
659 1,687 421 15 2,782
Direcção de Informação 225 151
376
Administração e Financas 134 1,190
119 15 1,458
Radio-Timor-Leste 122 184
306
Direcção de Apoio Tecnico da RTTL EP 178 162
302
642
Comissão Nacional das Elelcoes 529 812 1,000 197 2,538
Comissão Nacional das Eleicoes 529 812 1,000 197
2,538
Comissão Anti Corrupção 567 773 309 1,649
Comissão de Anti-Corrupção 567 773
309
1,649
Comissão da Função Pública 298 1,070 138 1,506
Comissão da Função Publiça 298 1,070 138 1,506

53
RDTL General State Budget for 2011 as Presented to Parliament 15 November 2010. Scanned, with some parts translated, by La’o Hamutuk. For more information see http://www.laohamutuk.org/econ/OGE11/10OJE2011.htm
Annex II-B to Budget Law
Annex 2-B: Budget Expenditures for 2011 ($’000)
Infrastructure Fund
Programas Capital
Desenvolvimento Total das Despesas
Total 317,306 317,306
Agricultura 1,819 1,819
irrigação 1,819 1,819
Desenvolvimento Urbano o Rural 900 900
Edificios Públicos 9,900 9,900
Educação 2,400 2,400
Escolas 2,400 2,400
Energia Electrica 166,741 166,741
Equipamento informatico 9,400 9,400
MDG 65,000 65,000
Água e Sanitação 20,420 20,420
Habitação 44,580 44,580
Saúde 1,670 1,670
Hospitals / Clinicas 1,670 1,670
Segurança a Defesa 3,912 3,912
Soiidaridade e social 1,650 1,650
Monumentos 1,650 1,650
Tasi Mane 31,100 31,100
Aeroportos 6,500 6,500
Estrados e Pontes 980 980
Petroleo e Gas infraestrutura 23,620 23,620
Transporta 22,813 22,813
Aeroportos 2,228 2,228
Estradas e Pontes 15,485 15,485
Portos 5,100 5,100

54
RDTL General State Budget for 2011 as Presented to Parliament 15 November 2010. Scanned, with some parts translated, by La’o Hamutuk. For more information see http://www.laohamutuk.org/econ/OGE11/10OJE2011.htm
Annex II-C to Budget Law
Annex 2-C: Budget Expenditures for 2011 ($’000)
Human Capital Development Fund
Bens e Servisos Total das Despesas
Fundo de Desenvolvimento do Capital Humano
25,000 25,000
Formação Professional 4,810 4,810
Formação Tecnica 3,371 3,371
Bolsas de Estudos 12,952 12,952
Outros Tipos de Formação 3,867 3,867

55
RDTL General State Budget for 2011 as Presented to Parliament 15 November 2010. Scanned, with some parts translated, by La’o Hamutuk. For more information see http://www.laohamutuk.org/econ/OGE11/10OJE2011.htm
Annex III to Budget Law
Autonomous Organs that are partially funded by own revenues within the State
Budget of the Democratic Republic of Timor-Leste for 2011
(US$’000)
Expenditure Own
Revenues
Subsidy
from
Government
Electricity of Timor-Leste (EDTL)
Salaries and Wages 1,000
Goods and Services 45,488
Minor Capital 471
Development Capital 1,200
Total 48,159 14,500 33,659
ANATL (airports)
Salaries and Wages 251
Goods and Services 271
Minor Capital 12
Development Capital 0
Total 534 1,300 0
APORTIL (ports, including Berlin-Nakrona)
Salaries and Wages 87
Goods and Services 163
Minor Capital 0
Development Capital 0
Total 250 3,100 0
IGE (equipment management)
Salaries and Wages 653
Goods and Services 613
Minor Capital 52
Development Capital 0
Total 1,318 0 1,318
Total for Self-Funded Agencies 50,261 18,900 31,361
La’o Hamutuk note: the total subsidy column is reduced by the implied surpluses (not shown) from
ANATL($766) and APORTIL ($2,850). It does not include some subsidies in the CFTL budget.
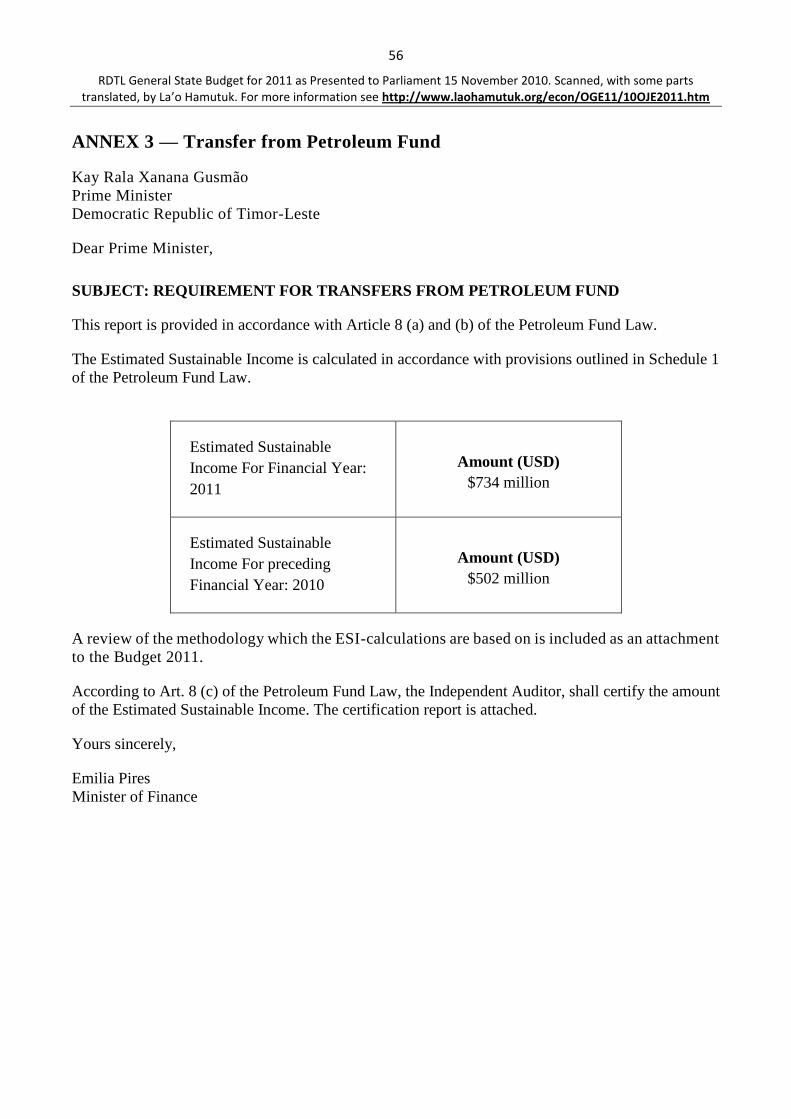
56
RDTL General State Budget for 2011 as Presented to Parliament 15 November 2010. Scanned, with some parts translated, by La’o Hamutuk. For more information see http://www.laohamutuk.org/econ/OGE11/10OJE2011.htm
ANNEX 3 — Transfer from Petroleum Fund
Kay Rala Xanana Gusmão
Prime Minister
Democratic Republic of Timor-Leste
Dear Prime Minister,
SUBJECT: REQUIREMENT FOR TRANSFERS FROM PETROLEUM FUND
This report is provided in accordance with Article 8 (a) and (b) of the Petroleum Fund Law.
The Estimated Sustainable Income is calculated in accordance with provisions outlined in Schedule 1
of the Petroleum Fund Law.
Estimated Sustainable
Income For Financial Year:
2011
Amount (USD)
$734 million
Estimated Sustainable
Income For preceding
Financial Year: 2010
Amount (USD)
$502 million
A review of the methodology which the ESI-calculations are based on is included as an attachment
to the Budget 2011.
According to Art. 8 (c) of the Petroleum Fund Law, the Independent Auditor, shall certify the amount
of the Estimated Sustainable Income. The certification report is attached.
Yours sincerely,
Emilia Pires
Minister of Finance

57
RDTL General State Budget for 2011 as Presented to Parliament 15 November 2010. Scanned, with some parts translated, by La’o Hamutuk. For more information see http://www.laohamutuk.org/econ/OGE11/10OJE2011.htm
ANNEX 4 — Deloitte Report