SATIN CREDITCARE NETWORK LIMITED
58
INVESTOR PRESENTATION – Q4FY16 SATIN CREDITCARE NETWORK LIMITED MAY 2016 BSE: 539404 | NSE: SATIN | CSE: 30024 Corporate Identity No. L65991DL1990PLC041796
-
Upload
khangminh22 -
Category
Documents
-
view
1 -
download
0
Transcript of SATIN CREDITCARE NETWORK LIMITED
INVESTOR PRESENTATION – Q4FY16
SATIN CREDITCARE NETWORK LIMITED
MAY 2016
BSE: 539404 | NSE: SATIN | CSE: 30024Corporate Identity No. L65991DL1990PLC041796
1
Disclaimer
This presentation (which may reflect some price sensitive information in terms of SEBI laws and Companies Act, 2013, as amended from time to time) has been prepared by Satin CreditcareNetwork Limited (the “Company”) solely for your information and for your use and may not be taken away, distributed, reproduced, or redistributed or passed on directly or indirectly to anyother person, whether within or outside your organization or firm, or published in whole or in part, for any purpose by recipients directly or indirectly to any other person. By accessing thispresentation, you agree to be bound by the trailing restrictions and to maintain absolute confidentiality regarding the information disclosed in these materials. The Company may alter, modifyor otherwise change in any manner the contents of this presentation, without obligation to notify any persons of such change or changes. This presentation and its contents are confidentialand may not be copied, published, reproduced or disseminated in any manner.
This presentation may contain certain forward looking statements within the meaning of applicable securities law and regulations. These statements include descriptions regarding the intent,belief or current expectations of the Company or its directors and officers with respect to the results of operations and financial condition of the Company. Such forward-looking statementsare not guarantees of future performance and involve risks and uncertainties, and actual results may differ from those in such forward-looking statements as a result of various factors andassumptions which the Company believes to be reasonable in light of its operating experience in recent years. Many factors could cause the actual results, performances, or achievements ofthe Company to be materially different from any future results, performances, or achievements. Significant factors that could make a difference to the Company’s operations include domesticand international economic conditions, changes in government regulations, tax regime and other statutes. The Company does not undertake to revise any forward-looking statement that maybe made from time to time by or on behalf of the Company.
This presentation contains certain supplemental measures of performance and liquidity that are not required by or presented in accordance with Indian GAAP, and should not be consideredan alternative to profit, operating revenue or any other performance measures derived in accordance with Indian GAAP or an alternative to cash flow from operations as a measure of liquidityof the Company.
In no event shall the Company be responsible to any person or entity for any loss or damage, whether direct, indirect, incidental, consequential or otherwise, arising out of access or use ordissemination of information contained in this presentation, including, but not limited to, loss of profits.
No representation, warranty, guarantee or undertaking (express or implied) is made as to, and no reliance should be placed on, the accuracy, completeness or correctness of any information,including any projections, estimates, targets and opinions, contained herein, and no liability whatsoever is accepted as to any errors, omissions or misstatements contained herein and,accordingly, none of the Company, its advisors and representative and any of its or their affiliates, officers, directors, employees or agents, and anyone acting on behalf of such persons acceptsany responsibility or liability whatsoever, in negligence or otherwise, arising directly or indirectly from this presentation or its contents or otherwise arising in connection therewith.
You must make your own assessment of the relevance, accuracy and adequacy of the information contained in this presentation and must make such independent investigation as you mayconsider necessary or appropriate for such purpose. Any opinions expressed in this presentation are subject to change without notice and past performance is not indicative of future results.By attending this presentation you acknowledge that you will be solely responsible for your own assessment of the market and the market position of the Company and that you will conductyour own analysis and be solely responsible for forming your own view of the potential future performance of the Company’s business.
This presentation is not for publication or distribution or release in any country where such distribution may lead to a breach of any law or regulatory requirement. The information containedherein does not constitute or form part of an offer, or solicitation of an offer to purchase or subscribe, for securities for sale. The distribution of this presentation in certain jurisdictions may berestricted by law and persons into whose possession this presentation comes should inform themselves about and observe any such restrictions
By accessing this presentation, you accept that this disclaimer and any claims arising out of the use of the information from this presentation shall be governed by the laws of India and onlythe courts in Delhi, and no other courts, shall have jurisdiction over the same.
2
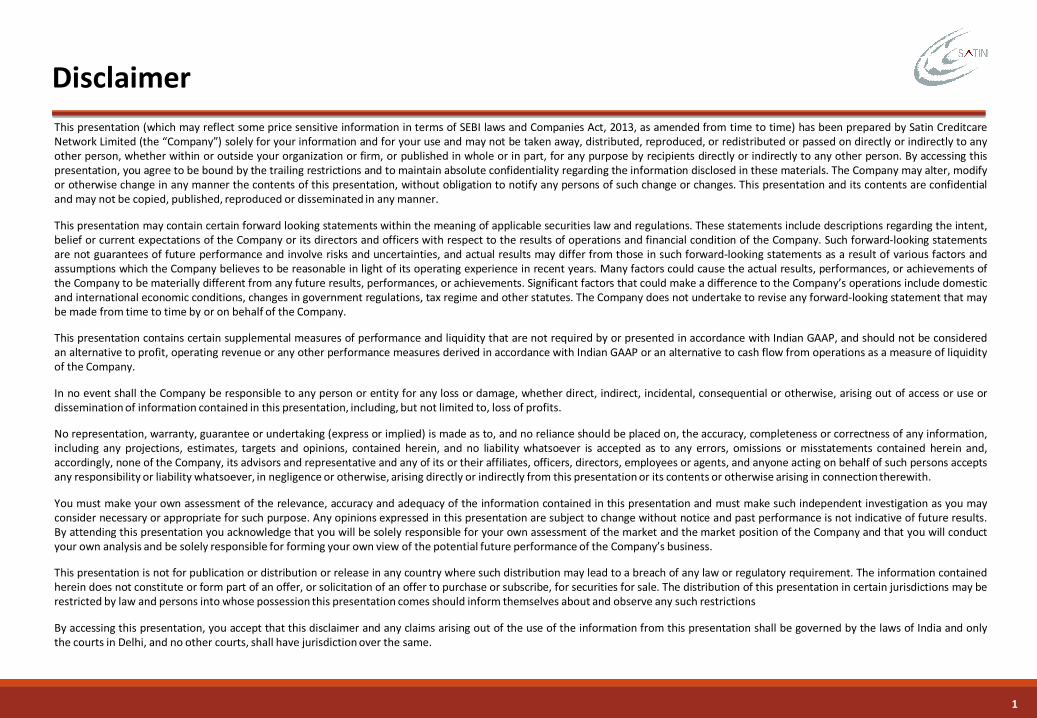
Contents
Details Slide No.
Business Performance Summary 3
Corporate Overview 6
Operational Overview 13
Financial Overview 23
Borrowing Profile 28
Operational Process Overview 32
Risk Management 36
Information Technology 38
Business Outlook 41
Corporate Governance & Management Team 43
CSR & Social Performance Management (SPM) 47
Microfinance Industry & Regulatory Scenario 49
Business Performance Summary
4
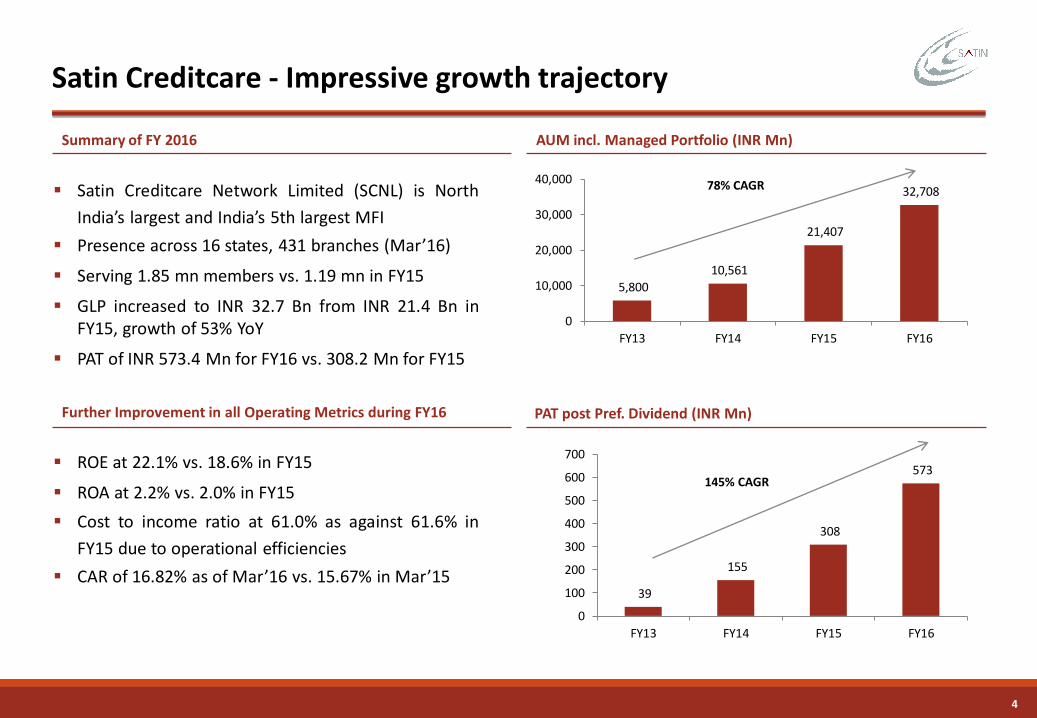
Satin Creditcare Network Limited (SCNL) is North
India’s largest and India’s 5th largest MFI
Presence across 16 states, 431 branches (Mar’16)
Serving 1.85 mn members vs. 1.19 mn in FY15
GLP increased to INR 32.7 Bn from INR 21.4 Bn inFY15, growth of 53% YoY
PAT of INR 573.4 Mn for FY16 vs. 308.2 Mn for FY15
Satin Creditcare - Impressive growth trajectory
5,800
10,561
21,407
32,708
0
10,000
20,000
30,000
40,000
FY13 FY14 FY15 FY16
78% CAGR
39
155
308
573
0
100
200
300
400
500
600
700
FY13 FY14 FY15 FY16
145% CAGR
ROE at 22.1% vs. 18.6% in FY15
ROA at 2.2% vs. 2.0% in FY15
Cost to income ratio at 61.0% as against 61.6% in
FY15 due to operational efficiencies
CAR of 16.82% as of Mar’16 vs. 15.67% in Mar’15
Summary of FY 2016 AUM incl. Managed Portfolio (INR Mn)
Further Improvement in all Operating Metrics during FY16 PAT post Pref. Dividend (INR Mn)
5
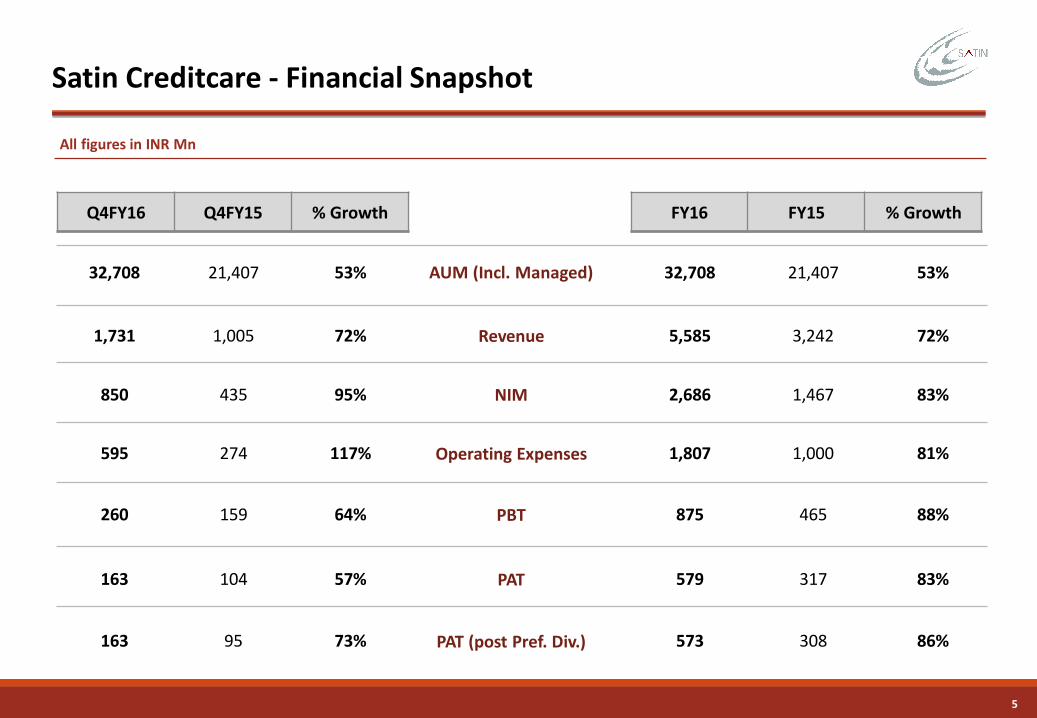
Satin Creditcare - Financial Snapshot
AUM (Incl. Managed)
Revenue
Operating Expenses
32,708 21,407 53%
1,731 1,005 72%
595 274 117%
32,708 21,407 53%
5,585 3,242 72%
1,807 1,000 81%
All figures in INR Mn
NIM850 435 95% 2,686 1,467 83%
PAT
PAT (post Pref. Div.)
163 104 57%
163 95 73%
579 317 83%
573 308 86%
PBT260 159 64% 875 465 88%
Q4FY16 Q4FY15 % Growth FY16 FY15 % Growth

Corporate Overview
7
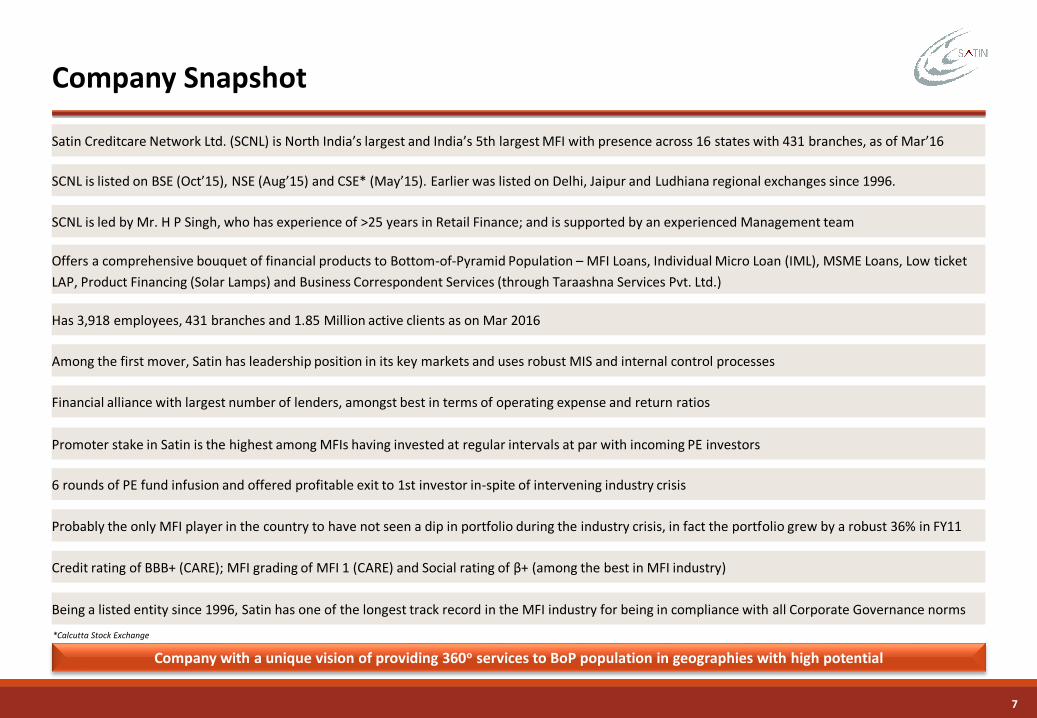
Satin Creditcare Network Ltd. (SCNL) is North India’s largest and India’s 5th largest MFI with presence across 16 states with 431 branches, as of Mar’16
Company Snapshot
Company with a unique vision of providing 360o services to BoP population in geographies with high potential
*Calcutta Stock Exchange
SCNL is listed on BSE (Oct’15), NSE (Aug’15) and CSE* (May’15). Earlier was listed on Delhi, Jaipur and Ludhiana regional exchanges since 1996.
SCNL is led by Mr. H P Singh, who has experience of >25 years in Retail Finance; and is supported by an experienced Management team
Offers a comprehensive bouquet of financial products to Bottom-of-Pyramid Population – MFI Loans, Individual Micro Loan (IML), MSME Loans, Low ticket
LAP, Product Financing (Solar Lamps) and Business Correspondent Services (through Taraashna Services Pvt. Ltd.)
Has 3,918 employees, 431 branches and 1.85 Million active clients as on Mar 2016
Among the first mover, Satin has leadership position in its key markets and uses robust MIS and internal control processes
Financial alliance with largest number of lenders, amongst best in terms of operating expense and return ratios
Promoter stake in Satin is the highest among MFIs having invested at regular intervals at par with incoming PE investors
6 rounds of PE fund infusion and offered profitable exit to 1st investor in-spite of intervening industry crisis
Credit rating of BBB+ (CARE); MFI grading of MFI 1 (CARE) and Social rating of β+ (among the best in MFI industry)
Probably the only MFI player in the country to have not seen a dip in portfolio during the industry crisis, in fact the portfolio grew by a robust 36% in FY11
Being a listed entity since 1996, Satin has one of the longest track record in the MFI industry for being in compliance with all Corporate Governance norms
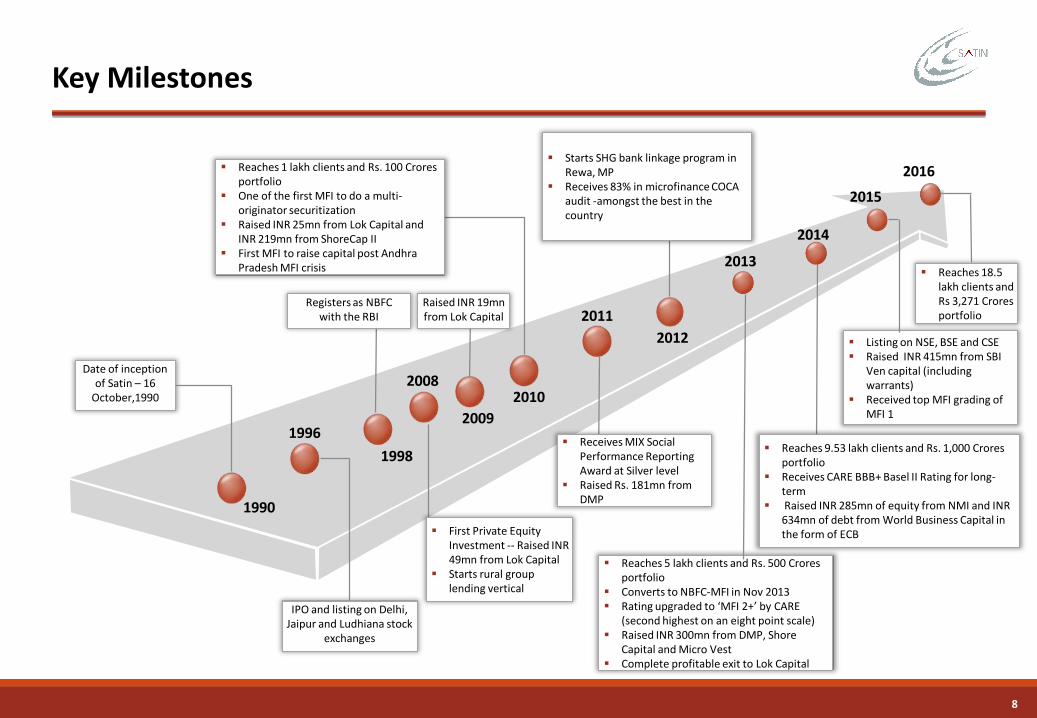
8
Key Milestones
Date of inception of Satin – 16
October,1990
IPO and listing on Delhi, Jaipur and Ludhiana stock
exchanges
Reaches 5 lakh clients and Rs. 500 Croresportfolio
Converts to NBFC-MFI in Nov 2013 Rating upgraded to ‘MFI 2+’ by CARE
(second highest on an eight point scale) Raised INR 300mn from DMP, Shore
Capital and Micro Vest Complete profitable exit to Lok Capital
Listing on NSE, BSE and CSE Raised INR 415mn from SBI
Ven capital (including warrants)
Received top MFI grading of MFI 1
1990
1996
1998
20082010
2011
2012
2013
2014
2015
Receives MIX Social Performance Reporting Award at Silver level
Raised Rs. 181mn from DMP
Starts SHG bank linkage program in Rewa, MP
Receives 83% in microfinance COCA audit -amongst the best in the country
Reaches 1 lakh clients and Rs. 100 Croresportfolio
One of the first MFI to do a multi-originator securitization
Raised INR 25mn from Lok Capital and INR 219mn from ShoreCap II
First MFI to raise capital post Andhra Pradesh MFI crisis
Registers as NBFC with the RBI
2009
Reaches 9.53 lakh clients and Rs. 1,000 Croresportfolio
Receives CARE BBB+ Basel II Rating for long-term
Raised INR 285mn of equity from NMI and INR 634mn of debt from World Business Capital in the form of ECB
Raised INR 19mn from Lok Capital
First Private Equity Investment -- Raised INR 49mn from Lok Capital
Starts rural group lending vertical
2016
Reaches 18.5 lakh clients and Rs 3,271 Crores portfolio
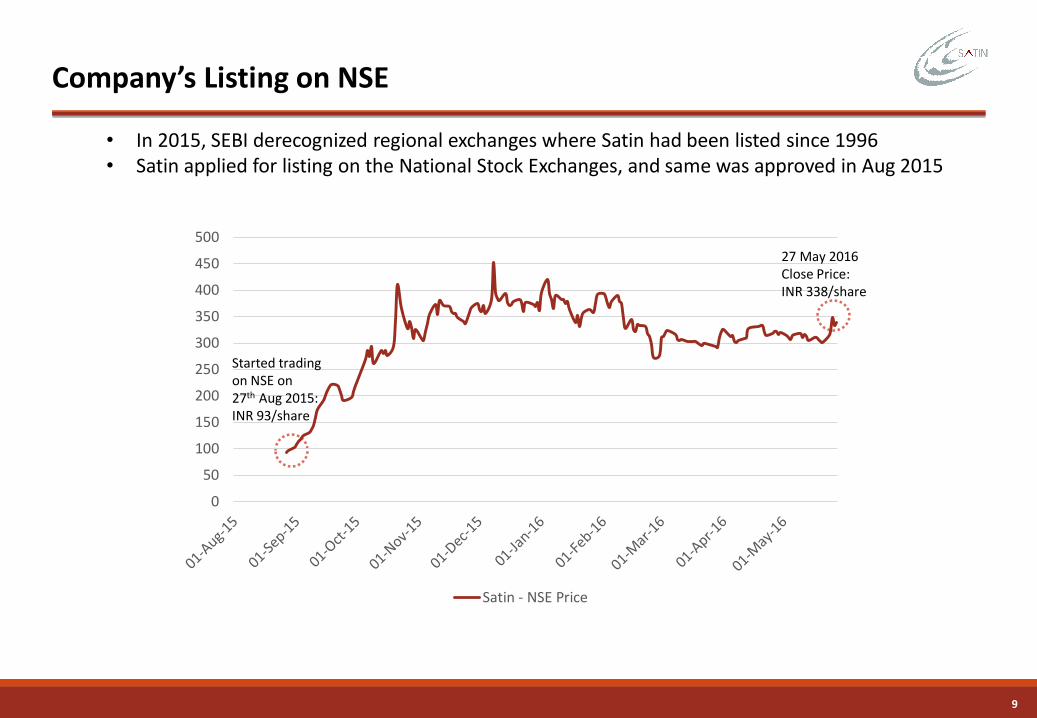
9
Company’s Listing on NSE
0
50
100
150
200
250
300
350
400
450
500
Satin - NSE Price
Started trading on NSE on 27th Aug 2015: INR 93/share
27 May 2016 Close Price: INR 338/share
• In 2015, SEBI derecognized regional exchanges where Satin had been listed since 1996• Satin applied for listing on the National Stock Exchanges, and same was approved in Aug 2015
10
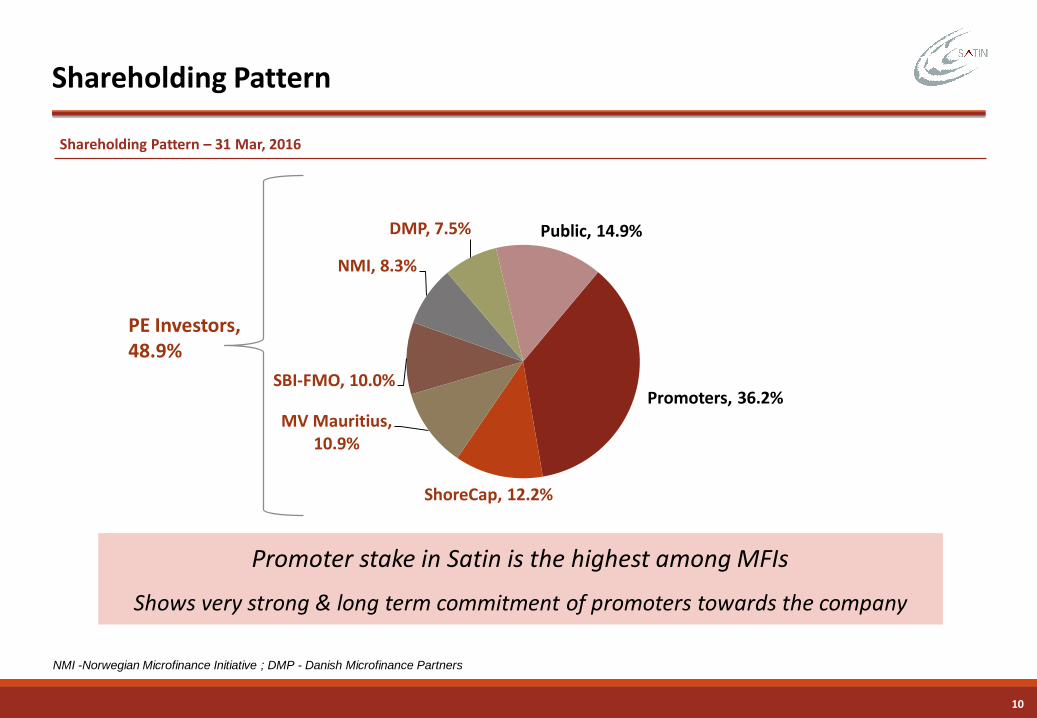
Shareholding Pattern
Shareholding Pattern – 31 Mar, 2016
Promoters, 36.2%
ShoreCap, 12.2%
MV Mauritius, 10.9%
SBI-FMO, 10.0%
NMI, 8.3%
DMP, 7.5% Public, 14.9%
Promoter stake in Satin is the highest among MFIs
Shows very strong & long term commitment of promoters towards the company
NMI -Norwegian Microfinance Initiative ; DMP - Danish Microfinance Partners
PE Investors,48.9%
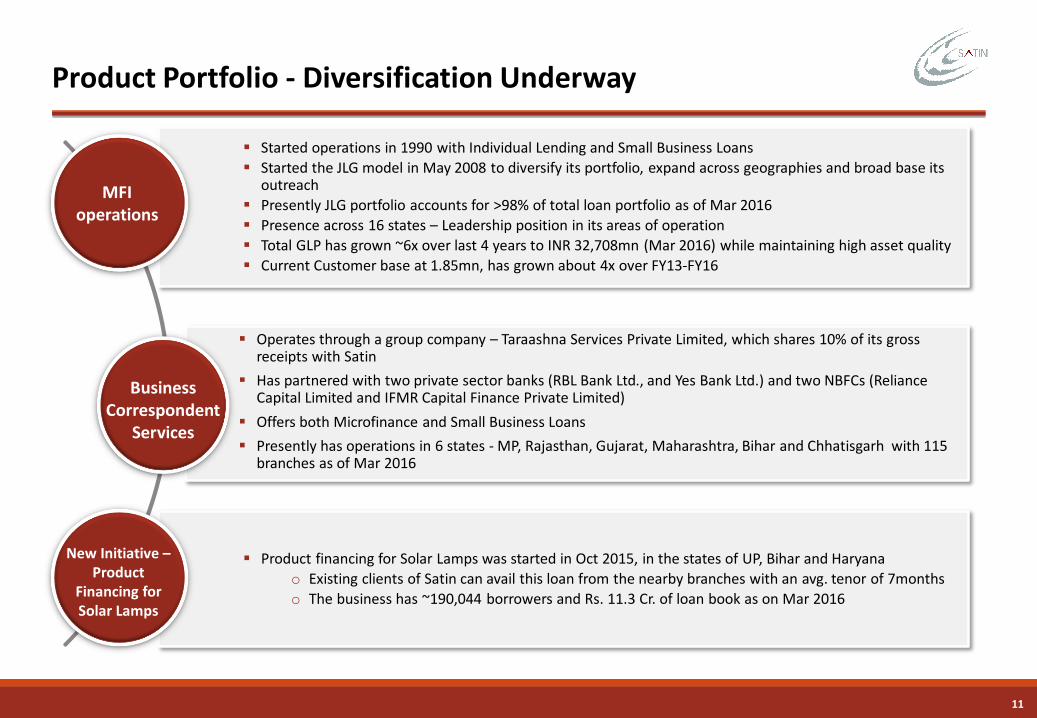
11
Product Portfolio - Diversification Underway
Started operations in 1990 with Individual Lending and Small Business Loans
Started the JLG model in May 2008 to diversify its portfolio, expand across geographies and broad base its outreach
Presently JLG portfolio accounts for >98% of total loan portfolio as of Mar 2016
Presence across 16 states – Leadership position in its areas of operation
Total GLP has grown ~6x over last 4 years to INR 32,708mn (Mar 2016) while maintaining high asset quality
Current Customer base at 1.85mn, has grown about 4x over FY13-FY16
Operates through a group company – Taraashna Services Private Limited, which shares 10% of its gross receipts with Satin
Has partnered with two private sector banks (RBL Bank Ltd., and Yes Bank Ltd.) and two NBFCs (Reliance Capital Limited and IFMR Capital Finance Private Limited)
Offers both Microfinance and Small Business Loans
Presently has operations in 6 states - MP, Rajasthan, Gujarat, Maharashtra, Bihar and Chhatisgarh with 115 branches as of Mar 2016
MFI operations
Business Correspondent
Services
Product financing for Solar Lamps was started in Oct 2015, in the states of UP, Bihar and Haryana
o Existing clients of Satin can avail this loan from the nearby branches with an avg. tenor of 7months
o The business has ~190,044 borrowers and Rs. 11.3 Cr. of loan book as on Mar 2016
New Initiative –Product
Financing for Solar Lamps
12
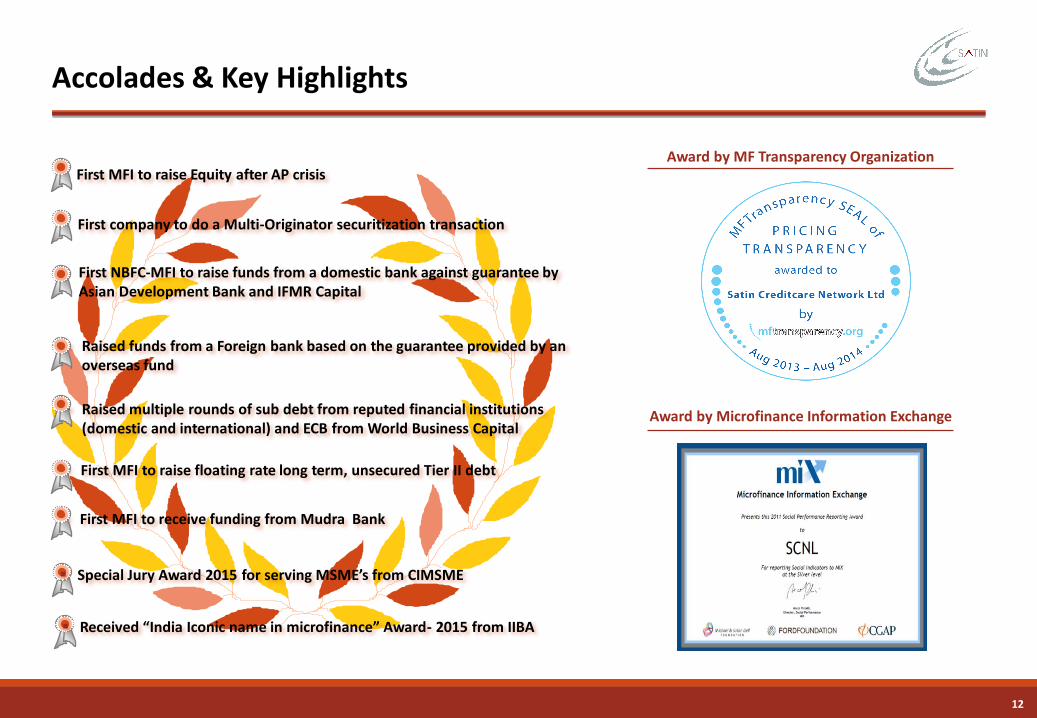
First MFI to raise Equity after AP crisis
First company to do a Multi-Originator securitization transaction
First NBFC-MFI to raise funds from a domestic bank against guarantee by Asian Development Bank and IFMR Capital
Raised funds from a Foreign bank based on the guarantee provided by an overseas fund
Raised multiple rounds of sub debt from reputed financial institutions (domestic and international) and ECB from World Business Capital
First MFI to raise floating rate long term, unsecured Tier II debt
First MFI to receive funding from Mudra Bank
Special Jury Award 2015 for serving MSME’s from CIMSME
Received “India Iconic name in microfinance” Award- 2015 from IIBA
Award by MF Transparency Organization
Accolades & Key Highlights
Award by Microfinance Information Exchange
Operational Overview
14
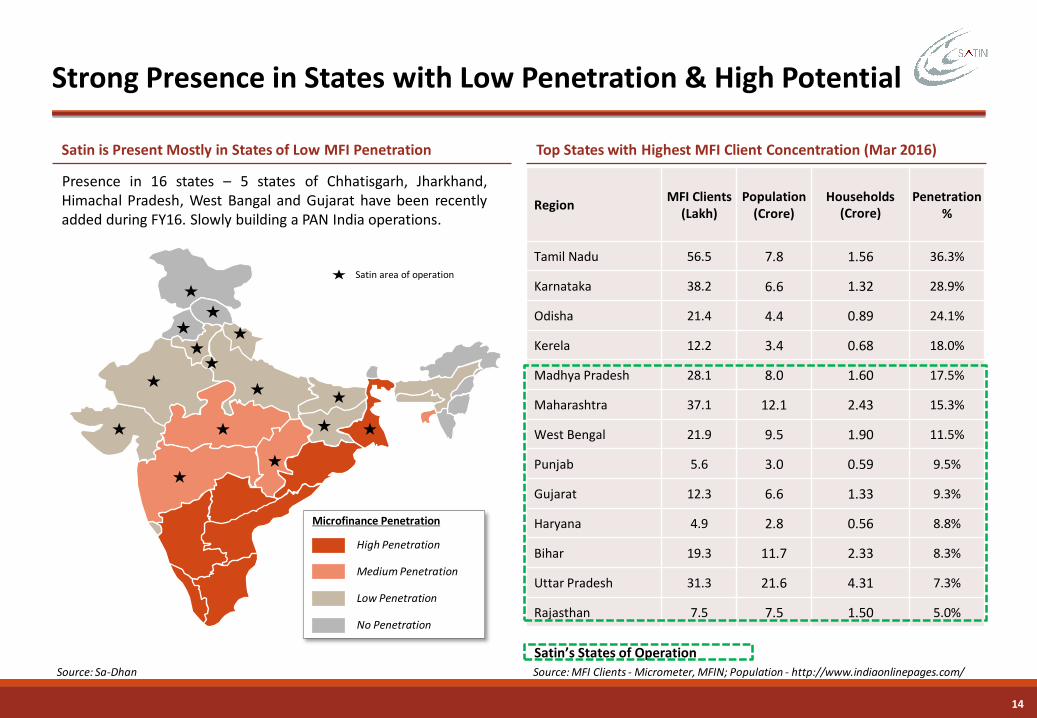
Satin is Present Mostly in States of Low MFI Penetration
Strong Presence in States with Low Penetration & High Potential
Source: Sa-Dhan
Presence in 16 states – 5 states of Chhatisgarh, Jharkhand,Himachal Pradesh, West Bangal and Gujarat have been recentlyadded during FY16. Slowly building a PAN India operations.
Satin area of operation
High Penetration
Microfinance Penetration
Medium Penetration
Low Penetration
No Penetration
Top States with Highest MFI Client Concentration (Mar 2016)
RegionMFI Clients
(Lakh)Population
(Crore)Households
(Crore)Penetration
%
Tamil Nadu 56.5 7.8 1.56 36.3%
Karnataka 38.2 6.6 1.32 28.9%
Odisha 21.4 4.4 0.89 24.1%
Kerela 12.2 3.4 0.68 18.0%
Madhya Pradesh 28.1 8.0 1.60 17.5%
Maharashtra 37.1 12.1 2.43 15.3%
West Bengal 21.9 9.5 1.90 11.5%
Punjab 5.6 3.0 0.59 9.5%
Gujarat 12.3 6.6 1.33 9.3%
Haryana 4.9 2.8 0.56 8.8%
Bihar 19.3 11.7 2.33 8.3%
Uttar Pradesh 31.3 21.6 4.31 7.3%
Rajasthan 7.5 7.5 1.50 5.0%
Satin’s States of Operation
Source: MFI Clients - Micrometer, MFIN; Population - http://www.indiaonlinepages.com/
15
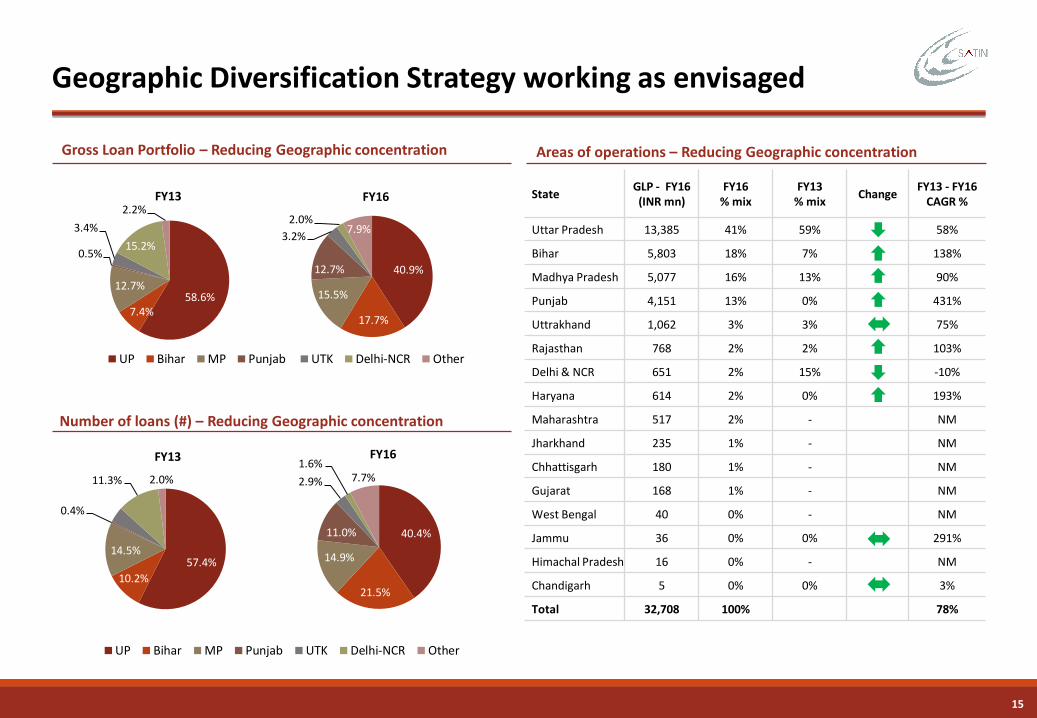
Gross Loan Portfolio – Reducing Geographic concentration
Geographic Diversification Strategy working as envisaged
Areas of operations – Reducing Geographic concentration
StateGLP - FY16 (INR mn)
FY16% mix
FY13% mix
ChangeFY13 - FY16
CAGR %
Uttar Pradesh 13,385 41% 59% 58%
Bihar 5,803 18% 7% 138%
Madhya Pradesh 5,077 16% 13% 90%
Punjab 4,151 13% 0% 431%
Uttrakhand 1,062 3% 3% 75%
Rajasthan 768 2% 2% 103%
Delhi & NCR 651 2% 15% -10%
Haryana 614 2% 0% 193%
Maharashtra 517 2% - NM
Jharkhand 235 1% - NM
Chhattisgarh 180 1% - NM
Gujarat 168 1% - NM
West Bengal 40 0% - NM
Jammu 36 0% 0% 291%
Himachal Pradesh 16 0% - NM
Chandigarh 5 0% 0% 3%
Total 32,708 100% 78%
58.6%7.4%
12.7%
0.5%
3.4%
15.2%
2.2%FY13
UP Bihar MP Punjab UTK Delhi-NCR Other
40.9%
17.7%
15.5%
12.7%
3.2%
2.0%7.9%
FY16
Number of loans (#) – Reducing Geographic concentration
57.4%
10.2%
14.5%
0.4%4.2%
11.3% 2.0%
FY13
UP Bihar MP Punjab UTK Delhi-NCR Other
40.4%
21.5%
14.9%
11.0%
2.9%
1.6%7.7%
FY16
16
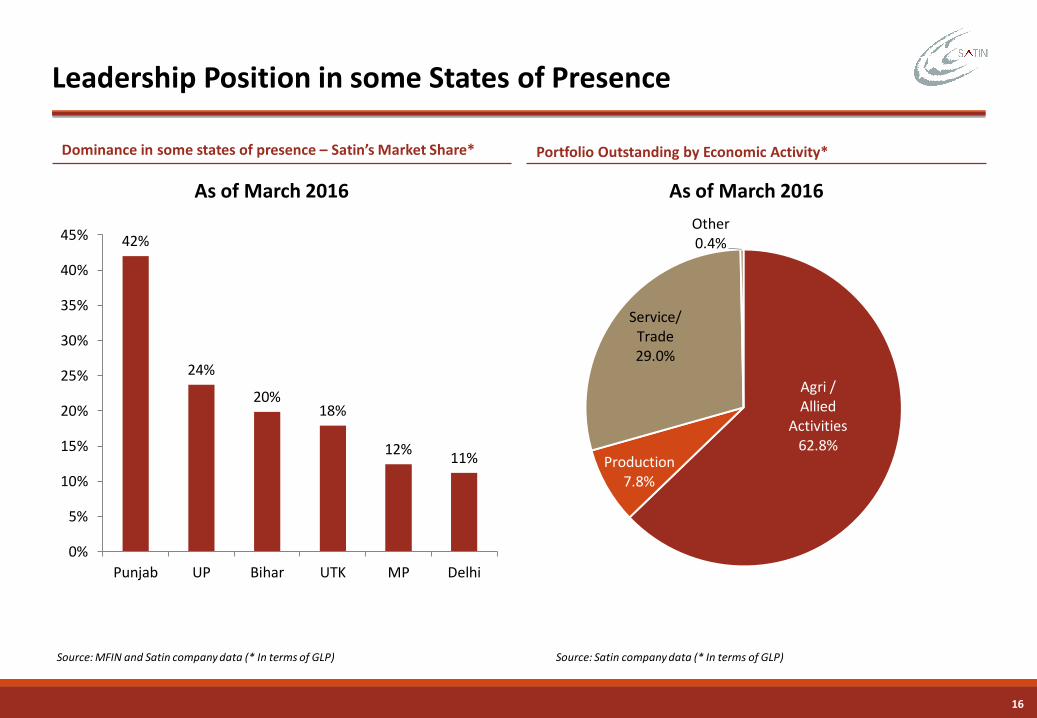
Leadership Position in some States of Presence
42%
24%
20%18%
12%11%
0%
5%
10%
15%
20%
25%
30%
35%
40%
45%
Punjab UP Bihar UTK MP Delhi
Source: MFIN and Satin company data (* In terms of GLP)
Dominance in some states of presence – Satin’s Market Share* Portfolio Outstanding by Economic Activity*
Agri / Allied
Activities62.8%
Production7.8%
Service/Trade29.0%
Other0.4%
As of March 2016As of March 2016
Source: Satin company data (* In terms of GLP)
17
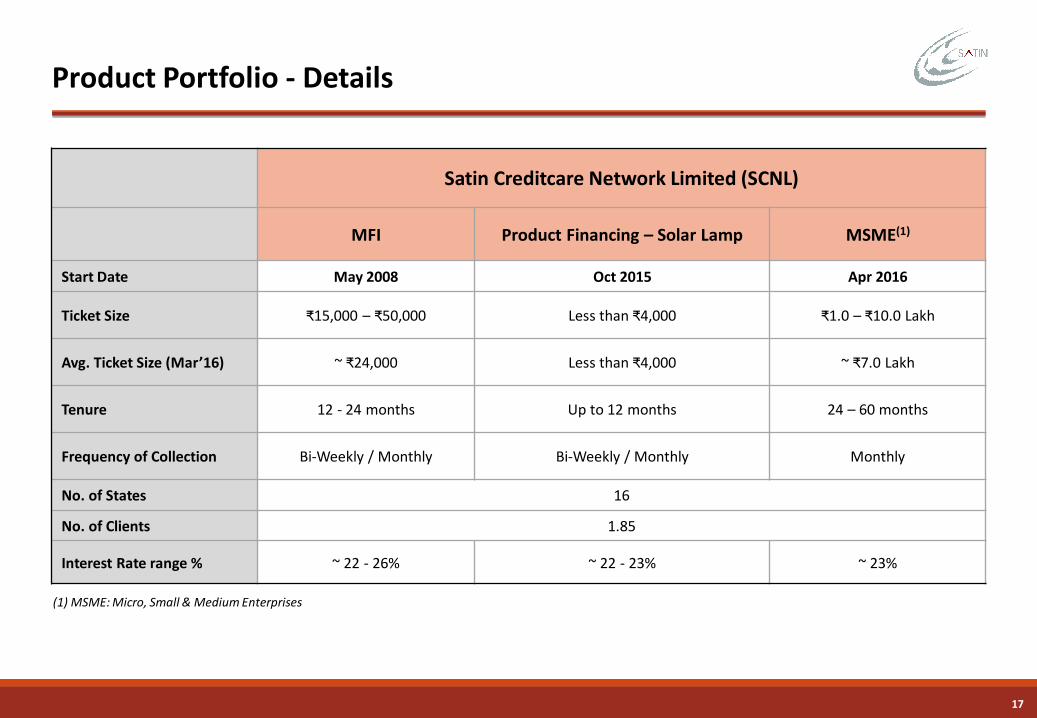
Product Portfolio - Details
Satin Creditcare Network Limited (SCNL)
MFI Product Financing – Solar Lamp MSME(1)
Start Date May 2008 Oct 2015 Apr 2016
Ticket Size ₹15,000 – ₹50,000 Less than ₹4,000 ₹1.0 – ₹10.0 Lakh
Avg. Ticket Size (Mar’16) ~ ₹24,000 Less than ₹4,000 ~ ₹7.0 Lakh
Tenure 12 - 24 months Up to 12 months 24 – 60 months
Frequency of Collection Bi-Weekly / Monthly Bi-Weekly / Monthly Monthly
No. of States 16
No. of Clients 1.85
Interest Rate range % ~ 22 - 26% ~ 22 - 23% ~ 23%
(1) MSME: Micro, Small & Medium Enterprises
18
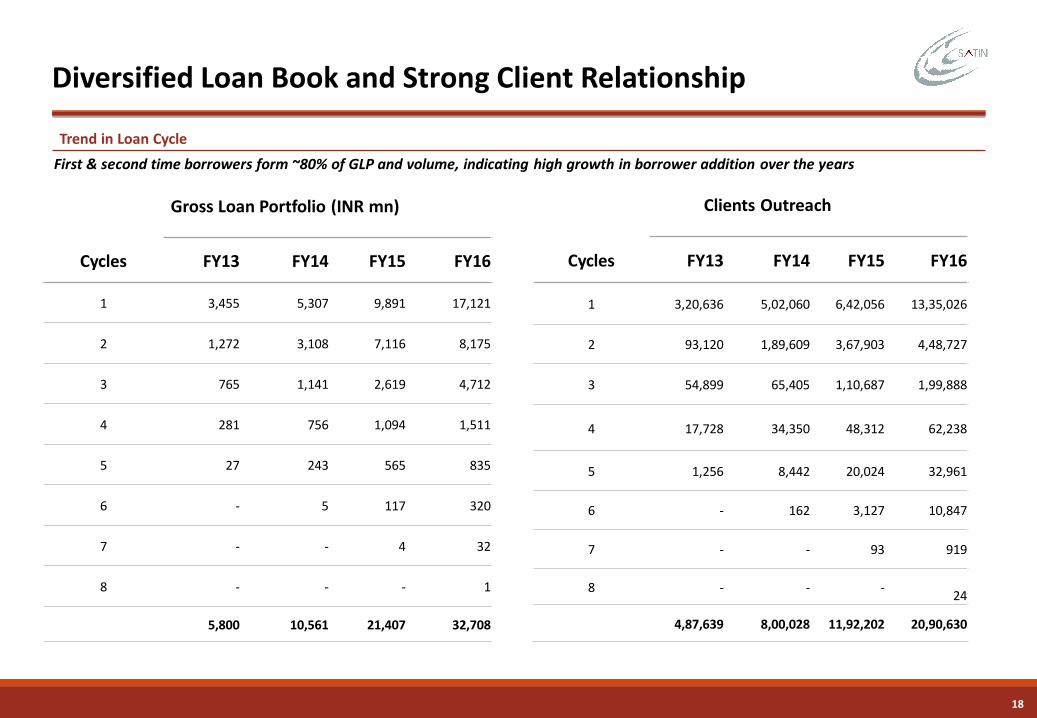
Diversified Loan Book and Strong Client Relationship
Trend in Loan Cycle
First & second time borrowers form ~80% of GLP and volume, indicating high growth in borrower addition over the years
Gross Loan Portfolio (INR mn)
Cycles FY13 FY14 FY15 FY16
1 3,455 5,307 9,891 17,121
2 1,272 3,108 7,116 8,175
3 765 1,141 2,619 4,712
4 281 756 1,094 1,511
5 27 243 565 835
6 - 5 117 320
7 - - 4 32
8 - - - 1
5,800 10,561 21,407 32,708
Clients Outreach
Cycles FY13 FY14 FY15 FY16
1 3,20,636 5,02,060 6,42,056 13,35,026
2 93,120 1,89,609 3,67,903 4,48,727
3 54,899 65,405 1,10,687 1,99,888
4 17,728 34,350 48,312 62,238
5 1,256 8,442 20,024 32,961
6 - 162 3,127 10,847
7 - - 93 919
8 - - -24
4,87,639 8,00,028 11,92,202 20,90,630
19
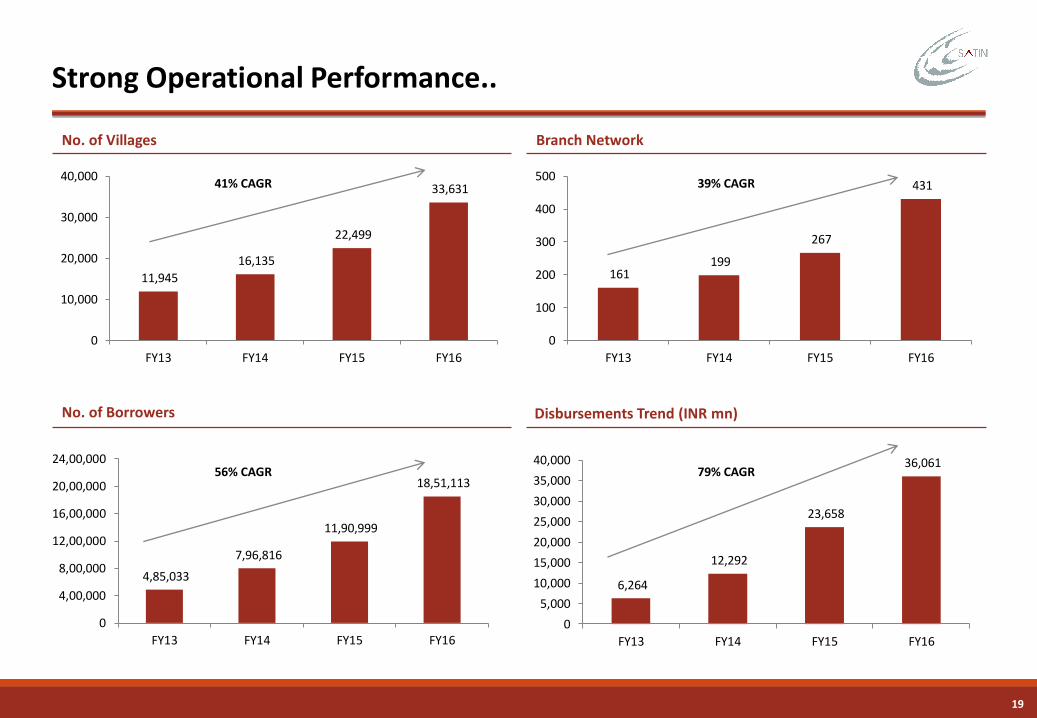
No. of Villages Branch Network
Strong Operational Performance..
11,945
16,135
22,499
33,631
0
10,000
20,000
30,000
40,000
FY13 FY14 FY15 FY16
161 199
267
431
0
100
200
300
400
500
FY13 FY14 FY15 FY16
39% CAGR41% CAGR
No. of Borrowers
4,85,033
7,96,816
11,90,999
18,51,113
0
4,00,000
8,00,000
12,00,000
16,00,000
20,00,000
24,00,000
FY13 FY14 FY15 FY16
56% CAGR
Disbursements Trend (INR mn)
6,264
12,292
23,658
36,061
0
5,000
10,000
15,000
20,000
25,000
30,000
35,000
40,000
FY13 FY14 FY15 FY16
79% CAGR
20
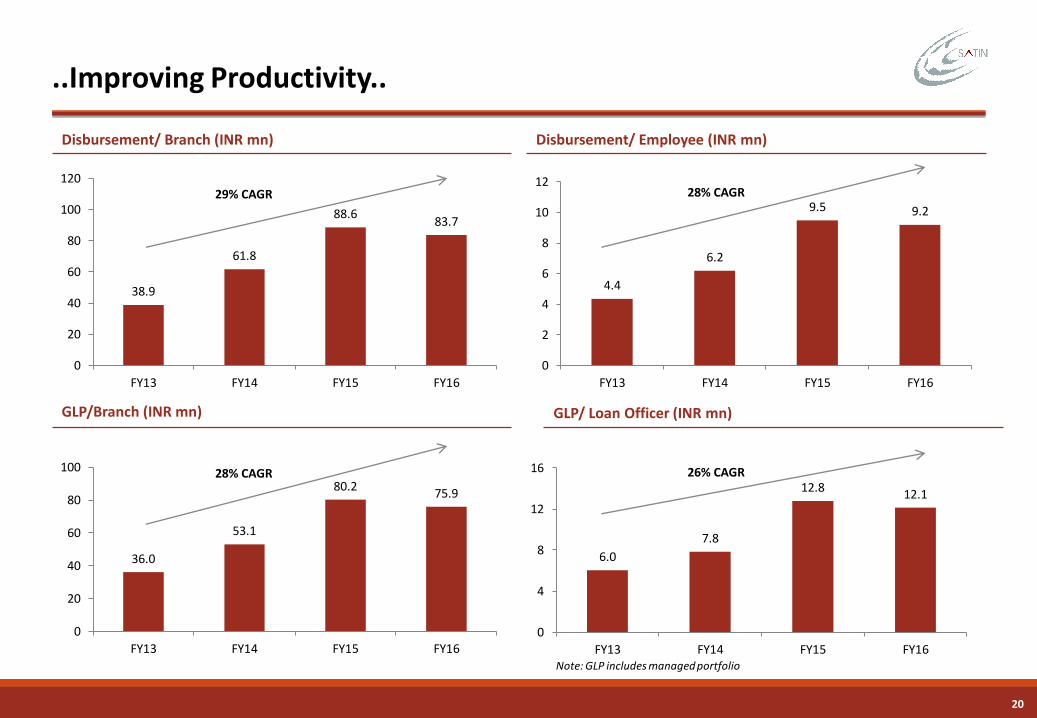
36.0
53.1
80.275.9
0
20
40
60
80
100
FY13 FY14 FY15 FY16
4.4
6.2
9.5 9.2
0
2
4
6
8
10
12
FY13 FY14 FY15 FY16
38.9
61.8
88.683.7
0
20
40
60
80
100
120
FY13 FY14 FY15 FY16
Disbursement/ Branch (INR mn) Disbursement/ Employee (INR mn)
GLP/Branch (INR mn)
..Improving Productivity..
29% CAGR 28% CAGR
GLP/ Loan Officer (INR mn)
28% CAGR
6.0
7.8
12.812.1
0
4
8
12
16
FY13 FY14 FY15 FY16
26% CAGR
Note: GLP includes managed portfolio
21
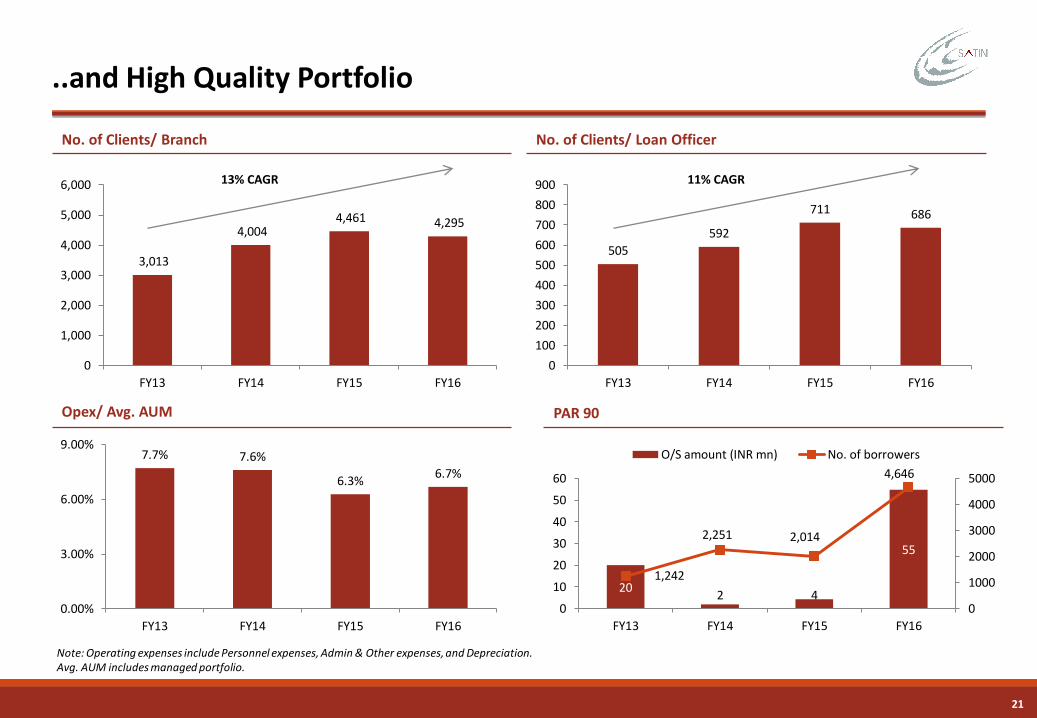
7.7% 7.6%
6.3%6.7%
0.00%
3.00%
6.00%
9.00%
FY13 FY14 FY15 FY16
505
592
711 686
0
100
200
300
400
500
600
700
800
900
FY13 FY14 FY15 FY16
3,013
4,004 4,461 4,295
0
1,000
2,000
3,000
4,000
5,000
6,000
FY13 FY14 FY15 FY16
No. of Clients/ Branch No. of Clients/ Loan Officer
Opex/ Avg. AUM
..and High Quality Portfolio
PAR 90
20 2 4
55
1,242
2,251 2,014
4,646
0
1000
2000
3000
4000
5000
0
10
20
30
40
50
60
FY13 FY14 FY15 FY16
O/S amount (INR mn) No. of borrowers
13% CAGR 11% CAGR
Note: Operating expenses include Personnel expenses, Admin & Other expenses, and Depreciation. Avg. AUM includes managed portfolio.
22
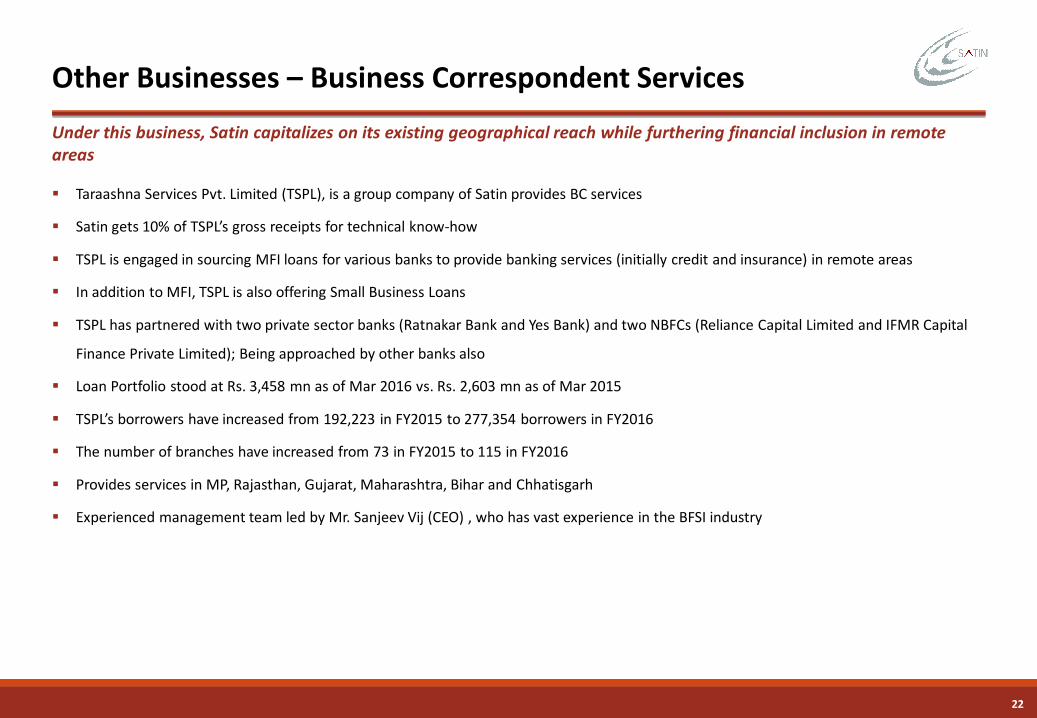
Taraashna Services Pvt. Limited (TSPL), is a group company of Satin provides BC services
Satin gets 10% of TSPL’s gross receipts for technical know-how
TSPL is engaged in sourcing MFI loans for various banks to provide banking services (initially credit and insurance) in remote areas
In addition to MFI, TSPL is also offering Small Business Loans
TSPL has partnered with two private sector banks (Ratnakar Bank and Yes Bank) and two NBFCs (Reliance Capital Limited and IFMR Capital
Finance Private Limited); Being approached by other banks also
Loan Portfolio stood at Rs. 3,458 mn as of Mar 2016 vs. Rs. 2,603 mn as of Mar 2015
TSPL’s borrowers have increased from 192,223 in FY2015 to 277,354 borrowers in FY2016
The number of branches have increased from 73 in FY2015 to 115 in FY2016
Provides services in MP, Rajasthan, Gujarat, Maharashtra, Bihar and Chhatisgarh
Experienced management team led by Mr. Sanjeev Vij (CEO) , who has vast experience in the BFSI industry
Other Businesses – Business Correspondent Services
Under this business, Satin capitalizes on its existing geographical reach while furthering financial inclusion in remote areas

Financial Overview
24
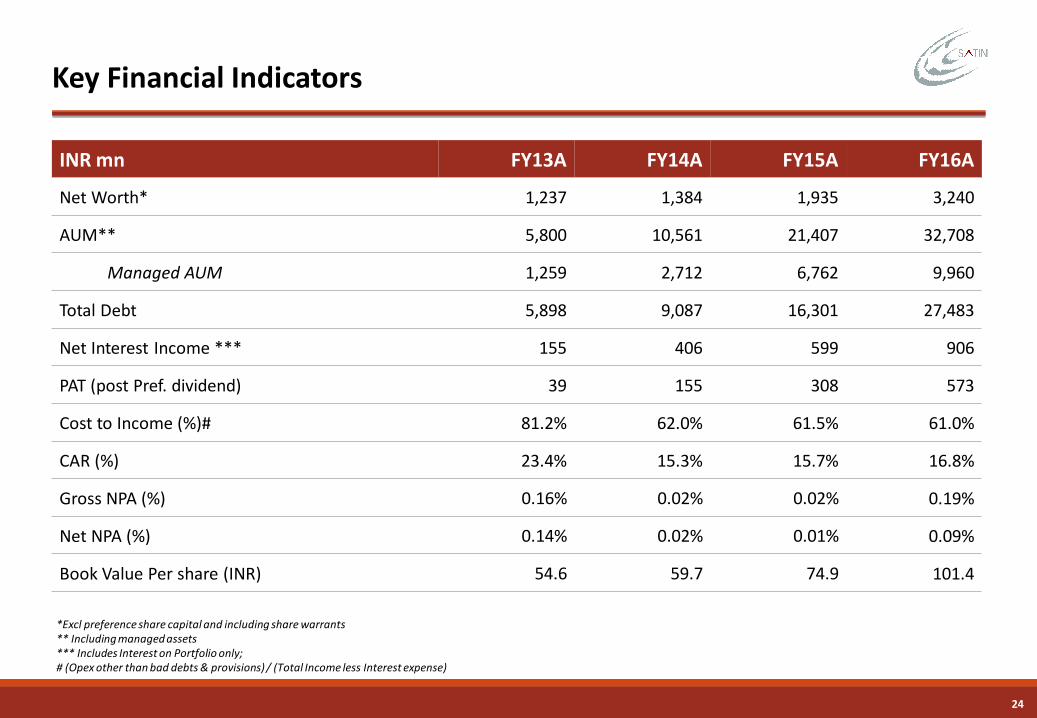
Key Financial Indicators
*Excl preference share capital and including share warrants** Including managed assets *** Includes Interest on Portfolio only; # (Opex other than bad debts & provisions) / (Total Income less Interest expense)
INR mn FY13A FY14A FY15A FY16A
Net Worth* 1,237 1,384 1,935 3,240
AUM** 5,800 10,561 21,407 32,708
Managed AUM 1,259 2,712 6,762 9,960
Total Debt 5,898 9,087 16,301 27,483
Net Interest Income *** 155 406 599 906
PAT (post Pref. dividend) 39 155 308 573
Cost to Income (%)# 81.2% 62.0% 61.5% 61.0%
CAR (%) 23.4% 15.3% 15.7% 16.8%
Gross NPA (%) 0.16% 0.02% 0.02% 0.19%
Net NPA (%) 0.14% 0.02% 0.01% 0.09%
Book Value Per share (INR) 54.6 59.7 74.9 101.4
25
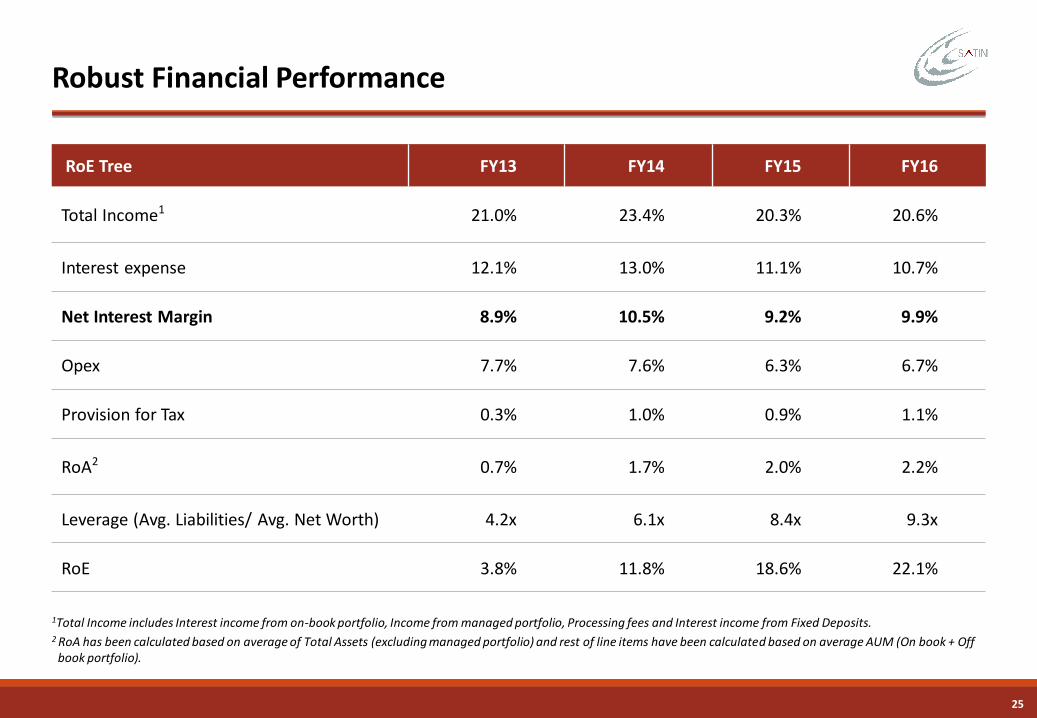
Robust Financial Performance
1Total Income includes Interest income from on-book portfolio, Income from managed portfolio, Processing fees and Interest income from Fixed Deposits.2 RoA has been calculated based on average of Total Assets (excluding managed portfolio) and rest of line items have been calculated based on average AUM (On book + Off
book portfolio).
RoE Tree FY13 FY14 FY15 FY16
Total Income1 21.0% 23.4% 20.3% 20.6%
Interest expense 12.1% 13.0% 11.1% 10.7%
Net Interest Margin 8.9% 10.5% 9.2% 9.9%
Opex 7.7% 7.6% 6.3% 6.7%
Provision for Tax 0.3% 1.0% 0.9% 1.1%
RoA2 0.7% 1.7% 2.0% 2.2%
Leverage (Avg. Liabilities/ Avg. Net Worth) 4.2x 6.1x 8.4x 9.3x
RoE 3.8% 11.8% 18.6% 22.1%
26
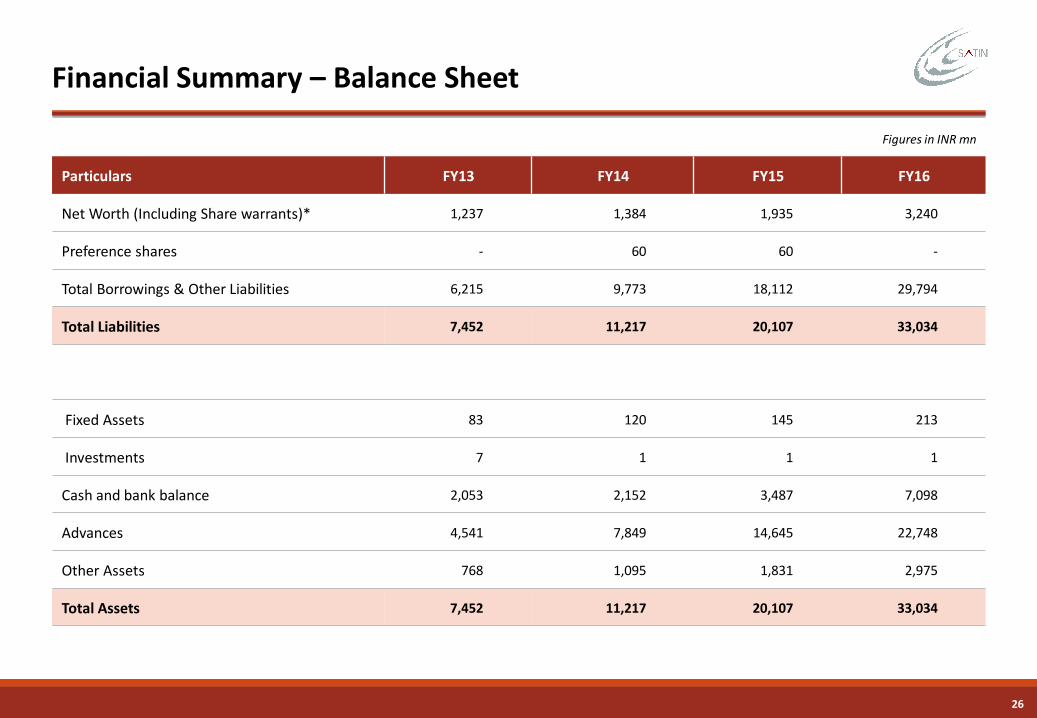
Financial Summary – Balance Sheet
Figures in INR mn
Particulars FY13 FY14 FY15 FY16
Net Worth (Including Share warrants)* 1,237 1,384 1,935 3,240
Preference shares - 60 60 -
Total Borrowings & Other Liabilities 6,215 9,773 18,112 29,794
Total Liabilities 7,452 11,217 20,107 33,034
Fixed Assets 83 120 145 213
Investments 7 1 1 1
Cash and bank balance 2,053 2,152 3,487 7,098
Advances 4,541 7,849 14,645 22,748
Other Assets 768 1,095 1,831 2,975
Total Assets 7,452 11,217 20,107 33,034
27
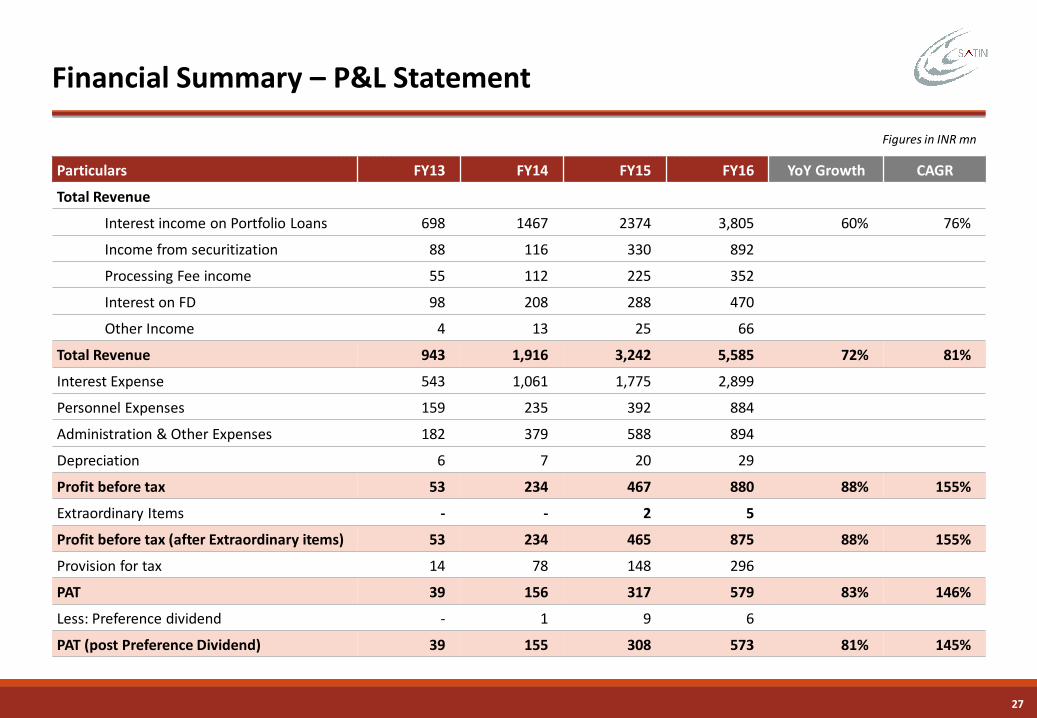
Financial Summary – P&L Statement
Figures in INR mn
Particulars FY13 FY14 FY15 FY16 YoY Growth CAGR
Total Revenue
Interest income on Portfolio Loans 698 1467 2374 3,805 60% 76%
Income from securitization 88 116 330 892
Processing Fee income 55 112 225 352
Interest on FD 98 208 288 470
Other Income 4 13 25 66
Total Revenue 943 1,916 3,242 5,585 72% 81%
Interest Expense 543 1,061 1,775 2,899
Personnel Expenses 159 235 392 884
Administration & Other Expenses 182 379 588 894
Depreciation 6 7 20 29
Profit before tax 53 234 467 880 88% 155%
Extraordinary Items - - 2 5
Profit before tax (after Extraordinary items) 53 234 465 875 88% 155%
Provision for tax 14 78 148 296
PAT 39 156 317 579 83% 146%
Less: Preference dividend - 1 9 6
PAT (post Preference Dividend) 39 155 308 573 81% 145%

Borrowing Profile
29
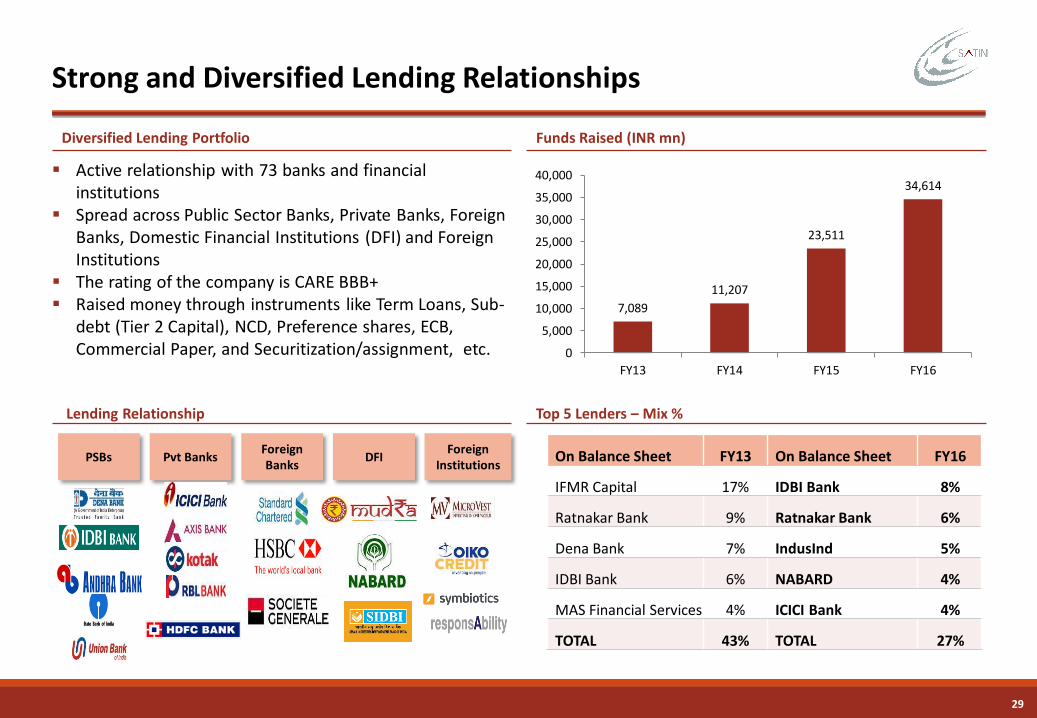
Strong and Diversified Lending Relationships
Diversified Lending Portfolio Funds Raised (INR mn)
Active relationship with 73 banks and financial institutions
Spread across Public Sector Banks, Private Banks, Foreign Banks, Domestic Financial Institutions (DFI) and Foreign Institutions
The rating of the company is CARE BBB+ Raised money through instruments like Term Loans, Sub-
debt (Tier 2 Capital), NCD, Preference shares, ECB, Commercial Paper, and Securitization/assignment, etc.
Lending Relationship
PSBsForeign Banks
Pvt BanksForeign
InstitutionsDFI
7,089
11,207
23,511
34,614
0
5,000
10,000
15,000
20,000
25,000
30,000
35,000
40,000
FY13 FY14 FY15 FY16
Top 5 Lenders – Mix %
On Balance Sheet FY13 On Balance Sheet FY16
IFMR Capital 17% IDBI Bank 8%
Ratnakar Bank 9% Ratnakar Bank 6%
Dena Bank 7% IndusInd 5%
IDBI Bank 6% NABARD 4%
MAS Financial Services 4% ICICI Bank 4%
TOTAL 43% TOTAL 27%
30
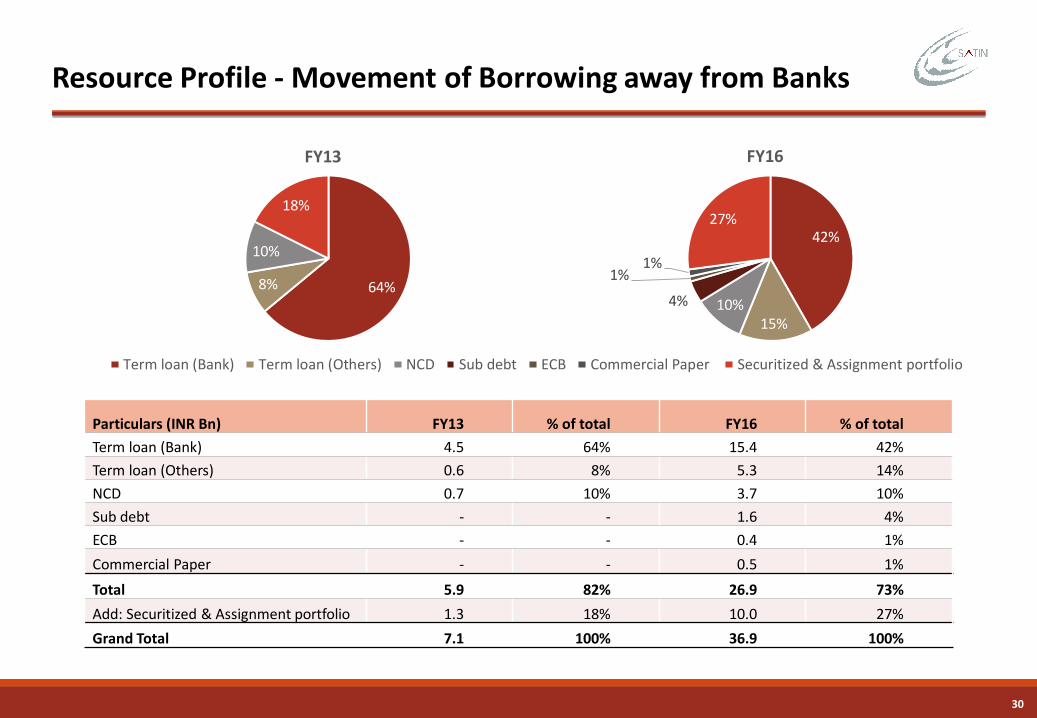
Particulars (INR Bn) FY13 % of total FY16 % of total
Term loan (Bank) 4.5 64% 15.4 42%
Term loan (Others) 0.6 8% 5.3 14%
NCD 0.7 10% 3.7 10%
Sub debt - - 1.6 4%
ECB - - 0.4 1%
Commercial Paper - - 0.5 1%
Total 5.9 82% 26.9 73%
Add: Securitized & Assignment portfolio 1.3 18% 10.0 27%
Grand Total 7.1 100% 36.9 100%
64%8%
10%
18%
FY13
42%
15%10%4%
1%1%
27%
FY16
Term loan (Bank) Term loan (Others) NCD Sub debt ECB Commercial Paper Securitized & Assignment portfolio
Resource Profile - Movement of Borrowing away from Banks
31
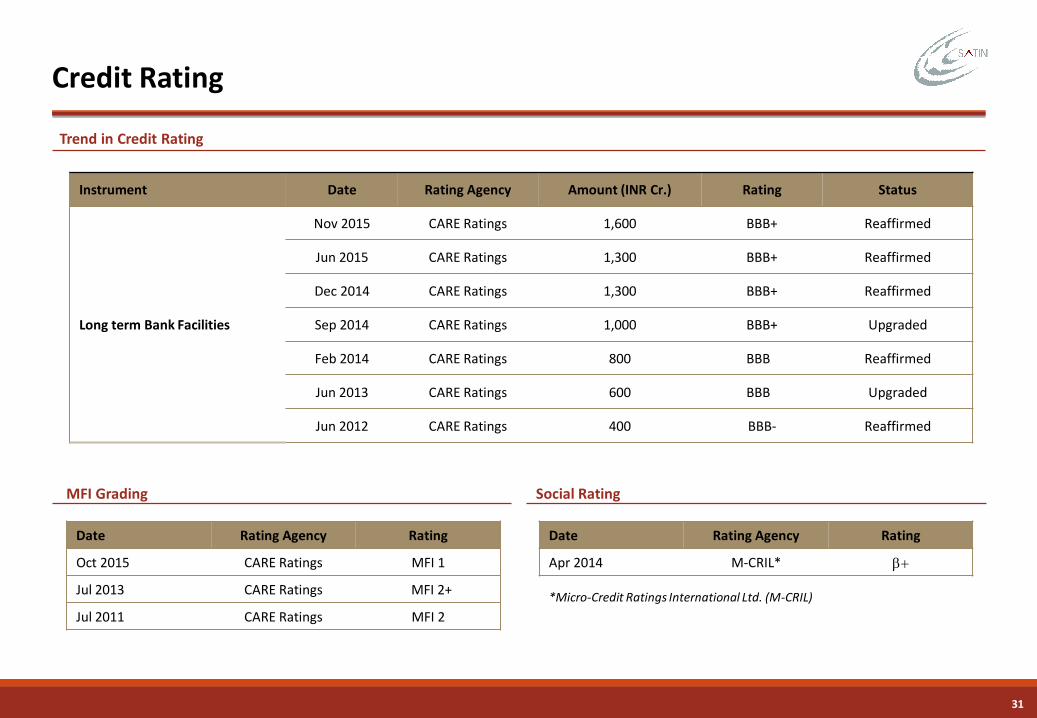
Credit Rating
MFI Grading Social Rating
Date Rating Agency Rating
Oct 2015 CARE Ratings MFI 1
Jul 2013 CARE Ratings MFI 2+
Jul 2011 CARE Ratings MFI 2
Date Rating Agency Rating
Apr 2014 M-CRIL* b+
*Micro-Credit Ratings International Ltd. (M-CRIL)
Trend in Credit Rating
Instrument Date Rating Agency Amount (INR Cr.) Rating Status
Long term Bank Facilities
Nov 2015 CARE Ratings 1,600 BBB+ Reaffirmed
Jun 2015 CARE Ratings 1,300 BBB+ Reaffirmed
Dec 2014 CARE Ratings 1,300 BBB+ Reaffirmed
Sep 2014 CARE Ratings 1,000 BBB+ Upgraded
Feb 2014 CARE Ratings 800 BBB+ Reaffirmed
Jun 2013 CARE Ratings 600 BBB+ Upgraded
Jun 2012 CARE Ratings 400 BBB- Reaffirmed
Operational Process Overview
33
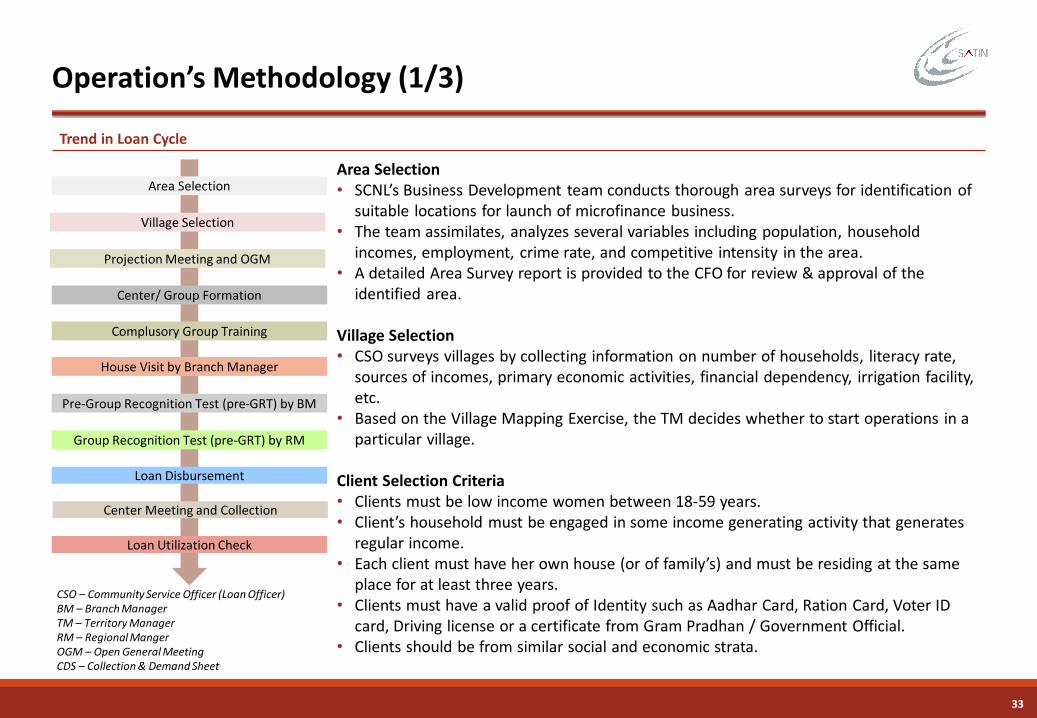
Operation’s Methodology (1/3)
Trend in Loan Cycle
Area Selection• SCNL’s Business Development team conducts thorough area surveys for identification of
suitable locations for launch of microfinance business.• The team assimilates, analyzes several variables including population, household
incomes, employment, crime rate, and competitive intensity in the area.• A detailed Area Survey report is provided to the CFO for review & approval of the
identified area.
Village Selection• CSO surveys villages by collecting information on number of households, literacy rate,
sources of incomes, primary economic activities, financial dependency, irrigation facility, etc.
• Based on the Village Mapping Exercise, the TM decides whether to start operations in a particular village.
Client Selection Criteria• Clients must be low income women between 18-59 years.• Client’s household must be engaged in some income generating activity that generates
regular income. • Each client must have her own house (or of family’s) and must be residing at the same
place for at least three years.• Clients must have a valid proof of Identity such as Aadhar Card, Ration Card, Voter ID
card, Driving license or a certificate from Gram Pradhan / Government Official.• Clients should be from similar social and economic strata.
CSO – Community Service Officer (Loan Officer)BM – Branch ManagerTM – Territory ManagerRM – Regional MangerOGM – Open General MeetingCDS – Collection & Demand Sheet
Area Selection
Village Selection
Projection Meeting and OGM
Center/ Group Formation
Complusory Group Training
House Visit by Branch Manager
Pre-Group Recognition Test (pre-GRT) by BM
Group Recognition Test (pre-GRT) by RM
Loan Disbursement
Center Meeting and Collection
Loan Utilization Check
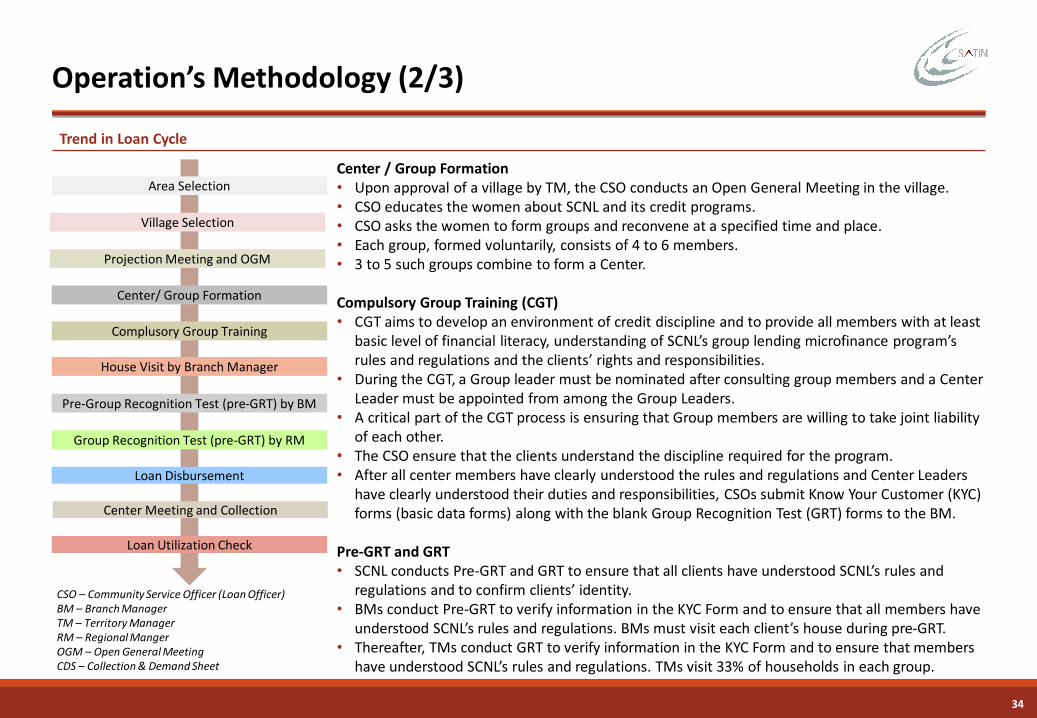
34
Operation’s Methodology (2/3)
Trend in Loan Cycle
Center / Group Formation• Upon approval of a village by TM, the CSO conducts an Open General Meeting in the village.• CSO educates the women about SCNL and its credit programs.• CSO asks the women to form groups and reconvene at a specified time and place.• Each group, formed voluntarily, consists of 4 to 6 members.• 3 to 5 such groups combine to form a Center.
Compulsory Group Training (CGT)• CGT aims to develop an environment of credit discipline and to provide all members with at least
basic level of financial literacy, understanding of SCNL’s group lending microfinance program’s rules and regulations and the clients’ rights and responsibilities.
• During the CGT, a Group leader must be nominated after consulting group members and a Center Leader must be appointed from among the Group Leaders.
• A critical part of the CGT process is ensuring that Group members are willing to take joint liability of each other.
• The CSO ensure that the clients understand the discipline required for the program. • After all center members have clearly understood the rules and regulations and Center Leaders
have clearly understood their duties and responsibilities, CSOs submit Know Your Customer (KYC) forms (basic data forms) along with the blank Group Recognition Test (GRT) forms to the BM.
Pre-GRT and GRT• SCNL conducts Pre-GRT and GRT to ensure that all clients have understood SCNL’s rules and
regulations and to confirm clients’ identity. • BMs conduct Pre-GRT to verify information in the KYC Form and to ensure that all members have
understood SCNL’s rules and regulations. BMs must visit each client’s house during pre-GRT. • Thereafter, TMs conduct GRT to verify information in the KYC Form and to ensure that members
have understood SCNL’s rules and regulations. TMs visit 33% of households in each group.
CSO – Community Service Officer (Loan Officer)BM – Branch ManagerTM – Territory ManagerRM – Regional MangerOGM – Open General MeetingCDS – Collection & Demand Sheet
Area Selection
Village Selection
Projection Meeting and OGM
Center/ Group Formation
Complusory Group Training
House Visit by Branch Manager
Pre-Group Recognition Test (pre-GRT) by BM
Group Recognition Test (pre-GRT) by RM
Loan Disbursement
Center Meeting and Collection
Loan Utilization Check
35
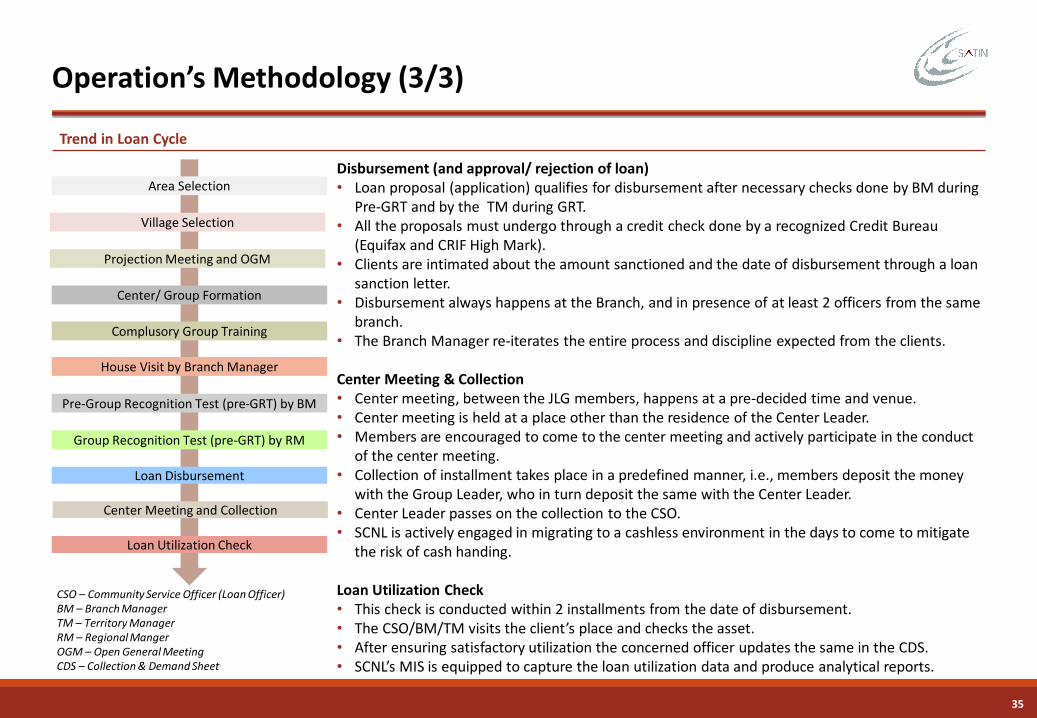
Operation’s Methodology (3/3)
Trend in Loan Cycle
Disbursement (and approval/ rejection of loan)• Loan proposal (application) qualifies for disbursement after necessary checks done by BM during
Pre-GRT and by the TM during GRT.• All the proposals must undergo through a credit check done by a recognized Credit Bureau
(Equifax and CRIF High Mark).• Clients are intimated about the amount sanctioned and the date of disbursement through a loan
sanction letter.• Disbursement always happens at the Branch, and in presence of at least 2 officers from the same
branch.• The Branch Manager re-iterates the entire process and discipline expected from the clients.
Center Meeting & Collection• Center meeting, between the JLG members, happens at a pre-decided time and venue.• Center meeting is held at a place other than the residence of the Center Leader.• Members are encouraged to come to the center meeting and actively participate in the conduct
of the center meeting.• Collection of installment takes place in a predefined manner, i.e., members deposit the money
with the Group Leader, who in turn deposit the same with the Center Leader.• Center Leader passes on the collection to the CSO.• SCNL is actively engaged in migrating to a cashless environment in the days to come to mitigate
the risk of cash handing.
Loan Utilization Check• This check is conducted within 2 installments from the date of disbursement. • The CSO/BM/TM visits the client’s place and checks the asset.• After ensuring satisfactory utilization the concerned officer updates the same in the CDS.• SCNL’s MIS is equipped to capture the loan utilization data and produce analytical reports.
CSO – Community Service Officer (Loan Officer)BM – Branch ManagerTM – Territory ManagerRM – Regional MangerOGM – Open General MeetingCDS – Collection & Demand Sheet
Area Selection
Village Selection
Projection Meeting and OGM
Center/ Group Formation
Complusory Group Training
House Visit by Branch Manager
Pre-Group Recognition Test (pre-GRT) by BM
Group Recognition Test (pre-GRT) by RM
Loan Disbursement
Center Meeting and Collection
Loan Utilization Check
Risk Management
37
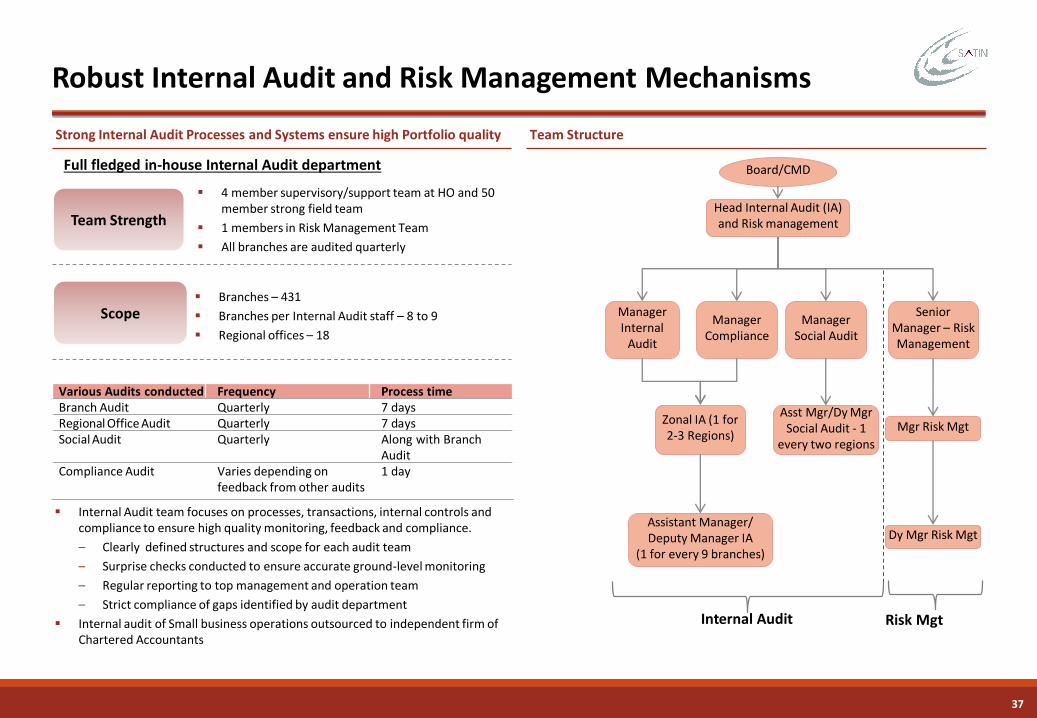
Robust Internal Audit and Risk Management Mechanisms
Strong Internal Audit Processes and Systems ensure high Portfolio quality
Internal Audit team focuses on processes, transactions, internal controls and compliance to ensure high quality monitoring, feedback and compliance.
– Clearly defined structures and scope for each audit team
– Surprise checks conducted to ensure accurate ground-level monitoring
– Regular reporting to top management and operation team
– Strict compliance of gaps identified by audit department
Internal audit of Small business operations outsourced to independent firm of Chartered Accountants
Various Audits conducted Frequency Process timeBranch Audit Quarterly 7 daysRegional Office Audit Quarterly 7 daysSocial Audit Quarterly Along with Branch
AuditCompliance Audit Varies depending on
feedback from other audits1 day
Team Strength
Scope
4 member supervisory/support team at HO and 50 member strong field team
1 members in Risk Management Team
All branches are audited quarterly
Branches – 431
Branches per Internal Audit staff – 8 to 9
Regional offices – 18
Full fledged in-house Internal Audit department
Manager Internal
Audit
Manager Compliance
Manager Social Audit
Assistant Manager/Deputy Manager IA
(1 for every 9 branches)
Asst Mgr/Dy MgrSocial Audit - 1
every two regions
Zonal IA (1 for 2-3 Regions)
Senior Manager – Risk Management
Mgr Risk Mgt
Dy Mgr Risk Mgt
Internal Audit Risk Mgt
Board/CMD
Head Internal Audit (IA) and Risk management
Team Structure
Information Technology Overview
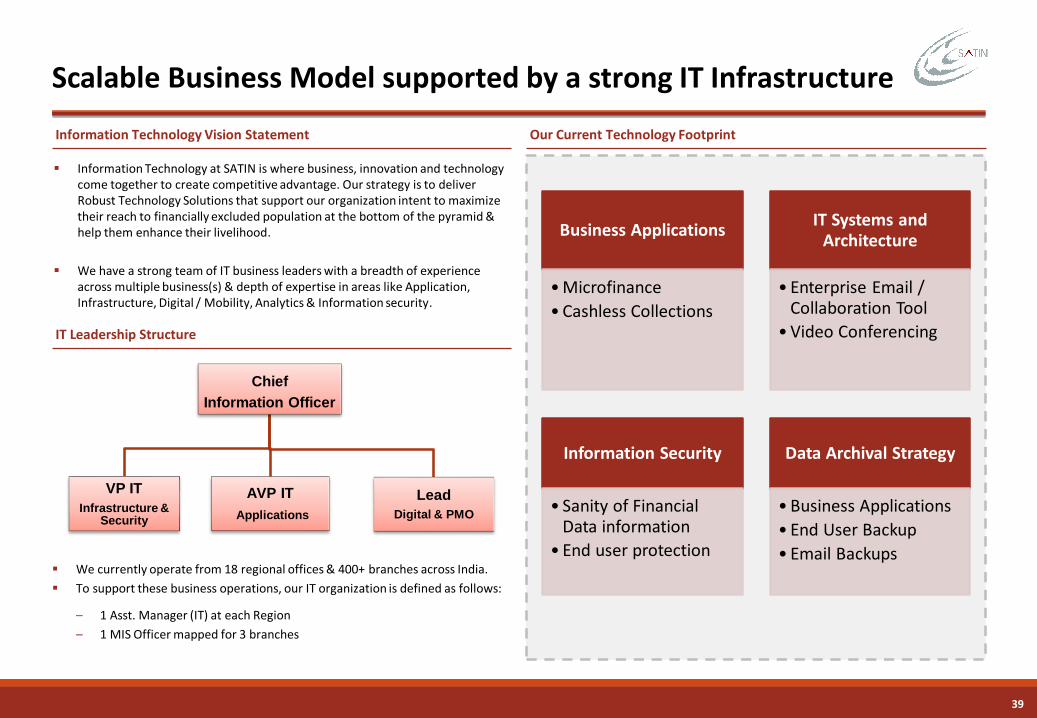
39
Chief
Information Officer
VP IT
Infrastructure & Security
AVP IT
Applications
Lead
Digital & PMO
Scalable Business Model supported by a strong IT Infrastructure
Information Technology Vision Statement
Information Technology at SATIN is where business, innovation and technology come together to create competitive advantage. Our strategy is to deliver Robust Technology Solutions that support our organization intent to maximize their reach to financially excluded population at the bottom of the pyramid & help them enhance their livelihood.
We have a strong team of IT business leaders with a breadth of experience across multiple business(s) & depth of expertise in areas like Application, Infrastructure, Digital / Mobility, Analytics & Information security.
We currently operate from 18 regional offices & 400+ branches across India.
To support these business operations, our IT organization is defined as follows:
– 1 Asst. Manager (IT) at each Region
– 1 MIS Officer mapped for 3 branches
Our Current Technology Footprint
IT Leadership Structure
Business Applications
• Microfinance
• Cashless Collections
IT Systems and Architecture
• Enterprise Email / Collaboration Tool
• Video Conferencing
Information Security
• Sanity of Financial Data information
• End user protection
Data Archival Strategy
• Business Applications
• End User Backup
• Email Backups
40
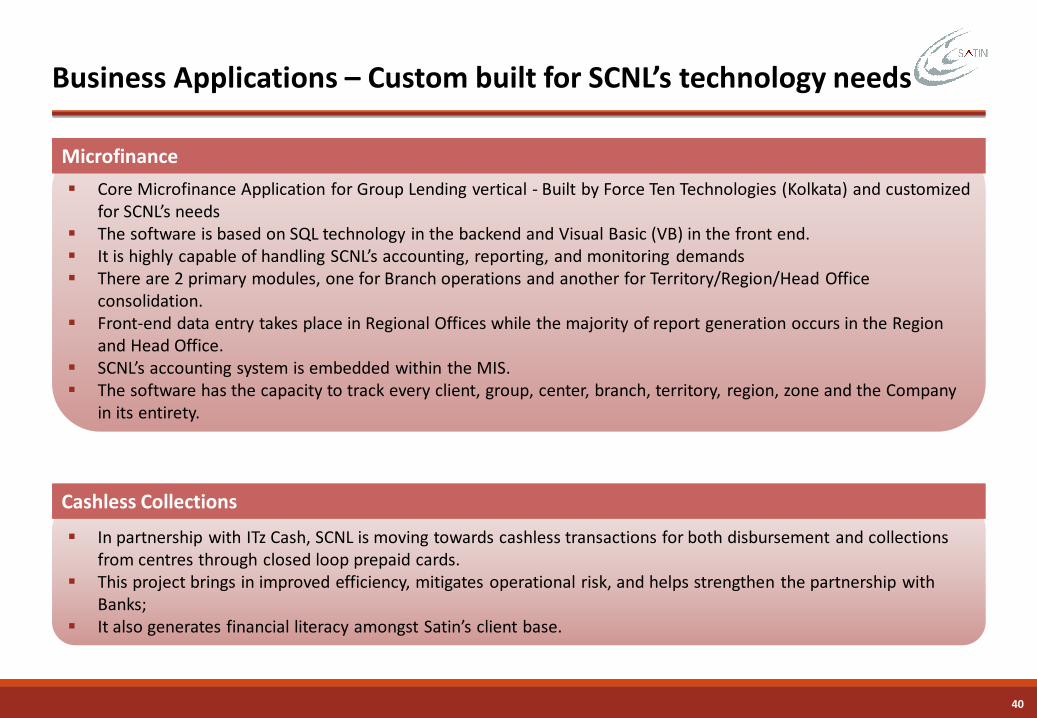
Business Applications – Custom built for SCNL’s technology needs
Core Microfinance Application for Group Lending vertical - Built by Force Ten Technologies (Kolkata) and customized for SCNL’s needs
The software is based on SQL technology in the backend and Visual Basic (VB) in the front end. It is highly capable of handling SCNL’s accounting, reporting, and monitoring demands There are 2 primary modules, one for Branch operations and another for Territory/Region/Head Office
consolidation. Front-end data entry takes place in Regional Offices while the majority of report generation occurs in the Region
and Head Office. SCNL’s accounting system is embedded within the MIS. The software has the capacity to track every client, group, center, branch, territory, region, zone and the Company
in its entirety.
Microfinance
In partnership with ITz Cash, SCNL is moving towards cashless transactions for both disbursement and collections from centres through closed loop prepaid cards.
This project brings in improved efficiency, mitigates operational risk, and helps strengthen the partnership with Banks;
It also generates financial literacy amongst Satin’s client base.
Cashless Collections

Business Outlook
42
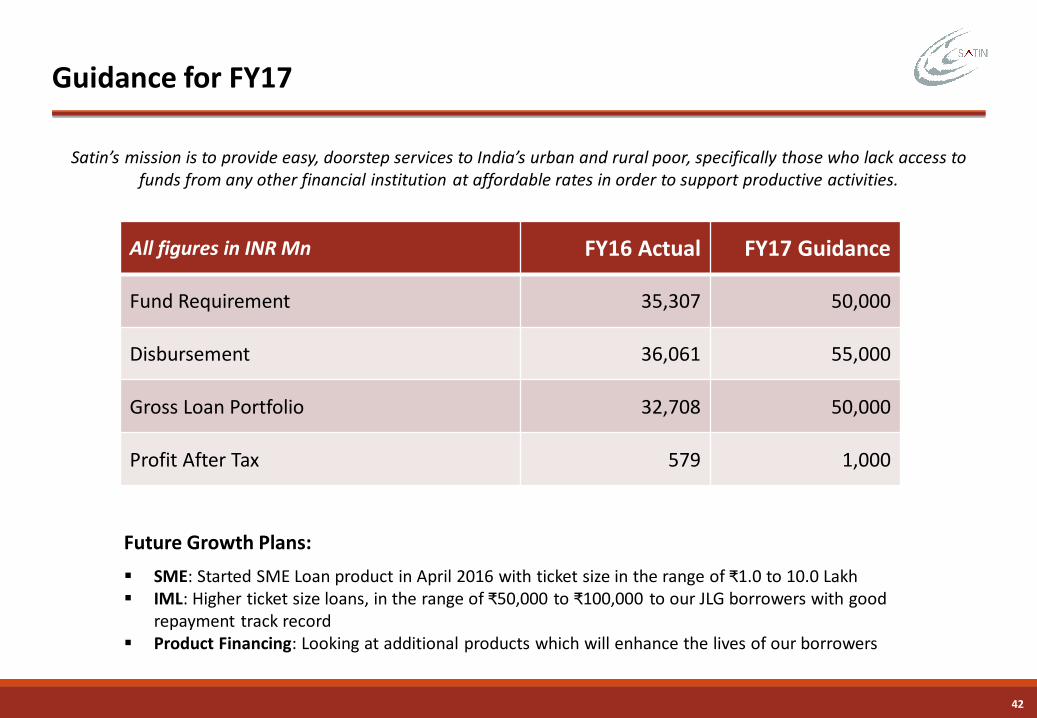
Guidance for FY17
Satin’s mission is to provide easy, doorstep services to India’s urban and rural poor, specifically those who lack access to funds from any other financial institution at affordable rates in order to support productive activities.
All figures in INR Mn FY16 Actual FY17 Guidance
Fund Requirement 35,307 50,000
Disbursement 36,061 55,000
Gross Loan Portfolio 32,708 50,000
Profit After Tax 579 1,000
Future Growth Plans:
SME: Started SME Loan product in April 2016 with ticket size in the range of ₹1.0 to 10.0 Lakh IML: Higher ticket size loans, in the range of ₹50,000 to ₹100,000 to our JLG borrowers with good
repayment track record Product Financing: Looking at additional products which will enhance the lives of our borrowers

Corporate Governance & Management Team
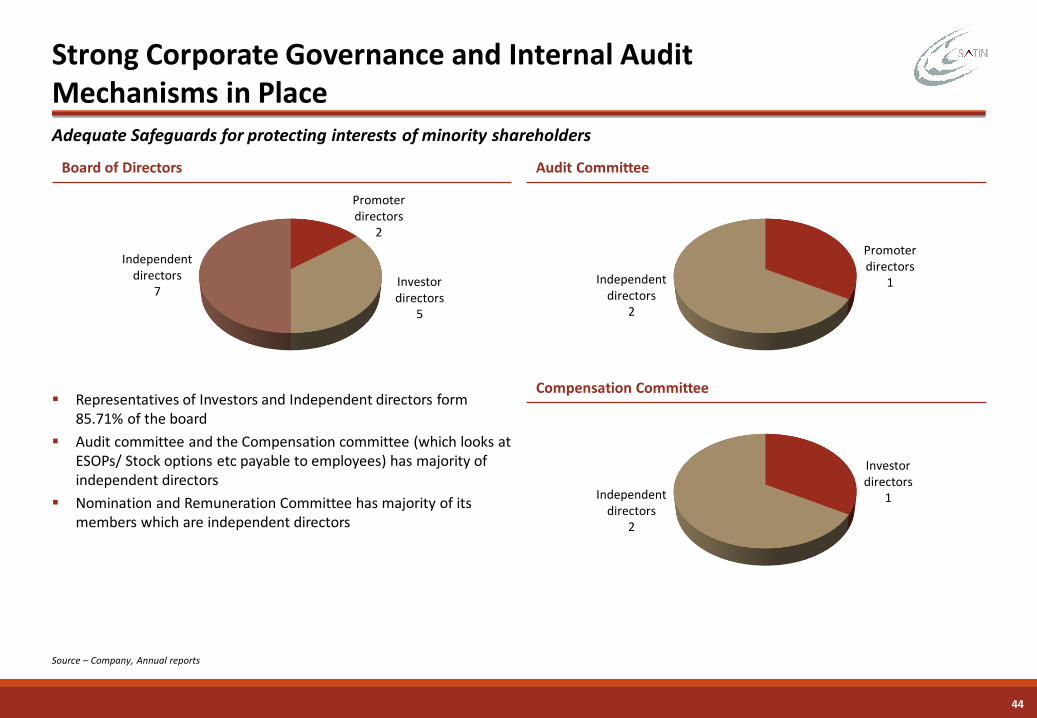
44
Investor directors
1Independent directors
2
Board of Directors Audit Committee
Strong Corporate Governance and Internal Audit Mechanisms in Place
Compensation Committee
Source – Company, Annual reports
Adequate Safeguards for protecting interests of minority shareholders
Promoter directors
1Independent directors
2
Promoter directors
2
Investor directors
5
Independent directors
7
Representatives of Investors and Independent directors form 85.71% of the board
Audit committee and the Compensation committee (which looks at ESOPs/ Stock options etc payable to employees) has majority of independent directors
Nomination and Remuneration Committee has majority of its members which are independent directors
45
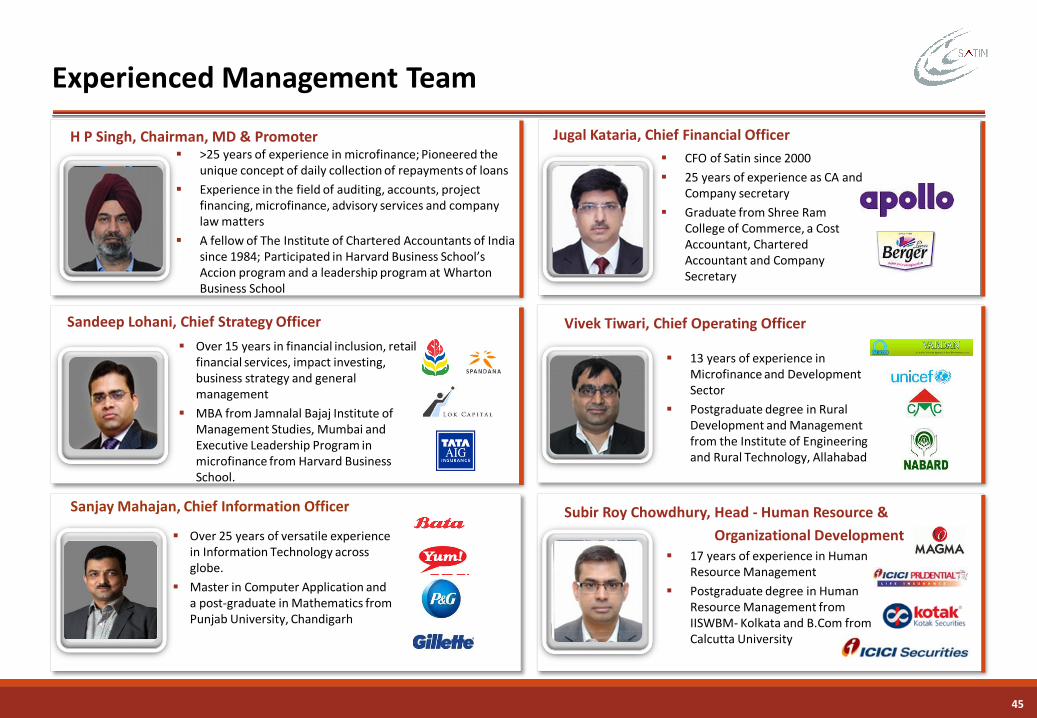
Experienced Management Team
>25 years of experience in microfinance; Pioneered the unique concept of daily collection of repayments of loans
Experience in the field of auditing, accounts, project financing, microfinance, advisory services and company law matters
A fellow of The Institute of Chartered Accountants of India since 1984; Participated in Harvard Business School’s Accion program and a leadership program at Wharton Business School
H P Singh, Chairman, MD & Promoter
CFO of Satin since 2000
25 years of experience as CA and Company secretary
Graduate from Shree Ram College of Commerce, a Cost Accountant, Chartered Accountant and Company Secretary
Jugal Kataria, Chief Financial Officer
13 years of experience in Microfinance and Development Sector
Postgraduate degree in Rural Development and Management from the Institute of Engineering and Rural Technology, Allahabad
Vivek Tiwari, Chief Operating OfficerSandeep Lohani, Chief Strategy Officer
Over 15 years in financial inclusion, retail financial services, impact investing, business strategy and general management
MBA from Jamnalal Bajaj Institute of Management Studies, Mumbai and Executive Leadership Program in microfinance from Harvard Business School.
Sanjay Mahajan, Chief Information Officer
Over 25 years of versatile experience in Information Technology across globe.
Master in Computer Application and a post-graduate in Mathematics from Punjab University, Chandigarh
Subir Roy Chowdhury, Head - Human Resource &
Organizational Development 17 years of experience in Human
Resource Management
Postgraduate degree in Human Resource Management from IISWBM- Kolkata and B.Com from Calcutta University
46
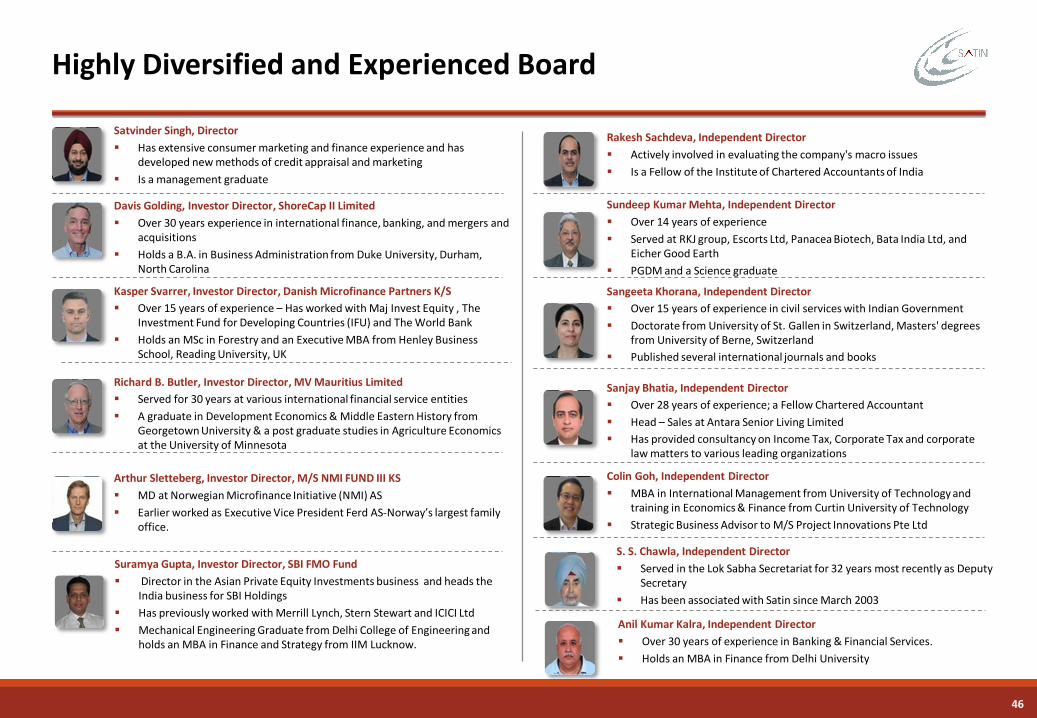
Highly Diversified and Experienced Board
Davis Golding, Investor Director, ShoreCap II Limited
Over 30 years experience in international finance, banking, and mergers and acquisitions
Holds a B.A. in Business Administration from Duke University, Durham, North Carolina
Satvinder Singh, Director
Has extensive consumer marketing and finance experience and has developed new methods of credit appraisal and marketing
Is a management graduate
Kasper Svarrer, Investor Director, Danish Microfinance Partners K/S
Over 15 years of experience – Has worked with Maj Invest Equity , The Investment Fund for Developing Countries (IFU) and The World Bank
Holds an MSc in Forestry and an Executive MBA from Henley Business School, Reading University, UK
Richard B. Butler, Investor Director, MV Mauritius Limited
Served for 30 years at various international financial service entities
A graduate in Development Economics & Middle Eastern History from Georgetown University & a post graduate studies in Agriculture Economics at the University of Minnesota
Arthur Sletteberg, Investor Director, M/S NMI FUND III KS
MD at Norwegian Microfinance Initiative (NMI) AS
Earlier worked as Executive Vice President Ferd AS-Norway’s largest family office.
Rakesh Sachdeva, Independent Director
Actively involved in evaluating the company's macro issues
Is a Fellow of the Institute of Chartered Accountants of India
Sundeep Kumar Mehta, Independent Director
Over 14 years of experience
Served at RKJ group, Escorts Ltd, Panacea Biotech, Bata India Ltd, and Eicher Good Earth
PGDM and a Science graduate
Sangeeta Khorana, Independent Director
Over 15 years of experience in civil services with Indian Government
Doctorate from University of St. Gallen in Switzerland, Masters' degrees from University of Berne, Switzerland
Published several international journals and books
Sanjay Bhatia, Independent Director
Over 28 years of experience; a Fellow Chartered Accountant
Head – Sales at Antara Senior Living Limited
Has provided consultancy on Income Tax, Corporate Tax and corporate law matters to various leading organizations
Colin Goh, Independent Director
MBA in International Management from University of Technology and training in Economics & Finance from Curtin University of Technology
Strategic Business Advisor to M/S Project Innovations Pte Ltd
S. S. Chawla, Independent Director
Served in the Lok Sabha Secretariat for 32 years most recently as Deputy Secretary
Has been associated with Satin since March 2003
Suramya Gupta, Investor Director, SBI FMO Fund
Director in the Asian Private Equity Investments business and heads the India business for SBI Holdings
Has previously worked with Merrill Lynch, Stern Stewart and ICICI Ltd
Mechanical Engineering Graduate from Delhi College of Engineering and holds an MBA in Finance and Strategy from IIM Lucknow.
Anil Kumar Kalra, Independent Director
Over 30 years of experience in Banking & Financial Services.
Holds an MBA in Finance from Delhi University
CSR & Social Performance Management (SPM)
48
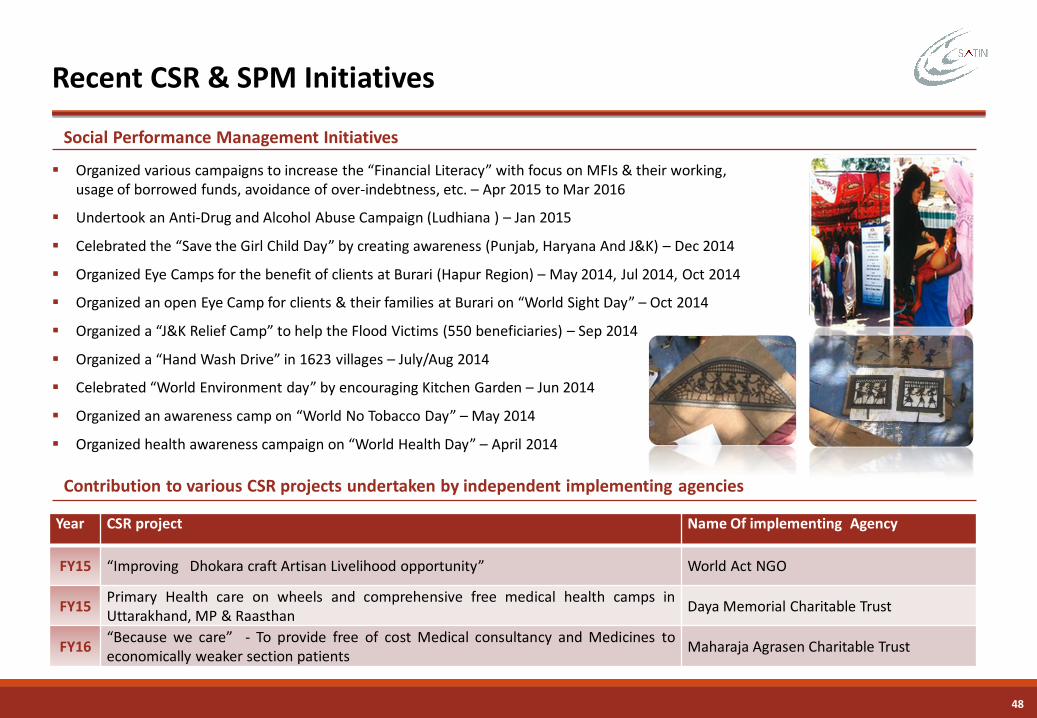
Social Performance Management Initiatives
Recent CSR & SPM Initiatives
Organized various campaigns to increase the “Financial Literacy” with focus on MFIs & their working, usage of borrowed funds, avoidance of over-indebtness, etc. – Apr 2015 to Mar 2016
Undertook an Anti-Drug and Alcohol Abuse Campaign (Ludhiana ) – Jan 2015
Celebrated the “Save the Girl Child Day” by creating awareness (Punjab, Haryana And J&K) – Dec 2014
Organized Eye Camps for the benefit of clients at Burari (Hapur Region) – May 2014, Jul 2014, Oct 2014
Organized an open Eye Camp for clients & their families at Burari on “World Sight Day” – Oct 2014
Organized a “J&K Relief Camp” to help the Flood Victims (550 beneficiaries) – Sep 2014
Organized a “Hand Wash Drive” in 1623 villages – July/Aug 2014
Celebrated “World Environment day” by encouraging Kitchen Garden – Jun 2014
Organized an awareness camp on “World No Tobacco Day” – May 2014
Organized health awareness campaign on “World Health Day” – April 2014
Contribution to various CSR projects undertaken by independent implementing agencies
Year CSR project Name Of implementing Agency
FY15 “Improving Dhokara craft Artisan Livelihood opportunity” World Act NGO
FY15Primary Health care on wheels and comprehensive free medical health camps inUttarakhand, MP & Raasthan
Daya Memorial Charitable Trust
FY16“Because we care” - To provide free of cost Medical consultancy and Medicines toeconomically weaker section patients
Maharaja Agrasen Charitable Trust
Microfinance Industry & Regulatory Scenario
50
174 249 289
532
19.4
23.7 22.6
32.5
0.0
5.0
10.0
15.0
20.0
25.0
30.0
35.0
40.0
0
100
200
300
400
500
600
FY13 FY14 FY15 FY16
No
. of
clie
nts
(mn
)
GLP
(IN
R b
n)
GLP (INR bn) Client outreach (mn)
174 249
401 365 423
532
19.4 23.7
30.5 26.1
28.8
32.5
0.0
5.0
10.0
15.0
20.0
25.0
30.0
35.0
40.0
0
100
200
300
400
500
600
FY13 FY14 FY15 Sep-15 Dec-15 Mar-16
No
. of
clie
nts
(m
n)
GLP
(IN
R b
n)
GLP (INR bn) Client outreach (mn)
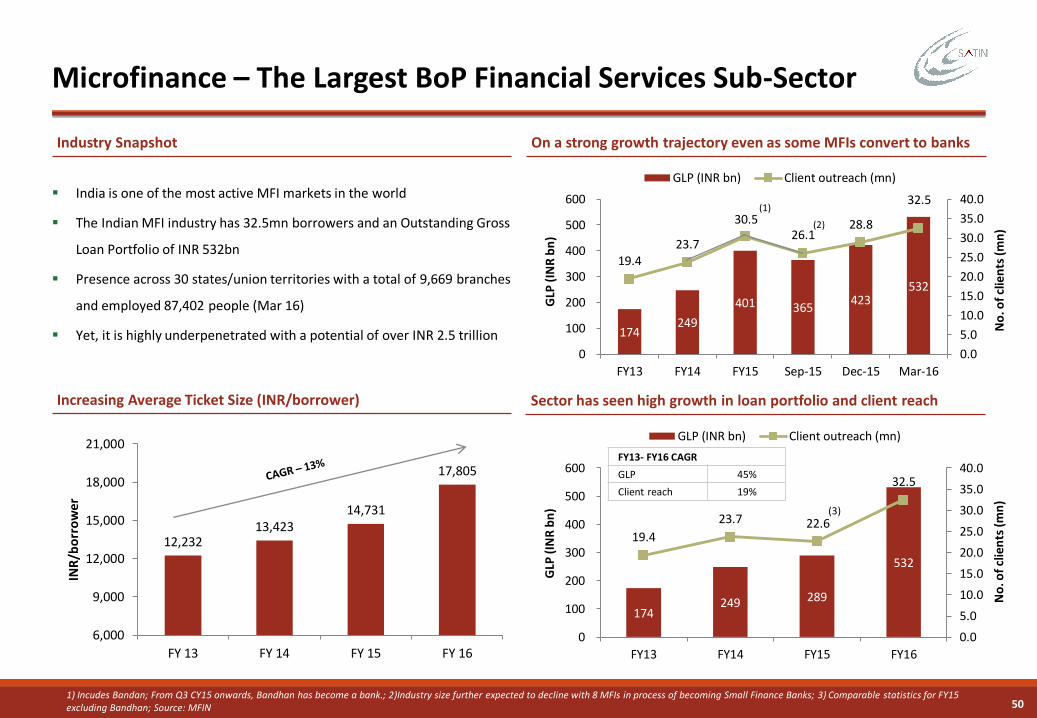
Industry Snapshot On a strong growth trajectory even as some MFIs convert to banks
Increasing Average Ticket Size (INR/borrower)
Microfinance – The Largest BoP Financial Services Sub-Sector
FY13- FY16 CAGR
GLP 45%
Client reach 19%
India is one of the most active MFI markets in the world
The Indian MFI industry has 32.5mn borrowers and an Outstanding Gross
Loan Portfolio of INR 532bn
Presence across 30 states/union territories with a total of 9,669 branches
and employed 87,402 people (Mar 16)
Yet, it is highly underpenetrated with a potential of over INR 2.5 trillion
(2)
12,23213,423
14,731
17,805
6,000
9,000
12,000
15,000
18,000
21,000
FY 13 FY 14 FY 15 FY 16
INR
/bo
rro
wer
1) Incudes Bandan; From Q3 CY15 onwards, Bandhan has become a bank.; 2)Industry size further expected to decline with 8 MFIs in process of becoming Small Finance Banks; 3) Comparable statistics for FY15 excluding Bandhan; Source: MFIN
Sector has seen high growth in loan portfolio and client reach
(3)
(1)
51
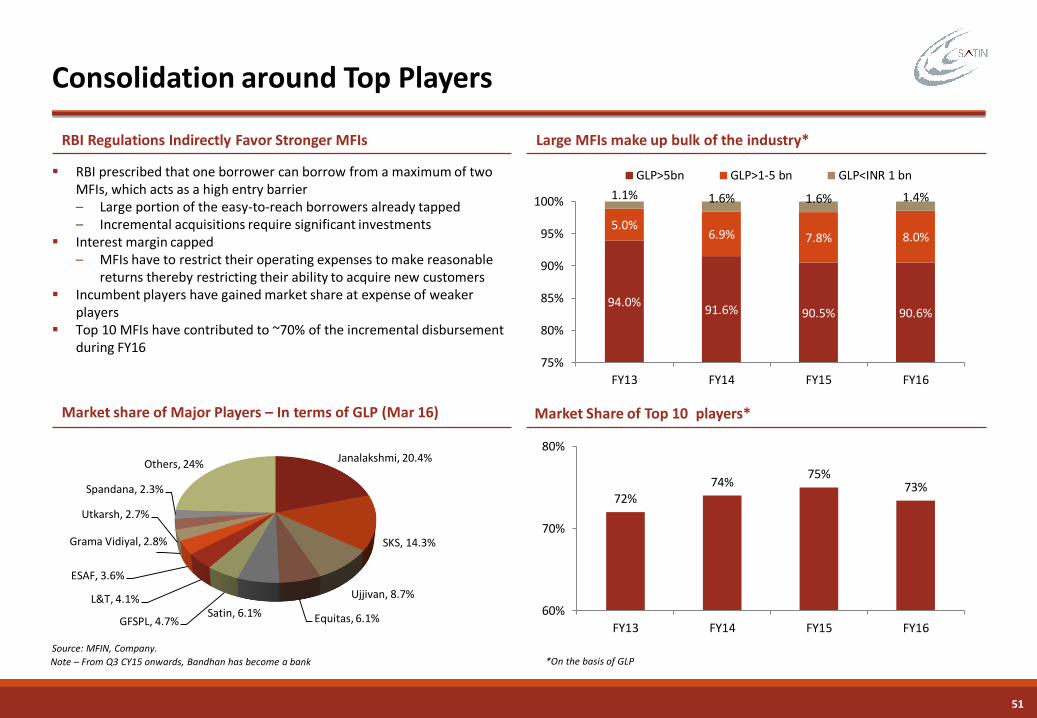
RBI Regulations Indirectly Favor Stronger MFIs Large MFIs make up bulk of the industry*
Consolidation around Top Players
Market share of Major Players – In terms of GLP (Mar 16) Market Share of Top 10 players*
RBI prescribed that one borrower can borrow from a maximum of two MFIs, which acts as a high entry barrier– Large portion of the easy-to-reach borrowers already tapped– Incremental acquisitions require significant investments
Interest margin capped– MFIs have to restrict their operating expenses to make reasonable
returns thereby restricting their ability to acquire new customers Incumbent players have gained market share at expense of weaker
players Top 10 MFIs have contributed to ~70% of the incremental disbursement
during FY16
94.0% 91.6% 90.5% 90.6%
5.0% 6.9% 7.8% 8.0%
1.1% 1.6% 1.6% 1.4%
75%
80%
85%
90%
95%
100%
FY13 FY14 FY15 FY16
GLP>5bn GLP>1-5 bn GLP<INR 1 bn
Janalakshmi, 20.4%
SKS, 14.3%
Ujjivan, 8.7%
Equitas, 6.1%Satin, 6.1%GFSPL, 4.7%
L&T, 4.1%
ESAF, 3.6%
Grama Vidiyal, 2.8%
Utkarsh, 2.7%
Spandana, 2.3%
Others, 24%
72%74%
75%73%
60%
70%
80%
FY13 FY14 FY15 FY16
*On the basis of GLPNote – From Q3 CY15 onwards, Bandhan has become a bank
Source: MFIN, Company.
52
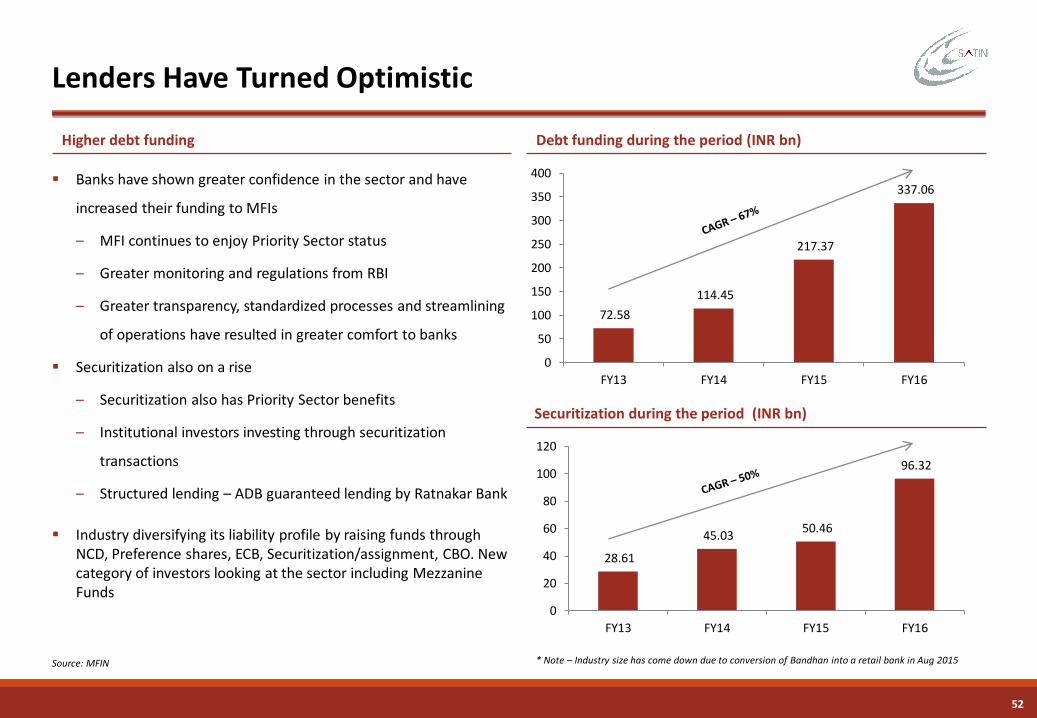
Higher debt funding Debt funding during the period (INR bn)
Lenders Have Turned Optimistic
Securitization during the period (INR bn)
Banks have shown greater confidence in the sector and have
increased their funding to MFIs
– MFI continues to enjoy Priority Sector status
– Greater monitoring and regulations from RBI
– Greater transparency, standardized processes and streamlining
of operations have resulted in greater comfort to banks
Securitization also on a rise
– Securitization also has Priority Sector benefits
– Institutional investors investing through securitization
transactions
– Structured lending – ADB guaranteed lending by Ratnakar Bank
Industry diversifying its liability profile by raising funds through NCD, Preference shares, ECB, Securitization/assignment, CBO. New category of investors looking at the sector including Mezzanine Funds
72.58
114.45
217.37
337.06
0
50
100
150
200
250
300
350
400
FY13 FY14 FY15 FY16
28.61
45.03 50.46
96.32
0
20
40
60
80
100
120
FY13 FY14 FY15 FY16
Source: MFIN * Note – Industry size has come down due to conversion of Bandhan into a retail bank in Aug 2015
53
Regulatory Tailwind Driving Industry Forward
RBI notifies a regulatory framework for MFIs
Reduces chances of interference by State/ Central governments
Guidelines byRBI
CreditBureaus
To gather credit data on the microfinance borrowers and provide it to the MFIs enabling them
assess the worthiness.
Usage of credit bureau on incremental lending
Credit Bureaus- Equifax & Highmark - were set up to collate data from MFIs on a weekly
basis
Details of millions of the smallest of small borrowers across India are now being documented, with
the potential to create one of the largest databases in the years to come.
20102011-2013
Andhra MFI Act
Allegations of malpractices like coercive collection methods, high interest rates resulting in farmer
suicides in Andhra Pradesh
Andhra Pradesh passes the MFI act – collection efficiencies drop to <20%
Relaxation ofinterest ratecap
Flexibility in pricing by linking price cap on loans to cost of funds
MFIN
RBI accords self regulatory organization (SRO) status to MFIN
MFIN member organizations consist of 48 of the leading NBFC-MFIs whose combined
business constitutes over 90% of the Indian microfinance sector (excluding SHGs).
Banking License
Bandhan Financial Services was awarded banking license thereby reinforcing the credibility of
the MFI industry
2014
54
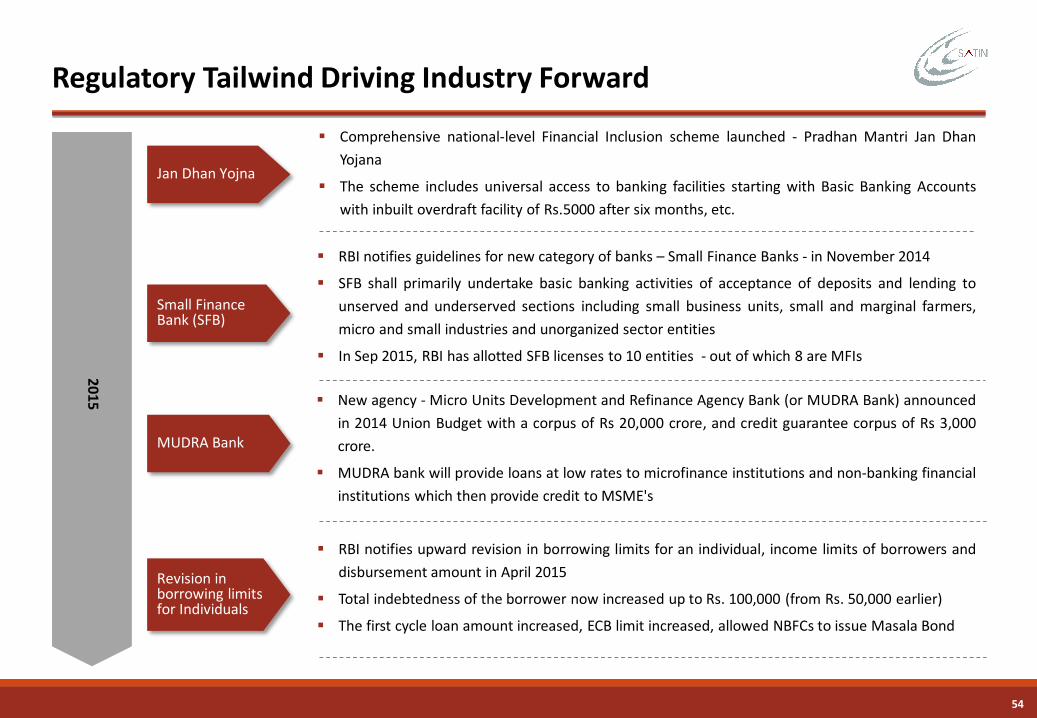
Regulatory Tailwind Driving Industry Forward
RBI notifies guidelines for new category of banks – Small Finance Banks - in November 2014
SFB shall primarily undertake basic banking activities of acceptance of deposits and lending to
unserved and underserved sections including small business units, small and marginal farmers,
micro and small industries and unorganized sector entities
In Sep 2015, RBI has allotted SFB licenses to 10 entities - out of which 8 are MFIs
Small Finance Bank (SFB)
Revision in borrowing limits for Individuals
MUDRA Bank
RBI notifies upward revision in borrowing limits for an individual, income limits of borrowers and
disbursement amount in April 2015
Total indebtedness of the borrower now increased up to Rs. 100,000 (from Rs. 50,000 earlier)
The first cycle loan amount increased, ECB limit increased, allowed NBFCs to issue Masala Bond
New agency - Micro Units Development and Refinance Agency Bank (or MUDRA Bank) announced
in 2014 Union Budget with a corpus of Rs 20,000 crore, and credit guarantee corpus of Rs 3,000
crore.
MUDRA bank will provide loans at low rates to microfinance institutions and non-banking financial
institutions which then provide credit to MSME's
2015
Jan Dhan Yojna
Comprehensive national-level Financial Inclusion scheme launched - Pradhan Mantri Jan Dhan
Yojana
The scheme includes universal access to banking facilities starting with Basic Banking Accounts
with inbuilt overdraft facility of Rs.5000 after six months, etc.
55
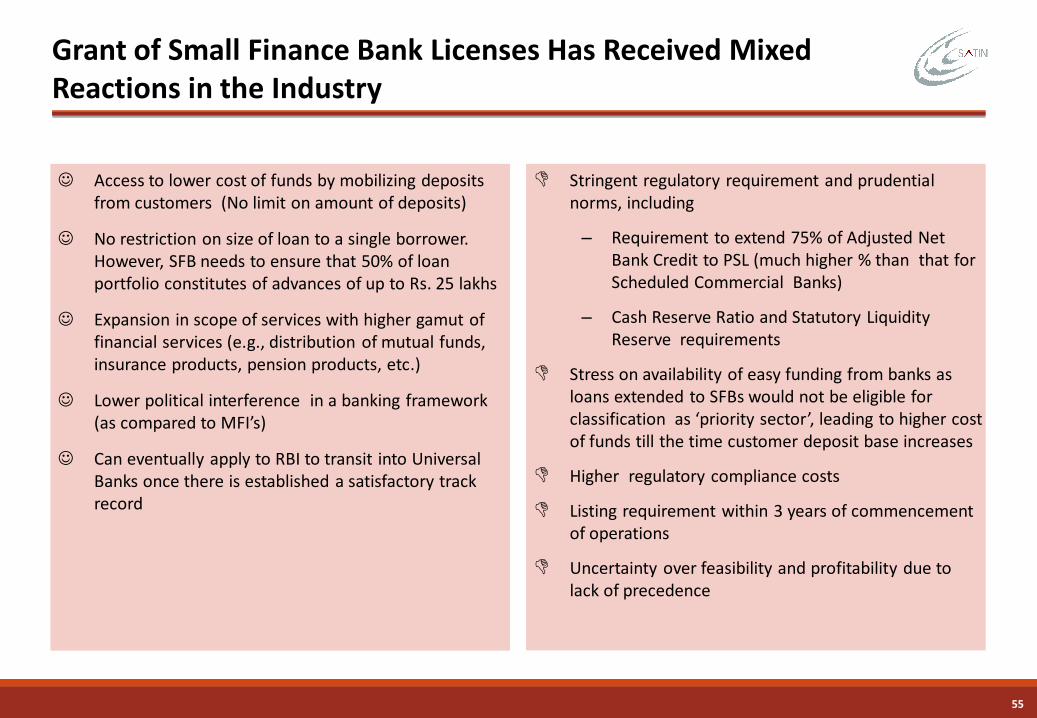
Grant of Small Finance Bank Licenses Has Received Mixed Reactions in the Industry
Stringent regulatory requirement and prudential norms, including
– Requirement to extend 75% of Adjusted Net Bank Credit to PSL (much higher % than that for Scheduled Commercial Banks)
– Cash Reserve Ratio and Statutory Liquidity Reserve requirements
Stress on availability of easy funding from banks as loans extended to SFBs would not be eligible for classification as ‘priority sector’, leading to higher cost of funds till the time customer deposit base increases
Higher regulatory compliance costs
Listing requirement within 3 years of commencement of operations
Uncertainty over feasibility and profitability due to lack of precedence
Access to lower cost of funds by mobilizing deposits from customers (No limit on amount of deposits)
No restriction on size of loan to a single borrower. However, SFB needs to ensure that 50% of loan portfolio constitutes of advances of up to Rs. 25 lakhs
Expansion in scope of services with higher gamut of financial services (e.g., distribution of mutual funds, insurance products, pension products, etc.)
Lower political interference in a banking framework (as compared to MFI’s)
Can eventually apply to RBI to transit into Universal Banks once there is established a satisfactory track record
56
Contact Information
For any queries, please contact:
Mansi Verma
AVP – Capital Markets
Satin Creditcare Network Limited
T: +91 11 4754 5000 (Ext – 243)
Thank You