Satellite-based primary forest degradation assessment in the Democratic Republic of the Congo,...
14
Satellite-based primary forest degradation assessment in the Democratic Republic of the Congo, 2000–2010 This article has been downloaded from IOPscience. Please scroll down to see the full text article. 2013 Environ. Res. Lett. 8 024034 (http://iopscience.iop.org/1748-9326/8/2/024034) Download details: IP Address: 87.66.185.208 The article was downloaded on 14/06/2013 at 15:27 Please note that terms and conditions apply. View the table of contents for this issue, or go to the journal homepage for more Home Search Collections Journals About Contact us My IOPscience
Transcript of Satellite-based primary forest degradation assessment in the Democratic Republic of the Congo,...
Satellite-based primary forest degradation assessment in the Democratic Republic of the
Congo 2000ndash2010
This article has been downloaded from IOPscience Please scroll down to see the full text article
2013 Environ Res Lett 8 024034
(httpiopscienceioporg1748-932682024034)
Download details
IP Address 8766185208
The article was downloaded on 14062013 at 1527
Please note that terms and conditions apply
View the table of contents for this issue or go to the journal homepage for more
Home Search Collections Journals About Contact us My IOPscience
IOP PUBLISHING ENVIRONMENTAL RESEARCH LETTERS
Environ Res Lett 8 (2013) 024034 (13pp) doi1010881748-932682024034
Satellite-based primary forestdegradation assessment in the DemocraticRepublic of the Congo 2000ndash2010
I Zhuravleva1 S Turubanova2 P Potapov2 M Hansen2 A Tyukavina2S Minnemeyer3 N Laporte4 S Goetz4 F Verbelen5 and C Thies5
1 Greenpeace Russia Leningradsky prospekt 261 125040 Moscow Russia2 Department of Geographical Sciences University of Maryland College Park MD 20742 USA3 World Resources Institute 10 G Street NE Suite 800 Washington DC 20002 USA4 Woods Hole Research Center Falmouth MA 02540 USA5 Greenpeace International Ottho Heldringstraat 5 1066 AZ Amsterdam The Netherlands
E-mail ilonazhuravlevagreenpeaceorg
Received 28 January 2013Accepted for publication 3 May 2013Published 5 June 2013Online at stacksioporgERL8024034
AbstractPrimary forest extent loss and degradation within the Democratic Republic of the Congo (DRC) werequantified from 2000 to 2010 by combining directly mapped forest cover extent and loss data (CARPE)with indirectly mapped forest degradation data (intact forest landscapes IFL) Landsat data were used toderive both map inputs and data from the GLAS (Geoscience Laser Altimetry System) sensor wereemployed to validate the discrimination of primary intact and primary degraded forests In the year 2000primary humid tropical forests occupied 104 455 kha of the country with 61 of these forests classifiedas intact From 2000 to 2010 102 of primary forest cover was lost due to clearing and almost 2 ofintact primary forests were degraded due to alteration and fragmentation While primary forest clearingincreased by a factor of two between 2000ndash2005 and 2005ndash2010 the degradation of intact forestsslightly decreased Fragmentation and selective logging were the leading causes of intact forestdegradation accounting for 91 of IFL area change The 10 year forest degradation rate withindesignated logging permit areas was 38 times higher compared to other primary forest areas Withinprotected areas the forest degradation rate was 37 times lower than in other primary forest areas Forestdegradation rates were high in the vicinity of major urban areas Given the observed forest degradationrates we infer that the degradation of intact forests could increase up to two-fold over the next decade
Keywords primary forests intact forest landscapes deforestation forest degradation remote sensingLandsat Democratic Republic of the Congo
1 Introduction
The Democratic Republic of the Congo (DRC) is one of thelargest countries in Africa and contains almost 23 of totalAfrican forest cover (FAO 2010) DRC contains nearly half ofthe humid tropical forests of the Congo Basinmdashthe second
Content from this work may be used under the terms ofthe Creative Commons Attribution 30 licence Any further
distribution of this work must maintain attribution to the author(s) and thetitle of the work journal citation and DOI
largest contiguous tropical forest realm after the Amazon(CBFP 2009) Congo Basin forests stand out globally as aregion with both high carbon stocks and rich biodiversity(Strassburg et al 2009) The total carbon stock of the DRCis about 27 billion tons or 60 of the total carbon stock ofthe Congo basin countries (CBFP 2009 Gibbs et al 2007)The level of plant and animal species diversity and endemismis high throughout the basin especially close to the AlbertineRift (WWF 2006 Olson et al 2001) The Congo Basin forestis home to many large forest mammals great apes forestelephants and okapi Their distribution and survival depends
11748-932613024034+13$3300 ccopy 2013 IOP Publishing Ltd Printed in the UK
Environ Res Lett 8 (2013) 024034 I Zhuravleva et al
to a large extent on the unfragmented natural forest areaswhich are still present within the region (WWF 2006)
While the annual deforestation rate of the Congo Basinis relatively low compared to the Amazon and south-eastAsian tropical forests (FAO 2010) the DRC features thehighest deforestation area among central African countries(CBFP 2009) During the last two decades political unrestcorruption and poor governance have stimulated unregulatedresource exploitation including timber removal charcoalproduction artisanal and commercial mining and wildlifepoaching These activities within the country threaten theremaining population of great apes and many other largeforest mammals (WWF 2006) High population densities(second highest among central Africa countries CBFP 2009)depend on subsistence agriculture a primary cause of forestconversion and degradation Additional forest degradation andresulting biodiversity loss are caused by new and existinginfrastructure transportation routes mining and logging roads(WWF 2006 Laporte et al 2007 Clark et al 2009) Forestroads provide access to heretofore intact areas and fragmentforest habitat increasing anthropogenic pressure and reducingforestsrsquo capacity to host wide-ranging species and to resistnatural disasters and climate change effects (Tabarelli et al2004 Laurance et al 2006 Thies et al 2011) High populationgrowth rates and armed conflicts stimulate human migrationinside core forests (Draulans and van Krunkelsven 2002)This process is in general uncontrolled and little informationabout population distribution and forest use exists at thenational scale
The use of medium spatial resolution satellite dataprovides a means for regular assessment and monitoring offorest change The medium resolution data collected by theLandsat program have been used to map and monitor DRCforests since the 1970s The first nation-wide land covermaps were created by the Service Permanent drsquoInventaire etdrsquoAmenagement Forestier (SPIAF) with the support of US-AID (United States Agency for International Development)and CIDA (Canadian International Development Agency) in1970ndash1990 (Wilkie 1994) Landsat multi-spectral scanner(MSS) data have been used to map forest cover changewithin selected areas of the DRC (Justice et al 1993) Itwas found however that the coarse spatial resolution ofMSS data and limited spectral information was inadequateto map small-scale changes resulting from subsistenceagriculture (Wilkie 1994) Landsat thematic mapper (TM) andenhanced thematic mapper plus (ETM+) sensors partiallyovercome these issues by offering higher spatial resolutionand short-wave infrared (SWIR) spectral bands importantfor forest cover loss and infrastructure detection Landsatdata were employed to provide national-scale estimates offorest cover and change within DRC for 1990ndash1997 (Achardet al 2002) 1990ndash2000 (Duveiller et al 2008) 2000ndash2005(Hansen et al 2008b Ernst et al 2012) time intervals usingsampling approaches While sampling approaches are aneffective and fast way to provide forest cover and changeestimates their precision is usually low due to uneven changedistribution within the country (Tucker and Townshend 2000)In fact the standard error of Duveiller et al (2008) change
estimate is almost 25 of the total change area Usinga stratified sampling design could increase sample-basedchange estimate precision (Broich et al 2009) howeveronly Hansen et al (2008b) employed stratification based onindependently derived low spatial resolution change map
In contrast to sample-based methods wall-to-wallmapping approaches have several advantages for forest coverand change estimates within Central Africa First it is bettersuited for change area estimation within regions featuringsmall-scale and non-random change dynamics If change isnot targeted directly using ancillary information systematicsampling methods are used and require large sample sizesto reduce overall uncertainty estimates (Broich et al 2009)Mapping change directly overcomes this limitation Secondwall-to-wall maps can be used to analyze the explicit spatialdistribution of deforested and degraded areas analysis ofdrivers of forest disturbance and provide the disaggregationof change estimates to sub-national even local scales(Potapov et al 2012) Third complete forest and change mapsare required for national-scale and local land-use planningfor conservation strategies implementation and for forest usesustainability assessments within logging concessions
The potential for satellite-based technology to con-tribute towards national-scale wall-to-wall assessments wasrestricted until recently due to the combined impacts ofhigh data costs and persistent cloud cover within humidtropical regions The recent changes in the distribution policyfor Landsat data and progress in automated Landsat dataprocessing have enabled wall-to-wall forest mapping andmonitoring for large regions such as the DRC (Hansenet al 2008a) Freely distributed medium spatial resolutionsatellite data have been used to provide the first Landsat-basednation-wide forest cover map and to analyze forest coverchange from 2000 to 2010 (Potapov et al 2012) This workwas supported by the USAID-funded CARPE (Central AfricaRegional Program for the Environment) project Forest coverand change maps (hereafter referred to as lsquoCARPE datasetrsquo)can be viewed and downloaded from the CARPE web site(httpcongoiluciorgcarpemapper)
Mapping forest degradation is a more difficult taskcompared to forest cover loss in the form of stand-replacementdisturbances A universal definition of forest degradation isabsent (Schoene et al 2007) For practical reasons degradationis usually defined as a reduction of tree canopy cover andcarbon stock while other aspects of forest ecosystems likereduction of biodiversity and ecological integrity are usuallyomitted (Sasaki and Putz 2009) One way to estimate canopyreduction mapped as lsquoforest degradationrsquo was presented byDuveiller et al (2008) Forest degradation was defined asthe expansion of a lsquodegraded forestrsquo class defined as lsquodenseforest perforated by small logging clearings or crop fieldsrsquo(Duveiller et al 2008) However this approach does notdisaggregate pervasive forest cover loss (due to small-scaleagriculture expansion) from forest fragmentation and selectivelogging The use of medium spatial resolution wall-to-wallchange detection products (like CARPE dataset describedabove) that provide information on small-scale forest coverchange makes the step of mapping the forest-agriculture
2
Environ Res Lett 8 (2013) 024034 I Zhuravleva et al
mosaic as lsquodegraded forestsrsquo redundant These productshowever donrsquot enable the estimation of another factor of treecanopy reductionmdashselective logging Congo Basin timberproduction relies on low intensity selective logging which haslittle effect on tree canopy cover change (Brown et al 2005)Moderate spatial resolution satellite data are of limited valuein quantifying low intensity disturbances (Asner et al 2002)However areas of selective logging are usually manifested bythe presence of logging road infrastructure (Margono et al2012) Buffering existing clearings and logging roads couldbe used to estimate the extent of degraded forests (Molliconeet al 2007)
Fragmentation analysis has been demonstrated by variousresearch groups in assessing forest degradation at the globalscale (McCloskey and Spalding 1989 Bryant et al 1997Sanderson et al 2002 Kareiva et al 2007) However theseanalyses were based on existing global maps which wereof extremely poor quality for Central African countriesThe alternative approach called the intact forest landscapesmethod based on medium spatial resolution satellite data hasbeen developed by a group of scientists and environmentalnon-governmental organizations led by Greenpeace andthe World Resources Institute (Potapov et al 2008) Theessence of the approach is to establish the boundaries oflarge undeveloped forest areas or intact forest landscapes(IFL) and to provide timely monitoring of forest conversionand degradation within them The IFL method has beenprototyped for forest degradation assessment and monitoringwithin European Russia Central Africa and other regions(Potapov et al 2009 Zhuravleva 2011) IFL mapping resultswithin the Tropics for circa 2000 2005 and 2010 can beviewed and downloaded from a dedicated web site wwwintactforestsorgdatamonitoringhtml
The objective of the current research is to assess thedegradation of primary humid tropical forests within DRCfrom 2000 to 2010 The year 2000 national-scale primaryforest extent from the CARPE dataset (Potapov et al 2012)was used as a baseline for our assessment Primary forestswere defined as mature dense natural forests with tree canopydensity above 60 The intact forests were mapped withinprimary forest area using the IFL method (Potapov et al2008) The combination of IFL and primary forest mapsallowed us to analyze intact and non-intact or degradedprimary forests (those not meeting IFL criteria) separatelyForest clearing selective logging and consequent forestlandscapes fragmentation were considered to be forms offorest degradation Forest cover loss data from 2000 to2010 were taken from CARPE dataset while IFL changemonitoring was performed for the 2000ndash2010 interval usingavailable cloud-free Landsat image composites Aggregationof forest cover loss and IFL degradation maps enabled theanalysis of primary forest degradation in terms of forestclearing and fragmentation Forest degradation drivers andthreats were analyzed using additional information (protectedareas maps and logging permits) provided by the WorldResources Institute (WRI 2010) Our results provide aframework for prospective assessments of threatened primaryforests from 2010 to 2020
11 Historical background of forest alteration in the DRC
As the African continent is the birthplace of the human raceanthropogenic activity has been a part of ecosystem dynamicsin the Congo basin for millennia The most important factorin shaping the present ecoregion boundaries was wide-scaleuse of fire for hunting and forest clearing It is believedthat shrinking forest cover and expansion of present daysavanna and woodlands ecosystems in the southern part ofthe basin was driven by prehistoric fire use and that currentsavanna extent is sustained due to frequent fires (Beerlingand Osborne 2006 Bond et al 2005) The Bantu migrationthat started around 1000 BC (Oliver 1966) fueled continuedagricultural expansion along the humid tropical forests andsavannas interface However the population of core humidtropical forest areas remained low until the 20th century
Intensive forest conversion and fragmentation of naturalecosystems was initiated during the late 19th centuryin the colonization of the region under the CongoFree State (1884ndash1908) with intensification of miningoperations logging and cash-crop agriculture Industrialtimber extraction began in 1924 (Amsallem 2002) At the peakof industrial development in the Belgian Congo in the 1950sthe country was the main exporter of agricultural productsand minerals in central Africa At the same time agriculturalexpansion and industrial activity were limited within thecentral part of the Congo Basin Agricultural clearing pastureexpansion and mineral resource exploitation were mostlyconcentrated to the eastern part of the basin in the AlbertineRift and the lake region (Mararo 1997 Carrere 2010) Inthe western part of the country most of the plantations andagriculture were located along the Congo River close to thecapital Timber was a valuable export product but logging waslimited as most of the tropical forests were located far fromports making transportation time-consuming and expensive(Hance and van Dongen 1958)
Since the 1980s and especially during the armedconflicts that started in 1996 (First Congo War 1996ndash1997and Second Congo War 1998ndash2003) industrial developmentdeclinedmdashtimber harvest volumes within the DRC werethe lowest among central African nations for 2007 (CBFP2009 Carrere 2010) Agriculture plantation productioncontinue to decrease plantations were abandoned exportshalted and no new plantations initiated (Carrere 2010)However the population growth and displacement during theperiod of political unrest caused unregulated expansion ofsmall-scale subsistence agriculture into primary forests Insome regions of the DRC the war led to the displacementof populations away from road networks and into interiorforests (Draulans and van Krunkelsven 2002) Illegal loggingcharcoal production mining and poaching flourished duringthis period of political and civil instability However withoutthe construction of new infrastructure new frontiers ofagricultural expansion hunting and logging were limited
Since the end of the Second Congo War in 2003 andespecially since 2005 economic activity is again increasingwithin the country although pockets of civil instabilityremain In 2009 a review of forest logging permits was
3
Environ Res Lett 8 (2013) 024034 I Zhuravleva et al
completed by DRC through a multi-stakeholder process and65 logging permits meeting legality criteria were reinstatedfurther permits were approved in 2011 A moratoriumestablished in 2005 banned the allocation of new industriallogging permits and is still in effect (WRI 2010) Mostof the logging permits are owned by foreign investmentcompanies Commercial plantation activity has also beenrestored with recent attempts to invest in industrial oil palmproduction by American European Canadian and Chinesecompanies (Carrere 2010) On the other hand persistentconflicts and the global economic downturn recently increasedthreats from illegal timber extraction poaching artisanalmining and subsistence agriculture expansion (Draulans andvan Krunkelsven 2002 Endamana et al 2010) One moredriver of primary forest degradation is the artisanal loggingpermit system (Greenpeace 2012) While the moratorium bansthe allocation of new industrial logging permits the DRCgovernment issues artisanal logging permits in lsquocommunityrsquoforests for small Congolese businesses However with thepersistent lack of law enforcement the process of permitissuing is uncontrolled and according to local ecologicalorganizations (Greenpeace 2012) some of the logging permitareas are used for industrial logging
2 Data
Landsat imagery was used as the main information source forour analysis as it represents the only freely available mediumspatial resolution satellite-based dataset over Central AfricaWhile high spatial resolution data provided by commercialsatellite systems may deliver better precision in humaninfluence mapping their use is limited due to the highdata cost andor restricted distribution Another importantadvantage of the Landsat program is its data acquisitionstrategy that ensures nation-wide observation coverage for thelast decade from the ETM+ sensor
The national-scale forest cover mapping and monitoringCARPE dataset from 2000 to 2010 of Potapov et al (2012)as well as the IFL map update for 2000 2005 and 2010were generated using time-sequential cloud-free Landsat datacomposites and time-series metrics The data processingapproach employed the entire archive of Landsat 7 datafrom 1999 to 2010 (8881 images total 78 images perscene footprint on average) The data processing algorithmis described in detail by Potapov et al (2012) Sourceimages were automatically processed to mask all cloud andcloud shadow affected areas and radiometrically normalizedusing standard MODIS-derived surface reflectance productsComposites of high quality observations closest in time toJanuary 1 of year 2000 2005 and 2010 were used as a sourcedata for visual image interpretation and IFL map updates
Because the initial year 2000 IFL mapping (Potapov et al2008) was done before the full Landsat data archive wasmade available data from the Global Land Cover Facility(httpglcfumiacsumdedu) specifically the Global LandSurvey (GLS 2000) image collection was used (Gutman et al2008) for this reference year One of the main disadvantagesof the GLS dataset is the low observation density mostly
restricted to a single image per each scene footprint Toimprove image interpretation quality and to map past forestdegradation events GLS 1990 data were also used to aidvisual interpretation
Data from GLAS (Geoscience Laser Altimetry System)for year 2005 were used as reference to test differences incanopy cover structure between intact and degraded forestsThe year 2005 was chosen as the year of inter-comparisonas this period coincides with GLAS data acquisitions whichwere made from 2003 to 2009 GLAS data were screenedfor noise and cloud cover and transformed into estimationof canopy height and the height of median energy (HOME)as described in Goetz et al (2010) In total 226 735 60 mellipsoidal footprints with GLAS-derived canopy structuremetrics for the year 2005 were employed
3 Methods
The forest degradation assessment was performed withinprimary humid tropical forests of the year 2000 Primaryforests were defined as mature humid tropical forests with treecanopy cover above 60 (Potapov et al 2012) Primary forestswere mapped using Landsat image composites and spectralmetrics employing visually interpreted training data and asupervised decision tree classifier (Potapov et al 2012) TheIFL method (Potapov et al 2008) allowed us to disaggregatethe year 2000 primary forests into intact primary forests(within IFLs) and non-intact or degraded primary forests(outside IFLs) The IFL definition and mapping method areoutlined below (section 31) Degraded primary forest definedas a natural forest which has been fragmented or subjectedto forest utilization including wood and or non-wood forestproduct harvesting that alters the canopy cover and overallforest structure (ITTO 2002 Margono et al 2012)
Forest degradation was defined as remotely detectableanthropogenic alteration and fragmentation of primaryforests Some forest disturbance events namely gross forestcover loss due to subsistence agriculture clearing roadconstruction and settlement expansion could be directlymapped using Landsat data Gross forest cover loss for2000ndash2010 was mapped by Potapov et al (2012) usingmulti-temporal Landsat spectral metrics and a supervisedchange detection algorithm Gross forest cover loss wasassessed within both intact and degraded primary forests
Forest degradation events like selective logging andlandscape fragmentation could not be directly mapped usingLandsat data in the DRC To address small-scale and scatteredforest degradation the IFL method was employed Thismethod enabled the mapping of areas affected by selectivelogging by buffering logging roads and to map smallprimary forest fragments separated from the core intactforests by transportation routes and agricultural areas Areasaffected by fragmentation and selective logging could notbe distinguished using the IFL method and were analyzedtogether The fragmentation and selective logging assessmentswere performed only within intact primary forests andresulted in the reclassification of intact primary forests todegraded primary forests
4
Environ Res Lett 8 (2013) 024034 I Zhuravleva et al
Forest degradation was assessed for two 5 year timeintervals (2000ndash2005 and 2005ndash2010) to estimate temporaltrends The roles of each forest degradation factor (clearingand fragmentation) have been analyzed separately Bothprimary forest clearing and intact primary forest degradationwere defined as unidirectional change events and noprimary forest expansion (through land abandonment andnatural restoration) was considered For primary forests ourchange mapping approach was similar to the one appliedfor Brazil within the PRODES (Programa de Calculo doDesflorestamento da Amazonia) project (Camara et al 2006)We considered the year 2000 primary forest extent as abaseline and no primary forest gain was considered duringthe analysis timeframe For the IFL mapping all disturbancesthat have occurred within the past 30 years are excluded fromthe intact area according to the IFL mapping methodology(Potapov et al 2008) This age since disturbance criteriondoes not allow considering intactness gain during the decadalanalysis timeframe
31 IFL mapping and monitoring
An intact forest landscape (IFL) is defined as an unbrokenexpanse of natural ecosystems that exhibit no remotely de-tectable signs of human activity or habitat fragmentation andis large enough to maintain all native biodiversity includingviable populations of wide-ranging species (Potapov et al2008) Along with forests an IFL may include a small fractionof other natural ecosystems (lakes swamps rocks etc) TheIFL mapping approach is based on lsquoinverse logicrsquo ie on map-ping the opposite of intactness altered and fragmented forestareas Medium resolution satellite data were used to mapareas affected by alteration or conversion (clearing logginginfrastructure development etc) To assess fragmentation allinfrastructure and settlements were buffered by 1 km and theremaining areas were checked to fit the IFL size and widthcriteria For the national-scale IFL analyses the followingcriteria were used (1) minimum area of 50 thousand ha (kha)(2) minimum IFL patch width of 10 km and (3) minimumcorridorappendage width of 2 km The criteria were chosento insure that IFL patch core areas are large enough to providerefuge for wide-ranging animal species
Decadal IFL monitoring was performed separatelyfor two 5 year intervals 2000ndash2005 and 2005ndash2010 tocorrespond with the CARPE dataset The IFL map for year2000 is a subset of the global IFL mapping results (Potapovet al 2008) For the current analysis the IFL map wasupdated using additional data namely cloud-free Landsatimage composites and regional expert information The IFLboundaries were updated for years 2005 and 2010 usingLandsat data visual interpretation and the same set of criteriaas for initial IFL mapping For the visual interpretation weused start and end-point image composites (eg circa 2000and circa 2005) along with SWIR band difference imageswhich facilitate forest change detection All areas cleared orfragmented within the analyzed period were excluded fromthe IFL map (figure 1) The area and width of the remainingIFL patches were analyzed to exclude patches that no longerfit our fragmentation criteria
32 Forest degradation drivers and threats assessment
The gross forest cover loss and intact forest degradation rateswere used for comparison 10 year and 5 year change rateswere calculated by dividing the forest loss (or intact forestdegradation) area within specified time interval by the primary(or primary intact) forest area for the beginning of the timeinterval
The forest degradation data have been analyzed for theentire country by administrative units (provinces) loggingpermits and protected areas using boundary layers from theInteractive Forest Atlas of the DRC (WRI 2010) The loggingpermits database used in this analysis was updated by theWRI in 2012 to include new logging titles deemed convertibleto legal logging concessions in January 2011 In additionwe analyzed forest degradation within buffer zones of 5 kmaround protected areas
To analyze primary forest loss and degradation due tourban population growth an analysis of forest cover changeand degradation rates was performed within a 100 km radiusof the major 55 urban areas of the DRC (Potapov et al2012) Urban areas were selected based on population densityderived from the LandScan 2005 Global Population Database(Dobson et al 2000)
A forest degradation threats assessment was performedfor the primary intact forests for the year 2010 to highlightareas under imminent threat of exploitation Two main factorsof forest degradation were accounted for agriculture andinfrastructure expansion from the established settlements andtransportation routes and legal industrial timber harvestingTo predict the possible reduction of intact forest areasfor the 2010ndash2020 time interval a buffering approach wasimplemented using the IFL 2010 map as a starting point Ourprediction model was based on the following assumptions (i)the speed of agriculture expansion within intact forests duringthis coming decade will be similar to the one observed forthe 2000ndash2010 interval (ii) the forest degradation frontierwill expand in all directions with the same speed and (iii)the maximum speed of the penetration fragmentedconvertedareas into IFL patches will be less or equal to 1 km yrminus1similar to what has been observed for the 2000ndash2010 interval(Potapov et al 2012) We predicted the expansion of thedegraded forest area from every compact patch of forestdegradation detected from 2000 to 2010 For each patchthe maximum distance between the year 2000 and year2010 IFL boundaries was measured and employed to mapmaximal possible expansion of degraded area by the year2020 using the buffering approach To predict the threat ofindustrial logging we assume that industrial timber harvestingwill be limited to the extent of established logging permitsand that no new logging titles will be approved during thenext decade We analyzed logging companiesrsquo activity withincurrent logging permits Using these data we predicted whichpermits have the highest probability of being exploited in thenearest future From the existing logging permits containingintact forests for 2010 we selected those that fulfil at leastone criterion (i) intact forest degradation 2000ndash2010 withinthe permit was higher than the average among all permits in
5
Environ Res Lett 8 (2013) 024034 I Zhuravleva et al
Figure 1 Composite images and forest degradation monitoring results Landsat image composites (Orientale Province subset centered at03 0prime 29primeprime north 24 48prime 55primeprime east) (a) circa year 2000 (b) circa year 2005 (c) circa year 2010 (d) primary forest cover and forestdegradation 2000ndash2010
the DRC and (ii) the permits belong to companies whichhave higher 10 year rate of forest degradation than theaverage among all companies in the DRC After predictingthe expansion of degraded areas for the 2010ndash2020 timeinterval the IFL layer was updated and remaining IFL patcheschecked to fit our size criteria The modeling approach wasused to highlight areas with a high probability of intact forestdegradation within the coming decade
33 Structural comparison of intact and degraded forestclasses
The canopy height and HOME estimations derived fromGLAS data have been shown to relate to tree canopy structurebiomass (Baccini et al 2008) and forest degradation due toselective logging (Margono et al 2012) GLAS-derived datafor 2005 were used within the DRC to quantify structuraldifferences between primary intact primary degraded andother forests The CARPE and IFL maps for 2005 were used
as the basis for the analysis To avoid problems that may arisewithin recently deforested patches all forest cover changeareas from 2000 to 2005 were excluded from the analysisBecause the GLAS laser illuminates an approximately 60 mellipsoidal footprint the forest cover type from the 60 m pixelnearest to the footprint center was used for comparison Themean and standard deviation of canopy height and HOMEparameters were calculated for each forest type and thestatistical significance of the inter-class differences evaluatedusing a 95 t-test confidence interval
4 Results
41 IFL and primary forests for year 2000
Within-country IFL area for the year 2000 was 64 676 khaThe national IFL extent stands out as the second largestwithin the tropical forest biome after Brazil (Potapov et al2008) According to the CARPE forest cover map of the
6
Environ Res Lett 8 (2013) 024034 I Zhuravleva et al
Figure 2 Intact primary forest degradation 2000ndash2010 by IFL patch
year 2000 IFLs in the DRC almost exclusively consist ofprimary humid tropical forests (992 of the year 2000 IFLarea) The remaining 08 was classified as secondary forestswater bodies and non-forest lands (primarily rocky outcrops)Intact forests are located in the central and northern partsof the country within the Congo River basin mostly withinCongolian lowland and swamp forests with a small fractionin the Albertine Rift montane forests
For the year 2000 primary humid tropical forestsoccupied 104 455 kha of the country (Potapov et al 2012)From this area 61 were found within IFLs and classified asprimary intact forests The remaining 39 of primary forestshave been fragmented or affected by selective logging andwere labeled degraded primary forests
42 Primary forest degradation 2000ndash2010
From CARPE dataset the total area of primary forest losswas 1067 kha and the loss area nearly doubled (from 367to 701 kha) between the two analyzed 5 year intervals Theforest loss represents 102 of total primary forests of year2000 (12 occurred within intact primary forests and 88within degraded primary forests) Primary intact forest extentwas reduced by 02 and primary degraded forests by 23
The change in area of intact primary forest is used asa fragmentation indicator From 2000 to 2010 the area ofintact primary forest decreased by 1214 kha which representsnearly 20 of the year 2000 area Intact forest fragmentationdecreased slightly over the two epochs with 624 kha lostduring the first 5 years and 590 kha during the second half ofthe decade The degradation rate was spatially heterogeneousas illustrated by a per-patch IFL change analysis (figure 2)From 187 IFL patches mapped in 2000 160 had lost less than5 of their area during the decade 19 had lost 5ndash10 8 lost10ndash40 and one IFL patch was excluded due to patch areareduction below the IFL minimal area threshold
To illustrate the spatial variability in forest degradationwe provide a disaggregation of primary forest area andchange per province (table 1 figure 3) As of 2000 eightDRC provinces contained primary intact forests and threenone From these three provinces two (Bas-Congo andKinshasa) likely lost their primary forest cover due to historicclearing and one (Katanga) is located mostly outside thehumid tropical forest biome The primary forest cover waspredominantly intact within the northern and eastern parts ofthe country while in more populated provinces (Bandunduand Kasai-Occidental) more than 50 of primary forestswere fragmented or degraded
Of all primary forest loss nearly half (49) was foundin the Northern part of the country (Equateur and Orientaleprovinces) However the decadal rate of primary forestloss was highest within the densely populated Kinshasa andBas-Congo provinces which lost 96 and 46 of theirprimary forests respectively Between the 2000ndash2005 and2005ndash2010 time intervals primary forest loss increased in allprovinces but the highest increase (more than by factor oftwo) was detected in Kinshasa Nord-Kivu Kasai-Occidentaland Bandundu provinces
The vast majority of intact forest degradation (74) wasdetected in the northern part of the DRC within EquateurOrientale and Nord-Kivu provinces Nord-Kivu had thehighest rate of intact forest degradation losing 53 of itsprimary intact area during the decade The rate of intact forestdegradation differed by region between two 5 year intervalsIt decreased in Nord-Kivu (almost by factor of five) andKasai-Occidental (by factor of four) increased in Equateurprovince by factor of four and remained relatively stable forthe rest of the country
43 Forest degradation factors
Two major degradation factors forest clearing and fragmen-tation (including areas affected by selective logging) were
7
Environ Res Lett 8 (2013) 024034 I Zhuravleva et al
Figure 3 Intact primary forest degradation 2000ndash2010 in the DRC (by province)
Table 1 Primary forests cover and change by DRC province
Province name
Total primaryforests2000 (kha)
Intact primaryforests 2000 ()
Total primaryforest loss2000ndash2005 (kha)
Total primaryforest loss2005ndash2010 (kha)
Intact primaryforestdegradationa
2000ndash2005 (kha)
Intact primaryforestdegradationa
2005ndash2010 (kha)
Country total 104 455 614 367 701 624 590Bandundu 10 018 482 338 676 42 35Bas-Congo 79 00 13 23 0 0Equateur 31 227 577 901 1622 330 78Kasai-Occidental
6 802 454 528 1104 14 62
Kasai-Oriental 7 881 676 366 625 18 29Katanga 621 00 35 53 0 0Kinshasa 15 00 04 10 0 0Maniema 7 721 636 301 540 44 46Nord-Kivu 3 595 725 100 264 22 116ProvinceOrientale
33 234 703 917 1804 142 211
Sud-Kivu 3 262 620 163 285 12 13
a Including forest cover loss and fragmentation within intact primary forests
assessed separately using a combination of forest loss and IFLchange detection methods Of the area of primary intact forestdegradation 9 was due to clearing and the remaining (91)due to fragmentation and selective logging
Visual analysis of the Landsat image composites withinthe IFL change areas shows that fragmentation is caused bothfrom agricultural expansion and infrastructure developmentprimarily of logging roads Logging road construction isexpected to occur within officially designated logging permitsThe impact of selective logging and agricultural expansionwithin areas of designated logging permits was analyzedusing a logging titles spatial database The expansion offorest degradation should be limited by the implementationof a national nature conservation strategy especially withinofficially designated protected areas The forest degradationanalysis within protected areas illustrates the effectiveness ofgovernmental regulations
431 Forest degradation within logging permits There are80 logging permits operated by 26 companies provisionally
approved for subsequent concession contract establishment inthe DRC including 65 permits approved by 2009 (WRI 2010)and 15 permits approved in 2011 Logging titles cover an areaof 14 838 kha
In 2000 industrial logging permits included 12 706 khaof primary forest (122 of total primary forest area) 62of which were classified as intact (124 of the total intactforest area) In total primary forests represented 86 ofthe permitrsquos area with primary intact forest covering 53Industrial logging permits with the largest proportion of intactforests are mostly concentrated along the Congo River in threeprovinces Equateur Orientale and Bandundu
The rate of intact primary forest degradation withinpermits (53) was significantly higher than outside of them(14) The primary intact forest degradation area withinlogging permits declined between the first and second half ofthe decade from 246 to 177 kha Of the total primary forestloss 13 (139 kha) was found within logging permits Thearea of primary forest loss increased by 51 inside permits(compared to 48 outside of them) in the most recent 5 years
8
Environ Res Lett 8 (2013) 024034 I Zhuravleva et al
Figure 4 Intact primary forests with high probability of degradation 2010ndash2020
432 Forest degradation within protected areas Primaryforests are included within 33 protected areas in the country5 national parks 12 nature reserves 2 hunting reserves and 14hunting domains (last two categories were analyzed together)Total area of protected primary forests for year 2000 was13 982 kha of this 11 004 kha were intact forests Of all intactprimary forests 76 and 71 respectively were locatedwithin national parks and nature reserves and 24 withinhunting reserves More than 55 of primary forests withinnature reserves and national parks and about 16 of primaryforests within hunting reserves were intact in 2000
During the last decade 41 kha of primary forests inprotected areas have been cleared (including 6 kha withinintact primary forests) Additionally about 48 kha of intactprimary forests were fragmented and resulted in 54 kha ofintact forest area being degraded inside protected areas Thedecadal rates of forest loss and degradation within protectedareas were significantly lower than within the rest of countryThe primary forest loss rate (03) was 34 times lower thennational average (102 was lost within primary forests inthe DRC) and the intact primary forest degradation (05)was 37 times lower National parks have the lowest rate ofprimary forest loss and intact primary forest degradation (006and 008 respectively) while hunting reserves feature thehighest rate of change for protected areas (06 and 17respectively)
Primary forest loss within protected areas increasedbetween the first and second half of the decade by 48The highest increase was observed in hunting reserves (by50) while it decreased within National Parks from 2 kha(2000ndash2005) to 1 kha (2005ndash2010) Intact primary forestdegradation decreased in all categories of protected areas by42 Within 5 km buffer zones around protected areas theintact primary forest degradation rate was higher than withinthese areas by factor of 5
44 Forest degradation in the vicinity of urban areas
The high rate of population growth and urbanization in theDRC is thought to be a reason for intensive primary forest
degradation in the vicinity of urban areas We analyzed100 km buffer zones around each of the 55 major urban areasIn total 42 of all primary forests and 36 of intact primaryforests were located within the buffer zones The buffer zoneswere the site of 65 of total forest cover loss within primaryforests and of 69 of all intact forest degradation The rate ofprimary forest cover loss within these areas was 36 higherthan the average for the country and the rate of intact primaryforest degradation was 49 higher The primary forest coverloss area increase between 2000ndash2005 and 2005ndash2010 timeintervals was twice higher compared to the national average
45 Primary intact forests threat assessment
Our prediction model showed the maximum extent of intactprimary forests that could be degraded during 2010ndash2020if agricultural and infrastructure expansion speed was heldconstant The model predicted that the intact primary forestarea in the DRC could be reduced by 2435 kha during thenext 10 years or by 4 of year 2010 primary intact forest area(figure 4) The majority of the predicted changes would be dueto rapid agricultural expansion in Nord-Kivu and Orientaleprovinces and with logging infrastructure expansion withinthe logging permits in Equateur and Orientale province Ofall 2010 IFL patches 13 small patches will have their areareduced below the IFL area threshold The predicted intactforest degradation rate is twice higher than the observeddecadal degradation rate for 2000ndash2010 time interval Itshould be noted that our forecast model represents themaximum possible area of forest degradation and does notaccount for local difference in future forest degradationtrends
In addition to primary intact forests that are in the vicinityof recent degradation hotspots intact areas within activelymanaged logging permits are under threat of fragmentationand alteration by industrial logging Of 68 permits that includeintact primary forests 32 were highlighted as having thehighest probability of rapid forest degradation (using set ofcriteria described in section 32) Intact forests within theseactive logging concessions represent 4 of the total IFL area
9
Environ Res Lett 8 (2013) 024034 I Zhuravleva et al
Figure 5 Mean and standard deviation of GLAS-derived within primary intact primary degraded and non-primary (lsquootherrsquo) forests(a) vegetation height (b) HOME metrics for year 2005
46 Tree canopy structure metrics
Mean GLAS-derived vegetation height quantifies a differenceof 07 m between primary intact and primary degraded forestsand a difference of 78 m between primary degraded andother forests (including secondary humid tropical forests andwoodlands according to the CARPE dataset) While themean vegetation height difference between primary intact andprimary degraded forest is small it is statistically significantwith t-test p-values of 0000 for the 95 confidenceinterval The difference of the mean HOME estimate forprimary intact and primary degraded forests equals 20 m andis also statistically significant with t-test p-values of0000for the 95 confidence interval (figure 5)
5 Discussion
51 Primary and intact forest extent in the DRC
Given the long history of anthropogenic influence and theexpansion of illegal logging and poaching in recent decadesit is generally assumed that the extent of intact forest areasin the Congo basin is limited Comparison of the IFL map foryear 2000 with existing global intactness datasets (McCloskeyand Spalding 1989 Bryant et al 1997 Sanderson et al2002) showed that all former approaches which were basedon outdated and imprecise road maps in the core CentralAfrican forests showed high forest degradation levels Infact medium resolution satellite imagery analyzed from1990 to 2010 did not reveal high road densities within thecentral Congo basin According to the LandScan datasetthe mean population density in DRC within IFL for year2000 is 34 persons per square km which totals morethan 2 million people Because our mapping algorithmdoes not permit inclusion of any permanent settlements oragriculture areas within IFLs such population density seemssignificantly overestimated Another argument against thedesignation of remaining IFLs as lsquointactrsquo is the wide-scalepoaching within the country leading to lsquodefaunizationrsquo ofprimary forest patches (Redford 1992) Wildlife hunting isa significant problem in central Africa and poaching may
occur in remote areas away from roads and settlements Itwas shown however that large animals are hunted mostly inthe vicinity of roads and within fragmented andor secondaryforests (Barnes et al 1995 Barnes 2002) While poachingand consequent local animal extirpation is one of the majorthreats to forest ecosystems in Congo Basin hunting wasnot analyzed in our remote-sensing based assessment due todata limitations Large intact forest areas selected using theIFL approach have several features that make them importantfor priority conservation First with their natural (unaltered)plant species composition and large patch areas sustainingrelatively inaccessible core zones intact forests provide arefuge for animal populations ensuring their resilience tonatural disturbances and climate fluctuations Second limitedaccess due to a lack of infrastructure discourages and limitshunting Third these areas play an important role in carbonsequestration due to the preservation of natural forest structureand dynamics The DRC plays an important role in primaryforest conservation in Central Africa having 41 of its totalforest cover within IFLs and accounting for two-thirds of totalCongo Basin IFL area
52 Results accuracy and data availability
The presented analysis was based on the integration of twoindependent and well established methods and productssupervised Landsat-based forest cover and change mapping(Hansen et al 2008a Potapov et al 2012) and fragmentationanalysis using the IFL approach (Potapov et al 2008 2009)Thus the primary forest degradation dataset uncertaintyshould be derived from the source datasets (CARPE datasetand IFL dataset) uncertainty The CARPE dataset was createdusing supervised expert-driven classification similarly toother Landsat-based national-scale change estimation projects(Achard et al 2002 Duveiller et al 2008 Hansen et al 2008b2008a) To map the primary forests and change areas aniterative supervised classification approach was used withcross-verification by international and local experts (Potapovet al 2012) Presented forest cover and change estimatesare close to UNFAO estimates (FAO 2010) However thespatial accuracy of change detection was not validated due
10
Environ Res Lett 8 (2013) 024034 I Zhuravleva et al
to the lack of high spatial resolution data or field plots Themain limitation for the 2000ndash2010 product validation wasthe absence of reference field andor high spatial resolutionsatellite imagery for the year 2000 epoch Establishing aregular and recurring validation data collection strategy isrequired for future monitoring of the DRC (Potapov et al2012)
The low intensity of selective logging did not allow usto map forest degradation directly except for the extensionof logging roads However we were able to predict areasthat have a high probability of selective logging using theIFL approach The IFL method had been shown to be aneffective method for large-scale forest degradation assessment(Potapov et al 2009) The simplicity of the IFL mappingcriteria and large minimal size of the IFL patch ensures thatonly areas without significant recent anthropogenic influenceare mapped as lsquointactrsquo The structural analysis of tree canopycover within primary intact and degraded forests using GLASdata quantifies a structural difference between primary intactand primary degraded forests with degraded forests havingslightly lower maximum canopy height and significantlylower mean HOME values The observed difference ismost probably a consequence of selective logging practicesincluding the extraction of large commercially valuable treesconsequent disturbance of portions of the tree canopy duringfelling and removal with a large portion of the canopyremaining intact (Brown et al 2005) Similar results fordegraded forests affected by selective logging were obtainedby Margono et al (2012) for Sumatra Indonesia
While several projects have been performed to estimateforest cover and change within the DRC few have made theirresults along with baseline satellite imagery available forindependent assessment and cross-validation Both productsused in our analysis are available online For the IFL producta continuous external review process has been organized on adedicated web site (wwwintactforestsorg) The CAPRE mapis also freely available (httpcongoiluciorgcarpemapper)Both the CARPE and IFL maps are being used as the basisfor the National Forest Monitoring system of the DRC (wwwrdc-snsforg) We believe that the unrestricted distributionof satellite-derived products is a fast and effective way forcross-validation and quality assessment
53 Forest degradation factors and intact forestsconservation strategy
Our analysis of forest degradation factors (forest loss andfragmentation) performed independently for two 5 yeartime intervals showed that while forest cover loss nearlydoubled intact forest fragmentation remained stable andeven decreased slightly Visual image analysis and literaturereview suggested that the major driver of forest loss andfragmentation was agricultural expansion and other meansof forest clearing (eg charcoal production) fueled bypopulation growth As population continued to increaseso did subsistence agriculture area expansion Howeveragricultural expansion was mostly located around settlementsand existing infrastructure objects affecting mainly degraded
forests The observed rate of forest loss within degradedprimary forests was 12 times higher compared to intact areasThe highest forest degradation rates were observed in theeastern part of the country along the Congo River close tothe Great Lakes region and in the vicinity of mining towns inthe southern forestsavanna border Nord-Kivu province wasa noteworthy hope spot where agricultural expansion wasprobably related to internally displaced populations
Industrial logging one of the most important factorsof forest fragmentation in other central African countries(eg Gabon and the Republic of Congo) remained limitedwithin the DRC due to political and economic instabilityLimited industrial logging expansion is thought to be theprimary reason why intact forest degradation in the DRCis the less compared to other countries of the Congo basin(Zhuravleva 2011) Fragmentation by logging roads wasdetected mostly in the eastern part of the country especiallywithin areas having approved logging permits where itslowed during the second half of the decade Several factorscould be responsible for the observed degradation reductionincluding the global economic downturn of 2008 Becauseforest fragmentation in the DRC is mostly connected withagriculture expansion and not with selective logging intactforest fragmentation reduction within the DRC was smallercompared to other Central African countries where IFLdegradation decreased from 35 in 2000ndash2005 to 2 in2005ndash2010 (Zhuravleva 2011) The future of intact forestswithin the DRC timber concessions depends on the successfulimplementation of government policies
Considering current agriculture and road networkexpansion speed we predicted that intact forest degradationcould increase up to two-fold during the next decade Thisscenario is plausible taking into account the high rates ofpopulation growth However due to the intensification ofselective logging within current logging permits the rate ofintact forest degradation could increase even higher Protectedareas establishment could be one way to preserve intactprimary forests Our analysis shows that both intact primaryforest degradation and forest loss within protected areas weresignificantly lower than the national average National parkswere the most effective in protecting primary forests fromdegradation The rate of intact primary forest degradationwithin a 5 km buffer around protected areas was significantlyhigher than inside the protected areas illustrating the ongoingthreats from neighboring developed areas
The derived primary forest cover map change detectionresults and forest degradation prediction model results couldbe used as a baseline for forest conservation planningwithin the country New road construction opening accessto heretofore intact forest areas should be considered thegreatest threat to intact forest areas While intact primaryforest protection should be considered as a goal it is expectedthat there will be a further degradation of the remainingprimary forest In this case a zoning strategy could beimplemented to minimize infrastructure impact on core intactforest areas while leaving peripheral parts for sustainable use(Thies et al 2011 Sidle et al 2012) Zoning strategies havebeen successfully implemented in some of the central African
11
Environ Res Lett 8 (2013) 024034 I Zhuravleva et al
countries eg in Cameroon (WRI 2007) The lsquopermanentforest zonersquo in Cameroon prohibits forest conversion toagriculture or plantations This zone is further separatedinto strictly protected areas and logging concessions wherelimited timber extraction is permitted In the DRC zoninghave been successfully implemented on a sub-national levelspecifically within Congo Basin Forest Partnership (CBFP)landscapes (Sidle et al 2012) National-scale forest zoningin DRC is supported by a National Steering Committee forForest Zoning since 2009 Another important tool wouldbe limiting access and supporting vegetation restorationon abandoned logging roads to prevent expansion ofhunting range and agricultural clearing Land-use zoningand management planning is especially important withindegraded primary forest to prevent further land degradationand permanent deforestation
References
Achard F Eva H D Stibig H J Mayaux P Gallego J Richards Tand Malingreau J P 2002 Determination of deforestation ratesof the worldrsquos humid tropical forests Science 297 999ndash1002
Amsallem I 2002 Status and Trends in Forest Management inCentral Africa (Forest Management Working Paper vol 3)(Rome FAO Forest Resources Development Service ForestResources Division)
Asner G P Keller M Pereira R and Zweede J C 2002 Remotesensing of selective logging in Amazonia assessing limitationsbased on detailed field observations Landsat ETM+ andtextural analysis Remote Sens Environ 80 483ndash96
Baccini A Laporte N Goetz S J Sun M and Dong H 2008 A firstmap of tropical Africarsquos above-ground biomass derived fromsatellite imagery Environ Res Lett 3 045011
Barnes R F W 2002 The bushmeat boom and bust in West andCentral Africa Oryx 36 236ndash42
Barnes R F W Bloom A and Alers M P T 1995 A review of thestatus of forest elephants it Loxodonta africana in CentralAfrica Biol Conserv 71 125ndash32
Beerling D J and Osborne C P 2006 The origin of the savannabiome Glob Change Biol 12 2023ndash31
Bond W J Woodward F I and Midgley G F 2005 The globaldistribution of ecosystems in a world without fire New Phytol165 525ndash38
Broich M Stehman S V Hansen M C Potapov P andShimabukuro Y E 2009 A comparison of sampling designs forestimating deforestation from Landsat imagery a case study ofthe Brazilian Legal Amazon Remote Sens Environ113 2448ndash54
Brown S Pearson T Moore N Parveen A Ambagis S and Shoch D2005 Impact of Selective Logging on the Carbon Stocks ofTropical Forests Republic of Congo as a Case Study(Arlington Winrock International)
Bryant D Nielsen D and Tangley L 1997 The Last Frontier ForestsEcosystems and Economies on the Edge (Washington DCWorld Resources Institute)
Camara G Valeriano D M and Soares J V 2006 Metodologia para oCalculo da Taxa Anual de Desmatamento na Amazonia Legal(Sao Jose dos Campos INPE)
Carrere R 2010 Oil Palm in Africa Past Present and FutureScenarios (World Rainforest Movement Series on TreePlantations vol 15) (Montevideo World Rainforest Movement)
CBFP (Congo Basin Forest Partnership) 2009 The Forests of theCongo BasinmdashState of the Forest 2008 ed C de WasseigeD Devers P de Marcken A R Ebarsquoa R Nasi and
Ph Mayaux (Luxembourg Publications Office of the EuropeanUnion)
Clark C J Poulsen J R Malonga R and Elkan P W Jr 2009 Loggingconcessions can extend the conservation estate for CentralAfrican tropical forests Conserv Biol 23 1281ndash93
Dobson J E Bright E A Coleman P R Durfee R C and Worley B A2000 LandScan a global population database for estimatingpopulations at risk Photogramm Eng Remote Sens 66 849ndash57
Draulans D and van Krunkelsven E 2002 The impact of war onforest areas in the Democratic Republic of Congo Oryx36 35ndash40
Duveiller G Defourny P Desclee B and Mayaux P 2008Deforestation in Central Africa estimates at regional nationaland landscape levels by advanced processing ofsystematically-distributed Landsat extracts Remote SensEnviron 112 1969ndash81
Endamana D Boedhihartono A K Bokoto B Defo L Eyebe ANdikumagenge C Nzooh Z Ruiz-Perez M and Sayer J A 2010A framework for assessing conservation and development in aCongo Basin Forest Landscape Trop Conserv Sci 3 262ndash81
Ernst C Verheggen A Mayaux P Hansen M and Defourny P 2012Central African forest cover and cover change mapping TheForests of the Congo BasinmdashState of the Forest 2010ed C de Wasseige P de Marcken N Bayol F Hiol Ph MayauxB Desclee R Nasi A Billand P Defournyand A R Ebarsquoa (Luxembourg Publications Office of theEuropean Union) pp 23ndash42
FAO (Food and Agricultural Organization) 2010 Global ForestResources Assessment 2010 (Rome UNFAO)
Gibbs H Brown S Niles J and Foley J 2007 Monitoring andestimating tropical forest carbon stocks making REDD areality Environ Res Lett 2 045023
Goetz S J Sun M Baccini A and Beck P S A 2010 Synergistic useof space-borne LiDAR and optical imagery for assessing forestdisturbance an Alaska case study J Geophys ResmdashBiogeosci115 G00E07
Greenpeace 2012 lsquoArtisanal Loggingrsquo = Industrial Logging inDisguise (Kinshasa Greenpeace Africa)
Gutman G Byrnes R Masek J Covington S Justice C Franks Sand Headley R 2008 Towards monitoring land-cover andland-use changes at a global scale the global land survey 2005Photogramm Eng Remote Sens 74 6ndash10
Hance W A and van Dongen I S 1958 Matadi focus of BelgianAfrican transport Ann Assoc Am Geogr 48 41ndash72
Hansen M C Roy D P Lindquist E Adusei B Justice C O andAltstatt A 2008a A method for integrating MODIS andLandsat data for systematic monitoring of forest cover andchange and preliminary results for Central Africa Remote SensEnviron 112 2495ndash513
Hansen M C et al 2008b Humid tropical forest clearing from 2000to 2005 quantified by using multitemporal and multiresolutionremotely sensed data Proc Natl Acad Sci USA 105 9439ndash44
ITTO (International Tropical Timber Organization) 2002 ITTOGuidelines for the Restoration Management andRehabilitation of Degraded and Secondary Tropical Forests(ITTO Policy Development Series vol 13) (YokohamaInternational Tropical Timber Organization)
Justice C O Horning N and Laporte N 1993 Central Africa GlobalClimate Change and DevelopmentmdashSynopsis Remote Sensingand GIS Contributions to a Climate Change Program inCentral Africa (Washington DC Biodiversity SupportProgram)
Kareiva P Watts S McDonald R and Boucher T 2007 Domesticatednature shaping landscapes and ecosystems for human welfareScience 316 1866ndash9
Mararo B 1997 Land power and ethnic conflict in Masisi(Congo-Kinshasa) 1940s-1994 Int J Afr Hist Stud30 503ndash38
12
Environ Res Lett 8 (2013) 024034 I Zhuravleva et al
Margono B A Turubanova S Zhuravleva I Potapov PTyukavina A Baccini A Goetz S and Hansen M C 2012Mapping and monitoring deforestation and forest degradationin Sumatra (Indonesia) using Landsat time series data setsfrom 1990 to 2010 Environ Res Lett 7 034010
McCloskey J M and Spalding H 1989 A reconnaissance levelinventory of the amount of wilderness remaining in the worldAmbio 18 221ndash7
Mollicone D et al 2007 An incentive mechanism for reducingemissions from conversion of intact and non-intact forestsClim Change 83 477ndash93
Laporte N T Stabach J A Grosch R Lin T S and Goetz S J 2007Expansion of industrial logging in Central Africa Science316 1451
Laurance W F Croes B M Tchignoumba L Lahm S A Alonso ALee M E Campbell P and Ondzeano C 2006 Impacts of roadsand hunting on Central African Rainforest Mammals ConservBiol 20 1251ndash61
Oliver R 1966 The problem of the Bantu expansion J Afr Hist7 361ndash76
Olson D M et al 2001 Terrestrial ecoregions of the world a newmap of life on earth Bioscience 51 933ndash8
Potapov P V Laestadius L Yaroshenko A and Turubanova S 2009Case Studies on Measuring and Assessing Forest DegradationGlobal Mapping and Monitoring the Extent of ForestAlteration the Intact Forest Ladscape method (FAO WorkingPaper vol 166) (Rome FAO Forest Resources AssessmentProgramme)
Potapov P V Turubanova S A Hansen M C Adusei B Broich MAltstatt A Mane L and Justice C O 2012 Quantifying forestcover loss in Democratic Republic of the Congo 2000ndash2010with Landsat ETM+ data Remote Sens Environ 122 106ndash16
Potapov P V et al 2008 Mapping the worldrsquos intact forestlandscapes by remote sensing Ecol Soc 13 51
Redford K H 1992 The empty forest Bioscience 42 412ndash22Sanderson E W Malanding J Levi M A Redford K H
Wannebo A V and Woolmer G 2002 The human footprint andthe last of the wild Bioscience 52 891ndash904
Sasaki N and Putz F E 2009 Critical need for new definitions offorest and lsquoforest degradationrsquo in global climate changeagreements Conserv Lett 2 226ndash32
Schoene D Killmann W von Lupke H and LoycheWilkie M 2007Definitional Issues Related to Reducing Emissions fromDeforestation in Developing Countries (FAO Forests andClimate Change Working Paper vol 5) (Rome UNFAO)
Sidle J G Dupain J Beck J Nackoney J de Wasseige CBiang J D M Leprohon R and Malele S 2012 Forest zoningexperience in Central Africa The Forests of the CongoBasinmdashState of the Forest 2010 ed C de WasseigeP de Marcken N Bayol F Hiol Ph Mayaux B DescleeR Nasi A Billand P Defourny and A R Ebarsquoa (LuxembourgPublications Office of the European Union) pp 207ndash31
Strassburg B B N et al 2009 Global congruence of carbon storageand biodiversity in terrestrial ecosystems Conserv Lett3 98ndash105
Tabarelli M Cardoso Da Silva J and Gascon C 2004 Forestfragmentation synergisms and the impoverishment ofneotropical forests Biodivers Conserv 13 1419ndash25
Thies C Rosoman G Cotter J and Meaden S 2011 Intact ForestLandscapes Why It is Critical to Protect Them FromIndustrial Exploration (Amsterdam Greenpeace)
Tucker C J and Townshend J R G 2000 Strategies for monitoringtropical deforestation using satellite data Int J Remote Sens21 1461ndash71
Wilkie D S 1994 Remote sensing imagery for resource inventoriesin Central Africa the importance of detailed field dalta HumEcol 22 379ndash403
WRI (World Resources Institute) 2007 Interactive Forestry Atlas ofCameroonmdashVersion 20 (Washington DC World ResourcesInstitute)
WRI (World Resources Institute) 2010 Atlas Forestier Interactif dela Republique Democratique du CongomdashVersion 10(Washington DC World Resources Institute)
WWF (World Wildlife Fund) 2006 A Vision for BiodiversityConservation in Central Africa Biological Priorities forConservation in the GuineanmdashCongolian Forest andFreshwater Region (Washington DC WWF-USCentralAfrican Regional Program Office)
Zhuravleva I V 2011 Intact forest landscapes in the tropics mappingand monitoring in 2000ndash2010 Abstracts of Fifth Int ConfEarth from the Space The Most Effective Solutions (MoscowScanex)
13

Environ Res Lett 8 (2013) 024034 I Zhuravleva et al
mosaic as lsquodegraded forestsrsquo redundant These productshowever donrsquot enable the estimation of another factor of treecanopy reductionmdashselective logging Congo Basin timberproduction relies on low intensity selective logging which haslittle effect on tree canopy cover change (Brown et al 2005)Moderate spatial resolution satellite data are of limited valuein quantifying low intensity disturbances (Asner et al 2002)However areas of selective logging are usually manifested bythe presence of logging road infrastructure (Margono et al2012) Buffering existing clearings and logging roads couldbe used to estimate the extent of degraded forests (Molliconeet al 2007)
Fragmentation analysis has been demonstrated by variousresearch groups in assessing forest degradation at the globalscale (McCloskey and Spalding 1989 Bryant et al 1997Sanderson et al 2002 Kareiva et al 2007) However theseanalyses were based on existing global maps which wereof extremely poor quality for Central African countriesThe alternative approach called the intact forest landscapesmethod based on medium spatial resolution satellite data hasbeen developed by a group of scientists and environmentalnon-governmental organizations led by Greenpeace andthe World Resources Institute (Potapov et al 2008) Theessence of the approach is to establish the boundaries oflarge undeveloped forest areas or intact forest landscapes(IFL) and to provide timely monitoring of forest conversionand degradation within them The IFL method has beenprototyped for forest degradation assessment and monitoringwithin European Russia Central Africa and other regions(Potapov et al 2009 Zhuravleva 2011) IFL mapping resultswithin the Tropics for circa 2000 2005 and 2010 can beviewed and downloaded from a dedicated web site wwwintactforestsorgdatamonitoringhtml
The objective of the current research is to assess thedegradation of primary humid tropical forests within DRCfrom 2000 to 2010 The year 2000 national-scale primaryforest extent from the CARPE dataset (Potapov et al 2012)was used as a baseline for our assessment Primary forestswere defined as mature dense natural forests with tree canopydensity above 60 The intact forests were mapped withinprimary forest area using the IFL method (Potapov et al2008) The combination of IFL and primary forest mapsallowed us to analyze intact and non-intact or degradedprimary forests (those not meeting IFL criteria) separatelyForest clearing selective logging and consequent forestlandscapes fragmentation were considered to be forms offorest degradation Forest cover loss data from 2000 to2010 were taken from CARPE dataset while IFL changemonitoring was performed for the 2000ndash2010 interval usingavailable cloud-free Landsat image composites Aggregationof forest cover loss and IFL degradation maps enabled theanalysis of primary forest degradation in terms of forestclearing and fragmentation Forest degradation drivers andthreats were analyzed using additional information (protectedareas maps and logging permits) provided by the WorldResources Institute (WRI 2010) Our results provide aframework for prospective assessments of threatened primaryforests from 2010 to 2020
11 Historical background of forest alteration in the DRC
As the African continent is the birthplace of the human raceanthropogenic activity has been a part of ecosystem dynamicsin the Congo basin for millennia The most important factorin shaping the present ecoregion boundaries was wide-scaleuse of fire for hunting and forest clearing It is believedthat shrinking forest cover and expansion of present daysavanna and woodlands ecosystems in the southern part ofthe basin was driven by prehistoric fire use and that currentsavanna extent is sustained due to frequent fires (Beerlingand Osborne 2006 Bond et al 2005) The Bantu migrationthat started around 1000 BC (Oliver 1966) fueled continuedagricultural expansion along the humid tropical forests andsavannas interface However the population of core humidtropical forest areas remained low until the 20th century
Intensive forest conversion and fragmentation of naturalecosystems was initiated during the late 19th centuryin the colonization of the region under the CongoFree State (1884ndash1908) with intensification of miningoperations logging and cash-crop agriculture Industrialtimber extraction began in 1924 (Amsallem 2002) At the peakof industrial development in the Belgian Congo in the 1950sthe country was the main exporter of agricultural productsand minerals in central Africa At the same time agriculturalexpansion and industrial activity were limited within thecentral part of the Congo Basin Agricultural clearing pastureexpansion and mineral resource exploitation were mostlyconcentrated to the eastern part of the basin in the AlbertineRift and the lake region (Mararo 1997 Carrere 2010) Inthe western part of the country most of the plantations andagriculture were located along the Congo River close to thecapital Timber was a valuable export product but logging waslimited as most of the tropical forests were located far fromports making transportation time-consuming and expensive(Hance and van Dongen 1958)
Since the 1980s and especially during the armedconflicts that started in 1996 (First Congo War 1996ndash1997and Second Congo War 1998ndash2003) industrial developmentdeclinedmdashtimber harvest volumes within the DRC werethe lowest among central African nations for 2007 (CBFP2009 Carrere 2010) Agriculture plantation productioncontinue to decrease plantations were abandoned exportshalted and no new plantations initiated (Carrere 2010)However the population growth and displacement during theperiod of political unrest caused unregulated expansion ofsmall-scale subsistence agriculture into primary forests Insome regions of the DRC the war led to the displacementof populations away from road networks and into interiorforests (Draulans and van Krunkelsven 2002) Illegal loggingcharcoal production mining and poaching flourished duringthis period of political and civil instability However withoutthe construction of new infrastructure new frontiers ofagricultural expansion hunting and logging were limited
Since the end of the Second Congo War in 2003 andespecially since 2005 economic activity is again increasingwithin the country although pockets of civil instabilityremain In 2009 a review of forest logging permits was
3
Environ Res Lett 8 (2013) 024034 I Zhuravleva et al
completed by DRC through a multi-stakeholder process and65 logging permits meeting legality criteria were reinstatedfurther permits were approved in 2011 A moratoriumestablished in 2005 banned the allocation of new industriallogging permits and is still in effect (WRI 2010) Mostof the logging permits are owned by foreign investmentcompanies Commercial plantation activity has also beenrestored with recent attempts to invest in industrial oil palmproduction by American European Canadian and Chinesecompanies (Carrere 2010) On the other hand persistentconflicts and the global economic downturn recently increasedthreats from illegal timber extraction poaching artisanalmining and subsistence agriculture expansion (Draulans andvan Krunkelsven 2002 Endamana et al 2010) One moredriver of primary forest degradation is the artisanal loggingpermit system (Greenpeace 2012) While the moratorium bansthe allocation of new industrial logging permits the DRCgovernment issues artisanal logging permits in lsquocommunityrsquoforests for small Congolese businesses However with thepersistent lack of law enforcement the process of permitissuing is uncontrolled and according to local ecologicalorganizations (Greenpeace 2012) some of the logging permitareas are used for industrial logging
2 Data
Landsat imagery was used as the main information source forour analysis as it represents the only freely available mediumspatial resolution satellite-based dataset over Central AfricaWhile high spatial resolution data provided by commercialsatellite systems may deliver better precision in humaninfluence mapping their use is limited due to the highdata cost andor restricted distribution Another importantadvantage of the Landsat program is its data acquisitionstrategy that ensures nation-wide observation coverage for thelast decade from the ETM+ sensor
The national-scale forest cover mapping and monitoringCARPE dataset from 2000 to 2010 of Potapov et al (2012)as well as the IFL map update for 2000 2005 and 2010were generated using time-sequential cloud-free Landsat datacomposites and time-series metrics The data processingapproach employed the entire archive of Landsat 7 datafrom 1999 to 2010 (8881 images total 78 images perscene footprint on average) The data processing algorithmis described in detail by Potapov et al (2012) Sourceimages were automatically processed to mask all cloud andcloud shadow affected areas and radiometrically normalizedusing standard MODIS-derived surface reflectance productsComposites of high quality observations closest in time toJanuary 1 of year 2000 2005 and 2010 were used as a sourcedata for visual image interpretation and IFL map updates
Because the initial year 2000 IFL mapping (Potapov et al2008) was done before the full Landsat data archive wasmade available data from the Global Land Cover Facility(httpglcfumiacsumdedu) specifically the Global LandSurvey (GLS 2000) image collection was used (Gutman et al2008) for this reference year One of the main disadvantagesof the GLS dataset is the low observation density mostly
restricted to a single image per each scene footprint Toimprove image interpretation quality and to map past forestdegradation events GLS 1990 data were also used to aidvisual interpretation
Data from GLAS (Geoscience Laser Altimetry System)for year 2005 were used as reference to test differences incanopy cover structure between intact and degraded forestsThe year 2005 was chosen as the year of inter-comparisonas this period coincides with GLAS data acquisitions whichwere made from 2003 to 2009 GLAS data were screenedfor noise and cloud cover and transformed into estimationof canopy height and the height of median energy (HOME)as described in Goetz et al (2010) In total 226 735 60 mellipsoidal footprints with GLAS-derived canopy structuremetrics for the year 2005 were employed
3 Methods
The forest degradation assessment was performed withinprimary humid tropical forests of the year 2000 Primaryforests were defined as mature humid tropical forests with treecanopy cover above 60 (Potapov et al 2012) Primary forestswere mapped using Landsat image composites and spectralmetrics employing visually interpreted training data and asupervised decision tree classifier (Potapov et al 2012) TheIFL method (Potapov et al 2008) allowed us to disaggregatethe year 2000 primary forests into intact primary forests(within IFLs) and non-intact or degraded primary forests(outside IFLs) The IFL definition and mapping method areoutlined below (section 31) Degraded primary forest definedas a natural forest which has been fragmented or subjectedto forest utilization including wood and or non-wood forestproduct harvesting that alters the canopy cover and overallforest structure (ITTO 2002 Margono et al 2012)
Forest degradation was defined as remotely detectableanthropogenic alteration and fragmentation of primaryforests Some forest disturbance events namely gross forestcover loss due to subsistence agriculture clearing roadconstruction and settlement expansion could be directlymapped using Landsat data Gross forest cover loss for2000ndash2010 was mapped by Potapov et al (2012) usingmulti-temporal Landsat spectral metrics and a supervisedchange detection algorithm Gross forest cover loss wasassessed within both intact and degraded primary forests
Forest degradation events like selective logging andlandscape fragmentation could not be directly mapped usingLandsat data in the DRC To address small-scale and scatteredforest degradation the IFL method was employed Thismethod enabled the mapping of areas affected by selectivelogging by buffering logging roads and to map smallprimary forest fragments separated from the core intactforests by transportation routes and agricultural areas Areasaffected by fragmentation and selective logging could notbe distinguished using the IFL method and were analyzedtogether The fragmentation and selective logging assessmentswere performed only within intact primary forests andresulted in the reclassification of intact primary forests todegraded primary forests
4
Environ Res Lett 8 (2013) 024034 I Zhuravleva et al
Forest degradation was assessed for two 5 year timeintervals (2000ndash2005 and 2005ndash2010) to estimate temporaltrends The roles of each forest degradation factor (clearingand fragmentation) have been analyzed separately Bothprimary forest clearing and intact primary forest degradationwere defined as unidirectional change events and noprimary forest expansion (through land abandonment andnatural restoration) was considered For primary forests ourchange mapping approach was similar to the one appliedfor Brazil within the PRODES (Programa de Calculo doDesflorestamento da Amazonia) project (Camara et al 2006)We considered the year 2000 primary forest extent as abaseline and no primary forest gain was considered duringthe analysis timeframe For the IFL mapping all disturbancesthat have occurred within the past 30 years are excluded fromthe intact area according to the IFL mapping methodology(Potapov et al 2008) This age since disturbance criteriondoes not allow considering intactness gain during the decadalanalysis timeframe
31 IFL mapping and monitoring
An intact forest landscape (IFL) is defined as an unbrokenexpanse of natural ecosystems that exhibit no remotely de-tectable signs of human activity or habitat fragmentation andis large enough to maintain all native biodiversity includingviable populations of wide-ranging species (Potapov et al2008) Along with forests an IFL may include a small fractionof other natural ecosystems (lakes swamps rocks etc) TheIFL mapping approach is based on lsquoinverse logicrsquo ie on map-ping the opposite of intactness altered and fragmented forestareas Medium resolution satellite data were used to mapareas affected by alteration or conversion (clearing logginginfrastructure development etc) To assess fragmentation allinfrastructure and settlements were buffered by 1 km and theremaining areas were checked to fit the IFL size and widthcriteria For the national-scale IFL analyses the followingcriteria were used (1) minimum area of 50 thousand ha (kha)(2) minimum IFL patch width of 10 km and (3) minimumcorridorappendage width of 2 km The criteria were chosento insure that IFL patch core areas are large enough to providerefuge for wide-ranging animal species
Decadal IFL monitoring was performed separatelyfor two 5 year intervals 2000ndash2005 and 2005ndash2010 tocorrespond with the CARPE dataset The IFL map for year2000 is a subset of the global IFL mapping results (Potapovet al 2008) For the current analysis the IFL map wasupdated using additional data namely cloud-free Landsatimage composites and regional expert information The IFLboundaries were updated for years 2005 and 2010 usingLandsat data visual interpretation and the same set of criteriaas for initial IFL mapping For the visual interpretation weused start and end-point image composites (eg circa 2000and circa 2005) along with SWIR band difference imageswhich facilitate forest change detection All areas cleared orfragmented within the analyzed period were excluded fromthe IFL map (figure 1) The area and width of the remainingIFL patches were analyzed to exclude patches that no longerfit our fragmentation criteria
32 Forest degradation drivers and threats assessment
The gross forest cover loss and intact forest degradation rateswere used for comparison 10 year and 5 year change rateswere calculated by dividing the forest loss (or intact forestdegradation) area within specified time interval by the primary(or primary intact) forest area for the beginning of the timeinterval
The forest degradation data have been analyzed for theentire country by administrative units (provinces) loggingpermits and protected areas using boundary layers from theInteractive Forest Atlas of the DRC (WRI 2010) The loggingpermits database used in this analysis was updated by theWRI in 2012 to include new logging titles deemed convertibleto legal logging concessions in January 2011 In additionwe analyzed forest degradation within buffer zones of 5 kmaround protected areas
To analyze primary forest loss and degradation due tourban population growth an analysis of forest cover changeand degradation rates was performed within a 100 km radiusof the major 55 urban areas of the DRC (Potapov et al2012) Urban areas were selected based on population densityderived from the LandScan 2005 Global Population Database(Dobson et al 2000)
A forest degradation threats assessment was performedfor the primary intact forests for the year 2010 to highlightareas under imminent threat of exploitation Two main factorsof forest degradation were accounted for agriculture andinfrastructure expansion from the established settlements andtransportation routes and legal industrial timber harvestingTo predict the possible reduction of intact forest areasfor the 2010ndash2020 time interval a buffering approach wasimplemented using the IFL 2010 map as a starting point Ourprediction model was based on the following assumptions (i)the speed of agriculture expansion within intact forests duringthis coming decade will be similar to the one observed forthe 2000ndash2010 interval (ii) the forest degradation frontierwill expand in all directions with the same speed and (iii)the maximum speed of the penetration fragmentedconvertedareas into IFL patches will be less or equal to 1 km yrminus1similar to what has been observed for the 2000ndash2010 interval(Potapov et al 2012) We predicted the expansion of thedegraded forest area from every compact patch of forestdegradation detected from 2000 to 2010 For each patchthe maximum distance between the year 2000 and year2010 IFL boundaries was measured and employed to mapmaximal possible expansion of degraded area by the year2020 using the buffering approach To predict the threat ofindustrial logging we assume that industrial timber harvestingwill be limited to the extent of established logging permitsand that no new logging titles will be approved during thenext decade We analyzed logging companiesrsquo activity withincurrent logging permits Using these data we predicted whichpermits have the highest probability of being exploited in thenearest future From the existing logging permits containingintact forests for 2010 we selected those that fulfil at leastone criterion (i) intact forest degradation 2000ndash2010 withinthe permit was higher than the average among all permits in
5
Environ Res Lett 8 (2013) 024034 I Zhuravleva et al
Figure 1 Composite images and forest degradation monitoring results Landsat image composites (Orientale Province subset centered at03 0prime 29primeprime north 24 48prime 55primeprime east) (a) circa year 2000 (b) circa year 2005 (c) circa year 2010 (d) primary forest cover and forestdegradation 2000ndash2010
the DRC and (ii) the permits belong to companies whichhave higher 10 year rate of forest degradation than theaverage among all companies in the DRC After predictingthe expansion of degraded areas for the 2010ndash2020 timeinterval the IFL layer was updated and remaining IFL patcheschecked to fit our size criteria The modeling approach wasused to highlight areas with a high probability of intact forestdegradation within the coming decade
33 Structural comparison of intact and degraded forestclasses
The canopy height and HOME estimations derived fromGLAS data have been shown to relate to tree canopy structurebiomass (Baccini et al 2008) and forest degradation due toselective logging (Margono et al 2012) GLAS-derived datafor 2005 were used within the DRC to quantify structuraldifferences between primary intact primary degraded andother forests The CARPE and IFL maps for 2005 were used
as the basis for the analysis To avoid problems that may arisewithin recently deforested patches all forest cover changeareas from 2000 to 2005 were excluded from the analysisBecause the GLAS laser illuminates an approximately 60 mellipsoidal footprint the forest cover type from the 60 m pixelnearest to the footprint center was used for comparison Themean and standard deviation of canopy height and HOMEparameters were calculated for each forest type and thestatistical significance of the inter-class differences evaluatedusing a 95 t-test confidence interval
4 Results
41 IFL and primary forests for year 2000
Within-country IFL area for the year 2000 was 64 676 khaThe national IFL extent stands out as the second largestwithin the tropical forest biome after Brazil (Potapov et al2008) According to the CARPE forest cover map of the
6
Environ Res Lett 8 (2013) 024034 I Zhuravleva et al
Figure 2 Intact primary forest degradation 2000ndash2010 by IFL patch
year 2000 IFLs in the DRC almost exclusively consist ofprimary humid tropical forests (992 of the year 2000 IFLarea) The remaining 08 was classified as secondary forestswater bodies and non-forest lands (primarily rocky outcrops)Intact forests are located in the central and northern partsof the country within the Congo River basin mostly withinCongolian lowland and swamp forests with a small fractionin the Albertine Rift montane forests
For the year 2000 primary humid tropical forestsoccupied 104 455 kha of the country (Potapov et al 2012)From this area 61 were found within IFLs and classified asprimary intact forests The remaining 39 of primary forestshave been fragmented or affected by selective logging andwere labeled degraded primary forests
42 Primary forest degradation 2000ndash2010
From CARPE dataset the total area of primary forest losswas 1067 kha and the loss area nearly doubled (from 367to 701 kha) between the two analyzed 5 year intervals Theforest loss represents 102 of total primary forests of year2000 (12 occurred within intact primary forests and 88within degraded primary forests) Primary intact forest extentwas reduced by 02 and primary degraded forests by 23
The change in area of intact primary forest is used asa fragmentation indicator From 2000 to 2010 the area ofintact primary forest decreased by 1214 kha which representsnearly 20 of the year 2000 area Intact forest fragmentationdecreased slightly over the two epochs with 624 kha lostduring the first 5 years and 590 kha during the second half ofthe decade The degradation rate was spatially heterogeneousas illustrated by a per-patch IFL change analysis (figure 2)From 187 IFL patches mapped in 2000 160 had lost less than5 of their area during the decade 19 had lost 5ndash10 8 lost10ndash40 and one IFL patch was excluded due to patch areareduction below the IFL minimal area threshold
To illustrate the spatial variability in forest degradationwe provide a disaggregation of primary forest area andchange per province (table 1 figure 3) As of 2000 eightDRC provinces contained primary intact forests and threenone From these three provinces two (Bas-Congo andKinshasa) likely lost their primary forest cover due to historicclearing and one (Katanga) is located mostly outside thehumid tropical forest biome The primary forest cover waspredominantly intact within the northern and eastern parts ofthe country while in more populated provinces (Bandunduand Kasai-Occidental) more than 50 of primary forestswere fragmented or degraded
Of all primary forest loss nearly half (49) was foundin the Northern part of the country (Equateur and Orientaleprovinces) However the decadal rate of primary forestloss was highest within the densely populated Kinshasa andBas-Congo provinces which lost 96 and 46 of theirprimary forests respectively Between the 2000ndash2005 and2005ndash2010 time intervals primary forest loss increased in allprovinces but the highest increase (more than by factor oftwo) was detected in Kinshasa Nord-Kivu Kasai-Occidentaland Bandundu provinces
The vast majority of intact forest degradation (74) wasdetected in the northern part of the DRC within EquateurOrientale and Nord-Kivu provinces Nord-Kivu had thehighest rate of intact forest degradation losing 53 of itsprimary intact area during the decade The rate of intact forestdegradation differed by region between two 5 year intervalsIt decreased in Nord-Kivu (almost by factor of five) andKasai-Occidental (by factor of four) increased in Equateurprovince by factor of four and remained relatively stable forthe rest of the country
43 Forest degradation factors
Two major degradation factors forest clearing and fragmen-tation (including areas affected by selective logging) were
7
Environ Res Lett 8 (2013) 024034 I Zhuravleva et al
Figure 3 Intact primary forest degradation 2000ndash2010 in the DRC (by province)
Table 1 Primary forests cover and change by DRC province
Province name
Total primaryforests2000 (kha)
Intact primaryforests 2000 ()
Total primaryforest loss2000ndash2005 (kha)
Total primaryforest loss2005ndash2010 (kha)
Intact primaryforestdegradationa
2000ndash2005 (kha)
Intact primaryforestdegradationa
2005ndash2010 (kha)
Country total 104 455 614 367 701 624 590Bandundu 10 018 482 338 676 42 35Bas-Congo 79 00 13 23 0 0Equateur 31 227 577 901 1622 330 78Kasai-Occidental
6 802 454 528 1104 14 62
Kasai-Oriental 7 881 676 366 625 18 29Katanga 621 00 35 53 0 0Kinshasa 15 00 04 10 0 0Maniema 7 721 636 301 540 44 46Nord-Kivu 3 595 725 100 264 22 116ProvinceOrientale
33 234 703 917 1804 142 211
Sud-Kivu 3 262 620 163 285 12 13
a Including forest cover loss and fragmentation within intact primary forests
assessed separately using a combination of forest loss and IFLchange detection methods Of the area of primary intact forestdegradation 9 was due to clearing and the remaining (91)due to fragmentation and selective logging
Visual analysis of the Landsat image composites withinthe IFL change areas shows that fragmentation is caused bothfrom agricultural expansion and infrastructure developmentprimarily of logging roads Logging road construction isexpected to occur within officially designated logging permitsThe impact of selective logging and agricultural expansionwithin areas of designated logging permits was analyzedusing a logging titles spatial database The expansion offorest degradation should be limited by the implementationof a national nature conservation strategy especially withinofficially designated protected areas The forest degradationanalysis within protected areas illustrates the effectiveness ofgovernmental regulations
431 Forest degradation within logging permits There are80 logging permits operated by 26 companies provisionally
approved for subsequent concession contract establishment inthe DRC including 65 permits approved by 2009 (WRI 2010)and 15 permits approved in 2011 Logging titles cover an areaof 14 838 kha
In 2000 industrial logging permits included 12 706 khaof primary forest (122 of total primary forest area) 62of which were classified as intact (124 of the total intactforest area) In total primary forests represented 86 ofthe permitrsquos area with primary intact forest covering 53Industrial logging permits with the largest proportion of intactforests are mostly concentrated along the Congo River in threeprovinces Equateur Orientale and Bandundu
The rate of intact primary forest degradation withinpermits (53) was significantly higher than outside of them(14) The primary intact forest degradation area withinlogging permits declined between the first and second half ofthe decade from 246 to 177 kha Of the total primary forestloss 13 (139 kha) was found within logging permits Thearea of primary forest loss increased by 51 inside permits(compared to 48 outside of them) in the most recent 5 years
8
Environ Res Lett 8 (2013) 024034 I Zhuravleva et al
Figure 4 Intact primary forests with high probability of degradation 2010ndash2020
432 Forest degradation within protected areas Primaryforests are included within 33 protected areas in the country5 national parks 12 nature reserves 2 hunting reserves and 14hunting domains (last two categories were analyzed together)Total area of protected primary forests for year 2000 was13 982 kha of this 11 004 kha were intact forests Of all intactprimary forests 76 and 71 respectively were locatedwithin national parks and nature reserves and 24 withinhunting reserves More than 55 of primary forests withinnature reserves and national parks and about 16 of primaryforests within hunting reserves were intact in 2000
During the last decade 41 kha of primary forests inprotected areas have been cleared (including 6 kha withinintact primary forests) Additionally about 48 kha of intactprimary forests were fragmented and resulted in 54 kha ofintact forest area being degraded inside protected areas Thedecadal rates of forest loss and degradation within protectedareas were significantly lower than within the rest of countryThe primary forest loss rate (03) was 34 times lower thennational average (102 was lost within primary forests inthe DRC) and the intact primary forest degradation (05)was 37 times lower National parks have the lowest rate ofprimary forest loss and intact primary forest degradation (006and 008 respectively) while hunting reserves feature thehighest rate of change for protected areas (06 and 17respectively)
Primary forest loss within protected areas increasedbetween the first and second half of the decade by 48The highest increase was observed in hunting reserves (by50) while it decreased within National Parks from 2 kha(2000ndash2005) to 1 kha (2005ndash2010) Intact primary forestdegradation decreased in all categories of protected areas by42 Within 5 km buffer zones around protected areas theintact primary forest degradation rate was higher than withinthese areas by factor of 5
44 Forest degradation in the vicinity of urban areas
The high rate of population growth and urbanization in theDRC is thought to be a reason for intensive primary forest
degradation in the vicinity of urban areas We analyzed100 km buffer zones around each of the 55 major urban areasIn total 42 of all primary forests and 36 of intact primaryforests were located within the buffer zones The buffer zoneswere the site of 65 of total forest cover loss within primaryforests and of 69 of all intact forest degradation The rate ofprimary forest cover loss within these areas was 36 higherthan the average for the country and the rate of intact primaryforest degradation was 49 higher The primary forest coverloss area increase between 2000ndash2005 and 2005ndash2010 timeintervals was twice higher compared to the national average
45 Primary intact forests threat assessment
Our prediction model showed the maximum extent of intactprimary forests that could be degraded during 2010ndash2020if agricultural and infrastructure expansion speed was heldconstant The model predicted that the intact primary forestarea in the DRC could be reduced by 2435 kha during thenext 10 years or by 4 of year 2010 primary intact forest area(figure 4) The majority of the predicted changes would be dueto rapid agricultural expansion in Nord-Kivu and Orientaleprovinces and with logging infrastructure expansion withinthe logging permits in Equateur and Orientale province Ofall 2010 IFL patches 13 small patches will have their areareduced below the IFL area threshold The predicted intactforest degradation rate is twice higher than the observeddecadal degradation rate for 2000ndash2010 time interval Itshould be noted that our forecast model represents themaximum possible area of forest degradation and does notaccount for local difference in future forest degradationtrends
In addition to primary intact forests that are in the vicinityof recent degradation hotspots intact areas within activelymanaged logging permits are under threat of fragmentationand alteration by industrial logging Of 68 permits that includeintact primary forests 32 were highlighted as having thehighest probability of rapid forest degradation (using set ofcriteria described in section 32) Intact forests within theseactive logging concessions represent 4 of the total IFL area
9
Environ Res Lett 8 (2013) 024034 I Zhuravleva et al
Figure 5 Mean and standard deviation of GLAS-derived within primary intact primary degraded and non-primary (lsquootherrsquo) forests(a) vegetation height (b) HOME metrics for year 2005
46 Tree canopy structure metrics
Mean GLAS-derived vegetation height quantifies a differenceof 07 m between primary intact and primary degraded forestsand a difference of 78 m between primary degraded andother forests (including secondary humid tropical forests andwoodlands according to the CARPE dataset) While themean vegetation height difference between primary intact andprimary degraded forest is small it is statistically significantwith t-test p-values of 0000 for the 95 confidenceinterval The difference of the mean HOME estimate forprimary intact and primary degraded forests equals 20 m andis also statistically significant with t-test p-values of0000for the 95 confidence interval (figure 5)
5 Discussion
51 Primary and intact forest extent in the DRC
Given the long history of anthropogenic influence and theexpansion of illegal logging and poaching in recent decadesit is generally assumed that the extent of intact forest areasin the Congo basin is limited Comparison of the IFL map foryear 2000 with existing global intactness datasets (McCloskeyand Spalding 1989 Bryant et al 1997 Sanderson et al2002) showed that all former approaches which were basedon outdated and imprecise road maps in the core CentralAfrican forests showed high forest degradation levels Infact medium resolution satellite imagery analyzed from1990 to 2010 did not reveal high road densities within thecentral Congo basin According to the LandScan datasetthe mean population density in DRC within IFL for year2000 is 34 persons per square km which totals morethan 2 million people Because our mapping algorithmdoes not permit inclusion of any permanent settlements oragriculture areas within IFLs such population density seemssignificantly overestimated Another argument against thedesignation of remaining IFLs as lsquointactrsquo is the wide-scalepoaching within the country leading to lsquodefaunizationrsquo ofprimary forest patches (Redford 1992) Wildlife hunting isa significant problem in central Africa and poaching may
occur in remote areas away from roads and settlements Itwas shown however that large animals are hunted mostly inthe vicinity of roads and within fragmented andor secondaryforests (Barnes et al 1995 Barnes 2002) While poachingand consequent local animal extirpation is one of the majorthreats to forest ecosystems in Congo Basin hunting wasnot analyzed in our remote-sensing based assessment due todata limitations Large intact forest areas selected using theIFL approach have several features that make them importantfor priority conservation First with their natural (unaltered)plant species composition and large patch areas sustainingrelatively inaccessible core zones intact forests provide arefuge for animal populations ensuring their resilience tonatural disturbances and climate fluctuations Second limitedaccess due to a lack of infrastructure discourages and limitshunting Third these areas play an important role in carbonsequestration due to the preservation of natural forest structureand dynamics The DRC plays an important role in primaryforest conservation in Central Africa having 41 of its totalforest cover within IFLs and accounting for two-thirds of totalCongo Basin IFL area
52 Results accuracy and data availability
The presented analysis was based on the integration of twoindependent and well established methods and productssupervised Landsat-based forest cover and change mapping(Hansen et al 2008a Potapov et al 2012) and fragmentationanalysis using the IFL approach (Potapov et al 2008 2009)Thus the primary forest degradation dataset uncertaintyshould be derived from the source datasets (CARPE datasetand IFL dataset) uncertainty The CARPE dataset was createdusing supervised expert-driven classification similarly toother Landsat-based national-scale change estimation projects(Achard et al 2002 Duveiller et al 2008 Hansen et al 2008b2008a) To map the primary forests and change areas aniterative supervised classification approach was used withcross-verification by international and local experts (Potapovet al 2012) Presented forest cover and change estimatesare close to UNFAO estimates (FAO 2010) However thespatial accuracy of change detection was not validated due
10
Environ Res Lett 8 (2013) 024034 I Zhuravleva et al
to the lack of high spatial resolution data or field plots Themain limitation for the 2000ndash2010 product validation wasthe absence of reference field andor high spatial resolutionsatellite imagery for the year 2000 epoch Establishing aregular and recurring validation data collection strategy isrequired for future monitoring of the DRC (Potapov et al2012)
The low intensity of selective logging did not allow usto map forest degradation directly except for the extensionof logging roads However we were able to predict areasthat have a high probability of selective logging using theIFL approach The IFL method had been shown to be aneffective method for large-scale forest degradation assessment(Potapov et al 2009) The simplicity of the IFL mappingcriteria and large minimal size of the IFL patch ensures thatonly areas without significant recent anthropogenic influenceare mapped as lsquointactrsquo The structural analysis of tree canopycover within primary intact and degraded forests using GLASdata quantifies a structural difference between primary intactand primary degraded forests with degraded forests havingslightly lower maximum canopy height and significantlylower mean HOME values The observed difference ismost probably a consequence of selective logging practicesincluding the extraction of large commercially valuable treesconsequent disturbance of portions of the tree canopy duringfelling and removal with a large portion of the canopyremaining intact (Brown et al 2005) Similar results fordegraded forests affected by selective logging were obtainedby Margono et al (2012) for Sumatra Indonesia
While several projects have been performed to estimateforest cover and change within the DRC few have made theirresults along with baseline satellite imagery available forindependent assessment and cross-validation Both productsused in our analysis are available online For the IFL producta continuous external review process has been organized on adedicated web site (wwwintactforestsorg) The CAPRE mapis also freely available (httpcongoiluciorgcarpemapper)Both the CARPE and IFL maps are being used as the basisfor the National Forest Monitoring system of the DRC (wwwrdc-snsforg) We believe that the unrestricted distributionof satellite-derived products is a fast and effective way forcross-validation and quality assessment
53 Forest degradation factors and intact forestsconservation strategy
Our analysis of forest degradation factors (forest loss andfragmentation) performed independently for two 5 yeartime intervals showed that while forest cover loss nearlydoubled intact forest fragmentation remained stable andeven decreased slightly Visual image analysis and literaturereview suggested that the major driver of forest loss andfragmentation was agricultural expansion and other meansof forest clearing (eg charcoal production) fueled bypopulation growth As population continued to increaseso did subsistence agriculture area expansion Howeveragricultural expansion was mostly located around settlementsand existing infrastructure objects affecting mainly degraded
forests The observed rate of forest loss within degradedprimary forests was 12 times higher compared to intact areasThe highest forest degradation rates were observed in theeastern part of the country along the Congo River close tothe Great Lakes region and in the vicinity of mining towns inthe southern forestsavanna border Nord-Kivu province wasa noteworthy hope spot where agricultural expansion wasprobably related to internally displaced populations
Industrial logging one of the most important factorsof forest fragmentation in other central African countries(eg Gabon and the Republic of Congo) remained limitedwithin the DRC due to political and economic instabilityLimited industrial logging expansion is thought to be theprimary reason why intact forest degradation in the DRCis the less compared to other countries of the Congo basin(Zhuravleva 2011) Fragmentation by logging roads wasdetected mostly in the eastern part of the country especiallywithin areas having approved logging permits where itslowed during the second half of the decade Several factorscould be responsible for the observed degradation reductionincluding the global economic downturn of 2008 Becauseforest fragmentation in the DRC is mostly connected withagriculture expansion and not with selective logging intactforest fragmentation reduction within the DRC was smallercompared to other Central African countries where IFLdegradation decreased from 35 in 2000ndash2005 to 2 in2005ndash2010 (Zhuravleva 2011) The future of intact forestswithin the DRC timber concessions depends on the successfulimplementation of government policies
Considering current agriculture and road networkexpansion speed we predicted that intact forest degradationcould increase up to two-fold during the next decade Thisscenario is plausible taking into account the high rates ofpopulation growth However due to the intensification ofselective logging within current logging permits the rate ofintact forest degradation could increase even higher Protectedareas establishment could be one way to preserve intactprimary forests Our analysis shows that both intact primaryforest degradation and forest loss within protected areas weresignificantly lower than the national average National parkswere the most effective in protecting primary forests fromdegradation The rate of intact primary forest degradationwithin a 5 km buffer around protected areas was significantlyhigher than inside the protected areas illustrating the ongoingthreats from neighboring developed areas
The derived primary forest cover map change detectionresults and forest degradation prediction model results couldbe used as a baseline for forest conservation planningwithin the country New road construction opening accessto heretofore intact forest areas should be considered thegreatest threat to intact forest areas While intact primaryforest protection should be considered as a goal it is expectedthat there will be a further degradation of the remainingprimary forest In this case a zoning strategy could beimplemented to minimize infrastructure impact on core intactforest areas while leaving peripheral parts for sustainable use(Thies et al 2011 Sidle et al 2012) Zoning strategies havebeen successfully implemented in some of the central African
11
Environ Res Lett 8 (2013) 024034 I Zhuravleva et al
countries eg in Cameroon (WRI 2007) The lsquopermanentforest zonersquo in Cameroon prohibits forest conversion toagriculture or plantations This zone is further separatedinto strictly protected areas and logging concessions wherelimited timber extraction is permitted In the DRC zoninghave been successfully implemented on a sub-national levelspecifically within Congo Basin Forest Partnership (CBFP)landscapes (Sidle et al 2012) National-scale forest zoningin DRC is supported by a National Steering Committee forForest Zoning since 2009 Another important tool wouldbe limiting access and supporting vegetation restorationon abandoned logging roads to prevent expansion ofhunting range and agricultural clearing Land-use zoningand management planning is especially important withindegraded primary forest to prevent further land degradationand permanent deforestation
References
Achard F Eva H D Stibig H J Mayaux P Gallego J Richards Tand Malingreau J P 2002 Determination of deforestation ratesof the worldrsquos humid tropical forests Science 297 999ndash1002
Amsallem I 2002 Status and Trends in Forest Management inCentral Africa (Forest Management Working Paper vol 3)(Rome FAO Forest Resources Development Service ForestResources Division)
Asner G P Keller M Pereira R and Zweede J C 2002 Remotesensing of selective logging in Amazonia assessing limitationsbased on detailed field observations Landsat ETM+ andtextural analysis Remote Sens Environ 80 483ndash96
Baccini A Laporte N Goetz S J Sun M and Dong H 2008 A firstmap of tropical Africarsquos above-ground biomass derived fromsatellite imagery Environ Res Lett 3 045011
Barnes R F W 2002 The bushmeat boom and bust in West andCentral Africa Oryx 36 236ndash42
Barnes R F W Bloom A and Alers M P T 1995 A review of thestatus of forest elephants it Loxodonta africana in CentralAfrica Biol Conserv 71 125ndash32
Beerling D J and Osborne C P 2006 The origin of the savannabiome Glob Change Biol 12 2023ndash31
Bond W J Woodward F I and Midgley G F 2005 The globaldistribution of ecosystems in a world without fire New Phytol165 525ndash38
Broich M Stehman S V Hansen M C Potapov P andShimabukuro Y E 2009 A comparison of sampling designs forestimating deforestation from Landsat imagery a case study ofthe Brazilian Legal Amazon Remote Sens Environ113 2448ndash54
Brown S Pearson T Moore N Parveen A Ambagis S and Shoch D2005 Impact of Selective Logging on the Carbon Stocks ofTropical Forests Republic of Congo as a Case Study(Arlington Winrock International)
Bryant D Nielsen D and Tangley L 1997 The Last Frontier ForestsEcosystems and Economies on the Edge (Washington DCWorld Resources Institute)
Camara G Valeriano D M and Soares J V 2006 Metodologia para oCalculo da Taxa Anual de Desmatamento na Amazonia Legal(Sao Jose dos Campos INPE)
Carrere R 2010 Oil Palm in Africa Past Present and FutureScenarios (World Rainforest Movement Series on TreePlantations vol 15) (Montevideo World Rainforest Movement)
CBFP (Congo Basin Forest Partnership) 2009 The Forests of theCongo BasinmdashState of the Forest 2008 ed C de WasseigeD Devers P de Marcken A R Ebarsquoa R Nasi and
Ph Mayaux (Luxembourg Publications Office of the EuropeanUnion)
Clark C J Poulsen J R Malonga R and Elkan P W Jr 2009 Loggingconcessions can extend the conservation estate for CentralAfrican tropical forests Conserv Biol 23 1281ndash93
Dobson J E Bright E A Coleman P R Durfee R C and Worley B A2000 LandScan a global population database for estimatingpopulations at risk Photogramm Eng Remote Sens 66 849ndash57
Draulans D and van Krunkelsven E 2002 The impact of war onforest areas in the Democratic Republic of Congo Oryx36 35ndash40
Duveiller G Defourny P Desclee B and Mayaux P 2008Deforestation in Central Africa estimates at regional nationaland landscape levels by advanced processing ofsystematically-distributed Landsat extracts Remote SensEnviron 112 1969ndash81
Endamana D Boedhihartono A K Bokoto B Defo L Eyebe ANdikumagenge C Nzooh Z Ruiz-Perez M and Sayer J A 2010A framework for assessing conservation and development in aCongo Basin Forest Landscape Trop Conserv Sci 3 262ndash81
Ernst C Verheggen A Mayaux P Hansen M and Defourny P 2012Central African forest cover and cover change mapping TheForests of the Congo BasinmdashState of the Forest 2010ed C de Wasseige P de Marcken N Bayol F Hiol Ph MayauxB Desclee R Nasi A Billand P Defournyand A R Ebarsquoa (Luxembourg Publications Office of theEuropean Union) pp 23ndash42
FAO (Food and Agricultural Organization) 2010 Global ForestResources Assessment 2010 (Rome UNFAO)
Gibbs H Brown S Niles J and Foley J 2007 Monitoring andestimating tropical forest carbon stocks making REDD areality Environ Res Lett 2 045023
Goetz S J Sun M Baccini A and Beck P S A 2010 Synergistic useof space-borne LiDAR and optical imagery for assessing forestdisturbance an Alaska case study J Geophys ResmdashBiogeosci115 G00E07
Greenpeace 2012 lsquoArtisanal Loggingrsquo = Industrial Logging inDisguise (Kinshasa Greenpeace Africa)
Gutman G Byrnes R Masek J Covington S Justice C Franks Sand Headley R 2008 Towards monitoring land-cover andland-use changes at a global scale the global land survey 2005Photogramm Eng Remote Sens 74 6ndash10
Hance W A and van Dongen I S 1958 Matadi focus of BelgianAfrican transport Ann Assoc Am Geogr 48 41ndash72
Hansen M C Roy D P Lindquist E Adusei B Justice C O andAltstatt A 2008a A method for integrating MODIS andLandsat data for systematic monitoring of forest cover andchange and preliminary results for Central Africa Remote SensEnviron 112 2495ndash513
Hansen M C et al 2008b Humid tropical forest clearing from 2000to 2005 quantified by using multitemporal and multiresolutionremotely sensed data Proc Natl Acad Sci USA 105 9439ndash44
ITTO (International Tropical Timber Organization) 2002 ITTOGuidelines for the Restoration Management andRehabilitation of Degraded and Secondary Tropical Forests(ITTO Policy Development Series vol 13) (YokohamaInternational Tropical Timber Organization)
Justice C O Horning N and Laporte N 1993 Central Africa GlobalClimate Change and DevelopmentmdashSynopsis Remote Sensingand GIS Contributions to a Climate Change Program inCentral Africa (Washington DC Biodiversity SupportProgram)
Kareiva P Watts S McDonald R and Boucher T 2007 Domesticatednature shaping landscapes and ecosystems for human welfareScience 316 1866ndash9
Mararo B 1997 Land power and ethnic conflict in Masisi(Congo-Kinshasa) 1940s-1994 Int J Afr Hist Stud30 503ndash38
12
Environ Res Lett 8 (2013) 024034 I Zhuravleva et al
Margono B A Turubanova S Zhuravleva I Potapov PTyukavina A Baccini A Goetz S and Hansen M C 2012Mapping and monitoring deforestation and forest degradationin Sumatra (Indonesia) using Landsat time series data setsfrom 1990 to 2010 Environ Res Lett 7 034010
McCloskey J M and Spalding H 1989 A reconnaissance levelinventory of the amount of wilderness remaining in the worldAmbio 18 221ndash7
Mollicone D et al 2007 An incentive mechanism for reducingemissions from conversion of intact and non-intact forestsClim Change 83 477ndash93
Laporte N T Stabach J A Grosch R Lin T S and Goetz S J 2007Expansion of industrial logging in Central Africa Science316 1451
Laurance W F Croes B M Tchignoumba L Lahm S A Alonso ALee M E Campbell P and Ondzeano C 2006 Impacts of roadsand hunting on Central African Rainforest Mammals ConservBiol 20 1251ndash61
Oliver R 1966 The problem of the Bantu expansion J Afr Hist7 361ndash76
Olson D M et al 2001 Terrestrial ecoregions of the world a newmap of life on earth Bioscience 51 933ndash8
Potapov P V Laestadius L Yaroshenko A and Turubanova S 2009Case Studies on Measuring and Assessing Forest DegradationGlobal Mapping and Monitoring the Extent of ForestAlteration the Intact Forest Ladscape method (FAO WorkingPaper vol 166) (Rome FAO Forest Resources AssessmentProgramme)
Potapov P V Turubanova S A Hansen M C Adusei B Broich MAltstatt A Mane L and Justice C O 2012 Quantifying forestcover loss in Democratic Republic of the Congo 2000ndash2010with Landsat ETM+ data Remote Sens Environ 122 106ndash16
Potapov P V et al 2008 Mapping the worldrsquos intact forestlandscapes by remote sensing Ecol Soc 13 51
Redford K H 1992 The empty forest Bioscience 42 412ndash22Sanderson E W Malanding J Levi M A Redford K H
Wannebo A V and Woolmer G 2002 The human footprint andthe last of the wild Bioscience 52 891ndash904
Sasaki N and Putz F E 2009 Critical need for new definitions offorest and lsquoforest degradationrsquo in global climate changeagreements Conserv Lett 2 226ndash32
Schoene D Killmann W von Lupke H and LoycheWilkie M 2007Definitional Issues Related to Reducing Emissions fromDeforestation in Developing Countries (FAO Forests andClimate Change Working Paper vol 5) (Rome UNFAO)
Sidle J G Dupain J Beck J Nackoney J de Wasseige CBiang J D M Leprohon R and Malele S 2012 Forest zoningexperience in Central Africa The Forests of the CongoBasinmdashState of the Forest 2010 ed C de WasseigeP de Marcken N Bayol F Hiol Ph Mayaux B DescleeR Nasi A Billand P Defourny and A R Ebarsquoa (LuxembourgPublications Office of the European Union) pp 207ndash31
Strassburg B B N et al 2009 Global congruence of carbon storageand biodiversity in terrestrial ecosystems Conserv Lett3 98ndash105
Tabarelli M Cardoso Da Silva J and Gascon C 2004 Forestfragmentation synergisms and the impoverishment ofneotropical forests Biodivers Conserv 13 1419ndash25
Thies C Rosoman G Cotter J and Meaden S 2011 Intact ForestLandscapes Why It is Critical to Protect Them FromIndustrial Exploration (Amsterdam Greenpeace)
Tucker C J and Townshend J R G 2000 Strategies for monitoringtropical deforestation using satellite data Int J Remote Sens21 1461ndash71
Wilkie D S 1994 Remote sensing imagery for resource inventoriesin Central Africa the importance of detailed field dalta HumEcol 22 379ndash403
WRI (World Resources Institute) 2007 Interactive Forestry Atlas ofCameroonmdashVersion 20 (Washington DC World ResourcesInstitute)
WRI (World Resources Institute) 2010 Atlas Forestier Interactif dela Republique Democratique du CongomdashVersion 10(Washington DC World Resources Institute)
WWF (World Wildlife Fund) 2006 A Vision for BiodiversityConservation in Central Africa Biological Priorities forConservation in the GuineanmdashCongolian Forest andFreshwater Region (Washington DC WWF-USCentralAfrican Regional Program Office)
Zhuravleva I V 2011 Intact forest landscapes in the tropics mappingand monitoring in 2000ndash2010 Abstracts of Fifth Int ConfEarth from the Space The Most Effective Solutions (MoscowScanex)
13
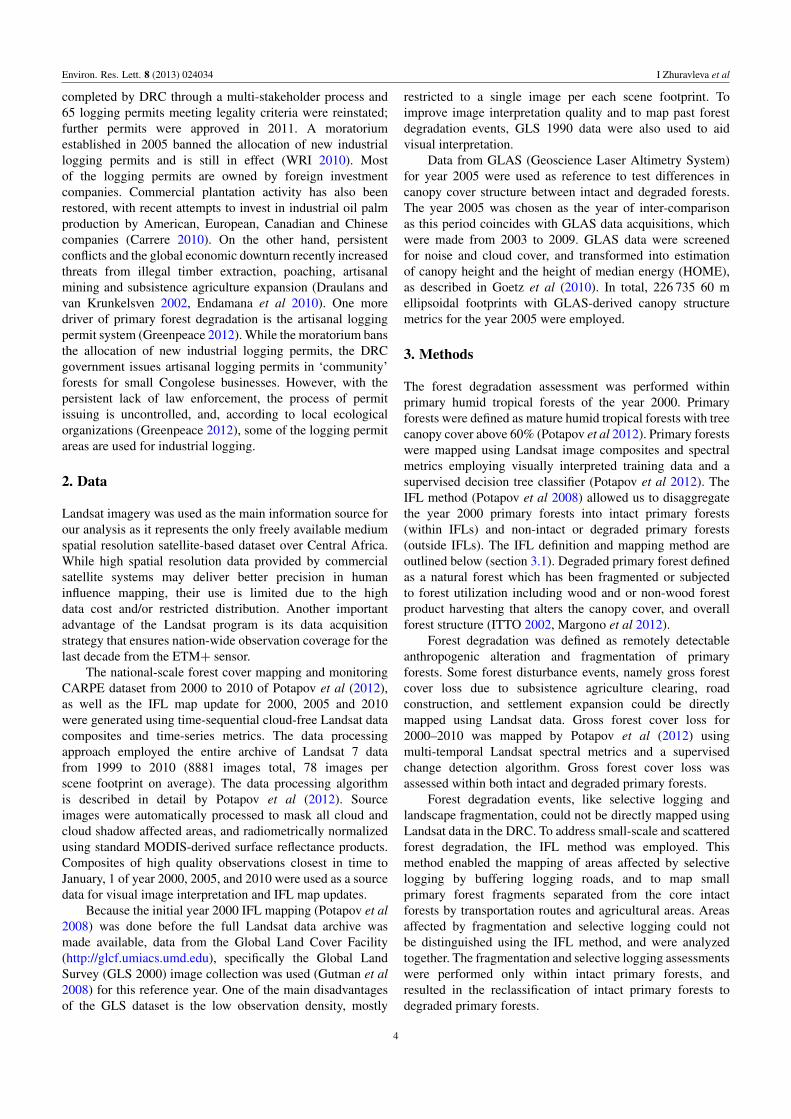
Environ Res Lett 8 (2013) 024034 I Zhuravleva et al
Figure 1 Composite images and forest degradation monitoring results Landsat image composites (Orientale Province subset centered at03 0prime 29primeprime north 24 48prime 55primeprime east) (a) circa year 2000 (b) circa year 2005 (c) circa year 2010 (d) primary forest cover and forestdegradation 2000ndash2010
the DRC and (ii) the permits belong to companies whichhave higher 10 year rate of forest degradation than theaverage among all companies in the DRC After predictingthe expansion of degraded areas for the 2010ndash2020 timeinterval the IFL layer was updated and remaining IFL patcheschecked to fit our size criteria The modeling approach wasused to highlight areas with a high probability of intact forestdegradation within the coming decade
33 Structural comparison of intact and degraded forestclasses
The canopy height and HOME estimations derived fromGLAS data have been shown to relate to tree canopy structurebiomass (Baccini et al 2008) and forest degradation due toselective logging (Margono et al 2012) GLAS-derived datafor 2005 were used within the DRC to quantify structuraldifferences between primary intact primary degraded andother forests The CARPE and IFL maps for 2005 were used
as the basis for the analysis To avoid problems that may arisewithin recently deforested patches all forest cover changeareas from 2000 to 2005 were excluded from the analysisBecause the GLAS laser illuminates an approximately 60 mellipsoidal footprint the forest cover type from the 60 m pixelnearest to the footprint center was used for comparison Themean and standard deviation of canopy height and HOMEparameters were calculated for each forest type and thestatistical significance of the inter-class differences evaluatedusing a 95 t-test confidence interval
4 Results
41 IFL and primary forests for year 2000
Within-country IFL area for the year 2000 was 64 676 khaThe national IFL extent stands out as the second largestwithin the tropical forest biome after Brazil (Potapov et al2008) According to the CARPE forest cover map of the
6
Environ Res Lett 8 (2013) 024034 I Zhuravleva et al
Figure 2 Intact primary forest degradation 2000ndash2010 by IFL patch
year 2000 IFLs in the DRC almost exclusively consist ofprimary humid tropical forests (992 of the year 2000 IFLarea) The remaining 08 was classified as secondary forestswater bodies and non-forest lands (primarily rocky outcrops)Intact forests are located in the central and northern partsof the country within the Congo River basin mostly withinCongolian lowland and swamp forests with a small fractionin the Albertine Rift montane forests
For the year 2000 primary humid tropical forestsoccupied 104 455 kha of the country (Potapov et al 2012)From this area 61 were found within IFLs and classified asprimary intact forests The remaining 39 of primary forestshave been fragmented or affected by selective logging andwere labeled degraded primary forests
42 Primary forest degradation 2000ndash2010
From CARPE dataset the total area of primary forest losswas 1067 kha and the loss area nearly doubled (from 367to 701 kha) between the two analyzed 5 year intervals Theforest loss represents 102 of total primary forests of year2000 (12 occurred within intact primary forests and 88within degraded primary forests) Primary intact forest extentwas reduced by 02 and primary degraded forests by 23
The change in area of intact primary forest is used asa fragmentation indicator From 2000 to 2010 the area ofintact primary forest decreased by 1214 kha which representsnearly 20 of the year 2000 area Intact forest fragmentationdecreased slightly over the two epochs with 624 kha lostduring the first 5 years and 590 kha during the second half ofthe decade The degradation rate was spatially heterogeneousas illustrated by a per-patch IFL change analysis (figure 2)From 187 IFL patches mapped in 2000 160 had lost less than5 of their area during the decade 19 had lost 5ndash10 8 lost10ndash40 and one IFL patch was excluded due to patch areareduction below the IFL minimal area threshold
To illustrate the spatial variability in forest degradationwe provide a disaggregation of primary forest area andchange per province (table 1 figure 3) As of 2000 eightDRC provinces contained primary intact forests and threenone From these three provinces two (Bas-Congo andKinshasa) likely lost their primary forest cover due to historicclearing and one (Katanga) is located mostly outside thehumid tropical forest biome The primary forest cover waspredominantly intact within the northern and eastern parts ofthe country while in more populated provinces (Bandunduand Kasai-Occidental) more than 50 of primary forestswere fragmented or degraded
Of all primary forest loss nearly half (49) was foundin the Northern part of the country (Equateur and Orientaleprovinces) However the decadal rate of primary forestloss was highest within the densely populated Kinshasa andBas-Congo provinces which lost 96 and 46 of theirprimary forests respectively Between the 2000ndash2005 and2005ndash2010 time intervals primary forest loss increased in allprovinces but the highest increase (more than by factor oftwo) was detected in Kinshasa Nord-Kivu Kasai-Occidentaland Bandundu provinces
The vast majority of intact forest degradation (74) wasdetected in the northern part of the DRC within EquateurOrientale and Nord-Kivu provinces Nord-Kivu had thehighest rate of intact forest degradation losing 53 of itsprimary intact area during the decade The rate of intact forestdegradation differed by region between two 5 year intervalsIt decreased in Nord-Kivu (almost by factor of five) andKasai-Occidental (by factor of four) increased in Equateurprovince by factor of four and remained relatively stable forthe rest of the country
43 Forest degradation factors
Two major degradation factors forest clearing and fragmen-tation (including areas affected by selective logging) were
7
Environ Res Lett 8 (2013) 024034 I Zhuravleva et al
Figure 3 Intact primary forest degradation 2000ndash2010 in the DRC (by province)
Table 1 Primary forests cover and change by DRC province
Province name
Total primaryforests2000 (kha)
Intact primaryforests 2000 ()
Total primaryforest loss2000ndash2005 (kha)
Total primaryforest loss2005ndash2010 (kha)
Intact primaryforestdegradationa
2000ndash2005 (kha)
Intact primaryforestdegradationa
2005ndash2010 (kha)
Country total 104 455 614 367 701 624 590Bandundu 10 018 482 338 676 42 35Bas-Congo 79 00 13 23 0 0Equateur 31 227 577 901 1622 330 78Kasai-Occidental
6 802 454 528 1104 14 62
Kasai-Oriental 7 881 676 366 625 18 29Katanga 621 00 35 53 0 0Kinshasa 15 00 04 10 0 0Maniema 7 721 636 301 540 44 46Nord-Kivu 3 595 725 100 264 22 116ProvinceOrientale
33 234 703 917 1804 142 211
Sud-Kivu 3 262 620 163 285 12 13
a Including forest cover loss and fragmentation within intact primary forests
assessed separately using a combination of forest loss and IFLchange detection methods Of the area of primary intact forestdegradation 9 was due to clearing and the remaining (91)due to fragmentation and selective logging
Visual analysis of the Landsat image composites withinthe IFL change areas shows that fragmentation is caused bothfrom agricultural expansion and infrastructure developmentprimarily of logging roads Logging road construction isexpected to occur within officially designated logging permitsThe impact of selective logging and agricultural expansionwithin areas of designated logging permits was analyzedusing a logging titles spatial database The expansion offorest degradation should be limited by the implementationof a national nature conservation strategy especially withinofficially designated protected areas The forest degradationanalysis within protected areas illustrates the effectiveness ofgovernmental regulations
431 Forest degradation within logging permits There are80 logging permits operated by 26 companies provisionally
approved for subsequent concession contract establishment inthe DRC including 65 permits approved by 2009 (WRI 2010)and 15 permits approved in 2011 Logging titles cover an areaof 14 838 kha
In 2000 industrial logging permits included 12 706 khaof primary forest (122 of total primary forest area) 62of which were classified as intact (124 of the total intactforest area) In total primary forests represented 86 ofthe permitrsquos area with primary intact forest covering 53Industrial logging permits with the largest proportion of intactforests are mostly concentrated along the Congo River in threeprovinces Equateur Orientale and Bandundu
The rate of intact primary forest degradation withinpermits (53) was significantly higher than outside of them(14) The primary intact forest degradation area withinlogging permits declined between the first and second half ofthe decade from 246 to 177 kha Of the total primary forestloss 13 (139 kha) was found within logging permits Thearea of primary forest loss increased by 51 inside permits(compared to 48 outside of them) in the most recent 5 years
8
Environ Res Lett 8 (2013) 024034 I Zhuravleva et al
Figure 4 Intact primary forests with high probability of degradation 2010ndash2020
432 Forest degradation within protected areas Primaryforests are included within 33 protected areas in the country5 national parks 12 nature reserves 2 hunting reserves and 14hunting domains (last two categories were analyzed together)Total area of protected primary forests for year 2000 was13 982 kha of this 11 004 kha were intact forests Of all intactprimary forests 76 and 71 respectively were locatedwithin national parks and nature reserves and 24 withinhunting reserves More than 55 of primary forests withinnature reserves and national parks and about 16 of primaryforests within hunting reserves were intact in 2000
During the last decade 41 kha of primary forests inprotected areas have been cleared (including 6 kha withinintact primary forests) Additionally about 48 kha of intactprimary forests were fragmented and resulted in 54 kha ofintact forest area being degraded inside protected areas Thedecadal rates of forest loss and degradation within protectedareas were significantly lower than within the rest of countryThe primary forest loss rate (03) was 34 times lower thennational average (102 was lost within primary forests inthe DRC) and the intact primary forest degradation (05)was 37 times lower National parks have the lowest rate ofprimary forest loss and intact primary forest degradation (006and 008 respectively) while hunting reserves feature thehighest rate of change for protected areas (06 and 17respectively)
Primary forest loss within protected areas increasedbetween the first and second half of the decade by 48The highest increase was observed in hunting reserves (by50) while it decreased within National Parks from 2 kha(2000ndash2005) to 1 kha (2005ndash2010) Intact primary forestdegradation decreased in all categories of protected areas by42 Within 5 km buffer zones around protected areas theintact primary forest degradation rate was higher than withinthese areas by factor of 5
44 Forest degradation in the vicinity of urban areas
The high rate of population growth and urbanization in theDRC is thought to be a reason for intensive primary forest
degradation in the vicinity of urban areas We analyzed100 km buffer zones around each of the 55 major urban areasIn total 42 of all primary forests and 36 of intact primaryforests were located within the buffer zones The buffer zoneswere the site of 65 of total forest cover loss within primaryforests and of 69 of all intact forest degradation The rate ofprimary forest cover loss within these areas was 36 higherthan the average for the country and the rate of intact primaryforest degradation was 49 higher The primary forest coverloss area increase between 2000ndash2005 and 2005ndash2010 timeintervals was twice higher compared to the national average
45 Primary intact forests threat assessment
Our prediction model showed the maximum extent of intactprimary forests that could be degraded during 2010ndash2020if agricultural and infrastructure expansion speed was heldconstant The model predicted that the intact primary forestarea in the DRC could be reduced by 2435 kha during thenext 10 years or by 4 of year 2010 primary intact forest area(figure 4) The majority of the predicted changes would be dueto rapid agricultural expansion in Nord-Kivu and Orientaleprovinces and with logging infrastructure expansion withinthe logging permits in Equateur and Orientale province Ofall 2010 IFL patches 13 small patches will have their areareduced below the IFL area threshold The predicted intactforest degradation rate is twice higher than the observeddecadal degradation rate for 2000ndash2010 time interval Itshould be noted that our forecast model represents themaximum possible area of forest degradation and does notaccount for local difference in future forest degradationtrends
In addition to primary intact forests that are in the vicinityof recent degradation hotspots intact areas within activelymanaged logging permits are under threat of fragmentationand alteration by industrial logging Of 68 permits that includeintact primary forests 32 were highlighted as having thehighest probability of rapid forest degradation (using set ofcriteria described in section 32) Intact forests within theseactive logging concessions represent 4 of the total IFL area
9
Environ Res Lett 8 (2013) 024034 I Zhuravleva et al
Figure 5 Mean and standard deviation of GLAS-derived within primary intact primary degraded and non-primary (lsquootherrsquo) forests(a) vegetation height (b) HOME metrics for year 2005
46 Tree canopy structure metrics
Mean GLAS-derived vegetation height quantifies a differenceof 07 m between primary intact and primary degraded forestsand a difference of 78 m between primary degraded andother forests (including secondary humid tropical forests andwoodlands according to the CARPE dataset) While themean vegetation height difference between primary intact andprimary degraded forest is small it is statistically significantwith t-test p-values of 0000 for the 95 confidenceinterval The difference of the mean HOME estimate forprimary intact and primary degraded forests equals 20 m andis also statistically significant with t-test p-values of0000for the 95 confidence interval (figure 5)
5 Discussion
51 Primary and intact forest extent in the DRC
Given the long history of anthropogenic influence and theexpansion of illegal logging and poaching in recent decadesit is generally assumed that the extent of intact forest areasin the Congo basin is limited Comparison of the IFL map foryear 2000 with existing global intactness datasets (McCloskeyand Spalding 1989 Bryant et al 1997 Sanderson et al2002) showed that all former approaches which were basedon outdated and imprecise road maps in the core CentralAfrican forests showed high forest degradation levels Infact medium resolution satellite imagery analyzed from1990 to 2010 did not reveal high road densities within thecentral Congo basin According to the LandScan datasetthe mean population density in DRC within IFL for year2000 is 34 persons per square km which totals morethan 2 million people Because our mapping algorithmdoes not permit inclusion of any permanent settlements oragriculture areas within IFLs such population density seemssignificantly overestimated Another argument against thedesignation of remaining IFLs as lsquointactrsquo is the wide-scalepoaching within the country leading to lsquodefaunizationrsquo ofprimary forest patches (Redford 1992) Wildlife hunting isa significant problem in central Africa and poaching may
occur in remote areas away from roads and settlements Itwas shown however that large animals are hunted mostly inthe vicinity of roads and within fragmented andor secondaryforests (Barnes et al 1995 Barnes 2002) While poachingand consequent local animal extirpation is one of the majorthreats to forest ecosystems in Congo Basin hunting wasnot analyzed in our remote-sensing based assessment due todata limitations Large intact forest areas selected using theIFL approach have several features that make them importantfor priority conservation First with their natural (unaltered)plant species composition and large patch areas sustainingrelatively inaccessible core zones intact forests provide arefuge for animal populations ensuring their resilience tonatural disturbances and climate fluctuations Second limitedaccess due to a lack of infrastructure discourages and limitshunting Third these areas play an important role in carbonsequestration due to the preservation of natural forest structureand dynamics The DRC plays an important role in primaryforest conservation in Central Africa having 41 of its totalforest cover within IFLs and accounting for two-thirds of totalCongo Basin IFL area
52 Results accuracy and data availability
The presented analysis was based on the integration of twoindependent and well established methods and productssupervised Landsat-based forest cover and change mapping(Hansen et al 2008a Potapov et al 2012) and fragmentationanalysis using the IFL approach (Potapov et al 2008 2009)Thus the primary forest degradation dataset uncertaintyshould be derived from the source datasets (CARPE datasetand IFL dataset) uncertainty The CARPE dataset was createdusing supervised expert-driven classification similarly toother Landsat-based national-scale change estimation projects(Achard et al 2002 Duveiller et al 2008 Hansen et al 2008b2008a) To map the primary forests and change areas aniterative supervised classification approach was used withcross-verification by international and local experts (Potapovet al 2012) Presented forest cover and change estimatesare close to UNFAO estimates (FAO 2010) However thespatial accuracy of change detection was not validated due
10
Environ Res Lett 8 (2013) 024034 I Zhuravleva et al
to the lack of high spatial resolution data or field plots Themain limitation for the 2000ndash2010 product validation wasthe absence of reference field andor high spatial resolutionsatellite imagery for the year 2000 epoch Establishing aregular and recurring validation data collection strategy isrequired for future monitoring of the DRC (Potapov et al2012)
The low intensity of selective logging did not allow usto map forest degradation directly except for the extensionof logging roads However we were able to predict areasthat have a high probability of selective logging using theIFL approach The IFL method had been shown to be aneffective method for large-scale forest degradation assessment(Potapov et al 2009) The simplicity of the IFL mappingcriteria and large minimal size of the IFL patch ensures thatonly areas without significant recent anthropogenic influenceare mapped as lsquointactrsquo The structural analysis of tree canopycover within primary intact and degraded forests using GLASdata quantifies a structural difference between primary intactand primary degraded forests with degraded forests havingslightly lower maximum canopy height and significantlylower mean HOME values The observed difference ismost probably a consequence of selective logging practicesincluding the extraction of large commercially valuable treesconsequent disturbance of portions of the tree canopy duringfelling and removal with a large portion of the canopyremaining intact (Brown et al 2005) Similar results fordegraded forests affected by selective logging were obtainedby Margono et al (2012) for Sumatra Indonesia
While several projects have been performed to estimateforest cover and change within the DRC few have made theirresults along with baseline satellite imagery available forindependent assessment and cross-validation Both productsused in our analysis are available online For the IFL producta continuous external review process has been organized on adedicated web site (wwwintactforestsorg) The CAPRE mapis also freely available (httpcongoiluciorgcarpemapper)Both the CARPE and IFL maps are being used as the basisfor the National Forest Monitoring system of the DRC (wwwrdc-snsforg) We believe that the unrestricted distributionof satellite-derived products is a fast and effective way forcross-validation and quality assessment
53 Forest degradation factors and intact forestsconservation strategy
Our analysis of forest degradation factors (forest loss andfragmentation) performed independently for two 5 yeartime intervals showed that while forest cover loss nearlydoubled intact forest fragmentation remained stable andeven decreased slightly Visual image analysis and literaturereview suggested that the major driver of forest loss andfragmentation was agricultural expansion and other meansof forest clearing (eg charcoal production) fueled bypopulation growth As population continued to increaseso did subsistence agriculture area expansion Howeveragricultural expansion was mostly located around settlementsand existing infrastructure objects affecting mainly degraded
forests The observed rate of forest loss within degradedprimary forests was 12 times higher compared to intact areasThe highest forest degradation rates were observed in theeastern part of the country along the Congo River close tothe Great Lakes region and in the vicinity of mining towns inthe southern forestsavanna border Nord-Kivu province wasa noteworthy hope spot where agricultural expansion wasprobably related to internally displaced populations
Industrial logging one of the most important factorsof forest fragmentation in other central African countries(eg Gabon and the Republic of Congo) remained limitedwithin the DRC due to political and economic instabilityLimited industrial logging expansion is thought to be theprimary reason why intact forest degradation in the DRCis the less compared to other countries of the Congo basin(Zhuravleva 2011) Fragmentation by logging roads wasdetected mostly in the eastern part of the country especiallywithin areas having approved logging permits where itslowed during the second half of the decade Several factorscould be responsible for the observed degradation reductionincluding the global economic downturn of 2008 Becauseforest fragmentation in the DRC is mostly connected withagriculture expansion and not with selective logging intactforest fragmentation reduction within the DRC was smallercompared to other Central African countries where IFLdegradation decreased from 35 in 2000ndash2005 to 2 in2005ndash2010 (Zhuravleva 2011) The future of intact forestswithin the DRC timber concessions depends on the successfulimplementation of government policies
Considering current agriculture and road networkexpansion speed we predicted that intact forest degradationcould increase up to two-fold during the next decade Thisscenario is plausible taking into account the high rates ofpopulation growth However due to the intensification ofselective logging within current logging permits the rate ofintact forest degradation could increase even higher Protectedareas establishment could be one way to preserve intactprimary forests Our analysis shows that both intact primaryforest degradation and forest loss within protected areas weresignificantly lower than the national average National parkswere the most effective in protecting primary forests fromdegradation The rate of intact primary forest degradationwithin a 5 km buffer around protected areas was significantlyhigher than inside the protected areas illustrating the ongoingthreats from neighboring developed areas
The derived primary forest cover map change detectionresults and forest degradation prediction model results couldbe used as a baseline for forest conservation planningwithin the country New road construction opening accessto heretofore intact forest areas should be considered thegreatest threat to intact forest areas While intact primaryforest protection should be considered as a goal it is expectedthat there will be a further degradation of the remainingprimary forest In this case a zoning strategy could beimplemented to minimize infrastructure impact on core intactforest areas while leaving peripheral parts for sustainable use(Thies et al 2011 Sidle et al 2012) Zoning strategies havebeen successfully implemented in some of the central African
11
Environ Res Lett 8 (2013) 024034 I Zhuravleva et al
countries eg in Cameroon (WRI 2007) The lsquopermanentforest zonersquo in Cameroon prohibits forest conversion toagriculture or plantations This zone is further separatedinto strictly protected areas and logging concessions wherelimited timber extraction is permitted In the DRC zoninghave been successfully implemented on a sub-national levelspecifically within Congo Basin Forest Partnership (CBFP)landscapes (Sidle et al 2012) National-scale forest zoningin DRC is supported by a National Steering Committee forForest Zoning since 2009 Another important tool wouldbe limiting access and supporting vegetation restorationon abandoned logging roads to prevent expansion ofhunting range and agricultural clearing Land-use zoningand management planning is especially important withindegraded primary forest to prevent further land degradationand permanent deforestation
References
Achard F Eva H D Stibig H J Mayaux P Gallego J Richards Tand Malingreau J P 2002 Determination of deforestation ratesof the worldrsquos humid tropical forests Science 297 999ndash1002
Amsallem I 2002 Status and Trends in Forest Management inCentral Africa (Forest Management Working Paper vol 3)(Rome FAO Forest Resources Development Service ForestResources Division)
Asner G P Keller M Pereira R and Zweede J C 2002 Remotesensing of selective logging in Amazonia assessing limitationsbased on detailed field observations Landsat ETM+ andtextural analysis Remote Sens Environ 80 483ndash96
Baccini A Laporte N Goetz S J Sun M and Dong H 2008 A firstmap of tropical Africarsquos above-ground biomass derived fromsatellite imagery Environ Res Lett 3 045011
Barnes R F W 2002 The bushmeat boom and bust in West andCentral Africa Oryx 36 236ndash42
Barnes R F W Bloom A and Alers M P T 1995 A review of thestatus of forest elephants it Loxodonta africana in CentralAfrica Biol Conserv 71 125ndash32
Beerling D J and Osborne C P 2006 The origin of the savannabiome Glob Change Biol 12 2023ndash31
Bond W J Woodward F I and Midgley G F 2005 The globaldistribution of ecosystems in a world without fire New Phytol165 525ndash38
Broich M Stehman S V Hansen M C Potapov P andShimabukuro Y E 2009 A comparison of sampling designs forestimating deforestation from Landsat imagery a case study ofthe Brazilian Legal Amazon Remote Sens Environ113 2448ndash54
Brown S Pearson T Moore N Parveen A Ambagis S and Shoch D2005 Impact of Selective Logging on the Carbon Stocks ofTropical Forests Republic of Congo as a Case Study(Arlington Winrock International)
Bryant D Nielsen D and Tangley L 1997 The Last Frontier ForestsEcosystems and Economies on the Edge (Washington DCWorld Resources Institute)
Camara G Valeriano D M and Soares J V 2006 Metodologia para oCalculo da Taxa Anual de Desmatamento na Amazonia Legal(Sao Jose dos Campos INPE)
Carrere R 2010 Oil Palm in Africa Past Present and FutureScenarios (World Rainforest Movement Series on TreePlantations vol 15) (Montevideo World Rainforest Movement)
CBFP (Congo Basin Forest Partnership) 2009 The Forests of theCongo BasinmdashState of the Forest 2008 ed C de WasseigeD Devers P de Marcken A R Ebarsquoa R Nasi and
Ph Mayaux (Luxembourg Publications Office of the EuropeanUnion)
Clark C J Poulsen J R Malonga R and Elkan P W Jr 2009 Loggingconcessions can extend the conservation estate for CentralAfrican tropical forests Conserv Biol 23 1281ndash93
Dobson J E Bright E A Coleman P R Durfee R C and Worley B A2000 LandScan a global population database for estimatingpopulations at risk Photogramm Eng Remote Sens 66 849ndash57
Draulans D and van Krunkelsven E 2002 The impact of war onforest areas in the Democratic Republic of Congo Oryx36 35ndash40
Duveiller G Defourny P Desclee B and Mayaux P 2008Deforestation in Central Africa estimates at regional nationaland landscape levels by advanced processing ofsystematically-distributed Landsat extracts Remote SensEnviron 112 1969ndash81
Endamana D Boedhihartono A K Bokoto B Defo L Eyebe ANdikumagenge C Nzooh Z Ruiz-Perez M and Sayer J A 2010A framework for assessing conservation and development in aCongo Basin Forest Landscape Trop Conserv Sci 3 262ndash81
Ernst C Verheggen A Mayaux P Hansen M and Defourny P 2012Central African forest cover and cover change mapping TheForests of the Congo BasinmdashState of the Forest 2010ed C de Wasseige P de Marcken N Bayol F Hiol Ph MayauxB Desclee R Nasi A Billand P Defournyand A R Ebarsquoa (Luxembourg Publications Office of theEuropean Union) pp 23ndash42
FAO (Food and Agricultural Organization) 2010 Global ForestResources Assessment 2010 (Rome UNFAO)
Gibbs H Brown S Niles J and Foley J 2007 Monitoring andestimating tropical forest carbon stocks making REDD areality Environ Res Lett 2 045023
Goetz S J Sun M Baccini A and Beck P S A 2010 Synergistic useof space-borne LiDAR and optical imagery for assessing forestdisturbance an Alaska case study J Geophys ResmdashBiogeosci115 G00E07
Greenpeace 2012 lsquoArtisanal Loggingrsquo = Industrial Logging inDisguise (Kinshasa Greenpeace Africa)
Gutman G Byrnes R Masek J Covington S Justice C Franks Sand Headley R 2008 Towards monitoring land-cover andland-use changes at a global scale the global land survey 2005Photogramm Eng Remote Sens 74 6ndash10
Hance W A and van Dongen I S 1958 Matadi focus of BelgianAfrican transport Ann Assoc Am Geogr 48 41ndash72
Hansen M C Roy D P Lindquist E Adusei B Justice C O andAltstatt A 2008a A method for integrating MODIS andLandsat data for systematic monitoring of forest cover andchange and preliminary results for Central Africa Remote SensEnviron 112 2495ndash513
Hansen M C et al 2008b Humid tropical forest clearing from 2000to 2005 quantified by using multitemporal and multiresolutionremotely sensed data Proc Natl Acad Sci USA 105 9439ndash44
ITTO (International Tropical Timber Organization) 2002 ITTOGuidelines for the Restoration Management andRehabilitation of Degraded and Secondary Tropical Forests(ITTO Policy Development Series vol 13) (YokohamaInternational Tropical Timber Organization)
Justice C O Horning N and Laporte N 1993 Central Africa GlobalClimate Change and DevelopmentmdashSynopsis Remote Sensingand GIS Contributions to a Climate Change Program inCentral Africa (Washington DC Biodiversity SupportProgram)
Kareiva P Watts S McDonald R and Boucher T 2007 Domesticatednature shaping landscapes and ecosystems for human welfareScience 316 1866ndash9
Mararo B 1997 Land power and ethnic conflict in Masisi(Congo-Kinshasa) 1940s-1994 Int J Afr Hist Stud30 503ndash38
12
Environ Res Lett 8 (2013) 024034 I Zhuravleva et al
Margono B A Turubanova S Zhuravleva I Potapov PTyukavina A Baccini A Goetz S and Hansen M C 2012Mapping and monitoring deforestation and forest degradationin Sumatra (Indonesia) using Landsat time series data setsfrom 1990 to 2010 Environ Res Lett 7 034010
McCloskey J M and Spalding H 1989 A reconnaissance levelinventory of the amount of wilderness remaining in the worldAmbio 18 221ndash7
Mollicone D et al 2007 An incentive mechanism for reducingemissions from conversion of intact and non-intact forestsClim Change 83 477ndash93
Laporte N T Stabach J A Grosch R Lin T S and Goetz S J 2007Expansion of industrial logging in Central Africa Science316 1451
Laurance W F Croes B M Tchignoumba L Lahm S A Alonso ALee M E Campbell P and Ondzeano C 2006 Impacts of roadsand hunting on Central African Rainforest Mammals ConservBiol 20 1251ndash61
Oliver R 1966 The problem of the Bantu expansion J Afr Hist7 361ndash76
Olson D M et al 2001 Terrestrial ecoregions of the world a newmap of life on earth Bioscience 51 933ndash8
Potapov P V Laestadius L Yaroshenko A and Turubanova S 2009Case Studies on Measuring and Assessing Forest DegradationGlobal Mapping and Monitoring the Extent of ForestAlteration the Intact Forest Ladscape method (FAO WorkingPaper vol 166) (Rome FAO Forest Resources AssessmentProgramme)
Potapov P V Turubanova S A Hansen M C Adusei B Broich MAltstatt A Mane L and Justice C O 2012 Quantifying forestcover loss in Democratic Republic of the Congo 2000ndash2010with Landsat ETM+ data Remote Sens Environ 122 106ndash16
Potapov P V et al 2008 Mapping the worldrsquos intact forestlandscapes by remote sensing Ecol Soc 13 51
Redford K H 1992 The empty forest Bioscience 42 412ndash22Sanderson E W Malanding J Levi M A Redford K H
Wannebo A V and Woolmer G 2002 The human footprint andthe last of the wild Bioscience 52 891ndash904
Sasaki N and Putz F E 2009 Critical need for new definitions offorest and lsquoforest degradationrsquo in global climate changeagreements Conserv Lett 2 226ndash32
Schoene D Killmann W von Lupke H and LoycheWilkie M 2007Definitional Issues Related to Reducing Emissions fromDeforestation in Developing Countries (FAO Forests andClimate Change Working Paper vol 5) (Rome UNFAO)
Sidle J G Dupain J Beck J Nackoney J de Wasseige CBiang J D M Leprohon R and Malele S 2012 Forest zoningexperience in Central Africa The Forests of the CongoBasinmdashState of the Forest 2010 ed C de WasseigeP de Marcken N Bayol F Hiol Ph Mayaux B DescleeR Nasi A Billand P Defourny and A R Ebarsquoa (LuxembourgPublications Office of the European Union) pp 207ndash31
Strassburg B B N et al 2009 Global congruence of carbon storageand biodiversity in terrestrial ecosystems Conserv Lett3 98ndash105
Tabarelli M Cardoso Da Silva J and Gascon C 2004 Forestfragmentation synergisms and the impoverishment ofneotropical forests Biodivers Conserv 13 1419ndash25
Thies C Rosoman G Cotter J and Meaden S 2011 Intact ForestLandscapes Why It is Critical to Protect Them FromIndustrial Exploration (Amsterdam Greenpeace)
Tucker C J and Townshend J R G 2000 Strategies for monitoringtropical deforestation using satellite data Int J Remote Sens21 1461ndash71
Wilkie D S 1994 Remote sensing imagery for resource inventoriesin Central Africa the importance of detailed field dalta HumEcol 22 379ndash403
WRI (World Resources Institute) 2007 Interactive Forestry Atlas ofCameroonmdashVersion 20 (Washington DC World ResourcesInstitute)
WRI (World Resources Institute) 2010 Atlas Forestier Interactif dela Republique Democratique du CongomdashVersion 10(Washington DC World Resources Institute)
WWF (World Wildlife Fund) 2006 A Vision for BiodiversityConservation in Central Africa Biological Priorities forConservation in the GuineanmdashCongolian Forest andFreshwater Region (Washington DC WWF-USCentralAfrican Regional Program Office)
Zhuravleva I V 2011 Intact forest landscapes in the tropics mappingand monitoring in 2000ndash2010 Abstracts of Fifth Int ConfEarth from the Space The Most Effective Solutions (MoscowScanex)
13
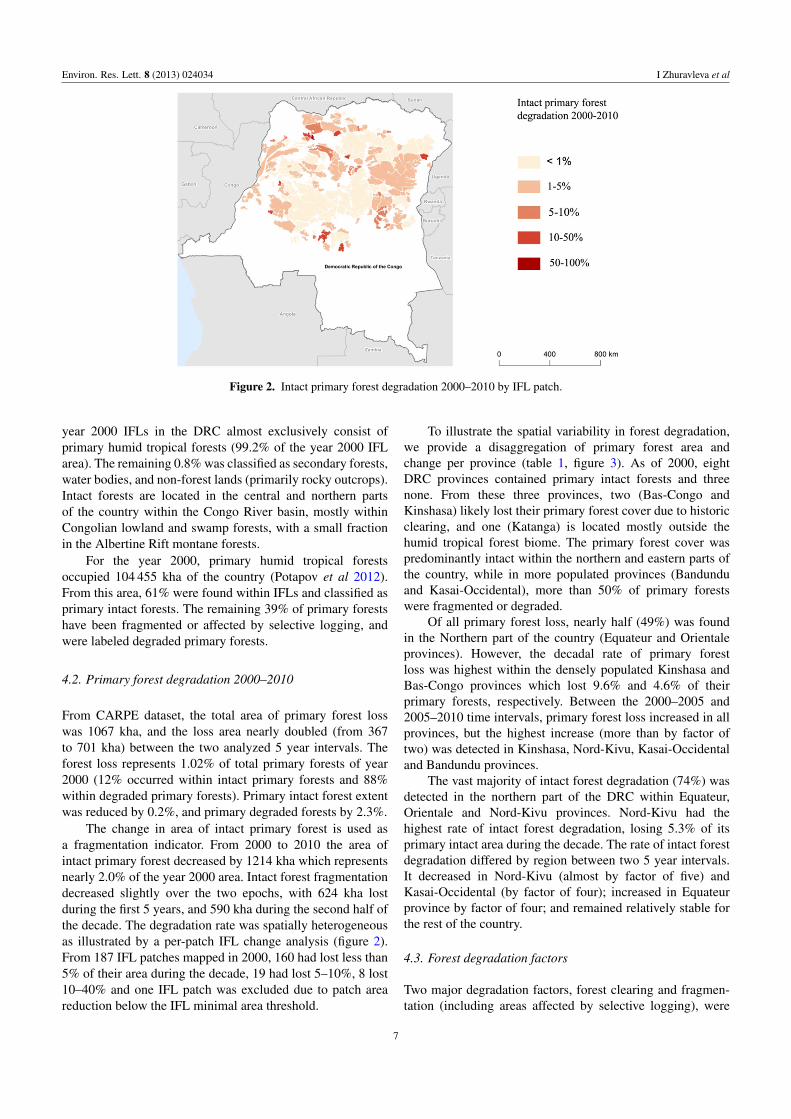
Environ Res Lett 8 (2013) 024034 I Zhuravleva et al
Figure 2 Intact primary forest degradation 2000ndash2010 by IFL patch
year 2000 IFLs in the DRC almost exclusively consist ofprimary humid tropical forests (992 of the year 2000 IFLarea) The remaining 08 was classified as secondary forestswater bodies and non-forest lands (primarily rocky outcrops)Intact forests are located in the central and northern partsof the country within the Congo River basin mostly withinCongolian lowland and swamp forests with a small fractionin the Albertine Rift montane forests
For the year 2000 primary humid tropical forestsoccupied 104 455 kha of the country (Potapov et al 2012)From this area 61 were found within IFLs and classified asprimary intact forests The remaining 39 of primary forestshave been fragmented or affected by selective logging andwere labeled degraded primary forests
42 Primary forest degradation 2000ndash2010
From CARPE dataset the total area of primary forest losswas 1067 kha and the loss area nearly doubled (from 367to 701 kha) between the two analyzed 5 year intervals Theforest loss represents 102 of total primary forests of year2000 (12 occurred within intact primary forests and 88within degraded primary forests) Primary intact forest extentwas reduced by 02 and primary degraded forests by 23
The change in area of intact primary forest is used asa fragmentation indicator From 2000 to 2010 the area ofintact primary forest decreased by 1214 kha which representsnearly 20 of the year 2000 area Intact forest fragmentationdecreased slightly over the two epochs with 624 kha lostduring the first 5 years and 590 kha during the second half ofthe decade The degradation rate was spatially heterogeneousas illustrated by a per-patch IFL change analysis (figure 2)From 187 IFL patches mapped in 2000 160 had lost less than5 of their area during the decade 19 had lost 5ndash10 8 lost10ndash40 and one IFL patch was excluded due to patch areareduction below the IFL minimal area threshold
To illustrate the spatial variability in forest degradationwe provide a disaggregation of primary forest area andchange per province (table 1 figure 3) As of 2000 eightDRC provinces contained primary intact forests and threenone From these three provinces two (Bas-Congo andKinshasa) likely lost their primary forest cover due to historicclearing and one (Katanga) is located mostly outside thehumid tropical forest biome The primary forest cover waspredominantly intact within the northern and eastern parts ofthe country while in more populated provinces (Bandunduand Kasai-Occidental) more than 50 of primary forestswere fragmented or degraded
Of all primary forest loss nearly half (49) was foundin the Northern part of the country (Equateur and Orientaleprovinces) However the decadal rate of primary forestloss was highest within the densely populated Kinshasa andBas-Congo provinces which lost 96 and 46 of theirprimary forests respectively Between the 2000ndash2005 and2005ndash2010 time intervals primary forest loss increased in allprovinces but the highest increase (more than by factor oftwo) was detected in Kinshasa Nord-Kivu Kasai-Occidentaland Bandundu provinces
The vast majority of intact forest degradation (74) wasdetected in the northern part of the DRC within EquateurOrientale and Nord-Kivu provinces Nord-Kivu had thehighest rate of intact forest degradation losing 53 of itsprimary intact area during the decade The rate of intact forestdegradation differed by region between two 5 year intervalsIt decreased in Nord-Kivu (almost by factor of five) andKasai-Occidental (by factor of four) increased in Equateurprovince by factor of four and remained relatively stable forthe rest of the country
43 Forest degradation factors
Two major degradation factors forest clearing and fragmen-tation (including areas affected by selective logging) were
7
Environ Res Lett 8 (2013) 024034 I Zhuravleva et al
Figure 3 Intact primary forest degradation 2000ndash2010 in the DRC (by province)
Table 1 Primary forests cover and change by DRC province
Province name
Total primaryforests2000 (kha)
Intact primaryforests 2000 ()
Total primaryforest loss2000ndash2005 (kha)
Total primaryforest loss2005ndash2010 (kha)
Intact primaryforestdegradationa
2000ndash2005 (kha)
Intact primaryforestdegradationa
2005ndash2010 (kha)
Country total 104 455 614 367 701 624 590Bandundu 10 018 482 338 676 42 35Bas-Congo 79 00 13 23 0 0Equateur 31 227 577 901 1622 330 78Kasai-Occidental
6 802 454 528 1104 14 62
Kasai-Oriental 7 881 676 366 625 18 29Katanga 621 00 35 53 0 0Kinshasa 15 00 04 10 0 0Maniema 7 721 636 301 540 44 46Nord-Kivu 3 595 725 100 264 22 116ProvinceOrientale
33 234 703 917 1804 142 211
Sud-Kivu 3 262 620 163 285 12 13
a Including forest cover loss and fragmentation within intact primary forests
assessed separately using a combination of forest loss and IFLchange detection methods Of the area of primary intact forestdegradation 9 was due to clearing and the remaining (91)due to fragmentation and selective logging
Visual analysis of the Landsat image composites withinthe IFL change areas shows that fragmentation is caused bothfrom agricultural expansion and infrastructure developmentprimarily of logging roads Logging road construction isexpected to occur within officially designated logging permitsThe impact of selective logging and agricultural expansionwithin areas of designated logging permits was analyzedusing a logging titles spatial database The expansion offorest degradation should be limited by the implementationof a national nature conservation strategy especially withinofficially designated protected areas The forest degradationanalysis within protected areas illustrates the effectiveness ofgovernmental regulations
431 Forest degradation within logging permits There are80 logging permits operated by 26 companies provisionally
approved for subsequent concession contract establishment inthe DRC including 65 permits approved by 2009 (WRI 2010)and 15 permits approved in 2011 Logging titles cover an areaof 14 838 kha
In 2000 industrial logging permits included 12 706 khaof primary forest (122 of total primary forest area) 62of which were classified as intact (124 of the total intactforest area) In total primary forests represented 86 ofthe permitrsquos area with primary intact forest covering 53Industrial logging permits with the largest proportion of intactforests are mostly concentrated along the Congo River in threeprovinces Equateur Orientale and Bandundu
The rate of intact primary forest degradation withinpermits (53) was significantly higher than outside of them(14) The primary intact forest degradation area withinlogging permits declined between the first and second half ofthe decade from 246 to 177 kha Of the total primary forestloss 13 (139 kha) was found within logging permits Thearea of primary forest loss increased by 51 inside permits(compared to 48 outside of them) in the most recent 5 years
8
Environ Res Lett 8 (2013) 024034 I Zhuravleva et al
Figure 4 Intact primary forests with high probability of degradation 2010ndash2020
432 Forest degradation within protected areas Primaryforests are included within 33 protected areas in the country5 national parks 12 nature reserves 2 hunting reserves and 14hunting domains (last two categories were analyzed together)Total area of protected primary forests for year 2000 was13 982 kha of this 11 004 kha were intact forests Of all intactprimary forests 76 and 71 respectively were locatedwithin national parks and nature reserves and 24 withinhunting reserves More than 55 of primary forests withinnature reserves and national parks and about 16 of primaryforests within hunting reserves were intact in 2000
During the last decade 41 kha of primary forests inprotected areas have been cleared (including 6 kha withinintact primary forests) Additionally about 48 kha of intactprimary forests were fragmented and resulted in 54 kha ofintact forest area being degraded inside protected areas Thedecadal rates of forest loss and degradation within protectedareas were significantly lower than within the rest of countryThe primary forest loss rate (03) was 34 times lower thennational average (102 was lost within primary forests inthe DRC) and the intact primary forest degradation (05)was 37 times lower National parks have the lowest rate ofprimary forest loss and intact primary forest degradation (006and 008 respectively) while hunting reserves feature thehighest rate of change for protected areas (06 and 17respectively)
Primary forest loss within protected areas increasedbetween the first and second half of the decade by 48The highest increase was observed in hunting reserves (by50) while it decreased within National Parks from 2 kha(2000ndash2005) to 1 kha (2005ndash2010) Intact primary forestdegradation decreased in all categories of protected areas by42 Within 5 km buffer zones around protected areas theintact primary forest degradation rate was higher than withinthese areas by factor of 5
44 Forest degradation in the vicinity of urban areas
The high rate of population growth and urbanization in theDRC is thought to be a reason for intensive primary forest
degradation in the vicinity of urban areas We analyzed100 km buffer zones around each of the 55 major urban areasIn total 42 of all primary forests and 36 of intact primaryforests were located within the buffer zones The buffer zoneswere the site of 65 of total forest cover loss within primaryforests and of 69 of all intact forest degradation The rate ofprimary forest cover loss within these areas was 36 higherthan the average for the country and the rate of intact primaryforest degradation was 49 higher The primary forest coverloss area increase between 2000ndash2005 and 2005ndash2010 timeintervals was twice higher compared to the national average
45 Primary intact forests threat assessment
Our prediction model showed the maximum extent of intactprimary forests that could be degraded during 2010ndash2020if agricultural and infrastructure expansion speed was heldconstant The model predicted that the intact primary forestarea in the DRC could be reduced by 2435 kha during thenext 10 years or by 4 of year 2010 primary intact forest area(figure 4) The majority of the predicted changes would be dueto rapid agricultural expansion in Nord-Kivu and Orientaleprovinces and with logging infrastructure expansion withinthe logging permits in Equateur and Orientale province Ofall 2010 IFL patches 13 small patches will have their areareduced below the IFL area threshold The predicted intactforest degradation rate is twice higher than the observeddecadal degradation rate for 2000ndash2010 time interval Itshould be noted that our forecast model represents themaximum possible area of forest degradation and does notaccount for local difference in future forest degradationtrends
In addition to primary intact forests that are in the vicinityof recent degradation hotspots intact areas within activelymanaged logging permits are under threat of fragmentationand alteration by industrial logging Of 68 permits that includeintact primary forests 32 were highlighted as having thehighest probability of rapid forest degradation (using set ofcriteria described in section 32) Intact forests within theseactive logging concessions represent 4 of the total IFL area
9
Environ Res Lett 8 (2013) 024034 I Zhuravleva et al
Figure 5 Mean and standard deviation of GLAS-derived within primary intact primary degraded and non-primary (lsquootherrsquo) forests(a) vegetation height (b) HOME metrics for year 2005
46 Tree canopy structure metrics
Mean GLAS-derived vegetation height quantifies a differenceof 07 m between primary intact and primary degraded forestsand a difference of 78 m between primary degraded andother forests (including secondary humid tropical forests andwoodlands according to the CARPE dataset) While themean vegetation height difference between primary intact andprimary degraded forest is small it is statistically significantwith t-test p-values of 0000 for the 95 confidenceinterval The difference of the mean HOME estimate forprimary intact and primary degraded forests equals 20 m andis also statistically significant with t-test p-values of0000for the 95 confidence interval (figure 5)
5 Discussion
51 Primary and intact forest extent in the DRC
Given the long history of anthropogenic influence and theexpansion of illegal logging and poaching in recent decadesit is generally assumed that the extent of intact forest areasin the Congo basin is limited Comparison of the IFL map foryear 2000 with existing global intactness datasets (McCloskeyand Spalding 1989 Bryant et al 1997 Sanderson et al2002) showed that all former approaches which were basedon outdated and imprecise road maps in the core CentralAfrican forests showed high forest degradation levels Infact medium resolution satellite imagery analyzed from1990 to 2010 did not reveal high road densities within thecentral Congo basin According to the LandScan datasetthe mean population density in DRC within IFL for year2000 is 34 persons per square km which totals morethan 2 million people Because our mapping algorithmdoes not permit inclusion of any permanent settlements oragriculture areas within IFLs such population density seemssignificantly overestimated Another argument against thedesignation of remaining IFLs as lsquointactrsquo is the wide-scalepoaching within the country leading to lsquodefaunizationrsquo ofprimary forest patches (Redford 1992) Wildlife hunting isa significant problem in central Africa and poaching may
occur in remote areas away from roads and settlements Itwas shown however that large animals are hunted mostly inthe vicinity of roads and within fragmented andor secondaryforests (Barnes et al 1995 Barnes 2002) While poachingand consequent local animal extirpation is one of the majorthreats to forest ecosystems in Congo Basin hunting wasnot analyzed in our remote-sensing based assessment due todata limitations Large intact forest areas selected using theIFL approach have several features that make them importantfor priority conservation First with their natural (unaltered)plant species composition and large patch areas sustainingrelatively inaccessible core zones intact forests provide arefuge for animal populations ensuring their resilience tonatural disturbances and climate fluctuations Second limitedaccess due to a lack of infrastructure discourages and limitshunting Third these areas play an important role in carbonsequestration due to the preservation of natural forest structureand dynamics The DRC plays an important role in primaryforest conservation in Central Africa having 41 of its totalforest cover within IFLs and accounting for two-thirds of totalCongo Basin IFL area
52 Results accuracy and data availability
The presented analysis was based on the integration of twoindependent and well established methods and productssupervised Landsat-based forest cover and change mapping(Hansen et al 2008a Potapov et al 2012) and fragmentationanalysis using the IFL approach (Potapov et al 2008 2009)Thus the primary forest degradation dataset uncertaintyshould be derived from the source datasets (CARPE datasetand IFL dataset) uncertainty The CARPE dataset was createdusing supervised expert-driven classification similarly toother Landsat-based national-scale change estimation projects(Achard et al 2002 Duveiller et al 2008 Hansen et al 2008b2008a) To map the primary forests and change areas aniterative supervised classification approach was used withcross-verification by international and local experts (Potapovet al 2012) Presented forest cover and change estimatesare close to UNFAO estimates (FAO 2010) However thespatial accuracy of change detection was not validated due
10
Environ Res Lett 8 (2013) 024034 I Zhuravleva et al
to the lack of high spatial resolution data or field plots Themain limitation for the 2000ndash2010 product validation wasthe absence of reference field andor high spatial resolutionsatellite imagery for the year 2000 epoch Establishing aregular and recurring validation data collection strategy isrequired for future monitoring of the DRC (Potapov et al2012)
The low intensity of selective logging did not allow usto map forest degradation directly except for the extensionof logging roads However we were able to predict areasthat have a high probability of selective logging using theIFL approach The IFL method had been shown to be aneffective method for large-scale forest degradation assessment(Potapov et al 2009) The simplicity of the IFL mappingcriteria and large minimal size of the IFL patch ensures thatonly areas without significant recent anthropogenic influenceare mapped as lsquointactrsquo The structural analysis of tree canopycover within primary intact and degraded forests using GLASdata quantifies a structural difference between primary intactand primary degraded forests with degraded forests havingslightly lower maximum canopy height and significantlylower mean HOME values The observed difference ismost probably a consequence of selective logging practicesincluding the extraction of large commercially valuable treesconsequent disturbance of portions of the tree canopy duringfelling and removal with a large portion of the canopyremaining intact (Brown et al 2005) Similar results fordegraded forests affected by selective logging were obtainedby Margono et al (2012) for Sumatra Indonesia
While several projects have been performed to estimateforest cover and change within the DRC few have made theirresults along with baseline satellite imagery available forindependent assessment and cross-validation Both productsused in our analysis are available online For the IFL producta continuous external review process has been organized on adedicated web site (wwwintactforestsorg) The CAPRE mapis also freely available (httpcongoiluciorgcarpemapper)Both the CARPE and IFL maps are being used as the basisfor the National Forest Monitoring system of the DRC (wwwrdc-snsforg) We believe that the unrestricted distributionof satellite-derived products is a fast and effective way forcross-validation and quality assessment
53 Forest degradation factors and intact forestsconservation strategy
Our analysis of forest degradation factors (forest loss andfragmentation) performed independently for two 5 yeartime intervals showed that while forest cover loss nearlydoubled intact forest fragmentation remained stable andeven decreased slightly Visual image analysis and literaturereview suggested that the major driver of forest loss andfragmentation was agricultural expansion and other meansof forest clearing (eg charcoal production) fueled bypopulation growth As population continued to increaseso did subsistence agriculture area expansion Howeveragricultural expansion was mostly located around settlementsand existing infrastructure objects affecting mainly degraded
forests The observed rate of forest loss within degradedprimary forests was 12 times higher compared to intact areasThe highest forest degradation rates were observed in theeastern part of the country along the Congo River close tothe Great Lakes region and in the vicinity of mining towns inthe southern forestsavanna border Nord-Kivu province wasa noteworthy hope spot where agricultural expansion wasprobably related to internally displaced populations
Industrial logging one of the most important factorsof forest fragmentation in other central African countries(eg Gabon and the Republic of Congo) remained limitedwithin the DRC due to political and economic instabilityLimited industrial logging expansion is thought to be theprimary reason why intact forest degradation in the DRCis the less compared to other countries of the Congo basin(Zhuravleva 2011) Fragmentation by logging roads wasdetected mostly in the eastern part of the country especiallywithin areas having approved logging permits where itslowed during the second half of the decade Several factorscould be responsible for the observed degradation reductionincluding the global economic downturn of 2008 Becauseforest fragmentation in the DRC is mostly connected withagriculture expansion and not with selective logging intactforest fragmentation reduction within the DRC was smallercompared to other Central African countries where IFLdegradation decreased from 35 in 2000ndash2005 to 2 in2005ndash2010 (Zhuravleva 2011) The future of intact forestswithin the DRC timber concessions depends on the successfulimplementation of government policies
Considering current agriculture and road networkexpansion speed we predicted that intact forest degradationcould increase up to two-fold during the next decade Thisscenario is plausible taking into account the high rates ofpopulation growth However due to the intensification ofselective logging within current logging permits the rate ofintact forest degradation could increase even higher Protectedareas establishment could be one way to preserve intactprimary forests Our analysis shows that both intact primaryforest degradation and forest loss within protected areas weresignificantly lower than the national average National parkswere the most effective in protecting primary forests fromdegradation The rate of intact primary forest degradationwithin a 5 km buffer around protected areas was significantlyhigher than inside the protected areas illustrating the ongoingthreats from neighboring developed areas
The derived primary forest cover map change detectionresults and forest degradation prediction model results couldbe used as a baseline for forest conservation planningwithin the country New road construction opening accessto heretofore intact forest areas should be considered thegreatest threat to intact forest areas While intact primaryforest protection should be considered as a goal it is expectedthat there will be a further degradation of the remainingprimary forest In this case a zoning strategy could beimplemented to minimize infrastructure impact on core intactforest areas while leaving peripheral parts for sustainable use(Thies et al 2011 Sidle et al 2012) Zoning strategies havebeen successfully implemented in some of the central African
11
Environ Res Lett 8 (2013) 024034 I Zhuravleva et al
countries eg in Cameroon (WRI 2007) The lsquopermanentforest zonersquo in Cameroon prohibits forest conversion toagriculture or plantations This zone is further separatedinto strictly protected areas and logging concessions wherelimited timber extraction is permitted In the DRC zoninghave been successfully implemented on a sub-national levelspecifically within Congo Basin Forest Partnership (CBFP)landscapes (Sidle et al 2012) National-scale forest zoningin DRC is supported by a National Steering Committee forForest Zoning since 2009 Another important tool wouldbe limiting access and supporting vegetation restorationon abandoned logging roads to prevent expansion ofhunting range and agricultural clearing Land-use zoningand management planning is especially important withindegraded primary forest to prevent further land degradationand permanent deforestation
References
Achard F Eva H D Stibig H J Mayaux P Gallego J Richards Tand Malingreau J P 2002 Determination of deforestation ratesof the worldrsquos humid tropical forests Science 297 999ndash1002
Amsallem I 2002 Status and Trends in Forest Management inCentral Africa (Forest Management Working Paper vol 3)(Rome FAO Forest Resources Development Service ForestResources Division)
Asner G P Keller M Pereira R and Zweede J C 2002 Remotesensing of selective logging in Amazonia assessing limitationsbased on detailed field observations Landsat ETM+ andtextural analysis Remote Sens Environ 80 483ndash96
Baccini A Laporte N Goetz S J Sun M and Dong H 2008 A firstmap of tropical Africarsquos above-ground biomass derived fromsatellite imagery Environ Res Lett 3 045011
Barnes R F W 2002 The bushmeat boom and bust in West andCentral Africa Oryx 36 236ndash42
Barnes R F W Bloom A and Alers M P T 1995 A review of thestatus of forest elephants it Loxodonta africana in CentralAfrica Biol Conserv 71 125ndash32
Beerling D J and Osborne C P 2006 The origin of the savannabiome Glob Change Biol 12 2023ndash31
Bond W J Woodward F I and Midgley G F 2005 The globaldistribution of ecosystems in a world without fire New Phytol165 525ndash38
Broich M Stehman S V Hansen M C Potapov P andShimabukuro Y E 2009 A comparison of sampling designs forestimating deforestation from Landsat imagery a case study ofthe Brazilian Legal Amazon Remote Sens Environ113 2448ndash54
Brown S Pearson T Moore N Parveen A Ambagis S and Shoch D2005 Impact of Selective Logging on the Carbon Stocks ofTropical Forests Republic of Congo as a Case Study(Arlington Winrock International)
Bryant D Nielsen D and Tangley L 1997 The Last Frontier ForestsEcosystems and Economies on the Edge (Washington DCWorld Resources Institute)
Camara G Valeriano D M and Soares J V 2006 Metodologia para oCalculo da Taxa Anual de Desmatamento na Amazonia Legal(Sao Jose dos Campos INPE)
Carrere R 2010 Oil Palm in Africa Past Present and FutureScenarios (World Rainforest Movement Series on TreePlantations vol 15) (Montevideo World Rainforest Movement)
CBFP (Congo Basin Forest Partnership) 2009 The Forests of theCongo BasinmdashState of the Forest 2008 ed C de WasseigeD Devers P de Marcken A R Ebarsquoa R Nasi and
Ph Mayaux (Luxembourg Publications Office of the EuropeanUnion)
Clark C J Poulsen J R Malonga R and Elkan P W Jr 2009 Loggingconcessions can extend the conservation estate for CentralAfrican tropical forests Conserv Biol 23 1281ndash93
Dobson J E Bright E A Coleman P R Durfee R C and Worley B A2000 LandScan a global population database for estimatingpopulations at risk Photogramm Eng Remote Sens 66 849ndash57
Draulans D and van Krunkelsven E 2002 The impact of war onforest areas in the Democratic Republic of Congo Oryx36 35ndash40
Duveiller G Defourny P Desclee B and Mayaux P 2008Deforestation in Central Africa estimates at regional nationaland landscape levels by advanced processing ofsystematically-distributed Landsat extracts Remote SensEnviron 112 1969ndash81
Endamana D Boedhihartono A K Bokoto B Defo L Eyebe ANdikumagenge C Nzooh Z Ruiz-Perez M and Sayer J A 2010A framework for assessing conservation and development in aCongo Basin Forest Landscape Trop Conserv Sci 3 262ndash81
Ernst C Verheggen A Mayaux P Hansen M and Defourny P 2012Central African forest cover and cover change mapping TheForests of the Congo BasinmdashState of the Forest 2010ed C de Wasseige P de Marcken N Bayol F Hiol Ph MayauxB Desclee R Nasi A Billand P Defournyand A R Ebarsquoa (Luxembourg Publications Office of theEuropean Union) pp 23ndash42
FAO (Food and Agricultural Organization) 2010 Global ForestResources Assessment 2010 (Rome UNFAO)
Gibbs H Brown S Niles J and Foley J 2007 Monitoring andestimating tropical forest carbon stocks making REDD areality Environ Res Lett 2 045023
Goetz S J Sun M Baccini A and Beck P S A 2010 Synergistic useof space-borne LiDAR and optical imagery for assessing forestdisturbance an Alaska case study J Geophys ResmdashBiogeosci115 G00E07
Greenpeace 2012 lsquoArtisanal Loggingrsquo = Industrial Logging inDisguise (Kinshasa Greenpeace Africa)
Gutman G Byrnes R Masek J Covington S Justice C Franks Sand Headley R 2008 Towards monitoring land-cover andland-use changes at a global scale the global land survey 2005Photogramm Eng Remote Sens 74 6ndash10
Hance W A and van Dongen I S 1958 Matadi focus of BelgianAfrican transport Ann Assoc Am Geogr 48 41ndash72
Hansen M C Roy D P Lindquist E Adusei B Justice C O andAltstatt A 2008a A method for integrating MODIS andLandsat data for systematic monitoring of forest cover andchange and preliminary results for Central Africa Remote SensEnviron 112 2495ndash513
Hansen M C et al 2008b Humid tropical forest clearing from 2000to 2005 quantified by using multitemporal and multiresolutionremotely sensed data Proc Natl Acad Sci USA 105 9439ndash44
ITTO (International Tropical Timber Organization) 2002 ITTOGuidelines for the Restoration Management andRehabilitation of Degraded and Secondary Tropical Forests(ITTO Policy Development Series vol 13) (YokohamaInternational Tropical Timber Organization)
Justice C O Horning N and Laporte N 1993 Central Africa GlobalClimate Change and DevelopmentmdashSynopsis Remote Sensingand GIS Contributions to a Climate Change Program inCentral Africa (Washington DC Biodiversity SupportProgram)
Kareiva P Watts S McDonald R and Boucher T 2007 Domesticatednature shaping landscapes and ecosystems for human welfareScience 316 1866ndash9
Mararo B 1997 Land power and ethnic conflict in Masisi(Congo-Kinshasa) 1940s-1994 Int J Afr Hist Stud30 503ndash38
12
Environ Res Lett 8 (2013) 024034 I Zhuravleva et al
Margono B A Turubanova S Zhuravleva I Potapov PTyukavina A Baccini A Goetz S and Hansen M C 2012Mapping and monitoring deforestation and forest degradationin Sumatra (Indonesia) using Landsat time series data setsfrom 1990 to 2010 Environ Res Lett 7 034010
McCloskey J M and Spalding H 1989 A reconnaissance levelinventory of the amount of wilderness remaining in the worldAmbio 18 221ndash7
Mollicone D et al 2007 An incentive mechanism for reducingemissions from conversion of intact and non-intact forestsClim Change 83 477ndash93
Laporte N T Stabach J A Grosch R Lin T S and Goetz S J 2007Expansion of industrial logging in Central Africa Science316 1451
Laurance W F Croes B M Tchignoumba L Lahm S A Alonso ALee M E Campbell P and Ondzeano C 2006 Impacts of roadsand hunting on Central African Rainforest Mammals ConservBiol 20 1251ndash61
Oliver R 1966 The problem of the Bantu expansion J Afr Hist7 361ndash76
Olson D M et al 2001 Terrestrial ecoregions of the world a newmap of life on earth Bioscience 51 933ndash8
Potapov P V Laestadius L Yaroshenko A and Turubanova S 2009Case Studies on Measuring and Assessing Forest DegradationGlobal Mapping and Monitoring the Extent of ForestAlteration the Intact Forest Ladscape method (FAO WorkingPaper vol 166) (Rome FAO Forest Resources AssessmentProgramme)
Potapov P V Turubanova S A Hansen M C Adusei B Broich MAltstatt A Mane L and Justice C O 2012 Quantifying forestcover loss in Democratic Republic of the Congo 2000ndash2010with Landsat ETM+ data Remote Sens Environ 122 106ndash16
Potapov P V et al 2008 Mapping the worldrsquos intact forestlandscapes by remote sensing Ecol Soc 13 51
Redford K H 1992 The empty forest Bioscience 42 412ndash22Sanderson E W Malanding J Levi M A Redford K H
Wannebo A V and Woolmer G 2002 The human footprint andthe last of the wild Bioscience 52 891ndash904
Sasaki N and Putz F E 2009 Critical need for new definitions offorest and lsquoforest degradationrsquo in global climate changeagreements Conserv Lett 2 226ndash32
Schoene D Killmann W von Lupke H and LoycheWilkie M 2007Definitional Issues Related to Reducing Emissions fromDeforestation in Developing Countries (FAO Forests andClimate Change Working Paper vol 5) (Rome UNFAO)
Sidle J G Dupain J Beck J Nackoney J de Wasseige CBiang J D M Leprohon R and Malele S 2012 Forest zoningexperience in Central Africa The Forests of the CongoBasinmdashState of the Forest 2010 ed C de WasseigeP de Marcken N Bayol F Hiol Ph Mayaux B DescleeR Nasi A Billand P Defourny and A R Ebarsquoa (LuxembourgPublications Office of the European Union) pp 207ndash31
Strassburg B B N et al 2009 Global congruence of carbon storageand biodiversity in terrestrial ecosystems Conserv Lett3 98ndash105
Tabarelli M Cardoso Da Silva J and Gascon C 2004 Forestfragmentation synergisms and the impoverishment ofneotropical forests Biodivers Conserv 13 1419ndash25
Thies C Rosoman G Cotter J and Meaden S 2011 Intact ForestLandscapes Why It is Critical to Protect Them FromIndustrial Exploration (Amsterdam Greenpeace)
Tucker C J and Townshend J R G 2000 Strategies for monitoringtropical deforestation using satellite data Int J Remote Sens21 1461ndash71
Wilkie D S 1994 Remote sensing imagery for resource inventoriesin Central Africa the importance of detailed field dalta HumEcol 22 379ndash403
WRI (World Resources Institute) 2007 Interactive Forestry Atlas ofCameroonmdashVersion 20 (Washington DC World ResourcesInstitute)
WRI (World Resources Institute) 2010 Atlas Forestier Interactif dela Republique Democratique du CongomdashVersion 10(Washington DC World Resources Institute)
WWF (World Wildlife Fund) 2006 A Vision for BiodiversityConservation in Central Africa Biological Priorities forConservation in the GuineanmdashCongolian Forest andFreshwater Region (Washington DC WWF-USCentralAfrican Regional Program Office)
Zhuravleva I V 2011 Intact forest landscapes in the tropics mappingand monitoring in 2000ndash2010 Abstracts of Fifth Int ConfEarth from the Space The Most Effective Solutions (MoscowScanex)
13
Environ Res Lett 8 (2013) 024034 I Zhuravleva et al
Figure 3 Intact primary forest degradation 2000ndash2010 in the DRC (by province)
Table 1 Primary forests cover and change by DRC province
Province name
Total primaryforests2000 (kha)
Intact primaryforests 2000 ()
Total primaryforest loss2000ndash2005 (kha)
Total primaryforest loss2005ndash2010 (kha)
Intact primaryforestdegradationa
2000ndash2005 (kha)
Intact primaryforestdegradationa
2005ndash2010 (kha)
Country total 104 455 614 367 701 624 590Bandundu 10 018 482 338 676 42 35Bas-Congo 79 00 13 23 0 0Equateur 31 227 577 901 1622 330 78Kasai-Occidental
6 802 454 528 1104 14 62
Kasai-Oriental 7 881 676 366 625 18 29Katanga 621 00 35 53 0 0Kinshasa 15 00 04 10 0 0Maniema 7 721 636 301 540 44 46Nord-Kivu 3 595 725 100 264 22 116ProvinceOrientale
33 234 703 917 1804 142 211
Sud-Kivu 3 262 620 163 285 12 13
a Including forest cover loss and fragmentation within intact primary forests
assessed separately using a combination of forest loss and IFLchange detection methods Of the area of primary intact forestdegradation 9 was due to clearing and the remaining (91)due to fragmentation and selective logging
Visual analysis of the Landsat image composites withinthe IFL change areas shows that fragmentation is caused bothfrom agricultural expansion and infrastructure developmentprimarily of logging roads Logging road construction isexpected to occur within officially designated logging permitsThe impact of selective logging and agricultural expansionwithin areas of designated logging permits was analyzedusing a logging titles spatial database The expansion offorest degradation should be limited by the implementationof a national nature conservation strategy especially withinofficially designated protected areas The forest degradationanalysis within protected areas illustrates the effectiveness ofgovernmental regulations
431 Forest degradation within logging permits There are80 logging permits operated by 26 companies provisionally
approved for subsequent concession contract establishment inthe DRC including 65 permits approved by 2009 (WRI 2010)and 15 permits approved in 2011 Logging titles cover an areaof 14 838 kha
In 2000 industrial logging permits included 12 706 khaof primary forest (122 of total primary forest area) 62of which were classified as intact (124 of the total intactforest area) In total primary forests represented 86 ofthe permitrsquos area with primary intact forest covering 53Industrial logging permits with the largest proportion of intactforests are mostly concentrated along the Congo River in threeprovinces Equateur Orientale and Bandundu
The rate of intact primary forest degradation withinpermits (53) was significantly higher than outside of them(14) The primary intact forest degradation area withinlogging permits declined between the first and second half ofthe decade from 246 to 177 kha Of the total primary forestloss 13 (139 kha) was found within logging permits Thearea of primary forest loss increased by 51 inside permits(compared to 48 outside of them) in the most recent 5 years
8
Environ Res Lett 8 (2013) 024034 I Zhuravleva et al
Figure 4 Intact primary forests with high probability of degradation 2010ndash2020
432 Forest degradation within protected areas Primaryforests are included within 33 protected areas in the country5 national parks 12 nature reserves 2 hunting reserves and 14hunting domains (last two categories were analyzed together)Total area of protected primary forests for year 2000 was13 982 kha of this 11 004 kha were intact forests Of all intactprimary forests 76 and 71 respectively were locatedwithin national parks and nature reserves and 24 withinhunting reserves More than 55 of primary forests withinnature reserves and national parks and about 16 of primaryforests within hunting reserves were intact in 2000
During the last decade 41 kha of primary forests inprotected areas have been cleared (including 6 kha withinintact primary forests) Additionally about 48 kha of intactprimary forests were fragmented and resulted in 54 kha ofintact forest area being degraded inside protected areas Thedecadal rates of forest loss and degradation within protectedareas were significantly lower than within the rest of countryThe primary forest loss rate (03) was 34 times lower thennational average (102 was lost within primary forests inthe DRC) and the intact primary forest degradation (05)was 37 times lower National parks have the lowest rate ofprimary forest loss and intact primary forest degradation (006and 008 respectively) while hunting reserves feature thehighest rate of change for protected areas (06 and 17respectively)
Primary forest loss within protected areas increasedbetween the first and second half of the decade by 48The highest increase was observed in hunting reserves (by50) while it decreased within National Parks from 2 kha(2000ndash2005) to 1 kha (2005ndash2010) Intact primary forestdegradation decreased in all categories of protected areas by42 Within 5 km buffer zones around protected areas theintact primary forest degradation rate was higher than withinthese areas by factor of 5
44 Forest degradation in the vicinity of urban areas
The high rate of population growth and urbanization in theDRC is thought to be a reason for intensive primary forest
degradation in the vicinity of urban areas We analyzed100 km buffer zones around each of the 55 major urban areasIn total 42 of all primary forests and 36 of intact primaryforests were located within the buffer zones The buffer zoneswere the site of 65 of total forest cover loss within primaryforests and of 69 of all intact forest degradation The rate ofprimary forest cover loss within these areas was 36 higherthan the average for the country and the rate of intact primaryforest degradation was 49 higher The primary forest coverloss area increase between 2000ndash2005 and 2005ndash2010 timeintervals was twice higher compared to the national average
45 Primary intact forests threat assessment
Our prediction model showed the maximum extent of intactprimary forests that could be degraded during 2010ndash2020if agricultural and infrastructure expansion speed was heldconstant The model predicted that the intact primary forestarea in the DRC could be reduced by 2435 kha during thenext 10 years or by 4 of year 2010 primary intact forest area(figure 4) The majority of the predicted changes would be dueto rapid agricultural expansion in Nord-Kivu and Orientaleprovinces and with logging infrastructure expansion withinthe logging permits in Equateur and Orientale province Ofall 2010 IFL patches 13 small patches will have their areareduced below the IFL area threshold The predicted intactforest degradation rate is twice higher than the observeddecadal degradation rate for 2000ndash2010 time interval Itshould be noted that our forecast model represents themaximum possible area of forest degradation and does notaccount for local difference in future forest degradationtrends
In addition to primary intact forests that are in the vicinityof recent degradation hotspots intact areas within activelymanaged logging permits are under threat of fragmentationand alteration by industrial logging Of 68 permits that includeintact primary forests 32 were highlighted as having thehighest probability of rapid forest degradation (using set ofcriteria described in section 32) Intact forests within theseactive logging concessions represent 4 of the total IFL area
9
Environ Res Lett 8 (2013) 024034 I Zhuravleva et al
Figure 5 Mean and standard deviation of GLAS-derived within primary intact primary degraded and non-primary (lsquootherrsquo) forests(a) vegetation height (b) HOME metrics for year 2005
46 Tree canopy structure metrics
Mean GLAS-derived vegetation height quantifies a differenceof 07 m between primary intact and primary degraded forestsand a difference of 78 m between primary degraded andother forests (including secondary humid tropical forests andwoodlands according to the CARPE dataset) While themean vegetation height difference between primary intact andprimary degraded forest is small it is statistically significantwith t-test p-values of 0000 for the 95 confidenceinterval The difference of the mean HOME estimate forprimary intact and primary degraded forests equals 20 m andis also statistically significant with t-test p-values of0000for the 95 confidence interval (figure 5)
5 Discussion
51 Primary and intact forest extent in the DRC
Given the long history of anthropogenic influence and theexpansion of illegal logging and poaching in recent decadesit is generally assumed that the extent of intact forest areasin the Congo basin is limited Comparison of the IFL map foryear 2000 with existing global intactness datasets (McCloskeyand Spalding 1989 Bryant et al 1997 Sanderson et al2002) showed that all former approaches which were basedon outdated and imprecise road maps in the core CentralAfrican forests showed high forest degradation levels Infact medium resolution satellite imagery analyzed from1990 to 2010 did not reveal high road densities within thecentral Congo basin According to the LandScan datasetthe mean population density in DRC within IFL for year2000 is 34 persons per square km which totals morethan 2 million people Because our mapping algorithmdoes not permit inclusion of any permanent settlements oragriculture areas within IFLs such population density seemssignificantly overestimated Another argument against thedesignation of remaining IFLs as lsquointactrsquo is the wide-scalepoaching within the country leading to lsquodefaunizationrsquo ofprimary forest patches (Redford 1992) Wildlife hunting isa significant problem in central Africa and poaching may
occur in remote areas away from roads and settlements Itwas shown however that large animals are hunted mostly inthe vicinity of roads and within fragmented andor secondaryforests (Barnes et al 1995 Barnes 2002) While poachingand consequent local animal extirpation is one of the majorthreats to forest ecosystems in Congo Basin hunting wasnot analyzed in our remote-sensing based assessment due todata limitations Large intact forest areas selected using theIFL approach have several features that make them importantfor priority conservation First with their natural (unaltered)plant species composition and large patch areas sustainingrelatively inaccessible core zones intact forests provide arefuge for animal populations ensuring their resilience tonatural disturbances and climate fluctuations Second limitedaccess due to a lack of infrastructure discourages and limitshunting Third these areas play an important role in carbonsequestration due to the preservation of natural forest structureand dynamics The DRC plays an important role in primaryforest conservation in Central Africa having 41 of its totalforest cover within IFLs and accounting for two-thirds of totalCongo Basin IFL area
52 Results accuracy and data availability
The presented analysis was based on the integration of twoindependent and well established methods and productssupervised Landsat-based forest cover and change mapping(Hansen et al 2008a Potapov et al 2012) and fragmentationanalysis using the IFL approach (Potapov et al 2008 2009)Thus the primary forest degradation dataset uncertaintyshould be derived from the source datasets (CARPE datasetand IFL dataset) uncertainty The CARPE dataset was createdusing supervised expert-driven classification similarly toother Landsat-based national-scale change estimation projects(Achard et al 2002 Duveiller et al 2008 Hansen et al 2008b2008a) To map the primary forests and change areas aniterative supervised classification approach was used withcross-verification by international and local experts (Potapovet al 2012) Presented forest cover and change estimatesare close to UNFAO estimates (FAO 2010) However thespatial accuracy of change detection was not validated due
10
Environ Res Lett 8 (2013) 024034 I Zhuravleva et al
to the lack of high spatial resolution data or field plots Themain limitation for the 2000ndash2010 product validation wasthe absence of reference field andor high spatial resolutionsatellite imagery for the year 2000 epoch Establishing aregular and recurring validation data collection strategy isrequired for future monitoring of the DRC (Potapov et al2012)
The low intensity of selective logging did not allow usto map forest degradation directly except for the extensionof logging roads However we were able to predict areasthat have a high probability of selective logging using theIFL approach The IFL method had been shown to be aneffective method for large-scale forest degradation assessment(Potapov et al 2009) The simplicity of the IFL mappingcriteria and large minimal size of the IFL patch ensures thatonly areas without significant recent anthropogenic influenceare mapped as lsquointactrsquo The structural analysis of tree canopycover within primary intact and degraded forests using GLASdata quantifies a structural difference between primary intactand primary degraded forests with degraded forests havingslightly lower maximum canopy height and significantlylower mean HOME values The observed difference ismost probably a consequence of selective logging practicesincluding the extraction of large commercially valuable treesconsequent disturbance of portions of the tree canopy duringfelling and removal with a large portion of the canopyremaining intact (Brown et al 2005) Similar results fordegraded forests affected by selective logging were obtainedby Margono et al (2012) for Sumatra Indonesia
While several projects have been performed to estimateforest cover and change within the DRC few have made theirresults along with baseline satellite imagery available forindependent assessment and cross-validation Both productsused in our analysis are available online For the IFL producta continuous external review process has been organized on adedicated web site (wwwintactforestsorg) The CAPRE mapis also freely available (httpcongoiluciorgcarpemapper)Both the CARPE and IFL maps are being used as the basisfor the National Forest Monitoring system of the DRC (wwwrdc-snsforg) We believe that the unrestricted distributionof satellite-derived products is a fast and effective way forcross-validation and quality assessment
53 Forest degradation factors and intact forestsconservation strategy
Our analysis of forest degradation factors (forest loss andfragmentation) performed independently for two 5 yeartime intervals showed that while forest cover loss nearlydoubled intact forest fragmentation remained stable andeven decreased slightly Visual image analysis and literaturereview suggested that the major driver of forest loss andfragmentation was agricultural expansion and other meansof forest clearing (eg charcoal production) fueled bypopulation growth As population continued to increaseso did subsistence agriculture area expansion Howeveragricultural expansion was mostly located around settlementsand existing infrastructure objects affecting mainly degraded
forests The observed rate of forest loss within degradedprimary forests was 12 times higher compared to intact areasThe highest forest degradation rates were observed in theeastern part of the country along the Congo River close tothe Great Lakes region and in the vicinity of mining towns inthe southern forestsavanna border Nord-Kivu province wasa noteworthy hope spot where agricultural expansion wasprobably related to internally displaced populations
Industrial logging one of the most important factorsof forest fragmentation in other central African countries(eg Gabon and the Republic of Congo) remained limitedwithin the DRC due to political and economic instabilityLimited industrial logging expansion is thought to be theprimary reason why intact forest degradation in the DRCis the less compared to other countries of the Congo basin(Zhuravleva 2011) Fragmentation by logging roads wasdetected mostly in the eastern part of the country especiallywithin areas having approved logging permits where itslowed during the second half of the decade Several factorscould be responsible for the observed degradation reductionincluding the global economic downturn of 2008 Becauseforest fragmentation in the DRC is mostly connected withagriculture expansion and not with selective logging intactforest fragmentation reduction within the DRC was smallercompared to other Central African countries where IFLdegradation decreased from 35 in 2000ndash2005 to 2 in2005ndash2010 (Zhuravleva 2011) The future of intact forestswithin the DRC timber concessions depends on the successfulimplementation of government policies
Considering current agriculture and road networkexpansion speed we predicted that intact forest degradationcould increase up to two-fold during the next decade Thisscenario is plausible taking into account the high rates ofpopulation growth However due to the intensification ofselective logging within current logging permits the rate ofintact forest degradation could increase even higher Protectedareas establishment could be one way to preserve intactprimary forests Our analysis shows that both intact primaryforest degradation and forest loss within protected areas weresignificantly lower than the national average National parkswere the most effective in protecting primary forests fromdegradation The rate of intact primary forest degradationwithin a 5 km buffer around protected areas was significantlyhigher than inside the protected areas illustrating the ongoingthreats from neighboring developed areas
The derived primary forest cover map change detectionresults and forest degradation prediction model results couldbe used as a baseline for forest conservation planningwithin the country New road construction opening accessto heretofore intact forest areas should be considered thegreatest threat to intact forest areas While intact primaryforest protection should be considered as a goal it is expectedthat there will be a further degradation of the remainingprimary forest In this case a zoning strategy could beimplemented to minimize infrastructure impact on core intactforest areas while leaving peripheral parts for sustainable use(Thies et al 2011 Sidle et al 2012) Zoning strategies havebeen successfully implemented in some of the central African
11
Environ Res Lett 8 (2013) 024034 I Zhuravleva et al
countries eg in Cameroon (WRI 2007) The lsquopermanentforest zonersquo in Cameroon prohibits forest conversion toagriculture or plantations This zone is further separatedinto strictly protected areas and logging concessions wherelimited timber extraction is permitted In the DRC zoninghave been successfully implemented on a sub-national levelspecifically within Congo Basin Forest Partnership (CBFP)landscapes (Sidle et al 2012) National-scale forest zoningin DRC is supported by a National Steering Committee forForest Zoning since 2009 Another important tool wouldbe limiting access and supporting vegetation restorationon abandoned logging roads to prevent expansion ofhunting range and agricultural clearing Land-use zoningand management planning is especially important withindegraded primary forest to prevent further land degradationand permanent deforestation
References
Achard F Eva H D Stibig H J Mayaux P Gallego J Richards Tand Malingreau J P 2002 Determination of deforestation ratesof the worldrsquos humid tropical forests Science 297 999ndash1002
Amsallem I 2002 Status and Trends in Forest Management inCentral Africa (Forest Management Working Paper vol 3)(Rome FAO Forest Resources Development Service ForestResources Division)
Asner G P Keller M Pereira R and Zweede J C 2002 Remotesensing of selective logging in Amazonia assessing limitationsbased on detailed field observations Landsat ETM+ andtextural analysis Remote Sens Environ 80 483ndash96
Baccini A Laporte N Goetz S J Sun M and Dong H 2008 A firstmap of tropical Africarsquos above-ground biomass derived fromsatellite imagery Environ Res Lett 3 045011
Barnes R F W 2002 The bushmeat boom and bust in West andCentral Africa Oryx 36 236ndash42
Barnes R F W Bloom A and Alers M P T 1995 A review of thestatus of forest elephants it Loxodonta africana in CentralAfrica Biol Conserv 71 125ndash32
Beerling D J and Osborne C P 2006 The origin of the savannabiome Glob Change Biol 12 2023ndash31
Bond W J Woodward F I and Midgley G F 2005 The globaldistribution of ecosystems in a world without fire New Phytol165 525ndash38
Broich M Stehman S V Hansen M C Potapov P andShimabukuro Y E 2009 A comparison of sampling designs forestimating deforestation from Landsat imagery a case study ofthe Brazilian Legal Amazon Remote Sens Environ113 2448ndash54
Brown S Pearson T Moore N Parveen A Ambagis S and Shoch D2005 Impact of Selective Logging on the Carbon Stocks ofTropical Forests Republic of Congo as a Case Study(Arlington Winrock International)
Bryant D Nielsen D and Tangley L 1997 The Last Frontier ForestsEcosystems and Economies on the Edge (Washington DCWorld Resources Institute)
Camara G Valeriano D M and Soares J V 2006 Metodologia para oCalculo da Taxa Anual de Desmatamento na Amazonia Legal(Sao Jose dos Campos INPE)
Carrere R 2010 Oil Palm in Africa Past Present and FutureScenarios (World Rainforest Movement Series on TreePlantations vol 15) (Montevideo World Rainforest Movement)
CBFP (Congo Basin Forest Partnership) 2009 The Forests of theCongo BasinmdashState of the Forest 2008 ed C de WasseigeD Devers P de Marcken A R Ebarsquoa R Nasi and
Ph Mayaux (Luxembourg Publications Office of the EuropeanUnion)
Clark C J Poulsen J R Malonga R and Elkan P W Jr 2009 Loggingconcessions can extend the conservation estate for CentralAfrican tropical forests Conserv Biol 23 1281ndash93
Dobson J E Bright E A Coleman P R Durfee R C and Worley B A2000 LandScan a global population database for estimatingpopulations at risk Photogramm Eng Remote Sens 66 849ndash57
Draulans D and van Krunkelsven E 2002 The impact of war onforest areas in the Democratic Republic of Congo Oryx36 35ndash40
Duveiller G Defourny P Desclee B and Mayaux P 2008Deforestation in Central Africa estimates at regional nationaland landscape levels by advanced processing ofsystematically-distributed Landsat extracts Remote SensEnviron 112 1969ndash81
Endamana D Boedhihartono A K Bokoto B Defo L Eyebe ANdikumagenge C Nzooh Z Ruiz-Perez M and Sayer J A 2010A framework for assessing conservation and development in aCongo Basin Forest Landscape Trop Conserv Sci 3 262ndash81
Ernst C Verheggen A Mayaux P Hansen M and Defourny P 2012Central African forest cover and cover change mapping TheForests of the Congo BasinmdashState of the Forest 2010ed C de Wasseige P de Marcken N Bayol F Hiol Ph MayauxB Desclee R Nasi A Billand P Defournyand A R Ebarsquoa (Luxembourg Publications Office of theEuropean Union) pp 23ndash42
FAO (Food and Agricultural Organization) 2010 Global ForestResources Assessment 2010 (Rome UNFAO)
Gibbs H Brown S Niles J and Foley J 2007 Monitoring andestimating tropical forest carbon stocks making REDD areality Environ Res Lett 2 045023
Goetz S J Sun M Baccini A and Beck P S A 2010 Synergistic useof space-borne LiDAR and optical imagery for assessing forestdisturbance an Alaska case study J Geophys ResmdashBiogeosci115 G00E07
Greenpeace 2012 lsquoArtisanal Loggingrsquo = Industrial Logging inDisguise (Kinshasa Greenpeace Africa)
Gutman G Byrnes R Masek J Covington S Justice C Franks Sand Headley R 2008 Towards monitoring land-cover andland-use changes at a global scale the global land survey 2005Photogramm Eng Remote Sens 74 6ndash10
Hance W A and van Dongen I S 1958 Matadi focus of BelgianAfrican transport Ann Assoc Am Geogr 48 41ndash72
Hansen M C Roy D P Lindquist E Adusei B Justice C O andAltstatt A 2008a A method for integrating MODIS andLandsat data for systematic monitoring of forest cover andchange and preliminary results for Central Africa Remote SensEnviron 112 2495ndash513
Hansen M C et al 2008b Humid tropical forest clearing from 2000to 2005 quantified by using multitemporal and multiresolutionremotely sensed data Proc Natl Acad Sci USA 105 9439ndash44
ITTO (International Tropical Timber Organization) 2002 ITTOGuidelines for the Restoration Management andRehabilitation of Degraded and Secondary Tropical Forests(ITTO Policy Development Series vol 13) (YokohamaInternational Tropical Timber Organization)
Justice C O Horning N and Laporte N 1993 Central Africa GlobalClimate Change and DevelopmentmdashSynopsis Remote Sensingand GIS Contributions to a Climate Change Program inCentral Africa (Washington DC Biodiversity SupportProgram)
Kareiva P Watts S McDonald R and Boucher T 2007 Domesticatednature shaping landscapes and ecosystems for human welfareScience 316 1866ndash9
Mararo B 1997 Land power and ethnic conflict in Masisi(Congo-Kinshasa) 1940s-1994 Int J Afr Hist Stud30 503ndash38
12
Environ Res Lett 8 (2013) 024034 I Zhuravleva et al
Margono B A Turubanova S Zhuravleva I Potapov PTyukavina A Baccini A Goetz S and Hansen M C 2012Mapping and monitoring deforestation and forest degradationin Sumatra (Indonesia) using Landsat time series data setsfrom 1990 to 2010 Environ Res Lett 7 034010
McCloskey J M and Spalding H 1989 A reconnaissance levelinventory of the amount of wilderness remaining in the worldAmbio 18 221ndash7
Mollicone D et al 2007 An incentive mechanism for reducingemissions from conversion of intact and non-intact forestsClim Change 83 477ndash93
Laporte N T Stabach J A Grosch R Lin T S and Goetz S J 2007Expansion of industrial logging in Central Africa Science316 1451
Laurance W F Croes B M Tchignoumba L Lahm S A Alonso ALee M E Campbell P and Ondzeano C 2006 Impacts of roadsand hunting on Central African Rainforest Mammals ConservBiol 20 1251ndash61
Oliver R 1966 The problem of the Bantu expansion J Afr Hist7 361ndash76
Olson D M et al 2001 Terrestrial ecoregions of the world a newmap of life on earth Bioscience 51 933ndash8
Potapov P V Laestadius L Yaroshenko A and Turubanova S 2009Case Studies on Measuring and Assessing Forest DegradationGlobal Mapping and Monitoring the Extent of ForestAlteration the Intact Forest Ladscape method (FAO WorkingPaper vol 166) (Rome FAO Forest Resources AssessmentProgramme)
Potapov P V Turubanova S A Hansen M C Adusei B Broich MAltstatt A Mane L and Justice C O 2012 Quantifying forestcover loss in Democratic Republic of the Congo 2000ndash2010with Landsat ETM+ data Remote Sens Environ 122 106ndash16
Potapov P V et al 2008 Mapping the worldrsquos intact forestlandscapes by remote sensing Ecol Soc 13 51
Redford K H 1992 The empty forest Bioscience 42 412ndash22Sanderson E W Malanding J Levi M A Redford K H
Wannebo A V and Woolmer G 2002 The human footprint andthe last of the wild Bioscience 52 891ndash904
Sasaki N and Putz F E 2009 Critical need for new definitions offorest and lsquoforest degradationrsquo in global climate changeagreements Conserv Lett 2 226ndash32
Schoene D Killmann W von Lupke H and LoycheWilkie M 2007Definitional Issues Related to Reducing Emissions fromDeforestation in Developing Countries (FAO Forests andClimate Change Working Paper vol 5) (Rome UNFAO)
Sidle J G Dupain J Beck J Nackoney J de Wasseige CBiang J D M Leprohon R and Malele S 2012 Forest zoningexperience in Central Africa The Forests of the CongoBasinmdashState of the Forest 2010 ed C de WasseigeP de Marcken N Bayol F Hiol Ph Mayaux B DescleeR Nasi A Billand P Defourny and A R Ebarsquoa (LuxembourgPublications Office of the European Union) pp 207ndash31
Strassburg B B N et al 2009 Global congruence of carbon storageand biodiversity in terrestrial ecosystems Conserv Lett3 98ndash105
Tabarelli M Cardoso Da Silva J and Gascon C 2004 Forestfragmentation synergisms and the impoverishment ofneotropical forests Biodivers Conserv 13 1419ndash25
Thies C Rosoman G Cotter J and Meaden S 2011 Intact ForestLandscapes Why It is Critical to Protect Them FromIndustrial Exploration (Amsterdam Greenpeace)
Tucker C J and Townshend J R G 2000 Strategies for monitoringtropical deforestation using satellite data Int J Remote Sens21 1461ndash71
Wilkie D S 1994 Remote sensing imagery for resource inventoriesin Central Africa the importance of detailed field dalta HumEcol 22 379ndash403
WRI (World Resources Institute) 2007 Interactive Forestry Atlas ofCameroonmdashVersion 20 (Washington DC World ResourcesInstitute)
WRI (World Resources Institute) 2010 Atlas Forestier Interactif dela Republique Democratique du CongomdashVersion 10(Washington DC World Resources Institute)
WWF (World Wildlife Fund) 2006 A Vision for BiodiversityConservation in Central Africa Biological Priorities forConservation in the GuineanmdashCongolian Forest andFreshwater Region (Washington DC WWF-USCentralAfrican Regional Program Office)
Zhuravleva I V 2011 Intact forest landscapes in the tropics mappingand monitoring in 2000ndash2010 Abstracts of Fifth Int ConfEarth from the Space The Most Effective Solutions (MoscowScanex)
13

Environ Res Lett 8 (2013) 024034 I Zhuravleva et al
Figure 4 Intact primary forests with high probability of degradation 2010ndash2020
432 Forest degradation within protected areas Primaryforests are included within 33 protected areas in the country5 national parks 12 nature reserves 2 hunting reserves and 14hunting domains (last two categories were analyzed together)Total area of protected primary forests for year 2000 was13 982 kha of this 11 004 kha were intact forests Of all intactprimary forests 76 and 71 respectively were locatedwithin national parks and nature reserves and 24 withinhunting reserves More than 55 of primary forests withinnature reserves and national parks and about 16 of primaryforests within hunting reserves were intact in 2000
During the last decade 41 kha of primary forests inprotected areas have been cleared (including 6 kha withinintact primary forests) Additionally about 48 kha of intactprimary forests were fragmented and resulted in 54 kha ofintact forest area being degraded inside protected areas Thedecadal rates of forest loss and degradation within protectedareas were significantly lower than within the rest of countryThe primary forest loss rate (03) was 34 times lower thennational average (102 was lost within primary forests inthe DRC) and the intact primary forest degradation (05)was 37 times lower National parks have the lowest rate ofprimary forest loss and intact primary forest degradation (006and 008 respectively) while hunting reserves feature thehighest rate of change for protected areas (06 and 17respectively)
Primary forest loss within protected areas increasedbetween the first and second half of the decade by 48The highest increase was observed in hunting reserves (by50) while it decreased within National Parks from 2 kha(2000ndash2005) to 1 kha (2005ndash2010) Intact primary forestdegradation decreased in all categories of protected areas by42 Within 5 km buffer zones around protected areas theintact primary forest degradation rate was higher than withinthese areas by factor of 5
44 Forest degradation in the vicinity of urban areas
The high rate of population growth and urbanization in theDRC is thought to be a reason for intensive primary forest
degradation in the vicinity of urban areas We analyzed100 km buffer zones around each of the 55 major urban areasIn total 42 of all primary forests and 36 of intact primaryforests were located within the buffer zones The buffer zoneswere the site of 65 of total forest cover loss within primaryforests and of 69 of all intact forest degradation The rate ofprimary forest cover loss within these areas was 36 higherthan the average for the country and the rate of intact primaryforest degradation was 49 higher The primary forest coverloss area increase between 2000ndash2005 and 2005ndash2010 timeintervals was twice higher compared to the national average
45 Primary intact forests threat assessment
Our prediction model showed the maximum extent of intactprimary forests that could be degraded during 2010ndash2020if agricultural and infrastructure expansion speed was heldconstant The model predicted that the intact primary forestarea in the DRC could be reduced by 2435 kha during thenext 10 years or by 4 of year 2010 primary intact forest area(figure 4) The majority of the predicted changes would be dueto rapid agricultural expansion in Nord-Kivu and Orientaleprovinces and with logging infrastructure expansion withinthe logging permits in Equateur and Orientale province Ofall 2010 IFL patches 13 small patches will have their areareduced below the IFL area threshold The predicted intactforest degradation rate is twice higher than the observeddecadal degradation rate for 2000ndash2010 time interval Itshould be noted that our forecast model represents themaximum possible area of forest degradation and does notaccount for local difference in future forest degradationtrends
In addition to primary intact forests that are in the vicinityof recent degradation hotspots intact areas within activelymanaged logging permits are under threat of fragmentationand alteration by industrial logging Of 68 permits that includeintact primary forests 32 were highlighted as having thehighest probability of rapid forest degradation (using set ofcriteria described in section 32) Intact forests within theseactive logging concessions represent 4 of the total IFL area
9
Environ Res Lett 8 (2013) 024034 I Zhuravleva et al
Figure 5 Mean and standard deviation of GLAS-derived within primary intact primary degraded and non-primary (lsquootherrsquo) forests(a) vegetation height (b) HOME metrics for year 2005
46 Tree canopy structure metrics
Mean GLAS-derived vegetation height quantifies a differenceof 07 m between primary intact and primary degraded forestsand a difference of 78 m between primary degraded andother forests (including secondary humid tropical forests andwoodlands according to the CARPE dataset) While themean vegetation height difference between primary intact andprimary degraded forest is small it is statistically significantwith t-test p-values of 0000 for the 95 confidenceinterval The difference of the mean HOME estimate forprimary intact and primary degraded forests equals 20 m andis also statistically significant with t-test p-values of0000for the 95 confidence interval (figure 5)
5 Discussion
51 Primary and intact forest extent in the DRC
Given the long history of anthropogenic influence and theexpansion of illegal logging and poaching in recent decadesit is generally assumed that the extent of intact forest areasin the Congo basin is limited Comparison of the IFL map foryear 2000 with existing global intactness datasets (McCloskeyand Spalding 1989 Bryant et al 1997 Sanderson et al2002) showed that all former approaches which were basedon outdated and imprecise road maps in the core CentralAfrican forests showed high forest degradation levels Infact medium resolution satellite imagery analyzed from1990 to 2010 did not reveal high road densities within thecentral Congo basin According to the LandScan datasetthe mean population density in DRC within IFL for year2000 is 34 persons per square km which totals morethan 2 million people Because our mapping algorithmdoes not permit inclusion of any permanent settlements oragriculture areas within IFLs such population density seemssignificantly overestimated Another argument against thedesignation of remaining IFLs as lsquointactrsquo is the wide-scalepoaching within the country leading to lsquodefaunizationrsquo ofprimary forest patches (Redford 1992) Wildlife hunting isa significant problem in central Africa and poaching may
occur in remote areas away from roads and settlements Itwas shown however that large animals are hunted mostly inthe vicinity of roads and within fragmented andor secondaryforests (Barnes et al 1995 Barnes 2002) While poachingand consequent local animal extirpation is one of the majorthreats to forest ecosystems in Congo Basin hunting wasnot analyzed in our remote-sensing based assessment due todata limitations Large intact forest areas selected using theIFL approach have several features that make them importantfor priority conservation First with their natural (unaltered)plant species composition and large patch areas sustainingrelatively inaccessible core zones intact forests provide arefuge for animal populations ensuring their resilience tonatural disturbances and climate fluctuations Second limitedaccess due to a lack of infrastructure discourages and limitshunting Third these areas play an important role in carbonsequestration due to the preservation of natural forest structureand dynamics The DRC plays an important role in primaryforest conservation in Central Africa having 41 of its totalforest cover within IFLs and accounting for two-thirds of totalCongo Basin IFL area
52 Results accuracy and data availability
The presented analysis was based on the integration of twoindependent and well established methods and productssupervised Landsat-based forest cover and change mapping(Hansen et al 2008a Potapov et al 2012) and fragmentationanalysis using the IFL approach (Potapov et al 2008 2009)Thus the primary forest degradation dataset uncertaintyshould be derived from the source datasets (CARPE datasetand IFL dataset) uncertainty The CARPE dataset was createdusing supervised expert-driven classification similarly toother Landsat-based national-scale change estimation projects(Achard et al 2002 Duveiller et al 2008 Hansen et al 2008b2008a) To map the primary forests and change areas aniterative supervised classification approach was used withcross-verification by international and local experts (Potapovet al 2012) Presented forest cover and change estimatesare close to UNFAO estimates (FAO 2010) However thespatial accuracy of change detection was not validated due
10
Environ Res Lett 8 (2013) 024034 I Zhuravleva et al
to the lack of high spatial resolution data or field plots Themain limitation for the 2000ndash2010 product validation wasthe absence of reference field andor high spatial resolutionsatellite imagery for the year 2000 epoch Establishing aregular and recurring validation data collection strategy isrequired for future monitoring of the DRC (Potapov et al2012)
The low intensity of selective logging did not allow usto map forest degradation directly except for the extensionof logging roads However we were able to predict areasthat have a high probability of selective logging using theIFL approach The IFL method had been shown to be aneffective method for large-scale forest degradation assessment(Potapov et al 2009) The simplicity of the IFL mappingcriteria and large minimal size of the IFL patch ensures thatonly areas without significant recent anthropogenic influenceare mapped as lsquointactrsquo The structural analysis of tree canopycover within primary intact and degraded forests using GLASdata quantifies a structural difference between primary intactand primary degraded forests with degraded forests havingslightly lower maximum canopy height and significantlylower mean HOME values The observed difference ismost probably a consequence of selective logging practicesincluding the extraction of large commercially valuable treesconsequent disturbance of portions of the tree canopy duringfelling and removal with a large portion of the canopyremaining intact (Brown et al 2005) Similar results fordegraded forests affected by selective logging were obtainedby Margono et al (2012) for Sumatra Indonesia
While several projects have been performed to estimateforest cover and change within the DRC few have made theirresults along with baseline satellite imagery available forindependent assessment and cross-validation Both productsused in our analysis are available online For the IFL producta continuous external review process has been organized on adedicated web site (wwwintactforestsorg) The CAPRE mapis also freely available (httpcongoiluciorgcarpemapper)Both the CARPE and IFL maps are being used as the basisfor the National Forest Monitoring system of the DRC (wwwrdc-snsforg) We believe that the unrestricted distributionof satellite-derived products is a fast and effective way forcross-validation and quality assessment
53 Forest degradation factors and intact forestsconservation strategy
Our analysis of forest degradation factors (forest loss andfragmentation) performed independently for two 5 yeartime intervals showed that while forest cover loss nearlydoubled intact forest fragmentation remained stable andeven decreased slightly Visual image analysis and literaturereview suggested that the major driver of forest loss andfragmentation was agricultural expansion and other meansof forest clearing (eg charcoal production) fueled bypopulation growth As population continued to increaseso did subsistence agriculture area expansion Howeveragricultural expansion was mostly located around settlementsand existing infrastructure objects affecting mainly degraded
forests The observed rate of forest loss within degradedprimary forests was 12 times higher compared to intact areasThe highest forest degradation rates were observed in theeastern part of the country along the Congo River close tothe Great Lakes region and in the vicinity of mining towns inthe southern forestsavanna border Nord-Kivu province wasa noteworthy hope spot where agricultural expansion wasprobably related to internally displaced populations
Industrial logging one of the most important factorsof forest fragmentation in other central African countries(eg Gabon and the Republic of Congo) remained limitedwithin the DRC due to political and economic instabilityLimited industrial logging expansion is thought to be theprimary reason why intact forest degradation in the DRCis the less compared to other countries of the Congo basin(Zhuravleva 2011) Fragmentation by logging roads wasdetected mostly in the eastern part of the country especiallywithin areas having approved logging permits where itslowed during the second half of the decade Several factorscould be responsible for the observed degradation reductionincluding the global economic downturn of 2008 Becauseforest fragmentation in the DRC is mostly connected withagriculture expansion and not with selective logging intactforest fragmentation reduction within the DRC was smallercompared to other Central African countries where IFLdegradation decreased from 35 in 2000ndash2005 to 2 in2005ndash2010 (Zhuravleva 2011) The future of intact forestswithin the DRC timber concessions depends on the successfulimplementation of government policies
Considering current agriculture and road networkexpansion speed we predicted that intact forest degradationcould increase up to two-fold during the next decade Thisscenario is plausible taking into account the high rates ofpopulation growth However due to the intensification ofselective logging within current logging permits the rate ofintact forest degradation could increase even higher Protectedareas establishment could be one way to preserve intactprimary forests Our analysis shows that both intact primaryforest degradation and forest loss within protected areas weresignificantly lower than the national average National parkswere the most effective in protecting primary forests fromdegradation The rate of intact primary forest degradationwithin a 5 km buffer around protected areas was significantlyhigher than inside the protected areas illustrating the ongoingthreats from neighboring developed areas
The derived primary forest cover map change detectionresults and forest degradation prediction model results couldbe used as a baseline for forest conservation planningwithin the country New road construction opening accessto heretofore intact forest areas should be considered thegreatest threat to intact forest areas While intact primaryforest protection should be considered as a goal it is expectedthat there will be a further degradation of the remainingprimary forest In this case a zoning strategy could beimplemented to minimize infrastructure impact on core intactforest areas while leaving peripheral parts for sustainable use(Thies et al 2011 Sidle et al 2012) Zoning strategies havebeen successfully implemented in some of the central African
11
Environ Res Lett 8 (2013) 024034 I Zhuravleva et al
countries eg in Cameroon (WRI 2007) The lsquopermanentforest zonersquo in Cameroon prohibits forest conversion toagriculture or plantations This zone is further separatedinto strictly protected areas and logging concessions wherelimited timber extraction is permitted In the DRC zoninghave been successfully implemented on a sub-national levelspecifically within Congo Basin Forest Partnership (CBFP)landscapes (Sidle et al 2012) National-scale forest zoningin DRC is supported by a National Steering Committee forForest Zoning since 2009 Another important tool wouldbe limiting access and supporting vegetation restorationon abandoned logging roads to prevent expansion ofhunting range and agricultural clearing Land-use zoningand management planning is especially important withindegraded primary forest to prevent further land degradationand permanent deforestation
References
Achard F Eva H D Stibig H J Mayaux P Gallego J Richards Tand Malingreau J P 2002 Determination of deforestation ratesof the worldrsquos humid tropical forests Science 297 999ndash1002
Amsallem I 2002 Status and Trends in Forest Management inCentral Africa (Forest Management Working Paper vol 3)(Rome FAO Forest Resources Development Service ForestResources Division)
Asner G P Keller M Pereira R and Zweede J C 2002 Remotesensing of selective logging in Amazonia assessing limitationsbased on detailed field observations Landsat ETM+ andtextural analysis Remote Sens Environ 80 483ndash96
Baccini A Laporte N Goetz S J Sun M and Dong H 2008 A firstmap of tropical Africarsquos above-ground biomass derived fromsatellite imagery Environ Res Lett 3 045011
Barnes R F W 2002 The bushmeat boom and bust in West andCentral Africa Oryx 36 236ndash42
Barnes R F W Bloom A and Alers M P T 1995 A review of thestatus of forest elephants it Loxodonta africana in CentralAfrica Biol Conserv 71 125ndash32
Beerling D J and Osborne C P 2006 The origin of the savannabiome Glob Change Biol 12 2023ndash31
Bond W J Woodward F I and Midgley G F 2005 The globaldistribution of ecosystems in a world without fire New Phytol165 525ndash38
Broich M Stehman S V Hansen M C Potapov P andShimabukuro Y E 2009 A comparison of sampling designs forestimating deforestation from Landsat imagery a case study ofthe Brazilian Legal Amazon Remote Sens Environ113 2448ndash54
Brown S Pearson T Moore N Parveen A Ambagis S and Shoch D2005 Impact of Selective Logging on the Carbon Stocks ofTropical Forests Republic of Congo as a Case Study(Arlington Winrock International)
Bryant D Nielsen D and Tangley L 1997 The Last Frontier ForestsEcosystems and Economies on the Edge (Washington DCWorld Resources Institute)
Camara G Valeriano D M and Soares J V 2006 Metodologia para oCalculo da Taxa Anual de Desmatamento na Amazonia Legal(Sao Jose dos Campos INPE)
Carrere R 2010 Oil Palm in Africa Past Present and FutureScenarios (World Rainforest Movement Series on TreePlantations vol 15) (Montevideo World Rainforest Movement)
CBFP (Congo Basin Forest Partnership) 2009 The Forests of theCongo BasinmdashState of the Forest 2008 ed C de WasseigeD Devers P de Marcken A R Ebarsquoa R Nasi and
Ph Mayaux (Luxembourg Publications Office of the EuropeanUnion)
Clark C J Poulsen J R Malonga R and Elkan P W Jr 2009 Loggingconcessions can extend the conservation estate for CentralAfrican tropical forests Conserv Biol 23 1281ndash93
Dobson J E Bright E A Coleman P R Durfee R C and Worley B A2000 LandScan a global population database for estimatingpopulations at risk Photogramm Eng Remote Sens 66 849ndash57
Draulans D and van Krunkelsven E 2002 The impact of war onforest areas in the Democratic Republic of Congo Oryx36 35ndash40
Duveiller G Defourny P Desclee B and Mayaux P 2008Deforestation in Central Africa estimates at regional nationaland landscape levels by advanced processing ofsystematically-distributed Landsat extracts Remote SensEnviron 112 1969ndash81
Endamana D Boedhihartono A K Bokoto B Defo L Eyebe ANdikumagenge C Nzooh Z Ruiz-Perez M and Sayer J A 2010A framework for assessing conservation and development in aCongo Basin Forest Landscape Trop Conserv Sci 3 262ndash81
Ernst C Verheggen A Mayaux P Hansen M and Defourny P 2012Central African forest cover and cover change mapping TheForests of the Congo BasinmdashState of the Forest 2010ed C de Wasseige P de Marcken N Bayol F Hiol Ph MayauxB Desclee R Nasi A Billand P Defournyand A R Ebarsquoa (Luxembourg Publications Office of theEuropean Union) pp 23ndash42
FAO (Food and Agricultural Organization) 2010 Global ForestResources Assessment 2010 (Rome UNFAO)
Gibbs H Brown S Niles J and Foley J 2007 Monitoring andestimating tropical forest carbon stocks making REDD areality Environ Res Lett 2 045023
Goetz S J Sun M Baccini A and Beck P S A 2010 Synergistic useof space-borne LiDAR and optical imagery for assessing forestdisturbance an Alaska case study J Geophys ResmdashBiogeosci115 G00E07
Greenpeace 2012 lsquoArtisanal Loggingrsquo = Industrial Logging inDisguise (Kinshasa Greenpeace Africa)
Gutman G Byrnes R Masek J Covington S Justice C Franks Sand Headley R 2008 Towards monitoring land-cover andland-use changes at a global scale the global land survey 2005Photogramm Eng Remote Sens 74 6ndash10
Hance W A and van Dongen I S 1958 Matadi focus of BelgianAfrican transport Ann Assoc Am Geogr 48 41ndash72
Hansen M C Roy D P Lindquist E Adusei B Justice C O andAltstatt A 2008a A method for integrating MODIS andLandsat data for systematic monitoring of forest cover andchange and preliminary results for Central Africa Remote SensEnviron 112 2495ndash513
Hansen M C et al 2008b Humid tropical forest clearing from 2000to 2005 quantified by using multitemporal and multiresolutionremotely sensed data Proc Natl Acad Sci USA 105 9439ndash44
ITTO (International Tropical Timber Organization) 2002 ITTOGuidelines for the Restoration Management andRehabilitation of Degraded and Secondary Tropical Forests(ITTO Policy Development Series vol 13) (YokohamaInternational Tropical Timber Organization)
Justice C O Horning N and Laporte N 1993 Central Africa GlobalClimate Change and DevelopmentmdashSynopsis Remote Sensingand GIS Contributions to a Climate Change Program inCentral Africa (Washington DC Biodiversity SupportProgram)
Kareiva P Watts S McDonald R and Boucher T 2007 Domesticatednature shaping landscapes and ecosystems for human welfareScience 316 1866ndash9
Mararo B 1997 Land power and ethnic conflict in Masisi(Congo-Kinshasa) 1940s-1994 Int J Afr Hist Stud30 503ndash38
12
Environ Res Lett 8 (2013) 024034 I Zhuravleva et al
Margono B A Turubanova S Zhuravleva I Potapov PTyukavina A Baccini A Goetz S and Hansen M C 2012Mapping and monitoring deforestation and forest degradationin Sumatra (Indonesia) using Landsat time series data setsfrom 1990 to 2010 Environ Res Lett 7 034010
McCloskey J M and Spalding H 1989 A reconnaissance levelinventory of the amount of wilderness remaining in the worldAmbio 18 221ndash7
Mollicone D et al 2007 An incentive mechanism for reducingemissions from conversion of intact and non-intact forestsClim Change 83 477ndash93
Laporte N T Stabach J A Grosch R Lin T S and Goetz S J 2007Expansion of industrial logging in Central Africa Science316 1451
Laurance W F Croes B M Tchignoumba L Lahm S A Alonso ALee M E Campbell P and Ondzeano C 2006 Impacts of roadsand hunting on Central African Rainforest Mammals ConservBiol 20 1251ndash61
Oliver R 1966 The problem of the Bantu expansion J Afr Hist7 361ndash76
Olson D M et al 2001 Terrestrial ecoregions of the world a newmap of life on earth Bioscience 51 933ndash8
Potapov P V Laestadius L Yaroshenko A and Turubanova S 2009Case Studies on Measuring and Assessing Forest DegradationGlobal Mapping and Monitoring the Extent of ForestAlteration the Intact Forest Ladscape method (FAO WorkingPaper vol 166) (Rome FAO Forest Resources AssessmentProgramme)
Potapov P V Turubanova S A Hansen M C Adusei B Broich MAltstatt A Mane L and Justice C O 2012 Quantifying forestcover loss in Democratic Republic of the Congo 2000ndash2010with Landsat ETM+ data Remote Sens Environ 122 106ndash16
Potapov P V et al 2008 Mapping the worldrsquos intact forestlandscapes by remote sensing Ecol Soc 13 51
Redford K H 1992 The empty forest Bioscience 42 412ndash22Sanderson E W Malanding J Levi M A Redford K H
Wannebo A V and Woolmer G 2002 The human footprint andthe last of the wild Bioscience 52 891ndash904
Sasaki N and Putz F E 2009 Critical need for new definitions offorest and lsquoforest degradationrsquo in global climate changeagreements Conserv Lett 2 226ndash32
Schoene D Killmann W von Lupke H and LoycheWilkie M 2007Definitional Issues Related to Reducing Emissions fromDeforestation in Developing Countries (FAO Forests andClimate Change Working Paper vol 5) (Rome UNFAO)
Sidle J G Dupain J Beck J Nackoney J de Wasseige CBiang J D M Leprohon R and Malele S 2012 Forest zoningexperience in Central Africa The Forests of the CongoBasinmdashState of the Forest 2010 ed C de WasseigeP de Marcken N Bayol F Hiol Ph Mayaux B DescleeR Nasi A Billand P Defourny and A R Ebarsquoa (LuxembourgPublications Office of the European Union) pp 207ndash31
Strassburg B B N et al 2009 Global congruence of carbon storageand biodiversity in terrestrial ecosystems Conserv Lett3 98ndash105
Tabarelli M Cardoso Da Silva J and Gascon C 2004 Forestfragmentation synergisms and the impoverishment ofneotropical forests Biodivers Conserv 13 1419ndash25
Thies C Rosoman G Cotter J and Meaden S 2011 Intact ForestLandscapes Why It is Critical to Protect Them FromIndustrial Exploration (Amsterdam Greenpeace)
Tucker C J and Townshend J R G 2000 Strategies for monitoringtropical deforestation using satellite data Int J Remote Sens21 1461ndash71
Wilkie D S 1994 Remote sensing imagery for resource inventoriesin Central Africa the importance of detailed field dalta HumEcol 22 379ndash403
WRI (World Resources Institute) 2007 Interactive Forestry Atlas ofCameroonmdashVersion 20 (Washington DC World ResourcesInstitute)
WRI (World Resources Institute) 2010 Atlas Forestier Interactif dela Republique Democratique du CongomdashVersion 10(Washington DC World Resources Institute)
WWF (World Wildlife Fund) 2006 A Vision for BiodiversityConservation in Central Africa Biological Priorities forConservation in the GuineanmdashCongolian Forest andFreshwater Region (Washington DC WWF-USCentralAfrican Regional Program Office)
Zhuravleva I V 2011 Intact forest landscapes in the tropics mappingand monitoring in 2000ndash2010 Abstracts of Fifth Int ConfEarth from the Space The Most Effective Solutions (MoscowScanex)
13
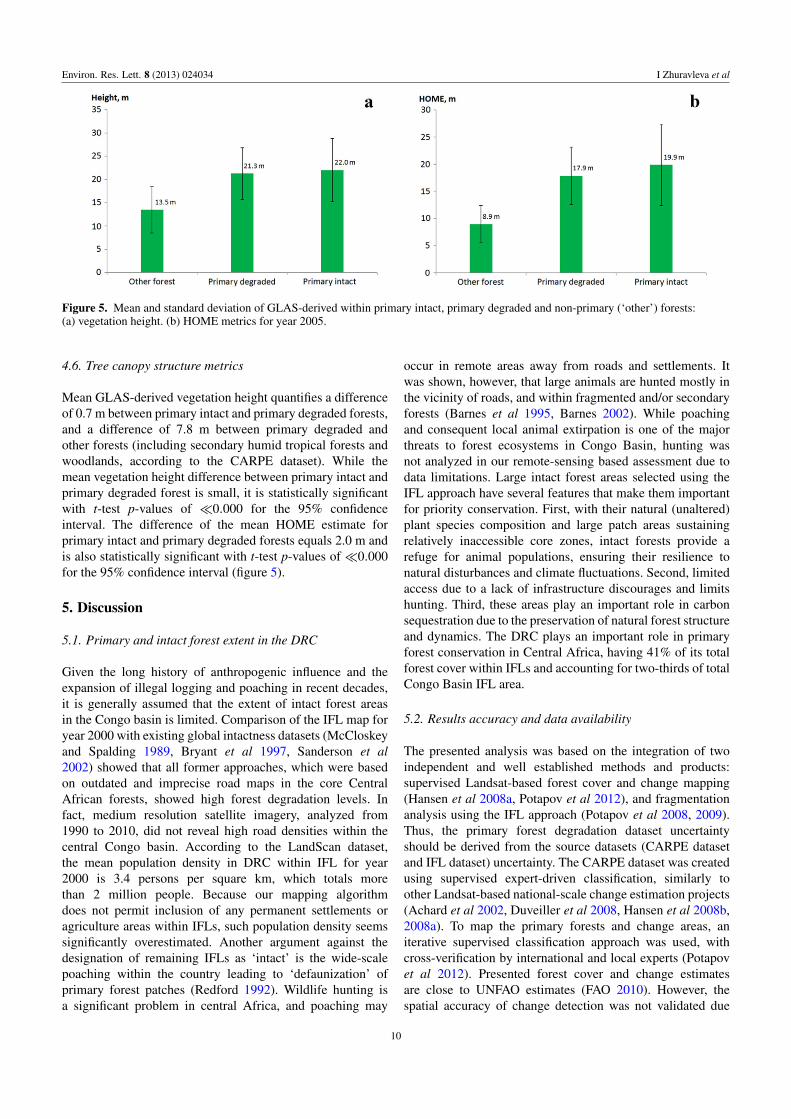
Environ Res Lett 8 (2013) 024034 I Zhuravleva et al
Figure 5 Mean and standard deviation of GLAS-derived within primary intact primary degraded and non-primary (lsquootherrsquo) forests(a) vegetation height (b) HOME metrics for year 2005
46 Tree canopy structure metrics
Mean GLAS-derived vegetation height quantifies a differenceof 07 m between primary intact and primary degraded forestsand a difference of 78 m between primary degraded andother forests (including secondary humid tropical forests andwoodlands according to the CARPE dataset) While themean vegetation height difference between primary intact andprimary degraded forest is small it is statistically significantwith t-test p-values of 0000 for the 95 confidenceinterval The difference of the mean HOME estimate forprimary intact and primary degraded forests equals 20 m andis also statistically significant with t-test p-values of0000for the 95 confidence interval (figure 5)
5 Discussion
51 Primary and intact forest extent in the DRC
Given the long history of anthropogenic influence and theexpansion of illegal logging and poaching in recent decadesit is generally assumed that the extent of intact forest areasin the Congo basin is limited Comparison of the IFL map foryear 2000 with existing global intactness datasets (McCloskeyand Spalding 1989 Bryant et al 1997 Sanderson et al2002) showed that all former approaches which were basedon outdated and imprecise road maps in the core CentralAfrican forests showed high forest degradation levels Infact medium resolution satellite imagery analyzed from1990 to 2010 did not reveal high road densities within thecentral Congo basin According to the LandScan datasetthe mean population density in DRC within IFL for year2000 is 34 persons per square km which totals morethan 2 million people Because our mapping algorithmdoes not permit inclusion of any permanent settlements oragriculture areas within IFLs such population density seemssignificantly overestimated Another argument against thedesignation of remaining IFLs as lsquointactrsquo is the wide-scalepoaching within the country leading to lsquodefaunizationrsquo ofprimary forest patches (Redford 1992) Wildlife hunting isa significant problem in central Africa and poaching may
occur in remote areas away from roads and settlements Itwas shown however that large animals are hunted mostly inthe vicinity of roads and within fragmented andor secondaryforests (Barnes et al 1995 Barnes 2002) While poachingand consequent local animal extirpation is one of the majorthreats to forest ecosystems in Congo Basin hunting wasnot analyzed in our remote-sensing based assessment due todata limitations Large intact forest areas selected using theIFL approach have several features that make them importantfor priority conservation First with their natural (unaltered)plant species composition and large patch areas sustainingrelatively inaccessible core zones intact forests provide arefuge for animal populations ensuring their resilience tonatural disturbances and climate fluctuations Second limitedaccess due to a lack of infrastructure discourages and limitshunting Third these areas play an important role in carbonsequestration due to the preservation of natural forest structureand dynamics The DRC plays an important role in primaryforest conservation in Central Africa having 41 of its totalforest cover within IFLs and accounting for two-thirds of totalCongo Basin IFL area
52 Results accuracy and data availability
The presented analysis was based on the integration of twoindependent and well established methods and productssupervised Landsat-based forest cover and change mapping(Hansen et al 2008a Potapov et al 2012) and fragmentationanalysis using the IFL approach (Potapov et al 2008 2009)Thus the primary forest degradation dataset uncertaintyshould be derived from the source datasets (CARPE datasetand IFL dataset) uncertainty The CARPE dataset was createdusing supervised expert-driven classification similarly toother Landsat-based national-scale change estimation projects(Achard et al 2002 Duveiller et al 2008 Hansen et al 2008b2008a) To map the primary forests and change areas aniterative supervised classification approach was used withcross-verification by international and local experts (Potapovet al 2012) Presented forest cover and change estimatesare close to UNFAO estimates (FAO 2010) However thespatial accuracy of change detection was not validated due
10
Environ Res Lett 8 (2013) 024034 I Zhuravleva et al
to the lack of high spatial resolution data or field plots Themain limitation for the 2000ndash2010 product validation wasthe absence of reference field andor high spatial resolutionsatellite imagery for the year 2000 epoch Establishing aregular and recurring validation data collection strategy isrequired for future monitoring of the DRC (Potapov et al2012)
The low intensity of selective logging did not allow usto map forest degradation directly except for the extensionof logging roads However we were able to predict areasthat have a high probability of selective logging using theIFL approach The IFL method had been shown to be aneffective method for large-scale forest degradation assessment(Potapov et al 2009) The simplicity of the IFL mappingcriteria and large minimal size of the IFL patch ensures thatonly areas without significant recent anthropogenic influenceare mapped as lsquointactrsquo The structural analysis of tree canopycover within primary intact and degraded forests using GLASdata quantifies a structural difference between primary intactand primary degraded forests with degraded forests havingslightly lower maximum canopy height and significantlylower mean HOME values The observed difference ismost probably a consequence of selective logging practicesincluding the extraction of large commercially valuable treesconsequent disturbance of portions of the tree canopy duringfelling and removal with a large portion of the canopyremaining intact (Brown et al 2005) Similar results fordegraded forests affected by selective logging were obtainedby Margono et al (2012) for Sumatra Indonesia
While several projects have been performed to estimateforest cover and change within the DRC few have made theirresults along with baseline satellite imagery available forindependent assessment and cross-validation Both productsused in our analysis are available online For the IFL producta continuous external review process has been organized on adedicated web site (wwwintactforestsorg) The CAPRE mapis also freely available (httpcongoiluciorgcarpemapper)Both the CARPE and IFL maps are being used as the basisfor the National Forest Monitoring system of the DRC (wwwrdc-snsforg) We believe that the unrestricted distributionof satellite-derived products is a fast and effective way forcross-validation and quality assessment
53 Forest degradation factors and intact forestsconservation strategy
Our analysis of forest degradation factors (forest loss andfragmentation) performed independently for two 5 yeartime intervals showed that while forest cover loss nearlydoubled intact forest fragmentation remained stable andeven decreased slightly Visual image analysis and literaturereview suggested that the major driver of forest loss andfragmentation was agricultural expansion and other meansof forest clearing (eg charcoal production) fueled bypopulation growth As population continued to increaseso did subsistence agriculture area expansion Howeveragricultural expansion was mostly located around settlementsand existing infrastructure objects affecting mainly degraded
forests The observed rate of forest loss within degradedprimary forests was 12 times higher compared to intact areasThe highest forest degradation rates were observed in theeastern part of the country along the Congo River close tothe Great Lakes region and in the vicinity of mining towns inthe southern forestsavanna border Nord-Kivu province wasa noteworthy hope spot where agricultural expansion wasprobably related to internally displaced populations
Industrial logging one of the most important factorsof forest fragmentation in other central African countries(eg Gabon and the Republic of Congo) remained limitedwithin the DRC due to political and economic instabilityLimited industrial logging expansion is thought to be theprimary reason why intact forest degradation in the DRCis the less compared to other countries of the Congo basin(Zhuravleva 2011) Fragmentation by logging roads wasdetected mostly in the eastern part of the country especiallywithin areas having approved logging permits where itslowed during the second half of the decade Several factorscould be responsible for the observed degradation reductionincluding the global economic downturn of 2008 Becauseforest fragmentation in the DRC is mostly connected withagriculture expansion and not with selective logging intactforest fragmentation reduction within the DRC was smallercompared to other Central African countries where IFLdegradation decreased from 35 in 2000ndash2005 to 2 in2005ndash2010 (Zhuravleva 2011) The future of intact forestswithin the DRC timber concessions depends on the successfulimplementation of government policies
Considering current agriculture and road networkexpansion speed we predicted that intact forest degradationcould increase up to two-fold during the next decade Thisscenario is plausible taking into account the high rates ofpopulation growth However due to the intensification ofselective logging within current logging permits the rate ofintact forest degradation could increase even higher Protectedareas establishment could be one way to preserve intactprimary forests Our analysis shows that both intact primaryforest degradation and forest loss within protected areas weresignificantly lower than the national average National parkswere the most effective in protecting primary forests fromdegradation The rate of intact primary forest degradationwithin a 5 km buffer around protected areas was significantlyhigher than inside the protected areas illustrating the ongoingthreats from neighboring developed areas
The derived primary forest cover map change detectionresults and forest degradation prediction model results couldbe used as a baseline for forest conservation planningwithin the country New road construction opening accessto heretofore intact forest areas should be considered thegreatest threat to intact forest areas While intact primaryforest protection should be considered as a goal it is expectedthat there will be a further degradation of the remainingprimary forest In this case a zoning strategy could beimplemented to minimize infrastructure impact on core intactforest areas while leaving peripheral parts for sustainable use(Thies et al 2011 Sidle et al 2012) Zoning strategies havebeen successfully implemented in some of the central African
11
Environ Res Lett 8 (2013) 024034 I Zhuravleva et al
countries eg in Cameroon (WRI 2007) The lsquopermanentforest zonersquo in Cameroon prohibits forest conversion toagriculture or plantations This zone is further separatedinto strictly protected areas and logging concessions wherelimited timber extraction is permitted In the DRC zoninghave been successfully implemented on a sub-national levelspecifically within Congo Basin Forest Partnership (CBFP)landscapes (Sidle et al 2012) National-scale forest zoningin DRC is supported by a National Steering Committee forForest Zoning since 2009 Another important tool wouldbe limiting access and supporting vegetation restorationon abandoned logging roads to prevent expansion ofhunting range and agricultural clearing Land-use zoningand management planning is especially important withindegraded primary forest to prevent further land degradationand permanent deforestation
References
Achard F Eva H D Stibig H J Mayaux P Gallego J Richards Tand Malingreau J P 2002 Determination of deforestation ratesof the worldrsquos humid tropical forests Science 297 999ndash1002
Amsallem I 2002 Status and Trends in Forest Management inCentral Africa (Forest Management Working Paper vol 3)(Rome FAO Forest Resources Development Service ForestResources Division)
Asner G P Keller M Pereira R and Zweede J C 2002 Remotesensing of selective logging in Amazonia assessing limitationsbased on detailed field observations Landsat ETM+ andtextural analysis Remote Sens Environ 80 483ndash96
Baccini A Laporte N Goetz S J Sun M and Dong H 2008 A firstmap of tropical Africarsquos above-ground biomass derived fromsatellite imagery Environ Res Lett 3 045011
Barnes R F W 2002 The bushmeat boom and bust in West andCentral Africa Oryx 36 236ndash42
Barnes R F W Bloom A and Alers M P T 1995 A review of thestatus of forest elephants it Loxodonta africana in CentralAfrica Biol Conserv 71 125ndash32
Beerling D J and Osborne C P 2006 The origin of the savannabiome Glob Change Biol 12 2023ndash31
Bond W J Woodward F I and Midgley G F 2005 The globaldistribution of ecosystems in a world without fire New Phytol165 525ndash38
Broich M Stehman S V Hansen M C Potapov P andShimabukuro Y E 2009 A comparison of sampling designs forestimating deforestation from Landsat imagery a case study ofthe Brazilian Legal Amazon Remote Sens Environ113 2448ndash54
Brown S Pearson T Moore N Parveen A Ambagis S and Shoch D2005 Impact of Selective Logging on the Carbon Stocks ofTropical Forests Republic of Congo as a Case Study(Arlington Winrock International)
Bryant D Nielsen D and Tangley L 1997 The Last Frontier ForestsEcosystems and Economies on the Edge (Washington DCWorld Resources Institute)
Camara G Valeriano D M and Soares J V 2006 Metodologia para oCalculo da Taxa Anual de Desmatamento na Amazonia Legal(Sao Jose dos Campos INPE)
Carrere R 2010 Oil Palm in Africa Past Present and FutureScenarios (World Rainforest Movement Series on TreePlantations vol 15) (Montevideo World Rainforest Movement)
CBFP (Congo Basin Forest Partnership) 2009 The Forests of theCongo BasinmdashState of the Forest 2008 ed C de WasseigeD Devers P de Marcken A R Ebarsquoa R Nasi and
Ph Mayaux (Luxembourg Publications Office of the EuropeanUnion)
Clark C J Poulsen J R Malonga R and Elkan P W Jr 2009 Loggingconcessions can extend the conservation estate for CentralAfrican tropical forests Conserv Biol 23 1281ndash93
Dobson J E Bright E A Coleman P R Durfee R C and Worley B A2000 LandScan a global population database for estimatingpopulations at risk Photogramm Eng Remote Sens 66 849ndash57
Draulans D and van Krunkelsven E 2002 The impact of war onforest areas in the Democratic Republic of Congo Oryx36 35ndash40
Duveiller G Defourny P Desclee B and Mayaux P 2008Deforestation in Central Africa estimates at regional nationaland landscape levels by advanced processing ofsystematically-distributed Landsat extracts Remote SensEnviron 112 1969ndash81
Endamana D Boedhihartono A K Bokoto B Defo L Eyebe ANdikumagenge C Nzooh Z Ruiz-Perez M and Sayer J A 2010A framework for assessing conservation and development in aCongo Basin Forest Landscape Trop Conserv Sci 3 262ndash81
Ernst C Verheggen A Mayaux P Hansen M and Defourny P 2012Central African forest cover and cover change mapping TheForests of the Congo BasinmdashState of the Forest 2010ed C de Wasseige P de Marcken N Bayol F Hiol Ph MayauxB Desclee R Nasi A Billand P Defournyand A R Ebarsquoa (Luxembourg Publications Office of theEuropean Union) pp 23ndash42
FAO (Food and Agricultural Organization) 2010 Global ForestResources Assessment 2010 (Rome UNFAO)
Gibbs H Brown S Niles J and Foley J 2007 Monitoring andestimating tropical forest carbon stocks making REDD areality Environ Res Lett 2 045023
Goetz S J Sun M Baccini A and Beck P S A 2010 Synergistic useof space-borne LiDAR and optical imagery for assessing forestdisturbance an Alaska case study J Geophys ResmdashBiogeosci115 G00E07
Greenpeace 2012 lsquoArtisanal Loggingrsquo = Industrial Logging inDisguise (Kinshasa Greenpeace Africa)
Gutman G Byrnes R Masek J Covington S Justice C Franks Sand Headley R 2008 Towards monitoring land-cover andland-use changes at a global scale the global land survey 2005Photogramm Eng Remote Sens 74 6ndash10
Hance W A and van Dongen I S 1958 Matadi focus of BelgianAfrican transport Ann Assoc Am Geogr 48 41ndash72
Hansen M C Roy D P Lindquist E Adusei B Justice C O andAltstatt A 2008a A method for integrating MODIS andLandsat data for systematic monitoring of forest cover andchange and preliminary results for Central Africa Remote SensEnviron 112 2495ndash513
Hansen M C et al 2008b Humid tropical forest clearing from 2000to 2005 quantified by using multitemporal and multiresolutionremotely sensed data Proc Natl Acad Sci USA 105 9439ndash44
ITTO (International Tropical Timber Organization) 2002 ITTOGuidelines for the Restoration Management andRehabilitation of Degraded and Secondary Tropical Forests(ITTO Policy Development Series vol 13) (YokohamaInternational Tropical Timber Organization)
Justice C O Horning N and Laporte N 1993 Central Africa GlobalClimate Change and DevelopmentmdashSynopsis Remote Sensingand GIS Contributions to a Climate Change Program inCentral Africa (Washington DC Biodiversity SupportProgram)
Kareiva P Watts S McDonald R and Boucher T 2007 Domesticatednature shaping landscapes and ecosystems for human welfareScience 316 1866ndash9
Mararo B 1997 Land power and ethnic conflict in Masisi(Congo-Kinshasa) 1940s-1994 Int J Afr Hist Stud30 503ndash38
12
Environ Res Lett 8 (2013) 024034 I Zhuravleva et al
Margono B A Turubanova S Zhuravleva I Potapov PTyukavina A Baccini A Goetz S and Hansen M C 2012Mapping and monitoring deforestation and forest degradationin Sumatra (Indonesia) using Landsat time series data setsfrom 1990 to 2010 Environ Res Lett 7 034010
McCloskey J M and Spalding H 1989 A reconnaissance levelinventory of the amount of wilderness remaining in the worldAmbio 18 221ndash7
Mollicone D et al 2007 An incentive mechanism for reducingemissions from conversion of intact and non-intact forestsClim Change 83 477ndash93
Laporte N T Stabach J A Grosch R Lin T S and Goetz S J 2007Expansion of industrial logging in Central Africa Science316 1451
Laurance W F Croes B M Tchignoumba L Lahm S A Alonso ALee M E Campbell P and Ondzeano C 2006 Impacts of roadsand hunting on Central African Rainforest Mammals ConservBiol 20 1251ndash61
Oliver R 1966 The problem of the Bantu expansion J Afr Hist7 361ndash76
Olson D M et al 2001 Terrestrial ecoregions of the world a newmap of life on earth Bioscience 51 933ndash8
Potapov P V Laestadius L Yaroshenko A and Turubanova S 2009Case Studies on Measuring and Assessing Forest DegradationGlobal Mapping and Monitoring the Extent of ForestAlteration the Intact Forest Ladscape method (FAO WorkingPaper vol 166) (Rome FAO Forest Resources AssessmentProgramme)
Potapov P V Turubanova S A Hansen M C Adusei B Broich MAltstatt A Mane L and Justice C O 2012 Quantifying forestcover loss in Democratic Republic of the Congo 2000ndash2010with Landsat ETM+ data Remote Sens Environ 122 106ndash16
Potapov P V et al 2008 Mapping the worldrsquos intact forestlandscapes by remote sensing Ecol Soc 13 51
Redford K H 1992 The empty forest Bioscience 42 412ndash22Sanderson E W Malanding J Levi M A Redford K H
Wannebo A V and Woolmer G 2002 The human footprint andthe last of the wild Bioscience 52 891ndash904
Sasaki N and Putz F E 2009 Critical need for new definitions offorest and lsquoforest degradationrsquo in global climate changeagreements Conserv Lett 2 226ndash32
Schoene D Killmann W von Lupke H and LoycheWilkie M 2007Definitional Issues Related to Reducing Emissions fromDeforestation in Developing Countries (FAO Forests andClimate Change Working Paper vol 5) (Rome UNFAO)
Sidle J G Dupain J Beck J Nackoney J de Wasseige CBiang J D M Leprohon R and Malele S 2012 Forest zoningexperience in Central Africa The Forests of the CongoBasinmdashState of the Forest 2010 ed C de WasseigeP de Marcken N Bayol F Hiol Ph Mayaux B DescleeR Nasi A Billand P Defourny and A R Ebarsquoa (LuxembourgPublications Office of the European Union) pp 207ndash31
Strassburg B B N et al 2009 Global congruence of carbon storageand biodiversity in terrestrial ecosystems Conserv Lett3 98ndash105
Tabarelli M Cardoso Da Silva J and Gascon C 2004 Forestfragmentation synergisms and the impoverishment ofneotropical forests Biodivers Conserv 13 1419ndash25
Thies C Rosoman G Cotter J and Meaden S 2011 Intact ForestLandscapes Why It is Critical to Protect Them FromIndustrial Exploration (Amsterdam Greenpeace)
Tucker C J and Townshend J R G 2000 Strategies for monitoringtropical deforestation using satellite data Int J Remote Sens21 1461ndash71
Wilkie D S 1994 Remote sensing imagery for resource inventoriesin Central Africa the importance of detailed field dalta HumEcol 22 379ndash403
WRI (World Resources Institute) 2007 Interactive Forestry Atlas ofCameroonmdashVersion 20 (Washington DC World ResourcesInstitute)
WRI (World Resources Institute) 2010 Atlas Forestier Interactif dela Republique Democratique du CongomdashVersion 10(Washington DC World Resources Institute)
WWF (World Wildlife Fund) 2006 A Vision for BiodiversityConservation in Central Africa Biological Priorities forConservation in the GuineanmdashCongolian Forest andFreshwater Region (Washington DC WWF-USCentralAfrican Regional Program Office)
Zhuravleva I V 2011 Intact forest landscapes in the tropics mappingand monitoring in 2000ndash2010 Abstracts of Fifth Int ConfEarth from the Space The Most Effective Solutions (MoscowScanex)
13
Environ Res Lett 8 (2013) 024034 I Zhuravleva et al
to the lack of high spatial resolution data or field plots Themain limitation for the 2000ndash2010 product validation wasthe absence of reference field andor high spatial resolutionsatellite imagery for the year 2000 epoch Establishing aregular and recurring validation data collection strategy isrequired for future monitoring of the DRC (Potapov et al2012)
The low intensity of selective logging did not allow usto map forest degradation directly except for the extensionof logging roads However we were able to predict areasthat have a high probability of selective logging using theIFL approach The IFL method had been shown to be aneffective method for large-scale forest degradation assessment(Potapov et al 2009) The simplicity of the IFL mappingcriteria and large minimal size of the IFL patch ensures thatonly areas without significant recent anthropogenic influenceare mapped as lsquointactrsquo The structural analysis of tree canopycover within primary intact and degraded forests using GLASdata quantifies a structural difference between primary intactand primary degraded forests with degraded forests havingslightly lower maximum canopy height and significantlylower mean HOME values The observed difference ismost probably a consequence of selective logging practicesincluding the extraction of large commercially valuable treesconsequent disturbance of portions of the tree canopy duringfelling and removal with a large portion of the canopyremaining intact (Brown et al 2005) Similar results fordegraded forests affected by selective logging were obtainedby Margono et al (2012) for Sumatra Indonesia
While several projects have been performed to estimateforest cover and change within the DRC few have made theirresults along with baseline satellite imagery available forindependent assessment and cross-validation Both productsused in our analysis are available online For the IFL producta continuous external review process has been organized on adedicated web site (wwwintactforestsorg) The CAPRE mapis also freely available (httpcongoiluciorgcarpemapper)Both the CARPE and IFL maps are being used as the basisfor the National Forest Monitoring system of the DRC (wwwrdc-snsforg) We believe that the unrestricted distributionof satellite-derived products is a fast and effective way forcross-validation and quality assessment
53 Forest degradation factors and intact forestsconservation strategy
Our analysis of forest degradation factors (forest loss andfragmentation) performed independently for two 5 yeartime intervals showed that while forest cover loss nearlydoubled intact forest fragmentation remained stable andeven decreased slightly Visual image analysis and literaturereview suggested that the major driver of forest loss andfragmentation was agricultural expansion and other meansof forest clearing (eg charcoal production) fueled bypopulation growth As population continued to increaseso did subsistence agriculture area expansion Howeveragricultural expansion was mostly located around settlementsand existing infrastructure objects affecting mainly degraded
forests The observed rate of forest loss within degradedprimary forests was 12 times higher compared to intact areasThe highest forest degradation rates were observed in theeastern part of the country along the Congo River close tothe Great Lakes region and in the vicinity of mining towns inthe southern forestsavanna border Nord-Kivu province wasa noteworthy hope spot where agricultural expansion wasprobably related to internally displaced populations
Industrial logging one of the most important factorsof forest fragmentation in other central African countries(eg Gabon and the Republic of Congo) remained limitedwithin the DRC due to political and economic instabilityLimited industrial logging expansion is thought to be theprimary reason why intact forest degradation in the DRCis the less compared to other countries of the Congo basin(Zhuravleva 2011) Fragmentation by logging roads wasdetected mostly in the eastern part of the country especiallywithin areas having approved logging permits where itslowed during the second half of the decade Several factorscould be responsible for the observed degradation reductionincluding the global economic downturn of 2008 Becauseforest fragmentation in the DRC is mostly connected withagriculture expansion and not with selective logging intactforest fragmentation reduction within the DRC was smallercompared to other Central African countries where IFLdegradation decreased from 35 in 2000ndash2005 to 2 in2005ndash2010 (Zhuravleva 2011) The future of intact forestswithin the DRC timber concessions depends on the successfulimplementation of government policies
Considering current agriculture and road networkexpansion speed we predicted that intact forest degradationcould increase up to two-fold during the next decade Thisscenario is plausible taking into account the high rates ofpopulation growth However due to the intensification ofselective logging within current logging permits the rate ofintact forest degradation could increase even higher Protectedareas establishment could be one way to preserve intactprimary forests Our analysis shows that both intact primaryforest degradation and forest loss within protected areas weresignificantly lower than the national average National parkswere the most effective in protecting primary forests fromdegradation The rate of intact primary forest degradationwithin a 5 km buffer around protected areas was significantlyhigher than inside the protected areas illustrating the ongoingthreats from neighboring developed areas
The derived primary forest cover map change detectionresults and forest degradation prediction model results couldbe used as a baseline for forest conservation planningwithin the country New road construction opening accessto heretofore intact forest areas should be considered thegreatest threat to intact forest areas While intact primaryforest protection should be considered as a goal it is expectedthat there will be a further degradation of the remainingprimary forest In this case a zoning strategy could beimplemented to minimize infrastructure impact on core intactforest areas while leaving peripheral parts for sustainable use(Thies et al 2011 Sidle et al 2012) Zoning strategies havebeen successfully implemented in some of the central African
11
Environ Res Lett 8 (2013) 024034 I Zhuravleva et al
countries eg in Cameroon (WRI 2007) The lsquopermanentforest zonersquo in Cameroon prohibits forest conversion toagriculture or plantations This zone is further separatedinto strictly protected areas and logging concessions wherelimited timber extraction is permitted In the DRC zoninghave been successfully implemented on a sub-national levelspecifically within Congo Basin Forest Partnership (CBFP)landscapes (Sidle et al 2012) National-scale forest zoningin DRC is supported by a National Steering Committee forForest Zoning since 2009 Another important tool wouldbe limiting access and supporting vegetation restorationon abandoned logging roads to prevent expansion ofhunting range and agricultural clearing Land-use zoningand management planning is especially important withindegraded primary forest to prevent further land degradationand permanent deforestation
References
Achard F Eva H D Stibig H J Mayaux P Gallego J Richards Tand Malingreau J P 2002 Determination of deforestation ratesof the worldrsquos humid tropical forests Science 297 999ndash1002
Amsallem I 2002 Status and Trends in Forest Management inCentral Africa (Forest Management Working Paper vol 3)(Rome FAO Forest Resources Development Service ForestResources Division)
Asner G P Keller M Pereira R and Zweede J C 2002 Remotesensing of selective logging in Amazonia assessing limitationsbased on detailed field observations Landsat ETM+ andtextural analysis Remote Sens Environ 80 483ndash96
Baccini A Laporte N Goetz S J Sun M and Dong H 2008 A firstmap of tropical Africarsquos above-ground biomass derived fromsatellite imagery Environ Res Lett 3 045011
Barnes R F W 2002 The bushmeat boom and bust in West andCentral Africa Oryx 36 236ndash42
Barnes R F W Bloom A and Alers M P T 1995 A review of thestatus of forest elephants it Loxodonta africana in CentralAfrica Biol Conserv 71 125ndash32
Beerling D J and Osborne C P 2006 The origin of the savannabiome Glob Change Biol 12 2023ndash31
Bond W J Woodward F I and Midgley G F 2005 The globaldistribution of ecosystems in a world without fire New Phytol165 525ndash38
Broich M Stehman S V Hansen M C Potapov P andShimabukuro Y E 2009 A comparison of sampling designs forestimating deforestation from Landsat imagery a case study ofthe Brazilian Legal Amazon Remote Sens Environ113 2448ndash54
Brown S Pearson T Moore N Parveen A Ambagis S and Shoch D2005 Impact of Selective Logging on the Carbon Stocks ofTropical Forests Republic of Congo as a Case Study(Arlington Winrock International)
Bryant D Nielsen D and Tangley L 1997 The Last Frontier ForestsEcosystems and Economies on the Edge (Washington DCWorld Resources Institute)
Camara G Valeriano D M and Soares J V 2006 Metodologia para oCalculo da Taxa Anual de Desmatamento na Amazonia Legal(Sao Jose dos Campos INPE)
Carrere R 2010 Oil Palm in Africa Past Present and FutureScenarios (World Rainforest Movement Series on TreePlantations vol 15) (Montevideo World Rainforest Movement)
CBFP (Congo Basin Forest Partnership) 2009 The Forests of theCongo BasinmdashState of the Forest 2008 ed C de WasseigeD Devers P de Marcken A R Ebarsquoa R Nasi and
Ph Mayaux (Luxembourg Publications Office of the EuropeanUnion)
Clark C J Poulsen J R Malonga R and Elkan P W Jr 2009 Loggingconcessions can extend the conservation estate for CentralAfrican tropical forests Conserv Biol 23 1281ndash93
Dobson J E Bright E A Coleman P R Durfee R C and Worley B A2000 LandScan a global population database for estimatingpopulations at risk Photogramm Eng Remote Sens 66 849ndash57
Draulans D and van Krunkelsven E 2002 The impact of war onforest areas in the Democratic Republic of Congo Oryx36 35ndash40
Duveiller G Defourny P Desclee B and Mayaux P 2008Deforestation in Central Africa estimates at regional nationaland landscape levels by advanced processing ofsystematically-distributed Landsat extracts Remote SensEnviron 112 1969ndash81
Endamana D Boedhihartono A K Bokoto B Defo L Eyebe ANdikumagenge C Nzooh Z Ruiz-Perez M and Sayer J A 2010A framework for assessing conservation and development in aCongo Basin Forest Landscape Trop Conserv Sci 3 262ndash81
Ernst C Verheggen A Mayaux P Hansen M and Defourny P 2012Central African forest cover and cover change mapping TheForests of the Congo BasinmdashState of the Forest 2010ed C de Wasseige P de Marcken N Bayol F Hiol Ph MayauxB Desclee R Nasi A Billand P Defournyand A R Ebarsquoa (Luxembourg Publications Office of theEuropean Union) pp 23ndash42
FAO (Food and Agricultural Organization) 2010 Global ForestResources Assessment 2010 (Rome UNFAO)
Gibbs H Brown S Niles J and Foley J 2007 Monitoring andestimating tropical forest carbon stocks making REDD areality Environ Res Lett 2 045023
Goetz S J Sun M Baccini A and Beck P S A 2010 Synergistic useof space-borne LiDAR and optical imagery for assessing forestdisturbance an Alaska case study J Geophys ResmdashBiogeosci115 G00E07
Greenpeace 2012 lsquoArtisanal Loggingrsquo = Industrial Logging inDisguise (Kinshasa Greenpeace Africa)
Gutman G Byrnes R Masek J Covington S Justice C Franks Sand Headley R 2008 Towards monitoring land-cover andland-use changes at a global scale the global land survey 2005Photogramm Eng Remote Sens 74 6ndash10
Hance W A and van Dongen I S 1958 Matadi focus of BelgianAfrican transport Ann Assoc Am Geogr 48 41ndash72
Hansen M C Roy D P Lindquist E Adusei B Justice C O andAltstatt A 2008a A method for integrating MODIS andLandsat data for systematic monitoring of forest cover andchange and preliminary results for Central Africa Remote SensEnviron 112 2495ndash513
Hansen M C et al 2008b Humid tropical forest clearing from 2000to 2005 quantified by using multitemporal and multiresolutionremotely sensed data Proc Natl Acad Sci USA 105 9439ndash44
ITTO (International Tropical Timber Organization) 2002 ITTOGuidelines for the Restoration Management andRehabilitation of Degraded and Secondary Tropical Forests(ITTO Policy Development Series vol 13) (YokohamaInternational Tropical Timber Organization)
Justice C O Horning N and Laporte N 1993 Central Africa GlobalClimate Change and DevelopmentmdashSynopsis Remote Sensingand GIS Contributions to a Climate Change Program inCentral Africa (Washington DC Biodiversity SupportProgram)
Kareiva P Watts S McDonald R and Boucher T 2007 Domesticatednature shaping landscapes and ecosystems for human welfareScience 316 1866ndash9
Mararo B 1997 Land power and ethnic conflict in Masisi(Congo-Kinshasa) 1940s-1994 Int J Afr Hist Stud30 503ndash38
12
Environ Res Lett 8 (2013) 024034 I Zhuravleva et al
Margono B A Turubanova S Zhuravleva I Potapov PTyukavina A Baccini A Goetz S and Hansen M C 2012Mapping and monitoring deforestation and forest degradationin Sumatra (Indonesia) using Landsat time series data setsfrom 1990 to 2010 Environ Res Lett 7 034010
McCloskey J M and Spalding H 1989 A reconnaissance levelinventory of the amount of wilderness remaining in the worldAmbio 18 221ndash7
Mollicone D et al 2007 An incentive mechanism for reducingemissions from conversion of intact and non-intact forestsClim Change 83 477ndash93
Laporte N T Stabach J A Grosch R Lin T S and Goetz S J 2007Expansion of industrial logging in Central Africa Science316 1451
Laurance W F Croes B M Tchignoumba L Lahm S A Alonso ALee M E Campbell P and Ondzeano C 2006 Impacts of roadsand hunting on Central African Rainforest Mammals ConservBiol 20 1251ndash61
Oliver R 1966 The problem of the Bantu expansion J Afr Hist7 361ndash76
Olson D M et al 2001 Terrestrial ecoregions of the world a newmap of life on earth Bioscience 51 933ndash8
Potapov P V Laestadius L Yaroshenko A and Turubanova S 2009Case Studies on Measuring and Assessing Forest DegradationGlobal Mapping and Monitoring the Extent of ForestAlteration the Intact Forest Ladscape method (FAO WorkingPaper vol 166) (Rome FAO Forest Resources AssessmentProgramme)
Potapov P V Turubanova S A Hansen M C Adusei B Broich MAltstatt A Mane L and Justice C O 2012 Quantifying forestcover loss in Democratic Republic of the Congo 2000ndash2010with Landsat ETM+ data Remote Sens Environ 122 106ndash16
Potapov P V et al 2008 Mapping the worldrsquos intact forestlandscapes by remote sensing Ecol Soc 13 51
Redford K H 1992 The empty forest Bioscience 42 412ndash22Sanderson E W Malanding J Levi M A Redford K H
Wannebo A V and Woolmer G 2002 The human footprint andthe last of the wild Bioscience 52 891ndash904
Sasaki N and Putz F E 2009 Critical need for new definitions offorest and lsquoforest degradationrsquo in global climate changeagreements Conserv Lett 2 226ndash32
Schoene D Killmann W von Lupke H and LoycheWilkie M 2007Definitional Issues Related to Reducing Emissions fromDeforestation in Developing Countries (FAO Forests andClimate Change Working Paper vol 5) (Rome UNFAO)
Sidle J G Dupain J Beck J Nackoney J de Wasseige CBiang J D M Leprohon R and Malele S 2012 Forest zoningexperience in Central Africa The Forests of the CongoBasinmdashState of the Forest 2010 ed C de WasseigeP de Marcken N Bayol F Hiol Ph Mayaux B DescleeR Nasi A Billand P Defourny and A R Ebarsquoa (LuxembourgPublications Office of the European Union) pp 207ndash31
Strassburg B B N et al 2009 Global congruence of carbon storageand biodiversity in terrestrial ecosystems Conserv Lett3 98ndash105
Tabarelli M Cardoso Da Silva J and Gascon C 2004 Forestfragmentation synergisms and the impoverishment ofneotropical forests Biodivers Conserv 13 1419ndash25
Thies C Rosoman G Cotter J and Meaden S 2011 Intact ForestLandscapes Why It is Critical to Protect Them FromIndustrial Exploration (Amsterdam Greenpeace)
Tucker C J and Townshend J R G 2000 Strategies for monitoringtropical deforestation using satellite data Int J Remote Sens21 1461ndash71
Wilkie D S 1994 Remote sensing imagery for resource inventoriesin Central Africa the importance of detailed field dalta HumEcol 22 379ndash403
WRI (World Resources Institute) 2007 Interactive Forestry Atlas ofCameroonmdashVersion 20 (Washington DC World ResourcesInstitute)
WRI (World Resources Institute) 2010 Atlas Forestier Interactif dela Republique Democratique du CongomdashVersion 10(Washington DC World Resources Institute)
WWF (World Wildlife Fund) 2006 A Vision for BiodiversityConservation in Central Africa Biological Priorities forConservation in the GuineanmdashCongolian Forest andFreshwater Region (Washington DC WWF-USCentralAfrican Regional Program Office)
Zhuravleva I V 2011 Intact forest landscapes in the tropics mappingand monitoring in 2000ndash2010 Abstracts of Fifth Int ConfEarth from the Space The Most Effective Solutions (MoscowScanex)
13

Environ Res Lett 8 (2013) 024034 I Zhuravleva et al
countries eg in Cameroon (WRI 2007) The lsquopermanentforest zonersquo in Cameroon prohibits forest conversion toagriculture or plantations This zone is further separatedinto strictly protected areas and logging concessions wherelimited timber extraction is permitted In the DRC zoninghave been successfully implemented on a sub-national levelspecifically within Congo Basin Forest Partnership (CBFP)landscapes (Sidle et al 2012) National-scale forest zoningin DRC is supported by a National Steering Committee forForest Zoning since 2009 Another important tool wouldbe limiting access and supporting vegetation restorationon abandoned logging roads to prevent expansion ofhunting range and agricultural clearing Land-use zoningand management planning is especially important withindegraded primary forest to prevent further land degradationand permanent deforestation
References
Achard F Eva H D Stibig H J Mayaux P Gallego J Richards Tand Malingreau J P 2002 Determination of deforestation ratesof the worldrsquos humid tropical forests Science 297 999ndash1002
Amsallem I 2002 Status and Trends in Forest Management inCentral Africa (Forest Management Working Paper vol 3)(Rome FAO Forest Resources Development Service ForestResources Division)
Asner G P Keller M Pereira R and Zweede J C 2002 Remotesensing of selective logging in Amazonia assessing limitationsbased on detailed field observations Landsat ETM+ andtextural analysis Remote Sens Environ 80 483ndash96
Baccini A Laporte N Goetz S J Sun M and Dong H 2008 A firstmap of tropical Africarsquos above-ground biomass derived fromsatellite imagery Environ Res Lett 3 045011
Barnes R F W 2002 The bushmeat boom and bust in West andCentral Africa Oryx 36 236ndash42
Barnes R F W Bloom A and Alers M P T 1995 A review of thestatus of forest elephants it Loxodonta africana in CentralAfrica Biol Conserv 71 125ndash32
Beerling D J and Osborne C P 2006 The origin of the savannabiome Glob Change Biol 12 2023ndash31
Bond W J Woodward F I and Midgley G F 2005 The globaldistribution of ecosystems in a world without fire New Phytol165 525ndash38
Broich M Stehman S V Hansen M C Potapov P andShimabukuro Y E 2009 A comparison of sampling designs forestimating deforestation from Landsat imagery a case study ofthe Brazilian Legal Amazon Remote Sens Environ113 2448ndash54
Brown S Pearson T Moore N Parveen A Ambagis S and Shoch D2005 Impact of Selective Logging on the Carbon Stocks ofTropical Forests Republic of Congo as a Case Study(Arlington Winrock International)
Bryant D Nielsen D and Tangley L 1997 The Last Frontier ForestsEcosystems and Economies on the Edge (Washington DCWorld Resources Institute)
Camara G Valeriano D M and Soares J V 2006 Metodologia para oCalculo da Taxa Anual de Desmatamento na Amazonia Legal(Sao Jose dos Campos INPE)
Carrere R 2010 Oil Palm in Africa Past Present and FutureScenarios (World Rainforest Movement Series on TreePlantations vol 15) (Montevideo World Rainforest Movement)
CBFP (Congo Basin Forest Partnership) 2009 The Forests of theCongo BasinmdashState of the Forest 2008 ed C de WasseigeD Devers P de Marcken A R Ebarsquoa R Nasi and
Ph Mayaux (Luxembourg Publications Office of the EuropeanUnion)
Clark C J Poulsen J R Malonga R and Elkan P W Jr 2009 Loggingconcessions can extend the conservation estate for CentralAfrican tropical forests Conserv Biol 23 1281ndash93
Dobson J E Bright E A Coleman P R Durfee R C and Worley B A2000 LandScan a global population database for estimatingpopulations at risk Photogramm Eng Remote Sens 66 849ndash57
Draulans D and van Krunkelsven E 2002 The impact of war onforest areas in the Democratic Republic of Congo Oryx36 35ndash40
Duveiller G Defourny P Desclee B and Mayaux P 2008Deforestation in Central Africa estimates at regional nationaland landscape levels by advanced processing ofsystematically-distributed Landsat extracts Remote SensEnviron 112 1969ndash81
Endamana D Boedhihartono A K Bokoto B Defo L Eyebe ANdikumagenge C Nzooh Z Ruiz-Perez M and Sayer J A 2010A framework for assessing conservation and development in aCongo Basin Forest Landscape Trop Conserv Sci 3 262ndash81
Ernst C Verheggen A Mayaux P Hansen M and Defourny P 2012Central African forest cover and cover change mapping TheForests of the Congo BasinmdashState of the Forest 2010ed C de Wasseige P de Marcken N Bayol F Hiol Ph MayauxB Desclee R Nasi A Billand P Defournyand A R Ebarsquoa (Luxembourg Publications Office of theEuropean Union) pp 23ndash42
FAO (Food and Agricultural Organization) 2010 Global ForestResources Assessment 2010 (Rome UNFAO)
Gibbs H Brown S Niles J and Foley J 2007 Monitoring andestimating tropical forest carbon stocks making REDD areality Environ Res Lett 2 045023
Goetz S J Sun M Baccini A and Beck P S A 2010 Synergistic useof space-borne LiDAR and optical imagery for assessing forestdisturbance an Alaska case study J Geophys ResmdashBiogeosci115 G00E07
Greenpeace 2012 lsquoArtisanal Loggingrsquo = Industrial Logging inDisguise (Kinshasa Greenpeace Africa)
Gutman G Byrnes R Masek J Covington S Justice C Franks Sand Headley R 2008 Towards monitoring land-cover andland-use changes at a global scale the global land survey 2005Photogramm Eng Remote Sens 74 6ndash10
Hance W A and van Dongen I S 1958 Matadi focus of BelgianAfrican transport Ann Assoc Am Geogr 48 41ndash72
Hansen M C Roy D P Lindquist E Adusei B Justice C O andAltstatt A 2008a A method for integrating MODIS andLandsat data for systematic monitoring of forest cover andchange and preliminary results for Central Africa Remote SensEnviron 112 2495ndash513
Hansen M C et al 2008b Humid tropical forest clearing from 2000to 2005 quantified by using multitemporal and multiresolutionremotely sensed data Proc Natl Acad Sci USA 105 9439ndash44
ITTO (International Tropical Timber Organization) 2002 ITTOGuidelines for the Restoration Management andRehabilitation of Degraded and Secondary Tropical Forests(ITTO Policy Development Series vol 13) (YokohamaInternational Tropical Timber Organization)
Justice C O Horning N and Laporte N 1993 Central Africa GlobalClimate Change and DevelopmentmdashSynopsis Remote Sensingand GIS Contributions to a Climate Change Program inCentral Africa (Washington DC Biodiversity SupportProgram)
Kareiva P Watts S McDonald R and Boucher T 2007 Domesticatednature shaping landscapes and ecosystems for human welfareScience 316 1866ndash9
Mararo B 1997 Land power and ethnic conflict in Masisi(Congo-Kinshasa) 1940s-1994 Int J Afr Hist Stud30 503ndash38
12
Environ Res Lett 8 (2013) 024034 I Zhuravleva et al
Margono B A Turubanova S Zhuravleva I Potapov PTyukavina A Baccini A Goetz S and Hansen M C 2012Mapping and monitoring deforestation and forest degradationin Sumatra (Indonesia) using Landsat time series data setsfrom 1990 to 2010 Environ Res Lett 7 034010
McCloskey J M and Spalding H 1989 A reconnaissance levelinventory of the amount of wilderness remaining in the worldAmbio 18 221ndash7
Mollicone D et al 2007 An incentive mechanism for reducingemissions from conversion of intact and non-intact forestsClim Change 83 477ndash93
Laporte N T Stabach J A Grosch R Lin T S and Goetz S J 2007Expansion of industrial logging in Central Africa Science316 1451
Laurance W F Croes B M Tchignoumba L Lahm S A Alonso ALee M E Campbell P and Ondzeano C 2006 Impacts of roadsand hunting on Central African Rainforest Mammals ConservBiol 20 1251ndash61
Oliver R 1966 The problem of the Bantu expansion J Afr Hist7 361ndash76
Olson D M et al 2001 Terrestrial ecoregions of the world a newmap of life on earth Bioscience 51 933ndash8
Potapov P V Laestadius L Yaroshenko A and Turubanova S 2009Case Studies on Measuring and Assessing Forest DegradationGlobal Mapping and Monitoring the Extent of ForestAlteration the Intact Forest Ladscape method (FAO WorkingPaper vol 166) (Rome FAO Forest Resources AssessmentProgramme)
Potapov P V Turubanova S A Hansen M C Adusei B Broich MAltstatt A Mane L and Justice C O 2012 Quantifying forestcover loss in Democratic Republic of the Congo 2000ndash2010with Landsat ETM+ data Remote Sens Environ 122 106ndash16
Potapov P V et al 2008 Mapping the worldrsquos intact forestlandscapes by remote sensing Ecol Soc 13 51
Redford K H 1992 The empty forest Bioscience 42 412ndash22Sanderson E W Malanding J Levi M A Redford K H
Wannebo A V and Woolmer G 2002 The human footprint andthe last of the wild Bioscience 52 891ndash904
Sasaki N and Putz F E 2009 Critical need for new definitions offorest and lsquoforest degradationrsquo in global climate changeagreements Conserv Lett 2 226ndash32
Schoene D Killmann W von Lupke H and LoycheWilkie M 2007Definitional Issues Related to Reducing Emissions fromDeforestation in Developing Countries (FAO Forests andClimate Change Working Paper vol 5) (Rome UNFAO)
Sidle J G Dupain J Beck J Nackoney J de Wasseige CBiang J D M Leprohon R and Malele S 2012 Forest zoningexperience in Central Africa The Forests of the CongoBasinmdashState of the Forest 2010 ed C de WasseigeP de Marcken N Bayol F Hiol Ph Mayaux B DescleeR Nasi A Billand P Defourny and A R Ebarsquoa (LuxembourgPublications Office of the European Union) pp 207ndash31
Strassburg B B N et al 2009 Global congruence of carbon storageand biodiversity in terrestrial ecosystems Conserv Lett3 98ndash105
Tabarelli M Cardoso Da Silva J and Gascon C 2004 Forestfragmentation synergisms and the impoverishment ofneotropical forests Biodivers Conserv 13 1419ndash25
Thies C Rosoman G Cotter J and Meaden S 2011 Intact ForestLandscapes Why It is Critical to Protect Them FromIndustrial Exploration (Amsterdam Greenpeace)
Tucker C J and Townshend J R G 2000 Strategies for monitoringtropical deforestation using satellite data Int J Remote Sens21 1461ndash71
Wilkie D S 1994 Remote sensing imagery for resource inventoriesin Central Africa the importance of detailed field dalta HumEcol 22 379ndash403
WRI (World Resources Institute) 2007 Interactive Forestry Atlas ofCameroonmdashVersion 20 (Washington DC World ResourcesInstitute)
WRI (World Resources Institute) 2010 Atlas Forestier Interactif dela Republique Democratique du CongomdashVersion 10(Washington DC World Resources Institute)
WWF (World Wildlife Fund) 2006 A Vision for BiodiversityConservation in Central Africa Biological Priorities forConservation in the GuineanmdashCongolian Forest andFreshwater Region (Washington DC WWF-USCentralAfrican Regional Program Office)
Zhuravleva I V 2011 Intact forest landscapes in the tropics mappingand monitoring in 2000ndash2010 Abstracts of Fifth Int ConfEarth from the Space The Most Effective Solutions (MoscowScanex)
13