
Salvation Army Leadership Study - Saint Mary's University
151
Motivation for transformational leadership 1 RUNNING HEAD: MOTIVATION FOR TRANSFORMATIONAL LEADERSHIP Motivation for Transformational Leadership in Two Organizations By Stephanie L. Gilbert A Dissertation Submitted to Saint Mary’s University, Halifax, Nova Scotia in Partial Fulfillment of the Requirements of Doctor of Philosophy in Industrial and Organizational Psychology June, 2015, Halifax, Nova Scotia Copyright Stephanie L. Gilbert, 2015 Approved: Dr. E. Kevin Kelloway PhD Advisor Approved: Dr. Victor Catano Committee Member Approved: Dr. Catherine Loughlin Committee Member Approved: Dr. Sonya Stevens Committee Member Approved: Dr. Jacques Forest External Examiner Date: June 12 th , 2015
-
Upload
khangminh22 -
Category
Documents
-
view
2 -
download
0
Transcript of Salvation Army Leadership Study - Saint Mary's University

Motivation for transformational leadership 1
RUNNING HEAD: MOTIVATION FOR TRANSFORMATIONAL LEADERSHIP
Motivation for Transformational Leadership in Two Organizations
By
Stephanie L. Gilbert
A Dissertation Submitted to
Saint Mary’s University, Halifax, Nova Scotia
in Partial Fulfillment of the Requirements of
Doctor of Philosophy in Industrial and Organizational Psychology
June, 2015, Halifax, Nova Scotia
Copyright Stephanie L. Gilbert, 2015
Approved: Dr. E. Kevin Kelloway
PhD Advisor
Approved: Dr. Victor Catano
Committee Member
Approved: Dr. Catherine Loughlin
Committee Member
Approved: Dr. Sonya Stevens
Committee Member
Approved: Dr. Jacques Forest
External Examiner
Date: June 12th
, 2015

Motivation for transformational leadership 2
Table of Contents
LIST OF TABLES....................................................................................................................... 4
LIST OF FIGURES ..................................................................................................................... 5
ABSTRACT .............................................................................................................................. 6
MOTIVATION FOR TRANSFORMATIONAL LEADERSHIP IN TWO ORGANIZATIONS ..................... 7
STUDY ONE .......................................................................................................................... 23 ORGANIZATIONAL CONTEXT: LEADERSHIP IN THE SALVATION ARMY ....................................................... 24 EXPECTED FACTOR STRUCTURE OF THE MTFL SCALE ............................................................................ 26 METHOD ...................................................................................................................................... 33
Participants ........................................................................................................................... 33 Measures ............................................................................................................................... 35 Design and Procedure ........................................................................................................... 38
ANALYSIS ...................................................................................................................................... 39 RESULTS ....................................................................................................................................... 40
Descriptive Results ................................................................................................................ 42 Factor Structure .................................................................................................................... 44 Hypothesis Testing ................................................................................................................ 46 Test-Retest Reliability ........................................................................................................... 48 Discriminant Validity ............................................................................................................ 48
DISCUSSION .................................................................................................................................. 51 Model Testing ........................................................................................................................ 51 Hypothesis Testing ................................................................................................................ 53 Study Implications ................................................................................................................. 58 Limitations ............................................................................................................................. 61
CONCLUSION ................................................................................................................................. 63
STUDY TWO ......................................................................................................................... 63 Research on Change in Motivation ....................................................................................... 65
METHOD ...................................................................................................................................... 68 Participants ........................................................................................................................... 68 Design and Procedure ........................................................................................................... 69
ANALYSIS ...................................................................................................................................... 69 RESULTS ....................................................................................................................................... 71 DISCUSSION .................................................................................................................................. 80
Implications ........................................................................................................................... 84 Limitations ............................................................................................................................. 85 Future research ..................................................................................................................... 87
CONCLUSION ................................................................................................................................. 89
STUDY THREE ....................................................................................................................... 90 HYPOTHESES ................................................................................................................................. 94 METHOD ...................................................................................................................................... 94 ORGANIZATIONAL CONTEXT ............................................................................................................. 94
Participants ........................................................................................................................... 95 Design and Procedure ........................................................................................................... 97 Measures ............................................................................................................................... 98

Motivation for transformational leadership 3 ANALYSIS .................................................................................................................................... 100 RESULTS ..................................................................................................................................... 104 DISCUSSION ................................................................................................................................ 110
Predicting Active-Constructive Leadership ........................................................................ 110 Predicting Passive-Avoidant Leadership ............................................................................ 111 Study Implications ............................................................................................................... 114 Limitations ........................................................................................................................... 117 Future Research .................................................................................................................. 118
GENERAL DISCUSSION ........................................................................................................ 120 SUMMARY OF STUDIES ONE, TWO, AND THREE ................................................................................. 120 IMPLICATIONS .............................................................................................................................. 122 LIMITATIONS AND FUTURE RESEARCH DIRECTIONS ............................................................................. 123 CONCLUSION ............................................................................................................................... 124
APPENDIX A ....................................................................................................................... 144
APPENDIX B ....................................................................................................................... 146
APPENDIX C ....................................................................................................................... 148
APPENDIX D ....................................................................................................................... 149
APPENDIX E ....................................................................................................................... 150

Motivation for transformational leadership 4
List of Tables
Table 1. Observed Frequencies: Demographic Characteristics 34
Table 2. Intercorrelations With Means, Standard Deviations, And Internal Consistency
Values For Scales And Subscales (N = 242). 41
Table 4. Results Of Competing Models In Cfa. 45
Table 5. CFA Standardized Factor Loadings 45
Table 6. Results Of Hierarchical Regression Analysis Predicting Job Satisfaction,
Turnover Intentions And Transformational Leadership. 52
Table 8. Linear Growth Model Results. 79
Table 9. Descriptive Statistics And Intercorrelations For Level-One Study Variables. 104
Table 10. Descriptive Statistics And Intercorrelations For Level-Two Study Variables.105
Table 11. Results Of Mixed-Level Analysis. 109

Motivation for transformational leadership 5
List of Figures
Figure 1. The Self-Determination Continuum. 10
Figure 2. Hypothesized Relationships Between Levels Of Internalization And Leadership
Behaviour In Motivation For Transformational Leadership Theory. 21
Figure 3. Change In Mean Motivation For Transformational Leadership Scores Over
Three Time Points. 78

Motivation for transformational leadership 6
Abstract
Motivation for Transformational Leadership in Two Organizations
By Stephanie L. Gilbert
Abstract: A critical assumption of the leadership development literature is that leaders
want to engage in effective leadership behaviors (Gilbert & Kelloway, 2014). Drawing
on self-determination theory, I address the question of what motivates leaders to engage
in effective leadership behaviors as defined by transformational leadership theory. Three
studies addressed the research question. First, I conducted a cross-sectional validation
study using a sample of 279 Salvation Army leaders in order to refine and validate the
motivation for transformational leadership scale (Gilbert, Horsman, & Kelloway, 2014)
and to examine its internal consistency, test-retest reliability, and leadership outcomes.
Study Two examined the stability of the construct over a nine month time period using a
sample of 58 Salvation Army leaders. Study Three examined the effects of motivation for
transformational leadership on subordinate transformational leadership ratings using a
sample of 37 leaders matched with 179 followers in the Salvation Army and Cumberland
Health Authority. This research provides future researchers with a reliable and valid tool
to measure motivation for transformational leadership and provides preliminary evidence
of the nature of this new construct.
June 12, 2015.

Motivation for transformational leadership 7
Motivation for Transformational Leadership in Two Organizations
Organizational leadership has attracted the attention of an increasing number of
organizational researchers, resulting in an ever-growing list of leadership theories (for a
review see Barling, Hoption & Christie, 2011). There is an extensive body of literature
attesting to the effects of leadership on the attitudes and behaviors of followers such as
job satisfaction, organizational commitment, and task performance (for a review see
Barling et al., 2011). There is also a large literature attesting to the effectiveness of
leadership development initiatives in organizations (e.g., Avolio, Reichard, Hannah,
Walumba & Chan, 2009; Collins & Holton, 2004).
One key assumption of the leadership literature is that leaders want to engage in
effective leadership behaviors. However, leaders may vary in their motivation to be
effective in a leadership role, leading to different levels of performance. The available
data support the notion that there are individual differences that predict both leader
emergence and leader effectiveness (Atwater, Dionne, Avolio, Camobreco & Lau, 1999).
One such difference may be the motivation of the leader to engage in effective leadership
behaviors. The self-determination theory literature links autonomous forms of motivation
to higher job performance (e.g., Gagné & Deci, 2005; Van den Broeck, Vansteenkiste, &
DeWitte, 2008), suggesting that leaders who are autonomously motivated may also be
more effective.
To study what motivates leaders to be good leaders, Gilbert and Kelloway (2014)
proposed a new research area, referred to as motivation for transformational leadership,
which integrates transformational leadership theory (Bass, 1985; 1990) and self-

Motivation for transformational leadership 8
determination theory (Deci & Ryan, 1985; Ryan & Deci, 2000). The current research
offers empirical support to these suggestions. First, I provide evidence for the
psychometric properties of a measure of motivation for transformational leadership
originally proposed by Gilbert, Horsman, & Kelloway (2014). Second, I examine the
stability of motivation in a three wave longitudinal study. Finally, I used matched data to
examine the associations between leaders’ motivation for, and followers’ perceptions of,
transformational leadership. To introduce this research, I will first review the tenets of
both transformational leadership theory and self-determination theory, and how they are
integrated into motivation for transformational leadership.
Self-Determination Theory. Self-determination theory (SDT; Deci & Ryan,
1985; Ryan & Deci, 2000) distinguishes between three basic types of motivation
(intrinsic, extrinsic, and amotivation) that each influence behavior differently. Whereas
there is only one form of intrinsic motivation, extrinsic motivation refers to engaging in
behavior for instrumental reasons, and SDT specifies different levels of this type of
motivation based on level of internalization (Gagné et al., 2014). Amotivation does not
involve any intentional activity or motivation whatsoever, and thus does not lie on the
autonomy to control continuum. All other types of motivation range along a continuum of
intentional activity from controlled to autonomous motivation (Deci & Ryan, 2000).
Autonomy involves having the experience of choice in one’s work, whereas control
involves feeling a sense of pressure in what actions one must engage in (Gagné & Deci,
2005).
While intrinsic motivation is inherently autonomous, levels of extrinsic motivation
lie on a continuum from controlled to autonomous. Controlled motivation involves

Motivation for transformational leadership 9
feeling a sense of pressure to engage in specific activities and is represented by external
and introjected regulation. External regulation is the most controlled form of extrinsic
motivation and it is necessary when a task is not at all autonomous to the individual, so
external contingencies like rewards and punishments are necessary for motivation (Gagné
& Deci, 2005). Here, an individual may put effort into being a good leader in order to
glean greater job security, a promotion, or to avoid losing their job. Introjected regulation
is a moderately controlled form of motivation whereby the individual’s ego is involved in
deciding whether or not to engage in a task (Gagné & Deci, 2005). If an individual feels
that their self-esteem is linked to their job performance, this represents introjected
regulation. Leaders motivated by introjected regulation may behave as a good leader
because they will feel guilty if they do not, or because they feel it is their duty to be a
good leader (Gagné et al., 2014).
Autonomous motivation consists of integrated and identified forms of extrinsic
regulation as well as intrinsic motivation. Identified regulation is extrinsic motivation that
is described as slightly autonomous, whereby the individual’s behavior corresponds with
their personal goals and values, reflecting a part of them (Gagné & Deci, 2005). Leaders
motivated by identified regulation are likely to see the value of behaving as a good leader,
and thus to behave as such, even though they do not find leadership inherently interesting.
Integrated regulation is a type of extrinsic motivation that is slightly more autonomous
because the individual identifies with the importance of the work and sees it as an integral
part of him or herself (Gagné & Deci, 2005). A leader motivated by integrated regulation
is likely to feel that being a good leader is a part of who they are, that it fits with their life
goals, and is a means through which to reach self-actualization.

Motivation for transformational leadership 10
Intrinsic motivation lies on the most autonomous end of the continuum because
the individual chooses to engage in behaviour under his or her own volition (Gagné &
Deci, 2005). Intrinsic motivation occurs when the behaviour itself is seen as enjoyable
and satisfying and where the behaviour is its own reward (Gagné & Deci, 2005). For
example, a leader who is intrinsically motivated to behave as a good leader may choose to
do so because he or she finds it enjoyable, exciting, or interesting.
Self-determination theory also recognizes the possibility of amotivation – the state
that exists when an individual experiences a lack of control and alienation (Gagné &
Deci, 2005). Amotivated leadership behaviours of any sort are minimal, mechanical, and
not typically sustained over a long period of time because the leader feels that good
leadership is not a priority. See Figure 1 for an outline of self-determination theory.
Figure 1. The self-determination continuum.
Full-Range Transformational Leadership Theory. A key purpose of this study is to
establish motivation for effective leadership, which entails defining what I mean by good
leadership. Significant research evidence supports the tenets of Bass’s (1990)
transformational leadership theory, and particularly supports the positive outcomes of this
Autonomous Controlled
Integrated
Regulation
Intrinsic
Motivation
Identified
Regulation
Introjected
Regulation
External
Regulation Amotivation

Motivation for transformational leadership 11
leadership style at both individual- and organizational- levels (see Barling et al., 2011 for
a review). Given the support for this theory, I will define effective leadership in this study
as that which is transformational, and less effective leadership as transactional.
Transformational leadership has been defined as superior leadership performance
that occurs when leaders “broaden and elevate the interests of their employees, when they
generate awareness and acceptance of the purposes and mission of the group, and when
they stir their employees to look beyond their own self-interest for the good of the group”
(Bass, 1985, p. 21). Bass (1985) suggested that the transformational leadership style
comprises four dimensions, namely idealized influence, inspirational motivation,
intellectual stimulation and individualized consideration. Idealized influence occurs when
leaders engender the trust and respect of their followers by doing the right thing, thereby
serving as a role model (Bass, 1985). This dimension is often characterized by
empowering followers, making sacrifices for the good of the group, and involving
followers in decision-making (Barling et al., 2011). Leaders who engage in inspirational
motivation “raise the bar” for their employees, encouraging them to achieve levels of
performance beyond their own expectations (Bass, 1985). Here, leaders inspire
employees to achieve a certain vision for themselves, which often makes work more
meaningful. Intellectual stimulation involves engaging the rationality of subordinates,
getting them to challenge their assumptions and to think about old problems in new ways
(Bass, 1985). Intellectually stimulating leaders may also empower their followers to
become involved in decision-making and encourage them to voice their opinions (Barling
et al., 2011). Lastly, individualized consideration deals with treating employees as

Motivation for transformational leadership 12
individuals and helping them to meet their needs (Bass, 1985). Spending time coaching
and mentoring employees are both examples of individual consideration.
A large body of research literature supports the effectiveness of transformational
leadership behaviours in the workplace. Transformational leadership is related to
subordinate attitudes and behaviours such as satisfaction (Hater & Bass, 1988; Koh,
Steers & Terborg, 1995), organizational commitment (Barling, Weber, & Kelloway,
1996; Bycio, Hacket, & Allen, 1995; Koh et al., 1995), trust in management (Barling et
al., 1996), organizational citizenship behaviors (Koh et al., 1995), psychological well-
being (McKee et al., 2009), and workplace safety, (Mullen & Kelloway, 2009).
Transformational leadership may also have an impact on organizational level outcomes,
as it is related to higher task performance (e.g., Howell & Frost, 1989; Kirkpatrick &
Locke, 1996; Sosik, Avolio & Kahai, 1997), unit financial performance (Howell &
Avolio, 1993) and group performance and financial performance (Barling et al., 1996).
Given the positive impact of transformational leadership, there is strong support for
promoting this leadership style in organizations.
Bass (1985) also defined more transactional styles of leadership, which are based
on individual exchanges between the leader and each follower. These styles of leadership
range from a lack of response (laissez-faire leadership), to responding to only negative
behaviours (as in active and passive management-by-exception), to providing contingent
rewards and punishments (as in contingent reward leadership). A laissez-faire leader is
simply not involved in the tasks of leadership and avoids decision-making and other
responsibilities associated with their position (Bass, 1985; Hater & Bass, 1988). This
style of leadership is related to lower leader effectiveness, (Hinkin & Schriesheim, 2008a;

Motivation for transformational leadership 13
Offerman & Hellman, 1996), lower employee performance and cohesion (Bass, Avolio,
Jung, & Berson, 2003), increased employee stress and decreased employee well-being
(Kelloway et al., 2006; Skogstad, Einarsen, Torsheim, Aasland, & Hetland, 2007).
Leaders engaging in management-by-exception intervene with corrective action.
In active management by exception (Bass, 1985), leaders actively monitor employees to
ensure that there are no deviations in performance. Evidence of the outcomes of this
leadership style shows mixed results. Active management by exception has been
negatively related to satisfaction with supervisor and overall job satisfaction (Judge &
Bono, 2000), but positively related to leader job performance, effectiveness, and follower
motivation (Judge & Piccolo, 2004). Leaders engaging in passive management by
exception do not intervene until problems are either brought to their attention or become
serious enough to demand action (Bass, 1985). This style of leadership has been related to
increased injury rates (Zohar, 2002), decreased business unit performance (Howell &
Avolio, 1993), and reduced employee organizational commitment and work motivation
(Judge & Bono, 2000).
Finally, contingent reward leadership is seen as a positive form of transactional
leadership in which leaders engage in goal setting and the provision of task-contingent
feedback to employees. Contingent reward leadership has been closely related to
transformational leadership in some studies (Avolio, Bass, & Jung, 1999; Antonakis,
2001) and can have positive results such as higher leader effectiveness and follower
motivation (Judge & Piccolo, 2004).
Motivation for transformational leadership. Much of the existing leadership
literature focuses on how leaders can motivate subordinates, and a great deal of research

Motivation for transformational leadership 14
supports the basic tenets of transformational leadership theory in achieving this outcome
(see Judge & Piccolo, 2004). However, the literature has not addressed the nature and
effects of leaders’ own motivation. Once in a formal leadership role, does the leader’s
motivation influence their likelihood of engaging in transformational or transactional
leadership behaviors? Individual reasons to accept a formal leadership role, or motivation
for role occupancy, may include increased pay, job security, seniority, or personal
interest. However, reasons to be effective once in that role may differ from these.
Importantly, motivation for role occupancy is not necessarily related to motivation for
leader effectiveness. Bass (2008) argued that the qualities required for leader emergence
are not the same as those required for leader effectiveness. The current research is based
on an integration of self-determination theory and transformational leadership theory to
examine the motivation to be an effective leader.
Chan and Drasgow (2001) addressed the question of what motivates individuals
for leadership role occupancy. The authors suggested that individuals might vary in their
motivation to assume a formal leadership role. Their construct called motivation to lead
(MTL) outlines three forms of motivation for leadership role occupancy. Affective-
identity MTL refers to individuals who enjoy leading; social-normative motivation to
MTL refers to individuals who feel a duty or responsibility to lead; and, non-calculative
motivation to MTL refers to individuals who lead because they have an agreeable
personality and prefer group harmony and not because of the ‘perks’ of being a leader
(Chan and Drasgow, 2001). These authors define motivation to lead as an “individual-
differences construct that affects a leader’s or leader-to-be’s decision to assume
leadership training, roles, and responsibilities and that affect his or her intensity of effort

Motivation for transformational leadership 15
at leading and persistence as a leader” (p. 482). Although Chan and Drasgow (2001)
identified motivation to lead as relatively stable construct, some research suggests that it
can change with experience and training, as management students exposed to
transformational leadership training exhibited significantly more social-normative and
non-calculative motivation to lead than students not exposed to the training (Waldman,
Galvin, & Walumbwa, 2012). Each type of motivation may also predict leader emergence
differently depending on the context. Hong, Catano, and Laio (2011) found that while
affective-identity and non-calculative motivation to lead were positively related to leader
emergence in leaderless discussions, social-normative motivation to lead was related to
leader emergence in long-term project teams, which may be more highly influenced by
social norms.
Using Chan and Drasgow’s (2001) model, Kark and Van Dijks (2007) proposed
that leaders who are affectively motivated to lead (i.e., they enjoy leadership) would be
more likely to be transformational because they are more likely to take risks and to be
innovative due to their drive for personal growth and enjoyment in the role. They also
proposed that leaders who are social-normative in their motivation to lead would be more
likely to be transactional because they are motivated out of a sense of duty or obligation,
and are less likely to take risks. Friman (2000) found that transactional leadership was
positively related to values like conformity and security, which may drive prevention-
focused behaviours such as the maintenance of the status quo and preventing deviations
in performance. Transformational leadership was negatively related to values of tradition
in this study. Consistent with these arguments, Hendricks and Payne (2007) found that
affective-identity MTL was positively related to both team ratings of leader effectiveness

Motivation for transformational leadership 16
and to team performance, whereas social-normative MTL was negatively related to team
leadership effectiveness ratings and unrelated to team performance, suggesting that
social-normative MTL may not be a sufficient form of motivation to facilitate leader
effectiveness.
Although Chan and Drasgow’s motivation to lead appears similar to this proposed
theory of motivation for transformational leadership, there are some important
distinguishing features. Specifically, motivation to lead examines factors that motivate
leaders to take on formal leadership roles, whereas motivation for transformational
leadership examines factors that motivate leaders to lead effectively once they are already
in a leadership role. In other words, the primary outcome of motivation to lead is
leadership role occupancy, whereas the primary outcome of interest in motivation for
transformational leadership is leader effectiveness. Specifically, motivation for
transformational leadership defines effective leadership as transformational. I argue that,
while motivation to participate in leadership may indirectly affect level of effort put forth
in leadership, this theory does not directly assess motivation to lead effectively.
Importantly, many leaders are motivated to attain a leadership role, but may not
subsequently be motivated to be effective in that role. In order to address this gap in the
literature, the proposed construct of motivation for transformational leadership (Gilbert &
Kelloway, 2014) integrates transformational leadership theory and self-determination
theory to describe how leaders’ self-determined motivation to perform well in a
leadership role predicts leadership behavior.
I expect that transformational, transactional, and laissez-faire leadership
behaviours may be related to different levels of internalization. Specifically, the SDT

Motivation for transformational leadership 17
literature overwhelmingly supports the idea that, on complex tasks, autonomous
regulation is related to higher performance and controlled regulation is related to lower
performance (Amabile, 1982; Grolnick & Ryan, 1987; McGraw & McCullers, 1979).
Accordingly, I predict that autonomous forms of regulation are related to more effective
styles of leadership (transformational and contingent reward leadership), whereas
controlled forms of regulation are related to less effective leadership styles (active and
passive management by exception and laissez-faire leadership) as defined by full-range
transformational leadership theory. First, individuals who are amotivated will be more
likely to engage in laissez-faire or passive leadership behaviours (Kelloway, Mullen &
Francis, 2006; Mullen, Kelloway, & Teed, 2011). Amotivation is characterized by no
intentional activity (Gagné & Deci, 2005), which is similar to the leadership definition of
laissez-faire leadership, whereby the leader does not engage in leadership tasks (Bass,
1985). Thus, I expect that leaders with little motivation to lead effectively will be likely to
engage in very little deliberate and purposeful leadership behavior.
Extrinsic motivation is likely related to transactional leadership behaviours
including contingent reward and both active and passive management by exception.
Transactional leadership is characterized by an exchange relationship between leader and
follower that maximizes the self-interests of both parties (Burns, 1978). By definition,
then, I think that transactional leadership is extrinsically motivated behavior. That is,
transactional leaders may lead well for instrumental reasons (e.g., in order to preserve
one’s ego or to earn a promotion. As such, these leaders may be more extrinsically
motivated.

Motivation for transformational leadership 18
In active and passive management by exception, intervention may take the form of
corrective action when employees fail to meet performance standards (active), or
addressing a problem that is unavoidable (passive; Bass, 2008). A key difference between
active and passive management by exception is the extent to which the leader monitors
the work of followers for deviations in performance. In passive management by
exception, the leader only intervenes when standards are not met, such that the leader has
no motivation to prevent problems, but only to address problems when absolutely
necessary (Bass, 1990). This type of leadership is most likely externally regulated, the
most controlled type of extrinsic motivation in which an individual acts only when that
action will obtain a desired consequence or avoid an undesired consequence (Gagné &
Deci, 2005). Leaders characterized by active management by exception engage in
ongoing monitoring in order to prevent deviations from work standards and are likely to
be more effective than leaders using passive management by exception (Bass, 1999).
These types of leaders show an interest in knowing about potential problems so that they
may prevent them, perhaps out of a sense of duty or in order to preserve their ego (Kark
& Van Dijk, 2007; McConnell, 2007). In other words, any problems that do occur may
reflect badly on the leader, and so the leader actively tries to prevent problems. This
particular type of leadership, then, may be slightly more autonomously regulated and,
thus, most highly motivated by introjected regulation, whereby conserving self-worth or
protecting the ego motivates an individual. Overall, management by exception is likely
related to the most controlled levels of extrinsic regulation.
Contingent reward leaders tend to reinforce good follower performance in order to
maintain high performance. Although contingent reward leadership may sometimes be

Motivation for transformational leadership 19
transformational (Avolio, Bass, & Jung, 1999; Antonakis, 2001), the primary motivation
for these leaders is instrumental, such that they persist in this pattern of reinforcement
primarily for the value of achieving desired outcomes. Given the close relationship
between contingent reward leadership and transformational leadership, contingent reward
is most likely related to the most internalized forms of extrinsic motivation: identified and
integrated regulation, where leader behavior is at least somewhat consistent with the
leaders’ own identity, goals, and values. That is, these leaders identify with, and value,
good leadership, but this leadership is still based primarily on exchanges or transactions
with followers that maximize the self-interests of both parties and is not intrinsic.
Finally, I hypothesize that transformational leadership behavior is intrinsically
motivated. By definition, transformational leaders are not concerned with their own self-
interest, but with the well-being, success, and development of followers (Bass, 2008) and
they often make sacrifices for the good of the group (Barling et al., 2011). These
behaviours reflect intrinsic motivation because they involve a genuine interest by the
leader and are not likely to be motivated by external rewards or punishments or by a sense
of pressure. The key distinguishing characteristic of this form of leadership is that the
leader sacrifices his or her own self-interests, and thereby demonstrates an inherent
interest in the success of their followers, reflecting intrinsic motivation (Gagné & Deci,
2005). This fully internalized motivation may be the key to developing the commitment
necessary for becoming a transformational leader. Further support of this link comes from
empirical evidence, which relates autonomous motivation with prosocial behaviours
(Gagné, 1993; Smith, Organ, & Near, 1983), which are characteristic of transformational
leadership. Importantly, autonomous motivation is related to the highest levels of

Motivation for transformational leadership 20
performance in many domains (e.g., Grolnick & Ryan, 1989), particularly when the task
and requires creativity, cognitive flexibility, and complex problem solving (Gagné &
Deci, 2005). Thus, in the domain of leadership, which is characterized by complex tasks
and problem-solving, I predict that autonomous motivation will be related to
transformational leadership, the most effective leadership style defined by full-range
transformational leadership theory (Bass, 1985). Figure 2 depicts the hypothesized
relationships between components of self-determination theory and transformational
leadership theory.
Self-Determination
Theory
Transformational Leadership
Theory
Intrinsic
Motivation
Integrated
Regulation
Identified
Regulation
Introjected
Regulation
External
Regulation
Amotivation
Transformational
Contingent
Reward
Active
Management by
Exception
Passive
Management by
Exception
Laissez-Faire
Extr
insi
c M
oti
vat
ion

Motivation for transformational leadership 21
Figure 2. Hypothesized relationships between levels of internalization and leadership behaviour in motivation for transformational leadership theory.
Gilbert et al. (2014) examined the validity of the Motivation for Transformational
Leadership Scale in a cross-sectional survey study involving 310 full-time and part-time
employees that were recruited by a market research firm and through online snowball
sampling. The hypotheses described above were tested using hierarchical multiple
regression analyses whereby the five motivation levels and amotivation were regressed
onto each type of leadership. They found that amotivation and identified regulation
significantly predicted transformational leadership. The results suggested that
transformational leaders are most likely to have low levels of amotivation and high levels
of identified regulation. Here, intrinsic motivation was not related to transformational
leadership, as was expected. However, this form of motivation was related to one type of
transformational leadership behavior: inspirational motivation. Gilbert et al. (2014)
suggested that inspirational motivation may be a more enjoyable aspect of
transformational leadership, whereas individualized consideration, intellectual
stimulation, and idealized influence may require more effort or discipline, characterized
by extrinsic motivation. In this analysis, amotivation seemed to be the strongest predictor
of transformational leadership, based on the absolute size of the standardized regression
coefficients. The second strongest predictor was identified regulation, which may suggest
that the leaders’ belief that good leadership is important for their self-selected goals is
more likely to motivate transformational leadership behaviour than even more
internalized forms of motivation. In predicting the other leadership styles, amotivation

Motivation for transformational leadership 22
was the only significant predictor of laissez-faire leadership, as was predicted. External
regulation and intrinsic motivation predicted passive management by exception and
external regulation alone predicted active management by exception. Identified and
amotivated regulations together predicted contingent reward.
The Current Research. The current research responds to a call for more
motivation research that considers the context and situation (Turner & Patrick, 2008;
Sivan, 1986; Paris & Turner, 1994; Hickey, 1997), which are “critical in eliciting or
maximizing any predisposition to achieve” (Maehr, 1974, p. 64). Three studies served to
develop and understand the construct of motivation for transformational leadership in two
different organizational contexts.
Study One validated the factor structure of the motivation for transformational
leadership scale and examined the hypothesized relationships between full-range
transformational leadership theory and motivation for transformational leadership. In
doing so, Study One replicated and extended the analysis of Gilbert et al. (2014).
Study Two examined the natural stability of motivation for transformational
leadership over time. This study responded to a call for descriptive research aimed at
understanding how phenomena such as motivation for transformational leadership unfold
over time (Kelloway & Francis, 2012). In particular, Study Two used a three wave
longitudinal study to examine the growth curves associated with motivation for
transformational leadership over a seven-month period.
Finally, Study Three examined the influence of leader motivation for
transformational leadership on subordinate transformational leadership ratings in a
multilevel study. In doing so, this Study Three examined whether leaders’ individual

Motivation for transformational leadership 23
motivation had an effect on follower perceptions of transformational leadership.
Conceptually, this is an important question because the effects of leadership are thought
to be mediated largely through employee perceptions (see for example Kelloway &
Barling, 2000). Methodologically, use of data from both employees and leaders
addresses the problem of common method variance, which poses a threat to the
identification of substantive relationships (Podsakoff., MacKenzie, Podsakoff & Lee,
2003).
Specifically, the goals of the current research were to:
1. To further refine and validate a measure of motivation for transformational
leadership.
2. To test the hypothesized relationships between motivation for
transformational leadership and transformational, transactional, and laissez-faire
leadership (as depicted in Figure 2).
3. To look at the nature of change in motivation for transformational leadership
over time.
4. To examine leader- and subordinate-level outcomes of motivation for
transformational leadership, including leader job attitudes and subordinate
leadership ratings.
Study One
The purpose of Study One was to examine the psychometric properties of the
motivation for transformational leadership scale developed by Gilbert et al. (2014). In the
initial study, the scale was validated using a sample of 137 leaders and 161 non-leaders

Motivation for transformational leadership 24
(12 unidentified) who were all full-time or part-time employees (Gilbert et al., 2014). In
contrast, my goal in the current study was to further establish the validity of the scale
using a sample of exclusively formal leaders and to examine its relationship with key
attitudinal and behavioural outcomes. These outcomes include leaders’ own job
satisfaction and turnover intentions as well as their self-rated leadership effectiveness.
Specifically, I examined its criterion validity to predict transformational
leadership, job satisfaction, and turnover intentions as well as its discriminant validity
from Chan and Drasgow’s (2001) motivation to lead scale, and its internal consistency
and test-retest reliability across two test administrations. This study involved a sample of
279 organizational leaders (both clergy and non-clergy) from within The Salvation Army.
Organizational Context: Leadership in The Salvation Army
The Salvation Army (SA) is Canada’s largest non-governmental provider of social
services, including addictions programs, family services, children’s summer camps, and
corrections and justice services. It is a Christian, not-for-profit, charitable organization
with a mission to meet the needs of marginalized members of the community. Leadership
is critical to the effectiveness of The Salvation Army, which is driven by its mission to
serve human needs and functions on minimal resources (Watson & Brown, 2001).
Leaders in this organization derive a great deal of meaning and joy from their work,
which may drive them to put money to maximum use with great resourcefulness and
innovativeness (Watson & Brown, 2001).
Salvation Army leaders consist of both officer (clergy) and layperson employees
who work in full-time paid positions. Officers have a Certificate in Salvation Army
Officership from the College for Officer Training and have been commissioned

Motivation for transformational leadership 25
(ordained) by the SA. Officers are compensated with housing, a vehicle lease or vehicle
allowance, furnishing and utilities, and a cash allowance based on years of service (The
Salvation Army, 2011). Among the five most senior officers in Canada and Bermuda
territory in 2010/2011, the average annual cash allowance was $34, 185 (The Salvation
Army, 2011).
There are two main career streams for officers: one is corps service (i.e., church
ministry) and the other is social services work. Officers may be appointed to any number
of leadership positions within these two streams, including the management of corps, or
social services work within family services, summer camps, or overseeing other officers
within a given division. Every year, any given officer may be re-appointed to a different
position, resulting in little job stability over time. This job change may be stressful for
officers, who may need to learn new skills to master their new position. Over the past
several years, the SA has experienced a large decline in officership, resulting in a greater
proportion of layperson leaders. The cause of this decline is unknown, but may be due to
the two-year commitment to attend the residential College for Officer Training, to the low
annual income, or to the lack of job stability and independence that accompany
officership (McCalister, 2012).
Within the Canada and Bermuda territory, there were 836 active SA officers, 928
retired SA Officers, and 9 123 employees as of the 2010/2011 year (The Salvation Army,
2011). Layperson employees outnumber officers tenfold and lay leaders have opportunity
to make much more income than officers, with average incomes of $131 625 for senior
technical and professional leaders (The Salvation Army, 2011). Unlike officers, layperson
leaders are not compensated with housing, a vehicle lease or vehicle allowance,
Motivation for transformational leadership 26
furnishings or utilities. Layperson leaders are not assigned to run corps, but may
otherwise have similar roles as officers. Officers may differ from layperson leaders due to
their long-term formal commitment to the organization. Officers are also likely to have
less job stability than lay leaders because of annual officer moves, which layperson
leaders are not subject to. The Salvation Army will make decisions about if and where
officers will be moved in June of every year and officers who are moved will begin their
new appointments the following August. The frequency of moves during an officers’
career will vary significantly and is based on the needs of the organization. On the other
hand, layperson leaders have more autonomy in their roles and greater freedom to leave
the organization with fewer consequences compared to officers. Both groups experience
great joy in service, meaning in their work, and high levels of commitment to the
organization (Watson & Brown, 2001). Because of the uniqueness of the organization,
these leaders may be restricted in range on level of commitment to the organization and
the results from this study may not be generalizeable to a more heterogeneous group of
workers. Both layperson and officer leaders participated all three studies below. The
psychometric properties of the motivation for transformational leadership scale were
examined within this Salvation Army context.
Expected Factor Structure of the MTFL Scale
Self-determination theory posits that there are six levels of self-determined motivation
including amotivation, four forms of extrinsic motivation ranging from controlled to
autonomous (external, introjected, identified, and integrated regulations) and intrinsic
regulation (Gagné & Deci, 2005). Some existing measures based on self-determination
theory empirically support these six levels of internalization (e.g., Motivation Towards

Motivation for transformational leadership 27
the Environment Scale, Pelletier et al., 1998; Regulation of Eating Behaviour, Pelletier,
Dion, Slovinec-D'Angelo, & Reid, 2004; Exercise Motivation Scale, Li, 1999; an
expanded model of the Behavioural Regulation in Exercise Questionnaire, Wilson,
Rodgers, Loitz, & Scime, 2006; Work Extrinsic and Intrinsic Motivation Scale,
Trembley, Blanchard, Taylor, Pelletier, & Villeneuve, 2009; and the Motivation for
Transformational Leadership Scale, Gilbert et al., 2014). Previous researchers have found
empirical support for a model represented by a controlled motivation composite,
consisting of external and introjected regulations, and an autonomous motivation
composite score, where identified and intrinsic motivation are merged together (e.g.,
Vansteenkiste, Lens, De Witte, De Witte, & Deci, 2004). However, Deci et al. (2014)
argue that examining the first-order factors of motivation may be more appropriate for
certain research questions because the subtypes have been related to different outcomes in
previous research (e.g., Pelletier, Tuson, Green-Demers, Noels, & Beaton, 1998;
Koestner, Losier, Vallerand, & Carducci, 1996). Further, Gilbert et al. (2014) found
support for the 6-factor structure of the Motivation for Transformational Leadership
Scale. Therefore, the current study hypothesizes that a 6-factor structure will emerge from
the data that represents the full model of motivation as proposed by Deci and Ryan
(1985). Following good modeling practice, I compared the hypothesized 6-factor model
against three competing models: a 1-factor (Kelloway, 2015), a 3-factor model comprised
of amotivation, controlled regulation (external, and introjected), and autonomous
regulation (integrated, identified and intrinsic), and a higher-order model with
amotivation, autonomous, and controlled regulation) as second-order factors.

Motivation for transformational leadership 28
H1: Motivation for transformational leadership will be best represented by a 6-
factor structure, which includes amotivation, external regulation, introjected
regulation, identified regulation, integrated regulation, and intrinsic motivation.
Validity
Leadership Style: A second set of hypotheses was designed to examine the
relationships between motivation for transformational leadership and full range
transformational leadership style. As proposed above (p. 16), transformational, laissez-
faire, contingent reward, and both active and passive management by exception
leadership behaviours may be motivated differently by each level of internalization.
Specifically, this leads to the following hypotheses:
H2a: Amotivation will positively predict laissez-faire leadership.
H2b: External regulation will predict passive management by exception.
H2c: Introjected regulation will predict active management by exception.
H2d: Identified and integrated regulation will predict contingent reward leadership.
H2e: Intrinsic motivation will predict transformational leadership behavior.
Job Satisfaction: As hypothesized above, transformational leaders are more likely to be
intrinsically motivated, such that they enjoy their work and find it inherently satisfying.
Thus, intrinsically motivated leaders may be more satisfied with their work. Enacting
transformational leadership can have a positive effect on subordinate job satisfaction
(Bass, 1985; Howell and Frost, 1989), but it may also positively influence leaders’ own
job satisfaction through several mechanisms.
Transformational leaders are more likely to promote healthier and more effective
work environments by influencing followers positively (e.g., Barling et al., 2011; McKee
et al., 2009) and in doing so, leaders may enhance their own job satisfaction.

Motivation for transformational leadership 29
Transformational leadership yields the highest performance outcomes compared to
transactional and laissez-faire leadership (Bass, 1985), which will be more intrinsically
and extrinsically rewarding for leaders, and as a result, contribute to job satisfaction
according to self-determination theory and expectancy theories (Deci & Ryan, 1985;
Lawler & Porter, 1967). A more productive work environment and higher performance by
followers, which may be intrinsically satisfying to leaders and may also lead to extrinsic
rewards such as promotion. The effects of rewards due to effective leadership on
satisfaction may be secondary to the effects of its intrinsic rewards. Specifically,
Intrinsically motivated individuals who are engaged in tasks that they find to be important
and interesting tend to have superior job performance as well as job satisfaction (Baard et
al., 2004; Gagné & Deci, 2005). Interestingly, controlled motivation is related to higher
performance, but only in boring and mundane tasks and it is largely unrelated to job
satisfaction (Gagné & Deci, 2005). Vansteenkiste et al. (2007) found that intrinsic work
value orientation was positively related to job satisfaction, whereas external work value
orientation was unrelated to this outcome. In a more recent study, all forms of motivation
(external, introjected, identified, and intrinsic) were positively related to job satisfaction
and that the more internalized the regulation, the greater the job satisfaction (Gagné et al.,
2010). Although the evidence is mixed, taken together, they suggest that autonomous
motivation is related to higher job satisfaction, and that more controlled regulation will be
negatively related or unrelated to this outcome.
Given the challenges and complex relationships leaders manage in their roles,
intrinsic motivation is likely to lead to better performance in these roles as well as to
better job satisfaction. Autonomously motivated leaders may have greater job satisfaction

Motivation for transformational leadership 30
because they promote an enjoyable and healthy work environment and develop more
positive relationships with followers (Barling et al., 2011). Study One examines whether
motivation for transformational leadership predicts job satisfaction, and specifically
whether it explains significant additional variance in job satisfaction over and above Chan
and Drasgow’s (2001) Motivation to Lead Scale. That outcome will help to differentiate
motivation for transformational leadership from motivation to lead.
In hierarchical regression analyses, Gilbert et al. (2014) found that motivation for
transformational leadership accounted for significant additional variance explained in job
satisfaction above and beyond motivation to lead. Of the motivation for transformational
leadership variables, introjected and identified regulation were the only two significant
predictors of job satisfaction, such that introjected regulation negatively predicted job
satisfaction and identified regulation positively predicted this attitude. These results
suggested that engaging in effective leadership because one identifies with the value of
leadership plays a key role in promoting positive attitudes towards work. However,
engaging in effective leadership out of a sense of duty or feelings of guilt can detract from
job satisfaction. Interestingly, these results suggest that intrinsic motivation is not
necessary for high job satisfaction. Based on Gagné and Deci’s (2005) and Gilbert et al.’s
(2014) findings, I predict that autonomous forms of motivation will be positively related
to job satisfaction, and controlled motivation will be unrelated or negatively related to this
attitude.
H3: Autonomous forms of motivation will be positively related to job satisfaction and controlled motivation
will be unrelated or negatively related to this attitude.

Motivation for transformational leadership 31
Turnover intentions: In addition to its influence on job satisfaction, motivation for
transformational leadership may influence turnover intentions for similar reasons.
Considering the organizational cost of leader turnover and the shortage of officer leaders
within the Salvation Army, research on how to promote leader retention in this non-profit
organization is critical to the sustainability of this particular organization. Leader turnover
is costly for organizations because of losses in investing in leader training, recruitment,
and organizational learning. New leaders need adequate time to become familiar with
organizational procedures and policies before they can be effective (Rowe, Canella,
Rankin, & Gorman, 2005). Thus, examining factors that can promote leader retention is
vital to organizational performance.
Forest et al. (2009) argued that autonomous motivation might be an important
mechanism influencing turnover and organizational financial success. Leaders’ own
regulation may impact their turnover intentions with the organization because of the
positive effects of more internalized regulation on work relationships, productivity, and
the work environment (Baard et al., 2004; Gagné & Deci, 2005). More autonomously
motivated leaders who value and identify with the role of leader will, by definition, be
more likely to enjoy their work and to find it meaningful, an important factor in
promoting retention (George & Jones, 1996). Leaders with higher controlled motivation
may be more likely to turnover in times where resources are limited in the organization or
when downsizing is occurring whereas intrinsically motivated leaders may have
intentions to stay despite these conditions. Motivation to lead may be more likely to affect
decisions to become a leader (i.e., role occupancy), whereas motivation for
transformational leadership may be more likely to affect decisions about whether to

Motivation for transformational leadership 32
remain in that role (i.e. turnover intentions). Thus, I predict that motivation for
transformational leadership should explain significant additional variance in turnover
intentions above and beyond motivation to lead.
H4: Autonomous forms of motivation will be negatively related to turnover intentions and controlled
motivation will be positively related to turnover intentions above and beyond motivation to lead.
Motivation to Lead: A final series of hypothesis were also devised in order to examine
the relationship between Chan and Drasgow’s (2001) Motivation to Lead construct and
Motivation for Transformational Leadership. As discussed above, I expected that
motivation to assume a leadership role is different than motivation to be a good leader,
and; therefore, there should be evidence of discriminate discriminant validity between the
two constructs. Further, I expected that motivation to be a good leader should add
incremental validity to the prediction of leadership style (e.g. transformational leadership)
and job attitudes (job satisfaction and turnover intentions). Therefore hypotheses three to
six dealt with distinguishing motivation to lead from motivation for transformational
leadership:
H5: Motivation for transformational leadership will show evidence of discriminate validity from
motivation to lead.
H6: Motivation for transformational leadership will add incremental validity in predicting
transformational leadership over and above motivation to lead.
H7: Motivation for transformational leadership will add incremental validity in predicting job
satisfaction over and above motivation to lead.
H8: Motivation for transformational leadership will add incremental validity in predicting turnover
intentionsturnover intentions over and above motivation to lead.

Motivation for transformational leadership 33
Additionally, Study One examined the test-retest reliability of the scale across two
test administrations. Responses should be related over time if they reflect the same true
variable (Carmines & Zeller, 1979). The test-retest reliability coefficient, or coefficient of
stability, is equal to the correlation between the scores obtained at time one and time two
on the same scale (Carmines & Zeller, 1979; Crocker & Algina, 2006).
H9: Motivation for transformational leadership will demonstrate high test-retest reliability across two
administrations of the scale.
Method
Participants
All officers and lay-people that were in a leadership role in the Salvation Army’s
Canada and Bermuda territory were contacted by email for this study. A total of 917
organizational leaders within The Salvation Army who have at least one subordinate were
surveyed at three time points over the course of a year as part of this entire set of studies.
For Study One, leaders who responded at time one only and/or time one and time two
were selected for this sample. Table 1 presents the demographic characteristics of the
respondents. Participants included a total of 279 leaders (a response rate of 30.4%)
including 216 officer leaders and 45 layperson leaders (18 unidentified), 138 males and
122 females (19 unknown). Leaders’ ages ranged from 25 to 74 with a mean age of 50.82.
Organizational tenure ranged from 2.5 years to 45 years, with a mean tenure of 21.86.
Most participants had an undergraduate degree (29.4%) as their highest level of
education, while the remainder had high school (20%), diploma (22.7%), or graduate
degree educations (27.8%). All ten divisions (including Territorial Headquarters as its
own division) were represented in the sample, with the majority of participants working

Motivation for transformational leadership 34
in the Ontario Central East division (26.4%). The only notable demographic difference
between the two groups were that the layperson leaders tended to be more highly
educated with only 4.7% of layperson leaders that had high school only (versus 23.2% of
officer leaders) and 41.9% of layperson leaders who had graduate degrees (versus only
25.1% of officer leaders). See Table 1 for demographic characteristics.
Table 1. Observed Frequencies: Demographic Characteristics Time 1
Respondents
(n = 147)
Time 1 & 2
Respondents
(n = 132)
Total Sample
(N = 279)
N % N % N %
Gender
Male 65 48.5 73 57.9 138 53.1
Female 69 51.5 53 42.1 122 46.9
Officership
Officer 112 83.6 120 94.5 216 82.8
Layperson 22 16.4 7 5.5 45 17.2
Level of Education
High School 31 23.7 20 16.1 51 20.0
Diploma 27 20.6 31 25.0 58 22.7
Undergraduate 45 34.4 30 24.2 75 29.4
Graduate 28 21.4 43 34.7 71 27.8
Division
Alberta 6 4.8 9 7.2 15 6.0
Bermuda 3 2.4 2 1.6 5 2.0
British Columbia 10 8.0 18 14.4 28 11.2
Maritime 12 9.6 6 4.8 18 7.2
Newfoundland and Labrador 14 11.2 14 11.2 29 11.6
Ontario Central East 33 26.4 24 19.2 58 23.1
Ontario Great Lakes 23 18.4 19 15.2 42 16.7
Prairie 10 8.0 11 8.8 25 10.0
Quebec 3 2.4 5 4.0 8 3.2
Territorial Headquarters 11 8.8 17 13.6 23 9.2
There were two survey administrations, which took place in October 2012 and
February 2013. Table 1 presents a comparison of respondents at Time 1 and Time 2. A
total of 132 of the 279 leaders completed the survey at both Time 1 and Time 2, and this
sample included 104 officer leaders and 23 layperson leaders (5 unidentified), 173 males

Motivation for transformational leadership 35
and 53 females (6 unknown). Leaders’ ages ranged from 31 to 69 with a mean age of
52.02. Organizational tenure ranged from 3 years to 45 years, with a mean tenure of
22.18. Most of these participants had a graduate degree (34.7%) as their highest level of
education, while the remainder had high school (16.1%), diploma (25%), or
undergraduate degree educations (24.2%). All ten divisions (including Territorial
Headquarters as its own division) were represented in the sample, with the majority of
participants working in the Ontario Central East division (19.2%).
Measures
The survey instrument gathered demographic information on gender, age,
leadership status (officer or layperson), education level, current appointment, and any
recent change in appointment and the possible impact of the change on lifestyle.
Respondents replied to the question: “What is the degree of impact this appointment
change has had on your lifestyle?” using a rating scale from 1 (very weak) to 7 (very
strong) to measure the perceived impact of the change. Other measures are described
below. All inter-scale correlations and reliability information is presented in Table 2.
Motivation for Transformational Leadership Scale
In an initial study of motivation for transformational leadership, Gilbert et al.,
(2014) developed a scale adapted from the Motivation at Work Scale (Gagné, Forest,
Gilbert, Aube, Morin, & Malorni, 2010), which addresses each level of internalization.
Respondents are asked to read a definition of “good leadership,” which describes the four
transformational leadership dimensions. The scale begins with the question stem “I put

Motivation for transformational leadership 36
effort into being a good leader…” and responses are scored on a scale from 1 (strongly
disagree) to 7 (strongly agree). Three items address each type of motivation, including:
external regulation (e.g., “Because I risk losing my job if I don’t”), introjected regulation
(e.g., “Because it makes me feel proud of myself”), identified regulation (e.g., “Because I
personally value leadership”), integrated regulation (e.g., “Because being a leader allows
me to express my personal values”), intrinsic motivation (e.g., “Because being a leader
makes me happy”). To measure amotivation, participants responded to the following
question: “Please rate the extent to which you agree or disagree on how you feel about
being a good leader” (e.g., “I just don’t care about being a good leader”). Gilbert et al.
(2014) found support for the discriminant validity of the scale from motivation to lead
and its predictive validity for leader outcomes (job satisfaction and transformational
leadership). Alpha reliabilities in the current study were high, ranging from .77-.89.
Motivation to Lead
Motivation to lead was assessed using Chan and Drasgow’s (2001) 27-item scale.
This measure addresses different reasons for wanting to hold a formal leadership role. All
responses use a five-point Likert-type scale from 1 (strongly disagree) to 5 (strongly
agree) and assess affective-identity (e.g., “I usually want to be a leader in the groups that I
work in”), social-normative (e.g., “I was taught to believe in the value of leading others”),
and non-calculative (e.g., “I am only interested to lead a group if there are clear
advantages for me”) forms of motivation to lead. Alpha reliabilities ranged from .84-.91
for the three scales across three different samples (Drasgow, 2001). In the current study,
internal consistency values ranged from .67 to .78. These values are slightly lower than

Motivation for transformational leadership 37
those found in other studies (e.g., ranging from .78 to .82; Clemmons & Fields, 2011, and
.75-.88; Hong, Catano, & Liao, 2011).
Transformational Leadership
Transformational leadership was assessed using the 36-item Multifactor
Leadership Questionnaire (Bass & Avolio, 1994); however, the items from the scale that
assessed leader outcomes such as effectiveness, satisfaction, and extra effort, were
removed as they were not relevant. All items assessing full-range transformational
leadership were retained. Items were assessed on a scale from 0 (not at all) to 4
(frequently, if not always) and leaders were asked to rate how they think others in their
workplace would rate them on their display of each leadership behavior. Internal
consistency was reliable at α > 0.77 for all subscales (Bass & Avolio, 1990). Due to high
correlations between the four components of transformational leadership (.405 < r < .603)
all four components of transformational leadership were combined into one overall factor,
an approach that is consistent with previous research (e.g., Bono & Judge, 2003;
Kelloway, Turner, Barling, & Loughlin, 2012; Kovjanic et al., 2012). The proposed
hypotheses do not differentiate among the four dimensions of transformational leadership,
which further supports their combination into a unidimensional scale. Reliability values in
the current study ranged from .68 to .86 for the transformational and transactional
leadership subscales.
Job Satisfaction
Job satisfaction was assessed using a five-item version of Brayfield and Rothe’s
(1951) measure. One example item is “I feel very satisfied with my present job”. The

Motivation for transformational leadership 38
items were measured on a seven-point scale from 1 (strongly disagree) to 7 (strongly
agree). Previous research has reported reliabilities of α = .80 (Judge, Bono, & Locke,
2000; Judge & Klinger, 2008) and α = .88 (Judge, Locke, Durham, & Kluger, 1998) for
this scale. In the current study, the reliability value was .84.
Turnover Intentions
Turnover intentions was measured using three items from the Michigan
Organizational Assessment Questionnaire (Cammann, Fichman, Jenkins, & Klesh, 1979).
Items are measured on a 5-point Likert scale from 1 (strongly disagree) to 5 (strongly
agree). Items include: “I often think about quitting my job,” “It is very likely that I will
actively look for a new job in the next year,” and “I will leave this organization in the
next year.” Previous studies have reported alpha reliabilities of .90 (Eby & Allen, 2002)
and .86 (Reio & Segredo, 2013). Reliability in the current study was .88.
Design and Procedure
Prior to sending the first of three survey administrations, an email was sent to all
participants by The Salvation Army indicating their support for the project and
emphasizing that it was voluntary and confidential. The survey was conducted online
using Qualtrics, a secure online server. The Salvation Army provided emails for 771
officers and 146 layperson leaders from within the Canada and Bermuda territory. An
email including a link to the informed consent letter and to the survey was sent to all
participants in October, 2012. All three survey administrations included the same scales
(i.e., transformational leadership, motivation for transformational leadership, motivation
to lead, job satisfaction, and turnover intentions) and the demographic information.

Motivation for transformational leadership 39
Informed consent was obtained if participants clicked “agree” to consent to the study. The
second survey was sent to all participants by email in February, 2012 and the final survey
was distributed in May 2012. Leaders’ responses were linked through their work email
addresses. No incentives were provided to participants for responding, as the survey took
fewer than 20 minutes to complete. However, a donation was made to the Salvation Army
of $1 per survey completed or $5 for individuals who completed all three surveys.
Analysis
The factor structure of the Motivation for Transformational Leadership Scale was
analyzed using maximum likelihood confirmatory factor analysis in Mplus v. 7 to
confirm the 6-factor structure hypothesized by Gagné and Deci (2005). In looking for a
good fit to the data, several fit indices were examined. The root mean square error of
approximation (RMSEA) provides a test of close fit of the model to the data by analyzing
residuals and should be less than .10 for a good fit to the data or smaller than .05 for a
very good fit to the data (Steger, 1990). Other research has suggested that RMSEA < .06
suggests a very good fit to the data (Hu & Bentler, 1999). The statistic pclose provides a
test of significance regarding whether the RMSEA value is significantly different from
.05, such that a significant pclose test suggests that the RMSEA value is significantly
different from .05 (Kelloway, 2015). Comparative fit indices compare the hypothesized
model to a null or baseline model in which no relationships are specified between
variables in the model (Kelloway, 2014). Two indices of comparative fit will also were
also examined in this study: the comparative fit index (CFI) and Tucker-Lewis Index
(TLI; a non-normed fit index). Both of these indices should also be greater or equal to

Motivation for transformational leadership 40
0.95 for a good fit to the data (Hu & Bentler, 1999). According to these guidelines, my
the criteria for a good fitting model was a non-significant chi square test, an RMSEA
value less than or equal to .06, a non-significant pclose test with 90% confidence intervals
that do not include zero, and CFI and TLI values exceeding .95. In the case of closely-
fitting models, theory and parsimony were also considered in choosing the best model.
Hypotheses two to seven were examined using SPSS v. 20.0 and Mplus v. 7.0.
Multiple hierarchical regression analyses were used to test Hypothesis 2 whereby the
control variables age, gender, and education were entered into step one and the
Motivation for Transformational Leadership subscales were entered in step two to predict
each transformational leadership style. Correlational analyses tested Hypotheses 5 and 9,
which examined discriminant validity and test-retest reliability. Hypotheses 6-8 were
examined using hierarchical regression with the control variables entered into step one,
motivation to lead entered in step two of the analysis and motivation for transformational
leadership entered in step three.
Results
Study intercorrelations, means and standard deviations are presented in Table 2.

Motivation for transformational leadership 41
Table 2. Intercorrelations with means, standard deviations, and internal consistency values for scales and subscales (N = 242). Variable Mean (SD) Intercorrelations
1 2 3 4 5 6 7 8 9 10 11 12
1. Age 50.82 (8.50) ----
2. Gender 1.47 (.50) -.07 ----
3. Education 2.58 (1.10) .14* .01 ----
4. Amotivated MTFL 1.40 (.57) .07 -.18† -.09 (.87)
5. External MTFL 2.41 (1.34) -.04 -.06 .00 .18† (.83)
6. Introjected MTFL 4.08 (1.45) -.09 .18† -.03 .07 .26† (.82)
7. Identified MTFL 6.37 (0.62) -.05 .18† .09 -.59† -.16* .04 (.77)
8. Integrated MTFL 4.91 (1.20) -.17† .09 .02 -.32† -.06 .04 .49† (.89)
9. Intrinsic MTFL 5.94 (0.87) .01 .16† .13* -.53† -.13* -.08 .57† .46† (.87)
10. AI MTL 3.35 (.54) -.15* .02 .17† -.26† -.15* -.09 .30† .57† .28† (.78)
11. NC MTL 3.89 (.39) .01 .07 -.05 -.42† -.29† -.19† .32† .09 .21† .17† (.67)
12. SN MTL 3.35 (.48) -.12 -.03 .16* -.17† .05 .03 .23† .34† .25† .33† .14* (.76)
13. Laissez Faire .37 (.42) -.04 .01 .08 .29† .11 .12 -.26† -.31† -.26† -.29† -.27† -.11
14. PMBE .72 (.59) -.06 .00 -.09 .20† .06 .19† -.24† -.22† -.24† -.17† -.21† .04
15. AMBE 1.22 (.82) .00 -.06 -.01 -.04 .07 .08 .06 .09 -.02 -.05 -.07 .18†
16. Cont. Reward 2.82 (.59) .08 .09 .08 -.23† .03 .01 .36† .23† .25† .18† .14* .17*
17. Transformational 3.07 (.42) .03 .03 .10 -.43† -.17† -.18† .51† .41† .48† .32† .30† .20†
18. Job Satisfaction 5.14 (.79) .17† .06 .14* -.35† -.08 -.01 .27† .16* .42† .09 .21† .07
19. Turnover intentions 1.63 (.79) -.13* -.10 -.03 .19† .12 -.03 -.14* -.02 -.25† .02 -.15* -.07
Notes. * = p < .05. † < .01; MTFL = Motivation for Transformational Leadership; AI MTL = Affective-Identity Motivation to Lead; NC MTL -=
Non Calculative Motivation to Lead; SN MTL = Social Normative Motivation to Lead. Coefficient alphas (α) are on the diagonal in parentheses.

Motivation for transformational leadership 42
Table 2. Continued
Intercorrelations
13 14 15 16 17 18 19
13. Laissez Faire (.68)
14. PMBE .45† (.70)
15. AMBE .05 .19† (.86)
16. Cont. Reward -.21† -.21† .13* (.68)
17. Transformational -.33† -.38† .00 .59† (.83)
18. Job Satisfaction -.18† -.21† -.06 .22† .41† (.84)
19. Turnover intentions .09 .03 -.02 -.02 -.13 -.41† (.88)
Notes. * = p < .05. † < .01; PMBE = Passive Management by Exception; AMBE = Active Management by
Exception; Cont. Reward = Contingent Reward. Coefficient alphas (α) are on the diagonal in parentheses.
Descriptive Results
Officers and lay leaders did differ slightly on some of the study variables. Officer
leaders had significantly lower external regulation (M = 2.243, SD = 1.11) than layperson
leaders (M = 3.32, SD = 1.87, t (49.41) = -3.67, p < .01) and exhibited significantly
greater passive management by exception (M = .74, SD = .59) than layperson leaders (M
= .51, SD = .52, t (256) = 2.39, p < .05). Layperson leaders exhibited significantly greater
social normative motivation to lead (M = 3.49, SD = .53) than officer leaders (M = 3.31,
SD = .47, t(258) = -2.33, p < .05). Otherwise, there were no significant differences
between the two groups on leadership styles, motivation for transformational leadership,
motivation to lead, job satisfaction, or turnover intentions. Table 3 presents the t-test
results comparing officers and layperson leaders on all study variables.

Motivation for transformational leadership 43 Table 3. T-test results comparing officer (N = 216) and layperson (N = 45) leaders on study variables.
Variable Officers Laypeople
M (SD) M (SD) T value df
Amotivated MTFL 1.42 (.60) 1.29 (.43) 1.74 80.85
External MTFL 2.24 (1.11) 3.32 (1.87) -3.67† 49.41
Introjected MTFL 4.16 (1.44) 3.87 (1.52) 1.20 257
Identified MTFL 6.34 (.61) 6.52 (.62) -1.73 258
Integrated MTFL 4.90 (1.16) 4.95 (1.35) -.24 256
Intrinsic MTFL 5.93 (.89) 6.01 (.78) -1.11 258
AI MTL 3.33 (.47) 3.40 (.50) -.83 258
NC MTL 3.88 (.39) 3.95 (.40) -1.15 258
SN MTL 3.31 (.47) 3.49 (.53) -2.33* 258
Laissez Faire .39 (.43) .26 (.36) 1.88 258
PMBE .74 (.59) .51 (.52) 2.39* 256
AMBE 1.14 (.74) 1.35 (1.06) -1.23 53.50
Cont. Reward 2.79 (.58) 2.97 (.58) -1.80 248
Transformational 3.05 (.42) 3.14 (.44) -1.23 259
Job Satisfaction 5.13 (.77) 5.25 (.88) -.96 256
Turnover intentions 1.59 (.75) 1.70 (.85) -.93 255
Notes. * = p < .05. † < .01; MTFL = Motivation for Transformational Leadership; AI MTL = Affective-
Identity Motivation to Lead; NC MTL -= Non Calculative Motivation to Lead; SN MTL = Social
Normative Motivation to Lead; PMBE = Passive Management by Exception; AMBE = Active Management
by Exception; Cont. Reward = Contingent Reward.
I further examined how demographic variables were related to the motivation for
transformational leadership subscales. Tenure in current appointment and organizational
tenure were both unrelated to leader motivation. Age was significantly related to

Motivation for transformational leadership 44
integrated regulation (r = -.17, p < .05) and education was significantly related to intrinsic
motivation (r = .13, p < .05). Males and females also significantly differed on some forms
of motivation: males (M = 1.50, SD = .64) tended to be higher in amotivation than
females (M = 1.29, SD = .48, t(257) = 2.88, p < .05). Females (M = 4.39, SD = 1.45)
scored significantly higher on introjected regulation than males (M = 3.87, SD = 1.41,
t(256) = -2.94, p < .05). Females scored higher on identified regulation (M = 6.49, SD =
.59) than males (M = 6.27, SD = .62, t(257) = -2.87, p < .05); and females (M = 6.10, SD
= .75) scored higher than males on intrinsic motivation (M = 5.81, SD = .96, t(257) = -
2.64, p < .05).
Factor Structure
Hypothesis 1 predicted that Motivation for Transformational Leadership would be
represented by a 6-factor structure confirming Gagné and Deci’s (2005) model, which
includes amotivation, external regulation, introjected regulation, identified regulation,
integrated regulation, and intrinsic motivation. This hypothesis was tested using
Confirmatory Factor Analysis (CFA) in Mplus. Hypothesis 1 was fully supported; the
hypothesized 6-factor structure was a good fit to the data (χ2
(120, N = 278) = 228.31, p <
0.001; CFI = 0.96, TLI = .95, RMSEA = 0.06, pclose = 0.15, 90% C.I. = 0.05 - 0.07) and
all items loaded on their prospective factors as expected (see Table 4 for CFA results
comparing four different models and Table 5 for the standardized factor loadings from the
6-factor model).
I tested three competing models against the 6-factor model: a 1-factor model, a 3-
factor model representing amotivated, controlled (external, and introjected), and
autonomous (integrated, identified and intrinsic) motivation, and a higher-order model

Motivation for transformational leadership 45
with amotivation, autonomous, and controlled regulation) as second-order factors. The 6-
factor structure fit the data better than a one-factor solution (χ2
(135, N = 278) =1667.65, p <
0.001; CFI = 0.44, TLI = .36, RMSEA = 0.20, pclose = 0.00, 90% C.I. = 0.19 - 0.21) and
a 3-factor model (χ2
(132, N = 278) = 1024.18, p < 0.001; CFI = 0.67, TLI = .62, RMSEA =
0.16, pclose = 0.00, 90% C.I. = 0.15 - 0.16). The higher-order model fit the data well
(χ2
(127, N = 278) = 240.50, p < 0.001; CFI = 0.96, TLI = .95, RMSEA = 0.06, pclose = 0.15,
90% C.I. = 0.05 -0.07), however a Chi square difference test comparing the 6-factor
solution and the higher-order solution was non significant (χ2
diff = 12.19, p > .05).
Table 4. Results of competing models in CFA. Model Chi Square df CFI TLI RMSEA pclose
1-factor 1667.65 135 .44 .36 .20 .00
3-factor 1024.18 132 .67 .62 .16 .00
6-factor 228.31 120 .96 .95 .06 .15
Higher-
order
240.50 127 .96 .95 .06 .15
Table 5. CFA Standardized Factor Loadings
External Regulation F1 F2 F3 F4 F5 F6
...because others will reward me financially
(e.g., supervisor, colleagues, family, clients)
(Ext8)
.69
...to avoid losing financial benefits (ext9) .96
...because I risk losing my job if I don’t
(ext10) .75
Introjected Regulation
...because otherwise I will feel guilty (intro 2) .81
...because otherwise I will feel bad about
myself (Intro3)
.86
...because otherwise I would be ashamed of
myself (intro6)
.67
Identified regulation
...because it has a lot of personal meaning to
me (ident4)
.77
...because I believe it is worth the effort to be a
good leader (ident5)
.76
...because it aligns with my values (ident6) .65
Integrated Regulation

Motivation for transformational leadership 46 ...because it comes naturally to me (integ5) .84
...because I was born to be a leader (integ6) .92
...because it is part of my identity (integ7) .79
Intrinsic Motivation
...because what I do as a leader is exciting
(int6)
.90
...because the work I do as a leader is
interesting (int7)
.92
...because I find it energizes me (int9) .71
Amotivation
I put little effort into being a good leader
(amot5)
.85
I don’t care about being a good leader (amot6) .89
I really feel like I would be wasting my time
by being a good leader (amot4)
.78
Hypothesis Testing
In order to examine Hypothesis 2, which posited that different sources of motivation
might be more closely related to specific leadership styles. A hierarchical regression
analysis was conducted whereby age, gender, and education were entered as control
variables in step one of the analysis and the five motivation levels and amotivation were
entered in step two to predict each type of leadership. Hypothesis 2a predicted that
amotivation would positively predict laissez-faire leadership. The control variables
together accounted to .1% of the variance in the criterion, F(3, 235) = .58, p > .05, and
none of the predictors were significant. The model including all six types of motivation in
step two accounted for 15% additional variance explained in laissez-faire leadership, ΔF(6,
229) = 6.51, p < .01. This hypothesis was supported: amotivation was a significant predictor
(β = .19, t(229) = 2.41, p < .05) in predicting laissez-faire leadership, which was also
predicted by integrated regulation (β = -.24, t(229) = -3.29, p < .01).
Hypothesis 2b predicted that external regulation would predict passive
management by exception. The control variables accounted for 1% of the variance in this

Motivation for transformational leadership 47
style, F(3, 233) = .54, p > .05, and none of the predictors were significant. The model in
step two accounted for an additional 12% of the variance in MBEP, ΔF(6, 227) = 5.37, p
< .01. The hypothesis was not supported: introjected regulation (β = .20, t(227) = 2.96, p <
.01) and integrated regulation (β = -.18, t(227) = -2.48, p < .05) were the only two
significant predictors of MBEP and external regulation was not a significant predictor.
Hypothesis 2c predicted introjected regulation would predict active management
by exception. This hypothesis was also not supported. In predicting active management
by exception, none of the control variables were significant predictors in step one of the
analysis (R2
= .00, F(3, 234) = .22, p > .05) were significant. The model in step two
accounted for an additional 3% of the variance explained in this style, and this amount
was not significant ( ΔF(6, 228) = 1.07, p > .05).
Hypothesis 2d predicted that identified and integrated regulation would predict
contingent reward leadership. This hypothesis was partially supported. The model in step
one accounted for 2% of the variance in contingent reward leadership (F(3, 228) = 1.56, p >
.05) and none of the predictors were significant. The MTFL subscales added step two
accounted for an additional 12% of the variance in this outcome (ΔF(6, 222) = 5.27, p <
.01). In this step, identified regulation (β = .32, t(222) = 3.50, p < .01) was the only
significant predictor.
Finally, hypothesis 2e predicted that intrinsic motivation would predict
transformational leadership behavior. This hypothesis was supported, as none of the
control variables significantly predicted this style in step one (R2
= .12, F3, 236) = 1.03, p >
.05), and in step two intrinsic (β = .16, t(236) = 2.32, p < .05) as well as integrated (β = .17,
t(236) = 2.63, p < .01), identified (β = .27, t(236) = 27, p < .01), introjected regulation (β = -

Motivation for transformational leadership 48
.16, t(236) = -3.52, p < .01), and amotivation (β = -.15, t(236) = -2.23, p < .01) were all
significant predictors. The model accounted for 37.0% of the variance explained in
transformational leadership (F(6, 236) = 23.27, p < .001). Regression results are presented
in Appendix E.
Test-Retest Reliability
Internal consistency values for the Motivation for Transformational Leadership
subscales were high, ranging from .77 to .89. As another measure of reliability, I also
assessed test-retest reliability on a subset of the total study sample consisting of 132
participants who responded at both time one and time two. The two test administrations
were approximately four months apart. Stability coefficients were computed at the scale
level as the number of subjects available for the analysis was insufficient for modeling.
The following coefficients were obtained for each scale: amotivation, r = .69 external, r =
.68; introjected, r = .62; identified, r = .67; integrated, r = .82; intrinsic, r = .68. Paired t-
tests did not reveal any significant differences between mean scores at the two
administrations and there were no significant differences between time 1 and time 2 scale
mean scores.
Discriminant Validity
Hypothesis 3 addressed whether the motivation for transformational leadership
construct was distinct from the Chan and Drasgow (2001) motivation to lead construct.
Hypothesis 3 predicted that motivation for transformational leadership would show
evidence of discriminate discriminant validity from motivation to lead. The data largely
supported this hypothesis, as the vast majority of correlations between the two constructs

Motivation for transformational leadership 49
were moderate to low (ranging from - .30 to + .30), with four exceptions (ranging
between -.42 to +.57). Correcting for attenuation, correlations were largely still moderate
to low (ranging from - .30 to + .30) with eight exceptions (ranging from - .55 to + .68).
The highest correlations, corrected for attenuation, were between integrated motivation
for transformational leadership and affective identity motivation to lead (r = .68) and
between amotivation and non-calculative motivation to lead (r = -.55). All correlations
are presented in Table 2.
Hypothesis 4 predicted that motivation for transformational leadership would add
incremental validity in predicting transformational leadership over and above motivation
to lead. The results are presented in table three. In step one of a hierarchical regression
analysis, the control variables age, gender, and education were entered due to correlations
between these variables and the motivation for transformational leadership subscales and
this step accounted for 1.3% of the variance in transformational leadership, F(3, 235) =
1.007, p > .05 and none of the predictors were significant. In step two of the analysis,
affective identity, social normative, and noncalculative motivation to lead were entered
together as the motivation to lead construct, which accounted for an additional 20.3% of
the variance in transformational leadership, ΔF(3, 232) = 20.07, p < .001. In this step,
noncalculative motivation to lead (β = .29, t(232) = 4.89, p < .001) and affective-identity
motivation to lead (β = .26, t(232) = 4.15, p < .001) were significant predictors of
transformational leadership and social normative was not a significant predictor. Step
three saw the addition of amotivation, external, introjected, identified, and integrated
regulation, as well as intrinsic motivation; all of which form the motivation for
transformational leadership scale. MFTL accounted for an additional 18.6% of the

Motivation for transformational leadership 50
variance in transformational leadership beyond that of MTL, ΔF(6, 226) = 11.72, p < .001.
In this step, introjected (β = -.14, t(226) = -2.52, p < .01), identified (β = .25, t(226) = 3.33, p
< .001), and intrinsic motivation (β = .15, t(226) = 2.23, p < .05) were significant unique
predictors of transformational leadership.
Hypothesis 5 predicted that motivation for transformational leadership would add
incremental validity in predicting job satisfaction over and above motivation to lead. The
control variables accounted for 3.7% of the variance in job satisfaction in step one (F(3,
233) = 2.96, p < .05), and none of the predictors were significant. In step two, MTL
accounted for an additional 6.6% of the variance in job satisfaction (ΔF(3, 230) = 5.66, p <
.001) and here, non-calculative motivation to lead was the only significant predictor (β =
.21, t(230) = 3.33, p < .001). In step three, with the addition of the motivation for
transformational leadership subscales, an additional 12.7% of the variance was accounted
for ΔF(6, 224) = 6.16, p < .001 and amotivation (β = -.19, t(224) = -2.28, p < .05) and intrinsic
motivation (β = .30, t(224) = 3.78, p < .001) were significant predictors.
Finally, Hypothesis 6 posited that motivation for transformational leadership would
add incremental validity in predicting turnover intentions over and above motivation to
lead. In step one, the control variables accounted for 2.5% of the variance in turnover
intentions , F(3, 232) = 1.97, p > .05 and none of the varibles were significant. MTL
accounted for an additional 7.9% of the variance in turnover intentions, ΔF(3, 229) = 4.52, p
< .01 and social normative (β = -.15, t(229) = -2.20, p < .05) and non-calculative (β = -.17,
t(229) = -2.70, p < .01) motivation to lead were significant predictors. With the addition of
motivation for transformational leadership, variance explained increased by 6.7% (ΔF(6,

Motivation for transformational leadership 51
223) = 2.94, p < .01) and intrinsic motivation was the only significant predictor (β = -.24,
t(223) = -2.890, p < .01).
Discussion
Model Testing
Study One’s results supported the 6-factor model of self-determined motivation
for effective leadership, which is fully representative of Gagné and Deci’s (2005) model.
Although the 6-factor model did not fit significantly better than the second-order model,
previous theory best supports the 6-factor model. This model is the most parsimonious, as
fewer parameters are estimated and because it doesn’t involve a higher-order structure.
These findings are particularly significant in that they empirically distinguished
between identified and integrated regulation, which supports the theoretical difference
between these two levels of internalization. This difference has been difficult to establish
in previous studies of SDT (e.g. Gagné et al., 2010; Ryan & Connell, 1989; Vallerand et
al., 1992), however Gilbert et al.’s (2014) findings support the results of the current
study. The higher-order model did not fit significantly better than the 6-factor model,
suggesting that the 6-factor solution is the best solution and most parsimonious model
with more theory supporting its structure.

Motivation for transformational leadership 52
Table 6. Results of Hierarchical Regression Analysis predicting job satisfaction, turnover intentions and transformational leadership.
Job Satisfaction Transformational Leadership Turnover Intentions
B SEB β t B SEB β t B SEB β t
Step 1: Control Variables ΔR2 = .037, ΔF(3, 233) =
2.963*
ΔR2 = .013, ΔF(3, 235) =
1.001
ΔR2 = .025, ΔF(3, 232) =
1.965
Age .011 .006 .124 1.903 .001 .003 .029 .444 -.009 .006 -.096 -1.458
Gender .116 .102 .073 1.138 .043 .055 .050 .776 -.188 .098 -.125 -1.919
Education .082 .047 .115 1.766 .036 .025 .094 1.433 -.016 .045 -.023 -.351
Step 2: MTL Scales ΔR2 = .103, ΔF(3, 230) = 5.661† ΔR
2 = .216, ΔF(3, 232) = 20.07†
ΔR2 = .079, ΔF(3, 229) = 4.516†
Affective Identity MTL .127 .098 .87 1.293 .202 .049 .259 4.147† .031 .095 .023 .330
Non-calculative MTL .433 .130 .212 3.335† .315 .065 .289 4.889† -.232 .105 -.150 -2.199*
Social-normative MTL .093 .111 .057 .837 .099 .054 .114 1.817 -.341 .126 -.175 -2.704†
Step 3: MFTL Scales ΔR2 = .230, ΔF(6, 224) = 6.157† ΔR
2 = .402, ΔF(6, 226) = 11.722†
ΔR2 = .147, ΔF(6, 223) = 2.937†
Amotivation -.249 .110 -.187 -2.276* -.072 .050 -.100 -1.428 .014 .107 .011 .129
External Regulation .010 .037 .017 .257 -.006 .018 -.018 -.314 .060 .038 .108 1.594
Introjected Regulation .038 .035 .071 1.104 -.041 .016 -.143 -2.526† -.044 .035 -.084 -1.240
Identified Regulation -.048 .114 -.036 -.418 .178 .053 .254 3.330† -.080 .115 -.064 -.701
Integrated Regulation .016 .055 .025 .295 .044 .026 .126 1.725 .104 .055 .168 1.903
Intrinsic Motivation .284 .075 .305 3.783† .074 .033 .155 2.238* -.207 .071 -.243 -2.895†
Notes. * = p < .05, † = p < .01.

Motivation for transformational leadership 53
Hypothesis Testing
I found partial support for some hypotheses. As expected, amotivation predicted
laissez-faire leadership. Interestingly, integrated regulation also emerged as a significant
negative predictor, suggesting that, in addition to having higher levels of amotivation,
laissez-faire leaders also tend to have lower levels of the most autonomous form of
extrinsic regulation. These types of leaders are unlikely to believe that being a good
leader is a part of their identity, that it fits with their life goals, and is a means of
achieving fulfillment, which may be a key reason why they tend to have no motivation to
exhibit good leadership. In other words, if leaders feel that being a good leader can
contribute to fulfillment of life goals, then they are unlikely to be laissez-faire leaders.
Gilbert et al. (2014) also found a significant positive relationship between amotivation
and laissez-faire leadership, but did not find that integrated regulation predicted this
leadership style.
External regulation was expected to predict passive management by exception
(Hypothesis 2b) and introjected regulation to predict active management by exception
(Hypothesis 2c). These hypotheses were not supported, as introjected and integrated
regulations significantly predicted passive management by exception such that these
leaders are more likely to be introjected and less likely to be integrated. Gilbert et al.
(2014) found that external regulation positively predicted passive management by
exception and that intrinsic motivation negatively predicted this style. Perhaps in this
particular sample of leaders, those who wait for problems to emerge or become dire (as in
passive management by exception) tend to be more motivated to action by their own
feelings of guilt that are a result of their inaction to prevent problems from occurring.
Motivation for transformational leadership 54
Further, leaders who identify as a leader (as in integrated regulation) are less likely to be
passive avoidant.
Motivation for transformational leadership did not predict active management by
exception, where leaders actively seek out and address deviations in performance. Much
previous research has noted that active and passive management by exception are
independent constructs with low or non-significant correlations (e.g., Avolio, Bass, &
Jung, 1998; Garman, Davis-Lenane, Corrigan, 2003). As such, there may be something
inherently different between these two styles of leadership that explains why motivation
for transformational leadership predicts passive but not active management by exception.
Active management by exception is more likely to be perceived as abusive by followers,
as these leaders are more likely to loudly and publicly correct followers’ mistakes,
leading to embarrassment and decreased well-being over time (Barling et al., 2011;
Kelloway, Sivanathan, Francis, & Barling, 2005). Whereas passive managers by
exception may be less effective because they lack leadership skills, active managers by
exception may be less effective because they are overly punitive and so heavily focused
on mistakes rather than accomplishments (Kelloway, Sivanathan, Francis, & Barling,
2005). While passive managers may desire and attempt to be effective leaders in some
circumstances, active management by exception is more highly related to an abusive and
punitive style of leadership. Thus, I think that passive managers by exception may
sometimes be motivated to be transformational, whereas active management by exception
may simply be unrelated to motivation for transformational leadership. However, this was
not the case in Gilbert et al.’s (2014) study, which found that external regulation was a
significant positive predictor of active management by exception. The inconsistency may

Motivation for transformational leadership 55
be due to differences between the two samples, and specifically to higher ratings of active
management by exception in the Gilbert et al. sample.
There was partial support for Hypothesis 2d, in that identified regulation was
positively related to contingent reward leadership, suggesting that these leaders identify
with the importance of good leadership, but do not fully internalize it. This level of
autonomous extrinsic motivation, then, may inspire this more positive form of
transactional leadership, where the focus is still on exchange, but where rewards are
offered for good performance. Integrated regulation was not important for contingent
reward perhaps because, as a more autonomous regulation, it is more predictive of
transformational leadership than contingent reward leadership. These results are partially
consistent with Gilbert et al.’s (2014) findings, where identified and amotivated
regulations were predictive of contingent reward such that identified was a positive
predictor and amotivation was a negative predictor.
Hypothesis 2e was supported; intrinsic motivation predicted transformational
leadership behavior. In addition, integrated and identified regulations both positively
predicted transformational leadership and introjected motivation and amotivation were
significant negative predictors of transformational leadership. These findings suggest that
transformational leaders tend to have high levels of intrinsic and autonomous forms of
extrinsic regulation, and low levels of introjected regulation and amotivation. These
findings are partially consistent with Gilbert et al.’s (2014) findings, where identified
regulation positively predicted transformational leadership and amotivation negatively
predicted this style. Transformational leaders are likely to not only enjoy being good
leaders but also to feel like they identify with the importance of good leadership and that

Motivation for transformational leadership 56
being a transformational leader is a part of who they are. In addition, transformational
leaders are less likely to feel that their self-esteem is linked to their job performance or to
act out of guilt or a sense of duty. Interestingly, external regulation does not seem related
to transformational leadership, suggesting that seeking external contingencies may not
affect whether one exhibits this style of leadership. In short, these findings support the
idea that motivation for transformational leadership is important for transformational
leadership, and that, in general, transformational leaders have high autonomous regulation
and low controlled motivation and amotivation.
Test-retest reliability of the Motivation for Transformational Leadership Scale was
assessed using stability coefficients. The interpretation of stability coefficients is
somewhat ambiguous, as there are few, if any, accepted standards for acceptable values
(Crocker & Algina, 2006). The values found here compare favourably with those found
for other well-accepted scales; For example, aptitude tests such as the Weschler Adult
Intelligence Scale (WAIS), tend to have the highest test-retest stability values (Crocker &
Algina, 2006) and the WAIS has shown short-term test-retest coefficients in the .70s
(Weschler, 1958); Crocker and Algina (2006) suggested that attitude scales often have
scores lower than those shown by aptitude tests. Similar scales assessing motivation
based on self-determination theory, such as the motivation for sport scale, which assesses
amotivation, external, introjected and identified forms of motivation towards sport, had
test-retest values ranging from .58-.84 (Pelletier, Fortier, Vallerand, Tuson, Brière, &
Blais, 1995); In another study, test-retest correlations of a scale of motivation for
academic motivation ranged from .71 to .83 (Vallerand, Pelletier, Blais, Brière , Senécal,
& Vallières, 1992). In addition, Amabile, Hill, Hennessey, and Tighe (1994) found

Motivation for transformational leadership 57
support for high stability in their work preference inventory, which assesses extrinsic and
intrinsic motivation orientation where they saw short-term stability coefficients ranging
from .80 to .94. They conclude that this stability provides evidence for the nature of
motivation as an enduring individual difference characteristic. As such, scores in the .60s,
such as those obtained for the Motivation for Transformational Leadership Scale, suggest
acceptable stability in this scale.
The test-retest reliability may be underestimated in this study because of the length of
time (4 months) between testing. In this situation, memory is not likely to affect
responses, such that the respondent is less likely to remember their responses for the
previous test and to respond the same way (Carmines & Zeller, 1979). In fact, it’s likely
that these values underestimate the test-retest reliability because of reactivity, whereby by
measuring motivation for transformational leadership at time one, this has made
participants more sensitive to their own type of motivation by the time two measure,
resulting in different scores at time two (Carmines & Zeller, 1979). It is also possible that
true change in motivation for transformational leadership has occurred over time due to
other circumstances such as organizational change or other factors, which is contributing
to low correlations between scores at time one and time two. Reliability is necessary to
establish validity, but is not enough evidence on its own to establish validity (Nunnally,
1978). Further analyses attempted to establish the validity of the scale by examining its
discriminant and concurrent validity.
I found support for the discriminant validity of the Motivation for Transformational
Leadership Scale from Chan and Drasgow’s (2001) Motivation to Lead Scale. Low

Motivation for transformational leadership 58
correlations between the two sets of subscales suggest that these two scales measure
different constructs and supports its use in future research.
Motivation for transformational leadership also accounted for significant incremental
variance above and beyond motivation to lead in predicting transformational leadership,
job satisfaction, and turnover intentions. These results further support the utility of the
scale in adding unique prediction to these outcomes and distinguish it from motivation to
lead. The findings also suggest the importance of motivation for transformational
leadership for leader outcomes of job satisfaction and turnover intentions as well as
transformational leadership. Specifically, intrinsic motivation for transformational
leadership is key in leaders’ own job satisfaction and turnover intentions. So, promoting
this type of motivation in leaders or selecting intrinsically motivated leaders, may be
important for the leaders’ own wellbeing and for organizational outcomes.
Study Implications
The results of this study confirmed the factor structure of the motivation for
transformational leadership items and provided support for its internal consistency, test-
retest reliability, discriminant validity from the motivation to lead scale and its criterion
validity for predicting transformational leadership, job satisfaction, and turnover
intentions. To my knowledge, this is the first study to examine leaders’ own motivation to
be effective in their roles.
An important implication for this study is the confirmation of the 6-factor model
of leader motivation, which supports Gagné and Deci’s (2005) model of self-
determination and the structure of similar scales based on the theory (Gagné et al., 2010;
Scott et al., 2011). This model uniquely identifies each of the five levels of internalization

Motivation for transformational leadership 59
as well as amotivation. The motivation for transformational leadership scale represents
self-determination theory in applying it to leadership and extends previous research that
links autonomous forms of motivation to higher job performance (e.g., Gagné & Deci,
2005; Van den Broeck, Vansteenkiste, & DeWitte, 2008). These results and those of the
previous work on the scale (Gilbert et al., 2014) support its utility for use in future
studies.
Although some research has examined motivation for leader emergence (Chan &
Drasgow, 2001; Hong et al., 2011), there is a dearth of literature examining motivation
for leader effectiveness. The current study addresses this gap by validating a scale to
measure leaders’ motivations to perform well in a leadership role. By integrating two
prominent organizational theories, transformational leadership theory and self-
determination theory, this study also extends beyond Chan and Drasgow’s (2001) model
of motivation to lead in that it addresses leader motivation for effectiveness rather than
motivation to occupy a leadership role. As the findings above suggest, motivation for
transformational leadership is distinct from motivation to lead and shows concurrent
validity in predicting transformational leadership, job satisfaction, and turnover
intentions.
This study supports the utility of motivation for transformational leadership in
predicting transformational leadership and organizational outcomes. Limited research has
examined predictors of transformational leadership, but has identified some predictors
such as personality (Judge & Bono, 2000), emotional intelligence (Barling, Slater, &
Kelloway, 2000) and aspects of the work environment such as control (Nielsen & Cleal,
2011). Given the large body of literature that supports the positive impact of

Motivation for transformational leadership 60
transformational leadership on subordinate outcomes such as job satisfaction (Hater &
Bass, 1988; Koh, Steers & Terborg, 1995), psychological well-being (McKee et al.,
2009), and task performance (e.g., Howell & Frost, 1989; Kirkpatrick & Locke, 1996;
Sosik, Avolio & Kahai, 1997), there is strong support for promoting this leadership style
in organizations. Identifying predictors of transformational leadership will inform
successful leader selection and development practices that promote this style of
leadership.
These results have practical implications for selection and training. First, in terms of
leadership selection, these results suggest that it may be very important to screen out
amotivated candidates, because amotivation was strongly negatively related to the most
effective form of leadership (transformational) and positively related to the most
ineffective form of leadership (laissez-faire). These results largely support those of
Gilbert et al. (2014).
Further implications concern our finding that all forms of autonomous motivation
including intrinsic motivation were significant positive predictors of transformational
leadership, and that introjected regulation and amotivation were significant negative
predictors. Based on these findings, organizations may also want to select people who
score high on autonomous motivation for transformational leadership. In addition,
organizations may be able to promote autonomous regulation and discourage controlled
motivation and amotivation in order to support effective leadership. Self-determination
theorists ague that degree of internalization is predicted by the satisfaction of
psychological needs, such that higher needs satisfaction promotes higher levels of
internalization (Baard, Deci, & Ryan, 2004; Gagné & Deci, 2005; Ryan & Deci, 2002).

Motivation for transformational leadership 61
The three needs are: autonomy (having a choice about whether to initiate behaviour based
on personal interest and compatibility with personal values), relatedness (feeling
connected with others); and competence (having a sense of proficiency; Deci, 1975; Ryan
& Deci, 2002). Some evidence suggests that organizations can support self-determined
motivation by manipulating the work environment to support the autonomy of employees.
Self-determination theorists acknowledge that organizational culture and practices can
serve to either support employees’ autonomy by promoting choice or to control behavior
via external pressures (Deci & Ryan, 1987). For example, an autonomy-supportive social
context where the organization provides a meaningful rationale for tasks, offers choice to
leaders in decision-making, and acknowledges the feelings of the leader may promote
higher levels of internalization (Deci et al., 1994). Organizations may be able to
implement autonomy support in leadership training and development in order to promote
internalization by leaders, and may also use similar strategies in succession planning
when candidates are being developed for future leadership positions. Autonomy-
supportive activities in these domains may include soliciting and being responsive to
leaders’ suggestions for policy improvements, relating to leaders’ feelings about their
roles, and providing relevant information for leaders to do their work well (Deci & Ryan,
2008; Gagné & Deci, 2005).
Limitations
All responses in this study were self-report, presenting a possibility for common
method bias, which should be taken into account when interpreting the results. Common
method bias is the potential for inflation of the correlations due to collecting all data from
the same source. This bias can be reduced in future research by collecting data from

Motivation for transformational leadership 62
various sources or by conducting a longitudinal study design. A final limitation involves
the skewed distribution of the Motivation for Transformational Leadership subscales, as
very few participants reported amotivation or external regulation and the majority
reported intrinsic and/or more autonomous regulation. The nature of the study population
may explain the pattern of the data, as it is comprised of individuals who are more likely
to have a “calling” to their work and/or officership in a non-profit Christian organization.
As such, they are more likely to be autonomously motivated and amotivation and external
regulation may not matter as much in predicting effective leadership, reflecting range
restriction in the sample. The nature of this data will reduce the generalizeability of the
results to populations with more normally distributed responses. The primarily cross-
sectional nature of this data also precludes any causal conclusions, and future studies
should examine the hypothesized relationships using longitudinal data.
There is potential for the comparisons made between motivation to lead and
motivation for transformational leadership in Study One to have been an unfair
comparison. Cooper and Richardson (1986) argued that when two theories are compared,
one theory may be operationalized more strongly in the research than the other, which
may lead to the potentially incorrect conclusion that one theory is stronger than the other.
Motivation for transformational leadership may predict transformational leadership more
strongly than motivation to lead because participants are presented with a definition of
transformational leadership prior to responding to the items in this measure. Future
research should address this potential and use some of the strategies recommended by
Cooper and Richardson (1986) to make comparisons fairer.

Motivation for transformational leadership 63
Conclusion
Despite the limitations of this study, the findings contribute to the knowledge of a
new theory of leader motivation and help to establish the validity and reliability of the
motivation for transformational leadership scale. The findings suggest that motivation is
related to leadership style, and specifically, high levels of autonomous and intrinsic
motivation and low levels of controlled regulation and amotivation are related to
transformational leadership. With these study goals accomplished, Study Two builds
upon its findings by examining the stability of leader motivation over time.
Study Two
Study One established the validity and stability of the motivation for
transformational leadership construct and its construct stability over time. Study Two
extends these findings to further understand the nature of this construct, particularly
whether it changes over time. According to Singer and Willett (2003), there are two main
questions that researchers can ask about change in a variable: “1) How does the outcome
change over time? And 2) Can we predict differences in these changes?” (p. 7). Study
Two addresses the first question, namely to discover whether motivation for
transformational leadership changes over time, and if so, how does it change? When
exploring a new construct, Ployhart and Vandenburg (2010) argued that it is necessary to
first understand the descriptive nature of the construct before attempting to explain
change in that construct. Kelloway and Francis (2012) agreed with this assertion, and
added that there are many constructs in the field of occupational health psychology for
which we do not understand the trajectory of change due to a lack of descriptive

Motivation for transformational leadership 64
longitudinal studies. As such, it is critical in the development of a new construct to
examine the nature of change in order to guide future research aimed at predicting that
change. The purpose of Study Two is to look at the nature of motivation for
transformational leadership over time.
Study Two seeks to answer the question of whether the construct is a state or trait.
Does it remain stable within individuals (e.g., a horizontal line) or can it change over time
(e.g., a linear or non-linear relationship)? If it can change, is change consistent over time,
or does it fluctuate? Does initial level of motivation affect subsequent change in
motivation? To address these types of questions, Kelloway and Francis (2012) advocate
for the utility of measuring a single outcome at three or more time points and conducting
univariate analyses using growth curve analysis or other longitudinal methods to examine
change. These types of studies are valuable in that they can examine each individual’s
growth trajectory, specifically looking at the magnitude, pattern (linear or non-linear), and
direction of change (Ployhart et al., 2010; Singer & Willett, 2003; Preacher, Wichman,
MacCallum, & Briggs, 2008), which will contribute to our understanding of the nature of
the construct.
Study Two is a true longitudinal study, in that it measures motivation for
transformational leadership at three time points. Although previous studies have
attempted to address change using two waves of data, two-wave designs are unable to
examine the nature or processes of change over time, such that we can only look at linear
relationships with two-wave data (Kelloway & Francis, 2012; Singer & Willett, 2003).
Two-wave studies can also confound measurement error with actual change (Singer &
Willett, 2003; Ployhart & Vandenberg, 2010). As such, only studies with three or more

Motivation for transformational leadership 65
waves of measurement should be considered longitudinal (Singer & Willett, 2003;
Ployhart & Vandenberg, 2010; Kelloway & Francis 2012; Kelloway, 2014). Three-wave
data enhances statistical power, and allows for analysis that can’t be done with two-wave
data, such as latent growth curve modeling that requires at least three time points of data
(Kelloway, 2014; Preacher, Wichman, MacCallum, & Briggs, 2008) and. Latent growth
curve modeling is used in Study Two.
Research on Change in Motivation
Turner and Patrick (2008) argued that motivation researchers should focus more
on development and change in motivation, and that it is imperative that research look at
how motivation changes in response to context. Kinderman and Valsiner (1995) argued
that motivation research should seek to understand the “processes of individuals’
adaptation to changing contexts, . . . processes of context adaptation to changing
individuals, and [to] individuals’ potential to instigate and shape the development of their
contexts, as well as [to] contexts’ potential to instigate and shape the developmental
pathways of individuals.” (p. 230) In other words, how does the work context influence
motivation and how does individuals’ level of motivation influence the context? In
motivation research, employees are often asked to describe their beliefs about why they
should exert effort across many situations or occasions, such as “at work”. As Turner and
Patrick (2008) note, this practice implies that there is constancy across how an individual
experiences work, or that such differences are inconsequential. As Singer and Willet
(2003) note, “change is pervasive in everyday life” (p. 1). Change is constant, and
inevitable, especially in today’s dynamic and complex global organizations, such as The
Salvation Army, where leaders deal with near constant change. This study addresses the

Motivation for transformational leadership 66
question of whether leaders experience their work differently or the same across three
time periods.
An implicit assumption of self-determination theory is that level of motivation, or
degree of internalization, can change over time (Deci & Ryan, 1987; Ryan & Deci, 2000).
Some self-determination theorists argue that level of internalization is predicted by the
degree to which psychological needs are met, such that the satisfaction of these needs
promotes higher levels of internalization (Baard, Deci, & Ryan, 2004; Gagné & Deci,
2005; Ryan & Deci, 2002). The three fundamental needs include autonomy (having a
choice about whether to initiate behaviour based on personal interest and compatibility
with personal values), relatedness (feeling connected with others), and competence
(having a sense of proficiency; Deci, 1975; Ryan & Deci, 2002). Satisfaction of all three
needs has been positively related to more highly internalized motivation as well as other
positive performance and attitude outcomes (Baard, Deci, & Ryan, 2004; Gagné & Deci,
2005; Van den Broeck, Vansteenkiste, De Witte, Soenens, & Lens, 2010); This concept is
the basis of proposed interventions aimed at promoting more autonomous motivation. For
example, Baard (2002) suggests that making the organizational context more supportive
of autonomy can satisfy need for autonomy and promote higher internalization at work.
Research supports the effectiveness of psychological needs satisfaction in promoting
self-determined behavior. Autonomy support has been related to greater autonomous
motivation for smoking cessation and, in turn, more successful smoking cessation
(Williams et al., 2006), higher internalization of academic goals in school children and
better self- and teacher-rated motivation (Grolnick & Ryan, 1989), and greater
autonomous motivation for weight loss and better success with maintaining weight loss in

Motivation for transformational leadership 67
a healthcare setting (Williams et al., 1996). The above evidence suggests that motivation
can change when efforts are made to promote the psychological needs of individuals.
Study Two explores whether there is natural change in motivation for
transformational leadership over time that coincides with natural changes within the
organizational context. In order to look at natural change in motivation for
transformational leadership, it is important that the phenomenon is not examined during a
time of organizational change. As such, this study does not examine the effects of
interventions aimed at promoting higher levels of internalization nor does it coincide with
organizational change initiatives in The Salvation Army. However, although the
organizational context as a whole may not be changing, each leader is expected to have
natural variations in their work roles and workload over the course of the study, which
may influence their motivation for transformational leadership. For example, officers and
lay leaders are affected by moves that are announced in May and take place in August
each year. The officers included in this survey would not have had a change in
appointment during the time of study, as moves are announced in May/June. However,
half of the leaders in the current sample were relatively new to their current appointment
and reported in a demographic question in this study that their recent appointment change
affected themselves and their families to a large extent. Further, leaders in the Salvation
Army experience seasonal variation in their workload. For example, the Christmas season
is an incredibly busy time where leaders experience extreme demands on their time (more
than typical changes/fluctuations in seasons). Christmas preparations begin in October,
with the Christmas kettle and Red Shield campaigns, and self-denial campaign around
Easter. With these natural fluctuations in leader responsibilities and workload may come

Motivation for transformational leadership 68
fluctuations in motivation as well. Thus, the purpose of this study is to explore the nature
of the construct of motivation for transformational leadership, and specifically its natural
development or change over time.
Method
Participants
This study includes 58 leaders who were surveyed across three time points.
Participants included a total of 58 leaders including 48 officer leaders and 8 layperson
leaders (2 unidentified), 36 males and 20 females (2 unknown). Leaders’ ages ranged
from 32 to 63 with a mean age of 53.05. Organizational tenure ranged from 5 years to 41
years, with a mean tenure of 23.16. Most participants had a graduate degree (38.2%) as
their highest level of education, while the remainder had high school (21.8%), diploma
(23.6%), or undergraduate degree educations (16.4%). All ten divisions (including
Territorial Headquarters) were represented in the sample, with the majority of participants
working in the Ontario Central East division (19.6%). See Table 7 for demographic
characteristics. Of these leaders, 22 (54%) were new to their current appointment within
the past three years and 22 were in their current role for 4 years or longer. The majority of
leaders (47.9%) reported that their most recent change in appointment impacted
themselves and their families “to a large extent.”
Attrition effects over time were assessed by looking for significant differences in
motivation for transformational leadership between the group of participants who
responded at all three time points and those who responded only at Time 1. There was no
significant MANOVA effect (Pillai’s Trace = .04, F(6, 267) = 1.82, p > .05). There were

Motivation for transformational leadership 69
also no significant differences between the two groups on any of the demographic
variables.
Differences were examined between officer and layperson leaders on all study
variables at time one. There was a significant MANOVA effect (Pillai’s Trace = .52, F(6,
48) = 8.62, p < .001), and this effect is due to a significant difference in external
regulation, whereby layperson leaders (M = 4.79, SD = 2.03) score higher than officers
(M = 1.99, SD = .94; F(1, 53) = 40.75, p < .001). There were no significant differences on
any of the other types of motivation.
Design and Procedure
All officers and lay-people that were in a leadership role in the Canada and
Bermuda territory were contacted by email for this study. A total of 917 organizational
leaders within The Salvation Army who had at least one subordinate were surveyed three
times over the course of a seven month period. Measures were taken 3-4 months apart:
Time 1 - October 2012, Time 2- February 2013, and Time 3- May 2013. Participants
completed the Motivation for Transformational Leadership Scale (Gilbert et al., 2014)
described above and demographic information such as age, gender, tenure, and job title.
Analysis
Latent growth curve modeling using a structural equation modeling approach was
conducted using Mplus v 7.0 to examine changes in the latent growth curve of motivation
for transformational leadership over the three time points. This type of analysis can
describe the stability or change in a construct over time by examining the latent trajectory
of change at the individual level (Tisak & Tisak, 2000). Latent growth curve modeling is

Motivation for transformational leadership 70
a special case of structural equation modeling, which allows the researcher to test for
mean change over time by evaluating model fit while also accounting for measurement
error and dealing effectively with missing data (Preacher, Wichman, MacCallum, &
Briggs, 2008).
Latent growth curve modeling is an application of confirmatory factor analysis,
but where the loadings of the observed variables on the latent variables are fixed in order
to estimate the slope and variance parameters instead (Kelloway, 2014). Models where
one construct is measured at multiple time points are called first-order latent growth curve
models (FGM; e.g., Hancock, Kuo, & Lawrence, 2001). In FGM, the linear model is
represented by an intercept, slope and error variance, where the intercept is the initial
status of the observed variable and slope is the rate of linear change over time (Geiser,
Keller, & Lockhart, 2013). Path loadings can be changed to estimate different growth
patterns, if necessary, where a linear growth model is set at equal intervals (e.g., 0, 1, and
2) and a quadratic curve is set to the square of the linear path values (e.g., 0, 1, and 4).
Latent growth curve modeling estimates two latent variables: the intercept
(represents the starting value) and the slope (represents rate of change over time). For
each of these variables, a mean and variance is obtained. The mean intercept tells us the
mean starting score, and the intercept variance tells us whether individuals start at
different levels. The mean slope explains whether there has been change in the sample
(change occurs if significant) as well as the average rate of change in the sample. The
slope variance explains whether rate of change differs across individuals (Kelloway,
2014). To estimate a linear pattern of change, the slope parameters were fixed to 0, 1, and
2 for each measurement period. In the event that a linear model does not fit, but a

Motivation for transformational leadership 71
quadratic model does fit the data better, I tested both linear and quadratic models for all
types of motivation and amotivation. A quadratic model was estimated by fixing the slope
parameters to 0, 1, and 4. It was unnecessary to estimate the loadings for the intercepts,
because the program fixes the intercepts to one to indicate lack of change over time.
Goodness of fit of the model to the data was assessed using the chi square test of
model fit and root mean square error of approximation (RMSEA; Hu & Bentler, 1999),
and comparative fit index (CFI; Bentler, 1990). Criteria for a good fit was an RMSEA
smaller than .10 for a good fit to the data or smaller than .05 for a very good fit (Steger,
1990), with a non significant pclose and 90% confidence intervals that do not include
zero. The pclose statistic provides a test of significance regarding whether the value is
significantly different from .05, such that a significant pclose test suggests that the
RMSEA value is significantly different from .05 (Kelloway, 2015). In addition, the
comparative fit index (CFI) should be greater or equal to 0.95 (Hu & Bentler, 1999) as
per the criteria discussed in Study One.
There are few guidelines for sample size recommendations for multilevel data.
However, Mathieu et al. (2012) found that the median level two sample size in 79
multilevel investigations published in the Journal of Applied Psychology between 2000
and 2010 was 51. This compares favourably to the level two sample of 58 reported here,
especially given the level one follower sample size of 174.
Results
Study intercorrelations, means and standard deviations are presented in Table 7. The
fit of the model for amotivation showed an excellent fit to data (χ2
(1, N = 57) = .04, p = 0.85;
CFI = 1.00, RMSEA = 0.00, pclose = 0.86, 90% C.I. = . 0.00 - 0.12). The sample starting

Motivation for transformational leadership 72
score was significant (M = 1.43, p < .001) but the slope mean representing rate of change
in amotivation non-significant (M = -.011, p > .05), suggesting that there is no significant
change in amotivation over time. A non-significant correlation between the intercept and
the slope (r = -.022, p > .05) suggests that there is no relationship between initial
amotivation scores and subsequent rate of change over time. The significant intercept
variance (s2
= .28, p < .05) and non-significant slope variance (s2 = .00, p > .05) suggest
that participants started at significantly different scores but did not change at significantly
different rates.

Motivation for transformational leadership 73 Table 7. Intercorrelations with means, standard deviations, and internal consistency values for scales and subscales (N = 58).
Variable Mean (SD) Intercorrelations
1 2 3 4 5 6 7 8 9 10 11 12
1. Amotivated T1 1.42(.64) (.87)
2. Amotivated T2 1.43(.61) .67† (.67)
3. Amotivated T3 1.40 (.65) .60† .57† (.92)
4. External T1 2.40(1.51) .25 .17 .21 (.83)
5. External T2 2.48(1.51) .36† .27* .30* .85† (.92)
6. External T3 2.33(1.33) .26* .16 .25 .78† .85† (.88)
7. Introjected T1 4.01(1.56) .15 .22 .04 .31* .24 .25 (.82)
8. Introjected T2 3.90(1.53) .08 .18 .10 .38† .34† .36† .77† (.85)
9. Introjected T3 4.26(1.59) -.07 .03 -.04 .30* .30* .31* .72† .76† (.89)
10. Identified T1 6.37(.60) -.63† -.47† -.54† -.23 -.23 -.28* .11 -.01 .13 (.77)
11. Identified T2 6.33(.56) -.66† -.55† -.62† -.09 -.22 -.15 .12 .12 .20 .62† (.77)
12. Identified T3 6.26(.73) -.58† -.49† -.71† -.16 -.13 -.20 .10 .06 .23 .70† .72† (.83)
13. Integrated T1 4.51(1.21) -.23 -.20 -.35† .01 .14 .06 .06 .14 .14 .42† .40† .39†
14. Integrated T2 4.52(1.11) -.35† -.25 -.41† -.03 .06 .02 -.02 .12 .13 .39† .40† .42†
15. Integrated T3 4.51 (1.29) -.18 -.12 -.26* .03 .18 .10 -.06 .06 .04 .25 .31* .28*
16. Intrinsic T1 5.89(.73) -.32* -.11 -.36† -.19 -.14 -.09 -.06 -.10 .02 .47† .50† .46†
17. Intrinsic T2 5.70(.83) -.49† -.32* -.48† -.34* -.28* -.27* -.09 -.14 -.03 .68† .61† .62†
18. Intrinsic T3 5.72(.77) -.33† -.13 -.51† -.13 -.11 -.10 .00 -.05 .00 .48† .48† .48†
Notes. * = p < .05. † < .01; Coefficient alphas (α) are on the diagonal in parentheses

Motivation for transformational leadership 74 Table 7.
Continued
Intercorrelations
13 14 15 16 17
13. Integrated T1 (.89)
14. Integrated T2 .84† (.78)
15. Integrated T3 .84† .80† (.91)
16. Intrinsic T1 .41† .40† .26 (.87)
17. Intrinsic T2 .54† .47† .33* .71† (.78)
18. Intrinsic T3 .41† .45† .37† .57† .62† (.78)
Notes. * = p < .05. † < .01; Coefficient alphas (α) are on the diagonal in parentheses
Since the linear model was non-significant for amotivation, I tested a quadratic curve
to determine whether it would result in a better fit. I fixed the slope loadings to 0, 1, and 4
(the square of the linear curve loading values). The quadratic growth model for
amotivation did fit better than the linear growth model (χ2
(1, N = 57) = .01, p = 0.92; CFI =
1.00, RMSEA = 0.00, pclose = 0.93, 90% C.I. = . 0.00 - 0.12). The intercept value was
still significant (M = 1.430, p < .001), and there was no significant change in slope (M = -
.01, p > .05), and no relationship between initial amotivation score and subsequent change
in amotivation (r = -.01, p > .05). The intercept variance was significant (s2
= .27, p < .05)
and slope variance was non-significant (s2 = .00, p > .05).
The fit of the linear model for external regulation was also an excellent fit to data (χ2
(1,
N = 58) = 1.25, p = 0.26; CFI = 1.00, RMSEA = 0.07, pclose = 0.20, 90% C.I. = 0.00 -
0.36). The intercept mean was significantly different from zero (M = 2.44, p < .001). A
non-significant slope mean (M = -.06, p > .05) suggested no change in external regulation
over time. The starting value and slope of external regulation correlated significantly (r =
-.39, p < .05) such that the higher the initial external score, the less participants changed
in external regulation over time. The intercept variance was positive and significant (s2 =

Motivation for transformational leadership 75
2.34, p < .001) as was the slope variance (s2
=.26, p < .05), suggesting that participants’
initial scores varied significantly and that they changed at different rates.
The quadratic growth model for external regulation was an even better fit (χ2
(1, N = 58) =
0.56, p = 0.45; CFI = 1.00, RMSEA = 0.00, pclose = 0.49, 90% C.I. = 0.00 - 0.31). The
intercept mean was significantly different from zero (M = 2.47, p < .001). A non-
significant slope mean (M = -.04, p > .05) suggested no change in external regulation over
time. The starting value and slope of external regulation correlated significantly (r = -.13,
p < .05) such that the higher the initial external score, the less participants changed in
external regulation over time. The intercept variance was positive and significant (s2 =
2.34, p < .001), however, the slope variance is no longer significant in this model (s2
=
.06, p > .05) suggesting that participants do not change at significantly different rates.
The model for introjected regulation was an excellent fit (χ2
(1, N = 58) = 4.04, p < .05;
CFI = .97, RMSEA = 0.23, pclose = 0.06, 90% C.I. = 0.03 - 0.48). The intercept mean
significantly differed from zero (M = 3.93, p < .001), and a non-significant slope mean (M
= .12, p > .05) suggests that there was no significant change over time in introjected
regulation. The slope and intercept did not correlate (r = -.03, p > .05) suggesting that
initial introjected scores were unrelated to subsequent change. The intercept variance was
significant (s2
= 1.80, p < .001), but the slope variance was not (s2
= .05, p > .05)
suggesting that there was significant variance in initial level of introjection, but that
participants did not change at different rates.
The quadratic model for introjected was an even better fit (χ2
(1, N = 58) = 2.00, p = 0.16;
CFI = .99, RMSEA = 0.13, pclose = 0.19, 90% C.I. = 0.00 - 0.40). In this model, the
intercept mean was also significant (M = 3.92, p < .001) and initial scores were again

Motivation for transformational leadership 76
unrelated to subsequent change (r = -.01, p > .05). The slope mean was significant (M =
.08, p < .05), suggesting that there was a significant increase in non-linear change over
time. Paired t-tests showed that participants’ scores did not significantly change from
time one to time two (t(56) = .67, p > .05), but significantly increased from Time 2 to
Time 3 (t(57) = -2.57, p < .05; Figure 3 shows the mean change over time). As in the
linear model, the intercept variance was significant (s2
= 1.79, p < .001), but the slope
variance was not (s2
= .02, p > .05).
The model for identified regulation had an excellent fit (χ2
(1, N = 58) = .09, p = 0.76; CFI
= 1.00, RMSEA = 0.00, pclose = 0.78, 90% C.I. = 0.00 - 0.24). The intercept mean was
significantly different from zero (M = 6.38, p < .001), but the slope mean was non
significant (M = -.05, p > .05) suggesting no significant change over time. The slope and
intercept were correlated (r = .10, p < .05) such that the higher the initial value of
identified regulation, the more leaders changed over time. The intercept variance was non
significant (s2
=.11, p > .05), as was the slope variance (s2
= -.05, p > .05) suggesting that
leaders did not differ in initial values of identified regulation, nor did they change at
different rates over time.
The quadratic growth model for identified regulation had an even better fit (χ2
(1, N = 58)
= .02, p = 0.88; CFI = 1.00, RMSEA = 0.000, pclose = 0.89, 90% C.I. = 0.00 - 0.17). The
intercept mean was significantly different from zero (M = 6.36, p < .001), but the slope
mean was non-significant (M = -.02, p > .05) suggesting no significant change over time.
The slope and intercept were correlated (r = .03, p < .05) such that the higher the initial
value of identified regulation, the more leaders changed over time. In this model the
intercept variance was significant (s2
= .17, p < .01), suggesting that leaders did differ in

Motivation for transformational leadership 77
their initial values of identified regulation. The slope variance was non-significant (s2
= -
.01, p > .05).
The model for integrated regulation was also an excellent fit to the data (χ2
(1, N = 58) =
.04, p = 0.83; CFI = 1.00, RMSEA = 0.00, pclose = 0.84, 90% C.I. = 0.00 - 0.20). The
intercept mean was significantly different from zero (M = 4.52, p < .001), but the slope
mean was non-significant (M = .00, p > .05), suggesting no significant change over time.
The correlation between the slope and intercept was not significant (r = .18, p > .05),
suggesting that the intercept was unrelated to subsequent change over time. The intercept
variance was significant (s2
=.93, p < .001) suggesting that participants’ initial levels of
integrated regulation varied significantly and the slope variance was non significant (s2
=
-.17, p > .05), suggesting that they changed at similar rates. The quadratic curve was not a
better fit than the linear curve (χ2
(1) = .04, p = 0.83; CFI = 1.00, RMSEA = 0.00, pclose =
0.83, 90% C.I. = 0.00 - 0.20), suggesting that the linear model best represents the
trajectory of change for integrated regulation.
Finally, the linear model for intrinsic motivation also showed an excellent fit to data
(χ2
(1, N = 58) = 2.29, p = 0.13; CFI = .98, RMSEA = 0.15, pclose = 0.16, 90% C.I. = 0.00 -
0.41). There was a significant intercept mean (M = 5.88, p < .001) and slope mean (M = -
.09, p < .05) such that there has been negative change at the group level over time. The
slope and intercept were uncorrelated (r = -.11, p > .05). There was a significant intercept
variance (s2
= .56, p < .001) such that participants started at different levels of intrinsic
motivation, but a non-significant slope variance (s2
= .08, p > .05) suggesting that
participants did not change at different rates over time. Quadratic curves were used to
compare the fit. This model did not fit better than the linear model for intrinsic motivation

Motivation for transformational leadership 78
(χ2
(1, N = 58) = 4.20, p = 0.04; CFI = .95, TLI = .86, RMSEA = 0.23, pclose = 0.16, 90%
C.I. = 0.04 - 0.48). These results support the linear model as most representative of the
trajectory of change in intrinsic motivation. The linear growth model results are presented
in Table 8 for all five forms of motivation.
Figure 3. Change in mean motivation for transformational leadership scores over three
time points.
0
1
2
3
4
5
6
7
1 2 3
Mea
n S
core
Change in Mean Scores over Time
Amotivation
External
Introjected
Identified
Integrated
Intrinsic
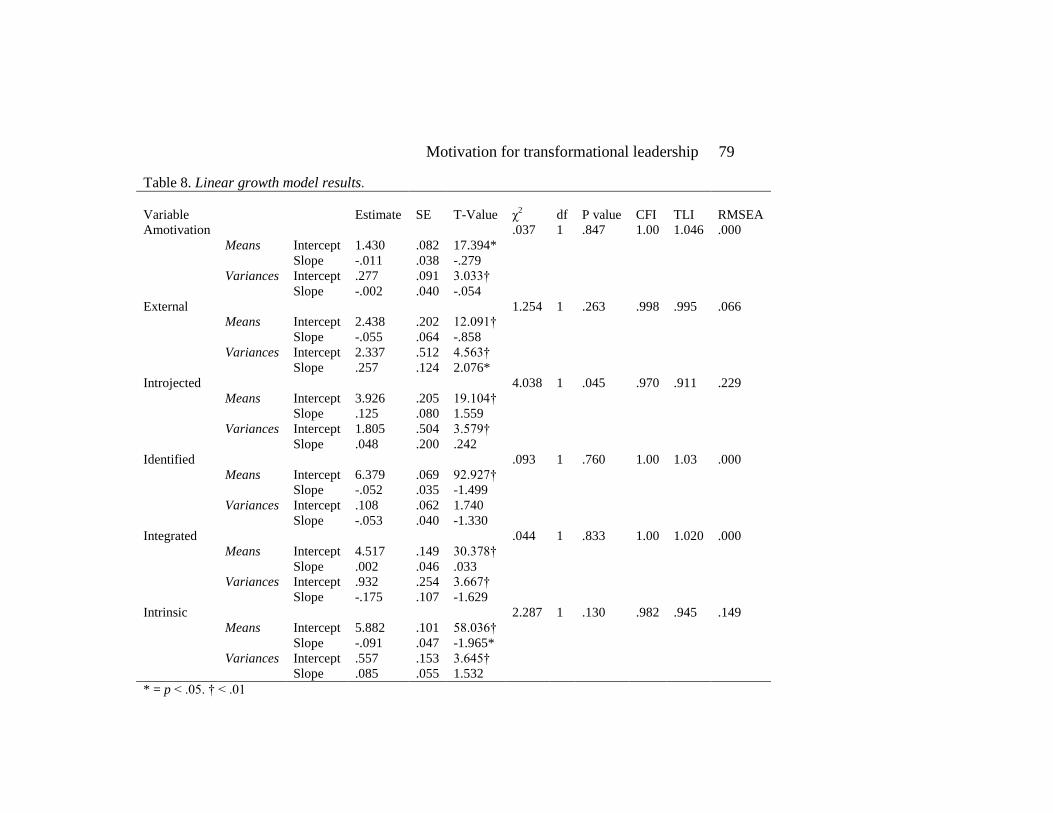
Motivation for transformational leadership 79
Table 8. Linear growth model results.
Variable Estimate SE T-Value χ2 df P value CFI TLI RMSEA
Amotivation .037 1 .847 1.00 1.046 .000
Means Intercept 1.430 .082 17.394*
Slope -.011 .038 -.279
Variances Intercept .277 .091 3.033†
Slope -.002 .040 -.054
External 1.254 1 .263 .998 .995 .066
Means Intercept 2.438 .202 12.091†
Slope -.055 .064 -.858
Variances Intercept 2.337 .512 4.563†
Slope .257 .124 2.076*
Introjected 4.038 1 .045 .970 .911 .229
Means Intercept 3.926 .205 19.104†
Slope .125 .080 1.559
Variances Intercept 1.805 .504 3.579†
Slope .048 .200 .242
Identified .093 1 .760 1.00 1.03 .000
Means Intercept 6.379 .069 92.927†
Slope -.052 .035 -1.499
Variances Intercept .108 .062 1.740
Slope -.053 .040 -1.330
Integrated .044 1 .833 1.00 1.020 .000
Means Intercept 4.517 .149 30.378†
Slope .002 .046 .033
Variances Intercept .932 .254 3.667†
Slope -.175 .107 -1.629
Intrinsic 2.287 1 .130 .982 .945 .149
Means Intercept 5.882 .101 58.036†
Slope -.091 .047 -1.965*
Variances Intercept .557 .153 3.645†
Slope .085 .055 1.532
* = p < .05. † < .01

Motivation for transformational leadership 80
Discussion
This study provided a preliminary understanding of the nature of motivation for
transformational leadership over a short period of time. The results suggest that
amotivation, external, identified, and integrated forms of regulation are stable over a
seven-month time period whereas intrinsic motivation decreased and introjected
regulation showed non-linear change over time. There are some theoretical and
methodological implications for future research if I’m not seeing change over a seven-
month period for some forms of regulation. Theoretically, this research suggests that
extrinsic forms of leader motivation and amotivation may be more resistant to change
over a short time period. Methodologically, this study provides some guidance for future
research in terms of the measurement spacing and length of longitudinal studies of
motivation. The null results may be an artifact of the spacing between measurements,
such that three months between measurements may not be sufficient time to detect
change. The overall stability in the construct may be due to stability in the working
environment. Perhaps there were no changes in the work environment that would
precipitate change in motivation since measurements were obtained only 3-4 months
apart and over the course of 7 months. I found only one study examining natural change
in self-determined motivation, which found that academic intrinsic motivation decreased
over time in children between ages 9 to 17 years (Gottfried et al., 2001). These findings
together suggest that intrinsic motivation may be subject to change based on situational
factors. Future research should address whether measurements obtained further apart or
closer together would detect change and examine samples in different industries and
organizational contexts.

Motivation for transformational leadership 81
A key finding of this study is that intrinsic motivation decreased while most other
forms of motivation remained stable. Also, introjected regulation showed quadratic
growth, with stability between times one and two and a significant increase in scores from
time two to time three. Given the low power in this study, these significant effects may
actually be quite substantial. The changes in intrinsic motivation and introjected
regulation may be related such that intrinsic motivation is replaced by introjected
regulation, where leaders are now motivated more out of sense of duty or to avoid
feelings of guilt rather than by inherent interest.
There are several potential explanations for these changes. First, the results could
potentially be due to the nature of the sample consisting of religious leaders who feel
called by God to their roles. Salvation Army leaders may be drawn to leadership roles in
the organization due to high levels of intrinsic motivation to be effective in those roles.
They may initially find the work as an officer or lay leader to be extremely fulfilling,
enjoyable, and interesting. However, over time, intrinsic motivation may decrease due to
contextual factors in the organization that influence psychological need satisfaction.
Satisfaction of the basic psychological needs for autonomy, competence, and relatedness
have been linked to greater autonomous motivation (Gagné et al., 2010; Van den Broeck
et el., 2011). For example, pressure to attain imposed goals reduces feelings of autonomy
and is likely to result in decreased intrinsic motivation and greater external locus of
causality (Deci & Ryan, 1985; Ryan & Deci, 2000). Perhaps if the organization is not
supportive of needs satisfaction, then intrinsic motivation will decrease over time, and
introjected regulation will increase.

Motivation for transformational leadership 82
A second explanation may be that intrinsic motivation waxes and wanes over the
course of the year, showing higher levels in the fall and lower levels just prior to the
summer, when my final measurement was taken. At this point in the year, officers are
usually looking forward to taking summer furlough after a busy Christmas and Easter
holiday season. Longer longitudinal studies will be necessary to determine if motivation
shows a cyclical pattern, with higher levels at certain times of the year and lower levels at
others. Some research suggests that a period of recovery, such as a vacation, allows
employees to rebuild resources and reduce strain and burnout, allowing employees to
return to work with greater energy and motivation (Demerouti, Bakker, Nachreiner, &
Schaufeli, 2001; Stevens, 2010; Westman & Etzion, 2001). As such, Salvation Army
leaders may experience lower levels of autonomous motivation at times of the year when
there have greater job demands and higher levels of autonomous motivation following a
vacation or furlough, when they can “top up” their motivation.
A third explanation may relate to financial compensation within the organization.
First, many Salvation Army leaders are lifelong members of the organization and have
previously volunteered in similar work prior to becoming employees or leaders. Being
paid for work may undermine intrinsic motivation such that, once a member of The
Salvation Army becomes an employee in the organization and is now paid for similar
work he or she may have done on a volunteer basis in the past, he or she may derive less
pleasure from that work. Previous research has found that receiving tangible rewards does
undermine intrinsic motivation for a task (Deci, 1975; Deci, Koestner, & Ryan, 1999).
Second, some authors have argued that higher base pay contributes more to psychological
needs satisfaction through greater perceptions of distributive justice and recognition of

Motivation for transformational leadership 83
high competency by the organization, which in turn promotes greater intrinsic motivation
(Gagné & Forest, 2008; Kuvaas, 2006). The low level of base pay that Salvation Army
leaders, particularly officers, receive may undermine intrinsic motivation. As such,
intrinsic motivation may be especially hard to maintain within The Salvation Army
setting, which may have implications for the organization in that it may need to explicitly
support or maintain intrinsic motivation using strategies besides improving base pay such
as providing autonomy support.
There was some evidence that initial levels of both external and identified
regulation influenced subsequent change in the construct, such that the higher the initial
level of external regulation, the less leaders changed over time in this level of
internalization and the higher leaders were initially on identified regulation, the more they
changed over time. The correlation was small and positive for identified and large and
negative for external such that if leaders initially scored high on external regulation, then
these leaders were likely to stay high. Perhaps those who are highly externally motivated
will be unlikely to become more autonomously motivated over time. It is plausible that
these leaders may be more resistant to change. Or maybe it’s just harder for someone who
is externally regulated to become autonomously regulated at all. If leaders initially scored
high on identified regulation, then these leaders were more likely to change, and
specifically decrease over time. Identified regulation may be showing regression to the
mean, where if a leader scores high initially, they are unlikely to be able to move
anywhere but down. The model for external regulation also showed significant slope
variance, so the leaders changed at different rates, suggesting that this level of
internalization is represented by a more individualized trajectory of change.

Motivation for transformational leadership 84
This study responds to a problem highlighted by Kelloway and Francis (2012)
wherein there is a lack of descriptive longitudinal research in Occupational Health
Psychology, such that we have little understanding of the nature of the phenomena we
study in the field. In developing this new construct of motivation for transformational
leadership, this study has contributed to our understanding of the nature of change in this
construct and provides support for the stability of most extrinsic forms of motivation and
amotivation.
Implications
The results have implications for organizations in the selection and development
of leaders. If motivation for transformational leadership is stable within individuals, then
there are implications for leader selection. In order to have autonomously regulated
leaders who exhibit effective leadership behaviours, it will become more important to
screen out leaders who are high on amotivation or controlled regulation and to select
leaders who score high on autonomous/intrinsic motivation for transformational
leadership.
Little is known about assessing leader motivation as part of leader selection
practices, but if leaders’ own motivation does predict leader effectiveness (which will be
examined in Study Three), then this measure has promise for selecting candidates with
the potential to be more effective. Further, there are implications for organizations to try
to promote or maintain intrinsic motivation, as this was the only level of motivation for
transformational leadership that showed evidence of significant change over time aside
from introjected. What can organizations do if intrinsic motivation is decreasing, or initial
levels are low in employees? The answers to these questions have implications for

Motivation for transformational leadership 85
leadership culture and training and development as well as selection. Perhaps leadership
development programs can promote more autonomous regulation, which we have seen in
previous studies above is predictive of transformational leadership behavior.
Limitations
Several limitations should be considered when interpreting the results of this
study. First, the small sample size limits the stability of the results, even though the
sample size was comparable to that of other multi-level studies in the social sciences
(Mathieu et al., 2012). The lack of change detected could be a result of lack of power due
to low sample size. However, the absolute magnitude of the effects suggests that even
with a larger sample size, there still may be no significant change. The effect sizes are so
small that the outcome is unlikely to be simply a result of low power, and it is likely that
they will remain small with higher power. The implications of this finding are that most
non-intrinsic forms of motivation (aside from introjected) are likely to remain stable over
time, even when studied in larger samples. However, due to the small sample size and
lack of generalizeability, the effects of change in all forms of motivation for
transformational leadership should still be replicated in future research using larger and
more diverse samples.
Second, motivation for transformational leadership was measured at only three
time points, which were only seven months apart. Some researchers recommend at least
four or five waves of data to model latent growth curves, depending on the complexity of
the model (Stoolmiller, 1995; MacCallum, Kim, Malarkey, & Kiecolt-Glaser, 1997;
Hertzog, Lindenberger, Ghisletta, & von Oertzen, 2006); however, others suggest that
three measurements are sufficient for modeling longitudinal change over time (Kelloway

Motivation for transformational leadership 86
& Francis, 2012; Ployhart & Vandenberg, 2010; Singer & Willett, 2003). My models
were simple descriptive linear and quadratic curves that included no predictors, so
three waves was probably sufficient for linear and non-linear growth curve modeling,
although future studies should examine change over more than three time points.
Because there is no real guidance in the literature regarding the ideal lag times
between measurements or the time frames for detecting change, the measurement time
points in this study were selected based on the highest likelihood of response by the
leaders. In particular, I chose time points that would be the least busy times for
Salvation Army leaders, and avoided busy times such as September, Christmas or
Easter. This practice served to minimize attrition, one of the biggest pitfalls of
longitudinal research. However, I still ended up with a small sample size of only 58
leaders despite my original sample of over 900 leaders. This small sample size limited
my power to detect significant effects (Maas & Hox, 2005).
A further limitation is that this study included 48 officer leaders and only 8
layperson leaders (2 unidentified). The sample was too small for me to be able to compare
growth curves between the two groups, but I did conduct a MANOVA comparing the two
groups on all study variables at time one. Lay leaders did have higher external regulation
than officers, although I did not find any significant differences on any of the other
variables. Officers may have lower external regulation due to their commitment to the
organization despite the challenges involved in their work. Officers often have lower base
salaries than lay leaders and their work is more of a lifestyle rather than a 9-5 job.
Because of these differences between the two groups of leaders, the officer group may be
restricted in range on external regulation and the results from this study may not be

Motivation for transformational leadership 87
generalizeable to a more heterogeneous group of workers. Future research should
examine the stability of motivation for transformational leadership in different leader
roles and organizational contexts.
This study spanned the course of seven months, so the context itself may be
relatively stable within this time period, making it hard to see change. Change in
motivation for transformational leadership may occur over a longer time period, or within
a time period where organizational change occurs. Future research should further examine
change in motivation for transformational leadership within a changing context. Kelloway
and Francis (2012) argued that there is little basis for deciding how long of a period of
time qualifies as longitudinal research, but that it is likely longer than a year.
Future research
This study provides only preliminary evidence of the trajectory of change of
motivation for transformational leadership. Now that there is evidence that intrinsic
motivation does change over time, future research can build on these results to examine
potential predictors of that change. Before research can examine what predicts change in
other types of motivation, first, we need to know whether non-intrinsic forms of
motivation do change. The findings from this study may guide future research in
designing more powerful research designs, which may be more effective at detecting
change by building on the limitations of this study. Specifically, allowing longer time
frame for research may result in detecting change over a longer period of time, perhaps by
studying motivation at yearly intervals for several years. Much more work should be
undertaken into order to more fully understand how and why this construct changes over
time.

Motivation for transformational leadership 88
Future research should extend these findings by conducting more long-term and
rigorous longitudinal research, which could determine whether motivation for
transformational leadership is state or trait based. Traits are “stable, long-lasting, and
internally caused”, whereas states are “temporary, brief, and caused by external
circumstances” (Chaplin, John, & Goldberg, 1988, p. 541). Many researchers argue that
states and traits are not discrete (e.g., Allen & Potkay, 1981) and that demonstrating
stability over time in a construct is not sufficient for distinguishing a state from a trait
(Allen & Potkay, 1981; Fridhandler, 1986). Other criteria for distinguishing a state from a
trait may include cross-situational consistency (Mischel, 1968), and personal versus
situational causation (Speilberger, 1972). Chaplin, John, and Goldberg, (1988) argued
that distinguishing states from traits can take an empirical view (e.g., high test-retest
reliabilities may be indicative of trait) but can also consider an intuitive conceptualization
of the construct. Motivation is intuitively context-based, however, the current measure
does look at context-specific motivation, which may be stable, according to the results of
this study. Future research needs to further establish the stability of motivation for
transformational leadership over time and perhaps also within changing contexts.
Previous SDT research and psychological needs theorists have strongly argued
that motivation can be improved by satisfying the three psychological needs (Deci &
Ryan, 2000; Vansteenkiste, Ryan, & Deci, 2008), and as such, imply that motivation is a
state that changes over time. However, the results of this study suggest that motivation
may tend to be more of a trait construct, or a combination of state/trait, where we have a
certain, stable level of motivation, which perhaps might fluctuate within a range based on
situational factors. Future research should look at whether this might be the case by using

Motivation for transformational leadership 89
larger samples, longer studies, and include potential predictors of motivation, such as
psychological needs satisfaction.
Based on the results of this study, I recommend more than three measurement
time points that are spread six months to a year apart to determine if there is change
occurring over a longer timeframe. These studies should take into consideration the
stability of the organizational context over the duration of the study. Future research
should also examine the stability of motivation for transformational leadership in the
context of organizational change. What happens to motivation when the organizational
environment is changing? How does leader motivation change in a leadership
development context? Individual and organizational level factors should be assessed in
these studies to determine whether these factors predict change in motivation, or vice
versa. Future research should examine what magnitude of change in intrinsic motivation
predicts performance, well-being, and employee attitude outcomes and also what factors
predict change in intrinsic motivation.
Conclusion
These results support tenets of SDT, which suggest that intrinsic motivation can
be promoted, perhaps through the satisfaction of psychological needs, as has been
proposed by many (e.g., Baard, 2002, Ryan & Deci, 2002 Baard, Deci, & Ryan, 2004;
Gagné & Deci, 2005). Specifically, by promoting an organizational context that supports
autonomy, relatedness, and competence of leaders, these researchers purport that
organizations can promote more internalized regulation. Although this study does not
examine the idea that the satisfaction of these needs specifically can improve intrinsic

Motivation for transformational leadership 90
motivation, it does support the idea that intrinsic motivation can change over time. Future
research needs to examine the predictors of this change, and perhaps examine needs
satisfaction in particular as a potential predictor.
Study Three
Following from Studies One and Two, Study Three addresses the predictive validity
of motivation for transformational leadership and specifically asks whether motivation for
transformational leadership influences perceptions of leader effectiveness. To address
some of the limitations of Studies One and Two, namely that they consisted of only self-
report data, Study Three includes both self- and other-ratings using self-ratings of
motivation for transformational leadership to predict follower ratings of transformational
leadership in two organizations. This study also expands on findings in Study One and by
Gilbert at al. (2014), linking motivation for transformational leadership with leadership
behavior. Some of the findings in these two studies were inconsistent, possibly because of
self-report bias or sample differences. This study will address some of the limitations of
self-reported leadership assessed in the above studies: self-rating bias and limited
generalizeability.
The results from Study One as well as from Gilbert et al.’s (2014) study show
some mixed results regarding the role of motivation in the prediction of leadership. In
Study One, all forms of motivation with the exception of external regulation predicted
transformational leadership. Gilbert et al. (2014) found that transformational leadership
was negatively predicted by amotivation and external regulation and positively predicted
by identified regulation. Contingent reward leadership was positively predicted by
identified regulation in Study One, and by amotivation as well as identified regulation by

Motivation for transformational leadership 91
Gilbert et al. (2014). Passive management by exception was predicted by external
regulation and intrinsic motivation in Gilbert et al.’s study, and by introjected regulation
in Study One. Active management by exception was predicted by external regulation in
Gilbert et al.’s study and by none of the predictors in the current research. Finally, Gilbert
et al. found that amotivation most strongly predicted laissez-faire leadership, whereas
amotivation and integrated regulation were both significant predictors in the current
research.
The differences in prediction between these two studies may be attributable to
differences between the samples. Whereas Gilbert et al. (2014) included a sample of both
formal and informal leaders across industries; Study One included formal leaders within a
global non-profit organization. Given these differences, context may play an important
role in how level of internalization predicts behavior and may moderate these
relationships. Potential moderators may include amount of financial compensation or
amount of autonomy and control experienced by the leader. Given these concerns, the
current study compares the relationships between motivation for transformational
leadership and perceived leader effectiveness in two contexts: healthcare and non-profit.
Study Three also addresses issues of self-rating bias in previous studies of
motivation for transformational leadership. Some researchers have found evidence for the
unreliability of leaders’ self-ratings compared to other-ratings or objective criteria
(Ashford, 1989; Harris & Schaubroeck, 1988; Mabe & West, 1982; Yammarino &
Atwater, 1993). Research comparing leaders’ and followers’ ratings of the leader’s
effectiveness suggests that leaders may have inflated perceptions of their leadership. Bass
and Yammarino (1991) found that, compared to follower ratings, US navy officers rated

Motivation for transformational leadership 92
themselves more favourably on all forms of transformational leadership, contingent
reward, and active management by exception, and rated themselves lower on laissez-faire
leadership. Discrepancies ranged from .28 for active management by exception to .94 for
contingent reward leadership. Leaders who were evaluated by supervisors as more
effective were least likely to inflate their transformational leadership scores compared to
subordinates’ scores. Yammarino and Atwater (1997) suggested that many factors might
influence a discrepancy between the leaders’ self-perceptions and the others’ perceptions
of the leader, including biographical characteristics, individual characteristics, such as
cognitive ability, job and organizational context, job relevant experiences, such as past
successes or failures, and cognitive processes. Based on previous findings highlighting
differences between self- and other-ratings of leadership, there may be different
relationships between motivation and subordinate ratings of leadership than between
motivation and self-ratings of leadership. Due to the potential discrepancies between self-
and other-ratings of leadership, it is important to evaluate leadership from a variety of
sources. That is why Study Three examines perceptions of leadership effectiveness by
followers as the outcome.
Study Three asks whether motivation for transformational leadership actually
makes a difference in perceptions of transformational leadership by followers. If I find
that this is the case, then motivation for transformational leadership will likely have
implications for follower outcomes. The transformational leadership research strongly
supports the benefits of transformational leadership for follower and organizational
outcomes. For example, transformational leadership has been linked to greater
subordinate job satisfaction (Hater & Bass, 1988; Koh, Steers & Terborg, 1995),

Motivation for transformational leadership 93
organizational commitment (Barling, Weber, & Kelloway, 1996; Bycio, Hacket, & Allen,
1995; Koh et al., 1995), trust in management (Barling et al., 1996), organizational
citizenship behaviors (Koh et al., 1995), psychological well-being (Kelloway, Turner,
Barling, & Laughlin, 2012; McKee et al., 2009), as well as organizational-level outcomes
such as higher task performance (e.g., Howell & Frost, 1989; Kirkpatrick & Locke, 1996;
Sosik, Avolio & Kahai, 1997), unit financial performance (Howell & Avolio, 1993), and
group performance and financial performance (Barling et al., 1996). Importantly, Bono
and Judge (2003) found that followers of transformational leaders were more likely to set
more autonomous goals, to be more affectively committed to their organization, and to
have higher job satisfaction. Gagné and Deci (2005) argued that transformational leaders
promote basic psychological needs satisfaction, and particularly support followers’
autonomy, which may contribute to these positive outcomes. If motivation for
transformational leadership can predict transformational leadership, then it may also
predict employee and organizational outcomes that we know are related to
transformational leadership.
The purpose of this study was to examine whether leaders’ motivation (level 2
predictor) predicts followers’ transformational leadership ratings (at level 1) in a
multilevel analysis. Bliese, Halverson, and Schriesheim (2002) noted that “the study of
leadership is inherently multilevel in nature’’ (p. 4) such that a single leader has an effect
on multiple followers. This study examines followers in clusters according to leader;
therefore, reducing the likelihood of an inflated Type I error (Cohen, Cohen, West, &
Aiken, 2003; Kelloway, 2014).

Motivation for transformational leadership 94
Hypotheses
Study Three will test two multi-level models each at the group and individual
levels of analysis regressing follower transformational leadership ratings on motivation
for transformational leadership by clustering followers by leader. Based on high
correlations between some leadership dimensions, transformational leadership and
contingent reward leadership were combined into a dimension called active-constructive
leadership and laissez-faire leadership and passive management by exception into a
dimension called passive-avoidant leadership. I have excluded active management by
exception from the analyses based on results from Study One showing no significant
correlations with motivation for transformational leadership. More details on this process
are provided in the measures section. I will test the following hypotheses:
H10: Intrinsic motivation, integrated and identified regulation will positively predict active-
constructive leadership.
H11: External and introjected regulation will positively predict passive-avoidant leadership.
Method
Organizational Context
Given the unique context of the Salvation Army, a second organization was
recruited to participate in Study Three in order to test the hypotheses in two
organizations. Leaders and followers from these two organizations participated in this
study. Study One described the organizational context of The Salvation Army. The
second participating organization in Study Three was Cumberland Health Authority, a
small district health authority in Nova Scotia. There were a total of 43 managers, each of

Motivation for transformational leadership 95
whom was is in charge of a work unit including nurses, administrative personnel, and
allied health professionals. Work unit specializations ranged from community healthcare
to oncology and emergency care.
Participants
In total, participants in this study included 179 followers, nested within 37 leaders,
grouped according to 2 organizations. In the health authority, 20 managers were matched
with 121 followers, and 17 Salvation Army leaders were matched with 58 followers.
The Salvation Army
A total of 17 commissioned officers in The Salvation Army participated in the
current study. Of these leaders, 14 were recruited as part of the five-year pre-confirmation
institute, which involves all officers across Canada and Bermuda territory who are in their
fifth year of commissioned officership. The institute provides training and development
for relatively new officers. The remaining three leaders were recruited from the Canadian
Maritimes region. Of the total 17 leaders included in the current study, 9 were male and 4
were female (4 unidentified), the average age was 42.23 with a range from 25 to 55 years.
A large percentage of the leaders held an undergraduate degree (43.8%) while 25% had
diploma education, 12.5% had high school, and 18.8% had graduate degree education.
Leaders had 17.27 subordinates reporting to them, on average, and a mean of 24.15
people working in his or her department. Average organizational tenure was 11.17 years
and average length of time in current appointment was 4.03 years. Each leader was rated
by between 1 and 9 followers, with an average of 3.4 raters per leader.

Motivation for transformational leadership 96
In addition to leaders, this study also included follower data. For the purposes of
this study, “follower” was defined as a congregation member, volunteer, or employee
who works regularly with a Salvation Army leader. This study included 58 followers,
who each rated one leader. Followers included 22 females and 20 males (16 unidentified),
with a mean age of 51.07 and an age range from 20-71. Followers reported that they have
worked with their leader between 0 and 30 years, with an average of 4.06 years and
followers interacted with their leader either once or twice per week (36.2%), more than
once per day (24.1%), once daily (3.4%), three to four times per week (33.4%), or fewer
than once per week (13.8%). Many followers had a diploma education (35.2%) while
25.9% had an undergraduate degree, 20.4% had high school, and 18.5% had graduate
degree educations. Followers identified their leader as one or more of the following: as
their corps officer (church minister; 63.5%), as their boss (25%), or as a volunteer
coordinator (19%).
Cumberland Health Authority
The study also included a sample of 20 managers in the Health Authority who
were formal leaders in the organization with at least one subordinate. Of these managers,
6 were male, 14 female. The average age was 50.9 years with a range from 40 to 64 years.
Many of the leaders held an undergraduate degree (45%) while others had high school
(15%), diploma (5%) or graduate degree (35%) educations. Leaders had 29.6
subordinates reporting to them, on average, and a mean of 32.8 people working in his or
her department. Average organizational tenure was 11.2 years and average length of time
in current position was 6.8 years. Each leader was rated by between 1 and 15 followers
with an average of 6 raters per leader.

Motivation for transformational leadership 97
This study also included 121 followers, who each rated only their own leader.
Followers from Cumberland Health were 88.4% female, 11.6% male, with a mean age of
45.94 and an age range from 23-63. Followers reported that they have worked with their
leader between 0 and 24 years, with an average of 3.6 years and many followers
interacted with their leader more than once per day (38.8%) while others interacted once
daily (7.4%), three to four times per week (19%), one or two times per week (19.8%), or
fewer than once per week (14.9%). A large percentage of followers had a diploma
education (48.8%) while others had high school education (6.6%), undergraduate degrees
(26.4%), or graduate degree educations (18.2%).
Design and Procedure
The Salvation Army
An email was sent to all leaders involved in the pre-confirmation institute, which
consists of all officers in the Canada and Bermuda territory who have five years of
service. To increase the sample size, officers from the Maritime Provinces with
comparable lengths of tenure (under 15 years) were also recruited. The email included a
leader survey link for the leader to complete and a follower survey link for the leader to
distribute to up to ten followers. I asked the leaders to recruit followers on my behalf in
order to select the followers with whom they interacted the most and who would be able
to give more informed ratings of the leader. Leaders were asked to email a recruitment
script to up to ten followers, which included a follower survey link. Leaders provided
self-ratings for transformational leadership and motivation for transformational
leadership. Followers provided ratings of their leader’s transformational leadership. All
surveys were completed online using Qualtrics. Leaders in the pre-confirmation institute

Motivation for transformational leadership 98
were aware that they would be receiving feedback on their scores in a leadership training
session that was held in January, 2012, which is likely why the higher response rates were
in this group.
Cumberland Health Authority
All managers within Cumberland Health Authority received an email containing a
link to the online survey containing the transformational leadership and motivation for
transformational leadership measures. In order to collect direct report data, all employees
within the organization (N = 850-900) were sent an email including the subordinate
survey link and were asked to rate their direct supervisor’s leadership. For ethical reasons,
all employees received the recruitment email and I was not able to specifically target
followers who interacted often with their managers as I did in The Salvation Army
sample. To further promote participation, managers were also asked to distribute flyers to
employees informing them of the survey and to read a recruitment script at a staff
meeting. Of the total sample of almost 900 employees, 121 followers participated who
could be matched with leaders who also responded to the survey (for a response rate of
approximately 14%).
Measures
Leaders completed the Motivation for Transformational Leadership Scale (Gilbert
et al., 2014) and Multifactor Leadership Questionnaire (MLQ; Bass & Avolio, 1994),
described above. As in Study One, the four dimensions of transformational leadership
(intellectual stimulation, idealized influence, inspirational motivation, and individualized
consideration) were aggregated into a single measure based on high correlations between
the subscales (rs ranged from .80 to .91) and on previous research (e.g., Barling et al.,

Motivation for transformational leadership 99
2010; Kelloway et al., 2012). Demographic information such as age, tenure, years of
experience, and position were included. Followers rated their leaders using the MLQ and
also provided demographic information including the nature of their relationship with the
leader (e.g., employee, congregation member, volunteer, etc.) and how often they
interacted with their leader.
Descriptive analysis of the results revealed very high correlations between both
transformational and contingent reward leadership (correlated r = .93, p < .001) and
laissez-faire and passive management by exception (r = .81, p < .011). The correlations
are were so high that they preclude me from examining them as separate outcomes as I
did in Study One because of the lack of discriminant validity in this study. As a result,
contingent reward and transformational leadership were combined into a single composite
factor called active-constructive leadership. These scales have been combined this way in
previous research (Bycio, Hackett & Allen, 1995; Kelloway, Turner, Barling, &
Loughlin, 2012), which supports the idea that there is no clear distinction between the two
leadership styles, and they both represent positive forms of leadership. Bycio, Hackett,
and Allen (1995) found support for a two-factor model of full-range transformational
leadership comprising active leadership, a composite of transformational and contingent
reward leadership, and passive leadership, a composite of management by exception
leadership (laissez-faire leadership was not examined in this study). These authors found
insufficient discriminant validity between the contingent reward and transformational
leadership scales.
Passive management by exception and laissez-faire leadership were also
combined into a factor called passive-avoidant leadership. These scales have also been

Motivation for transformational leadership 100
combined in previous research (Bass & Riggio, 2006; Medley & LaRochelle, 1994; Den
Hartog et al., 1997; Druskat, 1994; Yammarino & Bass, 1990), with a similar rationale.
This is consistent with the view that these scales overlap – indeed Kelloway Mullen &
Francis (2006) combined items from both scales into one variable that they refer to as
passive leadership (see also Mullen, Kelloway & Teed, 2011). In both studies passive
leadership was distinct from, and predicted criterion variance above and beyond the
effects of, transformational leadership (Kelloway et al., 2006; Mullen et al., 2011).
Analysis
In this data, multiple followers rated the same leader, and this violates the
assumption of independence of observations (Kelloway, 2015). Multilevel modeling
(MLM) clusters followers’ ratings according to their respective leaders, which is an
effective analysis to account for a lack of independence in responses (Hofman, Griffin, &
Gavin, 2000). Multilevel modeling using Mplus v. 7.0 was conducted to analyze the
relationships between leaders’ motivation for transformational leadership and subordinate
transformational leadership ratings. Two methods of analysis were used to examine both
individual-level and group-level leadership ratings. Individual-level analysis allows for
the examination of whether a leaders’ motivation influences leadership ratings differently
based on their unique relationship with each follower, whereas group-level analysis
allows for the examination of the effect of leader motivation on the shared perceptions of
leadership by the entire group of followers (Kelloway, 2014). In other words, does
motivation predict leadership differently when it is based on the individual experience
with a particular leader versus when it is based on a more objective group-level rating of
leadership?

Motivation for transformational leadership 101
In the individual-level analysis, leader motivation for transformational leadership
constituted level two of the analysis and subordinate ratings of transformational
leadership constituted level one. The model was conceptualized as a cross-level direct
effects model (Kozlowski & Klein, 2000), where motivation for transformational
leadership was considered a group-level effect and leadership perceptions were
considered an individual-level effect. Followers were nested, or grouped, within their
leaders. The group-level analysis is conceptualized as a level 2 model, where subordinate
ratings were aggregated to the group level so that both leader motivation and follower
ratings were included as level two variables.
Hypothesis testing using multilevel modeling involves accounting for significant
between-group and within-group variance on the dependent variable, transformational
leadership. In this study, between-group variance refers to differences in the average
transformational leadership scores between groups, and within group variance refers to
differences between followers reporting to the same leader. In the current study, I
estimated between-group and within-group variance on the dependent variables using two
models testing each hypothesis. The first model will look at individual-level leadership
ratings (at level 1) and the second model will look at group-level leadership ratings (at
level 2). Effects in multilevel modeling can be specified as either fixed or random (Kreft
& de Leeuw, 1998). Study Three was interested in the fixed effects in the model where
the slope is assumed to be constant across groups. In other words, it was expected that
motivation for transformational leadership would predict leadership in the same way
across groups. In this study, all model estimation was based on Maximum Likelihood,

Motivation for transformational leadership 102
and the -2 Log Likelihood (-2LL) was used to determine improvement in fit in subsequent
models, with smaller values suggesting a better model fit.
The first step of the analysis is to run the intercepts-only model to determine whether
enough variance exists across leaders in transformational leadership ratings to justify
multilevel modeling (Heck, Thomas, & Tabata, 2014). In this model, no predictors are
included and Mplus partitions the variance within and between groups to determine how
much variance in transformational leadership ratings lies at the leader level (level 2). It
allowed only the intercepts to freely vary across groups. This analysis generated a statistic
called the intra-class coefficient (ICC); an ICC of zero indicates that there is no variance
between groups on leadership ratings and that all variation exists within individuals
(Peugh, 2010). As the ICC value increases, so does the amount of variance that exists
across groups, meaning that the assumption of independence of observations is violated
and that multilevel modeling is an appropriate approach (Peugh, 2010). ICC values
between .05 and .20 are common in multilevel studies within the social sciences (Peugh,
2010; Muthén, 1991, 1994; Muthén & Satorra, 1989; Spybrook, Raudenbush, Liu,
Congdon, & Martinez, 2008). If there is no significant difference on the dependent
variable at level two, then further analysis cannot be justified because the point is to
explain group differences on the dependent variable. This model is also meant to establish
a baseline fit against which to compare subsequent models that include predictors using
the -2LL value for the baseline model.
The level-one model is as follows:
Yij =β0j + β1j (Xij- �̅�j) + rij

Motivation for transformational leadership 103
Where Yij is the leadership rating for the ith person under leader j, β0j is the intercept
value for leader j, e1j is the slope value for leader j, and Xij is the motivation for
transformational leadership value for leader j, which is grand-mean centered by
subtracting the overall motivation for transformational leadership mean (�̅�j), and rij
represents the residual score for leadership ratings between followers.
The equation for the level 1 null model is as follows:
Null Model: Yij =β0j + rij
The second step is to run the conditional model, which includes the motivation for
transformational leadership subscales as the predictor variables assessed at the leader
level. This model is referred to as a means-as-outcomes model because all predictors are
assessed at the between level, so it is trying to predict differences in group means
(Kelloway, 2014).
In this data, leaders are also nested within two different organizations, making it
necessary to account for differences between organizations when attempting to explain
the dependent variable. Although a three-level analysis is possible where followers are
nested within leaders, which are nested within organizations, having only two clusters at
level three significantly reduces the number of parameters the model can estimate. As
such, I controlled for organization in the analysis by conducting multi-sample analysis,
whereby results are grouped by organization. No other control variables were included in
the analysis because of the small sample size. As recommended by Kelloway (2014) and
Peugh (2010) all level two predictor variables, meaning all motivation for
transformational leadership scales, were grand mean centered such that the sample mean

Motivation for transformational leadership 104
for each motivation for transformational leadership subscale was subtracted from each
leaders’ motivation for transformational leadership subscale score.
Results
Means, standard deviations, and intercorrelations for the level one and level two study
variables are presented in Tables 9 and 10.
Table 9. Descriptive statistics and intercorrelations for level-one study variables. Intercorrelations
N Mean (SD) 1 2
Cumberland Health
1. Active-constructive 121 2.02 (1.24) (.93)
2. Passive-avoidant 121 1.38 (1.11) -.76† (.95)
Salvation Army
3. Active-constructive 58 2.99 (.70) (.89)
4. Passive-avoidant 58 0.78 (.69) -.51† (.89)
Notes. * = p < .05. † < .01; Coefficient alphas (α) are on the diagonal in parentheses

Motivation for transformational leadership 105
Table 10. Descriptive statistics and intercorrelations for level-two study variables. Intercorrelations
N Mean (SD) Amotivated External Introjected Identified Integrated Intrinsic
Cumberland Health 104
1. Amotivated MTFL 104 1.43 (.59) (.89)
2. External MTFL 104 2.62(1.22) .30† (.71)
3. Introjected MTFL 104 3.61(1.77) -.37† .27† (.85)
4. Identified MTFL 104 6.06(.91) -.64† -.06 .77† (.87)
5. Integrated MTFL 104 4.81(.86) -.28† -.07 .15 .17 (.79)
6. Intrinsic MTFL 104 5.56(.94) -.73† -.10 .49† .76† .26† (.84)
Salvation Army
7. Amotivated MTFL 58 1.30(.41) (.65)
8. External MTFL 58 2.80(1.00) -.19 (.47)
9. Introjected MTFL 58 4.91(1.00) -.03 .19 (.88)
10. Identified MTFL 58 6.39(.75) -.12 -.02 .03 (.89)
11. Integrated MTFL 48 4.77(1.44) -.27 -.21 -.04 .68† (.95)
12. Intrinsic MTFL 48 5.66(.96) -.43† .53 .17 .30* .04 (.82)
Notes. * = p < .05. † < .01; MTFL = Motivation for Transformational Leadership; Coefficient alphas (α) are on the diagonal in parentheses

Motivation for transformational leadership 106
I tested the hypotheses in four multi-sample multi-level analyses, predicting active-
constructive and passive-avoidant leadership at both the individual and group-level with
the five levels of regulation, grouping the results by organization.
First, I tested the cross-level direct effects of the leaders’ motivation for
transformational leadership (at level two) on individual-level leadership ratings (at level
one). The null model results for active-constructive leadership suggest that there is
significant between-groups variance in both The Salvation Army sample (ICC = .42) and
the Cumberland Health sample (ICC = .41), which warrants cross-level analysis in each
organization. This statistic means that differences across leaders account for 42.4% of the
variance in active-constructive leadership ratings in The Salvation Army and 41.5% of
the variance in these ratings in Cumberland Health Authority.
In the null model, the -2LL was -232.32. To test the conditional model, level-two
predictors were included. This model’s -2LL value decreased to 188.29, suggesting an
improvement in model fit over the null model. In Cumberland Health, identified
regulation was the only significant predictor of active-constructive leadership (β = .99, SE
= .34, β/SE = 2.93, p = .003), whereas in the Salvation Army, intrinsic motivation (β =
1.09, SE = .25, β/SE = 4.30, p < .001) and external regulation (β = -.66, SE = .28, β/SE = -
2.31, p = .021) were significant predictors.
The null model results for passive-avoidant leadership also showed significant
variance between groups in both The Salvation Army sample (ICC = .30) and the
Cumberland Health sample (ICC = .46). The null model -2LL was -209.77. Including
predictors, the -2LL in the cross-level conditional model decreased to -171.00. Intrinsic
motivation (β = -0.52, SE = 0.24, β/SE = -2.16, p = 0.031) alone negatively predicted

Motivation for transformational leadership 107
passive-avoidant leadership in Cumberland Health authority, but none of the levels of
motivation were significant predictors of passive-avoidant leadership and the individual-
level in the Salvation Army.
The null model for group level active-constructive leadership ratings had a -2LL
of -41.77. Although an intra-class correlation coefficient cannot be obtained in this
analysis because it does not include individual-level data, the between group variance of
the intercept can be reviewed to determine whether groups significantly differ in
leadership ratings. In this case, the between-groups variance, denoted by τ00, in active-
constructive leadership is significant in the Salvation Army (τ00 = .34, p < .001) and
Cumberland Health (τ00 = .85, p < .001) samples. This significant between-groups
variance supports a multi-level analysis. When predictors were added to the model, the -
2LL decreased to -27.50, suggesting a better fit to the data over the null model. In the
Cumberland Health Authority, intrinsic regulation (β = 0.45, SE = 0.13, β/SE = 3.34, p <
0.001) and external regulation (β = -0.34, SE = 0.12, β/SE = -2.80, p = 0.005) were
significant predictors of mean active-constructive leadership. In the Salvation Army,
intrinsic motivation (β = .77, SE = 0.26, β/SE = 2.96, p = 0.003) and external regulation (β
= -0.49, SE = 0.18, β/SE = -2.65, p = 0.008) also predicted the group mean of active-
constructive leadership.
In predicting the group mean of passive-avoidant leadership ratings, the null model
between-groups variance, denoted by τ00, in passive-avoidant leadership is significant in
the Salvation Army (τ00 = .24, p < .001) and the Cumberland Health (τ00 = .60, p < .001)
samples and the -2LL = -35.35. Adding predictors reduced the -2LL to -20.68, suggesting
a better fit. Identified regulation was the only significant predictor of mean passive-

Motivation for transformational leadership 108
avoidant leadership in Cumberland Health (β = -0.75, SE = 0.26, β/SE = -2.83, p = 0.005),
whereas introjected (β = -0.32, SE = 0.15, β/SE = -2.12, p = 0.03) and intrinsic regulations
(β = -0.61, SE = 0.24, β/SE = -2.60, p = 0.009) predicted this outcome in the Salvation
Army sample. Table 11 provides the results of the mixed-level analyses at both the
individual- and group-levels.

Motivation for transformational leadership 109
Table 11. Results of mixed-level analysis.
Group-Level Individual-Level
Group-Level Predictors ACL PAL ACL PAL
Cumberland Health β SE β/SE β SE β/SE β SE β/SE β SE β/SE
External MTFL -0.341 .122 -2.802† .031 .274 .113 -.347 .207 -1.678 .096 .236 .408
Introjected MTFL -.160 .146 -1.094 .392 .283 1.386 -.346 .292 -1.186 -.175 .321 -.543
Identified MTFL .050 .179 .279 -0.746 0.264 -2.832† .993 .339 2.932† -.097 .569 -.170
Integrated MTFL -.083 .088 -.949 .269 .197 1.365 .028 .362 -.165 .127 .233 .547
Intrinsic MTFL 0.448 0.134 3.338† -.143 .184 -.775 -.271 .362 -.747 -0.520 0.241 -2.162*
Salvation Army
External MTFL -0.491 0.185 -2.648† .203 .251 .811 -.657 .285 -2.310* .101 .278 .364
Introjected MTFL -.162 .145 -1.113 -0.316 0.149 -2.125* -.098 .194 -.507 -.128 .283 -.452
Identified MTFL .081 .286 .284 .212 .267 .795 -.222 .254 -.872 -.115 .620 -.185
Integrated MTFL -.219 .218 -1.003 -.109 .259 -.421 -.065 .282 -.231 .244 .352 .692
Intrinsic MTFL .771 0.260 2.962† -0.614 0.236 -2.604† 1.087 .253 4.296† -.651 .556 -1.172
Notes. * = p < .05. † < .01; MTFL = Motivation for Transformational Leadership; ACL = Active-Constructive Leadership; PAL = Passive avoidant
leadership

Motivation for transformational leadership 110
Discussion
Predicting Active-Constructive Leadership
Motivation for transformational leadership predicted active-constructive
leadership similarly in each organization at both levels of analysis. In the Salvation Army,
intrinsic and external regulations were the only significant predictors at both the
individual and group levels. This finding supports the idea that autonomous motivation
promotes active-constructive leadership, as was hypothesized, but also the idea that
external regulation may be detrimental to this more effective leadership style. In
Cumberland Health, identified regulation was the only significant predictor at the
individual level of analysis, whereas intrinsic and external regulations were significant
predictors at the group level. Identified is an autonomous form of extrinsic motivation,
and this finding further supports the general idea that autonomous motivation positively
predicts effective leadership. Previous research has found that, whereas intrinsic
motivation predicts higher performance on interesting tasks, autonomous forms of
extrinsic motivation predict higher performance on tasks that are important but not
interesting and thus require discipline (Koestner & Losier, 2002). Hypothesis 10, which
predicted that intrinsic, integrated, and identified regulation would predict active
constructive leadership was partially supported in both samples such that certain
autonomous forms of regulation did predict this style of leadership across organizations.
It is interesting that, although intrinsic and identified regulation played a role in
predicting effective leadership, integrated regulation did not emerge as a significant
predictor. Some previous researchers have had difficulty empirically distinguishing

Motivation for transformational leadership 111
integrated from intrinsic and identified regulation (Gagné et al., 2010; Ryan & Connell,
1989; Scott et al., 2014; Vallerand et al., 1992). Deci and Ryan (2008) argued that
integration may be very similar to intrinsic motivation, in that both types of motivation
involve a high level of choice and autonomy, but differ in that integrated regulation is not
fully intrinsic. Thus, although integrated regulation is similar to intrinsic motivation, it is
theoretically distinct because it is not based on interest in the behaviour itself, as in
intrinsic motivation, and rather has to do with fully integrating the value of the behaviour
(Deci & Ryan, 2008; 2000). Integrated and identified regulations were highly correlated
in the Salvation Army sample, but not in the Cumberland Health sample. So, in the
Salvation Army sample, integrated may be too similar to identified regulation to
distinguish the two, although they both emerged as separate factors in Study One.
Predicting Passive-Avoidant Leadership
Hypothesis 11 predicted that introjected and external regulation would positively
predict passive avoidant leadership. In The Salvation Army, nothing predicted individual-
level passive avoidant leadership, but at the group level, introjected and intrinsic
regulations were both significant negative predictors of this leadership style. These results
do not support Hypothesis 11, as they do not suggest that controlled types of motivation
promote this leadership style, and in fact, higher levels of introjected motivation may be
related to less passive-avoidant leadership in this sample. So, Salvation Army leaders who
are good leaders in order to avoid feeling guilty or to promote one’s own self-esteem may
actually be less likely to be passive-avoidant leaders. This result may be directly related
to the organizational context, where, in this Christian environment, leaders feel ‘called’ to
their roles in the Salvation Army. As a result, leaders may be perceived as poor leaders if

Motivation for transformational leadership 112
they would not feel guilty if they ignored a call by God to be a good leader. The
introjected items pertain to putting in good effort as a leader in order to avoid feeling
guilty, bad about oneself, or ashamed. These leaders, who feel called by God to be in their
roles, might feel this way if they did shirk their responsibilities. Although this reflects an
external contingency, in this context, it may be important in followers’ perceptions of
good or bad leadership. Consistent with previous findings, intrinsic motivation was
negatively related to passive leadership in this sample.
In Cumberland Health, passive-avoidant leadership had different predictors across
individual- and group-levels. Specifically, intrinsic motivation was a sole negative
predictor of this form of leadership at the individual level, but identified was the sole
significant negative predictor at the group-level. These results provided no support for the
idea that controlled types of motivation lead to more passive-avoidant leadership in any
of the analyses. However, these results do support the idea that passive-avoidant
leadership is negatively related to autonomous motivation; meaning that autonomously
motivated leaders are less likely to exhibit passive-avoidant leadership.
The results largely support the role of autonomous forms of regulation in
negatively predicting this style of leadership, with the interesting exception of introjected
regulation negatively predicting this style in the Salvation Army. This finding was
unexpected, however, it does make intuitive sense. Compared to external regulation,
introjection is an internal regulation, meaning that the behavior has been taken in by the
person and no longer requires an external contingency for motivation (Gagne & Deci,
2005). Although introjected regulation is still controlled, the control comes from within
the person. Also, it is an active form of motivation (i.e. it is not amotivation), and thus is

Motivation for transformational leadership 113
related negatively to a lack of enacted leadership behavior. Introjection is characterized
by wanting to demonstrate ability or to avoid failure to maintain feelings of worth (Deci
& Ryan, 2000), and these are motives that demand action and are incompatible with
laissez-faire and even passive management by exception. In this study, no form of
motivation positively predicted passive leadership. Conversely, autonomous forms of
motivation are related to less passive-avoidant leadership, particularly intrinsic and
identified regulation.
Hypothesis 10 predicted that intrinsic, integrated, and identified regulation would
be positively related to active-constructive leadership. This hypothesis was partially
supported in some analyses, where intrinsic and identified regulation emerged as
significant positive predictors of active-constructive leadership. In order to exhibit active-
constructive leadership in the Salvation Army, high intrinsic motivation as well as low
external regulation is important. However, in Cumberland Health Authority, highly
identified regulation alone is significant. What explains the differences in prediction
between these two samples? The answer may lie in the organizational context and the
way in which these leaders are compensated. In the Salvation Army, leaders receive very
low compensation. They receive a very small salary on top of which the Salvation Army
provides for their houses, cars, and bills. Thus, if these leaders have high external
regulation, they will not be motivated to behave as active-constructive leaders, because
they do not have access to many external rewards in their jobs. As such, it is critical that
these leaders are motivated more by intrinsic rewards from their jobs: fulfillment,
enjoyment, and interest. In their discussion of leadership in The Salvation Army, Watson
and Brown (2001) noted: “joy in service is one of The Salvation Army’s primary

Motivation for transformational leadership 114
recruitment and retention tools” (p. 206). However, in Cumberland Health, leaders
receive more reasonable/fair salaries for their work and promotions that are associated
with higher pay, which may change the nature of motivation for transformational
leadership in this setting. Here, fully internalized motivation may not be as necessary,
and external regulation is not a significant predictor. However, a more controlled form of
autonomous motivation, such as identified regulation, is more important in this setting-
identified regulation. Thus, autonomous motivation is still important in this setting for
effective leadership, but it does not have to be as highly internalized as in the Salvation
Army setting, and perhaps similar types of non-profit service organizations.
Study Three highlights the importance of motivation for transformational
leadership for follower perceptions of transformational leadership. We know that
transformational leadership is related to more positive job attitudes (e.g., Barling, Weber,
& Kelloway, 1996; Bycio, Hacket, & Allen, 1995; Hater & Bass, 1988; Koh, Steers &
Terborg, 1995), contextual performance (Koh et al., 1995), and task performance (e.g.,
Howell & Frost, 1989; Kirkpatrick & Locke, 1996; Sosik, Avolio & Kahai, 1997).
Because of the strong relationships between transformational leadership and these other
outcomes, it is likely that motivation for transformational leadership may also affect these
outcomes indirectly through transformational leadership. Mediation models examining
the effect of leader motivation on follower and, in turn, organizational outcomes should
be tested in future research.
Study Implications
The results from Study Three suggest that how a leader is motivated relates to
leadership effectiveness as rated by followers. In short: why we lead affects how we lead.

Motivation for transformational leadership 115
As such, leaders’ own motivation does seem to matter for leadership outcomes, and there
may be a trickle down effect where a leaders’ motivation ultimately influences followers’
attitudes and performance. The findings have implications for research and practice.
Study Three highlights the importance of organizational context for motivation
for transformational leadership because it examined leader motivation in two types of
organizations. In the non-profit sector, where external rewards are scarce and where
compensation is low, it may be more important for leaders to have high levels of fully
internalized motivation and low levels of external regulation, in order to be effective.
Individuals high in external regulation are likely just not a good fit for the Salvation
Army officer role. Officers do have their basic needs met and live a comfortable life
despite the low annual allowance that they receive (housing, car, and utilities are all taken
care of by the organization). However, in this sector, leaders do not receive financial
incentives based on performance, nor do they receive a financial bonus at the end of the
year (Watson & Brown, 2001). These leaders are aware of these limitations when they
become commissioned. The “bonus” that these leaders receive comes in the form of
intrinsic satisfaction from helping others and deriving joy from service (Watson &
Brown, 2001). Externally regulated officers will be unmotivated by these internal
rewards, and with nothing to motivate them, they will be less successful, and likely to
have lower job satisfaction and greater turnover (according to findings from Study One).
As such, it may be more critical for non-profit organizations to screen out externally
regulated leaders and also emphasize the intrinsic rewards of the work as a means of
ensuring a good fit between the employee and the organizational context. When
implementing this practice, it is important to fairly compensate all leaders and not screen

Motivation for transformational leadership 116
out externally regulated leaders as a means to get them to work for substandard wages.
Nonprofit organizations may consider developing and implementing programs designed
to promote more internalized motivation in leaders.
In the healthcare sector, and perhaps in other public organizations, motivation
may predict leadership effectiveness differently due to the presence of external rewards
and higher salaries. Autonomous motivation is still important, but avoiding external
regulation and aiming for high intrinsic motivation may not be as critical. In these
organizations, incorporating motivation measures into selection procedures to hire more
autonomously motivated leaders may be useful, and interventions designed to promote
autonomous motivation may increase overall leader effectiveness in the organization.
Interventions to promote autonomous motivation for transformational leadership
may entail structuring the work environment to be more conducive to the satisfaction of
leaders’ basic psychological needs (Deci & Ryan, 2000). For example, organizations may
support leaders’ autonomy by ensuring that leaders have choice and flexibility in how
they make decisions and delegate tasks (Baard et al., 2004). Need for relatedness may be
supported by an organizational culture that values respect, and by allowing opportunities
for leaders to meet with and support one another (Baard, 2002). Finally, need for
competence may be satisfied by properly training and supporting leaders, providing
regular feedback, and recognizing leaders’ achievements (Baard, 2002). When
organizations take specific action to attempt to satisfy these basic needs in employees,
they make the workplace more conducive to the growth and well-being of leaders and, in
turn, their subordinates (Ryan & Deci, 2002).

Motivation for transformational leadership 117
Limitations
This study had several limitations that should be noted when interpreting the
results. First, Study Three is limited by a small level-two sample size of 37 leaders. Due
to the complexity of calculating power and sample size requirements in multilevel study
designs, little advice is readily available regarding appropriate multilevel sample sizes
(Scherbaum & Ferretter, 2009). Maas and Hox (2005) found that a sample size of less
than 50 level-two units led to biased estimates of the level-two standard errors, but not to
biased regression coefficients in a simulation study. Kreft and De Leeuw (1998)
suggested that 30 is the smallest acceptable number of level-two units in multi-level
modeling. Other researchers acknowledge that there still may be utility in conducting
multilevel analyses on level two samples as small as 10 (Snijders & Bosker, 1999) and
that much organizational research uses level-two sample sizes that are less than 30
(Scherbaum & Ferretter, 2009). To account for low sample size, I included no control
variables and reduced the number of parameters estimated in the model and I used the
maximum likelihood with robust errors estimator, which is robust to non-normality
(Kelloway, 2014) and helps to correct for bias in small samples. Importantly, despite
having a small sample size, I did detect significant effects, which suggests that these
relationships may be substantial and should be replicated in future studies using larger
samples.
Second, the Salvation Army sample included followers who were not necessarily
subordinates and/or employees of leaders, and may instead have been volunteers or
congregation members. As such, the sample of followers may not generalize to some
employee subordinate samples found in the workplace. A third limitation was that

Motivation for transformational leadership 118
leaders recruited their own followers to participate in the study by sending them a link to
the survey on my behalf. This sampling method may have led to inflated leadership
ratings, as leaders could have selected followers who were most likely to give them
higher ratings and avoided recruiting followers who would give them poor leadership
ratings.
The limitations of this study need to be taken into consideration when interpreting the
results of this study and in designing future studies examining the construct. However,
Study Three provides some further evidence to support the relationships between leader
motivation and leader effectiveness as perceived by followers.
Future Research
Future research should build on these findings by examining how motivation
relates to follower outcomes, such as workplace attitudes, turnover intentions, worker
well-being, or employees’ own motivation to work. The relationships assessed between
motivation and perceptions of leader effectiveness should also be examined using larger
samples across industries to determine whether they hold true in different contexts.
As this study established that leader motivation is a significant predictor of
follower perceptions of leader effectiveness, future studies might examine how leader
motivation might be assessed and used in leader selection procedures to hire more
autonomously motivated leaders. In addition, studies may examine whether targeted
interventions, an autonomy-supportive leadership culture, or certain organizational
practices may promote more autonomous motivation. For example, transformational
leadership training may be a mechanism through which leader motivation may become
more internalized by satisfying leaders’ intrinsic psychological needs (Baard, Deci, &

Motivation for transformational leadership 119
Ryan, 2004; Gagné & Deci, 2005). Transformational leadership training may satisfy the
need for competence by providing leaders with skills to perform effectively in their work.
Training may further support autonomy by allowing leaders to choose their own goals
and personal leadership mission, allowing for the possibility of failure, and providing
feedback in follow-up sessions, all of which are supportive of autonomy according to
Baard (2002). Finally, this training would provide an opportunity for leaders to connect
with colleagues who are also leaders in a similar context, which is supportive of
relatedness (Baard, 2002). Besides training, organizational culture and practices are likely
drivers of autonomous motivation, and these should be explored as potential predictors in
future research. Specifically, when their intrinsic needs are met, leaders can perform
optimally and are more likely to enjoy leading others (Baard, 2002), and this enjoyment
may lead to intrinsic satisfaction.
This construct needs further development in terms of examining its antecedents
and outcomes. Potential antecedents of leader motivation may include personality, locus
of control, efficacy, and psychological needs satisfaction. Outcomes may include leader
outcomes such as health and well-being and objective performance measures, and
follower outcomes such as well-being, motivation, and turnover.

Motivation for transformational leadership 120
General Discussion
Summary of Studies One, Two, and Three
The findings of these three studies are important for advancing knowledge of
leadership in the area of Industrial/Organizational Psychology. The three studies served to
develop and explore the nature of a new construct, motivation for transformational
leadership, and they contribute to the overall understanding of leadership behavior. Study
One replicated results of a recent study initially examining the factor structure of this new
construct, and found evidence for the validity of the motivation for transformational
leadership scale. Study Two found that motivation for transformational leadership is
relatively stable over a seven month time period, except for intrinsic and introjected
regulations, which may be more likely to change within this time. Also, highly externally
regulated leaders are less likely to change over time, whereas highly identified leaders
tend to change more over time (in a negative direction). Study Three found that leaders’
motivation significantly predicted follower leadership ratings, and that, in general,
autonomous motivation was related to more active-constructive leadership and less
passive-avoidant leadership, consistent with findings by Gilbert et al. (2014). By relating
motivation for transformational leadership to perceptions of effective leadership, this set
of studies supports motivation for transformational leadership as an important construct
for future study. Based on these results, organizations should emphasize the development
of autonomous motivation in leaders and potentially even select more autonomously
motivated leaders.

Motivation for transformational leadership 121
Together, these studies find that a leaders’ own motivation to be an effective
leader is an important antecedent of leadership outcomes. These studies fill a gap in the
literature in terms of our understanding of the predictors of effective leadership as rated
by leaders and followers. The findings suggest that a leaders’ own motivation makes a
difference in their leadership performance. Although the leaders’ level of internalization
of effective leadership may not be explicit to followers, it is likely to influence leadership
behavior and, ultimately, impact followers’ experiences with the leader. As such, in the
leadership selection process when screening for important knowledge, skills, abilities, and
other characteristics (KSAOs) likely to lead to success in a leadership role, it may be
critical to also look at why a leader wants that job. A leader who possesses the key
KSAOs and wants to do well in the position, may be a star candidate who is likely to
exhibit the most effective styles of leadership. The motivation for transformational
leadership measure may be implemented as a selection tool or a tool to inform training
and development needs. For example, leaders may benefit from tailored leadership
training targeted at improving their level of internalization. In short, leader motivation
matters, and should be included in future studies to further understand its role in
leadership.
Different relationships between motivation for transformational leadership and
transformational leadership were found in Studies One and Three. Studies One and Three
both examined the relationships between leader motivation and leader performance. The
results differed slightly, perhaps because Study One used leader self-ratings of
transformational leadership, whereas Study Three used follower ratings and thus
addressed concerns about common method bias. I was able to examine all leadership

Motivation for transformational leadership 122
outcomes separately in Study One, but they were combined in Study Three due to high
correlations. As such, in Study Three I was unable to confirm the findings from Study
One by examining the same relationships.
Implications
The current set of studies explored leaders’ motivation to enact effective leader
behaviours, an area of research that has not yet been explored. The results of these studies
suggest that motivation for transformational leadership matters for leader outcomes and is
also related to self-rated leadership behavior and perceptions of leader effectiveness.
Importantly, this study also provided evidence for the validity of a measure of motivation
for transformational leadership, which may be used in future research on the construct.
Although substantial research has examined the outcomes of transformational
leadership, much less work has examined predictors of this behavior (Barling, Slater, &
Kelloway, 2000; Bass, 1998; Nielsen & Cleal, 2011). The current research contributes to
knowledge of the predictors of transformational leadership behaviours, which currently
includes personality (Judge & Bono, 2000), emotional intelligence (Barling, Slater, &
Kelloway, 2000) and aspects of the work environment such as control (Nielsen & Cleal,
2011). Combined with these other findings, the current research may help to inform more
successful leader selection procedures wherein autonomously motivated leaders are
selected over amotivated or controlled candidates.
Further implications concern the finding that intrinsic motivation is not always the
best predictor of transformational leadership, but that in general, autonomous regulation
tends to predict this style of leadership. This finding is significant for practice because it

Motivation for transformational leadership 123
may be more realistic for organizations to promote autonomous regulation than to
promote fully internalized intrinsic motivation. There is evidence that organizations can
support self-determined motivation by manipulating the social context. For example, an
autonomy-supportive social context where the organization provides a meaningful
rationale for tasks, offers choice to leaders in decision-making, and acknowledges the
feelings of the leader may promote integrated internalization (Deci et al., 1994).
Organizations may be able to implement autonomy support in leadership training and
development in order to promote internalization by leaders, and may also use similar
strategies in succession planning when candidates are being developed for future
leadership positions.
Limitations and Future Research Directions
Limitations of the current research include the use of primarily self-report data in
Studies One and Two, which generates the possibility for mono-method bias. Future
studies should make greater use of other-report data from peers, supervisors, and
subordinates or look at objective performance data, such as actual subordinate turnover,
as outcomes of motivation for transformational leadership. This series of studies also took
place largely within the context of a unique Christian non-profit organization, which may
reduce the generalizeability of the results to other types of organizations, particularly
publicly traded companies. Future research should try to replicate the results in different
organizational contexts and in different leadership roles. Other studies may also attempt
to explore motivation for effective leadership using leadership models that may be more
widely espoused in religious contexts, such as servant leadership, coaching models of

Motivation for transformational leadership 124
leadership, or similar models that are more focused on self-sacrifice and focus on
communal goals and well-being.
Future studies may also examine other predictors of motivation for
transformational leadership, which may include personality, psychological needs
satisfaction, or situational variables. Other outcomes of the construct may include
engagement, job performance, or innovativeness. Future research should also examine
whether more autonomous motivation for effective leadership can be developed through
leader interventions. Intervention studies could examine questions such as: What type of
intervention will promote more autonomous motivation for good leadership?; How much
can motivation change?; Can an externally regulated leader become intrinsically
motivated over time, or will they at most become an introject?; Is it possible for an
amotivated leader to become motivated at all?; How much change might we see in leaders
who are already autonomously motivated?; How long is the change process?; What other
factors influence change? Research should examine the nature of change in leader
motivation using different time lags, and by including different organizational and
individual-level covariates that may be related to the change.
Conclusion
This set of studies makes an important contribution to the leadership literature in
that they develop and validate a new construct, which is an important predictor of
effective leadership as rated by leaders and their followers. As such, this research fills a
gap in the literature where little is known about the predictors of leadership. In short, the
leaders’ own motivation matters- both for leaders’ own outcomes, such as job satisfaction
and turnover intentions, and for effectiveness in their roles (as perceived by self and

Motivation for transformational leadership 125
others). The findings suggest that motivation is related to leadership style, and that
generally, autonomous forms of motivation promote transformational leadership whereas
controlled regulation and amotivation are negatively related to transformational
leadership. Further, the results of this study support the idea that certain forms of
motivation can change over time, which is consistent with the tenets of self-determination
theory.

Motivation for transformational leadership 126
References
Allen, N. J., & Meyer, J. P. (1990). The measurement and antecedents of affective,
continuance and normative commitment to the organization. Journal of
Occupational Psychology, 63, 1–18.
Amabile, T. M. (1982). Social psychology of creativity: a consensual assessment
technique. Journal of Personality and Social Psychology, 43, 997–1013.
Antonakis, J. (2001). The validity of the transformational, transactional, and laissez-faire
leadership model as measured by the Multifactor Leadership Questionnaire (MLQ
5X). Doctoral dissertation, Yale University, New Haven, CT.
Atwater, L. E., Dionne, S. D., Avolio, B., Camobreco, J. E., & Lau, A. W. (1999). A
longitudinal study of the leadership development process: Individual differences
predicting leader effectiveness. Human Relations, 52(12), 1543-1562.
Avolio, B. J., Bass, B. M., & Jung, D. I. (1999). Reexamining the components of
transformational and transactional leadership using the Multifactor Leadership
Questionnaire. Journal of Occupational and Organizational Psychology, 72, 441-
462.
Avolio, B. J., Reichard, R. J., Hannah, S. T., Walumbwa, F. O., & Chan, A. (2009). A
meta-analytic review of leadership impact research: Experimental and quasi-
experimental studies. The Leadership Quarterly, 20(5), 764-784.
Baard, P. P. (2002). Intrinsic need satisfaction in organizations: A motivational basis of
success in for-profit and not-for-profit settings. In E. L. Deci & R. M. Ryan (Eds.),
Handbook of self-determination research (pp. 255-275). Rochester, NY: University
of Rochester Press.

Motivation for transformational leadership 127
Baard, P. P., Deci, E. L., & Ryan, R. M. (2004). Intrinsic need satisfaction: A
motivational basis of performance and well-being in two work settings. Journal of
Applied Social Psychology, 34(10), 2045-2068.
Bandura, A. (Ed.). (1995). Self-efficacy in changing societies. New York: Cambridge
University Press.
Bandura, A., & Cervone, D. (1983). Selfevaluative and self-efficacy mechanisms
governing the motivational effects of goal systems. Journal of Personality and
Social Psychology, 45, 1017-1028.
Banks, M. J., Clegg, C. W., Jackson, P. R., Kemp, N. J., Stafford, E. M., & Wall, T. D.
(1980). The use of the General Health Questionnaire as an indication of mental
health in occupational settings. Journal of Occupational Psychology, 53, 187–194.
Barling, J., Christie, A., & Hoption, C. (2011). Leadership. In S. Zedeck (Ed.), Handbook
of Industrial and Organizational Psychology (vol 1). Washington, DC: APA Books.
Barling, J., Slater, F., & Kelloway, E. K. (2000). Transformational leadership and
emotional intelligence: An exploratory study. Leadership & Organization
Development Journal, 21(3), 157-161.
Barling, J., Weber, T. & Kelloway, E.K. (1996). Effects of transformational leadership
training on attitudinal and financial outcomes: A field experiment. Journal of
Applied Psychology, 81, 827-83
Baron, R. M., & Kenny, D. A. (1986). The moderator–mediator variable distinction in
social psychological research: conceptual, strategic, and statistical considerations.
Journal of Personality and Social Psychology, 51, 1173–1182.

Motivation for transformational leadership 128
Bass, B, M. & Avolio, B. J. (1989). Potential biases in leadership measures: How
prototypes, leniency, and general satisfaction relate to ratings and rankings of
transformational and transactional leadership constructs. Educational and
Psychological Measurement, 49, 509-527.
Bass, B. (1985). Leadership and performance beyond expectations. New York: Free
Press.
Bass, B. M. (1990). From transactional to transformational leadership: Learning to share
the vision. Organizational Dynamics, 18(3), 19-36.
Bass, B. M. (1998). Transformational leadership: Industry, military, and educational
impact. Mahwah, NJ: Erlbaum.
Bass, B. M. (Ed.). (2008). The Bass handbook of leadership: Theory, research, and
managerial applications. New York, NY: Free Press.
Bass, B. M., & Avolio, B. J. (Eds.). (1994). Improving organizational effectiveness
through transformational leadership. Thousand Oaks, CA: Sage.
Bass, B. M., Avolio, B. J., & Goodheim, L. (1987). Biography and the assessment of
transformational leadership at the world-class level. Journal of Management, 13, 7-
19.
Bass, B.M., & Avolio, B.J. (1990). Transformational leadership development: Manual
for the Multifactor Leadership Questionnaire. Palo Alto, CA: Consulting
Psychologists Press.
Bass, B.M., & Yammarino, F. J. (1991). Congruence of self and others' leadership ratings
of naval officers for understanding successful performance. Applied Psychology: An

Motivation for transformational leadership 129
International Review, Vol 40(4), 437-454. doi: 10.1111/j.1464-
0597.1991.tb01002.x
Baumeister, R. F., & Leary, M. R. (1995). The need to belong: Desire for interpersonal
attachments as a fundamental human motivation. Psychological Bulletin, 117(3),
497-529.
Bono, J. E. & Ilies, R. (2006). Charisma, positive emotions and mood contagion. The
Leadership Quarterly, 17(4), 317-334.
Bono, J. E. & Judge, T. A. (2003). Core self-evaluations: A review of the trait and its role
in job satisfaction and job performance. European Journal of Personality, 17(S1),
S5-S18.
Brayfield, A. H., & Rothe, H. F. (1951). An index of job satisfaction. Journal of Applied
Psychology, 35, 307-311.
Watson, R. A., & Brown, B. (2001). “The most effective organization in the U.S.”
Leadership secrets of The Salvation Army. New York: Crown Business.
Burns, J. M. (1978). Leadership. New York: Harper & Row.
Bycio, P., Hackett, R.D., & Allen, J.S. (1995). Further assessments of Bass’s (1985)
conceptualization of transactional and transformational leadership. Journal of
Applied Psychology, 80, 468-478.
Cammann, C., Fichman, M., Jenkins, D., & Klesh, J. (1979). The Michigan
Organizational Assessment Questionnaire. Unpublished Manuscript, University of
Michigan, Ann Arbor, Michigan.
Chan, D. (1998). The conceptualization and analysis of change over time: An integrative
approach incorporating longitudinal mean and covariance structures analysis

Motivation for transformational leadership 130
(LMACS) and multiple indicator latent growth modeling (MLGM). Organizational
Research Methods, 1, 421-483.
Chan, K., & Drasgow, F. (2001). Toward a theory of individual differences and
leadership: Understanding the motivation for transformational leadership. Journal of
Applied Psychology, 86(3), 481-498.
Chen, G., Gully, S. M., & Eden, D. (2001). Validation of a new general self-efficacy
scale. Organizational Research Methods, 4, 62–83.
Clemmons, A. I., & Fields, D. (2011). Values as determinants of the motivation to lead.
Military Psychology, 23(6), 587-600. doi:10.1080/08995605.2011.616787
Collins, D. B., & Holton, E. F. (2004). The effectiveness of managerial leadership
development programs: A meta‐analysis of studies from 1982 to 2001. Human
resource development quarterly, 15(2), 217-248.
Cooper, William H., & Richardson, Alan J. (1986). Unfair comparisons. Journal of
Applied Psychology, 71(2), 179-184.
Dansereau, F. (1995). A dyadic approach to leadership: Creating and nurturing this
approach under fire. Leadership Quarterly, 6, 479-490.
Deci, E. L. (1975). Intrinsic motivation. New York: Plenum.
Deci, E. L., & Ryan, R. M. (1985). Intrinsic motivation and self-determination in human
behavior. New York: Plenum.
Deci, E. L., & Ryan, R. M. (2000). The “What” and “Why” of goal pursuits: Human
needs and the self-determination of behavior. Psychological Inquiry, 11, 227-268.
Demerouti, E., Bakker, A. B., Nachreiner, F., & Schaufeli, W. B. (2001). The job
demands–resources model of burnout. Journal of Applied Psychology, 86, 499–512.

Motivation for transformational leadership 131
Eby, L. T., & Allen, T. D. (2002). Further investigation of protégés' negative mentoring
experiences: Patterns, relative impact, and outcomes. Group & Organization
Management, 27, 456-479.
Eby, L. T., Freeman, D. M., Rush, M. C., & Lance, C. E. (1999). Motivational bases of
affective commitment: a partial test of an integrative theoretical model. Journal of
Occupational and Organizational Psychology, 72, 463–483.
Ferguson, C. J. (2009). An effect size primer: A guide for clinicians and researchers.
Professional Psychology: Research and Practice, 40, 532–538.
Forest, J., Gilbert, M. H., Beaulieu, G., LeBrock, P., & Gagné, M. (2009). The theoretical
and economic utility of self-determined motivation for mental health at work.
Unpublished manuscript, Université du Québec à Montréal.
Friman, T. (2001). The relationship between leadership style and values. Unpublished
Master’s thesis, Hebrew University of Jerusalem.
Gagné , M. (2003). The role of autonomy support and autonomy orientation in the
engagement of prosocial behavior. Motivation and Emotion, 27, 199–223.
Gagné, M., & Deci, E. L. (2005). Self-determination theory and work motivation. Journal
of Organizational Behaviour, 26, 331-362.
Gagné, M., & Koestner, R. (2002). Self-determination theory as a framework for
understanding organizational commitment. Paper presented at the annual meeting of
the Society for Industrial and Organizational Psychology, Toronto, Canada.
Gagné, M., Boies, K., Koestner, R., & Martens, M. (2004). How work motivation is
related to organizational commitment: a series of organizational studies.
Manuscript, Concordia University.

Motivation for transformational leadership 132
Gagné, M., & Forest, J. (2008). The Study of Compensation Systems Through the Lens of
Self-Determination Theory: Reconciling 35 Years of Debate. Canadian
Psychology, 49(3), p. 225-232.
Gagné, M., Forest, J., Gilbert, M., Aube, C., Morin, E., & Malorni, A. (2010). The
Motivation at Work Scale: Validation in two languages. Educational and
Psychological Measurement, 70, 628-646.
Gagné, M., Guntert, S. T., Forest, J., Vansteenkiste, M., Crevier-Braud, L., Van den
Broeck, A, Aspeli, A. K., Bellerose, J, Benabou, C, & Chemolli, E. (2014). The
multidimensional work motivation scale: Validation evidence in seven languages
and nine countries. European Journal of Work and Organizational Psychology, 1-
19. doi: 10.1080/1359432X.2013.877892doi: 10.1080/1359432X.2013.877892
Garman, A. N., Davis-Lenane, D., & Corrigan, P. W. (2003). Factor structure of the
transformational leadership model in human service teams. Journal of
Organizational Behavior, 24, 803–812.
George, J. M., & Jones, G. R. (1996). The experience of work and turnover intentions:
interactive effects of value attainment, job satisfaction, and positive mood. Journal
of Applied Psychology, 81(3), 318.
Gilbert, S. L., Horsman, P., & Kelloway, E. K. (in press). The Motivation for
Transformational Leadership Scale: An examination of the factor structure and
initial tests. Leadership and Organizational Development Journal.
Gilbert, S., & Kelloway, E. K. (2014). Leadership. In M. Gagné (Ed.), The Oxford
Handbook of Work Engagement, Motivation, and Self-Determination Theory (pp.
181-198). New York, NY: Oxford University Press.
Motivation for transformational leadership 133
Grolnick, W. D. & Ryan R. M. (1989). Parent styles associated with children’s self-
regulation and competence in school. Journal of Educational Psychology, 81, 143-
154.
Hater, J.J., & Bass, B.M. (1988). Superiors’ evaluations and subordinates’ perceptions of
transformational and transactional leadership. Journal of Applied Psychology, 73,
695-702.
Hendricks, J. W., & Payne, S. C. (2007). Beyond the big five: Leader goal orientation as a
predictor of leadership effectiveness. Human Performance, 20(4), 317-343.
Hertzog, C., Lindenberger, U., Ghisletta, P., & Oertzen, T. V. (2006). On the power of
multivariate latent growth curve models to detect correlated change. Psychological
methods, 11(3), 244.
Hickey, D. T. (1997). Motivation and contemporary socio-constructivist instructional
perspectives. Educational Psychologist, 32(3), 175-193.
Hofmann, D. A., Griffin, M. A., & Gavin, M. B. (2000). The application of hierarchical
linear modeling to organizational research. In K. Klein & S. Kozlowski (Eds.),
Multilevel theory, research, and methods in organizations: Foundations, extensions,
and new directions (pp. 467-511). San Francisco: Jossey-Bass.
Hong, Y., Catano, V. M., & Laio, H. (2011). Leader emergence: The role of emotional
intelligence and motivation to lead. Leadership and Organizational Development
Journal, 32(4), 320-343. DOI: http://dx.doi.org/10.1108/01437731111134625
Hoption, C., Barling, J. & Kelloway, E.K. (2010). Daily transformational leadership.
Manuscript submitted for publication.

Motivation for transformational leadership 134
Howell, J.M., & Avolio, B.J. (1993). Transformational leadership, transactional
leadership, locus of control, and support for innovation: Key predictors of business
unit performance. Journal of Applied Psychology, 78, 891-902.
Howell, J.M., & Frost, P.J. (1989). A laboratory study of charismatic leadership.
Organizational Behavior and Human Decision Processes, 43, 243-269.
Judge, T. A., & Klinger, R. (2007). Job satisfaction: Subjective well-being at work. In M.
Eid & R. Larsen (Eds.), The science of subjective well-being (pp. 393-413). New
York: Guilford Publications.
Judge, T. A., & Bono, J. E. (2000). Five-factor model of personality and transformational
leadership. Journal of applied psychology, 85(5), 751.
Judge, T. A., Bono, J. E., & Locke, E. A. (2000). Personality and job satisfaction: The
mediating role of job characteristics. Journal of Applied Psychology, 85, 237-249.
Judge, T. A., Piccolo, R. F. (2004). Transformational and transactional leadership: A
meta-analytic test of their relative validity. Journal of Applied Psychology, 89(5),
755-768.
Jung, D. I. & Avolio, B. J. (2000). Opening the black box: An experimental investigation
of the mediating effects of trust and value congruence on transformational and
transactional leadership. Journal of Organizational Behaviour, 21(8), 949-964.
Kark, R., Shamir, B., & Chen, G. (2003). The two faces of transformational leadership:
Empowerment and dependency. Journal of Applied Psychology, 88(2), 246-255.
Kark, R., & Van Dijk, D. (2007). Motivation to lead, motivation to follow: The role of the
self-regulatory focus in leadership processes. Academy of Management Review,
32(2), 500-528.

Motivation for transformational leadership 135
Kelloway E. K., & Francis L. (2012). Longitudinal research and data analysis. In Sinclair
R. R., Wang M., Tetrick L. E. (Eds.), Research methods in occupational health
psychology: Measurement, design and data analysis. New York, NY: Routledge.
Kelloway, E. K., & Barling, J. (2010). Leadership development as an intervention in
occupational health psychology. Work and Stress, 24(3), 260-279.
Kelloway, E. K., Sivanathan, N., Francis, L., & Barling, J. (2005). Poor leadership. In J.
Barling & E. K. Kelloway (Eds.), Handbook of work stress (pp. 89-112). Thousand
Oaks, CA: Sage.
Kelloway, E. K., Turner, N., Barling, J., & Loughlin, C. (2012). Transformational
leadership and employee psychological well-being: The mediating role of employee
trust in leadership. Work & Stress, 26(1), 39-55.
Kelloway, E.K., Barling, J., & Helleur, J. (2000). Enhancing transformational leadership:
The roles of training and feedback. The Leadership and Organizational
Development Journal, 21, 145-149
Kelloway, E.K., Mullen, J., & Francis, L. (2006). Divergent effects of passive and
transformational leadership on safety outcomes. Journal of Occupational Health
Psychology, 11, 76-86.
Kelloway, E. K., & Barling, J. (2000). What we have learned about developing
transformational leaders. Leadership & Organization Development Journal, 21(7),
355-362.
Kirkpatrick, S. A., & Locke, E. A. (1996). Direct and indirect effects of three core
charismatic leadership components on performance and attitudes. Journal of
Applied Psychology, 81, 36-51.

Motivation for transformational leadership 136
Kline, R. B. (2005). Principles and practice of structural equation modeling (2nd
Ed.).
The Guilford Press: New York, NY.
Koh, W.L., Steers, R.M., & Terborg, J.R. (1995). The effects of transformational
leadership on teacher attitudes and student performance in Singapore. Journal of
Organizational Behavior, 16, 319-333.
Kreft, I., & de Leeuw, J. (1998). Introduction to multilevel modeling. London, England:
Sage.
Kuvaas, B. (2006). Work performance, affective commitment, and work motivation: The
roles of pay administration and pay level. Journal of Organizational Behaviour, 27,
365-385.
Leone, D. (1995). The relation of work climate, higher-order need satisfaction, need
salience, and causality orientations to work engagement, psychological adjustment,
and job satisfaction. Unpublished doctoral dissertation, University of Rochester.
Li, F. (1999). The exercise motivation scale: Its multifaceted structure and construct
validity. Journal of Applied Sport Psychology, 11(1), 97-115.
Maehr, M. L. (1974). Culture and achievement motivation. American Psychologist,
29(12), 887.
Mathieu, J. E., Aguinis, H., Culpepper, S. A., & Chen, G. (2012). Understanding and
estimating the power to detect cross-level interaction effects in multilevel modeling.
Journal of Applied Psychology, 97(5), 951.
McCalister, J. (Interviewer) & Waters, F., Braye, M., Slous, K. Smith, M. (Interviewees).
(2012). Exploring Officership: The Salvation Army still needs officers. But how do
we encourage Salvationists to consider this unique call to ministry? [Interview

Motivation for transformational leadership 137
transcript]. Retrieved from The Salvationist Web site:
http://salvationist.ca/2012/03/exploring-officership/.
McConnell, C. R. (2007). The leadership contradiction: Examining leadership's mixed
motivations. The health care manager, 26(3), 273-283.
McCormick, M. J. & Martinko, M. J. (2004). Identifying leader social cognitions:
Integrating the causal reasoning perspective into social cognitive theory. Journal of
Leadership & Organizational Studies, 10(4), 2-11.
McKee, M., Driscoll, C., Kelloway, E.K., & Kelley, E. (2009). Leading to wellbeing.
Paper presented at the annual meeting of the European Academy of Work and
Organizational Psychology, Santiago de Compostella, Spain.
Meyer, J. P., & Herscovitch, L. (2001). Commitment in the workplace: Toward a general
model. Human Resource Management Review, 11,299–326.
Meyer, J. P., Becker, T. E., & Vandenberghe, C. (2004). Employee commitment and
motivation: A conceptual analysis and integrative model. Journal of Applied
Psychology, 89(6), 991-1007.
Meyer, J.P., Allen, N.J., & Smith, C.A. (1993). Commitment to organizations and
occupations: Extension and test of a three-component conceptualization. Journal of
Applied Psychology, 78, 538-551.
Mullen, J. & Kelloway, E.K. (2009). Safety leadership: A longitudinal study of the effects
of transformational leadership on safety outcomes. Journal of Occupational and
Organizational Psychology, 20, 253-272.
Mullen, J., Kelloway E. K., & Teed, M. (in press). Inconsistent leadership as a predictor
of safety behavior. Work & Stress.

Motivation for transformational leadership 138
Mullen, J., Kelloway, E. K., & Teed, M. (2011). Inconsistent style of leadership as a
predictor of safety behaviour. Work & Stress, 25(1), 41-54.
Ng, K., Ang, S., & Chan, K. (2008). Personality and leader effectiveness: A moderated
mediation model of leadership self-efficacy, job demands, and job autonomy.
Journal of Applied Psychology, 93(4), 733-743.
Nielsen, K., & Cleal, B. (2011). Under which conditions do middle managers exhibit
transformational leadership behaviors? An experience sampling method study on
the predictors of transformational leadership behaviors. The Leadership Quarterly,
22(2), 344-352.
Paris, S. G., & Turner, J. C. (1994). Situated motivation. Student motivation, cognition,
and learning: Essays in honor of Wilbert J. McKeachie, 213-237.
Pelletier, L. G., Dion, S. C., Slovinec-D'Angelo, M., & Reid, R. (2004). Why do you
regulate what you eat? Relationships between forms of regulation, eating behaviors,
sustained dietary behavior change, and psychological adjustment. Motivation and
Emotion, 28(3), 245-277.
Pelletier, L. G., Tuson, K. M., Green‐Demers, I., Noels, K., & Beaton, A. M. (1998).
Why are you doing things for the environment?: The motivation toward the
environment scale (MTES). Journal of Applied Social Psychology, 28(5), 437-468.
Piccolo, R. F. & Colquitt, J. A. (2006). Transformational leadership and job behaviours:
The mediating role of core job characteristics. Academy of Management, 49(2),
327-340.

Motivation for transformational leadership 139
Pillai, R., Schriesheim, C. A., & Williams, E. S. (1999). Fairness perceptions and trust as
mediators for transformational and transactional leadership. Journal of
Management, 25, 897–933.
Ployhart, R. E. & Vandenberg, R. J. (2010). Longitudinal research: The theory, design,
and analysis of change. Journal of Management, 36, 94-120.
Podsakoff, P. M., MacKenzie, S. B., Lee, J. Y., & Podsakoff, N. P. (2003). Common
method biases in behavioral research: a critical review of the literature and
recommended remedies. Journal of applied psychology, 88(5), 879.
Powell, D. M., & Meyer, J. P. (2004). Side-bet theory and the three component model of
organizational commitment. Journal of Vocational Behavior, 65, 157–177.
Preacher, K. J., Rucker, D. D., & Hayes, A. F. (2007). Addressing moderated mediation
hypotheses: Theory, methods and prescriptions. Multivariate Behavioral Research,
42, 185–227.
Reio, T. G., Jr., & Segredo, M. (2013). Turnover intent among middle school teachers. In
M. S. Plakhotnik & S. M. Nielsen (Eds.), Proceedings of the 12th Annual South
Florida Education Research Conference (pp. 181-188). Miami: Florida International
University. Retrieved from http://education.fiu.edu/research_conference/
Rowe, W. G., Canella, A. A., Rankin, D., & Gorman, D. (2005). Leader succession and
organizational performance: Integrating the common sense, ritual scapegoating, and
vicious-circle succession theories. The Leadership Quarterly, 16(2), 197-219.
Rubin, R. S., Munz, D. C., & Bommer, W. H. (2005). Leading from within: The effects of
emotion recognition and personality on transformational leadership. Academy of
Management Journal, 48, 845-858.

Motivation for transformational leadership 140
Ryan, R. M., & Deci, E. L. (2002). Overview of self-determination theory: An organismic
dialectical perspective. In E. L. Deci & R. M. Ryan (Eds.), Handbook of self-
determination research (pp. 3-33). Rochester, NY: University of Rochester Press.
Scholl, R. W. (1981). Differentiating organizational commitment from expectancy as a
motivating force. Academy of Management Review, 6, 589–599.
Scott, N., Fleming, M., & Kelloway, E. K. (2014). Understanding why employees behave
safely from a self-determination theory perspective. In M. Gagné (Ed). The Oxford
Handbook of Work Engagement, Motivation, and Self-Determination Theory. New
York, NY: Oxford University Press.
Sivan, E. (1986). Motivation in social constructivist theory. Educational Psychologist,
21(3), 209-233.
Smith, C. A., Organ, D. W., & Near, J. P. (1983). Organizational citizenship behavior: its
nature and antecedents. Journal of Applied Psychology, 68, 653–663.
Sosik, J., Avolio, B., & Kahai, S. (1997). Effects of leadership style and anonymity on
group potency and effectiveness in a GDSS environment. The Journal of Applied
Psychology, 82(1), 89-103.
Sparks, J. R. & Schenk, J. A. (2001). Explaining the effects of transformational
leadership: An investigation of the effects of higher-order motives in multilevel
marketing organizations. Journal of Organizational Behaviour, 22(8), 849-869.
Srivastava, A., Bartol, K. M., & Locke, E. A. (2006). Empowering leadership in
management teams: Effects on knowledge sharing, efficacy, and performance.
Academy of Management Journal, 49, 1239–1251.

Motivation for transformational leadership 141
Stevens, S. N. (2010). Understanding how employees unwind after work: expanding the
construct of" recovery" (Unpublished doctoral dissertation). Saint Mary’s
University, Halifax, Nova Scotia.
Stone, D., Deci, E. L., & Ryan, R. M. (2009). Beyond talk: Creating autonomous
motivation through self-determination theory. Journal of General Management, 34,
75-91.
The Salvation Army. (n.d.). The Salvation Army Canada and Bermuda 2010/2011 annual
review. Retrieved October 31, 2011, from,
http://annualreview.salvationarmy.ca/annualreview/2010-2011/
Tremblay, M. A., Blanchard, C. M., Taylor, S., Pelletier, L. G., & Villeneuve, M. (2009).
Work Extrinsic and Intrinsic Motivation Scale: Its value for organizational
psychology research. Canadian Journal of Behavioural Science/Revue canadienne
des sciences du comportement, 41(4), 213.
Turner, J. C., & Patrick, H. (2008). How does motivation develop and why does it
change? Reframing motivation research. Educational Psychologist, 43(3), 119-131.
Broeck, A., Vansteenkiste, M., Witte, H., Soenens, B., & Lens, W. (2010). Capturing
autonomy, competence, and relatedness at work: Construction and initial validation
of the Work‐related Basic Need Satisfaction scale. Journal of Occupational and
Organizational Psychology, 83(4), 981-1002.
van Dierendonck, D., Haynes, C., Borrill, C., & Stride, C. (2004). Leadership behavior
and subordinate well-being. Journal of Occupational Health Psychology, 9(2), 165-
175.

Motivation for transformational leadership 142
Van Katwyk, P. T., Fox, S., Spector, P. E., & Kelloway, E. K. (2000). Using the Job-
related Affective Well-being Scale (JAWS) to investigate affective responses to
work stressors. Journal of Occupational Health Psychology, 5, 219–230.
Vansteenkiste, M., Ryan, R. M., & Deci, E. L. (2008). Self-determination theory and the
explanatory role of psychological needs in human well-being. In L. Bruni, F.
Comim, & M. Pugno (Eds.), Capabilities and happiness (pp. 187–223). Oxford:
Oxford University Press.
Van Yperen, N. W., & Hagedoorn, M. (2003). Do high job demands increase intrinsic
motivation or fatigue or both? The role of job control and job social support.
Academy of Management Journal, 46(3), 339-348.
Waldman, D. A., Galvin, B. M., & Walumbwa, F. O. (2012). The development of
motivation to lead and leader role identity. Journal of Leadership and
Organizational Studies, 20(2), 156-168. DOI: 10.1177/1548051812457416
Wanous, J. P., Reichers, A. E., & Hudy, M. J. (1997). Overall job satisfaction measures:
How good are single-item measures? Journal of Applied Psychology, 82, 247–252.
Westman, M., & Etzion, D. (2001). The impact of vacation and job stress on burnout and
absenteeism. Psychology and Health, 16, 595–606.
Wiener, Y. (1982). Commitment in organizations: A normative view. Academy of
Management Review, 7, 418–428.
Wilson, P. M., Rodgers, W. M., Loitz, C. C., & Scime, G. (2006). 'It's Who I
Am...Really!' The Importance of Integrated Regulation in Exercise Contexts.
Journal Of Applied Biobehavioral Research, 11(2), 79-104. doi:10.1111/j.1751-
9861.2006.tb00021.x

Motivation for transformational leadership 143
Wood, R. E. & Bandura, R. E. (1989). Social cognitive theory of organizational
management. Academy of Management Review, 14, 361-384.
Zaccaro, S. J., & Klimoski, R. J. (Eds.). (2002). The nature of organizational leadership:
Understanding the performance imperatives confronting today's leaders (Vol. 12,
pp. 3-41). John Wiley & Sons.
Zohar, D. (2002). The effects of leadership dimensions, safety climate, and assigned
priorities on minor injuries in work groups. Journal of Organizational Behavior, 23,
75–92.

Motivation for transformational leadership 144
Appendix A
Motivation for Transformational Leadership Scale
(Gilbert, Horsman, & Kelloway, 2014)
Leadership Definition: Being a good leader involves challenging, inspiring, and
motivating others to do their best, acting as a role model by doing the right thing, and
treating others as individuals and helping them to meet their needs.
INSTRUCTIONS: There are a variety of reasons why people put effort into being a good
leader at work. Please read the definition of good leadership above and then indicate the
extent to which you agree with each of the following reasons for why you put effort into
being a good leader.
I put effort into being a good leader…
S
tro
ng
ly
Dis
agre
e
Mo
der
atel
y
Dis
agre
e
Sli
gh
tly
Dis
agre
e
Nei
ther
Ag
ree
no
r D
isag
ree
Sli
gh
tly A
gre
e
Mo
der
atel
y
Ag
ree
Str
ong
ly A
gre
e
External Regulation
1. Because others will reward me
financially (e.g., supervisor,
colleagues, family, clients).
1 2 3 4 5 6 7
2. To avoid losing financial benefits. 1 2 3 4 5 6 7
3. Because I risk losing my job if I
don’t. 1 2 3 4 5 6 7
Introjected Regulation
4. Because otherwise I will feel guilty. 1 2 3 4 5 6 7
5. Because otherwise I will feel bad
about myself. 1 2 3 4 5 6 7
6. Because otherwise I would be
ashamed of myself. 1 2 3 4 5 6 7
Identified Regulation

Motivation for transformational leadership 145
7. Because it has a lot of personal
meaning to me. 1 2 3 4 5 6 7
8. Because I believe it is worth the
effort to be a good leader. 1 2 3 4 5 6 7
9. Because it aligns with my values. 1 2 3 4 5 6 7
Integrated Regulation
10. Because it comes naturally to me. 1 2 3 4 5 6 7
11. Because I was born to be a leader. 1 2 3 4 5 6 7
12. Because it is part of my identity. 1 2 3 4 5 6 7
Intrinsic Motivation
13. Because what I do as a leader is
exciting. 1 2 3 4 5 6 7
14. Because the work I do as a leader is
interesting. 1 2 3 4 5 6 7
15. Because I find it energizes me. 1 2 3 4 5 6 7
Please rate the extent to which you
agree or disagree on how you feel
about being a good leader.
Str
ong
ly
Dis
agre
e
Mo
der
atel
y
Dis
agre
e
Sli
gh
tly D
isag
ree
Nei
ther
Ag
ree
no
r D
isag
ree
Sli
gh
tly A
gre
e
Mo
der
atel
y
Ag
ree
Str
ong
ly A
gre
e
Amotivation
16. I really feel like I would be wasting
my time by being a good leader. 1 2 3 4 5 6 7
17. I put little effort into being a good
leader. 1 2 3 4 5 6 7
18. I just don’t care about being a good
leader. 1 2 3 4 5 6 7

Motivation for transformational leadership 146
Appendix B
Salvation Army Demographic Items
1. Name: __________________________
2. Are you currently in a formal leadership role? Yes
No
a. If yes, how many subordinates report to you? _____________
3. Please tell us which Salvation Army Division in which you currently reside
_____________________
4. Are you a commissioned Salvation Army officer?
Yes No
5. If yes to question 3 above, how long ago was your most recent change in
appointment?
_____Years and _____Months
6. Please indicate below the extent to which your most recent change in appointment
impacted yourself and/or your family.
1 2 3 4 5
Not at all Somewhat To a very large
extent
7. How many people work in your department? ______________
8. Age __________ years
9. Gender Male Female
10. Tenure with current organization __________Years _________Months
11. Tenure in current job __________Years _________Months
12. Job title ________________________________________
13. Have you received any work-related leadership training within the past two years?
Yes No

Motivation for transformational leadership 147
a. If yes, please describe the training (what aspect of leadership did it focus
on, what did you do in the training, etc.)
____________________________________________________________
____________________________________________________________
____________________________________________________________
__________________
14. What is your highest level of education?
High school Diploma
Undergraduate degree Graduate degree
15. Would you like to be emailed a personal results profile which includes your own
self-ratings of leadership and leadership ratings from any followers whom you
recruit to the study? (This information will only be shown to you for personal
development only and will be not be used to make any administrative or personnel
decisions).
Yes No

Motivation for transformational leadership 148
Appendix C
Cumberland Health Leader Demographic Items
1. Are you currently in a formal leadership role? Yes
No
a. If yes, how many subordinates report to you? _____________
2. How many people work in your department? ______________
3. Age __________ years
4. Gender Male Female
5. Tenure with current organization __________Years _________Months
6. Tenure in current job __________Years _________Months
7. Job title ________________________________________
8. Have you received any work-related leadership training within the past two years?
Yes No
b. If yes, please describe the training (what aspect of leadership did it focus
on, what did you do in the training, etc.)
____________________________________________________________
____________________________________________________________
____________________________________________________________
__________________
9. What is your highest level of education?
High school Diploma
Undergraduate degree Graduate degree

Motivation for transformational leadership 149
Appendix D
Follower Demographic Items
Please create a Personal Identification Number (PIN) using the following three questions
so that we can link your responses from both surveys while maintaining your anonymity.
1. First four letters of mother’s maiden name (e.g., MAID) ____________
2. Day of the month that you were born (e.g., 30) _________________
3. Last two letters of father’s name (e.g., EN) ______________
PIN Code: MAID30EN
[For phases Four and Seven only, the following question will be included:
Did you previously complete this survey in a different phase?
Yes No
If yes, how many times have you completed this survey? __________]
1. Age __________ years
2. Gender Male Female
3. What is your highest level of education?
High school Diploma
Undergraduate degree Graduate degree
Please answer the following questions as they relate to your relationship with the
leader whom you rated on this survey.
4. Please choose your leaders’ name from the drop-down menu below. [WILL
INSERT DROP-DOWN MENU HERE].
5. What is the nature of your relationship with this leader?
a. He/she is my corps officer (I am a congregation member)
b. He/she is my boss (I am a Salvation Army employee)
c. He/she is my volunteer coordinator (I am a Salvation Army volunteer)
d. Other. Please describe: _____________________________
6. How often do you interact with the leader whom you rated on this survey?
a. More than once per day
b. Once daily
c. Three to four times per week
d. One to two times per week
e. Fewer than once per week
7. How long have you worked with this leader in his or her current Salvation Army
appointment? _________Years and ________Months

Motivation for transformational leadership 150
Appendix E
Table 12. Results of Hierarchical Regression Analysis predicting laissez-faire, active and passive management by exception, contingent reward, and
transformational leadership styles.
Step 1: Control Variables Step 2: MTFL Subscales
Gender Age Education Amotivation
External
Regulation
Introjected
Regulation
Identified
Regulation
Integrated
Regulation
Intrinsic
Motivation
Transformational Leadership
Overall Model R2 = .13, F(3, 236) = 1.03 ΔR
2 = .37, ΔF(6, 230) = 23.27†
B .04 .00 .04 -.11 -.01 -.04 .19 .06 .07
SEB .05 .00 .02 .05 .02 .02 .05 .02 .03
β .05 .03 .09 -.15 -.04 -.16 .27 .17 .16
t .79 .45 1.44 -.2.23* -.79 3.52† 3.52† 2.63† 2.32*
Contingent Reward
Overall Model R2 = .02, F(3, 228) = 1.56 ΔR
2 = .12, ΔF(6, 222) = 5.27†
B .11 .00 .05 -.02 .03 -.00 .31 .03 .00
SEB .08 .00 .04 .08 .03 .03 .09 .04 .06
β .09 .05 .09 -.02 .08 -.01 .32 .06 .00
t 1.42 .80 1.35 -.23 1.18 -.17 3.50† .77 .03
Active Management By
Exception
Overall Model R2 = .00, F(3, 234) = .22 ΔR
2 = .03, ΔF(6, 228) = 1.07
B -.08 .00 .01 -.08 .06 .04 .06 .04 -.03
SEB .11 .01 .05 .12 .04 .04 .13 .05 .08
β -.05 -.01 .02 -.06 .10 .07 .05 .06 -.03

Motivation for transformational leadership 151
t -.76 -.22 .26 -.73 1.39 1.00 .48 .78 -.34
Passive Management By
Exception
Overall Model R2 = .01, F(3, 233) = .54 ΔR
2 = .12, ΔF(6, 227) = 5.37†
B .00 .00 -.04 .07 -.01 .08 -.14 -.09 .02
SEB .08 .00 .04 .08 .03 .03 .09 .04 .05
β .00 -.03 -.07 .06 -.02 .20 -.14 -.18 .03
t .07 -.51 -1.06 .82 -.33 2.96† -1.62 -2.48* .31
Laissez-Faire
Overall Model R2 = .01, F(3, 235) = .58 ΔR
2 = .15, ΔF(6, 229) = 6.51†
B -.00 .00 -.03 .14 .01 .02 -.02 -.08 .00
SEB .06 .00 .03 .06 .02 .02 .06 .02 .04
β .00 -.01 -.08 .19 .05 .08 -.02 -.24 .01
t -.06 -.14 -1.28 2.41* .76 1.25 -.27 -3.29† .12
Notes. * = p < .05, † = p < .01.