Salmonella biofilm formation and its control in pig and poultry ...
282
1 Salmonella biofilm formation and its control in pig and poultry production environments By Claire Elizabeth Oastler Submitted for the degree of Veterinary Medicine PhD School of Veterinary Medicine University of Surrey December 2021 Copyright © Claire Oastler 2021, © Crown copyright 2022
-
Upload
khangminh22 -
Category
Documents
-
view
1 -
download
0
Transcript of Salmonella biofilm formation and its control in pig and poultry ...

1
Salmonella biofilm formation and its control in pig
and poultry production environments
By
Claire Elizabeth Oastler
Submitted for the degree of Veterinary Medicine PhD
School of Veterinary Medicine
University of Surrey
December 2021
Copyright © Claire Oastler 2021, © Crown copyright 2022

2
Declaration of originality
This thesis and the work to which it refers are the results of my own efforts. Any ideas, data, or text
resulting from the work of others (whether published or unpublished) are fully identified as such
within the work and attributed to their originator in the text, bibliography or in footnotes. This thesis
has not been submitted in whole or in part for any other academic degree or professional qualification.
I agree that the University has the right to submit my work to the plagiarism detection service
TurnitinUK for originality checks. Whether or not drafts have been so assessed, the University reserves
the right to require an electronic version of the final document (as submitted) for assessment as
above.
Signed ……………………………………

3
Abstract
Salmonella can survive and persist in the environment, acting as a reservoir for infection of animals
and ultimately humans through the food chain. Biofilm formation contributes to Salmonella survival
and compromises cleaning and disinfection. The overall objective of the research detailed in this thesis
was to further understand biofilm formation by Salmonella in pig and poultry production
environments.
Biofilm formation by 132 Salmonella enterica subspecies enterica environmental isolates was studied
by phenotypic characterisation, genomic analysis, and representative in vitro biofilm models. Biofilm-
forming ability was assessed using the crystal violet microplate assay at environmentally relevant
temperatures, with analysis of the influence of serovar, culture conditions and source environment.
Bacterial motility, growth kinetics, antimicrobial resistance (AMR) profiles and colony morphology
were also studied. A subset of isolates were analysed using whole-genome sequencing and then
screened for genes associated with biofilm formation, AMR, and tolerance to quaternary ammonium
compounds (QACs), with comparative genomic analysis of phenotype-genotype associations. A subset
of S. 13,23:i:- isolates were evaluated for their tolerance to commercial disinfectants using modified
coupon-based and metabolic microplate-based assays. Finally, biofilm formation was assessed in a
developed in vitro model of a poultry drinking water system (DWS).
Most Salmonella isolates (130/132), representing a range of serovars, formed in vitro biofilms to
varying degrees. Differences were observed, particularly between serovars, in planktonic and biofilm
phenotypes and the prevalence of biofilm-associated genes and AMR determinants. However, any
definitive conclusions regarding the factors influencing in vitro biofilm formation could not be reached.
The findings suggest that the persistence of S. 13,23:i:- in the hatchery environment and its observed
tolerance to Benzalkonium-chloride and QAC-/glutaraldehyde-based disinfectants may be facilitated
by biofilm formation and/or the presence of QAC tolerance genes. In the poultry DWS model, biofilms
were formed and quantified successfully, despite inoculation with low levels of bacteria.

4
The studies presented in this thesis provide new information about biofilm formation by Salmonella
originating from pig and poultry production environments, and the poultry DWS provides a novel in
vitro method for the study of biofilm formation under realistic conditions. These findings may be used
to inform improved Salmonella control during primary production of food-producing animals.

5
Acknowledgements
Firstly, I would like to express my sincere gratitude to my supervisors Professor Roberto La Ragione,
Professor Mark Chambers, Dr Francesca Martelli, Dr Rob Davies, and Dr Becky Gosling, for their
support and guidance. I am very grateful for the opportunity given to me by the Animal and Plant
Health Agency (APHA) to undertake this PhD with funding provided by the Department for
Environment, Food and Rural Affairs (Defra) projects CR2000A, CR2000B and CR20005.
I would like to extend my thanks to my colleagues in the Bacteriology Department at APHA for their
support with my research, in particular to all the staff in the Salmonella reference laboratory. I would
like to thank the following people for their help with the laboratory studies, Beaulieu Puddicombe-
Coles for performing PCR testing, Olivia Turner for her assistance with DNA extraction, and William
Cooley and David Everest for performing scanning electron microscopy. From the University of Surrey,
I would also like to thank Dr Arnoud van Vliet for training me in bioinformatic analysis and Marcus
O’Reilly for his contribution to this thesis through the study of the biofilm-forming ability of the
Salmonella isolates originating from duck farms as part of his Master’s dissertation in 2018.
Last but not least, I would also like to thank my parents, my twin brother, and my friends for all their
encouragement and support during my studies, with special thanks to Dr Jonny Sheldon.

6
Conference papers
Biofilm-forming ability of Salmonella enterica serovars isolated from pig and poultry production
environments. Symposium Salmonella and Salmonellosis I3S 2018 – oral presentation. Saint-Malo,
France, 2018.
Using in vitro models of the farm environment to assess the biofilm-forming abilities of pig and
poultry production associated Salmonella enterica serovars. European Congress on Biofilms,
EUROBIOFILMS 2019 - poster presentation. Glasgow, UK.
Phenotypic and genotypic characterisation of biofilm-forming Salmonella enterica serovars isolated
from pig and poultry production environments. European Congress on Biofilms, EUROBIOFILMS 2019
- poster presentation. Glasgow, UK.
Phenotypic and genotypic characterisation of biofilm-forming Salmonella enterica serovars isolated
from pig and poultry production environments. University of Surrey, School of Veterinary Medicine
Research Celebration Event 2019 – poster presentation. Guildford, UK
Development of an in vitro model for studying biofilms in broiler drinking water systems. Avian
infectious Diseases Meeting 2021 – flash presentation. Online.
Biofilm-forming capability and disinfectant tolerance of persistent Salmonella 13,23:i:- isolates
recovered from a poultry hatchery. One Health European Joint Programme Annual Scientific Meeting
2021 – poster presentation. Online.
7
Table of contents
Declaration of originality .............................................................................................................. 2
Abstract ....................................................................................................................................... 3
Acknowledgements...................................................................................................................... 5
Conference papers ....................................................................................................................... 6
Table of contents ......................................................................................................................... 7
List of tables .............................................................................................................................. 14
List of figures ............................................................................................................................. 16
List of abbreviations ................................................................................................................... 18
Chapter 1 Introduction ............................................................................................................... 24
1.1. Salmonella .............................................................................................................................. 24 1.1.1 History of Salmonella ........................................................................................................... 24 1.1.2 Cultural and biochemical characteristics of Salmonella ...................................................... 24
1.1.2.1 Biochemical characteristics ........................................................................................... 24 1.1.2.2 Cell morphology ............................................................................................................ 24
1.1.2.2.1 Flagella ................................................................................................................... 25 1.1.2.2.2 Fimbriae ................................................................................................................. 25
1.1.3 Taxonomy of the genus Salmonella ..................................................................................... 26 1.1.4 The Salmonella genome ....................................................................................................... 26 1.1.5 Epidemiology of non-typhoidal Salmonella (NTS) in animals and humans ......................... 27
1.1.5.1 Pathogenesis ................................................................................................................. 27 1.1.5.2 Salmonellosis in animals ............................................................................................... 27 1.1.5.3 Salmonellosis in humans ............................................................................................... 28 1.1.5.4 Sources and transmission ............................................................................................. 29
1.2 Biofilms ............................................................................................................................ 30
1.2.1 History of biofilms ................................................................................................................ 30 1.2.2 Mechanisms of biofilm formation ....................................................................................... 30 1.2.3 Structure, regulation, and function of Salmonella biofilms ................................................. 31
1.2.3.1 The extracellular polymeric substances (EPS) matrix ................................................... 32 1.2.3.2 Genetic regulation of biofilm formation ....................................................................... 33 1.2.3.3 Factors influencing biofilm formation ........................................................................... 34 1.2.3.4 Role of biofilm formation in host colonization and host persistence ........................... 35
1.3 Structure of the British pig and poultry industries .............................................................. 36
1.3.1 Animal-feed production ....................................................................................................... 36 1.3.1.1 Feed mills ...................................................................................................................... 36 1.3.1.2 Prevalence of Salmonella in feed .................................................................................. 36
1.3.2 The pig industry ................................................................................................................... 37 1.3.2.1 Pig farms........................................................................................................................ 37

8
1.3.2.2 Prevalence of Salmonella in pigs ................................................................................... 37 1.3.3 The poultry industry ............................................................................................................. 38
1.3.3.1 Hatcheries ..................................................................................................................... 38 1.3.3.2 Poultry farms ................................................................................................................. 39
1.3.3.2.1 Egg-producing farms .............................................................................................. 39 1.3.3.2.2 Meat-producing farms ........................................................................................... 40 1.3.3.2.3 Feeding and drinking water systems ..................................................................... 40
1.3.3.3 The Salmonella National Control Programme (NCP) .................................................... 41 1.3.3.4 Prevalence of Salmonella in poultry ............................................................................. 41
1.3.4 Risk factors for Salmonella and biofilm formation in primary production environments .. 42 1.3.5 Strategies to control Salmonella and biofilm formation ..................................................... 44
1.3.5.1 Vaccination .................................................................................................................... 44 1.3.5.2 Feed and water additives .............................................................................................. 45 1.3.5.3 Cleaning and disinfection (C&D) ................................................................................... 47
1.3.5.3.1 Mechanisms of action and factors affecting the efficacy of disinfectants ............ 48 1.3.5.4 Antimicrobial treatment ............................................................................................... 50
1.3.5.4.1 Mechanisms of action of antimicrobials ................................................................ 50 1.3.5.4.2 Antimicrobial resistance (AMR) ............................................................................. 50
1.3.5.5 Mechanisms of antimicrobial resistance and disinfectant tolerance ........................... 51 1.3.5.5.1 Intrinsic resistance ................................................................................................. 52 1.3.5.5.2 Acquired resistance - genetic mechanisms ............................................................ 52
1.3.5.6 Alternative strategies .................................................................................................... 54 1.3.5.6.1 Brominated furanones ........................................................................................... 54 1.3.5.6.2 Bacteriophages ...................................................................................................... 54 1.3.5.6.3 Essential oils ........................................................................................................... 54 1.3.5.6.4 Quorum sensing (QS) inhibitors ............................................................................. 55 1.3.5.6.5 Micro- and nano-emulsions ................................................................................... 55 1.3.5.6.6 Surfaces to prevent biofilm adhesion .................................................................... 55 1.3.5.6.7 Combination treatments ........................................................................................ 56
1.4 Salmonella and biofilm study methods .............................................................................. 57
1.4.1 Methods for isolation, culture, and identification of Salmonella ........................................ 57 1.4.2 In vitro biofilm study methods ............................................................................................. 58
1.4.2.1 Quantitative biofilm study methods ............................................................................. 58 1.4.2.1.1 Static biofilm models ............................................................................................. 58 1.4.2.1.2 Dynamic biofilm models ........................................................................................ 59 1.4.2.1.3 Microcosm biofilm models .................................................................................... 60
1.4.2.2 Qualitative characterization of biofilms ........................................................................ 60 1.4.2.2.1 Identification of extracellular polymeric substances (EPS) matrix components ... 60 1.4.2.2.2 Microscopy-based methods ................................................................................... 61
1.4.3 In situ biofilm study methods .............................................................................................. 62 1.4.4 Disinfectant efficacy testing methods ................................................................................. 62
1.4.4.1 Planktonic tests ............................................................................................................. 62 1.4.4.2 Biofilm tests .................................................................................................................. 63
1.5 Project aims and hypothesis ................................................................................................. 64
Chapter 2 Materials and Methods .............................................................................................. 67
2.1 Salmonella isolate panel ................................................................................................... 67

9
2.1.1 Sample collection ................................................................................................................. 68 2.1.2 Salmonella isolation ............................................................................................................. 68 2.1.3 Salmonella identification ..................................................................................................... 69
2.1.3.1 Serotyping and phage typing ........................................................................................ 69 2.1.3.2 Polymerase chain reaction (PCR) .................................................................................. 70 2.1.3.3 Vaccine strain testing .................................................................................................... 70
2.1.4 Culture conditions ................................................................................................................ 71
2.2 Phenotypic characterisation techniques ............................................................................ 71
2.2.1 Crystal violet microplate biofilm assay ................................................................................ 71 2.2.1.1 Quantification of biofilm formation .............................................................................. 72
2.2.2 Motility test .......................................................................................................................... 73 2.2.3 Congo red agar (CRA) test .................................................................................................... 73
2.2.3.1 Luria Bertani (LB) w/o salt agar plates containing Congo red (CR) and Coomassie brilliant blue ........................................................................................................................................... 74 2.2.3.2 Colonisation factor antigen (CFA) agar plates containing Congo red (CR) ................... 74
2.2.4 Antimicrobial susceptibility testing (AST) ............................................................................ 75 2.2.5 Growth kinetics .................................................................................................................... 76
2.4 Whole-genome sequencing (WGS) .................................................................................... 78
2.4.1 DNA extraction ..................................................................................................................... 78 2.4.2 DNA sequencing ................................................................................................................... 79 2.4.3 Sequence analysis ................................................................................................................ 80
2.4.3.1 Genome assembly and quality control ......................................................................... 80 2.4.3.2 Phylogenetic analysis .................................................................................................... 80 2.4.3.3 Genome annotation and pangenome analysis ............................................................. 80
2.4.3.3.1 Detection of AMR determinants ............................................................................ 81 2.4.3.3.2 Detection of quaternary ammonium compound (QAC) tolerance genes ............. 81 2.4.3.3.3 Detection of biofilm-associated genes .................................................................. 82
2.5 Biofilm surface test ........................................................................................................... 85
2.5.1 Coupon preparation ............................................................................................................. 85 2.5.1.1 Poplar wood coupons, polyvinyl chloride (PVC) coupons, and stainless steel coupons................................................................................................................................................... 85 2.5.1.2 Screed coupons ............................................................................................................. 85
2.5.2 Formation of biofilms on coupons ....................................................................................... 86 2.5.3 Methods for removing biofilms from coupons .................................................................... 87
2.5.3.1 Vortexing with glass beads method .............................................................................. 87 2.5.3.2 Sonication method ........................................................................................................ 88 2.5.3.3 Cell scraper method ...................................................................................................... 88
2.5.4 Enumeration of biofilms ...................................................................................................... 88 2.5.5 Visualization of biofilms ....................................................................................................... 89
2.5.5.1 Dye staining ................................................................................................................... 89 2.5.5.2 Scanning electron microscopy (SEM) ............................................................................ 89
2.5.6 Biofilm surface disinfectant test .......................................................................................... 90
2.6 The biofilm-oriented antiseptics test (BOAT) and biofilm bactericidal test methods ............ 91
2.7 Poultry drinking water system (DWS) model ..................................................................... 93

10
2.7.1 Evaluation of planktonic growth and biofilm-forming ability at different inocula concentrations .............................................................................................................................. 93 2.7.2 Preparation of the bacterial inoculum for the poultry drinking water system (DWS) model ...................................................................................................................................................... 94 2.7.3 Set up of the poultry drinking water system (DWS) model ................................................. 94
2.10 Data analysis and statistics .............................................................................................. 98
Chapter 3 Quantitative assessment of the biofilm-forming ability of environmental Salmonella isolates .................................................................................................................................... 100
3.1 Introduction ................................................................................................................... 100
3.2 Results ........................................................................................................................... 102
3.2.1 In vitro biofilm-forming ability of Salmonella isolates ....................................................... 102 3.2.1.1 Salmonella isolated from animal-feed producing mills .............................................. 102 3.2.1.2 Salmonella isolated from indoor/outdoor pig farms .................................................. 103 3.2.1.3 Salmonella isolated from chicken/turkey hatcheries ................................................. 103 3.2.1.4 Salmonella isolated from egg-producing farms .......................................................... 106 3.2.1.5 Poultry meat-producing farms .................................................................................... 106
3.2.2 Relationship between the environmental conditions of the originating primary production environment and in vitro biofilm formation ............................................................................... 109
3.2.2.1 Relationship between source surface material/sample type and biofilm formation . 111 3.2.2.2 Relationship between ambient environmental temperature and biofilm formation 111
3.2.3 Influence of culture conditions in the crystal violet microplate assay on in vitro biofilm formation .................................................................................................................................... 112
3.2.3.1 Influence of incubation temperature on biofilm formation ....................................... 112 3.2.3.2 Influence of incubation length on biofilm formation ................................................. 113
3.3 Discussion ...................................................................................................................... 116
3.3.1 In vitro biofilm-forming ability of environmental Salmonella isolates .............................. 116 3.3.2 Relationship between the environmental conditions of the originating primary production environment and in vitro biofilm formation ............................................................................... 118 3.3.3 Influence of culture conditions in the crystal violet microplate assay on in vitro biofilm formation .................................................................................................................................... 119
3.4 Conclusion ...................................................................................................................... 122
Chapter 4 Characterisation of biofilm and planktonic phenotypes of environmental Salmonella isolates .................................................................................................................................... 123
4.1 Introduction ................................................................................................................... 123
4.2 Results ........................................................................................................................... 125
4.2.1 In vitro biofilm-forming ability of different Salmonella serovars ...................................... 125 4.2.2 Bacterial motility ................................................................................................................ 128 4.2.3 Fimbriae and cellulose expression in the Congo red agar (CRA) test ................................ 128
4.2.3.1 Colony morphology on LB w/o salt agar plates containing Congo red (CR) and Coomassie brilliant blue ............................................................................................................................ 129

11
4.2.3.1.1 Relationship between biofilm formation and colony morphology ...................... 130 4.2.3.2 Colony morphology on CFA agar plates containing Congo red (CR) ........................... 130
4.2.3.2.1 Relationship between biofilm formation and colony morphology ...................... 131 4.2.3.3 Comparison of colony morphology in the CRA test between the two types of agar plate................................................................................................................................................. 132
4.2.4 Antimicrobial resistance (AMR) profile .............................................................................. 132 4.2.4.1 Relationship between multi-drug resistance (MDR) and biofilm formation .............. 134
4.2.5 Growth kinetics study ........................................................................................................ 135 4.2.5.1 Relationship between growth kinetic parameters and biofilm formation ................. 136
4.3 Discussion ...................................................................................................................... 140
4.3.1 In vitro biofilm-forming ability of different Salmonella serovars ...................................... 140 4.3.2 Bacterial motility ................................................................................................................ 141 4.3.3 Relationship between colony morphology in the CRA test and in vitro biofilm formation .................................................................................................................................................... 142 4.3.4 Relationship between AMR and in vitro biofilm formation ............................................... 144 4.3.5 Relationship between growth kinetic parameters and in vitro biofilm formation ............ 145
4.4 Conclusion ...................................................................................................................... 146
Chapter 5 Comparative genomic and phenotypic analysis of biofilm formation, antimicrobial resistance, and tolerance to quaternary ammonium compounds in environmental Salmonella isolates .................................................................................................................................... 147
5.1 Introduction ................................................................................................................... 147
5.2 Results ........................................................................................................................... 148
5.2.1 Phylogenetic analysis ......................................................................................................... 148 5.2.2 Relationship between biofilm phenotype and the presence of biofilm-associated genes 150 5.2.3 Prevalence of genes associated with tolerance to quaternary ammonium compounds (QACs) ......................................................................................................................................... 151 5.2.4 Detection of antimicrobial resistance (AMR) determinants .............................................. 151
5.2.4.1 Prevalence of AMR genes ........................................................................................... 151 5.2.4.2 Prevalence of genes encoding for mobile genetic elements ...................................... 151
5.2.5 Comparative analysis of AMR phenotype-genotype ......................................................... 156
5.3 Discussion ...................................................................................................................... 158
5.3.1 Phylogenetic analysis ......................................................................................................... 158 5.3.2 Relationship between biofilm phenotype and the presence of biofilm-associated genes 159 5.3.3 Prevalence of AMR determinants and QAC tolerance genes ............................................ 162 5.3.4 Analysis of AMR phenotype-genotype associations .......................................................... 163
5.4 Conclusion ...................................................................................................................... 164
Chapter 6 In vitro models for studying Salmonella biofilm formation and tolerance to disinfectants................................................................................................................................................ 165
6.1 Introduction ....................................................................................................................... 165

12
6.2 Results ........................................................................................................................... 167
6.2.1 Adaptation of the biofilm surface test ............................................................................... 167 6.2.1.1 Comparative evaluation of methods for removing biofilms formed on porous, semi-porous, and non-porous coupons ........................................................................................... 167 6.2.1.2 Evaluation of the efficacy of a potassium peroxymonosulfate-based disinfectant against S. Enteritidis biofilms............................................................................................................... 170
6.2.2 Evaluation of the disinfectant tolerance of persistent S. 13,23:i:- isolates sourced from the environment of a broiler hatchery.............................................................................................. 171
6.2.2.1 The biofilm-oriented antiseptics test (BOAT) and biofilm bactericidal test methods 171 6.2.2.2 Biofilm surface disinfectant test ................................................................................. 175
6.3 Discussion ...................................................................................................................... 177
6.3.1 The disinfectant tolerance of persistent S. 13,23:i:- isolates sourced from the environment of a broiler hatchery ................................................................................................................... 177 6.3.2 Adaptation of the biofilm surface test ............................................................................... 182
6.4 Conclusion ...................................................................................................................... 184
Chapter 7 Development of an in vitro model of the poultry drinking water system .................... 185
7.1 Introduction ................................................................................................................... 185
7.2 Results ........................................................................................................................... 186
7.2.1 Evaluation of planktonic growth and biofilm formation at different inocula concentrations .................................................................................................................................................... 186
7.2.1.1 Comparative evaluation of planktonic growth at different inocula concentrations .. 186 7.2.1.2 Comparative evaluation of biofilm formation on polyvinyl chloride (PVC) coupons and stainless steel coupons at different inoculum concentrations ............................................... 187
7.2.2 Assessment of biofilm formation within the poultry drinking water system (DWS) model .................................................................................................................................................... 188
7.3 Discussion ...................................................................................................................... 189
7.3.1 In vitro biofilm formation within the poultry DWS model ................................................. 189 7.3.1.1 Advantages of the in vitro poultry DWS for the study of biofilms .............................. 189 7.3.1.2 Limitations of the in vitro poultry DWS for the study of biofilms ............................... 190
7.4 Conclusion ...................................................................................................................... 192
Chapter 8 Final discussions and future perspectives .................................................................. 193
8.1 Summary of results, limitations, and discussion ............................................................... 193
8.1.1 Assessment of biofilm-forming ability and characterisation of biofilm and planktonic phenotypes of environmental Salmonella isolates .................................................................... 194 8.1.2 Comparative genomic and phenotypic analysis of biofilm formation and antimicrobial resistance (AMR) in environmental Salmonella isolates ............................................................ 199 8.1.3 Biofilm-forming ability and the disinfectant tolerance of persistent S. 13,23:i:- isolates sourced from the environment of a broiler hatchery ................................................................. 201

13
8.1.4 Biofilm formation in a developed in vitro model of the poultry drinking water system (DWS) .......................................................................................................................................... 204
8.2 Conclusions .................................................................................................................... 205
8.3 Future perspectives ........................................................................................................ 206
References ............................................................................................................................... 210
Appendix I ............................................................................................................................... 229
Appendix II .............................................................................................................................. 238
Appendix III ............................................................................................................................. 239
Appendix IV ............................................................................................................................. 244
Appendix V .............................................................................................................................. 254
Appendix VI ............................................................................................................................. 256
Appendix VII ............................................................................................................................ 258
Appendix VIII ........................................................................................................................... 263
Appendix IX ............................................................................................................................. 265
Appendix X .............................................................................................................................. 271
Appendix XI ............................................................................................................................. 274
Appendix XII ............................................................................................................................ 275
Appendix XIII ........................................................................................................................... 279

14
List of tables
Table 1-1: Temperature-dependent expression of S. Enteritidis fimbriae ........................................... 26
Table 1-2: Salmonella vaccines licensed for use in pigs or poultry in GB ............................................. 46
Table 1-3: Salmonella colony morphotype and expression of EPS matrix components on agar plates containing CR ........................................................................................................................................ 61
Table 2-1: Calculations used to classify biofilm-forming ability in the crystal violet microplate assay 73
Table 2-2: The panel of 16 antimicrobials of human and veterinary importance used for the disc diffusion test and the associated breakpoints used to determine resistance...................................... 76
Table 2-3: FLUOstar® OPTIMA settings used for the growth curves run .............................................. 77
Table 2-4: List of nine genes associated with tolerance to QACs ......................................................... 82
Table 2-5: List of 38 biofilm-associated genes ...................................................................................... 83
Table 2-6. Classification of disinfectant activity in the BOAT and biofilm bactericidal test methods .. 93
Table 4-1: Biofilm-forming abilities of 14 Salmonella serovars .......................................................... 126
Table 4-2: Guide to Salmonella colony morphologies on LB w/o salt agar plates containing CR and Coomassie brilliant blue and on CFA agar plates containing CR ........................................................ 128
Table 4-3: Colony morphologies on LB w/o salt agar plates containing CR and Coomassie brilliant blue ............................................................................................................................................................ 129
Table 4-4: Biofilm formation and colony morphologies on LB w/o salt agar plates containing CR and Coomassie brilliant blue ...................................................................................................................... 130
Table 4-5: Colony morphologies on CFA agar plates containing CR ................................................... 131
Table 4-6: Biofilm formation and colony morphologies on CFA agar plates containing CR ............... 132
Table 4-7: Trends of AMR profiles and MDR in Salmonella serovars ................................................. 135
Table 4-8: Salmonella biofilm formation and growth kinetics parameters ........................................ 137
Table 5-1: Overall sensitivity, specificity, PPV, NPV, and concordance of AMR phenotype-genotype in Salmonella ........................................................................................................................................... 158
Table 6-1: Comparison of the quantity of biofilm recovered from coupons using different biofilm removal methods ................................................................................................................................ 168
Table 6-2: Bactericidal activity of a BZK-based disinfectant and a QAC-/glutaraldehyde-based disinfectant against S. 13,23:i:- biofilms ............................................................................................. 173
Table 7-1: Quantification of bacterial growth and biofilm recovered from within the poultry DWS… 189
Table 9-1: Metadata for the panel 134 Salmonella isolates ............................................................... 229

15
Table 9-2: Media formulations ........................................................................................................... 238
Table 9-3: Biofilm-forming ability of 134 Salmonella isolates in the crystal violet microplate assay. 239
Table 9-4: Salmonella colony morphologies in the CRA test on CFA agar plates containing CR and on LB w/o salt agar plates containing CR and Coomassie brilliant blue .................................................. 244
Table 9-5: Biofilm formation and growth kinetics parameters for 27 Salmonella isolates ................ 254
Table 9-6: Assembly quality statistics for 93 Salmonella isolates ....................................................... 256
Table 9-7: SNP distance matrix for 20 S. 13,23:i:- isolates ................................................................. 258
Table 9-8: SNP distance matrix for 19 S. Infantis isolates ................................................................... 259
Table 9-9: SNP distance matrix for 17 S. Enteritidis isolates .............................................................. 260
Table 9-10: SNP distance matrix for 16 S. Typhimurium isolates ....................................................... 261
Table 9-11: SNP distance matrix for 19 S. 4,[5],12:i:- isolates ............................................................ 262
Table 9-12: Phenotypic AMR (from AST) and genotypic antimicrobial resistance (from WGS) for a panel of 91 Salmonella isolates .................................................................................................................... 265
Table 9-13: Sensitivity, specificity, PPV, NPV and concordance of phenotypic and genotypic AMR in Salmonella for the NCBI AMRFinderPlus database............................................................................. 271
Table 9-14: Sensitivity, specificity, PPV, NPV and concordance of phenotypic and genotypic AMR in Salmonella for the Resfinder database ............................................................................................... 272
Table 9-15: Sensitivity, specificity, PPV, NPV and concordance of phenotypic and genotypic AMR in Salmonella for the APHA SeqFinder database .................................................................................... 273
Table 9-16: Sensitivity, specificity, PPV, NPV and concordance of phenotypic and genotypic AMR in Salmonella for the PointFinder database ........................................................................................... 273
Table 9-17: Dye staining of Salmonella biofilms formed on stainless steel coupons, PVC coupons, poplar wood coupons, and screed coupons ....................................................................................... 274
Table 9-18: Results of the BOAT and biofilm bactericidal test for a BZK-based disinfectant at general usage concentration and Defra GO rate against S. 13:23:i:- biofilms ................................................. 279
Table 9-19: Results of the BOAT and biofilm bactericidal test for a QAC-/glutaraldehyde-based disinfectant at Defra DoP and GO rates against S. 13:23:i:- biofilms ................................................. 281

16
List of figures
Figure 2-1: Layout of coupons in a 12-well microplate for the biofilm surface test ............................ 87
Figure 2-2: Photograph of the poultry DWS model set up ................................................................... 96
Figure 2-3: Flow diagram of the poultry DWS set up ............................................................................ 97
Figure 3-1: Biofilm-forming ability of Salmonella collected from the environment of GB feed mills. 103
Figure 3-2: Biofilm-forming ability of Salmonella collected from the environment of GB pig farms.105
Figure 3-3: Biofilm-forming ability of Salmonella collected from the environment of GB hatcheries ............................................................................................................................................................ 105
Figure 3-4: Biofilm-forming ability of Salmonella collected from the environment of GB breeder duck, layer duck, and layer hen farms .......................................................................................................... 106
Figure 3-5: Biofilm-forming ability of Salmonella collected from the environment of GB poultry-meat producing farms .................................................................................................................................. 108
Figure 3-6: Comparative biofilm formation by Salmonella collected from eight pig and poultry primary production environments ................................................................................................................... 110
Figure 3-7: Comparative biofilm formation by Salmonella collected from seven surface materials/sample types ...................................................................................................................... 111
Figure 3-8: Association between biofilm formation and the ambient temperature of the source primary production environment ..................................................................................................................... 112
Figure 3-9: Comparative biofilm formation by Salmonella after 48-hour or 72-hour aerobic incubation at 20±1°C or 25±1°C ............................................................................................................................ 114
Figure 3-10: Biofilm-forming ability by 14 Salmonella serovars after 48-hour or 72-hour aerobic incubation at 20±1°C or 25±1°C .......................................................................................................... 115
Figure 4-1: Biofilm formation by five Salmonella serovars ................................................................. 127
Figure 4-2: Occurrence of AMR in Salmonella .................................................................................... 133
Figure 4-3: Comparative 48-hour growth curves for 27 Salmonella isolates ..................................... 138
Figure 4-4: Associations between Salmonella biofilm formation and growth kinetics parameters... 139
Figure 5-1: Phylogenetic tree of Salmonella spp. and the presence of biofilm-associated genes ..... 153
Figure 5-2: Phylogenetic tree of Salmonella spp. and the presence of genes associated with AMR and tolerance to QACs ............................................................................................................................... 154
Figure 5-3: Phylogenetic tree of Salmonella spp. and the presence of genes encoding for plasmids and the class 1 integron-integrase (int1) ................................................................................................... 155
Figure 6-1: Comparison of the quantity of biofilm recovered from coupons using different biofilm removal methods ................................................................................................................................ 169

17
Figure 6-2: Effectivity of a POMS-based disinfectant against Salmonella biofilms formed on coupons ............................................................................................................................................................ 171
Figure 6-3: Reduction in metabolic activity by a BZK-based disinfectant and a QAC-/glutaraldehyde-based disinfectant against S. 13,23:i:- biofilms .................................................................................. 174
Figure 6-4: Comparative evaluation of the effectivity of a QAC-/glutaraldehyde-based disinfectant against Salmonella biofilms formed on coupons after a 30-minute and 3-hour contact time .......... 176
Figure 7-1: Comparative evaluation of bacterial growth after four days incubation using four different starting inocula ................................................................................................................................... 187
Figure 7-2: Comparative evaluation of biofilm formation on coupons after four days incubation using four different starting inocula ............................................................................................................. 188
Figure 9-1: BLASTn alignment for the csgD gene with the Salmonella isolate 27655S ...................... 263
Figure 9-2: BLASTn alignment for lpfD gene with four S. Typhimurium Salmonella isolates ............. 264
Figure 9-3: SEM photographs of a Salmonella biofilm formed on poplar wood coupons ................. 275
Figure 9-4: SEM photographs of a Salmonella biofilm formed on screed coupons ........................... 276
Figure 9-5: SEM photographs of a Salmonella biofilm formed on PVC coupons ................................ 277
Figure 9-6: SEM photographs of a Salmonella biofilm formed on stainless steel coupons ............... 278

18
List of abbreviations
°C degrees Celsius
µg microgram
µL microliter
µm micrometre
A adenosine
ABRicate tool for mass screening of contigs for antimicrobial and virulence genes/ pangenome analysis software
AdrA agfD-dependent regulator
AHDB Agriculture and Horticulture Development Board
AMC amoxicillin-clavulanic acid
AMK amikacin
AMP ampicillin
AMR antimicrobial resistance
APHA Animal and Plant Health Agency
APR apramycin
AST antimicrobial susceptibility testing
ASTM International American Society for Testing and Materials
AUC logistic Area Under the Curve
BapA biofilm associated protein A
BDAR brown, dry, and rough
BGA Brilliant Green Agar
BLASTn Basic Local Alignment Search Tool at nucleotide level
bp base pair(s)
BPW Buffered Peptone Water
BS British Standards
BSAC British Society for Antimicrobial Chemotherapy

19
bcs bacterial cellulose synthesis
BZK benzalkonium chloride
C cytidine
C&D cleaning and disinfection
CAZ ceftazidime
CDC Centers for Disease Control
CFA colonization factor antigen
CFU colony-forming units
CHL chloramphenicol
CIP ciprofloxacin
CLSM confocal laser scanning microscopy
cm centimetre
cm2 square centimetre
CR Congo red
CRA Congo red agar
csg curli subunit
CTX cefotaxime
Defra Department of Environment, Food and Rural Affairs
DNA deoxyribonucleic acid
DoP Diseases of Poultry Order
DT definitive phage type
DWS drinking water system
ECDC European Centre for Disease Prevention and Control
EFSA European Food Safety Authority
EPS extracellular polymeric substances
EU European Union
EN European Standards

20
FSA Food Standards Agency
FUR furazolidone
G guanine
g gravity at the earth’s surface
GB Great Britain
GEN gentamicin
GO General Orders
HP-CIAs Highest Priority Critically Important Antimicrobials
hrs hours
ID inside diameter
IQ-Tree efficient software for phylogenomic inference
ISO International Organization for Standardization
iTOL Interactive Tree of Life
k carrying capacity
kHz kilohertz
L litre
L50 a count of the smallest number of contigs whose length makes up half the genome size
LB Luria-Bertani
lpf long polar fimbriae
max. maximum
MBEC minimal biofilm eradication concentration
MDR multi-drug resistant
MFS major facilitator superfamily
mg milligram
MIC minimum inhibitory concentration
min. minimum

21
MKTTn Muller Kauffmann Tetrathionate Novobiocin Broth
ml millilitre
mm millimetre
MSRV Modified Semi-Solid Rappaport-Vassiliadis
N50 the minimum contig length required to cover 50% of the assembled genome sequence
NAL nalidixic acid
NCBI National Center for Biotechnology Information
NCP National Control Programme
NEO neomycin
nm nanometre
no. number
NOPT sample has a natural phage infection
NPV negative predictive value
NTS non-typhoidal Salmonella
OD optical density
OD24h optical density value at 570nm after 24 hours incubation
OD490 optical density value at 490nm
OD570 optical density value at 570nm
ODc optical density cut-off
ODmax maximum optical density value at 570nm obtained
OMPs outer membrane proteins
PBS phosphate-buffered saline
PCR polymerase chain reaction
PDAR pink, dry and rough
pef plasmid-encoded fimbriae
PHE Public Health England

22
PPV positive predictive value
Prokka rapid prokaryotic genome annotation software
PT phage type
PVC polyvinyl chloride
QACs quaternary ammonium compounds
QS quorum sensing
QUAST Quality Assessment Tool for Genome Assemblies
r growth rate
RCF Relative Centrifugal Force (x g)
RDAR red, dry and rough
RDNC reacts with the phages but does not conform to a recognised phage type
RNA ribonucleic acid
RO Reverse Osmosis
rpm revolutions per minute
rpoS RNA polymerase sigma factor
RVS Rappaport Vassiliadis Soya
S3 sulfonamide compounds
SAW smooth and white
SBA sheep blood agar
SD standard deviation
sef Salmonella Enteritidis fimbriae
SEM scanning electron microscopy
Shovill genome assembly software
SISTR Salmonella in Silico Typing Resource
SMR small multidrug resistance
Snippy rapid haploid variant calling and core genome alignment software
SNP single-nucleotide polymorphism

23
snp-dists pairwise SNP distance matrix software
spp. species
STR streptomycin
SXT sulphamethoxazole-trimethoprim
T thymidine
tDT doubling time
TET tetracycline
TTC Triphenyltetrazolium chloride
U uridine
UK United Kingdom
UNTY a culture which does not react with any of the phages in the typing scheme
USA United States of America
v software version
v/v volume/volume
VBNC viable but nonculturable
VMD Veterinary Medicines Directorate
w/o Without
WGS whole-genome sequencing
WHO World Health Organization
XLD Xylose Lysine Desoxycholate

24
Chapter 1 Introduction
1.1. Salmonella
1.1.1 History of Salmonella
Salmonella was first visualised in 1880 by Karl Eberth in the spleen of a patient who died from Typhoid
fever and was first cultured by George Theodor Gaffky in 1884 from porcine intestines. In 1900
Salmonella was named after the veterinary pathologist Daniel Elmer Salmon, who, along with
Theobald Smith, isolated Salmonella (S.) Choleraesuis from pigs in 1885.
1.1.2 Cultural and biochemical characteristics of Salmonella
Salmonella spp. are Gram-negative, non-spore-forming bacteria. They are facultative anaerobes and
chemotrophs, obtaining their energy from oxidation and reduction reactions using organic sources
(Fabrega and Vila, 2013). Generally, Salmonellae can grow at temperatures between 8°C and 45°C
(optimum growth at 37°C) and at pH levels between 4.0 and 9.5 (optimum pH 6.5–7.0) (Chlebicz and
Slizewska, 2018). Salmonellae has a cyclic lifestyle, mediated in most cases by varying periods of
survival outside the host, and this prolonged environmental survival ability is a very important aspect
of the epidemiology of most serovars that affect food animal production (Waldner et al., 2012).
1.1.2.1 Biochemical characteristics
Many Salmonellae are indole-negative, catalase-positive, oxidase-negative, sucrose fermenting, and
hydrogen sulphide producing except for some S. Choleraesuis and most S. Paratyphi A, as well as some
individual strains of several other serovars. Most Salmonellae are aerogenic except S. Typhi and some
variants of S. Dublin (Grimont and Weill, 2007; Popoff and Le Minor, 2015; Public Health England
[PHE], 2021b); World Health Organization [WHO] (2018).
1.1.2.2 Cell morphology
Salmonellae are rod-shaped and range in size from a diameter of 0.7-1.5µm and a length of 2-5µm.
The proteinaceous components of flagella and fimbriae, expressed by Salmonella on the surface of

25
the bacterial cell, are important for the survival and colonization of Salmonella within the environment
and in the host (Andino and Hanning, 2015).
1.1.2.2.1 Flagella
Flagella are composed of three subunits: the basal body, a transmembrane motor, and filaments. Their
function is to allow Salmonella to be motile within the environment and the host, except for the few
non-motile Salmonella serovars, such as S. Pullorum and S. Gallinarum, and some individual non-
motile strains of other serovars (Andino and Hanning, 2015; Jones, 2013; PHE, 2021b; WHO, 2018).
Flagella play a role in surface adhesion as motility is required for bacteria to reach the attachment
surface and help the bacterial cell to overcome the repulsive forces between the bacterial cell and
surface (Van Houdt and Michiels, 2010).
1.1.2.2.2 Fimbriae
There are many different types of fimbriae expressed by Salmonella. The most common fimbriae
identified in Enterobacteriaceae are type 1 fimbriae (Salmonella Enteritidis fimbriae [SEF] 21) which
are about 6-7nm in diameter and up to 100nm long. Type II fimbriae are non-hemagglutinating
variants of type 1 fimbriae and have only been described in serovars S. Gallinarum, S. Pullorum, S.
Paratyphi B and S. Dublin. Type III fimbriae, such as SEF14 and SEF18, are about 3-5nm in diameter,
with SEF14 fimbriae only expressed by certain serovars such as S. Enteritidis and S. Dublin. Type IV
fimbriae, such as SEF17, are expressed in some but not all Salmonella serovars. Other types of fimbriae
expressed by Salmonella are long polar fimbriae (lpf) and plasmid-encoded fimbriae (pef). Pef fimbriae
have been described in serovars S. Enteritidis, S. Typhimurium and S. Choleraesuis but are absent in S.
Gallinarum and S. Dublin. Fimbriae play a role in surface adhesion and virulence by overcoming the
electrostatic forces between bacteria and surfaces. In S. Enteritidis, the expression of curli fimbriae is
temperature-dependent with SEF14 fimbriae not expressed below 28°C, see Table 1-1 (Austin et al.,
1998; Dibb-Fuller et al., 1997; Jones, 2013; Van Houdt and Michiels, 2010; Walker et al., 1999;
Woodward et al., 2000).

26
Table 1-1: Temperature-dependent expression of S. Enteritidis fimbriae. Fimbriae expression by S. Enteritidis
after aerobic incubation at 20°C, 25°C, and 37°C (Austin et al., 1998; Dibb-Fuller et al., 1997; Walker et al., 1999;
Woodward et al., 2000).
Fimbrial type Aerobic incubation temperature
20°C 25°C 37°C
SEF14 not expressed no data Expressed
SEF21 very poorly expressed no data very poorly expressed
SEF17 expressed expressed not expressed
1.1.3 Taxonomy of the genus Salmonella
Salmonella belongs to the family Enterobacteriaceae. The genus Salmonella can be classified into two
species: Salmonella enterica and Salmonella bongori. Salmonella enterica is divided into six
subspecies, with Salmonella enterica subspecies salamae, arizonae, diarizonae, indica, and houtenae
primarily infecting cold-blooded hosts. In contrast, Salmonella enterica subspecies enterica primarily
infects warm-blooded hosts, including humans. Salmonella enterica subspecies enterica is functionally
divided into two groups: typhoidal serovars and non-typhoidal serovars. Typhoidal serovars cause
severe disease in humans, and non-typhoidal Salmonella (NTS), of which there are about 2600
serovars which are largely non-host adapted, are commonly associated with food poisoning incidents
(MacKenzie et al., 2017; Waldner et al., 2012).
1.1.4 The Salmonella genome
The size of the S. Typhimurium genome is approximately 4.8 million base pairs (bp) (McClelland et al.,
2001). Genome sizes of Salmonella vary among serovars; for instance, the S. Enteritidis genome is
approximately 4.7 million bp, and the S. Typhimurium genome is 4.9 million bp (Andino and Hanning,
2015). As of November 2021, there were over 320,000 Salmonella genomes available on Enterobase
(https://enterobase.warwick.ac.uk/). The bacterial genome is composed of two types of genes: the
core genome and the accessory genome. The core genome describes the genes common to all the
isolates in a group, and the accessory genome describes the genes missing from at least one isolate in
a group. The pangenome describes all the genes in the core and accessory genomes (Jacobsen et al.,
2011; Sanderson and Nair, 2013).

27
1.1.5 Epidemiology of non-typhoidal Salmonella (NTS) in animals and humans
Salmonella has a worldwide distribution. Between 2005 and 2019, Salmonella was the second most
commonly reported animal or foodborne zoonotic agent (bacterial, viral, or parasitic) in the European
Union (EU) after Campylobacter (European Food Safety Authority [EFSA] and European Centre for
Disease Prevention and Control (ECDC), 2021a). Salmonella is a zoonotic pathogen, and the majority
of Salmonella serovars can infect a wide range of host species, including humans, livestock (pigs,
poultry, and cattle), wildlife (foxes, wild birds, and rodents) and domestic animals (cats, dogs, and
reptiles). The infection of humans and animals by NTS is known as salmonellosis and is important for
public health and for the food production industry (Romich, 2008; WHO, 2018). The economic costs
of salmonellosis result from the direct costs of illness, such as hospitalisation and indirect costs, such
as worker absence, production losses by the livestock farmer, and the withdrawal of contaminated
food products (Sockett, 1991).
1.1.5.1 Pathogenesis
The infectious dose of Salmonella varies between serovars, but it must be sufficient to overcome
stomach acidity and complete with the intestinal flora (Romich, 2008). For example, Hinton (1988)
showed that only a few bacterial cells (0.1-0.3 to 100-300 Salmonella per gram of feed) were required
to cause infection in chicks. Salmonella survives through the gastrointestinal tract and colonises the
small and large intestines (and the crop and caeca in poultry), invading the epithelium and may
produce toxins. Invasion of the epithelial cells induces an acute inflammatory reaction, causing
gastroenteritis symptoms. In poultry, S. Enteritidis, like S. Gallinarum and S. Pullorum, can also
colonise the reproductive organs (ovaries and oviduct), leading to infection of developing eggs (Chen
et al., 2020; Gast, 2005; Giannella, 1996).
1.1.5.2 Salmonellosis in animals
Salmonella infection in poultry and adult or slaughter pigs is usually asymptomatic, but where clinical
symptoms occur, the severity of the disease depends on the animal's age and the Salmonella serovar.

28
Host-generalised serovars, for example, S. Enteritidis and S. Typhimurium, can cause infections in a
diverse range of animal and human hosts. They usually cause acute and self-limiting (non-invasive)
gastroenteritis but can result in more severe disease in very young or old animals; examples are S.
Enteritidis and S. Typhimurium. Host-adapted serovars such as S. Dublin in cattle and S. Choleraesuis
in pigs (which also has a high mortality rate in humans) usually only infect specific hosts but can infect
a limited number of other species. Host-specific serovars such as S. Pullorum and S. Gallinarium can
only infect a specific host and cause severe disease. S. Pullorum causes pullorum disease, resulting in
systemic disease and diarrhoea, leading to death in young chicks and affecting egg production in laying
hens. S. Gallinarum causes fowl typhoid and is more frequently seen in older birds, causing
septicaemia and diarrhoea with a high mortality rate (Andino and Hanning, 2015; Animal and Plant
Health Agency [APHA], 2021; Romich, 2008; Tindall et al., 2005). The prevalence of Salmonella in pigs
and poultry in the United Kingdom (UK) are described in Chapter 1, sections 1.3.2.2 and 1.3.3.4,
respectively.
1.1.5.3 Salmonellosis in humans
The clinical signs of infection by NTS in humans relate to gastroenteritis with symptoms of fever,
abdominal pain, diarrhoea, nausea, and vomiting. Symptoms usually develop 12 to 72 hours after
infection and last for four and seven days (PHE, 2021a). Salmonellosis is usually relatively mild and
self-limiting and does not usually require treatment meaning that the number of actual cases is
assumed to be 10 to 15-fold higher than the numbers reported. However, the disease and associated
dehydration can become severe and life-threatening for individuals in risk groups (young, elderly, and
immunocompromised patients). These individuals may require treatment with electrolytes and
intravenous rehydration therapy or antibiotics such as 3rd and 4th generation cephalosporins or
fluoroquinolones (Rabsch, Simon and Humphrey, 2013; Veterinary Medicines Directorate [VMD],
2019b; WHO, 2018).

29
Following a long period of declining numbers of human cases of salmonellosis, since 2015, the number
of cases reported in the European Union (EU) each year has stabilised. In 2019 there were 87,923
reported cases in the EU and 9,718 cases reported in the UK. In the EU, the majority of human
infections were attributed to S. Enteritidis (50.3%), S Typhimurium (11.9%), S. 4,[5],12:i:- [a
monophasic variant of S. Typhimurium] (8.2%), and S. Infantis (2.4%) (APHA, 2020; EFSA and ECDC,
2021a).
1.1.5.4 Sources and transmission
Salmonella infection occurs via the faecal to oral route following contact with infected individuals or
animals who can shed Salmonella whilst clinically infected or as asymptotic carriers (Romich, 2008;
WHO, 2018). In humans, the primary sources of infection are the consumption of contaminated food
products, particularly eggs, pork, and poultry meat products. However, other meat products, dairy
products, fruits, and vegetables are also possible sources of infection. Fruit and vegetables can
become contaminated with Salmonella if they have been in contact with livestock, raw manure, or
contaminated irrigation water (EFSA and ECDC, 2021a; Steenackers et al., 2012). Meat and eggs can
become contaminated with Salmonella due to infected animals, or meat products can become
contaminated due to cross-contamination of carcasses at the abattoir or during further processing
(Ahmet, Gulay and Erman, 2015; Botteldoorn et al., 2003).
Salmonella was responsible for 17.9% of all EU food-borne outbreaks in 2019, with the majority
(72.4%) of outbreaks caused by S. Enteritidis (EFSA and ECDC, 2021a). For example, in 2016, a multi-
country S. Enteritidis outbreak occurred due to the survival of Salmonella in contaminated eggs during
transportation between different countries (EFSA and ECDC, 2017); and more recently, between 2018
and 2020, a multi-country S. Enteritis outbreak with 193 human cases was associated with consuming
frozen breaded chicken products from Poland (EFSA and ECDC, 2021b). In terms of ongoing outbreaks,
since 2015, there has been an outbreak of Salmonella in the UK associated with feeder mice (for
reptiles) imported from Lithuania, with 850 cases reported (Food Standards Agency [FSA], 2021a); and

30
since September 2020, an S. Infantis outbreak associated with contaminated pork scratchings has
occurred (FSA, 2021b).
The colonization of the animal and human hosts and the survival and persistence of Salmonella in the
environment is facilitated by mechanisms such as biofilm formation which will be explained in more
detail in the following sections.
1.2 Biofilms
1.2.1 History of biofilms
A biofilm is a community of microbial cells attached to a surface and enclosed in a self-produced matrix
of extracellular polymeric substances (EPS). The ability to form biofilms has been observed in many
bacteria, including Gram-positive bacteria such as Staphylococcus spp. and Listeria monocytogenes,
and Gram-negative bacteria such as Campylobacter spp., Pseudomonas aeruginosa, Escherichia coli
and Salmonella spp. (Donlan, 2002).
The discovery of biofilms was credited to Antonie Leeuwenhoek (1684) when he observed
microorganisms on tooth surfaces and later observed by H. Heukelekian and A. Heller (1940) for
marine microorganisms with the first scientific study of biofilms published by Claude E. Zobell (1943).
The first detailed examination of biofilms was by Jones, Roth and Sanders (1969), who used scanning
electron microscopy and transmission electron microscopy to examine trickling filters in a wastewater
treatment plant and identified the biofilm EPS matrix.
1.2.2 Mechanisms of biofilm formation
Quorum sensing (QS) is cell to cell communication and functions to regulate metabolic activity in the
biofilm by enabling bacteria of the same or different species to communicate their growth phase and
the nutrient availability of the environment to each other. Biofilm formation and maturation rely on
the interaction between these bacterial cells, the attachment surface, and their environment with the

31
five main stages detailed below (Lamas et al., 2018; Lembre, Lorentz and Di Martino, 2012; Surette
and Bassler, 1998; Van Houdt and Michiels, 2010; Verderosa, Totsika and Fairfull-Smith, 2019):
▪ Stage 1: Surface attachment; planktonic bacteria move towards the surface via passive (shear
forces) or active means (motility). They weakly attach and are encased in small quantities of EPS.
During this stage, some bacteria detach from the surface and return to the planktonic state.
▪ Stage 2: Irreversible surface attachment; bacteria produce more EPS, resulting in cell
aggregation and EPS matrix formation. The biofilm becomes ‘irreversibly’ attached to the surface with
strong forces such as mechanical action now required to detach the biofilm from the surface.
▪ Stage 3: Early biofilm formation; more planktonic bacteria from the surrounding area become
incorporated into the biofilm via QS. Bacterial growth and the production of more EPS matrix helps to
strengthen the attachment to the surface and stabilize the biofilm against environmental stresses.
▪ Stage 4: Biofilm maturation; after about ten days, a mature biofilm has formed and is more
complex than the early biofilm, containing features such as water channels and pores and has a 3D
structure. The bacteria within the biofilm also now show different physiology and metabolism from
planktonic bacterial cells.
▪ Stage 5: Biofilm dispersal; in the final stage, bacterial cells are released from the biofilm due
to several factors, including overpopulation and starvation. This process is regulated by QS and helps
to maintain the integrity of the biofilm and regulate the biofilm in response to nutrient conditions.
Microbial enzymes break down the EPS matrix, and the released bacterial cells revert to their
planktonic state and colonise new biofilms.
1.2.3 Structure, regulation, and function of Salmonella biofilms
The structure, mechanisms and factors influencing Salmonella biofilm formation in single-species
biofilms have been widely investigated and will be described in more detail in this section. Just a single
bacterial species can form a biofilm, but in the environment, Salmonella usually forms mixed-species

32
biofilms with other environmental bacteria such as Pseudomonas aeruginosa or Escherichia coli. The
biofilm structure is complex, consisting of bacterial cells, cellular material from the environment such
as minerals or clay or silt particles, enzymes, and extracellular deoxyribonucleic acid (eDNA) enclosed
in an EPS matrix (Donlan, 2002; Srey, Jahid and Has, 2013).
1.2.3.1 The extracellular polymeric substances (EPS) matrix
The EPS matrix composition varies between bacterial species and depends on environmental
conditions but usually accounts for over 90% of the dry mass of the biofilm (Ćwiek, Bugla-Płoskońska
and Wieliczko, 2019; Flemming and Wingender, 2010). In Salmonella biofilms, the EPS matrix is
predominately composed of polysaccharides (cellulose, O-antigenic capsule, colonic acid), and
proteins (biofilm-associated protein A [BapA], fimbriae, flagella, outer membrane proteins [OMPs])
(Ćwiek, Bugla-Płoskońska and Wieliczko, 2019; Milanov et al., 2017; Steenackers et al., 2012). The
weak physiochemical interactions (ionic attractive forces, electrostatic attractive forces, Van der
Waals interactions, hydrogen bonding) between the biofilm components hold the biofilm together
and provide stability to the EPS matrix (Ćwiek, Bugla-Płoskońska and Wieliczko, 2019; Donlan, 2002;
Lembre, Lorentz and Di Martino, 2012).
The function of the EPS matrix is to provide protection (by acting as a chemical and mechanical barrier)
to the bacteria embedded within it, facilitate the aggregation of bacterial cells, enhance QS, and aid
surface adhesion. Each component of the EPS matrix plays a functional role in biofilm formation, with
the BapA protein aiding fimbriae-mediated interactions such as bacterial aggregation (Bridier et al.,
2015; Latasa et al., 2005). Fimbriae and cellulose are both important for structural support of the EPS
matrix, with cellulose being responsible for the sticky texture of the EPS matrix. Each type of fimbriae
has a different role in biofilm formation. For example, SEF17 fimbriae are involved in bacterial
aggregation, while SEF21 fimbriae are involved in surface adhesion (Ćwiek, Bugla-Płoskońska and
Wieliczko, 2019; Peng, 2016; Steenackers et al., 2012). Bacterial surface adhesion is initiated by
flagella, after which bacteria then transition to a non-motile state during biofilm maturation. Flagella

33
are then involved in biofilm dispersal as bacteria released from the biofilm revert to a motile,
phenotype state and colonise new biofilms (Guttenplan and Kearns, 2013; Lembre, Lorentz and Di
Martino, 2012; Srey, Jahid and Has, 2013; Steenackers et al., 2012; Van Houdt and Michiels, 2010).
1.2.3.2 Genetic regulation of biofilm formation
Biofilm formation and the expression of EPS matrix components in Salmonella are mediated by the
expression of specific genes at each stage of the biofilm formation process. The genes encoding for
the expression of curli fimbriae and cellulose have been studied in much detail in S. Enteritidis and S.
Typhimurium using knock-out mutants (Allen-Vercoe et al., 1997; Dibb-Fuller et al., 1997; Solano et
al., 2002; Woodward et al., 2000).
The genes encoding for QS (such as luxS and sdiA) make up about 10% of the bacterial genome (Wolska
et al., 2016). Over 50 genes are involved in the production of flagellar components in S. Typhimurium,
including fliC and fljB, regulated by the fljA and hin genes, respectively (Jones, 2013). Biosynthesis of
cellulose is encoded by the bacterial cellulose synthesis (bcs) ABZC operon (previously called yhjONML)
and the bcsEFG operon, which are regulated by the cellulose synthesis protein, the agfD-dependent
regulator [AdrA] (encoded by adrA gene) protein (Ćwiek, Bugla-Płoskońska and Wieliczko, 2019;
Gerstel and Romling, 2003). Different genes control the biosynthesis of the different types of fimbriae.
Curli fimbriae (SEF17) expression is controlled by the two divergently transcribed operons, curli
subunit (csg) DEFG (previously called agfDEFG) and csgABC (Ćwiek, Bugla-Płoskońska and Wieliczko,
2019). Type-1 fimbriae (SEF21) are encoded by the fim operon (fimAICDHF), SEF14 fimbriae by the
sefA gene and SEF18 by the sefD gene (Ćwiek, Bugla-Płoskońska and Wieliczko, 2019; Dibb-Fuller et
al., 1997; Gerstel and Romling, 2003; Jones, 2013). The lpfABCDE operon encodes for lpf fimbriae, and
pef fimbriae are encoded by the pefBCD operon and the orf5 and orf6 genes (Peng, 2016; Silva et al.,
2019; Wolska et al., 2016).

34
The global transcriptional regulator CsgD, encoded by the csgD gene, previously called agfD in S.
Typhimurium, is part of a complex regulatory system responsible for biofilm formation. CsgD is either
directly or indirectly (via AdrA) involved in the expression of the genes involved in cellulose, fimbriae
and BapA (encoded by the bapA gene) biosynthesis. The expression of the csgD gene is affected by
environmental conditions (including nutrient availability, temperature, oxygen availability, and
osmolarity and pH), and its expression is maximal at temperatures below 30°C and when nutrient
availability is limited (Gerstel, Park and Romling, 2003; Gerstel and Romling, 2003; Steenackers et al.,
2012). The transcription of the csgD gene is regulated by factors such as the OmpR, the ribonucleic
acid (RNA) polymerase sigma factor (rpoS), and the marT protein, encoded by the ompR, rpoS, and
marT genes, respectively. The marT protein also regulates the transcription of other genes, such as
the fimbrial genes fimA, fimD, fimF, fimH and csgA (Eran et al., 2020; Peng, 2016; Solano et al., 2002;
Yin et al., 2018).
1.2.3.3 Factors influencing biofilm formation
Biofilm formation varies between different bacterial species and also between and within Salmonella
serovars. The ability of Salmonella to adhere to surfaces and form biofilms is affected by
environmental conditions, the physicochemical properties of the attachment surface, and the
properties of the bacterial cell (such as the cell surface hydrophobicity and the production of EPS
matrix components) (Steenackers et al., 2012).
Biofilm formation is influenced by the physicochemical properties of the attachment surface such as
hydrophobicity, roughness or texture, surface charge and presence of a conditioning film. The pre-
existing EPS matrix on the surface facilitates further biofilm formation (Agarwal et al., 2011; De
Oliveira et al., 2014). Salmonella can form biofilms on biotic surfaces in the host, including gallstones
or epithelial cells (Peng, 2016) and abiotic surfaces commonly found in the food production chain.
These include, but are not limited to, aqueous environments including within drinking water systems
(Maes et al., 2019); concrete/cement (Adetunji and Odetokun, 2012; Joseph et al., 2001); organic
35
materials, including dust (Monteiro et al., 2021), eggshells (Pande, McWhorter and Chousalkar, 2016),
wood shavings (Monteiro et al., 2021) and animal faeces (Pate et al., 2019); plastics (Agarwal et al.,
2011; Borges et al., 2018; De Oliveira et al., 2014; Piras et al., 2015; Stepanovic et al., 2000; Zou et al.,
2014); stainless steel (Giaouris and Nychas, 2006; Joseph et al., 2001; Møretrø et al., 2009); glass
(Solano et al., 2002); rubber, and polytetrafluoroethylene (Sinde and Carballo, 2000).
The ability of Salmonella to adhere to surfaces and form biofilms is affected by environmental
conditions such as temperature, pH, available water (aw), cations, nutrient availability, and
hydrodynamics (Agarwal et al., 2011; Borges et al., 2018; Lamas et al., 2018; Schonewille et al., 2012;
Srey, Jahid and Has, 2013; Steenackers et al., 2012). Biofilm formation increases as the environmental
conditions become less favourable. For example, Stepanovic et al. (2004) observed, under laboratory
conditions, that Salmonella produced more biofilm when grown in nutrient-poor growth media
compared to nutrient-rich growth media. The effect of temperature of biofilm formation is more
varied, with Salmonella reported to form in vitro biofilms at a wide range of temperatures (Lamas et
al., 2018; Lianou and Koutsoumanis, 2011; Schonewille et al., 2012), although Yin et al. (2018)
observed that in vitro biofilm formation was inhibited when Salmonella was grown at 4°C.
1.2.3.4 Role of biofilm formation in host colonization and host persistence
Biofilm-associated bacteria can be differentiated from their planktonic counterparts due to the
production of EPS matrix, reduced growth rates and the up-and down-regulation of specific genes
(Donlan, 2002). In the host, biofilm formation functions as a virulence mechanism for survival and
facilitates host colonisation, for example, facilitating the colonisation of S. Enteritidis in the chicken
oviduct (Chen et al., 2020). In the environment, biofilm formation functions as a survival mechanism
against environmental stresses such as temperature extremes, desiccation, starvation, pH,
antimicrobials, and exposure to biocides (Milanov et al., 2017). There are many different factors across
the pig and poultry industry that can support the survival of Salmonella and biofilms and will be
explained in the following sections.

36
1.3 Structure of the British pig and poultry industries
1.3.1 Animal-feed production
1.3.1.1 Feed mills
The production of animal feedstuffs starts by delivering raw feed ingredients (such as feed cereal and
soya) into intake pits before transportation via conveyors and elevators to storage bins inside the mill.
Feed is processed using a separate production line for each type of feed. The raw ingredients are first
weighed and processed before undergoing heat treatment. Heat treatment is carried out in
conditioners where steam is added to raise the temperature, with temperatures of 80°C for 2 minutes
being considered sufficient to cause a 3-log reduction in Salmonella. After conditioning, pelleting
occurs in the pellet press where pelleted feed is cooled to ambient temperature (usually between 20
and 30°C), and the finished feed product (such as compound feed, pelleted rations, meal, whole grain,
breeder feed) stored in feed bins. Air aspiration cyclone systems are present in the mills to help
prevent dust build-up (Lamas et al., 2018; Scientific Opinion of the Panel on Biological Hazards
[BIOHAZ], 2008; Steenackers et al., 2012).
1.3.1.2 Prevalence of Salmonella in feed
There were nine isolations of Salmonella reported from compound pig feed in 2020, with the most
commonly reported serovar being S. Rissen. This was an increase from the number of isolations
reported in 2019 but a decrease from the numbers reported in 2018. From compound poultry feed,
37 isolations of Salmonella were reported, fewer than reported in the two previous years, with the
top three most common serovars being S. Tennessee, S. 13,23:i:- and S. Kedougou (APHA, 2021).
However, these figures are likely to be an underestimate of the true prevalence of Salmonella in feed
ingredients and in the finished animal feed product.

37
1.3.2 The pig industry
1.3.2.1 Pig farms
In December 2020, the total number of pigs in the UK was 4.8 million, with 4.3 million pigs in the
fattening herd and 504 thousand pigs in the breeding herd (sows, boars and gilts) (Agriculture and
Horticulture Development Board [AHDB], 2021; Department of Environment Food & Rural Affairs
[Defra], 2021b). In 2019 there were 10,539 total pig farms in the UK (AHDB, 2021). Some pig farms
house pigs for their entire production life (farrow to finish systems), while others are specific to one
particular rearing group, such as nucleus, multiplier, commercial breeder, nursery, rearing or finisher
farms (Andres and Davies, 2015).
In the UK, most commercial pig farms are based in East Anglia or Yorkshire, where the climate is
relatively dry and lends itself to outdoor pig farming, with about 40% of the breeding herd reared
outside. In contrast, most finisher pigs are only reared indoors. On outdoor units, pigs are usually bred
and raised until weaning in paddocks and housed in metal arcs or tents filled with straw. On indoor
farms, the housing conditions vary between individual farms. They are usually based on the
production stage of the pig, with finisher pigs usually housed in straw-filled barns, on solid (concrete)
or part-slatted floor pens with bedding on plastic-or perforated metal-slatted floor pens. On indoor
farms, the ambient temperature of the pig housing depends on the age of the pig with sows kept at a
minimum of 15-20°C, with higher temperatures for younger pigs between 22-32°C and finisher pigs
kept at between 13-21°C (Defra, 2020; Strak, 2017).
1.3.2.2 Prevalence of Salmonella in pigs
The exact prevalence of Salmonella within the Great Britain (GB) pig herd is difficult to determine as
there is currently no national scheme for monitoring Salmonella on pig farms in GB with figures
reported by the APHA on the numbers of Salmonella isolations from pigs only obtained following
investigation of clinically diseased animals (APHA, 2021). However, regular monitoring is carried out
in abattoirs, and the 2019 abattoir survey of caecal contents of pigs reported by Martelli et al. (2021)

38
estimated that the prevalence of Salmonella in GB finisher pigs at slaughter was 32.3% which was not
significantly different from the last abattoir survey conducted in the UK in 2013. In 2021, APHA
reported S. Typhimurium, monophasic S. Typhimurium and S. Derby as the most frequently isolated
serovars from clinically infected pigs, which is consistent with reports from previous years. A small
number (<10% of total isolations from pigs) of other Salmonella serovars (S. London, S. Reading, S.
Kedougou, S. Newport, S. Bovismorbificans, S. Bardo and S. Panama) were isolated from GB pigs
between 2016 and 2020 (APHA, 2021).
1.3.3 The poultry industry
Grandparent flocks are at the top of the commercial production pyramid, followed by different tiers
of breeding flocks which breed and raise hens to produce fertile eggs. Fertile eggs from the parent
generation are sent to commercial hatcheries for hatching. The hatched chicks are then sent to
producer farms to be raised for meat (broiler, fattening turkey, or meat duck farms) or to produce
eggs for human consumption (laying hen or laying duck farms) (EFSA BIOHAZ Panel, 2019).
1.3.3.1 Hatcheries
In September 2021, there were 2.4 million commercial layer chicks, 88.5 million broiler chicks and 1.6
million chicks placed. There were 107 million commercial broiler eggs, 4.9 million broiler breeder eggs,
1.3 million turkey eggs, and 8.9 million commercial layer eggs set (Defra, 2021c). For successful egg
hatching and chick welfare, the temperature and humidity in the hatchery must be precisely
controlled. The movement of eggs, airflow, and staff in hatcheries is carried out in a bio-secure one-
way direction, starting with the arrival of eggs at the egg receiving area (19-21°C). For hatching, eggs
are first incubated in egg setters at 37.5-37.8°C and then in hatcher machines at 37°C located within
setter room (24-27°C) and hatcher rooms (24-27°C), respectively. Once hatched, the day-old chicks
are sorted and vaccinated before leaving the hatchery from the chick-take off area in lorries and taken
to farms for rearing. All waste (including eggshells, chick fluff and other debris) is macerated in a
macerator before disposal in skips designed for animal by-products and then sent for rendering. The

39
egg trays, setter trays, hatcher baskets and chick delivery baskets are cleaned in tray-wash machines
in the washroom (22-24°C) before being re-used. General hatchery areas and hallways are maintained
at a temperature of 24°C. The surfaces found in hatcheries are durable and easy to clean. Floor
surfaces are usually made of cement, incorporating a hard stone aggregate, and slope down to drains,
which have traps to deal with the large quantities of wash water and solid matter (eggshells and
debris) present (Cobb-Vantress, 2008; Withenshaw et al., 2021).
1.3.3.2 Poultry farms
1.3.3.2.1 Egg-producing farms
In 2019, there were approximately 42 million birds in the UK laying flock. In 2020, an estimated 11.2
billion eating eggs were produced (Defra, 2021d) with over 90% eggs produced under the British Lion
scheme. Eggs produced under the British Lion quality assurance scheme display the British Lion mark
and show that they have been produced under high standards of food safety including vaccination of
all hens against Salmonella (British Lion eggs, no date-a). There are four production systems in layer
hen farms (organic, free-range, barn, and colony cages), and in all production systems, hens must have
access to perches and a nest box for laying eggs (British Lion eggs, 2020; Defra, 2021d). Free-range
farms, where birds have access to outdoor runs covered with vegetation, account for 53.6% of eggs
produced, with 3.5% of eggs produced by organic farms. Eggs produced from hens in enriched colony
cages systems account for 40.4% of all eggs produced, and in this system, metal cages are multi-tiered
with separate polypropylene conveyor belts below for collection of eggs and manure, while deep litter
barn systems make up only 2.5% of eggs produced (British Lion eggs, 2019; British Lion eggs, no date-
b; British Lion eggs, no date-c). The optimum ambient temperature for adult layer hens is 17-25°C
(Defra, 2018). Breeding and egg-laying ducks are housed in open-sided straw-bedded barns with free-
range access (Newton, 2012).

40
1.3.3.2.2 Meat-producing farms
Compared to the broilers and turkeys, the duck industry is a niche market in the UK, with an average
of 1.7 thousand tonnes carcass weight of duck produced in September 2021 compared to 6.9 thousand
tonnes and 141.2 thousand tonnes produced in the same month for turkeys and broilers, respectively
(Defra, 2021c). Broiler chickens, fattening turkeys, and meat ducks are reared indoors in sheds with
concrete floors, although floors in some older meat duck houses are made of rammed chalk or earth.
Floors are covered in a deep litter, usually composed of wood shavings, straw, or composite material.
Environmental conditions of humidity, ventilation and light are monitored and controlled in poultry
sheds, with temperature regulated using environmental monitoring systems controlling air inlets and
exhaust fans. The recommended temperature depends on the production stage and the age of the
birds (AHDB, 2018; Newton, 2012). For broilers, the ambient temperature for day-old chicks is 32-
34°C, reducing to 30°C by the time the chicks are one week old, and then lowered each week by 4°C,
reaching 20°C by the time the birds are four weeks old (AHDB, 2018). For fattening turkeys, the
ambient temperature for 29°C at one week old and lowered by 1-2°C every week, reaching 13°C by
the time the birds are 14-weeks old (Avigen Turkeys Ltd, 2015b). The optimum temperature for day-
old ducklings is 30°C, reducing by 3-4°C every week to 15°C by 28 days old for meat ducks (Cornell
University, 2016).
1.3.3.2.3 Feeding and drinking water systems
Water is delivered into the poultry house from main water or boreholes to poultry through
automated, regulated water systems within the poultry housing (Sherwin, 2010). Floor drinking water
systems (DWS) comprise a regulated pressure unit, nipple pipe with drinker nipples and sometimes
cups and a breather unit. A medicator may also be added. The plastic parts of the system are made of
different types of plastics: acrylonitrile butadiene styrene for the plastic transition pieces, pressure
regulator, and connector; polyoxymethylene for the drinker nipple body; polyvinyl chloride (PVC) for
the nipple pipe; and polypropylene for the drip cups (Lubing, 2012). In DWS, turkey ‘Plasson’ bell-type

41
drinkers and drinking troughs may also be used depending on the production system. Poultry feeders
also differ depending on the production system, with linear, circular or tough feeders used. (British
Lion eggs, 2019; British Lion eggs, no date-c; Newton, 2012).
1.3.3.3 The Salmonella National Control Programme (NCP)
The three National Control Programmes (NCPs) introduced in EU poultry flocks (breeding, laying, and
broiler) to control the prevalence of the Salmonella serovars of importance to human health were
introduced in 2007, 2008, and 2009, respectively. The NCPs regulate S. Enteritidis, S. Typhimurium,
and monophasic S. Typhimurium in breeding turkeys, fattening turkeys, broilers and laying hens; and
S. Enteritidis, S. Typhimurium, monophasic S. Typhimurium, S. Hadar, S. Infantis, and S. Virchow in
breeding hens (APHA, 2021; EFSA and ECDC, 2021a). Salmonella surveillance is voluntary in duck
production but is commonly practised within the Duck Assurance Scheme launched in 2010 (Martelli
et al., 2017; Newton, 2012).
1.3.3.4 Prevalence of Salmonella in poultry
In 2020, the prevalence of regulated Salmonella serovars (S. Enteritidis, monophasic S. Typhimurium,
and S. Typhimurium) in GB chicken flocks was well below the EU targets of 1% for breeding flocks, 2%
for laying hen flocks, and 1% for broiler flocks (APHA, 2021). Since the introduction of the NCPs, the
prevalence of Salmonella in broiler flocks in the EU and GB has been decreasing. However, since 2018
the trend has started to reverse due to increasing isolations of non-regulated ‘exotic’ serovars such as
S. 13,23:i:-, S. Mbandaka, and S. Kedougou (APHA, 2021; EFSA and ECDC, 2021a). Since 2014, in GB
turkey flocks (breeders and fattening turkeys), there has been a decreasing trend of Salmonella, with
isolations of regulated serovars remaining below the EU target levels of 1-2%; except in 2018 when
the prevalence of Salmonella in turkey breeders exceeded the target flock prevalence for the first
time. Between 2010 and 2019, S. Derby was the most frequently reported serovar from turkeys, but
in 2020, S. Kedougou became the most common serovar, followed by S. Anatum and S. Derby. There
has been a decreasing trend of Salmonella isolations from ducks since 2018 and 2020. The top three
42
serovars isolated from ducks in 2020 were S. Indiana, S. Give var. 15+ (a variant of S. Give), and S.
Hadar, which is consistent with the prevalence of these serovars reported in 2018 and 2019 (APHA,
2021).
1.3.4 Risk factors for Salmonella and biofilm formation in primary production environments
Many of the Salmonella serovars found in the environments of feed mills, hatcheries and broiler farms
are relatively insignificant in terms of human health but are challenging to eradicate (Davies, 2005),
with their survival facilitated by biofilm formation. Salmonella persisting in the environment,
especially after cleaning and disinfection (C&D), can act as a reservoir for Salmonella infection of pig
herds, poultry flocks, eggs, hatched chicks or for re-contamination of feed after heat treatment
(Carrascosa et al., 2021; Davies, Liebana and Breslin, 2003; González-Rivas et al., 2018; Lamas et al.,
2018; Milanov et al., 2017; Prunic et al., 2017; Wray, Davies and Evans, 1999).
Salmonella can be introduced into feed mills through contaminated raw feed ingredients. Some
Salmonella serovars (such as S. Montevideo, S. Mbandaka, and S. Senftenberg) have been found to
colonise the feed production system and persist in the environment for many years (APHA, 2020;
Vestby et al., 2009a). The coolers are a critical point for re-contamination of feed after heat treatment
either by air from a contaminated part of the mill or due to contamination of the coolers themselves.
The coolers can become contaminated when condensation forms following a significant temperature
drop between conditioning and cooling if the feed is not cooled to within 5°C of ambient temperature
(Scientific Opinion of the Panel on Biological Hazards [BIOHAZ], 2008).
Contaminated feed is one route of Salmonella transmission into pig and poultry farms. Other potential
sources of Salmonella are infected animals and people (especially asymptomatic carriers shedding
Salmonella in their faeces), contaminated transport vehicles and equipment, and wildlife including
wild birds, rodents, flies, and litter beetles. These sources can also spread Salmonella within the farm
environment and, especially in laying hen farms that are continuously occupied, provide a continuous

43
source of contamination (Davies, 2005; Zheng, Bonde and Sørensen, 2007). Risk areas for Salmonella
contamination and biofilm formation are areas that are difficult to access, such as high beams, feeding
or drinking water systems, wall crevices or joints, with poor C&D as a risk factor for the persistence of
Salmonella (González-Rivas et al., 2018; Rose et al., 2000; Wray, Davies and Evans, 1999).
Drinking water can become contaminated with Salmonella at the source, such as from a bore-hole, or
may become contaminated once it enters the farm if the water head tank has become contaminated
by dust or during routine maintenance or cleaning. The prevalence of Salmonella in poultry drinking
water systems (DWS) has been reported to range from 2.4% after C&D from Salmonella-positive UK
turkey farms (Mueller-Doblies et al., 2010) to 5.5% in Spanish commercial laying hens farms (Marin,
Hernandiz and Lainez, 2009) to 5-45% from broiler farms in New Zealand (Castañeda-Gulla, Sattlegger
and Mutukumira, 2020). Unlike feeding systems, biofilm formation has not been proved for water
lines. However, enclosed drinker lines in poultry sheds are at risk of bacterial growth due to factors
such as warm ambient temperatures, slow water flow rates (especially when water consumption is
low by young chicks), and C&D only in-between flocks (Maes et al., 2019; Milanov et al., 2017; Riley,
2017).
Salmonella infection at the primary breeding bird or grandparent level can cause Salmonella infection
further down the food chain as Salmonella can enter the hatchery via eggs laid by infected hens can
infect other eggs or chicks via horizontal transmission. Hatcheries are an important source of
contamination for the rest of the poultry industry as infected chicks can spread Salmonella to the
farms to which they are delivered (Bailey et al., 2001; Cox, Berrang and Cason, 2000). Once Salmonella
contamination is resident in a hatchery it can be challenging to eliminate as C&D is often ineffective
either due to poor accessibility of contaminated areas or the presence of large amounts of
contaminated organic matter such as eggshells, dust, and chick fluff. Salmonella contamination can
also be spread around a hatchery very easily between hatchers via dust and hatcher fluff; setters
especially multistage machines, by egg-transfer and chick handling equipment; by hatcher baskets

44
cleaned in a Salmonella-contaminated tray washer; and in waste-handling, macerator, and washing
areas via aerosol and surface water (Cason, Cox and Bailey, 1994; Cox, Berrang and Cason, 2000;
Davies et al., 2001; Davies, 2005; Davies and Breslin, 2004; Milanov et al., 2017).
1.3.5 Strategies to control Salmonella and biofilm formation
Control of Salmonella in the pig and poultry industry starts at the primary production level, i.e., farms,
hatcheries, and feed mills and reduces Salmonella infection in pigs and poultry and ultimately in
humans. Here the current methods of Salmonella control implemented in the pig and poultry industry
and described as well as some alternative control strategies. Anti-biofilm control strategies either
prevent the early stages of biofilm formation or remove the biofilm (using dispersal and eradication
methods) by disrupting the EPS matrix and killing the bacteria inside the biofilm (Verderosa, Totsika
and Fairfull-Smith, 2019).
1.3.5.1 Vaccination
Vaccination is a prophylactic measure of Salmonella control. It aims to prime the immune response
and establish a higher hurdle for Salmonella infection by reducing colonisation, persistence, and
invasion of the intestinal tract and internal organs. Vaccination is one the most successful ways to
reduce S. Enteritidis and S. Typhimurium in the poultry industry (O'Brien, 2013) with several
commercial S. Enteritidis and/or S. Typhimurium vaccines available for chickens (breeders, layers, and
broilers), turkeys (breeders and fattening) or meat ducks. Not all vaccines are licensed for broilers,
meat turkeys, or ducks and are rarely used in commercial meat generations. Withdrawal periods must
be adhered to when vaccinating birds for meat or egg production. A variety of live attenuated vaccines
and inactivated (killed) vaccines for Salmonella are widely used to vaccine against serovars of public
health interest (S. Enteritidis and S. Typhimurium) and the vaccines currently licensed for use in GB
are detailed in Table 1-2; these are either administered by injection or by administration via drinking
water from the first day of life, with booster vaccines given according to the recommended vaccination
schedule. Live Salmonella vaccine strains can be differentiated from field strains of Salmonella. For

45
example, Avipro® Vac E and Avipro® Vac T carry different antimicrobial resistance markers, and
Salmovac® 440 contains mutations causing auxotrophism for histidine and adenine (APHA, 2021;
VMD, 2020b; VMD, 2020e; VMD, 2021b).
1.3.5.2 Feed and water additives
Feed and water additives are commonly used as a preventative measure of Salmonella control along
with vaccination and include probiotics, competitive exclusion treatment, and organic acids. Lactic
acid bacteria-based probiotics, mainly consisting of Lactobacillus, Pediococcus, and Enterococcus, are
used in poultry (Tellez et al., 2012) and pigs; with three Lactobacillus strains: L. lactis, L. curvatus, and
L. sakei, also found to inhibit in vitro Salmonella biofilm formation (Gómez et al., 2016). Simple
probiotics are very rarely used in poultry. Conventional probiotics usual contain one or more microbial
strains such as lactobacilli, and specific Bifidobacteria species are added to feed or drinking water or
administered by spray application in the hatchery (Mead, 2005). Competitive exclusion products aim
to prevent Salmonella colonisation through the early establishment of an adult-type microflora in
chicks and several commercial preparations available such as Aviguard® and Broilact®.
Commercial organic acid products are widely used in the pig and poultry industries and are added to
feed or water to reduce microbial growth and improve animal health (Pande, McWhorter and
Chousalkar, 2018). Previous in vivo poultry studies have shown that the addition of organic acids in
feed reduced the level of shedding and caecal colonization of S. enterica in poultry and reduced the
total S. enterica counts in different feed (Koyuncu et al., 2013) and water. Some commercial organic
acid products have been found to significantly reduce the number of viable cells from S. Typhimurium
biofilms but did not eliminate all biofilm cells (Pande, McWhorter and Chousalkar, 2018).

46
Table 1-2: Salmonella vaccines licensed for use in pigs or poultry in GB. Data obtained from (MSD Animal Health, 2021; VMD, 2018; VMD, 2020a; VMD, 2020b; VMD, 2020c;
VMD, 2020d; VMD, 2020e; VMD, 2021a; VMD, 2021b).
Vaccine name Marketing authorization holder Vaccine type Target species Protection against
Mode of administration
AviPro® Salmonella Vac T
Elanco Europe Ltd. (Hook, UK) live attenuated
chickens (layers, breeders, broilers)
S. Typhimurium drinking water
AviPro® Salmonella Vac E
Elanco Europe Ltd. (Hook, UK) live attenuated
chickens (layers, breeders) S. Enteritidis drinking water
AviPro® Salmonella Duo
Elanco Europe Ltd. (Hook, UK) live attenuated
chickens (layers, breeders) ducks turkeys (meat, breeders)
S. Enteritidis S. Typhimurium
drinking water
Salmovac® 440 Ceva Animal Health Ltd (Amersham, UK) live attenuated
chickens (layers, breeders) S. Enteritidis drinking water
Gallimune® SE + ST Boehringer Ingelheim Animal Health UK Limited (Bracknell, UK)
inactivated chickens (layer pullets) S. Enteritidis S. Typhimurium
Injection
Nobilis® Salenvac T MSD Animal Health UK Limited (Milton Keynes, UK)
inactivated chickens (layers, breeders) S. Enteritidis S. Typhimurium
Injection
Nobilis® Salenvac ETC MSD Animal Health UK Limited (Milton Keynes, UK)
inactivated chickens (layers, breeders) S. Enteritidis S. Typhimurium S. Infantis
Injection
Salmoporc® ST Ceva Animal Health Ltd (Amersham, UK) live attenuated
pigs S. Typhimurium drinking water

47
1.3.5.3 Cleaning and disinfection (C&D)
Cleaning is the physical removal of inorganic and organic matter, including dust, grease, and bacteria,
from a surface using a combination of dry (e.g. brushing) and wet (detergents) cleaning methods;
while disinfection is the process of killing microorganisms on a surface (Traverse and Aceto, 2015). In
pig and poultry production premises, the main steps of a C&D protocol are: 1) removal of loose dirt
and organic matter, 2) soaking with a detergent, 3) power washing to remove the detergent and
organic matter loosened by the detergent, 4) drying and 5) application of a disinfectant with an
appropriate active ingredient(s) at the recommended concentration and contact time for the target
microorganism(s) (5m Editor, 2012; 5m Publishing, 2012). Disinfectant usage is covered by the Biocidal
Products Regulation (EC 528/2012) and ensures that disinfectants are safe for the operator and the
environment (Gosling et al., 2017). Disinfectants are widely grouped into chemical classes based on
their active ingredients: alcohols (for example, ethanol), aldehydes (for example, formaldehyde,
glutaraldehyde), biguanides (for example, chlorhexidine), halogens (for example, sodium
hypochlorite, iodine), phenols, peroxygens (for example, peracetic acid, potassium
peroxymonosulfate) and quaternary ammonium compounds [QACs] (for example, benzalkonium
chloride) (Al-Adham, Haddadin and Collier, 2013).
Due to their low cost and ease of use, disinfectants are the main strategy for controlling Salmonella
contamination in the pig and poultry industries. C&D is carried out in-between flocks or herds on pig
and poultry farms, with disinfection of tools, equipment (such as feeding, drinking water, or egg
collection systems), ventilation systems, and surfaces in animals housing such as walls and floors
(Gosling et al., 2017). While in feed mills, wet C&D is kept to a minimum to keep the environment dry,
with sweeping and vacuuming usually carried out several times a day (Møretrø et al., 2009). Potassium
peroxymonosulphate-based disinfectants are widely used for surface disinfection and in boot dips in
pig and poultry farms (Gosling et al., 2017). In the poultry industry, QAC- and glutaraldehyde-based
combination disinfectants are widely used. Formaldehyde is used for fogging eggs in hatchers, and

48
peroxygens or QAC-based disinfectants are used for general surface disinfection in hatcheries.
Formaldehyde is also used for fogging of poultry sheds after C&D. Terminal disinfection of drinking
water lines in-between flocks is carried out with peracetic acid-based, QAC-based or hydrogen
peroxide-based disinfectants and/or dilute concentrations can also be added to treat the drinking
water whilst animals are present (Lubing, 2012; Newton, 2012). There are hazards associated with
some disinfectants compounds, including being corrosive to metals (peroxygens and QACs at high
concentrations); being irritants (QACs, aldehydes, phenols, halogens) or being mutagenetic or
carcinogenic (formaldehyde and glutaraldehyde) (Al-Adham, Haddadin and Collier, 2013).
However, before a disinfectant can be applied, a cleaning step must be implemented to remove
organic matter (such as soil or faeces, or limescale in drinkers) from the surface and prevents the build-
up of biofilms (Al-Adham, Haddadin and Collier, 2013; Rossi et al., 2017). Once a mature biofilm has
formed on a surface, it is much more challenging to eradicate. For disinfectant to be effective the EPS
matrix must first be disrupted using either mechanical forces (scraping, brushing, pressure washing)
or chemicals (enzymes or detergents/surfactants), which then allows for the bacteria inside the
biofilm to be exposed to the biocide (Merino et al., 2019; Srey, Jahid and Has, 2013).
1.3.5.3.1 Mechanisms of action and factors affecting the efficacy of disinfectants
The mechanism of action varies between disinfectant classes, but in Gram-negative bacteria, such as
Salmonella, the main targets are functional or structural proteins and the bacterial cell membrane
(Bridier et al., 2011). There have been many published studies (Corcoran et al., 2014; Gosling et al.,
2017; Møretrø et al., 2009; Ramesh et al., 2002; Wong et al., 2010) that evaluate the ability of
commercial disinfectants to eliminate Salmonella biofilms. However, as there are many differences in
the test methodologies, the findings from these studies are difficult to compare with variable success
in eliminating Salmonella in a biofilm seen, even within the same disinfectant class. Aldehyde-based
or chlorocresol-based disinfectants are generally considered to be the most effective disinfectant

49
against Salmonella biofilms, and products containing more than one active ingredient were
demonstrated by Gosling et al. (2017) to be more effective than each active ingredient on their own.
Disinfectants can be fast-acting (such as alcohols, halogens and peroxygens), or slow-acting (such as
aldehydes). The biocidal effectiveness of a disinfectant is affected by many factors such as the usage
(concentration and type of active ingredient, contact time, concentration, application rate and
method), environmental conditions (pH, ambient temperature, water hardness, presence of organic
matter, biofilm formation) and the properties of the application surface (porosity, surface material)
(Rossi et al., 2017; Srey, Jahid and Has, 2013; Wales et al., 2021). In particular, the presence of organic
matter, which is abundant in the environment, may interfere with or reduce the effectiveness of
disinfectants such as QACs (Al-Adham, Haddadin and Collier, 2013; Rossi et al., 2017).
Bacteria in biofilm show more tolerance to disinfectants than bacteria in the planktonic state due to
the multi-layer, protective structure of the EPS matrix, making it more difficult for the active
ingredients to reach and kill the bacterial cells within (Rossi et al., 2017; Stewart, 2015). Salmonella
can also form mixed-species biofilms with other environmental bacteria such as Pseudomonas spp.
and Escherichia coli, which may have a positive, negative or neutral effect on the bacteria in terms of
their growth and tolerance to disinfectants (Milho et al., 2019; Srey, Jahid and Has, 2013). Wang et al.
(2013) reported that the dual-species Escherichia coli and Salmonella biofilms displayed enhanced
resistance to QAC-based disinfectants. While studies by Pang, Yang and Yuk (2017), and Pang, Chen
and Yuk (2020) found that although dual-species biofilms of Pseudomonas spp. and Salmonella
inhibited the growth of Salmonella, the dual-species biofilm protected Salmonella cells in biofilms
from disinfection treatment by QACs, due to the production of more EPS matrix in a dual‐species
biofilm than in a mono‐species one.
The mechanisms of antimicrobial resistance and disinfectant tolerance are described in more detail in
Chapter 1, section 1.3.5.5.
50
1.3.5.4 Antimicrobial treatment
Historically antimicrobials are included in feed or water for therapeutic, prophylactic or performance-
enhancing purposes (Mead, 2005), but now in both the pig and poultry industries, the use of
antibiotics is limited to the treatment and prevention of clinical disease, and the use of antimicrobials
to control non-clinical Salmonella cases is prohibited in chickens and turkeys (APHA, 2021). The
Highest Priority Critically Important Antimicrobials (HP-CIAs) for treating human and veterinary
Salmonella infections include the following three classes: 3rd generation (including ceftazidime and
cefotaxime) and 4th generation cephalosporins (including ceftiofur); fluoroquinolones (including
ciprofloxacin); and colistin, and these should only be used as a last resort in food animals, although
HP-CIAs are more widely used in companion animals (VMD, 2019b). The use of antimicrobials in the
pig and poultry industry has been diminishing, and since 2013, there has been a 74.2% reduction in
the use of antibiotics in the poultry meat sectors (chickens, turkeys and ducks) (British Poultry Council
[BPC], 2021; VMD, 2019b), there is still an increasing prevalence of Salmonella isolated from pigs and
the environment, but resistance to HP-CIAs are still rare (i.e. at very low levels or not detected) in UK
Salmonella, especially colistin resistance (APHA, 2021; VMD, 2019b).
1.3.5.4.1 Mechanisms of action of antimicrobials
Different classes of antimicrobials have differing modes of action by targeting specific parts of the
bacterial cell, which impairs functions vital for bacterial growth. For example, by inhibiting protein
synthesis (amphenicols, aminoglycosides and tetracyclines), damaging or inhibiting the synthesis of
the bacterial cell wall (ß-lactams), interacting with the synthesis of bacterial DNA (nitrofurans and
quinolones) or targeting nucleic acid synthesis (sulphonamides and diaminopyrimidine, including
Trimethoprim) (Alcock et al., 2020; Boolchandani, D'Souza and Dantas, 2019; Van Hoek et al., 2011).
1.3.5.4.2 Antimicrobial resistance (AMR)
Antimicrobial resistance (AMR) is the ability of a microorganism to resist the effect of an antimicrobial
agent i.e., survive and replicate in the presence of an antimicrobial (Hathroubi et al., 2017). Antibiotic

51
tolerance describes antimicrobial resistance in bacteria populations, whilst antibiotic persistence
describes antimicrobial resistance shown by a subset of a bacterial population known as persister cells.
The descendants of these persister cells are as susceptible to the antimicrobial as bacteria in the
parent population (Balaban et al., 2019). AMR is considered to be a worldwide concern, and prior to
the Coronavirus disease (COVID-19) pandemic, it was estimated that by 2050 AMR infections will be
the leading cause of death in people (O'Neill, 2014). AMR is a major concern for human and animal
health as resistant bacteria can be transmitted between animals, food, and humans (Dalhoff, 2012;
VMD, 2019b); for example, multi-drug resistant (MDR) S. Infantis is an emerging threat in the poultry
industry because of its high levels of multidrug resistance and has now spread widely in the broiler
production chain in Europe (EFSA and ECDC, 2017). MDR S. Infantis is very infectious, and there is a
lot of horizontal spread, for example, during thinning of broiler flocks, and the UK aims to stamp out
the occasional incursions that do occur (Newton et al., 2020).
1.3.5.5 Mechanisms of antimicrobial resistance and disinfectant tolerance
The mechanism by which bacteria show resistance to antimicrobials is dependent on the antimicrobial
and its mode of action/target in the bacterial cell but includes: efflux of the antimicrobial from the
bacterial cell, degradation of the antimicrobial and modification of the antimicrobial target to prevent
the binding or acquisition of alternative metabolic pathways to those inhibited by the antimicrobial
(Alcock et al., 2020; Boolchandani, D'Souza and Dantas, 2019). Bacterial resistance to biocides
(antimicrobials and disinfectants) can either be intrinsic or acquired. Intrinsic resistance is the natural
resistance that some bacterial species have to certain biocides due to their cell structure or by forming
a biofilm. For example, Gram-negative bacteria are generally less susceptible to biocides than Gram-
positive bacteria due to their cell wall. Acquired resistance is where susceptible bacteria become less
susceptible to a biocide through gene mutations or the acquisition of genes conferring resistance
(Donlan and Costerton, 2002).

52
1.3.5.5.1 Intrinsic resistance
Bacteria in biofilms can be up to 1,000 times more resistant to biocides than when the same bacteria
grow in a planktonic state and require contact times of between 20-2160 times longer to be
bactericidal (Chylkova et al., 2017; Olson et al., 2002). Biofilm resistance to disinfectants is often
considered to actually be disinfectant tolerance as the bacteria’s susceptibility to the disinfectant can
be increased once the bacteria are released from the biofilm and revert back to a planktonic state.
This disinfectant tolerance can be attributed to several mechanisms: the multi-layer protective
structure of the EPS matrix can slow or limit the diffusion of the biocide or have a neutralising effect,
the presence of persister cells or dormant bacteria in the depths of the biofilm, increased efflux pump
expression, or there may be extracellular enzymes present in the EPS matrix that are capable of
degrading disinfectants such as glutaraldehyde (Cepas et al., 2019; Chylkova et al., 2017; González-
Rivas et al., 2018; Hathroubi et al., 2017; Korber et al., 1997; McBain, Sufya and Rickard, 2013; Russell,
1999; Soto, 2013). Persister cells are phenotypic variants that are dormant, non-dividing bacterial cells
that have a distinct mechanism of antimicrobial resistance as the activity of antibiotic targets is
apparently diminished in dormant persisters, accounting for antibiotic tolerance (Lewis, 2007).
1.3.5.5.2 Acquired resistance - genetic mechanisms
Antimicrobial resistance (AMR) genes can be acquired through horizontal gene transfer or occur by
single-nucleotide polymorphism (SNP)-based mutations present within chromosomal genes, such as
in quinolones. Overexpression or duplication of existing AMR genes can lead to increased resistance
as multiple copies of the same genes can have an additive effect (Alcock et al., 2020; Boolchandani,
D'Souza and Dantas, 2019).
Examples of genes identified in Salmonella conferring resistance to antimicrobial classes of
importance in human and veterinary medicine are β-lactams: blaTEM, blaCARB; aminoglycosides: aac(3),
aac(6), ant(3), aph(3), aph(4), aph(6), aadA1, aadA2, aadA4, aadA22; quinolones: plasmid-mediated
genes qnrB5, qnrB19, and point mutations in chromosome-encoded genes gyrA, gyrB, parC, parE;

53
amphenicols: cmlA1, floR; sulphonamides: sul1, sul2, sul3; trimethoprim: dfrA12, dfrA14; nitrofurans:
nfsB; and tetracyclines: tet(A), tet(B), tet(G) (Alcock et al., 2020; Duggett et al., 2017; Van Hoek et al.,
2011). Each gene has a specific role in conferring antimicrobial resistance. For example, the tet(A),
tet(B), and tet(G) genes encode for tetracycline efflux proteins and are found in many Gram-negative
bacteria; and point mutations in gyrA and parC genes confer resistance by preventing fluoroquinolone
antibiotics from binding to specific sites within the bacterial cell (Alcock et al., 2020).
There are several biocide resistance genes reported in the literature as conferring resistance to
biocides, with multi-drug resistant efflux pumps being an important biocide resistance mechanism in
Enterobacteriaceae as they expel the biocide from the bacterial cell. Efflux pumps confer both unique
and overlapping biocide and antimicrobial selectivity. The single-component TolC-independent
multidrug-resistant efflux pumps are specifically associated with biocide resistance: small multidrug
resistance (SMR) members encoded by the qacA, qacB, qacG, qacH, qacJ, and qacZ genes, and major
facilitator superfamily (MFS) members encoded by the emrD, smvA, and mdfA genes. Furthermore,
these genes can spread rapidly between Enterobacteriae on mobile genetic elements. SMR members
can transport relatively large cationic compounds, primarily QACs and a limited range of
antimicrobials. MFS members confer both QACs and fluoroquinolone resistance (Gillings, Holley and
Stokes, 2009; Gillings et al., 2009; Slipski, Zhanel and Bay, 2018).
AMR genes can be located on chromosomes (for example, gyrA, gyrB, parC, parE) or on mobile DNA
within the bacterial genome that can be moved within or between bacterial genomes, for example,
qnrB5 and qnrB19. This DNA is located on mobile genetic elements such as plasmids, transposons, and
genomic islands, and integrons, which are associated with AMR genes, and contribute to the dispersal
of antimicrobial determinants between different bacteria. Integrons are genetic elements that can
capture and mobilize genes. Integrons can be divided into four classes based on the intI genes: intI1
as class1, intI2 as class 2, intI3 as class 3, and intI4 as class 4 (Alcock et al., 2020; Van Hoek et al., 2011).

54
Biofilms also provide an optimal environment for the exchange of genetic material between bacteria
and for quorum sensing (Milanov et al., 2017). Biofilms may contribute to the dissemination of AMR
genes due to the persistence, stress conditions and proximity of bacteria in a biofilm providing optimal
conditions or stimuli for the horizontal transfer of genes on mobile genetic elements between bacteria
(Akrami, Rajabnia and Pournajaf, 2019; Hathroubi et al., 2017; Lamas et al., 2018; Milanov et al., 2017;
Zou et al., 2014).
1.3.5.6 Alternative strategies
As biofilm formation makes Salmonella less susceptible to biocides such as disinfectants, alternative
strategies for inhibiting or dispersing biofilms are being currently being researched. Examples of some
of those found to be effective against Salmonella biofilms that may have the potential to be used in
the pig and poultry industries are briefly discussed here.
1.3.5.6.1 Brominated furanones
Although brominated furanones have been found to be effective at inhibiting Salmonella biofilm
formation (Janssens et al., 2008), it is not known what effect these would have on other
microorganisms in the environment, such as those in a mixed-species biofilm.
1.3.5.6.2 Bacteriophages
Bacteriophages are viruses that infect and lyse bacteria. Although not currently used in the field in GB,
they have been proposed as a potential method for Salmonella and biofilm control in the food
production industry as they are non-toxic and they specifically target and kill bacteria (Gutiérrez et al.,
2016). For example, phage SE2 had an efficient bacteriolytic effect with biofilm dispersing ability
against Salmonella (Tiwari, Kim and Kim, 2013).
1.3.5.6.3 Essential oils
Natural antimicrobials such as essential oils of cinnamon (cinnamaldehyde), sporran (a proprietary
mixture of clove and thyme essential oils, rosemary extract and cinnamaldehyde) (Keelara, Thakur and

55
Patel, 2016), peppermint (Mentha piperita), lemongrass (Cymbopogon citratus) (Valeriano et al.,
2012), and carvacrol (Trevisan et al., 2018) have been found to have antibacterial activity against
Salmonella biofilms. However, they may have limited use in the environment as they easily
decompose when directly exposed to heat, humidity, light, or oxygen (Bilia et al., 2014).
1.3.5.6.4 Quorum sensing (QS) inhibitors
Compounds that interference with the QS pathway, such as Amomum tsaoko extract (a ginger-like
plant grown in China) (Rahman et al., 2017) or compound 7955004, a small molecule adenosine
mimetic (Koopman et al., 2015), have been found to inhibit or reduce biofilm formation by Salmonella.
1.3.5.6.5 Micro- and nano-emulsions
Micro-emulsions and nano-emulsions are emulsions of oil and water and are less than 100nm in size.
Micro-emulsions, such as TEOP which is an oil-in-water micro-emulsion of ethyl oleate with Tween 80
as emulsifier and n-pentano as a co-emulsifier, are thermodynamically stable and formed
spontaneously. Whereas nano-emulsions, such as BCTP which is an oil-in-water nano-emulsion of
soybean oil and tri-n-butyl phosphate emulsified with Triton X-100, are kinetically stable and formed
by mechanical shear forces (Sadekuzzaman et al., 2015; Teixeira et al., 2007). Both TEOP and BCTP
have been found to reduce the presence of S. Typhimurium biofilm after 30 minutes of treatment. The
effectivity of these emulsions is due to the active ingredients of n-pentanol (a type of alcohol) in TEOP,
and tri-n-butyl phosphate in BCTP, which acts as a surfactant and disrupts the bacterial cell membrane
(Teixeira et al., 2007).
1.3.5.6.6 Surfaces to prevent biofilm adhesion
The best strategy to control biofilms would probably be to prevent their formation by selecting or
modifying surfaces so that they have physiochemical properties that do not promote initial biofilm
attachment (Srey, Jahid and Has, 2013). Briefly, examples are grafting of poly[2-(dimethylamino)ethyl
methacrylate] to polyethene and silicone rubber surfaces (Contreras-García et al., 2011), using copper

56
surfaces as an alternative to stainless steel (Pontin et al., 2021), applying antimicrobial surface
coatings such as silver (Kumar et al., 2017), reducing surface roughness using electropolishing
(Carpentier and Cerf, 1993), pre-conditioning of surfaces with biosurfactants, or use of nanoparticle
coatings. Biosurfactants are microbial compounds that can modify the physicochemical properties of
surfaces by changing bacterial interactions and consequently adhesion, and pre-conditioning of
surfaces with the biosurfactants surfactin (produced by Bacillus subtilis) reduced the adhesion of
Salmonella to polystyrene (Gomes and Nitschke, 2012). Nanoparticles are antibacterial agents without
the toxicity of organic compounds and nanoparticulate coatings such as metal oxide nanoparticles
(such as Silver (Ag) (Kaung et al., 2017), zinc oxide (ZnO) (Hajipour et al., 2012), copper oxide (CuO),
palladium (Pdnon), or platinum (Ptnon) nanoparticles have been found to have antimicrobial effects
against planktonic Salmonella bacteria (Duffy et al., 2018). Although Ag nanoparticles were found to
be successful in inhibiting and removing Salmonella biofilms (Kaung et al., 2017), Pdnon and Ptnon
were less effective against biofilm cells (Chlumsky et al., 2021).
1.3.5.6.7 Combination treatments
The use of combination treatment has been reported to increase their effectiveness against
Salmonella biofilms more than when treatments are considered separately. Briefly, X-ray irradiation
improved the biocidal activity of sodium hypochlorite (Jung, Park and Ha, 2018); triclosan increased
the effectiveness of ciprofloxacin (Tabak et al., 2009); carvacrol, thymol, and eugenol compounds
increased the effectiveness of nalidixic acid (Miladi et al., 2017); the use of low-intensity ultrasonic or
sonic agitation improved the biocidal activity of a chlorhexidine-based disinfectant (Shen et al., 2010);
and the presence of synthetic brominated furanones improved the biocidal activity of hypochlorite-
or benzalkonium chloride-based disinfectants (Janssens et al., 2008).

57
1.4 Salmonella and biofilm study methods
1.4.1 Methods for isolation, culture, and identification of Salmonella
International Organization for Standardization (ISO) 6579-1:2017 is the standard protocol for the
detection of Salmonella from a range of sample types from food (for example, eggs, meat, shellfish,
or dairy products) or environmental samples such as water, animal feed, animal faeces, and
environmental swabs. The first stage is pre-enrichment of the sample in Buffered Peptone Water
(BPW) in ten-fold dilution and incubation for 18±2hrs at 34-38°C. The second step is selective
enrichment by subculturing the incubated BPW broth onto either Modified Semi-Solid Rappaport-
Vassiliadis (MSRV) agar or in broth media (Rappaport Vassiliadis Soya [RVS] broth and Muller
Kauffmann Tetrathionate Novobiocin [MKTTn]) and incubated for 24±3hrs at either 37±1°C (MKTTn)
or 41.5±1°C (RVS broth or MSRV agar). MSRV agar is used for the detection of Salmonella in animal
faeces and environmental samples from the primary production stage. MKTTn, along with RVS broth
and MSRV agar, is used for the detection of Salmonella in food, animal, feed, and environmental
samples from the food production area. MKTTn broth is helpful for the isolation of serotypes of
Salmonella that are inhibited by the constituents of RVS broth. MSRV agar is intended for the detection
of motile Salmonella strains only and the addition of novobiocin suppresses competing organisms.
Following incubation, an aliquot of these selective enrichment media is plated on at least two selective
agar plates. Xylose Lysine Desoxycholate (XLD) agar must be used along with a second agar that is
complementary to XLD agar and must have different biochemical characteristics, for example,
(modified) Brilliant Green Agar (BGA) or Rambach™ Agar. The use of both non-selective and selective
enrichment media helps reduce false negatives in samples where Salmonella may be present in low
numbers or under stress. Confirmation of suspected Salmonella colonies and S. enterica subspecies is
performed through biochemical tests (including API 20E), serological, or PCR methods (Popoff and Le
Minor, 2015). The White–Kauffmann–Le Minor scheme, first published in 1929, to divide Salmonella
into more than 2600 serovars based on their unique antigenic formula is used as the basis for full
serotyping (Grimont and Weill, 2007) but molecular or whole-genome sequencing (WGS)-based
58
methods are becoming increasingly more commonly used (Ashton et al., 2016). Monophasic strains
of Salmonella such as S. 4,[5],12:i:- (monophasic S. Typhimurium) and S. 13,23:i:- lack both sets of
flagella (APHA, 2021). Phage typing of S. Typhimurium, including monophasic variants, and S.
Enteritidis is based on the Public Health England (PHE) Phage Typing scheme (Anderson et al., 1977;
Jones, McLaren and Wray, 2000; Ward, de Sa and Rowe, 1987).
1.4.2 In vitro biofilm study methods
There are many published methodologies for the quantitative or qualitative characterisation of
biofilms (Wilson et al., 2017).
1.4.2.1 Quantitative biofilm study methods
Based on the conditions under which biofilms form, biofilms can be formed in static (closed), dynamic
(open) or microcosm biofilm models (Lebeaux et al., 2013; Wilson et al., 2017). The biofilms in these
models can then be studied using quantitative methods and the study of bacteria in biofilms can be
broadly classified as direct or indirect methods. Direct quantification methods, for example, plate
counts or microscopy methods enumerate viable bacteria cells (colony-forming units [CFU]) within the
biofilm. Indirect quantification methods, such as the crystal violet or metabolic dye microplate assays
use a proxy marker, such as biofilm mass, protein content, or metabolic activity, to infer the number
of bacteria within the biofilm.
1.4.2.1.1 Static biofilm models
Static (closed) biofilm models are used for the study of early biofilms as biofilms are grown under static
growth conditions with no shear forces present and no continuous supply of nutrients from fresh
media or removal of waste products (Merritt, Kadouri and O'Toole, 2005; O'Toole, 2011). The first
biofilm study method developed was the glass test tube adherence test, developed by Christensen et
al. (1982), and this allowed for the biofilm formation to be visualised with or without crystal violet dye
staining of the total biofilm biomass. The tissue culture plate assay, known today as the crystal violet

59
microplate assay, was developed by Christensen et al. (1985) to replace the glass test tube adherence
with biofilms formed in 96-well polystyrene microplates and the extent of biofilm formed qualitatively
measured by staining of the biofilm biomass with crystal violet dye and absorbance measured using a
plate reader.
The crystal violet microplate assay is the most commonly used method for the evaluation of biofilm
formation due to its simplicity, low cost, and suitability for high throughput testing of a range of
organisms under different growth conditions. Within microplates, biofilms form on the bottom of the
well if the bacteria are non-motile and on the well wall at the air-liquid interface if the bacteria are
motile. Although only early biofilms can be formed due to the static growth conditions, some features
of mature biofilms are seen, such as biocide resistance (Lebeaux et al., 2013; O'Toole, 2011). Even
among the literature on Salmonella this basic method is widely used, although many variations in the
method have emerged regarding the broth medium and incubation conditions, types of microtiter
plates, inoculum concentrations, fixing methods of bacteria (if used), the concentration of crystal
violet dye and the crystal violet dye solubilizing agent and rinsing of plates prior to staining (Merritt,
Kadouri and O'Toole, 2005; Peng, 2016; Stepanovic et al., 2004; Vestby et al., 2009b). Agarwal et al.
(2011) compares some of these modifications.
Static biofilm models are not just limited to microplate-based assays with biofilms grown under static
conditions on different surfaces including, but not limited to glass microscope slides (Grønseth et al.,
2017), stainless steel coupons (Luppens et al., 2002), and wooden coupons. New technology such as
the calScreener™ Biofilm Assay (Symcel AB, Solna, Sweden) allows monitoring of biofilm formation in
real-time but requires specialist equipment.
1.4.2.1.2 Dynamic biofilm models
Dynamic (open) biofilm models are used for the study of mature biofilms as biofilms are grown under
dynamic conditions with a continuous flow of fresh nutrients (media) in and waste products out, and

60
these allow for the control of environmental conditions such as the shear forces exerted on the biofilm
and for the development of mature biofilms. However, dynamic biofilm models are not suitable for
high throughput testing and require the use of expensive and specialist equipment (Lebeaux et al.,
2013) such as the Centers for Disease Control (CDC) Biofilm Reactor® (Biosurface technologies
corporation, Montana, United States of America [USA]) in which biofilms are formed on coupons; the
BioFlux system (Fluxion Biosciences, California, USA); and the xCELLigence System (ACEA Biosciences
Inc., San Diego, CA, USA).
1.4.2.1.3 Microcosm biofilm models
Microcosm biofilm models are more sophisticated than either static or dynamic biofilm models as they
aim to mimic real-world conditions using small-scale models, but these are used infrequently due to
their complexity (Lebeaux et al., 2013). Reported examples include Boddicker et al. (2002), who used
a continuous in vitro flow system to study S. Typhimurium biofilm formation on a confluent monolayer
of epithelial-like HEp-2 cells.
1.4.2.2 Qualitative characterization of biofilms
1.4.2.2.1 Identification of extracellular polymeric substances (EPS) matrix components
Another way of studying biofilm formation is to determine the presence of EPS matrix components
such as fimbriae and cellulose. Alternative methods for detecting the expression of EPS matrix
components include detecting cellulose expression based on the fluorescence of colonies on
calcofluor agar (Solano et al., 2002); using luminescent oligothiophenes for real-time in situ detection
and differentiation of curli and cellulose (Choong et al., 2016); staining of cellulose and fimbriae with
the ECtracer™ (Ebba Biotech AB, Solna, Sweden) fluorescence dye; and staining of the live and dead
bacteria and biofilm matrix with FilmTracer™ (Thermo Fisher Scientific, Waltham, USA).
The Congo red agar (CRA) test is a method that allows for the semi-quantitative determination of the
expression levels of fimbriae and cellulose based on the colony morphology when bacteria are grown
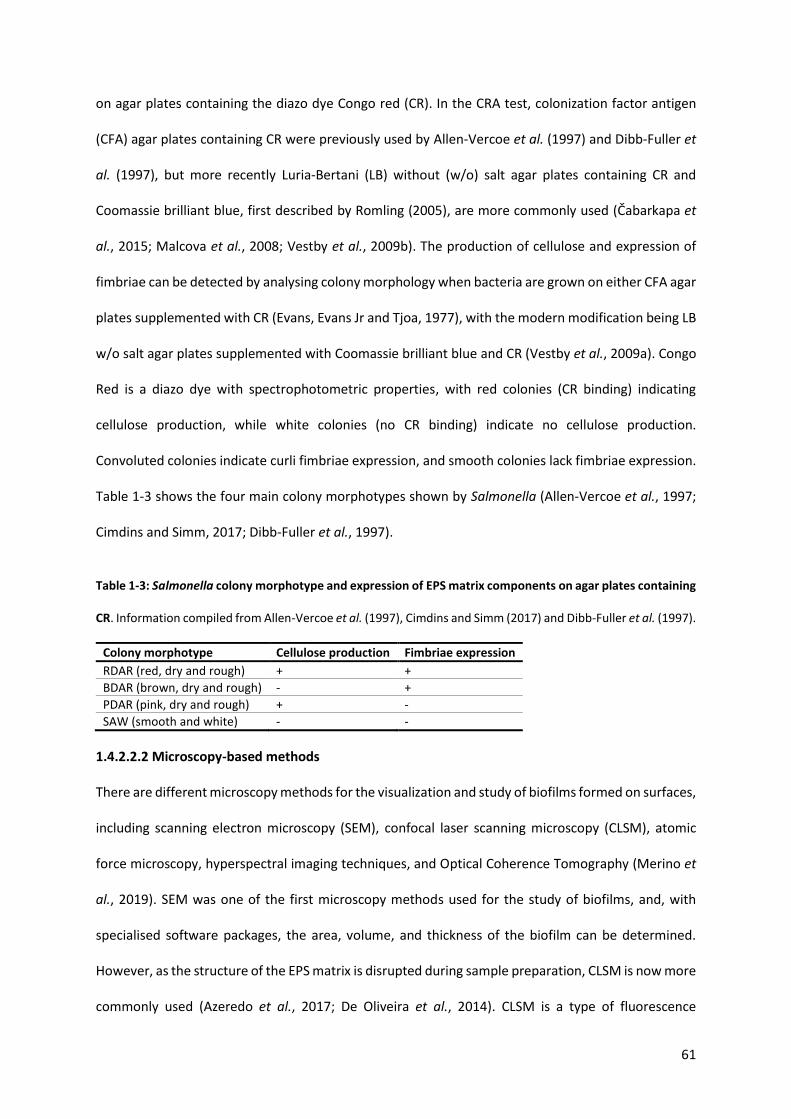
61
on agar plates containing the diazo dye Congo red (CR). In the CRA test, colonization factor antigen
(CFA) agar plates containing CR were previously used by Allen-Vercoe et al. (1997) and Dibb-Fuller et
al. (1997), but more recently Luria-Bertani (LB) without (w/o) salt agar plates containing CR and
Coomassie brilliant blue, first described by Romling (2005), are more commonly used (Čabarkapa et
al., 2015; Malcova et al., 2008; Vestby et al., 2009b). The production of cellulose and expression of
fimbriae can be detected by analysing colony morphology when bacteria are grown on either CFA agar
plates supplemented with CR (Evans, Evans Jr and Tjoa, 1977), with the modern modification being LB
w/o salt agar plates supplemented with Coomassie brilliant blue and CR (Vestby et al., 2009a). Congo
Red is a diazo dye with spectrophotometric properties, with red colonies (CR binding) indicating
cellulose production, while white colonies (no CR binding) indicate no cellulose production.
Convoluted colonies indicate curli fimbriae expression, and smooth colonies lack fimbriae expression.
Table 1-3 shows the four main colony morphotypes shown by Salmonella (Allen-Vercoe et al., 1997;
Cimdins and Simm, 2017; Dibb-Fuller et al., 1997).
Table 1-3: Salmonella colony morphotype and expression of EPS matrix components on agar plates containing
CR. Information compiled from Allen-Vercoe et al. (1997), Cimdins and Simm (2017) and Dibb-Fuller et al. (1997).
Colony morphotype Cellulose production Fimbriae expression
RDAR (red, dry and rough) + +
BDAR (brown, dry and rough) - +
PDAR (pink, dry and rough) + -
SAW (smooth and white) - -
1.4.2.2.2 Microscopy-based methods
There are different microscopy methods for the visualization and study of biofilms formed on surfaces,
including scanning electron microscopy (SEM), confocal laser scanning microscopy (CLSM), atomic
force microscopy, hyperspectral imaging techniques, and Optical Coherence Tomography (Merino et
al., 2019). SEM was one of the first microscopy methods used for the study of biofilms, and, with
specialised software packages, the area, volume, and thickness of the biofilm can be determined.
However, as the structure of the EPS matrix is disrupted during sample preparation, CLSM is now more
commonly used (Azeredo et al., 2017; De Oliveira et al., 2014). CLSM is a type of fluorescence
62
microscopy and allows the spatial structure of the biofilm, the distribution of the bacterial cells in
biofilm matrix and, with SYTO™ 9 staining, the presence of live and dead bacterial cells to be
investigated (Merino et al., 2019).
1.4.3 In situ biofilm study methods
Biofilm formation is usually studied using in vitro methods, but several commercial products exist that
can be used for the direct study or collection of biofilms in the field. These include the DEPOSENS®
sensor (LAGOTEC GmbH, Magdeburg) which can be installed in water pipe systems and monitors
biofilm formation in situ; or the Biofinder (Itram Higiene, Barcelona, Spain) solution which produces
foam in the presence of biofilms and microorganisms on a surface.
1.4.4 Disinfectant efficacy testing methods
There is no universal test for assessing the efficacy of biocides, but several well-defined standards do
exist for testing disinfectants against bacteria in the planktonic state and in biofilms and will be
discussed.
1.4.4.1 Planktonic tests
The most commonly used methods for testing of biocides against planktonic bacteria are the
quantitative suspension test (European Standards [EN] 1656:2019) or minimum inhibitory
concentration (MIC) and minimum bactericidal concentration (MBC) tests, which are used to
determine the required concentration of biocide to have bacteriostatic or bactericidal activity
(Prescott and Baggot, 1985). For testing of antimicrobials, solid plate methods such as the Kirby–Bauer
disc diffusion (Bauer et al., 1966) can also be used, and based on the zone of inhibition (area with no
bacterial growth) around the antimicrobial disc resistance is determined in accordance with well-
defined cut-off values specific for different antimicrobials and organisms.
In the UK, the Department of Environment, Food and Rural Affairs (Defra) disinfectant approvals
scheme is used to test disinfectants with five orders: Diseases of Poultry (DoP) Order 2003, Foot and

63
Mouth Disease Order 2006, Diseases of Swine Regulations 2014, and the Tuberculosis in Animals
Order 2021. General Orders (GO) covers all notifiable animal diseases not covered by the four specific
orders mentioned above. In the Defra GO test, disinfectant efficacy is determined based on the
reduction of viable bacteria compared to the control, with a successful disinfectant being defined as
one that demonstrates a 5-log reduction compared to the water control (Defra, 2021a; Wales et al.,
2021).
1.4.4.2 Biofilm tests
There are many published methods for assessing the efficacy of biocides against bacteria in biofilms
but there are only a few standardised methods, such as the static (closed) biofilm model, the MBEC
(minimal biofilm eradication concentration) Assay® (Innovotech, Edmonton, Canada) (American
Society for Testing and Materials [ASTM International] standard E2799), formerly the Calgary Biofilm
Device; and discussed above in Chapter 2 (section 1.4.2.2.2) the CDC Biofilm Reactor® can also be used
for disinfectant testing (ASTM E2871/E3161). However, both require specialist and expensive
equipment, and these methods have only been standardised for use with Pseudomonas biofilms. The
surface test (EN 16437) may also be considered to be a type of biofilm disinfectant test as it mimics
biofilms by drying planktonic bacteria onto a wooden surface.
Therefore, alternative methods have been developed by different institutes by adapting microplate-
based or coupon-based static biofilm models, with or without artificial contamination, to allow for the
effect of anti-biofilm compounds on cell viability or disruption of the EPS matrix to be determined.
Examples include the Bead Assay for Biofilms (Konrat et al., 2016) using glass beads, the artificial dry
surface biofilm models (Ledwoch et al., 2019), the High-throughput screening (HTS) assay (Paytubi et
al., 2017), the biofilm surface test (Grønseth et al., 2017), and biofilm formation on wooden dowels
(Gosling et al., 2017).

64
The effectiveness of biocidal products can be determined by assessing bacterial cell viability using
endpoint staining assays or bacterial cell enumeration to determine the log reduction in bacterial
counts. Bacterial cell enumeration is the most extensively used method for evaluating cell viability and
allows for the log reduction in viable bacteria after exposure to the anti-biofilm compound to be
quantitatively assessed. However, its limitations are that it is time-consuming, and the number of
viable bacteria present may be underestimated as only the bacteria detached from the biofilm are
counted, and as it is not able to detect bacteria in the viable but nonculturable (VBNC) state (Merino
et al., 2019). Viable bacteria can also be semi-quantitatively assessed by assessing positive or negative
re-growth of bacteria in enrichment broth after re-incubation (Gosling et al., 2017). Alternatively, an
indirect semi-quantitative measurement of cell viability can be determined by measuring bacterial
metabolic activity based on the reduction of a dye to a coloured or fluorescent product that can be
measured using a plate reader (Azeredo et al., 2017; González-Rivas et al., 2018). Resazurin sodium
salt (commonly known as alamarBlue™), or Tetrazolium sodium salts such as Triphenyltetrazolium
chloride [TTC], 3-(4,5-dimethylthiazol-2-yl)-2,5-diphenyltetrazolium bromide [MTT], and 2,3-bis-(2-
methoxy-4-nitro-5-sulfophenyl)-2H-tetrazolium-5-carboxanilide [XTT] are commonly used. Although
the use of metabolic dyes is suitable for high throughput screening of anti-biofilm compounds, similar
to the bacteria cell enumeration method, the number of viable bacteria may be underestimated as
the dye may not stain live bacteria in the centre of the biofilm and does not enable counting of bacteria
in a VBNC state (Grønseth et al., 2017).
1.5 Project aims and hypothesis
The prevalence of non-regulated Salmonella serovars, known as ‘exotic’ serovars, have been
increasing and are now widespread in the poultry industry. They are also found to persist in the
environment of pig and poultry production environments even after C&D and to re-infect replacement
animals. This is partly due to the conditions within these production environments that provide a
varied range of temperatures, moisture, organic matter, and sometimes infrequent C&D. These

65
conditions (animal housing) are ideal for biofilm formation, which is highly influenced by
environmental conditions. Biofilms can lead to Salmonella persisting in the environment and can, in
turn, lead to infection of pigs and poultry and ultimately people through the food chain. There has
been a large amount of research conducted into the mechanisms of biofilm formation by S. Enteritidis
and S. Typhimurium, particularly under conditions relevant for host infection. However, a more
comprehensive understanding of the in vitro biofilm-forming abilities of exotic serovars and other
regulated serovars relevant to the pig and poultry production industry is needed. In particular,
assessing their tolerance to disinfectant products commonly used in their industries may lead to
further understanding of the role that biofilm formation plays in the persistence of Salmonella in these
environments. The main aim of the thesis was to research the bacterial characteristics (genetic and
phenotypic) that give rise to Salmonella biofilm formation in a panel of selected serovars under
relevant environmental conditions using developed realistic in vitro biofilms models. The testable
hypothesis was that the persistence of Salmonella in the environment of pig and poultry production
premises is facilitated by biofilm formation and that low pathogenic ‘exotic’ Salmonella serovars that
predominantly originate from the feed industry and that have disseminated and populated poultry
and pig production facilities, as well as the predominant zoonotic serovars associated with these food
animal species, can form a biofilm that enhances their survival and biocide tolerance, and that use of
appropriate biofilm models, supplemented by phenotypic characterisation and genomic analysis of
isolates, can be developed to facilitate the study of such biofilm and their control.
This was achieved through the following aims and objectives:
▪ To assess the biofilm-forming ability of a panel of Salmonella enterica spp. enterica isolates
originating from the environment of eight types of GB pig and poultry production premises and assess
the influence of culture conditions and origin of the isolates on their in vitro biofilm-forming ability
(discussed in Chapter 3).

66
▪ To phenotypically characterise a panel of Salmonella using biofilm, motility, AMR, colony
morphology and growth kinetics assays (discussed in Chapter 4).
▪ To assess the relationship between biofilm formation and the phenotypic characteristics of MDR,
colony morphology (expression of fimbriae and cellulose), and growth kinetics parameters
(growth rate and logistic Area Under the Curve [AUC]) (discussed Chapter 4).
▪ To identify genes associated with biofilm formation, AMR, and resistance to QACs using WGS
(discussed in Chapter 5).
▪ To evaluate the disinfectant tolerance of S. 13,23:i:- isolates to commercial disinfectant products
using modified versions of published in vitro biofilm models (discussed in Chapter 6).
▪ To assess biofilm formation in the poultry drinking water system by building a microcosm in vitro
biofilm model (discussed in Chapter 7).

67
Chapter 2 Materials and Methods
2.1 Salmonella isolate panel
One-hundred and thirty-four Salmonella enterica subspecies enterica isolates were used in all the
studies presented in this thesis unless otherwise specified; see Appendix I, Table 9-1. This isolate panel
consisted of 132 environmental Salmonella isolates belonging to 14 serovars and two Salmonella (S.)
Enteritidis PT13a biofilm controls (27655R and 27655S). The isolates 27655R and 27655S were chosen
as biofilm controls as they have constitutively curliated and non-curliated phenotypes, respectively,
which have been previously described by Allen-Vercoe et al. (1997), Allen-Vercoe, Collighan and
Woodward (1998) and Woodward et al. (2000).
Selection of Salmonella serovars for inclusion in the isolate panel gave priority to four serovars of
public health importance: S. Enteritidis (21 isolates), S. Typhimurium (29 isolates), S. 4,[5],12:i:-
[monophasic S. Typhimurium] (21 isolates), and S. Infantis (19 isolates). The 21 S. Enteritidis isolates
included two isolates that were field strains of the Salmovac® 440 vaccine. The other Salmonella
serovars were non-regulated serovars, referred to as ‘exotic’ serovars that are not commonly
associated with Salmonella infections in humans but are commonly isolated in GB from pigs, poultry
(chickens, turkeys, or ducks) or animal feed (APHA, 2021) or were associated with persistent
environmental contamination in the primary production premises that they were collected from.
These ten serovars were S. 13,23:i:- (20 isolates), S. Senftenberg (4 isolates), S. Kedougou (4 isolates),
S. Mbandaka (3 isolates), S. Ohio (3 isolates), S. Indiana (2 isolates), S. Bovismorbificans (2 isolates), S.
4,12:d:- (2 isolates), S. Reading (1 isolate), and S. Montevideo (1 isolate).
The two biofilm control strains were sourced from the bacteriology strain collection at APHA
(Weybridge, UK), and the 132 environmental Salmonella isolates were soured from the Salmonella
strain collection at APHA (Weybridge, UK). The 132 environmental isolates in the panel originated
from animal-feed producing mills [4 mills, 8 isolates]; hatcheries for broilers (Gallus gallus) and turkeys
(Meleagris gallopavo) [2 hatcheries, 28 isolates]; farms producing hen [1 farm, 4 isolates] or duck
68
(Anas platyrhynchos domestica) [2 farms, 4 isolates] eggs for human consumption or duck breeding [1
farm, 4 isolates]; and farms producing meat from broilers [8 farms, 31 isolates], fattening turkeys [5
farms, 12 isolates], ducks [5 farms, 13 isolates], or pigs (Sus scrofa domesticus) [8 farms, 28 isolates].
2.1.1 Sample collection
The panel of 132 environmental Salmonella field isolates were chosen from representative
environmental samples collected from pig or poultry production premises in GB by staff in the
Bacteriology Department and the Department of Epidemiology at APHA (Weybridge, UK) between
2012 and 2018 as part of Defra-funded research or surveillance projects. Briefly, from each production
premise, samples were collected from equipment and the environment, including from voided pig or
poultry faeces, using a large (900 cm2) sterile, moist, hand-held gauze swab (Robinson Healthcare Ltd,
Worksop, UK) to swab 0.5 m2 of the area of interest. For each environmental sample, the metadata
recorded at the time of sampling included: date of sample collection, type of primary production
premises, sampling location, and the sample type or predominant material of the collection surface.
The categories used to classify isolates into material and/or sample type were aqueous samples
(standing water, drains and drinkers), organic samples (pig faeces, poultry faeces and/or litter), dust
samples, concrete surfaces, metal surfaces, plastic surfaces, and surfaces sampled after C&D. For
samples collected from indoor sampling areas, the lower and upper ambient environmental
temperature was estimated based on industry-recommended ambient temperatures (AHDB, 2018;
Avigen Turkeys Ltd, 2015b; Cobb-Vantress, 2008; Cornell University, 2016; Defra, 2018; Defra, 2020;
Lamas et al., 2018; Newton, 2012). For samples collected after C&D or from outdoor areas, the
minimum or maximum temperature in the GB district region during the month of sample collection
were used (Met Office, 2020).
2.1.2 Salmonella isolation
Salmonella was isolated from the environmental samples using a modified version of ISO 6579-1:2017
by the Salmonella reference laboratory at APHA (Weybridge, UK). Briefly, swabs were placed into

69
225ml of BPW (Merck KGaA, Darmstadt, Germany). After aerobic incubation for 16-20 hours at
37±1°C, 100µl of overnight broth was plated onto MSRV agar plates (Mast Group Ltd, Bootle, UK)
supplemented with 1mg/ml of novobiocin (Sigma-Aldrich, Missouri, USA) and incubated for 24±3
hours at 41.5±1°C. After aerobic incubation, 1µl from each MSRV agar plate was inoculated onto a
Rambach™ agar plate (Merck KGaA, Darmstadt, Germany) for selective enrichment of Salmonella.
2.1.3 Salmonella identification
2.1.3.1 Serotyping and phage typing
The 132 environmental Salmonella isolates and the two biofilm control strains underwent serotyping
and phage typing (where applicable), performed by the Salmonella reference laboratory at APHA
(Weybridge, UK). Serotyping was performed with reference to the White-Kauffmann-Le Minor
serotyping scheme (Grimont and Weill, 2007). Briefly, using a serological test method, a pure culture
of Salmonella was exposed to somatic (O-antigen) and flagellar (H-antigen) antisera, and agglutination
evaluated. In the presence of a homologous antibody, agglutination was observed. Based on
agglutination reactions to specific antisera, the antigenic structure of the Salmonella culture was
identified and classified into one of approximately 2600 Salmonella serovars.
Only S. Enteritidis, S. Typhimurium, and monophasic S. Typhimurium isolates were phage typed as no
phage typing scheme exists in the UK for the other serovars. Phage typing was performed with
reference to the PHE phage typing scheme (Anderson et al., 1977; Callow, 1959; Ward, de Sa and
Rowe, 1987). Briefly, for each Salmonella isolate, bacterial cultures were seeded onto phage nutrient
agar plates with the appropriate Salmonella phages and incubated overnight at 35±3°C. After
incubation, the plates were read, and a phage type was assigned based on the pattern and degree of
lysis.

70
2.1.3.2 Polymerase chain reaction (PCR)
The identity of the two Salmonella isolates S04017-12 and S04018-12 as S. Typhimurium was
confirmed by multiplex PCR using a method adapted from Barco et al. (2011) and Tennant et al. (2010).
Briefly, for the deoxyribonucleic acid (DNA) extraction, 1µl of bacterial culture from test isolates
S04017-12 and S04018-12 was recovered from Dorset Egg slopes and resuspended in 200µl of 7.5%
chelex solution (Bio-Rad Laboratories, California, USA). The suspension was boiled for 10 minutes in a
heat block (Techne Dri-Block, Sigma-Aldrich, Missouri, USA), centrifuged (Heraeus Biofuge Fresco, DJB
Labcare Ltd, Pagnell, UK) for 10 minutes at a RCF of approximately 13200 x g, and 100µl of supernatant
transferred to an Eppendorf tube. The boilate DNA was stored at 4°C until use. The PCR reactions were
performed using 10µl HotStarTaq Plus Master Mix (QIAGEN Manchester Ltd, Manchester, UK) with a
final concentration of 0.1µm of the forward FLIB and reverse FLIA primers, a final concentration of
1µm of Sense-59 and Antisense-83 primers, and 3µl of genomic of DNA from each test isolate. Four
Salmonella controls (S. Typhimurium, monophasic S. Typhimurium, S. Lagos, and S. Agama) were also
run. The PCR reaction was run on the Applied Biosystems GeneAmp PCR system 9700 (Thermo Fisher
Scientific, Waltham, USA) using the following cycling conditions: 1 cycle of 95˚C for 5 minutes; 30
cycles of 95˚C for 30 seconds, 64˚C for 30 seconds and 72˚C for 90 seconds and finally one cycle of
72˚C for 10 minutes before holding at 4˚C. The PCR products were analysed by agarose gel
electrophoresis and the amplicon profiles by the test isolates compared to the patterns produced by
the Salmonella control strains. The preparation and analysis of the multiplex PCR reactions were
performed by Beaulieu Puddicombe-Coles of the Bacteriology Department, APHA (Weybridge, UK).
2.1.3.3 Vaccine strain testing
The two S. Enteritidis isolates S03467-16 and S03463-16, originating from a laying hen farm where the
Salmovac® 440 vaccine had been administered, were confirmed as field isolates of the Salmovac® 440
vaccine strain using the APHA Salmonella vaccine strain test method performed by the Salmonella
reference laboratory at APHA (Weybridge, UK). Briefly, test isolates S03467-16 and S03463-16 were

71
recovered from Dorset Egg slopes on Blood Agar Base No.2 plates (Oxoid Limited, Altrincham, UK)
supplemented with lactose (100g/L) and 1% Neutral Red (60ml/L), after overnight aerobic incubation
for 37±3°C. The two test isolates, a Salmovac® 440 vaccine strain (control) and a field strain of S.
Enteritidis phage type 4 (PT4) (control) and were plated onto M9 minimal agar plates (Appendix II,
Table 9-2), and M9 minimal agar plates supplemented with histidine (20µg/ml) and/or adenine
(20µg/ml). After overnight aerobic incubation at 37±3°C, growth by the two test isolates was
compared to the Salmovac® 440 vaccine strain, which possesses mutations causing auxotrophism for
histidine and adenine.
2.1.4 Culture conditions
The 134 Salmonella isolates in this isolate panel were stored at -80°C in a 10% glycerol stock (Appendix
II, Table 9-2). They were recovered on 5% sheep blood agar (SBA) plates (Oxoid Limited, Altrincham,
UK) after aerobic incubation at 37±1°C for 24±3 hours.
2.2 Phenotypic characterisation techniques
2.2.1 Crystal violet microplate biofilm assay
The ability of the 134 Salmonella isolates to form a biofilm in vitro was determined using the crystal
violet microplate assay as previously described by Schonewille et al. (2012) with some modifications.
Bacterial suspensions were prepared for each Salmonella isolate by transferring 1µl of bacterial
culture (cultured as described in Chapter 2, section 2.1.4) from 5% SBA plates (Oxoid Limited,
Altrincham, UK) into 10ml LB broth (Appendix II, Table 9-2) and aerobically incubated at 37±1°C for 18
hours. For each isolate, 30µl of this LB broth culture was added to 100µl of LB broth w/o salt (Appendix
II, Table 9-2) in two wells (technical replicates) of 96-well microplates (Nunc™ flat-bottom 96-well clear
polystyrene plates with the Nunclon™ Delta surface treatment and lid; Scientific Laboratory Supplies
Limited, Nottingham, UK). Two wells were also filled with sterile LB broth w/o salt as a blank control
in each microplate. Microplates underwent static, aerobic incubation under one of four test
conditions: 20±1°C or 25±1°C for 48 hours or 72 hours. Biofilms formed on the walls of microplate

72
wells at the air-liquid interface. After aerobic incubation, each microplate was first inverted to remove
the broth from each well, righted, and then rinsed twice with 250µl of Reverse Osmosis (RO) water
(once using a pipette and then once with a wash bottle) to remove any loosely attached bacteria. Once
the microplate was visibly dry, the remaining adhered bacteria were heat-fixed at 65°C for 30 minutes
in a drying oven (Hybaid Mini 10 Hybridisation Oven; Hybaid Limited, Altrincham, UK); then cooled at
room temperature for 10 minutes. The biofilms in the microplate wells were stained by adding 150µl
of 1% crystal violet dye (Sigma-Aldrich, Missouri, USA) to each well and incubated at room
temperature for 30 minutes. Each microplate was inverted to remove the crystal violet dye, rinsed
three times with approximately 250µl of sterile RO water, and dried at 37±1°C for 10 minutes. Bound
crystal violet dye was dissolved by adding 150µl of a 95% ethanol/5% RO water solution (v/v) to each
well and left at room temperature for 15 minutes. Optical density (OD) at 570nm (OD570) was
measured using a microplate reader (Dynex Technologies Inc, Worthing, UK). This experiment was
performed on three separate occasions with two technical replicates.
2.2.1.1 Quantification of biofilm formation
The OD570 values generated by the crystal violet assay were used to classify the biofilm-forming ability
of the Salmonella isolates using the terms ‘strong biofilm producer’, 'moderate biofilm producer',
'weak biofilm producer' or 'non-biofilm producer'. Terms were assigned using the calculations in Table
2-1. The OD cut-off (ODc) value was calculated as three standard deviations above the mean OD570
value of the six blank controls wells generated across the three biological replicates.
For each Salmonella isolate, a mean of OD570 values from six replicates was calculated to give the mean
OD570. For use in statistical analysis, for each Salmonella isolate, the mean OD570 of the blank control
wells was subtracted from each of the six OD570 values generated across the three biological replicates
to give the blank corrected OD570 value. For each Salmonella isolate, a mean of six blank corrected
OD570 values was calculated, and negative values changed to zero to give the final OD570 value.

73
Table 2-1: Calculations used to classify biofilm-forming ability in the crystal violet microplate assay. These
calculations, described by Stepanovic et al. (2004), classified biofilm-forming ability using the OD570 data
obtained for each Salmonella isolate in the crystal violet microplate assay.
Biofilm-forming ability Calculation
strong producer mean OD570 > 4xODc
moderate producer 2xODc < mean OD570 ≤ 4xODc
weak producer ODc < mean OD570 ≤ 2xODc
non-producer mean OD570 ≤ ODc
ODc = OD cut-off value.
2.2.2 Motility test
The motility of 134 Salmonella isolates was evaluated in motility test medium agar using the semi-
solid agar method previously described by Tittsler and Sandholzer (1936). The Salmonella Pullorum
reference strain ST573, used as a negative (non-motile) control, was stored at -80°C on cryovial beads
(Microbank; Pro-Lab Diagnostics, Wirral, UK) and recovered onto 5% SBA plates (Oxoid Limited,
Altrincham, UK) after incubation at 37±1°C for 24±3 hours. For each Salmonella isolate, semi-solid
motility test medium agar (Appendix II, Table 9-2), supplemented with 5ml/L of 1% TTC (Merck KGaA,
Darmstadt, Germany), was inoculated in duplicate by stabbing a 1µl loopful of bacterial culture
(cultured as described in Chapter 2, section 2.1.4) from 5% SBA plates (Oxoid Limited, Altrincham, UK)
through the centre of the agar. Both sets of motility test medium agar were aerobically incubated for
48 hours with one set incubated at 20±1°C and the other at 25±1°C. After incubation, isolates were
recorded as motile (positive result) when there was bacterial growth, characterised by turbidity and
red colour, away from the inoculation line. Isolates were recorded as non-motile (negative result)
when bacterial growth was only observed at the line of inoculation. This experiment was performed
once with one technical replicate.
2.2.3 Congo red agar (CRA) test
Colony morphotypes of the 134 Salmonella isolates at 20±1°C and 25±1°C were determined after
aerobic incubation for 96 hours on two types of agar plate containing Congo red (CR).

74
2.2.3.1 Luria Bertani (LB) w/o salt agar plates containing Congo red (CR) and Coomassie brilliant blue
Colony morphologies were determined on LB w/o salt agar plates (Appendix II, Table 9-2)
supplemented with CR and Coomassie brilliant blue as described by Malcova et al. (2008) and Nesse
et al. (2020). Bacterial suspensions were prepared for each Salmonella isolate by transferring 1µl of
bacterial culture (cultured as described in Chapter 2, section 2.1.4) from 5% SBA plates (Oxoid Limited,
Altrincham, UK) into 10ml LB broth and aerobically incubated at 37±1°C for 16 hours. One drop (1µl)
of this overnight culture was inoculated, in duplicate, onto the LB w/o salt agar plates supplemented
with CR (40 μg/ml) and Coomassie brilliant blue (20 μg/ml). Both set of plates underwent aerobic
incubation for 96 hours with one set incubated at 20±1°C and the other at 25±1°C. After incubation,
colony morphotypes were determined based on the colony appearance when viewed
macroscopically. Colony morphotypes were classified as red, dry and rough (RDAR); brown, dry and
rough (BDAR); pink, dry and rough (PDAR) and smooth and white (SAW). This experiment was
performed once with one technical replicate.
2.2.3.2 Colonisation factor antigen (CFA) agar plates containing Congo red (CR)
Colony morphologies were determined on colonisation factor antigen (CFA) agar plates supplemented
with CR based on the methods by Allen-Vercoe et al. (1997) and Dibb-Fuller et al. (1997). Bacterial
suspensions were prepared for each Salmonella isolate by transferring 1µl of bacterial culture
(cultured as described in Chapter 2, section 2.1.4) from 5% SBA plates (Oxoid Limited, Altrincham, UK)
into 10ml LB broth and aerobically incubated at 37±1°C for 16 hours. This overnight bacterial culture
was serially diluted in 0.1M phosphate-buffered saline [PBS] (Appendix II, Table 9-2) to approximately
1x10⁵ CFU/ml. One drop (5µl) of the 1x10⁵ CFU/ml dilution was inoculated, in duplicate, onto each of
three CFA agar plates supplemented with different concentrations of CR (0.001%, 0.05% and 0.1%).
All plates underwent aerobic incubation for 96 hours with one set incubated at 20±1°C and the other
at 25±1°C. After incubation, colony morphotypes were determined based on the colony appearance
when viewed macroscopically. Colony morphotypes were classified as RDAR, BDAR, PDAR, and SAW,

75
and a single colony morphotype was assigned based on the results from the three agar plates
containing different concentrations of CR. This experiment was performed once with one technical
replicate.
2.2.4 Antimicrobial susceptibility testing (AST)
The resistance of the Salmonella isolates to a panel of 16 antimicrobials, belonging to six antimicrobial
classes, was determined. This panel is used by APHA for the routine surveillance of AMR in Salmonella
isolates and represents a core set of antimicrobial classes for both licensed antimicrobials currently in
use and antimicrobials historically used in veterinary practice. Some of these antimicrobials are either
no longer authorised for use in food animals, have limited use in GB but are indicative of important
transferrable resistance determinants, or are important for human medicine. The resistance of 134
Salmonella isolates to these 16 antimicrobials was determined by the Salmonella reference laboratory
at APHA (Weybridge, UK) using a disk diffusion method which aligns with the British Society for
Antimicrobial Chemotherapy (BSAC) method (BSAC, 2015). Briefly, each Salmonella isolate was
inoculated onto Iso Sensitest Agar (Oxoid Limited, Altrincham, UK) plates, and the 16 antibiotic discs
(Oxoid Limited, Altrincham, UK) listed in Table 2-2 were placed on the surface of the agar. The agar
plates were aerobically incubated for 18-20 hours at 37±3°C. Following incubation, sensitivity or
resistance to each antimicrobial was determined based on measurement of the diameter (mm) of the
zone of inhibition for each antimicrobial disk compared to the published BSAC human clinical
breakpoints or, where no BSAC human clinical breakpoints were available, the historical APHA
veterinary breakpoints (VMD, 2019a) were used; see Table 2-2. Multi-drug resistant (MDR) bacteria
were defined, based on the EFSA and ECDC definition as resistance to at least three antimicrobial
classes (EFSA and ECDC, 2017) according to historical APHA veterinary breakpoints or the BSAC human
clinical breakpoints.

76
Table 2-2: The panel of 16 antimicrobials of human and veterinary importance used for the disc diffusion test
and the associated breakpoints used to determine resistance. An isolate was classified as resistant to an
antimicrobial if the diameter of the zone of inhibition (mm) was less than or equal to the historical APHA
veterinary breakpoint (a) or the BSAC human clinical breakpoint (b) (VMD, 2019a).
Antimicrobial Code Antimicrobial class Disc concentration (µg per ml)
Zone diameter: resistant ≤ mm
amikacin AMK
aminoglycosides
30 18b
apramycin APR 15 13a
gentamicin GEN 10 19b
neomycin NEO 10 13a
streptomycin STR 10 13b
amoxicillin-clavulanic acid AMC
β-lactams
30 14b
ampicillin AMP 10 14b
cefotaxime CTX 30 29b
ceftazidime CAZ 30 26b
ciprofloxacin CIP quinolones
1 19b
nalidixic acid NAL 30 13a
furazolidone FUR nitrofurans 15 13a
chloramphenicol CHL amphenicols 30 20b
sulfonamide compounds S3 sulphonamides
300 13a
sulphamethoxazole-trimethoprim SXT 25 15b
tetracycline TET tetracyclines 10 13a
2.2.5 Growth kinetics
Growth curves were produced for a subset of 27 Salmonella isolates using the local APHA ‘FLUOstar®
Growth Curves for Salmonella species’ method. These 27 Salmonella isolates (listed in Appendix I,
Table 9-1) included the two biofilm control isolates (27655R and 27655S) and five randomly selected
isolates from each of the main five serovars in the Salmonella isolate panel: S. Typhimurium,
monophasic S. Typhimurium, S. 13,23:i:- S. Infantis, and S. Enteritidis including the two S. Enteritidis
isolates that were field strains of the Salmovac® 440 vaccine. For each Salmonella isolate, 1µl of
bacterial culture (cultured as described in Chapter 2, section 2.1.4) was transferring from 5% SBA
plates (Oxoid Limited, Altrincham, UK) into 3ml LB broth (Appendix II, Table 9-2) and incubated for 18
hours at 37±1°C. 1.5µl of this overnight culture was then added to 1498.5µl of LB broth w/o salt
(Appendix II, Table 9-2) to create a 0.1% stock solution. For each isolate, 200µl of 0.1% stock solution

77
was added to three wells in a 96-well microplate (Nunc™ flat-bottom 96-well clear polystyrene plates
with the Nunclon™ Delta surface treatment and lid; Scientific Laboratory Supplies Limited,
Nottingham, UK). Three wells of sterile LB broth w/o salt were included on the same microplate as the
blank control wells. The microplate was incubated in the FLUOstar® OPTIMA (BMG Labtech Ltd,
Aylesbury, UK) plate reader with software v1.32 R2 (BMG Labtech Ltd, Aylesbury, UK), and the growth
curve run using the test parameters detailed in Table 2-3. A OD570 measurement was taken every 15
minutes until 48 hours had elapsed. This experiment was performed once with three technical
replicates.
Table 2-3: FLUOstar® OPTIMA settings used for the growth curves run.
Parameter Setting
positioning delay 0.5
number of kinetic windows 1
number of cycles 195
number of flashes per well and cycle 10
cycle time (seconds) 1440
well scanning Orbital
additional shaking 5 seconds before the cycle
well diameter 3mm
temperature 25°C
excitation filter 570nm
emission filter Empty
To produce a growth curve for each Salmonella isolate, the OD570 data obtained from the FLUOstar®
OPTIMA growth curves run was processed as follows. At every time point, with each Salmonella isolate
considered separately, the mean OD570 of the blank control wells was subtracted from the OD570 values
from the three technical replicates to give the blank corrected OD570 value. The mean of these blank
corrected OD570 values was calculated, and negative values changed to zero to give the mean OD570
value. Using the mean OD570 values, the logistic equation was fitted to the growth curve for each
Salmonella isolate in RStudio v1.3.1073 (RStudio Team, 2020) using the growthcurver package v0.3.1
(Sprouffske, 2020; Sprouffske and Wagner, 2016) and four growth parameters estimated: growth rate
(r), carrying capacity (K), doubling time (tDT), the logistic Area Under the Curve (AUC). Growth rate (r)
represented the intrinsic growth rate of the population that would occur if there was no restriction on

78
the total population size. Carrying capacity (K) represented the maximum possible population size.
Doubling time (tDT) was the time in hours taken for the OD570 value to double. The AUC summarized
the growth curve into a single value (Sprouffske and Wagner, 2016). The maximum OD570 obtained
(ODmax) and the OD570 value at the 24 hour time point in the growth curve run (OD24h) were also
recorded. The growth curves were visualised in RStudio v1.3.1073 (RStudio Team, 2020) using the
packages dplyr v1.0.7 (Wickham et al., 2021), reshape2 v1.4.4 (Wickham, 2007), ggplot2 v3.3.5
(Wickham, 2016), purrr v0.3.4 (Henry and Wickham, 2020), and melt v1.0.0 (Kim, 2021).
2.4 Whole-genome sequencing (WGS)
From the 134 Salmonella isolate panel, 93 isolates were selected for WGS analysis and detailed in
Appendix I, Table 9-1. These 93 isolates included the two biofilm control isolates (27655R and 27655S)
and all isolates from the five main serovars in Salmonella isolate panel (S. Enteritidis, S. Typhimurium,
monophasic S. Typhimurium, S. 13,23:i:-, and S. Infantis), excluding the two S. Enteritidis isolates that
were field strains of the Salmovac® 440 vaccine. The 17 Salmonella isolates originating isolated from
meat duck, breeder duck, and layer duck farms were also excluded as these isolates were added to
the Salmonella isolate panel after the isolates for WGS had been chosen. Eight Salmonella isolates
(S00793-17, S01898-17, S01899-17, S01902-17, S01904-17, S03578-16, S04697-15, and S04700-15)
had been sequenced previously as part of Defra-funded research or surveillance projects, and the
Illumina paired-end reads for these isolates were obtained from the Department of Bacteriology at
APHA (Weybridge, UK).
2.4.1 DNA extraction
DNA was extracted from the 85 Salmonella isolates for which genomic sequence data was not already
available using the local APHA method ‘Semi-automated extraction of genomic DNA from Salmonella
using the KingFisher purification system’, based on the instructions provided in the commercial
MagMax™ CORE Nucleic Acid Purification Kit (Thermo Fisher Scientific, Waltham, USA). Briefly,
Salmonella was cultured as described in Chapter 2, section 2.1.4 on 5% SBA plates (Oxoid Limited,
79
Altrincham, UK) and a single colony inoculated into 10ml LB broth (Appendix II, Table 9-2). Bacterial
suspensions were aerobically incubated in a shaking incubator at 37±1°C for four hours. To every well
in a KingFisher 96-well microplate (Thermo Fisher Scientific, Waltham, USA), 500µl of wash buffer no.1
was added. Then 500µl of wash buffer no.2 was added to every well in a KingFisher Flex 96 deep-well
plate (Thermo Fisher Scientific, Waltham, USA), and 90µl of elution buffer was added to every well in
a 96-well elution plate. In a second KingFisher 96-well microplate, 30µl of proteinase K and magnetic
bead mix (10µl proteinase K with 20µl of magnetic beads) was added to every well. To each well in
this plate, 270µl of bacterial suspension was added and pipetted six times to mix and incubated at
room temperature for 2 minutes; then 700µl of lysis and binding buffer mixture (350µl lysis buffer and
350µl binding buffer) was added to each well. The microplates were placed in the KingFisher Flex
(Thermo Fisher Scientific, Waltham, USA) and the ‘MagMax™_Core_HEAT’
(https://www.thermofisher.com/order/catalog/product/A32700) run. At the end of the run, the
elution plate containing the extracted DNA was removed from the KingFisher Flex, sealed, and stored
at -20°C until DNA sequencing was performed.
2.4.2 DNA sequencing
DNA sequencing was performed on the 85 DNA samples by the sequencing unit at APHA (Weybridge,
UK). Briefly, the DNA concentration in the samples was normalised using the QuantiFluor dsDNA
System kit (Promega UK, Southampton, UK). Genomic libraries were created using Nextera XT kit
(Illumina Inc., California, USA), and PCR was performed using the following thermocycler conditions:
1 cycle of 72˚C for 3 minutes; one cycle of 95˚C for 30 seconds, 12 cycles of 95˚C for 10 seconds, 55˚C
for 30 seconds and 72˚C for 30 seconds, and finally one cycle of 72˚C for 5 minutes before holding at
10˚C. DNA sequencing was performed on the Illumina MiSeq System (Illumina Inc, California, USA).

80
2.4.3 Sequence analysis
2.4.3.1 Genome assembly and quality control
The 93 Salmonella genomes were assembled from the Illumina paired-end reads using the Shovill
pipeline v1.0.1 (https://github.com/tseemann/shovill) with a minimum contig coverage length of 2
and a minimum contig length of 20,000 bp). The assemblies were checked for quality parameters using
QUAST (quality assessment tool for genome assemblies) v5.0.2 (Gurevich et al., 2013): genome size,
size of the largest contig, the minimum contig length required to cover 50% of the assembled genome
sequence (N50), and a count of the smallest number of contigs whose length makes up half the
genome size (L50). All 93 assembled genomes were included in the downstream sequence analysis as
they met the minimum quality metrics of a minimum contig length of 20,000 bp and a L50 of <50
contigs (see Appendix VI, Table 9-6).
2.4.3.2 Phylogenetic analysis
Salmonella serovar predictions were performed using SISTR (Salmonella in Silico Typing Resource)
v1.0.2 (Yoshida et al., 2016). A phylogenetic tree of the 93 Salmonella isolates was created using
Snippy v4.6.0 (https://github.com/tseemann/snippy) to align and phylogenetically cluster the
Salmonella isolates based on core genome SNPs. The phylogenetic tree was visualised using iTOL
[Interactive Tree of Life] v6.4.1 (Letunic and Bork, 2021) by first converting the Snippy output using
IQ-TREE v1.6.12 (Minh et al., 2020). The reference genome Salmonella Typhimurium strain LT2
(National Center for Biotechnology Information [NCBI]: txid99287) was used as the root for the tree.
A pairwise SNP distance matrix was generated using snp-dists v0.8.2
(https://github.com/tseemann/snp-dists) and a SNP threshold for closely related Salmonella was
defined as ≤20 SNPs as previously used by Wang et al. (2018) and Jagadeesan et al. (2019).
2.4.3.3 Genome annotation and pangenome analysis
The 93 assembled genomes were annotated using Prokka v1.14.5 (Seemann, 2014).

81
2.4.3.3.1 Detection of AMR determinants
The annotated genomes of only the 91 environmental Salmonella isolates (the biofilm control isolates
27655R and 27655S were omitted) were screened for the presence of AMR determinants using
ABRicate v1.0.1 (Seemann, 2020) with a minimum coverage of 80% against the three gene databases:
NCBI AMRFinderPlus (Feldgarden et al., 2019), ResFinder (Zankari et al., 2012), and APHA SeqFinder
(Duggett et al., 2017). A gene was considered present if there was a ≥98.0% identity match, based on
the suggested threshold for ResFinder (Zankari et al., 2012). Only the genes conferring resistance to
aminoglycosides, amphenicols, β-lactams, nitrofurans, sulphonamides, quinolones, and tetracyclines,
based on the function of the genes identified by Alcock et al. (2020), were considered. From the APHA
SeqFinder database, the int1 gene encoding for the class 1 integron-integrase (Int1) and genes
encoding for plasmids were also considered. PointFinder v3.1.0 (Zankari et al., 2017) was used to
screen the assembled genomes for chromosomal point mutations in genes conferring resistance to
quinolones (gyrA, gyrB, parC, and parE).
2.4.3.3.2 Detection of quaternary ammonium compound (QAC) tolerance genes
A database of nine genes encoding associated with tolerance to QACs in Salmonella spp. from Slipski,
Zhanel and Bay (2018) was compiled; see Table 2-4. For each gene, the published nucleotide sequence
was obtained from NCBI (https://www.ncbi.nlm.nih.gov/) and trimmed from the start codon (ATG) to
the stop codon (TAG, TAA or TGA). The annotated genomes for only the 91 environmental Salmonella
isolates (the biofilm control isolates 27655R and 27655S were omitted) were screened using ABRicate
v1.0.1 (Seemann, 2020) against this database, and the presence of these eight genes was determined.

82
Table 2-4: List of nine genes associated with tolerance to QACs. Gene identities and descriptions are adapted
from NCBI (https://www.ncbi.nlm.nih.gov/).
Gene name NCBI gene identity Description
emrE 13855288 efflux SMR protein emrE [S. Weltevreden strain 2007-60-3289-1]
qacE 1255864 QACs efflux SMR transporter QacE [S. Typhimurium strain LT2]
qacEΔ1 263137 QACs efflux SMR transporter QacEΔ1 [S. Typhimurium strain LT2]
qacF 3283273 QACs resistance protein QacF [S. Choleraesuis strain SC-B67]
qacH 24956671 QACs resistance protein QacH [S. Choleraesuis]
qacL 39663268 QACs SMR transporter QacL [Salmonella enterica subspecies Enterica]
emrD 1255325 MFS multidrug transporter EmrD [S. Typhimurium strain LT2]
smvA 1253092 MFS multidrug transporter smvA [S. Typhimurium strain LT2]
mdfA 1252385 MFS multidrug transporter MdfA [S. Typhimurium strain LT2]
SMR = small multidrug resistance, MFS = major facilitator superfamily.
2.4.3.3.3 Detection of biofilm-associated genes
A database of 38 genes encoding biofilm-associated processes (quorum sensing, cellulose production,
fimbriae expression, or biofilm regulatory genes) was compiled; see Table 2-5. For each gene, the
published nucleotide sequences were obtained from NCBI (https://www.ncbi.nlm.nih.gov/) and
trimmed from the start codon (ATG) to the stop codon (TAG, TAA or TGA). The annotated genomes of
the 93 Salmonella isolates were screened using ABRicate v1.0.1 (Seemann, 2020) against this database
of genes, and the presence of these 38 genes was determined. If there was a less than 100% identity
match between the published nucleotide sequences and the annotated Salmonella genomes, point
mutations between these two nucleotide sequences were identified using Basic Local Alignment
Search Tool (BLASTn) (Mount, 2007).

83
Table 2-5: List of 38 biofilm-associated genes. Gene identities and descriptions are adapted from NCBI (https://www.ncbi.nlm.nih.gov/).
Gene name
NCBI gene identity
Description Gene function Reference(s)
adrA 1251904 diguanylate cyclase AdrA [S. Typhimurium strain LT2] agfD-dependent regulator protein (cellulose biosynthesis regulator)
(Ćwiek, Bugla-Płoskońska and Wieliczko, 2019; Gerstel and Romling, 2003; Steenackers et al., 2012; Yin et al., 2018)
bcsA 1255142 uridine diphosphate-glucose-forming cellulose synthase catalytic subunit BcsA [S. Typhimurium strain LT2]
bsc operon (cellulose synthesis)
(Ćwiek, Bugla-Płoskońska and Wieliczko, 2019; Gerstel and Romling, 2003; Steenackers et al., 2012)
bcsB 1255141 cellulose synthase regulator BcsB [S. Typhimurium strain LT2]
bcsC 1255139 cellulose biosynthesis protein BcsC [S. Typhimurium strain LT2]
bcsE 1255145 cellulose biosynthesis protein BcsE [S. Typhimurium strain LT2]
bcsF 1255146 cellulose biosynthesis protein BcsF [S. Typhimurium strain LT2]
bcsG 66757950 cellulose biosynthesis protein BcsG [S. bongori N268-08]
bcsZ 6948685 endo-1,4-D-glucanase [S. Enteritidis strain P125109]
csgA 1252662 curli major subunit CsgA [S. Typhimurium strain LT2]
csg operon (SEF21 expression)
(Ćwiek, Bugla-Płoskońska and Wieliczko, 2019; Jones, 2013; Steenackers et al., 2012; Yin et al., 2018)
csgB 1252661 curli minor subunit precursor CsgB [S. Typhimurium strain LT2]
csgC 1252663 curli assembly protein CsgC [S. Typhimurium strain LT2]
csgE 1252659 curli assembly protein CsgE [S. Typhimurium strain LT2]
csgF 1252658 curli assembly protein CsgF [S. Typhimurium strain LT2]
csgG 1252657 curli production assembly/transport protein CsgG [S. Typhimurium strain LT2]
csgD 1252660 transcriptional regulator CsgD [S. Typhimurium strain LT2] global biofilm regulator/csg operon (SEF21 expression)
(Chen et al., 2020; Ćwiek, Bugla-Płoskońska and Wieliczko, 2019; Gerstel, Park and Romling, 2003; Gerstel and Romling, 2003; Steenackers et al., 2012; Yin et al., 2018)
fimA 1252063 type-1 fimbrial protein subunit A FimA [S. Typhimurium strain LT2]
fim operon (SEF21 expression)
(Ćwiek, Bugla-Płoskońska and Wieliczko, 2019; Dibb-Fuller et al., 1997; Gerstel and Romling, 2003; Jones, 2013; Obe et al., 2021)
fimC 1252065 type-1 fimbrial chaperone protein FimC [S. Typhimurium strain LT2]
fimD 1252066 type-1 fimbrial outer membrane usher protein FimD [S. Typhimurium strain LT2]

84
fimF 1252068 type-1 fimbrial adhesin protein FimF [S. Typhimurium strain LT2]
fimH 1252067 type-1 fimbrial adhesin protein FimH [S. Typhimurium strain LT2]
fimI 1252064 fimbrial protein FimI [S. Typhimurium strain LT2]
lpfA 1255164 long polar fimbrial protein LpfA [S. Typhimurium strain LT2]
lpf operon (lpf expression) (Peng, 2016; Silva et al., 2019; Wolska et al., 2016)
lpfB 1255163 long polar fimbrial chaperone LpfB [S. Typhimurium strain LT2]
lpfC 1255162 fimbrial assembly protein LpfC [S. Typhimurium strain LT2]
lpfD 1255161 long polar fimbrial protein LpfD [S. Typhimurium strain LT2]
lpfE 1255160 long polar fimbrial protein LpfE [S. Typhimurium strain LT2]
orf5 1256225 plasmid-encoded fimbrial outer membrane protein Orf5 [S. Typhimurium strain LT2]
pef expression (Peng, 2016; Silva et al., 2019; Wolska et al., 2016)
orf6 1256224 plasmid-encoded fimbrial outer membrane protein Orf6 [S. Typhimurium strain LT2]
pefB 1256219 plasmid-encoded fimbrial regulation PefB [S. Typhimurium strain LT2]
pef operon (pef expression) (Peng, 2016; Silva et al., 2019; Wolska et al., 2016)
pefC 1256222 plasmid-encoded fimbrial usher protein PefC [S. Typhimurium strain LT2]
pefD 1256223 plasmid-encoded fimbriae chaperone protein PefD [S. Typhimurium strain LT2]
bapA 66757103 biofilm-associated protein BapA [S. bongori strain N268-08] BapA protein (bacterial aggregation)
(Latasa et al., 2005; Obe et al., 2021)
glyA 1254077 serine hydroxymethyltransferase [S. Typhimurium strain LT2] biofilm regulator (Gerstel and Romling, 2003)
marT 1255283 marT putative transcriptional regulatory protein [S. Typhimurium strain LT2]
biofilm regulator (Eran et al., 2020)
ompR 1255025 two-component system response regulator OmpR [S. Typhimurium strain LT2]
OmpR (biofilm regulator) (Peng, 2016; Solano et al., 2002; Yin et al., 2018)
rpoS 1254447 RNA polymerase sigma factor rpoS [S. Typhimurium strain LT2] RNA polymerase sigma factor S (stress response and biofilm regulator)
(Peng, 2016; Solano et al., 2002; Yin et al., 2018)
seqA 1252217 replication initiation regulator SeqA [S. Typhimurium strain LT2] SeqA protein (biofilm regulator)
(Brown et al., 2001; Kim and Yoon, 2019; Latasa et al., 2005; Uğur et al., 2018; Wolska et al., 2016)
sdiA 1253471 transcriptional regulator SdiA [S. Typhimurium strain LT2] quorum sensing (Wolska et al., 2016)
luxS 1254340 S-ribosyl homocysteine lyase [S. Typhimurium strain LT2] quorum sensing (Wolska et al., 2016)

85
2.5 Biofilm surface test
Vestby and Nesse (2015) published the biofilm surface test to evaluate the bactericidal effect of
antiseptics against Staphylococcus aureus biofilms formed on glass slides using cell scrapers to remove
biofilms. This thesis adapted their method as described here to study Salmonella biofilms formed on
poplar wood coupons, polyvinyl chloride (PVC), stainless steel or screed coupons using two test
methods. The first method quantified biofilms formed on these coupons (Chapter 2, sections 2.5.1-
2.5.5), and the second method evaluated the activity of disinfectants against biofilms formed on these
coupons (Chapter 2, section 2.5.6).
2.5.1 Coupon preparation
2.5.1.1 Poplar wood coupons, polyvinyl chloride (PVC) coupons, and stainless steel coupons
Poplar wood coupons (10 x 20 x 0.6 mm) were sourced from DES-IN-test supply (Stuttgart, Germany).
PVC coupons (10 x 20 x 0.8 mm) and stainless steel coupons (SS304-2B, 10 x 20 x 0.8 mm) were sourced
from Pegen industries Inc. (Ontario, Canada). The PVC coupons and stainless steel coupons were
washed in detergent (10% detergent [Andarta; Arrow Country Supplies Ltd, Shrewsbury, UK]), rinsed
three times in distilled water with agitation for approximately 1 minute, then dried on a paper towel
(Giaouris and Nychas, 2006; Zhao et al., 2011). PVC coupons and stainless steel coupons were
disinfected by submersion in 95% ethanol (v/v) for 10 minutes and left to dry at room temperature
(Giaouris and Nychas, 2006; Ramesh et al., 2002; Zhao et al., 2011). Poplar wood coupons were
sterilised by autoclaving at 121°C for 15 minutes.
2.5.1.2 Screed coupons
Screed coupons (10 mm3) were prepared in-house as per the manufacturer's instructions. In a silicon
ice cube mould, one part (v/v) of Bluecircle Mastercrete cement Jewson (Tarmac Trading Limited,
Birmingham, UK) was mixed with four parts (v/v) of sharp sand (Jewson, Saint-Gobain Building
Distribution Limited, Loughborough, UK) and 1 part (v/v) tap water. Coupons were left to cure at room
temperature (19-24°C) for two days. Coupons were then removed from the ice cube mould and placed

86
in a glass petri dish to continue curing at room temperature for at least eight days (19-24°C). As
Portland cement is highly alkaline with a pH of >11, the following steps were devised to reduce the
surface pH of the screed coupons to a neutral pH and simulate weathering of the cement through
washing. The screed coupons were washed in a dishwasher (Aquastart 6L, Exxcel; Robert Bosch GmbH,
Stuttgart, Germany) using the pre-rinse cycle for 60 minutes, sonicated for 5 minutes in a sonicating
water bath (40KHz Ultrasonic cleaner; Ultracleaner, UK), and washed for a further 90 minutes in the
dishwasher using the pre-rinse cycle, and then rinsed a final time in sterile distilled water. To check
that the pH of the coupon surface was at pH7, as described in ASTM F710-19, a drop of distilled water
was placed on the coupon surface, and after 60±5 seconds, the surface pH was measured using a pH
strip (Johnson pH indicating strips, pH1-14; Scientific Laboratory Supplies Limited, Nottingham, UK).
Screed coupons were disinfected by submersion in 95% ethanol (v/v) for 10 minutes and left to dry at
room temperature (Adetunji and Odetokun, 2012).
2.5.2 Formation of biofilms on coupons
A bacterial suspension of 1 McFarland (approximately 3x10⁸ CFU/ml), determined with a suspension
turbidity meter (Den-1 Densitometer; Biosan, Riga, Latvia), was prepared using a sterile wooden swab
with a cotton tip (TS/9-D; Technical Service Consultants Ltd, Heywood, UK) to inoculate 20ml LB broth
w/o salt with pure Salmonella colonies from 5% SBA plates (Oxoid Limited, Altrincham, UK) cultured
as described in Chapter 2, section 2.1.4. For each of the four coupons (poplar wood, PVC, stainless
steel, and screed), 1.5ml of the bacterial suspension was added to two wells (technical replicates) in a
12-well microplate (Nunc™ flat-bottom 12-well clear polystyrene plates with the Nunclon™ Delta
surface treatment and lid; Scientific Laboratory Supplies Limited, Nottingham, UK). Four wells were
filled with 1.5.ml of sterile LB broth w/o salt as a negative control, and one sterile coupon was placed
in each well, as shown in Figure 2-1. Microplates underwent static, aerobic incubation for 48 hours at
20±1°C. After aerobic incubation, coupons were washed to remove loosely adherent bacteria by

87
dipping each coupon with light agitation three times in 9ml sterile 0.85% physiological saline (saline;
Appendix II, Table 9-2).
Figure 2-1: Layout of coupons in a 12-well microplate for the biofilm surface test. In each well of a 12-well
microplate, coupons were positioned so that only the bottom half of each coupon was submerged in LB broth
w/o salt. The poplar wood coupons (A), stainless steel coupons (C), and PVC coupons (D) were placed on their
longest side, and screed coupons (B) were placed with the top (rough) side down. Biofilms were formed at the
air-liquid interface on the coupons after aerobic incubation at 20±1°C for 48 hours.
2.5.3 Methods for removing biofilms from coupons
After incubation, one of the three methods described below was used to remove biofilms from the
coupons. In each method, the screed coupons were placed in sterile 0.1M PBS (Appendix II, Table 9-
2) instead of sterile saline at each step to buffer the pH increase observed to occur when the screed
coupons were agitated.
2.5.3.1 Vortexing with glass beads method
Biofilms were removed from the coupons by vortexing with glass beads, based on the method
described by Zhao et al. (2011). Each coupon was placed in 5ml sterile saline (or 0.1M PBS for screed
coupons) with 30 glass beads (5mm soda lime glass beads; Z265942; Sigma-Aldrich, Missouri, USA)
and shaken at the lowest speed on a vortex-mixer (Vortex-Genie 2, Scientific Industries Inc., New York,
USA) for 2 minutes before a further 5ml of saline (or 0.1M PBS for screed coupons) was added.
A B C D

88
2.5.3.2 Sonication method
Biofilms were removed from the coupons using sonication as described in EN 16437:2014. Each
coupon was placed in 10ml sterile saline (or 0.1M PBS for screed coupons) and sonicated for 5 minutes
at 0-4°C in a sonicating water bath (40KHz Ultrasonic cleaner; Ultracleaner, UK).
2.5.3.3 Cell scraper method
Biofilms were removed from the coupons using a cell scraper as described by Vestby and Nesse (2015).
Each coupon was scraped with a sterile cell scraper (Falcon 18mm blade cell scraper; Scientific
Laboratory Supplies Limited, Nottingham, UK) until all visible biofilm was removed. The cell scraper
was swirled in 10ml saline (or 0.1M PBS for screed coupons) containing 20 glass beads (3mm soda lime
glass beads, Sigma-Aldrich, Missouri, USA) and vortexed at a shaking speed of 2000rpm for 1 minute
with a vortex (IKA® MS1 Shaker; IKA-Werke, Staugen, Germany).
2.5.4 Enumeration of biofilms
Once biofilms were removed from the coupons, serial dilutions were performed in 9ml sterile saline
(or 0.1M PBS for screed coupons) to 10-6, using the 10ml dilutant (PBS or saline) as dilution 100. From
the 10-4, 10-5, and 10-6 dilutions for the vortexing with glass beads and sonication methods, and the 10-
3, 10-4, and 10-5 dilutions for the cell scraper method, 100µl was spread-plated on 5% SBA plates (Oxoid
Limited, Altrincham, UK) and all plates aerobically incubated overnight at 37±1°C. After incubation,
colonies on the 5% SBA plates were enumerated. The number of bacteria recovered from each coupon
was expressed as log10 CFU/cm2 and calculated as follows: log10 CFU/cm2 =AV
VA × VD × D ×
1
SA
using the average colony count across the two 5% SBA plates (AV); the 0.1ml plated on the 5% SBA
plates (VA); the 10ml dilutant (VD); the serial dilution from which average colony counts were
obtained (D); and the coupon surface area (cm2) including both sides of the coupon as well as the side
areas or all six sides for the cuboid screed coupons (SA). This experiment was performed on three
separate occasions with two technical replicates.

89
2.5.5 Visualization of biofilms
2.5.5.1 Dye staining
As described in Chapter 2, section 2.5.2, Salmonella biofilms were formed on eight poplar wood
coupons, eight screed coupons, 16 PVC coupons, and 16 stainless steel coupons. The three biofilm
removal methods described in Chapter 2, section 2.5.3, were each used to remove biofilms from two
poplar wood coupons, two screed coupons, four PVC coupons and four stainless steel coupons.
Biofilms were not removed from the remaining coupons. After drying at room temperature, for each
biofilm removal method and when biofilms were not removed, biofilms on the coupons underwent
dye staining. Two of each of the PVC coupons and stainless steel coupons were submerged in 1%
crystal violet dye, and two of each of the PVC coupons, stainless coupons, poplar wood coupons and
screed coupons were submerged in 1% TTC dye. All coupons were aerobically incubated at room
temperature for 30 minutes before coupons were washed in saline until all excess dye was removed.
Coupons were dried at room temperature and photographed macroscopically.
2.5.5.2 Scanning electron microscopy (SEM)
As described in Chapter 2, section 2.5.2, Salmonella biofilms were formed in duplicate on poplar wood
coupons, PVC coupons, stainless steel coupons, and screed coupons. Following incubation, coupons
were washed three times with light agitation in 0.1M PBS. Biofilms were removed from one coupon
in each pair using the vortexing with glass beads as described in Chapter 2, section 2.5.3.1, and biofilms
were not removed from the other coupon in the pair. All coupons (samples) were submerged in 0.1M
PBS and sent for SEM imaging. Further sample preparation and SEM imaging were performed by David
Everest and William Cooley of the Pathology Department, APHA (Weybridge, UK). Briefly, the samples
were fixed by submersion in 3% glutaraldehyde and postfixed in 1% osmium tetroxide. Samples were
dehydrated using a graded alcohol series and then dried using hexamethyldisilazane. For SEM imaging,
coupons were secured onto aluminium stubs using double-sided carbon discs.

90
2.5.6 Biofilm surface disinfectant test
Two variations of the biofilm surface disinfectant test were performed as described here. For protocol
one, the test organism was S. Enteritidis isolate 27655R, the disinfectant was a peroxymonosulphate-
based product prepared in WHO hard water at the Defra GO rate (1 part disinfectant to 100 parts
WHO hard water [v/v]), and the disinfectant control was saline. For protocol two, the test organism
was S. 13,23:i:- isolate S03363-15, the disinfectant was a QAC-/glutaraldehyde-based product at Defra
GO rate (1 part disinfectant to 33 parts WHO hard water [v/v]), and the disinfectant control was WHO
hard water.
For disinfectant testing, biofilms of the test organism were formed in duplicate (protocol A) or in
quadruple (protocol B) on poplar wood coupons, PVC coupons, stainless steel coupons, and screed
coupons as described in Chapter 2, section 2.5.2, with the modification of biofilm formed at an
incubation temperature of 25±1°C. Biofilms were then dried at room temperature (aerobically) and
submerged in either 2.5 ml of the disinfectant product or 2.5 ml of the disinfectant control. Coupons
were incubated at 25±1°C for 30 minutes (or 3 hours, protocol B only) before being transferred to
2.5ml of lecithin (Appendix II, Table 9-2) and incubated at room temperature for 5 minutes. Lecithin
was validated, as described in British Standards (BS) 6734:2014, as a suitable neutraliser for these
peroxymonosulphate and QAC-/glutaraldehyde-based disinfectants in the Defra GO test as part of the
Defra disinfectant approvals scheme (Defra, 2021a). Biofilms were removed from the coupons by
vortexing with glass beads as described in Chapter 2, section 2.5.3.1, and bacterial cell enumeration
was performed as described in Chapter 2, section 2.5.4. As defined in BS 6734:2014 and BS EN
1656:2019, disinfectants were considered to be effective against the biofilm if they caused a ≥5-log
reduction in the number of bacteria recovered from the coupon compared to the disinfectant control.
The bactericidal activity of the disinfectant was evaluated after transferring all coupons into 9ml BPW,
and the presence or absence of Salmonella was determined using the method described in Chapter 2,
section 2.1.2.

91
2.6 The biofilm-oriented antiseptics test (BOAT) and biofilm bactericidal test methods
Grønseth et al. (2017) published the Biofilm-oriented antiseptics test (BOAT) and biofilm bactericidal
test methods to evaluate the antibacterial effect of antiseptics against Staphylococcus aureus biofilms.
This thesis adapted their method as described here to evaluate the activity of two disinfectant
products against biofilms of twelve S. 13,23:i:- isolates originating from the environment of broiler
hatchery H1 (detailed in Appendix I, Table 9-1). A bacterial suspension of 0.5 McFarland
(approximately 1.5x10⁸ CFU/ml), determined with a suspension turbidity meter (Den-1 Densitometer;
Biosan, Riga, Latvia), was prepared using a sterile wooden swab with a cotton tip (TS/9-D; Technical
Service Consultants Ltd, Heywood, UK) to inoculate 10ml LB broth w/o salt with pure Salmonella
colonies from 5% SBA plates (Oxoid Limited, Altrincham, UK) cultured as described in Chapter 2,
section 2.1.4. For each isolate, six wells of a 96-well microplate were filled with 200µl of the bacterial
suspension. Wells containing only sterile LB broth w/o salt were used as negative controls. Microplates
were prepared in quintuplet and aerobically incubated at 25±1°C for 48 hours. Following aerobic
incubation, the excess broth was removed from the microplates by pipetting, wells were washed once
with 220µl saline, and the microplates dried at room temperature, aerobically for 30 minutes. To each
microplate, 220µl of one of the following five products was added and the microplate incubated at
25±1°C for 30 minutes: WHO hard water control (Appendix II, Table 9-2); a benzalkonium chloride
(BZK)-based disinfectant at general usage concentration (1 part disinfectant to 100 parts WHO hard
water [v/v]), and at Defra GO rate (1 part disinfectant to 10 parts WHO hard water [v/v]); a QAC/-
glutaraldehyde-based disinfectant at Defra DoP rate (1 part disinfectant to 60 parts WHO hard water
[v/v]), and at Defra GO rate (1 part disinfectant to 30 parts WHO hard water [v/v]). Following aerobic
incubation, the product was removed from the microplate by pipetting. Any remaining disinfectant
was neutralized by adding 220µl of lecithin (Appendix II, Table 9-2) to all wells in the microplate,
aerobically incubated at room temperature for 5 minutes, then removed from the microplate by
pipetting. Lecithin was validated, as described BS 6734:2014, as a suitable neutraliser for these BZK-

92
based and QAC-/glutaraldehyde-based disinfectants in the Defra GO test as part of the Defra
disinfectant approvals scheme (Defra, 2021a).
In each microplate, the presence of metabolically active bacteria after exposure to one of the five
products was determined by adding 200µL of a 1% TTC/LB broth solution in the ratio of 1:20 (v/v) to
three of the six replicate wells for each isolate. All microplates were aerobically incubated, in the dark,
at 37±1 °C for 24 hours. Following aerobic incubation, for each microplate, absorbance was measured
at OD490 using a microplate reader (Infinite® M Nano, Tecan Austria GmbH, Grödig, Austria) to quantify
the reduction of TTC to formazan by metabolically active bacteria. For each biological replicate, the
median OD490 of the WHO hard water control was calculated. For each isolate, with each disinfectant
product considered separately, the percentage reduction in metabolic activity (OD490) was calculated
as follows; for each technical replicate, the OD490 value of the isolate was subtracted from the median
OD490 of the WHO hard water control for the corresponding biological replicate and converted to a
percentage with negative percentages corrected to zero.
In each microplate, the bactericidal activity of each of the five products was determined by adding
200µL of sterile LB broth to the other three replicate wells for each isolate. All microplates were
aerobically incubated, in the dark, at 37±1°C for 24 hours. From each well containing only LB broth,
5µl was spot plated onto 5% SBA plates (Oxoid Limited, Altrincham, UK) and incubated at 37±1°C for
24 hours. After incubation, the results were evaluated visually based on the presence (positive) or
absence (negative) of Salmonella colonies on the 5% SBA plates. This experiment was performed on
three separate occasions with two technical replicates.
The activity of the disinfectant against Salmonella biofilms was classified into four groups: bactericidal,
not bactericidal as VBNC bacteria present, bacteriostatic, or no activity. These classifications were
based on the percentage reduction in metabolic activity (OD490) caused by the disinfectant in the BOAT
method and a positive or negative result in the biofilm bactericidal test method; see Table 2-6.

93
Table 2-6. Classification of disinfectant activity in the BOAT and biofilm bactericidal test methods. The BOAT
result is the percentage reduction in metabolic activity (OD490) for the disinfectant compared to the WHO hard
water control. The biofilm bactericidal test result is the presence or absence of Salmonella growth on 5% SBA
plates after 24 hours of aerobic incubation in LB broth at 37±1°C.
Disinfectant Activity
BOAT result Biofilm bactericidal test result
Reduction in metabolic activity
Metabolically active bacteria recovered after 24 hours
Growth on 5% SBA plates
Bactericidal effect
no activity 0% reduction yes yes not bactericidal
bacteriostatic 0 ≥ % reduction ≤ 100 yes yes not bactericidal
not bactericidal (VBNC bacteria)
100% reduction no yes not bactericidal
bactericidal 100% reduction no no bactericidal
2.7 Poultry drinking water system (DWS) model
2.7.1 Evaluation of planktonic growth and biofilm-forming ability at different inocula concentrations
The biofilm-forming ability and planktonic growth of the Salmonella isolate S03467-16 (a field isolate
of the Salmovac® 440 vaccine strain) at four different inocula concentrations was determined by
forming biofilms on PVC coupons and stainless steel coupons using a modified version of the method
described by Maes et al. (2020). A bacterial suspension of 0.5 McFarland (approximately 1.5x10⁸
CFU/ml), determined with a suspension turbidity meter (Den-1 Densitometer; Biosan, Riga, Latvia),
was prepared using a wooden swab with a cotton tip (TS/9-D; Technical Service Consultants Ltd,
Heywood, UK) to inoculate M9 minimal broth (Appendix II, Table 9-2) with pure colonies of isolate
S03467-16 from a 5% SBA plate (Oxoid Limited, Altrincham, UK) cultured as described in Chapter 2,
section 2.1.4. Serial dilutions from the 0.5 McFarland bacterial suspension were prepared in M9
minimal broth (Appendix II, Table 9-2) down to approximately 102 CFU/ml. Each of the 102 CFU/ml
(log102), 103 CFU/ml (log103), 104 CFU/ml (log104) and 106 CFU/ml (log106) dilutions were inoculated at
a ratio of 1:20 (v/v) into WHO hard water (Appendix II, Table 9-2) supplemented with histidine
(20µg/ml) and adenine (20µg/ml) to prepare the bacterial inocula. In triplicate, PVC coupons and
stainless steel coupons were fully submerged in separate universals containing 2ml of each of the four
bacterial inocula and aerobically incubated at room temperature, shaking at 50rpm, for four days.
After incubation, biofilms were removed from the coupons using sonication as described in section

94
Chapter 2, section 2.5.3.2, and bacterial cell enumeration was performed as described in Chapter 2,
section 2.5.4. This experiment was performed on three separate occasions with two technical
replicates.
2.7.2 Preparation of the bacterial inoculum for the poultry drinking water system (DWS) model
For the poultry DWS, the bacterial inoculum containing 103 CFU/ml of Salmonella isolate S03467-16
in a low nutrient broth was prepared. A bacterial suspension of 0.5 McFarland (approximately 1.5x10⁸
CFU/ml), determined with a suspension turbidity meter (Den-1 Densitometer; Biosan, Riga, Latvia),
was prepared using a sterile wooden swab with a cotton tip (TS/9-D; Technical Service Consultants
Ltd, Heywood, UK) to inoculate 10ml of M9 minimal broth (Appendix II, Table 9-2) with pure colonies
of isolate S03467-16 from a 5% SBA plate (Oxoid Limited, Altrincham, UK) cultured as described in
Chapter 2, section 2.1.4. 1ml of the 0.5 McFarland bacterial suspension was diluted in 100ml M9
minimal media to give a 106 CFU/ml suspension, 1ml was then diluted in 100ml M9 minimal media to
make a 104 CFU/ml, suspension and then 5ml was taken and diluted in 50ml to make a 103 CFU/ml
suspension. Then 25ml of this 103 CFU/ml suspension was added to 500ml of WHO hard water
supplemented with histidine (20µg/ml) and adenine (20µg/ml).
2.7.3 Set up of the poultry drinking water system (DWS) model
The DWS model was constructed with most components sourced from Lubing UK & Ireland Ltd
(Ormskirk, UK), a major supplier of commercial poultry drinking systems, with PVC coupons and
stainless steel coupons also placed with the system to aid sampling. The PVC coupons were placed at
either end of the drinker pipe, one stainless steel coupon was placed in the tap connected to the spring
breather, and another stainless coupon was placed in each of the square bottles under the drinker
nipples.
The DWS photographed in Figure 2-2 was inoculated with simulated contaminated water prepared as
described in Chapter 2, section 2.7.2. Briefly, this was a low nutrient broth (1 part M9 minimal broth

95
to 20 parts WHO hard water, supplemented with histidine [20µg/ml)] and adenine [20µg/ml]) to allow
replication of the auxotrophic vaccine), containing 103 CFU/ml of the S. Enteritidis isolate S03467-16.
As briefly shown in the annotated photograph in Figure 2-2 and the flow diagram in Figure 2-3, the
DWS was run as a closed continuous flow system starting from the inoculum Duran flask into the
pressure regulator at a flow rate of approximately 1.5 to 2.5ml/min. Water dripped from each drinker
nipple into the square bottles and was recirculated back to the Duran. The system was run for four
days at room temperature (19.8°C to 25.2°C) to allow biofilms to form with the system.
After four days, the DWS was drained into a waste Duran, and each drinker nipple unscrewed using a
sterile dual nipple key (LA systems Limited, Derby, UK). The stainless steel coupons were removed
from the square bottles and from inside the tap using sterile tweezers. Biofilms were removed from
the drinker nipples and the stainless coupons using sonication as described in Chapter 2.5.3.2, and
CFU counts performed as described in 2.5.4. It was not possible to remove the PVC coupons from
either end of the drinker pipe as they had become stuck to the bottom of the PVC drinker pipe.
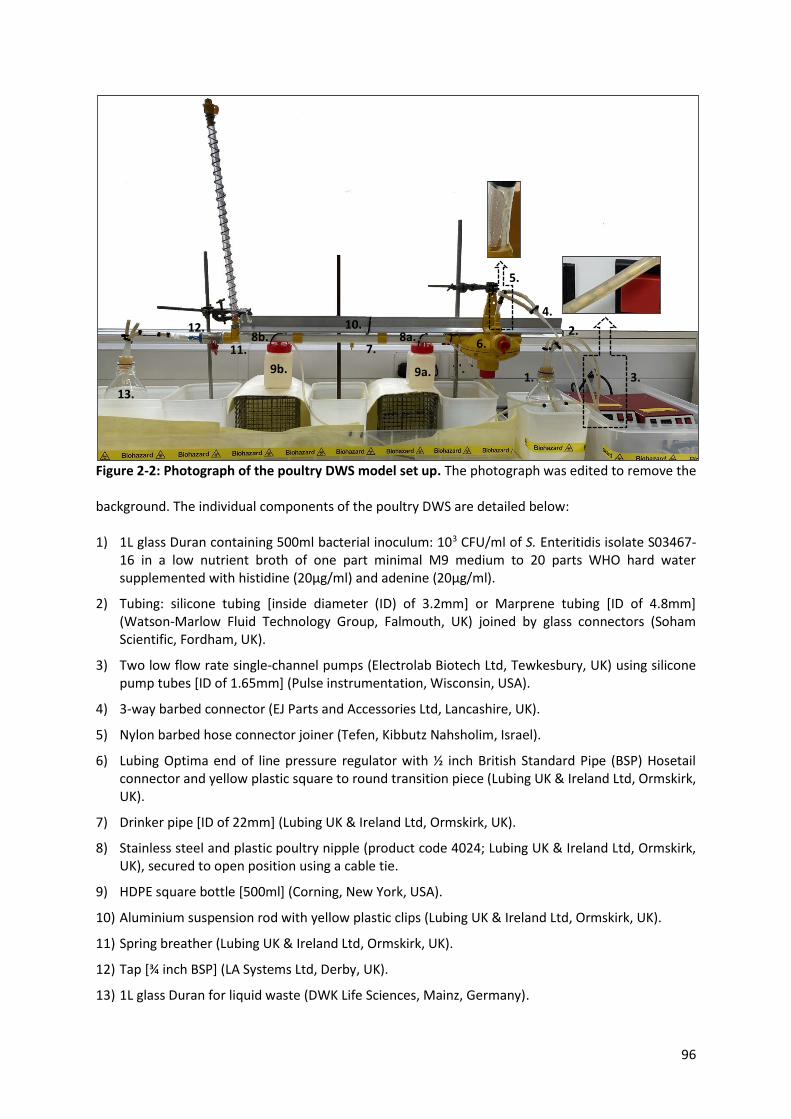
96
Figure 2-2: Photograph of the poultry DWS model set up. The photograph was edited to remove the
background. The individual components of the poultry DWS are detailed below:
1) 1L glass Duran containing 500ml bacterial inoculum: 103 CFU/ml of S. Enteritidis isolate S03467-16 in a low nutrient broth of one part minimal M9 medium to 20 parts WHO hard water supplemented with histidine (20µg/ml) and adenine (20µg/ml).
2) Tubing: silicone tubing [inside diameter (ID) of 3.2mm] or Marprene tubing [ID of 4.8mm] (Watson-Marlow Fluid Technology Group, Falmouth, UK) joined by glass connectors (Soham Scientific, Fordham, UK).
3) Two low flow rate single-channel pumps (Electrolab Biotech Ltd, Tewkesbury, UK) using silicone pump tubes [ID of 1.65mm] (Pulse instrumentation, Wisconsin, USA).
4) 3-way barbed connector (EJ Parts and Accessories Ltd, Lancashire, UK).
5) Nylon barbed hose connector joiner (Tefen, Kibbutz Nahsholim, Israel).
6) Lubing Optima end of line pressure regulator with ½ inch British Standard Pipe (BSP) Hosetail connector and yellow plastic square to round transition piece (Lubing UK & Ireland Ltd, Ormskirk, UK).
7) Drinker pipe [ID of 22mm] (Lubing UK & Ireland Ltd, Ormskirk, UK).
8) Stainless steel and plastic poultry nipple (product code 4024; Lubing UK & Ireland Ltd, Ormskirk, UK), secured to open position using a cable tie.
9) HDPE square bottle [500ml] (Corning, New York, USA).
10) Aluminium suspension rod with yellow plastic clips (Lubing UK & Ireland Ltd, Ormskirk, UK).
11) Spring breather (Lubing UK & Ireland Ltd, Ormskirk, UK).
12) Tap [¾ inch BSP] (LA Systems Ltd, Derby, UK).
13) 1L glass Duran for liquid waste (DWK Life Sciences, Mainz, Germany).
1.
2.
7.
5.
4.
3. 9a.
8a. 6.
8b. 10.
9b.
11.
12.
13.

97
Figure 2-3: Flow diagram of the poultry DWS set up. Square boxes show the components of the DWS,
with sampling points indicated by grey boxes. Blue arrows show the direction of water flow.
Salmonella inoculum
103 CFU/ml
presistalic pump
pressure regulator
drinker pipe
2x drinker nipples
HDPE square bottles
+ stainless steel coupons
drinker pipe
end-air outlet
+ stainless steel coupons
2x
per
ista
ltic
pu
mp
s

98
2.10 Data analysis and statistics
Figures (dot plots, boxplots, heatmaps and scatterplots) were created in RStudio v1.3.1073 (RStudio
Team, 2020) using the packages: ggplot2 v3.3.5 (Wickham, 2016), scales v1.1.1 (Wickham and Seidel,
2020), gridExtra v2.3 (Auguie, 2017), and lemon v0.4.5 (Edwards, 2020).
All statistical tests were performed in R (R Core Team, 2020) using the packages: Dunn.test v1.3.5
(Dinno, 2017), FSA v0.9.1 (Ogle et al., 2021), rcompanion v2.4.1 (Mangiafico, 2021), and dplyr v1.0.7
(Wickham et al., 2021). For statistical analysis, unless otherwise specified, all datasets were analysed
using non-parametric tests with p-values <0.05 considered significant. Non-parametric tests were
used either due to small sample sizes where the distribution of the data could not be validated or due
to failure of normality testing using the Shapiro-Wilks test using the ggpubr package v0.4.0
(Kassambara, 2020).
The Kruskal-Wallis test with post hoc Dunn’s test with Bonferroni correction (where significant
differences were present) was used to analyse differences in the following datasets. Firstly, differences
in biofilm formation, represented by OD570 values, between primary production environments
(Chapter 3, section 3.2.2), surface material/sample type (Chapter 3, section 3.2.2.1), Salmonella
serovar (Chapter 4, section 4.2.1), colony morphology on LB w/o salt agar plates containing CR and
Coomassie brilliant blue (Chapter 4, section 4.2.3.1.1) and colony morphology on CFA agar plates
containing CR (Chapter 4, section 4.2.3.2.1), with each incubation temperature (20±1°C and 25±1°C)
considered separately. Secondly, differences in growth kinetics parameter values between Salmonella
serovars (Chapter 4, section 4.2.5). Thirdly, differences in log10 CFU counts from Salmonella biofilms
formed on coupons using different biofilm removal methods (Chapter 6, section 6.2.1.1), after
exposure to a potassium peroxymonosulphate-based disinfectant (Chapter 6, section 6.2.1.2), and
after exposure to a QAC-/glutaraldehyde-based disinfectant for a 30-minute and 3-hour contact time
(Chapter 6, section 6.2.2.2). Fourthly, differences in metabolic activity, represented by OD490, by
Salmonella in a biofilm, after exposure to different products (Chapter 6, section 6.2.2.1). Lastly,

99
differences in planktonic growth (Chapter 7, section 7.2.1.1) and biofilm formation (Chapter 7, section
7.2.1.2) by Salmonella, represented by log10 CFU counts, between different inocula concentrations.
The Mann-Whitney U test was used to perform a pairwise comparison between groups in the
following datasets. Firstly, differences in biofilm formation, represented by OD570 values, between
MDR and non-MDR isolates (Chapter 4, section 4.2.4.1); between two incubation temperatures
(20±1°C and 25±1°C) with each group in the following datasets considered separately: primary
production environments (Chapter 3, section 3.2.2), incubation length (Chapter 3, section 3.2.3.2) and
Salmonella serovar (Chapter 4, section 4.2.1); and between incubation lengths (48-hour and 72-hour)
with each incubation temperature considered separately (Chapter 3, section 3.2.3.1). Secondly, log10
CFU counts from Salmonella biofilms after exposure to a QAC-/glutaraldehyde-based disinfectant
between a 30-minute and 3-hour contact time (Chapter 6, section 6.2.2.2). Lastly, biofilm formation,
represented by log10 CFU counts, by Salmonella between PVC coupons and stainless steel coupons,
with different inocula concentrations considered separately (Chapter 7, section 7.2.1.2).
The Spearman's rank correlation test was used to analyse the correlation between biofilm formation,
represented by OD570 values, and growth kinetics parameters (Chapter 4, section 4.2.5.1), and the
upper and lower ambient environmental temperatures (Chapter 3, section 3.2.2.2) with each
incubation temperature considered separately.
To evaluate the association between phenotype-genotype for antimicrobial resistance in Chapter 5,
section 5.2.5, the positive predictive value (PPV), negative predictive value (NPV), sensitivity and
specificity were calculated in R (R Core Team, 2020) using the package reportROC v3.5 (Du and Hao,
2020).

100
Chapter 3 Quantitative assessment of the biofilm-forming ability of environmental Salmonella
isolates
3.1 Introduction
Salmonella remains the second most commonly reported zoonosis in the EU in 2019, with
contaminated pork and poultry food products being the primary sources of human infection (EFSA
and ECDC, 2021a). The lifecycle of Salmonella involves colonisation of host species, including humans
and food-production animals such as pigs and poultry, and is mediated in most cases by varying
periods of survival outside the host. Salmonella has developed mechanisms, such as biofilm formation,
to aid its survival and persistence in the host and the environment, with Salmonella in the environment
acting as a reservoir for infection of poultry flocks, eggs, pig herds, or re-contamination of feed after
heat treatment (Carrascosa et al., 2021; Davies and Breslin, 2003; García-Soto et al., 2020; González-
Rivas et al., 2018; Gradel et al., 2005; Lamas et al., 2018; Milanov et al., 2017; Prunic et al., 2017; Rose
et al., 2000; Wray, Davies and Evans, 1999).
Recent critical reviews, such as those by Carrascosa et al. (2021), Merino et al. (2019), Chlebicz and
Slizewska (2018), and Lamas et al. (2018) report that the mechanisms of Salmonella biofilm formation
have been widely investigated, with in vitro biofilm formation commonly studied using the crystal
violet microplate assay, first described by Christensen et al. (1985). Environmental conditions, such as
those encountered in pig and poultry production or farm environments, influence bacterial growth,
survival, and biofilm formation and include temperature, pH, nutrient availability, competition by
other microorganisms, and the type of attachment surface (Agarwal et al., 2011; De Oliveira et al.,
2014; Steenackers et al., 2012).
Research on Salmonella biofilm formation have focused on the clinically-relevant Salmonella serovars
in humans such as S. Enteritidis and S. Typhimurium, often of human or animal origin with biofilm
formation studied at temperatures of 37°C (Borges et al., 2018; Ćwiek et al., 2020; De Oliveira et al.,
2014; Diez-Garcia, Capita and Alonso-Calleja, 2012; Farahani et al., 2018; Silva et al., 2019; Wang et

101
al., 2017; Yin et al., 2018). Although there are other studies describing the biofilm-forming ability of
Salmonella of environmental origin, including by other serovars, at environmentally relevant
temperatures these studies are mainly focused on Salmonella sourced from poultry farms (Marin,
Hernandiz and Lainez, 2009; Pande, McWhorter and Chousalkar, 2016; Schonewille et al., 2012), feed
mills outside of GB (Vestby et al., 2009b), and abattoirs (Piras et al., 2015).
Therefore, this chapter first focuses on the evaluation of the in vitro biofilm-forming ability of
Salmonella originating from the environments of commercial poultry or pig primary production
premises in GB and covering in this instance: animal-feed mills, hatcheries, laying hen farms, broiler
farms, fattening turkey farms, duck (meat, breeder, and egg production) farms, and pig farms.
Secondly, this chapter will investigate how in vitro biofilm formation is influenced by culture
conditions (incubation temperature and incubation length) in the crystal violet microplate assay and
the environmental conditions from which isolates originated (type of primary production
environment, ambient environmental temperature, and surface material/sample type). The aims and
objectives of this chapter were:
▪ To use the crystal violet microplate assay to quantitively assess biofilm-forming ability after
aerobic incubation for 48 hours at environmental temperatures of 20±1°C and 25±1°C for a panel
of 134 Salmonella isolates (132 environmental Salmonella isolates and two biofilm control
isolates).
▪ To investigate the influence of two culture conditions (incubation temperature and incubation
length) on the in vitro biofilm-forming ability of the 132 Salmonella environmental isolates.
▪ To investigate the relationship between in vitro biofilm-forming ability and the environmental
conditions from which isolates were collected (type of primary production environment, ambient
environmental temperature, and surface material/sample type) for the 132 Salmonella
environmental isolates.

102
3.2 Results
3.2.1 In vitro biofilm-forming ability of Salmonella isolates
The in vitro biofilm-forming abilities of 134 Salmonella at two temperatures (20±1°C and 25±1°C) was
evaluated using the crystal violet microplate assay using the method described in Chapter 2, section
2.2.1. Overall, after aerobic incubation for 48 hours, 130 (98.5%) of the 132 environmental Salmonella
isolates formed biofilms. Of the 130 biofilm producers, 125 isolates (96.2%) produced a biofilm at both
incubation temperatures (20±1°C and 25±1°C), while five isolates (3.8%) only produced a biofilm at
one of the two incubation temperatures. At both incubation temperatures, the biofilm control isolates
27655R and 27655S were strong and weak biofilm producers, respectively, and were not included in
any further analysis in this chapter; see Appendix III, Table 9-3.
3.2.1.1 Salmonella isolated from animal-feed producing mills
The eight Salmonella isolates, recovered from dust that had escaped from feed milling equipment in
persistently contaminated mills, showed a range of biofilm-forming abilities. The one S. Montevideo
isolate (L02647-16) was classified as a moderate biofilm producer at both temperatures (20±1°C and
25±1°C). The S. Ohio and three S. Mbandaka isolates were strong biofilm producers, except S02945-
16 (S. Mbandaka) a moderate biofilm producer after aerobic incubation at 20±1°C. Two (S03311-17
and S03312-17) of the three S. Kedougou isolates were non-biofilm producers after incubation at
20±1°C but were moderate biofilm producers after incubation at 25±1°C, while isolate S01618-17 was
a strong biofilm producer at both incubation temperatures; see Figure 3-1.

103
Figure 3-1: Biofilm-forming ability of Salmonella collected from the environment of GB feed mills. Heatmap
showing biofilm formation in the crystal violet microplate assay after aerobic incubation for 48 hours at 20±1°C
or 25±1°C. Salmonella isolates are grouped by serovar; SM = S. Montevideo, SO = S. Ohio. The experiment was
performed on three separate occasions with two technical replicates.
3.2.1.2 Salmonella isolated from indoor/outdoor pig farms
Twenty-eight Salmonella isolates originating from the general pig farm environment (voided faeces or
farm equipment) showed a range of biofilm-forming abilities. The one S. Reading isolate was a strong
biofilm producer after aerobic incubation at both temperatures (20±1°C and 25±1°C). Of the 26 S.
Typhimurium/monophasic S. Typhimurium definitive phage type 193 (DT193) isolates, 24 isolates
(92.3%) were either moderate or strong biofilm producers at both incubation temperatures, including
the four isolates (L04571-15, L04573-15, L04576-15, L04578-15) isolated from pig pens after C&D.
While isolate L03379-15 (S. Typhimurium DT193) was moderate biofilm producer at 20±1°C but a weak
biofilm producer at 25±1°C, and isolate S05273-18 (S. Typhimurium DT193) did not produce a biofilm
at either temperature. The one S. Typhimurium DT41 isolate was a weak biofilm producer at both
incubation temperatures; see Figure 3-2.
3.2.1.3 Salmonella isolated from chicken/turkey hatcheries
The 28 Salmonella isolates originating from the hatchery environment (egg handling, chick processing,
or waste areas), including from cleaning equipment, showed a range of biofilm-forming abilities. All
five S. Enteritidis isolates and 16 (80%) of the 20 S. 13,23:i:- isolates were strong biofilm producers
after aerobic incubation at both temperatures (20±1°C and 25±1°C); while two S. 13,23:i:- isolates
(S03467-18 and S02592-15) were strong biofilm producers at one temperature and moderate biofilm

104
producers at the other temperature. The remaining two S. 13,23:i:- isolates (S02757-17 and S02769-
17) were moderate biofilm producers at 25±1°C but only weak biofilm producers at 20±1°C. None of
the three S. Senftenberg isolates produced a biofilm at 25±1°C. S. Senftenberg isolate L01508-17 also
did not produce a biofilm at 20±1°C, while isolates L01515-17 and L01512-17 were moderate and weak
biofilm producers, respectively; see Figure 3-3.

105
Figure 3-2: Biofilm-forming ability of Salmonella collected from the environment of GB pig farms. Heatmap showing biofilm formation in the crystal violet microplate assay
after aerobic incubation for 48 hours at 20±1°C or 25±1°C. Salmonella isolates are grouped by serovar, then phage type; SR = S. Reading, ST = S. Typhimurium. The experiment
was performed on three separate occasions with two technical replicates.
Figure 3-3: Biofilm-forming ability of Salmonella collected from the environment of GB hatcheries. Heatmap showing biofilm formation in the crystal violet microplate
assay after aerobic incubation for 48 hours at 20±1°C or 25±1°C. Salmonella isolates are grouped by serovar, then phage type; SE = S. Enteritidis, RDNC = reacts but does not
conform to a recognised phage type, NOPT = sample has a natural phage infection. The experiment was performed on three separate occasions with two technical replicates

106
3.2.1.4 Salmonella isolated from egg-producing farms
All four S. Typhimurium, two S. Bovismorbificans and two S. Enteritidis isolates originating from litter
in occupied breeding duck or laying duck houses were either moderate or strong biofilm producers at
both incubation temperatures (20±1°C and 25±1°C). The same trend was observed for the two S.
Infantis isolates and the two field isolates of the Salmovac® 440 vaccine strain (S03463-16 and S03467-
16) sourced from the general laying hen farm environment including from farm equipment; see Figure
3-4.
Figure 3-4: Biofilm-forming ability of Salmonella collected from the environment of GB breeder duck, layer
duck, and layer hen farms. Heatmap showing biofilm formation in the crystal violet microplate assay after
aerobic incubation for 48 hours at 20±1°C or 25±1°C. Salmonella isolates are grouped by serovar, then phage
type; SB = S. Bovismorbificans, Field isolate of the Salmovac® 440 vaccine strain (*). The experiment was
performed on three separate occasions with two technical replicates.
3.2.1.5 Poultry meat-producing farms
Salmonella isolates sourced from the environment (inside and outside of poultry houses) of three
types of poultry-meat producing farm environments showed varying biofilm-forming abilities. From
broiler farms, one isolate (S03726-16, S. Infantis) was a weak and moderate biofilm producer after
aerobic incubation at 20±1°C and 25±1°C. While the other 30 Salmonella isolates (covering the
serovars S. 4,12:d:-, S. Infantis, S. Ohio, S. Enteritidis, S. Senftenberg, and S. Typhimurium) were either
moderate or strong biofilm producers at both temperatures; see Figure 3-5A. From meat duck farms,
the two monophasic S. Typhimurium DT193 isolates, and the two S. Indiana isolates were either
moderate or strong biofilm producers at both temperatures. While, the nine S. Typhimurium

107
DT41/DT41b isolates were moderate biofilm producers at 25±1°C, but only weak biofilm producers at
20±1°C apart from two isolates (S05645-12 and S04920-14) which were moderate and non-biofilm
producers, respectively; see Figure 3-5B. For fattening turkey farms, all 12 Salmonella isolates
(covering the serovars S. Enteritidis, S. Typhimurium, and S. Kedougou) were strong biofilm producers
at both incubation temperatures, except for isolate S02455-17 (S. Enteritidis PT13a), which was a
moderate biofilm producer at 25±1°C; see Figure 3-5C.

108
Figure 3-5: Biofilm-forming ability of Salmonella collected from the environment of GB poultry-meat producing farms. Heatmaps (A = broiler farms, B = meat duck farms,
C = fattening turkey farms) showing biofilm formation in the crystal violet microplate assay after aerobic incubation for 48 hours at 20±1°C or 25±1°C. Salmonella isolates are
grouped by serovar, then phage type; SE = S. Enteritidis, ST = S. Typhimurium, SS = S. Senftenberg, SK = S. Kedougou, RDNC = reacts but does not conform to a recognised
phage type, NOPT = sample has a natural phage infection. The experiment was performed on three separate occasions with two technical replicates.
A
B C

109
3.2.2 Relationship between the environmental conditions of the originating primary production
environment and in vitro biofilm formation
Significant differences (Kruskal-Wallis test, p-value<0.05) in biofilm formation, represented by OD570,
were found between Salmonella isolates originating from each of eight types of primary production
environment. After aerobic incubation for 48 hours at 20±1°C, isolates originating from fattening
turkey farms and hatcheries produced significantly (Kruskal-Wallis test with post hoc Dunn’s test, p-
value<0.05) more biofilm than isolates originating from the broiler chicken, meat duck, and pig farms,
see Figure 3-6A. A similar trend was observed after aerobic incubation at 25±1°C with isolates
originating from fattening turkey farms producing significantly (Kruskal-Wallis test with post hoc
Dunn’s test, p-value<0.05) more biofilm than isolates originating from broiler farms and meat duck
farms; see Figure 3-6B. Isolates from hatcheries, meat duck farms, and pig farms produced significantly
(Mann-Whitney U test, p-value<0.05) different quantities of biofilm after aerobic incubation at 20±1°C
and 25±1°C, While no significant difference (Mann-Whitney U test) in biofilm formation between the
two incubation temperatures was found for broiler farms (p-value=0.632), fattening turkey farms (p-
value=0.470), feed mills (p-value=0.875), layer/breeding duck farm (p-value=0.130), or laying hen
farms (p-value=0.686).

110
Figure 3-6: Comparative biofilm formation by Salmonella collected from eight pig and poultry primary production environments. Boxplot showing of biofilm formation,
represented by OD570, by 132 Salmonella isolates (n = the number of isolates collected from each production environment) in the crystal violet microplate assay after 48
hours of aerobic incubation at 20±1°C (A) or 25±1°C (B). With each incubation temperature considered separately, significant differences (Kruskal-Wallis test with post hoc
Dunn’s test, p-value<0.05) in biofilm formation between production environments are labelled with different letters. The experiment was performed on three separate
occasions with two technical replicates.
b a
ab
a
ab ab
b
b
A
B
ab
b
b
ab
ab
ab
ab
a

111
3.2.2.1 Relationship between source surface material/sample type and biofilm formation
In vitro biofilm production did not differ significantly (Kruskal-Wallis test; 20±1°C: p-value=0.068;
25±1°C: p-value=0.179) between Salmonella isolates collected from each of seven types of surface
materials/sample types in the primary production environment, see Figure 3-7.
Figure 3-7: Comparative biofilm formation by Salmonella collected from seven surface materials/sample
types. Boxplot showing biofilm formation, represented by OD570, by 132 Salmonella isolates (n = the number of
isolates collected from each surface material/sample type) in the crystal violet microplate assay after 48 hours
of aerobic incubation at 20±1°C or 25±1°C. The experiment was performed on three separate occasions with
two technical replicates.
3.2.2.2 Relationship between ambient environmental temperature and biofilm formation
A weak negative correlation was identified between the upper ambient temperature in the primary
production environment at the time of isolate collection, and biofilm formation in the crystal violet
microplate assay (Spearman's rank correlation test; incubation at 20±1°C, p-value=0.011; incubation
at 25±1°C, p-value=0.004). In comparison, no significant association was found between the lower
ambient temperature and biofilm formation at either incubation temperature (Spearman's rank
correlation test; incubation at 20±1°C, p-value=0.247; incubation at 25±1°C, p-value=0.981); see
Figure 3-8.
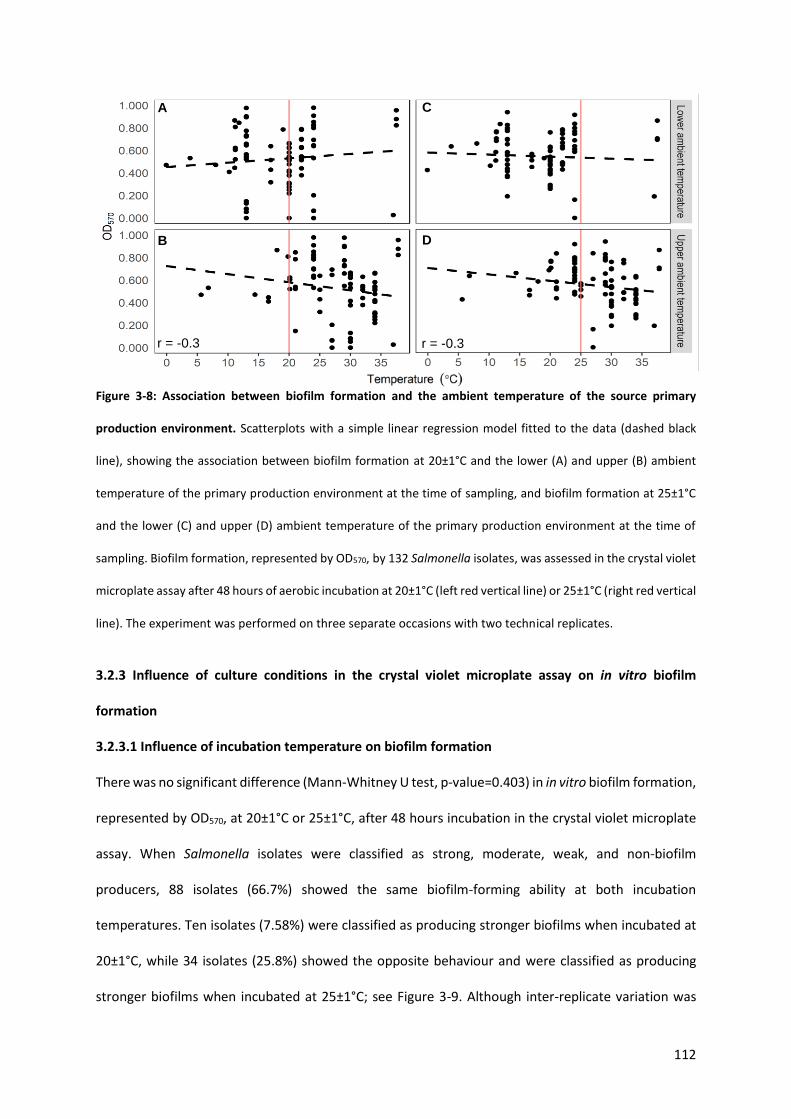
112
Figure 3-8: Association between biofilm formation and the ambient temperature of the source primary
production environment. Scatterplots with a simple linear regression model fitted to the data (dashed black
line), showing the association between biofilm formation at 20±1°C and the lower (A) and upper (B) ambient
temperature of the primary production environment at the time of sampling, and biofilm formation at 25±1°C
and the lower (C) and upper (D) ambient temperature of the primary production environment at the time of
sampling. Biofilm formation, represented by OD570, by 132 Salmonella isolates, was assessed in the crystal violet
microplate assay after 48 hours of aerobic incubation at 20±1°C (left red vertical line) or 25±1°C (right red vertical
line). The experiment was performed on three separate occasions with two technical replicates.
3.2.3 Influence of culture conditions in the crystal violet microplate assay on in vitro biofilm
formation
3.2.3.1 Influence of incubation temperature on biofilm formation
There was no significant difference (Mann-Whitney U test, p-value=0.403) in in vitro biofilm formation,
represented by OD570, at 20±1°C or 25±1°C, after 48 hours incubation in the crystal violet microplate
assay. When Salmonella isolates were classified as strong, moderate, weak, and non-biofilm
producers, 88 isolates (66.7%) showed the same biofilm-forming ability at both incubation
temperatures. Ten isolates (7.58%) were classified as producing stronger biofilms when incubated at
20±1°C, while 34 isolates (25.8%) showed the opposite behaviour and were classified as producing
stronger biofilms when incubated at 25±1°C; see Figure 3-9. Although inter-replicate variation was
B
A C
D
r = -0.3 r = -0.3

113
observed in the crystal violet assay, these trends in biofilm-forming ability generally remained
consistent between biological replicates.
Overall, at the 20±1°C incubation temperature, of the 132 Salmonella isolates, 70 isolates (53.0%)
were classified as strong biofilm producers, 44 isolates (33.3%) as moderate biofilm producers, 13
isolates (9.8%) as weak biofilm producers, and five isolates (3.8%) did not produce a biofilm.
Corresponding values after aerobic incubation at 25±1°C were 82 isolates (62.1%), 45 isolates (34.1%),
one isolate (0.8%), and four isolates (3.0%). Five isolates (S03311-17, S03312-17 [S. Kedougou];
S04920-14 [S. Typhimurium]; L01512-17, L01515-17 [S. Senftenberg]) only produced a biofilm at one
of the two incubation temperatures. Two isolates (L01508-17 [S. Senftenberg] and S05273-18 [S.
Typhimurium] did not form biofilms; see Figure 3-10.
3.2.3.2 Influence of incubation length on biofilm formation
Overall, about half (67 isolates, 50.8%) of the 132 Salmonella isolates (20±1°C: 79 isolates, 59.8%;
25±1°C: 97 isolates, 73.5%) showed no change in biofilm-forming ability after aerobic incubation for
48 hours or 72 hours, with 62 isolates (47.0%) classified as strong biofilm producers at both incubation
temperatures; see Figure 3-10. Although, after aerobic incubation at 25±1°C, biofilm formation,
represented by OD570, increased significantly (Mann-Whitney U test, p-value<0.05) when the
incubation duration was increased from 48 hours to 72 hours, no significant change (Mann-Whitney
U test, p-value=0.439) in biofilm formation was found after aerobic incubation at 20±1°C; see Figure
3-9. Although not included in the analysis here, the biofilm-forming ability of the biofilm control
isolates 27655R and 27655S did not change after incubation for 72 hours, remaining strong and weak
biofilm producers, respectively; see Appendix III, Table 9-3.
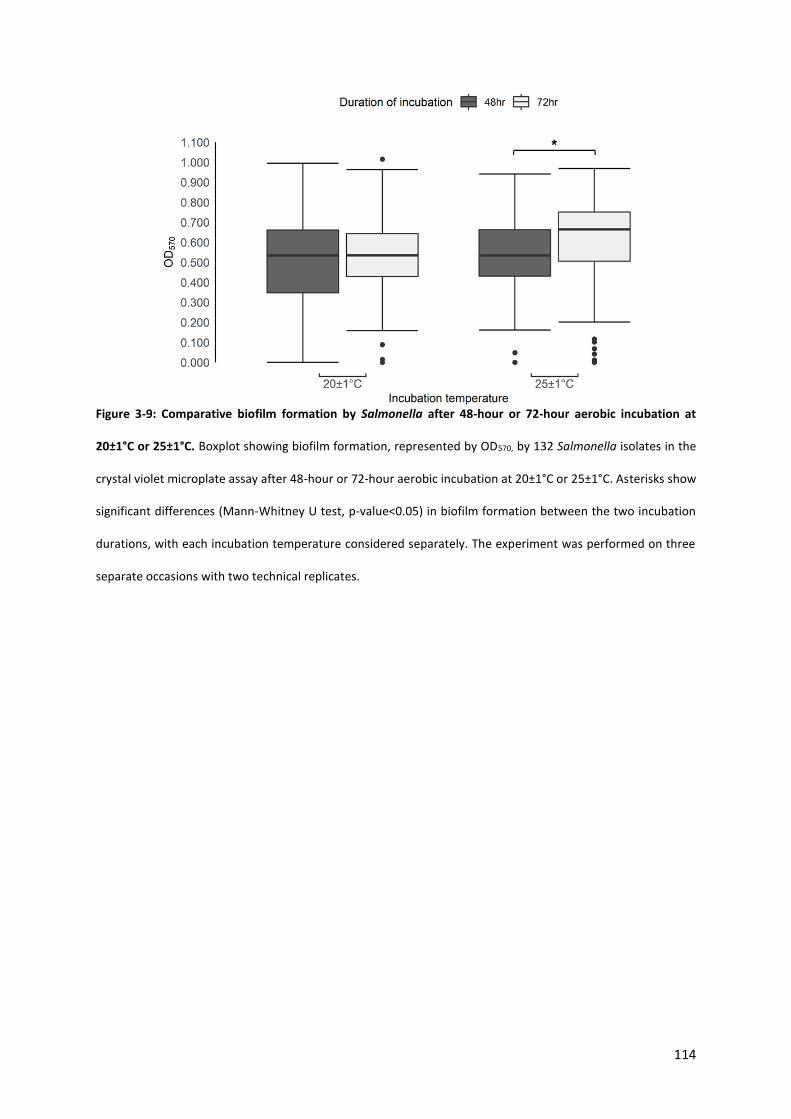
114
Figure 3-9: Comparative biofilm formation by Salmonella after 48-hour or 72-hour aerobic incubation at
20±1°C or 25±1°C. Boxplot showing biofilm formation, represented by OD570, by 132 Salmonella isolates in the
crystal violet microplate assay after 48-hour or 72-hour aerobic incubation at 20±1°C or 25±1°C. Asterisks show
significant differences (Mann-Whitney U test, p-value<0.05) in biofilm formation between the two incubation
durations, with each incubation temperature considered separately. The experiment was performed on three
separate occasions with two technical replicates.

115
Figure 3-10: Biofilm-forming ability by 14 Salmonella serovars after 48-hour or 72-hour aerobic incubation at
20±1°C or 25±1°C. Heatmap showing biofilm formation in the crystal violet microplate assay after 48-hour or 72-
hour aerobic incubation at 20±1°C or 25±1°C. Salmonella isolates are grouped by serovar, then phage type;
Salmovac® 440 vaccine strain (*), RDNC = reacts but does not conform to a recognised phage type, NOPT =
sample has a natural phage infection. The experiment was performed on three separate occasions with two
technical replicates.

116
3.3 Discussion
The studies detailed here found that 130 of the 132 environmental Salmonella isolates tested could
form in vitro biofilms, to varying degrees, in the crystal violet microplate assay when incubated
aerobically at 20±1°C or 25±1°C for 48 hours. When the incubation duration was increased to 72 hours,
one more Salmonella isolate (S05273-18, S. Typhimurium DT193) formed a weak biofilm, while isolate
L01508-17 (S. Senftenberg) did still not produce a biofilm.
Although in vitro biofilm-forming ability was found to be partly influenced by the environmental
source of the Salmonella isolates (primary production environment, the ambient environmental
temperature at the time of sample collection, but not the surface material/sample type from which
isolates were collected) and by culture conditions in the crystal violet assay (incubation length but not
incubation temperature) the factors affecting in vitro biofilm formation could not be conclusively
determined.
3.3.1 In vitro biofilm-forming ability of environmental Salmonella isolates
The studies in this thesis chapter found Salmonella isolated from the environment of a range of pig
and poultry production environments to form in vitro biofilms, in microtiter plates, at environmentally
relevant temperatures. As biofilm formation may promote the persistence of Salmonella
contamination in the environment, and plastic is a surface type widely found on farms and production
environments, this is a matter of concern for controlling Salmonella and will be discussed in more
detail here.
There have been many studies of the biofilm-forming abilities of Salmonella isolated from the
environment of Norwegian feed mills (Møretrø et al., 2009; Vestby et al., 2009a; Vestby et al., 2009b),
but the current study is the first to assess the biofilm-forming ability of Salmonella sourced from the
environment of GB feed mills. Salmonella serovars such as S. Montevideo, S. Mbandaka, S. Ohio, and
S. Kedougou are feed-associated and can colonise the feed production systems in feed mills,

117
particularly coolers, and can re-contaminate heat-treated feed (APHA, 2020). This chapter found that
S. Kedougou isolates still showed variation in biofilm-forming ability in the crystal violet assay even
after 72 hours incubation, while all the S. Ohio and S. Mbandaka isolates were strong biofilm producers
by 72 hours. The one S. Montevideo isolate investigated in this chapter was classified as a moderate
biofilm producer at 20±1°C, which agrees with the findings of Vestby et al. (2009b), who found isolates
of this serovar to be associated with persistent contamination in Norwegian feed mills and to have
good biofilm-forming abilities under the same incubation conditions.
The study of the biofilm-forming ability of pig-associated Salmonella has been mainly limited to
isolates collected from abattoir environments, with a single study by Tassinari et al. (2019) looking at
isolates obtained from the environment of Irish pig farms. This chapter observed that monophasic S.
Typhimurium isolates sourced from the environment of pig farms were all moderate or strong biofilm
producers after incubation at 20±1°C or 25±1°C, while the biofilm-forming abilities of S. Typhimurium
isolates were observed to vary from non-biofilm producers to moderate biofilm producers. Similar
biofilm-forming abilities of monophasic S. Typhimurium and S. Typhimurium isolates were observed
by Tassinari et al. (2019) after incubation at 22°C, with considerable variation in biofilm-forming ability
was observed between different isolates within the same serovar.
The current study is the first to assess the biofilm-forming ability of Salmonella collected from the
environment of hatcheries and to study biofilm formation in S. 13,23:i:-. Salmonella 13,23:i:- is thought
to be a monophasic variant of S. Idikan and has become established in feed mills, hatcheries, and on
broiler farms over recent years (APHA, 2020). All but two S. 13,23:i:- isolates in this chapter were
strong biofilm producers. In comparison, although S. Senftenberg is a very commonly isolated
persistent serovar in hatcheries, including in its originating hatchery environment, no strong biofilm
producers were identified in this chapter. Therefore, suggesting that other survival mechanisms may
be responsible for the relatively common persistence of this serovar in hatcheries.

118
This study is also the first to assess the biofilm-forming abilities of Salmonella isolated from
commercial duck farms (meat, breeding, and laying), which showed varying biofilm-forming abilities.
Salmonella originating from breeding or laying duck farms were all moderate and strong biofilm
producers, while Salmonella originating from meat duck farms were showed a full range of biofilm-
forming abilities from non-biofilm producers to strong biofilm producers. This may be due to
differences in environmental conditions found within these environments, but it may also just be due
to the different Salmonella serovars and phage types that were tested. Although Salmonella is known
to form biofilms at the temperatures found in broiler farms, fattening turkey farms, or egg-producing
farms, it is not known whether Salmonella is isolated from the equivalent environments in duck farms
which are cooler and damper environments, also show biofilm-forming abilities. Except for S.
Typhimurium isolates originating from meat ducks, despite the differing environmental conditions,
duck-associated Salmonella isolates showed similar biofilm-forming abilities (moderate and strong
biofilm producers) to Salmonella originating from the equivalent turkey and chicken farms.
3.3.2 Relationship between the environmental conditions of the originating primary production
environment and in vitro biofilm formation
Significant (p-value<0.05) differences in biofilm-forming ability were observed by isolates originating
from different primary production environments. However, it should be noted that there were small
sample sizes for some environments, particularly for layer hen farms and duck farms, which may have
affected the robustness of the comparison made between these environments, especially as
Salmonella serovars differed between environments. Different environmental conditions are found in
each of these types of primary production environments, with environmental conditions (including
temperature) a known factor influencing biofilm formation. For example, in vitro studies by Agarwal
et al. (2011) and De Oliveira et al. (2014) observed that Salmonella produced biofilms more readily on
hydrophobic surfaces (such as plastic) than hydrophilic surfaces (such as metal). However, the current
study observed no trends between in vitro biofilm formation and the surface material/sample type

119
from which isolates were collected, and only a weak correlation was observed between biofilm
formation and the upper ambient environmental temperature at the time of sample collection. All
Salmonella isolated from surfaces after C&D were found to be moderate and strong biofilm producers.
This suggests that biofilm formation may have facilitated the survival of these isolates during C&D, but
this cannot be confirmed as there were not sufficient numbers of isolates to allow for a robust
comparison to be made between Salmonella isolated from the environment before and after C&D.
Although the sources of the Salmonella isolates were not the same, Stepanovic et al. (2004) also
observed no trends in the biofilm-forming ability of Salmonella depending on its source (food, animals
or humans), while Piras et al. (2015) found that Salmonella recovered from abattoir surfaces in contact
with meat showed significantly greater biofilm production than samples recovered from other
surfaces. This may indicate that other environmental conditions or Salmonella serovar could be
confounding factors, as particular serovars predominate in each primary production environment.
This theory is supported by Agarwal et al. (2011), who suggested that the individual bacterial
characteristics, which differ between Salmonella serovars, may be more important in determining the
biofilm-forming ability of an isolate than the environmental conditions and so was investigated further
in Chapter 4.
3.3.3 Influence of culture conditions in the crystal violet microplate assay on in vitro biofilm
formation
In vitro biofilm production was found to be partly influenced by assay conditions of incubation length
but not incubation temperature. Although significant differences in biofilm formation between the
two incubation temperatures tested (20±1°C and 25±1°C) were not found, an isolate-dependent effect
was observed with 24.3% isolates showing a preference for biofilm formation at one of the two
temperatures. Biofilm formation is often compared between environmental temperatures and
Salmonella host temperatures (37°C in humans, 42°C in poultry and in pigs) (Dawoud et al., 2017;
Lamas et al., 2018; Schonewille et al., 2012). However, as we were interested in the biofilm-forming

120
ability of Salmonella in the environment rather than in the host, biofilm formation after incubation at
37°C was not tested as temperatures rarely exceed 30°C in pig or poultry production environments,
except for in egg hatchers/setters or in some parts of the feed mill cooling system which operate at
30-40°C. As the ambient temperature of the eight pig and poultry primary production environments
studied is dictated by industry guidelines for animal welfare or the GB climate, there is an extensive
temperature range, so a single incubation temperature cannot represent the temperature across all
environments. Using the estimated ambient temperatures of the environment at the time of sampling
for the 132 Salmonella isolates the lowest and highest reported temperatures were -0.1°C and 37.8°C
respectively, with mean lower and upper ambient temperatures of 16°C and 24°C respectively; see
Appendix 1, Table 9-1. However, an incubation temperature of 20±1°C was chosen because this is the
lower end/mid-point of the temperature range found in pig farms, hatcheries, feed mills, and
temperature-controlled poultry farms. As the general ambient temperature is controlled at 24-27°C
in hatcheries and 20-30°C in feed mills and the temperature in meat bird housing starts at around 30°C
and cools down as the birds age, a second slightly warmer incubation temperature of 25±1°C was also
selected (AHDB, 2018; Avigen Turkeys Ltd, 2015b; Cobb-Vantress, 2008; Cornell University, 2016;
Dean and Sandhu, 2014; Defra, 2018; Defra, 2020; Lamas et al., 2018; Newton, 2012; Sherwin, 2010).
Biofilm production increased significantly (p-value<0.05) with increased incubation length from 48
hours to 72 hours, which agrees with previous studies (Agarwal et al., 2011; Borges et al., 2018; Lamas
et al., 2018; Schonewille et al., 2012; Srey, Jahid and Has, 2013; Steenackers et al., 2012). For some
isolates (for example, monophasic S. Typhimurium isolate S02715-13) there was less biofilm
production after 72 hours compared to 48 hours incubation, but this is not surprising as the crystal
violet microplate assay is a static biofilm model and so a decrease in measurable (attached) biofilm
could be expected if the bacterial growth rate was sufficient to deplete the nutrients in the culture
media, resulting in the dispersal of bacteria from the biofilm due to QS (Surette and Bassler, 1998).

121
Critical review papers by Azeredo et al. (2017) and Merritt, Kadouri and O'Toole (2005) have
highlighted the poor reproducibility of the crystal violet microplate assay, which is partially due to
loosely adhered biofilm becoming detached from the well wall during the washing steps and so not
being measured. Poor reproducibility was noted during the crystal violet microplate assays performed
in this chapter, with sizeable variations in OD570 observed between replicates; see Appendix III, Table
9-3. In the published literature, most researchers classify biofilm-forming ability in the crystal violet
microplate assay using the mean OD570, as described by Stepanovic et al. (2004), and this allows
biofilm-forming ability to be compared across different published studies where the OD values
themselves cannot be directly compared. However, it should be noted that the sizeable inter-replicate
variation observed in this chapter could lead to a different biofilm-forming ability being assigned if OD
values are close to the cut-off values for each biofilm classification.
The crystal violet microplate assay is also limited in how well it can replicate the variable
environmental conditions found in pig and poultry production environments. Between and within
these environments, Salmonella can be exposed to various environmental conditions, including
varying ambient temperatures and different types of surface materials. They can also usually form
mixed-species biofilms with other environmental bacteria such as Pseudomonas aeruginosa (Srey,
Jahid and Has, 2013). However, the microtiter assay plate shows that Salmonella isolates can form
biofilms, and this ability can be ranked. The crystal violet microplate assay also has the benefit of being
standardised, inexpensive and straightforward, so it is helpful as an initial high-throughput screening
tool to assess whether an isolate has biofilm-forming ability on a plastic surface by using a simplified
representation of environmental conditions. Isolates of interest identified in the crystal violet
microplate assay can then be studied in more detail using more expensive or complex biofilm models,
and this is discussed further in Chapters 6 and 7). These models attempt to overcome some of the
limitations of the crystal violet microplate assay but can only test a small number of isolates at a time
(Azeredo et al., 2017).

122
3.4 Conclusion
In conclusion, the studies in this thesis chapter identified that Salmonella collected from GB pig and
poultry production environments have the ability to produce in vitro biofilms in the crystal violet
microplate assay. This included isolates sourced from commercial feed mills, hatcheries, and duck
farms, which have not been previously studied. The extent to which these isolates formed biofilms in
the crystal violet microplate assay was influenced by the incubation length but not by the incubation
temperature. Isolates originating from different pig and poultry production environments showed
significant differences in their in vitro biofilm-forming ability, but no clear relationship was found
between biofilm formation and the source environmental conditions. This is suggested to be due to
differences in the biofilm-forming abilities of different Salmonella serovars, which differ in prevalence
between production environments. Although widely used for studying in vitro biofilm formation, it
must be recognised that there are some limitations to the information the crystal violet microplate
assay can provide on biofilm formation, including whether isolates produce biofilms to the same
extent in vitro as they do under more complex and variable conditions in the real world.

123
Chapter 4 Characterisation of biofilm and planktonic phenotypes of environmental Salmonella
isolates
4.1 Introduction
As applied to bacteria, 'phenotype' describes a bacterial cell's observable visible and behavioural
characteristics, including growth rate, motility, colony morphology, and biochemical characteristics,
and can be divided into the planktonic phenotype and the biofilm phenotype. In the biofilm
phenotype, bacteria demonstrate multicellular behaviour and have slower multiplication rates but are
more resistant to environmental stresses than bacteria in the planktonic phenotype (Milanov et al.,
2017).
The biofilm EPS matrix is predominately composed of proteinaceous surface components (such as
fimbriae and flagella) and polysaccharides (such as cellulose). The EPS matrix has been studied in
detail, and it is known that fimbriae, flagella, and cellulose have a functional role in stabilising the EPS
matrix and/or aiding in attachment to a surface during biofilm formation (Flemming and Wingender,
2010; Steenackers et al., 2012). In S. Enteritidis, at least four types of curli fimbriae are expressed:
SEF21 (type-1 fimbriae), SEF14, SEF17, and SEF18 (Dibb-Fuller et al., 1997; Walker et al., 1999;
Woodward et al., 2000). Other types of fimbriae expressed by Salmonella include long polar fimbriae
(lpf) and plasmid-encoded fimbriae (pef) (Dibb-Fuller et al., 1997; Jones, 2013; Steenackers et al.,
2012; Walker et al., 1999; Woodward et al., 2000).
The Highest Priority Critically Important Antimicrobials (HP-CIAs) for treating human and veterinary
Salmonella infections include the following three antimicrobial classes: 3rd generation cephalosporins
(including ceftazidime and cefotaxime), 4th generation cephalosporins, fluoroquinolones (including
ciprofloxacin), and colistin (VMD, 2019b). AMR is the acquired ability of microorganisms to resist the
effect of an antimicrobial agent (Hathroubi et al., 2017) with multi-drug resistant (MDR) bacteria
defined by EFSA and ECDC (2017) as reduced susceptibility to at least three different antimicrobial

124
classes according to the European Committee on Antimicrobial Susceptibility Testing (EUCAST)
epidemiological cut-off (ECOFF) values.
Agarwal et al. (2011) suggested that the individual bacterial characteristics which differ between
Salmonella serovars, may be more important in determining the biofilm-forming ability of an isolate
than the environmental conditions. Although expression of curli fimbriae and cellulose by Salmonella
has been studied in detail in S. Enteritidis and S. Typhimurium in knock-out mutants (Allen-Vercoe et
al., 1997; Dibb-Fuller et al., 1997; Solano et al., 2002; Woodward et al., 2000), few studies have
investigated this in wild-type strains or other serovars. Additionally, few studies have explored the
relationship between phenotypic growth kinetics and biofilm-formation. Therefore, this chapter will
first focus on techniques, including AMR profiling and the study of bacterial cell characteristics
(motility, growth kinetics, and colony morphology) to enable the 134 isolate Salmonella panel to be
well-characterised. Secondly, this chapter will investigate the relationship between these bacterial cell
characteristics on in vitro biofilm-forming ability. The aims and objectives of this chapter were:
▪ To use a combination of characterisation techniques to determine bacterial motility and colony
morphology of a panel of 134 Salmonella isolates after aerobic incubation at 20±1°C and 25±1°C
for 48 hours and 96 hours, respectively.
▪ To investigate the growth kinetics of a sub-panel of 27 Salmonella isolates.
▪ To determine the AMR profile of the panel of 134 Salmonella isolates considering resistance to 16
antimicrobials of importance in human and veterinary medicine.
▪ To study the relationship between the biofilm-forming ability and each of Salmonella serovar,
colony morphology, AMR profile, and growth kinetics parameters within the panel of Salmonella
isolates.

125
4.2 Results
4.2.1 In vitro biofilm-forming ability of different Salmonella serovars
The in vitro biofilm-forming abilities of the panel of 132 environmental Salmonella isolates and the
biofilm control isolates 27655R and 27655S have already been described in this thesis in Chapter 3
(section 3.2.1) and summarised by Salmonella serovar in Table 4-1. Eleven of the twelve Salmonella
serovars with more than one isolate showed differing biofilm-forming abilities among the isolates with
a mixture of biofilm-producing and non-biofilm producing isolates observed within the serovars S.
Kedougou (4 isolates), S. Senftenberg (4 isolates), and S. Typhimurium (29 isolates). Serovar S. 4,12:d:-
showed no such variation as both isolates were classified as strong biofilm producers after incubation
at both 20±1°C and 25±1°C. Variation was only observed within serovars S. Bovismorbificans (2
isolates) and S. Indiana (2 isolates) after incubation at 25±1°C, and S. Mbandaka (3 isolates) after
incubation at 20±1°C. Despite originating from the same laying hen farm on the same day, variation
in biofilm-forming ability was observed between the two S. Enteritidis field isolates of the Salmovac®
440 vaccine strain after incubation 20±1°C; see Table 4-1).
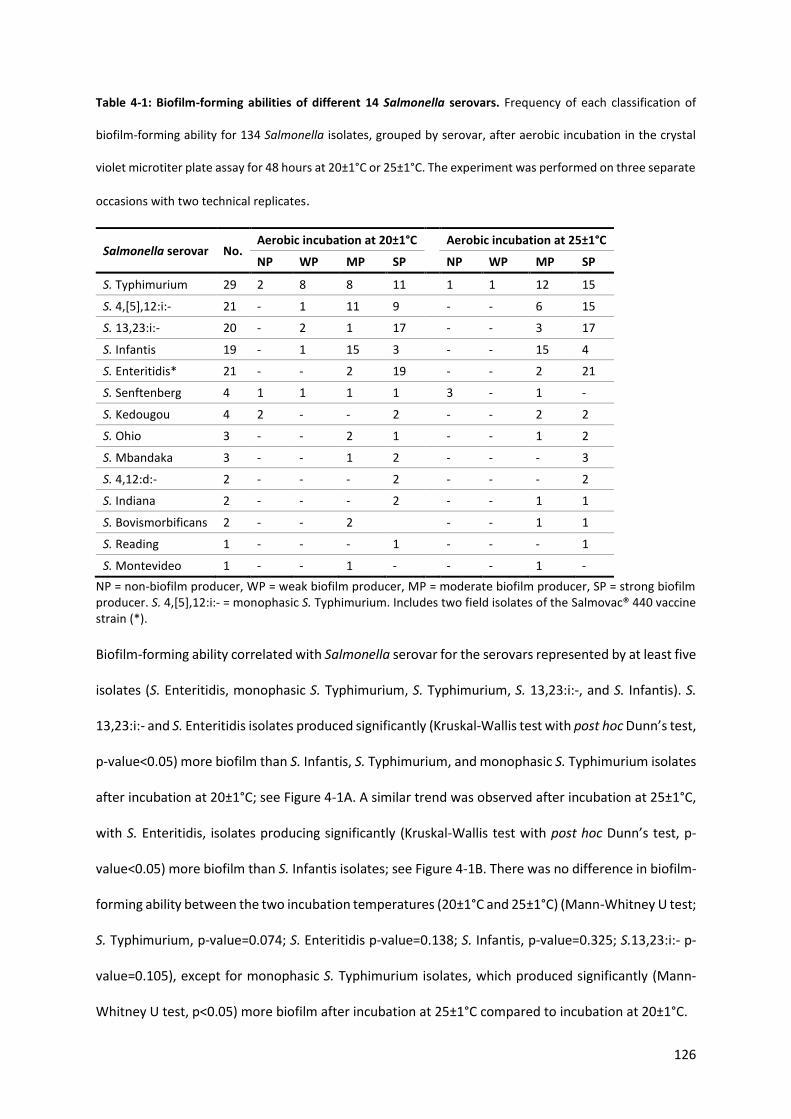
126
Table 4-1: Biofilm-forming abilities of different 14 Salmonella serovars. Frequency of each classification of
biofilm-forming ability for 134 Salmonella isolates, grouped by serovar, after aerobic incubation in the crystal
violet microtiter plate assay for 48 hours at 20±1°C or 25±1°C. The experiment was performed on three separate
occasions with two technical replicates.
Salmonella serovar No. Aerobic incubation at 20±1°C Aerobic incubation at 25±1°C
NP WP MP SP NP WP MP SP
S. Typhimurium 29 2 8 8 11 1 1 12 15
S. 4,[5],12:i:- 21 - 1 11 9 - - 6 15
S. 13,23:i:- 20 - 2 1 17 - - 3 17
S. Infantis 19 - 1 15 3 - - 15 4
S. Enteritidis* 21 - - 2 19 - - 2 21
S. Senftenberg 4 1 1 1 1 3 - 1 -
S. Kedougou 4 2 - - 2 - - 2 2
S. Ohio 3 - - 2 1 - - 1 2
S. Mbandaka 3 - - 1 2 - - - 3
S. 4,12:d:- 2 - - - 2 - - - 2
S. Indiana 2 - - - 2 - - 1 1
S. Bovismorbificans 2 - - 2 - - 1 1
S. Reading 1 - - - 1 - - - 1
S. Montevideo 1 - - 1 - - - 1 -
NP = non-biofilm producer, WP = weak biofilm producer, MP = moderate biofilm producer, SP = strong biofilm producer. S. 4,[5],12:i:- = monophasic S. Typhimurium. Includes two field isolates of the Salmovac® 440 vaccine strain (*).
Biofilm-forming ability correlated with Salmonella serovar for the serovars represented by at least five
isolates (S. Enteritidis, monophasic S. Typhimurium, S. Typhimurium, S. 13,23:i:-, and S. Infantis). S.
13,23:i:- and S. Enteritidis isolates produced significantly (Kruskal-Wallis test with post hoc Dunn’s test,
p-value<0.05) more biofilm than S. Infantis, S. Typhimurium, and monophasic S. Typhimurium isolates
after incubation at 20±1°C; see Figure 4-1A. A similar trend was observed after incubation at 25±1°C,
with S. Enteritidis, isolates producing significantly (Kruskal-Wallis test with post hoc Dunn’s test, p-
value<0.05) more biofilm than S. Infantis isolates; see Figure 4-1B. There was no difference in biofilm-
forming ability between the two incubation temperatures (20±1°C and 25±1°C) (Mann-Whitney U test;
S. Typhimurium, p-value=0.074; S. Enteritidis p-value=0.138; S. Infantis, p-value=0.325; S.13,23:i:- p-
value=0.105), except for monophasic S. Typhimurium isolates, which produced significantly (Mann-
Whitney U test, p<0.05) more biofilm after incubation at 25±1°C compared to incubation at 20±1°C.

127
Figure 4-1: Biofilm formation by five Salmonella serovars. Boxplot showing biofilm formation by 110 Salmonella isolates, grouped by serovar. Biofilm formation, indicated
by OD570, was assessed after 48 hours of aerobic incubation in the crystal violet microplate assay at 20±1°C (A) or 25±1°C (B). With each incubation temperature considered
separately, differences in biofilm formation between serovars are labelled with different letters (Kruskal-Wallis test with post hoc Dunn’s test, p-value<0.05). The experiment
was performed on three separate occasions with two technical replicates.
a ac
b bc
abc
BA
a
a a
b b
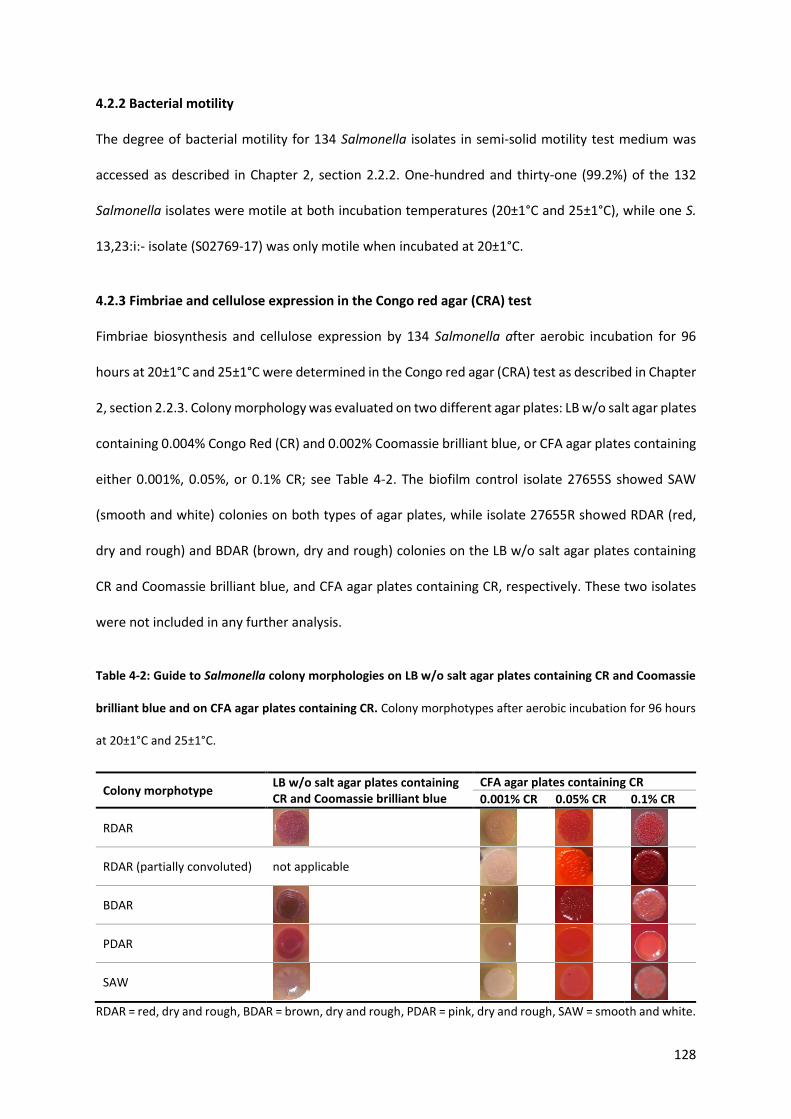
128
4.2.2 Bacterial motility
The degree of bacterial motility for 134 Salmonella isolates in semi-solid motility test medium was
accessed as described in Chapter 2, section 2.2.2. One-hundred and thirty-one (99.2%) of the 132
Salmonella isolates were motile at both incubation temperatures (20±1°C and 25±1°C), while one S.
13,23:i:- isolate (S02769-17) was only motile when incubated at 20±1°C.
4.2.3 Fimbriae and cellulose expression in the Congo red agar (CRA) test
Fimbriae biosynthesis and cellulose expression by 134 Salmonella after aerobic incubation for 96
hours at 20±1°C and 25±1°C were determined in the Congo red agar (CRA) test as described in Chapter
2, section 2.2.3. Colony morphology was evaluated on two different agar plates: LB w/o salt agar plates
containing 0.004% Congo Red (CR) and 0.002% Coomassie brilliant blue, or CFA agar plates containing
either 0.001%, 0.05%, or 0.1% CR; see Table 4-2. The biofilm control isolate 27655S showed SAW
(smooth and white) colonies on both types of agar plates, while isolate 27655R showed RDAR (red,
dry and rough) and BDAR (brown, dry and rough) colonies on the LB w/o salt agar plates containing
CR and Coomassie brilliant blue, and CFA agar plates containing CR, respectively. These two isolates
were not included in any further analysis.
Table 4-2: Guide to Salmonella colony morphologies on LB w/o salt agar plates containing CR and Coomassie
brilliant blue and on CFA agar plates containing CR. Colony morphotypes after aerobic incubation for 96 hours
at 20±1°C and 25±1°C.
RDAR = red, dry and rough, BDAR = brown, dry and rough, PDAR = pink, dry and rough, SAW = smooth and white.
Colony morphotype LB w/o salt agar plates containing CR and Coomassie brilliant blue
CFA agar plates containing CR
0.001% CR 0.05% CR 0.1% CR
RDAR
RDAR (partially convoluted) not applicable
BDAR
PDAR
SAW

129
4.2.3.1 Colony morphology on LB w/o salt agar plates containing Congo red (CR) and Coomassie
brilliant blue
After aerobic incubation for 96 hours at 20±1°C, the most prevalent colony morphotype on the LB w/o
salt agar plates containing CR and Coomassie brilliant blue was RDAR (106 isolates, 80.3%), followed
by PDAR [pink, dry and rough] (11 isolates, 0.76%), SAW (8 isolates, 6.1%), and BDAR (7 isolates, 5.3%).
After aerobic incubation at 25±1°C, the most prevalent colony morphotype was RDAR (106 isolates,
80.3%), followed by PDAR (12 isolates, 9.1%), BDAR (9 isolates, 6.8%), and SAW (5 isolates, 3.8%); see
Table 4-3. All the isolates belonging to the serovars, monophasic S. Typhimurium, S. Enteritidis, S.
Ohio, and S. 4,12,d:- showed the same colony morphology, while variation between isolates was
observed within the other serovars. Overall, 122 isolates showed the same colony morphology after
incubation at both incubation temperatures; see Appendix IV, Table 9-4.
Table 4-3: Colony morphologies on LB w/o salt agar plates containing CR and Coomassie brilliant blue.
Distribution of colony morphotypes for 132 environmental Salmonella isolates, grouped by serovar, after
aerobic incubation for 96 hours at 20±1°C and 25±1°C on LB w/o salt agar plates containing CR and Coomassie
brilliant blue. The experiment was performed once with one technical replicate.
Serovar No. Aerobic incubation at 20±1°C Aerobic incubation at 25±1°C
RDAR BDAR PDAR SAW RDAR BDAR PDAR SAW
S. Typhimurium 27 14 2 6 5 16 2 7 2
S. 4,[5],12:i:- 23 23 - - - 23 - - -
S. Enteritidis* 21 21 - - - 21 - - -
S. 13,23:i:- 20 20 - - - 17 1 2 -
S. Infantis 19 18 1 - - 18 1 - -
S. Kedougou 4 3 1 - - 3 1 - -
S. Senftenberg 4 - 1 - 3 - 1 - 3
S. Mbandaka 3 - 2 1 - - 3 - -
S. Ohio 3 3 - - - 3 - - -
S. 4,12:d:- 2 2 - - - 2 - - -
S. Bovismorbificans 2 - - 2 - - - 2 -
S. Indiana 2 1 - 1 - 1 - 1 -
S. Montevideo 1 1 - - - 1 - - -
S. Reading 1 - - 1 - 1 - - -
Total 132 106 7 11 8 106 9 12 5
Colony morphology was not shown by this serovar (-). S. 4,[5],12:i:- = monophasic S. Typhimurium. Includes two field isolates of the Salmovac® 440 vaccine strain (*). RDAR = red, dry and rough, BDAR = brown, dry and rough, PDAR = pink, dry and rough, SAW = smooth and white.

130
4.2.3.1.1 Relationship between biofilm formation and colony morphology
Biofilm-forming ability differed significantly (Kruskal-Wallis test with post hoc Dunn’s test, p-
value<0.05) between the four colony morphotypes at both incubation temperatures. After incubation
at 20±1°C, isolates showing RDAR colonies produced significantly more biofilm than isolates showing
SAW colonies. A similar trend was observed after incubation at 25±1°C with isolates showing either
RDAR or PDAR colonies producing more biofilm than isolates showing SAW colonies; see Table 4-4.
Table 4-4: Biofilm formation and colony morphologies on LB w/o salt agar plates containing CR and Coomassie
brilliant blue. Associations between colony morphotypes and biofilm-forming abilities for 132 environmental
Salmonella isolates after aerobic incubation at 20±1°C and 25±1°C. Colony morphologies were evaluated on LB
w/o salt agar plates containing CR and Coomassie brilliant blue after 96 hours of incubation. Biofilm formation,
indicated by OD570, was assessed after 48 hours of aerobic incubation in the crystal violet microplate assay.
Differences in biofilm formation between colony morphotypes with each incubation temperature considered
separately are labelled with different letters (Kruskal-Wallis test with post hoc Dunn’s test, p-value<0.05). The
experiment was performed once with one technical replicate.
RDAR = red, dry and rough, BDAR = brown, dry and rough, PDAR = pink, dry and rough, SAW = smooth and white.
4.2.3.2 Colony morphology on CFA agar plates containing Congo red (CR)
After aerobic incubation at 20±1°C on CFA agar plates containing CR, the most prevalent morphotype
was RDAR including partially convoluted colonies (103 isolates, 78.0%), followed by PDAR (24 isolates,
18.2%), BDAR (4 isolates, 3.0%), and SAW (1 isolate, 0.76%). After incubation at 25±1°C, the same
trend was observed as the most prevalent morphotype being RDAR including partially convoluted
colonies (11 isolates, 84.1%), followed by PDAR (18 isolates, 13.6%), and BDAR (3 isolates, 2,3%). No
Colony morphology
Aerobic incubation at 20±1°C Aerobic incubation at 25±1°C
No. Median OD570
Min. OD570
Max. OD570
No. Median OD570
Min. OD570
Max. OD570
RDAR 106 0.569b 0.000 0.994 106 0.547a 0.000 0.940
BDAR 7 0.538ab 0.000 0.625 9 0.543ab 0.191 0.637
PDAR 11 0.180ac 0.053 0.589 12 0.488a 0.217 0.783
SAW 8 0.051c 0.000 0.202 5 0.000b 0.000 0.387

131
isolates showed the SAW morphotype; see Table 4-5. Seventy-eight isolates showed the same colony
morphology at both incubation temperatures; see Appendix IV, Table 9-4.
Table 4-5: Colony morphologies on CFA agar plates containing CR. Distribution of colony morphotypes between
Salmonella serovars for 132 environmental Salmonella isolates. Colony morphologies were evaluated on CFA
agar plates after aerobic incubation for 96 hours at 20±1°C and 25±1°C. The experiment was performed once
with one technical replicate.
Serovar No. Aerobic incubation at 20±1°C Aerobic incubation at 25±1°C
RDAR BDAR PDAR SAW RDAR BDAR PDAR SAW
S. Typhimurium 27 8 [+13] 1 4 1 13 [+10] 0 4 0
S. 4,[5],12:i:- 23 7 [+12] 0 4 0 18 [+4] 0 1 0
S. Enteritidis* 21 7 [+12] 0 2 0 19 0 2 0
S. 13,23:i:- 20 4 [+12] 0 4 0 13 [+6] 0 1 0
S. Infantis 19 5 [+9] - 5 0 4 [+9] 0 6 0
S. Kedougou 4 4 0 0 0 4 0 0 0
S. Senftenberg 4 1 3 0 0 1 3 0 0
S. Mbandaka 3 0 [+1] 0 2 0 0 [+2] 0 1 0
S. Ohio 3 2 [+1] 0 0 0 2 [+1] 0 0 0
S. 4,12:d:- 2 2 0 0 0 2 0 0 0
S. Bovismorbificans 2 0 0 2 0 0 0 2 0
S. Indiana 2 0 [+2] 0 0 0 1 [+1] 0 0 0
S. Montevideo 1 1 0 0 0 1 0 0 0
S. Reading 1 0 0 1 0 0 0 1 0
Total 132 41 [+62] 4 24 1 78 [+33] 3 18 0
Colony morphology was not shown by this serovar (-). S. 4,[5],12:i:- = monophasic S. Typhimurium. Includes two field isolates of the Salmovac® 440 vaccine strain (*). RDAR = red, dry and rough with numbers of partially convoluted colonies in square brackets, BDAR = brown dry and rough, PDAR = pink, dry and rough, SAW = smooth and white.
4.2.3.2.1 Relationship between biofilm formation and colony morphology
Biofilm-forming ability differed significantly (Kruskal-Wallis test with post hoc Dunn’s test, p-
value<0.05) between the four colony morphotypes at both incubation temperatures. After incubation
at both 20±1°C and 25±1°C, the same trends were observed, as isolates showing BDAR colonies
produced significantly more biofilm than isolates showing RDAR colonies (including partially
convoluted colonies); see Table 4-6.

132
Table 4-6: Biofilm formation and colony morphologies on CFA agar plates containing CR. Association between
colony morphotypes and biofilm-forming abilities for 132 environmental Salmonella isolates after aerobic
incubation at 20±1°C and 25±1°C. Colony morphologies were evaluated on CFA agar plates after 96 hours of
incubation. Biofilm formation, indicated by OD570, was assessed after 48 hours of aerobic incubation in the
crystal violet microplate assay. Differences in biofilm formation between colony morphotypes with each
incubation temperature considered separately are labelled with different letters (Kruskal-Wallis test with post
hoc Dunn’s test, p-value<0.05). The experiment was performed once with one technical replicate.
RDAR = red, dry and rough with numbers of partially convoluted colonies in brackets, BDAR = brown, dry and rough, PDAR = pink, dry and rough, SAW = smooth and white.
4.2.3.3 Comparison of colony morphology in the CRA test between the two types of agar plate
Overall, good agreement was observed between colony morphologies on the CFA agar plates
containing CR and the LB w/o salt agar plates containing CR and Coomassie brilliant blue with 96
isolates (72.7%) and 101 isolates (76.5%) showing the same morphotype on both agar plates after
incubation at 20±1°C and 25±1°C, respectively; see Appendix IV, Table 9-4.
4.2.4 Antimicrobial resistance (AMR) profile
The sensitivity or resistance of the 134 Salmonella isolates to 16 antimicrobials, across eight
antimicrobial classes of importance for human and veterinary medicine, was determined using disk
diffusion as described in Chapter 2 (section 2.2.4). The two field isolates (S03463-16 and S03467-16)
of the Salmovac® vaccine strain and the two biofilm control strains (27655R and 27655S) were
sensitive to all 16 antimicrobials and were not included in any further analysis. The most common
resistances observed within the remaining 130 Salmonella isolates were to sulphonamides (56
isolates, 42.4%), streptomycin (54 isolates, 41.0%), and tetracycline (52 isolates, 39.4%). Resistance to
amikacin, amoxicillin-clavulanic acid, and cefotaxime was not detected in any isolates (see Figure 4-
Colony morphology
Aerobic incubation at 20±1°C Aerobic incubation at 25±1°C
No. Median OD570
Min. OD570
Max. OD570
No. Median OD570
Min. OD570
Max. OD570
RDAR 41 (+62)
0.548b 0 0.994 78 (+33)
0.550b 0 0.940
BDAR 4 0.032a 0 0.202 3 0.000a 0.000 0.000
PDAR 24 0.432ab 0.049 0.878 18 0.501ab 0.048 0.048
SAW 1 0ab - - 0 - - -

133
2). Multi-drug resistant (MDR) bacteria, resistant to ≥3 antimicrobial classes from the panel of 16
antimicrobials, was identified in 53 (40.2%) Salmonella isolates, and 26 isolates (19.7%) were resistant
to one or two antimicrobials. The remaining 53 isolates (40.2%) were susceptible to all 16
antimicrobials; see Appendix IX, Table 9-12.
Figure 4-2: Occurrence of AMR in Salmonella. Resistance of 130 Salmonella isolates to 16 antimicrobials
belonging to seven antimicrobial classes (aminoglycosides, β-lactams, quinolones, nitrofurans, amphenicols,
sulfonamide compounds, and tetracyclines). Resistance was determined using disk diffusion based on historical
APHA veterinary breakpoints or the BSAC human clinical breakpoints. The experiment was performed once with
one technical replicate.
Five Salmonella isolates (3.8%) were resistant to HP-CIAs. The S. 13,23:i:- isolates (S02593-15, S02981-
17, S01780-15, and S02971-17) originating from a chicken hatchery and one S. Typhimurium DT41b
(S01798-15) isolate originating from a meat duck farm were resistant to ciprofloxacin
(fluoroquinolones). Isolate S05336-18, one S. Typhimurium DT193 from a pig farm, was resistant to
ceftazidime (3rd generation cephalosporins). Resistance to cefotaxime (3rd generation cephalosporins)
was not detected in any isolates; see Appendix I (Table 9-1) and Appendix IX (Table 9-12).

134
4.2.4.1 Relationship between multi-drug resistance (MDR) and biofilm formation
Overall, the 53 MDR isolates showed significantly (Mann-Whitney U-test, p-value<0.05) less biofilm
production at both incubation temperatures (20±1°C and 25±1°C) than the 79 non-MDR isolates.
However, when serovar was investigated, significant differences (Mann-Whitney U-test, p-
value<0.05) in biofilm production were only found within serovar S. Typhimurium after incubation at
20±1°C when the 14 MDR isolates produced significantly (Mann-Whitney U-test, p-value<0.05) more
biofilm than the 15 non-MDR isolates. While no significant difference was found between MDR and
biofilm formation at 25±1°C for S. Typhimurium (Mann-Whitney U-test, p-value=0.85); see Table 4-7.
Multi-drug resistance varied between serovars with all isolates belonging to the serovars S. Mbandaka,
S. Bovismorbificans, S. Indiana, S. Montevideo, S. Reading, and S. 13,23:i:- either being sensitive to all
16 antimicrobials tested or showing resistance to one or two antimicrobials. While 19 of the 20
monophasic S. Typhimurium isolates were MDR, including two monophasic S. Typhimurium DT193
isolates (L04540-15 and L04552-15) from the same pig farm, which were resistant to nine
antimicrobials: ampicillin, apramycin, chloramphenicol, gentamicin, neomycin, compound
sulphonamides, streptomycin, sulphamethoxazole-trimethoprim, and tetracycline; see Appendix I
(Table 9-1) and Appendix IX (Table 9-12).

135
Table 4-7: Trends of AMR profiles and MDR in Salmonella serovars. Distribution of AMR profiles, grouped by
Salmonella serovar, covering 16 antimicrobials belonging to the antimicrobial classes: aminoglycosides, β-
lactams, quinolones, nitrofurans, amphenicols, sulfonamide compounds, and tetracyclines. Resistance was
determined using disk diffusion based on historical APHA veterinary breakpoints or the BSAC human clinical
breakpoints with MDR defined as resistance to ≥3 antimicrobial classes. The experiment was performed once
with one technical replicate.
Serovar No. MDR Non-MDR Most common AMR profile
S. Typhimurium 29 14 15 sensitive to all 16 antimicrobials
S. 4,[5],12:i:- 21 20 1 AMP S S3 T
S. 13,23:i:- 20 0 20 sensitive to all 16 antimicrobials
S. Infantis 19 15 4 NA FUR SXT S S3 T
S. Enteritidis 19 2 17 NA
S. Kedougou 4 0 4 sensitive to all 16 antimicrobials
S. Mbandaka 3 0 3 sensitive to all 16 antimicrobials
S. Ohio 3 1 2 -
S. Senftenberg 4 1 3 NA
S. 4,12:d:- 2 0 2 -
S. Bovismorbificans 2 0 2 sensitive to all 16 antimicrobials
S. Indiana 2 0 2 sensitive to all 16 antimicrobials
S. Montevideo 1 0 1 sensitive to all 16 antimicrobials
S. Reading 1 0 1 sensitive to all 16 antimicrobials
No predominant AMR profile (-). S. 4,[5],12:i:- = monophasic S. Typhimurium. AMP = ampicillin, S = streptomycin, S3 = compound sulphonamides, TET = tetracycline, NA = nalidixic acid, FUR = furazolidone, SXT = sulphamethoxazole-trimethoprim.
4.2.5 Growth kinetics study
Growth curves in LB broth w/o salt were generated for 27 Salmonella isolates and were fitted to the
logistic model; see Figure 4-4. This panel consisted of 25 Salmonella isolates belonging to the S.
Typhimurium, monophasic S. Typhimurium, S. Infantis, S.13,23:i:-, S. Enteritidis (including two field
isolates of the Salmovac® 440 vaccine strain) and the biofilm control isolates (27655R and 27655s).
Growth kinetics parameters were calculated from these growth curves: growth rate (r) in OD570/hour
ranged from 0.240 to 0.480 with a mean of 0.339; carrying capacity (K), which represented the
maximum possible population size in OD570, ranged from 0.780 to 1.290 with a mean of 1.093;
doubling time (tDT) ranged from 1.46hrs to 2.92hrs; the highest OD570 value reached (ODmax) ranged
from 1.012 to 1.341 with a mean of 1.170; the OD570 value at 24 hours incubation (OD24h) ranged from
0.945 to 1.242 with a mean of 1.090; the AUC ranged from 32.2 to 46.0 with a mean of 38.7. For the
136
two biofilm controls, the strong biofilm producing isolate 27655R had a faster growth rate (0.480/hr)
than the weak biofilm producer isolate 27655S (0.230/hr) but had a lower carrying capacity, slower
doubling time, lower ODmax, lower OD24h and a smaller AUC; see Appendix V, Table 9-5.
Growth kinetic parameters varied between the five serovars, excluding the two biofilm control strains,
but with no significant difference (Kruskal-Wallis test; r, p-value=0.054; K, p-value=0.064; tDT, p-
value=0.068; ODmax, p-value=0.097; OD24h, p-value=0.372; AUC, p-value=0.086); see Table 4-8.
4.2.5.1 Relationship between growth kinetic parameters and biofilm formation
The ability of 25 Salmonella strains to form biofilms was related to their growth kinetic parameters.
Using the Spearman's rank correlation test, biofilm formation was strongly positively correlated (p-
value<0.05) with growth rate (r), strongly negatively correlated with carrying capacity (K), doubling
time (tDT), ODmax, and moderately negatively correlated with the AUC. No correlation was observed
between biofilm formation and ODmax (Spearman's rank correlation test, p-value=0.199); see Figure 4-
4.

137
Table 4-8: Salmonella biofilm formation and growth kinetics parameters. Mean growth kinetics parameters and biofilm production for 25 environmental Salmonella isolates,
grouped by serovar, after aerobic incubation in LB broth w/o salt for 48 hours at 25±1.5°C. Biofilm formation, indicated by OD570, was assessed in the crystal violet microplate
assay after 48 hours of aerobic incubation at 25±1°C.
Growth kinetics parameter
S. Enteritidis* S. Typhimurium S. 4,[5],12:i:- S. Infantis S. 13,23,i:-
Mean ±SD
Min. Max. Mean ±SD
Min. Max. Mean ±SD
Min. Max. Mean ±SD
Min. Max. Mean ±SD
Min. Max.
Biofilm formation
0.676 ±0.151
0.512 0.865 0.269 ±0.255
0 0.627 0.546 ±0.096
0.43 0.656 0.465 ±0.067
0.387 0.55 0.445 ±0.264
0.161 0.768
r 0.404 ±0.040
0.370 0.460 0.282 ±0.0476
0.240 0.360 0.358 ±0.100
0.250 0.480 0.298 ±0.063
0.240 0.400 0.354 ±0.037
0.300 0.400
K 0.964 ±0.064
0.910 1.070 1.150 ±0.137
0.930 1.290 1.110 ±0.119
0.960 1.270 1.172 ±0.095
1.010 1.260 1.100 ±0.123
0.990 1.280
tDT 1.73 ±0.17
1.50 1.89 2.52 ±0.39
1.92 2.92 2.08 ±0.611
1.46 2.82 2.40 ±0.45
1.74 2.89 1.98 ±0.21
1.75 2.32
ODmax 1.05 ±0.065
1.012 1.169 1.20 ±0.116
1.019 1.328 1.19 ±0.078
1.079 1.285 1.22 ±0.081
1.086 1.307 1.18 ±0.109
1.068 1.341
OD24h 1.04 ±0.070
0.988 1.161 1.08 ±0.101
0.960 1.212 1.09 ±0.097
0.945 1.205 1.14 ±0.075
1.056 1.242 1.13 ±0.075
1.050 1.229
AUC 35.4 ±2.9
32.2 40.0 38.7 ±4.8 33.0 44.9 37.5 ±2.5
33.9 40.0 41.5 ±2.3
38.5 44.4 40.3 ±4.0
36.8 46.0
r = growth rate, K = carrying capacity, tDT = doubling time (hours), ODmax = maximum OD570 reached, OD24h = OD570 after 24 hours incubation, AUC = logistic Area Under the Curve. Includes two field isolates of the Salmovac® 440 vaccine strain (*). SD = standard deviation.

138
Figure 4-3: Comparative 48-hour growth curves for 27 Salmonella isolates. Growth curves were produced after
aerobic incubation in LB broth w/o salt for 48 hours at 25±1.5°C and fitted to a logistic model (shown by the red
line). The experiment was performed once with three technical replicates. Includes two field isolates (S03463-
16 and S03467-16) of the Salmovac® 440 vaccine strain (*).

139
Figure 4-4: Associations between Salmonella biofilm formation and growth kinetics parameters. Scatterplots of 25 environmental Salmonella isolates showing associations
between biofilm formation, indicated by OD570, after aerobic incubation in LB broth w/o salt at 25±1°C for 48 hours, and growth kinetics parameters after incubation in LB
broth w/o salt at 25±1.5°C for 48 hours. The experiment was performed once with three technical replicates. Growth parameters: tDT=doubling time, r = growth rate, k =
carrying capacity, ODmax = maximum OD570 reached, OD24h = OD570 at 24 hours incubation. The black line shows a linear regression with only statistically significant Spearman's
rank correlation test r values shown.
r = -0.569 r = -0.755 r = 0.783
r = -0.784 r = -0.686

140
4.3 Discussion
To build on the studies that assessed the biofilm-forming abilities of this panel of 134 Salmonella in
Chapter 3, further phenotypic characterisation and AMR profiling found that the expression of the
individual bacterial characteristics of colony morphology (fimbriae and cellulose expression), AMR
(particularly MDR), and growth kinetics were associated with differences in biofilm-forming abilities,
and also differed between Salmonella serovars in some cases.
4.3.1 In vitro biofilm-forming ability of different Salmonella serovars
The significant differences in the biofilm-forming abilities within the panel of 132 Salmonella isolates
found between the 14 serovars and the variation in biofilm-forming ability observed between isolates
belonging to the same serovar agree with previously reported studies (Agarwal et al., 2011; Borges et
al., 2018; Schonewille et al., 2012; Srey, Jahid and Has, 2013; Steenackers et al., 2012). For example,
Tassinari et al. (2019) found monophasic S. Typhimurium and S. Typhimurium isolates obtained from
the environment of pig farms had similar biofilm-forming abilities after incubation at 22°C, ranging
from non-biofilm producers to moderate biofilm producers, with considerable variation in biofilm-
forming ability also observed between different isolates within the same serovar. The findings from
the studies reported in this thesis are at odds with the poor biofilm formation capabilities of S. Infantis
strains sourced from Hungarian broiler flocks reported by Schonewille et al. (2012) and also from
Slovakian broiler flocks reported by Pate et al. (2019). The studies reported in this chapter found all
monophasic S. Typhimurium/S. Typhimurium isolates originating from pig farms, except for one non-
biofilm producing isolate, to be moderate biofilm producers or strong producers. In contrast, Piras et
al. (2015) found S. Typhimurium DT193 isolated from pigs and abattoirs to be either non-biofilm
producers or weak biofilm producers after incubation for 24 hours at 22°C. This disagreement is likely
due to differences in methodology with Piras et al. (2015) using shorter incubation time. However,
since the same nutrient broth (LB broth w/o salt), incubation time (48 hours), and incubation
temperature of 20°C were in the crystal violet assays regarding the S. Infantis isolates, the

141
disagreements here may be due to different clones of S. Infantis being present in different countries
(Pate et al., 2019).
This chapter did not primarily aim to compare the in vitro biofilm-forming abilities of live-vaccine and
field strains of S. Enteritidis from layer-hen farms, but the two field isolates of the Salmovac® 440
vaccine showed good biofilm-forming abilities after incubation at 20±1°C, similar to S. Enteritidis field-
strains, and this is of interest as it contradicts Schonewille et al. (2012). However, the authors do not
provide details of the live-vaccine strain tested, but it is likely to be a different vaccine strain such as
AviPro® Vac E. The AviPro® Vac E vaccine has poor survival in the environment due to attenuations
that increase the permeability of the cell membrane and, therefore, its susceptibility to antimicrobials
(VMD, 2020b), while the Salmovac® 440 vaccine has been reported to be isolated from the
environment, such as from chicken litter, up to 13 days after vaccination (HPRA, 2016) and also for
over one year after vaccination, but this is likely to due to ongoing shedding by some birds after
vaccination (APHA surveillance data, unpublished, 2021).
4.3.2 Bacterial motility
It is not surprising that the 130 environmental Salmonella isolates tested in this chapter showed
motility as they were isolated from environmental samples using a modified version of ISO 6579-
1:2017 that utilises the MSRV agar, which selects for motile isolates. One S. 13,23:i:- isolate, S02769-
17, was only motile when incubated at 20±1°C, and although this isolate may only be motile at a lower
temperature, it is more likely that this is a false-negative result obtained when the bacterial flagella
have become damaged or if the bacteria is just weakly motile (Tittsler and Sandholzer, 1936). The
limitation of using the motility test medium to determine bacterial motility is that it provides only a
negative or positive result. Future work would be to use microscopy or measure swimming motility by
inoculating the Salmonella onto agar plates and measuring the diameter of turbid growth at different
time points, similar to studies described by Wang et al. (2020), and assessing the correlation with the
degree of biofilm formation observed in the crystal violet assay. However, in terms of biofilm

142
formation, motility may not be as crucial as the mere presence of flagella, as isolates belonging to the
non-motile serovar S. Pullorum are reported to be biofilm producers (Lu et al., 2011). However, Wang
et al. (2020) observed that flagellar-deficient mutants were weaker biofilm producers than motile
wild-type isolates.
4.3.3 Relationship between colony morphology in the CRA test and in vitro biofilm formation
The RDAR morphotype is also associated with persistence and survival in adverse conditions (Lamas
et al., 2018; Vestby et al., 2009a; White et al., 2006) as curli fimbriae and cellulose expression are
thought to play an important role in biofilm formation. The studies in this chapter found that isolates
displaying RDAR colonies were stronger biofilm producers than the small number of isolates displaying
SAW colonies which is in agreement with others (Eguale et al., 2014; Romling, 2005; Solano et al.,
2002). It was initially thought that the production of both fimbriae and cellulose were essential for
biofilm formation (Milanov et al., 2015), but it is now considered that although cellulose is important
for structural support of the EPS matrix, it is not essential for biofilm formation as both the RDAR and
BDAR morphotypes are excellent biofilm producers. Milanov et al. (2015) and Vestby et al. (2009a)
found that S. Agona isolates showing the BDAR morphotype (i.e., expressing fimbriae but not
cellulose) could survive and persist in adverse feed mill conditions. Although in this chapter, most
isolates producing the RDAR or BDAR morphotype were also moderate biofilm producers or strong
biofilm producers, some isolates displaying other morphotypes were also moderate biofilm producers
or strong biofilm producers. This may suggest that the formation of biofilms may be primarily due to
the expression of curli fimbriae and not the combined action of both cellulose and curli fimbriae.
Alternatively, cellulose may only be required in small quantities at levels below the detection limit of
the agar plates.
Similar to studies by White et al. (2006) and Vestby et al. (2009b), isolates of the same Salmonella
serovar produced various morphotypes. Čabarkapa et al. (2015) observed that S. Enteritidis isolates
produced a range of morphotypes, but, in contrast, all S. Enteritidis isolates in this chapter produced

143
RDAR colonies. Similar to the findings by Vestby et al. (2009b), the one S. Montevideo isolate tested
in this study produced the RDAR morphotype after incubation at 20±1°C, the S. Senftenberg isolates
produced the RDAR or BDAR morphotypes, and S. Typhimurium isolates mainly expressed the RDAR
morphotype, but a few isolates also expressed the SAW morphotype. An apparent temperature-
dependent association between biofilm formation and colony morphology was observed, but serovar
was a confounding factor. This association is in agreement with many authors, including Malcova et
al. (2008), who studied biofilm formation after incubation at 28°C, and Čabarkapa et al. (2015), who
studied the biofilm-forming ability of S. Enteritidis after incubation at 25°C. In contrast, Ćwiek, Bugla-
Płoskońska and Wieliczko (2019) found no significant relationship between morphotype and biofilm
in environmental poultry S. Enteritidis isolates. Solomon et al. (2005) also found no correlation
between biofilm-forming ability and colony morphology, but this is likely to be due to the different
incubation temperatures (28°C and 30°C) used for the crystal violet assay and the assessment of
colony morphology, as the transcriptional regulator csgD is only expressed at temperatures below
30°C (Gerstel and Romling, 2003; Romling, 2005).
Characterisation of the colony morphology on LB w/o salt agar plates containing CR and Coomassie
brilliant blue allowed the work to be compared to others as this method was first used in 2005 by
Romling (2005) is now the more commonly used agar in the CRA test (Čabarkapa et al., 2015; Malcova
et al., 2008; Vestby et al., 2009b). To the best of our knowledge, the study in this chapter is the first
to compare these two types of agar plates. This comparison found agreement in fimbriae and cellulose
expression to be about ~75% after incubation at 20±1°C and 25±1°C, respectively, with differences
noted in cellulose and fimbriae expression. This may be due to the difficulties observed in
differentiating between colony colours (indicating cellulose expression) on CFA agar plates containing
CR compared to LB w/o salt agar plates containing CR and Coomassie brilliant blue. This may be due
to the different dyes and concentrations of CR used to stain the EPS matrix components differing
between the agar plates, ranging from 0.001% to 0.1% CR in the CFA agar plates and 0.004% CR in the

144
LB w/o salt agar plates with the addition of Coomassie brilliant blue, which stains proteins.
Additionally, these discrepancies may be due to the differing nutrient compositions of the agars, with
CFA agar plates and LB w/o salt agar plates being nutrient-rich and nutrient-deficient media,
respectively. As SEF17 fimbriae expression is regulated by the transcriptional regulator csgD its
expression is affected by environmental conditions, including nutrient availability, with maximal
expression when nutrient availability is limited (Gerstel and Romling, 2003; Steenackers et al., 2012).
Future work could confirm cellulose expression using alternative methods such as the screening
method first described by Solano et al. (2002) based on the fluorescence of colonies on calcofluor agar
or a novel method by Choong et al. (2016) for real-time, in situ detection and differentiation of curli
and cellulose in Salmonella, using non-toxic, luminescent conjugated oligothiophenes.
4.3.4 Relationship between AMR and in vitro biofilm formation
Salmonellosis in humans does not usually require treatment with antimicrobials except in severe cases
where patients are most commonly treated with ciprofloxacin, azithromycin, or 3rd generation
cephalosporins (VMD, 2019b). In the pig and poultry industry, AMR is a significant concern for human
and animal health as these bacteria can be transmitted between animals, food, and humans. There is
an increasing frequency of Salmonella with resistance to antimicrobials that are used to treat severe
cases of salmonellosis in humans, as these have been previously used as broad-spectrum
antimicrobials in animals (Dalhoff, 2012; VMD, 2019b). The pig, poultry, and feed-associated
environmental Salmonella isolates used in this study in total showed resistance to 13 of the 16
antimicrobials tested. The sensitivity detected to amikacin, cefotaxime, amoxicillin-clavulanate is
unsurprising as resistance to these compounds is extremely rare in UK Salmonella isolates due to
minimal usage of high priority antimicrobials. However, the resistance demonstrated by four isolates
to ciprofloxacin and one isolate to ceftazidime is of concern as resistance to these compounds is
currently extremely rare in UK food animal Salmonella isolates as these antimicrobials are HP-CIAs
(VMD, 2019b).

145
Biofilm formation may contribute to the emergence and dissemination of AMR due to the proximity
of bacteria in a biofilm providing optimal conditions for the horizontal transfer of AMR genes between
bacteria (Hathroubi et al., 2017; Lamas et al., 2018; Milanov et al., 2017). Although several studies by
Hoffman et al. (2005), Kaplan (2011), and Hathroubi et al. (2017) have suggested that sub-lethal doses
of antimicrobials can induce biofilm formation, the relationship between biofilm formation and
antimicrobial resistance is unclear. The studies in this chapter found that, overall, MDR Salmonella
isolates showed significantly less biofilm production than non-MDR isolates, but this may be serovar-
dependent with an opposite trend observed in S. Typhimurium isolates. These findings are in
agreement with Dorgham et al. (2019) and Farahani et al. (2018), who also found a relationship
between biofilm formation and antimicrobial resistance in S. Enteritidis isolates from humans and
poultry. Whereas others found no significant relationship between MDR and the ability of S. Enteritidis
sourced from poultry (Ćwiek et al., 2020) and from pig slaughterhouses (Piras et al., 2015) to form
biofilms. Therefore, in a single-species biofilm, AMR may potentially compromise or enhance biofilm
formation in Salmonella, but differences may be due to different panels of antimicrobials tested or
different serovars/strains. A further limitation of these in vitro studies is that most only study a single
species of biofilms, while most biofilms that are found in the environment are comprised of at least
one bacterial species and are likely to contain different species with differing susceptibilities to AMR
(Srey, Jahid and Has, 2013).
4.3.5 Relationship between growth kinetic parameters and in vitro biofilm formation
The studies reported here found that the biofilm formation was positively correlated with growth rate
and negatively correlated with AUC, carrying capacity (k), doubling rate (tDT), and maximum OD570
value. There were no significant differences in growth rates found between the serovars S. Enteritidis,
monophasic S. Typhimurium, S. Typhimurium, S. Infantis, and S. 13,23:i:- It should be noted that for
the growth curves, the incubation temperature was only able to be controlled to 25±1.5°C, rather than
the 25±1°C used in the crystal violet assay to study biofilm formation. In contrast to the current study,

146
Lianou and Koutsoumanis (2011) found no association between growth rate and biofilm formation for
their Salmonella isolates, including serovars S. Enteritidis, S. Typhimurium, and S. Infantis isolates.
However, they only tested a small number of isolates. In agreement with the findings presented in this
thesis, Diez-Garcia, Capita and Alonso-Calleja (2012) also found strong correlations between biofilm
production and growth kinetics parameters, but in contrast to this chapter, they concluded that this
was because of serovar. Oscar (2007) also observed differences in growth rates between serovars and
found S. Enteritidis isolates to have significantly slower growth rates than S. Typhimurium isolates.
These differences in findings may be partly due to differences in the models used to fit growth curves
and methodology, with Diez-Garcia, Capita and Alonso-Calleja (2012) using incubation temperatures
of 37°C, and differences in isolate panels, with the majority of the panel, used by Diez-Garcia, Capita
and Alonso-Calleja (2012) being S. Enteritidis isolates.
4.4 Conclusion
In conclusion, differences were observed in the phenotypic characteristics of colony morphology, AMR
profile (including MDR) and growth kinetics between the 132 environmental Salmonella isolates.
Some phenotypic characteristics, such as MDR and colony morphology, showed an association with
biofilm-forming ability, this was often associated with temperature or was serovar dependent, with
some isolate-dependent variation also being observed. This suggests that although individual bacterial
characteristics may play a role in the differing biofilm-forming abilities of Salmonella, no specific
bacterial characteristics could be determined. This may be due to either genetic differences between
the isolates, and so genomic analysis of a subset of isolates was undertaken in Chapter 5, or, although
not studied in this thesis, may also be due to difference in gene expression in response to
environmental conditions (i.e., temperature and nutrient availability) as the expression of
transcriptional regulator CsgD, which regulates the production of both cellulose and curli in Salmonella
is influenced by environmental conditions (Gerstel, Park and Romling, 2003; Gerstel and Romling,
2003).

147
Chapter 5 Comparative genomic and phenotypic analysis of biofilm formation, antimicrobial
resistance, and tolerance to quaternary ammonium compounds in environmental Salmonella
isolates
5.1 Introduction
Since becoming more affordable in the early 2000s next-generation sequencing techniques, including
whole-genome sequencing (WGS), have been increasingly used to study bacterial genomes. The
bacterial pangenome is the entire set of genes in a bacterial species and includes those present in all
isolates (core genome) and those only present in some isolates (accessory genome) (Jacobsen et al.,
2011; Sanderson and Nair, 2013). WGS analysis can be used as a tool for the study of bacterial
genomes with phylogenetic analysis allowing for the relatedness of bacteria of the same or different
species to be determined through single-nucleotide polymorphisms (SNPs) and the identification of
serovar using methods such as the Salmonella In Silico Typing Resource (SISTR) tool. Study of the
bacterial genome also allows for the bacterial genotype to be identified and the phenotype predicted
by determining the presence/absence of genes or identification of gene mutations (nucleotide
changes, insertions, or deletions) in genes of interest, for example, genes associated with virulence,
biofilm formation, quorum sensing, surface adhesion, and antimicrobial resistance and biocide
resistance.
The Salmonella genome has been studied in detail, with over 320,000 Salmonella genomes available
on Enterobase (https://enterobase.warwick.ac.uk/) as of November 2021. In particular, the presence
of AMR determinants and the functions of many genes involved in biofilm-associated processes have
been described in Salmonella. However, most studies, such as those by El Hag et al. (2018), Shetty et
al. (2019), and Teplitski, Al-Agely and Ahmer (2006) have used knockout mutants to deduce the
function of genes associated with biofilm formation. Only a few studies, such as those by Lu et al.
(2012) and Yin et al. (2018), have investigated the prevalence of genes associated with biofilm
formation in wild type Salmonella isolates and/or the genetic characterisation of biofilm-forming

148
isolates belonging to serovars other than S. Enteritidis or S. Typhimurium. It has been suggested that
differences found in Salmonella serovars may be related to gene presence or absence and expression
levels of these genes (Andino and Hanning, 2015).
Therefore, this chapter firstly focused on the determination of the prevalence of genes associated
with biofilm formation processes and resistance to antimicrobials and quaternary ammonium
compounds (QACs) in the genomes of Salmonella originating from the environment of pig and poultry
production premises. Secondly, this chapter focused on the predictive ability of WGS for determining
the phenotypic characteristics of biofilm-forming ability and colony morphology. The aims and
objectives of this chapter were:
▪ To study the relatedness of a sub-panel of 93 Salmonella isolates (91 environmental Salmonella
isolates and two biofilm control isolates) through the creation of a phylogenetic tree and the
determination of SNPs distances between isolates belonging to the same serovar.
▪ To determine the prevalence of 38 genes associated with biofilm formation processes among the
sub-panel of 93 Salmonella isolates.
▪ To determine the prevalence of genes associated with resistance to seven classes of antimicrobials
of importance for human and veterinary medicine and to QACs in the 91 environmental
Salmonella isolates.
▪ To compare the predicted AMR and biofilm genotypes obtained through WGS analysis with the
observed phenotype for the 91 environmental Salmonella isolates.
5.2 Results
5.2.1 Phylogenetic analysis
The panel of 93 Salmonella isolates was sequenced as described in Chapter 2, section 2.4.2.
Comparison of the in silico prediction of serovar using SISTR v1.0.2 (as detailed Chapter 2, section
2.4.3.2) with the serotype assigned according to the White-Kauffmann-Le Minor serotyping scheme
(as described in Chapter 2, 2.1.3.1) found that the serovar designation by SISTR matched the serovar

149
obtained through serotyping, except for the 20 isolates belonging to the serovar S. 13,23:i:- which
were identified by WGS as either S. Idikan or S. Kedougou. The phylogenetic tree, created as described
in Chapter 2, section 2.4.3.2 and shown in Figure 5-1, showed clustering of the 93 Salmonella isolates
into four clades according to their respective serovars, with S. Typhimurium and monophasic S.
Typhimurium isolates belonging to the same clade. As described in Chapter 2 (section 2.4.3.2), SNPs
distances between isolates within each Salmonella serovar were calculated with closely related
isolates defined as those with ≤20 SNPs difference, based on the definition given by Jagadeesan et al.
(2019).
All 19 S. Enteritidis isolates, including the two biofilm control isolates 27655R and 27655S, clustered
into a single clade, and all 20 S. 13,23:i:- isolates also clustered into a single clade. The S. Infantis
isolates were clustered into a single clade with two subclades, with 18 isolates in one subclade and
one isolate (S04697-15) in a separate subclade. Most of the isolates within the serovars S. Infantis, S.
Enteritidis, and S. 13,23:i:- were closely related or genetically very similar (just above the 20 SNPs cut-
off value) even when isolated from different premises or at different sampling visits. The range of SNPs
differences calculated between isolates was as follows: S. 13,23:i:- (0-33 SNPs, see Appendix VII [Table
9-7]); S. Infantis (0-28 SNPs, see Appendix VII [Table 9-8]), and S. Enteritidis (0-27 SNPs; see Appendix
VII [Table 9-9]). Within the serovars S. Infantis and S. Enteritidis there were a few isolates that were
distantly related: the two S. Infantis isolates sourced from the same laying hen farm environment were
103-120 SNPs and 581-602 SNPs different from the other isolates in the same serovar, and one S.
Enteritidis isolate (S03579-16) sourced from broiler farm B5 was 65-73 SNPs different from the other
isolates. There were six subclades nested in the S. Typhimurium/monophasic S. Typhimurium clade,
with all the 19 monophasic S. Typhimurium having 0-64 SNPs difference; see Appendix VII (Table 9-
11). While the 16 S. Typhimurium isolates clustered into five subclades and so showed more genetic
variation with only a few isolates collected from within the same premises being closely related having
0-869 SNPs difference; see Appendix VII (Table 9-10).

150
5.2.2 Relationship between biofilm phenotype and the presence of biofilm-associated genes
Screening of all 93 Salmonella isolates for the presence of 38 genes identified in the literature as being
associated with biofilm-related processes (quorum sensing, cellulose synthesis, fimbriae expression,
and the main regulatory genes) and listed in Chapter 2 (section 2.4.3.3.3), detected 28 of these genes
as being present in all 93 Salmonella isolates; see Figure 5-1. These 28 genes were all nine genes
associated with biofilm regulation (glyA, marT, ompR, rpoS, sdiA, seqA and adrA) and quorum sensing
(luxS and sdiA). Six of the seven of the genes controlling cellulose biosynthesis (bcsEFG operon and the
bcsABZC operon) were present in all Salmonella isolates, with the bcsZ gene absent in all isolates. The
genes encoding for curli fimbriae, csgDEFG operon, the csgABC operon, and the fimAICDHF operon
were present in all 93 isolates Although the csgD allele in the S. Enteritidis isolate 27655S only shared
a 99.85% identity with the published sequence as it possessed three point mutations: a single adenine
(A) deletion, guanine (G) to A substitution, and thymine (T) to cytosine (C) substitution; see Appendix
VIII, Figure 9-1.
Genes encoding expression of other types of fimbriae, lpf operon (lpfABCDE) and pef operon (pefBCD,
orf5, orf6), were only detected in some serovars. The lpf operon was present in all monophasic S.
Typhimurium, S. Typhimurium, S. Enteritidis, and S. Infantis isolates but was absent in all S.13,23:i:-
isolates; although the lpfD gene in the lpf operon was present in four of the S. Typhimurium isolates
L00893-18, S00882-18, S02723-17, and S05273-18 with an identity of 99.07% and possessed a deletion
of 10 base pairs; see Appendix VIII, Figure 9-2. The pefBCD operon was only present in S. Enteritidis
isolates and S. Typhimurium isolates and the orf5 and orf6 genes were only present in S. Typhimurium
isolates. The sefD gene, encoding for SEF18 fimbriae, was absent from all 93 isolates.
There did not appear to be any clear association between the biofilm phenotype and genotype with
the presence/absence of some fimbriae genes (which differed between serovars) and the absence of
the cellulose bcsZ gene not directly associated with the observed differences in biofilm formation or
in cellulose or fimbriae expression (indicated by colony morphology); see Figure 5-1.

151
5.2.3 Prevalence of genes associated with tolerance to quaternary ammonium compounds (QACs)
Only the 91 environmental Salmonella isolates in the panel were screened for the presence of nine
genes identified in the literature as the encoding for efflux-pumps associated with tolerance to QACs
(as described in Chapter 2, section 2.4.3.3.2) and five of these genes (qacE, emrE, emrD, smvA, mdfA)
detected in all isolates. The next most prevalent genes were the qacΔE1 and qacF genes, which were
present in 32 isolates (35.2%) and 10 isolates (11.0%), respectively. The qacH and qacL genes were
absent in all isolates. Within the serovar, S. 13,23:i:-, the qacE, emrD, smvA, and mdfA genes present
in all isolates, while the qacEΔ1 gene was only present in two of the 20 S.13,23:i:- isolates (S02757-17
and S02769-17); see Figure 5-1.
5.2.4 Detection of antimicrobial resistance (AMR) determinants
5.2.4.1 Prevalence of AMR genes
The 91 environmental Salmonella isolates were screened for the presence of AMR genes as described
in Chapter 2, section 2.4.3.3.1. The nfsB gene and aac(6')-Ia gene, conferring resistance to nitrofurans
and aminoglycosides, respectively, were detected in all 91 Salmonella isolates. The next most
prevalent resistance genes were aac(6')-Iy (56 isolates, 61.5%) and aph(3'')-Ib (42 isolates (46.2%)
conferring resistance to aminoglycosides. The presence of at least one gene or mutation associated
with quinolone resistance was detected in 53 isolates (58.2%), with PointFinder detecting
chromosomal point mutations, causing amino acid changes, in gryA and parC genes (both encoding
for resistance to quinolones), but no mutations were identified in other genes encoding for resistance
to quinolones (gyrB and parE); see Figure 5-2. The results of the analysis between AMR phenotype
and genotype are presented in Chapter 5, section 5.2.5.
5.2.4.2 Prevalence of genes encoding for mobile genetic elements
Using the APHA SeqFinder database, genes encoding for 19 plasmid replicon types (Col-RNAI, Col440I,
Col440II, Col-156, Col-pVC, Col-8282, RepA, FIA, FIB, FII, HI1A, HI1B, HI2, HI2A, IncAC, IncI1, IncI2,
IncLM, IncQ1) were identified among the panel of 91 environmental Salmonella isolates, with 80
152
isolates (87.9%) possessing at least one plasmid-related gene. The most frequently detected plasmids
were FIB (51 isolates, 56.0%), followed by FII (35 isolates, 38.5%), the Col-RNAI (24 isolates, 26.4%),
Col440I (21 isolates, 23.1%), Col440II (20 isolates, 22.0%), H1A (18 isolates, 19.8%), and H1B (18
isolates, 19.8%), with the other plasmids detected in fewer than 10% of isolates, see Figure 5-3.
The class I integrase-integron Int1 was present in 30 isolates (34%) among the serovars monophasic
S. Typhimurium, S. Typhimurium, S. Infantis, and S. 13,23:i:-, but was absent in all S. Enteritidis isolates;
see Figure 5-3.

153
Figure 5-1: Phylogenetic tree of Salmonella spp. and the presence of biofilm-associated genes. Phylogenetic
tree of 93 Salmonella isolates, rooted to S. Typhimurium strain LT2 (NCBI: txid99287). Biofilm-forming ability
(BF) was evaluated in the crystal violet microplate assay after aerobic incubation 20±1°C or 25±1°C for 48 hours.
Colony morphologies were evaluated after aerobic incubation at 20±1°C or 25±1°C for 96 hours on LB w/o salt
agar plates containing CR and Coomassie brilliant blue. Colonies were classified as RDAR (red, dry and rough),
BDAR (brown, dry and rough), PDAR (pink, dry and rough) or SAW (smooth and white). Genes were absent (white
squares) or present in the bacterial genomes with a 100% identity (dark grey squares) or a 98-100% identity
(light grey squares) to the published gene sequence from NCBI (https://www.ncbi.nlm.nih.gov/).
S. Typhimurium
S. 4,[5],12:i:-
S. Enteritidis
S. Infantis
S. 13,23:i:-

154
Figure 5-2: Phylogenetic tree of Salmonella spp. and the presence of genes associated with AMR and tolerance
to QACs. Core genome SNP phylogenetic tree of 93 Salmonella isolates, rooted to S. Typhimurium strain LT2
(NCBI: txid99287). Phenotypic resistance to seven antimicrobial classes was determined using disk diffusion
based on historical APHA veterinary breakpoints or the BSAC human clinical breakpoints with AMR profile
classified as sensitive (not resistant to any of the 16 antimicrobials), resistant (resistant to one to two
antimicrobial classes) or MDR (resistant to ≥3 antimicrobial classes). AMR genes were absent (white squares) or
present (blue squares) in the bacterial genomes with a ≥98% identity to the gene in one or more of the NCBI
AMRFinderPlus, ResFinder, and APHA SeqFinder databases, or if a chromosomal point mutation was identified
by PointFinder. QAC-tolerance genes were absent (white squares) or present (grey squares) with a ≥98% identity
to the published gene sequence from NCBI (https://www.ncbi.nlm.nih.gov/).
S. 13,23:i:-
S. Typhimurium
S. Enteritidis
S. Infantis
S. 4,[5],12:i:-

155
Figure 5-3: Phylogenetic tree of Salmonella spp. and the presence of genes encoding for plasmids and the class
1 integron-integrase (int1). Core genome SNP phylogenetic tree of 93 Salmonella isolates, rooted to S.
Typhimurium strain LT2 (NCBI: txid99287). Phenotypic AMR profile was classified as sensitive (not resistant to
any of the 16 antimicrobials), resistant (resistant to one to two antimicrobial classes) or MDR (resistant to ≥3
antimicrobial classes). Genes were absent (white squares) or present (grey squares) in the bacterial genomes
with a ≥98% identity to the gene in the APHA SeqFinder database.
S. Typhimurium
S. 4,[5],12:i:-
S. Enteritidis
S. Infantis
S. 13,23:i:-

156
5.2.5 Comparative analysis of AMR phenotype-genotype
To determine the ability of WGS to predict phenotypic AMR, for each isolate, resistance or sensitivity
to antimicrobials using disk diffusion from Chapter 4, 4.2.4, was compared with the presence or
absence of known corresponding AMR gene(s) detected using WGS analysis in Chapter 5, section 5.2.4.
Concordance (the percentage of isolates for which the genotype matched the expected phenotype)
was based on the presence of at least one resistance gene or mutation associated with an AMR class
and phenotypic resistance to at least one antimicrobial in the antimicrobial class. With each database
considered separately, the APHA SeqFinder databases included genes with resistance to all seven
antimicrobial classes of interest (aminoglycosides, amphenicols, ß-lactams, nitrofurans, quinolones,
sulphonamides, and tetracyclines), with an average concordance of 91.9%; see Appendix X, Table 9-
15. The ResFinder databases included genes with resistance to five antimicrobial classes
(aminoglycosides, amphenicols, ß-lactams, sulfonamides, and tetracyclines) with an average
concordance of 88.8%; see Appendix X, Table 9-14. The NCBI AMRFinderPlus database included genes
with resistance to six antimicrobial classes (aminoglycosides, amphenicols, ß-lactams, quinolones,
sulfonamides, and tetracyclines), and an average concordance of 85.9%; see Appendix X, Table 9-13.
The PointFinder database only included genes associated with quinolone resistance and had a
concordance of 91.2%; see Appendix X, Table 9-16.
To allow for comparison between databases, resistance for only the five antimicrobial classes that
were included in all databases (aminoglycosides, amphenicols, ß-lactams, sulfonamides, and
tetracyclines) was taken into consideration. The average phenotype-genotype concordance was
highest for the NCBI AMRFinderPlus (93.0%) database, followed by the APHA SeqFinder (91.9%) and
the ResFinder (88.8%) databases. Overall, across the four AMR databases, phenotype-genotype
concordance varied between the antimicrobial classes with the highest concordance (98.9%) seen
with ß-lactams using the ResFinder, APHA SeqFinder, and NCBI AMRFinderPlus databases and the

157
lowest concordance (16.5%) with nitrofurans using the APHA SeqFinder database; see Appendix X,
Tables 9-13 to 9-16.
The overall concordance, when all the genes identified by NCBI AMRFinderPlus, APHA SeqFinder,
ResFinder, and PointFinder databases were considered together, the concordance was 78.6%, with a
positive predictive value (PPV) of 70.9%, a negative predictive value (NPV) of 92.0%, a sensitivity of
92.4% and specificity of 63.1%; see Table 5-1. For each database considered separately, the PPV
ranged from 15.8% for quinolones for the APHA SeqFinder and NCBI AMRFinderPlus databases to
100% for ß-lactams for the NCBI AMRFinderPlus, ResFinder, and APHA SeqFinder databases. The NPV
ranged from 59.7% for quinolones for APHA SeqFinder and NCBI AMRFinderPlus databases to 98.4%
for ß-lactams for the ResFinder and APHA SeqFinder databases. For the five antimicrobials which were
found in the NCBI AMRFinderPlus, APHA SeqFinder, and ResFinder databases, the average PPV was
highest for NCBI AMRFinderPlus (92.0%), followed by ResFinder (84.5%) and APHA SeqFinder (84.3%);
and for the average NPV, NCBI AMRFinderPlus (92.9%), APHA SeqFinder (90.6%) and ResFinder
(85.9%); see Appendix X, Tables 9-13 to 9-16.

158
Table 5-1: Overall sensitivity, specificity, PPV, NPV, and concordance of AMR phenotype-genotype in
Salmonella. Comparison for 91 environmental Salmonella isolates, between genotypic AMR prediction by WGS
and phenotypic AMR from disk diffusion using historical APHA veterinary breakpoints or the BSAC human clinical
breakpoints. For each antimicrobial class, at least one AMR gene was present in at least one of the AMRFinder,
APHA SeqFinder, ResFinder, and PointFinder databases.
Antimicrobial class
Resistant phenotype
Susceptible phenotype
Sensitivity (%)
Specificity (%)
PPV (%)
NPV (%)
Concordance (%)
AMR gene +
AMR gene -
AMR gene +
AMR gene -
aminoglycosides 48 0 43 0 100.0 0.0 52.7 - 91.2
ß-lactams 30 1 0 60 96.8 100.0 100.0 98.4 98.9
amphenicols 14 2 2 73 87.5 97.3 87.5 97.3 95.6
nitrofurans 15 0 76 0 100.0 0.0 16.5 - 16.5
quinolones 22 10 31 28 96.9 62.7 58.5 97.4 74.7
sulfonamides 41 7 4 39 85.4 90.7 91.1 84.8 87.9
tetracyclines 37 9 4 41 80.4 91.1 90.2 82.0 85.7
overall 30 4 23 34 92.4 63.1 70.9 92.0 78.6
5.3 Discussion
5.3.1 Phylogenetic analysis
Phylogenetic analysis of the panel of 93 Salmonella isolates found these environmental isolates to be
tightly clustered together within their respective serovars. Most of the isolates within the serovars S.
Infantis, S. Enteritidis, and S. 13,23:i:- were closely related (≤20 SNPs) or genetically very similar (just
above the 20 SNPs cut-off value) even when isolated from different premises or at different sampling
visits. The presence of closely related bacteria within the same production premises over time
suggests that they are likely to be persisting in the environment. For example, the 20 S. 13,23:i:-
isolates recovered from the same hatchery over a four-year period were very closely related (≤20
SNPs) with no changes observed in the presence of the biofilm genes studied (see Figure 5-1) during
this time and only a few changes in the presence of AMR genes, but this was not observed to differ
between sampling visits and appeared to be isolate-specific. Therefore, this serovar is highly likely to
be persisting in hatchery H1, including as biofilm, especially as almost all isolates were identified as

159
strong biofilm producers and gross surface biofilm remained visible on several surfaces sampled after
C&D. This finding is also supported by the known epidemiological situation relating to this hatchery,
and other publications are in preparation that will present this data (Newton et al., 2022, in
preparation). It is worth noting that in the literature, there are no clearly defined SNP cut-off values
relating to clonality, and these range from 0 -30 SNPs, so there can be some ambiguity in the definition
of closely related Salmonella (Gymoese et al., 2017). In this thesis, a threshold value of 20 SNPs was
applied for closely related isolates as this approach had been shown previously by Wang et al. (2018)
and Jagadeesan et al. (2019) to be relevant for closely related Salmonella in the food production
environment.
Salmonella In Silico Typing Resource (SISTR) which uses several additional sequence-based typing
analyses of Multi-Locus Sequence Typing (MLST), ribosomal MLST (rMLST), and core genome MLST
(cgMLST) to derive the serovar based on genetic associations (detection of genetic differences in
somatic and flagellar determinants for antigen and serovar prediction) (Yoshida et al., 2016) was found
to be able to accurately predict serovar compared to the gold standard method of serotyping for the
serovars S. Enteritidis, S. Infantis, S. Typhimurium, and monophasic S. Typhimurium. However, as it
was unable to type S. 13,23:i:- isolates correctly, which is a known limitation of the current version of
the pipeline due to being unable to differentiate between monophasic and biphasic S. Kedougou and
S. Idikan isolates. Therefore, as S. 13,23:i:- isolates cannot be correctly identified without further
bioinformatic analysis, WGS is currently not a suitable alternative to conventional serotyping for
identification of this Salmonella serovar, although validated further analytical refinements to the
pipeline will be implemented in future (personal communication with Yue Tang, APHA).
5.3.2 Relationship between biofilm phenotype and the presence of biofilm-associated genes
The presence of genes associated with regulation of biofilm formation (glyA, marT, ompR, rpoS, sdiA,
seqA, adrA, and csgD) and quorum sensing (luxS and sdiA) in all 93 Salmonella isolates is not surprising
as 92 of 93 isolates had been previously characterised in this thesis (Chapter 3) as possessing the ability
160
to form biofilms in vitro, and these genes are readily identified in the literature as being associated
with key processes in biofilm formation and being present in biofilm-forming Enterobacteriaceae,
including Salmonella (Ćwiek et al., 2020; De Oliveira, Brandelli and Tondo, 2006; Uğur et al., 2018; Yin
et al., 2018). However, it is interesting that these same genes were also present in isolate S05273-18
(S. Typhimurium), which did not form a biofilm. Two of these genes (adrA and csgD) have also been
reported by De Oliveira, Brandelli and Tondo (2006) to be present in non-biofilm-forming Salmonella,
so it may be that in non-biofilm forming Salmonella that these genes are present but are non-
functional or poorly expressed.
There was no clear relationship between biofilm phenotype-genotype identified in this chapter. The
expression of colony morphologies associated with cellulose and fimbriae biosynthesis and degree of
biofilm formation by the Salmonella isolates varied according to incubation conditions and could not
be clearly attributed to the absence of biofilm genes. Therefore, either genes and mechanisms
involved in biofilm formation are present in different serovars that were not studied here, or the
differences in biofilm formation observed are due to differences in the transcription of biofilm-
associated genes (if present in the bacterial genome) under different environmental conditions. For
example, two S. Typhimurium isolates (S05273-18 and L0893-18) were weak or non-biofilm producers
in the crystal violet microplate assay with point mutations being observed in the lpfD gene, one of
several genes encoding for the synthesis of lpf. As this gene was present and complete in almost all
the other S. Typhimurium isolates which were moderate and strong biofilm producers, it was initially
suggested that this might explain the observed difference in biofilm-forming ability. However, both
these isolates showed variable fimbriae expression with both the BDAR and SAW morphotypes
produced, and another two S. Typhimurium isolates (S00882-18 and S02723-17) also possessed the
same mutation in the lpfD gene but did not show reduced biofilm-forming abilities. A similar mutation
(an insertion of 10 bp) was identified in this gene by Bawn et al. (2020) in poultry-associated S.
Typhimurium isolates and suggested that the disruption of the lpfD gene did not impair its function.

161
The isolate 27655S possessed a mutation in the csgD gene, was a weak biofilm producer and displayed
the SAW morphotype, and it is likely that the function of the csgD, which is a global regulator for
biofilm formation, cellulose synthesis, and fimbriae expression, was disrupted by this mutation (i.e.,
not transcribed) although this could not be proven without transcriptomics studies. It is well
researched in S. Typhimurium that the transcription of the global regulator CsgD is affected by factors
such as nutrient availability and temperature with maximal expression at temperatures below 30°C
and when nutrient availability is limited (Gerstel, Park and Romling, 2003; Gerstel and Romling, 2003;
Steenackers et al., 2012). Therefore, colony morphology on agar plates is likely influenced by the
nutrient composition of the agar and the incubation temperature. As the expression of curli fimbriae
is regulated by the CsgD protein, their expression is also temperature-dependent. For example, SEF14
Fimbriae are not expressed at 37°C but are expressed at 20°C, while the opposite is true for SEF17
fimbriae (Austin et al., 1998; Dibb-Fuller et al., 1997; Walker et al., 1999; Woodward et al., 2000). This
may result in the difference in the behaviour of organisms under different experimental conditions,
as well as in the natural and agricultural environment.
Importantly, the presence of key genes involved in biofilm formation in serovars other than S.
Typhimurium and S. Enteritidis provides valuable information as it suggests that there are similar
genetic mechanisms of biofilm formation between different serovars. Additionally, although not all
types of fimbriae were expressed by different Salmonella serovars, this does not appear to affect their
ability to form biofilms, with all serovars containing some isolates that were strong biofilm producers,
and this finding is not unexpected as these genes have been mainly studied in S. Enteritidis and S.
Typhimurium. The absence of the sefA gene, encoding for SEF14 fimbriae, in serovars monophasic S.
Typhimurium, S. Infantis, and S. 13,23:i:- is not unexpected as this gene has only previously been
detected in group D serovars such as S. Enteritidis (Amini et al., 2010; Turcotte and Woodward, 1993).
Similarly, the sefD gene, encoding for SEF18 fimbriae, has previously only been detected in group D
serovars (Morales et al., 2012), while studies in this thesis found that it was absent from all 93 isolates,

162
including S. Enteritidis. Both lpf and pef contribute to the early steps of biofilm formation (Peng, 2016).
The variability in the occurrence of other fimbriae genes among different Salmonella serovars is
corroborated by other studies, with Rahman, Prager and Tschape (2000) also finding the presence of
both sets of genes in all S. Enteritidis isolates while in S. Typhimurium, only the pef operon genes were
present. Further work to determine the relationship between biofilm-associated genes and colony
morphology and biofilm-formation would be to use Genome-wide association studies (GWAS) which
uses genomes from multiple strains within a population to identify genomic elements that are
statistically associated with a given phenotype or environmental condition (Read and Massey, 2014).
5.3.3 Prevalence of AMR determinants and QAC tolerance genes
At least one gene associated with resistance to antimicrobials of importance to human and veterinary
medicine was identified in all isolates in the panel of 91 Salmonella environmental isolates. This
included multiple genes/mutations associated with quinolone resistance which are HP-CIAs, and
although these genes have also been detected in Salmonella (Monte et al., 2019; Srisanga et al., 2017;
Tassinari et al., 2019) the lack of point mutations in the gyrB and parE genes is expected as mutations
in these genes are rare in all Salmonella serovars in countries where agricultural usage of quinolones
is low. The prevalence of Int1 (34%) in Salmonella in this thesis was similar to the prevalence found by
other studies of 28.3% (Gargano et al., 2021) and 36% (Asgharpour et al., 2014) and plays a role in the
movement of resistance genes in bacteria.
In the S. 13,23:i- isolates, the qacEΔ1 gene was only present in the two isolates (S02757-17 and
S02769-17) that were weak biofilm producers, and this may explain their survival in the environment
despite poor biofilm-forming abilities. Along with qacL, genes associated with the SMR and MFS efflux
pump expression were also identified in other environmental Salmonella isolates studied in this thesis,
which is not surprising as they have been detected in other Enterobacteriaceae such as Escherichia
coli (Gillings, Holley and Stokes, 2009; Zou et al., 2014) as well as Salmonella (Slipski, Zhanel and Bay,
2018). These multidrug resistance efflux pumps may not be specific to QACs, and their expression may
163
aid the efflux of other antimicrobials such out of the bacterial cell. Along with genes encoding for AMR,
they are often located on plasmids and integrons. Therefore, the presence of these genes, along with
genes encoding for plasmids and integrons as found in this chapter, is of concern as it can lead to the
rapid co-dissemination of antimicrobial and disinfectant resistance genes amongst bacteria in the pig
and poultry industries, especially in strains that are biofilm formers. However, this did not appear to
be the case with the qacEΔ1 gene or genes encoding for quinolone resistance as the qacEΔ1 gene was
only present in two of the give total S. 13,23:i:- isolates sourced from the environment of the same
hatchery over a four year period and genotypic and phenotypic resistance to quinolones was not
widely observed despite three isolates showing phenotypic resistance to nalidixic acid and or
ciprofloxacin.
5.3.4 Analysis of AMR phenotype-genotype associations
The AMR phenotype-genotype concordance varied between the AMR databases and was dependent
on the antimicrobial class, ranging from a low of 16.5% for nitrofurans to 98.9% for ß-lactams, with
the overall concordance for each database being 88.8% for ResFinder, 85.9% for NCBI AMRFinderPlus,
and 91.9% for APHA SeqFinder. These values are lower than the phenotype-genotype concordances
found by other authors of >95% (Bortolaia et al., 2020) and 99.74% in pig-associated Salmonella
(Zankari et al., 2013) for ResFinder, 98% for NCBI AMRFinderPlus, and 99% for APHA SeqFinder
(Stubberfield et al., 2019). Discrepancies may be due to differences in the phenotypic AMR tests used
with different antimicrobials or cut-off values used to determine resistance as some resistance genes
may confer reduced susceptibility to but not at a high enough level to qualify as resistant
(Boolchandani, D'Souza and Dantas, 2019; Bortolaia et al., 2020; Feldgarden et al., 2019; Stubberfield
et al., 2019).

164
5.4 Conclusion
In conclusion, genotypic characterisation of the panel of Salmonella isolates in this chapter identified
the presence of a wide range of genes associated with tolerance to antimicrobial and tolerance to
QACs as well as the presence of plasmids and integrons, which, combined with the biofilm-forming
abilities of these isolates, has potential for the dissemination of AMR genes in the environment. The
Salmonella isolates were found to be genetically very similar in terms of the prevalence of biofilm
genes, mainly serovar-specific differences in fimbriae, and there was no clear correlation between
biofilm phenotype-genotype. Mutations were identified in the csgD or lpfD genes of a small number
of isolates, and this may be associated with decreased biofilm-forming abilities in Salmonella, but this
cannot be confirmed without further genomic analysis. As these findings suggest that the differences
of in vitro biofilm-forming ability observed may be due to differences in gene transcription, rather
than genomic differences between isolates, further interrogation of genomes of Salmonella isolates
to identify more genes associated with biofilm and the extension of studies to include transcriptomics
would be beneficial.

165
Chapter 6 In vitro models for studying Salmonella biofilm formation and tolerance to disinfectants
6.1 Introduction
Salmonella 13,23:i:- was one of the top three serovars isolated from broiler chicken flocks and
hatcheries in GB during the study period [2015-2018](APHA, 2019). Hatcheries are an important
source of Salmonella for the rest of the poultry industry, and serovars, including S. 13:23:i- have been
reported to persistently colonise the hatchery environment. Salmonella has been demonstrated to
form biofilms on a diverse range of abiotic surface materials that can be found in the hatchery
environment, including eggshells (Pande, McWhorter and Chousalkar, 2016), cement (Adetunji and
Odetokun, 2012; Joseph et al., 2001), PVC (De Oliveira et al., 2014) and stainless steel (Giaouris and
Nychas, 2006; Joseph et al., 2001; Møretrø et al., 2009).
Cleaning and disinfection (C&D) of hatchery equipment, using disinfectants such as peroxygens,
aldehydes, and quaternary ammonium compounds (QACs), occurs regularly in-between batches of
eggs and chicks, with formaldehyde also used for fogging eggs in the hatchers (Avigen Turkeys Ltd,
2015a; Gosling et al., 2017). Tray washers, macerators, hatcher incubators, and drains are some of the
areas at particular risk of Salmonella contamination and biofilm formation due to the presence of
potentially contaminated organic matter such as eggshells, dust, and chick fluff and their poor
accessibility for C&D (Bailey et al., 2001; Cason, Cox and Bailey, 1994; Cox, Berrang and Cason, 2000;
Davies and Breslin, 2004; Milanov et al., 2017; Withenshaw et al., 2021). Additionally, bacteria in
biofilms are more resistant to biocides than bacteria in a planktonic state, requiring higher
concentrations and longer contact times to be bactericidal (Buckingham-Meyer, Goeres and Hamilton,
2007; Chylkova et al., 2017; Langsrud et al., 2003). However, the resistance to disinfectants that
biofilms show is considered to be a disinfectant tolerance as the bacteria's susceptibility to the
disinfectant can be reduced or lost once the bacteria are released from the biofilm and revert to a
planktonic state (González-Rivas et al., 2018; Korber et al., 1997; Russell, 1999).

166
There is no universal test for assessing the efficacy of disinfectants against planktonic or biofilm
bacteria. However, several well-defined standards exist for testing disinfectants against bacteria in the
planktonic state, including Defra General Orders (GO) test and the quantitative suspension test (EN
1656:2019) (Wales et al., 2021). Although there are many published methods for testing disinfectants
against bacteria in a biofilm, only a few, such as the MBEC Assay® (ASTM E2799) and the CDC Biofilm
Reactor® (ASTM E2871/E3161), are standardised. However, these methods have high initial costs for
the equipment and consumables, and they also have some limitations in terms of the environmental
conditions, such as surface materials on which biofilm formation can be assessed. Therefore, other
biofilm models are often used in literature for disinfectant testing, such as the BOAT assay, published
by Grønseth et al. (2017) and the biofilm surface test published by Vestby and Nesse (2015). The
studies detailed in this chapter focused on adapting these two published biofilm methods to make
them applicable for use in studies of Salmonella biofilm formation in the poultry industry with the aim
to address knowledge gaps regarding the disinfectant tolerance of the emerging serovar S. 13,23:i:-
which has not previously been studied. The aims and objectives of this chapter were:
▪ To compare the performance of three published methods for removing biofilms from porous
(poplar wood), semi-porous (screed), and non-porous (polyvinyl chloride [PVC] and stainless steel)
coupons using bacterial cell enumeration and visualisation methods (scanning electron
microscopy and dye staining).
▪ To modify the biofilm surface test published by Vestby and Nesse (2015) and use it to test the
effectiveness of a potassium peroxymonosulfate-based disinfectant against S. Enteritidis biofilms
formed on poplar wood coupons, screed coupons, PVC coupons, and stainless steel coupons.
▪ To modify the Biofilm-oriented antiseptic test (BOAT) and the biofilm bactericidal test methods
published by Grønseth et al. (2017) and use them to determine the disinfectant tolerance of two
commercial disinfectant products (a Benzalkonium chloride (BZK)-based disinfectant and a
quaternary ammonium compound (QAC)-/glutaraldehyde-based combination disinfectant)
against a sub-panel of 12 S. 13,23:i:- environmental hatchery-associated isolates.
167
▪ To use the adapted biofilm surface test to determine the effectiveness of a QAC- and
glutaraldehyde-based combined disinfectant product at Defra GO rate after the recommended
contact time (30 minutes) and after an extended contact time (3 hours) against biofilms of one S.
13,23:i:- isolate formed on poplar wood coupons, screed coupons, PVC coupons, and stainless
steel coupons.
6.2 Results
6.2.1 Adaptation of the biofilm surface test
6.2.1.1 Comparative evaluation of methods for removing biofilms formed on porous, semi-porous,
and non-porous coupons
The performance of three biofilm removal methods from published literature to remove biofilms from
porous (poplar wood), semi-porous (screed), and non-porous (polyvinyl chloride [PVC] or stainless
steel) coupons were compared in the biofilm surface test as described in Chapter 2, section 2.5. These
three methods were using a cell scraper (section 2.5.3.3), sonication (section 2.5.3.2), and vortexing
with glass beads (section 2.5.3.1). Although none of the three methods were able to remove the entire
biofilm from the coupon surface, the vortexing with glass beads method had the best performance
and so was selected for use in the adapted biofilm surface test in this chapter, while the cell scraper
method consistently performed the worst. Although there was no overall significant difference
(Kruskal-Wallis test, p-value=0.71) in CFU counts between the sonication method or vortexing with
glass beads method, the vortexing with glass beads method showed less variation in CFU counts, see
Table 6-1. The vortexing with glass method recovered higher median log CFU/cm2 counts from
stainless steel coupons and PVC coupons than sonication, but this was not statistically significant (see
Figure 6-1) but showed less variation (i.e., smaller standard deviation) than the sonication method
(see Table 6-1). Vortexing with glass beads was also observed, using 1% crystal violet and/or 1% TTC
dye staining, to remove more biofilm biomass and viable bacteria from the PVC coupons, stainless
steel coupons, and screed coupons than the sonication method, but was not able to remove the entire

168
biofilm from the coupon surface. Due to background staining, it was difficult to observe the viable
bacteria on the poplar wood coupons; Appendix XI, Table 9-17.
Table 6-1: Comparison of the quantity of biofilm recovered from coupons using different biofilm removal
methods. Mean log10 CFU/cm2 counts recovered from S. Enteritidis (isolate 27655R) biofilms formed on coupons
using three biofilm removal methods. Biofilms were formed after aerobic incubation for 48 hours 20±1°C in LB
broth w/o salt. The experiment was performed on three separate occasions with two technical replicates.
Significant differences (Kruskal-Wallis test with post hoc Dunn’s test, p-value<0.05) differences in CFU counts
between coupons are labelled with a different letter with each method considered separately.
SD = standard deviation.
The numbers of biofilm cells recovered from each type of coupon varied depending on the type of
biofilm removal method used with the lowest CFU counts recovered from the screed coupons for all
methods; however, this was only significant for the vortexing with glass beads and sonication
methods, and not when using the cell scraper method (Kruskal-Wallis test, p-value=0.06); see Table
6.1. The performance of each biofilm removal method varied between the different coupons.
Although the vortexing with glass beads method was most effective for removing viable bacteria from
the PVC coupons and screed coupons, the sonication method was the most effective for the poplar
wood coupons, and for the stainless steel coupons there was no significant difference (Kruskal-Wallis
test, p-value=1) in CFU counts between the sonication and the vortexing with glass beads methods;
see Figure 6-1. However, the cell scraper method removed significantly fewer biofilm bacteria from
all four surfaces than either the sonication or vortexing with glass beads methods, removing an
average of log 0.7 to log 1.6 fewer CFU/cm2; see Table 6-1. When coupons subjected to the cell scraper
method were stained with 1% crystal violet dye and/or 1% TTC dye, it was observed that although this
Coupon Mean ±SD log10 CFU/cm2
Vortexing with glass beads method Sonication method Cell scraper method
poplar wood 7.7 ±0.2a 8.1 ±0.2a 6.5 ±0.3
PVC 7.9 ±0.2a 7.5 ±0.3ab 6.3 ±0.6
screed 7.0 ±0.2b 6.8 ±0.3b 6.1 ±0.3
stainless steel 7.6 ±0.2ab 7.6 ±0.2ab 6.7 ±0.2

169
method disrupted the biofilm biomass, viable bacteria were spread across the surface of the coupon
rather than being removed; see Appendix XI, Table 9-17.
Figure 6-1: Comparison of the quantity of biofilm recovered from coupons using different biofilm removal
methods. Log CFU/cm2 of S. Enteritidis (isolate 27655R) recovered from biofilms formed on poplar wood
coupons, PVC coupons, screed coupons, or stainless coupons using either cell scraper, sonication or vortexing
with glass beads methods. Biofilms were formed after aerobic incubation for 48 hours 20±1°C in LB broth w/o
salt. The solid black line shows median log CFU/cm2. Significant differences (Kruskal-Wallis test with post hoc
Dunn’s test, p-value<0.05) in log CFU/cm2 counts between methods are labelled with a different letter with each
coupon considered separately. The experiment was performed on three separate occasions with two technical
replicates.
Using scanning electron microscopy (SEM), as described in Chapter 2, section 2.5.5.2, the presence of
biofilm structures, including EPS matrix and adhered single bacteria were observed on all four
coupons, see Appendix XII. However, the structure, thickness, and distribution of the biofilm control
isolate 27655R biofilm differed depending on the surfaces. On the PVC coupons (Appendix XII, Figure
9-5) and stainless steel coupons (Appendix XII, Figure 9-6) the biofilm was observed to be thickest
where it had formed on the coupon at the air-liquid interface (due to the coupons being partially
submerged in broth during incubation) with small clusters of biofilm structures or adhered single
a
b
b ab
a
ab
b
a
ab
b a
ab
170
bacteria sporadically across the rest of the coupon, while on the poplar wood coupons (Appendix XII,
Figure 9-4) there was a thick homologous biofilm across the entire coupon surface, running along the
grain of the wood. Despite the screed coupons having a rough surface with narrow cracks, bacteria
were not observed to reside in these. The SEM images also showed that, although the vortexing with
glass beads method was able to dislodge most of the adhered biofilm and bacterial cells, small clusters
of biofilm cells and adhered bacteria remained on all four coupons as seen with the 1% crystal violet
dye and/or 1% TTC staining; see Appendix XI, Table 9-17.
6.2.1.2 Evaluation of the efficacy of a potassium peroxymonosulfate-based disinfectant against S.
Enteritidis biofilms
To test the adapted biofilm surface disinfectant test method, the efficacy of a commercial potassium
peroxymonosulfate (POMS)-based disinfectant was assessed. The general usage concentration of 1
part product to 100 parts WHO hard water with a 30-minute contact time at room temperature was
tested against S. Enteritidis biofilms formed on poplar wood coupons, PVC coupons, screed coupons,
and stainless steel coupons was determined as described in Chapter 2, section 2.5.6. The POMS-based
disinfectant gave a median ≥5-log reduction in CFU/cm2 counts compared to the saline control on the
PVC coupons and stainless steel coupons, but it was not effective, i.e., it was not able to produce a ≥5
log reduction in bacteria against biofilms formed on poplar wood coupons; see Figure 6-2. The efficacy
of the POMS-based disinfectant was very variable; for some replicates, the disinfectant demonstrated
bactericidal activity against biofilms formed on the PVC coupons, screed coupons, and stainless
coupons, while at other times, there was a less than a 5-log reduction in CFU/cm2 counts. VBNC bacteria
were recovered after coupons were incubated in a recovery broth (LB broth) overnight from the
screed coupons and the poplar wood coupons. There was no statistically significant difference
(Kruskal-Wallis test, p-value=0.193) in the number of bacteria recovered after exposure to the POMS-
based disinfectant between the four types of coupon surfaces.

171
Figure 6-2: Effectivity of a POMS-based disinfectant against Salmonella biofilms formed on coupons. Log
CFU/cm2 of S. Enteritidis (isolate 27655R) recovered from biofilms after exposure to either a saline control or a
POMS-based disinfectant at Defra GO rate for 30 minutes at room temperature. Biofilms were formed on poplar
wood coupons, PVC coupons, screed coupons, or stainless steel coupons after aerobic incubation at 20±1°C for
48 hours in LB broth w/o salt. Coloured dots indicate the activity of the disinfectant either being bactericidal
(blue dots) or not bactericidal (red dots). The solid black line shows median log10 CFU/cm2. The experiment was
performed on three separate occasions with two technical replicates.
6.2.2 Evaluation of the disinfectant tolerance of persistent S. 13,23:i:- isolates sourced from the
environment of a broiler hatchery
Twelve S. 13,23:i:- isolates from the environment of a single GB broiler hatchery collected over a
period of four years were evaluated for their tolerance to two commercial disinfectants: a BZK-based
disinfectant and a QAC-/glutaraldehyde-based combination disinfectant, each at two concentrations.
6.2.2.1 The biofilm-oriented antiseptics test (BOAT) and biofilm bactericidal test methods
The metabolic activity of bacterial cells after exposure to each commercial disinfectant was
determined using a modified version of the BOAT method and biofilm bactericidal test published by
Grønseth et al. (2017) as described in Chapter 2, section 2.6. All twelve S. 13,23:i:- isolates showed
tolerance to both the BZK-based disinfectant and the QAC-/glutaraldehyde-based disinfectant, with
less tolerance observed to the QAC-/glutaraldehyde-based disinfectant than to the BZK-based

172
disinfectant. Variation in disinfectant tolerance was observed between the 12 isolates; see Appendix
XIII, Table 9-18 and Table 9-19.
When exposed to the BZK-based disinfectant at both the general usage and the Defra GO rates, the
metabolic activity of the bacteria was significantly higher than for bacteria exposed to the WHO hard
water control. However, for the bactericidal biofilm test, the same trend was not observed, see Table
6-2. Overall, the BZK-based disinfectant at general usage concentration, which was used in the
hatchery at the start of the sampling period, showed no reduction in metabolic activity against nine
of the 12 S. 13,23:i:- isolates and showed some bacteriostatic activity against the other isolates. While
even at the Defra GO rate, the disinfectant was only slightly more effective, with no metabolic activity
shown against three isolates and having bacteriostatic activity against the other nine isolates.
Metabolic activity was significantly reduced following exposure to the QAC-/glutaraldehyde-based
product at the Defra GO rate, while at Defra DoP concentration, there was no significant (Kruskal
Wallis test, p-value=0.633) reduction in metabolic activity, see Table 6-2. At the Defra GO rate, there
was a bactericidal effect demonstrated for at least one biological replicate for ten of the 12 S. 13,23:i:-
isolates, excluding isolates S02757-17 and S02769-17 where VBNC bacteria were recovered. Isolate
S03363-15 was identified as showing the highest tolerance to the disinfectant as it demonstrated the
lowest median reduction in metabolic activity compared to the WHO hard water control; see Figure
6-3.

173
Table 6-2: Bactericidal activity of a BZK-based disinfectant and a QAC-/glutaraldehyde-based disinfectant against S. 13,23:i:- biofilms. Summarised results from the BOAT
and biofilm bactericidal test methods showing the disinfectant tolerance of twelve S. 13,23:i:- biofilms after exposure to a BZK-based disinfectant or a QAC-/glutaraldehyde-
based disinfectant, each at two concentrations for 30 minutes at 25±1°C. Biofilms were formed in microplates after aerobic incubation at 25±1°C for 48 hours in LB broth
w/o salt. The experiment was performed on three separate occasions with three technical replicates.
Dilution figures given are parts of WHO hard water per 1 part of the product. No. = the number of replicates. Significant differences (Kruskal-Wallis test with post hoc Dunn’s
test) are labelled with a different letter, with each test considered separately. Defra GO = Defra General Orders rate, Defra DoP = Defra Diseases of Poultry rate. *One
replicate was excluded as absorbance measurement above plate reader limit of 4 OD. Three biological replicates with three technical replicates were performed, excluding
the QAC-/glutaraldehyde-based disinfectant at DoP rate where only two biological replicates were performed.
Product Concentration Dilution BOAT Biofilm bactericidal test
No.
Median OD490nm
Min. OD490nm
Max. OD490nm
Bactericidal replicates
WHO hard water - - 107* 2.693c 2.041 3.662 0/108
BZK-based disinfectant general usage 100 107* 3.175a 0.000 3.693 1/108
Defra GO rate 10 108 3.036b 0.000 3.866 4/108
QAC-/glutaraldehyde-based disinfectant DoP rate 49 72 2.839c 0.000 3.579 21/72
Defra GO rate 33 108 0.036d 0.000 3.653 42/108

174
Figure 6-3: Reduction in metabolic activity by a BZK-based disinfectant and a QAC-/glutaraldehyde-based disinfectant against S. 13,23:i:- biofilms. Percentage reduction
in metabolic activity by twelve S. 13,23:i:- biofilms compared to the WHO hard water control after exposure to either a BZK-based disinfectant (stronger dilution = Defra
General Orders [GO] rate, weaker dilution = general usage concentration) or a QAC-/glutaraldehyde-based disinfectant (stronger dilution = Defra Diseases of Poultry [DoP]
rate, weaker dilution = Defra GO rate) for 30 minutes at 25±1°C. Biofilms of 12 S. 13,23:i:- isolates were formed in microplates after aerobic incubation for 48 hours in LB
broth w/o salt at 25±1°C. The activity of the disinfectant was determined using results from both the Biofilm-oriented antiseptic test (BOAT) and biofilm bactericidal test
methods. BOAT: number of technical replicates with a 100% reduction in metabolic activity compared to the WHO hard water control. Biofilm bactericidal test: number of
technical replicates with no bacterial re-growth after aerobic incubation for 24 hours in LB broth at 37±1°C. Three biological replicates with three technical replicates were
performed, excluding the QAC-/glutaraldehyde-based disinfectant at DoP rate where only two biological replicates were performed.

175
6.2.2.2 Biofilm surface disinfectant test
The effectiveness of a QAC-/glutaraldehyde-based disinfectant at Defra GO rate against biofilms
formed by S. 13,23:i:- isolate S03363-15 on poplar wood coupons, screed coupons, PVC coupons, or
stainless steel coupons was determined after the recommended contact time of 30 minutes and after
an extended contact time of 3 hours, as described in Chapter 2, section 2.5.6.
After a 30-minute contact time, the QAC-/glutaraldehyde-based disinfectant was successful in causing
a greater than 5-log reduction in CFU counts compared to the WHO hard water control on the PVC
coupons, stainless steel coupons, and screed coupons, but was only able to inactivate organisms
within biofilms formed on the PVC coupons. A 3-hour contact time was required to fully inactivate
organisms within biofilms formed on the stainless steel coupons, while for the screed coupons, VBNC
bacteria were still recovered after 3 hours of disinfectant exposure. The QAC-/glutaraldehyde-based
disinfectant was ineffective against biofilms formed on poplar wood coupons after a 30-minute
contact time, with a 3-hour contact time required to achieve a greater than 5-log reduction in bacteria,
but organisms within biofilms were not fully inactivated, see Figure 6.4.
There was only a significant (Mann-Whitney U test, p-value<0.05) decrease in the number of bacteria
recovered from the poplar wood coupons between 30-minute and 3-hour contact times with five out
of the six replicates recovering no bacterial counts. For the screed coupons, there was no significant
difference (Mann-Whitney U test; p-value=0.405) in the number of bacteria recovered coupons after
a 3-hour contact time, although it was biological relevant with no bacterial counts recovered from
screed coupons after a 3-hour contact time compared to five out of six replicates after a 30-minute
contact time. The PVC coupons and stainless steel coupons were not analysed as no bacteria were
recovered. There was no difference (Kruskal-Wallis test, p-value<0.05) in the bacterial counts
recovered from the surface coupons after a 3-hour contact time as all replicates from the poplar wood
coupons recovered no countable bacteria.

176
Figure 6-4: Comparative evaluation of the effectivity of a QAC-/glutaraldehyde-based disinfectant against Salmonella biofilms formed on coupons after a 30-minute and
3-hour contact time. Median log CFU/cm2 of the S. 13,23:i:- isolate S03363-15 recovered from biofilms after exposure to either a WHO hard water control or a QAC-
/glutaraldehyde-based disinfectant at Defra GO rate at 25±1°C for either 30 minutes or 3 hours. Biofilms were formed on poplar wood coupons, PVC coupons, screed coupons,
or stainless steel coupons after aerobic incubation at 25±1°C for 48 hours in LB broth w/o salt. Coloured dots indicate the activity of the disinfectant either being bactericidal
(blue dots) or not bactericidal (red dots). The solid black line shows median log CFU/cm2 recovered. The experiment was performed on three separate occasions with two
technical replicates.

177
6.3 Discussion
In this chapter, the BOAT method and the adapted biofilm surface test were used to evaluate the
effectiveness of commercial disinfectant products against Salmonella biofilms. These methods were
both static biofilm models, each using a different method for assessing the inhibitory effect of the
disinfectant compounds in semi-quantitative and quantitative terms, respectively, and the advantages
and limitations of each method for assessing disinfectant efficacy against biofilms will be discussed.
6.3.1 The disinfectant tolerance of persistent S. 13,23:i:- isolates sourced from the environment of
a broiler hatchery
To the best of our knowledge, the study in this chapter is the first to assess the tolerance of S. 13,23:i:
biofilms to disinfectants and evaluate the efficacy of an extended disinfectant contact time of 3 hours.
The S. 13,23:i:- isolates tested in this study were associated with persistent Salmonella contamination
over several years in a GB hatchery and were not able to be entirely eradicated during the study
period, despite changes to the C&D regime (Newton et al., 2021, under review). The main findings
from the two disinfectant tests conducted in this chapter were that all twelve Salmonella isolates
tested showed disinfectant tolerance, with the BZK-based disinfectant being unable to eliminate two-
day-old S. 13,23:i:- biofilms. While the QAC-/glutaraldehyde-based disinfectant showed variable
effectiveness, with its biocidal activity being dependent on the material on which the biofilm was
formed and the disinfectant contact time. The findings from this chapter suggest that the persistence
of S. 13,23:i- in the hatchery environment may be facilitated by biofilm formation among other
mechanisms. Therefore, recommendations for Salmonella control would ideally be to use a higher
concentration (Defra GO rate, 3%) of the QAC-/glutaraldehyde-based disinfectant, combined with a
three-hour contact time, as this is likely to be more effective for elimination of Salmonella, by causing
a ≥5-log reduction as shown in Figure 6-4. However, as higher concentrations (>3%) of this disinfectant
produce noxious fumes, just using a longer contact time is a more practical suggestion, although this
is not possible for incubators that are typically cleaned (imperfectly), power washed with detergent

178
(with no drying time therefore diluting and possibly interfering with the activity of the subsequent
disinfectant) and disinfected within a one to two hour period before refilling with eggs. In situations
where Salmonella is established, such routine procedures are inadequate, and incubator rooms should
be removed from production for a longer period to allow effective C&D, but this is rarely possible for
commercial reasons.
The BZK-based disinfectant, at the lower concentration of 1% (general usage concentration, 0.01%
active ingredient), was used in the hatchery's C&D regime at the start of the study period in 2015. All
12 S. 13,23:i:- isolates sourced from the hatchery showed tolerance to this disinfectant at both
concentrations even when the disinfectant was used at a higher concentration of 10% (Defra GO rate,
0.1% active ingredient). This suggests that the concentration used in the hatchery at the start of the
study was at a sub-lethal level, but the 10% Defra GO rate recommended for Salmonella is considered
too costly and creates slip hazards for hatchery workers. The use of sub-lethal levels of BZK has been
reported to induce disinfectant tolerance in Salmonella (Mangalappalli-Illathu and Korber, 2006) and
enhance the biofilm-forming abilities of these isolates. Studies by Capita et al. (2019) and Rodríguez-
Melcón et al. (2019) observed that although BZK can be effective against 24-hour old Salmonella
biofilms when used at sufficiently high concentrations, exposure to sub-lethal concentration of BZK
induces biofilm formation. Wong et al. (2010) also reported that a BZK product at 1.5% was able to
eliminate all 3-day old S. Typhimurium biofilms on polystyrene after 5 minutes. The use of sub-lethal
concentrations of QACs such as BZK has also been found to lead to increased ciprofloxacin (CIP)
resistance (Maertens et al., 2020). However, only one isolate (S02593-15) out of the 12 isolates tested
in the current study showed CIP resistance (Chapter 4, section 4.2.4.), but this may just be due to the
small number of isolates selected for testing in this study and other nalidixic acid or ciprofloxacin-
resistant isolates have been recovered from the hatchery and chicks supplied by the hatchery (APHA
surveillance data, unpublished, 2021).

179
The QAC-/glutaraldehyde-based product was used in the hatchery's C&D regime at the end of the
study period at both the Defra DoP rate (2%) and Defra GO rate (3%), and although it was found to be
more effective against Salmonella biofilms than the BZK-product in the microtiter plate assay, it was
still unable to eliminate the biofilms in the hatchery. When this disinfectant was tested at the Defra
GO rate against the most tolerant S. 13,23:i:- isolate (S03363-15), sourced from the hatchery
macerator, the biocidal activity of the disinfectant was affected by the surface material. The
disinfectant was able to eliminate biofilms formed on PVC coupons after a 30-minute contact time
and after a 3-hour contact time on stainless steel coupons. While the disinfectant was effective (≥5
log reduction) on the screed coupons after a 30-minute contact time and a 3-hour contact time on the
poplar wood coupons it was not able to eliminate all Salmonella within the biofilm. Corcoran et al.
(2014) also found that 2-day old Salmonella biofilms formed on concrete could not be eliminated even
after up to a 90-minute contact time. In comparison, Gosling et al. (2017) found that the same QAC-
/glutaraldehyde-based product at 2% was much more effective and was able to eliminate monophasic
S. Typhimurium biofilms, up to 9 days old, formed on wood in the presence of pig faeces. This has
been reported by Dhaliwal, Cordier and Cox (2008) to be related to the type of surface to which
biofilms were attached. The reduced efficacy of the QAC-/glutaraldehyde-based disinfectant against
Salmonella formed on poplar wood coupons and screed coupons, compared to the PVC coupons and
stainless steel coupons is likely to be due to the surface roughness and porosity, as Korber et al. (1997)
observed that S. Enteritidis biofilms formed on rough surfaces were less susceptible to disinfectants
then biofilms formed on smooth surfaces due to the physical protection offered to bacteria residing
in cracks, crevices or pits on the surface.
It should be noted that in the hatchery, there is likely to be more variability in the efficacy of
disinfectant(s) against S. 13:23i:- isolates then anticipated due to the real-world conditions that have
not been accounted for in these experiments but would affect the effectiveness of C&D, including
disinfectant usage (mode of disinfectant application, evaporation over the 3-hour contact time, short

180
contact time on non-porous vertical surfaces or on the underside of equipment), the presence of
biofilms or interfering organic matter after ineffective C&D which reduces QACs effectiveness
(Ramesh et al., 2002), or multispecies biofilms which are more stable and resistant to C&D because
they have a more complex structure, or the presence of mature biofilms, which are less effective
against disinfectants, including BZK (Corcoran et al., 2014; González-Rivas et al., 2018; Rossi et al.,
2017; Srey, Jahid and Has, 2013; Van Houdt and Michiels, 2010; Wales et al., 2021). For example,
although the disinfectant was able to cause a ≥5-log reduction in bacteria against biofilms formed on
PVC coupons and stainless coupons VBNC bacteria were sometimes recovered which could
recontaminate the environment. Therefore, further disinfection may still be required, particularly on
surfaces where organic matter is present and also for porous surfaces, as shown by the wood coupons,
or where surfaces have deteriorated or become damaged during abrasive cleaning as they may have
crevices or pitting as seen on the screed coupons, making effective disinfection more difficult.
6.3.2 The BOAT and biofilm bactericidal test methods
The advantage of the BOAT method is that it allows rapid high throughput testing of disinfectant(s)
against a panel of Salmonella isolates. The BOAT assay provides an indirect semi-quantitative
measurement of the numbers of viable bacteria after exposure to the disinfectant product by taking
an endpoint measurement of the reduction of TTC dye by metabolically active bacteria. The results
from the metabolic assay were helpful in providing an indication of the efficacy of the two commercial
disinfectant products against S. 13,23:i:- biofilms, informing the selection of a Salmonella isolate and
disinfectant for further testing in the biofilm surface disinfectant test. The use of the bactericidal test
alongside the BOAT method also provided valuable information about the bactericidal activity and the
presence of VBNC bacteria, which staining with TTC alone is not able to provide.
The main modification made to the BOAT method to exact the incubation period for TTC dye from 12
hours to 24 hours as it was not practical to read the assay after 12 hours incubation and a shorter
181
incubation period of 3 or 4 hours, as suggested by Tengerdy, Nagy and Martin (1967) did not allow for
sufficient metabolic activity. However, the use of variable endpoint times for metabolic assay may
have affected the results reported and make comparisons between studies difficult (Günther et al.,
2017). This extended incubation time may explain the two OD492nm readings that were over the
maximum absorbance measurement of the plate reader (4 OD) and had to be disregarded and
suggests that further work to optimise the incubation time for the TTC may be required to adapt it to
the specific requirements of each combination of microorganism and disinfectant. Although large
variation in susceptibility for the same isolate between biological replicates and technical replicates
were observed, this is typical for biofilm testing due to natural differences in biofilm growth and
structure (Günther et al., 2017) and has relevance for the efficacy of the disinfectant in the real-world
where greater variability would be expected.
A further interesting observation relating to the BOAT assay was that metabolic activity, represented
by OD492nm values of TTC, was higher for the wells exposed to disinfectant than those not exposed to
disinfectant. This observation has not been reported by other authors using metabolic assays, but
there may be several reasons for this. The most likely explanation is cross-reaction between the TTC
dye and the disinfectants. Although plausible, when Günther et al. (2017) analysed possible biofilm
disruption caused by disinfectants using crystal violet staining, they found no significant disruption or
dispersion of the biofilms with any disinfectant, except for a sodium hypochlorite-based product.
Another possible explanation is that degradation of the biofilm by the disinfectant leads to the release
of more bacteria from the biofilm. Grønseth et al. (2017) suggested that metabolic dyes may not be
able to stain bacteria in the depths of the biofilm and so may underestimate the number of viable
cells. Alternatively, bacteria exposed to residual or sub-lethal concentrations of disinfectant have been
found to produce greater amounts of biofilm than unexposed bacteria due to changes in the bacterial
growth rate (Capita et al., 2019). However, as no increase in bacterial density, as determined by
measuring OD570 of LB broth (not reported here) during the same incubation period, was observed in

182
the current study, this seems unlikely. It has been reported that optical readings from metabolic assays
show a good correlation with CFU counts, and therefore, further studies to determine the relevance
of this specific metabolic assay in terms of numbers of viable bacteria would be beneficial (Merino et
al., 2019; Tengerdy, Nagy and Martin, 1967).
6.3.2 Adaptation of the biofilm surface test
Despite there being many ways of removing biofilms formed on surfaces to allow for bacterial cell
enumeration in laboratory studies, there have been few studies comparing the efficacy of these
methods, particularly between porous and non-porous surfaces. In this chapter, low-speed vortexing
with 5mm glass beads for 2 minutes, based on the method published by Zhao et al. (2011), was
suggested as a possible alternative method to the sonication and swabbing methods used more
commonly in published studies. Some of the methods used to remove biofilms from surfaces can also
affect cell viability, for example, although sonication is recommended as a good method for biofilm
surface test studies (Webber et al., 2019), it has been noted by Asséré, Oulahal and Carpentier (2008)
that this method leads to an underestimation of viable bacteria on a surface as ultrasound can be
lethal to bacteria. However, bacterial cell damage can be limited by sonicating bacteria under chilled
conditions (0-4°C) as recommended by EN 16437, and this chapter observed that sonication was more
effective in recovering bacteria from the porous poplar wood coupons than the vortexing with glass
beads method when the recommendation of a chilling the bacteria during sonication was applied. The
other commonly used method for both in vitro biofilm surface test studies (Joseph et al., 2001;
Ramesh et al., 2002) and in the field is swabbing, but this method is known not to remove all bacteria
from a surface with some bacteria also retained within the swab itself (Asséré, Oulahal and Carpentier,
2008; González-Rivas et al., 2018). The study in this chapter found similar limitations with the cell
scraper method (Vestby and Nesse, 2015), which recovered the fewest CFU/cm2 from all four coupons
compared to sonication or vortexing with glass beads. These findings contrast with those by Luppens
et al. (2002), who evaluated the performance of swabbing, shaking, sonication, vortexing with and
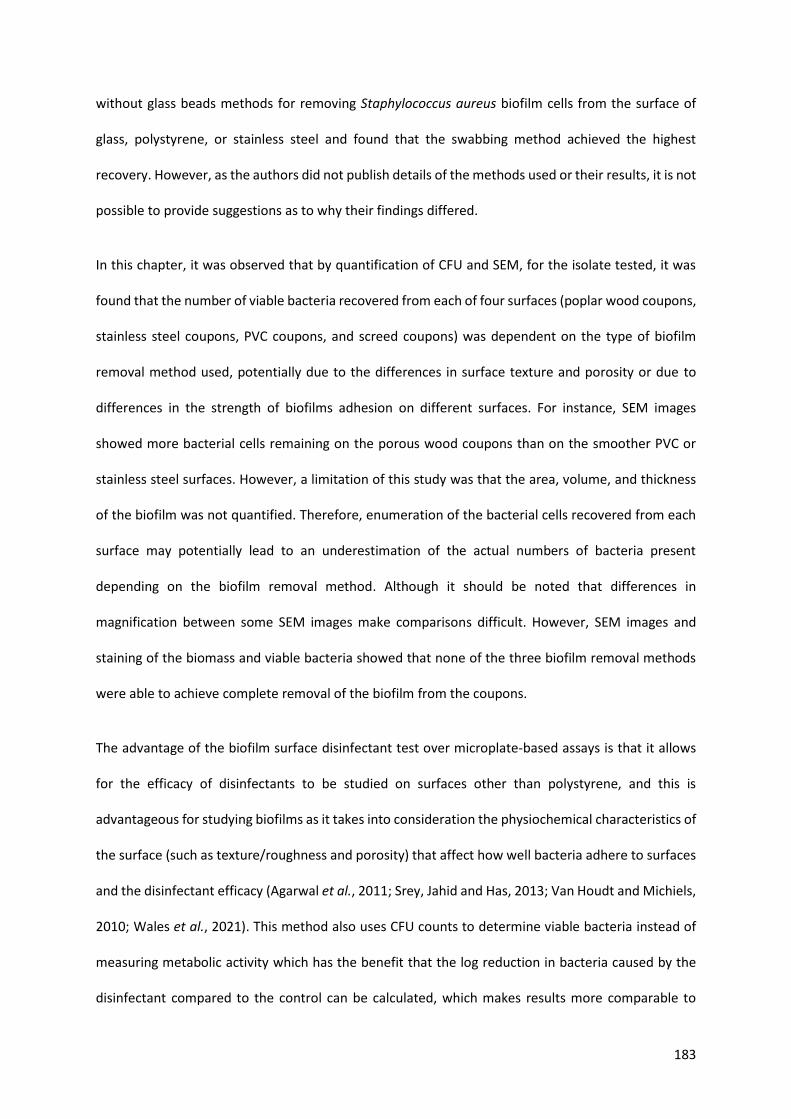
183
without glass beads methods for removing Staphylococcus aureus biofilm cells from the surface of
glass, polystyrene, or stainless steel and found that the swabbing method achieved the highest
recovery. However, as the authors did not publish details of the methods used or their results, it is not
possible to provide suggestions as to why their findings differed.
In this chapter, it was observed that by quantification of CFU and SEM, for the isolate tested, it was
found that the number of viable bacteria recovered from each of four surfaces (poplar wood coupons,
stainless steel coupons, PVC coupons, and screed coupons) was dependent on the type of biofilm
removal method used, potentially due to the differences in surface texture and porosity or due to
differences in the strength of biofilms adhesion on different surfaces. For instance, SEM images
showed more bacterial cells remaining on the porous wood coupons than on the smoother PVC or
stainless steel surfaces. However, a limitation of this study was that the area, volume, and thickness
of the biofilm was not quantified. Therefore, enumeration of the bacterial cells recovered from each
surface may potentially lead to an underestimation of the actual numbers of bacteria present
depending on the biofilm removal method. Although it should be noted that differences in
magnification between some SEM images make comparisons difficult. However, SEM images and
staining of the biomass and viable bacteria showed that none of the three biofilm removal methods
were able to achieve complete removal of the biofilm from the coupons.
The advantage of the biofilm surface disinfectant test over microplate-based assays is that it allows
for the efficacy of disinfectants to be studied on surfaces other than polystyrene, and this is
advantageous for studying biofilms as it takes into consideration the physiochemical characteristics of
the surface (such as texture/roughness and porosity) that affect how well bacteria adhere to surfaces
and the disinfectant efficacy (Agarwal et al., 2011; Srey, Jahid and Has, 2013; Van Houdt and Michiels,
2010; Wales et al., 2021). This method also uses CFU counts to determine viable bacteria instead of
measuring metabolic activity which has the benefit that the log reduction in bacteria caused by the
disinfectant compared to the control can be calculated, which makes results more comparable to

184
standard planktonic disinfectant tests, for instance, in the Defra GO test and EN 1656:2019 methods,
where an effective disinfectant is considered to be one that causes a 5-log reduction in Salmonella
(Wales et al., 2021). However, CFU counting methods have their disadvantages: 1) they are time-
consuming, so they only allow for testing of a limited number of strains and disinfectants; 2) there is
more natural variation in the biofilms formed on coupons than in microplates (Günther et al., 2017;
Wales et al., 2021), 3) they do not enumerate bacteria in the VBNC state, and 4) the number of viable
bacteria may be underestimated as only bacteria detached from the biofilm are enumerated, so it is
dependent on the efficiency of the biofilm removal method selected (Azeredo et al., 2017; González-
Rivas et al., 2018; Günther et al., 2017; Merino et al., 2019).
6.4 Conclusion
In conclusion, the studies presented in this chapter highlight some of the possible issues associated
with comparing results from biofilm disinfectant studies and demonstrate the usefulness of applicable
disinfectant tests for informing Salmonella control in real-world scenarios and the potential benefit
this may provide. This chapter also generated novel data on the disinfectant tolerance of S. 13,23:i:-,
finding biofilms of this serovar to show tolerance to commonly used commercial disinfectants in
hatcheries under simulated conditions of use such as surface materials and relevant ambient
temperatures of 25°C. However, it should be noted that the limitations of the biofilm surface
disinfectant test are that there may be more variability in the efficacy of disinfectant(s) against S.
13:23i:- isolates than anticipated due to the real-world conditions that have not been accounted for
in these experiments but would affect the effectiveness of C&D.

185
Chapter 7 Development of an in vitro model of the poultry drinking water system
7.1 Introduction
Good quality drinking water is essential for both general bird health and performance. However,
drinking water can become contaminated if there is a reservoir or ongoing source of contaminated
water, including entry of dust from the poultry house environment into water tanks. This
contamination can be both non-pathogenic strains of environmental bacteria such as certain
Enterobacteriaceae or Bacillus spp., and pathogenic bacteria including Salmonella, Enterococcus,
Clostridia, or avian pathogenic Escherichia coli (APEC), making the water unpalatable and potentially
perpetuating flock infections (Maes et al., 2019; Milanov et al., 2017; Riley, 2017). Some of the
bacteria such as Salmonella, Escherichia coli, and Pseudomonas can also form biofilms. As
demonstrated by Maes et al. (2019), Watkins (2006), and Trachoo, Frank and Stern (2002), there is a
risk of biofilm formation within the drinking water system (DWS), especially as C&D of the drinking
water lines is only carried out in-between flocks, although sometimes dilute concentrations of
disinfectants may be added to treat the drinking water whilst birds are present (Lubing, 2012; Newton,
2012).
More study of biofilm formation in drinking water systems is needed, but since it is difficult to sample
inside the DWS when birds are present, in vitro models are required to study biofilm formation and to
test the efficacy of disinfectant products designed for DWS C&D. There are few in vitro laboratory-
based models used to study biofilm formation by Salmonella and other pathogens in the poultry DWS
with the most realistic being a closed biofilm model described by Maes et al. (2020), who simulated
environmental conditions in a poultry DWS by growing biofilms of a field strain collected from a
poultry DWS at relevant temperatures of 25°C in a low nutrient growth medium on coupons made out
of plastic drinking water lines, simulating low flow conditions by shaking at low speed (50rpm).
Although this method is limited as it only simulates individual DWS components and materials rather
than the whole drinking water system so there is a need to develop more realistic in vitro biofilm

186
models as this setup does not replicate many aspects of the poultry environment. The aims and
objectives of this chapter were:
▪ To evaluate planktonic growth, and biofilm-formation on PVC coupons and stainless steel
coupons, by S. Enteritidis isolate S03467-16 a field isolate of the Salmovac® 440 vaccine strain, at
different inocula concentrations.
▪ To develop an in vitro microcosm model of a poultry DWS and assess biofilm formation by S.
Enteritidis isolate S03467-16, a field isolate of the Salmovac® 440 vaccine strain within this model.
7.2 Results
The developed poultry DWS was an in vitro small-scale microcosm model of the floor-based drinking
water system found on commercial poultry farms such as in layer hen barns.
7.2.1 Evaluation of planktonic growth and biofilm formation at different inocula concentrations
A preliminary experiment tested the planktonic growth and biofilm-forming ability of a field isolate
(S03467-16) of the Salmovac® 440 vaccine strain when a range of inocula concentrations was used;
with a starting inoculum of 1x10³ CFU/ml selected to contaminate the water in the poultry DWS model.
7.2.1.1 Comparative evaluation of planktonic growth at different inocula concentrations
Figure 7-1 showed that although a range of starting inocula (102 to 106 CFU/ml) was used, after 4-days
aerobic incubation at room temperature in a low nutrient broth with shaking at 50rpm, the 4-day
broth log10 CFU/ml counts were not significantly different (Kruskal-Wallis test, p-value=0.75). Although
not statistically significant, due to low sample numbers, this is biologically significant, as there was an
increase in bacteria for the 1x10² CFU/ml and 1x10³ CFU/ml inocula by log1.7 to log4.7 (median log3.5)
and log1 to log3.7 (median log2.9), respectively. In comparison, there was a change from the 1x10⁴
inocula by -log1 to log2.8 (median log1.9), and for the 1x10⁶ CFU/ml, a change of -log3 to log0.7
(median log0.1) from the starting inoculum.

187
Figure 7-1: Comparative evaluation of bacterial growth after four days incubation using four different starting
inocula. Differences in log CFU/cm2 counts of isolate S03467-16 (Salmovac® 440 vaccine field isolate), using
starting inocula of between 1x10² CFU/ml (log2) to 1x10⁶ CFU/ml (log6), after aerobic incubation in LB broth w/o
salt, with shaking at 50rpm, for four days at room temperature (18.9°C-25.2°C). The dashed grey line indicates
the starting inoculum in log CFU/ml. The solid black line shows the median log CFU/ml. The experiment was
performed three times with four technical replicates.
7.2.1.2 Comparative evaluation of biofilm formation on polyvinyl chloride (PVC) coupons and
stainless steel coupons at different inoculum concentrations
In these preliminary studies, PVC coupons and stainless steel coupons were used as a proxy for the
plastic and metal components of the DWS system and were also incorporated in the DWS model to
aid sampling. Figure 7-2 showed that for each coupon considered separately, the different bacterial
inocula did not result in significantly different quantities of biofilm formation (Kruskal-Wallis test; PVC
coupon, p-value=0.20; stainless steel coupon, p-value=0.14). Overall, there was no significant
difference (Mann-Whitney U-test, p-value=0.35) in the amount of biofilm formed on the submerged
PVC coupons compared to stainless steel coupons.

188
Figure 7-2: Comparative evaluation of biofilm formation on coupons after four days incubation using four
different starting inocula. Comparative evaluation of log CFU/cm2 of isolate S03467-16 (Salmovac® 440 vaccine
field isolate) using starting inocula of between 1x10² CFU/ml (log2) to 1x10⁶ CFU/ml (log6), after aerobic
incubation in LB broth w/o salt, with shaking at 50rpm, for four days at room temperature. The dashed grey line
indicates the starting inoculum. The solid black line shows the median log CFU/cm2 recovered from biofilms
formed on PVC or stainless steel coupons. The experiment was performed on three separate occasions with two
technical replicates
7.2.2 Assessment of biofilm formation within the poultry drinking water system (DWS) model
The DWS model was set up as described in section 2.7.3 (Chapter 2) and even with the relatively low
initial bacterial load, after 4-days incubation at room temperature (19.8°C-25.2°C), between log4.4
and log5.4 CFU/cm2 of Salmonella was recovered from biofilms formed on stainless steel surfaces
within the DWS, see Table 7-1. Although not quantified, thick biofilms were also observed to form
within the tubing between the inoculum Duran and the pressure regulator; see Figure 2-2, Chapter 2.
Stainless steel coupon PVC coupon

189
Table 7-1: Quantification of bacterial growth and biofilm recovered from within the poultry DWS. Salmonella
was recovered from different components of the poultry DWS after four days of aerobic incubation at room
temperature. The experiment was performed once with one technical replicate.
DWS component Log10 CFU/ml Log10 CFU/cm2
Salmonella inoculum broth 4.9 -
stainless steel drinker nipple A - 5.4
stainless steel coupon in square bottle A - 5.0
stainless steel drinker nipple B - 5.0
stainless steel coupon in square bottle B - 4.4
stainless steel coupon in tap - 5.4
7.3 Discussion
This thesis is the first to describe the development of an in vitro model of the poultry drinking water
system to this extent and builds on the more basic model described by Maes et al. (2020).
7.3.1 In vitro biofilm formation within the poultry DWS model
The main finding was that at ambient temperatures found in poultry houses, between log4.4 and
log5.4 CFU/cm2 of Salmonella was recovered from biofilms formed within the DWS even with a
relatively low initial bacterial load (1x10³ [log10 3.0] CFU/ml of Salmonella) and under low nutrient
conditions. Few studies have shown biofilm formation within the DWS either in situ or in vitro,
although Maes et al. (2019) suggested that biofilms were present on 63% of surfaces they sampled
within a DWS as microorganisms were present combined with at least one chemical component, which
could be part of the biofilm EPS matrix. Biofilm formation in the DWS is of concern as biofilms provide
a reservoir for opportunistic pathogens and the exchange of AMR genes (Rilstone et al., 2021) and
bacteria in the water also make it unpalatable, reducing bird health further (Milanov et al., 2017).
7.3.1.1 Advantages of the in vitro poultry DWS for the study of biofilms
Poultry DWS are difficult to access and sample in situ, making the study of biofilms in the field difficult.
The advantages of the in vitro model described in this thesis compared to other current methods of
studying biofilms in DWS systems are described as follows. Although new technology such as the
DEPOSENS® sensor (LAGOTEC GmbH, Magdeburg) can be installed in water pipe systems and monitors

190
biofilm formation in situ, this does not allow studies to be carried out under controlled conditions. The
model described in this chapter also has advantages over similar in vitro studies performed by Maes
et al. (2020) in terms having of using actual parts from a drinking water system, having a more realistic
bacterial load, and more accurately replicating the flow of water in the DWS. As Castañeda-Gulla,
Sattlegger and Mutukumira (2020) recovered a mean count of log3.67 CFU/ml of Salmonella from
poultry drinkers, the DWS model in this chapter used a more realistic bacterial inoculum of log CFU/ml
than the high inoculum of log6.0 CFU/ml used by Maes et al. (2020). The Salmonella isolate used in
this model was a field isolate of the Salmovac® 440 vaccine strain isolated from a layer hen farm where
were the Salmovac 440 vaccine was used. Salmovac® 440 is a double-attenuated adenine-histidine
auxotrophic S. Enteritidis mutant of the strain 441/014 and was used in this model for health and
safety reasons, but was expected to behave in a similar way to an S. Enteritidis field strain (as discussed
in Chapter 3), and has also been isolated from the environment, such as from chicken litter, up to 13
days after vaccination (VMD, 2020e), and been recovered from boot swab samples taken from the
litter of laying flocks more than a year after vaccination in a small number of cases (APHA surveillance
data, unpublished, 2021).
7.3.1.2 Limitations of the in vitro poultry DWS for the study of biofilms
The most significant limitation of the DWS model is the flow rate of 1.5 to 2.5ml/minute, which is
much lower than the flow rate usually found in floor DWS, for example, 30ml/minute for breeder
flocks between ages of 0 to 7 days (Cobb-Vantress, no date). The flow rate reached in the DWS
developed in this chapter was limited due to the use of low flow rate pumps and small diameter
tubing. This flow rate is likely to have affected the amount of biofilm formed within the DWS, although
the effect of hydrodynamics on biofilm formation is complex, so the exact effect is difficult to
determine. While Mangalappalli-Illathu et al. (2008) observed thicker biofilms under high flow
conditions than low flow conditions, it would be expected that under low flow conditions that more
biofilm would form as stagnant water allows bacteria to drop out of suspension and settle in the pipes

191
(Riley, 2017) which was observed in the tubing in the DWS model developed in this chapter. However,
the low flow rate simulated here represents a worst-case and is still a realistic scenario where water
can stagnate, such as at the ends of water lines.
Further refinements and enhancements of the model are recommended to make the model more
realistic and would allow it to have potential to be used to study the effectiveness of water sanitisers
for either preventing the formation of biofilm within the drinking system or removing biofilms already
formed. As the DWS model was only run once, it would be essential to repeat this work to determine
the repeatability of this type of model, ideally collecting additional samples to aid the robustness of
the statistical analysis. In particular, sampling of the plastic components such as inside the pressure
regulator and the water pipe using swabbing methods would provide additional information on
biofilm formation within the DWS system. Next, regulation of the ambient temperature and/or the
temperature of the water to mimic the poultry house would improve the repeatability of the model
and could be achieved by running the DWS in a temperature-controlled room. Higher flow rates should
also be incorporated into the DWS by using a larger peristaltic pump and tubing with a wider diameter.
Once these initial improvements have been made, more complex refinements could then be made to
the DWS to further improve how well it replicates the poultry DWS. For example, transforming the
poultry DWS model from a closed static biofilm model to an open dynamic flow model would allow
for the removal of waste products from the system and the input of fresh nutrients. This would allow
for the formation of mature biofilms and enable the system to be run for a longer duration than four
days to simulate biofilms formed during the lifespan of a flock, for example, up to 28 days. In the
environment, Salmonella usually forms mixed-species biofilms, and so additional organisms could also
be incorporated into the biofilm model, such as Pseudomonas aeruginosa or Escherichia coli (Branco
et al., 2016; Srey, Jahid and Has, 2013).
192
7.4 Conclusion
To conclude, this chapter proposes an in vitro biofilm model that facilitates the study of biofilms in
poultry DWS and is the first to do so to this extent. Although Salmonella biofilms were formed in this
model within the drinker nipples and on stainless steel coupons and were able to be quantified, further
refinements to the model would improve the extent to which it replicates the real-life conditions
under which biofilms form in the DWS and therefore improve the usefulness of the data that it
provides. Briefly, these suggested refinements are increasing the water pressure in the system,
incorporation of multi-species biofilms, regulation of the ambient temperature, making a dynamic
flow model instead of a static biofilm model, increasing the number of samples collected, and
extending the duration of time for which the model is run. Ultimately, once fully refined, this model
could be used to study the effectiveness of water sanitisers for preventing biofilm formation within
drinking systems or, during C&D, the removal of biofilms that have already formed. This would provide
a very realistic, although low throughput, biocide test method and would overcome some of the
limitations of current biofilm models discussed in the thesis regarding obtaining accurate information
on bacterial biofilm formation in the environment using more realistic in vitro biofilm models.

193
Chapter 8 Final discussions and future perspectives
8.1 Summary of results, limitations, and discussion
The ability of Salmonella to form biofilms is known to aid its survival and persistence within the host
and in the environment, including during and after C&D. Therefore greater understanding of the
mechanisms of biofilm formation is critical for effective Salmonella control in the pig and poultry
industries (Steenackers et al., 2012). However, biofilm formation, and the phenotypic and genotypic
mechanisms influencing it, have not yet been characterised for a wide range of Salmonella serovars.
In particular, non-regulated ‘exotic’ serovars found in the British pig and poultry industries, such as S.
13,23:i:- and multi-drug resistant S. Infantis, especially under realistic environmental conditions.
Therefore, the studies presented in this thesis primarily aimed to further knowledge regarding the
formation of biofilms by Salmonella originating from pig and poultry production environments by
means of phenotypic and genotypic characterisation and the development of in vitro biofilm models.
In this thesis, we demonstrated that 130 of the 132 Salmonella enterica subspecies enterica isolates
collected from a variety of environmental sources within the commercial British pig and poultry
production industry were able to form in vitro biofilms at environmentally relevant temperatures
(20±1°C and 25±1°C). The selection also included isolates sourced from commercial feed mills,
hatcheries, and duck farms in GB, which have not been previously studied. Most isolates were
moderate and strong biofilm producers, with variations in in vitro biofilm-forming abilities being
observed, particularly between Salmonella serovars. However, neither phenotypic nor genomic
characterisation was able to conclusively determine the mechanisms behind these observed
differences. Tolerance by S. 13,23:i:- biofilms were identified to commercial BZK-based and QAC-
/glutaraldehyde-based disinfectant products, with reduced efficacy found against biofilms formed on
porous surfaces compared to non-porous surfaces. Finally, the development of an in vitro biofilm
model facilitated the study of biofilms in a simulated model of the DWS commonly used in commercial

194
poultry houses, with Salmonella being formed and quantified within the model even when inoculated
with a relatively small bacterial load.
The mechanisms of Salmonella biofilm formation have been widely studied, as described in critical
reviews by Ćwiek, Bugla-Płoskońska and Wieliczko (2019), Lamas et al. (2018) and Milanov et al.
(2017), including the environmental factors affecting bacterial growth, survival and biofilm production
(Steenackers et al., 2012). However, the study of biofilm formation by environmental Salmonella has
mainly focused on poultry farms (Marin, Hernandiz and Lainez, 2009; Pande, McWhorter and
Chousalkar, 2016; Schonewille et al., 2012), or feed mills outside of GB (Laviniki, Lopes and Pellegrini,
2015; Vestby et al., 2009b). There are also knowledge gaps regarding Salmonella isolated from other
poultry industry sectors such as duck farms and hatcheries, particularly under relevant environmental
conditions. Biofilm formation has been widely studied for S. Typhimurium, including monophasic S.
Typhimurium, which predominate in the GB pig industry (APHA, 2021), and S. Enteritidis, which is
implicated in foodborne outbreaks relating to poultry meat and eggs (EFSA and ECDC, 2021a).
However, little is known about the role of biofilm formation in the environmental persistence of other
serovars that are of current importance within the poultry industry, such as S. 13,23:i:- and MDR S.
Infantis, which were considered in the current study.
8.1.1 Assessment of biofilm-forming ability and characterisation of biofilm and planktonic
phenotypes of environmental Salmonella isolates
As reported in Chapter 3, 130 (98.4%) of the 132 Salmonella enterica subspecies enterica isolates
originating from the environment of pig and poultry primary production environments were able to
form in vitro biofilms demonstrated using the crystal violet microplate assay first described by
Christensen et al. (1985). Most isolates were moderate or strong biofilm producers after aerobic
incubation for 48 hours. These findings supported the hypothesis that Salmonella isolated from pig
and poultry production environments can form in vitro biofilms which may enhance their persistence
and potential susceptibility to biocides such as disinfectants. Most Salmonella isolates reported in the

195
scientific literature are not tested for biofilm formation, but where isolates are evaluated for their
biofilm-forming abilities, Salmonella is mainly reported to form biofilms, with non-biofilm producers
rarely reported except for lab-derived knockout mutants.
The crystal violet microplate assay originally described by Christensen et al. (1985) is inexpensive,
straightforward, and widely used as an initial high-throughput screening tool for biofilm formation.
When used in conjunction with the classification of biofilm formation calculations described by
Stepanovic et al. (2004), findings on biofilm formation can be easily compared between studies to
readily investigate populations of diverse strains of organisms recovered from different environments.
Biofilm production by Salmonella isolated from the environment at environmentally relevant
temperatures of 20±1°C and 25±1°C suggests that Salmonella can form biofilms at temperatures found
within pig and poultry production environments. Although this is demonstrated on a plastic surface
by using a simplified representation of environmental conditions, it suggests that biofilm formation
may play a role in the persistence of Salmonella within the environment. This suggestion is supported
by the findings of Vestby et al. (2009b), who found Salmonella strains that persisted in a feed mill
environment for many years (S. Agona and S. Montevideo) and produced more biofilm than strains
that persisted for shorter periods of time (S. Senftenberg) and non-persistent strains (S. Typhimurium).
In Chapter 3, section 3.2.1.2, isolates belonging to the predominating serovars in the GB pig industry
(S. Typhimurium/monophasic S. Typhimurium DT193) were reported to be moderate or strong biofilm
producers in vitro, which may be of particular importance for their survival in the environment of
outdoor pig farms where the standard methods of Salmonella control by C&D cannot be easily applied
(Andres and Davies, 2015; Callaway et al., 2005; Smith et al., 2017). The small panel of 13 Salmonella
isolates (S. Typhimurium of various phage types, monophasic S. Typhimurium DT193, S.
Bovismorbificans, S. Enteritidis PT9b and S. Indiana) analysed in this thesis originating from
commercial duck (meat, breeding, and table egg-laying) farms formed biofilms. This has not previously
been reported and so helps to fill a knowledge gap relating to biofilm formation by Salmonella

196
associated with less common food animal species. A small number of feed-associated Salmonella
serovars (S. Montevideo, S. Mbandaka, S. Ohio, and S. Kedougou) isolated from the environment of
GB feed mills were reported (Chapter 3; section 3.2.1.1) to be moderate or strong biofilm producers
at ambient feed mill temperatures. These findings agree with Vestby et al. (2009b), who also found S.
Montevideo, associated with persistent contamination in Norwegian feed mills, to be a moderate
biofilm producer under the same incubation conditions. All Salmonella isolates displayed either the
RDAR (red, dry and rough) or BDAR (brown, dry and rough) morphotypes, which are associated with
strong biofilm producing abilities and persistence and survival in adverse conditions such as the very
dry environment within feed mills (Lamas et al., 2018; Vestby et al., 2009a; White et al., 2006). The
observed biofilm-forming abilities of these serovars may explain why they are good environmental
persisters and can colonise the feed production systems in feed mills, particularly coolers, and re-
contaminate heat-treated feed (APHA, 2021; Jones, 2011). Contaminated feed is an important source
of Salmonella for pig and poultry farms; therefore, understanding the mechanisms of Salmonella
persistence in feed mills is particularly important for Salmonella control, especially after the ban on
formaldehyde-based products in animal feed production introduced in the EU in January 2018 (APHA,
2021; Esterhuizen, 2019).
The serovars S. Enteritidis and S. Typhimurium have been reported to be rapidly eliminated from
hatcheries after cessation of hatching of eggs from infected breeding flocks, and they do not persist
for long in the production environment in the absence of ongoing infection of a living host, apart from
in dusty material (APHA, 2021; Davies et al., 2001; Davies, Liebana and Breslin, 2003; Davies and Wray,
1996; EFSA and ECDC, 2021a). However, S. Infantis is reported to be very difficult to eradicate from
poultry flocks, requiring enhanced C&D to be eliminated from broiler farms (Drauch et al., 2020;
Newton et al., 2020). As reported in Chapter 3.2.1.5, S. Infantis isolates were generally moderate
biofilm producers, a finding which is at odds with Schonewille et al. (2012), who reported that S.
Infantis strains sourced from Hungarian broiler flocks had poor biofilm-forming abilities. Despite being

197
reported to be less persistent in the environment than S. Infantis, generally, the S. Typhimurium and
S. Enteritidis (PT13a and PT8) isolates were observed to be stronger biofilm producers than the S.
Infantis isolates. The S. Enteritidis PT13a and PT8 isolates were strong biofilm producers and showed
the RDAR morphotype, and the S. Typhimurium DT2 and DT104 isolates were moderate or strong
biofilm producers and displayed the BDAR or RDAR morphotypes. It is not clear why S. Enteritidis and
S. Typhimurium do not persist in the environment to the same extent as S. Infantis, and it may be that
for these serovars that as biofilm formation is a virulence mechanism for survival in the host and other
additional survival mechanisms may apply for environmental persistence. S. Enteritidis is known to
colonise the tissues of the avian reproductive tract at host temperatures of 41°C (Chen et al., 2020),
suggesting that biofilm formation may enhance the vertical transmission of S. Enteritidis in chickens
and increase its virulence or persistence in the host. Therefore, it was interesting that S. Enteritidis
also shows biofilm formation at the lower environmental temperatures tested in the studies reported
in Chapter 3. Biofilm formation, in part, may also enhance its survival within fertile eggs and
transmission into hatcheries as well as survival within table eggs, causing outbreaks such as the 2016
multi-country S. Enteritidis outbreak due to the presence of Salmonella in contaminated eggs traded
between different countries (EFSA and ECDC, 2020).
The initial aim to evaluate biofilm formation in 14 different Salmonella serovars originating from eight
primary production environments may have introduced several variables as potential confounding
factors and could have limited the potential to identify how phenotypic characteristics of isolates and
their environmental sources might affect their biofilm-forming abilities. Variation in biofilm formation
was observed between isolates and was considered significantly different between serovars
(discussed in Chapter 4; section 4.2.1), which has also been reported by others (Agarwal et al., 2011;
Borges et al., 2018; Schonewille et al., 2012; Srey, Jahid and Has, 2013; Steenackers et al., 2012).
Agarwal et al. (2011) have suggested that the individual bacterial characteristics (such as expression
of fimbriae and cellulose), which differ between Salmonella serovars, may be more important in

198
determining the biofilm-forming ability of an isolate than environmental conditions when
temperatures are below 30°C. The findings presented in this thesis support this, with the results of
the CRA test (Chapter 4, section 4.2.3) reporting that Salmonella isolates displaying the RDAR
morphologies (indicating the expression of both fimbriae and cellulose) produced significantly more
biofilm than isolates displaying the SAW (smooth and white) morphotype (indicating the lack of
fimbriae and cellulose expression). This suggests that curli fimbriae and cellulose expression play an
important role in the biofilm formation in different Salmonella serovars, in agreement with others
(Eguale et al., 2014; Romling, 2005; Solano et al., 2002).
Temperature-related differences in biofilm formation were observed in the studies reported in
Chapter 3, section 3.2.3.1 but were not statistically significant (Mann-Whitney U test, p-value=0.403),
despite incubation temperature being reported in previous studies (Agarwal et al., 2011; Borges et al.,
2018; Lamas et al., 2018; Schonewille et al., 2012; Srey, Jahid and Has, 2013; Steenackers et al., 2012)
to be a factor influencing biofilm formation. This is most likely due to the narrow range of incubation
temperatures used of 20±1°C and 25±1°C, which may have made it challenging to identify any
significant influence of temperature on biofilm formation. However, it does highlight the variable
nature of some isolates’ ability to produce biofilms, with a greater degree of in vitro biofilm formation
generally observed at the higher incubation temperature. This is likely to be due to the increased
bacterial growth rate, which causes the depletion of nutrients in the crystal violet microplate assay,
which is a static biofilm model, leading to increased biofilm production. This is supported by the
positive correlation between growth rate and biofilm reported in the growth kinetic assays in Chapter
4 (section 4.2.2) and also by Diez-Garcia et al. (2012). This phenomenon is due to the expression of
the global regulator CsgD, which is responsible for the synthesis of curli fimbriae and cellulose, being
greatest when nutrient availability is limited (Gerstel and Romling, 2003; Steenackers et al., 2012). On
reflection, selecting either a lower temperature to reflect the ambient outside GB temperature or a
higher temperature, such as 30°C (commonly in the early stages of rearing of chicks), may have

199
provided more information regarding the influence of temperature on biofilm formation. However,
although the isolates originated from different environments within the pig and poultry production
industries, where temperatures can vary widely, the two selected temperatures used were
representative of the most commonly encountered temperatures within these environments.
8.1.2 Comparative genomic and phenotypic analysis of biofilm formation and antimicrobial
resistance (AMR) in environmental Salmonella isolates
As discussed in Chapter 3, differences in vitro biofilm formation were identified among the 132 tested
Salmonella isolates. However, their biofilm and planktonic phenotypes could not be fully explained by
the studies reported in Chapters 3 and 4. WGS analysis of a subset of 93 isolates in Chapter 5 was also
unable to identify any genomic differences that could explain the observed differences in biofilm
formation, particularly concerning the two isolates that were weak or non-biofilm producers, S.
Typhimurium isolates (S05273-18 and L0893-18) in the crystal violet microplate assay, despite point
mutations being observed in the lpfD gene, which is one of several genes encoding for the synthesis
of long polar fimbriae (lpf).
Phylogenetic analysis and determination of SNP distances revealed the 93 Salmonella isolates to
mostly be closely related (≤20 SNPs difference) within their respective serovars, except for within the
clade of S. Typhimurium and monophasic S. Typhimurium. Biofilm-associated genes have been
predominately studied in either S. Typhimurium or S. Enteritidis (Kim and Yoon, 2019). However, most
studies (El Hag et al., 2018; Teplitski, Al-Agely and Ahmer, 2006) have used knockout mutants (Allen-
Vercoe et al., 1997; Dibb-Fuller et al., 1997; Solano et al., 2002; Woodward et al., 2000) to deduce the
function of genes associated with biofilm formation. Genomic analysis of the 93 Salmonella isolates in
Chapter 5 (section 5.2.2) found a similar prevalence of biofilm-associated genes, with the majority of
the 38 biofilm-associated genes screened for being present in all 93 Salmonella isolates. These genes
were those identified in the literature as being involved in QS and directly or indirectly regulating or
encoding for the synthesis of components of the EPS matrix such as fimbriae and cellulose (Brown et

200
al., 2001; Kim and Yoon, 2019; Latasa et al., 2005; Uğur et al., 2018; Wolska et al., 2016). The genes
that were not present were either absent from all isolates (bcsZ and lpfA) or were only present in some
serovars (lpf operon, pef operon, orf5, orf6). The absence of some or all of the genes encoding for lpf
and/or plasmid-encoded fimbriae (pef) in S. Infantis, S. 13,23:i:-, monophasic S. Typhimurium, and S.
Enteritidis is not unexpected as these types of fimbriae have only been previously reported in S.
Enteritidis and/or S. Typhimurium. In these serovars, genes encoding for other types of fimbriae are
present and the absence of these particular fimbriae genes does not appear to impact fimbriae
expression or biofilm formation as these isolates were capable of forming moderate or strong biofilms
and displayed either the BDAR or RDAR morphotype indicating the expression of fimbriae.
The panel of 93 Salmonella used for the WGS analysis included about 20 isolates of each serovar,
which limited the usefulness of the comparative genomic analysis performed as large datasets are
needed to obtain robust data and detect meaningful differences between genomes. Although the
Salmonella isolates showed a range of biofilm-forming abilities, only a few isolates were weak biofilm
producers, and there were no genuine non-biofilm producers in the panel. The non-biofilm producing
S. Typhimurium isolate S05273-18 was able to produce a weak biofilm once aerobically incubated for
72 hours in the crystal violet assay; discussed in Chapter 3, section 3.2.3.2. A study that incorporates
additional biofilm-associated genomes and a more extensive set of genomes, including a panel of wild
type strains of non-biofilm producing Salmonella, would be beneficial and may facilitate the
identification of genetic differences linked to biofilm phenotype. Although not investigated, the
differences observed in biofilm formation reported in this thesis are likely to be due to differences in
the level of the transcription of these biofilm-associated genes. This was suggested as the expression
of CsgD, the global regulator of biofilm formation, is affected by environmental conditions, including
temperature (Gerstel, Park and Romling, 2003; Gerstel and Romling, 2003; Steenackers et al., 2012).
All 91 environmental Salmonella isolates (the two biofilm control isolates 27655R and 27655S were
excluded from this analysis) possessed at last one gene conferring resistance to antimicrobials

201
(discussed in Chapter 5, section 5.2.4), with these genes are often located on mobile genetic elements
(such as plasmids or integrons), which were also present in 80 isolates (87.9%); discussed in Chapter
5, 5.2.5. This can lead to the rapid co-dissemination of AMR genes between bacteria in the
environment, especially when Salmonella forms biofilms; due to the proximity of bacteria in a biofilm
providing optimal conditions for the horizontal transfer of AMR genes between bacteria (Hathroubi et
al., 2017; Lamas et al., 2018; Milanov et al., 2017). The data reported in Chapter 4 (section 4.2.4) found
that MDR Salmonella isolates produced significantly less biofilm than non-MDR isolates, although the
potential association between MDR and biofilm formation is disputed in the literature (Piras et al.
2015, Farahani et al. 2018, Ćwiek et al. 2019, Dorgham et al. 2019) and it has been reported that MDR
can incur fitness costs in Salmonella and other Enterobacteriaceae (Siceloff et al., 2021). However,
understanding Salmonella serovars' ability to form biofilms is still important for the pig and poultry
industry to help reduce the prevalence of AMR-resistant bacteria in the primary production and meat
processing environments.
8.1.3 Biofilm-forming ability and the disinfectant tolerance of persistent S. 13,23:i:- isolates sourced
from the environment of a broiler hatchery
Hatcheries are an important source of contamination for the whole of the poultry industry (Bailey et
al., 2001). The 20 S. 13,23:i:- isolates reported in this thesis were associated with Salmonella
contamination in a single GB hatchery, and this resident contamination could not be eradicated during
the 4-year study period, despite changes to the C&D regime. The genomic analysis found these 20
isolates to be closely related (discussed in Chapter 5; section 5.2.1) and so S. 13,23:i:- was likely to be
persisting in the hatchery environment as a biofilm as gross surface biofilm remained visible on several
surfaces sampled after C&D (Newton et al., 2021, under review). This also provides insight on why S.
13,23:i:- has become established and is persisting in feed mills, hatcheries, and broiler farms, and in
2020 was the most frequently reported Salmonella serovar in GB (APHA, 2021).

202
Many studies have demonstrated that bacteria in biofilms are more tolerant to biocides and
antimicrobials than bacteria in a planktonic state (Buckingham-Meyer, Goeres and Hamilton, 2007;
Chylkova et al., 2017; Langsrud et al., 2003). There are numerous published methods for testing
disinfectants against bacteria in a biofilm, although there are many variations among methodologies,
and they have focused mainly on testing of S. Typhimurium and S. Enteritidis biofilms (Corcoran et al.,
2014; Gosling et al., 2017; Møretrø et al., 2009; Ramesh et al., 2002; Wong et al., 2010). The few
standardised methods such as the MBEC® assay or CDC Biofilm Reactor® have high initial equipment
or ongoing running costs. Standardised methods do not allow much flexibility in the test conditions,
making it difficult to replicate the conditions of the pig and poultry environment, leaving a gap in the
research for efficacy testing of disinfectant products under farm-like scenarios and knowledge about
the disinfectant tolerance of some Salmonella serovars.
This thesis is the first reported study to assess the biofilm-forming abilities and disinfectant tolerance
of this particular serovar. The findings presented here suggest that two different mechanisms are
facilitating the persistence and disinfectant tolerance of S. 13,23:i:- isolates within this hatchery.
Biofilm formation was identified as the primary mechanism, and it was reported in Chapters 3 (section
3.2.1.3) and Chapter 4 (section 4.2.3) that 18 (90%) of S. 13,23:i:- isolates were strong biofilm
producers, displayed the RDAR morphology, and the ten isolates evaluated in the BOAT assay showed
tolerance to both disinfectant products. The second mechanism facilitating the disinfectant tolerance
of S.13,23:i:- was the presence of genes associated with tolerance to QACs. Although five genes
associated with tolerance to QACs were detected in all 20 S. 13,23:i:- isolates, another specific
tolerance to QACs gene, qacEΔ1, was only detected in the isolates S02757-17 and S02769-17
(discussed in Chapter 5; section 5.2.3). Despite only being weak biofilm producers, these two isolates
showed similar tolerance levels to the ten isolates that were strong biofilm producers to both
disinfectant products in the BOAT assay. Therefore, it is likely that the presence of the qacEΔ1 gene
facilitates their survival during and after C&D. This second mechanism was only identified in two

203
isolates (collected at a single visit) out of the 20 isolates randomly selected from the hundreds of
Salmonella isolates from multiple sampling occasions at the hatchery. Without further evaluation of
trends in the biofilm-forming abilities and disinfectant tolerance of more of these Salmonella isolates,
it cannot be determined whether this additional mechanism also facilitated the persistence of
Salmonella within the hatchery environment despite weak biofilm-producing abilities.
In Chapter 6 (section 6.2.2.1), analysis of a sub-set of 12 S. 13,23:i:- isolates using the biofilm-oriented
antiseptic test (BOAT), a high-throughput TTC microplate-based metabolic assay, showed all isolates
to have the tolerance to two commercial disinfectants used in situ in the hatchery of origin during the
study period; a BZK-based disinfectant and a QAC-/glutaraldehyde-based combination disinfectant.
Although helpful as initial high throughput screening methods, the main limitation of all microplate
assays such as BOAT for assessing tolerance to disinfectants is that they only allow estimation of the
ability of Salmonella to form biofilms on plastic surfaces. Therefore, in Chapter 6.2.2.2, the biofilm
surface test published by Vestby and Nesse (2015) was adapted to evaluate further the disinfectant
tolerance of S. 13, 23:i:- on surfaces other than plastic. This disinfectant test provides additional
support for the value of findings on disinfectant tolerance in relation to the real-world control of S.
13,23:i:- in the hatchery. The QAC-/glutaraldehyde-based combination disinfectant was observed to
have differing effectiveness against a S. 13,23:i:- biofilm (isolate S03363-15) formed on different
coupons (PVC, stainless steel, concrete, screed, and poplar wood) found in the hatchery environment.
Most notably, there was reduced disinfectant efficacy on poplar wood coupons. After the
manufacturer's recommended 30-minute contact time at the Defra General Orders (GO) rate, the
disinfectant successfully eradicated biofilms formed on PVC coupons, while VBNC bacteria were
recovered from poplar wood and screed coupons even after a 3-hour contact time (six times the
manufacturer's recommended contact time) using the Defra GO rate. It is important to take these
findings into consideration alongside other real-world conditions that have not been accounted for in
these experiments, but which may affect the effectiveness of disinfectants, when selecting an

204
effective (bactericidal) disinfectant to use to control persistent S. 13,23:i:- contamination. This is
because although a disinfectant may appear to be effective on plastic surfaces, the presence of VBNC
bacteria can result in recontamination of the environment after C&D. These findings add to others
that note that, among other factors, the surface material affects how well bacteria adhere to surfaces
and thereby the efficacy of a disinfectant (Agarwal et al., 2011; Srey, Jahid and Has, 2013; Van Houdt
and Michiels, 2010; Wales et al., 2021).
8.1.4 Biofilm formation in a developed in vitro model of the poultry drinking water system (DWS)
Alternative, more realistic methods compared to the microplate assay for studying in vitro biofilm
formation exist, but these methods have their limitations in only being able to replicate a single aspect
of the environment. Although they are much more complex and incorporate more variables,
microcosm models aim to mimic real-world conditions using small-scale in vitro models that replicate
combinations of conditions that exist in a real-world situation (Lebeaux et al., 2013). A particular
aspect of the poultry house environment that requires further study is the interior of the poultry DWS,
which is important for the maintenance of water quality and flock health but is challenging to study in
situ. The poultry DWS model developed in this study and described in Chapter 7 proposes a novel in
vitro model to fill this knowledge gap using a more realistic experimental environment. This work
builds upon the static biofilm model used by Maes et al. (2020) by providing a more realistic study of
biofilms by simulating low water flow conditions that can apply at the end of a poultry house drinker
line, realistic surface materials and low levels of bacterial contamination. Salmonella was recovered
from biofilms formed within the poultry DWS, even when using a relatively low bacterial load of 103
CFU/ml. The importance of these findings for the poultry industry is that biofilm within the DWS can
make effective C&D more difficult, with surviving bacteria potentially perpetuating flock infections,
providing a reservoir for opportunistic pathogens and the exchange of AMR genes. Bacterial
contamination of drinking water also makes it unpalatable and therefore reduces the health and
growth performance of the birds (Milanov et al., 2017; Rilstone et al., 2021).
205
It was only possible to run the model with one biological replicate because of the complexity and
resource limitations, but it should be possible to construct more user-friendly realistic model system
given sufficient commercial interest. During this study, the most significant limitation was the flow
rate, which was much lower than that commonly found in poultry farms, except at the ends of water
lines where it is often observed that turbid suspensions of organic material can accumulate. Another
limitation of the model was the use of a single-species (S. Enteritidis) biofilm, as in the natural
environment, bacteria exist in a mixed-species biofilm (Srey, Jahid and Has, 2013). However, in most
biofilm studies, it is usual to experiment with a single species biofilm to establish a method before
moving on to a mixed biofilm model, which is more complex and variable. The suggested refinements
for the poultry DWS model that would enable it to be used to ultimately be used a model for testing
the efficacy of disinfectant products intended to prevent or remove biofilms formed within the DWS
are discussed in detail in section 8.4. Briefly, these suggested refinements are increasing the water
pressure in the system, incorporation of mixed-species biofilms, regulation of the ambient
temperature, creating a dynamic flow model instead of a static biofilm model, increasing the number
of samples (technical and biological replicates) collected, and extending the duration of time during
which biofilms can form within the model.
8.2 Conclusions
In conclusion, the studies presented here demonstrated that Salmonella isolates representing a range
of serovars, and isolated from a variety of environmental sources within the pig and poultry industry
were able to form in vitro biofilms, to varying degrees, at environmentally relevant temperatures of
20±1°C and 25±1°C. Beyond observation of biofilm formation differing between Salmonella serovars,
phenotypic analysis and comparative genomic analysis were unable to reach definitive conclusions
regarding the mechanisms behind the observed differences in biofilm formation and the factors
influencing in vitro biofilm formation. This may have been associated with the wide diversity of isolates
and their origins selected for the initial isolate panel and the absence of non-biofilm producing

206
Salmonella for comparison. A wide range of genes associated with antimicrobial or tolerance to QACs
and mobile genetic elements were observed within the environmental isolates. Further analysis
showed disinfectant tolerance among a sub-panel of S. 13,23:i:- isolates, suggesting that the presence
of these QACs tolerance genes, along with biofilm formation, may facilitate their persistence in the
hatchery environment. These findings supported the primary hypothesis that the persistence of
Salmonella in the environment of pig and poultry production premises is facilitated by biofilm
formation.
These findings add to the current body of knowledge on biofilm formation of well-researched
Salmonella serovars such as S. Enteritidis and S. Typhimurium isolated from pig and poultry production
environments. They also provide new information about biofilm formation by Salmonella originating
from commercial feed mills, hatcheries, and duck farms in GB, including emerging non-regulated
‘exotic’ serovars of increasing importance within the poultry industry such as MDR S. Infantis and S.
13,23:i:-. This thesis also provided a novel methodology through the development of an in vitro
microcosm biofilm model, which could be used to facilitate the study of biofilm formation in the
poultry DWS.
8.3 Future perspectives
The findings presented here provide a basis for further research in the following areas:
1) To further investigate the factors influencing Salmonella biofilm formation. The study of biofilm
formation in Chapter 3 of pig and poultry-associated environmental Salmonella isolates could
focus on evaluating the biofilm-forming abilities of a greater number of Salmonella isolates of each
serovar originating from the same production premises and associated with environmental
persistence. Salmonella serovars of particular interest for further studies would be these currently
understudied in terms of biofilms formation such as S. 13,23:i:- but are emerging in the poultry
industry and other serovars not studied in this thesis (or only studied in small numbers) such as S.
Kedougou, S. Montevideo, S. Anatum, S. Derby, and S. Indiana which although not associated with
207
salmonellosis in humans they are commonly isolated from pig and poultry are commonly reported
from the UK poultry industry (APHA, 2021). This information would allow the biofilm-forming
abilities of these serovars to be determined and a more in-depth analysis of the culture conditions
influencing biofilms such as under a broader range of temperatures, including cooler outside
environmental UK temperatures such as 4°C and warmer temperatures above 30°C found within
poultry housing. These studies could be performed in a high-throughput manner using the crystal
violet assay and would build on the work by others such as Borges et al. (2018), who investigated
the influence of environmentally relevant temperatures on biofilm formation.
2) To investigate transcriptomics. The molecular characterisation in Chapter 5 focused on the
presence/absence of genes associated with biofilm formation. However, it did not account for
gene expression, which plays an important role in the mechanisms of biofilm formation in
Salmonella as the transcription of the global regulator CsgD is affected by environmental factors
such as temperature (Gerstel, Park and Romling, 2003; Gerstel and Romling, 2003; Steenackers et
al., 2012) and stress responses. The differences observed in vitro biofilm-forming ability between
the Salmonella isolates was suggested to be due to differences in gene transcription rather than
the presence/absence of genes. In addition, further analysis to determine the effect of the
observed mutation on the transcription of the lpfD gene would be of interest for biofilm
formation, and the expression of this gene could be determined using transcriptomics
technologies such as RNA sequencing, which allow for the levels of gene expression under
different conditions to be evaluated (Boolchandani, D'Souza and Dantas, 2019; Wang, Gerstein
and Snyder, 2009). For example, Arteaga et al. (2019) performed gene expression studies on
biofilm-related genes to evaluate the effects of a novel antibiofilm compound on biofilm
mechanisms.
3) To perform more extensive testing of biocides and cleaning agents using the biofilm surface
disinfectant test. To build on the biofilm disinfectant studies against Salmonella biofilms in
Chapter 6.2.3.2, further testing the efficacy of disinfectant products by extending the panel of S.

208
13,23:i:- isolates sourced from this same hatchery environment and the disinfectant products
belonging to disinfectant classes could be conducted. This would enable further information to be
gathered regarding selecting a suitable disinfectant to eliminate persistent Salmonella
contamination found in this hatchery. Incorporation of additional surfaces found within the
hatchery environment such as egg and chick crates and materials used in ventilation ducting and
tray washers, different disinfectant products, and the inclusion of organic matter such as fluff and
egg contents/eggshells would be beneficial as these factors are all known to affect the efficacy of
a disinfectant (Corcoran et al., 2013; Jones, 2013; Rycroft, 2013; Wales et al., 2021).
4) To continue the development of the poultry DWS model. To build on the novel work started in
Chapter 7, further enhancements of the poultry DWS model would improve the realism of this
microcosm model. The refinements would also allow it to be used to study the formation of
biofilms with the DWS and for testing commercial water sanitiser products intended to prevent
the formation of biofilms within the DWS or disrupt or inactivate bacteria in biofilms that are
already formed. This would allow a more accurate assessment of the possible effectivity of these
products than conventional biofilm disinfectant test models or even field samples collected after
C&D. Enhancements to the DWS would provide more realistic environmental conditions and
improve the repeatability of the experiment. Higher flow rates could be incorporated using a
larger peristaltic pump and tubing with a wider diameter, and the aim would be to achieve a flow
rate of 30ml/minute as this is the minimum flow rate found in the DWS of breeder flocks between
ages of 0 to 7 days (Cobb-Vantress, 2021). Regulation of the ambient temperature to mimic the
poultry house could be achieved by running the DWS in a temperature-controlled room.
Additional sampling within the DWS system, especially of the plastic components such as inside
the pressure regulator and the water pipe using swabbing methods, would increase the number
of data points and improve the statistical significance of the results. Although further modification
to create a dynamic flow model may increase the system's complexity, the removal of waste
products from the system and input of fresh nutrients and bacteria would allow for the formation

209
of mature biofilms and enable the system to be run for a longer duration than four days, for
instance up to 6-weeks which is the usual length of time before the DWS is cleaned and disinfected
between broiler chicken flocks.

210
References
5m Editor. 2012. Role of Cleaning and Disinfection [Online]. The Poultry Site: Global AG Media. Available: https://www.thepoultrysite.com/articles/role-of-cleaning-and-disinfection [Accessed 28 February 2022].
5m Publishing. 2012. Cleaning and Disinfection [Online]. The Pig Site: Global AG Media. Available: https://www.thepigsite.com/articles/cleaning-and-disinfection [Accessed 28 February 2022].
Adetunji, V. O. & Odetokun, I. A. 2012. Assessment of biofilm in E. coli O157:H7 and Salmonella strains: influence of cultural conditions. American Journal of Food Technology, 7 (10), pp. 582-595. doi:10.3923/ajft.2012.582.595.
Agarwal, R., Singh, S., Bhilegaonkar, K. & Singh, V. 2011. Optimization of microtitre plate assay for the testing of biofilm formation ability in different Salmonella serotypes. International Food Research Journal, 18 (4), pp. 1493-1498. https://www.researchgate.net/publication/286964964_Optimization_of_microtitre_plate_assay_for_the_testing_of_biofilm_formation_ability_in_different_Salmonella_serotypes.
Agriculture and Horticulture Development Board [AHDB]. 2018. Controlled environment for livestock: principles, systems and technologies – air, temperature and light [Online]. Available: https://projectblue.blob.core.windows.net/media/Default/Pork/Documents/Controlled%20Environment%20%20for%20Livestock%20WEB [Accessed 01 June 2019].
Agriculture and Horticulture Development Board [AHDB]. 2021. UK pig numbers and holdings [Online]. Available: https://ahdb.org.uk/pork/uk-pig-numbers-and-holdings [Accessed 01 October 2021].
Ahmet, A., Gulay, F. & Erman, G. 2015. Chicken carcasses bacterial concentration at poultry slaughtering facilities. Asian Journal of Biological Sciences, 8 (1), pp. 16-29. doi:10.3923/ajbs.2015.16.29.
Akrami, F., Rajabnia, M. & Pournajaf, A. 2019. Resistance integrons: a mini review. Caspian Journal of Internal Medicine, 10 (4), pp. 370-376. doi:10.22088/cjim.10.4.370.
Al-Adham, I., Haddadin, R. & Collier, P. 2013. Types of microbicidal and microbistatic agents. In: FRAISE, A. P., MAILLARD, J.-Y. & SATTAR, S. (eds.) Russell, Hugo and Ayliffe's Principles and Practice of Disinfection, Preservation and Sterilization. 5th ed.
Alcock, B. P., Raphenya, A. R., Lau, T. T. Y., Tsang, K. K., Bouchard, M., Edalatmand, A., Huynh, W., Nguyen, A. V., Cheng, A. A., Liu, S., Min, S. Y., Miroshnichenko, A., Tran, H. K., Werfalli, R. E., Nasir, J. A., Oloni, M., Speicher, D. J., Florescu, A., Singh, B., Faltyn, M., Hernandez-Koutoucheva, A., Sharma, A. N., Bordeleau, E., Pawlowski, A. C., Zubyk, H. L., Dooley, D., Griffiths, E., Maguire, F., Winsor, G. L., Beiko, R. G., Brinkman, F. S. L., Hsiao, W. W. L., Domselaar, G. V. & McArthur, A. G. 2020. CARD 2020: Antibiotic resistome surveillance with the comprehensive antibiotic resistance database. Nucleic Acids Research, 48 (D1), pp. D517-D525. doi:10.1093/nar/gkz935.
Allen-Vercoe, E., Collighan, R. & Woodward, M. J. 1998. The variant rpoS allele of S. Enteritidis strain 27655R does not affect virulence in a chick model nor constitutive curliation but does generate a cold-sensitive phenotype. Fems Microbiology Letters, 167, pp. 245-253. doi:10.1111/j.1574-6968.1998.tb13235.x.
Allen-Vercoe, E., Dibb-Fuller, M., Thorns, C. J. & Woodward, M. J. 1997. SEF17 fimbriae are essential for the convoluted colonial morphology of Salmonella Enteritidis. Fems Microbiology Letters, 153 (1), pp. 33-42. doi:10.1016/s0378-1097(97)00219-x.
Amini, K., Salehi, T. Z., Nikbakht, G., Ranjbar, R., Amini, J. & Ashrafganjooei, S. B. 2010. Molecular detection of invA and spv virulence genes in Salmonella Enteritidis isolated from human and animals in Iran. African Journal of Microbiology Research, 4 (21).
Anderson, E. S., Ward, L. R., Saxe, M. J. & de Sa, J. D. 1977. Bacteriophage-typing designations of Salmonella Typhimurium. The Journal of Hygiene, 78 (2), pp. 297-300. doi:10.1017/s0022172400056187.
Andino, A. & Hanning, I. 2015. Salmonella enterica: survival, colonization, and virulence differences among serovars. The Scientific World Journal, 2015 (7), pp. 1-16. doi:10.1155/2015/520179.
Andres, V. M. & Davies, R. D. 2015. Biosecurity measures to control Salmonella and other infectious agents in pig farms: A review. Comprehensive Reviews in Food Science and Food Safety, 14 (4). doi:10.1111/1541-4337.12137.
Animal and Plant Health Agency [APHA]. 2019. Salmonella in livestock production in GB, 2018 [Online]. Available: https://webarchive.nationalarchives.gov.uk/20200803212253/https://www.gov.uk/government/publications/salmonella-in-livestock-production-in-great-britain [Accessed 01 August 2020].

211
Animal and Plant Health Agency [APHA]. 2020. Salmonella in livestock production in GB, 2019 [Online]. Available: https://webarchive.nationalarchives.gov.uk/ukgwa/20210803031053/https://www.gov.uk/government/publications/salmonella-in-livestock-production-in-great-britain [Accessed 01 November 2020].
Animal and Plant Health Agency [APHA]. 2021. Salmonella in livestock production in GB, 2020 [Online]. Available: https://assets.publishing.service.gov.uk/government/uploads/system/uploads/attachment_data/file/1018523/salm-livestock-prod-gb20.pdf [Accessed 01 November 2021].
Arteaga, V., Lamas, A., Regal, P., Vázquez, B., Miranda, J. M., Cepeda, A. & Franco, C. M. 2019. Antimicrobial activity of apitoxin from Apis mellifera in Salmonella enterica strains isolated from poultry and its effects on motility, biofilm formation and gene expression. Microbial Pathogenesis, 137. doi:10.1016/j.micpath.2019.103771.
Asgharpour, F., Rajabnia, R., Ferdosi Shahandashti, E., Marashi, M. A., Khalilian, M. & Moulana, Z. 2014. Investigation of class I integron in Salmonella Infantis and its association with drug resistance. Jundishapur Journal of Microbiology, 7 (5), pp. e10019. doi:10.5812/jjm.10019.
Ashton, P. M., Nair, S., Peters, T. M., Bale, J. A., Powell, D. G., Painset, A., Tewolde, R., Schaefer, U., Jenkins, C., Dallman, T. J., de Pinna, E. M., Grant, K. A. & Whole Genome Sequencing Implementation Group. 2016. Identification of Salmonella for public health surveillance using whole genome sequencing. PeerJ - Life & Environment. doi:10.7717/peerj.1752.
Asséré, A., Oulahal, N. & Carpentier, B. 2008. Comparative evaluation of methods for counting surviving biofilm cells adhering to a polyvinyl chloride surface exposed to chlorine or drying. Journal of Applied Microbiology, 104 (6), pp. 1692-1702. doi:10.1111/j.1365-2672.2007.03711.x.
Auguie, B. 2017. gridExtra: Miscellaneous Functions for "Grid" Graphics [Online]. Available: https://CRAN.R-project.org/package=gridExtra [Accessed 01 November 2021].
Austin, J. W., Sanders, G., Kay, W. W. & Collinson, S. K. 1998. Thin aggregative fimbriae enhance Salmonella Enteritidis biofilm formation. Fems Microbiology Letters, 162 (2), pp. 295-301. https://www.ncbi.nlm.nih.gov/pubmed/9627964.
Avigen Turkeys Ltd. 2015a. Hatchery cleaning and disinfection [Online]. Available: http://www.aviagenturkeys.com/uploads/2015/11/20/HA10%20Hatchery%20Cleaning%20and%20Disinfection%20EN%20V3.pdf [Accessed 01 September 2020].
Avigen Turkeys Ltd. 2015b. Management essentials for commercial turkeys [Online]. Available: http://www.aviagenturkeys.com/uploads/2015/11/05/CL07%20Management%20Essentials%20for%20Commercial%20Turkeys%20EN%20V3.pdf [Accessed 30 November 2021].
Azeredo, J., Azevedo, N. F., Briandet, R., Cerca, N., Coenye, T., Costa, A. R., Desvaux, M., Di Bonaventura, G., Hébraud, M., Jaglic, Z., Kačániová, M., Knøchel, S., Lourenço, A., Mergulhão, F., Meyer, R. L., Nychas, G., Simões, M., Tresse, O. & Sternberg, C. 2017. Critical review on biofilm methods. Criticial Reviews in Microbiology, 43 (3), pp. 313-351. doi:10.1080/1040841X.2016.1208146.
Bailey, J. S., Stern, N. J., P Fedorka-Cray, P., Craven, S. E., Cox, N. A., Cosby, D. E., Ladely, S. & Musgrove, M. T. 2001. Sources and movement of Salmonella through integrated poultry operations: a multistate epidemiological investigation. Journal of Food Protection, 64 (11), pp. 1690-1697. doi:10.4315/0362-028x-64.11.1690.
Balaban, N. Q., Helaine, S., Lewis, K., Ackermann, M., Aldridge, B., Dan I. Andersson, D. I., Brynildsen, M., P., Bumann, D., Camilli, A., Collins, J., J., Dehio, C., Fortune, S., Ghigo, J.-M., Hardt, W.-D., Harms, A., Heinemann, M., Hung, D., T., Jenal, U., Levin, B., R., Michiels, J., Storz, G., Tan, M.-W., Tenson, T., Van Melderen, L. & Zinkernagel, A. 2019. Definitions and guidelines for research on antibiotic persistence. Nature Reviews Microbiology, 17 (7), pp. 441-448. doi:10.1038/s41579-019-0196-3.
Barco, L., Lettini, A. A., Ramon, E., Longo, A., Saccardin, C., Pozza, M. C. & Ricci, A. 2011. A rapid and sensitive method to identify and differentiate Salmonella enterica serotype Typhimurium and Salmonella enterica serotype 4,[5],12:i:- by combining traditional serotyping and multiplex polymerase chain reaction. Foodborne Pathogens and Disease, 8, pp. 741-743. doi:10.1089/fpd.2010.0776.
Bauer, A. W., Kirby, W. M., Sherris, J. C. & Turck, M. 1966. Antibiotic susceptibility testing by a standardized single disk method. Am J Clin Pathol, 45 (4), pp. 493-496. https://www.ncbi.nlm.nih.gov/pubmed/5325707.
Bawn, M., Alikhan, N.-F., Thilliez, G., Kirkwood, M., Wheeler, N., Petrovska, L., Dallman, T. J., Adriaenssens, E. M., Hall, N. & Kingsley, R. A. 2020. Evolution of Salmonella enterica serotype

212
Typhimurium driven by anthropogenic selection and niche adaptation. PLOS Genetics, 16 (6: e1008850), pp. 1-29. doi:10.1371/journal.pgen.1008850.
Bilia, A. R., Guccione, C., Isacchi, B., Righeschi, C., Firenzuoli, F. & Bergonzi, M. C. 2014. Essential Oils Loaded in Nanosystems: A Developing Strategy for a Successful Therapeutic Approach. Evidence-Based Complementary and Alternative Medicine, 2014 (6: 651593), pp. 1-14. doi:10.1155/2014/651593.
Boddicker, J. D., Ledeboer, N. A., Jagnow, J., Jones, B. D. & Clegg, S. 2002. Differential binding to and biofilm formation on, HEp-2 cells by Salmonella enterica serovar Typhimurium is dependent upon allelic variation in the fimH gene of the fim gene cluster. Molecular Microbiology, 45 (5), pp. 1255-1265. doi:10.1046/j.1365-2958.2002.03121.x.
Boolchandani, M., D'Souza, A. W. & Dantas, G. 2019. Sequencing-based methods and resources to study antimicrobial resistance. Nature Reviews Genetics, 20 (6), pp. 356-370. doi:10.1038/s41576-019-0108-4.
Borges, K. A., Furian, T. Q., Souza, S. N., Menezes, R., Tondo, E. C., Salle, C. T. P., Moraes, H. & do Nascimento, V. P. 2018. Biofilm formation capacity of Salmonella serotypes at different temperature conditions. Pesquisa Veterinária Brasileira, 1 (38), pp. 71-76. doi:10.1590/1678-5150-pvb-4928.
Bortolaia, V., Kaas, R. S., Ruppe, E., Roberts, M. C., Schwarz, S., Cattoir, V., Philippon, A., Allesoe, R. L., Rebelo, A. R., Florensa, A. F., Fagelhauer, L., Chakraborty, T., Neumann, B., Werner, G., Bender, J. K., Stingl, K., Nguyen, M., Coppens, J., Xavier, B. B., Malhotra-Kumar, S., Westh, H., Pinholt, M., Anjum, M. F., Duggett, N. A., Kempf, I., Nykasenoja, S., Olkkola, S., Wieczorek, K., Amaro, A., Clemente, L., Mossong, J., Losch, S., Ragimbeau, C., Lund, O. & Aarestrup, F. M. 2020. ResFinder 4.0 for predictions of phenotypes from genotypes. Journal of Antimicrobial Chemotherapy, 75 (12), pp. 3491-3500. doi:10.1093/jac/dkaa345.
Botteldoorn, N., Heyndrickx, M., Rijpens, N., Grijspeerdt, K. & Herman, L. 2003. Salmonella on pig carcasses: positive pigs and cross contamination in the slaughterhouse. Journal of Applied Microbiology, 95 (5), pp. 891-903. doi:10.1046/j.1365-2672.2003.02042.x.
Branco, L. O., Chagas, L. G. S., de Melo, R. T., Guimarães, E. C. & Lima, A. 2016. Biofilm production by Escherichia coli in poultry water drinkers. Revista Brasileira de Ciência Veterinária, 23 (3-4), pp. 133-137. doi:10.4322/rbcv.2016.044.
Bridier, A., Briandet, R., Thomas, V. & Dubois-Brissonnet, F. 2011. Resistance of bacterial biofilms to disinfectants: a review. Biofouling, 27 (9), pp. 1017-1032. doi:10.1080/08927014.2011.626899.
Bridier, A., Sanchez-Vizuete, P., Guilbaud, M., Piard, J.-C., Naïtali, M. & Briandet, R. 2015. Biofilm-associated persistence of food-borne pathogens. Food Microbiology, 45 (Part B), pp. 167-178. doi:10.1016/j.fm.2014.04.015.
British Lion eggs. 2019. Barn egg production [Online]. Available: https://www.egginfo.co.uk/egg-facts-and-figures/production/barn-egg [Accessed 27 October 2021].
British Lion eggs. 2020. Industry data [Online]. Available: https://www.egginfo.co.uk/egg-facts-and-figures/industry-information/data [Accessed 21 October 2021].
British Lion eggs. no date-a. British Lion eggs [Online]. Available: https://www.egginfo.co.uk/british-lion-eggs [Accessed 25 February 2022].
British Lion eggs. no date-b. Free range egg production [Online]. Available: https://www.egginfo.co.uk/egg-facts-and-figures/production/free-range-egg [Accessed 27 October 2021].
British Lion eggs. no date-c. Laying cage systems [Online]. Available: https://www.egginfo.co.uk/egg-facts-and-figures/production/cage-egg [Accessed 27 October 2021].
British Poultry Council [BPC]. 2021. BPC antibiotics stewardship report 2021 [Online]. Available: https://britishpoultry.org.uk/wp-content/uploads/2021/09/FINAL-AB-21.pdf [Accessed 03 October 2021].
British Society for Antimicrobial Chemotherapy [BSAC]. 2015. BSAC Methods for Antimicrobial Susceptibility Testing [Online]. Available: https://bsac.org.uk/wp-content/uploads/2012/02/BSAC-disc-susceptibility-testing-method-Jan-2015.pdf [Accessed 23 February 2022].
Brown, P. K., Dozois, C. M., Nickerson, C. A., Zuppardo, A., Terlonge, J. & Curtiss, R. I. 2001. MlrA, a novel regulator of curli (AgF) and extracellular matrix synthesis by Escherichia coli and Salmonella enterica serovar Typhimurium. Molecular Microbiology, 41 (2), pp. 349-363. doi:10.1046/j.1365-2958.2001.02529.x.
Buckingham-Meyer, K., Goeres, D. M. & Hamilton, M. A. 2007. Comparative evaluation of biofilm disinfectant efficacy tests. Journal of Microbiological Methods, 70 (2), pp. 236-244. doi:10.1016/j.mimet.2007.04.010.

213
Čabarkapa, I., Škrinjar, M., Lević, J., Kokić, B., Blagojev, N., Milanov, D. & Suvajdžić, L. 2015. Biofilm forming ability of Salmonella Enteritidis in vitro. Acta Veterinaria, 65 (3), pp. 371-389. doi:10.1515/acve-2015-0031.
Callaway, T. R., Morrow, J. L., Johnson, A. K., Dailey, J. W., Wallace, F. M., Wagstrom, E. A., McGlone, J. J., Lewis, A. R., Dowd, S. E., Poole, T. L., Edrington, T. S., Anderson, R. C., Genovese, K. J., Byrd, J. A., Harvey, R. B. & Nisbet, D. J. 2005. Environmental prevalence and persistence of Salmonella spp. in outdoor swine wallows. Foodborne Pathogens and Disease, 2 (3), pp. 263-273. doi:10.1089/fpd.2005.2.263.
Callow, B. R. 1959. A new phage-typing scheme for Salmonella Typhimurium. Journal of Hygiene, 57 (3), pp. 346-359. doi:10.1017/s0022172400020209.
Capita, R., Fernández-Pérez, S., Buzón-Durán, L. & Alonso-Calleja, C. 2019. Effect of sodium hypochlorite and benzalkonium chloride on the structural parameters of the biofilms formed by ten Salmonella enterica serotypes. Pathogens, 8 (3), pp. 154. doi:10.3390/pathogens8030154.
Carpentier, B. & Cerf, O. 1993. Biofilms and their consequences, with particular reference to hygiene in the food industry. Journal of Applied Bacteriology, 75 (6), pp. 499-511. doi:10.1111/j.1365-2672.1993.tb01587.x.
Carrascosa, C., Raheem, D., Ramos, F., Saraiva, A. & Raposo, A. 2021. Microbial biofilms in the food industry - A comprehensive review. International Journal of Environmental Research and Public Health, 18 (4), pp. 2014. doi:/doi.org/10.3390/ijerph18042014.
Cason, J. A., Cox, N. A. & Bailey, J. S. 1994. Transmission of Salmonella Typhimurium during hatching of broiler chicks. Avian Diseases, 38 (3), pp. 583-588. https://www.ncbi.nlm.nih.gov/pubmed/7832712.
Castañeda-Gulla, K., Sattlegger, E. & Mutukumira, A. N. 2020. Persistent contamination of Salmonella, Campylobacter, Escherichia coli, and Staphylococcus aureus at a broiler farm in New Zealand. Canadian Journal of Microbiology, 66 (3), pp. 171-185. doi:10.1139/cjm-2019-0280.
Cepas, V., López, Y., Muñoz, E., Rolo, D., Ardanuy, C., Martí, S., Xercavins, M., Horcajada, J. P., Bosch, J. & Soto, S. M. 2019. Relationship between biofilm formation and antimicrobial resistance in Gram-negative bacteria. Microbial Drug Resistance, 25 (1), pp. 72-79. doi:10.1089/mdr.2018.0027.
Chen, S., Feng, Z., Sun, H., Zhang, R., Qin, T. & Peng, D. 2020. Biofilm-formation-related Genes csgD and bcsA promote the vertical transmission of Salmonella Enteritidis in chicken. Frontiers in Veterinary Science, 7 (article 625049). doi:10.3389/fvets.2020.625049.
Chlebicz, A. & Slizewska, K. 2018. Campylobacteriosis, Salmonellosis, Yersiniosis, and Listeriosis as zoonotic foodborne diseases: A review. International Journal of Environmental Research and Public Health, 15. doi:10.3390/ijerph15050863.
Chlumsky, O., Purkrtova, S., Michova, H., Sykorova, H., Slepicka, P., Fajstavr, D., Ulbrich, P., Viktorova, J. & Demnerova, K. 2021. Antimicrobial properties of palladium and platinum nanoparticles: a new tool for combating food-borne pathogens. International Journal of Molecular Sciences, 22 (15), pp. 78892. doi:10.3390/ijms22157892.
Choong, F. X., Bäck, M., Fahlén, S., Johnasson, L. B. G., Melica, K., Rhen, M., Nilsson, K. P. R. & Richter-Dahlfors, A. 2016. Real-time optotracing of curli and cellulose in live Salmonella biofilms using luminescent oligothiophenes. Biofilms and Microbiomes, 2 (article 16024). doi:10.1038/npjbiofilms.2016.24.
Christensen, G. D., Simpson, W. A., Bisno, A. L. & Beachey, E. H. 1982. Adherence of slime-producing strains of Staphylococcus epidermidis to smooth surfaces. Infection and Immunity, 37 (1), pp. 318-326. doi:10.1128/iai.37.1.318-326.1982.
Christensen, G. D., Simpson, W. A., Younger, J. J., Baddour, L. M., Barrett, F. F., Melton, D. M. & Beachey, E. H. 1985. Adherence of coagulase-negative Staphylococci to plastic tissue culture plates: A quantitative model for the adherence of Staphylococci to medical devices. Journal of Clinical Microbiology, 22 (6), pp. 996-1006. doi:10.1128/jcm.22.6.996-1006.1985.
Chylkova, T., Cadena, M., Ferreiro, A. & Pitesky, M. 2017. Susceptibility of Salmonella biofilm and planktonic bacteria to common disinfectant agents used in poultry processing. Journal of Food Protection, 80 (8), pp. 1072-1079. doi:10.4315/0362-028X.JFP-16-393.
Cimdins, A. & Simm, R. 2017. Semiquantitative analysis of the red, dry, and rough colony morphology of Salmonella enterica serovar Typhimurium and Escherichia coli using Congo red. Methods in Molecular Biology, (1657), pp. 225-241. doi:10.1007/978-1-4939-7240-1_18.
Cobb-Vantress. 2008. Hatchery management guide [Online]. Available: http://www.cobb-vantress.com/docs/default-source/management-guides/hatchery_management_guide_englishAB158662CC0DBEA86B974859.pdf [Accessed 01 March 2018].

214
Cobb-Vantress. no date. Nipple drinker guidelines [Online]. Available: https://www.cobb-vantress.com/assets/Cobb-Files/6caa3390df/Nipple-Drinker-Poster-Digital.pdf [Accessed 01 August 2021].
Contreras-García, A., Bucio, E., Brackman, G., Coenye, T., Concheiro, A. & Alvarez-Lorenzo, C. 2011. Biofilm inhibition and drug-eluting properties of novel DMAEMA-modified polyethylene and silicone rubber surfaces. Biofouling, 27 (2), pp. 123-135. doi:10.1080/08927014.2010.548115.
Corcoran, M., Morris, D., De Lappe, N., O'Connor, J., Lalor, P., Dockery, P. & Cormican, M. 2013. Salmonella enterica biofilm formation and density in the Centers for Disease Control and Prevention's biofilm reactor model is related to serovar and substratum. Journal of Food Protection, 76 (4), pp. 662-667. doi:10.4315/0362-028X.JFP-12-303.
Corcoran, M., Morris, D., De Lappe, N., O'Connor, J., Lalor, P., Dockery, P. & Cormican, M. 2014. Commonly used disinfectants fail to eradicate Salmonella enterica biofilms from food contact surface materials. Applied and Environmental Microbiology, 80 (4), pp. 1507-1514. doi:10.1128/aem.03109-13.
Cornell University. 2016. Duck housing and management [Online]. Available: https://www.vet.cornell.edu/animal-health-diagnostic-center/programs/duck-research-lab/housing-and-management [Accessed 30 November 2021].
Cox, N. A., Berrang, M. E. & Cason, J. A. 2000. Salmonella penetration of egg shells and proliferation in broiler hatching eggs-a review. Poultry Science, 79 (11), pp. 1571-1574. doi:10.1093/ps/79.11.1571.
Ćwiek, K., Bugla-Płoskońska, G. & Wieliczko, A. 2019. Salmonella biofilm development: Structure and significance. Advances in Hygiene and Experimental Medicine, 73, pp. 937-943. doi:10.5604/01.3001.0013.7866.
Ćwiek, K., Korzekwa, K., Tabis, A., Bania, J., Bugla-Płoskońska, G. & Wieliczko, A. 2020. Antimicrobial resistance and biofilm formation capacity of Salmonella enterica serovar Enteritidis strains isolated from poultry and humans in Poland. Pathogens, 9 (8), pp. 643. doi:10.3390/pathogens9080643.
Dalhoff, A. 2012. Resistance surveillance studies: a multifaceted problem—the fluoroquinolone example. Infection, 40 (3), pp. 239-262. doi:10.1007/s15010-012-0257-2.
Davies, R., Breslin, M., Corry, J. E., Hudson, W. & Allen, V. M. 2001. Observations on the distribution and control of Salmonella species in two integrated broiler companies. Veterinary Record, 149 (8), pp. 227-232. doi:10.1136/vr.149.8.227.
Davies, R., Liebana, E. & Breslin, M. 2003. Investigation of the distribution and control of Salmonella enterica serovar Enteritidis PT6 in layer breeding and egg production. Avian Pathology, 32 (3), pp. 225-237. doi:10.1080/0307945031000097822.
Davies, R. H. 2005. Pathogen populations on poultry farms. In: MEAD, G. C. (ed.) Food safety control in the poultry industry. Cambridge: Woodhead Publishing.
Davies, R. H. & Breslin, M. 2003. Investigation of Salmonella contamination and disinfection in farm egg-packing plants. Journal of Applied Microbiology, 94 (2), pp. 191-196. doi:10.1046/j.1365-2672.2003.01817.x.
Davies, R. H. & Breslin, M. F. 2004. Observations on the distribution and control of Salmonella contamination in poultry hatcheries. British Poultry Science, 45 (supplement 1), pp. S12-14. doi:10.1080/00071660410001697994.
Davies, R. H. & Wray, C. 1996. Persistence of Salmonella Enteritidis in poultry units and poultry food. British Poultry Science, 37 (3), pp. 589-596. doi:10.1080/00071669608417889.
Dawoud, T. M., Davis, M. L., Park, S. H., Kim, S. A., Kwon, Y. M., Jarvis, N., O’Bryan, C. A., Shi, Z., Crandall, P. G. & Ricke, S. C. 2017. The potential link between thermal resistance and virulence in Salmonella: A review. Frontiers in Veterinary Science, 4 (93). doi:10.3389/fvets.2017.00093.
De Oliveira, D. C. V., Júnior, A. F., Kaneno, R., Silva, M. G., Júnior, J. P. A., Silva, N. C. C. & Rall, V. L. M. 2014. Ability of Salmonella spp. to produce biofilm is dependent on temperature and surface material. Foodborne Pathogens and Disease, 11 (6), pp. 478-483. doi:10.1089/fpd.2013.1710.
De Oliveira, F. A., Brandelli, A. & Tondo, E. C. 2006. Antimicrobial resistance in Salmonella Enteritidis from foods involved in human salmonellosis outbreaks in southern Brazil. New Microbiologica, 29 (1), pp. 49-54. https://www.ncbi.nlm.nih.gov/pubmed/16608125.
Dean, W. F. & Sandhu, T. S. 2014. Optimum temperature for ducks [Online]. Available: https://ahdc.vet.cornell.edu/Sects/duck/housing.cfm [Accessed 05 April 2018].
Department of Environment Food & Rural Affairs [Defra]. 2018. Code of practice for the welfare of laying hens and pullets [Online]. Available: https://assets.publishing.service.gov.uk/government/uploads/system/uploads/attachment_dat

215
a/file/732227/code-of-practice-welfare-of-laying-hens-pullets.pdf [Accessed 27 November 2021].
Department of Environment Food & Rural Affairs [Defra]. 2020. Caring for pigs [Online]. Available: https://www.gov.uk/government/publications/pigs-on-farm-welfare/caring-for-pigs [Accessed 01 September 2021].
Department of Environment Food & Rural Affairs [Defra]. 2021a. Defra-approved disinfectant: when and how to use it [Online]. Available: https://www.gov.uk/guidance/defra-approved-disinfectant-when-and-how-to-use-it [Accessed 01 November 2021].
Department of Environment Food & Rural Affairs [Defra]. 2021b. Farming statistics - Livestock populations at 1 December 2020, UK [Online]. Available: https://assets.publishing.service.gov.uk/government/uploads/system/uploads/attachment_data/file/973322/structure-dec20-ukseries-25mar21i.pdf [Accessed 01 November 2021].
Department of Environment Food & Rural Affairs [Defra]. 2021c. Monthly statistics on the activity of UK hatcheries and UK poultry slaughterhouses (data for September 2021) [Online]. Available: https://www.gov.uk/government/statistics/poultry-and-poultry-meat-statistics/monthly-statistics-on-the-activity-of-uk-hatcheries-and-uk-poultry-slaughterhouses-data-for-january-2021 [Accessed 01 November 2021].
Department of Environment Food & Rural Affairs [Defra]. 2021d. Quarterly UK statistics about eggs - statistics notice (data to September 2021) [Online]. Available: https://www.gov.uk/government/statistics/egg-statistics/quarterly-uk-statistics-about-eggs-statistics-notice-data-to-june-2021 [Accessed 01 November 2021].
Dhaliwal, D. S., Cordier, J. L. & Cox, L. J. 2008. Impedimetric evaluation of the efficiency of disinfectants against biofilms. Letters in Applied Microbiology, 15 (5), pp. 217 - 221. doi:10.1111/j.1472-765X.1992.tb00767.x.
Dibb-Fuller, M., Allen-Vercoe, E., M.J., W. & Thorns, C. J. 1997. Expression of SEF17 fimbriae by Salmonella Enteritidis. Letters in Applied Microbiology, 25, pp. 447-452.
Diez-Garcia, M., Capita, R. & Alonso-Calleja, C. 2012. Influence of serotype on the growth kinetics and the ability to form biofilms of Salmonella isolates from poultry. Food Microbiology, 31 (2), pp. 173-180. doi:10.1016/j.fm.2012.03.012.
Dinno, A. 2017. dunn.test: Dunn's test of multiple comparisons using rank sums [Online]. Available: https://CRAN.R-project.org/package=dunn.test [Accessed 01 October 2021].
Donlan, R. M. 2002. Biofilms: Microbial life on surfaces. Emerging Infectious Diseases, 8 (9), pp. 881-890. doi:10.3201/eid0809.020063.
Donlan, R. M. & Costerton, J. W. 2002. Biofilms: Survival mechanisms of clinically relevant microorganisms. Clinical Microbiology Reviews, 15 (2), pp. 167-193. doi:10.1128/cmr.15.2.167-193.2002.
Dorgham, S. M., Hedia, R. H., Arafa, A., Khairy, E. A. & Kandil, M. M. 2019. Antibiotic resistance pattern and biofilm genes of different Salmonella serotypes isolated from chicken samples. International Journal of Veterinary Science, 8 (4), pp. 324-328.
Drauch, V., Ibesich, C., Vogl, C., Hess, M. & Hess, C. 2020. In-vitro testing of bacteriostatic and bactericidal efficacy of commercial disinfectants against Salmonella Infantis reveals substantial differences between products and bacterial strains. The International Journal of Food Microbiology, 328, pp. 108660. doi:10.1016/j.ijfoodmicro.2020.108660.
Du, Z. & Hao, Y. 2020. reportROC: an easy way to report ROC analysis [Online]. Available: https://cran.r-project.org/web/packages/reportROC/index.html [Accessed 01 October 2021].
Duffy, L. L., Osmond-McLeod, M. J., Judy, J. & King, T. 2018. Investigation into the antibacterial activity of silver, zinc oxide and copper oxide nanoparticles against poultry-relevant isolates of Salmonella and Campylobacter. Food Control, 92, pp. 293-300.
Duggett, N. A., Sayers, E., AbuOun, M., Ellis, R. J., Nunez-Garcia, J., Randall, L., Horton, R., Rogers, J., Martelli, F., Smith, R. P., Brena, C., Williamson, S., Kirchner, M., Davies, R., Crook, D., Evans, S., Teale, C. & Anjum, M. F. 2017. Occurrence and characterization of mcr-1-harbouring Escherichia coli isolated from pigs in Great Britain from 2013 to 2015. Journal of Antimicrobial Chemotherapy, 72 (3), pp. 691-695. doi:10.1093/jac/dkw477.
Edwards, S. M. 2020. lemon: freshing up your 'ggplot2' plots [Online]. Available: https://CRAN.R-project.org/package=lemon [Accessed 01 October 2021].
EFSA Panel on Biological Hazards [EFSA BIOHAZ Panel], Koutsoumanis, K., Allende, A., Alvarez-Ordonez, A., Bolton, D., Bover-Cid, S., Chemaly, M., De Cesare, A., Herman, L., Hilbert, F., Lindqvist, R., Nauta, M., Peixe, L., Ru, G., Simmons, M., Skandamis, P., Suffredini, E., Dewulf, J., Hald, T., Michel, V., Niskanen, T., Ricci, A., Snary, E., Boelaert, F., Messens, W. & Davies,

216
R. 2019. Salmonella control in poultry flocks and its public health impact. EFSA Journal, 17 (2), pp. e05596. doi:10.2903/j.efsa.2019.5596.
Eguale, T., Marshall, J. M., Molla, B., Bhatiya, A., Gebreyes, W. A., Engidawork, E., Asrat, D. & Gunn, J. S. 2014. Association of multicellular behaviour and drug resistance in Salmonella enterica serovars isolated from animals and humans in Ethiopia. Journal of Applied Microbiology, 117 (4), pp. 961-971. doi:10.1111/jam.12579.
El Hag, M., Feng, Z., Su, Y., Wang, X., Yassin, A., Chen, S., Peng, D. & Liu, X. 2018. The role of csgA and bcsA genes on biofilm formation and virulence in Salmonella enterica serovar Typhimurium. Pakistan Veterinary Journal, 38 (2), pp. 159-164.
Eran, Z., Akçelik, M., Yazici, B. C., Özcengiz, G. & Akçelik, N. 2020. Regulation of biofilm formation by marT in Salmonella Typhimurium. Molecular Biology Reports, 47, pp. 5041-5050. doi:10.1007/s11033-020-05573-6.
Esterhuizen, J. 2019. Review of Salmonella control treatment: Is formaldehyde the only option? AFMA Matrix, 28 (3), pp. 16-17.
European Food Safety Authority [EFSA] & European Centre for Disease Prevention and Control [ECDC] 2017. The European Union summary report on antimicrobial resistance in zoonotic and indicator bacteria from humans, animals and food in 2015. EFSA Journal, 15 (2), pp. e04694. doi:10.2903/j.efsa.2017.4694.
European Food Safety Authority [EFSA] & European Centre for Disease Prevention and Control [ECDC]. 2020. Multi-country outbreak of Salmonella Enteritidis infections linked to eggs, third update – 6 February 2020 [Online]. Available: https://www.ecdc.europa.eu/sites/default/files/documents/salmonella-enteritidis-rapid-outbreak-assessment-third-update.pdf [Accessed 01 November 2021].
European Food Safety Authority [EFSA] & European Centre for Disease Prevention and Control [ECDC] 2021a. The European Union One Health 2019 Zoonoses Report. EFSA Journal, 19 (2: 6406), pp. 1-212. doi:10.2903/j.efsa.2021.6406.
European Food Safety Authority [EFSA] & European Centre for Disease Prevention and Control [ECDC]. 2021b. Multi-country outbreak of Salmonella Enteritidis sequence type (ST)11 infections linked to poultry products in the EU/EEA and the United Kingdom [Online]. Available: https://efsa.onlinelibrary.wiley.com/doi/pdf/10.2903/sp.efsa.2021.EN-6486 [Accessed 27 November 2021].
Evans, D. G., Evans Jr, D. J. & Tjoa, W. 1977. Hemagglutination of human group A erythrocytes by enterotoxigenic Escherichia coli isolated from adults with diarrhea: correlation with colonization factor. Infection and Immunity, 18 (2), pp. 330-337. doi:10.1128/iai.18.2.330-337.1977.
Fabrega, A. & Vila, J. 2013. Salmonella enterica serovar Typhimurium skills to succeed in the host: virulence and regulation. Clinical Microbiology Reviews, 26 (2), pp. 308-341. doi:10.1128/CMR.00066-12.
Farahani, R., R.K., Parastoo, E., Mina, E.-R. & Azad, K. 2018. Molecular detection, virulence genes, biofilm formation, and antibiotic resistance of Salmonella enterica serotype Enteritidis isolated from poultry and clinical samples. Jundishapur Journal of Microbiology, 11 (10). doi:10.5812/jjm.69504.
Feldgarden, M., Brover, V., Haft, D. H., Prasad, A. B., Slotta, D. J., Tolstoy, I., Tyson, G. H., Zhao, S., Hsu, C. H., McDermott, P. F., Tadesse, D. A., Morales, C., Simmons, M., Tillman, G., Wasilenko, J., Folster, J. P. & Klimke, W. 2019. Validating the NCBI AMRFinder tool and resistance gene database using antimicrobial resistance genotype-phenotype correlations in a collection of NARMS isolates. Antimicrobial Agents and Chemotherapy. doi:10.1128/AAC.00483-19.
Flemming, H.-C. & Wingender, J. 2010. The biofilm matrix. Nature Reviews Microbiology, 8 (9), pp. 623-633. doi:10.1038/nrmicro2415.
Food Standards Agency [FSA]. 2021a. Advice to reptile owners amid Salmonella outbreak linked to feeder rodents [Online]. Available: https://www.food.gov.uk/news-alerts/news/advice-to-reptile-owners-amid-salmonella-outbreak-linked-to-feeder-rodents [Accessed 27 November 2021].
Food Standards Agency [FSA]. 2021b. FSA issues advice to consumers not to eat several pork scratching products linked to Salmonella poisoning [Online]. Available: https://www.food.gov.uk/news-alerts/news/fsa-issues-advice-to-consumers-not-to-eat-several-pork-scratching-products-linked-to-salmonella-poisoning [Accessed 31 August 2021].
García-Soto, S., Abdel-Gil, M. Y., Tomaso, H., Linde, J. & Methner, U. 2020. Emergence of multidrug-resistant Salmonella enterica subspecies enterica serovar Infantis of multilocus sequence type 2283 in German broiler farms. Frontiers in Microbiology, 11, pp. 1741. doi:10.3389/fmicb.2020.01741.

217
Gargano, V., Sciortino, S., Gambino, D., Costa, A., Agozzino, V., Reale, S., Alduina, R. & Vicari, D. 2021. Antibiotic susceptibility profile and tetracycline resistance genes detection in Salmonella spp. strains isolated from animals and food. Antibiotics (Basel), 10 (7). doi:10.3390/antibiotics10070809.
Gast, R. K. 2005. Bacterial infection of eggs. Food safety and control in the poultry industry. Cambridge: Woodhead Publishing Limited.
Gerstel, U., Park, C. & Romling, U. 2003. Complex regulation of CsgD promoter activity by global regulatory proteins. Molecular Biology, 49 (3), pp. 639-654. doi:10.1046/j.1365-2958.2003.03594.x.
Gerstel, U. & Romling, U. 2003. The CsgD promoter, a control unit for biofilm formation in Salmonella Typhimurium. Research in Microbiology, 154 (10), pp. 659-667. doi:10.1016/j.resmic.2003.08.005.
Giannella, R. A. 1996. Salmonella. In: BARON, S. (ed.) Journal of Medical Microbiology. 4th ed. Galveston: University of Texas Medical Branch at Galveston.
Giaouris, E. & Nychas, G.-J. E. 2006. The adherence of Salmonella Enteritidis PT4 to stainless steel: the importance of the air-liquid interface and nutrient availability. Food Microbiology, 23 (8), pp. 747-752. doi:10.1016/j.fm.2006.02.006.
Gillings, M. R., Holley, M. P. & Stokes, H. W. 2009. Evidence for dynamic exchange of qac gene cassettes between class 1 integrons and other integrons in freshwater biofilms. FEMS Microbiology Letters, 296 (2), pp. 282-288. doi:10.1111/j.1574-6968.2009.01646.x.
Gillings, M. R., Xuejun, D., Hardwick, S. A., Holley, M. P. & Stokes, H. W. 2009. Gene cassettes encoding resistance to quaternary ammonium compounds: a role in the origin of clinical class 1 integrons? The ISME Journal: Multidisciplinary Journal of Microbial Ecology, 3 (2), pp. 209-215. doi:10.1038/ismej.2008.98.
Gomes, M. Z. D. & Nitschke, M. 2012. Evaluation of rhamnolipid and surfactin to reduce the adhesion and remove biofilms of individual and mixed cultures of food pathogenic bacteria. Food Control, 25 (2), pp. 441-447. doi:10.1016/j.foodcont.2011.11.025.
Gómez, N. C., Ramiro, J. M. P., Quecan, B. X. V. & de Melo Franco, B. D. 2016. Use of potential probiotic Lactic Acid Bacteria (LAB) biofilms for the control of Listeria monocytogenes, Salmonella Typhimurium, and Escherichia coli O157:H7 biofilms formation. Frontiers in Microbiology, 7 (863), pp. 1-15. doi:10.3389/fmicb.2016.00863.
González-Rivas, F., Ripolles-Avila, C., Fontecha-Umana, F., Rıos-Castillo, A. G. & Rodrıguez-Jerez, J. J. 2018. Biofilms in the spotlight: detection, quantification, and removal methods. Comprehensive Reviews in Food Science and Food Safety, 17. doi:10.1111/1541-4337.12378.
Gosling, R. J., Mawhinney, I., Vaughan, K., Davies, R. H. & Smith, R. P. 2017. Efficacy of disinfectants and detergents intended for a pig farm environment where Salmonella is present. Veterinary Microbiology, 204, pp. 46-53. doi:10.1016/j.vetmic.2017.04.004.
Gradel, K. O., Randall, L., Sayers, A. R. & Davies, R. H. 2005. Possible associations between Salmonella persistence in poultry houses and resistance to commonly used disinfectants and a putative role of mar. Veterinary Microbiology, 107 (1-2), pp. 127-138. doi:10.1016/j.vetmic.2005.01.013.
Grimont, P. A. & Weill, F.-X. 2007. Antigenic formulae of the Salmonella serovars. 9 ed.: WHO Collaborating Centre for Reference and Research on Salmonella.
Grønseth, T., Vestby, L. K., Nesse, L. L., Thoen, E., Habimana, O., von Unge, M. & Silvola, J. 2017. Lugol's solution eradicates Staphylococcus aureus biofilm in vitro. International Journal of Pediatric Otorhinolaryngology Case Reports, 103, pp. 58-64. doi:10.1016/j.ijporl.2017.09.025.
Günther, F., Scherrer, M., Kaiser, S. J., DeRosa, A. & Mutters, N. T. 2017. Comparative testing of disinfectant efficacy on planktonic bacteria and bacterial biofilms using a new assay based on kinetic analysis of metabolic activity. Journal of Applied Microbiology, 122 (3), pp. 625-633. doi:10.1111/jam.13358.
Gurevich, A., Saveliev, V., Vyahhi, N. & Tesler, G. 2013. QUAST: quality assessment tool for genome assemblies. Bioinformatics, 29 (8), pp. 1072-1075. doi:10.1093/bioinformatics/btt086.
Gutiérrez, D., Rodríguez-Rubio, L., Martínez, B., Rodríguez, A. & García, P. 2016. Bacteriophages as weapons against bacterial biofilms in the food industry. Frontiers in Microbiology, 7 (article 825). doi:10.3389/fmicb.2016.00825.
Guttenplan, S. B. & Kearns, D. B. 2013. Regulation of flagellar motility during biofilm formation. FEMS Microbiology Reviews, 37 (6), pp. 849-871. doi:10.1111/1574-6976.12018.
Gymoese, P., Sørensen, G., Litrup, E., Olsen, J. E., Nielsen, E. M. & Torpdahl, M. 2017. Investigation of outbreaks of Salmonella enterica serovar Typhimurium and its monophasic variants using

218
whole-genome sequencing, Denmark. Emerging Infectious Diseases, 23 (10), pp. 1631–1639. doi:10.3201/eid2310.161248.
Hajipour, M. J., Fromm, K. M., Ashkarran, A. A., Jimenez de Aberasturi, D., de Larramendi, I. R., Rojo, T., Serpooshan, V., Parak, W. J. & Mahmoudi, M. 2012. Antibacterial properties of nanoparticles. Trends in Biotechnology, 30 (10), pp. 499-511. doi:10.1016/j.tibtech.2012.06.004.
Hathroubi, S., Mekni, M. A., Domenico, P., Nguyen, D. & Jacques, M. 2017. Biofilms: Microbial Shelters Against Antibiotics. MICROBIAL DRUG RESISTANCE, 23 (2), pp. 147-156. doi:10.1089/mdr.2016.0087.
Henry, L. & Wickham, H. 2020. purrr: functional programming tools [Online]. Available: https://CRAN.R-project.org/package=purrr [Accessed 01 October 2021].
Heukelekian, H. & Heller, A. 1940. Relation between food concentration and surface for bacterial growth. Journal of Bacteriology, 40 (4), pp. 547-548. doi:10.1128/jb.40.4.547-558.1940.
Hinton, M. 1988. Salmonella infection in chicks following the consumption of artificially contaminated feed. Epidemiology & Infection, 100 (2), pp. 247-256. doi:10.1017/s0950268800067388.
Hoffman, L. R., D'Argenio, D. A., MacCoss, M. J., Zhang, Z., Jones, R. A. & Miller, S. I. 2005. Aminoglycoside antibiotics induce bacterial biofilm formation. Nature, 436 (7054), pp. 1171-1175. doi:10.1038/nature03912.
HPRA. 2016. Summary of Product Characteristics - SALMOVAC 440 [Online]. Available: https://www.hpra.ie/img/uploaded/swedocuments/LicenseSPC_10524-005-001_11032016135943.pdf [Accessed July 2021].
International Organization for Standardization [ISO] 2017. ISO 6579-1:2017 Microbiology of the food chain — Horizontal method for the detection, enumeration and serotyping of Salmonella — Part 1: Detection of Salmonella spp. Switzerland: International Organization for Standardization.
Jacobsen, A., Hendriksen, R. S., Aaresturp, F. M., Ussery, D. W. & Friis, C. 2011. The Salmonella enterica pan-genome. Microbial Ecology, 62 (3), pp. 487-504. doi:10.1007/s00248-011-9880-1.
Jagadeesan, B., Gerner-Smidt, P., W.Allard, M., Leuillet, S., Winkler, A., Xiao, Y., Chaffron, S., Van Der Vossen, J., Tang, S., Katase, M., McClure, P., Kimura, B., Chai, L. C., Chapman, J. & Grant, K. 2019. The use of next generation sequencing for improving food safety: Translation into practice. Food Microbiolgy, 79, pp. 96-115. doi:10.1016/j.fm.2018.11.005.
Janssens, J. C. A., Steenackers, H., Robijns, S., Gellens, E., Levin, J., Zhao, H., Hermans, K., De Coster, D., Verhoeven, T. L., Marchal, K., Vanderleyden, J., De Vos, D. E. & De Keersmaecker, S. C. J. 2008. Brominated furanones inhibit biofilm formation by Salmonella enterica serovar Typhimurium. Applied and Environmental Microbiology, 74 (21), pp. 6639-6648. doi:10.1128/aem.01262-08.
Jones, F. T. 2011. A review of practical Salmonella control measures in animal feed. Journal of Applied Poultry Research, 20 (1), pp. 102-113. doi:10.3382/japr.2010-00281.
Jones, H. C., Roth, I. L. & Sanders, W. M., 3rd 1969. Electron microscopic study of a slime layer. Journal of Bacteriology, 99 (1), pp. 316-325. doi:10.1128/jb.99.1.316-325.1969.
Jones, M. A. 2013. Fimbriae and flagella of Salmonella enterica. In: BARROW, P. A. & METHNER, U. (eds.) Salmonella in Domestic Animals. 2nd ed. Wallingford: CABI.
Jones, Y. E., McLaren, I. M. & Wray, C. 2000. Salmonella in Domestic Animals. Laboratory Aspects of Salmonella. Wallington, United Kingdom: CABI Publishing.
Joseph, B., Otta, S. K., Karunasagar, I. & Karunasagar, I. 2001. Biofilm formation by Salmonella spp. on food contact surfaces and their sensitivity to sanitizers. The International Journal of Food Microbiology, 64 (3), pp. 367–372. doi:10.1016/s0168-1605(00)00466-9.
Jung, S.-J., Park, S. Y. & Ha, S.-D. 2018. Synergistic effect of X-ray irradiation and sodium hypochlorite against Salmonella enterica serovar Typhimurium biofilms on quail eggshells. Food Research International, 107, pp. 496-502. doi:10.1016/j.foodres.2018.02.063.
Kaplan, J. B. 2011. Antibiotic-induced biofilm formation. The International Journal of Artificial Organs, 34 (9), pp. 737-751. doi:10.5301/ijao.5000027.
Kassambara, A. 2020. ggpubr: 'ggplot2' based publication ready plots [Online]. Available: https://CRAN.R-project.org/package=ggpubr [Accessed 01 October 2021].
Kaung, K., Ayaka, H., Hiroaki, I., Takayuki, K., Kinnosuke, Y., Shigeru, M., Katsuhiko, O., T., H., Tomohiro, S. & Takuro, N. 2017. Silver nanoparticles as potential antibiofilm agents against human pathogenic bacteria. Chemistry Letters, 46 (4), pp. 594-596. doi:10.1246/cl.161198.
Keelara, S., Thakur, S. & Patel, J. 2016. Biofilm formation by environmental isolates of Salmonella and their sensitivity to natural antimicrobials. Foodborne Pathogens and Disease, 13 (9), pp. 509-516. doi:10.1089/fpd.2016.2145.

219
Kim, E. 2021. melt: multiple empirical likelihood tests [Online]. Available: https://CRAN.R-project.org/package=melt [Accessed 01 October 2021].
Kim, S. I. & Yoon, H. 2019. Roles of YcfR in biofilm formation in Salmonella Typhimurium ATCC 14028. Molecular Plant-Microbe Interactions, 32 (6), pp. 708-716. doi:10.1094/MPMI-06-18-0166-R.
Konrat, K., Schwebke, I., Laue, M., Dittmann, C., Levin, K., Andrich, R., Arvand, M. & Schaudinn, C. 2016. The bead assay for biofilms: A quick, easy and robust method for testing disinfectants. PLoS ONE, 11 (6), pp. e0157663. doi:10.1371/journal.pone.0157663.
Koopman, J. A., Marshall, J. M., Bhatiya, A., Eguale, T., Kwiek, J. J. & Gunn, J. S. 2015. Inhibition of Salmonella enterica biofilm formation using small-molecule adenosine mimetics. Antimicrobial Agents and Chemotherapy, 59 (1), pp. 76-84. https://www.ncbi.nlm.nih.gov/pmc/articles/PMC4291424/pdf/zac76.pdf.
Korber, D. R., Choi, A., Wolfaardt, G. M., Ingham, S. C. & Caldwell, D. E. 1997. Substratum topography influences susceptibility of Salmonella Enteritidis biofilms to trisodium phosphate. Applied and Environmental Microbiology, 63 (9), pp. 3352–3358. http://aem.asm.org/content/63/9/3352.full.pdf.
Koyuncu, S., Andersson, M. G., Löfström, C., Skandamis, P. N., Gounadaki, A., Zentek, J. & Häggblom, P. 2013. Organic acids for control of Salmonella in different feed materials. BMC Veterinary Research, 9 (article 81). doi:10.1186/1746-6148-9-81.
Kumar, A., Alam, A., Rani, M., Ehtesham, N. Z. & Hasnain, S. E. 2017. Biofilms: Survival and defense strategy for pathogens. International Journal of Medical Microbiology, 307 (8), pp. 481-489. doi:10.1016/j.ijmm.2017.09.016.
Lamas, A., Regal, P., Vazquez, B., Miranda, J. M., Cepeda, A. & Franco, C. M. 2018. Salmonella and Campylobacter biofilm formation: a comparative assessment from farm to fork. Journal of Science of Food and Agriculture, 98 (11), pp. 4014-4032. doi:10.1002/jsfa.8945.
Langsrud, S., Sidhu, M. S., Heir, E. & Holck, A. L. 2003. Bacterial disinfectant resistance – a challenge for the food industry. International Biodeterioration & Biodegradation, 51 (4), pp. 283–290. doi:10.1016/S0964-8305(03)00039-8.
Latasa, C., Roux, A., Toledo-Arana, A., Ghigo, J. M., Gamazo, C., Penades, J. R. & Lasa, I. 2005. BapA, a large secreted protein required for biofilm formation and host colonization of Salmonella enterica serovar Enteritidis. Molecular Microbiology, 58 (5), pp. 1322-1339. doi:10.1111/j.1365-2958.2005.04907.x.
Laviniki, V., Lopes, G. & Pellegrini, D. 2015. Biofilm formation by Salmonella enterica strains isolated from feed mills. Epidemiology and control of hazards in pork production chain – SAFEPORK. Iowa State Digital Press.
Lebeaux, D., Chauhan, A., Rendueles, O. & Beloin, C. 2013. From in vitro to in vivo model of bacterial biofilm-related infections. Pathogens, 2 (2), pp. 288-356. doi:10.3390/pathogens2020288.
Ledwoch, K., Said, J., Norville, P. & Maillard, J.-Y. 2019. Artificial dry surface biofilm models for testing the efficacy of cleaning and disinfection. Letters in Applied Microbiology, 68 (4), pp. 329-336. doi:10.1111/lam.13143.
Leeuwenhoek, A. 1684. An abstract of a letter dated Sep. 17. 1683. Containing some microscopical observations, about animals in the scurf of the teeth, the substrance call'd worms in the nose, the cuticula consisting of scales. Philosophical Transactions, 14, pp. 568-574.
Lembre, P., Lorentz, C. & Di Martino, P. 2012. Exopolysaccharides of the biofilm matrix: a complex biophysical world. In: KARUNARATNE, D. N. (ed.) The complex world of polysaccharides. IntechOpen.
Letunic, I. & Bork, P. 2021. Interactive Tree Of Life (iTOL) v5: an online tool for phylogenetic tree display and annotation. Nucleic Acids Research, 49 (W1), pp. W293-W296. doi:10.1093/nar/gkab301.
Lewis, K. 2007. Persister cells, dormancy and infectious disease. Nat Rev Microbiol, 5 (1), pp. 48-56. doi:10.1038/nrmicro1557.
Lianou, A. & Koutsoumanis, K. P. 2011. Effect of the growth environment on the strain variability of Salmonella enterica kinetic behavior. Food Microbiology, 28 (4), pp. 828-837. doi:10.1016/j.fm.2010.04.006.
Lu, Y., Chen, S., Dong, H., Sun, H., Peng, D. & Liu, X. 2012. Identification of genes responsible for biofilm formation or virulence in Salmonella enterica serovar Pullorum. Avian Diseases, 56 (1), pp. 134-143. doi:10.1637/9806-052411-Reg.1.
Lu, Y., Dong, H., Chen, S., Yiping, C., Peng, D. & Liu, X. 2011. Characterization of biofilm formation by Salmonella enterica serovar Pullorum strains. African Journal of Microbiology Research, 5 (17).
Lubing. 2012. Assembly instructions and operators manual - floor drinking systems [Online]. Available: https://service.lubing.de/manuals/en/0939-

220
1_Assembly_instruction_and_operators_manual_Floor_Drinking_System_V1.1_EN.pdf [Accessed 30 June 2021].
Luppens, S. B., Reij, M. W., van der Heijden, R. W., Rombouts, F. M. & Abee, T. 2002. Development of a standard test to assess the resistance of Staphylococcus aureus biofilm cells to disinfectants. Applied and Environmental Microbiology, 68 (9), pp. 4194-4200. doi:10.1128/AEM.68.9.4194-4200.2002.
MacKenzie, K., Palmer, M., Köster, W. & White, A. P. 2017. Examining the link between biofilm formation and the ability of pathogenic Salmonella strains to colonize multiple host species. Frontiers in Veterinary Science, 4 (138), pp. 1-19. doi:10.3389/fvets.2017.00138.
Maertens, H., Demeyere, K., De Reu, K., Dewulf, J., Vanhauteghem, D., Van Coillie, E. & Meyer, E. 2020. Effect of subinhibitory exposure to quaternary ammonium compounds on the ciprofloxacin susceptibility of Escherichia coli strains in animal husbandry. BMC Microbiology, 20 (1 article 155). doi:10.1186/s12866-020-01818-3.
Maes, S., De Reu, K., Van Weyenberg, S., Lories, B., Heyndrickx, M. & Steenackers, H. 2020. Pseudomonas putida as a potential biocontrol agent against Salmonella Java biofilm formation in the drinking water system of broiler houses. BMC Microbiology, 20 (article 373). doi:10.21203/rs.3.rs-34399/v1.
Maes, S., Vackier, T., Huu, S. N., Heyndrickx, M., Steenackers, H., Sampers, I., Raes, K., Verplaetse, A. & De Reu, K. 2019. Occurrence and characterisation of biofilms in drinking water systems of broiler houses. BMC Microbiology, 19 (1 article 77). doi:10.1186/s12866-019-1451-5.
Malcova, M., Hradecka, H., Karpiskova, R. & Rychlik, I. 2008. Biofilm formation in field strains of Salmonella enterica serovar Typhimurium: Identification of a new colony morphology type and the role of SGI1 in biofilm formation. Veterinary Microbiology, 29, pp. 360–366. doi:10.1016/j.vetmic.2007.12.006.
Mangalappalli-Illathu, A. K. & Korber, D. R. 2006. Adaptive resistance and differential protein expression of Salmonella enterica serovar Enteritidis biofilms exposed to benzalkonium chloride. Antimicrobial Agents and Chemotherapy, 50 (11), pp. 3588-3596. doi:10.1128/AAC.00573-06.
Mangalappalli-Illathu, A. K., Lawrence, J. R., Swerhone, G. D. & Korber, D. R. 2008. Architectural adaptation and protein expression patterns of Salmonella enterica serovar Enteritidis biofilms under laminar flow conditions. International Journal of Food Microbiology, 123 (1-2), pp. 109-120. doi:10.1016/j.ijfoodmicro.2007.12.021.
Mangiafico, S. 2021. rcompanion: functions to support extension education program evaluation [Online]. Available: https://CRAN.R-project.org/package=rcompanion [Accessed 01 October 2021].
Marin, C., Hernandiz, A. & Lainez, M. 2009. Biofilm development capacity of Salmonella strains isolated in poultry risk factors and their resistance against disinfectants. Poultry Science, 88 (2), pp. 424-431. doi:10.3382/ps.2008-00241.
Martelli, F., Gosling, R. J., Callaby, R. & Davies, R. 2017. Observations on Salmonella contamination of commercial duck farms before and after cleaning and disinfection. Avian Pathology, 46 (2), pp. 131-137. doi:10.1080/03079457.2016.1223835.
Martelli, F., Oastler, C., Barker, A., Jackson, G., Smith, R. P. & Davies, R. 2021. Abattoir-based study of Salmonella prevalence in pigs at slaughter in Great Britain. Epidemiology & Infection, 149, pp. e218. doi:10.1017/S0950268821001631.
McBain, A. J., Sufya, N. & Rickard, A. H. 2013. Biofilm recalcitrance: theories and mechanisms. In: FRAISE, A. P., MALILLARD, J.-Y. & SATTAR, S. A. (eds.) Russell, Hugo and Ayliffe's Principles and practice of disinfection, preservation and sterilization. 5th ed. New Jersey: Wiley-Blackwell.
McClelland, M., Sanderson, K. E., Spieth, J., Clifton, S. W., Latreille, P., Courtney, L., Porwollik, S., Ali, J., Dante, M., Du, F., Hou, S., Layman, D., Leonard, S., Nguyen, C., Scott, K., Holmes, A., Grewal, N., Mulvaney, E., Ryan, E., Sun, H., Florea, L., Miller, W., Stoneking, T., Nhan, M., Waterston, R. & Wilson, R. K. 2001. Complete genome sequence of Salmonella enterica serovar Typhimurium LT2. Nature, 413 (6858), pp. 852-826. doi:10.1038/35101614.
Mead, G. C. 2005. The use of probiotics to control foodboune pathogens in poultry. In: MEAD, G. C. (ed.) Food safety control in the poultry industry. Cambridge, England: Woodhead publishing limited.
Merino, L., Procura, F., Trejo, F. M., Bueno, D. J. & Golowczyc, M. A. 2019. Biofilm formation by Salmonella sp. in the poultry industry: detection, control and eradication strategies. Food Research International, 119, pp. 530-540. doi:10.1016/j.foodres.2017.11.024.
Merritt, J. H., Kadouri, D. E. & O'Toole, G. A. 2005. Growing and analyzing static biofilms. Current Protocols in Microbiology, Chapter 1 (22). doi:10.1002/9780471729259.mc01b01s00.

221
Met Office. 2020. Climate and climate change: UK and regional series [Online]. Available: https://www.metoffice.gov.uk/research/climate/maps-and-data/uk-and-regional-series [Accessed 30 June 2019].
Miladi, H., Zmantar, T., Kouidhi, B., Chaabouni, Y., Mahdouani, K., Bakhrouf, A. & Chaieb, K. 2017. Use of carvacrol, thymol, and eugenol for biofilm eradication and resistance modifying susceptibility of Salmonella enterica serovar Typhimurium strains to nalidixic acid. Microbial Pathogenesis, 104, pp. 56-63. doi:10.1016/j.micpath.2017.01.012.
Milanov, D., Ljubojević, D., Čabarkapa, I., Karabasil, N. & Velhner, M. 2017. Biofilm as risk factor for Salmonella contamination in various stages of poultry production. Poultry Science, 81, pp. 14. doi:10.1399/eps.2017.190.
Milanov, D., Prunic, B., Velhner, M., Pajić, M. & Čabarkapa, I. 2015. RDAR morphotype: A resting stage of some Enterobacteriaceae. Food and Feed Research, 42 (1), pp. 42-50. doi:10.5937/FFR1501043M.
Milho, C., Silva, M. D., Alves, D., Oliveira, H., Sousa, C., Pastrana, L. M., Azeredo, J. & Sillankorva, S. 2019. Escherichia coli and Salmonella Enteritidis dual-species biofilms: interspecies interactions and antibiofilm efficacy of phages. Scientific reports, 9, pp. 1-15.
Minh, B. Q., Schmidt, H. A., Chernomor, O., Schrempf, D., Woodhams, M. D., von Haeseler, A. & Lanfear, R. 2020. IQ-TREE 2: New models and efficient methods for phylogenetic inference in the genomic era. Molecular Biology and Evolution, 37 (5), pp. 1530-1534. doi:10.1093/molbev/msaa015.
Monte, D. F., Lincopan, N., Berman, H., Cerdeira, L., Keelara, S., Thakur, S., Fedorka-Cray, P. J. & Landgraf, M. 2019. Genomic features of high-priority Salmonella enterica serovars circulating in the food production chain, Brazil, 2000–2016. Scientific reports, 9.
Monteiro, G. P., Rossi, D. A., Valadares Jr, E. C., Peres, P. A. B. M., Braz, R. F., Notário, F. O., Gomes, M. M., Silva, R. R., Carrijo, K. F. & Fonseca, B. B. 2021. Lactic bacterium and Bacillus Sp. biofilms can decrease the viability of Salmonella Gallinarum, Salmonella Heidelberg, Campylobacter Jejuni and Methicillin Resistant Staphylococcus Aureus on different substrates. Brazilian Journal of Poultry Science, 23 (2). doi:10.1590/1806-9061-2020-1408
Morales, C. A., Guard, J., Sanchez-Ingunza, R., Shah, D. H. & Harrison, M. 2012. Virulence and metabolic characteristics of Salmonella enterica serovar Enteritidis strains with different sefD variants in hens. Applied and Environmental Microbiology, 78 (18), pp. 6405-6412. doi:10.1128/AEM.00852-12.
Møretrø, T., Vestby, L. K., Nesse, L. L., Storheim, S. E., Kotlarz, K. & Langsrud, S. 2009. Evaluation of efficacy of disinfectants against Salmonella from the feed industry. Journal of Applied Microbiology, 106 (3), pp. 1005-1012. doi:10.1111/j.1365-2672.2008.04067.x.
Mount, D. W. 2007. Using the Basic Local Alignment Search Tool (BLAST). Cold Spring Harbor Protocols, 2007. doi:10.1101/pdb.top17.
MSD Animal Health. 2021. Nobilis Salenvac T [Online]. Available: https://www.msd-animal-health-hub.co.uk/Products/Nobilis-SalenvacT [Accessed 01 October 2021].
Mueller-Doblies, D., Carrique-Mas, J. J., Sayers, A. R. & Davies, R. H. 2010. A comparison of the efficacy of different disinfection methods in eliminating Salmonella contamination from turkey houses. Journal of Applied Microbiology, 109 (2), pp. 471-479. doi:10.1111/j.1365-2672.2010.04667.x.
Nesse, L. L., Osland, A. M., Mo, S. S., Sekse, C., Slettemeås, J. S., Bruvoll, A. E. E., Urdahl, A. M. & Vestby, L. K. 2020. Biofilm forming properties of quinolone resistant Escherichia coli from the broiler production chain and their dynamics in mixed biofilms. BMC Microbiology, 20 (1 article 46). doi:10.1186/s12866-020-01730-w.
Newton, J. 2012. An overview of the UK duck industry [Online]. Available: randd.defra.gov.uk/Document.aspx?Document=13034_OZ0345Finalreport.pdf [Accessed 28 February 2018].
Newton, K., Gosling, B., Rabie, A. & Davies, R. 2020. Field investigations of multidrug-resistant Salmonella Infantis epidemic strain incursions into broiler flocks in England and Wales. Avian Pathology, 49 (6), pp. 631-641. doi:10.1080/03079457.2020.1809634.
O'Brien, S. J. 2013. The "decline and fall" of nontyphoidal Salmonella in the United kingdom. Clinical Infectious Diseases, 56 (5), pp. 705-710. doi:10.1093/cid/cis967.
O'Neill, J. 2014. Review on antimicrobial resistance: tackling a crisis for the health and wealth of nations. O'Toole, G. A. 2011. Microtiter dish biofilm formation assay. Journal of Visualized Experiments, 47 (47),
pp. 2437. doi:10.3791/2437.

222
Obe, T., Nannapaneni, R., Schilling, W., Zhang, L. & Kiess, A. 2021. Antimicrobial tolerance, biofilm formation, and molecular characterization of Salmonella isolates from poultry processing equipment. Journal of Applied Poultry Research, 30 (4), pp. 100195.
Ogle, D. H., Doll, J. C., Wheeler, P. & Dinno, A. 2021. FSA: fisheries stock analysis [Online]. Available: https://github.com/droglenc/FSA [Accessed 01 October 2021].
Olson, M. E., Ceri, H., Morck, D. W., Buret, A. G. & Read, R. R. 2002. Biofilm bacteria: formation and comparative susceptibility to antibiotics. The Canadian Journal of Veterinary Research, 66 (2), pp. 86-92. https://www.ncbi.nlm.nih.gov/pubmed/11989739.
Oscar, T. P. 2007. Variation of lag time and specific growth rate amoung 11 strains of Salmonella inoculated onto sterile ground chicken breast burgers and incubated at 25C. Journal of Food Safety, 20 (4), pp. 225-236. doi:10.1111/j.1745-4565.2000.tb00301.x.
Pande, V., McWhorter, A. R. & Chousalkar, K. K. 2018. Anti-bacterial and anti-biofilm activity of commercial organic acid products against Salmonella enterica isolates recovered from an egg farm environment. Avian Pathol, 47 (2), pp. 189-196. doi:10.1080/03079457.2017.1394979.
Pande, V. V., McWhorter, A. R. & Chousalkar, K. K. 2016. Salmonella enterica isolates from layer farm environments are able to form biofilm on eggshell surfaces. Biofouling, 32 (7), pp. 699-710. doi:10.1080/08927014.2016.1191068.
Pang, X., Chen, L. & Yuk, H. G. 2020. Stress response and survival of Salmonella Enteritidis in single and dual species biofilms with Pseudomonas fluorescens following repeated exposure to quaternary ammonium compounds. International Journal of Food Microbiology, 325, pp. 108643. doi:10.1016/j.ijfoodmicro.2020.108643.
Pang, X. Y., Yang, Y. S. & Yuk, H. G. 2017. Biofilm formation and disinfectant resistance of Salmonella sp in mono- and dual-species with Pseudomonas aeruginosa. Journal of Applied Microbiology, 123 (3), pp. 651-660. doi:10.1111/jam.13521.
Pate, M., Mičunovič, J., Golob, M., Vestby, L. K. & Ocepek, M. 2019. Salmonella Infantis in broiler flocks in Slovenia: the prevalence of multidrug resistant strains with high genetic homogeneity and low biofilm-forming ability. BioMed Research International, 2019 (article 4981463). doi:10.1155/2019/4981463.
Paytubi, S., de La Cruz, M., Tormo, J. R., Martín, J., González, I., González-Menendez, V., Genilloud, O., Reyes, F., Vicente, F., Madrid, C. & Balsalobre, C. 2017. A high-throughput screening platform of microbial natural products for the discovery of molecules with antibiofilm properties against Salmonella. Frontiers in Microbiology, 8 (article 326). doi:10.3389/fmicb.2017.00326.
Peng, D. 2016. Biofilm formation of Salmonella. In: DHANASEKARAN, D. & THAJUDDIN, N. (eds.) Microbial biofilms - importance and applications. IntechOpen.
Piras, F., Fois, F., Consolati, S. G., Mazza, R. & Mazzette, R. 2015. Influence of temperature, source, and serotype on biofilm formation of Salmonella enterica isolates from pig slaughterhouses. Journal of Food Protection, 78 (10), pp. 1875-1878. doi:10.4315/0362-028X.JFP-15-085.
Pontin, K. P., Borges, K. A., Furian, T. Q., Carvalho, D., Wilsmann, D. E., Cardoso, H. R. P., Alves, A. K., Chitolina, G. Z., Salle, C. T. P., Moraes, H. L. S. & do Nascimento, V. P. 2021. Antimicrobial activity of copper surfaces against biofilm formation by Salmonella Enteritidis and its potential application in the poultry industry. Food Microbiology, 94 (4), pp. 103645. doi:10.1016/j.fm.2020.103645.
Popoff, Y. M. & Le Minor, L. 2015. Salmonella. In: KRIEG, N. R. & HOLT, J. G. (eds.) Bergey's Manual of Systematic Bacteriology. Baltimore: John Wiley & Sons, Inc.
Prescott, J. F. & Baggot, J. D. 1985. Antimicrobial susceptibility testing and antimicrobial drug dosage. Journal of the American Veterinary Medical Association, 187 (4), pp. 363-368. https://www.ncbi.nlm.nih.gov/pubmed/4030470.
Prunic, B., Milanov, D., Masic, A., Jakšić, S. & Nesic, K. 2017. Facilities for animal feed production as Salmonella reservoirs and sources of final products contamination. Archives of Veterinary Medicine, 10 (1), pp. 71-83.
Public Health England [PHE]. 2021a. Salmonella: guidance, data and analysis [Online]. Available: https://www.gov.uk/government/collections/salmonella-guidance-data-and-analysis [Accessed 01 October 2021].
Public Health England [PHE]. 2021b. UK Standards for Microbiology Investigations - Identification of Salmonella species [Online]. Available: https://assets.publishing.service.gov.uk/government/uploads/system/uploads/attachment_data/file/969498/ID_24i4.pdf [Accessed 01 October 2021].
R Core Team. 2020. R: a language and environment for statistical computing [Online]. Available: https://www.R-project.org/ [Accessed 01 June 2021].

223
Rabsch, W., Simon, S. & Humphrey, T. 2013. Public health aspects of Salmonella infection. In: BARROW, P. A. & METHNER, U. (eds.) Salmonella in domestic animals. Wallingford: CABI.
Rahman, H., Prager, R. & Tschape, H. 2000. Occurrence of sef & pef genes among different serovars of Salmonella. Indian Journal of Medical Research, 111, pp. 40-42.
Rahman, M. R. T., Lou, Z. X., Yu, F. H., Wang, P. & Wang, H. X. 2017. Anti-quorum sensing and anti-biofilm activity of Amomum tsaoko (Amommum tsao-ko Crevost et Lemarie) on foodborne pathogens. Saudi Journal of Biological Sciences, 24 (2), pp. 324-330. doi:10.1016/j.sjbs.2015.09.034.
Ramesh, N., Joseph, S. W., Carr, L. E., Douglass, L. W. & Wheaton, F. W. 2002. Evaluation of chemical disinfectants for the elimination of Salmonella biofilms from poultry transport containers. Poultry Science, 81 (6), pp. 904-910. doi:10.1093/ps/81.6.904.
Read, T. D. & Massey, R. C. 2014. Characterizing the genetic basis of bacterial phenotypes using genome-wide association studies: a new direction for bacteriology. Genome Medicine, 6 (article 109). doi:10.1186/s13073-014-0109-z.
Riley, J. 2017. Getting water right on broiler farms [Online]. Poultry World. Available: https://www.poultryworld.net/Nutrition/Articles/2017/12/Getting-water-right-on-broiler-farms-223471E/ [Accessed 01 July 2021].
Rilstone, V., Vignale, L., Craddock, J., Cushing, A., Filion, Y. & Champagne, P. 2021. The role of antibiotics and heavy metals on the development, promotion, and dissemination of antimicrobial resistance in drinking water biofilms. Chemosphere, 282, pp. 131048. doi:10.1016/j.chemosphere.2021.131048.
Rodríguez-Melcón, C., Capita, R., Rodriguez-Jerez, J. J., Martinez-Suarez, J. V. & Alonso-Calleja, C. 2019. Effect of low doses of disinfectants on the biofilm-forming ability of Listeria monocytogenes. Foodborne Pathogens and Disease, 16 (4), pp. 262-268. doi:10.1089/fpd.2018.2472.
Romich, J. A. 2008. Bacterial Zoonoses. Understanding Zoonotic Diseases. Thomson Delmar Learning. Romling, U. 2005. Characterization of the rdar morphotype, a multicellular behaviour in
Enterobacteriaceae. Cellular and Molecular Life Sciences, 62 (11), pp. 1234-1246. doi:10.1007/s00018-005-4557-x.
Rose, N., Beaudeau, F., Drouin, P., Toux, J. Y., Rose, V. & Colin, P. 2000. Risk factors for Salmonella persistence after cleansing and disinfection in French broiler-chicken houses. Preventive Veterinary Medicine, 44 (1-2), pp. 9-20. doi:10.1016/s0167-5877(00)00100-8.
Rossi, D. A., Melo, R. T., Mendonça, E. P. & Monteiro, G. P. 2017. Biofilms of Salmonella and Campylobacter in the poultry industry. In: MILAD, M. (ed.) Poultry Science. IntechOpen.
RStudio Team. 2020. RStudio: integrated development environment for R [Online]. Available: http://www.rstudio.com/ [Accessed 01 June 2020].
Russell, A. D. 1999. Bacterial resistance to disinfectants: present knowledge and future problems. Journal of Hospital Infection, 43 (Supplement S57-68). doi:10.1016/s0195-6701(99)90066-x.
Rycroft, A. N. 2013. Structure, function and synthesis of surface polysaccharides in Salmonella. In: BARROW, P. A. & METHNER, U. (eds.) Salmonella in Domestic Animals. 2nd ed. Wallingford: CABI.
Sadekuzzaman, M., Yang, S., Mizan, M. F. R. & Ha, S. D. 2015. Current and recent advanced strategies for combating biofilms. Comprehensive Reviews in Food Science and Food Safety, 14 (4), pp. 491-509. doi:10.1111/1541-4337.12144.
Sanderson, K. E. & Nair, S. 2013. Taxonomy and species concepts in the genus Salmonella. In: BARROW, P. A. & METHNER, U. (eds.) Salmonella in Domestic Animals. 2nd ed. Wallingford: CABI.
Schonewille, E., Nesse, L. L., Hauck, R., Windhorst, D., Hafez, H. M. & Vestby, L. K. 2012. Biofilm building capacity of Salmonella enterica isolates from the poultry farm environment. Fems Immunology and Medical Microbiology, 65 (2), pp. 360-365. doi:10.1111/j.1574-695X.2012.00966.x.
Scientific Opinion of the Panel on Biological Hazards [BIOHAZ] 2008. European commission on microbiological risk assessment in feedingstuffs for foodproducing animals. EFSA Journal, 720, pp. 1-84. doi:10.2903/j.efsa.2008.720.
Seemann, T. 2014. Prokka: rapid prokaryotic genome annotation. Bioinformatics, 30 (14), pp. 2068-2069. doi:10.1093/bioinformatics/btu153.
Seemann, T. 2020. ABRicate: mass screening of contigs for antimicrobial resistance or virulence genes [Online]. Available: https://github.com/tseemann/abricate [Accessed 01 October 2021].

224
Shen, Y., Stojicic, S., Qian, W., Olsen, I. & Haapasalo, M. 2010. The synergistic antimicrobial effect by mechanical agitation and two chlorhexidine preparations on biofilm bacteria. Journal of Endodontics, 36 (1), pp. 100-104. doi:10.1016/j.joen.2009.09.018.
Sherwin, C. M. 2010. Turkeys: Behavior, Management and Well-Being. In: POND, W. G. & BELL, A. W. (eds.) The Encyclopaedia of Animal Science.
Shetty, D., Abrahante, J. E., Chekabab, S. M., Wu, X., Korber, D. R. & Vidovic, S. 2019. Role of CpxR in biofilm development: Expression of key fimbrial, O-antigen and virulence operons of Salmonella Enteritidis. International Journal of Molecular Sciences, 20 (20). doi:10.3390/ijms20205146.
Siceloff, A. T., Ohta, N., Norman, K. N., Loneragan, G. H., Norby, B., Scott, H. M. & Shariat, N. W. 2021. Antimicrobial resistance hidden within multiserovar Salmonella populations. Antimicrobial Agents and Chemotherapy, 65 (6), pp. e00048-00021. doi:10.1128/AAC.00048-21.
Silva, P., Goulart, L. R., Reis, T. F. M., Mendonca, E. P., Melo, R. T., Penha, V. A. S., Peres, P., Hoepers, P. G., Beletti, M. E. & Fonseca, B. B. 2019. Biofilm formation in different Salmonella serotypes isolated from poultry. Current Microbiology, 76 (1), pp. 124-129. doi:10.1007/s00284-018-1599-5.
Sinde, E. & Carballo, J. 2000. Attachment of Salmonella spp. and Listeria monocytogenes to stainless steel, rubber and polytetrafluorethylene: The influence of free energy and the effect of commercial sanitizers. Food Microbiology, 17 (4), pp. 439-447. doi:10.1006/fmic.2000.0339.
Slipski, C. J., Zhanel, G. G. & Bay, D. C. 2018. Biocide selective TolC-Independent efflux pumps in Enterobacteriaceae. Journal of Membrane Biology, 251 (1), pp. 15-33. doi:10.1007/s00232-017-9992-8.
Smith, R. P., Andres, V., Dormer, L., Gosling, R., Oastler, C. & Davies, R. H. 2017. Study of the impact on Salmonella of moving outdoor pigs to fresh land. Epidemiology & Infection, 145 (10), pp. 1983-1992. doi:10.1017/S0950268817000930.
Sockett, P. N. 1991. The economic implications of human Salmonella infection. Journal of Applied Microbiology, 71 (4), pp. 289-295. doi:10.1111/j.1365-2672.1991.tb03792.x.
Solano, C., García, B., Valle, J., Berasain, C., Ghigo, J. M., Gamazo, C. & Lasa, I. 2002. Genetic analysis of Salmonella Enteritidis biofilm formation: critical role of cellulose. Molecular Microbiology, 43 (3), pp. 793-808. doi:10.1046/j.1365-2958.2002.02802.x.
Solomon, E. B., Niemira, B. A., Sapers, G. M. & Annous, B. A. 2005. Biofilm formation, cellulose production, and curli biosynthesis by Salmonella originating from produce, animal, and clinical sources. Journal of Food Protection, 68 (5), pp. 906-912. doi:10.4315/0362-028x-68.5.906.
Soto, S. M. 2013. Role of efflux pumps in the antibiotic resistance of bacteria embedded in a biofilm. Virulence, 4 (3), pp. 223-229. doi:10.4161/viru.23724.
Sprouffske, K. 2020. growthcurver: simple metrics to summarize growth curves [Online]. Available: https://CRAN.R-project.org/package=growthcurver [Accessed 01 October 2021].
Sprouffske, K. & Wagner, A. 2016. Growthcurver: an R package for obtaining interpretable metrics from microbial growth curves. BMC Bioinformatics, 17 (article 172). doi:10.1186/s12859-016-1016-7.
Srey, S., Jahid, I. K. & Has, S.-D. 2013. Biofilm formation in food industries: A food safety concern. Food Control, 31 (2), pp. 572-585.
Srisanga, S., Angkititrakul, S., Sringam, P., Le Ho, P. T., Vo, A. T. T. & Chuanchuen, R. 2017. Phenotypic and genotypic antimicrobial resistance and virulence genes of Salmonella enterica isolated from pet dogs and cat. Journal of Veterinary Science, 18 (3), pp. 273-281. doi:10.4142/jvs.2017.18.3.273.
Steenackers, H., Hermans, K., Vanderleyden, J. & De Keersmaecker, S. 2012. Salmonella biofilms: An overview on occurrence, structure, regulation and eradication. Food Research International, 45 (2). doi:10.1016/j.foodres.2011.01.038.
Stepanovic, S., Cirkovic, I., Ranin, L. & Svabic-Vlahovic, M. 2004. Biofilm formation by Salmonella spp. and Listeria monocytogenes on plastic surface. Letters in Applied Microbiology, 38 (5), pp. 428-432. doi:10.1111/j.1472-765X.2004.01513.x.
Stepanovic, S., Vukovic, D., Dakic, I., Savic, B. & Svabic-Vlahovic, M. 2000. A modified microtiter-plate test for quantification of staphylococcal biofilm formation. Journal of Microbiological Methods, 40 (2), pp. 175-179. doi:10.1016/s0167-7012(00)00122-6.
Stewart, P. S. 2015. Antimicrobial tolerance in biofilms. Microbiology Spectrum, 3 (3). doi:10.1128/microbiolspec.MB-0010-2014.
Strak, J. 2017. United Kingdom: A pig industry on the edge [Online]. Pig Progress. Available: http://www.pigprogress.net/World-of-Pigs1/Articles/2017/12/United-Kingdom-A-pig-industry-on-the-edge-214053E/ [Accessed 15 Feburary 2018].

225
Stubberfield, E., AbuOun, M., Sayers, E., O’Connor, H. M., Card, R. M. & Anjum, M. F. 2019. Use of whole genome sequencing of commensal Escherichia coli in pigs for antimicrobial resistance surveillance, United Kingdom, 2018. Eurosurveillance, 24 (50). doi:10.2807/1560-7917.ES.2019.24.50.1900136.
Surette, M. G. & Bassler, B. L. 1998. Quorum sensing in Escherichia coli and Salmonella Typhimurium. Proceedings of the National Academy of Sciences of the United States of America, 95 (12), pp. 7046-7050. doi:10.1073/pnas.95.12.7046.
Tabak, M., Scher, K., Chikindas, M. L. & Yaron, S. 2009. The synergistic activity of triclosan and ciprofloxacin on biofilms of Salmonella Typhimurium. Fems Microbiology Letters, 301 (1), pp. 69-76. doi:10.1111/j.1574-6968.2009.01804.x.
Tassinari, E., Duffy, G., Bawn, M., Burgess, C. M., McCabe, E. M., Lawlor, P. G., Gardiner, G. & Kingsley, R. A. 2019. Microevolution of antimicrobial resistance and biofilm formation of Salmonella Typhimurium during persistence on pig farms. Scientific Reports, 9 (1). doi:10.1038/s41598-019-45216-w.
Teixeira, P. C., Leite, G. M., Domingues, R. J., Silva, J., Gibbs, P. A. & Ferreira, J. P. 2007. Antimicrobial effects of a microemulsion and a nanoemulsion on enteric and other pathogens and biofilms. International Journal of Food Microbiology, 118 (1), pp. 15-19. doi:10.1016/j.ijfoodmicro.2007.05.008.
Tellez, G., Pixley, C., Wolfenden, R. E., Layton, S. L. & Hargis, B. M. 2012. Probiotics/direct fed microbials for Salmonella control in poultry. Food Research International, 45 (2), pp. 628–633. doi:10.1016/j.foodres.2011.03.047.
Tengerdy, R. P., Nagy, J. G. & Martin, B. 1967. Quantitative measurement of bacterial growth by the reduction of tetrazolium salts. Applied Microbiology, 15 (4), pp. 954-955. doi:10.1128/am.15.4.954-955.1967.
Tennant, S. M., Diallo, S., Levy, H., Livio, S., Sow, S. O., Tapia, M., Fields, P. I., Mikoleit, M., Tamboura, B., Kotloff, K. L., Nataro, J. P., Galen, J. E. & M.M., L. 2010. Identification by PCR of non-typhoidal Salmonella enterica serovars associated with invasive infections among febrile patients in Mali. PLOS Neglected Tropical Diseases, 4 (3), pp. e621. doi:10.1371/journal.pntd.0000621.
Teplitski, M., Al-Agely, A. & Ahmer, B. M. M. 2006. Contribution of the SirA regulon to biofilm formation in Salmonella enterica serovar Typhimurium. Microbiology, 152 (11). doi:10.1099/mic.0.29118-0.
The British Standards Institution 2014. BS 6734:2004 Antimicrobial efficacy of disinfectants for veterinary and agricultural use. Method. London: British Standards Institute.
The British Standards Institution 2019. BS EN 1656:2019 Chemical disinfectants and antiseptics. Quantitative suspension test for the evaluation of bactericidal activity of chemical disinfectants and antiseptics used in the veterinary area. Test method and requirements (phase 2, step 1). London: British Standards Institute.
Tindall, B. J., Grimont, P. A. D., Garrity, G. M. & Euzéby, J. P. 2005. Nomenclature and taxonomy of the genus Salmonella. The International Journal of Systematic and Evolutionary Microbiology, 55 (1), pp. 521-524. doi:10.1099/ijs.0.63580-0.
Tittsler, R. P. & Sandholzer, L. A. 1936. The use of semi-solid agar for the detection of bacterial motility. Journal of Bacteriology, 31 (6), pp. 575-580. doi:10.1128/jb.31.6.575-580.1936.
Tiwari, B., Kim, S. & Kim, J. 2013. A virulent Salmonella enterica serovar Enteritidis phage SE2 with a strong bacteriolytic activity of planktonic and biofilmed cells. Journal of Bacteriology and Virology, 43 (3), pp. 186. doi:10.4167/jbv.2013.43.3.186.
Trachoo, N., Frank, J. F. & Stern, N. J. 2002. Survival of Campylobacter jejuni in biofilms Isolated from chicken houses. Journal of Food Protection, 65 (7), pp. 1110-1116. doi:10.4315/0362-028x-65.7.1110.
Traverse, M. & Aceto, H. 2015. Environmental cleaning and disinfection. Veterinary Clinics of North America: Small Animal Practice, 45 (2), pp. 299-300. doi:10.1016/j.cvsm.2014.11.011.
Trevisan, D. A., da Silva, A. F., Negri, M., de Abreu Filho, B. A., Machinski Junior, M., Patussi, E. V., Campanerut-Sá, P. A. & Mikcha, J. M. 2018. Antibacterial and antibiofilm activity of carvacrol against Salmonella enterica serotype Typhimurium. Brazilian Journal of Pharmaceutical Sciences, 54. doi:10.1590/s2175-97902018000117229.
Turcotte, C. & Woodward, M. J. 1993. Cloning, DNA nucleotide sequence and distribution of the gene encoding the SEF14 fimbrial antigen of Salmonella Enteritidis. Journal of General Microbiology, 139 (7), pp. 1477-1485. doi:10.1099/00221287-139-7-1477.

226
Uğur, S., Akçelik, N., Yüksel , F. N., Karatuğ, N. T. & Akçelik, M. 2018. Effects of dam and seqA genes on biofilm and pellicle formation in Salmonella. Pathogens and Global Health, 112 (7), pp. 368-377. doi:10.1080/20477724.2018.1539803.
Valeriano, C., de Oliveira, T. L. C., de Carvalho, S. M., Cardoso, M. D. G., Alves, E. & Piccoli, R. H. 2012. The sanitizing action of essential oil-based solutions against Salmonella enterica serotype Enteritidis S64 biofilm formation on AISI 304 stainless steel. Food Control, 25 (2), pp. 673-677. doi:10.1016/j.foodcont.2011.12.015.
Van Hoek, A. H., Mevius, D., Guerra, B., Mullany, P., Roberts, A. P. & Aarts, H. J. 2011. Acquired antibiotic resistance genes: An overview. Frontiers in Microbiology, 2, pp. 203. doi:10.3389/fmicb.2011.00203.
Van Houdt, R. & Michiels, C. W. 2010. Biofilm formation and the food industry, a focus on the bacterial outer surface. Journal of Applied Microbiology, 109 (4), pp. 1117-1131. doi:10.1111/j.1365-2672.2010.04756.x.
Verderosa, A. D., Totsika, M. & Fairfull-Smith, K. E. 2019. Bacterial biofilm eradication agents: a current review. Frontiers in Chemistry, 7 (article 824). doi:10.3389/fchem.2019.00824.
Vestby, L. K., Møretrø, T., Ballance, S., Langsrud, S. & Nesse, L. L. 2009a. Survival potential of wild type cellulose deficient Salmonella from the feed industry. Bmc Veterinary Research, 5, pp. 43. doi:10.1186/1746-6148-5-43.
Vestby, L. K., Møretrø, T., Langsrud, S., Heir, E. & Nesse, L. L. 2009b. Biofilm forming abilities of Salmonella are correlated with persistence in fish meal- and feed factories. Bmc Veterinary Research, 5, pp. 6. doi:10.1186/1746-6148-5-20.
Vestby, L. K. & Nesse, L. L. 2015. Wound care antiseptics - performance differences against Staphylococcus aureus in biofilm. Acta Veterinaria Scandinavica, 57 (1). doi:10.1186/s13028-015-0111-5.
Veterinary Medicines Directorate [VMD]. 2018. Summary of product characteristics - Gallimune SE + ST [Online]. Available: https://www.vmd.defra.gov.uk/productinformationdatabase/files/SPC_Documents/SPC_175926.PDF [Accessed 01 October 2021].
Veterinary Medicines Directorate [VMD]. 2019a. Supplementary Material UK-VARSS 2019 [Online]. Available: https://assets.publishing.service.gov.uk/government/uploads/system/uploads/attachment_data/file/950128/UK-VARSS_2019_Supplementary_Material__2020-TPaccessible.pdf [Accessed 27 November 2021].
Veterinary Medicines Directorate [VMD]. 2019b. UK One Health Report - Joint report on antibiotic use and antibiotic resistance, 2013–2017 [Online]. Available: https://assets.publishing.service.gov.uk/government/uploads/system/uploads/attachment_data/file/921039/Ted_Final_version__1318703-v45-One_Health_Report_2019_FINAL-accessible.pdf [Accessed 27 November 2021].
Veterinary Medicines Directorate [VMD]. 2020a. Summary of product characteristics - AviPro Salmonella Duo [Online]. Available: https://www.vmd.defra.gov.uk/productinformationdatabase/files/SPC_Documents/SPC_324583.PDF [Accessed 01 October 2021].
Veterinary Medicines Directorate [VMD]. 2020b. Summary of product characteristics - AviPro Salmonella Vac E [Online]. Available: https://www.vmd.defra.gov.uk/productinformationdatabase/files/SPC_Documents/SPC_108551.PDF [Accessed 01 October 2021].
Veterinary Medicines Directorate [VMD]. 2020c. Summary of product characteristics - Nobilis Salenvac ETC [Online]. Available: https://www.vmd.defra.gov.uk/productinformationdatabase/files/SPC_Documents/SPC_1840289.PDF [Accessed 01 October 2021].
Veterinary Medicines Directorate [VMD]. 2020d. Summary of product characteristics - Salmoporc ST [Online]. Available: https://www.vmd.defra.gov.uk/productinformationdatabase/files/SPC_Documents/SPC_1589958.PDF [Accessed 01 October 2021].
Veterinary Medicines Directorate [VMD]. 2020e. Summary of product characteristics - Salmovac 440 [Online]. Available: https://www.vmd.defra.gov.uk/productinformationdatabase/files/SPC_Documents/SPC_182109.PDF [Accessed 30 July 2021].
Veterinary Medicines Directorate [VMD]. 2021a. Product information database [Online]. Available: https://www.vmd.defra.gov.uk/productinformationdatabase [Accessed 27 October 2021].

227
Veterinary Medicines Directorate [VMD]. 2021b. Summary of product characteristics - AviPro Salmonella Vac T [Online]. Available: https://www.vmd.defra.gov.uk/productinformationdatabase/files/QRD_Documents/QRD-Auth_393266.PDF [Accessed 01 October 2021].
Waldner, L. L., MacKenzie, K. D., Köster, W. & White, A. P. 2012. From exit to entry: long-term survival and transmission of Salmonella. Pathogens, 1 (2), pp. 128-155. doi:10.3390/pathogens1020128.
Wales, A. D., Gosling, R. J., Bare, H. L. & Davies, R. H. 2021. Disinfectant testing for veterinary and agricultural applications: A review. Zoonoses and Public Health, 68 (2), pp. 361-375. doi:10.1111/zph.12830.
Walker, S. L., Sojka, M., Dibb-Fueller, M. & Woodward, M. J. 1999. Effect of pH, temperature and surface contact on the elaboration of fimbriae and flagella by Salmonella serotype Enteritidis. Journal of Medical Microbiology, 48 (3), pp. 253-261.
Wang, F., Deng, L., Huang, F., Wang, Z., Lu, Q. & Xu, C. 2020. Flagellar motility Is critical for Salmonella enterica serovar Typhimurium biofilm development. Frontiers in Microbiology, 11. doi:10.3389/fmicb.2020.01695.
Wang, R., Kalchayanand, N., Schmidt, J. W. & Harhay, D. M. 2013. Mixed biofilm formation by shiga toxin–producing Escherichia coli and Salmonella enterica serovar Typhimurium enhanced bacterial resistance to sanitization due to extracellular polymeric substances. Journal of Food Protection, 76 (9), pp. 1513-1522.
Wang, R., Schmidt, J. W., Harhay, D. M., Bosilevac, J. M., King, D. A. & Arthur, T. M. 2017. Biofilm formation, antimicrobial resistance, and sanitizer tolerance of Salmonella enterica strains isolated from beef trim. Foodborne Pathogens and Disease, 14 (12), pp. 687-695. doi:10.1089/fpd.2017.2319.
Wang, Y. U., Pettengill, J. B., Pightling, A., Timme, R., Allard, M., Strain, E. & Rand, H. 2018. Genetic diversity of Salmonella and Listeria isolates from food facilities. Journal of Food Protection, 81 (12), pp. 2082-2089. doi:10.4315/0362-028X.JFP-18-093.
Wang, Z., Gerstein, M. & Snyder, M. 2009. RNA-Seq: a revolutionary tool for transcriptomics. Nature Reviews Genetics, 10 (1), pp. 57-63. doi:10.1038/nrg2484.
Ward, L. R., de Sa, J. D. H. & Rowe, B. 1987. A phage typing scheme for Salmonella Enteritidis. Epidemiology and Infection, 99, pp. 291-294.
Watkins, S. 2006. Clean water lines for flock health Avian Advice, pp. 3-5. https://cpb-us-e1.wpmucdn.com/wordpressua.uark.edu/dist/8/147/files/2016/05/Clean-Water-Lines-Promotes-Flock-Health-04-14-15.pdf.
Webber, B., Picollo de Oliveira, A. P., Pottker, E. S., Daroit, L., Levandowski, R., dos Santos, L. R., do Nascimento, V. P. & Rodrigues, L. B. 2019. Salmonella Enteritidis forms biofilm under low temperatures on different food industry surfaces. Ciência Rural, 49 (7), pp. 1-9. doi:10.1590/0103-8478cr20181022.
White, A. P., Gibson, D. L., Kim, W., Kay, W. W. & Surette, M. G. 2006. Thin aggregative fimbriae and cellulose enhance long-term survival and persistence of Salmonella. Journal of Bacteriology, 188 (9), pp. 3219-3227. doi:10.1128/jb.188.3219-3227.2006.
Wickham, H. 2007. Reshaping data with the reshape package. Journal of Statistical Software, 21 (12), pp. 1-20. doi:10.18637/jss.v021.i12.
Wickham, H. 2016. ggplot2: elegant graphics for data analysis. New York: Springer-Verlag. Wickham, H., François, R., Henry, L. & Müller, K. 2021. dplyr: A grammar of data manipulation [Online].
Available: https://CRAN.R-project.org/package=dplyr [Accessed 01 October 2021]. Wickham, H. & Seidel, D. 2020. scales: scale functions for visualization [Online]. Available:
https://CRAN.R-project.org/package=scales [Accessed 01 October 2021]. Wilson, C., Lukowicz, R., Merchant, S., Valquier-Flynn, H., Caballero, J., Sandoval, J., Okuom, M.,
Huber, C., Brooks, T. D., Wilson, E., Clement, B., Wentworth, C. D. & Holmes, A. E. 2017. Quantitative and qualitative assessment methods for biofilm growth: a mini-review. Research & Reviews: Journal of Engineering and Technology, 6 (4). https://www.ncbi.nlm.nih.gov/pubmed/30214915.
Withenshaw, S. M., Cawthraw, S., Gosling, B., Newton, K., Oastler, C. E., Smith, R. P. & Davies, R. H. 2021. Risk factor analysis for Salmonella contamination of broiler chicken (Gallus gallus) hatcheries in Great Britain. Preventive Veterinary Medicine, 196, pp. 105492. doi:10.1016/j.prevetmed.2021.105492.
Wolska, K. I., Grudniak, A. M., Rudnicka, Z. & Markowska, K. 2016. Genetic control of bacterial biofilms. Journal of Applied Genetics, 57 (2), pp. 225-238. doi:10.1007/s13353-015-0309-2.

228
Wong, H. S., Townsend, K. M., Fenwick, S. G., Maker, G., Trengove, R. D. & O'Handley, R. M. 2010. Comparative susceptibility of Salmonella Typhimurium biofilms of different ages to disinfectants. Biofouling, 26 (7), pp. 859-864. doi:10.1080/08927014.2010.527959.
Woodward, M. J., Sojka, M., Sprigings, K. A. & Humphrey, T. J. 2000. The role of SEF14 and SEF17 fimbriae in the adherence of Salmonella enterica serotype Enteritidis to inanimate surfaces. Journal of Medical Microbiology, 49, pp. 481-487.
World Health Organization [WHO]. 2018. Salmonella (non-typhodial) [Online]. Available: http://www.who.int/mediacentre/factsheets/fs139/en/ [Accessed 19 March 2018].
Wray, C., Davies, R. & Evans, S. 1999. Salmonella infection in poultry: the production environment. In: RICHARDSON, R. I. & MEAD, G. C. (eds.) Poultry Meat Science. Wallingford: CABI.
Yin, B., Zhu, L., Zhang, Y., Dong, P., Mao, Y., Liang, R., Niu, L. & Luo, X. 2018. The characterization of biofilm formation and detection of biofilm-related genes in Salmonella isolated from beef processing plants. Foodborne Pathogens and Disease, 15 (10), pp. 660-667. doi:10.1089/fpd.2018.2466.
Yoshida, C. E., Kruczkiewicz, P., Laing, C. R., Lingohr, E. J., Gannon, V. P., Nash, J. H. & Taboada, E. N. 2016. The Salmonella In Silico Typing Resource (SISTR): An open web-accessible tool for rapidly typing and subtyping draft Salmonella genome assemblies. PLoS ONE, 11 (1), pp. e0147101. doi:10.1371/journal.pone.0147101.
Zankari, E., Allesoe, R., Joensen, K. G., Cavaco, L. M., Lund, O. & Aarestrup, F. M. 2017. PointFinder: a novel web tool for WGS-based detection of antimicrobial resistance associated with chromosomal point mutations in bacterial pathogens. Journal of Antimicrobial Chemotherapy, 72 (10), pp. 2764-2768. doi:10.1093/jac/dkx217.
Zankari, E., Hasman, H., Cosentino, S., Vestergaard, M., Rasmussen, S., Lund, O., Aarestrup, F. M. & Larsen, M. V. 2012. Identification of acquired antimicrobial resistance genes. Journal of Antimicrobial Chemotherapy, 67 (11), pp. 2640-2644. doi:10.1093/jac/dks261.
Zankari, E., Hasman, H., Kaas, R. S., Seyfarth, A. M., Agersø, Y., Lund, O., Larsen, M. V. & Aarestrup, F. M. 2013. Genotyping using whole-genome sequencing is a realistic alternative to surveillance based on phenotypic antimicrobial susceptibility testing. Journal of Antimicrobial Chemotherapy, 68 (4), pp. 771-777. doi:10.1093/jac/dks496.
Zhao, T., Zhao, P., Cannon, J. L. & Doyle, M. P. 2011. Inactivation of Salmonella in biofilms and on chicken cages and preharvest poultry by levulinic acid and sodium dodecyl sulfate. Journal of Food Protection, 74 (12), pp. 2024-2030. doi:10.4315/0362-028X.JFP-11-197.
Zheng, D. M., Bonde, M. & Sørensen, J. T. 2007. Associations between the proportion of Salmonella seropositive slaughter pigs and the presence of herd level risk factors for introduction and transmission of Salmonella in 34 Danish organic, outdoor (non-organic) and indoor finishing-pig farms. Livestock Science, 106 (2), pp. 189-199. doi:10.1016/j.livsci.2006.08.003.
Zobell, C. E. 1943. The effect of solid surfaces upon bacterial activity. Journal of Bacteriology, 46 (1), pp. 39-56. doi:10.1128/jb.46.1.39-56.1943.
Zou, L., Meng, J., McDermott, P. F., Wang, F., Yang, Q., Cao, G., Hoffmann, M. & Zhao, S. 2014. Presence of disinfectant resistance genes in Escherichia coli isolated from retail meats in the USA. Journal of Antimicrobial Chemotherapy, 69 (10), pp. 2644-2649. doi:10.1093/jac/dku197.

229
Appendix I
Table 9-1: Metadata for the panel 134 Salmonella isolates. The panel of 134 Salmonella enterica subspecies enterica isolates used in the studies presented in this thesis,
along with metadata recorded at the time of sampling about the date of sample collection, type of primary production premises, sampling location, the sample type or
predominant material of the collection surface, and the upper and lower ambient temperature at the time of sample collected [data obtained from (METOffice, 2020)].
Salmonella isolates were soured from the Salmonella strain collection at APHA (Weybridge, UK).
Study Isolate Salmonella Serovar
Phage type
Sample collection
Primary production environment Sampling Ambient temperature
Type ID Year (month/visit no.)
Area Site Surface material/ sample type
Lower (°C)
Upper (°C)
acd 27655R† S. Enteritidis PT13a - - - - - - - -
acd 27655S† S. Enteritidis PT13a - - - - - - - -
abcde S01063-17 S. Infantis - Broiler farm
B1 2017 (April/3)
Poultry house Fan box Metal 20.0 34.0
ac S02016-17 S. Infantis - Broiler farm
B1 2017 (July/5)
Outside Trailer Metal 20.0 34
ac S00794-17 S. Infantis - Broiler farm
B1 2017 (March/1)
Poultry house Dust Dust 20.0 34.0
abcd S00798-17 S. Infantis - Broiler farm
B1 2017 (March/1)
Poultry house Poultry litter/ faeces
Organic 20.0 34.0
ac S00802-17 S. Infantis - Broiler farm
B1 2017 (March/1)
Poultry house Poultry litter/ faeces
Organic 20.0 34.0
ac S00884-17 S. Infantis - Broiler farm
B1 2017 (March/2)
Poultry house Poultry litter/ faeces
Organic 20.0 34.0
abcd S00888-17 S. Infantis - Broiler farm
B1 2017 (March/2)
Poultry house Dust Dust 20.0 34.0
ac S00896-17 S. Infantis - Broiler farm
B1 2017 (March/2)
Poultry house Poultry litter/ faeces
Organic 20.0 34.0

230
ac S01258-17 S. Infantis - Broiler farm
B1 2017 (May/4)
Poultry house Poultry litter/ faeces
Organic 20.0 34.0
abcd S01454-17 S. Infantis - Broiler farm
B1 2017 (May/4)
Poultry house Dust Dust 20.0 34.0
acd S04280-16 S. Infantis - Broiler farm
B2 2016 (November/2)
Poultry house Poultry litter/ faeces
Organic 20.0 34.0
abcd S04288-16 S. Infantis - Broiler farm
B2 2016 (November/2)
Poultry house Poultry litter/ faeces
Organic 20.0 34.0
ac S04295-16 S. Infantis - Broiler farm
B2 2016 (November/2)
Poultry house Poultry litter/ faeces
Organic 20.0 34.0
ac S03724-16 S. Infantis - Broiler farm
B2 2016 (September/1)
Poultry house Drain (post-C&D)
Post-C&D 11.7 18.7
acd S03726-16 S. Infantis - Broiler farm
B2 2016 (September/1)
Outside Drain Aqueous 11.7 18.7
acd S03728-16 S. Infantis - Broiler farm
B2 2016 (September/1)
Outside Concrete apron Concrete 11.7 18.7
acd S01770-17 S. Ohio - Broiler farm
B3 2017 (June/1)
Poultry house Poultry litter/ faeces
Organic 20.0 34.0
acd S02722-17 S. Senftenberg - Broiler farm
B3 2017 (August/2)
Poultry house Dust Dust 20.0 34.0
ac S02723-17 S. Typhimurium DT2 Broiler farm
B3 2017 (August/2)
Poultry house Poultry litter/ faeces
Organic 20.0 34.0
abc S00882-18 S. Typhimurium DT2 Broiler farm
B3 2018 (February/3)
Poultry house Poultry litter/ faeces
Organic 20.0 34.0
abc S02954-16 S. Infantis - Broiler farm
B4 2016 (June/1)
Poultry house Poultry litter/ faeces
Organic 20.0 34.0
ac S03578-16 S. Typhimurium DT104 Broiler farm
B5 2016 (September/1)
Poultry house Cracks in wall (post-C&D)
Post-C&D 11.6 19.7
ac S03586-16 S. Typhimurium DT104 Broiler farm
B5 2016 (September/1)
Outside Bobcat scraper Metal 11.6 19.7
abc S03590-16 S. Typhimurium DT104 Broiler farm
B5 2016 (September/1)
Outside Digger bucket Metal 11.6 19.7
ac S03591-16 S. Typhimurium DT104 Broiler farm
B5 2016 (September/1)
Poultry house Outlet vents (post-C&D)
Post-C&D 11.6 19.7
ac L02662-16 S. Typhimurium DT104 Broiler farm
B5 2016 (September/2)
Outside Concrete apron Concrete 11.6 19.7

231
ac S03579-16 S. Enteritidis RDNC Broiler farm
B5 2016 (September/1)
Poultry house Floor (post-C&D)
Post-C&D 11.6 19.7
ac S03527-17 S. Enteritidis PT13a Broiler farm
B6 2017 (October/1)
Outside Concrete apron Concrete 10.2 15.2
abc L01477-17 S. 4,12:d:- - Broiler farm
B7 2017 (August/1)
Outside Drain Aqueous 11.8 21.1
ac L01476-17 S. Ohio - Broiler farm
B7 2017 (August/1)
Outside Drain Aqueous 11.8 21.1
ac S01860-17 S. 4,12:d:- - Broiler farm
B8 2017 (July/1)
Poultry house Poultry litter/ faeces
Organic 20.0 34.0
ac S04036-12 S. Typhimurium DT30 Breeder duck farm
BD1 2012 (August/3)
Poultry house Poultry litter/ faeces
Organic 11.2 20.1
ac S02260-13 S. Typhimurium DT30 Breeder duck farm
BD1 2013 (May/2)
Poultry house Poultry litter/ faeces
Organic 8.0 14.4
ac S04017-12 S. Typhimurium DT8 Breeder duck farm
BD1 2012 (August/1)
Poultry house Poultry litter/ faeces
Organic 11.2 20.1
ac S04018-12 S. Typhimurium DT8 Breeder duck farm
BD1 2012 (August/1)
Poultry house Poultry litter/ faeces
Organic 11.2 20.1
abc S05632-12 S. 4,[5],12:i:- DT193 Meat duck farm
D1 2012 (October/1)
Poultry house Poultry litter/ faeces
Organic 13.0 30.0
ac S05645-12 S. Typhimurium DT41 Meat duck farm
D1 2012 (November/2)
Outside Pooled water Aqueous 13.0 30.0
a S01896-13 S. Typhimurium DT41 Meat duck farm
D1 2013 (April/3)
Poultry house Pooled water Aqueous 13.0 30.0
ac S02748-13 S. Typhimurium DT41 Meat duck farm
D1 2013 (April/3)
Poultry house Poultry litter/ faeces
Organic 13.0 30.0
a S02300-13 S. Indiana - Meat duck farm
D2 2013 (May/1)
Poultry house Floor (post-C&D)
Post-C&D 5.4 14.4
a S02308-13 S. Indiana - Meat duck farm
D2 2013 (May/1)
Poultry house Floor (post-C&D)
Post-C&D 5.4 14.4
a S03539-14 S. Typhimurium DT41 Meat duck farm
D3 2014 (July/1)
Outside Loader spike Metal 11.6 21.7
a S02715-13 S. 4,[5],12:i:- DT193 Meat duck farm
D4 2013 (June/1)
Poultry house Dust Dust 13.0 30.0
abc S04920-14 S. Typhimurium DT41 Meat duck farm
D5 2014 (October/1)
Poultry house Poultry litter/ faeces
Organic 13.0 30.0

232
abe S04932-14 S. Typhimurium DT41 Meat duck farm
D5 2014 (October/1)
Outside Pooled water Aqueous 8.9 14.7
ab S01788-15 S. Typhimurium DT41b Meat duck farm
D5 2015 (March/2)
Poultry house anti-room
Floor Concrete 13.0 30.0
ac S01798-15 S. Typhimurium DT41b Meat duck farm
D5 2015 (March/2)
Poultry house Poultry litter/ faeces
Organic 13.0 30.0
ac S02047-15 S. Typhimurium DT41b Meat duck farm
D5 2015 (March/2)
Poultry house Poultry litter/ faeces
Organic 13.0 30.0
ac S02945-16 S. Mbandaka - Feed mill F1 2016 (June/1)
Ingredient area Intake pit Dust 20.0 30.0
ac S01618-17 S. Kedougou - Feed mill F2 2017 (June/1)
Feed processing area
Sieve Dust 20.0 30.0
ac S01589-17 S. Ohio - Feed mill F2 2017 (June/1)
Ingredient area Intake pit Dust 20.0 30.0
ac L02647-16 S. Montevideo - Feed mill F3 2016 (September/1)
Ingredient area Ingredient handling
Dust 20.0 30.0
ac S03311-17 S. Kedougou - Feed mill F4 2017 (September/1)
Feed processing area
Dust aspiration/ cyclone
Dust 20.0 30.0
ac S03312-17 S. Kedougou - Feed mill F4 2017 (September/1)
Feed treatment area
Conditioner/ press
Dust 20.0 30.0
ac S03306-17 S. Mbandaka - Feed mill F4 2017 (September/1)
Feed processing area
Dust aspiration/ cyclone
Dust 20.0 30.0
ac S03308-17 S. Mbandaka - Feed mill F4 2017 (September/1)
Ingredient area Intake pit Dust 20.0 30.0
ac S02592-15 S. 13,23:i:- - Hatchery (broiler)
H1 2015 (May/1)
Chick take-off area
Cleaning tools Plastic 22.0 24.0
ac S02593-15 S. 13,23:i:- - Hatchery (broiler)
H1 2015 (May/1)
Macerator area Floor Concrete 24.0 24.0
ac S03363-15 S. 13,23:i:- - Hatchery (broiler)
H1 2015 (May/1)
Macerator area Macerator machine
Metal 24.0 24.0
ac S02750-17 S. 13,23:i:- - Hatchery (broiler)
H1 2017 (August/2)
Egg loading bay Floor Concrete 11.8 21.0
a S02753-17 S. 13,23:i:- - Hatchery (broiler)
H1 2017 (August/2)
Setter room Setter machine floor
Concrete 37.5 37.8
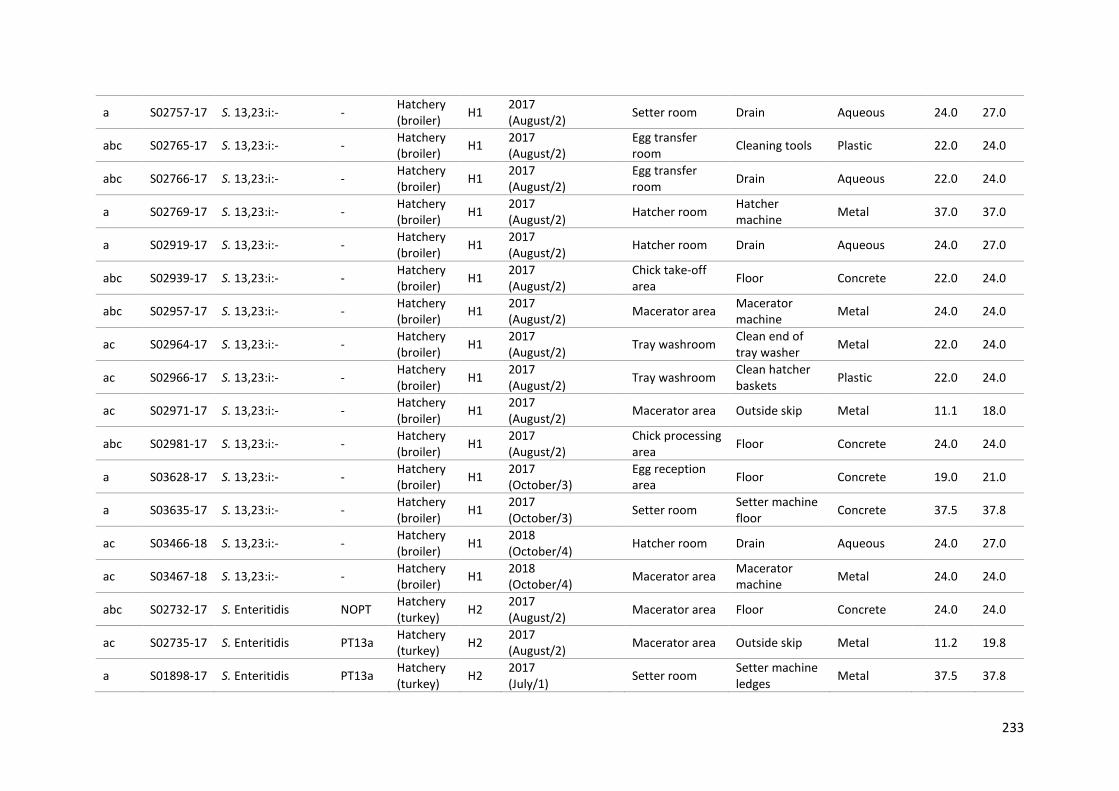
233
a S02757-17 S. 13,23:i:- - Hatchery (broiler)
H1 2017 (August/2)
Setter room Drain Aqueous 24.0 27.0
abc S02765-17 S. 13,23:i:- - Hatchery (broiler)
H1 2017 (August/2)
Egg transfer room
Cleaning tools Plastic 22.0 24.0
abc S02766-17 S. 13,23:i:- - Hatchery (broiler)
H1 2017 (August/2)
Egg transfer room
Drain Aqueous 22.0 24.0
a S02769-17 S. 13,23:i:- - Hatchery (broiler)
H1 2017 (August/2)
Hatcher room Hatcher machine
Metal 37.0 37.0
a S02919-17 S. 13,23:i:- - Hatchery (broiler)
H1 2017 (August/2)
Hatcher room Drain Aqueous 24.0 27.0
abc S02939-17 S. 13,23:i:- - Hatchery (broiler)
H1 2017 (August/2)
Chick take-off area
Floor Concrete 22.0 24.0
abc S02957-17 S. 13,23:i:- - Hatchery (broiler)
H1 2017 (August/2)
Macerator area Macerator machine
Metal 24.0 24.0
ac S02964-17 S. 13,23:i:- - Hatchery (broiler)
H1 2017 (August/2)
Tray washroom Clean end of tray washer
Metal 22.0 24.0
ac S02966-17 S. 13,23:i:- - Hatchery (broiler)
H1 2017 (August/2)
Tray washroom Clean hatcher baskets
Plastic 22.0 24.0
ac S02971-17 S. 13,23:i:- - Hatchery (broiler)
H1 2017 (August/2)
Macerator area Outside skip Metal 11.1 18.0
abc S02981-17 S. 13,23:i:- - Hatchery (broiler)
H1 2017 (August/2)
Chick processing area
Floor Concrete 24.0 24.0
a S03628-17 S. 13,23:i:- - Hatchery (broiler)
H1 2017 (October/3)
Egg reception area
Floor Concrete 19.0 21.0
a S03635-17 S. 13,23:i:- - Hatchery (broiler)
H1 2017 (October/3)
Setter room Setter machine floor
Concrete 37.5 37.8
ac S03466-18 S. 13,23:i:- - Hatchery (broiler)
H1 2018 (October/4)
Hatcher room Drain Aqueous 24.0 27.0
ac S03467-18 S. 13,23:i:- - Hatchery (broiler)
H1 2018 (October/4)
Macerator area Macerator machine
Metal 24.0 24.0
abc S02732-17 S. Enteritidis NOPT Hatchery (turkey)
H2 2017 (August/2)
Macerator area Floor Concrete 24.0 24.0
ac S02735-17 S. Enteritidis PT13a Hatchery (turkey)
H2 2017 (August/2)
Macerator area Outside skip Metal 11.2 19.8
a S01898-17 S. Enteritidis PT13a Hatchery (turkey)
H2 2017 (July/1)
Setter room Setter machine ledges
Metal 37.5 37.8

234
ac S01899-17 S. Enteritidis PT8 Hatchery (turkey)
H2 2017 (July/1)
Macerator area Macerator machine
Metal 24.0 24.0
ac S02733-17 S. Enteritidis RDNC Hatchery (turkey)
H2 2017 (August/2)
Macerator area Macerator machine
Metal 24.0 24.0
ac L01508-17 S. Senftenberg - Hatchery (turkey)
H3 2017 (July/1)
Hatcher room Drain Aqueous 24.0 27.0
ac L01512-17 S. Senftenberg - Hatchery (turkey)
H3 2017 (July/1)
Hatcher room Main exhaust Metal 24.0 27.0
ac L01515-17 S. Senftenberg - Hatchery (turkey)
H3 2017 (July/1)
Hatcher room Drain Aqueous 24.0 27.0
abc S06506-12 S. Enteritidis PT9b Layer duck farm
LD1 2012 (December/1)
Poultry house Poultry litter/ faeces
Organic 3.8 6.8
a S01005-13 S. Enteritidis PT9b Layer duck farm
LD1 2013 (February/2)
Poultry house Poultry litter/ faeces
Organic -0.1 5.6
a S02758-12 S. Bovismorbificans - Layer duck farm
LD2 2012 (June/1)
Poultry house Poultry litter/ faeces
Organic 11.1 16.6
a S02771-12 S. Bovismorbificans - Layer duck farm
LD2 2012 (June/1)
Poultry house Poultry litter/ faeces
Organic 10.2 16.6
a S03463-16 S. Enteritidis* PT4 Layer hen farm
LH1 2016 (August/2)
Poultry house Poultry litter/ faeces
Organic 20.0 24.0
a S03467-16 S. Enteritidis* PT4 Layer hen farm
LH1 2016 (August/2)
Poultry house Poultry litter/ faeces
Organic 22.0 24.0
a S04697-15 S. Infantis - Layer hen farm
LH1 2015 (September/1)
Poultry house Manure belt and curtain
Plastic 20.0 24.0
a S04700-15 S. Infantis - Layer hen farm
LH1 2015 (September/1)
Poultry house Cleaning tools Plastic 20.0 24.0
a S05273-18 S. Typhimurium DT193 Pig farm P1 2018 (October/1)
Outdoor pig pen Voided pig faeces
Organic 6.8 11.5
a L00893-18 S. Typhimurium DT41 Pig farm P1 2018 (November/2)
Outdoor pig pen Voided pig faeces
Organic 3.4 8.6
a S05336-18 S. 4,[5],12:i:- DT193 Pig farm P2 2018 (October/1)
Outdoor pig pen Voided pig faeces
Organic 3.4 8.6
a S03031-17 S. Typhimurium DT193 Pig farm P3 2017 (August/2)
Indoor pig pen (weaners)
Drinker Aqueous 22.0 32.0
a S03072-17 S. Typhimurium DT193 Pig farm P3 2017 (August/2)
Indoor pig pen (weaners)
Feeder Metal 22.0 32.0

235
a S01382-17 S. Typhimurium DT193 Pig farm P3 2017 (May/1)
Indoor pig pen (weaners)
Drinker Aqueous 22.0 32.0
a S01393-17 S. Typhimurium DT193 Pig farm P3 2017 (May/1)
Indoor pig pen (weaners)
Feeder Metal 22.0 32.0
a S01426-17 S. Typhimurium DT193 Pig farm P3 2017 (May/1)
Indoor pig pen (weaners)
Drinker Aqueous 22.0 32.0
a S01430-17 S. Typhimurium DT193 Pig farm P3 2017 (May/1)
Indoor pig pen (weaners)
Feeder Metal 22.0 32.0
ac L01290-17 S. 4,[5],12:i:- DT193 Pig farm P4 2017 (August/1)
Outside Wheelbarrow Metal 10.6 19.4
ac L01319-17 S. 4,[5],12:i:- DT193 Pig farm P4 2017 (August/1)
Outside Muck scraper Metal 10.6 19.4
ac L01320-17 S. 4,[5],12:i:- DT193 Pig farm P4 2017 (August/1)
Outside Concrete apron Concrete 10.6 19.4
abc L02796-16 S. 4,[5],12:i:- DT193 Pig farm P5 2016 (October/1)
Outside Concrete apron Concrete 6.9 13.4
ac L02808-16 S. 4,[5],12:i:- DT193 Pig farm P5 2016 (October/1)
Outside Walkway Concrete 6.9 13.4
abc L02828-16 S. 4,[5],12:i:- DT193 Pig farm P5 2016 (October/1)
Outside Trailer Metal 6.9 13.4
ac L02830-16 S. 4,[5],12:i:- DT193 Pig farm P5 2016 (October/1)
Outside Pig board Plastic 6.9 13.4
ac L02831-16 S. 4,[5],12:i:- DT193 Pig farm P5 2016 (October/1)
Outside Tractor Metal 6.9 13.4
ac L02833-16 S. 4,[5],12:i:- DT193 Pig farm P5 2016 (October/1)
Outside Loading ramp Metal 6.9 13.4
ac L02834-16 S. 4,[5],12:i:- DT193 Pig farm P5 2016 (October/1)
Outside JCB footwell Metal 6.9 13.4
ac L02857-16 S. 4,[5],12:i:- DT193 Pig farm P5 2016 (October/1)
Outside Drain Aqueous 6.9 13.4
ac L04540-15 S. 4,[5],12:i:- DT193 Pig farm P6 2015 (October/1)
Indoor pig pen (finishers)
Voided pig faeces
Organic 13.0 21.0
abc L04552-15 S. 4,[5],12:i:- DT193 Pig farm P6 2015 (October/1)
Indoor pig pen (finishers)
Voided pig faeces
Organic 13.0 21.0
ac L04571-15 S. 4,[5],12:i:- DT193 Pig farm P6 2015 (October/1)
Indoor pig pen Floor (post-C&D)
Post-C&D 6.4 13.8
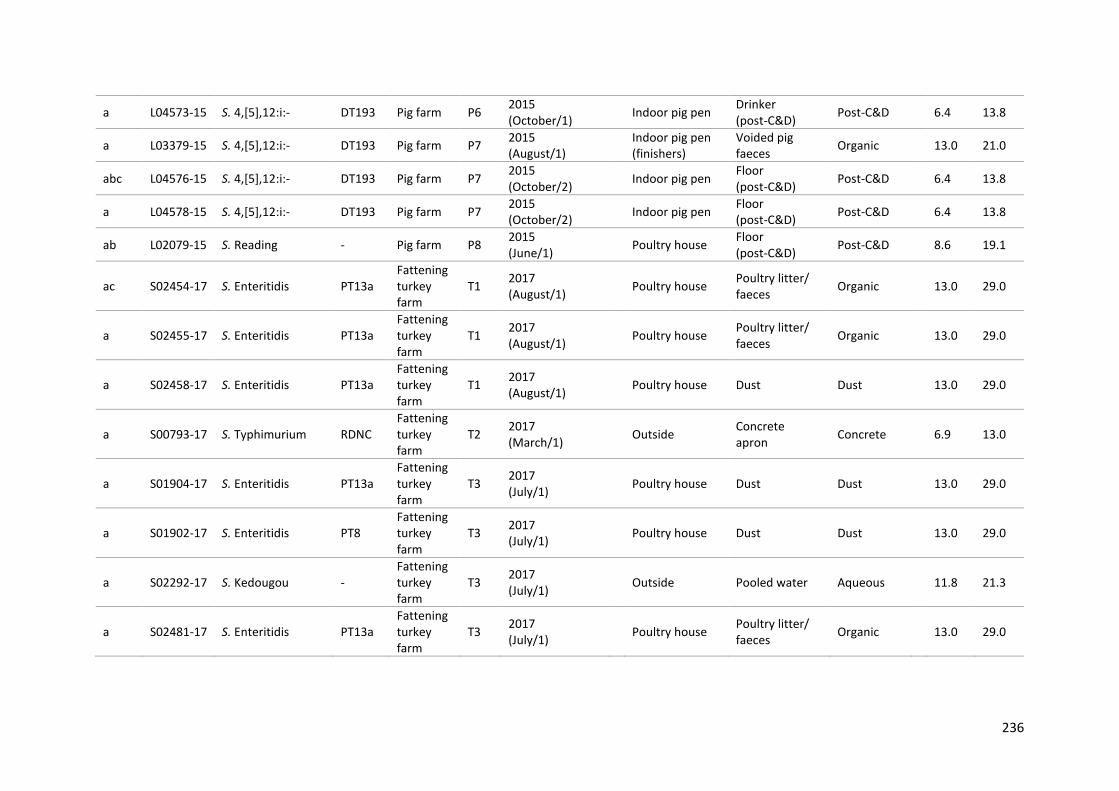
236
a L04573-15 S. 4,[5],12:i:- DT193 Pig farm P6 2015 (October/1)
Indoor pig pen Drinker (post-C&D)
Post-C&D 6.4 13.8
a L03379-15 S. 4,[5],12:i:- DT193 Pig farm P7 2015 (August/1)
Indoor pig pen (finishers)
Voided pig faeces
Organic 13.0 21.0
abc L04576-15 S. 4,[5],12:i:- DT193 Pig farm P7 2015 (October/2)
Indoor pig pen Floor (post-C&D)
Post-C&D 6.4 13.8
a L04578-15 S. 4,[5],12:i:- DT193 Pig farm P7 2015 (October/2)
Indoor pig pen Floor (post-C&D)
Post-C&D 6.4 13.8
ab L02079-15 S. Reading - Pig farm P8 2015 (June/1)
Poultry house Floor (post-C&D)
Post-C&D 8.6 19.1
ac S02454-17 S. Enteritidis PT13a Fattening turkey farm
T1 2017 (August/1)
Poultry house Poultry litter/ faeces
Organic 13.0 29.0
a S02455-17 S. Enteritidis PT13a Fattening turkey farm
T1 2017 (August/1)
Poultry house Poultry litter/ faeces
Organic 13.0 29.0
a S02458-17 S. Enteritidis PT13a Fattening turkey farm
T1 2017 (August/1)
Poultry house Dust Dust 13.0 29.0
a S00793-17 S. Typhimurium RDNC Fattening turkey farm
T2 2017 (March/1)
Outside Concrete apron
Concrete 6.9 13.0
a S01904-17 S. Enteritidis PT13a Fattening turkey farm
T3 2017 (July/1)
Poultry house Dust Dust 13.0 29.0
a S01902-17 S. Enteritidis PT8 Fattening turkey farm
T3 2017 (July/1)
Poultry house Dust Dust 13.0 29.0
a S02292-17 S. Kedougou - Fattening turkey farm
T3 2017 (July/1)
Outside Pooled water Aqueous 11.8 21.3
a S02481-17 S. Enteritidis PT13a Fattening turkey farm
T3 2017 (July/1)
Poultry house Poultry litter/ faeces
Organic 13.0 29.0

237
a S02189-17 S. Enteritidis PT8 Fattening turkey farm
T3 2017 (July/1)
Poultry house Dust Dust 13.0 29.0
ac S02662-17 S. Enteritidis PT13a Fattening turkey farm
T3 2017 (July/1)
Poultry house Dust Dust 13.0 29.0
ab S02445-17 S. Enteritidis PT13a Fattening turkey farm
T4 2017 (August/1)
Outside Pooled water Aqueous 10.8 19.0
abf S02239-17 S. Enteritidis PT3a Fattening turkey farm
T5 2017 (July/1)
Poultry house Poultry litter/ faeces
Organic 13.0 29.0
The studies in this thesis that the isolates were used for are coded as follows: a = crystal violet biofilm assay (Chapter 3), motility testing (Chapter 4, section 4.2.2), Congo red agar test (Chapter 4, section 4.2.3) and antimicrobial resistance profiling (Chapter 4, section 4.2.4); b = growth kinetics study (Chapter 4, section 4.2.5); c = whole-genome sequencing (Chapter 5); d = biofilm surface disinfectant test (Chapter 6) = biofilm-oriented antiseptic test (BOAT) (Chapter 6, section 6.2.2.1); f = poultry drinking water system model (Chapter 7). The two biofilm control strains (†) were sourced from the bacteriology strain collection at APHA (Weybridge, UK) and were previously charactered by Allen-Vercoe et al. (1997), Allen-Vercoe, Collighan and Woodward (1998), and Woodward et al. (2000). Field isolate of the Salmovac® 440 vaccine strain (*). Phage typing designations are only used for Salmonella serovars S. Enteritidis, S. Typhimurium, and monophasic S. Typhimurium (S. 4,[5],12:i:-), RDNC = reacts but does not conform to a recognised phage type, NOPT = sample has a natural phage infection. For anonymity, each premise was assigned a premises code: broiler farms were coded B1 to B8, the breeder farm coded BD1, meat duck farms coded D1 to D5, feed mills coded F1 to F4, hatcheries coded H1 to H3, layer duck farms coded LD1 and LD2, the layer hen farm coded LH1, the pig farms coded P1 to P8, and the fattening turkey farms coded T1 to T5. Post-C&D = samples collected after cleaning and disinfection.

238
Appendix II
Table 9-2: Media formulations. All media was prepared by the biotechnology department at APHA (Weybridge,
UK).
Media Ingredients
10% glycerol broth proteose peptone (10.0g/L), glycerol (100ml/L) and distilled water (900ml/L)
M9 minimal agar bacto agar (15.0g/L), 20% glucose (10ml/L), M9 minimal salts x10 concentration (100ml/L), 1M magnesium sulphate (1ml/L), 1M calcium chloride (0.1ml/L) and distilled water (900ml/L)
LB broth [pH7.2] tryptone (15g/L), sodium chloride (5g/L), yeast extract (5g/L) and distilled water (1000ml/L)
LB broth w/o salt [pH 7.2]
bacto tryptone (10g/L), yeast extract (5g/L) and distilled water (1000ml/L)
0.1M Phosphate Buffered Saline [pH 7.2]
one part (v/v) of solution A [potassium dihydrogen orthophosphate (4.5g/L), sodium chloride (4.3g/L) and distilled water (1000ml/L)] combined with 3.5 parts (v/v) of solution B [disodium hydrogen phosphate 2H2O [Sorensen’s salt] (5.9g/L), sodium chloride (4.3g/L) and distilled water (1000ml/L)]
motility test medium agar
tryptose (10g/L), sodium chloride (5g/L), agar (5g/L) 1% triphenyl tetrazolium chloride (5ml/L) and distilled water (1000ml/L)
colonisation factor antigen (CFA) agar plates
casamino acids (10g/L), yeast extract (1.5g/L), magnesium sulphate (0.05g/L), agar (20g/L) and distilled water (1000ml/L)
LB w/o salt agar plates
tryptone (15g/L), sodium chloride (5g/L), yeast extract (5g/L), agar (15g/L) and distilled water (1000ml/L)
0.85% physiological saline
sodium chloride (8.5g/L) and distilled water (1000ml/L)
WHO hard water calcium chloride 2H20 (0.30g/L), magnesium chloride 6H20 (0.14g/L) and purified water (1000ml/L)
lecithin neutraliser tween 80 [polysorbate 80] (30g/L), saponin (30g/L), lecithin [egg] (3g/L) and distilled water (1000ml/L)
M9 minimal broth 20% glucose (10ml/L), M9 minimal salts x10 concentration (100ml/L), 1M magnesium sulphate (1ml/L), 1M calcium chloride (0.1ml/L) and distilled water (900ml/L)

239
Appendix III
Table 9-3: Biofilm-forming ability of 134 Salmonella in the crystal violet microtiter plate assay. Biofilm forming ability (BF) was assessed after 48 hours or 72 hours aerobic
incubation in the crystal violet microplate assay at 20±1°C and 25±1°C. These experiments were performed three times with two technical replicates.
Isolate Salmonella serovar
Phage type
Aerobic incubation at 20±1°C Aerobic incubation at 25±1°C
48 hours 72 hours 48 hours 72 hours
BF ability
Mean OD570 ±SD BF ability
Mean OD570 ±SD BF ability
Mean OD570 ±SD BF ability
Mean OD570 ±SD
S02592-15 S. 13,23:i:- - SP 0.790 ±0.388 MP 0.471 ±0.428 MP 0.468 ±0.425 SP 0.773 ±0.385
S02593-15 S. 13,23:i:- - SP 0.909 ±0.377 SP 0.689 ±0.110 SP 0.686 ±0.112 SP 0.834 ±0.330
S02750-17 S. 13,23:i:- - SP 0.846 ±0.289 SP 0.835 ±0.196 SP 0.832 ±0.199 SP 0.662 ±0.193
S02753-17 S. 13,23:i:- - SP 0.823 ±0.205 SP 0.865 ±0.201 SP 0.862 ±0.205 SP 0.887 ±0.250
S02757-17 S. 13,23:i:- - WP 0.065 ±0.086 WP 0.161 ±0.346 MP 0.158 ±0.348 WP 0.011 ±0.027
S02765-17 S. 13,23:i:- - SP 0.702 ±0.420 SP 0.637 ±0.092 SP 0.634 ±0.091 SP 0.800 ±0.398
S02766-17 S. 13,23:i:- - SP 0.784 ±0.436 SP 0.667 ±0.119 SP 0.664 ±0.117 SP 0.780 ±0.105
S02769-17 S. 13,23:i:- - WP 0.027 ±0.052 MP 0.191 ±0.370 MP 0.188 ±0.372 NP 0.000 ±0.017
S02919-17 S. 13,23:i:- - SP 0.646 ±0.331 SP 0.609 ±0.109 SP 0.606 ±0.112 SP 0.651 ±0.141
S02939-17 S. 13,23:i:- - SP 0.788 ±0.303 SP 0.705 ±0.171 SP 0.702 ±0.173 SP 0.707 ±0.185
S02957-17 S. 13,23:i:- - SP 0.825 ±0.387 SP 0.768 ±0.165 SP 0.765 ±0.169 SP 0.679 ±0.125
S02964-17 S. 13,23:i:- - SP 0.696 ±0.344 SP 0.786 ±0.151 SP 0.783 ±0.154 SP 0.693 ±0.249
S02966-17 S. 13,23:i:- - SP 0.623 ±0.193 MP 0.493 ±0.447 SP 0.490 ±0.446 SP 0.616 ±0.232
S02971-17 S. 13,23:i:- - SP 0.867 ±0.385 SP 0.585 ±0.113 SP 0.582 ±0.113 SP 0.697 ±0.120
S02981-17 S. 13,23:i:- - SP 0.979 ±0.332 SP 0.917 ±0.119 SP 0.914 ±0.122 SP 0.695 ±0.198
S03363-15 S. 13,23:i:- - SP 0.852 ±0.255 SP 0.611 ±0.079 SP 0.608 ±0.078 SP 0.771 ±0.304
S03466-18 S. 13,23:i:- - SP 0.694 ±0.176 SP 0.836 ±0.226 SP 1.112 ±0.212 SP 0.839 ±0.137
S03467-18 S. 13,23:i:- - MP 0.532 ±0.147 SP 0.746 ±0.214 SP 1.015 ±0.368 MP 0.340 ±0.274
S03628-17 S. 13,23:i:- - SP 0.786 ±0.357 MP 0.531 ±0.124 SP 0.528 ±0.124 SP 0.793 ±0.194
S03635-17 S. 13,23:i:- - SP 0.878 ±0.380 SP 0.695 ±0.172 SP 0.692 ±0.173 SP 0.759 ±0.220
L01290-17 S. 4,[5],12:i:- DT193 MP 0.347 ±0.316 SP 0.590 ±0.143 SP 0.587 ±0.143 SP 0.761 ±0.220
L01319-17 S. 4,[5],12:i:- DT193 MP 0.435 ±0.144 SP 0.592 ±0.075 SP 0.589 ±0.074 SP 0.753 ±0.110
L01320-17 S. 4,[5],12:i:- DT193 MP 0.429 ±0.149 MP 0.479 ±0.236 MP 0.476 ±0.235 SP 0.661 ±0.102
L02796-16 S. 4,[5],12:i:- DT193 SP 0.570 ±0.349 SP 0.603 ±0.067 SP 0.600 ±0.072 SP 0.626 ±0.132
L02808-16 S. 4,[5],12:i:- DT193 SP 0.561 ±0.155 SP 0.673 ±0.081 SP 0.670 ±0.082 SP 0.634 ±0.151

240
L02828-16 S. 4,[5],12:i:- DT193 MP 0.226 ±0.138 MP 0.430 ±0.284 MP 0.427 ±0.287 SP 0.674 ±0.239
L02830-16 S. 4,[5],12:i:- DT193 MP 0.348 ±0.071 MP 0.507 ±0.115 SP 0.504 ±0.118 SP 0.775 ±0.154
L02831-16 S. 4,[5],12:i:- DT193 SP 0.568 ±0.212 SP 0.635 ±0.112 SP 0.632 ±0.113 SP 0.671 ±0.251
L02833-16 S. 4,[5],12:i:- DT193 SP 0.597 ±0.186 MP 0.515 ±0.082 SP 0.512 ±0.078 MP 0.512 ±0.041
L02834-16 S. 4,[5],12:i:- DT193 MP 0.408 ±0.153 SP 0.656 ±0.143 SP 0.653 ±0.147 SP 0.721 ±0.220
L02857-16 S. 4,[5],12:i:- DT193 SP 0.607 ±0.245 SP 0.575 ±0.076 SP 0.572 ±0.073 SP 0.895 ±0.162
L03379-15 S. 4,[5],12:i:- DT193 WP 0.149 ±0.211 MP 0.437 ±0.174 MP 0.434 ±0.180 SP 0.717 ±0.306
L04540-15 S. 4,[5],12:i:- DT193 SP 0.522 ±0.314 SP 0.583 ±0.089 SP 0.580 ±0.090 SP 0.673 ±0.158
L04552-15 S. 4,[5],12:i:- DT193 SP 0.540 ±0.191 MP 0.516 ±0.060 SP 0.513 ±0.060 SP 0.553 ±0.107
L04571-15 S. 4,[5],12:i:- DT193 MP 0.312 ±0.176 SP 0.544 ±0.179 SP 0.541 ±0.180 SP 0.754 ±0.219
L04573-15 S. 4,[5],12:i:- DT193 MP 0.426 ±0.267 MP 0.430 ±0.187 MP 0.427 ±0.186 SP 0.740 ±0.275
L04576-15 S. 4,[5],12:i:- DT193 MP 0.347 ±0.361 MP 0.460 ±0.098 MP 0.457 ±0.099 SP 0.723 ±0.255
L04578-15 S. 4,[5],12:i:- DT193 MP 0.423 ±0.162 MP 0.514 ±0.132 SP 0.511 ±0.134 SP 0.605 ±0.252
S02715-13 S. 4,[5],12:i:- DT193 SP 0.566 ±0.143 MP 0.700 ±0.066 SP 0.284 ±0.240 MP 0.460 ±0.196
S05336-18 S. 4,[5],12:i:- DT193 MP 0.423 ±0.161 SP 0.385 ±0.061 MP 0.963 ±0.088 SP 0.666 ±0.108
S05632-12 S. 4,[5],12:i:- DT193 SP 0.646 ±0.151 SP 0.695 ±0.153 SP 0.665 ±0.533 SP 0.687 ±0.269
L01477-17 S. 4,12:d:- - SP 0.660 ±0.296 MP 0.521 ±0.097 SP 0.518 ±0.098 SP 0.766 ±0.104
S01860-17 S. 4,12:d:- - SP 0.659 ±0.286 SP 0.632 ±0.117 SP 0.629 ±0.118 SP 0.798 ±0.172
S02758-12 S. Bovismorbificans - MP 0.446 ±0.229 MP 0.510 ±0.245 SP 0.459 ±0.104 MP 0.222 ±0.095
S02771-12 S. Bovismorbificans - MP 0.410 ±0.220 MP 0.463 ±0.146 MP 0.515 ±0.157 MP 0.263 ±0.121
S02732-17 S. Enteritidis NOPT SP 0.639 ±0.131 SP 0.637 ±0.113 SP 0.634 ±0.109 SP 0.839 ±0.165
27655R S. Enteritidis† PT13a SP 0.942 ±0.226 SP 0.873 ±0.172 SP 0.870 ±0.172 SP 0.677 ±0.120
27655S S. Enteritidis† PT13a WP 0.111 ±0.058 WP 0.134 ±0.047 WP 0.131 ±0.046 WP 0.114 ±0.109
S01898-17 S. Enteritidis PT13a SP 0.957 ±0.251 SP 0.707 ±0.102 SP 0.704 ±0.103 SP 0.761 ±0.186
S01904-17 S. Enteritidis PT13a SP 0.895 ±0.262 SP 0.773 ±0.135 SP 0.770 ±0.137 SP 0.678 ±0.095
S02445-17 S. Enteritidis PT13a SP 0.779 ±0.195 MP 0.537 ±0.170 SP 0.534 ±0.167 SP 0.795 ±0.250
S02454-17 S. Enteritidis PT13a SP 0.724 ±0.238 SP 0.556 ±0.379 SP 0.553 ±0.379 SP 0.750 ±0.221
S02455-17 S. Enteritidis PT13a SP 0.733 ±0.200 MP 0.473 ±0.500 MP 0.470 ±0.503 SP 0.968 ±0.364
S02458-17 S. Enteritidis PT13a SP 0.775 ±0.149 SP 0.827 ±0.512 SP 0.824 ±0.513 SP 0.910 ±0.183
S02481-17 S. Enteritidis PT13a SP 0.659 ±0.302 SP 0.783 ±0.188 SP 0.780 ±0.191 SP 0.677 ±0.171
S02662-17 S. Enteritidis PT13a SP 0.733 ±0.270 SP 0.655 ±0.106 SP 0.652 ±0.111 SP 0.618 ±0.211
S02735-17 S. Enteritidis PT13a SP 0.809 ±0.230 SP 0.685 ±0.105 SP 0.682 ±0.104 SP 0.800 ±0.105
S03527-17 S. Enteritidis PT13a SP 0.994 ±0.306 SP 0.825 ±0.182 SP 0.822 ±0.184 SP 0.680 ±0.124
S02239-17 S. Enteritidis PT3a SP 0.977 ±0.325 SP 0.800 ±0.101 SP 0.797 ±0.103 SP 0.651 ±0.142
S01899-17 S. Enteritidis PT8 SP 0.800 ±0.443 SP 0.588 ±0.039 SP 0.585 ±0.042 SP 0.704 ±0.255
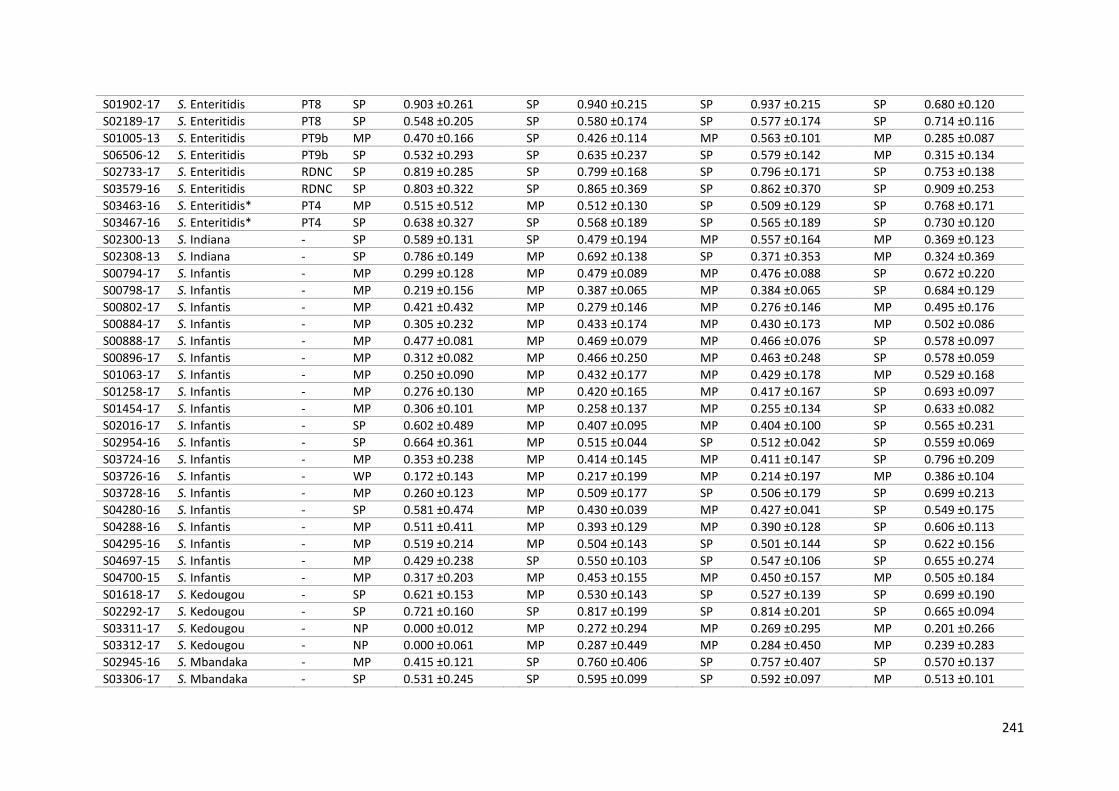
241
S01902-17 S. Enteritidis PT8 SP 0.903 ±0.261 SP 0.940 ±0.215 SP 0.937 ±0.215 SP 0.680 ±0.120
S02189-17 S. Enteritidis PT8 SP 0.548 ±0.205 SP 0.580 ±0.174 SP 0.577 ±0.174 SP 0.714 ±0.116
S01005-13 S. Enteritidis PT9b MP 0.470 ±0.166 SP 0.426 ±0.114 MP 0.563 ±0.101 MP 0.285 ±0.087
S06506-12 S. Enteritidis PT9b SP 0.532 ±0.293 SP 0.635 ±0.237 SP 0.579 ±0.142 MP 0.315 ±0.134
S02733-17 S. Enteritidis RDNC SP 0.819 ±0.285 SP 0.799 ±0.168 SP 0.796 ±0.171 SP 0.753 ±0.138
S03579-16 S. Enteritidis RDNC SP 0.803 ±0.322 SP 0.865 ±0.369 SP 0.862 ±0.370 SP 0.909 ±0.253
S03463-16 S. Enteritidis* PT4 MP 0.515 ±0.512 MP 0.512 ±0.130 SP 0.509 ±0.129 SP 0.768 ±0.171
S03467-16 S. Enteritidis* PT4 SP 0.638 ±0.327 SP 0.568 ±0.189 SP 0.565 ±0.189 SP 0.730 ±0.120
S02300-13 S. Indiana - SP 0.589 ±0.131 SP 0.479 ±0.194 MP 0.557 ±0.164 MP 0.369 ±0.123
S02308-13 S. Indiana - SP 0.786 ±0.149 MP 0.692 ±0.138 SP 0.371 ±0.353 MP 0.324 ±0.369
S00794-17 S. Infantis - MP 0.299 ±0.128 MP 0.479 ±0.089 MP 0.476 ±0.088 SP 0.672 ±0.220
S00798-17 S. Infantis - MP 0.219 ±0.156 MP 0.387 ±0.065 MP 0.384 ±0.065 SP 0.684 ±0.129
S00802-17 S. Infantis - MP 0.421 ±0.432 MP 0.279 ±0.146 MP 0.276 ±0.146 MP 0.495 ±0.176
S00884-17 S. Infantis - MP 0.305 ±0.232 MP 0.433 ±0.174 MP 0.430 ±0.173 MP 0.502 ±0.086
S00888-17 S. Infantis - MP 0.477 ±0.081 MP 0.469 ±0.079 MP 0.466 ±0.076 SP 0.578 ±0.097
S00896-17 S. Infantis - MP 0.312 ±0.082 MP 0.466 ±0.250 MP 0.463 ±0.248 SP 0.578 ±0.059
S01063-17 S. Infantis - MP 0.250 ±0.090 MP 0.432 ±0.177 MP 0.429 ±0.178 MP 0.529 ±0.168
S01258-17 S. Infantis - MP 0.276 ±0.130 MP 0.420 ±0.165 MP 0.417 ±0.167 SP 0.693 ±0.097
S01454-17 S. Infantis - MP 0.306 ±0.101 MP 0.258 ±0.137 MP 0.255 ±0.134 SP 0.633 ±0.082
S02016-17 S. Infantis - SP 0.602 ±0.489 MP 0.407 ±0.095 MP 0.404 ±0.100 SP 0.565 ±0.231
S02954-16 S. Infantis - SP 0.664 ±0.361 MP 0.515 ±0.044 SP 0.512 ±0.042 SP 0.559 ±0.069
S03724-16 S. Infantis - MP 0.353 ±0.238 MP 0.414 ±0.145 MP 0.411 ±0.147 SP 0.796 ±0.209
S03726-16 S. Infantis - WP 0.172 ±0.143 MP 0.217 ±0.199 MP 0.214 ±0.197 MP 0.386 ±0.104
S03728-16 S. Infantis - MP 0.260 ±0.123 MP 0.509 ±0.177 SP 0.506 ±0.179 SP 0.699 ±0.213
S04280-16 S. Infantis - SP 0.581 ±0.474 MP 0.430 ±0.039 MP 0.427 ±0.041 SP 0.549 ±0.175
S04288-16 S. Infantis - MP 0.511 ±0.411 MP 0.393 ±0.129 MP 0.390 ±0.128 SP 0.606 ±0.113
S04295-16 S. Infantis - MP 0.519 ±0.214 MP 0.504 ±0.143 SP 0.501 ±0.144 SP 0.622 ±0.156
S04697-15 S. Infantis - MP 0.429 ±0.238 SP 0.550 ±0.103 SP 0.547 ±0.106 SP 0.655 ±0.274
S04700-15 S. Infantis - MP 0.317 ±0.203 MP 0.453 ±0.155 MP 0.450 ±0.157 MP 0.505 ±0.184
S01618-17 S. Kedougou - SP 0.621 ±0.153 MP 0.530 ±0.143 SP 0.527 ±0.139 SP 0.699 ±0.190
S02292-17 S. Kedougou - SP 0.721 ±0.160 SP 0.817 ±0.199 SP 0.814 ±0.201 SP 0.665 ±0.094
S03311-17 S. Kedougou - NP 0.000 ±0.012 MP 0.272 ±0.294 MP 0.269 ±0.295 MP 0.201 ±0.266
S03312-17 S. Kedougou - NP 0.000 ±0.061 MP 0.287 ±0.449 MP 0.284 ±0.450 MP 0.239 ±0.283
S02945-16 S. Mbandaka - MP 0.415 ±0.121 SP 0.760 ±0.406 SP 0.757 ±0.407 SP 0.570 ±0.137
S03306-17 S. Mbandaka - SP 0.531 ±0.245 SP 0.595 ±0.099 SP 0.592 ±0.097 MP 0.513 ±0.101

242
S03308-17 S. Mbandaka - SP 0.625 ±0.362 MP 0.543 ±0.066 SP 0.540 ±0.067 SP 0.540 ±0.159
L02647-16 S. Montevideo - MP 0.377 ±0.196 MP 0.400 ±0.220 MP 0.397 ±0.221 MP 0.520 ±0.160
L01476-17 S. Ohio - MP 0.190 ±0.172 SP 0.719 ±0.257 SP 0.716 ±0.258 SP 0.582 ±0.135
S01589-17 S. Ohio - SP 0.665 ±0.378 MP 0.536 ±0.144 SP 0.533 ±0.144 SP 0.706 ±0.221
S01770-17 S. Ohio - MP 0.407 ±0.166 MP 0.469 ±0.110 MP 0.466 ±0.110 SP 0.770 ±0.142
L02079-15 S. Reading - SP 0.535 ±0.101 SP 0.596 ±0.110 SP 0.593 ±0.107 SP 0.688 ±0.116
L01508-17 S. Senftenberg - NP 0.000 ±0.016 NP 0.000 ±0.022 NP 0.000 ±0.019 NP 0.000 ±0.105
L01512-17 S. Senftenberg - WP 0.063 ±0.189 NP 0.000 ±0.017 NP 0.000 ±0.014 WP 0.116 ±0.301
L01515-17 S. Senftenberg - MP 0.202 ±0.403 NP 0.000 ±0.042 NP 0.000 ±0.043 WP 0.102 ±0.282
S02722-17 S. Senftenberg - SP 0.538 ±0.159 MP 0.293 ±0.360 MP 0.290 ±0.356 MP 0.493 ±0.145
L02662-16 S. Typhimurium DT104 SP 0.605 ±0.232 MP 0.531 ±0.148 SP 0.528 ±0.149 SP 0.614 ±0.148
S03578-16 S. Typhimurium DT104 MP 0.407 ±0.264 SP 0.620 ±0.159 SP 0.617 ±0.158 SP 0.605 ±0.184
S03586-16 S. Typhimurium DT104 SP 0.584 ±0.250 MP 0.451 ±0.236 MP 0.448 ±0.236 SP 0.615 ±0.226
S03590-16 S. Typhimurium DT104 MP 0.434 ±0.099 SP 0.661 ±0.311 SP 0.658 ±0.312 SP 0.752 ±0.287
S03591-16 S. Typhimurium DT104 MP 0.498 ±0.269 MP 0.309 ±0.057 MP 0.306 ±0.053 MP 0.445 ±0.189
S01382-17 S. Typhimurium DT193 MP 0.514 ±0.101 SP 0.749 ±0.307 SP 0.746 ±0.307 SP 0.757 ±0.254
S01393-17 S. Typhimurium DT193 SP 0.537 ±0.151 MP 0.488 ±0.083 SP 0.485 ±0.083 SP 0.893 ±0.180
S01426-17 S. Typhimurium DT193 MP 0.379 ±0.123 MP 0.485 ±0.158 SP 0.482 ±0.157 SP 0.873 ±0.166
S01430-17 S. Typhimurium DT193 MP 0.441 ±0.126 SP 0.619 ±0.210 SP 0.616 ±0.210 SP 0.910 ±0.201
S03031-17 S. Typhimurium DT193 SP 0.630 ±0.169 SP 0.777 ±0.106 SP 0.774 ±0.109 SP 0.708 ±0.202
S03072-17 S. Typhimurium DT193 SP 0.547 ±0.319 MP 0.430 ±0.182 MP 0.427 ±0.184 SP 0.664 ±0.241
S05273-18 S. Typhimurium DT193 NP 0.000 ±0.009 WP 0.000 ±0.018 NP 0.014 ±0.092 WP 0.068 ±0.079
S00882-18 S. Typhimurium DT2 SP 0.582 ±0.153 SP 0.622 ±0.216 SP 0.619 ±0.212 SP 0.806 ±0.174
S02723-17 S. Typhimurium DT2 SP 0.544 ±0.240 SP 0.627 ±0.131 SP 0.624 ±0.133 SP 0.745 ±0.180
S02260-13 S. Typhimurium DT30 MP 0.471 ±0.283 SP 0.661 ±0.273 SP 0.760 ±0.142 MP 0.488 ±0.156
S04036-12 S. Typhimurium DT30 SP 0.521 ±0.229 SP 0.707 ±0.349 SP 0.858 ±0.209 MP 0.422 ±0.156
L00893-18 S. Typhimurium DT41 WP 0.049 ±0.029 WP 0.048 ±0.048 WP 0.089 ±0.049 WP 0.041 ±0.061
S01896-13 S. Typhimurium DT41 WP 0.130 ±0.243 MP 0.363 ±0.219 MP 0.407 ±0.276 MP 0.308 ±0.254
S02748-13 S. Typhimurium DT41 WP 0.053 ±0.079 SP 0.364 ±0.174 MP 0.634 ±0.261 MP 0.391 ±0.134
S03539-14 S. Typhimurium DT41 WP 0.052 ±0.097 MP 0.387 ±0.231 MP 0.183 ±0.194 MP 0.488 ±0.231
S04920-14 S. Typhimurium DT41 NP 0.000 ±0.049 MP 0.191 ±0.130 MP 0.248 ±0.223 MP 0.254 ±0.127
S04932-14 S. Typhimurium DT41 WP 0.138 ±0.080 MP 0.413 ±0.150 MP 0.326 ±0.277 MP 0.318 ±0.102
S05645-12 S. Typhimurium DT41 MP 0.180 ±0.306 MP 0.375 ±0.171 MP 0.362 ±0.353 MP 0.263 ±0.166
S01788-15 S. Typhimurium DT41b WP 0.079 ±0.067 MP 0.375 ±0.199 MP 0.362 ±0.188 MP 0.441 ±0.104
S01798-15 S. Typhimurium DT41b WP 0.053 ±0.064 SP 0.414 ±0.215 MP 0.578 ±0.326 MP 0.311 ±0.204
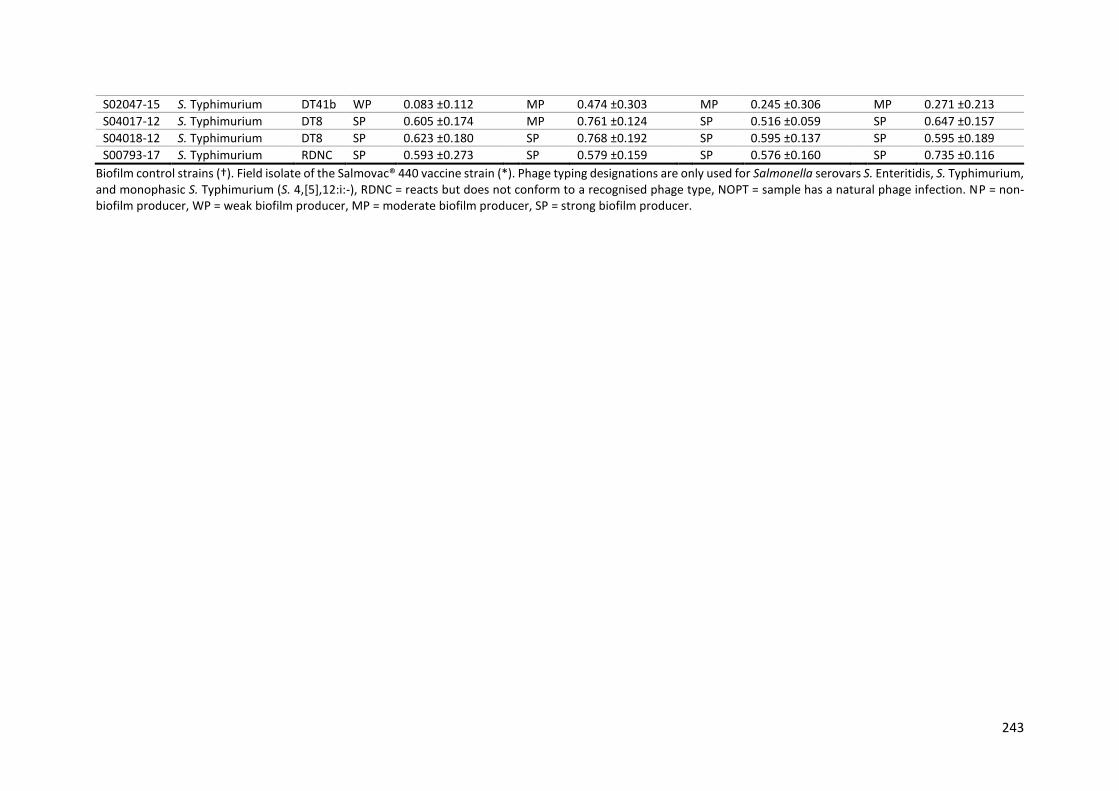
243
S02047-15 S. Typhimurium DT41b WP 0.083 ±0.112 MP 0.474 ±0.303 MP 0.245 ±0.306 MP 0.271 ±0.213
S04017-12 S. Typhimurium DT8 SP 0.605 ±0.174 MP 0.761 ±0.124 SP 0.516 ±0.059 SP 0.647 ±0.157
S04018-12 S. Typhimurium DT8 SP 0.623 ±0.180 SP 0.768 ±0.192 SP 0.595 ±0.137 SP 0.595 ±0.189
S00793-17 S. Typhimurium RDNC SP 0.593 ±0.273 SP 0.579 ±0.159 SP 0.576 ±0.160 SP 0.735 ±0.116
Biofilm control strains (†). Field isolate of the Salmovac® 440 vaccine strain (*). Phage typing designations are only used for Salmonella serovars S. Enteritidis, S. Typhimurium, and monophasic S. Typhimurium (S. 4,[5],12:i:-), RDNC = reacts but does not conform to a recognised phage type, NOPT = sample has a natural phage infection. NP = non-biofilm producer, WP = weak biofilm producer, MP = moderate biofilm producer, SP = strong biofilm producer.

244
Appendix IV
Table 9-4: Salmonella colony morphologies in the CRA test on CFA agar plates containing CR and on LB w/o salt agar plates containing CR and Coomassie brilliant blue.
Colony morphologies of 134 Salmonella isolates after aerobic incubation for 96 hours at 20±1°C or 25±1°C on two types of agar plates: CFA agar plates containing 0.001%,
0.05% or 0.1% CR, and LB w/o salt agar plates containing CR and Coomassie brilliant blue. Testing and photographing of colonies was carried out over multiple days. The
experiment was performed once with one technical replicate.
Isolate Salmonella serovar ± phage type
Aerobic incubation at 20±1°C Aerobic incubation at 25±1°C
CFA agar plates LB w/o salt agar plates
CFA agar plates LB w/o salt agar plates 0.001%
CR 0.05% CR
0.1% CR
0.001% CR
0.05% CR
0.1% CR
27655R S. Enteritidis PT13a†
RDAR
BDAR
RDAR
BDAR
27655S S. Enteritidis PT13a†
SAW
SAW
SAW
SAW
S02592-15 S. 13,23:i:-
(RDAR)
RDAR
RDAR
RDAR
S02593-15 S. 13,23:i:-
[RDAR]
RDAR
RDAR
RDAR
S02750-17 S. 13,23:i:-
RDAR
RDAR
RDAR
RDAR
S02753-17 S. 13,23:i:-
RDAR
RDAR
RDAR
RDAR
S02757-17 S. 13,23:i:-
[RDAR]
RDAR
RDAR
RDAR

245
S02765-17 S. 13,23:i:-
[RDAR]
RDAR
RDAR
PDAR
S02766-17 S. 13,23:i:-
PDAR
RDAR
[RDAR]
RDAR
S02769-17 S. 13,23:i:-
[RDAR]
RDAR
[RDAR]
RDAR
S02919-17 S. 13,23:i:-
PDAR
RDAR
PDAR
PDAR
S02939-17 S. 13,23:i:-
[RDAR]
RDAR
[RDAR]
RDAR
S02957-17 S. 13,23:i:-
[RDAR]
RDAR
[RDAR]
RDAR
S02964-17 S. 13,23:i:-
[RDAR]
RDAR
RDAR
BDAR
S02966-17 S. 13,23:i:-
PDAR
RDAR
[RDAR]
RDAR
S02971-17 S. 13,23:i:-
[RDAR]
RDAR
RDAR
RDAR
S02981-17 S. 13,23:i:-
RDAR
RDAR
RDAR
RDAR
S03363-15 S. 13,23:i:-
[RDAR]
RDAR
[RDAR]
RDAR
S03466-18 S. 13,23:i:-
[RDAR]
RDAR
RDAR
RDAR
S03467-18 S. 13,23:i:-
RDAR
RDAR
RDAR
RDAR
S03628-17 S. 13,23:i:-
[RDAR]
RDAR
RDAR
RDAR

246
S03635-17 S. 13,23:i:-
PDAR
RDAR
RDAR
RDAR
S04017-12 S. 4,[5],12:i:- DT8
RDAR
RDAR
RDAR
RDAR
S04018-12 S. 4,[5],12:i:- DT8
RDAR
RDAR
RDAR
RDAR
L02828-16 S. 4,[5],12:i:- DT107
[RDAR]
RDAR
RDAR
RDAR
L01290-17 S. 4,[5],12:i:- DT193
RDAR
RDAR
RDAR
RDAR
L01319-17 S. 4,[5],12:i:- DT193
[RDAR]
RDAR
PDAR
RDAR
L01320-17 S. 4,[5],12:i:- DT193
PDAR
RDAR
RDAR
RDAR
L02796-16 S. 4,[5],12:i:- DT193
[RDAR]
RDAR
[RDAR]
RDAR
L02808-16 S. 4,[5],12:i:- DT193
RDAR
RDAR
RDAR
RDAR
L02830-16 S. 4,[5],12:i:- DT193
[RDAR]
RDAR
RDAR
RDAR
L02831-16 S. 4,[5],12:i:- DT193
[RDAR]
RDAR
RDAR
RDAR
L02833-16 S. 4,[5],12:i:- DT193
[RDAR]
RDAR
RDAR
RDAR
L02834-16 S. 4,[5],12:i:- DT193
PDAR
RDAR
RDAR
RDAR
L02857-16 S. 4,[5],12:i:- DT193
PDAR
RDAR
RDAR
RDAR
L03379-15 S. 4,[5],12:i:- DT193
[RDAR]
RDAR
RDAR
RDAR

247
L04540-15 S. 4,[5],12:i:- DT193
[RDAR]
RDAR
[RDAR]
RDAR
L04552-15 S. 4,[5],12:i:- DT193
[RDAR]
RDAR
[RDAR]
RDAR
L04571-15 S. 4,[5],12:i:- DT193
[RDAR]
RDAR
RDAR
RDAR
L04573-15 S. 4,[5],12:i:- DT193
PDAR
RDAR
RDAR
RDAR
L04576-15 S. 4,[5],12:i:- DT193
[RDAR]
RDAR
RDAR
RDAR
L04578-15 S. 4,[5],12:i:- DT193
[RDAR]
RDAR
[RDAR]
RDAR
S02715-13 S. 4,[5],12:i:- DT193
RDAR
RDAR
RDAR
RDAR
S05336-18 S. 4,[5],12:i:- DT193
RDAR
RDAR
RDAR
RDAR
S05632-12 S. 4,[5],12:i:- DT193
RDAR
RDAR
RDAR
RDAR
L01477-17 S. 4,12:d:-
RDAR
RDAR
RDAR
RDAR
S01860-17 S. 4,12:d:-
RDAR
RDAR
RDAR
RDAR
S02758-12 S. Bovismorbificans
PDAR
PDAR
PDAR
PDAR
S02771-12 S. Bovismorbificans
PDAR
PDAR
PDAR
PDAR
S02239-17 S. Enteritidis PT3a
RDAR
RDAR
RDAR
RDAR
S01899-17 S. Enteritidis PT8
[RDAR]
RDAR
RDAR
RDAR

248
S01902-17 S. Enteritidis PT8
RDAR
RDAR
RDAR
RDAR
S02189-17 S. Enteritidis PT8
[RDAR]
RDAR
RDAR
RDAR
S01005-13 S. Enteritidis PT9b
RDAR
RDAR
RDAR
RDAR
S06506-12 S. Enteritidis PT9b
RDAR
RDAR
RDAR
RDAR
S01898-17 S. Enteritidis PT13a
[RDAR]
RDAR
RDAR
RDAR
S01904-17 S. Enteritidis PT13a
RDAR
RDAR
RDAR
RDAR
S02445-17 S. Enteritidis PT13a
PDAR
RDAR
PDAR
RDAR
S02454-17 S. Enteritidis PT13a
PDAR
RDAR
RDAR
RDAR
S02455-17 S. Enteritidis PT13a
RDAR
RDAR
RDAR
RDAR
S02458-17 S. Enteritidis PT13a
[RDAR]
RDAR
RDAR
RDAR
S02481-17 S. Enteritidis PT13a
[RDAR]
RDAR
RDAR
RDAR
S02662-17 S. Enteritidis PT13a
[RDAR]
RDAR
RDAR
RDAR
S02735-17 S. Enteritidis PT13a
[RDAR]
RDAR
PDAR
RDAR
S03527-17 S. Enteritidis PT13a
[RDAR]
RDAR
RDAR
RDAR
S02732-17 S. Enteritidis NOPT
[RDAR]
RDAR
RDAR
RDAR

249
S02733-17 S. Enteritidis RDNC
[RDAR]
RDAR
RDAR
RDAR
S03579-16 S. Enteritidis RDNC
[RDAR]
RDAR
RDAR
RDAR
S03463-16 S. Enteritidis* PT4
RDAR
RDAR
RDAR
RDAR
S03467-16 S. Enteritidis* PT4
[RDAR]
RDAR
RDAR
RDAR
S02300-13 S. Indiana
[RDAR]
PDAR
[RDAR]
PDAR
S02308-13 S. Indiana
[RDAR]
RDAR
RDAR
RDAR
S00794-17 S. Infantis
PDAR
RDAR
[RDAR]
RDAR
S00798-17 S. Infantis
[RDAR]
RDAR
[RDAR]
RDAR
S00802-17 S. Infantis
RDAR
RDAR
RDAR
RDAR
S00884-17 S. Infantis
[RDAR]
RDAR
[RDAR]
RDAR
S00888-17 S. Infantis
RDAR
RDAR
[RDAR]
RDAR
S00896-17 S. Infantis
[RDAR]
RDAR
[RDAR]
RDAR
S01063-17 S. Infantis
[RDAR]
RDAR
[RDAR]
RDAR
S01258-17 S. Infantis
PDAR
RDAR
PDAR
RDAR
S01454-17 S. Infantis
RDAR
RDAR
RDAR
RDAR

250
S02016-17 S. Infantis
RDAR
RDAR
RDAR
RDAR
S02954-16 S. Infantis
[RDAR]
RDAR
[RDAR]
RDAR
S03724-16 S. Infantis
[RDAR]
RDAR
PDAR
RDAR
S03726-16 S. Infantis
PDAR
RDAR
[RDAR]
RDAR
S03728-16 S. Infantis
PDAR
RDAR
PDAR
RDAR
S04280-16 S. Infantis
[RDAR]
BDAR
[RDAR]
BDAR
S04288-16 S. Infantis
[RDAR]
RDAR
PDAR
RDAR
S04295-16 S. Infantis
RDAR
RDAR
RDAR
RDAR
S04697-15 S. Infantis
[RDAR]
RDAR
PDAR
RDAR
S04700-15 S. Infantis
PDAR
RDAR
PDAR
RDAR
S01618-17 S. Kedougou
RDAR
RDAR
RDAR
RDAR
S02292-17 S. Kedougou
RDAR
RDAR
RDAR
RDAR
S03311-17 S. Kedougou
RDAR
BDAR
RDAR
BDAR
S03312-17 S. Kedougou
RDAR
RDAR
RDAR
RDAR
S02945-16 S. Mbandaka
PDAR
PDAR
[RDAR]
BDAR

251
S03306-17 S. Mbandaka
PDAR
BDAR
PDAR
BDAR
S03308-17 S. Mbandaka
[RDAR]
BDAR
[RDAR]
BDAR
L02647-16 S. Montevideo
RDAR
RDAR
RDAR
RDAR
L01476-17 S. Ohio
[RDAR]
RDAR
[RDAR]
RDAR
S01589-17 S. Ohio
RDAR
RDAR
RDAR
RDAR
S01770-17 S. Ohio
RDAR
RDAR
RDAR
RDAR
L02079-15 S. Reading
PDAR
PDAR
PDAR
RDAR
L01508-17 S. Senftenberg
BDAR
SAW
BDAR
SAW
L01512-17 S. Senftenberg
BDAR
SAW
BDAR
SAW
L01515-17 S. Senftenberg
BDAR
SAW
BDAR
SAW
S02722-17 S. Senftenberg
RDAR
BDAR
RDAR
BDAR
S00882-18 S. Typhimurium DT2
RDAR
RDAR
RDAR
RDAR
S02723-17 S. Typhimurium DT2
RDAR
BDAR
RDAR
BDAR
S02260-13 S. Typhimurium DT30
[RDAR]
RDAR
RDAR
RDAR
S04036-12 S. Typhimurium DT30
[RDAR]
BDAR
RDAR
RDAR

252
L00893-18 S. Typhimurium DT41b
PDAR
SAW
PDAR
SAW
S01896-13 S. Typhimurium DT41b
PDAR
PDAR
[RDAR]
PDAR
S02748-13 S. Typhimurium DT41b
[RDAR]
PDAR
PDAR
PDAR
S03539-14 S. Typhimurium DT41b
[RDAR]
SAW
[RDAR]
PDAR
S04920-14 S. Typhimurium DT41b
BDAR
SAW
PDAR
PDAR
S04932-14 S. Typhimurium DT41b
[RDAR]
PDAR
[RDAR]
PDAR
S05645-12 S. Typhimurium DT41b
[RDAR]
PDAR
RDAR
PDAR
S01788-15 S. Typhimurium DT41b
[RDAR]
PDAR
[RDAR]
RDAR
S01798-15 S. Typhimurium DT41b
[RDAR]
SAW
[RDAR]
SAW
S02047-15 S. Typhimurium DT41b
[RDAR]
PDAR
[RDAR]
PDAR
L02662-16 S. Typhimurium DT104
RDAR
RDAR
RDAR
RDAR
S03578-16 S. Typhimurium DT104
[RDAR]
RDAR
RDAR
RDAR
S03586-16 S. Typhimurium DT104
PDAR
RDAR
[RDAR]
RDAR
S03590-16 S. Typhimurium DT104
PDAR
RDAR
PDAR
RDAR
S03591-16 S. Typhimurium DT104
[RDAR]
RDAR
[RDAR]
RDAR

253
Biofilm control strains (†). Field isolate of the Salmovac® 440 vaccine strain (*). RDAR = red, dry and rough, [RDAR] = partially convoluted RDAR colonies, BDAR = brown, dry and rough, PDAR = pink, dry and rough, SAW = smooth and white.
S01382-17 S. Typhimurium DT193
[RDAR]
RDAR
RDAR
RDAR
S01393-17 S. Typhimurium DT193
RDAR
RDAR
RDAR
RDAR
S01426-17 S. Typhimurium DT193
RDAR
RDAR
RDAR
RDAR
S01430-17 S. Typhimurium DT193
RDAR
RDAR
RDAR
RDAR
S03031-17 S. Typhimurium DT193
RDAR
RDAR
RDAR
RDAR
S03072-17 S. Typhimurium DT193
[RDAR]
RDAR
RDAR
RDAR
S05273-18 S. Typhimurium DT193
SAW
SAW
[RDAR]
BDAR
S00793-17 S. Typhimurium RDNC
RDAR
RDAR
RDAR
RDAR

254
Appendix V
Table 9-5: Biofilm formation and growth kinetics parameters for 27 Salmonella isolates. Estimated growth kinetics parameters for 27 Salmonella isolates based on growth
curves, fitted to the logistic model, after aerobic incubation for 48 hours at 25±1.5°C. The experiment was performed once with three technical replicates. Biofilm-forming
(BF) ability was assessed after aerobic incubation for 48 hours at 25±1°C in the crystal violet microplate assay.
Isolate Serovar Phage type Biofilm formation Growth kinetics parameters
Biofilm forming ability Mean OD570 r K tDT ODmax OD24h AUC
S02757-17 S. 13,23:i:- - moderate biofilm producer 0.161 0.30 1.28 2.32 1.341 1.229 45.99
S02769-17 S. 13,23:i:- - moderate biofilm producer 0.191 0.35 1.08 1.98 1.165 1.121 38.73
S02957-17 S. 13,23:i:- - strong biofilm producer 0.768 0.40 0.99 1.75 1.099 1.069 37.08
S02966-17 S. 13,23:i:- - strong biofilm producer 0.493 0.35 1.16 1.99 1.229 1.177 42.77
S03363-15 S. 13,23:i:- - strong biofilm producer 0.611 0.37 0.99 1.86 1.068 1.050 36.78
L01290-17 S. 4,[5],12:i:- DT193 strong biofilm producer 0.590 0.39 1.11 1.76 1.232 1.205 39.99
L01319-17 S. 4,[5],12:i:- DT193 strong biofilm producer 0.592 0.41 1.04 1.70 1.155 1.148 38.24
L02828-16 S. 4,[5],12:i:- DT193 moderate biofilm producer 0.430 0.25 1.27 2.82 1.285 0.945 36.03
L02834-16 S. 4,[5],12:i:- DT193 strong biofilm producer 0.656 0.48 0.96 1.46 1.079 1.073 33.90
L04576-15 S. 4,[5],12:i:- DT193 moderate biofilm producer 0.460 0.26 1.17 2.64 1.206 1.082 39.22
27655R S. Enteritidis† PT13a strong biofilm producer 0.873 0.48 0.78 1.44 0.844 0.831 29.77
27655S S. Enteritidis† PT13a weak biofilm producer 0.127 0.23 1.24 3.02 1.277 1.076 42.32
S02732-17 S. Enteritidis NOPT strong biofilm producer 0.637 0.37 0.96 1.89 1.026 1.005 35.23
S02733-17 S. Enteritidis RDNC strong biofilm producer 0.799 0.37 0.96 1.86 1.012 1.006 35.18
S03579-16 S. Enteritidis RDNC strong biofilm producer 0.865 0.46 0.92 1.50 1.039 1.034 34.25
S03463-16 S. Enteritidis* - strong biofilm producer 0.512 0.39 0.91 1.78 1.021 0.988 32.19
S03467-16 S. Enteritidis* - strong biofilm producer 0.568 0.43 1.07 1.62 1.169 1.161 40.01
S00798-17 S. Infantis - moderate biofilm producer 0.387 0.24 1.21 2.89 1.226 1.056 40.20
S01258-17 S. Infantis - moderate biofilm producer 0.420 0.25 1.20 2.74 1.225 1.132 42.68
S02954-16 S. Infantis - strong biofilm producer 0.515 0.40 1.01 1.74 1.086 1.076 38.45
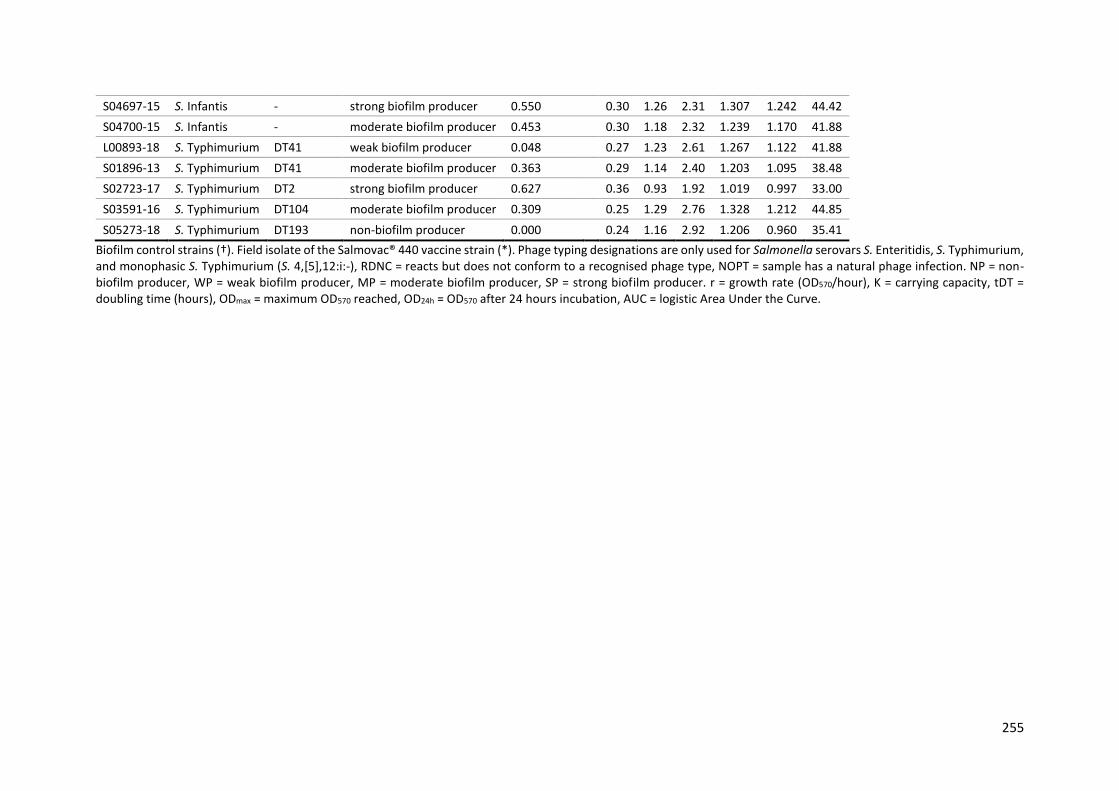
255
S04697-15 S. Infantis - strong biofilm producer 0.550 0.30 1.26 2.31 1.307 1.242 44.42
S04700-15 S. Infantis - moderate biofilm producer 0.453 0.30 1.18 2.32 1.239 1.170 41.88
L00893-18 S. Typhimurium DT41 weak biofilm producer 0.048 0.27 1.23 2.61 1.267 1.122 41.88
S01896-13 S. Typhimurium DT41 moderate biofilm producer 0.363 0.29 1.14 2.40 1.203 1.095 38.48
S02723-17 S. Typhimurium DT2 strong biofilm producer 0.627 0.36 0.93 1.92 1.019 0.997 33.00
S03591-16 S. Typhimurium DT104 moderate biofilm producer 0.309 0.25 1.29 2.76 1.328 1.212 44.85
S05273-18 S. Typhimurium DT193 non-biofilm producer 0.000 0.24 1.16 2.92 1.206 0.960 35.41
Biofilm control strains (†). Field isolate of the Salmovac® 440 vaccine strain (*). Phage typing designations are only used for Salmonella serovars S. Enteritidis, S. Typhimurium, and monophasic S. Typhimurium (S. 4,[5],12:i:-), RDNC = reacts but does not conform to a recognised phage type, NOPT = sample has a natural phage infection. NP = non-biofilm producer, WP = weak biofilm producer, MP = moderate biofilm producer, SP = strong biofilm producer. r = growth rate (OD570/hour), K = carrying capacity, tDT = doubling time (hours), ODmax = maximum OD570 reached, OD24h = OD570 after 24 hours incubation, AUC = logistic Area Under the Curve.

256
Appendix VI
Table 9-6: Assembly quality statistics for 93 Salmonella isolates. Quality statistics were obtained using the
QUAST tool v5.0.2 (Gurevich et al., 2013). the minimum contig length required to cover 50% of the assembled
genome sequence (N50), a count of the smallest number of contigs whose length makes up half the genome
size (L50).
Isolate Serovar Phage type Total genome length (bp)
Largest contig (bp) N50 (bp) L50
L04552-15 S. 4,[5],12:i:- DT193 5234234 499428 224341 8
L04573-15 S. 4,[5],12:i:- DT193 5223517 597393 225415 8
L02808-16 S. 4,[5],12:i:- DT193 5014231 628534 223409 7
L03379-15 S. 4,[5],12:i:- DT193 5185359 628624 223915 8
L01290-17 S. 4,[5],12:i:- DT193 5015510 628718 200884 8
L02831-16 S. 4,[5],12:i:- DT193 5068959 628718 172007 8
L02834-16 S. 4,[5],12:i:- DT193 5012330 628733 213455 8
L02833-16 S. 4,[5],12:i:- DT193 5005959 628892 224317 7
S05336-18 S. 4,[5],12:i:- DT193 5232895 633687 224317 7
L04571-15 S. 4,[5],12:i:- DT193 5233708 634217 224341 8
L04540-15 S. 4,[5],12:i:- DT193 5224818 635357 225415 7
L04578-15 S. 4,[5],12:i:- DT193 4909850 702189 224317 8
L01320-17 S. 4,[5],12:i:- DT193 5035485 726539 279721 6
L01319-17 S. 4,[5],12:i:- DT193 5015915 726632 223212 7
L02828-16 S. 4,[5],12:i:- DT107 5002891 726725 234307 7
L02857-16 S. 4,[5],12:i:- DT193 5004100 726881 271742 6
L02830-16 S. 4,[5],12:i:- DT193 5004795 727067 223915 7
L02796-16 S. 4,[5],12:i:- DT193 5006289 727079 224317 7
L04576-15 S. 4,[5],12:i:- DT193 5137540 820873 224317 7
S03635-17 S. 13,23:i:- - 5080035 530491 251598 7
S03628-17 S. 13,23:i:- - 5122987 575780 188502 8
S02757-17 S. 13,23:i:- - 5117155 594539 238962 7
S02592-15 S. 13,23:i:- - 4728605 609421 249445 6
S03467-18 S. 13,23:i:- - 5079568 619384 237310 6
S02981-17 S. 13,23:i:- - 5207437 620116 234885 7
S02957-17 S. 13,23:i:- - 5029565 630710 235004 7
S03363-15 S. 13,23:i:- - 4728875 630866 531142 4
S02964-17 S. 13,23:i:- - 5079291 630974 367651 6
S02919-17 S. 13,23:i:- - 5148965 630998 234769 6
S02766-17 S. 13,23:i:- - 5031640 631013 367779 5
S02939-17 S. 13,23:i:- - 5032212 631052 234769 6
S02769-17 S. 13,23:i:- - 5116225 631171 367786 6
S02971-17 S. 13,23:i:- - 5122390 631195 355279 6
S03466-18 S. 13,23:i:- - 5046306 631215 367724 6
S02593-15 S. 13,23:i:- - 4703072 631249 531383 4
S02753-17 S. 13,23:i:- - 5071730 631249 360862 6
S02750-17 S. 13,23:i:- - 5076203 728580 348169 5
S02765-17 S. 13,23:i:- - 5085573 728835 393732 5
S02966-17 S. 13,23:i:- - 4803113 747192 530138 4
S02454-17 S. Enteritidis PT13a 4698834 593559 310468 6
S02239-17 S. Enteritidis PT3a 4698993 933011 307678 5
S02733-17 S. Enteritidis RDNC 4700475 937314 410422 4

257
S01899-17 S. Enteritidis PT8 4699008 937376 410967 4
S01904-17 S. Enteritidis PT13a 4700620 937376 410540 4
S03527-17 S. Enteritidis PT13a 4699240 1215005 400895 4
S01898-17 S. Enteritidis PT13a 4699648 1345582 478852 3
S02662-17 S. Enteritidis PT13a 4700905 1508189 478453 3
S02735-17 S. Enteritidis PT13a 4699047 1508202 469836 3
S01902-17 S. Enteritidis PT8 4708776 1508231 479279 3
S02481-17 S. Enteritidis PT13a 4703124 1508231 400397 3
S02189-17 S. Enteritidis PT8 4699511 1508270 478453 3
S02458-17 S. Enteritidis PT13a 4700366 1508309 410737 3
S02732-17 S. Enteritidis NOPT 4703022 1508334 410564 3
S03579-16 S. Enteritidis RDNC 4703558 1508457 410564 3
S02455-17 S. Enteritidis PT13a 4698606 1508716 410532 3
S02445-17 S. Enteritidis PT13a 4709581 1508936 410968 3
27655S S. Enteritidis† PT13a 4660545 1467315 406462 4
27655R S. Enteritidis† PT13a 4700755 1509578 410830 3
S03728-16 S. Infantis - 4957821 719655 212684 7
S00794-17 S. Infantis - 4957312 1194928 244973 5
S00896-17 S. Infantis - 4959674 1195114 245351 5
S02016-17 S. Infantis - 4959192 1195114 245111 5
S03726-16 S. Infantis - 4958440 1195114 245232 5
S00884-17 S. Infantis - 4958235 1195207 245351 5
S02954-16 S. Infantis - 4958366 1195207 245351 5
S03724-16 S. Infantis - 4958954 1195207 350324 4
S00798-17 S. Infantis - 4959653 1195300 245351 5
S00888-17 S. Infantis - 4960312 1195300 212914 5
S01063-17 S. Infantis - 4960290 1195300 245351 5
S01258-17 S. Infantis - 4958780 1195300 252363 5
S01454-17 S. Infantis - 4964634 1195300 444241 4
S04288-16 S. Infantis - 4966462 1195300 415770 4
S04295-16 S. Infantis - 4960541 1195300 218275 5
S04280-16 S. Infantis - 4953122 1195319 218311 5
S00802-17 S. Infantis - 4966396 1195324 194600 6
S04700-15 S. Infantis - 4928877 1195727 386019 4
S04697-15 S. Infantis - 4667448 1237393 225340 4
S03591-16 S. Typhimurium DT104 4980655 455091 180289 9
S02723-17 S. Typhimurium DT2 4893795 535240 270788 6
S00882-18 S. Typhimurium DT2 4883916 535386 270764 6
S05273-18 S. Typhimurium DT193 4892858 537963 225625 7
L00893-18 S. Typhimurium DT41 4982769 538410 225891 7
S03586-16 S. Typhimurium DT104 4992210 546611 205043 8
S00793-17 S. Typhimurium RDNC 4856137 547541 204770 7
S01393-17 S. Typhimurium DT193 5010910 628266 225815 7
S01430-17 S. Typhimurium DT193 5002395 628341 223945 8
S01426-17 S. Typhimurium DT193 5012584 628343 225698 7
S03578-16 S. Typhimurium DT104 4986474 680949 204810 7
S03590-16 S. Typhimurium DT104 5080961 681568 223019 7
L02662-16 S. Typhimurium DT104 4989577 689216 204578 7
S01382-17 S. Typhimurium DT193 5012067 820701 271211 6
S03031-17 S. Typhimurium DT193 4966750 820992 270612 6
S03072-17 S. Typhimurium DT193 4968569 821341 279654 6
Biofilm control strains (†). Phage typing designations are only used for Salmonella serovars S. Enteritidis, S. Typhimurium, and monophasic S. Typhimurium (S. 4,[5],12:i:-), reacts but does not conform to a recognised phage type (RNDC), the sample has a natural phage infection (NOPT).

258
Appendix VII
Table 9-7: SNP distance matrix for 20 S. 13,23:i:- isolates. The number of core-genome SNPs between 20 S.
13,23:i:- isolates that originated from hatchery H1. Closely related isolates (≤20 SNPs) are highlighted in grey.
S. 13,23:i:-
Iso
late
S02
59
2-1
5
S02
59
3-1
5
S03
36
3-1
5
S02
75
0-1
7
S02
75
3-1
7
S02
75
7-1
7
S02
76
5-1
7
S02
76
6-1
7
S02
76
9-1
7
S02
91
9-1
7
S02
93
9-1
7
S02
95
7-1
7
S02
96
4-1
7
S02
96
6-1
7
S02
97
1-1
7
S02
98
1-1
7
S03
62
8-1
7
S03
63
5-1
7
S03
46
6-1
8
S03
46
7-1
8
Isolate Visit v1 v1 v1 v2 v2 v2 v2 v2 v2 v2 v2 v2 v2 v2 v2 v2 v3 v3 v4 v4
S02592-15 v1 - 17 15 33 17 18 19 12 18 20 16 18 13 19 17 17 22 21 19 20
S02593-15 v1 17 - 4 20 4 5 6 7 5 7 3 5 10 6 4 4 9 8 6 7
S03363-15 v1 15 4 - 20 4 5 6 7 5 7 3 5 10 6 4 4 9 8 6 7
S02750-17 v2 33 20 20 - 16 19 18 21 19 21 17 19 24 20 18 18 23 22 20 21
S02753-17 v2 17 4 4 16 - 3 4 5 3 5 1 3 8 4 2 2 7 6 4 5
S02757-17 v2 18 5 5 19 3 - 5 6 2 4 2 4 7 5 3 3 6 7 3 4
S02765-17 v2 19 6 6 18 4 5 - 7 5 7 3 5 10 6 4 4 9 8 6 7
S02766-17 v2 12 7 7 21 5 6 7 - 6 8 4 6 11 7 5 5 10 9 7 8
S02769-17 v2 18 5 5 19 3 2 5 6 - 4 2 4 7 5 3 3 6 7 3 4
S02919-17 v2 20 7 7 21 5 4 7 8 4 - 4 6 9 7 5 5 8 9 5 6
S02939-17 v2 16 3 3 17 1 2 3 4 2 4 - 2 7 3 1 1 6 5 3 4
S02957-17 v2 18 5 5 19 3 4 5 6 4 6 2 - 9 5 3 3 8 7 5 6
S02964-17 v2 13 10 10 24 8 7 10 11 7 9 7 9 - 10 8 8 11 12 8 9
S02966-17 v2 19 6 6 20 4 5 6 7 5 7 3 5 10 - 4 4 9 8 6 1
S02971-17 v2 17 4 4 18 2 3 4 5 3 5 1 3 8 4 - 2 7 4 4 5
S02981-17 v2 17 4 4 18 2 3 4 5 3 5 1 3 8 4 2 - 7 6 4 5
S03628-17 v3 22 9 9 23 7 6 9 10 6 8 6 8 11 9 7 7 - 11 7 8
S03635-17 v3 21 8 8 22 6 7 8 9 7 9 5 7 12 8 4 6 11 - 8 9
S03466-18 v4 19 6 6 20 4 3 6 7 3 5 3 5 8 6 4 4 7 8 - 5
S03467-18 v4 20 7 7 21 5 4 7 8 4 6 4 6 9 1 5 5 8 9 5 -

259
Table 9-8: SNP distance matrix for 19 S. Infantis isolates. The number of core-genome SNPs between 19 S.
Infantis isolates in broiler farms (B1-B4) and a layer hen farm (LH1). Closely related isolates (≤20 SNPs) are
highlighted in grey.
S. Infantis Iso
late
S01
06
3-1
7
S02
01
6-1
7
S00
79
4-1
7
S00
79
8-1
7
S00
80
2-1
7
S00
88
4-1
7
S00
88
8-1
7
S00
89
6-1
7
S01
25
8-1
7
S01
45
4-1
7
S04
28
0-1
6
S04
28
8-1
6
S04
29
5-1
6
S03
72
4-1
6
S03
72
6-1
6
S03
72
8-1
6
S02
95
4-1
6
S04
69
7-1
5
S04
70
0-1
5
ID B1 B1 B1 B1 B1 B1 B1 B1 B1 B1 B2 B2 B2 B2 B2 B2 B4 LH1 LH1
Isolate ID Visit v3 v5 v1 v1 v1 v2 v2 v2 v4 v4 v2 v2 v2 v1 v1 v1 v1 v1 v1
S01063-17 B1 v3 - 5 4 2 2 1 1 4 2 15 14 13 14 2 1 14 6 590 107
S02016-17 B1 v5 5 - 7 5 5 4 4 7 3 16 17 16 17 5 4 17 9 593 110
S00794-17 B1 v1 4 7 - 4 4 3 3 6 4 17 16 15 16 4 3 16 8 592 109
S00798-17 B1 v1 2 5 4 - 2 1 1 4 2 15 14 13 14 2 1 14 6 590 107
S00802-17 B1 v1 2 5 4 2 - 1 1 4 2 15 14 13 14 2 1 14 6 590 107
S00884-17 B1 v2 1 4 3 1 1 - 0 3 1 14 13 12 13 1 0 13 5 589 106
S00888-17 B1 v2 1 4 3 1 1 0 - 3 1 14 13 12 13 1 0 13 5 589 106
S00896-17 B1 v2 4 7 6 4 4 3 3 - 4 17 16 15 10 4 3 16 8 592 103
S01258-17 B1 v4 2 3 4 2 2 1 1 4 - 13 14 13 14 2 1 14 6 590 107
S01454-17 B1 v4 15 16 17 15 15 14 14 17 13 - 27 26 27 15 14 27 19 603 120
S04280-16 B2 v2 14 17 16 14 14 13 13 16 14 27 - 3 16 14 13 26 12 588 105
S04288-16 B2 v2 13 16 15 13 13 12 12 15 13 26 3 - 15 13 12 25 11 587 104
S04295-16 B2 v2 14 17 16 14 14 13 13 10 14 27 16 15 - 14 13 26 12 592 103
S03724-16 B2 v1 2 5 4 2 2 1 1 4 2 15 14 13 14 - 1 14 6 590 107
S03726-16 B2 v1 1 4 3 1 1 0 0 3 1 14 13 12 13 1 - 13 5 589 106
S03728-16 B2 v1 14 17 16 14 14 13 13 16 14 27 26 25 26 14 13 - 18 602 119
S02954-16 B4 v1 6 9 8 6 6 5 5 8 6 19 12 11 12 6 5 18 - 588 105
S04697-15 LH1 v1 590 593 592 590 590 589 589 592 590 603 588 587 592 590 589 602 588 - 581
S04700-15 LH1 v1 107 110 109 107 107 106 106 103 107 120 105 104 103 107 106 119 105 581 -

260
Table 9-9: SNP distance matrix for 17 S. Enteritidis isolates. The number of core-genome SNPs between 17 S. Enteritidis isolates. Closely related isolates (≤20 SNPs) are
highlighted in grey.
S. Enteritidis Iso
late
S03
57
9-1
6
S03
52
7-1
7
S01
89
8-1
7
S01
89
9-1
7
S02
73
2-1
7
S02
73
3-1
7
S02
73
5-1
7
S02
45
4-1
7
S02
45
5-1
7
S02
45
8-1
7
S01
90
2-1
7
S01
90
4-1
7
S02
18
9-1
7
S02
48
1-1
7
S02
66
2-1
7
S02
44
5-1
7
S02
23
9-1
7
PT RDNC PT13a PT13a PT8 NOPT RDNC PT13a PT13a PT13a PT13a PT8 PT13a PT8 PT13a PT13a PT13a PT3a
ID B5 B6 H2 H2 H2 H2 H2 T1 T1 T1 T3 T3 T3 T3 T3 T4 T5
Isolate PT ID Visit v1 v1 v1 v1 v2 v2 v2 v1 v1 v1 v1 v1 v1 v1 v1 v1 v1
S03579-16 RDNC B5 v1 - 65 63 65 65 64 70 71 65 64 62 66 62 66 66 66 73
S03527-17 PT13a B6 v1 65 - 4 6 14 5 19 12 6 5 3 7 3 7 7 5 12
S01898-17 PT13a H2 v1 63 4 - 4 12 3 17 10 4 3 1 5 1 5 5 5 12
S01899-17 PT8 H2 v1 65 6 4 - 14 5 13 12 0 5 3 1 3 7 7 1 14
S02732-17 NOPT H2 v2 65 14 12 14 - 13 7 20 14 13 11 15 11 15 15 15 22
S02733-17 RDNC H2 v2 64 5 3 5 13 - 18 11 5 4 2 6 2 6 6 6 13
S02735-17 PT13a H2 v2 70 19 17 13 7 18 - 19 13 18 16 14 16 14 20 14 27
S02454-17 PT13a T1 v1 71 12 10 12 20 11 19 - 12 11 9 13 9 7 13 13 20
S02455-17 PT13a T1 v1 65 6 4 0 14 5 13 12 - 5 3 1 3 7 7 1 14
S02458-17 PT13a T1 v1 64 5 3 5 13 4 18 11 5 - 2 6 2 6 6 6 13
S01902-17 PT8 T3 v1 62 3 1 3 11 2 16 9 3 2 - 4 0 4 4 4 11
S01904-17 PT13a T3 v1 66 7 5 1 15 6 14 13 1 6 4 - 4 8 8 2 15
S02189-17 PT8 T3 v1 62 3 1 3 11 2 16 9 3 2 0 4 - 4 4 4 11
S02481-17 PT13a T3 v1 66 7 5 7 15 6 14 7 7 6 4 8 4 - 8 8 15
S02662-17 PT13a T3 v1 66 7 5 7 15 6 20 13 7 6 4 8 4 8 - 8 15
S02445-17 PT13a T4 v1 66 5 5 1 15 6 14 13 1 6 4 2 4 8 8 - 13
S02239-17 PT3a T5 v1 73 12 12 14 22 13 27 20 14 13 11 15 11 15 15 13 -
PT = phage type, RDNC = reacts but does not conform to a recognised phage type, NOPT = sample has a natural phage infection. B5 - B6 = broiler farms, H2 = hatchery, T1 – T5 = turkey farms.

261
Table 9-10: SNP distance matrix for 16 S. Typhimurium isolates. The number of core-genome SNPs between 16 S. Typhimurium isolates. Closely related isolates (≤20 SNPs)
are highlighted in grey.
S. Typhimurium Iso
late
S00
79
3-1
7
S01
38
2-1
7
S01
39
3-1
7
S01
42
6-1
7
S01
43
0-1
7
S03
57
8-1
6
S03
58
6-1
6
S03
59
0-1
6
S03
59
1-1
6
S05
27
3-1
8
L00
89
3-1
8
L02
66
2-1
6
S02
72
3-1
7
S03
03
1-1
7
S03
07
2-1
7
S00
88
2-1
8
PT RDNC DT193 DT193 DT193 DT193 DT104 DT104 DT104 DT104 DT193 DT41 DT104 DT2 DT193 DT193 DT2
Code T2 P3 P3 P3 P3 B5 B5 B5 B5 P1 P1 B5 B3 P3 P3 B3
Isolate PT Code Visit v1 v1 v1 v1 v1 v1 v1 v1 v1 v1 v2 v2 v2 v2 v2 v3
S00793-17 RDNC T2 v1 - 471 472 471 471 279 280 281 280 818 802 281 571 472 475 571
S01382-17 DT193 P3 v1 471 - 5 0 0 522 523 524 523 801 785 524 554 5 8 554
S01393-17 DT193 P3 v1 472 5 - 5 5 523 524 525 524 802 786 525 555 6 9 555
S01426-17 DT193 P3 v1 471 0 5 - 0 522 523 524 523 801 785 524 554 5 8 554
S01430-17 DT193 P3 v1 471 0 5 0 - 522 523 524 523 801 785 524 554 5 8 554
S03578-16 DT104 B5 v1 279 522 523 522 522 - 1 2 1 867 851 2 620 523 526 620
S03586-16 DT104 B5 v1 280 523 524 523 523 1 - 1 0 868 852 1 621 524 527 621
S03590-16 DT104 B5 v1 281 524 525 524 524 2 1 - 1 869 853 2 622 525 528 622
S03591-16 DT104 B5 v1 280 523 524 523 523 1 0 1 - 868 852 1 621 524 527 621
S05273-18 DT193 P1 v1 818 801 802 801 801 867 868 869 868 - 32 869 635 802 805 635
L00893-18 DT41 P1 v2 802 785 786 785 785 851 852 853 852 32 - 853 619 786 789 619
L02662-16 DT104 B5 v2 281 524 525 524 524 2 1 2 1 869 853 - 622 525 528 622
S02723-17 DT2 B3 v2 571 554 555 554 554 620 621 622 621 635 619 622 - 555 558 0
S03031-17 DT193 P3 v2 472 5 6 5 5 523 524 525 524 802 786 525 555 - 5 555
S03072-17 DT193 P3 v2 475 8 9 8 8 526 527 528 527 805 789 528 558 5 - 558
S00882-18 PT2 B3 v3 571 554 555 554 554 620 621 622 621 635 619 622 0 555 558 -
PT = phage type, RDNC = reacts but does not conform to a recognised phage type. B3 – B6 = broiler farms, H2 = hatchery, T2 = turkey farm, P1 – P3 = pig farms

262
Table 9-11: SNP distance matrix for 19 S. 4,[5],12:i:- isolates. The number of core-genome SNPs between 19
monophasic S. Typhimurium (S. 4,[5],12:i:-) DT193 isolates originating from pig farms (P2-P7). Closely related
isolates (≤20 SNPs) are highlighted in grey.
S. 4,[5],12:i:- Iso
late
S05
33
6-1
8
L01
29
0-1
7
L01
31
9-1
7
L01
32
0-1
7
L02
79
6-1
6
L02
80
8-1
6
L02
82
8-1
6
L02
83
0-1
6
L02
83
1-1
6
L02
83
3-1
6
L02
83
4-1
6
L02
85
7-1
6
L03
37
9-1
5
L04
54
0-1
5
L04
55
2-1
5
L04
57
1-1
5
L04
57
3-1
5
L04
57
6-1
5
L04
57
8-1
5
ID P2 P4 P4 P4 P5 P5 P5 P5 P5 P5 P5 P5 P7 P6 P6 P6 P6 P7 P7
Isolate ID Visit v1 v1 v1 v1 v1 v1 v1 v1 v1 v1 v1 v1 v1 v1 v1 v1 v1 v2 v2
S05336-18 P2 v1 - 60 61 60 60 61 60 60 61 60 60 60 51 62 62 64 63 51 50
L01290-17 P4 v1 60 - 3 2 2 3 2 2 3 2 2 2 27 40 40 42 41 27 26
L01319-17 P4 v1 61 3 - 3 3 2 3 3 4 3 3 3 28 41 41 43 42 28 27
L01320-17 P4 v1 60 2 3 - 2 3 2 2 1 2 2 2 27 40 40 42 41 27 26
L02796-16 P5 v1 60 2 3 2 - 3 0 0 3 0 0 0 27 40 40 42 41 27 26
L02808-16 P5 v1 61 3 2 3 3 - 3 3 4 3 3 3 28 41 41 43 42 28 27
L02828-16 P5 v1 60 2 3 2 0 3 - 0 3 0 0 0 27 40 40 42 41 27 26
L02830-16 P5 v1 60 2 3 2 0 3 0 - 3 0 0 0 27 40 40 42 41 27 26
L02831-16 P5 v1 61 3 4 1 3 4 3 3 - 3 3 3 28 41 41 43 42 28 27
L02833-16 P5 v1 60 2 3 2 0 3 0 0 3 - 0 0 27 40 40 42 41 27 26
L02834-16 P5 v1 60 2 3 2 0 3 0 0 3 0 - 0 27 40 40 42 41 27 26
L02857-16 P5 v1 60 2 3 2 0 3 0 0 3 0 0 - 27 40 40 42 41 27 26
L03379-15 P7 v1 51 27 28 27 27 28 27 27 28 27 27 27 - 31 31 33 32 0 1
L04540-15 P6 v1 62 40 41 40 40 41 40 40 41 40 40 40 31 - 0 2 1 31 30
L04552-15 P6 v1 62 40 41 40 40 41 40 40 41 40 40 40 31 0 - 2 1 31 30
L04571-15 P6 v1 64 42 43 42 42 43 42 42 43 42 42 42 33 2 2 - 3 33 32
L04573-15 P6 v1 63 41 42 41 41 42 41 41 42 41 41 41 32 1 1 3 - 32 31
L04576-15 P7 v2 51 27 28 27 27 28 27 27 28 27 27 27 0 31 31 33 32 - 1
L04578-15 P7 v2 50 26 27 26 26 27 26 26 27 26 26 26 1 30 30 32 31 1 -

263
Appendix VIII
Query 1 ATGTTTAATGAAGTCCATAGTAGTCATGGTCACACACTATTGTTGATCACAAAGCCATCT 60
Subject 288307 ............................................................ 288248
Query 61 CTGCAAGCTACGGCATTATTGCAACATTTAAAGCAATCGCTGGCCATAACCGGAAAACTG 120
Subject 288247 ............................................................ 288188
Query 121 CATAATATTCAACGTTCTCTGGAAGATATCTCGGCCGGTTGCATTGTTTTAATGGATATG 180
Subject 288187 ................................A........................... 288128
Query 181 ATGGAAGCGGATAAGAAGCTTATCCACTATTGGCAGGATAATTTAAGCCGCAAAAACAAT 240
Subject 288127 .......................................................-.... 288069
Query 241 AATATAAAAACATTATTGTTAAATACCCCTGACGATTATCCCTACCGTGAAATTGAAAAC 300
Subject 288068 ............................................................ 288009
Query 301 TGGCCTCATATTAACGGCGTGTTTTACGCTACTGAAGACCAGGAACACGTGGTCAGCGGA 360
Subject 288008 .............................C.............................. 287949
Query 361 TTACAGGGTATTCTGCGTGGCGAATGCTATTTTTCACAAAAATTAGCCAGTTACCTGATT 420
Subject 287948 ............................................................ 287889
Query 421 ACGCACTCAGGAAATTACCGCTACAACAGCACCGAGTCCGCATTACTCACTCATCGCGAA 480
Subject 287888 ............................................................ 287829
Query 481 AAAGAGATCCTCAATAAGTTACGTATTGGTGCCTCTAATAATGAAATCGCGAGGTCGCTA 540
Subject 287828 ............................................................ 287769
Query 541 TTTATCAGCGAGAATACGGTTAAGACACATCTTTATAATCTTTTCAAAAAGATAGCTGTC 600
Subject 287768 ............................................................ 287709
Query 601 AAAAATCGCACCCAGGCAGTTTCATGGGCAAACGATAATCTCAGGCGGTAA 651
Subject 287708 ................................................... 287658
Figure 9-1: BLASTn alignment for the csgD gene with Salmonella isolate 27655S. The BLASTn (Mount, 2007)
pairwise alignment of the nucleotide query sequence (csgD, NCBI gene ID: 1252660) and the subject sequence
(Salmonella biofilm control isolates 27655S). Dots show matches between query and subject sequences.
Mismatches in the subject sequence are shown with dashes for gaps and single letter abbreviations for
nucleotide differences (A = adenosine, C =cytidine).
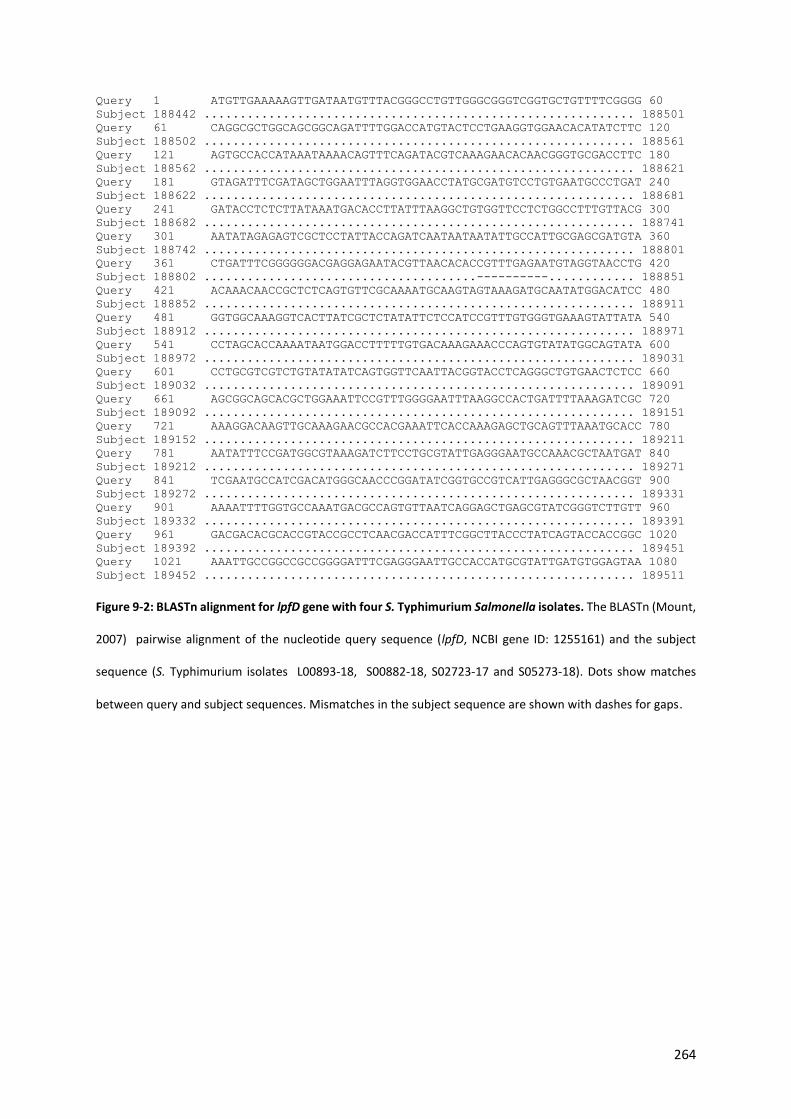
264
Query 1 ATGTTGAAAAAGTTGATAATGTTTACGGGCCTGTTGGGCGGGTCGGTGCTGTTTTCGGGG 60
Subject 188442 ............................................................ 188501
Query 61 CAGGCGCTGGCAGCGGCAGATTTTGGACCATGTACTCCTGAAGGTGGAACACATATCTTC 120
Subject 188502 ............................................................ 188561
Query 121 AGTGCCACCATAAATAAAACAGTTTCAGATACGTCAAAGAACACAACGGGTGCGACCTTC 180
Subject 188562 ............................................................ 188621
Query 181 GTAGATTTCGATAGCTGGAATTTAGGTGGAACCTATGCGATGTCCTGTGAATGCCCTGAT 240
Subject 188622 ............................................................ 188681
Query 241 GATACCTCTCTTATAAATGACACCTTATTTAAGGCTGTGGTTCCTCTGGCCTTTGTTACG 300
Subject 188682 ............................................................ 188741
Query 301 AATATAGAGAGTCGCTCCTATTACCAGATCAATAATAATATTGCCATTGCGAGCGATGTA 360
Subject 188742 ............................................................ 188801
Query 361 CTGATTTCGGGGGGACGAGGAGAATACGTTAACACACCGTTTGAGAATGTAGGTAACCTG 420
Subject 188802 ......................................----------............ 188851
Query 421 ACAAACAACCGCTCTCAGTGTTCGCAAAATGCAAGTAGTAAAGATGCAATATGGACATCC 480
Subject 188852 ............................................................ 188911
Query 481 GGTGGCAAAGGTCACTTATCGCTCTATATTCTCCATCCGTTTGTGGGTGAAAGTATTATA 540
Subject 188912 ............................................................ 188971
Query 541 CCTAGCACCAAAATAATGGACCTTTTTGTGACAAAGAAACCCAGTGTATATGGCAGTATA 600
Subject 188972 ............................................................ 189031
Query 601 CCTGCGTCGTCTGTATATATCAGTGGTTCAATTACGGTACCTCAGGGCTGTGAACTCTCC 660
Subject 189032 ............................................................ 189091
Query 661 AGCGGCAGCACGCTGGAAATTCCGTTTGGGGAATTTAAGGCCACTGATTTTAAAGATCGC 720
Subject 189092 ............................................................ 189151
Query 721 AAAGGACAAGTTGCAAAGAACGCCACGAAATTCACCAAAGAGCTGCAGTTTAAATGCACC 780
Subject 189152 ............................................................ 189211
Query 781 AATATTTCCGATGGCGTAAAGATCTTCCTGCGTATTGAGGGAATGCCAAACGCTAATGAT 840
Subject 189212 ............................................................ 189271
Query 841 TCGAATGCCATCGACATGGGCAACCCGGATATCGGTGCCGTCATTGAGGGCGCTAACGGT 900
Subject 189272 ............................................................ 189331
Query 901 AAAATTTTGGTGCCAAATGACGCCAGTGTTAATCAGGAGCTGAGCGTATCGGGTCTTGTT 960
Subject 189332 ............................................................ 189391
Query 961 GACGACACGCACCGTACCGCCTCAACGACCATTTCGGCTTACCCTATCAGTACCACCGGC 1020
Subject 189392 ............................................................ 189451
Query 1021 AAATTGCCGGCCGCCGGGGATTTCGAGGGAATTGCCACCATGCGTATTGATGTGGAGTAA 1080
Subject 189452 ............................................................ 189511
Figure 9-2: BLASTn alignment for lpfD gene with four S. Typhimurium Salmonella isolates. The BLASTn (Mount,
2007) pairwise alignment of the nucleotide query sequence (lpfD, NCBI gene ID: 1255161) and the subject
sequence (S. Typhimurium isolates L00893-18, S00882-18, S02723-17 and S05273-18). Dots show matches
between query and subject sequences. Mismatches in the subject sequence are shown with dashes for gaps.

265
Appendix IX
Table 9-12: Phenotypic AMR (from AST) and genotypic antimicrobial resistance (from WGS) for a panel of 91 Salmonella isolates. List of AMR genes detected in the
pangenomes of 91 Salmonella isolates by ABRicate against the NCBI AMRFinderPlus, ResFinder and APHA SeqFinder databases, and presence of AMR genes with chromosomal
point mutations detected by PointFinder. Phenotypic expression of AMR was determined by antimicrobial susceptibility testing, with resistance determined based on
historical APHA veterinary or the BSAC human clinical breakpoints.
Isolate Antimicrobials Resistance NCBI AMRFinderPlus Resfinder APHA SeqFinder PointFinder
L04540-15 APR, GEN, NEO, STR, AMP, CHL, S3, SXT, TET
MDR
aac(3)-Iva, aadA1, aadA2, aph(3'')-Ib, aph(3')-IIa, aph(3')-Ia, aph(4)-Ia, aph(6)-Id, TEM-1, cmlA1, dfrA12, sul1, sul3, tet(A), tet(B)
aac(3)-Iva, aac(6')-Iaa, aph(3'')-Ib, aph(3')-IIa, aph(3')-Ia, aph(4)-Ia, aph(6)-Id, TEM-1, cmlA1, dfrA12, sul2, sul3, tet(B)
aac(3)-Iva, aac(6')-Iaa, aadA2, aph(3'')-Ib, aph(3')-IIa, aph(3')-Ia, aph(4)-Ia, aph(6)-Id, TEM-1, nfsB, cmlA1, dfrA14, sul3, tet(A), tet(B)
-
L04552-15 APR, GEN, NEO, STR, AMP, CHL, S3, SXT, TET
MDR
aac(3)-Iva, aadA1, aadA2, aph(3'')-Ib, aph(3')-IIa, aph(3')-Ia, aph(4)-Ia, aph(6)-Id, TEM-1, cmlA1, dfrA12, sul1, sul3, tet(A), tet(B)
aac(3)-Iva, aac(6')-Iaa, aadA2, aph(3'')-Ib, aph(3')-IIa, aph(3')-Ia, aph(4)-Ia, aph(6)-Id, TEM-1, cmlA1, dfrA12, sul2, sul3, tet(B)
aac(3)-Iva, aac(6')-Iaa, aadA2, aph(3'')-Ib, aph(3')-IIa, aph(3')-Ia, aph(4)-Ia, aph(6)-Id, TEM-1, nfsB, cmlA1, dfrA14, sul3, tet(A), tet(B)
-
L04571-15 APR, GEN, NEO, STR, AMP, S3, SXT, TET
MDR
aac(3)-Iva, aadA1, aadA2, aph(3'')-Ib, aph(3')-IIa, aph(3')-Ia, aph(4)-Ia, aph(6)-Id, TEM-1, cmlA1, dfrA12, sul1, sul3, tet(A), tet(B)
aac(3)-Iva, aac(6')-Iaa, aph(3'')-Ib, aph(3')-IIa, aph(3')-Ia, aph(4)-Ia, aph(6)-Id, TEM-1, cmlA1, dfrA12, sul2, sul3, tet(B)
aac(3)-Iva, aac(6')-Iaa, aadA2, aph(3'')-Ib, aph(3')-IIa, aph(3')-Ia, aph(4)-Ia, aph(6)-Id, TEM-1, nfsB, cmlA1, dfrA14, sul3, tet(A), tet(B)
-
L04573-15 APR, GEN, STR, AMP, CHL, S3, SXT, TET
MDR
aac(3)-Iva, aadA1, aadA2, aph(3'')-Ib, aph(3')-IIa, aph(3')-Ia, aph(4)-Ia, aph(6)-Id, TEM-1, cmlA1, dfrA12, sul1, sul3, tet(A), tet(B)
aac(3)-Iva, aac(6')-Iaa, aph(3'')-Ib, aph(3')-IIa, aph(3')-Ia, aph(4)-Ia, aph(6)-Id, TEM-1, cmlA1, dfrA12, sul2, sul3, tet(B)
aac(3)-Iva, aac(6')-Iaa, aadA2, aph(3'')-Ib, aph(3')-IIa, aph(3')-Ia, aph(4)-Ia, aph(6)-Id, TEM-1, nfsB, cmlA1, dfrA14, sul3, tet(A), tet(B)
-
L04578-15 APR, STR, GEN, AMP, S3, TET
MDR aph(3'')-Ib, aph(6)-Id, TEM-1, sul2
aac(6')-Iaa, aph(3'')-Ib, aph(6)-Id, TEM-1, sul2
aac(6')-Iaa, aph(3'')-Ib, aph(6)-Id, TEM-1, nfsB, sul2
-
S00793-17 APR, STR, GEN, AMP, S3, TET
MDR - aac(6')-Iaa aac(6')-Iaa, nfsB -
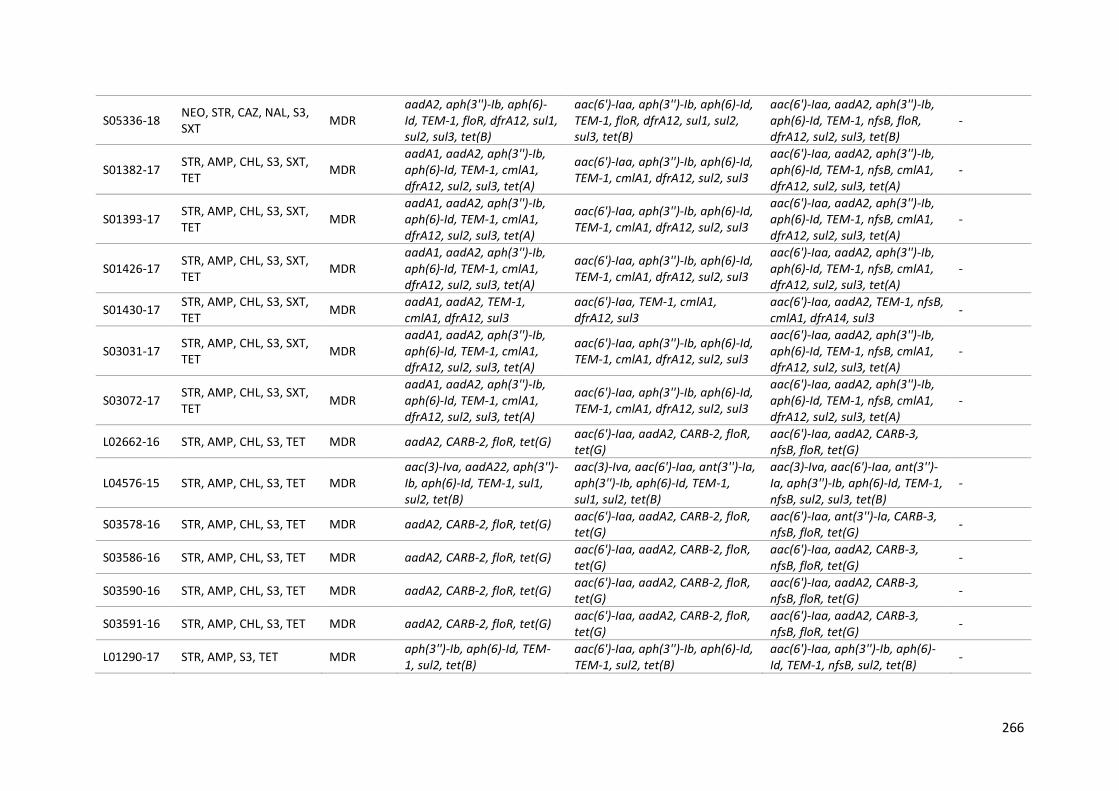
266
S05336-18 NEO, STR, CAZ, NAL, S3, SXT
MDR aadA2, aph(3'')-Ib, aph(6)-Id, TEM-1, floR, dfrA12, sul1, sul2, sul3, tet(B)
aac(6')-Iaa, aph(3'')-Ib, aph(6)-Id, TEM-1, floR, dfrA12, sul1, sul2, sul3, tet(B)
aac(6')-Iaa, aadA2, aph(3'')-Ib, aph(6)-Id, TEM-1, nfsB, floR, dfrA12, sul2, sul3, tet(B)
-
S01382-17 STR, AMP, CHL, S3, SXT, TET
MDR aadA1, aadA2, aph(3'')-Ib, aph(6)-Id, TEM-1, cmlA1, dfrA12, sul2, sul3, tet(A)
aac(6')-Iaa, aph(3'')-Ib, aph(6)-Id, TEM-1, cmlA1, dfrA12, sul2, sul3
aac(6')-Iaa, aadA2, aph(3'')-Ib, aph(6)-Id, TEM-1, nfsB, cmlA1, dfrA12, sul2, sul3, tet(A)
-
S01393-17 STR, AMP, CHL, S3, SXT, TET
MDR aadA1, aadA2, aph(3'')-Ib, aph(6)-Id, TEM-1, cmlA1, dfrA12, sul2, sul3, tet(A)
aac(6')-Iaa, aph(3'')-Ib, aph(6)-Id, TEM-1, cmlA1, dfrA12, sul2, sul3
aac(6')-Iaa, aadA2, aph(3'')-Ib, aph(6)-Id, TEM-1, nfsB, cmlA1, dfrA12, sul2, sul3, tet(A)
-
S01426-17 STR, AMP, CHL, S3, SXT, TET
MDR aadA1, aadA2, aph(3'')-Ib, aph(6)-Id, TEM-1, cmlA1, dfrA12, sul2, sul3, tet(A)
aac(6')-Iaa, aph(3'')-Ib, aph(6)-Id, TEM-1, cmlA1, dfrA12, sul2, sul3
aac(6')-Iaa, aadA2, aph(3'')-Ib, aph(6)-Id, TEM-1, nfsB, cmlA1, dfrA12, sul2, sul3, tet(A)
-
S01430-17 STR, AMP, CHL, S3, SXT, TET
MDR aadA1, aadA2, TEM-1, cmlA1, dfrA12, sul3
aac(6')-Iaa, TEM-1, cmlA1, dfrA12, sul3
aac(6')-Iaa, aadA2, TEM-1, nfsB, cmlA1, dfrA14, sul3
-
S03031-17 STR, AMP, CHL, S3, SXT, TET
MDR aadA1, aadA2, aph(3'')-Ib, aph(6)-Id, TEM-1, cmlA1, dfrA12, sul2, sul3, tet(A)
aac(6')-Iaa, aph(3'')-Ib, aph(6)-Id, TEM-1, cmlA1, dfrA12, sul2, sul3
aac(6')-Iaa, aadA2, aph(3'')-Ib, aph(6)-Id, TEM-1, nfsB, cmlA1, dfrA12, sul2, sul3, tet(A)
-
S03072-17 STR, AMP, CHL, S3, SXT, TET
MDR aadA1, aadA2, aph(3'')-Ib, aph(6)-Id, TEM-1, cmlA1, dfrA12, sul2, sul3, tet(A)
aac(6')-Iaa, aph(3'')-Ib, aph(6)-Id, TEM-1, cmlA1, dfrA12, sul2, sul3
aac(6')-Iaa, aadA2, aph(3'')-Ib, aph(6)-Id, TEM-1, nfsB, cmlA1, dfrA12, sul2, sul3, tet(A)
-
L02662-16 STR, AMP, CHL, S3, TET MDR aadA2, CARB-2, floR, tet(G) aac(6')-Iaa, aadA2, CARB-2, floR, tet(G)
aac(6')-Iaa, aadA2, CARB-3, nfsB, floR, tet(G)
L04576-15 STR, AMP, CHL, S3, TET MDR aac(3)-Iva, aadA22, aph(3'')-Ib, aph(6)-Id, TEM-1, sul1, sul2, tet(B)
aac(3)-Iva, aac(6')-Iaa, ant(3'')-Ia, aph(3'')-Ib, aph(6)-Id, TEM-1, sul1, sul2, tet(B)
aac(3)-Iva, aac(6')-Iaa, ant(3'')-Ia, aph(3'')-Ib, aph(6)-Id, TEM-1, nfsB, sul2, sul3, tet(B)
-
S03578-16 STR, AMP, CHL, S3, TET MDR aadA2, CARB-2, floR, tet(G) aac(6')-Iaa, aadA2, CARB-2, floR, tet(G)
aac(6')-Iaa, ant(3'')-Ia, CARB-3, nfsB, floR, tet(G)
-
S03586-16 STR, AMP, CHL, S3, TET MDR aadA2, CARB-2, floR, tet(G) aac(6')-Iaa, aadA2, CARB-2, floR, tet(G)
aac(6')-Iaa, aadA2, CARB-3, nfsB, floR, tet(G)
-
S03590-16 STR, AMP, CHL, S3, TET MDR aadA2, CARB-2, floR, tet(G) aac(6')-Iaa, aadA2, CARB-2, floR, tet(G)
aac(6')-Iaa, aadA2, CARB-3, nfsB, floR, tet(G)
-
S03591-16 STR, AMP, CHL, S3, TET MDR aadA2, CARB-2, floR, tet(G) aac(6')-Iaa, aadA2, CARB-2, floR, tet(G)
aac(6')-Iaa, aadA2, CARB-3, nfsB, floR, tet(G)
-
L01290-17 STR, AMP, S3, TET MDR aph(3'')-Ib, aph(6)-Id, TEM-1, sul2, tet(B)
aac(6')-Iaa, aph(3'')-Ib, aph(6)-Id, TEM-1, sul2, tet(B)
aac(6')-Iaa, aph(3'')-Ib, aph(6)-Id, TEM-1, nfsB, sul2, tet(B)
-

267
L01319-17 STR, AMP, S3, TET MDR aph(3'')-Ib, aph(6)-Id, TEM-1, sul2, tet(B)
aac(6')-Iaa, aph(3'')-Ib, aph(6)-Id, TEM-1, sul2, tet(B)
aac(6')-Iaa, aph(3'')-Ib, aph(6)-Id, TEM-1, nfsB, sul2, tet(B)
-
L01320-17 STR, AMP, S3, TET MDR aph(3'')-Ib, aph(6)-Id, TEM-1, sul2, tet(B)
aac(6')-Iaa, aph(3'')-Ib, aph(6)-Id, TEM-1, sul2, tet(B)
aac(6')-Iaa, aph(3'')-Ib, aph(6)-Id, TEM-1, nfsB, sul2, tet(B)
-
L02796-16 STR, AMP, S3, TET MDR aph(3'')-Ib, aph(6)-Id, TEM-1, sul2, tet(B)
aac(6')-Iaa, aph(3'')-Ib, aph(6)-Id, TEM-1, sul2, tet(B)
aac(6')-Iaa, aph(3'')-Ib, aph(6)-Id, TEM-1, nfsB, sul2, tet(B)
-
L02808-16 STR, AMP, S3, TET MDR aph(3'')-Ib, aph(6)-Id, TEM-1, sul2, tet(B)
aac(6')-Iaa, aph(3'')-Ib, aph(6)-Id, TEM-1, sul2, tet(B)
aac(6')-Iaa, aph(3'')-Ib, aph(6)-Id, TEM-1, nfsB, sul2, tet(B)
-
L02828-16 STR, AMP, S3, TET MDR aph(3'')-Ib, aph(6)-Id, TEM-1, sul2, tet(B)
aac(6')-Iaa, aph(3'')-Ib, aph(6)-Id, TEM-1, sul2, tet(B)
aac(6')-Iaa, aph(3'')-Ib, aph(6)-Id, TEM-1, nfsB, sul2, tet(B)
-
L02830-16 STR, AMP, S3, TET MDR aph(3'')-Ib, aph(6)-Id, TEM-1, sul2, tet(B)
aac(6')-Iaa, aph(3'')-Ib, aph(6)-Id, TEM-1, sul2, tet(B)
aac(6')-Iaa, aph(3'')-Ib, aph(6)-Id, TEM-1, nfsB, sul2, tet(B)
-
L02831-16 STR, AMP, S3, TET MDR aph(3'')-Ib, aph(6)-Id, TEM-1, sul2, tet(B)
aac(6')-Iaa, aph(3'')-Ib, aph(6)-Id, TEM-1, sul2, tet(B)
aac(6')-Iaa, aph(3'')-Ib, aph(6)-Id, TEM-1, nfsB, sul2, tet(B)
-
L02833-16 STR, AMP, S3, TET MDR aph(3'')-Ib, aph(6)-Id, TEM-1, sul2, tet(B)
aac(6')-Iaa, aph(3'')-Ib, aph(6)-Id, TEM-1, sul2, tet(B)
aac(6')-Iaa, aph(3'')-Ib, aph(6)-Id, TEM-1, nfsB, sul2, tet(B)
-
L02834-16 STR, AMP, S3, TET MDR aph(3'')-Ib, aph(6)-Id, TEM-1, sul2, tet(B)
aac(6')-Iaa, aph(3'')-Ib, aph(6)-Id, TEM-1, sul2, tet(B)
aac(6')-Iaa, aph(3'')-Ib, aph(6)-Id, TEM-1, nfsB, sul2, tet(B)
-
L02857-16 STR, AMP, S3, TET MDR aph(3'')-Ib, aph(6)-Id, TEM-1, sul2, tet(B)
aac(6')-Iaa, aph(3'')-Ib, aph(6)-Id, TEM-1, sul2, tet(B)
aac(6')-Iaa, aph(3'')-Ib, aph(6)-Id, TEM-1, nfsB, sul2, tet(B)
-
S02954-16 STR, NA, FUR, S3, TET MDR aadA1, dfrA14, sul1, tet(A) aac(6')-Iaa, ant(3'')-Ia, dfrA14, sul1
aac6-Iy, ant(3'')-Ia, nfsB, dfrA14, sul3, tet(A)
gyrA, parC
S00884-17 STR, NAL, FUR, S3, SXT, TET
MDR aadA1, dfrA14, sul1, tet(A) aac(6')-Iaa, ant(3'')-Ia, dfrA14, sul1
aac6-Iy, ant(3'')-Ia, nfsB, dfrA14, sul3, tet(A)
gyrA, parC
S00896-17 STR, NAL, FUR, S3, SXT, TET
MDR aadA1, dfrA14, sul1, tet(A) aac(6')-Iaa, ant(3'')-Ia, dfrA14, sul1
aac6-Iy, ant(3'')-Ia, nfsB, dfrA14, sul3, tet(A)
gyrA, parC
S01063-17 STR, NAL, FUR, S3, SXT, TET
MDR aadA1, dfrA14, sul1, tet(A) aac(6')-Iaa, ant(3'')-Ia, dfrA14, sul1
aac6-Iy, ant(3'')-Ia, nfsB, dfrA14, sul3, tet(A)
gyrA, parC
S01258-17 STR, NAL, FUR, S3, SXT, TET
MDR aadA1, dfrA14, sul1, tet(A) aac(6')-Iaa, ant(3'')-Ia, dfrA14, sul1
aac6-Iy, ant(3'')-Ia, nfsB, dfrA14, sul3, tet(A)
gyrA, parC
S01454-17 STR, NAL, FUR, S3, SXT, TET
MDR aadA1, dfrA14, sul1, tet(A) aac(6')-Iaa, ant(3'')-Ia, dfrA14, sul1
aac6-Iy, ant(3'')-Ia, nfsB, dfrA14, sul3, tet(A)
gyrA, parC
S02016-17 STR, NAL, FUR, S3, SXT, TET
MDR aadA1, dfrA14, sul1, tet(A) aac(6')-Iaa, ant(3'')-Ia, dfrA14, sul1
aac6-Iy, ant(3'')-Ia, nfsB, dfrA14, sul3, tet(A)
gyrA, parC
S03724-16 STR, NAL, FUR, S3, SXT, TET
MDR aadA1, dfrA14, sul1, tet(A) aac(6')-Iaa, ant(3'')-Ia, dfrA14, sul1
aac6-Iy, ant(3'')-Ia, nfsB, dfrA14, sul3, tet(A)
gyrA, parC

268
S03726-16 STR, NAL, FUR, S3, SXT, TET
MDR aadA1, dfrA14, sul1, tet(A) aac(6')-Iaa, ant(3'')-Ia, dfrA14, sul1
aac6-Iy, ant(3'')-Ia, nfsB, dfrA14, sul3, tet(A)
gyrA, parC
S03728-16 STR, NAL, FUR, S3, SXT, TET
MDR aadA1, dfrA14, sul1, tet(A) aac(6')-Iaa, ant(3'')-Ia, dfrA14, sul1
aac6-Iy, ant(3'')-Ia, nfsB, dfrA14, sul3, tet(A)
gyrA, parC
S04280-16 STR, NAL, FUR, S3, SXT, TET
MDR aadA1, dfrA14, sul1, tet(A) aac(6')-Iaa, ant(3'')-Ia, dfrA14, sul1
aac6-Iy, ant(3'')-Ia, nfsB, dfrA14, sul3, tet(A)
gyrA, parC
S04288-16 STR, NAL, FUR, S3, SXT, TET
MDR aadA1, dfrA14, sul1, tet(A) aac(6')-Iaa, ant(3'')-Ia, dfrA14, sul1
aac6-Iy, ant(3'')-Ia, nfsB, dfrA14, sul3, tet(A)
gyrA, parC
S00798-17 STR, NAL, FUR, S3, TET MDR aadA1, dfrA14, sul1, tet(A) aac(6')-Iaa, ant(3'')-Ia, dfrA14, sul1
aac6-Iy, ant(3'')-Ia, nfsB, dfrA14, sul3, tet(A)
gyrA, parC
S00888-17 STR, NAL, FUR, S3, TET MDR aadA1, dfrA14, sul1, tet(A) aac(6')-Iaa, ant(3'')-Ia, dfrA14, sul1
aac6-Iy, ant(3'')-Ia, nfsB, dfrA14, sul3, tet(A)
gyrA, parC
S04295-16 STR, NAL, FUR, S3, TET, MDR aadA1, dfrA14, sul1, tet(A) aac(6')-Iaa, ant(3'')-Ia, dfrA14, sul1
aac6-Iy, ant(3'')-Ia, nfsB, dfrA14, sul3, tet(A)
gyrA, parC
S02189-17 STR, NAL, S3, TET MDR - aac(6')-Iaa aac6-Iy, nfsB gyrA
S02593-15 CIP resistant qnrB19 aac(6')-Iaa aac6-Iy, nfsB parC
S02981-17 CIP resistant qnrB19 aac(6')-Iaa aac6-Iy, nfsB parC
S02971-17 CIP, NAL resistant qnrB19 aac(6')-Iaa aac6-Iy, nfsB parC
S01898-17 NAL resistant - aac(6')-Iaa aac6-Iy, nfsB gyrA
S01902-17 NAL resistant - aac(6')-Iaa aac6-Iy, nfsB gyrA
S01904-17 NAL resistant - aac(6')-Iaa aac6-Iy, nfsB gyrA
S02445-17 NAL resistant - aac(6')-Iaa aac6-Iy, nfsB gyrA
S02454-17 NAL resistant - aac(6')-Iaa aac6-Iy, nfsB gyrA
S02455-17 NAL resistant - aac(6')-Iaa aac6-Iy, nfsB gyrA
S02458-17 NAL resistant - aac(6')-Iaa aac6-Iy, nfsB gyrA
S02481-17 NAL resistant - aac(6')-Iaa aac6-Iy, nfsB gyrA
S02662-17 NAL resistant - aac(6')-Iaa aac6-Iy, nfsB gyrA
S02733-17 NAL resistant - aac(6')-Iaa aac6-Iy, nfsB gyrA
S03527-17 NAL resistant - aac(6')-Iaa aac6-Iy, nfsB gyrA
S00802-17 NAL, TET resistant aadA1, dfrA14, sul1, tet(A) aac(6')-Iaa, ant(3'')-Ia, dfrA14, sul1
aac6-Iy, ant(3'')-Ia, nfsB, dfrA14, sul3, tet(A)
gyrA, parC
S01899-17 NEO, CHL resistant - aac(6')-Iaa aac6-Iy, nfsB gyrA

269
S02769-17 S3 resistant aadA4, qnrB19, sul1 aac(6')-Iaa, aadA4, sul1 aac6-Iy, aadA4, nfsB, sul4 parC
L03379-15 STR, AMP, S3 resistant aac(3)-Iva, aadA22, aph(3'')-Ib, aph(6)-Id, TEM-1, sul1, sul2, tet(B)
aac(3)-Iva, aac(6')-Iaa, ant(3'')-Ia, aph(3'')-Ib, aph(6)-Id, TEM-1, sul1, sul2, tet(B)
aac(3)-Iva, aac(6')-Iaa, ant(3'')-Ia, aph(3'')-Ib, aph(6)-Id, TEM-1, nfsB, sul2, sul3, tet(B)
-
L00893-18 - sensitive - aac(6')-Iaa aac(6')-Iaa, nfsB -
S00794-17 - sensitive aadA1, dfrA14, sul1, tet(A) aac(6')-Iaa, ant(3'')-Ia, dfrA14, sul1
aac6-Iy, ant(3'')-Ia, nfsB, dfrA14, sul3, tet(A)
gyrA, parC
S00882-18 - sensitive - aac(6')-Iaa aac(6')-Iaa, nfsB
S02239-17 - sensitive - aac(6')-Iaa aac6-Iy, nfsB gyrA
S02592-15 - sensitive qnrB19 aac(6')-Iaa aac6-Iy, nfsB parC
S02723-17 - sensitive - aac(6')-Iaa aac(6')-Iaa, nfsB --
S02732-17 - sensitive - aac(6')-Iaa aac6-Iy, nfsB -
S02735-17 - sensitive - aac(6')-Iaa aac6-Iy, nfsB -
S02750-17 - sensitive qnrB19 aac(6')-Iaa aac6-Iy, nfsB parC
S02753-17 - sensitive qnrB19 aac(6')-Iaa aac6-Iy, nfsB parC
S02757-17 - sensitive aadA4, qnrB19, sul1 aac(6')-Iaa, aadA4, sul1 aac6-Iy, aadA4, nfsB, sul3 parC
S02765-17 - sensitive - aac(6')-Iaa aac6-Iy, nfsB parC
S02766-17 - sensitive qnrB19 aac(6')-Iaa aac6-Iy, nfsB parC
S02919-17 - sensitive qnrB19 aac(6')-Iaa aac6-Iy, nfsB parC
S02939-17 - sensitive qnrB19 aac(6')-Iaa aac6-Iy, nfsB parC
S02957-17 - sensitive qnrB19 aac(6')-Iaa aac6-Iy, nfsB parC
S02964-17 - sensitive qnrB19 aac(6')-Iaa aac6-Iy, nfsB parC
S02966-17 - sensitive qnrB19 aac(6')-Iaa aac6-Iy, nfsB parC
S03363-15 - sensitive qnrB19 aac(6')-Iaa aac6-Iy, nfsB parC
S03466-18 - sensitive qnrB19 aac(6')-Iaa aac6-Iy, nfsB parC
S03467-18 - sensitive qnrB19 aac(6')-Iaa aac6-Iy, nfsB parC
S03579-16 - sensitive - aac(6')-Iaa aac6-Iy, nfsB -
S03628-17 - sensitive qnrB19 aac(6')-Iaa aac6-Iy, nfsB parC
S03635-17 - sensitive qnrB19 aac(6')-Iaa aac6-Iy, nfsB parC
S04697-15 - sensitive - aac(6')-Iaa aac6-Iy, nfsB parC
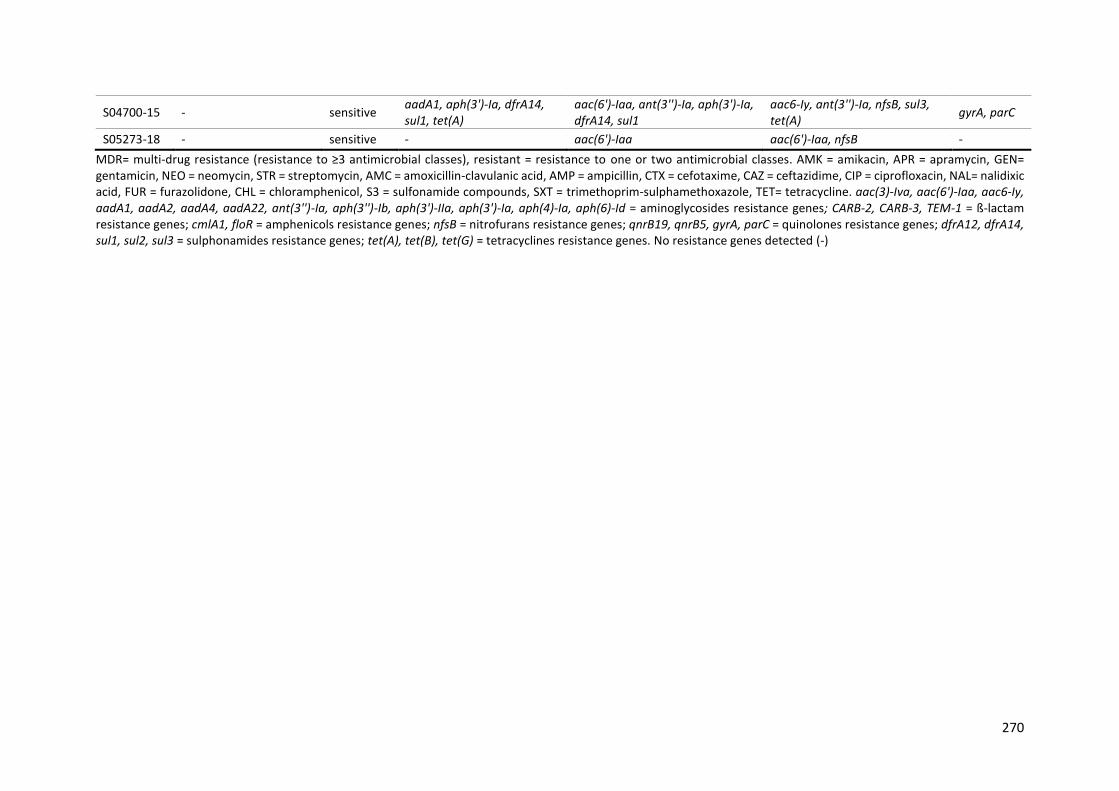
270
S04700-15 - sensitive aadA1, aph(3')-Ia, dfrA14, sul1, tet(A)
aac(6')-Iaa, ant(3'')-Ia, aph(3')-Ia, dfrA14, sul1
aac6-Iy, ant(3'')-Ia, nfsB, sul3, tet(A)
gyrA, parC
S05273-18 - sensitive - aac(6')-Iaa aac(6')-Iaa, nfsB -
MDR= multi-drug resistance (resistance to ≥3 antimicrobial classes), resistant = resistance to one or two antimicrobial classes. AMK = amikacin, APR = apramycin, GEN= gentamicin, NEO = neomycin, STR = streptomycin, AMC = amoxicillin-clavulanic acid, AMP = ampicillin, CTX = cefotaxime, CAZ = ceftazidime, CIP = ciprofloxacin, NAL= nalidixic acid, FUR = furazolidone, CHL = chloramphenicol, S3 = sulfonamide compounds, SXT = trimethoprim-sulphamethoxazole, TET= tetracycline. aac(3)-Iva, aac(6')-Iaa, aac6-Iy, aadA1, aadA2, aadA4, aadA22, ant(3'')-Ia, aph(3'')-Ib, aph(3')-IIa, aph(3')-Ia, aph(4)-Ia, aph(6)-Id = aminoglycosides resistance genes; CARB-2, CARB-3, TEM-1 = ß-lactam resistance genes; cmlA1, floR = amphenicols resistance genes; nfsB = nitrofurans resistance genes; qnrB19, qnrB5, gyrA, parC = quinolones resistance genes; dfrA12, dfrA14, sul1, sul2, sul3 = sulphonamides resistance genes; tet(A), tet(B), tet(G) = tetracyclines resistance genes. No resistance genes detected (-)

271
Appendix X
Table 9-13: Sensitivity, specificity, PPV, NPV and concordance of phenotypic and genotypic AMR in Salmonella
for the NCBI AMRFinderPlus database. Comparison between genotypic AMR prediction by WGS and phenotypic
expression for 91 Salmonella isolates. Genotypic AMR prediction was determined using ABRicate to screen for
AMR genes against the NCBI AMRFinderPlus database. Nitrofurans AMR genes were not detected in the NCBI
AMRFinderPlus database. Phenotypic AMR was determined by antimicrobial susceptibility testing with
resistance determined based on historical APHA veterinary or the BSAC human clinical breakpoints. Phenotype-
genotype concordance.
Antimicrobial class
Resistant phenotype
Susceptible phenotype
Sensitivity (%)
Specificity (%)
PPV (%)
NPV (%)
Concordance (%)
AMR gene +
AMR gene -
AMR gene +
AMR gene -
aminoglycosides 45 3 5 38 93.8 88.4 90.0 92.7 91.2
ß-lactams 30 0 0 60 96.8 100 100 98.4 98.9
amphenicols 14 2 2 73 87.5 97.3 87.5 97.3 95.6
nitrofurans 3 29 16 43 9.4 72.9 15.8 59.7 50.5
quinolones 41 7 4 39 85.4 90.7 91.1 84.8 87.9
sulphonamides 42 4 4 41 91.3 91.1 91.3 91.1 91.2
tetracyclines 29.0 8.0 5.0 49.0 77.4 90.1 79.3 87.3 85.9
average 45 3 5 38 93.8 88.4 90.0 92.7 91.2

272
Table 9-14: Sensitivity, specificity, PPV, NPV and concordance of phenotypic and genotypic AMR in Salmonella
for the Resfinder database. Comparison between genotypic AMR prediction by WGS and phenotypic expression
for 91 Salmonella isolates. Genotypic AMR prediction was determined using ABRicate to screen for AMR genes
against the Resfinder database. Nitrofurans or quinolones AMR genes were not detected in the ResFinder
database. Phenotypic AMR was determined by antimicrobial susceptibility testing with resistance determined
based on historical APHA veterinary or the BSAC human clinical breakpoints.
Antimicrobial class
Resistant phenotype
Susceptible phenotype
Sensitivity (%)
Specificity (%)
PPV (%)
NPV (%)
Concordance (%)
AMR gene +
AMR gene -
AMR gene +
AMR gene -
aminoglycosides 48 0 43 0 100 0.0 52.7 - 91.2
ß-lactams 30 1 0 60 96.8 100 100 98.4 98.9
amphenicols 14 2 2 73 87.5 97.3 87.5 97.3 95.6
sulphonamides 41 7 4 39 85.4 90.7 91.1 84.8 87.9
tetracyclines 21 25 2 43 45.7 95.6 91.3 63.2 70.3
average 30.8 7.0 10.2 43.0 83.1 76.7 84.5 85.9 88.8

273
Table 9-15: Sensitivity, specificity, PPV, NPV and concordance of phenotypic and genotypic AMR in Salmonella
for the APHA SeqFinder database. Comparison between genotypic AMR prediction by WGS and phenotypic
expression for 91 Salmonella isolates. Genotypic AMR prediction was determined using ABRicate to screen for
AMR genes against the APHA SeqFinder database. Phenotypic AMR was determined by antimicrobial
susceptibility testing with resistance determined based on historical APHA veterinary or the BSAC human clinical
breakpoints.
Antimicrobial class
Resistant phenotype
Susceptible phenotype
Sensitivity (%)
Specificity (%)
PPV (%)
NPV (%)
Concordance (%)
AMR gene +
AMR gene -
AMR gene +
AMR gene -
aminoglycosides 48 0 43 0 100 0.0 52.7 - 91.2
ß-lactams 30 1 0 60 96.8 100 100 98.4 98.9
amphenicols 14 2 2 73 87.5 97.3 87.5 97.3 95.6
nitrofurans 15 0 76 0 100 0.0 16.5 - 16.5
quinolones 3 29 16 43 9.4 72.9 15.8 59.7 50.5
sulphonamides 41 7 4 39 85.4 90.7 91.1 84.8 87.9
tetracyclines 37 9 4 41 80.4 91.1 90.2 82.0 85.7
average 26.9 6.9 20.7 36.6 79.9 64.6 64.8 84.4 75.2
Table 9-16: Sensitivity, specificity, PPV, NPV and concordance of phenotypic and genotypic AMR in Salmonella
for the PointFinder database. Comparison between genotypic AMR prediction by WGS and phenotypic
expression for 91 Salmonella isolates. Genotypic AMR prediction was determined using PointFinder to detect
chromosomal point mutations in quinolone resistance genes. Phenotypic AMR was determined by antimicrobial
susceptibility testing with resistance determined based on historical APHA veterinary or the BSAC human clinical
breakpoints.
Antimicrobial class
Resistant phenotype
Susceptible phenotype
Sensitivity (%)
Specificity (%)
PPV (%)
NPV (%)
Concordance (%)
AMR gene +
AMR gene -
AMR gene +
AMR gene -
quinolones 28 4 4 55 87.5 93.2 87.5 93.2 91.2

274
Appendix XI
Table 9-17: Dye staining of Salmonella biofilms formed on stainless steel coupons, PVC coupons, poplar wood coupons, and screed coupons. Biofilms formed by S.
Enteritidis (isolate 27655R) on coupons after aerobic incubation in LB broth w/o salt for 48 hours at 20±1°C. Coupons were subjected to one of three biofilm removal methods
(vortexing with glass beads, sonication, or cell scraping) or not subjected to any biofilm removal method. Both sides (A and B) of each coupon were photographed with
metabolically active bacteria stained red with 1% TTC dye and biofilm biomass stained purple with 1% crystal violet dye (stainless steel coupons and PVC coupons only). The
experiment was performed once with two technical replicates.
Re
mo
val
me
tho
d
Stainless steel coupon PVC coupon Poplar wood coupon Screed coupon
1% TTC dye 1% crystal violet dye 1% TTC 1% crystal violet dye 1% TTC 1% TTC
A B A B A B A B A B A B
no
ne
vort
ex
son
icat
ion
cell
scra
per

275
Appendix XII
Figure 9-3: SEM photographs of a Salmonella biofilm formed on poplar wood coupons. Biofilms of S. Enteritidis
(isolate 27655R) biofilm formed on poplar wood coupons after aerobic incubation in LB broth w/o salt for 48
hours at 20±1°C. Images show intact biofilm on the coupon (A, B, C), and biofilm after coupon was subjected to
vortexing at low speed for 2 minutes with 5mm glass beads in saline (D, E, F).
A D
B E
C F

276
Figure 9-4: SEM photographs of a Salmonella biofilm formed on screed coupons. Biofilms of S. Enteritidis
(isolate 27655R) biofilm formed on screed coupons after aerobic incubation in LB broth w/o salt for 48 hours at
20±1°C. Images show intact biofilm on the coupon (A, B, C), and biofilm after coupon was subjected to vortexing
at low speed for 2 minutes with 5mm glass beads in saline (D, E, F). Note the difference in magnification between
SEM images B and E.
B
C F
E
A D

277
Figure 9-5: SEM photographs of a Salmonella biofilm formed on PVC coupons. SEM images of an S. Enteritidis
(isolate 27655R) biofilm formed after aerobic incubation in LB broth w/o salt for 48 hours at 20±1°C. The intact
biofilm formed at (A, B, C) the air-liquid interface with the edge shown by black arrows above (D) and below (E,
F). The biofilm after coupon was subjected to vortexing at low speed for 2 minutes with 5mm glass beads in
saline (G, H). Note the difference in magnification between SEM images.
A
H G
F E
B
D C

278
Figure 9-6: SEM photographs of a Salmonella biofilm formed on stainless steel coupons. SEM images of an S.
Enteritidis (isolate 27655R) biofilm formed after aerobic incubation in LB broth w/o salt for 48 hours at 20±1°C.
The intact biofilm formed at the air-liquid interface (A, B), above (D) and below (D) with the edge of the air-liquid
interface shown by arrows. The biofilm after coupon was subjected to vortexing at low speed for 2 minutes with
5mm glass beads in saline (E, F). Note the difference in magnification for SEM image F.
A
F E
D C
B

279
Appendix XIII
Table 9-18: Results of the BOAT and biofilm bactericidal test for a BZK-based disinfectant at general usage concentration and Defra GO rate against S. 13:23:i:- biofilms.
Biofilms of 12 S. 13,23:i:- isolates were formed in microplates after aerobic incubation for 48 hours in LB broth w/o salt at 25±1°C. The biofilm was exposed to the disinfectant
for 30 minutes at 25±1°C. The activity of the disinfectant was determined using results from both the Biofilm-oriented antiseptic test (BOAT) and biofilm bactericidal test.
BOAT: number of technical replicates with a 100% reduction in metabolic activity compared to the WHO hard water control. Biofilm bactericidal test: number of technical
replicates with no bacterial re-growth after aerobic incubation for 24 hours in LB broth at 37±1°C. The experiment was performed up to three times (biological replicates,
B1-B3) with three technical replicates.
Isolate Dilution
Technical replicate 1 Technical replicate 2 Technical replicate 3 Overall
% Reduction Bactericidal
% Reduction Bactericidal
% Reduction Bactericidal
% Reduction
B1 B2 B3 B4 B5 B6 B7 B8 B9 Median Min. Max.
S02592-15
gen
eral
usa
ge
0.0 0.0 0.0 No (3) 0.0 0.0 0.0 No (3) 0.0 0.0 0.0 No (3) 0.0 0.0 0.0
S02593-15 0.0 0.0 0.0 No (3) 0.0 0.0 0.0 No (3) 0.0 0.0 0.0 No (3) 0.0 0.0 0.0
S02757-17 0.0 0.0 0.0 No (3) 0.0 0.0 0.0 No (3) 0.0 0.0 0.0 No (3) 0.0 0.0 0.0
S02769-17 0.0 99.6 0.0 No (3) 0.0 0.0 2.0 No (3) 0.0 0.0 0.0 No (3) 0.0 0.0 99.6
S02957-17 4.5 4.7 0.0 No (3) 0.0 - 0.0 No (2) * 5.4 0.0 99.6 No (3) 0.0 0.0 0.0
S02964-17 0.0 4.1 0.0 No (3) 0.0 0.0 0.0 No (2)/Yes (1) 8.8 0.0 11.3 No (3) 0.0 0.0 11.3
S02966-17 0.0 0.0 0.0 No (3) 0.0 0.0 0.0 No (3) 0.0 100 0.0 No (3) 0.0 0.0 100
S03363-15 0.0 0.0 0.0 No (3) 0.0 0.0 0.0 No (3) 0.0 0.0 0.0 No (3) 0.0 0.0 0.0
S03466-18 0.0 0.0 0.0 No (3) 0.0 0.0 0.0 No (3) 0.0 0.0 0.0 No (3) 0.0 0.0 0.0
S03467-18 0.0 0.0 0.0 No (3) 0.0 0.0 0.0 No (3) 0.0 0.0 0.0 No (3) 0.0 0.0 0.0
S03628-17 0.0 0.0 0.0 No (3) 0.0 0.0 0.0 No (3) 0.0 0.0 0.0 No (3) 0.0 0.0 0.0
S03635-17 0.0 0.0 0.0 No (3) 0.0 0.0 0.0 No (3) 0.0 0.0 0.0 No (3) 0.0 0.0 0.0
S02592-15
GO
rate
0.0 0.0 0.0 No (3) 0.0 0.0 0.0 No (3) 0.0 0.0 14.6 No (2)/Yes (1) 0.0 0.0 14.6
S02593-15 0.0 0.0 15.9 No (3) 0.0 0.0 0.0 No (3) 30.3 0.0 0.0 No (3) 0.0 0.0 30.3

280
S02757-17 0.0 0.0 0.0 No (3) 0.0 0.0 0.0 No (3) 0.0 - 0.0 No (2) * 0.0 0.0 0.0
S02769-17
GO
rat
e
0.0 0.0 0.0 No (3) 0.0 0.0 0.0 No (3) 0.0 0.0 0.0 No (3) 0.0 0.0 0.0
S02957-17 0.0 0.0 26.1 No (3) 0.0 0.0 0.0 No (3) 1.5 0.0 1.4 No (3) 0.0 0.0 26.1
S02964-17 29.2 28.5 0.0 No (2)/Yes (1) 24.2 15.5 4.4 No (3) 6.6 95.8 8.1 No (3) 15.5 0.0 95.8
S02966-17 0.0 0.0 3.0 No (3) 7.0 0.0 100 No (2)/Yes (1) 0.0 0.0 0.0 No (3) 0.0 0.0 100
S03363-15 0.0 0.0 0.0 No (2)/Yes (1) 0.0 0.0 0.0 No (3) 0.0 0.0 0.0 No (3) 0.0 0.0 0.0
S03466-18 0.0 0.0 0.0 No (3) 0.0 0.0 0.0 No (3) 4.8 0.0 0.0 No (3) 0.0 0.0 4.8
S03467-18 0.0 1.3 0.0 No (3) 0.0 0.0 0.0 No (3) 0.0 0.0 85.0 No (3) 0.0 0.0 85.0
S03628-17 0.0 0.0 0.0 No (3) 0.0 0.0 0.0 No (3) 0.0 0.0 0.0 No (3) 0.0 0.0 0.0
S03635-17 0.0 0.0 0.0 No (3) 95.1 0.0 0.0 No (3) 0.0 0.0 84.3 No (3) 0.0 0.0 95.1
GO = Defra General Orders rate. *One technical replicate excluded as optical density measurement was above the plate reader’s absorbance reading limit
.
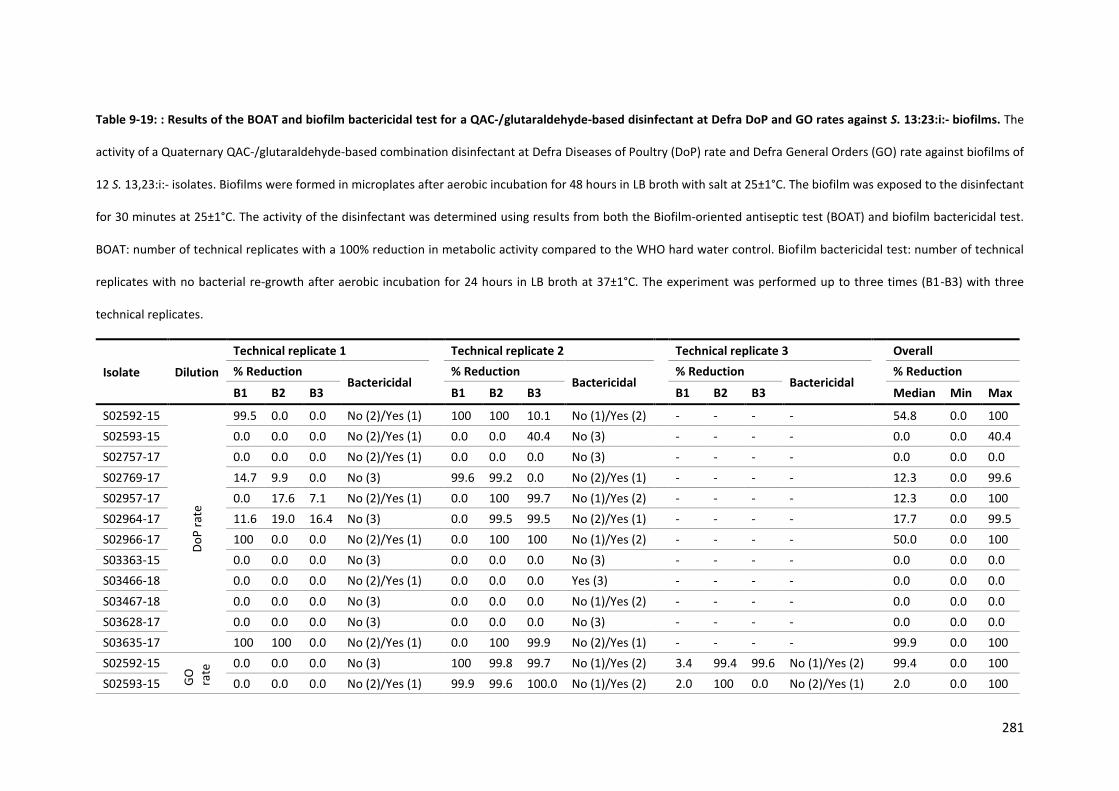
281
Table 9-19: : Results of the BOAT and biofilm bactericidal test for a QAC-/glutaraldehyde-based disinfectant at Defra DoP and GO rates against S. 13:23:i:- biofilms. The
activity of a Quaternary QAC-/glutaraldehyde-based combination disinfectant at Defra Diseases of Poultry (DoP) rate and Defra General Orders (GO) rate against biofilms of
12 S. 13,23:i:- isolates. Biofilms were formed in microplates after aerobic incubation for 48 hours in LB broth with salt at 25±1°C. The biofilm was exposed to the disinfectant
for 30 minutes at 25±1°C. The activity of the disinfectant was determined using results from both the Biofilm-oriented antiseptic test (BOAT) and biofilm bactericidal test.
BOAT: number of technical replicates with a 100% reduction in metabolic activity compared to the WHO hard water control. Biofilm bactericidal test: number of technical
replicates with no bacterial re-growth after aerobic incubation for 24 hours in LB broth at 37±1°C. The experiment was performed up to three times (B1-B3) with three
technical replicates.
Isolate Dilution
Technical replicate 1 Technical replicate 2 Technical replicate 3 Overall
% Reduction Bactericidal
% Reduction Bactericidal
% Reduction Bactericidal
% Reduction
B1 B2 B3 B1 B2 B3 B1 B2 B3 Median Min Max
S02592-15
Do
P r
ate
99.5 0.0 0.0 No (2)/Yes (1) 100 100 10.1 No (1)/Yes (2) - - - - 54.8 0.0 100
S02593-15 0.0 0.0 0.0 No (2)/Yes (1) 0.0 0.0 40.4 No (3) - - - - 0.0 0.0 40.4
S02757-17 0.0 0.0 0.0 No (2)/Yes (1) 0.0 0.0 0.0 No (3) - - - - 0.0 0.0 0.0
S02769-17 14.7 9.9 0.0 No (3) 99.6 99.2 0.0 No (2)/Yes (1) - - - - 12.3 0.0 99.6
S02957-17 0.0 17.6 7.1 No (2)/Yes (1) 0.0 100 99.7 No (1)/Yes (2) - - - - 12.3 0.0 100
S02964-17 11.6 19.0 16.4 No (3) 0.0 99.5 99.5 No (2)/Yes (1) - - - - 17.7 0.0 99.5
S02966-17 100 0.0 0.0 No (2)/Yes (1) 0.0 100 100 No (1)/Yes (2) - - - - 50.0 0.0 100
S03363-15 0.0 0.0 0.0 No (3) 0.0 0.0 0.0 No (3) - - - - 0.0 0.0 0.0
S03466-18 0.0 0.0 0.0 No (2)/Yes (1) 0.0 0.0 0.0 Yes (3) - - - - 0.0 0.0 0.0
S03467-18 0.0 0.0 0.0 No (3) 0.0 0.0 0.0 No (1)/Yes (2) - - - - 0.0 0.0 0.0
S03628-17 0.0 0.0 0.0 No (3) 0.0 0.0 0.0 No (3) - - - - 0.0 0.0 0.0
S03635-17 100 100 0.0 No (2)/Yes (1) 0.0 100 99.9 No (2)/Yes (1) - - - - 99.9 0.0 100
S02592-15
GO
rate
0.0 0.0 0.0 No (3) 100 99.8 99.7 No (1)/Yes (2) 3.4 99.4 99.6 No (1)/Yes (2) 99.4 0.0 100
S02593-15 0.0 0.0 0.0 No (2)/Yes (1) 99.9 99.6 100.0 No (1)/Yes (2) 2.0 100 0.0 No (2)/Yes (1) 2.0 0.0 100
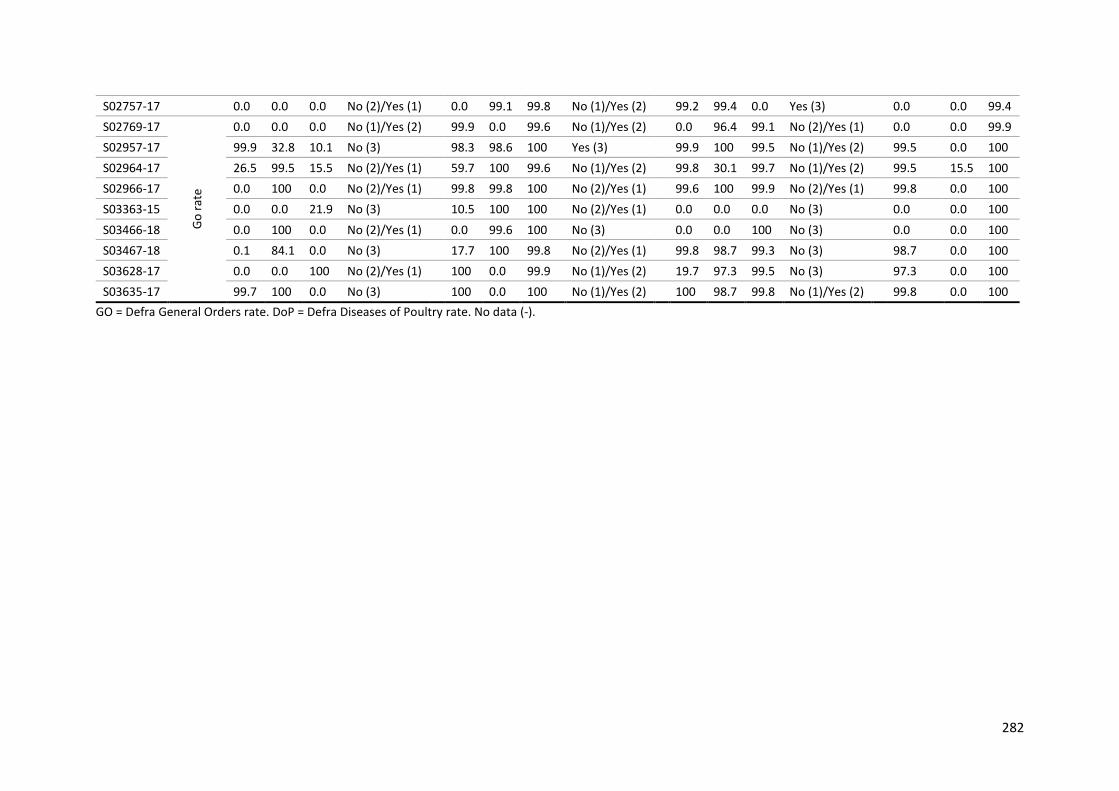
282
S02757-17 0.0 0.0 0.0 No (2)/Yes (1) 0.0 99.1 99.8 No (1)/Yes (2) 99.2 99.4 0.0 Yes (3) 0.0 0.0 99.4
S02769-17
Go
rat
e
0.0 0.0 0.0 No (1)/Yes (2) 99.9 0.0 99.6 No (1)/Yes (2) 0.0 96.4 99.1 No (2)/Yes (1) 0.0 0.0 99.9
S02957-17 99.9 32.8 10.1 No (3) 98.3 98.6 100 Yes (3) 99.9 100 99.5 No (1)/Yes (2) 99.5 0.0 100
S02964-17 26.5 99.5 15.5 No (2)/Yes (1) 59.7 100 99.6 No (1)/Yes (2) 99.8 30.1 99.7 No (1)/Yes (2) 99.5 15.5 100
S02966-17 0.0 100 0.0 No (2)/Yes (1) 99.8 99.8 100 No (2)/Yes (1) 99.6 100 99.9 No (2)/Yes (1) 99.8 0.0 100
S03363-15 0.0 0.0 21.9 No (3) 10.5 100 100 No (2)/Yes (1) 0.0 0.0 0.0 No (3) 0.0 0.0 100
S03466-18 0.0 100 0.0 No (2)/Yes (1) 0.0 99.6 100 No (3) 0.0 0.0 100 No (3) 0.0 0.0 100
S03467-18 0.1 84.1 0.0 No (3) 17.7 100 99.8 No (2)/Yes (1) 99.8 98.7 99.3 No (3) 98.7 0.0 100
S03628-17 0.0 0.0 100 No (2)/Yes (1) 100 0.0 99.9 No (1)/Yes (2) 19.7 97.3 99.5 No (3) 97.3 0.0 100
S03635-17 99.7 100 0.0 No (3) 100 0.0 100 No (1)/Yes (2) 100 98.7 99.8 No (1)/Yes (2) 99.8 0.0 100
GO = Defra General Orders rate. DoP = Defra Diseases of Poultry rate. No data (-).