Sakellaridi S, Christova P, Christopoulos V, Vialard A, Peponis J, Georgopoulos A, 2015, "Cognitive...
12
ORIGINAL RESEARCH ARTICLE published: 20 March 2015 doi: 10.3389/fnins.2015.00060 NEUROSCIENCE Cognitive mechanisms underlying instructed choice exploration of small city maps Sofia Sakellaridi 1,2 , Peka Christova 2,3 , Vassilios N. Christopoulos 4 , Alice Vialard 5 , John Peponis 5 and Apostolos P. Georgopoulos 1,2,3 * 1 Center for Cognitive Sciences, University of Minnesota, Minneapolis, MN, USA 2 Brain Sciences Center, Veterans Affairs Medical Center, Minneapolis, MN, USA 3 Department of Neuroscience, University of Minnesota Medical School, Minneapolis, MN, USA 4 Division of Biology and Biological Engineering, California Institute of Technology, Pasadena, CA, USA 5 School of Architecture, College of Architecture, Georgia Institute of Technology, Atlanta, GA, USA Edited by: Scott A. Huettel, Duke University, USA Reviewed by: Shunsuke Kobayashi, Fukushima Medical University, Japan Douglas Nitz, University of California, San Diego, USA *Correspondence: Apostolos P. Georgopoulos, Brain Sciences Center (11B), VAHCS, One Veterans Drive, Minneapolis, MN 55417, USA e-mail: [email protected] We investigated the cognitive mechanisms underlying the exploration and decision-making in realistic and novel environments. Twelve human subjects were shown small circular U.S. city maps with two locations highlighted on the circumference, as possible choices for a post office (“targets”). At the beginning of a trial, subjects fixated a spot at the center of the map and ultimately chose one of the two locations. A space syntax analysis of the map paths (from the center to each target) revealed that the chosen location was associated with the less convoluted path, as if subjects navigated mentally the paths in an “ant’s way,” i.e., by staying within street boundaries, and ultimately choosing the target that could be reached from the center in the shortest way, and the fewest turns and intersections. The subjects’ strategy for map exploration and decision making was investigated by monitoring eye position during the task. This revealed a restricted exploration of the map delimited by the location of the two alternative options and the center of the map. Specifically, subjects explored the areas around the two target options by repeatedly looking at them before deciding which one to choose, presumably implementing an evaluation and decision-making process. The ultimate selection of a specific target was significantly associated with the time spent exploring the area around that target. Finally, an analysis of the sequence of eye fixations revealed that subjects tended to look systematically toward the target ultimately chosen even from the beginning of the trial. This finding indicates an early cognitive selection bias for the ensuing decision process. Keywords: instructed choice exploration, spatial decision making, eye fixations, map reading INTRODUCTION To make good decisions within a novel environment, we first have to explore it. But how people explore novel environments to make decisions is poorly understood. Consider a hypothetical scenario that you have been accepted by a graduate school and you are visiting the university for the first time to find a house to rent. The school has provided you with a map that marks the student houses around campus and also gives you information about the bus stations, classrooms, libraries, food service, etc. Abstractly, you face an example of a common decision problem, in which you have to explore and evaluate all the alternative options to find the best place to rent. Choosing between alternative options requires assigning and integrating values along a multitude of dimensions (e.g., rental rate, amenities, distance from school, etc.). How do people explore novel environments to extract information and make decisions is considered one of the fundamental problems in decision science. After many years of intense research in various disciplines ranging from psychology to economics, substantial progress has been made in understanding the cognitive mechanisms of decision-making in a variety of tasks. A series of experimen- tal studies in humans and animals have provided evidence that the brain makes simple decisions by integrating various relevant determinants of an option into a single subjective value, and then comparing these values to make a choice (Roesch and Olson, 2004; Padoa-Schioppa and Assad, 2006; Padoa-Schioppa, 2007, 2011; Wallis, 2007; Rangel and Clithero, 2013). Although these studies have contributed significantly in understanding the cogni- tive mechanisms of decision making, they have focused heavily on simple decisions that (a) take place in artificial environments, and (b) rely on values of the alternative options that depend only on the options themselves and not on the environmental properties. Whereas in many decisions the environmental properties do not influence the economic values of the alternatives, such as deciding between products in a grocery store, there are other cases in which the value of an option strongly depends on its environ- ment. For instance, student houses that are closer to campus are usually more expensive than distant houses, even when they share similar characteristics. Solving this type of decision problem, like any other executive process, requires exploring the surroundings www.frontiersin.org March 2015 | Volume 9 | Article 60 | 1
Transcript of Sakellaridi S, Christova P, Christopoulos V, Vialard A, Peponis J, Georgopoulos A, 2015, "Cognitive...
ORIGINAL RESEARCH ARTICLEpublished: 20 March 2015
doi: 10.3389/fnins.2015.00060NEUROSCIENCE
Cognitive mechanisms underlying instructed choiceexploration of small city mapsSofia Sakellaridi1,2, Peka Christova2,3, Vassilios N. Christopoulos4, Alice Vialard5, John Peponis5 and
Apostolos P. Georgopoulos1,2,3*
1 Center for Cognitive Sciences, University of Minnesota, Minneapolis, MN, USA2 Brain Sciences Center, Veterans Affairs Medical Center, Minneapolis, MN, USA3 Department of Neuroscience, University of Minnesota Medical School, Minneapolis, MN, USA4 Division of Biology and Biological Engineering, California Institute of Technology, Pasadena, CA, USA5 School of Architecture, College of Architecture, Georgia Institute of Technology, Atlanta, GA, USA
Edited by:
Scott A. Huettel, Duke University,USA
Reviewed by:
Shunsuke Kobayashi, FukushimaMedical University, JapanDouglas Nitz, University ofCalifornia, San Diego, USA
*Correspondence:
Apostolos P. Georgopoulos, BrainSciences Center (11B), VAHCS, OneVeterans Drive, Minneapolis, MN55417, USAe-mail: [email protected]
We investigated the cognitive mechanisms underlying the exploration and decision-makingin realistic and novel environments. Twelve human subjects were shown small circular U.S.city maps with two locations highlighted on the circumference, as possible choices for apost office (“targets”). At the beginning of a trial, subjects fixated a spot at the center ofthe map and ultimately chose one of the two locations. A space syntax analysis of the mappaths (from the center to each target) revealed that the chosen location was associatedwith the less convoluted path, as if subjects navigated mentally the paths in an “ant’s way,”i.e., by staying within street boundaries, and ultimately choosing the target that could bereached from the center in the shortest way, and the fewest turns and intersections. Thesubjects’ strategy for map exploration and decision making was investigated by monitoringeye position during the task. This revealed a restricted exploration of the map delimitedby the location of the two alternative options and the center of the map. Specifically,subjects explored the areas around the two target options by repeatedly looking atthem before deciding which one to choose, presumably implementing an evaluation anddecision-making process. The ultimate selection of a specific target was significantlyassociated with the time spent exploring the area around that target. Finally, an analysis ofthe sequence of eye fixations revealed that subjects tended to look systematically towardthe target ultimately chosen even from the beginning of the trial. This finding indicates anearly cognitive selection bias for the ensuing decision process.
Keywords: instructed choice exploration, spatial decision making, eye fixations, map reading
INTRODUCTIONTo make good decisions within a novel environment, we first haveto explore it. But how people explore novel environments to makedecisions is poorly understood. Consider a hypothetical scenariothat you have been accepted by a graduate school and you arevisiting the university for the first time to find a house to rent.The school has provided you with a map that marks the studenthouses around campus and also gives you information about thebus stations, classrooms, libraries, food service, etc. Abstractly,you face an example of a common decision problem, in which youhave to explore and evaluate all the alternative options to find thebest place to rent. Choosing between alternative options requiresassigning and integrating values along a multitude of dimensions(e.g., rental rate, amenities, distance from school, etc.). How dopeople explore novel environments to extract information andmake decisions is considered one of the fundamental problemsin decision science.
After many years of intense research in various disciplinesranging from psychology to economics, substantial progresshas been made in understanding the cognitive mechanisms of
decision-making in a variety of tasks. A series of experimen-tal studies in humans and animals have provided evidence thatthe brain makes simple decisions by integrating various relevantdeterminants of an option into a single subjective value, and thencomparing these values to make a choice (Roesch and Olson,2004; Padoa-Schioppa and Assad, 2006; Padoa-Schioppa, 2007,2011; Wallis, 2007; Rangel and Clithero, 2013). Although thesestudies have contributed significantly in understanding the cogni-tive mechanisms of decision making, they have focused heavily onsimple decisions that (a) take place in artificial environments, and(b) rely on values of the alternative options that depend only onthe options themselves and not on the environmental properties.
Whereas in many decisions the environmental properties donot influence the economic values of the alternatives, such asdeciding between products in a grocery store, there are other casesin which the value of an option strongly depends on its environ-ment. For instance, student houses that are closer to campus areusually more expensive than distant houses, even when they sharesimilar characteristics. Solving this type of decision problem, likeany other executive process, requires exploring the surroundings
www.frontiersin.org March 2015 | Volume 9 | Article 60 | 1
Sakellaridi et al. Cognitive mechanisms of spatial decision-making
of the alternative options, extracting information about the prop-erties of the environment, and integrate this information withvalue information related to the options themselves.
In this study, we designed a novel experiment to investigatehow people explore realistic environments to make decisions. Forthat purpose, we used a set of real maps of various U.S. metropoli-tan cities with different street network types, and marked twolocations as possible post offices from which subjects had to pickone as their choice. We then investigated the map attributes andsequential eye fixations to gain an insight into the dynamics of thedecision making process and the reasons for the subjects’ ultimatechoice.
MATERIALS AND METHODSSUBJECTSTwelve healthy right-handed subjects, 6 women and 6 men, par-ticipated in this study as paid volunteers. They ranged in age from19 to 58 years (women’s age 36.8 ± 5.8 years, mean ± SEM;men’s age 38.8 ± 7 years). The age did not differ significantlybetween the two genders (P = 0.36, t-test). The study protocolwas approved by the relevant Institutional Review Boards, and aninformed consent was obtained from all the participants prior tothe study based on the Declaration of Helsinki.
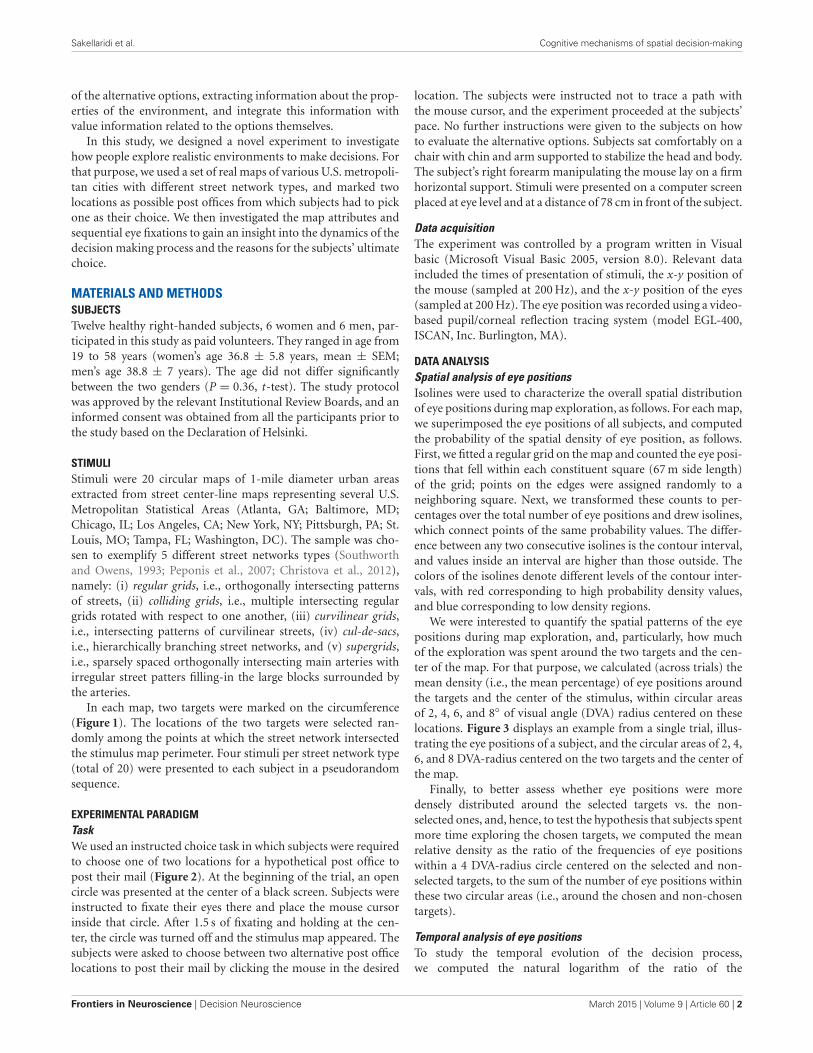
STIMULIStimuli were 20 circular maps of 1-mile diameter urban areasextracted from street center-line maps representing several U.S.Metropolitan Statistical Areas (Atlanta, GA; Baltimore, MD;Chicago, IL; Los Angeles, CA; New York, NY; Pittsburgh, PA; St.Louis, MO; Tampa, FL; Washington, DC). The sample was cho-sen to exemplify 5 different street networks types (Southworthand Owens, 1993; Peponis et al., 2007; Christova et al., 2012),namely: (i) regular grids, i.e., orthogonally intersecting patternsof streets, (ii) colliding grids, i.e., multiple intersecting regulargrids rotated with respect to one another, (iii) curvilinear grids,i.e., intersecting patterns of curvilinear streets, (iv) cul-de-sacs,i.e., hierarchically branching street networks, and (v) supergrids,i.e., sparsely spaced orthogonally intersecting main arteries withirregular street patters filling-in the large blocks surrounded bythe arteries.
In each map, two targets were marked on the circumference(Figure 1). The locations of the two targets were selected ran-domly among the points at which the street network intersectedthe stimulus map perimeter. Four stimuli per street network type(total of 20) were presented to each subject in a pseudorandomsequence.
EXPERIMENTAL PARADIGMTaskWe used an instructed choice task in which subjects were requiredto choose one of two locations for a hypothetical post office topost their mail (Figure 2). At the beginning of the trial, an opencircle was presented at the center of a black screen. Subjects wereinstructed to fixate their eyes there and place the mouse cursorinside that circle. After 1.5 s of fixating and holding at the cen-ter, the circle was turned off and the stimulus map appeared. Thesubjects were asked to choose between two alternative post officelocations to post their mail by clicking the mouse in the desired
location. The subjects were instructed not to trace a path withthe mouse cursor, and the experiment proceeded at the subjects’pace. No further instructions were given to the subjects on howto evaluate the alternative options. Subjects sat comfortably on achair with chin and arm supported to stabilize the head and body.The subject’s right forearm manipulating the mouse lay on a firmhorizontal support. Stimuli were presented on a computer screenplaced at eye level and at a distance of 78 cm in front of the subject.
Data acquisitionThe experiment was controlled by a program written in Visualbasic (Microsoft Visual Basic 2005, version 8.0). Relevant dataincluded the times of presentation of stimuli, the x-y position ofthe mouse (sampled at 200 Hz), and the x-y position of the eyes(sampled at 200 Hz). The eye position was recorded using a video-based pupil/corneal reflection tracing system (model EGL-400,ISCAN, Inc. Burlington, MA).
DATA ANALYSISSpatial analysis of eye positionsIsolines were used to characterize the overall spatial distributionof eye positions during map exploration, as follows. For each map,we superimposed the eye positions of all subjects, and computedthe probability of the spatial density of eye position, as follows.First, we fitted a regular grid on the map and counted the eye posi-tions that fell within each constituent square (67 m side length)of the grid; points on the edges were assigned randomly to aneighboring square. Next, we transformed these counts to per-centages over the total number of eye positions and drew isolines,which connect points of the same probability values. The differ-ence between any two consecutive isolines is the contour interval,and values inside an interval are higher than those outside. Thecolors of the isolines denote different levels of the contour inter-vals, with red corresponding to high probability density values,and blue corresponding to low density regions.
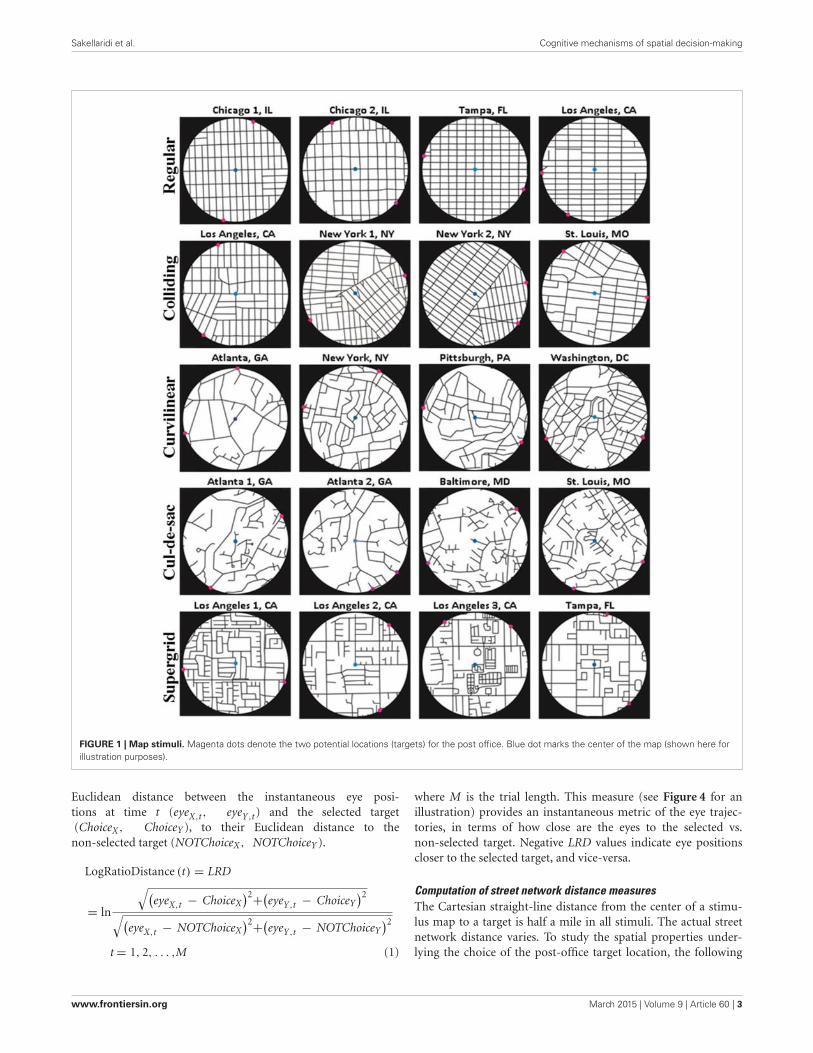
We were interested to quantify the spatial patterns of the eyepositions during map exploration, and, particularly, how muchof the exploration was spent around the two targets and the cen-ter of the map. For that purpose, we calculated (across trials) themean density (i.e., the mean percentage) of eye positions aroundthe targets and the center of the stimulus, within circular areasof 2, 4, 6, and 8◦ of visual angle (DVA) radius centered on theselocations. Figure 3 displays an example from a single trial, illus-trating the eye positions of a subject, and the circular areas of 2, 4,6, and 8 DVA-radius centered on the two targets and the center ofthe map.
Finally, to better assess whether eye positions were moredensely distributed around the selected targets vs. the non-selected ones, and, hence, to test the hypothesis that subjects spentmore time exploring the chosen targets, we computed the meanrelative density as the ratio of the frequencies of eye positionswithin a 4 DVA-radius circle centered on the selected and non-selected targets, to the sum of the number of eye positions withinthese two circular areas (i.e., around the chosen and non-chosentargets).
Temporal analysis of eye positionsTo study the temporal evolution of the decision process,we computed the natural logarithm of the ratio of the
Frontiers in Neuroscience | Decision Neuroscience March 2015 | Volume 9 | Article 60 | 2
Sakellaridi et al. Cognitive mechanisms of spatial decision-making
FIGURE 1 | Map stimuli. Magenta dots denote the two potential locations (targets) for the post office. Blue dot marks the center of the map (shown here forillustration purposes).
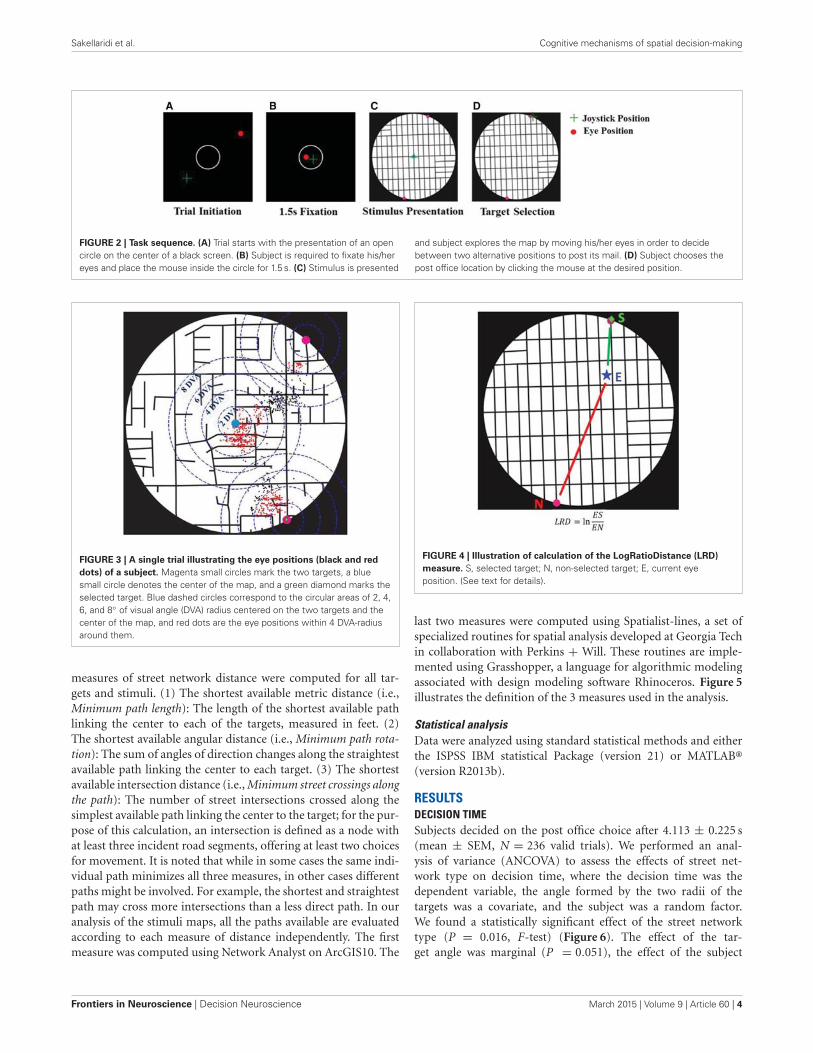
Euclidean distance between the instantaneous eye posi-tions at time t (eyeX,t, eyeY,t) and the selected target(ChoiceX, ChoiceY ), to their Euclidean distance to the
non-selected target (NOTChoiceX, NOTChoiceY ).
LogRatioDistance (t) = LRD
= ln
√(eyeX,t − ChoiceX
)2+(eyeY,t − ChoiceY
)2
√(eyeX,t − NOTChoiceX
)2+(eyeY,t − NOTChoiceY
)2
t = 1, 2, . . . ,M (1)
where M is the trial length. This measure (see Figure 4 for anillustration) provides an instantaneous metric of the eye trajec-tories, in terms of how close are the eyes to the selected vs.non-selected target. Negative LRD values indicate eye positionscloser to the selected target, and vice-versa.
Computation of street network distance measuresThe Cartesian straight-line distance from the center of a stimu-lus map to a target is half a mile in all stimuli. The actual streetnetwork distance varies. To study the spatial properties under-lying the choice of the post-office target location, the following
www.frontiersin.org March 2015 | Volume 9 | Article 60 | 3
Sakellaridi et al. Cognitive mechanisms of spatial decision-making
FIGURE 2 | Task sequence. (A) Trial starts with the presentation of an opencircle on the center of a black screen. (B) Subject is required to fixate his/hereyes and place the mouse inside the circle for 1.5 s. (C) Stimulus is presented
and subject explores the map by moving his/her eyes in order to decidebetween two alternative positions to post its mail. (D) Subject chooses thepost office location by clicking the mouse at the desired position.
FIGURE 3 | A single trial illustrating the eye positions (black and red
dots) of a subject. Magenta small circles mark the two targets, a bluesmall circle denotes the center of the map, and a green diamond marks theselected target. Blue dashed circles correspond to the circular areas of 2, 4,6, and 8◦ of visual angle (DVA) radius centered on the two targets and thecenter of the map, and red dots are the eye positions within 4 DVA-radiusaround them.
measures of street network distance were computed for all tar-gets and stimuli. (1) The shortest available metric distance (i.e.,Minimum path length): The length of the shortest available pathlinking the center to each of the targets, measured in feet. (2)The shortest available angular distance (i.e., Minimum path rota-tion): The sum of angles of direction changes along the straightestavailable path linking the center to each target. (3) The shortestavailable intersection distance (i.e., Minimum street crossings alongthe path): The number of street intersections crossed along thesimplest available path linking the center to the target; for the pur-pose of this calculation, an intersection is defined as a node withat least three incident road segments, offering at least two choicesfor movement. It is noted that while in some cases the same indi-vidual path minimizes all three measures, in other cases differentpaths might be involved. For example, the shortest and straightestpath may cross more intersections than a less direct path. In ouranalysis of the stimuli maps, all the paths available are evaluatedaccording to each measure of distance independently. The firstmeasure was computed using Network Analyst on ArcGIS10. The
FIGURE 4 | Illustration of calculation of the LogRatioDistance (LRD)
measure. S, selected target; N, non-selected target; E, current eyeposition. (See text for details).
last two measures were computed using Spatialist-lines, a set ofspecialized routines for spatial analysis developed at Georgia Techin collaboration with Perkins + Will. These routines are imple-mented using Grasshopper, a language for algorithmic modelingassociated with design modeling software Rhinoceros. Figure 5illustrates the definition of the 3 measures used in the analysis.
Statistical analysisData were analyzed using standard statistical methods and eitherthe ISPSS IBM statistical Package (version 21) or MATLAB®(version R2013b).
RESULTSDECISION TIMESubjects decided on the post office choice after 4.113 ± 0.225 s(mean ± SEM, N = 236 valid trials). We performed an anal-ysis of variance (ANCOVA) to assess the effects of street net-work type on decision time, where the decision time was thedependent variable, the angle formed by the two radii of thetargets was a covariate, and the subject was a random factor.We found a statistically significant effect of the street networktype (P = 0.016, F-test) (Figure 6). The effect of the tar-get angle was marginal (P = 0.051), the effect of the subject
Frontiers in Neuroscience | Decision Neuroscience March 2015 | Volume 9 | Article 60 | 4
Sakellaridi et al. Cognitive mechanisms of spatial decision-making
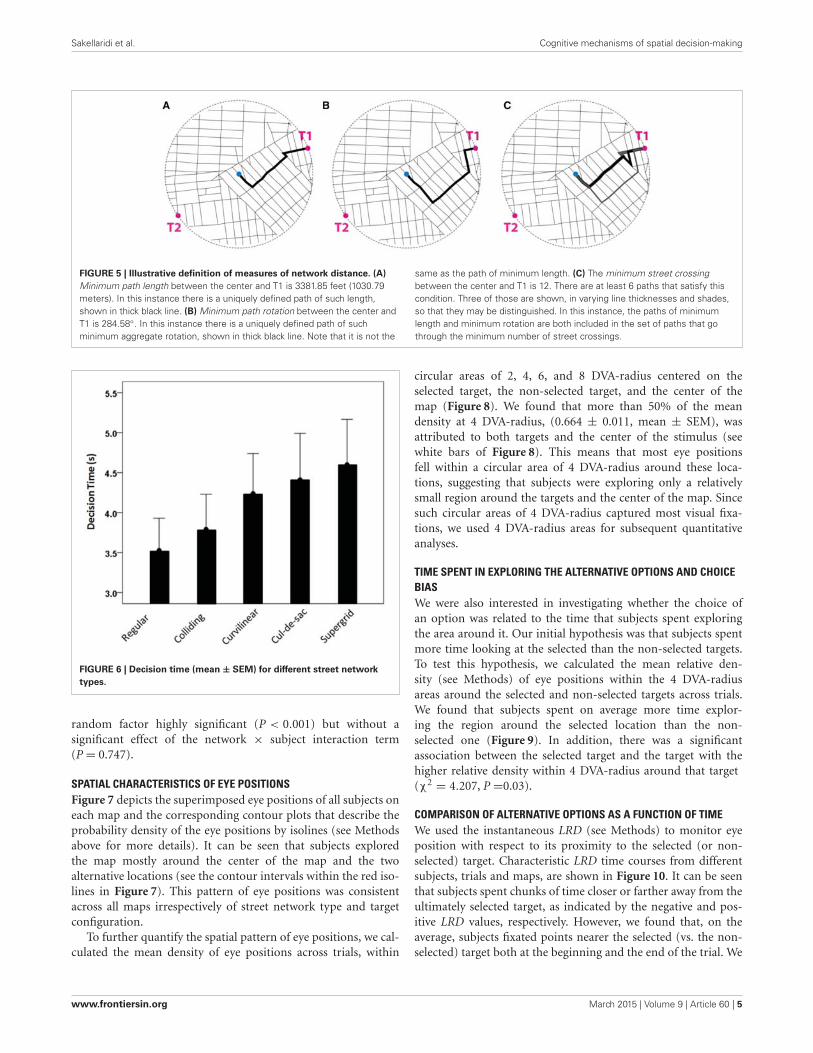
FIGURE 5 | Illustrative definition of measures of network distance. (A)
Minimum path length between the center and T1 is 3381.85 feet (1030.79meters). In this instance there is a uniquely defined path of such length,shown in thick black line. (B) Minimum path rotation between the center andT1 is 284.58◦. In this instance there is a uniquely defined path of suchminimum aggregate rotation, shown in thick black line. Note that it is not the
same as the path of minimum length. (C) The minimum street crossingbetween the center and T1 is 12. There are at least 6 paths that satisfy thiscondition. Three of those are shown, in varying line thicknesses and shades,so that they may be distinguished. In this instance, the paths of minimumlength and minimum rotation are both included in the set of paths that gothrough the minimum number of street crossings.
FIGURE 6 | Decision time (mean ± SEM) for different street network
types.
random factor highly significant (P < 0.001) but without asignificant effect of the network × subject interaction term(P = 0.747).
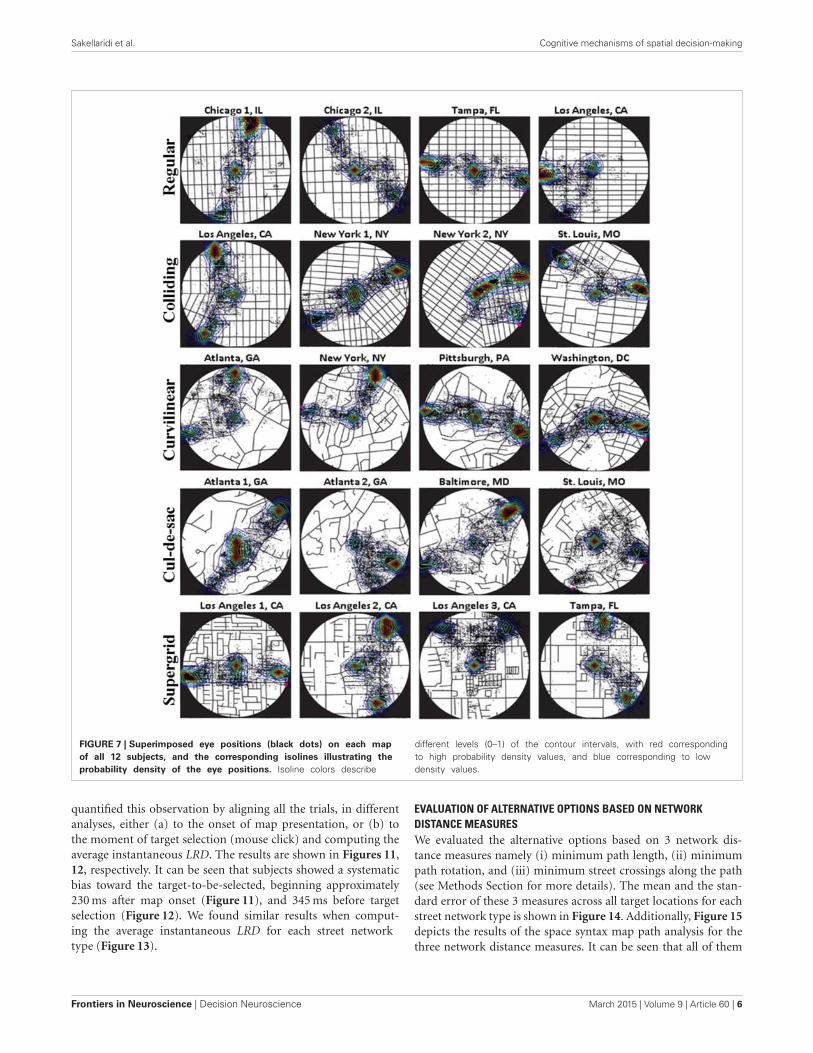
SPATIAL CHARACTERISTICS OF EYE POSITIONSFigure 7 depicts the superimposed eye positions of all subjects oneach map and the corresponding contour plots that describe theprobability density of the eye positions by isolines (see Methodsabove for more details). It can be seen that subjects exploredthe map mostly around the center of the map and the twoalternative locations (see the contour intervals within the red iso-lines in Figure 7). This pattern of eye positions was consistentacross all maps irrespectively of street network type and targetconfiguration.
To further quantify the spatial pattern of eye positions, we cal-culated the mean density of eye positions across trials, within
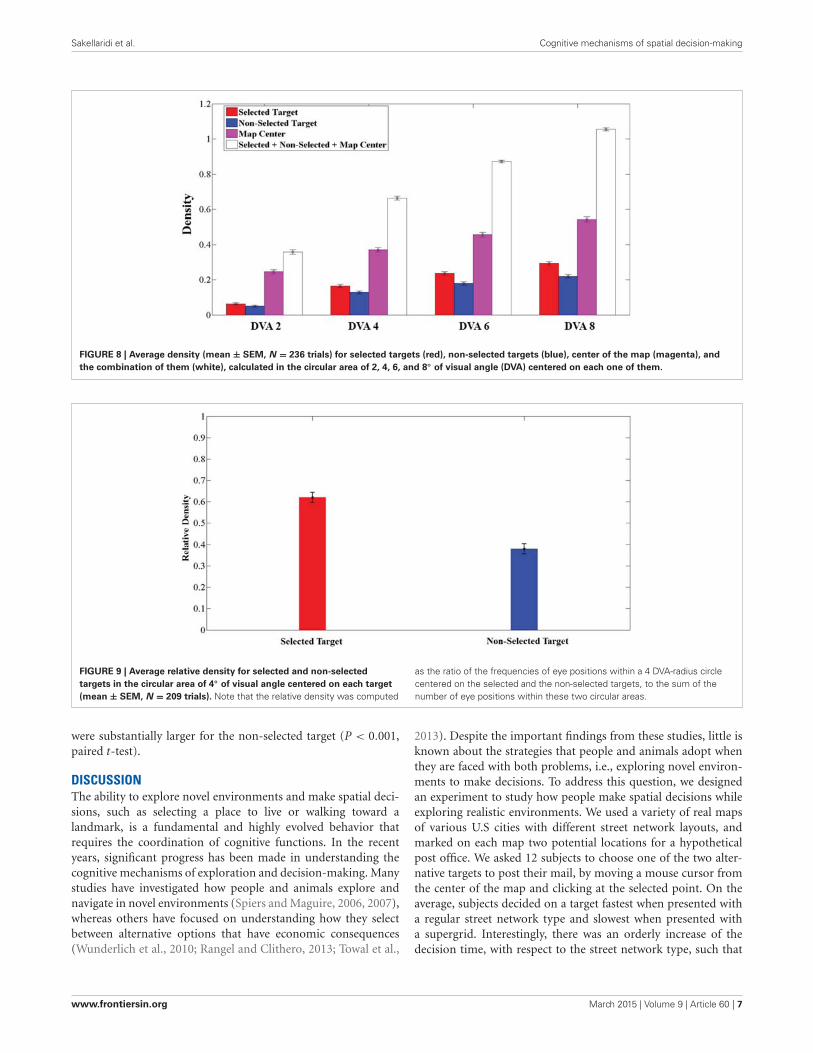
circular areas of 2, 4, 6, and 8 DVA-radius centered on theselected target, the non-selected target, and the center of themap (Figure 8). We found that more than 50% of the meandensity at 4 DVA-radius, (0.664 ± 0.011, mean ± SEM), wasattributed to both targets and the center of the stimulus (seewhite bars of Figure 8). This means that most eye positionsfell within a circular area of 4 DVA-radius around these loca-tions, suggesting that subjects were exploring only a relativelysmall region around the targets and the center of the map. Sincesuch circular areas of 4 DVA-radius captured most visual fixa-tions, we used 4 DVA-radius areas for subsequent quantitativeanalyses.
TIME SPENT IN EXPLORING THE ALTERNATIVE OPTIONS AND CHOICEBIASWe were also interested in investigating whether the choice ofan option was related to the time that subjects spent exploringthe area around it. Our initial hypothesis was that subjects spentmore time looking at the selected than the non-selected targets.To test this hypothesis, we calculated the mean relative den-sity (see Methods) of eye positions within the 4 DVA-radiusareas around the selected and non-selected targets across trials.We found that subjects spent on average more time explor-ing the region around the selected location than the non-selected one (Figure 9). In addition, there was a significantassociation between the selected target and the target with thehigher relative density within 4 DVA-radius around that target(χ2 = 4.207, P =0.03).
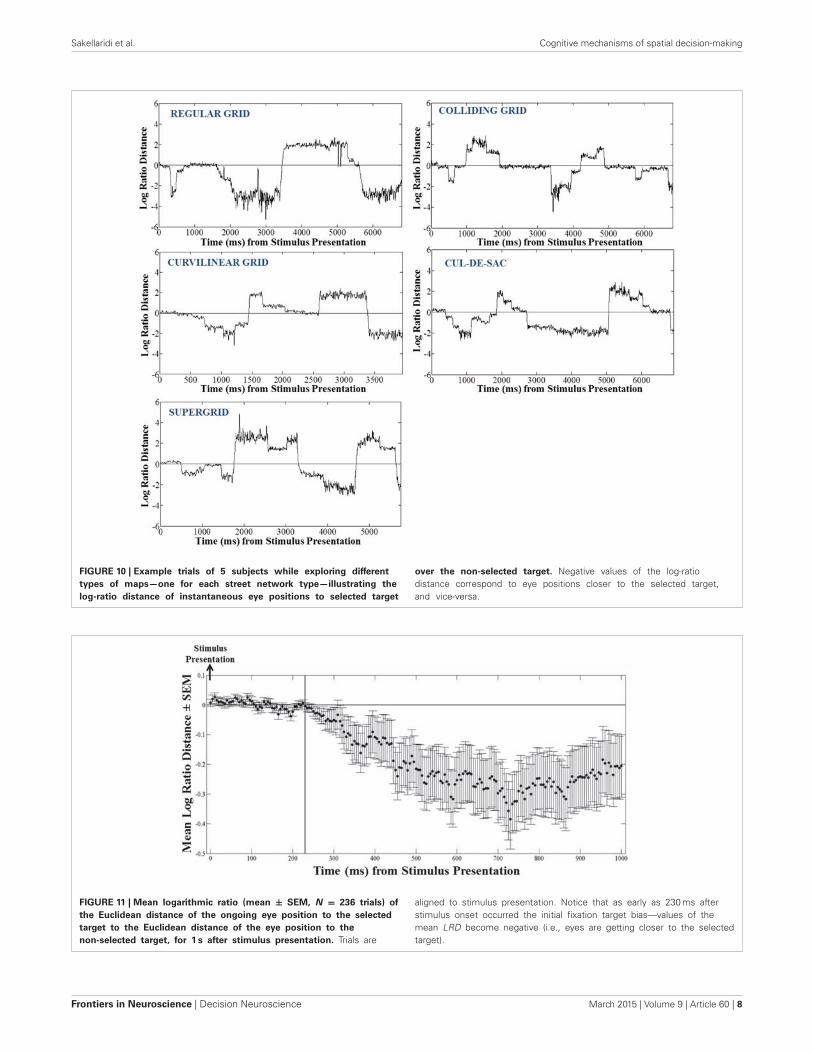
COMPARISON OF ALTERNATIVE OPTIONS AS A FUNCTION OF TIMEWe used the instantaneous LRD (see Methods) to monitor eyeposition with respect to its proximity to the selected (or non-selected) target. Characteristic LRD time courses from differentsubjects, trials and maps, are shown in Figure 10. It can be seenthat subjects spent chunks of time closer or farther away from theultimately selected target, as indicated by the negative and pos-itive LRD values, respectively. However, we found that, on theaverage, subjects fixated points nearer the selected (vs. the non-selected) target both at the beginning and the end of the trial. We
www.frontiersin.org March 2015 | Volume 9 | Article 60 | 5
Sakellaridi et al. Cognitive mechanisms of spatial decision-making
FIGURE 7 | Superimposed eye positions (black dots) on each map
of all 12 subjects, and the corresponding isolines illustrating the
probability density of the eye positions. Isoline colors describe
different levels (0–1) of the contour intervals, with red correspondingto high probability density values, and blue corresponding to lowdensity values.
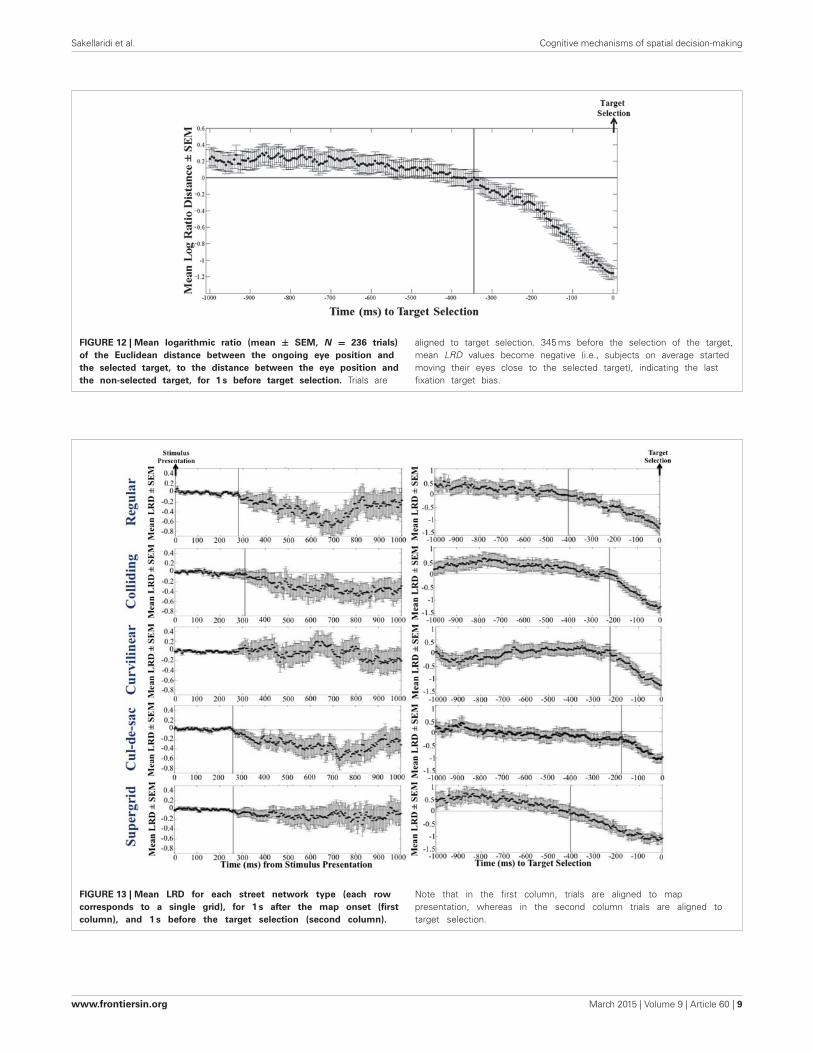
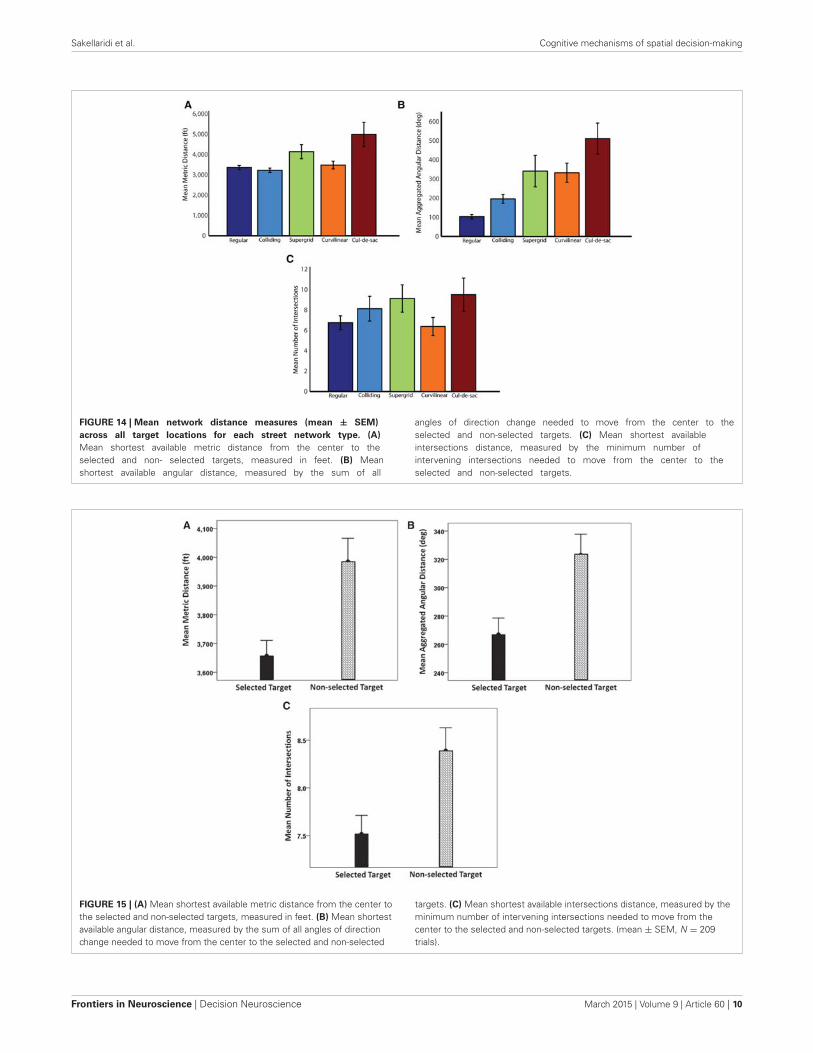
quantified this observation by aligning all the trials, in differentanalyses, either (a) to the onset of map presentation, or (b) tothe moment of target selection (mouse click) and computing theaverage instantaneous LRD. The results are shown in Figures 11,12, respectively. It can be seen that subjects showed a systematicbias toward the target-to-be-selected, beginning approximately230 ms after map onset (Figure 11), and 345 ms before targetselection (Figure 12). We found similar results when comput-ing the average instantaneous LRD for each street networktype (Figure 13).
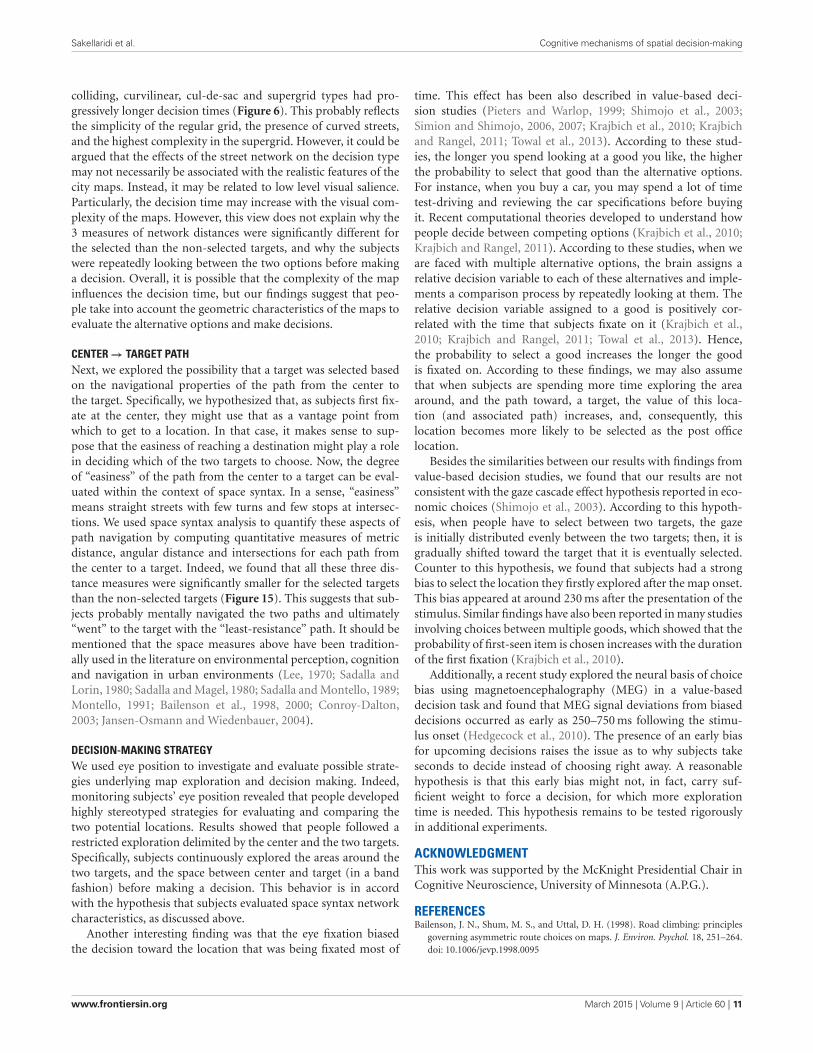
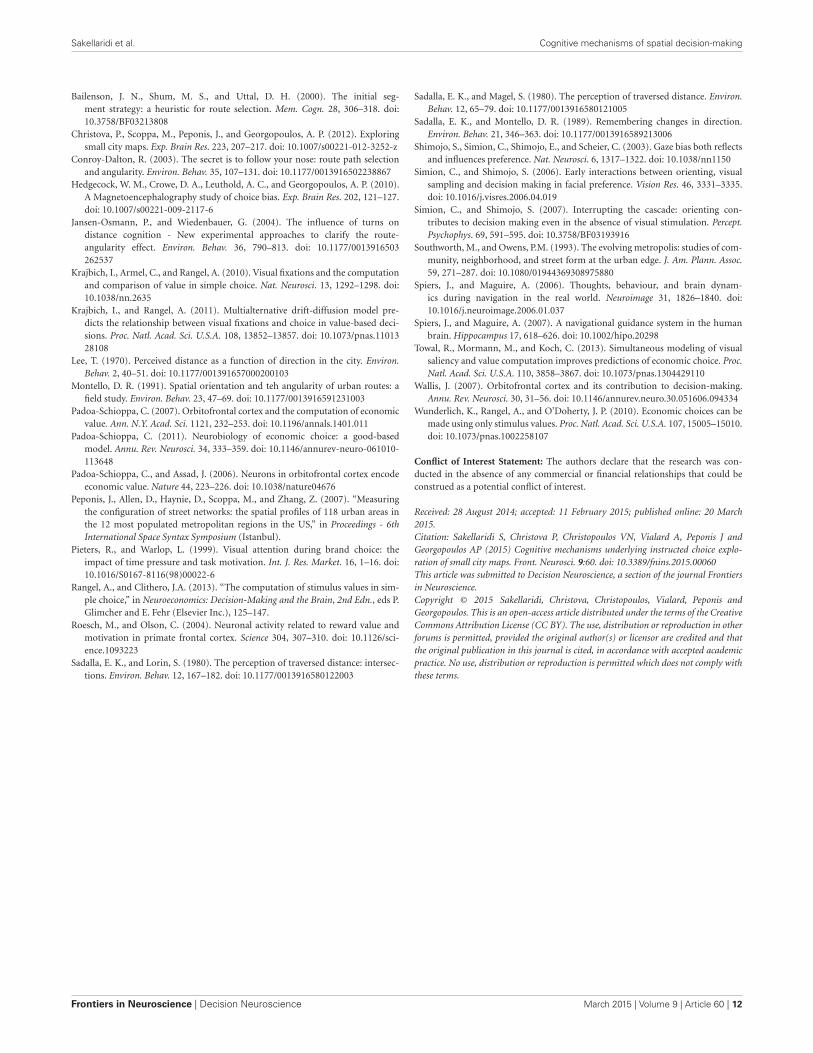
EVALUATION OF ALTERNATIVE OPTIONS BASED ON NETWORKDISTANCE MEASURESWe evaluated the alternative options based on 3 network dis-tance measures namely (i) minimum path length, (ii) minimumpath rotation, and (iii) minimum street crossings along the path(see Methods Section for more details). The mean and the stan-dard error of these 3 measures across all target locations for eachstreet network type is shown in Figure 14. Additionally, Figure 15depicts the results of the space syntax map path analysis for thethree network distance measures. It can be seen that all of them
Frontiers in Neuroscience | Decision Neuroscience March 2015 | Volume 9 | Article 60 | 6
Sakellaridi et al. Cognitive mechanisms of spatial decision-making
FIGURE 8 | Average density (mean ± SEM, N = 236 trials) for selected targets (red), non-selected targets (blue), center of the map (magenta), and
the combination of them (white), calculated in the circular area of 2, 4, 6, and 8◦ of visual angle (DVA) centered on each one of them.
FIGURE 9 | Average relative density for selected and non-selected
targets in the circular area of 4◦ of visual angle centered on each target
(mean ± SEM, N = 209 trials). Note that the relative density was computed
as the ratio of the frequencies of eye positions within a 4 DVA-radius circlecentered on the selected and the non-selected targets, to the sum of thenumber of eye positions within these two circular areas.
were substantially larger for the non-selected target (P < 0.001,paired t-test).
DISCUSSIONThe ability to explore novel environments and make spatial deci-sions, such as selecting a place to live or walking toward alandmark, is a fundamental and highly evolved behavior thatrequires the coordination of cognitive functions. In the recentyears, significant progress has been made in understanding thecognitive mechanisms of exploration and decision-making. Manystudies have investigated how people and animals explore andnavigate in novel environments (Spiers and Maguire, 2006, 2007),whereas others have focused on understanding how they selectbetween alternative options that have economic consequences(Wunderlich et al., 2010; Rangel and Clithero, 2013; Towal et al.,
2013). Despite the important findings from these studies, little isknown about the strategies that people and animals adopt whenthey are faced with both problems, i.e., exploring novel environ-ments to make decisions. To address this question, we designedan experiment to study how people make spatial decisions whileexploring realistic environments. We used a variety of real mapsof various U.S cities with different street network layouts, andmarked on each map two potential locations for a hypotheticalpost office. We asked 12 subjects to choose one of the two alter-native targets to post their mail, by moving a mouse cursor fromthe center of the map and clicking at the selected point. On theaverage, subjects decided on a target fastest when presented witha regular street network type and slowest when presented witha supergrid. Interestingly, there was an orderly increase of thedecision time, with respect to the street network type, such that
www.frontiersin.org March 2015 | Volume 9 | Article 60 | 7
Sakellaridi et al. Cognitive mechanisms of spatial decision-making
FIGURE 10 | Example trials of 5 subjects while exploring different
types of maps—one for each street network type—illustrating the
log-ratio distance of instantaneous eye positions to selected target
over the non-selected target. Negative values of the log-ratiodistance correspond to eye positions closer to the selected target,and vice-versa.
FIGURE 11 | Mean logarithmic ratio (mean ± SEM, N = 236 trials) of
the Euclidean distance of the ongoing eye position to the selected
target to the Euclidean distance of the eye position to the
non-selected target, for 1 s after stimulus presentation. Trials are
aligned to stimulus presentation. Notice that as early as 230 ms afterstimulus onset occurred the initial fixation target bias—values of themean LRD become negative (i.e., eyes are getting closer to the selectedtarget).
Frontiers in Neuroscience | Decision Neuroscience March 2015 | Volume 9 | Article 60 | 8
Sakellaridi et al. Cognitive mechanisms of spatial decision-making
FIGURE 12 | Mean logarithmic ratio (mean ± SEM, N = 236 trials)
of the Euclidean distance between the ongoing eye position and
the selected target, to the distance between the eye position and
the non-selected target, for 1 s before target selection. Trials are
aligned to target selection. 345 ms before the selection of the target,mean LRD values become negative (i.e., subjects on average startedmoving their eyes close to the selected target), indicating the lastfixation target bias.
FIGURE 13 | Mean LRD for each street network type (each row
corresponds to a single grid), for 1 s after the map onset (first
column), and 1 s before the target selection (second column).
Note that in the first column, trials are aligned to mappresentation, whereas in the second column trials are aligned totarget selection.
www.frontiersin.org March 2015 | Volume 9 | Article 60 | 9
Sakellaridi et al. Cognitive mechanisms of spatial decision-making
FIGURE 14 | Mean network distance measures (mean ± SEM)
across all target locations for each street network type. (A)
Mean shortest available metric distance from the center to theselected and non- selected targets, measured in feet. (B) Meanshortest available angular distance, measured by the sum of all
angles of direction change needed to move from the center to theselected and non-selected targets. (C) Mean shortest availableintersections distance, measured by the minimum number ofintervening intersections needed to move from the center to theselected and non-selected targets.
FIGURE 15 | (A) Mean shortest available metric distance from the center tothe selected and non-selected targets, measured in feet. (B) Mean shortestavailable angular distance, measured by the sum of all angles of directionchange needed to move from the center to the selected and non-selected
targets. (C) Mean shortest available intersections distance, measured by theminimum number of intervening intersections needed to move from thecenter to the selected and non-selected targets. (mean ± SEM, N = 209trials).
Frontiers in Neuroscience | Decision Neuroscience March 2015 | Volume 9 | Article 60 | 10
Sakellaridi et al. Cognitive mechanisms of spatial decision-making
colliding, curvilinear, cul-de-sac and supergrid types had pro-gressively longer decision times (Figure 6). This probably reflectsthe simplicity of the regular grid, the presence of curved streets,and the highest complexity in the supergrid. However, it could beargued that the effects of the street network on the decision typemay not necessarily be associated with the realistic features of thecity maps. Instead, it may be related to low level visual salience.Particularly, the decision time may increase with the visual com-plexity of the maps. However, this view does not explain why the3 measures of network distances were significantly different forthe selected than the non-selected targets, and why the subjectswere repeatedly looking between the two options before makinga decision. Overall, it is possible that the complexity of the mapinfluences the decision time, but our findings suggest that peo-ple take into account the geometric characteristics of the maps toevaluate the alternative options and make decisions.
CENTER → TARGET PATHNext, we explored the possibility that a target was selected basedon the navigational properties of the path from the center tothe target. Specifically, we hypothesized that, as subjects first fix-ate at the center, they might use that as a vantage point fromwhich to get to a location. In that case, it makes sense to sup-pose that the easiness of reaching a destination might play a rolein deciding which of the two targets to choose. Now, the degreeof “easiness” of the path from the center to a target can be eval-uated within the context of space syntax. In a sense, “easiness”means straight streets with few turns and few stops at intersec-tions. We used space syntax analysis to quantify these aspects ofpath navigation by computing quantitative measures of metricdistance, angular distance and intersections for each path fromthe center to a target. Indeed, we found that all these three dis-tance measures were significantly smaller for the selected targetsthan the non-selected targets (Figure 15). This suggests that sub-jects probably mentally navigated the two paths and ultimately“went” to the target with the “least-resistance” path. It should bementioned that the space measures above have been tradition-ally used in the literature on environmental perception, cognitionand navigation in urban environments (Lee, 1970; Sadalla andLorin, 1980; Sadalla and Magel, 1980; Sadalla and Montello, 1989;Montello, 1991; Bailenson et al., 1998, 2000; Conroy-Dalton,2003; Jansen-Osmann and Wiedenbauer, 2004).
DECISION-MAKING STRATEGYWe used eye position to investigate and evaluate possible strate-gies underlying map exploration and decision making. Indeed,monitoring subjects’ eye position revealed that people developedhighly stereotyped strategies for evaluating and comparing thetwo potential locations. Results showed that people followed arestricted exploration delimited by the center and the two targets.Specifically, subjects continuously explored the areas around thetwo targets, and the space between center and target (in a bandfashion) before making a decision. This behavior is in accordwith the hypothesis that subjects evaluated space syntax networkcharacteristics, as discussed above.
Another interesting finding was that the eye fixation biasedthe decision toward the location that was being fixated most of
time. This effect has been also described in value-based deci-sion studies (Pieters and Warlop, 1999; Shimojo et al., 2003;Simion and Shimojo, 2006, 2007; Krajbich et al., 2010; Krajbichand Rangel, 2011; Towal et al., 2013). According to these stud-ies, the longer you spend looking at a good you like, the higherthe probability to select that good than the alternative options.For instance, when you buy a car, you may spend a lot of timetest-driving and reviewing the car specifications before buyingit. Recent computational theories developed to understand howpeople decide between competing options (Krajbich et al., 2010;Krajbich and Rangel, 2011). According to these studies, when weare faced with multiple alternative options, the brain assigns arelative decision variable to each of these alternatives and imple-ments a comparison process by repeatedly looking at them. Therelative decision variable assigned to a good is positively cor-related with the time that subjects fixate on it (Krajbich et al.,2010; Krajbich and Rangel, 2011; Towal et al., 2013). Hence,the probability to select a good increases the longer the goodis fixated on. According to these findings, we may also assumethat when subjects are spending more time exploring the areaaround, and the path toward, a target, the value of this loca-tion (and associated path) increases, and, consequently, thislocation becomes more likely to be selected as the post officelocation.
Besides the similarities between our results with findings fromvalue-based decision studies, we found that our results are notconsistent with the gaze cascade effect hypothesis reported in eco-nomic choices (Shimojo et al., 2003). According to this hypoth-esis, when people have to select between two targets, the gazeis initially distributed evenly between the two targets; then, it isgradually shifted toward the target that it is eventually selected.Counter to this hypothesis, we found that subjects had a strongbias to select the location they firstly explored after the map onset.This bias appeared at around 230 ms after the presentation of thestimulus. Similar findings have also been reported in many studiesinvolving choices between multiple goods, which showed that theprobability of first-seen item is chosen increases with the durationof the first fixation (Krajbich et al., 2010).
Additionally, a recent study explored the neural basis of choicebias using magnetoencephalography (MEG) in a value-baseddecision task and found that MEG signal deviations from biaseddecisions occurred as early as 250–750 ms following the stimu-lus onset (Hedgecock et al., 2010). The presence of an early biasfor upcoming decisions raises the issue as to why subjects takeseconds to decide instead of choosing right away. A reasonablehypothesis is that this early bias might not, in fact, carry suf-ficient weight to force a decision, for which more explorationtime is needed. This hypothesis remains to be tested rigorouslyin additional experiments.
ACKNOWLEDGMENTThis work was supported by the McKnight Presidential Chair inCognitive Neuroscience, University of Minnesota (A.P.G.).
REFERENCESBailenson, J. N., Shum, M. S., and Uttal, D. H. (1998). Road climbing: principles
governing asymmetric route choices on maps. J. Environ. Psychol. 18, 251–264.doi: 10.1006/jevp.1998.0095
www.frontiersin.org March 2015 | Volume 9 | Article 60 | 11
Sakellaridi et al. Cognitive mechanisms of spatial decision-making
Bailenson, J. N., Shum, M. S., and Uttal, D. H. (2000). The initial seg-ment strategy: a heuristic for route selection. Mem. Cogn. 28, 306–318. doi:10.3758/BF03213808
Christova, P., Scoppa, M., Peponis, J., and Georgopoulos, A. P. (2012). Exploringsmall city maps. Exp. Brain Res. 223, 207–217. doi: 10.1007/s00221-012-3252-z
Conroy-Dalton, R. (2003). The secret is to follow your nose: route path selectionand angularity. Environ. Behav. 35, 107–131. doi: 10.1177/0013916502238867
Hedgecock, W. M., Crowe, D. A., Leuthold, A. C., and Georgopoulos, A. P. (2010).A Magnetoencephalography study of choice bias. Exp. Brain Res. 202, 121–127.doi: 10.1007/s00221-009-2117-6
Jansen-Osmann, P., and Wiedenbauer, G. (2004). The influence of turns ondistance cognition - New experimental approaches to clarify the route-angularity effect. Environ. Behav. 36, 790–813. doi: 10.1177/0013916503262537
Krajbich, I., Armel, C., and Rangel, A. (2010). Visual fixations and the computationand comparison of value in simple choice. Nat. Neurosci. 13, 1292–1298. doi:10.1038/nn.2635
Krajbich, I., and Rangel, A. (2011). Multialternative drift-diffusion model pre-dicts the relationship between visual fixations and choice in value-based deci-sions. Proc. Natl. Acad. Sci. U.S.A. 108, 13852–13857. doi: 10.1073/pnas.1101328108
Lee, T. (1970). Perceived distance as a function of direction in the city. Environ.Behav. 2, 40–51. doi: 10.1177/001391657000200103
Montello, D. R. (1991). Spatial orientation and teh angularity of urban routes: afield study. Environ. Behav. 23, 47–69. doi: 10.1177/0013916591231003
Padoa-Schioppa, C. (2007). Orbitofrontal cortex and the computation of economicvalue. Ann. N.Y. Acad. Sci. 1121, 232–253. doi: 10.1196/annals.1401.011
Padoa-Schioppa, C. (2011). Neurobiology of economic choice: a good-basedmodel. Annu. Rev. Neurosci. 34, 333–359. doi: 10.1146/annurev-neuro-061010-113648
Padoa-Schioppa, C., and Assad, J. (2006). Neurons in orbitofrontal cortex encodeeconomic value. Nature 44, 223–226. doi: 10.1038/nature04676
Peponis, J., Allen, D., Haynie, D., Scoppa, M., and Zhang, Z. (2007). “Measuringthe configuration of street networks: the spatial profiles of 118 urban areas inthe 12 most populated metropolitan regions in the US,” in Proceedings - 6thInternational Space Syntax Symposium (Istanbul).
Pieters, R., and Warlop, L. (1999). Visual attention during brand choice: theimpact of time pressure and task motivation. Int. J. Res. Market. 16, 1–16. doi:10.1016/S0167-8116(98)00022-6
Rangel, A., and Clithero, J.A. (2013). “The computation of stimulus values in sim-ple choice,” in Neuroeconomics: Decision-Making and the Brain, 2nd Edn., eds P.Glimcher and E. Fehr (Elsevier Inc.), 125–147.
Roesch, M., and Olson, C. (2004). Neuronal activity related to reward value andmotivation in primate frontal cortex. Science 304, 307–310. doi: 10.1126/sci-ence.1093223
Sadalla, E. K., and Lorin, S. (1980). The perception of traversed distance: intersec-tions. Environ. Behav. 12, 167–182. doi: 10.1177/0013916580122003
Sadalla, E. K., and Magel, S. (1980). The perception of traversed distance. Environ.Behav. 12, 65–79. doi: 10.1177/0013916580121005
Sadalla, E. K., and Montello, D. R. (1989). Remembering changes in direction.Environ. Behav. 21, 346–363. doi: 10.1177/0013916589213006
Shimojo, S., Simion, C., Shimojo, E., and Scheier, C. (2003). Gaze bias both reflectsand influences preference. Nat. Neurosci. 6, 1317–1322. doi: 10.1038/nn1150
Simion, C., and Shimojo, S. (2006). Early interactions between orienting, visualsampling and decision making in facial preference. Vision Res. 46, 3331–3335.doi: 10.1016/j.visres.2006.04.019
Simion, C., and Shimojo, S. (2007). Interrupting the cascade: orienting con-tributes to decision making even in the absence of visual stimulation. Percept.Psychophys. 69, 591–595. doi: 10.3758/BF03193916
Southworth, M., and Owens, P.M. (1993). The evolving metropolis: studies of com-munity, neighborhood, and street form at the urban edge. J. Am. Plann. Assoc.59, 271–287. doi: 10.1080/01944369308975880
Spiers, J., and Maguire, A. (2006). Thoughts, behaviour, and brain dynam-ics during navigation in the real world. Neuroimage 31, 1826–1840. doi:10.1016/j.neuroimage.2006.01.037
Spiers, J., and Maguire, A. (2007). A navigational guidance system in the humanbrain. Hippocampus 17, 618–626. doi: 10.1002/hipo.20298
Towal, R., Mormann, M., and Koch, C. (2013). Simultaneous modeling of visualsaliency and value computation improves predictions of economic choice. Proc.Natl. Acad. Sci. U.S.A. 110, 3858–3867. doi: 10.1073/pnas.1304429110
Wallis, J. (2007). Orbitofrontal cortex and its contribution to decision-making.Annu. Rev. Neurosci. 30, 31–56. doi: 10.1146/annurev.neuro.30.051606.094334
Wunderlich, K., Rangel, A., and O’Doherty, J. P. (2010). Economic choices can bemade using only stimulus values. Proc. Natl. Acad. Sci. U.S.A. 107, 15005–15010.doi: 10.1073/pnas.1002258107
Conflict of Interest Statement: The authors declare that the research was con-ducted in the absence of any commercial or financial relationships that could beconstrued as a potential conflict of interest.
Received: 28 August 2014; accepted: 11 February 2015; published online: 20 March2015.Citation: Sakellaridi S, Christova P, Christopoulos VN, Vialard A, Peponis J andGeorgopoulos AP (2015) Cognitive mechanisms underlying instructed choice explo-ration of small city maps. Front. Neurosci. 9:60. doi: 10.3389/fnins.2015.00060This article was submitted to Decision Neuroscience, a section of the journal Frontiersin Neuroscience.Copyright © 2015 Sakellaridi, Christova, Christopoulos, Vialard, Peponis andGeorgopoulos. This is an open-access article distributed under the terms of the CreativeCommons Attribution License (CC BY). The use, distribution or reproduction in otherforums is permitted, provided the original author(s) or licensor are credited and thatthe original publication in this journal is cited, in accordance with accepted academicpractice. No use, distribution or reproduction is permitted which does not comply withthese terms.
Frontiers in Neuroscience | Decision Neuroscience March 2015 | Volume 9 | Article 60 | 12