Safety Environment Future - Institut für Zweiradsicherheit
364
:1 nstitut für weiradsicherhei t e. V. *Bochum ISSN 2701-522X Nr.7 Safety Environment Future Proceedings of the 1991 International Motorcycle Conference edited by Institut für Zweiradsicherheit Forschungshefte Zweiradsicherheit herausgegeben von Reiner Brendicke
-
Upload
khangminh22 -
Category
Documents
-
view
3 -
download
0
Transcript of Safety Environment Future - Institut für Zweiradsicherheit
:1 nstitut für fZweiradsicherheit e. V. *Bochum
ISSN 2701-522X
Nr.7
Safety Environment Future Proceedings of the 1991 International Motorcycle Conference
edited by Institut für Zweiradsicherheit
Forschungshefte Zweiradsicherheit herausgegeben von Reiner Brendicke
Forschungshefte Zweiradsicherheit, herausgegeben von Reiner Brendicke, Institut für Zweiradsicherheit e. V.
In der Reihe "Forschungshefte Zweiradsicherheit" erscheinen wissenschaftliche Arbeiten zu Themen aus verschiedenen Bereichen der Zweiradsicherheitsforschung. Die Reihe ist für alle wissenschaftlichen Disziplinen offen. Manuskripte erbeten an das Institut für Zweiradsicherheit.
Die in dieser Reihe erscheinenden Arbeiten geben die Meinung des Autors, nicht in jedem Fall die Meinung des Instituts für Zweiradsicherheit wieder.
Redaktion und Manuskriptgestaltung: Brigitte Daniel
Literatur: Brigitte Langer-Reick
Übersetzung der IfZ-Beiträge: Susanne Gorys
1. Auflage Institut für Zweiradsicherheit e. V. Bochum 1991 Verlag: Institut für Zweiradsicherheit GmbH Westenfelder Str. 58 4630 Bochum 6 Tel.: 02327/6090 ISBN: 3-923994-11-7 ISSN: 0175-2626
Contents
Editor's Preface and Introductory Remarks
Accident Research and Trends in Development
Elias M. Ghoueiri, Rüdiger Lamm: A Comparative Analysis of Motorcycle Accident Statistics in Western Europe and the United States, 1970-1987
Peter J. Fassnacht, Garl D. Spurgeon, Elizabeth A. Weaver: The Status of Motorcycle Safety in the USA
Jean-Rene Garre, Glaude Filou: Mobility and Accident Risk for Motorcycling in France
Ulrich Schulz, Hubert Koch: Factors that Influence the Involvement of Motorbikers in Traffic Accidents
Anita Kautz: Statistical Analysis of Motorcycle Accidents in Dresden
Hans-Jochen Jahndel, Hans-Jürgen Neumann: Safety Risks and Consequences of Development of the Two-Wheeled Motor Vehiele in the Traffie of Tomorrow
Nicholas M. Rogers: A Preliminary Study Into the Feasibility of Motoreyele Airbags
Oleg Sokolov: Trends in Development of Motoreyeles in the USSR
7
31
55
89
105
117
135
173
Heimets
Clinton O. Chichester, George Snively: Rotational Acceleration of the Head Induced by Glancing Impacts
James Tangorra, Albert R. George: Wind Noise of Motorcycle Heimets
Dietmar Otte, Günter Feiten: Requirements on Chin Protection in Full-Face for Motorcyclist Impact and Injury Situations
Brakes
Hans Eberspächer: Psychological Consideration on Brake Use Patterns of Motorcyclists
Alois Weideie: Braking While Cornering on a Motorcycle _ Problems of Riding Dynamics, Influences of Rider Personality,
Potentials of Development
Touichira Hikichi, Tatsuhiro Tomari, Masaie Katoh, Michael Thiem: Research on the Motorcycle Antilock Brake System. Part 3: Braking Effectiveness of an Electronically Controlled ABS on Road Surfaces with
Different Levels
Yukimasa Nishimoto, Knau Iwashita, Tetsuo Tsuchida, Michael Thiem:
Research on Combined Brake System for Motorcycle
Traffic Behaviour and Risk Taking Behaviour
Falko Rheinberg: Flow-Experience when Motorcycling: A Study of a Special Human Condition
183
201
229
267
277
301
327
349
Frederick H. Ford, Linda G. Alverson-Eiland: The Relationship Between Anxiety and Task Performance and Skill Acquisition in the Motorcycle Safety Foundation's Motorcycle RiderCourse
Tsuyoshi Katayama, Masanori Motoki, Hideo Ochiai, Makoto Nakanishi: Comparison of Riding Behaviour Between Inexperienced Riders and Experienced Riders
Peter Braoks: Driver Error in a Mixed-Traffic Environment: The Need for Increasing 'Technical Awareness'
Roger Eggers, Peter C. Compes: Risk Taking Behaviour of Motorcyclists: Strategical Aspects of Risk Analysis and Risk Control
Reiner Brendicke: Attitudes of Motorcycle Riders Toward Risk Exposure - A Study of Various Age Groups
Ulrich Schulz, Heike Gresch, Hartmut Kerwien: Motorbiking: Motives and Emotions
Construction und Development
Tilo Schweers, Christoph Albus: Objective Assessment of Motorcycle Manoeuvrability
Ludwig Iffelsberger: Application of Vehicle Dynamics Simulation in Motorcycle Development
Rudolf Sagerer, Gerhard Heinrich: Strength Testing for Substantiating the Frame Stability of Motorcycle and Sidecar Combinations form Single Unit Production
Urs Tobler: Ergonomics and Motorcycles
363
381
405
427
447
465
487
511
527
541
Arnold Wagner: Concept, Realisation and Driving Experience of/in Motorcyles
with Enclosed Cabin
John W. Zellner, Scott A. Kebschull, Kenneth D. Wiley: Motorcycle Leg Protectors: An Analysis of Overall Effectiveness Via computer Simulation
Environment
Reiner Stenschke: Possibilities for Reducing Noise Emissions from Motorcyles
Heinrich Steven: Noise Generated by Motorcycles
Peer-Olaf Kalis, Norbert Gorißen, Lutz Hartung, Hermann Appel: Reduction of Exhaust Gas Emissions of Motorcycles
Vsevolod Kleniksky: Fuel Consumption Reduction and Emission Decrease in an Utilitarian PTW 2-Stroke Engine by Simple Modification
559
585
645
663
683
703
Editor's Preface and Introductory Remarks
The "Forschungsheft Nr.7" (research paper No 7) of the Institut für Zweiradsicherheit is a special issue within this series. It is published in the year of the institute's 10th anniversary, and it contains the proceedings of the International Motorcycle Conference "Safety - Environment - Future" hosted by the IfZ. This conference unquestionably will be the highlight of ten years of safety work of the IfZ. The international character of the conference becomes evident by the great number of represented nations. In addition to that the event is a eooperation of the Motorcycle Safety Foundation (MSF), USA, and the IfZ. In fact, the conferenee will complete the international conferenee held from Oetober 31 to November 3, 1990 in Orlando, Florida. Whereas the USA conferenee focussed on the motoreyele rider as important factor of the triangle rider - motorcyc/e - road, the conference in Bochum will plaee further aceents on technical aspects. However, the tangential points between the factors rider, motoreycle and road will be treated attentively as weil. The cooperation with the MSF, at the same time frank and fruitful, was an important prerequisite for the suecessful planning, organisation and realisation of both conferences. Many thanks to Allen A. Isley, President of the MSF and Peter J. Fassnacht, Vice President, Safety Programs, of the MSF.
Bochum was not chosen aecidentally to host the international motorcycle conference. The IfZ has its headquarters in this city and Bochum has thus been the center for national safety work for nearly ten years. The generous sponsoring by the Initiativkreis Ruhrgebiet, a group of 58 leading German enterprises supporting the Ruhrgebiet by funding events of cultural interest, like sports events or seientific events, built up the basis for the conferenee in general. The support by this group was at the same time a privilege and an incentive for the IfZ.
Apart from the support by the Initiativkreis, BMW, Harley Davidson, JAMA (Japan Automobile Manufacturers Association, Inc.) and other enterprises funded the conferenee. I like to thank all sponsors as weil as the members of the Steering Committee and all those who eontributed to the eonferenee's sueeess by their scientific work. I owe special thanks to Dr. Hubert Koch who founded the IfZ in 1981 and who had the initial idea for the conference. As chairman of the Steering Committee he set the course for the scientific basis of the conference with his competence and profound international experience.
Last not least I owe thanks to the staff members of the IfZ. All of them did their very best to support and realise the conference. Special thanks to Mrs. Brigitte Daniel who run the whole organisation and who, with her enthusiasm and perfect preparations, was a guarantee for the eonferenee's success.
2
The title of the conference "Safety - Environment - Future" comprises all central aspects of the event:
Safety, a notion wh ich cannot be seperated from the discussion on powered twowheelers. The International Motorcycle Conference in 1991 thus will directly complete the IfZ-workshops on motorcycle safety in 1983 and 1986 as weil as events which took place in cooperation with the VDI (Verein Deutscher Ingenieure), for example the "Dritte Fachtagung Motorrad" in 1989 at the Technical University of Darmstadt. Safety improvements for the motorcyclists always have been the main concern of all discussions, as the headlines of numerous conference proceedings already indicate. Keywords in this context are "Motorcycle accidents: Description, Analysis and Prevention" or "Passive Safety for Motorcycle Riders".
The International Motorcycle Conference, however, will offer still more. Motorcycle riding will no longer be considered as an isolated phenomenon. In fact, international scientists will embed the motorcycles and their riders in a context of ecology, traffic planning and sociology. The improvement of active and passive motorcycle safety by technological innovations is one central aspect of the 1991 conference. A further motivating force - not merely in the field of safety research but also concerning activities in the field of engineering - will be environmental aspects in connection with motorcycle riding and the resulting status of the two-wheelers in the future traffic situation of a highly industrial society.
The six sessions of the conference provide a cross-section of all actually discussed topics on motorcycle riding.
The session "Accident Research and Trends in Development" will describe and analyse empirical accident data of the most important European industrial nations as weil as data from the USA. This section presents causally related accident factors and, as a consequence, possible countermeasures. Technical innovations like for example airbags provide additional help on our way to improved safety.
The effectiveness of protective heimets has been acknowleged worldwide for some time already. However, I")ew possibilities for further improvements of their protective effects and additional constructive innovations are in the actual discussion. The second session presents analyses of real accidents as weil as of experiments in laboratories.
The apparently most important technical innovations of the last years have been made in the field of brakes. Motorcycles with anti-lock braking systems are able to take off some of the riders's strain when riding and thus contribute to improved safety. Apart from anti-lock braking systems this session will present innovative solutions for
3
combined brakes. As weil braking when cornering and the rather complex interaction of rider and vehicle will be discussed in this session.
The fourth session deals with the rider himself. The riding behaviour as weil as the risk behaviour of motorcycle riders is in the center of interest. After all it is the rider himself who decides on sense and non-sense of technical innovations. A risky way of riding, as said to be typical for young riders, may lead to an attitude that does not consider technical innovation as safety reserve, but as a possibility to spread out one's upper performance limits. Pedagogues and psychologists deal with attitudes and behavioural aspects of motorcyclists in order to develop ways for a further reducuction of accident rates by combining defensive riding and the achievements in the field of constructive safety research.
The fifth session will present constructive developments on behalf of the safety of the powered two-wheeler and its rider. Standards for the measuring of motorcycles' manouevrability, possible effects and limits of leg protection as weil as test methods for motorcycle frames will be discussed. A further point of discussion in this session will be ergonomic aspects and innovative concepts for the present and the future traffic situation.
Environment has become a keyword in many discussions of today. One point of interest during the conference thus will be dedicated to ecological questions. The lectures of this session deal with the analyses of present deficites and problems in the field of ecological aspects in connection with motorcycling. In spite of the rather small share of motorcycles in the entire pollution caused by the motoring public, motorcycle riders can contribute to environmental protection as weil. Several studies describe ways of noise and emission reduction.
The International Conference "Safety - Environment - Future" offers a worldwide forum for the international exchange of actual results in the field of motorcycle research. It thus provides a perspective for further steps towards motorcycling as a synthesis relating experience, safety and environmental aspects.
Reiner Brendicke Institut für Zweirad sicherheit e. V.
Accident Research
Elias M. Choueiri, Rüdiger Lamm: A Comparative Analysis of Motorcycle Accident Statistics
in Western Europe and the United States, 1970-1987
Peter J. Fassnacht, Carl D. Spurgeon, Elizabeth A. Weaver: The Status of Motorcycle Safety in the USA
Jean-Rene Carre, Claude Filou: Mobility and Accident Risk for Motorcycling in France
Ulrich Schulz, Hubert Koch: Factors Influencing the Accident Involvement of Motorcyclists
Anita Kautz: Statistical Analysis of Motorcycle Accidents in Dresden
Trends in Development
Hans-Jochen Jahndel, Hans-Jürgen Neumann: Safety Risks and Consequences of Development of the Two-Wheeled
Motor Vehicle in the Traffic of Tomorrow
Nicholas M. Rogers: A Preliminary Study Into the Feasibility of Motorcycle Airbags
Oleg Sokolov: Trends in Development of Motorcycles in the USSR
A Comparative Analysis of Motorcycle Accident Statistics in Western Europe and the United States,
1970-1987
Elias M. Choueiri
SUNY - North Country Community College
SUNY - Canton College of Technology
USA
Rüdiger Lamm
Institut für Straßen- und Eisenbahnwesen
Universität Karlsruhe
Germany
h
9
1 Abstract
Motorcycle accident characteristics of Western Europe, including Austria, Belgium, Denmark, Federal Republic of Germany, France, Great Britain, Italy, The Netherlands, Norway, Sweden and Switzerland, and the USA are analyzed to determine some of the problem areas in traffic safety of motorcycle use.
The specific objectives of the study were to:
(1) Show quantitatively the changes in motorcycle fatalities in Western Europe and the United States between 1970 and 1987.
(2) Show quantitatively the changes in fatality rates (fatalities per 100,000 inhabitants, fatalities per 10,000 registered motorcycles) between 1970· and 1987.
(3) Identify those age groups that were most frequently involved in fatal motorcycle accidents.
(4) Determine whether there were statistically significant changes during the 1970-1987 time period in the motorcycle accident characteristics studied. To achieve this important objective of the study, the statistical analysis t-test concerning the difference between means was conducted for testing the significance of the difference between means of fatalities for selected time periods within the period 1970-1987 in each of the subject countries.
Some conclusions of the study follow:
(1) Between 1970 and 1987, the Western European countries under study experienced decreases in the number of motorcycle fatalities. In contrast, the United States experienced an increase of 76.8% in the number of motorcycle fatalities.
(2) Between 1970 and 1987, the Western European countries experienced decreases in the number of motorcycle fatalities per 100,000 inhabitants. In contrast, the United States experienced an increase of 48.0% in the number of motorcycle fatalities per 100,000 inhabitants.
(3) Between 1970 and 1987, the Western European countries and the United States experienced reductions in the number of fatalities per 10,000 registered motorcycles.
10
(4) In 1987, 57.9% of the motorcycle accident deaths in Western Europe occurred among persons aged 15-24 years. In contrast, the highest percentage of motorcycle fatalities (52.4%) in the United States occurred among persons aged 25-64 years.
(5) In Western Europe and the United States motorcycle death rates (fatalities per 100000 inhabitants) varied tremendously by age. They were highest for ages 15-24 years.
(6) In general, the results of t-tests reveal that the motorcycle fatality development in Western Europe was a lot more favorable than that of the USA during the last two decades. For Western Europe as a whole, improvements in motorcycle safety, which were often significant at the 95% level of confidence, were identified between the time periods compared. The motorcycle fatality development in the USA revealed significant deteriorations twice during the periods studied. But, it should not be forgotten that in the 1980's, at least a marginal improvement in motorcycle safety was experienced by the USA.
Furthermore, a literature review, related especially to the USA, has shown that the countries under study should
(1) strongly enforce their existing helmet-use laws,
and
(2) require motorcyclists to leave their headlights on du ring the day.
• 11
2 Introduction
Motorcycles are unique vehicles. They travel at highway speeds like cars and trucks, but they are less stable, harder to see, and offer less protection for riders in an accident [NYSDOT, 1989, (19)]. It is therefore not surprising that the death rate per 100 million person miles of travel is more than 15 times the rate for cars. The ratio of deaths to reported injuries is twice as great for motorcyclists as for occupants of passenger vehicles [Baker, O'Neili and Karpf, 1984, (1)].
Investigated in this study are motorcycle fatalities in Western Europe and the United States during the period 1970-1987. Western Europe (WE) in this study includes the following eleven countries: Austria (A), Belgium (B), Denmark (DK), Federal Republic of Germany (FRG), France (F), Great Britain (GB), Italy (I), The Netherlands (NL), Norway (N), Sweden (S), and Switzerland (CH).
The specific objectives of the study were to:
(1) Show quantitatively the changes in demographie characteristics, such as population, number of registered· motorcycles/motorcycles per capita, as experienced by each of the eleven Western European countries, by these countries as a whole (WE), and by the USA between 1970 and 1987;
(2) Identify the changes in fatalities and fatality rates (fatalities per 100,000 inhabitants, and fatalities per 10,000 registered motorcycles) between 1970 and 1987.
(3) Identify those age groups that were most frequently endangered in fatal motorcycle accidents.
(4) Determine whether there were statistically significant changes during the 1970-1987 time period in the fatal motorcycle accident characteristics studied.
The majority of the data used for the study were obtained from the United Nations, Statistics of Road Traffic Accidents in Europe rUN, up to 1990, (23)], and from various national statistics, such as [USDOC, 1990, (22)]. The reader who is interested in additional information on the data used should consult [Choueiri, 1984, (6); Lamm, Lin, Choueiri, Kloeckner, 1984, (7); Lamm, Choueiri, Kloeckner, 1986 (16)].
Absolute comparisons of fatality data in different countries must be treated with considerable care, as they can contain results arising from such diverse factors as differing traffic compositions, traffic laws, driving behavior, variations regarding the proportion of rural and urban travel, and/or special influences such as highway
12
standards, legislation, different qualities of street lighting, etc. Furthermore, the accident rep9rtin9 procedures can be very different. For instance, while a death within 30 days of an accident is classified in most countries as a fatal injury, in Italy a road fatality is described as being due to a road accident if death occurs within seven days; in France, six days; while, in Austria, a road fatality is described as being due to a road accident if death occurs within three days [O'Flaherty, 1986, (20)]. To compensate for these discrepancies the European Conference of Ministers of Transport [ECMT, 1970, (10)] came to the tentative conclusion that figures in respect of deaths resulting from accidents can be broken down according to the time when
they occur roughly as folIows:
- Died at the scene of the accident - Died within three days - Died within six days - Died within seven days - Died within thirty days
46% 80% 84% 85% 92%.
Because death within 30 days of an accident was taken as a basis for this study, the motorcycle fatality data for Austria, France and Italy were converted using the above
percentages.
It should be noted that at the time the manuscript was completed the data were as up to date as possible. Countries like Spain, potugal, and Greece were not included in the study due to lack of data for these countries, especially in the 1970's.
Generally speaking, in 1987 motorcycle accidents comprised 16.4% of all traffic fatalities in Austria, 11.8% in Belgium, 11.0% in Denmark, 15.0% in France, 13.6% in Federal Republic of Germany, 13.9% in Great Britain, 17.3% in Italy, 12.5% in Netherlands, 12.3% in Norway, iO.5% in Sweden, 23.7% in Switzerland, 14.8% in Western Europe as a whole, and 8.7% in the United States.
3 population Figures, 1970-1987
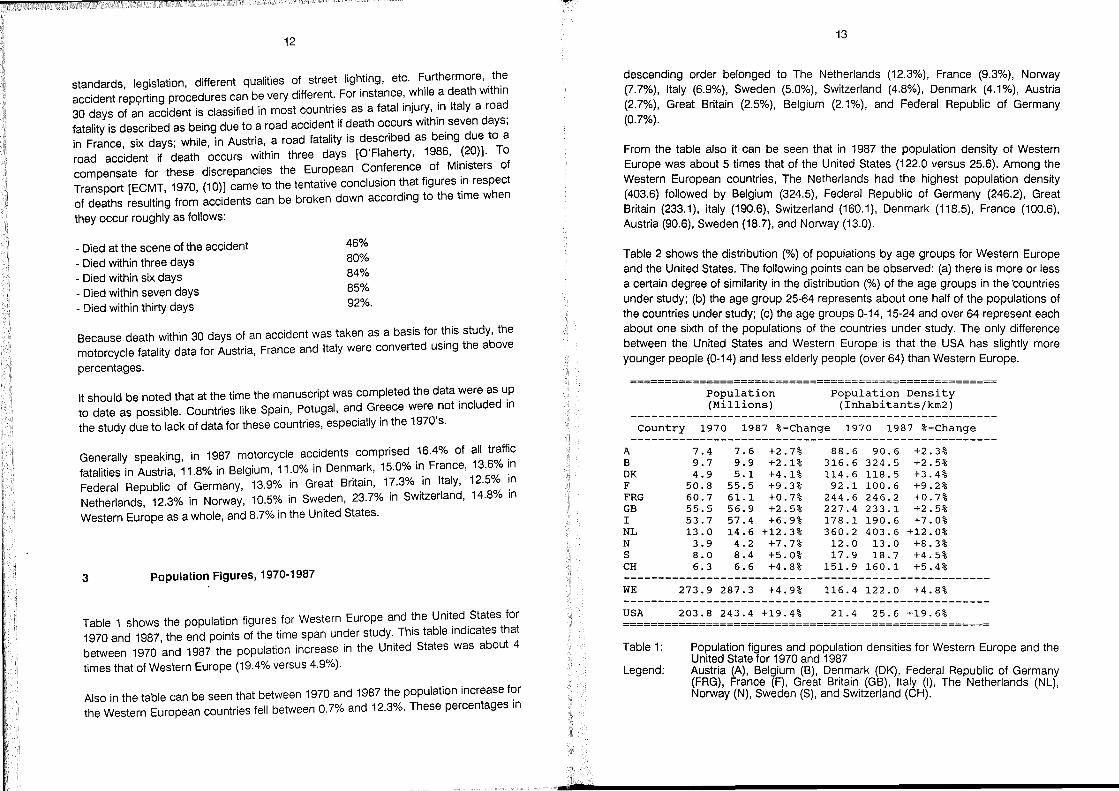
Table 1 shows the population figures for Western Europe and the United States for 1970 and 1987, the end points of the time span under study. This table indicates that between 1970 and 1987 the population increase in the United States was about 4
times that of Western Europe (19.4% versus 4.9%).
Also in the table can be seen that between 1970 and 1987 the population increase for the Western European countries fell between 0.7% and 12.3%. These percentages in
13
descending order belonged to The Netherlands (12.3%), France (9.3%), Norway (7.7%), Italy (6.9%), Sweden (5.0%), Switzerland (4.8%), Denmark (4.1%), Austria (2.7%), Great Britain (2.5%), Belgium (2.1%), and Federal Republic of Germany (0.7%).
From the table also it can be seen that in 1987 the population density of Western Europe was about 5 times that of the United States (122.0 versus 25.6). Among the Western European countries, The Netherlands had the highest population density (403.6) followed by Belgium (324.5), Federal Republic of Germany (246.2), Great Britain (233.1), Italy (190.6), Switzerland (160.1), Denmark (118.5), France (100.6), Austria (90.6), Sweden (18.7), and Norway (13.0).
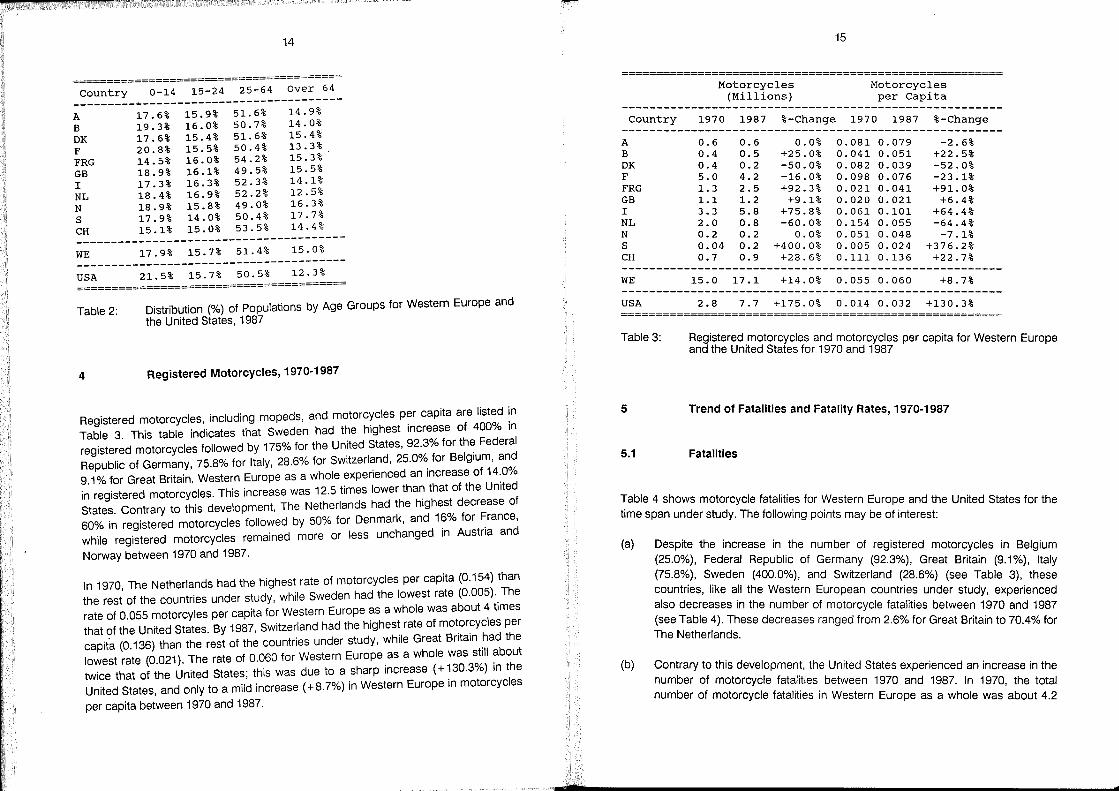
Table 2 shows the distribution (%) of populations by age groups for Western Europe and the United States. The following points can be observed: (a) there is more or less a certain degree of similarity in the distribution (%) of the age groups in the 'countries under study; (b) the age group 25-64 represents about one half of the populations of the countries under study; (c) the age groups 0-14, 15-24 and over 64 represent each about one sixth of the populations of the countries under study. The only difference between the United States and Western Europe is that the USA has slightly more younger people (0-14) and less elderly people (over 64) than Western Europe.
Population Population Density (Millions) (Inhabitants/km2)
-----------------------------------------------------Country 1970 1987 %-Change 1970 1987 %-Change
-----------------------------------------------------A 7.4 7.6 +2.7% 88.6 90.6 +2.3% B 9.7 9.9 +2.1% 316.6 324.5 +2.5% DK 4.9 5.1 +4.1% 114.6 118.5 +3.4% F 50.8 55.5 +9.3% 92.1 100.6 +9.2% FRG 60.7 61.1 +0.7% 244.6 246.2 +0.7% GB 55.5 56.9 +2.5% 227.4 233.1 +2.5% I 53.7 57.4 +6.9% 178.1 190.6 +7.0% NL 13.0 14.6 +12.3% 360.2 403.6 +12.0% N 3.9 4.2 +7.7% 12.0 13.0 +8.3% S 8.0 8.4 +5.0% 17.9 18.7 +4.5% CH 6.3 6.6 +4.8% 151. 9 160.1 +5.4% -----------------------------------------------------WE 273.9 287.3 +4.9% 116.4 122.0 +4.8% -----------------------------------------------------USA
Table 1:
Legend:
203.8 243.4 +19.4% 21.4 25.6 +19.6%
Population figures and population densities for Western Europe and the Umted State for 1970 and 1987 Austria (A), Belgium (B), Denmark (DK), Federal Republic of Germany (FRG), France (F), Great Britain (GB), Italy (I), The Netherlands (NL), Norway (N), Sweden (S), and Switzerland (CH).
A A ~A VR
14
=======================================
Country 0-14 15-24 25-64 Over 64 ---------~-----------------------------A 17.6% 15.9% 51. 6% 14.9%
B 19.3% 16.0% 50.7% 14.0%
DK 17.6% 15.4% 51. 6% 15.4% 13.3% F 20.8% 15.5% 50.4%
FRG 14.5% 16.0% 54.2% 15.3% 15.5% GB 18.9% 16.1% 49.5% 14.1% I 17.3% 16.3% 52.3%
NL 18.4% 16.9% 52.2% 12.5% 16.3% N 18.9% 15.8% 49.0%
S 17.9% 14.0% 50.4% 17.7%
CH 15.1% 15.0% 53.5% 14.4% ---------------------------------------WE 17.9% 15.7% 51.4% 15.0% ---------------------------------------USA 21.5% 15.7% 50.5% 12.3% =======================================
Table 2:
4
Distribution (%) of populations by Age Groups for Western Europe and the United States, 1987
Registered Motorcycles, 1970-1987
Registered motorcycles, including mopeds, and motorcycles per capita are listed in Table 3. This table indicates that Sweden had the highest increase of 400% in registered motorcycles followed by 175% for the United States, 92.3% for the Federal Republic of Germany, 75.8% for Italy, 28.6% for Switzerland, 25.0% for Belgium, and 9.1 % for Great Britain. Western Europe as a whole experienced an increase of 14.0% in registered motorcycles. This increase was 12.5 times lower than that of the United States. Contrary to this development, The Netherlands had the highest decrease of 60% in registered motorcycles followed by 50% for Denmark, and 16% for France, while registered motorcycles remained more or less unchanged in Austria and
Norway between 1970 and 1987.
In 1970, The Netherlands had the highest rate of motorcycles per capita (0.154) than the rest of the countries under study, while Sweden had the lowest rate (0.005). The rate of 0.055 motorcyles per capita for Western Europe as a whole was about 4 times that of the United States. By 1987, Switzerland had the highest rate of motorcycles per capita (0.136) than the rest of the countries under study, while Great Britain had the lowest rate (0.021). The rate of 0.060 for Western Europe as a whole was still about twice that of the United States; this was due to a sharp increase (+ 130.3%) in the United States, and only to a mild increase (+8.7%) in Western Europe in motorcycles
per capita between 1970 and 1987.
m
15
Motorcycles Motorcycles (Millions) per capita
-------------------------------------------------------Country 1970 1987 %-Change 1970 1987 %-Change
-------------------------------------------------------A B DK F FRG GB I NL N S CH
WE
USA
Table 3:
0.6 0.6 0.0% 0.081 0.079 -2.6% 0.4 0.5 +25.0% 0.041 0.051 +22.5% 0.4 0.2 -50.0% 0.082 0.039 -52.0% 5.0 4.2 -16.0% 0.098 0.076 -23.1% 1.3 2.5 +92.3% 0.021 0.041 +91. 0% 1.1 1.2 +9.1% 0.020 0.021 +6.4% 3.3 5.8 +75.8% 0.061 0.101 +64.4% 2.0 0.8 -60.0% 0.154 0.055 -64.4% 0.2 0.2 0.0% 0.051 0.048 -7.1% 0.04 0.2 +400.0% 0.005 0.024 +376.2% 0.7 0.9 +28.6% 0.111 0.136 +22.7%
15.0 17.1 +14.0% 0.055 0.060 +8.7%
2.8 7.7 +175.0% 0.014 0.032 +130.3%
Registered .motorcycles and motorcycles per capita for Western Europe and the Unlted States for 1970 and 1987
5 Trend of Fatalities and Fatality Rates, 1970-1987
5.1 Fatalities
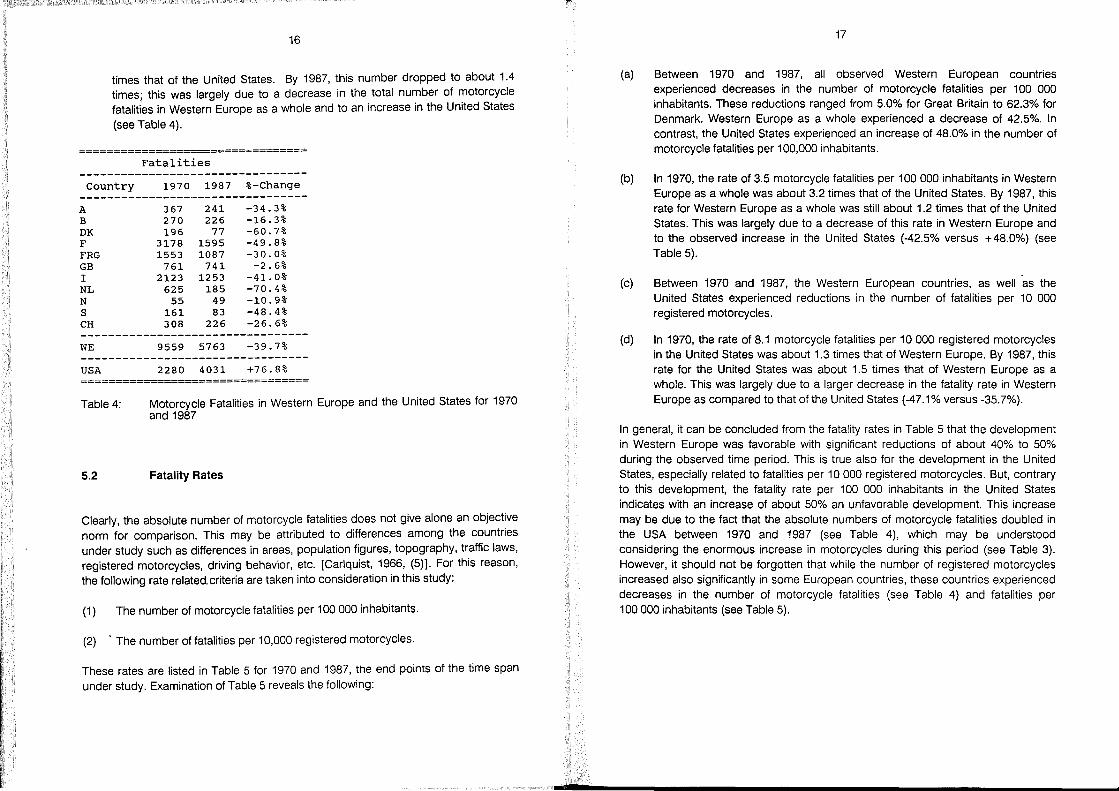
Table 4 shows motorcycle fatalities for Western Europe and the United States for the time span under study. The following points may be of interest:
(a) Despite the increase in the number of registered motorcycles in Belgium (25.0%), Federal Republic of Germany (92.3%), Great Britain (9.1%), Italy (75.8~), S~eden (400.0%), and Switzerland (28.6%) (see Table 3), these countnes, like all the Western European countries under study, experienced also decreases in the number of motorcycle fatalities between 1970 and 1987 (see Table 4). These decreases ranged from 2.6% for Great Britain to 70.4% for The Netherlands.
(b) Contrary to this development, the United States experienced an increase in the number of motorcycle fatalities between 1970 and 1987. In 1970, the total number of motorcycle fatalities in Western Europe as a whole was about 4.2
d
16
times that of the United States. By 1987, this number dropped to about 1.4 times; this was largely due to a decrease in the total number of motorcycle fatalities in Western Europe as a whole and to an increase in the United States
(see Table 4).
================================= Fatalities
Country 1970 1987 %-Change
A 367 241 -34.3% B 270 226 -16.3% DK 196 77 -60.7% F 3178 1595 -49.8% FRG 1553 1087 -30.0% GB 761 741 -2.6% I 2123 1253 -41. 0% NL 625 185 -70.4% N 55 49 -10.9% S 161 83 -48.4% CH 308 226 -26.6%
WE 9559 5763 -39.7%
USA 2280 4031 +76.8% =================================
Table 4: Motorcycle Fatalities in Western Europe and the United States for 1970 and 1987
5.2 Fatality Rates
Clearly, the absolute number of motorcycle fatalities does not give alone an objective norm for comparison. This may be attributed to differences among the countries under study such as differences in areas, population figures, topography, traffic laws, registered motorcycles, driving behavior, etc. [Carlquist, 1966, (5)]. For this reason, the following rate related.criteria are taken into consideration in this study:
(1) The number of motorcycle fatalities per 100000 inhabitants.
(2) . The number of fatalities per 10,000 registered motorcycles.
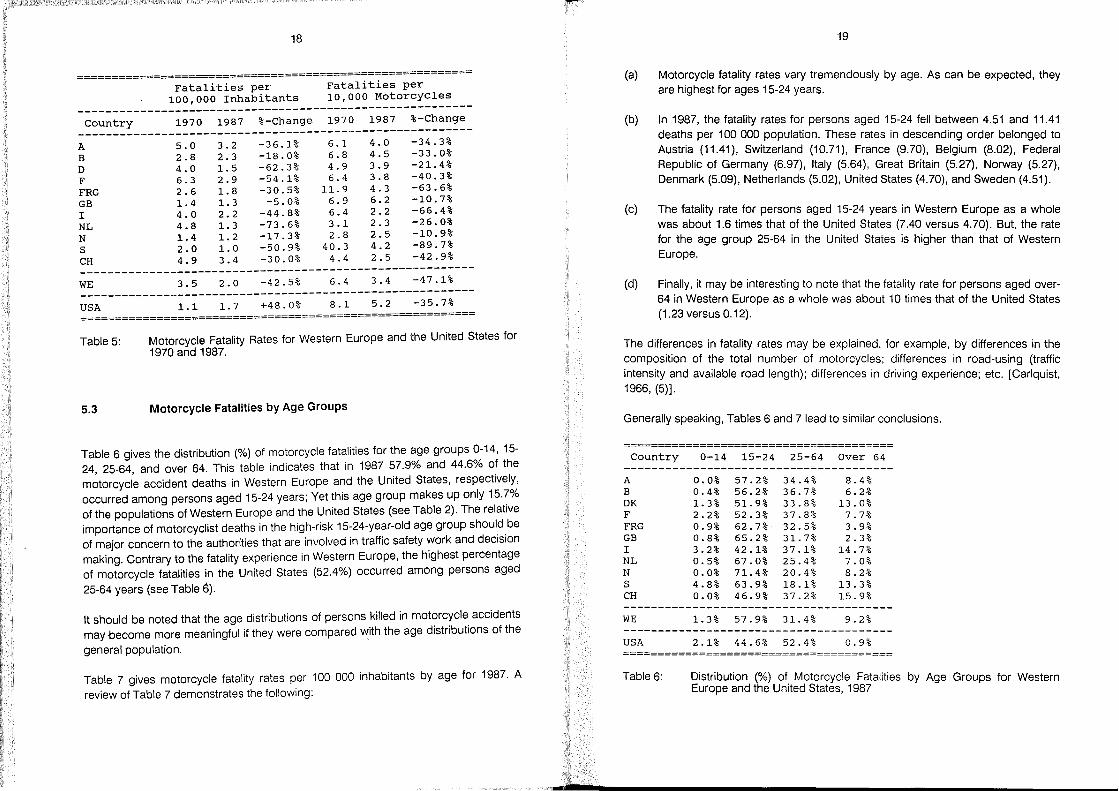
These rates are listed in Table 5 for 1970 and 1987, the end points of the time span under study. Examination ofTable 5 reveals the following:
17
(a) Between 1970 and 1987, all observed Western European countries experienced decreases in the number of motorcycle fatalities per 100 000 inhabitants. These reductions ranged from 5.0% for Great Britain to 62.3% for Denmark. Western Europe as a whole experienced a decrease of 42.5%. In contrast, the United States experienced an increase of 48.0% in the number of motorcycle fatalities per 100,000 inhabitants.
(b) In 1970, the rate of 3.5 motorcycle fatalities per 100000 inhabitants in Western Europe as a whole was about 3.2 times that of the United States. By 1987, this rate for Western Europe as a whole was still about 1.2 times that of the United States. This was largely due to a decrease of this rate in Western Europe and to the observed increase in the United States (-42.5% versus +48.0%) (see Table 5).
(c) Between 1970 and 1987, the Western European countries, as weil 'as the United States experienced reductions in the number of fatalities per 10 000 registered motorcycles.
(d) In 1970, the rate of 8.1 motorcycle fatalities per 10000 registered motorcycles in the United States was about 1.3 times that of Western Europe. By 1987, this rate for the United States was about 1.5 times that of Western Europe as a whole. This was largely due to a larger decrease in the fatality rate in Western Europe as compared to that of the United States (-47.1% versus -35.7%).
In general, it can be concluded from the fatality rates in Table 5 that the development in Western Europe was favorable with significant reductions of about 40% to 50% during the observed time period. This is true also for the development in the United States, especially related to fatalities per 10000 registered motorcycles. But, contrary to this development, the fatality rate per 100 000 inhabitants in the United States indicates with an increase of about 50% an unfavorable development. This increase may be due to the fact that the absolute numbers of motorcycle fatalities doubled in the USA between 1970 and 1987 (see Table 4), which may be understood considering the enormous increase in motorcycles during this period (see Table 3). However, it should not be forgotten that while the number of registered motorcycles increased also significantly in some European countries, these countries experienced decreases in the number of motorcycle fatalities (see Table 4) and fatalities per 100000 inhabitants (see Table 5).
18
========================================================= Fatalities per Fatalities per
100,000 Inhabitants 10,000 Motorcycles ---------------------------------------------------------Country 1970 1987 %-Change 1970 1987 %-Change
---------------------------------------------------------A 5.0 3.2 -36.1% 6.1 4.0 -34.3%
B 2.8 2.3 -18.0% 6.8 4.5 -33.0%
D 4.0 1.5 -62.3% 4.9 3.9 -21.4%
F 6.3 2.9 -54.1% 6.4 3.8 -40.3%
FRG 2.6 1.8 -30.5% 11.9 4.3 -63.6%
GB 1.4 1.3 -5.0% 6.9 6.2 -10.7%
I 4.0 2.2 -44.8% 6.4 2.2 -66.4%
NL 4.8 1.3 -73.6% 3.1 2.3 -26.0%
N 1.4 1.2 -17.3% 2.8 2.5 -10.9%
S 2.0 1.0 -50.9% 40.3 4.2 -89.7%
CH 4.9 3.4 -30.0% 4.4 2.5 -42.9% ---------------------------------------------------------WE 3.5 2.0 -42.5% 6.4 3.4 -47.1% ---------------------------------------------------------USA 1.1 1.7 +48.0% 8.1 5.2 -35.7% =========================================================
Table 5: Motorcycle Fatality Rates for Western Europe and the United States for 1970 and 1987.
5.3 Motorcycle Fatalities by Age Groups
Table 6 gives the distribution (%) of motorcycle fatalities for the age groups 0-14, 15-24, 25-64, and over 64. This table indicates that in 1987 57.9% and 44.6% of the motorcycle accident deaths in Western Europe and the United States, respectively, occurred among persons aged 15-24 years; Yet this age group makes up only 15.7% of the populations of Western Europe and the United States (see Table 2). The relative importance of motorcyclist deaths in the high-risk 15-24-year-old age group should be of major concern to the authorities that are involved in traffic safety work and decision making. Contrary to the fatality experience in Western Europe, the highest percentage of motorcycle fatalities in the United States (52.4%) occurred among persons aged
25-64 years (see Table 6).
It should be noted that the age distributions of persons killed in motorcycle accidents may become more meaningful if they were compared with the age distributions of the
general population.
Table 7 gives motorcycle fatality rates per 100 000 inhabitants by age for 1987. A review of Table 7 demonstrates the following:
1m
(a)
(b)
(c)
19
Motorcycle fatality rates vary tremendously by age. As can be expected, they are highest for ages 15-24 years.
In 1987, the fatality rates for persons aged 15-24 fell between 4.51 and 11.41 deaths per 100000 population. These rates in descending order belonged to Austria (11.41), Switzerland (10.71), France (9.70), Belgium (8.02), Federal Republic of Germany (6.97), Italy (5.64), Great Britain (5.27), Norway (5.27), Denmark (5.09), Netherlands (5.02), United States (4.70), and Sweden (4.51).
The fatality rate for persons aged 15-24 years in Western Europe as a whole was about 1.6 times that of the United States (7.40 versus 4.70). But, the rate for the age group 25-64 in the United States is higher than that of Western Europe.
(d) Finally, it may be interesting to note that the fatality rate for persons aged over-64 in Western Europe as a whole was about 10 times that of the United States (1.23 versus 0.12).
The differences in fatality rates may be explained, for example, by differences in the composition of the total number of motorcycles; differences in road-using (traffic intensity and available road length); differences in driving experience; etc. [Carlquist, 1966, (5)].
Generally speaking, Tables 6 and 7 lead to similar conclusions.
Country 0-14 15-24 25-64 Over 64
A 0.0% 57.2% 34.4% 8.4% B 0.4% 56.2% 36.7% 6.2% DK 1. 3% 51. 9% 33.8% 13.0% F 2.2% 52.3% 37.8% 7.7% FRG 0.9% 62.7% 32.5% 3.9% GB 0.8% 65.2% 31. 7% 2.3% I 3.2% 42.1% 37.1% 14.7% NL 0.5% 67.0% 25.4% 7.0% N 0.0% 71. 4% 20.4% 8.2% S 4.8% 63.9% 18.1% 13.3% CH 0.0% 46.9% 37.2% 15.9% ---------------------------------------WE
USA
Table 6:
1.3% 57.9% 31.4% 9.2%
2.1% 44.6% 52.4% 0.9%
Distribution (%) of Motorcycle Fatalities by Age Groups for Western Europe and the United States, 1987
20
========================================= Fatalities per 100 000 Inhabitants
-----------------------------------------Country 0-14 15-24 25-64 Over 64
-----------------------------------------A 0.00 11.41 2.11 1. 79
B 0.05 8.02 1. 65 1. 01 DK 0.11 5.09 0.99 1. 27
F 0.30 9.70 2.16 1. 66 FRG 0.11 6.97 1. 07 0.45
GB 0.06 5.27 0.83 0.19
I 0.40 5.64 1. 55 2.28
NL 0.03 5.02 0.62 0.71
N 0.00 5.27 0.49 0.59
S 0.26 4.51 0.35 0.74 CH 0.00 10.71 2.38 3.78 -----------------------------------------WE 0.15 7.40 1. 23 1. 23 -----------------------------------------USA 0.16 4.70 1.72 0.12 =========================================
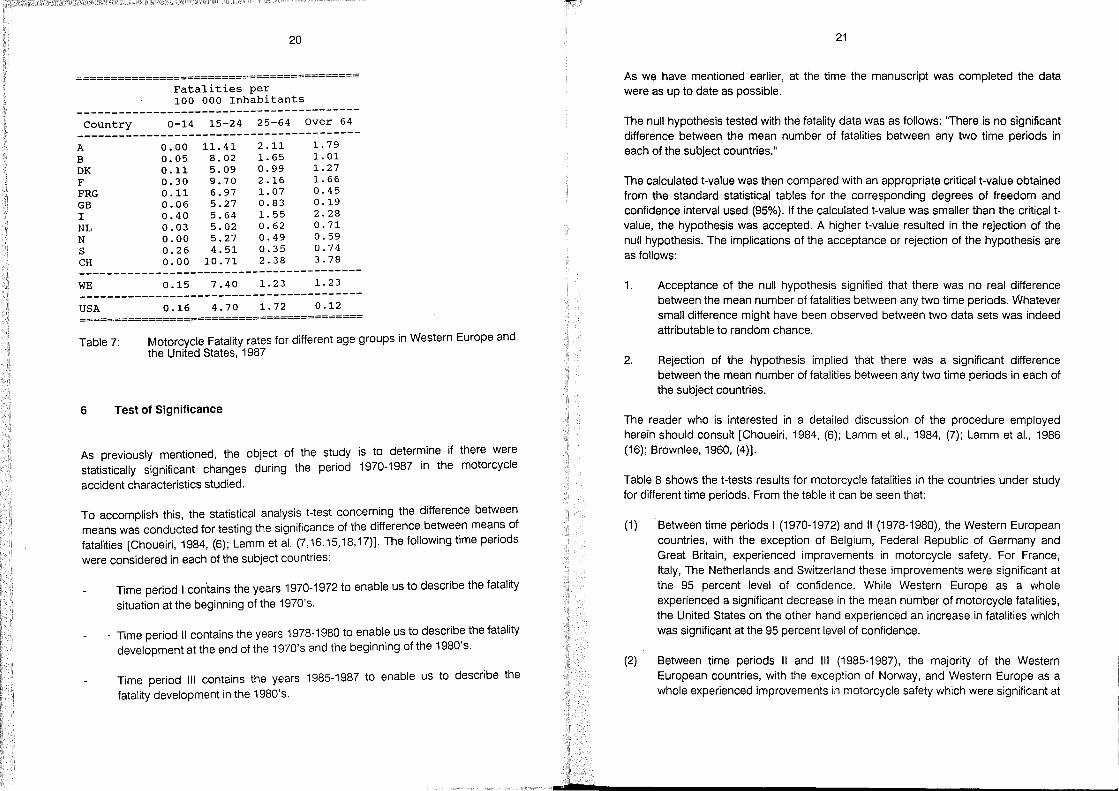
Table 7: Motorcycle Fatality rates for different age groups in Western Europe and the United States, 1987
6 Test of Significance
As previously mentioned, the object of the study is to determine if there were statistically significant changes during the period 1970-1987 in the motorcycle
accident characteristics studied.
To accomplish this, the statistical analysis t-test concerning the difference between means was conducted for testing the significance of the difference between means of fatalities [Choueiri, 1984, (6); Lamm et al. (7,16.15,18,17)]. The following time periods
were considered in each of the subject countries:
Time period I contains the years 1970-1972 to enable us to describe the fatality
situation at the beginning of the 1970's.
Time period 11 contains the years 1978-1980 to enable us to describe the fatality development at the end of the 1970's and the beginning of the 1980's.
Time period 111 contains the years 1985-1987 to enable us to describe the
fatality development in the 1980's.
L
21
As we have mentioned earlier, at the time the manuscript was completed the data were as up to date as possible.
The null hypothesis tested with the fatality data was as folIows: "There is no significant difference between the me an number of fatalities between any two time periods in each of the subject countries. "
The calculated t-value was then compared with an appropriate critical t-value obtained from the standard statistical tables for the corresponding degrees of freedom and confidence interval used (95%). If the calculated t-value was smaller than the critical tvalue, the hypothesis was accepted. A higher t-value resulted in the rejection of the null hypothesis. The implications of the acceptance or rejection of the hypothesis are as folIows:
1.
2.
Acceptance of the null hypothesis signified that there was no real difference between the mean number of fatalities between any two time periods. Whatever small difference might have been observed between two data sets was indeed attributable to random chance.
Rejection of the hypothesis implied that there was a significant difference between the mean number of fatalities between any two time periods in each of the subject countries.
The reader who is interested in a detailed discussion of the procedure employed herein should consult [Choueiri, 1984, (6); Lamm et al. , 1984, (7); Lamm et al. , 1986 (16); Brownlee, 1960, (4)).
Table 8 shows the t-tests results for motorcycle fatalities in the countries under study for different time periods. From the table it can be seen that:
(1) Between time periods I (1970-1972) and 11 (1978-1980), the Western European countries, with the exception of Belgium, Federal Republic of Germany and Great Britain, experienced improvements in motorcycle safety. For France, Italy, The Netherlands and Switzerland these improvements were significant at the 95 percent level of confidence. While Western Europe as a whole experienced a significant decrease in the mean number of motorcycle fatalities, the United States on the other hand experienced an increase in fatalities which was significant at the 95 percent level of confidence.
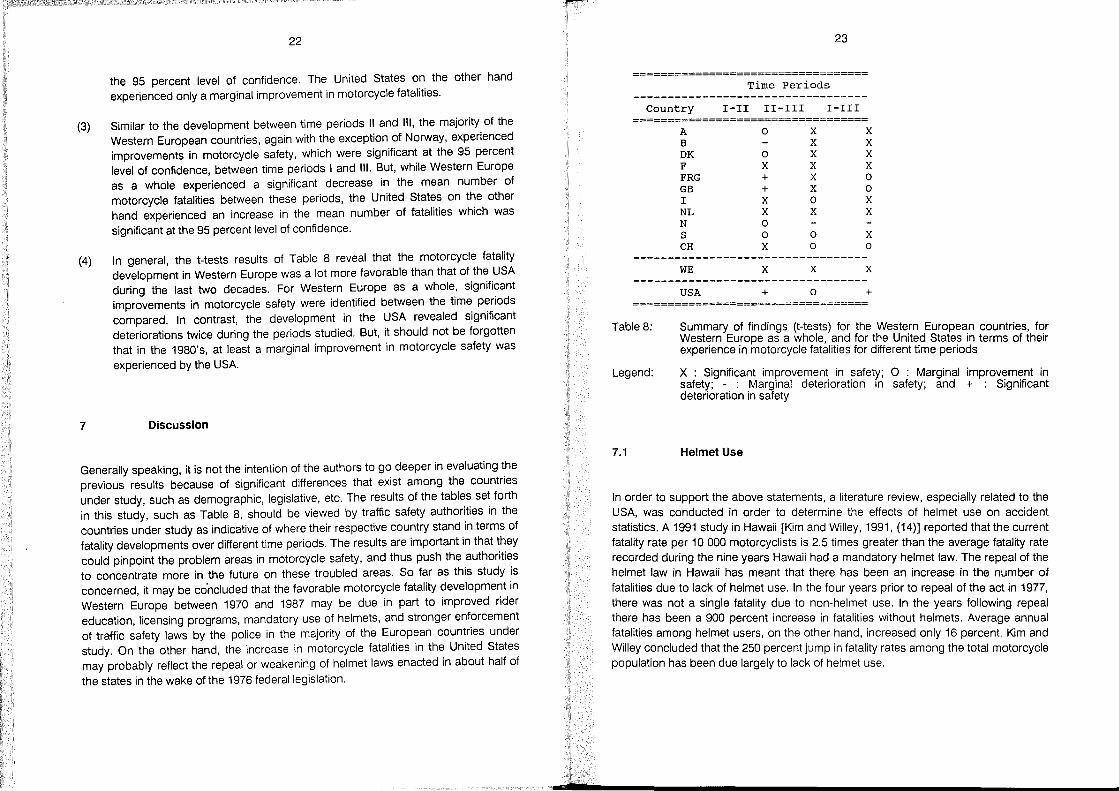
(2) Between time periods 11 and 111 (1985-1987), the majority of the Western European countries, with the exception of Norway, and Western Europe as a whole experienced improvements in motorcycle safety which were significant at
(3)
(4)
7
22
the 95 percent level of confidence. The United States on the other hand exper(enced only a marginal improvement in motorcycle fatalities.
Similar to the development between time periods 11 and 111, the majority of the Western European countries, again with the exception of Norway, experienced improvements in motorcycle safety, which were significant at the 95 percent level of confidence, between time periods land 111. But, while Western Europe as a whole experienced a significant decrease in the mean number of motorcycle fatalities between these periods, the United States on the other hand experienced an increase in the mean number of fatalities which was significant at the 95 percent level of confidence.
In general, the t-tests results of Table 8 reveal that the motorcycle fatality development in Western Europe was a lot more favorable than that of the USA during the last two decades. For Western Europe as a whole, significant improvements in motorcycle safety were identified between the time periods compared. In contrast, the development in the USA revealed significant deteriorations twice during the periods studied. But, it should not be forgotten that in the 1980's, at least a marginal improvement in motorcycle safety was
experienced by the USA.
Discussion
Generally speaking, it is not the intention of the authors to go deeper in evaluating the previous results because of significant differences that exist among the countries under study, such as demographic, legislative, etc. The results of the tables set forth in this study, such as Table 8, should be viewed by traffic safety authorities in the countries under study as indicative of where their respective country stand in terms of fatality developments over different time periods. The results are important in that they could pinpoint the problem areas in motorcycle safety, and thus push the authorities to concentrate more in the future on these troubled areas. So far as this study is concerned, it may be co'ncluded that the favorable motorcycle fatality development in Western Europe between 1970 and 1987 may be due in part to improved rider education, licensing programs, mandatory use of heimets, and stronger enforcement of traffic safety laws by the police in the majority of the European countries under study. On the other hand, the increase in motorcycle fatalities in the United States may probably reflect the repeal or weakening of heimet laws enacted in about half of
the states in the wake of the 1976 federallegislation.
L
23
================================== Time Per iods
Country I-I! I!-II! I-lI! ==================================
Table 8:
Legend:
A 0 X X B X X DK 0 X X F X X X FRG + X 0 GB + X 0 I X 0 X NL X X X N 0 S 0 0 X CH X 0 0
WE X X X
USA + o +
Summary of findings (t-tests) for the Western European countries, for Western Europe as a whole, and for the United States in terms of their experience in motorcycle fatalities for different time periods
X : Significant improvement in safety; 0 : Marginal improvement in safety; - : Marginal deterioration in safety; and + : Significant deterioration in safety
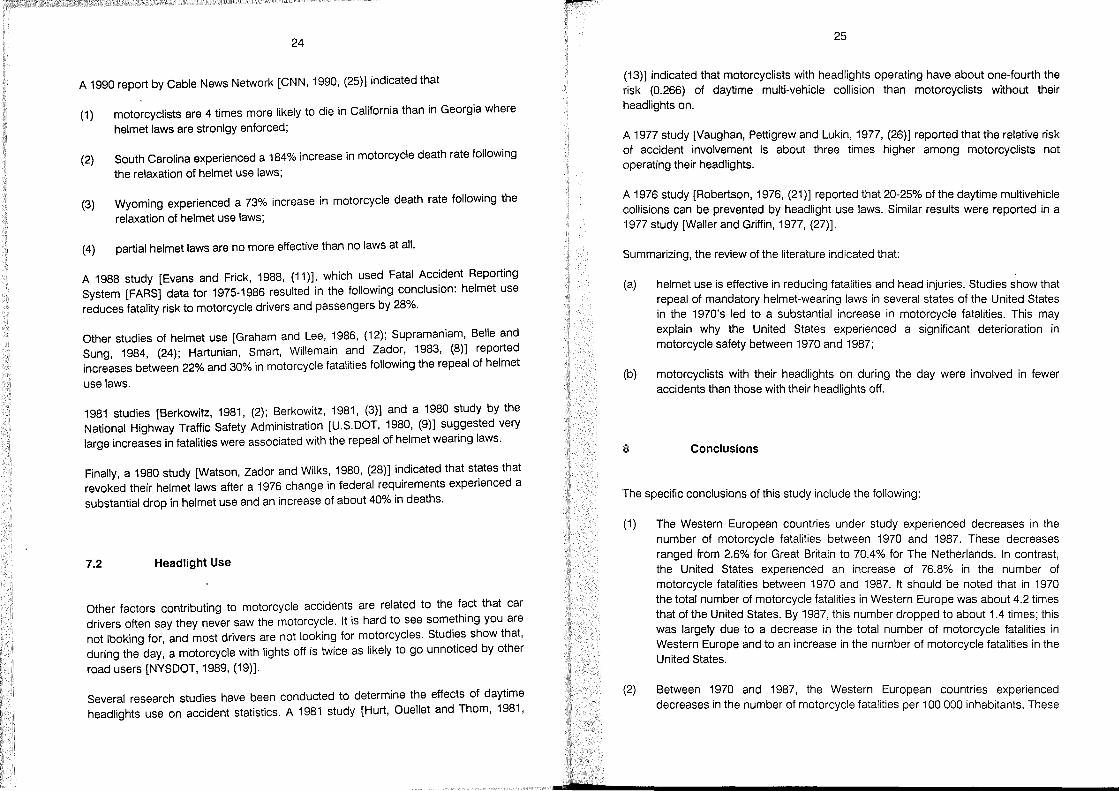
7.1 Heimet Use
In order to support the above statements, a literature review, especially related to the USA, was conducted in order to determine the effects of heimet use on accident statistics. A 1991 study in Hawaii [Kim and Willey, 1991, (14)] reported that the current fatality rate per 10000 motorcyclists is 2.5 times greater than the average fatality rate recorded during the nine years Hawaii had a mandatory heimet law. The repeal of the heimet law in Hawaii has meant that there has been an increase in the number of fatalities due to lack of heimet use. In the four years prior to repeal of the act in 1977, there was not a single fatality due to non-heimet use. In the years following repeal there has been a 900 percent increase in fatalities without heimets. Average annual fatalities among heimet users, on the other hand, increased only 16 percent. Kim and Willey concluded that the 250 percent jump in fatality rates among the total motorcycle population has been due largely to lack of heimet use.
24
A 1990 report by Cable News Network [CNN, 1990, (25)] indicated that
(1) motorcyclists are 4 times more likely to die in California than in Georgia where
heimet laws are stronlgy enforced;
(2) South Carolina experienced a 184% increase in motorcycle death rate tollowing
the relaxation of heimet use laws;
(3) Wyoming experienced a 73% increase in motorcycle death rate following the
relaxation of heimet use laws;
(4) partial heimet laws are no more effective than no laws at all.
A 1988 study [Evans and Frick, 1988, (11)], which used Fatal Accident Reporting System [FARS] data tor 1975-1986 resulted in the following conclusion: heimet use reduces fatality risk to motorcycle drivers and passengers by 28%.
Other studies of heimet use [Graham and Lee, 1986, (12); Supramaniam, Belle and Sung, 1984, (24); Hartunian, Smart, Willemain and Zador, 1983, (8)] reported increases between 22% and 30% in motorcycle fatalities following the repeal of heimet
use laws.
1981 studies [Berkowitz, 1981, (2); Berkowitz, 1981, (3)] and a 1980 study by the National Highway Traffic Safety Administration [U.S.DOT, 1980, (9)] suggested very large increases in fatalities were associated with the repeal of heimet wearing laws.
Finally, a 1980 study [Watson, Zador and Wilks, 1980, (28)] indicated that states that revoked their heimet laws after a 1976 change in federal requirements experienced a substantial drop in heimet use and an increase of about 40% in deaths.
7.2 Headlight Use
Other factors contributing to motorcycle accidents are related to the fact that car drivers often say they never saw the motorcycle. It is hard to see something you are not Iboking for, and most drivers are not looking for motorcycles. Studies show that, during the day, a motorcycle with lights off is twice as likely to go unnoticed by other
road users [NYSDOT, 1989, (19)].
Several research studies have been conducted to determine the effects of daytime headlights use on accident statistics. A 1981 study [Hurt, Ouellet and Thom, 1981,
r
L
25
(13)] indicated that motorcyclists with headlights operating have about one-fourth the risk (0.266) of daytime multi-vehicle collision than motorcyclists without their headlights on.
A 1977 study [Vaughan, Pettigrew and Lukin, 1977, (26)] reported that the relative risk of accident involvement is about three times higher among motorcyclists not operating their headlights.
A 1976 study [Robertson, 1976, (21)] reported that 20-25% of the daytime multivehicle collisions can be prevented by headlight use laws. Similar results were reported in a 1977 study [Waller and Griffin, 1977, (27)].
Summarizing, the review of the literature indicated that:
(a) heimet use is effective in reducing fatalities and head injuries. Studies s·how that repeal of mandatory helmet-wearing laws in several states of the United States in the 1970's led to a substantial increase in motorcycle fatalities. This may explain why the United States experienced a significant deterioration in motorcycle safety between 1970 and 1987;
(b) motorcyclists with their headlights on du ring the day were involved in fewer accidents than those with their headlights off.
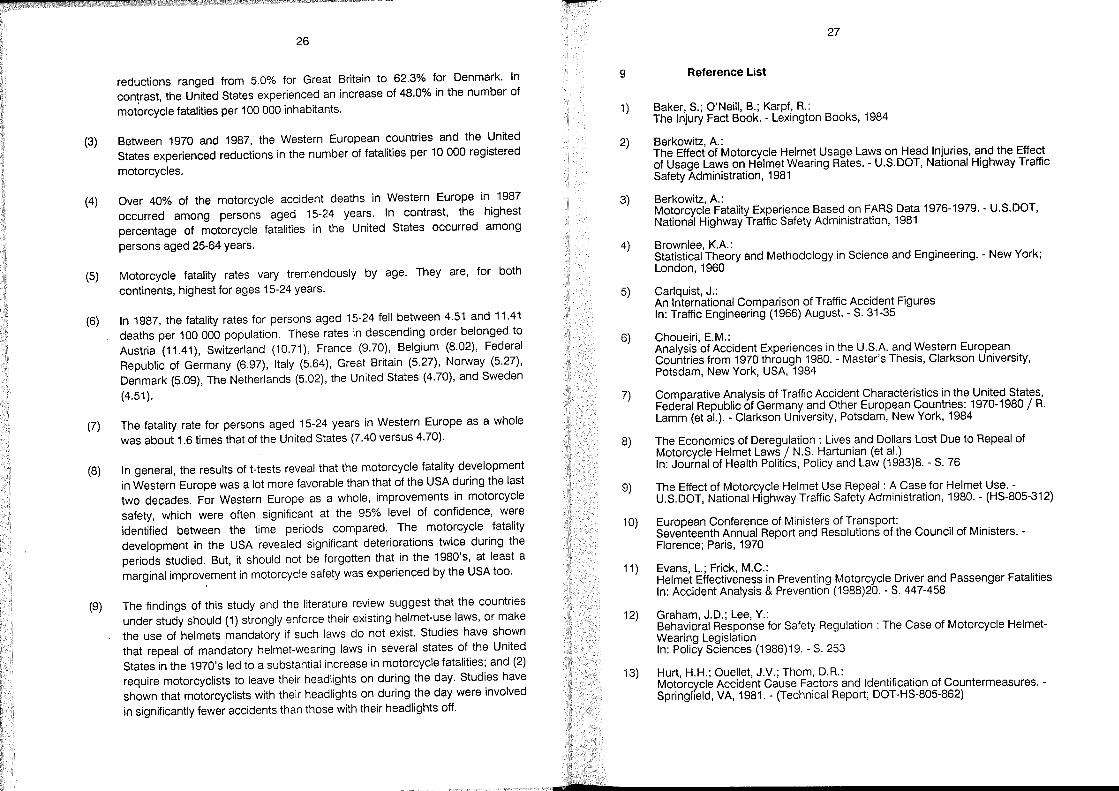
8 Conclusions
The specific conclusions of this study include the following:
(1) The Western European countries under study experienced decreases in the number of motorcycle fatalities between 1970 and 1987. These decreases ranged trom 2.6% for Great Britain to 70.4% for The Netherlands. In contrast, the United States experienced an increase of 76.8% in the number of motorcycle fatalities between 1970 and 1987. It should be noted that in 1970 the total number of motorcycle fatalities in Western Europe was about 4.2 times that of the United States. By 1987, this number dropped to about 1.4 times; this was largely due to a decrease in the total number of motorcycle fatalities in Western Europe and to an increase in the number of motorcycle fatalities in the United States.
(2) Between 1970 and 1987, the Western European countries experienced decreases in the number of motorcycle fatalities per 100 000 inhabitants. These
(3)
(4)
(5)
(6)
(7)
(8)
(9)
26
reductions ranged from 5.0% for Great Britain to 62.3% for Denmark. In con~rast, the United States experienced an increase of 48.0% in the number of
motorcycle fatalities per 100 000 inhabitants.
Between 1970 and 1987, the Western European countries and the United States experienced reductions in the number of fatalities per 10000 registered
motorcycles.
Over 40% of the motorcycle accident deaths in Western Europe in 1987 occurred among persons aged 15-24 years. In contrast, the highest percentage of motorcycle fatalities in the United States occurred among
persons aged 25-64 years.
Motorcycle fatality rates vary tremendously by age. They are, for both
continents, highest for ages 15-24 years.
In 1987, the fatality rates for persons aged 15-24 fell between 4.51 and 11.41 deaths per 100000 population. These rates in descending order belonged to Austria (11.41), Switzerland (10.71), France (9.70), Belgium (8.02), Federal Republic of Germany (6.97), Italy (5.64), Great Britain (5.27), Norway (5.27), Denmark (5.09), The Netherlands (5.02), the United States (4.70), and Sweden
(4.51).
The fatality rate for persons aged 15-24 years in Western Europe as a whole was about 1.6 times that of the United States (7.40 versus 4.70).
In general, the results of t-tests reveal that the motorcycle fatality development in Western Europe was a lot more favorable than that of the USA during the last two decades. For Western Europe as a whole, improvements in motorcycle safety, which were often significant at the 95% level of confidence, were identified between the time periods compared. The motorcycle fatality development in the USA revealed significant deteriorations twice du ring the periods studied. But, it should not be forgotten that in the 1980's, at least a marginal improvement in motorcycle safety was experienced by the USA too.
The findings of this study and the literature review suggest that the countries under study should (1) strongly enforce their existing helmet-use laws, or make the use of heimets mandatory if such laws do not exist. Studies have shown that repeal of mandatory helmet-wearing laws in several states of the United States in the 1970's led to a substantial increase in motorcycle fatalities; and (2) require motorcyclists to leave their headlights on during the day. Studies have shown that motorcyclists with their headlights on during the day were involved
in significantly fewer accidents than those with their headlights off.
9
1)
2)
3)
4)
5)
6)
7)
8)
9)
10)
11 )
12)
13)
27
Reference List
Baker, S.; O'Neill, S.; Karpf, R.: The Injury Fact Book. - Lexington Books, 1984
Berkowitz, A.: The Effect of Motorcycle Heimet Usage Laws on Head Injuries, and the Effect of Usage Laws on Heimet Wearing Rates. - U.S.DOT, National Highway Traffic Safety Administration, 1981
Berkowitz, A.: Motorcycle Fatality Experience Based on FARS Data 1976-1979. - U.S.DOT, National Highway Traffic Safety Administration, 1981
Brownlee, KA: Statistical Theory and Methodology in Science and Engineering. - New York; London, 1960
Carlquist, J.: An International Comparison of Traffic Accident Figures In: Traffic Engineering (1966) August. - S. 31-35
Choueiri, E.M.: Analysi.s of Accident Experiences in the U.SA and Western European Countnes from 1970 through 1980. - Master's Thesis, Clarkson University, Potsdam, New York, USA, 1984
Comparative Analysis of Traffic Accident Characteristics in the United States Federal Republic of Germany and Other European Countries: 1970-1980/ R. Lamm (et al.). - Clarkson University, Potsdam, New York, 1984
The Economics of Deregulation : Lives and Dollars Lost Due to Repeal of Motorcycle Heimet Laws / N.S. Hartunian (et al.) In: Journal of Health Politics, Policy and Law (1983)8. - S. 76
The Effect of Motorcycle Heimet Use Repeal : A Case for Heimet Use. -U.S.DOT, National Highway Traffic Safety Administration, 1980. - (HS-805-312)
European Conference of Ministers of Transport: Seventeenth Annual Report and Resolutions of the Council of Ministers. -Florence; Paris, 1970
Evans, L.; Frick, M.C.: Heimet Effectiveness in Preventing Motorcycle Driver and Passenger Fatalities In: Accident Analysis & Prevention (1988)20. - S. 447-458
Graham, J.D.; Lee, Y.: Behavioral Response for Safety Regulation: The Case of Motorcycle HelmetWearing Legislation In: Policy Sciences (1986)19. - S. 253
Hurt, H.H.; Ouellet, J.V.; Thom, D.R.: Motorcycle Accident Cause Factors and Identification of Countermeasures. -Springfield, VA, 1981. - (Technical Report; DOT-HS-805-862)
28
14) Kim, K.; Willey, M.R.: Improving Motorcycle Safety in Hawaii: Recommendations Based Upon a SUJV~y of Motorcycle qwners and Operators; Paper presented at 70th Annual Meeting of Transportatlon Research Board, Washington, D.C. January 13-17 1991 ' ,
15) Lamm, R.; Choueiri, E.M.; Kloeckner, J.H.: Accidents in the U.S. and Europe: 1970-1980 In: Accident Analysis & Prevention (1985)17. - S. 429-438
16) Lamm, R.; Choueiri, E.M.; Kloeckner, J.H.: Comparative Analysis of Traffic Accident Characteristics in the United States Federal Republic ~f Germany and Other European Countries - Extension up 'to 1983 and Elaboration of a Second Edition. - Clarkson University, Potsdam, New York, 1986
17) Lamm, R.; Choueiri, E.M.: Comparison of the Accident Situation in the U.S.A. and Western Eurape fram 1970 to 1983 In: Bulletin of the Greek Association of Professional and Surveying Engineers (1990)93. - S. 10-17
18) Lamm, R.; Choueiri, E.M.; Kloeckner, J.H.: Experiences in Fatalities by Age and Road User Groups - USA vs. Western Europe, 1970-1983 In: Ro.ads and Traffic Safety on Two Continents, Gothenburg : Proceedings / Swedlsh Road and Traffic Research Institute. - Linkoeping, Sweden, 1988. - S. 128-144. - (VTI-rapport; 331A)
19) Motorcycle Operator's Manual / New York State Department of Motor Vehicles. - New York, 1989
20) O'Flaherty, C.A.: Traffic Planning and Engineering. - Edward Arnold (Publishers) Ud., 1986
21) Robertson, L.S.: An Instance of Effective Legal Regulation: Motorcyclist Heimet and Daytime Headlamp Laws In: Law & Society Review (1976)10. - S. 467-477
22) Statistical Abstract of the United States 1990. - 110th Ed. / U.S. Department of Commerce
23) Statistics of Road Traffic Accidents in Europe. - Editions up to 1990 / United Nations. - New.York; Geneva
24) Supramaniam, V.; Belle, G.v.; Sung, J.F.C.: Fatal ~otorcycle Ac;:cidents and. Heimet Laws in Peninsular Malaysia In: AccldentAnalysls & Preventlon (1984)16. - S. 157-162
25) Television Report on Heimet Use / Cable News Network (CNN). - Atlanta, Georgia, USA, November 14, 1990
;; ,
29
26) Vaughan, R.G.; Pettigrew, K.; Lukin, J.: Motorcycle Crashes: A Level Two Study. - New South Wales: Traffic Accident Research Unit, Dept. of Motor Transport, 1977
27) Waller, P.F.; Griffin, L.I.: The Impact of a Motorcycle Lights-on Law In: Proceedings of the American Association for Automotive Medicine. -Vancouver, 1977. - S. 14-25
28) Watson, G.S.; Zador, P.L.; Wilks, A.: The Repeal of Heimet Use Laws and Increased Motorcycle Mortality in the United States, 1975-1978 In: American Journal of Public Health (1980)70. - S. 579-585

F
The Status of Motorcycle Safety in the USA
Peter J. Fassnacht
Garl D. Spurgeon
Elizabeth A. Weaver
Motorcycle Safety Foundation, Irvine
USA
4
L
33
1 Abstract
This is areport of the status of motorcycle safety in the USA. It provides a statistical summary of the accident and fatality expereince of the last ten years and traces the development of safety countermeasures in rider education, operator licensing and public awareness. An overview of the regulations that exist (1990) that govern motorcycle operation and how they influence program efforts, is provided. The report will explain the role and function of the Motorcycle Safety Foundation in providing the leeadership and technical and financial support for the establishment of a network of productive safety programs in rider education, licensing and public awareness.
The Motorcycle Safety Foundation's purpose is improving the safety of motorcyclists on the nation's streets and highways. In an attempt to reduce motorcycle accidents and injuries, the Foundation has programs in rider education, licensing improvement, public information, and statistics. These programs are designed for both motorcyclists and motorists. A national non-profit organization, MSF is sponsored by the US distributors of Handa, Yamaha, Kawasaki, Suzuki and BMW motorcylces.
34
2 The Status fo Motorcycle Safety in the USA
The Motorcycle Safety Foundation has now been in existence for 18 years. A long time? That's almost twice as long as the average motorcyclist has been riding. But taken in the context of motorcycle history and the challenge of motorcycle safety, it is still a short time. Our goal - improving motorcycle safety - is simple to express, but complex and chalenging to address.
By looking back at MSF's 18 years, we're really looking back not just at what the organization has done, but what the entire motorcycle safety community has achieved. It is one of those instances where you can't separate the two. It's not the story of a small group of individuals, isolated and working in a vacuum, but a story about people - a large, varied group of dedicated motorcyclists and safety professionals hard at work all over the United States.
It's also a story about partnerships - some in the contractual sense - most in the form of willing collaboration in the pursuit of a common goal. This network of collaborators includes the Instructors and Chief Instructors trained throughout the years, training sponsors, the assistance of the funded state programs, and all the branches of the military who have contrubuted to the training of over 824 000 riders who willingly participated in beneficial motorcycle safety programs!
It includes the enthusiastic support by uncounted indivuals, motorcycle dealers, police departments, community organizations, schools, media, and motorcycle clubs.
It also includes the more formal relations which have existed with agencies such as the National Highway Traffic Safety Administraition, the Department of Defense, the American Association of Motor Vehicle Administrators, the American Motorcyclist Association, and various state agencies who have addressed motorcycle safety issues in licensing improvement, rider education, public awareness or research.
These years point out how a community, in this case motorcycling, can pool its human and financial resources to address its needs - helping preserve lives and making motorcycling GI better, more enjoyable experience.
What MSF has done best through the years is provide leadership for these resources in the form of key program objectives and support of all those who are trying to achieve these goals. The key objectives have been there form the start haven't changed since day one:
To make quality rider education courses avaHable for new and experienced riders;
35
To encourage and assist states in adopting effective motorcycle operator licensing practises;
To expand the collection of data and information on motorcycle safety;
To inform the public about the safety needs and responsibilities of both motorcyclists and the car-driving public; and
To represent the industry's safety interests to state and federal governments.
Safety in motorcycling often deals with attitudes. As such, the Motorcycle Safety Foundation's tasks have often taken on another form of leadership - leadership in altering of attitudes toward motorcycle safety.
These specific goals have brought many results, expansions, and changes both for MSF and the field of motorcycle safety. The short list includes several offive moves, the wxpansion to regional office support, and recent" reorganization as resource offices; program changes form BRC to MRC to MRC:RSS, BBP to ERC, to the withdrawal of Harley-Davidson as a board member and the joining of BMW; licensing tests and materials such as MOST, MOST 11, Alternate MOST, MIT, MOM; creation of state-funded programs and state motorcycle safety coordinators, and the State Motorcycle Safety Coordinators Council; International Safety Conferences; and public awareness campaigns such as: Sharing the Roadway, voluntary heimet use "Get it on!", Motorcycle Awareness and You (MAY), "Learn to Ride Before your Ride", and currently "The More You Know, The Better it Gets."
A hall mark of MSF programs has always been a strong emphasis on research. While the first rider education program released, the Beginning Rider Course, was largely based on the best information available at the time, its successor, the Motorcycle Rider Course, was truly a research-based program.
The components that made up the MRC, first released in 1976, were the Motorcycle Task Analysis, its companion Photographic Analysis, Instructional Objectives tor Motorcycle Satety Education" and D.O.T.'s Curriculum Specitications. MSF buHt on this solid foundation with validation research and the course was amended accordingly. As the years went by volumes of results from many users, program sponsors and program coordinators were gathered; work was done for NHTSA by Harry Hurt and research team; and the stage was set for the development of the Motorcycle RiderCourse: Riding and Street Skills course. Released in 1986, the MRC:RSS forms the mainstay of rider education programs throughout the nation today and at military bases here and overseas.
36
The experienced rider was not overlooked. In 1979, MSF first pilot-tested a course for riders with a minimum of three month' experience. The Better Biking Program was released in 1980 after evaluations and alteration. Today the program of choice for rider improvement is the Interim Experienced Rider Course, a companion program to the Riding and Street Skills Course (MRC:RSS). It takes advantage of the new programming, audiovisuals, and instructiional/coaching techniques developed for the MRC:RSS. Annually, one-third of all course graduates participate in the experienced rider program, most of them trained in the military.
In 1988, an all newe Experienced RiderCourse with a differnt, direct approach tailored to the needs of the experienced rider, was released.
A thorough analysis of the Foundations's rider education efforts is presented in the work of Elizabeth Weaver entitled Motorcycle safety Education in the United States (2). This paper offers details on the development of the specific curricula used and the implementation of these programs.
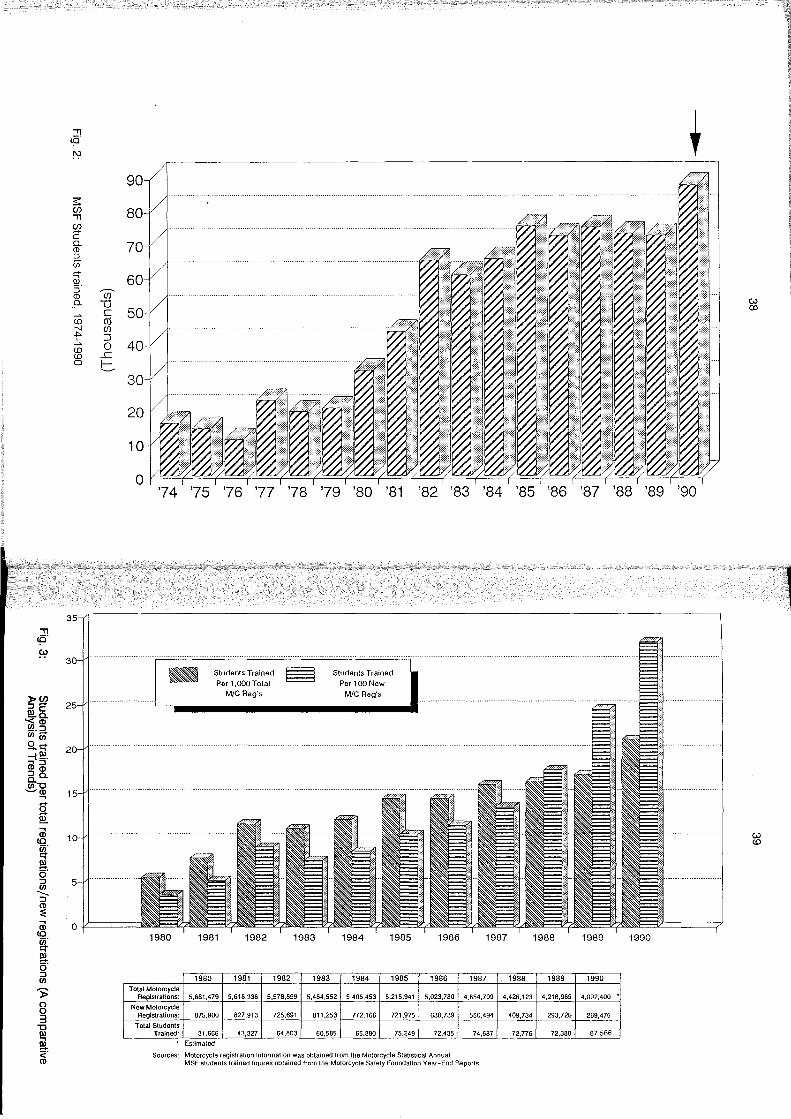
As of June 1991, 40 states have enacted legislation to fund state-coordinated rider education and safety programs. Funding for the coordination of rider education efforts is vital to making training available to the large and diverse popilation that makes up the United States of America. A common element in these funding laws is the dedication of funds from motorcycle registrations or other motorcyclist fees to the rider education program, separate from other state tax-based activities. The result is a program funded by motorcyclists for the benefit of the motorcycling community with the assistance of astate agency.
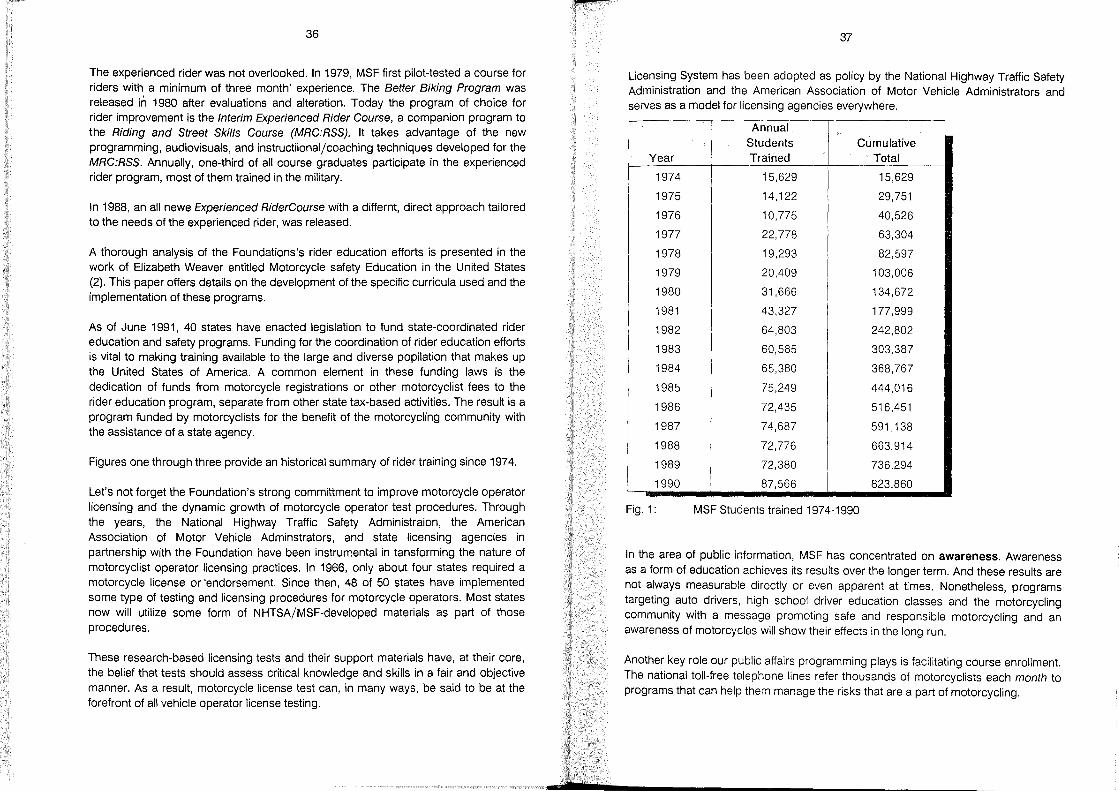
Figures one through three provide an historical summary of rider training since 1974.
Let's not forget the Foundation's strong committment to improve motorcycle operator Iicensing and the dynamic growth of motorcycle operator test procedures. Through the years, the National Highway Traffic Safety Administraion, the American Association of Motor Vehicle Adminstrators, and state Iicensing agencies in partners hip with the Foundation have been instrumental in tansforming the nature of motorcyclist operator licensing practices. In 1966, only about four states required a motorcycle license or ·endorsement. Since then, 48 of 50 states have implemented some type of testing and licensing procedures for motorcycle operators. Most states now will utilize some form of NHTSA/MSF-developed materials as part of those procedures.
These research-based licensing tests and their support materials have, at their core, the belief that tests should assess critical knowledge and skills in a fair and objective manner. As a result, motorcycle Iicense test can, in many ways, be said to be at the forefront of all vehicle operator license testing.
37
Licensing System has been adopted as policy by the National Highway Traffic Safety Administration and the American Association of Motor Vehicle Administrators and serves as a model for Iicensing agencies everywhere.
Annual Students Cumulative
Year Trained Total
1974 15,629 15,629
1975 14,122 29,751
1976 10,775 40,526
1977 22,778 63,304
1978 19,293 82,597
1979 20,409 103,006
1980 31,666 134,672
1981 43,327 177,999
1982 64,803 242,802
1983 60,585 303,387
1984 65,380 368,767
1985 75,249 444,016
1986 72,435 516,451
1987 74,687 591,138
1988 72,776 663,914
1989 72,380 736,294
1990 87,566 823,860
Fig.1: MSF Students trained 1974-1990
In the area of public information, MSF has concentrated on awareness. Awareness as a form of education achieves its results over the longer term. And these results are not always measurable directly or even apparent at times. Nonetheless, programs targeting auto drivers, high school driver education c1asses and the motorcycling community with a message promoting safe and responsible motorcycling and an awareness of motorcycles will show their effects in the long run.
Another key role our public affairs programming plays is facilitating course enrollment. The national toll-free telephone lines refer thousands of motorcyclists each month to programs that can help them manage the risks that are apart of motorcycling.
." <p' ~
>Cf) i6 c -a. '<m ~'~ 0 .... =i~, ""'::J mm ::Ja. a.-C ~m
""' .... Sl. !l1..
""' m IQ,
~ ~. o ::J Ul -.... ::J m ::E ä3 IQ,
~ !!l-0' ::J Ul
» 8 3 -c
~ ~
." <p' !'?
s: Cf) ." Cf)
C a. co ::J ur .... öl 5' (j) co a. U ~ c «) ro o--J (f)
f" ::J ~ 0 «) «) ..c 0 C
90
80
70
60
50 I/I
40
30
20
10
O. '74 '75 '76 '77 '78 '79 '80 '81
- Students Trained ~ Per 1,000 Tolal E:::::::::l
M/C Reg',
Sludents Trained
Per 100 New M/C Reg',
1980 1981 1982 1983 1984 1985
1980 1981 1982 1983 1984 1985 Total Motorcycle
Aeglslratlons: 5,681,479 5,618,336 5,578,859 5,484,552 5,405,453 5,215,941
New MOlorcycle Registratlons: 875,900 827,913 725,691 811,253 772,166 721,975
Total Students Tralned: 31,666 43,327 64,803 60,585 65,380 75,249
Estimated
~
~}I~I~il~}I~I~}I~········I~I~····1 ' M ~ ~ 8 ~ ~ ~ B ~I
'82 '83 '84 '85 '86 '87 '88 '89 '90
1986 1987 1988 1989 1990
1986 1987 1988 1989 1990
5,023,780 4,654,709 4,426,123 4,218,985 4,092,400 •
630,739 550,494 409,734 293,726 269,475
72,435 74,687 72,776 72,380 87,566
Sourees: MOlorcycle regislration Information was obtained from the Motorcycle Slatistical AnnuaL MSF studenls trained {igures obtained Irom the Motorcycle Salely Foundation Year-End Reporls.
w (Xl
w «)
-1
40
A great deal can be learned from the past. To loosely paraphrase an old saying: To do otherwise destines us to live in the past. In this self-analysis we can adk: How have we done? .. How can the gains made in the past be extended in the years ahead. What's left to be done, and how are we going to do it? .. Are new goals needed? and, What can be learned from past efforts that achieved only limited success? These questions, and more, need to be answered to keep our future on the right track.
Experience, in this context, is a valuable resource. And it is this experience, and carefully gathered input from many sources, that will be put to good use in our future work.
While the achievements seen over the past 18 years are notable and worthy of high praise, the fundamental reason for the existence of motorcycle safety programming still100ms over uso
At MSF's inception motorcycling fatalities were on the rise, and at a rate causing great concern. Even five years later, the Foundation reported, in frustration, a 23% increase in motorcycle accident fatalities.
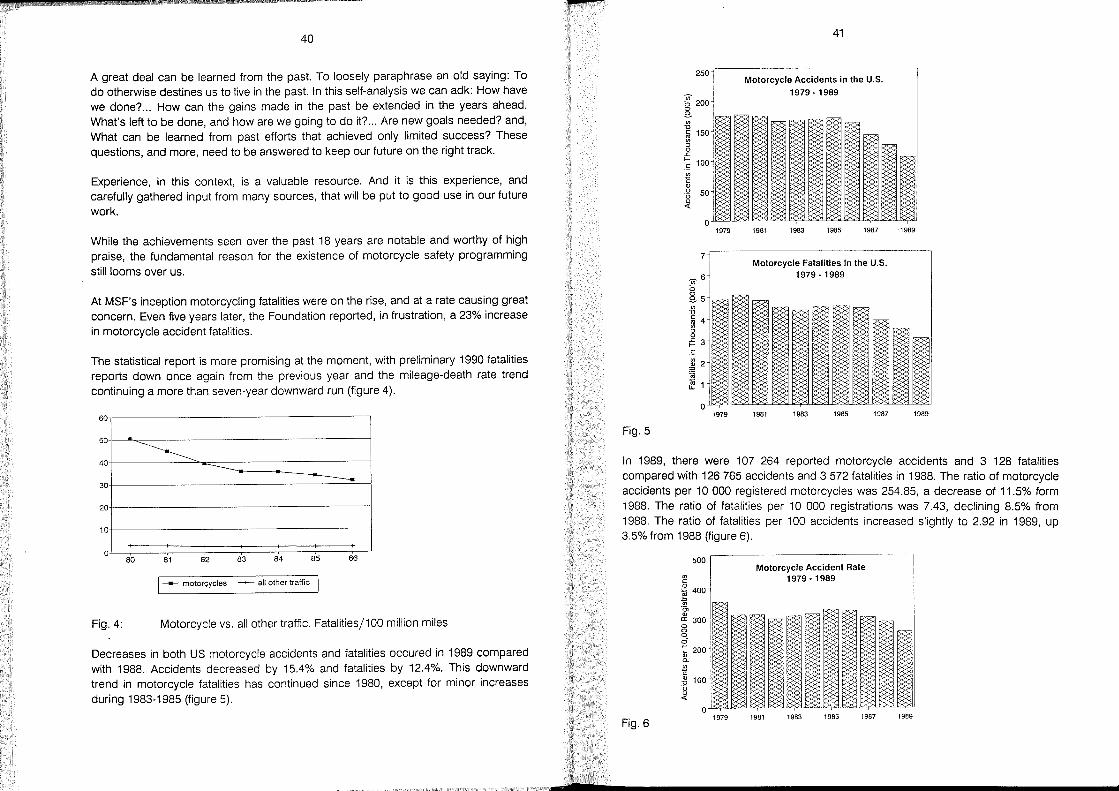
The statistical report is more promising at the moment, with preliminary 1990 fatalities reports down once again from the previous year and the mileage-death rate trend continuing a more than seven-year downward run (figure 4).
60~------------------------------------'
50-~
40 ~~.~ ______ _
-------30
20i---------------------------------------~
10i---------------------------------------~
0~~8;0====~81=====8~2====~83=====8~4====~85=====8~6~
1 ____ metercycles -- all ether traffic 1
Fig.4: Motorcycle VS. all other traffic. Fatalities/100 million miles
Decreases in both US motorcycle accidents and fatalities occured in 1989 compared with 1988. Accidents decreased by 15.4% and fatalities by 12.4%. This downward trend in motorcycle fatalities has continued since 1980, except for minor increases during 1983-1985 (figure 5).
250
<n 0 200 0 e.
"' u c: 150 '" "' " 0 .c: f-
100 ." j!J c: Q) u 50-'0 u <(
0 1979
7
_6 "' 0 0 e.5
'" u c: 4 '" "' ::J 0 .c: 3 f-
." "' 2 Q)
E
~ 1 CL
0 1979
Fig.5
41
Motorcycle Accidents in the U.S.
1979 - 1969
1981 1983 1985 1987
Motorcycle Fatalities in the U.S. 1979 -1969
1981 1983 1985 1987
1989
1989
In 1989, there were 107 264 reported motorcycle accidents and 3 128 fatalities compared with 126 765 accidents and 3 572 fatalities in 1988. The ratio of motorcycle accidents per 10 000 registered motorcycles was 254.85, a decrease of 11.5% form 1988. The ratio of fatalities per 10 000 registrations was 7.43, declining 8.5% from 1988. The ratio of fatalities per 100 accidents increased slightly to 2.92 in 1989, up 3.5% from 1988 (figure 6).
Fig.6
"' c:
500
2400 ~ 'Öl Q)
0: 300
g <5 :: 200 Q) a. j!J c: ~ 100 '0 :t
o 1979
Motorcycle Accident Rate 1979 -1969
1981 1983 1985 1987 1989

Fig.6
14
~ 12 .2 1ii tl 10 .", Ql
~ 8 o o ~ 6 :;;
.i 4
'" ~ 2
1979
42
Motorcycle Fatality Rate 1979 - 1989
1961 1963 1965 1967 1969
Statistics are obtained directly from all 50 states and the District of Columbia. When a state's accident figures are not available, MSF provides estimates based on historical trends. Criteria for reporting accidents to the police vary from state to state. Accidents with only minor property damage and those occuring on non-public or private property are sometimes not reported.
For 1989, the number of registered motorcycles was 4 208 986 - a drop of 4.4% from 1988. Registration figures provided by states may include vehicles other than motorcycles such as mopeds and off-highway vehicles. The vehicle types that are included in registration totals may not be comparable with those included in accident and fatality reports for each state.
Even with this encouraging news we know where the future lies. l1's in the continued pursuit of programming and public awareness to reduce the toll still further. To achieve this objective we all have to keep striving and collaborating. The Foundation will be there to the limits of its capabilities, armed with the strong lessons learned through experience and with the confidence in the trust that exists in the motorcycling community that these achievements can be made.
3
(1 )
(2)
4
43
Reference List
Spurgeon, C.: A Motorcycle Operator Licensing System In: The Human Element: 1990 International Motorcycle Safety Conference, Grosvenor Resort, Orlando, USA, Oct. 31 - Nov. 3, 1990; Proceedings / Motorcycle Safety Foundation. - Irvine, Calif., 1990. - Voll. - P. 2.52-2.74
Weaver, E.: Motorcycle Safety Education in The United States In: The Human Element: 1990 International Motorcycle Safety Conference, Grosvenor Resort, Orlando, USA, Oct. 31 - Nov. 3, 1990; Proceedings / Motorcycle Safety Foundation. - Irvine, Calif., 1990. - Voll. - P. 4.59-4.74
Appendixes
A summary of legislation affecting motorcycling and safety programs is provided by the following appendixes:
I. State Motorcycle Operator Licensing - 1991 11. State Motorcycle Equipment Requirements 111. State Motorcycle Rider Education Legislation - 1990
.t ; 2 u
44
\fZ~ , MOTORCYCLE SAFETY F~!;!~,~~!~~~ :W: 2 Jenner Street, Suite 150
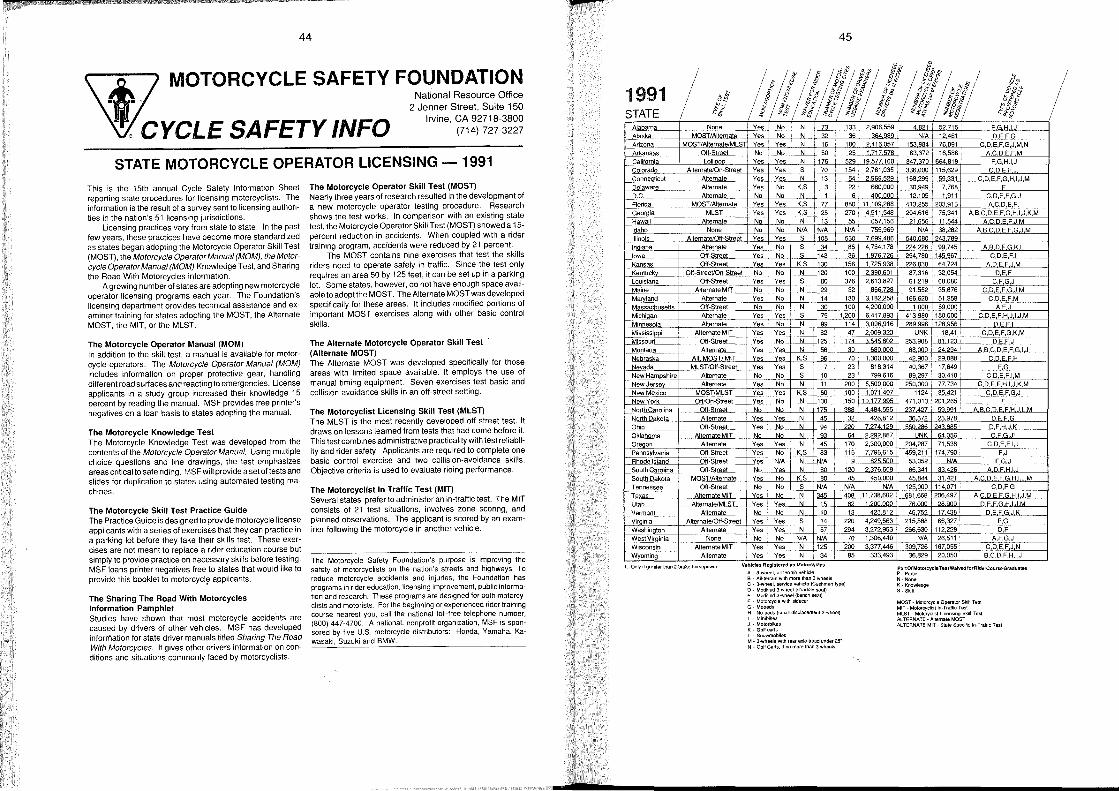
I. CYCLE SAFETY INFO Irvine, ~~;:~~~:;~~$ STATE MOTORCYCLE OPERATOR LlCENSING - 1991
This is the 15th annual Cycle Safety Information Sheet reporting state procedures for licensing motorcyclists. The information is the result of a survey se nt to licensing authoriti es in the nation's 51 licensing jurisdictions.
Licensing practices vary fram state to state. In the past few years, these practices have become more standardized as states began adopting the Motorcycle Operator Skill Test (MOST), the Motorcycle Operator Manual (MOM), the Motoreycle Operator Manual (MOM) Knowledge Test, and Sharing the Road With Motorcycles information.
A growing number of states are adopting new motorcycle operator licensing programs each year. The Foundation's licensing department provides technical assistance and examiner training for states adopting the MOST, the Alternate MOST, the MIT, or the MLST.
The Motorcycle Operator Manual (MOM) In addition to the skill test, a manual is available for motorcycle operators. The Motorcycle Operator Manual (MOM) includes information on proper protective gear, handling different road surtaces and reacting to emergeneies. License applicants in a study graup increased their knowledge 15 percent by reading the manual. MSF provides free printer's negatives on a loan basis to states adopting the manual.
The Motorcycle Knowledge Test The Motorcycle Knowledge Test was developed from the contents of the Motorcycle Operator Manual. Using multiple choice questions and line drawings, the test emphasizes areas critical to safe riding. /.1SF will provide a set of tests and slides for duplication to states using automated testing machines.
The Motorcycle Skill Test Praclice Guide The Practice Guide is designed to provide motorcycle license applicants with aseries of exercises that they can practice in a parking lot before they take their skills test. These exereises are not meant to replace a rider education course but simply to provide practice on necessary skills before testing. MSF loans printer negatives free to states that would like to pravide this booklet to motorcycl~ applicants.
The Sharing The Road With Motorcycles Information Pamphlet Studies have shown that most motorcycle accidents are caused by drivers of other vehicles. MSF has developed inforn'lation for state driver manuals titled Sharing The Road With Motorcycles. It gives other drivers information on conditions and situations commonly faced by motorcyclists.
The Motorcycle Operator Skill Test (MOST) Nearly three years of research resulted in the development of a new motorcycle operator testing pracedure. Research shows the test works. In comparison with an existing state test, the Motorcycle Operator Skill Test (MOST) showed a 15-percent reduction in accidents. When coupled with a rider training program, accidents were reduced by 21 percent.
The MOST contains nine exercises that test the skills riders need to operate safely in traffic. Since the test only requires an area 50 by 125 feet, it can be set up in a parking lot. Some states, however, do not have enough space available to adopt the MOST. The Alternate MOST was developed specifically for these areas. It includes modified portions of important MOST exereises along with other basic contra I skills.
The Alternate Motorcycle Operator Skill Test (Alternate MOST) The Alternate MOST was developed specifically for those areas with limited space available. It employs the use of manual timing equipment. Seven exereises test basic and collision avoidance skills in an off-street setting.
The Motorcyclist Licensing Skill Test (MLST) The MLST is the most recently developed off street test. It draws on lessons learned from tests that had come before it. This test combines administrative practicality with test reliability and rider safety. Applicants are required to complete one basic contral exercise and !Wo collision-avoidance skills. Objective criteria is used to evaluate riding pertormance.
The Motorcyclist In Traffic Test (MIT) Several states prefer to administer an in-traffic test. The MIT consists of 21 test situations, involves zone scoring, and planned observations. The applicant is scored by an examiner following the motorcycle in another vehicle.
The Motorcyde Safety Foundation's purpose is improving the safety of motorcyclists on the nation's streets and highways. Ta reduee motorcycle accidents and injuries, the Foundation has programs in rider education, licensing improvement, public information and research. These programs are designed tor both matoreyclists and motorists. For the beginning cr experienced rider training course nearest you, call the national toll-free telephone number, (800) 447-4700. Anational, nonprofit organlzation, MSF is sponsored by five U.S. motorcycle distributors: Honda, Yamaha, Kawasaki, Suzuki and BMW.
45
Ir
VI!~~ 'fi ,," ~
~' iJ ! Ifl&l tJ 1~~ !j[;~~ ~fP if0 3'~
1991 '" 5 fftf tsl; &$ &/iJ tsF~ tsF8 !!!fJ3 ts/§ t ~ /.t.o.:j;!
" $1:: $f!! $fjj $i &~!i $0rl 0/!!O
l~ f ", ~(f f3 1<: §!!! ~1?!P f§/5 !!3§ STATE ~§ ~§ ?g?] ?g ~~f ?~; /ff
Alabama None Ves No N 73 133 2906559 4821 52715 FG H IJ Alaska MOSTlftdtemate __ Ves No N t 32 36 364989 N/A 12461 DEFG Arizona MOST/Alternate/MLST Ves Ves N 16 180 2,:416057 1 153884 76091 CDEFGJMN Arkans;:ts Off-Street No No N 50 25 1717 578 63372 16586 ACDEFM California LolliooD Ves Ves N 176 529 19577100 847370 664819 FG H IJ Colorado Alternate/On-Street Ves Ves S 70 154 2761035 336000 115629 CD E FJ Connecticut Alternate Ves Ves N 13 54 2969529 168299 59331 CD E FG H I J M Delaware Alternate Ves No KS 3 22 660000 30949 7768 F D.C. Alternate No No N 1 6 400000 12105 1911 CDEFGJ Florida MOST/Alternate Ves Ves K,S Tl 880 11 ,109,288 413,255 203,913 A,C,D,E,F, Georgia MLST I Ves Ves K,S 25 270 4,511,548 204,616 75,341 A,B,C,D,E,F,G,H,I,J,K,M
Hawaii ~Iternate No No N 13 55 657156 21656 11544 ACDEFJM Idaho None No No N/A N/A N/A 755969 N/A 38282 ABCDEFGJM Illinois Allernate/Off-Street Ves Ves S 1105 530 7699486 540080 243789 Indiana Alternate Ves No S I 34 B5 4754178 224226 99745 ABDFGKL lowa Off-Street Ves No S ,143 I 36 1976726 254780 145967 CD E F I Kansas Off-Street Ves Ves KS 130 156 1725938 226630 64724 ADEFJM Kentuc!<y Off-StreeVOn-Street No No N 120 100 2390601 87316 32054 DEF Louisiana Off-Street Ves Ves S 80 376 2,613,827 I 61,219 68,080
CDCtF~~ Maine Alternate MIT No No N 29 32 866728 91552 35876 Maryland Alternate Ves No N 14 130 3,182,258 166,620 51,358 C,D,E,F,M Massachusetts : Off-Street No No N 30 100 4200000 1000 59000 A F J Michigan Alternate Ves Ves S 75 1,200 6,417,893 413,960 150,000 C,D,E,F,H,J,I,J,M
Minnesota Alternate Ves No I N 99 114 3096916 289996 128956 OE F I Mississippi Alternate MIT Ves Ves N 82 47 2,009,323 UNK 18,41 C,D,E,F,G,K,M
Mi=i Off-Slreet Ves No N 1 74 2 253.908 L1Zl DEF Montana I Alternate Ves Ves N 56 30 680000 68000 24294 ABCDEFGIJ
Nebras a Alt. MOST/MIT Ves Ves KS 96 70 1 300000 42900 29088 CDEFH Nevada MLST/Off-Street Ves ' Ves S 7 23 616314 40367 17649 FG New Hampshire Alternate No No S 10 23 799,616 89,297 30,410 C,D,E,F,I,M
New Jersey Alternate Ves No N 11 200 5,500,000 250,000 77,734 C,D,E,F,H,I,J,K,M NewMexico MOST/MLST Ves Ves KS 60 100 1 071 407 1124 35421 Q,D"E F G J NewVork Off/On-Stree Ves No N 100 150 10177995 471013 201 265 F
t'/QrthQarolina Off-Street I No No N 175 388 4484595 237427 59991 I ARCDEFHJLM
North Dakota Alternate Ves Ves N 45 32 426612 36372 23978 DEFG Ühio Off-Street Ves No N 94 220 7274129 550286 243 885 DFH K --
Oklahoma Alternate MIT No No N 93 64 2292867 UNK 64056 C FGJ1 Oregon Alternate Ves Ves N 45 170 2,300,000 204,287 71,536 C,D,E,F,I,J Pennsylvania Off-Street Ves No K,S 83 115 7,796,615 459,211 174,790 F,J
RhOdeJsland Off-Street Ves N/A N I N/A 9 825500 53052 N/A FGJ South Carolina Off-Street No Ves N 60 120 2376659 66341 33426 ADFHIJ
South Dakota MOST/Alternate Ves No KS 80 4S 450000 45844 31421 ACDEFGHIJM
Tennessee Off-Street No No S N/A N/A N/A 125,000 114,071 C,D,F,G
Texas _Alternate MIT -Ves . No N 345 408 11736602 681 668 206497 ACDEFGHIJM
Utah 81ternalelMLSL Vp, YP' N j.; Co 1 onn nnn 76.000 28.900 IM
Vermont Alternate No No N 10 13 423812 45752 17438 DEFGJK
Vl!:9.!nia Alternate/Off-Street Ves Ves S 14 220 4,249,563 215,588 66,327 F,G -Washi.!!gton Alternate Ves Ves N 57 294 3,272,953 266,630 112,228 D,F
~stVirginia None No No N/A N/A 70 1,306,440 N/A 26,511 A,F,G,J
Wisconsin Alternate MIT Ves Ves N 125 200 3,377,446 309,726 167,055 C,D,E,F,J,N
Wyoming Alternate Ves Ves N 34 85 333,493 36,829 20,050 B,C,D,F,H,I,J
1.0nlYllgreaterthan2brakehorsepower VehlclesReglsteredasMotorcycles
A - 3-wheel, alHerrainvehicie Part Of Motorcycle Test Walved lorRlderCourse Graduales P·Partial
B - AII·terrain Wllh more Ihan 3 wheels C· 3-wheel, selVicevehicle (Cushmantype) D· Modi!ted3-wheel (straddle seal) E - Modihed3·wheel {bench seat) F Motorcyclewlth sidecar G- Mopeds H - No peds {small d!splacemenl 2-wheel} I Mimbikes J. Motorbikes K· Gollearls L . Snowmobiles M 3·wheeISWllhreara:octelraadunder2S" N - Golf Carts. 11 no more Ihan 3 wheels
N-None K· Knowledge S -Skill
MOST - Molorcycle Operator Sklll Tesl MIT-Molorcyclislln-TrallicTest MLST - Moloryclist Ucensing Sklll Test ALTERNATE - Alternate MOST ALTERNATE MIT - Slale Spaciflc In-TraH!c Test
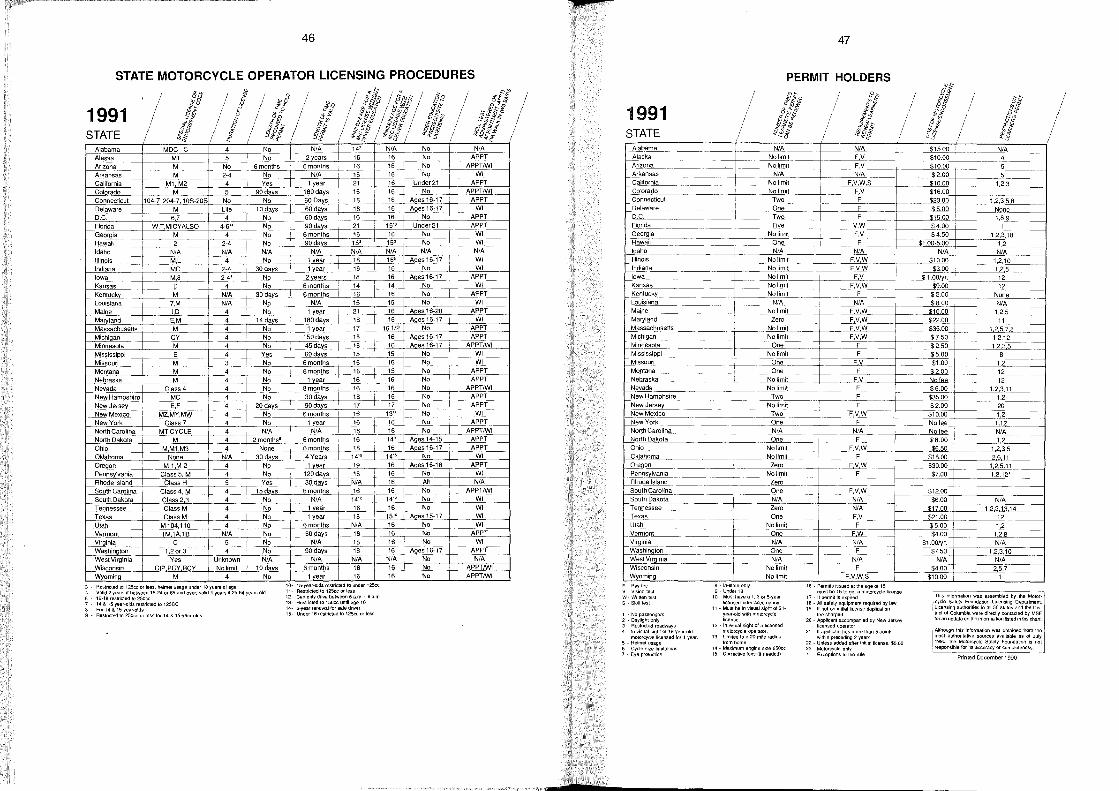
LW
46
1991
APPTIWI --WI --
Missouri M 3 No 6 months 16 16 No WI APPT APPT
~~ _____ M _____ ~-4~-~~N~o-_+--,~6~m~on~th~s~~-'~6~--'~~'~5~---;N~o-~'--~~---~
~~:~:~:ka ~~ r------91~s 4 : +--"'~~"-----+--8~~'JVlO"'~"'~~-s-_4,f__-----'~~~~~~f~~~~%~~~~~~t~:;~~,~-__1+,~~-~'t"'~~t~--~~ APPTIWI APPT ~ew Hampshire Me I 4 No 30 days 18 16 No I
_~_~wJersey E,F G ~Odays 90days 17 1,tL ~~ I ~:T _.-_ NeWMeXjQq~Z'MY'MW __ ~_ No 6monlhs 16 1~ __
_ ~ewYork~. <2-la557 =f 4 - No_~~~ar 16 16 No APPT~.;-__ NorthCarolina MTCYCLE ~ ___ ~~ __ N~~~,---+~1",6c-i~_-,N",o~c-f_ -,:,APe'P",Tf:IW"I,-----/ __ ~grthOakota i _____ M__ 4 2monthsB 6months 16 149 AQes14-1~__t_________APPT __ ~~ M,M1,M3. _ 4 None 6months 18 16 Ages16-17 APPT_ ~~~I ___ N~ N/A 30days 4Years 1415 ~-+--No WI
c_g~m~!:!~j---~-2 4 _____ No __ --------:~ 19 ~~_~~ PennsYlv~~r___~~ass5, M__ 4 No 120days 16 1"~6 i- NAO,, ------+-- NW/A
' __
16 No, _ __ APPTiW1_ 1412 No WI __
~J3hode Islan~~~lass H 5 Yes 30 d~s N/A
SouthCarQ!~r-----Class4 M 4 15da 5 --'6"'m",o"'n"'th"'s--t _ _""'6c-+----c,=-+--,_""'-
16 No 1'1"---1510 Aqes 15-17 ~: --
,South Dako!~ __ + ____ ?lass 2,3 4 No N/A 1412
~nessee g:::: ~ : No 1 year 16 -+--""c-+-~"'c--c-+-----'
~{:~s M104,110 4 ~~ ~~~s ~~ 16 No
Vermont 1M1A18 N/A No SOda..Ys 18 16 No APPT 16 No WI 16 Ages 16-17 APPT
Virginia C 5 _+_~N~o---t--=N"'ICCAc_+--c'8:c-+-2+=="~,_r__-""~--__j ~ 1,2or3 4 No 90days 18
West Virginia Yes Unknown N/A N/A N/A Wisconsin GIP PCY RCY No limit 10 days 6 months 18 Wyoming M ~ 4 No 1 year 16
3 - Reslnctedlo 125ccorless. heimet usage under 18 years 01 age 4 Va!id2yearsilbelWeen 15·240r65andover;valid4yearsif25-64yearsold 6 16·18restrictedlo250cc 7 14& 15year-oldsrestnc\edto 125CC 8· For14& 15·year·olds 9 - Restrictedl0250ccorlesslorl4& 15-year-olds
10-15-year-oldsrestnctedtounderI25cc 11- Restrictedto 125ccortess 12- CanontydnvebelWeen6a.m.-8p.m 13- Restricledto 150ccuntll age 16 14- 6·yearrenewalforsafednver 15- Under 16 restriCledto125ccorless
N/A No N/A 16 No APPTIWI 16 No APPTIWI
47
PERMIT HOLDERS
1991 STATE ~@P_~__ f'J!A-1, $15.00 N/A
4
!'Ia~a ___ --- =t ~t.. . ...• -... .F'V.~' .. _...p .. _.' ... $10,00 ~~o~ __ _ __ N_o Itm_II___ _ f~V____ _ _ $10.00 &kansas____ _--+-- ~_ ---------.-L __ ~ _ 2.00
t~~~ - --'- ~~::~:! -----L- F~~_S _. _._ $:c~'C~:"'~~"-i-----,-.~._-~o~9t~_ _ Two ~ F - -$23.00 1
J?,35,8 __
Qillaware_ .___ ---- Qne - ~- F ___ I - - -- $5.00 ' N9De _
_ D.,Q, __ Two F ... ! -----.U.5.00 . j 1 8~
-~:, . .:.,~ .... . .. ~.~[ :::l ,,~'" ~:: - - _ _ _~_ .-. -- ~~: - - ~ : -' - _~~A . -'~"-.- -$1.00-~~Ä ~*-_ lllin~ _________ f\JO'imit~-l ___ ~ F,V,W_ _ __$10.00 1_,2_,1_0 __ _ Indiana ---------l- No limit F V W- , - $300 1,25 lo~ --- --- I ~ml-t -- F,-V--- 1 $100/ r- '" 12
Kansas ----~ -~t ~ 2~~900 -Cj~.2,-----1 ~~ __ -----=--------==-i- Nohml! F _ $200 ~_ L~ian_a _____ ~ ~ __ , ___ N_/A___ $800 f\J!A
M~l~ __________ N~~ ~ 1000 125 M~aD_d ______ ~_ ~o ______ F,V_W___ $2200 11 Massachu~ __ ----r---- No limit _ ~ -l--~5 00 1 2578 _ ~hlgan ______ [ ___ N~ F,V,W _ $750 12,12
~SISSIPPI ===-~ No hmlt ---1-- F $500 s=--~ISSOUri ___ ___ _ __ ~ _______ ~F V $100 12
Mlnnesota One -------L---- F f 250 1235
_1Wb~ ______ ~o~ ~ 12 ..Montana __ _ ____ ~ ~~ 200 12-
Nevada ___ ---=F Nohmlt -- ___ F --~ ___ $_6_0Q.. J 1,2,3,11 __ _ NewHamphslre ___ ~o___ _F__ I $35~0 1,2 NewJersey Nohmlt F ~2 00 -2-0---
~ew Mexlco ---=-_ ----=+=-- Two ----------.: -F V W - ___ $_'_000 _ 1,2 _ NewYork One ,-+.__ F Nofee 112
~~~g:~~::a - I -~~~ =--==L= ~A __ ~J - - ~~f~~ _~~~-= Qhio_ ___ _ __ -----+-__ -------.HQJLm_i1 ___ ~f~__: _ 6.50 I ____ ~ __ _
_ Qldahoma _______ 1---- No limit _ ----+-____ F _____ ~- $18.00 _____ 2.§,~1 __ _ Ore9P_n _____ . _~ _______ ~ro___ _,' _~~ _ _~ _ $30.00 " _____ l,.s§,.1J Pennsylvanla ____ ----+-_ -~im-it---E" _,,_F____ _ __.~_ $7.00 __ ~_
-..--8bodelsland ____ , __ Z~ ___ ----+-- ____ , ' _______ _ SouthCarohna ~ One F,V,W $1200
SouthDakota -_ -------L- N/A _ 1 ___ N/A =X=$SOO N/A Tennessee ____ , __ ~ ----+- ~A ----.i1LQQ __ ~1~2,;3,l3~1~4 __
~as__ __ _~_ One * F,V $2100 ___ '_2 Utah --Noh~ --F- $500 _____ 1}2 ___ _
Verm~ -- --===t= 0;;;;--- F W 4 00 __ '~2_8~_
V".9Inla. . .. _ .. .-. . N/A . ___ ._N/A. ~. $100/.yr N/A yvashlngton _____ i ___ ~ ~' F ___ ___ $J;50 1,2,3,10
West Virginia N/A N/A N/A -~~ Wiscon~in_~~__ _ Noli~i~ .- -- _ F -" ._~_-_.-_ $4.00 -,- _" 2,5,7 Wyoming No limit F,V,W,S" $10.00 ----,--'
P Paylee V VISion test W-Wrillentest S Sklll lest
. No passengers
. Dayhghlonly Restncted roadways In visual slght 01 19-year·old motorcycleticensedlor1 year Heimet usage CycleSllehmila\!ons
. Eyeprotecllon
8·ln-stateonly 9 - Under 18
10- Muslhaveal.30r5-year hcensednderaccompany.
11 Mustbemvlsualsightol21-year·oldwlth motorcycle hcense
12·lnvlsualsighlolalicensed motorcycleoperator
13- Llmltedtoa20-mlleradllJs Iromhome
14- Maximum engme Slle 650cc 15 - Correctlve lens (ilneeded)
16· Permltslssuedaltheageo!15, mustbe16togelamolorcyclelicense
17·lfpermillsexpired 18 All saletyequlpmentreqUlfedbylaw 19-1Inolonmitlalltcenseduplicatlon
leecharged Appllcantaccompanied by New Jersey hcensedoperalor
21 lfapphcanlhasmorethan5pomls withm preceding 2years
22 - Unless addedafterlfllllailicense, $5.00 23- Motorcycle only
Excepllonstotherule
~~~;;li~~U~::lt~~S~I:~~1n:y o~;a:!~~:' llicenslng alJlhoriliestn all 50 states andlhe Dis-
I
lnCI olColumblaweredirecllyconlactedby MSF loranuPdat~onlheinlormationIiSledinths'h"",
Although Ihls mformatlon was oblained trom Ihe most authonlatlve SOUfces available as of JlJly 1990. Ihe Motorcycle safety FoundallOn 15 not ~~bleforllsaccuracyorcompleteness
Prin\ed December 1990
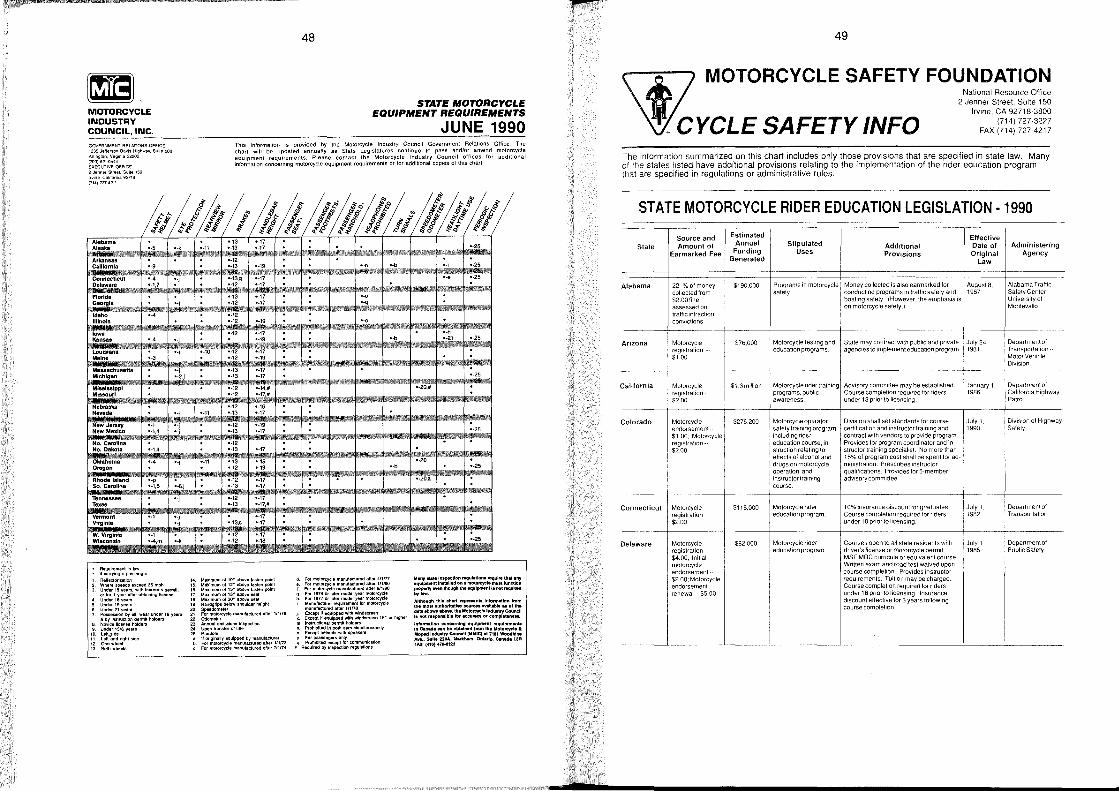
m. MOTORCYCLE INDUSTRY COUNCIL, INC.
GOVEANMENT RELATIONS OFFICE 1235 Jellerson Davis Highway, SUlle 600 A,llnglon,V"g,ms22202 (703)521-0444 eXeCUTIVEOFFICE 2Jenne,Slreel. Su,te 150 Irv,ne, Gahlorn,a 92718 (714)727-4211
Requirement In law Ifcarryingapusenger AellaClorilstlon Wheresp99ds&Xceed35mph Under 15years. wilhlaamer'sperfnll, orlorlyaaraftarobla'ningllcafl$e Under16ynrs Under 19years Under21 years Possessionbyall, waarundar19yaars &byinslluc1ionpermlthotdal'S
6 Novicellcansehotdars 9 Undar15'I:! ynrs
10. Left.;;ida 11 Laftandnghl5lde 12 Onewhaal 13. Bothwheets
48
STATE MOTORCYCLE EQUIPMENT REQUIREMENTS
JUNE 1990 This information is provided by the Motorcycle Industry Council Government Relations Office. The chan will be updaled annually as State Legislatures continue 10 pass and/cr amend motorcycle equlpment requir~ments, Please cantac! th.e Motorcycle In~ustry Cc:uncil ?Hices for additional information concernlng motorcycle equipmenl reqUiremenls cr lor additional COP!8S 01 thls chart.
14. Mwumumoll0" above lasten poinl 15 Ma'xlmumoI12" above lasten polnl 16 Maximum 01 15" aboval;nlanpoinl 17. Maximum 01 15" abovassal 16 Mv.imumol30" abovesOllt 19. Handgrlpsbelowshoulderhalght 20 5pf:!edomelar 21. Formolorcyclemanulac1urer.laltarll1f76 22. Odometar 23 Annualami5lilonslnspaclion 24. Upon!ranslaroltitle 25. Aandom
Uoriginallyaqulppadbymanulac1urer FormolorCYGlemanulac1urer.lanarll1l73 Formotorcycla manulac1urad alter 711f74
For motorcycla manulaclured altar 411m Formotorcycle manulac1uredalter 111180 Formotorcycle manulac1ured alter 911180 For 1974orlatermodalyearmolorcycla For19norlatermodelyearmolorcycle Manulac1urerraqulramenllormotorcycla manulactured after ll1f76
J E~C8pl!' aqulppedwith windscraan k Exeeplilaquippedwithwindscraan 15" orhlghar m. Instr,:,cllonalparmltholdars n. Prohlblladlnbolhursslmultaneously o. Exeept halmalswlth speakars p. Forpassangersonly q. Prohlblledexeeptlorcommunlcatlon
H AaquiredbYlnspec1ionragulations
MenyetetelnapKtionregulellon.requl .. th.'.ny eqlllpment In.teUed on e motorcycte mu.t luncll~m p!1)P'fIy IMIn 'hollgh the equlpmenll. not requlNd bylew.
Allholl9h Ihll ehlrt rep .... nte InlonTIlllon In:Im IhemoltlulhoritetlwOOUn:eI,""illllblellollhe dele ehown above, Ihl Mololq'Clllndualry CouneH Isnol .. lponalbl.foreccIlI1tCVOI'eompll'ene ...
InfonTIlUon concemlng eqllipment nlqul .. mente In Cenade cen be obtllnad In:Im the Motorcycl. & Moped Indu.lry ColincH {MMIC).t 7111 Woodbln. AW •• Sultl 22M, W.rldlam, Onterlo, Cened. L3R lA3; (411) 470-1123
49
Wci MOTORCYCLE SAFETY Fo~~~~~s~~~g~~
Irvine. CA 92718·3800
CYCLE SAFETY INFO (714)727·3227 ® FAX (714) 727·4217
The information summarized on this eh art includes only those provisions that are speeified in state law. Many 01 the states listed have additional provisions relating to the implementation of the rider edueation program that are speeified in regulations or administrative rules.
STATE MOTORCYCLE RIDER EDUCATION LEGISLATION ·1990
State
Alabama
Arizona
California
Colorado
Connecticut
Delaware
Source and Amount of
Earmarked Fee
22 %otmoney collected tram $2.00fme assessed on Irafficlnlraclion conviclions
Motorcyde reglstration -$1.00
Motorcycle registratlon-$2.00
Motorcycle endorsement .. $1 00: Motorcycle reglstratlOn·· $2.00
Motorcyde registration --$2.00
Motorcycle registration--$4.00; Initial molorcycle endorsement .-$2.00; Motorcycle endorsement renewal-- $5.00
Estimated Annual
Funding Generated
$190,000
$76.000
$1.3mlllion
$276,200
$118,000
$82,000
Stipulated Uses
Programs in motorcycle safety
MOlorcycle lesting and educaliOn programs.
Motorcyde nder training programs, public awareness
Motorcyde operator safety training program, mdudmgndE.( education course, in-struction relating to elfects of alcohol and drugs on motorcycle operation, and mstructortraming
Motorcycle rider education program.
Motorcycle nder education program
Additional Provisions
Money collecled 15 also earmarked for conductmg programs in !raHIG safely and boatlng safety. (However, the emphasis 15 on motorcycle safely.)
Slate may conlracl wlth pubhc and private agencI8s 10 implement educatlon program
Advisory commiltee may be established Course completlon reqUired for riders under 18 pnor to licensmg
DivISion shall set standards for course certlficatlon and mslruclor tralnmg and contracl wlth vendors to provide program Provldes for program coordlnator and In-
I structor trainmg speclalls.t No more than 15% 01 program cost shall be spent for ad-
I mlnlS~ratlon. Prescnbes Instructor quahflcallons Provldes for 5-member advisorycommittee
10% Insurance discount lor graduales Course completJon required for nders under 18 prior 10 hcensing
Courses open to alt slate resldents wl!h driver's license or motorcycle permit MSF MRC cUfflcula or eqUivalent course Written exam and road test walved upon course completion. Provides instructor reqUirements. Tuition may be charged Course completion required lor nders under 18 prior 10 licensing. Insurance discount elfec!ive tor 3 years tollowing course completlon
Effective Date 01 Original
Law
August 8, 1987
July 24, 1981
January 1, 1986
July 1, 1990
Julyl, 1982
Julyl, 1985
Administering Agency
Alabama T raHIG Safety Center, Universityof Monlevallo
Department 01 Transportation .. MotorVehlcie DivIsion
DepartmentoJ Callfornla Highway Patrol
DIvISion 01 Highway Safety
Department 01 Transportation
Departmenlol Public Safety
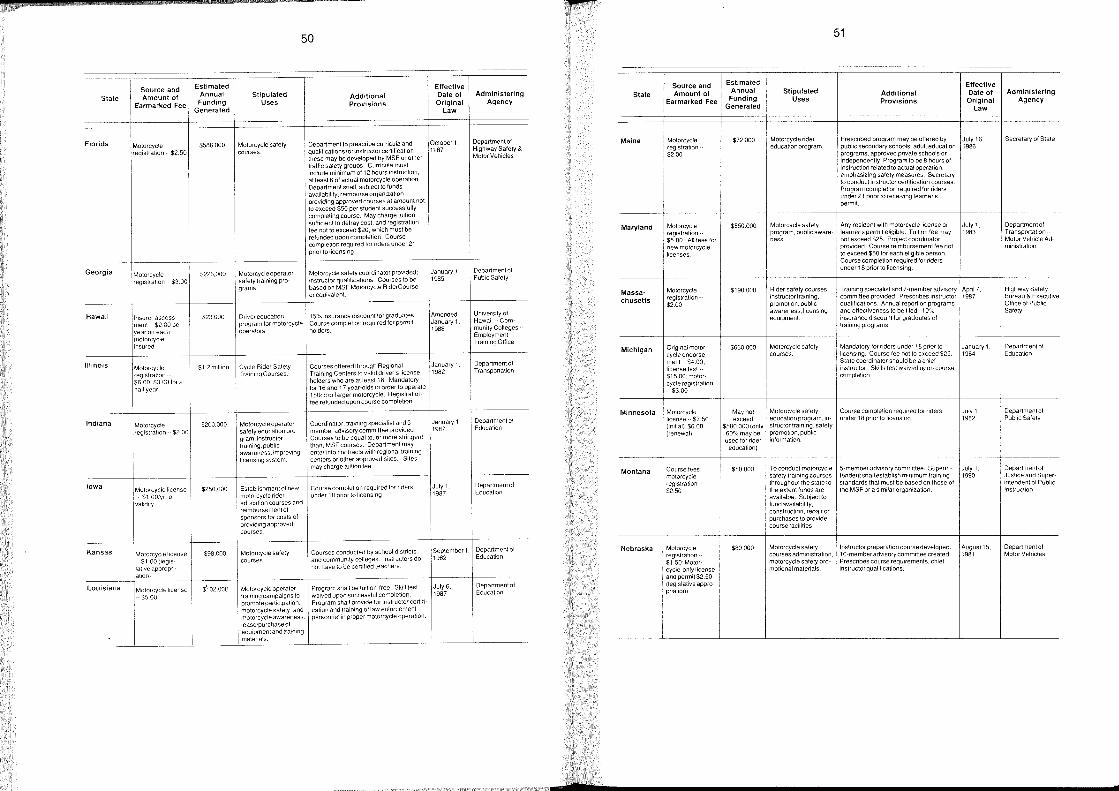
Source and State Amount 01
E'armarked Fee
Florida Motorcycle reg!stratlon· $2.50
Georgia
Estimated Annual
Funding Generated
$586,000
Stipulated Uses
Motorcycle safely courses
50
Additional Provisions
Hawaii Insurer assess $23000 DrIVer educatlon 15% Insurance discount for graduales
year on each operators holders
msured
EHective Date of Administering Original Agency
Law
Oelaber 1, 1987
Amended January 1, 1988
Department 01 Highway Safety & Molor Vehicles
Unlversltyof Hawaii·' Garn mUnily Colleges .. Employment TrammgOHlce ~
ment_ $2 00 per 'I _ program für motorcycle Course completIOn reqUired für permi!
motorcyde I i Illinois I ~~:r~~:- - i~~'I-,o-n-Tf-c-'-cl-e-R-'d-e,-s--a,-e,-,--~::;ses OHere~ through Regional --+"J-a-n-u-a-,,-,-, --I--De-p-a-rtm-e-n-to-'---
reglstratlon -- I Training Courses Training Centers to valid driver's license t 982 Transportation
$6 00. $3 00 tor a ,. '00 j holders who are at least 16 Mandatory hall year lor 16 and 17 year-olds In order 10 operale 150cc or larger motorcycle. Registratlon fee refunded upon course complellon
Indlana reglstratlon ' member advisory commlttee provlded
gram Inslruclor Courses 10 be equal 10, or more stringent training pubhc than, MSF courses. Department may
IIcenslng system centers or other approved sltes Sites I may charge tUlllon fee
January 1. 1987
Department 01 Educatlon Motorcycle $'"0001' · .~.OO I sMao,etOt,'Ce'dcU,eCOaPt,oe'nap;~or- CoordInator, training speclallst and 5·
--t-awareness Improvlng enter into contracts wlth regional training
IO~ I ------+~-~~~--, wa I Motorcycte Ilcense $250000 Eslabllshment of new Course completlon requlred for nders July 1. epartmento
$1 00 yr 01 molorcycle rlder under 18 pnor to hcenslng 1987 Educallon
Ivahdl'
Y I 1 :r~~C~~~~~~~U:IS~IS and sponsors lor costs 01 provldlng approved courses
I
latlve appropn not have to be certilied leachers
September 1, Oepartmenlol , 1982 Educatlon
;Zansa;-- - +:::~ycte license-I~ 000 I MOlorcycte salety -~~urses conducled by school dlstricts $1 00 (Iegls ~ courses and communlty colleges Instruclors do
allon) -+' _______ -+ ___________ -+ ___ -+ _____ _ Louislana - IM~OrCyctelicense $'102000 I' MOlorcycteoperator Program shall be tUitlon-lree Skill test July 6. Departmenlol
I $500 I ~~~~~~ec;;e~~;~~, ~~~~~~~~~~~~~~~I~s~~~~~n~frl~~~~~ certlfl-
I
' motorcycle safety, and callon and training ollaw enforcement _1'__ _ _ _ I motorcyc_le awareness. personnel in proper motorcycle operaliOn lease/purchaseol eqUipmenl and training materials
1987 Educatlon
State
Maine
Maryland
MassaM
chusetts
Michigan
Minnesota
Montana
Nebraska
L.
Source and Amount of
Earmarked Fee
Motorcycle registraliOn--$200
Motorcycle reglstration .. $5.00. All tees lor new mOlorcycle hcenses
Motorcycle registratlon--$2.00
Onginal motor-cycle endorse-ment-- $4.00; IIcense test _. $15.00, motor-cycle reglstration --$3.00
Motorcycle IIcense _. $7 50 (InitJaI):$6.00 (renewal)
Course tees, molorcycle reglstration .. $2.50
Motorcycle reglstratlon -$1.50; Motorcycle-only license and permit $2.50 (leglslatlVeappropnation)
Estimated Annual
Funding Generated
$72,000
$550,000
$190,000
$650.000
Maynot exceed
$500.000 (only 60% may be used for nder
educaliOn)
$50,000
$80.000
Stipulated Uses
Motorcycle rider educahon program
Motorcycle safety program, public aware· ness.
Rlder salety courses, Instructor training, promotion, publlc awareness,lIcenslng equipment
Motorcycle salety courses
Motorcycle safety educallon program, in-structor training. salely promotion, publlc Information
T 0 conduct motorcycle safety training courses throughoul the slate 10 the extent funds are availabie. Subject 10 fund availabilily, construclion, repalr or purchases 10 provide course facilities
Motorcycle salety courses administration, motorcycle salety promoliOnal materials
51
Effective Additional Date of Administering Provisions Original Agency
Law
Prescribed program may be oHered by July 16, Secretary 01 State public secondary schools, adult educatlon 1986 programs, approved private schools or independently. Program 10 be 8 hours 01 instrucllon related 10 actual operation, emphaslzing satety measures. Secretary 10 conducl mslruclor certilicatlon courses Program complellon required for nders under 21 pnor to recelvlng learner's permit
---- -
Any resident with motorcycle ilcense or Julyl, Department 01 learner's permit ehglble TUitlon lee may 1983 TransportatIOn .. not exceed $25. ProJect coordInator Motor Vehlcle Ad-provided. Course relmbursement lee not mlnlslratlon to exceed $50 lor each ehglble person Course completion required for nders under 18 prior to licenslng
" ~-~_._----
T ramj~g speCla~lst and 7 -member advisory Apnl7. Highway Safety commlttee provlded Prescnbes inSlructor 1987 Bureau & Executlve qualilicalions. Annual report on programs OHlce 01 Pubhc and eHectlveness 10 be Iiled. 10% Satety insurance discount tor graduales of training programs
-+- ---
Mandatory for nders under 18 pnor 10 licensmg. Course fee not to exceed $25 Stale coordlnator should be a chief mstructor. Skills tesl walVed upon course completlon
Course complellon reqUired for nders under 18 prior to licensmg
5-member advisorycommittee. Supenn· tendent shall estabhsh minimum training standards thaI must be based on those 01 Ihe MSF or a slmilar organlzatlon
Instruclor preparallon course developed 1 O-member advisory committee crealed Prescnbes course requiremenls, chief i nstructor quah hcations
January 1, Departmenlol 1984 Education
Julyl, Departmentof 1982 Pubhc Satety
July 1. Department 01 1990 Juslice and Super
intendent of Publlc Instructlon
August 15, Departmentol 1981 MotorVehlcies
•
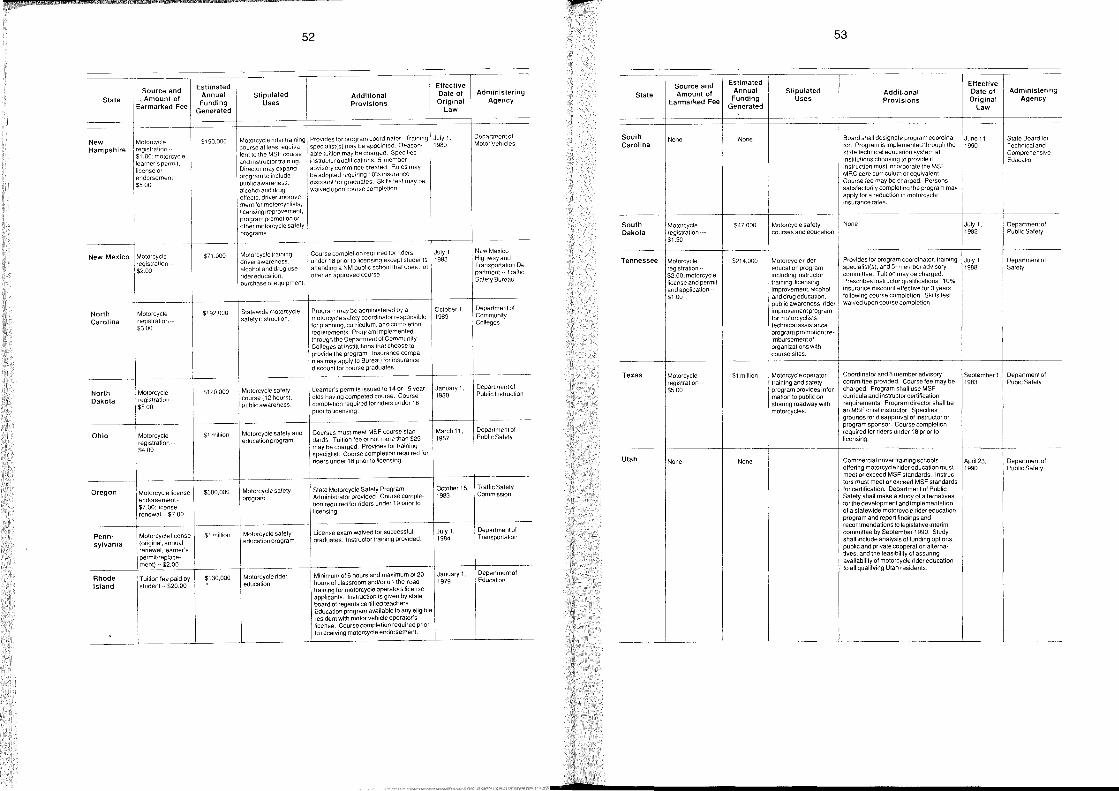
52
- --- --------~-=========:=::;:=====;:======== - 1-Source --:: Y---I ES~lmated-I------ --I ---------~ctlve I Earmarked Fee Fundmg Uses Provisions Orlgmal
State I. Amount of Annual Stlpulated I AdditIOnal Date of
u_~ _~j__ ,_ G~nerat~d law
New i::':'CYcle-ll- $15::- Motorcyclerldertralnmg Provldesforprogramcoordlnator Training I July 1
Hampshire I ~~~~S~~~I~~~~Ycle ~eOn~rt~et~~I~~~ ec~~:sae I :6~~~~:~~~~~;Yb~eC~~~;~~te~p=c~~:~n 1989 i learner's perm! and Instruclor training \lnstruclOrqUaliflcatlons 5 member
l
'lieense cr I Dlrector may expand advisory commlltee created Aules may endorsement·- I program 10 mclude be adopted requmng 10% iOsurance $5.00 pubhcawareness I discount for graduales Skills test may be
I alcohol and drug walved upon course completlon
I effects dnver Improve
I ment for motoreyellsts I . I lieensmg Improvemenl
I
program promotion or other motoreyele safety I programs
~'---+'------~-----~---+I-----------New Mexico Motoreycle I $71.000 Motoreycle trammg. I Course eompletlOn reqUired for nders July 1 ,
reglstratlon .. drtver awareness. under 18 prior 10 lIeenslng except students 1983
1
$2.00 : aleohol and drug use attendmg a NM public school that does not
; l"'oo rlderedueatlon::10Her an approved course purchase 01 eqUipment
-----11-- --f.----North I Motorcycle $192,000 I Statewlde motorcycle Program may be admmlstered by a October 1, Carolina I reglstratlon -- salety mstrucllon moto.rcYcie safe.ty e.oordlnator responslble 1989
$300 lorplannlng, cUrriculum, and complellon reqUiremenls. Programlmplemented
North Dakota
Ohio
Oregon
Penn·
1 through Ihe Oepartment 01 Communlly ColI~ges at mstltuhons thaI choose 10 prov1de Ihe program. Insurance compa· nies may apply 10 Bureau for msuranee discount for course graduales
Motorcycle $120,000 Motorcycle satety Learner's permits Issued 10 14 or 15 year
reglstratlon _. course (12 hours), olds havlng eompeted course. Course
$500 publlcawareness complellon reqwred lor riders under 16 prior to hcenslng
Motorcycle $1 million Motorcyde salety and Courses must meel MSF course stan-
registratlon _. education program dards. Tuition fee 01 not more than $25
$4.00 may be charged Provides for trainmg speClalisl. Course completion required for riders under 18 prior 10 hcensing
Motorcycle hcense $300,000 Motorcycle salety State Motorcycle Safety Program
endorsemenl- program Administrator provided. Course comple-
$7.00.hcense tion required lor riders under 19 prior to
renewal-- $7.00 hcenslng
Motorcycle hcense $1 milhon Motorcycle salety License exam waived lor successful
sylvania (original, annual educatlon program graduales Instructor traming provlded
renewal.learner's permlUreplace-ment) .. $2.00
Rhode T uition lee paid by $130,000 Motorcycle rider Mmimum 016 hours and maximum 0120
Island student -. $20 00 educallon hours of classroom and/or on-the·road training for motorcyde operators license applicants. Instruction is given by state board 01 regents certified teachers Education program available to any eligible resident with motor vehicle operator's license. Course completion required prior 10 receiving motorcyc!e endorsemenl.
January 1. 1980
MarchlI, 1987
Oetober 15, 1983
July 1, 1984
January 1, 1979
Administering Agency
Oepartmentof Motor Vehlcles
New Mexlco Highwayand Transportation Department·- TraHlc Safety Bureau
Departmentof Commumly Colleges
Department 01 Pubhe Instruclion
Department 01 Public Salety
T raffic Safety ComffilSSlon
Department of TransportalIon
Oepartmenlol Educatlon
State Source and Amount of
Earmarked Fee
Estimated Annual Stipulated
Funding Uses Generated
53
Additional Provisions
Effective Date of Administering Original Agency
Law
====~===t===i======~==~~====.~'-+===~~~= South Carolina
South Dakota
Tennessee
Texas
Utah
None
Motorcycle reglstration --$1.50
Motorcycle regislratlon·$200; motorcycle heense and perm! and apphcation .$1.00
Motoreycle regislratlon -$500
None
None
$47,000 Motorcycle safety courses and educatlon
$214,000 Motorcycle nder education program Includlng Instructor training, hcenslng improvement, aleohol and drug educatlon, pubhc awareness, rider Improvementprogram formotorcyclists, technical assistance, program promohon; reimbursement of orgamzations wlth course slles
$1 million Motorcycleoperator
None
training and salety program provldes mformation to public on sharing roadway with motorcyc!es.
Board shall deslgnate program coordmator Program IS Implemented through the state lechmcal educatlon system al mstltutlons choosmg to provlde II InslructlOn must Incorporate the MSF MRC core cUrriculum or eqUivalent Course lee may be charged Persons satlslactonly completmg Ihe program may apply for a reductlon In motorcycle Insurance rates
None
Provldes for program coordlnator, trammg speclahst(s), and 5- member advisory commiltee. Twtlon may be charged Prescrlbes Instructor quahflcalions 10% insurance discount effective for 3 years foUowlng course compleiion. Skills test walved upon course comptetlon
July 1, 1982
July1, 1988
State Board for T echmeal and Comprehenslve Educatlon
Department 01 Pubhc Safety
Department 01 Safety
Coord~nator an~ 8 member advisory September 1. Departmentof
~~~~~~~e:r~~~~~~h~,f~~~e ~e;F may be 1983 Publc Safety
cUrricula and instructor certilicalion reqUirements. Program director shall be an MSF chiel instructor. Specilles grounds lor disapprova! 01 instructor or program sponsor. Course completion r.equired for nders under 18 prior to licenslng
Com.merclal dnver training schools Apn123. oHering motorcycle rider educatlon must 1990 meet or exceed MSF standards. Inslruc-tors must meet or exeeed MSF standards for certificatlon. Oepartment 01 Public Salety shaU make a study 01 alternatives for the development and implementation 01 a statewide motorcyde rider educatlon program and report findlngs and recommendalions to legislahve mterim eom~ittee by Septe.mber 1990. Study shal~ mclude analYSIS 01 fun.ding options, public and pnvale cooperatlon alterna-tive~, a~? the feasibilily of. assuring availablhly of motorcycle nder education 10 all qualilying Utah residents
Department 01 Public Safety
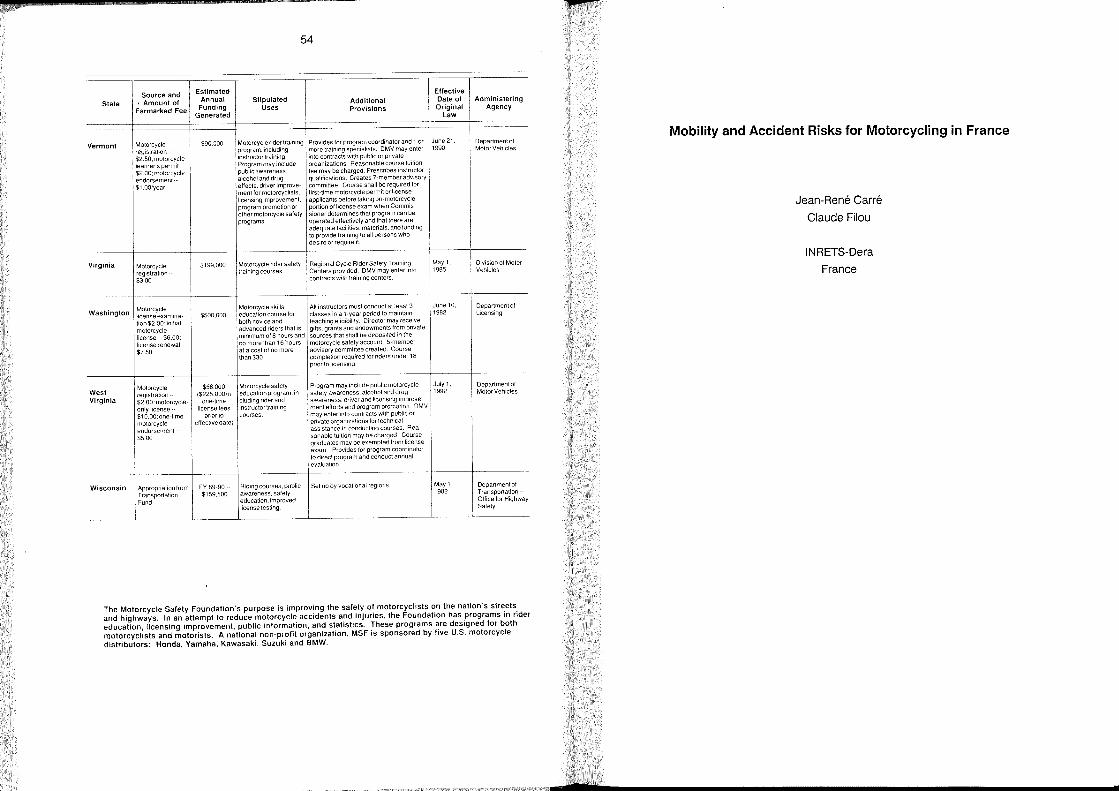
.. State
Vermont
Virginia
Washington
West Virginia
Wisconsin
Source and . Amount 01
Earmarked Fee
Motorcycle reglslrat!on .. $2.50, motorcycle learner's perm!--$2.00: mOlorcycle endorsement--$1 OQ/year
Motorcycle reglstraliOn·· $3.00
Motorcycle hcense examma-tlon $2.00: imllal motorcycle license -- $6.00. license :-enewal --$7 SO
Motorcycle reglstration -" $2.00; molorcycle-only hcense .. $10.00,one-tlme motorcycle endorsement .. $5.00
Appropriation hom T ransportahon Fund
Estimated Annual Funding
Generated
$90,000
$199,000
$500.000
$58,000 ($225.000m
one-tlme hcense lees
pnorto effectlvedate)
FY 89-90--$159,500
54
Stipulated Uses
Motorcycle nder training
I ~~I~~~~~i~~:~~~~~ Program may include pubhc awareness, aleohol and drug eHecIs, driver improve-menl for motorcycl!sts. hcenslng Improvement. program promotion or other motorcycle safety programs
Motorcycle nder safety training courses.
Molorcycle skills educatlon course lor bolh novlce and advanced nders thaI IS
mmlmum 01 8 hours and no more than 16 hours at a cost 01 no more than$30
---Molorcycle safety educatlon program. m· cluding rider and instructor training
Ridmg courses, public awareness, safely education,lmproved license tesling
Additional Provisions
Provides for program coordinalor and 1 cr more training specialists. DM" may enter inlo contracls with public cr private organizatlOns Reasonable course IUllion fee may be charged. Prescnbes instruclor qualificahons. Creates 7-member advisory commlttee. Course shall be reqUired far firsHlme motorcycle permit or Ilcense appllcants before taking on·motorcycle portion 01 hcense exam when Commls-sionerdetermines that program can be operated eHectlvely and that there are adequate facilities, materials, and funding to provide tralnmg 10 all persons who desire or require It
RegIOnal Cycle Rider Safety Training Centers provided. DMV may enter mto contracts with trammg centers
Ailinstructors mus! conduct at least 3 classes In a l·year period 10 mainlaln teaching eliglbillty. Director may receive gifts, grants and endowments from private sources thaI shall be dpooslted in the molorcycle salety accounl. 5·member advisory commiltee crealed. Course complehon required for nders under 18 prior 10 Ilcensing
~-
Program may mclude public motorcycle salety awareness, alcohol and drug awareness, driver and licenslng improve-ment eHorts and program promotion. DMV may enter mto contracts wllh publlc or private organlzatlons for techmcal assistance In conducllng courses. Rea· sonable tUition may be charged Course graduales may be exempted from hcense exam Provides for program coordinator to direct program and conducl annual evaluation
Set up by vocatlonal regions
Effective Date 01 Original
Law
June21, 1990
Mayl. 1985
June 10, 1982
July 1, 1992
May 1, 1982
Administering Agency
Department 01 MotorVehlcies
Division of Molor Vehlcles
Department 01 llcensing
Department 01 MolorVehlcles
Department of Transportation --Office for Highway Safety
The Motorcycle Safety Foundation's purpose is improving the safety of motorcyclists on the nation's streets and highways, In an attempt to reduce motorcycle accidents and injuries, the Foundation has programs in rider education, licensing improvement, public information, and statistics. These programs are designed for both lTlotorcyclists and motorists. A national non-profit organization, MSF is sponsored by five U.S. motorcycle distributors: Honda, Vamaha, Kawasaki, Suzuki and BMW_
I i
Mobility and Accident Risks for Motorcycling in France
Jean-Rene Carre
Claude Filou
INRETS-Dera
France
•
57
1 Abstract
1.1 Objectives
Users of motorised two-wheeled vehicles are, along with pedestrians and cyclists, the most vulnerable category of road users in an injury accident. In France, contrary to pedestrians, they have not derived any great benefit from recent improvements in safety. Furthermore, accidents involving two-wheelers, particularly significant in France, concern specific socio-demographic categories. The aim of this paper is to present the current state of knowledge on the risk of motorised two-wheelers in FRANCE.
1.2 Methodology
In order to assess this risk, we have compared data on mobility (vehicle fleets, driving licences, results of surveys and namely results of arecent survey on two-wheeler use) with data on accidents (national statistics, complemented by multidimensional analyses of the INRETS file of police re ports on accidents).
1.3 Results
Astrang decline in the use of two-wheelers over the past ten years has been observed. This is due essentially to the diminution in the use of the moped (without licence). The population graups representing the highest risk differ according to the category of two-wheeler concerned: teenagers for mopeds and young adults for motorcycles. The characteristics of the accident also differ according to the category: the motorcyclist is often the only person involved in the accident, whereas other motor vehicles are frequently involved in moped accidents (namely in manoeuvres at intersections).
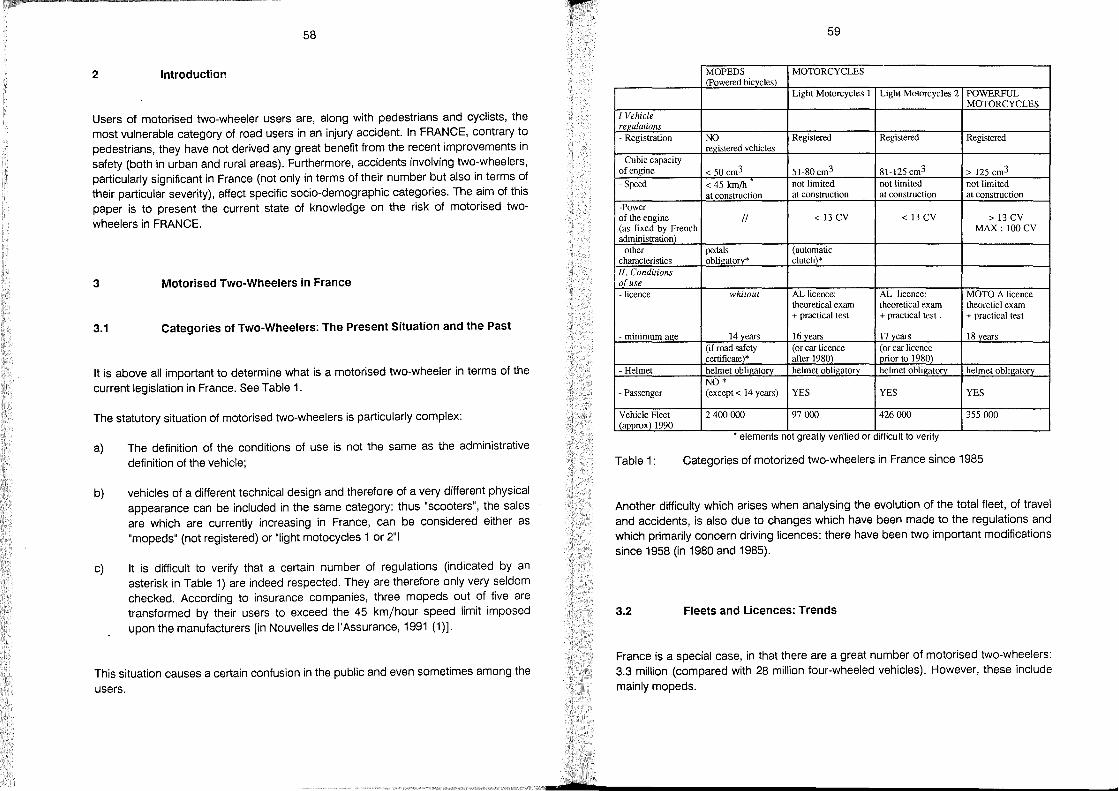
» 58
2 Introduction
Users of motorised two-wheeler users are, along with pedestrians and cyclists, the most vulnerable category of road users in an injury accident. In FRANCE, contrary to pedestrians, they have not derived any great benefit from the recent improvements in safety (both in urban and rural areas). Furthermore, accidents involving two-wheelers, particularly significant in France (not only in terms of their number but also in terms of their particular severity), affect specific socio-demographic categories. The aim of this paper is to present the current state of knowledge on the risk of motorised two
wheelers in FRANCE.
3 Motorised Two-Wheelers in France
3.1 Categories of Two-Wheelers: The Present Situation and the Past
It is above all important to determine what is a motorised two-wheeler in terms of the
current legislation in France. See Table 1.
The statutory situation of motorised two-wheelers is particularly complex:
a)
b)
c)
The definition of the conditions of use is not the same as the administrative
definition of the vehicle;
vehicles of a different technical design and therefore of a very different physical appearance can be included in the same category: thus "scooters", the sales are which are currently increasing in France, can be considered either as "mopeds" (not registered) or "light motocycles 1 or 2"!
It is difficult to verify that a certain number of regulations (indicated by an asterisk in Table 1) are indeed respected. They are therefore only very seldom checked. According to insurance companies, three mopeds out of five are transformed by their users to exceed the 45 km/hour speed limit imposed upon the manufacturers [in Nouvelles de l'Assurance, 1991 (1)].
This situation causes a certain confusion in the public and even sometimes among the
users.
59
MOPEDS MOTORCYCLES (Powered bicvcles)
Light Motorcycles 1 Light Motorcycles 2 POWERFUL MOTORCYCLES
J Vehic/e regulations - Registration NO Registered Registered Registered
registered vehicles - Cubic capacity of engine < 50 cm3 51-80cm3 81-125 cm3 > 125 cm3
- Speed < 45 km/h not limited not limitcd not limited atconstruction at conslrUction at construction atconstruction
-Power of the engine // < 13 CV < 13 CV > 13 CV (as fixed by French MAX: 100CV administration) - other pedals (automatie characteristics obligatory* clutch)* II. Conditions ofuse -licence whitout AL licence: AL licence: MOTO A licence
theoretical exam theoretical cxam theoreticl exam + practical test + practical tcst . + practical test
- minimum age 14 vears 16 vears 17 years 18 vears (if road safety (or car licence (or car liccncc certificate )* aftcr 1980) prior to 1980)
-HeImet heImet obligatorv heImet obligatorv heimet obligatorv heImet obligatorv NO*
- Passenger (except< 14 years) YES YES YES
Vehicle Fleet 2400000 97000 426000 355000 (approx) 1990
* .. . .
elements not greatly venfled or dlfflcult to venfy
Table 1: Categories of motorized two-wheelers in France since 1985
Another difficulty which arises when analysing the evolution of the total fleet, of travel and accidents, is also due to changes which have been made to the regulations and which primarily concern driving licences: there have been two important modifications
since 1958 (in 1980 and 1985).
3.2 Fleets and Licences: Trends
France is a special case, in that there are a great number of motorised two-wheelers: 3.3 million (compared with 28 million four-wheeled vehicles). However, these include
mainly mopeds.
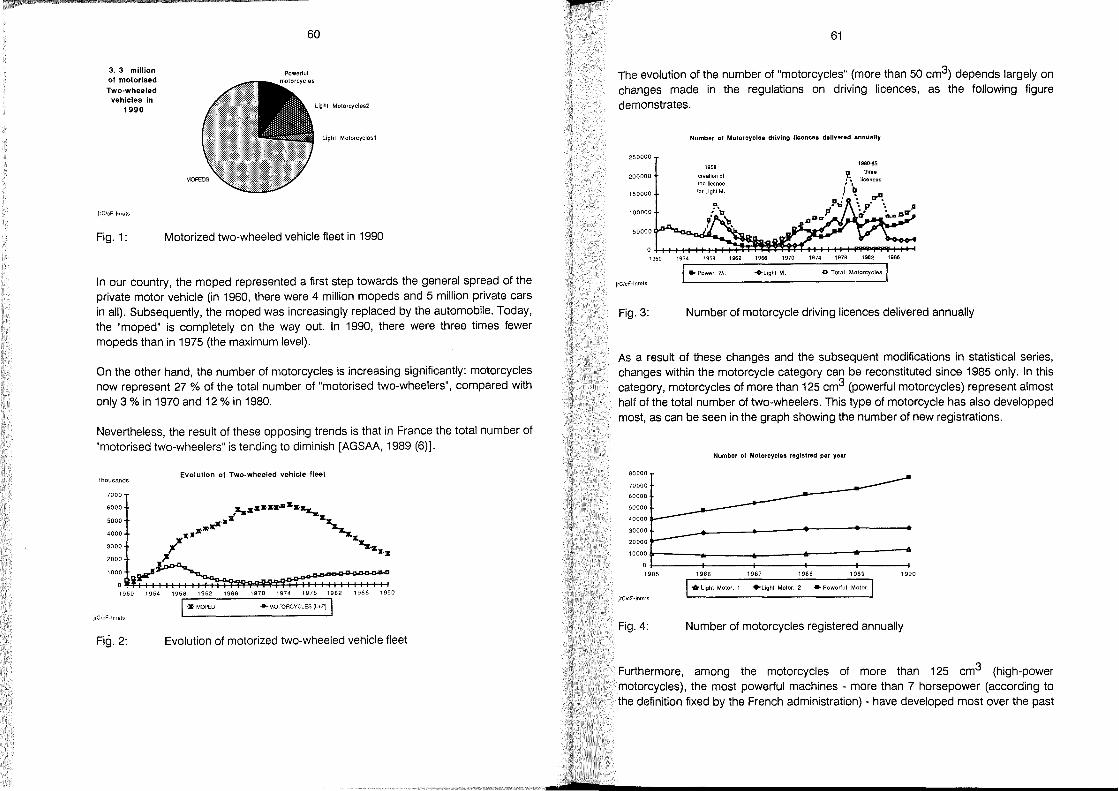
3.3 million of motorised
Two·wheeled vehicles in
1990
jrC/cF-lnrets
Fig.1:
60
Light MOlorcycles2
light Motorcyclesl
Motorized two-wheeled vehicle fleet in 1990
In our country, the moped represented a first step towards the general spread of the private motor vehicle (in 1960, there were 4 million mopeds and 5 million private cars in all). Subsequently, the moped was increasingly replaced by the automobile. Today, the "moped" is completely on the way out. In 1990, there were three times fewer mopeds than in 1975 (the maximum level).
On the other hand, the number of motorcycles is increasing significantly: motorcycles now represent 27 % of the total number of "motorised two-wheelers", compared with only 3 % in 1970 and 12 % in 1980.
Nevertheless, the result of these opposing trends is that in France the total number of "motorised two-wheelers" is tending to diminish [AGSAA, 1989 (6)].
thousands Evolution of Two-wheeled vehicle fleet
7000
6000
5000
4000
3000
2000
1000
1950 1954 1958 '962 1966 1970 1974 1978 1982 1986 1990
JrC/cF-lnrets
I'S:' MOPED .a-MOTORCYClES (L+P) I
Fig.2: Evolution of motorized two-wheeled vehicle fleet
61
The evolution of the number of "motorcycles" (more than 50 cm3) depends largely on changes made in the regulations on driving Iicences, as the following figure demonstrates.
250000
200000
150000
100000
50000
Number of Motorcycles drlving Heene •• daliv.red annually
1958
crealion 01 the licence
for Lighl M.
1980-85
Ihres
IicenC9S
1950 1954 1958 1962 1966 1970 1974 1978 1982 1986
jrClcF-lnrets
,. Power. M. Go Total Molorcycles I +UghlM.
Fig.3: Number of motorcycle driving licences delivered annually
As a result of these changes and the subsequent modifications in statistical series, changes within the motorcycle category can be reconstituted since 1985 only. In this category, motorcycles of more than 125 cm3 (powerful motorcycles) represent almost half of the total number of two-wheelers. This type of motorcycle has also developped most, as can be seen in the graph showing the number of new registrations.
80000
70000
60000
50000
40000
30000
20000
Number of Motorcycles registted per yaar
10000 +-____ ---_----6-----6-----6 1985 1986 1987 1988 1989 1990
.. Light Motor. 1 "Light Molor. 2 .. Powerlul Motor.
jrClcF-lnrels
Fig.4: Number of motorcycles registered annually
Furthermore, among the motorcycles of more than 125 cm3 (high-power motorcycles), the most powerful machines - more than 7 horsepower (according to the definition fixed by the French administration) - have developed most over the past
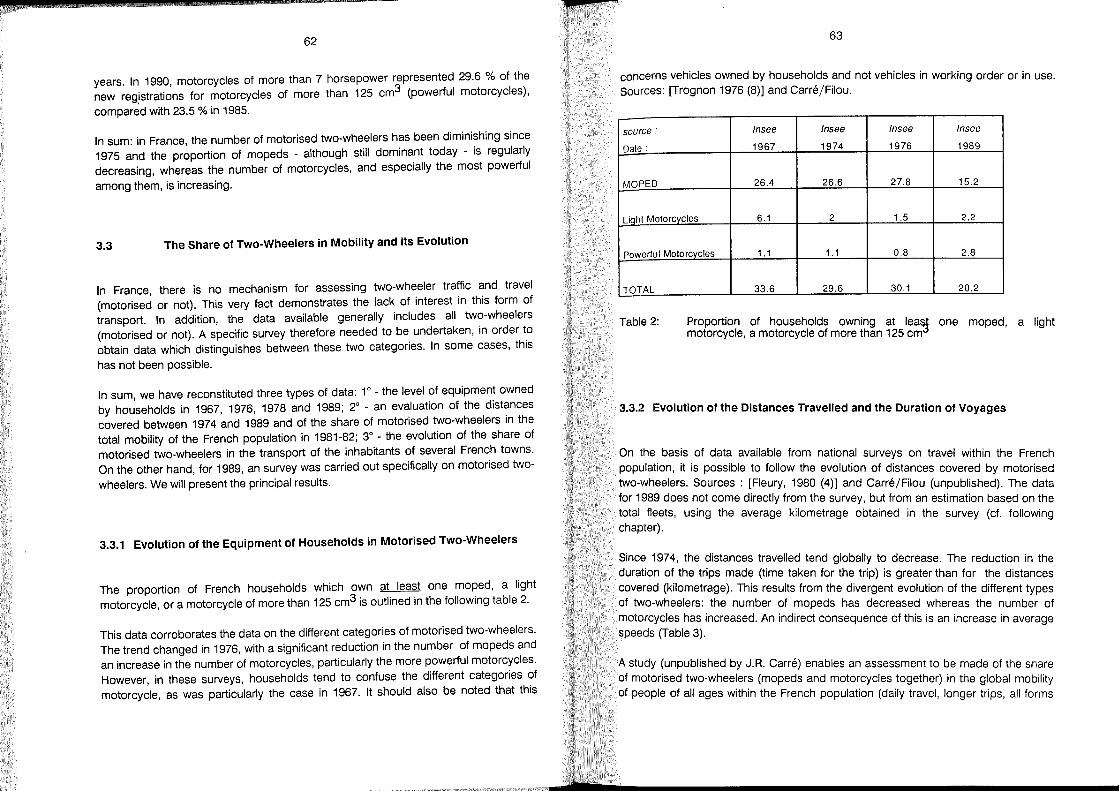
p
62
years. In 1990, motorcycles of more than 7 horsepower rjpresented 29.6 % of the new reg.istrations for motorcycles of more than 125 cm (powerful motorcycles),
compared with 23.5 % in 1985.
In sum: in France, the number of motorised two-wheelers has been diminishing since 1975 and the proportion of mopeds - although still dominant today - is regularly decreasing, whereas the number of motorcycles, and especially the most powerful
among them, is increasing.
3.3 The Share of Two-Wheelers in Mobility and its Evolution
In France, there is no mechanism for assessing two-wheeler traffic and travel (motorised or not). This very fact demonstrates the lack of interest in this form of transport. In addition, the data available generally includes all two-wheelers (motorised or not). A specific survey therefore needed to be undertaken, in order to obtain data which distinguishes between these two categories. In some cases, thls
has not been possible.
In sum, we have reconstituted three types of data: 10 - the level of equipment owned
by households in 1967, 1976, 1978 and 1989; 20 - an evaluation of the distances
covered between 1974 and 1989 and of the share of motorised two-wheelers in the total mobility of the French population in 1981-82; 30
- the evolution of the share of motorised two-wheelers in the transport of the inhabitants of several French towns. On the other hand, for 1989, an survey was carried out specifically on motorised two
wheelers. We will present the principal results.
3.3.1 Evolution of the Equipment of Households in Motorised Two-Wheelers
The proportion of French households which own at least one moped, a light motorcycle, or a motorcycle of more than 125 cm3 is outlined in the following table 2.
This data corroborates the data on the different categories of motorised two-wheelers. The trend changed in 1976, with a significant reduction in the number of mopeds and an increase in the number of motorcycles, particularly the more powerful motorcycles. However, in these surveys, households tend to confuse the different categories of motorcycle, as was particularly the case in 1967. It should also be noted that this
63
concerns vehicles owned by households and not vehicles in working order or in use. Sources: [Trognon 1976 (8)] and Garre/Filou.
source: Insee Insee Insee Insee
Date: 1967 1974 1976 1989
MOPED 26.4 26.6 27.8 15.2
Light Motorcycles 6.1 2 1.5 2.2
powertul Motorcycles 1.1 1.1 0.8 2.8
TOTAL 33.6 29.6 30.1 20.2
Table 2: Proportion of households owning at lea7J one moped, a light motorcycle, a motorcycle of more than 125 cm
3.3.2 Evolution of the Distances Travelled and the Duration of Voyages
On the basis of data available from national surveys on travel within the French population, it is possible to follow the evolution of distances covered by motorised two-wheelers. Sources : [Fleury, 1980 (4)] and Garre/Filou (unpublished). The data for 1989 does not come directly from the survey, but from an estimation based on the total fleets, using the average kilometrage obtained in the survey (cf. following chapter).
Since 1974, the distances travelled tend globally to decrease. The reduction in the duration of the trips made (time taken for the trip) is greater than for the distances covered (kilometrage). This results from the divergent evolution of the different types of two-wheelers: the number of mopeds has decreased whereas the number of motorcycles has increased. An indirect consequence of this is an increase in average speeds (Table 3).
A study (unpublished by J.R. Garre) enables an assessment to be made of the share of motorised two-wheelers (mopeds and motorcycles together) in the global mobility of people of all ages within the French population (daily travel, longer trips, all forms
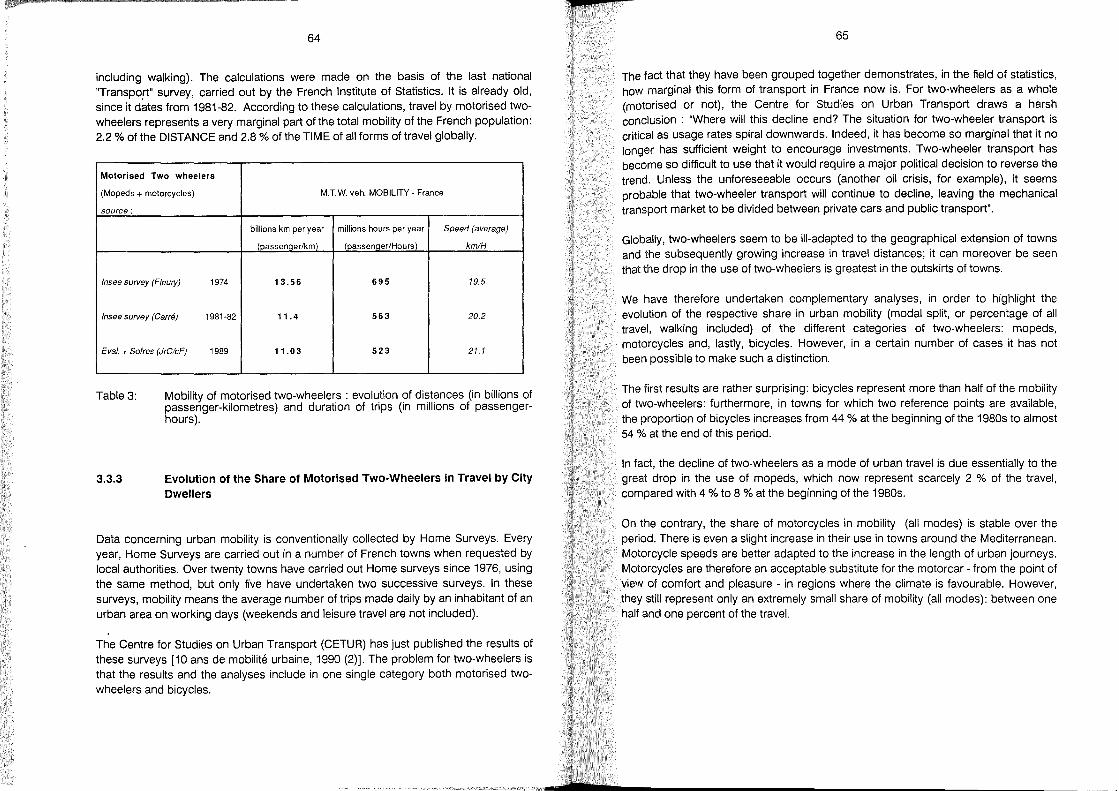
$2
64
including walking). The calculations were made on the basis of the last national ''Transpo,rt'' survey, carried out by the French Institute of Statistics. It is already old, since it dates fram 1981-82. According to these calculations, travel by motorised twowheelers represents a very marginal part of the total mobility of the French population: 2.2 % of the DISTANCE and 2.8 % of the TIME of all forms of travel globally.
Motorised Two wheelers
(Mopeds + motorcycles) M. T. W. veh. MOBILITY - France
source:
billions km per year millions hours per year Speed (average)
(passenqerlkm) (passenqer/Hours) km/H
Insee survey (Fleury) 1974 13.56 695 19.5
Insee survey (Garre) 1981-82 11.4 563 20.2
Eval. + Sofres (JrC/cF) 1989 11.03 523 21.1
Table 3: Mobility of motorised two-wheelers : evolution of distances (in billions of passenger-kilometres) and duration of trips (in millions of passen gerhours).
3.3.3 Evolution of the Share of Motorised Two-Wheelers in Travel by City Dwellers
Data concerning urban mobility is conventionally collected by Home Surveys. Every year, Home Surveys are carried out in a number of French towns when requested by local authorities. Over twenty towns have carried out Home surveys since 1976, using the same method, but only five have undertaken two successive surveys. In these surveys, mObility means the average number of trips made daily by an inhabitant of an urban area on working days (weekends and leisure travel are not included).
The Centre for Studies on Urban Transport (CETUR) has just published the results of these surveys [10 ans de mobilite urbaine, 1990 (2)]. The problem for two-wheelers is that the results and the analyses include in one single category both motorised twowheelers and bicycles.
65
The fact that they have been grouped together demonstrates, in the field of statistics, how marginal this form of transport in France now iso For two-wheelers as a whole (motorised or not), the Centre for Studies on Urban Transport draws a harsh conclusion : "Where will this decline end? The situation for two-wheeler transport is critical as usage rates spiral downwards. Indeed, it has become so marginal that it no longer has sufficient weight to encourage investments. Two-wheeler transport has become so difficult to use that it would require a major political decision to reverse the trend. Unless the unforeseeable occurs (another oil crisis, for example), it seems probable that two-wheeler transport will continue to decline, leaving the mechanical transport market to be divided between private cars and public transport".
Globally, two-wheelers seem to be ill-adapted to the geographical extension of towns and the subsequently growing increase in travel distances; it can moreover be seen that the drop in the use of two-wheelers is greatest in the outskirts of towns.
We have therefore undertaken complementary analyses, in order to highlight the evolution of the respective share in urban mobility (modal split, or percentage of all travel, walking included) of the different categories of two-wheelers: mopeds, motorcycles and, lastly, bicycles. However, in a certain number of cases it has not been possible to make such a distinction.
The first results are rather surprising: bicycles represent more than half of the mobility of two-wheelers: furthermore, in towns for wh ich two reference points are available, the proportion of bicycles increases from 44 % at the beginning of the 1980s to almost 54 % at the end of this period.
In fact, the decline of two-wheelers as a mode of urban travel is due essentially to the great drop in the use of mopeds, which now represent scarcely 2 % of the travel, compared with 4 % to 8 % at the beginning of the 1980s.
On the contrary, the share of motorcycles in mobility (all modes) is stable over the period. There is even a slight increase in their use in towns around the Mediterranean. Motorcycle speeds are better adapted to the increase in the length of urban journeys. Motorcycles are therefore an acceptable substitute for the motorcar - fram the point of view of comfort and pleasure - in regions where the climate is favourable. However, they still represent only an extremely small share of mobility (all modes): between one half and one percent of the travel.
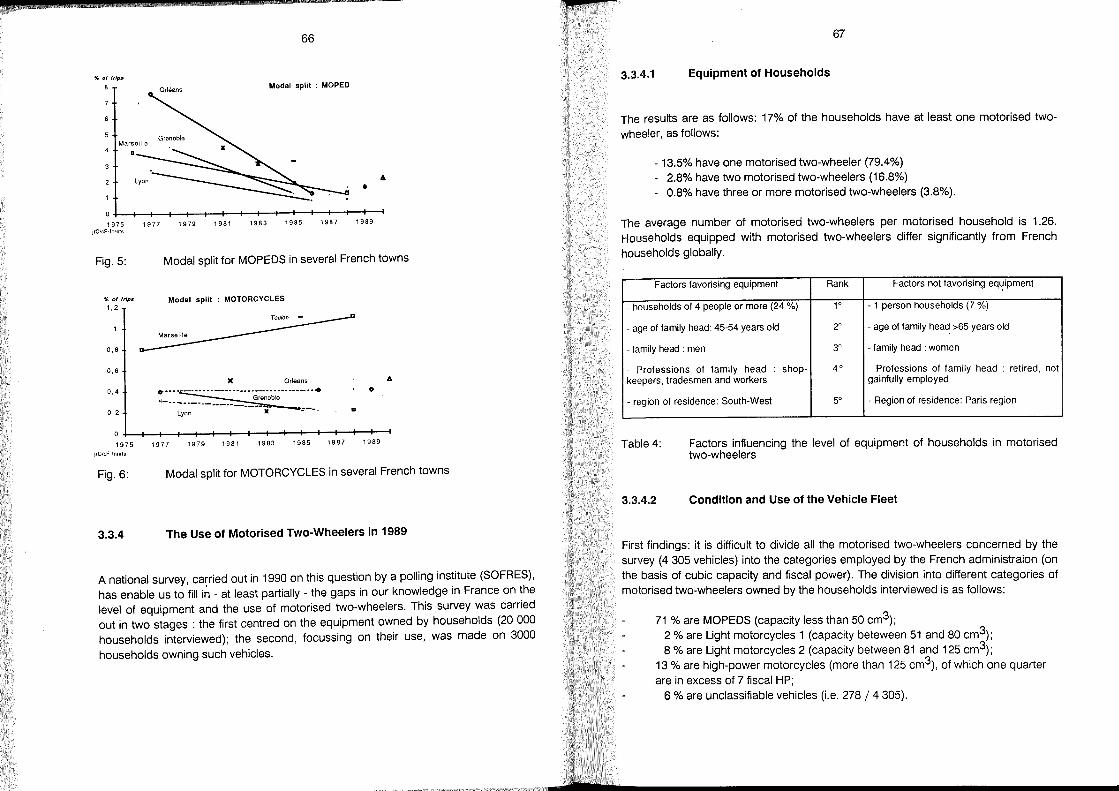
p
66
" 01 trip$ Modal .pli! : MOPED
6
•
1975 1977 1979 1981 1983 1985 1987 1989 jrC/cF-lnrets
Fig. 5: Modal split for MOPEDS in several French towns
" of trips
1.2
0.8
0.6
0.4
0.2
Modal .pli! : MOTORCYCLES
)( Orleans 6
o ~~::~ ...• Lyon - :---
1975 1977 1979 1981 1983 1985 1987 1989
jrC/cF-!nrels
Fig.6: Modal split for MOTORCYCLES in several French towns
3.3.4 The Use of Motorised Two-Wheelers in 1989
Anational survey, carried out in 1990 on this question bya polling institute (SOFRES), has enable us to fill in - at least partially - the gaps in our knowledge in France on the level of equipment and the use of motorised two-wheelers. This survey was carried out in two stages : the first centred on the equipment owned by households (20 000 households interviewed); the second, focussing on their use, was made on 3000
households owning such vehicles.
67
3.3.4.1 Equipment of Households
The results are as folIows: 17% of the households have at least one motorised twowheeler, as folIows:
- 13.5% have one motorised two-wheeler (79.4%) - 2.8% have two motorised two-wheelers (16.8%) - 0.8% have three or more motorised two-wheelers (3.8%).
The average number of motorised two-wheelers per motorised household is 1.26. Households equipped with motorised two-wheelers differ significantly from French households globally.
Factors favorising equipment Rank Factors not favorising eq~ipment
- households of 4 people or more (24 %) 1° . 1 person households (7 %)
- age of family head: 45-54 years old 2° . age of family head >65 years old
- family head : men 3° - family head : women
Professions of family head shop- 4° - Professions of family head : retired, not keepers, tradesmen and workers gainfully employed
- region of residence: South-West 5° - Region of residence: Paris region
Table 4: Factors influencing the level of equipment of households in motorised two-wheelers
3.3.4.2 Condition and Use of the Vehicle Fleet
First findings: it is difficult to divide all the motorised two-wheelers concerned by the survey (4 305 vehicles) into the categories employed by the French administraion (on the basis of cubic capacity and fiscal power). The division into different categories of motorised two-wheelers owned by the households interviewed is as folIows:
71 % are MOPEDS (capacity less than 50 cm3); 2 % are Light motorcycles 1 (capacity beteween 51 and 80 cm3); 8 % are Light motorcycles 2 (capacity between 81 and 125 cm3);
13 % are high-power motorcycles (more than 125 cm3), ofwhich one quarter are in excess of 7 fiscal HP;
6 % are unclassifiable vehicles (i.e. 278 / 4 305).
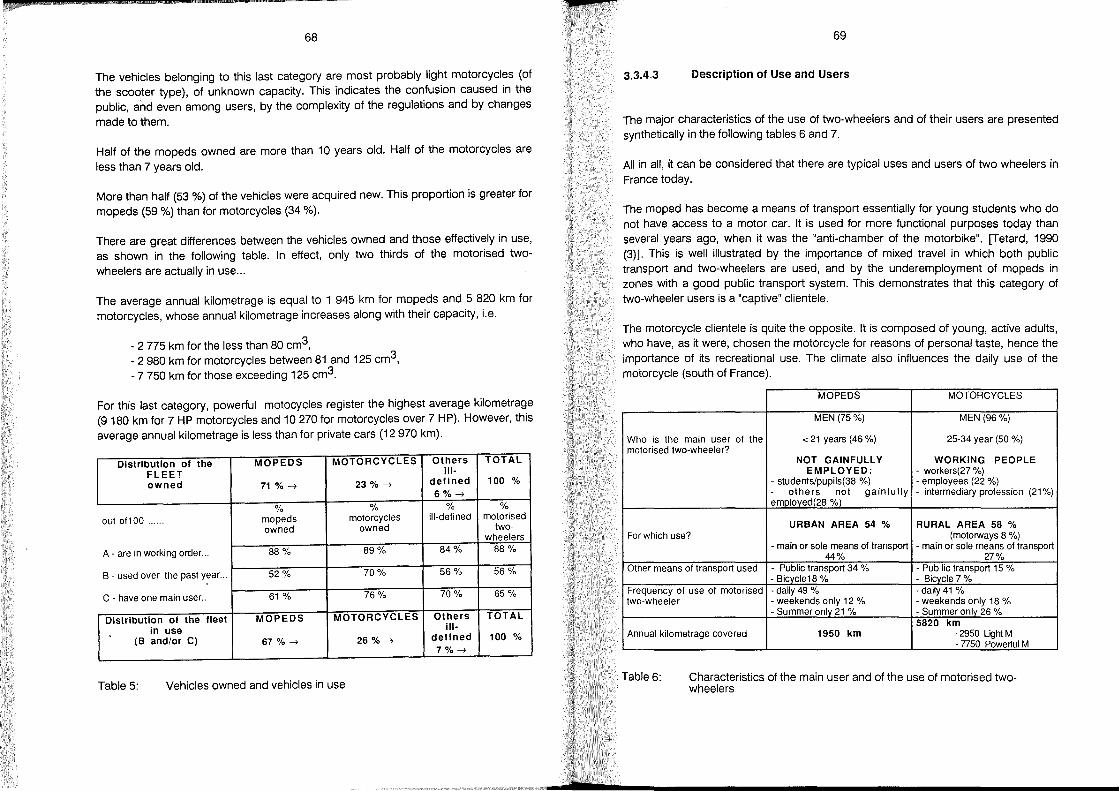
p
68
The vehicles belonging to this last category are most probably light motorcycles (of the scooter type), of unknown capacity. This indicates the confusion caused in the public, and even among users, by the complexity of the regulations and by changes
made to them.
Half of the mopeds owned are more than 10 years old. Half of the motorcycles are less than 7 years old.
More than half (53 %) of the vehicles were acquired new. This proportion is greater for mopeds (59 %) than for motorcycles (34 %).
There are great differences between the vehicles owned and those effectively in use, as shown in the following table. In effect, only two thirds of the motorised twowheelers are actually in use ...
The average annual kilometrage is equal to 1 945 km for mopeds and 5 820 km for motorcycles, whose annual kilometrage increases along with their capacity, Le.
- 2 775 km for the less than 80 cm3, - 2 980 km for motorcycles between 81 and 125 cm3, - 7 750 km for those exceeding 125 cm3.
For this last category, powerful motocycles register the highest average kilometrage (9180 km for 7 HP motorcycles and 10270 for motorcycles over 7 HP). However, this average annual kilometrage is less than for private cars (12970 km).
Distribution of the MOPEDS MOTORCYCLES Others TOTAL
FLEET 111-owned 71 %-7 23 %-7 defined 100 %
6% -7
% % % %
out of100 . ... mopeds motorcycles ill-defined motorised owned owned two-
wheelers
A - are in working order ... 88% 89% 84% 88%
B - used over the past year ... 52% 70% 56% 56 %
C - have one main user .. 61 % 76% 70% 65 %
Distribution of the fleet MOPEDS MOTORCYCLES Others TOTAL
in use ill·
(B and/or C) 67 %-7 26 %-7 defined 100 % 7% -7
Table 5: Vehicles owned and vehicles in use
69
3.3.4.3 Description of Use and Users
The major characteristics of the use of two-wheelers and of their users are presented synthetically in the following tables 6 and 7.
All in all, it can be considered that there are typical uses and users of two wheelers in France today.
The moped has become a means of transport essentially for young students who do not have access to a motor car. It is used for more functional purposes today than several years ago, when it was the "anti-chamber of the motorbike". [Tetard, 1990 (3)]. This is weil illustrated by the importance of mixed travel in which both public transport and two-wheelers are used, and by the underemployment of mopeds in zones with a good public transport system. This demonstrates that this category of two-wheeler users is a "captive" clientele.
The motorcycle clientele is quite the opposite. It is composed of young, active adults, who have, as it were, chosen the motorcycle for reasons of personal taste, hence the importance of its recreational use. The climate also influences the daily use of the motorcycle (south of France).
MOPEDS MOTORCYCLES
MEN (75%) MEN (96%)
Who is the main user 01 the < 21 years (46 %) 25-34 year (50 %) motorised two-wheeler?
NOT GAINFULL Y WORKING PEOPLE EMPLOYED: - workers(27 %)
- students/pupils(38 %) - employees (22 %) others not gainfully - intermediary profession (21%)
employed(28 %)
URBAN AREA 54 % RURAL AREA 58 % For which use? (motorways 8 %)
- main or sole means 01 transport - main or sole means of transport 44% 27%
Other means 01 transport used - Public transport 34 % - Pub Iic transport 15 % - Bicycle18 % - Bicycle 7%
Frequency 01 use of motorised -daily49 % -daily41 % two-wheeler - weekends only 12 % - weekends only 18 %
- Summer onlv 21 % - Summer onlv 26 % 5820 km
Annual kilometrage covered 1950 km - 2950 Light M - 7750 Powerful M
Table 6: Characteristics of the main user and of the use of motorised twowheelers
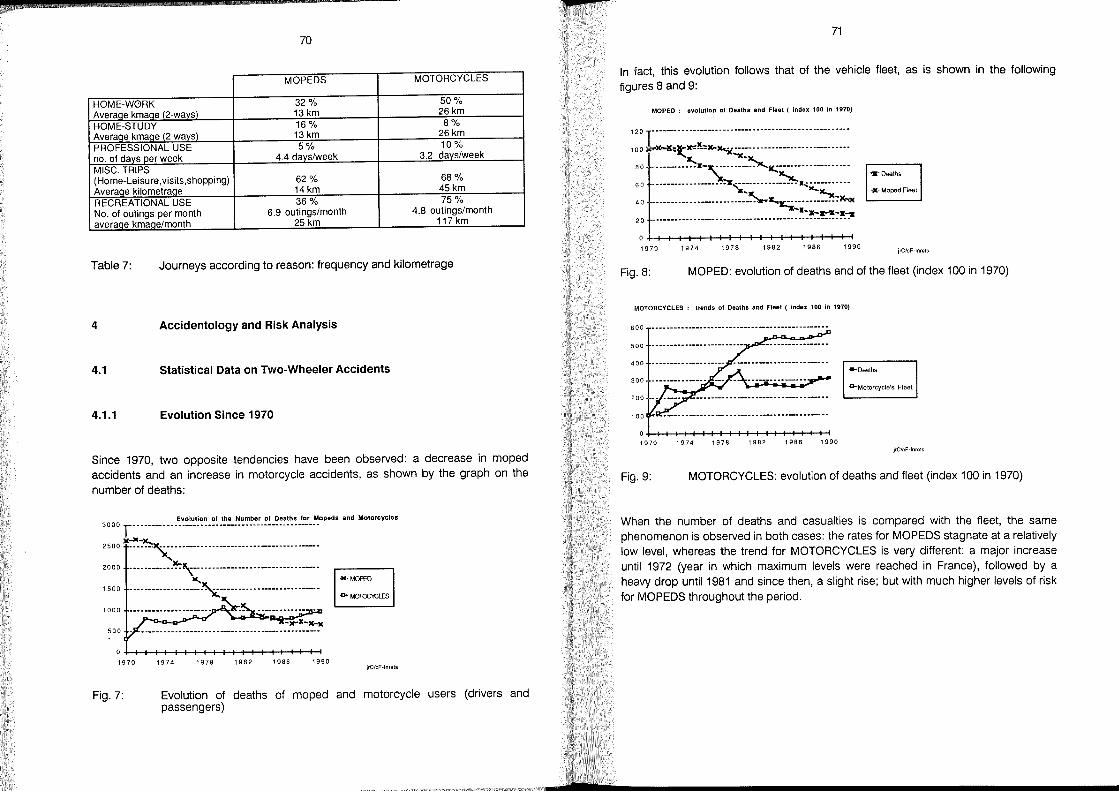
p:
70
MOPEDS MOTORCYCLES
HOME-WORK 32% 50%
AveraQe kmaQe (2-waysl 13km 26km
HOME-STUDY 16% 8% AveraQe kmaQe (2-ways) 13 km 26km
PROFESSIONAL USE 5% 10%
no. 01 davs per week 4.4 davs/week 3.2 davs/week
MISC. TRIPS (Home-Leisure,visits,shopping) 62% 68%
AveraQe kilometraQe 14km 45 km
RECREATIONAL USE 36% 75%
No. 01 outings per month 6.9 outings/month 4.8 outings/month
average kmage/month 25km 117 km
Table 7: Journeys according to reason: frequency and kilometrage
4 Accidentology and Risk Analysis
4.1 Statistical Data on Two-Wheeler Accidents
4.1.1 Evolution Since 1970
Since 1970, two opposite tendencies have been observed: a decrease in moped accidents and an increase in motorcycle accidents, as shown by the graph on the number of deaths:
Evolution 01 the Number 01 Deaths for Mopeds and MOlorcycles 3000 T~""" ----- .......... ----- -- ...... ----- .. -- --~ ----- .. ~ _ .... ---_ ..
X .... -x..,
:::: :::::~~~~~~:::::::~~~::::::::~~~:::::::~~~:: .....
:::: ::::::::::::::::=:~:;;:.:~ 500 - ______ -------------- ----------------------------
o H-f--+-+-I-+-+--+-I-+-+--+-I-+-i--+-+-+-i-"i 1970 1974 1978 1982 1986 1990
jrC/cF-lnrets
Fig.7: Evolution of deaths of moped and motorcycle users (drivers and passengers)
71
In fact, this evolution follows that of the vehicle fleet, as is shown in the following figures 8 and 9:
MOPED: evolution 01 Deaths and Fleet ( index 100 in 1970)
1970 1974 1978 1982 1986 1990 jrC/cF-lnrets
Fig.8: MOPED: evolution of deaths and of the fleet (index 100 in 1970)
MOTORCYCLES; trends of Deaths and Fleet ( index 100 in 1970)
600 .... _ .. ---- .... ----- _ .. --_ ...... ----- .... --_ ...... ---- _ ... -----
500
400
300
200
100
1970 1974 1978 1982 19861990 jrCfcF-lnrelS
Fig.9: MOTORCYCLES: evolution of deaths and fleet (index 100 in 1970)
When the number of deaths and casualties is compared with the fleet, the same phenomenon is observed in both cases: the rates for MOPEDS stagnate at a relatively low level, whereas the trend for MOTORCYCLES is very different: a major increase until 1972 (year in which maximum levels were reached in France), followed by a heavy drop until1981 and since then, a slight rise; but with much higher levels of risk for MOPEDS throughout the period.
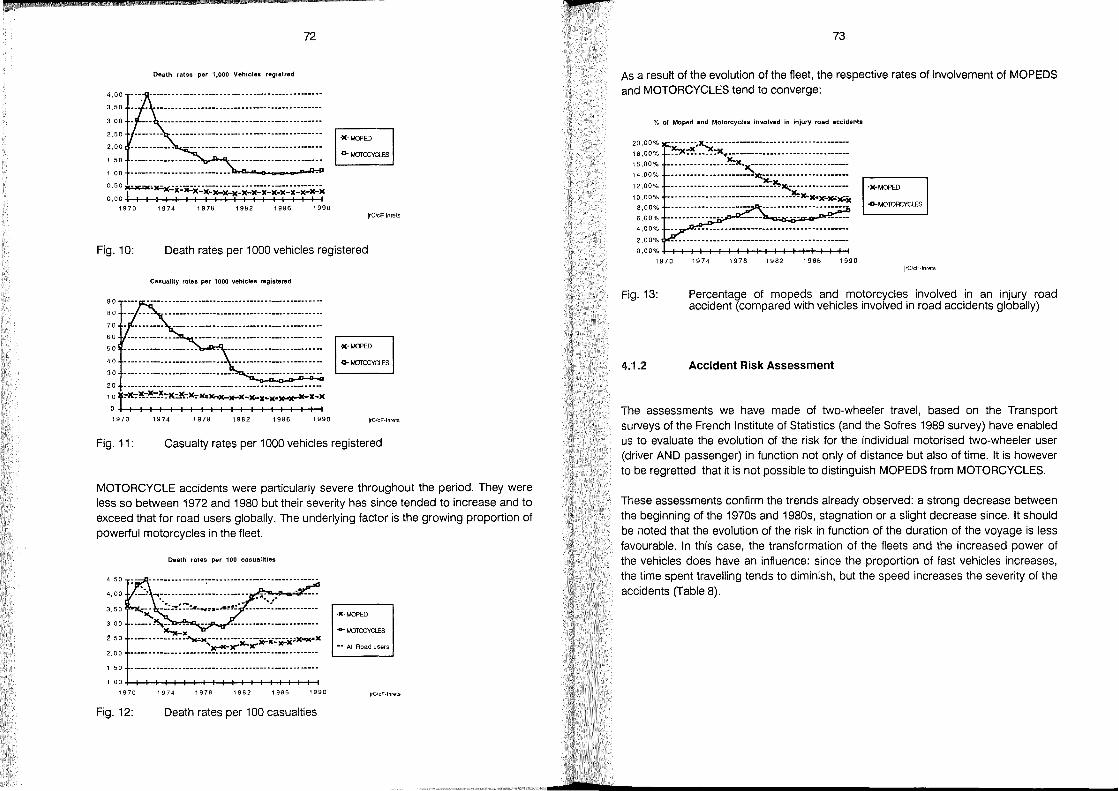
• 4,00
3,50
3,00
2,50
2,00
1,50
1,00
Oeath rates per 1,000 Vehicles registred
72
0,50 ~:.x.=:.,c:~~----------- .-----.-- -----._.-----_.----0,00 I I I I ,-~-7~-~-~-~-f~-~-~-~-~-~-r~-~
1970 1974 1978 1982 1986 1990 jrC/cF-lnrets
Fig.10: Death rates per 1000 vehicles registered
90
BO
70
60
50
40
30
Casuality rates per 1000 vehicles regi.larad
20 .. _ ••• __ -._ •• __________________ • _____ ... ______ • ____ ..... _
10 !::-It';~':':-l!::1l::~~)(::-)(=~~-X_X.)(. __ -x.)(
0+ I I I I I I I I I I I I I I I I I I I I 1970 1974 197B 1982 1986 1990 jrC/cF-lnrels
Fig. 11: Casualty rates per 1000 vehicles registered
MOTORCYCLE accidents were particularly severe throughout the period. They were less so between 1972 and 1980 but their severity has since tended to increase and to exceed that for road users globally. The underlying factor is the growing proportion of powerful motorcycles in the fleet.
4,50
4,00
3,50
3,00
~,50
2,00
Death rates per 100 casualities
1 ,50 .. ____ .... --__ ...... ____ .... ---.... _ ._ ....... ----- .. ---_ ... - ._-_ ..
1 ,00 -I--J-+-+-+-J-+--+-+-J-+-+-+-J-+-+-+-t-+-+-i 1970 1974 1978 1982 1986 1990
Fig.12: Death rates per 100 casualties
,X'MOPED
-- All Roa.d users
JrC/cF-lnrets
73
As a result of the evolution of the fleet, the respective rates of involvement of MOPEDS and MOTORCYCLES tend to converge:
% of Moped and Motorcycles Involved in injury road accidents
~~:~~~ ~~~:5;~::::::::::::::::::::::::::::::::
~ng ~::::::::~:~:::"~~~;;L~~=l 8,00%
6,00%
4,00%
2,00%
o ,00 % -I--J-+-+-J-+--+-.......,t-+-J-+-l-+-+-+-+-J-+-I'-1 1970 1974 1978 1982 1986 1990
jrC/cF-lnrets
Fig.13: Percentage of mopeds and motorcycles involved in an injury road accident (compared with vehicles involved in road accidents globally)
4.1.2 Accident Risk Assessment
The assessments we have made of two-wheeler travel, based on the Transport surveys of the French Institute of Statistics (and the Sofres 1989 survey) have enabled us to evaluate the evolution of the risk for the individual motorised two-wheeler user (driver AND passenger) in function not only of distance but also of time. It is however to be regretted that it is not possible to distinguish MOPEDS from MOTORCYCLES.
These assessments confirm the trends al ready observed: a strong decrease between the beginning of the 1970s and 1980s, stagnation or a slight decrease since. It should be noted that the evolution of the risk in function of the duration of the voyage is less favourable. In this case, the transformation of the fleets and the increased power of the vehicles does have an influence: since the proportion of fast vehicles increases, the time spent travelling tends to diminish, but the speed increases the severity of the accidents (Table 8).
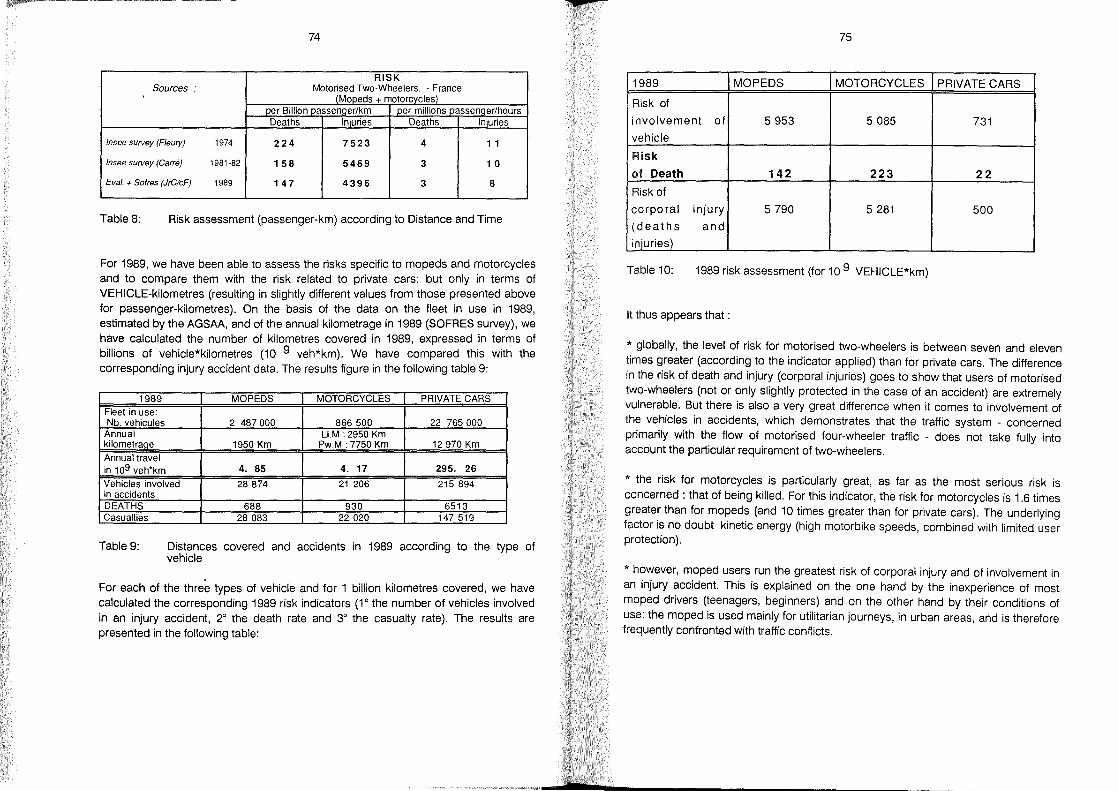
p
74
RISK Sources : Motorised Two-Wheelers. - France
(Mopeds + motorcyc!es) j:ler Billion~assenger/km .1J.er millionsQ.assenger/hours
Deaths Injuries Deaths Injuries
Insee sUlVey (Fleury) 1974 224 7523 4 1 1
Insee sUlVey (Garre) 1981-82 158 5469 3 10
Eval. + Sofres (JrC/cF) 1989 147 4396 3 8
Table 8: Risk assessment (passen ger-km) according to Distance and Time
For 1989, we have been able to assess the risks specific to mopeds and motorcycles and to compare them with the risk related to private cars: but only in terms of VEHICLE-kilometres (resulting in slightly different values from those presented above for passenger-kilometres). On the basis of the data on the fleet in use in 1989, estimated by the AGSAA, and of the annual kilometrage in 1989 (SOFRES survey), we have calculated the number of kilometres covered in 1989, expressed in terms of billions of vehicie*kilometres (10 9 veh*km). We have compared this with the corresponding injury accident data. The results figure in the following table 9:
1989 MOPEDS MOTORCYCLES PRIVATE CARS Fleet in use: Nb. vehicules 2 487000 866500 22 765000
Annual Li.M : 2950 Km kilometrage 1950 Km Pw.M : 7750 Km 12970 Km
Annual travel in 109 veh*km 4. 85 4. 17 295. 26
Vehicles involved 28874 21 206 215 894 in accidents DEATHS Casualties
Table 9:
688 930 6513 28083 22020 147519
Distances covered and accidents in 1989 according to the type of vehicie
For each of the three types of vehicie and for 1 billion kilometres covered, we have calculated the corresponding 1989 risk indicators (1 ° the number of vehicies involved in an injury accident, 2° the death rate and 3° the casualty rate). The results are presented in the following table:
75
1989 MOPEDS MOTORCYCLES PRIVATE CARS
Risk of
i nvolve ment of 5953 5085 731 vehicle
Risk
of Death 142 223 22 Risk of
corporal injury 5790 5281 500 (deaths and
injuries)
Table 10: 1989 risk assessment (for 10 9 VEHICLE*km)
It thus appears that :
* globally, the level of risk for motorised two-wheelers is between seven and eleven times greater (according to the indicator applied) than for private cars. The difference in the risk of death and injury (corporal injuries) goes to show that users of motorised two-wheelers (not or only slightly protected in the case of an accident) are extremely vulnerable. But there is also a very great difference when it comes to involvement of the vehicles in accidents, which demonstrates that the traffic system - concerned primarily with the flow of motorised four-wheeler traffic - does not take fully into account the particular requirement of two-wheelers.
* the risk for motorcycles is particularly great, as far as the most serious risk is concerned : that of being killed. For this indicator, the risk for motorcycles is 1.6 times greater than for mopeds (and 10 times greater than for private cars). The underlying factor is no doubt kinetic energy (high motorbike speeds, combined with limited user protection) .
* however, moped users run the greatest risk of corporal injury and of involvement in an injury accident. This is explained on the one hand by the inexperience of most moped drivers (teenagers, beginners) and on the other hand by their conditions of use: the moped is used mainly for utilitarian journeys, in urban areas, and is therefore frequently confronted with traffic conflicts.
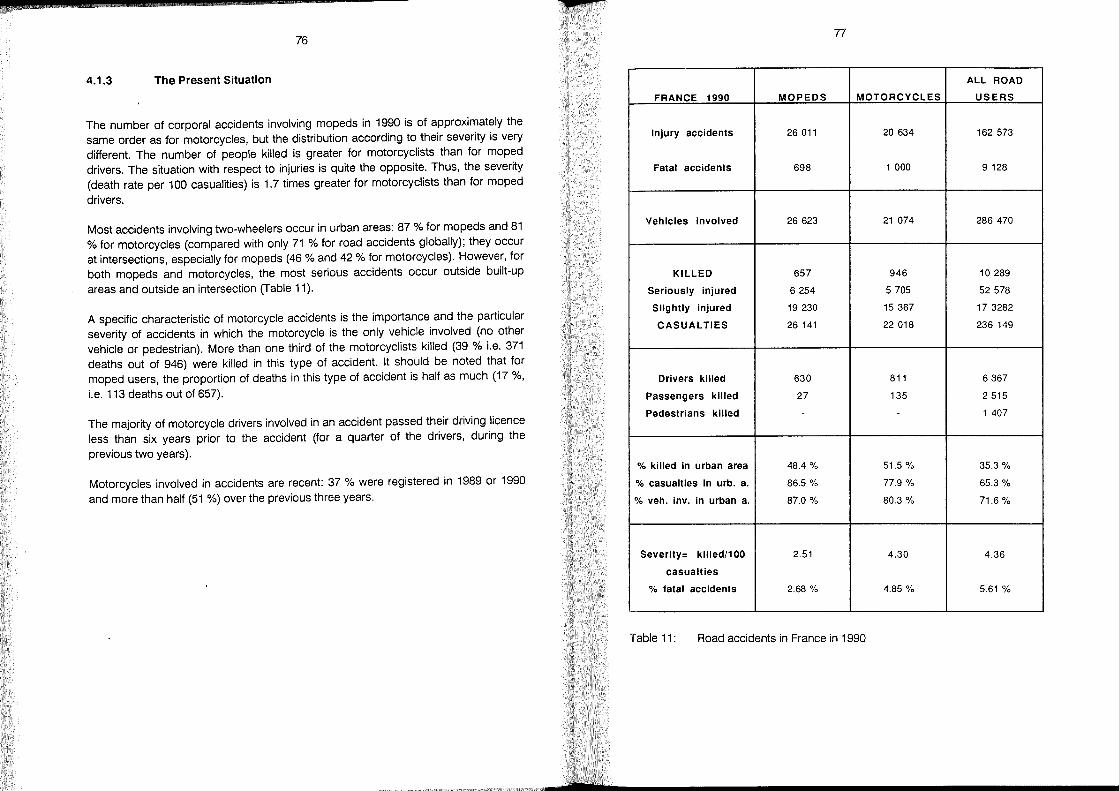
p
76
4.1.3 The Present Situation
The number of corporal accidents involving mopeds in 1990 is of approximately the same order as for motorcycles, but the distribution according to their severity is very different. The number of people killed is greater for motorcyclists than for moped drivers. The situation with respect to injuries is quite the opposite. Thus, the severity (death rate per 100 casualities) is 1.7 times greater for motorcyclists than for moped
drivers.
Most accidents involving two-wheelers occur in urban areas: 87 % for mopeds and 81 % for motorcycles (compared with only 71 % for road accidents globally); they occur at intersections, especially for mopeds (46 % and 42 % for motorcycles). However, for both mopeds and motorcycles, the most serious accidents occur outside built-up areas and outside an intersection (T able 11).
A specific characteristic of motorcycle accidents is the importance and the particular severity of accidents in which the motorcycle is the only vehicle involved (no other vehicle or pedestrian). More than one third of the motorcyclists killed (39 % Le. 371 deaths out of 946) were killed in this type of accident. It should be noted that for moped users, the proportion of deaths in this type of accident is half as much (17 %,
Le. 113 deaths out of 657).
The majority of motorcycle drivers involved in an accident passed their driving licence less than six years prior to the accident (for a quarter of the drivers, during the
previous two years).
Motorcycles involved in accidents are recent: 37 % were registered in 1989 or 1990 and more than half (51 %) over the previous three years.
77
FRANCE 1990 MOPEDS MOTORCYCLES
Injury accidents 26011 20634
Fatal accidents 698 1 000
Vehicles involved 26623 21 074
KILLED 657 946
Seriously injured 6254 5705
Slightly injured 19230 15367
CASUALTIES 26141 22018
Drivers killed 630 811
Passengers killed 27 135
Pedestrians killed - -
% killed In urban area 48.4 % 51.5%
% casualties in urb. a. 86.5 % 77.9 %
% veh. Inv. in urban a. 87.0 % 80.3 %
Severity= killed/100 2.51 4.30
casualties
% fatal accidents 2.68 % 4.85 %
Table 11: Road accidents in France in 1990
ALL ROAD
USERS
162573
9128
286470
10289
52578
17 3282
236 149
6367
2515
1 407
35.3 %
65.3 %
71.6%
4.36
5.61 %
s 78
The wearing of a heimet has now become customary practice, especially for motorcyclists: 92 % of motorcycle drivers and 85 % of moped drivers wear a heimet. For users '(drivers and passengers) not wearing a heimet, the severity of the accident (deaths/100 casualties) is twice as great for mopeds and 1.8 times greater for motorcyclists than for users wearing a heimet; however, there is a great difference between open countryside and urban areas, as shown in the following table:
DEATHS MOPEDS MOTORCYCLES
Der 1 00 Casualitie~
1990 with Heimet without Heimet with Heimet without Helme
RURALAREA 9.0% 10.6% 9.3% 13.2%
URBAN AREA 1.1% 3.1% 2.6% 5.9%
TOTAL 2.2% 4.3% 4.1% 7.5%
Table 12: Severity in function of wearing a heimet and localisation in 1990
Because motorised two-wheelers are used mainly by young people, this category is particularly affected: for moped users (drivers and passengers) aged about 17 and for motorcyclists aged about 20 , the number of deaths is seven to ten times greater than for other age groups :
Fig.14:
160
'40
'20
'00
80
60
40
Number of Deaths by Age (1988+1989)
20 I ",,-J.lL~~~~~~~~-orb lffS 051015202530354045505560657075808590
jrC/cF-lnrals
Number of moped users and motorcyclists killed according to age (for 1988 + 1989)
79
The mortality rate among young users of motorised two-wheelers is very high: almost five times the average rate for users of this type of vehicle as a whole (all ages). There is always the same discrepancy between the age groups which are the most affected : 17-19 years for moped users and 20-24 years for motorcyclists, the age at wh ich the maximum rate is reached.
Fig.15:
Oeath Rates by Aga (average1988-89) par 100,000 population
8,00,...---------------_ 7,00 +-______ _ 6,00 -1-__ _
5,00 -1----
4,00 kc:m---3,00
2,00
1,00
0,00
---I =::QE5 I 14-16 17-1 9 20-24 25-29 AtiAges
jrCfcF-lnrets
Death rates per age group (for 1988 + 1989)
If we consider the rate for all casualties combined (deaths and injuries), we are still confronted with the excess risk value for "young people", but the situation of moped users seems less favourable. Inexperience is doubtless a supplementary risk factor for the youngest among them.
Fig.16:
Rate. of InJurles by Aga, 1989 per 100,000 population
400,00.,..---------------
350,00 +-----r;;rn..----------300,00+-__
250,00
200,00
150,00
100,00
50,00
~---------- 1=::QE51
0,00
14-1617-1920-2425-29 A1IAGES irClcF-lnrats
Casualty rates (fatal and non-fatal injuries) for 1989

a 80
4.2 Analysis of Accidents and Determinant Risk Factors
A statistical analysis has been made on the basis of a file covering 1/50 th of the injury accidents which occurred in France in 1989, and set up by INRETS with a specific SPAD.N programme (Portable System of Data Analysis). The procedure used (DEMOD) enables each form of a variable or the variable itself globally to be characterized. The characteristic elements are classified in order of importance according to a statistical criterion ("value-test"), associated with a probability: the greater the value-test (the lesser the probability), the more the element is characteristic.
For this analysis, we have considered the driver as a unit and have taken into consideration a certain number of characteristics concerning:
the accident in which he is involved (date, localisation, type of road, vehicles involved etc ... ), the vehicle he was driving (type, part hit, driver manoeuvre ... ), specific details concerning the driver (sex, age, profession, alcohol level, severity ... )
The drivers have been divided into four categories, according to the type of vehicle driven, i.e. bicycles, motorised two-wheelers, light cars, utility vehicles.
A first analysis has been carried out, taking the four categories into account. It considers all 5 486 drivers. A second analysis considers only the 906 two-wheeler drivers and enables a distinction to be made between moped drivers (527) and motorcyclists (379).
4.2.1 Characterization of MOTORISED TWO WHEELER Drivers Compared with Two- or Four-Wheeler Drivers Globally
The variables (46 in all) used in the analysis enable the four categories of driver we have considered to be differenciated. For each of these variables, we therefore obtain a significant chi2.
The 18 most discriminating variables concerning drivers and motorised two-wheeler accidents, compared with motorised two or four-wheeler drivers as a whole, have been classified in order of importance (ranking from 1 to 18) and are as folIows:
81
1° severity (twice as great as for drivers globally); 2° characteristics of the driver (age : rank 2, profession: rank 3, alcohollevel : rank 7, sex: rank 11, reason for trip: rank 12); 3° the manoeuvres and circumstances of the accident:
a) manoeuvres (manoeuvre characterising the accident : rank 5, individual man oeuvre of the two-wheeler driver: rank 6)
b) circumstances (number of passengers transported : rank 4, number of vehicles involved : rank 9, type of collision : rank 10, part hit: rank 14, number of pedestrian(s) : rank 16);
c) localisation (within or outside a built-up area : rank 8, type of road : rank 13, in or outside an intersection : rank 15);
d) date (month : rank 17, hour : rank 18).
The modalities of these variables which best characterize drivers of motorised twowheelers, compared with two and four wheeler drivers globally (Le. whose great frequency is highly significant) are shown in the table below. For each variable, we present the frequency of the modality: on the one hand, for drivers of two-wheelers, on the other hand, for drivers as a whole.
VARIABLE Frequency Frequency for lor the Driver 01 all 2-4 whee/er
motorised Two-wheelers drivers together
AGE 16-17 years (19%) 3.% 18-19years (16%) 6% 14-15 years '(6 %). 1.%
SEVERITY Death(5%) 3% of the driver Serious injury 22%) 10%
Sliqht iniurv 65%) 39% With or without passenqer Without (87%) 71% Localisation In urban area (83%) 68% Localisation At an intersection 52% 47% Sex Male (90%1 78% Number of vehicles involved 2 vehicles (77%) 64% Type of collision Lateral 61% 49% Manoeuvre characterising Turns at Intersection (32%) 22% the accident globally Chanae of direction in mid-block '(16%) 10% Individual driver manoeuvre Overtaking (10%) 4%
Same direction (61%) 54% Part hit Front (73%) 64%
Riaht-hand side(6%) 4% Reason for trip Horne-Work, Horne-Study (20%) 12% Vehicle owned, borrowed Borrowed (20%) 14%
Belonas to household' (74%) 70% Month of accident Mav to Auaust (39%) 34% Presence of pedestrian No 194%) 91% Hour of the accident 17h-20h 24% 21%
Table 13: Characterization of motorised two-wheeler drivers INVOLVED IN AN ACCIDENT compared with drivers of 2 and 4 wheelers globally.
p
82
The principal results of the analysis are as folIows:
The majority of drivers of motorised two-wheelers involved in an accident are young men and the accidents are the most severe. The accident in which they are involved occurs most frequently in a built-up area, at an intersection and involved two vehicles. It frequently occurs in Summer and at the beginning of the evening.
The most frequent type of collision is the lateral collision, but it is the front part of the
vehicle which is hit.
In one case out of three, the manoeuvre which characterizes the accident globally results from a vehicle turning left or right at an intersection. In one case out of six, this man oeuvre is made by a vehicle changing direction in mid-block.
However, the most frequent individual manoeuvre by the driver of the motorised twowheeler consists of driving without changing direction (6 cases out of 10).
In the light of this analysis, it can be seen that the most discriminatory variables do not explain why the accident happened, strictly speaking.
Severity means that the driver of the motorised two-wheeler is more vulnerable and less protected than the other drivers.
The characteristics of the two-wheeler driver involved in an injury accident, such as age, sex or the type of journey are, in the end, just as important as the manoeuvres performed or the circumstances of the accident.
4.2.2 Characterization of MOPED and MOTORCYCLE Drivers
The second analysis concerns only motorised two-wheeler drivers and makes the distinction between moped users and motorcyclists.
The variables considered are identical to those used in the preceeding analysis. However, when we apply the DEMOD procedure, we observe that a certain number of them do not give significant results (chi2) in terms of differentiation between the two classes of drivers. This concerns the severity of the driver or the localisation - in or outside a built-up area - in which the accident occurred.
83
All in all , 18 variables distinguish between moped and motorcycle drivers and accidents. They have been classified in order of importance (ranking from 1 to 18), grouped together and are as folIows:
1 ° the characteristics of the driver (age : rank 1, profession: rank 2, sex: rank 4, reason for trip: rank 5, ownership of vehicle : rank 10, wearing of heimet: rank 12); 2° the man oeuvres (individual manoeuvre by the two-wheeler driver : rank 3, manoeuvre characterizing the accident : rank 8); 3° the circumstances (number of vehicles involved : rank 6, presence of a passenger : rank 7, part of the two-wheeler hit: rank 9, type of collision : rank 11 ); 4° date of the accident (month : rank 13, hour : rank 17, type of day : rank 18); 5° localisation (type of road : rank 14, horizontal alignment : rank 15, in or outside intersection : rank 16).
The modalities of these variables which best differentiate mopeds from motorcycles and vice versa are shown in table 14.
Compared with drivers gene rally (two- and four-wheelers together), accidents involving motorised two-wheelers globally are differentiated above all by their severity and by the socio-demographic characteristics of their drivers. Analysis of moped accidents compared with motorcycle accidents shows that the factors related to the way the accident occurred are much more discriminating. In effect, the manoeuvres and the circumstances are very different in each of these categories (Table 14).
In sum, the characteristic moped accident involves two vehicles. It is caused by the interference of another driver at an intersection and the moped user does not change direction; the most frequent type of collision is therefore a lateral collision and it is the back of the vehicle which is hit. On the other hand, it occurs more frequentlyon working days and in autumn.
The characteristic motorcycle accident occurs without interference of another vehicle. It occurs on abend and outside a junction. In one case out of four, the manoeuvre which globally characterizes the accident is the result of a loss of control by the motorcyclist without interference from another driver or pedestrian (compared with only one case in ten for moped users). Thus, the individual manoeuvres characteristic of motorcyclists are loss of control (one case in four), and overtaking of another vehicle (one case in six). The typical collision in which the motorcyclist is involved is a collision with a fixed obstacle, a carriageway exit or a rollover. The part of the vehicle most frequently hit is the right-hand side, but the motorcycle is often reduced to a complete wreck. Finally, from the temporal point of view, these accidents are

2
84
completely different from moped accidents : they occur most frequently over the weekend" in summer and at the beginning of the night.
VARIABLE MOPEDS MOTORCYCLES
Dominant modalities Dominant modalities
~requency in % Moped<->Motor"l'cI~ (frequence in % Motorcvcle<->Moped)
AGE 16-17 years (29%<->6%) 25-29 years (25%<->7%)
14-15 years (9%<->0%) 20-24 year (31%<->12%)
>60 years(6%<->0%) 30-39 years (18%<->8%)
40-59 years (10%<->6%)
18-19 years (19%<->13%)
Sex Females (16%<->2%) Males (98%<->84%)
Manoeuvre by two- Change of direction (13%<->2%) Loss of control(23%<->10%)
wheeler driver Same direction (B4%<->56o/~l Overtakinq (15%<->6%)
Number of vehicles Two vehicles (84%<->67%) One vehicle (25%<->12%)
involved Three and more (8%<->4%)
OcclJj)ation Driver alone (92%<->80%) One passenaer (20%<->8%)
Reason for trip Home-Work, Home-Study (25%<-> 12°""1 Professional (11%<->4%1
Manoeuvre characterizing Without change of direction Loss of control without interference by
accident globally at intersection (15%<->7%) another driver or pedestrian
Siowinq down (7%<->3%) ~ 23%<-> 1 0%)
Type of collision Lateral (66%<->55%) Without collision (10%<->4%)
Fixed Obstacle (11 %<->5%)
Part hit Back (9%<->4%) Right-hand side(10%<->3%)
Wreck (8%<->5%)
Owner of two-wheeler Borrowedj25%<-> 13%) Belongs 10 household (78%<->72%)
Month of Ihe accident September-December (35%<->25°/<» May-Auaust (46%<->36%)
Day of the week Workinq day (75%<->69%) Weekend (31 %<->25%)
Localisation At intersectionj56%<->48%) Outside intersection (52%<->44%)
Horizontal alignment Straight line (75%<->68%) Curve (32%<->25%)
Type of road Secondary road (63%<->56%) Motorway (3%<->0%)
Heimet Without heimet (14%<->8%) NS
Hour of accident NS 20h-24h (15%<->8%)
Table 14: Differentiation of the characteristics of moped and motorcycle drivers involved in an accident
85
These results can be considered as strong stable characteristics, since they were already observed in an earlier French study on accidents in 1975 [Favero 1981 (3)].
As for the socio-demographic characteristics of the drivers, they confirm the differences observed in terms of use. Moped users involved in an accident are most often women (teenagers or over 40) and are not carrying a passen ger. They travel rather between their home and work or between their home and school on a borrowed moped.
Motorcyclists involved in accidents are generally young adult men transporting a passenger. They travel rather for professional reasons on a vehicle belonging to a member of the household.
It should be noted that even if wearing a heimet is customary practice, moped drivers (14%) travel more frequently without a heimet than motorcyclists (8%).
5 Conclusions and Perspectives
Whereas globally the motorised two-wheeler fleet tends to be declining in France, the number and above all the severity of the accidents affecting this user category have remained stable and at a high level over the past several years. In other words, there is a tendency towards an increased risk. Furthermore, young people are more particularly affected by this risk. It is impossible to remain indifferent in the face of such an observation. Does this mean that motorised two-wheelers are intrinsically dangerous?
It can not be denied that motorised two-wheelers represent an EXCESS RISK FACTOR : this is apparent, whatever indicator is used. But what is really measured when such a risk is revealed ? A group of related factors of risk which are very difficult to separate: those relative to the driver, to the use and, lastly, to the vehicle itself.
1) "DRIVER" risk. In this case, the factor is not favourable.
Moped drivers are beginners and have relatively little experience, since they are mostly young people who are not yet old enough to drive other types of motor vehicles : moreover, they comprise a "captive" clientele.
Motorcycle drivers are young adults who have chosen this form of transport for reasons of personal taste. Although a little more experienced than moped users, they

Si 11 22
86
are concerned rather with the pleasure they derive from this type of vehicle (namely
speed) than with the dangers of the road.
2) "USE" risk. This is also unfavourable.
The moped is the only type of two-wheeler still used most frequently for utilitarian travel in urban areas. It is therefore frequently confronted with traffic conflicts. The recreational use of motorcycles is dominant, which inevitably tends to be
accompanied by a certain risk-takking.
3) "VEHICLE" risk. This is comprised of several elements:
* "two-wheeler" risk, intrinsic to any vehicle of this type (motorised or not) : instability, sensitivity to road defects and, lastly, limited protection of drivers and passengers;
* the supplementary risk resulting from the motorisation of two-wheelers. There is no doubt about this factor, which increases with kinetic energy, as all the data
demonstrates.
* the risk related to the particular technology of the vehicle and playing on its
capacities: road-holding, braking, indicator lights etc ...
What should be envisaged in order to achieve a better accident prevention?
From a technical point of view, improvements are always possible, but the problem is their cost. In addition, it can be thought that they will influence only a relatively marginal part of the risk. Better safety should therefore be achieved by modifying
especially the conditions of use of motorised two-wheelers :
* in distinguishing more clearly normal use of public roads and recreational use of the
vehicle;
* in increasing requirements for driving licences, at both ends of the scale : mopeds and powerful motorcycles, as suggested in arecent report commissioned by the
European Community [For a European road safety policy, 1990 (5)]:
* in integrating speed limits into the construction and, in this case also, at both ends
of the scale.
All in all, questions can indeed be raised as to the future of motorised two-wheelers in a country such as France. Some [10 ans de mobilite urbaine 1990 (2)] see hardly any reason for renewed development, except in unforseen circumstances (for example, a new oil crisis). Reduced as a result of competition from the motor car to a marginal
6
1)
2)
3)
4)
5)
6)
7)
8)
87
Reference list
Danger : 3 cyclos "gonfies" sur 5 In: Nouvelles de I' Assurance (1991 )406
10 ans de mobilite urbaine / Centre d'Etudes des Transports Urbains. -Bagneux, 1990
Favero, J.l.; Ferrandez, F.: Etude de I'influence des facteurs relatifs EI la conception des deux-roues sur leur securite. - Paris, 1981. - (ONSER Cahier d'Etude; 52)
Fleury, D.: Utilisation des deux roues. - Paris, 1980. - (ONSER Cahier d'Etude; 49)
Pour une politique europeenne de securite routiere / Comite d'experts de la securite routiere, Commision des Communautes Europeennes DG7. -Bruxelles, 1990
Recueil de donnees statistiques sur I'assurance automobile en France / AGSAA (Association Generale des Societes d'Assurances contre les Accidents). - Paris, 1989
Tetard, C.; Assailly, J.P.: Renouvellement des contenus et des modalites pedagogiques de I'ASSR. -Arcueil, 1991. - (INRETS rapport provisoire)
Trognon, A.: Les menages, la bicyclette et les motocycles en 1976. - Paris, 1979. -(Collections de I'INSEE-M; 77)

z
Factors that Influence the Involvement of Motorbikers in Traffic Accidents
Ulrich Schulz
Universität Bielefeld
Hubert Koch
Industrie-Verband Motorrad Deutschland e. V., Essen
Germany
2
1
91
1 Abstract
Recent studies have shown that age, driving experience, and risk exposure, measured in annual mileage, have a major influence on the involvement of motorbikers in accidents. Recent studies have shown that a further factor that is frequently discussed namely the performance of the motorbike, does not possess the importance that is attributed to it in the public discussion. Recent studies in Germany and other countries show that machine performance has no significant influence on accident involvement in the sense of a correlation between high performance and a high number of accidents. In the present study, a sam pie of more than 800 motorbikers were surveyed with a detailed questionnaire on accident involvement at the IFMA and the Motorshow in Essen in 1990. The detailed assessment of individual re ports on motorbikes and accidents permitted a further study of the fundamental effects of the above mentioned factors in the most comprehensive sam pie yet to be studied in Germany. It also provided detailed information on involvement in accidents.
2 92
2 Introduction
Up to now two different methods have been used to study motorcycle accidents. The first is the statistical processing of data collected by the police at traffic accidents. These data generally refer to the type, location, and time of the accident as weil as material dammage and physical injury. Data that provide more detailed descriptions of the vehicle and the rider are hardly ever collected. The lack of depth in the assessment of accident related data is a weakness of the surveys performed by the police. A further deficit can be considered to be a large number of unreported accidents, for example, accidents not involving other road users.
The second possiblilty of collecting data is to carry out detailed surveys of road users. This method is used to obtain more detailed information on the location, type, and severity of accidents as weil as specific information on the accident vehicle and the road users involved. In recent years, it has frequently been used to gain more detailed information on the involvement of motorbikers in accidents [see Koch and Hagstotz, 1990, (3); Schulz, 1990, (8), (9); Schulz and Hagstotz, 1990, (10); McKnight and Robinson, 1990, (7); Simard, 1990, (11); Taylor and Maycock, 1990, (12); Taylor and Lockwood, 1990, (13)]. The last studies were able to provide a more precise analysis of the impact on the vehicle and the driver. Effects of the driver have been shown for the variables, gender, age, driving experience, and the goal of biking. A further effect is shown by the type and the extent of risk exposure. The time of year, location, and the annual mileage are important variables. Finally, the motorbike's engine size and performance are discussed as variables of the vehicle.
3 A Discussion of the Variables
3.1 Effects of the Person
Statistical accident surveys have shown that age is an important variable in accidents [Kroj and Stöcker, 1986, (3); Koch, 1990, (2)]. In general, accident statistics show a decreasing trend in accidents with increasing age [Kroj and Stöcker, 1986, (3); McKnight and Robinson, 1990, (7); Taylor and Maycock, 1990 (12); Koch, 1990, (3); Schulz, 1990 a,b, (8,9). In the western part of Germany, accident involvement peaks among 18- and 19-year-olds [Koch, 1990, (2)]. A closer analysis of the influence of age on the risk of accidents shows that a moderator function is present here. The age variable assesses not only the riding experience in young motorbikers but also zadolescent risky behavior. These two, potentially independent, variables can contribute to an increased involvement in accidents. One variable is the age specific
93
tendency to search for new experiences and test own skills; the other variable is the learner riders' inexperience in riding a motorbike through the complex system of road traffic. Therefore, driving experience is generally assessed with age. If the former variable is additionally measured through the length of regular motorbiking, it is found to correlate very highly with the age variable. Only one American study, which also encluded very young motorcyclists without driver's licenses, has been able to achieve a high level of independence. With this exceptional data set, McKnight and Robinson (1990,7) have been able to show that the accident rate of motorcyclists clearly dropped with increasing riding experience (measured in years of riding practice). Ac orresponding impact of riding experience on the accident rate among British motorcyclists has also been confirmed by Taylor and Maycock (1990, 12) and Taylor and Lockwood (1990, 13). A second type of riding experience is regular riding practice. Both Taylor and Maycock (1990, 12) and Taylor and Lockwood (1990, 13) have shown that low annual driving practice in an automobile leads to higher accident involvement with a motorbike. This is not the case in persons with intensive automobile driving practice. Schulz (1990 a,b, 8,9) was also able to show that motorbikers with a low annual riding practice tended to have a higher rate of accidents not involving other road users.
Effects of gender have only been reported by Taylor and Lockwood (1990, 13) and Taylor and Maycock (1990, 12). They found that young men were much more frequently involved in accidents than young women. Vice versa, the involvement in accidents of women who were over the age of 20 was somewhat higher than the rates found for men of the same age. Type and extent of risk exposure It is common practice to use the distance travelled by unit of time as a measure of risk exposure in traffic. Koch and Hagstotz (1990, 3), Schulz (1990 a,b, 8,9), Schulz and Hagstotz (1990, 10), Taylor and Maycock (1990, 12), and Taylor and Lockwood (1990, 13) have been able to demonstrate clearly that the accident rate increases with as a function of the extent of risk exposure in riders with intermediate to high annual mileage. A markedly higher involvement in falls and accidents involving no other road users was only found in very low annual mileages, which represent a measure of a lack of driving experience. According to Taylor and Maycock (1990, 12) and Taylor and Lockwood (1990, 13), further factors of risk exposure are the location, time of year, and purpose of road use. For example, riding motorcycles in inner city traffic, riding mostly during the winter months, and using a motorcyle purely as a means of transport (as opposed to riding as a leisure-time-activity) lead to higher accident rates. The latter should mostly be determined by the fact that the use of a motorbike for occupational purposes is strongly linked to road use in open areas, wheras the motorbike is mostly used as a leisure time vehicle in rural districts.
2
94
3.2 The Impact of the Motorbike
Accident statistics [e.g., Kroj and Stöcker, 1986, (4)] confirm that higher motor capacity or performance leads to an increased involvement in accidents. This circumstance has frequently been discussed by traffic experts and has had a marked impact on driving licensing for motorbikers in Germany. The literature reveals an intensive discussion on this phenomenon. Broughton's (1988, 1) analysis of British accident rates, which considered the mileage on motorcycles of various capacity, showed that mileage function is a moderator variable in relation between accident involvement and cubic capacity. In arecent analysis of accident data in Canada, Mayhew and Simpson (1989,6) were unable to find any influence of motor capacity on the frequency of collisions. Taylor and Maycock (1990,12) and Taylor and Lockwood (1990, 13) showed that a large number of motorbiking accidents occured in open areas, and that high capacity motorbikes had a lower accident rate in rural areas than low capacity motorbikes. The German studies from Schulz (1990 a,b, 8,9), Schulz and Hagstotz (1990, 10) also do not support the hypothesis that high motor performance leads to an increase of accidents if the mileage was also taken into account. It is more the case that these studies show certain paralleis to the results from Broughton (1988, 1), who indicated that intermediate motorperformance determined higher accident rates. As shown above, clear effects of the person and the extent of risk exposure can be determined in previous studies but no effects of the performance of the motorbike. A broader empirical basis for data is provided by the studies from Taylor and Lockwood (1990, 13) in Great Britain. Previous studies carried out in Germany on involvement of motorbikes in traffic accidents tended to be included as a side issue in other studies. For this reason the University of Bielefeld and the Institute for Motorcycle Safety prepared and carried out aseparate survey that included all important aspects of accidents in autumn 1990. The findings of the survey will be
presented below.
4 Questionnaire Survey of Accident Data
4.1 A Questionnaire
[)ata of accidents were cOllected by adopting and expanding parts of a previous survey Of motorbikers that dealt with persons and involvement in accidents. Data were collected on gender, acquisition of various stages of a motorbike license (class Ib, la, I), and information on the acquisition of an automobile driving license. The reports on motorbikes referred to the type, performance, and engine size of the motorbike. Reports on biking practice were assessed not only with the length of regular use of a
95
motorbike with class I or class la driving licenses, but also the mileage driven per year over this period. Subjects were also asked the major purpose for using their motorbike and whether they also regurlarly drove an automobile. When yes, they were also asked to re port their annual mileage with the automobile. Subjects had also to report their annual riding period, and whether they had previous driving experience on a low performance motorcycle (e.g., mopeds) before switching to a motorbike. This data collection was followed by the second part of the survey. This assessed the number of spills during the years of regular driving with the motorbike as weil as the number of accidents during this period. If accidents were reported, the subjects had to answer more specific questions concerning those involved in the accidents, the amount of material and personal dammage, and the causes of the accident.
4.2 Survey procedure
The survey was carried out at three motorbike exhibitions. These were the IFMA 1990 held at Cologne in September, the Motorshow 1990 held at Essen in December, and a motorbike exhibition in the Bielefeld region in March 1991. Subjects were persons who had a motorbike driving license, and had regularly driven a motorbike in 1990. The survey was carried out with questionnaires. A total of 1 100 persons was surveyed. After the study, the questionnaire results were processed with a computer. As the data for 1990 were not based on the same periods because of the different survey dates, the analysis as restricted to those persons who had provided information on motorbiking for the entire year of 1989. After this and the removal of missing data, the final sampie was reduced to 800 subjects.
5 Results
In the total of 800 subjects, 89.2% were male and 10.8% were female. Their average age was 27.7 years. 47.8% reported that they mainly used their motorbike for leisure time purposes. The rest of the subjects used their motorbikes half for leisure time and half for work. On average, the subjects had regularly driven motorbikes for six years. 37.5% had previously used a light machine. In 1989, the subjects had driven their motorbikes for an average of 8.5 months. They had driven an average distance of 11 100 km. The average cubic capacity of motorbikes they used was 63.2 PS.
The dependence of accident data on the person and motor performance variables was analyzed with a poisson regression analysis (see Maddala, 1983, 5). The basic
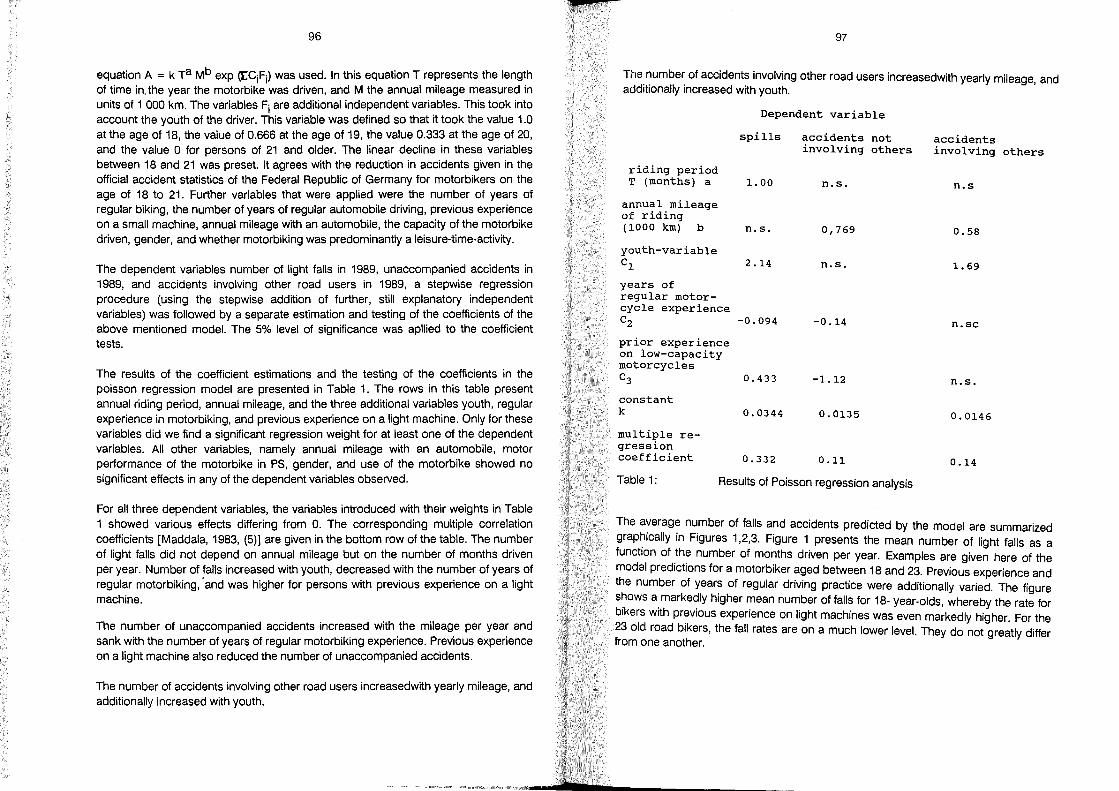
96
equation A = k Ta Mb exp (t'CiFi) was used. In this equation T represents the length of time in, the year the motorbike was driven, and M the annual mileage measured in units of 1 000 km. The variables Fi are additional independent variables. This took into account the youth of the driver. This variable was defined so that it took the value 1.0 at the age of 18, the value of 0.666 at the age of 19, the value 0.333 at the age of 20, and the value 0 for persons of 21 and older. The linear decline in these variables between 18 and 21 was preset. It agrees with the reduction in accidents given in the official accident statistics of the Federal Republic of Germany for motorbikers on the age of 18 to 21. Further variables that were applied were the number of years of regular biking, the number of years of regular automobile driving, previous experience on a small machine, annual mileage with an automobile, the capacity of the motorbike driven, gender, and whether motorbiking was predominantly a leisure-time-activity.
The dependent variables number of light falls in 1989, unaccompanied accidents in 1989, and accidents involving other road users in 1989, a stepwise regression procedure (using the stepwise addition of further, still explanatory independent variables) was followed by aseparate estimation and testing of the coefficients of the above mentioned model. The 5% level of significance was apllied to the coefficient tests.
The results of the coefficient estimations and the testing of the coefficients in the poisson regression model are presented in Table 1. The rows in this table present annual riding period, annual mileage, and the three additional variables youth, regular experience in motorbiking, and previous experience on a light machine. Only for these variables did we find a significant regression weight for at least one of the dependent variables. All other variables, namely annual mileage with an automobile, motor performance of the motorbike in PS, gender, and use of the motorbike showed no significant effects in any of the dependent variables observed.
For all three dependent variables, the variables introduced with their weights in Table 1 showed various effects differing from O. The corresponding multiple correlation coefficients [Maddala, 1983, (5)] are given in the bottom row of the table. The number of light falls did not depend on annual mileage but on the number of months driven per year. Number of falls increased with youth, decreased with the number of years of regular motorbiking, ·and was higher for persons with previous experience on a light machine.
Tl1e number of unaccompanied accidents increased with the mileage per year and sank with the number of years of regular motorbiking experience. Previous experience on a light machine also reduced the number of unaccompanied accidents.
The number of accidents involving other road users increasedwith yearly mileage, and additionally increased with youth.
97
The number of accidents involving other road users increasedwith yearly mileage, and additionally increased with youth.
Dependent variable
spills accidents not accidents involving others involving others
riding per iod T (months) a 1. 00 n.s. n.s
annual mileage of riding (1000 km) b n.s. 0,769 0.58
youth-variable Cl 2.14 n.s. 1. 69
years of regular motor-cycle experience C2 -0.094 -0.14 n.sc
prior experience on low-capacity motorcycles C3 0.433 -1.12 n.s.
constant k 0.0344 0.0135 0.0146
multiple re-gression coefficient 0.332 0.11 0.14
Table 1: Results of Poisson regression analysis
The average number of falls and accidents predicted by the model are summarized graphically in Figures 1,2,3. Figure 1 presents the mean number of light falls as a function of the number of months driven per year. Examples are given here of the model predictions for a motorbiker aged between 18 and 23. Previous experience and the number of years of regular driving practice were additionally varied. The figure shows a markedly higher mean number of falls for 18- year-olds, whereby the rate for bikers with previous experience on light machines was even markedly higher. For the 23 old road bikers, the fall rates are on a much lower level. They do not greatly differ from one another.

98
6~A~nn~u~a~lm~ea~n~n~u~m~b~e~r~Of~S~P~il~IS~ ________________________ ~
5
4
3
2
0~1::::2::::3~~4~~5~~~6~~7~~8~~9~==1~0==~11~~12 Annual riding period (months)
- 18 Y. no exp, no pr --*- 18 y, exp • no pr 23 Y, no exp, no pr
~ 23 y, exp, no pr 23 y, no exp, 5y pr -x-- 23 y, exp, 5 y pr
Fig.1: Spills
Figure 2 presents the dependence of the mean number of unaccompanied accidents on annual mileage, the presence of previous experience with a light machine, and the number of years of regular biking practice (0 to 5 years). The mean number of accidents increased with increasing annual mileage. It was higher for persons without previous experience with light machines, and those without driving practice. For persons without previous experience on light machines but with five years drivi~g practice, the accident curve showed the second highest course, for persons wlth previous experience on a light machine and no biking practice, it was the second lowest. And for persons with five years driving experience and previous experience on
a light machine it was the lowest.
Fig.2:
0,14 ~A~nn~u~a~lm~ea~n~n~u~m~b~e~r~of~a~c~c~id~e~nt~s~ __________________ ~
0,12 -
0,1
0,08
0,06
0;04
0'02~~~~~~~~~~===:======::~~=;~~~J o 1 2 3 4 5 6 7 8 9 10 11 12 13 14 15 17 18 19 20
Annual Mileage (1000 km)
------- no exp., no pract. ----I-- exp., no pract.
-----%- no exp, 5 y. pract. --B-- exp., 5 y. pract.
Accident not involving others
99
Figure 3 presents the dependence of the mean number of accidents involving other road users as a function of annual mileage. As here, only youth showed an additional effect, the effect of youth was completely varied from 18 years (1.0) across 19 years (0.66), and 20 years (0.33) down to 0 by the over twenties. The average number of accidents increased with annual mileage. It took the highest course for 18- year-olds and then dropped for 19- and 20-year-olds until at least the level of the over twenties. For this group of subjects, the accidents curve was relatively flat.
Fig.3:
6
Annual mean number of accidents 0,5,---------------------------------------------,
0,4
0,3
0,2
2 3 4 5 6 7 8 9 10 11 12 13 14 15 16 17 18 19 20
Annual Mileage (1000 km)
~ 18 years -+- 19 years -+- 20 years -8- ) 20 years
Accidents involving others
Discussion
The present questionnaire study represents the most comprehensive and detailed study to be carried out in Germany up to now that has used survey methods to address the accident involvement of motorbikers. In this study, the relevant variables were assessed with the comparable thoroughness to the study of Taylor and Maycock (1990, 12). None the less, the subjects belonged to a circle of interested, active motorbikers who could be found at motorbike exhibitions. Mean age and gender should be about the same as that in a representative sam pie of motorbikers. The same applies to the average mileage per year and the number of years of regular biking practice. However, the performance of the motorbikes was slightly higher than that in representative motorbike sampies. The results of the analysis of the dependence of the single types of accident on the independent variables show that a separate consideration of the single types of accidents was appropriate. It is shown
22
100
that it is not just the size of the single variables that has a varying effect on the depende!1t variables, but that other predictors are effective even by different kinds of accident. For example, it is notable that the number of falls does not depend on annual mileage, but on the number of months driven per year. On the one hand, the number of falls depends on whether the motorbike is driven across country or on streets. On the other hand, it depends on seasonable circumstances. In autumn and winter,light falls are more frequent than in summer. Such influences are recorded by the number of months driven per year. In the analysis of different influences on the involvement of motorbikers in accidents that are linked to age, the risks of youth are separated fram the risks of lack of driving experience. This differentiation was introduced into the analysis by the youth variable and aseparate measurement of driving experience in the form of the number of years of regular motorbiking practice. These two variables showed a different impact on the various types of accident. In light falls, both variables had a significant impact in the anticipated direction. In light, unaccompanied accidents, only riding experience in the form of regular driving practice had an effect, while in accidents involving other road users, only the youth variable had a significant effect.
A further variable of riding experience, which is frequently discussed in the literature, is previous experience on light machines. This was assessed for the first time in the present study, and praved to be an important predictor. In unaccompanied accidents, previous experience with light machines leads to a marked decrease in the accident rate. In light falls, in contrast, such previous experience leads to an increase. The reason for this could be that particular young motorbike learners with previous experience show a trend toward a somewhat more risky driving behavior of road and in unfavorable weather conditions. The anticipated dependence of unaccompanied accidents as weil as accidents involving other road users on the annual mileage once more demonstrates the dependence of accident rates on the level of risk exposure.
In contrast to the British studies from Taylor and Maycock (1990, 12) and Taylor and Lockwood (1990, 13), we are unable to find any dependence of the three accident variables on gender, what the use of the motorbike, and the amount of driving experience with automobiles. The data analysis did not supply even the slightest hint that these independent variables influence the dependent variables. As in many previous studies, which are also discussed in detail above, the analysis of the three types of accidents once more reveals that motor performance has no influence on the frequencies of the three types of accident when risk exposure in the form of distance travelled per unit of time is also taken into account. In all, the findings of this study agree with the results on the variables effecting motorbike accidents in the western part of Germany that have previously been reported by Koch and Hagstotz (1990, 3), Schulz (1990, 8; 1990, 9), and Schulz and Hagstotz (1990, 10). By differentiating various types of accidents and differentiating important variables such as youth and regular driving practice as weil as including previous expierences, it was possible to
101
greatly refine and specify these findings. Even compared with the much braader basis of the British studies from Taylor and Lockwood, we are able to obtain important new findings. On the other hand, the low sampie size is certainly also responsible for the fact that we are unable to demonstrate the influence of less important factors, unlike the British studies.
2
7
1)
2)
3)
4)
102
Reference List
Broughton, J.: The relation between motorcycle size and accident risk. - Crowthorne, 1988. -(TRRL Research Report; 169)
Koch, H.: Evaluation of the effectiveness of a graduated driving license model for beginner motorcycle riders In: The Human Element: 1990 International Motorcycle Safety Conference, Grosvenor Resort, Orlando, Oct. 31 - Nov. 3,1990; proceedings / Motorcycle Safety Foundation. - Irvine, 1990. - S. 2.27-2.42
Koch, H.; Hagstotz, W.: Einflußfaktoren auf die Unfälle von Motorradfahrern In: Motorradfahren : Faszination und Restriktion / H. Koch (Hrsg.). Institut für Zweiradsicherheit. - Bochum, 1990. - S. 139-164. - (Forschungshefte Zweiradsicherheit; 6)
Kroj, G.; Stöcker, U.: Statistische Analyse der Unfall- und Bestandsentwicklung motorisierter Zweiräder In: Der Motorradunfall : Beschreibung, Analyse, Prävention / H. Koch (Hrsg.). Institut für Zweiradsicherheit. - Bremerhaven, 1986. - S. 1-46. -(Forschungshefte Zweiradsicherheit; 3)
5) Maddala, G.S.: Limited-dependent and qualitative variables in econometrics. - Cambridge, 1983
6) Mayhew, D.R.; Simpson, H.M.: Motorcycle Engine Size and Traffic Safety. - Ottawa, Ontario: Traffic Injury Research Foundation of Canada, 1989
7) McKnight, A.; Robinson, A.R.: The involvement of age and experience in motorcycle accidents In: The Human Element: 1990 international Motorcycle Safety Conference, Grosvenor Resort, Orlando, Oct. 31 - Nov. 3,1990; proceedings / Motorcycle Safety Foundation. - Irvine, 1990. - S. 1.1-1.13
8) Schulz, U: Zur Unfallverwicklung von Motorradfahranfängern In: Motorradfahren : Faszination und Restriktion / H. Koch (Hrsg.). Institut für Zweiradsicherh·eit. - Bochum, 1990. - S. 165-186. - (Forschungshefte Zweiradsicherheit; 6)
9) Schulz, U.: Factors affecting different kinds of motorcycle accidents In: The Human Element: 1990 International Motorcycle Safety Conference, Grosvenor Resort, Orlando, Oct. 31 - Nov. 3, 1990; proceedings / Motorcycle Safety Foundation. - Irvine, 1990. - S. 1.14-1.33
10)
1 i)
12)
13)
103
Schulz, U.; Hagstotz, W.: Zur l!nfallverwicklung v~n Motorradfahranfängern : Analyse der Unfalldaten der Studie Motorradfahren In Deutschland: Basisstudie 1988 In: ~otor~adfahr~n : Faszination und Restriktion / H. Koch (Hrsg.). Institut für ZweiradsIcherheit. - Bochum, 1990. - S. 187-208. - (Forschungshefte Zweiradsicherheit; 6)
Simard, R: Motorcycle accidents in the province of Quebec during the 1980s In: The Human Element: 1990 International Motorcycle Safety Conference Grosvenor Res~rt, Orla~do, Oct. 31 - Nov. 3, 1990; proceedings / Motorcycle Safety Foundatlon. -Irvlne, 1990. - S. 1.34-1.44
Taylor, M.; Maycock, G.: Factors affecting the accident liability of British motorcyclists In: The Human Element: 1990 International Motorcycle Safety Conference Grosvenor Res~rt, Orla~do, Oct. 31 - Nov. 3, 1990; proceedings / Motorcycle Safety Foundatlon. -Irvlne, 1990. - S. 1.45-1.70
Taylor, M.C.; Lockwood, C.R.: Factors affecting the accident liability of motorcyclists : a multivariate analysis of survey data. - Crowthorne, 1990. - (TRRL Research Report; 270)
&
Statistical Analysis of Motorcycle Accidents in Dresden
Anita Kautz
Hochschule tür Verkehrssicherheit Dresden
Fachbereich tür Rechts- und Sicherheitswissenschaften
Institut tür Verkehrssicherheit
Germany
2 107
1 Abstract
This report contains an analysis of 501 motorcycle accidents in the area of Dresden during 1988. Data was collected from official police report sketches and met standards according to the GOR legislation at that time.
The purpose of the present analysis was to identify major risk traffic situations. Accident data was analysed by taking the following aspects into consideration:
age of the involved motorcycle rider accident causing factors accident patterns and circumstances, involved parties injury types.
50% of the analysed motorcyclists who suffered an accident were aged 14 - 20 years. 25% alone belonged to the group of 17 and 18 year old riders.
As regards accident patterns, 45.3% frontal collisions (head-on and rear-end), and 32.7% lateral collisions were registered; in 22% the motorcycle was the only vehicle involved (loss of control or a skid). Other involved parties in most cases (46.5%) were automobiles. Most injuries were suffered to the lower extremities.
Accidents caused by the motorcyclists themselves most often were due to speed inappropriate to traffic conditions, loss of control because of operator's fault, too narrow following distance to the vehicle in front and violations of priority regulations. Accidents not caused by the motorcyclists in most cases were due to visibility
reasons (67%).
A typical accident situation was cornering in connection with either too high speed or faults in handling the machine. This is especially true for young, inexperienced riders. A fact which can be explained additionally by the young riders' proneness to risk exposure and misjudgements of their objective and subjective riding skill.
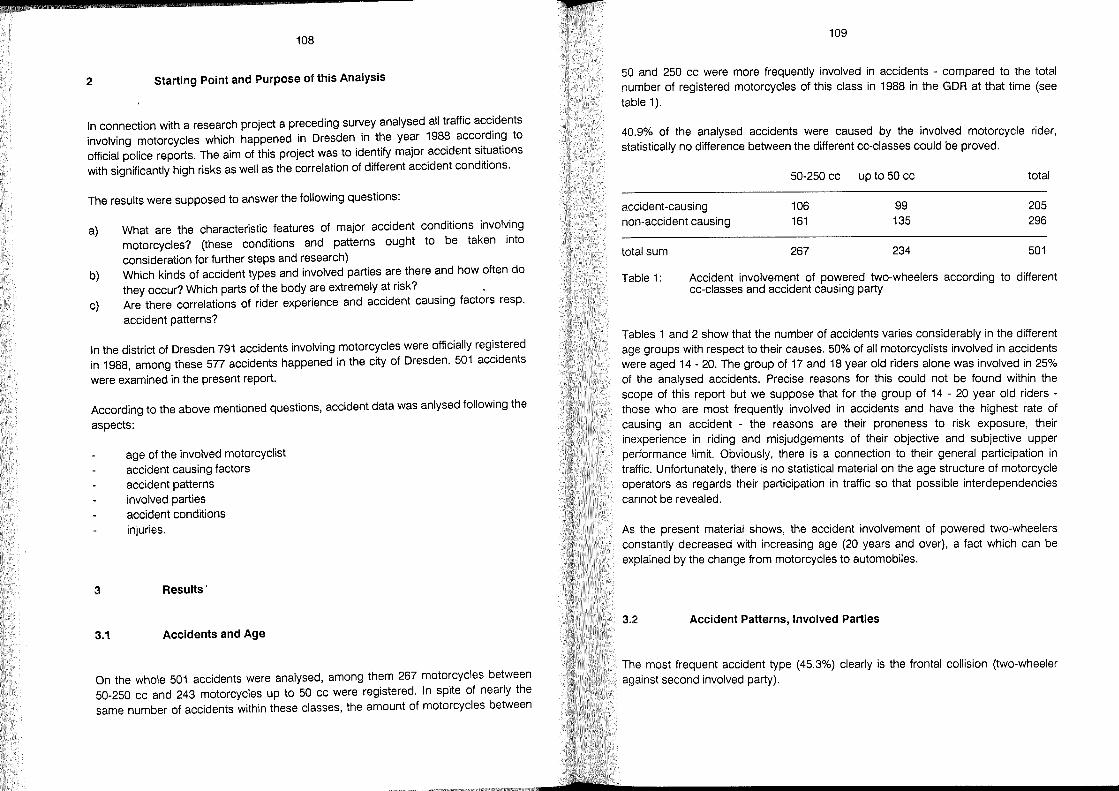
2 108
2 Starting Point and Purpose of this Analysis
In connection with a research project a preceding survey analysed all traffic accidents involving motorcycles which happened in Dresden in the year 198~ acco.rdin~ to official police reports. The aim of this project was to identify major accldent situations with significantly high risks as weil as the correlation of different accident conditions.
The results were supposed to answer the following questions:
a)
b)
c)
What are the characteristic features of major accident conditions involving motorcycles? (these conditions and patterns ought to be taken into
consideration for further steps and research) Which kinds of accident types and involved parties are there and how often do they occur? Which parts of the body are extremely at risk? . Are there correlations of rider experience and accident causing factors resp.
accident patterns?
In the district of Dresden 791 accidents involving motorcycles were officially registered in 1988, among these 577 accidents happened in the city of Dresden. 501 accidents
were examined in the present re port.
According to the above mentioned questions, accident data was anlysed following the
aspects:
3
age of the involved motorcyclist accident causing factors accident patterns involved parties accident conditions injuries.
Results'
3.1 Accidents and Age
On the whole 501 accidents were analysed, among them 267 motorcycles between 50-250 cc and 243 motorcycles up to 50 cc were registered. In spite of nearly the same number of accidents within these classes, the amount of motorcycles between
109
50 and 250 cc were more frequently involved in accidents - compared to the total number of registered motorcycles of this class in 1988 in the GDR at that time (see table 1).
40.9% of the analysed accidents were caused by the involved motorcycle rider, statistically no difference between the different cc-classes could be proved.
accident-causing non-accident causing
total sum
50-250 cc up to 50 cc
106 161
267
99 135
234
total
205 296
501
Table 1: Accident involvement of powered two-wheelers according to different cc-classes and accident causing party
Tables 1 and 2 show that the number of accidents varies considerably in the different age groups with respect to their causes. 50% of all motorcyclists involved in accidents were aged 14 - 20. The group of 17 and 18 year old riders alone was involved in 25% of the analysed accidents. Precise reasons for this could not be found within the scope of this report but we suppose that for the group of 14 - 20 year old riders -those who are most frequently involved in accidents and have the highest rate of causing an accident - the reasons are their proneness to risk exposure, their inexperience in riding and misjudgements of their objective and subjective upper performance limit. Obviously, there is a connection to their general participation in traffic. Unfortunately, there is no statistical material on the age structure of motorcycle operators as regards their participation in traffic so that possible interdependencies cannot be revealed.
As the present material shows, the accident involvement of powered two-wheelers constantly decreased with increasing age (20 years and over), a fact which can be explained by the change from motorcycles to automobiles.
3.2 Accident Patterns, Involved Parties
The most frequent accident type (45.3%) clearly is the frontal collision (two-wheeler against second involved party).
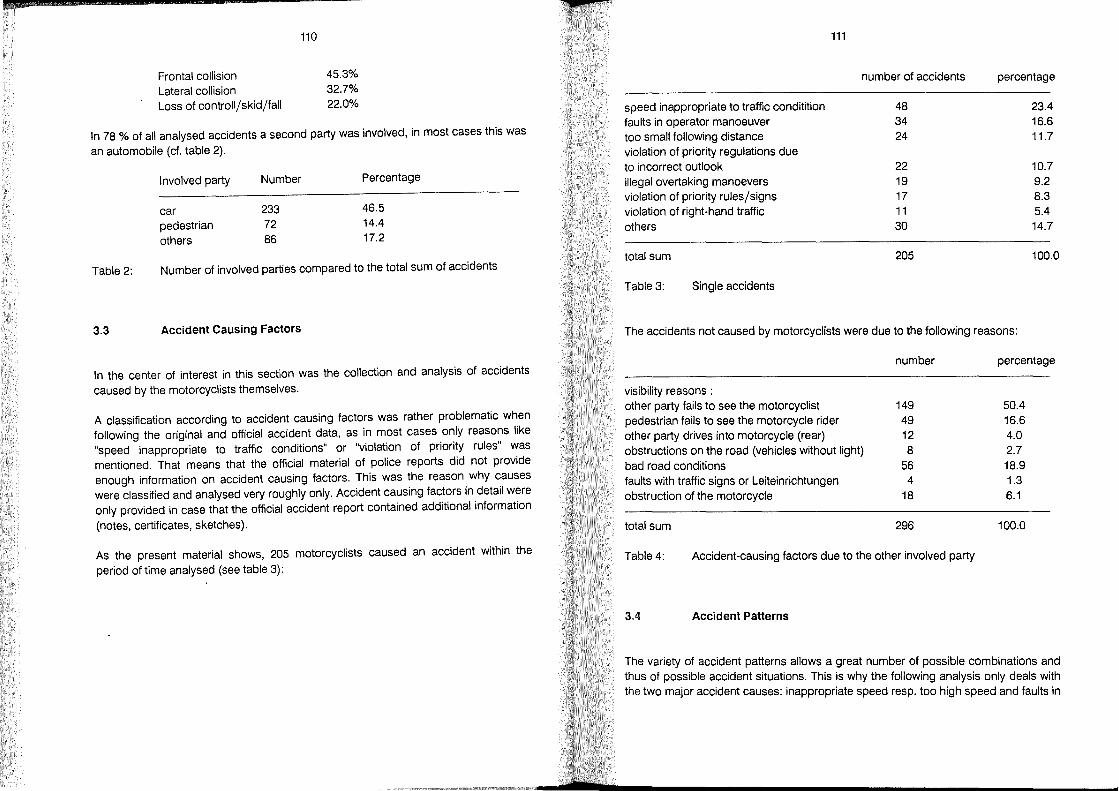
2
110 111
Frontal collision 45.3% Lateral collision Loss of controll/skid/fall
32.7% 22.0%
In 78 % of all analysed accidents a second party was involved, in most cases this was
an automobile (cf. table 2).
Involved party Number Percentage
car 233 46.5
pedestrian 72 14.4
others 86 17.2
Table 2: Number of involved parties compared to the total sum of accidents
3.3 Accident Causing Factors
In the center of interest in this section was the collection and analysis of accidents caused by the motorcyclists themselves.
A classification according to accident causing factors was rather problematic wh.en following the original and official accident data, as in most cases only reasons IIke "speed inappropriate to traffic conditions" or "violation of priori~ rules" ~as mentioned. That means that the official material of police reports dld not provlde enough information on accident causing factors. This was ~he reason. why ~auses were classified and analysed very roughly only. Accident causlng factors In detail were only provided in case that the official accident report contained additional information
(notes, certificates, sketches).
As the present material shows, 205 motorcyclists caused an accident within the
period of time analysed (see table 3):
speed inappropriate to traffic conditition faults in operator manoeuver too small following distance violation of priority regulations due to incorrect outlook illegal overtaking manoevers violation of priority rules/signs violation of right-hand traffic others
total sum
Table 3: Single accidents
number of accidents
48 34 24
22 19 17 11 30
205
percentage
23.4 16.6 11.7
10.7 9.2 8.3 5.4 14.7
100.0
The accidents not caused by motorcyclists were due to the following reasons:
visibility reasons : other party fails to see the motorcyclist pedestrian fails to see the motorcycle rider other party drives into motorcycie (rear) obstructions on the road (vehicles without light) bad road conditions faults with traffic signs or Leiteinrichtungen obstruction of the motorcycle
total sum
number
149 49 12 8
56 4
18
296
Table 4: Accident-causing factors due to the other involved party
3.4 Accident Patterns
percentage
50.4 16.6 4.0 2.7 18.9 1.3 6.1
100.0
The variety of accident patterns allows a great number of possible combinations and thus of possible accident situations. This is why the following analysis only deals with the two major accident causes: inappropriate speed resp. too high speed and faults in
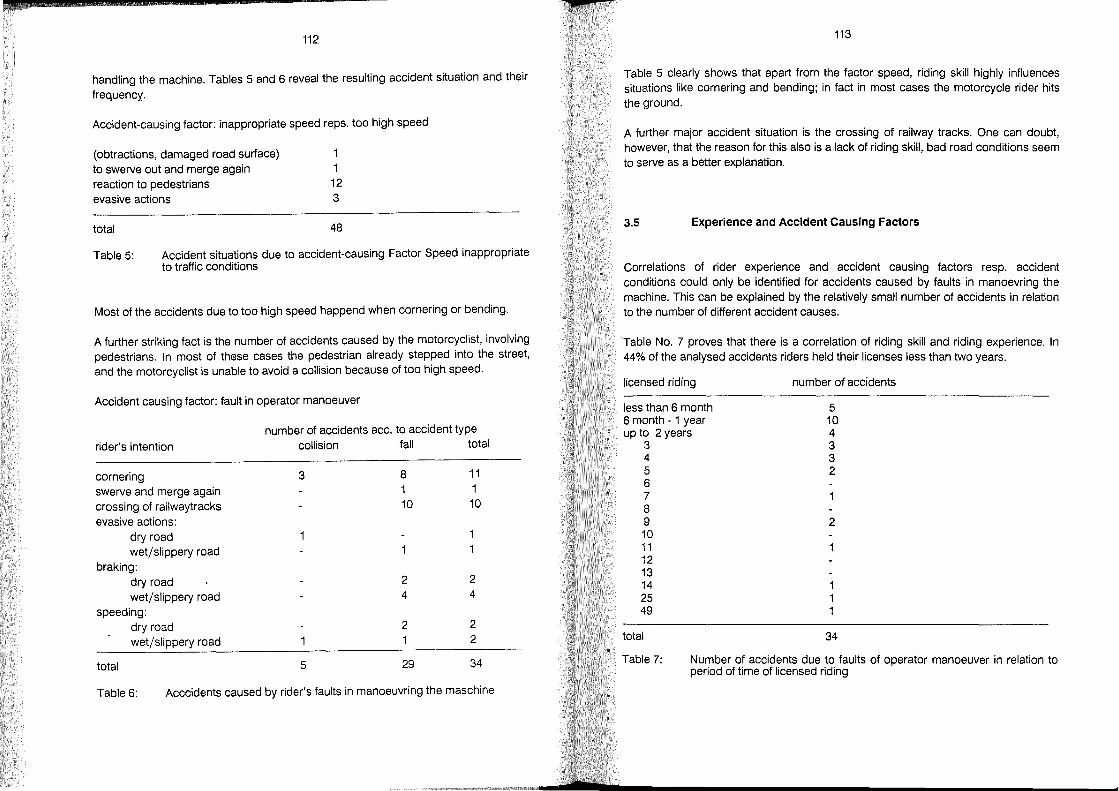
2 112
handling the machine. Tables 5 and 6 reveal the resulting accident situation and their frequency..
Accident-causing factor: inappropriate speed reps. too high speed
(obtractions, damaged road surface) to swerve out and merge again reaction to pedestrians 12 evasive actions 3
total 48
Table 5: Accident situations due to accident-causing Factor Speed inappropriate to traffic conditions
Most of the accidents due to too high speed happend when cornering or bending.
A further striking fact is the number of accidents caused by the motorcyclist, involving pedestrians. In most of these cases the pedestrian al ready stepped into the street, and the motorcyclist is unable to avoid a collision because of too high speed.
Accident causing factor: fault in operator manoeuver
number of accidents acc. to accident type
rider's intention cOllision fall total
cornering 3 8 11
swerve and merge again 1
crossing of railwaytracks 10 10
evasive actions: dry road wetjslippery road
braking: dry road 2 2
wetjslippery road 4 4
speeding: dry road 2 2
wetjslippery road 1 2
total 5 29 34
Table 6: Acccidents caused by rider's faults in manoeuvring the maschine
113
Table 5 ciearly shows that apart from the factor speed, riding skill highly influences situations like cornering and bending; in fact in most cases the motorcycie rider hits the ground.
A further major accident situation is the crossing of railway tracks. One can doubt, however, that the reason for this also is a lack of riding skill, bad road conditions seem to serve as a better explanation.
3.5 Experience and Accident Causing Factors
Correlations of rider experience and accident causing factors resp. accident conditions could only be identified for accidents caused by faults in manoevring the machine. This can be explained by the relatively smali number of accidents in relation to the number of different accident causes.
Table No. 7 proves that there is a correlation of riding skill and riding experience. In 44% of the analysed accidents riders held their licenses less than two years.
licensed riding
less than 6 month 6 month - 1 year up to 2 years
3 4 5 6 7 8 9 10 11 12 13 14 25 49
total
number of accidents
5 10 4 3 3 2
2
34
Table 7: Number of accidents due to faults of operator manoeuver in relation to period of time of licensed riding
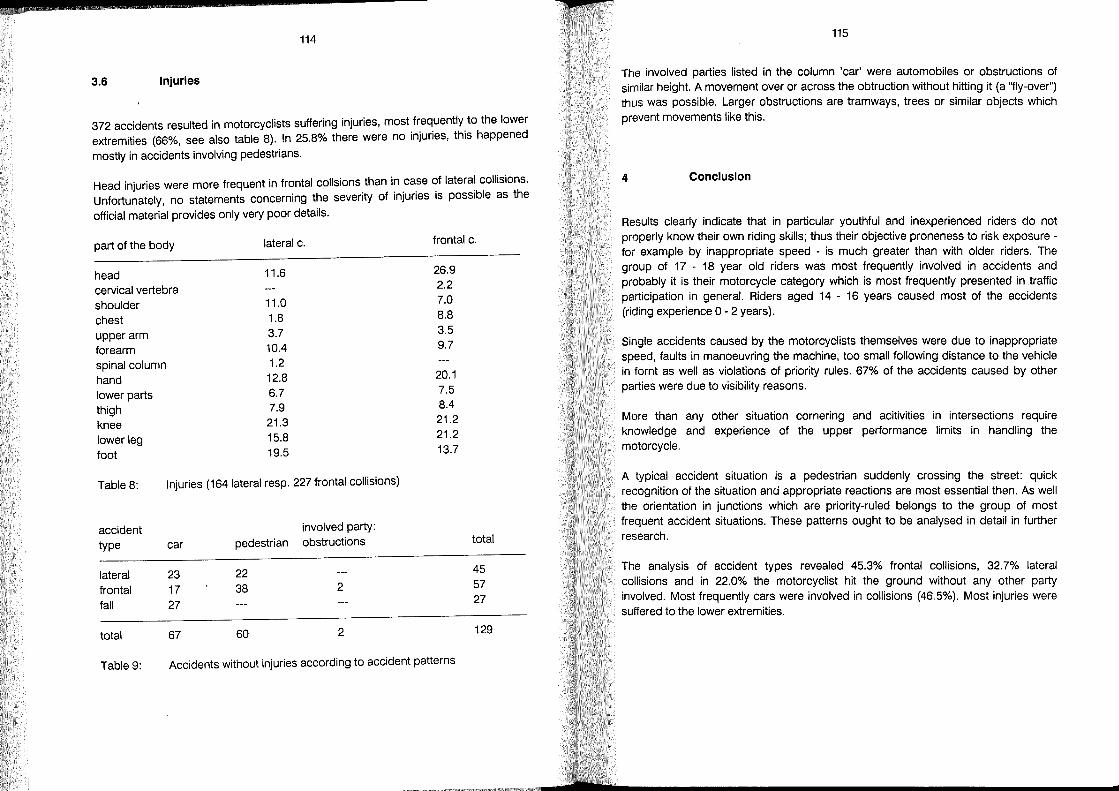
5 114
3.6 Injuries
372 accidents resulted in motorcyclists suffering injuries, most frequently to the lower extremities (66%, see also table 8). !n 25.8% there were no injuries, this happened
mostly in accidents involving pedestrians.
Head injuries were more frequent in frontal collsions than in case of lateral collisions. Unfortunately, no statements concerning the severity of injuries is possible as the
official material provides only very poor details.
part of the body lateral c.
head 11.6
cervical vertebra shoulder 11.0
chest 1.8
upper arm 3.7
forearm 10.4
spinal column 1.2
hand 12.8
lower parts 6.7
thigh 7.9
knee 21.3
lower leg 15.8
foot 19.5
Table 8: Injuries (164 lateral resp. 227 frontal collisions)
accident involved party:
type car pedestrian obstructions
lateral 23 22 frontal 17 38 2
fall 27
total 67 60 2
frontal c.
26.9 2.2 7.0 8.8 3.5 9.7
20.1 7.5 8.4 21.2 21.2 13.7
total
45 57 27
129
Table 9: Accidents without injuries according to accident patterns
115
The involved parties listed in the column 'car' were automobiles or obstructions of similar height. A movement over or across the obtruction without hitting it (a "fly-over") thus was possible. Larger obstructions are tramways, trees or similar objects which prevent movements like this.
4 Conclusion
Results clearly indicate that in particular youthful and inexperienced riders do not properly know their own riding skills; thus their objective proneness to risk exposure -for example by inappropriate speed - is much greater than with older riders. The group of 17 - 18 year old riders was most frequently involved in accidents and probably it is their motorcycle category which is most frequently presented in traffie participation in general. Riders aged 14 - 16 years caused most of the accidents (riding experience 0 - 2 years).
Single accidents eaused by the motorcyclists themselves were due to inappropriate speed, faults in manoeuvring the machine, too small following distance to the vehicle in fornt as weil as violations of priority rules. 67% of the accidents caused by other parties were due to visibility reasons.
More than any other situation cornering and acitivities in intersections require knowledge and experience of the upper performance limits in handling the motorcycle.
A typical accident situation is a pedestrian suddenly crossing the street: quick recognition of the situation and äppropriate reactions are most essential then. As weil the orientation in junctions which are priority-ruled belongs to the group of most frequent accident situations. These patterns ought to be analysed in detail in further research.
The analysis of accident types revealed 45.3% frontal collisions, 32.7% lateral collisions and in 22.0% the motorcyclist hit the ground without any other party involved. Most frequently cars were involved in eollisions (46.5%). Most injuries were suffered to the lower extremities.
&
Safety Risks and Consequences of Development of the Two-Wheeled Motor Vehicle on the Traffic of Tomorrow
Hans-Jochen Jahndel
Hans-Jürgen Neumann
Hochschule für Verkehrswesen "Friedrich List", Dresden
Germany
2 119
1 Abstract
In view of increasing mobilisation and the resulting traffic problems, particularly in towns and cities, the two-wheeled motor vehicle in the form of an easy commercial vehicle of the moped type is proposed as an element of a two-wheel oriented mobility strategy due to its ecological, economic and traffic advantages. Potential safety risks of that mobility strategy are discussed. The field of research and model of two-wheel oriented mobility strategy is East Germany (former GDR). Until the reunification the number of two-wheeled motor vehicles was nearly as high as that of the private cars. West Germany (old federal states of the FRG) was taken as the comparative area. Detailed figures refer to the year 1989, which was representative for the aspects of investigation. The results indicate that the safety risks of the moped type vehicle relevant for the two-wheel oriented mobility strategy are not any obstacle for such a strategy. In that sense necessary consequences of development for improving the safety of two-wheeled motor vehicles are proposed concerning vehicular technology, traffic facilities and the riders of two-wheeled vehicles.
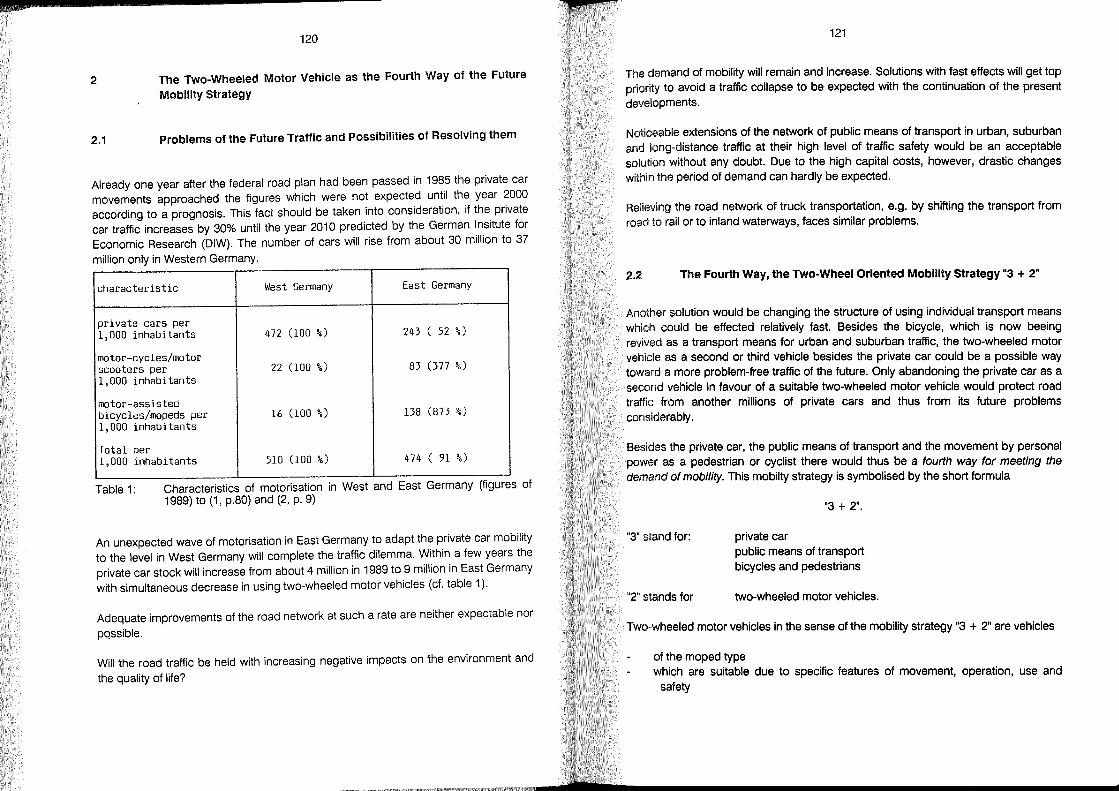
2
2
120
The Two-Wheeled Motor Vehiele as the Fourth Way of the Future
Mobility Strategy
2.1 Problems of the Future Traffie and Possibilities of Resolving them
Already one year after the federal road plan had been passed in 1985 the private car movements approached the figures which were not expected until the year 2000 according to a prognosis. This fact should be taken into consideration, if the private car traffic increases by 30% until the year 2010 predicted by the German Insitute for Economic Research (DIW). The number of cars will rise from about 30 million to 37
million only in Western Germany.
characteristic West Germany East Germany
private cars per 1,000 inhabitants 472 (100 %) 243 ( 52 %)
motor-cycles/motor scooters per 22 (100 %) 83 (377 %)
1,000 inhabitants
motor-assisted bicycles/mopeds per 16 (100 %) 138 (873 %)
1,000 inhabitants
Total per 1,000 inhabitants 510 (100 %) 474 ( 91 %)
Table 1: Characteristics of motorisation in West and East Germany (figures of 1989) to (1, p.80) and (2, p. 9)
An unexpected wave of motorisation in East Germany to adapt the private car mobility to the level in West Germany will complete the traffic dilemma. Within a few years the private car stock will increase from about 4 million in 1989 to 9 million in East Germany with simultaneous decrease in using two-wheeled motor vehicles (cf. table 1).
Adequate improvements of the road network at such a rate are neither expectable nor
pqssible.
Will the road traffic be held with increasing negative impacts on the environment and
the quality of life?
121
The demand of mobility will remain and increase. Solutions with fast effects will get top priority to avoid a traffie collapse to be expected with the eontinuation of the present developments.
Noticeable extensions of the network of publie means of transport in urban, suburban and long-distanee traffie at their high level of traffic safety would be an aeeeptable solution without any doubt. Due to the high capital eosts, however, drastie ehanges within the period of demand can hardly be expected.
Relieving the road network of truck transportation, e.g. by shifting the transport from road to rail or to inland waterways, faces similar problems.
2.2 The Fourth Way, the Two-Wheel Orlented Mobility Strategy"3 + 2"
Another solution would be changing the structure of using individual transport means whieh could be effected relatively fast. Besides the bicycle, which is now beeing revived as a transport means for urban and suburban traffie, the two-wheeled motor vehiele as a second or third vehicle besides the private car could be a possible way toward a more problem-free traffic of the future. Only abandoning the private ear as a seeond vehiele in favour of a suitable two-wheeled motor vehicle would proteet road traffie from another millions of private ears and thus from its future problems considerably.
Besides the private ear, the publie me ans of transport and the movement by personal power as a pedestrian or cyclist there would thus be a fourth way for meeting the demand of mobility. This mobilty strategy is symbolised by the short formula
"3" stand for:
"2" stands for
"3 + 2".
private car publie means of transport bieycles and pedestrians
two-wheeled motor vehicles.
Two-wheeled motor vehicles in the sense of the mobility strategy "3 + 2" are vehieles
of the moped type which are suitable due to specifie features of movement, operation, use and
safety
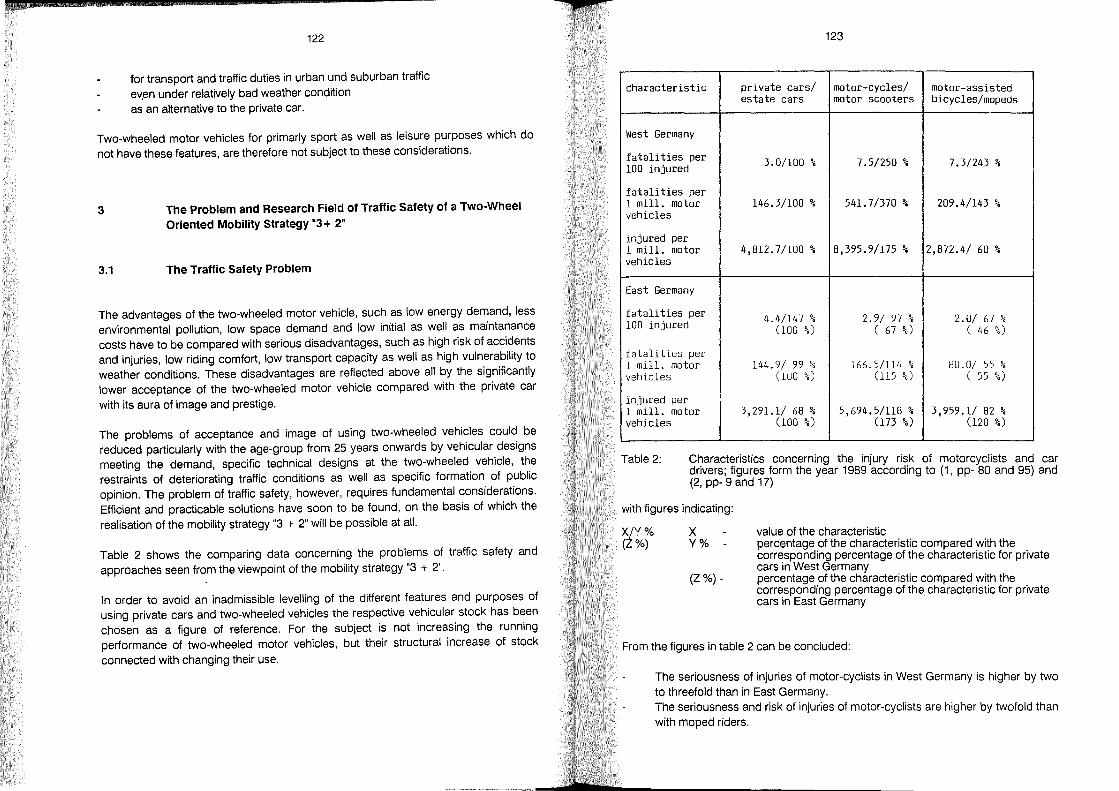
122
for transport and traffic duties in urban und suburban traffic eV,en under relatively bad weather condition as an alternative to the private car.
Two-wheeled motor vehicles for primarly sport as weil as leisure purposes which do not have these features, are therefore not subject to these considerations.
3 The Problem and Research Field of Traffie Safety of a Two-Wheel Oriented Mobility Strategy "3 + 2"
3.1 The Traffie Safety Problem
The advantages of the two-wheeled motor vehicle, such as low energy demand, less environmental pollution, low space demand and low initial as weil as maintanance costs have to be compared with serious disadvantages, such as high risk of accidents and injuries, low riding comfort, low transport capacity as weil as high vulnerability to weather conditions. These disadvantages are reflected above all by the significantly lower acceptance of the two-wheeled motor vehicle compared with the private car
with its aura of image and prestige.
The problems of acceptance and image of using two-wheeled vehicles could be reduced particularly with the age-group from 25 years onwards by vehicular designs meeting the demand, specific technical designs at the two-wheeled vehicle, the restraints of deteriorating traffic conditions as weil as specific formation of public opinion. The problem of traffic safety, however, requires fundamental considerations. Efficient and practicable solutions have soon to be found, on the basis of wh ich the
realisation of the mobility strategy "3 + 2" will be possible at all.
Table 2 shows the comparing data concerning the problems of traffic safety and approaches seen from the viewpoint of the mobility strategy"3 + 2".
In order to avoid an inadmissible levelling of the different features and purposes of using private cars and two-wheeled vehicles the respective vehicular stock has been chosen as a figure of reference. For the subject is not increasing the running performance of two-wheeled motor vehicles, but their structural increase of stock
connected with changing their use.
123
characteristic private cars/ motor-cycles/ motor-assisted estate cars motor scooters bicycles/mopeds
West Germany
fatali ties per 3.0/100 % 7.5/250 % 7.3/243 % 100 injured
fatali ties per 1 mill. motor 146.3/100 % 541. 7/370 % 209.4/143 % vehicles
injured per 1 mill. motor 4,812.7/100 % 8,395.9/175 % 2,872.4/ 60 % vehic1es
East Germany
fatali ties per 4.4/147 % 2.9/ 97 % 2.0/ 67 % 100 injured (100 %) ( 67 %) ( 46 %)
fatali ties per 1 mill. motor 144.9/ 99 % 166.5/114 % BO.O/ 55 % vehicles (100 %) (ll5 %) ( ss %)
injured per 1 mill. motor 3,291.11 68 % 5,694.5/118 % 3,959.1/ 82 % vehicles (100 %) 073 %) (120 %)
Table 2: C~aract~ristics concerning the injury risk of motorcyclists and car dnvers; flgures form the year 1989 according to (1, pp- 80 and 95) and (2, pp- 9 and 17)
with figures indicating:
X/Y% (Z %)
X Y%
(Z%) -
value of the characteristic percentage of the characteristic compared with the corresponding percentage of the characteristic for private cars in West Germany percentage of the characteristic compared with the corresponding percentage of the characteristic for private cars in East Germany .
From the figures in table 2 can be concluded:
The seriousness of injuries of motor-cyclists in West Germany is higher by two to threefold than in East Germany. The seriousness and risk of injuries of motor-cyclists are higher by twofold than with moped riders.
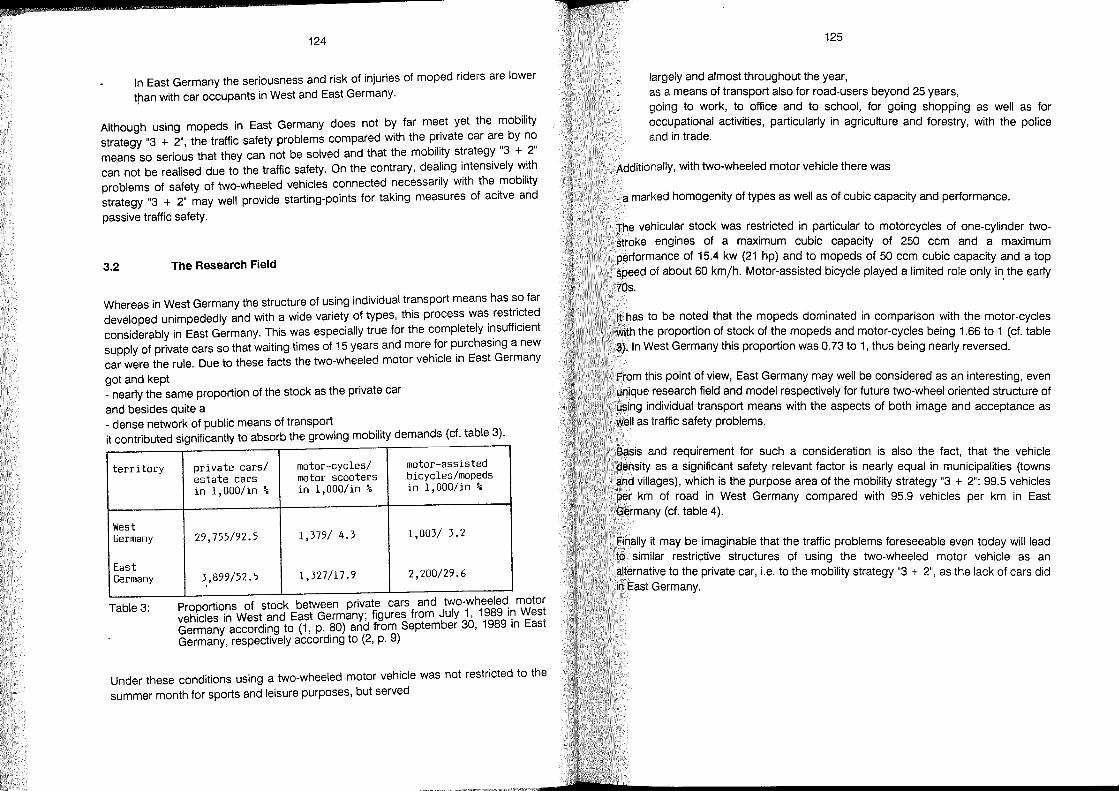
124
In East Germany the seriousness and risk of injuries of moped riders are lower
tran with car occupants in West and East Germany.
Although using mopeds in East Germany does not by far meet yet the mobility strategy "3 + 2", the traffic safety problems compared with the private car are by no means so serious that they can not be solved and that the mobility strategy "3 + 2" can not be realised due to the traffic safety. On the contrary, dealing intensively with problems of safety of two-wheeled vehicles connected ~ecessarily with the .mobility strategy "3 + 2" may weil provide starting-points for taklng measures of aCltve and
passive traffic safety.
3.2 The Research Field
Whereas in West Germany the structure of using individual transport means has so far developed unimpededly and with a wide variety of types, this process wa~ rest~i~ted considerably in East Germany. This was especially true for the completely I~sufflclent supply of private cars so that waiting times of 15 years and more for purchaslng a new car were the rule. Due to these facts the two-wheeled motor vehicle in East Germany
got and kept _ nearly the same proportion of the stock as the private car
and besides quite a - dense network of public means of transport it contributed significantly to absorb the growing mobility demands (cf. table 3).
territory
West Germany
East Germany
Table 3:
private cars/ estate cars in 1,000!in %
29,755/92.5
3,899/52.5
motor-cycles/ motor scooters in 1, OOO!in %
1,379/ 4.3
1,327/17.9
motor-assisted bicycles/mopeds in 1,000/in %
1,003/ 3.2
2,200/29.6
Proportions of stock between private cars and two-wheeled. motor vehicles in West and East Germany; figures from July 1, 1989 I~ West Germany according to (1, p. 80) and from September 30, 1989 In East Germany, respectively according to (2, p. 9)
Under these conditions using a two-wheeled motor vehicle was not restricted to the summer month for sports and leisure purposes, but served
125
largely and alm ost throughout the year, as a means of transport also for road-users beyond 25 years, going to work, to office and to sChool, for going shopping as weil as for occupational activities, particularly in agriculture and forestry, with the police and in trade.
Additionally, with two-wheeled motor vehicle there was
_ a marked homogenity of types as weil as of cubic capacity and performance.
The vehicular stock was restricted in particular to motorcycles of one-cylinder twostroke engines of a maximum cubic capacity of 250 ccm and a maximum performance of 15.4 kw (21 hp) and to mopeds of 50 ccm cubic capacity and a top speed of about 60 km/ho Motor-assisted bicycle played a limited role only in. the early 70s.
It has to be noted that the mopeds dominated in comparison with the motor-cycles with the proportion of stock of the mopeds and motor-cycles being 1.66 to 1 (cf. table 3). In West Germany this proportion was 0.73 to 1, thus being nearly reversed.
From this point of view, East Germany may weil be considered as an interesting, even unique research field and model respectively for future two-wheel oriented structure of using individual transport means with the aspects of both image and acceptance as weil as traffic safety problems.
Basis and requirement for such a consideration is also the fact, that the vehicle density as a significant safety relevant factor is nearly equal in municipalities (towns and villages), which is the purpose area of the mobility strategy "3 + 2": 99.5 vehicles per km of road in West Germany compared with 95.9 vehicles per km in East Germany (cf. table 4).
Finally it may be imaginable that the traffic problems foreseeable even today will lead to similar restrictive structures of using the two-wheeled motor vehicle as an alternative to the private car, i.e. to the mobility strategy "3 + 2", as the lack of cars did in East Germany.
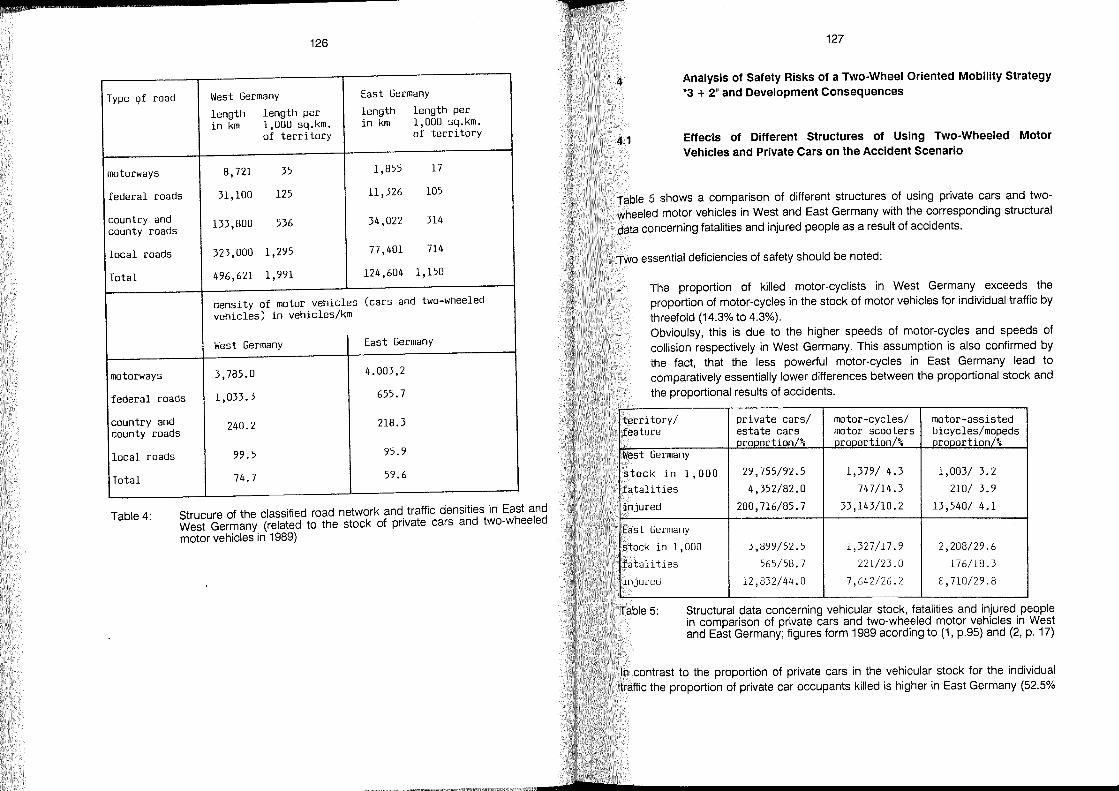
2
Type Qf road
motorways
federal wads
country and county roads
local wads
Total
motorways
federal roads
country and county roads
local wads
Total
126
West Germany East Germany
length length per length length per in km 1,000 sq.km. in km 1,000 sq.km.
of territory of territory
8,721 35 1,855 17
31,100 125 11,326 105
133,800 536 34,022 314
323,000 1,295 77 ,401 714
496,621 1,991 124,604 1,150
density of motor vehicles (cars and two-wheeled vehicles) in vehicles/km
West Germany East Germany
3,785.0 4.003,2
1,033.3 655.7
240.2 218.3
99.5 95.9
74.7 59.6
Table 4: Strucure of the classified road network and traffic densities in East and West Germany (related to the stock of private cars and two-wheeled motor vehicles in 1989)
4
127
Analysis of Safety Risks of a Two-Wheel Oriented Mobility Strategy "3 + 2" and Development Consequences
4.1 Effects of Different Structures of Using Two-Wheeled Motor Vehicles and Private Cars on the Accident Scenario
Table 5 shows a comparison of different structures of using private cars and twowheeled motor vehicles in West and East Germany with the corresponding structural data concerning fatalities and injured people as a result of accidents.
Two essential deficiencies of safety should be noted:
The proportion of killed motor-cyclists in West Germany exceeds the proportion of motor-cycles in the stock of motor vehicles for individual traffic by threefold (14.3% to 4.3%). Obvioulsy, this is due to the higher speeds of motor-cycles and speeds of collision respectively in West Germany. This assumption is also confirmed by the fact, that the less powerful motor-cycles in East Germany lead to comparatively essentially lower differences between the proportional stock and the proportional results of accidents.
territory/ private cars/ motor-cycles/ motor-assisted feature estate cars motor sco~;~rs bicycles/mopeds
prooorüon/% proportion % orooorüon/% West Germany
stock in 1,000 29,755/92.5 1,379/ 4.3 1,003/ 3.2
fatalities 4,352/82.0 747/14.3 210/ 3.9
injured 280,716/85.7 33,143/10.2 13,540/ 4.1
East Germany
stock in 1,000 3,899/52.5 1,327/17.9 2,208/29.6
fatali ties 565/58.7 221/23.0 176/18.3
injured 12,832/44.0 7,642/26.2 S,710/29.8
Table 5: Structural data concerning vehicular stock, fatalities and injured people in comparison of private cars and two-wheeled motor vehicles in West and East Germany; figures form 1989 acording to (1, p.95) and (2, p. 17)
In contrast to the proportion of private cars in the vehicular stock for the individual traffic the proportion of private car occupants killed is higher in East Germany (52.5%

128
to 58.7%). Obviously this is due to the lower level of passive safety of the types of
private cars typical for East Germany.
These two deficiencies of safety are relatively insignificant for a two-wheel oriented change in the structure of use, since the level of passive safety is adapting to that of West Germany by the renewal process, which has al ready started, on the one hand and for the mobility strategy "3 + 2" the two-wheeled vehicles of the moped type restricted in power and speed are considered on the other hand. Without any doubt, both things will have posivite effects on the safety of two-wheeled vehicle. In this category of vehicles there are no rem ar kable deficiencies of safety between the structures of stock and the accident results, as indicated in table 5; on the contrary, the proportion of killed moped riders of 18.3% is lower than the proportion of stock of
29.6%.
Seen from these points of view, the change to a higher proportion of using twowheeled motor vehicles of the moped type might not cause additional risks of safety, since a gradual quantitative adaptation of the East German road and traffic facilities to these in West Germany can be expected and since accompanying traffic safety measures will have to be taken for the mobility strategy "3 + 2" in order to reduce the
injury risk of the motor-cyclists and moped riders.
Due to the limited chances of increasing the passive safety of motor-cyclists and moped riders safety measures have primarily to be aimed at the prevention of accidents. Fort that purpose a systematic analysis of the individual fields of risk will be required, such as causes of accidents, locations of accidents, age groups of the accident causes etc. From those findings starting points and priorities for the
prevention of accidents can be derived.
4.2 Accident Related Safety Risks
Table 6 shows a diagram concerning the structure of the main accident causes of moped riders in c.omparison with car drivers and motor-cyclists as a basis for the analysis of accident related safety risks of the mobility strategy "3 + 2".
The purpose of this analysis is evaluationg potenital effects of
the structural changes of the purpose of using two-wheeled motor vehicles as
weil as an average increase of age and riding experience of the motor-cyclists and
moped riders
129
on safety risks related to accident causes which are connected with the mObility
strategy "3 + 2".
The speed related safety risks, the share of which in the accident causes is already lower than that of private cars and motor-cycles, will decrease, as the increasing proportion of motor-cyclists and moped riders older than 25 years will bring corresponding positive effects due to their higher feeling of responsibility and longer riding experience.
The safety risks related to the accident cause of ignoring the right of way will hardly change, as positive effects due to higher age and longer experience can not be expected as shown by the high proportion of that accident cause of 27% with car
drivers.
As to the accident cause of effects of alcohol, which is already significantly above the average with the moped riders at a rate of 13%, an increase of the corresponding safety risks is to be expected, due to foreseeable regulations about the blood alcohol
level.
The safety risks related to the accident cause of using the wrong lane with its outstanding proportion of 16% are particularly due to the ignoring the rule of driving on the right side. There is a direct connection with the bad conditions of the roadsides. Sudden manouevres of overtaking are thus provoked causing collisions with following or passing vehicles.
Improvements of the road conditions but also traffic management measures will reduce these safety risks.
Safety risks due to inadequate safety distances can be reduced by technical stability during braking as weil as by improved methods in training motor-cyclists and moped riders and in practising braking two-wheeled vehicles adequately. Special investigations of 500 accidents with two-wheeled motor vehicles (3, p- 15) indicated that about 40% of the accidents are due to mistakes in braking directly or indirectly.
Safety risks during overtaking will not be very important under the conditions of urban traffic.
Summarizing it can be evaluated that there will be positive effects on the safety risks related to accident causes resulting from improvements of the road conditions and the development in the fields of vehicular technology, purpose of use of two-wheeled motor vehicles and the age and experience of their riders. Measures to relieve traffic to limit speeds and to ban certain types of vehicles as weil as specific measures t~
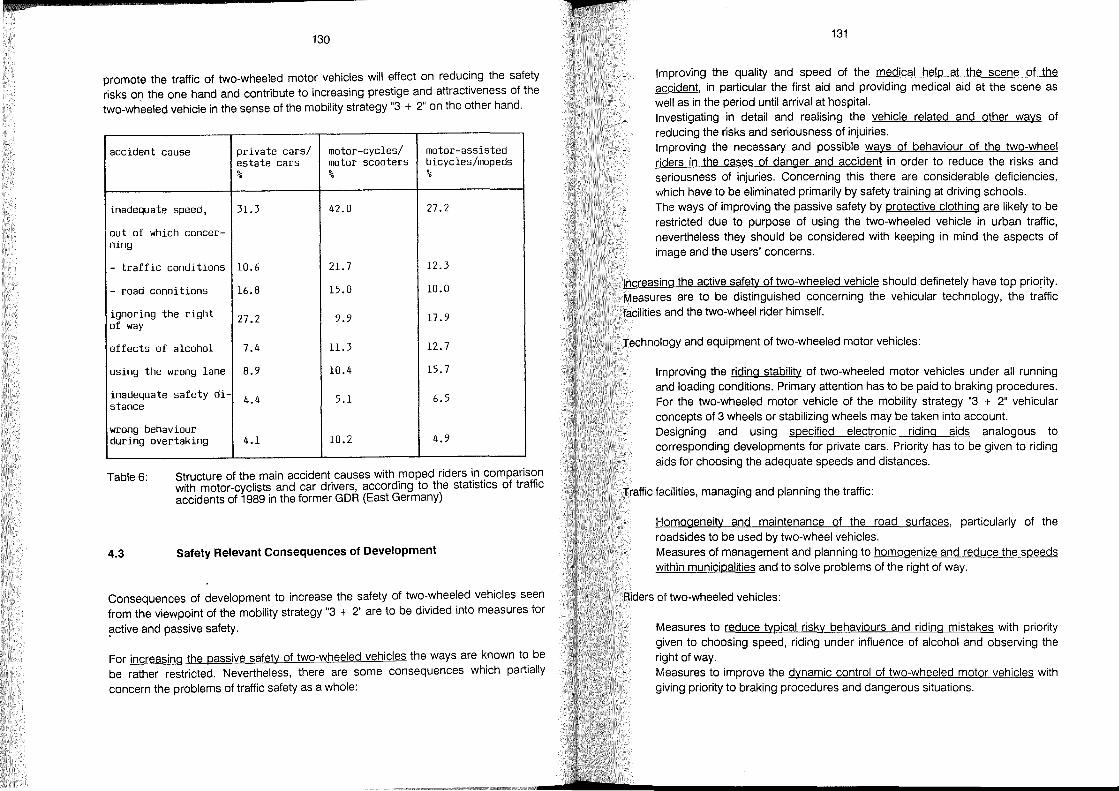
s 130
promote the traffic of two-wheeled motor vehicles will effect on reducing the safety risks on the one hand and contribute to increasing prestige and attractiveness of the two-wh~eled vehicle in the sense of the mobility strategy "3 + 2" on the other hand.
accident cause private cars/ motor-cyc1es/ motor-assisted es ta te cars motor scooters bicycles/mopeds % % %
inadequate speed, 31.3 42_0 27.2
out of which concer-ning
- traffic conditions 10.6 21.7 12.3
- road conditions 16.8 15.0 10.0
ignoring the right 27.2 of way 9.9 17.9
effects of a1coho1 7.4 11.3 12.7
using the wrong 1ane 8.9 10.4 15.7
inadequate safety di- 4.4 5.1 6.5 stance
wrong behaviour during overtaking 4.1 10.2 4.9
Table 6: Structure of the main accident causes with moped riders in comparison with motor-cyclists and car drivers, according to the statistics of traffic accidents of 1989 in the former GDR (East Germany)
4.3 Safety Relevant Consequences of Development
Consequences of development to increase the safety of two-wheeled vehicles seen from the viewpoint of the mobility strategy "3 + 2" are to be divided into measures for
?lctive and passive safety.
For increasing the passive safety of two-wheeled vehicles the ways are known to be be rather restricted. Nevertheless, there are some consequences which partially concern the problems of traffic safety as a whole:
131
Improving the quality and speed of the medical help at the scene of the accident, in particular the first aid and providing medical aid at the scene as weil as in the period until arrival at hospital. Investigating in detail and realising the vehicle related and other ways of reducing the risks and seriousness of injuiries. Improving the necessary and possible ways of behaviour of the two-wheel riders in the cases of dang er and accident in order to reduce the risks and seriousness of injuries. Concerning this there are considerable deficiencies, which have to be eliminated primarily by safety training at driving schools. The ways of improving the passive safety by protective c10thing are likely to be restricted due to purpose of using the two-wheeled vehicle in urban traffic, nevertheless they should be considered with keeping in mind the aspects of image and the users' concerns.
Increasing the active safety of two-wheeled vehicle should definetely have top priority. Measures are to be distinguished concerning the vehicular technology, the traffic facilities and the two-wheel rider himself.
Technology and equipment of two-wheeled motor vehicles:
Improving the riding stability of two-wheeled motor vehicles under all running and loading conditions. Primary attention has to be paid to braking procedures. For the two-wheeled motor vehicle of the mobility strategy "3 + 2" vehicular concepts of 3 wheels or stabilizing wheels may be taken into account. Designing and using specified electronic riding aids analogous to corresponding developments for private cars. Priority has to be given to riding aids for choosing the adequate speeds and distances.
Traffic facilities, managing and planning the traffic:
Homogeneity and maintenance of the road surfaces, particularly of the roadsides to be used by two-wheel vehicles. Measures of management and planning to homogenize and reduce the speeds within municipalities and to solve problems of the right of way.
Riders of two-wheeled vehicles:
Measures to reduce typical risky behaviours and riding mistakes with priority given to choosing speed, riding under influence of alcohol and observing the right of way. Measures to improve the dynamic control of two-wheeled motor vehicles with giving priority to braking procedures and dangerous situations.
2 132
In view of doubtless ecological and economic advantages of the two-wheeled motor vehicle the investigations show that it can play an adequate role in the future traffic besides the private car, the public means of transport and the bicycle even with considering the safety risks. Corresponding technical desings at the vehicle as weil as traffic safety measures, growing traffic problems in towns and cities and forming the public opinion in favour of the two-wheeled vehicle can contribute significantly to reduce present safety risks and problems of acceptance and attractiveness.
5
1)
2)
3)
133
Reference List
Deutschland < Bundesrepublik > / Deutscher Bundestag /11. Wahlperiode: Unfallverhütungsbericht Straßenverkehr 1989. - Bonn, Mal 1990. - (Drucksache 11/7344)
Deutschland <DDR> / Ministerium des Innern / Hauptabteilung Vekehrspolizei: Straßenverkehrsunfälle in der DDR 1989. - Berlin, April 1990
Unfallforschung bei motorisierten Zweiradfahrzeugen, Zwischen bericht / H.J. Jahndel (u.a.). - Dresden: Hochschule für Verkehrswesen, Institut für Verkehrssicherheit, 1990
s
A Preliminary Study Into the Feasibility of Motorcycle Airbags
Nicholas M. Rogers
International Motorcycle Manufacturers Association
France

3 137
1 Abstract
This paper summarizes the results of preliminary research into the feasibility of applying passenger car airbag technology to motorcycles. Preliminary work by the motorcycle industry and associated research organizations has involved: a review of the technical literature concerning motorcycle airbags; a comprehensive review and selection of InJury evaluation methods, indices, and criteria needed to assess motorcycle airbag performance in the future; 19 sledge tests of a medium conventional motorcycle fitted with 2 different passenger car airbag systems; 750 computer simulations to evaluate systematically the effects of airbag design, vehicle, rider and impact parameters on airbag performance. The literature review showed that the prior research has been largely exploratory, nonsystematic, and limited in methodology; and also that no work has been published on the subjects of out-of-position riders; the consequences of unintended deployment; or neck injury potential in general. Sied ge test and simulation results showed that, with airbags fitted, a tradeoff exists between reduced head injury potential in some impacts, and increased neck or head injury potential in other impacts and deployments; and that the results are very sensitive to differences in impact condition and airbag design. The review of injury criteria and evaluation methods showed that clearer answers to airbag feasibility depend on development of an appropriate motorcycle airbag dummy and associated injury criteria; and a short term plan for this is described. Further computer simulation, sledge tests and full scale tests to assess four main concepts of motorcycle airbags, using expanded evaluation methods, are proposed; and the research is continuing.
138
2 Introduction
This paper summarizes a preliminary study within programme to assess the feasibility of motorcycle airbags.
2.1 Objectives
an overall research
The overall and effects intended to:
objective on injury
of this research is costs of motorcycle
to assess the feasibility airbag systems which are
Reduce injuries to the head and upper body of motorcycle occupants in collisions,
Not increase the overall costs of injuries resulting from
collisions, and
Not increase the likelihood of injury in other situations.
This preliminary study covered the following initial tasks:
A review of past literature describing motorcycle airbag
research
The definition of preliminary injury evaluation methods for assessing airbag impact tests
criteria and performance in
associated simulated
Exploratory sledge tests to study rider motions during airbag
deployment
Computer simulations of motorcyclejpassenger car impacts, for an initial assessment of the effects of various airbag, vehicle, rider, and impact parameters, on airbag performance
2.2 Technical Approach
lowards these objectives, the foliowing tasks were performed:
139
A preliminary review of 15 previous reports on motorcycle airbag research was done by the Japan Automotive Manufacturers Association Motorcycle Rider Protection Subcommittee
A comprehensive review of approximately 140 technical references, to identify potential injury criteria, evaluation methods and dummy technology applicable to assessing motorcycle airbag performance, was done by Biokinetics and Associates, Ud.
A preliminary series of 19 sledge tests involving a conventional motorcycle fitted with 2 different passenger car airbag systems, was conducted at the Japan Automobile Research Institute
A preliminary series of approximately 750 computer simulations were performed, to assess the effects of airbag, vehicle, rider and impact variables on airbag performance, at Dynamic Research, Inc.
3 Results
The results of these 4 research projects are described in detail in the summary report [Dynamic Research, 1991 (18)] and associated technical re ports [JAMA, 1990 (1), (19), (20); Biokinetics, 1990 (9); Biokinetics, 1991 (10); Dynamic Research, 1990 (11)]. Together, these comprise approximately 85 volumes of reports and data, which are of a preliminary nature.
Due to the extensive volume of the results, only a summary of the main findings, conclusions and recommendations are described below.
4 Summary
4.1 Overall Cdnclusions
Assessing the feasibility of motorcycle airbags is dependent on the choice of appropriate and realistic:
p 140
Impact conditions
Injury indices and criteria
Crash dummy biofidelity
Test and computer simulation methods
Past studies have generally been exploratory in nature, and have been very limited with regard to the above factors.
The current study was also preliminary and took an ad hoc approach
to these issues.
Some systematic exploration using sledge tests and computer simulation was accomplished and the results are summarized below. However, the results are tentative, and subject to change as the above methodology factors listed above are developed.
The research examined airbags similar in design to those used in passenger cars, mounted in the handlebar region of a medium sized conventional motorcycie.
The sledge test and simulation results, in general, showed a tradeoff between reduced injury potential with airbags in some impacts, and increased InJury potential with airbags in other deployments and impacts. The increased injury potential due to airbags was notably to the neck, as weil as other body regions.
The results of the research were found to be very sensitive to differences in impact condition, airbag design parameters, and to some extent, type of motorcycie.
4.2 Uterature Review
A literature review oi the following references was performed:
[Bothwell, a.o., 1973 (2)]
[Bothwell, 1975 (3)]
[Bothwell, 1976 (4) ]
[Peterson, a.o., 1981 (13)]
[Danner, a.o., 1985 (6) ]
[Chinn, a.o., 1985 ((5)]
[Sporner, a.o., 1987 (15)]
[Watson, 1987 (21)]
[Sporner, a.o., 1989 (17)]
[Watson, a.o., 1989 (22)]
141
[Sicherheit bei Motorisierten Zeiraden, 1980 (23)]
[Finnis, 1990(7) ]
[Oulette, 1990 (14)]
[Happian-Smith, a.o., 1990 (8) ]
[Sporner, a.o., 1990(16)]
The literature review indicated that:
Very little objective data has been published, and most of this has been the exploratory work of Bothwell (for NHTSA) and more recently Chinn and Finnis (of TRRL)
No work has been published on the subjects of out-of-position riders or unintended deployments
Apparently, no previous motorcycie airbag work has examined neck injury potential, which may be crucial
The choice of test conditions has been very limited and has involved only a small fraction of the accident relevant configurations described by Pedder, a.o. [1989 (12)]
Bothwell recommended investigation of many possibilities inciuding: "winged bags", forward and recessed gas diffusers, means for preventing leg flail, different motorcycle contours, shaped nose cones for anti pitch, and larger airbags
3 142
TRRL and Sporner (a.o., of HUK Verband) recommended use of knee protectors or pads with airbags (either to lower the head and put the bag in compression (TRRL); or to raise the head above the roof (HUK)). The two concepts seem to be in conflict.
There are at least four concepts for motorcycle airbags, which
should be considered:
"Restraint" (or retention)type, with or without leg protectors
(per TRRL)
_ "Trajectory control" type, with or without knee pads(per HUK)
_ "Passenger car cushion" or "energy absorption" type (suggested
by the Bothwell work)
"Combination" airbag, involving elements of the other three
types
4.3 Injury Criteria
A comprehensive review of approximately 140 biomechanical references was done [Biokinetics, 1990 (9)), and requirements were defined for a preliminary motorcycle airbag dummy [Biokinetics, 1991(10)].
Efforts to identify InJury criteria applicable to motorcycle airbags indicated that crash dummies for passenger cars and associated injury indices and criteria have been developed to evaluate:
Blunt, hard impacts to specific points on the torso
Belt type restraints
Head motion as a result of belt restraint
Fore/aft only (or lateral only) motions
As such, passenger car crash dummies are unsuitable in their current forms for large, three dimensional, unrestrained, exposed motions and impacts involving motorcycles, riders and airbags.
143
Key factors in the definition of pertinent injury criteria and dummy hardware for motorcycle airbag evaluation are:
The relatively exposed position of the rider's neck relative to a motorcycle mounted airbag
Likely heimet/airbag interaction (in the vertical direction)
Unrestrained motion, in general (eg, lack of a vertical reaction surface for the airbag)
Key body regions and provisional injury criteria are as shown in Table 1 which can be summarized as folIows:
Head: Generalized Acceleration Model for Brain Injury Tolerance
Neck: Maximum Flexion and Extension Moments, and Combined Loa(j Criterion
Chest: Velocity Compression Criterion
Abdomen: Rouhana Crush Criterion
Preliminary dummy biofidelity parameter "corridors" for the head, neck, ehest, abdomen and lumbar spine, pertinent to motorcycle airbag type motions, have been defined, as shown in Table 2. To meet the biofidelity requirements and to use the injury criteria, extensive short and long term modifications to a Hybrid 111 dummy are required. In the interim, a set of informal, "ad hoc" injury criteria, shown in Table 3, were adopted for use in the current study, for a preliminary evaluation of sledge test and computer simulation results. However, because of their nature, they are tentative and may have distorting effects on data interpretation.
4.4 Siedge Tests
Nineteen (19) sledge tests involving 2 different passenger car airbags (65 I, 155 I) mounted ahead of and behind the handlebar of a medium conventional motorcycle as summarized in Table 4 were conducted [JAMA, 1990 (19),(20)). As summarized in part in Table 5, these tests (based on ad hoc test methods, dummy, and injury criteria) showed that:
5 144
The larger airbag seemed to provide a larger potential in frontal impacts, but also larger potential for unintended deployments with position, compared to the sm aller airbag
reduction in injury increases in injury the rider out-of-
The results were very sensitive to changes in some parameters such as test conditions and airbag design. This suggests that a larger, more representative set of test conditions is needed to assess whether a given airbag is beneficial or harmful
Apparent hyper-extension observed in some cases this is still unclear)
of the neck and lumbar spine were (though the realism and significance of
With a pillion passenger, the large airbag had noticeably less effect on rider dummy motion and torso pitch was apparent
An additional 10 ms inflation delay had little effect on dummy motions
Some head lift was observed with the 155 I airbag
The 65 airbag had little apparent effect on dummy motions during impact, but also seemed less injurious in unintended deployments
At high headjairbag velocities, head acceleration increased
Some difficulties and the position and sidejroof ensemble
4.5 Computer Simulation
test inconsistencies were structure of the simulated
encountered passenger
with car
750 computer simulations of motorcycle airbags were conducted using the model described in Table 6 [Dynamic Research, 1990 (11)]. These were used to evaluate the sensitivity of the airbag performance to impact condition, vehicle and rider parameters, and airbag design.
Validation results showed that the simulation accurately predicted the general motion and relative injury effects of airbags, when the results were compared to the sledge test data. A relatively high correlation coefficient (0.91) between simulated and actual relative injury potential was obtained, as shown in Fig 1.
145
A "reference" (84 I) airbag, described in Table 7 and iIIustrated in Fig 2, was positioned to the re ar of the handlebars of a medium conventional motorcycle and produced (Table 8):
Beneficial effects on injuries in 14% of 150 impact conditions
No net change in injury potential in 25% of the impacts
Harmful effects in 61% ofthe impacts
Injuries from the airbag which were most often associated with increased neck forces or moments and in some cases (eg, passenger car front impacts), increased head or chest accelerations
and, in general, was found to be very sensitive to variations in the test conditions examined.
Variations in motorcycle design, rider characteristics and airbag design were assessed for 8 basic test conditions. These were:
With a stationary passenger car, 900 impacts into the front at 25, 50, 75 kmjh
With a stationary passenger car 900 impacts into the side at 25, 50,75 kmjh
With a stationary motorcycle, unintended deployment with the dummy in the normal and prone riding positions
The reference airbag showed (Table 9):
Similar results between the medium conventional motorcycle and a large sports motorcycle
Greatly increased injuries interaction of the rider's more direct headjairbag impact)
for a knees
step-through scooter (due with the fairing, resulting
to in
More injuries when the anti pitch structure was lengthened, and fewer injuries when it was removed

146
Little sensitivity to rider weight or the presence of a pillion passenger (although in the latter case the result may be related
to use of a rotationally stiff airbag mount)
Variation in the reference airbag dimensions showed that (fable 10):
Only airbags having a height of (Iess than or equal to) 470 mm and a width of (Iess than or equal to) 270 mm reduced injuries, across the 8 basic test conditions. These airbags seemed to reduce head and neck injuries in 50 and 75 km/h impacts into the side of a passenger car; and to have no injurious effects in unintended deployments with the dummy out of position. Performance in other impact configurations is not yet known.
Variations in other airbag parameters (with the reference airbag
dimensions) showed that (fable 10):
Locating the airbag more towards the rear was more harmful; more
towards the front made Iittle change
A much larger exhaust area (gas outflow orifice) reduced airbag injuries. This may be related to the nearness and high stiffness
of the passenger car roof structures
A shorter total inflation time (of about 30 ms, including delay and fill times) reduced airbag related InJunes. This is shorter than current typical passenger car airbags and suggests the need for more sensitive triggers and faster burn rates
A sm aller airbag mounting base tends to reduce airbag injuries,
by allowing more airbag rotation
4.6 Recommendations
The following ·directions for future research into the feasibility of
airbags for motorcycles are recommended.
147
4.6.1 Overall Recommendations
Completion of the necessary interim methodology motorcycle airbag feasibility, including injury criteria, an injury cost model, a motorcycle airbag and associated instrumentation and data acquisition system
for assessing indices and
crash dummy,
Investigation of four concepts of airbags by means of testing and computer simulation, to identify the most workable concept
These, and the more detailed recommendations listed below are summarized as a recommended short term research plan in Table 11.
4.6.2 üterature Review
A more detailed examination of the Bothwell and TRRL data
A review of which may motorcycles
4.6.3 injury Criteria
passenger car airbag be related to the
literature, to feasibility
uncover factors of airbags for
Extension of the criteria to cover the full range of AIS for head, neck, chest, and abdomen
Completion of a injury comparison different tests
second generation among different
injury body
cost model, to allow regions and among
Detailed design, fabrication and assembly of the MATD-2 dummy, including a modified neck
Dummy checkout, calibration and validation
Overall dummy validation by means of cadaver tests
Longer term studies to allow for lateral or angled airbag tests, including: modifications to the dummy ribs, shoulder, and neck; as weil as internal data acquisition system improvement
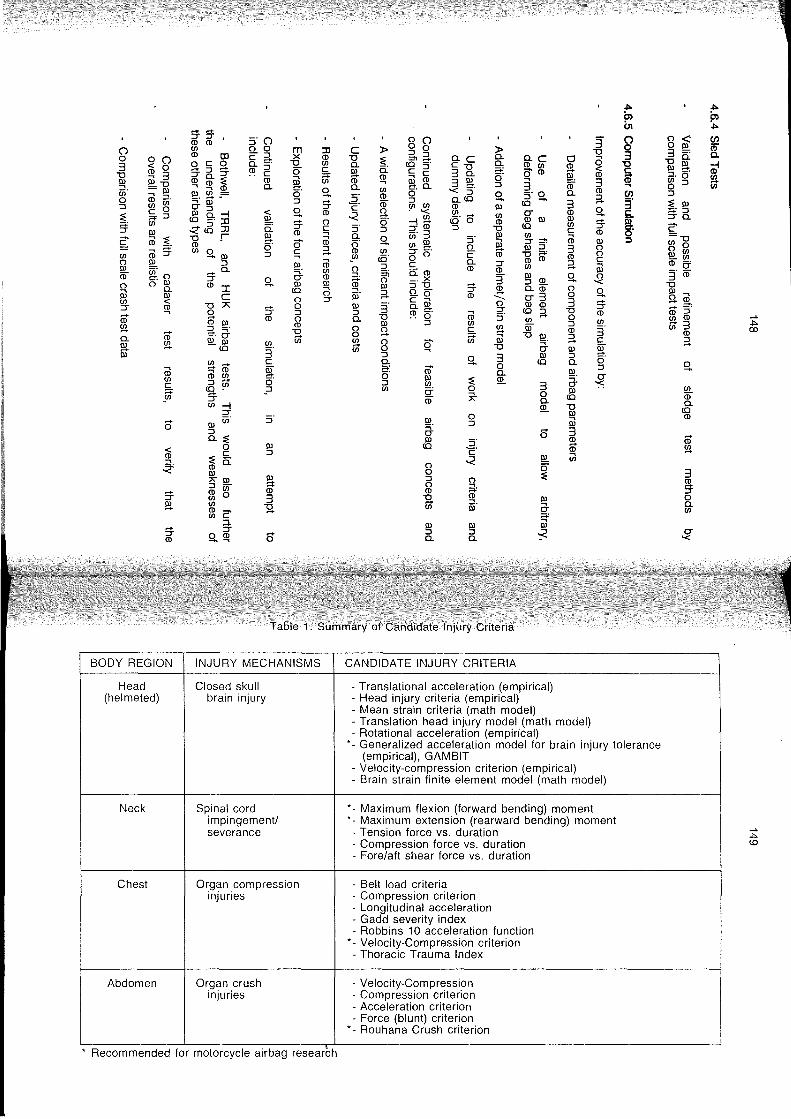
C) o 3 -0 ~ w' o :::J
:E s: ~ 00 o III CD o ro 00 :::T
CD ~ Q.
!!l-III
oC) < 0 ~ 3 ~-o .., III CD ::!. 00 00 c 0 ;:+:::J 00 III CD :E CD g ~ w' :::t. () o !ll
Q.
~ ~
CD ~
CD 00 C
-~
ö
< ~ ~
g. !!l-
g. CD
:f:r CD CD 00 CD CD o C 0 -:::J:::TQ.:::T CD CD :E .., .., CD
Q? ~ -= .., III
g5.-i (Q -':0 -< t5 :0 -0 r CD -00 0
-lll :::J
-Q. :::T CD I
C -0;:>\ Sl. CD !ll :::J -, !:t. a~!ll
(Q 00 _
@~ :::J 00 (Q , g. 00 -i
:::T !ll w' :::J Q.:E
o C
~ 0:: !ll 5~ CD 00 00 0 00 CD _
00 C
5: o CD -..,
5' C) \20 C :::J a.~ CD :::J " C
CD Q.
< ~ Ci !!l-0' :::J
Q,
g. CD
00
~r C §I 0' _:J
5'
III :::J
~ CD 3 11
ö
~ -0
Q !!l-0' :::J
Q, g. CD
Ö !::i !ll a: !ll
(Q
o o :::J o CD
11 00
:0 CD 00 C ;:+ 00
Q, g. CD o !::i CD ~ CD 00 CD !ll Cl :::T
C -0 Q.
!!l-CD Q.
.;!: C
-< 5' Q. ö' CD
_00
Q
~ w' !ll :::J Q. o o 00 ur
» :E Ci ~ 00 CD CD U 0' :::J
Q. 00 «5' :::J g. !ll ~ 3' -0 III U 8 :::J Q. ;::;: 0' :::J 00
oC) o 0 :::J :::J
c3" g" C C .., CD !!l-Q. 0' :::J 00 !",<
00 -i:::T CD w' 3 cn ~. :::To o C
o::~ S'"Q.. \20
5. ~. ~ g
Q m !ll 00 a' CD
!ll a: ~
o o :::J o CD 11 00
III :::J Q.
Q.C C-o 3 Q.
3 ~, '< :::J Q.(Q CD
t5' ö :::J
5' o C Q. CD
g. CD
CD 00 C @'
Q,
:E Q A
o :::J
.;!: C
-< Q ~: .., w' !ll :::J Q.
~ 0-;::;: 0' :::J
Q, !ll 00 CD -0 III .., !!l-CD :::T CD
3" $!l.
--o :::T 5' ~ ro -0
3 o Q. Ql
Q.C So 00 o CD
3 -, 0 :J _
(Q
er !ll III (Q
00 ::r~
{l~ CD CD 00
~Ql Q.CD er3 !ll CD (Q :::J
00 -iii" -0 Q1,
0-!ll (Q
3 o Q. Ql
ö
~
~ !ll 0-q !ll
.;<
o $!l. Q1, CD Q.
3 CD III 00 C CD 3 CD ~ Q, o o 3 -0 o :::J CD ~ !ll :::J Q.
!ll
~ !ll
(Q
-0 !ll ro 3 $!l. ~ 00
3" -0
~ CD 3 CD
~ Q, g. CD
~ o C ro ~ Q, g. CD 00
3' C §I 0' :::J
~
.,.. a, i.n g 3
~ .., cn 3' c:: §I 0' :J
Table 1, Summary of Candidate Injury Criteria
BODY REGION INJURY MECHANISMS CANDIDATE INJURY CRITERIA
Head Closed skull - Translational acceleration (empirical) (helmeted) brain injury - Head injury criteria (empirical)
- Mean strain criteria (math model) - Translation head injury model (math model) - Rotational acceleration (empirical)
* - Generalized acceleration model for brain injury tolerance (empirical), GAMBIT
- Velocity-compression criterion (empirical) - Brain strain finite element model (math model)
Neck Spinal cord * - Maximum flexion (forward bending) moment impingementl * - Maximum extension (rearward bending) moment severance - Tension force VS, duration
- Compression force VS, duration - Fore/aft shear force VS, duration
Chest Organ compression - Belt load criteria injuries - Compression criterion
- Longitudinal acceleration - Gadd severity index - Robbins 10 acceleration function
* - Velocity-Compression criterion - Thoracic Trauma Index
Abdomen Organ crush - Velocity-Compression injuries - Compression criterion
- Acceleration criterion - Force (blunt) criterion
* - Rouhana Crush criterion
* Recommended for motorcycle airbag research
o < ~B: -0 !ll Q) d". :::!. 0 00 :::J o :::J
:E !ll
9'5. 2' =-0 00 0 o 00 !ll 00 CDa' 3' CD -0 !ll .., um. r+ -=i" CD CD ~3 00 CD
~
Q.
00 CD Q.
(Q CD
CD ~
3 g o Q. 00
~
.,.. !:n .,.. cn CD 0-
i
-"'" .j>. <Xl
-"'" .j>. <0
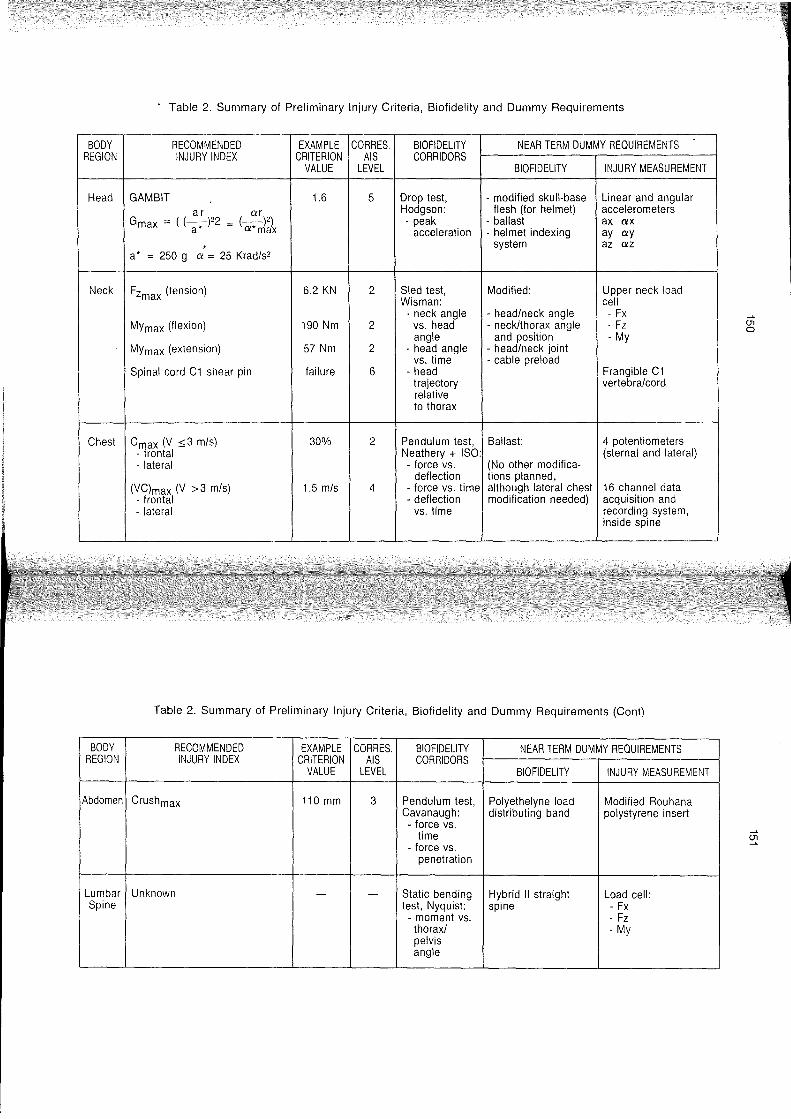
· Table 2. Summary of Preliminary Injury Criteria, Biofidelity and Dummy Requirements
BODY RECOMMENDED EXAMPLE CORRES, BIOFIDELITY NEAR TERM DUMMY REOUIREMENTS REGION INJURY INDEX CRITERION AIS CORRIDORS
VALUE LEVEL BIOFIDELITY INJURY MEASUREMENT
Head GAMBIT 1.6 5 Drop test, - modified skull-base Linear and angular ar ar Hodgson: flesh (for heimet) accelerometers
Gmax = ( (-)22 = (_~2) - peak - ballast ax ax a* a* ax acceleration - heimet indexing ay ay
* system az az a* = 250 g a = 25 Krad/52
Neck Fzmax (tension) 6,2 KN 2 Sied test, Modified: Upper neck load I Wisman: cell
- neck angle - head/neck angle - Fx -"
MYmax (flexion) 190 Nm 2 vs. head - neck/thorax angle - Fz angle and position - My
(Jl o
MYmax (extension) 57 Nm 2 - head angle - head/neck jOint vs, time - cable preload
Spinal cord C1 shear pin failure 6 - head Frangible C1 trajectory vertebra/cord relative to thorax
Chest Cmax (V s3 m/s) 30% 2 Pendulum test, Ballast: 4 potentiometers - frontal Neathery + ISO: (sternal and lateral) - lateral - force vs, (No other modifica-
deflection tions planned, (VC)max (V >3 m/s) 1,5 m/s 4 - force vs, time although lateral chest 16 channel data - frontal - deflection modification needed) acquisition and - lateral vs. time recording system,
inside spine - ,-- - __ ... ____ .. __ .... _____ .. __ . __ .. ___ ... .1
Table 2, Summary of Preliminary Injury Criteria, Biofidelity and Dummy Requirements (Cont)
BODY RECOMMENDED EXAMPLE CORRES, BIOFIDELITY NEAR TERM DUMMY REOUIREMENTS REGION INJURY INDEX CRITERION AIS CORRIDORS
VALUE LEVEL BIOFIDELITY INJURY MEASUREMENT
Abdomen Crushmax 110 mm 3 Pendulum test, Polyethelyne load Modified Rouhana Cavanaugh: distributing band polystyrene insert - force vs,
time -" (Jl
- force vs, -"
penetration
Lumbar Unknown - - Static bending Hybrid" straight Load cell: Spine test, Nyquist: spine - Fx
- moment vs. - Fz thorax/ - My pelvis angle
- ----
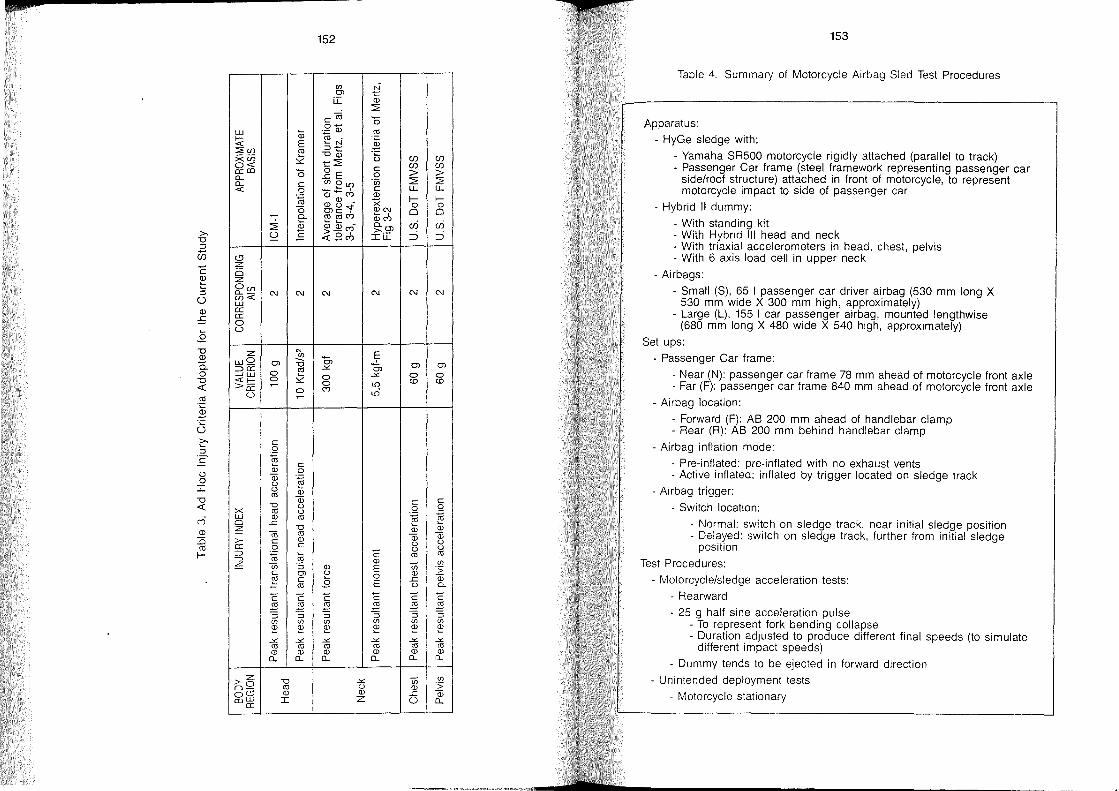
"0 Q)
ä. o "0 « rn '2 .-= o i::' :::J ·e ü o
I "0 « ~
Q)
:0 rn I-
w I-4: :::2:U) xü) 04: 0: co 0-0-4:
0 z Ci z OU) 0-_ U)4: w 0: 0: 0 Ü
Z wQ ::::>0: -'w 4:1->0:
ü
x w c ~ >-0: ::::> "J
~
Z >-0 0-0 0 CO w
0:
m E rn ~ Ö e 0
~ 0
~ 0..
:2: m S2 c -
C\J C\J
N fJ)
Ol =a rn 0 ~ 0
~
0 ~
e 0 .e;;
e m 0 Q) ~ ü ü m rn Q) "0 ü rn ü Q) rn
.s:::. "0
Cii rn e Q)
.2 .s:::.
Cti ~ Ui "3 e Ol
~ e rn
C C ~ ~ :::J :::J fJ) fJ)
~ ~ -'" -'" rn rn Q) Q)
0.. 0..
"0 rn Q)
I
152
fJ) N Ol
~ ü: :2:
e Cii Ö 0-:;:::;0) rn rn N- :~ ~
:::J-"Om t:2: U
e ~E 0 (/)el,{)
.ü;
'ö-c;:, e Q)
Q) Q) - x O)g"1 Q)C\J rnrnC') ~ ,
Q) C') m 03 - §:;.2' > _ C') «.8M ILL
C\J C\J
fi' Öl Öl -'"
0 -'" 0 l{) C')
u-i
C Q)
Q) E ü 0 .2 E C C ~ ~ :::J :::J fJ) fJ)
~ ~ -'" -'" rn rn Q) Q)
0.. 0..
..>:: ü Q)
Z
Cf) Cf) Cf) Cf)
> > :2: :2: LL LL
I- I-0 0 0 0
cr.i cr.i :::::> :::::>
C\J C\J
Ol Ol
0 0 CD CD
e e 0 0
.~ .~
Q) Q)
Q) Q) ü ü ü ü rn rn fJ) Cii "5 Q)
Q) .s:::. ü 0..
C C ~ ~ :::J :::J fJ) fJ)
~ ~ -'" ..>:: rn rn Q) Q)
0.. 0.. .-
Cii fJ)
"> Q) .s:::. Q) 0 0..
153
Table 4. Summary 01 Motorcycle Airbag Sied Test Procedures
Apparatus:
- HyGe sledge with:
- Yamaha SR500 motorcycle rigidly attached (parallel to track) - Passenger Car frame (steel Iramework representing passenger car
side/roof structure) attached in front of motorcycle, to represent motorcycle impact to side of passenger car
- Hybrid 11 dummy:
- With standing kit - With Hybrid 111 head and neck - With triaxial accelerometers in head, ehest, pelvis - With 6 axis load cell in upper neck
- Airbags:
- Small (S), 65 I passenger car driver airbag (530 mm long X 530 mm wide X 300 mm high, approximately)
- Large (L), 155 I car passenger airbag, mounted lengthwise (680 mm long X 480 wide X 540 high, approximately)
Set ups:
- Passenger Car frame:
- Near (N): passenger car frame 78 mm ahead of motorcycle front axle - Far (F): passenger car frame 840 mm ahead of motorcycle front axle
- Airbag location:
- Forward (F): AB 200 mm ahead of handlebar clamp - Rear (R): AB 200 mm behind handlebar clamp
- Airbag inflation mode:
- Pre-inflated: pre-inflated with no exhaust vents - Active inllated: inllated by trigger located on sledge track
- Airbag trigger:
- Switch location:
- Normal: switch on sledge track, near initial sledge position - Delayed: switch on sledge track, further Irom initial sledge
position
Test Procedures:
- Motorcycle/sledge acceleration tests:
- Rearward
- 25 9 hall sine acceleration pulse - To represent fork bending collapse - Duration adjusted to produce different final speeds (to simulate
different impact speeds)
- Dummy tends to be ejected in forward direction
- Unintended deployment tests
- Motorcycle stationary
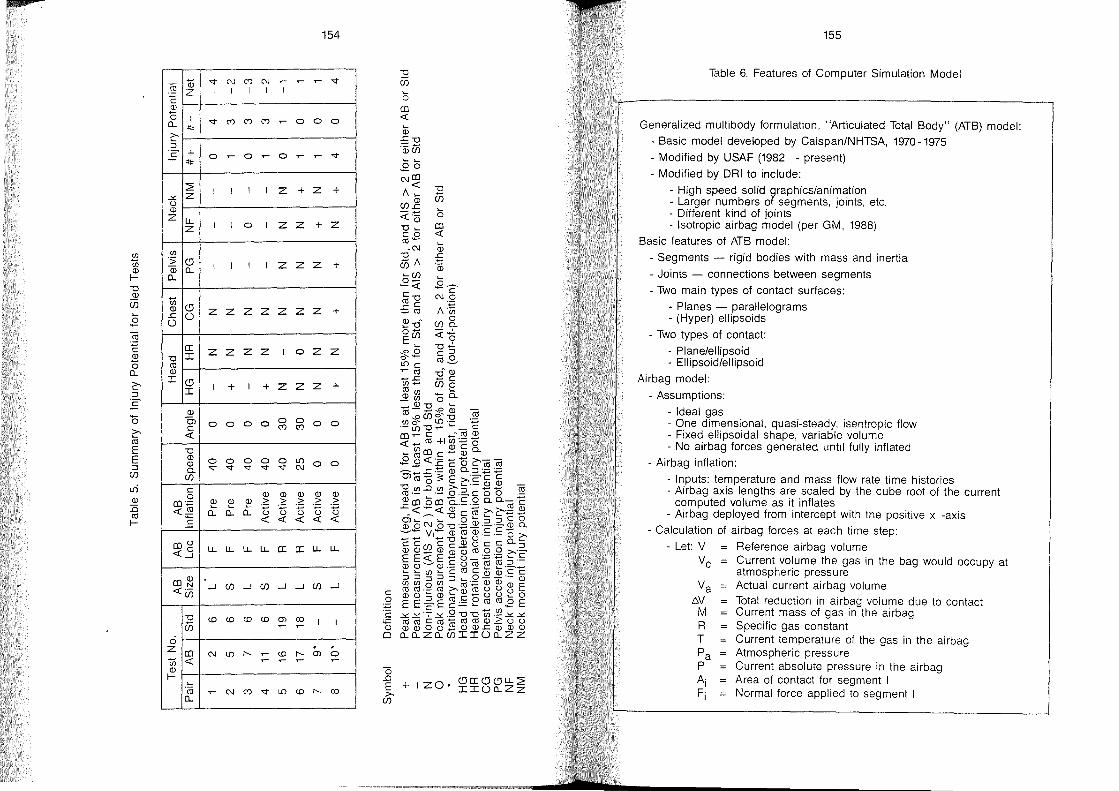
Cf)
ül <ll I-"0 <ll
ü5
Cii ~ Ql
Cl 0..
'0 ;::-cO E E ::J
Cf)
L!"i Ql :0 cO I-
Qi Cii Z .~
<ll
Cl 1 0..
* ;::-::J
C + - * :2
-'" Z ü Ql Z u..
Z
Cf) .;;; Cl Gi 0.. 0..
ül Cl Ql
.c Ü Ü
ce "0 I cO Ql I Cl
I
<ll Cl c: < "0 <ll Ql 0..
Cf)
c: 0
aJ"';:::: <~ c
CO ü
<.::1
CO~ < .-Cf)
"0 ü5
ci Z CO ül < <ll I-
~
·Cö 0..
"<t N (') N 1 1 1 1
"<t (') (') (')
0 ~ 0 ~
1 1 1 1
1 1 0 1
1 1 1 1
Z Z Z Z
z z z Z
1 + 1 +
0 0 0 0
0 0 0 0 "<t "<t "<t "<t
<ll
~ ~ ~ > 0.. 0.. 0.. "'B
<
u.. u.. u.. u..
..J Cf) ..J Cf)
<0 <0 <0 <0
N L!) I"- ~
~
~ N (') "<t
154
~ ~ ~ "<t 1
~ 0 0 0
0 ~ ~ "<t
Z + Z +
Z Z + Z
Z Z Z +
Z Z Z +
1 0 Z Z
Z Z Z +
0 0 0 0 C') C')
0 L!) 0 0 "<t N
Ql Ql <ll <ll .2: > > > ü "TI ~ ~ < < < <
ce ce u.. u..
..J ..J Cf) ..J
(j) <Xl 1 1 ~ ,-
. . <0 I"- (j) 0 ~ ~ ~
L!) <0 I"- <Xl
155
Table 6. Features of Computer Simulation Model
Generalized multibody formulation, "Articulated Total Body" (ATB) model:
- Basic model developed by Calspan/NHTSA, 1970-1975
- Modified by USAF (1982 - present)
- Modified by DRI to include:
- High speed solid graphics/animation - Larger numbers of segments, joints, etc. - Different kind of joints - Isotropic airbag model (per GM, 1988)
Basic features of ATB model:
- Segments - rigid bodies with mass and inertia
- Joints - connections between segments
- Two main types of contact surfaces:
- Planes - parallelograms - (Hyper) ellipsoids
- Two types of contact:
- Plane/ellipsoid - Ellipsoid/ellipsoid
Airbag model:
- Assumptions:
- Ideal gas - One dimensional, quasi-steady, isentropic flow - Fixed ellipsoidal shape, variable volume - No airbag forces generated until fully inflated
- Airbag inflation:
- Inputs: temperature and mass flow rate time histories - Airbag axis lengths are scaled by the cube root of the current
computed volume as it inflates - Airbag deployed fram intercept with the positive x -axis
- Calculation of airbag forces at each time step:
- Let: V Reference airbag volume V c Current volume the gas in the bag would occupy at
atmospheric pressure Va Actual current airbag volume
tN Total reduction in airbag volume due to contact M Current mass of gas in the airbag R Specific gas constant T Current temperature of the gas in the airbag Pa Atmospheric pressure P Current absolute pressure in the airbag Ai Area of contact for segment I Fi Normal force applied to segment I
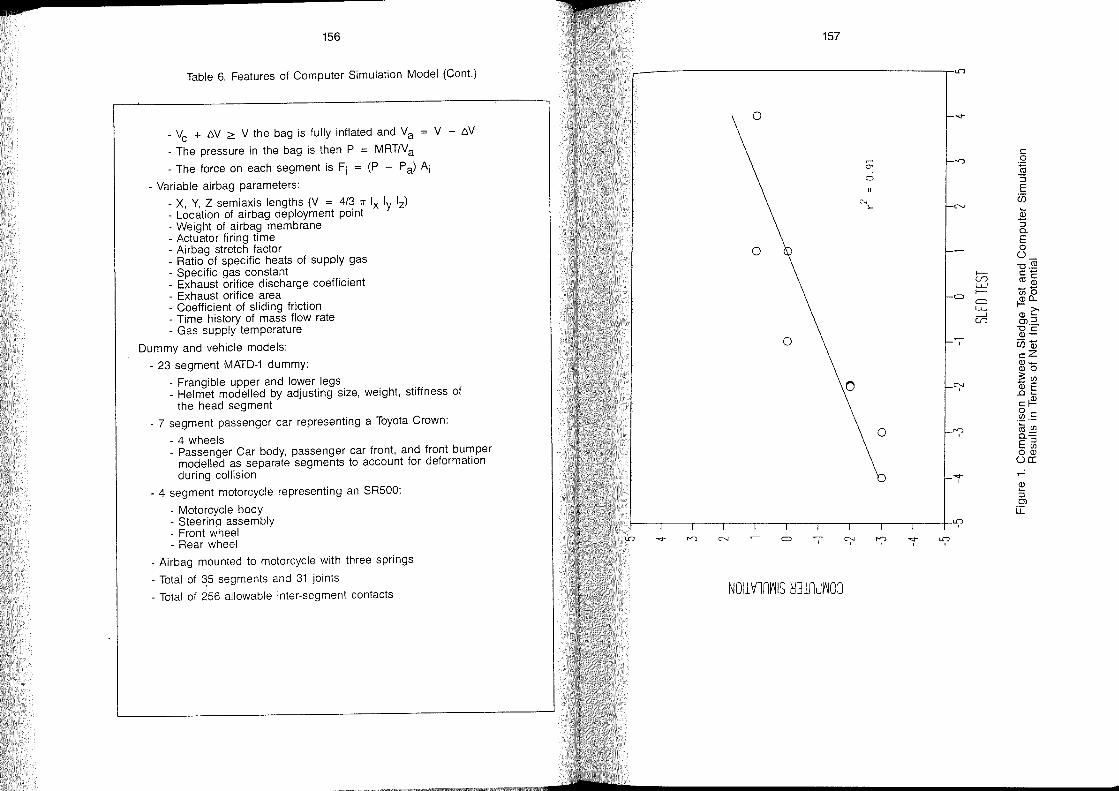
s 156
Table 6. Features of Computer Simulation Model (Con!.)
- Vc + 6V ;::: V the bag is fully inflated and Va = V - 6V
- The pressure in the bag is then P = MRT/Va - The force on each segment is Fi = (P - Pa) Ai
- Variable airbag parameters:
- X, Y, Z semiaxis lengths (V = 4/3 7r Ix Iy Iz) - Location of airbag deployment point - Weight of airbag membrane - Actuator firing time - Airbag stretch factor - Ratio of specific heats of supply gas - Specific gas constant - Exhaust orifice discharge coefficient - Exhaust orifice area - Coefficient of sliding friction - Time history of mass flow rate - Gas supply temperature
Dummy and vehicle models:
- 23 segment MATD-1 dummy:
- Frangible upper and lower legs _ Heimet modelied by adjusting size, weight, stiffness of
the head segment
- 7 segment passenger car representing a Toyota Crown:
- 4 wheels _ Passenger Car body, passenger car front, and front bumper
modeiled as separate segments to account for deformation during coilision
- 4 segment motorcycle representing an SR500:
- Motorcycle body - Steerinq assemblv - Front w~heel . - Rear wheel
- Airbag mounted to motorcycle with three springs
- Total of ~5 segments and 31 joints
- Total of 256 allowable inter-segment contacts
157
o
0
0
0
0
.... ..,.., C"'-I = "7 "";"' '?
NOll VlnV'lIS ~31ndV'lOJ
=
"7
"";"'
'?
-r
"(
.... "( I
f--c.n LW f--
= LW ---' c.n
~ ::J Ol Li:
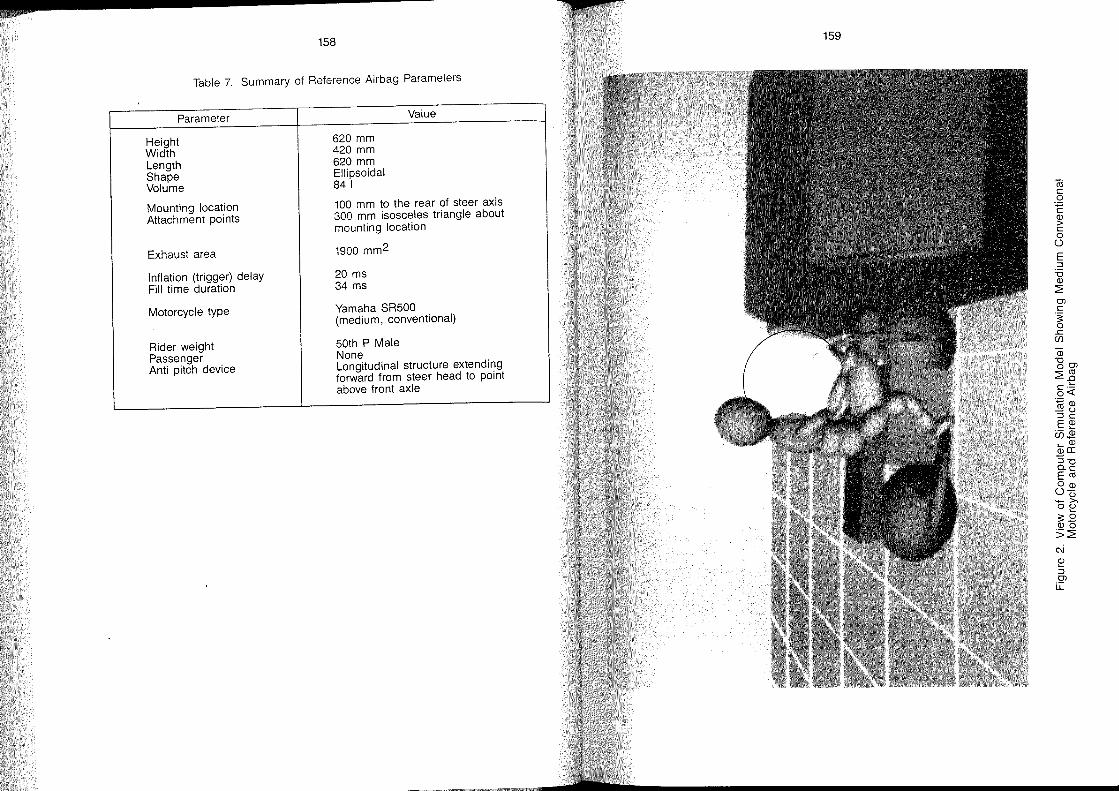
158
Table 7. Summary of Referenee Airbag Parameters
Parameter
Height Width Length Shape Volume
Mounting loeation Attaehment points
Exhaust area
Inflation (trigger) delay Fill time duration
Motoreyele type
Rider weight Passenger Anti piteh deviee
620 mm 420 mm 620 mm Ellipsoidal 84 I
Value
100 mm to the rear of steer axis 300 mm isoseeles triangle about mounting loeation
1900 mm2
20 ms 34 ms
Yamaha SR500 (medium, eonventional)
50th P Male None Longitudinal strueture extending forward from steer head to point above front axle
159
Cii c o .~
(]J > c o
Ü
E :::J '6 (]J
~ 0> C
.~
.J:: (j)
(]J "0 00>
~~ 15<\: §~ :::JC E~ U52 ~(]J (]Ja:
'5"0 o..c Ern O(]J
Üü - >-o~
:::.8 (]JO
>~
N ~ :::J 0> Li:
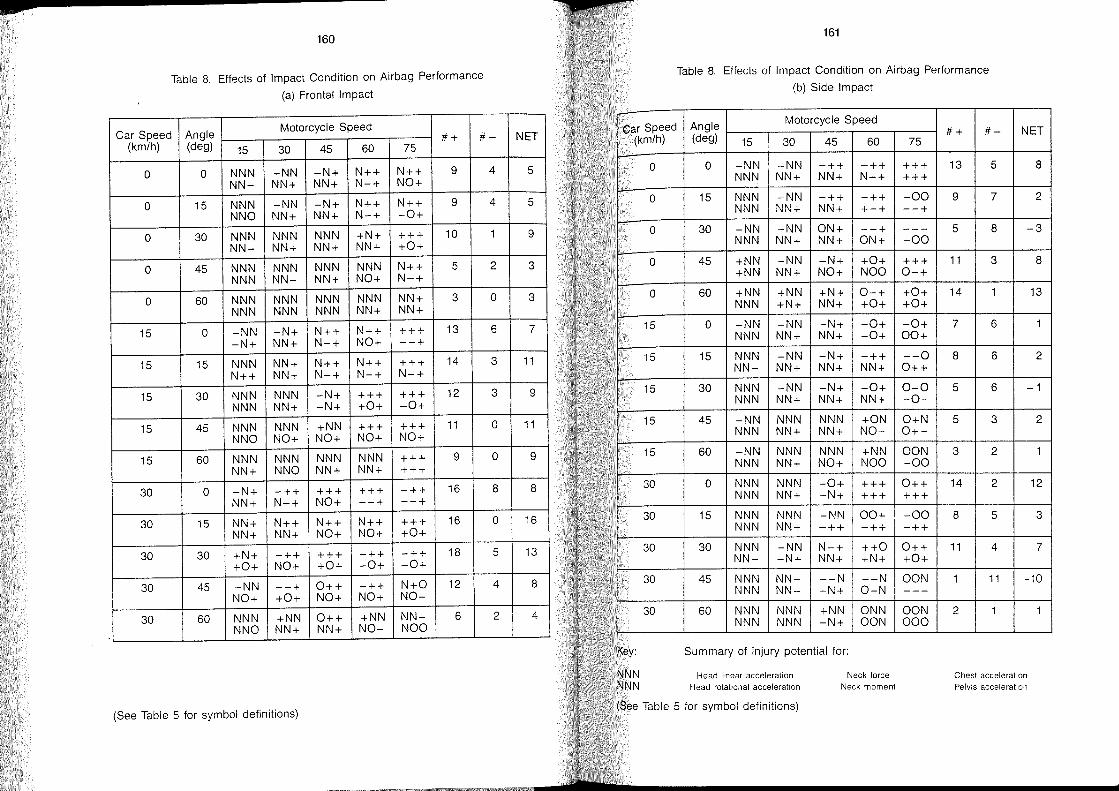
s 160
Table 8. Effects of Impact Condition on Airbag Performance (a) Frontal Impact
Car Speed Angle Motorcycle Speed #+ #-
(km/h) (deg) 15 30 45 60 75
0 0 NNN -NN -N+ N++ N++ 9 4 NN- NN+ NN+ N-+ NO+
0 15 NNN -NN -N+ N++ N++ 9 4 NNO NN+ NN+ N-+ -0+
0 30 NNN NNN NNN +N+ +++ 10 1 NN- NN+ NN+ NN+ +0+
0 45 NNN NNN NNN NNN N++ 5 2 NNN NN- NN+ NO+ N-+
0 60 NNN NNN NNN NNN NN+ 3 0 NNN NNN NNN NN+ NN+
15 0 -NN -N+ N++ N++ +++ 13 6 -N+ NN+ N-+ NO+ --+
15 15 NNN NN+ N++ N++ +++ 14 3 N++ NN+ N-+ N-+ N-+
15 30 NNN NNN -N+ +++ +++ 12 3 NNN NN+ -N+ +0+ -0+
15 45 NNN NNN +NN +++ +++ 11 0 NNO NO+ NO+ NO+ NO+
15 60 NNN NNN NNN NNN +++ 9 0 NN+ NNO NN+ NN+ +++
30 0 -N+ -++ +++ +++ -++ 16 8 NN+ N-+ NO+ --+ --+
30 15 NN+ N++ N++ N++ +++ 16 0 NN+ NN+ NO+ NO+ +0+
30 30 +N+ -++ +++ -++ -++ 18 5 +0+ NO+ +0+ -0+ -0+
30 45 -NN +-+ 0++ -++ N+O 12 4 NO+ +0+ NO+ NO+ NO-
30 60 NNN +NN 0++ +NN NN- 6 2 NNO NN+ NN+ NO- NOO
(See Table 5 for symbol definitions)
NET
5
5
9
3
3
7
11
9
11
9
8
16
13
8
4
Car Speed (km/h)
0
0
0
0
0
15
15
15
15
15
30
30
30
30
30
161
Table 8. Effects of Impact Condition on Airbag Performance (b) Side Impact
Angle Motorcycle Speed (deg) 15 30 45 60
0 -NN -NN -++ -++ NNN NN+ NN+ N-+
15 NNN -NN -++ -++ NNN NN+ NN+ +-+
30 -NN -NN ON+ --+ NNN NN+ NN+ ON+
45 +NN -NN -N+ +0+ +NN NN+ NO+ NOO
60 +NN +NN +N+ 0-+ NNN +N+ NN+ +0+
0 -NN -NN -N+ -0+ NNN NN+ NN+ -0+
15 NNN -NN -N+ -++ NN- NN+ NN+ NN+
30 NNN -NN -N+ -0+ NNN NN+ NN+ NN+
45 -NN NNN NNN +ON NNN NN+ NN+ NO-
60 -NN NNN NNN +NN NNN NN+ NO+ NOO
0 NNN NNf\1 -0+ +++ NNN NN+ -N+ +++
15 NNN NNN -f\IN 00+ NNN NN+ -++ -++
30 NNN -NN N-+ ++0 NN- -N+ NN+ +N+
45 NNN NN- --N --N NNN NN- -N+ O-N
60 NNN NNN +NN ONN NNN NNN -N+ OON
Summary of injury potential for:
Head linear acceleration Head rotational acceleration
Neck force Neck moment
75
+++ +++
-00 --+
----00
+++ 0-+
+0+ +0+
-0+ 00+
--0 0++
0-0 -0-
O+N 0+-
OON -00
0++ +++
-00 -++
0++ +0+
OON ---
OON 000
#+ #- NET
13 5 8
9 7 2
5 8 -3
11 3 8
14 1 13
7 6 1
8 6 2
5 6 -1
5 3 2
3 2 1
14 2 12
8 5 3
11 4 7
1 11 -10
2 1 1
Chest acceleration Pelvis acceleration
(See Table 5 for symbol definitions)
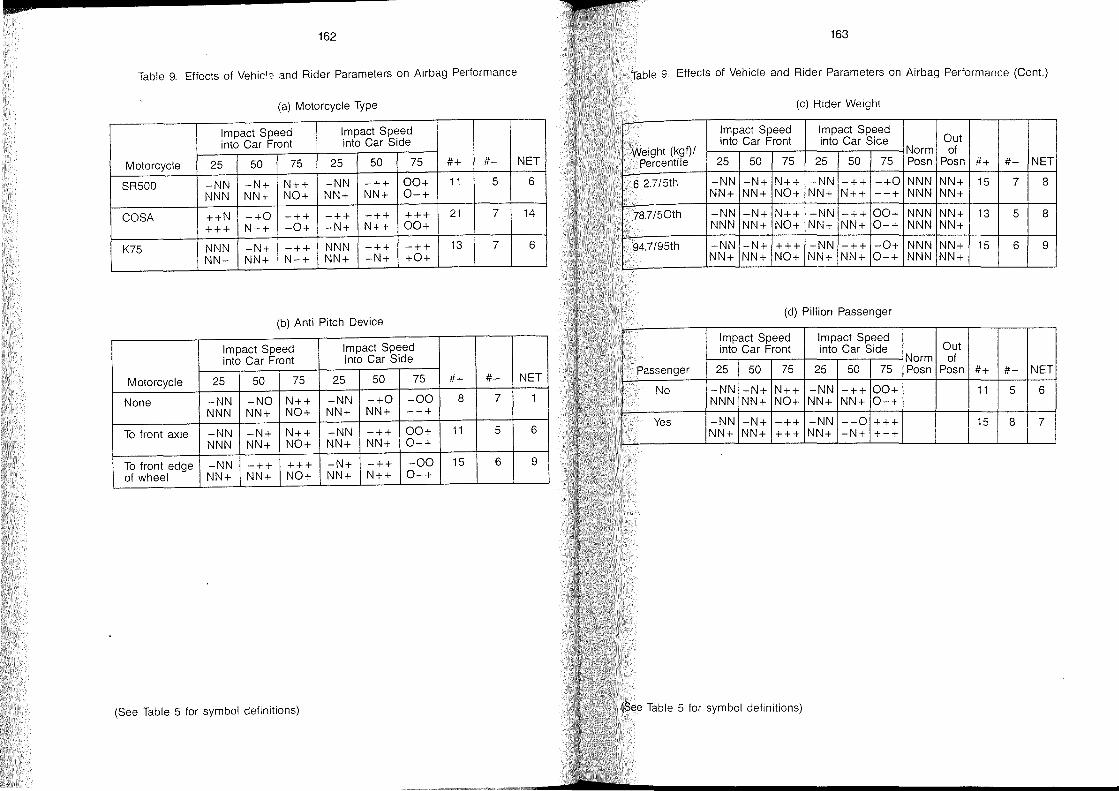
u ........ ---------------------162 163
Table 9. Effects of Vehic '? and Rider Parameters on Airbag Performance Table 9. Effects of Vehicle and Rider Parameters on Airbag Performance (Cont.)
(a) Motorcycle Type (c) Rider Weight
Impact Speed Impact Speed into Car Front into Car Side
Motorcycle 25 50 75 25 50 75 #+ #- NET
Impact Speed Impact Speed Out into Car Front into Car Side
Weight (kgf)/ Norm of Percentile 25 50 75 25 50 75 Posn Posn #+ #- NET
SR500 -NN -N+ N++ -NN -++ 00+ 11 5 6 NNN NN+ NO+ NN+ NN+ 0-+
6 2.7/5th -NN -N+ N++ -NN -++ -+0 NNN NN+ 15 7 8 NN+ NN+ NO+ NN+ N++ --+ NNN NN+
COSA ++N -+0 -++ -++ -++ +++ 21 7 14
+++ N-+ -0+ -N+ N++ 00+ 78.7/50th -NN -N+ N++ -NN -++ 00+ NNN NN+ 13 5 8
NNN NN+ NO+ NN+ NN+ 0-+ NNN NN+
K75 NNN -N+ -++ NNN -++ -++ 13 7 6 NN- NN+ N-+ NN+ -N+ +0+
94.7/95th -NN -N+ +++ -NN -++ -0+ NNN NN+ 15 6 9 NN+ NN+ NO+ NN+ NN+ 0-+ NNN NN+
(b) Anti Pitch Device (d) Pillion Passenger
Impact Speed Impact Speed into Car Front into Car Side
Motorcycle 25 50 75 25 50 75 #+ #- NET
None -NN -NO N++ -NN -+0 -00 8 7 NNN NN+ NO+ NN+ NN+ --+
To front axle -NN -N+ N++ -NN -++ 00+ 11 5 6 NNN NN+ NO+ NN+ NN+ 0-+
Impact Speed Impact Speed Out into Car Front into Car Side
Norm of Passenger 25 50 75 25 50 75 Posn Posn #+ #- NET
No -NN -N+ N++ -NN -++ 00+ 11 5 6 NNN NN+ NO+ NN+ NN+ 0-+
Yes -NN -N+ -++ -NN --0 +++ I 15 8 7 NN+ NN+ +++ NN+ -N+ +-+
To front edge -NN -++ +++ -N+ -++ -00 15 6 9 of wheel NN+ NN+ NO+ NN+ N++ 0-+
(See Table 5 for symbol definitions) (See Table 5 for symbol definitions)

H W
8 8
8 8
8 8
8 M
8 M
8 M
8 L
8 L
8 L
M 8
M 8
M 8
M M
M M
M M
M L
M L
164
Table 10. Effects of Airbag Parameters on Airbag Performance
(a) A.irbag Dimensions
L F25 F50 F75 825 850 875 NP OP #+
8 ONN ON- N+O ONN -N- 0-- NNN NNN 3 NNN NN+ NOO NNN NN+ 00- NNN NNN
M ONN ON- N-O -NN -+- 0-- NNN NNN 2 NNN NN+ NOO NNN NNO -0- NNN NNN
L -NN ON- N-+ ONN -N- 0-- NNN NN+ 6 NN+ NN+ NO+ NNN NN- -0- NNN NN+
8 -NN -NO +++ -NN ++- 00- NNN NN+ 13 NN+ NN+ NO+ NN+ +N+ 0-- NNN NN+
M -NN -N+ +++ -NN 0+- 0-- NNN NN+ 12 NN+ NN+ N++ NN+ NN- -0- NNN NN+
L -NN -N+ +++ -NN -++ 00- NNN NN+ 15 NN+ NN+ N++ NN+ N++ 0-- NNN NN+
8 -NN -N+ +++ -NN -+0 ++- NNN NN+ 14 NN+ NN+ NO+ NN+ NN+ 0-- NNN NN+
M -NN -N+ +++ -NN -++ ++- NNN NN+ 18 NN+ NN+ N+O NN+ N++ ++- NNN NN+
L -NN -N+ +++ -NN -++ +0+ NNN +N+ 18 NNN NN+ +0+ NN+ N++ +0- NNN NN+
8 +NN -N+ ++- -NN -++ -0- NNN NN+ 12 NN+ NN+ +0- NN+ NN+ 0-0 NNN NNN
M -NN -N+ +++ -NN 0++ -++ NNN NN+ 19 NN+ NN+ +0+ NN+ +N+ +0+ NNN NN+
L -NN -N+ +++ -NN +++ -++ NNN NN+ 21 NNN NN+ +++ NN+ +++ +-+ NNN NN+
8 -NN -++ +++ -NN -++ 0++ NNN NN+ 18 NN+ NN+ NO+ NN+ NN+ +-+ NNN NN+
M -NN -N+ N++ -NN -++ 00+ NNN NN+ 13 NNN NN+ NO+ NN+ NN+ 0-+ NNN NN+
L -NN -N+ N++ -NN -++ -0+ NNN NN+ 14 NNN NN+ NO+ NN+ N++ 0-+ NNN NN+
8 -NN -++ +++ -NN -++ 0++ NNN NN+ 16 NN+ NN+ NO+ NN+ NN+ 000 NNN NN+
M -NN -++ N++ -NN -++ -++ NNN +N+ 18 NN+ NN+ NO+ NN+ N++ 00+ NNN NN+
(8ee Table 5 far symbol definitions)
#- NET
6 -3
9 -7
10 -4
7 6
9 3
7 8
7 f
6 12
5 13
8 4
4 15
5 16
5 13
5 8
6 8
4 12
5 13
165
Table 10. Elfects 01 Airbag Parameters on Airbag Performance (Cant.)
(a) Airbag Dimensions (Cont.) r
W L H F25 F50 F75 825 850 875 NP OP #+ #- NET M L L -NN -N+ +++ -NN -++ -++ NNN +N+ 18 5 13
NN+ NN+ NO+ NNN N++ +0+ NNN NN+
L 8 8 -NN -++ +++ -NN -++ 0+- NNN NN+ 20 6 14 NN+ NN+ +0+ NN+ +++ +-+ I'JNN NN+
L 8 M -NN -N+ ++- -NN -++ --- NNN NN+ 15 10 5 NN+ NN+ ++- NN+ NN+ +-+ hiNN NN+
L 8 L -NN -N+ N++ -NN -++ +-+ NNN NN+ 17 5 12 NNN NN+ N++ NN+ NN+ +++ NNN NN+
L M 8 -NN -++ ++- -NN 0++ 00+ NNN NN+ 17 6 11 NN+ NN+ N+- NN+ +N+ +-+ NNN NN+
L M M -NN -N+ 0++ -NN 0++ +0+ NNN NN+ 17 4 13 NNN NN+ +0+ NN+ +N+ +-+ NNN NN+
L M L -NN -N+ +++ -NN -++ 00+ NNN NN+ 17 5 12 NN+ NN+ +0+ NN+ NN+ +-+ NNN NN+
L L 8 -NN -++ ++- -NN 0+- 0+- NNN +++ 20 9 11 NN+ NN+ +0- N++ +++ +-- NNN +N+
L L M -NN -N+ ++- -NN -++ -++ NNN +++ 20 8 12 NNN NN+ NO- NN+ +++ +-+ NNN +++
L L L -NN -N- N+- -NN -++ -++ NNN +++ 19 9 10 NN+ NN+ +0- NN+ +++ +-+ NN+ NN+
(b) Airbag Mounting Location
Deployment F25 F50 F75 825 850 875 NP OP #+ #- r NET Location
350 mm -N+ -N+ N++ -N+ -++ 00- NN+ NN+ 18 6 12 behind forks NN+ NN+ NO+ NN+ N++ 0+- NN+ NN+
100 mm -NN -N+ N++ -NN -++ 00+ NNN NN+ 13 5 8 behind fork NNN NN+ NO+ NN+ NN+ 0-+ NNN NN+ 150 mm ahead -NN -N+ +++ -NN -N+ -0+ NNN NN+ 15 6 9 of forks NN+ NN+ N++ NN+ NN+ 0-+ NNN NN+
(See Table 5 for symbol definitions)

....... --------------------166
Table 10. Effects of Airbag Parameters on Airbag Performance (Cont.) (c) Airbag Exhaust Area
Exhaust F25 F50 F75 825 850 875 NP OP #+ #--Area (mm)
600 -NN -++ N++ -NN -++ -0+ NNN NN+ 15 6 NN+ NN+ NO+ NN+ NN+ 0-+ NNN NN+
1900 -NN -N+ N++ -NN -++ 00+ NNN NN+ 13 5 NNN NN+ NO+ NN+ NN+ 0-+ NNN NN+
3200 -NN -N+ N++ -NN -++ 000 NNN NN+ 12 6 NNN NN+ NO+ NN+ NN+ --+ NNN NN+
4500 -NN -N+ N++ -NN -++ -00 NNN NN+ 11 7 NNN NN+ NO+ NN+ NN+ --+ NNN NNN
5800 -NN -NO N++ -NN -++ -00 NNN NN+ 9 8 NNN NN+ N-+ NNN NN+ --+ NNN NNN
7100 -NN +NO N++ -NN -+0 --- NNN NN+ 9 8 NNN NN+ NO+ NNN NN+ --+ NNN NNN
(d) Airbag Inflation Delay and Fill Time
Delay Inflation F25 F50 F75 825 850 875 NP OP #+ #-(msec) (msec)
10 10 -NN -N+ N++ NA* -NO --0 NNN NN+ 10 8 NNN NN+ NO+ NN+ --+ NNN NN+
10 34 -NN -N+ N++ -NN -++ -00 NNN NN+ 12 6 NNN NN+ NO+ NN+ NN+ 0-+ NNN NN+
10 58 -NN -++ +++ -NN -++ 0-- NNN NN+ 14 8 NN+ NN+ NO+ NN+ NN+ --0 NNN NN+
20 10 -NN -N+ N++ -NN -NO --0 X X 10 8 NNN NN+ NO+ NN+ NN+ --+
20 34 -NN -N+ N++ -NN -++ 100+ X X 13 5 NNN NN+ NO+ NN+ NN+ 0-+
20 58 -NN -++ +++ -NN +++ 0-- X X 15 7 NN+ NN+ NO+ NN+ NN+ -0-
30 10 -NN -N+ N++ -NN -++ -00 X X 13 6 NNN NN+ NO+ NN+ NN+ +-+
30 34 -NN -++ +++ -NN -++ 0+- X X 15 5 NN+ NN+ NO+ NN+ NN+ 000
30 58 -NN -++ N++ -NN +++ 000 X X 15 5 NN+ NN+ NO+ NN+ +N+ -0-
* Assumed to be the same as other "825" cases X Assumed to be the same as other "NP" and "OP" cases
NET
9
8
6
4
1
1
NET
2
6
6
2
8
8
7
10
10
167
Table 10. Effects of Airbag Parameters on Airbag Performance (Cont.)
(e) Airbag Mounting Base 8ize
Mounting F25 F50 F75 825 850 875 Base -+ #-
300 mm NN -N+ N++ -NN -++ 00+ 11 5 NNN NN+ NO+ NN+ NN+ 0-+ 100 mm -NN -N+ -++ -NN -++ 00+ 10 7 NNN NN+ N-+ NNN NN+ 0-+
(See Table 5 for symbol definitions)
NET
6
3
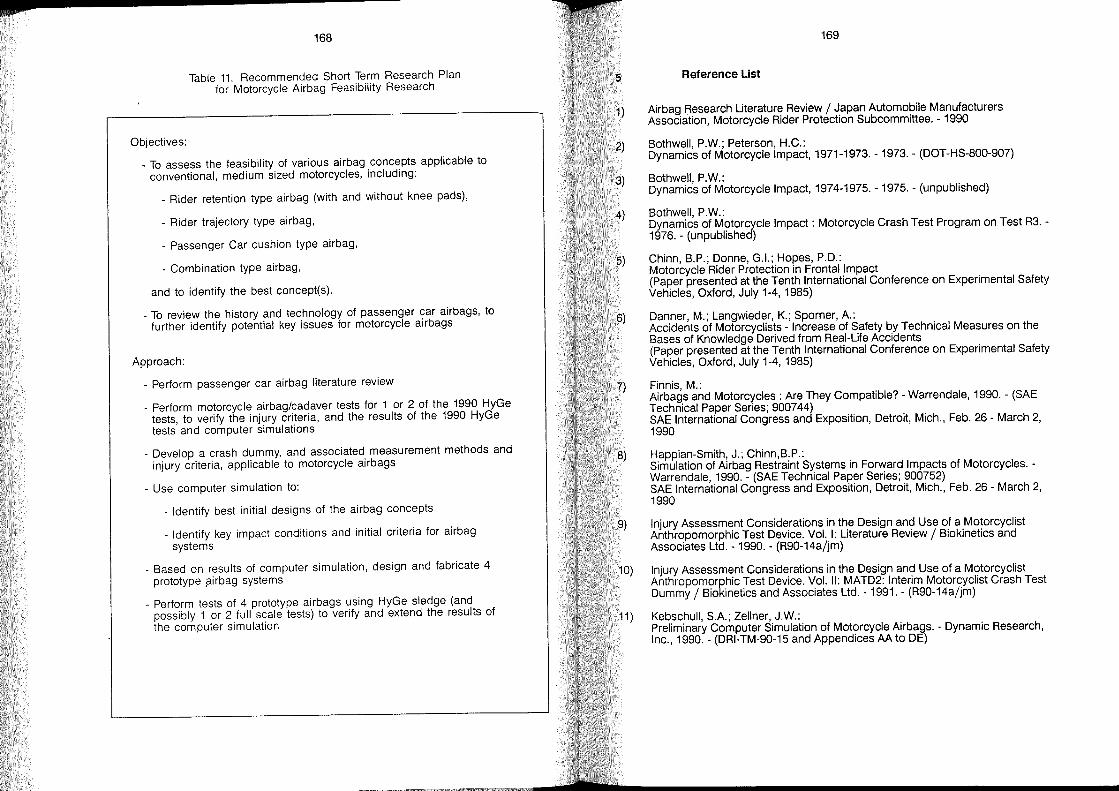
s 168
Table 11. Recommended Short Term Research Plan for Motorcycle Airbag Feasibility Research
Objectives:
_ To assess the feasibility of various airbag concepts applicable to conventional, medium sized motorcycles, including:
_ Rider retention type airbag (with and without knee pads),
- Rider trajectory type airbag,
- Passenger Car cushion type airbag,
- Combination type airbag,
and to identify the best concept(s).
_ To review the history and technology of passenger car airbags, to further identify potential key issues for motorcycle airbags
Approach:
- Perform passenger car airbag literature review
_ Perform motorcycle airbag/cadaver tests for 1 or 2 of the 1990 HyGe tests, to verify the injury criteria, and the results of the 1990 HyGe tests and computer simulations
_ Develop a crash dummy, and associated measurement methods and injury criteria, applicable to motorcycle airbags
- Use computer simulation to:
- Identify best initial designs of the airbag concepts
_ Identify key impact conditions and initial criteria for airbag systems
_ Based on results of computer simulation, design and fabricate 4 prototype p.irbag systems
_ Perform tests of 4 prototype airbags using HyGe sied ge (and possibly 1 or 2 full scale tests) to verify and extend the results of the computer simulation
1)
2)
3)
4)
5)
6)
7)
8)
9)
10)
11 )
169
Reference List
Airbag. R~search Literatur~ Review / Japan Automobile Manufacturers Assoclatlon, Motorcycle Rlder Protection Subcommittee. - 1990
Bothwell, p.w.; Peterson, H.C.: Dynamics of Motorcycle Impact, 1971-1973. - 1973. - (DOT-HS-800-907)
Bothwell, p.w.: Dynamics of Motorcycle Impact, 1974-1975. - 1975. - (unpublished)
Bothwell, p.w.: Dynamics of Motorcycle Impact: Motorcycle Crash Test Program on Test R3 -1976. - (unpublished) .
Chinn, B.P.; Donne, G.I.; Hopes, P.D.: Motorcycle Rider Protection in Frontal Impact (Paper presented at the Tenth International Conference on Experimental Safety Vehicles, Oxford, July 1-4,1985)
Danner, M.; Langwieder, K.; Sporner, A.: Accidents of Motorcyclists - Increase of Safety by Technical Measures on the Bases of Knowledge Derived from Real-Life Accidents (Paper presented at the Tenth International Conference on Experimental Safety Vehicles, Oxford, July 1-4, 1985)
Finnis, M.: Airbag.s and Motorcycles : Are They Compatible? - Warrendale, 1990. - (SAE Technlcal Paper Series; 900744) SAE International Congress and Exposition Detroit Mich. Feb. 26 - March 2 1990 ' " ,
Happian-Smith, J.; Chinn,B.P.: Simulation of Airbag Restraint Systems in Forward Impacts of Motorcycles. -Warrendale, .1990. - (SAE Technical Paper Series; 900752) SAE International Congress and Exposition Detroit Mich. Feb. 26 - March 2 1990 ' " ,
Injury Assessm~nt Conside.rations in th.e Design and Use of a Motorcyclist Anthropomorphlc Test Devlce. Vol. I: literature Review / Biokinetics and Associates Ud. - 1990. - (R90-14a/jm)
Injury Assessm~nt Conside.rations in the Design and Use of a Motorcyclist Anthropomorphlc Test Devlce. Vol. 11: MATD2: Interim Motorcyclist Crash Test Dummy / Biokinetics and Associates Ud. - 1991. - (R90-14a/jm)
Kebschull, S.A.; Zellner, J.w.: Preliminary Computer Simulation of Motorcycle Airbags. - Dynamic Research Inc., 1990. - (DRI-TM-90-15 and Appendices AA to DE) ,
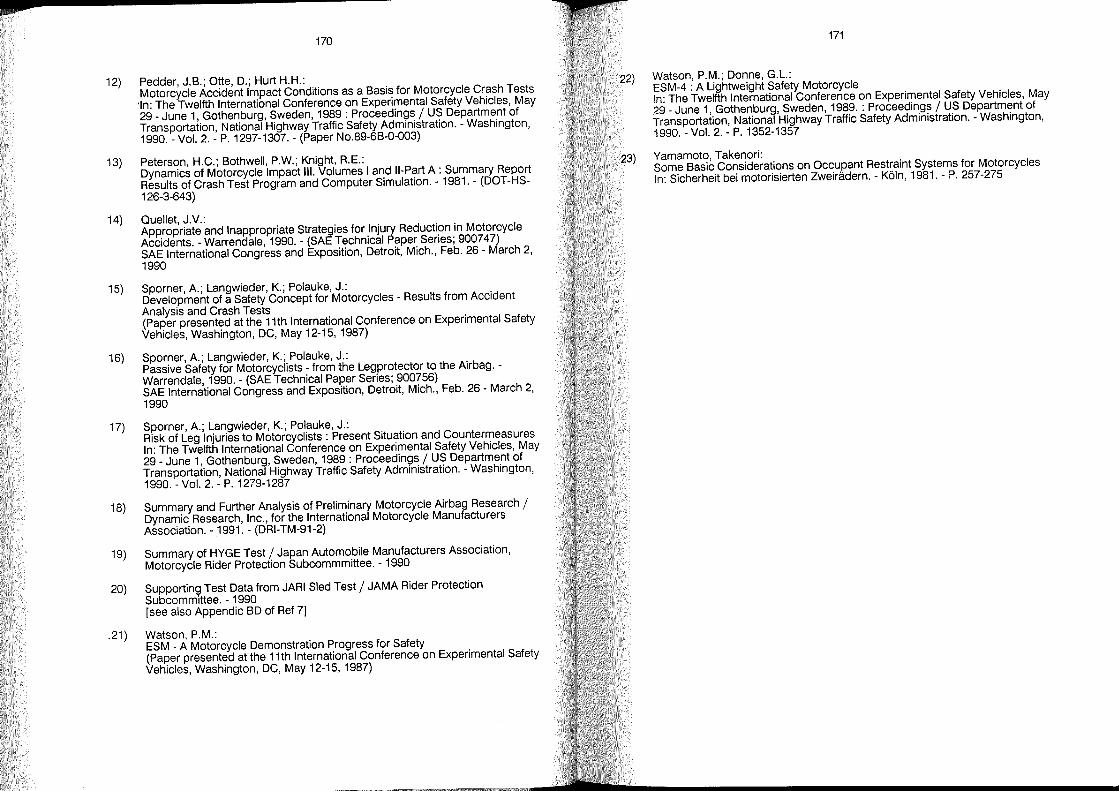
» 170
12) Pedder, J.B.; Otte, D.; Hurt H.H.: Motorcycle Accident Impact Conditions as a Basis for Motorcycle Crash Tests 'In: The Twelfth International Conference on Experimental Safety Vehicles, May 29 - June 1, Gothenburg, Sweden, 1989: Proceedings / US Department of Transportation, National Highway Traffic Safety Administration. - Washington, 1990. - Vol. 2. - P. 1297-1307. - (Paper No.89-6B-0-003)
13) Peterson, H.C.; Bothwell, p.w.; Knight, R.E.: Dynamics of Motorcycle Impact 111. Volumes I and li-Part A : Summary Report Results of Crash Test Program and Computer Simulation. - 1981. - (DOT-HS-126-3-643)
14) Quellet, J.v.: Appropriate and Inappropriate Strategies for Injury Reduction in Motorcycle Accidents. - Warrendale, 1990. - (SAE Technical Paper Series; 900747) SAE International Congress and Exposition, Detroit, Mich., Feb. 26 - March 2, 1990
15) Sporner, A.; Langwieder, K.; Polauke, J.: Development of a Safety Concept for Motorcycles - Results from Accident Analysis and Crash Tests (Paper presented at the 11th International Conference on Experimental Safety Vehicles, Washington, DC, May 12-15, 1987)
16) Sporner, A.; Langwieder, K.; Polauke, J.: Passive Safety for Motorcyclists - from the Legprotector to the Airbag. -Warrendale, 1990. - (SAE Technical Paper Series; 900756) SAE International Congress and Exposition, Detroit, Mich., Feb. 26 - March 2, 1990
17) Sporner, A.; Langwieder, K.; Polauke, J.: Risk of Leg Injuries to Motorcyclists : Present Situation and Countermeasures In: The Twelfth International Conference on Experimental Safety Vehicles, May 29 - June 1, Gothenburg, Sweden, 1989: Proceedings / US Department of Transportation, National Highway Traffic Safety Administration. - Washington, 1990. - Vol. 2. - P. 1279,1287
18) Summary and Further Analysis of Preliminary Motorcycle Airbag Research / Dynamic Research, Inc., for the International Motorcycle Manufacturers Association. - 1991. - (DRI-TM-91-2)
19) Summary of HYGE Test / Japan Automobile Manufacturers Association, Motorcycle Rider Protection Subcommmittee. - 1990
20) Supporting Test Data from JARl Sied Test / JAMA Rider Protection Subcommittee. - 1990 [see also Appendic BD of Ref 7]
.21) Watson, P.M.: ESM - A Motorcycle Demonstration Progress for Safety (Paper presented at the 11 th International Conference on Experimental Safety Vehicles, Washington, DC, May 12-15,1987)
171
Watson, P.M.; Donne, G.L.: ESM-4 : A Lightweight Safety Motorcycle In: The Twelfth International Conference on Experimental Safety Vehicles, May 29 - June 1, Gothenburg, Sweden, 1989. : Proceedings / US Department of Transportation, National Highway Traffic Safety Administration. - Washington, 1990. - Vol. 2. - P. 1352-1357
Yamamoto, Takenori: Some Basic Considerations on Occupant Restraint Systems for Motorcycles In: Sicherheit bei motorisierten Zweirädern. - Köln, 1981. - P. 257-275
p
Trends in Development of Motorcycles in the USSR
Oleg Sokolov
VNllmotoprom
USSR
p 175
1 Abstract
Specific motorcyle riding conditons in the USSR, the production and import figures, how motorcycles are used are analysed in this re port, as weil as trends in popularity of various types of motorcycles. Research has been conducted on the basis of market developments, demand trends, sociological surveys and prediction.
c 176
2 Introduction
Specific climatic conditions, bad roads, lack of service stations for motorcycles are factors, determining motorcycle riding in the USSR. This explains certain historically formed features. Powered Two Wheelers (PTWs) play an important role in the USSR and by significance can be compared to cars, due to the vastness of the country, scarcity of the surfaces roads, low incomes and traditionally low prices for PTWs.
3 Motorcyle Riding in the USSR
The Soviet Union covers 1/6 of the Earth's land, that is 22 million sq.km. Overall length of the roads is 1 610 thousand km, only 694000 km of them have asphalt and concrete surfacing - that is 43% of the road network. 502 000 km or 31% have crushed stone surfacing, and 414 000 km or 26% of the roads have no surfacing at all. Low quality asphalt and concrete surfacing, as weil as poor maintenance of it put our roads weil behind world standards. So it is nearly impossible to find here a highway coming close to a German autobahn.
Climatic conditions in the USSR varying in January from +4° C in the South down to-50° C in the North, with July temperatures ranging from + 30° C and more in the South down to -1°C in the North. In Siberia, in the town of Dymyakon they recorded _71° C, and in a Southern town of Termes +50° C. Average humidity ranges from 90 down 20%. Climate in the USSR is largely temperated continental or sharply continental with clearcut summer and winter periods. The ground in the winter is mostly covered with snow, so riders use their machines usually in the summertime. Geographical conditions in our country are aggravated by problems in getting gasoline and in availability of technical maintenance and re pair services. Since the 2-cycle motorcycles in the USSR do not have automatic lubrication systems and lubricating oils at gas stations are available as a rule in unpacked form, each refuelling stop becomes an unpleasant affair. Spare network of maintenance service stations for the PTWs causes the rider himself. More often than not he is bound to make some spare parts with his own hands. All these problems make riding the sophisticated motorcycles in the üSSR rather difficult.
4 General Features of PTWs Parc in the USSR
The PTWs parc in the USSR is around 21 million, that is 60 motorcycles per 1 000 of population. Outdated models, production of wh ich has been discontinued a long time
177
ago, comprise a major section of the parc. Heavily represented are motorcycles: 31% light types, 23% middle class types. Sidecar motorcycles account for 15%.
5 Output of PTWs by Types and Models
It was very back in 1913/14 when first attempts have been made to assemble motorcycles in our country, but 1930 had to come before volume production had started. In 1990 1 433000 PTWs were produced, with three main basic models with 125, 175 and 200 cc. They account for 28% of the output. Second come motorcycles with one or two cylinder 2-stroke 350cc engines (23%), they are used either as solo, or with a sidecar. Its chassis is edging closer to the world standards in the way that it sports hydraulic front disc brake and cast alloy wheels. 17% of the output are sidecar models with 2-cylinder 4-stroke 650cc engines. There are three basic models here, one model has a driven sidecar wheel. Their style is kept traditionally rugged, the wheels of evolution grind slowly here. Then there are four basic models of mokicks, mopeds and minimokicks with a quite unpretentious design: 15% of the output. Three models have got the same engine model with a 2-speed gear box. Here you will not find any hydraulic shock absorbers - this fact is an obstacle to comfortable riding.
Freight scooters which are quite popular and for which there exists a steady demand take up 17% of the market. Since their introduction the design of scooters has been improving. Since the 1960s our country has been improving JAWA motorcycles from the CSFR and up to 1989 their share in the overall motorcycle production in the USSR was 7%. Today their import is practically a trickle.
6 PTWs and how they are Used
Sociological surveys show that teenagers (14-18 years old) are the main customer group for mokicks, mopeds and mini-mokicks. 79% of young men use their vehicles for sports, touring and leisure. Motorcycles are preferred by young men aged 20-30. 55% of them use their machines for commuting, riding to their garden plots outside the city etc. Practically all freight scooters are used in the country by people ranging in age from 42 to 50. In the 19-24 age group the following features are appreciated in motorcycles:
> 178
- modern appearance 15% - fuel economy 15% - high maximum speed 12% - quality of manufacture 12% - high power output 10% - maintenance friendly 9% - cross-country capability 11 %
The following is valued by 40-49 years age group:
- fuel economy 17 % - quality of manufacture 17% - cross-country capability 15% - high power output 13% - easy engine starting 12% - maintenance friendly 12%
7 Trends in PlW Demand
The demand for sidecar motorcycles has declined in 1975-1989, but still exceeded the offer. Poor demand was recorded for Kiev and Izhevsk motorcycles. Now that people are earning more money the demand for long-Iasting goods - that includes motorcycies too - is on the rise. It is estimated that the demand for sidecar motorcycies exceeds the offer by a factor of 2.6.
The demand for middle-class motorcycles has passed its trough and began a steady climb. Reasons for that - overall increase in consumer goods demand and alm ost no imported JAWA motorcycles from GSFR. Demand here exceeds the offer by a factor of 1.8. In 1986-1987 when popularity of light motorcycles beg an to fade, its production was cut by 20%. By 47% was cut the light motorcycles production because in the last ten years right up to 1985 demand for them had flagged. Now that the quality of these models has improved, the demand for them exceeds the offer by a factor of 2.
8 Developments in Improving the Motorcycle Engineering
Scientific potential of desigers' departments in motorcycle producing tactories is quite high. At the R & D Institute for motorcycle engineering some engine and assembly prototypes have been successfully developed and test-run. They can easily pass EGE regulations for toxic emissions and noise level retaining at the same time low fuel
179
consumption. In the 50-125 cc range engines have liquid cooling, multiple scavenging passage system, an oil pump, a membrane valve, an automatic gearbox.
A 650cc engine prototype has an optimized combustion chamber, some composites which proved themselves in aerospace technology have also been used for better noise, vibration and emission control, as weil as lower mass. VNllmotoprom is looking for new materials to be used in the motorcycle. Garbon fiber reinforced plastics made on the basis of phenolic and polyamide resins are thought to be suitable materials for connecting rods and the crankcase. Research is conducted also on using aluminium alloys with silicon carbide for pistons and pushrods in valve train. Geramics based on boron carbide will be used for valve guides, valve seats and cams. In the long run titan alloys reinforced by carbon fibers may be used tor various applications. The engine using composites would be 50% lighter than the one made of traditional materials, noise level would be reduced by 2-3dB due to composites having better damping performance.
The Institute VNllmotoprom has organised a small-scale production of hydraulic disc brakes which outperform drum brakes as far as heat and water fading is concerned. A factory has been approached to produce such brakes on a large scale so as to equip with themall motorcycles manufactured in the USSR. Gas shock absorbers and pivoted front forks are also being produced on a small scale at the Institute. New kinds of PTWs are about to appear on the scene, for instance freight scooters with Diesel engine and closed driver's cabine. A wide range ot trailers for solo and sidecar motorcycles will be offered on the market in not distant future. Underdeveloped road net calls for introduction of 4-wheeled ATVs. First batches of these vehicles with 2-cycle 175 and 350 cc engines have already been built.
9 Conclusions
It is quite safe to say now that the most popular middle-ciass motorcycle in the near future will be a powerful off-road model with modern styling. As tor heavy side-car motorcycies, they will be repeated to some extent with cars, but still they are expected to hold their own on the domestic market for a long time to come. A steady demand is expected for freight scooters with closed drivers' cabine and for the 4-wheel ATVs of utility type to be used with trailers.
>
Heimets
Clinton O. Chichester, George Snively: Rotational Acceleration of the Head Induced by Glancing Impacts
James Tangorra, Albert R. George: Wind Noise of Motorcycle Heimets
Dietmar Otte, Günter Feiten: Requirements on Chin Protection in Full-Face for Motorcyclist Impact
and Injury Situations
>
Rotational Acceleration of the Head Induced by Glancing Impacts
Clinton O. Chichester
George Snively
C & G Associates
USA
p 185
1 Abstract
It has been suggested that many injuries to the brain are caused by rotational acceleration (RA) which in turn is caused by head impacts. Furhter, RA of the brain would be accentuated if the blows to the head approached tangential. Since a large number of accidents involving two wheeled vehicles involve the rider being thrown from their vehicle in a manner which results in sliding, or tangential blows to the head, the measurement of RA under such conditions becomes important. No performance test of protective heimets measures RA, and indeed most tests, with the exception of the British Standards Institute test (Standard 2495), use only linear impacts in their protocols.
In order to measure RA during sliding or tangential impacts, a helmeted (fiberglass shell with a polystyrene liner) or unhelmeted head form, instrumented with linear and rotational accelerometers, was impacted at angles approaching tangential. The head form was suspended by nylon cord in a manner such that it could be considered a free floating mass. A hard covered ball, propelled by air to high velocities, was used as the impacting mass in some cases; on others a pendulum was used as the impacting mass.
Results of a number of impacts suggest that even when the angle of impact approaches tangential, the rotational acceleration is small compared to the linear acceleration. This occured even when the surface of the heimet was abraded to increase its coefficient of friction, or when the surface of the heimet was covered with fine sandpaper.
It may be concluded that under the conditions described only low levels of RA are transmitted to the head, compared to linear acceleration, and thus RA is not as major a factor in the injury causing accidents as was thought.
> 186
2 Introduction
Impacf injury to the brain has received a grat deal of attention over the years since this type of injury os central in many fatalities. Puncture wounds such as obviously cause direct disruption of the brain contents. However, non-penetrating impacts to the brain are very common in many "reallife" situations. The impacts to the head can be thought of as an abrupt change in velocity over time, thus acceleration. The more abrupt the impacts, the higher the rate of change of acceleration with time. In many physiological situations the rate of change is of extreme importance. This particular aspect when applied to the human brain has not been explored terribly effectively. The main parameters that have been investigated are the rates of change of velocity; e.g., the accelerations of the head and its contents (11). In frontal impact at the midsagittal plane in line with the center of mass of the head, the head is constrained by the neck and rotates on the neck at an approximate point of C-6 C-7 (24, 23).
In a lateral impact the head also rotates with respect to the body with a center of rotation approximately C-7, T-1. In all of these conditions the rotation ot the head is relative to a point outside of the head, center of gravity.
The elegant analysis of head motion under acceleration was developed by Spenny and Wismans and considers the dynamic behavior of the head when it is uniformly accelerated or de-accelerated (20,21). In these analyses no direct impacts of an object with the head are described. It is interesting to note that almost all of the data described in the literature in regards to impact of the head against various shaped objects considers lineal acceleration or de-acceleration, and in some cases relates these to inter-cranial pressure changes (3,13). These studies used cadavers and measured the inter-cranial pressures developed on impacts. They made the assumption that when a cadaver sustained a linear fraction a moderate to severe concussion would occur in the living human being (17). Earlier Holbourn had proposed that the physiological effects were related to both acceleration and time duration of that acceleration; this assumption appears to be the case in almost all analyses. Based upon this work, a number of tolerance curves were developed relating the linear acceleration of the head to the injury. These include the Wayne State tolerance curve (WSTC), the GADD severity index (GSI) (8). These were modified over time ·and the final recommendation was that the GSI limit of 1 500 was suggested (7). A further refindement of the GSI was suggested by John Versace (22). This was entitled "The Head Injury Criteria" (HIC). Other criteria for establishing the limits of tolerance before injury was the Vienna Institute index (19) but the first proposal to include more than a single degree of freedom was the REM, or revised brain model advanced by William Fan (6). In this rotation al velocity was included as a constant times the relative displacement of brain to skull. The human head impact tolerance curve (JARl) was developed by Ono et al. and did not include any reference to rotational acceleration (12). All of these indexes referred only to brain displacement
187
finearly or related to the impact point. In aseries of animal experiments using a large number of monkeys Nakamura et al. specifically considered rotational acceleration impacts, but the rotation they considered was that experienced by whole head impacts and the rotation generally about the axis C-6 C-7 (5,18). Ommaya et al. studied several animal models and suggested the overall acceleration and angular acceleration of 1 800 radia/S2 (2,5,10,18). It appears however that these angular rotations are those occuring around C-6 C-7 primarily.
In contrast to Ommaya's data, Ewing demonstrated with human volunteer subjects that angular accelerations of 2 675 radia/S2 did not cause injury (4). Later, Glaister Suggested rotational acceleration exceeding 4 500 radia/S2 would not cause rupture of bridging veins (9). Low and Stalnaker proposed a model for rotational head motion but did not validate this with actual impact data (14). Becker, in proposing a mechanical model based upon data obtained from human volunteer experiments apparently does not consider rotation about the center mass of the head in a horizontal plane since his linkage proposes 4 pivots all of which constrain head rotations about its center of mass in impact plane (1).
It would seem thus that although references made to head rotations, the rotations generally referred to are those of the head about a pivot point in the cervical spine. In other cases rotational accelerations of the head about its center of mass have been implicated in injuries of the head. The injury criteria as HIC etc. do not consider the effect of head rotation per se and relate to translational accelerations almost without exclusion. Despite this, it has been suggested that rotation accelerations are important. Data are lacking as to magnitude of such accelerations in impacts to head models.
3 Methodology
Two types of impact situations were utilized in the investigation. In the first, a head mass of approximately 3 430 grams (DOT Head Form C) was freely suspended on a nylon cone and impacted with a hard ball (a U.S. baseball) covered with hide of approximately 350 grams. The baseball was driven by an air gun and its velocity just prior to impact was measured by a pair of optical beams. Two velocities were utilized, 20 meters per second and 28 meters per second. The head form was covered with carbon paper in order to delineate the point of impact, with reference to center of mass. All impacts were lateral to the head form, e.g., on the X asis, see figure 1.
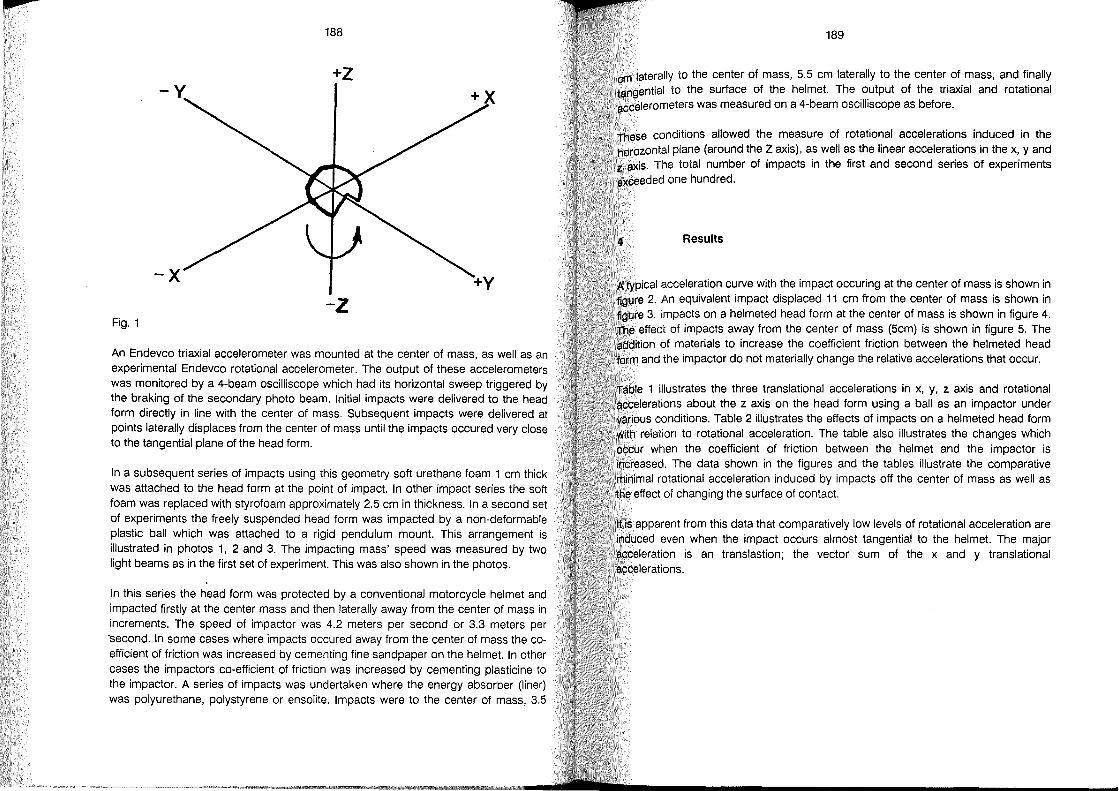
p 188
+z
-z Fig.1
An Endevco triaxial accelerometer was mounted at the center of mass, as weil as an experimental Endevco rotational accelerometer. The output of these accelerometers was monitored by a 4-beam oscilliscope which had its horizontal sweep triggered by the braking of the secondary photo beam. Initial impacts were delivered to the head form directly in line with the center of mass. Subsequent impacts were delivered at points laterally displaces from the center of mass until the impacts occured very close to the tangential plane of the head form.
In a subsequent series of impacts using this geometry soft urethane foam 1 cm thick was attached to the head form at the point of impact. In other impact series the soft foam was replaced with styrofoam approximately 2.5 cm in thickness. In a second set of experiments the freely suspended head form was impacted by a non-deformable plastic ball which was attached to a rigid pendulum mount. This arrangement is illustrated in photos 1, 2 and 3. The impacting mass' speed was measured by two light beams as in the first set of experiment. This was also shown in the photos.
In this series the head form was protected by a conventional motorcycle heimet and impacted firstly at the center mass and then laterally away from the center of mass in increments. The speed of impactor was 4.2 meters per second or 3.3 meters per ·second. In some cases where impacts occured away from the center of mass the coefficient of friction was increased by cementing fine sandpaper on the heimet. In other cases the impactors co-efficient of friction was increased by cementing plasticine to the impactor. Aseries of impacts was undertaken where the energy absorber (liner) was polyurethane, polystyrene or ensolite. Impacts were to the center of mass, 3.5
189
m laterally to the center of mass, 5.5 cm laterally to the center of mass, and finally ~ ngential to the surface of the heimet. The output of the triaxial and rotational :Ccelerometers was measured on a 4-beam oscilliscope as before.
These conditions allowed the measure of rotational accelerations induced in the horozontal plane (around the Z axis), as weil as the linear accelerations in the x, yand z axis. The total number of impacts in the first and second series of experiments exceeded one hundred.
4 Results
A typical acceleration curve with the impact occuring at the center of mass is shown in figure 2. An equivalent impact displaced 11 cm from the center of mass is shown in figure 3. Impacts on a helmeted head form at the center of mass is shown in figure 4. The effect of impacts away from the center of mass (5cm) is shown in figure 5. The addition of materials to increase the coefficient friction between the helmeted head form and the impactor do not materially change the relative accelerations that occur.
Table 1 iIIustrates the three translational accelerations in x, y, z axis and rotation al accelerations about the z axis on the head form using a ball as an impactor under various conditions. Table 2 illustrates the effects of impacts on a helmeted head form with relation to rotational acceleration. The table also illustrates the changes which occur when the coefficient of friction between the heimet and the impactor is increased. The data shown in the figures and the tables illustrate the comparative minimal rotational acceleration induced by impacts off the center of mass as weil as the effect of changing the surface of contact.
It is apparent from this data that comparatively low levels of rotation al acceleration are induced even when the impact occurs almost tangential to the heimet. The major acceleration is an translastion; the vector sum of the x and y translational accelerations.

jiiiilP
190 191
Z Z
0 0
.... .... <C <C -Cl: J ~_ Cl: - X
w X w y ...J -- Y
...J
W W Z u Z U U U ZR < Z R <C
I l I I I 1 I 1 I 2 4 6 8 10
TIME IN MILLISECONDS TIME
Fig.2 Fig.4
, Z 0 Z
0 .... <C
~~ ....
Cl: <C X w Cl:
X ...J W Y w V y ...J Z U Z
w U 1\....".
U <C f R U
ZR [
" , I <C
TIME TIME
Fig.3 Fig.5
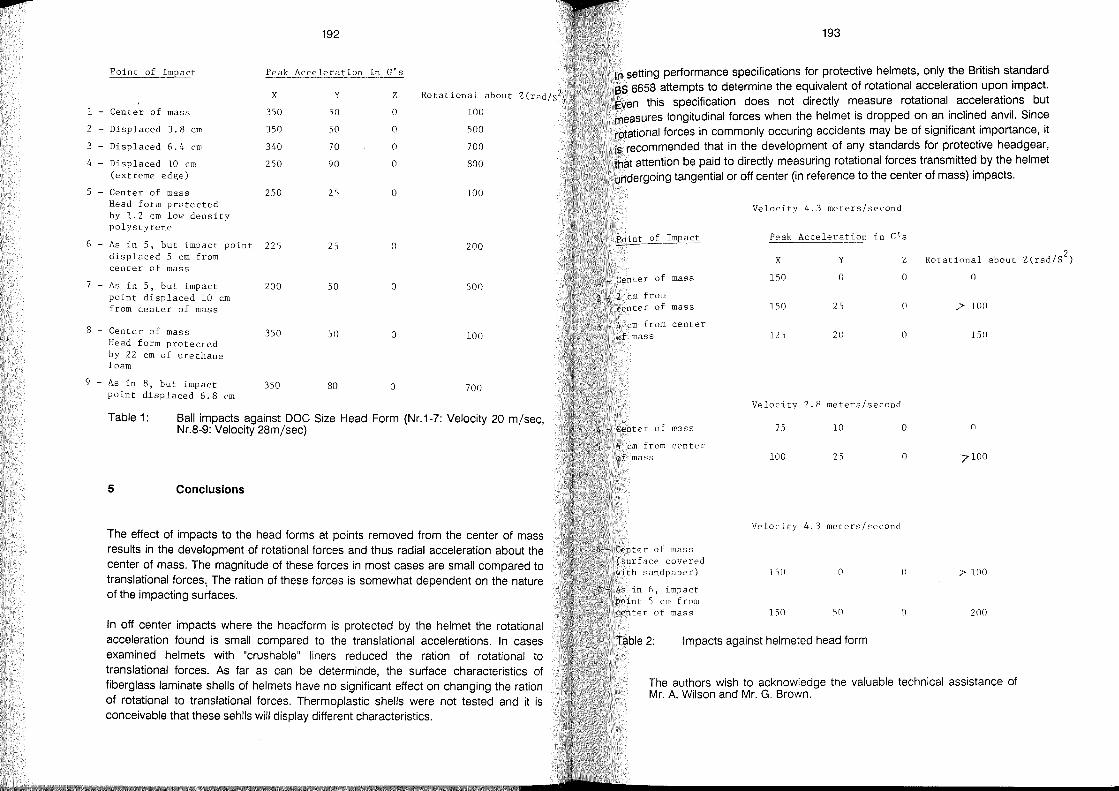
192
Point of Impact Peak Acceleration in G's
1 - Center of mass
2 - Disp1aced 3.8 cm
3 - Displaced 6.4 cm
4 - Displaced 10 cm (extreme edge)
5 - Center of mass Head form protected by 1.2 cm low density po1ystyrene
X
350
350
340
250
250
6 - As in 5, but impact point 225 disp1aced 5 cm from center of mass
7 - As in 5, but impact point displaced 10 cm from center of mass
8 - Center of mass Head form protected by 22 cm of urethane foam
9 - As in 8, but impact point disp1aced 6.8 cm
200
350
350
y
50
50
70
90
2'1
25
50
50
80
Z
o o o o
o
o
o
o
o
Rotational about Z(rad/s2j
100
500
700
800
100
200
500
100
700
Table 1: Ball impacts against DOe Size Head Form (Nr.1-7: Velocity 20 m/sec Nr.8-9: Velocity 28m/sec) ,
5 Conclusions
The effect of impacts to the head forms at points removed from the center of mass results in the development of rotational forces and thus radial acceleration about the center of mass. The magnitude of these forces in most cases are small compared to translational forces, The ration of these forces is somewhat dependent on the nature of the impacting surfaces.
In off center impacts where the headform is protected by the heimet the rotational 2lcceleration found is small compared to the translational accelerations. In cases examined heimets with "crushable" liners reduced the ration of rotation al to translational forces. As far as can be determinde, the surface characteristics of fiberglass laminate shells of heimets have no significant effect on chan ging the ration of rotational to translational forces. Thermoplastic shells were not tested and it is conceivab!e that these sehlls will display different characteristics.
193
In setting performance specifications for protective heimets, only the British standard BS 6658 attempts to determine the equivalent of rotational acceleration upon impact. Even this specification does not directly measure rotational accelerations but measures longitudinal forces when the heimet is dropped on an inclined anvil. Since rotational forces in commonly occuring accidents may be of significant importance, it is recommended that in the development of any standards for protective headgear, that attention be paid to directly measuring rotation al forces transmitted by the heimet undergoing tangential or off center (in reference to the center of mass) impacts.
point of Impact
_ Center of mass
_ 2 cm from center of mass
_ 4 cm from cen ter of mass
'... Center of mass
5 cm from center of mass
Center of mass (surface covered with sandpaper )
As in fi, impact point '1 cm from center of mass
Velocity 4.3 meters/second
Peak Acce1eration in G's
X
150
150
12'i
Velori ty
7e,
100
2. R
y
o
25
20
meters/second
10
2')
Velocity 4.3 meters/second
1')(1 o
l'jO 'iO
Z
o
(1
o
0
()
o
n
Table 2: Impacts against helmeted head form
Rotaciona1 about Z(rad/S2
)
()
/-,. 10(1
ISO
0
'7 100
;;> 100
200
The authors wish to acknowledge the valuable technical assistance of Mr. A. Wilson and Mr. G. Brown.
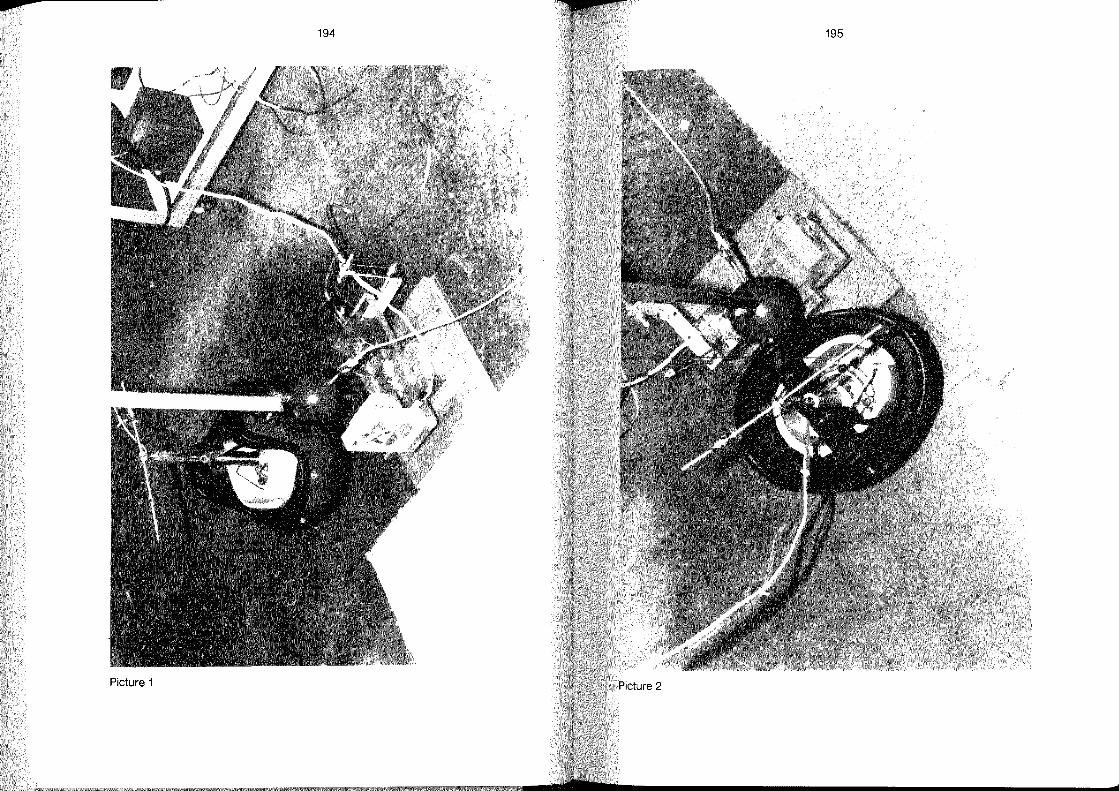
pt
194
Picture 1
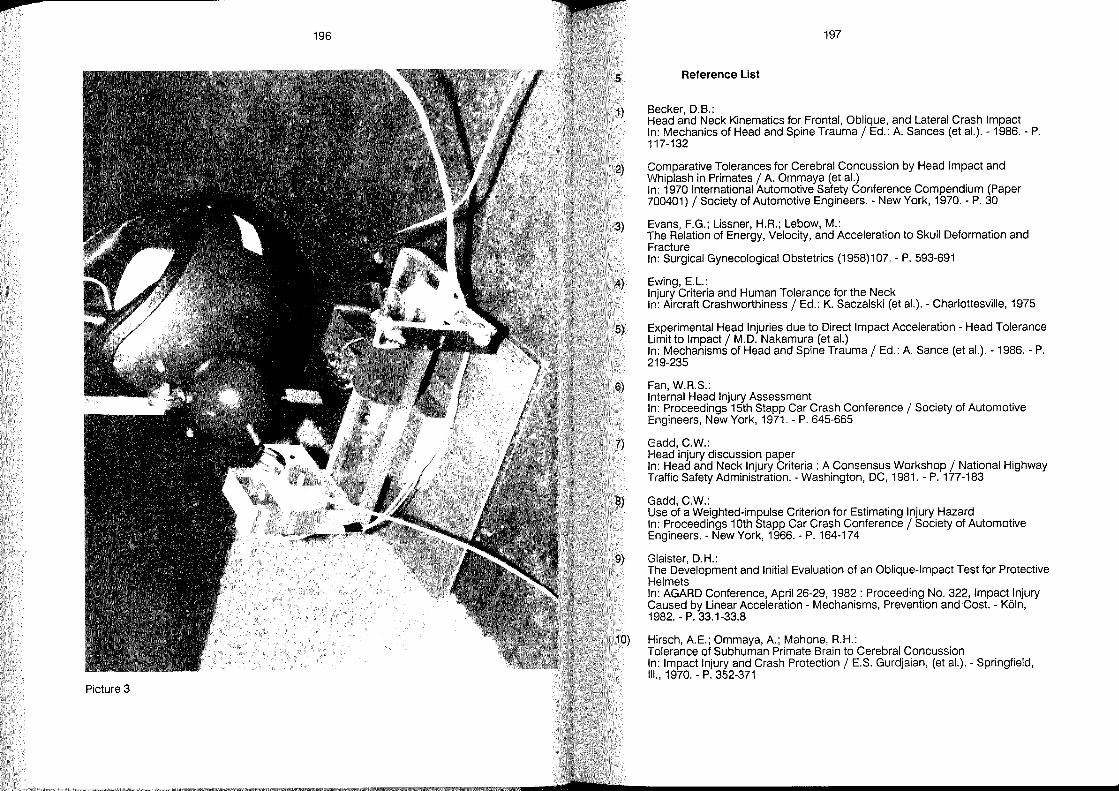
pt
197
Reference list
Becker, D.B.: Head and Neck Kinematics for Frontal, Oblique, and Lateral Crash Impact In: Mechanics of Head and Spine Trauma I Ed.: A Sances (et al.). - 1986. - P. 117-132
Comparative Tolerances for Cerebral Concussion by Head Impact and Whiplash in Primates I A Ommaya (et al.) In: 1970 International Automotive Safety Conference Compendium (Paper 700401) I Society of Automotive Engineers. - New York, 1970. - P. 30
Evans, F.G.; Lissner, H.R.; Lebow, M.: The Relation of Energy, Velocity, and Acceleration to Skull Deformation and Fracture In: Surgical Gynecological Obstetrics (1958)107. - P. 593-691
Ewing, EL.: Injury Criteria and Human Tolerance for the Neck In: Aircraft Crashworthiness I Ed.: K. Saczalski (et al.). - Charlottesville, 1975
Experimental Head Injuries due to Direct Impact Acceleration - Head Tolerance Limit to Impact I M.D. Nakamura (et al.) In: Mechanisms of Head and Spine Trauma I Ed.: A Sance (et al.). - 1986. - P. 219-235
Fan, W.R.S.: Internal Head Injury Assessment In: Proceedings 15th Stapp Car Crash Conference I Society of Automotive Engineers, NewYork, 1971. - P. 645-665
Gadd, C.w.: Head injury discussion paper In: Head and Neck Injury Criteria : A Consensus Workshop I National Highway Traffic Safety Administration. - Washington, DC, 1981. - P. 177-183
Gadd, C.w.: Use of a Weighted-impulse Criterion for Estimating Injury Hazard In: Proceedings 10th Stapp Car Crash Conference I Society of Automotive Engineers. - NewYork, 1966. - P. 164-174
Glaister, D.H.: The Development and Initial Evaluation of an Oblique-Impact Test for Protective Heimets In: AGARD Conference, April 26-29, 1982: Proceeding No. 322, Impact Injury Caused by Linear Acceleration - Mechanisms, Prevention and Cost. - Köln, 1982. - P. 33.1-33.8
Hirsch, AE; Ommaya, A; Mahone, R.H.: Tolerance of Subhuman Primate Brain to Cerebral Concussion In: Impact Injury and Crash Protection I ES. Gurdjaian, (et al.). - Springfield, 111., 1970. - P. 352-371
> 198
11) Holbourn, A.H.S.: The Mechanics of Brain Injuries In: British Medical Bulletin (1945)3. - P. 147-149
12) Human Head Tolerance to Sagittal Impact Reliable Estimation Deduced from Experimental Head Injury Using Subhuman Primates and Human Cadaver Skulls / K. Ono (et al.) In: Proceeding 24th Stapp Car Crash Conference / Society of Automotive Engineers. - Warrendale, Pa., 1980. - P. 101-160
13) Lissner, H.R.; Lebow, M.; Evans, F.G.: Experimental Studies on the Relation Between Acceleration and Intracranial Pressure Changes in Man In: Surgical Gynecological Obstetrics (1960) Sept. - P. 329-338
14) Low, T.C.; Stalnaker, R.L.: A lumped Parameter Approach to Simulate the Rotational Head Motion In: Internati~:m~IIRCOBI Conference on the Biomechanics of Impacts, Sept. 8-10, 1987, Blrmlngham (UK) : Proceedings / International Research Council on Biokinetics of Impacts. - Bron (France), 1987. - P. 203-215
15) Ommaya, A.; Grubb, R.; Naumann, R.: Coup and Countre-coup Injury : Observation on the Mechanics of Visible Brain Injuries in the Rhesus Monkeys In: Journal of Neurosurgery (1971)35. - P. 503-515
16) Ommaya, A.; Hirsch, A.: Protection of the Brain from Injury During Impact. - 1971. - (Experimental Studies on the Biomechanics of Head Injury, AGARD; CP-88-71)
17) Patrick, L.M.; Lissner, H.R.; Gurdjian, E.S.: Survival by Design - Head Protection In: Proceedings 7th Stapp Car Crash Conference / Society of Automotive Engineers. - New York, 1963. - P. 483-499
18) Pudenz, R.H.; Sheldon, C.H.: The Lucite Calvarium - A Method for Direct Observation of the Brain. 11. Cranial Trauma and Brain Movement In: Journal of Neurosurgery (1946)3. - P. 487
19) Slattenschek, A.: Behavior of Motor Vehicle Windscreens in Impact Tests with Phantom Head In: Automobiltechnische Zeitschrift (1968)70. - P. 223-241
20) Spenny, C.H.·: Analysis of Head Response to Torso Acceleration. - Cambridge, Mass.: Transportation Systems Center, in press (Technical Report, prepared for the U.S. Dept. of Transportation, National Highway Traffic Safety Administration)
21) Spenny, C.H.; Wismans, J.: Dynamic Analysis of Head Motion In: Mechanisms of Head and Spine Trauma / Ed.: A. Sances (et al.). - 1986. -P.157-185
199
Vers ace, J.: A Review of the Severity Index In: Proceedings 15th Stapp Car Crash Conference / Society of Automotive Engineers, NewYork, 1971. - P. 771-796
Wismans, J.; Spenny, C.H.: Head-Neck Response on Frontal Flexion In: Proceeding 28th Stapp Car Crash Conference / society of Automotive Engineers. - Warrendale, Pa., 1984. - P. 161-171
Wismans, J.; Spenny, C.H.: Performance Requirements of Mechanical Necks in Lateral Flexion In: Proceedings 27th Stapp Car Crash Conference / Society of Automotive Engineers. - Warrendale, Pa., 1983. - P. 137-148
p
Wind Noise of Motorcycle Heimets
James Tangorra
Albert R. George
Cornell University, Ithaca, New York
USA
203
Abstract
Aeroaeoustie tests were performed on three motoreyele heimets to determine how the gaps, seals, and edges of a heimet affected the wind noise generated by the heimet. To simulate the eonditions a heimet would encounter when worn by a motorcyclist, the heimets were placed on the head of a mannequin, whieh was then plaeed in the uniform flow of a wind tunnel. A microphone, located inside the right ear of the mannequin, picked up the wind noise transmitted into the heimet. A sound level meter, attached to the mieraphone, measured the overall and oetave band deeibel levels of the noise reaching the mierophone. These sound levels represented the noise levels that would be heard by a motoreyelist travelling at eruising speeds of about 100 km/h (60 MPH). The gaps, edges, and general shapes of the three heimets were modified and each heimet modifieation was tested to determine how it had changed the air flow araund the heimet and the amount of wind noise at the ear. At typieal cruising speeds, around 100 km/h, a standard, unmodified, heimet generated noise levels that would be a long term hazard to the motoreycle rider's hearing, and would mask warning signals fram other raad traffie. It was found that these excessive wind noise levels could be signifieantly reduced by making relatively simple changes to the design of the heimet. In other tests the effeet of a turbulent shear layer impinging on the heimet, as fram a fairing, was found to inerease the sound level further above that with a uniform flow.
204
2 Introduction
In the· past, the engine, ex haust, and sometimes the drive train or tires of a motorcycle, or an automobile, were the main sources of the noise heard by the driver. As automobile design has become more technologically advanced, these sources have been quieted. However, aerodynamic noise source levels typically increase with velocity to the sixth power. Thus, as vehicles become increasingly capable of travelling at higher speeds, and other noise sources continue to be quieted, aeroacoustic noise is becoming more important to vehicle design. A summary of the knowledge of aerodynamic noise effects on ground vehicles is given in reference (3).
On motorcycles, the traditionally "un-aerodynamic" shape of the vehicle creates aeroacoustic noise as it moves through the air. However, it is actually the air flow over the rider's heimet that generates the primary noise heard by the rider at cruising speeds. The air flow over the helmet's openings, gaps and edges creates the wind noise that is transmitted to the rider's ears. The helmet's edges and gaps disturb the air flow, and create regions of turbulence, separation, and pressure fluctuations, which generate sound that propagates to the inside of the heimet. This paper looks in detail at the three major areas of the heimet that disturb the air flow, and explores how they affect the wind noise generated by the heimet. They are: 1) The large opening from the chin of the heimet to the neck of the rider, wh ich allows air to flow into the heimet, and creates a large region under the heimet of loud, turbulent flow. 2) The edges, and gaps, between the helmet's face shield and the heimet body. They can have turbulent flow over them, wh ich may generate noise. 3) Gross separation effects. The air flow from the front of the heimet usually stays attached up to the crest, or top, of the heimet, but then separates off the heimet into a large wake region behind the heimet. This separation adds drag to the heimet, and its turbulence generates so me noise. We study whether delaying separation, and reducing the wake area, create a noise improvement.
Not only is wind noise annoying, but it can be dangerous to a motorcyclist. At 60 mph (100 km/h) the noise levels inside a heimet are weil over 100 dBA. Levels 01 over 90 dBA are ge':lerally thought to lead to hearing damage over long exposure times. Levels of over 100 dBA are only allowed for periods 01 less than two hours a day in US laws (OSHA regulations) and for less than one hour a day in many other countries (ISO regulations). Heimet wind noise levels also far exceed the recommendations for non-occupational noise exposure (2). These excessive sound levels are likely to create permanent hearing damage to motorcyclists. The wind noise also masks out dang er signals, such as horns, sirens, and the sounds 01
205
approaching traffic that a motorcyclist wants, and needs, to hear. Thus, the heimet should be quiet in self-generated wind noise, but should allow other noises to reach the rider's ears. An exceptionally quiet heimet could be made by putting a large amount of sound blocking and absorbing material near the rider's ears (for example including ear plugs or ear muffs). However, this would isolate the rider from all outside auditory outside stimuli and would be dangerous. Clearly the use 01 heimets with less wind noise would be more satisfactory.
Excellent previous studies of heimet noise were given in references (1) and (4). They considered primarily the noise of existing heimet designs and their effects on hearing damage and the ability to hear warning and other environmental sounds. The purpose of this research is to study the causes of the noise generated by the air flow over the heimet, and to investigate some possible modifications that would reduce this aeroacoustic noise to a lower level.
3 Experimental Methods and Apparatus
A Genrad model 1982 Precision Sound Level Meter and Analyzer with microphone was used to measure the wind noise levels generated by a motorcycle heimet placed in the air flow of a wind tunnel. The noise levels created by the air flow were determined by comparing: 1) the noise levels inside the heimet when in the air flow, 2) the noise levels in the heimet when it was outside the air flow but in the background noise field, and 3) the background noise field levels. Using clay, cardboard, and tape, various modifications were made to the heimet to determine what heimet configurations created the least wind noise.
The experiments were carried out in Cornell University's open circuit low speed wind tunnel. This tunnel has an approximately 20 by 30 inch (50 by 75 cm) cross section, with a maximum air speed of about 65 mph (100 km/h). The tunnel's fans are upstream of the contraction and test section, so it is possible to test objects in the outlet jet of the tunnel as weil as in the test section.
The wind tunnel was evaluated for suitability of background noise level based on a method used by Castelluccio and Masoero (5) to evaluate the feasibility of aerodynamic noise studies of automobiles in wind tunnels with background noise. To study the aeroacoustic noise of the heimet, it is necessary to distinguish between the background noise of the wind tunnel, and the additional noise created by the heimet. To separate these noises adequately, there should ideally be at a minimum fen decibels difference between the noise inside the heimet when it is in the air flow,
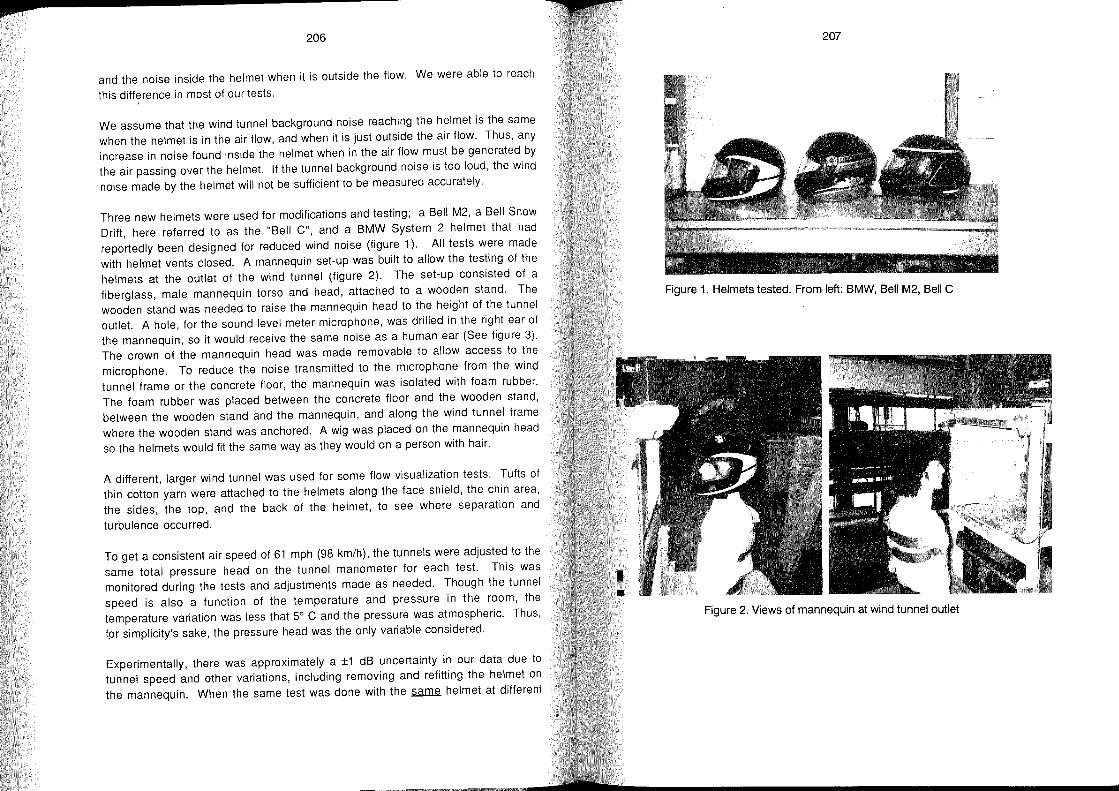
p 206
and the noise inside the heimet when it is outside the flow. We were able to reach
this difference in most of our tests.
We assume that the wind tunnel background noise reaching the heimet is the same when the heimet is in the air flow, and when it is just outside the air flow. Thus, any increase in noise found inside the heimet when in the air flow must be generated by the air passing over the heimet. If the tunnel background noise is too loud, the wind noise made by the heimet will not be sufficient to be measured accurately.
Three new heimets were used for modifications and testing; a Bell M2, a Bell Snow Drift, here referred to as the "Bell C", and a BMW System 2 heimet that had reportedly been designed for reduced wind noise (figure 1). All tests were made with heimet vents closed. A mannequin set-up was built to allow the testing of the heimets at the outlet of the wind tunnel (figure 2). The set-up consisted of a fiberglass, male mannequin torso and head, attached to a wooden stand. The wooden stand was needed to raise the mannequin head to the height of the tunnel outlet. A hole, for the sound level meter microphone, was drilled in the right ear of the mannequin, so it would receive the same noise as a human ear (See figure 3). The crown of the mannequin head was made removable to allow access to the microphone. To reduce the noise transmitted to the microphone from the wind tunnel frame or the concrete floor, the mannequin was isolated with foam rubber. The foam rubber was placed between the concrete floor and the wooden stand, between the wooden stand and the mannequin, and along the wind tunnel frame where the wooden stand was anchored. A wig was placed on the mannequin head so the heimets would fit the same way as they would on a person with hair.
A different, larger wind tunnel was used for some flow visualization tests. Tufts of thin cotton yarn were attached to the heimets along the face shield, the chin area, the sides, the top, and the back of the heimet, to see where separation and
turbulence occurred.
To get a consistent air speed of 61 mph (98 km/h), the tunnels were adjusted to the same total pressure head on the tunnel manometer for each test. This was monitored during tl'le tests and adjustments made as needed. Though the tunnel speed is also a function of the temperature and pressure in the room, the temperature variation was less that 5° C and the pressure was atmospheric. Thus, fpr simplicity's sake, the pressure head was the only variable considered.
Experimentally, there was approximately a ±1 dB uncertainty in our data due to tunnel speed and other variations, including removing and refitting the heimet on the mannequin. When the same test was done with the ~ heimet at different
207
Figure 1. Heimets tested. From left: BMW, Bell M2, Bell C
Figure 2. Views of mannequin at wind tunneloutlet
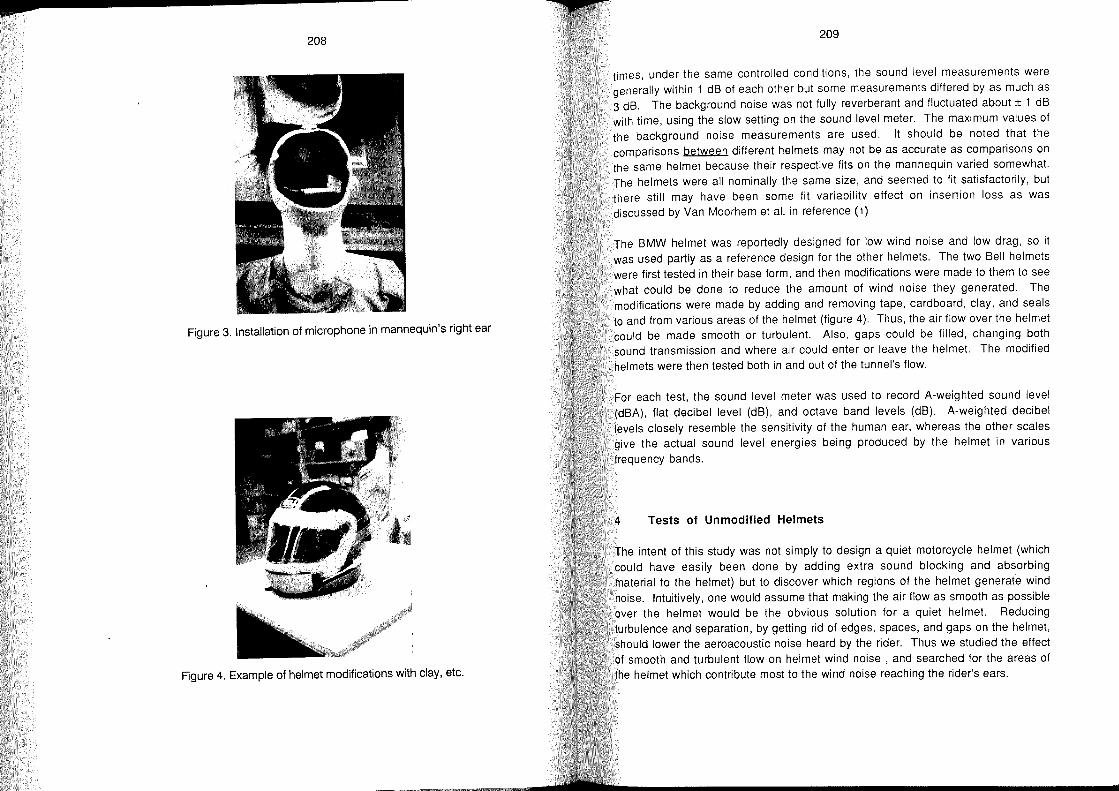
$ 208
Figure 3. Installation of microphone in mannequin's right ear
Figure 4. Example of heimet modifications with clay, etc.
209
times, under the same controlled conditions, the sound level measurements were gene rally within 1 dB of each other but some measurements differed by as much as 3 dB. The background noise was not fully reverberant and fluctuated about ± 1 dB with time, using the slow setting on the sound level meter. The maximum values of the background noise measurements are used. It should be noted that the comparisons between different heimets may not be as accurate as comparisons on the same heimet because their respective fits on the mannequin varied somewhat. The heimets were all nominally the same size, and seemed to fit satisfactorily, but there still may have been some fit variabilitv effect on insertion loss as was discussed by Van Moorhem et al. in reference (1)
The BMW heimet was reportedly designed for low wind noise and low drag, so it was used partly as a reference design for the other heimets. The two Bell heimets were first tested in their base form, and then modifications were made to them to see what could be done to reduce the amount of wind noise they generated. The modifications were made by adding and removing tape, cardboard, clay, and seals to and from various areas of the heimet (figure 4). Thus, the air flow over the heimet could be made smooth or turbulent. Also, gaps could be filled, changing both sound transmission and where air could enter or leave the heimet. The modified heimets were then tested both in and out of the tunnel's flow.
For each test, the sound level meter was used to record A-weighted sound level (dBA), flat decibel level (dB), and octave band levels (dB). A-weighted decibel levels closely resemble the sensitivity of the human ear, whereas the other scales give the actual sound level energies being produced by the heimet in various
frequency bands.
4 Tests of Unmodified Heimets
The intent of this study was not simply to design a quiet motorcycle heimet (wh ich could have easily been done by adding extra sound blocking and absorbing material to the heimet) but to discover which regions of the heimet generate wind noise. Intuitively, one would assume that making the air flow as smooth as possible over the heimet would be the obvious solution for a quiet heimet. Reducing turbulence and separation, by getting rid of edges, spaces, and gaps on the heimet, should lower the aeroacoustic noise heard by the rider. Thus we studied the effect of smooth and turbulent fl.ow on heimet wind noise , and searched for the areas of the heimet which contribute most to the wind noise reaching the rider's ears.
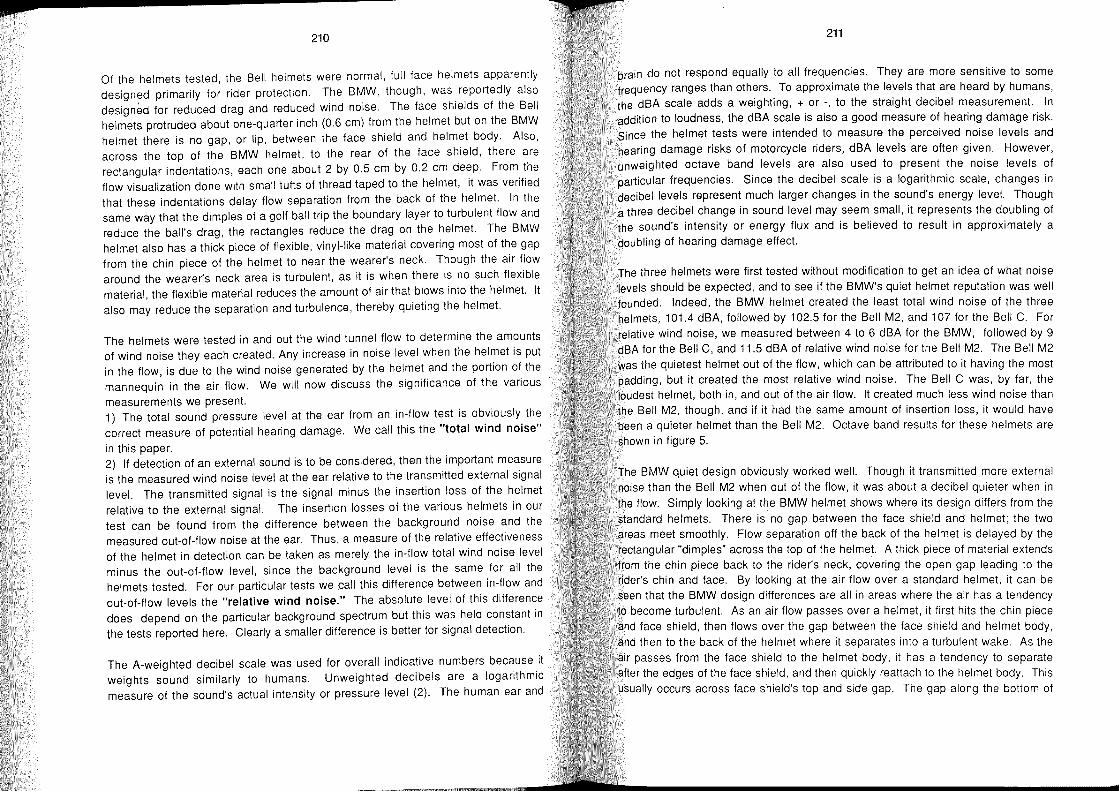
p 210
Of the heimets tested, the Bell heimets were normal, full face heimets apparently designed primarily for rider protection. The BMW, though, was reportedly also designed for reduced drag and reduced wind noise. The face shields of the Bell heimets protruded about one-quarter inch (0.6 cm) from the heimet but on the BMW heimet there is no gap, or lip, between the face shield and heimet body. Also, across the top of the BMW heimet, to the rear of the face shield, there are
rectangular indentations, each one about 2 by 0.5 cm by 0.2 cm deep. From the flow visualization done with small tufts of thread taped to the heimet, it was verified that these indentations delay flow separation from the back of the heimet. In the same way that the dimples of a golf ball trip the boundary layer to turbulent flow and reduce the ball's drag, the rectangles reduce the drag on the heimet. The BMW heimet also has a thick piece of flexible, vinyl-like material covering most of the gap from the chin piece of the heimet to near the wearer's neck. Though the air flow around the wearer's neck area is turbulent, as it is when there is no such flexible material, the flexible material reduces the amount of air that blows into the heimet. It also may reduce the separation and turbulence, thereby quieting the heimet.
The heimets were tested in and out the wind tunnel flow to determine the amounts of wind noise they each created. Any increase in noise level when the heimet is put in the flow, is due to the wind noise generated by the heimet and the portion of the mannequin in the air flow. We will now discuss the significance of the various
measurements we present. 1) The total sound pressure level at the ear from an in-flow test is obviously the correct measure of potential hearing damage. We call this the "total wind noise"
in this paper. 2) If detection of an external sound is to be considered, then the important measure is the measured wind noise level at the ear relative to the transmitted external signal level. The transmitted signal is the signal minus the insertion loss of the heimet relative to the external signal. The insertion losses of the various heimets in our test can be found from the difference between the background noise and the measured out-of-flow noise at the ear. Thus, a measure of the relative effectiveness of the heimet in detection can be taken as merely the in-flow total wind noise level minus the out-of-flow level, since the background level is the same for all the heimets tested. For our particular tests we call this difference between in-flow and out-of-flow levels the "relative wind noise." The absolute level of this difference does depend on the particular background spectrum but this was held constant in the tests reported here. Clearly a smaller difference is better for signal detection.
The A-weighted decibel scale was used for overall indicative numbers because it weights sound similarly to humans. Unweighted decibels are a logarithmic measure of the sound's actual intensity or pressure level (2). The human ear and
211
brain do not respond equally to all frequencies. They are more sensitive to some frequency ranges than others. To approximate the levels that are heard by humans, the dBA scale adds a weighting, + or -, to the straight decibel measurement. In addition to loudness, the dBA scale is also a good measure of hearing damage risk. Since the heimet tests were intended to measure the perceived noise levels and hearing damage risks of motorcycle riders, dBA levels are often given. However, unweighted octave band levels are also used to present the noise levels of particular Irequencies. Since the decibel scale is a logarithmic scale, changes in decibel levels represent much larger changes in the sound's energy level. Though a three decibel change in sound level may seem smalI, it represents the doubling 01 the sound's intensity or energy flux and is believed to result in approximately a
doubling 01 hearing damage effect.
The three heimets were first tested without modification to get an idea of what noise levels should be expected, and to see if the BMW's quiet heimet reJ:lutation was weil founded. Indeed, the BMW heimet created the least total wind noise of the three heimets, 101.4 dBA, followed by 102.5 for the Bell M2, and 107 for the Bell C. For relative wind noise, we measured between 4 to 6 dBA for the BMW, followed by 9 dBA for the Bell C, and 11.5 dBA of relative wind noise for the Bell M2. The Bell M2 was the quietest heimet out of the flow, which can be attributed to it having the most padding, but it created the most relative wind noise. The Bell C was, by far, the loudes! heimet, both in, and out of the air flow. It created much less wind noise than the Bell M2, though, and if it had the same amount of insertion loss, it would have been a quieter heimet than the Bell M2. Octave band results for these heimets are
shown in figure 5.
The BMW quiet design obviously worked weil. Though it transmitted more external noise than the Bell M2 when out of the flow, it was about a decibel quieter when in
the Ilow. Simply looking at the BMW heimet shows where its design differs from the standard heimets. There is no gap between the face shield and heimet; the two areas meet smoothly. Flow separation off the back of the heimet is delayed by the rectangular "dimples" across the top of the heimet. A thick piece of material extends from the chin piece back to the rider's neck, covering the open gap leading to the rider's chin and face. By looking at the air flow over a standard heimet, it can be seen that the BMW design differences are all in areas where the air has a tendency 10 become turbulent. As an air flow passes over a heimet, it first hits the chin piece and face shield, then flows over the gap between the face shield and heimet bOdy, and then to the back of the heimet where it separates into a turbulent wake. As the air passes from the face shield to the heimet body, it has a tendency to separate after the edges of the face shield, and then quickly reattach to the heimet body. This usually occurs ac ross face shield's top and side gap. The gap along the bottom of
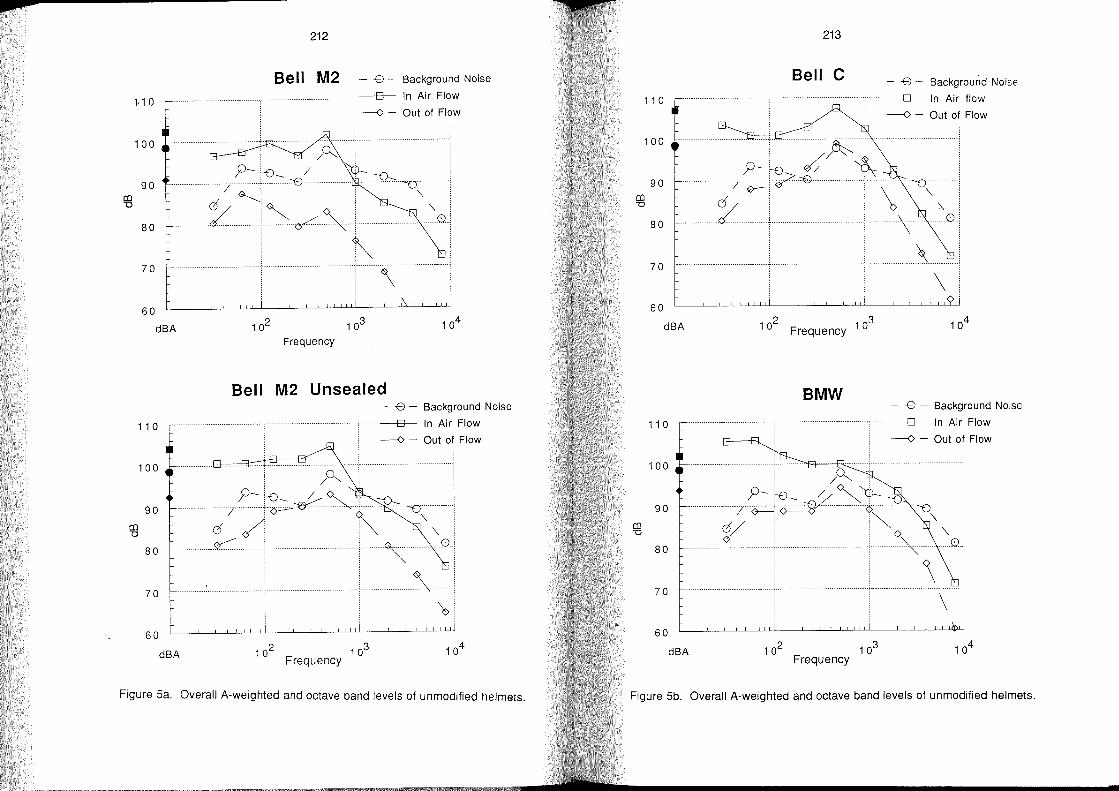
> 212
Bell M2 - B - Background Noise
1.10 ~"""""""""""""""""""""""',"'" ............................................ -a-- In Air Flow
co -0
100
90
80
70
60
dBA
--<> - Out 01 Flow
Frequency
Bell M2 Unsealed - B - Background Noise
110 , ............................................... , .................................................. , ....... -a-- In Air Flow
co -0
100
90
80
70
60
--<> - Out 01 Flow
p-
dBA 102 103 Frequency
Figure 5a, Overall A-weighted and octave band levels 01 unmodilied heimets,
co -0
213
Bell C - B - Background Noise
110 ~ .............................................. , ................................................... , ....... -a-- In Air Ilow
--<> - Out 01 Flow
100
90
80
70
60
dBA 1 02
Frequency 103
BMW - B - Background Noise
110 , ............................................... , .................................................. , ....... -a-- In Air Flow
--<> - Out 01 Flow
100 ~ ............................................. ,········~r--Bk ; ........................................... !
90
80
70
60
dBA 102 103 Frequency
Figure 5b, Overall A-weighted and octave band levels 01 unmodilied heimets,
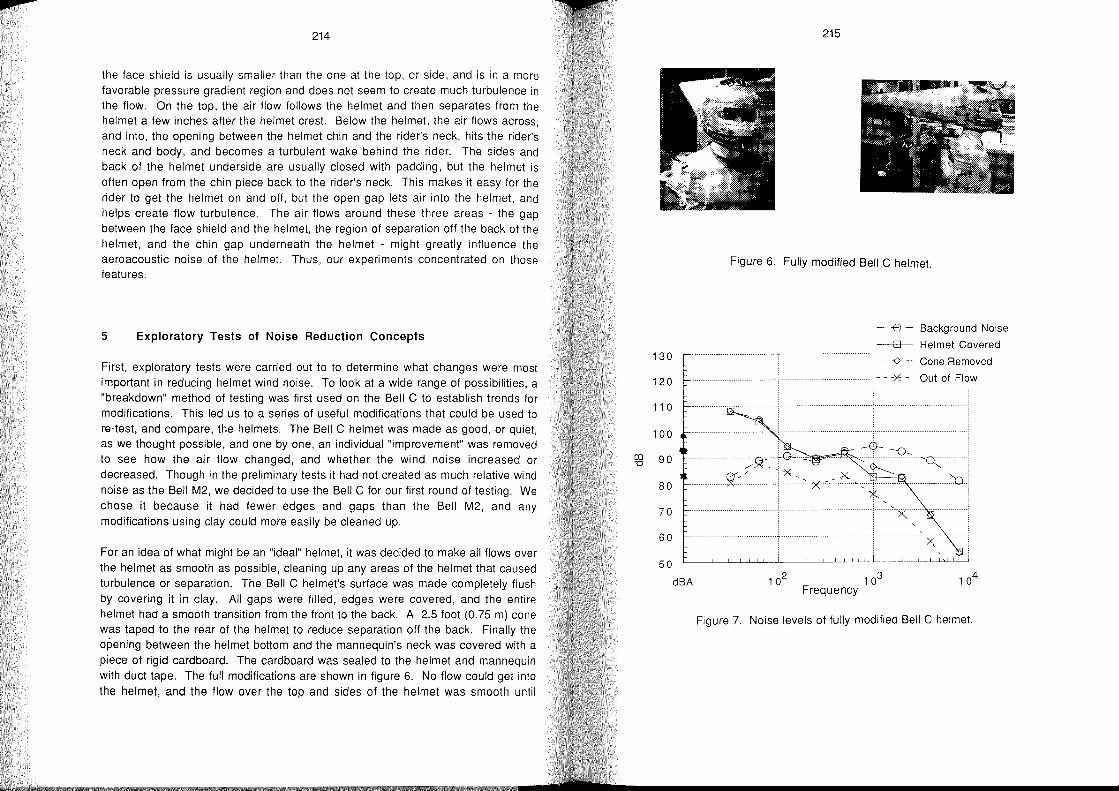
... 214
the face shield is usually smaller than the one at the top, or side, and is in a more favorable pressure gradient region and does not seem to create much turbulence in the flow. On the top, the air flow follows the heimet and then separates from the heimet a few inches after the heimet crest. Below the heimet, the air flows across, and into, the opening between the heimet chin and the rider's neck, hits the rider's neck and body, and becomes a turbulent wake behind the rider. The sides and back of the heimet underside are usually closed with padding, but the heimet is olten open from the chin piece back to the rider's neck. This makes it easy for the rider to get the heimet on and off, but the open gap lets air into the heimet, and helps create flow turbulence. The air flows around these three areas - the gap between the face shield and the heimet, the region of separation off the back of the heimet, and the chin gap underneath the heimet - might greatly influence the aeroacoustic noise of the heimet. Thus, our experiments concentrated on those features.
5 Exploratory Tests of Noise Reduction Concepts
First, exploratory tests were carried out to to determine what changes were most important in reducing heimet wind noise. To look at a wide range of possibilities, a "breakdown" method of testing was first used on the Bell C to establish trends for modifications. This led us to aseries of useful modifications that could be used to re-test, and compare, the heimets. The Bell C heimet was made as good, or quiet, as we thought possible, and one by one, an individual "improvement" was removed to see how the air flow changed, and whether the wind noise increased or decreased. Though in the preliminary tests it had not created as much relative wind noise as the Bell M2, we decided to use the Bell C for our first round of testing. We chose it because it had fewer edges and gaps than the Bell M2, and any modifications using clay could more easily be cleaned up.
For an idea of what might be an "ideal" heimet, it was decided to make all flows over the heimet as smooth as possible, cleaning up any areas of the heimet that caused turbulence or separation. The Bell C helmet's surface was made completely flush by covering it in clay. All gaps were filled, edges were covered, and the entire heimet had a smooth transition from the front to the back. A 2.5 foot (0.75 m) cone was taped to the rear of the heimet to reduce separation off the back. Finally the opening between the heimet bottom and the mannequin's neck was covered with a piece of rigid cardboard. The cardboard was sealed to the heimet and mannequin with duct tape. The full modifications are shown in figure 6. No flow could get into
the heimet, and the flow over the top and sides of the heimet was smooth until
130
120
110
100
co 90 "0
80
70
60
50
215
Figure 6. Fully modified Bell C heimet.
- B - Background Noise
-a-- Heimet Covered
---<> - Cone Removed
- - -)« - Out 01 Flow
dBA 102 103 Frequency
Figure 7. Noise levels of fully modified Bell C heimet.
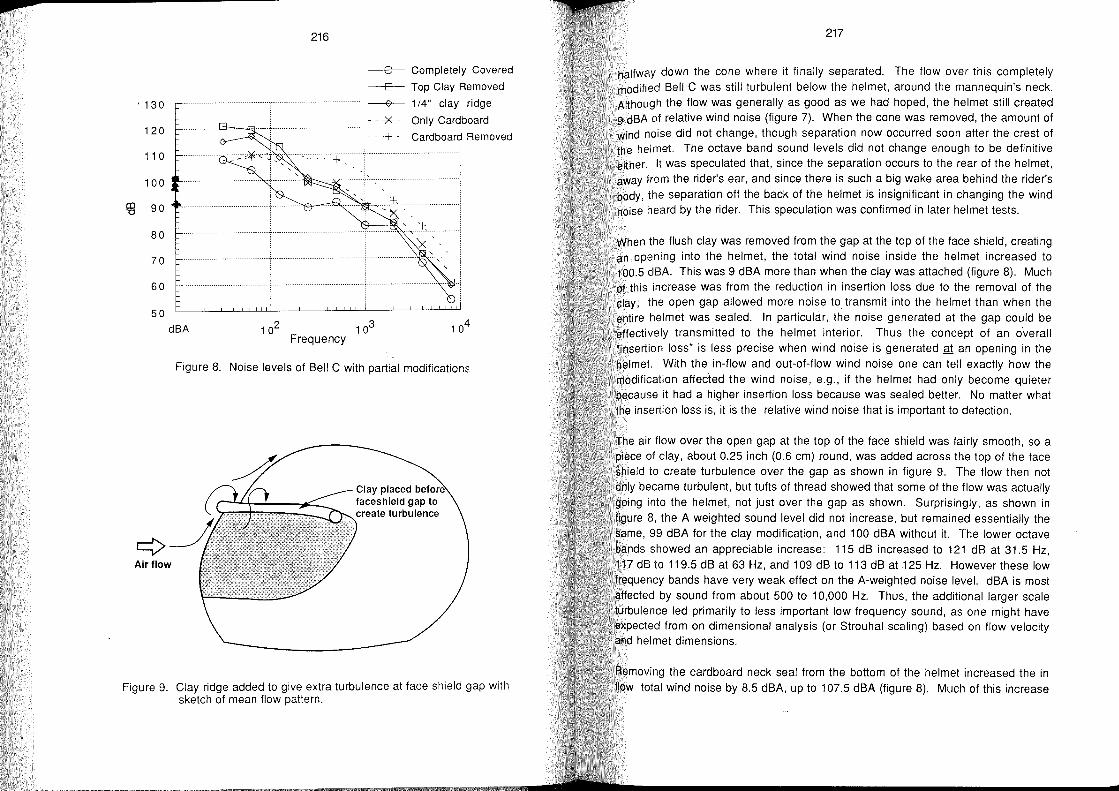
p
, 130
120
110
100
Cl) 90 "'0
80
70
60
50 dBA
216
-e-- Completely Covered
--a- Top Clay Removed
~ 1/4" clay ridge
- -Xc - Only Cardboard
- -+ - Cardboard Removed
102 103 Frequency
Figure 8. Noise levels of Bell C with partial modificationf
y Airflow
Clay placed before faceshield gap to create turbulence
Figure 9. Clay ridge added to give extra turbulence at face shield gap with sketch of mean flow pattern.
217
halfway down the cone where it finally separated. The flow over this completely modified Bell C was still turbulent below the heimet, around the mannequin's neck. Although the flow was generally as good as we had hoped, the heimet still created 9 dBA of relative wind noise (figure 7). When the cone was removed, the amount of wind noise did not change, though separation now occurred soon after the crest of the heimet The octave band sound levels did not change enough to be definitive either. It was speculated that, since the separation occurs to the rear of the heimet, away from the rider's ear, and since there is such a big wake area behind the rider's body, the separation off the back of the heimet is insignificant in changing the wind noise heard by the rider. This speculation was confirmed in later heimet tests.
When the flush clay was removed from the gap at the top of the face shield, creating an opening into the heimet, the total wind noise inside the heimet increased to 100.5 dBA. This was 9 dBA more than when the clay was attached (figure 8). Much of this increase was from the reduction in insertion loss due to the removal of the clay; the open gap allowed more noise to transmit into the heimet than when the entire heimet was sealed. In particular, the noise generated at the gap could be effectively transmitted to the heimet interior. Thus the concept of an Overall "insertion loss" is less precise when wind noise is generated at an opening in the heimet. With the in-flow and out-of-flow wind noise one can tell exactly how the modification affec'ted the wind noise, e.g., if the heimet had only become quieter because it had a higher insertion loss because was sealed better. No matter what the insertion loss is, it is the relative wind noise that is importantto detection.
The air flow over the open gap at the top of the face shield was fairly smooth, so a piece of clay, about 0.25 inch (0.6 cm) round, was added across the top of the face shield to create turbulence over the gap as shown in figure 9. The flow then not only became turbulent, but tufts of thread showed that some of the flow was actually going into the heimet, not just over the gap as shown. Surprisingly, as shown in figure 8, the A weighted sound level did not increase, but remained essentially the same, 99 dBA for the clay modification, and 100 dBA without it. The lower octave bands showed an appreciable increase: 115 dB increased to 121 dB at 31.5 Hz, 117 dB to 119.5 dB at 63 Hz, and 109 dB to 113 dB at 125 Hz. However these low frequency bands have very weak effect on the A-weighted noise level. dBA is most affected by sound from about 500 to 10,000 Hz. Thus, the additionallarger scale turbulence led primarily to less important low frequency sound, as one might have expected from on dimensional analysis (or Strouhal scaling) based on flow velocity and heimet dimensions.
Removing the cardboard neck seal from the bottom of the heimet increased the in flow total wind noise by 8.5 dBA, up to 107.5 dBA (figure 8). Much of this increase
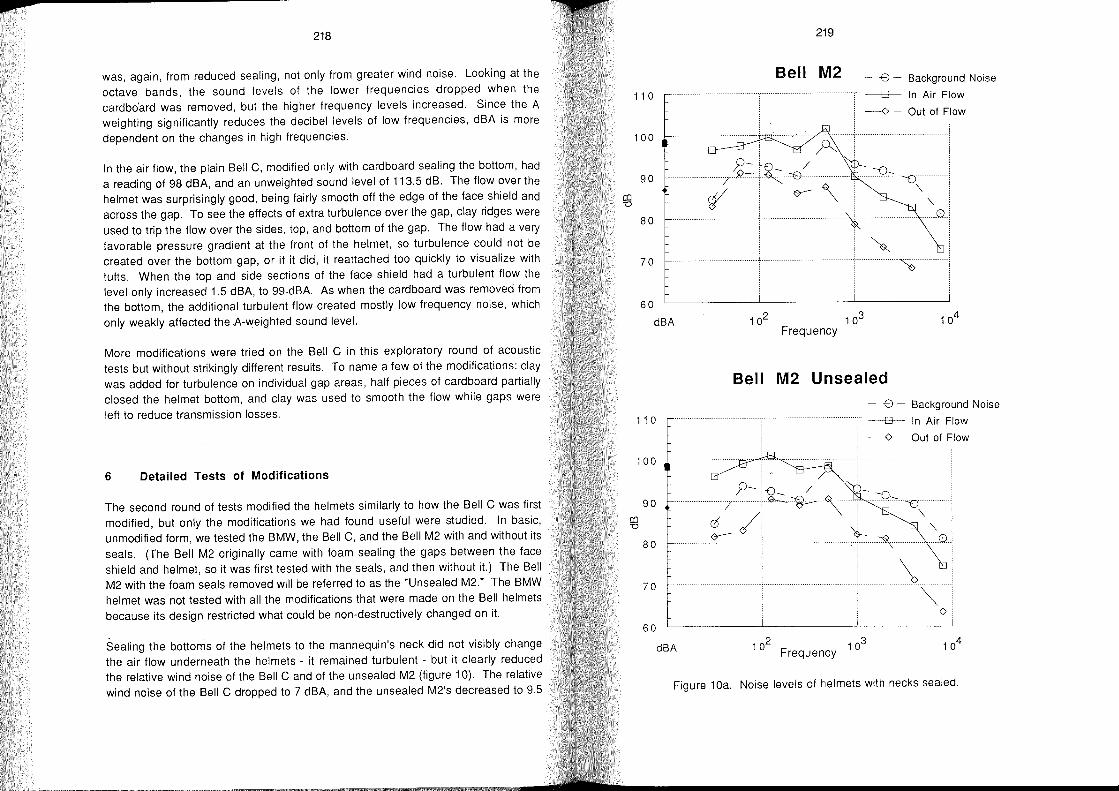
> 218
was, again, from reduced sealing, not only from greater wind noise. Looking at the octave bands, the sound levels of the lower frequencies dropped when the cardbo'ard was removed, but the higher frequency levels increased. Since the A weighting significantly reduces the decibel levels of low frequencies, dBA is more dependent on the changes in high frequencies.
In the air flow, the plain Bell C, modified only with cardboard sealing the bottom, had a reading of 98 dBA, and an unweighted sound level of 113.5 dB. The flow over the heimet was surprisingly good, being fairly smooth off the edge of the face shield and across the gap. To see the effects of extra turbulence over the gap, clay ridges were used to trip the flow over the sides, top, and bottom of the gap. The flow had a very favorable pressure gradient at the front of the heimet, so turbulence could not be created over the bottom gap, or if it did, it reattached too quickly to visualize with tufts. When the top and side sections of the face shield had a turbulent flow the level only increased 1.5 dBA, to 99·dBA. As when the cardboard was removed from the bottom, the additional turbulent flow created mostly low frequency noise, which only weakly affected the A-weighted sound level.
More modifications were tried on the Bell C in this exploratory round of acoustic tests but without strikingly different results. To name a few of the modifications: clay was added for turbulence on individual gap areas, half pieces of cardboard partially closed the heimet bottom, and clay was used to smooth the flow while gaps were
left to reduce transmission losses.
6 Detailed Tests of Modifications
The second round of tests modified the heimets similarly to how the Bell C was first modified, but only the modifications we had found useful were studied. In basic, unmodified form, we tested the BMW, the Bell C, and the Bell M2 with and without its seals. (The Bell M2 originally came with foam sealing the gaps between the face shield and heimet, so it was first tested with the seals, and then without it.) The Bell M2 with the foam seals removed will be referred to as the "Unsealed M2." The BMW heimet was not tested with all the modifications that were made on the Bell heimets because its design restricted what could be non-destructively changed on it.
Sealing the bottoms of the heimets to the mannequin's neck did not visibly change the air flow underneath the heimets - it remained turbulent - but it clearly reduced the relative wind noise of the Bell C and of the unsealed M2 (figure 10). The relative wind noise of the Bell C dropped to 7 dBA, and the unsealed M2's decreased to 9.5
219
Bell M2 - -e Background Noise
110 , ................................................................................................... -a---- In Air Flow
--<> - Out of Flow
100
90
co -0
80
70
60
dBA
110
100
co -0
90
80
70
60
Frequency
Bell M2 Unsealed - -e - Background Noise
, ............................................... , ................................................... , .. -a---- In Air Flow
--<> - Out of Flow
dBA 102 103 Frequency
Figure 10a. Noise levels of heimets with necks sealed.
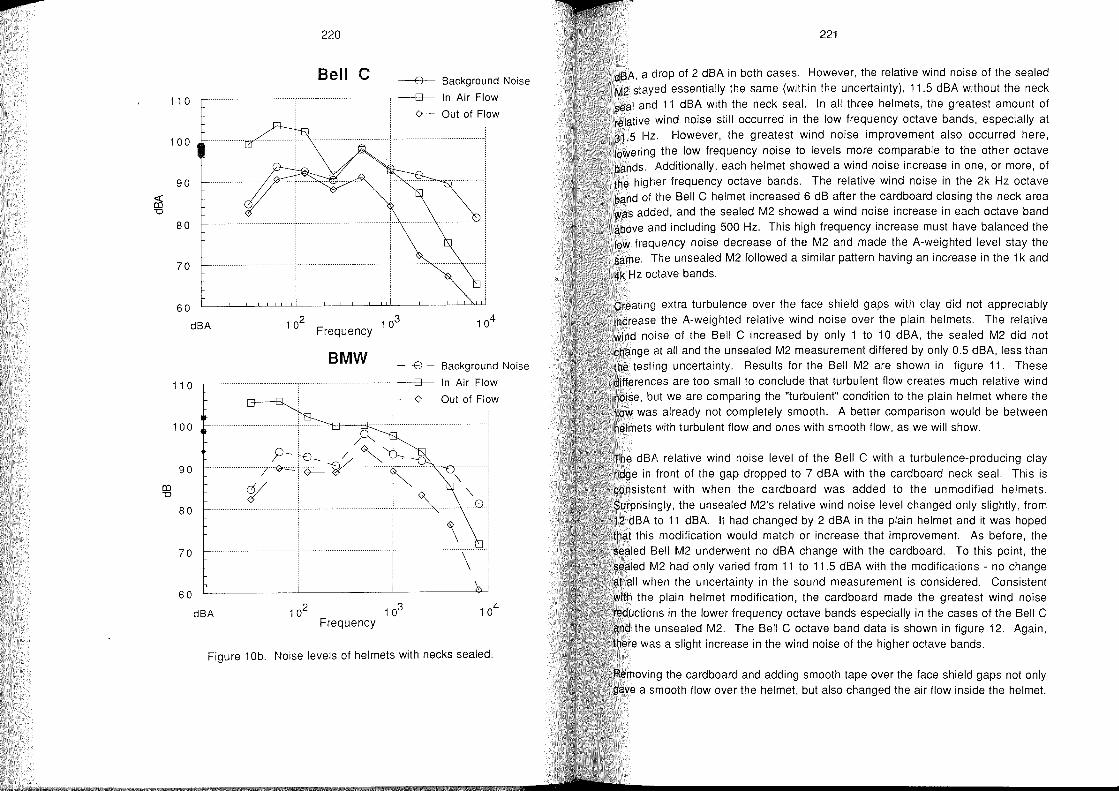
p
220
Bell C -----e- Background Noise
110 ,. ............................................... , ................................................. , -B- In Air Flow
~ Out 01 Flow
100
90
OS "0
80
70
60
dBA 102 Frequency
103 104
BMW -B Background Noise
110 -B- In Air Flow
--0 Out 01 Flow
100
90
CO "0
80
70
60
dBA Frequency
Figure 10b. Noise levels of heimets with necks sealed.
221
dBA, a drop 01 2 dBA in both cases. However, the relative wind noise of the sealed M2 stayed essentially the same (within the uncertainty), 11.5 dBA without the neck seal and 11 dBA with the neck seal. In all three heimets, the greatest amount of relative wind noise still occurred in the low frequency octave bands, especially at 31.5 Hz. However, the greatest wind noise improvement also occurred here, lowering the low Irequency noise to levels more comparable to the other octave bands. Additionally, each heimet showed a wind noise increase in one, or more, 01
the higher frequency octave bands. The relative wind noise in the 2k Hz octave band of the Bell C heimet increased 6 dB after the cardboard closing the neck area was added, and the sealed M2 showed a wind noise increase in each octave band above and including 500 Hz. This high frequency increase must have balanced the low frequency noise decrease of the M2 and made the A-weighted level stay the same. The unsealed M2 followed a similar pattern having an increase in the 1 k and 4k Hz octave bands.
Creating extra turbulence over the face shield gaps with clay did not appreciably increase the A-weighted relative wind noise over the plain heimets. The relative wind noise of the Bell C increased by only 1 to iOdBA, the sealed M2 did not change at all and the unsealed M2 measurement differed by only 0.5 dBA, less than the testing uncertainty. Results for the Bell M2 are shown in figure 11. These
rences are too small to conclude that turbulent flow creates much relative wind noise, but we are comparing the "turbulent" condition to the plain heimet where the flow was already not completely smooth. A better comparison would be between heimets with turbulent flow and on es with smooth Ilow, as we will show.
The dBA relative wind noise level of the Bell C with a turbulence-producing clay ridge in front of the gap dropped to 7 dBA with the cardboard neck seal. This is
nsistent with when the cardboard was added to the unmodified heimets. Surprisingly, the unsealed M2's relative wind noise level changed only slightly, from 12 dBA to 11 dBA. It had changed by 2 dBA in the plain heimet and it was hoped that this modification would match or increase that improvement. As before, the sealed Bell M2 underwent no dBA change with the cardboard. To this point, the sealed M2 had only varied from 11 to 11.5 dBA with the modifications - no change at all when the uncertainty in the sound measurement is considered. Consistent with the plain heimet modification, the cardboard made the greatest wind noise
ans in the lower frequency octave bands especially in the cases of the Bell C the unsealed M2. The Bell C octave band data is shown in figure 12. Again,
was a slight increase in the wind noise 01 the higher octave bands.
ng the cardboard and adding smooth tape over the face shield gaps not only a smooth flow over the heimet, but also changed the air Ilow inside the heimet.
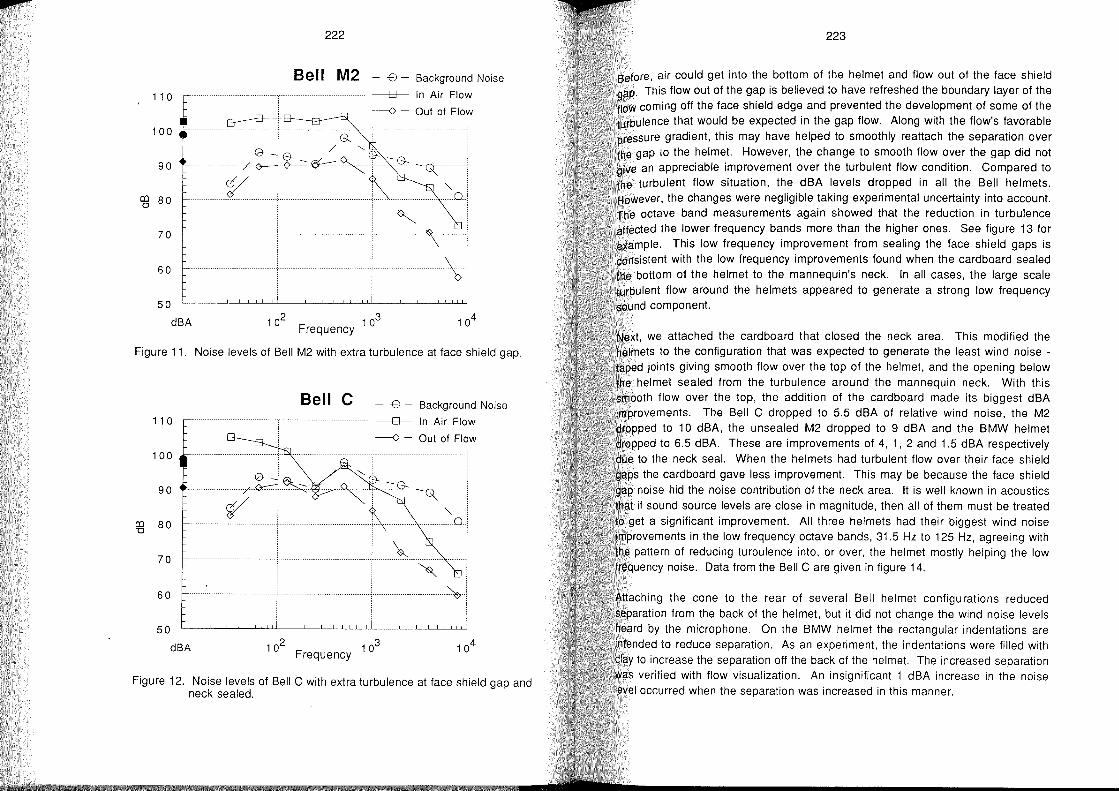
co -0
110
100
90
80
70
60
50
222
Bell M2 - -e - Background Noise ,""""""" """""" """"""""" """"" """"""""",""""""""""" """"""""""""" """"""" """"""""" -B-- In Air Flow
--<> - Out 01 Flow
dBA 102 103 Frequency
Figure 11" Noise levels of Bell M2 with extra turbulence at face shield gap"
Bell C -e Background Noise ,"""""""""""""""""""""""""""""""""""""""""""""""("""""""""""""""""""""""""""""""""""""""""""""""" -B-- In Air Flow
--<> - Out 01 Flow
102 103 Frequency
Figure 12. Noise levels of Bell C with extra turbulence at face shield gap and neck sealed.
223
Before, air could get into the bottom of the heimet and flow out of the face shield gap. This flow out of the gap is believed to have refreshed the boundary layer of the flow coming off the face shield edge and prevented the development of some of the turbulence that would be expected in the gap flow. Along with the flow's favorable pressure gradient, this may have helped to smoothly reattach the separation over the gap to the heimet. However, the change to smooth flow over the gap did not give an appreciable improvement over the turbulent flow condition. Compared to
""'JJ0Jf'"' "<,,, the turbulent flow situation, the dBA levels dropped in all the Bell heimets. However, the changes were negligible taking experimental uncertainty into account. The octave band measurements again showed that the reduction in turbulence affected the lower frequency bands more than the higher ones. See figure 13 for example. This low frequency improvement from sealing the face shield gaps is consistent with the low frequency improvements found when the cardboard sealed the bottom of the heimet to the mannequin's neck. In all cases, the large scale turbulent flow around the heimets appeared to generate a strong low frequency sound component.
Next, we attached the cardboard that closed the neck area. This modified the heimets to the configuration that was expected to generate the least wind noise -taped joints giving smooth flow over the top of the heimet, and the opening below the heimet sealed from the turbulence around the mannequin neck. With this smooth flow over the top, the addition of the cardboard made its biggest dBA improvements. The Bell C dropped to 5.5 dBA of relative wind noise, the M2 dropped to 10 dBA, the unsealed M2 dropped to 9 dBA and the BMW heimet dropped to 6.5 dBA. These are improvements of 4, 1, 2 and 1.5 dBA respectively due to the neck seal. When the heimets had turbulent flow over their face shield gaps the cardboard gave less improvement. This may be because the face shield
noise hid the noise contribution of the neck area. It is weil known in acoustics that if sound source levels are close in magnitude, then all of them must be treated 10 get a significant improvement. All three heimets had their biggest wind noise improvements in the low frequency octave bands, 31.5 Hz to 125 Hz, agreeing with the pattern of reducing turbulence into, or over, the heimet mostly helping the low frequency noise. Data from the Bell C are given in figure 14.
Attaching the cone to the rear of several Bell heimet configurations reduced separation from the back of the heimet, but it did not change the wind noise levels heard by the microphone. On the BMW heimet the rectangular indentations are intended to reduce separation. As an experiment, the indentations were filled with
to increase the separation off the back of the heimet. The increased separation was verified with flow visualization. An insignificant 1 dBA increase in the noise level occurred when the separation was increased in this manner.
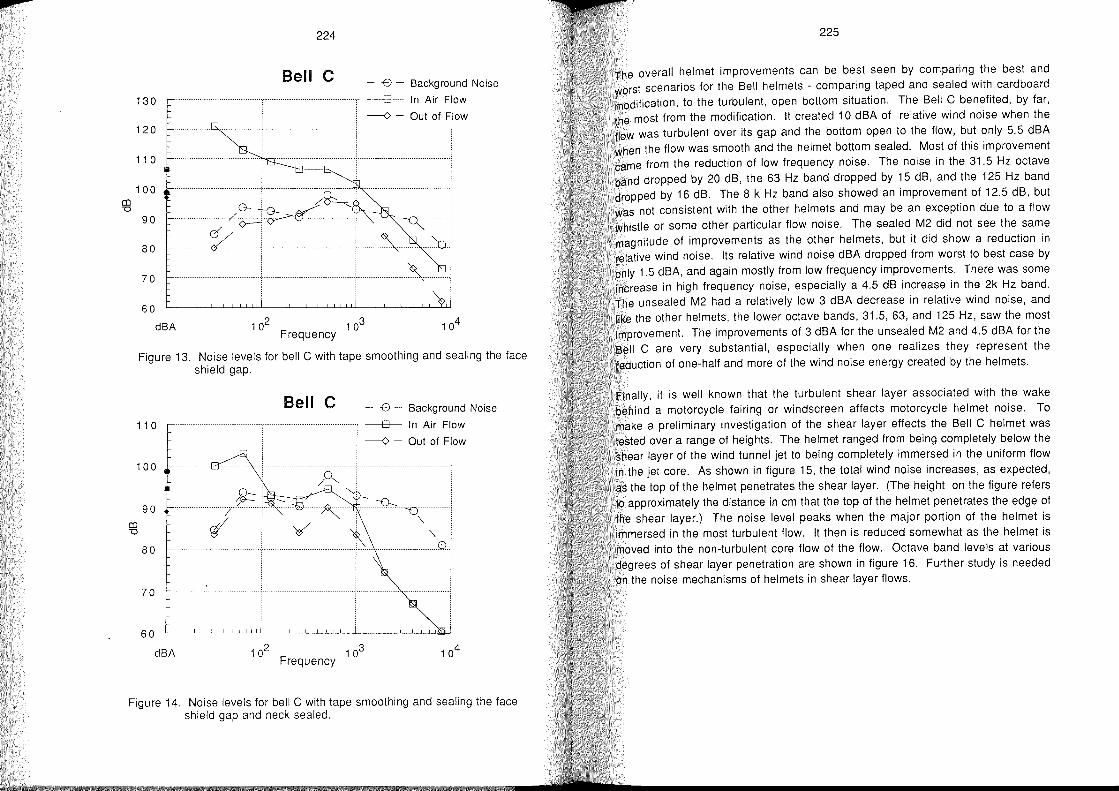
co 'D
224
Bell C - B Background Noise
130 -B- In Air Flow ---<> - Out of Flow
120
110
100
90
80
70
60
dBA 102 103 Frequency
Figure 13. Noise levels for bell C with tape smoothing and sealing the face shield gap.
Bell C - B - Background Noise
110 ,--............................................... , ................................................... -B- In Air Flow
---<> - Out of Flow
100
90 co 'D
80
70
60
dBA 102 103 Frequency
Figure 14. Noise levels for bell C with tape smoothing and sealing the face shield gap and neck sealed.
225
The overall heimet improvements can be best seen by comparing the best and worst scenarios for the Bell heimets - comparing taped and sealed with cardboard modification, to the turbulent, open bottom situation. The Bell C benefited, by far, the most Irom the modilication. It created 10 dBA 01 relative wind noise when the flow was turbulent over its gap and the bottom open to the flow, but only 5.5 dBA when the Ilow was smooth and the heimet bottom sealed. Most 01 this impravement came from the reduction 01 low frequency noise. The noise in the 31.5 Hz octave band dropped by 20 dB, the 63 Hz band dropped by 15 dB, and the 125 Hz band dropped by 16 dB. The 8 k Hz band also showed an improvement 01 12.5 dB, but was not consistent with the other heimets and may be an exception due to a Ilow whistle or some other particular Ilow noise. The sealed M2 did not see the same magnitude 01 improvements as the other heimets, but it did show a reduction in relative wind noise. Its relative wind noise dBA dropped lram worst to best case by only 1.5 dBA, and again mostly lram low Irequency improvements. There was some increase in high Irequency noise, especially a 4.5 dB increase in the 2k Hz band. The unsealed M2 had a relatively low 3 dBA decrease in relative wind noise, and like the other heimets, the lower octave bands, 31.5, 63, and 125 Hz, saw the most impravement. The impravements 01 3 dBA lor the unsealed M2 and 4.5 dBA lor the Bell C are very substantial, especially when one realizes they represent the reduction 01 one-hall and more 01 the wind noise energy created by the heimets.
Finally, it is weil known that the turbulent shear layer associated with the wake behind a motorcycle lairing or windscreen affects motorcycle heimet noise. To make a preliminary investigation 01 the shear layer effects the Bell C heimet was tested over a range 01 heights. The heimet ranged lram being completely below the shear layer 01 the wind tunnel jet to being completely immersed in the unilorm flow in the jet core. As shown in ligure 15, the total wind noise increases, as expected, as the top of the heimet penetrates the shear layer. (The height on the ligure relers to appraximately the distance in cm that the top 01 the heimet penetrates the edge 01 the shear layer.) The noise level peaks when the major portion 01 the heimet is immersed in the most turbulent Ilow. It then is reduced somewhat as the heimet is moved into the non-turbulent core Ilow 01 the Ilow. Octave band levels at various degrees of shear layer penetration are shown in ligure 16. Further study is needed on the noise mechanisms 01 heimets in shear layer /lows.
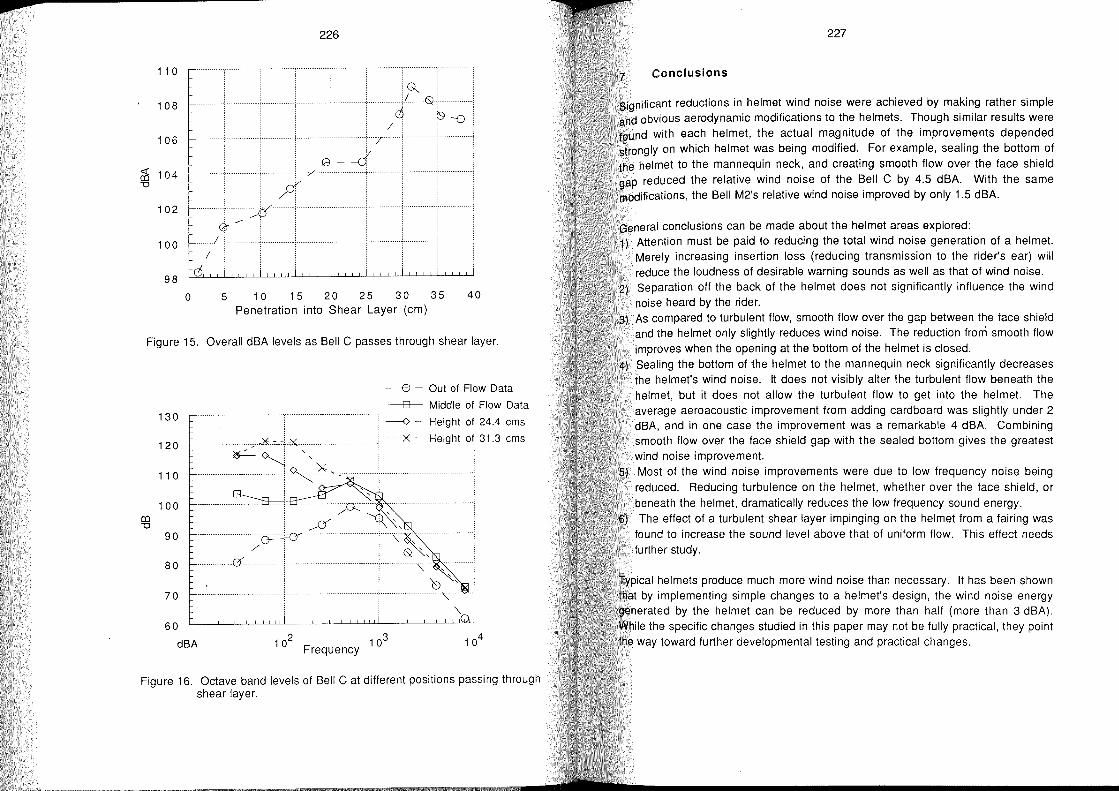
p 226
110
/ '" 108 C :9-0
/ 106 f- ......
I
f-. ' ca ----c
•
/0 CiS 104 "0
102 .-/}
---/0.
I
•
100
98 -c),
o 5 10 15 20 25 30 35 40 Penetration into Shear Layer (cm)
Figure 15. Overall dBA levels as Bell C passes through shear layer.
B - Out 01 Flow Data
---B--- Middle 01 Flow Data 130 ~............................................. , ...............................................•
---<> Height 01 24.4 cms
120 I-- ........................... c .. ~"' .. ~ .. c~.~"' ............................................. - - -)E - Height 01 31.3 cms ~
110
100 co "0
90
80
70
60
dBA 102 103 Frequency
Figure 16. Octave band levels of Bell C at different positions passing through shear layer.
227
Conclusions
Significant reductions in heimet wind noise were achieved by making rather simple and obvious aerodynamic modifications to the heimets. Though similar results were found with each heimet, the actual magnitude of the improvements depended strongly on which heimet was being modified. For example, sealing the bottom 01
the heimet to the mannequin neck, and creating smooth flow over the face shield gap reduced the relative wind noise of the Bell C by 4.5 dBA. With the same modifications, the Bell M2's relative wind noise improved by only 1.5 dBA.
General conclusions can be made about the heimet areas explored: 1) Attention must be paid to reducing the total wind noise generation of a heimet.
Merely increasing insertion loss (reducing transmission to the rider's earl will reduce the loudness of desirable warning sounds as weil as that of wind noise. Separation off the back of the heimet does not significantly influence the wind noise heard by the rider. As compared to turbulent flow, smooth flow over the gap between the face shield and the heimet only slightly reduces wind noise. The reduction from smooth flow improves when the opening at the bottom of the heimet is closed.
4) Sealing the bottom of the heimet to the mannequin neck significantly decreases the helmet's wind noise. It does not visibly alter the turbulent flow beneath the heimet, but it does not allow the turbulent flow to get into the heimet. The average aeroacoustic improvement from adding cardboard was slightly under 2 dBA, and in one case the improvement was a remarkable 4 dBA. Combining smooth flow over the face shield gap with the sealed bottom gives the greatest wind noise improvement. Most of the wind noise improvements were due to low frequency noise being reduced. Reducing turbulence on the heimet, whether over the face shield, or beneath the heimet, dramatically reduces the low frequency sound energy. The effect of a turbulent shear layer impinging on the heimet from a fairing was
found to increase the sound level above that of uniform flow. This effect needs further study.
Typical heimets produce much more wind noise than necessary. It has been shown that by implementing simple changes to a helmet's design, the wind noise energy generated by the heimet can be reduced by more than half (more than 3 dBA). While the specific changes studied in this paper may not be fully practical, they point the way toward further developmental testing and practical changes.
228
8 Acknowledgment
We wbuld like to thank Eric T. Walsh, Sunil Gulrajani, and John R. Callister for their help in numerous aspects of this research. We also would like to thank Dean Fisher of the Bell Heimet Company, who donated the two Bell heimets used in the study.
9
1)
2)
3)
4)
5)
Reference List
The Effects of Motorcycle Heimets on Hearing and the Detection of Warning Signals / W.K. Van Moorhem (a.o.) In: Journal of Sound and Vibration 77(1981)1. - P. 39-49
Fundamentals of Acoustics / L.E. Kinsler (a.o.). - 3rd Ed. - New York, 1982
George, A.R.; Callister, J.R.: Aerodynamic Noise of Ground Vehicles. - Warrendale, 1991. - (SAE Paper; 911027)
Hüttenbrink, K. B.: Lärmmessung unter Motorradhelmen In: Zeitschrift für Lärmbekämpfung (1982)29. - P. 182-187
A Wind-Tunnel Method for Evaluating the Aerodynamic Noise of Cars / A.Lorca (a.o.). - Warrendale, 1986. - (SAE Technical Paper; 860215)
Requirements on Chin Protection in Full-Face Heimets for Motorcyclist Impact and Injury Situations
Dietmar Otte
Medizinische Hochschule Hannover
Abteilung Verkehrsunfallforschung
Germany
Günter Feiten
TÜV Rheinland e.v., Köln
Institut für Verkehrssicherheit
Germany
231
1 Abstract
Heimets with integrated chin protection are currently the most widespread heimet design in Europe. Heimet design is extensively prescribed by design and performance regulations. An evaluation of the Japanese, American and European regulations proves that this is not the case for chin protection. Results from investigations between 1984 and 1991 show the development tendencies for the protection of the head in the chin area. The measurement methods used in the investigations enabled the parallel measurement of chin forces, chin strap forces and head deceleration in a simulated impact in the chin area. The results give the first information on the combined effects of the padding of the chin section, the geometry of the chin section and chin strap attachment and the effects on load distribution in the case of an impact on the chin section.
Most of the test regulations do not consider the chin region. This study analyses impact situations in real accidents.
The impact situation of 598 analysed crash heimets reveals that only 57.7% of all impact points are situated within the protection region defined by ECE, 14.1% in the marginal region and 28.2% clearly outside this region. The highest percentage of impacts occurres in the chin region, with predominantly flat impact patterns. The socalled 'turn' is not confirmed in accident reality. The most frequent impact for the chin region is the impact measured 4 to 6 cm away from the middle of the chin-bar. Biomechanically regarded, two typical force directions were defined, on the one hand oblique from below, with subsequent injuries to the lower jaw and other indirect injuries to the top of the scull, and on the other hand a more sagittal right-angular effecting force, causing fractures to the lower jaw as weil as extensive facial fractures. The fracture of the scull base appears to be a frequent side effect. In an oblique direction from below it is valuated as an indirect injury, in a rectangular impact, however, it is regarded as a direct injury. Within the respective framework conditions, the optimum heimet tests can be defined by this analysis.
232
2 Introduction and Objective
Crash heimets for motorcyclists are subject to certain test specifications by national and international reglements. Manufacturers of crash heimets have to comply with these regulations in their conception. For the most eurapean countries the ECE-R22 (1) is valid, in America the tests are made according to SNELL (2) as weil as FMVSS 218 (3).
In all test procedures the protruding stability, the form stability of the shell and the shock absorption is tested.
Within the framework of this study the defined test conditions of ECE-R22 will compared with real accident situations. This is carried out in an interdisziplinary study of a test house (TÜV Rheinland) in cooporation with an accident research unit (Med. University Hannover). At first the test regulation will be described especially for the chinbar. A second step analyse the real accident situation of head impact.
It is the objective of this study to compare the impact situations in accident reality. Special attention should be paid to the chin region, and possibly occurring force and impact circumstances must be defined.
3 Chin Protection in Full-Face Heimets as Reflected in the Standards
3.1 Existing Standardisations
The motorcyclist's crash heimet is one of the protective devices for the head needing to satisfy a multiplicity of requirements.
Its central task is the pratection fram head injuries in the event of a fall. In addition to this, the heimet also needs to ensure adequate vision and comfortable climate even under poor conditions. Good aerodynamics and good ear isolation need to keep out loud noises, without making the act of putting on the heimet uncomfortable. Here we could continue to list any number of other aspects that make up the requirement profile for the heimet. The significant thing is, however, that there is hardly any other safety component with such wide-ranging and as a rule contradictory requirements; requirements which impose the task of constant development work on heimet manufacturers.
233
The many requirements and the existing technical possibilities are also res~onsible f~r the fact that heimet standardisation initially only places performance requlrements In reas which can be adequately described with regard to injury situations and possible
a rotective effects. For jaw and chin protection in full-face heimets, we are still in the ~arlY stages of standardisation, even though the large majority of heimets sold in Europe are in fact full-face heimets.
The expression "full-face heimet" refers to a heimet design with a jaw or chin guard, which protects the lower half of the face. (The term "chin guard" is also used in some translations for apart which is fixed onto the chin strap and which can be fixed over the point of the chin as a cap (chin-cup). This is not the definition intended here and is not discussed here.)
The following evaluation of standards shows that for jaw protection there is only a very small range of concrete requirements:
The following standards were investigated • ECE regulation 22.03 (4) - JIS T8133 (11) • FMVSS No. 218 (8) • SNELL-Standard (13) • CSA Standard D230-1970 (12) • NF S72-305 (2) • BS 6658: 1985 (14) • CEN EN 398 (10)
In the standards mentioned the following recommendations are given on the subject of jaw protection/ chin protection:
ECE Regulation 22/03
"Lower face cover" means a detachable or integral part of the heimet covering the lower part of the face;
General Regulations
The protective heimet may have ... a lower face cover. The shell ... may incorporate an integrallower face cover. There shall be no inward-facing sharp edges on the inside of the heimet; rigid, projecting internal parts shall be covered with padding so that any stresses transmitted to the head are not highly concentrated.
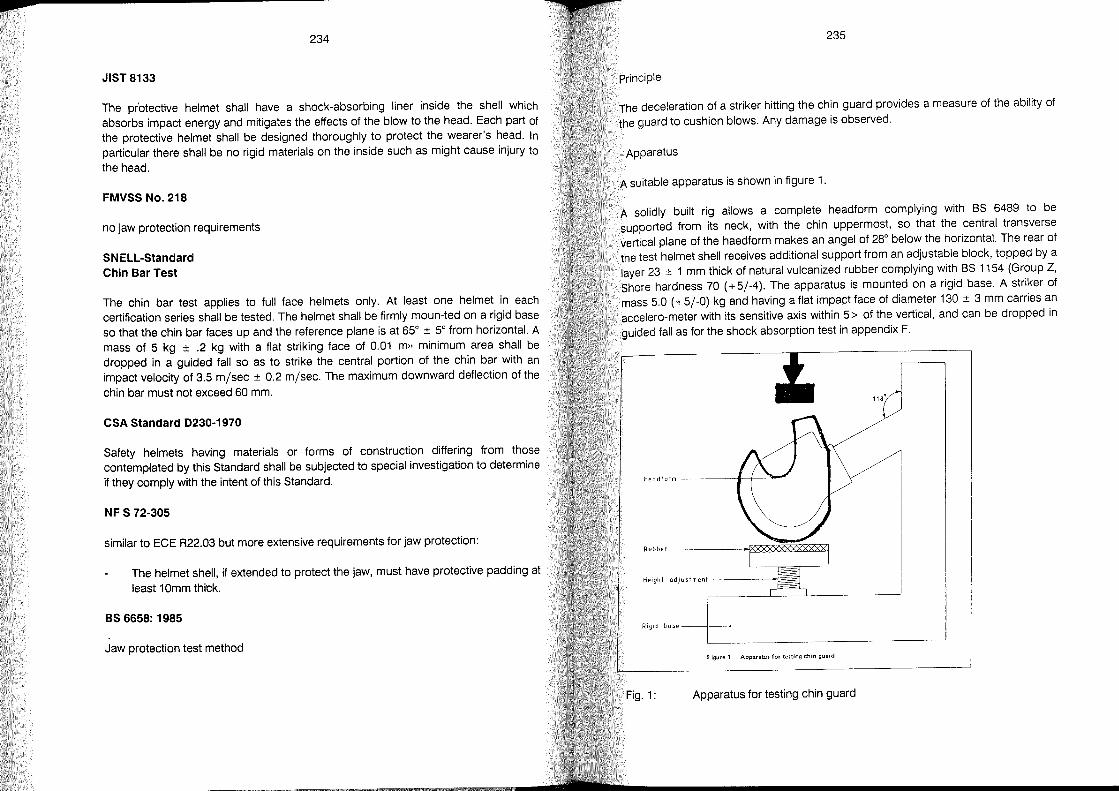
p
234
JIST 8133
The pr'otective heimet shall have a shock-absorbing liner inside the shell which absorbs impact energy and mitigates the effects of the blow to the head. Each part of the protective heimet shall be designed thoroughly to protect the wearer's head. In particular there shall be no rigid materials on the inside such as might cause injury to the head.
FMVSS No. 218
no jaw protection requirements
SNELL-Standard Chin Bar Test
The chin bar test applies to full face heimets only. At least one heimet in each certification series shall be tested. The heimet shall be firmly moun-ted on a rigid base so that the chin bar faces up and the reference plane is at 65° ± 5° from horizontal. A mass of 5 kg ± .2 kg with a flat striking face of 0.01 m» minimum area shall be dropped in a guided fall so as to strike the central portion of the chin bar with an impact velo city of 3.5 m/sec ± 0.2 m/sec. The maximum downward deflection of the chin bar must not exceed 60 mm.
CSA Standard 0230-1970
Safety heimets having materials or forms of construction differing from those contemplated by this Standard shall be subjected to special investigation to determine if they comply with the intent of this Standard.
NF S 72-305
similar to ECE R22.03 but more extensive requirements for jaw protection:
The heimet shell, if extended to protect the jaw, must have protective padding at
least 1 Omm thick.
BS 6658: 1985
Jaw protection test method
235
principle
The deceleration of a striker hitting the chin guard provides a measure of the ability of the guard to cushion blows. Any damage is observed.
_ Apparatus
A suitable apparatus is shown in figure 1.
A solidly built rig allows a complete headform complying with BS 6489 to be supported from its neck, with the chin uppermost, so that the central transverse vertical plane of the haedform makes an angel of 28° below the horizontal. The rear of the test heimet shell receives additional support from an adjustable block, topped by a layer 23 ± 1 mm thick of natural vulcanized rubber complying with BS 1154 (Group Z, Shore hardness 70 (+5/-4). The apparatus is mounted on a rigid base. A striker of mass 5.0 (+5/-0) kg and having a flat impact face of diameter 130 ± 3 mm carries an accelero-meter with its sensitive axis within 5> of the vertical, and can be dropped in guided fall as for the shock absorption test in appendix F.
Headform ----"'-j-----
Rubber -----4iZS~~S:2:2Z:Z1
Rigid base ---t-~
Figure 1 Apparatus for testing chin guard
Fig.1: Apparatus for testing chin guard
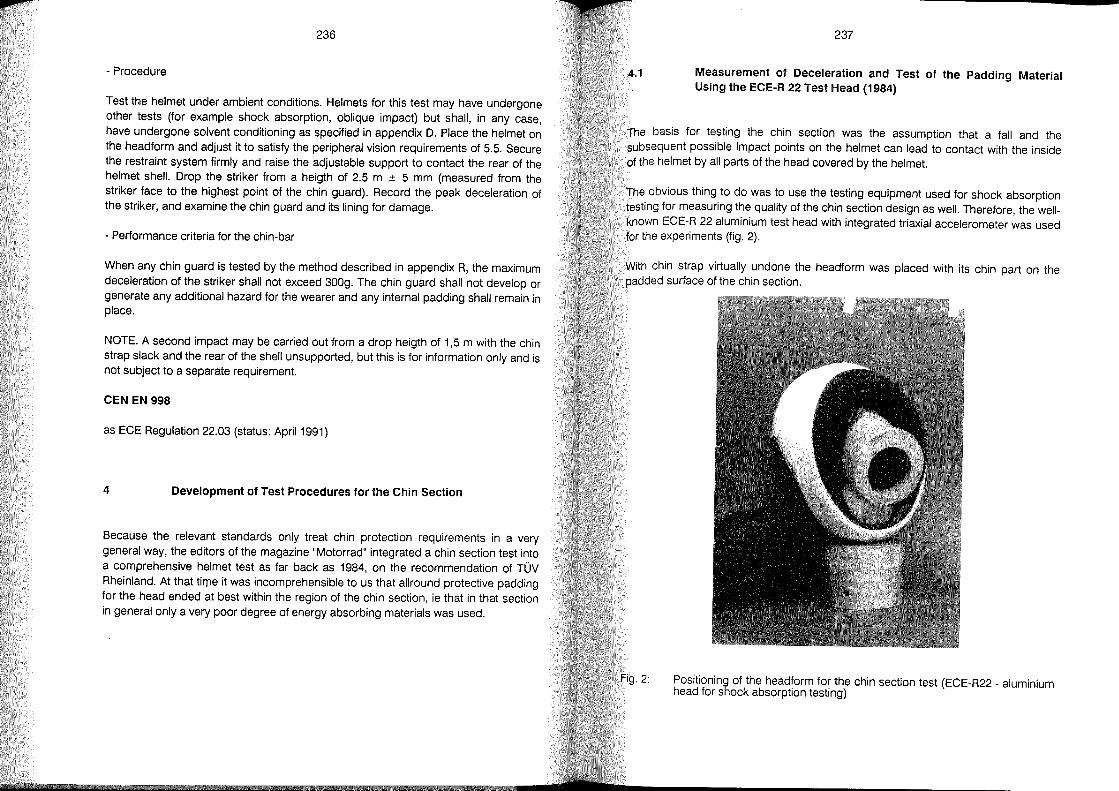
236
- Procedure
Test the heimet under ambient conditions. Heimets for this test may have undergone other tests (for example shock absorption, oblique impact) but shall, in any case, have undergone solvent conditioning as specified in appendix D. Place the heimet on the headform and adjust it to satisfy the peripheral vision requirements of 5.5. Secure the restraint system firmly and raise the adjustable support to contact the re ar of the heimet shell. Drop the striker from a heigth of 2.5 m ± 5 mm (measured from the striker face to the highest point of the chin guard). Record the peak deceleration of the striker, and examine the chin guard and its lining for damage.
- Performance criteria for the chin-bar
When any chin guard is tested by the method described in appendix R, the maximum deceleration of the striker shall not exceed 300g. The chin guard shall not develop or generate any additional hazard for the wearer and any internal padding shall remain in place.
NOTE. A second impact may be carried out from a drop heigth of 1,5 m with the chin strap slack and the re ar of the shell unsupported, but this is for information only and is not subject to aseparate requirement.
CEN EN 998
as ECE Regulation 22.03 (status: April 1991)
4 Development of Test Procedures for the Chin Seetion
Because the relevant standards only treat chin protection requirements in a very general way, the editors of the magazine "Motorrad" integrated a chin section test into a comprehensive heimet test as far back as 1984, on the recommendation of TÜV Rheinland. At that time it was incomprehensible to us that allround protective padding for the head ended at best within the region of the chin section, ie that in that section in general only a very poor degree of energy absorbing materials was used.
4.1
237
Measurement of Deceleration and Test of the Padding Material Using the ECE-R 22 Test Head (1984)
The basis for testing the chin section was the assumption that a fall and the subsequent possible impact points on the heimet can lead to contact with the inside of the heimet by all parts of the head covered by the heimet.
The obvious thing to do was to use the testing equipment used for shock absorption testing for measuring the quality of the chin section design as weil. Therefore, the wellknown ECE-R 22 aluminium test head with integrated tri axial accelerometer was used for the experiments (fig. 2).
With chin strap virtually undone the headform was placed with its chin part on the padded surface of the chin section.
Positioning of the headform for the chin section test (ECE-R22 - aluminium head for shock absorption testing)
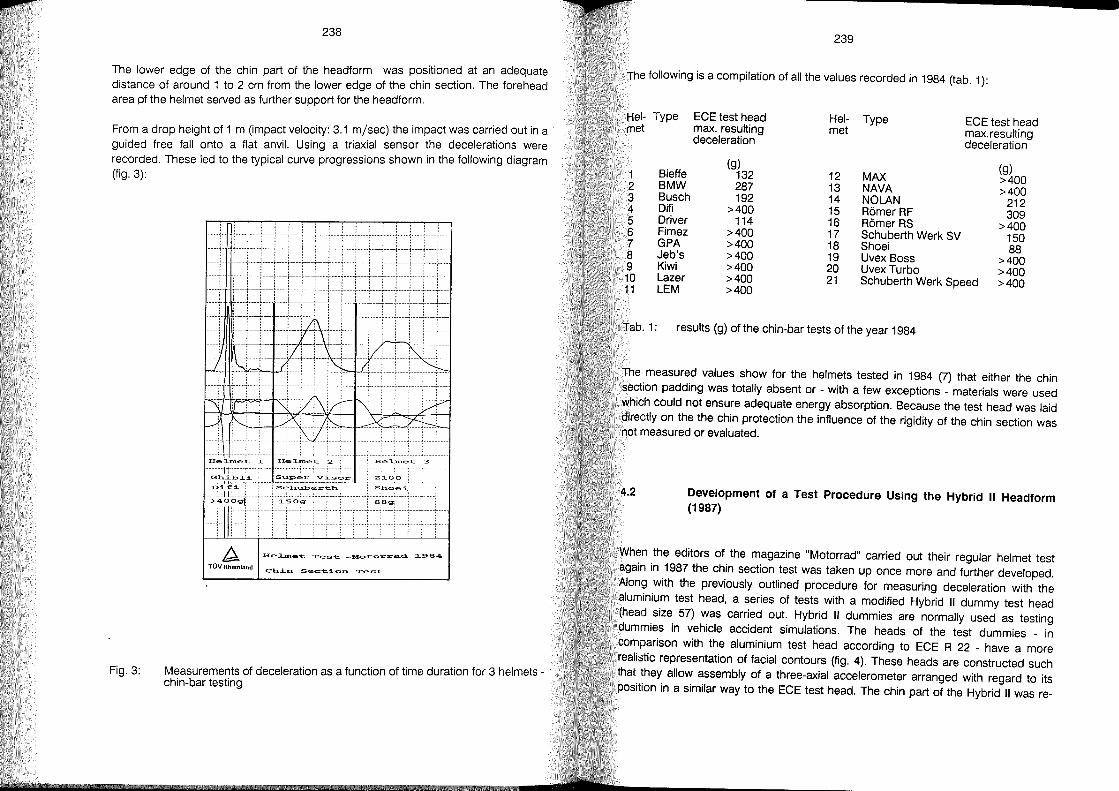
238
The lower edge of the chin part of the headform was positioned at an adequate distance of around 1 to 2 cm from the lower edge of the chin section. The forehead area pf the heimet served as further support for the headform.
From a drop height of 1 m (impact velocity: 3.1 m/sec) the impact was carried out in a guided free fall onto a flat anvil. Using a triaxial sensor the decelerations were recorded. These led to the typical curve progressions shown in the following diagram (fig. 3):
Fig.3:
L 1 , :
IJJiL . :
I·····
Ir\. I·· \ ',-.
J V ~
~a ( !'-. I :'-..
Ä
'-. V \ [;--: " • ~ v
H f'..- A f'--.. LX :7-'--i ...... ,\../ •..... I' •• 11·········· .
, Ir ., ..... IEI:IE:~T~ 2 ! .. He:::l...Inet 3
Gh·L01 Isup~r Visor, : Z100-r
Difi Schu..berth. Sihoi~i. ...... •......
>400g 150g, , 8.8 9
1II11 .
•• 1··.······· llD ..• . .... L .... ,
A He:::J...rne:t Test _MC)"torrad.. 1984
TÜV Rheinland Ch.i~ Sectio~ Test
Measurements of deceleration as a function of time duration for 3 heimets -chin-bar testing
239
The following is a compilation of all the values recorded in 1984 (tab. 1):
Hel- Type ECE test head Hel- Type ECE test head met max. resulting met max.resulting deceleration deceleration
(g) (g) 1 Bieffe 132 12 MAX >400 2 BMW 287 13 NAVA >400 3 Busch 192 14 NOLAN 212 4 Difi >400 15 Römer RF 309 5 Driver 114 16 Römer RS >400 6 Fimez >400 17 Schuberth Werk SV 150 7 GPA >400 18 Shoei 88 8 Jeb's >400 19 Uvex Boss >400 9 Kiwi >400 20 UvexTurbo >400 10 Lazer >400 21 Schuberth Werk Speed >400 11 LEM >400
Tab. 1: results (g) of the chin-bar tests of the year 1984
The measured values show for the heimets tested in 1984 (7) that either the chin section padding was totally absent or - with a few exceptions - materials were used which could not ensure adequate energy absorption. Because the test head was laid directly on the the chin protection the influence of the rigidity of the chin section was not measured or evaluated.
4.2 Development of a Test Procedure USing the Hybrid 11 Headform (1987)
When the editors of the magazine "Motorrad" carried out their regular heimet test again in 1987 the chin section test was taken up on ce more and further developed. Along with the previously outlined procedure for measuring deceleration with the aluminium test head, aseries of tests with a modified Hybrid " dummy test head (head size 57) was carried out. Hybrid " dummies are normally used as testing dummies in vehic/e accident simulations. The heads of the test dummies - in comparison with the aluminium test head according to ECE R 22 - have a more realistic representation of facial contours (fig. 4). These heads are constructed such that they allow assembly of a three-axial accelerometer arranged with regard to its position in a similar way to the ECE test head. The chin part of the Hybrid " was re-
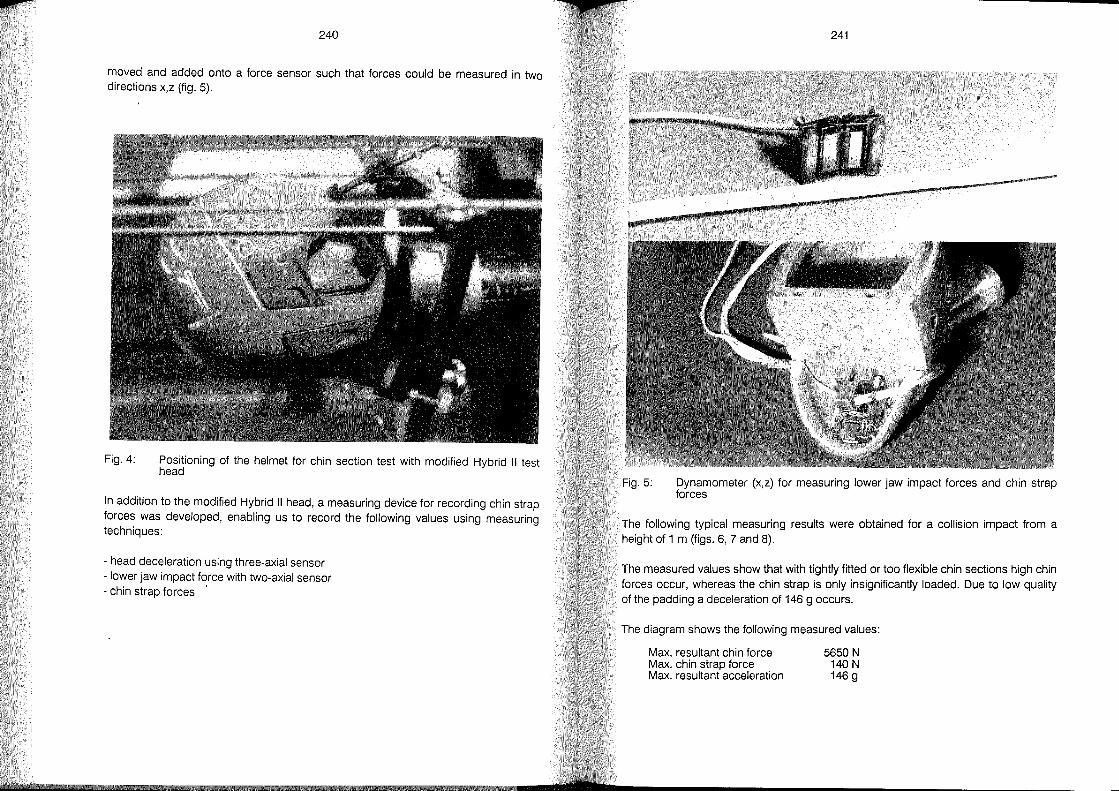
240
moved and added onto a force sensor such that forces could be measured in two directions x,z (fig. 5).
Fig.4: Positioning of the heimet for chin section test with modified Hybrid 11 test head
In addition to the modified Hybrid 11 head, a measuring device for recording chin strap forces was developed, enabling us to record the foliowing values using measuring techniques:
- head deceleration using three-axial sensor - lower jaw impact force with two-axial sensor - chin strap forces .
241
Fig.5: Dynamometer (x,z) for measuring lower jaw impact forces and chin strap forces
The foliowing typical measuring results were obtained for a coliision impact from a height of 1 m (figs. 6, 7 and 8).
The measured values show that with tightly fitted or too flexible chin sections high chin forces occur, whereas the chin strap is only insignificantly loaded. Due to low quality of the padding a deceleration of 146 9 occurs.
The diagram shows the foliowing measured values:
Max. resultant chin force Max. chin strap force Max. resultant acceleration
5650 N 140 N 146 9
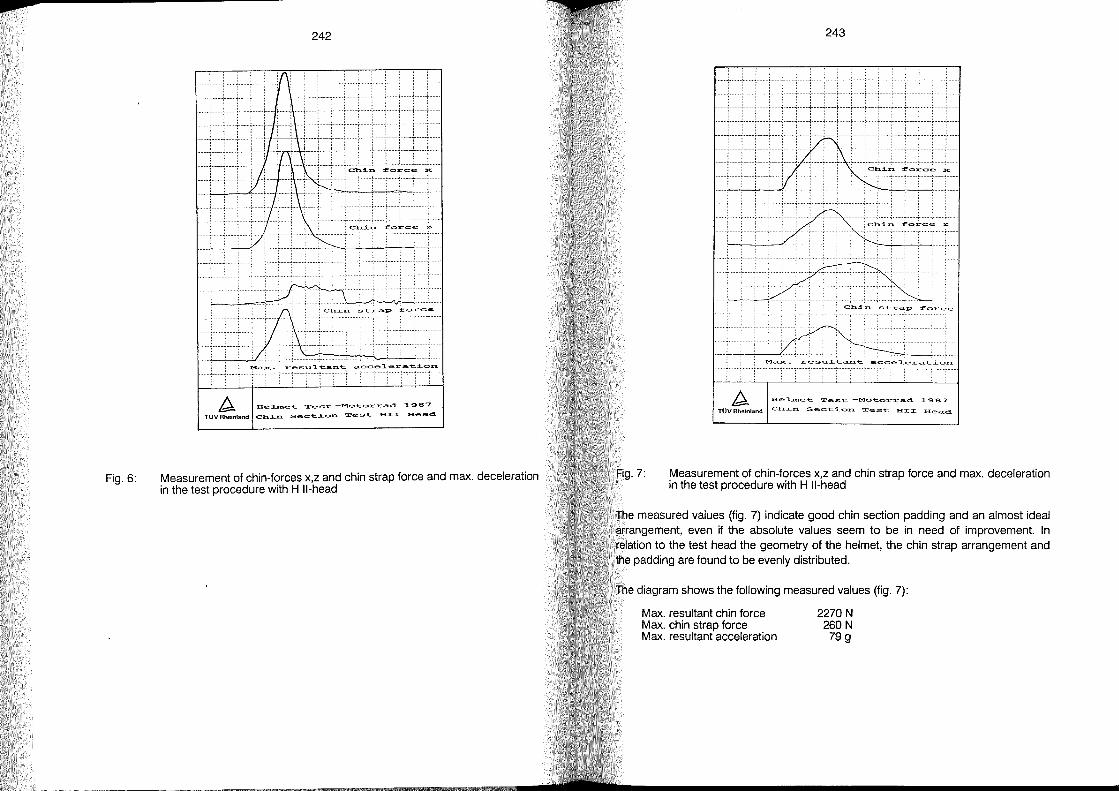
p
Fig.6:
242 243
I :.·'11' ': 'i {' : ..
,
I , ,
I \ ,
" \ : V \ •
: --C::h..i...r.l. f orc.e. ::K
\ "---/ \
• , ...
T. , I·
'\ ~.c:" f~~=~ z
. ./ ••
••
, " ,
I,.' .,.' i ..... • .........
................ ~\ T " IJ· , I\ ' 'f~r=;'"
, . / \ . , •• . - I \
.l •
, I , , , Ma.x_ re, ., ~==~'
, ·
~ He~et Test-M~t~rrad 1987
TÜV Rheinland Ch~r.l. sect~Or.l. Test HII Head
Measurement of chin-forces X,Z and chin strap force and max. deceleration in the test procedure with H II-head
~ He:::I..ro.et Test:. -Motorrad. 1987
TOVRheinland Ch.:i..n. Sect:...:LcH."'l. Test:. HII Head
Measurement of chin-forces X,Z and chin strap force and max. deceleration in the test procedure with H II-head
The measured values (fig. 7) indicate good chin section padding and an almost ideal arrangement, even if the absolute values seem to be in need of improvement. In relation to the test head the geometry of the heimet, the chin strap arrangement and the padding are found to be evenly distributed.
The diagram shows the foliowing measured values (fig. 7):
Max. resultant chin force Max. chin strap force Max. resultant acceleration
2270N 260 N 79 9

>
Fig.8:
244
. : : T···· + ...... , ..... . ... , ..... ·,.1 , ,
I .. · \ •... ]1 •••••• J \ lt ·IV> Ch.:i..n.. forc~ =
I·· I? '" •
:\ ~'i ...... ,~, .. , •........
. /' ",' \t'~';~X'1 ;;:'rc~ z
.. I / "-.! ......................
.... ............. . .. , .. ""r: ........ 'T I· .•
---..J • .................. i·· .~
Chin. stra..p forcE'! , .. :.... ... , .. I
/< .......... .........
, Ma...:x:_ res-u..l.ta..n.t::. a..r~r.~r~:a.. :t:-~~.:y:.~ ....
•
•
~ He:::L.ntE'!t. Test "_Moto:rra..d 1987
TÜV Rheinland Ch.:i..n. Sect:i..on. Test::. HII Hea..d.
measurement of chin-forces X,Z and chin strap force and max. deceleration in the test procedure with H II-head
Although the tested heimet has sufficient padding material in the chin section, the chin only touches the excessively large chin section to an insignificant degree. The head almost hangs itself on the chin strap, and, because its particular design with low degree of deformation, slips through in the experiment described! The measured acceleration value is. largely influenced by this neck bracing effect.
The diagram shows the following measured values (fig. 8):
Max. resultant chin force Max. chin strap force Max. resultant acceleration
1060 N 1200 N
82 9
The investigations of 1987 led to the following results:
Tabular compilation of the measured results recorded using the ECE head, measuring set-up as described in 3.1 (tab. 1)
Test with ECE head form HeImet Type max. resulting
deceleration
AGV X 1000 BMW System I I Boeri Kosmo GPA SJ Jeb I s 385 GTP KIWI K 20 Krauter MV 1
(g) 567 192 569 525 551 144 114
Test with Hybrid 11 Test HeImet Type max. res.
chin force (N)
AGV X 1000 3780 BMW System 11 2270 Boeri Kosmo 2080 GPA SJ 5170 Jeb I s 385 GTP 2270 KIWI K 20 2170 Krauter MV 1 1060 MDS M 90 1320 Nava 8 4040 Nolan N 25 Racing 2780 Römer Road Star 2910 Shoei RF-105 1770 Schuberth Aero 5650 Uvex X 1 (2.Lfrg.) 2270
Head
245
HeImet Type
MDS M 90 Nava 8 Nolan N 25 Racing Römer Road Star Shoei RF-105 Schuberth Aero Uvex X 1
max. resulting deceleration
(g) 111 403 432 229 270 502 382
chin strap max. res. force (N) deceleration
(g) 410 135 260 79 460 97
155 * 130
300 97 >1200 82
590 60 136
470 105 * 104
480 75 140 146 580 82
Tab. 2: Results . (~) of .the chin-bar tests of the year 1987 using an ECE-head in companslon wlth the hybrid 11 test-head
In the places marked "*", the chin strap force was recorded wrongly, because pressure forces affected the chin strap force sensor due to the geometry of the heimet shell, thus influencing the tensile forces intended to be measured. The values ~how that even in 1987 heimet manufacturers still did not atlach any high er Impo~ance to chin section padding and that padding quality still did not show any great Improvement. The measured results obtained with the modified Hybrid 11 head set-up gave more extensive indications about the course of movement of the head inside the heimet during a collision in the chin area and the forces occurring as a result of this.
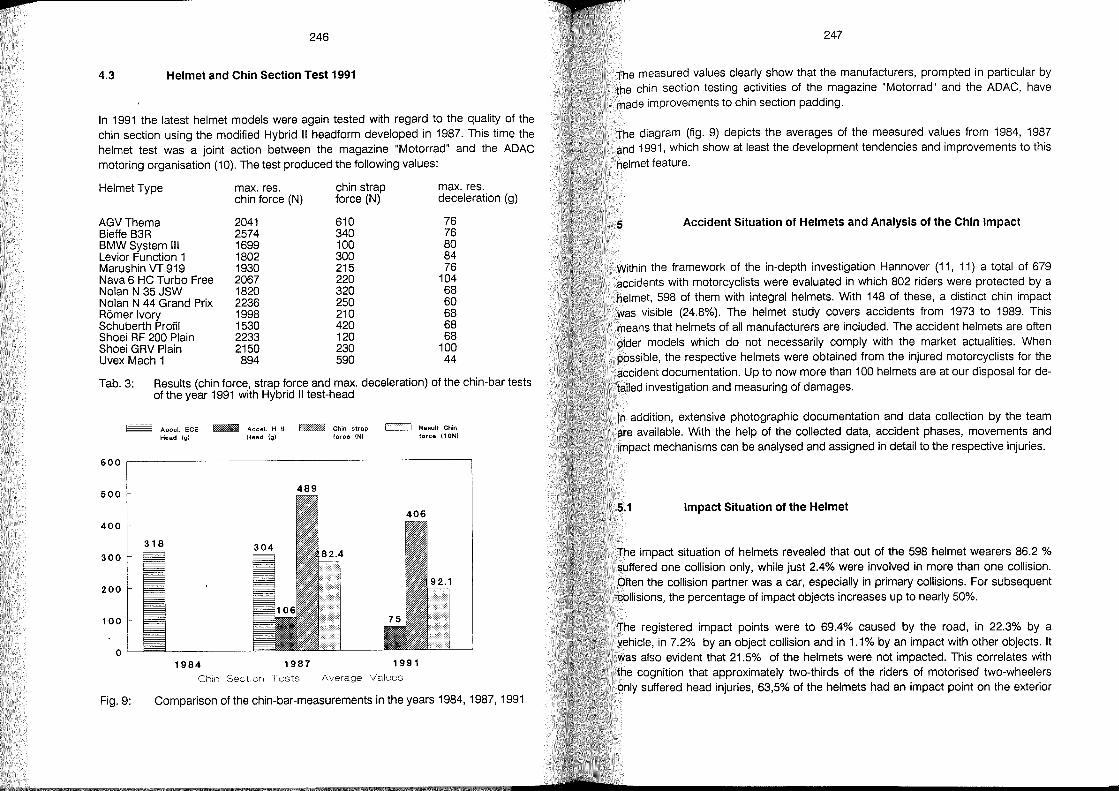
p
246
4.3 Heimet and Chin Section Test 1991
In 1991 the latest heimet models were again tested with regard to the quality of the chin section using the modified Hybrid 11 headform developed in 1987. This time the heimet test was a joint action between the magazine "Motorrad" and the ADAC motoring organisation (10). The test produced the following values:
Heimet Type max. res. chin strap max. res. chin force (N) force (N) deceleration (g)
AGVThema 2041 610 76 Bieffe B3R 2574 340 76 BMW System 111 1699 100 80 Levior Function 1 1802 300 84 Marushin VT 919 1930 215 76 Nava 6 HC Turbo Free 2067 220 104 Nolan N 35 JSW 1820 320 68 Nolan N 44 Grand Prix 2236 250 60 Römer Ivory 1998 210 68 Schuberth Profil 1530 420 68 Shoei RF 200 Plain 2233 120 68 Shoei GRV Plain 2150 230 100 Uvex Mach 1 894 590 44
Tab. 3: Results (chin force, strap force and max. deceleration) of the chin-bar tests of the year 1991 with Hybrid 11 test -head
~ Aces!. ECE ~ Aces!. H 11 ~ Chin strap c=:=J Result Chin Head {gJ Head (g) force (N) force (1 ON)
600 ~----------------------------------------------~
500 489
400
318 300
200
100
0 1984 1987 1991
Ch,n Sectlon Tests - Average Values
Fig.9: Comparison of the chin-bar-measurements in the years 1984, 1987, 1991
247
The measured values clearly show that the manufacturers, prompted in particular by the chin section testing activities of the magazine "Motorrad" and the ADAC, have made improvements to chin section padding.
The diagram (fig. 9) depicts the averages of the measured values from 1984, 1987 and 1991, which show at least the development tendencies and improvements to this heimet feature.
5 Accident Situation of Heimets and Analysis of the Chin Impact
Within the framework of the in-depth investigation Hannover (11, 11) a total of 679 accidents with motorcyclists were evaluated in which 802 riders were protected by a heimet, 598 of them with integral heimets. With 148 of these, a distinct chin impact was visible (24.8%). The heimet study covers accidents from 1973 to 1989. This means that heimets of all manufacturers are included. The accident heimets are often older models which do not necessarily comply with the market actualities. When possible, the respective heimets were obtained from the injured motorcyclists for the accident documentation. Up to now more than 100 heimets are at our disposal for detailed investigation and measuring of damages.
In addition, extensive photographic documentation and data collection by the team are available. With the help of the collected data, accident phases, movements and impact mechanisms can be analysed and assigned in detail to the respective injuries.
5.1 Impact Situation of the Heimet
The impact situation of heimets revealed that out of the 598 heimet wearers 86.2 % suffered one collision only, while just 2.4% were involved in more than one collision. Often the collision partner was a car, especially in primary collisions. For subsequent collisions, the percentage of impact objects increases up to nearly 50%.
The registered impact points were to 69.4% caused by the road, in 22.3% by a vehicle, in 7.2% by an object collision and in 1.1% by an impact with other objects. It was also evident that 21.5% of the heimets were not impacted. This correlates with the cognition that approximately two-thirds of the riders of motorised two-wheelers only suffered head injuries, 63,5% of the heimets had an impact point on the exterior
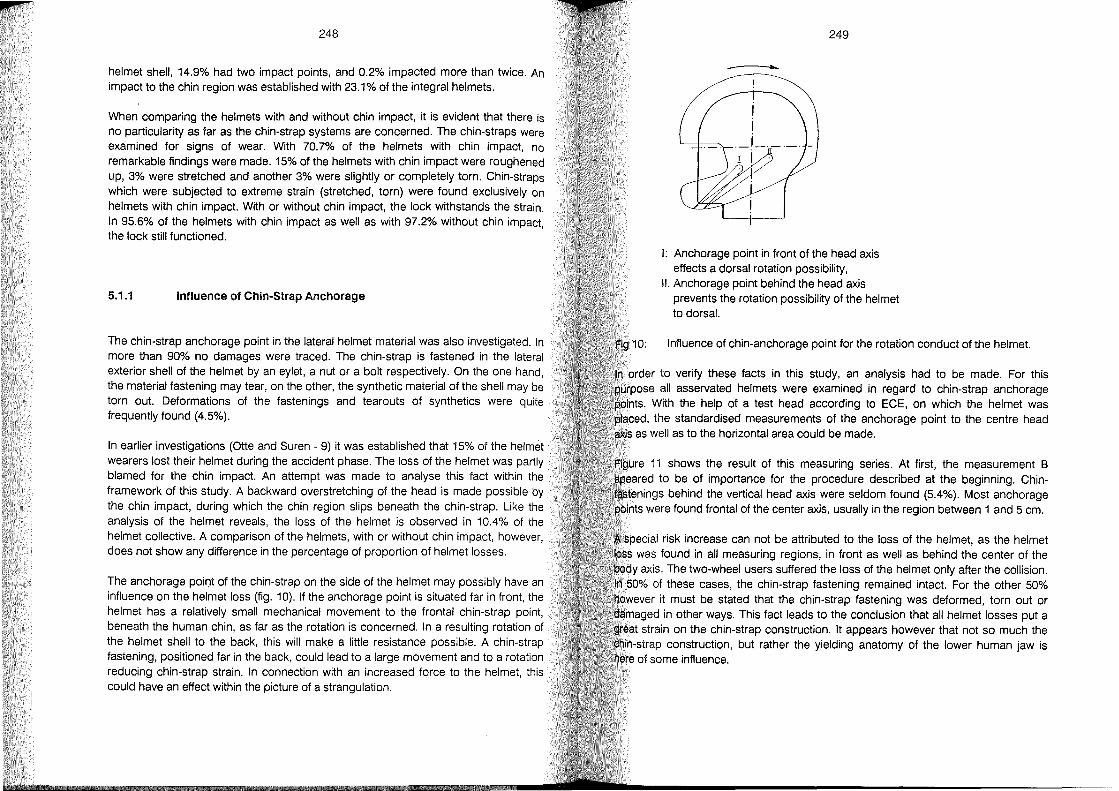
248
heimet shell, 14.9% had two impact points, and 0.2% impacted more than twice. An impact to the chin region was established with 23.1 % of the integral heimets.
When comparing the heimets with and without chin impact, it is evident that there is no particularity as far as the chin-strap systems are concerned. The chin-straps were examined for signs of wear. With 70.7% of the heimets with chin impact, no remarkable findings were made. 15% of the heimets with chin impact were roughened up, 3% were stretched and another 3% were slightly or completely tom. Chin-straps which were subjected to extreme strain (stretched, tom) were found exclusively on heimets with chin impact. With or without chin impact, the lock withstands the strain. In 95.6% of the heimets with chin impact as weil as with 97.2% without chin impact, the lock still functioned.
5.1.1 Influence of Chin-Strap Anchorage
The chin-strap anchorage point in the lateral heimet material was also investigated. In more than 90% no damages were traced. The chin-strap is fastened in the lateral exterior shell of the heimet by an eylet, a nut or a bolt respectively. On the one hand, the material fastening may tear, on the other, the synthetic material of the shell may be tom out. Deformations of the fastenings and tearouts of synthetics were quite frequently found (4.5%).
In earlier investigations (Otte and Suren - 9) it was established that 15% of the heimet wearers lost their heimet during the accident phase. The loss of the heimet was partly blamed for the chin impact. An attempt was made to analyse this fact within the framework of this study. A backward overstretching of the head is made possible by the chin impact, during which the chin region slips beneath the chin-strap. Like the analysis of the heimet reveals, the loss of the heimet is observed in 10.4% of the heimet collective. A comparison of the heimets, with or without chin impact, however, does not show any difference in the percentage of proportion of heimet losses.
The anchorage poil')t of the chin-strap on the side of the heimet may possibly have an influence on the heimet loss (fig. 10). If the anchorage point is situated far in front, the heimet has a relatively small mechanical movement to the frontal chin-strap point, beneath the human chin, as far as the rotation is concerned. In a resulting rotation of the heimet shell to the back, this will make a little resistance possible. A chin-strap fastening, positioned far in the back, could lead to a large movement and to a rotation reducing chin-strap strain. In connection with an increased force to the heimet, this could have an effect within the picture of a strangulation.
249
I: Anchorage point in front of the head axis effects a dorsal rotation possibility,
11. Anchorage point behind the head axis prevents the rotation possibility of the heimet to dorsal.
Influence of chin-anchorage point for the rotation conduct of the heimet.
order to verify these facts in this study, an analysis had to be made. For this purpose all asservated heimets were examined in regard to chin-strap anchorage
With the help of a test head according to ECE, on which the heimet was placed, the standardised measurements of the anchorage point to the centre head
as weil as to the horizontal area could be made.
11 shows the result of this measuring series. At first, the measurement B ",r,,,,,,,r,,,rl to be of importance for the procedure described at the beginning. Chinr,."r"rlllll'" behind the vertical head axis were seldom found (5.4%). Most anchorage
were found frontal of the center axis, usually in the region between 1 and 5 cm.
A special risk increase can not be attributed to the loss of the heimet, as the heimet lass was found in all measuring regions, in front as weil as behind the center of the
axis. The two-wheel users suffered the loss of the heimet only after the collision. 50% of these cases, the chin-strap fastening remained intact. For the other 50%
... "" .. ~"ö, it must be stated that the chin-strap fastening was deformed, tom out or .">I,m""RIl in other ways. This fact leads to the conclusion that all heimet losses put a
strain on the chin-strap construction. It appears however that not so much the construction, but rather the yielding anatomy of the lower human jaw is
of some influence.
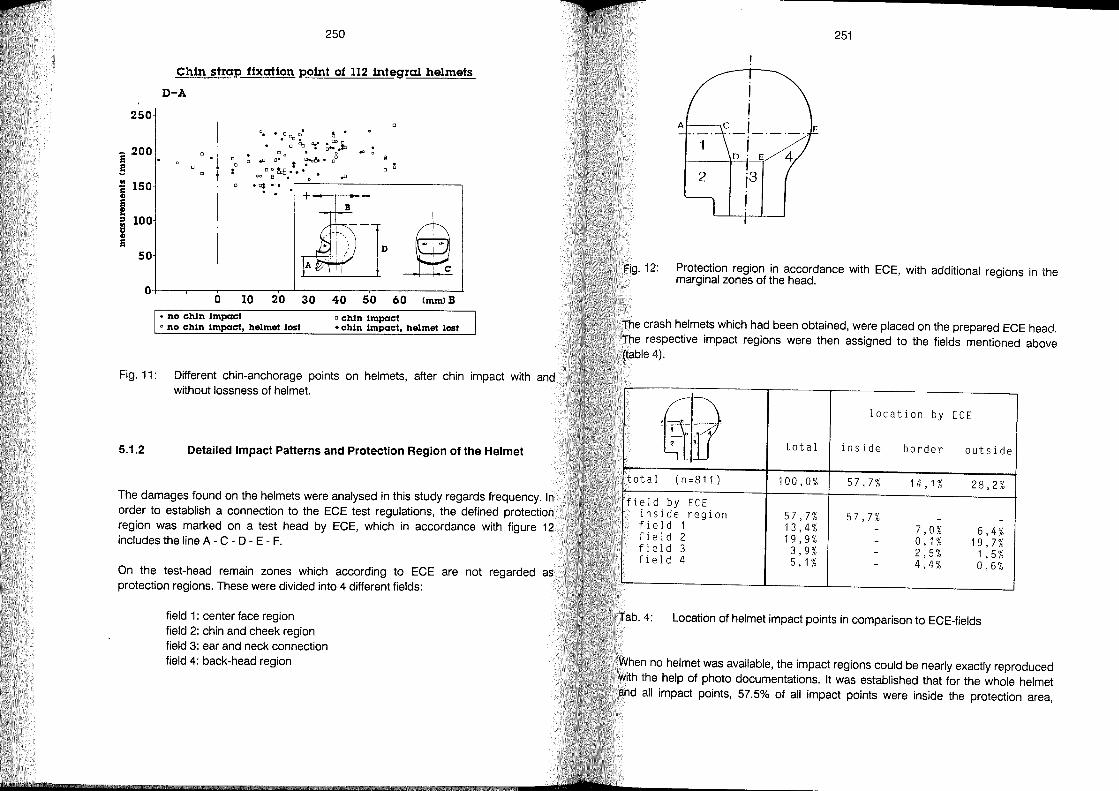
250
250
Chin strap fixation point of 112 lnt~ral helmets
D-A
I 00 0 - 200
: . t e • D • .§ D
: D ~ .. '2 150 G>
I e G> .. ::s 100 .. D
I G> e
50
. '" .. . . .
D~ -'---------'-
O;+---,-~--~--~~~~~~--~----~ o 10 20 30 40 50 60 (mmJB
• no chin impact D chin impact o no chin impact, helmet lost + chin impact, helme! losl
Fig. 11: Different chin-anchorage points on heimets, after chin impact with and without lossness of heimet.
5.1.2 Detailed Impact Patterns and Protection Region of the Heimet
The damages found on the heimets were analysed in this study regards frequency. In order to establish a connection to the ECE test regulations, the defined protection region was marked on a test head by ECE, which in accordance with figure 12 includes the line A - C - D - E - F.
On the test-head remain zones which according to ECE are not regarded as protection regions. These were divided into 4 different fields:
field 1: center face region field 2: chin and cheek region field 3: ear and neck connection field 4: back-head region
251
Protection region in accordance with ECE, with additional regions in the marginal zones of the head.
The crash heimets which had been obtained, were placed on the prepared ECE head. The respective impact regions were then assigned to the fields mentioned above (table 4).
'61lf location by ECE
2 , total inside border outside
(n =811 ) 100,0% 57,7% 14,1% 28,2% field by ECE
inside region 57,7% 57,7% fi el d 1 13,4% 7,0% 6,4% fi eId 2 19,9% 0,1% 19,7% field 3 3,9% 2,5% 1,5% fi el d 4 5,1% 4,4% 0,6%
Location of heimet impact points in comparison to ECE-fields
When no heimet was available, the impact regions could be nearly exactly reproduced with the help of photo documentations. It was established that for the whole heimet and all impact points, 57.5% of all impact points were inside the protection area,

252
defined by ECE. 14.1 % were in the marginal region and 28.2% clearly outside this region. The chin region (field 2) must be mentioned in 19.9% of the cases.
The detailed impact points on the whole heimet are shown in figure 13.
,4 %_---' --- ----~
1 ,9% ~ 1 , 9~ _- - / _'...- ... -...... ---... .. '" ~ 8,2%
• 6,5% ,
5,7%
;>,1%
. -- 'r-- ---__ • 1,7% ,
-----."1,7%
j})10' 1% !i"--- ---.
4,4% .-,o_. __ ~,l% ------
0,6% _ . 6,5%
-_ I
"-i- .. _- ------- ... -, 15,2% I 1,9%
Fig. 13: Distribution of established impact points on the crash heimet in all collisions.
The percentual distribution shows that the left chin region is more frequently involved than the right one (19.9% to 15.2%). The chin-strap represents the highest percentage. With 8.2% on the right and 10.1% on the left side, the forehead region is involved especially frequently. Divided into primary and secondary collisions, it shows that the chin region is clearly more often involved during the first collision, while in the second collision the region of the back and side (occipital) of the motorcyclists head are involved more frequently. Of the total of impact points in the secondary collision 41.1 % are found eXclusively in the front half, while a total of 70.4 % occurred during the first in the front region.
5.1.3 Shape of the Impact Objects
The impact object for the chin region is the road in almost 60% of the cases (59.6%), to almost 30.5% a vehicle impact, and in 7.8% a tree or wall respectively. As far as the shape of impact objects is concerned, these are mainly even areas. 74.3% were
253
evaluated as flat, 19.2% as edgy and 7.8% as rounded objects. For the ECE-R22 and also the other regulations the test is made with a flat and a hemispheric test body. These correlate with the realistic conditions. The regulations does however not exclude the possibility of a second impact to the same point. The secondary impact as required in standards, so-called "double-impact" was not confirmed in accident reality. In only 4% (n=7) of the impact situations a second impact to the same point was established. An analysis of the so-called "double impact" this mainly occurred flat on the road, and with clearly lesser force. They consequently only caused negligible abrasions on the heimet exterior. This proves that these norms does not comply with accident reality .
5.2. Systematic of the Chin Impact
Impact Frequency in the Chin-Strap Region
The total established impact points on 143 integral heimets were tested again in detail regarding to their exact localisation. For this purpose the impact points on the chinstrap were measured, in relation to the centre of chin bar. For the available heimets, the impact points could be measured relatively exactly, while the evaluation of the photographic material was only possible with limitations. The established distance of the chin-impact point from the centre of the bar is shown in figure 14.
n 20
16
o 1 % , .. 11 • 7 • • 10 11 12. U 14 15:.. 111
cm
nght 69. lett 63. center 1 1
Measured distance of the impact point on the chin-bar out of the center
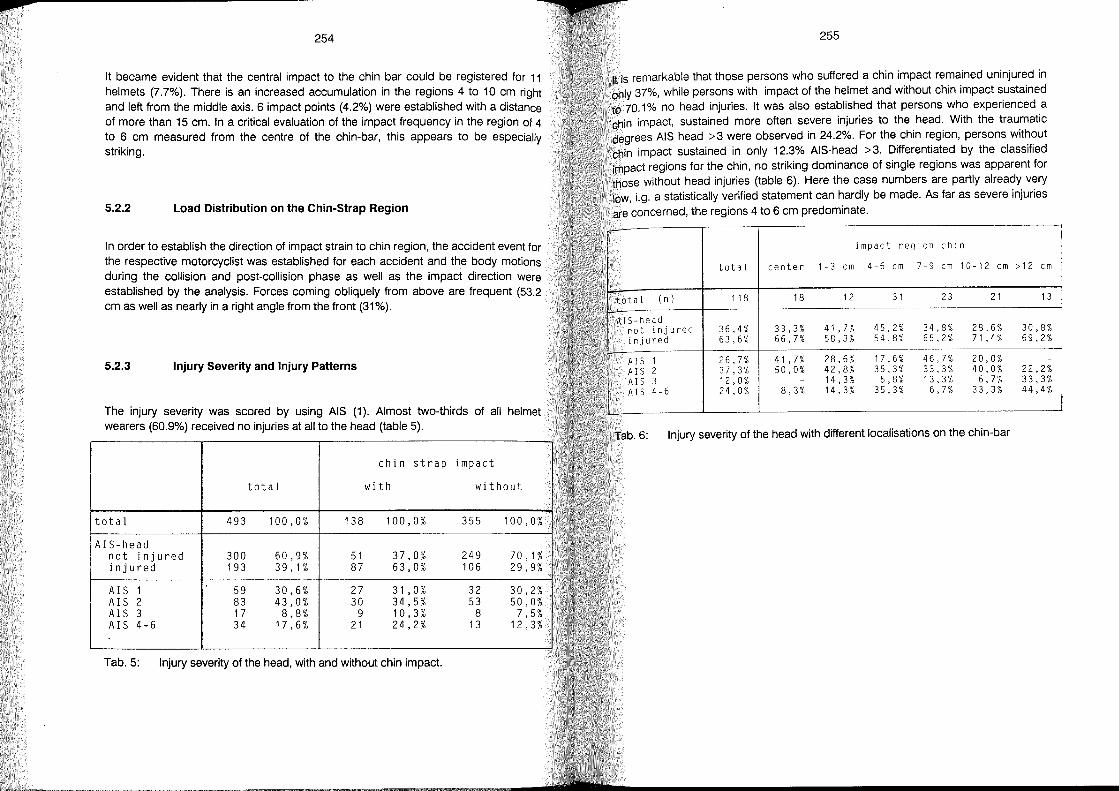
p;:a
254
It became evident that the central impact to the chin bar could be registered for 11 heimets (7.7%). There is an increased accumulation in the regions 4 to 10 cm right and left from the middle axis. 6 impact points (4.2%) were established with a distance of more than 15 cm. In a critical evaluation of the impact frequency in the region of 4 to 6 cm measured from the centre of the chin-bar, this appears to be especially striking.
5.2.2 Load Distribution on the Chin-Strap Region
In order to establish the direction of impact strain to chin region, the accident event for the respective motorcyclist was established for each accident and the body motions during the collision and post-collision phase as weil as the impact direction were established by the analysis. Forces coming obliquely from above are frequent (53.2 cm as weil as nearly in a right angle from the front (31%).
5.2.3 Injury Severity and Injury Patterns
The injury severity was scored by using AIS (1). Almost two-thirds of all heimet wearers (60.9%) received no injuries at all to the head (table 5).
chin strap impact
total with without
total 493 100,0% 138 100,0% 355 100,0%
AIS-head not injured 300 60,9% 51 37,0% 249 70,1% injured 193 39,1% 87 63,0% 106 29,9%
AIS 1 59 30,6% 27 31,0% 32 30,2% AIS 2 83 43,0% 30 34,5% 53 50,0% AIS 3 17 8,8% 9 10,3% 8 7,5% AIS 4-6 34 17,6% 21 24,2% 13 12,3%
Tab. 5: Injury severity of the head, with and without chin impact.
255
It is remarkable that those persons who suffered a chin impact remained uninjured in only 37%, while persons with impact of the heimet and without chin impact sustained to 70.1 % no head injuries. It was also established that persons who experienced a chin impact, sustained more often severe injuries to the head. With the traumatic degrees AIS head >3 were observed in 24.2%. For the chin region, persons without chin impact sustained in only 12.3% AIS-head > 3. Differentiated by the classified impact regions for the chin, no striking dominance of single regions was apparent for those without head injuries (table 6). Here the case numbers are partly already very low, i.g. a statistically verified statement can hardly be made. As far as severe injuries are concerned, the regions 4 to 6 cm predominate.
impact region chin
total center 1 - 3 cm 4-6 cm 7-9 cm 10- 12 cm >12 cm
(n) 118 18 12 31 23 21 13
AIS-head 41,7% 45,2% 34,8% 28,6% 30,8% not injured 36,4% 33,3%
injured 63,6% 66,7% 58,3% 54,8% 65,2% 71,4% 69,2%
AIS 1 26,7% 41,7% 28,6% 17,6% 46,7% 20,0% AIS 2 37,3% 50,0% 42,8% 35,3% 33,3% 40,0% 22,2% AIS 3 12,0% 14,3% 5,8% 13,3% 6,7% 33,3% AIS 4-6 24,0% 8,3% 14,3% 35,3% 6,7% 33,3% 44,4%
Injury severity of the head with different localisations on the chin-bar
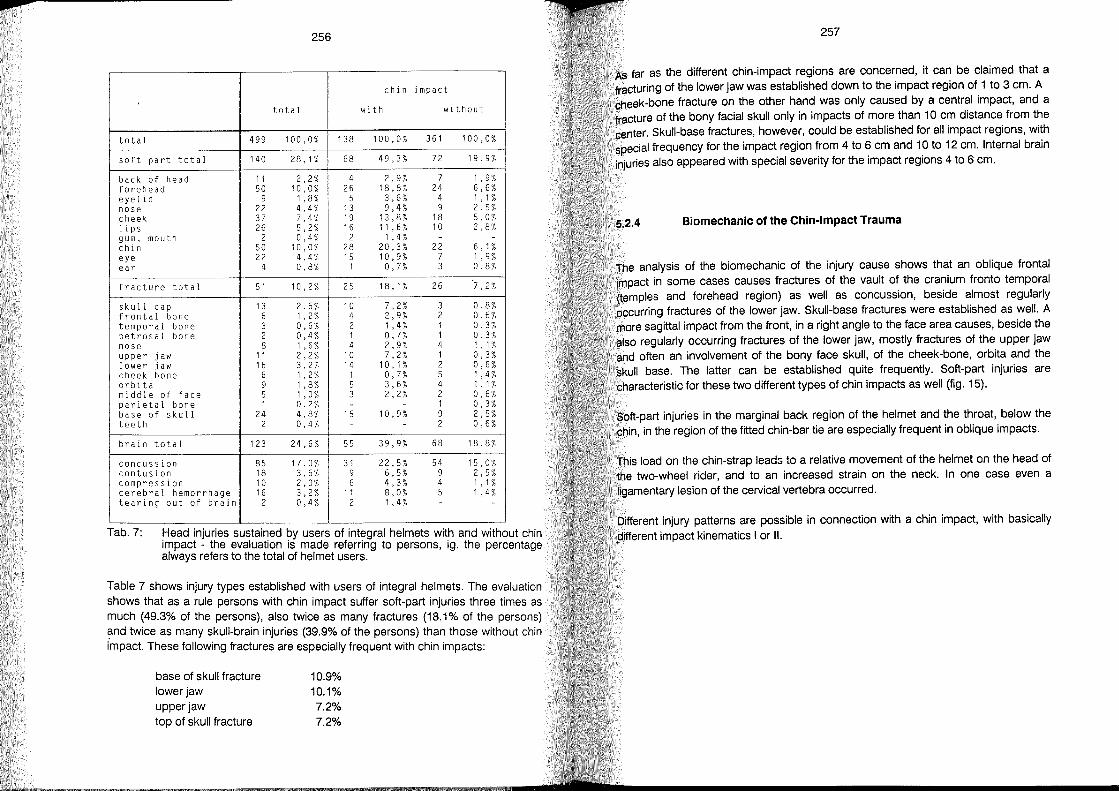
p
256
chin impact
tota I with without
total 499 100,0% 138 100,0% 361 100,0%
soft part total 140 28,1% 68 49,3% 72 19,9%
back of head 11 2,2% 4 2,9% 7 1,9% forehead 50 10,0% 26 18,8% 24 6,6% eye lid 9 1,8% 5 3,6% 4 1,1% nose 22 4,4% 13 9,4% 9 2,5% cheek 37 7,4% 19 13,8% 18 5,0% I i ps 26 5,2% 16 11,6% 10 2,8% gum, mouth 2 0,4% 2 1,4% - -
chin 50 10,0% 28 20,3% 22 6,1% eye 22 4,4% 15 10,9% 7 1,9% ear 4 0,8% 1 0,7% 3 0,8%
fracture total 51 10,2% 25 18,1% 26 '7,2%
skull cap 13 2,6% 10 7,2% 3 0,8% frontal bone 6 1,2% 4 2,9% 2 0,6% temporal bone 3 0,6% 2 1,4% 1 0,3% petrosal bone 2 0,4% 1 0,7% 1 0,3% no se 8 1,6% 4 2,9% 4 1,1% upper jaw 11 2,2% 10 7,2% 1 0,3% lower jaw 16 3,2% 14 10,1% 2 0,6% cheek bone 6 1,2% 1 0,7% 5 1,4% orbita 9 1,8% 5 3,6% 4 1,1% middle of face 5 1,0% 3 2,2% 2 0,6% parietal bone 1 0,2% - - 1 0,3% base of skull 24 4,8% 15 10,9% 9 2,5% teeth 2 0,4% - - 2 0,6%
brain total 123 24,6% 55 39,9% 68 18,8%
concussion 85 17,0% 31 22,5% 54 15,0% contusion 18 3,6% 9 6,5% 9 2,5% compression 10 2,0% 6 4,3% 4 1,1% cerebra I hemorrhage 16 3,2% 11 8,0% 5 1,4% tearing out of brain 2 0,4% 2 1,4% - -
Tab. 7: Head injuries sustained by users of integral heimets with and without chin impact - the evaluation is made referring to persons, ig. the percentage always refers to the total of heimet users.
Table 7 shows injury types established with users of integral heimets. The evaluation shows that as a rule persons with chin impact suffer soft-part injuries three times as much (49.3% of the persons), also twice as many fractures (18.1% of the persons) ~lnd twice as many skull-brain injuries (39.9% of the persons) than those without chin impact. These following fractures are especially frequent with chin impacts:
base of skull fracture lower jaw upper jaw top of skull fracture
10.9% 10.1% 7.2% 7.2%
257
As far as the different chin-impact regions are concerned, it can be claimed that a fracturing of the lower jaw was established down to the impact region of 1 to 3 cm. A cheek-bone fracture on the other hand was only caused by a central impact, and a fracture of the bony facial skull only in impacts of more than 10 cm distance from the center. Skull-base fractures, however, could be established fer all impact regions, with special frequency for the impact region from 4 to 6 cm and 10 to 12 cm. Internal brain injuries also appeared with special severity for the impact regions 4 to 6 cm.
5.2.4 Biomechanic of the Chin-Impact Trauma
The analysis of the biomechanic of the injury cause shows that an oblique frontal impact in some cases causes fractures of the vault of the cranium fronto temporal (temples and forehead region) as weil as concussion, beside almost regularly Qccurring fractures of the lower jaw. Skull-base fractures were established as weil. A more sagittal impact from the front, in a right angle to the face area causes, beside the also regularly occurring fractures of the lower jaw, mostly fractures of the upper jaw and often an involvement of the bony face skulI, of the cheek-bone, orbita and the skull base. The latter can be established quite frequently. Soft-part injuries are characteristic for these two different types of chin impacts as weil (fig. 15).
Soft-part injuries in the marginal back region of the heimet and the throat, below the chin, in the region of the fitted chin-bar tie are especially frequent in oblique impacts.
This load on the chin-strap leads to a relative movement of the heimet on the head of the two-wheel rider, and to an increased strain on the neck. In one case even a ligamentary lesion of the cervical vertebra occurred.
Different injury patterns are possible in connection with a chin impact, with basically different impact kinematics I or 11.
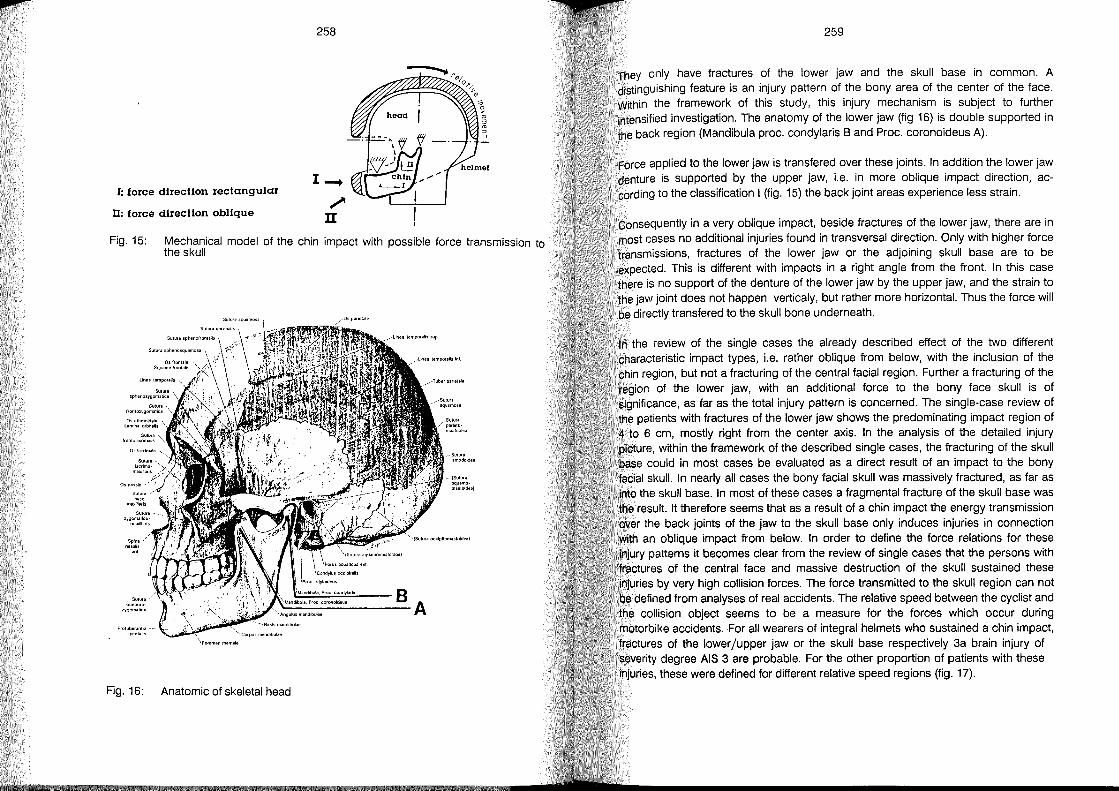
I: force dlrecUon reclangular
D: force dlrecUon oblique
258
--;--..,. r ~/ Q--ji-
" '3 ~ ro i5 " -
Fig. 15: Mechanical model of the chin impact with possible force transmission to the skull
Fig. 16: Anatomic of skeletal head
259
They only have fractures of the lower jaw and the skull base in common. A distinguishing feature is an injury pattern of the bony area of the center of the face. Within the framework of this study, this injury mechanism is subject to further intensified investigation. The anatomy of the lower jaw (fig 16) is double supported in the back region (Mandibula proc. condylaris Band Proc. coronoideus A).
Force applied to the lower jaw is transfered over these joints. In addition the lower jaw denture is supported by the upper jaw, Le. in more oblique impact direction, according to the classification I (fig. 15) the back joint areas experience less strain.
Consequentiy in a very oblique impact, beside fractures of the lower jaw, there are in most cases no additional injuries found in transversal direction. Only with high er force transmissions, fractures of the lower jaw or the adjoining skull base are to be expected. This is different with impacts in a right angle from the front. In this ca se there is no support of the denture of the lower jaw by the upper jaw, and the strain to the jaw joint does not happen verticaly, but rather more horizontal. Thus the force will be directly transfered to the skull bone underneath.
In the review of the single cases the al ready described effect of the two different characteristic impact types, Le. rather oblique from below, with the inclusion of the chin region, but not a fracturing of the central facial region. Further a fracturing of the region of the lower jaw, with an additional force to the bony face skull is of significance, as far as the total injury pattern is concerned. The single-case review of the patients with fractures of the lower jaw shows the predominating impact region of 4 to 6 cm, mostly right from the center axis. In the analysis of the detailed injury picture, within the framework of the described single cases, the fracturing of the skull base could in most cases be evaluated as a direct result of an impact to the bony facial skull. In nearly all cases the bony facial skull was massively fractured, as far as into the skull base. In most of these cases a fragmental fracture of the skull base was the result. It therefore seems that as a result of a chin impact the energy transmission over the back joints of the jaw to the skull base only induces injuries in connection with an oblique impact from below. In order to define the force relations for these injury patterns it becomes clear from the review of single cases that the persons with fractures of the central face and massive destruction of the skull sustained these injuries by very high collision forces. The force transmitted to the skull region can not be defined from analyses of real accidents. The relative speed between the cyclist and the collision object seems to be a measure for the forces which occur during motorbike accidents. For all wearers of integral heimets who sustained a chin impact, fractures of the lower jupper jaw or the skull base respectively 3a brain injury of severity degree AIS 3 are probable. For the other proportion of patients with these injuries, these were defined for different relative speed regions (fig. 17).
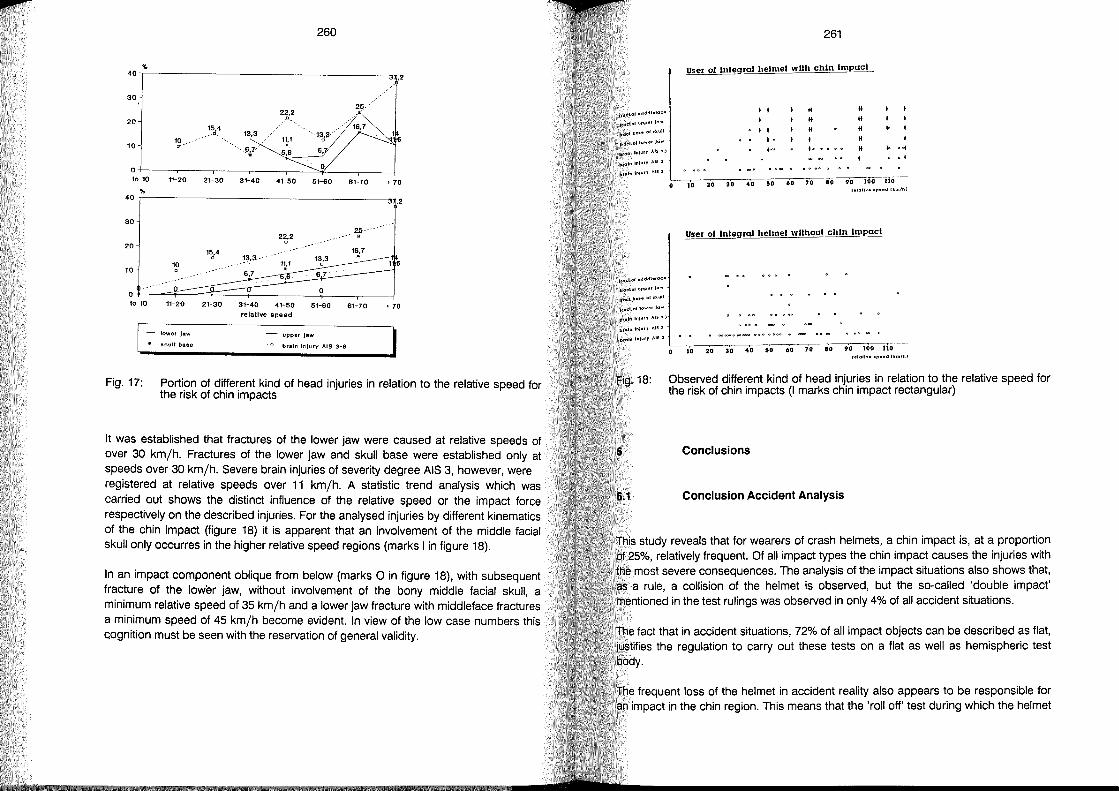
Fig. 17: Portion of different kind of head injuries in relation to the relative speed for the risk of chin impacts
It was established that fractures of the lower jaw were caused at relative speeds of over 30 km/ho Fractures of the lower jaw and skull base were established only at speeds over 30 km/ho Severe brain injuries of severity degree AIS 3, however, were registered at relative speeds over 11 km/ho A statistic trend analysis which was carried out shows the distinct influence of the relative speed or the impact force respectively on the described injuries. For the analysed injuries by different kinematics of the chin impact (figure 18) it is apparent that an involvement of the middle facial skull only occurres in the higher relative speed regions (marks I in figure 18).
In an impact component oblique from below (marks 0 in figure 18), with subsequent fracture of the lower jaw, without involvement of the bony middle facial skulI, a minimum relative speed of 35 km/h and a lower jaw fracture with middleface fractures a minimum speed of 45 km/h become evident. In view of the low case numbers this Qognition must be seen with the reservation of general validity.
'taetal mlddl .. laco
((actoIIiPpe, Jaw
flllc:Lb ... "ol.kull
rtae!.ollow •• Jci ...
braln 1"IUff AIS >3
1;1,<11,,11>111 ,,"153
261
User oliniegral helmel wllh chln Imp~
I I H 11
11 11
I I 11 11
I· I H
.... 10 00 00 11
0000
...
... o~
01
2. 30 40 50 60 '0 '0 '0 loilllo-b(.:II" 11\1"" AlS ~ L~--:c:--=----;-::--=---;;-::--..;--.;;--...
l'<JclofmlddhIOC"
ffOc:loIIlPp.or/aw
nClcl.bO."ollkull
I(cel. olto ..... ,!"'"
btaln In/U" AIS >3
b,lIi" Inlu', AIS 3
10 nlaH". Ip •• d (kmlnl
User 01 Inh!gral helmel wllhoul chln Impacl
00"",,,"00"""" .... 0 .......... CCDO .... -
braln Inlur, AIS 3 L-I~.--:2~0--:3~0--:4"'"0 --:6'0~ --:6"'"0 --:,";;-. --:,";;-. ---;;.";;-. ---';;10011-0 -
, .. laU va Ipood ltm/hl
Observed different kind of head injuries in relation to the relative speed for the risk of chin impacts (I marks chin impact rectangular)
Conclusions
Conclusion Accident Analysis
This study reveals that for wearers of crash heimets, a chin impact is, at a proportion of 25%, relatively frequent. Of all impact types the chin impact causes the injuries with the most severe consequences. The analysis of the impact situations also shows that, as a rule, a collision of the heimet is observed, but the so-called 'double impact' mentioned in the test rulings was observed in only 4% of all accident situations.
The fact that in accident situations, 72% of all impact objects can be described as flat, justifies the regulation to carry out these tests on a flat as weil as hemispheric test body.
The frequent loss of the heimet in accident reality also appears to be responsible for an impact in the chin region. This means that the 'roll off' test during which the heimet
p 262
is moved in frontal direction, as implemented in the test regulations, should be supplemented, in view of the movement of the heimet to the back in consequence of a chin impact in real accident situations.
No influence of the chin-strap anchorage point on the loss of the heimet could be established within the framework of this study. A frequent force on the chin strap as weil as on the humam chin was observed in chin impacts.
Only 57.5% of heimet impacts occurred within the protection region by ECE-R22, but 28.2% occurred outside this region. In view of this cognition, the presently defined protection region should be extended, especially to the cheek and chin region.
Lateral impact directions are very frequent. An absolutely central impact was established in the study to only 15.8% of the cases. As far as the injury frequency as weil as the injury severity are concerned, the region of 4 to 6 cm right or left of the chin center appears to be a very exposed point. In subsequence to a chin impact, fractures to the lower and upper jaw, to the scull base and the scull cup were established especially frequently. For this reason, an optimum test for the chin region has to be formulated as folIows:
Impact of the heimet with chin region 4 to 6 cm right or left centered in rightangled position of the face region, onto a flat test bOdy, in impact direction and at an impact speed of 30 km/ho
The analysis of the biomechanic proved that a chin impact may occur in two different kinematics: an oblique impact from the lower front to the chin strap, beside alm ost regularly occurring fractures of the lower jaw, can in so me cases cause fractures of the scull top and a concussion. In a more sagittal impact direction from the front and rather right-angular to the facial area, fractures of the upper jaw and the bony facial scull as weil as the scull base are also caused in most cases, beside almost regularly induced fractures of the lower jaw.
As far as the injury risk for the scull base is concerned, the more right-angular impact could be defined as a 'direct impact trauma', and the oblique impact from below to the chin region as an 'indirect trauma'. Feasible alterations for the heimet construction could be made in view of these findings. For the force dispersion, the more oblique force from below appears to be the more favourable, in view of the relatively extensive s.upport via the denture and joints of the lower jaw, to the scull-top region. With a rounded respectively chin bar, an impact right-angularly from the front could lead to a slipping and rotation of the head and the heimet system, and thus change in an oblique force.
263
In this connection it can be referred to the findings by Cooter (15), who observed in investigations on motorcyclists at Adelaide / Australia, that fatally injured motorcyclists who sustained an impact to the facial region, also suffered fractures of the scull base. Cooter also analysed that a force, transfered from the chin region and the joints of the lower jaw to the scull base, was the cause. His cognitions, which absolutely correspond with those from this study, conclude with the recommendation to modify the construction for the chin region by a backward moving chin bar and an inside shell, moving independently from the outer shell. The objective of these modifications is to be seen in the reduction of the impact force.
In view of the detailed types of chin impacts described in this study and possible subsequent injuries, further possibilities for constructive alterations are suggested for the reduction of the traumatic effect of a chin impact, by the design of a rounded shell contour of the chin bar.
6.2 Conclusion Technical Demands
The compilation of measured values for the chin bar recorded for heimets in the period 1984 to 1991 using the measurements chin force, chin strap force, and test head acceleration shows a tendency for improvement to heimets, i.e. a reduction in load values.
The mutual influence of chin force, chin strap force and head acceleration leads to the requirement for an individual adaptation of the chin section to the individual facial form.
The measuring equipment described (mod. Hybrid 11 head) is fundamentally suitable for recording the quality of chin protection using measuring techniques.
The information given from the accident analysis concerning impact and injury situations shows that a central impact on the chin section in the area of the point of the chin is a special case. Therefore, the measuring equipment used in 1991 is fitted with a six-axial sensor able to measure forces in three directions and momentum in three levels.
For an improved general classification of the technical measured values, biomechanicallimiting values for chin impact need to be made available.
When such values have been produced, the technical measuring methods should be correspondingly adapted or further developed.
Adoption of a chin bar test procedure into the ECE-R22 and all other standards that goes beyond known requirements should be the ultimate approach.
7
(1 )
(2)
(3)
(4)
(5)
(6)
(7)
(8)
(9)
(10)
(11 )
(12)
(13)
(14)
(15)
264
Reference List
, The Abbreviated Injury Scale. - Revision 85 / American Association for Automotive Medicine. - Morton Grove, lliinois/USA, 1985
Casques de protection pour usagers de motocycles, velomoteurs et cyclomoteurs / L'assoclation francaise de normalisation (afnor). - Paris, 1984. _ (NF; S72-305)
Dilling, J; Otte, 0.: Die B"edeutung örtlicher Unfallerhebungen im Rahmen der Unfallforschung In: Jahrestagung 1986 der Deutschen Gesellschaft für Verkehrsmedizin eV., 7. bis 8. März f98c Hannover: Kongreßbericht / Bundesanstalt für Straßenwesen. - Bergisch-Gladbach, 1986. - S. 59-65. - (Unfall- und Sicherheitsforschung Straßenverkehr; 56)
Einheitliche Vorschriften für die Genehmigung der Schutzhelme für Fahrer und Mitfahrer von Krafträdern, Fahrrädern mit Hilfsmotor und Mopeds. -Ludwigsburg: Dokumentation Kraftfahrwesen e.V. - (ECE; 22-03)
Erhebungen am Unfallort / D. Otte (u.a.). - Köln: Bundesanstalt für Straßenwesen, 1982. - (Unfall- und Sicherheitsforschung Straßenverkehr; 37)
Heimet Induced Skull Base Fracture in a Motorcyclist / D. Cooter (et al.) In: The Lancet (January 1988). - S. 84-85
Motor Presse Verlag: Ausgaben 8/84, 11/87, 8/91. - Stuttgart
Motorcycle Heimets In: Code of Federal Regulations, Transportation, Office of the Federal Register National Archives and Records Administration as a special Edition of the Federal Register. - S. 513-528. - (FMVSS Standard; 218)
Otte, 0.; Suren, E.G.: Schutzhelme für motorisierte Zweiradfahrer. Band 2: Auswertung von Zweiradunfällen. - Bergisch-Gladbach: Bundesanstalt für Straßenwesen, 1985. - (Forschungsberichte der Bundesanstalt für Straßenwesen; 113)
Protective heimets for drivers and passengers of motor cycles and mopeds / CEN, Comite Europeen de Normalisation. - (CEN; EN398)
Protective Heimets for Vehicular User, UDC 614.891.1 :G14.862.629.115.3/8/ Japanese Standards Association. - Tokyo, 1982. - (Japanese Industrial Standard; JIS T8133-1982)
Safety Heimets for Motorcycle Riders / Canadian Standards Association. _ Ontario, Canada, 1970. - (CSA Standard; 0230-1970)
SNELL : Standard for Protective Headgear / Snell Memorial Foundation. _ Wakefield, USA, 1985
Specification tor Protective Heimets tor Vehicle Users / British Standards Institution. - London, 1985. - (BS; 6658:1985)
14 Helme im Visier In: ADAC Motorwelt (1991)4. - S. 32
Brakes
Hans Eberspächer: Psychological Consideration on Brake Use Patterns of Motorcyclists
Alois Weideie: Braking While Cornering on a Motorcycle - Problems of Riding Dynamics,
Influences of Rider Personality, Potentials of Development
Touichiro Hikichi, Tatsuhiro Tomari, Masaie Katoh, Michael Thiem: Research on the Motorcycle Antilock Brake System. Part 3: Braking
Effectiveness of an Electronically Controlled ABS on Road Surfaces with Different p. Levels
Yukimasa Nishimoto, Knau Iwashita, Tetsuo Tsuchida, Michael Thiem: Research on Combined Brake System for Motorcycle
Psychological Consideration on Brake Use Patterns of Motorcyclists
Hans Eberspächer
Universität Heidelberg
Germany
269
1 Abstract
In this manuscript the braking behaviour of motorcyclists is analysed on the basis of psychological and theoretical reflection. The analyze leeds the author to this cognition: The braking of a powered two-wheelers is expecting to much of the rider. He is not in the position to realize all possible and necesarry deceleration values.
The results of this observation are special demands to the designers of motorcycle brakes. Motorcycle brakes should be more practical, that means, the limits of human acting should be taken into account .
270
The following statements are based on data of a multitude of narrative interviews and observations as a referee and instructor of approx. 20 perfection trainings for more
than 2000 motorcyclists.
2 Requirements
The requirement when riding a motorcycle reduces itself on acceleration: positive, crosswise, negative - accelerating, bending, braking. In the following, the lastnamed requirement will be dealt with.
In the awareness of motorcyclists, positive and crosswise acceleration are obviously in the foreground - they have a character of prestige. The fascination of motorcycling almost seems to result from these two forms of acceleration ([6] RHEINBERG; 1991). With no other vehicle they can be obtained so easily and so cheaply. The motorcycle industry underlines this fascination and charisma by an adequate product design mostly oriented at the racing.
In situations of competition, late braking has a very high prestige, too, but it is very different from the braking in the road traffic because the moments of braking are normally freely chosen. In the road traffic, however, the negative acceleration is considered as an essential necessity which is rather thrust aside/displaced and depreciated in the field of dangerous situations.
3 Training
The above-mentioned process of depreciation and displacement is encouraged by brake exercises during the training of motorcyclists which are being practiced under unrealistic conditions, e.g. with low speed on well-gripping roads and intendedly arranged. The motorcycle rider determines the moment of the braking, something he would hardly (be able to) do in the normal road traffic and especially not in critical
situations.
Because of the risks of accidents and falls, motorcyclists as weil as driving instructors avoid brake trainings with high speed on wet roads before solid obstacles and under normal conditions, e.g. high speed (for instance motorway, wet, two persons, luggage). In our opinion this can only be explained by the fact that the problems of
271
braking are being repressed from the mind expecially when potentially dangerous situations are concerned.
self-fulfilling prophecy ([1] BANDURA, 1977; [2] EBERSPÄCHER, 1990) in the sense of conviction of the efficacy of one's own possibilities to act cannot develop from such an opinion. But exactly this (self-fulfilling prophecy) would be the cognitive ability wh ich could support controlled acting in dangerous situations ("I am convinced that I am able to brake in every situation").
4 Analysises
Accident analysises show that too high and inappropriate speed come by far first in the supposed reasons for accidents. We are convinced that in many cases inappropriate braking behaviour and acting would be a correcter description. In these pretended analysises, the objective reality seems to be dominated rather by the personal experience of the analysts than by the factual background.
5 Problems
From our point of view, the optimisation of the braking behaviour of motorcyclists would be a urgently necessary measure in order to reduce the number of accidents. This requirement is emphasized - among other things - by three objectively dangerous conditions of motorcycling:
low passive security; consequences of suboptimal brake behaviour; inclined position during crosswise acceleration.
In addition to that comes the subjective change of perception connected with a change of acting in dangerous situations, e. g. in the case of enforced full brakings. The experience shows that motorcyclists have good chances to decelerate alm ost optimally when they themselves can choose the moment of braking.
The problem starts when braking is enforced. Here, the discrepancy between the possibilities of human acting and the brake technology derived from the racing sport becomes clear. A result of this discrepancy is an overcharge of capacity. In order to equalize this discrepancy, a motorcyclist should produce the following coordination

272
performance in an enforced and not freely chosen situation and conscious of the consequence of a crash into asolid obstacle:
handle two independen brakes with hand and foot, at the same time regulate the different effects of delay and the completely different effect on the road behaviour of the motorcycle; at the same time co-ordinate the front and the rear wheel brake, adjust them to the possibly changing friction factor of the underground and at the same time observe the traffic situation.
In unproblematical, that means self-chosen situations without consequences, this coordination normally functions. In situations of potentially grave consequence (possibly fateful consequences, externally provoked), this complicated co-ordination can literally collapse and change into a behaviour of shock and panik.
Shock counts for a short-term reaction to unexpected, suddenly appearing intensive stimuli. The action carried out right before the shock is shortly being interrupted, "shock paralysis" or at least a disorganisation of acting are possible.
Similar is the case in situations of panik and stress, even concerning apparently stable skills without consequences in everyday life - compared to the act of motorcycling -(for instance parking before spectators). In extremes, this disorganisation of acting is manifested in a form of hyperactivity ("rage of acting") or hypoactivity ("paralysation"), each connected with a destabilisation of the co-ordination of acting. The consequences for the motorcycling and especially the full brake seem to be obvious ([4] EHLERS et al., 1986).
When this happens can not be stated objectively but only in dependence on the personal experience of the motorcyclist. For the fundamental psychic priciple that behaviour is regulated by perception and valuation - thus by the subjective image of a situation and not the objective situation itself- is valid not only in the case of braking on two wheels. On the other hand this means that motorcyclists may react and act completely inedequate in objectively simple situations - with the corresponding consequences. Good examples for this are the potentials of fear most of the motorcyclists develop with rain and the behaviour in inclined position. Picture 1 shows the discrepancy between objective and experienced inclined position.
273
Objective and subjective inclined position ([3] EBERSPÄCHER, 1991)
In order to optimize the action of braking by special training measures, it seems helpful to first make an analysis. The model of the hierarchical structure (of behaviour) and the regulation of behaviour ([5] HACKER; 1978; [7] VOLPERT, 1976) offers a productive approach. We can differenciate between three levels for the regulation of behaviour:
intellectual/consciousness-regulated level- conscious conceptive/perceptive-regulated level- possibly conscious sensomotorical or programme-steered level - unconscious
The braking performance is appropriate to the capacity and close to the optimum as long as it can be intellectually regulated in situations experienced as harmless. The usual brake exercises in driving schools and perfection trainings stay on this level and therefore the motorcyclist is lead to believe that he is able to brake.
In dangerous situations however, the perceptive behaviour changes in a way that the obstacle and the consequences of an inadequate brake may completely monopolize the intellectual canal capacity of the motorcyclist. This can lead to hypnotic effects,
274
shock, paralysation, panik and others ([4] EHLERS et al., 1986) and therefore cause inadequate behaviour. This process is being superposed by the exterior determination - moment and course of the action are imposed. Two simultaneous actions are impossible on the intellectual consciuousness-regulated level; one actionin this case the braking - would therefore have to be "delegated" to a lower regulation level.
This delegation however succeds only under the condition that a programme has been put up by systematical training which can be regulated on both levels. If this didn't take place, action primitivisms such as spasmical gripping to the handbrake or "car brake", that is frantically inadequate pushing of the pedal brake of the motorbyke.
6 Conclusions
Systematic brake training in oder to learn programme-steered brake behaviour. This is only possible by
large-scale an high intensity of the training. This includes in the first place a considerable increase of the time spent. In addition to that one has to make appropriate and realistic demands concerning the training (for instance changing road surfaces, humidity, changing speeds usual for traffic, e.g. high speed); stronger emphasis on enforced brake behaviour in contrast to deliberately chosen, intended brakes. This means, the decision, when the brake is going to start and with wh ich intensity it is going to be carried out has - to a large extent - to be decided by a third party (exterior), e.g. the driving teacher or trainer and not - as usual - by the motorcyclist.
The motorcycle brake technology has to be adapted to the possibilities of human behaviour. The technical material available on the market up to know is insufficiently. adapted. A machine with demands comparable to those of a motorcycle for brake would not get a licence in the industry! Essential would be
One-handle brake (many racing motorcyclist brake only with the handbrake and thus deliberately renounce to apart of the braking action in favour of the possibility of regulation); automatic co-ordination between front wheel and rear wheel braking action (apportionment of the brake horse power); appropriate anti-lock system for motorcycles.
7
1)
2)
3)
4)
5)
6)
7)
275
Reference List
Bandura, A. (1977): Self.Efficacy: Toward a Unifying Theory of Behavioral Change. Psycholgoical Review, 84, p. 1991-215
Eberspächer, H. (1990): Sportpsychologie, 4. Aufl. 1990, Reinbek. Rowohlt
Eberspächer, H. (1991): Mentale Trainingsformen in der Praxis, 2. Aufl. 1991, Oberhaching: sportinform
Ehle:rs, A.; f0argraf, J.; ~oth, W.T.: (1986): Panik und Angst: Theone und Forschung zu einer neuen Klassifikation von Angststörungen. Zeitschrift für klinische Psychologie, 15 (4), p. 281-302
Hacker, W. (1978): Allgemeine Arbeits- und Ingenieurpsychologie. Berlin (Ost): VEB Deutscher Verlag der Wissenschaften
Rheinberg, F. (1991): Flow-Erleben beim Motorradfahren: Eine Erkundungsstudie zu einem besonderen Funktionszustand. Safety, Environment, Future: Proceedings of the ~991 !nterna~ional Motorcycle Conference, ed. by Institut für ZweiradsIcherheit. - Bochum, 1991. - (Forschungshefte Zweiradsicherheit, 7)
Volpert, W. (1976): Optimierung von Trainingsprogrammen, 2. Aufl. Lollar/Lahn: Achenbach
(transl. by Monika Kohler, Münster)
Braking While Cornering on a Motorcycle - Problems of Riding Dynamies, Influences of Rider Personality,
Potentials of Development
Alois Weideie
Technische Hochschule Darmstadt
Germany
279
1 Abstract
In the Department of Vehicle Technology (Fachgebiet Fahrzeugtechnik = FZD, Director: Prof. Dr.-Ing. B. Breuer) at Darmstadt Technical College, the poss-ibilities of improving br'aking reliability and the travelling stability during motor cycle braking, particularly under the difficult condictions of the dynamics of travelling through curves were and are being studied theoretically and in the course of practical experiments.
Particular attention has been paid to the link between different riders' riding skill and the quality of braking in curves with different brake systems; the quality of a braking procedure while riding in a curve is not just described by features typical for braking, such as, for example, the deceleration aChieved, but, in particular, by criteria of riding stability, such as the increase in steering unstead-iness, and the reliable adherence to the given driving line, e.g. the deviation from course.
There proved to be a link between the rider's experience and the deceleration achieved in a curve, but by no means with respect to the lateral dynamic stability features (increase in steering unsteadiness, braking steering moment); here, at least in the test situation recorded, the lead in objective active safety is compensated or in individual cases overcom-pensated by increased subjective willingness to take a risk.
Building up on the results obtained, a concept proposal was prepared for a linear, transverse and vertical dynamically regulated, load-controlled combination brake, also containing measures against the particular problems specific to single track vehicles, the off-track fluctuations critical for rid-ing stability and the braking steering moment. The requisite sensory mechanism was designed and its suitability for use in practice was demonstrated in an experiment on the dynamics of vehicle movement. In subsequent experiments, the braking system defined as being suitable for curves, including the improved braking power regulation is to be constructed so that the gain in braking reliability and driving stability can be examined in practice.
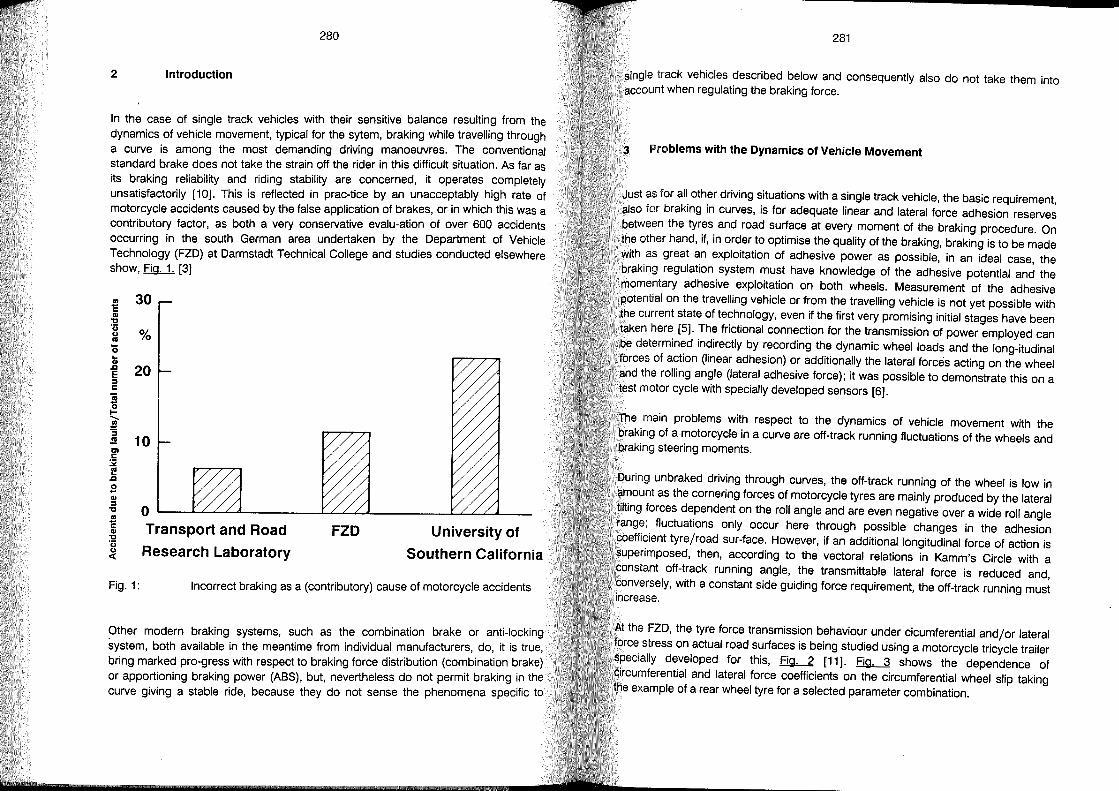
280
2 Introduction
In the case of single track vehicles with their sensitive balance resulting from the dynamics of vehicle movement, typical for the sytem, braking while travelling through a curve is among the most demanding driving manoeuvres. The conventional standard brake does not take the strain off the rider in this difficult situation. As far as its braking reliability and riding stability are concerned, it operates completely unsatisfactorily [10]. This is reflected in prac-tice by an unacceptably high rate of motorcycle accidents caused by the false application of brakes, or in which this was a contributory factor, as both a very conservative evalu-ation of over 600 accidents occurring in the south German area undertaken by the Department of Vehicle Technology (FZD) at Darmstadt Technical College and studies conducted elsewhere show, Ei.9.,...1,. [3]
.. 30 c GI
" 'u ~ % ö lil ~ 20 :::I C
~ "3 J! 10 CI c
:.ii! f! .Q
oS GI :::I
" .. C GI
" 'u ... oe(
o Transport and Road
Research Laboratory
FZD University of
Southern California
Fig.1: Incorrect braking as a (contributory) cause of motorcycle accidents
Other modern braking systems, such as the combination brake or anti-Iocking system, both available in the meantime from individual manufacturers, do, it is true, bring marked pro-gress with respect to braking force distribution (combination brake) er apportioning braking power (ASS), but, nevertheless do not permit braking in the curve giving a stable ride, because they do not sense the phenomena specific to
281
single track vehicles described below and consequently also do not take them into account when regulating the braking force.
3 Problems with the Dynamics of Vehicle Movement
Just as for all other driving situations with a single track vehicle, the basic requirement, also for braking in curves, is for adequate linear and lateral force adhesion reserves between the tyres and road surface at every moment of the braking procedure. On the other hand, if, in order to optimise the quality of the braking, braking is to be made with as great an exploitation of adhesive power as possible, in an ideal case, the braking regulation system must have knowledge of the adhesive potential and the momentary adhesive exploitation on both wheels. Measurement of the adhesive potential on the travelling vehicle or from the travelling vehicle is not yet possible with the current state of technology, even if the first very promising initial stages have been taken here [5]. The frictional connection for the transmission of power employed can be determined indirectly by recording the dynamic wheel loads and the long-itudinal forces of action (linear adhesion) or additionally the lateral forcss acting on the wheel and the rolling angle (lateral adhesive force); it was possible to demonstrate this on a test motor cycle with specially developed sensors [6].
The main problems with respect to the dynamics of vehicle movement with the braking of a motorcycle in a curve are off-track running fluctuations of the wheels and braking steering moments.
During unbraked driving through curves, the off-track running of the wheel is low in amount as the cornering forces of motorcycle tyres are mainly produced by the lateral tilting forces dependent on the roll angle and are even negative over a wide roll angle range; fluctuations only occur here through possible changes in the adhesion coefficient tyrejroad sur-face. However, if an additional longitudinal force of action is superimposed, then, according to the vectoral relations in Kamm's Circle with a constant off-track running angle, the transmittable lateral force is reduced and ~onversely, with a constant side guiding force requirement, the off-track running mus~ Increase.
At the FZD, the tyre force transmission behaviour under cicumferential andjor lateral force stress on actual road surfaces is being studied using a motorcycle tricycle trailer specially developed for this, ~ [11]. ~ shows the dependence of circumferential and lateral force coefficients on the circumferential wheel slip taking the example of a rear wheel tyre for a selected parameter combination.
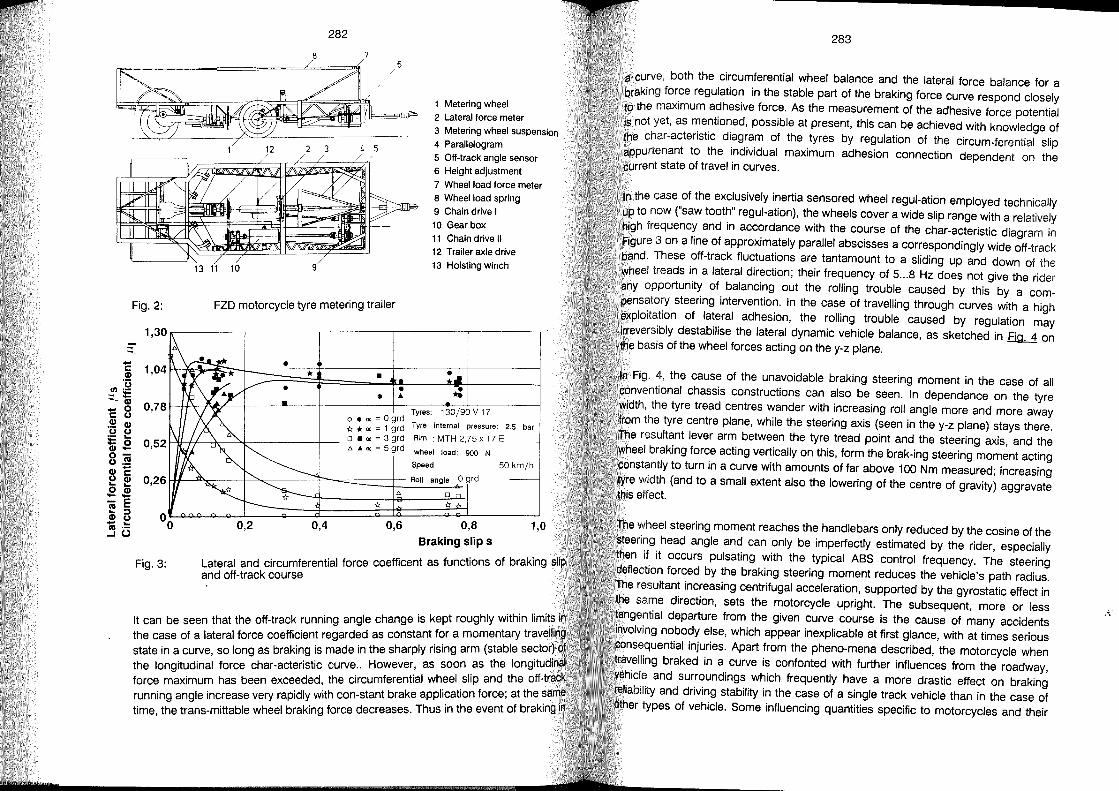
-c: 0) '(3
1/1 .-- := ""-0) _ 0
c: u .!!! 0) u u := (; 0)-0-u .!!! O)c U 0) ... ... o 0)
='E ~ ::l 0) U - ... ca .--I(J
Fig.2:
Fig.3:
282
8
1 Metering wheel 2 Lateral force meter
3 Metering wheel suspension 4 Parallelogram 5 Off-track angle sensor 6 Height adjustment
7 Wheel load force meter 8 Wheel load spring 9 Chain drive I
10 Gearbox 11 Chain drive 1/ 12 Trailer axle drive
13 Hoisting winch
FZD motorcycle tyre metering trailer
*
0,2 0,4
• • . '"
•
Tyres: 130/90 V 17 o • '" = 0 grd * * '" = 1 grd Tyre internal pressure: 2.5 bar o .",=3grd Rim :MTH2,75x17E
'" '" '" = 5 grd wheel load: 900 N
Speed 50 km/h
Roll angle 0 grd
'" 0
* * 0,6 0,8 1,0
Braking Slip s
Lateral and circumferential force coefficent as functions of braking slip and off-track course
It can be seen that the off-track running angle change is kept roughly within limit~ in the case of a lateral force coefficient regarded as constant for a momentary travelhn~ state in a curve, so long as braking is made in the sharply rising arm (stable se~tor~ 0
the longitudinal force char-acteristic curve .. However: as soon .as the 10ngltudln~ force maximum has been exceeded, the circumferentlal wh.eel.slip and the off-trac running angle increase very rapidly with con-stant brake applicatJon force; at the ~an:e time the trans-mittable wheel braking force decreases. Thus in the event of braklng In ,
283
a curve, both the circumferential wheel balance and the lateral force balance for a braking force regulation in the stable part of the braking force curve respond closely to the maximum adhesive force. As the measurement of the adhesive force potential is not yet, as mentioned, possible at present, this can be achieved with knowledge of the char-acteristic diagram of the tyres by regulation of the circum-ferential slip appurtenant to the individual maximum adhesion connection dependent on the current state of travel in curves.
In the case of the exclusively inertia sensored wheel regul-ation employed technically up to now ("saw tooth" regul-ation), the wheels cover a wide slip range with a relatively high frequency and in accordance with the course of the char-acteristic diagram in Figure 3 on a line of approximately parallel abscisses a correspondingly wide off-track band. These off-track fluctuations are tantamount to a sliding up and down of the wheel treads in a lateral direction; their frequency of 5 ... 8 Hz does not give the rider any opportunity of balancing out the rolling trouble caused by this by a compensatory steering intervention. In the case of travelling through curves with a high exploitation of lateral adhesion, the rolling trouble caused by regulation may irreversibly destabilise the lateral dynamic vehicle balance, as sketched in Fig. 4 on the basis of the wheel forces acting on the y-z plane.
In Fig. 4, the cause of the unavoidable braking steering moment in the case of all conventional chassis constructions can also be seen. In dependance on the tyre width, the tyre tread centres wander with increasing roll angle more and more away trom the tyre centre plane, while the steering axis (seen in the y-z plane) stays there. The resultant lever arm between the tyre tread point and the steering axis, and the wheel braking force acting vertically on this, form the brak-ing steering moment acting constantly to turn in a curve with amounts of far above 100 Nm measured; increasing
width (and to a small extent also the lowering of the centre of gravity) aggravate this effect.
The wheel steering moment reaches the handlebars only reduced by the cosine of the steering head angle and can only be imperfectly estimated by the rider, especially
if it occurs pulsating with the typical ASS control frequency. The steering deflection forced by the braking steering moment reduces the vehicle's path radius. The resultant increasing centrifugal acceleration, supported by the gyrostatic effect in the same direction, sets the motorcycle upright. The subsequent, more or less tangential departure from the given curve course is the cause of many accidents involving nobody else, which appear inexplicable at first glance, with at times serious consequential injuries. Apart trom the pheno-mena described, the motorcycle when travelling braked in a curve is confonted with turther influences from the roadway,
and surroundings which frequently have a more drastic effect on braking ity and driving stability in the case of a single track vehicle than in the case of types of vehicle. Some influencing quantities specific to motorcycles and their
,".'
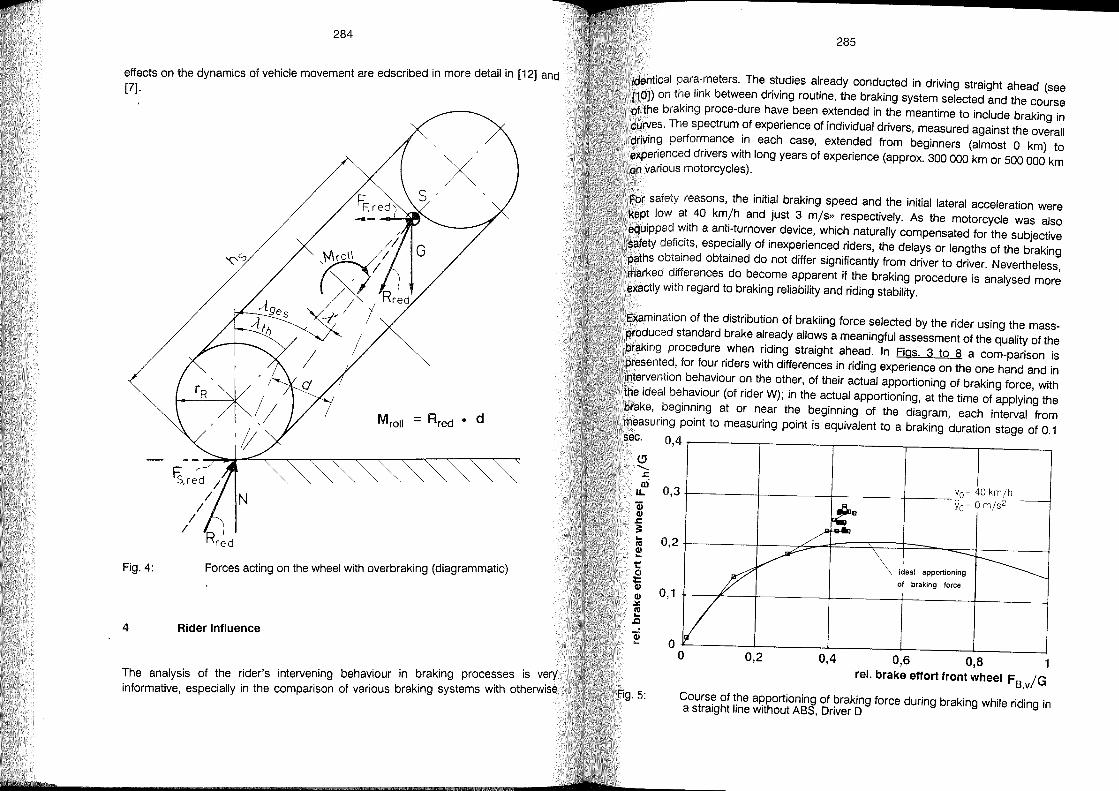
284
effects on the dynamics of vehicle movement are edscribed in more detail in [12] and [7].
Fig.4: Forces acting on the wheel with overbraking (diagrammatic)
4 Rider Influence
The analysis of the rider's intervening behaviour in braking proce~ses is v~ry informative, especially in the comparison of various braking systems wlth otherwlse
285
identical para-meters. The studies al ready conducted in driving straight ahead (see [10]) on the link between driving routine, the braking system selected and the course of the braking pro ce-du re have been extended in the meantime to include braking in curves. The spectrum of experience of individual drivers, measured against the overall driving performance in each case, extended from beginners (almost 0 km) to experienced drivers with long years of experience (approx. 300000 km or 500 000 km on various motorcycles).
For safety reasons, the initial braking speed and the initial lateral acceleration were kept low at 40 km/h and just 3 m/s» respectively. As the motorcycle was also equipped with a anti-turnover device, which naturally compensated for the subjective safety deficits, especially of inexperienced riders, the delays or lengths of the braking paths obtained obtained do not differ significantly trom driver to driver. Nevertheless, marked differences do become apparent if the braking procedure is analysed more exactly with regard to braking reliability and riding stability.
Examination of the distribution of brakiing force selected by the rider using the massproduced standard brake already allows a meaningful assessment of the quality of the braking procedure when riding straight ahead. In Figs. 3 to 8 a com-parison is presented, for four riders with differences in riding experience on the one hand and in intervention behaviour on the other, of their actual apportioning of braking force, with the ideal behaviour (of rider W); in the actual apportioning, at the time of applying the brake, beginning at or near the beginning of the diagram, each interval from measuring point to measuring point is equivalent to a braking duration stage of 0.1
Cl ........ .l::
ai u.. 'iii CI) J: := ... ltI CI) ... t: 0 ;: CI)
CI) .lI:: ltI >-.CI
'iii ...
0,4
0,3
0,2
0,1
vo = 40 kmjh +-----+------+-----+--- yo= 0 mjs
2
ideal apportioning
01 braking force
0,4 0,6 0,8 rel. brake effort front wheel F
s /G
,v
Course of the apportioning of braking force during braking while riding in a straight line without ASS, Driver D
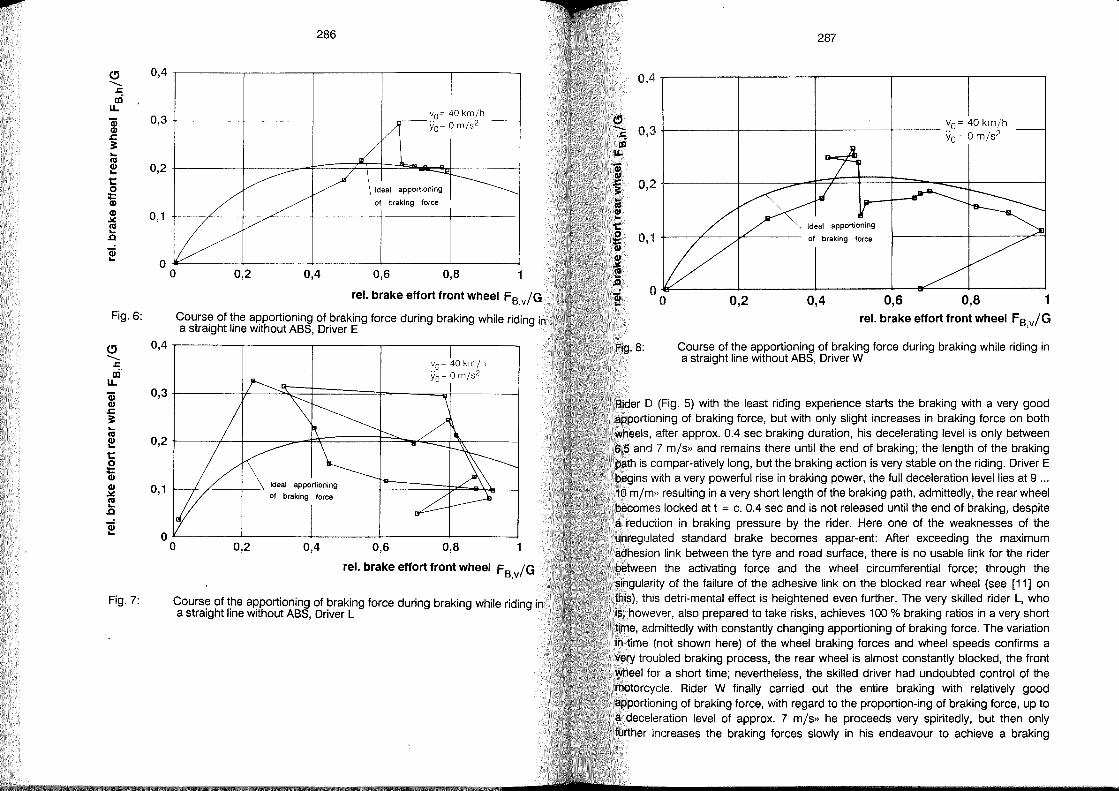
e" 0,4 ........
.r:: a:i'
u.. Qj 0,3 GI s::. 3: ... 1\1 GI 0,2 ... t:: 0
~ GI 0,1 .:.: 1\1 ... .Q
Qj ... °
Fig.6:
e" 0,4 ........
.r:: a:i'
u.. Qj 0,3 GI s::. 3: ... 1\1
0,2 GI ... t:: 0
~ GI 0,1 .:.: 1\1 ... .Q
Qj ...
Fig.7:
286
vo~ 40 km/h +-----t-------I------+-.,,--yo~ 0 m/s2
° 0,2 0,4
ideal apportioning
of braking force
0,6 0,8
rel. brake effort front wheel FS,v/G
Course of the apportioning of braking force during braking while riding in a straight line without ABS, Driver E
0,6
Vo~ 40 km/h Yo~ 0 m/s2
0,8
rel. brake effort front wheel FS,v/G
Course of the apportioning of braking force du ring braking while riding in a straight line without ABS, Driver L
287
0,4 r---------,----------,---------,---------,r---------,
vo= 40 km/h 0,3 -I------l------f-----+--- Yo= 0 m/s2
ideal apportioning
0,1 +---7''---...,...'------ of braking force
Fig.8:
0,2 0,4 0,6 0,8 1 rel. brake effort front wheel FS,v/G
Course of the apportioning of braking force during braking while riding in a straight line without ABS, Driver W
Rider D (Fig. 5) with the least riding experience starts the braking with a very good apportioning of braking force, but with only slight increases in braking force on both wheels, after approx. 0.4 sec braking duration, his decelerating level is only between 6.5 and 7 m/s» and remains there until the end of braking; the length of the braking path is compar-atively long, but the braking action is very stable on the riding. Driver E begins with a very powerful rise in braking power, the full deceleration level lies at 9 ... 10 m/m» resulting in a very short length of the braking path, admittedly, the rear wheel becomes locked at t = c. 0.4 sec and is not released until the end of braking, despite a reduction in braking pressure by the rider. Here one of the weaknesses of the unregulated standard brake becomes appar-ent After exceeding the maximum adhesion link between the tyre and road surface, there is no usable link for the rider between the activating force and the wheel circumferential force; through the singularity of the failure of the adhesive link on the blocked rear wheel (see [11] on this), this detri-mental effect is heightened even further. The very skilled rider L, who is, however, also prepared to take risks, achieves 100 % braking ratios in a very short time, admittedly with constantly changing apportioning of braking force. The variation in time (not shown here) of the wheel braking forces and wheel speeds confirms a very troubled braking process, the rear wheel is almost constantly blocked, the front wheel for a short time; nevertheless, the skilled driver had undoubted control of the motorcycle. Rider W finally carried out the entire braking with relatively good apportioning of braking force, with regard to the proportion-ing of braking force, up to a deceleration level of approx. 7 m/s» he proceeds very spiritedly, but then only further increases the braking forces slowly in his endeavour to achieve a braking
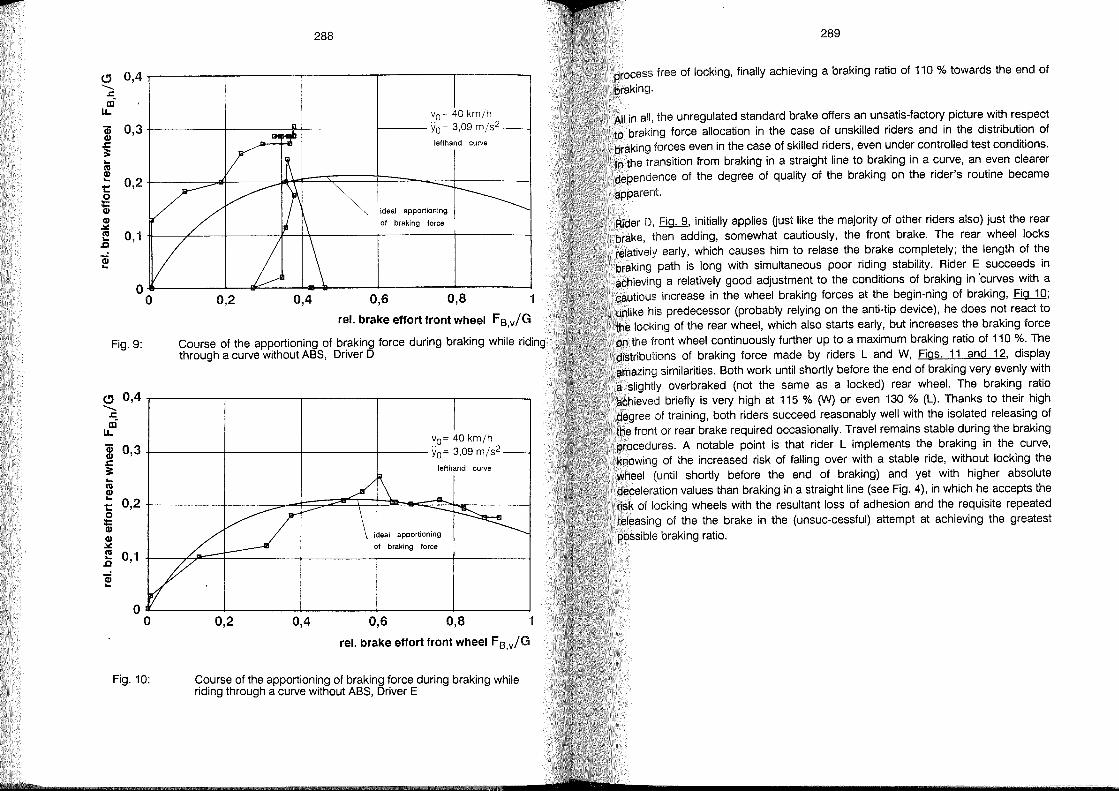
288
~ 0,4r---------,---------,---------,---------,--------.........
..c: Cll
LL vO= 40 kmjh
(j) 0,3 r------+----+t-------l---- Yo = 3,09 m/s2 CI) .c 3: "co CI) ... 1:: o 1il
lefthand curve
ideal apportioning
of braking force CI) .lC: co ... .c
0,1~--~--~----~_+~----_,--------+_------~
(j) ...
Fig.9:
0,2 0,4 0,6 0,8 1
rel. brake effort front wheel FB,v/G
Course of the apportioning of braking force during braking while riding through a curve without ABS, Driver D
~ 0,4r--------r-------,--------,-------~------~ .........
..c: al
LL
(j) 0,3 CI) .c 3: ... co CI) ...
0,2 1:: 0 = CI)
CI) .lC: CO 0,1 ... .c (j) ...
Fig.10:
vo= 40 km/h
Yo= 3,09 m/s2
lefthand curve
ideal apportioning
of braking force
rel. brake effort front wheel FB.v/G
Course of the apportioning of braking force during braking while riding through a curve without ABS, Driver E
289
process free of locking, finally achieving a braking ratio of 110 % towards the end of
braking .
All in all, the unregulated standard brake ofters an unsatis-factory picture with respect to braking force allocation in the case of unskilled riders and in the distribution of braking forces even in the case of skilled riders, even under controlled test conditions. In the transition from braking in a straight li ne to braking in a curve, an even clearer dependence of the degree of quality of the braking on the rider's routine became
apparent.
Rider D, .El.gJl., initially applies aust like the majority of other riders also) just the rear brake, then adding, somewhat cautiously, the front brake. The re ar wheel locks relatively early, which causes him to relase the brake completely; the length of the braking path is long with simultaneous poor riding stability. Rider E succeeds in achieving a relatively good adjustment to the conditions of braking in 'curves with a cautious increase in the wheel braking forces at the begin-ning of braking, Fig 10; unlike his predecessor (probably relying on the anti-tip device), he does not react to the locking of the rear wheel, which also starts early, but increases the braking force on the front wheel continuously further up to a maximum braking ratio of 110 %. The distributions of braking force made by riders Land W, Figs. 11 and 12, display amazing similarities. Both work until shortly before the end of braking very evenly with a slightly overbraked (not the same as a locked) re ar wheel. The braking ratio achieved briefly is very high at 115 % (W) or even 130 % (L). Thanks to their high degree of training, both riders succeed reasonably weil with the isolated releasing of the front or re ar brake required occasionally. Travel remains stable during the braking procedures. A notable point is that rider L implements the braking in the curve, knowing of the increased risk of falling over with a stable ride, without locking the wheel (until shortly before the end of braking) and yet with higher absolute deceleration values than braking in a straight line (see Fig. 4), in which he accepts the risk of locking wheels with the resultant loss of adhesion and the requisite repeated releasing of the the brake in the (unsuc-cessful) attempt at achieving the greatest possible braking ratio.
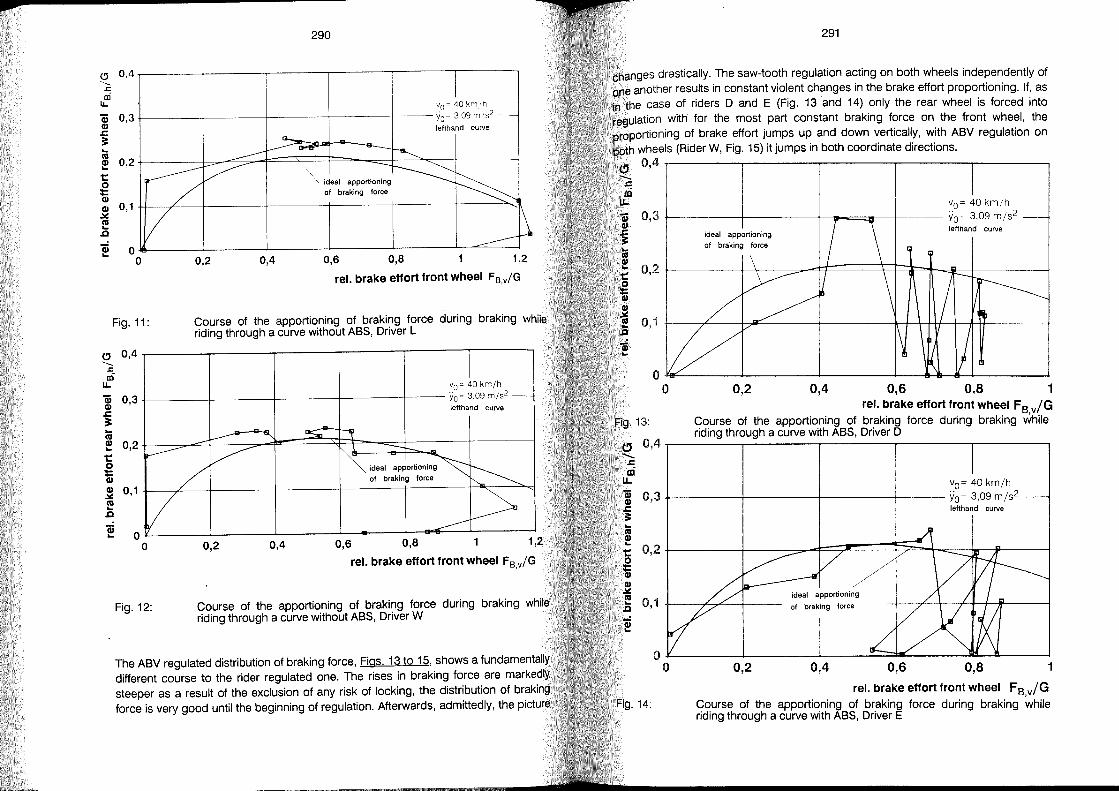
F
(!) 0,4
---.c al
LL.
Cii 0,3 CI) .c == .. RI
0,2 CI) .. 1:: 0 :; CI) 0,1 ~ RI .. .c Cii ° ...
290
vo~ 40 km/h t-~~~-t~~~~+~~~~+-~~~-if-~~ Yo= 3,09 m Is2
° 0,2 0,4
ideal apportioning of braking force
lefthand curve
0,6 0,8 1,2
rel. brake effort front wheel FB,v/G
Fig.11: Course of the apportioning of braking force during braking while riding through a curve without ABS, Driver L
(!)
---.c ai
LL.
Cii CI) .c == .. RI CI) .. 1:: 0 = CI)
CI) ~ RI .. .c Cii ..
0,4
0,3
0,2
0,1
°
Vo = 40 km/h
+--~~~~f-~~~-+~~~~-+~~~~+~~- Yo= 3,09 m/s2
0 0,2 0,4
ideal apportioning
of braking force
lefthand curve
0,6 0,8 1,2
rel. brake effort front wheel FB,v/G
Fig.12: Course of the apportioning of braking force during braking while riding through a curve without ABS, Driver W
The ABV regulated distribution of braking force, Figs. 13 to 15, shows a fundamentally different course to the rider regulated one. The rises in braking force are markedly steeper as a result of the exclusion of any risk of locking, the distribution of braking force is very good until the beginning of regulation. Afterwards, admittedly, the picture
291
changes drastically. The saw-tooth regulation acting on both wheels independently of one another results in constant violent changes in the brake effort proportioning. If, as in the case of riders D and E (Fig. 13 and 14) only the re ar wheel is forced into regulation with for the most part constant braking force on the front wheel, the proportioning of brake effort jumps up and down vertically, with ABV regulation on both wheels (Rider W, Fig. 15) it jumps in both coordinate directions . ~ 0,4.-------,--------,------~--------~------~ -,r: al u..
CJ -,r: al
vo= 40 km/h
0,3 t-----+-----+ ... ==~-+--- yo= 3,09 m/s2
ideal apportioning lefthand curve
0,2 +-----++-~_4=lf=====+=t===i==-h~+_----
0,1
o~------~------~------~---+~~~------~
° 0,2 0,4 0,6 0.8 1 rel. brake effort front wheel FB,v/G
Course of the apportioning of braking force during braking while riding through a curve with ABS, Driver D
LI.. vo= 40 km/h
m 0,3 +-----+-----I-----+--~ yo= 3,09 m/s2
i leflhand curve .. RI CI) .. 1:: o :; ~ ~ 0,1
!
0,2
ideal apportioning
of braking force
0,4 0,6 0,8 1
rel. brake effort front wheel FB v/G Course of the apportioning of braking force during braking ~hile riding through a curve with ABS, Driver E
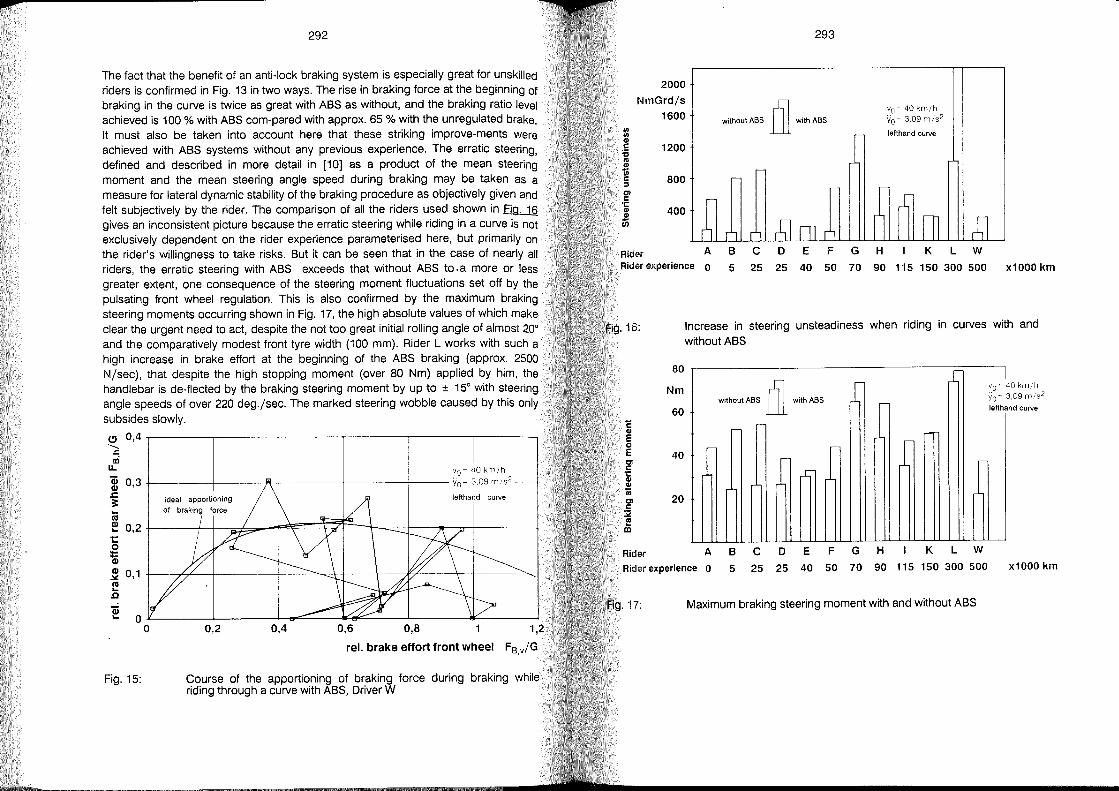
292
The fact that the benefit of an anti-lock braking system is especially great for unskilled riders is confirmed in Fig. 13 in two ways. The rise in braking force at the beginning of braking in the curve is twice as great with ASS as without, and the braking ratio level achieved is 100 % with ASS com-pared with approx. 65 % with the unregulated brake. It must also be taken into account here that these striking improve-ments were achieved with ASS systems without any previous experience. The erratic steering, defined and described in more detail in [10] as a product of the mean steering moment and the mean steering angle speed during braking may be taken as a measure for lateral dynamic stability of the braking procedure as objectively given and feit subjectively by the rider. The comparison of all the riders used shown in Fig. 16 gives an inconsistent picture because the erratic steering while riding in a curve is not exclusively dependent on the rider experience parameterised here, but primarily on the rider's willingness to take risks. Sut it can be seen that in the case of nearly all riders, the erratic steering with ASS exceeds that without ASS to. a more or less greater extent, one consequence of the steering moment fluctuations set oft by the pulsating front wheel regulation. This is also confirmed by the maximum braking steering moments occurring shown in Fig. 17, the high absolute values of which make clear the urgent need to act, despite the not too great initial rolling angle of almost 20° and the comparatively modest front tyre width (100 mm). Rider L works with such a high increase in brake eftort at the beginning of the ASS braking (approx. 2500 Njsec), that despite the high stopping moment (over 80 Nm) applied by him, the handlebar is de-flected by the braking steering moment by up to ± 15° with steering angle speeds of over 220 deg.jsec. The marked steering wobble caused by this only subsides slowly.
~ 0,4r--------,---------,--------r--------,--------,-------~ .........
.:= m
u. Va= 40 km/h
3i 0,3 +----------4--------J'4-4---------+--------+----- '10 = 3.09 m / s2
.c 3: ideal apportioning lefthand curve
>CIS 2! 0,2 +----I-+-~~-~~~~~~-=,__l.--_r__,,,__l_---_J 1: o i ~ 0,1 +---~~-+---------+---~~~+---~--~~----~. CIS ... .c äi ... o~---~------~~~--~~----~----~~----~
o
Fig.15:
0,2 0,4 0,6 0,8 1,2
rel. brake effort front wheel FB.v/G
Course of the apportioning of braking force during braking while riding through a curve with ASS, Driver W
2000
NmGrd/s 1600
1200
800
400
Rider A Rider experience 0
293
without ABS ru with ABS
C 0 E F G H
Vo = 40 kmjh
Yo = 3.09 m/s2
lefthand curve
K L W B
5 25 25 40 50 70 90 115 150 300 500 x1000 km
Increase in steering unsteadiness when riding in curves with and withoutASS
80
Nm
60 'C CI> E 0
I E 40 Cl c ';:: CI> CI> ;; Cl 20 c :;;; I!! al
Rider A
Rider experience 0
-C without ABS ru with ABS Ir
r-
n ,.....
I I [ I ,..r::;-
C 0 E F G H K L W B
5 25 25 40 50 70 90 115 150 300 500
Maximum braking steering moment with and without ASS
I va' 40krn/h
yo- 3,09 m/s2
leftha nd curve
x1000 km

1,6
m
1,2
c: .2 1; 0,8 'S; GI 'tI GI :!! :::J 0 0,4 u
Rider A
Rider experience 0
B
5
294
without ASS ill with ASS
C 0 E F G H
Vo - 40 km/h
Yoc 3,09 m/s 2
lefthand curve
K L W
25 25 40 50 70 90 115 150 300 500
Fig. 18: Curve deviation when travelling in curves with and without ASS
x1000 km
The course deviation caused by the braking steering moment, Fig. 18, shows a trend towar<:ls a clearly rising dependency on driving experience. The noticeably low values of individual riders with ASS controlled braking in curves always come about when brakes are applied with exclusively rear wheel regulation. In this case, the reduction in rolling angle caused by the braking steering moment is compensated in whole or in part by the effect of the pulsating off-track running of the rear wheel increasing the rolling angle. When evalu-ating the deviations from course measured with regard to their relevance fo accidents in practical road traffic terms, it must be borne in mind that in the case of the studies forming the basis here, the initial braking speed was relat-ively low at 40 km/h .. With normal driving speeds, e.g. on country roads, one has to reckon with considerably higher offsets. The deviation in course increases in comparable braking procedures at almost the square of the initial braking speed.
5 Development potential
:Just as in earlier studies, the results presented here as examples show too how unsatisfactorily the conventional standard brake fulfils the requirements for a braking system suitable for use in curves. Sut even the ASS regulated brake is unsatisfactory with respect to lateral dynamic stability at the present stage of technology.
Marked improvement in riding stability and maintaining course during braking in
295
curves can be attained already with readily available technical means, if an ASS regulated combination brake is employed with a lead-in overbraked rear wheel. With this system, by "freezing" the braking pressure at the time when the rear wheel regulation begins, the front wheel can be stopped on homogeneous road surfaces with a high adhesion exploitation just below the regulating threshold.
A really promising motorcycle braking system suitable for curves should, however, be in a position to adapt to the constantly changing frictional contact conditions between the type and road surface to be found in practice, even in the case of drastically changing tyre grip (wet road markings [2], manhole covers, etc.), to monitor the offtrack course decisive for lateral dynamic driving stability on both wheels and to effectively counter the braking steering moment dis-turbing the course.
I
I I (')h
I Alh/\.ges
I FR1
I
I L
FR2
FS1
FS2
Sv ----
I
I
- - - ~
Electronic
control device
Front wheel
Rear wheel
Triggering
braking steering 1--__ moment prevention
device
Fig.19: Functional diagram of a braking system suitable for curves
The theoretical bases for this were worked out at the FZD, a regulation concept, BQ.,. ~, was prepared and the requisite measurable variables of the dynamics of vehicle movement were defined. For the presentation of the linear, lateral and vertical dynamics-sensing braking force regulation system, in addition to the input variables taken into account by present ASS systems, the dynamic wheel loads, the lateral forces acting on the wheels (not identical with the lateral guiding forces) and the motorcycle roll angle are recorded. The requisite sensory mechanism has already been tried out in a practical experiment on a test motorcycle.
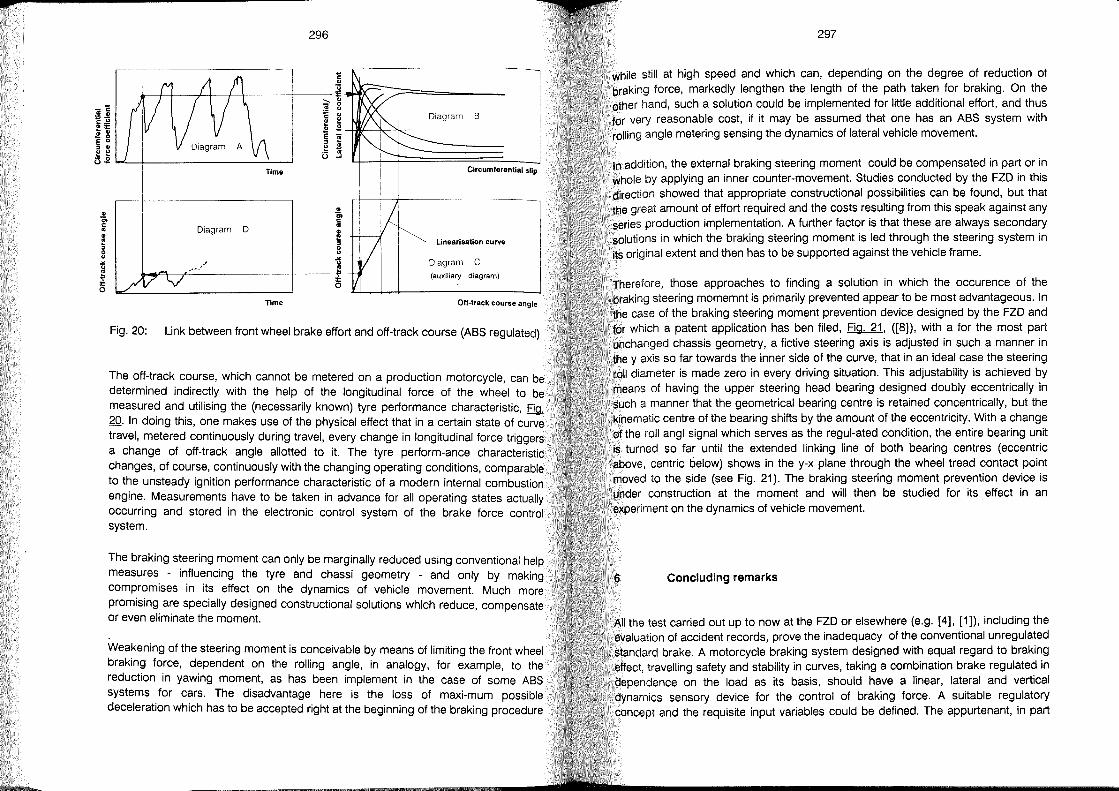
296
Diagram B
Time Clrcumferential slip
" .. tn tn
c c
" " ~ ~
8 '" ! o
Diagram 0 .. ~ ~ o "
~~~~'~"_/_'-----------+-----I Time
Unearisation curve
Diagram C
(auxiliary diagram)
Off-track course angle
Fig. 20: Link between front wheel brake effort and off-track course (A8S regulated)
The off-track course, which cannot be metered on a production motorcycle, can be determined indirectly with the help of the longitudinal force of the wheel to be measured and utilising the (necessarily known) tyre performance characteristic, & 20. In doing this, one makes use of the physical effect that in a certain state of curve travel, metered continuously during travel, every change in longitudinal force triggers a change of off-track angle allotted to it. The tyre perform-ance characteristic changes, of course, continuously with the changing operating conditions, comparable to the unsteady ignition performance characteristic of a modern internal combustion engine. Measurements have to be taken in advance for all operating states actually occurring and stored in the electronic control system of the brake force control system.
The braking steering moment can only be marginally reduced using conventional help measures - influencing the tyre and eh ass i geometry - and only by making compromises in its effect on the dynamics of vehicle movement. Much more promising are specially designed constructional solutions which reduce, compensate or even eliminate the moment.
Weakening of the steering moment is conceivable by means of limiting the front wheel braking force, dependent on the rolling angle, in analogy, for example, to the reduction in yawing moment, as has been implement in the case of some ASS systems for cars. The disadvantage here is the loss of maxi-mum possible deceleration which has to be accepted right at the beginning of the braking procedure
297
while still at high speed and which can, depending on the degree of reduction of braking force, markedly lengthen the length of the path taken for braking. On the other hand, such a solution could be implemented for little additional effort, and thus for very reasonable cost, if it may be assumed that one has an A8S system with rolling angle metering sensing the dynamics of lateral vehicle movement.
In addition, the external braking steering moment could be compensated in part or in whole by applying an inner counter-movement. Studies conducted by the FZD in this direction showed that appropriate constructional possibilities can be found, but that the great amount of effort required and the costs resulting from this speak against any se ries production implementation. A further factor is that these are always secondary solutions in which the braking steering moment is led through the steering system in its original extent and then has to be supported against the vehicle frame.
Therefore, those approaches to finding a solution in which the occurence of the braking steering momemnt is primarily prevented appear to be most advantageous. In the case of the braking steering moment prevention device designed by the FZD and for which a patent application has ben filed, Fig. 21, ([8]), with a for the most part unchanged chassis geometry, a fictive steering axis is adjusted in such a manner in the y axis so far towards the inner side of the curve, that in an ideal case the steering roll diameter is made zero in every driving situation. This adjustability is achieved by means of having the upper steering head bearing designed doubly eccentrically in such a manner that the geometrical bearing centre is retained concentrically, but the kinematic centre of the bearing shifts by the amount of the eccentricity. With a change of the roll angl signal which serves as the regul-ated condition, the entire bearing unit is turned so far until the extended linking line of both bearing centres (eccentric above, centric below) shows in the y-x plane through the wheel tread contact point moved to the side (see Fig. 21). The braking steering moment prevention device is under construction at the moment and will then be studied for its effect in an experiment on the dynamics of vehicle movement.
6 Concluding remarks
All the test carried out up to now at the FZD or elsewhere (e.g. [4]. [1]), including the evaluation of accident records, prove the inadequacy of the conventional unregulated standard brake. A motorcycle braking system designed with equal regard to braking effect, travelling safety and stability in curves, ta king a combination brake regulated in dependence on the load as its basis, should have a linear, lateral and vertical dynamics sensory device for the control of braking force. A suitable regulatory concept and the requisite input variables could be defined. The appurtenant, in part
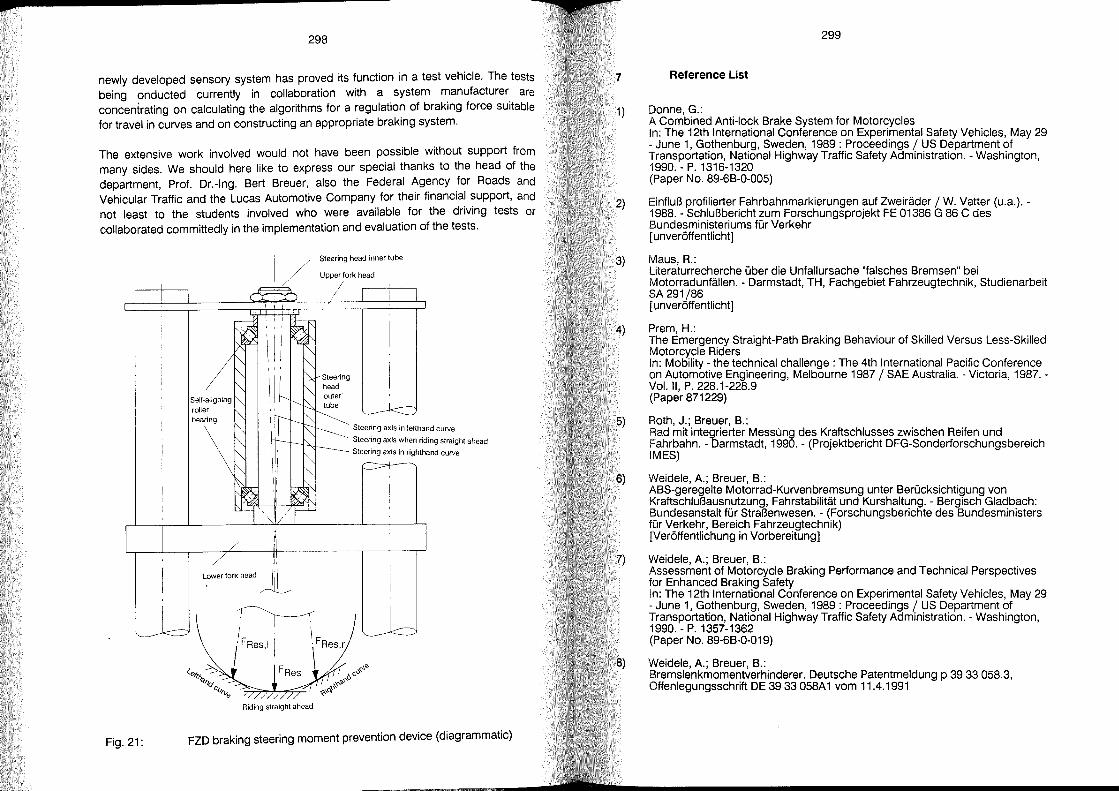
p
298
newly developed sensory system has proved its function in a test vehicle. The tests being onducted currently in collaboration with a system manufacturer are concentrating on calculating the algorithms for a regulation of braking force suitable for travel in curves and on constructing an appropriate braking system.
The extensive work involved would not have been possible without support from many sides. We should here like to express our special thanks to the head of the department, Prof. Dr.-Ing. Bert Breuer, also the Federal Agency for Roads and Vehicular Traffic and the Lucas Automotive Company for their financial support, and not least to the students involved who were available for the driving tests or collaborated committedly in the implementation and evaluation of the tests.
Fig.21:
roller bearing
L.ower lork head JL
Riding straight ahead
Steering head inner tube
Upper lork head
/ /
Steering head outer tube
Steering axis in letthand curve
Steering axis when riding straight ahead
Steering axis in righthand curve
FZD braking steering moment prevention device (diagrammatic)
7
1)
2)
3)
4)
5)
299
Reference List
Donne, G.: A Combined Anti-lock Brake System for Motorcycles In: The 12th International Conference on Experimental Safety Vehicles, May 29 - June 1, Gothenburg, Sweden, 1989: Proceedings / US Department of Transportation, National Highway Traffic Safety Administration. - Washington, 1990. - P. 1316-1320 (Paper No. 89-6B-0-005)
Einfluß profilierter Fahrbahnmarkierungen auf Zweiräder / W. Vatter (u.a.). -1988. - Schlußbericht zum Forschungsprojekt FE 01386 G 86 C des Bundesministeriums für Verkehr [unveröffentlicht]
Maus, R.: Literaturrecherche über die Unfallursache "falsches Bremsen" bei Motorradunfällen. - Darmstadt, TH, Fachgebiet Fahrzeugtechnik, Studienarbeit SA 291/86 [unveröffentlicht]
Prem, H.: The Emergency Straight-Path Braking Behaviour of Ski lied Versus Less-Skilled Motorcycle Riders In: Mobility - the technical challenge : The 4th International Pacific Conference on Automotive Engineering, Melbourne 1987 / SAE Australia. - Victoria, 1987. -Vol. 11, P. 228.1-228.9 (Paper 871229)
Roth, J.; Breuer, B.: Rad mit integrierter Messung des Kraftschlusses zwischen Reifen und Fahrbahn. - Darmstadt, 1990. - (Projektbericht DFG-Sonderforschungsbereich IMES)
6) Weideie, A.; Breuer, B.:
7)
ABS-geregelte Motorrad-Kurvenbremsung unter Berücksichtigung von Kraftschlußausnutzung, Fahrstabilität und Kurshaltung. - Bergisch Gladbach: Bundesanstalt für Straßenwesen. - (Forschungsberichte des Bundesministers für Verkehr, Bereich Fahrzeugtechnik) [Veröffentlichung in Vorbereitung]
Weideie, A.; Breuer, B.: Assessment of Motorcycle Braking Performance and Technical Perspectives for Enhanced Braking Safety In: The 12th International Conference on Experimental Safety Vehicles, May 29 - June 1, Gothenburg, Sweden, 1989 : Proceedings / US Department of Transportation, National Highway Traffic Safety Administration. - Washington, 1990. - P. 1357-1362 (Paper No. 89-6B-0-019)
8) Weideie, A.; Breuer, B.: Bremslenkmomentverhinderer. Deutsche Patentmeldung p 39 33 058.3, Offenlegungsschrift DE 39 33 058A 1 vom 11.4.1991

300
9) Weideie, A.; Schmieder, M.; Breuer, B.: Kraftradbremsen - ABV und Kurvenbremsung. - Bergisch Gladbach: ~undesanstalt für Straßenwesen, 1989. - (Forschungsberichte des Bundesministers für Verkehr, Bereich Fahrzeugtechnik)
10) Weideie, A.; Breuer, B.: Kraftradbremsen - Kombibremsen und ABV. - Düsseldorf, 1987. - (Deutsche Kraftfahrtforschung und Straßenverkehrstechnik; 301)
11) Weideie, A.; Schmieder, M.: Research on the Power Transfer of Motorcycle Tyres on Real Road Surfaces. In: Proceedings of the XXIII International FISITA Congress, Torino, Italy, 7.-11.5.1990. Vol. 11, P. 715-720. - (Paper 905 213)
12) Weideie, A.: Untersuchungen zur Kurvenbremsung von Motorrädern - Gedanken zur Bremssicherheit In: Motorrad: 3. Fachtagung, Darmstadt, 5. u. 6. Oktober 1989 / VDI-Ges. Fahrzeugtechnik. - Düsseldorf, 1989. - P. 303-330. - (VDI-Berichte; 779)
Research on Motorcycle Antilock Brake System: Part 3: Braking Effectiveness of an Electronically Controlled
Prototype ABS on Road Surfaces with Different p. levels
Touichiro Hikichi
Tatsuhiro Tomari
Masaie Katoh
Honda R & D Co. Ud., Tokyo
Japan
Michael Thiem
Honda R & D Europe GmbH, Offenbach
Germany
303
Abstract
Research was carried out on the braking effectiveness and its influence on motorcycle
behavior using an electronically controlled antilock braking system (hereinafter referred to
as ASS). The ASS was equipped on a large-sized touring machine (HONDA ST1100).
Braking tests were carried out on a course with different ~ levels, namely 0.99, 0.81, 0.62,
0.51, 0.39, and 0.19, for both the front and re ar wheels independently. The allowable slip
ratios of the tires were tested, for straight runs and turns, by setting the ASS to activate at
different points. The ASS unit constituted wheel velocity sensors, an electronic control unit
(hereinafter referred to as ECU), and a modulator for adjusting the brake caliper hydraulic
pressure. Test results showed the following:
(1) The braking effectiveness of ASS in straight runs, tested on road surfaces with high ~ (=
0.99) to low ~ (= 0.19) levels, showed deceleration rates exceeding 90%, compared to
those of the riders' best braking values. The braking with ASS had only little influence
on the motorcycle behavior so that stability was maintained, even in cases where the
ti re slip ratios were relatively great.
(2) The braking effectiveness of ASS in turns, whereby the ~ value of the road surface was
0.39 and over, also showed favorable deceleration rates exceeding 90%, cornpared to
those of the riders' best braking values. However, it was found that the stability of the
rnotorcycle decreased depending on factors such as decrease in the road surface ~
level, increase in the banking angle, and increase in the slip ratio.
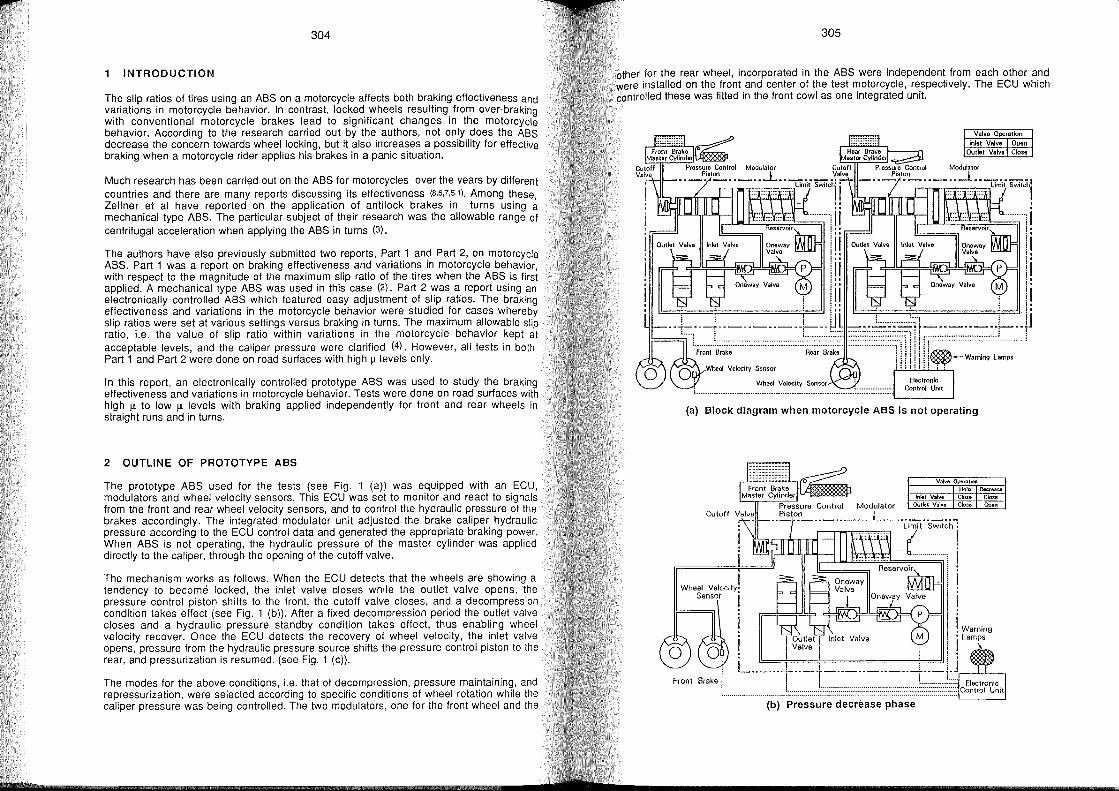
304
INTRODUCTION
The slip ratios 01 tires using an ASS on a motorcycle affects both braking effectiveness and variations in motorcycle behavior. In contrast, locked wheels resulting from over-braking with conventional motorcycle brakes lead to significant changes in the motorcycle behavior. According to the research carried out by the authors, not only does the ASS decrease the concern towards wheel locking, but it also increases a possibility for effective braking when a motorcycle rider applies his brakes in a panic situation.
Much research has been carried out on the ASS for motorcycles over the vears by different countries and there are many reports discussing its effectiveness {8,6,7,5,1}. Among these, Zellner et al have reported on the application of anti lock brakes in turns using a mechanical type ASS. The particular subject of their research was the allowable range of centrifugal acceleration when applying the ASS in turns (3).
The authors have also previously submitted !wo reports, Part 1 and Part 2, on motorcycle ASS. Part 1 was areport on braking effectiveness and variations in motorcycle behavior, with respect to the magnitude of the maximum slip ratio of the tires when the ASS is first applied. A mechanical type ASS was used in this case (2). Part 2 was areport using an electronically controlled ASS which featured easy adjustment of slip ratios. The braking effectiveness and variations in the motorcycle behavior were studied for cases whereby slip ratios were set at various settings versus braking in turns. The maximum allowable slip ratio, Le. the value of slip ratio within variations in the motorcycle behavior kept at acceptable levels, and the caliper pressure were clarified (4). However, all tests in both Part 1 and Part 2 were done on road surfaces with high 1.1 levels only.
In this report, an electronically controlled prototype ASS was used to study the braking effectiveness and variations in motorcycle behavior. Tests were done on road surfaces with high 1.1 to low 1.1 levels with braking applied independently for front and rear wheels in straight runs and in turns.
2 OUTLINE OF PROTOTYPE ASS
The prototype ASS used for the tests (see Fig. 1 (a)) was equipped with an ECU, modulators and wheel velocity sensors. This ECU was set to monitor and react to signals from the front and rear wheel velocity sensors, and to control the hydraulic pressure of the brakes accordingly. The integrated modulator unit adjusted the brake caliper hydraulic press ure according to the ECU control data and generated the appropriate braking power. When ASS is not operating, the hydraulic pressure of the master cylinder was applied directly to the caliper, through the opening 01 the cutoff valve.
The mechanism works as lollows. When the ECU detects that the wheels are showing a tendency to become locked, the inlet valve closes while the outlet valve opens, the pressure control piston shifts to the Iront, the cutoff valve closes, and a decompression condition takes effect (see Fig. 1 (b)). Alter a lixed decompression period the outlet valve closes and a hydraulic pressure standby condition takes effect, thus enabling wheel vBlocity recover. Once the ECU detects the recovery 01 wheel velocity, the inlet valve opens, pressure Irom the hydraulic pressure source shifts the pressure control piston to the rear, and pressurization is resumed. (see Fig. 1 (c)).
The modes lor the above conditions, i.e. that 01 decompression, press ure maintaining, and repressurization, were selected according to specilic conditions 01 wheel rotation while the caliper pressure was being controlled. The !wo modulators, one lor the Iront wheel and the
305
other tor the re ar wheel, incorporated in the ASS were independent Irom each other and were installed on the front and center 01 the test motorcycle, respectively. The ECU which controlled these was fitted in the front cowl as one integrated uni!.
Raar 8rake
Wheel Velocity Sensor l ................................ __ . ___ ............................................... .
'-----'
Valve Operation
Inlet Valve Open Cuttet Valve Close
(a) Block diagram when motorcycle ABS Is not operating
I . I
Wheel Ve oClly. Sensor i
I}===j]
I
(b) Pressure decrease phase
Valve Operation Hold Decrllatt
Inlet ValvII Close Close Open
! Warning i Lam~s
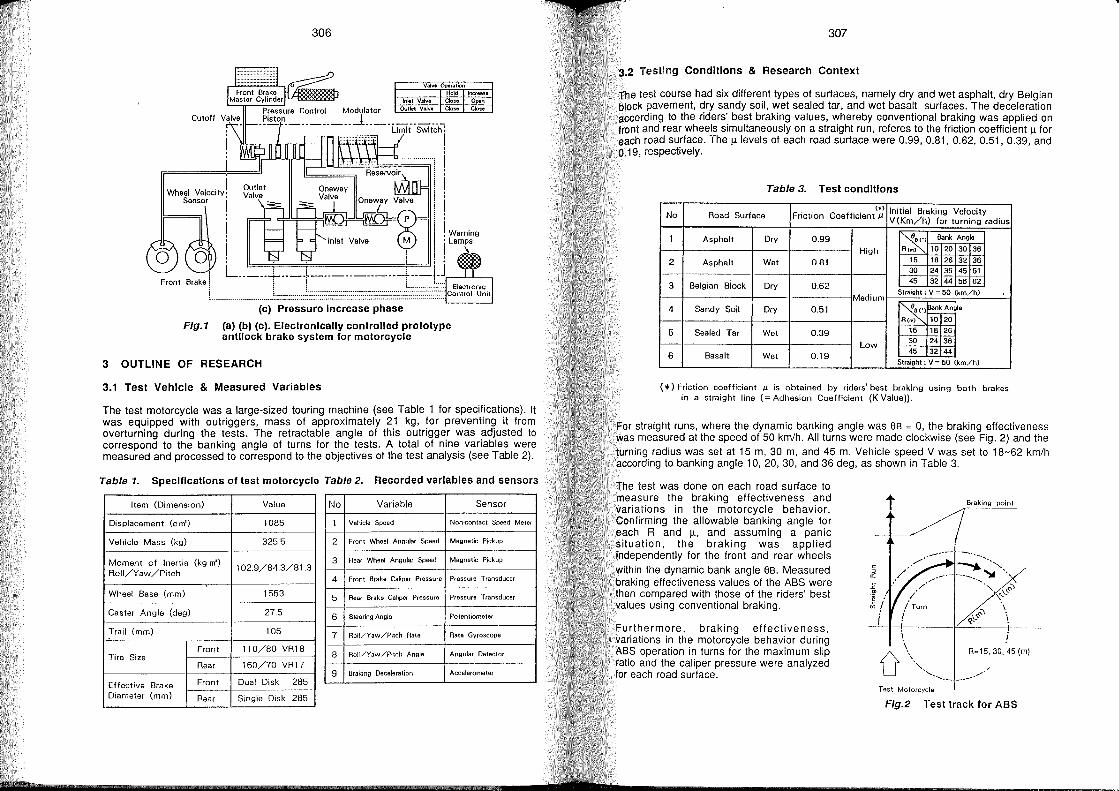
Cutoff Valve
Wheel velodt) Sensor i
1r===;J
! I
! Front Brake i
L
306
ValvlOperalion Hold Incr.a:..
Inlet Valve Qose Opon OUlIoI Valvi Glose C~$.
Warning Lamps
\
(c) Pressure Increase phase
Flg.l (a) (b) (c). Electronlcally controlled prototype antllock brake system for motorcycle
3 OUTLINE OF RESEARCH
3.1 Test Vehicle & Measured Variables
The test motorcycle was a large-sized touring machine (see Table 1 lor speci~icati?ns). II was equipped with outriggers, mass 01 approximately 2.1 kg, ~or preventln~ It Irom overturning during the tests. The retractable angle 01 thls outngge.r was .adJusted 10 correspond to the banking angle 01 turns lor the tests. A total 01 nln~ vanables were measured and processed to correspond to the objectives 01 the test analysIs (see Table 2).
Table 1_ Speclflcatlons of test motorcycle Table 2. Recorded variables and sensors
Item (Dimension) Value No Variable Sensor
Displaeement (e m') 1085 1 Vehicle Speed Non-contact Speed MeIer
Vehicie Mass (kg) 325.5 2 Front Wheel Angular Speed Magnetic Pickup
Moment of Inertia (kg m') 102.9/84.3/81.3
Roli/Yaw/Pitch
3 Rear Wheel Angular Speed Magnetic Pickup
4 Front Srake Caliper Pressure Pressure Transducer
Wheel Base (mm) 1553 5 Rear Srake CaUper Pressure Pressure Transducer
Caster Angle (deg) 27.5 6 Sieering Angle Potentiometer
Trail (mm) 105 7 RoU/Yaw/Pitch Rale Rate Gyroscope
Front 110/80 VR18 Tire Size 8 Roll/Yaw/Pitch Angle Angular Detector
Rear 160/70 VR17 9 Braking Deceleration Accelerometer
Effeetive Brake Front Dual Disk 285
Diameter (mm) Rear Single Disk 285
307
3.2 TesUng Conditions & Research Context
The test course had six different types of surfaces, namely dry and wet asphalt, dry Selgian block pavement, dry sandy soil, wet sealed taro and wet basalt surfaces. The deceleration according to the riders' best braking values, whereby conventional braking was applied on Iront and rear wheels simultaneously on a straight run, releres to the Iriction coefficient J.! lor each road surlace. The J.! levels 01 each road surface were 0.99, 0.81, 0.62, 0.51, 0.39, and 0.19, respectively.
Table 3. Test condltlons
(+) Initial Braking Velocity No Road Surfaee Friction Coefficiant J1 V (Km/h) for turning radius
1 Asphalt Dry 0.99 I~ Bank Angle
High Rem) 10 20 30 36
2 Asphalt Wet 0.81 16 18 26 32 36 30 24 36 45 61
0.62 45 32 44 56 62 3 Belgian Block Dry
Slraighl ; V-50 (km/hJ Madium
4 Sandy Soil Dry 0.51 ~ ~nkAngla
Rem) CW'2ä 6 Sealed Tar Wet 0.39 15 16 26
Low 30 24 36
6 Basalt Wat 0.19 45 32 44
Slraight ; V-50 (km/hJ
(*) Frietion coeffieient J1 is obtained by rider. best braking using both brakes in a straight line (= Adhesion Coefficient (K Value)).
For straight runs, where the dynamic banking angle was SB = 0, the braking effectiveness was measured at the speed 0150 km/ho All turns were made clockwise (see Fig. 2) and the turning radius was set at 15 m, 30 m, and 45 m. Vehicle speed V was set to 18-62 km/h according to banking angle 10, 20, 30, and 36 deg, as shown in Table 3.
The test was done on each road surface to measure the braking effectiveness and variations in the motorcycle behavior. Confirming the allowable banking angle for each Rand J.!. and assuming a panic situation, the braking was applied independentiy lor the Iront and rear wheels within the dynamic bank angle SB. Measured braking ellectiveness values 01 the ASS were then compared wilh those 01 the riders' best values using conventional braking.
Furthermore, braking effectiveness, variations in the motorcycle behavior during ASS operation in turns lor the maximum slip ratio and the caliper pressure were analyzed lor each road surlace.
c o a: E '"
"- _.-" ./ Test Motorcycle
Flg.2 Test track for ASS
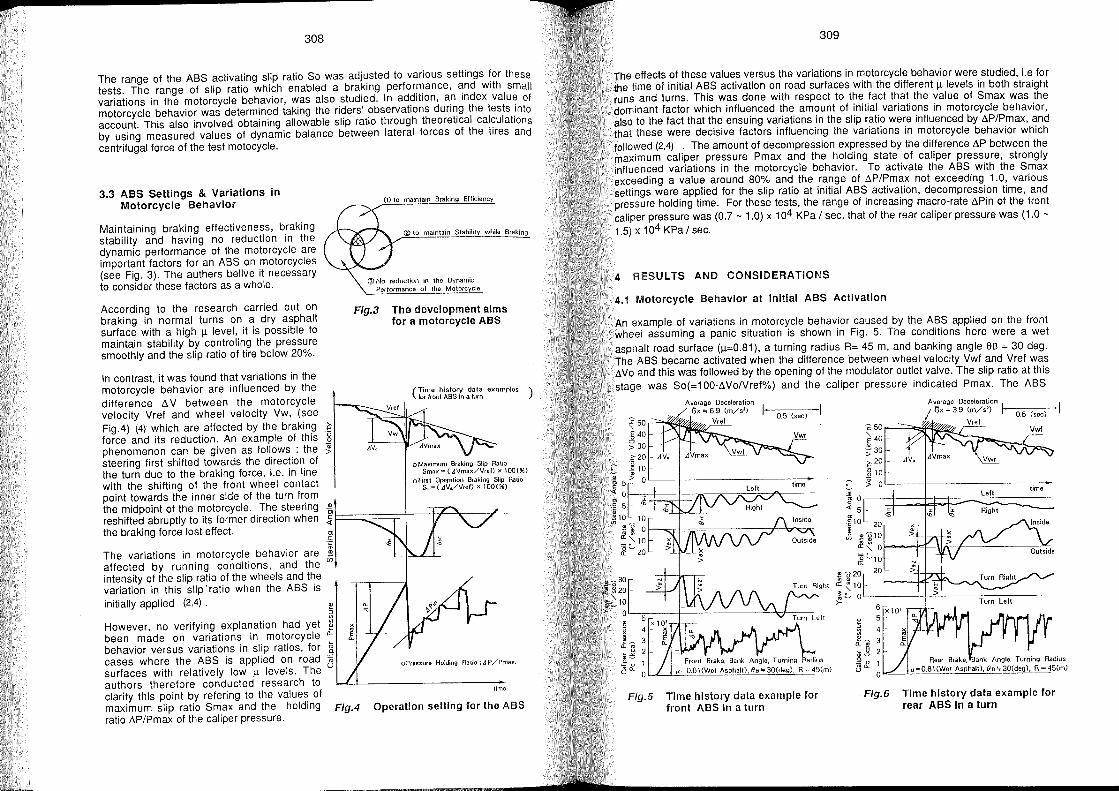
p
308
The range 01 the ASS activating slip ratio So was adj~sted to various settings ~or these tests. The range 01 slip ratio which enabled a brakmg perfor:nance, and wlth small variations in the motorcycle behavior, was also studled. In ad?IIIOn, an Index value of motorcycle behavior was determined taking the riders' ?bservatlons dunng the tests .Into account. This also involved obtaining allowable slip ratio through theoretlcal calculatlons by using measured values 01 dynamic balance between lateral lorces 01 the ti res and centrifugal lorce of the test motocycle.
3.3 ABS Settings & Variations In Motorcycle Behavlor
Maintaining braking effectiveness, braking stability and having no reduction in the dynamic perlormance 01 the motorcycle are important lactors lor an ASS on motorcycles (see Fig. 3). The authers belive it necessary to consider these factors as a whole.
According to the research carried out on braking in normal turns on a dry asphalt surlace with a high j.I. level, it is possible to maintain stability by controling the pressure smoothly and the slip ratio 01 tire below 20%.
CD 10 maintain Braking Efficiency
@ to maintain Stability while Braking
@ No reduction in the Dvnamic Performance of Ihe Motorcycle
Flg.3 The development alms for a motorcycle ABS
(Time his tory data examples ) for front ABS in a turn
In contrast, it was lound that variations in the motorcycle behavior are influenced by the difference I'. V between the motorcycle velocity Vrel and wheel velocity Vw, (see FigA) (4) which are affected by the braking ~ lorce and its reduction. An example 01 this 'g phenomenon can be given as follows : the ~ steering first shifted towards the direction 01 the turn due to the braking lorce, Le. in line with the shifting 01 the Iront wheel contact point towards the inner side 01 the turn Irom the midpoint 01 the motorcycle. The steering -5, reshifted abruptiy to its former direction when .'i l==::;:::==::;::=-t--tr-~~---:T-the braking force lost ellect. Cl>
c 'e
Q)
The variations in motorcycle behavior are cl'; affected by running conditions, and the intensity 01 the slip ratio 01 the wheels and the variation in this slip 'ratio when the ASS is initially applied (2,4). i!!
:J
'" However, no verilying explanation had yet ~ been made on variations in motorcycle CL
behavior versus variations in slip ratios, lor cases where the ASS is applied on road surlaces with relatively low j.I. levels. The authors therelore conducted research to clarily this point by relering to the values 01 maximum slip ratio Smax and the holding ratio t.P/Pmax 01 the caliper pressure.
oPrassure Holding Ratio; LI P /Prnax..
timo
FlgA Operation setting for Ihe ABS
309
The ellects 01 these values versus the variations in motorcycle behavior were studied, Le lor the time of initial ASS activation on road surlaces with the different j.I. levels in both straight runs and turns. This was done with respect to the fact that the value 01 Smax was the dominant lactor which influenced the amount 01 initial variations in motorcycle behavior, also 10 the lact that the ensuing variations in the slip ratio were influenced by t.P/Pmax, and thai these were decisive factors influencing the variations in motorcycle behavior which lollowed (2,4)' . The amount 01 decompression expressed by the difference t.P between the maximum caliper pressure Pmax and the holding state 01 caliper pressure, strongly influenced variations in the motorcycle behavior. To activate the ASS with the Smax exceeding a value around 80% and the range 01 t.P/Pmax not exceeding 1.0, various settings were applied for the slip ratio at initial ASS activation, decompression time, and pressure holding time. For these tests, the range 01 increasing macro-rate t.Pin of the front caliper pressure was (0.7 - 1.0) x 104 KPa / sec, that 01 the rear caliper pressure was (1.0 -1.5) x 104 KPa / sec.
4 RESULTS AND CONSIDERATIONS
4.1 Molorcycle Behavlor at Initial ABS Activation
An example 01 variations in motorcycle behavior caused by the ASS applied on the Iront wheel assuming a panic situation is shown in Fig. 5. The conditions here were a wet asphalt road surlace (j.I.=0.81), a turning radius R= 45 m, and banking angle eB = 30 deg. The ASS became activated when Ihe difference between wheel velocity Vwf and Vrel was t.Vo and this was lollowed by the opening 01 the modulator outiet valve. The slip ratio at this stage was So(=1 00·1'. Vo/Vrel%) and the caliper pressure indicated Pmax. The ASS
Average Deceleration Gx" 6.9 (m/s')
Fig.5 Time history data example for front ABS In a turn
0.5 (sec)
Flg.6 Time history data example for rear ASS In a turn
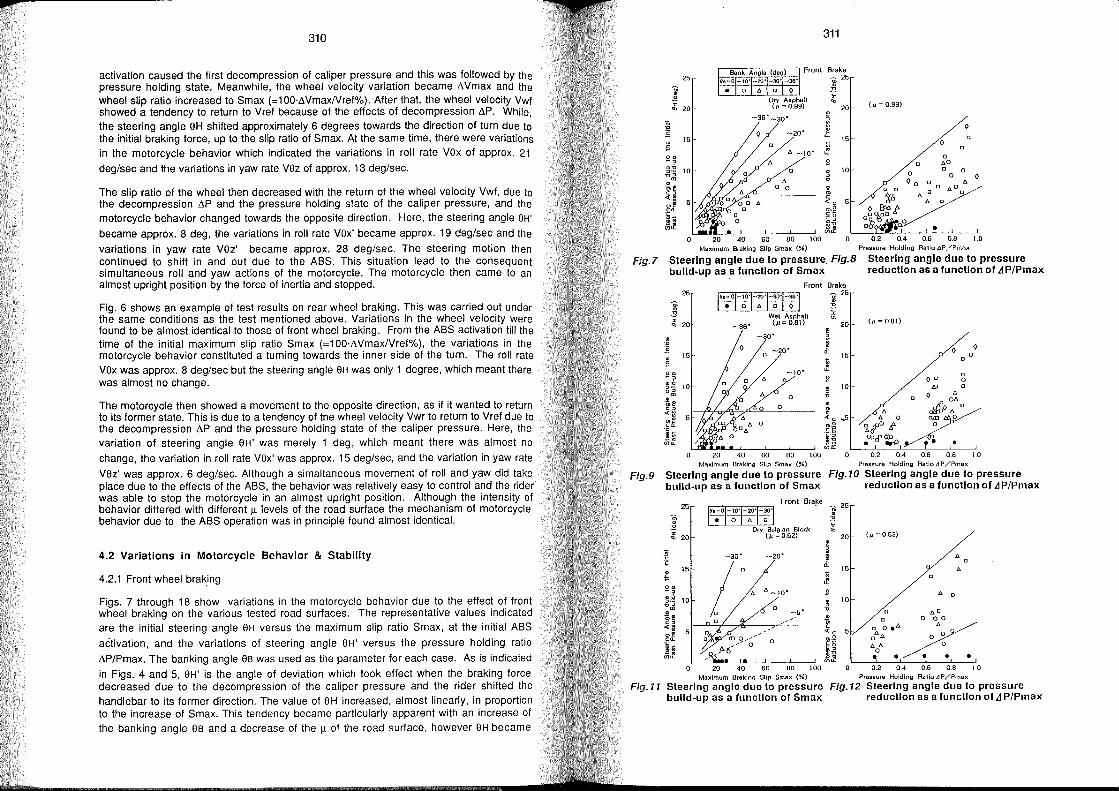
310
activation caused the first decompression of caliper pressure and this was followed by the pressure holding state. Meanwhile, the wheel velocity variation became t. Vmax and the wheel sLip ratio increased to Smax (=100·t.VmaxlVref%). After that, the wheel velocity Vwf showed a tendency to return to Vref because of the effects of decompression t.P. While, the steering angle eH shifted approximately 6 degrees towards the direction of turn due to the initial braking force, up to the slip ratio of Smax. At the same time, there were variations in the motorcycle behavior wh ich indicated the variations in roll rate vex of approx. 21
deg/sec and the variations in yaw rate vez of approx. 13 deg/sec.
The slip ratio of the wheel then decreased with the return of the wheel velocity Vwf, due 10 the decompression t.P and the pressure holding state of the caliper pressure, and the motorcycle behavior changed towards the opposite direction. Here, the steering angle eH'
became approx. 8 deg, the variations in roll rate vex' became approx. 19 deg/sec and the
variations in yaw rate vez' became approx. 28 deg/sec. The steering motion then continued to shift in and out due to the ASS. This situation lead to the consequenl simultaneous roll and yaw actions of the motorcycle. The motorcycle then came to an almost upright position by the force of inertia and stopped.
Fig. 6 shows an example of test results on rear wheel braking. This was carried out under the same conditions as the test mentioned above. Variations in the wheel velocity were found to be almost identical to those of front wheel braking. From the ASS activation till the time of the initial maximum slip ratio Smax (=100·t.VmaxlVref%), the variations in the motorcycle behavior constiluted a turning towards the inner side of the turn. The roll rate vex was approx. 8 deg/sec but the steering angle eH was only 1 degree, which meant there was almost no change.
The motorcycle then showed a movement to the opposite direction, as if it wanted to return to its former state. This is due to a tendency of the wheel velocity Vwr to return to Vref due to the decompression t.P and the pressure holding state of the caliper pressure. Here, the variation of steering angle eH' was merely 1 deg, which meant there was almost no
change, the variation in roll rate vex' was approx. 15 deg/sec, and the variation in yaw rate
vez' was approx. 6 deg/sec. Although a simaltaneous movement of roll and yaw did take place due to the effects of the ASS, the behavior was relatively easy to control and the rider was able to stop the motorcycle in an almost upright position. Although the intensity 01 behavior differed with different 11 levels of the road surface the mechanism of motorcycle behavior due to the ASS operation was in principle found almost identical.
4.2 Variations in Motorcycle Behavior & Stability
4.2.1 Front wheel bra~ing
Figs. 7 through 18 show variations in the motorcycle behavior due to the effect of front wheel braking on the various tested road surfaces. The representative values indicated are the initial steering angle eH versus the maximum slip ratio Smax, at the initial ASS
activation, and the variations of steering angle eH' versus the pressure holding ratio
t.P/Pmax. The banking angle eB was used as the parameter for each case. As is indicated
in Figs. 4 and 5, eH' is the angle of deviation which took effect when the braking force decreased due to the decompression of the caliper pressure and the rider shifted Ihe handlebar to its former direction. The value of eH increased, almost linearly, in proportion to the increase of Smax. This tendency became particularly apparent with an increase 01 the banking angle eB and a decrease of the 11 01 the road surface, however eH became
311
25
g ~
'--~Ba~nk~An-gl~.~(d~.g"")-' front Brake
'i 25
-;: '" z
'" 20 - 20 -
-36' -30' ~ ~ a.
15 1;; ~
S 0 . 10 ,
" -ij, c "'c 5
.~.g ~,
~-g "'0:
40 60 00 100 0
Maximum Braking Slip Smax (%)
Fig.7 Steerlng angle due to pressure Flg.8 bulld-up as a function of Smax
Front Brake 25 1'-0'-;"'01-:-~",o·:rI_7::CT·I_-::"'··I_7::::1·1 f5
Wat Asphalt ~ (.=0.81) 20--36'
~ .t
15
~ S
~ 10 -
20 40 60 80
o
o
0.2 0.4 0.6 0.8 1.0 Pressure Holding Ratio AP /Pmf\x
Steerlng angle due to pressure reducllon as a function of .dP/Pmax
o o o
0.2 0.4 0.6 0.8 1.0 Maximum Braking Slip Smax (%) Pressure Holding RatioAP/Pmax
Flg.9 Steerlng angle due to pressure Flg.10 Steerlng angle due to pressure bulld-up as a functlon of Smax reductlon as a function of .dP/Pmax
25 Front Bra~e
126
rn 1,,;01-~oH1~ . ~ Dry Belgian Block ;:; z
'" 20 (. = 0.62) 20 (. = 0.62)
.. -30' -20' ~ " :e
.f
! ~ ° a. . 15 - ° 15 " .c 1;;
co. J'
" :~ " ~10· S " 0 :::J;:;: 10
~ 10
".il 0 -5'
~e . ,,0 c, D> ° 0 00
"'~ c oo.,,~ ",e 5 - "'c 5
01::..6. 0 0 ca. 0 .§"g ." "l-. 0 !: $' 0 Ul"-
I I u-;~ • • • • 0 20 60 80 100 0 0.2 0.4 0.6 0.8 1.0
Maximum Braking Slip Smax (%) Prossure Holding Ratio A P /Pmsx
Flg.11 Steerlng angle due 10 pressure Flg.12 Sieering angle due to pressure bulld-up as a function of Smax reducllon as a functlon of .d P/Pmax
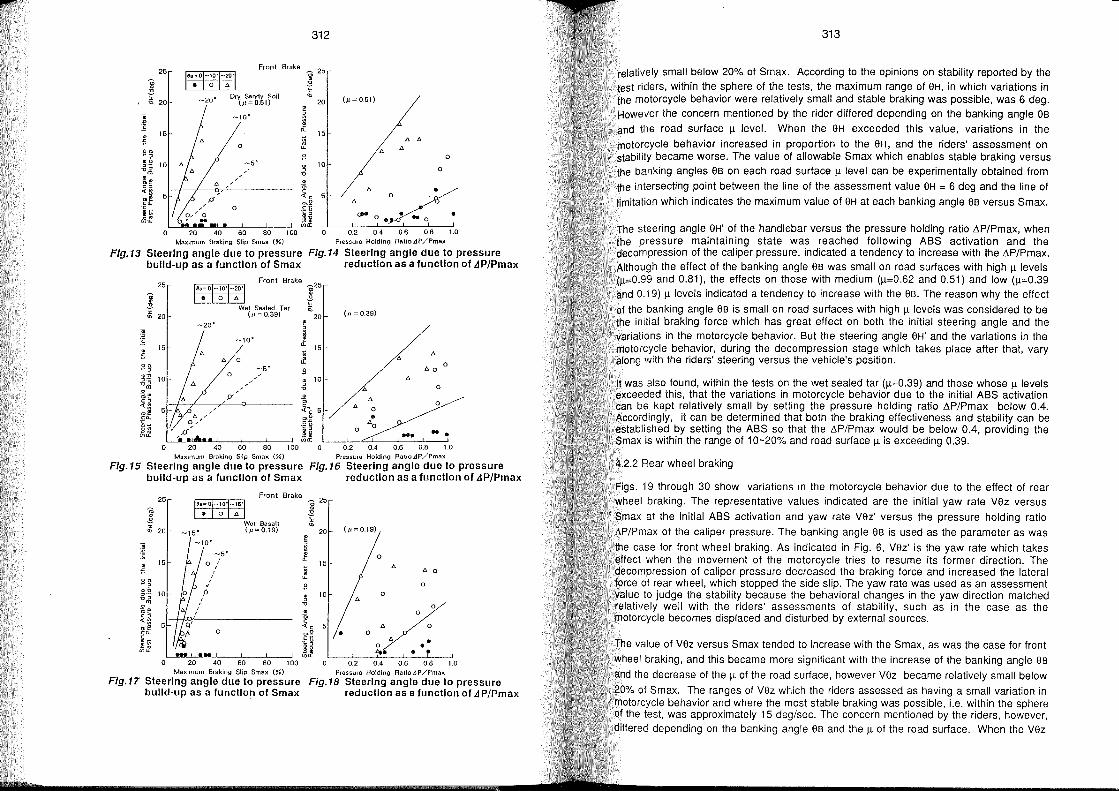
312
Front Srake g 25
3 ~
25
1 ~ 20-
B o ~ 10- o
"_"00 • .. -~ • ~o, ~
o 0.2 OA 0.6 0.8 1.0 Maximum Braking Slip Smax (%) Pressure Holding RatioAP/PmBx
Flg.13 Steerlng angle due 10 pressure Flg.14 Steerlng angle due 10 pressure bulld-up as a functlon of Smax reductlon as a functlon of Ä P/Pmax
~ . u
25
~ 20-
RI=frr1 Front Braka _25
-20'
Wal Seeled Tar ("~0.39)
-10'
" 0
o
p"
-5'
g 3
" '" 20
~ ~
<L 15 -
:;; .f B · 10 , u .., ~o 5 -",2
"i Y u;~
(t, = 0.39)
" " 60
0
6
" 0
" 6 0 0
• 0
"0 ... .. • o 20 40 60 80 100 0.2 OA 0.6 0.8 1.0
Maximum Braking Slip Smax (%) Pres$ure Holding RatioAP/Pmax
Flg.15 Sleering angle due to pressure FIg,16 Steerlng angle due 10 pressure bulld-up as a funcllon of Smax reductlon as a functlon of LlP/Pmax
26 Front Brake
f5 lo';ol-~t:6'1 '" . 3 " :c Wet Basalt '" '" 20 - -15' ("~0.19) 20 ("=0.19)
.. ~
.p -5'
~ :f .t 0
;; 0 , , 15 -
" , · " 0 , · 00. , u-
;~ . B 0
~ 10 0 u' " ."' u ./: ÖlE · 0' 0,
:~ 0 "0 5-
O<L 0 tll.Q • 0 ·0 CI, " . ~~ H o • Ulu- .;.,. .
-'----J UlOC 0 20 40 60 80 100 0.2 OA 0.6 0.8 1.0
Maximum Braking Slip Smax (%) Pressure Holding RatioAP/Pmax
FIg,17 Steerlng angle due 10 pressure Fig.18 Sleering angle due to pressure bulld-up as a funcllon of Smax reductlon as a functlon of LlP/Pmax
313
relatively small below 20% 01 Smax. According to the opinions on stability reported by the test riders, within the sphere of the tests, the maximum range 01 eH, in which variations in the molorcycle behavior were relatively small and stable braking was possible, was 6 deg. However the concern mentioned by the rider dillered depending on the banking angle eB and Ihe road surlace 11 level. When the eH exceeded this value, variations in the molorcycle behavior increased in proportion to the eH, and the riders' assessment on stability became worse. The value 01 allowable Smax which enables stable braking versus the banking angles eB on each road surface 11 level can be experimentally obtained from the inlersecting point between the line of the assessment value eH = 6 deg and the line of
limitation which indicates the maximum value of eH at each banking angle eB versus Smax .
The steering angle eH' of the handlebar versus the pressure holding ratio L'iP/Pmax, when the pressure maintaining state was reached following ABS activation and the decompression of the caliper pressure, indicated a tendency to increase with the L'iP/Pmax. Although the effect of the banking angle eB was sm all on road surfaces with high 11 levels (11=0.99 and 0.81), the effects on those with medium (11=0.62 and 0.51) and low (11=0.39 and 0.19) 11 levels indicated a tendency to increase with the eB. The reason why the effect
of the banking angle eB is small on road surfaces with high 11 levels was considered to be the initial braking force which has great effect on both the initial steering angle and the variations in the motorcycle behavior. But the steering angle eH' and the variations in the motorcycle behavior, during the decompression stage which takes place after that, vary along with the riders' steering versus the vehicle's position.
It was also found, within the tests on the wet sealed tar (11=0.39) and those whose 11 levels exceeded Ihis, that the variations in motorcycle behavior due to the initial ABS activation can be kept relatively small by setting the pressure holding ratio L'iP/Pmax below 0.4. Accordingly, it can be determined that both the braking effectiveness and stability can be established by setting the ABS so that the L'iP/Pmax would be below 0.4, providing the Smax is within the range of 10-20% and road surface 11 is exceeding 0.39.
4.2.2 Rear wheel braking
Figs. 19 through 30 show variations in the motorcycle behavior due to the effect of rear wheel braking. The representative values indicated are the initial yaw rate vez versus
Smax al the initial ABS activation and yaw rate vez' versus the pressure holding ratio L'iP/Pmax of the caliper pressure. The banking angle eB is used as the parameter as was the case tor front wheel braking. As indicated in Fig. 6, vez' is the yaw rate which takes effect when the movement of the motorcycle tri es to resume its former direction. The decompression of caliper pressure decreased the braking force and increased the lateral force of rear wheel, which stopped the side slip. The yaw rate was used as an assessment value 10 judge the stability because the behavioral changes in the yaw direction matched relatively weil with the riders' assessments of stability, such as in the case as the motorcycle becomes displaced and disturbed by external sourees.
The value of vez versus Smax tended to increase with the Smax, as was the case for front wheel braking, and this became more significant with the increase of the banking angle eB and the decrease of the 11 of the road surface, however vez became relatively sm all below 20% of Smax. The ranges of vez which the riders assessed as having a small variation in motorcycle behavior and where the most stable braking was possible, i.e. within the sphere of the test, was approximately 15 deg/sec. The concern mentioned by the riders, however, differed depending on the banking angle eB and the 11 of the road surface. When the vez
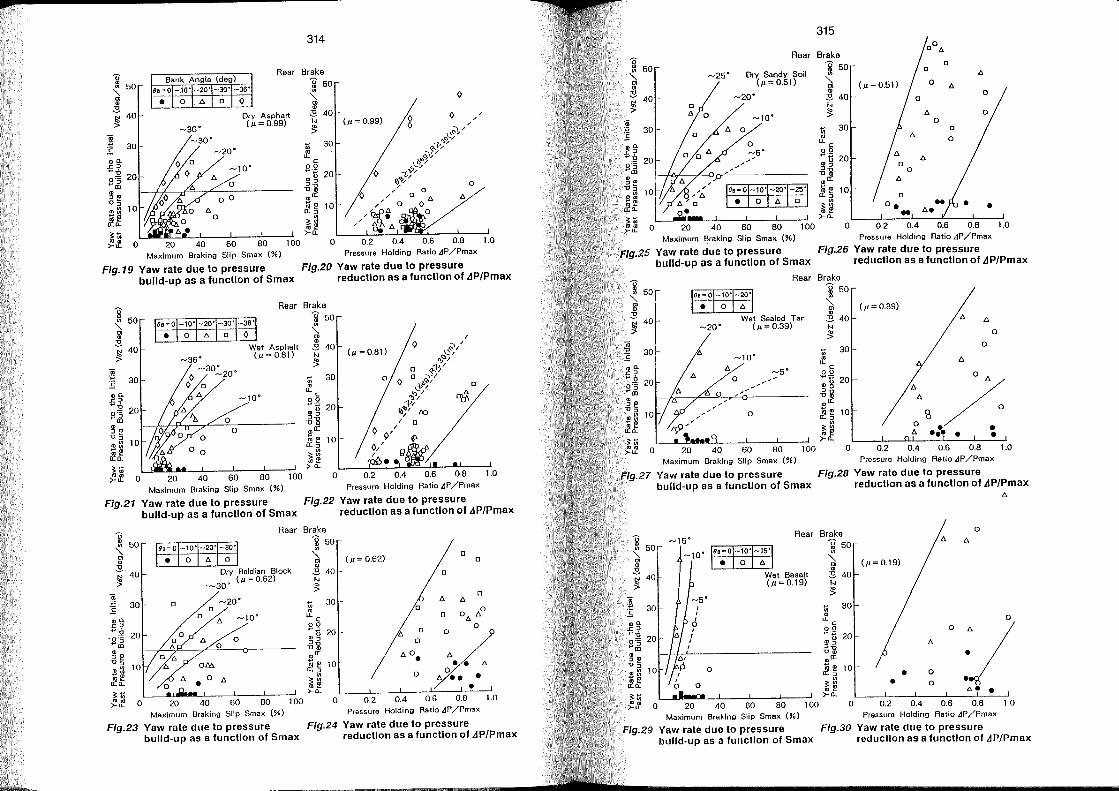
f 314
g '" 50
Raar Braka M 50
~ .:g ~ 40
-36·
-20·
Dry Asphalt (/L=0.99)
-10·
o
00
" Cl .. .:g 40 N
~ ti 30 of
c 00 :ß 20
-ö~ .. a: ~5 10
d :>-n.
o
60 80 100 0 1.0 Press ure Holding Ratio.dP /Pm.x Maximum Braking Slip Smax (%)
Flg.19 Yaw rate due to pressure bulld-up as a funetlon of Smax
Fig.20 Yaw rate due to pres5ure reduetlon as a funetlon of .<\P/Pmax
~ 50
Rear Braka
Cl .. .:g ~ 40
lo·;t~O·I-:ol~o·I-~6·1 Wet Asphalt
(/L=0.81)
-10·
o o
20 40 60 80 100
Maximum Braking Slip Smax (%)
Flg.21 Yaw rate due to pressure bulld·up as a funetlon of Smax
g " 50 Cl ..
.:g 40 ~
30
Flg.23
o
20
Raar
Dry Beldian Block .-30. (/L = 0.62)
-20·
-10·
o
40 60 BO 100
Maximum Br.king Slip Smax (%)
Yaw rate due to pressure bulld-up as a funetlon of Smax
~ 50
~ .. .:g 40 N
~
'"
~
of c 00
30
:B 20
-6~ .. a: ~ 5 10
'" ~e :>-n.
o Pressure Holding Ratio.dP /Pmax
Flg.22 Yaw rate due to pressure reduetlon as a functlon of .<\P/Pmax
Braka g 50
~ (/L=0.62) .:g 40 N
~
o 0.2
o
o o
,,0 • o
0.4
o o
o
o
" .. " o ".. . • 0.6 0.0 1.0
Pressura Holding Ratio JP /Pmax
Flg.24 Yaw rate due to pressure reduetlon as a funetlon of ,dP/Pmax
315
'0 Raar Brake
.. 50
" Cl .. 3. 40
~
20 40
Dry Sandy Soil (p = 0.50
-20·
-10·
60 BO 100 Maximum Braking Slip Smax (%)
Flg.25 Yaw rate due to pressure bulld-up as a functlon of Smax
~ 50
g> .:g 40
~ on tU
U.C
00
30
:B 20
-5~ .. a: ~ ~ 10
~~ >-n.
o
(/L = 0.51)
o o. ..
0.2 0.4
" o o o
0.6
o
o
• 0.8
Pressure Holding Ratio.dP /Pmax 1.0
Flg.26 Yaw rate due to pressure reduetlon as a funetlon of ,dP/Pmax
~ 50
Raar Brake g 50
Cl GI
.:g ~ 40 -20·
Wel Sealed Tar (/L=0.39)
-10·
o
1--~---7~~~~---o
o
"g> .:g 40 N
~ 1;:; 30 of
c 00 :B 20 .g-g .. a: ~ ~ 10
~~ :>-n.
(p=0.39)
o o
\ ~ o ./ .0
'" .... . 20 40 60 80 100 0 0.2 0.4 0.6 0.8 1.0
Maximum Braking Slip Smax (%)
Fig.27 Yaw rate due to pressure bulld-up as a funetlon of Smax
Prossure Holding Ratio.dP /Pmax
Flg.28 Yaw rate due to pressure reduetlon a5 a funetlon of .<\P/Pmax
" o
Rear Brake -15·
-10·
20
lo.;ol-~o·I-:5·1
o
40 60
Wat Basalt (/L=0.19)
80 100 Maximum Braking Slip Smax (%)
Flg.29 Yaw rate due to pressure bulld-up as a funetlon of Smax
l.l 60
"-Cl QJ
:B 40 N
~
o
• • 0.2 0.4
o o
0.6 0.8 Pressura Holding Ratio.dP /Pmax
1.0
Flg.30 Yaw rate due to pressure reduetlon as a funetlon of ,dP/Pmax
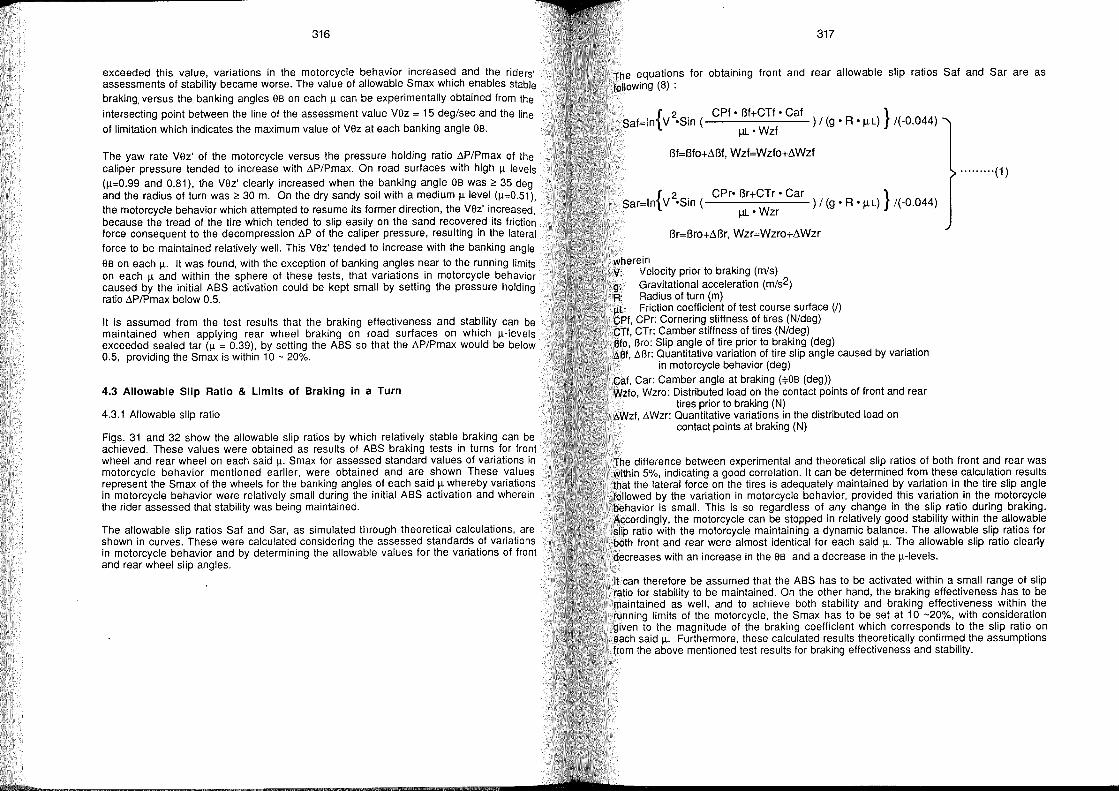
316
exceeded this value. variations in the motorcycle behavior increased and the riders' assessments of stability became worse. The value of allowable Smax which enables stable braking, versus the banking angles Os on each Jl can be experimentally obtained from the
intersecting point between the line of the assessment value VOz = 15 deg/sec and the line
of limitation which indicates the maximum value of VOz at each banking angle Os.
The yaw rate VOz' of the motorcycle versus the pressure holding ratio öP/Pmax of the caliper pressure tended to increase with öP/Pmax. On road surfaces with high Jl levels (Jl=0.99 and 0.81). the VOz' clearly increased when the banking angle Os was<:: 35 deg and the radius of turn was<:: 30 m. On the dry sandy soil with a medium Jllevel (Jl=0.51).
the motorcycle behavior which attempted to resume its former direction. the VOz' increased. because the tread of the tire which tended to slip easily on the sand recovered its friction force consequent to the decompression öP of the caliper pressure. resulting in the lateral force to be maintained relatively weil. This VOz' tended to increase with the banking angle
Os on each Jl. It was found. with the exception of banking angles near to the running limits on each Jl and within the sphere of these tests. that variations in motorcycle behavior caused by the initial ABS activation could be kept sm all by setting the pressure holding ratio öP/Pmax below 0.5.
It is assumed from the test results that the braking effectiveness and stability can be maintained when applying rear wheel braking on road surfaces on which Jl-Ievels exceeded sealed tar (Jl = 0.39). by setting the ABS so that the öP/Pmax would be below 0.5. providing the Smax is within 10 - 20%.
4.3 Allowable Slip Ratio & Limits of Braking in a Turn
4.3.1 Allowable slip ratio
Figs. 31 and 32 show the allowable slip ratios by which relatively stable braking can be achieved. These values were obtained as results of ABS braking tests in turns for front wheel and rear wheel on each said Jl. Smax for assessed standard values of variations in motorcycle behavior mentioned earlier. were obtained and are shown These values represent the Smax of the wheels for the banking angles of each said Jl whereby variations in motorcycle behavior were relatively small during the initial ABS activation and wherein the rider assessed that stability was being maintained.
The allowable slip ratios Saf and Sar. as simulated through theoretical calculations. are shown in curves. These were calculated considering the assessed standards of variations in motorcycle behavior and by determining the allowable values for the variations of front and rear wheel slip angles.
317
The equations for obtaining front and rear allowable slip ratios Saf and Sar are as followin9 (8) :
saf=ln{v 2'Sin ( CPf· ßf+CTf· Caf ) I (9' R' JlL) } 1(-0.044) JlL' Wzf
ßf=ßfo+~ßf. Wzf=Wzfo+~Wzf
{ 2 CPr' ßr+CTr' Car }
Sar=ln V 'Sin ( ) 1 (9' R • Jl L) 1(-0.044) JlL' Wzr
ßr=ßro+~ßr. Wzr=Wzro+~Wzr
wherein V: Velocity prior to braking (m/s)
Gravitational acceleration (m/s2) R: Radius of turn (m) JlL: Friction coefficient of test course surface (I) CPf. CPr: Cornering stiffness of tires (N/deg) CTf. CTr: Camber stiffness of tires (N/deg) BIo. Bro: Slip angle of tire prior to braking (deg) Mf. öBr: Quantitative variation of ti re slip angle caused by variation
in motorcycle behavior (deg)
Caf. Car: Camber angle at braking (~OS (deg)) Wzfo. Wzro: Distributed load on the contact points of front and re ar
tires prior to braking (N) !J.Wzl. !J.Wzr: Quantitative variations in the distributed load on
contact points at braking (N)
· .. ··· .. ·(1)
The difference between experimental and theoretical slip ratios of both front and rear was within 5%. indicating a good correlation. It can be determined from these calculation results that the lateral force on the tires is adequately maintained by variation in the tire slip angle followed by the variation in motorcycle behavior. provided this variation in the motorcycle behavior is small. This is so regardless of any change in the slip ratio during braking. Accordingly. the motorcycle can be stopped in relatively good stability within the allowable slip ratio with the motorcycle maintaining adynamie balance. The allowable slip ratios for both front and rear were almost identical for each said Jl. The allowable slip ratio clearly decreases with an increase in the Os and a decrease in the Jl-Ievels.
II can therefore be assumed that the ABS has to be activated within a small range of slip ratio for stability to be maintained. On the other hand. the braking effectiveness has to be maintained as weil. and to achieve both stability and braking effectiveness within the running limits of the motorcycle. the Smax has to be set at 10 -20%. with consideration given 10 the magnitude of the braking coefficient which corresponds to the slip ratio on each said Jl. Furthermore. these calculated results theoretically confirmed the assumptions from !he above mentioned test results for braking effectiveness and stability.
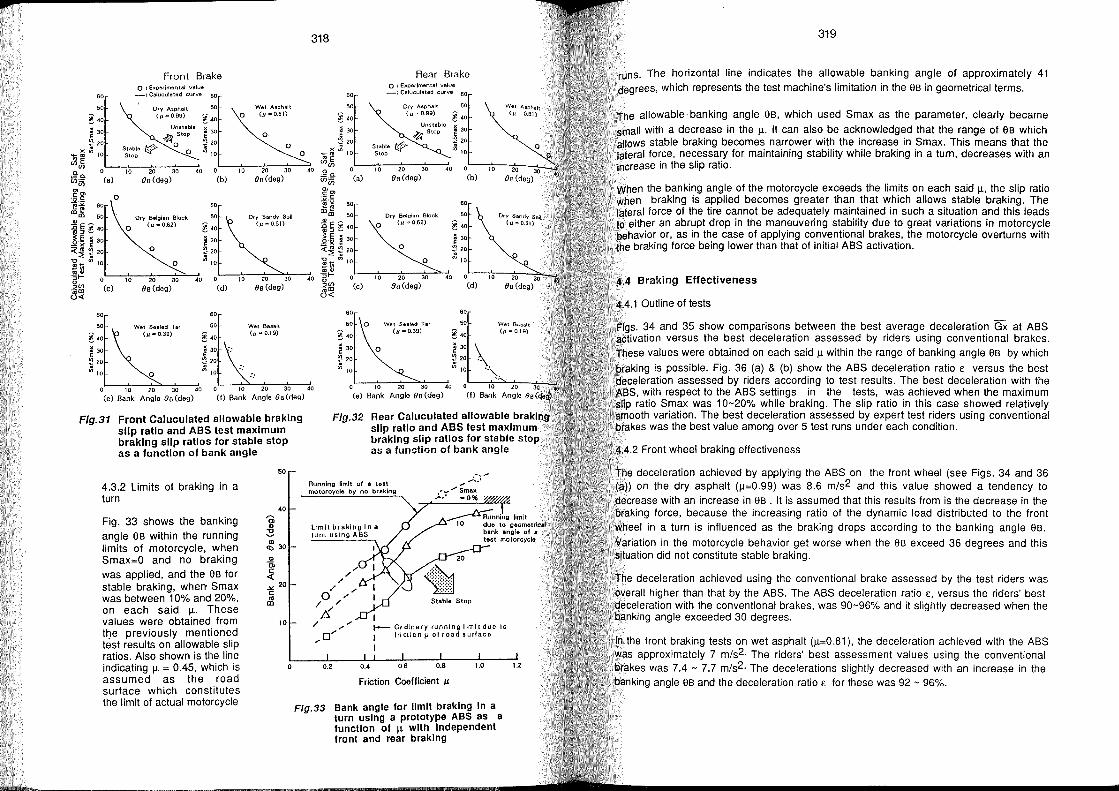
60
50
'0 30
20
0
Front Brake o : EMperimental va/ua _: Cllluculated cur ... a 60
Dry Asphalt 50
(" - 0.99) ~40 Unsteble
~ 30 ~ Stap E
~ 20 Stable ti> 0 0 Stap '" '0
'0 20 30 '0 0
OB (deg) (b)
60
Dry Belgien Block 50
0 (11 "'0.62) ~ 40
0 ~ 30 E
~ 20
0 '" '0
0
'0
Wal Asphalt (JJ" O.BI)
0
0
20 30
OB(deg)
Dry Sendy Soll (JJ -0.51)
318
Rear Brake o : Experimental velue
60 _: Caluculated curve
50 Dry Asphalt
'0 (JJ '"' 0.99) ~
Unstable ~ 30 E
20 ~ >< ,;l
0 -.. '0
~J5 '0 ß-a. 0 '0 20 30 '0
UJ:'=:: (a) OB (deg) (/)
I.E .. -" 60 mJ5 50 - Dry Belgian Block
~ ~ g 40 0 (Il .... 0.62) ~ ~.~ i 30
~
0 E
«~ ~ 20 ~ -g ... CI) 10 0 "', ~'" .. "
'0 20 30 '0 0 10 20 30 40 :;1- 0 '0 20 30 '0 g(/)
8B (deg) (d)
60 60
50 Wat Seeled Ter 50
~ 40 (IJ ""0,39) ~ 40
~ 30 ~ 30 -. E E ~ 20 ~ 20
'" '0 0 '" '0
OB (deg) 8~
W •• Basalt (11- 0.19)
;: ::
60
~ 30 E ~ 20
'" 10
(C)
o
OB (deg)
Wet Seated Ter (tl ""0.39)
o 10 20 30 40
(e) Bank Angle OB (deg) o 10 20 30 40 0 10 20 30 40
(e) Bank Angle OB (deg) (I) Bank Angle OB (deg)
Flg.31 Front Caluculated allowable braklng slip ratio and ASS test maximum braklng slip ratlos tor stable stop as a functlon of bank angle
4.3.2 Limits of braking in a turn
Fig. 33 shows the banking angle 9B within the running limits of motorcycle, when Smax=O and no braking
'0 ;S ID
50
40
Q) 30
G> D> ~ -'" 20 c ci'l
10
F/g.32 Rear Caluculated allowable braklng slip ratio and ASS test maximum braking slip ratlos for stable stop a~ a functlon of bank angle
Runnlng limit of a teat motorcycle by no brllklng
Um!! braklng In 8 turn uslng ABS
Stable Stop
~ Ordinary running 11m!! due 10 I Irlelion Jl 01 road surlace
I
Friction Coefficient J1.
1.2
was applied, and the 9B for stable braking, when- Smax was between 10% and 20%, on each said 1-1-. These values were obtained from t~e previously mentioned test results on allowable slip ratios. Also shown is the line indicating 1-1- = 0.45, which is assumed as the road surface which constitutes the limit of actual motorcycle
Flg.33 Bank angle for limit braklng In a turn uslng a prototype ABS as a funcUon of 1-1- wlth Independent front and rear braklng
319
runs. The horizontal line indicates the allowable banking angle of approximately 41 degrees, which represents the test machine's limitation in the 98 in geometrical terms.
The allowable banking angle 9B, which used Smax as the parameter, clearly became small with a decrease in the 1-1-. It can also be acknowledged that the range of 9B wh ich allows stable braking becomes narrower with the increase in Smax. This means that the lateral force, necessary for maintaining stability while braking in a turn, decreases with an increase in the slip ratio.
When the banking angle of the motorcycle exceeds the limits on each said 1-1-, the slip ratio when braking is applied becomes greater than that which allows stable braking. The lateral force of the tire cannot be adequately maintained in such a situation and this leads to either an abrupt drop in the maneuvering stability due to great variations in motorcycle behavior or, as in the case of applying conventional brakes, the motorcycle overturns with the braking force being lower than that of initial ABS activation.
4.4 Sraklng Effectiveness
4.4.1 Outline of tests
Figs. 34 and 35 show comparisons between the best average deceleration Gx at ABS activation versus the best deceleration assessed by riders using conventional brakes. These values were obtained on each said 1-1- within the range of banking angle 9B by which braking is possible. Fig. 36 (a) & (b) show the ABS deceleration ratio e versus the best deceleration assessed by riders according to test results. The best deceleration with the ABS, with respect to the ABS settings in the tests, was achieved when the maximum slip ratio Smax was 10-20% while braking. The slip ratio in this case showed relatively smooth variation. The best deceleration assessed by expert test riders using conventional brakes was the best value among over 5 test runs under each condition.
4.4.2 Front wheel braking effectiveness
The deceleration achieved by applying the ABS on the front wheel (see Figs. 34 and 36 (a)) on the dry asphalt (1-1-=0.99) was 8.6 m/s2 and this value showed a tendency to decrease with an increase in SB . It is assumed that this results from is the decrease in the braking force, because the increasing ratio of the dynamic load distributed to the front wheel in a turn is influenced as the braking drops according to the banking angle 98.
Variation in the motorcycle behavior get worse when the 9B exceed 36 degrees and this situation did not constitute stable braking.
The deceleration achieved using the conventional brake assessed by the test riders was overall higher than that by the ABS. The ABS deceleration ratio e, versus the riders' best deceleration with the conventional brakes, was 90-96% and it slightly decreased when the banking angle exceeded 30 degrees.
In the front braking tests on wet asphalt (1-1-=0.81), the deceleration achieved with the ABS was approximately 7 m/s2. The riders' best assessment values using the conventional brakes was 7.4 - 7.7 m/s2. The decelerations slightly decreased with an increase in the banking angle SB and the deceleration ratio e for these was 92 - 96%.
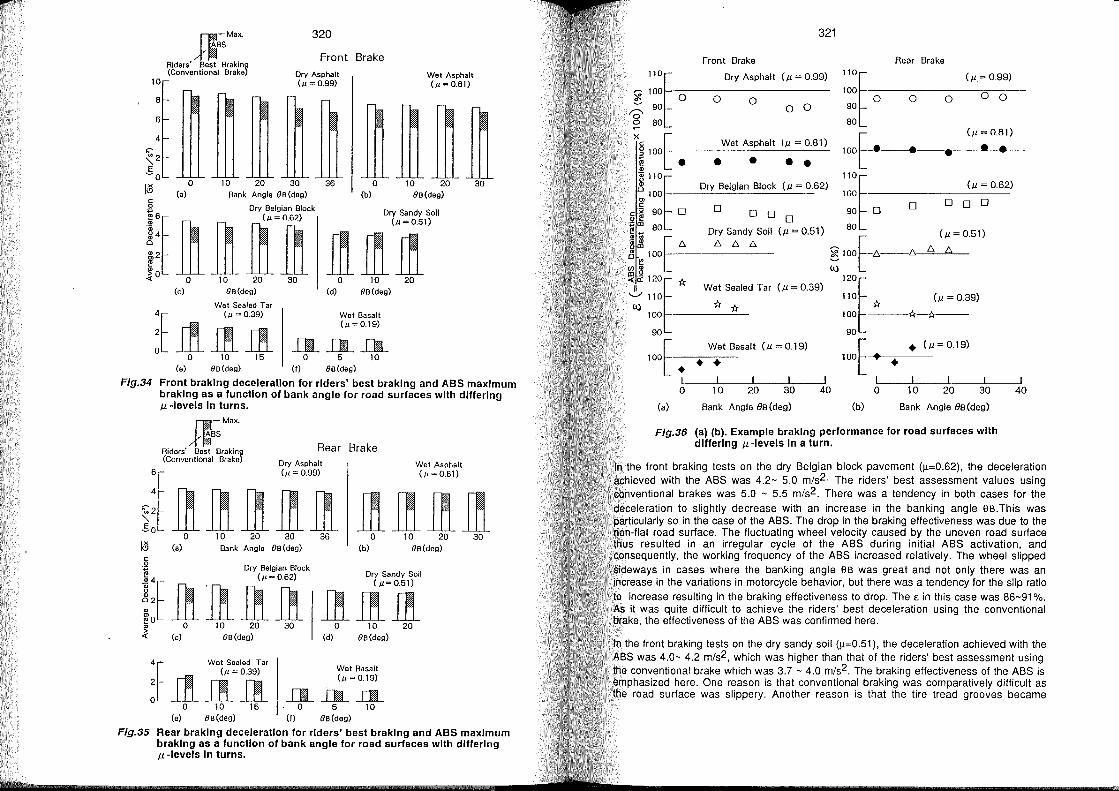
10
Il2-Max. )"~BS
Ride,. Best Brakina (Conventional Braka)
320
Front Brake
Dry Asphalt (}1 =0.99)
Wa. Asphalt (/,=0.61)
m ft ~~~~ 8
6
4
c:
o (a)
10 20 30 36 0 10 20 30 Bank Angle OS(deg) (b) OS(deg)
!:U~ lh M~~" ~ ~ ~~'l.' ~o 0 10 20 30 0 10 20
(c) OS(deg) (d) Oe(deg)
Wat Sealed T ar
:t ~ rii ft ~':! o 10 15 0 5 10
(e) 8e(deg) (f) Oe(deg)
Flg.34 Front braklng deceleratlon for rlders' best braklng and ABS maximum braklng as a functlon of bank angle for road surfaces wllh dlfferlng J,l-Ievels In turns.
ß~Max.
Rear Brake Rider. Best Brakiny
~fiOOi~ J! i~ ~ i7i;'~ o 0 10 20 30 36 0 10 20 30
I~ (a) Bank Angle OB (deg) (b) OB (deg)
Dry Belgien Block D S d S'I
lh Th Ifi l! I~Ji o 10 20
(c) OS(deg)
(}1 =0.39) 4
r Wat Sealad Tar
:J!l!ß o 10 16
(e) Oe(deg)
30 o 10 20 (d) OS(deg)
Wet Basalt (}1 =0.19)
a~J1 o 5 10
(j) OB (deg)
Flg.35 Rear braklng deceleratlon for rlders' best braklng and ABS maximum braklng as a functlon of bank angle for road surfaces wlth dlfferlng J,l-Ievels In turns.
321
Front Braka Rear Brake
'T Dry Asphalt (Jl = 0.99) "l (Jl= 0.99)
~ 100 100 0 0 0 0 0 0 0 0 ~ 90 0 0 90
'0' ~ 80 80
(Il = 0.81)
x§ 100r 100r-·--· Wet Asphalt (Jl = 0.81) • . -•
i • • • • • I"l '''~ Dry Bel9ian Block (Jl = 0.62) (Jl = 0.62) 0 100 100 g>
0 0 0 0 0 c:l2 90 0 0 0 90 0 o f! 0 ';:;m 80
Dry Sandy Soil (Jl = 0.51) 80 (Jl = 0.51)
~l t /':,. /':,. /':,. /':,. ~100r-/':,.--/':,. /':,. /':,. ~ ~ 100 ",GI
~~"l * ,w~ Wat Sealed Tar (Jl = 0.39) ';;; 110
* * 110 * (!l=0.39)
100 100 ---1.~
90 90
100r
Wat Basalt (Jl=0.19)
100r • (Jl = 0.19)
• • • • • I I I I I I I I I 0 10 20 30 40 0 10 20 30
(a) Bank Angle eB (deg) (b) Bank Angle eB (deg)
Flg.36 (a) (b). Example braklng performance for road surfaces wlth dlfferlng J,l-Ievels In a turn.
I 40
In the front braking tests on the dry Belgian block pavement (~=0.62), the deceleration achieved with the ABS was 4.2- 5.0 m/s2. The riders' best assessrnent values using conventional brakes was 5.0 - 5.5 rn/s2 . There was a tendency in both cases for the deceleration to slightly decrease with an increase in the banking angle eB.This was particularly so in the case of the ABS. The drop in the braking effectiveness was due to the non-flat road surface. The fluctuating wheel velocity caused by the uneven road surface thus resulted in an irregular cycle of the ABS during initial ABS activation, and consequently, the working frequency of the ABS increased relatively. The wheel slipped sideways in cases where the banking angle eB was great and not only there was an increase in the variations in rnotorcycle behavior, but there was a tendency for the slip ratio to increase resulting in the braking effectiveness to drop. The E in this case was 86-91 %. As it was quite difficult to achieve the riders' best deceleration using the conventional brake, the effectiveness of the ABS was confirrned here.
In the front braking tests on the dry sandy soil (~=0.51), the deceleration achieved with the ABS was 4.0- 4.2 rn/s2 , wh ich was higher than that of the riders' best assessrnent using the conventional brake which was 3.7 - 4.0 rn/s2. The braking effectiveness of the ABS is ernphasized here. One reason is that conventional braking was cornparatively difficult as the road surface was slippery. Another reason is that the tire tread grooves becarne
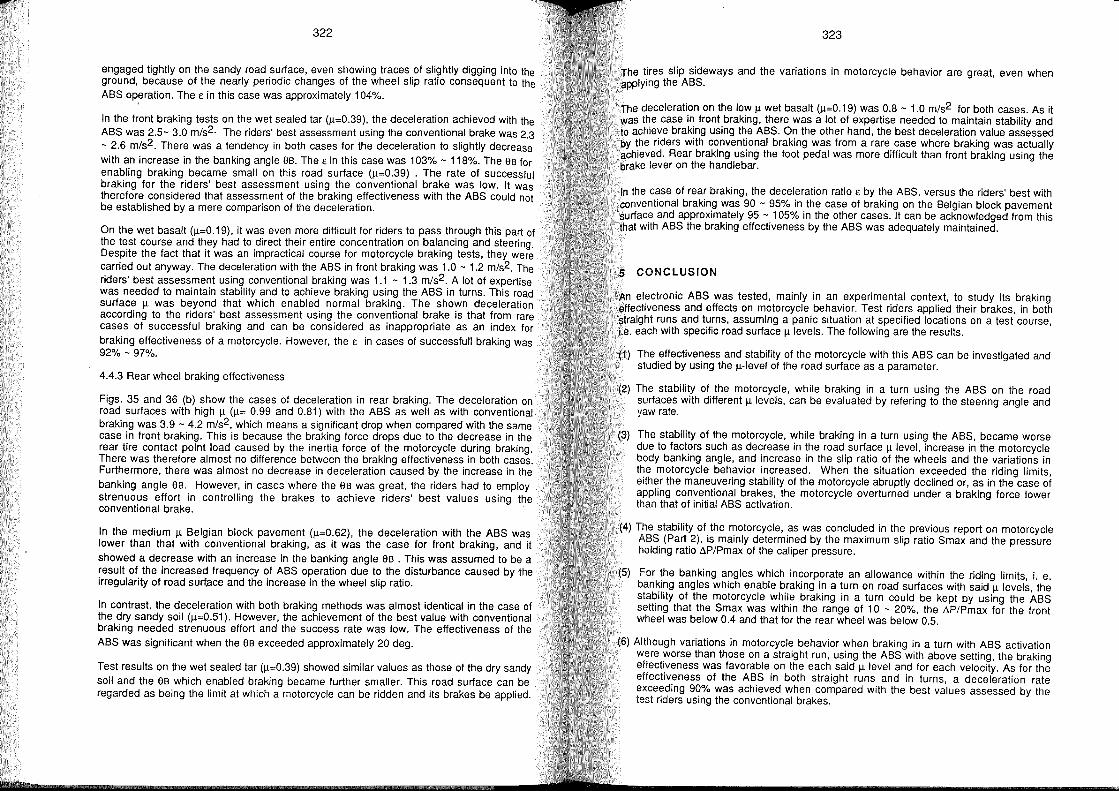
322
engaged tightly on the sandy road surface, even showing traces of slightly digging into the ground, because of the nearly periodic changes of the wheel slip ratio consequent to the ABS operation. The e in this case was approximately 104%.
In the front braking tests on the wet sealed tar (~=0.39). the deceleration achieved with the ABS was 2.5- 3.0 m/s2. The riders' best assessment using the conventional brake was 2.3 - 2.6 m/s2. There was a tendency in both cases for the deceleration to slightly decrease with an increase in the banking angle OB. The ein this case was 103% - 118%. The OB for enabling braking became sm all on this road surface (~=0.39) . The rate of successful braking for the riders' best assessment using the conventional brake was low. It was therefore considered that assessment of the braking effectiveness with the ABS could not be established by a mere comparison of the deceleration.
On the wet basalt (~=0.19), it was even more difficult for riders to pass through this part of the test course and they had to direct their entire concentration on balancing and steering. Despite the fact that it was an impractical course for motorcycle braking tests, they were carried out anyway. The deceleration with the ABS in front braking was 1.0 - 1.2 m/s2. The riders' best assessment using conventional braking was 1.1 - 1.3 m/s2. A lot of expertise was needed to maintain stability and to achieve braking using the ABS in turns. This road surface ~ was beyond that which enabled normal braking. The shown deceleration according to the riders' best assessment using the conventional brake is that from rare cases of successful braking and can be considered as inappropriate as an index for braking effectiveness of a motorcycle. However, the e in cases of successfull braking was 92% - 97%.
4.4.3 Rear wheel braking effectiveness
Figs. 35 and 36 (b) show the cases of deceleration in rear braking. The deceleration on road surfaces with high ~ (~= 0.99 and 0.81) with the ABS as weil as with conventional braking was 3.9 - 4.2 m/s2, wh ich means a significant drop when compared with the same case in front braking. This is because the braking force drops due to the decrease in the rear tire contact point load caused by the inertia force of the motorcycle during braking. There was therefore almost no difference between the braking effectiveness in both cases. Furthermore, there was almost no decrease in deceleration caused by the increase in the banking angle OB. However, in cases where the OB was great, the riders had to employ strenuous eftort in controlling the brakes to achieve riders' best values using the conventional brake.
In the medium ~ Belgian block pavement (~=0.62), the deceleration with the ABS was lower than that with conventional braking, as it was the case for front braking, and it showed a decrease with an increase in the banking angle OB . This was assumed to be a result of the increased frequency of ABS operation due to the disturbance caused by the irregularity of road surf.ace and the increase in the wheel slip ratio.
In contrast, the deceleration with both braking methods was almost identical in the case of the dry sandy soil (~=0.51). However, the achievement of the best value with conventional braking needed strenuous effort and the success rate was low. The effectiveness of the ABS was significant when the OB exceeded approximately 20 deg.
Test results on the wet sealed tar (~=0.39) showed similar values as those of the dry sandy soil and the OB which enabled braking became further sm aller. This road surface can be regarded as being the limit at which a motorcycle can be ridden and its brakes be applied.
323
The lires slip sideways and the variations in motorcycle behavior are great, even when applying the ABS.
The deceleration on the low ~ wet basalt (~=0.19) was 0.8 - 1.0 m/s2 for both cases. As it was the case in front braking, there was a lot of expertise needed to maintain stability and to achieve braking using the ABS. On the other hand, the best deceleration value assessed by the riders with conventional braking was from a rare case where braking was actually achieved. Rear braking using the foot pedal was more difficult than front braking using the brake lever on the handlebar.
In the case of re ar braking, the deceleration ratio e by the ABS, versus the riders' best with conventional braking was 90 - 95% in the case of braking on the Belgian block pavement surface and approximately 95 - 105% in the other cases. It can be acknowledged from this that with ABS the braking effectiveness by the ABS was adequately maintained.
5 CONCLUSION
An electronic ABS was tested, mainly in an experimental context, to study its braking effectiveness and effects on motorcycle behavior. Test riders applied their brakes, in both straight runs and turns, assuming a panic situation at specified locations on a test course, te. each with specific road surface ~ levels. The following are the results.
(1) The effectiveness and stability of the motorcycle with this ABS can be investigated and sludied by using the ~-Ievel of the road surface as a parameter.
(2) The stability of the motorcycle, while braking in a turn using the ABS on the road surfaces with different ~ levels, can be evaluated by refering to the steering angle and yaw rate.
(3) The stability of the motorcycle, while braking in a turn using the ABS, became worse due to factors such as decrease in the road surface ~ level, increase in the motorcycle body banking angle, and increase in the slip ratio of the wheels and the variations in the motorcycle behavior increased. When the situation exceeded the riding limits, either the maneuvering stability of the motorcycle abruptly declined or, as in the case of appling conventional brakes, the motorcycle overturned under a braking force lower than that of initial ABS activation.
(4) The stability of the motorcycle, as was concluded in the previous report on motorcycle ABS (Part 2), is mainly determined by the maximum slip ratio Smax and the pressure holding ratio t.P/Pmax of the caliper pressure.
(5) For the banking angles which incorporate an allowance within the riding limits, i. e. banking angles which enable braking in a turn on road surfaces with said ~ levels, the slability of the motorcycle while braking in a turn could be kept by using the ABS setting that the Smax was within the range of 10 - 20%, the t.P/Pmax for the front wheel was below 0.4 and that for the rear wheel was below 0.5.
(6) Although variations in motorcycle behavior when braking in a turn with ABS activation were worse than those on a straight run, using the ABS with above setting, the braking effectiveness was favorable on the each said ~ level and for each velocity. As for the effectiveness of the ABS in both straight runs and in turns, a deceleration rate exceeding 90% was achieved when compared with the best values assessed by the test riders using the conventional brakes.
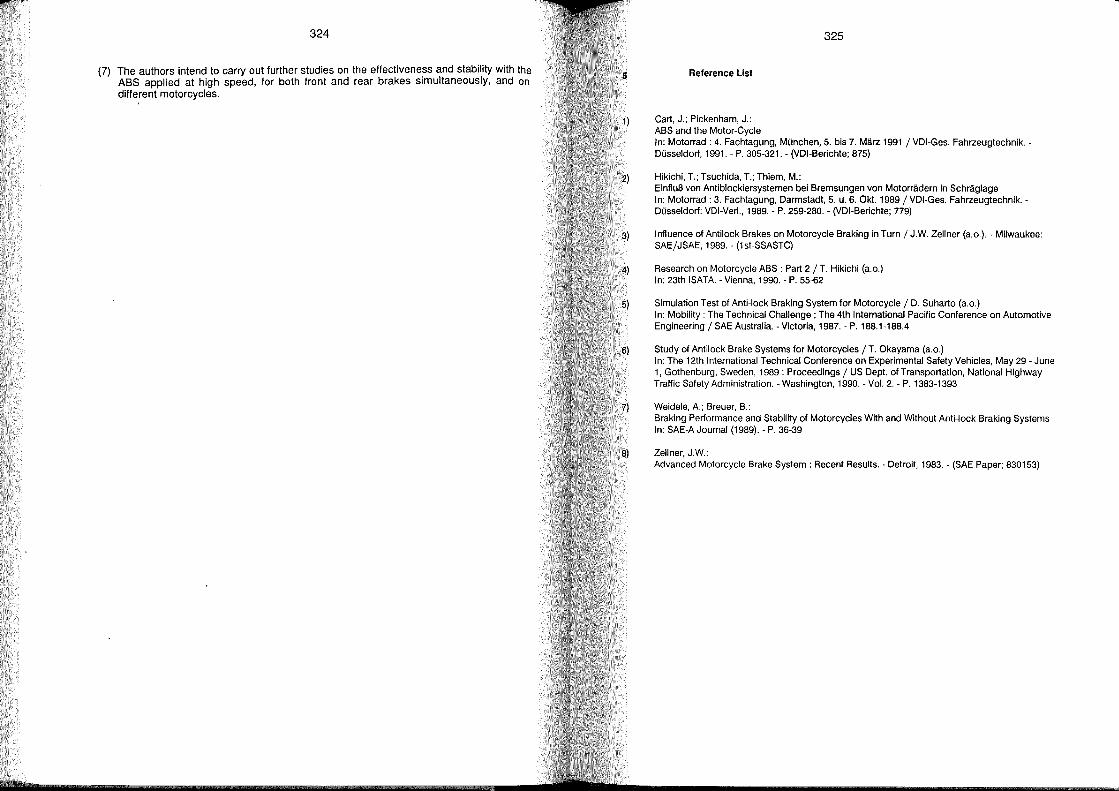
324
(7) The authors intend to carry out further studies on the effectiveness and stability with the ASS applied at high speed, for both front and re ar brakes simultaneously, and on different motorcycles.
325
Reference List
Gart, J.; Pickenham, J.: ABS and the Motor-Gycle In: Motorrad: 4. Fachtagung, München, 5. bis 7. März 1991 / VDI-Ges. Fahrzeugtechnik. -Düsseldorf, 1991. - P. 305-321. - (VDI-Berichte; 875)
Hikichi, T.; Tsuchida, T.; Thiem, M.: Einfluß von Antiblockiersystemen bei Bremsungen von Motorrädern in Schräglage In: Motorrad: 3. Fachtagung, Darmstadt, 5. u. 6. Okt. 1989/ VDI-Ges. Fahrzeugtechnik. -Düsseldorf: VDI-Verl., 1989. - P. 259-280. - (VDI-Berichte; 779)
Influence of Antilock Brakes on Motorcycle Braking in Turn / JW. ZeHner (a.o.). - Milwaukee: SAE/JSAE, 1989. - (1st-SSASTC)
Research on Motorcycle ABS : Part 2 / T. Hikichi (a.o.) In: 23th ISATA. - Vienna, 1990. - P. 55-62
Simulation Test of Anti-lock Braking System for Motorcycle / D. Suharto (a.o.) In: Mobility : The Technical GhaHenge ; The 4th International Pacific Gonference on Automotive Engineering / SAE Australia. - Victoria, 1987. - P. 188.1-188.4
Study of Antilock Brake Systems for Motorcycles / T. Okayama (a.o.) In: The 12th International Technical Conference on Experimental Safety Vehicles, May 29 - June 1, Gothenburg, Sweden, 1989 : Proceedings / US Dept. of Transportation, National Highway Traffic Safety Administration. - Washington, 1990. - Vol. 2. - P. 1383-1393
Weideie, A.; Breuer, B.: Braking Performance and Stability of Motorcycles With and Without Anti-lock Braking Systems In: SAE-A Journal (1989). - P. 36-39
ZeHner, JW.: Advanced Motorcycle Brake System: Recent Results. - Detroit, 1983. - (SAE Paper; 830153)
Research on Combined Brake System for Motorcycle
Yukimasa Nishimoto
Kanau Iwashita
Tetsuo Tsuchida
Honda R & D Co., Ud., Saitama-Ken
Japan
Michael Thiem
Honda R & D Europe GmbH, Offen bach
Germany
»
329
1 Abstract
Motorcycle brakes are generally comprised of a system wherein the front and rear
brakes are operated independently by the hand and foot respectively, and in order
to stabilize the behavior of the vehicle and bring out maximum brake performance it
is necessary to skililuily balance the hand and loot input.
Accordingly, in this paper we present a CBS (Combined Brake System) in which
the hand and loot operated systems together apply braking to the front and rear
wheels simultaneously. Braking tests were performed by varying the front and rear
braking force distribution characteristics, and tests were performed to find a braking
force distribution characteristic which also allows easier handling lor riders who are
accustomed to a conventional brake system. As a result, it was learned that brakes
which can be easily operated by a rider accustomed to a conventional brake
system can be obtained by means of a hand operated system CBS in which locking
of the front wheel occurs before the rear wheel, and a loot operated system CBS in
which, conversely, locking 01 the rear wheel occurs before locking of the front
wheel.
Using a test vehicle fitted with a CBS adjusted for a braking force distribution
characteristic of this kind, measurements were taken of the dispersion of the
deceleration produced by riders of varying levels of skill. Further, vehicle behavior
was measured during braking with the same characteristic, and comparisons were
made with vehicle behavior when a conventional brake system was used. As a
result, when comparison was made of independent hand and foot operation, the
generated deceleration was higher and the dispersion due to differences in the
rider's ski 11 was smaller with the use of the present CBS than with a conventional
brake system. Further, it was learned that changes in the vehicle's behavior were
also smaller with the CBS.
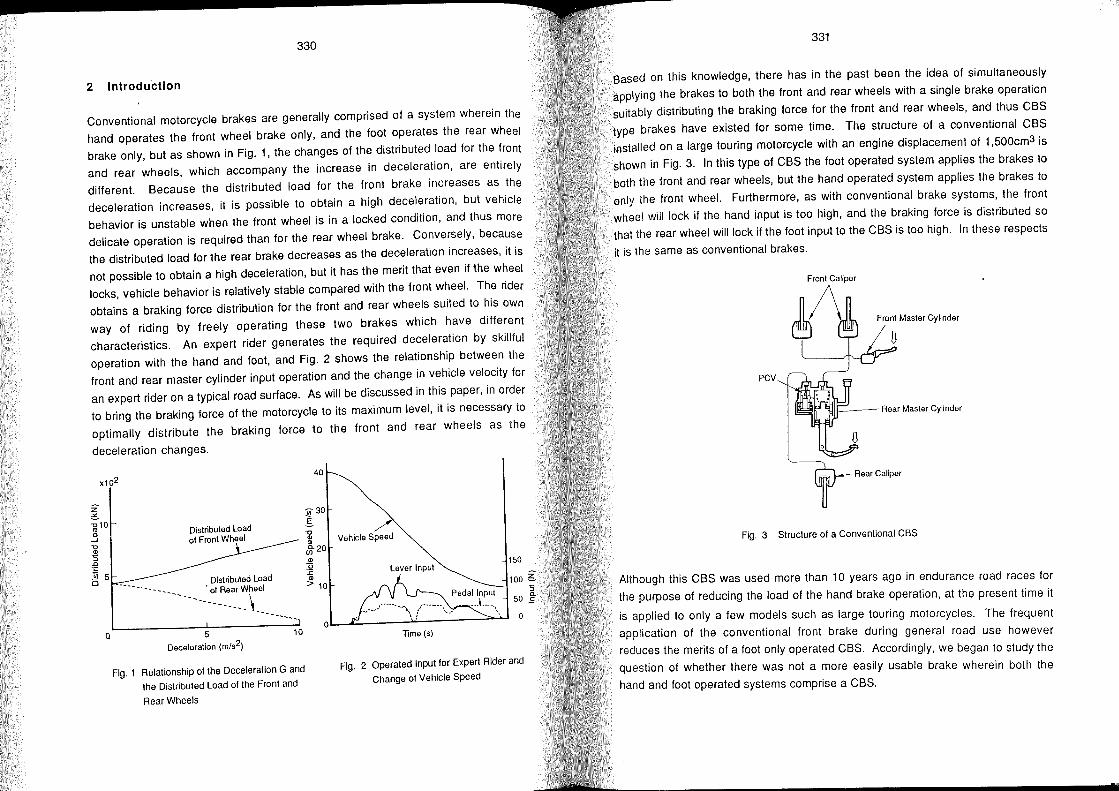
330
2 Introduction
Conventional motorcycle brakes are generally comprised of a system wherein the
hand operates the front wheel brake only, and the foot operates the rear wheel
brake only, but as shown in Fig. 1, the changes of the distributed load for the front
and rear wheels, which accompany the increase in deceleration, are entirely
different. Because the distributed load for the front brake increases as the
deceleration increases, it is possible to obtain a high deceleration, but vehicle
behavior is unstable when the front wheel is in a locked condition, and thus more
delicate operation is required than for the rear wheel brake. Conversely, because
the distributed load for the rear brake decreases as the deceleration increases, it is
not possible to obtain a high deceleration, but it has the merit that even if the wheel
locks, vehicle behavior is relatively stable compared with the front wheel. The rider
obtains a braking force distribution for the front and rear wheels suited to his own
way of riding by freely operating these two brakes which have different
characteristics. An expert rider generates the required deceleration by skillful
operation with the hand and foot, and Fig. 2 shows the relationship between the
front and rear master cylinder input operation and the change in vehicle velocity for
an expert rider on a typical road surface. As will be discussed in this paper, in order
to bring the braking force of the motorcycle to its maximum level, it is necessary to
optimally distribute the braking force to the front and rear wheels as the
deceleration changes.
Distributed Load • 01 Rear Wheel
-- ----- - -------\-
40
I 30
"0 Q) Q)
bl" 20 Q)
Ü :;:
Q)
> 10
Vehicle Speed
Lever Input
Pedal Input
150
100 g
" 50 ~ ,, ___ J-------'\ rr-----'--. _ .. L __ '. 0L-~------~------~~ o
Q 5 10
Deceleration (rn/52)
Fig. 1 Relationship of the Deceleration G and
the Distributed Load 01 the Front and
Rear Wheels
Time (5)
Fig. 2 Operated Input for Expert Rider and
Change of Vehicie Speed
331
Based on this knowledge, there has in the past been the idea of simultaneously
applying the brakes to both the front and rear wheels with a single brake operation
suitably distributing the braking force for the front and rear wheels, and thus CBS
type brakes have existed for so me time. The structure of a conventional CBS
installed on a large touring motorcycle with an engine displacement of 1 ,500cm3 is
shown in Fig. 3. In this type of CBS the foot operated system applies the brakes to
both the front and rear wheels, but the hand operated system applies the brakes to
only the front wheel. Furthermore, as with conventional brake systems, the front
wheel will lock if the hand input is too high, and the braking force is distributed so
thaI lhe rear wheel will lock if the foot input to the CBS is too high. In these respects
it is the same as conventional brakes.
pcv
_ Rear Master Cylinder
Fig. 3 Structure 01 a Conventional CBS
Although this CBS was used more than 10 years ago in endurance road races for
the purpose of reducing the load of the hand brake operation, at the present time it
is applied to only a few models such as large touring motorcycles. The frequent
application of the conventional front brake during general road use however
reduces the merits of a foot only operated CBS. Accordingly, we began to study the
question of whether there was not a more easily usable brake wherein both the
hand and foot operated systems comprise a CBS.
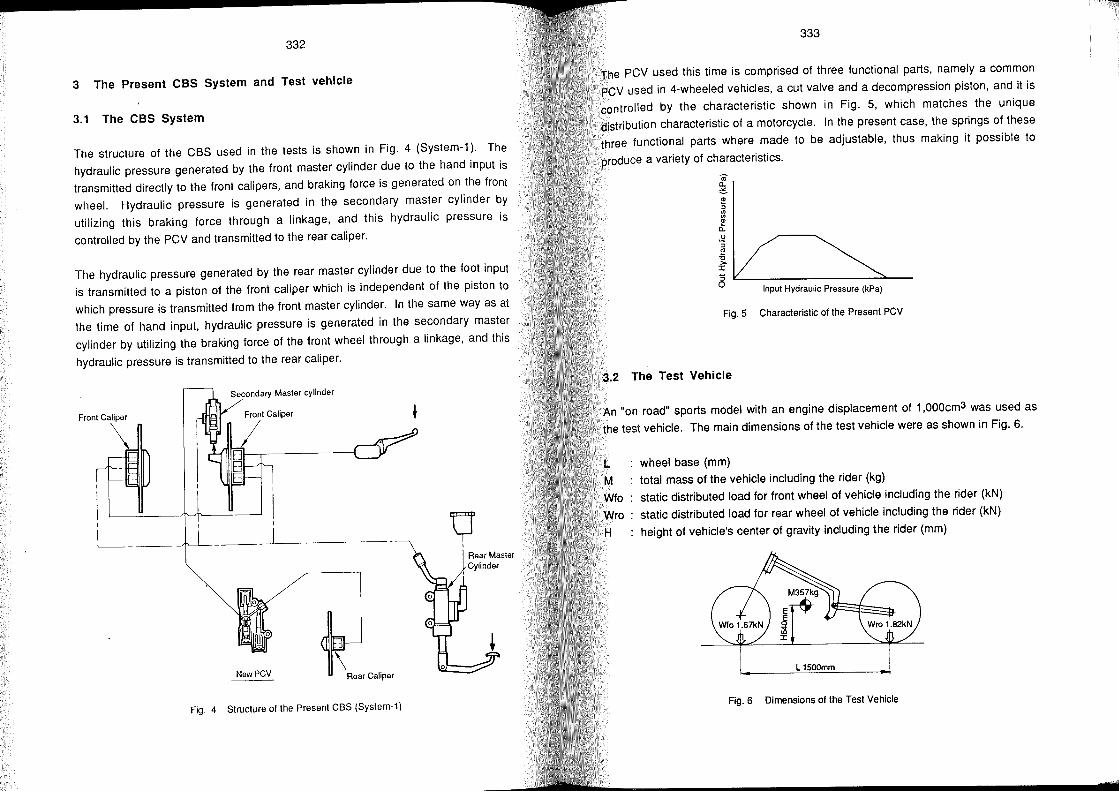
332
3 The Present CBS System and Test vehicle
3.1 The CBS System
The structure of the CBS used in the tests is shown in Fig. 4 (System-1). The
hydraulic pressure generated by the front master cylinder due to the hand input is
transmitted directly to the front calipers, and braking force is generated on the front
wheel. Hydraulic pressure is generated in the secondary master cylinder by
utilizing this braking force through a linkage, and this hydraulic pressure is
controlled by the PCV and transmitted to the rear caliper.
The hydraulic pressure generated by the rear master cylinder due to the foot input
is transmitted to a piston of the front caliper which is independent of the piston to
which pressure is transmitted from the front master cylinder. In the same way as at
the time of hand input, hydraulic pressure is generated in the secondary master
cylinder by utilizing the braking force of the front wheel through a linkage, and this
hydraulic pressure is transmitted to the rear caliper.
Secondary Master cylinder
Front Caliper
o I
I
---~-----
NewPCV Rear Caliper
Fig. 4 Structure 01 the Present CBS (System-1)
333
The PCV used this time is comprised of three functional parts, namely a common
PCV used in 4-wheeled vehicles, a cut valve and a decompression piston, and it is
controlled by the characteristic shown in Fig. 5, which matches the unique
distribution characteristic of a motorcycle. In the present case, the springs of these
three functional parts where made to be adjustable, thus making it possible to
produce a variety of characteristics.
Input Hydraulic Pressure (kPa)
Fig.5 Characteristic 01 the Present PCV
3.2 The Test Vehicle
An "on road" sports model with an engine displacement of 1,OOOcm3 was used as
the test vehicle. The main dimensions of the test vehicle were as shown in Fig. 6.
L wheel base (mm) M total mass of the vehicle including the rider (kg)
Wfo static distributed load for front wheel of vehicle including the rider (kN)
Wro static distributed load for rear wheel 01 vehicle including the rider (kN)
H height 01 vehicle's center 01 gravity including the rider (mm)
L 1500mm
Fig.6 Dimensions 01 the Test Vehicle
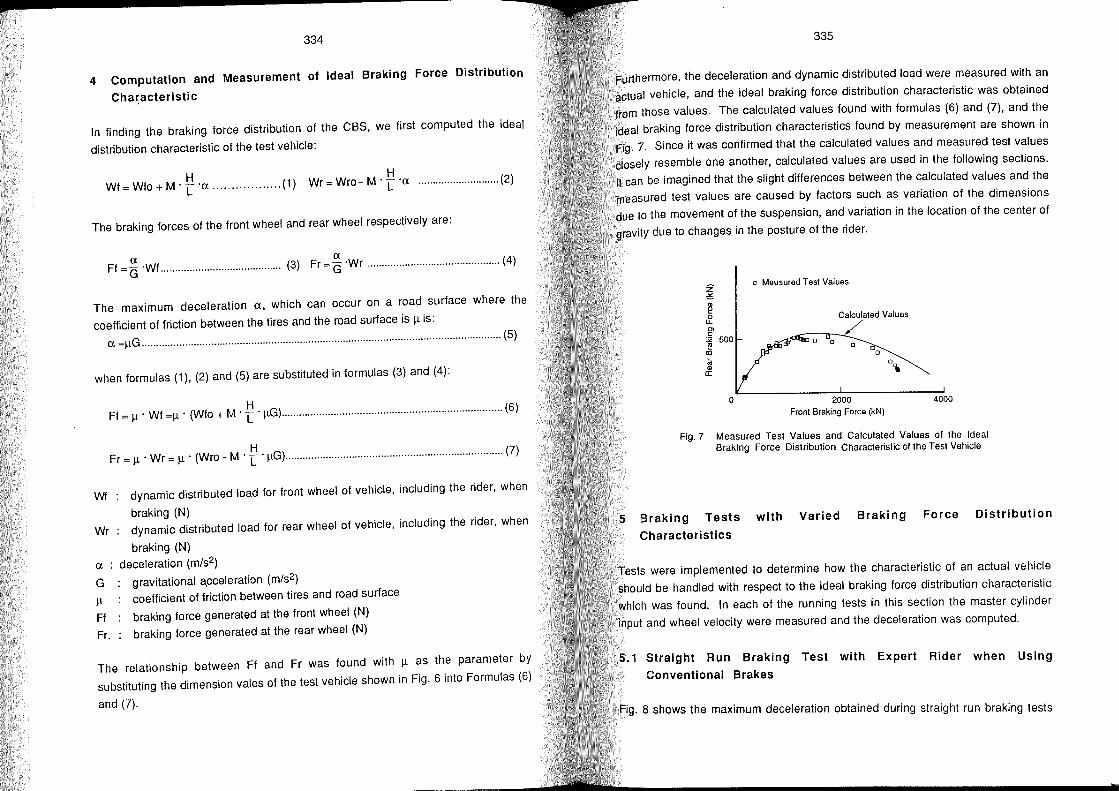
334
4 Computation and Measurement of Ideal Braking Force Distribution
Cha~acteristic
In finding the braking force distribution of the CBS, we first computed the ideal
distribution characteristic of the test vehicle:
H H Wf=Wfo+M.I.u .................. (1) Wr=Wro-M'I'u ............................ (2)
The braking forces of the front wheel and rear wheel respectively are:
U U Ff =(3" Wf... .............. ····.···················· (3) Fr =(3" Wr .............................................. (4)
The maximum deceleration u, which can occur on a road surface where the
coefficient of friction between the tires and the road surface is 11 is:
U =IlG ............................................................................................................................. (5)
when formulas (1), (2) and (5) are substituted in formulas (3) and (4):
H Ff = 11 . Wf =11 . (Wfo + M . I . IlG) ......................... ·························· ......................... (6)
H Fr = 11 . Wr = 11 . (Wro - M . I . IlG) ......................... ·························· ........................ (7)
Wf dynamic distributed load for front wheel of vehicle, including the rider, when
braking (N) Wr: dynamic distributed load for rear wheel of vehicle, including the rider, when
braking (N)
U : deceleration (m/s2)
G
11 Ff
Fr.
gravitational a.cceleration (m/s2)
coefficient of friction between tires and road surface
braking force generated at the front wheel (N)
braking force generated at the rear wheel (N)
The relationship between Ff and Fr was found with 11 as the parameter by
substituting the dimension vales of the test vehicle shown in Fig. 6 into Formulas (6)
and (7).
335
Furthermore, the deceleration and dynamic distributed load were measured with an
actual vehicle, and the ideal braking force distribution characteristic was obtained
from those values. The calculated values found with formulas (6) and (7), and the
ideal braking force distribution characteristics found by measurement are shown in
Fig. 7. Since it was confirmed that the calculated values and measured test values
closely resemble one another, calculated values are used in the following sections.
It can be imagined that the slight differences between the calculated values and the
measured test values are caused by factors such as variation of the dimensions
due to the movement of the suspension, and variation in the location of the center of
gravity due to changes in the posture of the rider.
z o Meusured Test Values
~
~ 0 Calculated Values
L1. / Cl c
:;oe 500 ° a ~ a
° m ° iii 0", (I)
a:
0 2000 4000
Front Braking Force (kN)
Fig. 7 Measured Test Values and Calculated Values 01 the Ideal Braking Force Distribution Characteristic 01 the Test Vehicie
5 Braking Tests with Va ried Braking Force Distribution
Characteristics
Tests were implemented to determine how the characteristic of an actual vehicle
should be handled with respect to the ideal braking force distribution characteristic
which was found. In each of the running tests in this section the master cylinder
input and wheel velocity were measured and the deceleration was computed.
5.1 Straight Run Braking Test with Expert Rider when Using
Conventional Brakes
Fig. 8 shows the maximum deceleration obtained during straight run braking tests
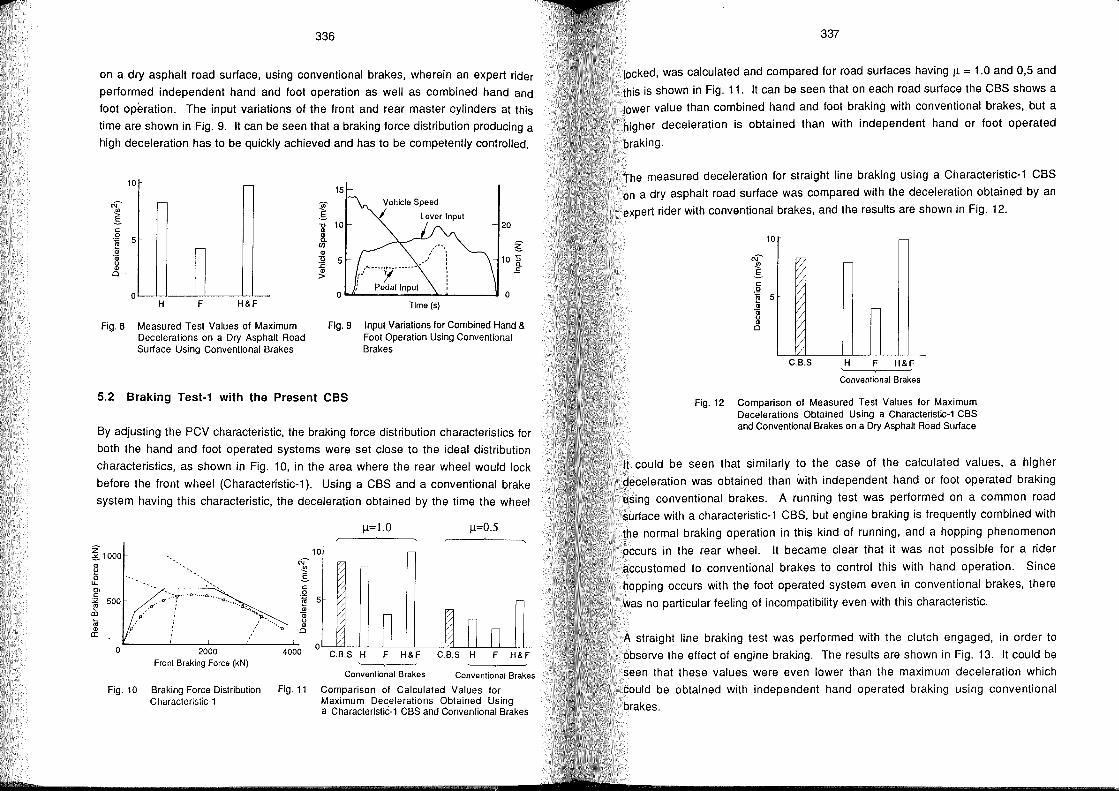
336
on a dry asphalt road surface, using conventional brakes, wherein an expert rider
performed independent hand and foot operation as weil as combined hand and
foot operation. The input variations of the front and rear master cylinders at this
time are shown in Fig. 9. It can be seen that a braking force distribution producing a
high deceleration has to be quickly achieved and has to be competently controlled.
10
",- ,-
~ g c: 0
5 ~ :;;
Qj u
'" Cl
0 H F H&F
Fig.8 Measured Test Values of Maximum Decelerations on a Dry Asphalt Road Surtace Using Conventional Brakes
15 Vehicle Speed
/ Lever Input 20
o 0 Time (s)
Fig. 9 Input Variations for Combined Hand & Foot Operation Using Convenlional Brakes
5.2 Braking Test-1 with the Present CBS
By adjusting the PCV characteristic, the braking force distribution characteristics for
both the hand and foot operated systems were set close to the ideal distribution
characteristics, as shown in Fig. 10, in the area where the rear wheel would lock
before the front wheel (Characteristic-1). Using a CBS and a conventional brake
system having this characteristic, the deceleration obtained by the time the wheel
~ 1000
~ ,f Cl c: ~ 500 <Il
tii '" er:
o
,u"
Q~~:"'r' ··O ..... (). ••• '0 •••••
." 2000
Front Braking Force (kN)
Fig. 10 Braking Force Distribution Characteristic-l
Fig.11
~=1.0 ~=O.5
10
Conventional 8rakes Conventional Brakes
Comparison of Calculated Values for Maximum Decelerations Obtained Using a Characterislic-1 CBS and Conventional Brakes
337
locked, was calculated and compared for road surfaces having ~ = 1.0 and 0,5 and
this is shown in Fig. 11. It can be seen that on each road surface the CBS shows a
tower value than combined hand and foot braking with conventional brakes, but a
higher deceleration is obtained than with independent hand or foot operated
braking.
The measured deceleration for straight line braking using a Characteristic-1 CBS
on a dry asphalt road surface was compared with the deceleration obtained by an
expert rider with conventional brakes, and the results are shown in Fig. 12.
N ~ g c:
.Q
10
(;j 5 :;; Qj u
'" Cl
f/ ~ r/ ~ ,-
~ ~
c.8.S H F H&F
Conventional Brakes
Fig. 12 Comparison of Measured Test Values for Maximum Decelerations Obtained Using a Characteristic-1 CBS and Conventional Brakes on a Dry Asphalt Road Surtace
It could be seen that similarly to the case of the calculated values, a higher
deceleration was obtained than with independent hand or foot operated braking
using conventional brakes. A running test was performed on a common road
surface with a characteristic-1 CBS, but engine braking is frequently combined with
the normal braking operation in this kind of running, and a hopping phenomenon
occurs in the rear wheel. It became clear that it was not possible for a rider
accustomed to conventional brakes to control this with hand operation. Since
hopping occurs with the foot operated system even in conventional brakes, there
was no particular feeling of incompatibility even with this characteristic.
A straight line braking test was performed with the clutch engaged, in order to
observe the effect of engine braking. The results are shown in Fig. 13. It could be
seen that these values were even lower than the maximum deceleration wh ich
could be obtained with independent hand operated braking using conventional
brakes.

338
Fig. 14 was obtained by measuring the hopping load which is generated on the
rear wheel due to combined use of engine and normal braking, and drawing this
area on 'a graph of the braking force distribution characteristic. It was learned thaI
with this braking force distribution characteristic, hopping occurs in the area of high
deceleration.
10
Fig.13
IT
( t/
~
~ .f
1000
1/ , e- g> 500 :i'
/
~ V
C.B.S H F H&F
Conventional Brakes
ra .:0 (ij <D
CI:
o
Comparison of Measured Test Fig. 14 Values for Maximum Deceleration Obtained Using a Characteristic-l CBS and Conventional Brakes on a Dry Asphalt Road Surface (Clutch In)
Front Braking Force (kN)
Hopping Generation Zone Superimposed on the Calculated Va lues of the Ideal Braking Force Distribution Characteristic of the Test Vehicle
5.3 Braking Test-2 with the Present CBS
In order that hopping would not occur, the hopping generation zone of Fig. 14 was
avoided for both the hand and foot operated systems, and a characteristic
(Characteristic-2) was selected which was close to the ideal braking force
distribution in the area where the front wheel will lock before the rear wheel, as in
Fig.15. The deceleration obtained by using a CBS having this characteristic were
measured on road surfaces having 11 = 1.0 and 0.5, and the results as compared
with conventional bra\.<es are shown in Fig. 16. Although the values are lower than
the results obtained with a Characteristic-1 CBS, it can be seen that a higher
deceleration can be obtained than with independent hand or foot operation using
cOI)Ventional brakes.
2000 4000
Front Braking Force (kN)
339
N
i c:
.Q
f1=1.0 10~
'§ 5
'" a; o ~
C.B.S H
Conventio~al Brakes
Fig. 15 Braking Force Distribution Characteristic-2
Fig.16 Comparison of Calculated Values tor Maximum Deceleration Obtained Using a Characteristic-2 CBS and Conventional Brakes
The results of a straight line braking test using a Characteristic-2 CBS on a dry
asphalt road surface with the clutch in and out are shown in Fig. 17. Th'e maximum
decelerations were nearly the same regardless of whether the clutch was engaged
or disengaged.
, A running test was performed using a Characteristic-2 CBS on a common road
surface; but it was discovered that the foot operated system was difficult to control
with this characteristic, in which the front wheel locks before the rear wheel.
Accordingly, the hand operated system was left adjusted for Characteristic - 2, and
then braking test-3 was performed using a characteristic wh ich would cause the
rear wheel to lock first, as explained in the next section.
0
N
~ c:
.Q '§ 5 <D a; o <D Cl
~
f': ~ e-
r; ~ c: /
V v ,-
r; ~/
V r:; v~ V /
(Clutch IN) (Clutch DUn H F H&F ~-~-~
C.B.S Conventional Brakes
Fig. 17 Comparison of Maximum Deceleration Obtained Using a Characteristic-2 CBS on a Dry Asphalt Road Surface with the Clutch In and Out
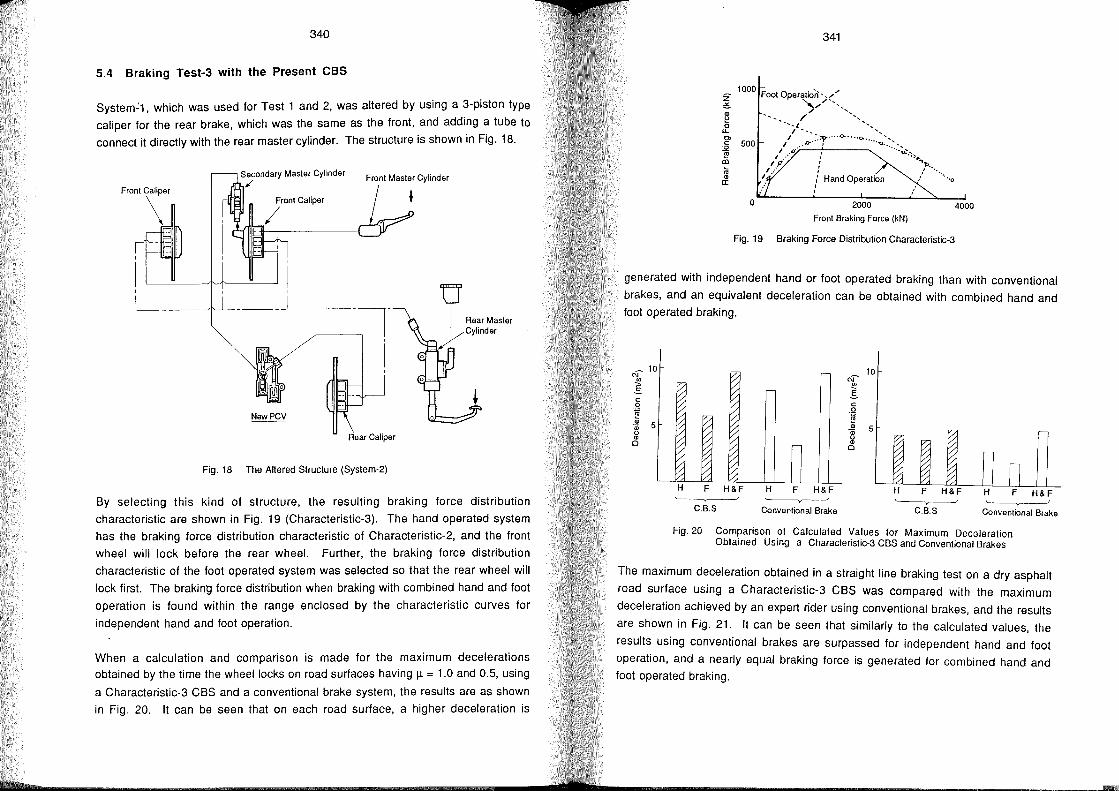
340
5.4 Braking Test-3 with the Present CBS
System~1, wh ich was used for Test 1 and 2, was altered by using a 3-piston type
caliper for the rear brake, which was the same as the front, and adding a tube to
connect it directly with the rear master cylinder. The structure is shown in Fig. 18.
Front\er
Secondary Master Cylinder /
I
I I
---~---~-
I
Rear Caliper
Fig. 18 The Altered Structure (System-2)
9 I Rear Master , Cylinder
By selecting this kind of structure, the resulting braking force distribution
characteristic are shown in Fig. 19 (Characteristic-3). The hand operated system
has the braking force distribution characteristic of Characteristic-2, and the front
wheel will lock before the rear wheel. Further, the braking force distribution
characteristic of the foot operated system was selected so that the rear wheel will
lock first. The braking force distribution when braking with combined hand and foot
operation is found within the range enclosed by the characteristic curves for
independent hand and loot operation.
When a calculation and comparison is made for the maximum decelerations
obtained by the time the wheel locks on road surfaces having Il = 1.0 and 0.5, using
a Characteristic-3 CBS and a conventional brake system, the results are as shown
in Fig. 20. It can be seen that on each road surface, a higher deceleration is
341
Z 1000 Foot Operatiofl-_ ......
~ " .... /'---'" ~ 500 ~
<ll iü .. a:
o
// '----'-l --_ , ...... ... ... " .D'.::'f .... oo •••• o. ••••• "o.~~ ..........
,'",Cf I ..• o:-.":.} .... I p', "'l>.
I'" I
I " ,: Hand Operation / ..... "0
I
2000
Front Braking Force (kN)
Fig. 19 Braking Force Distribution Characteristic-3
4000
generated with independent hand or foot operated braking than with conventional
brakes, and an equivalent deceleration can be obtained with combined hand and foot operated braking.
_ 10 N
i c: o .~
"* 5 o <l)
o
/
H&F F H&F '------v----' "----y--------'
C.B.S Conventional Brake
10
5
H&F '-------y-----
Conventional Brake
Fig. 20 Comparison of Calculated Values for Maximum Deceleration Obtained Using a Characteristic-3 CBS and Conventional Brakes
The maximum deceleration obtained in a straight line braking test on a dry asphalt
road surlace using a Characteristic-3 CBS was compared with the maximum
deceleration achieved by an expert rider using conventional brakes, and the results
are shown in Fig. 21. It can be seen that similarly to the calculated values, the
results using conventional brakes are surpassed for independent hand and foot
operation, and a nearly equal braking force is generated for combined hand and foot operated braking.
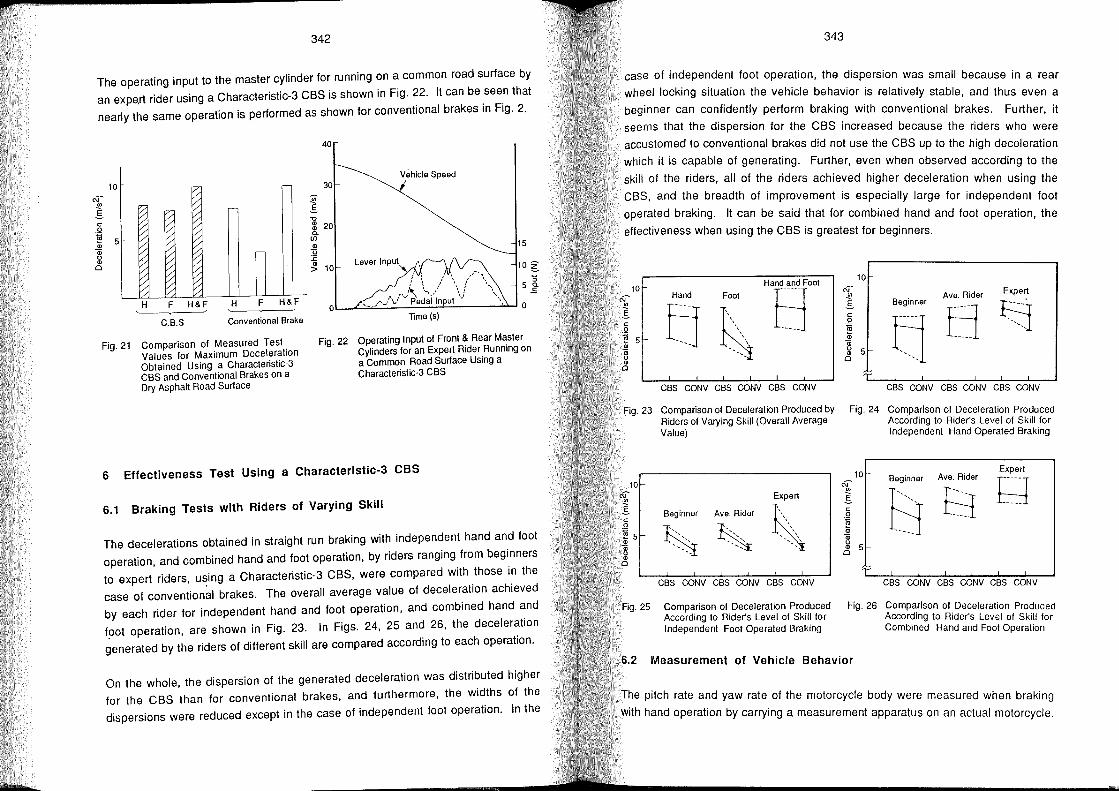
342
The operating input to the master cylinder for running on a common road surface by
an expe,rt rider using a Characteristic-3 CBS is shown in Fig. 22. It can be seen that
nearly the same operation is performed as shown for conventional brakes in Fig. 2.
10
Fig.21
H F H&F H F H&F ,------"
C.B.S Conventional Brake
Comparison 01 Measured Test. Values lor Maximum DeceleraliOn Obtained Using a Characteristic-3 CBS and Conventional Brakes on a Dry Asphalt Road Surtace
.!!! .s "0
40
30
g: 20 a. Ul ., ü :c ~ 10
Fig.22
Vehicle Speed
I
15
Operating Input 01 Front & Rear Master Cylinders lor an Expert Rider Running on a Common Road Surtace Using a Characteristic-3 CBS
6 Effectiveness Test Using a Characteristic-3 CBS
6.1 Braking Tests with Riders of Varying Skill
The decelerations obtained in straight run braking with independent hand and foot
operation, and combined hand and foot operation, by riders ranging from beginners
to expert riders, using a Characteristic-3 CBS, were compared with those in the
case of convention~1 brakes. The overall average value of deceleration achieved
by each rider for independent hand and foot operation, and combined hand and
foot operation, are shown in Fig. 23. In Figs. 24, 25 and 26, the deceleration
generated by the riders of different skill are compared according to each operation.
On the whole, the dispersion of the generated deceleration was distributed higher
for the CBS than for conventional brakes, and furthermore, the widths of the
dispersions were reduced except in the case of independent foot operation. In the
343
case of independent foot operation, the dispersion was small because in a rear
wheel locking situation the vehicle behavior is relatively stable, and thus even a
beginner can confidently perform braking with conventional brakes. Further, it
seems that the dispersion for the CBS increased because the riders who were
accustomed to conventional brakes did not use the CBS up to the high deceleration
which it is capable of generating. Further, even when observed according to the
skill 01 the riders, all of the riders achieved higher deceleration when using the
CBS, and the breadth of improvement is especially large for independent foot
operated braking. It can be said that for combined hand and foot operation, the
effectiveness when using the CBS is greatest for beginners.
q; 1 c: .2
10
~ 5 Q)
äi u Q)
Cl
Hand and Foot
fj~6 CBS CONV CBS CONV CBS CONV
Fig. 23 Comparison 01 Deceleration Produced by Riders 01 Varying Skill (Overall Average Value)
10 N
i c: o .~ 5 Q)
~ Q)
Cl
Fig.25
Beginner Ave. Rider
CBS CONV CBS CONV CBS CONV
Comparison 01 Deceleration Produced According to Rider's Level 01 Skill lor Independent Foot Operated Braking
N
i c: .2 iil Q; äi
10
~ 5 Cl
CBS CONV CBS CONV CBS CONV
Fig. 24 Comparison 01 Deceleration Produced According to Rider's Level 01 Skill lor Independent Hand Operated Braking
10 Beginner Expert
Ave~~ider r----T t---T t::=i 1=:1
CBS CONV CBS CONV CBS CONV
Fig. 26 Comparison 01 Deceleration Produced According to Rider's Level 01 Skill lor Combined Hand and Foot Operation
6.2 Measurement of Vehicle Behavior
The pitch rate and yaw rate of the motorcycle body were measured when braking
with hand operation by carrying a measurement apparatus on an actual motorcycle.
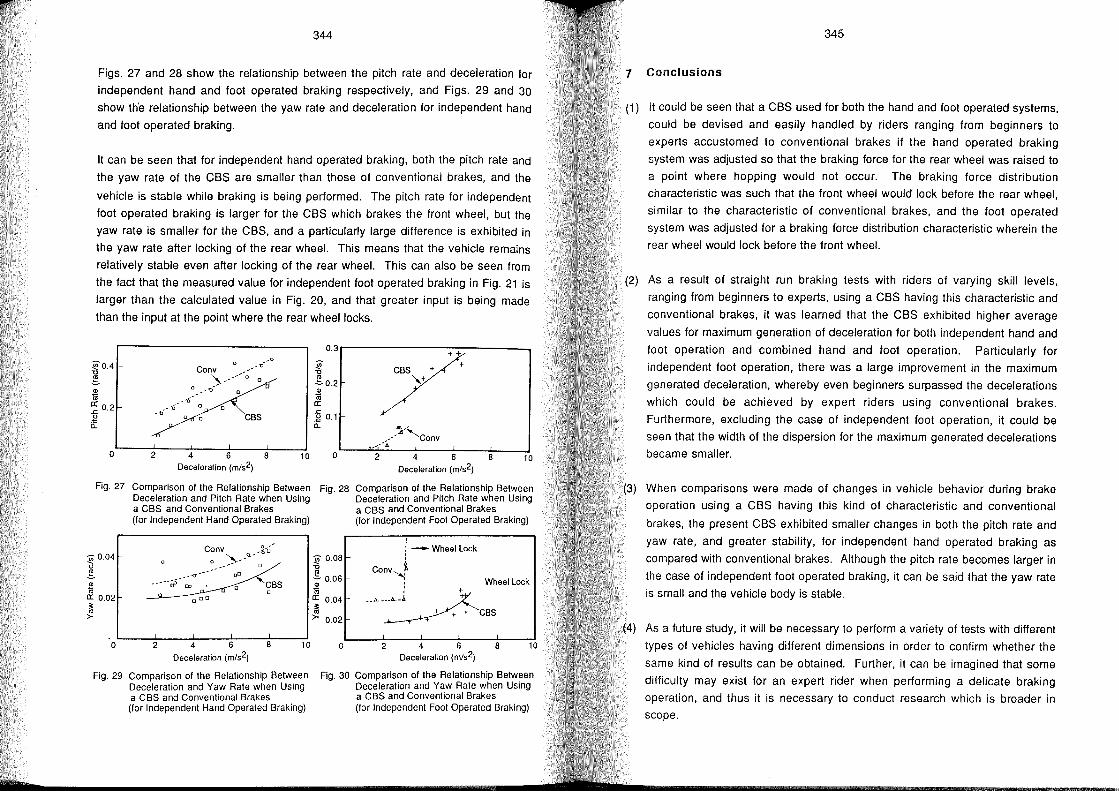
344
Figs. 27 and 28 show the relationship between the pitch rate and deceleration lor
independent hand and foot operated braking respectively, and Figs. 29 and 30
show the relationship between the yaw rate and deceleration lor independent hand
and loot operated braking.
It can be seen that lor independent hand operated braking, both the pitch rate and
the yaw rate 01 the CBS are smaller than those 01 conventional brakes, and the
vehicle is stable while braking is being performed. The pitch rate lor independent
loot operated braking is larger for the CBS which brakes the front wheel, but the
yaw rate is smaller lor the CBS, and a particularly large difference is exhibited in
the yaw rate after locking 01 the rear wheel. This means that the vehicle remains
relatively stable even after locking 01 the rear wheel. This can also be seen lrom
the fact that the measured value for independent loot operated braking in Fig. 21 is
larger than the calculated value in Fig. 20, and that greater input is being made
than the input at the point where the rear wheel locks.
0.3
;/ ~0.4 -" ~ Conv .......... "0 CBS + + "0
~ Q>
1ii ~ 0.2 0
.. " a..
0
Fig.27
-;;;0.04 '0 ~ Q>
1ii a: 0.02 ~
>-
o
, '0 \./ 0
0 _-0 ,
--__ -6 ...... 0
-" 0 0 CBS
2 4 6 8 10 Deceleration (rn/52)
Comparison 01 the Relationship Between Deceleration and Pitch Rate when Using a CBS and Conventional Brakes (Ior Independent Hand Operated Braking)
2 4 6 8 10
Deceleration (rn/52)
Fig. 29 Comparison 01 the Relationship Between Deceleration and Yaw Rate when Using a CBS and Conventional Brakes (for Independent Hand Operated Braking)
"0
'" ,,+ -=- 0.2 Q>
1ii a: .c .,\1 0.1 a.. tt./
_/A"-Conv ............. IJ.
0 2 4 6 8 10 Deceleration (rn/52)
Fig. 28 Comparison of the Relationship Between Deceleration and Pitch Rate when Using a CBS and Conventional Brakes
-;;; 0.08 '0 ~ 0.06 Q>
1ii a: 0.04 ~ >- 0.02
o
(Ior Independent Foot Operated Braking)
, ! - Wheel Lock
conv~ , Wheel Lock : +
--.A.-~CBS
2 4 6 8 10 Deceleration (rn/52)
Fig. 30 Comparison 01 the Relationship Between Deceleration and Yaw Rate when Using a CBS and Conventional Brakes (Ior Independent Foot Operated Braking)
345
7 Conclusions
(1) It could be seen that a CBS used lor both the hand and loot operated systems,
could be devised and easily handled by riders ranging lrom beginners to
experts accustomed to conventional brakes il the hand operated braking
system was adjusted so that the braking force lor the rear wheel was raised to
a point where hopping would not occur. The braking force distribution
characteristic was such that the front wheel would lock belore the rear wheel,
similar to the characteristic 01 conventional brakes, and the foot operated
system was adjusted for a braking lorce distribution characteristic wherein the
rear wheel would lock belore the front wheel.
(2) As a result 01 straight run braking tests with riders 01 varying skill levels,
ranging from beginners to experts, using a CBS having this characteristic and
conventional brakes, it was learned that the CBS exhibited higher average
values for maximum generation of deceleration for both independent hand and
foot operation and combined hand and foot operation. Particularly for
independent foot operation, there was a large improvement in the maximum
generated deceleration, whereby even beginners surpassed the decelerations
which could be achieved by expert riders using conventional brakes.
Furthermore, excluding the case 01 independent foot operation, it could be
seen that the width 01 the dispersion for the maximum generated decelerations
became smaller.
(3) When comparisons were made of changes in vehicle behavior during brake
operation using a CBS having this kind 01 characteristic and conventional
brakes, the present CBS exhibited smaller changes in both the pitch rate and
yaw rate, and greater stability, for independent hand operated braking as
compared with conventional brakes. Although the pitch rate becomes larger in
the case of independent foot operated braking, it can be said that the yaw rate
is small and the vehicle body is stable.
As a future study, it will be necessary to perform a variety of tests with different
types 01 vehicles having different dimensions in order to confirm whether the
same kind 01 results can be obtained. Further, it can be imagined that some
difficulty may exist lor an expert rider when performing a delicate braking
operation, and thus it is necessary to conduct research which is broader in
scope.
Traffic Behaviour
Falko Rheinberg: Flow-Experience when Motorcycling: A Study of a Special Human Condition
Frederick H. Ford, Linda G. Alverson-Eiland: The Relationship Between Anxiety and Task Performance and Skill Acquisition
in the Motorcycle Safety Foundation's Motorcycle RiderCourse
Tsuyoshi Katayama, Masanori Motoki, Hideo Ochiai, Makoto Nakanishi: Comparison of Riding Behaviour Between Inexperienced Riders
and Experienced Riders
Peter Brooks: Driver Error in a Mixed-Traffic Environment:
The Need for Increasing 'Technical Awareness'
Risk Taking Behaviour
Roger Eggers, Peter C. Compes: Risk Taking Behaviour of Motorcyclists:
Strategical Aspects of Risk Analysis and Risk Control
Reiner Brendicke: Attitudes of Motorcycle Riders Towards Risk Exposure
- A Study of Various Age Groups
Ulrich Schulz, Heike Gresch, Hartmut Kerwien: Motorbiking: Motives and Emotions
Flow-Experience when Motorcycling: A Study of a Special Human Condition
Falko Rheinberg
Psychologisches Institut der Universität Heidelberg
Germany
&
351
1 Abstract
Flow-Experience means the total immersion of a person in an activity; the person can be described as absorbed in his activity. Csiksentmihalyi (1975) was the first do describe the flow-phenomenon with its components, conditions and consequences by watching mountain climbers, chess players, dancers, surgeons etc. The characteristic features are the following: One experiences oneself no Ion ger elevated trom the action, one "merges" with the action, the person no longer is aware of his status as a protagonist of the action, the progression of action is perceived as smooth, one step flowing into the next, time flies, the perception is restricted to a very small field which is limited to the action. A necessary condition for a flow-experience is a congruence between demand and competence. This is described as astate between anxiety and boredom. Withdrawal experiments and everyday experiences show that so me persons seem to need flow-experience for their well-being and they are - even if they don't know it themselves - attracted by this state of mind.
Normally flow-conditions lead to an optimal level of performance and the persons enjoy their activities. This principle can be transferred to motorcycling. The (a) loss of reflection and control, the (b) restricted perception to a limited field of activity and the (c) "optimal" demand to driving competence can be particularly problematic when riding a motorcycle. The result might be a more "sportive" than defensive way of riding. In order not to rely on suppositions only 41 motorcyclists were questioned in an interview study regarding conditions and consequences of flow-experience when riding. The results cannot refute the supposition that the thrilling and joyful flowexperience when motorcycling leads to a more risky way of riding.
352
2 Introduction
This report is about a particular functional condition which has recently become of interest in the field of psychology. Meant is our ability to direkt an optimum of reflection free concentraion towards the smooth guidance of complex chains of action and while doing so complete merge in the activity [Flow-Experience Csikszentmihalyi, 1985 (1)]. If the frame of conditions are correct, this state comes without special intention, or acto of volition. It is as if the responsible control through the subsytem calls for and binds together through the increasing need of the whole system, the capacity of attention which is needed to succuessfully master the task. We trivially optimise our functions in such conditions, and one will generally rate them as positive. In the special case of riding a motorcycling, aside from positive, problematic aspects
come into play.
Let us image a motorcyclist who knows this kind of transportation inhibits considerable risks. He is aware that for various reasons falls and collisions are more probable, and of greater consequences as with most other common modes of transportation. He also knows how vulnerable a relatively soft organism is, should he with sufficient speed meet sharpened positions. He not being tormented with pathological wishes of self destruction, has the lasting intention to act defensive and reserved on the motorcycle. He aims to adjust his manner of riding in such a way that he is able to compensate under any circumstances for mistakes of others, as weil as unexpected situations. We are dealing with a person who from his basic knowledge and intentions is best equipt to act or therefore ride "Iogically". How is it possible that this same person not always but nevertheless, is seen negotiating turns at breathtaking speeds and angles of his favorite roads than "sane" conviction would dictate? The defensive intentions and the ever present margin of safety while riding are now nonexistant, but much to the contrary. It is possible that the rider becomes a risk as he while riding abend to the extrem comes dangerously close to the opposite lane
when exiting a turn.
For the existance of this obvious contradtiction between knwoledgejintention on the one hand and behaviour on the other hand, I can guarantee out of my own experience. We will soon see that I am not an exception. How does one explain such a phenomen? To attribute it to and to quickly blame it on "a lack of self discipline", "the irrational", and so on, hinders comprehension. One have to look at the whole process and have to examine its conditions to come to correct explanations.
Let us go back to the example. We notice as a typical cause that the rider doesn't reassess his defense riding intentions or consciously throw them away. We notice as the ride progresses that he is taking turns more swiftly. To be specific the person doesn't disregard his intentions but retains them, bit by bit he slips unnoticably into a
353
situation where these intentions are no longer valid. They loose their validity through the entire cognitive capacity, being bound by the precise controling of the rapid succession of events. The person is so involved in the activity, that to reflect on or to recall the general intentions, in this moment, is not possible. Normally this situation only ends when external occurances limit or completely interrupt progression, fo example a red traffic light, pot holes, an unpassable truck, etc. forces a stop. Occurances like these or bringing out sudden fear, will stop fluent progression of events from within.
3 Flow-Experience: The Joyful Involvement in the Activity
The total involvement in the activity is in no way just specific to motorcycling, but has for years been as Flow-Experience [Csikszentmihalyi, 1975, 1985 (1)]. It was initially observed and researched in the USA by watching different groups of people for example surgeons, chess players, mountain climbers, dancers, etc. There were following investigations in Germany observing computer freaks, musicians, and motorcyclists [summarized Rheinberg, now being printed (8)]. We have found that these groups of people, although involved in different activities, have had similar experiences wh ich have the following characteristics:
1. The demand of activity and re-registration an re clear, and free of interpretation, so that one always knows and without thinking about it, what has to be done.
2. To feel used to ones full ability and although high demands are made, to have a secure feeling of having the situation under contro!.
3. The progression is perceived as smooth, one step flowing into the next as if supplied out of an inner logic.
4. One doens't have to actively concentrate, but like breathing the concentration comes more on its own. It comes to a blocking out of all cognition not directly aimed at the present regulation of execution.
5. The sensation of time is strongly affected, one forgets the time and is not aware how long one has veen involved. One experiences oneself no longer elevated from the action, but wholly from ones own activity ("merge"). It comes to a loss of reflex and self confidence.
Through out all of these conditions a particular joy is experienced, regardless as to whether at work or during ones free time [Csikszentmihalyi, Le Fevre, 1989 (2)]. Data from interviews however reveals that most of those questioned are not aware that it is this particular state into a pretention of total reflextion free (involvement) that brings out satisfaction and joyful experience [Rheinberg, now beeing printed (8)]. This may stern from our pattern of thought tied to rationality and purpose which misleads us to

354
look for the joy and value of an activity primarily in the accomplished results, rather than the performance [Rheinberg, 1989 (9); particularly on motorcycling see Koch, 1977 (7)i Schulz, Kerwien, Koch, 1989 (11)]. Nevertheless a withdrawal experiment showed that the people become irritable and unable to concentrate when they omit the very things, with which they usually acchieve Flow Iike states.
4 The Problems of the Flow-Experiences when Motorcycling
Although empiristic not examined in detail, it should be clear that the Flow-conditions are especially productive. The person is at his highest level of concentration, all disturbing stimulants are blocked out, and all of his capacity goes fully into the performance of the activity, which strongly utilizes his ability without excessive demands. During productive activity these conditions are blurred to "creative exstasy", where hours go by like minutes. However when questioned computer freaks had al ready pointed out before hand, that Flow-conditions at the terminal can be harmful, because of the lost control of time as weil as lost reflections, other things are neglected.
Resulting from the loss of reflection and control we come across a Flow-aspect, which can be particularly problematic when riding a motorcycle. How should we picture this loss in detail? Helpful is the acceptance of the hierarchy in the structure of our activities, as they are common in work and engineering psychology [Hacker, 1978 (4)]: According to him the guidance af activities takes pi ace simultaneously on different levels. On the higher levels ("action", "activity") molar and time constant units of guidance are represented. Herein included are inparticular goals of action and also, as I would like to add, general intentions of performance (to comply with something orderly, conscientiously, quickly, carefully). Simulatenously the executing activites ("muscle action") are regulated in detail on the lower levels ("operation" and "motion") (see fig. 1).
Projected onto this analysing pattern Flow-condition is clearly markable by the lower guidance units combining all capacity onto them during high continuous demand. The hierarchistic higher levels "action" and "activity" play a minor role in the behavioral guidance function as they are only minimal requirements, during interpretation free demand and smooth progress.
The withdrawal or blocking out wouldn't be a problem if the levels were consistent at all times. This is in no way guaranteed. As newer analyses of volition psychology regarding faulty actions point out [Heckhausen, 1987, (6,5)], the lower activity levels are by no means determined by the higher levels, but are capable of leading a kind of
355
life of their own. This is how an action with full concentration on the lower regulatory levels can go wrong. Suddenly different goals are persued unnoticed than were originally intended by the (higher) action level [Heckhausen, 1987 (6)].
hierarchistic goal complex _ activities
Fig. 1:
1.. ................. 1 .................. 1.. ... _ goal
~ l-'_J_J ___ Jl __ operation (partial action) L,,,,, ,ooJ_
l _1 __ n]_ j llW[Of ~ specific muscle
W JL ____ _ Hierarchy construction of activiteis according to Hacker [1978; simplified to v. Cranach et al, 1980 (12)]
Since focusing on the stimuli, now of immediate importance to excecution, typically occurs when Flow-guidance units are tuned out (at least part of the time) which are already present on higher representational levels. Who after al is thinking about his final destination of his journey while riding through hair pin turns? I am afraid the same holds true for the general intentions towards ones manner of riding ("to always ride carefully"). The higher levels on which these guidance units are represented are not directly needed to control operations such as shifting gears, braking, or accelerating, or the harmonised regulation of leaning the motorcycle in turns, and usage of muscle. This than means they are not needed for the immediate process regulation inherent to the requirement. Instead, such higher representation standards as products of former evaluation processes who survive time would have to be carried over like foreign objects into the acutal guidance process and additionally transformed suitable to specific situations. But it is just this that becomes more unlikely the more the person enteres into the Flow in the lower regulation levels and drifts into the smooth uninterrupted stream of acitivity.
4
356
5 Entering into the Flow-Condition
The need for conceptual clarification still exists, as to how our person wiht his "rational" intentions, ends up in a riding condition needing such total demand that he is not aware of his intentions anymore. Several possibilities are to be considered, that first of alilie in the inherent characteristcs ofthe process of riding. A typical example is aseries of combined curves, as one accelerates out of the first turn to eliminate leaning, it can easily happen that the next connecting turn is entered at this increased speed and therefore requires more leaning. As the next turn follows one slowly slips into such a regulatory demand as was described previously, which is when Flow can occur. It is similar in aseparate sequence of the passing process. The acceleration of the first passing has the effect that the next vehicles become relatively slow, resulting in a new passing process, again increasing speed and so on.
These or similar occurrences without special intent or abrupt change can lead to manouevring at high speeds, and increased risk would then conform with normal standards. In these phase of perception ("You are riding to fast, risky", etc.) and evaluation of the occurance of movement on the higher integrated action level no longer take place, as the attention capacity is solely required for the regulation of operation sequences, and motion sequences.
Next to this inherent-functional paht, mo motivational moment is to be considered. According to the present results concerning Flow-Experience [Csikszentmihalyi, 1985 (1)] the merging into the activity is accomplished with mostly positive experiences (see below). You enjoy your own smooth functioning, and the fast interaction of different operations. Motorcycle and rider are experienced as an inseparable perfect and working with lightning speed unit. The positive incentive of this Flow-condition should be a contributing factor, that the safety standards on the higher controlling levels are so easily put out of action by fact inherent occurrance process.
A special problem of Flow-condition while riding motorcycles lies in the fact that not only - as described - higher priority safety standards are being ignored, in addition this state demands a strong occupance of capacity. Thus an equally demanding manner of riding is required. Is Flow - as just assumed - while riding a motorcycle experienced as satisfactory, it could not only be the cause but also the incentive to a manner of riding that is incompatible with ones safety standards. Flow would therefore transform into .a condition in which the rider although acting functionally optimated enters speed and risk levels while satisfying the necessary demand , which should better be avoided considering conditions of traffic.
357
6 The Interview Study
The statements so far are only unproven extrapolations at the moment concerning Flow-studies of motorcycling to date. In a first investigation [Schöntgen u. Köhmel, 1987 (10)]41 motorcyclists were questioned regarding conditions and consequences of Flow-experience when riding. (The characterisitcs of the spotcheck: between 20 and 37 years of age, driving experience from 1 month to 30 years, engine performance from 10 to 120 horsepower, social economic status is above average, university graduates are over-represented.) Aufter some warumup questions were asked regarding their motorcycles, their first exposure to riding, their present riding motivation etc. the participants were then asked to mentally picture a pleasant ride along their favorite road. They were asked to give a detailed description of what they were experiencing and what made it so pleasant and satisfying. If not yet mentioned the participants were asked if they knew the feeling "to feel one with the motorcycle, road, and environment". They were further asked if they were aware of the feelings that "verything was going smoothly" and "by numbers". Questions were asked as to what started as weil as what ended the state. Finally they were asked so me questions regarding the relevant safety aspects of their own style of riding (see below).
A categorized system regarding aspects of Flow-experience, when motorcycling was developed from these simulated descriptions. Table 1 shows a simplified version, the percentage indicates the frequent selection.
Merging: To be completely consumed in the ride, unity with the machine, feelings of harmony and happiness, complete "here and now"-feeling. Example: "I am at one with everything." 81%
Centralized perception: Focusing on the immediate relevant field of stimuli: increased attention. Example: "In this moment there is only the road and nothing else". 68%
Smooth action feedback cycle: Action requirements and feedback obvious: acting occurs without intermediate autority, in lightning speed and without contro. Example: "Everything functions as if by itself, I automatically know, how to ride, what to do, there is no time to think about it".
Total or temporary identity loss: no active perception on oneself. Example: "I am so gone that I feel that I don't exist".
Totalloss of identitiy
76%
64%
32%
358
Feeling of competence: Experiencing total or increased control, feeling as if mastering the situation, having a grip on things. Example: "In this condition I feel absolutely safe", "I think I ride better than normally".
Intrinsic motivation: Flow-condition occurs while riding because of the ride without apparent related purpose. Example: "I ride for the joy of it".
83%
90%
Table 1: Flow-categories resulting from the interview study regarding ridingsatisfaction on the favorite road (simplified version, n = 41)
When describing a particularly pleasurable ride down their favorite roads all Flowcomponents with the exeption of one, are mentioned by more than two thirds of the people spot checked. The Flow-characteristics of "merging" was almost always mentioned first, especially the being one with the machine, as weil as the complete harmonic bien ding into the act of riding. It was around this feeling that all other Flowelements arranged themselves. As in previous studies [Rheinberg, being printed (2)] "complete identity 1055" occurs more seldom (32%), coupled with temporary loss however it happens to 64% of the people interviewed.
Taking a look at the people questioned who had the least occurance of Flowexperiences we find that three people in the group, were completely alienated to Flowcomponents when riding a motorcycle. Two of these three had just received their licences to ride. The third only rode a motorcycle for reasons of practicality (parking space, and low operating costs). In Flow-experience we are therefore tracking a phenomina, which is quite common with motorcycling.
For every person an index was now calculated, which expressed (on the basis of tabulated subcategories which are not explained in detail at this point) how intensive and complete a reported Flow-condition occurs while riding. The index can range from 0 to 28. As can be expected from the percentage figures of table 1 the distribution leans clearly on the right (X = 19.9; Md = 20; SD = 5.49). Using this index certain connections regarding the extent of reported Flow-experiences, can be determined. The more the intensive flow experiences were described the more the following statements occured.
Statements to aspects of personal rding experience
Occurance of Flow can't be controlled
Flow is dependent on mood
Flow is interrupted by external circumstances
Thought excludes Flow
Fear interrupts flow
I am often afraid when riding a motorcycle
.40
.51
.47
.43
.35
.61
359
Correlation to intenstity of Flow-experience
significance
< 0.1
< 0.1
< 0.1
< 0.1
< 0.5
< 0.1
Table 2: Experience correlations and conditions of intensive Flow while motorcycling (n = 41)
Maybe most apparent is the negative connection with frequent personal effects or fear (r = .61). Intensive Flow-experiences seem to be incompatible with fear. The (although weak) correlation (r = .35) to the appropriate statement category shows, that the rider is at least parially aware of this. Other statements also refered to something like subjective theories [Groeben, Wahl, Schlee u. Scheele, 1988 (3)] regarding personal (Flow-)conditions. It is worth mentioning that Flow-experts, riders with a high flow count, don't think it is possible to directly control the start of desired state. Although one can set the stage, for instance ride down their favorite road, Flow is still dependent on mood and can be interfeared with by cognitive ("thinking") and external circumstances. Of those interviewed with intensive Flow-Experiences these interruptions appeared to be annoying and unwanted. Table 3 shows wether this perception can be maintained regarding traffinf safety aspects.
Statements regarding ones personal driving style
"sometimes ride risky, sometimes cautious" .52
"always ride cautious" -.36
prefered speed in city limits .48
prefered speed on highways .55
numbers of crash es/ accidents .32
360
Correlation to intensity of Flow-experience Significance
p < 0.1
P < 0.5
p < 0.1
p < 0.1
p < 0.5
Table 3: Self evaluation of safety relevant characteristics of motorcycling and their relation to the intensity of Flow-experience
Theoretically assuming intensive Flow-experience is tied to a sportive, challenging way of riding. This applies to a subjective overall characteristic ("partially risky") as weil as to more specific statements concerning preferred speeds. The correlation of "number of accidents/crashes" is to viewed with reservation. Correlation for one is low but more problematic is the unclear definition. Unfortunately this value is not in relative relation to the distance covered. The separation of "crash" and "accident" doesn't change much as the value of the sum is dominated by the number of crashes (five crashes in relation to one accident). At the same time one can notice that other correlations are not negative. The expected optimizing of Flow does not progress to a point where inspite of increased risk crashes and accidents decrease. If at all the crashes and accidents increase. It is this that requires a more exat method for proof in further studies.
7 Discussion
This preliminary study can and should only supply initial hints, as to whether it is worthwhile to further pursue the Flow-concept of motorcycling. In my opinion the
361
results speak for themselves. This would particularly explain the contradiction mentioned earlier, that normally "sane" peope act at times completely to the contrary of their commendable safety standards. Only five of the people questioned during this spot check realized that the joyful merging into the activity was soley responsible. They perceived the Flow-condition as dangerous, although or because it is then that they feel particularly safe, competent, and good. Among the others questioned, almost only the positive aspects of Flow-experience surfaced (see table 1).
Had we examined the making of music, or work at a computer a severe problem would hve hardly existed. The Flow-promoting total occupance of ones capacitiy here is mainly not problematic because possible mistakes are of relatively small consequence. That is entirly different when riding a motorcycle. A faulty executed action, for instance when leaning into a turn, can have severe and uncontrolable consequences depending on traffic conditions. The consequences bejng more severe the higher the speed cosen to attain total occupation. Should the first analysis be confirmed the question remains as to how to deal with Flow-experience, when motorcycling. Arider, constantly attempting to execute his activites according to general safety princicples, should not be sufficiently operable as he is uncomfortable and over tasked while riding. This is just as undesirable an aim, as taking a high speed ride along a windy road with a pleasant downhilI ski slope, not keeping in mind that wiping out on the road does not afford you with a cushioned fall into soft snow but may mean colliding with the sheet surface of the road, a guard rail, trees, cars, etc. If we can't or won't prevent Flow-experience while riding, the only option remaining is to step down the general safety intention into a multitude of situation- and riding condition details. This should attain signal character for the levels of partial activities or 0p6rations (see fig. 1), and should interact immediately with the level of progress regulation.
Therefore the educational action relaying a multitude of typical risk details/situations linked with reflex like reactions (for instance the opening of a car door, or a car making a "blind" left turn, etc.) not permanently conform to his prioritized safety intentions, but could in many (almost all?) risk inhibitant situations "automatically", meaning regulated on the higher operationallevel, do the right thing to avoid risks.
362
8 Reference List
1) Csikszentmihalyi, M.: Das Flow-Erlebnis : jenseits von Angst und Langeweile. - Stuttgart, 1985
2) Csikszentmihalyi, M.; Le Fevre, J.: Optimal experience in work and leisure In: Journal of Personality and Social Psychology 56(1989). - S. 815-822
3) Forschungsprogramm subjektive Theorien / N. Groeben (u.a.). - Tübingen, 1988
4)
5)
6)
7)
Hacker, W: Allgemeine Arbeits- und Ingenieurpsychologie. - Bern, 1978
Heckhausen, H.: Intentionsgeleitetes Handeln und seine Fehler In: Jenseits des Rubikon / Hrsg.: H. Heckhausen (u.a.). - Berlin, 1987. - S. 143-175
Heckhausen, H.: Perspektiven einer Psychologie des Wollens In: Jenseits des Rubikon / Hrsg.: H. Heckhausen (u.a.). - Berlin, 1987. - S. 121-142
Koch, H.: Motorradfahren heute: kommentierte Ergebnisse einer Befragung von Motorradfahrern auf der Internationalen Fahrrad- und Motorradausstellung (IFMA) 1977
8) Rheinberg, F.: Flow-Erleben, Freude an riskantem Sport und andere "unvernünftige" Motivationen In: Kognition, Motivation und Handlung / Heckhausen, H. (u.a.) (Hrsg.). -Göttingen, (in Vorb.)
9) Rheinberg, F.: Zweck und Tätigkeit: Motivationspsychologische Analysen zur Handlungsveranlassung. - Göttingen, 1989
10) Schöntges, A.; Kölmel, S.: Flow-Erleben und Risikobereitschaft beim Motorradfahren. - Heidelberg, Univ., Psycholog. Inst., Diplomarbeit, 1987
11) Schulz, U.; KerWien, H.; Koch, H.: Anreize des Motorradfahrens : Einschätzung durch Motorradfahrer In: Motorrad: 3. Fachtagung, Darmstadt, 5. u. 6. Okt. 1989/ VDI-Ges. Fahrzeugtechnik. - Düsseldorf, 1989. - S. 27-43. - (VDI-Serichte; 779)
12) Zielgerichtetes Handeln / M. von Cranach (u.a.). - Sern, 1980
The Relationship Between Anxiety and Task Performance and Skill Acquisition in the Motorcycle Safety Foundation's
Motorcycle RiderCourse
Frederick H. Ford
University of Montevallo, Alabama
USA
Linda G. Alverson-Eiland
Sirmingham, Alabama
USA
365
1 Abstract
Previous research indicates that anxiety could interfere with task performance and skill acquisition. Anxiety is a factor in determining the acquired levels of knowledge and skills required to operate a motorcycle in traffic. Instructors in the Motorcycle Safety Foundation's Motorcycle RiderCourse are continually alert to difficulties that students may have during the course, and anxiety in the student presents a special challenge that has not yet been directly addressed.
This study examined the anxiety levels of 107 students at the beginning of the Motorcycle RiderCourse. The State-Trait Anxiety Inventory (STAI) was utilized in an attempt to identify individuals who exhibit higher levels of anxiety than other individuals in the course. The initial part of the study was designed to determine if the STAI can reliably predict drop-outs from the course. There was a non-significant, positive correlation between initial anxiety levels of the students' and Skills Test scores. A class-by-class analysis suggested that the STAI could be used as a screening device to identify some students at-risk for performance problems due to anxiety. Experienced riders actually seemed to be more affected by anxiety than were novice riders.
The second part of the study, to design an effective intervention program, has been delayed until additional data can be obtained. At this time, the primary activity in the area has been to send questionnaires to various state programs to determine what measures are being taken in an effort to reduce anxiety among students enrolled in the course. Possible models for intervention will be briefly discussed.
p
366
2 Introduction
A number of factors may interfere with an individual's performance and learning in the Motorcycle Safety Foundation's Motorcycie RiderCourse. These include poor coordination, difficulty learning new motor skills, weather conditions, inadequate instruction, and anxiety. Anxiety is of interest because it is a modifiable variable. Researchers have found that anxiety can interfere with task performance as weil as skill acquisition [Smith and Lay, 1974 (8); Spielberg.er, ~9.83 (9)]. Psychologists often work with anxious persons In cllnl~al a.nd vocational settings. Through various methods of treatment, mciudmg relaxation and more tradition al psychotherapy, the anxious person learns to reduce their anxiety, at least in certain situations.
2.1 Anxiety
Over the last fifty years, anxiety has drawn a great deal of attention in the fields of psychology and psychiatry. Freud was the .first to propose that anxiety was a major contributor to one's personality, saymg that anxiety was "something felt--a specific unpleasant emotional state or condition of the human organism that included experiential, physiological, and behavioral components" [Freud, 1936 (2), S. 85]. To Freud, anxiety was the underlying dimension in neuroses and psychosomatic disorders. (2) Observable responses ass~~i~ted wi~h anxiety include negative statements about one's own abllitles, rapid heartbeat, sweaty palms, flushing, and shortness of breath.
Anxiety is of particular interest to the Motorcy.cle Rider~ourse instructor because an overly-anxious individual may mterfere wlth the training of others and can even cause problems on the training range. An anxious rider might drop-out before completion of the course or may perform poorly on the skills test at the conclusion of the ~rainin~. That same individual may continue to ride a motorcycie, desplte thelr lower level of expertise, thus making themselves a hazard on the roadway.
367
2.1.1 State-Trait Anxiety
Numerous studies have been done on anxiety, both as an unpleasant emotional state, as weil as a fairly stable individual characteristic, or traU. The anxiety state can be characterized "by subjective feelings of tension, apprehension, nervousness, and worry, as weil as by activation or arousal of the autonomic system" [Spielberger, 1983 (9), S. 1].
Anxiety as a trait can be defined as a relatively stable pattern of viewing situations as dangerous and threatening, and responding to these situations in a similar (anxious) manner. In other words, the more anxious an individual is, the more often they will exhibit the state of anxiety across numerous situations. A low-trait anxious individual would define fewer situations as threatening and dangerous, and thus less anxiety-provoking.
2.1.2 Measurement of Anxiety
Anxiety can be measured through physiological examination, self-report questionnaires or observable responses. Galvanic Skin Response (GSR). heartbeat, and respiration rate can all be used to indicate levels of anxiety.
Various self-report instruments have been developed to determine levels of anxiety in certain situations, or as a personality characteristic. Inventories that assess anxiety inciude Spielberger's State-Trait Anxiety Inventory (ST AI). Cattell's 16 Personality Factor (16PF). the California Psychology Inventory, the Edwards Personal Preference Schedule, Eysenck's Personality Inventory (EPI). the Institute for Personality and Ability Testing (IPAT) Anxiety Scale, and the Minnesota Multiphasic Personality Inventory (MMPI). These inventories vary in number of items and in administration time, from ten minutes (the STAI and IPAT), to one to two hours (the MMPI, wh ich includes numerous scales).
Spielberger developed the State-Trait Anxiety Inventory (STAI) as a research instrument for objectively measuring state and trait anxiety. The STAI is also used in clinical practice to evaluate levels of anxiety in medical, surgical, and psychiatric patients. The STAI can ascertain how the individual feels al the time they are responding 10 the questionnaire, and can assess the individual's general anxiely level. The
368
instrument can also be used to determine how an individual thinks they will feel in some anticipated situation, or how they feit in arecent experience·. The STAI is a forty-item self-report questionnaire, with twenty items assessing state level of anxiety (S-Anxiety), and twenty items for trait anxiety (T-Anxiety).
Test-retest reliability estimates are high for the T -Anxiety scale and low for the S-Anxiety scale, as it should be. Internal consistency estimates are quite acceptable. Concurrent, convergent, divergent and construct validity has been established by studies conducted over the last twenty years. The best source for articles on this research may be found in the comprehensive bibliographical work compiled by Spielberger [Spielberger, 1983 (8)]. 01 particular interest to this research project are the articles on test anxiety [Culler and Holahan, 1980 (1)] and on learning a motor task [Hollingsworth, 1975 (4); Weinberg, 1979 (12)].
2.2 Motorcycle RiderCourse
The Motorcycle RiderCourse: Riding and Street Skills (MRC:RSS) curriculum was developed by the Motorcycle Safety Foundation in 1985 [Motorcycle Safety Foundation, 1991 (6)]. The course, which has a co re of fifteen hours, was designed primarily for individuals who were interested in riding motorcycles, but who had either limited or no riding experience. The course was selected for use in this study because of its availability and widespread use nationwide, as weil as for the extensive developmental process utilized.
The MRC:RSS, conducted throughout the United States at civilian and military training sites and internationally at American military installations, is the result of years of research and revision. The initial training course developed by the MSF was the Seginning Rider Course (SRC) in 1974. From the SRC and the subsequent development of the Motorcycle Task Analysis, which "researched and made recommendations regarding the skills and knowledge necessary for safe motorcycling" [MSF, (6), S. 1-1]. a new curriculum was produced in 1976. The Motorcycle Rider Course (MRC) was field tested in 1977, and the results indicated that the curriculum was "1) instructionally effective, 2) administratively feasible, and 3) weil accepted by students, instructors, school administrators and parents" [MSF, (6), S. 1-1]. The MRC was revised in 1979. In 1983 a Curriculum Advisory Committee was created and "the MRC underwent a thorough analysis and revision to
369
bring it up-to-date with the latest state-of-the-art training techniques" [MSF, (6). S. 1-1]. The current MRC:RSS is the result of these efforts.
In an internationally recognized study, Hurt and his colleagues discovered that over 90% of the accident-involved riders had very little, if any, formal training. The study further indicated that formal rider training "reduces accident involvement and is related to reduced injuries in the event of accidents" [Hurt, Ouellet, Thom, 1981 (5), S. 417]. This study further stated that "the Motorcycle Rider Course of the Motorcycle Safety Foundation should be the prerequisite (or at least corequisite) of licensing and use of a motorcycle in traffic. This course is weil developed and has proven effective by containing the basic ingredients for safe operation of motorcycles in traffic" [Hurt, Ouellet, Thom, (5), S. 119-120]. Additional studies have also found the Motorcycle Rider Course to be effective [Thackray and Prescott, 1980 (11); Satten, 1980 (7)]. The current edition of the MRC:RSS utilized not only the extensive research mentioned above, wh ich includes the findings from the Hurt study, but observational data and instructor questionnaires as weil [Gibson, 1990 (3)].
3 The Study
The purpose of this study is to assess the relationship between anxiety and performance in the Motorcycle Safety Foundation's Motorcycle RiderCourse. A positive relationship between anxiety and the students' Skills Test performance is hypothesized. If an instructor can identily a highly anxious individual at the beginning of the Motorcycle RiderCourse, then perhaps attention can be given to that individual in such a way that could decrease anxiety levels, improve skill acquisition and decrease drop-out rates. Those who perform poorly on the Skills Test, and drop-outs from the course, are considered at risk for later accidents.
Performance is quantified by using the error score on the Skills Test. This score is obtained by assessing penalty points for incorrect or nonperformance of the various skills activities, with a maximum score of 20 penalty points allowed in order to pass that portion of the course. Drop-outs were given an artificial Skills Test score of 25. Anxiety level was determined trom STAI scores, either T -Anxiety or S-Anxiety, obtained at the beginning of the course. Correlations between anxiety
370
measures and Skills Test scores were calculated. Differences between drop-outs (individuals who did not take the Skills Test) and those who completed the course were also examined.
Another purpose of this study was to develop so me intervention techniques to be used during the course to decrease anxiety levels, and thus decrease drop-out rates and as weil as poor performance on the Skills Test. This aspect of the research is in a preliminary stage, with ideas to be discussed later.
3.1 Research Design
3.1.1 Data Collection
The model for collecting data during the Motorcycle RiderCourse is as folIows: At the beginning of the course the instructor reads a prepared statement which is a brief summary of the research, without stating the exact purpose of the study (the word "anxiety" is not mentioned). A consent form is given to the students to read and sign, with each person being given the option of not participating in the study. Biographical data is then obtained from those participating through abrief questionnaire. Following the questionnaire, the State-Trait Anxiety Inventory is distributed to the participants (The ST AI is not labeled with the word "anxiety" so as not to bias the respondent.). The STAI, SScale, is also administered near the conclusion of the course, just prior to the Skills Test.
3.1.2 Research Instrument
The ST AI was chosen as the research instrument because the STAI has been used to assess test anxiety and task performance, and because it is short and easy tci administer and score. The STAI requires about ten to fifteen minutes to complete, and about three to five minutes to score. Both the T -Anxiety and S-Anxiety scales were used for this project.
371
3.1.3 Data Analysis
Correlations (Pearson-Product Moment) between beginning-of-course ST AI scores and Skills Test scores were calculated. Differences in anxiety levels between drop-outs and those completing the course, and between those who passed and failed the Skills Test were calculated, using t-tests. Other post-hoc analyses will be discussed later.
4 Summary and Conclusions
4.1 Biographical Information
There were 107 sets of data collected from eleven Motorcycle RiderCourses in 1990. Eight of the courses were conducted at the training facility at the Alabama Traffic Safety Center at the University of Montevallo, two courses were held at the Huntsville site and one course was held at the Ft. Payne site. All courses followed an identical format or schedule, meeting for three and one-half hours on Friday evening and for eight hours on both Saturday and Sunday. The sampie collected consisted of 54 females and 53 males. Of the total sampie, 82 individuals considered themselves to be novice riders (having little or no riding experience), of which 46 were females and 36 males. The remaining 25 students considered themselves to be experienced riders (having more than just minimal riding experience). of wh ich 8 were females and 17 males. The age of the participants ranged from 15 to 57, with the average age for the group being 33.8 years of age. The average age was 35.7 years for females and 31.8 years for males. A total of 84 individuals passed the course: 42 females and 42 males. Three persons failed to successfully complete the Skills Test: one female and two males. There were 20 participants who dropped the course prior to the administration of the Skills Test: 11 females and 9 males.
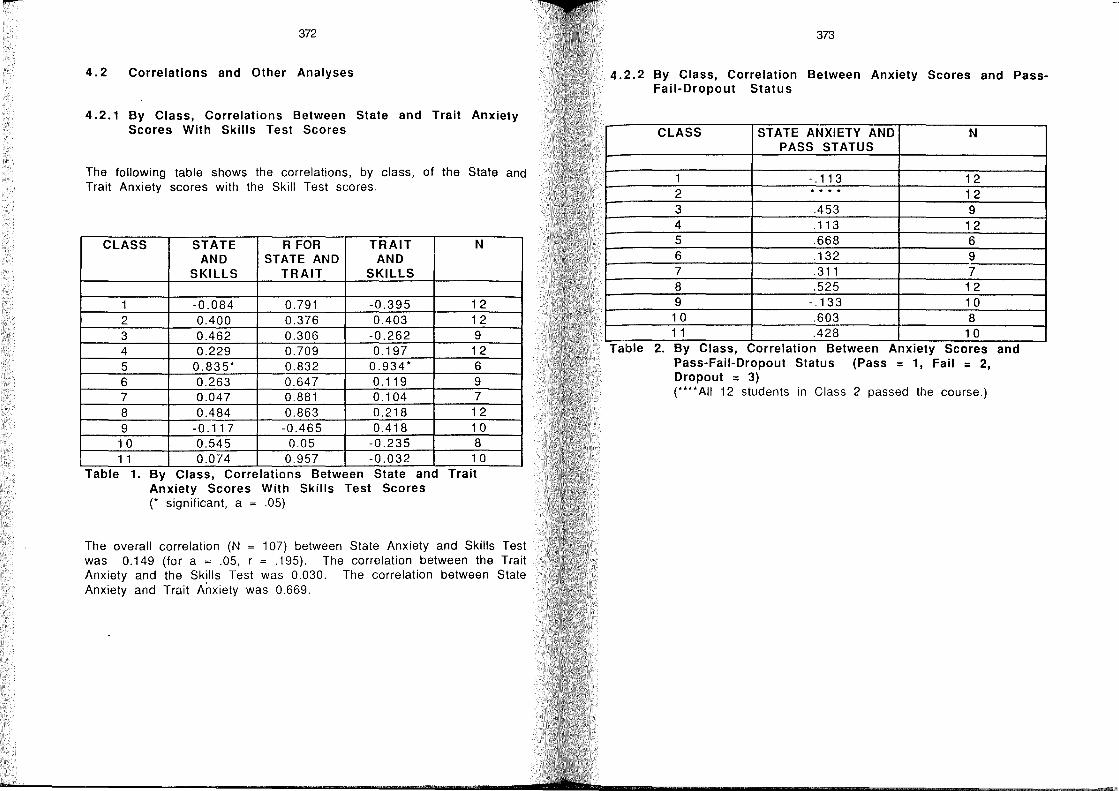
-372
4.2 Correlations and Other Analyses
4.2.1 By Class, Correlations Between State and Trait Anxiety Scores With Skills Test Scores
The following table shows the correlations, by class, of the State and Trait Anxiety scores with the Skill Test scores.
CLASS STATE R FOR TRAIT N AND STATE AND AND
SKILLS TRAIT SKILLS
1 -0.084 0.791 -0.395 12 2 0.400 0.376 0.403 12 3 0.462 0.306 -0.262 9 4 0.229 0.709 0.197 1 2 5 0.835* 0.832 0.934* 6 6 0.263 0.647 0.119 9 7 0.047 0.881 0.104 7 8 0.484 0.863 0.218 1 2 9 -0.117 -0.465 0.418 10 10 0.545 0.05 -0.235 8 1 1 0.074 0.957 -0.032 10
Table 1. By Class, Correlations Between State and Tralt Anxiety Scores With Skills Test Scores (* significant, a = .05)
The overall correlation (N = 107) between State Anxiety and Skills Test was 0.149 (for a = .05, r = .195). The correlation between the Trait Anxiety and the Skills Test was 0.030. The correlation between State Anxiety and Trait Anxiety was 0.669.
373
4.2.2 By Class, Correlation Between Anxiety Scores and PassFail-Dropout Status
CLASS STATE ANXIETY AND N PASS STATUS
1 -.11 3 12 2 . ... 12 3 .453 9 4 .113 12 5 .668 6 6 .132 9 7 .311 7 8 .525 12 9 -.133 10 10 .603 8 1 1 .428 10
Table 2. By Class, Correlatlon Between Anxlety Scores and Pass-Fail-Dropout Status (Pass = 1, Fail = 2, Dropout = 3) (**** All 12 students in Class 2 passed the course.)
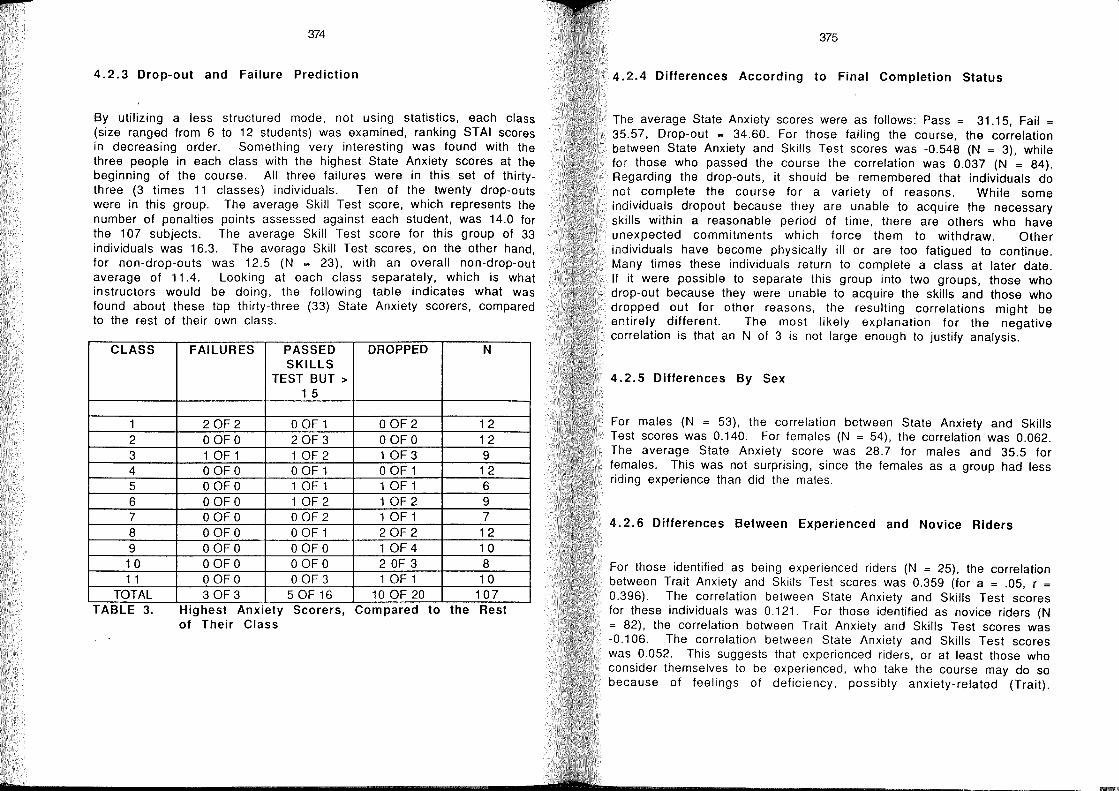
374
4.2.3 Drop-out and Failure Prediction
Sy utilizing a less structured mode, not using statistics, each cl ass (size ranged from 6 to 12 students) was examined, ranking STAI scores in decreasing order. Something very interesting was found with the three people in each class with the highest State Anxiety scores at the beginning of the course. All three failures were in this set of thirtythree (3 times 11 classes) individuals. Ten of the twenty drop-outs were in this group. The average Skill Test score, which represents the number of penalties points assessed against each student, was 14.0 for the 107 subjects. The average Skill Test score for this group of 33 individuals was 16.3. The average Skill Test scores, on the other hand, for non-drop-outs was 12.5 (N = 23), with an overall non-drop-out average of 11.4. Looking at each class separately, which is what instructors would be doing, the following table indicates what was found about these top thirty-three (33) State Anxiety scorers, compared to the rest of their own class.
ClASS
1 2 3 4 5 6 7 8 9 10 1 1
TOTAL TABlE 3.
FAllURES PASSED DROPPED N SKllLS
TEST SUT > 1 5
2 OF 2 o OF 1 o OF 2 12 o OFO 2 OF 3 o OF 0 12 1 OF 1 1 OF 2 1 OF 3 9 o OFO o OF 1 o OF 1 12 o OFO 1 OF 1 1 OF 1 6 o OFO 1 OF 2 1 OF 2 9 o OFO o OF 2 1 OF 1 7 o OFO o OF 1 20F2 12 o OFO o OF 0 1 OF 4 10 o OFO o OF 0 2 OF 3 8 o OFO o OF 3 1 OF 1 1 0 30F3 5 OF 16 10 OF 20 107
Highest Anxlety Scorers, Compared to the Rest of Their Class
375
4.2.4 Ditferences According to Final Completion Status
The average State Anxiety scores were as folIows: Pass = 31.15, Fail = 35.57, Drop-out = 34.60. For those failing the course, the correlation between State Anxiety and Skills Test scores was -0.548 (N = 3), while for those who passed the course the correlation was 0.037 (N = 84). Regarding the drop-outs, it should be remembered that individuals do not complete the course for a variety of reasons. While some individuals dropout because they are unable to acquire the necessary skills within a reasonable period of time, there are others who have unexpected commitments which force them to withdraw. Other individuals have become physically ill or are too fatigued to continue. Many times these individuals return to complete a class at later date. If it were possible to separate this group into two groups, those who drop-out because they were unable to acquire the skills and those who dropped out for other reasons, the resulting correlations might be entirely different. The most likely explanation for the negative correlation is that an N of 3 is not large enough to justify analysis.
4.2.5 Differences By Sex
For males (N = 53), the correlation between State Anxiety and Skills Test scores was 0.140. For females (N = 54), the correlation was 0.062. The average State Anxiety score was 28.7 for males and 35.5 for females. This was not surprising, since the females as a group had less riding experience than did the males.
4.2.6 Differences Between Experienced and Novice Riders
For those identified as being experienced riders (N = 25), the correlation between Trait Anxiety and Skills Test scores was 0.359 (for a = .05, r =
0.396). The correlation between State Anxiety and Skills Test scores for these individuals was 0.121. For those identified as novice riders (N = 82), the correlation between Trait Anxiety and Skills Test scores was -0.106. The correlation between State Anxiety and Skills Test scores was 0.052. This suggests that experienced riders, or at least those who consider themselves to be experienced, who take the course may do so because of feelings of deficiency, possibly anxiety-related (Trait).
= 376
Because of this finding, both T-Anxiety and S-Anxiety should be considered relevant.
4.3 Discussion and Conclusions
Although there was little that was statistically significant, several conclusions can be drawn from these results. First, anxiety seems to be a moderately influential factor in affecting the final status of students taking the Motorcycle RiderCourse. The overall correlation between State Anxiety and Skills Test scores approached significance. Class 4 had statistically significant results when looking at the correlation between S-Anxiety and Skills Test scores, as weil as T-Anxiety and Skills Test scores. Classes 3, 8, and 10 had moderately high, though not significant, correlations. The size of each class (Iess than 13) in itself made finding statistical signilicance difficult. Larger N's would be useful when trying to prove statistical significance. For example, with a class size of 8, an r 01 0.707 would be needed in order to find significance.
There also appeared to be some differences between males and females in regards to anxiety, but not in drop-out rates or failures. Males were generally less anxious and more experienced in riding. Males who were anxious did not perform as weil on the Skills Test when compared to other males. The course does not seem to discriminate between males and females in pass-Iail rates, regardless 01 past riding experience.
Several odd, meaning negative, correlations should be noted and explanations given. Class 1 had a negative, and almost negligible correlation (r = -.084) between State Anxiety and Skills Test scores. If one looks at the range of scores within that class, one notes that the two drop-outs were in the lower anxiety levels. In this specific case, the instructors for the class indicated that the couple that dropped-out were doing weil in the course, but decided to leave before the class was completed because of another commitment. Neither student was concerned about not being able to linish the course in order to receive a completion card, but expressed positive leelings about how much they had learned. Had this husband and wile completed the course, the correlation for this class would probably have been on the positive side. A positive note for this study, however, is that the two failures in thls class were among the top three regarding State Anxiety scores on the first day 01 the course. There are also examples of individuals who do not appear to be aware 01 the potential risks involved in learning to ride
377
a motorcycle. Many 01 these individuals might, therefore, appear in the low anxiety catagory, yet a problem such as poor coordination could lead to the decision to drop-out. It is certainly possible that at times an increase in anxiety levels could actually be positive or adaptive in raising alertness levels. Essentially, anxiety is not the only factor which contributes to drop-out and lailure rates.
Class 3 also showed a negative correlation, with two of the three dropouts not being among the top three State Anxiety scorers. By giving the drop-outs an artificial Skills Test score of 25, regardless of the reason these students did not complete the course, the statistical correlations are thus affected. However, it must again be noted that the top two Stale Anxiety scorers in this particular class had the highest "nonartificial" Skills Test scores.
Significance was almost obtained by separating the experienced riders from the novice riders. The correlation for the T -Anxiety scores and Skills Test scores 01 experienced riders approached significance (a = .05). This suggests that if Trait, or more pervasive, anxiety is a factor in the personality of an experienced rider, then it may signilicantly interfere with their performance and skill acquisition. Novice riders seemed to have been less affected by anxiety, both State and Trait.
As noted above, by examining differences within a particular class, the instructors could pinpoint students with the potential for problems. Out of the 33 chosen by looking at the three highest State Anxiety scorers in each class, over 50% had problems as defined by failure, poor performance or drop-out. This suggests that anxiety does affect some individuals' performances. It also appears to show that other factors, such as those mentioned in the Introduction, can also contribute to poor performance. By suggesting to instructors which students might have possible problems that are anxiety-related, efforts can be made to reduce anxiety in these individuals prior to beginning on-cycle training.
The long term goal of this project is to design an intervention program, targeting those individuals lor whom anxiety is a lactor in their ski 11 acquisition, as weil as their performance on the Skills Test in the Motorcycle RiderCourse. Several possible methods might be 01 assistance. Anxiety-reduction exercises could be included early in the training, and perhaps just prior to beginning the Skills Test. This could be a ten-minute relaxation training procedure, with imagery provided to the students which might lower their anxiety temporarily. The course could allow for one-to-one intervention procedures when the instructor discovers that an individual is particularly anxious. Perhaps new
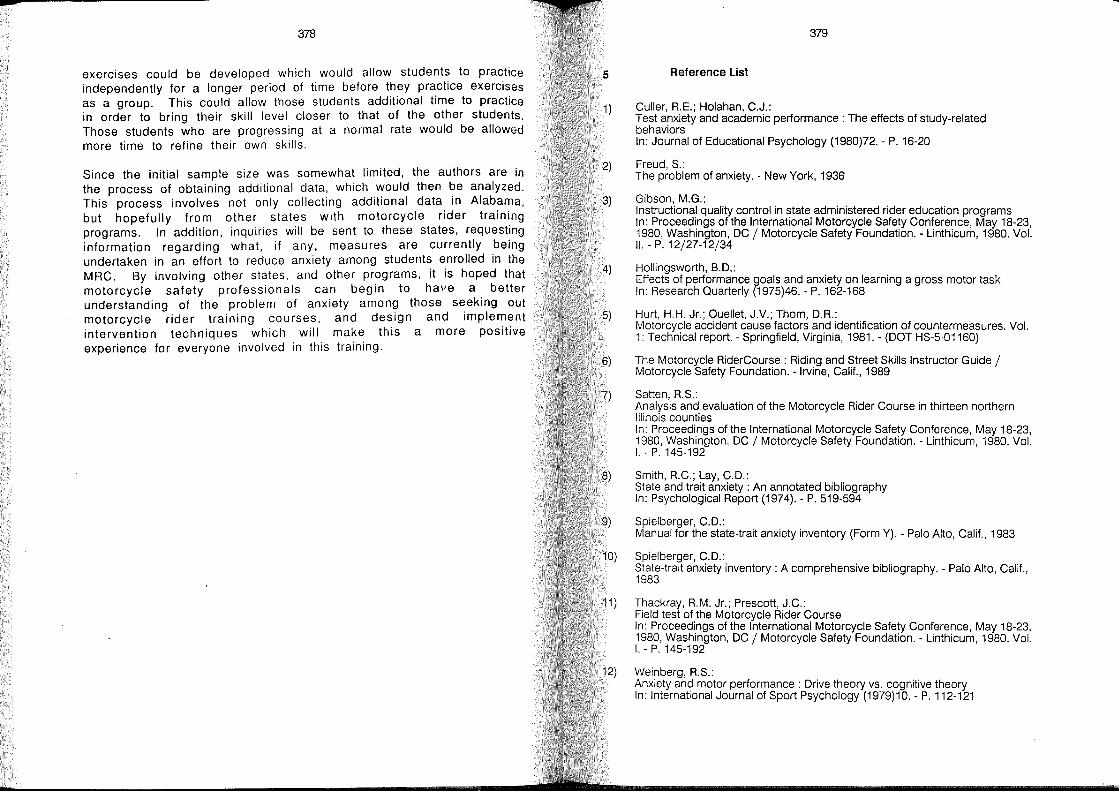
-378
exercises could be developed which would allow students to practice independently for a longer period of time before they practice exercises as a group. This could allow those students additional time to practice in order to bring their skill level closer to that of the other students. Those students who are progressing at a normal rate would be allowed more time to refine their own skills.
Since the initial sampie size was somewhat limited, the authors are in the process of obtaining additional data, which would then be analyzed. This process involves not only collecting additional data in Alabama, but hopefully from other states with motorcycle rider traini.ng programs. In addition, inquiries will be sent to these states, requestmg information regarding what, if any, measures are currently being undertaken in an effort to reduce anxiety among students enrolled in the MRC. By involving other states, and other programs, it is hoped that motorcycle safety professionals can begin to hal'e a better understanding of the problem of anxiety among those seeking out motorcycle rider training courses, and design and implement intervention techniques which will make this a more positive experience for everyone involved in this training.
5
1)
2)
3)
4)
5)
6)
7)
8)
9)
10)
11 )
12)
379
Reference List
Culler, RE.; Holahan, C.J.: Test anxiety and academic performance: The effects of study-related behaviors In: Journal of Educational Psychology (1980)72. - P. 16-20
Freud, S.: The problem of anxiety. - New York, 1936
Gibson, M.G.: Instructional quality control in state administered rider education programs In: Proceedings of the International Motorcycle Safety Conference, May 18-23, 1980, Washington, OC / Motorcycle Safety Foundation. - Linthicum, 1980. Vol. 11. - P. 12/27-12/34
Hollingsworth,8.0.: Effects of performance goals and anxiety on learning a gross motor task In: Research Quarterly (1975)46. - P. 162-168
Hurt, H.H. Jr.; Ouellet, J.v.; Thom, O.R: Motorcycle accident cause factors and identification of countermeasures. Vol. 1: Technical re port. - Springfield, Virginia, 1981. - (OOT HS-5-01160)
The Motorcycle RiderCourse : Riding and Street Skills Instructor Guide / Motorcycle Safety Foundation. - Irvine, Calif., 1989
Satten, RS.: Analysis and evaluation of the Motorcycle Rider Course in thirteen northern Illinois counties In: Proceedings of the International Motorcycle Safety Conference, May 18-23, 1980, Washington, OC / Motorcycle Safety Foundation. - Linthicum, 1980. Vol. I. - P. 145-192
Smith, RC.; Lay, C.O.: State and trait anxiety : An annotated bibliography In: Psychological Report (1974). - P. 519-594
Spielberger, C.O.: Manual for the state-trait anxiety inventory (Form V). - Palo Alto, Calif., 1983
Spielberger, C.O.: State-trait anxiety inventory : A comprehensive bibliography. - Palo Alto, Calif., 1983
Thackray, RM. Jr.; Prescott, J.C.: Field test of the Motorcycle Rider Course In: Proceedings of the International Motorcycle Safety Conference, May 18-23, 1980, Washington, OC / Motorcycle Safety Foundation. - Linthicum, 1980. Vol. I. - P. 145-192
Weinberg, R.S.: Anxiety and motor performance: Drive theory vs. cognitive theory In: International Journal of Sport Psychology (1979)10. - P. 112-121
Comparison of Riding Behaviour between Inexperienced Riders and Experienced Riders
Tsuyoshi Katayama
Masanori Motoki
Japan Automobile Research Institute, Inc.
Japan
Hideo Ochiai
Makoto Nakanishi
Honda Safety Driving Promotion Center
Japan
383
1 Abstract
Motorcycle accident analysis indicate that many accidents are caused by young and inexperienced riders, and a high accident rate related to incorrect recognition and judgement is noted.
The purpose of this study is to ofter an education program that can provide novice riders with appropriate education, in particular to improve recognition and judgement abilities. The study was initiated as a three-year plan, and this is the report of the second year (1990) study.
In this paper, the rider's abilities of recognition are discussed. Especially, using an eye movement monitoring system, inexperienced riders' abilities of acquiring environmental information were compared with those of experienced riders. The survey was conducted on five inexperienced riders and five experienced riders. The results of this study are as folIows:
Speed of Eye Movement:
The sight fine transfer rate of novice riders were lower than those of experienced riders in non-riding experiment, while in riding experiment novice riders' sight line transfer rate were higher than experienced riders'.
Object of Vision:
The inexperienced riders looked at environmental objects about once every two seconds, while the experienced riders looked at objects about once every second. Experienced riders looked at more kinds of environmental objects than novice riders, moreover they reviewed the same object more times than inexperienced riders. Experienced riders repeatedly looked at the objects which might move, while novice riders did not.
384
2 Introduetion
Motorcycle accident analysis indicate that many accidents are caused by young and inexperienced riders. It is generally said that the causes of novice riders' accidents are related to the lack of skills and to incorrect recognition and judgement abilities. Especially in Japan, it is pointed out that many motorcycle accidents are associated with the lack of riders' recognition and judgement abilities (2), (3). It is important to establish educational programs to improve recognition and judgement abilities in order to reduce motorcycle accidents.
With the above mentioned background, this study was started in 1989 as a three-year plan with the purpose of proposing an effective education program to improve rider's recognition and judgement abilities (1).
In the first year, the following three items were investigated:
1. Development of a Visual Communication System for rider education. 2. Survey of riding behaviour of beginner and experienced riders. 3. Survey of the eye movement while watching a traffic environment video.
Motoki and Yamazaki (1) described the procedures and the results of these investigations in detail.
The second year (1990) program was devoted to study riders' abilities of acquiring traffic environmental information. In order to clarify the differences in eye movement between experienced riders and inexperienced riders, their sight lines were measured using an eye camera system (1), when watching a traffic environment video and when riding in a training course.
This report gives the main results of the second year study. The outline of the experiments are given in the next section. Section 4 is the description of the results. The last section is devoted to the concluding remarks.
385
3 Experiment
3.1 Purpose
The purpose of this experiment was to clarify the differences in sight line between beginners and experienced riders, when they were acquiring traffic environmental information. In order to acchieve this, two different experiments were carried out, nonriding experiment (watching a traffic environment video) and riding experiment.
3.2 Subjeets
The subjects were five novice riders with less than three month experience of riding motorcycle on public roads, who were of 16 and 18 years of age, and five experienced riders with over ten years experience riding. The latter were instructors from a driving school, Rainbow Motor School Co. Ud. in Saitama Prefecture.
3.3 Experiment 1: Non-Riding Condition -Watehing a Traffie Environment Video
Five typical traffic situations were reproduced in a training course at the Rainbow Motor School. Traffic scenes were recorded on a video tape, which was about 7 minutes long.
Traffie Seenes
The five typical traffic schemes were as folIows:
1. R-S Conflict:
Passing through an interesection where an automobile was waiting to turn right as shown in Figure 1, referred as "Right (automobile)-Straight (motorcycle) Conflict" = RS Conflict (Traffic is left hand in Japan.).
2. Blind Intersection: Passing through an intersection with blind corners

386
3. Overtaking Bieycle: Overtaking aeyelist as shown in Figure 2.
4. Turning Right: Turning right after waiting at a red light in an interseetion.
5. Merging: Passing through a eurved road where an automobile is waiting to merge.
Traffie Environment Video Projection
The above mentioned environment video was projeeted onto the sereen by the video projeetor. The size of the sereen was 2 x 3 m, and the viewing distanee was 3 m. The horizontal viewing angle of the sereen was about 37°.
Eye Camera System
An eye movement monitoring system by Takei Kiki Kokyo, T.K.K 393 was used.
Measuring Proeedure
First, the riders tested were briefed on traffie eonditions while watehing a traffie environment video. Then they were asked to eomment on the objeets of their observation during sight li ne measuring period, and the riders' eomments were reeorded together with visual data of sight line measurements.
3.4 Experiment 2: Riding Condition
Traffie Situation
The same traffie situations that of the environment video were reprodueed every running experiment:
Eye Camera System
The same system that used in non-riding experiments was used again.
Test Vehicle
The test vehiele was a Honda CD 250 motoreyele with a 250 ee engine.
387
Measuring Procedure
The riders were fitted with a sensor for the eye eamera system and direeted to ride the entire test course twiee.
3.5 Data Processing
In both experiments, non-riding and riding experiments, sight line transfer rate, fixation frequeney, and the objeets of vision, were analysed using an eye movement data proeessing system.
4 Results of Experiments
The results of the experiments were eategorized in two groups. The first group ineludes the results eoneerned with the speed of eye movement, and the se co nd group eoneerned information whieh speeified the objeets of vision. In the foliowing, these two kinds of results are deseribed in detail.
4.1 Speed of Eye Movement
A typieaf exampfe of sight fine transfer is shown in Figure 3. This is a pieture by an eye eamera video, and shows that the sight line of the rider transfers from the road ahead to the right rear-view mirror. These data were processed using the automatie data proeessing system to yiefd the sight fine transfer rate and the frequeney of fixation.
4.1.1 Non-Riding Experiment
Figure 4 shows the sight fine transfer rates under non-riding eondition. fn this figure and the figures appearing hereafter, the blaek (white) diagrams represent the results of experieneed (inexperieneed) riders. This figure shows that the sight fine transfer
j#
388
rates of experienced riders are higher than those of inexperienced riders for all traffic scenes.
When a sight line transfer rate of under 5.0 deg/sec lasted for more than 250 msec, it was regarded as a fixation action in this study. The frequencies of fixation are shown in Figure 5. This shows that the novice riders fix their sight lines more often than the experienced riders except for the "turning right" situation.
4.1.2 Riding Experiment
The sight line transfer rates under riding condition are shown in Figure 6. Figure 7 shows the frequencies of fixation. Contrary to the results of non-riding experiment, these figures show that the sight line transfer rates of novice riders are high er than those of experienced riders and they fix their sight lines less often than experienced riders.
4.2 Objects of Vision
The objects of vision were analysed utilizing the above mentioned five traffic scenes fram which we abstracted the following three characteristics:
- frequency of vision, - variety of object and review rate, - vision frequency of individual object.
4.2.1 Frequency of Vision
The frequency of vision for traffic environment (average value) are shown in Figures 8 and 9. This frequency is defined as the numbers of glances at the environmental objects, excluding the road, (with a second). Figure 8 gives the results of non-riding experiment, and Figure 9 gives the results of riding experiment.
Figure 8 shows that the experienced riders glanced at some objects at about on ce per second, and the inexperienced riders glanced at objects at about once every two
389
two seconds, while watching a traffic environment video. Figure 9 shows that the results of riding experiment are almost the same as those of non-riding experiment. From these figures, it can be said that experienced riders look at environmental objects twice as much as novice riders do.
4.2.2 Variety of Object and Review Rate
Figures 10 and 11 show the varieties of object and review rates. These figures indicate the number of different kinds of object and their review rate. In Figure 10, for example, experienced riders looked at about seven kinds of object, and they reviewed these objects roughly twice, in the R-S Conflict situation. It can be seen fram these figures that experienced riders look at more kinds of object than inexperienced riders do, and moreover, in both experiments, they review an object more times than novice.
4.2.3 looking Frequency of Individual Object
Figures 12 and 13 show the looking frequency of individual object in two traffic situations, the R-S Conflict and the Merging (riding experiments). Only two examples are shown here, but other eight results showed the same characteristics as these two examples.
The experimental results of the R-S Conflict situation are shown in figure 12. This figure shows that experienced riders look at individual objects more times than inexperienced riders. This feature is notable when they look at the automobile waiting to turn right and the right corner of an intersection. In other words, experienced riders repeatedly look at the objects that might move and also the point located far from them. Figure 13 shows the results of the Merging situation. This also shows that experienced riders repeatedly look at merging automobile and the curved raad locate far from them.
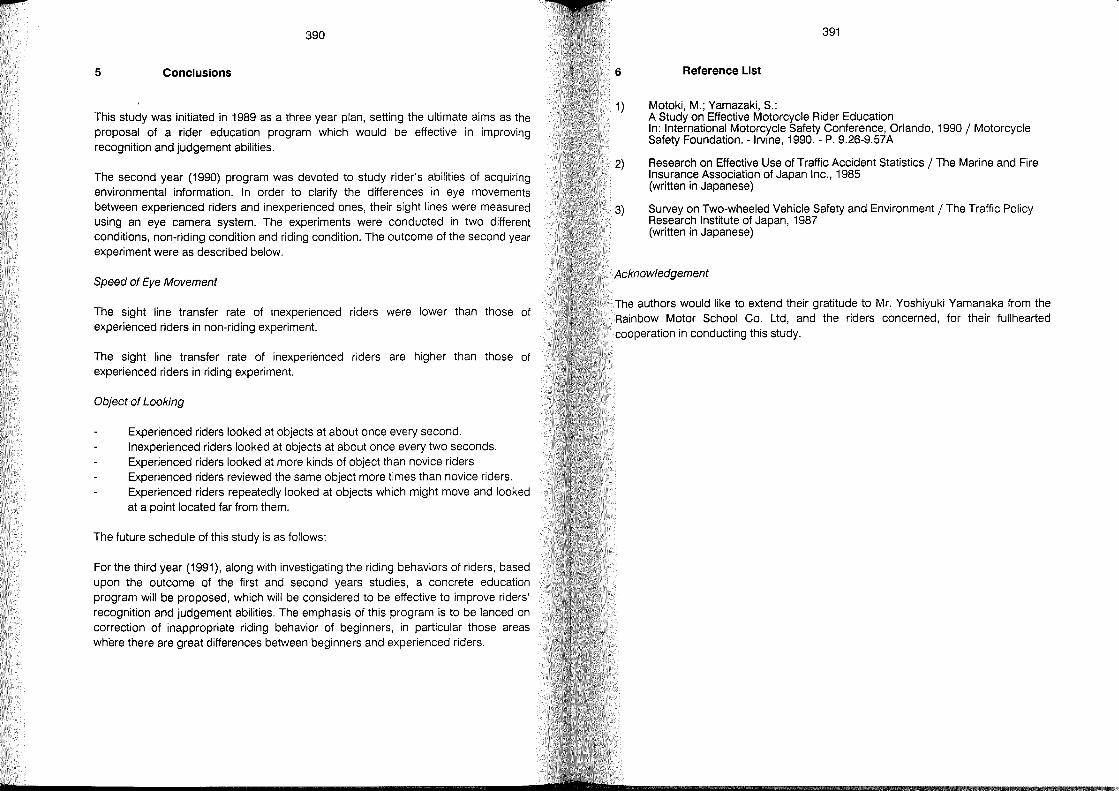
390
5 Conclusions
This study was initiated in 1989 as a three year plan, setting the ultimate aims as the praposal of a rider education program which would be effective in improving recognition and judgement abilities.
The second year (1990) program was devoted to study rider's abilities of acquiring environmental information. In order to clarify the differences in eye movements between experienced riders and inexperienced ones, their sight lines were measured using an eye camera system. The experiments were conducted in two different conditions, non-riding condition and riding condition. The outcome of the second year experiment were as described below.
Speed of Eye Movement
The sight line transfer rate of inexperienced riders were lower than those of experienced riders in non-riding experiment.
The sight line transfer rate of inexperienced riders are higher than those of experienced riders in riding experiment.
Object of Looking
Experienced riders looked at objects at about once every second. Inexperienced riders looked at objects at about once every two seconds. Experienced riders looked at more kinds of object than novice riders Experienced riders reviewed the same object more times than novice riders. Experienced riders repeatedly looked at objects which might move and looked at a point located far fram them.
The future schedule of this study is as folIows:
For the third year (1991), along with investigating the riding behaviors of riders, based upon the outcome cf the first and second years studies, a concrete education program will be proposed, which will be considered to be effective to improve riders' recognition and judgement abilities. The emphasis of this pragram is to be lanced on correction of inapprapriate riding behavior of beginners, in particular those areas where there are great differences between beginners and experienced riders.
6
1)
2)
3)
391
Reference List
Motoki, M.; Yamazaki, S.: A Study on Effective Motorcycle Rider Education In: International Motorcycle Safety Conference, Orlando, 1990/ Motorcycle Safety Foundation. - Irvine, 1990. - P. 9.26-9.57A
Research on Effective Use of Traffic Accident Statistics / The Marine and Fire Insurance Association of Japan Inc., 1985 (written in Japanese)
Survey on Two-wheeled Vehicle Safety and Environment / The Traffic Policy Research Institute of Japan, 1987 (written in Japanese)
Acknowledgement
The authors would like to extend their gratitude to Mr. Yoshiyuki Yamanaka fram the Rainbow Motor School Co. Ud, and the riders concerned, for their fullhearted cooperation in conducting this study.
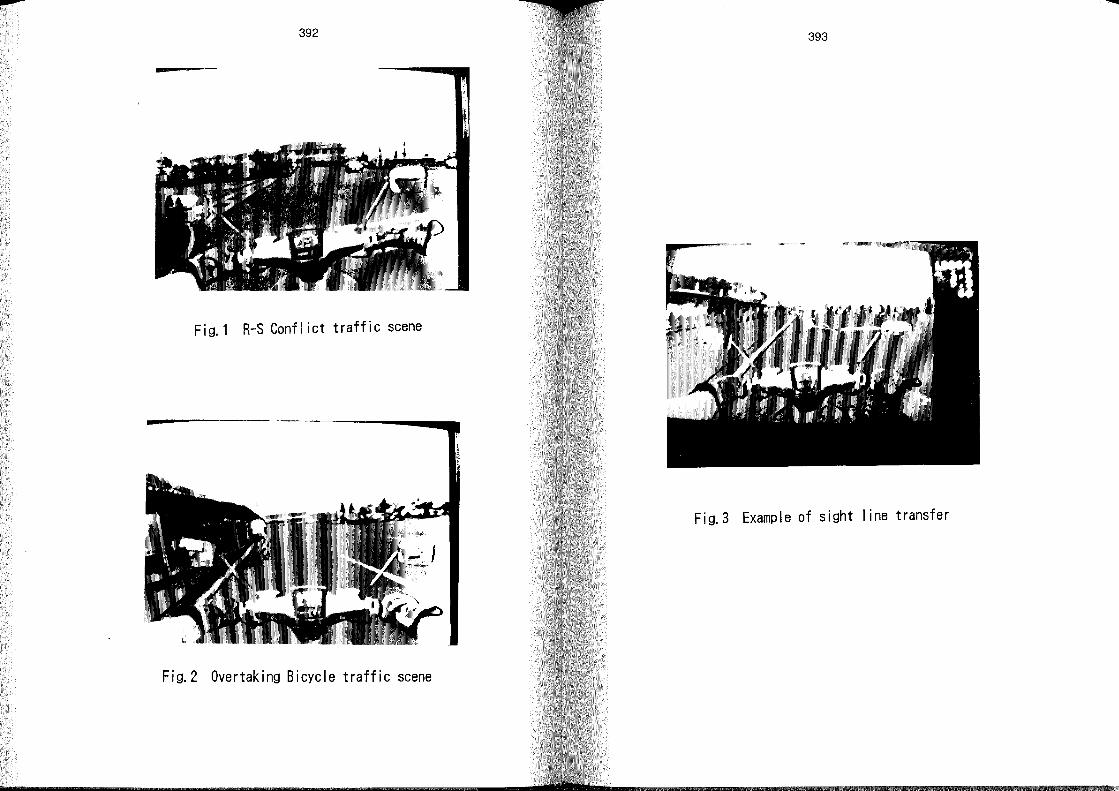
----392 393
Fig.1 R-S Confl ict traffic scene
Fig.3 Example of sight I ine transfer
Fig.2 Overtaking Bicycle traffic scene
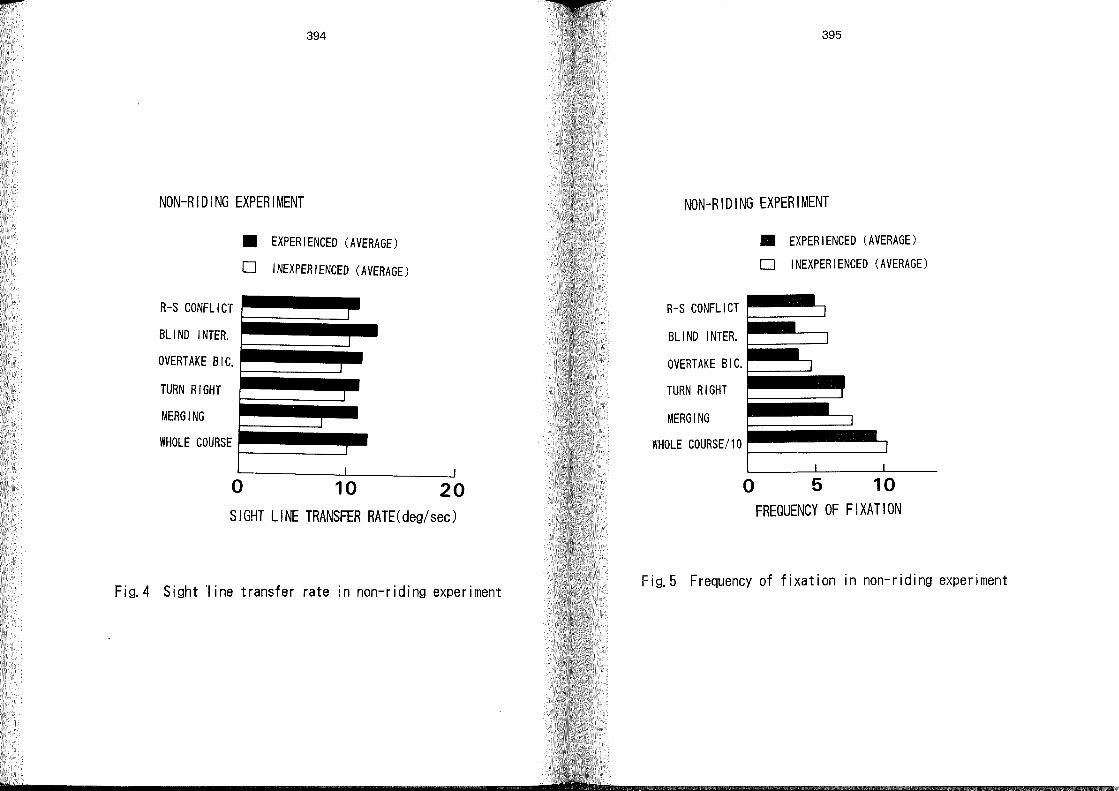
394
NON-RIDING EXPERIMENT
.. EXPERIENCED (AVERAGE)
[J INEXPERIENCED (AVERAGE)
R-S CONFLICT ~ •••••
BL I ND INTER.
OVERTAKE BI c. ~iiiiii." TURN RIGHT
MERGING
WHOLE COURSE ~iiiiii" ••
o 10 20 SIGHT LINE TRANSFER RATE(deg/sec)
Fig.4 Sight 1 ine transfer rate in non-riding experiment
395
NON-RIDING EXPERIMENT
11 EXPERIENCED (AVERAGE)
D I NEXPER I ENCED (AVERAGE)
R-S CONFL I CT ••• IL,
BL I ND INTER.
OVERT AKE BI C .• iiiL~ TURN RIGHT
MERGING
WHOLE COURSE/1 0 ••••• _IL, o 5 10
FREQUENCY OF FIXATION
Fig.5 Frequency of fixation in non-riding experiment
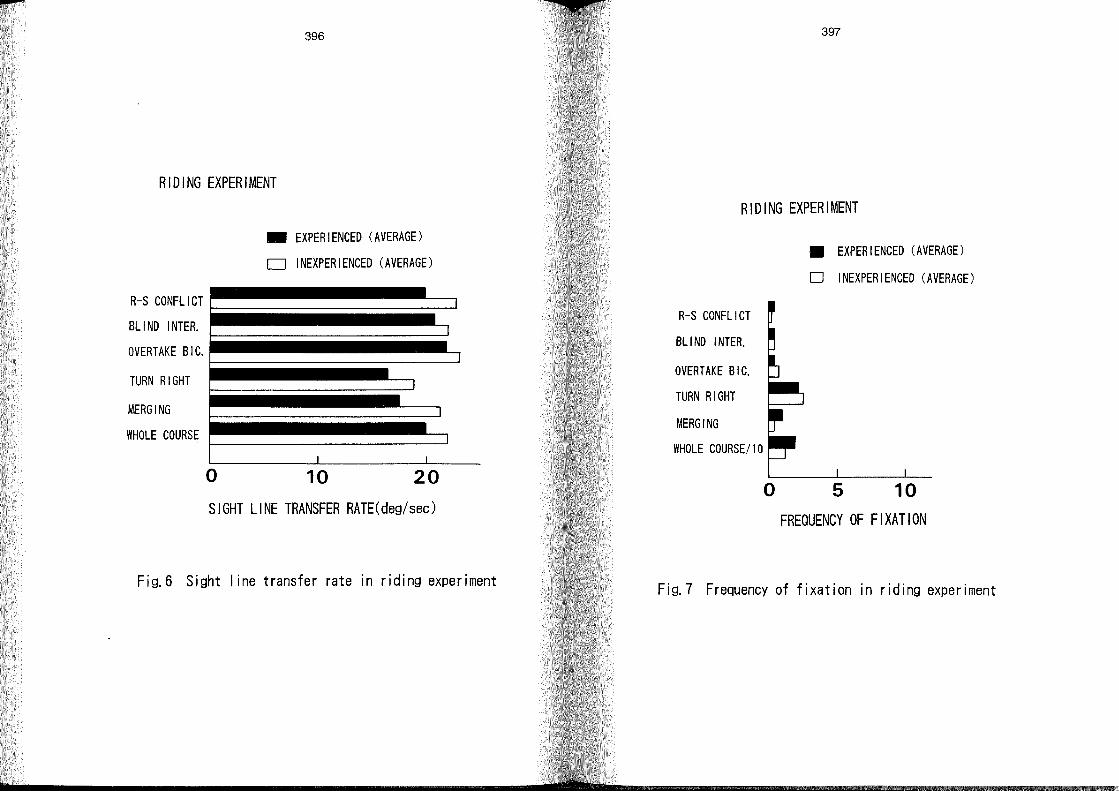
396
RIDING EXPERIMENT
_ EXPER I ENCED (AVERAGE)
c=J INEXPERIENCED (AVERAGE)
R-S CONFL I CT ~iiiiiiiiiiiiiiiiiiiiL~ BL I ND INTER. •
OVERTAKE BI C .• iiiiiiiiiiiiiiiiiiiiii~ TURN RIGHT
MERG I NG ~iiiiiiiiiiiiiiiiiiiiL, WHOLE COURSEl-• __________ ~
o 10 20
SIGHT LINE TRANSFER RATE(deg/sec)
Fig.6 Sight I ine transfer rate in riding experiment
397
RIDING EXPERIMENT
R-S CONFLICT
BL I ND INTER.
OVERTAKE BI C.
TURN RIGHT
MERGING
WHOLE COURSE/10
o
111 EXPERIENCED (AVERAGE)
[J INEXPERIENCED (AVERAGE)
5 10
FREQUENCY OF FIXATION
Fig.7 Frequency of fixation in riding experiment
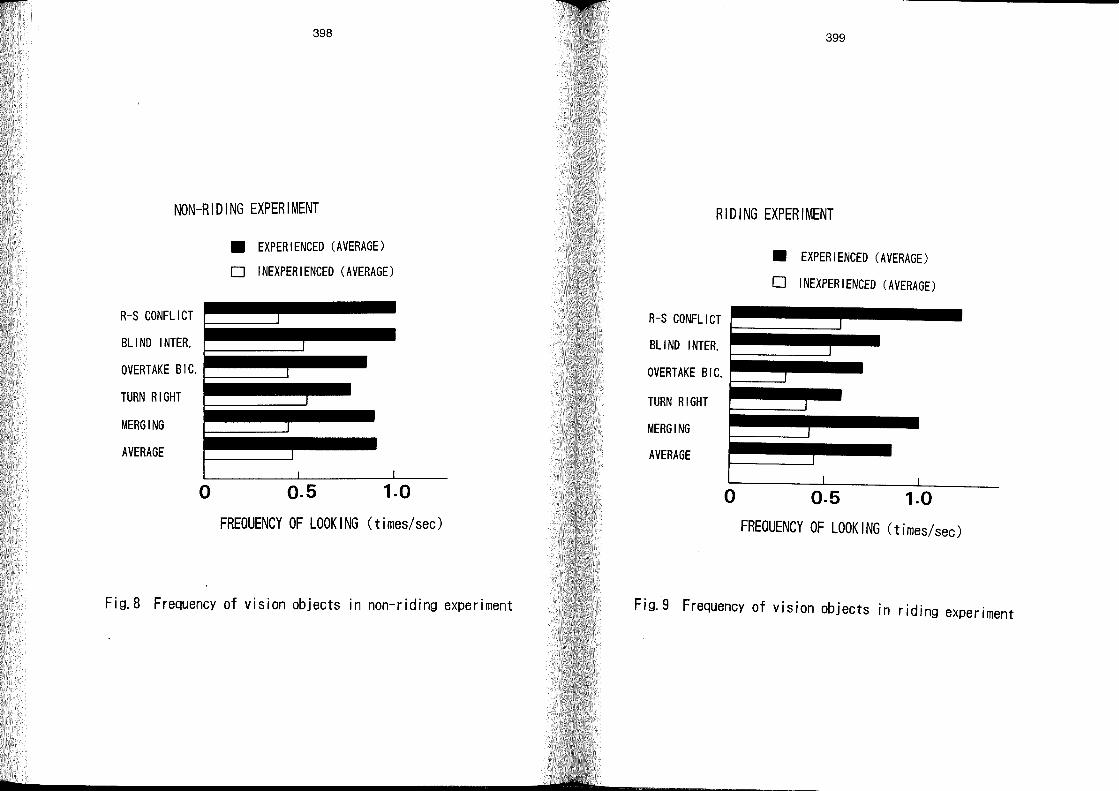
398
NON-RIDING EXPERIMENT
11 EXPERIENCED (AVERAGE)
[] INEXPERIENCED (AVERAGE)
R-S CONFLI CT
BL I ND INTER.
OVERTAKE BI c . • lilili ...... TURN RIGHT
MERGING
AVERAGE
o 0.5 1.0
FREOUENCY OF LOOKING (times/sec)
Fig.8 Frequency of vision objects in non-riding experiment
399
RIDING EXPERIMENT
• EXPER I ENCED (AVERAGE)
[J INEXPERIENCED (AVERAGE)
R-S CONFL ICT ••••••••••••
BL I ND INTER.
OVERTAKE BI c . •• Ii_.". TURN RIGHT
MERGING
AVERAGE
o 0.5 1.0
FREOUENCY OF LOOKING (times/sec)
Fig.9 Frequency of vision objects in riding experiment
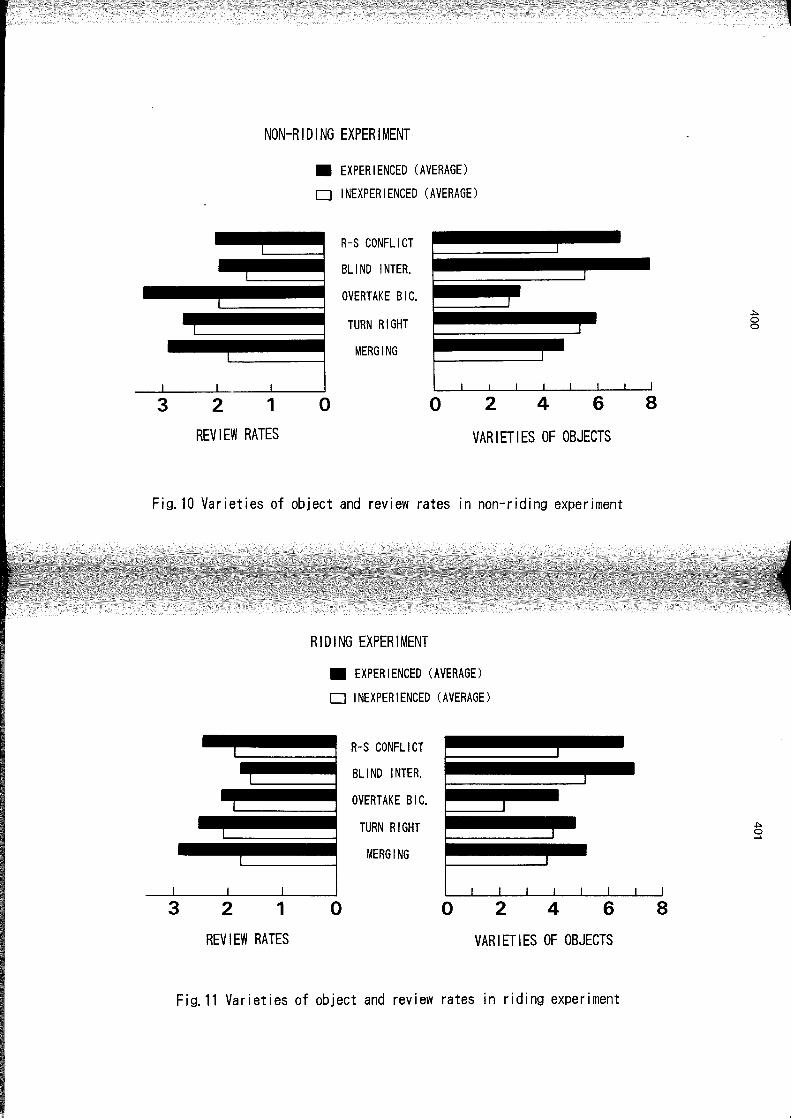
3 2
NON-RIDING EXPERIMENT
1
111 EXPERIENCED (AVERAGE)
c:J INEXPERIENCED (AVERAGE)
o
R-S CONFLI CT
BL I ND INTER.
OVERT AKE BI C.
TURN RIGHT
MERGING
o 2 4 6
REVIEW RATES VARIETIES OF OBJECTS
Fig. 10 Varieties of object and review rates in non-riding experiment
3 2 1
REVIEW RATES
RIDING EXPERIMENT
111 EXPERIENCED (AVERAGE)
c:J INEXPERIENCED (AVERAGE)
o
R-S CONFLICT
BL I ND INTER.
OVERTAKE BI C.
TURN RIGHT
MERGING
o 2 4 6
VARIETIES OF OBJECTS
Fig.11 Varieties of object and review rates in riding experiment
8
8
.j>. o o
.j>.
S
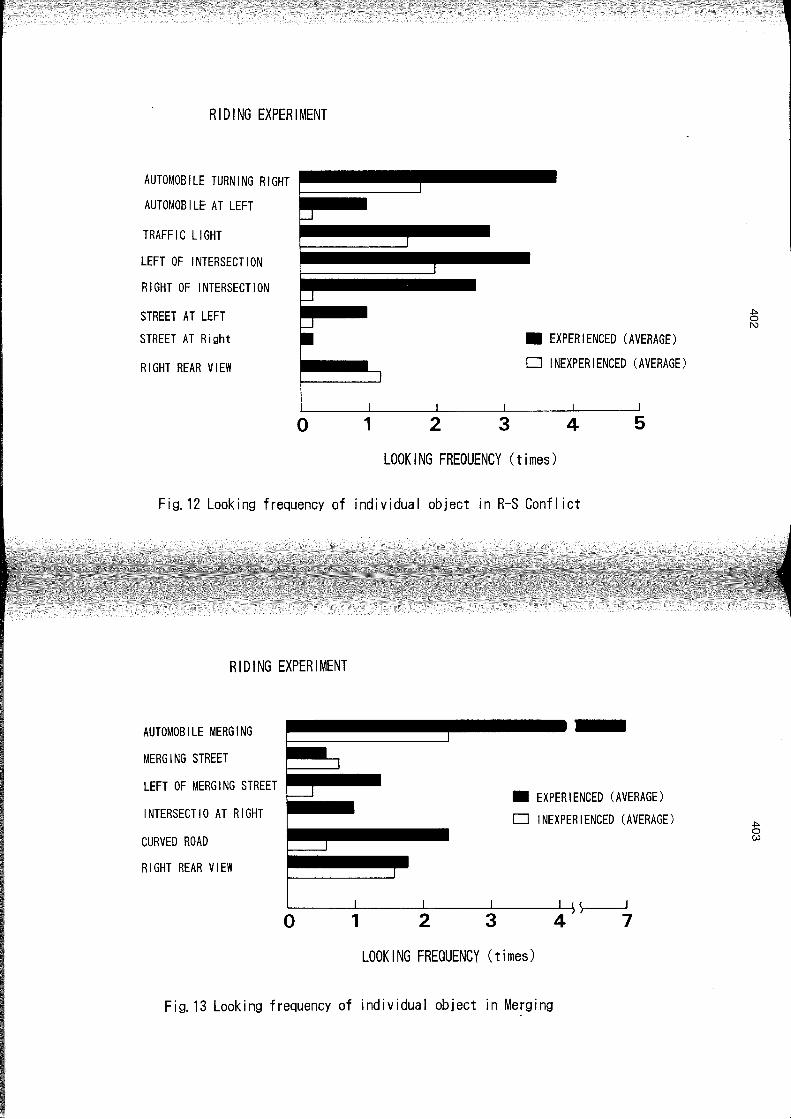
RIDING EXPERIMENT
AUTOMOBILE TURNING RIGHT
AUTOMOBILE AT LEFT ~
TRAFFIC LIGHT
LEFT OF INTERSECTION
RIGHT OF INTERSECTION
STREET AT LEFT STREET AT Right
RIGHT REAR VIEW
0 1 i
2 3
111 EXPERIENCED (AVERAGE)
c:J INEXPERIENCED (AVERAGE)
I I
4 5
LOOKING FREOUENCY (times)
Fig. 12 Laaking frequeney af individual abjeet in R-S Canfl iet
RIDING EXPERIMENT
AUTOMOBILE MERGING
MERGING STREET
LEFT OF MERG I NG STREET ~.ii .. 111 EXPERIENCED (AVERAGE)
c:J INEXPERIENCED (AVERAGE) INTERSECTIO AT RIGHT
CURVED ROAD
RIGHT REAR VIEW
~----~------~----~~----~'~~)r--~
2 3 4 7 o 1
LOOKING FREOUENCY (times)
Fig. 13 Laaking frequeney af individual abjeet in Merging
.j::. o
'"
.j::. o w
Driver Error in a Mixed-Traffic Environment: The Need for Increasing 'Technical Awareness'
Peter Brooks
Applied Psychology Unit
Cranfield Institute of Technology
United Kingdom
407
1 Abstract
Driver error rather than rider error is a major factor in powered two-wheeler (PTW) accidents. Although increasing the physical conspicuity of the PTW or rider has often been considered as the only necessary countermeasure, studies show that driver error is often the result of decisions made after detection of the PTW has taken place. This imposes the need to consider other aspects of the PTW, in addition to lack of conspicuity, which can lead to inappropriate driver behaviour. This paper therefore discusses technological, physical and design aspects of PTWs in relation to their potential accident-causing effects within a mixed traffic stream. Despite the need to consider different interpretations of driver error and several aspects of PTW operation, a unifying feature is the need for greater driver 'technical' awareness of PTWs. Empirical investigations of the nature and importance of drivers lack of Technical Awareness are reported, based on surveys of the opinions, knowledge and experience of drivers in Britain.
408
2 Driver Error and PTW Accidents
For as long as the road safety problem has been examined on the basis of accident statistics it has been identified that other vehicle driver error is one of the major causes of powered-two wheeler (PTW) accidents [e.g., Foldvary, 1967, (10); Waller, 1972, (34); Hurt et al., 1981, (16); Simard, 1990, (30)]. The constantfinding overthese years has been that approximately 70% of PTW accidents involve another vehicle and that in about 70% of these encounters the driver of the other vehicle is at fault. Responding to such figures, several investigations have suggested that the problem of driver involvement in PTW accidents may be more complex than one of lack of visibility of the PTW and rider. For example, Mortimer and Schuldt [1980, (25)] have suggested that junction accidents may involve perceptual factors such as judgements related to the distance and velocity of the PTW. However, Nagayama et al. [1980, (31)] obtained findings which they argued could not be explained by a difference in perceptual factors of subjective speed but which should be attributed instead to such nonperceptual factors as expectancy or decision criteria. More recently, Brooks [1988, (4)] has emphasised that driver error should be viewed as a problem of inappropriate decision making and response, sometimes occurring before failure to detect the PTW and sometimes occurring after detection.
It is apparent, however, that these rather high-level descriptions of driver error do not express a level of understanding which is sufficient to actually begin to develop appropriate countermeasures. It is therefore necessary to consider the issue in more detail.
2.1 Previous Descriptions of the Problem
Over two decades ago, Johnson [1969, (18), p.12] assessed the motorcycle accident problem in the United States and argued "the need to inform all motorists about certain characteristics of motorcycles". Johnson described a curriculum guide for high school education which emphasised typical car-PTW conflicts and characteristics of PTWs that "drivers ne~d to know to share roads intelligently with cyclists". Also at this time, Reiss and Haley [1968, (28), p.25] argued that "Since the motorcycle rider is sharing the public roads with other drivers and pedestrians, it is imperative that the general public know the capabilities and limitations of motorcyclists. They must build up 'a set of expectations as to what the intentions of the cyclist are, what his maneuvers mean, and why he is doing what he is doing".
Turning to the 1970s, Waller [1972, (34), p.ii] formulated three general PTW safety recommendations of which one was the need for public information through mass
409
communications in order that drivers and riders become "mutually aware". Unlike Johnson or Reiss and Haley, Waller referred only to rider, and not driver, education when commenting on the need for knowledge of the special problems concerning PTW operation. However, Howells et al. [1980, (8), p.1607/1608] have suggested that "one means of reducing the number of motorcycle intersection entry accidents is to provide at least minimal knowledge about the operating characteristics of a motorcycle to all drivers".
Buchanan and Tarrants [1982, (7)] have pointed out that several motorist awareness campaigns have been conducted in the United States. When considering the necessary elements of a motorist awareness campaign in high school driver education it was concluded that the high proportion of driver culpability in PTW accidents should be emphasised, along with the fact that such accidents usually result in serious injuries to the rider. Buchanan and Tarrants recommended that handbooks for car licence applicants should include information on. high risk situations involving PTWs. More recently, Harper [1990, (13), p.10-58] has described a public awareness campaign which had an objective to "educate motorists about the advantages and !imitations of motorcycles as a mode of transportation" .
Although all of these above examples originate from the United States, similar descriptions can be seen cross-nationally. Nagayama [1984, (26)] has proposed that PTW safety education in Japan should include car drivers and the need to understand the characteristics of a PTW. In Australia Herbert [1976, (14), p.220] has addressed the motorcyclist as a "victim of the system" with respect chiefly to traffic and road construction engineering and has suggested that "much could be done to make other road users more aware of motorcyclists and their problems". Huebner [1980, (15)] has reported the Australian Visibility it's Vital campaign which had the secondary aims of encouraging drivers to be more aware of riders' presence on, and right to share, the roads. She argued the need to change drivers' expectations about the likelihood of encountering PTWs, educating drivers how to detect a PTW in the road milieu and how to distinguish between PTWs and other classes of sm aller vehicles. The multinational publication by the Organisation for Economic Co-Operation and Development [OECD, 1978, (29), p.82] also reported the need to direct safety campaigns at other road users: "It is essential in order to avoid accidents, that the car drivers know what to expect from the riders of two-wheeled vehicles, as concerns speed, space requirement, difficult manoeuvres and often poor lighting". A similar conclusion was made after an analysis of PTW accidents in Germany rOtte, 1980, (27), p. 602]. Otte suggested that the users of other vehicles should be informed about "the special problems of two-wheel drivers". In the British literature, Menzies [1970, (21), p. 73] has suggested the existence of a "real ignorance" on the part of drivers as to the special properties of the PTW and needs of the rider and Whitaker [1980, (36), p. 24] has also suggested the "value of publicising to other road users the vulnerability of motorcyclists". Emphasis in the literature and in actual safety
410
campaigns in Britain has been on making other road users more aware of the difficulties of seeing PTWs and to gene rally "think bike" [Fulton, Kirby and Stroud, 1980, (12), p.16; Stroud, Kirby and Fulton, 1980, (32)].
2.2 A Revised Understanding of the Problem: Driver Error as a Function of Lack of Technical Awareness
The literature referred to in Section 1.1 was selected because of comments given on the causal nature of driver error and recommendations for driver education in relation to PTW safety. These recommendations expressed the need for greater knowledge in terms of making other road users aware of: 'rider vulnerability' [Menzies, 1970, (21); Whitaker, 1980, (36)]; 'certain characteristics of motorcycles' [Johnson, 1969, (18); Harper, 1990, (13)]; certain aspects of 'motorcycle operation' [Reiss and Haley, 1968, (28); Howells et al., 1980, (8)]; the road situations which are likely to lead to 'high risk situations involving motorcycles' [Johnson, 1969, (18); Buchanan and Tarrants, 1982, (7)] and the correct 'expectancies' [e.g., Huebner, 1980, (15)]; and/or 'decision criteria' [Nagayama et al., 1980, (31)] for appropriate judgements.
Such views have supported the formulation of the concept of lack of Technical Awareness [Brooks, 1987 (4); 1988 (5)] as a possible contributing factor to driver error in accidents involving PTWs. It is argued that a lack of knowledge of PTWs and of the complexities involved with riding a PTW could influence (or fail to influence) a driver's behaviour in potential conflict situations.
3 Technical Awareness: Awareness of what?
It has previously been suggested that "the task of riding a motorised two-wheeler is more complicated than driving a car" [OECD, 1976, (29), p.106] and that "Riding a motorcycle obviously mal:<es higher demands on specific handling skills than driving a car" [Blaauw and Poil, 1980, (2), p. 445]. One could therefore assume qualitative differences between the experiences of typical car drivers and PTW riders. In Section 2.1 several authors were seen to have referred to the 'complexities' involved in motorcycling. However, it is important to note that such statements have rarely been qualified by either describing exactly what the characteristics inherent with PTW operation are or precisely why it is necessary for drivers to be knowledgeable in them for greater PTW safety. Obviously, such issues must be understood for further work in this area to be justified and if effective safety measures are to be developed.
411
Johnson [1969, (18)] described the rider's human/machine/environment interface in order to summarise what he considered to be the special factors of the operator's riding task. Johnson particularly emphasised 'stability' and 'influence of the road surface'. These are therefore two areas in need of further exploration and comment. However, additional aspects of Technical Awareness are apparent and also need to be considered below.
3.1 PTW Stability and Manoeuvrability
Reiss and Haley [1968, (28)] have argued that non-motorcyclists might incorrectly believe the PTW to be extremely stable and forgiving and place few demands on the rider. Indeed, Hurt et al. [1981, (16), p.12] stated that "the stability and control of the single-track vehicle is spectacularly different from that of the conventional automobile". Similarly, Messiter [1972, (22), p. 8] has argued that "the lack of inherent stability in the motorcycle requires considerable rider skills in motor co-ordination and balance for its riding, which are not called for in driving other vehicles". Also, Foldvary [1967, (11)] has described the lesser manoeuvrability and greater vulnerability of the PTW in comparison with cars as a common cause of PTW accidents. However, it is interesting to note that Johnson [1969, (18)] considered a PTW to be easy to manoeuvre due to its size and Reiss and Haley [1968, (28)] stated the belief that under most conditions a PTW is more manoeuvrable than a car. This would actually only appear to be the case when a PTW is travelling very slowly. Indeed, Webb [1978, (1)] has emphasised that PTWs, unlike cars, are unable to change direction suddenly and that when exceeding about 10 mph (16 km/h) a rider can only swerve rather than turn. Furthermore, despite manoeuvrability probably being less limited at lower speeds, Kraus [1975, (19), p.95] have referred to a study [Watanabe and Yoshida, 1973] which indicates that evasive manoeuvrability performance is actually less for smaller engine capacity PTWs.
3.2 Influence of Road Surface
Monaghan [1982, (24)] has described how, when wet, the polished areas of tarmac can be very slippery and dark lines of dirt on the drainage lines of concrete roads reveal where tyres have left rubber or drainage sumps have deposited oil and can be treacherous. Furthermore, in pi aces where chippings have been removed by wear the surface underneath does not give good grip. Loose gravel offers hardly any grip at all and road markings give very little grip in the wet, along with manhole covers and any
412
other metallaid into the road surface (e.g., expansion plates on bridges). Even worse are petrol, diesel, mud, ice, snow, leaves, debris and pot-holes. In addition, Webb [1978, (1),"p.20] has described the negative effect of dry loose dust which will cause slipperiness and wood block surfaces, cobble and very smooth asphalt which can be encountered in towns. Webb has explained that care is always needed on bends and corners where a layer of tyre rubber may have been rubbed into the road, "presenting a difficult surface in dry conditions and alethal mixture with a little rain or morning dew".
Diesel, oil and impregnated rubber on the road surface are particularly likely on roundabouts and at heavily used junctions. These are thus particular areas where a motorist can expect a rider to have to alter speed and/or direction.
3.3 PTW Braking
The nature of the road surface is particularly crucial when attempting to slow down or stop a vehicle. Watson et a/. [1976, (35)] have reported that a number of variables affect braking performance apart from those inherent in the particular design of the PTW. Of these the weight transfer due to deceleration and the effects of machine camber were reported to have a marked influence on the braking performance and stability of the machine. Watson et a/. argued that when combined with changing road surface conditions, particularly when wet, the rider is faced with an almost impossible task of stopping a PTW under emergency conditions in the shortest distance without locking the wheels and losing control.
Whilst most conventional car braking systems are proportioned so that more than half of the braking effort is automatically directed onto the front wheels, for the PTW the proportioning of the braking applied to the front and the re ar wheel is determined solely by the rider. Brake actuation has not been simplified to one control as in cars for several reasons, the foremost of these being the essential requirement that the front brake is not locked since lateral control of the machine is then extremely difficult to maintain [e.g., Reiss and Haley, 1968, (28)]. Another is the problem of braking while a PTW is banked over and when gentle application of the re ar brake is all that can be done in relative safety. Furthermore, for the most effective braking from a particular speed to stand-still it is necessary to be able to vary the front/rear braking effort in order to avoid one or the other wheel locking. Across the range of PTWs the brake load distribution required for optimum braking varies from 70% at the front and 30% at the re ar on a dry and good surface to 33% at the front and 67% at the rear on a very slippery surface [Watson et a/., 1976, (35)]. A wheel will lock up if the braking load being applied to that wheel exceeds the friction between the tyre and the road.
413
Hence, if the grip of the tyres on the road is al ready reduced by rain, ice, snow, oil, wet leaves or some other hazard, the braking effort necessary to lock the wheel will also be reduced.
It has been suggested that a likely contributor to accident causation is that PTWs cannot stop as quickly as other vehicles [British Medical Journal, 1979, (23)]. However, Reiss and Haley [1968, (28)] have argued that although it is feit that the typical rider cannot stop a PTW in the same distance as a typical driver, generalisations should be avoided. In addition to the amount of brake swept area available, many tyre, road surface and rider variables will enter into the PTW's stopping ability. Indeed, as a result of the estimation of stopping distances in experimental situations Watson et a/. [1976, (35)] reported great variations between riders and illustrated the problem of the amount of skill and experience required.
Another aspect is the tendency for manufacturers to fit disc rather than drum brakes and tor the discs to be made of stainless steel rather than machine cast iron surfaces as in discs for cars. This is chiefly for aesthetic appeal and in wet weather the stainless steel discs do not work initially as the water acts as a lubricant between the pad and the disc [e.g., Wigan, 1976, (37)]. It is therefore vital that braking distances are judged in order to allow for the initial drying out period [e.g., Webb, 1978, (1)] and with the use of various materials for brake pads a considerable range in braking performance can be witnessed [Donne, 1984, (9)].
3.4 PTW Cornering
Associated with the complexities in slowing down and stopping PTWs, it was noted above that braking of consequence should only take place when the PTW is upright and travelling in a straight line. The application of brakes results in very large changes in the forces which hold the PTW on the road. At anything but the most lowest speeds a PTW must be cornered by being banked over so that the weight of the rider and PTW pull the moving mass away from its natural tendency to move in a straight line. In the cornering process there is a balance between the weight of the rider and PTW banked over, the frictional resistance to sliding of the tyre on the road surface and the centrifugal force tending to pull the PTW onto a straight course. Any change in these forces is likely to destabilise the precise balance and lead to a crash [Webb, 1978, (1)]. Indeed, after analysing the forces acting on the normal motion of a PTW on a roundabout at reasonable speed, Watson et a/. [1976, (35)] reported that potential wheel-Iock and adverse centrifugal forces become extremely likely on even slight braking and especially in wet conditions.
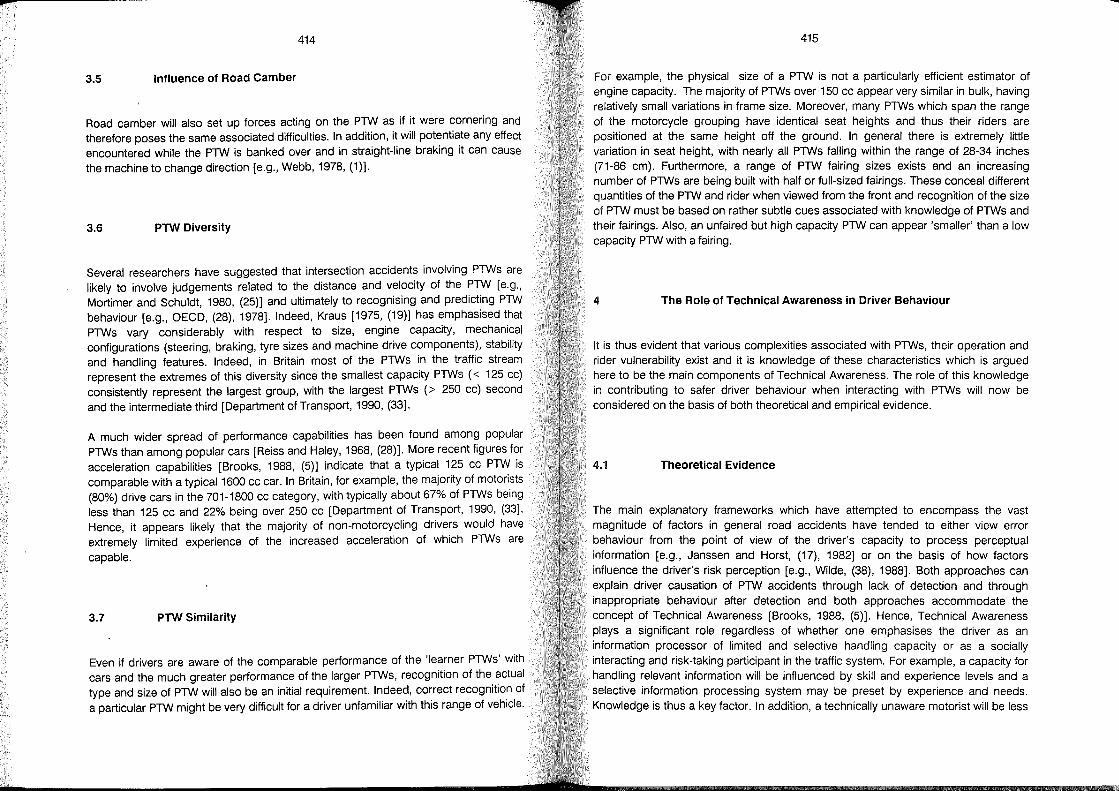
.....
414
3.5 Influence of Road Camber
Road camber will also set up forces acting on the PTW as if it were cornering and therefore poses the same associated difficulties. In addition, it will potentiate any effect encountered while the PTW is banked over and in straight-line braking it can cause the machine to change direction [e.g., Webb, 1978, (1)].
3.6 PTW Diversity
Several researchers have suggested that intersection accidents involving PTWs are likely to involve judgements related to the distance and velocity of the PTW [e.g., Mortimer and Schuldt, 1980, (25)] and ultimately to recognising and predicting PTW behaviour [e.g., OECD, (28), 1978]. Indeed, Kraus [1975, (19)] has emphasised that PTWs vary considerably with respect to size, engine capacity, mechanical configurations (steering, braking, tyre sizes and machine drive components), stability and handling features. Indeed, in Britain most of the PTWs in the traffic stream represent the extremes of this diversity since the smallest capacity PTWs « 125 cc) consistently represent the largest group, with the largest PTWs (> 250 cc) second and the intermediate third [Department ofTransport, 1990, (33].
A much wider spread of performance capabilities has been found among popular PTWs than among popular cars [Reiss and Haley, 1968, (28)]. More recent figures for acceleration capabilities [Brooks, 1988, (5)] indicate that a typical 125 cc PTW is comparable with a typical1600 cc car. In Britain, for example, the majority of motorists (80%) drive cars in the 701-1800 cc category, with typically about 67% of PTWs being less than 125 cc and 22% being over 250 cc [Department of Transport, 1990, (33]. Hence, it appears likely that the majority of non-motorcycling drivers would have extremely limited experience of the increased acceleration of which PTWs are
capable.
3.7 PTW Similarity
Even if drivers are aware of the comparable performance of the 'Iearner PTWs' with cars and the much greater performance of the larger PTWs, recognition of the actual type and size of PTW will also be an initial requirement. Indeed, correct recognition of a particular PTW might be very difficult for a driver unfamiliar with this range of vehicle.
415
For example, the physical size of a PTW is not a particularly efficient estimator of engine capacity. The majority of PTWs over 150 cc appear very similar in bulk, having relatively small variations in frame size. Moreover, many PTWs which span the range of the motorcycle grouping have identical seat heights and thus their riders are positioned at the same height off the ground. In general there is extremely little variation in seat height, with nearly all PTWs falling within the range of 28-34 inches (71-86 cm). Furthermore, a range of PTW fairing sizes exists and an increasing number of PTWs are being built with half or full-sized fairings. These conceal different quantities of the PTW and rider when viewed from the front and recognition of the size of PTW must be based on rather subtle cues associated with knowledge of PTWs and their fairings. Also, an unfaired but high capacity PTW can appear 'smaller' than a low capacity PTW with a fairing.
4 The Role of Technical Awareness in Driver Behaviour
It is thus evident that various complexities associated with PTWs, their operation and rider vulnerability exist and it is knowledge of these characteristics which is argued here to be the main components of Technical Awareness. The role of this knowledge in contributing to safer driver behaviour when interacting with PTWs will now be considered on the basis of both theoretical and empirical evidence.
4.1 Theoretical Evidence
The main explanatory frameworks which have attempted to encompass the vast magnitude of factors in general road accidents have tended to either view error behaviour from the point of view of the driver's capacity to process perceptual information [e.g., Janssen and Horst, (17), 1982] or on the basis of how factors influence the driver's risk perception [e.g., Wilde, (38), 1988]. Both approaches can explain driver causation of PTW accidents through lack of detection and through inappropriate behaviour after detection and both approaches accommodate the concept of Technical Awareness [Brooks, 1988, (5)]. Hence, Technical Awareness plays a significant role regardless of whether one emphasises the driver as an information processor of limited and selective handling capacity or as a socially interacting and risk-taking participant in the traffic system. For example, a capacity for handling relevant information will be influenced by ski 11 and experience levels and a selective information processing system may be preset by experience and needs. Knowledge is thus a key factor. In addition, a technically unaware motorist will be less
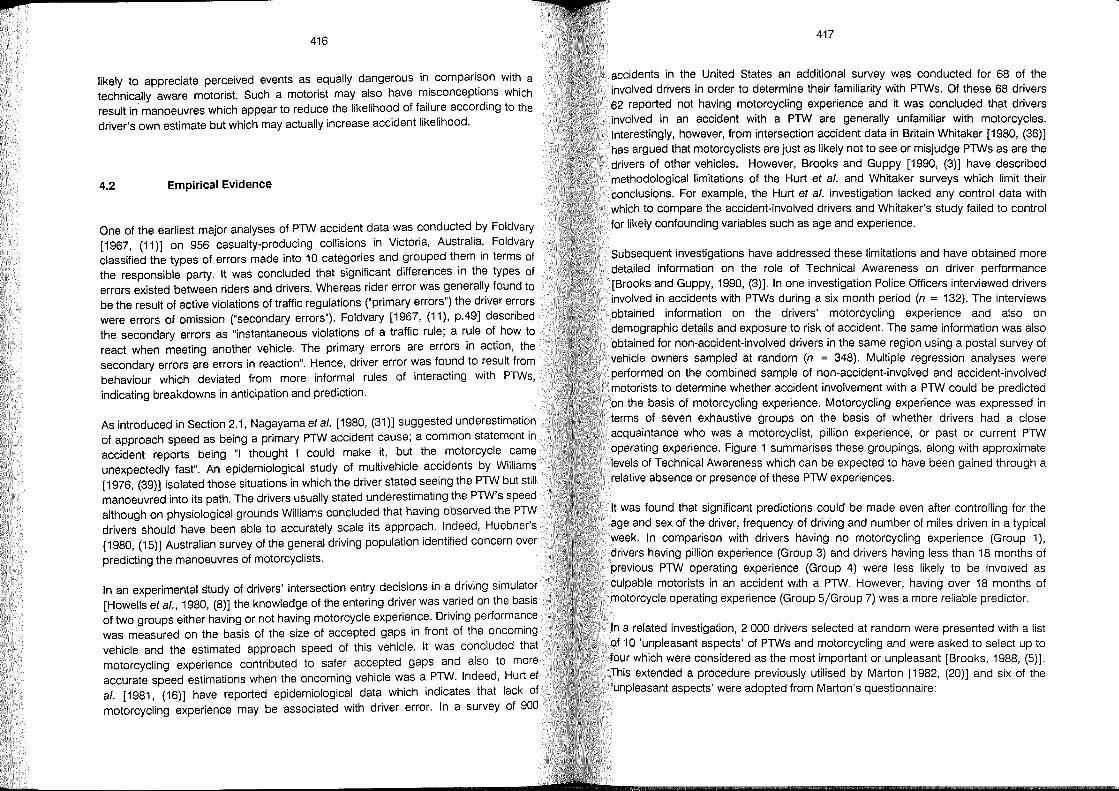
416
likely to appreciate perceived events as equally dangerous in comparison with a technically aware motorist. Such a motorist mayaiso have misconceptions which result in' man oeuvres which appear to reduce the likelihood of failure according to the driver's own estimate but which may actually increase accident likelihood.
4.2 Empirical Evidence
One of the earliest major analyses of PTW accident data was conducted by Foldvary [1967, (11)] on 956 easualty-producing collisions in Victoria, Australia. Foldvary classified the types of errors made into 10 categories and grouped them in terms of the responsible party. It was concluded that significant differences in the types of errors existed between riders and drivers. Whereas rider error was generally found to be the result of active violations of traffic regulations ("primary errors") the driver errors were errors of omission ("secondary errors"). Foldvary [1967, (11), p.49] described the secondary errors as "instantaneous violations of a traffie rule; a rule of how to react when meeting another vehicle. The primary errors are errors in action, the secondary errors are errors in reaction". Hence, driver error was found to result fram behaviour which deviated from more informal rules of interacting with PTWs, indicating breakdowns in anticipation and prediction.
As introduced in Section 2.1, Nagayama et a/. [1980, (31)] suggested underestimation of approach speed as being a primary PTW accident cause; a eommon statement in accident reports being "I thought I could make it, but the motorcycle came unexpectedly fast". An epidemiological study of multivehicle accidents by Williams [1976, (39)] isolated those situations in which the driver stated seeing the PTW but still manoeuvred into its path. The drivers usually stated underestimating the PTW's speed although on physiological grounds Williams concluded that having observed the PTW drivers should have been able to accurately scale its approach. Indeed, Huebner's [1980, (15)] Australian survey of the general driving population identified concern over predicting the manoeuvres of motorcyclists.
In an experimental study of drivers' intersection entry decisions in a driving simulator [Howells et al., 1980, (8)] the knowledge of the entering driver was varied on the basis of two groups either having or not having motorcycle experience. Driving performance was measured on the basis of the size of accepted gaps in front of the oncoming vehicle and the estimated approach speed of this vehicle. It was concluded that motorcycling experience contributed to safer accepted gaps and also to more accurate speed estimations when the oncoming vehicle was a PTW. Indeed, Hurt et al. [1981, (16)] have reported epidemiological data which indicates that lack of motorcycling experienee may be associated with driver error. In a survey of 900
417
accidents in the United States an additional survey was condueted tor 68 of the involved drivers in order to determine their familiarity with PTWs. Of these 68 drivers 62 reported not having motorcycling experience and it was concluded that drivers involved in an accident with a PTW are generally unfamiliar with motorcycles. Interestingly, however, from intersection accident data in Britain Whitaker [1980, (36)] has argued that motorcyclists are just as likely not to see or misjudge PTWs as are the drivers of other vehicles. However, Brooks and Guppy [1990, (3)] have described methodological limitations of the Hurt et al. and Whitaker surveys which limit their conclusions. For example, the Hurt et al. investigation lacked any control data with whieh to compare the accident-involved drivers and Whitaker's study failed to control for likely confounding variables such as age and experience.
Subsequent investigations have addressed these limitations and have obtained more detailed information on the role of Technical Awareness on driver performance [Braoks and Guppy, 1990, (3)]. In one investigation Police Officers interviawed drivers involved in accidents with PTWs during a six month period (n = 132). The interviews obtained information on the drivers' motorcycling experience and also on demographic details and exposure to risk of accident. The same information was also obtained for non-accident-involved drivers in the same region using apostal survey of vehicle owners sampled at random (n = 348). Multiple regression analyses were performed on the combined sampie of non-accident-involved and accident-involved motorists to determine whether accident involvement with a PTW could be predicted on the basis of motorcycling experience. Motorcycling experience was expressed in terms of seven exhaustive groups on the basis of whether drivers had a close acquaintance who was a motorcyclist, pillion experience, or past or current PTW operating experience. Figure 1 summarises these groupings, along with approximate levels of Technical Awareness which can be expected to have been gained through a relative absence or presence of these PTW experiences.
It was tound that significant predictions could be made even after controlling for the age and sex of the driver, frequency of driving and number of miles driven in a typical week. In comparison with drivers having no motorcycling experience (Group 1), drivers having pillion experience (Group 3) and drivers having less than 18 months of previous PTW operating experience (Group 4) were less likely to be involved as culpable motorists in an accident with a PTW. However, having over 18 months of motorcycle operating experience (Group 5/Group 7) was a more reliable predictor.
In a related investigation, 2 000 drivers selected at random were presented with a list of 10 'unpleasant aspects' of PTWs and motorcycling and were asked to select up to fo~r which were considered as the most important or unpleasant [Brooks, 1988, (5)]. Thls extended a procedure previously utilised by Marton [1982, (20)] and six of the 'unpleasant aspects' were adopted from Marton's questionnaire:
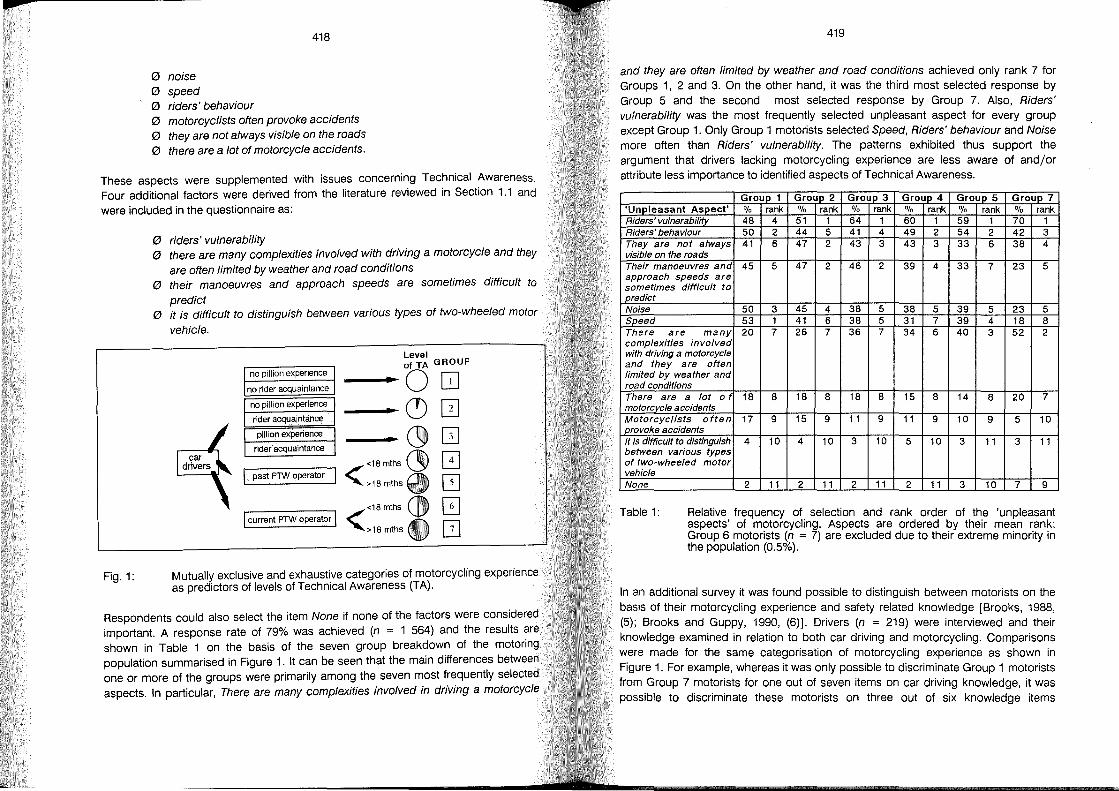
p
(2) noise (2) speed (2) riders' behaviour
418
(2) motorcyc/ists offen provoke accidents (2) they are not always visible on the roads (2) there are a lot of motorcycle accidents.
These aspects were supplemented with issues concerning Technical Awareness. Four additional factors were derived from the literature reviewed in Section 1.1 and were included in the questionnaire as:
Fig.1:
(2) riders' vulnerability (2) there are many complexities involved with driving a motorcycle and they
are offen /imited by weather and road conditions (2) their manoeuvres and approach speeds are sometimes difficult to
predict (2) it is difficult to distinguish between various types of two-wheeled motor
vehicle.
no pillion experience
no rider acquaintance
no pillion experience
rider acquaintance
pIlIion experience
rider acquaintance
past PTW operator
I current PTW operator I
Mutuaily exclusive and exhaustive categories of motorcycling experience as preäictors of levels of Technical Awareness (TA).
Respondents could also select the item None if none of the factors were considered important. A response rate of 79% was achieved (n = 1 564) and the results are shown in Table 1 on the basis of the seven group breakdown of the motoring population summarised in Figure 1. It can be seen that the main differences between one or more of the groups were primarily among the seven most frequently selected aspects. In particular, There are many complexities involved in driving a motorcyc/e
419
and they are offen /imited by weather and road conditions achieved only rank 7 for Groups 1, 2 and 3. On the other hand, it was the third most selected response by Group 5 and the second most selected response by Group 7. Also, Riders' vulnerability was the most frequently selected unpleasant aspect for every group except Group 1. Only Group 1 motorists selected Speed, Riders' behaviour and Noise more often than Riders' vulnerability. The patterns exhibited thus support the argument that drivers lacking motorcycling experience are less aware of and/or attribute less importance to identified aspects of Technical Awareness.
Group 1 GrouD 2 Group 3 GrouD 4 Group 5 GrouD 7 'Unpleasant Aspect' % rank % rank % rank % rank % rank % rank Riders' vulnerabilitv 48 4 51 1 64 1 60 1 59 1 70 1 Riders' behaviour 50 2 44 5 41 4 49 2 54 2 42 3 They are not always 41 6 47 2 43 3 43 3 33 6 38 4 visible on the roads Their manoeuvres and 45 5 47 2 46 2 39 4 33 7 23 5 approach speeds are sometimes difficult to PJedict Noise 50 3 45 4 38 5 38 5 39 5 23 5 S[Jf3ed 53 1 41 6 38 5 31 7 39 4 18 8 There are many 20 7 26 7 36 7 34 6 40 3 52 2 complexities involved with driving a motorcycle and they are often Iimited by weather and road conditions There are a lot of 18 8 18 8 18 8 15 8 14 8 20 7 motorcycle accidents Motorcyclists often 17 9 15 9 11 9 11 9 10 9 5 10 provoke accidents It is difficult to distinguish 4 10 4 10 3 10 5 10 3 11 3 11 between various types of two-wheeled motor vehicle None 2 11 2 11 2 11 2 11 3 10 7 9
Table 1: Relative, frequency of. selection and rank order of the 'unpleasant aspects of m?torcycling. Aspects are ordered by their mean rank; Group 6 motonsts (n = 7) are excluded due to their extreme minority in the population (0.5%).
In an additional survey it was found possible to distinguish between motorists on the basis of their motorcycling experience and safety related knowledge [Brooks, 1988, (5); Brooks and Guppy, 1990, (6)]. Drivers (n = 219) were interviewed and their knowledge examined in relation to both car driving and motorcycling. Comparisons were made for the same categorisation of motorcycling experience as shown in Figure 1. For example, whereas it was only possible to discriminate Group 1 motorists from Group 7 motorists for one out of seven items on car driving knowledge, it was possible to discriminate these motorists on three out of six knowledge items
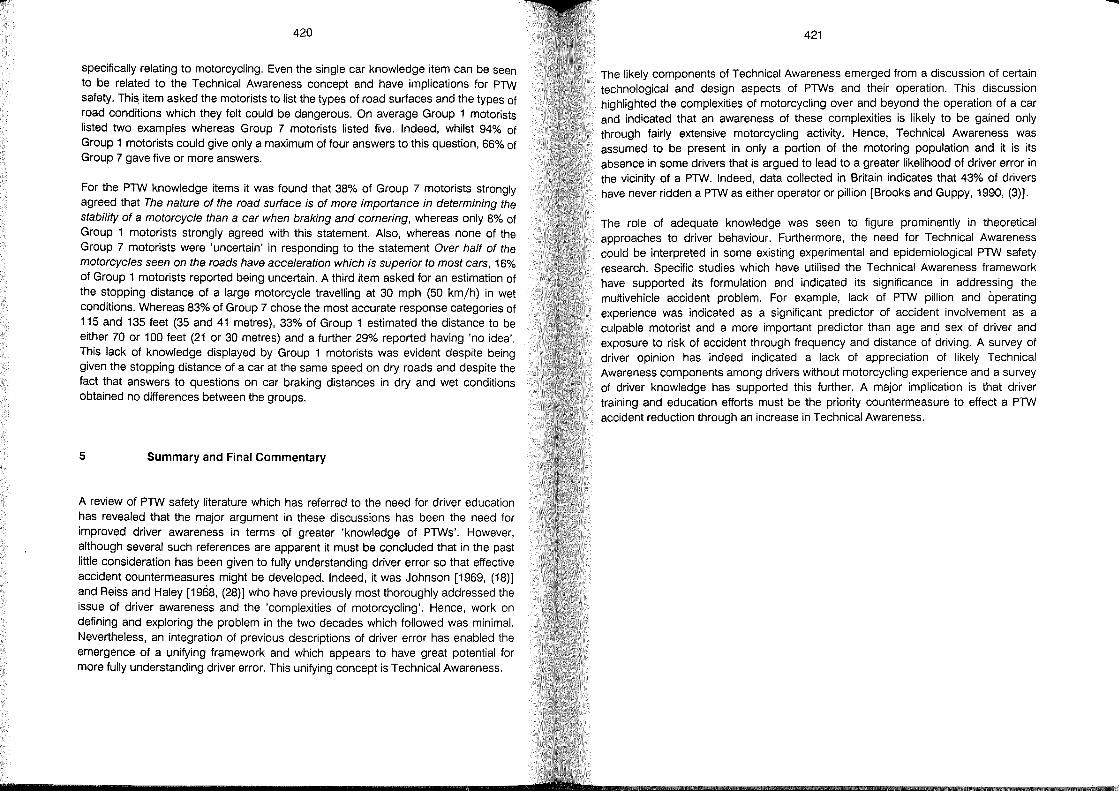
420
specifically relating to motorcycling. Even the single car knowledge item can be seen to be related to the Technical Awareness concept and have implications for PlW safety. Thi~ item asked the motorists to list the types of road surfaces and the types of road conditions which they feit could be dangerous. On average Group 1 motorists listed two examples whereas Group 7 motorists listed five. Indeed, whilst 94% of Group 1 motorists could give only a maximum of four answers to this question, 66% of Group 7 gave five or more answers.
For the PTW knowledge items it was found that 38% of Group 7 motorists strongly agreed that The nature of the road surface is of more importance in determining the stability of a motorcyc/e than a car when braking and cornering, whereas only 8% of Group 1 motorists strongly agreed with this statement. Also, whereas none of the Group 7 motorists were 'uncertain' in responding to the statement Over half of the motorcyc/es seen on the roads have acce/eration which is superior to most cars, 16% of Group 1 motorists reported being uncertain. A third item asked for an estimation of the stopping distance of a large motorcycle travelling at 30 mph (50 km/h) in wet conditions. Whereas 83% of Group 7 chose the most accurate response categories of 115 and 135 feet (35 and 41 metres), 33% of Group 1 estimated the distance to be either 70 or 100 feet (21 or 30 metres) and a further 29% reported having 'no idea'. This lack of knowledge displayed by Group 1 motorists was evident despite being given the stopping distance of a car at the same speed on dry roads and despite the fact that answers to questions on car braking distances in dry and wet conditions obtained no differences between the groups.
5 Summary and Final Commentary
A review of PTW safety literature which has referred to the need for driver education has revealed that the major argument in these discussions has been the need for improved driver awareness in terms of greater 'knowledge of PTWs'. However, although several such references are apparent it must be concluded that in the past little consideration has been given to fully understanding driver error so that effective accident countermeasures might be developed. Indeed, it was Johnson [1969, (18)) and Reiss and Haley [1968, (28)) who have previously most thoroughly addressed the issue of driver awareness and the 'complexities of motorcycling'. Hence, work on defining and exploring the problem in the two decades which followed was minimal. Nevertheless, an integration of previous descriptions of driver error has enabled the emergence of a unifying framework and which appears to have great potential for more fully understanding driver error. This unifying concept is Technical Awareness.
421
The likely components of Technical Awareness emerged from a discussion of certain technological and design aspects of PTWs and their operation. This discussion highlighted the complexities of motorcycling over and beyond the operation of a car and indicated that an awareness of these complexities is likely to be gained only through fairly extensive motorcycling activity. Hence, Technical Awareness was assumed to be present in only a portion of the motoring population and it is its absence in some drivers that is argued to lead to a greater likelihood of driver error in the vicinity of a PTW. Indeed, data collected in Britain indicates that 43% of drivers have never ridden a PTW as either operator or pillion [Brooks and Guppy, 1990, (3)).
The role of adequate knowledge was seen to figure prominently in theoretical approaches to driver behaviour. Furthermore, the need for Technical Awareness could be interpreted in some existing experimental and epidemiological PTW safety research. Specific studies which have utilised the Technical Awareness framework have supported its formulation and indicated its significance in addre~sing the multivehicle accident problem. For example, lack of PTW pillion and operating experience was indicated as a significant predictor of accident involvement as a culpable motorist and a more important predictor than age and sex of driver and exposure to risk of accident through frequency and distance of driving. A survey of driver opinion has indeed indicated a lack of appreciation of likely Technical Awareness components among drivers without motorcycling experience and a survey of driver knowledge has supported this further. A major implication is that driver training and education efforts must be the priority countermeasure to effect a PTW accident reduction through an increase in Technical Awareness.
422
6 Reference List
1) Adv'cmced Motorcycling j I. Webb (Ed.). - London, 1978
2) Blaauw, G.; Poil, K.:
3)
Hum~n factors and riding motorcycle : effects of types of motorcycle and rider expenence In: International Motorcycle Safety Conference Proceedings, Washington DC, May 1980, Volume 11. - P. 437-457
Brooks, P.; Guppy, A.: Driver awareness and motorcycie accidents In: Proceedings of the International Motorcycle Safety Conference: The Human Element, Orlando, Florida, 31 October - 3 November, 1990, Vol. 11. - P. 10.27 -10.56
4) Brooks, P: The importance of driver decision making and interaction in accidents involving motorcycles In: Road User Behaviour j T. Rothengatter; R. de Bruin (Ed.). -AssenjMaastricht, 1988. - P. 152-158
5) Brooks, P.: Motorcycle accidents : the analysis and prevention of driver error. - PhD Thesis Cranfield Institute ofTechnology, Bedford, 1988 '
6) Brooks, P; Guppy, A.: The soC?ial context of driver error in accidents involving motorcycies : a theoretlcal framework and empirical exploration In: Driving Behaviour in a Social Context j T. Benjamin (Ed.). - Caen: Paradigme 1990 '
7) Buchanan, L.; Tarrants, W.: Effectiveness and efficiency in motorcycle safety programs (evaluation summary report 1966-1981). - Washington, DC: National Highway Traffic Safety Administration, 1982. - (DOT-HS-806 133)
8) Decision m.aking in intersection entry accidents j R. Howells (et al.) In: International Motorcycie Safety Conference Proceedings, Washington DC, May 1980, Volume IV. - P. 1585-1611
9) Donne, G.: The performance of motorcycle disc brakes when wet. - Crowthorne, Berkshire, 1984. - (TRRL Rep.ort; LR 1121)
10) Foldvary, L.: A method of analysing collision accidents tested on Victorian road accidents of 1961 & 1962 (Part 1)
. In: Australian Road Research 3(1967)3. - P. 22-38
11) Foldvary, L.: A method of analysing collision accidents tested on Victorian road accidents of 1961 & 1962 (Part 2) In: Australian Road Research 3(1967)4. - P. 41-55
423
12) Fulton, E.; Kirby, C.; Stroud, P.: Day-time motorcycle conspicuity. - Crowthorne, Berkshire, 1980. - (TRRL Report; SR 625)
13)
14)
Harper, W.: The development of community-based programs which heighten awareness of motorcycles as part of the overall transportation mix In: Proceedings of the International Motorcycle Safety Conference: The Human Element, Orlando, Florida, 31 October - 3 November, 1990, Vol. 11. - P. 10.57 -10.88
Herbert, 0.: General discussion : a systematic look at motorcycling safety In: Proceedings of the Motorcycles and Safety Symposium j Australian Road Research Board. - Melbourne, 1976. - P. 208-220
15) Huebner, M.: ROSTA's motorcycle visibility campaign - its effect on use of headlights and high visibility clothing, on motorcycie involvement, and on public awareness In: International Motorcycie Safety Conference Proceedings, Washington DC, May 1980, Volume 11. - P. 715-739
16) Hurt, H.; Ouellet, J.; Thom, 0.: Motorcycie accident cause factors and identification of countermeasures; Vol. I:
17)
18)
Technical Report. - University of Southern California, 1981. - (DOT-HS-805 862)
Janssen, W.; Horst, R.: Predicting the accident potential of intersections from a consideration of information processing aspects In: Proceedings of the First Nordic Congress on Traffic Medicine, Linköping, Sweden, June 8-11, 1982
Johnson,D.: A concept of motorcycle education In: Traffic Digest and Review 17(1969)2. - P. 12-15
19) Kraus, J.: Some epidemiologic features of motorcycie collision injuries In: American Journal of Epidemiology (1975)105. - P. 74-98
20) Marton, L.: European attitudes towards motorcycling In: European Research (1982)10. - P. 120-128
21) Menzies,l.: Some social and psychological aspects of road safety. - London: Tavistock Institute of Human Relations, 1970
22) Messiter, G.: An assessment of measures to reduce cyclist and motorcyclist accidents : Traffic Accident Research Unit Report. - New South Wales Department of Motor Transport, 1972
23) A modern epidemic - motorcycie and bicycie accidents In: British Medical Journal (1979) 1. - P. 39-41
424
24) Monaghan, T.:
25)
26)
27)
Sorry mate, I didn't see you! - or a survivor's guide to motorcycling. - London: British Broadcasting Corporation, 1982
Mortimer, R.; Schuldt, R.: Field test evaluation of gap-acceptance of drivers as a function of motorcycle front lighting . . In: International Motorcycle Safety Conference Proceedlngs, Washington DC, May 1980, Vol. 11. - P. 945-954
Nagayama, Y.: An analysis of accidents involving motorcycles and suggestions for drivers' education In: International Association of Traffic and Safety Sciences (1984)8. - P. 28-39
Otte, D.: A review of different kinematic forms in two-wheel-accidents - their influence on effectiveness of protective measures In: Proceedings of the 24th Stapp Car Crash Conference, 1980. - P. 561-605
28) Reiss, M.; Haley, J.: Motorcycle safety. - New York: Airborne Instruments Laboratory, Transportation Research Department, 1968. - (FH-11-6543)
29) Safety on Two-Wheelers / Organisation for Economic Co-Operation and Development. - Paris, 1978
30) Simard, R.: Motorcycle accidents in the province of Quebec during the 1980s In: Proceedings of the International Motorcycle Safety Conference: The Human Element, Orlando, Florida, 31 October - 3 November, 1990, Vol. I. - P. 1.34-1.44
31) Speed judgement of oncoming motorcycles / Y. Nagayama (et al.) In: International Motorcycle Safety Conference Proceedings, Washington DC, May 1980, Vol. 11. - P. 955-971
32) Stroud, P.; Kirby, C.; Fulton, E.: Motorcycle conspicuity In: International Motorcycle Safety Conference Proceedings, Washington DC, May 1980, Vol. IV - supplementary papers. - P. 1705-1722
33) Transport Statistics Great Britain 1979-1989 / Department of Transport. -London, 1990
34) Waller, P.: An analysis of motorcycle accidents with recommendations for licensing and operation. - University of North Carolina, Highway Safety Research Centre, 1972
35) Watson, P.; Lander, F.; Miles, J.: Motorcycle braking In: Proceedings of the International Conference on Automobile Electronics / Institute of Electrical Engineers. - London, 1976. - P. 144-151
36) Whitaker, J.: A survey of motorcycle accidents. - Crowthorne, Berkshire, 1980. - (TRRL Report; LR 913)
37)
38)
39)
425
Wigan, M.: User issues in motorcycle safety .. In: Proceedings of the Motorcycles and Safety Symposium / Austrahan Road Research Board. - Melbourne, 1976. - P. 95-118
Wilde,G.: Risk homeostasis theory applied to a fictitious instance of an individual driver's decision making . . . In: Driving Behaviour in a Social Context / T. Benjamin (Ed.). - Caen: Paradlgme, 1990
Williams, M.: The importance of motorcycle visibility in accident caus~tion . In: Proceedings of the Motorcycles and Safety Symposium / Austrahan Road Research Board. - Melbourne, 1976. - P. 59-94
Riskology of Motoreyele Riding: Strategie Aspeets of Risk Analysis and Risk Control
Roger Eggers
Peter C. Compes
Bergische Universität Gesamthochschule Wuppertal
Germany
429
1 Abstract
The term "risk" is iIIustrated from different points of view and defined and explained as a central content of safety science. In representing elements, possibilities, claims and aims of riskology the systematic determination of accident types and risk types is demonstrated.
Investigations in riskology require the correct differentiation between "safety" and "protection" .
A judgement of risk examination is made to recognize accident concentrations and centers of hazard at motorcycle riding. Continuing it is possible to derive efficient measures for motorcyc/e accident prevention.
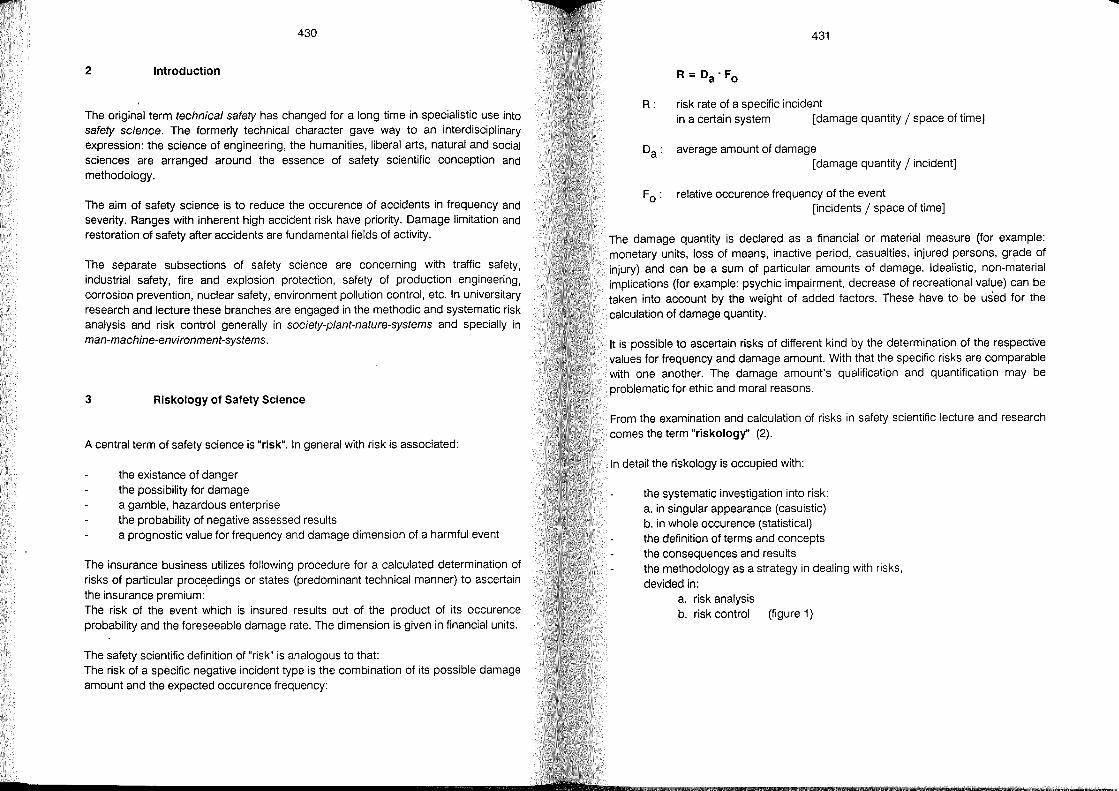
430
2 Introduction
The original term technical safety has changed for a long time in specialistic use into safety science. The formerly technical character gave way to an interdisciplinary expression: the science of engineering, the humanities, liberal arts, natural and social sciences are arranged around the essence of safety scientific conception and methodology.
The aim of safety science is to reduce the occurence of accidents in frequency and severity. Ranges with inherent high accident risk have priority. Damage limitation and restoration of safety after accidents are fundamental fields of activity.
The separate subsections of safety science are concerning with traffic safety, industrial safety, fire and explosion protection, safety of production engineering, corrosion prevention, nuciear safety, environment pOllution control, etc. In universitary research and lecture these branches are engaged in the methodic and systematic risk analysis and risk control gene rally in society-plant-nature-systems and specially in man-machine-environment-systems.
3 Riskology of Safety Science
A central term of safety science is "risk". In general with risk is associated:
the existance of danger the possibility for damage a gamble, hazardous enterprise the probability of negative assessed results a prognostic value for frequency and damage dimension of a harmful event
The insurance business utilizes following procedure for a calculated determination of risks of particular proce.edings or states (predominant technical manner) to ascertain the insurance premium: The risk of the event which is insured results out of the product of its occurence probability and the foreseeable damage rate. The dimension is given in financial units.
The safety scientific definition of "risk" is analogous to that The risk of a specific negative incident type is the combination of its possible damage amount and the expected occurence frequency:
431
R: risk rate of a specific incident in a certain system [damage quantity / space of time]
average amount of damage [damage quantity / incident]
relative occurence frequency of the event [incidents / space of time]
The damage quantity is deciared as a financial or material measure (for example: monetary units, loss of means, inactive period, casualties, injured persons, grade of injury) and can be a sum of particular amounts of damage. Idealistic, non-material implications (for example: psychic impairment, decrease of recreational val~e) can be taken into account by the weight of added factors. These have to be used for the calculation of damage quantity.
It is possible to ascertain risks of different kind by the determination of the respective values for frequency and damage amount. With that the specific risks are comparable with one another. The damage amount's qualification and quantification may be problematic for ethic and moral reasons.
From the examination and calculation of risks in safety scientific lecture and research comes the term "riskology" (2).
In detail the riskology is occupied with:
the systematic investigation into risk: a. in singular appearance (casuistic) b. in whole occurence (statistical) the definition of terms and concepts the consequences and results the methodology as a strategy in dealing with risks, devided in:
a. risk analysis b. risk control (figure 1)
......
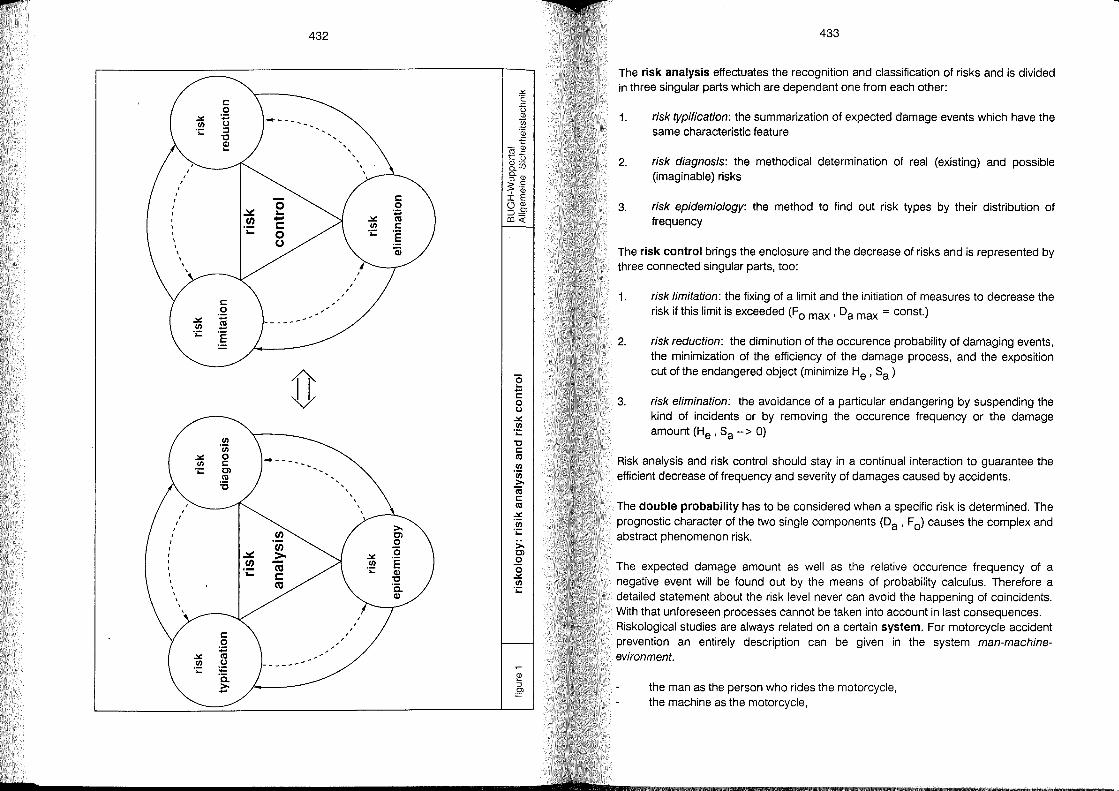
I I I I I
, ,
VI 'Uj o s= Cl . ~ "0
'0 10.. -s:::: o o
432
, ,
,
, , , ,
, , , ,
"0 ... E o o
.:.: VI .;: "0 s= CtI VI 'Uj >iii s= CtI .:.: VI .;:
>Cl
..Q o .:.: VI .;:
433
The risk analysis effectuates the recognition and classification of risks and is divided in three singular parts which are dependant one fram each other:
1. risk typification: the summarization of expected damage events which have the same characteristic feature
2. risk diagnosis: the methodical determination of real (existing) and possible (imaginable) risks
3. risk epidemiology: the method to find out risk types by their distribution of frequency
The risk control brings the enclosure and the decrease of risks and is represented by three connected singular parts, too:
1. risk /imitation: the fixing of a limit and the initiation of measures to decrease the risk if this limit is exceeded (F 0 max ' Da max = const.)
2. risk reduction: the diminution of the occurence probability of damaging events, the minimization of the efficiency of the damage process, and the exposition cut of the endangered object (minimize He ' Sa )
3. risk elimination: the avoidance of a particular endangering by suspending the kind of incidents or by removing the occurence frequency or the damage amount (He' Sa -- > 0)
Risk analysis and risk control should stay in a continual interaction to guarantee the efficient decrease of frequency and severity of damages caused by accidents .
The double probability has to be considered when a specific risk is determined. The prognostic character of the two single components (Da' F 0) causes the complex and abstract phenomenon risk.
The expected damage amount as weil as the relative occurence frequency of a negative event will be found out by the means of prabability calculus. Therefore a detailed statement about the risk level never can avoid the happening of coincidents. With that unforeseen processes cannot be taken into account in last consequences. Riskological studies are always related on a certain system. For motorcycle accident prevention an entirely description can be given in the system man-machineevironment.
the man as the person who rides the motorcycle, the machine as the motorcycle,
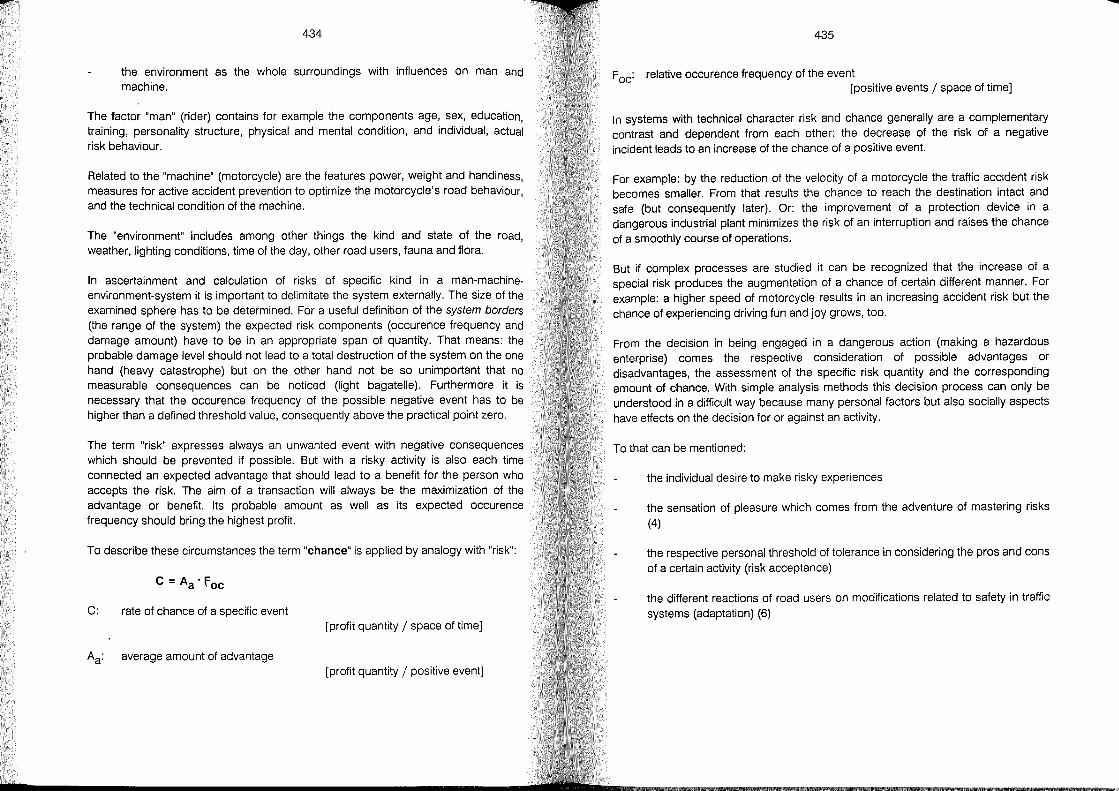
434
the environment as the whole surroundings with influences on man and machine.
The factor "man" (rider) contains for example the components age, sex, education, training, personality structure, physical and mental condition, and individual, actual risk behaviour.
Related to the "machine" (motorcycle) are the features power, weight and handiness, measures for active accident prevention to optimize the motorcycle's road behaviour, and the technical condition of the machine.
The "environment" includes among other things the kind and state of the road, weather, lighting conditions, time of the day, other road users, fauna and flora.
In ascertainment and calculation of risks of specific kind in a man-machineenvironment-system it is important to delimitate the system externally. The size of the examined sphere has to be determined. For a useful definition of the system borders (the range of the system) the expected risk components (occurence frequency and damage amount) have to be in an appropriate span of quantity. That means: the probable damage level should not lead to a total destruction of the system on the one hand (heavy catastrophe) but on the other hand not be so unimportant that no measurable consequences can be noticed (light bagatelle). Furthermore it is necessary that the occurence frequency of the possible negative event has to be higher than a defined threshold value, consequently above the practical point zero.
The term "risk" expresses always an unwanted event with negative consequences which should be prevented if possible. But with a risky activity is also each time connected an expected advantage that should lead to a benefit for the person who accepts the risk. The aim of a transaction will always be the maximization of the advantage or benefit. Its probable amount as weil as its expected occurence frequency should bring the highest profit.
To describe these circumstances the term "chance" is applied by analogy with "risk":
C = Aa ' f oc
C: rate of chance of a specific event [profit quantity / space of time]
Aa: average amount of advantage [profit quantity / positive event]
435
F oc: relative occurence frequency of the event [positive events / space of time]
In systems with technical character risk and chance generally are a complementary contrast and dependent from each other: the decrease of the risk of a negative incident leads to an increase of the chance of a positive event.
For example: by the reduction of the velocity of a motorcycle the traffic accident risk becomes smaller. From that results the chance to re ach the destination intact and safe (but consequentiy later). Or: the improvement of a protection device in a dangerous industrial plant minimizes the risk of an interruption and raises the chance of a smoothly course of operations.
But if complex processes are studied it can be recognized that the increase of a special risk produces the augmentation of a chance of certain different manner. For example: a higher speed of motorcycle results in an increasing accident risk but the chance of experiencing driving fun and joy grows, too.
From the decision in being engaged in a dangerous action (making a hazardous enterprise) comes the respective consideration of possible advantages or disadvantages, the assessment of the specific risk quantity and the corresponding amount of chance. With simple analysis methods this decision process can only be understood in a difficult way because many personal factors but also socially aspects have effects on the decision for or against an activity.
To that can be mentioned:
the individual desire to make risky experiences
the sensation of pleasure which comes from the adventure of mastering risks (4)
the respective personal threshold of tolerance in considering the pros and cons of a certain activity (risk acceptance)
the different reactions of road users on modifications related to safety in traffic systems (adaptation) (6)

436
4 Safety and Proteetion
In context with measures related to accident prevention is often mentioned "safety", although this term is not usable for a complete description of astate or a process. Safety is defined as a contrast to dangerousness, as a non-existance of danger, harmlessness. A safe state of affairs is regarded as undangerous, harmless.
That can be represented in a formula (3):
S = 1 - D
S : safety in a certain system D : dangerousness, sum of dangers in a system
In reality safety is only relative because a total safety would mean absolute, perfect harmlessness. This state is not obtainable in practice. A relative safety is referred to a special dangerousness which is inherent in, for example, substances, energies or processes. Relative safety can be Iimited in time and space.
The necessary complement to safety is the term "protection". In the context of safety science "protection" signifies the limitation of endangering at an existing source of danger (active protection) or the averting of damaging at the endangered object (passive protection).
This correlation can also be expressed in a formula (3):
t = ta + tp = 1 - (e + d)
t: protection (Iat. tectum) in a certain system ta : active protection at the source of danger tp : passive protection at the endangered object e' sum of the purposive endangerings in a certain system d: sum of the affected damages in the system
Protection is necessary to combat accidents (in difference to safety) in that case if an existing danger offers the possibility to an endangering or even a damaging. By this protection has the function to achieve damage prevention when safety is not given.
In fields of traffic accident prevention it is constantly spoken about "active safety" and "passive safety" (german-Ianguage) in the system driver (rider)-vehicle-environment. These terms will not do justice to the terminology of safety science.
437
"Active safety" means the entirety of measures with prophylactic character which lead to prevention of accidents. These measures are "active" because they are influencing technical, organisational and personal factors before an accident happens. These are, for example, at a motorcycle improved brakes and a more indifferent road behaviour, the road design in consideration of motorcycles, planning and control of traffic processes related to motorcycie accident avoidance and the efficient education, information and training of road users. In safety scientific use "active safety" can be better indicated in short form as active accident prevention. With the means of the active accident prevention will be achieved relative safety as weil as active protection.
"Passive safety" includes all measures which want to reduce the severity of accident consequences. To this belong among other things the wearing of protective clothing by a motorcycle rider, protection covers of guardrail posts, or the design of technical components as handlebar, fuel tank, fairing and also airbag. The aim is protection of the driver (rider) and the accident opponent. Instead of "passive safety" has to be used with greater accuracy the term passive accident proteetion because the result should be averting or reduction of damaging.
5 Definition of "Aceident" und "Accident Type"
The negative unwanted event which is a central part in the studies of safety science is the "aceident". It is per definition an unexpected, suddenly, surprising process with damaging course and result. The accident is going in a system and produces damage at system elements or at system functions.
The accident can be represented in a chronological connected chain (1):
hazard -- > endangering -- > trigger -- > damaging -- > damage (figure 2)
Hazard is the possibility for a damage. It can be specified in kind of energy, matter, process, design, etc. as weil as in quantity of the respective amount, charge, concentration, etc.
The endangering is the probability for damaging. The encounter of a potential damage receiver with a source of dang er means the purposive influence of the hazard on the endangered object. The quantity of a specific endangering potential is the analogous risk.
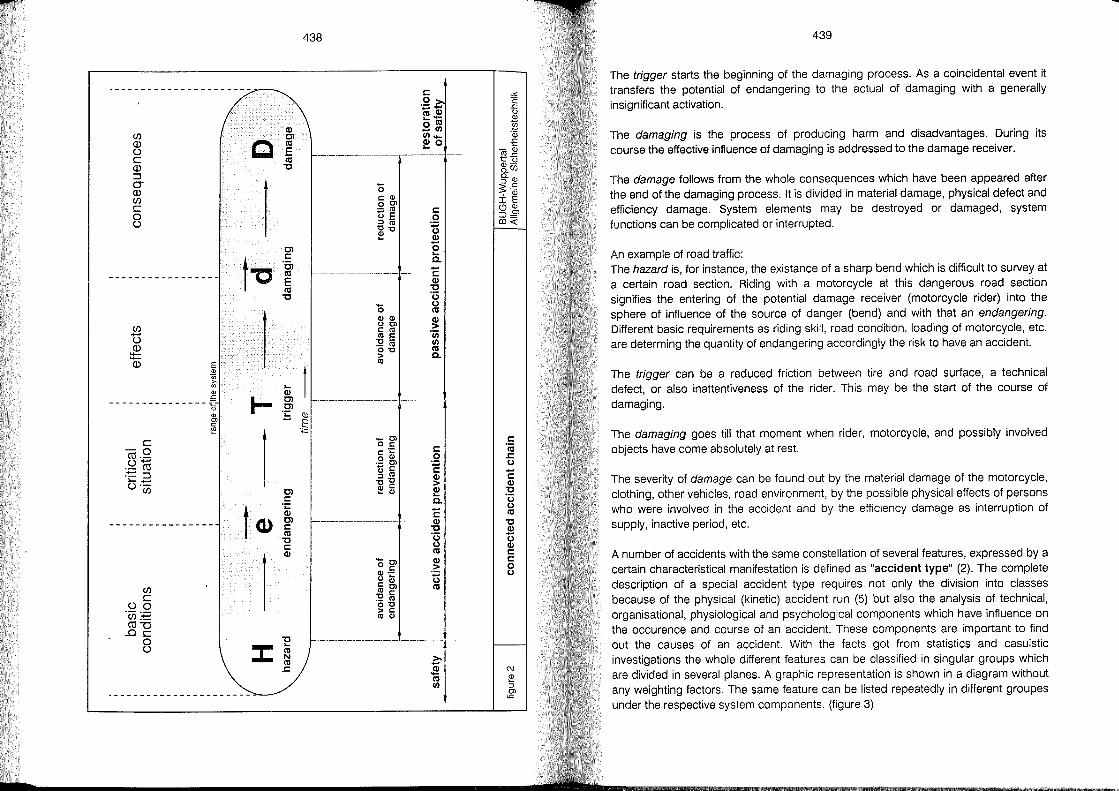
----------------------
Cl) Cf) Cl (1) C ca u E e ca (1) 't:I ::::l 0-
1
(1) Cf)
e 0 U
Cl c::
t-c '5> ----------------- ca
E ca 't:I
1
Cf) -U (1)
'+-">-(1) E
Q) 1;)
'" "' ~ Q) Cl) oS I- Cl
---------------~ Cl Q)
.;: Cl -c: ~
1
e -0 C'Cl.-u-.- C'Cl
.'!::: ::::l "- -U·-
Cf) Cl c::
t .;: Cl)
---------------- Q) Cl c:: ca 't:I c::
1
Cl)
Cf)
e uo 'ü) :-e C'Cl-o .oe
0 't:I ~
U J: ca N ca
..c:
._--------------------
438
c:: .Q~ m.:!! ~ca .90 0_ ~O
------------------ ---------
ö '" <I> 0 Cl
n ctI c:: E 0
:::J ctI '';::; ~"O U
Cl) -0 ~
a. ------------------ --- 'E
Cl) 't:I 'ö
Ö u ca
<I> <I> Cl) U Cl > '" ctI ctI E 'üj :2ct1 0 0'0 ca > a. ctI
------------------ ---------
CD
.§ ö Cl
.!: c:: '" Ci 0 .Q ~
Cl 'E '" :::J ctI Cl)
'0'0 <I> '"
> ~ <I> Cl)
~
a.
f-------------------- --- 'E Cl) 't:I 'ö u ca
Ö Cl Cl)
<I> .!: > u ~ :.;::; '" <I>
U ctl
Cl ca '0'" ._ ctI 0'0 > '" ro <I>
------------------ ---------
>--Cl) -ca 0
"'" 'E ..c: u <I>
!!l 'Qi -E
-<I> --- Ol..c:
tu <1>'-o.C/) 0.<1> ~.",
' <I> IE 0 <I> ::;).2>
~
---
c:: 'iij ..c: u -c:: Cl) 't:I 'ö u ca 't:I Cl) -U Cl) c:: c:: 0 u
---i----
C\J
[l! :::J Cl
""
439
The trigger starts the beginning of the damaging process. As a coincidental event it transfers the potential of endangering to the actual of damaging with a generally insignificant activation .
The damaging is the process of producing harm and disadvantages. During its course the effective influence of damaging is addressed to the damage receiver.
The damage follows from the whole consequences which have been appeared after the end of the damaging process. It is divided in material damage, physical defect and efficiency damage. System elements may be destroyed or damaged, system functions can be complicated or interrupted.
An example of road traffic: The hazard is, for instance, the existance of a sharp bend which is difficult to survey at a certain road section. Riding with a motorcycie at this dangerous road section signifies the entering of the potential damage receiver (motorcycie rider) into the sphere of influence of the source of danger (bend) and with that an endangering. Different basic requirements as riding skilI. road condition. loading of motorcycle. etc. are determing the quantity of endangering accordingly the risk to have an accident.
The trigger can be a reduced friction between tire and road surface. a technical defect. or also inattentiveness of the rider. This may be the start of the course of damaging.
The damaging goes till that moment when rider. motorcycle, and possibly involved objects have come absolutely at rest.
The severity of damage can be found out by the material damage of the motorcycle. clothing. other vehicies. road environment, by the possible physical effects of persons who were involved in the accident and by the efficiency damage as interruption of supply, inactive period. etc.
A number of accidents with the same constellation of several features, expressed by a certain characteristical manifestation is defined as "accident type" (2). The complete description of a special accident type requires not only the division into classes because of the physical (kinetic) accident run (5) but also the analysis of technical. organisational. physiological and psychological components which have influence on the occurence and course of an accident. These components are important to find out the causes of an accident. With the facts got from statistics and casuistic investigations the whole different features can be classified in singular groups which are divided in several planes. A graphic representation is shown in a diagram without any weighting factors. The same feature can be listed repeatedly in different groupes under the respective system components. (figure 3)
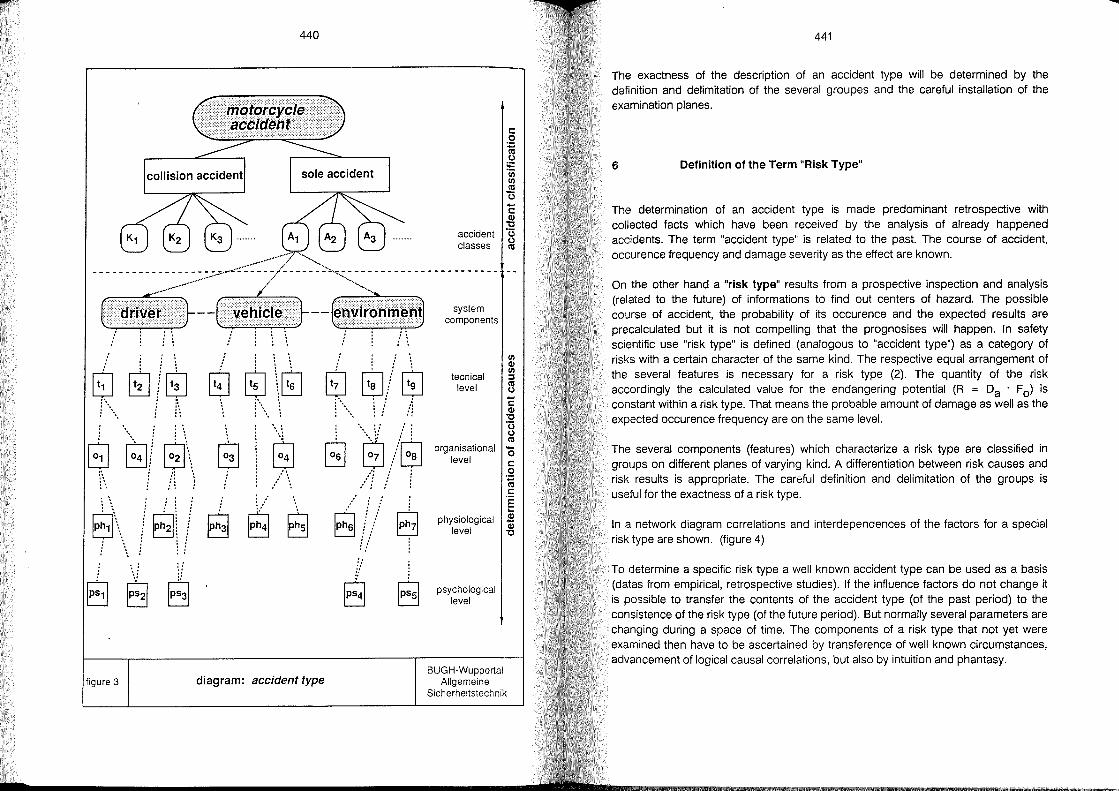
440
mOfdrcycle accident c:
o ;:
~ ;;:: 'Cij CI) ctI (3 -c: G,) 't:J
accident '(3 classes g
----- ---/;;~-<7~ --- -- ----- ---------( .... driver }--(vehicle cos~~~:nts
8 @ ~ ~ ~ @ f\\ j\
~ 51! 5J\ ~ & /l '} :::.\
: \
$J\ .. Ip~21\ Ip~31 Ip~41 8 i ....
\: .' .' ',: .'
Ip~11 Ip~21 Ip~31
figure 3 diagram: accident type
..
8 ~! ~ ; .. ~,
~ 8 '5] : /f / !
:
Ip~61 171 " "
Ip~41 B
tecnical level
CI) G,) CI) ::J ctI (,)
E G,) 't:J '(3 (,) ctI
organisational Ö level c:
o '';:::; ctI c: 'E ....
physiological .S! level ~
psychological level
BUGH-Wuppertal Allgemeine
Sicherheitstechnik
441
The exactness of the description of an accident type will be determined by the definition and delimitation of the several groupes and the careful installation of the examination planes.
6 Definition of the Term "Risk Type"
The determination of an accident type is made predominant retrospective with collected facts which have been received by the analysis of already happened accidents. The term "accident type" is related to the past. The course of accident, occurence frequency and damage severity as the effect are known.
On the other hand a "risk type" results from a prospective inspection and analysis (related to the future) of informations to find out centers of hazard. The possible course of accident, the probability of its occurence and the expected results are precalculated but it is not compelling that the prognosises will happen. In safety scientific use "risk type" is defined (analogous to "accident type") as a category of risks with a certain character of the same kind. The respective equal arrangement of the several features is necessary for a risk type (2). The quantity of the risk accordingly the calculated value for the endangering potential (R = Da . F 0) is constant within a risk type. That means the probable amount of damage as weil as the expected occurence frequency are on the same level.
The several components (features) wh ich charactarize a risk type are classified in groups on different planes of varying kind. A differentiation between risk causes and risk results is appropriate. The careful definition and delimitation of the groups is useful for the exactness of a risk type.
In a network diagram correlations and interdependences of the factors for a special risk type are shown. (figure 4)
To determine a specific risk type a weil known accident type can be used as a basis (datas from empirical, retrospective studies). If the influence factors do not change it is possible to transfer the contents of the accident type (of the past period) to the consistence of the risk type (of the future period). But normally several parameters are changing during aspace of time. The components of a risk type that not yet were examined then have to be ascertained by transference of weil known circumstances, advancement of logical causal correlations, but also by intuition and phantasy.
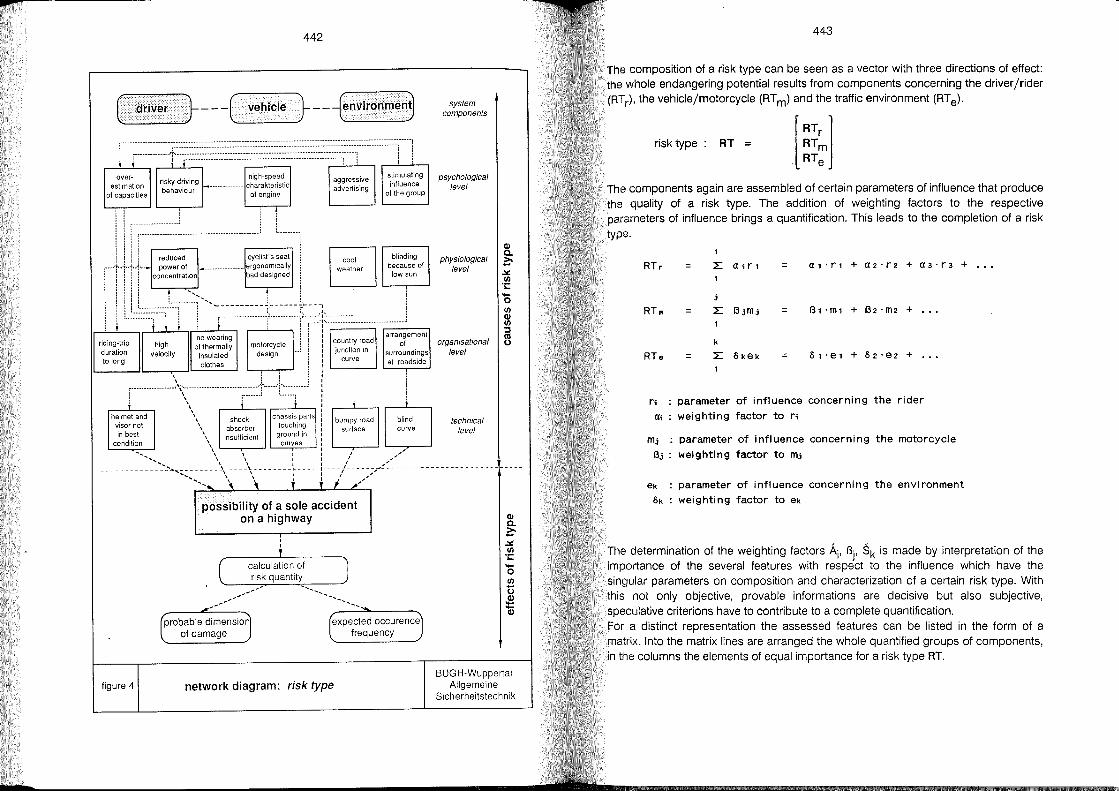
442
( driver }---( vehicle }-- enVironmen~
l r -i r·······················
over-estimation
of capacities
high-speed r~s~~a~~~~~g 1-................... charakteristic
of engina
, ........................ 1 .................................................. ,1 L .. . reduced
,····'r.·.·"··""····-1 power of concentration
cyclisfs seat . ___ ............. ergonomically
bad designed
............ , ! aggressive advertising
cool weather
stimulating influence
of the group
blinding because of
low sun
system components
psychological level
physiological level
ö r-'-'-_':,:::::::::::i······l i~r:T"i':':::::,J~:,:4i'~k ~""m"m
riding-trip high no wearing motorcycle 1 : country road of organisational
~~~ "'::\~::::~':"':, I! i":r "~":;;:~' ",,' l \ i i! l
\\" shock chassis parts :,' heimet and visor not in best
condition
absorber touching bUs~~~~~ad \ insufficient ground in : "\ curves! L-_,..,..-_..J
blind curve
technical level
.......... _- ,,\ :: / ,.,." -_ \ \ I I I ,." ----- -- ---- -- _ .......... ,: -- -- -- .. \\- ---\- -------i -----:- ---/- ----;,. ...... --- ----- ---- ---- ---- -- -----------.... \" , ,I /'
ligure 4
possibility of a sole accident on a highway
, , (
calculation 01 ~ __ r~is~k_q~u~a_n~ti~ty~ __ ~
"""""" ------------- .....
(probable dimension l 01 damage
(expected occurenc~ l Irequency )
network diagram: risk type
(I) a. ~ .::LVI 'i:: -o VI
ti
~
BUGH-Wuppertal Allgemeine
Sicherheitstechnik
443
The composition of a risk type can be seen as a vector with three directions of effect: the whole endangering potential results fram components concerning the driver /rider (RTr), the vehicle/motorcycle (RT m) and the traffic environment (RT e)'
risk type RT =
The components again are assembled of certain parameters of influence that produce the quality of a risk type. The addition of weighting factors to the respective parameters of influence brings a quantification. This leads to the completion of a risk type.
RTr = L airi = al ·rl + a2'r2 + a 3' r 3 + ...
RTm = L ßjmj = ßl ,ml + ß2'm2 + ...
k RTe = L llkek = 01 ·el + 02' e2 + ,. ,
r; parameter of influence concerning the rider
ai weighting factor to r;
mj parameter of i nfl uence concerning the motorcycle
ßj weighting factor to mj
ek parameter of i nfl uence concerning the envi ronment
ok weighting factor to ek
The determination of the weighting factors Ai' Bj• Sk is made by interpretation of the importance of the several features with respect to the influence which have the singular parameters on composition and characterization of a certain risk type. With this not only objective, pravable informations are decisive but also subjective, speculative criterions have to contribute to a complete quantification. For a distinct representation the assessed features can be listed in the form of a matrix. Into the matrix lines are arranged the whole quantified groups of components. in the columns the elements of equal importance for a risk type RT.
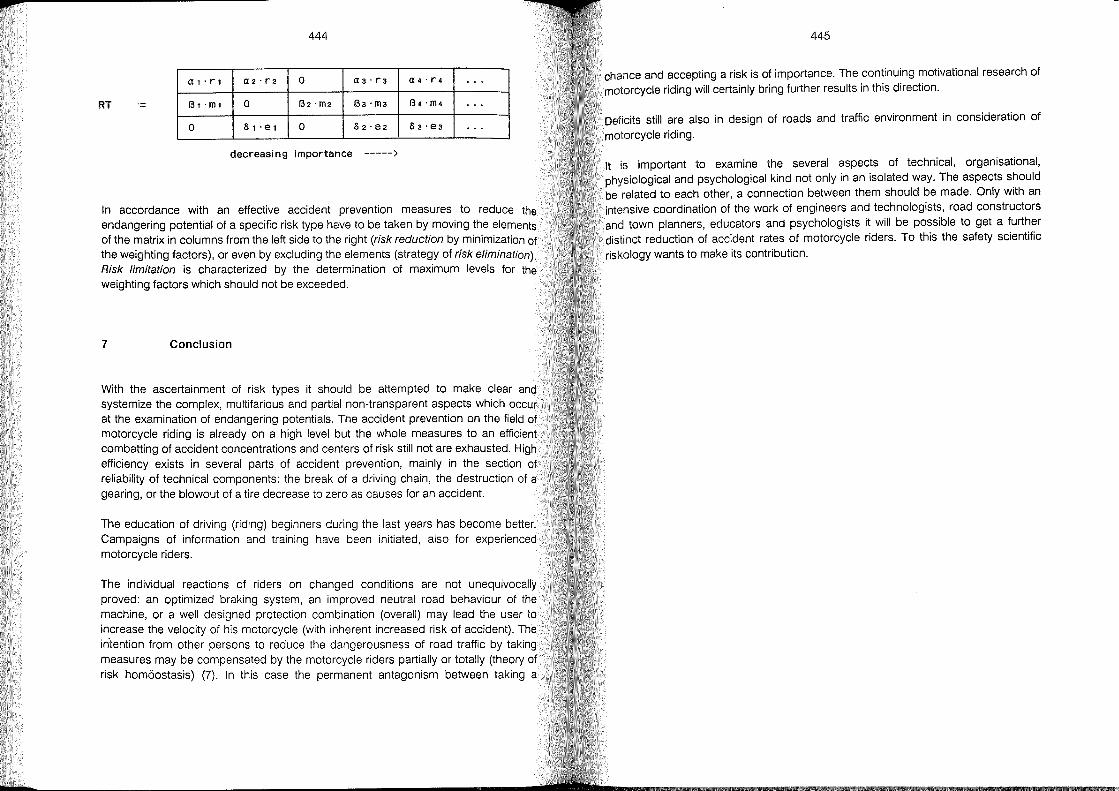
444
a,·rl a2·r2 0 a 3' r3 a 4' r4 .. "
RT ß,"m, 0 ß2' m2 ß3' m3 ß4 . m4 ... 0 S, ·e, 0 S 2' e2 S 3" e3 ...
decreasing Importance -----)
In accordance with an effective accident prevention measures to reduce the endangering potential of a specific risk type have to be taken by moving the elements of the matrix in columns from the left side to the right (risk reduction by minimization of the weighting factors), or even by excluding the elements (strategy of risk elimination). Risk limitation is characterized by the determination of maximum levels for the weighting factors wh ich should not be exceeded.
7 Conclusion
With the ascertainment of risk types it should be attempted to make c1ear and systemize the complex, multifarious and partial non-transparent aspects which occur at the examination of endangering potentials. The accident prevention on the field of motorcycle riding is already on a high level but the whole measures to an efficient combatting of accident concentrations and centers of risk still not are exhausted. High efficiency exists in several parts of accident prevention, mainly in the section of reliability of technical components: the break of a driving chain, the destruction of a gearing, or the blowout of a tire decrease to zero as causes for an accident.
The education of driving (riding) beginners during the last years has become better. Campaigns of information and training have been initiated, also for experienced motorcycle riders.
The individual reactions of riders on changed conditions are not unequivocally proved: an optimized braking system, an improved neutral road behaviour of the machine, or a weil designed protection combination (overall) may lead the user to increase the velocity of his motorcycle (with inherent increased risk of accident). The intention from other persons to reduce the dangerousness of road traffic by taking measures may be compensated by the motorcycle riders partially or totally (theory of risk homöostasis) (7). In this case the permanent antagonism between taking a
445
chance and accepting a risk is of importance. The continuing motivation al research of motorcycle riding will certainly bring further results in this direction.
Deficits still are also in design of roads and traffic environment in consideration of motorcycle riding.
It is important to examine the several aspects of technical, organisational, physiological and psychological kind not only in an isolated way. The aspects should be related to each other, a connection between them should be made. Only with an intensive coordination of the work of engineers and technologists, road constructors and town planners, educators and psychologists it will be possible to get a further distinct reduction of accident rates of motorcycle riders. To this the safety scientific riskology wants to make its contribution.
446
8 Reference List
(1) Compes, P.C.: Schutzziele - Konzeption und Pragmatik auf der Basis sicherheitswissenschaftlicher Terminologie und Methodologie In: Kernenergie: Heute - Morgen. - Düsseldorf, 1991. - (VDI-Berichte; 884)
(2) Compes, P.C.: .. Sicherheitswissenschaftliche Risikologie und Okologie, Umweltschutzprogramme mit Risiko-Analytik und -Kontrolle. - Wuppertal: Bergische Universität GH Wuppertal, 1990
(3) Compes, P.C.: Zur sicherheitswissenschaftlichen Risikologie : Entwurf einer Methode zur Objektivierung von Risiken im kollektiven Interesse In: Risiko - subjektiv und objektiv: IX. Internationales Sommer-Symposion der Gesellschaft für Sicherheitswissenschaft, 26.-28. Sept. 1988 Mainz. -Wuppertal, 1989. - S. 197-257
(4) Koch, H.: Die Lust am Motorrad: Fahrmotive und Erlebnisformen gestern und heute In: Motorradfahren : Faszination und Restriktion / Hrsg.: Hubert Koch. -Bochum: Institut für Zweiradsicherheit, 1990. S. 1-12. - (Forschungshefte Zweiradsicherheit; 6)
(5) Otte, D.: Motorradunfälle mit Sozius - Situationsbericht von Unfall und Verletzungsmustern In: Motorrad: 3. Fachtagung, Darmstadt, 5. u. 6. Okt. 1989/ VDI-Ges. Fahrzeugtechnik. - Düsseldorf: VDI-Verl., 1989. - S. 107-131. - (VDI-Berichte; 779)
(6) Pfafferott, 1.; Huguenin, R.D.: Adaptation nach Einführung von Sicherheitsmaßnahmen In: Zeitschrift für Verkehrssicherheit 37(1991)2. - S. 71-83
(7) Wilde, G.J.S.; Kunkel, E.: Die begriffliche und empirische Problematik der Risikokompensation! In: Zeitschrift für Verkehrssicherheit 30(1984)2. - S. 52-61
Attitudes of Motorcycle Riders Towards Risk Exposure - A Study of Various Age Groups
Reiner Brendicke
Institut für Zweiradsicherheit e. V.
Germany
r 449
1 Abstract
Empirical studies reveal that in spite of a general decrease in accident numbers young riders aged 18 - 20 are stili overrepresented in accidents. The present study analyses riders' attitudes towards risk exposure due to so-calied beginner risks and youth
risks.
A questionnaire was submitted to two groups of respondants on the occasion of motorcycle fairs. The total number of respondants amounted to 389. Data was differentiated and analysed according to the age of the test persons.
On the whole there are marked differences in attitudes between the different age groups. Especialiy for the young riders aged 18 - 20 the motorcycle is an essential element of their leisure-time activities and offers various possibilities of social contacts. young riders consider the motorcycle as an opportunity to have new sensational experiences and to es cape the monotony of their everyday lives.
The young riders in particular want to experience dynamic aspects and performance limits of their bikes and have a tendency to ascribe the motorcycles's performance to their individual abilities.
On the basis of these results the present study presents suggestions for a pedagogical concept linking leisure time facilities and safety training programs offroad, on race tracks and in real traffic in order to acheive a reduction in the risk exposure of young riders.
450
2 Motorcycle Accidents
In spite of a rise in registration numbers of motorcycles, accident numbers of powered two-wheelers have dropped constantly in the European industrial nations [Choueiri, 1991 (1)). Nevertheless, motorcycle riders still belong to the group of traffic participants highly at risk. Empirical studies clearly reveal that young riders (18 - 20 years) in particular are overrepresented in accidents [Koch, 1990 (5)). Possible explanations for the drop of accident numbers, however, have to consider the fact that du ring the last years there was a shift in the age structure of motorcycle riders. The number of young motorcycle riders clearly decreased. Pfafferott (1991, 11) for example proved an interdependency between the development of the age structure of the motorcycle rider population and the drop in accident numbers.
Actual trends on the German motorcycle market prove that in particular the young riders start their motoring career with a powered two-wheeler, as rising numbers of licenses and registrations for the last two years do clearly show. However, the problem of the over-representation in accidents of young riders aged 18 - 20 has not been solved yet. According to results of empirical investigation on the subject [Koch, 1990 (5)) an improvement of accident numbers cannot be expected, in spite of the implementation of a graduated licensing scheme in the European nations.
The purpose of the present report is to analyse young riders' attitudes towards risk exposure and to develop concepts in order to influence these attitudes and the resulting behaviour.
3 Young riders
The relevant literature on the subject offers two explanations for the overrepresentation of young traffic participants in accidents:
the so-called beginner risk, which means difficulties in coping with the rather complex traffic system the so-called youth risk, which means problems due to the adolescents' developmental crises
The commonly held opinion in traffic education and psychology explains the high accident rate of young riders and by an interdependency of both aspects. Numerous re ports on this subject [Schlag, 1986 (13); Schulz, 1990 (15); Schulze, 1990 (17)) provide further details on the nature of these aspects. The present study, however,
451
will concentrate on the specific attitudes of young riders and try to develop educational concepts.
4 Methodical Aspects
In cooperation with the University of Bielefeld, Department of Psychology, the IfZ developed an extensive questionnaire in order to analyse attitudes of motorcycle riders. This questionnaire was submitted to motorcycle riders on the occasion of several motorcycle fairs in Germany. The following evaluation refers to two different groups of respondants. Sam pie A constitutes of a survey among motorcycle riders on the occasion of the IFMA (international bicycle and motorcycle fair) in Cologne in 1988.
Data of sampie B was collected on the occasion of the international motorcycle fair in Essen in 1989. The IfZ provided a seperated area of its stand in order to have testpersons questioned without any disturbances or interruptions. The items were presented by the help of a computer, respondants had to answer yes/no questions by pressing the corresponding key.
The amount of items differed between the two sam pies. At the IFMA it was possible to present 57 statements, whereas the Motorshow, due to space problems, only allowed 27 questions of the whole corpus. A total of 283 persons could be questioned at the IFMA, in Essen the number of test persons amounted to 106.
The evaluation of the differences between the age groups was carried out by the help of a Chi-Square-Test. Test persons were divided into three groups according to age:
riders aged 18 - 20 riders aged 21 - 25 riders aged over 25
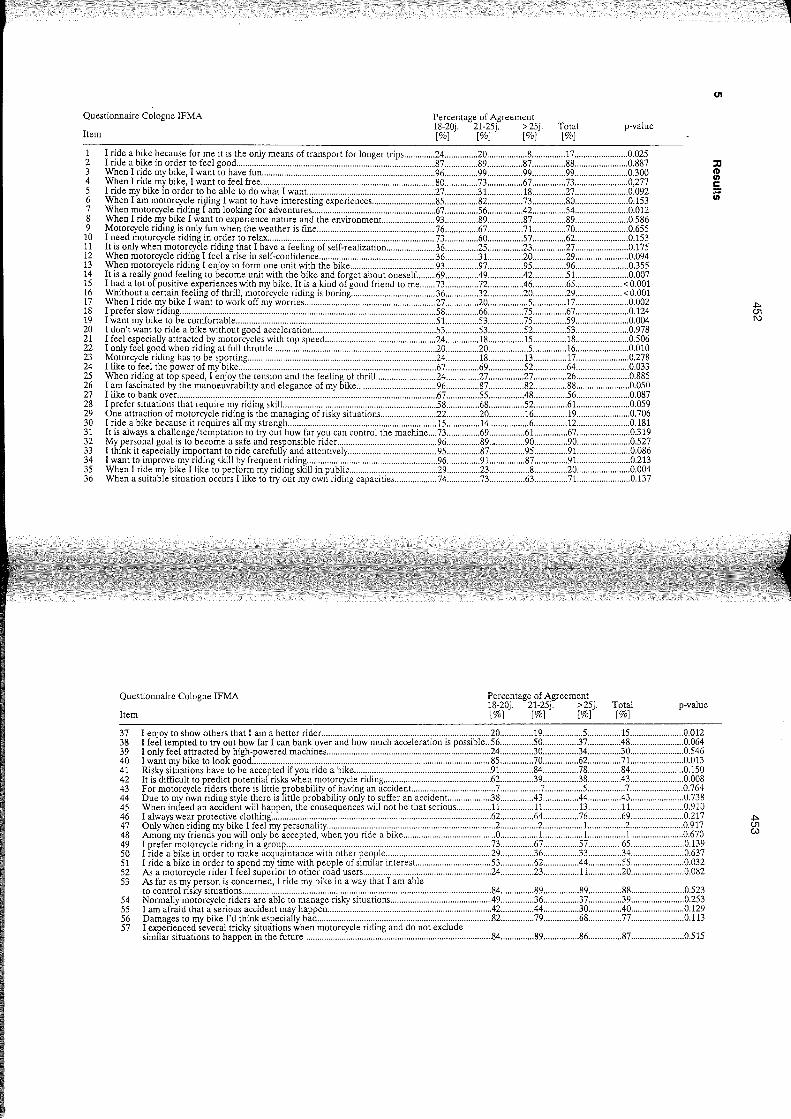
Questionnaire Cologne IFMA
Item
Percentage of Agreement 18-20j. 21-25j. > 25j. [%] [%] [%]
Total [%]
p-value
1 2 3 4 5 6 7 8 9 10 11 12 13 14 15 16 17 18 19 20 21 22 23 24 25 26 27 28 29 30 31 32 33 34 35 36
I ride a bike because far me it is the only means of transport for longer trips .............. 24 .............. .20 .................. 8 .............. .17 ........................ 0.025 I ride a bike in order to feel good ......................................................................................... .87 ............... 89 ................ 87 ............... 88 ........................ 0.887 When I ride my bike, I want to have fun .............................................................................. 96 ............... 99 ................ 99 ............... 99 ........................ 0.300 When I ride my bike, I want to feel free .............................................................................. .80 ............... 73 ................ 67 ............... 73 ........................ 0,277 I ride my bike m order to be able to do what I want.. ........................................................ 27 .............. .31.. .............. 18 ............... 27 ........................ 0.092 When I am motorcycle riging I want to have interesting experiences ............................. 85 ............... 82 ................ 73 ............... 80 ........................ 0.153 When motorcycle riding I am lookin~ for adventures ........................................................ 67 ............... 56 ................ 42 .............. .54 ........................ 0.012 When I ride my bike I want to expenence nature and the environment.. ...................... 93 ............... 89 ................ 87 ............... 89 ........................ 0.586 Motorcycle riding is only fun when the weather is fine ..................................................... .76 ............... 67 ................ 71.. ............. 70 ........................ 0.655 I need motorcycle riding in order to relax ............................................................................ 73 ............... 60 ............... .57 ............... 62 ........................ 0.153 It is only when motorcycle riding that I have a feeling of self-realization ...................... 36 .............. .25 ................ 23 .............. .27 ........................ 0.175 When motorcycle riding I feel a rise in self-confidence .................................................... .36 .............. .31.. .............. 20 ............... 29 ........................ 0.094 When motorcycle riding I enjoy to form one unit with the bike ....................................... 93 ............... 97 ................ 95 ............... 96 ........................ 0.355 It is a really rOd feeling to become unit with the bike and forget about oneself.. ....... 69 .............. .49 ................ 42 ............... 51.. ...................... 0.007 I had a lot 0 positive experiences with my bike. It is a kind of good friend to me ....... 73 ............... 72 ................ 46 ............... 65 ..................... < 0.001 Whithout a certain feeling of thrill, motorcycle riding is boring ...................................... 36 ............... 32 ................ 20 .............. .29 ..................... < 0.001
~~~fe~ ~\~~ ~~~~.~ .. I.~~~.t.~~ .. ~.~.~~ .. ~.ff .. ~~.~~~.ri~~:::::::::::::::::::::::::::::::::::::::::::::::::::::::::::~~:::::::::::::::~~::::::::::::::j~:::::::::::::jL:::::::::::::::::::::g:~g~ I want my bike to be comfortable .......................................................................................... 51 .............. .53 ................ 75 ............... 59 ........................ 0.004 I don't want to ride a bike without good acceleration ........................................................ 53 ............... 53 ................ 52 ............... 53 ........................ 0.978 I feel especially attracted by motorcycles with top speed .................................................. 24 ............... 18 ................ 15 ............... 18 ........................ 0.506 I only feel good when riding at full throttle ........................................................................ .20 ............... 20 .................. 5 ............... 16 ........................ 0.010
i1:r~~~f!~{:g~n~~:e:~r~~Pbi~~~~:::::::::::::::::::::::::::::::::::::::::::::::::::::::::::::::::::::::::::::::::::::~L::::::::::j~::::::::::::::::§L::::::::::j~::::::::::::::::::::::::g:~~~ When riding at top speed, I enjoy the tension and the feeling of thrill ........................... 24 ............... 27 ................ 27 ............... 26 ........................ 0.885 I am fascinated by the manoeuvrability and elegance of my bike .................................... 96 ............... 87 ................ 82 ............... 88 ........................ 0.050 I like to bank over ..................................................................................................................... 67 ............... 55 ................ 48 ............... 56 ........................ 0.087 I prefer situations that require my riding skill ..................................................................... 58 ............... 68 ................ 52 ............... 61.. ...................... 0.059 One attraction of motorcycle riding is the managing of risky situations ......................... .22 ............... 20 ................ 16 ............... 19 ........................ 0.706 I ride a bike because it requires all my strengh .................................................................... 15 ............... 14 .................. 6 ............... 12 ........................ 0.181 It is always a challenge/temptation to try out how far you can control the machine .... 73 ............... 69 ................ 61.. ............. 67 ........................ 0.319 My personal goal is to be co me a safe and responsible rider.. ........................................... 96 ............... 89 ............... 90 ............... 90 ........................ 0.527 I thlnk it especially important to ride carefully and attentively ......................................... 95 ............... 87 ................ 95 ............... 91... ..................... 0.086 I want to improve my riding skill by frequent riding ........................................................... 96 ............... 91.. .............. 87 ............... 91.. ...................... 0.213 When I ride my bike I like to perform my riding skill in public ........................................ 29 ............... 23 .................. 8 .............. .20 ........................ 0.004 When a suitable situation occurs I like to try out my own riding capacities ................... 74 ............... 73 ................ 63 ............... 71.. ...................... 0.137
Questionnaire Cologne IFMA
Item
Percentage of Agreement 18-20j. 21-25j. > 25j. [%] [%] [%]
Total [%]
p-value
37 38 39 40 41 42 43 44 45 46 47 48 49 50 51 52 53
I enjoy to show others that I am a better rider ............................................................................ 20 ............... 19 .................. 5 ............... 15 ........................ 0.012
54 55 56 57
I fee! temted to try out how far I can bank over and how much acceleration is possible .. 56 .............. .50 ................ 37 .............. .48 ........................ 0.064
~ ~~~tf~~ ~Jf~a~~el~~k ~~~~.~~~~~.~.~.~.~.~~.i~~~::::::::::::::::::: ......... '.':::::::::::::::::::.':::::::::::::::::::::::::.':::~~:::::::::::::::~g::::::::::::::::~i:::::::::::::::~~::::::::::::::::::::::::g:öi~ Risky situations have to be accepted ifyou ride a bike .............................................................. 91.. ............. 84 ................ 78 ............... 84 ........................ 0.150 It is difficult to predict potential risks when motorcycle riding ................................................. 62 ............... 39 ................ 38 ............... 43 ........................ 0.008 For motorcycle riders there is little probability of having an accident.. .................................... 7 .................. 7 ................. 5 ................. 7 ........................ 0.764 Due to my own riding style there is little prob ability only to suffer an accident.. ................. 38 .............. .43 ................ 44 .............. .43 ........................ 0.738 When indeed an accident will happen, the consequences will not be that serious ................ l1.. ............. 11.. .............. 13 ............... 11.. ...................... 0.910
~~~~:;~[ctf~~t~~t~&~ln~~lg~y'p~~~~~'~liiy:::::::::::::::::::::::::::::::::::.::::::::::::::::::::::::::::::::::::::~~:::::::::::::::~i::::::::::::::::~L::::::::::::~i:::::::::::::::::::::::xm Among my friends you will only be accepted, when you ride a bike .......................................... o ................. 1.. ................ 1.. ............... 1.. ...................... 0.670 I prefer motorcycle riding in a group ............................................................................................ 73 ............... 67 ................ 57 .............. 65 ........................ 0.139 I ride a bike in order to make acquaintance with other people ............................................... 29 ............... 36 ................ 33 ............... 34 ........................ 0.637 I ride a bike in order to spend my time with people of similar interest .................................. 53 ............... 62 ................ 44 .............. .55 ........................ 0.032 As a motorcycle rider I feel superior to other road users .......................................................... 24 ............... 23 ................ 11.. ............ .20 ........................ 0.082
~ :~~t~r:rsk:~i~~a~i~~s~.c~.r~~~: .. I.".i~~.~~.~i~~ .. i~.~.~~~.t~.~t.I .. ~~.~~.I~ .............................. 84 ............... 89 ................ 89 ............... 88 ........................ 0.523 Normally motorcycle riders are able to manage risky situations ............................................ ..49 ............... 36 ................ 37 ............... 39 ........................ 0.253
b'~.~:~~~i~ot~~ b;t~i?d~hl:~~~~~:Üyh~~g.~.~.::::: .................. : .. ::.:.::::::: .. : ...... : .......... :.:.:::: .. : ........... : ...... : .. ::.:::.:.:: .. : ...... ~~:::::::::::::::j~::::::: :::::::::~~:::::::::::::::~~::::::::::::::::::::::::g:ii~ I experienced several tricky situations when motorcycle riding and do not exclude simllar situations to happen in the future ................................................................................... .84 ............... 89 ................ 86 ............... 87 ........................ 0.515
U1
::tJ m c: iff
.j:>. (Jl I\:)
.j:>. (Jl W
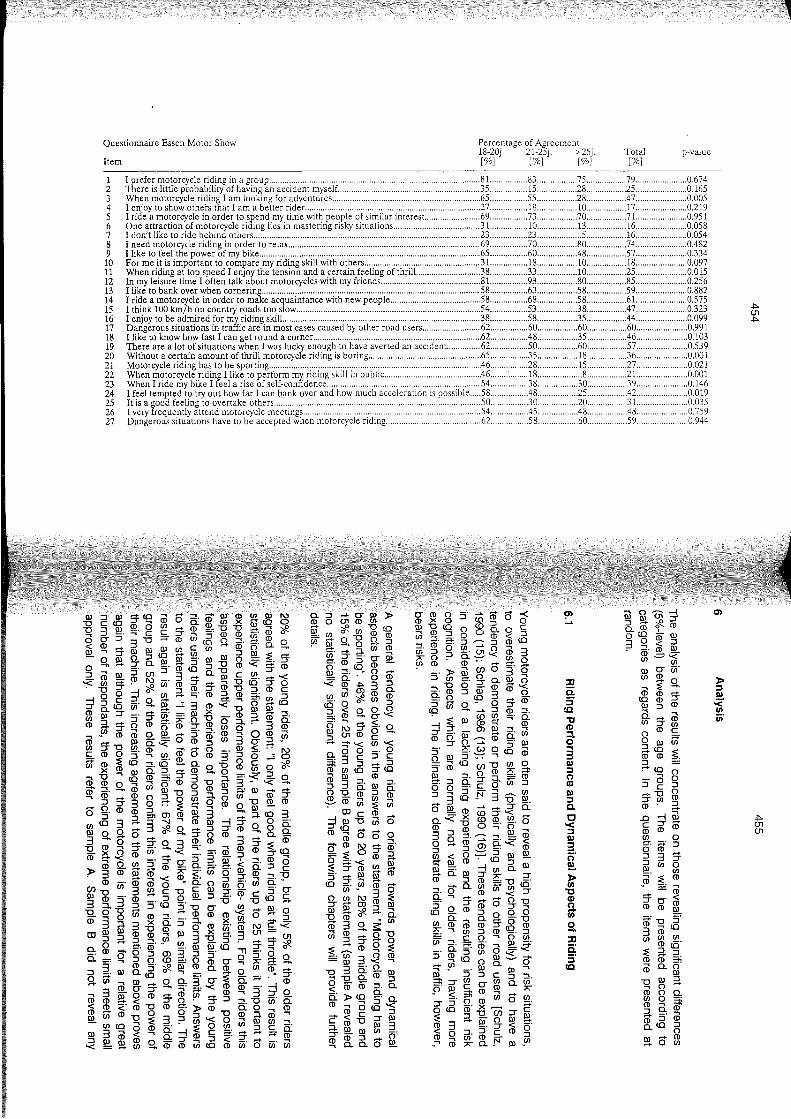
Questionnaire Essen Motor Show
!tem
Percentage of Agreement 18-20j 21-25j. >25j. [%] [%] [%]
Total [%]
p-value
1 2 3 4 5 6 7 8 9 W 11 U ß M ~ M D W ~ W 21 n n ~ ~ u n
I prefer motorcycJe riding in a group..................................... . ........................ 81 ................ 83....... . .. 75 ................. 79 ...................... 0.674 There is little prob ability of having an accident myself...... . .............. 35..... . ....... 15...... ..28.. . .. 25 ....................... 0.165
~~j~y~g;~.%c~~~~~~ntt~ta~~~~~ft~~rrfg:r~~.t~~.e.~:::::::::::::::::::::::::::::::::::::::: .................... :::::::~~::::.:::::.:::::i~:::::.. ·:::~~·.:::::::::::::::i+:::::::::::::::::::::::~:~n I ride a motorcycJe in order to spend my time with people of similar interest... ...................... 69 ................. 73 .................. 70 .................. 71... .................... 0.951 One attraction ofmotorcycJe riding lies in mastering risky situations ....................................... 31 ... .............. W .................. 13 .................. 16 ....................... 0.058 I don't like to ride behind others ............................................... : ...................................................... 23 ................ .23 .................... 5 .................. 16 ....................... 0.054
lli~~~~I}~~~Ig~I;~:~~~f~~rg~et~.~~I~::::::::::::::::::::::::::::::::::::::::::::::::::::::::::::::::::::::::::::::::::::JL::::::::::::::~~:::::::::::::::JL:::::::::::::::~t:::::::::::::::::::::~:m For me it is important to compare my riding skill with others ................................................ .... 31... .............. 18 .................. W .................. 18 ....................... 0.097 When riding at top speed I enjoy the tension and a certain feeling of thrill ............................. 38 ................ .33 .................. W ................. .25 ....................... 0.015 In my leisure time I often talk about motorcycJes with my friends ............................................. 81... .............. 93 .................. 80 .................. 85 ....................... 0.256 I like to bank over when cornering .................................................................................................. 58 ................. 63 .................. 58 .................. 59 ....................... 0.882 I ride a motorcycJe in order to make acJuaintance with new people ......................................... 58 ................. 68 .................. 58 .................. 61... .................... 0.575
I ~~j~ ~~~~~~~~df~~:z ~idg,sgt~kil1.~~:::::::::::::::::::::::::::::::::::::::::::::::::::::::::::::::::::::::::::::::::JL::::::::::::::~~::::::::::::::::JL::::::::::::::::L:::::::::::::::::J:Ö~~ Dangerous situations in traffic are in most cases caused by other road users .......................... 62 ................. 60 .................. 60 .................. 60 ....................... 0.991 I like to know how fast I can get round a corner ............................................................................ 62 ................ .48 .................. 35 .................. 46 ....................... 0.103 There are a lot of situations when I was lucky enough to have averted an accident.. ............. 62 ................. 50 .................. 60 .................. 57 ....................... 0.539 Without a certain amount of thrill motorcycJe riding is boring ................................................... 65 ................. 35 .................. 18 .................. 36 ....................... 0.001 MotorcycJe riding has to be sporting ................................................................................................ 46 ................ .28 .................. 15 .................. 27....... . .. 0.021 When mC?torcyc1e.riding I like. to perform my' riding skill in public............................. ...46 ................. 18 .................... 8 .................. 21... .................... 0.001 When I nde my blke I feel a Ilse of self-confidence .................................................................... 54 ................ 38.... . ..... 30 .................. 39 .0.146 I feel tempted to try out how far I can bank over and how much acceleration is possible ..... 58. .. ..... .48 .................. 25.. . .. 42. .. ... 0.019 It is a fOOd feeling to overtake others.................... ................... . ..... 50... . ... 30 .................. 20..... .. .. 31.. .............. 0.035 I very requently attend motorcycJe meetings................................... .. ..... 54. .45 .................. 48 ............... .48.... .. ..... 0.759 Dangerous situations have to be accepted when motorcycJe riding ........................................... 62 ................ 58 .................. 60..... ..59 .... 0.944
1ll:::J III 9'1Q äl Ö5:<t!)l ~!a.~ ~ "0 C(Q (l) 0 rJl ..... ~ (l)"O"O!!l.~ ,0 "Q 3 !!1, ::;' C C :::r ~ = (l) (l) w' (l) 0' o 0' :::J 3 "0 ;:+ (l) rJl t5 0 ::!. <:!" (l) 0 ~~9'IllIllIll!a.VirJl""~go.::::: - 0 III 0 :::J 'ß III 5' III III 0 ,z ~, :::r o -.. .... ;:!. 0. -, CD (Q :::J "0 (l) 9' (l) :::J ~ III :::J (]l :::J 3 .... 0. -g C !!!, .... '< - (l) ;:+ !D I\) -, :::r.... ~ "0 (Q :::r 0 ':<rJl:::r -;RrJl(l)(l):::r(l)"O:::J(l)C -g 0 :;f 0 ~ ~ :::;" m ~ ~ 3i U'J :J --l :::J ,S;; -, g, III -= 3 (l) '< 0 .... (Q :::ro.~rJl .... x "O1ll1ll (l) III :::r -, 9' w' = III "0 - (l) :::J CD ::!, ~ 3, .... 6 (l) <:!,,@g.(l) ~ =1,<+3 g-
rJl :::r ~ 0 -, ::!, (l) Q 0 (l) ~ ~. (l)(l)Q.!11:: ö :::J(l) rJl 3 :::J.rJl (l) .... Illo.,< (l):::J 0' .... rJl :::r "0 rJl (l) _ .... 0 _, III <, ., I\)
~ (l) 0 5' ~ !!!, ~ 0 (l) 3 6 ö -= ~ cn (l) :E (Q ::!, (Q - 0. 0 "0 (l) C 0 Cf(
x Ql III 0.S:9'(l) -0 =.z:::J 0 äl 16 0 IQ Ql ö' (l) 3 "0 6t 3' -<-ro :::!. - CD fJ) tu "0 g CD :J ;::;: Q) CD :T ~ (l) .... (l) O:::J 0 rJl;}o rJl"O (l) (l) .... 6:::r30:-!':Eq~!Dg,Ill-o -, (l) (l) a Ol (l) III 3 ;::!. (Q 3
:::J 3 3, ::;' -...J ~ CD III --l 9' 0-' [ß(Q 0 .... 3<f. 0 .... :::J:::r(l) g,8.§: 3g,ö~9'0-~@(l)39' (D "0 (l) ~ :::r -, - 3 ~ _ ~ (l) (l) :E (Q - Ä. 0 (l) rJl .... '< -, -3' (l):::J :::r ~ (l) ~ '< -, :::r 0' :::J W'::!, (l) 0 ~(l) [t!a.3,(l) ~9,r;l:g-ai g-:! C . 3 !!l. Ql '< (l):5. :::J:::r ~ -,}J
(l) -, (l) (l) 0 = 0. 0 rJl ö' rJl 0. Cf) rJl 3 rJl C "0 C III :::r - 5' 0' n, "0 .... ~ 0 III :::J -, (l) C ,~ C -(l)3(l) ~ - "O'''O~-3 =I, "0 3, 5' (Q 5' "0 0' .!Q _ III 0
"Q. Q 0 rJl (l) _, :-. (l) (l) (l) rJl 0 ::: :::J (l) 3 ;::!. 3 B g- :::J ;} (l) ~, CD I\) ~-< COIll~(l)(l)~Ill~x<:!'·3(]l;::;:(]l
:::J .... :::J~rJlrJl3"Q.:::J. -:::r-;R 0. 0 <:!" w" -, III III (Q "Tl :::r ~ 0 -, (l) 0' 0 :::J Ol 3 :::J 5' 5' 0 0 O'=~:::Jo(o=O(l)o,Q,,;::I:_ :::J 2. III ~ 5' <f. ~ ~ 0. ~ Q. ~, ~ 9' 9.cn~Ill~00'30'<:0'- (l)
(l) 0' :::r - ::;. -, '< (l) (l) 3 --l 0 ~3;:;;-0(l)_(l)cn_(l)~ ;:!._ (l) (l) ~ < :::r 0' :::r:::J::!, "0 rJl 0. < (l) <' (l) "0 (l) g. ~ (l) 0. 0 ~ (l)
~ cn (l) "0 ~ 3 ? iil '< 15 ~ 6t m ;. rJl (Q 0 (l) -, :E 0 rJl W :::J C 0.
III 3 äl < ~ §:--l(l) C 2:9'-;:+(l) ~ !11:: !!l. m g, (D 15 ül t5 ai w' Ö w' ül
0.:::J ~ 0 !1!, !il
rJl §I ~' ö' Q!. -<
c:t;g!)l~ <f.rJl"O(Q o "0 (l) (l) -..on.:J ..... ;::!.rJl(l) 15 5' 0' iil (Q (l) -:::!. = 0 ...... 0. 0 (l) (l) .j>. 3 :::J
rJlülOJ(l)o. 10' 0 Cf( rJl ~ S:aig,g..Q ö: '"'" ...... < III I\) :::r -, 0 :::J(]l(l)g...... =t'<(J)'< 0. 0 0 -, 0 :;ji3§::§ Ql[ß(Q:::r(Q (l) ~ (l) :::J 3 Ci III ::!, 0"O(l):::J0. (l) ;:n ~ rJl (l) ':-'''rJl:E ül
CO C (l) --l III "0 ~ 0-:::r (Q rJl CDmoöo o CD f\) ...... ::!. =:E0:::r~ o _. '< (l) -:E 9' (l) rJl !!l. S' g. ~ §! (1)
(Q w,.rJl (l) 0
orJll\)3:E :::r-CO(l)1ll ~&~aa. ~3g,s:rJl rJl~_o"O
...... ::J'" ...... o ;;, (j) (l) Q :E =1ll3.QQl "03CiQ.1ll 0"Q.9:(l):::J < (l) (l) ::!. 0. _. 0. 0. ~ (Q -, 0. (l)~0:::J,< _ (l) C (Q :::J C iii "0 :::r III ;::!. III III 3 15 (D ~ ~ ö' ~0.0.0Q!.
0'(l)0 (l) X 0 \l)"O(Q -. CD :::J ~ ffi' a-: w' :::J g '" 0 , rJl (l) , :::J G;'
~"O -, (l)
5' ....a. r+ (O(l) o (0 :::J o°g. ~~:::J _, (]l 0 o.~'< (l) --iilCf)6' ~, () Q. o :::! (l) :::J ~ 3
Ö~ o c < :::J (l)(Q
äl 3 !a.o 3' 6' III ~ -.Q (l) 0
(D O' 0-_ :::J:::r
:E III (0 ~ ~, 5: ;l;:!._~iil~~ (1)g.~~CDg;(J) ~. III S- ~ Q t5 ~
9,0 :::J -(Q rJl
S' äl (Q Cf)"O rJl 0
&-,:::J 5:g.~~$' o 0 -' C 0 rJl :::J :::J 3~t5F3~~rJl _ "0 III
o!11::(l)<o9'~Ci o.'<B(O(l)rJl .... (l) :::J (l) 0::;' o' 0 3 0 ::::!, -. ~ tu ~ o ...... (1) ....a. -, = .. .., :::J :::J~9,'< ai !a.<0~:::J1ll1ll ~1ll(l)·(Q:::J-
!!l.nlll;lrJlo.lll
(l) :::J (l) ~ :::r ~ 0' 0. rJl = "0 10' Ci~ ...... (1)(J)~::T 5' 0 :::r CD 6' 0 "0 (Qa:(l):::J 0 50 ~Qlälg-9'O"O = rJl:::J (l) (Q (l) Cif ~ ~ () ~ ö' ~
Ci ~, Cö" ~ tu _. 5' (l) ::J rJl o,z-<: ~Ylco 0 ~-ö' ~ :::J ~ C III ~ _, :::r rJl 0' rJl ::J ::!, 9~§:(l)~0.~ :::r 5' Ö' (l) rJl 6' rJl o co Cö' X r-""I ;:+" :E :::J"O Cf):::r
c
~3-Qf.g.~&-, (l) 0 ::!, :::J C (l) 0 ~ ., (J) (1) - :::J • (l)",0.J'l1ll,!ll
9l .....
::r:J ii S' ce "tJ (l) :=!. o 3 11) ::s o (l) 11) ::s a. C '< ::s 11)
3 ö' !! » 111
"C CD
~ o -::r:J ii S' ce
iil O O1-1 5.Wi<f.15 o (Q ..!....
3 0 (l) Dl ~ < :::J . -, (l) III (l)--rJl~'<
rJl III 0' -, rJl (l) rJl
~ ~ g, (l) (l) -(Q (l) :::r ~ :::J (1)
Q."""CD rJl :::r rJl o (l) C
~ g Dl
CD <g :E :::J = ;t' CO -
-0 :::J C .... "0 :::rrJl (l)'
.0 --l C :::r (l) (l)
o o ::J o (l)
~ !!l. (l)
rJl g. ;::;:g (l)
:::J :::J III
3 9'
.~' ~ rJl 0
rJl (l) ~
_ (l)
:::r0'< (l) (l) (l)
;:+" ~ (l) "0 :::J 3äl(Q rJl rJl rJl :E ~ 10' (1) CD ~ äl 0. 0'
III "0 III :::J ~ 0 -(l) 0 0. ~ Q :;ji :::J 0. (l) CD S" CD 0. (Q ::J o (l) III -_ 0
rJl
0)
~ ::s 11)
~ iij'
.j>. (]l .j>.
.j>. (]l (]l
456
statistically significant differences between the age groups, so that an interpretation in detail is not necessary. However, the results had similar tendencies.
Dynamical aspects, however, do no solely rely on the pleasure of experiencing the motoring power. Empirical studies reveal that especially young riders often buy offroad* machines, frequently out of financial reasons [Schulz, 1989 (14); Hagstotz, 1990 (4)]. These vehicles allow riding in-traffic as weil as off-road and require little maintenance only because of a rather uncomplicated technique. This synthesis of ergonomic aspects (handlebars, upright position), low weight and further technical data lead to an extremely good manoeuvrability in traffic.
The answers to the statement "I am fascinated by the manoeuvrability and elegance of the motorcycle" show that for the riders the attraction of motorcycle riding does not only rely on experiencing performance limits. The result reveals statistically significant differences in sampie A (this statement was not presented to sal"Dple B): nearly all (96%) of the young riders are fascinated by the dynamic aspects of motorcycle riding. In the group of riders aged 21 - 25, 87% agree with this statement, and the riders aged over 25 agree with 82%. Motorcycles differ from other vehicles in their manoeuvrability and elegance, characteristic features which offer an opportunity to demonstrate own riding skills. This direction of interpretation - on one hand the experiencing of upper limits, on the other hand the demonstration of own riding skills - is confirmed by the evaluation of further items, as folIows.
The explicit statement "I like to perform my riding skill in public" is accepted by 29% of the riders aged 18 - 20, by 23% of those aged 21 - 25 and by only 8% of the group of older riders (sampie A). Differences are statistically significant. This tendency is stressed by the results of sampie B: 46% of the young riders, 18% of the middle group and 8% of the older riders agree.
Results lead to the conclusion that motorcycle riding apparently offers a possibility -especially for young riders, but also for those up to 25 - to demonstrate riding skills to other traffic participants, for example to members of the own peer group. In addition to that, young riders seem to experience the motorycle as something more than only a means of transport. These, according to Näätänen and Summala (1976, 9) extrinsically-motivated. tendencies to demonstrate performance limits in traffic situations, cannot be considered as something positive. Demonstrations can very quickly turn into a rather too competitive behaviour or rivalry.
There is a further item pointing into the same direction: "I enjoy to show others that I am a better rider". Sampie A reveals anew statistically significant differences: 20% of the riders aged 18 - 20, 19% of the middle group and 5% of the older riders agree with this statement. Obviously a certain amount of the young riders and those aged 21- 25 enjoy not only the demonstration of their skill but also the competetive aspect.
457
Unfortunately, the demonstration of one's riding ski 11 in-traffic often goes hand in hand with a high exposure to risks due to far too extreme ways of riding. Sampie Breveals no statistically significant differences, nevertheless the above mentioned tendency is apparent in this group as weil.
Respondants of sam pie Brather explicitely admit positive feelings in competitive situations. 50% of the riders aged 18 - 20, 30% of the middle group and 20% of riders aged over 25 confirm the pleasure to be better than others when they agree with the statement "It is a good feeling to overtake", the differences are statistically significant. Again it has to be pointed out that this feeling of superiority might have fatal consequences when traffic rules are violated and potential dangers in traffic are ignored just to be faster than other traffic participants.
It is again the group of riders aged 18 - 20 who most frequently admit to experience upper performance limits even without spectators. 58% of riders aged 18 - 20, 48% of those aged 21 - 25 and 25% of those aged over 25 accept the statement "I feel tempted to try out how far I can bank over and how much acceleration is possible" (statistically significant in sampie B). Especially in the group of young riders, and still in the middle group, the juveniles obviously enjoy trying out upper limits with their powered two-wheelers. Young riders seem to feel tempted to try out the upper limits of their vehicles in traffic situations.
Dellen and Bliersbach (1981, 3) al ready described this pleasure in experiencing dangerous situations with the notion "thrilI". Astate of mind which is obviously frequently (and statistically significant in sampie B) found with young riders. In accordance with this, 38% of the young riders, 33% of the middle group and 10% of the riders aged over 25 agreed with the statement "When riding at top speed I enjoy the feeling of tension and thrilI". The experiencing of upper limits and the pleasure and joy in mastering dangerous situations as described above, seems to attract especially young riders who have little riding experience only and who, according to Schulz, reveal marked deficites in danger cognition. This lack of knowledge concerning potential dangers of motorcycle riding is confirmed by the answers to the following item: "It is difficult to predict potential risks when motorcycle riding". 72% of the riders aged 18 - 20, 39% of the middle group and 38% of the older riders accept this statement (sampie A only); the differences are statistically significant. According to this result, young riders seem to realise their inexperience in danger cognition. At the same time they reveal high propensity to skill performance.
• 458
6.2 Feelings and Experiences when Riding a Bike
The fascination of motorcycle riding is often characterized as an extraordinary intensive experience [Nowak, 1979 (10)). The motorcycle offers an opportunity to escape from the restrictions of everyday life and allows new and sensational experiences while riding. In a high-technology society sports like surfing, hang-gliding and of course motorcycle riding provide an opportunity of sensation seeking. The notion "escapism" rather concisely describes these above mentioned phenomenons. Several items of the questionnaire take this aspect into consideration. The following chapters will continue to describe further results according to the riders' age structure.
In sam pie A 67% of the riders aged 18 - 20, 56% of those aged 21 - 25 and 42% of the riders aged over 25 accept the statement "When motorcycle riding, I am looking for adventures". It is obviously again the group of young riders who is in thirst of adventures when motorcycle riding. Differences are statistically significant.
And they become still more obvious in sam pie B. 65% of the riders aged 18 - 20, 55% aged 21 - 25 and 28% of the riders over 25 agreed with the above mentioned statement. Tendencies like described above thus are statistically significant for sampie B aswell.
A further statement tries to render the rather abstract notion of "adventure" more concrete. "Without a certain amount of thrilI motorcycle riding is boring " was accepted by 36% of the young group, 32% of the middle group and by 20% of the older riders. These statistically significant differences were found with sampie A. The same statement met even higher approval in sampie B: 65% of the young riders, 35% of the riders aged 21- 25 and 18% of those aged over 25 accepted this statement. Especially many young riders of sampie B seem to enjoy the feeling of thrill when riding motorcycles.
The statement "When I ride my bike I want to work off my everyday worries" was accepted by 27% of the young riders, 20% of the middle group and 5% of the older riders of samlple A: the result is statistically significant. This item was not in the questionnaire for sampie B. According to the results mentioned above, it seems to be important especially for apart of the young riders to use their bikes in order to work off eyeryday worries.
A feeling of total immersion when motorcycling is described by the term flowexperience [Csikszentmihalyi, 1987 (2); Rheinberg, 1990 (12)). Scientists proved in different studies that activities like diving, operating (surgeoens) but also motorcycle riding arouse a certain state of mind, concentrating totallyon the actual activity. Take
459
for example the experience of motorcycle riding, people have the impression that the system of man and verhicle functions perfectly. However, the danger of this flowexperience lies in an exclusive concentration on the riding activity, and a resulting suppression of the appropriate lookout for the traffic situation, which may lead to ignoring potential dangers. According to results of empirical studies especially the young riders have a tendency to plunge into the flow-experience. Schulz (1990, 15) proved that young riders tend to underestimate potential risks in traffic and simultaneously overestimate their own capacity to control and manage tricky situations.
For sampie A this aspect was referred to by the statement "It is a good feeling to become a unit with the maschine and forget about oneself". The results were statistically significant: 69% of the young group, 49% of the riders aged 21 - 25 and 42% of the older riders confirm this statement. Again it is the group of young riders willing to plunge into the experience of motorcycle riding with all their concentration.
6.3 Identification with the Motorcycle as Leisure Time Vehicle
Studies on the leisure time acitivities of young riders [Schulze, 1990 (17)) reveal that two-wheeled as weil as four-wheeled vehicles play an important role concerning the juveniles' social status. In this context the car and, still the more, the motorbike is a linking element within the peer-group and often leisure time acitivites center around the powered vehicle. The function as a means of transport for the young riders is by no means an important aspect as far as the usage of the vehicle is concerned.
This interpretation is confirmed by the anwers to the statement "I ride a motorcycle because it is the only means of transport for me in order to do longer trips". 24% of the young riders, 20% of the middle group and 8% of the older group agree with this statement. It is true, of course, that for the young riders the motorcycle frequently is the only available vehicle, however, it is not even 25% of the total number of respondants in sam pie A who are dependent on the motorcycle as the only means of transport. This proves that the motorcycle for most of the riders is a leisure-time vehicle [Koch, 1990 (7); Hagstotz, 1990 (4)).
There is still a further item focussing on the motorcycle's status: "I had a lot of good experience with my bike, its a kind of good friend to me" (statement only presented to sampie A). 73% of the young riders, 27% of the riders aged 21 - 25 and 46% of the older riders seem to personify their vehicle. For them their bike means more than simply a means of transport, it is part of their lives. The result is statistically significant.
460
Apparently, there is a great difference in the demand requested from this leisure time vehicle motorcycle. The statement" I want my bike to be comfortable" (sampie A only) is accepted by 51% resp. 53% of the young and middle group, whereas for 75% of the riders aged over 25 this aspect is important. The result is statistically significant. Aspects of comfort are not that important for young riders, a fact which can be explained by their orientation towards performance and dynamic aspects. The importance of the motorcycle for the group of young riders is furtherly stressed by the statement "I want my bike to look good": for 85% of the riders aged 18 - 20 this is important, 70% of the middle group and 62% of the older riders agree with this item in sampie A (statistically significant). The identification with the vehicle seems to be much greater than with the older riders, characteristic features of the bike seem to be projected into the rider's personality.
6.4 Social Aspects
Motorcycle riding for many riders means a leisure-time activity performed together with people of similar interests. This refers to visiting biker meetings as weil as to traveling with a group. The questionnaire takes this aspects into consideration as weil. Statistically significant differences, however, were found with one item only.
The statement "I ride a motorbike in order to spend my time with people of similar interest" was accepted by 53% of the riders aged 18 - 20, 62% of the middle group and by 44% of the older riders of sampie A. The younger group, and also the riders up to 25 years (more than 50%) prefer motorcycle riding because it provides a possibility to spend time with people of similar interest. Motorcycle riding thus offers an opportunity of social contacts, the motorcycle itself serving as an instrument of contact, a common basis and topic for discussions.
There are no statistically significant differences concerning the statement "I prefer motorcycle riding in a group" in sampie A. Young riders, however, reveal a slightly higher agreement ratio.
7 Pedagogical Consequences
Summarizing the results of the questionnaire of both sam pies, there are differences in the attitudes of motorcycle riders according to their age.
461
For young riders their vehicle is an essential part of their lives, the motorcycle is an integrated part of their leisure time activities.
In addition to that the motorcycle is a linking element as far as social contacts are concerned.
The sensation seeking aspect of motorcycle riding is again dominant in the group of young riders. They want to experience adventures, thrilI and suspense in our highly technical world.
Concerning performance aspects, the young riders, in parts also those aged 21- 25, are keen on trying out their own performance limits. They tend to ascribe the bike's performance to their individual riding skill and like to test and thus demonstrate their riding skills to other road users resp. to their peer group. They seem to be in quest of a feeling of thrill and want to work off their everyday feelings.
The sensation seeking and the awareness to expose oneself to risky situations as weil as the positive experience of dangerous situations is a typical characteristic feature of young riders.
Which are the consequences for a traffic education aiming at the group of young motorcycle riders being especially at risk? Pedagogical work which does not have an alibi function only, but provides a creative offer for young persons. Where are the deficites of the present traffic education which has often failed to attract young people? .
Considering the average age of participants of safety training programs one notices that it is first and foremost the group of "older" riders who make use of this offer, often even several times. Thus the typical attendee of training programs are those riders who already have riding experience and who have a lower tendency of risk exposure and thus are not the main target group of these programs.
In order to explain the little acceptance of training programs among young riders, several factors are possible: According to the survey it is obvious that young riders feel attracted by high-powered bikes, looking for the adventure aspect in motorcycle riding. Organisations offering training programs thus have to consider critically whether the programs and concepts really do attract young riders.
Training programs have to take into account popular leisure time acitivites of young bikers. The safety aspect should be kept in the background - at least at first sight. Programs promising fun and interesting leisure-time activities will meet high approval. Nevertheless it will be possible to apply to the young persons' responsibility and try to change their attitudes towards risk taking behaviour.
462
The IfZ has organized for years alredy so called "motorcycle camps" in order to realize the above mentioned concepts. During these camps, which last two days, the participants ana instructors stay together the whole time. On the first day, they do riding exercises with their own bikes, the second day trial machines are at their disposal in order to practice off road the handling of the machine. The evening will be spent together as weil, sitting at a campfire, talking, having fun, discussing problems and thus joining the youths in group discussions, a form of socializing especially suitable for young people. This kind of safety training programs surely is one possibility only, parts of this example might be adopted and realized by other training organisers. The IfZ before all adresses those riders who like sportive riding and thus are especially at risk. These riders will not feel attracted by common training offers. A racetrack or trial course as training facility, however, has proved to be an attraction for the young riders. The purpose of the training programm of course is not fast and sportive riding, but the idea of using the racetrack as motivation in order to trans mit the safety message to the target group. The training itself has to rely on didactically sound concepts [Koch, 1990 (6)], for example by a division of the training-track into sections, riding under instruction as weil as regular group discussions. Thus the respect of physical limits of motorcycle riding can be transmitted even to those riders who think themselves extremely skilful in handling their bike. The basical idea is that the testing out of performance limits off-road will prevent further demonstrations in real traffic situations. This is achieved by showing potential risks for the traffic participants and thus demonstrating the ti ny margin between having luckily averted an accident and the possible fatal consequences of a collision. Experienced instructors who meet acceptance by the participants are the prerequisite for the realisation of these concepts. They have to make use of their entire pedagogical skill in order to influence positively motivational aspects of the participants. At the same time it is important to stress the strict separation of real traffic with often rather unpredictable behaviour and reactions of other road users and the training. Specially trained pedagogues, psychologists, social workers and instructors work for the IfZ in this sense. From time to time a racing motorcyclist is engaged in order to underline the differences between riding on a race track and riding in real traffic. They try to motivate the young riders providing an example of responsible riding and thus serve as a person to identify with.
A further step is the plan to link training programs of different training sites: trial courses, race tracks and real traffic. A program integrating attractive training and concrete instruction for riding in real traffic both, theoretically and practically, is able to counteract the tendency· to increase the potential propensity to risks by skill
improvements.
Apart from attractive offers for the target group, the financial factor is important as weil. Past experience shows that programs met high approval when the offer was lowpriced, especially concerning programs for those riders holding license 1 A. Present models of follow-up courses for young beginner riders after they passed their license could easily be linked to the above mentioned concepts. The young riders can be, as far as official support is provided, integrated in the respective concepts.
463
8 Reference List
(1) Choueiri, E.M.; Lamm, R.: A Comparative Analysis of Motorcycle Accident Statistics in Western Europe and the United States, 1970 - 1987 In: Safety - Environment - Future. Proceedings of the 1991 International Motorcycle Conference. ed. by Institut für Zweiradsicherheit. - Bochum 1991 (Forschungshefte Zweiradsicherheit) ,
(2) Csikszentmihalyi, M.: Das Flow-Erlebnis : jenseits von Angst und Langeweile. - Stuttgart, 1985
(3) Dellen, R.G.; Bliersbach, G.: Motiva~alytis~he Aspekte des gegenwärtigen Motorrad-Booms und Ergebnisse einer Auswertung von Motorrad-Unfällen. In: Die Sicherung des Zweiradverkehrs / Arbeits- und Forschungsgemeinschaft für Straßenverkehr und Verkehrssicherheit. - Köln 1978. - P. 117-145. - (Buchreihe der Arbeits- und Forschungsgemeinschaft für Straßenverkehr und Verkehrssicherheit; 31)
(4) Hagstotz, W.: Zur Typologie von Motorradfahrern In: Motorradfahren. Faszination und Restriktion. Hubert Koch (Hrsg). -Bochum, 1990. - P. 107-130. - (Forschungshefte Zweiradsicherheit; 6)
(5) Koch, H.: D~~. Ei~fluß des St~.fenführerscheins auf das Unfallgeschehen 18- und 19jahnger Fahranfanger. In: Motorradfahren : Faszination und Restriktion / Hubert Koch (Hrsg.). - Bochum, 1990. - P. 107-130. - (Forschungshefte Zweiradsicherheit; 6)
(6) Koch, H.; Brendicke, R.: How to influence risk taking behaviour within motorcycle rider training programs In: The Human Element: Proceedings of the International Motorcycle Safety Conference, Orlando, Florida - Orlando, 1990/ The Motorcycle Safety Foundation. -Irvine, Calif., 1990. - P. 9.1-9.25
(7) Koch, H.: Di~ Lust am Motorrad : F~hr~otive und Erl.e~nisformen gestern und heute In. Motorradfahren : Faszination und Restnktlon / Hubert Koch (Hrsg). -Bochum, 1990. - P. 1-12. - (Forschungshefte Zweiradsicherheit; 6)
(8) Koch, H.; Schulz, U.: Was beeinflußt das Unfallgeschehen von Motorradfahrern? In: Motorradfahren : Faszination und Restriktion / Hubert Koch (Hrsg.). Bochum, 1990. - P. 217-227. - (Forschungshefte Zweiradsicherheit; 6)
(9) Näätänen, R., Summala, H.: Road User Behaviour and Traffic Accidents. - Amsterdam, 1976
(10) Nowak, H.: Ergebnisse einer psychologischen Leitstudie als Vorstufe zur BasisUntersuchung "Motorradfahren in Deutschland". - Heidelberg, 1979
p
464
(11) Pfafferott, 1.; Müffeler-Römer, A: Zur Altersstruktur motorisierter Zweiradfahrer In: .Zeitschrift für Verkehrsicherheit 37(1991)3. - P. 122-124
(12) Rheinberg, F.: Flow-Erleben, Freude an riskantem Sport und andere "unvernünftige" Motivationen In: Kognition, Motivation und Handlung / Hrsg.: H. Heckhausen (u.a.). -Göttingen, 1990
(13) Schlag, S.; Ellinghaus, D.; Steinbrecher, J.: Risikobereitschaft junger Fahrer, Bergisch Gladbach, 1986. - (Unfall- und Sicherheitsforschung Straßenverkehr; 58)
(14) Schulz, U.; Kerwien, H.; Koch, H.: Anreize des Motorradfahrens. Einschätzung durch Motorradfahrer. In: Motorrad: 3. Fachtagung, Darmstadt, 5. u. 6. Okt. 1989/ VDI-Gesellschaft Fahrzeugtechnik. - Düsseldorf, 1989. - P. 27-43. - (VDI-Berichte; 779)
(15) Schulz, U.; Kerwien, H.: Risikowahrnehmung, Risikoeinschätzung und Risikobereitschaft junger Motorradfahrer In: Motorradfahren : Faszination und Restriktion / Hubert Koch (Hrsg.). -Bochum, 1990, P. 67-92. - (Forschungshefte Zweiradsicherheit; 6)
(16) Schulz, U.; Kerwien, H.; Brendicke, R.: Young motorcycle riders' risk taking In: The Human Element: Proceedings of the International Motorcycle Safety Conference Orlando, Florida, October 31 - November 3, 1990/ The Motorcycle Safety Foundation. -Irvine, Calif., 1990. - P. 9.81-9.118
(17) SCh4,lze, H.: Zur Okologie jugendlichen Freizeit- und Verkehrsverhaltens : BDP-Kongreß für Psychologie und Fortbildungsveranstaltung. - Rorschach, 1990
Motorbiking: Motives and Emotions
Ulrich Schulz
Heike Gresch
Hartmut Kerwien
Universität Bielefeld
Germany
-467
1 Abstract
Over the last 30 years, the motorbike has changed fram a pure utility vehicle into a leisure-time vehicle. This was first confirmed by statistics on motorbike usage. The few motivational studies addressing motorbikers [e.g., Rheinberg et al., 1986 (13); Schulz et al., 1989 (17)] have indicated accompanying changes in attitudes. They show that motorbiking today is almost exclusively an intrinsically motivated leisure-time activity with a varyingly strong sporting character. According to Schulz et al. (1989, 17), the motives for motorbiking are correspondingly differentiated among the users of different types of motorbike such as sport bikes, choppers, enduros, or touring bikes.
On the basis of our own studies, we developed a detailed instrument for assessing motives and emotions in motorbiking that comprehensively assessed the motivation al and emotional aspects of an intrinsically motivated leisure-time activity such as: positive experience, dynamic aspects of biking, performance aspects, social aspects, control beliefs, identification with the motorbike, as weil as experiencing flow and sensation seeking. It the last two aspects in particular have been studied intensively in motivational and differential research on high-risk leisure-time activities.
The instrument contains ascale for each of the above-mentioned aspects. It was tested on 376 motorbikers. The psychometrie analysis of the data demonstrated the quality of the instrument. Further statistical-differential studies have shown which differences in motives and emotions exist between single age groups an users of different types of motorbike. The different temperaments of the individual driver types are clearly expressed in motives and emotions.
p
468
2 Motorbiking as a Leisure-Time Activity
In the Western part of Germany, motorbikes have almost exclusively been used as leisure-time vehicles for more than 20 years. The original role of the motorbike as a means of transport has strongly diminished [Koch, 1977 (9); 1990 (10)]. The focus today is on the pleasure of biking. In agreement with Rheinberg et al. (1986, 13) and Rheinberg (1990, 14), biking can be characterized according to Csikszentmihalyi (1985,4) as an intrinsically motivated, autotelic activity.
Even if outsiders are unable to differentiate between various types of biker, it has been a long time, in any case, since they were a homogeneous group of persons who all practiced the same leisure-time activity. In recent years, it is more the case that leisure-time specializations have developed that are linked to different forms of experience and concepts of biking. Special types of motorbike have been developed for these particular purposes. We can differentiate between sport bikes, enduros, choppers, and touring bikes as the main directions. The differences in the form of experience can be traced back to the differentiation of driving motives. A first systematic assessment of important biking motives has been presented by Koch (1977,9). A psychoanalytically oriented study of motivational aspects of biking based on explorative interviews has been presented by Dellen and Bliersbach (1978, 5). Nagels has worked out a comprehensive catalogue of driving motives in bikers based on interview data and content analyses of bi king advertisements and articles in bikers' journals [Rheinberg, Dirksen, & Nagels, 1986 (13)].
Schulz, Kerwien, and Koch (1989, 17) have presented a comprehensive system of biking motives in six categories and have been able to demonstrate how the different forms of motorbiking experience could be traced back to diverse motives. Hagstotz (1990,8) found similar results in a study of a typology of bikers. Some of the findings from a study by Haeberlin, Stange, and Henning (1990, 7) can also be interpreted in
the same way.
In the last three studies mentioned above, the special motivational aspects were represented by single items in questionnaires. The goal of the present study is to use Schulz et al.'s 1989, 11) system of bikers' motives to develop an instrument that not only assesses the motivational aspects of biking as a leisure-time activity but also meets psychometric criteria. Motivational aspects presented in the literature were summarized into short, homogeneous scales that were then controlled for reliability. It was intended to use these scales to test whether individual groups of bikers differed on these motivational aspects. For this purpose, bikers were differentiated not only according to various forms of biking experience but also according to age groups.
469
3 Motivational Aspects of Biking
As an intrinsically motivated leisure-time activity, biking is coupled with positive emotions. These include joy, fun, and pleasure. Battmann (1984, 2) and Koch (1990, 10) have called the desire for such experiences hedonism.
As Nowak (1979, 11) has pointed out, biking as a leisure-time activity can involve a flight from everyday reality or even escape fram civilization. This includes aspects such as relaxing and switching off, forgetting everyday worries, fleeing the drabness of everyday life, self-discovery, or putting oneself in a good mood. These aspects can be summarized under the concept of escapism [Nowak, 1979, (11)].
Particularly when driving, one can seek the experience of acceleration, speed, mobility, and cornering. These motives, which are related to the physics of motorbikes, are labeled dynamic aspects of bi king [Rheinberg et al.: 1986 (13); Schulz et al., 1989 (17)].
For some, bi king has a sporting character. This is coupled with motives to master the vehicle and cope with the physical and psychological demands of driving. For some bikers, this also includes testing the performance limits of oneself and one's machine [Rheinberg et al., 1986 (13); Schulz et al., 1989 (17)]. Dellen and Bliersbach (1978,5) suspect that this is a consequence of an increase in perceived power. The performance aspect will be used as a heading for this concept.
Competent driving is not always a self-fulfilling goal. Particularly when bi king is understood as asport, a certain showing-off of performance is also intended. Dellen and Bliersbach (1978, 5) were the first to point out this phenomenon. Rheinberg (1990, 14) has called this the gladiator effect. Schulz (1990, 16) has called it exhibition driving.
Closely linked to the performance motive and the sporting nature of bi king is competition. This particularly includes aspects such as being fast er and better than others. Dellen and Bliersbach (1978, 5) attributed to some bikers a permanent need to assert themselves against other raad users. For these aspects, we will use the concept of rivalry.
Persons who are generally open and receptive to new stimuli can be interested in risky activities. Such persons seek out risky situations and activities in order to experience a subjectively optimal and pleasant state of physiological arousal. Within the more general construct of sensation seeking, Zuckerman (1984, 19) has particularly pointed to the search for adventure and thrills as a special subaspect of
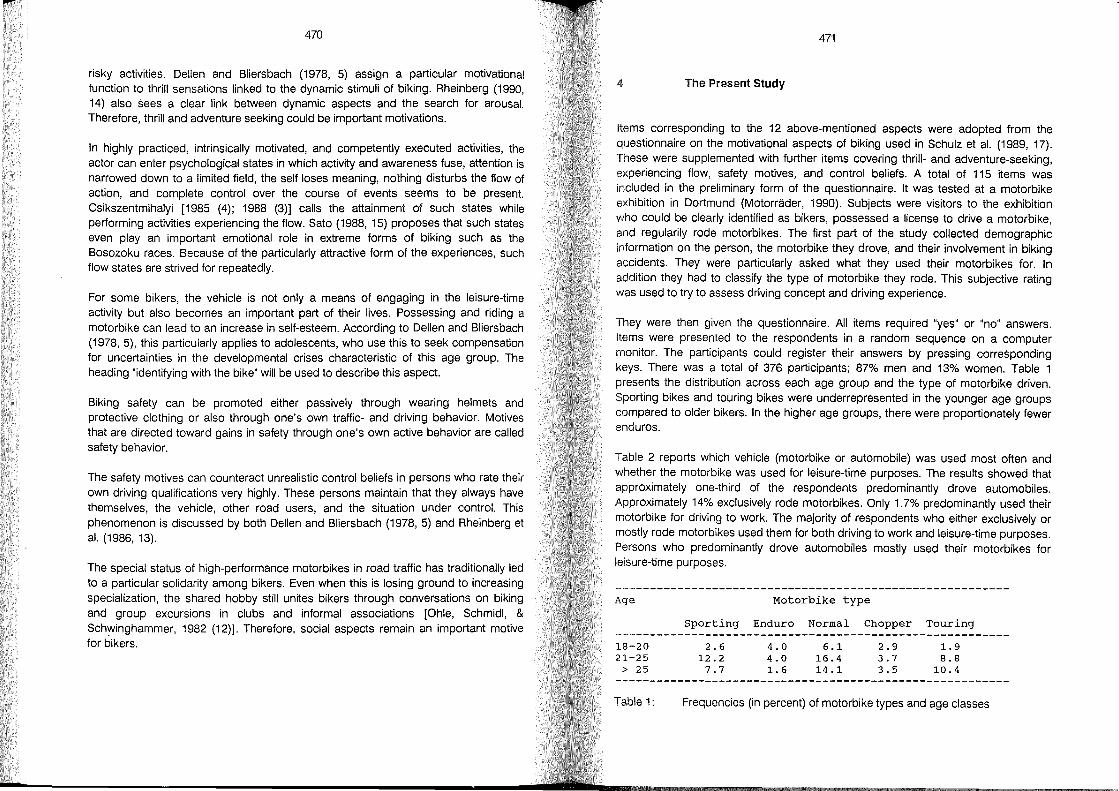
470
risky activities. Dellen and Bliersbach (1978, 5) assign a particular motivational function to thrill sensations linked to the dynamic stimuli of biking. Rheinberg (1990, 14) also sees a clear link between dynamic aspects and the search for arousal. Therefore, thrill and adventure seeking could be important motivations.
In highly practiced, intrinsically motivated, and competently executed activities, the actor can enter psychological states in which activity and awareness fuse, attention is narrowed down to a limited field, the seit loses meaning, nothing disturbs the flow of action, and complete control over the course of events seems to be present. Csikszentmihalyi [1985 (4); 1988 (3)] calls the attainment of such states while performing activities experiencing the flow. Sato (1988, 15) proposes that such states even play an important emotional role in extreme forms of biking such as the Bosozoku races. Because of the particularly attractive form of the experiences, such flow states are strived for repeatedly.
For some bikers, the vehicle is not only a means of engaging in the leisure-time activity but also becomes an important part of their lives. Possessing and riding a motorbike can lead to an increase in self-esteem. According to Dellen and Bliersbach (1978,5), this particularly applies to adolescents, who use this to seek compensation for uncertainties in the developmental crises characteristic of this age group. The heading "identifying with the bike" will be used to describe this aspect.
Biking safety can be promoted either passively through wearing heimets and protective clothing or also through one's own traffic- and driving behavior. Motives that are directed toward gains in safety through one's own active behavior are called safety behavior.
The safety motives can counteract unrealistic control beliefs in persons who rate their own driving qualifications very highly. These persons maintain that they always have themselves, the vehicle, other road users, and the situation under control. This phenomenon is discussed by both Dellen and Bliersbach (1978, 5) and Rheinberg et al. (1986, 13).
The special status of high-performance motorbikes in road traffic has traditionally led to a particular solidarity among bikers. Even when this is losing ground to increasing specialization, the shared hobby still unites bikers through conversations on biking and group excursions in clubs and informal associations [Ohle, Schmidl, & Sch~inghammer, 1982 (12)]. Therefore, social aspects remain an important motive for bikers.
471
4 The Present Study
Items corresponding to the 12 above-mentioned aspects were adopted from the questionnaire on the motivational aspects of biking used in Schulz et al. (1989, 17). These were supplemented with further items covering thrill- and adventure-seeking, experiencing flow, safety motives, and control beliefs. A total of 115 items was included in the preliminary form of the questionnaire. It was tested at a motorbike exhibition in Dortmund (Motorräder, 1990). Subjects were visitors to the exhibition who could be clearly identified as bikers, possessed a license to drive a motorbike and regularily rode motorbikes. The first part of the study collected demographi~ information on the person, the motorbike they drove, and their involvement in biking accidents. They were particularly asked what they used their motorbikes for. In addition they had to classify the type of motorbike they rode. This subjective rating was used to try to assess driving concept and driving experience.
They were then given the questionnaire. All items required "yes" or "no" answers. Items were presented to the respondents in a random sequence on a computer monitor. The participants could register their answers by pressing corresponding keys. There was a total of 376 participants; 87% men and 13% women. Table 1 presents the distribution across each age group and the type of motorbike driven. Sporting bikes and touring bikes were underrepresented in the younger age groups compared to older bikers. In the higher age groups, there were proportionately fewer enduros.
Table 2 reports which vehicle (motorbike or automobile) was used most often and whether the motorbike was used for leisure-time purposes. The results showed that approximately one-third of the respondents predominantly drove automobiles. Approximately 14% exclusively rode motorbikes. Only 1.7% predominantly used their motorbike for driving to work. The majority of respondents who either exclusively or mostly rode motorbikes used them for both driving to work and leisure-time purposes. Persons who predominantly drove automobiles mostly used their motorbikes for leisure-time purposes.
Age
18-20 21-25
> 25
Table 1:
Motorbike type
Sporting Enduro Normal Chopper Touring
2.6 12.2
7.7
4.0 4.0 1.6
6.1 16.4 14.1
2.9 3.7 3.5
1.9 8.8
10.4
Frequencies (in percent) of motorbike types and age classes
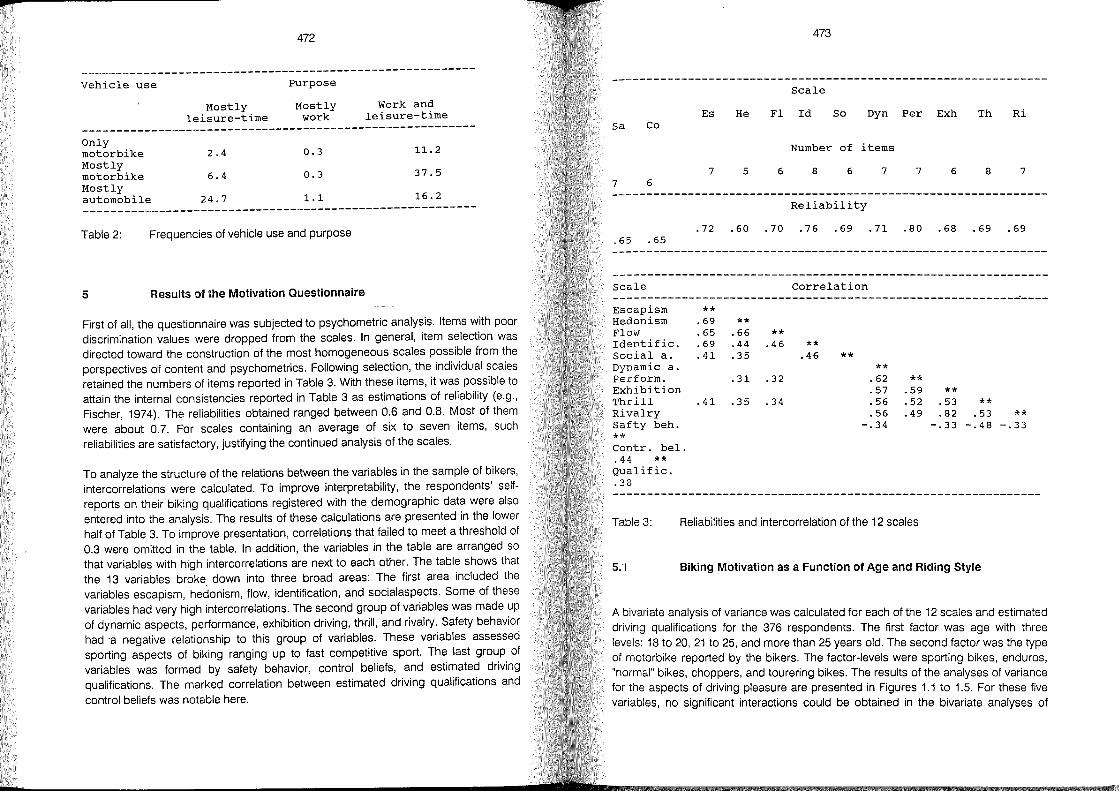
F
472
---------------------------------------------------------Vehicle use
Mostly leisure-time
Purpose
Mostly work
Work and leisure-time
---------------------------------------------------------Only motor bike 2.4 0.3 11.2 Mostly motorbike 6.4 0.3 37.5 Mostly automobile 24.7 1.1 16.2 ---------------------------------------------------------
Table 2: Frequencies of vehicie use and purpose
5 Results of the Motivation Questionnaire
First of all, the questionnaire was subjected to psychometric analysis. Items with poor discrimination values were dropped from the scales. In general, item selection was directed toward the construction of the most homogeneous scales possible from the perspectives of content and psychometrics. Following selection, the individual scales retained the numbers of items reported in Table 3. With these items, it was possible to attain the internal consistencies reported in Table 3 as estimations of reliability (e.g., Fischer, 1974). The reliabilities obtained ranged between 0.6 and 0.8. Most of them were about 0.7. Fbr scales containing an average of six to seven items, such reliabilities are satisfactory, justifying the continued analysis of the scales.
To analyze the structure of the relations between the variables in the sampie of bikers, intercorrelations were calculated. To improve interpretability, the respondents' selfreports on their biking qualifications registered with the demographic data were also ente red into the analysis. The results of these calculations are presented in the lower half of Table 3. To improve presentation, correlations that failed to meet a threshold of 0.3 were omitted in the table. In addition, the variables in the table are arranged so that variables with high intercorrelations are next to each other. The table shows that the 13 variables broke. down into three broad areas: The first area inciuded the variables escapism, hedonism, flow, identification, and socialaspects. Some of these variables had very high intercorrelations. The second group of variables was made up of dynamic aspects, performance, exhibition driving, thrili, and rivalry. Safety behavior had 'a negative relationship to this group of variables. These variables assessed sporting aspects of biking ranging up to fast competitive sport. The last group of variables was formed by safety behavior, control beliefs, and estimated driving qualifications. The marked correlation between estimated driving qualifications and control beliefs was notable here.
473
---------------------------------------------------------------Scale
Es He Fl Id So Dyn Per Exh Th Ri Sa Co
Number of items
7 5 6 8 6 7 7 6 8 7 7 6
Reliability
.72 .60.70.76.69.71.80.68.69.69 .65 .65
~~~~~---------------------~~~~~~~~i~~-------------------------
~~~~;i~~-----::-------------------------------------------~----
Hedonism .69 ** Flow .65 .66 ** Identific. .69 .44 .46 social a. .41 .35 Dynamic a. Perform. Exhibition Thrill Rivalry Safty beh. ** Contr. bel . . 44 ** Qualific. .38
.41
.31 .32
.35 .34
** .46 **
** .62 .57 .56 .56
-.34
** .59 .52 .49
Table 3: Reliabilities and intercorrelation of the 12 scales
** .53 ** .82 .53 **
-.33 -.48 -.33
5.1 Biking Motivation as a Function of Age and Riding Style
A bivariate analysis of variance was calculated for each of the 12 scales and estimated driving qualifications for the 376 respondents. The first factor was age with three levels: 18 ~o 20,21 to 25, and more than 25 years old. The second factor was the type of motorbike reported by the bikers. The factor-Ievels were sporting bikes enduros "normal" bikes, choppers, and tourering bikes. The results of the analyses ~f varianc~ for the aspects of driving pleasure are presented in Figures 1.1 to 1.5. For these five variables, no significant interactions could be obtained in the bivariate analyses of
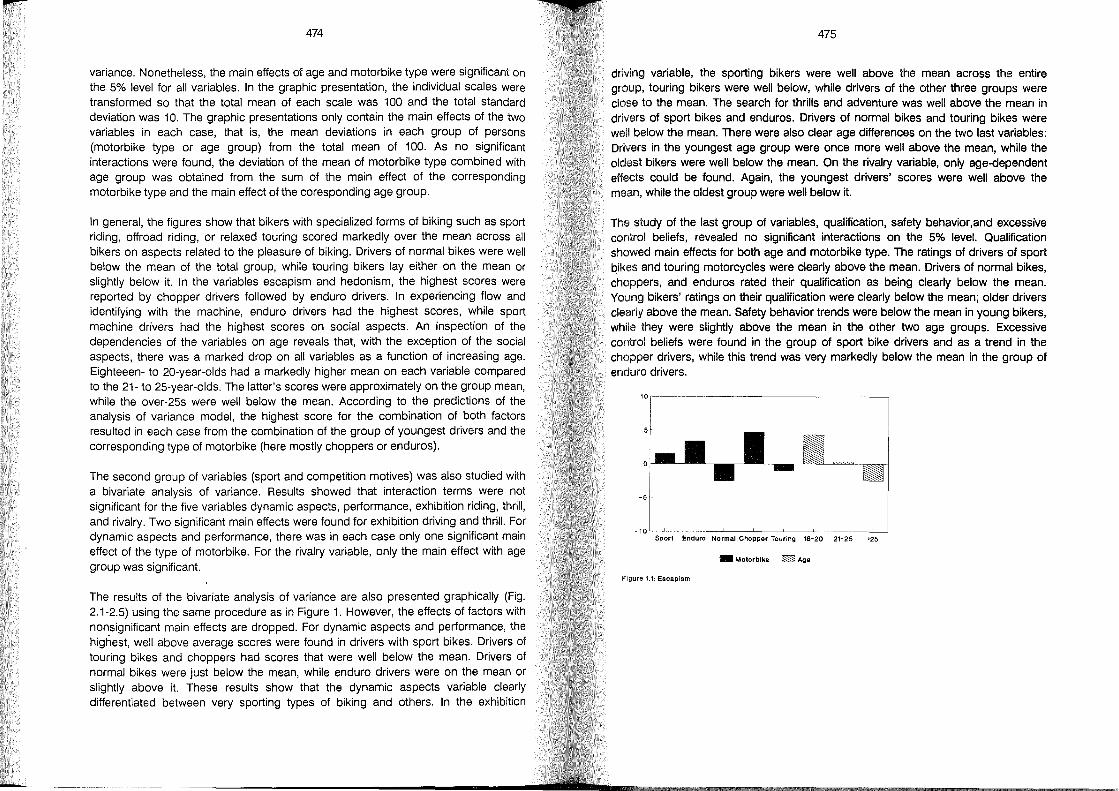
p
474
variance. Nonetheless, the main effects of age and motorbike type were significant on the 5% level for all variables. In the graphic presentation, the individual scales were transformed so that the total mean of each scale was 100 and the total standard deviation was 10. The graphic presentations only contain the main effects of the two variables in each case, that is, the mean deviations in each group of persons (motorbike type or age group) from the total mean of 100. As no significant interactions were found, the deviation of the mean of motorbike type combined with age group was obtained from the sum of the main effect of the corresponding motorbike type and the main effect of the coresponding age group.
In general, the figures show that bikers with specialized forms of biking such as sport riding, offroad riding, or relaxed touring scored markedly over the mean ac ross all bikers on aspects related to the pleasure of biking. Drivers of normal bikes were weil below the mean of the total group, while touring bikers lay either on the mean or slightly below it. In the variables escapism and hedonism, the highest scores were reported by chopper drivers followed by enduro drivers. In experiencing flow and identifying with the machine, enduro drivers had the highest scores, while sport machine drivers had the highest scores on social aspects. An inspection of the dependencies of the variables on age reveals that, with the exception of the social aspects, there was a marked drop on all variables as a function of increasing age. Eighteeen- to 20-year-olds had a markedly higher mean on each variable compared to the 21- to 25-year-olds. The latter's scores were approximately on the group mean, while the over-25s were weil below the mean. According to the predictions of the analysis of variance model, the highest score for the combination of both factors resulted in each case from the combination of the group of youngest drivers and the corresponding type of motorbike (here mostly choppers or enduros).
The second group of variables (sport and competition motives) was also studied with a bivariate analysis of variance. Results showed that interaction terms were not significant for the five variables dynamic aspects, performance, exhibition riding, thrilI, and rivalry. Two significant main effects were found for exhibition driving and thrill. For dynamic aspects and performance, there was in each case only one significant main effect of the type of motorbike. For the rivalry variable, only the main effect with age group was significant.
The results of the bivariate analysis of variance are also presented graphically (Fig. 2.1-2.5) using the same procedure as in Figure 1. However, the effects of factors with nonsignificant main effects are dropped. For dynamic aspects and performance, the highest, weil above average scores were found in drivers with sport bikes. Drivers of touring bikes and choppers had scores that were weil below the mean. Drivers of normal bikes were just below the mean, while enduro drivers were on the mean or slightly above it. These results show that the dynamic aspects variable elearly differentiated between very sporting types of bi king and others. In the exhibition
475
driving variable, the sporting bikers were weil above the mean across the entire group, touring bikers were weil below, while drivers of the other three groups were elose to the mean. The search for thrills and adventure was weil above the mean in drivers of sport bikes and enduros. Drivers of normal bikes and touring bikes were weil below the mean. There were also clear age differences on the two last variables: Drivers in the youngest age group were once more weil above the mean, while the oldest bikers were weil below the mean. On the rivalry variable, only age-dependent effects could be found. Again, the youngest drivers' scores were weil above the mean, while the oldest group were weil below it.
The study of the last group of variables, qualification, safety behavior,and excessive control beliefs, revealed no significant interactions on the 5% level. Qualification showed main effects for both age and motorbike type. The ratings of drivers of sport qikas and touring motorcycles were clearly above the mean. Drivers of normal bikes, choppers, and enduros rated their qualification as being clearly below the mean. Young bikers' ratings on their qualification ware clearly below the mean; older drivers clearly above the mean. Safety behavior trends were below the mean in young bikers, while they were slightly above the mean in the other two age groups. Excessive control beliefs were found in the group of sport bike drivers and as a trend in the chopper drivers, while this trend was very markedly below the mean in the group of enduro drivers.
10,--------------------------------,
-5
-10'-:-"----::--'-----'-----'------'------"-----"-----'--1 Sport Enduro Normal Chopper Touring 18-20 21-25 >25
_ Motorbike ~ Ag.
Figura 1.1: Escapism
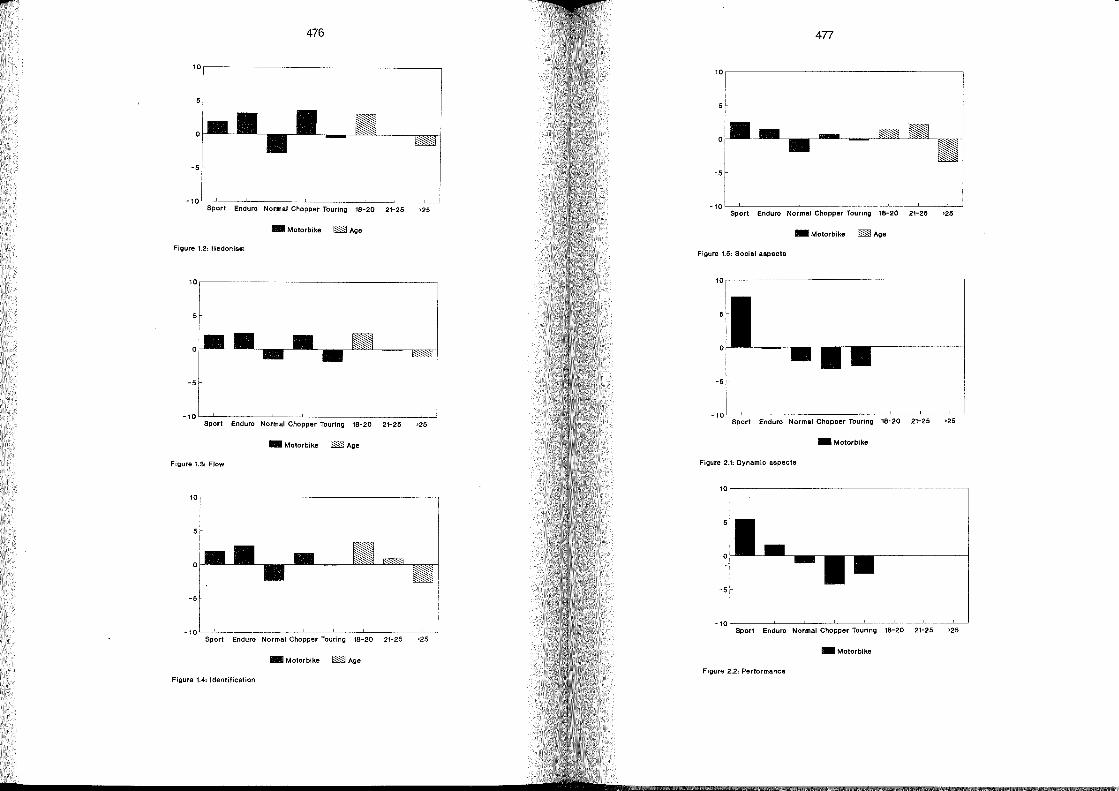
476
1o,---------------------------____________ __
-5
-10L-~----~--~-----L----~----L_ __ ~ ____ _L~ Sport Enduro Normal Chopper Touring 18-20 21-25 '25
_ Motorbike ~ Age
Figure 1.2: Hedonism
10,----------------------------------------,
5
-5
_10~-L--~-----L __ ~L----l-----L __ ~~--~~ Sport Enduro Normal Chopper Touring 18-20 21-26 >25
_ Motorbike rn Age
Figure 1.3: Flow
10,----------------------------------------,
-6
_10~-L--~-----L----L---~-----L--~ __ --~~ Sport Enduro Normal Chopper Touring 18-20 21-25 >25
_ Motorbik. rn Ag.
Figura 1.4: Idenlificetion
477
10,----------------------------------------,
-5
_10L-~--~--~~~~--~L-__.~~~~--~-" Sport Enduro Normal Chopper Touring 18-20 21-25 >26
_ Motorbike ~ Age
Figura 1.6: Soelel 8spects
10,--------------------------------------,
-5
-10L--L-----L-----L--~-L--~~--~8~2=0~~2~1-~2~5~~'2~6~ Sport Enduro Normal Chopper Touring 1-
_Motorbike
Figure 2.1: Oynamic aspects
10,--------------------------------------,
-5
-1 0 Ls-pLo-rt--E-n-dLu-ro--N-o~rLm-a-1 -C-hO-"p-p-.-r ~To-u~r-in-g--1~8~-2:-:0~-:2-:1-L2-:6-----:'2~5-
_Motorbike
Figure 2.2: Performance
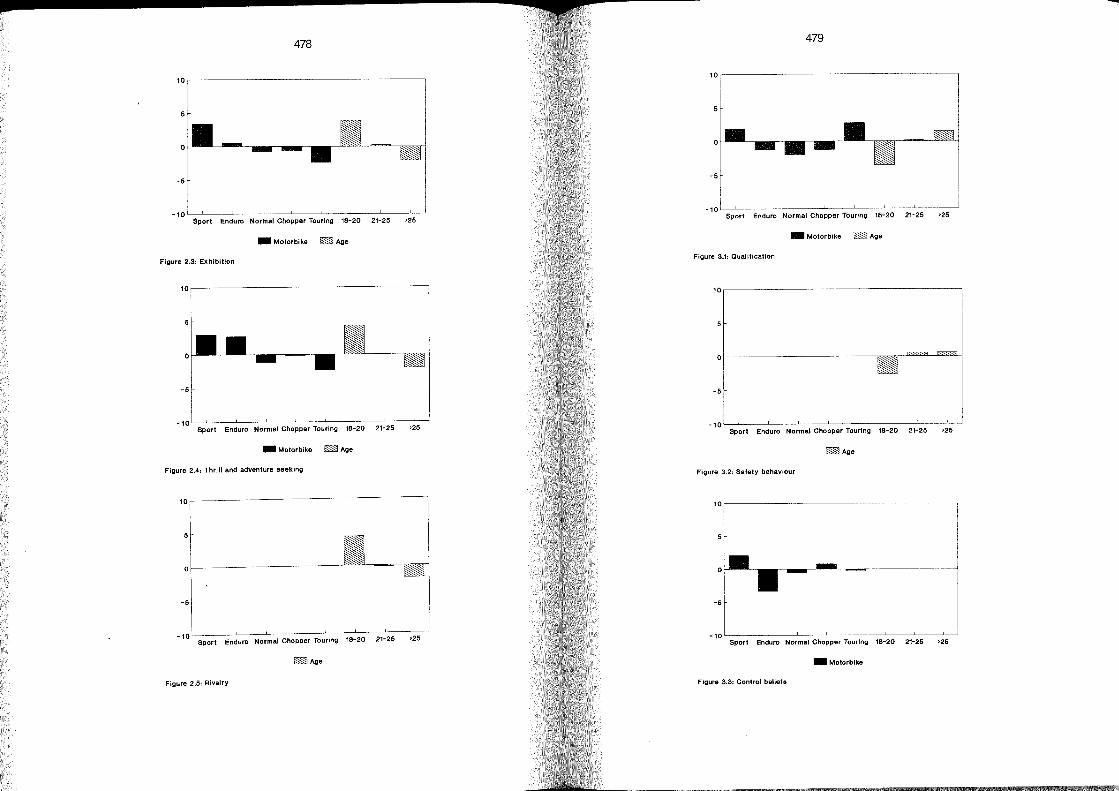
478 479
10~---------------------------------------'
o
-5 -5
_10L-~--~-----L----L----L----~--~-----L~ Sport Enduro Normal Chopper Touring 16-20 21-25
Sport Enduro Normal Chopper Touring 18-20 21-25 '25 '25
_ Motorbike ~ Aga _ Motorbike ~ Age
Figure 2.3: Exhibition Figure 3.1: Qualification
10~---------------------------------------- 1o,----------------------------------------,
O~----------------------
-5 -5
Sport Enduro Normal Chopper Touring 16-20 21-25 '25 _10~~--~----~---L----L----L----L----L~
Sport Enduro Normal Chopper Touring 18-20 21-25 >25
_ Motorbike ~ Aga ~Age
Figure 2.4: Thrill end adventure seeking Figura 3.2: Safety behaviour
10~--------------------------------------"' 10--------------------------------------,
O~-----------------------
-5 -5
-10--s~po-r-t--E-n~du-r-o--N-o~rm-.-I-c-h-oLp-pe-r-"-o-uLri-ng---18~-L2-0--~21J-~25~--'~25~ _10--~--~----~--~-----L--~-----L----~ Sport Enduro Normal Chopper Tourlng 18-20 21-25 '25
~Age _Motorbike
Figure 2.6: Rivalry Figura 3.3: Contral beliefe
480
6 Discussion and Conclusions
Recent years have seen more comprehensive studies on the motives for motorbiking as a leisure-time activity. Twelve particularly significant motivational aspects can be derived from these studies. It is possible to draw on the work of Schulz et al. (1989, 17) when formulating items for scales on hedonism, escapism, dynamic aspects, exhibition driving, rivalry, identification with the motorbike, and social aspects. New items are formulated for sensation seeking, flow, and control beliefs. An intensive item selection results in brief, homogeneous scales with a satisfactory reliability. The shortened questionnaire is thus a qualified instrument for the assessment of motives in motorbikers.
The 12 scales fall into three groups of variables with a relatively elose within-group relationship and a relatively loose relationship between groups. These groups of variables can be labeled: bi king for pleasure, bi king as a fast, competitive sport, and control over the motorbike. In an attempt to elassify motorbikers with attitude scales, Hagstotz (1990, 8) has found two groups of variables that are relatively similar to the first two groups presented here. Rheinberg et al. (1986, 13) have also found a dimension that is similar to our second group of variables in an analysis of the driving behavior of motorbikers.
The dependencies of the motives assessed with the scales on the factors of age and motorbike type show that drivers of specialized bikes such as sport bikes, choppers, and enduros are more interested in driving pleasure than the drivers of other mach in es. Dynamic aspects of driving mostly motivate drivers of sport bikes. Some of these drivers also like to exhibit their skills. Performance and aspects of sensation seeking in the form of adventure and thrills are more marked in the drivers of sport bikes and enduros. Touring bikers, drivers of normal motorcyeles, and chopper drivers have lower scores on these variables. Drivers of sport and touring bikes give particularly high ratings on their own qualification and have higher control beliefs.
These very clear motivational differences in the different types of driver confirm that the way in wh ich driving is experienced and the self-concept of bikers is based on different constellations of motives. The type of bikes chosen provide elear information on the bikers' motives and thus on the experiences they seek and their concept of biking. Naturally, this only holds when bikers ride the motorbike that they want to possess. When a touring biker has to drive a sport bike, this will not simultaneously alter his or her motivational structure. In addition, a certain variability in the constellations of motives has to be assumed within each group of drivers, so that the type of machine chosen represents the best alternative. If there were no financial constraints on buying motorbikes, the possession of several machines of different type would be completely conceivable.
481
Alongside the type of motorbike, the biker's age frequently plays an important role. Young bikers' scores on driving pleasure, exhibition driving, and thrills are higher than those in other age groups. In general, the young bikers show much higher tendencies to "live it up." Qualification and safety behavior are accordingly rated lower. Nonetheless, young drivers give fairly realistic ratings on their driving skills.
It can be demonstrated that major information on the motives of motorbiking and the strength of these motives can be obtained from such easily determined features as motorbike type and age. These, in turn, are closely related to the driving concepts and the type of driving experience sought. Therefore, we consider that it is unnecessary to use psychographic methods to form homogeneous groups of motorbikers, like Haeberlin et al. (1990, 7), to increase the effectiveness of driving instruction. It is much easier to construct homogeneous interest groups by selecting groups according to motorbike type and age. As yet, little attention has been paid to these concepts in driving instruction, except perhaps for drivers with sporting ambitions on race tracks. Particularly if driving instruction were to be meaningfully linked to driving in groups, the formation of groups according to homogeneous driving concepts would seem to be indicated.
p
7
1)
2)
3)
4)
5)
6)
7)
8)
9)
10)
11 )
482
Reference list
Angleitner, A.: Presidential address : Personality psychology ; Trends and developments In: European Journal of Personality (1990)
Battmann, W.: Qer jugendliche Motorradfahrer zwischen Hedonismus und Okologiebewußtsein In: Jugend und Werte / A. Stiksrud (Hrsg.). - Weinheim, 1984.- S. 289-299
Csikszentmihalyi, M.: The flow experience and its significance for human psychology In: Optimal experience / M. Csikszentmihalyi; I.S. Csikszentmihalyi (Hrsg.). -New York, 1988
Csikszentmihalyi, M.: Das Flow-Erlebnis : jenseits von Angst und Langeweile. - Stuttgart, 1985
Dellen, R.G.; Bliersbach, G.: Motivanalytische Aspekte des gegenwärtigen Motorrad-Booms und Ergebnisse einer Auswertung von Motorrad-Unfällen In: Die Sicherung des Zweiradverkehrs / Arbeits- und Forschungsgemeinschaft für Straßenverkehr und Verkehrssicherheit. - Köln, 1978. - S. 117-145. - (Buchreihe der Arbeits- und Forschungsgemeinschaft für Straßenverkehr und Verkehrssicherheit; 31)
Fischer, G.: Einführung in die Theorie psychologischer Tests, Teil I. - Bern, 1974
Haeberlin, F.; Stange. B.; Henning, U.: Selbstkonzepte von Motorradfahrern In: Zeitschrift für Verkehrssicherheit 36(1990)3. - S. 113-116
Hagstotz, W.: Zur Typologie von Motorradfahrern In: Motorradfahren : Faszination und Restriktion / H. Koch (Hrsg.). Institut für Zweiradsicherheit. - Bochum, 1990. - S. 107-130. - (Forschungshefte Zweiradsicherheit; 6)
Koch, H.: Motorradfahren heute: kommentierte Ergebnisse einer Befragung von Motorradfahrern auf der Internationalen Fahrrad- und Motorradausstellung (IFMA) 1977 .
Koch, H.: Die Lust am Motorrad: Fahrmotive und Erlebnisformen gestern und heute In: Motorradfahren : Faszination und Restriktion / H. Koch (Hrsg.). Institut für Zweiradsicherheit. - Bochum, 1990. - S. 1-12. - (Forschungshefte Zweiradsicherheit; 6)
Nowak, H.: Ergebnisse einer psychologischen Leitstudie als Vorstufe zur BasisUntersuchung "Motorradfahren in Deutschland". - Heidelberg, 1979
483
Ohle, K.; Schmidl, P.; Schwinghammer, T.: Gruppensoziologische Untersuchungen zum Freizeitverhalten und zur Unfallverwicklung motorisierter Zweiradfahrer In: Motorradclubs / Bundesanstalt für Straßenwesen. - Köln, 1982. - S. 7-110. -(Unfall- und Sicherheitsforschung Straßenverkehr; 38)
Rheinberg, F.; Dirksen, U.; Nagels, E.: Motivanalysen zu verschieden riskantem Motorradfahren In: Zeitschrift für Verkehrssicherheit 32(1986)2. - S. 75-80
Rheinberg, F.: Flow-Erleben, Freude an riskantem Sport und andere "unvernünftige" Motivationen In:. ~ognition, Motivation und Handlung / H. Heckhausen; J Kuhl (Hrsg.). -Gottlngen, 1990
Sato,l.: Bosozoku : flow in Japanese motorcycle gangs In: Optimal experience / M. Csikszentmihalyi; I. Csikszentmihalyi (Hrsg.). - New York, 1988
Schulz, U.: Verhalten von Motorradfahrern In: Motorradfahren : Faszination und Restriktion / H. Koch (Hrsg.) Institut für Zweiradsicherheit. - Bochum, 1990. - S. 13-66. - (Forschungshefte Zweiradsicherheit; 6)
Schulz, U.; Kerwien, H.; Koch, H.: Motive des Motorradfahrens : Einschätzung durch Motorradfahrer In: Motorrad: 3. Fachtagung, Darmstadt, 5. u. 6. Oktober 1989 / VDI-Ges. Fahrzeugtechnik. - Düsseldorf, 1989. - S. 27-43.- (VDI-Berichte; 779)
Zuckerman, M.: Sensation seeking and risk taking In: Emotions in personality and psychopathology / C.E. Izard (Hrsg.). - Plenum Press, 1979
Zuckerman, M.: Sensation see king : a comparative approach to a human trait In: The Behavioral Sciences 7(1984)3. - S. 413-471
Construction und Development
Tilo Schweers, Christoph Albus: Objective Assessment of Motorcycle Manoeuvrability
Ludwig Iffelsberger: Application 01 Vehicle Dynamics Simulation in Motorcycle Development
Rudolf Sagerer, Gerhard Heinrich: Strength Testing for Substantiating the Frame Stability of Motorcycle and
Sidecar Combinations form Single Unit Production
Urs Tobler: Ergonomies and Motorcycles
Arnold Wagner: Concept, Realisation and Driving Experience of/in Motorcycles
with Enclosed Cabin
John W. Zellner, Scott A. Kebschull, Kenneth D. Wiley: Motorcycle Leg Protectors:
An Analysis 01 Overall Effectiveness Via Computer Simulation
i'f
Objective Assessment of Motorcycle Manoeuvrability
Tilo Schweers
Institut für Kraftfahrwesen
Technische Universität Aachen
Germany
Christoph Albus
Bundesanstalt für Straßenwesen, Bergisch Gladbach
Germany
489
1 Abstract
The active safety of motorcycles depends as much on the skill of the rider as on the handling of the bike itself, and is determined primarily by bike stability and maneuverability. Maneuverability can be defined as the speed, efficiency and precision with wh ich the bike responds to changes in rider controls. These days, the maneuverability of motorbikes is gauged almost exclusively by subjective rider opinion, and opinions often vary widely.
Maneuvers based on the automobile swerve test were carried out at the Institute for Automotive Engineering at the Technical University Aachen, with the aim of establishing an objective method for determining motorcycie maneuverability. Comparative test rides on winding country roads established that the response lag between the start of a steering torque and the resultant bike roll angle represents a valid criterion for judging maneuverability. It does not depend on driver skill and accords weil with subjective evaluations.
An established and standardized test method for evaluating bike maneuverability would then allow test personnel to vary parameters and investigate the effects of particular bike design features. As weil this test maneuver should be suitable for computer simulations.
490
2 Introduction
Despite positive trends in accident statistics in recent years, motorized two-wheelers continue to represent the highest accident risk of all conventional methOds of transport. On-going goals aimed at reducing the danger of accidents include increasing active safety (accident avoidance), and optimizing passive safety (mitigating accident consequences), with the potential for improvement in the area of passive safety being limited by the very nature of motorbikes.
Active safety depends to some extent on driver skills, and these are particularly important in the case of motorbikes because of the complex control procedures involved. Motorcycle handling also plays an important role, being mainly determined by the criteria stability and maneuverability. Sy stability we mean the ability of the bike to maintain speed and direction under destabilizing conditions, and to damp natural frequences as a result of internal and external influences. Sy maneuverability we mean the speed, efficiency and precision with which the bike executes a change of speed andjor direction (e.g., evasive action or entry into a curve) in response to driver contro!. It is clear from these definitions that compromises have to be made between stability and maneuverability when specifying the numerous design parameters involved in motorcycle construction.
Optimizing maneuverability, and thereby avoiding accidents [3,8, 11], is especially important owing to the frequency of accidents indicating evasive action. The use of anti-lock braking systems allows the rider to maintain stability during panic braking. A reasonably experienced rider can use a combined brakingjsteering maneuver to avoid a collision in dangerous circumstances. A bike wh ich roacts sluggishly under normal driving conditions will also do so du ring evasive action, but maneuverability is therefore a fairly important criterion when it comes to active safety, not just a question of rider's pleasure in riding.
Whereas considerable research has al ready been undertaken into the effect of weave characteristics on bike-stability at high speed, leading to the establishment of objective evaluation techniques (e.g., relaxation time and damping measure), the importance of bike maneuverability for evasive action in dangerous situations has scarcely been examined.
On~ reason for the lack of research in this area is the lack of standardized and tested methods for objectively evaluating the maneuverability of motorized two-wheelers. At present, evaluation consists almost exclusively of riders' own opinions. Such evaluations of a motorized vehicle by a variety of riders can, however, differ widely, because riding style, rider competence, physique and personal taste, not to mention form on the day, play an important role in the perception of maneuverability.
491
This circumstance led to the investigations by the Institute for Automotive Engineering at the Technical University Aachen, using several rider jbike combinations. The first goal of the research was to establish an appropriate maneuver, based on proven data, wh ich could be used to evaluate maneuverability objectively. Great importance was attached to the correlation between the subjective evaluation by the rider and the objective data derived from road tests. Areport was to be prepared detailing the information obtained during this project.
3 Present State of Knowledge
According to [6], the following control input is available to the rider of a motorlzed twowheeler when changing direction of travel:
Introducing steering torque into steering system Rider lean angle between rider's upper body and motorcycle z-axis, thereby initiating a tipping moment about the roll axis Accelerating and decelerating while banking.
As a rule, bike riders employ several of the above techniques simultaneously, but to varying degrees [2], depending on the proposed maneuver, speed, the kind of motorbike, and the experience and ability of the rider. In the view of various authors [3, 6, 1, 14, 9] the effect of the steering torque as control input is considerably greater than leaning the rider's upper body, especially with heavy motorbikes. The motorbike response mainly takes the form of rotation about the roll, yaw and steering axis, with the degree of rotation forming a feedback to the rider's control input. Circumstances in wh ich bike maneuverability has a significant effect during normal driving conditions include entry into a curve, correction in the curve, exiting the curve, changing lanes, and taking evasive action, the latter often carried out under braking.
Watanabe and Yoshida's 1973 paper [11] is often quoted. A number of riders using three Hondas (SL 125, CS 350, CS 750) carried out aseries of braking and obstacle avoidance maneuvers in an attempt to establish a quantitative test method for evaluating handling performance. The procedures were tried out at different speeds (50-100 kmjh) on a test track. The direction (Ieft or right) of the evasive action was signaled to the driver as the bike rode over a contact. The criterion for evaluating the maneuver was effectiveness C, defined as the ratio of the longitudinal evasion path to the speed of trave!. This ratio depends on speed, and increases from 0.32 (50 kmjh) to 0.42 (100 kmjh). The effectiveness of the evasive action varied very little among the three bikes. Surprisingly, in the case of the SL 125, which was thought to be the most maneuverable, the effectiveness ratio of 0.41 was higher than that of the CS 750 (0.4)
Jf 492
or the CB 350 (0.39). The authors conclude that the speed of the evasive maneuver is limited firstly by the rotating mass of the front wheel (cf [6], and that the ratio of the moment of inertia about the roll axis to the radial moment about the yaw axis determines the maneuverability of a two-wheeler (cf [7]). Thus, the CB 350 recorded the best value at 1.67, followed by the CB 750 at 1.74 and the SL 125 at 1.78. The main outcome of the study was evidence of considerable rider influence during the avoidance maneuver. An experienced rider achieved an effectiveness figure of 0.365, whereas a beginner only managed a value of 0.44. These results show that targeted rider training is more effective than design changes to the bike. Comparisons with braking maneuvers showed that evasive action was usually more successful at speeds above approx. 30 km/ho
In the mid-80s Prem published a paper [9] on the skills and control strategies of motorbike riders of differing experience. As was recorded by Watanabe and Yoshida [24], the success of evasive action was very rider dependent, with experienced riders demonstrating shorter re action times and reaching a greater steering angle in a shorter time. According to Prem, there is a connection between rider lean angle and steering input, wh ich is more noticeable among inexperienced riders, and results in slower but appropriate steering input. Clearly, beginners rely on rider angle as their main control input. Riders with greater degrees of experience use upperbody movement and steering as separate control inputs.
In the 70s, Weir carried out multiple road tests on maneuverability and stability using five bikes and five riders with varying degrees of road experience [13, 12]. A single lane change maneuver proved to be a good method of testing bike maneuverability in the middle and upper response range. Experienced riders hardly moved their upper bodies at all (relative to the bike), and used the steering moment (up to 42 Nm) as their main control input. Less experienced riders held their upper bodies vertical (relative to the road surface), especially at higher speeds, and moved the bike back and forth under them.
Rice [10] reported on road tests (Iane changing, steady state circular run) using four riders of varying road experience on a Honda CB 360G. Measurements were taken of steering torque, rider lean angle, steering angle (as rider input), roll angle and yaw angle speed (as bike response). The influence of the rider was shown to be very great, and a variety of driving strategies were observed. It was especially noticeable that experienced riders changed lanes more smoothly and efficiently, thereby achi!3ving a higher limit. A comparison of the road test results with results from a simulation (8 degrees of freedom) showed that rider influence had to be taken into account particularly during the evaluation of maneuverability.
In [1] Aoki presented five different road tests for experimentally examlnlng the bike/rider combination. Testing was carried out using four heavy Japanese bikes. The
493
test included among other things a lane change maneuver, aU-turn and a slalom test around cones. The latter test yielded almost sine-shaped results, with frequencies up to 0.55 Hz (depending on speed and distance between cones). Aoki based his rider /bike system on the closed-Ioop model. His bike responses (outputs) were roll angle, steering angle, straight acceleration and yaw angle speed. Rider variables were either steering torque (single input) or steering torque plus rider lean angle (dual input). Tests were evaluated over time and frequency ranges. The main result of this research was that, given high mass ratios (bike mass: rider mass), the influence of the rider lean angle as control input was very slight in relation to the steering angle.
Hasegawa and Sugizaki [4] presented test results (double lane change at 60 and 80 km/h) using a Yamaha Tourer (XJ 900) and a Yamaha Soft-Chopper (750 cc). Control input consisted of the steering torque and yaw- and roll rate as the bike responses. The response lag between input and output data was less in the case of the Tourer than with the Chopper. In addition, the Chopper required high er steering torque. When results were compared, the closest correlation coefficients of the subjective judgements of the rider were with respect of the power spectrum density of the roll rate as weil as in the case of the response lag between the yaw rate and steering torque. In future tests, the authors plan to use different maneuvers und er a variety of riding conditions, and with multiple riders. Subjective judgements of ride characteristics in actual road traffic will also be recorded.
In [6], Koch compares the results of road tests into the stability and maneuverability of a BMW R90S with the results of a simulation (14 degrees of freedom). In developing his supplementary model for the bike/rider system, Koch took into account not only models for the frame and steering system, but also the purely mechanical characteristics of the riders's upper body. Maneuverability was judged using aU-turn (riding a straight line - entry into curve - steady state circular run - curve exit - riding a straight line). Compared with the rider lean angle the input of steering torque pulse was found to have much greater effect as the bike entered the curve. Koch claims that there is a closer relationship between steering torque pulse, the peak roll angle speed and approach speed. The following rate has been proposed:
K A
')...·v
As speed increases, this ratio approach es a limit, KK' which can be established for a steady curve radius. The KK value can be regarded as a criterion of maneuverability for a particular bike. A small KK value indicates a maneuverable bike. The only bike
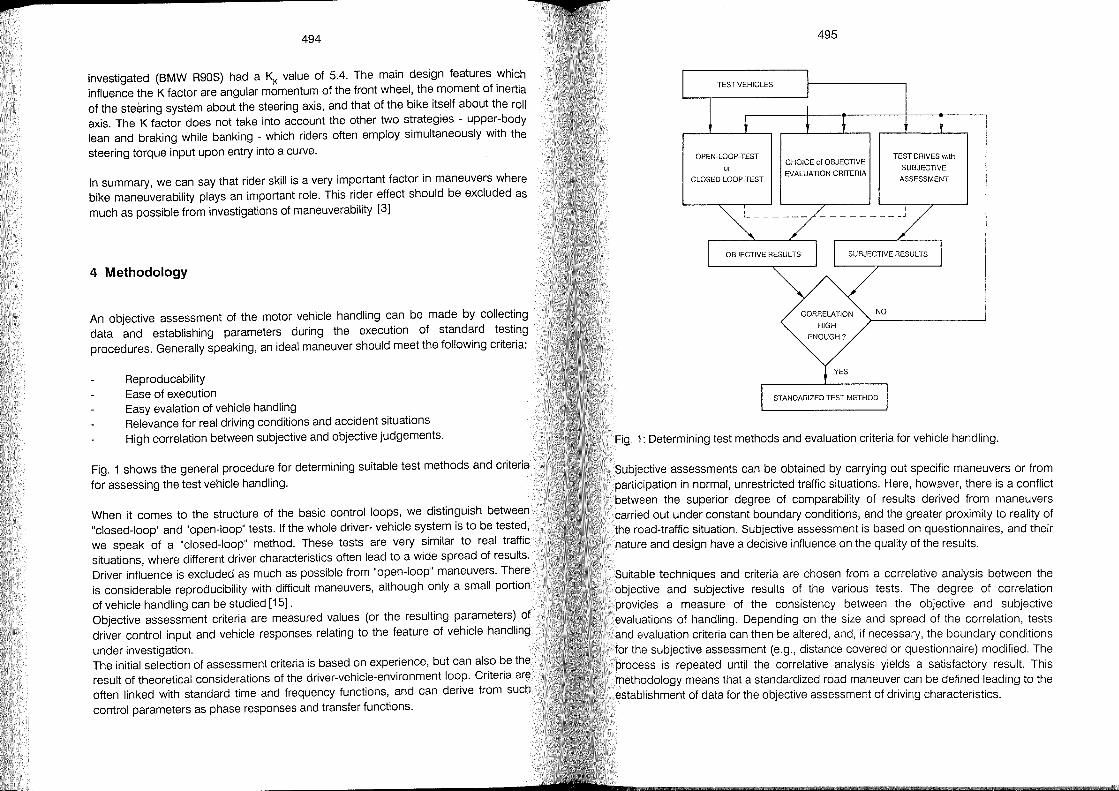
p
494
investigated (BMW R90S) had a KK value of 5.4. The main design features which influence the K factor are angular momentum of the front wheel, the moment of inertia of the steering system about the steering axis, and that of the bike itself about the roll axis. The K factor does not take into account the other two strategies - upper-body lean and braking while banking - which riders often employ simultaneously with the
steering torque input upon entry into a curve.
In summary, we can say that rider skill is a very important factor in maneuvers where bike maneuverability plays an important role. This rider effect should be excluded as much as possible from investigations of maneuverability [3]
4 Methodology
An objective assessment of the motor vehicle handling can be made by collecting data and establishing parameters du ring the execution of standard testing procedures. Generally speaking, an ideal maneuver should meet the following criteria:
Reproducability Ease of execution Easy evalation of vehicle handling Relevance for real driving conditions and accident situations High correlation between subjective and objective judgements.
Fig. 1 shows the general procedure for determining suitable test methods and criteria
for assessing the test vehicle handling.
When it comes to the structure of the basic control loops, we distinguish between "c1osed-loop" and "open-Ioop" tests. If the whole driver- vehicle system is to be tested, we speak of a "c1osed-loop" method. These tests are very similar to real traffic situations, where different driver characteristics often lead to a wide spread of results. Driver influence is excluded as much as possible from "open-Ioop" maneuvers. There is considerable reproäucibility with difficult maneuvers, although only a small portion
of vehicle handling can be studied [15]. Objective assessment criteria are measured values (or the resulting parameters) of driver control input and vehicle responses relating to the feature of vehicle handling
under investigation. The initial selection of assessment criteria is based on experience, but can also be the result of theoretical considerations of the driver-vehicle-environment loop. Criteria are often linked with standard time and frequency functions, and can derive from such control parameters as phase responses and transfer functions.
OPEN-LOOP-TEST
or CLOSED·LOOP-TEST
,
495
CHOICE 01 OBJECTIVE
EVALUATION CRITERIA
TEST DRIVES with
SUBJECTIVE
ASSESSMENT
I <-------
_______ __ .1
Fig. 1: Determining test methods and evaluation criteria for vehicle handling.
Subjective assessments can be obtained by carrying out specific maneuvers or from participation in normal, unrestricted traffic situations. Here, how9ver, there is a conflict between the superior degree of comparability of results derived from maneuvers carried out under constant boundary conditions, and the greater proximity to reality of the road-traffic situation. Subjective assessment is based on questionnaires, and their nature and design have a decisive influence on the quality of the results.
Suitable techniques and criteria are chosen from a correlative analysis between the objective and subjective results of the various tests. The degree of correlation provides a measure of the consistency between the objective and subjective evaluations of handling. Depending on the size and spread of the correlation, tests and evaluation criteria can then be altered, and, if necessary, the boundary conditions for the subjective assessment (e.g., distance covered or questionnaire) modified. The process is repeated until the correlative analysis yields a satisfactory result. This methodology means that a standardized road maneuver can be defined leading to the establishment of data for the objective assessment of driving characteristics.
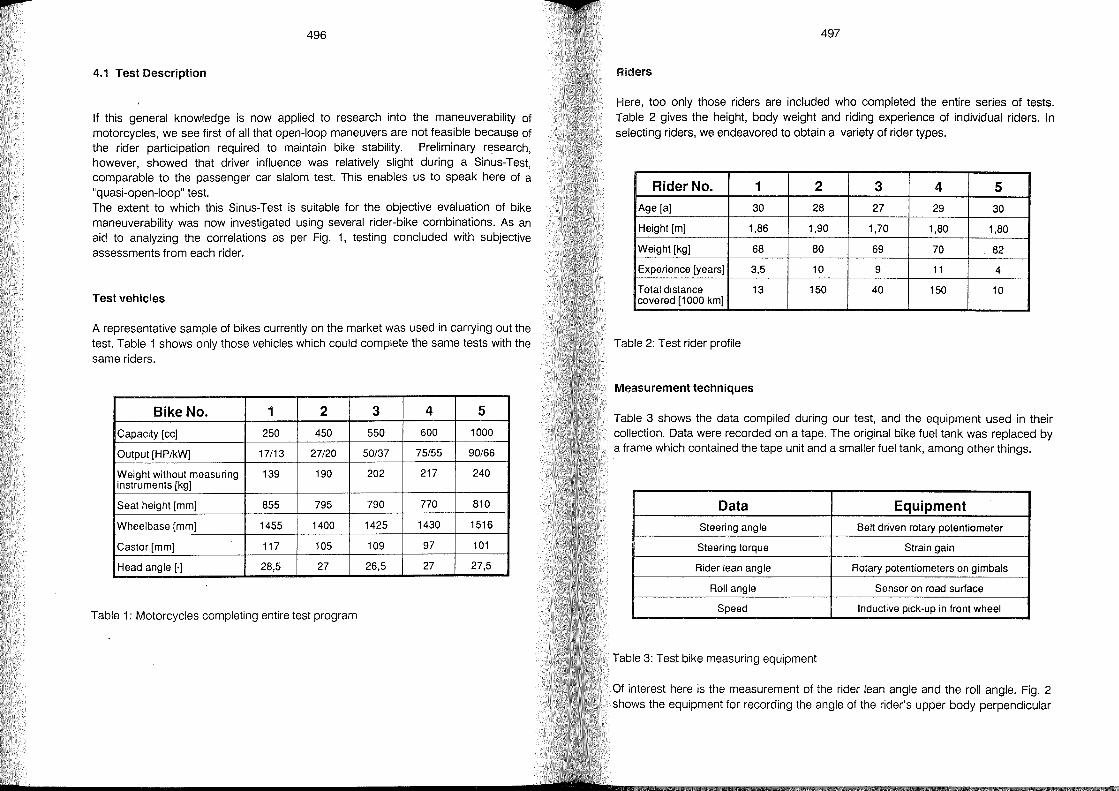
496
4.1 Test Description
If this general knowledge is now applied to research into the maneuverability of motorcycles, we see first of all that open-Ioop maneuvers are not feasible because of the rider participation required to maintain bike stability. Preliminary research, however, showed that driver influence was relatively slight du ring a Sinus-Test, comparable to the passenger car slalom test. This enables us to speak here of a "quasi-open-Ioop" test. The extent to which this Sinus-Test is suitable for the objective evaluation of bike maneuverability was now investigated using several rider-bike combinations. As an aid to analyzing the correlations as per Fig. 1, testing concluded with subjective assessments from each rider.
Test vehicles
A representative sampie of bikes currently on the market was used in carrying out the test. Table 1 shows only those vehicles which could complete the same tests with the same riders.
Bike No. 1 2 3 4 5
Capacity [cc] 250 450 550 600 1000
Output [HPlkW] 17/13 27/20 50/37 75/55 90/66
Weight without measuring 139 190 202 217 240 instruments [kg]
Seat height [mm] 855 795 790 770 810
Wheelbase [mm] 1455 1400 1425 1430 1516
Castor[mm] 117 105 109 97 101
Head angle [.] 28,5 27 26,5 27 27,5
Table 1: Motorcycles completing entire test program
497
FUders
Here, too only those riders are included who completed the entire series of tests. Table 2 gives the height, body weight and riding experience of individual riders. In selecting riders, we endeavored to obtain a variety of rider types.
RiderNo. 1 2 3 4 5 Age [al 30 28 27 29 30
Height [m] 1,86 1,90 1,70 1,80 1,80
Weight [kg] 68 80 69 70 82
Experience [years] 3,5 10 9 11 4
Total distance 13 150 40 150 10 covered [1000 km]
Table 2: Test rider profile
Measurement techniques
Table 3 shows the data compiled during our test, and the equipment used in their collection. Data were recorded on a tape. The original bike fuel tank was replaced by a frame wh ich contained the tape unit and a smaller fuel tank, among other things.
Oata Equipment
Steering angle Belt driven rotary potentiometer
Steering torque Strain gain
Rider lean angle Rotary potentiometers on gimbals
Roll angle Sensor on road surface
Speed Inductive pick-up in front wheel
Table 3: Test bike measuring equipment
Of interest here is the measurement of the rider lean angle and the roll angle. Fig. 2 shows the equipment for recording the angle of the rider's upper body perpendicular
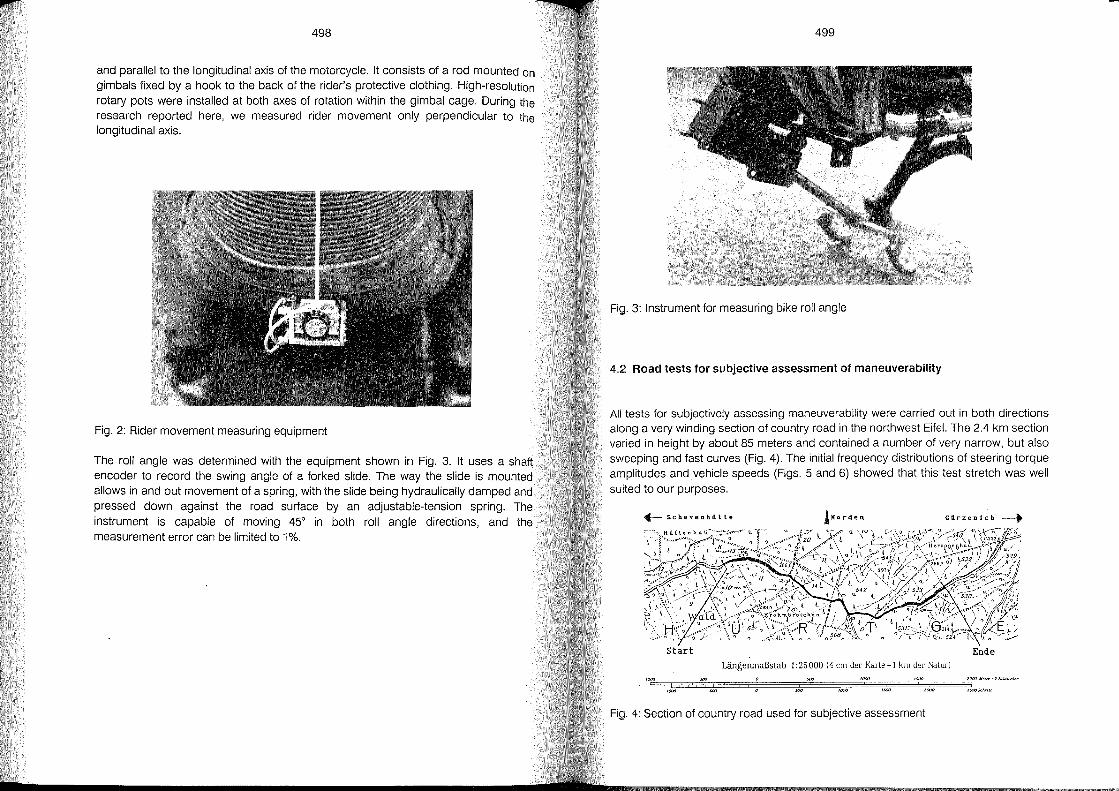
498
and parallel to the longitudinal axis of the motorcycle. It consists of a rod mounted On gimbals fixed by a hook to the back of the rider's protective clothing. High-resolution rotary pots were installed at both axes of rotation within the gimbal cage. During the research reported here, we measured rider movement only perpendicular to the longitudinal axis.
Fig. 2: Rider movement measuring equipment
The roll angle was determined with the equipment shown in Fig. 3. It uses a shaft encoder to record the swing angle of a forked slide. The way the slide is mounted allows in and out movement of aspring, with the slide being hydraulically damped and pressed down against the road surface by an adjustable-tension spring. The instrument is capable of moving 45° in both roll angle directions, and the measurement error can be limited to 1 %.
499
Fig. 3: Instrument for measuring bike roll angle
4.2 Roacl tests tor sublective assessment of maneuverability
All tests for subjectively assessing maneuverability were carried out in both directions along a very winding section of country road in the northwest Eifel. The 2.4 km section varied in height by about 85 meters and contained a number of very narrow, but also sweeping and fast curves (Fig. 4). The initial frequency distributions of steering torque amplitudes and vehicle speeds (Figs. 5 and 6) showed that this test stretch was weil suited to our purposes.
~ Schevenhütte
Start Ende Längenmaßstab 1: 25 000 (4 cm der Karte -1 km der Nalur)
Fig. 4: Section of country road used for subjective assessment
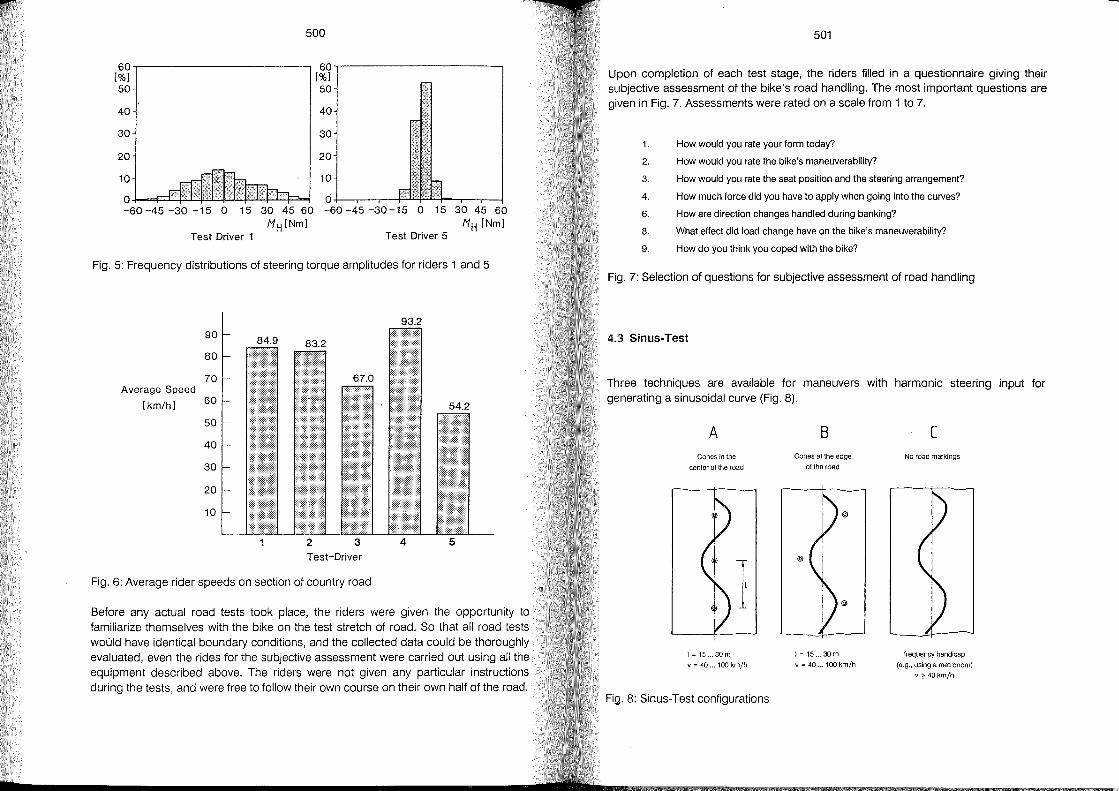
500
60~----------------------~ 60~--------------------~
[%] [%] 50 50
40
30
20
10
40
30
20
10
o Ö+--.-,r-~~ -60 -45 -30 -15 0 15 30 45 60 -60 -45 -30 -15 0 15 30 45 60
f1H [Nm] f1H [Nm] Test Driver 1 Test Driver 5
Fig. 5: Frequency distributions of steering torque amplitudes for riders 1 and 5
93.2 90
80
70 Average Speed
[km/h] 60
50
40
30
20
10
Test-Driver
Fig. 6: Average rider speeds on section of country road
Before any actual road tests took place, the riders were given the opportunity to familiarize themselves with the bike on the test stretch of raad. So that all road tests woüld have identical boundary conditions, and the collected data could be thoroughly evaluated, even the rides for the subjective assessment were carried out using all the equipment described above. The riders were not given any particular instructions during the tests, and were free to follow their own course on their own half of the raad.
501
Upon completion of each test stage, the riders filled in a questionnaire giving their subjective assessment of the bike's road handling. The most important questions are given in Fig. 7. Assessments were rated on a scale fram 1 to 7.
1 . How would you rate your form today?
How would you rate the bike's maneuverability? 2.
3.
4.
6.
8.
How would you rate the seat position and the steering arrangement?
How much force did you have to apply when going into the curves?
How are direction changes handled during banking?
What effect did load change have on the bike's maneuverability?
9. How do you think you coped with the bike?
Fig. 7: Selection of questions for subjective assessment of road handling
4.3 Sinus-Test
Three techniques are available for maneuvers with harmonic steering input for generating a sinusoidal curve (Fig. 8).
A Cones in the
center of the road
1 1= 15 .. 30 m
v = 40 .. 100km/h
Fig. 8: Sinus-Test configurations
B Cones at the edge
ofthe road
@
1= 15 ... 30m
v = 40 ... 100 km/h
(
No road markings
frequency handicap (s.g., using a metronom)
V? 40 km/h
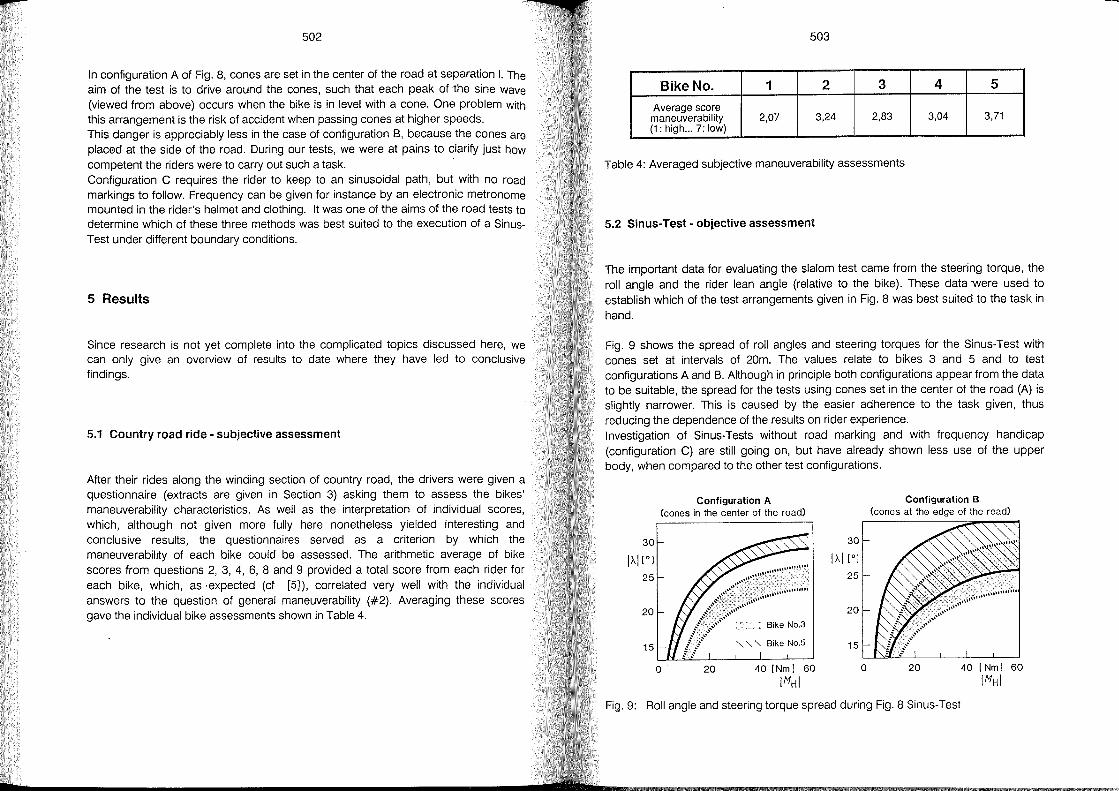
502
In configuration A of Fig. 8, cones are set in the center of the road at separation I. The aim of the test is to drive around the cones, such that each peak of the si ne wave (viewed fram above) occurs when the bike is in level with a cone. One problem with this arrangement is the risk of accident when passing cones at higher speeds. This dang er is appreciably less in the case of configuration B, because the cones are placed at the side of the road. During our tests, we were at pains to clarify just how competent the riders were to carry out such a task. Configuration C requires the rider to keep to an sinusoidal path, but with no road markings to follow. Frequency can be given for instance by an electronic metronome mounted in the rider's heimet and clothing. It was one of the aims of the road tests to determine which of these three methods was best suited to the execution of a SinusTest under different boundary conditions.
5 Results
Since research is not yet complete into the complicated topics discussed here, we can only give an overview of results to date where they have led to conclusive findings.
5.1 Country road ride - subjective assessment
After their rides along the winding section of country road, the drivers were given a questionnaire (extracts are given in Section 3) asking them to assess the bikes' maneuverability characteristics. As weil as the interpretation of individual scores, which, although not given more fully he re nonetheless yielded interesting and conclusive results, the questionnaires served as a criterion by wh ich the maneuverability of each bike could be assessed. The arithmetic average of bike scores from questions 2, 3, 4, 6, 8 and 9 provided a total score fram each rider for each bike, which, as ·expected (cf [5]), correlated very weil with the individual answers to the question of general maneuverability (#2). Averaging these scores gave the individual bike assessments shown in Table 4.
503
Bike No. 1 2 3 4 5
Average score maneuverability 2,07 3,24 2,83 3,04 3,71 (1: high ... 7: low)
Table 4: Averaged subjective maneuverability assessments
5.2 Sinus-Test - obLective assessment
The important data for evaluating the slalom test came from the steering torque, the roll angle and the rider lean angle (relative to the bike). These data were used to establish which of the test arrangements given in Fig. 8 was best suited to the task in hand.
Fig. 9 shows the spread of roll angles and steering torques for the Sinus-Test with cones set at intervals of 20m. The values relate to bikes 3 and 5 and to test configurations A and B. Although in principle both configurations appear from the data to be suitable, the spread for the tests using cones set in the center of the road (A) is slightly narrower. This is caused by the easier adherence to the task given, thus reducing the dependence of the results on rider experience. Investigation of Sinus-Tests without road marking and with frequency handicap (configuration C) are still going on, but have already shown less use of the upper body, when compared to the other test configurations.
20
15
Configuration A (cones in the center of the road)
o 20
Bike No.3
" " " Bike No.5
40 [Nm] 60
If1HI
20
15
o
Configuration B (cones at the edge of the road)
20 40 [Nm] 60
If1HI
Fig. 9: Roll angle and steering torque spread during Fig. 8 Sinus-Test
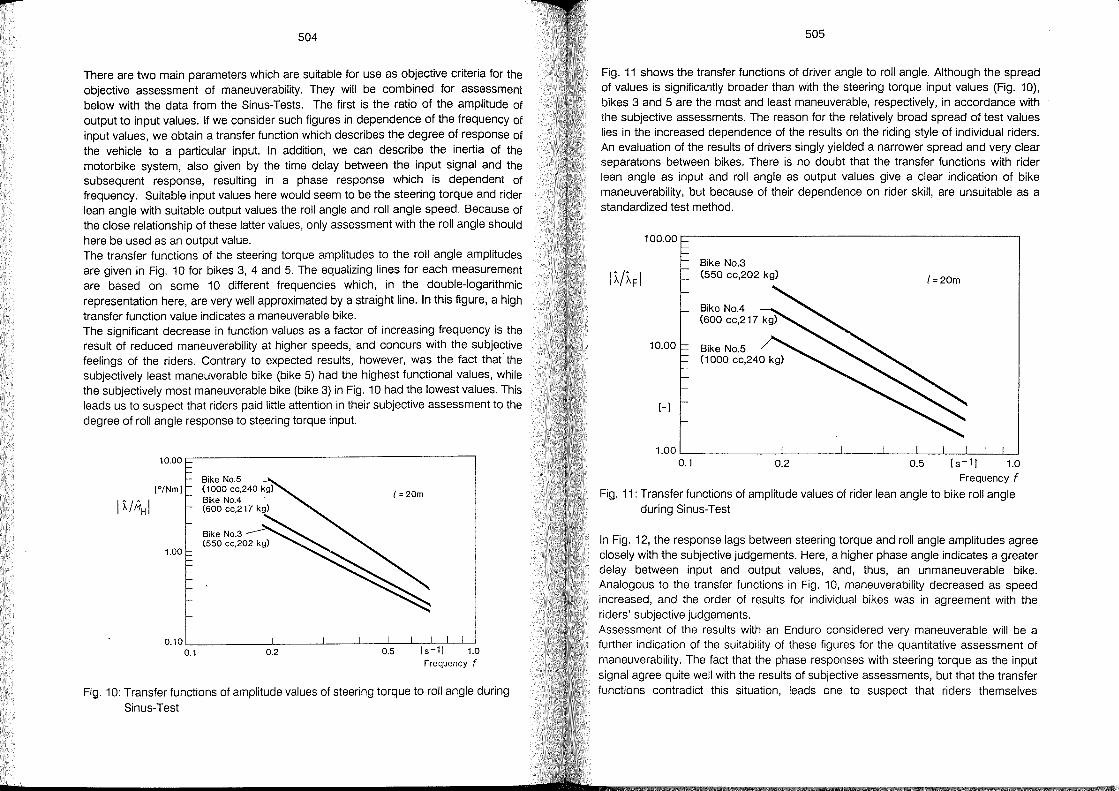
504
There are two main parameters which are suitable for use as objective criteria for the objective assessment of maneuverability. They will be combined for assessment below with the data from the Sinus-Tests. The first is the ratio of the amplitude of output to input values. If we consider such figures in dependence of the frequency of input values, we obtain a transfer function which describes the degree of response of the vehicle to a particular input. In addition, we can describe the inertia of the motorbike system, also given by the time delay between the input signal and the subsequent response, resulting in a phase response which is dependent of frequency. Suitable input values here would seem to be the steering torque and rider lean angle with suitable output values the roll angle and roll angle speed. Because of the close relationship of these latter values, only assessment with the roll angle should here be used as an output value. The transfer functions of the steering torque amplitudes to the roll angle amplitudes are given in Fig. 10 for bikes 3, 4 and 5. The equalizing lines for each measurement are based on some 10 different frequencies which, in the double-Iogarithmic representation here, are very weil approximated by a straight line. In this figure, a high transfer function value indicates a maneuverable bike. The significant decrease in function values as a factor of increasing frequency is the result of reduced maneuverability at higher speeds, and concurs with the subjective feelings of the riders. Contrary to expected results, however, was the fact that the subjectively least maneuverable bike (bike 5) had the highest functional values, while the subjectively most maneuverable bike (bike 3) in Fig. 10 had the lowest values. This leads us to suspect that riders paid little attention in their subjective assessment to the degree of roll angle response to steering torque input.
10.00 ,-----------------------,
IO/Nm]
1.00
0.10 L-_____ L-__ .-l __ ...l-_...l-_L--L-L-L~
0.1 0.2 0.5 1.0 Frequency f
Fig. 10: Transfer functions of amplitude values of steering torque to roll angle during Sinus-Test
505
Fig. 11 shows the transfer functions of driver angle to roll angle. Although the spread of values is significantly broader than with the steering torque input values (Fig. 10), bikes 3 and 5 are the most and least maneuverable, respectively, in accordance with the subjective assessments. The reason for the relatively broad spread of test values lies in the increased dependence of the results on the riding style of individual riders. An evaluation of the results of drivers singly yielded a narrower spread and very clear separations between bikes. There is no doubt that the transfer functions with rider lean angle as input and roll angle as output values give a clear indication of bike maneuverability, but because of their dependence on rider skilI, are unsuitable as a standardized test method.
100.00r-----------------------.
Bike NO.3 (550 cC,202 kg)
1=20m
10.00
[-]
1.00 '--______ ..L. ___ -L __ -L_--.l_.-l_-L.-l_L-!
0.1 0.2 0.5 1.0 Frequency f
Fig. 11: Transfer functions of amplitude values of rider lean angle to bike roll angle during Sinus-Test
In Fig. 12, the response lags between steering torque and roll angle amplitudes agree closely with the subjective judgements. Here, a high er phase angle indicates a greater delay between input and output values, and, thus, an unmaneuverable bike. Analogous to the transfer functions in Fig. 10, maneuverability decreased as speed increased, and the order of results for individual bikes was in agreement with the riders' subjective judgements. Assessment of the results with an Enduro considered very maneuverable will be a further indication of the suitability of these figures for the quantitative assessment of maneuverability. The fact that the phase responses with steering torque as the input signal agree quite weil with the results of subjective assessments, but that the transfer functions contradict this situation, leads one to suspect that riders themselves
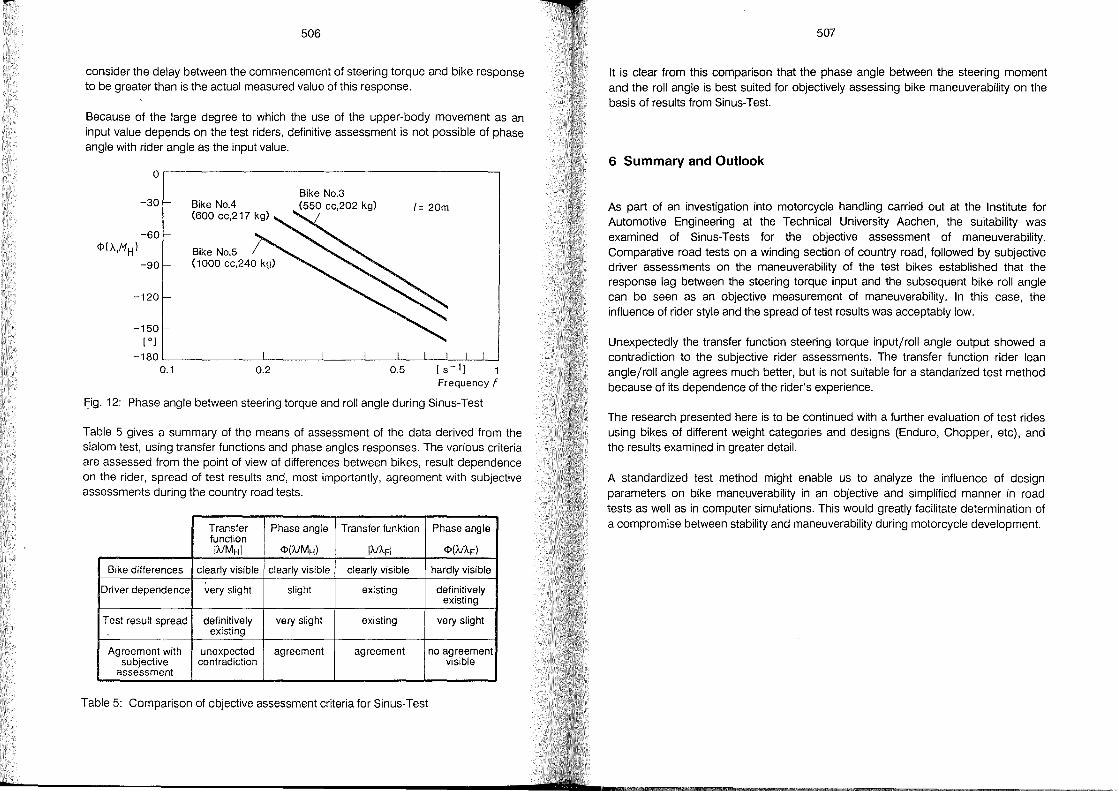
p
506
consider the delay between the commencement of steering torque and bike response to be greater than is the actual measured value of this response.
Because of the large degree to which the use of the upper-body movement as an input value depends on the test riders, definitive assessment is not possible of phase angle with rider angle as the input value.
o
-30
-90
-120
-150 [0 J
Bike No.3 (550 cC,202 kg) [= 20m
-180L-____________ L_ ______ L-__ ~ ____ l_ __ L__L~~~
0.1 0.2 0.5 Frequency f
Fig.12: Phase angle between steering torque and roll angle during Sinus-Test
Table 5 gives a summary of the means of assessment of the data derived from the slalom test, using transfer functions and phase angles responses. The various criteria are assessed from the point of view of differences between bikes, result dependence on the rider, spread of test results and, most importantly, agreement with subjective assessments during the country road tests.
Transfer Phase angle Transfer funktion Phase angle function IIJMHI <l>(IJMH) IIJAFI <l>(IJAF)
Bike differences clearly visible clearly visible clearly visible hardly visible
Driverdependence very slight slight existing definitively existing
Test result spread definitively very slight existing very slight existing
Agreement with unexpected agreement agreement no agreement subjective contradiction visible
assessment
Table 5: Comparison of objective assessment criteria for Sinus-Test
507
It is clear from this comparison that the phase angle between the steering moment and the roll angle is best suited for objectively assessing bike maneuverability on the basis of results from Sinus-Test.
6 Summary and Outlook
As part of an investigation into motorcycle handling carried out at the Institute for Automotive Engineering at the Technical University Aachen, the suitability was examined of Sinus-Tests for the objective assessment of maneuverability. Comparative road tests on a winding section of country road, followed by subjective driver assessments on the maneuverability of the test bikes established that the response lag between the steering torque input and the subsequent bike roll angle can be seen as an objective measurement of maneuverability. In this case, the influence of rider style and the spread of test results was acceptably low.
Unexpectedly the transfer function steering torque input/roll angle output showed a contradiction to the subjective rider assessments. The transfer function rider lean angle/roll angle agrees much better, but is not suitable for a standarized test method because of its dependence of the rider's experience.
The research presented here is to be continued with a further evaluation of test rides using bikes of different weight categories and designs (Enduro, Chopper, etc) , and the results exarnined in greater detail.
A standardized test method might enable us to analyze the influence of design parameters on bike maneuverability in an objective and simplified manner in road tests as weil as in computer simulations. This would greatly facilitate determination of a compromise between stability and maneuverability during motorcycle development.
7
1)
2)
3)
508
Reference List
Aoki, A:: Experimental Study on Motorcycle Steering Performance. - Warrendale, 1979. _ (SAE Paper; 790265)
Chenchenna, P.; Koch, J.; Willumeit, H.P.: Beitrag zum Fahrverhalten eines Zweiradfahrzeugs In: Automobil-Industrie (1976)4. - S. 49-54
Dreyer, A.: Betrachtungen zur Handlichkeit von Krafträdern In: Aktive und passive Sicherheit von Krafträdern: Tagung Berlin, 8. bis 9. Okt. 1987/ VDI-Ges. Fahrzeugtechnik. - Düsseldorf, 1987. - S. 137-157. - (VDIBerichte; 657)
4) Hasegawa, A.; Sugizaki, M.: Experimental Analysis of Transient Response in Motorcycle-Rider Systems In: Aktive und passive Sicherheit von Krafträdern: Tagung Berlin, 8. bis 9. Okt. 1987 / VDI-Ges. Fahrzeugtechnik. - Düsseldorf, 1987. - S. 159-173. - (VDIBerichte; 657)
5) Käppler, W.-D.; Godthelp, H.: Design and Use of the Two-Level Sequential Judgement Scale in the Identification of Vehicle Handling Criteria. - 1990. - (Report FAT; 79)
6) Koch, J.: Experimentelle und analytische Untersuchungen des Motorrad-Fahrer Systems. - Berlin, Diss., 1978
7) Kokoschinski, H.: Lenkgeometrie von Motorrädern In: Motorrad (1978)12. - S. 75-78
8) Michel, R.P.: Heutiger Stand und zukünftige MögliChkeiten der Sicherheitsmerkmale : Fachgespräch "Sicherheitsfragen bei schnell~n Motorrädern", Gifthorn, 3./4.7.1984. - Vereinigung der Technischen-Uberwachungs-Vereine e.V., 1984
9) Prem, H.: Motorcycle Rider Skill Assessment. - University of Melbourne, Doctor Thesis, 1985
10) Rice, R.S.: Rider Skillinfluences 'on Motorcycle Maneuvering. - Warrendale, 1978. - (SAE Paper; 780312)
11) Watanabe, Y.; Yoshida, K.: Motorcycle Handling Performance for Obstacle Avoidance (Paper presented at the Second International Congress on Automotive Safety, San Francisco, July 16-18, 1973)
'12)
13)
14)
15)
509
Weir, D.H.; Zellner, J.w.; Teper, G.L.: Motorcycle Handling, Vol. 11. - Washington, DC: NHTSA, 1979
Zellner, J.w.; Weir,D.H.: Development of Handling Test Procedures for Motorcycles. - 1978. - (SAE paper; 780313)
Zellner, J.w.; Weir, D.H.: Moped Directional Dynamics and Handling Qualities. - Warrendale, 1979. -(SAE Paper; 790260)
Zomotor, A. Fahrwerktechnik, Fahrverhalten. - Würzburg, 1987
Application of Vehicle Dynamics Simulation in Motorcycle Development
Ludwig Iffelsberger
BMW AG, München
Germany
513
1 Abstract
To improve the driving safety of motorcycles it is necessary to know about their dynamic characteristics. An excellent instrument for the theoretical analysis is the computer simulation. State of the art computer techniques permit the application of sophisticated models, the results of which closely correspond to those found in reality.
In BMW motorcycle research and development a complex motorcycle model is applied; its theoretical fundamentals are briefly presented. Selected results from the verification of the model elucidate the meaningfulness of computer simulation.
As focal point of the lecture selected simulation results from the fields of .straight running stability and manoeuvrability are presented and discussed. In this context the effects of modifications to the vehicle regarding, the influence of vehicle stability under different driving conditions, are emphasized.
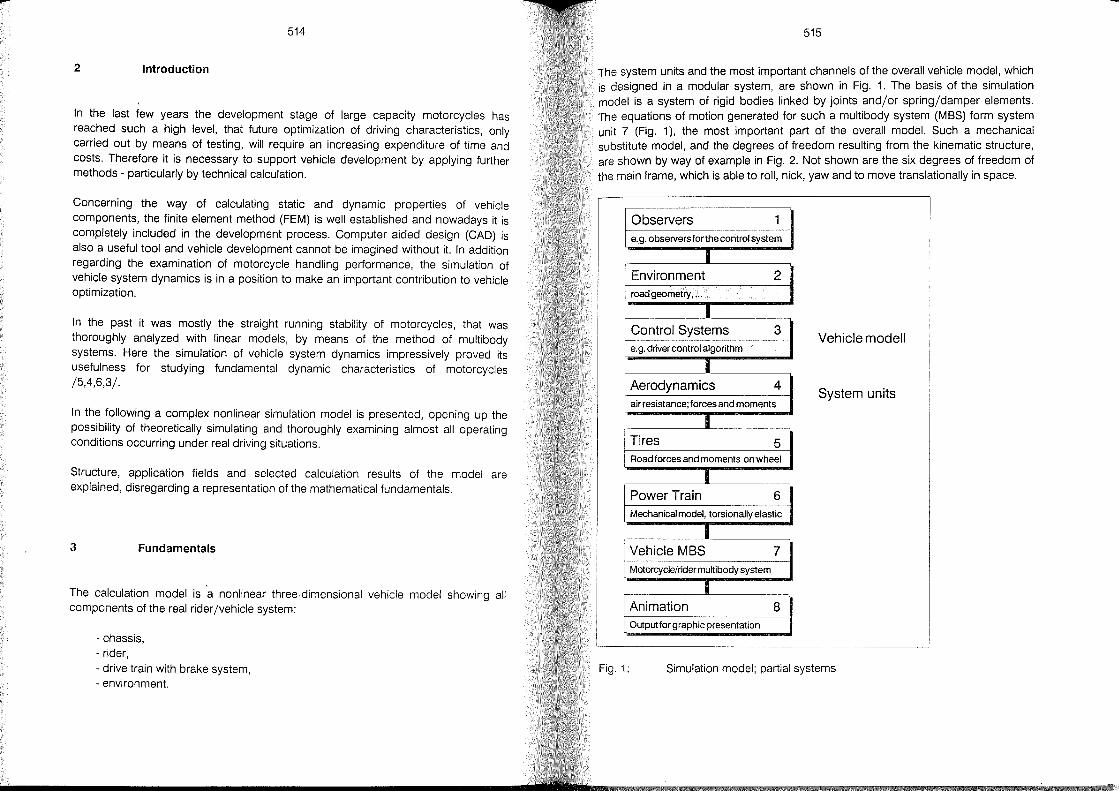
514
2 Introduction
In the last few years the development stage of large capacity motorcycles has reached such a high level, that future optimization of driving characteristics, only carried out by means of testing, will require an increasing expenditure of time and costs. Therefore it is necessary to support vehicle development by applying further methods - particularly by technical calculation.
Concerning the way of calculating static and dynamic properties of vehicle components, the finite element method (FEM) is weil established and nowadays it is completely included in the development process. Computer aided design (CAD) is also a useful tool and vehicle development cannot be imagined without it. In addition regarding the examination of motorcycle handling performance, the simulation of vehicle system dynamics is in a position to make an important contribution to vehicle optimization.
In the past it was mostly the straight running stability of motorcycles, that was thoroughly analyzed with linear models, by means of the method of multibody systems. Here the simulation of vehicle system dynamics impressively proved its usefulness for studying fundamental dynamic characteristics of motorcycles /5,4,6,3/.
In the following a complex non linear simulation model is presented, opening up the possibility of theoretically simulating and thoroughly examining almost all operating conditions occurring under real driving situations.
Structure, application fields and selected calculation results of the model are explained, disregarding a representation of the mathematical fundamentals.
3 Fundamentals
The calculation model is a nonlinear three-dimensional vehicle model showing all components of the real rider /vehicle system:
- chassis, - rider, - drive train with brake system, - environment.
515
The system units and the most important channels of the overall vehicle model, which is designed in a modular system, are shown in Fig. 1. The basis of the simulation model is a system of rigid bodies linked by joints and/or spring/damper elements. The equations of motion generated for such a multibody system (MBS) form system unit 7 (Fig. 1), the most important part of the overall model. Such a mechanical substitute model, and the degrees of freedom resulting from the kinematic structure, are shown by way of example in Fig. 2. Not shown are the six degrees of freedom of the main frame, which is able to roll, nick, yaw and to move translationally in space.
Observers 1 e. g. observers forthe control system
T Environment 2 roadgeometry, ...
I Control Systems 3
Vehicle modell e.g. driver contral algorithm
T Aerodynamics 4 air resistance; forces and moments
System units
• Tires 5 Road forces and moments on wheel
I I Power Train 6
MechanicaJ model, lorsionallyelastic
I Vehicle MBS 7 Motorcycle/ridermu~ibody system
I Animation 8 Output tor graphie presentation
Fig.1: Simulation model; partial systems

--
steering
516
~
r-'--,-_ = ---____ --' ~orsion of ~ . rear swing arm
lateral elasticity of rear swing arm
Fig.2: Motorcycle/rider multibody system (MBS)
System unit 6 contains the differential equations for the entire drive train and the road wheels. The drive train modelled as a one-dimensional oscillating system is shown in Fig. 3. The moments of inertia of the rotating masses, and the stiffness characteristic of the vibration damper in the drive shaft, have been taken into consideration.
CJ-I gearshaft3
I
rearwheel
clutch ge ar shaft 2
crankshaft gear shaft 1 /
vibration damper cardanshaft )
Fig.3: Drive train
517
contrary to the simulation model, represented in detail in /7/, the description of the steady state and transient tire properties is based on the "magie formula" described in /1;' This tire model (system unit 5) permits an excellent representation of measured tire characteristic diagrams, even the whole range of large camber angles and high lateral and longitudinal slip rates being included in a realistic way.
The effect of extern al forces on the vehicle caused by air resistance, cross-wind or uneven roads are also taken into consideration (system units 2 and 4).
As in the case of areal vehicle, driving conditions can be regulated by controlling the following variables:
- handle bar steering torque, - throttle opening angle, - gear, - brake pressure.
These control systems have been summarized in system unit 3. Gear shifts and clutch operations can be time and event controlled. The leaning position of vehicle model is controlled by steering torque.
All partial systems are combined in a computer program written in the simulation language ACSL. The connection of the individual components with the multibody system (system unit 7) is effected via force/moment intersections.
4 Applications
In the following some studies are shown glvlng information about the application possibilities of the simulation model. The reliability of the simulation is represented by comparing measurement and calculation results.
4.1 Riding Stability
An important aim in motorcycle development is to ensure excellent straight running stability in all speed ranges. Particularly in high-speed ranges stability is sometimes heavily affected by an oscillation mode, specific for motorcycles, which is called weave-mode. Weaving is a combined rolling, yawing and steering vibration of the
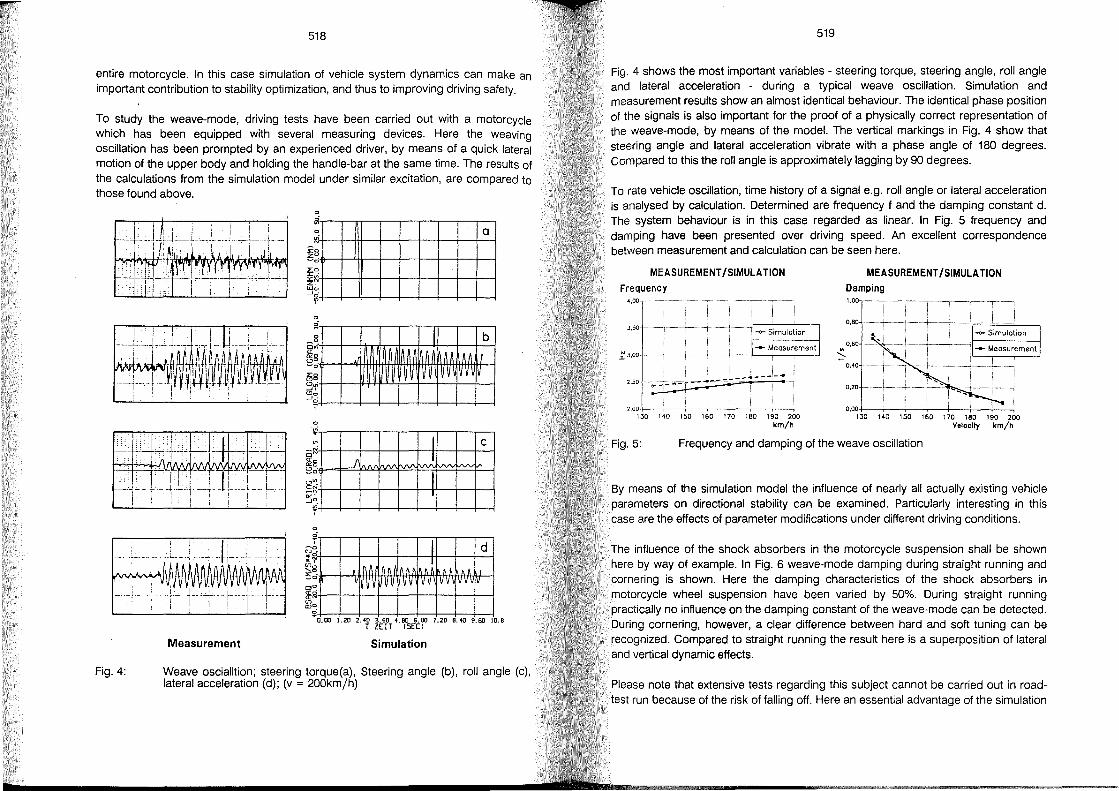
518
entire motorcycle. In this case simulation of vehicle system dynamics can make an important contribution to stability optimization, and thus to improving driving safety.
To study the weave-mode, driving tests have been carried out with a motorcycle which has been equipped with several measuring devices. Here the weaving oscillation has been prompted by an experienced driver, by means of a quick lateral motion of the upper body and holding the handle-bar at the same time. The results of the calculations from the simulation model under similar excitation, are compared to those found above.
Fig.4:
illlllllill al
I' .
\~~ ~-- -~,' " ... -'-' ""1'" ! I i I I , : ! ,
Measurement Simulation
Weave oscialltion; steering torque(a), Steering angle (b), roll angle (c), lateral acceleration (d); (v = 200km/h)
519
Fig. 4 shows the most important variables - steering torque, steering angle, roll angle and lateral acceleration - during a typical weave oscillation. Simulation and measurement results show an almost identical behaviour. The identical phase position of the signals is also important for the proof of a physically correct representation of the weave-mode, by means of the model. The vertical markings in Fig. 4 show that steering angle and lateral acceleration vi brate with a phase angle of 180 degrees. Compared to this the roll angle is approximately lagging by 90 degrees.
To rate vehicle oscillation, time history of a signal e.g. roll angle or lateral acceleration is analysed by calculation. Determined are frequency fand the damping constant d. The system behaviour is in this case regarded as linear. In Fig. 5 frequency and damping have been presented over driving speed. An excellent correspondence between measurement and calculation can be seen here.
MEASUREMENT !SIMULA TlON
Frequency 4.00
,.5o.~,l
140 150 160 170 180 190 200 km/h
MEASUREMENT !SIMULA TlON
Camping
HO 150 160 170 180 190 200 V.loclty km/h
Fig.5: Frequency and damping of the weave oscillation
By means of the simulation model the influence of nearly all actually existing vehicle parameters on directional stability can be examined. Particularly interesting in this case are the effects of parameter modifications under different driving conditions.
The influence of the shock absorbers in the motorcycle suspension shall be shown here by way of example. In Fig. 6 weave-mode damping du ring straight running and cornering is shown. Here the damping characteristics of the shock absorbers in motorcycle wheel suspension have been varied by 50%. During straight running practically no influence on the damping constant of the weave-mode can be detected. During cornering, however, a clear difference between hard and soft tuning can be recognized. Compared to straight running the result here is a superposition of lateral and vertical dynamic effects.
Please note that extensive tests regarding this subject cannot be carried out in roadtest run because of the risk of falling off. Here an essential advantage of the simulation
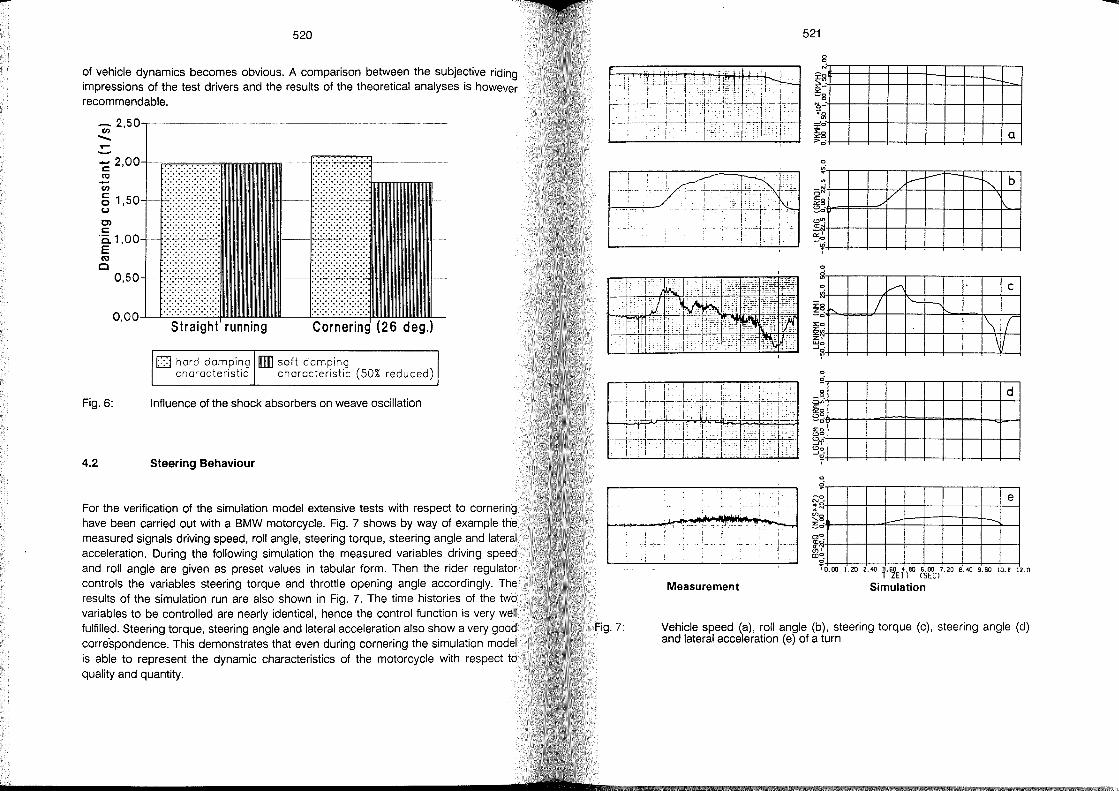
520
of vehicle dynamics becomes obvious. A comparison between the subjective riding impressions of the test drivers and the results of the theoretical analyses is however recommendable.
_2, CI) -,.... C 2,VV1 r.~~""""Fi ('CJ -CI)
g 1,5 (,.)
Cl c: '0. 1 ,00 E ('CJ
o 0,
o hord domping • soft domping chorocteristic chorocteristic (50% reduced)
Fig. 6: Influence of the shock absorbers on weave oscillation
4.2 Steering Behaviour
For the verification of the simulation model extensive tests with respect to cornering have been carried out with a BMW motorcycle. Fig. 7 shows by way of example the measured signals driving speed, roll angle, steering torque, steering angle and lateral acceleration. During the following simulation the measured variables driving speed and roll angle are given as preset values in tabular form. Then the rider regulator controls the variables steering torque and throttle opening angle accordingly. The results of the simulation run are also shown in Fig. 7. The time histories of the two variables to be controlled are nearly identical, hence the control function is very weil fulfilled. Steering torque, steering angle and lateral acceleration also show a very good correspondence. This demonstrates that even during cornering the simulation model is able to represent the dynamic characteristics of the motorcycle with respect to quality and quantity.
Fig.7:
, .
. ,
521
illlllill ~I I i .J.L
~~-"- -':-~-~-r-l--' I ~ .
o
~~IIII~llllfl . .~ " ,
~-.... "~:~ ! I' : , I _~___ _ __ . __ _ L~_
, , .l I ~iII18111[fI
'0.00 1.20 2.40 f.6ldtBO fs\~b7.20 8.'0 9.60 10.8 12.0
Measurement Simulation
Vehicle speed (a), roll angle (b), steering torque (c), steering angle (d) and lateral acceleration (e) of a turn
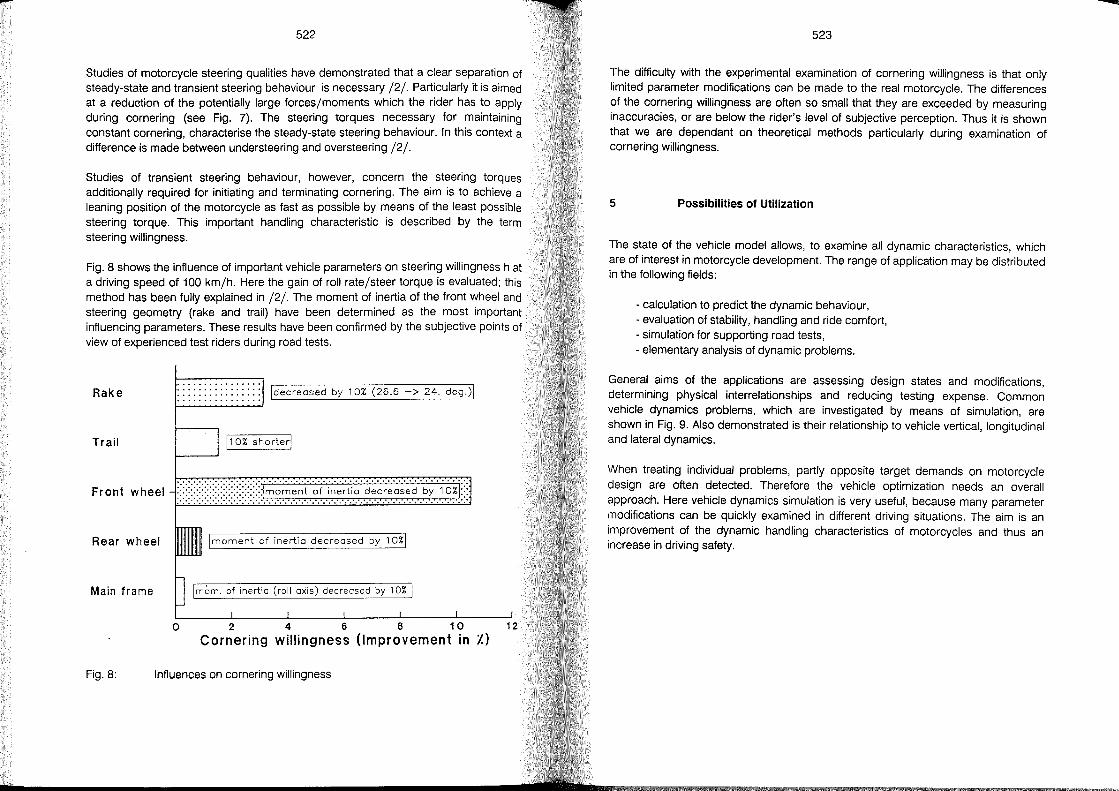
---522
Studies of motorcycle steering qualities have demonstrated that a clear separation of steady-state and transient steering behaviour is necessary /2/. Particularly it is aimed at a reduc:tion of the potentially large forces/moments which the rider has to apply during cornering (see Fig. 7). The steering torques necessary for maintaining constant cornering, characterise the steady-state steering behaviour. In this context a difference is made between understeering and oversteering /2/.
Studies of transient steering behaviour, however, concern the steering torques additionally required for initiating and terminating cornering. The aim is to achieve a leaning position of the motorcycle as fast as possible by means of the least possible steering torque. This important handling characteristic is described by the term steering willingness.
Fig. 8 shows the influence of important vehicle parameters on steering willingness h at a driving speed of 100 km/ho Here the gain of roll rate/steer torque is evaluated; this method has been fully explained in /2/. The moment of inertia of the front wheel and steering geometry (rake and trail) have been determined as the most important influencing parameters. These results have been confirmed by the subjective points of view of experienced test riders during road tests.
Rake Idecreased by 10% (26.6 -> 24. deg·)1
Trail 110% shorterl
Front wheel
Rear wheel Imoment of inertia decreased by 10%1
Main frame Imam. of inertia (roll axis) decreased by 10% 1
o 2 4 6 8 10 12
Cornering willingness (lmprovement in l)
Fig.8: Influences on cornering willingness
523
The difficulty with the experimental examination of cornering willingness is that only limited parameter modifications can be made to the real motorcycle. The differences of the cornering willingness are often so small that they are exceeded by measuring inaccuracies, or are below the rider's level of subjective perception. Thus it is shown that we are dependant on theoretical methods particularly during examination of cornering willingness.
5 Possibilities of Utilization
The state of the vehicle model allows, to examine all dynamic characteristics, which are of interest in motorcycle development. The range of application may be distributed in the following fields:
- calculation to predict the dynamic behaviour, - evaluation of stability, handling and ride comfort, - simulation for supporting road tests, - elementary analysis of dynamic problems.
General aims of the applications are assessing design states and modifications, determining physical interrelationships and reducing testing expense. Common vehicle dynamics problems, which are investigated by means of simulation, are shown in Fig. 9. Also demonstrated is their relationship to vehicle vertical, longitudinal and lateral dynamics.
When treating individual problems, partly opposite target demands on motorcycle design are often detected. Therefore the vehicle optimization needs an overall approach. Here vehicle dynamics simulation is very useful, because many parameter modifications can be quickly examined in different driving situations. The aim is an improvement of the dynamic handling characteristics of motorcycles and thus an increase in driving safety.
-
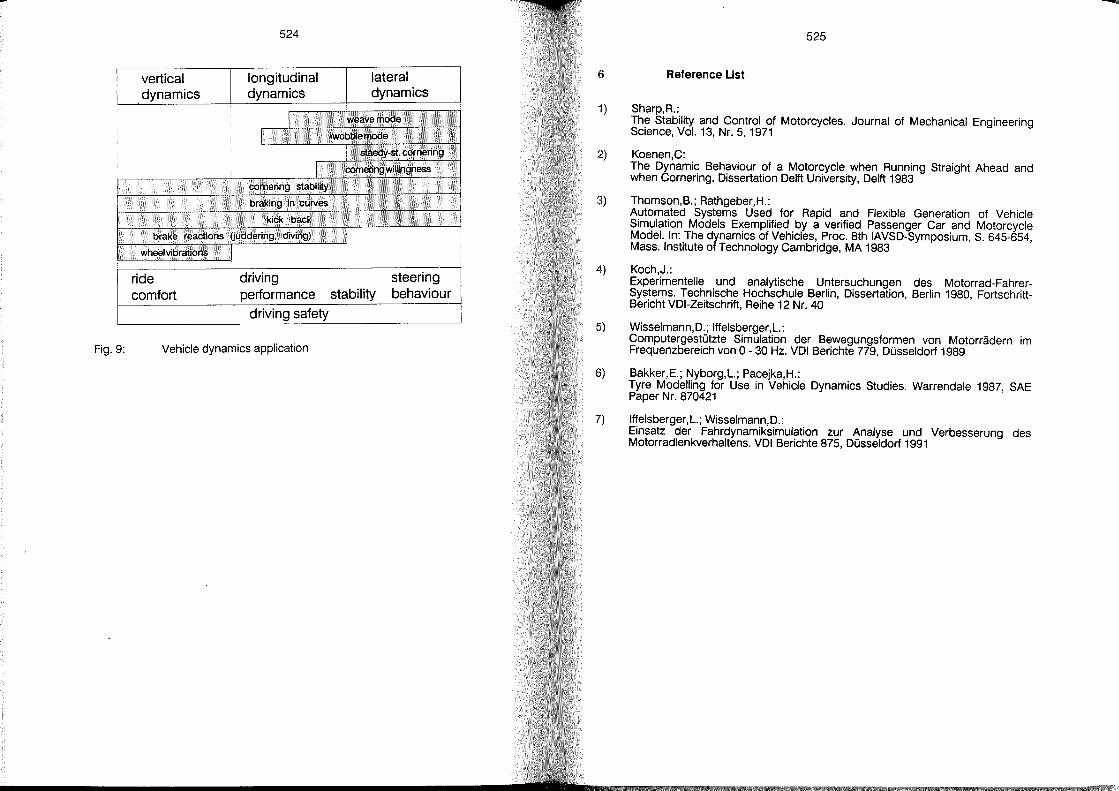
Fig.9:
524
vertical
I longitudinal
I lateral
dynamics dynamics/ dynamics
r' weavemode ......
f .
wobblemode ... .
I staedY.:St. cornering
. r comeringwillinghess
cornering stability· ...
braking in curves
kick back
brake reactions (juddering, cflVing)
wheelvibrations
ride comfort
I driving performance
driving safety
Vehicle dynamics application
.....
J •
stability
:
steering behaviour
6
1)
2)
3)
4)
5)
525
Reference List
Sharp,R.: The Stability and Control of Motorcycles. Journal of Mechanical Engineering Science, Vol. 13, Nr. 5, 1971
Koenen,C: The Dynamic Behaviour of a Motorcycle when Running Straight Ahead and when Cornering. Dissertation Delft University, Delft 1983
Thomson,B.; Rathgeber,H.: Automated Systems Used for Rapid and Flexible Generation of Vehicle Simulation Models Exemplified by a verified Passenger Car and Motorcycle Model. In: The dynamics of Vehicles, Proc. 8th IAVSD-Symposium, S. 645-654, Mass. Institute of Technology Cambridge, MA 1983
Koch,J.: Experimentelle und analytische Untersuchungen des Motorrad-FahrerSystems. Technische Hochschule Berlin, Dissertation, Berlin 1980, FortschrittBericht VDI-Zeitschrift, Reihe 12 Nr. 40
Wisselmann,D.; Iffelsberger,L.: Computergestützte Simulation der Bewegungsformen von Motorrädern im Frequenzbereich von 0 - 30 Hz. VDI Berichte 779, Düsseldorf 1989
6) Bakker,E.; Nyborg,L.; Pacejka,H.: Tyre Modelling for Use in Vehicle Dynamics Studies. Warrendale 1987, SAE Paper Nr. 870421
7) lffelsberger,L.; Wisselmann,D.: Einsatz der Fahrdynamiksimulation zur Analyse und Verbesserung des Motorradlenkverhaltens. VDI Berichte 875, Düsseldorf 1991
--
Strength Testing for Substaniating the Frame Stability of Motorcycle and Sidecar Combinations
from Single Unit Production
Rudolf Sagerer
Gerhard Heinrich
TÜV Bayern e. V.
Germany
529
Abstract
A testing procedure is intended to be established for adetermination of the operational endurance strength of motorcycle and sidecar combination.
A finite elements method data re cord is modified specifically for the condition represented by a motorcycle and sidecar combination.
Based on a comparison of actual measurements with the results of a calculation the criticalload areas are screened out.
Future examinations can rely on calculation using a program adapted to be run on a pe, with checkup measurements reduced to a few criticallocations on the vehicle.
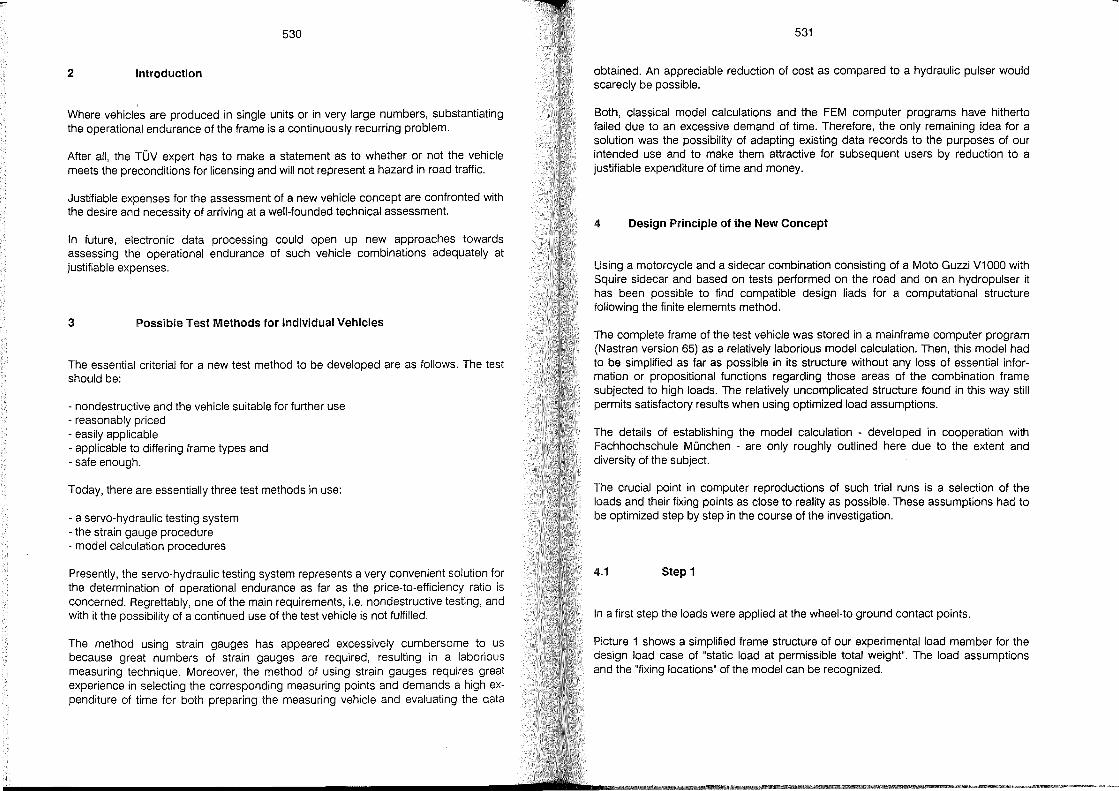
530
2 Introduction
Where vehicles are produced in single units or in very large numbers, substantiating the operational endurance of the frame is a continuously recurring problem.
After all, the TÜV expert has to make a statement as to whether or not the vehicle meets the preconditions for licensing and will not represent a hazard in road traffic.
Justifiable expenses for the assessment of a new vehicle concept are confronted with the desire and necessity of arriving at a well-founded technical assessment.
In future, electronic data processing could open up new approaches towards assessing the operational endurance of such vehicle combinations adequately at justifiable expenses.
3 Possible Test Methods for Individual Vehicles
The essential criterial for a new test method to be developed are as folIows. The test should be:
- nondestructive and the vehicle suitable for further use - reasonably priced - easily applicable - applicable to differing frame types and - safe enough.
Today, there are essentially three test methods in use:
- a servo-hydraulic testing system - the strain gauge procedure - model calculation procedures
Presently, the servo-hydraulic testing system represents a very convenient solution for the determination of operational endurance as far as the price-to-efficiency ratio is concerned. Regrettably, one of the main requirements, i.e. nondestructive testing, and with it the possibility of a continued use of the test vehicle is not fulfilled.
The method using strain gauges has appeared excessively cumbersome to us because great numbers of strain gauges are required, resulting in a laborious measuring technique. Moreover, the method of using strain gauges requires great experience in selecting the corresponding measuring points and demands a high expenditure of time for both preparing the measuring vehicle and evaluating the data
531
obtained. An appreciable reduction of cost as compared to a hydraulic pulser would scarecly be possible.
80th, classical model calculations and the FEM computer programs have hitherto failed due to an excessive demand of time. Therefore, the only remaining idea for a solution was the possibility of adapting existing data re cords to the purposes of our intended use and to make them attractive for subsequent users by reduction to a justifiable expenditure of time and money.
4 Design Principle of the New Concept
Using a motorcycle and a sidecar combination consisting of a Moto Guzzi V1000 with Squire sidecar and based on tests performed on the road and on an hydropulser it has been possible to find compatible design liads for a computational structure following the finite elememts method.
The complete frame of the test vehicle was stored in a mainframe computer program (Nastran version 65) as a relatively laborious model calculation. Then, this model had to be simplified as far as possible in its structure without any loss of essential information or propositional functions regarding those areas of the combination frame subjected to high loads. The relatively uncomplicated structure found in this way still permits satisfactory results when using optimized load assumptions.
The details of establishing the model calculation - developed in cooperation with Fachhochschule München - are only roughly outlined here due to the extent and diversity of the subject.
The crucial point in computer reproductions of such trial runs is a selection of the loads and their fixing points as close to reality as possible. These assumptions had to be optimized step by step in the course of the investigation.
4.1 Step 1
In a first step the loads were applied at the wheel-to ground contact points.
Picture 1 shows a simplified frame structure of our experimental load member for the design load case of "static load at permissible total weight". The load assumptions and the "fixing locations" of the model can be recognized.
-~
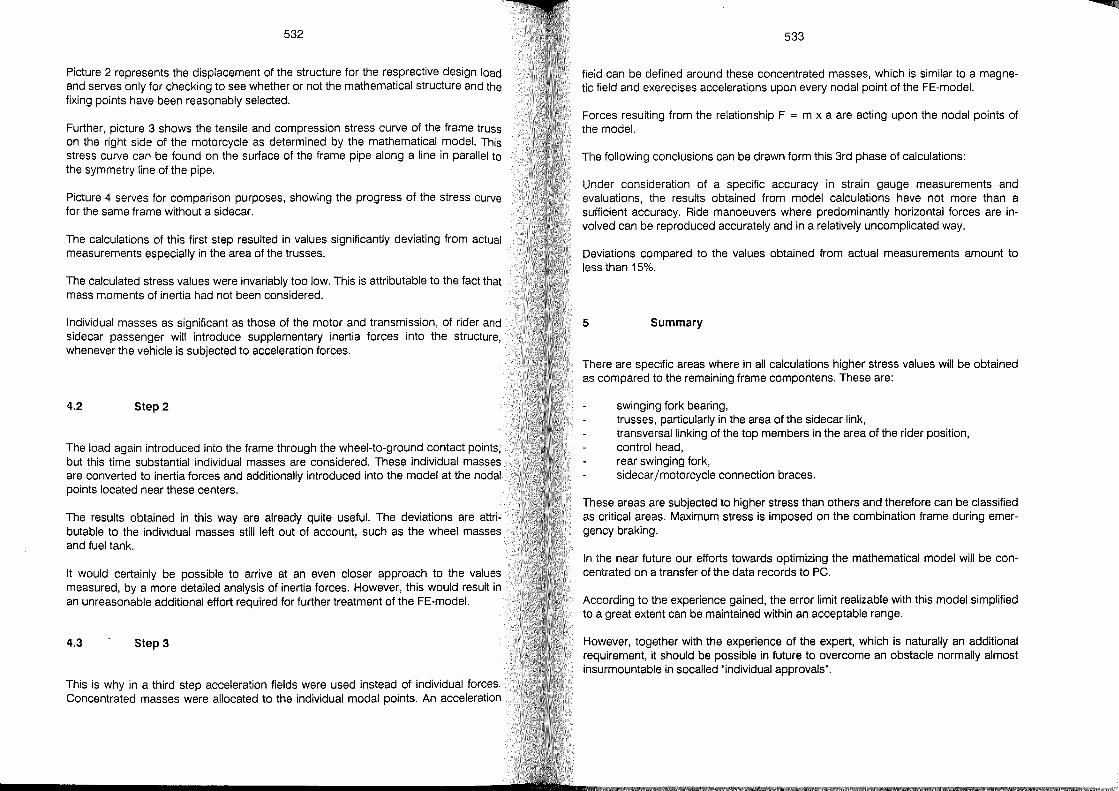
532
Picture 2 represents the displacement of the structure for the resprective design load and serves only for checking to see whether or not the mathematical structure and the fixing points have been reasonably selected.
Further, picture 3 shows the tensile and compression stress curve of the frame truss on the right side of the motorcycle as determined by the mathematical model. This stress curve can be found on the surface of the frame pipe along a line in parallel to the symmetry line of the pipe.
Picture 4 serves for comparison purposes, showing the progress of the stress curve for the same frame without a sidecar.
The calculations of this first step resulted in values significantly deviating from actual measurements especially in the area of the trusses.
The calculated stress values were invariably too low. This is attributable to the fact that mass moments of inertia had not been considered.
Individual masses as significant as those of the motor and transmission, of rider and sidecar passenger will introduce supplementary inertia forces into the structure, whenever the vehicle is subjected to acceleration forces.
4.2 Step 2
The load again introduced into the frame through the wheel-to-ground contact points, but this time substantial individual masses are considered. These individual masses are converted to inertia forces and additionally introduced into the model at the nodal points located near these centers.
The results obtained in this way are al ready quite useful. The deviations are attributable to the individual masses still left out of account, such as the wheel masses and fuel tank.
It would certainly be possible to arrive at an even closer approach to the values measured, by a more detailed analysis of inertia forces. However, this would result in an unreasonable additional effort required for further treatment of the FE-model.
4.3 Step 3
This is why in a third step acceleration fields were used instead of individual forces. Concentrated masses were allocated to the individual modal points. An acceleration
533
field can be defined around these concentrated masses, which is similar to a mag netic field and exerecises accelerations upon every nodal point of the FE-model.
Forces resulting from the relationship F = m x aare acting upon the nodal points of the model.
The following conclusions can be drawn form this 3rd phase of calculations:
Under consideration of a specific accuracy in strain gauge measurements and evaluations, the results obtained from model calculations have not more than a sufficient accuracy. Ride manoeuvers where predominantly horizontal forces are involved can be reproduced accurately and in a relatively uncomplicated way.
Deviations compared to the values obtained from actual measurements amount to less than 15%.
5 Summary
There are specific areas where in all calculations higher stress values will be obtained as compared to the remaining frame compontens. These are:
swinging fork bearing, trusses, particularly in the area of the sidecar link, transversallinking of the top members in the area of the rider position, control head, rear swinging fork, sidecar /motorcycle connection braces.
These areas are subjected to higher stress than others and therefore can be classified as critical areas. Maximum stress is imposed on the combination frame during emergency braking.
In the near future our efforts towards optimizing the mathematical model will be concentrated on a transfer of the data records to PC.
According to the experience gained, the error limit realizable with this model simplified to a great extent can be maintained within an acceptable range.
However, together with the experience of the expert, which is naturally an additional requirement, it should be possible in future to overcome an obstacle normally alm ost insurmountable in socalled "individual approvals".
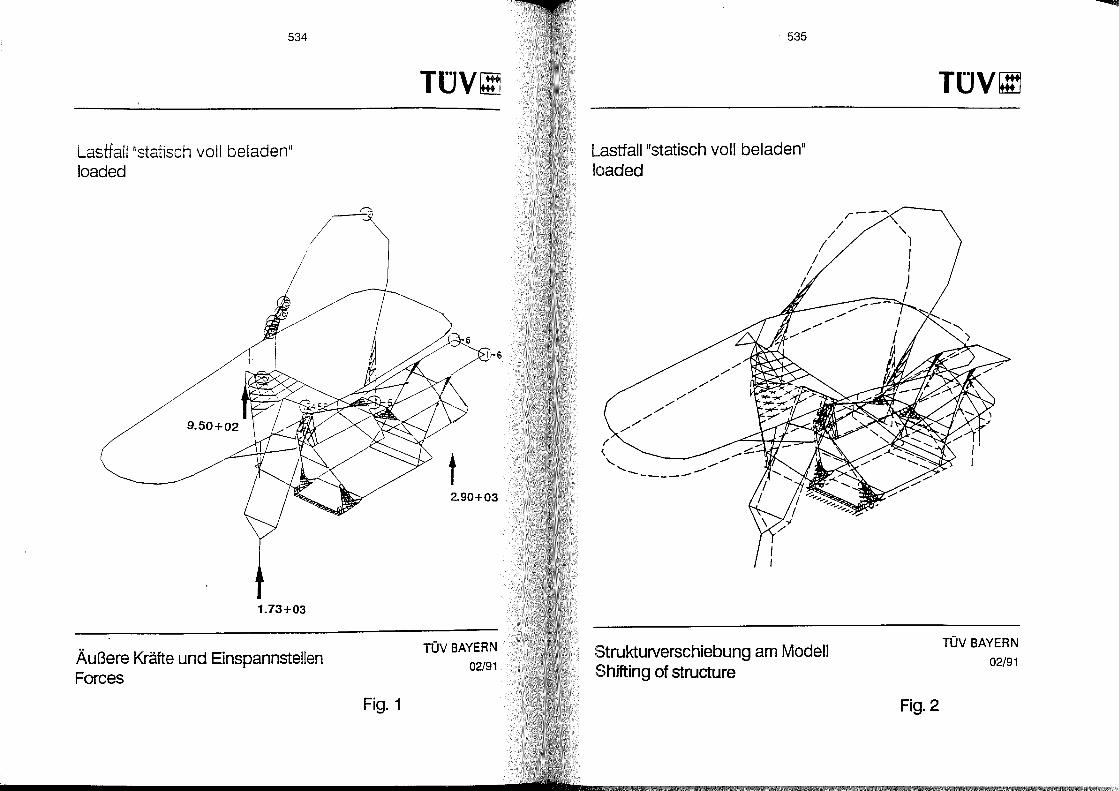
534
Lastfall "statisch voll beladen" loaded
9.50+02
1.73+03
Äußere Kräfte und Einspannstellen Forces
Fig.1
T(JV~
t 2.90+03
TÜV BAYERN 02/91
535
Lastfall"statisch voll beladen" loaded
t' ~
"- '-
/ /
----------
I /
/ /
Strukturverschiebung am Modell Shifting of structure
r-- .....
T(JV~
TÜV BAYERN
02/91
Fig.2
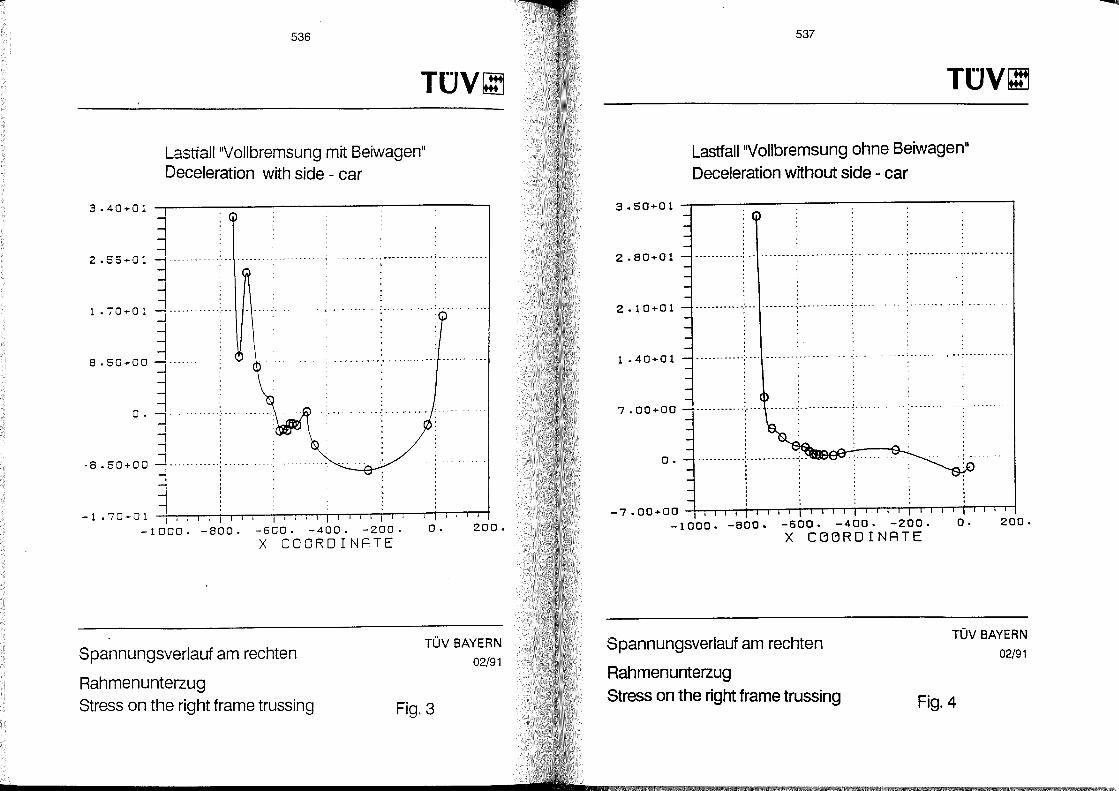
536
T(JV~
Lastfall"Vollbremsung mit Beiwagen" Deceleration with side - car
3.40+01
2.55 ... 01
1 • j' 0 + 0 1 "] ............ j .. .
-1 8.50+00 J ..
~ o. "J"""""""
I ..., ~
•• ; ..... a ............ _ .. ~ _ .... _____ • __
. . -. . ,-, ,- .. '"' ". ".
-8.50+00 ~ ........ .
-1.70+01 ~I ~'~'~~I~~~~~~~~~I~~rr~~~ 200. -1000. -800. -600. -400. -200. O.
X COORDINATE
Spannungsverlauf am rechten
Rahmenunterzug Stress on the right frame trussing
TÜV BAYERN
02/91
Fig.3
537
T(JV~
Lastfall"Vollbremsung ohne Beiwagen"
Deceleration without side - car
3.50+01 ~--------------------------------~
2.80+01 - - - - - - • _. - - _: - - - - - - - - - - ..;_ - - - - - •• - - - • ~ _. • _. • •• - • ~ .................. " - ~ ... 0" .... " ... . . . . . .
2.10+01 ...................... -,- .... _ ............. -:- .................... ~ ..... . . .
1.40+01 ------------,._-- -_ .. --_._----_.
7.00+00 ............ : ............ : ............ , .. .
O. . ........... ; ............ -: ..
-7.00+00 ~~~~~~~~~~~~~~~~~~ -1000. -800. -600. -400. -200.
X CBBROINATE
Spannungsverlauf am rechten
Rahmenunterzug
O. 200.
TÜV BAYERN
02/91
Stress on the right frame trussing Fig.4
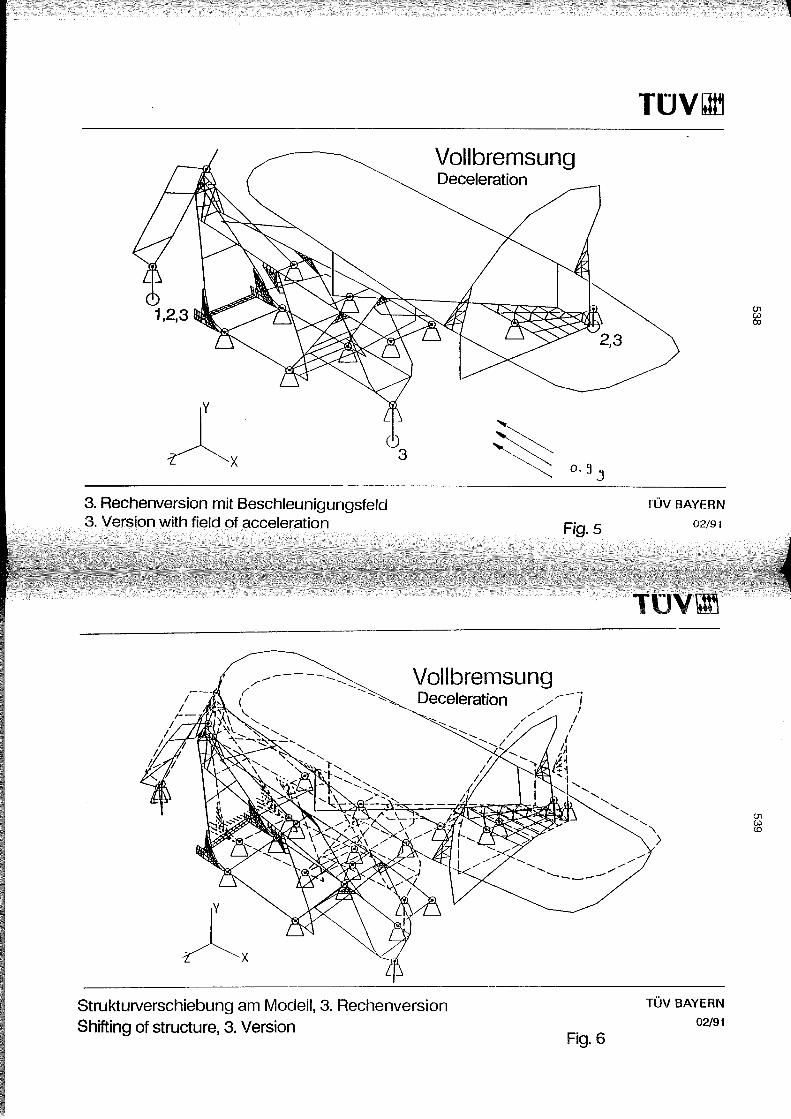
rlx (~ 3
3. Rechenversion mit Beschleunigungsfeld 3. Version with field of acceleration
-----
rlx
Vollbremsung Deceleration
~ o.jj
Vollbremsung Deceleration
""- "' :-.. .....
Fig.5
StruktuNerschiebung am Modell, 3. Rechenversion Shifting of structure, 3. Version
Fig.6
T(JV~
TÜV BAYERN
02/91
TÜV BAYERN
02/91
(]l w CD
(]l w CD
Y\"1
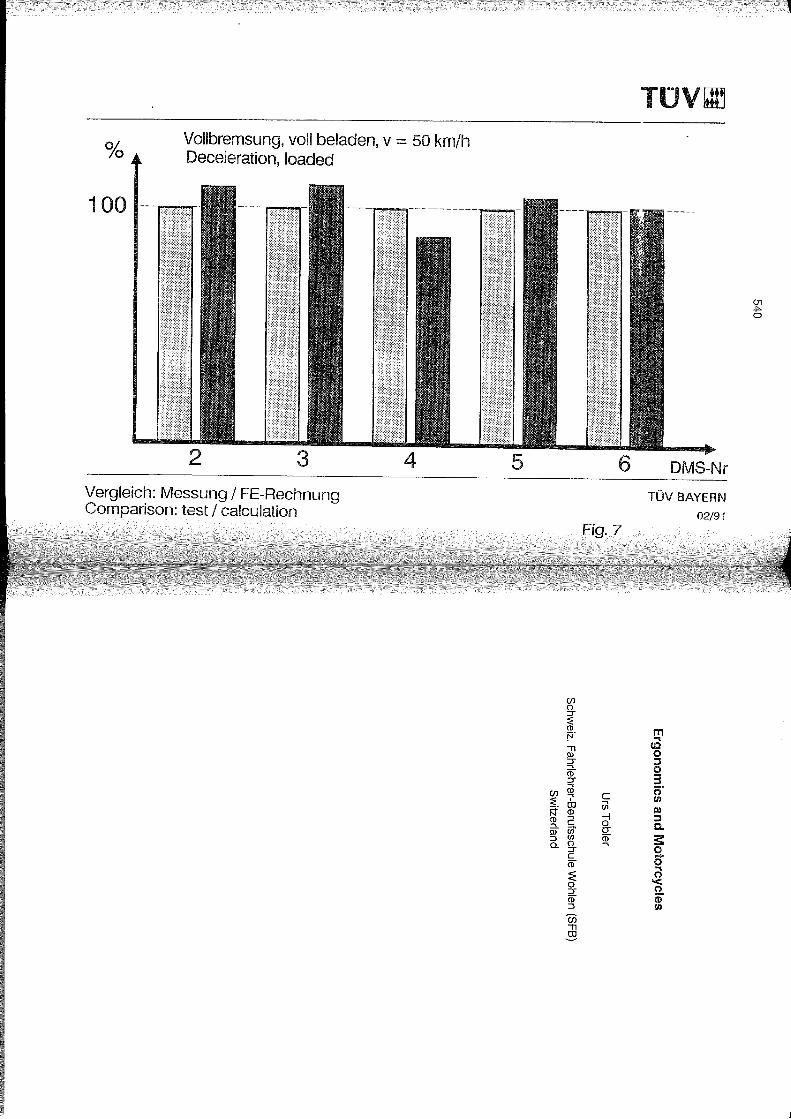
% Vollbremsung, voll beladen, v = 50 km/h Deceleration, loaded
1 00 .---~
3 Vergleich: Messung / FE-Rechnung Comparison: test! calculation
4 5
TUVOO
6 DMS-Nr
TÜV BAYERN
02/91
cn () ::r
Fig.7
~ m F cO '"Tl 0 !ll :J ;;r 0 m 3 ::r _. ~ 0
cn ~ C !II ::::' ., _. OJ Ul I» N(1) --l :J ~ 2 0 0.. iil~ ~ :s:: ::J ().... 0 a. ::r _
c 0 m .... :E ~ o 0 ::r _ - (I) ~ !II
W '"Tl ~
Ü1 -I>o
,
543
1 Abstract
State-of-the-art motorcycles leave hardly a wish unfulfilled with regard to safety, equipment and design. Every imaginable gap in the market has been filled and market researchers have become adept at divining the wishes of visitors to motorcycle shows and trade fairs.
With my paper, I wish to draw the attention of manufacturers to the fact that motorcycle riding is based on certain natural laws which, unfortunately, with increasing specialization (e.g. the craze for chopper bikes) have been increasingly ignored. This has led to a lob-sided range of products on the market: increasingly extreme fun-bikes, ranging from high- quality racing bike replicas to ultrathoroughbred sports enduro bikes, wh ich appear to have displaced standard bikes for the day-to-day rider. The first-time bike rider, and everybody faces a first time, has to somehow find an interim solution before he is able to ride alongside the experts. At the moment, this means that his options are largely limited to the used-bike market.
The 'sitting position' is a parameter of great importance with regard not only to the satisfaction and happiness of a bike owner but also to safety and well-being on longer journeys. Relatively minor features, such as the ability to adjust the handlebar grip-tolever spacing, footrests and gear-shifters, and also to adjust the seat height as weil as a choice of various types of handlebars would, at an acceptable cost, improve (still further) the quality of the product offered to the customer - an objective which all manufacturers should be striving for.
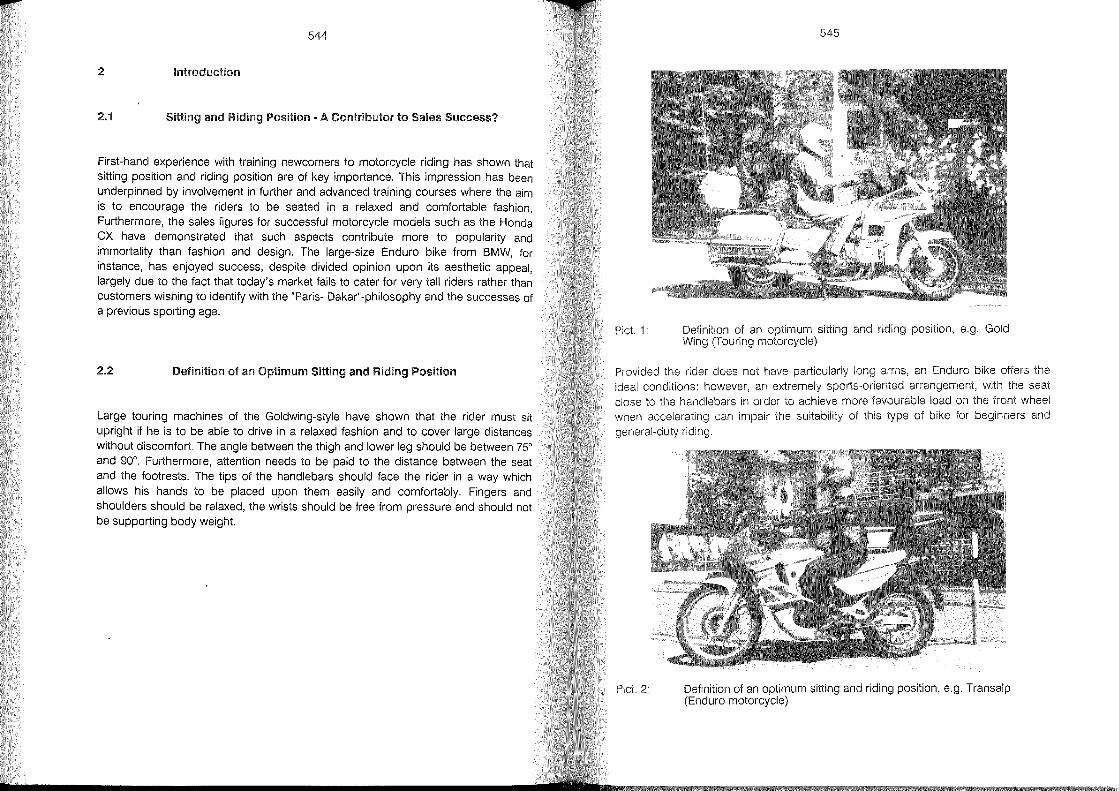
544
2 Introdl.lction
2.1 Sitting and Riding Position - A Contribl.ltor to Sales Success?
First-hand experience with training newcomers to motorcycle riding has shown that sitting position and riding position are of key importance. This impression has been underpinned by involvement in further and advanced training courses where the aim is to encourage the riders to be seated in a relaxed and comfortable fashion. Furthermore, the sales figures for successful motorcycle models such as the Honda CX have demonstrated that such aspects contribute more to popularity and immortality than fashion and design. The large-size Enduro bike from BMW, for instance, has enjoyed success, despite divided opinion upon its aesthetic appeal, largely due to the fact that today's market tails to cater for very tall riders rather than customers wishing to identify with the "Paris- Dakar"-philosophy and the successes of a previous sporting age.
2.2 Definition 01 an Optimum Sitting and Riding Position
Large touring machines of the Goldwing-style have shown that the rider must sit upright if he is to be able to drive in a relaxed fashion and to cover large distances without discomtort. The angle between the thigh and lower leg should be between 75° and 90°. Furthermore, attention needs to be paid to the distance between the seat and the footrests. The tips of the handlebars should face the rider in a way which allows his hands to be placed upon them easily and comfortably. Fingers and shoulders should be relaxed, the wrists should be free from pressure and should not be supporting body weight.
Piet. 1: Definition of an optimum Wing (Touring motorcycle)
545
and riding position, e.g. Gold
Provided the rider does not have arms, an Enduro bike ofters the ideal conditions: however, an arrangement, with the seat close to the handlebars in order to aehieve more favourable load on the front wheel when aceelerating ean impair the of this type of bike for beginners and
Piet. 2:
riding.
Definition of an optimum sitting and riding position, e.g. Transalp (Enduro motorcycle)
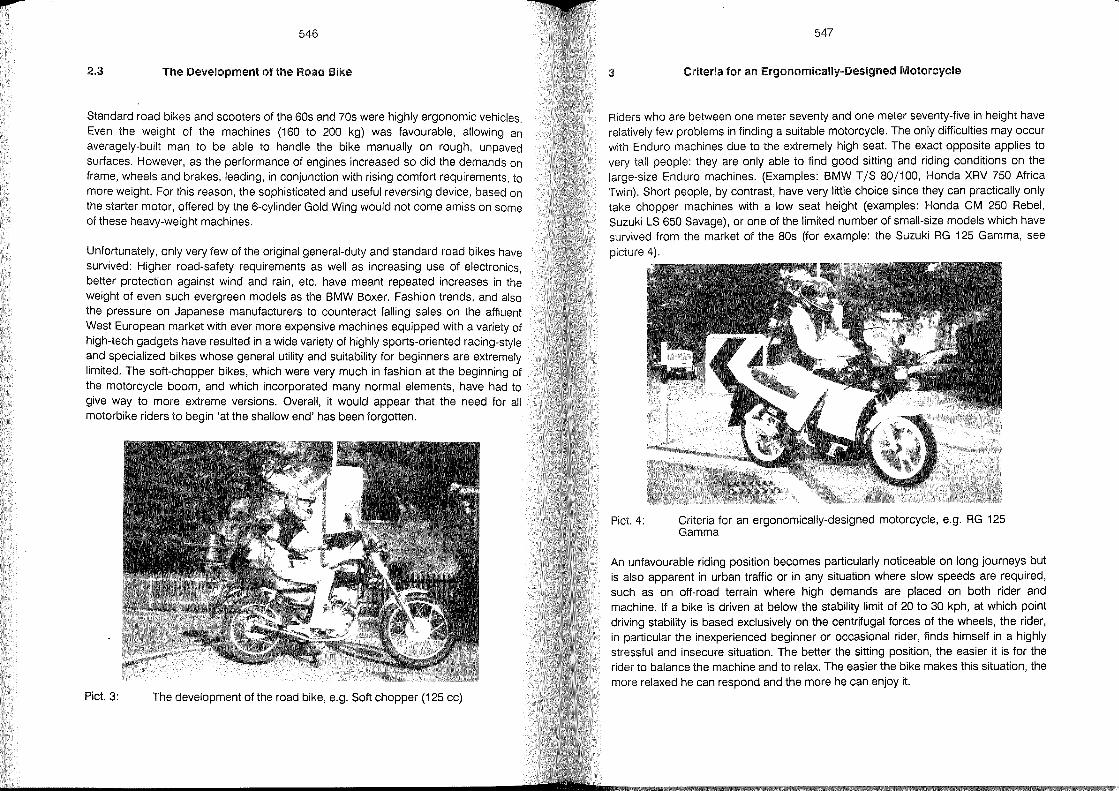
.... 546
2.3 The Development 01 the Road Bike
Standard road bikes and scooters of the 60s and 70s were highly ergonomic vehicles. Even the weight of the machines (160 to 200 kg) was favourable, allowing an averagely-built man to be able to handle the bike manually on rough, unpaved surfaces. However, as the performance of engines increased so did the demands on frame, wheels and brakes, leading, in conjunction with rising comfort requirements, to more weight. For this reason, the sophisticated and useful reversing device, based on the starter motor, offered by the 6-cylinder Gold Wing would not come am iss on some of these heavy-weight machines.
Unfortunately, only very few of the original general-duty and standard road bikes have survived: Higher road-safety requirements as weil as increasing use of electronics, better protection against wind and rain, etc. have meant repeated increases in the weight of even such evergreen models as the BMW Boxer. Fashion trends, and also the press ure on Japanese manufacturers to counteract falling sales on the affluent West European market with ever more expensive machines equipped with a variety of high-tech gadgets have resulted in a wide variety of highly sports-oriented racing-style and specialized bikes whose general utility and suitability for beginners are extremely limited. The soft-chopper bikes, which were very much in fashion at the beginning of the motorcycie boom, and which incorporated many normal elements, have had to give way to more extreme versions. Overall, it would appear that the need for all motorbike riders to begin 'at the shallow end' has been forgotten.
Pict. 3: The development of the road bike, e.g. Soft chopper (125 cc)
547
3 Criteria for an Ergonomically-Designed Motorcycle
Riders who are between one meter seventy and one meter seventy-five in height have relatively few problems in finding a suitable motorcycle. The only difficulties may occur with Enduro machines due to the extremely high seat. The exact opposite applies to very tall people: they are only able to find good sitting and riding conditions on the large-size Enduro machines. (Examples: BMW T /S 80/100, Honda XRV 750 Africa Twin). Short people, by contrast, have very little choice since they can practically only take chopper machines with a low seat height (examples: Honda CM 250 Rebel, Suzuki LS 650 Savage), or one of the limited number of small-size models which have survived from the market of the 80s (for example: the Suzuki RG 125 Gamma, see
picture 4).
Pict. 4: Criteria for an ergonomically-designed motorcycle, e.g. RG 125 Gamma
An unfavourable riding position becomes particularly noticeable on long journeys but is also apparent in urban traffic or in any situation where slow speeds are required, such as on off-road terrain where high demands are placed on both rider and machine. If a bike is driven at below the stability limit of 20 to 30 kph, at which point driving stability is based exclusively on the centrifugal forces of the wheels, the rider, in particular the inexperienced beginner or occasional rider, finds himself in a highly stressful and insecure situation. The better the sitting position, the easier it is for the rider to balance the machine and to relax. The easier the bike makes this situation, the more relaxed he can res pond and the more he can enjoy it.
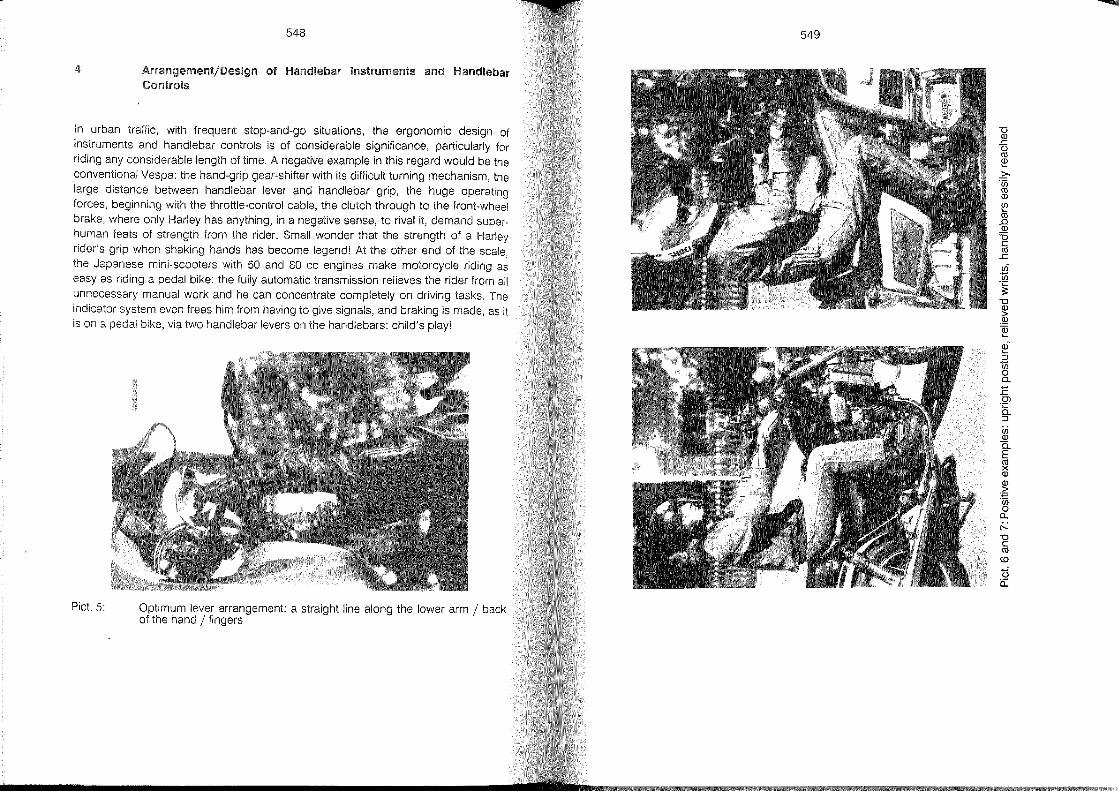
548
4 of Handlebar Instruments .md Hal1dlebar Conlrols
In urban traffie, with frequent stop-and-go situations, the ergonomie design of instruments and handlebar eontrols is of eonsiderable signifieanee, partieularly for riding any eonsiderable length of time, A negative example in this regard would be the eonventional Vespa: the hand-grip gear-shifter with its diffieult turning meehanism, the large distanee between handlebar lever and handlebar grip, the huge operating forees, beginning with the throttle-control eable, the elutch through to the front-wheel brake, where only Harley has anything, in a sense, to rival it, demand superhuman feats of strength from the rider, Small wonder that the strength of a Harley rider's grip when shaking hands has beeome legend! At the other end of the seale, the Japanese mini-seooters with 50 and 80 ee engines make motoreycle riding as easy as riding a pedal bike: the fully automatie transmission relieves the rider from all unneeessary manual work and he ean eoneentrate completely on driving tasks, The indieator system even frees him from having to give signals, and braking is made, as it is on a pedal bike, via two handlebar levers on the handlebars: ehild's play!
Piet. 5: Optimum lever arrangement: a straight line along the lower arm / baek of the hand / fingers
549
-0 Q)
.s:: u ro ~ .?'üj ro Q)
Ul
ro ..a Q)
=0 c (1j
.s:: ur t5 '~
-0
~ ,~
~ ai ::; t5 o a. E Cl .~
::J
Ul Q)
Ci. E ~ Q)
~ '';:; 'üj o ll. r--0 c ro co t5 Cl:
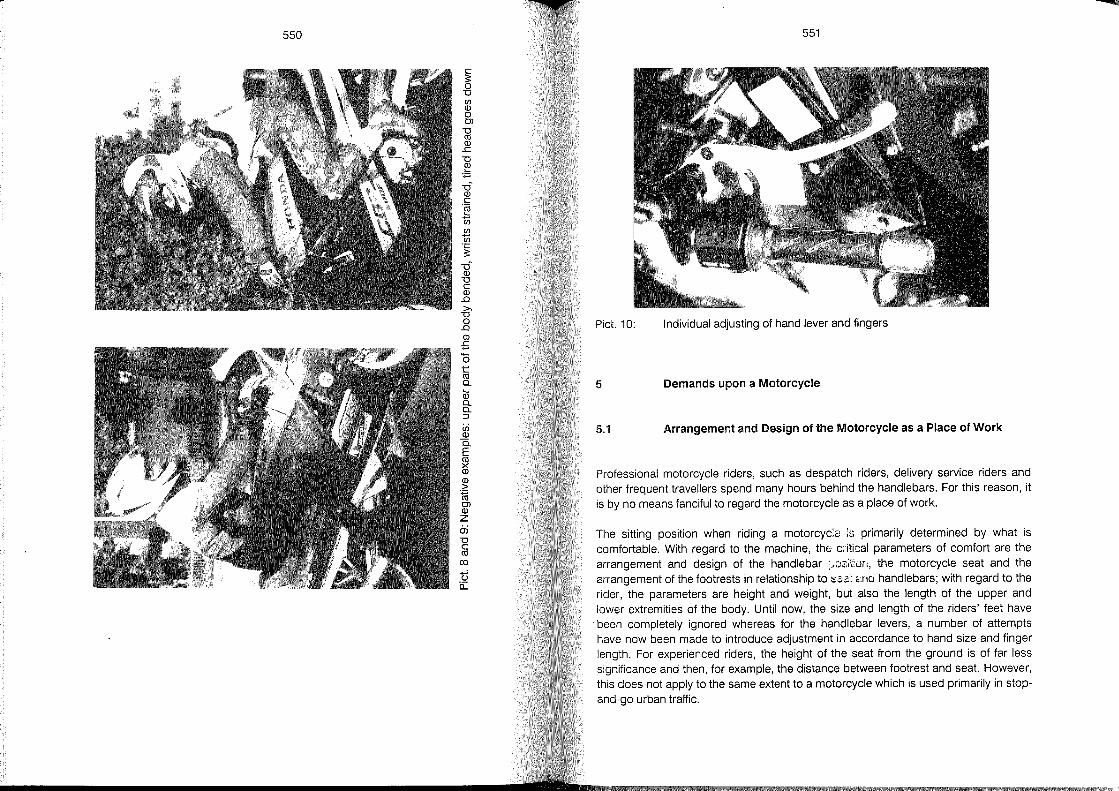
550
c s: 0 u Cf) Q) 0 Cl
U co Q) .c u ~
:;:;
u-Q) c .~
ti Cf)
ti .~
-ci Q) u c Q) .0 >-
U 0 .0 Q)
E Ci t co Q.
W Q. Q. ::J
Cf) Q)
0. E co >< Q)
Q) > ."ffi Cl Q)
Z 0; u c co
(Xl
ti i:i:
551
Pict. 10: Individual adjusting of hand lever and fingers
5 Demands upon a Motorcycle
5.1 Arrangement and Design of the Motorcycle as a Place of Work
Professional motorcycle riders, such as despatch riders, delivery service riders and other frequent travellers spend many hours behind the handlebars. For this reason, it is by no means fanciful to regard the motorcycle as a place of work.
The sitting position when riding a motorcyc:e is primarily determined by what is comfortable. With regard to the machine, thEi ctitical parameters of comfort are the arrangement and design of the handlebar ::;'')~;~:Ürl, the motorcycle seat and the arrangement of the foot rests in relationship to SElS: ,md handlebars; with regard to the rider, the parameters are height and weight, but also the length of the upper and lower extremities of the body. Until now, the size and length of the riders' feet have been completely ignored whereas for the handlebar levers, a number of attempts have now been made to introduce adjustment in accordance to hand size and finger length. For experienced riders, the height of the seat from the ground is of far less significance and then, for example, the distance between footrest and seat. However, this does not apply to the same extent to a motorcycle which is used primarily in stop
and-go urban traffic.
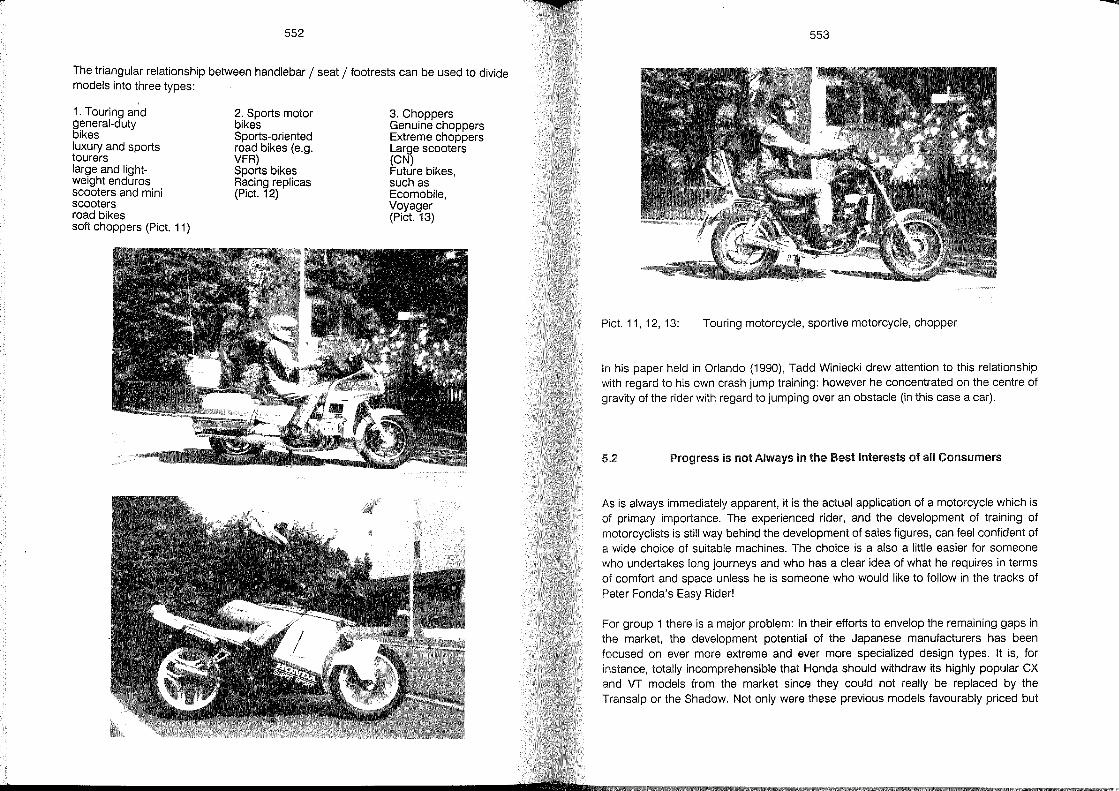
552
The triangular relationship between handlebar / seat / footrests can be used to divide models into three types:
1. Touring and general-duty bikes luxury and sports tourers large and lightweight enduros scooters and mini scooters road bikes soft choppers (Pict. 11)
2. Sports motor bikes Sports-oriented road bikes (e.g. VFR) Sports bikes Racing replicas (Pict. 12)
3. Choppers Genuine choppers Extreme choppers Large scooters (CN) Future bikes, such as Ecomobile, Voyager (Pict. 13)
553
Pict. 11, 12, 13: Touring motorcycle, sportive motorcycle, chopper
In his paper held in Orlando (1990), Tadd Winiecki drew attention to this relationship with regard to his own crash jump training: however he concentrated on the centre of gravity of the rider with regard to jumping over an obstacle (in this case a car).
5.2 Progress is not Always in the Best Interests of all Consumers
As is always immediately apparent, it is the actual application of a motorcycle which is of primary importance. The experienced rider, and the development of training of motorcyclists is still way behind the development of sales figures, can feel confident of a wide choice of suitable machines. The choice is a also a little easier for someone who undertakes lang journeys and who has a clear idea of what he requires in terms of comfort and space unless he is someone who would like to follow in the tracks of Peter Fonda's Easy Rider!
For group 1 there is a major problem: In their efforts to envelop the remaining gaps in the market, the development potential of the Japanese manufacturers has been focused on ever more extreme and ever more specialized design types. It is, for instance, totally incomprehensible that Honda should withdraw its highly popular CX and VT models from the market since they could not really be replaced by the Transalp or the Shadow. Not only were these previous models favourably priced but
-
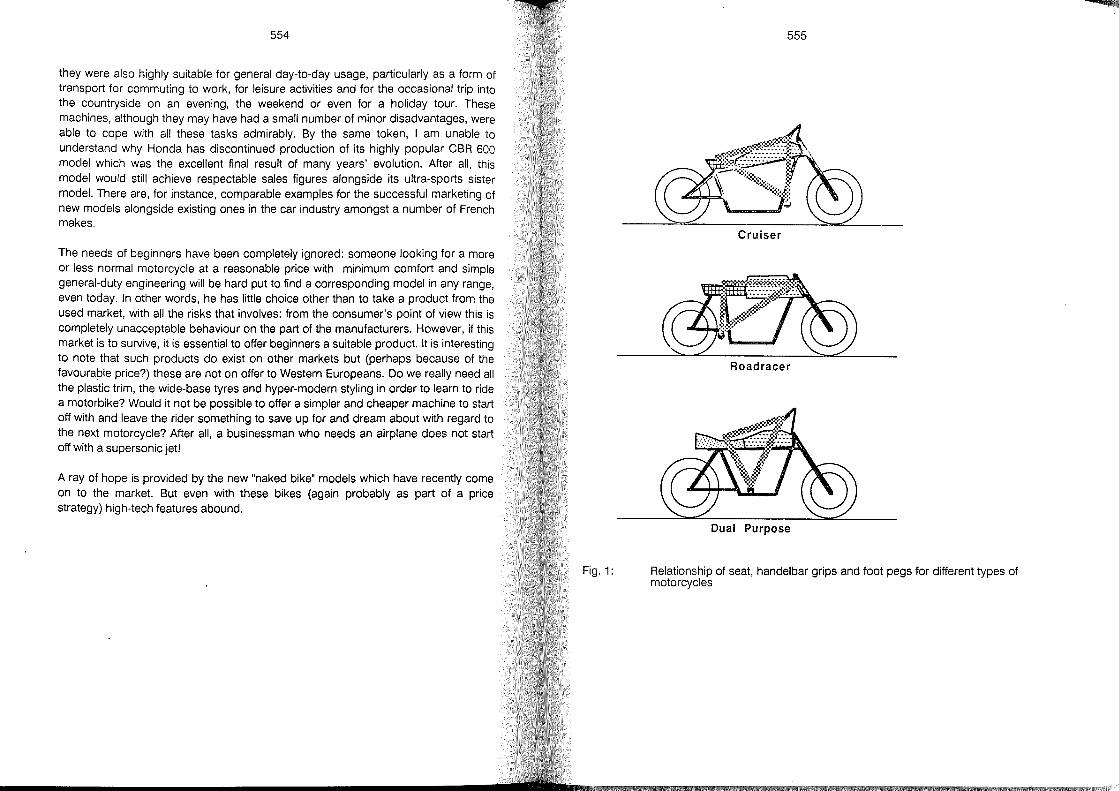
554
they were also highly suitable for general day-to-day usage, particularly as a form of transport for commuting to work, for leisure activities and for the occasional trip into the countryside on an evening, the weekend or even for a holiday tour. These machines, although they may have had a small number of minor disadvantages, were able to cope with all these tasks admirably. By the same token, I am unable to understand why Honda has discontinued production of its highly popular CBR 600 model which was the excellent final result of many years' evolution. After all, this model would still achieve respectable sales figures alongside its ultra-sports sister model. There are, for instance, comparable examples for the successful marketing of new models alongside existing ones in the car industry amongst a number of French makes.
The needs of beginners have been completely ignored: someone looking for a more or less normal motorcycle at a reasonable price with minimum comfort and simple general-duty engineering will be hard put to find a corresponding model in any range, even today. In other words, he has little choice other than to take a product from the used market, with all the risks that involves: from the consumer's point of view this is completely unacceptable behaviour on the part of the manufacturers. However, if this market is to survive, it is essential to offer beginners a suitable product. It is interesting to note that such products do exist on other markets but (perhaps because of the favourable price?) these are not on offer to Western Europeans. Do we really need all the plastic trim, the wide-base tyres and hyper-modern styling in order to learn to ride a motorbike? Would it not be possible to offer a simpler and cheaper machine to start off with and leave the rider something to save up for and dream about with regard to the next motorcycie? After all, a businessman who needs an airplane does not start off with a supersonic jet!
A ray of hope is provided by the new "naked bike" models which have recently come on to the market. But even with these bikes (again probably as part of a price strategy) high-tech features abound.
Fig. 1:
555
Cruiser
Roadracer
Dual Purpose
Relationship of seat, handel bar grips and foot pegs for different types of motorcycies
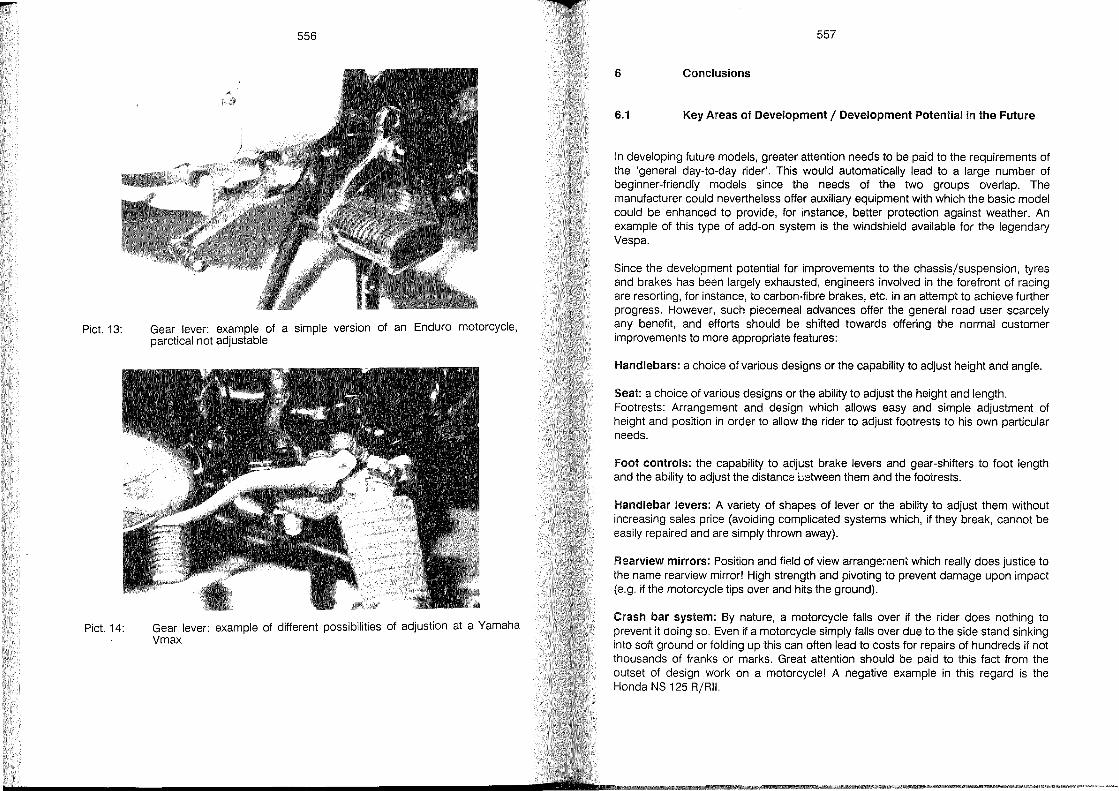
Piet. 13:
Piet. 14:
556
Gear lever: example of a simple version of an Enduro motoreyele, paretieal not adjustable
Gear lever: example of different possibilities of adjustion at a Yamaha Vmax
557
6 Conclusions
6.1 Key Areas of Development / Development Potential in the Future
In developing future models, greater attention needs to be paid to the requirements of the 'general day-to-day rider'. This would automatieally lead to a large number of beginner-friendly models since the needs of the two groups overlap. The manufacturer could nevertheless offer auxiliary equipment with which the basie model could be enhanced to provide, tor instance, better protection against weather. An example ot this type of add-on system is the windshield available tor the legendary Vespa.
Since the development potential for improvements to the chassis/suspension, tyres and brakes has been largely exhausted, engineers involved in the forefront of racing are resorting, tor instance, to carbon-fibre brakes, etc. in an attempt to achieve further progress. However, such piecemeal advances offer the general road user scarcely any benefit, and efforts should be shifted towards offering the normal eustomer improvements to more appropriate features:
Handlebars: a choice of various designs or the capability to adjust height and angle.
Seat: a ehoice of various designs or the ability to adjust the height and length. Footrests: Arrangement and design which allows easy and simple adjustment ot height and position in order to allow the rider to adjust tootrests to his own particular needs.
Foot controls: the capability to adjust brake levers and gear-shifters to foot length and the ability to adjust the distance iJetween them and the footrests.
Handlebar levers: A variety of shapes of lever or the ability to adjust them without increasing sales price (avoiding complicated systems which, if they break, cannot be easily repaired and are simply thrown away).
Rearview mirrors: Position and field of view arrange:-nen, which really does justice to the name rearview mirror! High strength and pilioting to prevent damage upon impact (e.g. if the motorcyele ti ps over and hits the ground).
Crash bar system: By nature, a motorcycle falls over if the rider does nothing to prevent it doing so. Even if a motorcycle simply falls over due to the side stand sinking into soft ground or folding up this can often lead to costs for repairs of hundreds if not thousands of tranks or marks. Great attention should be paid to this fact from the outset of design work on a motoreycle! A negative example in this regard is the Honda NS 125 R/RII.
-
558
6.2 Sales Strategy of the Future
For many years, the focus has been on ever more sophisticated and ever more expensive motorcycles. In many areas, utility has given way to the criteria of fun and ideology. The motorcycle community, in particular 'fanatical' bikers, have been provided with excellent service by the sales strategists who have read the minds of customers and provided the answer at acceptable prices in a wide variety of models in the very next year.
As a result, the man in the street has been able to aftord racing technology from Kocinski and Co. but sales prices overall have reached a level where they rival those for a car. In fact, if one were to spend a couple of thousand marks more it is possible to purchase a car which, all year round, ofters the power and fun which up until now, only a motorcycle has been able to ofter on public roads. Prime examples of such cars are the Nissan 100 NX and, slightly up-market, the Mazda MX-5.
If the motorcycle industry wishes to maintain a healthy basis it will have to not only ofter motorcycles for enthusiasts but also a wide range of general-duty and beginnerfriendly products. In contrast to the motorcycles for 'fanatics', which need to follow fashions and new trends slavishly, these general-utility models would not need to be revised every year and re-designed in order to find new customers. A number of manufacturers have proven, as has Yamaha with the XJ 900, that it is possible to keep a model up-to-date over a number of years, at least for a certain group of consumers. In Switzerland, for instance, the extremely strict regulations that apply have meant the continued marketing of 'old' motorcycles which were imported in accordance with older standards, leading to a consistency in the models on sale which has met with a positive response from consumers. In 1989, for instance, motorcycles designed and imported in 1983 were still marketed with great success. I also see prospects for improvement from the new demand created by the unification of Germany which is likely to lead to a reorganization and restructuring of model ranges. Although the introduction of cars such as the 850i or SLC make bigger headlines, the new version of the Escort or of the Golf is of far more significance to the average consumer because these are cars which, in the end, he himself will buy. With the introduction of user-friendly and easy-to-drive scooters, manufacturers have started a very positive trend. They are now called upon to take this a step further and to ofter a user-friendly and reasonably priced motorcycle which can be adapted to individual needs but whicl'l remains suitable for daily use both as a general means of transport and as a leisure pursuit. The question is: how long will we have to wait? How great must the sales' crisis be before they are finally forced to re-think their strategies?
Concept, Realization .md Driving Experience of/in Motorcycles with Enclosed Cabin
Arnold Wagner
PERAVES Ud., Winterthur
Switzerland
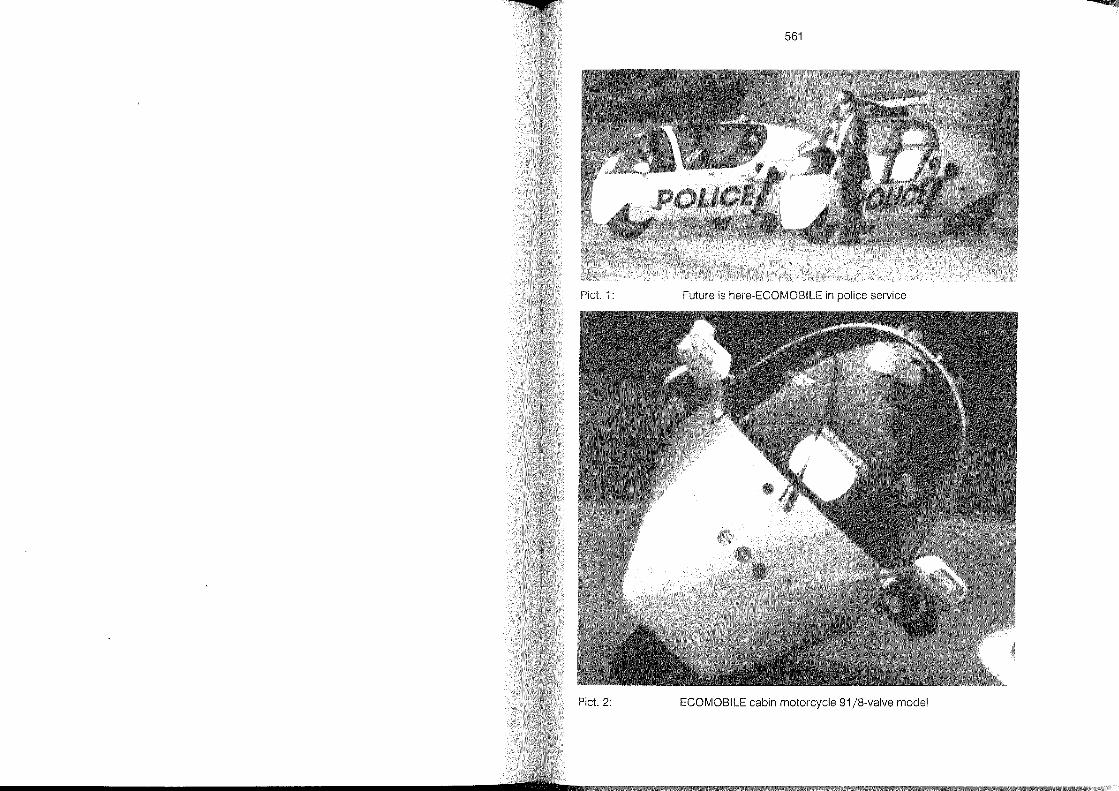
561
Pict. 1: Future is here-ECOMOBILE in police service
Pict. 2: ECOMOBILE cabin motorcycle 91 /8-valve model
562
1 Abstract
1.1 'General Aspects of Individual Traffic
Historical, technical, statistical and economical facts are analysed, and relative aspects of two-wheeler versus four-wheeler, as means of individual transport, discussed. Because of falling average load factor four-wheelers are now operated weil below efficient levels, while two-wheelers lack adequate safety, comfort and capacity.
1.2 Concept of Motorcycles with Enclosecl Cabin
Concepts to combine the car's practical usefulness with the motorcycle's fun, agility and low operating cost, Einspurautos, Monotrace, Dalniks etc., were tried out in history. Today's technical possibilities, such as composite-monocoque-structures, digital-servo-cybernetics, and hightech motorcycle components have been applied to these concepts. Effects of very long wheelbase, low GC, seated position and safety provisions such as crash-bars, seat belts, headrests as weil as aerodynamic features, including precautions for crosswind stability, are discussed. The engineer's role is emphasized.
1.3 Realization of the Cabin Motorcycle
Since 1981 the author's PERAVES company has developed ECOMOBILE, aligned to the above concept. Aircraft manufacturing technique is applied to a monocoquebody. The retractable outrigger wheels are operated by a computer-supervised, electrical servo system. The obvious "automatic retraction and lowering" has been found impractical. BMW-motorcycle components are used and partly modified. The result is compared to the modern car & motorcycle, regarding usefulness, efficiency and reliability. The top-performance-Ionglife-high-quality-concept of ECOMOBILE is explained. The much more marketable VOLKSMOBILE and its possible realization is discussed.
1.4 Driving Experience in Cabin Motorcycles
Results of nearly 1 000 000 road-kms are presented. Requirements for drivers, safety, handling and performance are discussed. Accident findings are shown with relation to
563
high-speed-, all-weather-and year-round-operation. Relative utilisation p.a. is compared.
1.5 legal Aspects and Future Development
The homologation process in Switzerland, Austria, Germany and Japan is discussed. The prime aspects of safety and negative effects of operation (noise and pollution), are shown in their relation to secondary points like vehicle category and legal formulae. Future legislation and its effect on cabin motorcycles is anticipated. Popular operation of cabin motorcycles, as means of individual transport, with technical, economical and ecological consequences is shown as a way to improve efficiency of the road traffic system.
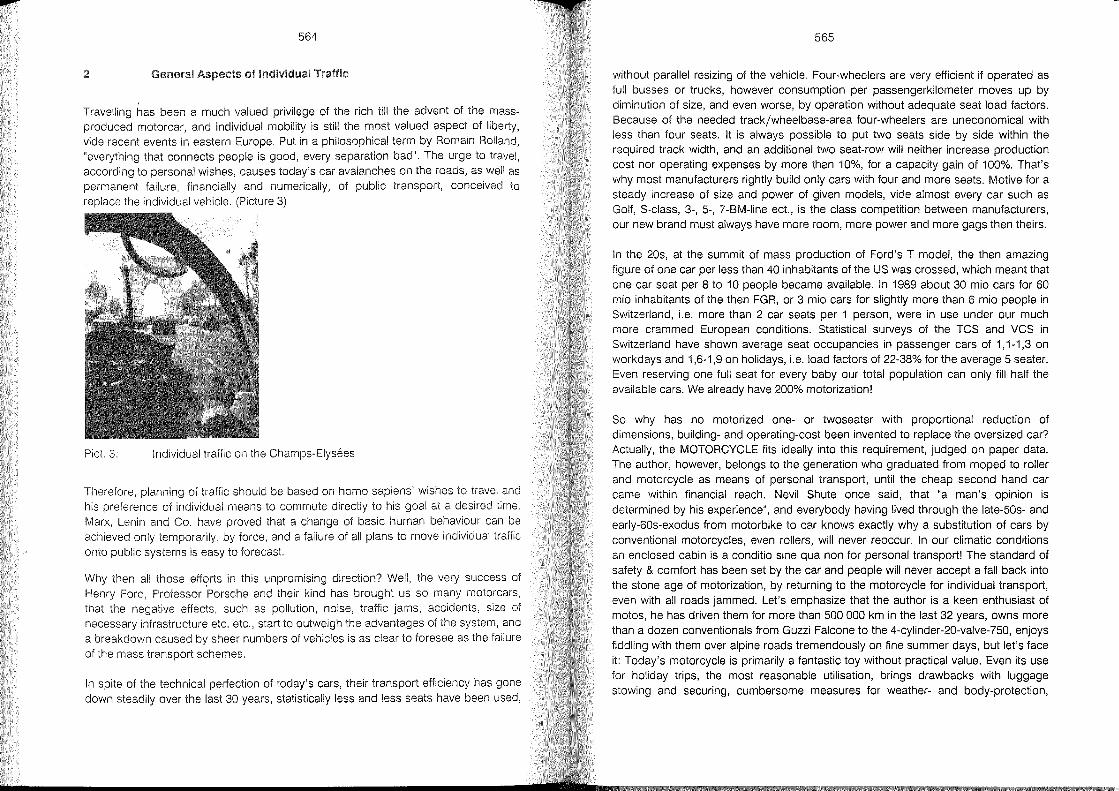
564
:2 General """''''''''''''' of Individual Traffic
Travelling has been a much valued privilege of the rich till the advent of the massproduced motorcar, and individual mobility is still the most valued aspect of liberty, vide recent events in eastern Europe. Put in a philosophical term by Romain Rolland, "everything that connects people is good, every separation bad". The urge to travel, according to personal wishes, causes today's car avalanches on the roads, as weil as permanent failure, financially and numerically, of public transport, eoneeived to replaee the individual vehiele. (Pieture 3)
Pie!. 3: Individual traffie on the Champs-Elysees
Therefore, planning of traffie should be based on homo sapiens' wishes to travel and his preference of individual means to commute directly to his goal at a desired time. Marx, Lenin and Co. have proved that a change of basic human behaviour can be achieved only temporarily, by force, and a failure of all plans to move individual traffic onto public systems is easy to forecast.
Why then all those in this unpromising direction? Weil, the very success of Henry Ford, Professor Porsche and their kind has brought us so many motorears, that the negative effects, such as pollution, noise, traffic jams, aeeidents, size of neeessary infrastrueture etc. ete., start to outweigh the advantages of the system, and a breakdown eaused by sheer numbers 01 vehieles is as clear to foresee as the failure of the mass transport schemes.
In spite of the technieal perfection of today's cars, their transport efficiency has gone down steadily over the last 30 years, statistically less and less seats have been used,
565
without parallel resizing of the vehicle. Four-wheelers are very efficient if operated as full busses or trucks, however eonsumption per passengerkilometer moves up by diminution of size, and even worse, by operation without adequate seat load factors. Because of the needed track/wheelbase-area four-wheelers are uneconomical with less than lour seats. It is always possible to put two seats side by side within the required track width, and an additional two seat-row will neither increase production cost nor operating expenses by more than 10%, for a capacity gain of 100%. That's why most manufacturers rightly build only cars with four and more seats. Motive for a steady increase of size and power of given models, vide almost every car such as Golf, S-class, 3-, 5-, 7-BM-line ect., is the class competition between manufacturers, our new brand must always have more room, more power and more gags then theirs.
In the 20s, at the summit of mass production of Ford's T model, the then amazing figure of one car per less than 40 inhabitants of the US was crossed, which meant that one car seat per 8 to 10 people became available. In 1989 about 30 mio cars for 60 mio inhabitants of the then FGR, or 3 mio cars for slightly more than 6 mio people in Switzerland, i.e. more than 2 car seats per 1 person, were in use under our much more crammed European conditions. Statistical surveys of the TCS and VCS in Switzerland have shown average seat occupancies in passenger cars of 1,1-1,3 on workdays and 1,6-1,9 on holidays, i.e. load factors of 22-38% for the average 5 seater. Even reserving one full seat for every baby our total population can only fill half the available cars. We already have 200% motorization!
So why has no motorized one- or twoseater with proportional reduction of dimensions, building- and operating-cost been invented to replace the oversized car? Actually, the MOTORCYCLE fits ideally into this requirement, judged on paper data. The author, however, belongs to the generation who graduated from moped to roller and motorcycle as means of personal transport, until the cheap second hand car came within financial reach. Nevil Shute once said, that "a man's opinion is determined by his experience", and everybody having lived through the late-50s- and early-60s-exodus trom motorbike to car knows exactly why a substitution of cars by conventional motorcycles, even rollers, will never reoccur. In our climatic conditions an enclosed cabin is a conditio sine qua non for personal transport! The standard of salety & comfort has been set by the car and people will never accept a fall back into the stone age of motorization, by returning to the motorcycle for individual transport, even with all roads jammed. Let's emphasize that the author is a keen enthusiast of motos, he has driven them for more than 500 000 km in the last 32 years, owns more than a dozen conventionals from Guzzi Falcone to the 4-cylinder-20-valve-750, enjoys fiddling with them over alpine roads tremendously on fine summer days, but let's face it: Today's motorcycle is primarily a fantastic toy without practical value. Even its use for holiday trips, the most reasonable utilisation, brings drawbacks with luggage stowing and securing, cumbersome measures for weather- and body-protection,
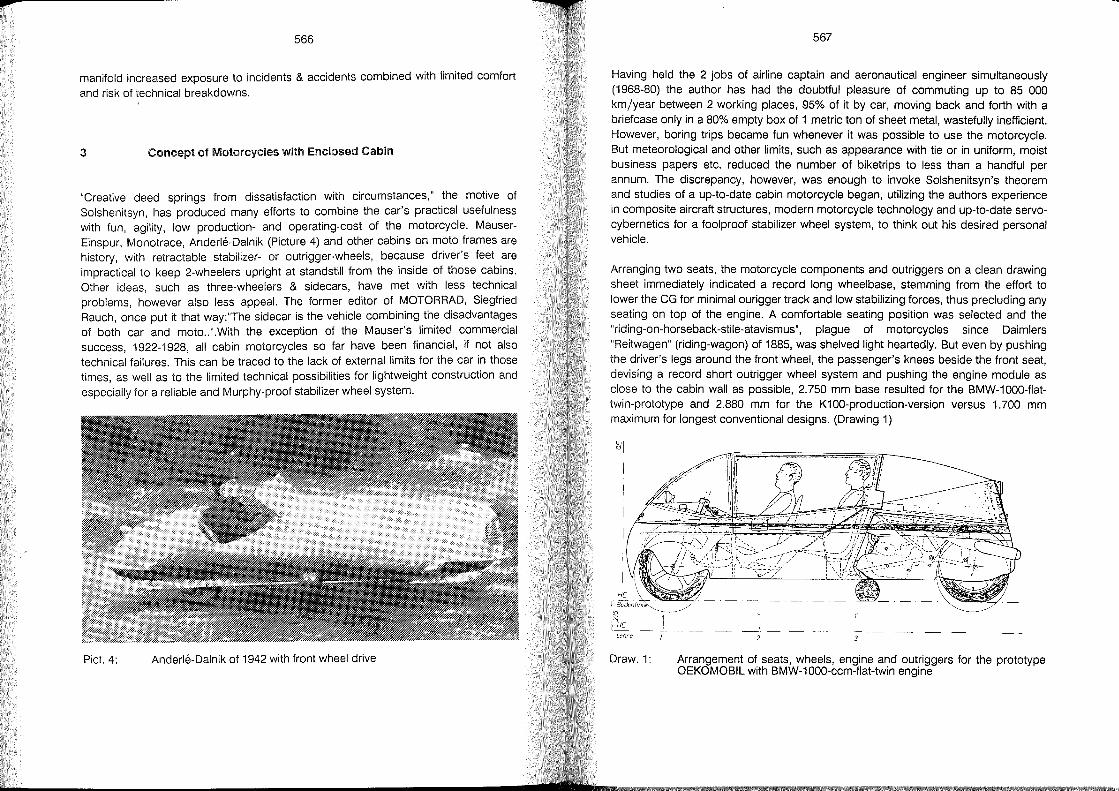
... 566
manifold increased exposure to incidents & accidents combined with limited comfort and risk of technical breakdowns.
3 Concept of Moiorcycles with Enclosed Cabin
"Creative deed springs from dissatisfaction with circumstances," the motive of SOlshenitsyn, has produced many efforts to combine the car's practical usefulness with fun, agility, low production- and operating-cost of the motorcycie. MauserEinspur, Monotrace, Anderle-Dalnik (Picture 4) and other cabins on moto frames are history, with retractable stabilizer- or outrigger-wheels, because driver's feet are impractical to keep 2-wheelers upright at standstill from the inside of those cabins. Other ideas, such as three-wheelers & sidecars, have met with less technical problems, however also less appeal. The former editor of MOTORRAD, Siegfried Rauch, once put it that way:'The sidecar is the vehicle combining the disadvantages of both car and moto .. ".with the exception of the Mauser's limited commercial success, 1922-1928, all cabin motorcycies so far have been financial, if not also technical failures. This can be traced to the lack of external limits for the car in those times, as weil as to the limited technical possibilities for lightweight construction and especially for a reliable and Murphy-proof stabilizer wheel system.
Pict. 4: Anderle-Dalnik of 1942 with front wheel drive
567
Having held the 2 jobs of airline captain and aeronautical engineer simultaneously (1968-80) the author has had the doubtful pleasure of commuting up to 85 000 km/year between 2 working places, 95% of it by car, moving back and forth with a briefcase only in a 80% empty box of 1 metric ton of sheet metal, wastefully inefficient. However, boring trips became fun whenever it was possible to use the motorcycie. But meteorological and other limits, such as appearance with tie or in uniform, moist business papers etc. reduced the number of biketrips to less than a handful per annum. The discrepancy, however, was enough to invoke Solshenitsyn's theorem and studies of a up-to-date cabin motorcycie began, utilizing the authors experience in composite aircraft structures, modern motorcycle technology and up-to-date servocybernetics for a foolproof stabilizer wheel system, to think out his desired personal vehicle.
Arranging two seats, the motorcycle components and outriggers on a ciean drawing sheet immediately indicated arecord long wheelbase, stemming from the effort to lower the CG for minimal ourigger track and low stabilizing forces, thus preciuding any seating on top of the engine. A comfortable seating position was selected and the "riding-on-horseback-stile-atavismus", plague of motorcycies since Daimlers "Reitwagen" (riding-wagon) of 1885, was shelved light heartedly. But even by pushing the driver's legs around the front wheel, the passenger's knees beside the front seat, devising arecord short outrigger wheel system and pushing the engine module as ciose to the cabin wall as possible, 2.750 mm base resulted for the BMW-1000-flattwin-prototype and 2.880 mm tor the K100-production-version versus 1.700 mm maximum for longest conventional designs. (Drawing 1)
Lehre
Draw.1:
- - - -~-
2 3
Arrangement of seats, wheels, engine and outriggers for the prototype OEKOMOBIL with BMW-1000-ccm-flat-twin engine
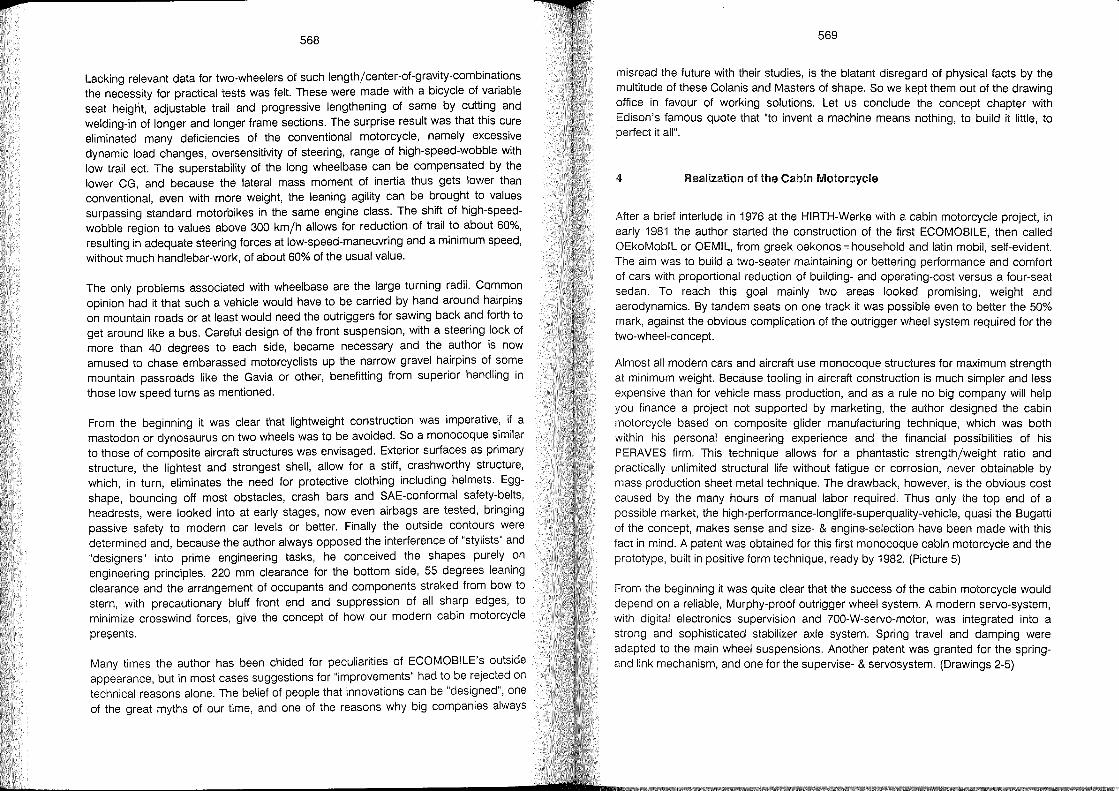
p
568
Lacking relevant data for two-wheelers of such length/center-of-gravity-combinations the necessity for practical tests was feit. These were made with a bicycle of variable seat heignt, adjustable trail and progressive lengthening of same by cutting and welding-in of longer and longer frame sections. The surprise result was that this cure eliminated many deficiencies of the conventional motorcycle, namely excessive dynamic load changes, oversensitivity of steering, range of high-speed-wobble with low trail ect. The superstability of the long wheelbase can be compensated by the lower CG and because the lateral mass moment of inertia thus gets lower than conventio~al, even with more weight, the leaning agility can be brought to values surpassing standard motorbikes in the same engine class. The shift of high-speedwobble region to values above 300 km/h allows for reduction of trail to about 60%, resulting in adequate steering forces at low-speed-maneuvring and a minimum speed, without much handlebar-work, of about 60% of the usual value.
The only problems associated with wheelbase are the large turning radii. CQmmon opinion had it that such a vehicle would have to be carried by hand around hairpins on mountain roads or at least would need the outriggers for sawing back and forth to get around like a bus. Careful design of the front suspension, with a steering lock of more than 40 degrees to each side, became necessary and the author is now amused to chase embarassed motorcyclists up the narrow gravel hairpins of some mountain passroads like the Gavia or other, benefitting from superior handling in those low speed turns as mentioned.
From the beginning it was clear that lightweight construction was imperative, if a mastodon or dynosaurus on two wheels was to be avoided. So a monocoque similar to those of composite aircraft structures was envisaged. Exterior surfaces as primary structure, the lightest and strongest shell, allow for a stiff, crashworthy structure, which, in turn, eliminates the need for protective clothing including heimets. Eggshape, bouncing off most obstacles, crash bars and SAE-conformal safety-belts, headrests, were looked into at early stages, now even airbags are tested, bringing passive safety to modern car levels or better. Finally the outside contours were determined and, because the author always opposed the interference of "stylists" and "designers" into prime engineering tasks, he conceived the shapes purelyon engineering principles. 220 mm clearance for the bottom side, 55 degrees leaning clearance and the arrangement of occupants and components straked from bow to stern, with precautionary bluff front end and suppression of all sharp edges, to minimize crosswind forces, give the concept of how our modern cabin motorcycle
pre$ents.
Many times the author has been chided for peculiarities of ECOMOBILE's outside appearance, but in most cases suggestions for "improvements" had to be rejected on technical reasons alone. The belief of people that innovations can be "designed", one of the great myths of our time, and one of the reasons why big companies always
569
misread the future with their studies, is the blatant disregard of physical facts by the multitude of these Colanis and Masters of shape. So we kept them out of the drawing office in favour of working solutions. Let us conclude the concept chapter with Edison's famous quote that "to invent a machine means nothing, to build it little, to perfect it all".
4 Realization of the Cabin Motorcycle
After abrief interlude in 1976 at the HIRTH-Werke with a cabin motorcycle project, in early 1981 the author started the construction of the first ECOMOBILE, then called OEkoMoblL or OEMIL, from greek oekonos=household and latin mobil, self-evident. The aim was to build a two-seater maintaining or bettering performance and comfort of cars with proportional reduction of building- and operating-cost versus a four-seat sedan. To re ach this goal mainly two areas looked promising, weight and aerodynamics. By tandem seats on one track it was possible even to better the 50% mark, against the obvious complication of the outrigger wheel system required for the two-wheel-concept.
Almost all modern cars and aircraft use monocoque structures for maximum strength at minimum weight. Because tooling in aircraft construction is much simpler and less expensive than for vehicle mass production, and as a rule no big company will help you finance a project not supported by marketing, the author designed the cabin motorcycle based on composite glider manufacturing technique, which was both within his personal engineering experience and the financial possibilities of his PERAVES firm. This technique allows for a phantastic strength/weight ratio and practically unlimited structural life without fatigue or corrosion, never obtainable by mass production sheet metal technique. The drawback, however, is the obvious cost caused by the many hours of manual labor required. Thus only the top end of a possible market, the high-performance-Ionglife-superquality-vehicle, quasi the Bugatti of the concept, makes sense and size- & engine-selection have been made with this fact in mind. A patent was obtained for this first monocoque cabin motorcycle and the prototype, built in positive form technique, ready by 1982. (Picture 5)
From the beginning it was quite clear that the success of the cabin motorcycle would depend on a reliable, Murphy-proof outrigger wheel system. A modern servo-system, with digital electronics supervision and 700-W-servo-motor, was integrated into a strong and sophisticated stabilizer axle system. Spring travel and damping were adapted to the main wheel suspensions. Another patent was granted for the springand link mechanism, and one for the supervise- & servosystem. (Drawings 2-5)
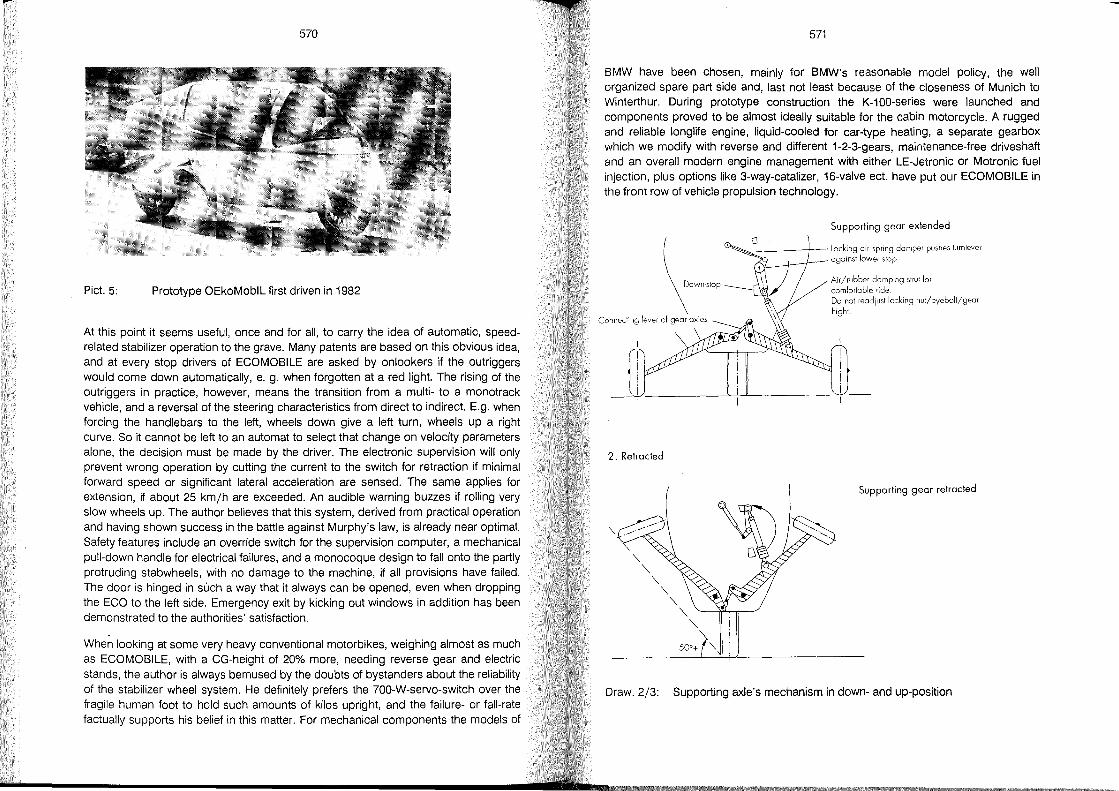
..... 570
Pict. 5: Prototype OEkoMoblL first driven in 1982
At this point it seems useful, once and for all, to carry the idea of automatic, speedrelated stabilizer operation to the grave. Many patents are based on this obvious idea, and at every stop drivers of ECOMOBILE are asked by onlookers if the outriggers would come down automatically, e. g. when forgotten at a red light. The rising of the outriggers in practice, however, means the transition from a multi- to a monotrack vehicle, and areversal of the steering characteristics from direct to indirect. E.g. when forcing the handlebars to the left, wheels down give a left turn, wheels up a right curve. So it cannot be left to an automat to select that change on velocity parameters alone, the decision must be made by the driver. The electronic supervision will only prevent wrong operation by cutting the current to the switch for retraction if minimal forward speed or significant lateral acceleration are sensed. The same applies for extension, if about 25 km/h are exceeded. An audible warning buzzes if rolling very slow wheels up. The author believes that this system, derived from practical operation and having shown success in the battle against Murphy's law, is already near optimal. Safety features include an override switch for the supervision computer, a mechanical pu li-down handle for electrical failures, and a monocoque design to fall onto the partly protruding stabwheels, with no damage to the machine, if all provisions have failed. The door is hinged in such a way that it always can be opened, even when dropping the ECO to the left side. Emergency exit by kicking out windows in addition has been demonstrated to the authorities' satisfaction.
When looking at some very heavy conventional motorbikes, weighing almost as much as ECOMOBILE, with a CG-height of 20% more, needing reverse gear and electric stands, the author is always bemused by the doubts of bystanders about the reliability of the stabilizer wheel system. He definitely prefers the 700-W-servo-switch over the fragile human foot to hold such amounts of kilos upright, and the failure- or fall-rate factually supports his belief in this matter. For mechanical components the models of
571
BMW have been chosen, mainly for BMW's reasonable model policy, the weil organized spare part side and, last not least because of the closeness of Munich to Winterthur. During prototype construction the K-100-series were launched and components proved to be almost ideally suitable for the cabin motorcycle. A rugged and reliable longlife engine, liquid-cooled for car-type heating, aseparate gearbox which we modify with reverse and different 1-2-3-gears, maintenance-free driveshaft and an overall modern engine management with either LE-Jetronic or Motronic fuel injection, plus options like 3-way-catalizer, 16-valve ect. have put our ECOMOBILE in the front row of vehicie propulsion technology.
~wc"oc Connecting lever of gear ax\es
2. Retracted
Supporting gear extended
~~----r-- Locking air spring damper pushes lurnlever against Iower stop.
Air/rubber damping slrul for comforlable ride. Do nol readjusllocking nul/eyeboli/gear
high!.
Supporting gear retracted
Draw. 2/3: Supporting axle's mechanism in down- and up-position
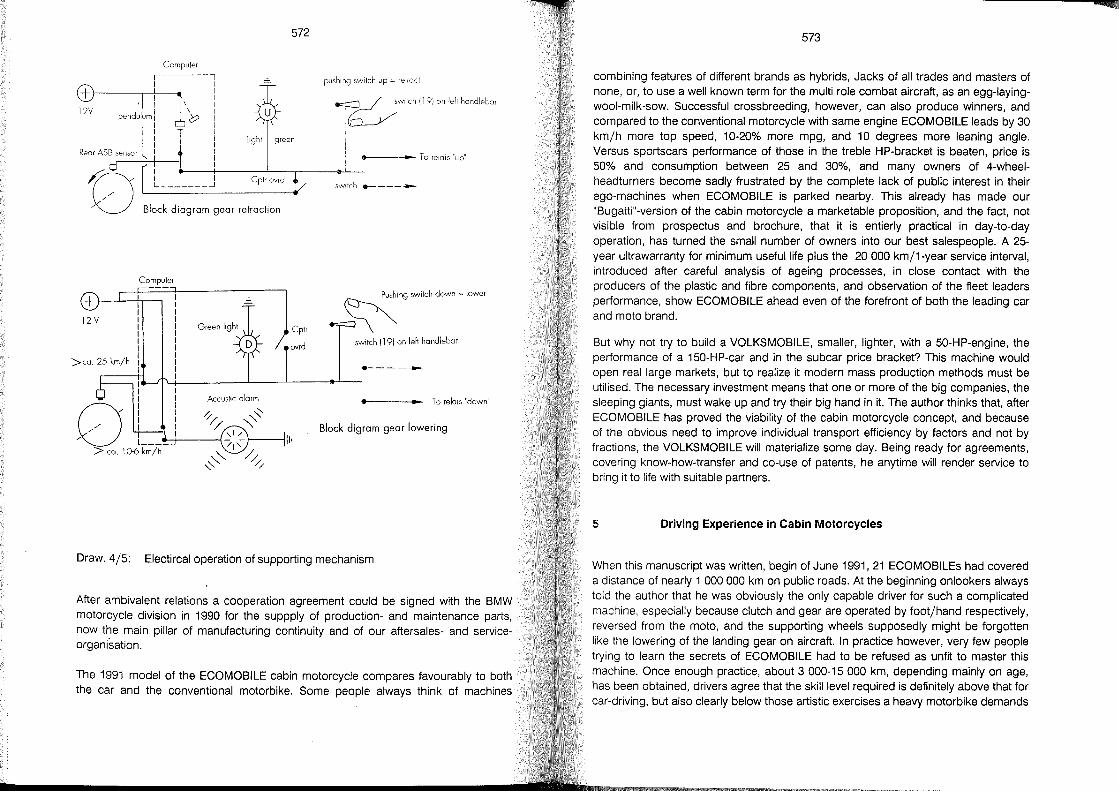
572
Compuler
,-------, I I
+l-------.----'--_ : \ I T
12V ~: u
l : I I I I I
lighl green
Rear ASB sensor I I
~8~ ,r l ___ I __ J Block diagram gear retraction
Cplr ovrd
Compuler
12 V
>ca. 25 km/h
Accuslic alarm
8 , ___ .t---t----l_
> ca. 10-6 km/h
/
Cplr
ovrd
pushing swilch up ~ relracl
0WilCh (19) on left handlebar
• .. To relais "up"
switch e----...-.
~~'"' ,,",,h 00w> - ",""
swilch (19) on left handlebar
e----....._...
• .. To relais "down"
Block digram gear lowering
Draw.4/5: Electircal operation of supporting mechanism
After ambivalent relations a cooperation agreement could be signed with the BMW motorcycle division in 1990 for the suppply of production- and maintenance parts, now the main pillar of manufacturing continuity and of our aftersales- and serviceorganisation.
The 1991 model of the ECOMOBILE cabin motorcycle compares favourably to both the car and the conventional motorbike. Some people always think of machines
573
combining features of different brands as hybrids, Jacks of all trades and masters of none, or, to use a weil known term for the multi role combat aircraft, as an egg-Iayingwool-milk-sow. Successful crossbreeding, however, can also produce winners, and compared to the conventional motorcycle with same engine ECOMOBILE leads by 30 km/h more top speed, 10-20% more mpg, and 10 degrees more leaning angle. Versus sportscars performance of those in the treble HP-bracket is beaten, price is 50% and consumption between 25 and 30%, and many owners of 4-wheelheadturners become sadly frustrated by the complete lack of public interest in their ego-machines when ECOMOBILE is parked nearby. This already has made our "Bugatti"-version of the cabin motorcycle a marketable proposition, and the fact, not visible from prospectus and brochure, that it is entierly practical in day-to-day operation, has turned the small number of owners into our best salespeople. A 25-year ultrawarranty for minimum usefullife plus the 20000 km/1-year service interval, introduced after careful analysis of ageing processes, in close contact with the producers of the plastic and fibre components, and observation of the fleet leaders performance, show ECOMOBILE ahead even of the forefront of both the leading car and moto brand.
But why not try to build a VOLKSMOBILE, smaller, lighter, with a 50-HP-engine, the performance of a 150-HP-car and in the subcar price bracket? This machine would open real large markets, but to realize it modern mass production methods must be utilised. The necessary investment means that one or more of the big companies, the sleeping giants, must wake up and try their big hand in it. The author thinks that, after ECOMOBILE has proved the viability of the cabin motorcycle concept, and because of the obvious need to improve individual transport efficiency by factors and not by fractions, the VOLKSMOBILE will materialize some day. Being ready for agreements, covering know-how-transfer and co-use of patents, he anytime will render service to bring it to life with suitable partners.
5 Driving Experience in Cabin Motorcycles
When this manuscript was written, begin of June 1991,21 ECOMOBILEs had covered a distance of nearly 1 000 000 km on public roads. At the beginning onlookers always told the author that he was obviously the only capable driver for such a complicated machine, especially because clutch and gear are operated by foot/hand respectively, reversed from the moto, and the supporting wheels supposedly might be forgotten like the lowering of the landing gear on aircraft. In practice however, very few people trying to learn the secrets of ECOMOBILE had to be refused as unfit to master this machine. Once enough practice, about 3 000-15 000 km, depending mainly on age, has been obtained, drivers agree that the ski 11 level required is definitely above that for car-driving, but also clearly below those artistic exercises a heavy motorbike demands
ICQj
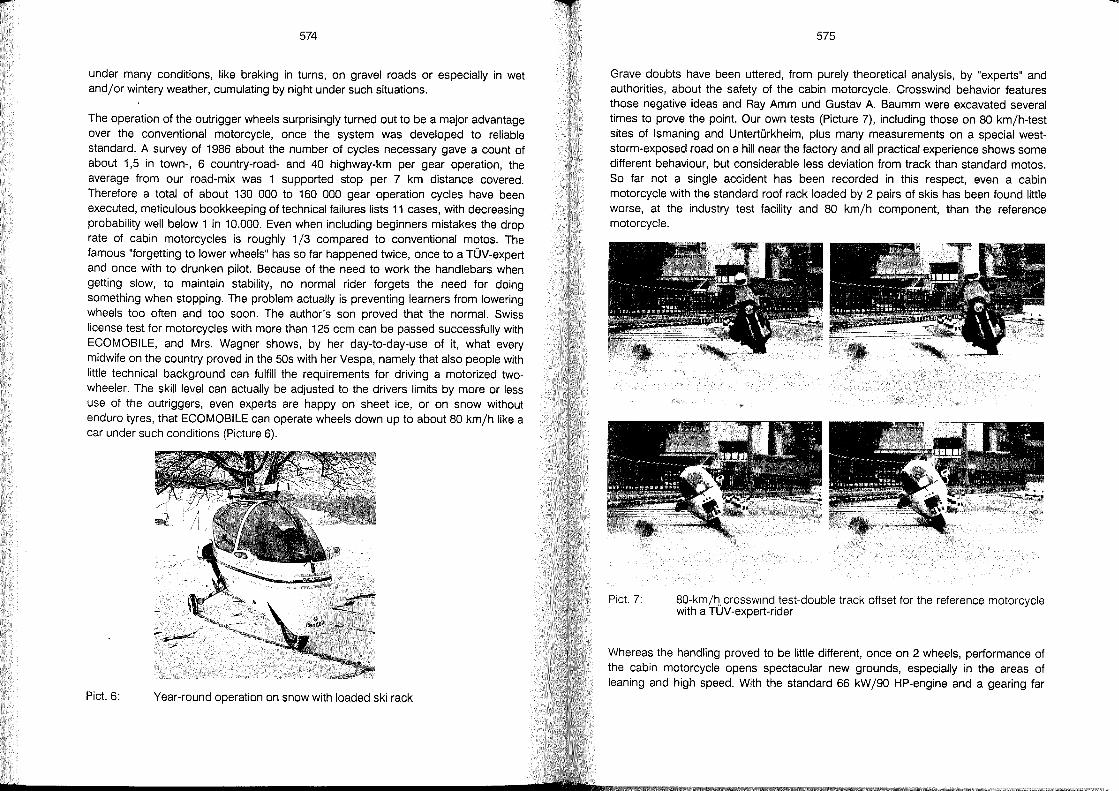
574
under many conditions, like braking in turns, on gravel roads or especially in wet and/or wintery weather, cumulating by night under such situations.
The operation of the outrigger wheels surprisingly turned out to be a major advantage over the conventional motorcycle, once the system was developed to reliable standard. A survey of 1986 about the number of cycles necessary gave a count of about 1,5 in town-, 6 country-road- and 40 highway-km per gear operation, the average from our road-mix was 1 supported stop per 7 km distance covered. Therefore a total of about 130 000 to 160 000 gear operation cycles have been executed, meticulous bookkeeping of technical failures lists 11 cases, with decreasing probability weil below 1 in 10.000. Even when including beginners mi stakes the drop rate of cabin motorcycles is roughly 1/3 compared to conventional motos. The famous "forgetting to lower wheels" has so far happened twice, on ce to a TÜV-expert and once with to drunken pilot. Because of the need to work the handlebars when getting slow, to maintain stability, no normal rider forgets the need for doing something when stopping. The problem actually is preventing learners from lowering wheels too often and too soon. The author's son proved that the normal. Swiss license test for motorcycles with more than 125 ccm can be passed successfully with ECOMOBILE, and Mrs. Wagner shows, by her day-to-day-use of it, what every midwife on the country proved in the 50s with her Vespa, namely that also people with little technical background can fulfill the requirements for driving a motorized twowheeler. The skill level can actually be adjusted to the drivers limits by more or less use of the outriggers, even experts are happy on sheet ice, or on snow without enduro tyres, that ECOMOBILE can operate wheels down up to about 80 km/h like a car under such conditions (Picture 6).
Pict. 6: Year-round operation on snow with loaded ski rack
575
Grave doubts have been uttered, from purely theoretical analysis, by "experts" and authorities, about the safety of the cabin motorcycle. Crosswind behavior features those negative ideas and Ray Amm und Gustav A. Baumm were excavated several times to prove the point. Our own tests (Picture 7), including those on 80 km/h-test sites of Ismaning and Untertürkheim, plus many measurements on a special weststorm-exposed road on a hili near the factory and all practical experience shows some different behaviour, but considerable less deviation from track than standard motos. So far not a single accident has been recorded in this respect, even a cabin motorcycle with the standard roof rack loaded by 2 pairs of skis has been found little worse, at the industry test facility and 80 km/h component, than the reference motorcycie.
Pic!. 7: 80-km/~. crosswind test-double track offset for the reference motorcycie with a TUV-expert-rider
Whereas the handling proved to be little different, once on 2 wheels, performance of the cabin motorcycle opens spectacular new grounds, especially in the areas of leaning and high speed. With the standard 66 kW /90 HP-engine and a gearing far
-
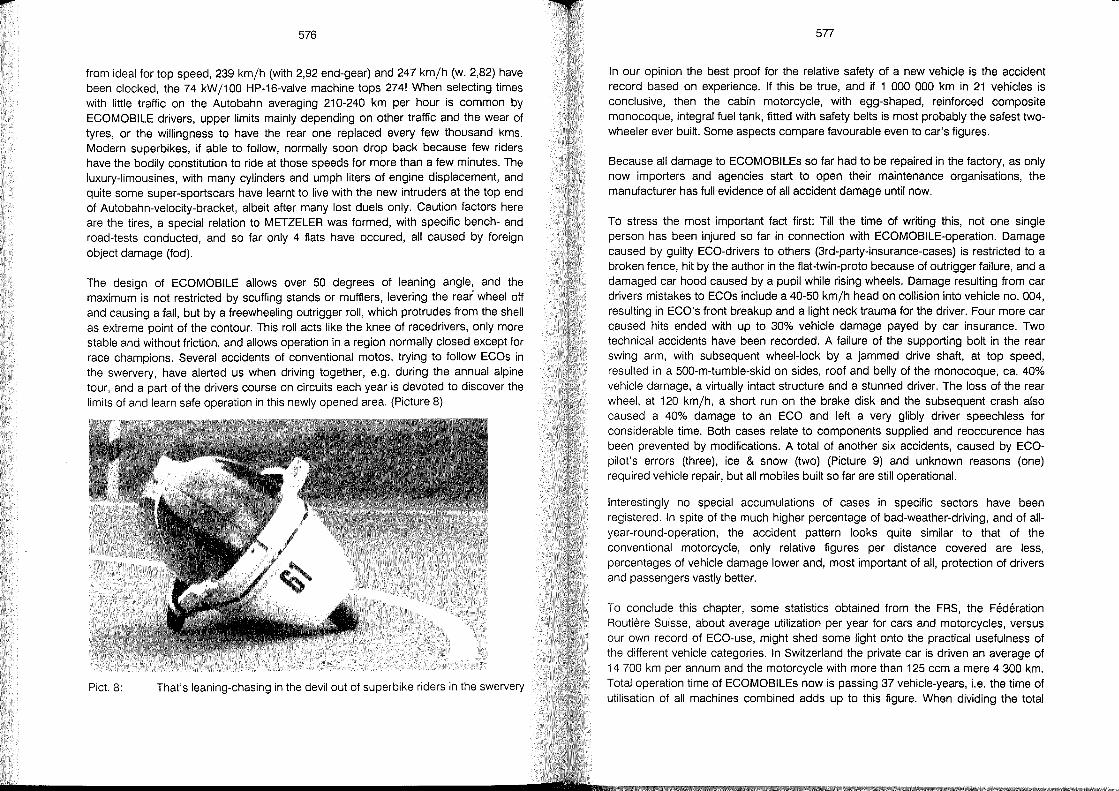
576
from ideal for top speed, 239 km/h (with 2,92 end-gear) and 247 km/h (w. 2,82) have been clocked, the 74 kW/100 HP-16-valve machine tops 274! When selecting times with little traffic on the Autobahn averaging 210-240 km per hour is common by ECOMOBILE drivers, upper limits mainly depending on other traffic and the wear of tyres, or the willingness to have the rear one replaced every few thousand kms. Modern superbikes, if able to follow, normally soon drop back because few riders have the bodily constitution to ride at those speeds for more than a few minutes. The luxury-limousines, with many cylinders and umph liters of engine displacement, and quite so me super-sportscars have learnt to live with the new intruders at the top end of Autobahn-velocity-bracket, albeit after many lost duels only. Caution factors here are the tires, a special relation to METZELER was formed, with specific bench- and road-tests conducted, and so far only 4 flats have occured, all caused by foreign object damage (fod).
The design of ECOMOBILE allows over 50 degrees of leaning angle, and the maximum is not restricted by scuffing stands or mufflers, levering the re ar wheel off and causing a fall, but by a freewheeling outrigger roll, which protrudes from the shell as extreme point of the contour. This roll acts like the knee of racedrivers, only more stable and without friction, and allows operation in a region normally closed except for race champions. Several accidents of conventional motos, trying to follow ECOs in the swervery, have alerted us when driving together, e.g. during the annual alpine tour, and apart of the drivers course on circuits each year is devoted to discover the limits of and learn safe operation in this newly opened area. (Picture 8)
Pict. 8: That's leaning-chasing in the devil out of superbike riders in the swervery
577
In our opinion the best proof for the relative safety of a new vehicle is the accident re cord based on experience. If this be true, and if 1 000 000 km in 21 vehicles is conclusive, then the cabin motorcycle, with egg-shaped, reinforced composite monocoque, integral fuel tank, fitted with safety belts is most probably the safest twowheeler ever built. Some aspects compare favourable even to car's figures.
Because all damage to ECOMOBILEs so far had to be repaired in the factory, as only now importers and agencies start to open their maintenance organisations, the manufacturer has full evidence of all accident damage until now.
To stress the most important fact first: Till the time of writing this, not one single person has been injured so far in connection with ECOMOBILE-operation. Damage caused by guilty ECO-drivers to others (3rd-party-insurance-cases) is restricted to a broken fence, hit by the author in the flat-twin-proto because of outrigger failure, and a damaged car hood caused by a pupil while rising wheels. Damage resulting from car drivers mistakes to ECOs include a 40-50 km/h head on collision into vehicle no. 004, resulting in ECO's front breakup and a light neck trauma for the driver. Four more car caused hits ended with up to 30% vehicle damage payed by car insurance. Two technical accidents have been recorded. A failure of the supporting bolt in the rear swing arm, with subsequent wheel-Iock by a jammed drive shaft, at top speed, resulted in a 500-m-tumble-skid on sides, roof and belly of the monocoque, ca. 40% vehicle damage, a virtually intact structure and a stunned driver. The loss of the re ar wheel, at 120 km/h, a short run on the brake disk and the subsequent crash also caused a 40% damage to an ECO and left a very glibly driver speechless for considerable time. Both cases relate to components supplied and reoccurence has been prevented by modifications. A total of another six accidents, caused by ECOpilot's errors (three), ice & snow (two) (Picture 9) and unknown reasons (one) required vehicle repair, but all mobiles built so far are still operational.
Interestingly no special accumulations of cases in specific sectors have been registered. In spite of the much higher percentage of bad-weather-driving, and of allyear-round-operation, the accident pattern looks quite similar to that of the conventional motorcycle, only relative figures per distance covered are less, percentages of vehicle damage lower and, most important of all, protection of drivers and passengers vastly better.
To conclude this chapter, some statistics obtained from the FRS, the Federation Routiere Suisse, about average utilization per year for cars and motorcycles, versus our own record of ECO-use, might shed some light onto the practical usefulness of the different vehicle categories. In Switzerland the private car is driven an average of 14 700 km per annum and the motorcycle with more than 125 ccm a mere 4 300 km. Total operation time of ECOMOBILEs now is passing 37 vehicle-years, i.e. the time of utilisation of all machines combined adds up to this figure. When dividing the total
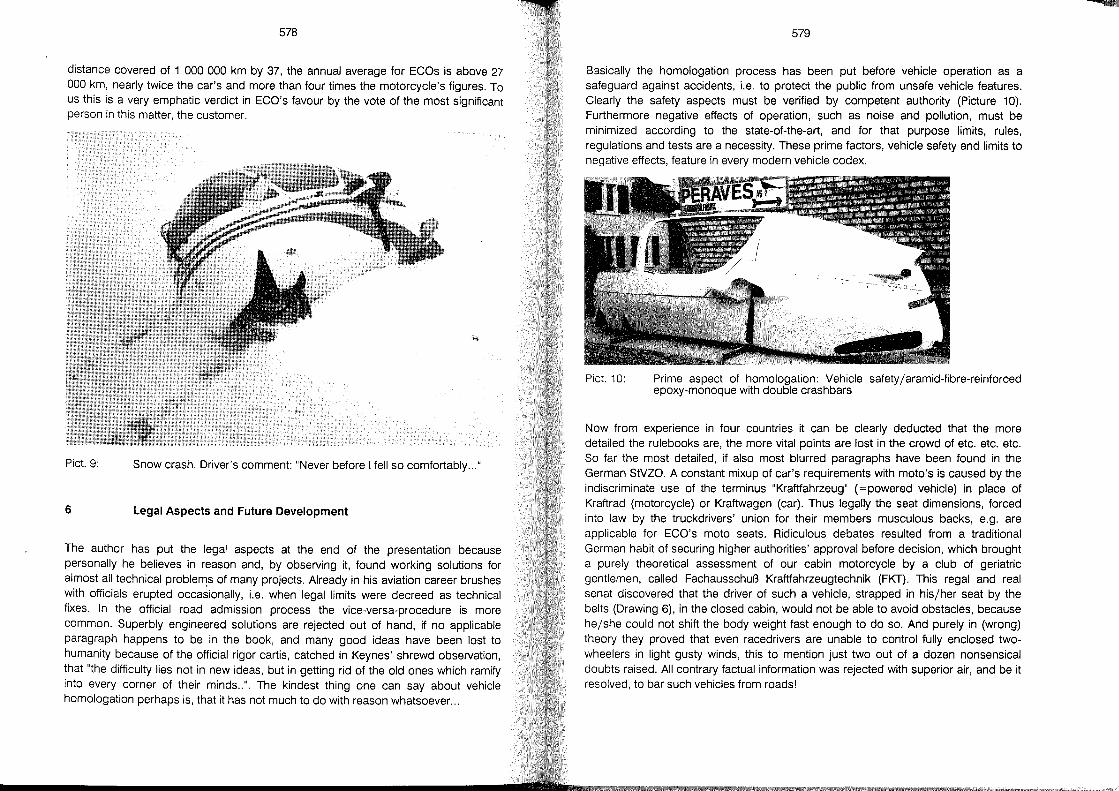
578
distance covered of 1 000000 km by 37, the annual average for ECOs is above 27 000 km, nearly twice the car's and more than tour times the motorcycle's figures. To us this is a very emphatic verdict in ECO's favour by the vote of the most significant person in this matter, the customer.
Picl. 9: Snow crash. Driver's comment: "Never before I fell so comfortably ... "
6 Legal Aspects and Future Development
The author has put the legal aspects at the end of the presentation because personally he believes in reason and, by observing it, found working solutions for almost all technical problerl!s of many projects. Already in his aviation career brushes with officials erupted occasionally, Le. when legal limits were decreed as technical fixes. In the official road admission process the vice-versa-procedure is more common. Superbly engineered solutions are rejected out of hand, if no applicable paragraph happens to be in the book, and many good ideas have been lost to humanity because of the official rigor cartis, catched in Keynes' shrewd observation, that "the difficulty lies not in new ideas, but in getting rid of the old ones which ramify into every corner of their minds .. ". The kindest thing one can say about vehicle homologation perhaps is, that it has not much to do with reason whatsoever. ..
579
Basically the homologation process has been put before vehicle operation as a safeguard against accidents, Le. to protect the public from unsafe vehicle features. Clearly the safety aspects must be verified by competent authority (picture 10). Furthermore negative effects of operation, such as noise and pollution, must be minimized according to the state-of-the-art, and for that purpose limits, rules, regulations and tests are a necessity. These prime factors, vehicle safety and limits to negative effects, feature in every modern vehicle codex.
Picl. 10: Prime aspect of homologation: Vehicle safety /aramid-fibre-reinforced epoxy-monoque with double crashbars
Now from experience in four countries it can be clearly deducted that the more detailed the rulebooks are, the more vital points are lost in the crowd of etc. etc. etc. So far the most detailed, if also most blurred paragraphs have been found in the German StVZO. A constant mixup of car's requirements with moto's is caused by the indiscriminate use of the terminus "Kraftfahrzeug" (= powered vehicle) in place of Kraftrad (motorcycle) or Kraftwagen (car). Thus legally the seat dimensions, forced into law by the truckdrivers' union for their members musculous backs, e.g. are applicable for ECO's moto seats. Ridiculous debates resulted from a traditional German habit of securing higher authorities' approval before decision, which brought a purely theoretical assessment of our cabin motorcycle by a club of geriatric gentlemen, called Fachausschuß Kraftfahrzeugtechnik (FKT). This regal and real senat discovered that the driver of such a vehicle, strapped in his/her seat by the belts (Drawing 6), in the closed cabin, would not be able to avoid obstacles, because he/she could not shift the body weight fast enough to do so. And purely in (wrong) theory they proved that even racedrivers are unable to control fully enclosed twowheelers in light gusty winds, this to mention just two out of a dozen nonsensical doubts raised. All contrary factual information was rejected with superior air, and be it resolved, to bar such vehicles from roads!
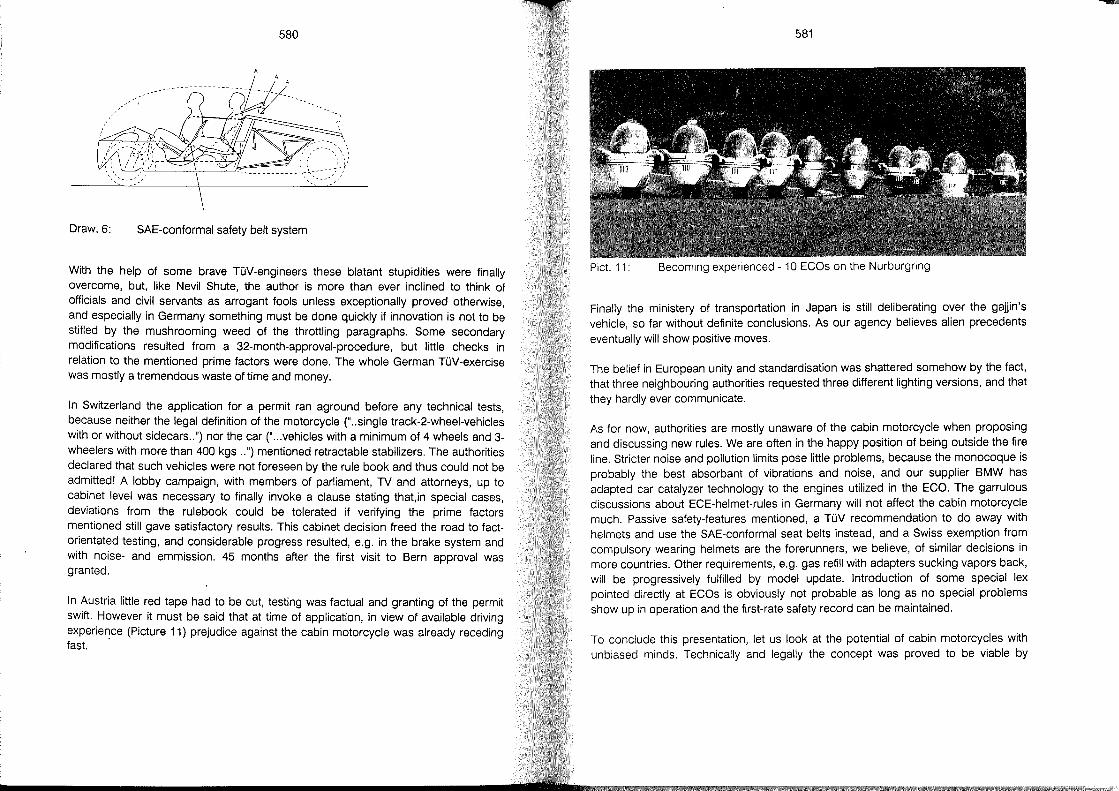
580
Draw.6: SAE-conformal safety belt system
With the help of some brave TüV-engineers these blatant stupidities were finally overcome, but, like Nevil Shute, the author is more than ever inclined to think of officials and civil servants as arrogant fools unless exceptionally proved otherwise, and especially in Germany something must be done quickly if innovation is not to be stifled by the mushrooming weed of the throttling paragraphs. Some secondary modifications resulted from a 32-month-approval-procedure, but little checks in relation to the mentioned prime factors were done. The whole German TüV-exercise was mostly a tremendous waste of time and money.
In Switzerland the application for apermit ran aground before any technical tests, because neither the legal definition of the motorcycle (" .. single track-2-wheel-vehicles with or without sidecars .. ") nor the car (" ... vehicles with a minimum of 4 wheels and 3-wheelers with more than 400 kgs .. ") mentioned retractable stabilizers. The authorities declared that such vehicles were not foreseen by the rule book and thus could not be admitted! A lobby campaign, with members of parliament, TV and attorneys, up to cabinet level was necessary to finally invoke a clause stating that,in special cases, deviations from the rulebook could be tolerated if verifying the prime factors mentioned still gave satisfactory results. This cabinet decision freed the road to factorientated testing, and considerable progress resulted, e.g. in the brake system and with noise- and emmission. 45 months after the first visit to Bern approval was granted.
In Austria little red tape had to be cut, testing was factual and granting of the permit swift. However it must be said that at time of application, in view of available driving experience (Picture 11) prejudice against the cabin motorcycle was already receding fast. .
581
Pict. 11: Becoming experienced - 10 ECOs on the Nurburgring
Finally the ministery of transportation in Japan is still deliberating over the gajjin's vehicle, so far without definite conclusions. As our agency believes alien precedents eventually will show positive moves.
The belief in European unity and standardisation was shattered somehow by the fact, that three neighbouring authorities requested three different lighting versions, and that they hardly ever communicate.
As for now authorities are mostly unaware of the cabin motorcycle when proposing and discus~ing new rules. We are often in the happy position of being outside the fi~e line. Stricter noise and pollution limits pose little problems, because the monocoque IS
probably the best absorbant of vibrations and noise, and our supplier BMW has adapted car catalyzer technology to the engines utilized in the ECO. -:he garrulous discussions about ECE-helmet-rules in Germany will not affect the cabln motorcycle much. Passive safety-features mentioned, a TüV recommendation to do away with heimets and use the SAE-conformal seat belts instead, and a Swiss exemption from compulsory wearing heimets are the forerunners, we believe, of si~ilar decisions in more countries. Other requirements, e.g. gas refill with adapters sucklng vapors back, will be progressively fulfilled by model update. Introduction of some. special lex pointed directly at ECOs is obviously not probable as long as no special problems show up in operation and the first-rate safety record can be maintained.
To conclude this presentation, let us look at the potential of cabin motorcycles with unbiased minds. Technically and legally the concept was proved to be viable by
---
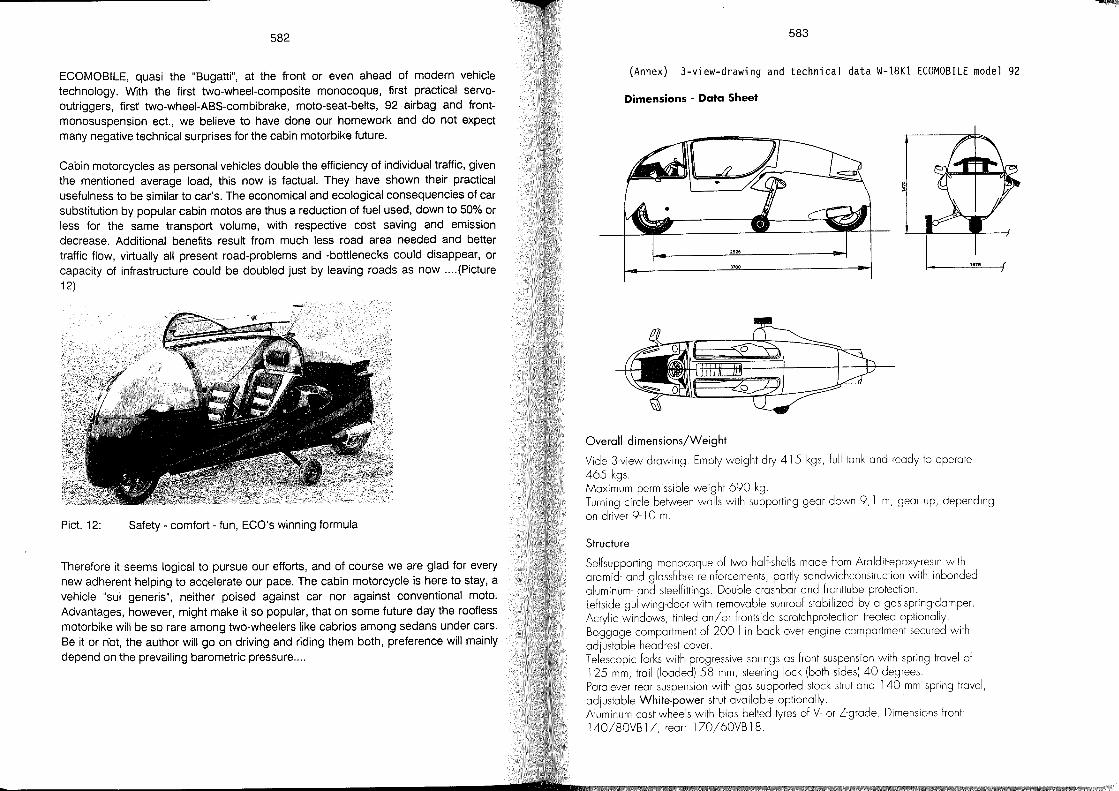
582
ECOMOBILE, quasi the "Bugatti", at the front or even ahead of modern vehicle technology. With the first two-wheel-composite monocoque, first practical servooutriggers, first two-wheel-ABS-combibrake, moto-seat-belts, 92 airbag and frontmonosuspension ect., we believe to have done our homework and do not expect many negative technical surprises for the cabin motorbike future.
Cabin motorcycles as personal vehicles double the efficiency of individual traffic, given the mentioned average load, this now is factual. They have shown their practical usefulness to be similar to car's. The economical and ecological consequencies of car substitution by popular cabin motos are thus a reduction of fuel used, down to 50% or less for the same transport volume, with respective cost saving and emission decrease. Additional benefits result from much less road area needed and better traffic flow, virtually all present road-problems and -bottlenecks could disappear, or capacity of infrastructure could be doubled just by leaving roads as now .... (Picture 12)
Pict. 12: Safety - comfort - fun, ECO's winning formula
Therefore it seems logical to pursue our efforts, and of course we are glad for every new adherent helping to accelerate our pace. The cabin motorcycle is here to stay, a vehicle "sui generis", neither poised against car nor against conventional moto. Advantages, however, might make it so popular, that on some future day the roofless motorbike will be so rare among two-wheelers like cabrios among sedans under cars. Be it or not, the author will go on driving and riding them both, preference will mainly depend on the prevailing barometric pressure ....
583
(Annex) 3-view-drawing and technical data W-18Kl ECOMOBIlE model 92
Dimensions - Data Sheet
1--__ ..l!14!ll"_--i!
Overall dimensions/Weight
Vide 3-view drawing. Empty weight dry 415 kgs, full tank and ready to operate 465 kgs. Maximum permissible weight 690 kg. T urning circle between walls with supporting gear down 9,1 m, gear up, depending on driver 9-10 m.
Structure
Selfsupporting monocoque of two half-shells made from Araldit-epoxy·resin with aramid- and glassfibre reinforcements, partly sandwichconstruction with inbonded aluminum- and steelfittings. Double crashbar and fronttube protection. Leftside gullwing-door with removable sunroof stabilized by a gas-spring-damper. Acrylic windows, tinted an/or frontside scratchprotection treated optionally. Baggage compartment of 200 I in back over engine compartment secured with adjustable headrest cover. Telescopic forb with progressive springs as front suspension with spring travel of 125 mm, trail (loaded) 58 mm, steering lock (both sides) 40 degrees. Para lever rear suspension with gos supported stock strut and 140 mm spring travel, adjustable White-power strut available optionally. Aluminum cast wheels with bias belted tyres of V- or Z-grade. Dimensions front: 140/80VB 17, rear 170/60VB 18.
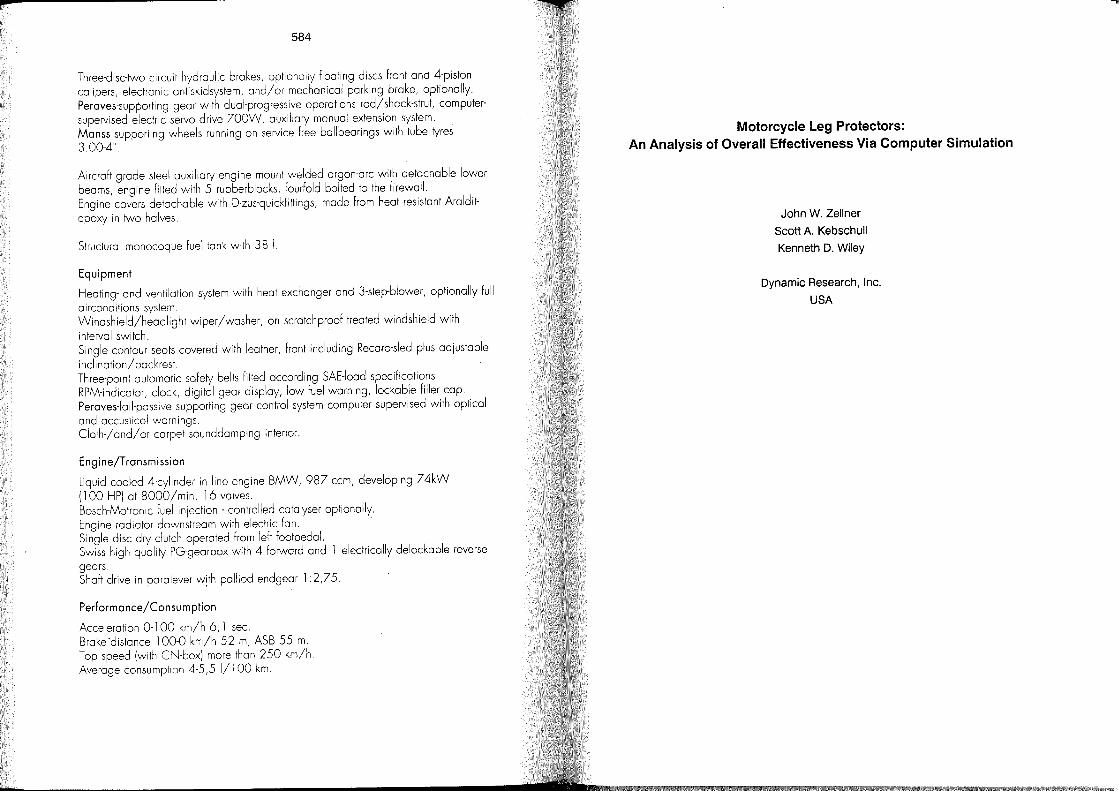
pa
584
Three-disc-two circuit hydroulic brakes, optiona',y floating discs front and 4-piston calipers, electronic antiskidsystem, and/or mechanical parking brake, optionolly. Peraves-supporting gear with dual-progressive operations rod/shock-strut, computersupervised electric servo drive 700W, auxiliary manual extension system. Manss supporting wheels running on service free bollbearings with tube tyres 3.00-4".
Aircraft grade steel auxiliary engine mount welded argon-arc with detachable lower beams, engine fitted with 5 rubberblocks, fourfold bol ted to the firewall. Engine covers detachable with D-zus-quickfittings, made from heat resistant Araldit
epoxy in two halves.
Structural monocoque fuel tank with 38 I.
Equipment
Heating- and ventilation system with heat exchanger and 3-step-blower, optionally full
airconditions system. Windshield/headlight wiper/washer, on scratchproof treated windshield with
interval switch. Single contour seats covered with leather, front induding Recaw-sled plus adjustable
i nd i nation/backrest Three-point automatic safety belts fitted according SAE-Ioad specifications. RPM-indicator, dock, digital gear display, low fuel warning, lockable filler cop. Peraves-fail-passive supporting gear control system computer supervised with optical
and accustical warnings. Cloth-/ and/ or carpet sounddamping interior.
Engine/T ransmission
Liquid cooled 4-cylinder in line engine BMW, 987 ccm, developing 74kW
(100 HP) at 8000/min, 16 valves. Bosch-Motronic fuel injection - controlied catalyser optionally. Engine radiator downstream with electric fan. Single disc dry dutch operated from left footpedal. Swiss high quality PG-gearbox with 4 forward and 1 electrically delockable reverse
gears. Shaft drive in paralever w!th palliod endgear 1 :2,75.
Performance/Consumption
Acceleration 0-100 km/h 6,1 sec. Brake'distance 100-0 km/h 52 m, ASB 55 m. Top speed Iwith CN-box) more thon 250 km/ho Average consumption 4-5,5 1/100 km.
Motorcycle Leg Protectors: An Analysis of Overall Effectiveness Via Computer Simulation
John W. Zellner
Scott A. Kebschull
Kenneth D. Wiley
Dynamic Research, Inc.
USA
--587
1 Abstract
This paper presents an analysis of the overall change in injury patterns and injury costs associated with proposed leg protection devices for motorcycle riders. The analysis was based on 3 motorcycie types (medium conventional; large sport; scooter), each fitted with different designs of UK Draft Specification leg protectors. The approach involved selecting an analytical model which is able to describe the crucial phenomena, including: rider, motorcycle and car three dimensional motions; and occurrence of rider leg and head injuries. The selected methods involved application of previous research including: Articulated Total Body (ATB) computer simulation of rider, motorcycle and car; use of 163 impact configurations known to occur, based on Hannover and Los Angeles accident data; and a biomechanics and bioeconomics based injury cost model, which provided a common basis for injury comparison. The results of 987 computer simulations show the distribution of the change in predicted injuries, and injury costs, due to addition of leg protectors, across th!3 accident population, for 3 motorcycle/leg protector designs. Results of the analyses are compared to previously published data from 16 full scale crash tests.
588
2 Introduction
2.1 Background
The feasibility of proposed devices intended to protect the legs of motorcyclists during collisions has been an active subject of research over the last two decades [Sakamoto, 1990 (14)]. Past investigations have been mainly experimental and empirical in nature. In recent years, there has been considerable divergence of results between principal researchers regarding the potential beneficial and harmful effects of such devices. In part, this is considered to be due to variations in evaluation methods, including differences in test conditions, impact dummies, measured data, and injury criteria [Sakamoto, 1990(14), pp 6-7].
More specifically, the set of results reported in the latter reference, indicate that UK Draft Specification (UKDS) leg protectors [UK Department of Transport, 1987-9 (5)) are harmful in various kinds of realistic impact configurations; while another set of results, eg, Chinn [1990 (2), P 13) has indicated reductions in injury potential when UKDS leg protectors are fitted.
Attempts to gain a more fundamental theoretical understanding of leg protector dynamic behavior has so far been limited. This is largely due to the relatively complex nature of the problem, eg:
Large three dimensional impact motions of motorcycle, rider and opposing vehicle, across different impact conditions
Complex biomechanical motions and injury mechanisms of the human rider
Complex impact physics including 3 dimensional contact surfaces, elastic deflection and plastic deformation, multi body dynamics, normal and tangential force effects
2.1.1 Impact Computer Simulations
Earlier a~empts at modelling motorcycle impacts have included:
Knight, et al [1971 (9)): Two-dimensional 900 impact into a flat rigid barrier, with 3 degree of freedom (DoF) motorcycle, 7 DoF rider, extern al force time history
589
Knight, et al [1973 (10)): Three-dimensional rigid barrier impact with 9 DoF motorcycle, "point mass" rider rigidly attached to motorcycle
Knight, et al [1981 (11)): Three-dimensional rigid barrier impact with 9 DoF motorcycle and Calspan Crash Victim Simulation (CVS) rider (work incomplete)
Sporner [1982 (15)): Two-dimensional 900 rigid barrier impact with 1 DoF motorcycle and multi DoF rider model
Happian-Smith, et al [1987 (7)): Two-dimensional 900 rigid barrier impact, with deforming motorcycle front end and single mass rider
Happian-Smith, et al [1989 (1)): Two-dimensional angled rigid barrier impact, with 3 DoF motorcycle and rigidly attached rider
Happian-Smith, et al [1990 (7)): Three-dimensional angled rigid barrier impact, with 6 DoF motorcycle, rigidly attached rider
Of the prior published work, the latter model appears to be the one most directed toward analysis of leg protectors. However, its authors note the following limitations with respect to the model's ability to describe observed phenomena:
A single point of contact (a spring) exists between motorcycle and barrier
The contact spring length and location must be varied, depending on the barrier angle
The rider is assumed to be rigidly attached to the motorcycle
The model outputs have been compared with results of earlier models, rather than with test results. There is no comprehensive set of barrier test results which can be used to validate the model
Tire road friction forces are neglected
The motorcycle is considered to be a single mass
The model is a very simple parametric model, one or two steps removed from realism, which cannot be used directly in motorcycle design
---
590
Other observations are that the latter 2 models have no rider or rider injury model; and the models assume that the motorcycle yaw rotation is the only output Qf interest.
Beyond motorcycle impact models, a parallel technical development has been the evolution of general purpose occupant simulation models, as reviewed, for example, by Prasad, et al [1989 (13)). Examples of these are:
MAOYMO 20/30 Version 4.2 - Oeveloped around 1975 at TNO, Netherlands, this generalized model consists of an unlimited number of linked rigid bodies connected with ball and socket joints, and having planar, ellipsoid and hyperellipsoid contact surfaces
CAL30 (also ATB; CVS) - Oeveloped mainly between 1970 and 1982 by Calspan Corporation for the US NHTSA and US Air Force, this general purpose model consists of 30 or more linked rigid bodies, plus a ground plane and other objects, with locked, pin, ball and socket, Euler, slip and null joints, and having planar, ellipsoid, and hyperellipsoid contact surfaces
The formulations of these multi body models are based on generalized Lagrangian/Newtonian methods, and their validity is mainly determined by the level of detail chosen in describing, measuring, formulating, verifying and validating the surface and joint force interactions among the components. Both of these large scale occupant models lend themselves to interactions among separate systems of rigid bodies (eg, occupant and one or more vehicles), and for this reason were chosen as a basis tor the current motorcycle/rider /LP /car impact simulation.
2.1.2 Accident Configurations
Motorcycle accidents involve a wide range of variables, including motorcycle type, speeds, impacted objects, impact angle and so on. For accidents involving impacts with passenger cars (which comprise about half of all accidents), work by Pedder, et al [1989, (12)) suggests there are at least 5 crucial impact· variables which are important in determining the resultant motions and injuries. These are:
Car contact location
Motorcycle contact location
Relative heading angle
591
Car impact speed
Motorcycle impact speed
In other words, a change in any one of these variables would be expected to change the outcome of a given motorcycle impact.
Of the available motorcycle accident databases, apparently only the Los Angeles and Hannover databases were found to comprise large random sam pies and to contain all five of these impact variables.
Using the Los Angeles and Hannover data as a basis, Pedder, et al [1989 (12)] sorted the accidents into defined ranges of the above 5 variables. Using the conventions adopted therein, 202 impact configurations were identified each having a defined frequency of occurrence.
The 202 Los Angeles/Hannover configurations can be used to describe motorcycle/car impact configurations which are known to occur.
In principle, when leg protectors or other safety devices are fittes to a given motorcycle, the outcome of any one of these impacts can be either beneficial or harmful to the rider.
2.1.3 Injury Criteria and Cost Model
In order to compare injuries across widely varying accide"t configurations and different body regions, it is useful to express injury potential in terms of a common index, eg, socio-economic costs of injuries. Biokinetics [1989 (4)) developed a preliminary model based on economic costs of medical treatment, disability, risk of fatality, lost work, and ancillary expenses, as functions of body region (head, upper leg, lower leg and knee), injury severity, and interaction among InJunes. For example, moderate severity (AIS = 2) leg injuries can be more costly than moderate severity head InJunes due to relatively higher disability costs. In contrast, serious head injuries are more costly than serious leg injuries because of higher costs of medical treatment, disability, and increased risk of fatality. This injury model was applied to crash test dummy measurements by Sakamoto [1990 (14)1 and is directly adaptable to suitably formulated and detailed computer simulations of motorcycle/rider impacts.
4
592
2.2 Objectives
The objectives of the current analysis were:
To develop a validated computer simulation of motorcycle/rider/leg protector Icar impacts applicable to the full range of accident configurations, and
To determine the overall change in injury patterns and injury costs, due to fitment of UKDS type leg protectors
2.3 Technical Approach
The approach to these objectives involved an application of previous research and methodologies, including:
Modified version of the Articulated Total Body (ATB) simulation
Examination of all accident configurations known to occur, and including their frequency of occurrence, as represented by the Los Angeles and Hannover databases analyzed by Pedder, et al [1989 (12)]
Injury criteria and socio-economical cost model, as developed by Biokinetics [1989 (4)]
Full scale crash test data to validate the computer simulation results across the 16 motorcycle/car impact tests described by Sakamoto [1990
(14)]
Lab test data and measured parameters describing the associated motorcycles, cars, leg protector designs and motorcycle crash dummy (Motorcycle Anthropomorphic Test Device-1, MATD-1, described by St. Laurent, et al [1989 (3) )
The process used to integrate these methodologies and analysis tools is shown schematically in Fig 1. Basically, the inputs to the computer simulation are the impact configurations (from the accident data) and the input parameters (from laboratory measurements); the outputs of the compu~er simulation are predicted rider motions and forces, which are input to the injury cost model to predict rider injuries and injury costs.
593
2.3.1 Computer Simulation Requirements
To summarize, the key technical requirements for a computer simulation describing motorcycle leg protector performance are:
3
Inclusion of large 3 dimensional multi body motions (6 DoF) of motorcycle, rider and opposing vehicle,
Inclusion of important biomechanical effects and injury mechanisms, including: articulated motions of the crash dummy, combined load fractures of the upper and lower leg bones, motion and impact accelerations of the helmeted headform
Inclusion of important impact effects including: 3 dimensional contact surfaces, elastic deflection and plastic deformation, normal and tangential forces including the effects of surface friction and deformation
Ability to describe the effects of the 5 impact variables present in the accident data (car and motorcycle contact locations and speeds, and relative heading angle)
Validation against full scale test results using a single consistent set of parameters, and using measured motorcycle, rider, and car motions and forces, and resultant injuries.
Description of the Computer Simulation
3.1 Basis
The starting point for the current simulation was the US Air Force Aerospace Medical Research Laboratory (AFAMRL) ATB Version IV [Fleck, et al (6) ]. This was significantly upgraded to allow larger numbers of masses ("segments") and joints, different types of joints, and joint failure criteria. A high speed, high resolution graphics post processor was also developed to allow interactive display of all impacting objects and surfaces. Together the preparation involved a relatively long and extensive process, and it is estimated that in excess of 30 man years have gone into the development of the basic software tools.
594
3.1.1 Model Features and Capabilities
Using these basic tools, a motorcycle impact model was developed over a 4 year period, comprising the following systems:
Motorcycle (4 segments - main frame, steering assembly, front wheel, re ar wheel, including 15 contact surfaces)
MATD-1 dummy (25 body segments, including 23 contact surfaces and breakable upper and lower legs and knees)
Car (7 segments - body, bonnet, front bumper, 4 wheels, including 13 contact surfaces)
UKDS leg protectors (12 ellipsoidal and planar contact surfaces, including 4 for the primary impact element and "smooth outer contour", and 8 for the knee protection element)
The features of the model are further summarized in Table 1. Together, the current model includes a total of:
36 mass segments, with
62 contact surfaces, and
35 joints
It is important to note that this model was built up in a step by step process involving detailed comparison with full scale and laboratory test data, over an extended per iod of continuous development. Starting with the simplest model, additions and refinements were made only when necessitated and theoretically justified, in order to match actual test data. In this sense, the above model represents the minimum complexity required to achieve the level of validation discussed below, across 16 full scale impact tests.
Of the nearly 2000 theoretlcally possible interactions among the 62 contact surfaces, 332 were modelled, based on test data and likelihood of actual contact during impact sequences. It was not necessary to model all contacts because they are either physically impossible (eg, head to lower torso) or very unlikely (eg, motorcycle front to re ar wheel).
595
The force interaction of each pair of contact surfaces was modelled by defining perpendicular force versus displacement functions of three types, as shown in Fig 2:
Elastic, piecewise linear
Plastic, piecewise linear
Plastic, constant force
and by defining a tangential force function, as described in Fig 3. The latter includes an increased friction coefficient as the deformation increases (eg, as a motorcycle wheel penetrates into a car door surface), which is an important feature. As would be expected, these empirical force functions depend on the specific characteristics of each pair of contact surfaces, such as materials, construction and so on, and are, in general, based on test data.
A ground contact plane is included, as are tire/road friction forces, and car and motorcycle suspension forces.
The head/helmet model includes the force/deflection energy absorbing property of the heimet liner.
Joint reaction forces, at both regular and fracturable joints, are, in general, piecewise linear functions of dis placement and displacement rate. Joints include sliding and bending motorcycle forks; and AFAMRL measured joint properties of a Hybrid 111 dummy, modified to include MATD-1 features such as fracturable joints in the upper and lower legs and knees.
The leg protector model includes the normal and tangential forces between the knee protection element and the rider's upper and lower legs and knees; and between the primary impact element and various car surfaces, as measured and observed in laboratory and full scale test data.
3.1.2 Input Data Sets
Data sets for the following vehicles were developed, based on measured data related to the tests reported by Sakamoto [1990(14)1 :
Piaggio Cosa CL 125 (scooter)
596
- Standard, and - With UKDS leg protectors
Yamaha XS 400 (medium conventional type)
- Standard, and - With UKDS leg protectors
BMW K 75 S (Iarge sport type)
- Standard, and - With UKDS leg protectors
Cars
- Toyota Celica (coupe) - Toyota Crown (sedan)
The motorcycles with their respective leg protectors are illustrated in Figs 4 to 6. Shown are the mathematical contact surfaces used in the computations. The leg protectors have the dimensions and properties of the devices designed and laboratory tested by 3 different design teams, to meet the requirements of the UKDS.
The Celica coupe model is illustrated in Fig 7.
3.1.3 Validation Against Full Scale Data
Perhaps the most crucial aspect in the modelling of physical systems is validation against actual test data. There is in principal no limit to the number of ways in which a system of interacting bodies can be modelled, ranging from extremely simple to extremely complex. However, any of these is only useful to the extent that it can be validated against real, measured data.
Since the current objective was to assess leg protectors over the full range of motorcycle/car collisions, the approach used was to validate the model and data sets over as broad a range of tests as possible. The 16 full scale. tests reported by Sakamoto [1990 (14)], the test conditions for which are summarized in Table 2, provided weil defined validation data.
597
The detailed validation 'vvas pursued at 3 levels, as summarized in Fig 8:
Comparison of 3 dimensional motions (of vehicles and their components, and dummy and its segments)
Comparison of recorded head accelerations, leg forces, and leg fractures
Comparison of resulting dummy "injuries" and injury costs
The goal was to obtain a single best-fit model and set of parameters (one set for each pair of vehicles) which best described all of the full scale data. This was essential since it was desired to apply the model to "all accidents known to occur". A model which would have to be specially adjusted in order to match data from a particular test would be of little use in this interpolation process. Rather, the single best-fit model for a given motorcycle was sought.
Using this single best-fit model approach, a typical comparison between full scale and simulated 3 dimensional motion is shown in Fig 9. Views from other camera angles confirmed that the motorcycle, dummy and car motions are very similar, not only at this time instant, but throughout the primary impact phase.
The correlation between full scale and simulated peak resultant head acceleration values is shown in Fig 10. The relativeiy high correlation coefficient of 0.8 indicates close agreement between model and full scale, taking into consideration the effects of test variability, unmodelled local stiffness variations, data acquisition procedures and other factors.
Table 3 compares full scale and simulated leg fracture occurrence. In general, there is better t~an 80 percent agreement in fracture and non fracture occurrence, as weil as in the sources and mechanisms of fracture.
Overall, the validation results correlation exists between the tests.
4 Accident Configurations
show that a relatively high level of simulation and the respective full scale
For simulation purposes, configurations were selected if they met two criteria: there were accident occurrences in either the Los Angeles or
598
Hannover database; and the configuration was physically realizable using typical crash test facilities. There were 163 impact configurations that met these criteria. These configurations and their associated frequencies of occurrence are listed in Fig 11 and Table 6.
5 Injury Criteria and Cost Model
The injury cost model of Biokinetics [1989 (4)], linearized as described by Sakamoto [1990(14)], was applied to the head accelerations, upper and lower leg fractures, and knee ligament tears computed in the simulation. Leg fracture occurred in the simulation when the combined upper or lower leg forces at the fracturable joints exceeded the criterion suggested by Mertz [St. Laurent, 1989 (3) J, as shown in Fig 12. At fracture, the breakable joint was released in its rotation al degrees of freedom, so as to have the appropriate effect on dummy motions. The knee ligaments could fail in either torsion or bending according to the cadaver data reported by St. Laurent, et al, [1989 (3)].
6 Resutts of Computer Simulation of 163 Impact Configurations
Computer simulations of the three motorcycles, with and without leg protectors, were run for the 163 Los Angeles/Hannover impact configurations. Each simulation was run from a time instant before initial motorcycle/car contact, through the primary impact phase, up until just prior to first rider / ground contact. Ground contact was not inciuded because validation of ground impact responses and injuries had not been completed.
For purposes of determining the distribution of injuries and injury costs, each impact configuration was weighted by its frequency of occurrence (FO) in Table 6. This represented 508 accidents, and appropriately emphasized configurations which are m9re common, and deemphasized configurations which are less common.
An enormous quantity of data was generated describing rider injuries and rider and· vehicle forces and motions in these 163 X 3 X 2 = 978 simulation runs. This paper summarizes the distributions of the changes in:
Peak resultant head acceleration
599
Head injury severity
Upper leg injury severity
Knee injury severity
Lower leg injury severity
Total injury costs
due to addition of leg protectors.
6.1 Change in Head Acceleration and Injury Severity Due to Leg Protectors
Figure 13 shows the distribution of the change in peak head acceleration, when leg protectors are fitted to the medium conventional motorcycle. The distribution shows that in some cases there is little change in head acceleration. However, there are more cases where there is an iricrease in head acceleration (55% of the 508 accidents) than there are cases with a decrease in head acceleration (32%).
The corresponding effect on head injury severity is shown in Fig 14. The percentage of accidents where the change in head injury is less than AIS = 1 is 68%. Some of the accidents (9%) result in reduced head injury severity. However, a larger proportion (23%) result in increased head injury severity.
Similar results for the large sport motorcycie are shown in Figs 15 and 16. The head acceleration data show that in 51% of the accidents, leg protectors increase head acceleration and in 33% of the cases, leg protectors decrease head acceleration. The head injury severity data show that in 11 % of accidents leg protectors have a harmful effect on head injury severity, versus 7% of cases where there is a beneficial effect.
Results for the scooter are shown in Figs 17 and 18. Again, in 54% of the accidents, head accelerations increase, while in 36% they decrease. In terms of head injury severity, leg protectors increase head injury severity in 24% of the accidents, and decrease head injury severity in 10% of the accidents.
-~
600
6.2 Change in Upper Leg Injury Severity Due to Leg Protectors
Figure 19 shows the distribution of the change in upper leg injury severity when leg protectors are fitted to the medium conventional motorcycie. Note that single fractures of the femur correspond to AIS =3 (severe) injury, per the injury criteria [Biokinetics, 1989 (4)].
The results show that in 88% of accidents, there is no change in upper leg injuries. In 6% of the 508 accidents, there is a decrease in upper leg injuries. In 6% of the accidents there is an increase in upper leg injuries. Detailed examination of the simulation data show that the former is due to decreased upper leg to vehicle impacts; and the latter is due to upper leg/knee protector combined load impacts.
Results for the large sport motorcycle are shown in Fig 20. In 79% of the accidents, there is no change in upper leg InJunes. In 1% of the accidents there is a reduction in leg injuries, and in 20% of accidents there is an increase in upper leg injuries, again due to combined impact loading of the upper leg.
Similar results for the scooter are shown in Fig 21. There is no change in 68% of the accidents, an increase in upper leg fractures in 23% of accidents and a decrease in fractures in 9% of accidents.
6.3 Change in Knee Ugament Injuries Due to Leg Protectors
Figure 22 shows the distribution of the change in knee InJunes due to ligament te ars (torsion al and varus vulgus) when leg protectors are added to the medium conventional motorcycle. In 97% of accidents there is no effect. In 2% of accidents there is a reduction in knee ligament injuries, and in 1 % of accidents there is an increase in injuries.
Results for the large sport motorcycle are shown in Fig 23. There is no effect in 84% of the accidents. There is a reduction in knee ligament injuries in 12% of the accidents, and an increase in injuries in 4% of accidents, due to leg protectors.
Similar results for the scooter are shown in Fig 24. There is no effect in 88% af accidents; and decreases in knee injuries in 11 % of accidents; and an increase in knee injuries in 1% of accidents.
601
6.4 Change in Lower leg Injuries Due to Leg Protectors
Figure 25 shows the distribution of the change in lower leg AIS=3 fractures, due to addition of leg protectors to the medium conventional motorcycle. There is no effect in 97% of the accidents; reduced lower leg injuries in 1% of the cases; and increased lower leg injuries in 2% of the cases.
Results for the large sport motorcycie are shown in Fig 26. There is no effect in 88% of the cases; a reduction of lower leg fractures in 3% of the cases; and an increase in injuries in 9% of the cases.
Results for the scooter are shown in Fig 27. There is no effect in 80% of the cases; a lower leg injury reduction in 8% of the cases and an increased injury in 12% of the cases.
6.5 Change in Injury Costs due to Leg Protectors
Injury costs were determined on aper accident basis, using the injury cast model [Biokinetics, 1989 (4); Sakamoto, 1990(14)] and including medical, disability, and ancillary costs, risk of fatality, and interactions among injuries.
Figure 28 shows the distribution of the change in injury costs, when leg protectors were added to the medium conventional motorcycle. There is no effect on injury costs in 60% of the accidents. Injury costs were increased in 26% of the accidents; and were reduced in 14% of the accidents. Injury costs were increased by an average of $4,200 per accident, across the 508 accidents.
Figure 29 shows corresponding results for the large sport motorcycle. Injury costs were unchanged in 53% of the accidents; increased in 32% of the accidents; and decreased in 15% of the accidents. The average injury cost per accident was increased by $7,200.
Results for the scooter are shown in Figure 30. Injury costs were unchanged in 35% of the accidents; increased in 43% of the accidents; and decreased in 22% of the accidents. The average injury cost per accident was increased by $8,200.
-
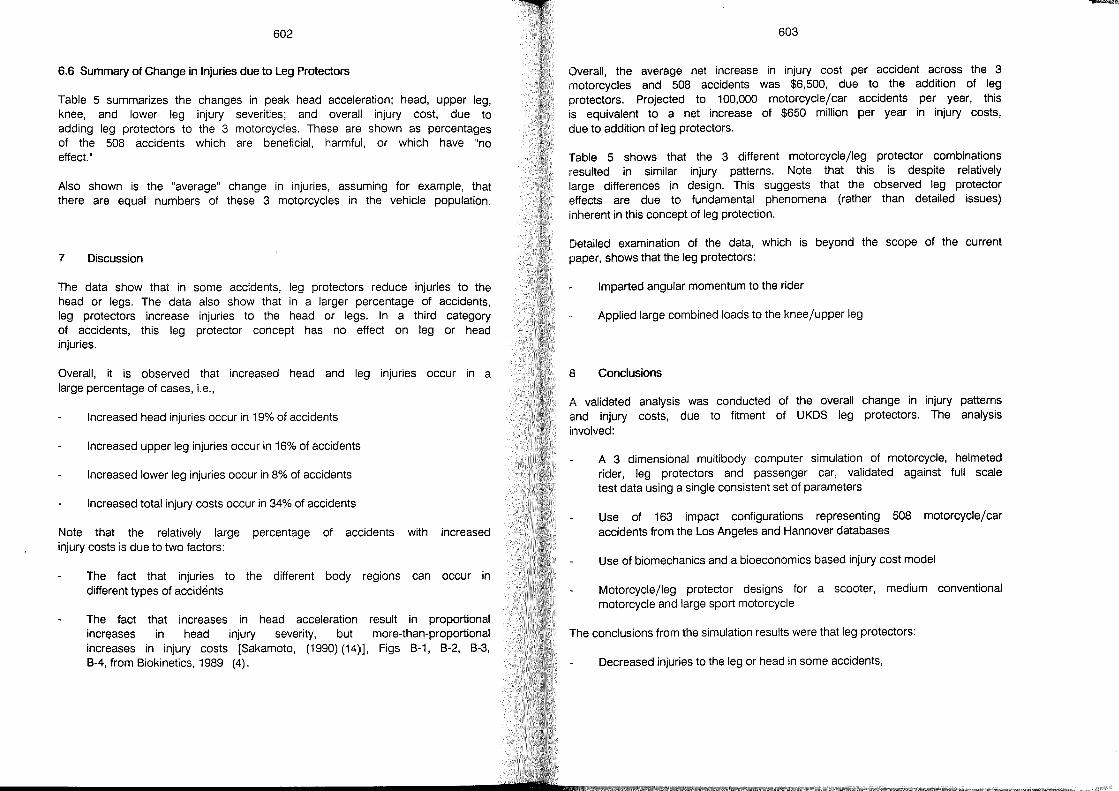
602
6.6 Summary of Change in Injuries due to Leg Protectors
Table 5 summarizes the changes in peak head acceleration; head, upper leg, knee, and lower leg injury severities; and overall injury cost, due to adding leg protectors to the 3 motorcycles. These are shown as percentages of the 508 accidents which are beneficial, harmful, or which have "no effect."
Also shown is the "average" change in injuries, assuming for example, that there are equal numbers of these 3 motorcycles in the vehicle population.
7 Discussion
The data show that in some accidents, leg protectors reduce injuries to the head or legs. The data also show that in a larger percentage of accidents, leg protectors increase injuries to the head or legs. In a third category of accidents, this leg protector concept has no effect on leg or head injuries.
Overall, it is observed that increased head and leg injuries occur in a large percentage of cases, i.e.,
Increased head injuries occur in 19% of accidents
Increased upper leg injuries occur in 16% of accidents
Increased lower leg injuries occur in 8% of accidents
Increased total injury costs occur in 34% of accidents
Note that the relatively large percentage of accidents with increased injury costs is due to two factors:
The fact that injuries to the different body regions can occur in different types of accidents
The fact that increases in head acceleration result in proportional incr~ases in head injury severity, but more-than-proportional increases in injury costs [Sakamoto, (1990) (14)i], Figs 8-1, 8-2, 8-3, 8-4, from 8iokinetics, 1989 (4).
603
Overall, the average net increase in injury cost per accident across the 3 motorcycles and 508 accidents was $6,500, due to the addition of leg protectors. Projected to 100,000 motorcycle/car accidents per year, this is equivalent to a net increase of $650 million per year in injury costs, due to addition of leg protectors.
Table 5 shows that the 3 different motorcycle/leg protector combinations resulted in similar injury patterns. Note that this is despite relatively large differences in design. This suggests that the observed leg protector effects are due to fundamental phenomena (rather than detailed issues) inherent in this concept of leg protection.
Detailed examination of the data, which is beyond the scope of the current paper, shows that the leg protectors:
Imparted angular momentum to the rider
Applied large combined loads to the knee/upper leg
8 Conclusions
A validated analysis was conducted of the overall change in injury patterns and injury costs, due to fitment of UKDS leg protectors. The analysis involved:
A 3 dimensional multibody computer simulation of motorcycle, helmeted rider, leg protectors and passenger car, validated against full scale test data using a single consistent set of parameters
Use of 163 impact configurations representing 508 motorcycle/car accidents from the Los Angeles and Hannover databases
Use of biomechanics and a bioeconomics based injury cost model
Motorcycle/leg protector designs for a scooter, medium conventional motorcycle and large sport motorcycle
The conclusions from the simulation results were that leg protectors:
Decreased injuries to the leg or head in some accidents,
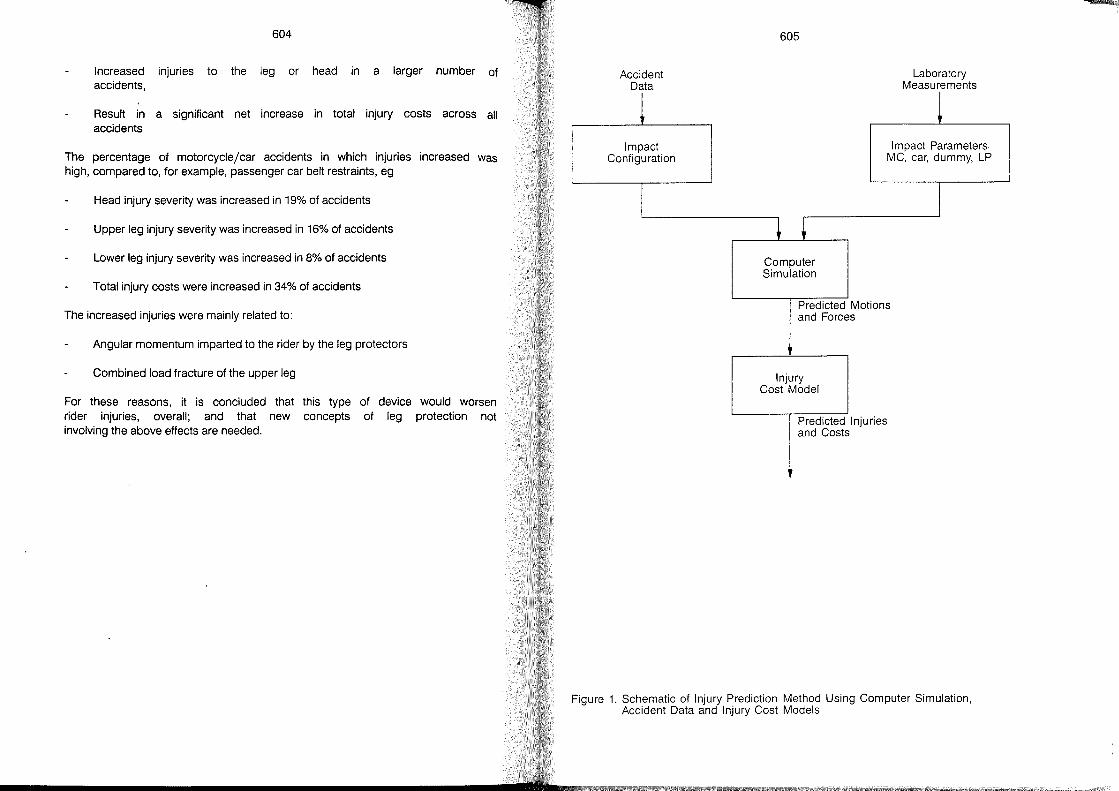
604
Increased injuries to the leg or head in a larger number of accidents,
Result in a significant net increase in total injury costs across all accidents
The percentage of motorcycle!car accidents in which injuries increased was high, compared to, for example, passenger car belt restraints, eg
Head injury severity was increased in 19% of accidents
Upper leg injury severity was increased in 16% of accidents
Lower leg injury severity was increased in 8% of accidents
Total injury costs were increased in 34% of accidents
The increased injuries were mainly related to:
Angular momentum imparted to the rider by the leg protectors
Combined load fracture of the upper leg
For these reasons, it is concluded that this type of device would worsen rider InJunes, overall; and that new concepts of leg protection not involving the above effects are needed.
Accident Data
t Impact
Configuration
I
605
+ + Computer Simulation
Laboratory Measurements
t Impact Parameters
MC, car, dummy, LP
I
Predicted Motions and Forces
Injury Cost Model
Predicted Injuries and Costs
Figure 1. Schematic of Injury Prediction Method Using Computer Simulation, Accident Data and Injury Cost Models
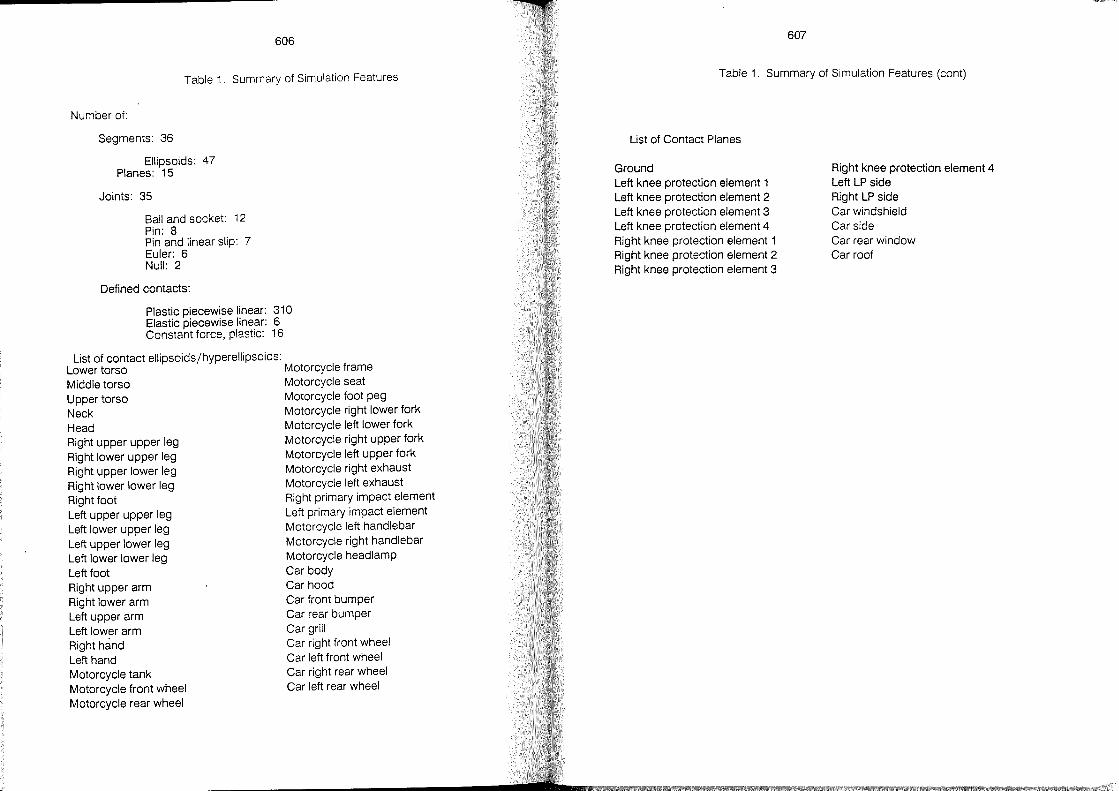
606
Table 1. Summary of Simulation Features
Number of:
Segments: 36
Ellipsoids: 47 Planes: 15
Joints: 35
Ball and socket: 12 Pin: 8 Pin and linear slip: 7 Euler: 6 Null: 2
Defined contacts:
Plastic piecewise linear: 310 Elastic piecewise linear: 6 Constant force, plastic: 16
List of contact ellipsoids/hyperellipsoids: Lower torso Motorcycle frame Middle torso Motorcycle seat Upper torso Motorcycle foot peg Neck Motorcycle right lower fork Head Motorcycle left lower fork Right upper upper leg Motorcycle right upper fork Right lower upper leg Motorcycle left upper fork Right upper lower leg Motorcycle right exhaust Right lower lower leg Motorcycle left exhaust Right foot Right primary impact element Left upper upper leg Left primary impact element Left lower upper leg Motorcycle left handlebar Left upper lower leg Motorcycle right handle bar Left lower lower leg Motorcycle headlamp Left foot Gar body Right upper arm Gar hood Right lower arm Gar front bumper Left upper arm Gar rear bumper Left lower arm Gar grill Right hand Gar right front wheel Left hand Gar left front wheel
Motorcycle tank Motorcycle front wheel Motorcycle re ar wheel
Gar right rear wheel Gar left rear wheel
607
Table 1. Summarj of Simulation Features (cont)
List of Gontact Planes
Ground Left knee protection element 1 Left knee protection element 2 Left knee protection element 3 Left knee protection element 4 Right knee protection element 1 Right knee protection element 2 Right knee protection element 3
Right knee protection element 4 Left LP side Right LP side Gar windshield Gar side Gar rear window Gar roof
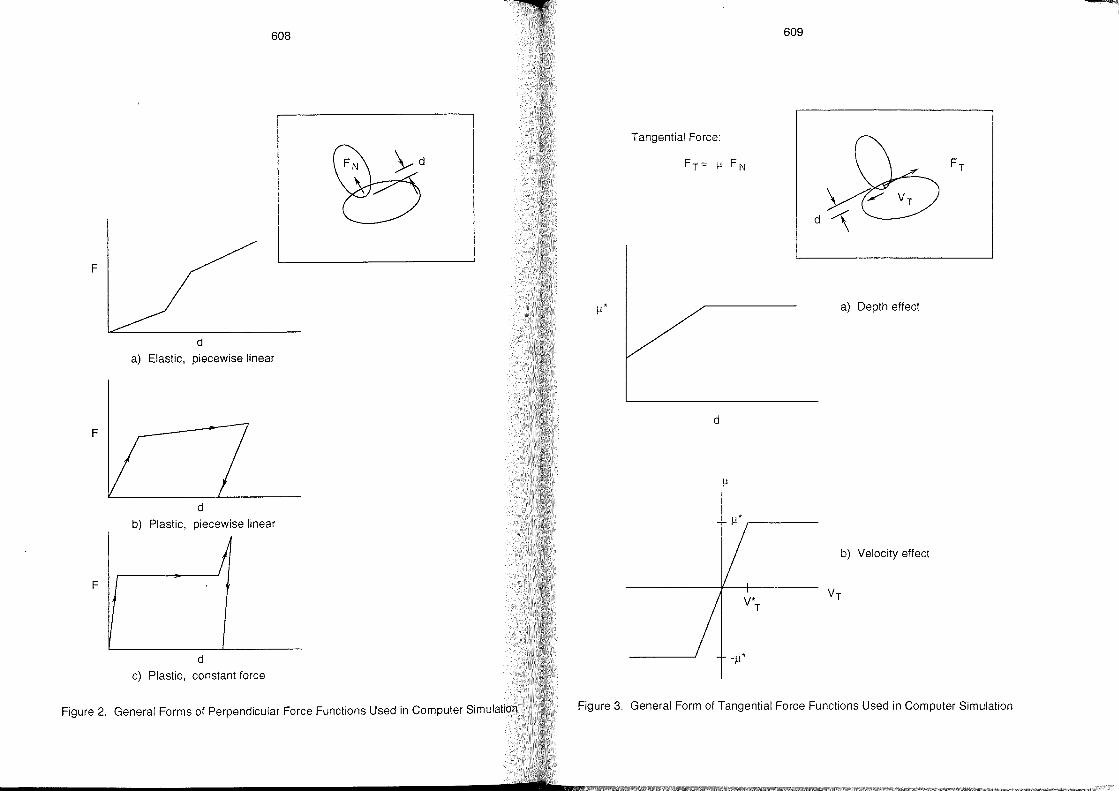
608 609
Tangential Force:
F
a) Depth effect
d
a) Elastic, piecewise linear
d F
d
b) Plastic, piecewise linear
b) Velocity effect
F
d c) Plastic, constant force
Figure 2. General Forms of Perpendicular Force Functions Used in Computer Simulation Figure 3. General Form of Tangential Force Functions Used in Computer Simulation
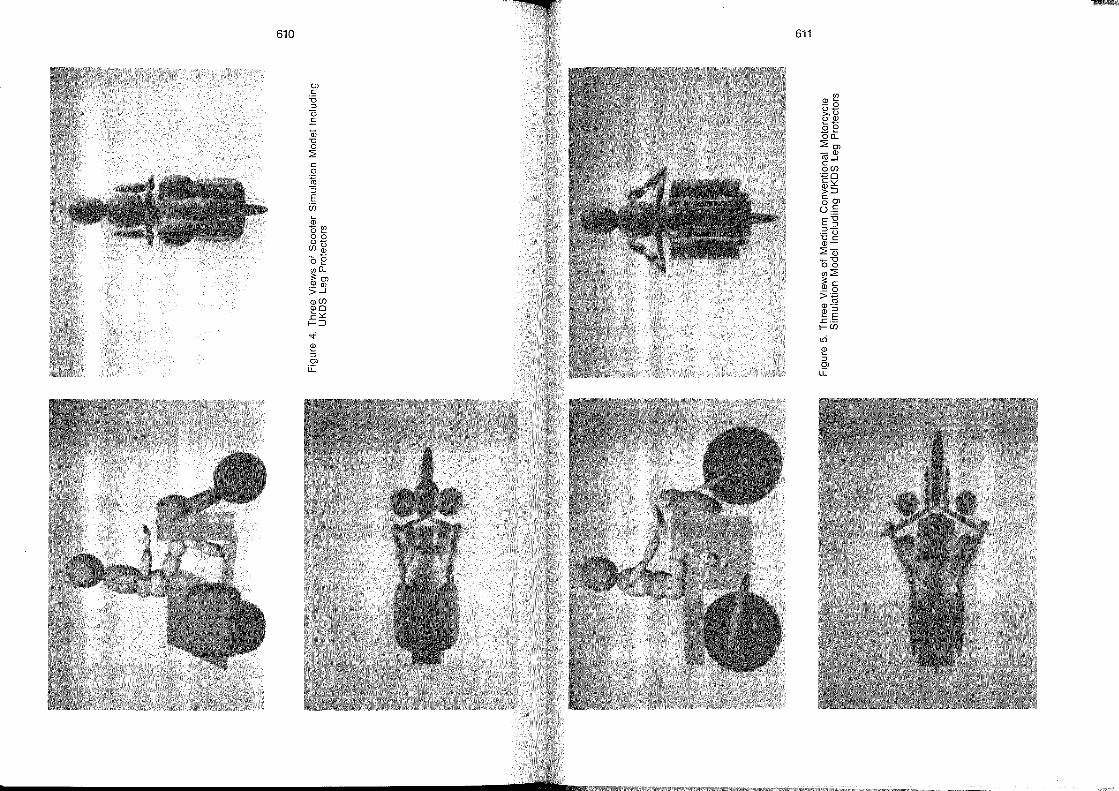
610 611
0) e:: w "0
" Ü E
O)~
-0 ü-
Gi
>,ü
"0
üO)
0
00 - ~ 00... ::2;0)
::2; -0) CO-J
e:: 0
~
e::
"
oU) :;:;0 e::~
~:::l E
ü5 §~ ü.-
Q; ö~ 00
E'g
ü-(/Jü
,,-0)
._ ü
152
"Oe:: 0)-
wo...
::2; Gi
>:0)
~"O
.'!' 0)
00
>-J
w::2;
O)(/J
.~ §
0)0
.c~
> . .;::;
f-:::l
co <D-<D" ~E ..t::._ f-U)
"<I' tri ~
" 0) i.L
~
" 0) i.L
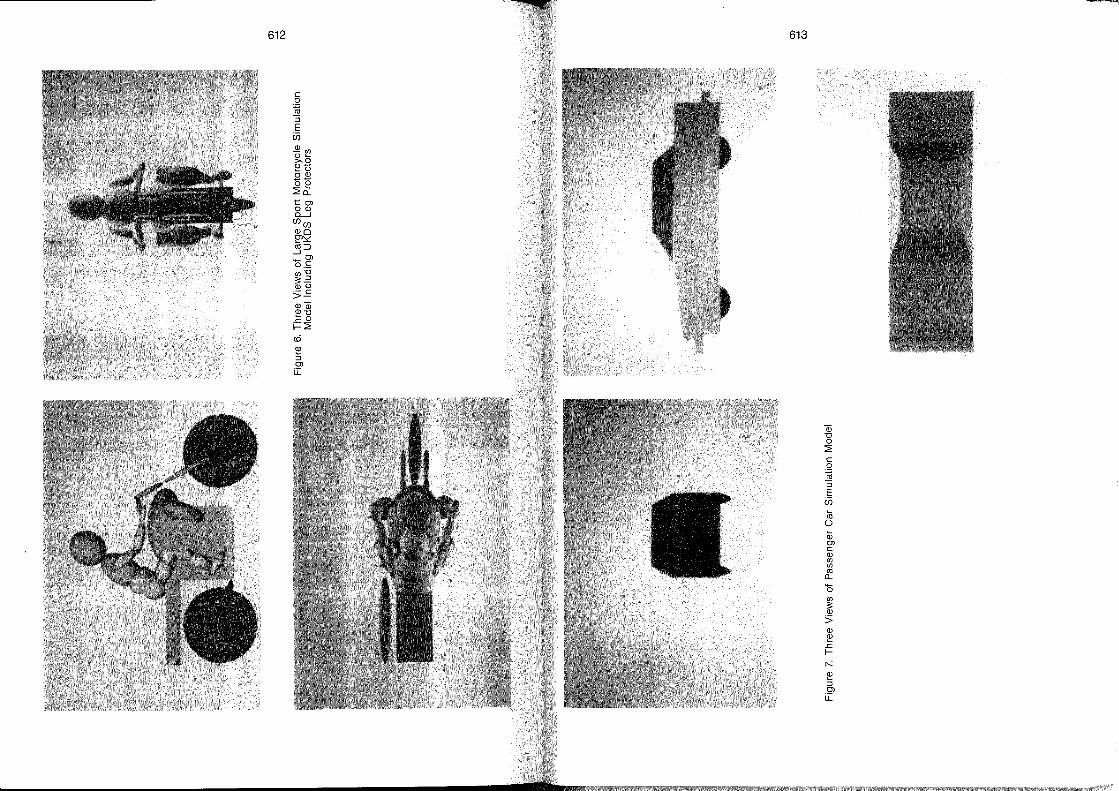
612 613
ä) 1:) o :2: c o ~ :; E
ü5 ro ü
m Ol C (J) rn rn
cf
~ :> (J) (J)
.c: l-
r-..: ~ ::J Ol ü:
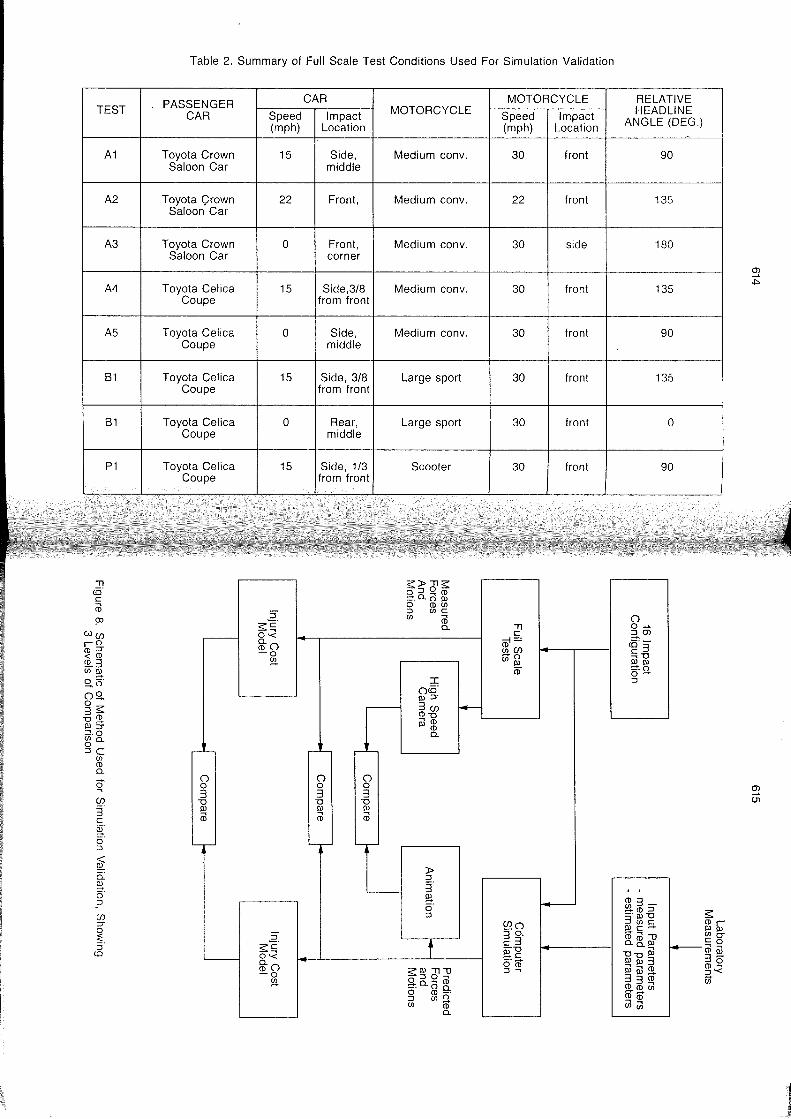
TEST
A1
A2
A3
A4
A5
Ol cö' C
Cil p:>
wen r O co:r <co ~3 Ullll 0=' _0
oQ, Os: 3 co u_ Ill:r ~·o Ulo.. o ::Je
Ul co 0..
~ en 3' C
§: 0' ::J
~ 0: !:!l. 0' ::J
en :r
~, ::J
(Q
81
81
P1
Table 2, Summary of Full Scale Test Gonditions Used For Simulation Validation
, PASSENGER GAR MOTORGYGLE
GAR Speed Impact MOTORGYGLE Speed Impact (mph) Location (mph) Location
Toyota Grown 15 Side, Medium conv, 30 front Saloon Gar middle
Toyota Crown 22 Front, Medium conv, 22 front Saloon Gar
Toyota Grown 0 Front, Medium conv, 30 side Saloon Gar corner
Toyota Gelica 15 Side,3/8 Medium conv, 30 front Goupe from front
Toyota Gelica 0 Side, Medium conv, 30 front Goupe middle
Toyota Gelica 15 Side, 3/8 Large sport 30 front Goupe from front
Toyota Gelica 0 Rear, Large sport 30 front Goupe middle
Toyota Gelica 15 Side, 1/3 Scooter 30 front Goupe from front
S:~61S: @. C4 o ~ o COUl
2: ::J UlC Ul Cil s:c 0.. Ol
,-- 0-< C
a}o c=l= ~en -0 -0
5!l. Ul lll Ci)
I ocö' Ill:r
- 3en I--COu ~co Ill CO
0..
,.-L- _L- -'-
0 0 0 0 0 0 3 3 3
u u U III III III Cil Cil Cil
-,.- -.- -.--
~ ::J
'---- 3' !:!l. 0' I-::J
Q?o 2, 3 0 ,
s:c T c3 -u
- 0-< !:!l.c a}o ö'crr -0 S::IllOl-U ::J~
5!l. o:Jo ....... ~.a.o ~ o co-, ::J UlO Ul CD
0..
RELATIVE HEADLINE
ANGLE (DEG,)
90
135
180
135
90
135
0
90
0 0->. aal cö'3" Siu Illlll =,0 0-::J
, ,
~3-_CO::J -'IllU 3 UlC Illc-m"-o o..~~ r uu lll 1ll1ll3 @ö3~ 33 co ~<D~ ~<D Uleil
•
s: COr Illlll UloCo ro@ 36 co~ ::J'< 1ii
~ .j>.
~ 01
J
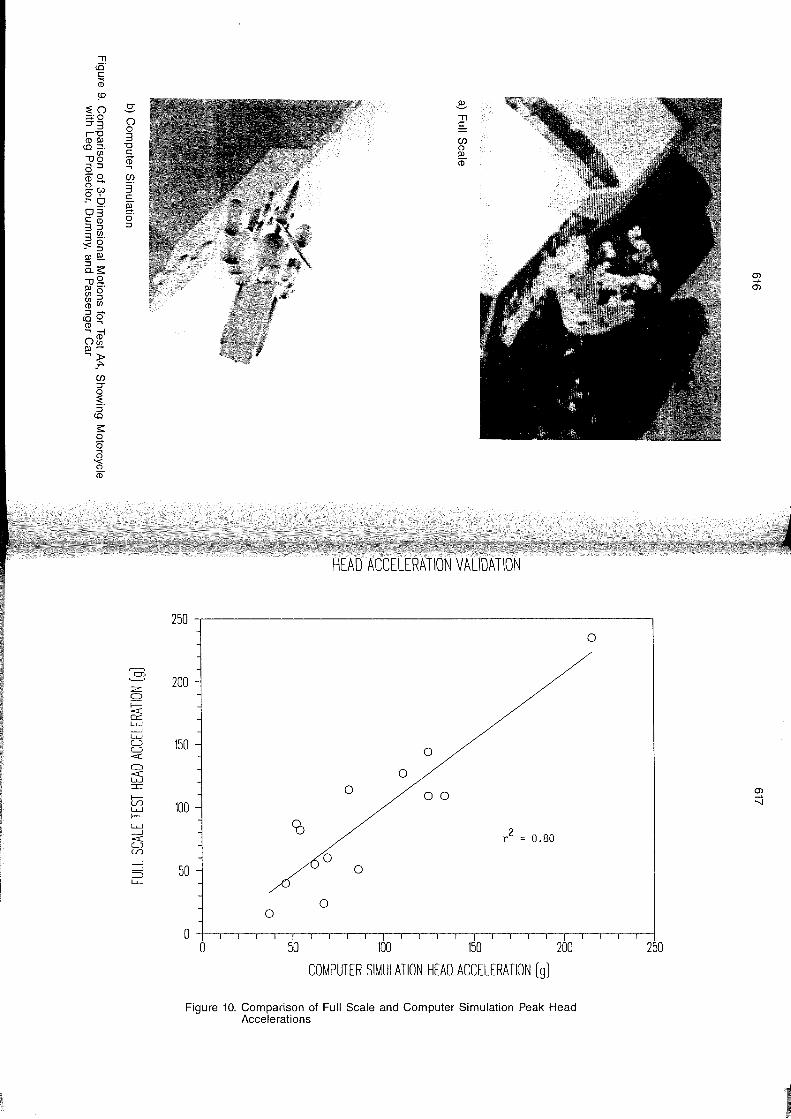
" cO· c äl ~
;:EO ;::::;:0 :::r3 r"O (!)Ill
tO ::!. (J)
<JO a::J -0 (!)-Q.w 0, _ .... 0 03· c(!) 3::J 3 ~. ,<0 - ::J Ill~
5.s:: <J!2. III _. (J)o (J)::J (!)(J)
::J-(00 (!) .... .... :::cI O~ Ill-.... »
:f> (J) :::r 0 :§. ::J (0
s:: !2. 0 (3 '< (")
<D
..s 0 0 3 "0 C
~ (J)
3· c
a ö· ::J
::§ = o I-<C = LW --.J LW U U <C
= L5 = tn LW I--LW --.J
L3 Ln
--' --.J :=> u-
~
" c
(J) (") III <D
~' :,1' --li
HEAD ACCELERATION VALIDATION
250 r---------------~ o
200
150 o o
o 00 100
co r 2 = 0.80
o 50 o
o o
o o ~ m M ~
COMPUTER SIMULATION HEAD ACCELERATION (9)
Figure 10. Comparison of Full Scale and Computer Simulation Peak Head Accelerations
250
O"l ..... O"l
O"l
:::J
.~
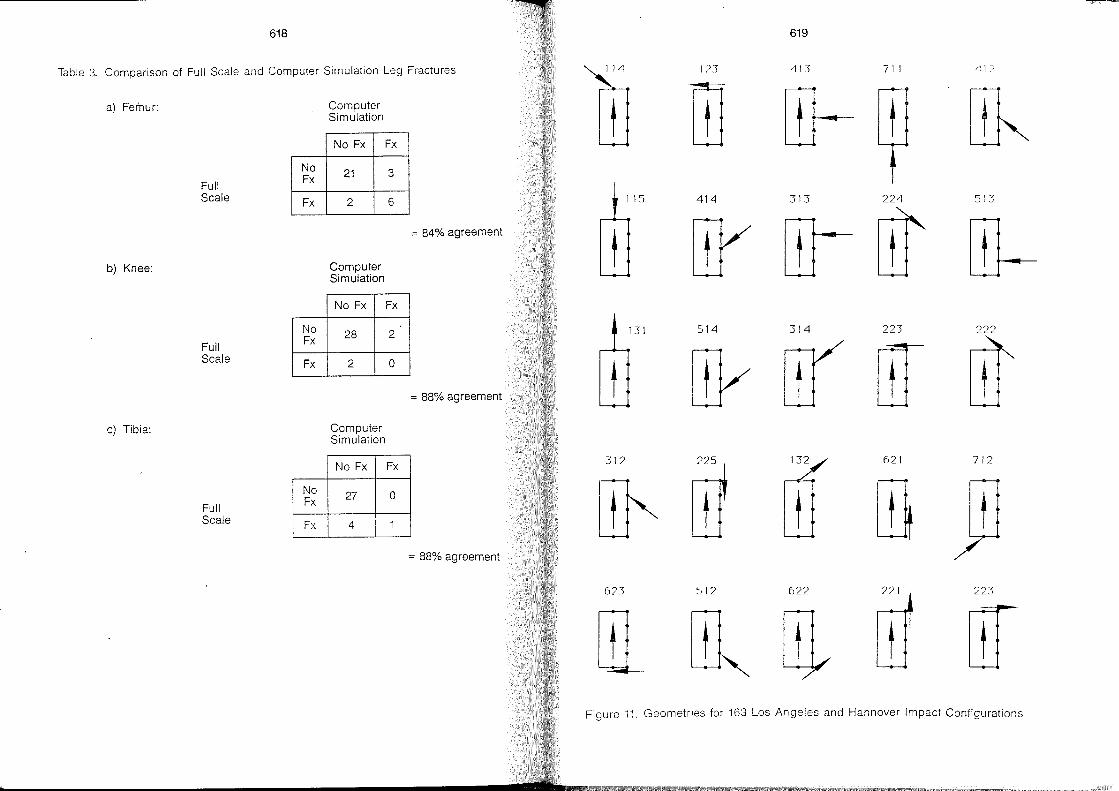
Table 3.
618
Comparison of Full Scale and Computer Simulation Leg Fractures
a) Femur:
b) Knee:
c) Tibia:
Full Scale
Full Scale
Full Scale
No Fx
Fx
No Fx
Fx
No Fx
Fx
Computer Simulation
No Fx
21
2
Computer Simulation
No Fx
28
2
Computer Simulation
No Fx
27
4 I
Fx
3
6
= 84% agreement
Fx
2
0
= 88% agreement
Fx
0
1
= 88% agreement
619
In -113 71 I
IT1 w-- t
115 414 313 224 513
t urrn--ww--514 314 223 222
UYIT(ww
223
Figure 11. Geometries for 163 Los Angeles and Hannover Impact Configurations
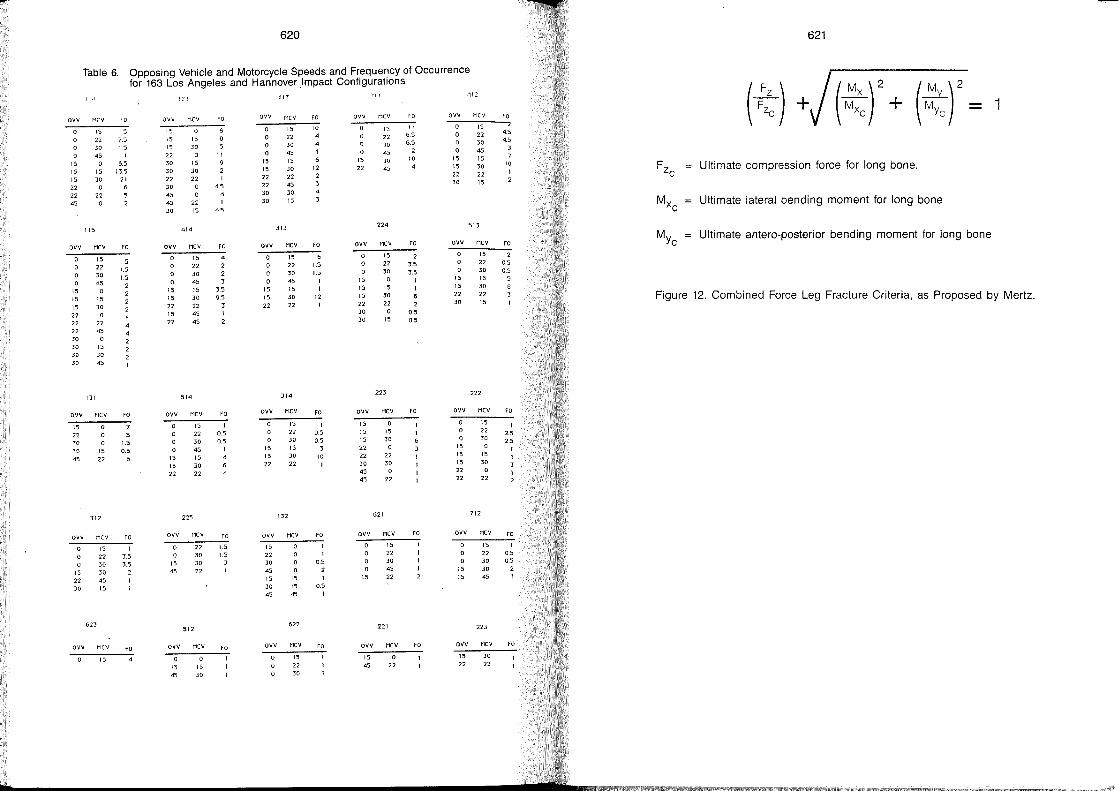
620
Table 6. Opposing Vehicle and Motorcycle Speeds and Frequency of Occurrence for 163 Los Angeles and Hannover .Impact Configurations
ovv
15 15 15 22 22 45
11·1
M(V ro
15 22 7.5 30 15 45 1 o 6.5
15 13.5 JO 2\ o
22
115
OVV Mev FO
15 15
15 22 22 22 30 30
15 22 30 45 o
15 30 o
22 45 o
15 30 JO 30 4S
131
OVV Mev
15
22 30 30 45
15 22
312
QVV Mev
15 22 30
623
15
22 30 30 45 15
ovv Mev
15
1.5 1.5
FO
1.5 0.5
5
FO
1 3.5 3.5
FO
121
ovv Mev
IS 15 15 22 30 30 22 30 45 45 30
15 30 o
15 30 22
22 15
414
OVV Mev
o o
15 15 22 15 22
514
15 22 30 45 15 30 22 45 45
ovv Mev
15 15
22
225
15
22 30 45 15
30 22
ovv Mev
15 45
512
22 30 30 22
QVV Mev
15 45
15 30
FO
11 9
4.5
45
FO
3.5 9.5
FO
0.5 0.5
FO
1.5
1.5
FO
41 J
QVV Mev
15 15
22 22 30 30
15
22 30 45 15 30 22 45 30 15
31J
OVV Mev
15 15
22
15 22 30 45 15 30 22
314
ovv Mev
o 15 15
22
132
15 22 30 15 30 22
ovv Mev
15 22 30 45 15 30 45
o 15 15 45
622
ovv Mev
15
22 30
FO
10
12 2
4
3
FO
6 1.5 1.5
12
FO
0.5 0.5
10
FO
0.5 2
0.5 I
FO
71 I
OVV Mev
15 22
15
22 30 45 JO 45
224
OVV Mev
o 15 15 15
22 30 30
15 22 30 o
15 30 22
15
223
OVV Mev
15 15 15 22 22 30 45 45
621
15 30
22 30
22
ovv Mev
15
15
22 30 45 22
221
OVV Mev
15 45 22
FO
11 6.5 6.5
10
FO
2 3.5 3.5
0.5 0.5
FO
FO
FO
,.,12
OVV Mev
15 15
22 30
15
22 30 45 15 30 22 15
513
ovv Mev
15
15 22 30
15 22 30 15
30 22 15
222
OVV Mev
15 15 15 22 22
15 22 30
15 30
22
712
OVV Mev
15 15
15 22 30 30 45
223
OVV Mev
15 22
30 22
FO
45 4.5
3
10
FO
2 0.5 0.5
5
FO
1 2.5 2.5
FO
0.5 0.5
2
FO
621
1
Ultimate compression force for long bone.
Ultimate lateral bending moment for long bone
Ultimate antero-posterior bending moment for long bone
Figure 12. Combined Force Leg Fracture Criteria, as Proposed by Mertz.
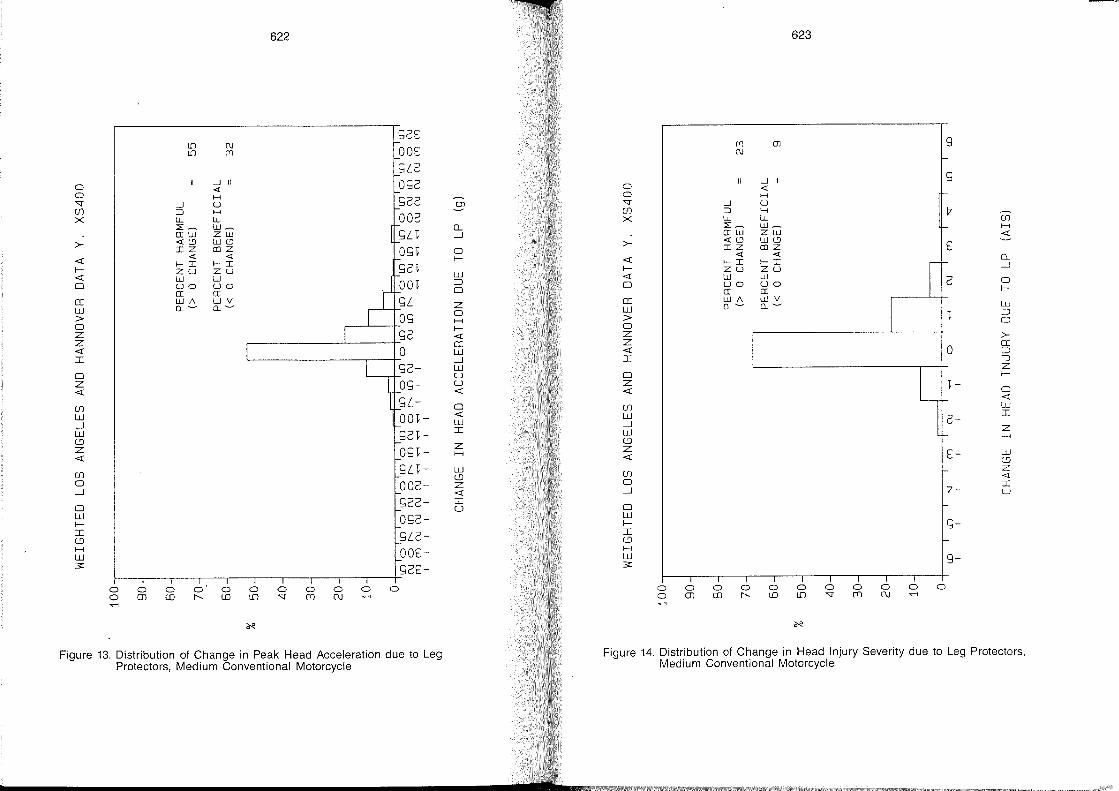
622 623
1.0 (\J t-<;2E
(l') 01 9 1.0 (l')
t-0OE (\J
"-
-.J 11
t-<;LG <; t-0<;2 -.J /I
0 <! 0 <! 0 H 0 H I-'T -.J u t-<;22 01 'T -.J U (f) ::J H (f) ::J H r x LL LL 002 x LL LL (f)
:::;:~ w~ I- 0... :::;:~ w~ I- H
a:w zw <;n -.J a:w zw <l:
>- <!(!) w(!) I- >- <!(!) w(!) E IZ (l)Z O<;"f 0 IZ (l)Z
<! <! <! <! <l: I-I I-I I- f- <l: I-I I-I
I - 0...
f- zu zu 1-<;2"f f- zu zu -.J
<l: W W W <l: W W 0 uo uo I-0O"f :J 0 UO uo 2 0
a: a:
~ 0 a: a: f-
([ w/\ wv I-<;L z ([ w/\ WV
I w 0..- 0..- W 0..- 0..- W
> 0<; 0 > "f :J H 0
0
I f- 0 z <;2 <l: z
I >-
z I
([ z ([
<l: 0 W <l: 0 :J I
\ -.J I J
<;2- w
~ z
0 u 0 ;-;
z 0<;- u z "f-<l: <l: <l: 0
<;L- I- <l: (f) 0 (f) w w 00"f- <l: w 2-
I
-.J W -.J I- I Z w <;2"f- w (!) (!) "- ;-;
I- Z Z O<;"f- Z <l:
H <l: E- w I- (!)
(f) <;n- w (f)
z t- (!) <l:
0 002- z 0 I -.J t- <l: -.J r- u
0 <;22- I I- U 0
w 0<;2- w f- f- <;-I
I- I (!) <;LG- (!)
H I- H
w OOE- w 9-3:
I- 3: <;2E-I I I I I
0 0 0 0 0 0 0 0 0 0 0 0 0 0 0 0 0 0 0 0 0 0 0 rn aJ f'. LD lf) 'T ('1l (\j .,.... 0 rn aJ f'. LD lf) 'T ('1l (\j .,.... .,....
~ ~
Figure 13. Distribution of Change in Peak Head Acceleration due to Leg Figure 14. Distribution of Change in Head Injury Severity due to Leg Protectors, Protectors, Medium Conventional Motorcycle Medium Conventional Motorcycle
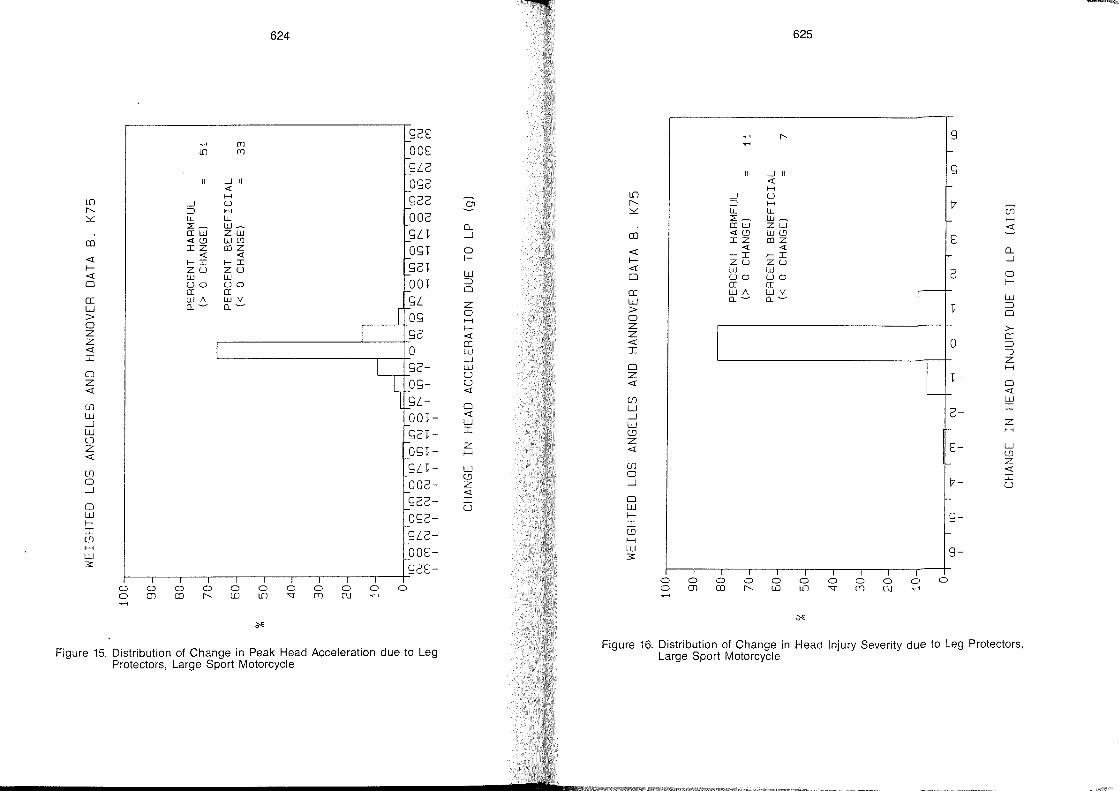
624 625
geE "<"< " 9 "<"< (Tl
lD (Tl OOE "<"<
-g{C
-111 g
-111 Oge « « H
LO H LO
-1 U /-gee -1 u
" ::J H 01 " ::J H
~ LL LL /-0 Oe ~ LL LL
17
2- W_ 2- W_ en
erw ZW f-gn 0... erw zw
H
CD «l!) Wl!) --.J CD «l!) Wl!) <I:
IZ COZ IZ COZ E
<I: « « f-og"f 0 <I:
« «
f-I--I I--I f- f-
I--I I--I f-- 0...
ZU ZU f--ge"f ZU ZU --.J
<I: W W W <I: W W
0 uo uo /-00"f :::J 0 UO uo e 0
er er 0 er er f-
0:: W/\ wv rf-
gL 0:: W/\ WV
I !-
w (1-~ (1-~ z w (1-~ (1-~ w
> Og 0 > "f :::J
0 H 0
0
z I ge f- z Z
<I: Z l >-
<I: I 0 0:: <I: 0
0::
I W I
:::J
~ --.J
J
0 ge- w 0 -L z
z f-- U Z H
<I: Og- U <I:
"f-f-- <I:
0
en f--gL- Ul f-- <I:
W 0 W
W
--.J i-0O"f- <I: --.J c- I
W W I
W Z
l') ge"f- l') - H
Z -- Z Z
<I: Og"f- H <I: E- w
-- l')
Ul gn- w en z
0 f-- l') 0
<I:
--.J OOe- z --.J 17- I
i- <I: U
0 gee- I 0
W i- U W
f- _Oge- f- g-I
I l') g{C- l')
H H w OOE- w
3: 9-3: geE- I I I I I
0 6 6 I 0 0 0 0 0 0 0 0 0 0 0
0 0 0 0 0 0 0 0 0 m OJ " LO LO 'q f11 CiJ "...
0 m OJ " LO LO 'q f11 CiJ '<""-1
'<""-1
~ ~
Figure 15. Distribution of Change in Peak Head Acceleration due to Leg Figure 16. Distribution of Change in Head Injury Severity due to Leg Protectors,
Protectors, Large Sport Motorcycle Large Sport Motorcycle
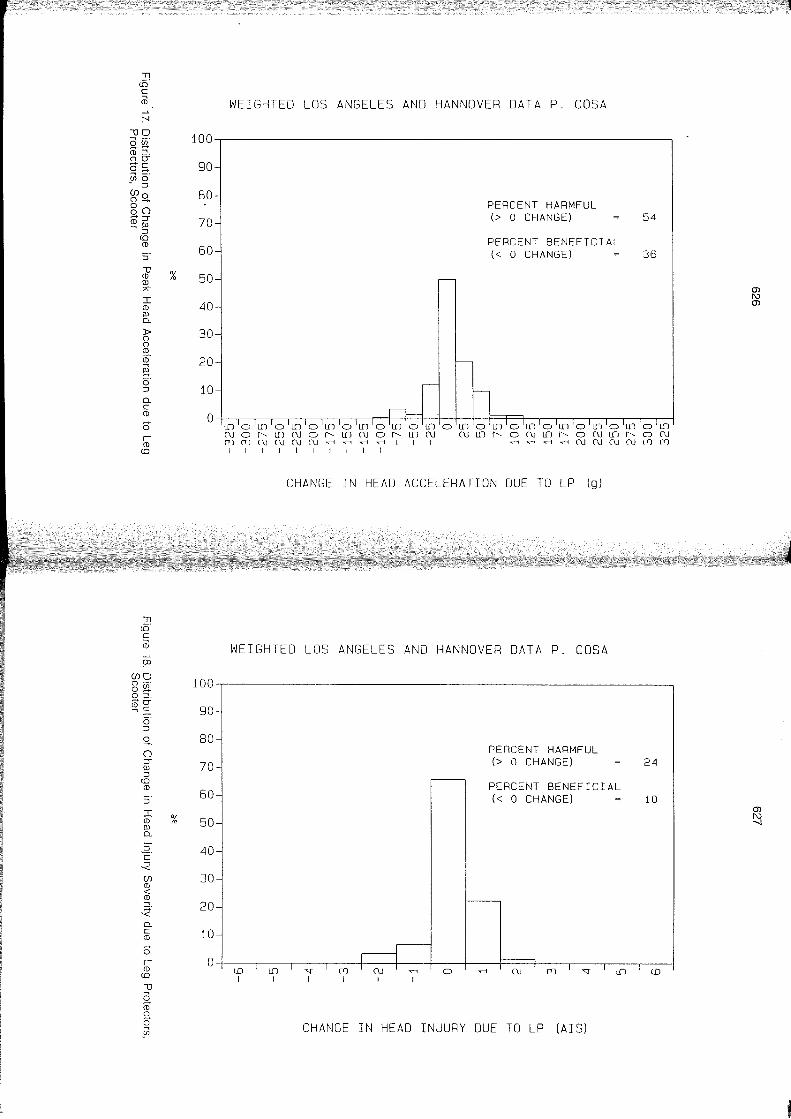
::!1 <.D e iil
:--.J 1)0
100 (3 w" ~~
<D ::::!. 00--e o~ 90 cn o' - :::J ({Jo 0- 80 80
70 ~::r <D(ll ~:::J
<.D <D
60 :::J
I) % 50 <D
(ll -
A
I 40 CD -(ll 0-
» 30 0 -
0 ~ g; 20 -~ 0
10 :::J -0-e
0 <D
Ö r-CD
<.D
::!1 <.D e iil ~
(Xl
({JO 100 o _.
o5!l. o :::!.
90 -0-CD e ~-o·
:::J
S- 80 O
70 ::r (ll :::J
<.D CD
:::J 60
I % 50 CD (ll 0-
2. e 40
..:;:: ({J 30 CD < CD
20 ~.
-< 0-
10 e CD
Ö r-CD
0 <.D
I) ~
2 CD 0 Ö Ul
WEIGHTEO LOS ANGELES ANO HANNOVER OATA P. COSA
PERCENT HARMFUL (> 0 CHANGE) 54
PERCENT BENEFICIAL « 0 CHANGE) 36
r-
-
1I--f rL. ~'o'~'o'~'o'~'o'~'o'~'c,'~'o'~'o'~'o'~'o'~'o'~'o'~'o'~ ruo~~ruo~~ruo~~ru ru~~oru~~oru~~oru ~~rurururu~~~~1 I I ~~~~rurururu~~
I I I I I I I I I I
CHANGE IN HEAO ACCELERATION OUE TO LP (g)
WEIGHTEO LOS ANGELES ANO HANNOVER OATA P. COSA
PERCENT HARMFUL (> 0 CHANGE) 24
,---
r-r--lD ~ 'f ~ ru ~ o I I I I I I
PERCENT BENEFICIAL « 0 CHANGE)
r----
~
10
~ ru ~ 'f ~ lD
CHANGE IN HEAO INJURY DUE TO LP (AIS)
(j) t\) (j)
(j) t\) -...I
t
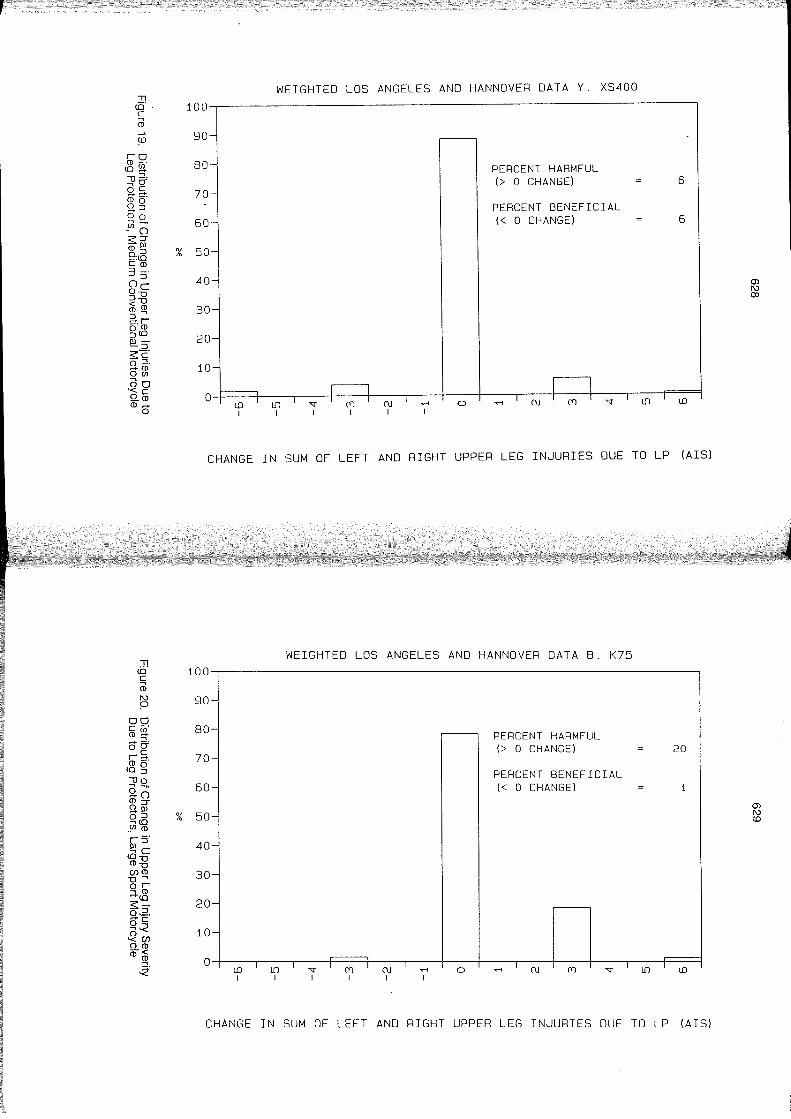
, ." ciS' • c m ~
ro co _. {O~ ""U~. ~O" oc CD g. ~::J 00 _en 0 :s;::r coOl
% o.::J _.(O Cco 3 S' oe 0-0 ::J-o <co 3~ !:!'".r OCO ::J{O Ol--::J :s;c' o ::::!. .... co Oen 00 '<c Q.co co ....
0
::!1 (O c m I\.)
~
OQ Cen co~ '-+rr °c r~. COo {O::J \Jo ~ -SO CO::r ~Ol
% Q(5 enco rS' !!le {o-o CO-o (nCO -o~
or ;:+~ :s;-0.2 . .... c Q-.< 0(n '<co Q.< CO co
~
WEIGHTEO LOS ANGELES ANO HANNOVER OATA Y . XS400
100
90-, ,---
BOl PERCENT HARMFUL (> 0 CHANGE) 6
70-
5~J PERCENT BENEFICIAL « 0 CHANGE) 6
50-
4°l
30-
20-
10-
O~ I I r=:l r=:l r !D L[) "f (\J ..... 0 ..... (\J "f L[) !D
I I I I
CHANGE IN SUM OF LEFT ANO RIGHT UPPER LEG INJURIES OUE TO LP (AIS)
100
90
BO
70
50
50
40
30
20
10
0
-
-
-
-
-
-
-
-
-
!D I
L[) I
WEIGHTEO LOS ANGELES ANO HANNOVER OATA B. K75
"f I
,.----. (Y) I
(\J I
..... I
,-
o
PERCENT HARMFUL (> 0 CHANGE)
PERCENT BENEFICIAL « 0 CHANGE)
,--
..... (\J (Y) "f
20
r---L[) !D
CHANGE IN SUM OF LEFT ANO RIGHT UPPER LEG INJURIES OUE TO LP (AIS)
(j) I\.) ())
(j) I\.) c.o
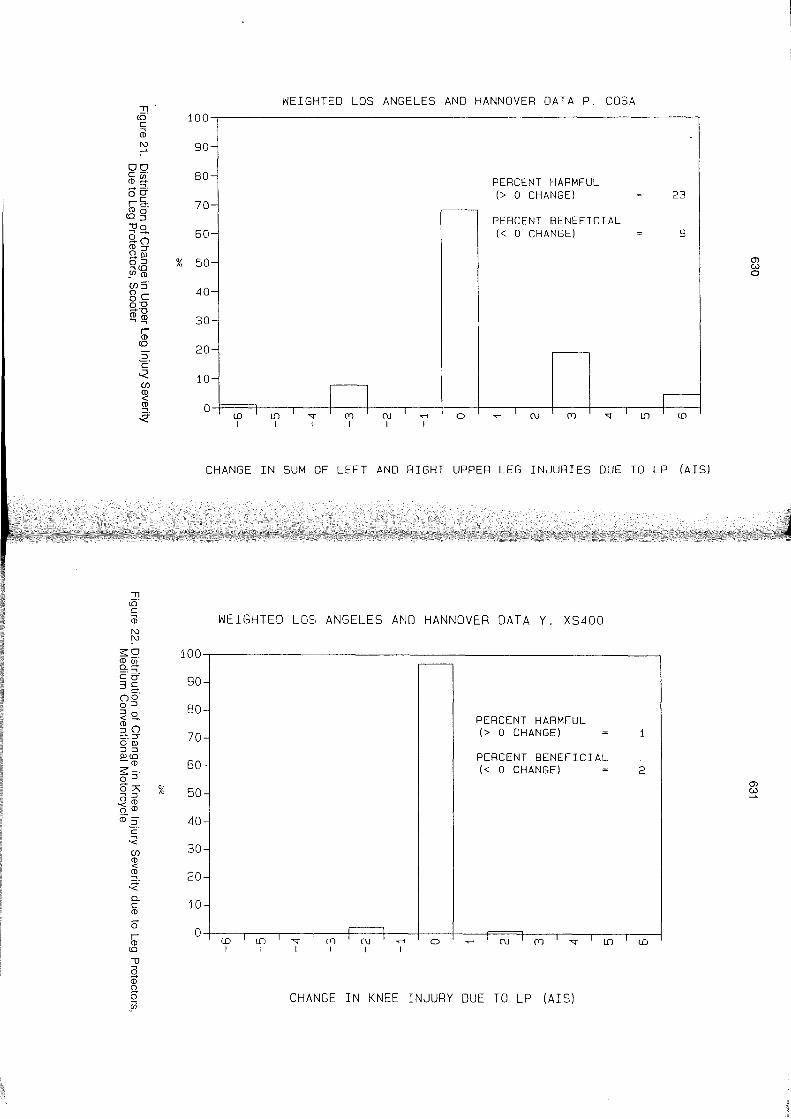
:TI (Q e ä3 t\J -'
og e(J) CDq-.-+8 oe r d". CDo (Q:J '"00 ~ .... 9.0 CD::y Q.n>
% O:J ~(Q
_(J) CD Cf) S' oe 0-0 9.-0 CD CD ~~
r CD
(Q
2-e -< Cf) CD < CD
~
" üS' e ä3 t\J !"
:5:0 CD w· 0.--,~
cO' 35-oa' 0::::J ::::Jo <-~o =.::::J"" On> ::::J::::J n>(Q -CD :5:-. 0::::J
0;>\ % ~::::J
°CD '(5 CD iö-
2. e
-< Cf) CD < CD ~
-< 0. e CD
0 r CD
(Q
'"0 (3 <D ° 0 öl
100
90
80
70
60
50
40
30
20
10
0
-
-
-
-
-
-
-
-
-
~
lD I
LO I
WEIGHTEO LOS ANGELES ANO HANNOVER OATA p, COSA
"f I
D (T)
I (\J I
~
.-i o I
PERCENT HARMFUL (> 0 CHANGE)
PERCENT BENEFICIAL « 0 CHANGE)
,.---
.-i (\J (T) "f
23
9
r-LO lD
CHANGE IN SUM OF LEFT ANO RIGHT UPPER LEG INJURIES OUE TO LP (AIS)
WEIGHTEO LOS ANGELES ANO HANNOVER OATA y, XS400
,--
r----l (l) C\J ~ o I I I
PERCENT HARMFUL (> 0 CHANGE)
PERCENT BENEFICIAL « 0 CHANGE) 2
L
~ C\J (l) ""l" LD lD
CHANGE IN KNEE INJURY DUE TO LP (AIS)
0) w o
0)
~
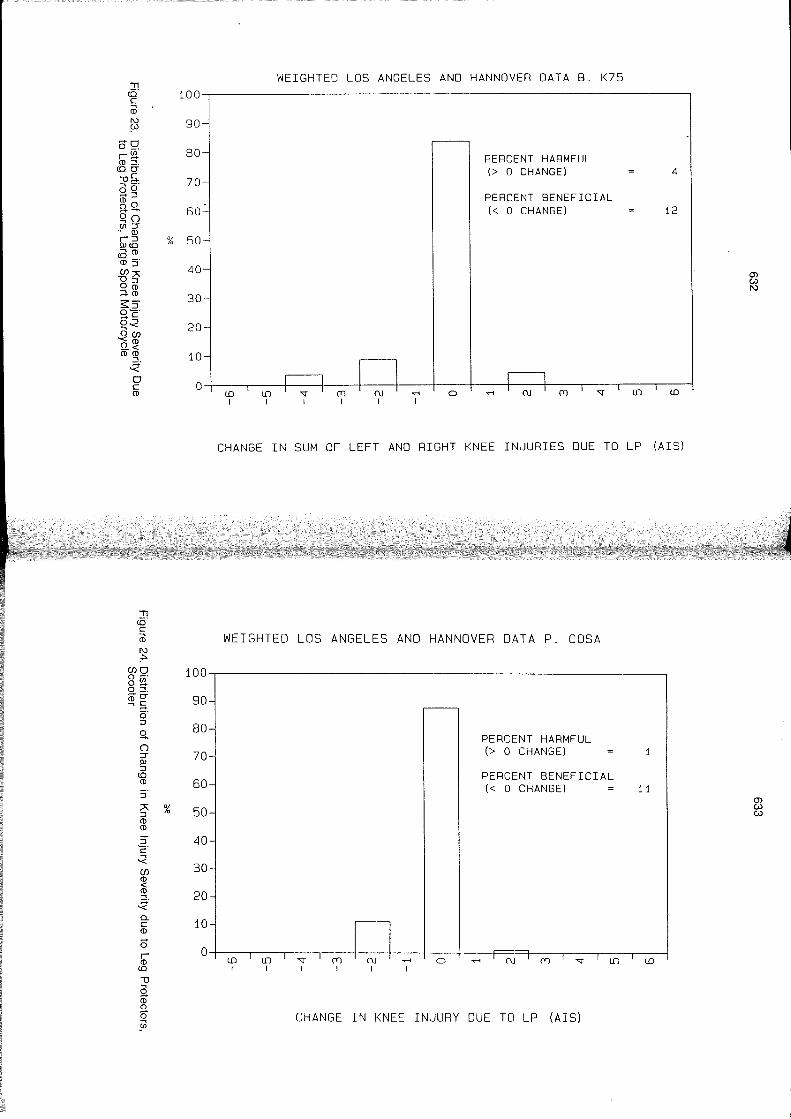
" 100 cO· c CD r\) 90 ~
..... 0 80
0_. r~ co ~.
(QCY
-os. 70 -, ö' Sl.:J
~~ 60 00 ül::r - IJ)
% 50 r:J IJ)(Q -'(1)
(Q _. (1):J
40 (/)"/\ "D:J 0(1) ;::l.(1)
30 $:S" 0-· ..... c
20 Q-< o(/) '<(1) Q.<
10 (1)(1)
~.
0 0 c (1)
" <Ci. e: CD r\)
:I"-(/)0 C) _.
o~ 100
o ::! . ..... CY
~s. o· :J
9-
90-
BoJ 0 ::r IJ) :J
(Q (1)
70j
60 :; "/\ % :J 50-1 (1) (1)
2. 40 e: -< (/) 30 (1) < ~. 20 -< Cl. e: (1)
Ö r
l:l (1)
(Q
lJ ., ~ (1) ~ 0
_00
lD I
WEIGHTEO LOS ANGEL ES ANO HANNOVER OATA B. K75
..... I
o
PERCENT HARMFUL (> 0 CHANGE) 4
PERCENT BENEFICIAL « 0 CHANGE) 12
..... lD
CHANGE IN SUM OF LEFT ANO RIGHT KNEE INJURIES OUE TO LP (AIS)
WEIGHTEO LOS ANGELES ANO HANNOVER OATA P. COSA
I PERCENT HARMFUL
I I (> 0 CHANGE)
PERCENT BENEFICIAL « 0 CHANGE) 11
lD lf) "f Cf) Cl ...... 0 ...... (\J ,
Cf) "f lf) lD I I I I I
CHANGE IN KNEE INJURY OUE TO LP (AIS)
0) w r\)
0) w w
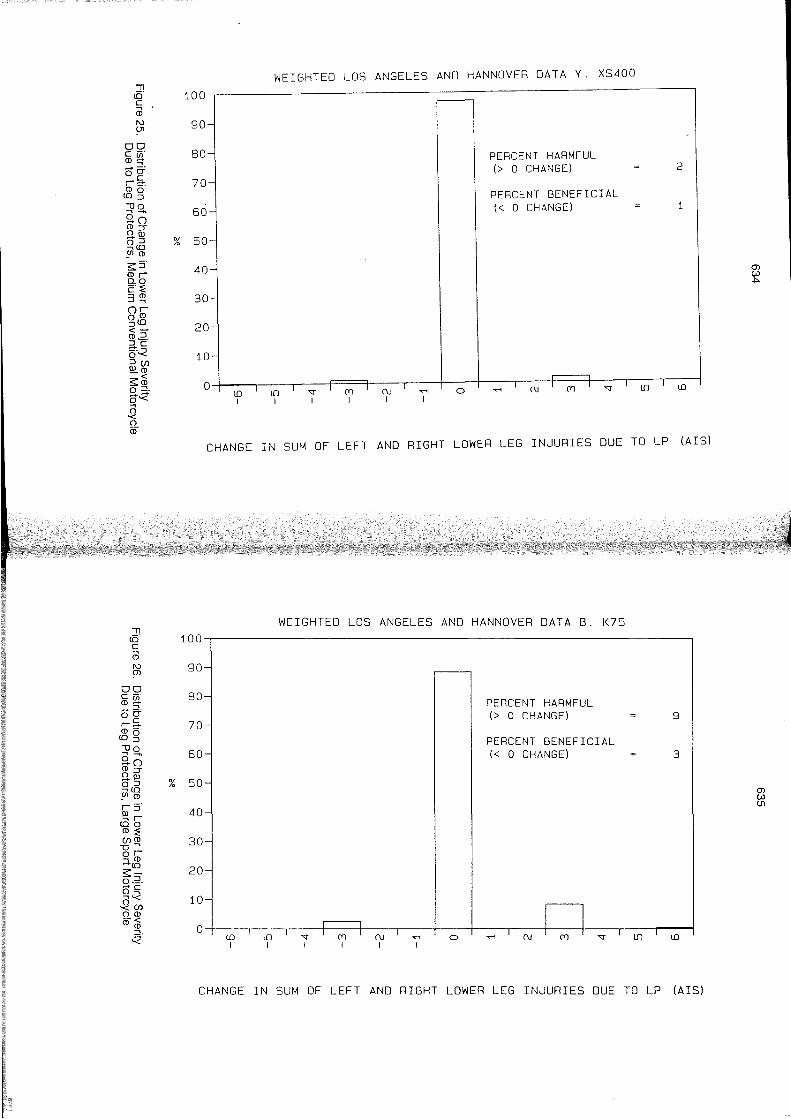
J:1 (0 c CD I\.)
~
00 C (ji' co'" ög' r~. COo (O::J -00
9.0 CO::T °lll
% .... ::J g(O !!'co s:: S' cor 0.0 c':;: 3~ ()r OCO ::J(O <-co.2. ::Je 5"-< ::J(f) lllCO ~Ct3 ~k 0 (3 '< 0 CD
11 ((5' e CD I\.)
~
00 e -' CD~ öcr r~ ~ §r -00 go CO::T Q.~ % g(O y' co rS' Q;r (00 co:;: (f)CO "0"" or ::\.CO (0 s::-0.2 . .... c g-< ~(f) OCO -< CD~
~
100
90-
80-
70-
60-
50-
40-
30-
20-
10-
o , tD I
WEIGHTEO LOS ANGELES ANO HANNOVER OATA Y. XS400
,.-
lf) -'-"'<t (1) (\) -rl
I I I I I o
PERCENT HARMFUL (> 0 CHANGE)
PERCENT BENEFICIAL « 0 CHANGE)
r---l -rl (\) ~···I "'<t
2
lf) tD
CHANGE IN SUM OF LEFT ANO RIGHT LOWER LEG INJURIES OUE TO LP (AIS)
WEIGHTEO LOS ANGELES ANO HANNOVER OATA B. K75 100
90-1 r---
80-
1
PERCENT HARMFUL (> 0 CHANGE) 9
70-
60~ PERCENT BENEFICIAL « 0 CHANGE) 3
50-
I 40-
30-
20-
1:-
1 tD lf) "'<t F(Y;l (\) -rl
I 0
1 -rl (\) r=:l "'<t lf) r tD
I I I I I I
CHANGE IN SUM OF LEFT ANO RIGHT LOWER LEG INJURIES OUE TO LP (AIS)
Ol W .j:>.
Ol w 01
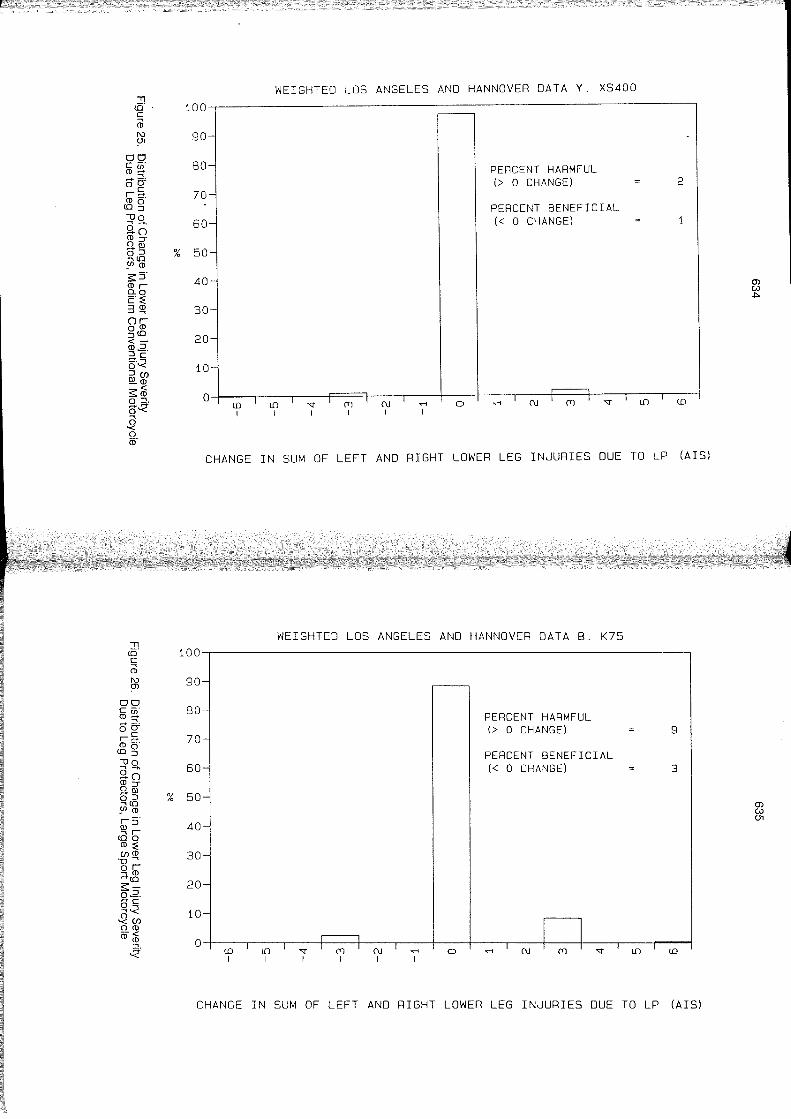
." «:i' . c äl I\.)
~
00 C (ji' CD", 05' ra., CDo CO::J -00 ""' .... 9.0 CD::y O!lJ '+::J Qco y' CD $:S' CDr 0..0 c'::! 3~ Or OCD ::JCO <-CD2, ::Jc g,.:< ::J(fJ ~CD
$:cr3 o ~. o~ 0 '< 0 CD
." «:i' c äl I\.) (j)
00 ~~ ocr rs:i.
~ ~T -00 ""' .... 9.0 CD::y ~~ % Qco _w CD rS' ~r coo CD::! (fJCD "0""' or ;:+CD
co $:-02, .+c Q.:< ~(fJ OCD CDcr3
~
100
90-
80-
70-
60-
% 50-
40-
30--1
20-
10-
0
WEIGHTED LOS ANGELES AND HANNOVER DA TA y, XS400
r-
----. w m ~ ~ ru ~ o I I I I I I
PERCENT HARMFUL (> 0 CHANGE)
PERCENT BENEFICIAL « 0 CHANGE)
,----, ~ ru ~ 1 ~
2
1
m w
CHANGE IN SUM OF LEFT AND RIGHT LOWER LEG INJURIES DUE TO LP (AIS)
WEIGHTED LOS ANGEL ES AND HANNOVER DATA B, K75 100
90-1 ,..-----
BO-
I PERCENT HARMFUL (> 0 CHANGE) 9
70-
60~ PERCENT BENEFICIAL « 0 CHANGE) 3
50-
I 40-
30-
20-
1:l w m ~ r=:=l ru ~
I 0
I ~ ru r=:l ~ m w
I I I I I I
CHANGE IN SUM OF LEFT AND RIGHT LOWER LEG INJURIES DUE TO LP (AIS)
(j) w .j>.
(j) w c.n
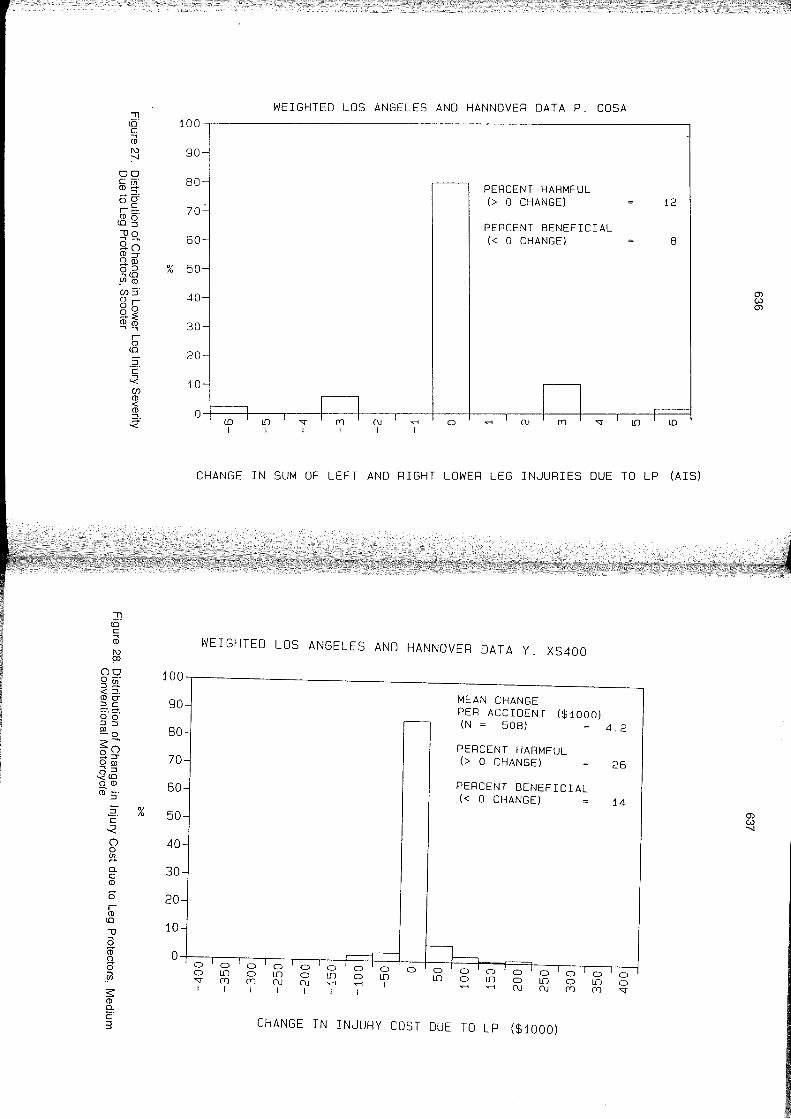
WEIGHTED LOS ANGELES AND HANNOVER DATA P. COSA "Tl
15· 100 c CD I\.) 90 :-J
00 fl5~ 80.
1
PERCENT HARMFUL oB' (> 0 CHANGE) 12 ra.. 70 CDo (O::J
60~ PERCENT BENEFICIAL -00 ""'- « 0 CHANGE) 8 Sl.o CD::::; 2~ % 50 Q(O _w CD (J) 5· 4°l Cl °r tu °0 Cl Sl.::E CD CD 30 ""'""' r
CD (0
20 ::J c· -< 10 (J) CD < ~ 0 ~. ID Lf) "I" (11 (\j ..... 0 .....
I
CHANGE IN SUM OF LEFT AND RIGHT LOWER LEG INJURIES DUE TO LP (AIS)
"Tl 15· c CD I\.)
9J WEIGHTED LOS ANGELES AND HANNOVER DATA Y. XS400
00 0-· :::J!!l. < ::!. CD 0" as. ö·ö· :::J:::J ~o ~C; Q.::::; 00:> ""':::J 0(0 '(5 co <D _.
:::J
2: % c -<
100
90J MEAN CHANGE PER ACCIOENT ($1000) n (N = 508) 4.2
80j PERCENT HARMFUL
70 (> 0 CHANGE) 26
60-i PERCENT BENEFICIAL « 0 CHANGE) 14
Cl 50-1 ~
0 0
40 !!l.
0.. C 30-CD
Ö 20 r CD (0
-0 10-(3 <D 2 0
_eil
~
0/ 0 0 0 0 0 or=o=1=:lo~o 000 0 0 o m 0 m 0 m 0 m m 0 m 0 m 0 m 0 "I" m m ru ru ~ ~ I ~ ~ ru ru m m "I" I I I I I I
co 0.. c 3 CHANGE IN INJURY COST DUE TO LP ($1000)
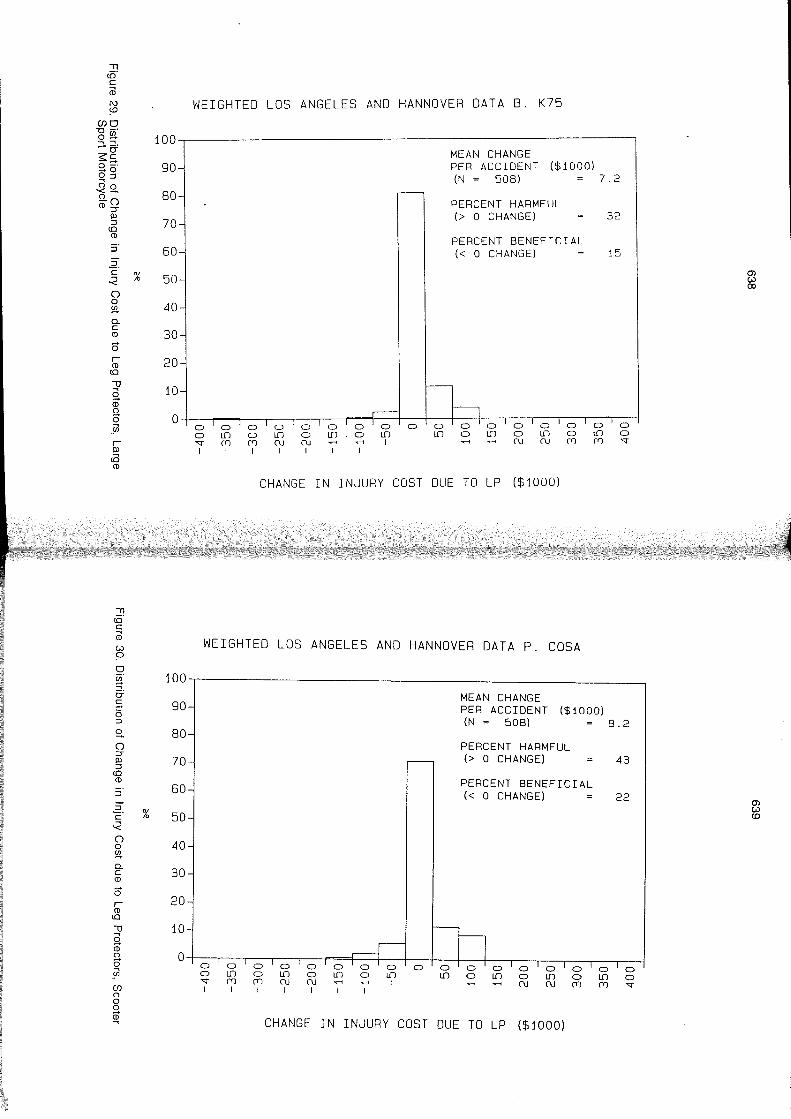
" US· c ä3 C\)
~ (1)0 "0 iii· 0_ ..., ::::::!. -0"
100 s::s. 0-· -0 O:::J
90 00 '< -Q.() CD::r
80 Pl :::J co 70 CD
:; 60 2. c % -< 50 () 0 !!l. 40 0. C CD 30 Ö r CD 20 co "U (3 10 <D n. 0 0 eil r Pl
cO CD
" US· c ä3 c.v 9 0
~ 100 ö'
90 S. ö· :::J
Q. 80 () ::r
70 Pl :::J
co CD
:; 60
50 ::; c· % -<
40 () 0 !!l.
30 0. C CD
Ö r 20 CD
co
::s' 10 9-CD
0 0 ö 5il (I) 0 0 9-CD ~
WEIGHTEO LOS ANGELES ANO HANNOVER OATA 8. K75
0 0 0 0 lf) 0
"'" (Tl (Tl
I I I
0 lf) (\j (\j ..-1 ..-1
I I I I
ME AN CHANGE PER ACCIDENT ($1000) (N = 508) 7.2
PERCENT HARMFUL (> 0 CHANGE) 32
PERCENT 8ENEF:CIAL « 0 CHANGE) 15
..-1 ..-1
o o
"'"
CHANGE IN INJURY COST OUE TO LP ($1000)
WEIGHTEO LOS ANGELES ANO HANNOVER OATA P. CaSA
0 0 0 0 lf) 0
"'" (Tl (Tl
I I I
0 lf) (\j ..-1 ..-1
I I I
MEAN CHANGE PER ACCIDENT ($1000) (N = 508) 8.2
PERCENT HARMFUL (> 0 CHANGE) 43
PERCENT 8ENEFICIAL « 0 CHANGE)
0'00000 lf) 0 lf) 0 lf)
..-1 ..-1 (\j (\j
22
o o
"'"
CHANGE IN INJURY CaST OUE TO LP ($1000)
0) c.v (Xl
0) c.v co
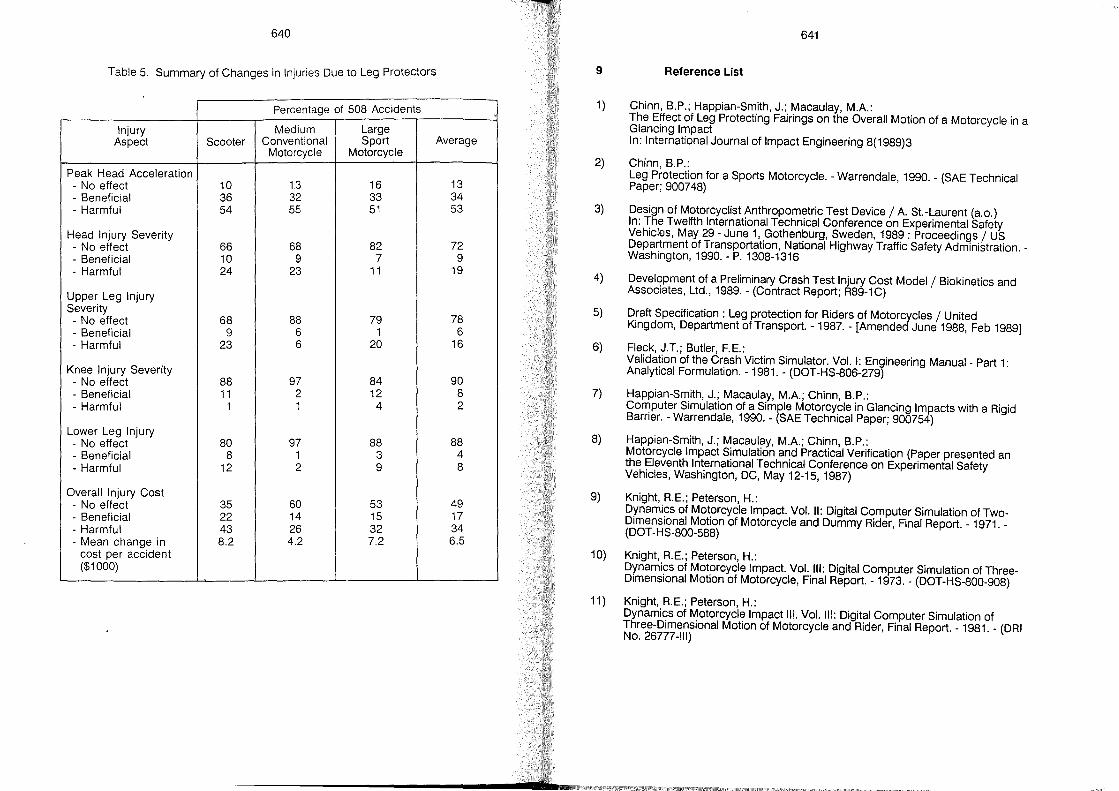
640
Table 5. Summary of Changes in Injuries Due to Leg Protectors
Percentage of 508 Accidents
Injury Medium Large Aspect Scooter Conventional Sport Average
Motorcycle Motorcycle
Peak Head Acceleration - No effect 10 13 16 13 - Beneficial 36 32 33 34 - Harmful 54 55 51 53
Head Injury Severity - No effect 66 68 82 72 - Beneficial 10 9 7 9 - Harmful 24 23 11 19
Upper Leg Injury Severity - No effect 68 88 79 78 - Beneficial 9 6 1 6 - Harmful 23 6 20 16
Knee Injury Severity - No effect 88 97 84 90 - Beneficial 11 2 12 8 - Harmful 1 1 4 2
Lower Leg Injury - No effect 80 97 88 88 - Beneficial 8 1 3 4 - Harmful 12 2 9 8
Overall Injury Cost - No effect 35 60 53 49 - Beneficial 22 14 15 17 - Harmful 43 26 32 34 - Mean change in 8.2 4.2 7.2 6.5
cost per accident ($1000)
641
9 Reference List
1) Chinn, B.P.; Happian-Smith, J.; Macaulay, M.A.: The Effect of Leg Protecting Fairings on the Overall Motion of a Motorcycle in a Glancing Impact In: International Journal of Impact Engineering 8(1989)3
2) Chinn, B.P.: Leg Protection for aSports Motorcycle. - Warrendale, 1990. - (SAE Technical Paper; 900748)
3) Design of Motorcyclist Anthropometric Test Device / A. St.-Laurent (a.o.) In: The Twelfth International Technical Conference on Experimental Safety Vehicles, May 29 - June 1, Gothenburg, Sweden, 1989: Proceedings / US Department of Transportation, National Highway Traffic Safety Administration. _ Washington, 1990. - P. 1308-1316
4) Development of a Preliminary Crash Test Injury Cost Model / Biokinetics and Associates, Ud., 1989. - (Contract Report; R89-1C)
5) Draft Specification : Leg protection for Riders of Motorcycles / United Kingdom, Department of Transport. - 1987. - [Amended June 1988, Feb 1989]
6) Fleck, J.T.; Butler, F.E.: Validation of the Crash Victim Simulator. Vol. I: Engineering Manual - Part 1: Analytical Formulation. - 1981. - (DOT-HS-806-279)
7) Happian-Smith, J.; Macaulay, M.A.; Chinn, B.P.: Computer Simulation of a Simple Motorcycle in Glancing Impacts with a Rigid Barrier. - Warrendale, 1990. - (SAE Technical Paper; 900754)
8) Happian-Smith, J.; Macaulay, M.A.; Chinn, B.P.: Motorcycle Impact Simulation and Practical Verification (Paper presented an the Eleventh International Technical Conference on Experimental Safety Vehicies, Washington, DC, May 12-15,1987)
9) Knight, R.E.; Peterson, H.: Dynamics of Motorcycie Impact. Vol. 11: Digital Computer Simulation of TwoDimensional Motion of Motorcycle and Dummy Rider, Final Report. - 1971. _ (DOT-HS-800-588)
10) Knight, R.E.; Peterson, H.: Dynamics of Motorcycie Impact. Vol. 111: Digital Computer Simulation of ThreeDimensional Motion of Motorcycle, Final Report. - 1973. - (DOT-HS-800-908)
11) Knight, R.E.; Peterson, H.: Dynamics of Motorcycie Impact 111. Vol. 111: Digital Computer Simulation of Three-Dimensional Motion of Motorcycle and Rider, Final Report. - 1981. - (DRI No. 26777-111)

12)
13)
14)
15)
642
Pedder, J.; Hurt, H.H.; Otte, D.: h Motorcycle Accident Impact Condition as a Basis for Motorcycle Cras Tests In: The Twelfth International Technical Conference on Expenmen~al Safety Vehicles, May 29 - June 1, Gothenburg, Sweden, 198~ : ProceedlnQs.l U~ Department of Transportation, National Highway Trafflc Safety Administration. -Washington, 1990. - P. 1297-1307
Prasad, P.; Chou, C.C.: h' d A Review of Mathematical Occupant Simulation Models, Crashwort Iness an Occupant Protection in Transportation Systems. - 1989. - (ASME, AMD-Vol. 106; BED-Vol. 13)
Sakamoto, S.: . (SAE Research History of Motorcycle Leg Protectlon. - Warrendale, 1990. -Technical Paper; 900755)
Sporner, A.: .., 11' . . Experimentelle und mathematische Simulat~?n von MotorradkC? ISI0!len Im Vergleich zum realen Unfallgeschehen. - Munchen, Techn. UnIv., DISS., 1982
Environment
Reiner Stenschke: Possibilities for Reducing Noise Emissions from Motorcycles
Heinrich Steven: Noise Generated by Motorcycles
Peer-Olaf Kalis, Norbert Gorißen, Lutz Hartung, Hermann Appel: Reduction of Exhaust Gas Emissions of Motorcycles
Vsevolod Kleniksky: Fuel Consumption Reduction and Emission Decrease
in an Utilitarian PTW 2-Stroke Engine by Simple Modification
Possibilities for Reducing Noise Emissions from Motorcycles
Reiner Stenschke
Umweltbundesamt, Berlin
Germany
647
1 Abstract
Motorcycles account for some 10% of all motor vehicles in traffic. Their annnual mileage is considerably lower than that of the other types of motorvehicles. Nevertheless, they are perceived as the most bother some source of road traffic noise, even surpassing heavy-duty vehicles.
Noise emission is still high for many motorcycles, and the noise problem is aggravated by the fact that they are frequently used by people just for fun- while the peace of others is disturbed.
The research into the reduction of noise from motorcycles, which has been performed to date under contract to the Federal Environmental Agency (Umweltbundesamt), has mainly focused on two areas:
- ascertaining the possibilities for reducing noise levels through technical measures; - anti-tampering measures for motorcycles with limited speeds.
Through optimization of the load change silencer as weil as additional measures aimed at modifying or encapsulating the engine, it was possible to achieve reductions in noise emissions of up to 7 dB(A) (mofa/moped) and of up to 10 dB(A) (motorcycle) for series-produced vehicles.
Since entry into force of the "anti-tampering catalogue" for all motorcycles with limited speeds as of January 1, 1986 as weil as the use of improved methods of "on-the-spot" checking the number of vehicles in this category which are still particularly conspicuous in terms of noise is negligible.
Technical measures alone cannot be expected to solve the noise problem. In future work, emphasis will therefore also be placed on the investigation of the relevant sociological and psychological aspects of motorcycling.
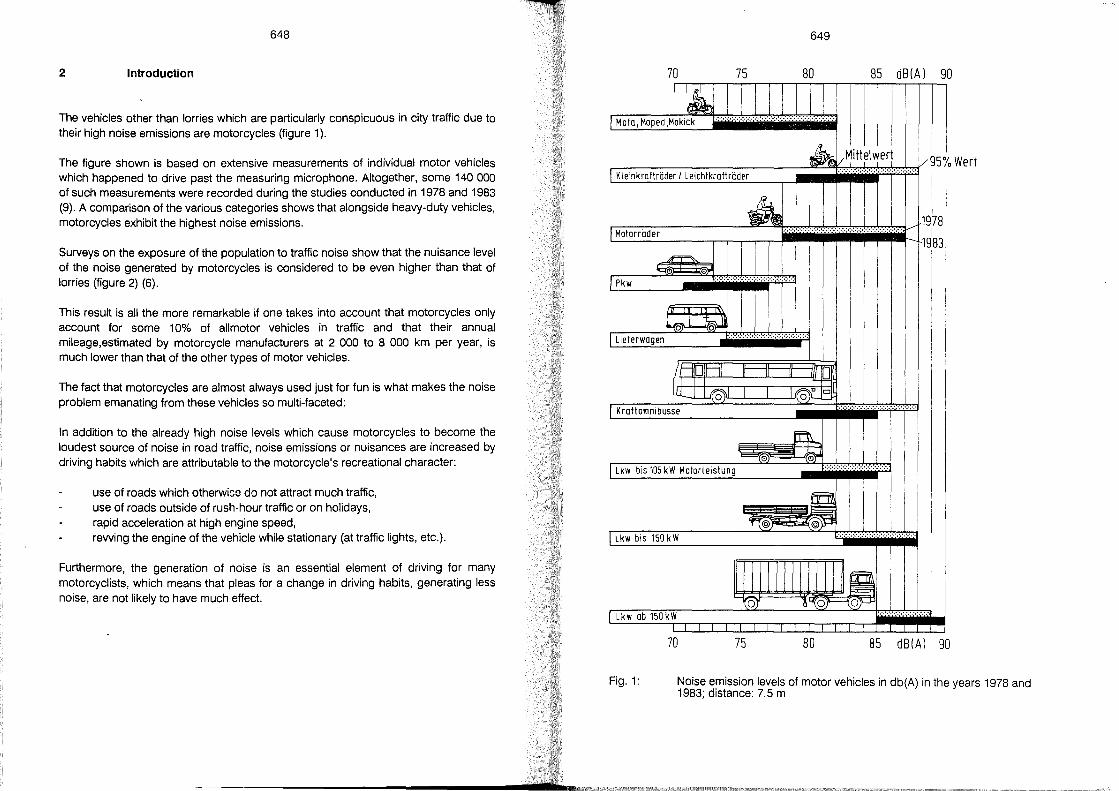
648
2 Introduction
The vehieles other than lorries whieh are partieularly eonspieuous in eity traffie due to their high noise emissions are motoreyeles (figure 1).
The figure shown is based on extensive measurements of individual motor vehieles whieh happened to drive past the measuring mierophone. Altogether, some 140000 of sueh measurements were reeorded during the studies eondueted in 1978 and 1983 (9). A eomparison of the various eategories shows that alongside heavy-duty vehicles, motoreyeles exhibit the highest noise emissions.
Surveys on the exposure of the population to traffie noise show that the nuisanee level of the noise generated by motoreyeles is eonsidered to be even higher than that of lorries (figure 2) (6).
This result is ali the more remarkable if one takes into aeeount that motoreyeles only aeeount for some 10% of alimotor vehicles in traffie and that their annual mileage,estimated by motoreyele manufaeturers at 2 000 to 8 000 km per year, is mueh lower than that of the other types of motor vehicles.
The faet that motoreyeles are almost always used just for fun is what makes the noise problem emanating from these vehieles so multi-faeeted:
In addition to the already high noise levels whieh eause motoreyeles to beeome the loudest souree of noise in road traffie, noise emissions or nuisanees are inereased by driving habits whieh are attributable to the motoreycle's reereational eharaeter:
use of roads whieh otherwise do not attraet mueh traffie, use of roads outside of rush-hour traffie or on holidays, rapid aeeeieration at high engine speed, rewing the engine of the vehiele while stationary (at traffie lights, ete.).
Furthermore, the generation of noise is an essential element of driving for many motoreyelists, whieh means that pleas for a ehange in driving habits, generating less noise, are not likely to have mueh effeet.
649
70 75 80 85 dB(A) 90
II~
I Mofa I Moped ,Mokick .. :
A Vi [/95"10 Wert I Kleinkrafträder I Leic" IK,uft. uder
A f19 78 I Motorräder rl~18; ~
I Pkw
1"", L .k-Jl I Lieferwagen :
a 11UIr 11 11 1fLQ~ UJ.~ ~
I Kraftomnibusse ..
~ I Lkw bis 105 kW Motorleistung ..
f:JEjj I~
~(ö))P
I I Lkw bis_150 kW
..
11 111I II~ (0) ~ ,uj" ))\...J.l
I Lkw ab 150 kW
70 75 80 85 dB(A) 90
Fig.1: Noise emission levels of motor vehieles in db(A) in the years 1978 and 1983; distanee: 7.5 m

650
very loud
.. ~------ matorcycle/moped
considerobly loud ~ truck ~ possenger cor
Gverage loud .... bus
not very loud
not loud
Fig.2: Assessment of intensity of sound form different kinds of vehicles
3 Noise Reduction Using Technical Measures
3.1 Motorcycles
The greatest potential for reducing noise from motorcycles is to be found in load change noises (intake and exhaust noise). In many cases "simple means", such as merely improving intake and exhaust silencers, can bring about significant reductions in driving noise.
Tests carried out for the Federal Environmental Agency using various motorcycles manufactured outside Germany showed that this modification in conjunction with higher gearing can produce reductions of between 3 and 7 dB(A) depending on the particular model. The aim of the higher gearing was merely to compensate for the improved tractive power (figure 3) brought about by the modification to the silencers and not to change operating modes in the type approval procedure.
J;
I i!'
(I GO L kW
651
Another simple method of reducing noise was identified. By using sound-proofing cowlings (modified standard all-round cowlings) it was possible to achieve reductions in noise levels of between 6 and 10 dB(A) depending on the model (1).
/' 60 --,-----r--, I1 kW
'CI 60
kW
~ 50 -- .----~ .-',,-+----1 '- 50-~
Laverda --original
i / \\ ~ -----modifled
40
30
70
'0
0
-----
80 n " \. Nm , \ .---'\--- ----. 60 cu
~
o --~ .----" -~ -- 40 -
Ducati .. - ==~~Wir,a~nl - 70
--.-.- m odil i ed 11
~
= o
o -~ ---- 40 -
Moto Gu~zi --originol - 20 ----- manillen
80 'CI Nm
10 1--,1---+--1
1----t---120
7(JOO f--~--+---I---~o
<1000 6000 min-1 10000
englne speed c:)
f----+---I---+------4 0 2000 4000 6000 min- 1 10000
f----+---I---+---+ 0 2000 4000 6000 min-1 10000
engl ne speed c:) englne speed c:)
Fig.3: Power and torque curves of original and modified state
The effect of improved engine acoustics has been investigated under contract to the Federal Environmental Agency in conjunction with a modified intake and exhaust silencing system, using a a BMW R 65 motorcycle (3). The aim of their research project was to reduce pass-by noise by 7 dB(A), as determined using the current method of measurement for type approval. The modifications were not to be detrimental to performance, and the appearance of the vehicle was to remain unchanged if at all possible.
With the obligation of retaining the basic design and as many standard parts as possible, displacement was raised from 650 cc to 800 cc while maximum engine output was retained and the engine was modified under aspects of engine acoustics, bearing in mind the feasibility in se ries production [figure 4].
All the acoustic modifications to the engine together resulted in a reduction in engine noise of between 5 and 8 dB(A) compared with the standard engine, depending on engine speed.
To damp intake and exhaust noise, modifications were above all necessary to the exhaust system, in the following areas:
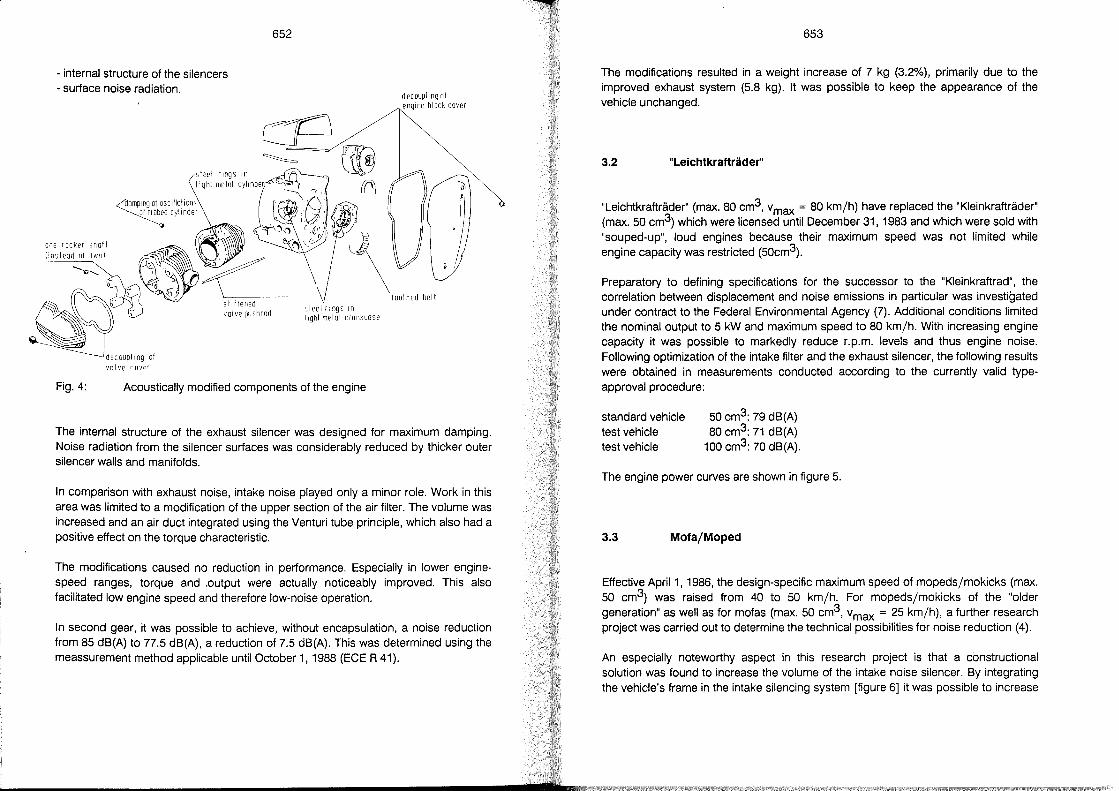
652
- internal structure of the silencers - surface noise radiation.
'\ steel rings In
lighl metol cronkcose
val ve cO'/er
Fig.4: Acoustically modified components of the engine
d ecoupl i ng 01 englne block cover
Ol
J , ,
loolhed bell
The internal structure of the exhaust silencer was designed for maximum damping. Noise radiation from the silencer surfaces was considerably reduced by thicker outer silencer walls and manifolds.
In comparison with exhaust noise, intake noise played only a minor role. Work in this area was limited to a modification of the upper section of the air filter. The volume was increased and an air duct integrated using the Venturi tube principle, which also had a positive effect on the torque characteristic.
The modifications caused no reduction in performance. Especially in lower enginespeed ranges, torque and .output were actually noticeably improved. This also facilitated low engine speed and therefore low-noise operation.
In second gear, it was possible to achieve, without encapsulation, a noise reduction from 85 dB(A) to 77.5 dB(A), a reduction of 7.5 dB(A). This was determined using the meassurement method applicable until October 1, 1988 (ECE R 41).
653
The modifications resulted in a weight increase of 7 kg (3.2%), primarily due to the improved exhaust system (5.8 kg). It was possible to keep the appearance of the vehicle unchanged.
3.2 "Leichtkrafträder"
"Leichtkrafträder" (max. 80 cm3, vmax = 80 km/h) have replaced the "Kleinkrafträder" (max. 50 cm3) which were licensed until December 31, 1983 and which were sold with "souped-up", loud engines because their maximum speed was not limited while engine capacity was restricted (50cm3).
Preparatory to defining specifications for the successor to the "Kleinkraftrad", the correlation between displacement and noise emissions in particular was investigated under contract to the Federal Environmental Agency (7). Additional conditions limited the nominal output to 5 kW and maximum speed to 80 km/ho With increasing engine capacity it was possible to markedly reduce r.p.m. levels and thus engine noise. Following optimization of the intake filter and the exhaust silencer, the following results were obtained in measurements conducted according to the currently valid typeapproval procedure:
standard vehicle 50 cm3: 79 dB(A) test vehicle 80 cm3: 71 dB(A) test vehicle 100 cm3: 70 dB(A).
The engine power curves are shown in figure 5.
3.3 Mofa/Moped
Effective April 1, 1986, the design-specific maximum speed of mopeds/mokicks (max. 50 cm3) was raised from 40 to 50 km/ho For mopeds/mokicks of the "older generation" as weil as for mofas (max. 50 cm3, vmax = 25 km/h), a further research project was carried out to determine the technical possibilities for noise reduction (4).
An especially noteworthy aspect in this research project is that a constructional solution was found to increase the volume of the intake noise silencer. By integrating the vehicle's frame in the intake silencing system [figure 6] it was possible to increase
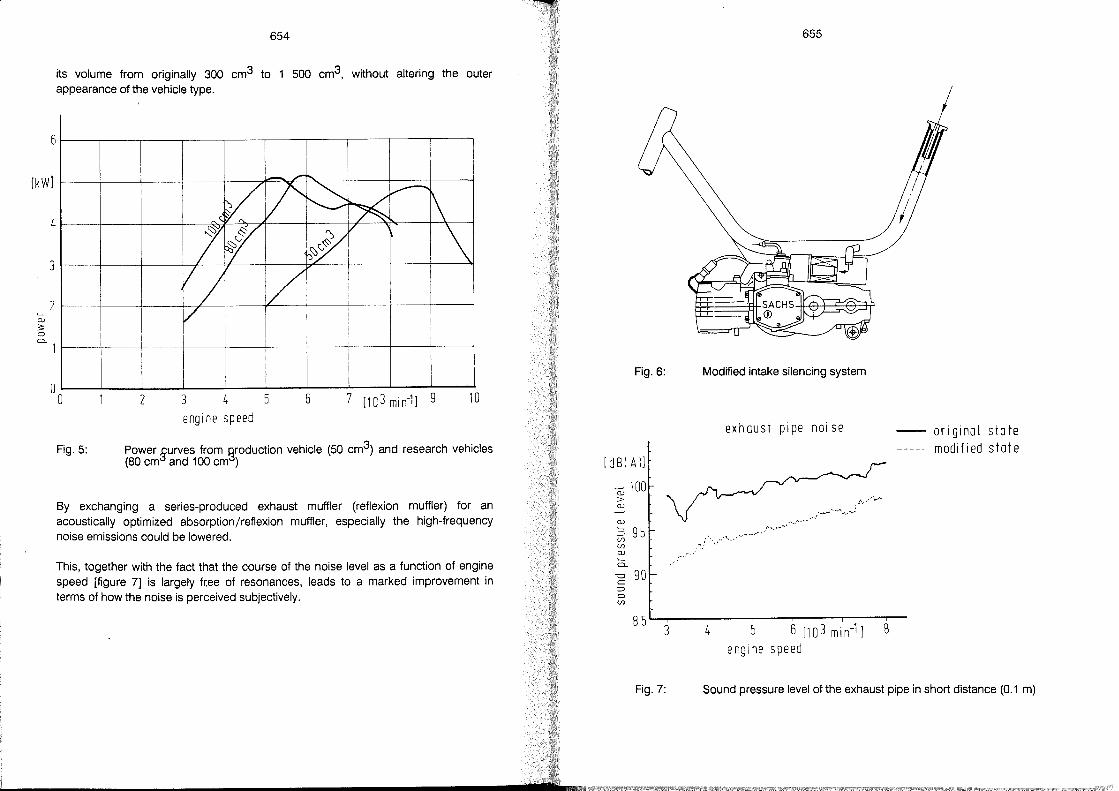
6
[kwl
L
W 3: Cl CL
4
3
2
o
654
its volume from originally 300 cm3 to 1 500 cm3, without alte ring the outer appearance of the vehicle type.
o
Fig.5:
I - /'" r-....
~VV' ~ .,---
\ l~ I~ ~~"~ i \ IA 1/1 I
I
I ! •
! I I
I
V I
,
i I I
2 3 4 5 6 10
engine speed
Power gurves from ~roduction vehicle (50 cm3) and research vehicles (80 cm and 100 cm )
By exchanging a series-produced exhaust muffler (reflexion muffler) for an acoustically optimized absorption/reflexion muffler, especially the high-frequency noise emissions could be lowered.
This, together with the fact that the course of the noise level as a function of engine speed [figure 7] is largely fr.ee of resonances, leads to a marked improvement in terms of how the noise is perceived subjectively.
Fig.6:
[ dB( Al)
ClJ 100
> ClJ
ClJ L- 95 :::J Ul Ul ClJ L-0..
,f "0 90 c :::J
l Cl (J)
0i: 8 5 :;i 3 ;r:: J>
Fig.7:
,-,' ,~ .'
655
Modified intake silencing system
exhaust pipe noi se
r- ...... ,.-'
," ",' '''l, •• ' ",,"'/'
:;:
".'''.'
............ -............. , ...... ; ,','
/',.,'")..,....
4 5 6 [103 min-1) 8 engine speed
original state modified state
Sound pressure level of the exhaust pipe in short distance (0.1 m)
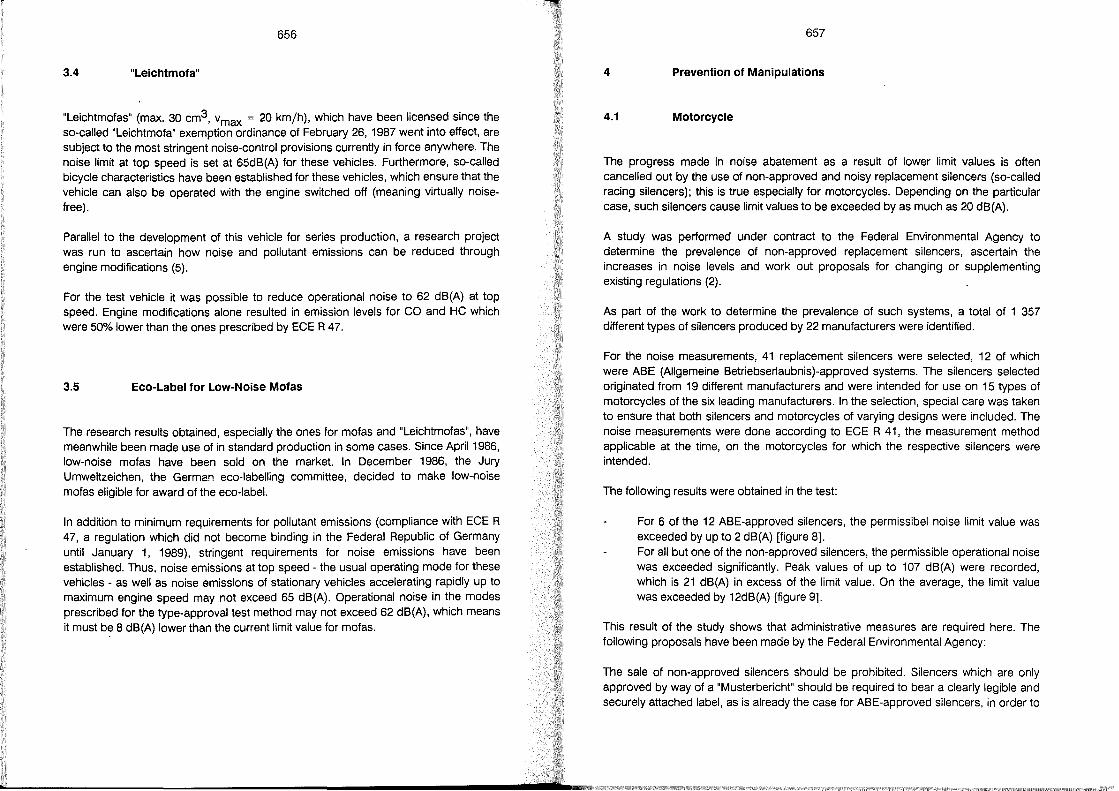
656
3.4 "Leichtmofa"
"Leichtmofas" (max. 30 cm3, vmax = 20 km/h), which have been licensed since the so-called "Leichtmofa" exemption ordinance of February 26, 1987 went into effect, are subject to the most stringent noise-control provisions currently in force anywhere. The noise limit at top speed is set at 65dB(A) for these vehicles. Furthermore, so-ca lied bicycle characteristics have been established for these vehicles, which ensure that the vehicle can also be operated with the engine switched off (meaning virtually noisefree).
Parallel to the development of this vehicle for series production, a research project was run to ascertain how noise and pollutant emissions can be reduced through engine modifications (5).
For the test vehicle it was possible to reduce operational noise to 62 dB(A) at top speed. Engine modifications alone resulted in emission levels for CO and HC which were 50% lower than the on es prescribed by ECE R 47.
3.5 Eco-Label for Low-Noise Mofas
The research results obtained, especially the on es for mofas and "Leichtmofas", have meanwhile been made use of in standard production in some cases. Since April 1986, low-noise mofas have been sold on the market. In December 1986, the Jury Umweltzeichen, the German eco-Iabelling committee, decided to make low-noise mofas eligible for award of the eco-Iabel.
In addition to minimum requirements for pollutant emissions (compliance with ECE R 47, a regulation which did not become binding in the Federal Republic of Germany until January 1, 1989), stringent requirements for noise emissions have been established. Thus, noise emissions at top speed - the usual operating mode for these vehicles - as weil as noise emissions of stationary vehicles accelerating rapidly up to maximum engine speed may not exceed 65 dB(A). Operational noise in the modes prescribed for the type-approval test method may not exceed 62 dB(A), which means it must be 8 dB(A) lower than the current limit value for mofas.
657
4 Prevention of Manipulations
4.1 Motorcycle
The progress made in noise abatement as a result of lower limit values is often cancelled out by the use of non-approved and noisy replacement silencers (so-called racing silencers); this is true especially tor motorcycles. Depending on the particular case, such silencers cause limit values to be exceeded by as much as 20 dB(A).
A study was performed under contract to the Federal Environmental Agency to determine the prevalence of non-approved replacement silencers, ascertain the increases in noise levels and work out proposals for changing or supplementing existing regulations (2).
As part of the work to determine the prevalence of such systems, a total of 1 357 different types of silencers produced by 22 manufacturers were identified.
For the noise measurements, 41 replacement silencers were selected, 12 of which were ABE (Allgemeine Betriebserlaubnis)-approved systems. The silencers selected originated from 19 different manufacturers and were intended for use on 15 types of motorcycles of the six leading manufacturers. In the selection, special care was taken to ensure that both silencers and motorcycles of varying designs were included. The noise measurements were done according to ECE R 41, the measurement method applicable at the time, on the motorcycles for which the respective silencers were intended.
The following results were obtained in the test:
For 6 of the 12 ABE-approved silencers, the permissibel noise limit value was exceeded by up to 2 dB(A) [figure 8]. For all but one of the non-approved silencers, the permissible operational noise was exceeded significantly. Peak values of up to 107 dB(A) were recorded, which is 21 dB(A) in excess of the limit value. On the average, the limit value was exceeded by 12dB(A) [figure 9].
This result of the study shows that administrative measures are required here. The following proposals have been made by the Federal Environmental Agency:
The sale of non-approved silencers should be prohibited. Silencers which are only approved by way of a "Musterbericht" should be required to be ar a clearly legible and securely attached label, as is already the case tor ABE-approved silencers, in order to
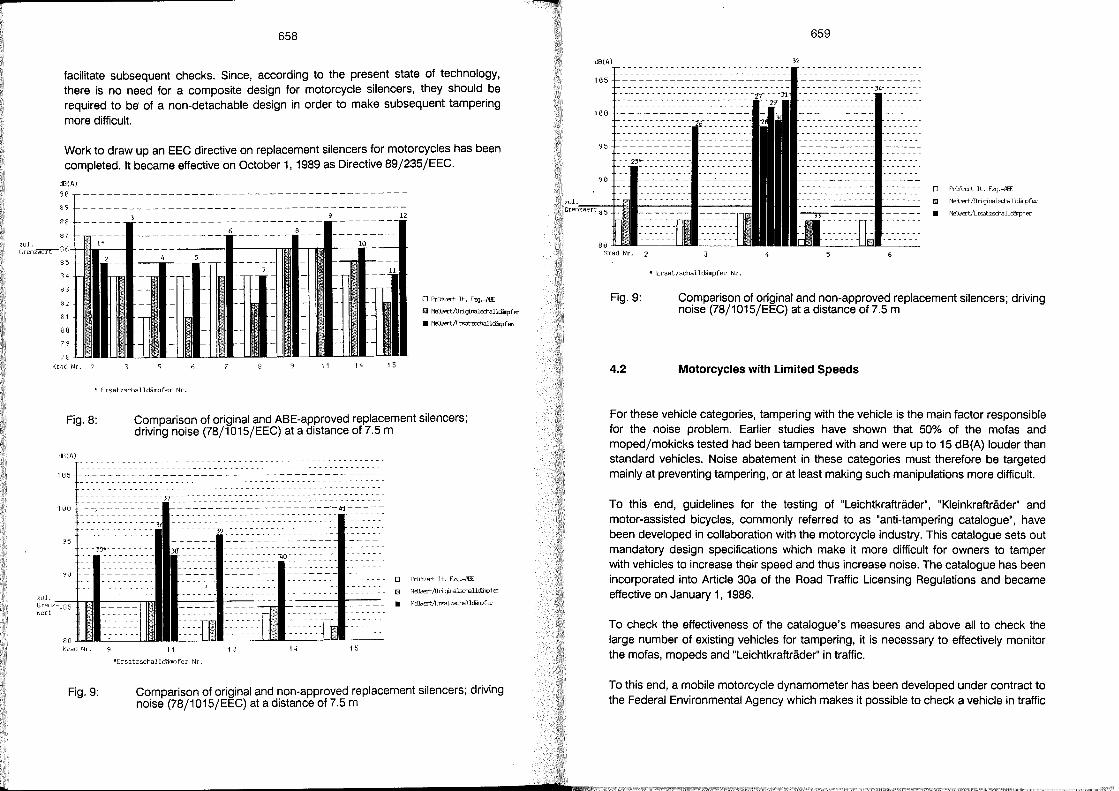
658
facilitate subsequent checks. Since, according to the present state of technology, there is no need for a composite design for motorcycle silencers, they should be required to be of a non-detachable design in order to make subsequent tampering more difficult.
Work to draw up an EEC directive on replacement silencers for motorcycles has been completed. It became effective on October 1,1989 as Directive 89/235/EEC.
dß(A)
9(1
12 88
wl. .-, Grenzwerr-.;;· ,
Krnc' Nr. 11 14
,. Ersatzschalldämp fer Nr.
15
o Prüfiuert It. Fzg.-Pff
fJ l'1EßlIa:t!Orig:iralochallcärpfer
• M€fuert;!:rsatzschal1cmpf..,
Fig.8: Comparison of original and ABE-approved replacement silencers; driving noise (78/1015/EEC) at a distance of 7.5 m
dl3(A)
lf1~ -- ----~------------------------------
100 --;-------- ---------------------~-----
'?5
'?O o Prüf\llff't It. Fzg.-JlBE
m f'ltßt!ert/Origina1schallcärpfer ?ul .. _-+.",...1-__ ,....,., Grenz-. - c; • I'1E1'1uert;trsatzs:t-allcfupfer
wert
::: ü JI-JI..!_-'-_--'...ll.l Krarl Nr.
Fig.9:
11 13 14 15
HErsatzschalldfimnfer Nr.
Comparison of original and non-approved re placement silencers; driving noise (78/1015/EEC) at a distance of 7.5 m
659
d8(A) 32
105 - - - - - - - - - - - - - -)4- - - - - - - -
10(1
95
o pfÜfulert It. Fzq.-PBE
In f1ffiL1ert/Originals:::halldirpfer
• Me'ltIert/EI'S3.tzschalldffipfer
Krad Nr. 2
* Ersatzschalldämpfer Nr.
Fig.9: Comparison of original and non-approved replacement silencers' driving noise (78/1015/EEC) at a distance of 7.5 m '
4.2 Motorcycles with limited Speeds
For these vehicle categories, tampering with the vehicle is the main factor responsible for the noise problem. Earlier studies have shown that 50% of the mofas and moped/mokicks tested had been tampered with and were up to 15 dB(A) louder than standard vehicles. Noise abatement in these categories must therefore be targeted mainly at preventing tampering, or at least making such manipulations more difficult.
To this end, guidelines for the testing of "Leichtkrafträder", "Kleinkrafträder" and motor-assisted bicycles, commonly referred to as "anti-tampering catalogue", have been developed in collaboration with the motorcycle industry. This catalogue sets out mandatory design specifications which make it more difficult for owners to tamper with vehicles to increase their speed and thus increase noise. The catalogue has been incorporated into Article 30a of the Road Traffic Licensing Regulations and became effective on January 1, 1986.
To check the effectiveness of the catalogue's measures and above all to check the large number of existing vehicles for tampering, it is necessary to effectively monitor the mofas, mopeds and "Leichtkrafträder" in traffic.
To this end, a mobile motorcycle dynamometer has been developed under contract to the Federal Environmental Agency which makes it possible to check a vehicle in traffic
660
under the same conditions as exist in type approval. An effective instrument has thereby been provided to the Federal States, which are responsible for supervision, to curb noise- and safety-relevant tampering (8).
5 Conclusions
Technical measures ~ cannot be expected to solve the noise problem; nevertheless, further improvements can be made in this area - also in the short term.
The following activities aimed at a further reduction of noise emissions from motorcycles are planned by the Federal Environmental Agency:
Measures to be implemented in the short term:
lowering of the limit values for noise emissions from mofas/mopeds, as the current limit values are no longer keeping with the state of the art; incorporation of the vehicle category "Leichtmofa" in the Road Traffic Licensing Regulations (at present, they are still licensed on the basis of the "exemption ordinance").
Measures to be implemented in the medium term:
further development of the sound measurement methods for motorcycles with the aim of attaining operating modes reflecting the driving behaviour in traffic and obtaining measurement data on high-performance vehicles; development of a concept for improved monitoring of vehicle components affecting noise emissions (notably re placement silencers); monitoring the effectiveness of the EEC directive on replacement silencers; development of a concept for improved monitoring of driving behaviour (particularly of maximum permissible speeds).
Accompanying measures:
compilation and evaluation of available data on psychosocial determinants of and factors influencing the driving, use and purchasing behaviour of "the motorcyclist"; development and testing of psychosocial strategies designed to bring about a change in the motorcyclists'driving habits.
6
1)
2)
3)
4)
5)
6)
7)
8)
9)
661
Reference list
Bessing, P.; Pluschke, M.: Ermittlung von technischen Möglichkeiten zur Geräuschminderung an Motorrädern. - Umweltbundesamt, 1984 - (FE-Bericht; 10505113/05)
Betzl, W.: Erarbeitung von administrativen Maßnahmen zur Verhinderung der Verwendung nicht zugelassener Ersatzschalldämpfer für Zweiräder. -Umweltbundesamt, 1987. - (FE-Bericht; 10505209)
Herrmann, R.; Gregotsch, K.; Groß, G.: Entwicklung eines lärmarmen Motorrades. - Umweltbundesamt, 1986. - (FEBericht; 10505 113/06)
Kurz, W.: Entwicklung und Demonstration lärmarmer und manipulationssicherer Fahrzeuge der Mofa- und der Moped/Mokick-Klasse. - Umweltbundesamt, 1985. - (FE-Bericht; 10505113/03)
Kurz, W.; Lück, K.: Entwicklung und Erprobung eines lärmarmen alternativen Antriebs (Radnabenmotor) für Fahrzeuge der Mofa-Klasse. - Umweltbundesamt, 1987. -(FE-Bericht; 10505 132/01)
Lärmbekämpfung '88 : Materialien zum vierten Immissionsschutzbericht der Bundesregierung. - Berlin, 1989
Menzel, K.-H.: Maßnahmen zur Absenkung des Geräusches an Krafträdern und Vermeidung der subjektiven Lästigkeit. - Umweltbundesamt, 1980. - (FE-Bericht 105 05107)
Rompe, K.; Kurz, W.; Wallrich, M.: Praktische Erprobung eines mobilen Zweiradprüfstandes. - Umweltbundesamt, 1986. - (FE-Bericht; 10502415/02)
Steven, H.: Ermittlung der Geräuschemissionsänderung von KfZ im Fünfjahreszeitraum. -Umweltbundesamt, 1985. - (FE-Bericht; 10505128)
~ ~~ Z'< ~
Noise Generated by Motorcycles
Heinrich Steven
FIGE GmbH, Forschungsinstitut Geräusche und
Erschütterungen, Herzogenrath
Germany
I _____________________________________ 'I" __ %,/"'~"","F"#'f~"'(~"'q'"~"A7,7P'1ii7;ypJ?P'"
I _____________________________________ II1II .... _,111""
665
1 Abstract
Although quantitatively-speaking motorcycles make up only a small proportion of total road traffic, they invariably rank first in opinion polis on noise nuisance, together with lorries. One reason for this is that they are used primarily at noise-sensitive times and in noise-sensitive places. Like lorries, therefore, motorcycles are of exceptional significance for noise abatement.
In recent years, the Umweltbundesamt (Federal Office of the Environment) has had detailed research carried out into motorcycle noise emissions as part of a set of complementary research projects concerning state-of-the-art technology and further development of the noise measuring procedure. In addition, riding states, operating states and noise generation und er real conditions have been registered and analyzed. The results reveal that, in road traffic, motorcycles are operated at average levels some 6 to 9 dB(A) louder than those for cars, depending on the traffic situation. There are three principal reasons for this: Firstly, less effective inlet and exhaust silencers and the absence of bodywork produce comparably higher engine and transmission noises. Secondly, engine operating speeds are substantially higher than those for cars, even given the same riding/driving behaviour. Thirdly, motorcycle engines are operated much more frequently at high engine speeds than are car engines. Noise abatement measures must take these relationships into consideration.
In line with current practice, noise values determined for motorcycles according to the homologation test procedure average some 8 dB(A) more than those for cars. The measuring method gene rally produces realistic results. The only deficiency is that, by using "Iong" gear ratios and poor throttle response, favourable noise levels can be achieved under unrealistic operating conditions. This problem can be eliminated by specifying minimum accelerations.
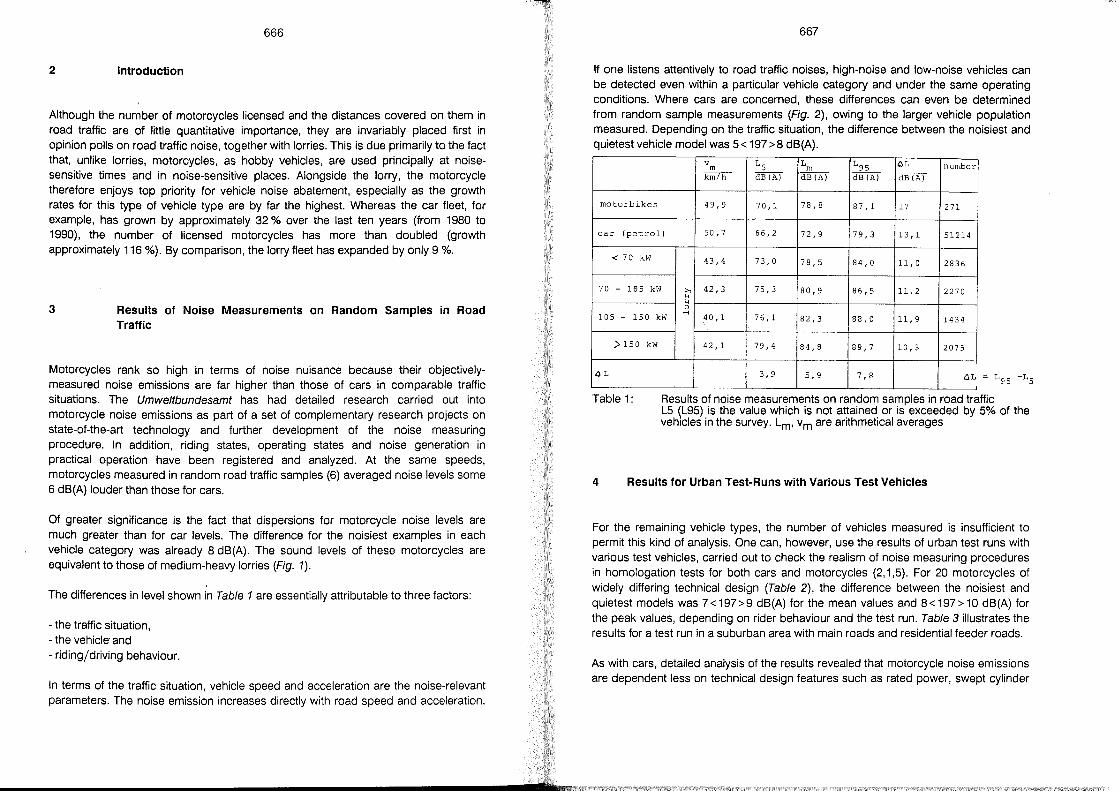
666
2 Introduetion
Although the number of motorcycles licensed and the distances covered on them in road traffic are of little quantitative importance, they are invariably placed first in opinion polis on road traffic noise, together with lorries. This is due primarily to the fact that, unlike lorries, motorcycles, as hobby vehicles, are used principally at noisesensitive times and in noise-sensitive places. Alongside the lorry, the motorcycle therefore enjoys top priority for vehicle noise abatement, especially as the growth rates for this type of vehicle type are by far the highest. Whereas the car fleet, for example, has grown by approximately 32 % over the last ten years (from 1980 to 1990), the number of licensed motorcycles has more than doubled (growth approximately 116 %). By comparison, the lorry fleet has expanded by only 9 %.
3 Results of Noise Measurements on Random Sampies in Road Traffie
Motorcycles rank so high in terms of noise nuisance because their objectivelymeasured noise emissions are far higher than those of cars in comparable traffic situations. The Umweltbundesamt has had detailed research carried out into motorcycle noise emissions as part of a set of complementary research projects on state-of-the-art technology and further development of the noise measuring procedure. In addition, riding states, operating states and noise generation in practical operation have been registered and analyzed. At the same speeds, motorcycles measured in random road traffic sam pies (6) averaged noise levels some 6 dB(A) louder than those for cars.
Of greater significance is the fact that dispersions for motorcycle noise levels are much greater than for car levels. The difference for the noisiest examples in each vehicle category was already 8 dB(A). The sound levels of these motorcycles are equivalent to those of medium-heavy lorries (Fig. 1).
The differences in level shown in Table 1 are essentially attributable to three factors:
- the traffic situation, - the vehicler and - riding/driving behaviour.
In terms of the traffic situation, vehicle speed and acceleration are the noise-relevant parameters. The noise emission increases directly with road speed and acceleration.
667
If one listens attentively to road traffic noises, high-noise and low-noise vehicles can be detected even within a particular vehicle category and under the same operating conditions. Where cars are concerned, these differences can even be determined from random sampie measurements (Fig. 2), owing to the larger vehicle population measured. Depending on the traffic situation, the difference between the noisiest and quietest vehicle model was 5< 197>8 dB(A).
v rn L 5 L L 95 öL nurnber rn krn/h dB(A) dB(A) dB(A) dB(A)
rnotorbikes 49,9 70,1 78,8 87,1 17 271
car (petrol) 50,7 66,2 72,9 79,3 13,1 51214
< 70 kW 43,4 73,0 78,5 84,0 11, ° 2836
70 - 165 kW >.
'"' 42,3 75,3 80,9 86,5 11,2 2270
'"' 0
105 - 150 kW .-<
40,1 76,1 82,3 88,0 11,9 1434
> 150 kW 42,1 79,4 84,8 89,7 10,3 2075
ClL 3,9 5,9 7,8 4L
Table 1: Results of noise measurements on random sam pies in road traffic L5 (L95) is the value which is not attained or is exceeded by 5% of the vehicles in the survey. Lm, vm are arithmetical averages
4 Results for Urban Test-Runs with Various Test Vehieles
For the remaining vehicle types, the number of vehicles measured is insufficient to permit this kind of analysis. One can, however, use the results of urban test runs with various test vehicles, carried out to check the realism of noise measuring procedures in homologation tests for both cars and motorcycles (2,1,5). For 20 motorcycles of widely differing technical design (Table 2), the difference between the noisiest and quietest models was 7<197>9 dB(A) for the mean values and 8<197>10 dB(A) for the peak values, depending on rider behaviour and the test run. Table 3 iIIustrates the results for a test run in a suburban area with main roads and residential feeder roads.
As with cars, detailed analysis of the results revealed that motorcycle noise emissions are dependent less on technical design features such as rated power, swept cylinder
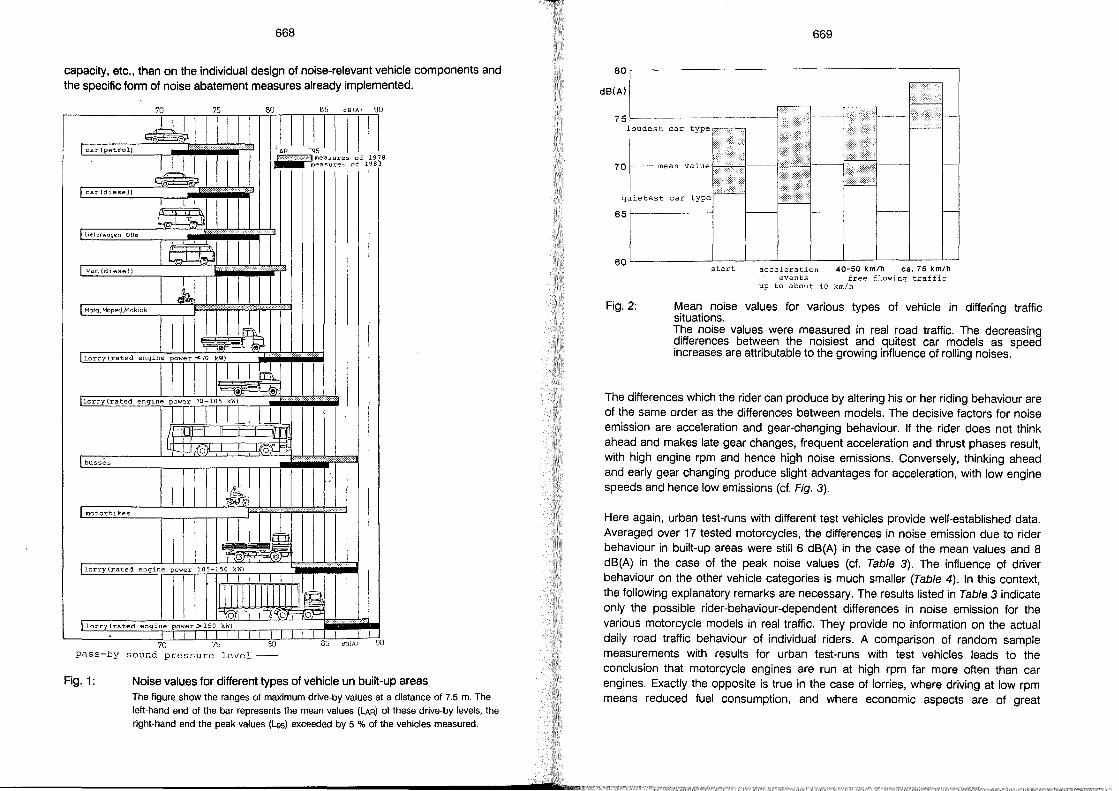
668
capaeity, ete., than on the individual design of noise-relevant vehiele eomponents and the speeifie form of noise abatement measures al ready implemented.
70
, I car (petrol)
I car (diesel)
I .1 I ~r,... I
I Lie/erwagen Olto
I van (diesel)
I~ I Mofa,Moped,Mokick
75
11
Ba B5 d81AI 90
JJ IJIIIIII !.;.·.":,.:,,,·,.:.::·,.:.:jmeasures of 1978
rneasure", of 1983
0~~ lorry (rated engine power <70 kW)
0~ lorry (rated engine power 70 105 kWj
~: OIHI 0111
l..l,(O'\J I«O)~ I busses
IJ I
..
~ C- I>!.
I IJn I motorbikes
~
llorry(rated engine power 105-150 kW)
lorry (rated engine power> 150 kWj
pass-by sound pressure level---
Fig.1: Noise values for different types of vehiele un built-up areas The ligure show the ranges 01 maximum drive-by values at a distance 01 7.5 m~ The left-hand end 01 the bar represents the mean values (LAR) 01 these drive-by levels, the
right-hand end the peak values (Les) exceeded by 5 % 01 the vehicles measured~
--------------------------------------------______________________ ......... ss~ .. _J
669
80~----------------------------------------------,
dB(A)
75 loudest car type
quietest car type
65 --------
60L-________ ~L_ __ ~ __ _L __ ~ ____ ~ __ _L __ ~~ __ ~~
Fig.2:
start acceleration 40-50 km/h ca. 75 km/h events free flowing traffic
up to about 40 km/h
Mean noise values for various types of vehiele in differing traffie situations. The noise values were measured in real road traffie. The deereasing differenees between the noisiest and quitest ear models as speed inereases are attributable to the growing influenee of rolling noises.
The differenees whieh the rider ean produee by altering his or her riding behaviour are of the same order as the differenees between models. The deeisive faetors for noise emission are aeeeieration and gear-ehanging behaviour. If the rider does not think ahead and makes late gear ehanges, frequent aeeeieration and thrust phases result, with high engine rpm and henee high noise emissions. Conversely, thinking ahead and early gear ehanging produee slight advantages for aeeeieration, with low engine speeds and henee low emissions (cf. Fig. 3).
Here again, urban test-runs with different test vehieles provide well-established data. Averaged over 17 tested motoreyeles, the differenees in noise emission due to rider behaviour in built-up areas were still 6 dB(A) in the ease of the mean values and 8 dB(A) in the ease of the peak noise values (ef. Table 3). The influenee of driver behaviour on the other vehiele eategories is mueh smaller (Table 4). In this eontext, the following explanatory remarks are neeessary. The results listed in Table 3 indieate only the possible rider-behaviour-dependent differenees in noise emission for the various motoreyele models in real traffie. They provide no information on the aetual daily road traffie behaviour of individual riders. A eomparison of random sampie measurements with results for urban test-runs with test vehieles leads to the eonclusion that motoreyele engines are run at high rpm far more often than ear engines. Exaetly the opposite is true in the ease of lorries, where driving at low rpm means redueed fuel eonsumption, and where eeonomic aspeets are of great
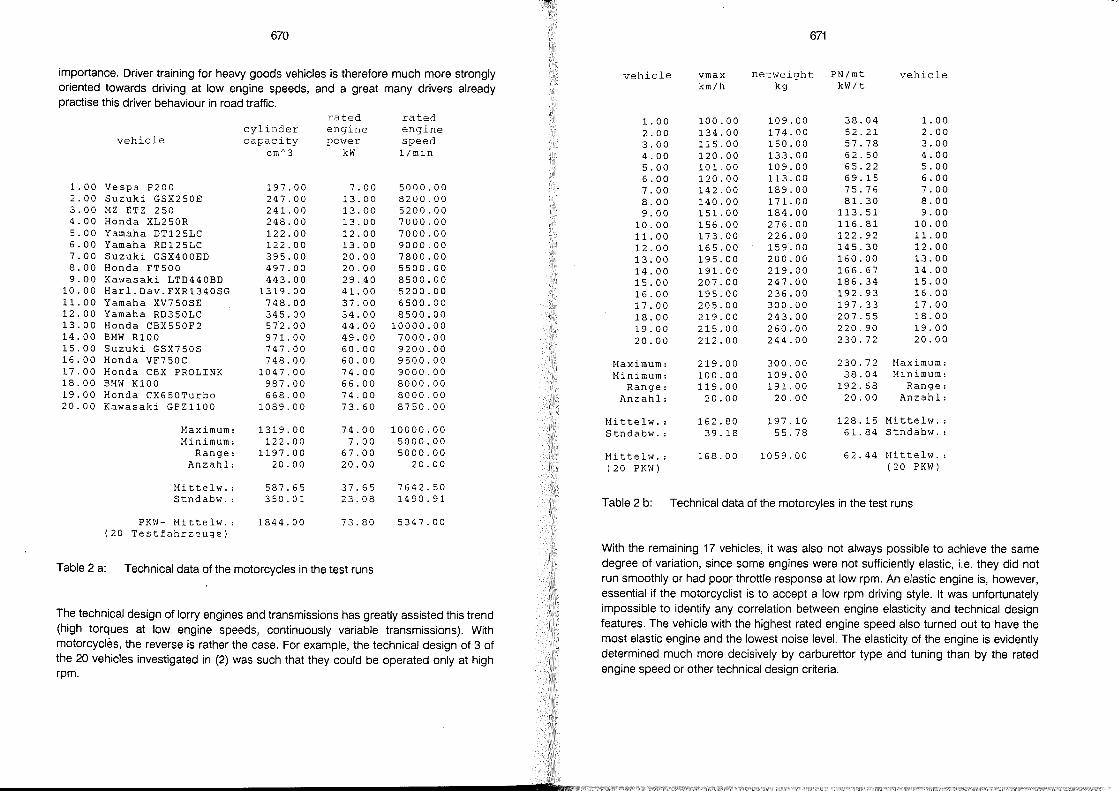
670
importance. Driver training for heavy goods vehicles is therefore much more strongly oriented towards driving at low engine speeds, and a great many drivers already practise this driver behaviour in road traffic.
ra ted rated cylinder engine engine
vehicle capacity power speed cm~3 kW 1/min
1. 00 Vespa P200 197.00 7.00 5000.00 2.00 Suzuki GSX250E 247.00 13.00 8200.00 3.00 MZ ETZ 250 241.00 13.00 5200.00 4.00 Honda XL250R 248.00 13.00 7000.00 5.00 Yamaha DT125LC 122.00 12.00 7000.00 6.00 Yamaha RD125LC 122.00 13.00 9000.00 7.00 Suzuki GSX400ED 395.00 20.00 7800.00 8.00 Honda FT500 497.00 20.00 5500.00 9.00 Kawasaki LTD440BD 443.00 29.40 8500.00
10.00 Harl.Dav.FXR1340SG 1319.00 41.00 5200.00 11.00 Yamaha XV750SE 748.00 37.00 6500.00 12.00 Yamaha RD350LC 345.00 34.00 8500.00 13.00 Honda CBX550F2 572.00 44.00 10000.00 14.00 BMW R100 971. 00 49.00 7000.00 15.00 Suzuki GSX750S 747.00 60.00 9200.00 16.00 Honda VF750C 748.00 60.00 9500.00 17.00 Honda CBX PROLINK 1047.00 74.00 9000.00 18.00 BMW K100 987.00 66.00 8000.00 19.00 Honda CX650Turbo 668.00 74.00 8000.00 20.00 Kawasaki GPZ1100 1089.00 73.60 8750.00
Maximum: 1319.00 74.00 10000.00 Minimum: 122.00 7.00 5000.00
Range: 1197.00 67.00 5000.00 Anzahl: 20.00 20.00 20.00
Mittelw. : 587.65 37.65 7642.50 Stndabw. : 350.01 23.08 1490.91
PK~l- Mittelw. : 1844.00 73.80 5347.00 (20 Testfahrzeuge)
Table 2 a: Technical data of the motorcycles in the test runs
The technical design of lorry engines and transmissions has greatly assisted this trend (high torques at low engine speeds, continuously variable transmissions). With motorcycles, the reverse is rather the case. For example, the technical design of 3 of the 20 vehicles investigated in (2) was such that they could be operated only at high rpm.
d
671
vehicle vmax netweight PN/mt vehicle km/h kg kW/t
1. 00 100.00 109.00 38.04 1. 00 2.00 134.00 174.00 52.21 2.00 3.00 115.00 150.00 57.78 3.00 4.00 120.00 133.00 62.50 4.00 5.00 101.00 109.00 65.22 5.00 6.00 120.00 113.00 69.15 6.00 7.00 142.00 189.00 75.76 7.00 8.00 140.00 171.00 81.30 8.00 9.00 151.00 184.00 113.51 9.00
10.00 156.00 276.00 116.81 10.00 11. 00 173.00 226.00 122.92 11.00 12.00 165.00 159.00 145.30 12.00 13.00 195.00 200.00 160.00 13.00 14.00 191.00 219.00 166.67 14.00 15.00 207.00 247.00 186.34 15.00 16.00 195.00 236.00 192.93 16.00 17.00 205.00 300.00 197.33 17.00 18.00 219.00 243.00 207.55 18.00 19.00 215.00 260.00 220.90 19.00 20.00 212.00 244.00 230.72 20.00
Maximum: 219.00 300.00 230.72 Maximum: Minimum: 100.00 109.00 38.04 Minimum:
Range: 119.00 191. 00 192.68 Range: Anzahl: 20.00 20.00 20.00 Anzahl:
Mittelw. : 162.80 197.10 128.15 Mittelw. : Stndabw. : 39.18 55.78 61.84 Stndabw. :
MittellV. : 168.00 1059.00 62.44 Hittelw. : (20 PKW) (20 PKW)
Table 2 b: Technical data of the motorcyles in the test runs
With the remaining 17 vehicles, it was also not always possible to achieve the same degree of variation, since so me engines were not sufficiently elastic, i.e. they did not run smoothly or had poor throttle response at low rpm. An elastic engine is, however, essential if the motorcyclist is to accept a low rpm driving style. It was unfortunately impossible to identify any correlation between engine elasticity and technical design features. The vehicle with the highest rated engine speed also turned out to have the most elastic engine and the lowest noise level. The elasticity of the engine is evidently determined much more decisively by carburettor type and tuning than by the rated engine speed or other technical design criteria.
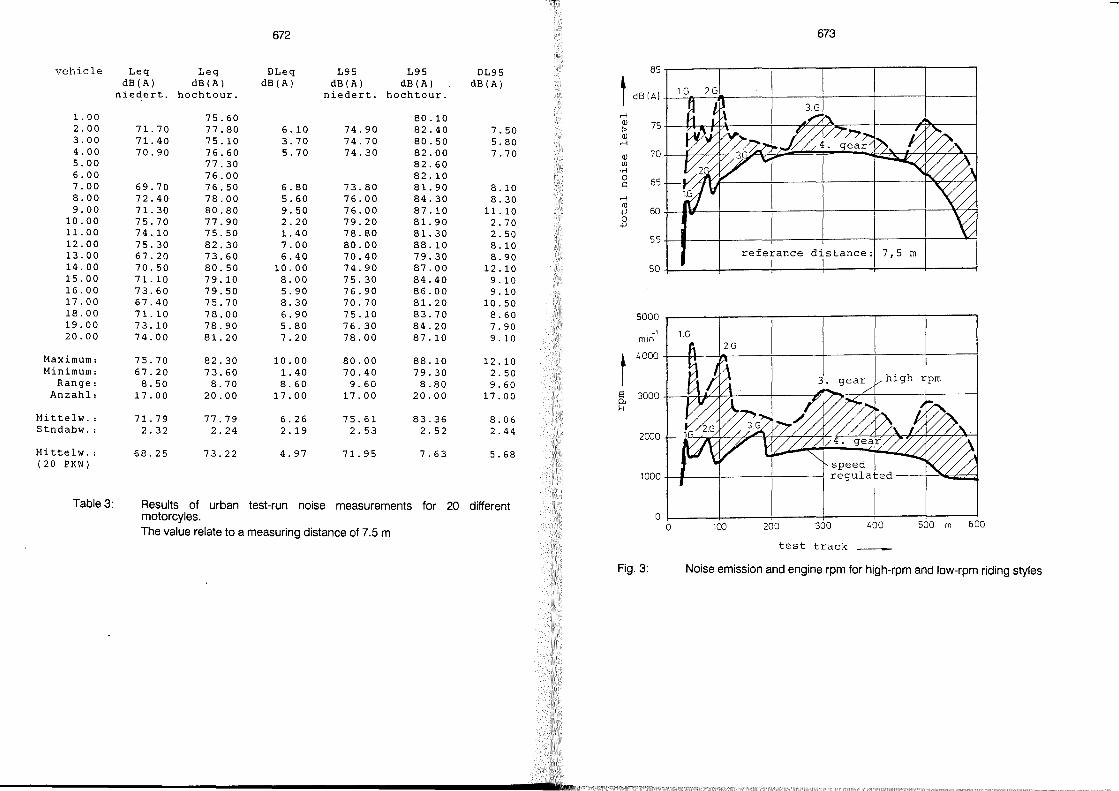
672 673
85 vehicle Leq Leq DLeq L95 L95 DL95 dB(A) dB(A) dB(A) dB(A) dB(A) dB(A) t niedert. hochtour. niedert. hochtour. dB (AI
1. 00 75.60 80.10 .-I Q)
2.00 71.70 77.80 6.10 74.90 82.40 7.50 :> 75 3.00 71. 40 75.10 3.70 74.70 80.50 5.80
Q) .-I
4.00 70.90 76.60 5.70 74.30 82.00 7.70 Q) 70 5.00 77.30 82.60 Ul
6.00 76.00 82.10 .,..j
0 65 7.00 69.70 76.50 6.80 73.80 81.90 8.10 ~
8.00 72.40 78.00 5.60 76.00 84.30 8.30 .-I
9.00 71.30 80.80 9.50 76.00 87.10 11.10 10
60 +-' 10.00 75.70 77.90 2.20 79.20 81.90 2.70 0
+-' 11. 00 74.10 75.50 1. 40 78.80 81.30 2.50 55 12.00 75.30 82.30 7.00 80.00 88.10 8.10 13.00 67.20 73.60 6.40 70.40 79.30 8.90 referance distance: 7,5 In
14.00 70.50 80.50 10.00 74.90 87.00 12.10 50 I 15.00 71.10 79.10 8.00 75.30 84.40 9.10 16.00 73.60 79.50 5.90 76.90 86.00 9.10 17.00 67.40 75.70 8.30 70.70 81.20 10.50 18.00 71.10 78.00 6.90 75.10 83.70 8.60 5000 19.00 73.10 78.90 5.80 76.30 84.20 7.90 20.00 -1 1.G 74.00 81.20 7.20 78.00 87.10 9.10 min
Maximum: 75.70 82.30 10.00 80.00 88.10 12.10
t 1.000
Minimum: 67.20 73.60 1. 40 70.40 79.30 2.50 Range: 8.50 8.70 8.60 9.60 8.80 9.60
Anzahl: 17.00 20.00 17.00 17.00 20.00 17.00 S 3000 ~ H
Mittelw. : 71. 79 77.79 6.26 75.61 83.36 8.06 Stndabw. : 2.32 2.24 2.19 2.53 2.52 2.44 2000
Mittelw. : 68.25 73.22 4.97 71. 95 7.63 5.68 (20 PKW)
1000
Table 3: Results of urban test-run noise measurements for 20 different motorcyles. 0
0 100 200 300 400 500 m 600 The value relate to a measuring distance of 7.5 m
test track
Fig.3: Noise emission and engine rpm for high-rpm and low-rpm riding styles
----------------------------------------------------....................... fl·~ .. u!~
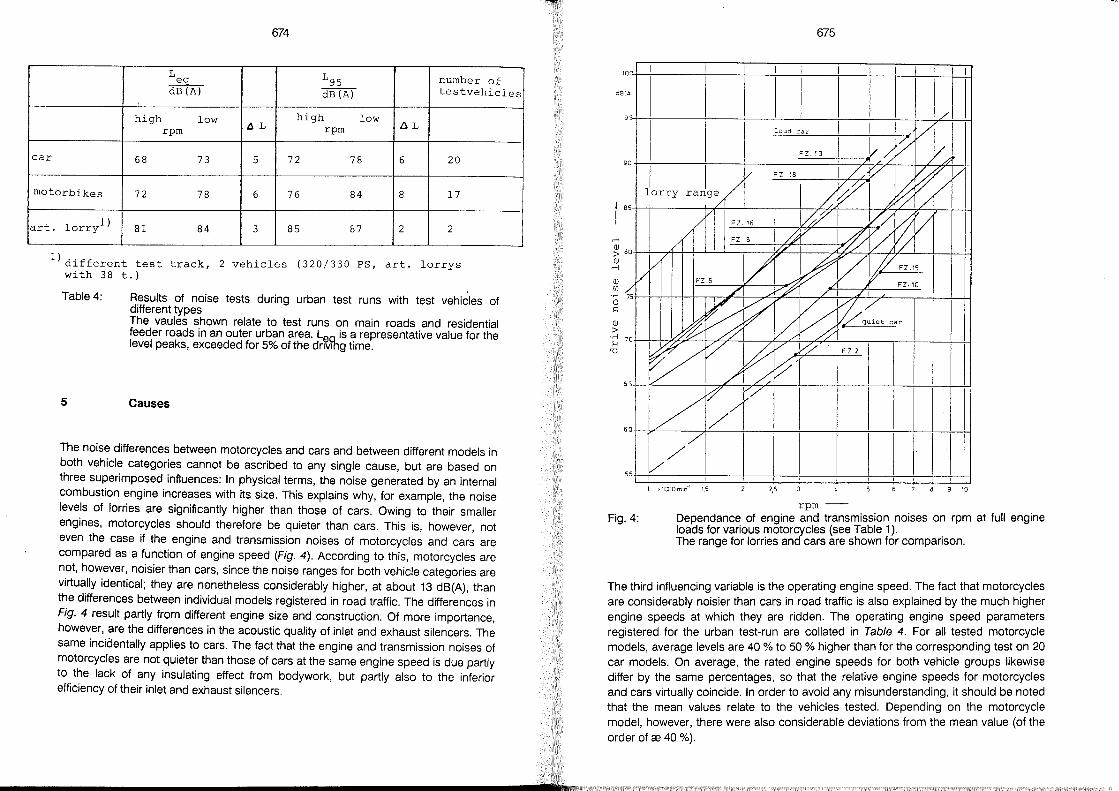
674
L L95 number of ~ dB(A) dB(A) testvehicles
high low high low AL ÖL rpm rpm
car 68 73 5 72 78 6 20
motorbikes 72 78 6 76 84 8 17
art. lorryl) 81 84 3 85 87 2 2
1) different test track, 2 vehicles (320/330 PS, art. lorrys with 38 t.)
Table 4:
5
Results of noise tests during urban test runs with test vehicles of different types The vaules shown relate to test runs on main roads and residential feeder roads in an outer urban area. Lea is a representative value for the level peaks, exceeded for 5% of the dnvlng time.
Causes
The noise differences between motorcycles and cars and between different models in both vehicle categories cannot be ascribed to any single cause, but are based on three superimposed influences: In physical terms, the noise generated by an internal combustion engine increases with its size. This explains why, for example, the noise levels of lorries are significantly higher than those of cars. Owing to their sm aller engines, motorcycles should therefore be quieter than cars. This is, however, not even the case if the engine and transmission noises of motorcycles and cars are compared as a function of engine speed (Fig. 4). According to this, motorcycles are not, however, noisier than cars, since the noise ranges for both vehicle categories are virtually identical; they are nonetheless considerably high er, at about 13 dB(A), than the differences between individual models registered in road traffic. The differences in Fig. 4 result partly trom different engine size and construction. Of more importance, however, are the differences in the acoustic quality of inlet and exhaust silencers. The same inciaentally applies to cars. The fact that the engine and transmission noises of motorcycles are not quieter than those of cars at the same engine speed is due partly to the lack of any insulating effect from bodywork, but partly also to the inferior efficiency of their inlet and exhaust silencers.
............................................................................... , ... w
675
d8
0° 1 1 1 1 1 I 1 1 ~ 1
lAI
1 1 1 1 1 1 1/ 1 9
1
loud car I I I ~V vi FZ. 1 J I 1))/ 90 "/f ~
I I V FZ 18 I/LV ~V' Y
lorry range / /fl~ ~ /v 85 /
/v FZ.15 ~/ V/ ~ V / # l.v V /
FZ 8
1// 80
Q) Ul
·ci o s:::
l/V FZ.5 vr~~ P FZ.15
V FZ.l0
Q)
:> ·ci
'"' 'Cl
<
70
6S
60
55
Fig.4:
/' // I ~
IY~ I~ ~:.:,w 1
~,Y/ //.
F Z.2
1 ~ i ~1 I /1/
1.;1' r/ //1 V ///
I I I I I I I I I , , 1 .1000 mln- I 1,5 2,5 9 10
rpm --Dependance of engine and transmission noises on rpm at full engine loads for various motorcycles (see Table 1). The range for lorries and cars are shown for comparison.
The third influencing variable is the operating engine speed. The fact that motorcycles are considerably noisier than cars in road traffic is also explained by the much higher engine speeds at which they are ridden. The operating engine speed parameters registered for the urban test-run are collated in Table 4. For all tested motorcycle models, average levels are 40 % to 50 % higher than for the corresponding test on 20 car models. On average, the rated engine speeds for both vehicle groups likewise differ by the same percentages, so that the relative engine speeds for motorcycles and cars virtually coincide. In order to avoid any misunderstanding, it should be noted that the mean values relate to the vehicles tested. Depending on the motorcycle model, however, there were also considerable deviations from the mean value (of the order of ce 40 %) .
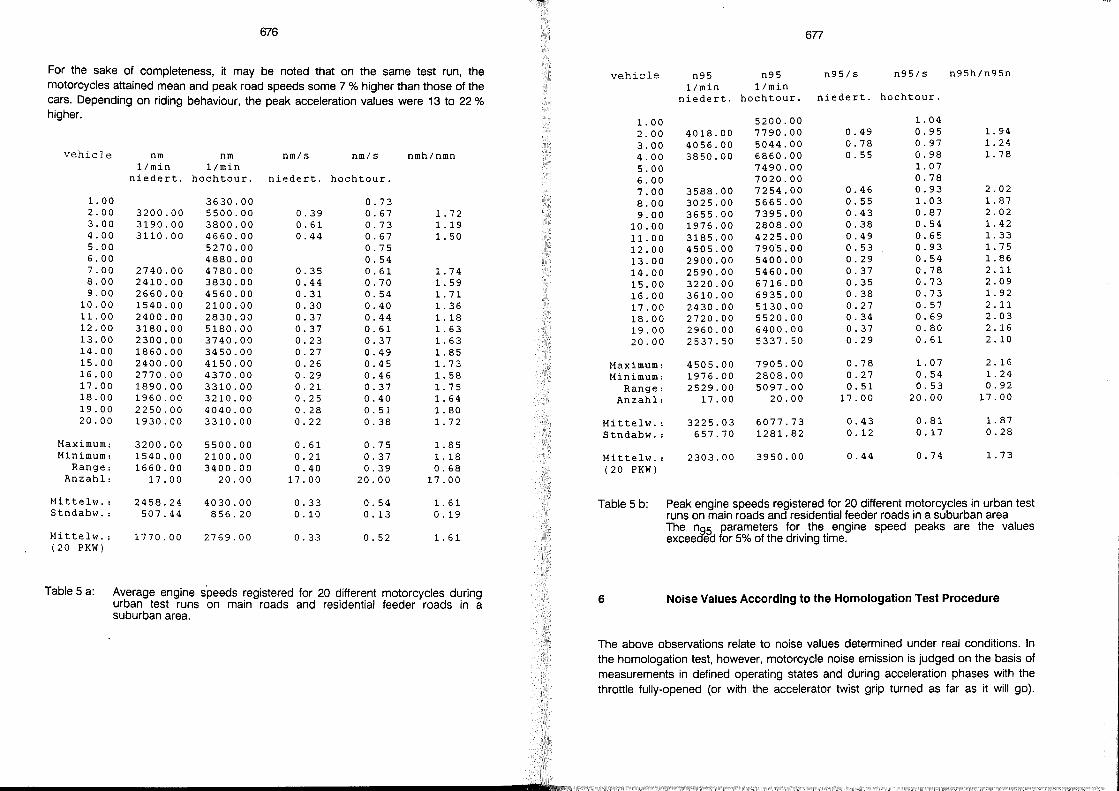
676
For the sake of completeness, it may be noted that on the same test run, the motorcycles attained mean and peak road speeds some 7 % higher than those of the cars. Depending on riding behaviour, the peak acceleration values were 13 to 22 % higher.
vehicle nm nm nm/s nm/s nmh/nmn l/min l/min
niedert. hochtour. niedert. hochtour.
1. 00 3630.00 0.73 2.00 3200.00 5500.00 0.39 0.67 1. 72 3.00 3190.00 3800.00 0.61 0.73 1. 19 4.00 3110.00 4660.00 0.44 0.67 1.50 5.00 5270.00 0.75 6.00 4880.00 0.54 7.00 2740.00 4780.00 0.35 0.61 1. 74 8.00 2410.00 3830.00 0.44 0.70 1. 59 9.00 2660.00 4560.00 0.31 0.54 1. 71
10.00 1540.00 2100.00 0.30 0.40 1.36 11. 00 2400.00 2830.00 0.37 0.44 1. 18 12.00 3180.00 5180.00 0.37 0.61 1. 63 13.00 2300.00 3740.00 0.23 0.37 1. 63 14.00 1860.00 3450.00 0.27 0.49 1. 85 15.00 2400.00 4150.00 0.26 0.45 1. 73 16.00 2770.00 4370.00 0.29 0.46 1. 58 17.00 1890.00 3310.00 0.21 0.37 1. 75 18.00 1960.00 3210.00 0.25 0.40 1. 64 19.00 2250.00 4040.00 0.28 0.51 1. 80 20.00 1930.00 3310.00 0.22 0.38 1. 72
Maximum: 3200.00 5500.00 0.61 0.75 1. 85 Minimum: 1540.00 2100.00 0.21 0.37 1. 18
Range: 1660.00 3400.00 0.40 0.39 0.68 Anzahl: 17.00 20.00 17.00 20.00 17.00
Mittelw. : 2458.24 4030.00 0.33 0.54 1. 61 Stndabw. : 507.44 856.20 0.10 0.13 0.19
Mittelw. : 1770.00 2769.00 0.33 0.52 1. 61 (20 PKW)
Table 5 a: Average engine speeds registered tor 20 different motorcycles during urban test runs on main roads and residential feeder roads in a suburban area.
~
677
vehicle n95 n95 n95/s n95/s n95h/n95n l/min l/min
niedert. hochtour. niedert. hochtour.
1. 00 5200.00 1. 04 2.00 4018.00 7790.00 0.49 0.95 1. 94
3.00 4056.00 5044.00 0.78 0.97 1. 24 4.00 3850.00 6860.00 0.55 0.98 1. 78
5.00 7490.00 1. 07 6.00 7020.00 0.78 7.00 3588.00 7254.00 0.46 0.93 2.02
8.00 3025.00 5665.00 0.55 1. 03 1. 87
9.00 3655.00 7395.00 0.43 0.87 2.02 10.00 1976.00 2808.00 0.38 0.54 1. 42
11. 00 3185.00 4225.00 0.49 0.65 1.33 12.00 4505.00 7905.00 0.53 0.93 1. 75 13.00 2900.00 5400.00 0.29 0.54 1. 86
14.00 2590.00 5460.00 0.37 0.78 2.11
15.00 3220.00 6716.00 0.35 0.73 2.09
16.00 3610.00 6935.00 0.38 0.73 1. 92
17.00 2430.00 5130.00 0.27 0.57 2.11 18.00 2720.00 5520.00 0.34 0.69 2.03 19.00 2960.00 6400.00 0.37 0.80 2.16 20.00 2537.50 5337.50 0.29 0.61 2.10
Maximum: 4505.00 7905.00 0.78 1. 07 2.16 Minimum: 1976.00 2808.00 0.27 0.54 1. 24
Range: 2529.00 5097.00 0.51 0.53 0.92
Anzahl: 17.00 20.00 17.00 20.00 17.00
Mittelw. : 3225.03 6077.73 0.43 0.81 1. 87 Stndabw. : 657.70 1281.82 0.12 0.17 0.28
Mittelw. : 2303.00 3950.00 0.44 0.74 1. 73 (20 PKW)
Table 5 b: Peak engine speeds registered for 20 different motorcycles in urban test runs on main roads and residential feeder roads in a suburban area The n~5 parameters for the engine speed peaks are the values excee eä for 5% of the driving time.
6 Noise Values According to the Homologation Test Procedure
The above observations relate to noise values determined under real conditions. In the homologation test, however, motorcycle noise emission is judged on the basis of measurements in defined operating states and during acceleration phases with the throttle fully-opened (or with the accelerator twist grip turned as far as it will go).
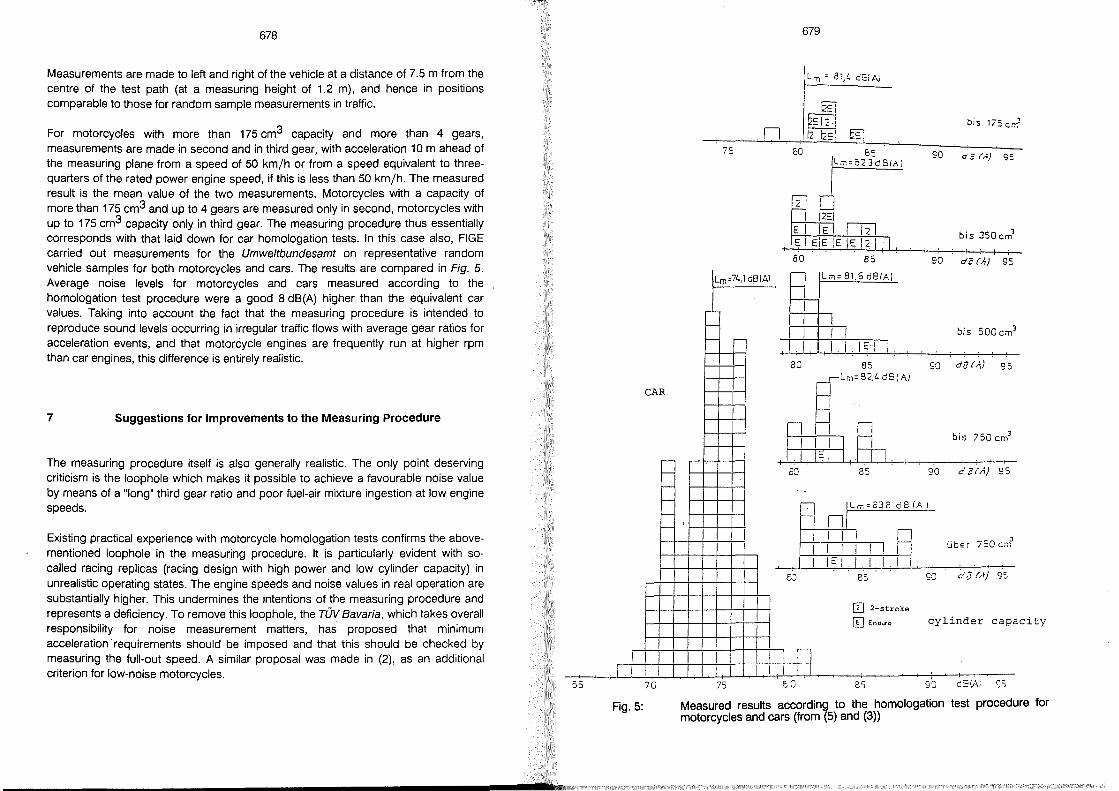
678
Measurements are made to left and right of the vehicle at a distance of 7.5 m from the centre of the test path (at a measuring height of 1.2 m), and hence in positions comparable to those for random sampie measurements in traffic.
For motorcycles with more than 175 cm3 capacity and more than 4 gears, measurements are made in second and in third gear, with acceleration 10 m ahead of the measuring plane from a speed of 50 km/h or from a speed equivalent to threequarters of the rated power engine speed, if this is less than 50 km/ho The measured result is the me an value of the two measurements. Motorcycles with a capacity of more than 175 cm3 and up to 4 gears are measured only in second, motorcycles with up to 175 cm3 capacity only in third gear. The measuring procedure thus essentially corresponds with that laid down for car homologation tests. In this case also, FIGE carried out measurements for the Umweltbundesamt on representative random vehicle sampies for both motorcycles and cars. The results are compared in Fig. 5. Average noise levels for motorcycles and cars measured according to the homologation test procedure were a good 8 dB(A) higher than the equivalent car values. Taking into account the fact that the measuring procedure is intended to reproduce sound levels occurring in irregular traffic flows with average gear ratios for acceleration events, and that motorcycle engines are frequently run at higher rpm than car engines, this difference is entirely realistic.
7 Suggestions for Improvements to the Measuring Procedure
The measuring procedure itself is also generally realistic. The only point deserving criticism is the loophole which makes it possible to achieve a favourable noise value by means of a "Iong" third gear ratio and poor fuel-air mixture ingestion at low engine speeds.
Existing practical experience with motorcycle homologation tests confirms the abovementioned loophole in the measuring procedure. It is particularly evident with socalled racing replicas (racing design with high power and low cylinder capa city) in unrealistic operating states. The engine speeds and noise values in real operation are substantially higher. This undermines the intentions of the measuring procedure and represents a deficiency. To remove this loophole, the TÜV Bavaria, which takes overall responsibility for noise measurement matters, has proposed that minimum acceleration' requirements should be imposed and that this should be checked by measuring the full-out speed. A similar proposal was made in (2), as an additional criterion for low-noise motorcycles. -05
______________________________________________________ ....................... J
CAR
-----I-
J I I
70
Fig.5:
I
n
lm=74,l dS(A)
I-I- ,.......
679
Lrn ::: 8:,l.. csr A}
cO es lrc= 02.3 d BIA I
EilE r-J:2l EIEiE!EIEI~I.I,
+-'--;--'.. .". I
80 85
P. /lm= 81.6 dBIA)
rL 1 1 I 1 1 1
.1 I. I. IE I. I. 80 85
,-Lm= 82.4 dSI AI
~ UI~:JE6
60 85
- -
bis 175 cd
SO .:'3 r.-;) 9S
bis 350cm'
, . 90 dUAl SS
bis SOOcm'
: 90 di] f Al 95
bis 750 cm'
, 90 d 3fA} 95
~ IL",=oa d81Ai
1-1 nl 1 I I I 1 n I 7 SO c;ö3 1 1 1 1 1 1 ! n über
~,I 1711,1: 1 : I. I . , c·) 85 SD ~,' J r/~} SS
o 2-stroke
1 [IJ E.nou-o cylinder cap acity
1 In 1 .1 1 1
- - -75 eo 85
Measured results according to the homologation test procedure for motorcycles and cars (trom (5) and (3»
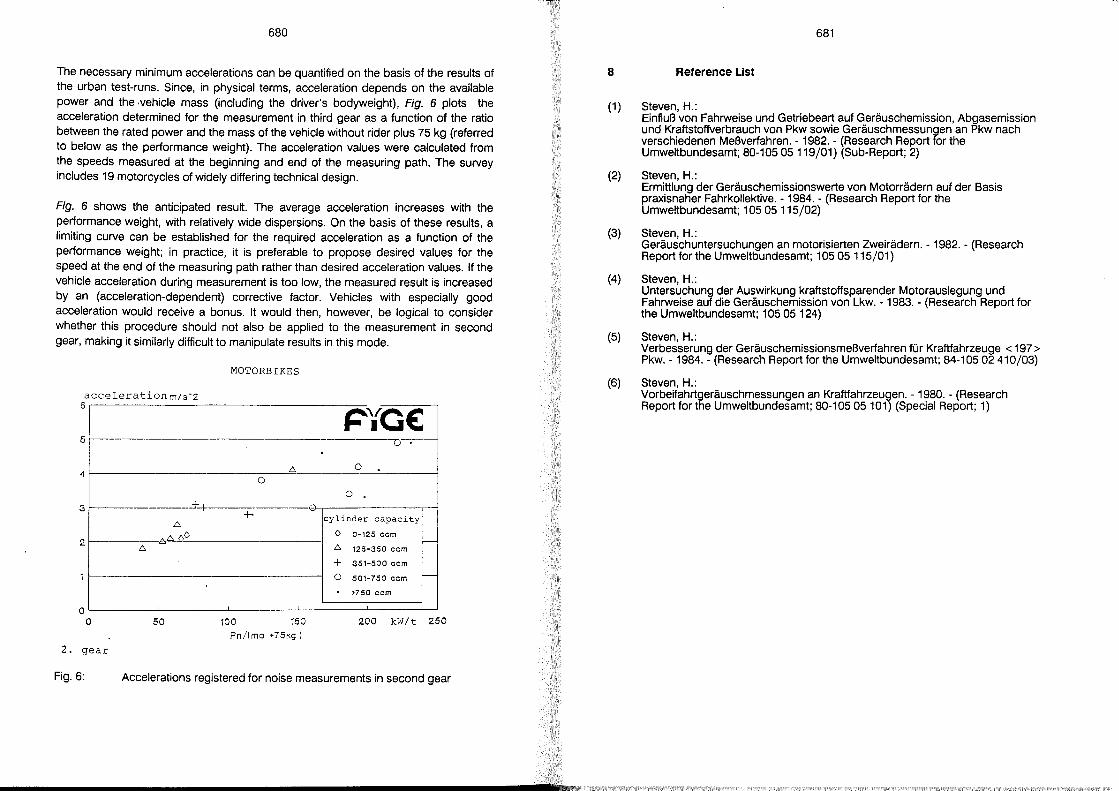
680
The necessary minimum accelerations can be quantified on the basis of the results of the urban test-runs. Since, in physical terms, acceleration depends on the available power and the ·vehicle mass (including the driver's bodyweight), Fig. 6 plots the acceleration determined for the measurement in third gear as a function of the ratio between the rated power and the mass of the vehicle without rider plus 75 kg (referred to below as the performance weight). The acceleration values were calculated from the speeds measured at the beginning and end of the measuring path. The survey includes 19 motorcycles of widely differing technical design.
Fig. 6 shows the anticipated result. The average acceleration increases with the performance weight, with relatively wide dispersions. On the basis of these results, a limiting curve can be established for the required acceleration as a function of the performance weight; in practice, it is preferable to propose desired values for the speed at the end of the measuring path rather than desired acceleration values. If the vehicle acceleration du ring measurement is too low, the measured result is increased by an (acceleration-dependent) corrective factor. Vehicles with especially good acceleration would receive a bonus. It would then, however, be logical to consider whether this procedure should not also be applied to the measurement in second gear, making it similarly difficult to manipulate results in this mode.
MOTORBIKES
acceleration m/s-2 6
P'YGE: 6 -------------·----------------u--;-----
4 -
3 J-. -4 6
2 f--. __ --bfd.!).O
6
J----------
o o
2. gear
50
6
0
+
100 160 Pn/(mo +75kg )
0
0 0
cylinder capacity
0 0-125 ccm
6 r--
126-350 ccm
+ 351-500 ccm
0 501-750 ccm r-->750 ccm
200 kW/t 250
Fig.6: Accelerations registered for noise measurements in second gear
8
(1)
(2)
(3)
(4)
(5)
(6)
681
Reference List
Steven, H.: Einfluß von Fahrweise und Getriebeart auf Geräuschemission, Abgasemission und Kraftstoffverbrauch von Pkw sowie Geräuschmessungen an Pkw nach verschiedenen Meßverfahren. - 1982. - (Research Report for the Umweltbundesamt; 80-10505119/01) (Sub-Report; 2)
Steven, H.: Ermittlung der Geräuschemissionswerte von Motorrädern auf der Basis praxisnaher Fahrkollektive. - 1984. - (Research Report for the Umweltbundesamt; 10505115/02)
Steven, H.: Geräuschuntersuchungen an motorisierten Zweirädern. - 1982. - (Research Report for the Umweltbundesamt; 10505115/01)
Steven, H.: Untersuchung der Auswirkung kraftstoffsparender Motorauslegung und Fahrweise auf die Geräuschemission von Lkw. - 1983. - (Research Report for the Umweltbundesamt; 10505124)
Steven, H.: Verbesserung der Geräuschemissionsmeßverfahren für Kraftfahrzeuge < 197 > Pkw. - 1984. - (Research Report for the Umweltbundesamt; 84-105 02 410/03)
Steven, H.: Vorbeifahrtgeräuschmessungen an Kraftfahrzeugen. - 1980. - (Research Report for the Umweltbundesamt; 80-10505101) (Special Report; 1)
Reduction of Exhaust Gas Emissions of Motorcycles
Peer-Olat Kalis
Lutz Hartung
Hermann Appel
Institut tür Fahrzeugtechnik
Technische Universität Berlin
Germany
Norbert Gorißen
Umweltbundesamt
Germany
686
2 Introduction
In 1989, the share of exhaust gas emissions from motorcycles in the total emission of passenger vehicles amounted to 1% for nitrogen oxides (NOx), 3% for carbon monoxide (CO), and approx. 4% for HC (2). It can, however, not be concluded from this that the exhaust gas emissions of motorcycles are insignificant, because
3
the pOllutant emissions of cars will continue to decrease; in the new Federal States and other EEC member countries, motorcycles play a greater role as a means of transport and thus generate a greater amount of emissions; and motorcycle emissions per kilometre are generally higher than those of cars, which means that emission reductions can presumably be attained at a lower technical and financial expenditure than would be possible for cars with already reduced pollutant emissions.
Emission Control Regulations tor Motorcycles
In the Federal Republic of Germany, maximum-permissible levels of pollutants in exhaust gas emissions of motorcycles are regulated by Article 47(7) of StVZO (Road Traffic Licensing Regulations), which became effective on January 1, 1989. This article also calls for the application of ECE (Economic Commission of Europe) Regulation No. 40 (7). This regulation requires motorcycles to be run on a chassis dynamometer in a driving cycle similar to that hitherto applicable in Europe for cars. Using the Constant Volume Sampling method, the exhaust gas is diluted, part of it is collected in bags and analyzed upon completion of the test cycle. Unlike car emissions, motorcycle emissions are measured when the engine is warm following two conditioning cycles.
However, the limit values stipulated in ECE-R 40 for exhaust gas emissions, which depend on the reference weight, are considerably higher than those for cars. This is all the more remarkable as the test cycle for motorcycles does not cover the emission-intensive cold start. The limit values of ECE-R 40 have not necessitated the use of emission reduction measures on the vehicles so far. We only know of some highemission vehicles with two-stroke engines, which were either fitted with an oxidation catalyst or taken off the market. On the international level, the further development of the limit values for exhaust gas emissions resulted in the adoption of ECE regulation 40/01 which, however, has not yet been incorporated in the StVZO.
687
In Switzerland, the limit values for exhaust gas emissions of motorcycles have been tightened in two stages, effective October 1, 1987 and October 1, 1990. The dependence of maximum-permissible emissions on the reference weight was abolished, as was the differentiation between limit values for type approval and conformity-of-production testing; in addition, a limit value for NOx was introduced (2). Austria, which currently applies modified ECE-R 40/01 limit values, will introduce the first stage of the Swiss limit values in 1992.
The most recent proposal for tightening the emission limits for motorcycles comes from Greece. Identicallimit values were proposed there for the first time for two-stroke and four-stroke motorcycles, independent of the reference weight, and without limitation of NOx emissions. The reasoning behind this proposal is the high trafficrelated pOllution in Athens and the concomitant formation of photo-chemical smog. Motorcycles there account for 15% of the HC, 6% of the CO and less than 1 % of the NOx emissions (9).
Table 1 shows a comparison of the various emission limits.
4 Research Project "Testing ot Motorcycles with Reduced Emissions"
From 1987 to 1990, a research proiect was carried out at the Institut für Fahrzeugtechnik of the Technical University Berlin und er contract to the Federal Environmental Agency to determine motorcycle exhaust gas emissions. The proiect had two main goals:
determining regulated and non-regulated exhaust gas components in legally prescribed and other driving cycles; testing the effect of emission reduction measures on exhaust gas emissions.
The components measured comprised CO, HC, NOx, benzene and polycyclic aromatic hydrocarbons (PAH).
Five vehicles belonging to different engine-power and weight categories were selected for the research proiect on the basis of the approval statistics of the Federal Office of Road Transportation (Kraftfahrtbundesamt). To also cover higher speed ranges, CO, HC and NOx were measured in the US certification test (FTP 75), the US Highway Driving Cycle (HDC), the New European Driving Cycle (NEDC) and at various constant speeds, in addition to the legally prescribed driving cycles. Benzene and PAH emissions were determined exclusively in the legally prescribed cycles.
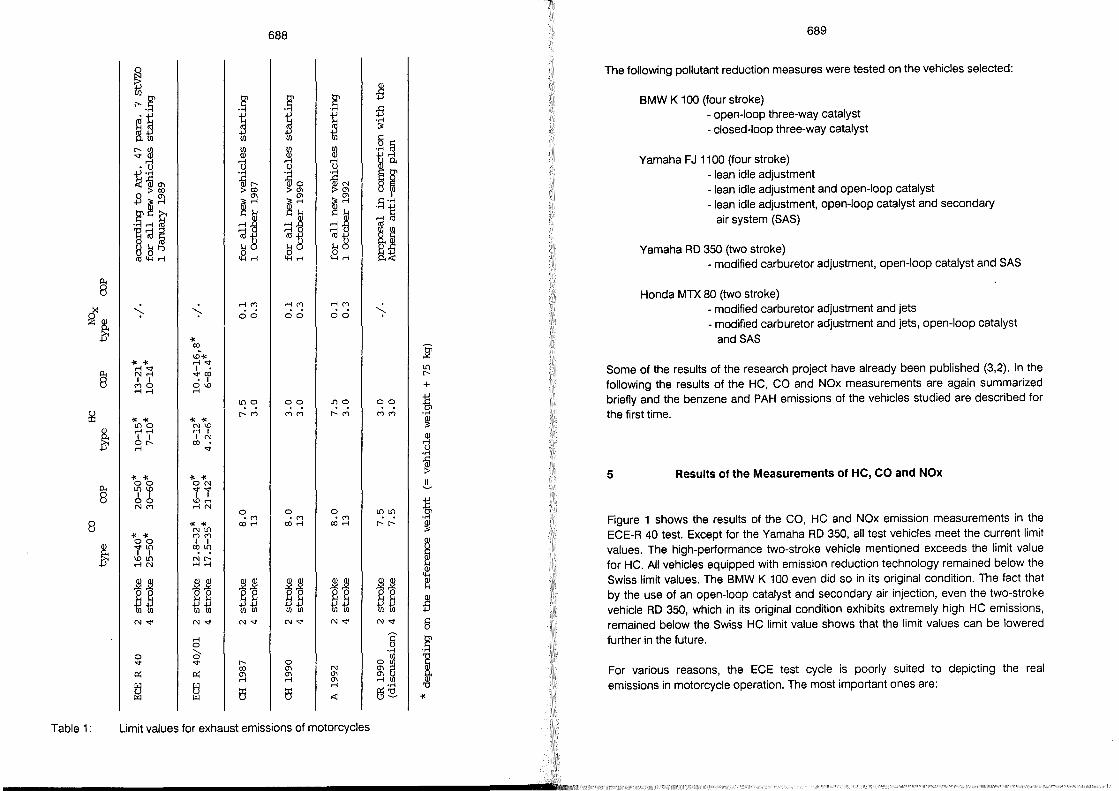
688 689
0 The following pollutant reduction measures were tested on the vehicles selected:
~ ~.~ g .~ .~ ~ BMW K 100 (four stroke)
:S o~ ~ ~ ~
• .-i - open-Ioop three-way catalyst
[00 ~ - closed-Ioop three-way catalyst § ~
~ ffi ffi ffi ffi • .-i
.-i .-i .-i .-i f~ Yamaha FJ 1100 (four strake) o U U U U
~j~ • .-i
~o ~N ~~ - lean idle adjustment '5lr--:>co :>'" :>'" - lean idle adjustment and open-Ioop catalyst
ß~~ ~~ '" '" I :i;.-i
~i ~ . .-i - lean idle adjustment, open-Ioop catalyst and secondary
~~ • .j.J
g.-i~ .-i~ .-i~ air system (SAS)
E'id~ 'id S 'id~ 'id~ ~i §~r:, ~.-i ~.-i ~.-i Yamaha RD 350 (two strake) <1l"-<.-i P...<x: - modified carburetor adjustment, open-Ioop catalyst and SAS
~ Honda MTX 80 (two stroke) .-iM .-iM .-iM
~~ ;. '-.
00 ;. - modified carburetor adjustment and jets 00 00
- modified carburetor adjustment and jets, open-Ioop catalyst -l< and SAS co
~ ID-l< -l< -l< .-i<l'
~ .-i<l' I t{) Some of the results of the research project have al ready been published (3,2). In the N.-i <l'CO r--I I o I
MO 010 + following the results of the HC, CO and NOx measurements are again summarized .-i.-i .-i
t{)0 00 t{)o 00 :l:j briefly and the benze ne and PAH emissions of the vehicles studied are described for t1>
§:l r--M 1'11'1 r--M 1'11'1 . .-i the first time. -l< -l< -l< -l< & ~
t{)o NID .-i.-i .-i I I I IN Q) or-- co .; .-i .-i U
. .-i
-l< -l< -l< -l< ~ 5 Results of the Measurements of HC, CO and NOx
00 ON .!!.. ~
t{)10 <l'<l' I I I I 00 ID.-i t NM .-iN
0 0 0 t{)t{)
8 01'1 01'1 01'1 • .-i Figure 1 shows the results of the CO, HC and NOx emission measurements in the -l< -l< co.-i CO.-i CO.-i r--r-- & Nt{)
-l< -l< 1'11'1 ECE-R 40 test. Except for the Yamaha RD 350, all test vehicles meet the current limit
~ 00 I I ~ <l't{) COt{) values. The high-performance two-stroke vehicle mentioned exceeds the limit value I I
~ 1Dt{) Nr--.-iN .-i.-i for HC. All vehicles equipped with emission reduction technology remained below the
"-<
~~ EE
llll EE EE EE
~ Swiss limit values. The BMW K 100 even did so in its original condition. The fact that
~~ ~~ ~ by the use of an open-Ioop catalyst and secondary air injection, even the two-stroke
00 00 00 00 00 00 00 00 vehicle RD 350, which in its original condition exhibits extremely high HC emissions, N<l' N<l' N<l' N<l' N<l' N<l' § remained below the Swiss HC limit value shows that the limit values can be lowered
.-i § g further in the future. 0
a- • .-i 0 00 i <l' <l' r-- 0
~§ p:; p:; co '" N For various reasons, the ECE test cycle is poorly suited to depicting the real '" '" '" .-i .-i '"
~ tl .-i • .-i 'Ö emissions in motorcycle operation. The most important ones are: r.:I tS tS A: f§~ -l<
Table 1: Limit values for exhaust emissions of motorcycles
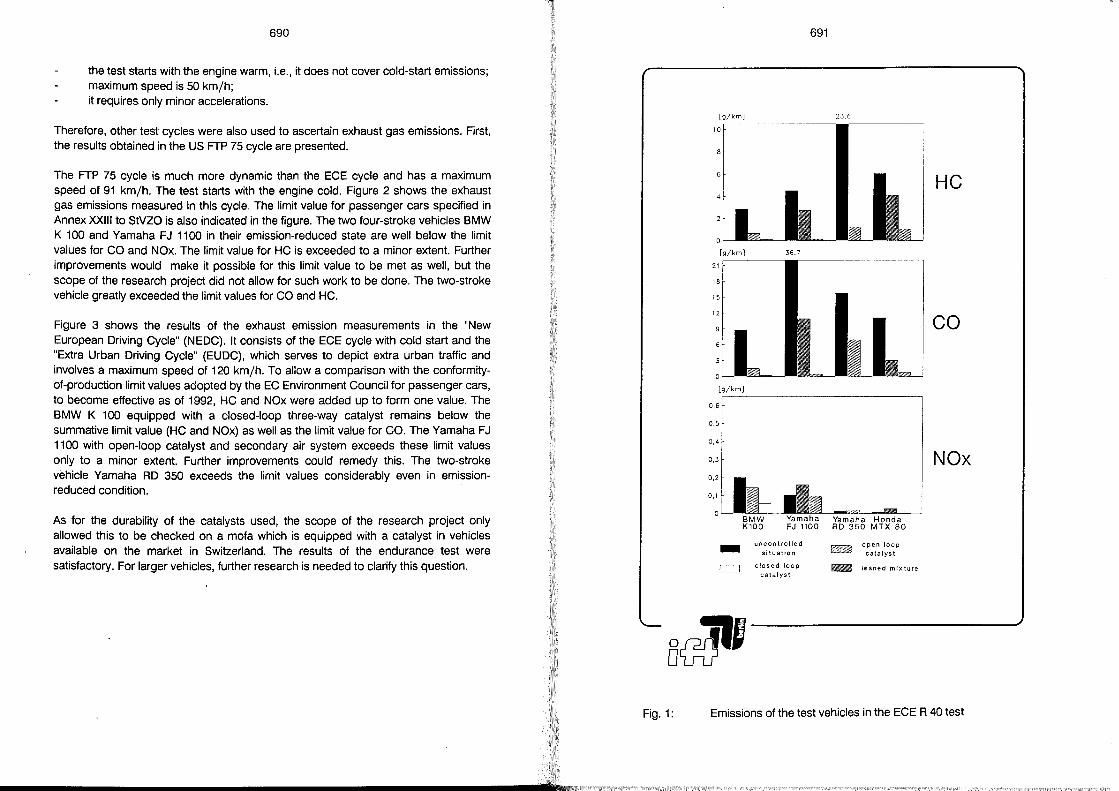
690
the test starts with the engine warm, Le., it does not cover cold-start emissions; maximum speed is 50 km/h; it requires only minor accelerations.
Therefore, other test cycles were also used to ascertain exhaust gas emissions. First, the results obtained in the US FTP 75 cycle are presented.
The FTP 75 cycle is much more dynamic than the ECE cycle and has a maximum speed of 91 km/ho The test starts with the engine cold. Figure 2 shows the exhaust gas emissions measured in this cycle. The limit value for passenger cars specified in Annex XXIII to StVZO is also indicated in the figure. The two four-stroke vehicles BMW K 100 and Yamaha FJ 1100 in their emission-reduced state are weil below the limit values for CO and NOx. The limit value for HC is exceeded to a minor extent. Further improvements would make it possible for this limit value to be met as weil, but the scope of the research project did not allow for such work to be done. The two-stroke vehicle greatly exceeded the limit values for CO and HC.
Figure 3 shows the results of the exhaust emission measurements in the "New European Driving Cycle" (NEDC). It consists of the ECE cycle with cold start and the "Extra Urban Driving Cycle" (EUDC), which serves to depict extra urban traffic and involves a maximum speed of 120 km/ho To allow a comparison with the conformityof-production limit values adopted by the EC Environment Council for passenger cars, to become effective as of 1992, HC and NOx were added up to form one value. The BMW K 100 equipped with a closed-Ioop three-way catalyst remains below the summative limit value (HC and NOx) as weil as the limit value for CO. The Yamaha FJ 1100 with open-Ioop catalyst and secondary air system exceeds these limit values only to a minor extent. Further improvements could remedy this. The two-stroke vehicle Yamaha RD 350 exceeds the limit values considerably even in emissionreduced condition.
As for the durability of the catalysts used, the scope of the research project only allowed this to be checked on a mofa which is equipped with a catalyst in vehicles available on the market in Switzerland. The results of the endurance test were satisfactory. For larger vehicles, further research is needed to clarify this question.
.............................................................................. c.'~~
Fig.1:
19jkmJ
10
° [g/kmJ
21
18
15
12
19/kmJ
0,6
0,5
0,4
0,3
691
36.7
BMW Yamaha
-c:::::J
K100 FJ 1100
uncontrolled situation
closed Icop
catalyst
23.6
Yamaha Honda RD 350 MTX 80
open loop catalyst
~ leaned mixture
HC
co
NOx
Emissions of the test vehicles in the ECE R 40 test
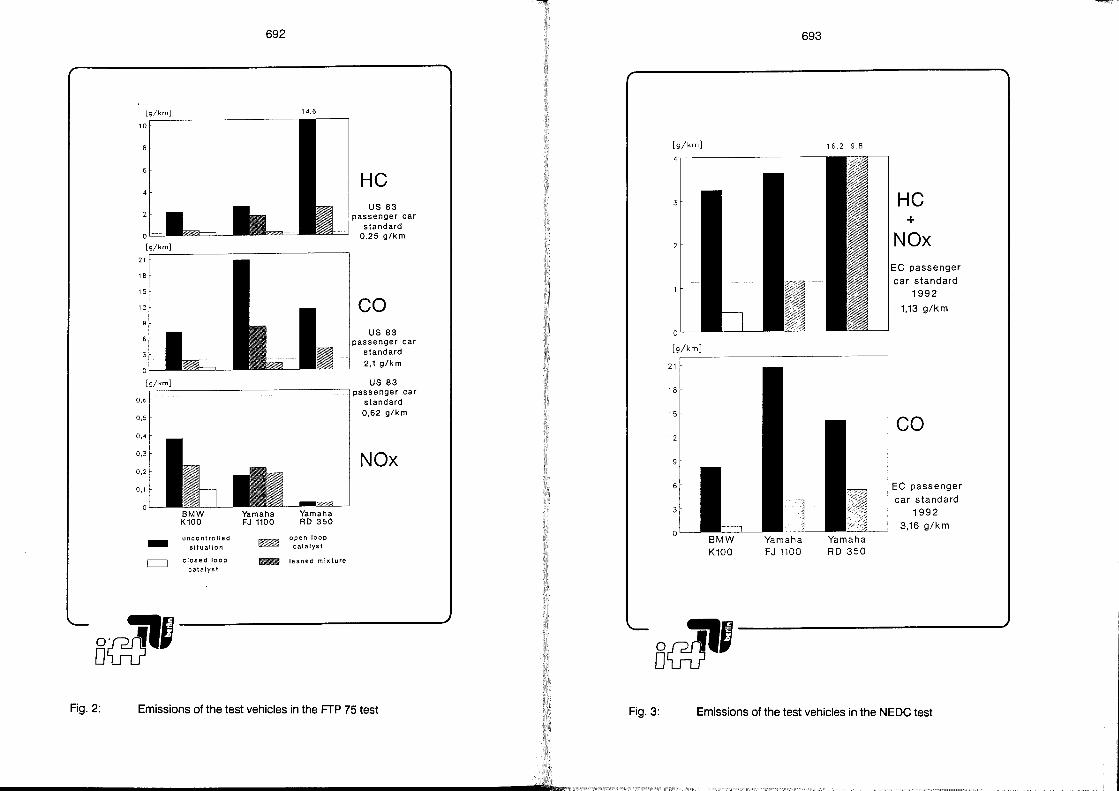
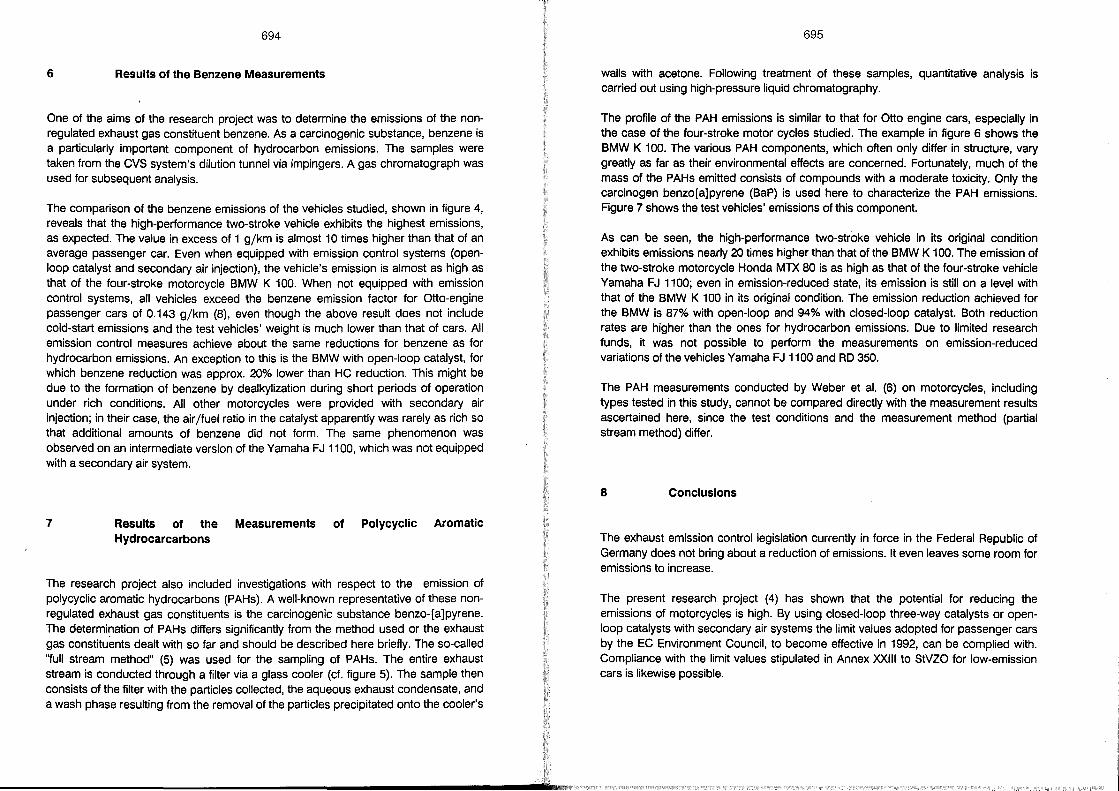
694
6 Results of the Benzene Measurements
One of the aims of the research projeet was to determine the emissions of the nonregulated exhaust gas constituent benzene. As a carcinogenic substance, benze ne is a particularly important component of hydrocarbon emissions. The sampies were taken from the CVS system's dilution tunnel via impingers. Agas chromatograph was used for subsequent analysis.
The comparison of the benzene emissions of the vehicles studied, shown in figure 4, reveals that the high-performance two-stroke vehicle exhibits the highest emissions, as expeeted. The value in excess of 1 g/km is almost 10 times higher than that of an average passenger car. Even when equipped with emission contra I systems (openloop catalyst and secondary air injection), the vehicle's emission is alm ost as high as that of the four-stroke motorcycle BMW K 100. When not equipped with emission control systems, all vehicles exceed the benzene emission factor for Otto-engine Passenger cars of 0.143 g/km (8), even though the above result does not include cold-start emissions and the test vehicles' weight is much lower than that of cars. All emission control measures achieve about the same reductions for benze ne as for hydrocarbon emissions. An exception to this is the BMW with open-Ioop catalyst, for which benzene reduction was approx. 20% lower than HC reduction. This might be due to the formation of benzene by dealkylization during short periods of operation under rich conditions. All other motorcycles were provided with secondary air injeetion; in their case, the air /fuel ratio in the catalyst apparently was rarely as rich so that additional amounts of benzene did not form. The same phenomenon was observed on an intermediate version of the Yamaha FJ 1100, which was not equipped with a secondary air system.
7 Results of the Measurements of Polycyclic Aromatic Hydrocarcarbons
The research project also included investigations with respect to the emission of polycyclic aramatic hydrocarbons (PAHs). A well-known representative of these nonregulated exhaust gas constituents is the carcinogenic substance benzo-[a]pyrene. The determination of PAHs differs significantly from the method used or the exhaust gas constituemts dealt with so far and should be described here briefly. The so-called "full stream method" (5) was used for the sampling of PAHs. The entire exhaust stream is condueted through a filter via a glass cooler (cf. figure 5). The sampie then consists of the filter with the particles collected, the aqueous exhaust condensate, and a wash phase resulting fram the removal of the particles precipitated onto the cooler's
695
walls with acetone. Following treatment of these sampies, quantitative analysis is carried out using high-press ure liquid chromatography.
The profile of the PAH emissions is similar to that for Otto engine cars, especially in the case of the four-stroke motor cycles studied. The example in figure 6 shows the BMW K 100. The various PAH components, which often only differ in strueture, vary greatly as far as their environmental effeets are concerned. Fortunately, much of the mass of the PAHs emitted consists of compounds with a moderate toxicity. Only the carcinogen benzo[a]pyrene (BaP) is used here to characterize the PAH emissions. Figure 7 shows the test vehicles' emissions of this component.
As can be seen, the high-performance two-stroke vehicle in its original condition exhibits emissions nearly 20 times higher than that of the BMW K 100. The emission of the two-stroke motorcycle Honda MTX 80 is as high as that of the four-stroke vehicle Yamaha FJ 1100; even in emission-reduced state, its emission is still on a level with that of the BMW K 100 in its original condition. The emission reduetion achieved for the BMW is 87% with open-Ioop and 94% with closed-Ioop catalyst. Both reduetion rates are higher than the ones for hydrocarbon emissions. Due to limited research funds, it was not possible to perform the measurements on emission-reduced variations of the vehicles Yamaha FJ 1100 and RD 350.
The PAH measurements conducted by Weber et al. (6) on motorcycles, including types tested in this study, cannot be compared directly with the measurement results ascertained here, since the test conditions and the measurement method (partial stream method) differ.
8 Conclusions
The exhaust emission control legislation currently in force in the Federal Republic of Germany does not bring about a reduction of emissions. It even leaves some room for emissions to increase.
The present research project (4) has shown that the potential for reducing the emissions of motorcycles is high. By using closed-Ioop three-way catalysts or openloop catalysts with secondary air systems the limit values adopted for passenger cars by the EC Environment Council, to become effective in 1992, can be complied with. Compliance with the limit values stipulated in Annex XXIII to StVZO for low-emission cars is likewise possible.

696
General conditions must be created by the government which are conducive to the introduction and promotion of low-emission technologies.
The emission reduction schemes presented can sufficiently reduce the emissions of the non-regulated pollutants benzene and PAHs. In view of the high relevance of these exhaust gas components to air quality, this is an important factor.
For two-stroke motorcycles, especially high-performance vehicles, it was not possible in all cases to achieve satisfactory reductions in pollutant emissions. Further development work or replacement by more modern four-stroke concepts is required here.
The question as to the durability of motorcycle catalysts could not be answered conclusively.
E ~
'-.. 0>
Fig.4:
1
697
0 co
"<t X t-
(') ::2 eil '0 C 0 I
0 f/) lO c (')
~ CI 0
"<t a: 'e
0 eil >
~I .;'.
0 -0 0 Q)
"<t ~
~ Oe:
LZ .!::.~ (')
c-O'"
eil u:> .s::: c:=: eil :>w
.. ,., .. '0 c::
~I 0 (,) .. ..
-;;
C\l 0 ~
-;; ,., -;; ?:: n; ,., .. n; n; n; (,) n; (,) 0. (,)
::.:: 0. 0 0. 0 2 0
~ ::2 ID
2 '0 2 c:: .. c:: .. .. .. 0. 2 0. 0 (,) 0 ..
N.. 0
~ 0
~ '" C'l ... .. co <.D .... 0 0 0
00
Benzene emissions of the test vehicles in the ECE R 40 test
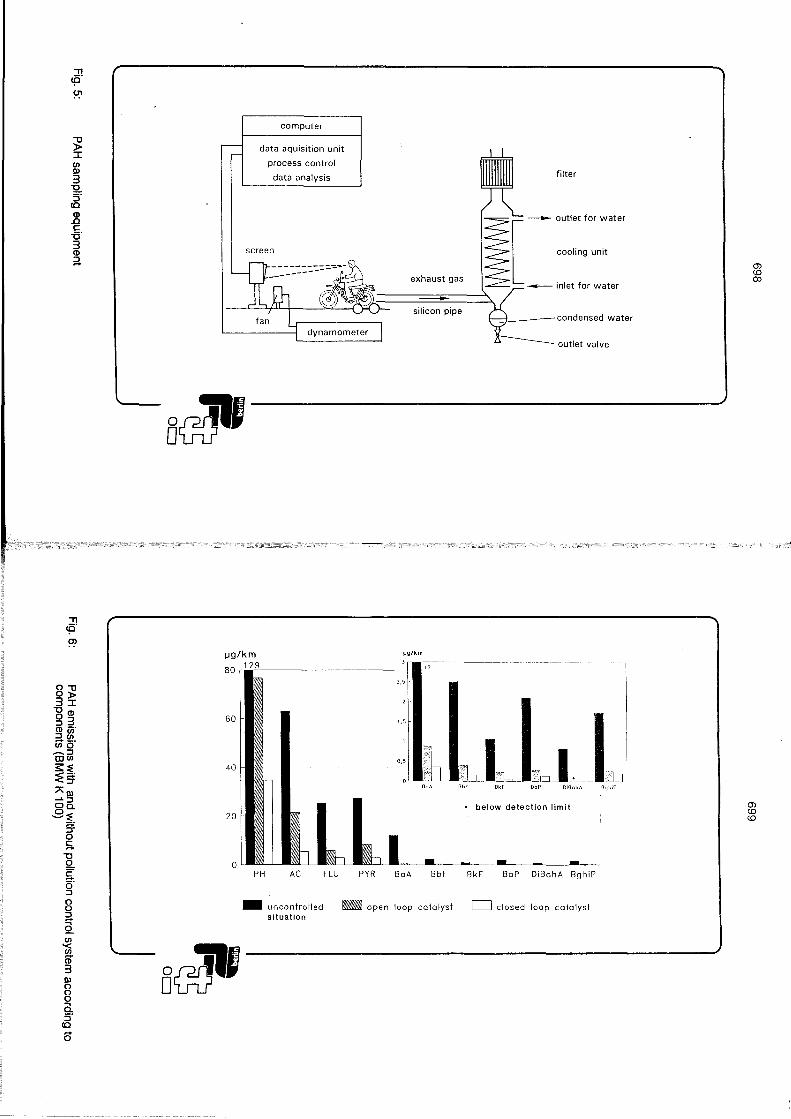
"Tl <P' ~
~ ::r I/)
tu 3
12-5'
(Q
(I) .0 C -0' 3 (I)
~
"Tl <P' !J?
0"'0 0> 3::r
"'0(1) 0 3 :::J _. (1)1/)
a~. 1/)0 ~:::J CD I/)
~~ "tu ...... :::J Oa.
8~. :T o S.
~ ~ g 8 ~ Q. I/)
'<
* 3 g o Q, :::J
(Q
Ö
B~
60
40
computer
data aquisition unit
process control
data analysis
sereen
PH AC FLU PYR
filter
exhaust gas 1[
-- outlet for water
coolmg unlt
___ miet fer water -silicon pipe ~condensed water
ug/km
3 r-_--·--~"·-12
l 7,'1 I iJ':.:L ~J2L- 11.,
OoA Obr BkF BoP DißohA 8ghiP
below detection limit
BoA BbF BkF BoP DiBahA BghiP
_ uncontrolled situation
_ open loop catalyst D closed loop catalyst
BciJI
(j) <.0 0:>
(j) <.0 <.0
J
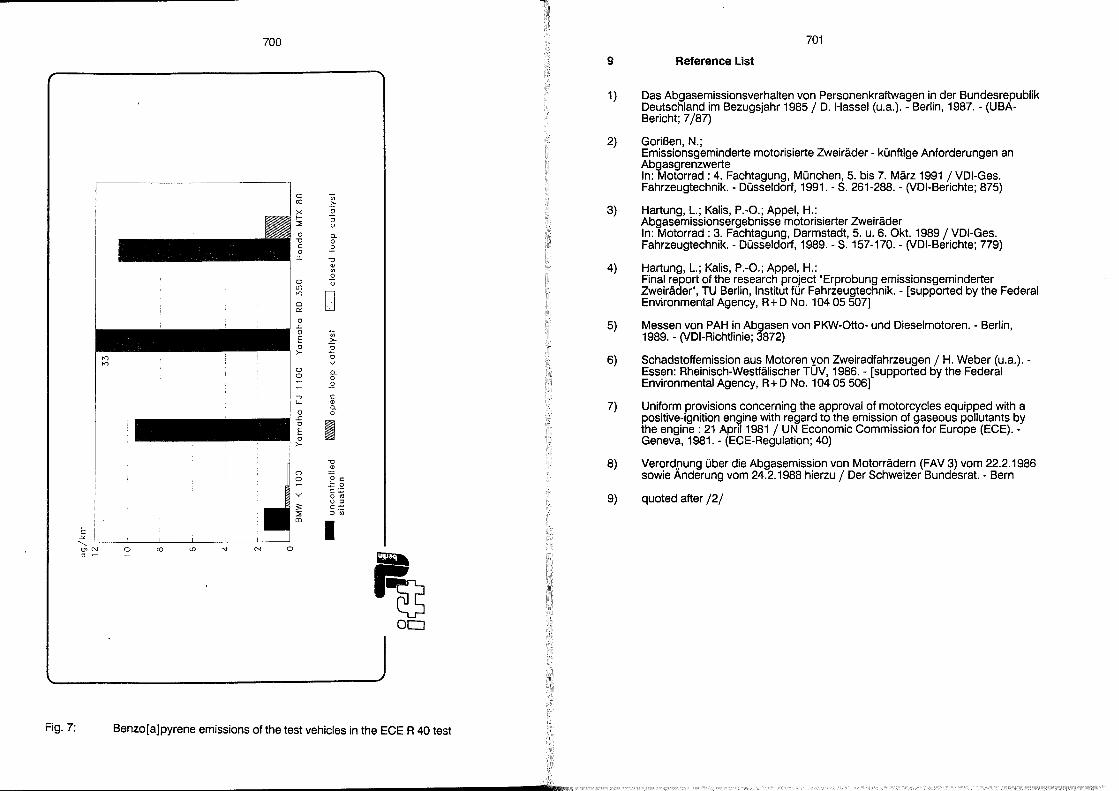
700
0 Vi co ~ x .2 f- 0 :::;; u 0 a.
-0 0 c .2 0 :r: -0
(I)
'" 0 0 u cl)
'" 0 0 0::
0 .<:: 0 Vi E ~ 0 .2 >-
0 u
0 a. 0 0 ~
.2 -, C 4- (I)
a. 0 0
.<::
I 0
E 0 >-
-0
0 ~
0 o c: ~ ';:0
"" c:.;: o '"
:;: u ::> c.~
:::;; ::J " CD
I E -'" '--enN ;: CO <D " N 0 ::1~ ..
~ 00
Fig.7: Benzo[a]pyrene emissions of the test vehicles in the ECE R 40 test
9
1)
2)
3)
4)
5)
6)
7)
8)
9)
701
Reference List
Das Abgasemissionsverhalten von Personenkraftwagen in der Bundesrepublik Deutschland im Bezugsjahr 1985 / D. Hassel (u.a.). - Berlin, 1987. - (UBABericht; 7/87)
Gorißen, N.; Emissionsgeminderte motorisierte Zweiräder - künftige Anforderungen an Abgasgrenzwerte In: Motorrad: 4. Fachtagung, München, 5. bis 7. März 1991 / VDI-Ges. Fahrzeugtechnik. - Düsseldorf, 1991. - S. 261-288. - (VDI-Berichte; 875)
Hartung, l.; Kalis, P.-O.; Appel, H.: Abgasemissionsergebnisse motorisierter Zweiräder In: Motorrad: 3. Fachtagung, Darmstadt, 5. u. 6. Okt. 1989/ VDI-Ges. Fahrzeugtechnik. - Düsseldorf, 1989. - S. 157-170. - (VDI-Berichte; 779)
Hartung, l.; Kalis, P.-O.; Appel, H.: Final report of the research project "Erprobung emissionsgeminderter Zweiräder", TU Berlin, Institut für Fahrzeugtechnik. - [supported by the Federal Environmental Agency, R+ D No. 10405507]
Messen von PAH in Abgasen von PKW-Otto- und Dieselmotoren. - Berlin, 1989. - (VDI-Richtlinie; 3872)
Schadstoffemission aus Motoren yon Zweiradfahrzeugen / H. Weber (u.a.). -Essen: Rheinisch-Westfälischer TUV, 1986. - [supported by the Federal Environmental Agency, R + D No. 104 05 506]
Uniform provisions concerning the approval of motorcycles equipped with a positive-ignition engine with regard to the emission of gaseous pollutants by the engine : 21 April 1981 / UN Economic Commission for Europe (ECE). -Geneva, 1981. - (ECE-Regulation; 40)
Verord.rung über die Abgasemission von Motorrädern (FAV 3) vom 22.2.1986 sowie Anderung vom 24.2.1988 hierzu / Der Schweizer Bundesrat. - Bern
quoted after /2/
Fuel Consumption Reduction and Emission Decrease in an Utilitarian PTW 2-stroke Engine by Simple Modification
Vsevolod Kleniksky
Minsk Motorcycle and Bicycle Plant, Motovelo
USSR
2Qj
705
1 Abstract
The present manuscript highlights the work carried out in order to research and modify the design of engine of an utilitarian powered two-wheeler (PTW). (The term "utilitarian" used hereafter means a vehicle of a very simple and low-cost design applied as transport means exclusively which requires minimum maintenance or seNice costs).
The task of modifying the design is constrained in the manuscript to the problems of fuel consumption and emission decrease in two-strake combustion engine with 125 c.c. dis placement.
The foliowing result of combined measures taken to modify the air-fuel mixture feeding system and gas exchange in the engine, equipping it with the system of air' pressure flattening in carburettor float chamber (system is pratected by the Inventor's Certificate of the USSR) and the system of air-fuel mixture separating reduction of specific fuel consumption by 23 to 31% within the working range of engine speed was registered. Vehicle fuel consumption was considerably decreased, influence of filtering element contamination on PTW operational data was decreased as minimum as possible.
An utmost simplicity and originality of technical solutions offered, minimum costs spent to intraduce them in existing PTW designs predetermine the application nature of the accomplished research work and value of the work in practice.
2 Introduction
There are still enough regions in the world where transport problems have not been solved. Under circumstances of an acute shortage of transport facilities all the advantages of an automobile lose its importance as compared to PTW which is accessible, quite cheap at the price and easy to operate, maintain and repair.
A demand for motorized vehicles in the market and inability to meet the requirements in cars in the country were the main factors which had been determining the tendency of PTW designs development in the USSR. The general task to manufacture cheap PTWs in large quantities (8 plants manufacture about 1 200 000 PTWs yearly) defined considerably means and methods to be chosen to modify vehicle design.
Improvement of PTW operation al data by making relatively simple modifications achieved through introducing technological changes at minimum cost - that is the task being done by PTW manufacturers and R & D institutions in the USSR, making some progress in this field.
The body of the lecture contains information about some research and development works that have been carried out by Minsk M/c and B/c Works in cooperation with leading R & D Institutions to reduce fuel consumption of motorcycle engine 125 c.c.
The material submitted is not achallenge at all to be a profound scientific and research study of the processes in question that take place inside the engine. The work done is more an experimental designing when the parameters of a prototype engine are being brought to some optimal values by means of laboratory, bench and road testing.
3 The Subject of Inquiry
Two-stroke internal combustion crankcase scavenged engine with 125 c.c. swept volume and air cooling was a subject of inquiry and engineering development. General engine specifications are as folIows: engine cylinder bore - 52 mm, piston stroke - 58 mm. Intake process control is made by piston slipper (there is not any valve in intake port.) Maximum output is 7.36 KW (10 h.p.), maximum torque 11.9 Nm (1.21 kgm) at 6200 r Imin engine speed.
The engine is installed on an all-road motorcycle, MMVZ 3.11211 model. This is an utilitarian, low cost vehicle of a simple design, the annual output of which is over 200000 pcs.
4 Goal and Task of Investigation
The major goal of the work accomplished is to improve performance of the motorcycle, MMVZ 3.112.11 model (its traction and dynamic data, acceleration, fuel consumption and gas emission).
Modification of the engine design in question has been constrained to preserving qualities and performance of an utilitarian PTW.
Research and development work to improve and modify the design of the subject of inquiry had three main leads:
1.
2.
3.
5
To synthesize optimal external engine speed characteristics with regard to conditions of ensuring fair acceleration data of a PTW. To lower a specified efficient fuel consumption of the engine by improving the process of air-fuel mixture flow in the cylinder. To narrow an actual dispersion of the PTW operational data by keeping the original characteristics of the engine during the operation term and minimizing fluctuation of engine effective performance properties under conditions of actual manufacturing.
Results of Testing
5.1 Optimization of External Engine Speed Characteristics
Selection of the optimal extern al engine speed characteristics of MMVZ-3.112.11 motorcycle was based on adjusting engine speed parameters in accordance with the classic rules regulating vehicle movement.
Long-stroke combustion engines (S/D = 1.11) with short timing of engine (crankshaft turn at 135 degrees for intake timing; 157- for exhaust and 115 - for scavenge ) allow
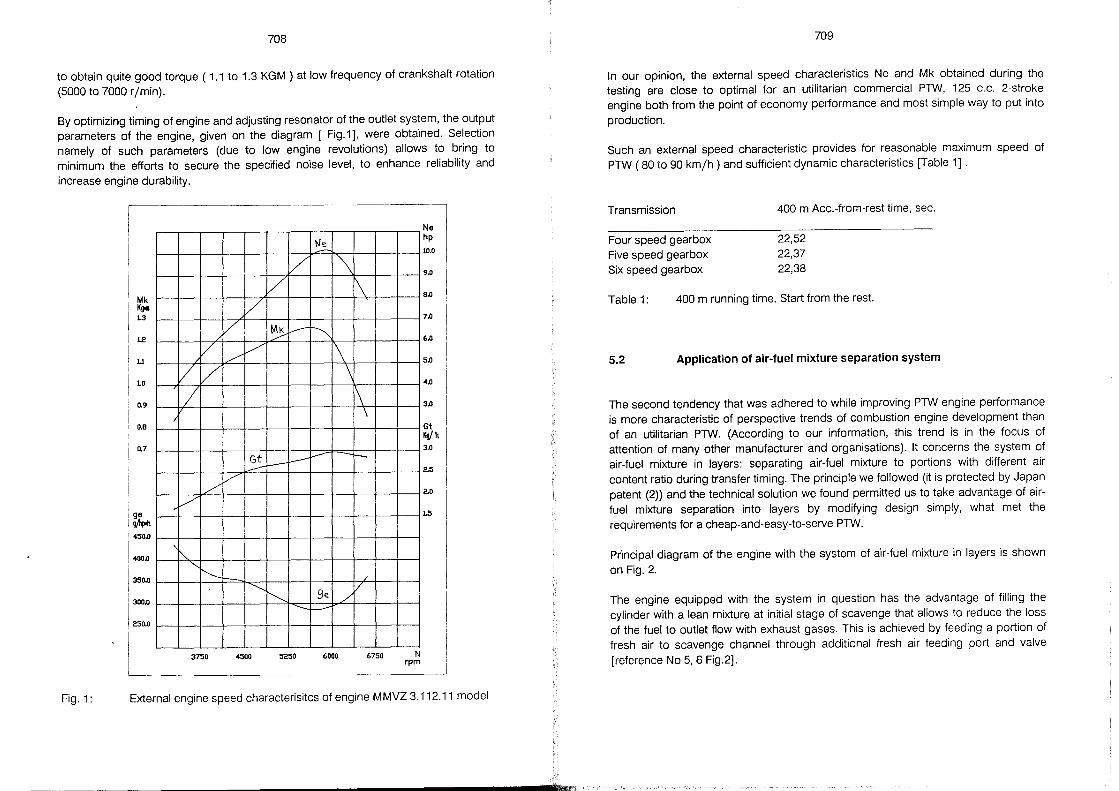
708
to obtain quite good torque ( 1.1 to 1.3 KGM ) at low frequency of crankshaft rotation (5000 to 7000 r Imin).
Sy optimizing timing of engine and adjusting resonator of the outlet system, the output parameters of the engine, given on the diagram [ Fig.1], were obtained. Selection namely of such parameters (due to low engine revolutions) aliows to bring to minimum the efforts to secure the specified noise level, to enhance reliability and increase engine durability.
Fig.1:
Mk K!J4I L3
L2
1.1
LO
0.9
0.8
0.7
ge ~ 450.0
400.0
350.0
300.0
250.0
V 1/ V 7
/'" /'
"-"-"--..
3750
V V
..-/ V
Gt ---V
'-~
4500
Ne
/ '\ 7
~ L-----"" [\ \
f....-~
~ ge ./ "-..:.:.: ---
5250 6000
\
1\ \
I-
/
6750 N rpm
Ne hp
10.0
9.0
8.0
7.0
6.0
5.0
4.0
3.0
Gt Kgjh 3.0
2,0
1.5
External engine speed characterisitcs of engine MMVZ 3.112.11 model
----------------------------------------~
709
In our opinion, the extern al speed characteristics Ne and Mk obtained during the testing are elose to optimal for an utilitarian commercial PTW, 125 c.c. 2-stroke engine both from the point of economy performance and most simple way to put into
production.
Such an external speed characteristic provides for reasonable maximum speed of PTW (80 to 90 km/h) and sufficient dynamic characteristics [Table 1] .
Transmission
Four speed gearbox Five speed gearbox Six speed gearbox
400 m Acc.-from-rest time, sec.
22,52 22,37 22,38
Table 1: 400 m running time. Start from the rest.
5.2 Application of air-fuel mixture separation system
The second tendency that was adhered to while improving PTW engine performance is more characteristic of perspective trends of combustion engine development than of an utilitarian PTW. (According to our information, this trend is in the focus of attention of many other manufacturer and organisations). It concerns the system of air-fuel mixture in layers: separating air-fuel mixture to portions with different air conte nt ratio during transfer timing. The principle we foliowed (it is protected by Japan patent (2)) and the technical solution we found permitted us to take advantage of airfuel mixture separation into layers by modifying design simply, what met the requirements for a cheap-and-easy-to-serve PTW.
Principal diagram of the engine with the system of air-fuel mixture in layers is shown on Fig. 2.
The engine equipped with the system in question has the advantage of filiing the cylinder with a lean mixture at initial stage of scavenge that allows to reduce the loss of the fuel to outlet flow with exhaust gases. This is achieved by feeding a portion of fresh air to scavenge channel through additional fresh air feeding port and valve [reference No 5, 6 Fig.2].
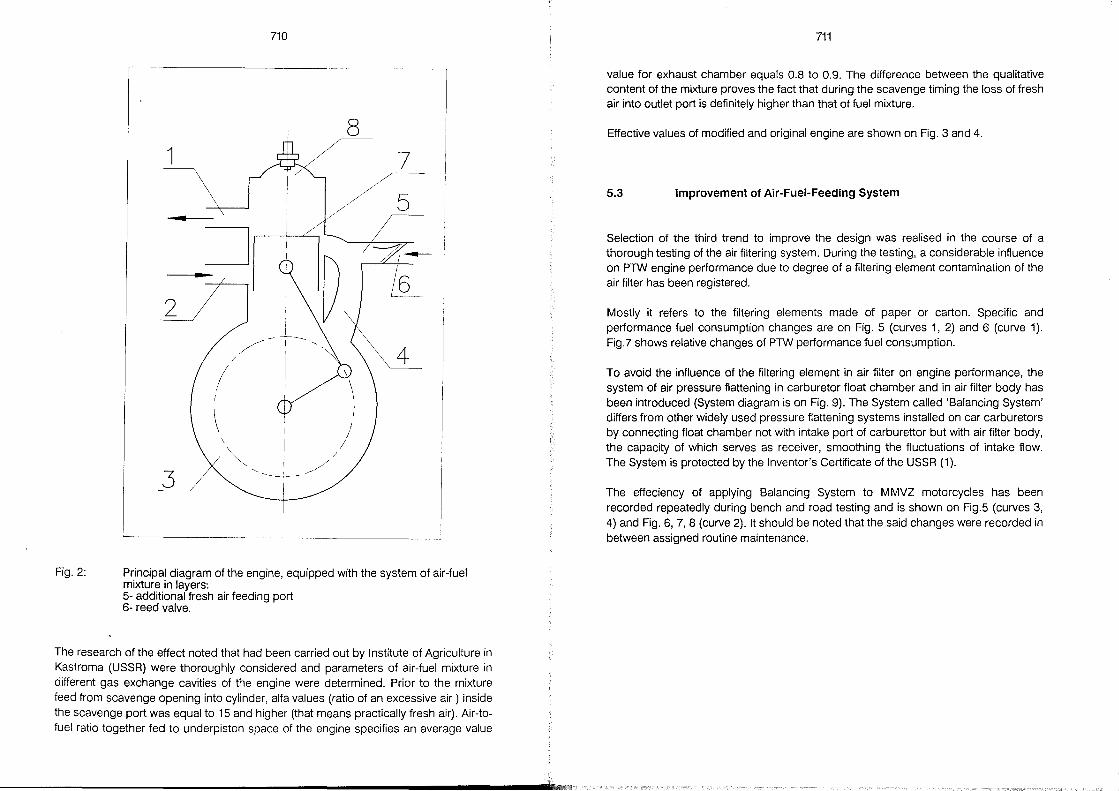
Fig.2:
710
Principal diagram of the engine, equipped with the system of air-fuel mixture in layers: 5- additional fresh air feeding port 6- reed valve.
The research of the effect noted that had been carried out by Institute of Agriculture in Kastroma (USSR) were thoroughly considered and parameters of air-fuel mixture in different gas exchange cavities of the engine were determined. Prior to the mixture feed from scavenge opening into cylinder, alfa values (ratio of an excessive air) inside the scavenge port was equal to 15 and higher (that means practically fresh air). Air -tofuel ratio together fed to underpiston space of the engine specifies an average value
711
value for exhaust chamber equals 0.8 to 0.9. The difference between the qualitative content of the mixture proves the fact that during the scavenge timing the loss of fresh air into outlet port is definitely higher than that of fuel mixture.
Effective values of modified and original engine are shown on Fig. 3 and 4.
5.3 Improvement of Air-Fuel-Feeding System
Selection of the third trend to improve the design was realised in the course of a thorough testing of the air filtering system. During the testing, a considerable influence on PTW engine performance due to degree of a filtering element contamination of the air filter has been registered.
Mostly it refers to the filtering elements made of paper or carton. Specific and performance fuel consumption changes are on Fig. 5 (curves 1, 2) and 6 (curve 1). Fig.7 shows relative changes of PTW performance fuel consumption.
To avoid the influence of the filtering element in air filter on engine performance, the system of air pressure flattening in carburetor float chamber and in air filter body has been introduced (System diagram is on Fig. 9). The System called 'Balancing System' differs from other widely used pressure flattening systems installed on car carburetors by connecting float chamber not with intake port of carburettor but with air filter bOdy, the capacity of which serves as receiver, smoothing the fluctuations of intake flow. The System is protected by the Inventor's Certificate of the USSR (1).
The effeciency of applying Balancing System to MMVZ motorcycles has been recorded repeatedly during bench and road testing and is shown on Fig.5 (curves 3, 4) and Fig. 6, 7, 8 (curve 2). It should be noted that the said changes were recorded in between assigned routine maintenance.
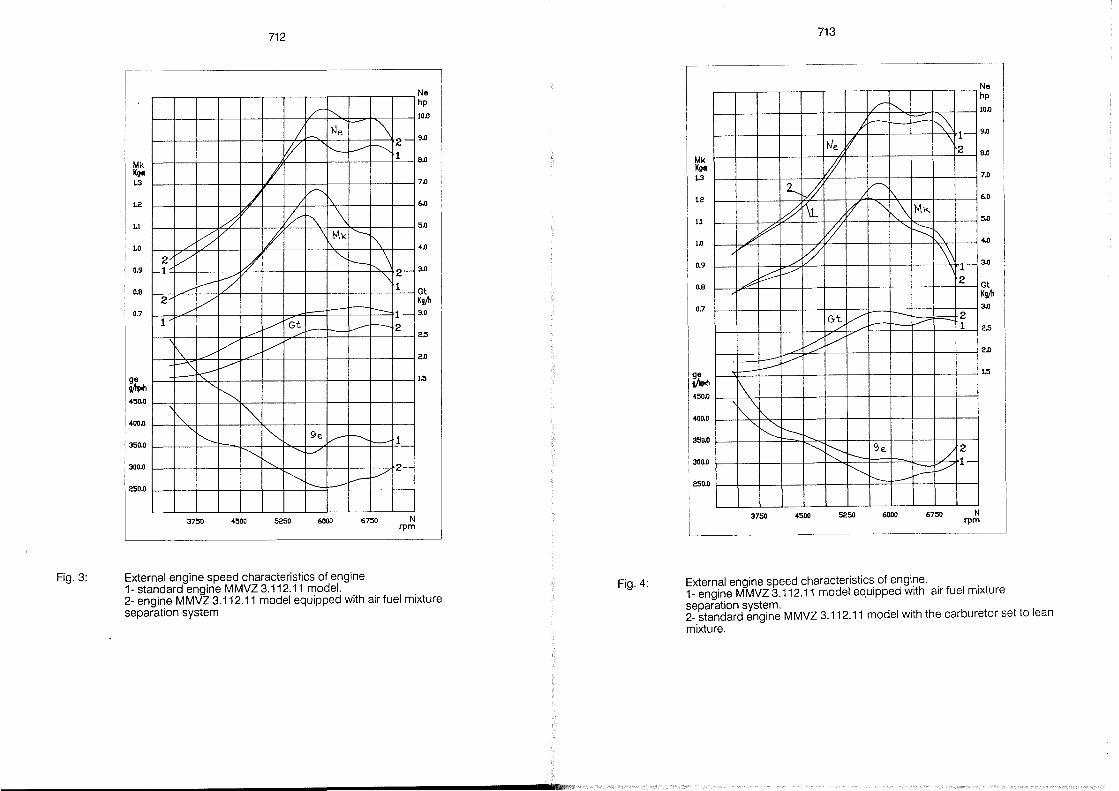
Fig.3:
Mk K'1'8 1.3
1.2
1J
1.0
0.9
D.8
0.7
ge gft.poh 450.()
400.0
350.0
300.0
250.0
2 -1
2
I
/~ /
.---V
.---V
~ .-/ ~ I----<
'"
~
i"--
3750
712
/ V
/ / /
A I!' V
/ 1/ /
-;;
V Gt ~
/ ~
V
------~
I~
"'" ~ ........
'-....
~
4500 5250
/" ~
L- Ne
'--
v---.
"" \ \ !v\\<.
"-..
--
ge ",.--/
i'- ---6000
= '\ --~ 2-
1
'----. '\
----",\ 2-'\ 1
- I-- l-
---- """'2
-......... 1
V 2-
I--
6750 N
Ne hp
10.0
9.0
e.o
7.0
5.0
4.0
3.0
Gt Kgftl 3.0
2.0
1 s
rpm
---------------------------~
External engine speed characteristics of engine 1- standard engine MMVZ 3.112.11 model. 2- engine M MVZ 3.112.11 model equipped with air fuel mixture separation system
----------------------",
Fig.4:
L2
1
1.1
1.0 A"V
~ #
0.9
0.8
0.7
--,----f\ ~ \1"-
"~
g8 gft.poh 450.0
400.0
350.0
300.0
250.0
3750
713
,
/" ~ r--_
/ We I ;{
,
~ 1-"\ 2
, Ne hp
10.0
9.0
8.0
7.0
2..... ß ~ I.
~ r\L )1 ~
/~ ~
G~ / .---
~ / V
----........
~ K---r--~
4500 5250
'" ,,\ MI<.
"''':::::: ~ ~
-
9e. /
1-2
2 1
2 1-
6.0 I
Gt Kgfo 3.0
2S
15
~ V
- :;p:::J !
~
External engine speed characteristics of engine. 1- engine MMVZ 3.112.11 model equipped with air fuel mixture separation system. 2- standard engine M MVZ 3.112.11 model with the carburetor set to lean mixture.
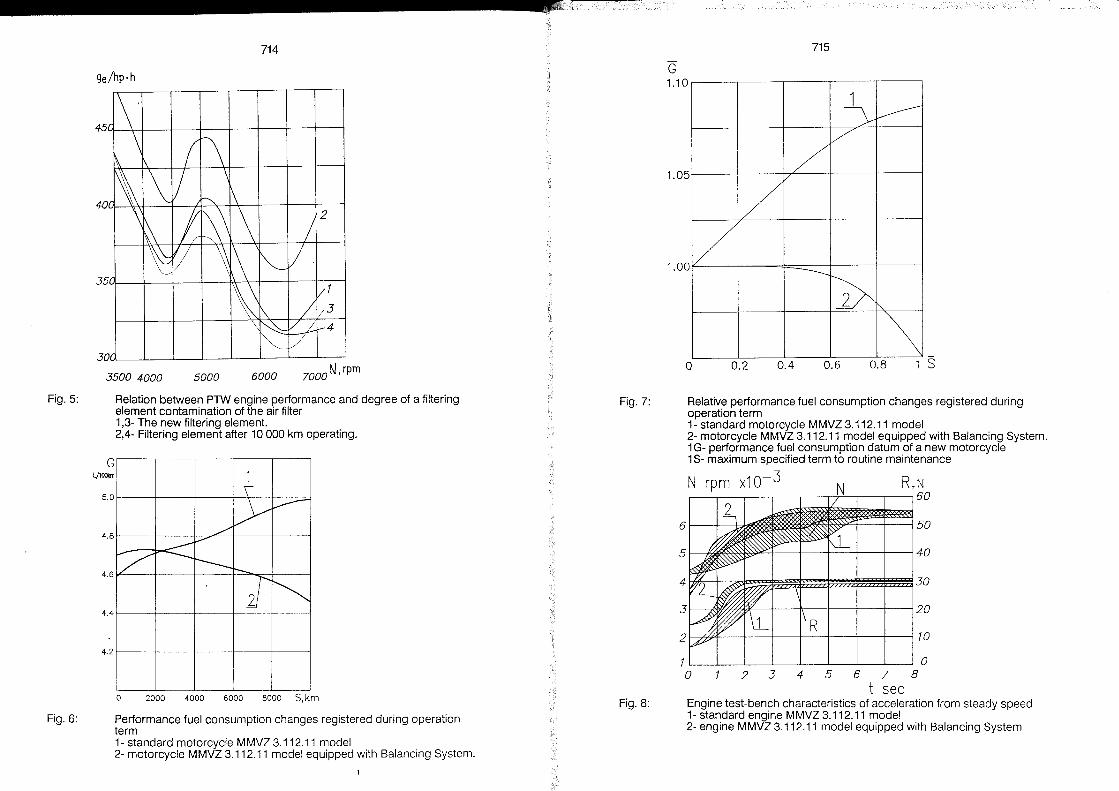
...................... ----.. ~------714
ge/hp. h
3
4
3500 4000 5000 6000 7000 N,rpm
Fig. 5: Relation between Plw engine performance and degree of a filtering element contamination of the air filter
G l/llXi1<m
5.0
4.8
4.6
4.4
4.2
Fig.6:
1,3- The new filtering element. 2,4- Filtering element after 10000 km operating.
1 \'
~ V--/""
----v
/ ---r----- !--
I ~
o 2000 4000 6000 8000 S,krn
Performance fuel consumption changes registered during operation term 1- standard motorcycle M MVZ 3.112.11 model 2- motorcycle MMVZ 3.112.11 model equipped with Balancing System.
Fig.7:
Fig.8:
715
G 1.10
~ ~ V
1.05 /
/ 1/ --1.00
1
~ '\
o 0.2 0.4 0.6 0.8
Relative performance fuel consumption changes registered during operation term 1- standard motorcycle MMVZ 3.112.11 model 2- motorcycle MMVZ 3.112.11 model equipped with Balancing System. 1 G- performance fuel consumption datum of a new motorcycle 1 S- maximum specified term to routine maintenance
N rpm x10- 3 R,N .--.---r--,---,--,~-r--,--,60
50
40
30
20
10
0 0 2 3 4 5 6 7 8
t sec Engine test-bench characteristics of acceleration from steady speed 1- standard engine M MVZ 3.112.11 model 2- engine M MVZ 3.112.11 model equipped with Balancing System
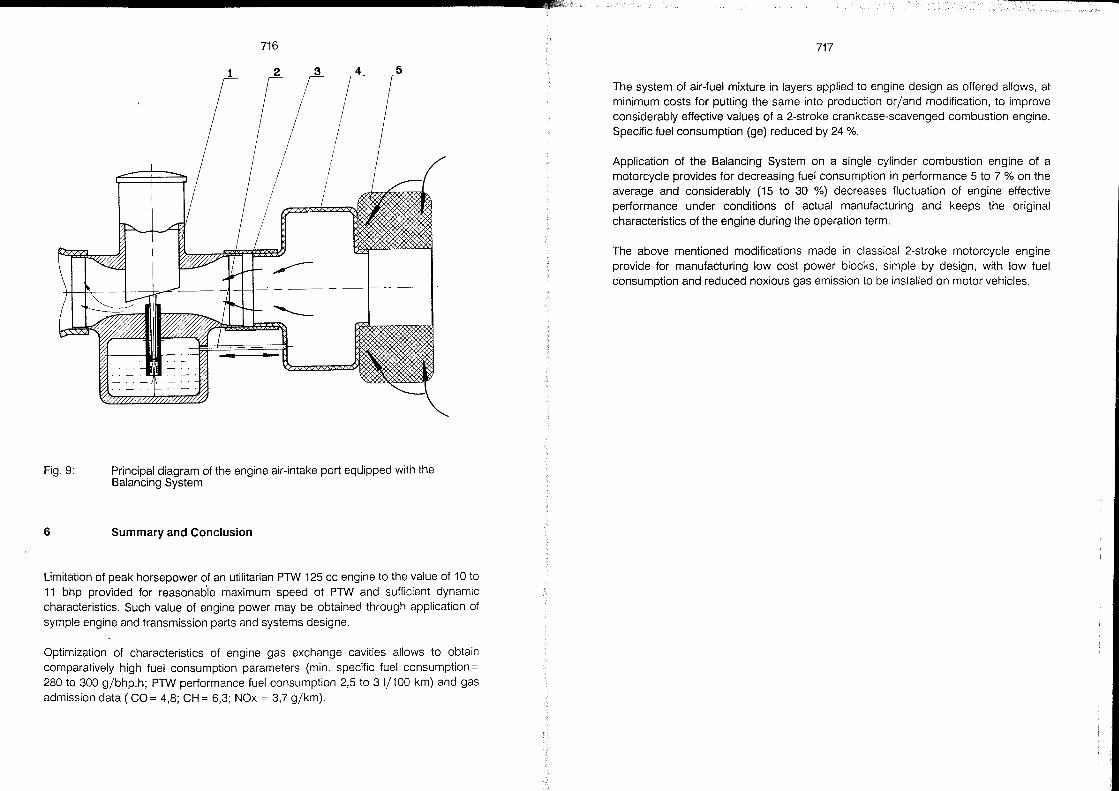
Fig.9:
6
716
Principal diagram of the engine air-intake port equipped with the Balancing System
Summary and Conclusion
Limitation of peak horsepower of an utilitarian PTW 125 cc engine to the value of 10 to 11 bhp provided for reasonable maximum speed of PTW and sufficient dynamic characteristics. Such value of engine power may be obtained through application of symple engine and transmission parts and systems designe.
Optimization of characteristics of engine gas exchange cavities aliows to obtain comparatively high fuel consumption parameters (min. specific fuel consumption = 280 to 300 g/bhp.h; PTW performance fuel consumption 2,5 to 3 1/100 km) and gas admission data (CO= 4,8; CH= 6,3; NOx = 3,7 g/km).
717
The system of air-fuel mixture in layers applied to engine design as offered allows, at minimum costs for putting the same into production or/and modification, to improve considerably effective values of a 2-stroke crankcase-scavenged combustion engine. Specific fuel consumption (ge) reduced by 24 %.
Application of the Balancing System on a single cylinder combustion engine of a motorcycle provides for decreasing fuel consumption in performance 5 to 7 % on the average and considerably (15 to 30 %) decreases fluctuation of engine effective performance under conditions of actual manufacturing and keeps the original characteristics of the engine du ring the operation term.
The above mentioned modifications made in classical 2-stroke motorcycle engine provide for manufacturing low cost power blocks, simple by design, with low fuel consumption and reduced noxious gas emission to be installed on motor vehicles.
"I
7
1)
2)
718
Reference List
Air-fuel mixture feeding system of 2-stroke internal combustion engine. -(Inventor's Certificate; 1288331)
2-cycle engine : Patent of Japan No (11) 60-1 08530(A) , Int. CI.F02833/30 Bisher erschienen:
Band 1 Koch, Hubert: Stufenführerschein für motorisierte Zweiradfahrer Synopse der vorliegenden
Modelle und Untersuchung
der empirischen Grundlagen.
Unter Mitarbeit von
Dorolhee Böhmer.
Bochum, 1983 (vergriffen).
Band 2 Schüler, Florian u.a.: Der Körperanprall gegen Schutzplanken beim Verkehrsunfall motorisierter Zweirad benutzer Bremerhaven, 1984.29,- DM
Band 3 Koch, Hubert (Hrsg.): Der Motorradunfall Beschreibung, Analyse,
Prävention.
Bremerhaven, 1986.54,- DM
Band 4 Bayer, Bernward:
Forsch u ngshefte Zweiradsicherheit
Das Pendeln und Flattern von Krafträdern Untersuchungen zur Fahrdynamik von
Krafträdern unter besonderer Berücksichtigung
konstruktiver Einflußparameter auf die
Hochgeschwindigkeitsgerodeausstabilität
Bremerhaven, 1986.42,- DM
Band 5 Koch, Hubert (Hrsg.): Passive Sicherheit für Zweiradfahrer Referate des 2. Bochumer Workshops
für Zweiradsicherheit.
Bochum, 1987.58,- DM
Band 6 Koch, Hubert (Hrsg.): Motorradfahren. Faszination und Restriktion Bochum, 1990.49,- DM
Band 7 Safety - Environment - Future Proceedings of the 1991 International
Motorcycle Conference.
Bochum, 1991.98,- DM
Bestellcoupon Bitte senden Sie mir gegen Rechnung folgende Forschungshefte:
__ Exemplar(e) Nr. 2
__ Exemplar(e) Nr. 3
__ Exemplar(e) Nr. 4
__ Exemplar(e) Nr. 5
__ Exemplar(e) Nr. 6
__ Exemplar(e) Nr. 7
Meine Adresse:
Alle Preise inkl. 7% Mehrwertsteuer plus Versandkosten An: Institut für Zweiradsicherheit GmbH, Westenfelder Str. 58, 4630 Bochum 6