SAFETY CLIMATE AMONG CONTRACTOR ORGANIZATIONS
11
C12 SAFETY CLIMATE AMONG CONTRACTOR ORGANIZATIONS Abdul Rahim Abdul Hamid 1* and Muhamad Firdauz A.Kadir 2 1, 2 Department of Structures and Materials, Faculty of Civil Engineering, Universiti Teknologi Malaysia, 81310 Johor bahru, Johor, Malaysia. *Corresponding author: [email protected] Abstract: Understanding the safety climate of a contractor organization with regard to safety and risk in the workplace will provide the overview of the current safety culture of that organization. The perceptions and attitudes of the workforce are important factors in assessing safety need to facilitate workplace safety improvement. Safety performance may fail if they do not take into account these current attitudes and perceptions. The aim of this study is to examine the factors and assessment of safety climate in contractor organizations. This study utilizes questionnaires survey to gauge employee attitudes and perceptions using several attitudes dimensions. The full employee attitude survey questionnaire were divided into two sections consists of 49 statements. The responses of this study were quiet encouraging with 60% participants responded. However, only 38 valid questionnaires sets were subject to analysis. The findings indicated that there are many factors and indicators of safety climate that had been found from the review of literature. There is no agreement on the number of factors required in the safety climate measurements, or which factors are the most effective. From the review of safety climate factors, the most frequently measured dimensions are related to management, safety systems and risk, followed by work pressure and competence and rules/procedures. On the assessment of the contractor safety climate, all the total average scores for each dimension are in level of satisfactory with score ranging from 6.48 to 8.04. Also all the safety climate dimensions show scores in the satisfactory values with score above six (6) for the system interfaces of the contractor organizations by safety climate matrix. Hence, those contractor organizations have the positive safety climate toward safety in their workplace. Keywords: Safety climate; Safety culture; Safety climate factors; Perception; Attitude 1.0 Introduction Many researchers and practitioners have explored various techniques, including some practices in other industries to reduce construction accidents and deaths. Although they may be well developed, it is still difficult to apply these practices in the construction industry. This means that the construction industry, as a sector, demands more specific safety practices. Improvements in working conditions and innovations in the equipment used in the industry are not enough to improve safety performance because organizational culture and human factors also play critical roles. In this regard, the influence of safety climate has attracted more and more attention in the development of safety practices. The safety climate is a term commonly used to describe the sum of employees’ perceptions and attitudes regarding overall safety within their organization. Nowadays, people always considered accident statistics and regular workplace audits as the expression for effective safety management. But actually safety performances often ignore the people side of safety. Audits can also give an incomplete picture of the level of risk within an organization and what is supposed to be happening .Yet, very little work has been undertaken systematically to measure expectations and attitudes toward occupational health and safety at various levels of organizations. For that matter, this study has been conducted with aimed at determining whether identifying attitudinal problem areas within contractor organizations will be
-
Upload
teknologimalaysia -
Category
Documents
-
view
1 -
download
0
Transcript of SAFETY CLIMATE AMONG CONTRACTOR ORGANIZATIONS

C12
SAFETY CLIMATE AMONG CONTRACTOR ORGANIZATIONS
Abdul Rahim Abdul Hamid1* and Muhamad Firdauz A.Kadir2
1, 2 Department of Structures and Materials, Faculty of Civil Engineering, Universiti Teknologi Malaysia, 81310 Johor bahru, Johor, Malaysia.
*Corresponding author: [email protected]
Abstract: Understanding the safety climate of a contractor organization with regard to safety and risk in the workplace will provide the overview of the current safety culture of that organization. The perceptions and attitudes of the workforce are important factors in assessing safety need to facilitate workplace safety improvement. Safety performance may fail if they do not take into account these current attitudes and perceptions. The aim of this study is to examine the factors and assessment of safety climate in contractor organizations. This study utilizes questionnaires survey to gauge employee attitudes and perceptions using several attitudes dimensions. The full employee attitude survey questionnaire were divided into two sections consists of 49 statements. The responses of this study were quiet encouraging with 60% participants responded. However, only 38 valid questionnaires sets were subject to analysis. The findings indicated that there are many factors and indicators of safety climate that had been found from the review of literature. There is no agreement on the number of factors required in the safety climate measurements, or which factors are the most effective. From the review of safety climate factors, the most frequently measured dimensions are related to management, safety systems and risk, followed by work pressure and competence and rules/procedures. On the assessment of the contractor safety climate, all the total average scores for each dimension are in level of satisfactory with score ranging from 6.48 to 8.04. Also all the safety climate dimensions show scores in the satisfactory values with score above six (6) for the system interfaces of the contractor organizations by safety climate matrix. Hence, those contractor organizations have the positive safety climate toward safety in their workplace. Keywords: Safety climate; Safety culture; Safety climate factors; Perception; Attitude 1.0 Introduction Many researchers and practitioners have explored various techniques, including some practices in other industries to reduce construction accidents and deaths. Although they may be well developed, it is still difficult to apply these practices in the construction industry. This means that the construction industry, as a sector, demands more specific safety practices. Improvements in working conditions and innovations in the equipment used in the industry are not enough to improve safety performance because organizational culture and human factors also play critical roles. In this regard, the influence of safety climate has attracted more and more attention in the development of safety practices. The safety climate is a term commonly used to describe the sum of employees’ perceptions and attitudes regarding overall safety within their organization. Nowadays, people always considered accident statistics and regular workplace audits as the expression for effective safety management. But actually safety performances often ignore the people side of safety. Audits can also give an incomplete picture of the level of risk within an organization and what is supposed to be happening .Yet, very little work has been undertaken systematically to measure expectations and attitudes toward occupational health and safety at various levels of organizations. For that matter, this study has been conducted with aimed at determining whether identifying attitudinal problem areas within contractor organizations will be
of any benefit as far as occupational health and safety is concerned. 1.1 Objectives
The aim of this project is to study the factors and assessment of safety climate in contractor organizations. To achieve the aim of this study, several objectives have been identified as follows:
1. To identify the safety climate factors and indicators 2. To measure safety attitudes and perceptions among contractors organizations 3. To determine strength and weakness of system interfaces among contractor
organizations. 1.2 Scope
Firstly, the scope for the literature review of safety climate in contractor organization has considered the literature surrounding safety climate and safety culture. Effort also being done on seeking and browsing through the internet to seek extra information with exploring the following key topics, safety climate, safety culture, safety climate factors, perceptions and attitudes. Specifically, this study only involves contractor construction firms that their employees had working experience with construction environment such as project managers, engineers and supervisory staff, safety personal (safety manager and safety officer) and others employees on that firm which involved directly in construction project around Johor Bahru district. This study was conducted by using one of the proposed methods which is an attitude survey by questionnaires form. 2.0 Literature Review There are many definitions put forward by the researchers from their discussion according to their research findings. Some of them say that, safety climate is the surface features of the safety culture discerned from the workforce's attitudes and perceptions at a given point in time (Flin, et al., 2000). For the purpose of this study safety climate is simply as an overall picture of the employees perceptions, attitudes and believes regarding to the safety and risk in their workplace. Safety climate and culture are respectively considered subsets of organizational climate and culture (Coyle et al, 1995), and both have received considerable attention in safety literature. Actually it is important to clarify the dissimilarity between both of the concept because the aim of the study is to measure safety climate, not safety culture. According to Cooper (2000) there are three components of safety culture that should be in focus. These components of safety culture can be separated into: psychological, situational and behavioral aspects (Gadd and Collins, 2002). There are several reason why the safety climate need to be assessed. Society is composed of people and their various cultures. It is because, there are a number of difficulties in trying to identify and change the culture of an organization. There is very hard in achieving cultural change because you have to change the fundamental beliefs and values that are shared by a group. These beliefs and values cannot just be created but this culture is developed over a period
of time and depends on a number of external factors (i.e. religion, legislation, language and education). Moreover, as safety climate represents an employee’s attitude to the original safety culture of an organization, an assessment of safety climate is seen as a valuable indication of safety culture. Many researchers have investigated safety climate constructs (Zohar, 1980; Coyle et al., 1995; Williamson et al., 1997) since Zohar proposed the safety climate model in 1980. However, there is no agreement on the number of factors required in the safety climate measurements, or which factors are the most effective. There are several safety climate questionnaires that have been developed to determine the factors that contribute to the safety climate. Typically in the form of self-report questionnaires administered as large-scale surveys in different sectors, principally the energy industries, but also in manufacturing and construction (Flin et al., 2000). The most commonly measured dimensions relate to management, safety systems, risk, followed by work pressure and competence (and rules/procedures may be worthy of more attention) Flin et al., (2000) although the areas are very wide. Previous attempts to replicate factor structures of safety climate scales have not been entirely fruitful (Coyle et al., 1995).Many questions remain to be investigated on beginning practices. If a basic factor set can be established, it must be shown to be reliable, valid, sufficiently broad and theoretically acceptable. 3.0 Study Methodology The objectives of this study were achieved by using two methods. The first method was the literature review of safety climate in contractor organization. The review has considered the literature surrounding safety climate and safety culture and all the classification aspect and terms use are derived from the journals, websites, articles as well as research report. Effort also being done on seeking and browsing through the internet to seek extra information by explores the key topics. The second method utilize questionnaires survey to asses employee attitudes an perceptions using several general attitudes dimensions, was adapted from Loughborough University Safety Climate Assessment Toolkit (LSCAT). The concepts relate to the employees' perceptions, beliefs and attitudes of people they could have been measured by either a qualitative or quantitative approach. For the purpose of this study a quantitative method was considered more appropriate which is an attitude survey by questionnaires form. Phase flow of the study methodology as shown in the Figure 1. The full employee attitude survey questionnaire that we modified are divided into two sections consists of 49 statements;
- Section A - Consist of six (6) questions for basic personal information. - Section B - Consist of (43) attitudes statement which all requiring answers on a five point
Likert-type scale (ranking from 1 = ‘strongly disagree to 5 = ''Strongly agree'). - As well as a final question allows respondents to give any other comments they may have
about health and safety in their workplace. Score item = Σ ai Xi / Σ Xi Where ai = Constant expressing the weight given to i Xi = variables expression the frequency of the response for i = 1,2,3,4, and 5

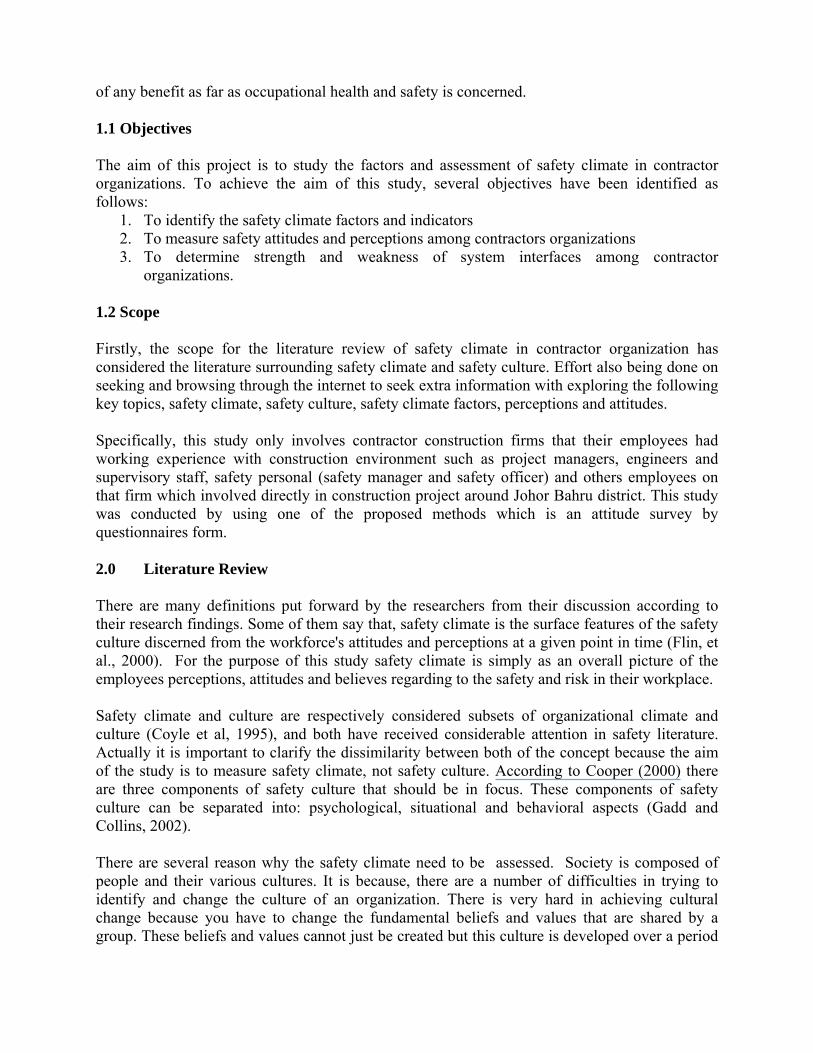
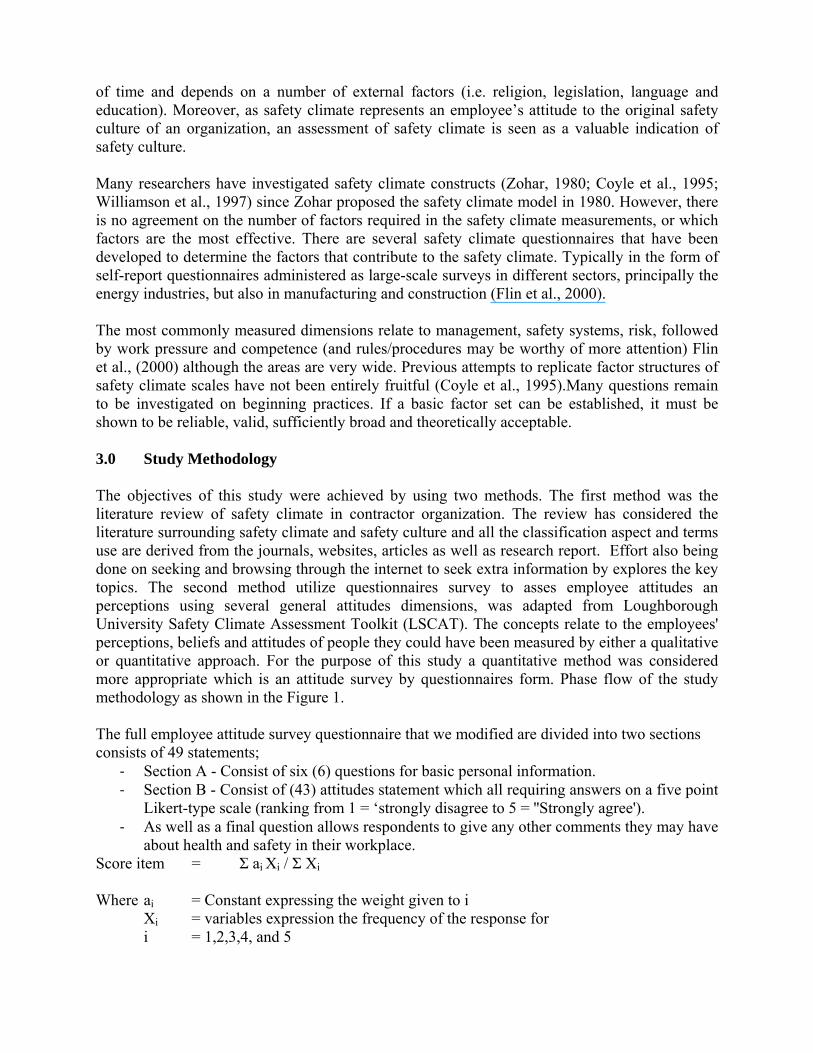
Scores for Each Dimension = Σ (Scores items) (Dimension Score) 4.0 Results and Analysis A total 80 sets of questionnaires were distributed to the targeted respondents around Johor Bahru district. The responses of this study were quiet encouraging with 60% of total rate responses. About 10 incomplete questionnaires with rate of 12.5 % had to be discarded due to an unacceptable amount of missing entries. As a result, 38 valid questionnaires were completed which represented a response rate of 47.5 % were final usable questionnaires subject to analysis. 4.1 Section A: Basic personal Information These surveys have identified several numbers of basic personal information in order to help interpret the results. Figure 2 until 3 shows the personal information’s of the target respondents. Figure 4 and 5 indicated that half of respondents were junior working in the less than five years old company and majority of them was diploma or degree holder as shown in Figure 6.
Report Writing Conclusion & Recommendation
PHASE 3
Presentation of ProjectPHASE 4
Figure 1: Research Methodology
Data
Data Analysis
Safety Climate Survey Questionnaires Form
Data Table, Radar Plot & System Interfaces
PHASE 2
Determination of Aims & Objective of the Study
Literature Review
Formulation of aims & Objective - Safety Climate - factors
& indicators - Existing methods - Existing tools
PHASE 1
Discussion
X 10
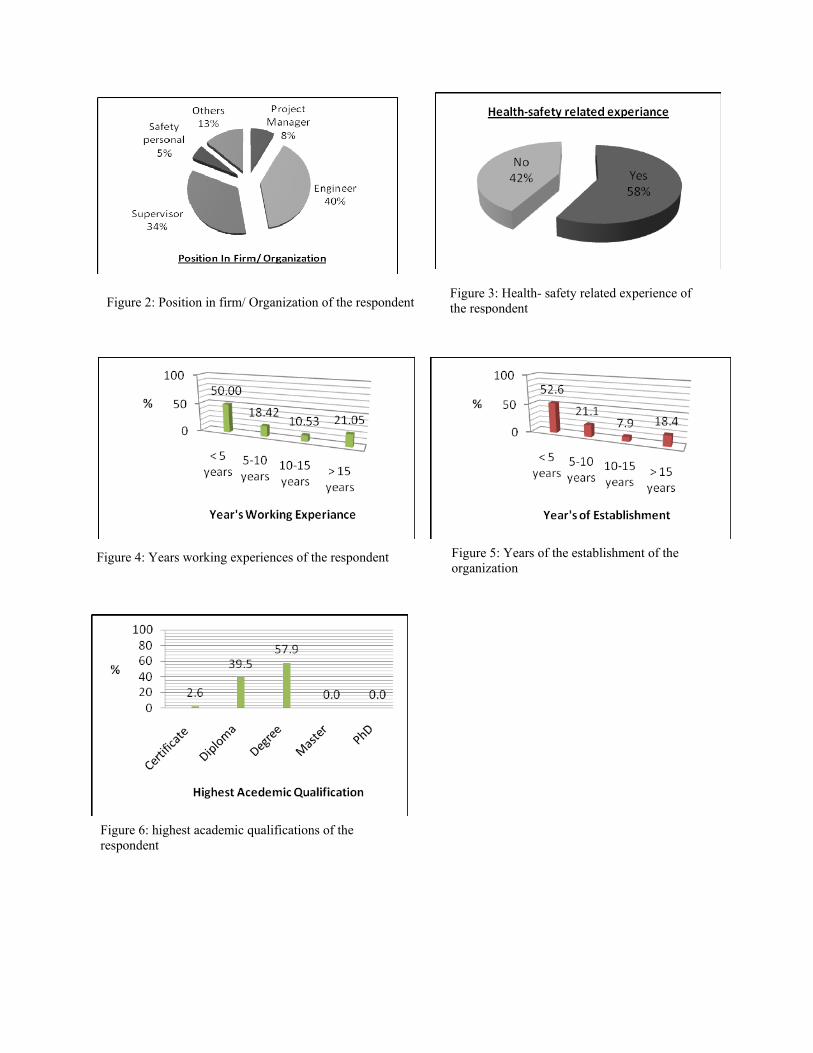
Figure 2: Position in firm/ Organization of the respondentFigure 3: Health- safety related experience of the respondent
Figure 4: Years working experiences of the respondent
Figure 5: Years of the establishment of the organization
Figure 6: highest academic qualifications of the respondent

Table 1: Summary of the Result of Safety Climate Dimensions Analysis
4.2 Section B: Attitudes Survey of Respondent These surveys had identified a number of general attitude dimensions with regard to views on and feelings about safety at work, using the questionnaire tool. These measures gave some indication of how people feel overall, that is, to what degree certain views and beliefs were shared among the workforce. Table 1 show the result of respondent’s rating of nine (9) Safety Climate Dimensions and the scores of each item.
Management Commitment Rate (%) Score Item SA(5) A(4) N(3) D(2) SD(1)
1. Management acts decisively when a safety concern is raised
NR 4 30 1 - 3 3.84 PR 10.53 78.95 2.63 - 7.89
2. Management acts only after accidents have occurred NR 8 7 18 2 3 3.03 PR 21.05 18.42 47.37 5.26 7.89
3. Corrective actions is always taken when management is told about unsafe practices
NR 5 20 3 8 2 3.47 PR 13.16 52.63 7.89 21.05 5.26 4. In my workplace management acts quickly to correct safety problems
NR 4 28 4 2 - 3.89 PR 10.53 73.68 10.53 5.26 - 5. In my workplace management turn a blind eye to safety issues
NR 1 3 3 22 9 3.92 PR 2.63 7.89 7.89 57.89 23.68 6. In my workplace managers/supervisors show interest in my safety
NR 3 32 3 - - 4.00 PR 7.89 84.21 7.89 - - 7. Managers and supervisors express concern if safety procedures are not adhered to
NR 4 27 1 4 2 3.71 PR 10.53 71.05 2.63 10.53 5.26
Communication Rate (%) Score Item SA (5) A (4) N (3) D (2) SD (1)
8. Management operates an open door policy on safety issues
NR 3 29 2 4 - 3.82 PR 7.89 76.32 5.26 10.53 - 9. My line manager/supervisor does not always inform me of current concerns and issues
NR - 4 9 18 7 3.74 PR - 10.53 23.68 47.37 18.42
10. I do not receive praise for working safely NR 1 11 8 15 3 3.21 PR 2.63 28.95 21.05 39.47 7.89
11. Safety information is always brought to my attention by my line manager/supervisor
NR 1 35 2 - - 3.97 PR 2.63 92.11 5.26 - - 12. There is good communication here about safety issues which affect me
NR 7 27 4 - - 3.92 PR 18.42 71.05 10.53 - -
Priority of Safety Rate (%) Score Item SA (5) A (4) N (3) D (2) SD (1)
13. I believe that safety issues are not assigned a high priority
NR - 6 6 14 12 3.84 PR - 15.79 15.79 36.84 31.58 14. Management clearly considers the safety of employees of great importance
NR 10 27 1 - - 4.24 PR 26.32 71.05 2.63 - -
15. Safety rules and procedures are carefully followed NR 4 32 2 - - 4.03 PR 10.53 84.21 5.26 - -
16. Management considers safety to be equally as important as production
NR 5 27 6 - - 3.97 PR 13.16 71.05 15.79 - -
Safety Rules and Procedures Rate (%) Score Item SA (5) A (4) N (3) D (2) SD (1)
17. Sometimes it is necessary to depart from safety requirements for production’s sake
NR - 9 11 14 4 3.34 PR - 23.68 28.95 36.84 10.53

18. Some health and safety rules and procedures are not really practical
NR 2 7 6 21 2 3.37 PR 5.26 18.42 15.79 55.26 5.26 19. Some safety rules and procedures do not need to be followed to get the job done safely
NR - 7 4 24 3 3.61 PR - 18.42 10.53 63.16 7.89
Supportive Environment Rate (%) Score Item SA (5) A (4) N (3) D (2) SD (1)
20. Employees are not encouraged to raise safety concerns NR - 4 12 14 8 3.68 PR - 10.53 31.58 36.84 21.05
21. Co-workers often give tips to each other on how to work safely
NR 2 27 6 2 1 3.84 PR 5.26 71.05 15.79 5.26 2.63
22. I am strongly encouraged to report unsafe conditions NR 4 28 5 1 - 3.92 PR 10.53 73.68 13.16 2.63 -
23. When people ignore safety procedures here, I feel it is none of my business
NR 1 3 2 13 19 4.21 PR 2.63 7.89 5.26 34.21 50.00 24. A no-blame approach is used to persuade people
acting unsafely that their behavior is inappropriate NR - 12 12 9 5 2.82 PR - 31.58 31.58 23.68 13.16
25. I can influence health and safety performance here Involvement
NR 4 23 4 7 - 3.63 PR 10.53 60.53 10.53 18.42 -
Involvement Rate (%) Score Item SA (5) A (4) N (3) D (2) SD (1)
26. I am involved in informing management of important safety issues
NR - 32 2 3 1 3.71 PR - 84.21 5.26 7.89 2.63
27. I am never involved in the ongoing review of safety NR 3 3 11 11 6 3.53 PR 7.89 7.89 28.95 28.95 15.79
28. I am involved with safety issues at work NR 3 29 3 3 - 3.84 PR 7.89 76.32 7.89 7.89 -
Personal Priorities and Need for Safety Rate (%) Score Item SA (5) A (4) N (3) D (2) SD (1)
29. Safety is the number one priority in my mind when completing a job
NR 8 28 1 1 - 4.13 PR 21.05 73.68 2.63 2.63 - 30. Personally I feel that safety issues are not the most important aspect of my job
NR - 7 3 16 12 3.87 PR - 18.42 7.89 42.11 31.58
31. I understand the safety rules for my job NR 4 33 1 - - 4.08 PR 10.53 86.84 2.63 - -
32. It is important to me that there is a continuing emphasis on safety
NR 5 31 2 - - 4.08 PR 13.16 81.58 5.26 - - 33. A safe place to work has a lot of personal meaning to me
NR 4 29 1 1 3 3.79 PR 10.53 76.32 2.63 2.63 7.89
Personal Appreciation of Risk Rate (%) Score Item SA (5) A (4) N (3) D (2) SD (1)
34. I am rarely worried about being injured on the job NR 6 25 1 2 4 3.71 PR 15.79 65.79 2.63 5.26 10.53
35. In my workplace the chances of being involved in an accident are quite large
NR 1 15 9 13 - 2.89 PR 2.63 39.47 23.68 34.21 - 36. I am sure it is only a matter of time before I am involved in an accident
NR - 19 7 9 3 2.89 PR - 50.00 18.42 23.68 7.89 37. I am clear about what my responsibilities are for health and safety
NR 4 32 1 1 - 4.03 PR 10.53 84.21 2.63 2.63 -
Work Environment Rate (%) Score Item SA (5) A (4) N (3) D (2) SD (1)
38. I cannot always get the equipment I need to do the job safely
NR - 12 1 22 3 3.42 PR - 31.58 2.63 57.89 7.89 39. Operational targets often conflict with safety measures NR 1 22 5 10 - 3.63

Table 2: Total Average Score each Dimensions
Figure 7: Result radar plot for total average scores
*Strongly Agree (SA), Agree (A), Neither Agree nor disagree (N), Disagree (D), strongly Disagree (SD), Number of Respondent (NR), Percentage of Respondent (PR)
PR 2.63 57.89 13.16 26.32 - 40. Sometimes conditions here hinder my ability to work safely
NR - 20 - 17 1 2.97 PR - 52.63 - 44.74 2.63 41. Sometimes I am not given enough time to get the job done safely
NR 1 12 6 19 - 3.13 PR 2.63 31.58 15.79 50.00 - 42. There are always enough people available to get the job done safely
NR 1 28 8 1 - 3.76 PR 2.63 73.68 21.05 2.63 - 43. This is a safer place to work than other companies I have worked for
NR 3 20 9 6 - 3.53 PR 7.89 52.63 23.68 15.79 - 4.3 Overall Data Profiling Table 2 and 3 then Figure 7 and 8 show the plotted scores derived from the safety climate measures to provide a graphical representation of each dimension and an overall picture of the current state of the organization and also comparative between position of workers in organization. The radar plot provided by this graph can be used as a comparison for future safety climate assessments for the same organization for improvement. Gap for improvements are shown on this graph as highest scores on each measure, thus the better the profile, the closer scores are to the outside of the graph.

Table 3: Total average scores between Engineer and Supervisor
Figure 8: Cooperative radar plots between Engineer and Supervisor
Safety Climate Dimension Average Score Engineer Supervisor
1. Management Commitment 7.37 7.36 2. Communication 7.49 7.29 3. Priority of Safety 7.73 8.27 4. Safety Rules and Procedures 7.29 6.82 5. Supportive Environment 7.31 7.28 6. Involvement 6.89 7.49 7. Personal Priorities and Need for Safety 7.89 7.85 8. Personal Appreciation of Risk 6.90 6.23 9. Work Environment 6.91 6.28
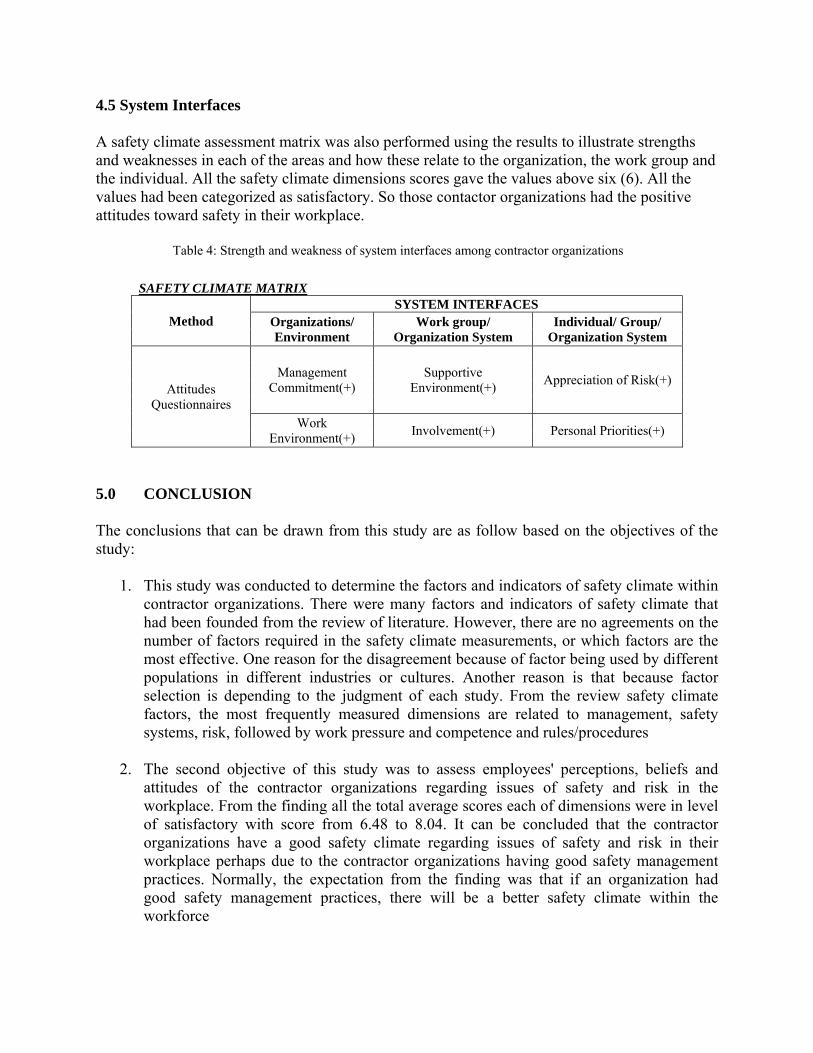
Table 4: Strength and weakness of system interfaces among contractor organizations
4.5 System Interfaces A safety climate assessment matrix was also performed using the results to illustrate strengths and weaknesses in each of the areas and how these relate to the organization, the work group and the individual. All the safety climate dimensions scores gave the values above six (6). All the values had been categorized as satisfactory. So those contactor organizations had the positive attitudes toward safety in their workplace.
SAFETY CLIMATE MATRIX
Method SYSTEM INTERFACES
Organizations/ Environment
Work group/ Organization System
Individual/ Group/ Organization System
Attitudes Questionnaires
Management Commitment(+)
Supportive Environment(+) Appreciation of Risk(+)
Work Environment(+) Involvement(+) Personal Priorities(+)
5.0 CONCLUSION The conclusions that can be drawn from this study are as follow based on the objectives of the study:
1. This study was conducted to determine the factors and indicators of safety climate within contractor organizations. There were many factors and indicators of safety climate that had been founded from the review of literature. However, there are no agreements on the number of factors required in the safety climate measurements, or which factors are the most effective. One reason for the disagreement because of factor being used by different populations in different industries or cultures. Another reason is that because factor selection is depending to the judgment of each study. From the review safety climate factors, the most frequently measured dimensions are related to management, safety systems, risk, followed by work pressure and competence and rules/procedures
2. The second objective of this study was to assess employees' perceptions, beliefs and
attitudes of the contractor organizations regarding issues of safety and risk in the workplace. From the finding all the total average scores each of dimensions were in level of satisfactory with score from 6.48 to 8.04. It can be concluded that the contractor organizations have a good safety climate regarding issues of safety and risk in their workplace perhaps due to the contractor organizations having good safety management practices. Normally, the expectation from the finding was that if an organization had good safety management practices, there will be a better safety climate within the workforce

3. The third objective was to determine strength and weakness of system interfaces among contractor organizations by safety climate matrix. From the finding, all the safety climate dimensions scores gave the values above six (6) for the system interfaces of the contractor organizations. All the values have been categories as satisfactory values. Those contractor organizations have the positive safety climate toward safety in their workplace
6.0 REFERENCES Cooper, M. D., 2000 Towards a model of safety culture. Safety Science, 36, 111-136. Cox, SJ & Cheyne, AJT (2000). Assessing safety culture in offshore environments. Safety Science.
vol.34, no. 1-3, p111-129 Flin, R., Mearns, K., O'Connor, P., & Bryden, R., 2000. Measuring safety climate: Identifying the
common features. Safety Science, 34, 177-192. Fiona Davies, Rachel Spencer, Karen Dooley., 2001 Summary guide to safety climate tools,
Offshore Technology Report 1999/063, HSE books, ISBN 0 7176 1958 3 Gadd, S. & Collins, A.M. , 2002 Safety Culture: a review of the literature Health & Safety
Laboratory HSL/2002/25 Guldenmund, F., 2000. The nature of safety culture: a review of theory and research. Safety
Science 34 (1-3), 215-257. Griffin, M. A., & Neal, A. , 2000 Perceptions of safety at work: A framework for linking safety
climate to safety performance, knowledge, and motivation. Journal of Occupational Health Psychology, 5,347-358.
Health & Safety Executive (HSE). , 2005 A review of safety culture and safety climate literature for the development of the safety culture inspection toolkit, Research report 367, HSE Books, ISBN 0 7176 6144 X
HSC (1993). ACSNI Study Group on Human Factors. 3rd Report: Organising for Safety. (London: HMSO
Oi-ling Siu. 2004. Safety climate and safety performance among construction workers in Hong Kong: The role of psychological strains as mediators, Accident Analysis & Prevention , Volume 36, Issue 3, May 2004, Pages 359-366.
Williamson, A., Feyer, A., Cairns, D., Biancotti, D., 1997. The development of a measure of safety climate: the role of safety perceptions and attitudes. Safety Science 25, 15±27
Zohar, D. 1980. Safety climate in industrial organizations: Theoretical and applied implications. Journal of Applied Psychology, 65, 96-102.