S E D A R - South Atlantic Fishery Management Council
511
S E D A R Southeast Data, Assessment, and Review ============================================= SEDAR 15 Stock Assessment Report 1 (SAR 1) South Atlantic Red Snapper February 2008 Revised March 2009 SEDAR is a Cooperative Initiative of: The Caribbean Fishery Management Council The Gulf of Mexico Fishery Management Council The South Atlantic Fishery Management Council NOAA Fisheries Southeast Regional Office NOAA Fisheries Southeast Fisheries Science Center The Atlantic States Marine Fisheries Commission The Gulf States Marine Fisheries Commission SEDAR Offices The South Atlantic Fishery Management Council 4055 Faber Place #201 North Charleston, SC 29405 (843) 571-4366
-
Upload
khangminh22 -
Category
Documents
-
view
1 -
download
0
Transcript of S E D A R - South Atlantic Fishery Management Council

S E D A R
Southeast Data, Assessment, and Review =============================================
SEDAR 15
Stock Assessment Report 1 (SAR 1)
South Atlantic Red Snapper
February 2008 Revised March 2009
SEDAR is a Cooperative Initiative of:
The Caribbean Fishery Management Council
The Gulf of Mexico Fishery Management Council
The South Atlantic Fishery Management Council
NOAA Fisheries Southeast Regional Office
NOAA Fisheries Southeast Fisheries Science Center
The Atlantic States Marine Fisheries Commission
The Gulf States Marine Fisheries Commission
SEDAR Offices The South Atlantic Fishery Management Council
4055 Faber Place #201
North Charleston, SC 29405
(843) 571-4366


Table of Contents South Atlantic Red Snapper
SEDAR 15 SAR 1
Stock Assessment Report 1 South Atlantic Red Snapper
Table of Contents
Section I Introduction
Section II Data Workshop Report
Section III Assessment Workshop Report
Section IV Review Workshop Report
Section V Addenda and Post-Review Updates

Table of Contents South Atlantic Red Snapper
SEDAR 15 SAR 1

Introduction South Atlantic Red Snapper
1
Section I. Introduction
Contents
1. SEDAR Overview ………………………………………………………. 3
2. Assessment History ……………………………………………….…….. 4
3. Management Review ……………………………………...…………….. 5
4. Southeast Region Maps …………………………………………………. 9
5. Summary Report ...………………………………………………………. 12
6. Stock Assessment Improvement (SAIP) Form .…………………………. 21
7. SEDAR Abbreviations ………………..………………………………… 22
Changes to the February 2008 Section I. Introduction April 24, 2008
1. Page 14, Fishing Mortality Trends - Text on page 15 preceding Figure 4 was amended to reflect that F40% was the proxy value for the fishing limit recommended by the review panel. The resultant value of F/F40% (a mean near 14) was entered to replace the value of F/Fmsy (a mean near 9.1).
2. Page 15, Figure 4 – The graph depicting F/Fmsy was replaced with a graph depicting F/F40%, the proxy value recommended by the review panel.
3. Page 16, Table 2 – The value of SSB2006/SSBF40% was corrected from 0.027 to 0.025. 4. Page 20, Table 5 – The heading of the sixth column was changed from SSB/SSB40% to
SSB/MSST40%. Column values did not change. 5. Page 21. Specific stock status data in the SAIP Form were amended to reflect changes 1-4
above. The B/Bmsy value of 0.027 was changed to 0.025, and the B/Blimit value of 0.029 was changed to 0.027.

Introduction South Atlantic Red Snapper
SEDAR 15 SAR 1 SECTION I
2

Introduction South Atlantic Red Snapper
SEDAR 15 SAR 1 SECTION I
1. SEDAR Overview
SEDAR (Southeast Data, Assessment and Review) was initially developed by the
Southeast Fisheries Science Center and the South Atlantic Fishery Management Council to
improve the quality and reliability of stock assessments and to ensure a robust and independent
peer review of stock assessment products. SEDAR was expanded in 2003 to address the
assessment needs of all three Fishery Management Council in the Southeast Region (South
Atlantic, Gulf of Mexico, and Caribbean) and to provide a platform for reviewing assessments
developed through the Atlantic and Gulf States Marine Fisheries Commissions and state agencies
within the southeast.
SEDAR strives to improve the quality of assessment advice provided for managing
fisheries resources in the Southeast US by increasing and expanding participation in the
assessment process, ensuring the assessment process is transparent and open, and providing a
robust and independent review of assessment products. SEDAR is overseen by a Steering
Committee composed of NOAA Fisheries representatives: Southeast Fisheries Science Center
Director and the Southeast Regional Administrator; Regional Council representatives: the
Executive Directors and Chairs of the South Atlantic, Gulf of Mexico, and Caribbean Fishery
Management Councils; and Interstate Commissions: the Executive Directors of the Atlantic
States and Gulf States Marine Fisheries Commissions.
SEDAR is organized around three workshops. First is the Data Workshop, during which
fisheries, monitoring, and life history data are reviewed and compiled. Second is the Assessment
workshop, during which assessment models are developed and population parameters are
estimated using the information provided from the Data Workshop. Third and final is the Review
Workshop, during which independent experts review the input data, assessment methods, and
assessment products.
SEDAR workshops are organized by SEDAR staff and the lead Council. Data and
Assessment Workshops are chaired by the SEDAR coordinator. Participants are drawn from
state and federal agencies, non-government organizations, Council members, Council advisors,
and the fishing industry with a goal of including a broad range of disciplines and perspectives.
All participants are expected to contribute to the process by preparing working papers,
contributing, providing assessment analyses, and completing the workshop report.
SEDAR Review Workshop Panels consist of a chair, a reviewer appointed by the
Council, and 3 reviewers appointed by the Center for Independent Experts (CIE), an independent
organization that provides independent, expert reviews of stock assessments and related work.
The Review Workshop Chair is appointed by the SEFSC director and is usually selected from a
NOAA Fisheries regional science center. Participating councils may appoint representatives of
their SSC, Advisory, and other panels as observers to the review workshop.
SEDAR 15 was charged with assessing red snapper and greater amberjack in the US
South Atlantic. This task was accomplished through workshops held between June 2007 and
January 2008.
3

Introduction South Atlantic Red Snapper
SEDAR 15 SAR 1 SECTION I
2. Assessment History
In the early 1990s, a series of unnumbered reports were prepared by the SAFMC Plan
Development Team (1990) and later by the Beaufort Reeffish Team (1991, 1992), in which
―snapshot‖ analyses were conducted for a list of snapper-grouper species, including red snapper.
These analyses included the estimation of SPR (spawning potential ratio) based on a single year
of data, and were intended to highlight species for future assessments. However, the only formal
assessment conducted on this stock of red snapper was by Manooch et al. [Population
assessment of the red snapper from the southeastern United States, Fisheries Research 38
(1998):19-32]. In that assessment, two age-structured models were used, an un-calibrated
separable VPA (emphasized in the abstract below) and FADAPT. The results from this latter
model were downplayed because the model was calibrated to a MARMAP chevron trap index,
for which low sample size was of major concern. Prior to publication, a report of this assessment
was prepared for the SAFMC and submitted on April 7, 1997. Estimates of SPR found in Potts
and Brennan (1998, 2001) are taken from the assessment report to SAFMC. The most recent
Gulf of Mexico red snapper assessment was conducted during the SEDAR 7 assessment process.
Abstract from Manooch et al: Changes in the age structure and population size of red snapper,
Lutjanus campechanus, from North Carolina through the Florida Keys were examined using
records of landings and size frequencies of fish from commercial, recreational, and headboat
fisheries from 1986 to 1995. Population size in numbers at age was estimated for each year by
applying separable virtual population analysis (SVPA) to the landings in numbers at age. SVPA
was used to estimate annual, age-specific fishing mortality (F) for four levels of natural mortality
(M=0.15, 0.20, 0.25, and 0.30). Although landings of red snapper for the three fisheries have
declined, minimum fish size regulations have also resulted in an increase in the mean size of red
snapper landed. Age at entry and age at full recruitment were age-1 for 1986-1991, compared
with age-2 and age-6, respectively, for 1992-1995. Levels of mortality from fishing (F) ranged
from 0.31 to 0.69 for the entire period. Spawning potential ratio (SPR) increased from 0.09 to
0.24 (M=0.25) from 1986 to 1995. The SPR level could be improved with a decrease in F, or an
increase in age at entry to the fisheries. The latter could be enhanced now if fishermen,
particularly recreational fishermen, comply with minimum size regulations.
4

Introduction South Atlantic Red Snapper
SEDAR 15 SAR 1 SECTION I
3. Management Review
Table 1. General Management Information
Species Red Snapper (Lutjanus campechanus)
Management Unit Southeastern US
Management Unit Definition All waters within South Atlantic Fishery
Management Council Boundaries
Management Entity South Atlantic Fishery Management Council
Management Contacts
SERO / Council
Jack McGovern/Rick DeVictor
Current stock exploitation status Overfishing
Current stock biomass status Unknown
Table 2. Specific Management Criteria
The 1998 assessment (Manooch et. al 1998) provided the value of F30%SPR, F40%SPR and M).
Criteria Current Proposed
Definition Value Definition Value
MSST [(1-M) or 0.5
whichever is
greater]*BMSY
Not specified MSST = [(1-
M) or 0.5
whichever is
greater]*BMSY
UNK (SEDAR 15)
MFMT F30%SPR=FMSY F=0.40 FMSY UNK (SEDAR 15)
MSY Yield at FMSY Not specified Yield at FMSY UNK (SEDAR 15)
FMSY F30%SPR F=0.40 FMSY UNK (SEDAR 15)
OY Yield at FOY Not specified Yield at FOY UNK (SEDAR 15)
FOY F40%SPR F=0.26 FOY =65%,
75%, 85%
FMSY
UNK (SEDAR 15)
M n/a 0.25 SEDAR 10 UNK (SEDAR 15)
5

Introduction South Atlantic Red Snapper
SEDAR 15 SAR 1 SECTION I
Table 3. Stock Rebuilding Information
If the stock is currently under a rebuilding plan, please provide the following details:
Rebuilding Parameter Value
Rebuilding Plan Year 1 *
Generation Time (Years)
Rebuilding Time (Years)
Rebuilt Target Date
Time to rebuild @ F=0 (Years)
*In the past, red snapper was listed as overfished. As such, Amendment 4 (regulations effective
January 1992) implemented a rebuilding plan ≤ 15 years beginning in 1991. Red snapper is
currently listed as unknown in terms of an overfished status. The overfished determination of
this stock has been changed to unknown to better reflect the current knowledge of its status. The
previous pre-SFA determination of overfished for this stock was based on SPR, which is
inadequate to determine the overfished status because it is not biomass-based and therefore does
not meet criteria specified in the SFA. A biomass-based determination that is SFA compliant
cannot be made at this time.
Table 4. Stock projection information. (This provides the basic information necessary to bridge the gap between the terminal year of the assessment and
the year in which any changes may take place or specific alternative exploitation rates should be evaluated)
Requested Information Value
First Year of Management 2009
Projection Criteria during interim years should be
based on (e.g., exploitation or harvest)
Fixed Exploitation; Modified
Exploitation; Fixed Harvest*
Projection criteria values for interim years should
be determined from (e.g., terminal year, avg of X
years)
Average of previous 3 years
*Fixed Exploitation would be F=FMSY (or F<FMSY) that would rebuild overfished stock to BMSY
in the allowable timeframe. Modified Exploitation would be allow for adjustment in F<=FMSY,
which would allow for the largest landings that would rebuild the stock to BMSY in the
allowable timeframe. Fixed harvest would be maximum fixed harvest with F<=FMSY that would
allow the stock to rebuild to BMSY in the allowable timeframe.
6

Introduction South Atlantic Red Snapper
SEDAR 15 SAR 1 SECTION I
Table 5. Quota Calculation Details
If the stock is managed by quota, please provide the following information
Quota Detail Value
Current Quota Value N/A
Next Scheduled Quota Change N/A
Annual or averaged quota ? N/A
If averaged, number of years to average N/A
Other? N/A
Table 6. Regulatory and FMP History
Description of Action FMP/Amendment Effective Date
4‖ Trawl mesh size and 12‖ TL minimum size limit Snapper Grouper FMP 8/31/1983
Prohibit trawls Snapper Grouper Amend 1 1/12/1989
Required permit to fish for, land or sell snapper
grouper species
Snapper Grouper Amend 3 1/31/1991
Prohibited gear: fish traps except bsb traps north of
Cape Canaveral, FL; entanglement nets; longline
gear inside 50 fathoms; bottom longlines to harvest
wreckfish; powerheads and bangsticks in
designated SMZs off S. Carolina. Established 20‖
TL minimum size and a 10 snapper/person/day bag
limit, excluding vermilion snapper, and allowing no
more than 2 red snappers.
Snapper Grouper Amend 4 1/1/1992
Oculina Experimental Closed Area. Snapper Grouper Amend 6 6/27/1994
Limited entry program; transferable permits and
225 lb non-transferable permits.
Snapper Grouper Amend 8 12/14/1998
Vessels with longline gear aboard may only possess
snowy grouper, warsaw grouper, yellowedge
grouper, misty grouper, golden tilefish, blueline
tilefish, and sand tilefish.
Snapper Grouper Amend 9 2/24/1999
Approved definitions for overfished and
overfishing. MSST = [(1-M) or 0.5 whichever is
greater]*BMSY.
MFMT = FMSY
Snapper Grouper Amend 11 12/2/1999
Extended for an indefinite period the regulation
prohibiting fishing for and possessing snapper
grouper species within the Oculina Experimental
Closed Area.
Snapper Grouper Amend
13A
4/26/2004
7

Introduction South Atlantic Red Snapper
SEDAR 15 SAR 1 SECTION I
Table 7. Annual Regulatory Summary 1
Commercial Fishery Regulations Recreational Fishery Regulations
Effective
Date
Size
Limit
Trip Limit Season Catch
Limit
Size
Limit
Possession Limit Season Catch
Target
Both/Other
8/31/1983 12‖ TL 12‖ TL
1/1/1992 20‖ TL 20‖ TL
1/1/1992 10 snapper/person/day
bag limit, excluding
vermilion snapper, and
allowing no more than
2 red snappers.
References
Manooch, C.S., III, J.C. Potts, D.S. Vaughan, and M.L. Burton. 1998. Population assessment of the red snapper from the southeastern
United States. Fisheries Research. 38:19-32.
8

Introduction South Atlantic Red Snapper
SEDAR 15 SAR 1 SECTION I
4. Southeast Region Maps
Southeast Region including Council and EEZ Boundaries
9

Introduction South Atlantic Red Snapper
SEDAR 15 SAR 1 SECTION I
South Atlantic Council Boundaries, including contours, EEZ, and statistical area grid
10

Introduction South Atlantic Red Snapper
SEDAR 15 SAR 1 SECTION I
*U.S. GPO:200-656-
140 Statistical Grids and Codes
11

Introduction South Atlantic Red Snapper
SEDAR 15 SAR 1 SECTION I
5. Summary Report
Stock Distribution and Identification
This assessment applies to the South Atlantic red snapper stock.
Stock Status
The assessment indicates that the stock has been overfished since 1960 and overfishing is currently
occurring.
Figure 1. Biomass and Spawning Stock Biomass.
Assessment Methods
A statistical catch-at-age model (SCA) and a surplus-projection model (ASPIC) were considered in this
assessment. A surplus-production model treats all fish in the population as having similar characteristics
such as vulnerability to predation or to being caught in the fishery, and similar reproductive capacity.
However, in fish populations natural mortality decreases with age, as fish become larger, and fecundity
– reproductive capacity – increases with age. A catch-at-age model takes into account the changes in
those characteristics with the age of the fish and it can account for recruitment variability and changes in
selectivity due to regulations. Because of this enhanced ability to capture demographics, the catch-at-
age model was chosen for evaluating stock status and providing management benchmarks and advice.
Assessment Data Summary
Data used for this assessment consist of records of commercial catch for the handline (hook-and-line)
and dive fisheries, logbook data from the recreational headboat fishery, and MRFSS survey data of the
rest of the recreational sector.
12

Introduction South Atlantic Red Snapper
SEDAR 15 SAR 1 SECTION I
Table 1. Assessment Data Availability
Fishery Landings Estimated Discards Indices
Commercial
handline 1945-2006 1984-2006 1993-2006
Commercial dive 1984-2006 -- --
Headboat 1972-2006 1984-2006 1976-2006
Recreational
(MRFSS)
1981-2006
1984-2006 1983-2006
A 12-inch length limit for red snapper was instituted in 1984, which is believed to have caused an
increase in discarding. The dive fishery was assumed to generate no discards because of the selectivity
of the method. Mortality rates used for discarded fish were 0.4 for the recreational fisheries and 0.9 for
the commercial handline fishery. The higher mortality in the commercial fishery is due to the depth at
which the fish are caught, and the effect of pressure changes as they are brought to the surface, and the
length of time fish may be on deck before being returned to the water – the handling time of the fishery.
The base natural mortality (M) in the fishery was 0.078. This was assumed to be a constant over time,
but varying with age because younger fish are much more vulnerable (for example, to predation) than
larger, older fish.
Red snapper do not change sex over their lifetimes, and studies supported a constant 50:50 sex ratio for
the population. The mean generation time of 20 years was estimated from data.
Catch Trends
The bulk of landings of red snapper come from the recreational fishery, which have exceeded the
landings of the commercial fishery by 2-3 fold over the assessment period. Total landings were
variable, with a downward trend through the 1990s.
13

Introduction South Atlantic Red Snapper
SEDAR 15 SAR 1 SECTION I
Figure 2. Landings by fishery sector, 1984-2006. (Discards by weight were unavailable in this
assessment).
Fishing Mortality Trends
Fishing mortality can be evaluated by examining the time series of fully-recruited fishing mortality for
both the landings and discards in the fishery. This is simply the sum of mortality by age in each
component of the fishery.
Figure 3. Fully recruited fishing mortality.
14

Introduction South Atlantic Red Snapper
SEDAR 15 SAR 1 SECTION I
The fishing mortality (F) is compared to what the fishing mortality would be if the fishery were operating
at the proxy level for maximum fishing (F40%). The ratio of F/F40% suggests a generally increasing trend
from the 1950s through the mid-1980s, and since 1985 has fluctuated about a mean near 14. This
indicates that overfishing has been occurring since 1960 at about 14 times the sustainable level, with the
2006 estimate of F/F40% at 12.021.
Figure 4. F/F40% The assessment review panel recommended the proxy value of F40% as the fishing
limit, due to uncertainty in the assessment and the overfished/overfishing status of the stock.
Stock Abundance and Biomass Trends
Estimated abundance-at-age shows truncation of the oldest ages from the 1950s into the 1980s; the age
structure continues to be in a truncated condition. Fish of age 10 and above are practically non-existent in
the population.
Estimated biomass-at-age follows a similar pattern of truncation as seen in the abundance data. Total
biomass and spawning biomass show nearly identical trends—sharp decline during the 1950s and 1960s,
continued decline during the 1970s, and stable but low levels since 1980.
Numbers of age-1 fish have declined during the same period, however notably strong year classes
occurred in 1983 and 1984, and again in 1998 and 1999.
15

Introduction South Atlantic Red Snapper
SEDAR 15 SAR 1 SECTION I
Figure 5. Age structure of the population (standardized to year-1 biomass).
Status Determination Criteria
The maximum fishing mortality threshold (MFMT) is defined by the Council as FMSY, and the minimum
stock size threshold (MSST) as (1 − M)SSBMSY, where SSB refers to Spawning Stock Biomass, SSBMSY
is the level of SSB when the fishery is operating at maximum sustainable yield, and constant M is 0.078.
Technically, ―overfishing‖ is defined as occurring whenever F > MFMT and a stock is ―overfished‖ when
SSB < MSST. Current status of the stock and fishery are represented by the latest assessment year
(2006).
Table 2. Status Summary Table (conditioned on the base run of the model).
Quantity Units Estimate
MFMT (F40%) per year 0.07
B40% mt 17347
SSBF40% mt 7891
MSSTF40% mt 7275
MSYF40% 1000 lb 2314
DF40% 1000 fish 37
FMSY per year 0.112
F2006/F40% – 12.021
SSB2006/SSBF40% – 0.025
In addition to MSY-related benchmarks, proxies were computed based on per recruit analyses. These
quantities may serve as proxies for FMSY, if the spawner-recruit relationship cannot be estimated reliably.
The proxies computed include Fmax, F30%, and F40%, along with their associated yields. The value of Fmax is
defined as the level of fishing, F, that maximizes yield per recruit. F30% and F40% are the levels
corresponding to 30% and 40% of the spawning potential ratio of the unfished stock. Uncertainty in the
assessment led the review panel to choose F40% as the MFMT value for red snapper.
16

Introduction South Atlantic Red Snapper
SEDAR 15 SAR 1 SECTION I
Stock Status
Initial stock status was well above the maximum sustainable yield (MSY) benchmark, but declined
sharply during the 1950s and 1960s. Declines slowed during the 1970s, and the stock has been stable at
low levels since 1980. Based on the ratio of current estimated biomass to biomass at MSY, the stock is
considered to be overfished. The benchmark history for period 1984-2006 is shown in Table 5.
Uncertainty
The effects of uncertainty in model structure were examined by comparing two structurally different
assessment models—the catch-at-age model and a surplus-production model. For each model,
uncertainty in data or assumptions was examined through sensitivity runs, which involve varying the
value of a parameter and evaluating its impact on the model. Precision of benchmarks was computed by
a parametric bootstrap procedure.
Projection methods
Projections were run to predict stock status in years after the assessment, 2007–2040. This 34 year time
frame is the sum of mean generation time (20 years) and the number of years it would take for spawning
biomass to reach SSBMSY if no fishing occurred. The structure of the projection model was the same as
that of the assessment model, and parameter estimates were those from the base run of the assessment
model. Time-varying quantities, such as fishery selectivity curves, were fixed to reflect the most recent
values of the assessment period, 2004-2006.
Table 3 shows the results of the 12 projection scenarios. What the discard-only projections show is that
in order to rebuild the stock, the total catch (landings and discards) of red snapper will need to be
reduced, not just the landings.
Special Comments
Reproduction in this model was calculated from mid-year spawning stock biomass (SSB), to reflect the
actual timing of spawn. In most SEDAR models, the Jan. 1 SSB is assumed representative for purposes
of calculating reproduction.
17

Introduction South Atlantic Red Snapper
SEDAR 15 SAR 1 SECTION I
Table 3. Projection Scenarios (based on a reference run of the model). These are model projections
based on the assumptions in the right hand column that provide an estimate of stock recovery dates.
Projection Scenario Projected Recovery Date
F = 0 2020
F = Fcurrent (reflecting 2004-2006) 0.3% of recovered value by 2040
FMSY 97.5% of recovered value by 2040
F65%MSY 2025
F75%MSY 2027
F85%MSY 2030
FRebuild (FRebuild = 0.109, about 97% of FMSY) 2040
Discard Only Scenarios: All fish caught at rate F are discarded, and discard mortalities
are applied
F = Fcurrent (without Commercial Dive
fishing)
Discard mortality: Com = 0.9, Rec = 0.4
15% of recovered value by 2040
F = Fcurrent (without Commercial Dive fishing)
Discard mortality: Com = 0.8, Rec = 0.2 25% of recovered value by 2040
F = Fcurrent (without Commercial Dive
fishing)
Discard mortality: Com = 1.0, Rec = 0.6
9.8% of recovered value by 2040
F = FRebuild
Discard mortality: Com = 0.9, Rec = 0.4 2040
F = FRebuild
Discard mortality: Com = 0.7, Rec = 0.4 2040
18

Introduction South Atlantic Red Snapper
SEDAR 15 SAR 1 SECTION I
Table 4. Landings by fishery sector in thousands of pounds (whole weight), and discards in
thousands of fish; 1984-2006.
Year Recreational Landings
Commercial Landings
Recreational Discards
Commercial Discards
1984 613.78 231.76 46.81 6.76
1985 691.65 225.27 31.78 3.34
1986 490.21 200.71 28.69 6.37
1987 329.50 173.24 28.85 13.82
1988 415.23 152.30 29.96 6.83
1989 384.54 243.63 10.55 2.52
1990 338.44 203.35 17.94 27.47
1991 294.30 130.69 9.35 3.70
1992 298.22 96.96 21.30 16.46
1993 301.50 212.11 31.68 16.07
1994 171.01 188.58 32.13 22.01
1995 167.52 174.24 29.28 21.74
1996 163.08 136.15 15.62 29.03
1997 165.22 106.37 9.52 30.35
1998 220.80 86.73 37.71 22.97
1999 319.33 88.84 69.51 20.66
2000 405.01 100.57 96.28 19.63
2001 432.89 189.85 98.88 21.31
2002 375.73 181.68 82.74 19.92
2003 340.80 134.45 74.24 17.04
2004 354.23 166.69 80.43 14.23
2005 331.95 124.40 75.91 13.74
2006 313.10 83.17 63.65 15.22
19

Introduction South Atlantic Red Snapper
SEDAR 15 SAR 1 SECTION I
Table 5. Benchmarks 1984-2006. The fishing mortality rate is full F, which includes discard
mortalities. B is the total biomass at the start of the year, and SSB is the spawning biomass at midyear.
B and SSB are in units mt (metric tonnes: 1,000 kg). SPR is static spawning potential ratio
Year F F/F40% B SSB SSB/SSB40% SPR
1984 1.076 15.376 839 180 0.025 0.011
1985 1.066 15.230 825 191 0.027 0.012
1986 1.000 14.284 663 173 0.024 0.013
1987 0.838 11.967 591 160 0.022 0.020
1988 0.852 12.176 616 163 0.023 0.018
1989 0.920 13.137 598 153 0.021 0.016
1990 1.037 14.815 553 141 0.020 0.014
1991 0.745 10.649 520 142 0.020 0.025
1992 0.897 12.807 575 169 0.024 0.033
1993 1.185 16.924 607 174 0.024 0.022
1994 1.166 16.664 509 158 0.022 0.026
1995 1.161 16.589 457 140 0.019 0.024
1996 1.027 14.669 413 123 0.017 0.028
1997 0.948 13.547 414 122 0.017 0.032
1998 0.932 13.321 504 138 0.019 0.030
1999 1.019 14.561 668 175 0.024 0.026
2000 1.058 15.113 814 224 0.031 0.025
2001 1.303 18.612 863 243 0.034 0.021
2002 1.223 17.465 797 235 0.033 0.023
2003 1.019 14.550 747 231 0.032 0.027
2004 1.160 16.574 720 215 0.030 0.022
2005 1.017 14.533 661 195 0.027 0.024
2006 0.841 12.021 644 194 0.027 0.030
20

1. SAIP Form (To be completed following the Review Workshop)
Stock Assessment Improvement Program Assessment Summary Form
This form must be completed for each stock assessment once it has passed review or been
rejected without anticipated revisions in the near future (<1 year). Please fill out all information
to the best of your ability. FMP Common Name Snapper-grouper Stock Red snapper (Lutjanus campechanus) Level of Input Data for
Abundance 1 0 = none; 1 = fishery CPUE or imprecise survey with size composition; 2 = precise, frequent survey with age composition; 3 = survey with estimates of q; 4 = habitat-specific survey Catch 4 0 = none; 1 = landed catch; 2 = catch size composition; 3 = spatial patterns (logbooks); 4 = catch age composition; 5 = total catch by sector (observers) Life History 2 0 = none; 1 = size; 2 = basic demographic parameters; 3 = sesaonal or spatial information (mixing, migration); 4 = food habits data
Assessment Details Area South Atlantic e.g., Gulf of Mexico, South Atlantic, Caribbean, Atlantic. Level 4 0 = none; 1 = index only (commercial or research CPUE); 2 = simple life history equilibrium models; 3 = aggregated production odels; 4 = size/age/stage-structured models; 5 = add ecosystem (multispecies, environment), spatial & seasonal analyses Frequency 1 0 = never; 1 = infrequent; 2 = frequent or recent (2-3 years); 3 = annual or more Year Reviewed 2008 Last Year of Data 2006 Used in the assessment Source SEDAR 15 Stock Assessment Report 1 Citation Review Result Accept Accept, Reject, Remand, or Not_reviewed Assessment Type Benchmark New, Benchmark, Update, or Carryover Notes
Stock Status F/Ftarget ? F/Flimit 12.02 B/BMSY 0.025 B/Blimit 0.027 Overfished? Yes Overfishing? Yes
Basis for Ftarget ? e.g., FOY Flimit F40% e.g., FMSY BMSY SSB at F40% Blimit MSST e.g., MSST
Next Scheduled Assessment Year not scheduled Month
Introduction South Atlantic Red Snapper
SEDAR 15 SAR 1 SECTION I 21

Introduction South Atlantic Red Snapper
SEDAR 15 SAR 1 SECTION I
6. SEDAR Abbreviations
ABC Allowable Biological Catch ACCSP Atlantic Coastal Cooperative Statistics Program ADMB AD Model Builder software program ALS Accumulated Landings System; SEFSC fisheries data collection program ASMFC Atlantic States Marine Fisheries Commission B stock biomass level BAC SAFMC SSC Bioassessment sub-Committee BMSY value of B capable of producing MSY on a continuing basis CFMC Caribbean Fishery Management Council CIE Center for Independent Experts CPUE catch per unit of effort GMFMC Gulf of Mexico Fishery Management Council F fishing mortality (instantaneous)
FSAP GMFMC Finfish Assessment Panel FMSY fishing mortality to produce MSY under equilibrium conditions FOY fishing mortality rate to produce Optimum Yield under equilibrium FXX% SPR fishing mortality rate that will result in retaining XX% of the maximum
spawning production under equilibrium conditions FMAX fishing mortality that maximises the average weight yield per fish recruited
to the fishery F0, a fishing mortality close to, but slightly less than, Fmax FWRI (State of) Florida Fisheries and Wildlife Research Institute GLM general linear model
GSMFC Gulf States Marine Fisheries Commission
GULF FIN GSMFC Fisheries Information Network Lbar mean length M natural mortality (instantaneous) MFMT maximum fishing mortality threshold, a value ofF above which overfishing
is deemed to be occurring MRFSS Marine Recreational Fisheries Statistics Survey; combines a telephone
survey of households to estimate number of trips with creel surveys to estimate catch and effort per trip
MSST minimum stock size threshold, a value of B below which the stock is deemed to be overfished
MSY maximum sustainable yield NMFS National Marine Fisheries Service NOAA National Oceanographic and Atmospheric Administration
OY optimum yield RVC Reef Visual Census—a diver-operated survey of reef-fish numbers SAFMC South Atlantic Fishery Management Council SAS Statistical Analysis Software, SAS corporation. SEDAR Southeast Data, Assessment and Review SEFSC NOAA Fisheries Southeast Fisheries Science Center SERO NOAA Fisheries Southeast Regional Office SFA Sustainable Fisheries Act of 1996 SPR spawning potential ratio, stock biomass relative to an unfished state of the
stock
22

Introduction South Atlantic Red Snapper
SEDAR 15 SAR 1 SECTION I
SEDAR Abbreviations – continued
SSB Spawning Stock Biomass SSC Science and Statistics Committee TIP Trip Incident Program; biological data collection program of the SEFSC
and Southeast States. Z total mortality, the sum of M and F
23

Introduction South Atlantic Red Snapper
SEDAR 15 SAR 1 SECTION I
24

Data Workshop Report South Atlantic Red Snapper
1
Section II. Data Workshop Report
Contents
1. Introduction ……………………………………….…..……………………...…………… 3
2. Life History…....………….……………….…….………………….…………………….. 7
3. Commercial Statistics…….……….……………………......……………….…………….. 27
4. Recreational and Headboat Statistics…………….…………………………..……………. 62
5. Indicators of Population Abundance……………….……………………………...………. 80
6. Submitted Comments ……………………………………………………………………. 134
Changes to the February 2008 Section II. Data Workshop Report April 24, 2008
1. Pages 77-79, Figure 4.2 – Individual graphs and their year/sample size designations, which were improperly matched, were matched properly. Errant lines were removed from the individual graphs.
2. Page 82, paragraph 5.3.1.3 – The text was changed to clarify what commercial trips were used to determine effective effort. There were no changes in methods, and no new analyses were performed.
3. Page 85, paragraph 5.3.2.3 – The text was changed to clarify what headboat trips were used to determine effective effort. There were no changes in methods, and no new analyses were performed.
4. Page 116, Figure 5.9 – Errant blank spaces were removed to reveal state and county lines. 5. Page 118, Figure 5.11 – Errant lines were removed from the figure.

Data Workshop Report South Atlantic Red Snapper
SEDAR 15 SAR 1 SECTION II
2

Data Workshop Report South Atlantic Red Snapper
SEDAR 15 SAR 1 SECTION II
1. Introduction
1.1 Workshop Time and Place
The SEDAR 15 Data Workshop was held July 9 - 13, 2007 in Charleston, SC.
1.2 Terms of Reference
1. Characterize stock structure and develop a unit stock definition. Provide a map of
species and stock distribution.
2. Tabulate available life history information (e.g., age, growth, natural mortality,
reproductive characteristics); provide appropriate models to describe growth,
maturation, and fecundity by age, sex, or length as applicable. Evaluate the
adequacy of available life-history information for conducting stock assessments
and recommend life history information for use in population modeling.
3. Provide measures of population abundance that are appropriate for stock
assessment. Document all programs used to develop indices, addressing program
objectives, methods, coverage, sampling intensity, and other relevant
characteristics. Provide maps of survey coverage. Consider relevant fishery
dependent and independent data sources; develop values by appropriate strata
(e.g., age, size, area, and fishery); provide measures of precision. Evaluate the
degree to which available indices adequately represent fishery and population
conditions. Recommend which data sources should be considered in assessment
modeling.
4. Characterize commercial and recreational catch, including both landings and
discard removals, in weight and number. Evaluate the adequacy of available data
for accurately characterizing harvest and discard by species and fishery sector.
Provide length and age distributions if feasible. Provide maps of fishery effort and
harvest.
5. Provide recommendations for future research in areas such as sampling, fishery
monitoring, and stock assessment. Include specific guidance on sampling
intensity and coverage where possible.
6. Prepare complete documentation of workshop actions and decisions (Section II. of
the SEDAR assessment report).
1.3 Participants
Workshop Panel
Alan Bianchi ...................................................................................................... NCDMF
Ken Brennan .............................................................................................NMFS SEFSC
Steve Brown ...................................................................................................... FL FWC
Christine Burgess ............................................................................................... NCDMF
Julie Califf ........................................................................................................ GA DNR
Rob Cheshire .............................................................................................NMFS SEFSC
Chip Collier ....................................................................................................... NCDMF
John Dean .............................................................................. SAFMC SSC/Univ. of SC
3

Data Workshop Report South Atlantic Red Snapper
SEDAR 15 SAR 1 SECTION II
David Gloeckner .......................................................................................NMFS SEFSC
Jack Holland ...................................................................................................... NCDMF
Stephanie McInerny ..................................................................................NMFS SEFSC
Doug Mumford .................................................................................................. NCDMF
Jennifer Potts .............................................................................................NMFS SEFSC
Marcel Reichert .................................................................................................. SC DNR
Jason Rueter ............................................................................................... NMFS SERO
Beverly Sauls ..................................................................................................... FL FWC
Kyle Shertzer .............................................................................................NMFS SEFSC
Tom Sminkey ...................................................................................................NMFS HQ
Doug Vaughan ...........................................................................................NMFS SEFSC
Byron White ....................................................................................................... SC DNR
Geoff White ..........................................................................................................ACCSP
David Wyanski ................................................................................................... SC DNR
Scott Zimmerman .......................................................................................... SAFMC AP
(FL Keys Comm. Fisherman’s Assoc.)
Council Representation
Brian Cheuvront...................................................................................SAFMC/NCDMF
Observers
Kevin Kolmos ................................................................................................... SC DNR
Mark Stratton .................................................................................................... SC DNR
Nate West .......................................................................................................... SC DNR
Megan Westmeyer ..................................................................................... SC Aquarium
Gabe Ziskin ........................................................................................ MARMAP/C of C
Staff
John Carmichael.....................................................................................SEDAR/SAFMC
Rick DeVictor ......................................................................................................SAFMC
Patrick Gilles...............................................................................................NMFS SEFSC
Rachael Lindsay................................................................................................... SEDAR
1.4 Workshop Documents
SEDAR15 South Atlantic Red Snapper & Greater Amberjack
Workshop Document List
Document # Title Authors
Documents Prepared for the Data Workshop
SEDAR15-DW1 Discards of Greater Amberjack and Red Snapper
Calculated for Vessels with Federal Fishing
Permits in the US South Atlantic
McCarthy, K.
4

Data Workshop Report South Atlantic Red Snapper
SEDAR 15 SAR 1 SECTION II
Documents Prepared for the Assessment Workshop
SEDAR15-AW-1 SEDAR 15 Stock Assessment Model Conn, P., K.
Shertzer, and E.
Williams
Documents Prepared for the Review Workshop
SEDAR15-RW1
SEDAR15-RW2
Final Assessment Reports
SEDAR15-AR1 Assessment of Red Snapper in the US South
Atlantic
SEDAR15-AR2 Assessment of Greater Amberjack in the US South
Atlantic
Reference Documents
SEDAR15-RD01 Age, growth, and reproduction of greater
amberjack, Seriola dumerili, off the Atlantic coast
of the southeastern United States
Harris, P. ,
Wyanski, D.,
White, D. B.
SEDAR15-RD02
2007.
A Tag and Recapture study of greater amberjack,
Seriola dumerili, from the Southeastern United
States
MARMAP, SCDNR
SEDAR15-RD03 Stock Assessment Analyses on Atlantic Greater
Amberjack
Legault, C.,
Turner, S.
SEDAR15-RD04 Age, Growth, And Reproduction Of The Red
Snapper, Lutjanus Campechanus, From The
Atlantic Waters Of The Southeastern U.S.
White, D. B.,
Palmer, S.
SEDAR15-RD05 Atlantic Greater Amberjack Abundance Indices
From Commercial Handline and Recreational
Charter, Private, and Headboat Fisheries through
fishing year 1997
Cummings, N.,
Turner, S.,
McClellan, D. B.,
Legault, C.
SEDAR15-RD06
2007. MS Thesis,
UNC Wilm. Dept.
Biol. & Marine Biol.
Age and growth of red snapper, Lutjanus
Campechanus, from the southeastern United States
McInerny, S.
SEDAR15-RD07
2005. CRP Grant #
NA03NMF4540416.
Characterization of commercial reef fish catch and
bycatch off the southeast coast of the United
States.
Harris, P.J., and J.A.
Stephen
SEDAR15-RD08 The 1960 Salt-Water Angling Survey, USFWS
Circular 153
Clark, J. R.
SEDAR15-RD09 The 1965 Salt-Water Angling Survey, USFWS
Resource Publication 67
Deuel, D. G. and J.
R. Clark
5

Data Workshop Report South Atlantic Red Snapper
SEDAR 15 SAR 1 SECTION II
SEDAR15-RD10 1970 Salt-Water Angling Survey, NMFS Current
Fisheries Statistics Number 6200
Deuel, D. G.
6

Data Workshop Report South Atlantic Red Snapper
SEDAR 15 SAR 1 SECTION II
2 Life History 2.1 Overview
State and federal biologists comprised the life history workgroup:
Chip Collier NCDMF
Stephanie McInerny NMFS, Beaufort
Paulette Mikell SCDNR
Jennifer Potts NMFS, Beaufort
Jessica Stephen SCDNR
Byron White SCDNR
David Wyanski SCDNR - chair
This group’s first task was to pull together the two red snapper age datasets supplied by
SCDNR and NMFS-Beaufort. The primary issue faced in combining these datasets was
not being able to convert increment counts in the SCDNR data to ages; no edge codes had
been assigned. Upon examination of data from NMFS, it was determined that only 3% of
the samples would be affected by not converting increment counts to age. A comparison
of von Bertalanffy growth curves based on fractional age and increment count data from
NMFS (corrected for size limits) revealed no difference in estimated theoretical growth
(Figure 2.2); therefore, using increment counts for this assessment should not affect the
overall result.
Another issue concerning the age data is determining the consistency of age estimates
between laboratories (NMFS Beaufort and SCDNR). To do this, one reader from each
laboratory examined a random subsample of 100 red snapper otoliths. An average
percent error (APE) of 9.65 % was calculated from this exchange. For 95% of the
samples exchanged, there was a difference of 0-2 increments between readers, suggesting
similar otolith interpretation. Plots of total length at increment count were similar
between laboratories (Figure 2.3).
A final issue facing the group was estimating discard mortality. A previous assessment
of the red snapper population along the Atlantic coast used point estimates of 10% and
25% for release mortality based on observations by NMFS personnel. These estimates
are low when compared to data in the recent red snapper assessment conducted in the
Gulf of Mexico (SEDAR7). We also considered recent observer data collected from the
headboat fishery on the Atlantic coast and commercial fisheries on the Atlantic coast and
in the Gulf of Mexico. The decision was made to recommend the use of slightly higher
point estimates of discard mortality in the commercial and recreational sectors (relative to
those in SEDAR7) for the current assessment because depth data indicate that fishing
occurs at greater depths in the Atlantic vs. Gulf of Mexico. Discard mortality was not
estimated by depth zone because the model in the current assessment will likely not have
a depth component.
7

Data Workshop Report South Atlantic Red Snapper
SEDAR 15 SAR 1 SECTION II
2.2 Stock definition and description
Red snapper has been managed as separate Atlantic and Gulf stock units, and the SEDAR
15 workshop panel was instructed by the SAFMC to continue with the two US
management units.
2.2.1 Otolith Chemistry
An otolith microchemistry study from the Gulf of Mexico region showed that Age 0 red
snapper collected in three areas (north central, northwest, and southwest) can be
classified to collection area with an accuracy of >87% based on the ratios of calcium to
barium, cadmium, magnesium, and strontium (Patterson et al. 2001a). It may be possible
to use this methodology to distinguish Gulf of Mexico and Atlantic coast fish.
2.2.2 Population genetics
There is no published evidence to date for separate Gulf of Mexico and Atlantic coast
populations. A study by Garber et al. (2004) based on sequences from the control region
of mtDNA concluded that red snapper constitute a single, panmictic population over the
sampled range (Yucatan Peninsula, northern Gulf of Mexico, and the east coast of
Florida). This question should be investigated again with the use of nuclear-DNA
markers to search for inter- and intra-regional differences.
2.2.3 Demographic comparisons
Temporal differences in growth for Atlantic red snapper were recently investigated by
NMFS (SEDAR15-RD06) and SCDNR (SEDAR15-RD04). Mean total length of red
snapper collected off North Carolina and South Carolina were significantly larger than
those sampled off the east coast of Florida (P = 0.01; SEDAR15-RD06). However, mean
calendar age was also significantly larger for North and South Carolina red snapper (P <
0.0001), indicating that a possible reason for larger fish is simply the presence of older
fish. To detect differences in red snapper growth between the Carolinas and Florida,
length at age was compared. Data from both NMFS (SEDAR15-RD06) and SCDNR
(SEDAR15-RD04) showed there were no significant differences in length at age between
areas (P > 0.05).
2.2.4 Larval transport and connectivity
It has been hypothesized that there are pathways for larval connectivity and transport
from the Gulf of Mexico to the Atlantic (Powles 1977), but oceanographic surface
conditions on the west coast of Florida do not favor transport of eggs and larvae in this
direction during the spawning peak of red snapper in the Gulf of Mexico (Jun - Aug;
SEDAR7-DW-35). A two-dimensional model that utilizes wind stress data shows that
the summer (Apr - Sep) months are characterized by continuous flow to the northwest
with Ekman surface transport toward the northwest Florida coast (Fitzhugh et al. 2005).
To evaluate transport below the surface, a three-dimensional model is necessary.
8

Data Workshop Report South Atlantic Red Snapper
SEDAR 15 SAR 1 SECTION II
2.2.6 Tagging
There is no evidence in tagging studies for movement of red snapper between the Gulf of
Mexico and the Atlantic coast (See 2.8. Movements and migrations).
2.3 Natural mortality
2.3.1 Juvenile (YOY)
Juvenile red snapper are rarely encountered (n = 0 to 4 per year) in a nearshore (<30 ft)
fishery-independent trawling program (SEAMAP) in the Atlantic. Little is known about
the life history of larval and juvenile red snapper; therefore, no estimate of natural
mortality is available.
2.3.2 Sub-adult/Adult
Natural mortality of red snapper was estimated using several methods. Initially, natural
mortality (M) of red snapper was estimated to be 0.078 using the regression model
reported by Hoenig (1983) for teleosts: ln(M) = 1.46-1.01*ln(tmax). Natural mortality
from Hoenig’s approach was 0.078 based on a maximum increment count of 53, since
counts were not converted to calendar ages in the data workshop. The maximum
calendar age of red snapper in the Gulf of Mexico is reported as 57 yr (Allman et al.
2002), which differs slightly from the maximum calendar age of 54 yr in the Atlantic
(SEDAR15-RD06). Natural mortality was also estimated using a variety of models based
on von Bertalanffy growth or reproductive parameters. Using these alternative models
(Alverson and Carney 1975, Beverton 1992, Pauly 1980, and Ralston 1987), M ranged
from 0.005 – 1.458 along the Atlantic coast. The Lorenzen (1996) model provides an
age-specific estimate of natural mortality that ranges from 0.07 – 0.17 for fish with
increment counts 2 to 53, with a higher estimate of 0.29 for fish with only 1 increment.
Manooch et al. (1998) reported an estimate of M = 0.25, but the maximum age in their
study was 25 yr.
Atypically low natural mortality estimates (M = 0.005) for Atlantic red snapper derived
from the Alverson and Carney (1975) equation and uncommonly high estimates (M =
1.458) resulting from an equation by Beverton (1992) may be due to the unique life
history of red snapper, as they mature at an early age but have the potential to live >50 yr.
With respect to age at maturity relative to maximum age, red snapper do not follow the
regression relationship previously established for some long-lived fishes (Beverton
1992).
Issue:
1.) Max age of red snapper in the Gulf is different than along the Atlantic coast.
2.) Natural mortality estimates using models based on growth and reproductive
parameters were highly variable.
9

Data Workshop Report South Atlantic Red Snapper
SEDAR 15 SAR 1 SECTION II
Recommendations:
1.) Use max age of 53 for this assessment since only increment counts are being used for
age analysis and differences in estimates from models utilizing max age is minimal.
2.) Use Lorenzen age-specific model for estimates of natural mortality for Ages 1+.
3.) If desired, use a baseline estimate of 0.10 for the initial evaluations with a sensitivity
analysis between 0.05 and 0.15. This baseline estimate matches the estimate used for
Ages 2+ in SEDAR7 (Gulf of Mexico red snapper). A value of 0.6 was used for Age 1 in
SEDAR7.
2.4 Discard Mortality
A previous assessment of the red snapper population along the Atlantic coast used release
mortality rates of 10% and 25% based on observations by NMFS personnel (Manooch et
al. 1998). These values are low estimates of discard mortality based on data in the recent
red snapper assessment conducted in the Gulf of Mexico. We also considered recent
observer data collected from the headboat fishery along the Atlantic coast and
commercial fisheries along the Atlantic coast and in the Gulf of Mexico.
A study by Burns et al. (2004) conducted on headboats off Florida in the Atlantic and
Gulf of Mexico found a release mortality of 64 % for red snapper. The majority of acute
mortalities in this study (capture depth of 9–42 m) were attributed to hooking (49%),
whereas barotrauma accounted for 13.5%. An earlier study by Burns et al. (2002), also
conducted in the Atlantic and Gulf of Mexico, had similar results, as J-hook mortality
accounted for 56% of the acute mortalities of red snapper on headboats. The effect of
depth on discard mortality was analyzed using barometric chambers. Mortality due to
barotrauma was not observed at depths of <20, 25, and 30 m (Burns et al. 2004).
Mortality increased to 40% at 45 m and 45% at 60 m. These values were similar to those
in other studies (Gitschlag and Renaud 1994; Koenig 2001). Patterson et al. (2001b) in
the Gulf of Mexico estimated a discard mortality of 9% at 21 m, 14% at 27 m, and 18%
at 32 m based on recaptures of tagged fish.
Higher release mortality was attributed to the commercial fishery in the Gulf of Mexico
than to the recreational fishery due to different handling times and depths fished.
Commercial fishermen have been observed to hold fish on deck until fishing at a site has
ceased. After fishing activity has slackened, fishermen measure and release undersized
fish. The prevalence of this practice in the commercial fishery is unknown, but higher
mortality due to handling time (Koenig 2001 as cited in SEDAR7-RW) and the effect of
hooking noted above may explain the high mortality (94% of 31 red snapper released)
observed in a study of the discards of one commercial fisherman from the Atlantic coast
(SEDAR15-RD07). Acute release morality in the commercial fishery ranged from 64-
69% in the Gulf of Mexico (Baker et al. 2004; Neiland et al., in prep.) to 94% along the
Atlantic coast (SEDAR15-RD07).
New data on red snapper release mortality is coming in from the headboat observers on
the Atlantic coast. One of those studies is the "Headboat At-Sea Observer" pilot study in
Florida (east coast and Florida Keys) conducted by conducted with federal funds by
10

Data Workshop Report South Atlantic Red Snapper
SEDAR 15 SAR 1 SECTION II
Beverly Sauls (Florida Wildlife Research Institute). The release condition of fish is noted
as: 1) released alive and swam down fast, 2) released alive and swam down slowly, 3)
released alive and floated at the surface 4) released dead, or 5) predator attacked released
fish. The observed release mortality for red snapper (n=1233) was very low (5%), as
most fish swam down (condition 1 and 2) after being released. Similar results were noted
in the headboat logbook reported by captains from Florida Keys to North Carolina in
2006 (1%, n =17,504). The MRFSS headboat observer data from north of Florida
(unpublished data) had very few observations of red snapper and release condition was
not recorded.
Recommendations:
The recommended discard mortality by depth (in parentheses) for red snapper in the Gulf
of Mexico stock assessment (SEDAR7) was 15% at 20-40 m to 40% at >40 m in the
recreational fishery and 71% at 55 m to 88% at 83 m in the commercial fishery. In the
current assessment, point estimates were discussed for discard mortality because the
model to be used will likely not have a depth component.
The Life History group recommends two values of discard mortality. For the recreational
fisheries (MRFSS and Headboat), release mortality should be set at 40% (30 to 50%
sensitivity range). For the commercial fishery, release mortality should be set at 90% (80
to 100% sensitivity range). Release mortality in the recreational fishery for red snapper
is lower than that in the commercial fishery because the recreational fishery tends to fish
in shallower waters. Actual locations of capture are not recorded, only minimum and
maximum depths for the fishing trip. The mean minimum depth in the recreational
(charter boat) fishery was 43 m (range 20 to 183 m). The mean maximum depth was 58
m (24 to 274 m). The commercial fishery had a mean minimum of 43 m (range 18 to 604
m). The mean maximum in the commercial fishery was 71 m (range 19 to 823 m).
These depth data indicate that fishing occurs at greater depths in the Atlantic vs. Gulf of
Mexico, thus the higher point estimates of discard mortality in the current assessment. In
addition, the likelihood of longer handling times (i.e., time spent on deck) in the
commercial fishery may increase release mortality.
2.5 Age Data
2.5.1 Age Structure Samples
Two sets of otolith-based age data were brought to the data workshop. Contributors
included NMFS Beaufort and SCDNR (SEDAR15-RD04). NMFS data were collected
from the U.S. South Atlantic commercial (n = 1,208) and recreational fisheries (n =
5,099) during 1977 – 2006 (Manooch and Potts 1997; SEDAR15-RD06). SCDNR data
were collected from 1980 – 2006 and included samples from the U.S. South Atlantic
commercial fishery (n = 612) as well as a fishery-independent survey (MARMAP; n =
405) (SEDAR15-RD04). The combined samples yielded a total of 7,324 red snapper age
estimates. A brief characterization of sampling and related issues follows:
11

Data Workshop Report South Atlantic Red Snapper
SEDAR 15 SAR 1 SECTION II
Issue:
Data from NMFS include increment counts converted to calendar age and fractional age
using measures of otolith edge condition (edge code). Data from SCDNR include only
increment counts without an edge code; therefore, counts cannot be converted to ages.
Recommendations:
1.) Combine data sets and perform age and growth analyses on only increment counts for
both data sources. Upon examination of data from NMFS (SEDAR15-RD06), it was
determined that only 3% of the samples would be affected by not converting to calendar
age or fractional age, thus, using increment counts for this assessment should not affect
the overall results of the analyses. To look for effects on growth estimates by using
increment counts as opposed to calculated ages, separate size-limit corrected (Diaz et al.
2004) von Bertalanffy curves derived from fractional age (L∞ = 896, k = 0.25, t0 = -0.16)
and increment count (L∞ = 898, k = 0.24, t0 = -0.23) were plotted using the NMFS data.
The plot and parameter estimates revealed no difference in estimated theoretical growth
between increment count and fractional age (Figure 2.1). In addition, the uncorrected
von Bertalanffy curve from SEDAR15-RD04 based on increment counts from fishery-
dependent samples (L∞ = 899, k = 0.22, t0 = -1.309) was plotted against an uncorrected
curve using NMFS fractional age (L∞ = 901, k = 0.22, t0 = -0.92) data (SEDAR15-RD06)
to further show no real difference in estimated theoretical growth (Figure 2.2).
2.) In future age assessments, ensure that all samples will be assigned an increment count
as well as an edge code for more complete information from the sample. A classification
of edge types has been developed by SCDNR denoting margin condition and quality of
the sample that will be used by both laboratories (Table 2.1).
2.5.2 Age Reader Precision
A random subsample of 100 red snapper otoliths was exchanged between NMFS
Beaufort and SCDNR to determine the consistency of age estimates between laboratories.
An average percent error (APE) of 9.65 % was calculated from this exchange. For 95%
of the samples exchanged, there was a difference of 0-2 increments between readers,
suggesting similar otolith interpretation. The slight differences in increment count do not
seem to affect the predicted growth of red snapper. Plots of total length at increment
count were similar between laboratories (Figure 2.3). SCDNR data included smaller fish
at several increments, most likely due to the addition of fishery-independent samples.
The comparison of uncorrected growth curves from SEDAR15-RD06 samples and
fishery-dependent data from SEDAR15-RD04 showed similar estimates of theoretical
growth, also suggesting similar aging techniques (Figure 2.2).
Issue:
Differences in otolith interpretation can lead to incompatible datasets.
Recommendation:
To continue the exchange of calibration otoliths sets among state and federal agencies to
maximize data comparability and for the purpose of quality control.
12

Data Workshop Report South Atlantic Red Snapper
SEDAR 15 SAR 1 SECTION II
2.5.3 Age Patterns
Several strong year classes were evident for Atlantic red snapper between 1977 and 2006.
These strong year classes were present in 1983, 1984, 1986 – 1989, 1991 – 1993, 1996,
and 1999 – 2001. These cohorts could be followed through the fishery for as long as 5 –
8 yr, first appearing most commonly as age 2 and 3 fish. Moderate to strong year classes
appeared to occur on average every 2 yr. Prior to 1983, large pulses of 2 and 3 year old
red snapper were entering the fishery indicating possible strong year classes, but these
cohorts could not be followed after age 3 (SEDAR15-RD06).
The maximum increment count in the dataset used for the current stock assessment is 53.
An age validation study based on measurements of nuclear-bomb 14
C in otoliths
confirmed that the longevity of red snapper in the Gulf of Mexico is at least 55 yr (Baker
and Wilson 2001).
2.6 Growth
Several age and growth studies have been published on red snapper in the U.S. South
Atlantic (Nelson and Manooch 1982; Manooch and Potts 1997; SEDAR15-RD04). The
updated data set includes about 6400 newly processed samples (SEDAR15-RD06) along
with samples from two out of the three previous aging studies (Manooch and Potts 1997;
SEDAR15-RD04) providing a more complete analysis of red snapper age and growth
along the Atlantic coast with increased spatial and temporal coverage. Data mentioned
above from NMFS Beaufort and SCDNR were combined to develop an overall growth
model for Atlantic red snapper.
Growth models can be influenced by the use of size-biased samples, for example, due to
minimum size limits affecting fishery-dependent sampling. Thus, an overall, weighted
von Bertalanffy growth model that corrects for size-selective data was used (L∞ = 894, k
= 0.25, t0 = -0.01) (Diaz et al. 2004). Model fits used temporal specific size-limits (1983
to 1991, 12 inches total length (TL); 1992 to 2006, 20 inches TL). The model was fit to
observed total lengths and increment counts.
Issues:
Size limit regulations for Atlantic red snapper changed within the study time period of
1977 to 2006 resulting in size-selective fishery-dependent samples (SEDAR15-RD06).
The von Bertalanffy growth model may be influenced by size-selective sampling and
may not appropriately represent the growth of the population.
Recommendations:
A modified von Bertalanffy growth model correcting for size limited data was used to
represent growth of red snapper in the U. S. South Atlantic (Diaz et al. 2004). This
model was previously used to estimate growth curves for Atlantic and Gulf of Mexico
gag grouper (SEDAR 10) as well as Gulf of Mexico red snapper (SEDAR 7).
13

Data Workshop Report South Atlantic Red Snapper
SEDAR 15 SAR 1 SECTION II
2.7 Reproduction
The study by White and Palmer (SEDAR15-RD04) represents the only available
information on the reproductive biology of red snapper along the Atlantic coast of the
southeastern U.S. Specimens were collected during 1979-2000 and the majority (64%) of
the specimens for the study came from a fishery-dependent source, primarily commercial
snapper reel catches. Additional fishery-independent data (MARMAP chevron trap)
collected during 2001-2006 were added to the dataset prepared for the current stock
assessment. All age-related results presented in this section were based on increment
counts (not converted to calendar or fractional age). Information below on spawning
seasonality, sexual maturity, and sex ratio is based on the most accurate technique
(histology) utilized to assess reproductive condition in fishes. Red snapper do not change
sex during their lifetime (gonochorism).
2.7.1 Spawning Seasonality
Based on the occurrence of hydrated oocytes and/or postovulatory follicles, spawning
occurred from May through October and peaked during July through September. Mean
values of a female gonadosomatic index peaked in June and July. Spawning females
were captured in mid-shelf to shelf-break depths from Cape Fear, NC, to Cape Canaveral,
FL.
2.7.2 Sexual Maturity
Maturity ogives for age and TL are available in tabular format in SEDAR15-RD04 (see
Table 8), a summary of which follows. The smallest mature male was 200 mm TL and
the youngest was age 1; the size at 50% maturity was 223 mm TL (95% CI = 147-258),
and the largest immature male was 378 mm TL, the oldest was age 4. All males were
mature at 401-450 mm TL and age 5. The smallest mature female was 287 mm TL, and
the youngest was age 2; the size at 50% maturity was 378 mm TL (95% CI = 364-389),
and the largest immature female was 435 mm TL, the oldest was age 4. All females were
mature by 451-500 mm TL and age 5. Age at 50% maturity (A50) for females was 1.62
yr (logistic; 95% CI = 1.21-1.87).
An update of the maturity ogives can be found in the “Maturity” tab of the spreadsheet
RSinput.xls. The logistic equation (1-1/(1+exp(a+b*age)) was used to estimate A50 for
males (a=-0.78, b=1.728) and females (a=-2.93, b=1.759).
2.7.3. Sex ratio
Tables with sex ratio by length class (mm TL) are available in SEDAR15-RD04 (see
Tables 6 and 7). The male:female sex ratios for all red snapper (including immature fish)
in fishery-independent and fishery-dependent collections from 1979-2000 were 1:1.04
and 1:1.22, respectively. Given the inclusion of immature fish in these sex ratios, the
decision was made to re-analyze the data. Mature specimens from both sources,
including the additional fishery-independent data collected during 2001-2006, comprised
the new dataset. The sex ratio (1:0.94, n = 898) was not significantly different (P > 0.05)
14

Data Workshop Report South Atlantic Red Snapper
SEDAR 15 SAR 1 SECTION II
from 1:1. An analysis of the two best years (1999-2000) of data produced the same result
(1:0.95, n = 465). Commercial fishermen involved in the study were permitted to land
undersized specimens. Updated sex ratio analyses can be found in the “Sex ratio” tab of
the spreadsheet RSinput.xls.
2.7.4 Spawning Frequency
No information available for red snapper along the Atlantic coast of the U.S. Estimate is
available from Gulf of Mexico (see Woods 2003; SEDAR7-DW-35).
2.7.5 Batch Fecundity
No information available for red snapper along the Atlantic coast of the U.S. Estimates
of fecundity at age are available from Gulf of Mexico (see Woods 2003; SEDAR7-DW-
35).
Recommendations:
2.8 Movements and migrations
Research on red snapper movements/migrations in Atlantic waters is limited. The limited
data available indicate high site fidelity. In the largest study, Burns et al. (2004) tagged
and released 5,272 red snapper in the Gulf of Mexico (from Naples, FL, to the eastern
border of Texas) and Atlantic (from Cape Canaveral, FL, to Georgia) over a 13 yr period.
Approximately 40% of these fish were tagged in the Atlantic. Forty-four percent of the
specimens were recaptured within 1.9 km of the tagging site. Less than 10 of the 410
recapture events showed movement >100 miles and movement between the Gulf of
Mexico and the Atlantic coast is not mentioned in the report.
The results of two smaller studies also indicate minimal movement in Atlantic red
snapper. The SC Marine Gamefish Tagging Program reports 1,597 red snapper tagged
with 171 recaptures. Ninety-three percent were recaptured within 2 km of the tagging
site. SCDNR (MARMAP) data indicates 45 red snapper tagged with two recaptures, one
of which was recaptured in same vicinity as tagged. The other recapture had no location
data.
Numerous publications have reported on red snapper tagging and movements in the Gulf
of Mexico (Fable 1980; Szedlmayer 1997; Watterson et al. 1998; Ingram and Patterson
2001; Patterson et al. 2001b; Patterson and Cowan 2003; Szedlmayer and Schropfer
2005; Schropfer and Szedlmayer 2006). Four studies from the Gulf of Mexico (Fable
1980; Szedlmayer 1997; Szedlmayer and Schropfer 2005; Schropfer and Szedlmayer
2006) found that red snapper have high site fidelity, moving less than 0.2 km to 1.6 km
from the original location tagged. Four other publications (Watterson et al. 1998; Ingram
and Patterson 2001; Patterson et al. 2001b; Patterson and Cowan 2003) found that red
snapper have low site fidelity (24.8-46% site fidelity estimates) in the Gulf of Mexico.
15

Data Workshop Report South Atlantic Red Snapper
SEDAR 15 SAR 1 SECTION II
However, three of those publications (Watterson et al. 1998; Ingram and Patterson 2001;
Patterson et al. 2001b) state that the low fidelity was due to hurricanes. Watterson et al.
(1998) reports that 80% of the recaptured red snapper that were not at liberty during
Hurricane Opal were recaptured at their site of release. Red snapper that were at liberty
during Hurricane Opal had a significantly higher likelihood (P <0.001) of movement
away from their site.
Recommendation:
Research on red snapper movements/migrations in Atlantic waters is limited. Available
data and the results of studies in the Gulf of Mexico indicate high site fidelity. Tropical
storms may cause greater than normal movement.
2.9 Meristics and conversion factors
Length/length, weight/length, and weight/weight relationships were calculated for red
snapper for total length (TL), fork length (FL), standard length (SL), whole weight (WW)
and gutted weight (GW), using various combined fishery-independent (SCDNR
MARMAP program) and fishery-dependent (SCNDR and FWRI (less the gutted weight))
data sets (Table 2.2). In addition, NMFS headboat samples provided whole weight, total
and fork lengths, while other NMFS samples provided whole weight and total length. All
weights are shown in grams and all lengths in millimeters. Coefficients of determination
were high for linear (length) and nonlinear (weight) regressions (r2
≥ 0.968).
2.10 Comments on adequacy of data for assessment analyses
The data available for this assessment should be viewed as adequate to more than
adequate. No information on Age 0 natural mortality, spawning frequency, and fecundity
is available in the Atlantic, but these gaps should not affect the assessment.
2.11 Research recommendations
1) Use new technology such as recent advances in genetics techniques (microsatellite
multiplex panels; see Saillant and Gold (2006)) to reinvestigate the stock structure and
estimate the effective population size of red snapper in the Gulf of Mexico and along the
Atlantic coast.
2) Obtain better estimates of red snapper natural mortality and release mortality in
commercial and recreational fisheries.
3) Investigate life history of larval/juvenile (age 0 and 1) red snapper, as little is known.
4) All future age assessments (any species) should include assessment of otolith edge
type. Classification schemes for edge type and quality of the otolith/section have been
developed by the MARMAP program (Table 2.1). These classifications are currently
used by MARMAP and NMFS Beaufort.
16

Data Workshop Report South Atlantic Red Snapper
SEDAR 15 SAR 1 SECTION II
5) Continue to conduct inter-lab comparison of age readings from test sets of otoliths in
preparation for any future stock assessments.
6) Obtain adequate data for gutted to whole weight conversions a priori (before stock
assessment data workshop).
7) Strategies for collection of ageing parts vary for estimations of age composition and
von Bertalanffy growth parameters. Typically, small specimens from fishery-
independent sampling are needed to produce good estimates of von Bertalanffy
parameters.
2.12 Itemized list of tasks for completion following workshop
1) Complete red snapper age composition: McInerny; August 17, 2007 - done
2.13 Literature cited
Allman, R. J., G. R. Fitzhugh, and W. A. Fable. 2002. Report of Red Snapper Otolith
Aging; 2000 Data Summary. NMFS, SFSC, Panama City Laboratory
Contribution Series: 02-02. 18 p.
Alverson, D. L., and M. J. Carney. 1975. A graphic review of the growth and decay of
population cohorts. J. Cons. Int. Explor. Mer 36: 133–143.
Baker, M. S., Jr., D. L. Nieland, and A. J. Fischer. 2004. Preliminary results: fate of
regulatory discards from the red snapper, Lutjanus campechanus, commercial
fishery in the northern Gulf of Mexico. Proc. Gulf Caribb. Fish. Inst. 55: 791-
796.
Baker, M. S., Jr., and C. A. Wilson. 2001. Use of bomb radiocarbon to validate otolith
section ages of red snapper Lutjanus campechanus from the northern Gulf of
Mexico. Limnol. Oceanogr. 46: 1819-1824.
Beverton, R. J. H. 1992. Patterns of reproductive strategy parameters in some marine
teleost fishes. J. Fish Biol. 41(Supplement B): 137–160.
Burns, K. M., C. C. Koenig, and F. C. Coleman. 2002. Evaluation of multiple factors
involved in release mortality of undersized red grouper, gag, red snapper and
vermilion snapper. Mote Marine Laboratory Tech. Rept. No. 790 funded by
NOAA under MARFIN Grant # NA87FF0421.
Burns, K. M., R. R. Wilson, and N. F. Parnell. 2004. Partitioning release mortality in the
undersized red snapper bycatch: comparison of depth vs. hooking effects. Mote
Marine Laboratory Tech. Rept. No. 932 funded by NOAA under MARFIN Grant
# NA97FF0349.
17

Data Workshop Report South Atlantic Red Snapper
SEDAR 15 SAR 1 SECTION II
Diaz, G. A., C. E. Porch, and M. Ortiz. 2004. Growth models for red snapper in U. S.
Gulf of Mexico waters estimated from landings with minimum size limit
restrictions. Southeast Fisheries Science Center, Sustainable Fisheries Division
Contribution: SFD-2004-038, SEDAR7-AW-01, 13 p.
Fable, W. F. 1980. Tagging studies of red snapper (Lutjanus campechanus) and vermilion
snapper (Rhomboplites aurorubens) off the south Texas coast. Contrib. Mar. Sci.
23: 115-121.
Fitzhugh, G. R., C. C. Koenig, F. C. Coleman, C. B. Grimes, and W. Sturges III. 2005.
Spatial and temporal patterns in fertilization and settlement of young gag
(Mycteroperca microlepis) along the west Florida shelf. Bull. Mar. Sci. 77(3):
377-396.
Garber, A. F., M. D. Tringali, and K. C. Stuck. 2004. Population structure and variation
in red snapper (Lutjanus campechanus) from the Gulf of Mexico and Atlantic
coast of Florida as determined from mitochondrial DNA control region sequence.
Mar. Biotechnol. 6: 175-185.
Gitschlag, G. R., and M. L. Renaud. 1994. Field experiments on survival rates of caged
and released red snapper. North. Am. J. Fish. Management 14: 131-136.
Hoenig, J. M. 1983. Empirical use of longevity data to estimate mortality rates. Fish.
Bull. 82: 898-903.
Ingram, G. W., Jr., and W. F. Patterson. 2001. Movement Patterns of Red Snapper
(Lutjanus campechanus), Greater Amberjack (Seriola dumerili), and Gray
Triggerfish (Balistes capriscus) in the Gulf of Mexico and the Utility of Marine
Reserves as Management Tools. Proc. Gulf Caribb. Fish. Inst. 52: 686-699.
Koenig, C. 2001. Preliminary results of depth-related capture-release mortality of
dominant reef fish in the eastern Gulf of Mexico. Special report to the Gulf of
Mexico Fishery Management Council.
Lorenzen, K. 1996. The relationship between body weight and natural mortality in
juvenile and adult fish: a comparison of natural ecosystems and aquaculture. J.
Fish Biol. 49: 627–647.
Manooch, C. S., III, and J. C. Potts. 1997. Age and growth of red snapper, Lutjanus
campechanus, Lutjanidae, collected along the southeastern United States from
North Carolina through the east coast of Florida. J. Elisha Mitchell Sci. Soc. 113:
111-122.
Manooch, C. S., III., J. C. Potts, D. S. Vaughan, and M. L. Burton. 1998. Population
assessment of the red snapper from the southeastern United States. Fish. Res. 38:
19-32.
18

Data Workshop Report South Atlantic Red Snapper
SEDAR 15 SAR 1 SECTION II
Neiland, D. L., A. J. Fischer, M. S. Baker, Jr., and C. A. Wilson (in prep). Red snapper
Lutjanus campechanus in the Northern Gulf of Mexico: Age and size
composition of the commercial harvest and mortality of regulatory discards. In
W. F. Patterson, J. H. Cowan, Jr., G. R. Fitzhugh, and D. L. Nieland (eds.), Red
Snapper Ecology and Fisheries in the US Gulf of Mexico. American Fisheries
Society, Symposium ZZ, Bethesda, Maryland.
Nelson, R. S., and C. S. Manooch. 1982. Growth and mortality of red snappers in the
west-central Atlantic ocean and northern Gulf of Mexico. Trans. Am. Fish. Soc.
111:465-475.
Patterson, W. F., W. J. Carter, R. L. Shipp and J. H. Cowan. 2001b. Movement of tagged
red snapper in the northern Gulf of Mexico. Trans. Am. Fish. Soc. 130(4): 533-
545.
Patterson, W. F., III, J. H. Cowan, Jr., C. A. Wilson, and N. Julien. 2001a.
Discriminating between Age-0 red snapper, Lutjanus campechanus, nursery areas
in the northern Gulf of Mexico using otolith microchemistry. Proc. Gulf Caribb.
Fish. Inst. 52: 74-86
Patterson, W. F., and J. H. Cowan. 2003. Site fidelity and dispersion of red snapper
associated with artificial reefs in the northern Gulf of Mexico. Fisheries, Reefs,
and Offshore Development. Am. Fish. Soc. Symp. 36: 181-193.
Pauly, D. 1980. On the interrelationships between natural mortality, growth parameters,
and mean environmental temperature in 175 fish stocks. J. Cons. Int. Explor. Mer
39: 175-192.
Powles, H. 1977. Larval distributions and recruitment hypotheses for snappers and
groupers of the South Atlantic Bight. Proc. Annual Conf. S.E. Assoc. Fish and
Wildlife Agencies 31: 362-371
Ralston, S. 1987. Mortality rates of snappers and groupers. In J. J. Polovina, S. Ralston
(eds.), Tropical Snappers and Groupers: Biology and Fisheries Management.
Westview Press: Boulder, CO. pp. 375-404.
Saillant, E., and J. R. Gold. 2006. Population structure and variance effective size of red
snapper (Lutjanus campechanus) in the northern Gulf of Mexico. Fish. Bull. 104:
136-148.
SEDAR7-DW-35. Fitzhugh, G. R., M. S. Duncan, L. A. Collins, W. T. Walling, and D.
W. Oliver. 2004. Characterization of red snapper (Lutjanus campechanus)
reproduction: for the 2004 Gulf of Mexico SEDAR. NOAA, NMFS, Panama City
Laboratory. Contribution Series: 04-01.
19

Data Workshop Report South Atlantic Red Snapper
SEDAR 15 SAR 1 SECTION II
SEDAR7-RW. 2005. Stock assessment report 1, SEDAR7 Gulf of Mexico red snapper,
480 p.
SEDAR15-RD04. White, D. B., and S. M. Palmer. 2004. Age, growth, and
reproduction of the red snapper, Lutjanus campechanus, from the Atlantic waters
of the southeastern U.S. Bull. Mar. Sci. 75: 335-360.
SEDAR15-RD06. McInerny, S. A. 2007. Age and growth of red snapper, Lutjanus
campechanus, from the Southeastern United States. MS Thesis. University of
North Carolina Wilmington, North Carolina. 89 p.
SEDAR15-RD07. Harris, P. J., and J. A. Stephen. 2005. Characterization of
commercial reef fish catch and bycatch off the southeast coast of the United
States. Final Report, CRP Grant No. NA03NMF4540416.
Schropfer, R. L. and S. T. Szedlmayer, 2006. Estimates of residence and site fidelity for
red snapper Lutjanus campechanus on artificial reefs in the northeastern Gulf of
Mexico. Bull. Mar. Sci. 78: 93-101.
Szedlmayer, S. T., and R.L. Schroepfer, 2005. Long-term residence of red snapper on
artificial reefs in the northeastern Gulf of Mexico. Trans. Am. Fish. Soc. 134:
315–325.
Szedlmayer, S. T., 1997. Ultrasonic telemetry of red snapper, Lutjanus campechanus, at
artificial reef sites in the northeast Gulf of Mexico. Copeia 1997: 846–850.
Watterson, J. C., W. F. Patterson, R. L. Shipp, and J. H. Cowan. 1998. Movement of Red
Snapper, Lutjanus campechanus, in the North Central Gulf of Mexico: Potential
Effects of Hurricanes. Gulf Mex. Sci. 16(1): 92-104.
Wilson, R. R., and K. M. Burns. 1996. Potential survival of released groupers caught
deeper than 40 m based on shipboard and in situ observations, and tag–recapture
data. Bull. Mar. Sci. 58: 234–247.
Woods, M. K. 2003. Reproductive biology of female red snapper (Lutjanus
campechanus) east and west of the Mississippi River. Masters Thesis. The
University of South Alabama.
20

Data Workshop Report South Atlantic Red Snapper
SEDAR 15 SAR 1 SECTION II
2.14 Tables
Table 2.1. Edge code and quality code developed by SCDNR to be incorporated into
aging studies by both SCDNR and NMFS.
Quality Code Action DescriptionA Omit otolith from analysis UnreadableB Agreement on age may be difficult to reach. Omit from analysis. Very difficult to readC Agreement after second reading is expected after some discussion. Fair readabilityD Agreement after second reading is expected without much discussion. Good readabilityE Age estimates between readers should be the same. Excellent readability
Edge Code EdgeDescription Translucent Width1 Opaque Zone on the edge None2 Narrow translucent zone on the edge Less than about 30% of previous increment3 Medium translucent zone on the edge About 30 - 60% of previous increment4 Wide translucent zone on the edge More than about 60% of previous increment
Table 2.2. Conversion equations for Atlantic red snapper using total length (TL), fork
length (FL), standard length (SL), whole weight (WW) and gutted weight (GW).
Conversion Equation N r2 a a SE b b SE
TL – FL FL = aTL + b 2252 0.9948 0.9387 0.0013 -1.2893 0.7542
TL – SL SL = aTL + b 1627 0.9905 0.8178 0.0019 -14.2895 1.091
FL – SL SL = aFL + b 1597 0.9929 0.8679 0.0018 -12.1576 0.9431
TL – WW WT = a(TL)b 5312 0.9753 0.000007 0.0000003 3.104 0.007103
FL – WW WT = a(FL)b 1976 0.9681 0.000009 0.0000007 3.108 0.0127
WW – GW GW = a(WW) + b 13 0.9996 0.9409 0.0059 -19.1681 25.4768
WW – GW (no intercept)
WW = GW*C C = 1.079 13
21

Data Workshop Report South Atlantic Red Snapper
SEDAR 15 SAR 1 SECTION II
2.15 Figures
0
100
200
300
400
500
600
700
800
900
1000
0 10 20 30 40 50 60
Age
To
tal
Le
ng
th (
mm
)
observed using fractional age
observed using incrementcount
Figure 2.1. Comparison of size-limit corrected (Diaz et al. 2004) von Bertalanffy curves
from NMFS red snapper data using fractional age and increment count.
22

Data Workshop Report South Atlantic Red Snapper
SEDAR 15 SAR 1 SECTION II
0
100
200
300
400
500
600
700
800
900
1000
0 10 20 30 40 50 60
Age
To
tal L
en
gth
(m
m)
observed NMFS (SEDAR15-RD06)
observed SCDNR (SEDAR15-RD04)
Figure 2.2. Comparison of uncorrected von Bertalanffy curves from NMFS fractional
age data and SCDNR increment count data. All samples were from fishery-dependent
sources.
23

Data Workshop Report South Atlantic Red Snapper
SEDAR 15 SAR 1 SECTION II
0
200
400
600
800
1000
1200
0 10 20 30 40 50 60
Increment Count
To
tal
Le
ng
th (
mm
)
NMFS (SEDAR15-RD06)
SCDNR (SEDAR15-RD04)
Figure 2.3. Red Snapper total length at increment comparison for all NMFS data vs. all
SCDNR data.
24

Data Workshop Report South Atlantic Red Snapper
SEDAR 15 SAR 1 SECTION II APPENDIX 1
Appendix 1. Addendum to Growth (Section 2.6)
Two errors in the calculation of the red snapper growth model were found and
addressed after the conclusion of the assessment workshop.
Firstly, within the Diaz model used to calculate the von Bertalanffy curve, the
fishery independent data from SCDNR were mistakenly treated as fishery dependent data
so were, therefore, corrected for size limit effects. This data has been rectified.
Secondly, within the SEDAR 7 document introducing the Diaz model (SEDAR7-AW-
01), it states that observations below the minimum size limit assigned to them should be
excluded from the analysis. This statement was overlooked and should have been taken
into account when fitting the red snapper growth model.
Both errors have been fixed resulting in a revised red snapper growth model (L∞ =
894.7, k = 0.235, t0 = -0.48) (Figure A1.1). The revised model appears to fit the observed
data well. Differences in parameter estimates between the original model and the revised
model were minor. When the original and revised models were plotted together,
differences in predicted length at increment count were visible for fish with 1 – 4
increments (Figure A1.2). When fish measuring under the minimum size limit (collected
while regulations were in effect) were excluded from the model, the von Bertalanffy
curve predicted higher lengths at increment counts 1 – 4.
0
200
400
600
800
1000
1200
0 5 10 15 20 25 30 35 40 45 50
Increment Count
To
tal
Le
ng
th (
mm
)
all red snapper observed
Von Bert curve
L= 894.7 * (1-e(-0.235(t+0.48)))
Figure A1.1. Revised von Bertalanffy model from all red snapper increment counts
using Diaz et al. model with appropriate size limits in place.
25

Data Workshop Report South Atlantic Red Snapper
SEDAR 15 SAR 1 SECTION II APPENDIX 1
0
100
200
300
400
500
600
700
800
900
1000
0 10 20 30 40 50 60
Increment Count
To
tal L
en
gth
(m
m)
predicted (SEDAR 15)
predicted (SEDAR 15 revised)
L = 893.6 * (1-e(-0.25(t+0.01)))
L = 894.7 * (1-e(-0.235(t+0.48)))
Figure A1.2. Von Bertalanffy Comparison of Original and Revised Diaz models for red
snapper.
26

3 Commercial Fishery 3.1 Overview A series of issues were discussed by the Commercial Working Group concerning stock boundaries both the southern boundary with the Gulf of Mexico and the northern boundary (north of North Carolina). No adjustments were deemed necessary for inclusion of unclassified snappers that would have been analogous to previous SEDAR assessments. Commercial landings for the U.S. South Atlantic red snapper stock were developed for the period 1900 through 2006. Estimated discards are presented for recent years (1992-2006) subsequent to the last change in minimum size limit for red snapper along the U.S. South Atlantic coast. Summaries of sampling intensity for lengths and age are presented, and length and age compositions by gear for which sample size was deemed minimally adequate. Several research recommendations are also given. 3.2 Commercial Landings Prior to the DW the commercial working group settled on the following numerical gear codes for dividing red snapper commercial landings into five categories: handline (600-616, 660, 665), diving (760, 941-943), trawl (200-220), traps (325-390, and other gear types (remaining gear codes including small amount of unknown). Although reported separately here, the trawl and trap landings may ultimately be pooled with other gear types. The first discussion by the working group concerned stock boundaries. In particular, Monroe County, Florida, is the focal point for the stock boundary between the U.S. South Atlantic and Gulf of Mexico waters. The Working Group decided to complement the recent Gulf of Mexico Greater Amberjack assessment (SEDAR 9), and parallel the decision made for the South Atlantic greater amberjack assessment also under consideration during SEDAR 15. In the SEDAR 9 Data Workshop report all Florida landings with water body codes 0010, 0019, and 7xxx and higher were considered South Atlantic catch. Also included were the small amount of landings from state 12 which represent Florida interior counties landed on Florida east coast. See maps showing shrimp statistical areas for the Gulf of Mexico and U.S. Atlantic coasts (Figure 3.1) and Florida statistical areas (Figure 3.2). For detailed description of the Accumulated Landing System (ALS), see addendum to this section. For the years 1992-2004 water body and jurisdiction allocations are based on water body ratios as reported in the Fishery Logbook data and applied to the total landings reported in the ALS data set for Monroe County. The group consensus was data reported directly by fishermen in the logbook program versus data reported third person by dealers and associated staff submitted to the ALS would be more precise in assigning area of capture to catch.
Data Workshop Report South Atlantic Red Snapper
SEDAR 15 SAR 1 SECTION II 27

Landings were obtained from the NMFS Northeast Regional Office from states north of North Carolina. The earliest landings were in 1970 (300 pounds, whole weight), positive landings were again obtained for 1987-1988, and continuously from 1993-2006 (with the exception of no landings reported for 2000). If we assume landings were truly 0 in those years none were reported for 1970-2006, then the average annual reported landings of red snapper from north of North Carolina was 83 pounds (whole weight). Based on this quantity, the working group decided to use the North Carolina-Virginia line as the northern boundary for purposes of this assessment. As in SEDAR 10 for South Atlantic gag, the Working Group decided to present all landings in gutted weight. The standard conversion of snappers for Georgia and Florida from gutted weight to whole weight is by multiplying gutted weight by 1.11 to convert to whole weight. South Carolina uses a conversion close to 1.11 (i.e., 1.111…..), obtained by dividing gutted weight by 0.9. North Carolina uses a conversion of 1.08. With landings data inputted to model in gutted weight, any conversions from gutted back to whole weight will be based on recent data from the South Carolina MARMAP program. Although the sample size was small (N=13) the R2 value was high (0.9996) with no value having high leverage. The no-intercept regression estimate for slope is 1.069 (the ratio of means for whole weight to gutted weight) (see Table 2.2 in Section 2). Commercial landings in gutted weight were developed based on classified red snapper by the Working Group from each state by gear for 1962-2006. Florida – the ALS data base was used to estimate landings by gear for 1962-2006. Water body codes as described above were used to proportion Florida Atlantic landings from Monroe County for 1962-1991; while the commercial logbook data were used for 1992-2006. Georgia –GA DNR provided landings by gear back to 1989 (state reported landings were almost identical to ALS landings), and the ALS data base was used to extend landings back to 1962. Whole weight was converted to gutted weight by dividing by 1.11. South Carolina – SC DNR provided landings by gear back to 1972 (state reported landings were very similar to ALS landings when adjusted to gutted weight), and the ALS data base was used to extend landings back to 1962. North Carolina – NC DMF provided landings by gear back to 1950 in pounds gutted weight (NC data for 1950-1961 was used in preference to the historical landings data cited below). Again, landings estimates from the ALS were almost identical to that provided by NC DMF. A summary of landings in gutted weight by gear are presented in Table 3.1 and Figure 3.3 for 1927-2006. Landings are also shown by state in Figure 3.4, but because of confidentiality issues, landings for Georgia through North Carolina are grouped together in Table 3.2. In recent years (since 2000), handlines represent about 87.9% compared with almost 10.6% for diving. Trivial amount of landings are associated with trawls (0.2%), traps
Data Workshop Report South Atlantic Red Snapper
SEDAR 15 SAR 1 SECTION II 28

(<0.1%), and other (1.2%). Recent landings by state break out as follows: 57% from Florida, 11% from Georgia, 22% from South Carolina, and 9% from North Carolina. Next, historical landings of red snapper for 1927-1961 were obtained from: Historical Catch Statistics, Atlantic and Gulf Coast States, 1879-1989 (US DOC/NOAA/NMFS, Current Statistics No. 9010, Historical Series Nos. 5-9). These landings are reported fairly consistently by state (North Carolina through east coast of Florida) back to 1927. With handlines as the dominant gear (representing 97% of the landings for 1962-2006), historical landings were assumed to be that gear (with the exception of small amounts of trawl landings in North Carolina reported for 1951-1952 and 1961). Conversion back to gutted weight was based on the respective state conversion values. The decision was made by the Working Group to extend landings prior to 1927 back to 1900 by linear interpolation. Zero landings are assumed for 1900 and for purposes of the interpolation, the average of 1927-1931 is used for 1927. Additionally, several gaps in landings were found in the period 1927-1961. In particular, there were no reported landings for 1933, 1935, 1941-1944, and 1946-1949. Again, a linear interpolation was applied to these years, with the exception of 1941-1944. Landings for these years were assumed to have been 0. This was felt reasonable based on the low landings reported for 1940 leading up to WWII, and presumed reduction of effort immediately prior to and during WWII. Total red snapper landings in gutted weight for 1900-2006 are presented in Figure 3.5. Commercial landings in weight were converted to commercial landings in numbers based on average weight (in whole weight, but converted to gutted weight based on 1.069 estimate above) from the TIP data for each state, gear, and year. These data was generally available from 1984 to 2004 for handlines (24,919 lengths). Data for the remaining gear types were sparse, with much more limited data from diving (640), trawls (301), traps (285), and other (1596) gear types available (annual sample sizes by gear and state in Table 3.3). Annual estimates of mean weight by gear, state and year are applied to the corresponding landings in weight when sample size greater than or equal to 30 are available (Table 3.4). When sample size do not meet this criterion, then averages across years or even across state and years (e.g., for trap and trawl) are used (Table 3.5). Because of a change in minimum size limits in 1992, mean weights from handlines are calculated before 1992 for any historical application, and for 1992 and later for any application for 1992 and later. Red snapper landings in numbers are summarized by gear in Table 3.6 and in Figures 3.6. 3.3 Commercial Discards The report titled ‘Discards of Greater Amberjack and Red Snapper Calculated for Vessels with Federal Fishing Permits in the US South Atlantic’ was prepared by Kevin McCarthy (SEDAR 15-DW01). A brief summary of the results and discussion for red snapper follows:
Data Workshop Report South Atlantic Red Snapper
SEDAR 15 SAR 1 SECTION II 29

Commercial discards of red snapper could only be calculated for handline vessels. Data for all other gear types was too limited for discard calculations. Significant differences among regions in cpue of handline vessel red snapper discards were identified in the GLM analysis. Mean red snapper cpue of all handline vessel trips reporting to the discard logbook program within each region, including those that did not have red snapper discards (zero discard trips), were used to calculate total discards:
Calculated discards=Mean red snapper discard cpue*total effort per region Yearly total effort (hook hours) of all trips by handline vessels within each region was multiplied by the mean discard cpue from the appropriate region to calculate total discards of red snapper by handline vessels. Calculated total discards for each region are provided in Table 3.7 for red snapper discarded from handline vessels, including effort in hook-hours. The calculated discards from each region were summed by year to provide yearly total red snapper handline vessel discards (Table 3.8). The reason reported for discarding red snapper was due to regulatory restrictions in nearly all reports. The number of trips reporting red snapper in the US south Atlantic was very low and the number of individual red snapper discarded per trip was also low. Stratification of the available data was limited because of such small sample sizes and, therefore, likely does not capture much of the variation in numbers of discards within the red snapper fisheries. How that may affect the number of calculated discards (over or under estimate) is unknown. Discards from the dive fisheries for red snapper could not be calculated due to lack of discard reports from those fisheries. The methods used in prosecuting the dive fisheries, however, may limit the number of discards due to greater selectivity available to the dive fisher. 3.4. Commercial Price Price per pound for red snapper sold in the South Atlantic states was calculated for the years 1962 through 2006. Two values were calculated for each year (Figure 3.7). The first values showed the actual price the fishermen received at the time of sale. The second value adjusted the amount using the Consumer Price Index (CPI) for each year using 1962 as base year to determine relative values for the price per pound. The CPI-calculated values held the value of one dollar constant throughout the time series. The actual price the fishermen received noted a general upwards trend from approximately $0.30 on average in 1962 to $3.28 per pound in 2006. There were sharp increases in the price per pound paid to fishermen for red snapper in the mid to late 1970's. When the price per pound of red snapper was held to a constant 1962 dollar value, the trend changes. From a low value of about $0.30 in 1962, the highest average value was $0.86 in 1978. In the last twenty years, the CPI adjusted price per pound has trended downward to where a pound of red snapper is worth just less than $0.50 in 2006.
Data Workshop Report South Atlantic Red Snapper
SEDAR 15 SAR 1 SECTION II 30

3.5 Biological Sampling Length frequency data were extracted from the TIP Online database. Data from the VA/NC line through Monroe County in FL were included in the extraction. Those data from Monroe County that were attributable to the Gulf were deleted from the data. All lengths were converted to TL in mm using conversions derived from the Life History Group. We had no conversions for standard length, so these were deleted. Lengths greater than 2000 mm were deleted, as the group felt that these extreme lengths may be errors and did not represent those lengths observed in the commercial fishery. Lengths were converted to cm and assigned to 1 cm length bins with a floor of 0.6 cm and a ceiling of 0.5 cm. Weights were converted to whole weight in grams using the length/weight relationship supplied by the Life History Group and then converted to whole weight in pounds. Mean weight were then calculated across year, state and gear. Landings data in gutted weight were converted to whole weight using the conversions supplied by the Life History Group. 3.5.1 Sampling Intensity Length Annual sample sizes are summarized in Table 3.3 by gear, and state for length data available for red snapper in the U.S. South Atlantic from the TIP data base for 1984-2006. 3.5.2 Length/Age Distribution Annual length compositions are created for each commercial gear using the following approach for weighting lengths across individual trips and by state:
• Trips: expand lengths by trip catch in numbers, • State: expand lengths by landings in numbers.
Annual length compositions for commercial handlines are shown weighted by the product of the landings in numbers and trip catch in numbers (for 1984-2006 in Figure 3.8). Annual length compositions for commercial diving (for 1999-2001 and 2003 in Figure 3.9), trawls (for 1984, 1986-1988 in Figure 3.10) and traps (for 1991 in Figure 3.11) are also summarized using weighting by landings in numbers and by trip catch in numbers. Sample size of red snapper ages are summarized by gear from commercial landings in the U.S. South Atlantic for 1980-2006 (Table 3.9). Length compositions were developed for handline (1988-2006, Fig. 3.12) and diving (2000, Fig. 3.13) gear types. Weighting is by length compositions shown in Figures 3.8 and 3.9, respectively. This corrects for a potential sampling bias of age samples relative to length samples (see Section 3 in SEDAR10 for South Atlantic gag).
Data Workshop Report South Atlantic Red Snapper
SEDAR 15 SAR 1 SECTION II 31

3.5.3 Adequacy for characterizing lengths Generally sample sizes for length composition may be adequate for the handline component of the commercial fishery (Table 3.3). Overall 24,806 fish lengths were collected from handlines between 1984-2006. However, no lengths were collected from Florida in 1984 and 1987, and only 5 fish collected in 1988. Useful length compositions are generally available for handlines for 1985-1986 and 1989-2006. Much more limited length compositions are available for diving (625 lengths), trawls (301 lengths), and traps (293 lengths) for the period 1984-2006. Annual length compositions for gear types other than handline were developed for diving (1999-2001 and 2003), trawls (1986-1988) and traps (1991). Handline length compositions should be applied to be ‘other’ gear types to represent length compositions. 3.6 Research Recommendations for red snapper The following research recommendations were developed by the Working Group:
• Still need observer coverage for the snapper-grouper fishery – 5-10% allocated by strata within states – possible to use exemption to bring in everything with no sale – get maximum information from fish
• Expand TIP sampling to better cover all statistical strata – Predominantly from Florida and by H&L gear – In that sense, we have decent coverage for lengths
• Trade off with lengths versus ages, need for more ages (i.e., hard parts) • Workshop to resolve historical commercial landings for a suite of snapper-
grouper species – Monroe County (SA-GoM division) – Species identification (not an issue with red snapper)
Data Workshop Report South Atlantic Red Snapper
SEDAR 15 SAR 1 SECTION II 32

============================================================ Addendum to Commercial Landings (Section 3.2): NMFS SEFIN Accumulated Landings (ALS) Information on the quantity and value of seafood products caught by fishermen in the U.S. has been collected as early as the late1890s. Fairly serious collection activity began in the 1920s. The data set maintained by the Southeast Fisheries Science Center (SEFSC) in the SEFIN database management system is a continuous data set that begins in 1962. In addition to the quantity and value, information on the gear used to catch the fish, the area where the fishing occurred and the distance from shore are also recorded. Because the quantity and value data are collected from seafood dealers, the information on gear and fishing location are estimated and added to the data by data collection specialists. In some states, this ancillary data are not available. Commercial landings statistics have been collected and processed by various organizations during the 1962-to-present period that the SEFIN data set covers. During the 16 years from 1962 through 1978, these data were collected by port agents employed by the Federal government and stationed at major fishing ports in the southeast. The program was run from the Headquarters Office of the Bureau of Commercial Fisheries in Washington DC. Data collection procedures were established by Headquarters and the data were submitted to Washington for processing and computer storage. In 1978, the responsibility for collection and processing were transferred to the SEFSC. In the early 1980s, the NMFS and the state fishery agencies within the Southeast began to develop a cooperative program for the collection and processing of commercial fisheries statistics. With the exception of two counties, one in Mississippi and one in Alabama, all of the general canvass statistics are collected by the fishery agency in the respective state and provided to the SEFSC under a comprehensive Cooperative Statistics Program (CSP). The purpose of this documentation is to describe the current collection and processing procedures that are employed for the commercial fisheries statistics maintained in the SEFIN database. 1960 - Late 1980s ================= Although the data processing and database management responsibility were transferred from the Headquarters in Washington DC to the SEFSC during this period, the data collection procedures remained essentially the same. Trained data collection personnel, referred to as fishery reporting specialists or port agents, were stationed at major fishing ports throughout the Southeast Region. The data collection procedures for commercial landings included two parts. The primary task for the port agents was to visit all seafood dealers or fish houses within their assigned areas at least once a month to record the pounds and value for each species or product type that were purchased or handled by the dealer or fish house. The agents summed the landings and value data and submitted these data in monthly reports to their area supervisors. All of the monthly data were submitted in essentially the same form. The second task was to estimate the quantity of fish that were caught by specific types of gear and the location of the fishing activity. Port agents provided this gear/area information for all of the landings data that they collected. The objective was to have gear and area information assigned to all monthly commercial landings data. There are two problems with the commercial fishery statistics that were collected from seafood dealers. First, dealers do not always record the specific species that are caught and second, fish or shellfish are not always purchased at the same location where they are unloaded, i.e., landed.
Data Workshop Report South Atlantic Red Snapper
SEDAR 15 SAR 1 SECTION II 33

Dealers have always recorded fishery products in ways that meet their needs, which sometimes make it ambiguous for scientific uses. Although the port agents can readily identify individual species, they usually were not at the fish house when fish were being unloaded and thus, could not observe and identify the fish. The second problem is to identify where the fish were landed from the information recorded by the dealers on their sales receipts. The NMFS standard for fisheries statistics is to associate commercial statistics with the location where the product was first unloaded, i.e., landed, at a shore-based facility. Because some products are unloaded at a dock or fish house and purchased and transported to another dealer, the actual 'landing' location may not be apparent from the dealers' sales receipts. Historically, communications between individual port agents and the area supervisors were the primary source of information that was available to identify the actual unloading location. Cooperative Statistics Program ============================== In the early 1980s, it became apparent that the collection of commercial fisheries statistics was an activity that was conducted by both the Federal government and individual state fishery agencies. Plans and negotiations were initiated to develop a program that would provide the fisheries statistics that are needed for management by both Federal and state agencies. By the mid- 1980s, formal cooperative agreements had been signed between the NMFS/SEFSC and each of the eight coastal states in the southeast, Puerto Rico and the US Virgin Islands. Initially, the data collection procedures that were used by the states under the cooperative agreements were essentially the same as the historical NMFS procedures. As the states developed their data collection programs, many of them promulgated legislation that authorized their fishery agencies to collect fishery statistics. Many of the state statutes include mandatory data submission by seafood dealers. Because the data collection procedures (regulations) are different for each state, the type and detail of data varies throughout the Region. The commercial landings database maintained in SEFIN contains a standard set of data that is consistent for all states in the Region. A description of the data collection procedures and associated data submission requirements for each state follows. Florida ======= Prior to 1986, commercial landings statistics were collected by a combination of monthly mail submissions and port agent visits. These procedures provided quantity and value, but did not provide information on gear, area or distance from shore. Because of the large number of dealers, port agents were not able to provide the gear, area and distance information for monthly data. This information, however, is provided for annual summaries of the quantity and value and known as the Florida Annual Canvas data (see below). Beginning in 1986, mandatory reporting by all seafood dealers was implemented by the State of Florida. The State requires that a report (ticket) be completed and submitted to the State for every trip. Dealers have to report the type of gear as well as the quantity (pounds) purchased for each species. Information on the area of catch can also be provided on the tickets for individual trips. As of 1986 the ALS system relies solely on the Florida trip ticket data to create the ALS landings data for all species other than shrimp. Georgia ======= Prior to 1977, the National Marine Fisheries Service collected commercial landings data Georgia. From 1977 to 2001 state port agents visited dealers and docks to collect the information on a regular basis. Compliance was mandatory for the fishing industry. To collect more timely and accurate data, Georgia initiated a trip ticket program in 1999, but the program was not fully implemented to allow complete coverage until 2001. All sales of seafood products landed in Georgia must be recorded on a trip ticket at
Data Workshop Report South Atlantic Red Snapper
SEDAR 15 SAR 1 SECTION II 34
the time of the sale. Both the seafood dealer and the seafood harvester are responsible for insuring the ticket is completed in full. South Carolina =========== Prior to 1972, commercial landings data were collected by various federal fisheries agents based in South Carolina, either U.S. Fish or Wildlife or National Marine Fisheries Service personnel. In 1972, South Carolina began collecting landings data from coastal dealers in cooperation with federal agents. Mandatory monthly landings reports on forms supplied by the Department are required from all licensed wholesale dealers in South Carolina. Until fall of 2003, those reports were summaries collecting species, pounds landed, disposition (gutted or whole) and market category, gear type and area fished; since September 2003, landings have been reported by a mandatory trip ticket system collecting landings by species, disposition and market category, pounds landed, ex-vessel prices with associated effort data to include gear type and amount, time fished, area fished, vessel and fisherman information. South Carolina began collecting TIP length frequencies in 1983 as part of the Cooperative Statistics Program. Target species and length quotas were supplied by NMFS and sampling targets of 10% of monthly commercial trips by gear were set to collect those species and length frequencies. In 2005, South Carolina began collecting age structures (otoliths) in addition to length frequencies, using ACCSP funding to supplement CSP funding. North Carolina The National Marine Fisheries Service prior to 1978 collected commercial landings data for North Carolina. Port agents would conduct monthly surveys of the state’s major commercial seafood dealers to determine the commercial landings for the state. Starting in 1978, the North Carolina Division of Marine Fisheries entered into a cooperative program with the National Marine Fisheries Service to maintain the monthly surveys of North Carolina’s major commercial seafood dealers and to obtain data from more dealers. The North Carolina Division of Marine Fisheries Trip Ticket Program (NCTTP) began on 1 January 1994. The NCTTP was initiated due to a decrease in cooperation in reporting under the voluntary NMFS/North Carolina Cooperative Statistics Program in place prior to 1994, as well as an increase in demand for complete and accurate trip-level commercial harvest statistics by fisheries managers. The detailed data obtained through the NCTTP allows for the calculation of effort (i.e. trips, licenses, participants, vessels) in a given fishery that was not available prior to 1994 and provides a much more detailed record of North Carolina’s seafood harvest. NMFS SEFIN Annual Canvas Data for Florida The Florida Annual Data files from 1976 – 1996 represent annual landings by county (from dealer reports) which are broken out on a percentage estimate by species, gear, area of capture, and distance from shore. These estimates are submitted by Port agents, which were assigned responsibility for the particular county, from interviews and discussions from dealers and fishermen collected through out the year. The estimates are processed against the annual landings totals by county on a percentage basis to create the estimated proportions of catch by the gear, area and distance from shore. (The sum of percentages for a given Year, State, County, Species combination will equal 100.) Area of capture considerations: ALS is considered to be a commercial landings data base which reports where the marine resource was landed. With the advent of some State trip ticket programs as the data source the definition is more loosely applied. As such one cannot assume reports from the ALS by State or county will accurately inform you of Gulf vs South Atlantic vs Foreign catch. To make that determination you must consider the area of capture.
Data Workshop Report South Atlantic Red Snapper
SEDAR 15 SAR 1 SECTION II 35

Table 3.1. Red snapper landings (gutted weight in pounds) by gear from the U.S. South Atlantic, 1927-2006. Year Lines Diving Traps Trawl Other Total
1927 111,737 0 0 0 0 111,737 1928 64,014 0 0 0 0 64,014 1929 60,736 0 0 0 0 60,736 1930 62,287 0 0 0 0 62,287 1931 102,753 0 0 0 0 102,753 1932 44,144 0 0 0 0 44,144 1933 90,541 0 0 0 0 90,541 1934 136,937 0 0 0 0 136,937 1935 131,532 0 0 0 0 131,532 1936 126,126 0 0 0 0 126,126 1937 189,189 0 0 0 0 189,189 1938 106,331 0 0 0 0 106,331 1939 88,338 0 0 0 0 88,338 1940 12,613 0 0 0 0 12,613 1941 0 0 0 0 0 0 1942 0 0 0 0 0 0 1943 0 0 0 0 0 0 1944 0 0 0 0 0 0 1945 225,325 0 0 0 0 225,325 1946 245,665 0 0 0 0 245,665 1947 266,004 0 0 0 0 266,004 1948 286,344 0 0 0 0 286,344 1949 306,683 0 0 0 0 306,683 1950 327,023 0 0 0 0 327,023 1951 459,459 0 0 6,944 0 466,404 1952 345,946 0 0 4,630 0 350,576 1953 363,964 0 0 0 0 363,964 1954 539,640 0 0 0 0 539,640 1955 448,649 0 0 0 0 448,649 1956 439,649 0 0 0 0 439,649 1957 788,605 0 0 0 0 788,605 1958 556,279 0 0 0 0 556,279 1959 597,126 0 0 0 0 597,126 1960 610,186 0 0 0 0 610,186 1961 717,251 0 0 3,426 0 720,676 1962 538,171 0 0 568 0 538,739 1963 409,000 0 0 0 1,217 410,218 1964 454,830 0 0 90 0 454,920 1965 534,515 0 0 0 0 534,515 1966 600,907 0 0 1,019 0 601,925 1967 788,331 0 648 185 0 789,164 1968 877,836 0 270 0 0 878,106 1969 558,477 0 10,981 370 1,712 571,540
Data Workshop Report South Atlantic Red Snapper
SEDAR 15 SAR 1 SECTION II 36

Table 3.1. (continued)
1970 519,354 0 3,692 0 0 523,046 1971 447,962 0 0 0 0 447,962 1972 366,390 0 21,154 0 0 387,544 1973 312,838 0 4,978 389 0 318,205 1974 517,558 0 1,802 0 0 519,360 1975 608,586 0 0 320 0 608,906 1976 495,072 0 0 16,967 0 512,038 1977 520,564 0 0 21,226 0 541,790 1978 482,345 0 23,456 3,946 115 509,862 1979 344,070 0 4,626 7,461 0 356,157 1980 301,405 0 2,892 24,773 1,017 330,087 1981 292,104 0 7,710 24,847 70 324,731 1982 251,218 0 725 15,086 530 267,559 1983 261,566 0 147 7,652 1,872 271,237 1984 206,509 1,131 937 5,778 2,445 216,799 1985 202,434 2,126 2,288 3,736 146 210,730 1986 182,659 515 1,925 1,970 686 187,755 1987 157,903 389 580 743 2,441 162,056 1988 138,476 274 172 1,450 2,094 142,465 1989 225,156 1,026 266 0 1,456 227,904 1990 180,488 1,552 2,972 0 5,212 190,224 1991 110,158 4,926 4,991 3 2,174 122,252 1992 79,092 8,802 28 517 2,263 90,702 1993 192,483 5,372 246 94 228 198,422 1994 163,174 12,139 366 0 732 176,410 1995 152,926 9,504 369 24 168 162,991 1996 119,594 5,777 1,293 17 683 127,364 1997 88,457 7,004 1,003 2 3,035 99,501 1998 70,914 7,473 471 0 2,277 81,135 1999 72,740 9,244 199 0 919 83,102 2000 82,307 10,624 90 0 1,059 94,080 2001 158,072 18,685 205 5 628 177,595 2002 147,937 21,401 43 48 521 169,949 2003 107,093 16,157 454 0 2,063 125,768 2004 137,287 17,981 249 6 413 155,935 2005 103,555 8,804 599 0 3,408 116,366 2006 70,563 3,837 377 0 3,023 77,800
Data Workshop Report South Atlantic Red Snapper
SEDAR 15 SAR 1 SECTION II 37

Table 3.2. Red snapper landings (gutted weight in pounds) by region from the U.S. South Atlantic, 1927-2006. Year Florida GA-NC Total
1927 53,153 58,584 111,7371928 42,342 21,672 64,0141929 17,117 43,619 60,7361930 30,631 31,657 62,2871931 100,901 1,852 102,7531932 44,144 0 44,1441933 90,541 0 90,5411934 136,937 0 136,9371935 131,532 0 131,5321936 126,126 0 126,1261937 189,189 0 189,1891938 105,405 926 106,3311939 86,486 1,852 88,3381940 12,613 0 12,6131941 0 0 01942 0 0 01943 0 0 01944 0 0 01945 221,622 3,704 225,3251946 241,802 3,863 245,6651947 261,982 4,022 266,0041948 282,162 4,181 286,3441949 302,342 4,341 306,6831950 322,523 4,500 327,0231951 459,459 6,944 466,4041952 345,946 4,630 350,5761953 362,162 1,802 363,9641954 536,937 2,703 539,6401955 448,649 0 448,6491956 308,108 131,541 439,6491957 579,279 209,326 788,6051958 530,631 25,648 556,2791959 566,667 30,459 597,1261960 600,901 9,285 610,1861961 610,811 109,866 720,6761962 529,584 9,155 538,7391963 406,379 3,839 410,2181964 446,717 8,203 454,9201965 519,844 14,670 534,5151966 591,835 10,090 601,9251967 733,301 55,863 789,1641968 789,871 88,235 878,1061969 544,517 27,023 571,540
Data Workshop Report South Atlantic Red Snapper
SEDAR 15 SAR 1 SECTION II 38

Table 3.2. (continued)
1970 498,012 25,034 523,0461971 391,932 56,029 447,9621972 326,597 60,947 387,5441973 284,717 33,488 318,2051974 469,280 50,080 519,3601975 576,252 32,654 608,9061976 426,995 85,044 512,0381977 409,869 131,921 541,7901978 312,475 197,387 509,8621979 206,477 149,680 356,1571980 192,773 137,314 330,0871981 166,062 158,669 324,7311982 134,104 133,455 267,5591983 141,099 130,138 271,2371984 118,516 98,282 216,7991985 127,659 83,071 210,7301986 112,243 75,513 187,7551987 105,465 56,591 162,0561988 84,629 57,837 142,4651989 98,692 129,212 227,9041990 89,469 100,755 190,2241991 61,923 60,329 122,2521992 53,534 37,168 90,7021993 74,326 124,096 198,4221994 73,633 102,777 176,4101995 96,745 66,246 162,9911996 83,144 44,220 127,3641997 73,618 25,884 99,5011998 57,436 23,699 81,1351999 44,352 38,750 83,1022000 63,706 30,374 94,0802001 104,467 73,128 177,5952002 83,596 86,353 169,9492003 66,078 59,689 125,7682004 90,741 65,194 155,9352005 65,890 50,475 116,3662006 51,147 26,653 77,800
Data Workshop Report South Atlantic Red Snapper
SEDAR 15 SAR 1 SECTION II 39

Table 3.3. Sample size of red snapper collected for lengths by gear and state from the U.S. South Atlantic TIP data base, 1984-2006. Handline Diving Trawl Traps Other Grand Year FL GA SC NC Total FL GA SC Total GA SC Total FL SC NC Total FL GA SC NC Total Total 1984 50 970 1069 2089 0 33 33 1 1 1 2 3 2126 1985 1250 203 1355 731 3539 0 0 0 14 33 14 61 3600 1986 170 144 272 660 1246 0 66 66 0 10 1 11 1323 1987 354 398 394 1146 2 2 49 15 64 2 2 90 90 1304 1988 5 233 176 207 621 0 138 138 0 1 17 18 777 1989 37 191 363 600 1191 0 0 0 10 10 1201 1990 204 148 435 787 0 0 6 6 18 12 5 35 828 1991 81 196 232 197 706 0 0 252 1 253 8 1 4 13 972 1992 180 110 144 78 512 4 5 9 0 9 9 12 12 542 1993 371 129 616 231 1348 8 8 0 5 5 31 25 1 57 1417 1994 217 77 417 456 1167 1 6 7 0 2 2 10 1 11 1187 1995 886 101 351 129 1467 25 25 0 1 3 4 44 44 1540 1996 426 105 282 58 871 21 7 28 0 0 18 18 917 1997 283 43 212 2 540 10 10 0 0 57 57 607 1998 166 228 22 416 0 0 0 84 84 500 1999 193 523 188 904 83 83 0 3 3 3 3 993 2000 323 65 434 59 881 129 129 0 0 14 14 1024 2001 581 93 454 280 1408 87 87 0 0 276 276 1771 2002 212 124 460 196 992 9 9 0 0 0 1001 2003 286 153 667 164 1270 210 210 0 0 0 1480 2004 35 214 456 90 795 8 8 0 0 566 566 1369 2005 45 94 377 102 618 3 3 0 0 180 1 181 802 2006 192 16 138 60 406 7 15 22 0 0 27 5 32 460 Total 6143 2695 9673 6408 24919 594 6 40 640 49 252 301 1 282 2 285 1096 310 44 146 1596 27741
Data Workshop Report South Atlantic Red Snapper
SEDAR 15 SAR 1 SECTION II 40

Table 3.4. Mean gutted weight (pounds) of red snapper by state and gear from the U.S. South Atlantic TIP data base, 1984-2006.
Handline Diving Trawl Traps Other Year FL GA SC NC FL GA SC GA SC FL SC NC FL GA SC NC 1984 4.25 4.47 6.42 2.06 1.21 3.50 26.421985 4.40 5.91 5.91 6.24 18.43 4.46 7.341986 5.77 9.27 5.97 5.79 7.09 14.19 5.711987 6.21 6.31 5.80 6.91 1.65 9.20 9.27 16.081988 14.82 6.65 6.18 4.18 3.36 2.85 19.021989 12.85 5.88 5.99 6.01 11.451990 5.22 3.61 6.19 9.41 22.83 11.02 6.721991 9.66 7.38 4.69 7.24 4.53 2.75 10.22 21.96 21.141992 12.71 10.61 7.76 9.68 8.66 11.57 6.55 15.31 1993 14.08 8.51 5.78 6.51 14.79 5.42 14.68 5.28 6.911994 8.96 7.69 6.94 7.53 7.82 10.27 10.41 6.81 6.551995 9.14 8.23 8.51 10.60 16.12 22.77 9.58 13.43 1996 9.93 8.39 10.19 8.08 10.50 13.53 14.43 1997 10.91 12.64 11.65 15.86 11.17 12.72 1998 9.75 10.99 7.10 9.45 1999 9.14 8.19 6.07 11.49 5.46 11.99 2000 8.66 7.78 9.58 9.30 7.87 12.01 2001 8.24 7.55 7.80 6.73 8.94 2.17 2002 9.26 6.75 7.55 7.35 10.97 2003 10.43 8.44 8.47 10.18 9.48 2004 11.03 10.17 10.02 13.39 10.29 8.36 2005 11.71 9.90 11.27 13.36 8.90 6.01 12.322006 10.94 12.98 12.95 12.68 13.61 14.38 11.39 16.16
Data Workshop Report South Atlantic Red Snapper
SEDAR 15 SAR 1 SECTION II 41

Table 3.5. Sample size and weighted mean weight in pounds (whole weight) of red snapper averaged across years , and when necessary across states. Handlines and Other (Florida only) had sufficient sampling to split into two time periods based on change of minimum size limit in 1992. Sample size: Period State Handlines Diving Traps Trawl Other <1992 FL 1747 594 285 301 50 GA 1371 46 285 301 310 SC 3914 46 285 301 44 NC 4293 46 285 301 146 >=1992 FL 4396 594 285 301 1046 GA 1324 46 285 301 310 SC 5759 46 285 301 44 NC 2115 46 285 301 146 Mean weights in pounds (whole weight): Period State Handlines Diving Traps Trawl Other <1992 FL 5.08 9.81 4.89 4.05 17.85 GA 6.61 12.02 4.89 4.05 2.48 SC 5.46 12.02 4.89 4.05 7.99 NC 6.08 12.02 4.89 4.05 15.00 >=1992 FL 9.96 9.81 4.89 4.05 8.99 GA 8.89 12.02 4.89 4.05 2.48 SC 8.70 12.02 4.89 4.05 7.99 NC 8.38 12.02 4.89 4.05 15.00
Data Workshop Report South Atlantic Red Snapper
SEDAR 15 SAR 1 SECTION II 42

Table 3.6. Red snapper landings (in numbers) by gear from the U.S. South Atlantic, 1900-2006. Year Lines Diving Traps Trawl Other Total
1900 0 01901 571 5711902 1,142 1,1421903 1,713 1,7131904 2,284 2,2841905 2,855 2,8551906 3,427 3,4271907 3,998 3,9981908 4,569 4,5691909 5,140 5,1401910 5,711 5,7111911 6,282 6,2821912 6,853 6,8531913 7,424 7,4241914 7,995 7,9951915 8,566 8,5661916 9,138 9,1381917 9,709 9,7091918 10,280 10,2801919 10,851 10,8511920 11,422 11,4221921 11,993 11,9931922 12,564 12,5641923 13,135 13,1351924 13,706 13,7061925 14,277 14,2771926 14,848 14,8481927 20,659 20,6591928 12,432 12,4321929 10,845 10,8451930 11,623 11,6231931 21,539 21,5391932 9,281 9,2811933 19,036 19,0361934 28,790 28,7901935 27,654 27,6541936 26,517 26,5171937 39,776 39,7761938 22,323 22,3231939 18,509 18,509
Data Workshop Report South Atlantic Red Snapper
SEDAR 15 SAR 1 SECTION II 43

Table 3.6. (continued)
1940 2,652 2,6521941 0 01942 0 01943 0 01944 0 01945 47,245 47,2451946 51,534 51,5341947 55,823 55,8231948 60,112 60,1121949 64,401 64,4011950 68,750 0 0 0 0 68,7501951 96,685 0 0 1,833 0 98,5181952 72,798 0 0 1,222 0 74,0201953 76,502 0 0 0 0 76,5021954 113,426 0 0 0 0 113,4261955 94,411 0 0 0 0 94,4111956 88,180 0 0 0 0 88,1801957 158,722 0 0 0 0 158,7221958 116,172 0 0 0 0 116,1721959 124,924 0 0 0 0 124,9241960 128,016 0 0 0 0 128,0161961 149,242 0 0 904 0 150,1461962 113,050 0 0 150 0 113,2001963 85,918 0 0 0 73 85,9911964 95,574 0 0 24 0 95,5981965 112,249 0 0 0 0 112,2491966 126,135 0 0 269 0 126,4041967 163,343 0 142 49 0 163,5331968 182,126 0 59 0 0 182,1851969 117,005 0 2,401 98 738 120,2411970 108,541 0 807 0 0 109,3481971 91,770 0 0 0 0 91,7701972 75,361 0 4,625 0 0 79,9851973 64,815 0 1,088 103 0 66,0061974 106,939 0 394 0 0 107,3331975 126,652 0 0 85 0 126,7371976 101,734 0 0 4,478 0 106,2131977 105,819 0 0 5,603 0 111,4211978 95,304 0 5,128 1,042 8 101,4811979 67,861 0 1,011 1,969 0 70,842
Data Workshop Report South Atlantic Red Snapper
SEDAR 15 SAR 1 SECTION II 44

Table 3.6. (continued)
1980 59,974 0 632 6,539 66 67,2111981 57,375 0 1,685 6,558 30 65,6491982 49,541 0 159 3,982 71 53,7531983 51,802 0 32 2,020 449 54,3021984 44,831 117 205 2,573 469 48,1951985 44,066 232 500 986 20 45,8031986 32,078 54 421 339 56 32,9481987 31,248 35 127 209 164 31,7831988 27,694 24 38 461 153 28,3701989 30,933 91 58 0 94 31,1761990 39,924 169 650 0 648 41,3901991 16,510 536 1,174 1 175 18,3951992 8,083 946 6 136 264 9,4361993 26,530 574 54 25 16 27,1991994 22,364 1,311 80 0 86 23,8411995 18,126 1,026 81 6 13 19,2521996 13,297 626 283 5 68 14,2781997 8,680 762 219 0 256 9,9181998 7,804 814 103 0 258 8,9791999 9,300 860 43 0 109 10,3132000 10,007 1,443 20 0 126 11,5962001 21,548 2,228 45 1 75 23,8972002 19,783 2,323 9 13 68 22,1962003 12,133 1,806 99 0 245 14,2832004 13,637 1,944 54 2 53 15,6902005 9,673 943 131 0 606 11,3532006 6,679 411 82 0 359 7,531
Data Workshop Report South Atlantic Red Snapper
SEDAR 15 SAR 1 SECTION II 45
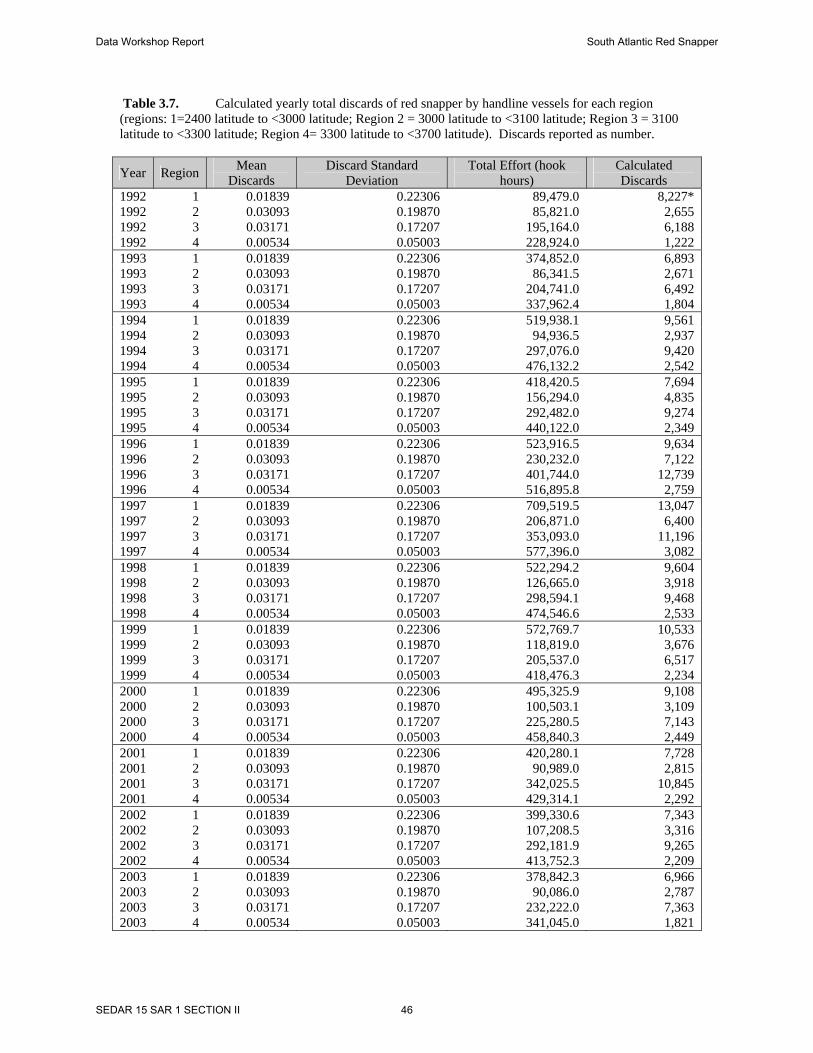
Table 3.7. Calculated yearly total discards of red snapper by handline vessels for each region (regions: 1=2400 latitude to <3000 latitude; Region 2 = 3000 latitude to <3100 latitude; Region 3 = 3100 latitude to <3300 latitude; Region 4= 3300 latitude to <3700 latitude). Discards reported as number.
Year Region Mean Discards
Discard Standard Deviation
Total Effort (hook hours)
Calculated Discards
1992 1 0.01839 0.22306 89,479.0 8,227* 1992 2 0.03093 0.19870 85,821.0 2,655 1992 3 0.03171 0.17207 195,164.0 6,188 1992 4 0.00534 0.05003 228,924.0 1,222 1993 1 0.01839 0.22306 374,852.0 6,893 1993 2 0.03093 0.19870 86,341.5 2,671 1993 3 0.03171 0.17207 204,741.0 6,492 1993 4 0.00534 0.05003 337,962.4 1,804 1994 1 0.01839 0.22306 519,938.1 9,561 1994 2 0.03093 0.19870 94,936.5 2,937 1994 3 0.03171 0.17207 297,076.0 9,420 1994 4 0.00534 0.05003 476,132.2 2,542 1995 1 0.01839 0.22306 418,420.5 7,694 1995 2 0.03093 0.19870 156,294.0 4,835 1995 3 0.03171 0.17207 292,482.0 9,274 1995 4 0.00534 0.05003 440,122.0 2,349 1996 1 0.01839 0.22306 523,916.5 9,634 1996 2 0.03093 0.19870 230,232.0 7,122 1996 3 0.03171 0.17207 401,744.0 12,739 1996 4 0.00534 0.05003 516,895.8 2,759 1997 1 0.01839 0.22306 709,519.5 13,047 1997 2 0.03093 0.19870 206,871.0 6,400 1997 3 0.03171 0.17207 353,093.0 11,196 1997 4 0.00534 0.05003 577,396.0 3,082 1998 1 0.01839 0.22306 522,294.2 9,604 1998 2 0.03093 0.19870 126,665.0 3,918 1998 3 0.03171 0.17207 298,594.1 9,468 1998 4 0.00534 0.05003 474,546.6 2,533 1999 1 0.01839 0.22306 572,769.7 10,533 1999 2 0.03093 0.19870 118,819.0 3,676 1999 3 0.03171 0.17207 205,537.0 6,517 1999 4 0.00534 0.05003 418,476.3 2,234 2000 1 0.01839 0.22306 495,325.9 9,108 2000 2 0.03093 0.19870 100,503.1 3,109 2000 3 0.03171 0.17207 225,280.5 7,143 2000 4 0.00534 0.05003 458,840.3 2,449 2001 1 0.01839 0.22306 420,280.1 7,728 2001 2 0.03093 0.19870 90,989.0 2,815 2001 3 0.03171 0.17207 342,025.5 10,845 2001 4 0.00534 0.05003 429,314.1 2,292 2002 1 0.01839 0.22306 399,330.6 7,343 2002 2 0.03093 0.19870 107,208.5 3,316 2002 3 0.03171 0.17207 292,181.9 9,265 2002 4 0.00534 0.05003 413,752.3 2,209 2003 1 0.01839 0.22306 378,842.3 6,966 2003 2 0.03093 0.19870 90,086.0 2,787 2003 3 0.03171 0.17207 232,222.0 7,363 2003 4 0.00534 0.05003 341,045.0 1,821
Data Workshop Report South Atlantic Red Snapper
SEDAR 15 SAR 1 SECTION II 46

Table 3.7. (continued)
Year Region Mean Discards Discard Standard Deviation Total Effort Calculated Discards 2004 1 0.01839 0.22306 343,562.0 6,318 2004 2 0.03093 0.19870 78,631.0 2,432 2004 3 0.03171 0.17207 167,070.6 5,298 2004 4 0.00534 0.05003 330,764.0 1,766 2005 1 0.01839 0.22306 273,803.3 5,035 2005 2 0.03093 0.19870 70,031.0 2,166 2005 3 0.03171 0.17207 204,396.6 6,481 2005 4 0.00534 0.05003 297,695.0 1,589 2006 1 0.01839 0.22306 267,566.5 4,920 2006 2 0.03093 0.19870 75,894.0 2,348 2006 3 0.03171 0.17207 248,067.9 7,866 2006 4 0.00534 0.05003 333,484.5 1,780
*in 1992 only 20% of vessels in Florida were required to report to the logbook program, the calculated discards for areas off Florida (region 1) was expanded by a factor of five. Table 3.8. Calculated yearly south Atlantic handline vessel red snapper discards. Discards are reported in number of fish.
Year Calculated Discards 1992 18,292* 1993 17,860 1994 24,459 1995 24,153 1996 32,254 1997 33,725 1998 25,524 1999 22,959 2000 21,810 2001 23,680 2002 22,133 2003 18,937 2004 15,813 2005 15,272 2006 16,914
*in 1992 only 20% of vessels in Florida were required to report to the logbook program, the calculated discards for areas off Florida (region 1) was expanded by a factor of five.
Data Workshop Report South Atlantic Red Snapper
SEDAR 15 SAR 1 SECTION II 47

Table 3.9. Sample size by gear of red snapper ages from commercial landings in the U.S. South Atlantic, 1980-2006
Year Handline Diving Total Ages 1980 5 51981 01982 01983 01984 01985 01986 01987 01988 34 341989 7 71990 28 281991 22 221992 48 481993 37 371994 49 491995 24 241996 167 1671997 182 1821998 75 751999 147 1472000 226 106 3322001 144 1442002 36 362003 51 512004 103 1032005 140 1402006 189 189
Grand Total 1714 106 1820
Data Workshop Report South Atlantic Red Snapper
SEDAR 15 SAR 1 SECTION II 48

Figure 3.1. Map of U.S. Atlantic and Gulf coast with shrimp area designations.
Figure 3.2. Map showing marine fisheries trip ticket fishing area code map for Florida.
Data Workshop Report South Atlantic Red Snapper
SEDAR 15 SAR 1 SECTION II 49

Figure 3.3. Red snapper landings by gear from the U.S. South Atlantic, 1927-2006.
0
100,000
200,000
300,000
400,000
500,000
600,000
700,000
800,000
900,000
1,000,000
1927
1930
1933
1936
1939
1942
1945
1948
1951
1954
1957
1960
1963
1966
1969
1972
1975
1978
1981
1984
1987
1990
1993
1996
1999
2002
2005
Poun
ds (G
W)
Lines Diving Traps
Trawl Other
Figure 3.4. Red snapper landings by state from the U.S. South Atlantic, 1900-2006.
0
100,000
200,000
300,000
400,000
500,000
600,000
700,000
800,000
900,000
1,000,000
1927
1930
1933
1936
1939
1942
1945
1948
1951
1954
1957
1960
1963
1966
1969
1972
1975
1978
1981
1984
1987
1990
1993
1996
1999
2002
2005
Poun
ds (G
W)
Florida Georgia
SC NC
Data Workshop Report South Atlantic Red Snapper
SEDAR 15 SAR 1 SECTION II 50

Figure 3.5. Red snapper landings from the U.S. South Atlantic, 1900-2006; with linear interpolation from 0 landings in 1900 to the average reported landings for 1927-1931 for 1927 when calculating the linear interpolations for 1901-1926.
0
100,000
200,000
300,000
400,000
500,000
600,000
700,000
800,000
900,000
1,000,000
1900
1905
1910
1915
1920
1925
1930
1935
1940
1945
1950
1955
1960
1965
1970
1975
1980
1985
1990
1995
2000
2005
Poun
ds (g
utte
d w
eigh
t)
Figure 3.6. Red snapper landings in numbers by gear from the U.S. South Atlantic, 1900-2006.
0
20,000
40,000
60,000
80,000
100,000
120,000
140,000
160,000
180,000
200,000
1900
1905
1910
1915
1920
1925
1930
1935
1940
1945
1950
1955
1960
1965
1970
1975
1980
1985
1990
1995
2000
2005
Land
ings
in N
umbe
rs
Lines Diving
Traps Trawl
Other
Data Workshop Report South Atlantic Red Snapper
SEDAR 15 SAR 1 SECTION II 51

Figure 3.7. U.S. South Atlantic red snapper, price per pound, adjusted and unadjusted for inflation, 1962-2006. Price is adjusted by consumer price index (CPI) using 1962 as base year.
$0.00
$0.50
$1.00
$1.50
$2.00
$2.50
$3.00
$3.5019
6219
6419
6619
6819
7019
7219
7419
7619
7819
8019
8219
8419
8619
8819
9019
9219
9419
9619
9820
0020
0220
0420
06
Year
Pric
e Pe
r Pou
nd
Unadjusted Price/lb.
CPI Adjusted Price/lb.
Data Workshop Report South Atlantic Red Snapper
SEDAR 15 SAR 1 SECTION II 52

Figure 3.8. Annual length composition of red snapper for commercial handline from TIP, 1984-2006, and sample size. Weighting based on landings and trip catch in numbers. Sample size and year are shown on each subplot.
30 36 42 48 54 60 66 72 78 84 900.00
0.05
0.10
0.15
0.202089 1984
30 36 42 48 54 60 66 72 78 84 900.00
0.05
0.10
0.15
0.203539 1985
30 36 42 48 54 60 66 72 78 84 900.00
0.05
0.10
0.15
0.201246 1986
30 36 42 48 54 60 66 72 78 84 900.00
0.05
0.10
0.15
0.201146 1987
30 36 42 48 54 60 66 72 78 84 900.00
0.05
0.10
0.15
0.20621 1988
30 36 42 48 54 60 66 72 78 84 900.00
0.05
0.10
0.15
0.201191 1989
30 36 42 48 54 60 66 72 78 84 900.00
0.05
0.10
0.15
0.20787 1990
30 36 42 48 54 60 66 72 78 84 900.00
0.05
0.10
0.15
0.20706 1991
30 36 42 48 54 60 66 72 78 84 900.00
0.05
0.10
0.15
0.20512 1992
30 36 42 48 54 60 66 72 78 84 900.00
0.05
0.10
0.15
0.201347 1993
Pro
porti
on
Total Length (cm)
Data Workshop Report South Atlantic Red Snapper
SEDAR 15 SAR 1 SECTION II 53

Figure 3.8. (continued)
30 36 42 48 54 60 66 72 78 84 900.00
0.05
0.10
0.15
0.201167 1994
30 36 42 48 54 60 66 72 78 84 900.00
0.05
0.10
0.15
0.201442 1995
30 36 42 48 54 60 66 72 78 84 900.00
0.05
0.10
0.15
0.20770 1996
30 36 42 48 54 60 66 72 78 84 900.00
0.05
0.10
0.15
0.20497 1997
30 36 42 48 54 60 66 72 78 84 900.00
0.05
0.10
0.15
0.20428 1998
30 36 42 48 54 60 66 72 78 84 900.00
0.05
0.10
0.15
0.20946 1999
30 36 42 48 54 60 66 72 78 84 900.00
0.05
0.10
0.15
0.20881 2000
30 36 42 48 54 60 66 72 78 84 900.00
0.05
0.10
0.15
0.201408 2001
30 36 42 48 54 60 66 72 78 84 900.00
0.05
0.10
0.15
0.20992 2002
30 36 42 48 54 60 66 72 78 84 900.00
0.05
0.10
0.15
0.201270 2003
Pro
porti
on
Total Length (cm)
Data Workshop Report South Atlantic Red Snapper
SEDAR 15 SAR 1 SECTION II 54

Figure 3.8. (continued)
30 36 42 48 54 60 66 72 78 84 900.00
0.05
0.10
0.15
0.20795 2004
30 36 42 48 54 60 66 72 78 84 900.00
0.05
0.10
0.15
0.20618 2005
30 36 42 48 54 60 66 72 78 84 900.00
0.05
0.10
0.15
0.20406 2006
Pro
porti
on
Total Length (cm)
Data Workshop Report South Atlantic Red Snapper
SEDAR 15 SAR 1 SECTION II 55

Figure 3.9. Length composition of red snapper for commercial diving from TIP, 1999-2001 and 2003. Weighting based on landings in numbers and trip catch in numbers. Sample size and year are shown on each subplot.
30 36 42 48 54 60 66 72 78 84 900.00
0.05
0.10
0.15
0.2083 1999
30 36 42 48 54 60 66 72 78 84 900.00
0.05
0.10
0.15
0.20129 2000
30 36 42 48 54 60 66 72 78 84 900.00
0.05
0.10
0.15
0.2087 2001
30 36 42 48 54 60 66 72 78 84 900.00
0.05
0.10
0.15
0.20210 2003
Pro
porti
on
Total Length (cm)
Data Workshop Report South Atlantic Red Snapper
SEDAR 15 SAR 1 SECTION II 56

Figure 3.10. Length composition of red snapper for commercial trawls from TIP, 1984, 1986-1988. Weighting based on landings in numbers and trip catch in numbers. Sample size and year are shown on each subplot.
30 36 42 48 54 60 66 72 78 84 900.00
0.05
0.10
0.15
0.2033 1984
30 36 42 48 54 60 66 72 78 84 900.00
0.05
0.10
0.15
0.2066 1986
30 36 42 48 54 60 66 72 78 84 900.00
0.05
0.10
0.15
0.2064 1987
30 36 42 48 54 60 66 72 78 84 900.00
0.05
0.10
0.15
0.20138 1988
Pro
porti
on
Total Length (cm)
Data Workshop Report South Atlantic Red Snapper
SEDAR 15 SAR 1 SECTION II 57

Figure 3.11. Length composition of red snapper for commercial traps from TIP, 1991. Weighting based on landings in numbers and trip catch in numbers. Sample size and year are shown on plot.
30 37 44 51 58 65 72 79 86 93
0.00
0.05
0.10
0.15
0.20252 1991
Pro
porti
on
Total Length (cm)
Data Workshop Report South Atlantic Red Snapper
SEDAR 15 SAR 1 SECTION II 58

Figure 3.12. Age composition of red snapper for commercial handline from TIP, 1988-2006. Weighting based on corresponding length composition available for 1988-2006. Sample size and year are shown on each subplot.
1 3 5 7 9 11 13 15 17 190.00
0.25
0.50
0.75
n= 34
1988
1 3 5 7 9 11 13 15 17 190.00
0.25
0.50
0.75
n= 7
1989
1 3 5 7 9 11 13 15 17 190.00
0.25
0.50
0.75
n= 28
1990
1 3 5 7 9 11 13 15 17 190.00
0.25
0.50
0.75
n= 22
1991
1 3 5 7 9 11 13 15 17 190.00
0.25
0.50
0.75
n= 48
1992
1 3 5 7 9 11 13 15 17 190.00
0.25
0.50
0.75
n= 37
1993
1 3 5 7 9 11 13 15 17 190.00
0.25
0.50
0.75
n= 49
1994
1 3 5 7 9 11 13 15 17 190.00
0.25
0.50
0.75
n= 24
1995
1 3 5 7 9 11 13 15 17 190.00
0.25
0.50
0.75
n= 167
1996
1 3 5 7 9 11 13 15 17 190.00
0.25
0.50
0.75
n= 182
1997
Pro
porti
on
Age
Data Workshop Report South Atlantic Red Snapper
SEDAR 15 SAR 1 SECTION II 59

Figure 3.12. (continued)
1 3 5 7 9 11 13 15 17 190.00
0.25
0.50
0.75
n= 75
1998
1 3 5 7 9 11 13 15 17 190.00
0.25
0.50
0.75
n= 147
1999
1 3 5 7 9 11 13 15 17 190.00
0.25
0.50
0.75
n= 226
2000
1 3 5 7 9 11 13 15 17 190.00
0.25
0.50
0.75
n= 144
2001
1 3 5 7 9 11 13 15 17 190.00
0.25
0.50
0.75
n= 36
2002
1 3 5 7 9 11 13 15 17 190.00
0.25
0.50
0.75
n= 51
2003
1 3 5 7 9 11 13 15 17 190.00
0.25
0.50
0.75
n= 103
2004
1 3 5 7 9 11 13 15 17 190.00
0.25
0.50
0.75
n= 140
2005
1 3 5 7 9 11 13 15 17 190.00
0.25
0.50
0.75
n= 189
2006
Pro
porti
on
Age
Data Workshop Report South Atlantic Red Snapper
SEDAR 15 SAR 1 SECTION II 60

Figure 3.13. Age composition of red snapper for commercial handline from TIP, 2000. Weighting based on corresponding length composition available for 2000. Sample size and year are shown on plot.
1 3 5 7 9 12 15 18
0.00
0.25
0.50
0.75
n= 106
2000
Pro
porti
on
Age
Data Workshop Report South Atlantic Red Snapper
SEDAR 15 SAR 1 SECTION II 61

Data Workshop Report South Atlantic Red Snapper
SEDAR 15 SAR 1 SECTION II
4 Recreational Fishery (TOR 4, 5)
4.1 Overview
Members of the Recreational Fishery Working Group:
Ken Brennan, National Marine Fisheries Service (NMFS), Southeast Fisheries Science Center
Doug Mumford, North Carolina Department of Environment and Natural Resources, Div of Marine Fisheries
Beverly Sauls (leader), Florida Fish & Wildlife Conservation Commission, Fish & Wildlife Research Institute
Tom Sminkey, NMFS, Office of Science and Technology.
The group discussed the geographic range of recreational fisheries for red snapper. North Carolina was
considered to be the northern limit of the recreational fishery, and recreational catches north of Cape Hatteras
are considered rare. The recreational fishery for red snapper tapers off in southeast Florida and a relatively small
amount of fish in the recreational fishery come from areas around the Atlantic coast of the Florida Keys and
Dry Tortugas, which is the southern boundary of the South Atlantic management area.
Major issues discussed by the group during the Data Workshop included issues with existing estimates of
recreational landings and discards that needed resolution in order to construct a complete time series. Those
issues addressed were sample size for weight estimates, back-calculation of estimates to 1962 as requested for
the assessment model, missing estimates for discards in the headboat fishery, changes in survey methodologies
over time, and the validity of shore catch estimates. In addition to historic data sets from the South Atlantic
Headboat Logbook Survey and the Marine Recreational Fisheries Statistics Survey, several new and regional
data sets were examined for their potential usefulness.
4.2 Sources of Recreational Fishery Dependent Data
NOAA Fisheries Service Southeast Region Headboat Survey
The Headboat Logbook Survey, conducted by the NMFS Beaufort Lab, provides a long time series of catch per
unit effort, total effort, and estimated landings in number and weight (kg) from headboats in the Atlantic from
North Carolina to Florida. Effort and harvest estimates are available for red snapper from NC and SC beginning
in 1972, and estimates south of SC are available beginning in 1981. The Headboat Survey included only vessels
from North Carolina and South Carolina from1972-1975. The Survey expanded to northeast Florida in 1976, to
southeast Florida in 1978 and finally to the Gulf of Mexico in 1986. From 1981-present the Survey included all
headboats operating in the southeastern U.S. EEZ.
The Beaufort Headboat Logbook Survey incorporates two components for estimating catch and effort. 1)
Information about total catch and effort are collected via the logbook, a form filled out by vessel personnel and
containing total catch and effort data for individual trips. 2) Information about mean size of fishes landed are
collected by port samplers during non-random dockside sampling, where fish are measured to the nearest mm
and weighed to the nearest 0.01 kg. These data are used to generate mean weights for all species by area and
month. Port samplers also collect otoliths for ageing studies during dockside sampling events. Data on
discarded catch for either species were not requested on the logbook data sheet until 2004, when fields were
added for number of fish released alive and number released dead. The logbook was designed to be a complete
census of headboat fishing effort and catch; however, compliance with the mandatory reporting requirement has
not been strictly enforced resulting in non-compliance in recent years, particularly for certain areas. Estimates
of total effort and landings for non-reporting vessels are derived using data from comparable (geographically
proximal, similar fishing characteristics) reporting vessels to estimate catch composition, and port agent
summaries of total vessel activity information to estimate total effort by vessel by month. Correction factors
derived from the ratio of total estimated effort/reported effort, on a by-month by-vessel basis, are applied to the
reported landings to generate total estimated landings, by species by vessel by month. Lastly, estimated total
landings in number are multiplied by the mean weight from the dockside sampling component, again by species
by month, to estimate total landings in weight (kg).
Marine Recreational Fisheries Statistics Survey (MRFSS)
62

Data Workshop Report South Atlantic Red Snapper
SEDAR 15 SAR 1 SECTION II
The Marine Recreational Fisheries Statistics Survey (MRFSS) provides a long time series of estimated catch per
unit effort, total effort, landings, and discards for six two-month periods (waves) each year. The survey provides
estimates for three recreational fishing modes: shore-based fishing (SH), private and rental boat fishing (PR),
and for-hire charter and guide fishing (CH). When the survey first began in Wave 2, 1981, headboats were
included in the for-hire mode, but were excluded after 1985 to avoid overlap with the Headboat Logbook
Survey.
The MRFSS survey covers coastal Atlantic states from Maine to Florida. The state of Florida is sampled as two
sub-regions. The east Florida sub-region includes counties adjacent to the Atlantic coast from Nassau County
south through Miami-Dade County, and the west Florida sub-region includes Monroe County (Florida Keys)
and counties adjacent to the Gulf of Mexico. Separate estimates are generated for each Florida subregion, and
those estimates may be post-stratified into smaller regions based on proportional sampling.
The MRFSS design incorporates two complementary survey methods for estimating catch and effort. Catch data
are collected through angler interviews during dockside intercept surveys. Effort data are collected in a random
digit dialing telephone survey of coastal households. Catch rates from dockside intercept surveys are combined
with estimates of effort from telephone interviews to estimate total landings and discards by wave, mode, and
area fished (inland, state, and federal waters). Catch estimates from early years of the survey are highly variable
with high percent standard errors (PSE’s, shown in Tables 4.2 and 4.3), and sample size in the dockside
intercept portion have been increased over time to improve precision of catch estimates. Full survey
documentation and ongoing efforts to review and improve survey methods are available on the MRFSS website
at: http://www.st.nmfs.gov/st1/recreational.
Survey methods for the for-hire fishing mode have seen the most improvement over time. Catch data were
improved through increased sample quotas and state add-ons to the intercept portion of the survey. It was also
recognized that the random household telephone survey was intercepting very few anglers in the for-hire fishing
mode and the For-Hire Telephone Survey (FHS) was developed to estimate effort in the for-hire mode. The new
method draws a random sample of known for-hire charter and guide vessels each week and vessel operators are
called and asked directly to report their fishing activity. The FHS was piloted in east Florida in 2000 and
officially adopted in all the Atlantic coast states in 2003. A further improvement in the FHS method was the
pre-stratification of Florida into smaller sub-regions for estimating effort. The FHS subregions include three
distinct regions bordering the Atlantic coast: Monroe County (sub-region 3), southeast Florida from Dade
through Indian River Counties (sub-region 4), and northeast Florida from Martin through Nassau Counties (sub-
region 5). The coastal household telephone survey method for the for-hire fishing mode continues to run
concurrently with new FHS method.
Headboat At-Sea Observer Survey
An observer survey of the recreational headboat fishery was launched in NC and SC in 2004 and in FL in 2005
to collect more detailed information on recreational headboat catch, particularly for discarded fish. Headboat
vessels are randomly selected throughout the year in each state, or each sub-region in Florida (defined the same
as FHS sub-regions). Biologists board selected vessels with permission from the captain and observe anglers as
they fish on the recreational trip. Data collected include number and species of fish landed and discarded, size
of landed and discarded fish, and the release condition of discarded fish (FL only). Data are also collected on
the length of the trip, area fished (inland, state, and federal waters) and, in Florida, the minimum and maximum
depth fished. In the Florida Keys (sub-region 3) some vessels that run trips that span more than 24 hours are
also sampled to collect information on trips that fish farther offshore and for longer durations, primarily in the
vicinities of the Dry Tortugas and Florida Middle Grounds. While this data set is a short time series, it provides
valuable quantitative information on the size distribution and release condition of fish discarded in the
recreational fishery.
North Carolina Saltwater Fishing Tournament
The Official North Carolina Saltwater Fishing Tournament was designed to recognize outstanding angling
achievement. Managed by the State of North Carolina, Department of Environment and Natural Resources’
Division of Marine Fisheries, the program presents certificates suitable for framing to anglers who catch eligible
fish at or over listed minimum weights. Applications are made through official weigh stations, located at many
63

Data Workshop Report South Atlantic Red Snapper
SEDAR 15 SAR 1 SECTION II
marinas, piers and tackle shops along the coast. Eligibility for an official citation requires that harvested red
snapper weigh at least 10 pounds.
Citation awards for red snapper in North Carolina are available from 1991 through 2006. The number of annual
citations awarded for red snapper ranged from a high of 72 during 2003 to only 9 fish recognized during 1997
(Table 4.4). Annual summaries from 1991-2006 along with individual citation records are available from 1996-
2006. The datasets may be requested from workgroup member D. Mumford.
South Carolina’s Angler-based Tagging Program
Since 1974, the South Carolina Marine Resources Division’s Office of Fisheries Management has operated a
tagging program that utilizes recreational anglers as a means for deploying external tags in marine game fish.
The angler-based tagging program has proven to be a useful tool for promoting the conservation of marine
game fish and increasing public resource awareness. In addition, the program has provided biologists with
valuable data on movement and migration rates between stocks, growth rates, habitat utilization, and mortality
associated with both fishing and natural events.
Select marine finfish species are targeted for tag and release based on their importance both recreationally and
commercially to the State and South Atlantic region. The list of target species is further narrowed down based
on the amount of historical data on that species with regards to seasonal movements, habitat requirements,
growth rates and release mortality. Although red drum constitutes the majority of fish tagged and released by
recreational anglers, program participants are encouraged to tag other eligible species where data gaps may
exist. A total of 1,598 red snapper have been tagged, resulting in 172 recaptures. Numbers of red snapper tagged
each year and the size range of tagged fish are provide in Table 4.5.
4.3 Recreational Landings
a. Missing cells in MRFSS estimates
The MRFSS calculates estimated landings in numbers and weight for each year, fishing mode, state, wave, and
area fished (inshore, state waters, federal waters) combination, and each combination is referred to as a cell.
Landings by weight are calculated by multiplying the average weight for all fish in a given cell by the estimated
number of fish in the same cell. When no fish are weighed in a given cell, the estimated weight of fish landed is
not generated for that cell. When there is an estimated number of fish landed, but no corresponding estimate for
weight, that cell is referred to as a “missing cell”. It is inaccurate to add cells together when there are missing
weight estimates; therefore, weight estimates were filled in for missing cells by pooling cells and applying a
pooled average weight to the number of fish in the cell with missing estimated weight. Weight landings were
substituted in cells (Sub-reg, St, Year, Wave, Mode_fx, Area_x) that did not have >1 fish weighed. Average
weight from sampled fish was calculated at the subregion, annual/wave level or higher, and applied to the
number sampled in those cells that lacked sufficient sampled weights. The new weight estimates were
substituted and included in the annual weight estimates for red snapper. For the 1981 to 2006 time series, there
were 9 missing cells for red snapper landings estimates. Due to the high frequency of cells where there were
zero estimated fish landed, cells had to be pooled for the entire year for all states combined (year, subregion).
Wave 1 estimates are not generated from Virginia to Georgia due to low fishing activity during January and
February. In east Florida, no landings estimates are available for Wave 1, only for the year 1981. We generated
Wave 1 estimates for A+B1 and B2 catch for red snapper using the average portion of Wave 1 catch estimates
to Waves 2-6 catch estimates for the four year period from 1983 to 1986. The 1981 annual landings were
increased by the mean value that Wave 1 contributed from the pooled years.
b. Headboat Estimates in MRFSS
Any catch estimates from the MRFSS survey program classified as Headboat mode were excluded from the
landings. This fishery is monitored by the NMFS Southeast Headboat Program and was only rarely and
sporadically sampled by the MRFSS.
c. Back-Calculating Landings in Time
For stock assessment modeling exercises, the workgroup was tasked with back-calculating recreational landings
for years prior to the start of data collections extending backwards to 1962. Catch estimates from the MRFSS
are not available from 1962 to 1980, and for headboat logbook estimates, red snapper landings estimates are not
available from 1962 to 1971 from North Carolina to South Carolina, and from 1962 to 1980 for Georgia
through Florida.
64

Data Workshop Report South Atlantic Red Snapper
SEDAR 15 SAR 1 SECTION II
The workgroup considered several historic data sets for comparison with recreational trends as a possible means
for regressing recreational statistics back in time. The U.S. Fish and Wildlife Survey of Fishing, Hunting, and
Wildlife-Associated Recreation began in 1955 and is conducted approximately every 5 years. Due to several
methodology changes over several time periods, the U.S. Fish and Wildlife Service does not recommend use of
this data set as a continuous time series and this data set could not be used. A database of the number of
registered recreational vessels in Florida was available for the time series 1964 to 2005. This database includes
all registered fishing and nonfishing recreational vessels in freshwater and saltwater. The data set was
considered as an index for comparison with recreational red snapper catch estimates, since the recreational
fishery is exclusively vessel based. The number of registered vessels in Florida steadily increased over time, and
this trend did not correspond well with recreational red snapper harvest, which peaks in the 1980’s and appears
to decline to a stable, but lower level in the 1990’s and 2000’s. Because the two trends do not track well, we did
not attempt to use registered recreational vessels to regress recreational landings back in time.
In the absence of a good surrogate data set for recreational catch and harvest trends, the workgroup considered
anecdotal accounts of the historic fishery and developments in technology in relation to fishing from
recreational vessels. Red snapper is an offshore fishery and fishing occurs specifically on hard bottom and reef
structure. The majority of private recreational boaters were not likely to venture far from sight of shore prior to
the development of Loran A, which was first developed during WWII. After the war, Loran A became popular
with commercial and recreational boaters as a means of navigation. However, it was not until the development
of Loran C, with its longer range and accuracy, that Loran technology was particularly useful as a fishing aid.
Prior to Loran C, it would be very difficult for recreational boaters to return to specific offshore fishing sites
known to be productive for red snapper. The first receivers for Loran C were also cost prohibitive. In 1964,
Raytheon offered a Loran C receiver for a retail cost of approximately $3,500. In 1979, SRD Labs came out
with a smaller, more affordable receiver which they marketed for under $1,000
(www.rodgersmarine.com/history.com). While the for-hire sector may have had an interest and investment in
expensive Loran C equipment as early as 1964, the private recreational sector would have been less likely to
invest in Loran C technology for use in recreational fishing until at least 1979.
During the data workshop, the workgroup decided to set for-hire mode catch estimates to 0 in 1964, and private
boat mode was estimated to be 0 in 1979 based on the limited technology for offshore fishing during those time
periods. The workgroup reconsidered these start dates during the writing of this report, based on historic
references which were not available during the data workshop. Historic accounts of recreational fisheries in
Florida indicate that red snapper was not within reach of the recreational anglers in the early 1900’s. Gregg
(1902) noted that red snapper were caught on reefs ten miles from shore or more off the coast of east Florida
and the species was described as “not exactly a sport fish”. In Gregg’s early accounts of Florida’s recreational
fishery, for-hire charters and guides were already catering to northern tourists who traveled by railroad to the
east coast of Florida. Ellis (et. al 1958), documented a well established charter and party boat industry along the
east coast of Florida (Ellis et al. 1958). The majority of charter and party vessels in the 1950’s were located in
the southeastern portion of the state; however, a small number of for-hire vessels were located in the north
eastern counties from Indian River north where red snapper are more likely to be targeted. Rosen and Ellis
(1961) surveyed coastal households in Florida and results indicate that private boat recreational anglers fished
offshore for red snapper; however, the study did not specify if this fishing occurred in the Gulf of Mexico,
Atlantic Ocean, or both. A later study of the developed offshore recreational fishery off eastern Florida indicates
that small numbers of charter, party, and private vessels in the northeastern section of the state did venture
offshore to catch red snapper prior to the introduction of Loran C recievers in 1964 (Moe 1963). In particular,
red snapper were accessible to recreational anglers fishing outside Ponce de Leon Inlet in Volusia county.
The workgroup decided to extend landings back to 1946 for all modes (charter, headboat, and private boat)
based on interviews with headboat captains (K. Brennan, personal communication) and historical reports from
South Carolina and Florida for charter, headboat, and private boat modes. Moe (1963) noted, “The exploitation
of the reef fishes on the offshore fishing grounds of Florida has increased tremendously since World War II.”
Based on this information, it is evident that fishing for offshore snapper-grouper species first developed
sometime after World War II and that any recreational fishing was likely non-existent during the war years. It is
also well documented that commercial fishing effort from large vessels was severely restricted during WWII.
Landings estimates from the first three years of available data (1981-1983 for MRFSS, 1972-1974 for
headboats) were averaged and the average was divided by the number of years between zero landings and the
average first catch estimates. Landings estimates for each year were incrementally declined backwards to zero
in 1946. Red snapper headboat landings were limited to North Carolina and South Carolina from 1972-1980
65

Data Workshop Report South Atlantic Red Snapper
SEDAR 15 SAR 1 SECTION II
and were estimated for specific reports and later digitized for assessment purposes. Trip reports for other areas
began in 1976 and gradually increased so that all the currently sampled areas (NC to the Tortugas) were
included by 1978. Landings for the non-coverage areas from 1972 -1980 were predicted by regressing landings
of North Carolina and South Carolina catches combined against Georgia and Florida catches combined. The
catch in numbers r2 value was 0.142 and was significant at p<0.06 . The catch in weight r2 value was 0.046 and
was not significant at p<0.293.
d. Change in Methodology for For-Hire Mode
The For-Hire Survey (FHS) method was piloted in east Florida in 2000 and officially adopted in 2003. In 2005,
the For-Hire survey was implemented throughout all the south Atlantic states. The MRFSS coastal household
telephone survey (CHTS) method for the for-hire fishing mode continues to run concurrently with the FHS
method in all states. Because this new survey methodology has only been in place two full years throughout the
south Atlantic region, there has been no evaluation of how the time series of landings estimates should be
adjusted to account for the new survey method. Any difference between the two survey methods could cause a
disjunct in the time series that may give a false signal of a change in landings. Therefore, we used MRFSS
coastal household telephone survey estimates for all years and all states. The workgroup recommends that in the
future, a comparison of the two methods be conducted before the next data workshop for this species so that
CHTS estimates from earlier years can be adjusted and the new FHS estimates used for later years.
e. Shore Estimates
Because red snapper is an offshore species with a strong association with reefs and hard bottom, the group felt
that it was implausible that this species would be landed from shore and shore landings for red snapper were
omitted from total landings estimates. Several species of nearshore fish are often referred to as “red snapper”,
which may explain the infrequent red snapper shore landing estimates in the MRFSS time series.
f. Monroe County
Monroe county landings estimates from the MRFSS are included in the total landings for the Gulf of Mexico.
While Monroe County landings can be post-stratified, they can not be partitioned into fish from waters of the
Atlantic Ocean or Gulf of Mexico. Because red snapper are less common on the extreme south Atlantic coast of
Florida, Atlantic Coast landings from Monroe County likely contribute only a very small amount to recreational
red snapper landings from the Atlantic. Because Gulf of Mexico red snapper could not be partitioned out of the
Monroe County landings, the recreational workgroup decided not to include Monroe County MRFSS estimates.
Headboat landings from Monroe County are seperated by area fished, and trips that occurred on the Atlantic
side of Keys and Dry Tortugas were included in headboat landings.
4.4 Recreational Discards
a. Headboat discards
The collection of discard data began in 2004 in the Headboat Survey; however, discard estimates for 2004-2005
were unavailable for this assessment. Estimates from 2006 are preliminary and were only used for comparison
purposes. Consequently, estimates of released (B2) fish from the MRFSS charter boat mode were used to
estimate the proportion of released fish from the headboat fishery. The charter boat mode is thought to most
closely approximate fishing practices followed by headboats. The ratio of released:retained (A+B1) fish in the
charter boat mode from MRFSS were applied to the headboat catch in numbers, providing estimates of the
number of released fish in the headboat fishery. The average of the ratio from 1981-1983 was applied for
discards back to 1947, with 0 discards in 1946.
b. MRFSS discards
During the period of conduct of the MRFSS, the relationship between estimated live released fish (b2
record/estimates) and the landed fish (a+b1 record/estimates) changed dramatically by decade for red snapper.
There is wide fluctuation in the number and proportion of discards in the 1980’s, suggesting either sample size
66

Data Workshop Report South Atlantic Red Snapper
SEDAR 15 SAR 1 SECTION II
issues or some real change in fishing behavior. During the 1980’s (1982-1989) live discards were a low
percentage of the annual total catch; during the 1990’s this proportion more than doubled and during the period
of 2000-2006 this proportion more than doubled again (Table 4.1). Regulatory changes during these time
periods may account for some of the differences. In 1983, a 12” size limit was implemented, which was
increased to 20” in 1992 along with implementation of a recreational bag limit of two fish per person. However,
the effect of these regulatory changes is hard to discern due to low sampling levels during the 1980’s and
imprecise estimates. During three years from 1982 to 1991, there were zero discarded fish estimated, and the
years with estimated discards have high PSE’s. Stock assessment analysts may consider smoothing discard
estimates by applying an average discard ratio to landings estimates. However, given changes in fishing
regulations over the time periods, it may be that the fishery operated with virtually no fish released fish prior to
1992 and the wide variation in estimated discard numbers from year to year may be explained by the rarity of
discard events in the sample. Therefore, it is recommended to use sensitivity runs to evaluate any potential
effects of substitute estimation.
Because of the decadal differences in discard rates, the proportion of live discards to harvested fish from the
1980’s were used when projecting backwards to provide a time series of live discard estimates. The average
discard portion does not include 1981 estimates and proportions for projection because data was only collected
in waves 2-6 and we already used proportional allocation to estimate the contribution of wave 1 fishing for that
year (see Section 4.3.a). The adjusted values of landed fish for 1981 was straight-line reduced to 0 in the
estimated first year of this fishery (1946). Then, from the proportional relationship of released fish to landed
fish in the 1980’s (0.365) and the estimated landed fish in 1981 (186,786) an estimate of the released fish in
1981 was computed (50.26 thousand fish). And, similar to the landings, this discard number was straight-line
reduced to 0 in 1946. Estimates of released red snapper, in numbers of fish, and respective PSE’s for charter
mode and private boat mode are shown in Tables 4.2 and 4.3.
4.5 Biological Sampling
4.5.1 Sampling Intensity Length/Age/Weight
a. MRFSS Length Frequency Analysis
The MRFSS’ angler intercept survey includes the collection of fish lengths from the harvested (landed, whole
condition) catch. Up to 15 of each species landed per angler interviewed is measured to the nearest mm along a
center line (defined as tip of snout to center of tail along a straight line, not curved over body). In those fish
with a forked tail, this measure would typically be referred to as a fork length, and in those fish that do not have
a forked tail it would typically be referred to as a total length with the exception of some fishes that have a
single, or few, caudal fin rays that extend further, e.g., the black sea bass. The angler intercept survey is
stratified by wave (2-month period), state, and fishing mode (shore, charter boat, party boat, private or rental
boat) so simple agreggations of fish lengths across strata cannot be used to characterize a regional, annual
length distribution of landed fish; a weighting scheme is needed to representatively include the distributions of
each stratum value. Annual numbers of red snapper measured for length in MRFSS intercepts are summarized
in Table 4.6.
The MRFSS’ angler intercept length frequency analysis produces unbiased estimates of length-class frequencies
for more than one strata by summing respectively weighted relative length-class frequencies across strata. The
steps utilized are:
1) output a distribution of measured fish among state/mode/area/wave strata,
2) output a distribution of estimated catch among state/mode/area/wave strata,
3) calculate and output relative length-class frequencies for each state/mode/area/wave stratum,
4) calculate appropriate relative weighting factors to be applied to the length-class frequencies for each
state/mode/area/wave stratum prior to pooling among strata,
5) sum across strata as defined, e.g., annual, sub-region length frequencies.
b. Headboat At-Sea Observer Survey Length Distributions
67

Data Workshop Report South Atlantic Red Snapper
SEDAR 15 SAR 1 SECTION II
In 2005 and 2006, a total of 81 headboat trips were sampled by at-sea observers in northeast Florida. Red
snapper was the number one target species for anglers who reported targeting a particular species of fish. Red
snapper was also the third most abundant species in the observed discards. Lengths were collected during at-sea
observer trips for both harvested and released (discarded) red snapper. A total of 148 harvested red snapper and
1,028 discarded red snapper were measured and the length frequency is plotted in Figure 1. Midline lengths
were converted to total length using a length/weight regression equation from red snapper sampled in Florida
recreational fishing surveys. These data are also available for trips sampled in South Carolina and North
Carolina from 2004 to 2006, but were not summarized for this report. These data provide useful information on
the proportion of discards to harvest and the size distribution. Size distribution of discarded fish in the
recreational fishery is not collected in any other survey.
c. Headboat Logbook Survey Length Distributions
Lengths were collected from 1972-2006 by headboat dockside samplers. From 1972-1975, only North Carolina
and South Carolina were sampled and Georgia and the northeast coast of Florida were sampled beginning in
1976. The headboat program sampled the entire range of Atlantic waters along the Southeast portion of the US
from the NC-VA border through the Florida Keys beginning in 1978. Numbers of red snapper measured in
headboat samples annually are summarized in Table 4.7.
The SEDAR 15 recreational data workgroup proposed using the lengths only from years where the entire range
was sampled and to weight the length frequencies by landings. The landings were aggregated by year, zone, and
season to generate weightings. The zones were delineated as North Carolina (NC), South Carolina (SC),
Georgia-North Florida (GA-NFL, to Cape Canaveral), and South Florida (SFL). The seasons were January
through May, June-August, and September-December. Landings estimates for NC and SC from 1978-80 were
reported by year and zone only and therefore the weightings are by year and zone for those years. Landings
estimates were not generated by the headboat program for GA-NFL or SFL prior to 1981. The landings were
estimated for Georgia and Florida combined using a regression approach (see landings section). These
combined landings from 1978-1980 were split between GA-NFL and SFL using the average proportion for each
area from 1981-1985. GA-NFL accounted for 96.1% of the landings and SFL accounted for 3.9% of the
landings. The 12 inch size limit implemented in 1983 had little influence on the size of fish landed from
headboat vessels (Figure 2). The 20 inch size limit implemented in 1992 is apparent in the length compositions
(Figure 2). A large number of undersize fish were reported in 1994; however, these fish were attributed to a
single month and a single region. After reviewing original logbook data and associated collection numbers, it
was determined an error occurred within the database. The records with conflicting fields were identified and
the undersized fish from the region and month in question were removed from the data set. Length frequency
distributions were recalculated and a new average weight was generated to produce a revised estimate for
landings by weight for that year.
4.5.2 Adequacy for characterizing catch
Annual sample sizes for length frequency from the MRFSS are less than 100 fish in most years, and this may
not be adequate for use in catch-at-age models. Headboat length samples add a substantial number to
recreational length frequencies in most years, but the two samples should not be pooled without weighting to
account for potential differences among modes and sample methods.
Opportunistic sampling of fish for biological data on age and growth of harvested fish during dockside
interviews for catch data can never yeild sample sizes sufficient for catch at age models. Age information must
be collected separate from MRFSS intercept surveys, and samples should be collected randomly using a survey
sample design that results in representative, unbiased age samples from the recreational fishery. This will
require dedicated funding for biological sampling, which has not been a high priority in the southeast. This
workgroup recommends that a survey design with species specific annual goals by state or subregion (in
Florida) and mode, and distributed throughout the fishing season, be a priority for funding in the southeast
region. Setting minimum standards for numbers of otoliths by state, subregion, mode and wave is beyond the
scope of this workgroup. However, a SEDAR workshop dedicated to this task with significant input from
assessment scientists on minimum samples sizes needed for stock assessment model inputs would be a proper
forum to guide funding initiatives in the southeast.
68

Data Workshop Report South Atlantic Red Snapper
SEDAR 15 SAR 1 SECTION II
4.5.3 Alternatives for characterizing discards
The at-sea observer survey of headboat trips collects quality data on the species identification and size of
discarded fish (Figure 1). The collection of release condition information should be expanded north of Florida,
and the survey should also record more detailed area fished and depth information. The workgroup recommends
that this new survey continue to add to the current time series for use in future assessment models. Currently for
private boat and charter modes, discards are reported by recreational anglers; however, no information on size
and limited information on release disposition are available. This method is subject to angler recall of both
species identification and number of fish. Because the headboat fishery operates differently than the charter
fishery, it may not be acceptable to apply the at-sea observer survey length frequencies to charter mode. Better
information on the size, condition, and area fished are needed for charter mode and private boat mode,
particularly for a species like red snapper where depth fished can have an impact on release mortality.
The South Carolina tagging program provides information on the area fished and size of red snapper caught and
released by participants in the tagging program, and this data set could be useful for characterization of
discards, though it is limited in geographic range. At the very least, this data set could be looked at for its
potential expansion to other states and regions as a means of collecting more detailed information from private
and charter anglers on discarded fish.
4.6 Research Recommendations
Six years of concurrent RDD and FHS effort estimates for east Florida need to be compared for adjusting effort
estimates in for-hire mode for future assessments. This has been done in the Gulf for six years of concurrent
data and resulted in significant changes to landings estimates for red snapper in the Gulf of Mexico assessment
(SEDAR 7).
The PSE’s for MRFSS estimates for reef-fish species continue to be high in the south Atlantic region, in spite of
increased sample sizes implemented in recent years. The workgroup recommends evaluating recreational
fishery survey data to study the relationship between sample size (both angler intercepts and effort interviews)
and precision of annual catch estimates of reef-fish species at the sub-region and state levels to determine what
sample sizes are needed to obtain minimum PSE levels of 20% or less.
Better geographic definition for estimated effort and catch are needed for red snapper in the south Atlantic. Red
snapper are considered rare north of Cape Hatteras, NC. In Florida, red snapper are abundant in northeast
Florida and less common in southeast Florida; however, private boat mode estimates are for the entire Florida
east coast. The FHS stratifies east Florida into two subregions for better precision. Monroe County is a separate
sub-region in the for-hire survey, but for private boat mode, MRFSS estimates effort and landings for the entire
Gulf Coast of Florida, which included Monroe County. There is currently no way to separate Monroe County
landings by Atlantic and Gulf waters in either the MRFSS or FHS. In addition to finer geographic scales, more
detailed information on location of catch are needed from angler interviews. Currently, the MRFSS and FHS
only delineate if fishing occurred in inland, state, or federal waters with no further detail on area fished or depth.
These issues come up repeatedly in data work shops and stock assessments for other species, and a finer scale
stratification for data collection and sample distribution with more detailed area fished information should be
pursued in efforts to refine and improve recreational data collections at the national level, which are currently
underway.
4.7 Literature Cited
Ellis, R.W., A. Rosen, and A.W. Moffett. 1958. A Survey of the Number of Anglers and of Their Fishing Effort
and Expenditures in the Coastal Recreational Fishery of Florida. Florida State Board of Conservation, Tech.
Ser. No. 24: 1-51.
Gregg, W.H. 1902. Where, When, and How to Catch Fish on the East Coast of Florida. The Matthews-Northrup
Works, New York. 268 pp.
69

Data Workshop Report South Atlantic Red Snapper
SEDAR 15 SAR 1 SECTION II
Moe, M.A. Jr. 1963. A Survey of Offshore Fishing in Florida. Florida State Board of Conservation. Professional
Papers Series. No. 4:1-117.
Rosen, A. and R. W. Ellis. 1961. Catch and Fishing Effort by Anglers in Florida’s Coastal and Offshore Waters.
The Marine Laboratory, University of Miami. Special Service Bulletin No. 18.
70

Data Workshop Report South Atlantic Red Snapper
SEDAR 15 SAR 1 SECTION II
Table 4.1. Red Snapper Recreational Catch by Category for South Atlantic sub-region (Boat modes only).
Released alive fish (b2) vs. landed fish (a+b1), charter boat and private/rental boat modes combined.
Year Landings (a+b1) Released Alive (b2) b2/(a+b1)
1982 60,373 0 0.00
1983 165,962 40,044 0.24
1984 412,028 127,308 0.31
1985 527,138 90,290 0.17
1986 180,503 0 0.00
1987 63,252 106,728 1.69
1988 128,991 48,373 0.38
1989 149,915 20,038 0.13
1990 14,928 0 0.00
1991 46,276 35,993 0.78
1992 81,278 29,450 0.36
1993 16,323 70,507 4.32
1994 27,353 63,911 2.34
1995 14,010 50,872 3.63
1996 14,357 19,925 1.39
1997 34,327 13,742 0.40
1998 16,903 27,457 1.62
1999 58,182 179,665 3.09
2000 73,774 259,421 3.52
2001 50,814 208,885 4.11
2002 53,287 131,322 2.46
2003 35,662 159,177 4.46
2004 38,886 189,477 4.46
2005 33,708 123,059 4.87
2006 27,017 137,803 5.10
Average proportion of
b2/(a+b1):
All years 1.961
1980's only 0.365
1990's only 1.793
2000's only 4.026
71

Data Workshop Report South Atlantic Red Snapper
SEDAR 15 SAR 1 SECTION II
PSE PSEHeadboat MRFSS total MRFSS Headboat MRFSS total MRFSS Headboat MRFSS total
1962* 8.502 64.80 73.305 25.2 3.10 23.63 26.734 30.0 11.602 88.437 100.0391963* 9.033 68.85 77.886 25.2 3.29 25.11 28.405 30.0 12.327 93.964 106.2911964* 9.564 72.90 82.468 25.2 3.49 26.59 30.076 30.0 13.052 99.491 112.5441965* 10.096 76.95 87.049 25.2 3.68 28.06 31.747 30.0 13.777 105.019 118.7961966* 10.627 81.00 91.631 25.2 3.88 29.54 33.418 30.0 14.503 110.546 125.0491967* 11.158 85.05 96.212 25.2 4.07 31.02 35.089 30.0 15.228 116.073 131.3011968* 11.690 89.10 100.794 25.2 4.26 32.50 36.759 30.0 15.953 121.601 137.5541969* 12.221 93.15 105.376 25.2 4.46 33.97 38.430 30.0 16.678 127.128 143.8061970* 12.752 97.20 109.957 25.2 4.65 35.45 40.101 30.0 17.403 132.655 150.0581971* 13.284 101.26 114.539 25.2 4.84 36.93 41.772 30.0 18.128 138.183 156.3111972* 11.980 105.31 117.285 25.2 4.37 38.40 42.774 30.0 16.349 143.710 160.0591973* 15.776 109.36 125.131 25.2 5.75 39.88 45.635 30.0 21.529 149.237 170.7671974* 13.689 113.41 127.095 25.2 4.99 41.36 46.351 30.0 18.681 154.765 173.4461975* 17.505 117.46 134.961 25.2 6.38 42.84 49.220 30.0 23.889 160.292 184.1811976* 19.387 121.51 140.893 25.2 7.07 44.31 51.384 30.0 26.457 165.819 192.2771977* 12.379 125.56 137.935 25.2 4.51 45.79 50.305 30.0 16.894 171.346 188.2401978* 12.954 129.61 142.560 25.2 4.72 47.27 51.992 30.0 17.678 176.874 194.5521979* 9.565 133.66 143.222 25.2 3.49 48.74 52.233 30.0 13.053 182.401 195.4541980* 14.511 137.71 152.218 25.2 5.29 50.22 55.514 30.0 19.803 187.928 207.7321981 35.719 186.52 222.234 25.1 0.38 2.00 2.383 100.0 36.102 188.515 224.6171982 19.553 60.37 79.926 30.6 0.00 0.00 0.000 0.0 19.553 60.373 79.9261983 30.698 165.96 196.660 19.8 7.41 40.04 47.451 38.0 38.105 206.006 244.1111984 31.146 412.03 443.174 17.9 9.62 127.31 136.931 29.5 40.769 539.336 580.1051985 50.336 527.14 577.475 19.0 8.62 90.29 98.912 43.9 58.958 617.429 676.3871986 16.625 180.50 197.128 32.2 0.00 0.00 0.000 0.0 16.625 180.503 197.1281987 24.996 63.25 88.247 19.7 42.18 106.73 148.906 57.8 67.174 169.979 237.1531988 36.527 128.99 165.518 28.3 13.70 48.37 62.071 47.3 50.225 177.364 227.5891989 23.453 149.92 173.368 19.9 3.13 20.04 23.173 41.9 26.588 169.953 196.5411990 20.919 14.93 35.846 30.6 0.00 0.00 0.000 0.0 20.919 14.927 35.8461991 13.857 46.28 60.133 33.1 10.78 35.99 46.771 51.5 24.635 82.269 106.9041992 5.301 81.28 86.578 18.5 1.92 29.45 31.371 29.4 7.222 110.727 117.9491993 7.347 16.32 23.670 21.8 31.74 70.51 102.242 28.4 39.082 86.830 125.9121994 8.225 27.35 35.578 25.9 19.22 63.91 83.129 28.9 27.443 91.264 118.7071995 8.826 14.01 22.837 29.7 32.05 50.87 82.918 20.2 40.872 64.883 105.7551996 5.543 14.36 19.899 41.2 7.69 19.93 27.618 38.0 13.236 34.281 47.5171997 5.770 34.33 40.097 48.5 2.31 13.74 16.052 26.9 8.080 48.069 56.1491998 4.741 16.90 21.644 24.0 7.70 27.46 35.158 32.5 12.442 44.360 56.8021999 6.836 58.18 65.017 20.9 21.11 179.67 200.775 15.9 27.946 237.846 265.7922000 8.437 73.77 82.211 20.3 29.67 259.42 289.089 14.8 38.105 333.195 371.3002001 12.028 50.81 62.842 16.6 49.44 208.89 258.329 13.8 61.472 259.699 321.1712002 12.931 53.29 66.218 15.8 31.87 131.32 163.190 18.2 44.799 184.609 229.4082003 5.706 35.66 41.367 16.5 25.47 159.18 184.646 16.2 31.175 194.838 226.0132004 10.842 38.89 49.728 14.9 52.83 189.48 242.306 14.3 63.671 228.363 292.0342005 8.907 33.71 42.615 18.2 32.52 123.06 155.576 13.4 41.424 156.767 198.1912006 5.945 27.02 32.962 18.8 30.32 137.80 168.126 18.2 36.268 164.820 201.088*Estimated landings are back-calculated using methods described in section 4.3
Table 4.2. Red snapper recreational landings and discards in numbers of fish. PSE=percent standard error.
Landings Discards Landings+ DiscardsNumber of Fish in 1000's
72
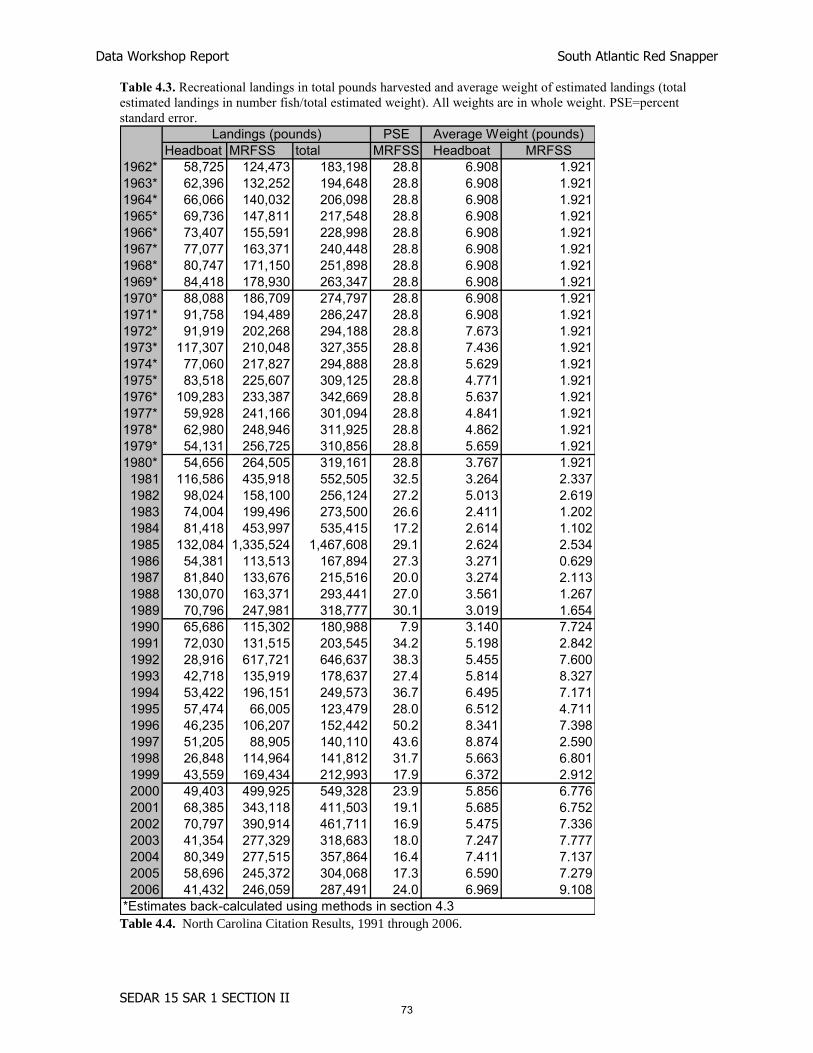
Data Workshop Report South Atlantic Red Snapper
SEDAR 15 SAR 1 SECTION II
Table 4.3. Recreational landings in total pounds harvested and average weight of estimated landings (total
estimated landings in number fish/total estimated weight). All weights are in whole weight. PSE=percent
standard error.
PSEHeadboat MRFSS total MRFSS Headboat MRFSS
1962* 58,725 124,473 183,198 28.8 6.908 1.9211963* 62,396 132,252 194,648 28.8 6.908 1.9211964* 66,066 140,032 206,098 28.8 6.908 1.9211965* 69,736 147,811 217,548 28.8 6.908 1.9211966* 73,407 155,591 228,998 28.8 6.908 1.9211967* 77,077 163,371 240,448 28.8 6.908 1.9211968* 80,747 171,150 251,898 28.8 6.908 1.9211969* 84,418 178,930 263,347 28.8 6.908 1.9211970* 88,088 186,709 274,797 28.8 6.908 1.9211971* 91,758 194,489 286,247 28.8 6.908 1.9211972* 91,919 202,268 294,188 28.8 7.673 1.9211973* 117,307 210,048 327,355 28.8 7.436 1.9211974* 77,060 217,827 294,888 28.8 5.629 1.9211975* 83,518 225,607 309,125 28.8 4.771 1.9211976* 109,283 233,387 342,669 28.8 5.637 1.9211977* 59,928 241,166 301,094 28.8 4.841 1.9211978* 62,980 248,946 311,925 28.8 4.862 1.9211979* 54,131 256,725 310,856 28.8 5.659 1.9211980* 54,656 264,505 319,161 28.8 3.767 1.9211981 116,586 435,918 552,505 32.5 3.264 2.3371982 98,024 158,100 256,124 27.2 5.013 2.6191983 74,004 199,496 273,500 26.6 2.411 1.2021984 81,418 453,997 535,415 17.2 2.614 1.1021985 132,084 1,335,524 1,467,608 29.1 2.624 2.5341986 54,381 113,513 167,894 27.3 3.271 0.6291987 81,840 133,676 215,516 20.0 3.274 2.1131988 130,070 163,371 293,441 27.0 3.561 1.2671989 70,796 247,981 318,777 30.1 3.019 1.6541990 65,686 115,302 180,988 7.9 3.140 7.7241991 72,030 131,515 203,545 34.2 5.198 2.8421992 28,916 617,721 646,637 38.3 5.455 7.6001993 42,718 135,919 178,637 27.4 5.814 8.3271994 53,422 196,151 249,573 36.7 6.495 7.1711995 57,474 66,005 123,479 28.0 6.512 4.7111996 46,235 106,207 152,442 50.2 8.341 7.3981997 51,205 88,905 140,110 43.6 8.874 2.5901998 26,848 114,964 141,812 31.7 5.663 6.8011999 43,559 169,434 212,993 17.9 6.372 2.9122000 49,403 499,925 549,328 23.9 5.856 6.7762001 68,385 343,118 411,503 19.1 5.685 6.7522002 70,797 390,914 461,711 16.9 5.475 7.3362003 41,354 277,329 318,683 18.0 7.247 7.7772004 80,349 277,515 357,864 16.4 7.411 7.1372005 58,696 245,372 304,068 17.3 6.590 7.2792006 41,432 246,059 287,491 24.0 6.969 9.108
Landings (pounds) Average Weight (pounds)
*Estimates back-calculated using methods in section 4.3 Table 4.4. North Carolina Citation Results, 1991 through 2006.
73

Data Workshop Report South Atlantic Red Snapper
SEDAR 15 SAR 1 SECTION II
Year Red Snapper Harvest
Citations
Year Red Snapper Harvest
Citations
1991 21 1999 11
1992 23 2000 11
1993 24 2001 14
1994 14 2002 29
1995 10 2003 72
1996 17 2004 73
1997 9 2005 42
1998 12 2006 41
Table 4.5. South Carolina Angler-Based Tagging Program, number of fish tagged and minimum and maximum
size range.
Year Number
Measured
Range
(inches) Year
Number
Measured
Range
(inches)
1990 1 10.5 1999 205 6-29.8
1991 2 11.5-14 2000 181 10-22
1992 52 13-20 2001 199 11-33
1993 133 10-20 2002 105 13-29.5
1994 102 6-19.5 2003 34 12-19.5
1995 79 11-20 2004 40 14-30
1996 56 9-24 2005 42 14-20.5
1997 91 11-21 2006 13 13.5-19.5
1998 223 9-20.5
Table 4.6. Red Snapper - South Atlantic Sub-Region - Annual Sample Sizes
Year Number of Lengths Year Number of Lengths
1981 44 1994 38
1982 29 1995 26
1983 161 1996 15
1984 370 1997 20
1985 249 1998 33
1986 226 1999 132
1987 63 2000 95
1988 87 2001 120
1989 59 2002 232
1990 18 2003 166
1991 16 2004 156
1992 17 2005 83
1993 23 2006 84
Table 4.7. Number of headboat biological samples of red snapper in the in Southeast US Atlantic 1972- 2006.
74

Data Workshop Report South Atlantic Red Snapper
SEDAR 15 SAR 1 SECTION II
Year NC SC GA\FL Total
1972 20 30 N\A 50
1973 21 20 N\A 41
1974 29 66 N\A 95
1975 75 91 N\A 166
1976 145 51 302 498
1977 59 82 562 703
1978 50 45 621 716
1979 7 8 222 237
1980 10 14 233 257
1981 18 3 654 675
1982 30 6 421 457
1983 53 24 929 1,006
1984 48 103 1,170 1,321
1985 170 51 970 1,191
1986 51 30 353 434
1987 50 53 203 306
1988 64 43 100 207
1989 50 53 274 377
1990 35 43 356 434
1991 7 29 116 152
1992 20 25 28 73
1993 22 128 53 203
1994 14 46 59 119
1995 13 41 77 131
1996 7 107 54 168
1997 4 14 52 70
1998 11 33 109 153
1999 7 15 136 158
2000 7 9 104 120
2001 17 0 239 256
2002 8 12 340 360
2003 9 21 282 312
2004 5 10 292 307
2005 3 3 186 192
2006 4 9 149 162
Total 1,143 1318 9,646 12,107
75

Data Workshop Report South Atlantic Red Snapper
SEDAR 15 SAR 1 SECTION II
Figure 4.1. Length frequency of harvested and discarded red snapper from at-sea headboat observer trips in
northeast Florida (Nassau through Brevard counties). The white arrow marks the size category where red
snapper legally recruit to the 508 mm TL size limit. N = 148 harvested fish + 1,028 discarded fish.
Length Frequency of Red Snapper from
Northeast Florida At-Sea Headboat Surveys
2005-2006
020406080
100120140160180200
150
200
250
300
350
400
450
500
550
600
650
700
750
800
850
Total Length (mm)
Nu
mb
er
of
Fis
hHarvestDiscard
76

20 26 32 38 44 50 56 62 68 74 80 86 920.00
0.05
0.10
0.15
0.201978 n= 740
20 26 32 38 44 50 56 62 68 74 80 86 920.00
0.05
0.10
0.15
0.201979 n= 245
20 26 32 38 44 50 56 62 68 74 80 86 920.00
0.05
0.10
0.15
0.201980 n= 258
20 26 32 38 44 50 56 62 68 74 80 86 920.00
0.05
0.10
0.15
0.201981 n= 674
20 26 32 38 44 50 56 62 68 74 80 86 920.00
0.05
0.10
0.15
0.201982 n= 457
20 26 32 38 44 50 56 62 68 74 80 86 920.00
0.05
0.10
0.15
0.201983 n= 1006
20 26 32 38 44 50 56 62 68 74 80 86 920.00
0.05
0.10
0.15
0.201984 n= 1317
20 26 32 38 44 50 56 62 68 74 80 86 920.00
0.05
0.10
0.15
0.201985 n= 1190
20 26 32 38 44 50 56 62 68 74 80 86 920.00
0.05
0.10
0.15
0.201986 n= 435
20 26 32 38 44 50 56 62 68 74 80 86 920.00
0.05
0.10
0.15
0.201987 n= 306
20 26 32 38 44 50 56 62 68 74 80 86 920.00
0.05
0.10
0.15
0.201988 n= 204
20 26 32 38 44 50 56 62 68 74 80 86 920.00
0.05
0.10
0.15
0.201989 n= 374
Pro
porti
on
Total Length (cm)
Figure 4.2. Catch weighted length frequencies of red snapper measured from headboat vessels from 1978- 2006. Vertical lines indicate size limits of 12 (dashed) and 20 (solid) inches implemented in September, 1983 and January, 1992 respectively. They are included on all graphs as reference values. The range of sizes from 20 to 95 cm total length excludes a small number of larger size classes of fish for presentation purposes.
Data Workshop Report South Atlantic Red Snapper
SEDAR 15 SAR 1 SECTION II 77

20 26 32 38 44 50 56 62 68 74 80 86 920.00
0.05
0.10
0.15
0.201990 n= 433
20 26 32 38 44 50 56 62 68 74 80 86 920.00
0.05
0.10
0.15
0.201991 n= 152
20 26 32 38 44 50 56 62 68 74 80 86 920.00
0.05
0.10
0.15
0.201992 n= 73
20 26 32 38 44 50 56 62 68 74 80 86 920.00
0.05
0.10
0.15
0.201993 n= 203
20 26 32 38 44 50 56 62 68 74 80 86 920.00
0.05
0.10
0.15
0.201994 n= 120
20 26 32 38 44 50 56 62 68 74 80 86 920.00
0.05
0.10
0.15
0.201995 n= 147
20 26 32 38 44 50 56 62 68 74 80 86 920.00
0.05
0.10
0.15
0.201996 n= 80
20 26 32 38 44 50 56 62 68 74 80 86 920.00
0.05
0.10
0.15
0.201997 n= 68
20 26 32 38 44 50 56 62 68 74 80 86 920.00
0.05
0.10
0.15
0.201998 n= 149
20 26 32 38 44 50 56 62 68 74 80 86 920.00
0.05
0.10
0.15
0.201999 n= 161
20 26 32 38 44 50 56 62 68 74 80 86 920.00
0.05
0.10
0.15
0.202000 n= 123
20 26 32 38 44 50 56 62 68 74 80 86 920.00
0.05
0.10
0.15
0.202001 n= 254
Pro
porti
on
Total Length (cm)
Figure 4.2 (continued)
Data Workshop Report South Atlantic Red Snapper
SEDAR 15 SAR 1 SECTION II 78
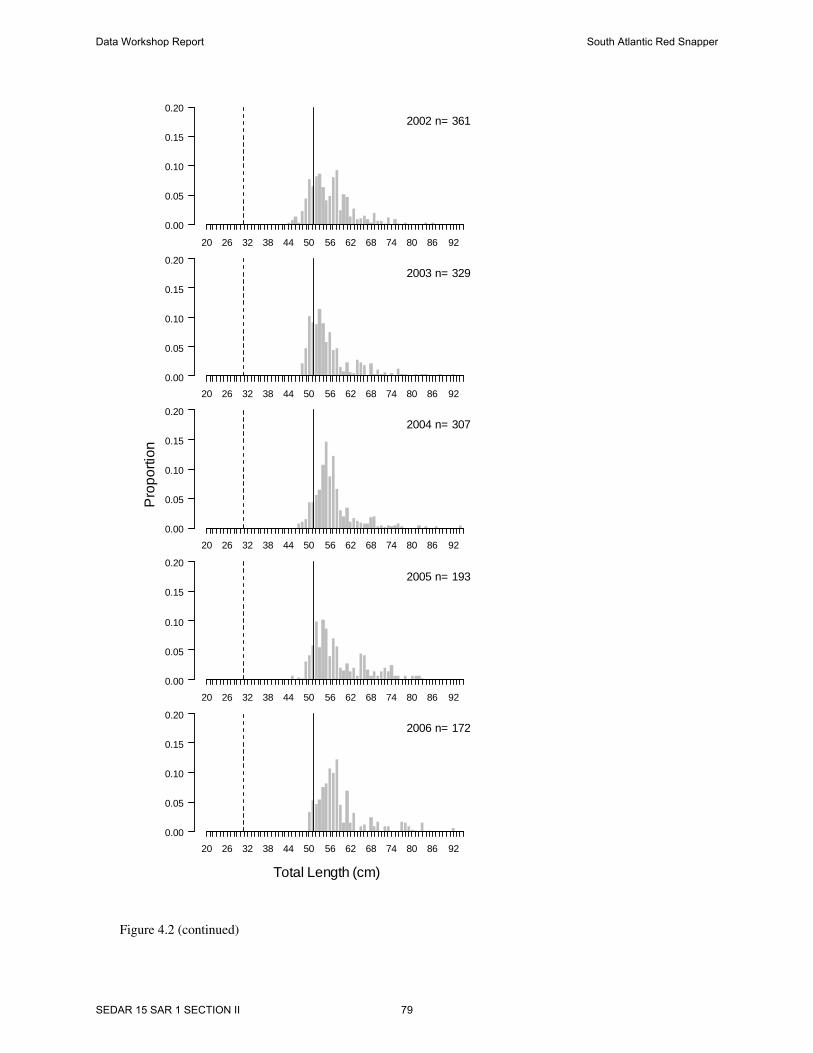
20 26 32 38 44 50 56 62 68 74 80 86 92
0.00
0.05
0.10
0.15
0.202002 n= 361
20 26 32 38 44 50 56 62 68 74 80 86 920.00
0.05
0.10
0.15
0.202003 n= 329
20 26 32 38 44 50 56 62 68 74 80 86 920.00
0.05
0.10
0.15
0.202004 n= 307
20 26 32 38 44 50 56 62 68 74 80 86 920.00
0.05
0.10
0.15
0.202005 n= 193
20 26 32 38 44 50 56 62 68 74 80 86 920.00
0.05
0.10
0.15
0.202006 n= 172
Pro
porti
on
Total Length (cm)
Figure 4.2 (continued)
Data Workshop Report South Atlantic Red Snapper
SEDAR 15 SAR 1 SECTION II 79

5. INDICATORS OF POPULATION ABUNDANCE 5.1 OVERVIEW
Several indices of abundance were considered for use in the assessment model. These indices are listed in Table 5.1, with pros and cons of each in Table 5.2. The possible indices came from fishery dependent and fishery independent data. The DW recommended that three fishery dependent indices be used in the assessment: one from commercial logbook data, one from headboat data, and one from general recreational data (Table 5.1, 5.2). The DW did not recommend using any of the fishery independent indices because of inadequate sample sizes. Membership of this DW working group included Christine Burgess, Rob Cheshire, Marcel Reichert, Kyle Shertzer (leader), and Geoff White. 5.2 FISHERY-INDEPENDENT INDICES 5.2.1 MARMAP
Red snapper have been sampled in low numbers by the MARMAP (Marine Resources Monitoring Assessment and Prediction) program with two gear types (gears detailed in previous working paper SEDAR10-DW-05): the chevron traps (1988–2006) and hook and line (1979–2002). Although these gear types and sampling methodology are not specifically designed to sample red snapper populations, the DW considered the data as a possible source to develop an index of abundance.
5.2.1.1 MARMAP Chevron trap:
Chevron traps were baited with cut clupeids and deployed at stations randomly selected by computer from a database of approximately 2,500 live bottom and shelf edge locations and buoyed (“soaked”) for approximately 90 minutes. During the 1990s, additional sites were selected, based on scientific and commercial fisheries sources, off North Carolina and south Florida to facilitate expanding the overall sampling coverage. In spite of relatively extensive regional coverage, the average number of red snapper collected in the traps each year between 1988 and 2006 was only 18.5 (range 4–41, total 351). The average CPUE was 0.065 fish/trap/hr (range 0.432–0.008). Because of the low catches and the high variability in the data, the DW did not recommend using MARMAP chevron trap samples to develop an index of abundance for red snapper off the southeastern U.S.
5.2.1.2 MARMAP hook and line: Hook and line stations were fished during dawn and dusk periods, one hour preceding and after actual sunrise and sunset. Rods utilizing Electromate motors powered 6/0 Penn Senator reels and 36 kg test monofilament line were fished for 30 minutes by three anglers. The terminal tackle consisted of three 4/0 hooks on 23 kg monofilament leaders 0.25 m long and 0.3 m apart, weighted with 0.5 to 1 kg sinkers. The top and bottom hooks were baited with cut squid and the middle hook baited with cut cigar minnow (Decapterus sp.). The same method of sampling was used from 1978 to 2002. However, less emphasis has been placed on hook and line sampling during the 1990s and
Data Workshop Report South Atlantic Red Snapper
SEDAR 15 SAR 1 SECTION II 80
early 2000s to put more effort on tagging of fish at night and running between chevron and long line stations to increase sample coverage.
The total number of red snappers caught between 1979 and 2002 was 81 (3.7/yr), but 39 of these fish were collected in a single year (1982), while 41% of years sampled had zero catches. Changes in personnel and level of effort have changed over time, compromising the utility of the hook and line survey as an index. Much of the hook and line effort was conducted over mid-shelf depths, and as such may not provide an adequate representation of the complete range of red snapper. As a result, the DW did not recommend using the MARMAP hook and line samples to develop an index of abundance off the southeastern U.S.
5.2.1.3 MARMAP short bottom long line (vertical long line):
The short bottom long line was deployed to catch grouper/snapper over high relief and rough bottom types at depths of 90 to 200 m. This bottom line consisted of 25.6 m of 6.4 mm solid braid dacron groundline dipped in green copper naphenate. The line is deployed by stretching the groundline along the vessel's gunwale with 11 kg weights attached at the ends of the line. Twenty gangions baited with whole squid were placed 1.2 m apart on the groundline which was then attached to an appropriate length of poly warp and buoyed to the surface with a Hi-Flyer. Sets are made for 90 minutes and the gear is retrieved using a pot hauler.
Few (0–10 per year) red snapper were collected by MARMAP short bottom long line. Because of the low catches and high variability, the DW did not recommend using the MARMAP short bottom long line samples to develop an index of abundance for red snapper off the southeastern U.S.
5.2.2 Other fishery independent sources
Other existing data sets (SEAMAP survey, Univ. of SC/Baruch Institute low tide motile nekton survey) were considered for their potential as an index, but they sampled either no or insufficient numbers of red snapper to be useful as an index of abundance. 5.3 FISHERY DEPENDENT INDICES 5.3.1 COMMERCIAL LOGBOOK (HANDLINE) 5.3.1.1 General description
The NMFS collects catch and effort data by trip from commercial fishermen who participate in fisheries managed by the SAFMC. For each fishing trip, data collected include date, gear, fishing area, days at sea, fishing effort, species caught, and weight of the catch (Appendix 5.1). The logbook program in the Atlantic started in 1992. In that year, logs were collected from a random sample representing 20% of vessels; starting in 1993, all vessels were required to submit logs. Using these data, an index of abundance was computed for 1993–2006. 5.3.1.2 Issues discussed at the DW Issue 1: Gear selection Option 1: Include all gear types
Data Workshop Report South Atlantic Red Snapper
SEDAR 15 SAR 1 SECTION II 81

Option 2: Include only handlines (composed of handline and electric reels) Decision: Option 2, because 98% of trips used handline. Issue 2: Year selection Option 1: Use all years of data (1992-2006) Option 2: Only use data from 1993 to 2006 Decision: Option 2, because 1992 included only 20% coverage of fishermen, whereas 1993 began 100% coverage. Issue 3:Defining which trips constitute effort Option 1: Include only positive trips Option 2: Use method of Stephens and MacCall (2004) to define effort that could have caught the focal species based on the composition of other species in the catch. This method would include trips with zero catch but positive effort. Option 3: Option 2, but apply Stephens and MacCall separately to regions north and south of Cape Canaveral Decision: Option 3, because it is likely that some trips had zero catch but positive effort, and because regions north and south of Cape Canaveral were found to have differences in species assemblages (Appendix 5.2). Miscellaneous decisions • A 12” TL size limit was implemented in August of 1983. In 1992, the size limit was
increased to 20” TL. The DW acknowledged that this issue could be handled by the assessment model through estimation of selectivity.
• Species included in the application of Stephens and MacCall (2004) were those in the snapper-grouper Fishery Management Plan.
5.3.1.3 Methods
The CPUE from commercial logbook data was computed in units of pounds caught per hook-hour. The duration of the time series was 1993–2006. Spatial coverage included the entire management area, from the Florida Keys through North Carolina (Figure 5.1). Each record describes weight (total lb) of a single species caught on a single trip, along with descriptive information of the trip, such as effort, date, and area fished.
Of trips that caught red snapper, approximately 98% used handline gear, defined here as gear with code H or E (Appendix 5.1). Thus, the analysis included handline gear only. Excluded were records suspected to be misreported or misrecorded, as in previous SEDAR assessments (e.g., SAFMC, 2006): The variable “effort” (hooks/line) was constrained to be between 1 and 40 (inclusive), the variable “numgear” (number of lines) to be between 1 and 10 (inclusive); the variable “crew” (number on boat) to be fewer than 13, the variable “totlbs” (weight of catch) to be less than 3000 lb, and hours fished to allow only positive values. These constraints removed fewer than 1% of handline records. Also excluded were records that did not report area fished, number of lines, number of hooks, time fished, or days at sea.
Effective effort was based on those trips from areas where red snapper were available to be caught. Without fine-scale geographic information on fishing location,
Data Workshop Report South Atlantic Red Snapper
SEDAR 15 SAR 1 SECTION II 82

trips to be included in the analysis must be inferred. To do so, the method of Stephens and MacCall (2004) was applied. The method uses multiple logistic regression to estimate a probability for each trip that the focal species was caught, given other species caught on that trip. As mentioned previously, the method was applied separately to data from regions north and south of Cape Canaveral, because of differences in species assemblages (Figure 5.2A,B, Appendix 5.2). To avoid spurious correlations, species that were rarely caught were excluded from each regression; species were included as factors if caught in at least X% of trips. A default value of X=5% was applied to the northern region, but this value was overly restrictive for the southern region (excluded the focal species) and was thus reduced to 1% for the southern region. A trip was then included if its associated probability of catching red snapper was higher than a threshold probability (Figure 5.3A,B). The threshold was defined to be that which results in the same number of predicted and observed positive trips, as in Stephens and MacCall (2004). After applying Stephens and MacCall (2004) and the constraints described above, the resulting data set contained 24,344 trips, of which ~61% were positive.
Standardized catch rates were estimated using a generalized linear model assuming delta-lognormal error structure (Lo et al., 1992; Maunder and Punt, 2004), in which the binomial distribution describes positive versus zero CPUE, and the normal distribution describes the log of positive CPUE. Explanatory variables considered, in addition to year (necessarily included), were month, geographic area, and a month×area interaction. Geographic areas reported in the logbooks were pooled into larger areas to provide adequate sample sizes for each level of this factor⎯NC (34°N ≤ latitude < 37°N), SC (32°N ≤ latitude < 34°N), GA (31°N ≤ latitude < 32°N), north FL (29°N ≤ latitude < 31°N), and south FL (latitude < 29°N). Interactions with year effects were not considered, because there was no a priori reason to expect them and because such effects may be inseparable from annual changes in abundance.
A forward stepwise approach was used to construct each GLM (binomial and lognormal). First a GLM was fit on year. These results reflect the distribution of the nominal data. Next, each main effect (area and month) was examined for its reduction in deviance per degree of freedom. The factor that caused the greatest reduction was added to the base model if it was significant based on a Chi-Square test ( 2χ ≤ 0.05) and if the reduction in deviance was greater than 1%. This model then became the base model. The process was repeated, adding main effects first and then two-way interaction terms, until no factor or interaction met the criteria for inclusion. The approach identified area as the only factor other than year to be used in the binomial GLM (Table 5.3A), and it identified area, month, and area×month as factors to be used in the lognormal GLM (Table 5.3B). 5.3.1.4 Sampling Intensity
The numbers of positive trips by year and area are tabulated in Table 5.4. The method of Stephens and MacCall (2004) does not necessarily select all positive trips. 5.3.1.5 Size/Age Data
Sizes and ages of fish represented by this index are the same as those of the commercial handline fishery (see chapter 3 of this DW report). 5.3.1.6 Catch Rates and Measures of Precision
Data Workshop Report South Atlantic Red Snapper
SEDAR 15 SAR 1 SECTION II 83

Diagnostic plots of residuals from the delta-GLM model fit are in Appendix 5.3. Table 5.5 shows nominal CPUE (pounds/hook-hr), standardized CPUE, confidence limits, coefficients of variation (CV), and annual sample sizes (number trips). Figure 5.4 shows standardized and nominal CPUE. 5.3.1.7 Comments on Adequacy for Assessment
The logbook index was recommended by the DW for use in the assessment. The DW, however, did express several concerns about this data set (Table 5.2). It was pointed out that there are problems associated with any abundance index and that convincing counter-evidence needs to be presented to not use the logbook data.
Three concerns merit further description. First, commercial fishermen may target different species through time. If changes in targeting have occurred, effective effort can be difficult to estimate. However, the DW recognized that the method of Stephens and MacCall (2004), used here to identify trips for the analysis, can accommodate changes in targeting, as long as species assemblages are consistent.
Second, the data are self-reported and largely unverified. Some attempts at verification have found the data to be reliable, but problems likely remain, such as the possibility of misidentification of other species (e.g., vermilion snapper) as red snapper.
Third and probably foremost, the data are obtained from a directed fishery and therefore the index could contain problems associated with any fishery dependent index. Fishing efficiency of the fleet has likely improved over time due to improved electronics. In addition, overall efficiency may have changed throughout the time series if fishermen of marginal skill have left the fishery at a greater rate than more successful fishermen. Also of concern is whether catch rates in a directed fishery are density-dependent. As fish abundance decreases, fishermen may maintain relatively high catch rates, and as fish abundance increases, catch rates may saturate.
The DW discussed how the assessment might attempt to account for changes in catchability over time. Constant catchability, though commonly assumed, would not be an appropriate assumption in this fishery, as the DW generally believed that catchability has increased with improvements in fishing gear and technology. The DW recommended that the base assessment model assume catchability increases by 2% per year, as was used in the SEDAR10 gag grouper assessment (SAFMC, 2006), and that sensitivity runs consider increases of 0% (i.e., constant) and 4% per year. 5.3.2 RECREATIONAL HEADBOAT SURVEY 5.3.2.1 General description
The headboat fishery is sampled separately from other recreational fisheries. The headboat fishery comprises large, for-hire vessels that generally charge a fee per angler and typically accommodate 20–60 passengers. Using the headboat data, an index of abundance was computed for 1976–2006. 5.3.2.2 Issues discussed at the DW Issue 1: Include/exclude years prior to full area or vessel coverage
Early years of headboat sampling did not have full area coverage. All headboats from North Carolina and South Carolina were sampled starting in 1973. Headboats from
Data Workshop Report South Atlantic Red Snapper
SEDAR 15 SAR 1 SECTION II 84

Georgia and northern Florida were sampled starting in 1976, and from southern Florida starting in 1978. All headboats across all areas were sampled starting in 1978. Option 1: Include all years (1973–2006) Option 2: Exclude early years; start the time series in 1976 (sampling did not include southern Florida) Option 3: Exclude early years; start the time series in 1978 (begins 100% coverage). Decision: Option 2, because most areas are represented throughout the time series; southern Florida is not represented in the first two years, but that area contributed only a small proportion of red snapper catches. Issue 2:Defining which trips constitute effort Option 1: Include only positive trips Option 2: Use method of Stephens and MacCall (2004) to define effort that could have caught the focal species based on the composition of other species in the catch. This method would include trips with zero catch but positive effort. Option 3: Option 2, but apply method of Stephens and MacCall (2004) separately to regions north and south of Cape Canaveral Decision: Option 3, because it is likely that some trips had zero catch but positive effort, and because regions north and south of Cape Canaveral were found to have differences in species assemblages (Appendix 5.2). Miscellaneous decisions • A 12” TL size limit was implemented in August of 1983. In 1992, the size limit was
increased to 20” TL. The DW acknowledged that size limits could be accounted for by the assessment model through estimation of selectivity.
• A bag limit of 10 snapper/person/day, excluding vermilion snapper, and allowing no more than two red snappers, was instituted for the recreational fishery in 1992. Bag analysis showed that the limit of two red snapper per angler had little effect, if any, on the headboat fishery (Table 5.6).
• Species included in the application of Stephens and MacCall (2004) were those in the snapper-grouper Fishery Management Plan.
5.3.2.3 Methods
The CPUE was computed in units of number of fish per hook-hour. The duration of the time series was 1976–2006. Spatial coverage included the entire management area (Figure 5.5). Trips were trimmed from the analysis if the number of red snapper per angler was in the upper 1%, to exclude outliers suspected to be misreported or misrecorded. Also excluded were records that did not report fields necessary to compute catch per unit effort.
Effective effort was based on those trips from areas where red snapper were available to be caught. Without fine-scale geographic information on fishing location, trips to be included in the analysis must be inferred. To do so, the method of Stephens and MacCall (2004) was applied. The method uses multiple logistic regression to estimate a probability for each trip that the focal species was caught, given other species caught on that trip. As mentioned previously, the method was applied separately to data from regions north and south of Cape Canaveral, because of differences in species
Data Workshop Report South Atlantic Red Snapper
SEDAR 15 SAR 1 SECTION II 85

assemblages (Figure 5.6A,B, Appendix 5.2). To avoid spurious correlations, species that were rarely caught were excluded from each regression; species were included as factors if caught in at least X% of trips. A default value of X=5% was applied to the northern region, but this value was overly restrictive for the southern region (excluded the focal species) and was thus reduced to 1% for the southern region. A trip was then included if its associated probability of catching red snapper was higher than a threshold probability (Figure 5.7A,B). The threshold was defined to be that which results in the same number of predicted and observed positive trips, as in Stephens and MacCall (2004). After applying Stephens and MacCall (2004) and the constraints described above, the resulting data set contained 42,802 trips, of which ~36% were positive.
Standardized catch rates were estimated using a generalized linear model assuming delta-lognormal error structure (Lo et al., 1992; Maunder and Punt, 2004), in which the binomial distribution describes positive versus zero CPUE, and the normal distribution describes the log of positive CPUE. Explanatory variables considered, in addition to year (necessarily included), were month, geographic area, month, trip type, and all possible interactions except those with year. Geographic areas reported in the headboat survey were pooled into larger areas (NC, SC, GA–north FL, and south FL) to provide adequate sample sizes for each level of this factor. Trip types were pooled into half-day trips (including three-quarter day) or full-day trips (including multi-day trips). Interactions with year effects were not considered, because there was no a priori reason to expect them and because such effects may be inseparable from annual changes in abundance.
A forward stepwise approach was used to construct each GLM (binomial and lognormal). First a GLM was fit on year. These results reflect the distribution of the nominal data. Next, each main effect (area, month, and trip duration) was examined for its reduction in deviance per degree of freedom. The factor that caused the greatest reduction was added to the base model if it was significant based on a Chi-Square test ( 2χ ≤ 0.05) and if the reduction in deviance was greater than 1%. This model then became the base model. The process was repeated, adding main effects first and then two-way interaction terms, until no factor or interaction met the criteria for inclusion. The approach identified area, month, type, and area×type as the factors other than year to be used in the binomial GLM (Table 5.7A), and it identified area, month, area×type as the factors to be used in the lognormal GLM (Table 5.7B). 5.3.2.4 Sampling Intensity The numbers of positive trips by year and area are tabulated in Table 5.8. The method of Stephens and MacCall (2004) does not necessarily select all positive trips. 5.3.2.5 Size/Age Data
Sizes and ages of fish represented by this index are the same as those sampled by the headboat survey (see chapter 4 of this DW report). 5.3.2.6 Catch Rates and Measures of Precision
Diagnostic plots of residuals from the delta-GLM model fit are in Appendix 5.4. Table 5.9 shows nominal CPUE (number/hook-hr), standardized CPUE, confidence
Data Workshop Report South Atlantic Red Snapper
SEDAR 15 SAR 1 SECTION II 86

limits, coefficients of variation (CV), and annual sample sizes (number trips). Figure 5.8 shows standardized and nominal CPUE. 5.3.2.7 Comments on Adequacy for Assessment
The headboat index was recommended by the DW for use in the assessment. However, the DW did discuss several concerns (Table 5.2). One concern was that this index may contain problems associated with fishery dependent indices, as described in section 5.3.1.7. The DW, however, did note that the headboat fishery is not a directed fishery for red snapper. Rather, it more generally fishes a complex of snapper-grouper species, and does so with only limited search time. Thus, the headboat index may be a more reliable index of abundance than one developed from a fishery that targets red snapper specifically.
The DW discussed a perceived shift in headboat effort during the 1980s, from full-day trips to half-day trips nearer shore. However, analysis of positive red snapper trips reveals that no such shift occurred during the 1980s. Half-day trips were initiated during the mid- to late-1970s, but have not increased since. Similar analyses of all headboat trips, by state and overall, revealed similar patterns. Furthermore, the DW noted that if there were a shift in trip type, it would be accounted for by the GLM, because trip type (half day, full day) was used as a factor.
The DW discussed how the assessment might attempt to account for changes in catchability over time. Constant catchability, though commonly assumed, would not be an appropriate assumption in this fishery, as the DW generally believed that catchability has increased with improvements in fishing gear and technology. The DW recommended that the base assessment model assume catchability increases by 2% per year, as was used in the SEDAR10 gag grouper assessment (SAFMC, 2006), and that sensitivity runs consider increases of 0% (i.e., constant) and 4% per year. 5.3.3 RECREATIONAL INTERVIEWS 5.3.3.1 General description
The general recreational fishery is sampled by the Marine Recreational Fisheries Statistics Survey (MRFSS). This general fishery includes all recreational fishing from shore, man-made structures, private boats, and charter boats (for-hire vessels that usually accommodate six or fewer anglers). Using the MRFSS data from Currituck County, North Carolina through Miami-Dade County, Florida (Figure 5.9), an index of abundance was computed for 1986–2006.
5.3.3.2 Issues discussed at DW Issue 1: Trip selection Option 1: Select angler-trips based on the method of Stephens and MacCall (2004) Option 2: Use MRFSS data on effective effort to select angler-trips: Apply proportion of intercepted trips that were "directed" [i.e., targeted or caught (A1+B1+B2)] to estimates of total marine recreational angler-trips. Decision: Option 2. MRFSS data contain information on targeting. This information identifies directed effort explicitly, whereas the method Stephens and MacCall (2004) does so implicitly.
Data Workshop Report South Atlantic Red Snapper
SEDAR 15 SAR 1 SECTION II 87

Issue 2: First year of time series Option 1: Start the time series in 1982, the first year of data collection. Option 2: Start the time series in 1983, because of small sample size in 1982. Decision: Option 2. The DW decided to start the time series in 1983, when the sample size increased substantially (Table 5.10).
Miscellaneous decisions • The group acknowledged the possibility that some red snapper were misreported as
other snappers. MRFSS data were used as reported. It was assumed that if red snapper were misreported, the misreporting was not systematic, such that the red snapper reported could be considered a random sample of all red snapper caught.
• A 12” TL size limit was implemented in August of 1983. In 1992, the size limit was increased to 20” TL. The DW acknowledged that size limits could be accounted for by the assessment model through estimation of selectivity.
• A bag limit of 10 snapper/person/day, excluding vermilion snapper, and allowing no more than two red snappers, was instituted for the recreational fishery in 1992. The DW believed that these limits were not likely to be reached in the recreational fishery and therefore would not influence an index of abundance derived from recreational fishery data.
• Estimates of CV of the catch per effort are not obtainable, but instead were represented by proportional standard error (PSE) of total catch.
5.3.3.3 Methods
The CPUE was computed in units of number fish per angler-trip. The method chosen produced unbiased estimates of "directed" angler trips by applying the proportion of intercepted trips that were "directed" toward red snapper to estimates of total marine recreational angler trips. Directed trips were defined as those trips where red snapper was listed as targeted (under the variables “prim1” or “prim2”) or caught (A1+B1+B2). Type B2 group catches (fish released alive) were assigned angler-trip values based on the leader with additional anglers acting as followers. The proportion of directed trips was calculated based on the count of directed trips relative to all samples taken in a year/state/wave/mode/area strata. That proportion was then applied to the effort estimate for the same strata and summed up to the year/region level. The MRFSS data used included those areas ranging from North Carolina to the east coast of Florida excluding Monroe County. The directed trip analysis was obtained from the Atlantic Coastal Cooperative Statistics Program website (ACCSP, 2007). 5.3.3.4 Sampling Intensity
Sampling intensity (number of intercepted angler-trips) by state is shown in Table 5.10.
5.3.3.5 Size/Age Data
Sizes and ages of fish represented by this index are the same as those of the recreational fishery as sampled by the MRFSS (see chapter 4 of this DW report).
Data Workshop Report South Atlantic Red Snapper
SEDAR 15 SAR 1 SECTION II 88

5.3.3.6 Catch Rates and Measures of Precision Table 5.11 shows nominal CPUE (number/angler-trip) and estimates of precision,
as does Figure 5.10.
5.3.3.7 Comments on Adequacy for Assessment The MRFSS index was recommended by the DW for use in the assessment.
However, the DW did discuss several concerns (Table 5.2). One concern was that this index may contain problems associated with fishery dependent indices, as described in section 5.3.1.7. Another concern was the large uncertainty in MRFSS landings and effort estimates.
The DW discussed how the assessment might attempt to account for changes in catchability over time. Constant catchability, though commonly assumed, would not be an appropriate assumption in this fishery, as the DW generally believed that catchability has increased with improvements in fishing gear and technology. The DW recommended that the base assessment model assume catchability increases by 2% per year, as was used in the SEDAR10 gag grouper assessment (SAFMC, 2006), and that sensitivity runs consider increases of 0% (i.e., constant) and 4% per year. 5.4 CONSENSUS RECOMMENDATIONS AND SURVEY EVALUATIONS No fishery independent indices were recommended for use in the assessment. Three fishery dependent indices were recommended: commercial handline (logbook), headboat, and MRFSS (Tables 5.1, 5.2). The three indices are compared in Figure 5.11 and their correlations are in Table 5.12. 5.5 RESEARCH RECOMMENDATIONS 1. Develop a method to correct for red snapper that are misclassified or unclassified on a
trip-by-trip basis. 2. Expand existing fishery independent sampling and/or development new fishery
independent sampling of red snapper population so off the southeastern U.S. Two ideas discussed were the following:
− Adding gears to MARMAP that are more effective at catching red snapper − Developing coast-wide sampling of larval and juvenile abundance
3. Examine how catchability has changed over time with increases in technology and
potential changes in fishing practices. This is of particular importance when considering fishery dependent indices.
4. Investigate potential density-dependent changes in catchability. 5. Examine possible temporal changes in species assemblages. Such changes could
influence how the Stephens and MacCall method is applied when determining effective effort.
Data Workshop Report South Atlantic Red Snapper
SEDAR 15 SAR 1 SECTION II 89

6. Continue and expand the “Headboat at Sea Observer Survey”. This survey collects
discard information, which would provide for a more accurate index of abundance. 5.6 ITEMIZED LIST OF TASKS FOR COMPLETION FOLLOWING WORKSHOP
• Generate tables and figures • Write chapter of DW report
• Submit data to Data Compiler
Data Workshop Report South Atlantic Red Snapper
SEDAR 15 SAR 1 SECTION II 90

5.7 LITERATURE CITED ACCSP (Atlantic Coastal Cooperative Statistics Program). 2007. Recreational –
Advanced Queries; generated by Geoff White; using ACCSP Data Warehouse
[online application], Washington, D.C: Available at http://www.accsp.org/
Data Center Data Warehouse, accessed July 9, 2007.
Kaufman, L., Rousseeuw and P.J. 1990. Finding groups in data: an introduction to cluster
analysis. John Wiley & Sons, Inc., New York, NY, 319 p.
Kruskal, J.B. 1964. Multidimensional scaling by optimizing goodness of fit to a
nonmetric hypothesis. Psychometrika 29:1–27.
Lo, N.C., Jacobson, L.D., Squire, J.L. 1992. Indices of relative abundance from fish
spotter data based on delta-lognormal models. Can. J. Fish. Aquat. Sci. 49:2515-
2526.
Maunder, M.N., Punt, A.E. 2004. Standardizing catch and effort data: a review of recent
approaches. Fish. Res. 70:141-159.
McCune, B., Grace, J.B. 2002. Analysis of ecological communities. MjM Software
Design, Gleneden Beach, Oregon. 300 p.
Rousseeuw, P.J. 1987. Silhouettes: a graphical aid to the interpretation and validation of
cluster analysis. J. Comp. Appl. Math. 20:53–65.
SAFMC. 2006. SEDAR 10 Stock Assessment Report 1: South Atlantic Gag Grouper.
(http://www.sefsc.noaa.gov/sedar/Sedar_Workshops.jsp?WorkshopNum=10)
Stephens, A., and A. MacCall. 2004. A multispecies approach to subsetting logbook data
for purposes of estimating CPUE. Fish. Res. 70:299-310.
Data Workshop Report South Atlantic Red Snapper
SEDAR 15 SAR 1 SECTION II 91

5.8 TABLES 1 2 3 4
Table 5.1. A summary of catch-effort time series available for the SEDAR 15 data workshop.
Fishery Type Data Source Area Years Units Standardization Method Size Range Issues Use?
Recreational Headboat Atlantic 1976-2006 Number per angler-hr
Stephens and MacCall; delta-lognormal GLM
Same as fishery Fishery dependent Y
Commercial Handline Atlantic 1993-2006 Pounds per hook-hr
Stephens and MacCall; delta-lognormal GLM
Same as fishery Fishery dependent Y
Recreational MRFSS Atlantic 1983-2006 Number per angler-trip
Angler-trips included if species was targeted or caught (A+B1+B2); Nominal
Same as fishery Fishery dependent Y
Independent
MARMAP Chevron trap
Atlantic 1988-2006 Number per trap-hr
Nominal
⎯
Low sample sizes; freq. annual zero (n = 4 to 41 per year)
N
Independent MARMAP Hook and line
Atlantic 1979-2002 Number per hook-hr
Nominal ⎯
Low sample sizes; freq. annual zeros (n = 0 to 39 per year)
N
Independent MARMAP Short longline
Atlantic 1980-2006 Number per hook-hr
Nominal ⎯
Low sample sizes; freq. annual zeros (n = 0 to 10 per year)
N
Independent SEAMAP Atlantic 1990-2006 Number per hectare
Nominal ⎯
Extremely low sample sizes; mostly annual zeros (n = 0 to 4 per year)
N
Independent USC Baruch Institute nekton survey
South Carolina
⎯ ⎯ ⎯ ⎯ n = 0 N
Data Workshop Report South Atlantic Red Snapper
SEDAR 15 SAR 1 SECTION II 92

Table 5.2. Issues with each data set considered for CPUE.
Fishery dependent indices Commercial Logbook – Handline (Recommended for use) Pros: Complete census Covers entire management area Continuous, 14-year time series Large sample size Cons: Fishery dependent Data are self-reported and largely unverified
Little information on discard rates Catchability may vary over time and/or abundance
Issues Addressed: Possible shift in fisherman preference [Stephens and MacCall
(2004) approach] In some cases, self-reported landings have been compared to TIP
data, and they appear reliable Increases in catchability over time (e.g., due to advances in
technology or knowledge) can be addressed in the assessment model
Recreational Headboat (Recommended for use)
Pros: Complete census Covers entire management area Longest time series available Data are verified by port samplers
Consistent sampling Large sample size Non-targeted for focal species
Cons: Fishery dependent Little information on discard rates Catchability may vary over time and/or abundance Issues Addressed:
Possible shift in fisherman preference [Stephens and MacCall (2004) approach]
The impression of some people that trip duration has shifted toward half-day trips is not consistent with the data (Exploratory data analysis reveals no such shift on red snapper trips or on headboat trips overall. In addition, trip duration is accounted for as a factor in the GLM.)
Increases in catchability over time (e.g., due to advances in technology or knowledge) can be addressed in the assessment model
MRFSS (Recommended for use) Pros: Relatively long time series
Data Workshop Report South Atlantic Red Snapper
SEDAR 15 SAR 1 SECTION II 93

Nearly complete area coverage (excluded Monroe County) Only fishery dependent index to include discard information (A+B1+B2)
Cons: Fishery dependent High uncertainty in MRFSS data Targeted species (fields prim1 and prim2) are missing for many
observations in the data set When fishing a multispecies assemblage, such as the snapper-
grouper complex, it is likely that fishermen would list target species other than red snapper when only able to record a maximum of two species. Trips would be eliminated from the analysis if anglers fished in areas where red snapper were likely to be present but were not actually caught, thus causing effort to be underestimated.
North Carolina Citation Program (Not recommended for use) Pros: May correlate with changes in size over time
Cons: No measure of effort Fishery dependent Limited geographic coverage Not designed to provide information on abundance Dependent on fishermen to call in and report citations Fishery independent MARMAP Chevron Trap Index (Not recommended for use) Pros: Fishery independent random hard bottom survey Adequate regional coverage Standardized sampling techniques
Cons: Low sample sizes. Only 4-41 fish caught per year. High standard errors Hook and Line Index (Not recommended for use) Pros: Fishery independent random hard bottom survey Adequate regional coverage Standardized sampling techniques
Cons: Low sample sizes. Only 0-39 fish caught per year with frequent zeros.
Restricted depth coverage (midshelf sampled) High standard errors Ability of samplers may have changed over time Level of effort has decreased over time
Data Workshop Report South Atlantic Red Snapper
SEDAR 15 SAR 1 SECTION II 94

Short Bottom Longline Index (Not recommended for use) Pros: Fishery independent Cons: Low sample sizes. Only 0-10 fish caught per year with frequent
zeros. SEAMAP Trawl Survey (Not Recommended for use) Pros: Stratified random sample design Adequate regional coverage Standardized sampling techniques Cons: Limited depth coverage (shallow water survey)
Only captured 20 red snapper from program inception in 1990 to 2006
University of South Carolina Baruch Institute Low Tide Motile Nekton Survey (Not Recommended for use) Pros: Fishery independent Cons: Estuarine survey not likely to capture the focal species Focal species not present in the database to date Inadequate regional coverage
Data Workshop Report South Atlantic Red Snapper
SEDAR 15 SAR 1 SECTION II 95

Table 5.3A. Red snapper: deviance analysis of the binomial sub-model of the delta-GLM applied to commercial logbook data. ****************************************************************************************************** The explanatory factors in the base model are: YEAR FACTOR DEGF DEVIANCE DEV/DF %REDUCTION LOGLIKE CHISQ PROBCHISQ -------------------------- ------ --------- --------- ------------ ----------- ----------- ----------- BASE 24330 31919.7 1.3119 -15959.8 AREA 24326 29688.5 1.2204 6.97 -14844.3 2231.14 0.00000 MONTH 24319 31682.8 1.3028 0.70 -15841.4 236.93 0.00000 ****************************************************************************************************** ****************************************************************************************************** The explanatory factors in the base model are: YEAR AREA FACTOR DEGF DEVIANCE DEV/DF %REDUCTION LOGLIKE CHISQ PROBCHISQ -------------------------- ------ --------- --------- ------------ ----------- ----------- ----------- BASE 24326 29688.5 1.2204 -14844.3 MONTH 24315 29479.3 1.2124 0.66 -14739.7 209.22 0.00000 ****************************************************************************************************** ****************************************************************************************************** The explanatory factors in the base model are: YEAR AREA FACTOR DEGF DEVIANCE DEV/DF %REDUCTION LOGLIKE CHISQ PROBCHISQ -------------------------- ------ --------- --------- ------------ ----------- ----------- ----------- BASE 24326 29688.5 1.2204 -14844.3 AREA*MONTH 24271 29410.8 1.2118 0.71 -14705.4 277.72 0.00000 ******************************************************************************************************
Table 5.3B. Red snapper: deviance analysis of the lognormal sub-model of the delta-GLM applied to commercial logbook data. ****************************************************************************************************** The explanatory factors in the base model are: YEAR FACTOR DEGF DEVIANCE DEV/DF %REDUCTION LOGLIKE CHISQ PROBCHISQ -------------------------- ------ --------- --------- ------------ ----------- ----------- ----------- BASE 14896 32597.9 2.1884 -26987.8 AREA 14892 28575.5 1.9188 12.32 -26006.0 1963.61 0.00000 MONTH 14885 32082.1 2.1553 1.51 -26868.9 237.81 0.00000 ****************************************************************************************************** ****************************************************************************************************** The explanatory factors in the base model are: YEAR FACTOR DEGF DEVIANCE DEV/DF %REDUCTION LOGLIKE CHISQ PROBCHISQ -------------------------- ------ --------- --------- ------------ ----------- ----------- ----------- BASE 14896 32597.9 2.1884 -26987.8 MONTH 14885 32082.1 2.1553 1.51 -26868.9 237.81 0.00000 ****************************************************************************************************** ****************************************************************************************************** The explanatory factors in the base model are: YEAR MONTH FACTOR DEGF DEVIANCE DEV/DF %REDUCTION LOGLIKE CHISQ PROBCHISQ -------------------------- ------ --------- --------- ------------ ----------- ----------- ----------- BASE 14885 32082.1 2.1553 -26868.9 AREA*MONTH 14837 28163.7 1.8982 11.93 -25897.8 1942.24 0.00000 ******************************************************************************************************
Data Workshop Report South Atlantic Red Snapper
SEDAR 15 SAR 1 SECTION II 96

Table 5.4. Number of trips by year and area (GA=Georgia, NC=North Carolina, NF=north Florida, SC=South Carolina, SF=south Florida) that caught red snapper, as reported in commercial logbook data.
Area
Year GA NC NF SC SF Total
1992 51 130 149 267 77 674
1993 180 513 461 971 202 2327
1994 186 508 569 951 310 2524
1995 180 316 634 822 357 2309
1996 208 246 630 627 324 2035
1997 140 219 480 567 320 1726
1998 104 250 473 547 242 1616
1999 123 379 374 539 167 1582
2000 99 255 437 467 192 1450
2001 181 505 463 785 179 2113
2002 195 567 407 787 192 2148
2003 134 260 319 612 131 1456
2004 122 163 340 597 103 1325
2005 112 134 276 514 149 1185
2006 60 107 239 415 142 963
Total 2075 4552 6251 9468 3087 25433
Data Workshop Report South Atlantic Red Snapper
SEDAR 15 SAR 1 SECTION II 97

Table 5.5. CPUE of red snapper off the southeastern U.S. based on handline gear reported in commercial logbooks. Columns are year, nominal CPUE (lb/hook-hr), nominal CPUE relative to its mean, standardized CPUE, lower (LCI) and upper (UCI) 95% confidence intervals of the standardized CPUE, annual sample size (N = number of positive and zero trips), and coefficient of variation (CV) of the standardized CPUE.
YEAR Nominal CPUE
Relative nominal
Standardized CPUE LCI UCI N CV
1993 0.294 0.888 1.052 0.918 1.205 1862 0.0681994 0.246 0.745 0.856 0.743 0.986 2058 0.0711995 0.360 1.087 0.879 0.760 1.017 2293 0.0731996 0.285 0.861 0.691 0.580 0.825 2104 0.0881997 0.325 0.983 0.610 0.498 0.748 2013 0.1021998 0.263 0.795 0.688 0.558 0.847 1782 0.1051999 0.291 0.880 0.851 0.699 1.035 1596 0.0982000 0.312 0.943 0.869 0.706 1.069 1571 0.1042001 0.452 1.366 1.347 1.175 1.545 1869 0.0682002 0.391 1.181 1.475 1.291 1.684 1758 0.0662003 0.385 1.162 1.220 1.029 1.446 1446 0.0852004 0.438 1.323 1.523 1.278 1.815 1369 0.0882005 0.356 1.075 1.263 1.038 1.537 1354 0.0982006 0.235 0.709 0.677 0.521 0.878 1269 0.131
Data Workshop Report South Atlantic Red Snapper
SEDAR 15 SAR 1 SECTION II 98

Table 5.6. Proportion of red snapper trips from the headboat fishery that exceeded two red snapper per angler. Starting in 1992, regulations allowed no more than two red snapper per angler per trip.
Year North of
Canaveral South of
Canaveral 1973 0.000 1974 0.003 1975 0.005 1976 0.066 1977 0.041 1978 0.048 0.0001979 0.039 0.0001980 0.018 0.0001981 0.029 0.0001982 0.007 0.0001983 0.010 0.0001984 0.021 0.0141985 0.021 0.0071986 0.001 0.0001987 0.005 0.0001988 0.008 0.0331989 0.006 0.0161990 0.006 0.0301991 0.003 0.0001992 0.007 0.0001993 0.003 0.0141994 0.004 0.0111995 0.003 0.0001996 0.002 0.0001997 0.000 0.0001998 0.000 0.0531999 0.002 0.0002000 0.003 0.0002001 0.005 0.0402002 0.011 0.0912003 0.004 0.0002004 0.003 0.0002005 0.002 0.0002006 0.006 0.000
Data Workshop Report South Atlantic Red Snapper
SEDAR 15 SAR 1 SECTION II 99

Table 5.7A. Red snapper: deviance analysis of the binomial sub-model of the delta-GLM applied to headboat data. ****************************************************************************************************** The explanatory factors in the base model are: YEAR FACTOR DEGF DEVIANCE DEV/DF %REDUCTION LOGLIKE CHISQ PROBCHISQ -------------------------- ------ --------- --------- ------------ ----------- ----------- ----------- BASE 42771 54586.9 1.2763 -27293.5 AREA 42768 44162.1 1.0326 19.09 -22081.0 10424.83 0.00000 TYPE 42770 46083.3 1.0775 15.58 -23041.6 8503.63 0.00000 MONTH 42760 52140.4 1.2194 4.46 -26070.2 2446.56 0.00000 ****************************************************************************************************** ****************************************************************************************************** The explanatory factors in the base model are: YEAR AREA FACTOR DEGF DEVIANCE DEV/DF %REDUCTION LOGLIKE CHISQ PROBCHISQ -------------------------- ------ --------- --------- ------------ ----------- ----------- ----------- BASE 42768 44162.1 1.0326 -22081.0 TYPE 42767 38836.2 0.9081 12.06 -19418.1 5325.89 0.00000 MONTH 42757 43364.7 1.0142 1.78 -21682.4 797.38 0.00000 ****************************************************************************************************** ****************************************************************************************************** The explanatory factors in the base model are: YEAR AREA TYPE FACTOR DEGF DEVIANCE DEV/DF %REDUCTION LOGLIKE CHISQ PROBCHISQ -------------------------- ------ --------- --------- ------------ ----------- ----------- ----------- BASE 42767 38836.2 0.9081 -19418.1 MONTH 42756 38271.1 0.8951 1.43 -19135.6 565.08 0.00000 ****************************************************************************************************** ****************************************************************************************************** The explanatory factors in the base model are: YEAR AREA TYPE MONTH FACTOR DEGF DEVIANCE DEV/DF %REDUCTION LOGLIKE CHISQ PROBCHISQ -------------------------- ------ --------- --------- ------------ ----------- ----------- ----------- BASE 42756 38271.1 0.8951 -19135.6 AREA*TYPE 42753 37187.5 0.8698 2.82 -18593.8 1083.58 0.00000 AREA*MONTH 42723 38117.7 0.8922 0.32 -19058.9 565.08 0.00000 MONTH*TYPE 42745 38181.7 0.8932 0.21 -19090.8 89.42 0.00000 ****************************************************************************************************** ****************************************************************************************************** The explanatory factors in the base model are: YEAR AREA TYPE MONTH AREA*TYPE FACTOR DEGF DEVIANCE DEV/DF %REDUCTION LOGLIKE CHISQ PROBCHISQ -------------------------- ------ --------- --------- ------------ ----------- ----------- ----------- BASE 42753 37187.5 0.8698 -18593.8 AREA*MONTH 42720 37008.2 0.8663 0.41 -18504.1 1083.58 0.00000 MONTH*TYPE 42742 37130.0 0.8687 0.13 -18565.0 57.56 0.00000 ******************************************************************************************************
Data Workshop Report South Atlantic Red Snapper
SEDAR 15 SAR 1 SECTION II 100

Table 5.7B. Red snapper: deviance analysis of the lognormal sub-model of the delta-GLM applied to headboat data. ****************************************************************************************************** The explanatory factors in the base model are: YEAR FACTOR DEGF DEVIANCE DEV/DF %REDUCTION LOGLIKE CHISQ PROBCHISQ -------------------------- ------ --------- --------- ------------ ----------- ----------- ----------- BASE 15255 20596.9 1.3502 -23969.1 MONTH 15244 19252.1 1.2629 6.46 -23453.0 1032.09 0.00000 AREA 15252 19607.9 1.2856 4.78 -23593.0 752.20 0.00000 TYPE 15254 20546.3 1.3469 0.24 -23950.3 37.63 0.00000 ****************************************************************************************************** ****************************************************************************************************** The explanatory factors in the base model are: YEAR MONTH FACTOR DEGF DEVIANCE DEV/DF %REDUCTION LOGLIKE CHISQ PROBCHISQ -------------------------- ------ --------- --------- ------------ ----------- ----------- ----------- BASE 15244 19252.1 1.2629 -23453.0 AREA 15241 18506.8 1.2143 3.85 -23151.2 603.57 0.00000 TYPE 15243 19209.3 1.2602 0.22 -23436.0 34.06 0.00000 ****************************************************************************************************** ****************************************************************************************************** The explanatory factors in the base model are: YEAR MONTH AREA FACTOR DEGF DEVIANCE DEV/DF %REDUCTION LOGLIKE CHISQ PROBCHISQ -------------------------- ------ --------- --------- ------------ ----------- ----------- ----------- BASE 15241 18506.8 1.2143 -23151.2 TYPE 15240 18491.6 1.2134 0.08 -23145.0 12.56 0.00039 ****************************************************************************************************** ****************************************************************************************************** The explanatory factors in the base model are: YEAR MONTH AREA FACTOR DEGF DEVIANCE DEV/DF %REDUCTION LOGLIKE CHISQ PROBCHISQ -------------------------- ------ --------- --------- ------------ ----------- ----------- ----------- BASE 15241 18506.8 1.2143 -23151.2 AREA*TYPE 15237 18316.8 1.2021 1.00 -23072.4 157.69 0.00000 AREA*MONTH 15210 18374.4 1.2080 0.51 -23096.4 109.76 0.00000 MONTH*TYPE 15229 18410.5 1.2089 0.44 -23111.4 79.70 0.00000 ****************************************************************************************************** ****************************************************************************************************** The explanatory factors in the base model are: YEAR MONTH AREA AREA*TYPE FACTOR DEGF DEVIANCE DEV/DF %REDUCTION LOGLIKE CHISQ PROBCHISQ -------------------------- ------ --------- --------- ------------ ----------- ----------- ----------- BASE 15237 18316.8 1.2021 -23072.4 AREA*MONTH 15206 18187.8 1.1961 0.50 -23018.3 108.11 0.00000 MONTH*TYPE 15226 18257.8 1.1991 0.25 -23047.7 49.34 0.00000 ******************************************************************************************************
Data Workshop Report South Atlantic Red Snapper
SEDAR 15 SAR 1 SECTION II 101

Table 5.8. Number of trips by year and area (NC=North Carolina, NF=Georgia and north Florida, SC=South Carolina, SF=south Florida) that caught red snapper, as reported in headboat data.
Area
Year NC NF SC SF Total1973 158 0 138 0 2961974 163 0 202 0 3651975 107 0 312 0 4191976 101 593 284 0 9781977 72 820 299 0 11911978 147 1267 316 15 17451979 121 1119 137 34 14111980 63 1248 192 59 15621981 111 1030 123 134 13981982 141 893 179 63 12761983 113 1183 239 92 16271984 72 1093 244 69 14781985 116 1306 322 140 18841986 103 1235 193 68 15991987 99 1324 261 61 17451988 145 1086 367 61 16591989 60 1059 223 64 14061990 33 987 272 33 13251991 83 754 211 20 10681992 127 536 211 60 9341993 169 611 447 72 12991994 120 923 285 91 14191995 108 1117 206 81 15121996 81 896 153 25 11551997 31 518 80 19 6481998 55 1022 164 19 12601999 105 1017 256 16 13942000 114 1086 211 29 14402001 181 1090 312 25 16082002 153 1041 327 11 15322003 83 937 209 7 12362004 65 1252 247 14 15782005 23 1200 147 27 13972006 19 1033 110 24 1186
Total 3442 31276 7879 1433 44030
Data Workshop Report South Atlantic Red Snapper
SEDAR 15 SAR 1 SECTION II 102

Table 5.9. CPUE of red snapper off the southeastern U.S. based on headboat data. Columns are year, nominal CPUE (number/hook-hr), nominal CPUE relative to its mean, standardized CPUE, lower (LCI) and upper (UCI) 95% confidence intervals of the standardized CPUE, annual sample size (N = number of positive and zero trips), and coefficient of variation (CV) of the standardized CPUE.
YEAR Nominal CPUE
Relative nominal
Standardized CPUE LCI UCI N CV
1976 0.0444 3.328 3.127 0.930 10.511 789 0.6661977 0.0293 2.193 2.078 0.434 9.963 812 0.9211978 0.0299 2.242 2.120 0.556 8.081 1419 0.7511979 0.0276 2.067 2.138 0.537 8.504 1264 0.7811980 0.0152 1.138 1.129 0.193 6.589 1333 1.0851981 0.0258 1.934 2.777 0.782 9.866 998 0.7031982 0.0110 0.823 1.044 0.164 6.629 1282 1.1621983 0.0185 1.383 1.705 0.401 7.243 1450 0.8291984 0.0214 1.606 1.554 0.332 7.276 1340 0.9021985 0.0222 1.663 2.285 0.672 7.770 1643 0.6741986 0.0072 0.539 0.511 0.059 4.442 2039 1.4891987 0.0079 0.591 0.612 0.079 4.728 2048 1.3571988 0.0091 0.678 0.563 0.069 4.580 1942 1.4131989 0.0137 1.026 0.952 0.148 6.111 1301 1.1711990 0.0112 0.838 0.987 0.161 6.031 1357 1.1261991 0.0074 0.553 0.619 0.071 5.374 1384 1.4891992 0.0025 0.186 0.081 0.003 2.546 2051 4.2851993 0.0039 0.295 0.213 0.013 3.554 1862 2.4981994 0.0047 0.353 0.225 0.014 3.732 1513 2.4881995 0.0053 0.400 0.302 0.022 4.205 1395 2.1571996 0.0037 0.277 0.202 0.010 4.075 1104 2.9271997 0.0032 0.239 0.223 0.010 5.195 820 3.3021998 0.0040 0.298 0.179 0.009 3.503 1465 2.8471999 0.0060 0.446 0.293 0.021 4.018 1448 2.1312000 0.0072 0.537 0.389 0.033 4.642 1270 1.9112001 0.0135 1.010 0.822 0.125 5.400 1460 1.1942002 0.0167 1.250 1.005 0.173 5.839 1350 1.0812003 0.0098 0.734 0.518 0.050 5.365 973 1.7082004 0.0131 0.981 0.969 0.161 5.824 1368 1.1122005 0.0115 0.859 0.903 0.136 5.998 1190 1.2042006 0.0071 0.531 0.473 0.043 5.224 1132 1.797
Data Workshop Report South Atlantic Red Snapper
SEDAR 15 SAR 1 SECTION II 103

Table 5.10. Number of intercepts from MRFSS that caught red snapper or reported red snapper as a targeted species. The index of abundance was computed for 1983–2006, because of total sample size and distribution across states.
Year Total NC SC GA FL1982 48 0 14 0 341983 168 0 29 8 1311984 398 15 81 7 2951985 215 18 29 17 1511986 154 4 4 11 1351987 196 112 5 17 621988 279 134 7 8 1301989 284 127 49 10 981990 114 82 5 0 271991 137 62 15 12 481992 278 63 0 93 1221993 180 34 2 93 511994 257 76 6 95 801995 171 54 0 70 471996 98 15 6 53 241997 76 0 44 15 171998 131 7 23 46 551999 386 27 80 47 2322000 508 16 110 40 3422001 555 44 22 30 4592002 567 61 19 23 4642003 535 47 24 64 4002004 554 9 38 181 3262005 400 14 33 115 2382006 493 25 32 164 272
Data Workshop Report South Atlantic Red Snapper
SEDAR 15 SAR 1 SECTION II 104

Table 5.11. CPUE of red snapper off the southeastern U.S. based on MRFSS data. Relative CPUE is CPUE standardized to its mean.
YEAR CPUE (number/
angler-trip) Relative CPUE PSE
1983 2.770 1.716 17.6 1984 2.533 1.569 15.3 1985 2.199 1.362 17.4 1986 1.154 0.715 32.2 1987 1.047 0.648 37.0 1988 1.137 0.704 24.9 1989 0.943 0.584 17.1 1990 0.323 0.200 29.9 1991 1.093 0.677 27.3 1992 1.723 1.067 15.2 1993 1.854 1.148 23.3 1994 1.201 0.744 20.9 1995 1.226 0.759 15.8 1996 1.073 0.665 28.0 1997 1.737 1.076 34.7 1998 1.295 0.802 21.5 1999 2.387 1.479 12.9 2000 2.163 1.340 12.2 2001 1.800 1.115 11.4 2002 1.604 0.994 13.7 2003 1.863 1.154 13.6 2004 2.088 1.294 11.7 2005 1.949 1.207 11.1 2006 1.585 0.982 15.5
Table 5.12. Pearson correlation between indices. Values in parentheses are p-values from a t-test of H0: ρ = 0. Headboat MRFSS Comm. logbook Headboat 1.0 0.39 (0.06) 0.88 (<0.001) MRFSS ⎯ 1.0 0.38 (0.18) Comm. logbook ⎯ ⎯ 1.0
Data Workshop Report South Atlantic Red Snapper
SEDAR 15 SAR 1 SECTION II 105

5.9 FIGURES Figure 5.1. Areas reported in commercial logbooks. First two digits signify degrees latitude, second two degrees longitude. Areas were excluded from the analysis if north of 36 degrees latitude or if in the Gulf of Mexico (codes=1, 2, 3,…). Areas were considered southern Florida at 28 degrees latitude and south (break near Cape Canaveral).
Data Workshop Report South Atlantic Red Snapper
SEDAR 15 SAR 1 SECTION II 106

Figure 5.2A. Estimates of species-specific regression coefficients from Stephens and MacCall method applied to commercial logbook data from north of Cape Canaveral, as used to estimate each trip’s probability of catching the focal species.
Gray.snapperScamp
GagVermilion.snapperLesser.amberjackBanded.rudderfish
Greater.amberjackAlmaco.jack
Snowy.GrouperBlack.sea.bass
Ocean.triggerfishGray.triggerfishBlack.Grouper
Red.porgyMutton.snapper
MargateRock.Hind
Knobbed.porgyJolthead.porgy
Red.GrouperRed.Hind
White.gruntBlueline.Tilefish
Hogfish
Regression coefficient
-0.5 0.0
0.5
1.0
1.5
Data Workshop Report South Atlantic Red Snapper
SEDAR 15 SAR 1 SECTION II 107

Figure 5.2B. Estimates of species-specific regression coefficients from Stephens and MacCall method applied to commercial logbook data from south of Cape Canaveral, as used to estimate each trip’s probability of catching the focal species.
ScampGag
Red.GrouperSilk.snapper
Red.porgyGray.triggerfish
Lane.snapperJolthead.porgy
Vermilion.snapperSnowy.GrouperBlack.Grouper
Greater.amberjackGray.snapper
Almaco.jackBlueline.Tilefish
French.gruntBlue.runner
Mutton.snapperTilefish
Bluestriped.gruntHogfish
White.gruntCrevalle.jack
Yellowtail.snapper
Regression coefficient
-2 -1 0 1 2
Data Workshop Report South Atlantic Red Snapper
SEDAR 15 SAR 1 SECTION II 108

Figure 5.3A. Absolute difference between observed and predicted number of positive trips from Stephens and MacCall method applied to commercial logbook data from north of Cape Canaveral. Left and right panels differ only in the range of probabilities shown.
0.0
0.2
0.4
0.6
0.8
1.0
0
5
10
15
20
25
30
35
Probability
Abs.
err
or (1
000)
0.35
0.40
0.45
0.50
0
1
2
3
4
5
Probability
Abs.
err
or (1
000)
Figure 5.3B. Absolute difference between observed and predicted number of positive trips from Stephens and MacCall method applied to commercial logbook data from south of Cape Canaveral. Left and right panels differ only in the range of probabilities shown.
0.0
0.2
0.4
0.6
0.8
1.0
0
5
10
15
20
25
30
35
Abs.
err
or (1
000)
0.12
0.14
0.16
0.18
0.20
0.22
0.24
0.5
1.0
1.5
2.0
Probability
Abs.
err
or (1
000)
Data Workshop Report South Atlantic Red Snapper
SEDAR 15 SAR 1 SECTION II 109

Figure 5.4. Red snapper: index of abundance from commercial logbook data.
Data Workshop Report South Atlantic Red Snapper
SEDAR 15 SAR 1 SECTION II 110

Figure 5.5. Areas from the headboat survey. Areas 11, 12, and 17 were considered southern Florida (break near Cape Canaveral).
1712
11
9
8
7
6
4
2
1
10
5
3
1712
11
9
8
7
6
4
2
1
10
5
3
Data Workshop Report South Atlantic Red Snapper
SEDAR 15 SAR 1 SECTION II 111

Figure 5.6A. Estimates of species-specific regression coefficients from Stephens and MacCall method applied to headboat data from areas in the northern region (excludes areas 11, 12, 17), as used to estimate each trip’s probability of catching the focal species.
Vermilion_snapper
Gag
Gray_snapper
Greater_amberjack
Gray_triggerfish
Scamp
Lane_snapper
Red_porgy
Whitebone_porgy
Black_sea_bass
Red_Grouper
Bank_sea_bass
Almaco_jack
Tomtate
Knobbed_porgy
White_grunt
Regression coefficient
-1.0
-0.5 0.0
0.5
1.0
Data Workshop Report South Atlantic Red Snapper
SEDAR 15 SAR 1 SECTION II 112

Figure 5.6B. Estimates of species-specific regression coefficients from Stephens and MacCall method applied to headboat data from areas in the southern region (areas 11, 12, 17), as used to estimate each trip’s probability of catching the focal species.
Black_sea_bassScamp
Silk_snapperGag
Greater_amberjackVermilion_snapper
Red_HindRed_GrouperAlmaco_jack
Black_GrouperMargate
Rock_HindWhitebone_porgy
Red_porgyOcean_triggerfish
HogfishLane_snapperGray_snapper
Bar_jackKnobbed_porgy
Bluestriped_gruntSchoolmaster
Black_margateSaucereye_porgy
Mutton_snapperJolthead_porgy
Queen_triggerfishBlue_runner
Gray_triggerfishFrench_gruntSand_tilefish
TomtateYellowtail_snapper
PorkfishBlackfin_snapper
White_gruntGraysby
Regression coefficient
-0.5 0.0
0.5
1.0
1.5
Data Workshop Report South Atlantic Red Snapper
SEDAR 15 SAR 1 SECTION II 113

Figure 5.7A. Absolute difference between observed and predicted number of positive trips from Stephens and MacCall method applied to headboat data from the northern region (excludes areas 11, 12, 17). Left and right panels differ only in the range of probabilities shown.
0.0
0.2
0.4
0.6
0.8
1.0
0
10
20
30
40
Probability
Abs.
err
or (1
000)
0.35
0.40
0.45
0.50
0
2
4
6
8
10
Probability
Abs.
err
or (1
000)
Figure 5.7B. Absolute difference between observed and predicted number of positive trips from Stephens and MacCall method applied to headboat data from the southern region (areas 11, 12, 17). Left and right panels differ only in the range of probabilities shown.
0.0
0.2
0.4
0.6
0.8
1.0
0
10
20
30
40
Probability
Abs.
err
or (1
000)
0.08
0.10
0.12
0.14
0.16
0.0
0.2
0.4
0.6
Probability
Abs.
err
or (1
000)
Data Workshop Report South Atlantic Red Snapper
SEDAR 15 SAR 1 SECTION II 114

Figure 5.8. Red snapper: index of abundance from headboat data.
Data Workshop Report South Atlantic Red Snapper
SEDAR 15 SAR 1 SECTION II 115

Figure 5.9. Counties sampled by the MRFSS, as used to compute the index of abundance, included those along the coast from Currituck County, NC through Miami-Dade County, FL.
Gulf of Mexico
AtlanticOcean
Monroe County, FL
Currituck County, NC
Miami-Dade County, FL
FLORIDA
GEORGIAALABAMA
VIRGINIAKENTUCKY
NORTHCAROLINA
TENNESSEE
SOUTHCAROLINA
INDIANA WESTVIRGINIA
OHIO
-80°
-80°
30°
30°
0 102030405Miles
Data Workshop Report South Atlantic Red Snapper
SEDAR 15 SAR 1 SECTION II 116

Figure 5.10. Red snapper: index of abundance from MRFSS data. Lower/upper confidence intervals are minus/plus two standard errors.
0.000
0.500
1.000
1.500
2.000
2.500
3.000
3.500
4.000
1980 1985 1990 1995 2000 2005
Year
CPU
E (n
umbe
r/an
gler
-tri
p)
CPUE LCI UCI
Data Workshop Report South Atlantic Red Snapper
SEDAR 15 SAR 1 SECTION II 117

Figure 5.11. Red snapper: indices of abundance recommended for use in the assessment. Vertical lines represent years with new regulations. Each index is scaled to its mean.
1975 1980 1985 1990 1995 2000 2005
0.0
0.5
1.0
1.5
2.0
2.5
3.0
Year
CPU
E (s
cale
d)
HeadboatCommercialMRFSS
Data Workshop Report South Atlantic Red Snapper
SEDAR 15 SAR 1 SECTION II 118

5.10 APPENDICES Appendix 5.1: Information contained in the commercial logbook data set (all variables are numeric unless otherwise noted):
schedule: this is a unique identifier for each fishing trip and is a character variable species: a character variable to define the species gear: a character variable, the gear type, multiple gear types may be used in a single trip, L = longline, H = handline, E = electric reels, B = bouy gear, GN = gill net, P = diver using power head gear, S = diver using spear gun, T = trap, TR = trolling area: area fished, in the south Atlantic these codes have four digits- the first two are degrees of latitude and the second two are the degrees of longitude conversion: conversion factor for calculating total pounds (totlbs) from gutted weight gutted: gutted weight of catch for a particular species, trip, gear, and area whole: whole weight of catch for a particular species, trip, gear, and area totlbs: a derived variable that sums the gutted (with conversion factor) and whole weights, this is the total weight in pounds of the catch for a particular species, trip, gear, and area length: length of longline (in miles) or gill net (in yards) mesh1 – mesh4: mesh size of traps or nets numgear: the amount of a gear used, number of lines (handlines, electric reels), number of sets (longlines), number of divers, number of traps, number of gill nets fished: hours fished on a trip, this is problematic for longline data as discussed later effort: like numgear, the data contained in this field depends upon gear type; number of hooks/line for handlines, electric reels, and trolling; number of hooks per longline for longlines; number of traps pulled for traps; depth of the net for gill nets, this field is blank for divers source: a character variable, this identifies the database that the record was extracted from, sg = snapper grouper, grf = gulf reef fish, all records should have this source code tif_no: a character variable, trip identifier, not all records will have a tif_no vesid: a character variable, a unique identifier for each vessel started: numeric (mmddyy8) variable, date the trip started landed: numeric (mmddyy8) variable, date the vessel returned to port unload: numeric (mmddyy8) variable, date the catch was unloaded received: numeric (mmddyy8) variable, date the logbook form was received from the fisherman opened: numeric (mmddyy8) variable, date the logbook form was opened and given a schedule number away: number of days at sea, this value should equal (landed-started+1) crew: number of crew members, including the captain
Data Workshop Report South Atlantic Red Snapper
SEDAR 15 SAR 1 SECTION II 119

dealer: character variable, identifier for the dealer who bought the catch, in some cases there may be multiple dealers for a trip state: character variable, the state in which the catch was sold county: character variable, the county in which the catch was sold area1 – area3: areas fished, if the trip included catch from multiple areas, those areas will be listed here trip_ticke: character variable, trip ticket number, a unique identifier for each trip not all trips have this identifier
Data Workshop Report South Atlantic Red Snapper
SEDAR 15 SAR 1 SECTION II 120

Appendix 5.2. Geographic areas with similarity in species landed.
This appendix describes multivariate statistical analyses used to identify
geographic areas with similarity in species landed. Two techniques were
applied⎯ordination and cluster analysis. Both require use of a measure of dissimilarity
(distance) among areas. These analyses used the Sørenson (also called Bray-Curtis)
measure of distance, a common measure in ecological studies (McCune and Grace,
2002).
To compute dissimilarities, each data set (commercial logbook and headboat) was
formatted as a matrix with rows representing geographic areas and columns representing
species. Each element of the matrix quantified the relative frequency of species landed
by geographic area. Thus, rows of the matrix summed to one. Geographic areas with a
trivial number of records (<0.01%) were removed from the analysis, which left 292,316
records of area-species in the recreational (headboat) data set and 239,991 in the
commercial data set. The resulting frequencies were then transformed using the arcsine
squareroot transformation, as is appropriate for proportion data (McCune and Grace,
2002). After transformation, a matrix of dissimilarities between areas was computed
using the Sørenson measure of distance.
To quantify similarity of areas based on their catch compositions, the ordination
method of nonmetric multidimensional scaling (NMDS) was applied to the matrix of
dissimilarities (Kruskal, 1964). In addition to ordination, nonhierarchical cluster analysis
was applied in order to partition the geographic areas. This cluster analysis used the
method of k-medoids, a more robust version of the classical method of k-means
(Kaufman and Rousseeuw, 1990). As with any nonhierarchical method, the number of
Data Workshop Report South Atlantic Red Snapper
SEDAR 15 SAR 1 SECTION II 121

clusters k must be specified a priori. This study applied a range of values and selected
the k most concordant with the data, as indicated by highest average silhouette width
(Rousseeuw, 1987). In both commercial logbook and headboat data sets, optimal k = 2,
with division between areas near Cape Canaveral, FL (Appendix 5.2A,B).
Data Workshop Report South Atlantic Red Snapper
SEDAR 15 SAR 1 SECTION II 122

Appendix 5.2A. Nonmetric multidimensional scaling of areas from the headboat data.
Rectangles in top left panel encapsulate areas with similar composition of landings, as
identified by k-medoid cluster analysis. Areas north of Cape Canaveral, FL are in bold
font.
11
12
17
1
2
3
4
5
6
7
8
9
10
Axis 1
Axis
2
11
12
17
1
2
3
4
5
6
78
9
10
Axis
3
11
12
17
1
2
3
4
5
6
78
9
10
Axis 2
Data Workshop Report South Atlantic Red Snapper
SEDAR 15 SAR 1 SECTION II 123

Appendix 5.2B. Nonmetric multidimensional scaling of areas from the commercial
logbook data (handline). Rectangles in top left panel encapsulate areas with similar
composition of landings, as identified by cluster analysis. Areas north of Cape Canaveral,
FL are in bold font.
2479
2480
24812482
2579
2580
26792680
2779
2780
287928802979
2980
2981
3076
30793080
3081
3179
31803181
3276
32773278
3279
3280
3374
3375
33763377
3378
33793474
3475
3476
3477
Axis 1
Axis
2
2479
2480
24812482
2579
2580 2679
2680
27792780
2879
2880
2979
29802981
3076
3079
30803081
3179
3180
3181
3276
3277
3278
3279 3280
3374
3375
3376
33773378
3379
3474
3475
3476
3477
Axis
3
2479
2480
24812482
2579
25802679
2680
27792780
2879
2880
2979
29802981
3076
3079
3080 3081
3179
3180
3181
3276
3277
3278
3279 3280
3374
3375
3376
33773378
3379
3474
3475
3476
3477
Axis 2
Data Workshop Report South Atlantic Red Snapper
SEDAR 15 SAR 1 SECTION II 124

Appendix 5.2. Red snapper: diagnostics of delta-GLM fitted to commercial logbook data. Appendix 5.2A.
Appendix 5.2B.
Data Workshop Report South Atlantic Red Snapper
SEDAR 15 SAR 1 SECTION II 125

Appendix 5.2C.
Appendix 5.2D.
Data Workshop Report South Atlantic Red Snapper
SEDAR 15 SAR 1 SECTION II 126

Appendix 5.2E.
Appendix 5.2F.
Data Workshop Report South Atlantic Red Snapper
SEDAR 15 SAR 1 SECTION II 127

Appendix 5.2G.
Data Workshop Report South Atlantic Red Snapper
SEDAR 15 SAR 1 SECTION II 128

Appendix 5.3. Red snapper: diagnostics of delta-GLM fitted to headboat data Appendix 5.3A.
Appendix 5.3B.
Data Workshop Report South Atlantic Red Snapper
SEDAR 15 SAR 1 SECTION II 129

Appendix 5.3C.
Appendix 5.3D.
Data Workshop Report South Atlantic Red Snapper
SEDAR 15 SAR 1 SECTION II 130

Appendix 5.3E.
Appendix 5.3F.
Data Workshop Report South Atlantic Red Snapper
SEDAR 15 SAR 1 SECTION II 131

Appendix 5.3G.
Appendix 5.3H.
Data Workshop Report South Atlantic Red Snapper
SEDAR 15 SAR 1 SECTION II 132

Appendix 5.3I.
Data Workshop Report South Atlantic Red Snapper
SEDAR 15 SAR 1 SECTION II 133

Data Workshop Report South Atlantic Red Snapper
SEDAR 15 SAR 1 SECTION II
6 Submitted Comments
6.1 None were received.
134

Assessment Workshop Report South Atlantic Red Snapper
SEDAR 15 SAR 1 SECTION III
Section III. Assessment Workshop Report
Contents
1. Workshop Proceedings Introduction …………….…………………...……………. 3
2. Recommendations and Comments ……………………………………..………….. 5
3. Data Review and Updates ….…………………………………………………….... 13
4. Stock Assessment Models and Results ..…………………………………………... 31
5. Submitted Comments ………………………………………………...……………. 212
Changes to Section III. Assessment Workshop Report Added Documentation of Final Review Model Configuration
In reply to the Review Panel, the following changes were made to the Stock Assessment Models and Results chapter (Chapter 3) of the Assessment Workshop Report (SAR Section III) and are shown in the Stock Assessment Report:
1) A figure of size at age (figure 3.20) is added. This figure was shown during the review workshop in the assessment presentation, but not previously in the document for peer review.
2) Units of measure have been stated in several locations of the text, specifically landings in 1000 lb whole weight, discards in 1000 dead fish, and spawning biomass in mt.
3) There is a correction of the description of how stochastic recruitment was modeled in
projections (i.e., lognormal recruitment deviations were applied to the spawner-recruit curve without bias correction). The methods were applied correctly, but the description in the report for peer review was inaccurate, as discussed during the review.

Assessment Workshop Report South Atlantic Red Snapper
SEDAR 15 SAR 1 SECTION III

Assessment Workshop Report South Atlantic Red Snapper
SEDAR 15 SAR 1 SECTION III
1. Workshop Proceeding
1.1 Introduction
1.1.1 Workshop Time and Place
The SEDAR 15 Assessment Workshop was held October 22-26, 2007 in Beaufort, NC.
1.1.2 Terms of Reference
1. Review any changes in data following the data workshop and any analyses suggested
by the data workshop. Summarize data as used in each assessment model. Provide
justification for any deviations from Data Workshop recommendations.
2. Develop population assessment models that are compatible with available data and
recommend which model and configuration is deemed most reliable or useful for
providing advice. Document all input data, assumptions, and equations.
3. Provide estimates of stock population parameters (fishing mortality, abundance,
biomass, selectivity, stock-recruitment relationship, etc); include appropriate and
representative measures of precision for parameter estimates.
4. Characterize uncertainty in the assessment and estimated values, considering
components such as input data, modeling approach, and model configuration. Provide
appropriate measures of model performance, reliability, and ‘goodness of fit’.
5. Provide yield-per-recruit, spawner-per-recruit, and stock-recruitment evaluations.
6. Provide estimates for SFA criteria. This may include evaluating existing SFA
benchmarks or estimating alternative SFA benchmarks (SFA benchmarks include
MSY, Fmsy, Bmsy, MSST, and MFMT); recommend proxy values where necessary.
7. Provide declarations of stock status relative to SFA benchmarks.
8. Estimate an Allowable Biological Catch (ABC) range.
9. Project future stock conditions (biomass, abundance, and exploitation) and develop
rebuilding schedules if warranted; include estimated generation time. Stock
projections shall be developed in accordance with the following:
A) If stock is overfished:
F=0, F=current, F=Fmsy, Ftarget (OY),
F=Frebuild (max that rebuild in allowed time)
B) If stock is overfishing
F=Fcurrent, F=Fmsy, F= Ftarget (OY)
C) If stock is neither overfished nor overfishing
F=Fcurrent, F=Fmsy, F=Ftarget (OY)
10. Evaluate the results of past management actions and, if appropriate, probable impacts
of current management actions with emphasis on determining progress toward stated
management goals.
11. Review the research recommendations provided by the Data Worskhop. Provide
additional recommendations for future research and data collection (field and
assessment) with a focus on those items which will improve future assessment efforts.
Provide details regarding sampling design, sampling strata and sampling intensity that
3

Assessment Workshop Report South Atlantic Red Snapper
SEDAR 15 SAR 1 SECTION III
will facilitate collection of data that will resolve identified deficiencies and
impediments in the current assessment.
12. Provide complete model output values and population estimates in an accessible and
formatted excel file.
13.Complete the Assessment Workshop Report (Section III of the SEDAR Stock
Assessment Report) and prepare a first draft of the Advisory Report.
1.1.3 Participants
Workshop Panel
Jeff Buckel ............................................................................... SAFMC SSC/NCSU
Brian Cheuvront ........................................................................... SAFMC/NC DMF
Rob Cheshire ..................................................................................... NMFS SEFSC
Chip Collier ................................................................................................ NC DMF
Paul Conn ........................................................................................... NMFS SEFSC
Pat Harris ............................................................................. SAFMC SSC/SC DNR
Jack McGovern ................................................................................... NMFS SERO
Marcel Reichert ........................................................................................... SC DNR
Kyle Shertzer ..................................................................................... NMFS SEFSC
Andi Stephens .............................................................................................. SAFMC
Doug Vaughan ................................................................................... NMFS SEFSC
Erik Williams ..................................................................................... NMFS SEFSC
David Wyanski............................................................................................ SC DNR
Observers
Alan Bianchi .............................................................................................. NC DMF
Ken Brennan ...................................................................................... NMFS SEFSC
Jeff Burton ......................................................................................... NMFS SEFSC
Stephanie McInerny ........................................................................... NMFS SEFSC
Paulette Mikell ............................................................................................ SC DNR
Mike Prager ........................................................................................ NMFS SEFSC
Jennifer Potts ...................................................................................... NMFS SEFSC
Jessica Stephen............................................................................................ SC DNR
Helen Takade ............................................................................................. NC DMF
Jim Waters ......................................................................................... NMFS SEFSC
Staff
John Carmichael........................................................................................... SAFMC
Julie Neer ..................................................................................................... SEDAR
Rachael Lindsay ........................................................................................... SEDAR
Dale Theiling ............................................................................................... SEDAR
1.1.4 Workshop Documents
Documents prepared for the SEDAR 15 assessment workshop:
SEDAR15-AW-1 SEDAR 15 Stock Assessment Model Conn, P., K. Shertzer, and E. Williams
4

Assessment Workshop Report South Atlantic Red Snapper
SEDAR15 SAR1 SECTION III
1.2 Panel Recommendations and Consensus Statements
1.2.1 Discussion and Recommendations Regarding Data Modifications and Updates
Data modifications are detailed in section 2 and address any group discussion and
recommendations.
Modeling Periods
There were three modeling periods. These were based on changes in regulations, time series of
landings data, and behavior of model.
1946-1984 – Period 1
1984-1991 – Period 2
1992-present – Period 3
Landings data went back as far as 1901. However, the model did not give reasonable results
with a 1901 start. It was sensitive to many small configuration changes. The start of 1946
seemed to provide needed stability. The assessment group supports 1946 start date as that is
when landings begin after no landings data during WW2. There were regulation changes
between period 1 and 2 and between period 2 and 3.
Sample size for age and length data
The decision of sample size for annual age and length composition data was a balance between
too little data and noise and including all data that might be informative. As a compromise
between these two, a minimum sample size of 40 was used.
Age-classes
Analysis showed the model insensitive to various choices of age-class saturation (plus-group
age). Life history characteristics saturate by age 20, therefore age 20 was chosen as the plus-
group.
Changes to timing in catch at age model
Annual SSB was estimated mid-year because peak spawning occurs in May-July. This was a
change from prior modeling where SSB was estimated at beginning of year. Total biomass and
abundance are estimated at start of year.
Stock Recruitment
There was concern that spikes in recruitment from initial runs were anomalies. However, these
strong year classes were present in age composition data. Landing spikes are driving
recruitment.
5
Assessment Workshop Report South Atlantic Red Snapper
SEDAR15 SAR1 SECTION III
First year of recruitment deviations (from constraint to S-R curve) is now an input parameter to
the model (i.e., can be chosen). Equivalent to an age structured production model when
constrained to stock recruitment model. When not constrained, deviations used to model
recruitment variation. As a potential attempt to fit length composition of headboat data (see
below) the recruit residuals were started earlier (1971?); ealier start dates of recruitment residuals
provided better fits to length composition data but S-R relationships were poor. The base model
has recruitment residuals beginning in 1974; sensitivities will be 1972 and 1976.
Smoothing of MRFSS catch to calculate landings (1992-2006)
The PSE’s for MRFSS landings data were often above 20% suggesting that annual estimates
were not reliable. For the surplus production model (see section below), there were two changes
made to the MRFSS landings data to reduce large interannual variability in individual fish
weight and numbers landed. First, the annual mean weight of individual fish was smoothed
using LOESS techniques (weight is smoothed by the square root of sample-size). Second, the
mean number of red snapper landed per year was smoothed using a three year running average.
The catch at age model only used the smoothing data on mean fish size initially but then changed
to same landings data as used in production model. The assessment text should clearly and
repeatedly state that smoothed MRFSS date were used; all figure legends should reflect that.
The text should also be clear on why MRFSS data were smoothed.
Fishery selectivities
The fishery selectivity functions vary by period and sector to deal with regulation changes in
three different fisheries. The length composition from each fishery and time period was used for
fishery selectivities. However, the recreational and headboat fishery selectivities in period 2
were determined using a logistic function fit using a slope parameter from a pdf from the VBGF
model and minimum size limit.
The length compositions from MRFSS show a large number of illegal fish. This was discussed
and it was determined that it was not a sample size issue because the minimum sample size was
40 per year.
Discards and discard selectivity
The calculation of discards in the assessment differed from the data workshop. Discards of red
snapper in MRFSS (B2’s) had high year-to-year variability. Therefore, a three year running
average was used on discards for both the catch at age model and the production model. The
recreational discards pre-1984 were modeled initially but then assumed no discard in later runs
(see Discussion below). Headboat discards were estimated using the landings/discards ratio
from MRFSS for 1984-2006. Commercial discards 1992-2006 from logbooks (hook and line
fishery); discards for previous periods assumed to be same landings/discards ratio. Discards for
diving fishery not estimated (assumed not to exist).
How much discarding under the 12” size? There was some indication 12” did little (len comp,
but little prior to size change). Could simplify and use 2 periods. That model was not pursued.
6

Assessment Workshop Report South Atlantic Red Snapper
SEDAR15 SAR1 SECTION III
There were no data to estimate selectivity functions for discards and the complement of the
logistic selectivity for the fishery was first chosen to model discard selectivity. Discussion
focused on likelihood that there probably was no discarding of any red snapper in period 1
because there were no size regulations. All concluded that this was valid assumption for
commercial and recreational fishery.
One problem with discard selectivities that was discussed had to do with too high of discards on
large fish. Discussion about whether or not to use probability size approach for selectivity (e.g.,
use age and growth data and pdf’s to determine probability of age-2 being below size limit).
Decision not to use that approach alone but to use estimated slopes from that approach but still
let data drive how selection function moves from left to right in model. Vbgf – pdf used to
calculate slope of logistic fnct…then use that slope instead of knife edge.
Period 1 (pre-1984): no discard
Periods 2 (HB and MRFSS): a50 = a(size limit) based on length composition and slope
determined from probability density function and VBGF. This
approach used for headboat and MRFSS only
Period 2 & 3 Commercial and Period 3 (HB and MRFSS): fishery selectivity based on length
composition
Discard mortality
The discard mortality for the commercial fishery was assumed to be 0.9 and for the recreational
fishery, 0.4. There was discussion that the commercial discard mortality was too high. The Gulf
of Mexico red snapper model used 0.7-0.8. It was decided that a sensitivity run with a
commercial discard of 0.7 should be examined. Cited deeper water as reason why discard
mortality might be higher in US South Atlantic. Also, habit of commercial fishers leaving fish
on deck was cited as reason for higher discard mortality overall. Is it critical? Maybe, but
discards not overly high so expectation is that results will not be sensitive. Noted the diff with
gulf, but that is inadequate justification. No advisors here to discuss, and would be affected by
mortality. Should we consider using another?
Multiple independent sensitivity runs were recommended: Commercial of 0.7, 0.8, 0.9, and 1.0
and recreational of 0.2, 0.4, and 0.6.
Likelihood weightings
Range from 1 to 1000….
1.2.2 Discussion and Critique of Each Model Considered
Address all models, note Preferred Model &Configuration, summarize Model Issues
Discussed and group consensus on issues.
7

Assessment Workshop Report South Atlantic Red Snapper
SEDAR15 SAR1 SECTION III
(Model is detailed by analyst in later section. Brief overview here, detail is on the issues
and recommendations to resolve issues.)
Surplus production model-ASPIC runs
Smoothing of landings data as described in CAA model section. Another issue that had to be
dealt with was that not all discards die. The calculation of dead discards was accepted by group.
Two assumption groups examined:
Assumption group 1: discards negligible before 1984; mean discard weight equal to mean
weight of individual fish in landings, (not preferred due to large fish being discarded).
Assumption group 2: decompose total selectivity into gear and fisherman selectivity; Assume
knife edge gear selectivity at age1; Assume fisherman selectivity due entirely to size limits;
Assume age specific M and constant F0 of 0.2
B1/K (equivalent to B0/K below)=0.9 because goes back to 1901 when virgin fishery
Sensitivity analyses examined changes in B1/K and smoothed vs not smoothed MRFSS data.
Status shows 27 out of last 30 yrs have F higher than Fmsy but not in last year. B lower than
Bmsy for majority of recent years.
Caveat- discard mortality makes up large proportion and lots of small fish. The numbers of fish
are not accounted for explicitly in model. These are better accounted for in an age-structured
model. Initial ASPIC results were viewed with skepticism because it was viewed as overly
optimistic.
There were new ASPIC runs using the updated landings data (see discussion regarding updated
landings data below). With new data, ASPIC predicted that the F/Fmsy and B/Bmsy from
ASPIC are similar to CAA model output though B/Bmsy was not quite as bad. Fits to headboat
indices using new landings data are better than initial ASPIC runs.
Catch-at-age model
The catch-at-age model gave a poor fit to the 1978 – 1983 headboat length composition data.
The problem has to do with large number of year classes that have similar size range –
confidence limits bound mean of ~700mm. The model forces many of older fish into that length
range. The removal of those predicted lengths during 1978-1983 requires either truncated age
classes from poor recruitment or removing those larger fish using high fishing mortality prior to
the 1978-1983 period.
The first attempt to fix this problem examined changes to selectivity patterns on larger fish early
in the time series and then allowing selectivity parameter to change annually. This did not
8

Assessment Workshop Report South Atlantic Red Snapper
SEDAR15 SAR1 SECTION III
provide a better fit to headboat length composition and was not retained in subsequent model
runs.
It was determined that the large number of recruits that were artificially put into system with
stock recruitment function during 50s and 60s was carrying through into predicted length
composition during 1978-1983. To reduce this problem, recruitment deviations were begun at
earlier year (1971) in model. Although this solution fixed the problem it may be doing so at
expense of missing a much higher F in the early years of modeling period. Discussion also
focused on fact that the observed recruitment pattern may not be defensible.
Next attempt at fitting headboat length compostion data focused on getting rid of larger fish
using increased selectivities in period 1. Assume in period 1 all selectivities are same across
fisheries and allow selectivities to change linearly (a50) each year shifting towards left and
getting steaper. This effectively kills off the larger fish earlier. Also fix slope of parameter in
period 2. See Fishery selectivity section for discussion of this approach. These changes in the
fishery selectivity functions did not improve fits to the headboat length composition.
The modifications of period 1 selectivities was dropped.
The following model runs went back to modifications of stock recruitment function to reduce
recruitment of fish during early period. The initial period of poor stock recruitment fits were
argued to be a “burn in” period and there was discussion that this might be defensible given that
it includes 1950s and 1960s. If the “burn in” period was dropped from S/R curve it looks good
and would be defensible. Is this satisfactory? It was decided that this approach was not
satisfactory because of possibly missing high fishing mortality during early period that was
documented in literature.
The landings data from period 1 were re-visited. A new approach of estimating MRFSS landings
from 1946 to 1980 was attempted using ratio of commercial to recreational from later periods
and applying that during period 1. These new MRFSS estimates did not fix the headboat length
composition fits; the increased recreational landings in period 1 was not enough to remove large
fish predictions in the 1978-1983 headboat fishery. Another approach allowed bias estimation of
those earlier landings which did fix headboat length fits. Discussion then focused on whether or
not the recreational landings (MRFSS + HB) are too low given USFWS reports and bias
estimation results. Data from these reports were not included in data workshop because
MRFSS? USFW? deemed these data untrustworthy. However, the assessment group felt that
creel surveys from the 1960s and 1970s could be considered trustworthy. Recreational landings
from these reports were much higher (order of magnitude) than linear interpolation approach
(from 1946 to 1980), ratio, and bias estimation? approach. The next step was to linear
interpolate between red snapper landings data from USFW reports; observed data for 1955,
1960, and 1965 was interpolated through from 1945 to 1980. Results were similar and a bias
parameter on those new landings data. The base run used these linear interpolations on the 1945
to 1980 for recreational landings (headboat and private); this allowed improvement of fits to
headboat length compositions. Anchor point years for linear interpolation of recreational
landings are 1946, 1960, 1965, 1970, and 1981. There are no head boat landings before 1972 in
base run.
9

Assessment Workshop Report South Atlantic Red Snapper
SEDAR15 SAR1 SECTION III
The biomass of the stock is below 5% of virgin biomass at terminal year in base run but also
when setting recruitment at low levels in period 1. The assessment group felt that high fishing
mortality based on survey from sportfishing report was more realistic and defensible than low
recruitment during period 1 and poor fit of S/R relationship.
The influence of B1/K on base model was examined. Examination of likelihoods to examine fits
and nothing really stood out as best B1/K. Examination of status indicators B/Bo, F/Fmsy, and
SSB/SSBmsy did not support any single value of B1/K. Since there are fishery landings prior to
1946, it was assumed that the stock was below a B1/K of 1.0 but probably not below 0.5; an
initial stock status of 0.75 was chosen.
The B/Bo values (in period 3) and the model fits to indices were not influenced by variation in
B1/K ranging from 0.5 to 1.0.
Projections using a 20 year generation time. Given generation time and rule of rebuilding the
rebuilding time for red snapper will be 30 years or 2039?
Red snapper projections with generation time of 20 years. F=0 shows rebuilt in 11 years at 2021.
However, this is highly unrealistic because F will not be 0 even if a moratorium because of
discard mortality.
For projections at Fmsy, population would be rebuilt by ~ 2040.
For projections at 0.75Foy, population can rebuild by 2039 if assume discards don’t get any
worse and recruitment stays same.
There were multiple sensitivity analyses (changes in M scaling, q values, steepness, discard
mortality of recreational and commercial sectors, and B1/K) and all results for F/Fmsy and
SSB/SSBmsy were similar. Population is so low that results in terminal years are all low even
though there are relative differences. The data workshop landings and the base run (USFW)
landings give similar results for period 3; however, the time that overfishing started changes
from 1960s (USFW) to 19770s? for DW landings. Changes in values of steepness also changed
patterns through time as well but end result same.
Retrospective analyses will be done week following assessment workshop along with projections
dealing with new discards given that what is in fishery now is predominantly bycatch (likely no
directed fishing for red snapper). Problem is that what they land now is an indirect
fishery….how to estimate a discard F??? Use all current landings and assume they would be
discarded? Take discard selectivity and fishery selectivity and add together to get new
selectivity and then take all landings currently and assume that will still happen. Given discard
mortalities the best we can do is to reduce F by ~50%? Fishing mortality from diving would go
completely (no discards).
10

Assessment Workshop Report South Atlantic Red Snapper
SEDAR15 SAR1 SECTION III
1.2.3 Recommended Parameter Estimates
1.2.4 Evaluation of uncertainty and model precision
There was discussion of how to determine precision for parameter estimates in CAA model.
There is no easy way to do this. Traditional precision measures are not appropriate in
likelihood/weighting framework. On the question of quantifying uncertainty in parameter
estimates, the preference of workshop participants was to consider different weightings of
likelihood components in an attempt to provide the best overall fit to trusted data sources. One
consequence of this decision was that traditional likelihood-based methods (involving the
Hessian or profile likelihood, for instance) no longer provided unbiased measures of precision.
In particular, likelihood weights greater than 1.0 typically result in overestimates of precision
(i.e., understatements of uncertainty). Because weights on certain likelihood components were
substantially higher than 1.0 workshop participants thus agreed that it would be misleading to
provide standard errors along with parameter estimates.
Another possibility for quantifying uncertainty is to compare results of different analyses where
model structure is allowed to vary. Sensitivity runs, for instance, could be used to evaluate the
variability in parameter estimates resulting from different assumptions. Unfortunately, model
averaging (cf. Burnham and Anderson 2002) could not be employed in a formal sense because
likelihood weights often changed between simulation runs. Nevertheless, comparison of
parameter estimates between runs provided a useful characterization of uncertainty.
Literature Cited
Burnham, K. P. and D. R. Anderson. 2002. Model Selection and Multimodel Inference:
A Practical Information-theoretic Approach, 2nd
Edition. Springer-Verlag: New York.
1.2.5 Discussion of YPR, SPR, Stock-Recruitment
1.2.6 Recommended SFA parameters and Management Criteria (Provide Table - existing
ests of past criteria, current ests of past criteria, currents ests of proposed/requested criteria.)
1.2.7 Status of Stock Declarations
1.2.8 Recommended ABC
1.2.9 Discussion of Stock Projections
1.2.10 Management Evaluation
Effectiveness/impacts of past management actions
- Have size, bag, harvest limits etc. affected the stock? achieved objectives?
- evaluation of rebuilding strategy (if implemented)
Possible impacts of proposed management actions
11
Assessment Workshop Report South Atlantic Red Snapper
SEDAR15 SAR1 SECTION III
- Optional. Special Comments, Advice if particular regulations are pending
1.2.11 Statements addressing any additional Terms of Reference not covered above
(optional)
1.2.12 Research Recommendations
12

Assessment Workshop Report South Atlantic Red Snapper
SEDAR 15 SAR 1 SECTION III
2 Data Input and Changes
Processing of data for the assessment is described in the SEDAR 15 Red Snapper Data
Workshop Report. This section describes additional manipulations to the data output for
use in the ADMB age structured model.
2.1 Growth, Maturity, and Mortality
Corrected von Bertalanffy growth function (VBGF) was estimated by the Life History
Working Group (LHWG), and presented in life history section in Data Workshop (DW)
report as
TL (mm) = 894.7 (1 – exp(-0.235(age + 0.48))),
and weight as a function of total length as
W (g) = 0.000007 TL (mm)3.104
.
Female maturity at age was estimated from the fitted logistic equation provided in Life
History section:
Pr{female mature} =1 - (1/(1 + exp(-2.9282 + 1.7594 age))),
and we assumed a sex ratio of 0.5. Size (mid-year), sex ratio and female maturity at age
are summarized for ages 1-20 in Table 2.1
We used estimates of age-varying M based on the approach of Lorenzen (1996) scaled to
cumulative mortality of 1.4% for ages 1-53 as provided by the LHWG (using corrected
growth parameters). They also recommended using upper and lower estimates (for
sensitivity runs) of age-varying M by scaling the Lorenzen estimates of M to 1 and 5%.
The various estimates of age-varying M are summarized in Table 2.2.
Discard mortality fractions were assumed constant at 0.4 for the recreational fisheries
(headboat and MRFSS) and 0.9 for the commercial fishery (hook & line). Additional
sensitivity model runs were made for commercial release mortalities of 0.7, 0.8 and 1.0
(0.7 was used for Gulf of Mexico red snapper). The LHWG believed that commercial
release mortality would be higher in the US south Atlantic than in the Gulf of Mexico
because of generally deeper water.
Generation time (G) was estimated from Eq. 3.4 in Gotelli (1998, p. 57):
G = Σ lxbxx/Σ lxbx,
where summation was over ages x = 1 through 100 (by which age the numerator and
denominator were both essentially zero), lx is the number of fish at age starting with 1
fish at age 1 and decrementing based on natural mortality only, and bx is per capita birth
13

Assessment Workshop Report South Atlantic Red Snapper
SEDAR 15 SAR 1 SECTION III
rate of females at age. Because female biomass is used as a proxy for female reproduction
in our model, we substitute the product of mxwx for bx in this equation, where mx is
proportion of females mature at age and wx is expected weight (of females) at age. This
weighted average of age for mature female biomass yields an estimate of 20 yrs
(rounded up from 19.5 yrs).
2.2 Recreational and Commercial Landings (Table 2.3)
The Recreational Working Group (RWG) provided MRFSS and headboat landings for
1946-2006. A linear interpolation was applied to MRFSS landings assuming 0 in 1946 to
the beginning of MRFSS landings estimates (A+B1) in 1981. Similarly, a linear
interpolation was applied to headboat landings assuming 0 in 1946 to the beginning of
headboat landings estimates in 1972. Concerns about the high PSE’s for the MRFSS
landings estimates led the Assessment Panel to consider using a 3-yr moving average to
smooth MRFSS landings estimates in numbers provided by the RWG for 1981-2006. In
addition, loess smoothing (weighted by inverse sample size) was applied to annual mean
weights of fish (catch in weight/catch in numbers). MRFSS harvest in weight was
calculated from the product of the smoothed estimated harvest in numbers times the
smoothed mean weight of fish.
The RWG applied a linear interpolation from 0 in 1946 to estimated values in 1981 for
MRFSS and 1972 for headboat. During the Assessment Workshop, preliminary model
runs suggested significantly higher landings in the early period (1946-1980) than
reflected in the landings. Although the RWG dismissed estimates from the Salt-Water
Angling reports (Clark 1962, Deuel and Clark 1968, Deuel 1973), the Assessment Panel
agreed that these estimates were at least as reasonable as the linear interpolation to zero
in 1946 used by the RWG. Therefore, recreational landings were interpolated between
zero in 1946 to 1981 with intermediate landings estimates used for 1960 (Clark 1962),
1965 (Deuel and Clark 1968), and 1970 (Deuel 1973). In general, these values were
assumed to include headboat landings for these years. Thus, when interpolating between
1970 and 1981, the headboat landings were subtracted for 1972-1980 (and listed
separately for headboat). Headboat landings prior to 1972 were assumed zero (i.e.,
included in the MRFSS landings). Recreational landings (MRFSS and headboat) as
estimated by the two approaches are compared in Figure 2.1.
Commercial fisheries were reduced to two gears, commercial hook & line and diving.
Trivial landings from commercial trawls, traps and other gears (2% for 1962-2006, and
1.2% since 2000) were pooled with landings from commercial hook & line. Commercial
landings were developed back to 1927 from historical records with some interpolation for
missing years by the Commercial Working Group. Additionally a linear interpolation was
used assuming 0 landings in 1900 to estimate values for 1900-1927.
The MRFSS PSE for A+B1 was used as the CV for estimates of MRFSS landings.
Annual CV’s were assigned to headboat landings with 0.1 used for 1972-1980 and 0.05
for 1981-2006. Annual CVs were assigned to hook & line and diving gears, with high CV
14

Assessment Workshop Report South Atlantic Red Snapper
SEDAR 15 SAR 1 SECTION III
for earliest years (0.30) and low CV for recent years (0.05). A linear interpolation was
made for intervening years (1927 to 1962).
2.4 Recreational and Commercial Discards (Table 2.4)
Because of high PSE’s associated with the MRFSS B2 estimates, the Assessment Panel
applied a 3-yr moving average to these B2 estimates for 1984-91, and 1992-2006
(separating these moving averages with change in management). To estimate headboat
discards, the Assessment Panel applied the annual MRFSS ratio of B2/A+B1 to headboat
landings to estimate headboat discards for 1984-2006. Furthermore, we set headboat
discard coefficient of variation (CV) to MRFSS B2 PSE.
Estimates of commercial hook & line discards were available for 1992-2006 from the
Commercial Working Group (CWG). The average discarding rate (discards/harvest) for
commercial hook & line was compared to that for MRFSS (B2/A+B1) for the period
1992-2006 (59%). MRFSS discarding rate (reduced by 59%) was applied to commercial
harvest for 1984-1991 to obtain commercial discard estimates for these years. CV’s for
commercial discard estimates was assumed twice those of the commercial landings.
2.5 Recreational and Commercial Length and Age Compositions (Tables 2.5-
2.12)
MRFSS, headboat, commercial hook & line, and commercial diving length compositions
were expressed as 3 cm intervals from 19-100 cm total length, with the largest interval
(100 cm) a plus group. Ages from 20-53 were pooled into a 20+ category for data from
these fisheries. Annual length and age compositions were retained for analysis when
sample size was 40 or larger.
2.6 Indices (Table 2.13)
Three fishery-dependent CPUE’s were provided by the Index Working Group (IWG).
CV’s associated with the fishery dependent indices were scaled to a maximum of 0.3
References:
Clark, J. 1962. The 1960 Salt-Water Angling Survey. U.S. Department of the Interior,
Bureau of Sport Fisheries and Wildlife, Circular 153, 36 pp.
Deuel, D. G. 1973. 1970 Salt-Water Angling Survey. U.S. Department of Commerce,
NOAA, Current Fishery Statistics No. 6200, 54 p.
Deuel, D. G., and J. R. Clark. 1968. The 1965 Salt-Water Angling Survey. U.S.
Department of the Interior, Bureau of Sport Fisheries and Wildlife, Resource
Publication 67, 51 p.
15

Assessment Workshop Report South Atlantic Red Snapper
SEDAR 15 SAR 1 SECTION III
Gotelli, Nicholas J. 1998. A Primer of Ecology, 2nd
Edition. Sinauer Associates, Inc.,
Sunderland, MA, 236 p.
Lorenzen, K. 1996. The relationship between body weight and natural mortality in
juvenile and adult fish: a comparison of natural ecosystems and aquaculture. Fish.
Biol. 49:627-647.
16

Assessment Workshop Report South Atlantic Red Snapper
SEDAR 15 SAR 1 SECTION III
Table 2.1. Red Snapper: Size (mid-year), sex ratio and female maturity at age. Length is
total length, weight is whole weight.
Age Length (mm) Length (in) Weight (kg) Weight (lb) Sex Ratio Female Maturity 1 332.9 13.11 0.5 1.04 0.5 0.237 2 450.5 17.74 1.2 2.66 0.5 0.644 3 543.6 21.40 2.2 4.77 0.5 0.913 4 617.1 24.30 3.2 7.07 0.5 0.984 5 675.2 26.58 4.2 9.36 0.5 0.997 6 721.2 28.39 5.2 11.48 0.5 1.000 7 757.5 29.82 6.1 13.37 0.5 1.000 8 786.3 30.96 6.8 15.01 0.5 1.000 9 809.0 31.85 7.4 16.39 0.5 1.000
10 826.9 32.56 8.0 17.55 0.5 1.000 11 841.1 33.11 8.4 18.50 0.5 1.000 12 852.3 33.56 8.7 19.28 0.5 1.000 13 861.2 33.91 9.0 19.91 0.5 1.000 14 868.2 34.18 9.3 20.41 0.5 1.000 15 873.8 34.40 9.4 20.82 0.5 1.000 16 878.2 34.57 9.6 21.15 0.5 1.000 17 881.6 34.71 9.7 21.41 0.5 1.000 18 884.4 34.82 9.8 21.62 0.5 1.000 19 886.5 34.90 9.9 21.78 0.5 1.000 20 888.2 34.97 9.9 21.91 0.5 1.000
17

Assessment Workshop Report South Atlantic Red Snapper
SEDAR 15 SAR 1 SECTION III
Table 2.2. Estimates of natural mortality, M, for red snapper based on Lorenzen (1996).
These estimates are then scaled to cumulative survival for ages 1-53 (maximum age) to
1.4% (preferred) and range using 1% and 5%. Ages 1-20 used in the statistical catch-at-
age model.
Age M Scaled M (0.014)
Upper (0.01)
Lower (0.05)
1 0.71 0.23 0.16 0.25 2 0.48 0.16 0.11 0.17 3 0.38 0.13 0.09 0.14 4 0.33 0.11 0.08 0.12 5 0.30 0.10 0.07 0.11 6 0.28 0.09 0.06 0.10 7 0.26 0.09 0.06 0.09 8 0.25 0.08 0.06 0.09 9 0.25 0.08 0.06 0.09
10 0.24 0.08 0.06 0.08 11 0.24 0.08 0.05 0.08 12 0.23 0.08 0.05 0.08 13 0.23 0.08 0.05 0.08 14 0.23 0.07 0.05 0.08 15 0.23 0.07 0.05 0.08 16 0.23 0.07 0.05 0.08 17 0.22 0.07 0.05 0.08 18 0.22 0.07 0.05 0.08 19 0.22 0.07 0.05 0.08 20 0.22 0.07 0.05 0.08 21 0.22 0.07 0.05 0.08 22 0.22 0.07 0.05 0.08 23 0.22 0.07 0.05 0.08 24 0.22 0.07 0.05 0.08 25 0.22 0.07 0.05 0.08 26 0.22 0.07 0.05 0.08 27 0.22 0.07 0.05 0.08 28 0.22 0.07 0.05 0.08 29 0.22 0.07 0.05 0.08 30 0.22 0.07 0.05 0.08 31 0.22 0.07 0.05 0.08 32 0.22 0.07 0.05 0.08 33 0.22 0.07 0.05 0.08 34 0.22 0.07 0.05 0.08 35 0.22 0.07 0.05 0.08 36 0.22 0.07 0.05 0.08 37 0.22 0.07 0.05 0.08 38 0.22 0.07 0.05 0.08 39 0.22 0.07 0.05 0.08
18

Assessment Workshop Report South Atlantic Red Snapper
SEDAR 15 SAR 1 SECTION III
Table 2.2. (cont.)
40 0.22 0.07 0.05 0.08 41 0.22 0.07 0.05 0.08 42 0.22 0.07 0.05 0.08 43 0.22 0.07 0.05 0.08 44 0.22 0.07 0.05 0.08 45 0.22 0.07 0.05 0.08 46 0.22 0.07 0.05 0.08 47 0.22 0.07 0.05 0.08 48 0.22 0.07 0.05 0.08 49 0.22 0.07 0.05 0.08 50 0.22 0.07 0.05 0.08 51 0.22 0.07 0.05 0.08 52 0.22 0.07 0.05 0.08 53 0.22 0.07 0.05 0.08
19

Assessment Workshop Report South Atlantic Red Snapper
SEDAR 15 SAR 1 SECTION III
Table 2.3. Red snapper: Landings and associated coefficient of variation, as used in the
assessment (base).
Landings in Whole Weight (1000 pounds) Coefficient of Variation (CV) Commercial Recreational Commercial Recreational Year Hook & Line Diving Headboat MRFSS Hook & Line Diving Headboat MRFSS
1945 240.9 0.17 1946 262.6 0.16 1947 284.4 292.4 0.16 0.29 1948 306.1 584.9 0.15 0.29 1949 327.8 877.3 0.14 0.29 1950 349.6 1169.8 0.14 0.29 1951 498.6 1462.2 0.13 0.29 1952 374.8 1754.7 0.12 0.29 1953 389.1 2047.1 0.12 0.29 1954 576.9 2339.6 0.11 0.29 1955 479.6 2632.0 0.10 0.29 1956 470.0 2924.4 0.10 0.29 1957 843.0 3216.9 0.09 0.29 1958 594.7 3509.3 0.08 0.29 1959 638.3 3801.8 0.08 0.29 1960 652.3 4094.2 0.07 0.29 1961 770.4 4411.8 0.06 0.29 1962 575.9 4729.3 0.05 0.29 1963 438.5 5046.9 0.05 0.29 1964 486.3 5364.4 0.05 0.29 1965 571.4 5682.0 0.05 0.29 1966 643.5 4933.2 0.05 0.29 1967 843.6 4184.4 0.05 0.29 1968 938.7 3435.6 0.05 0.29 1969 611.0 2686.8 0.05 0.29 1970 559.1 1938.0 0.05 0.29 1971 478.9 1787.3 0.05 0.29 1972 414.3 91.9 1544.7 0.05 0.10 0.29 1973 340.2 117.3 1368.6 0.05 0.10 0.29 1974 555.2 77.1 1258.2 0.05 0.10 0.29 1975 650.9 83.5 1101.0 0.05 0.10 0.29 1976 547.4 109.3 924.6 0.05 0.10 0.29 1977 579.2 59.9 823.2 0.05 0.10 0.29 1978 545.0 63.0 669.5 0.05 0.10 0.29 1979 380.7 54.1 527.7 0.05 0.10 0.29
20

Assessment Workshop Report South Atlantic Red Snapper
SEDAR 15 SAR 1 SECTION III
Table 2.3. (cont.)
1980 352.9 54.7 376.5 0.05 0.10 0.29 1981 347.1 116.6 280.4 0.05 0.05 0.33 1982 286.0 98.0 246.3 0.05 0.05 0.27 1983 290.0 74.0 329.8 0.05 0.05 0.27 1984 230.5 1.2 81.4 532.4 0.05 0.05 0.05 0.17 1985 223.0 2.3 132.1 559.6 0.05 0.05 0.05 0.29 1986 200.2 0.6 54.4 435.8 0.05 0.05 0.05 0.27 1987 172.8 0.4 81.8 247.7 0.05 0.05 0.05 0.20 1988 152.0 0.3 130.1 285.2 0.05 0.05 0.05 0.27 1989 242.5 1.1 70.8 313.7 0.05 0.05 0.05 0.30 1990 201.7 1.7 65.7 272.8 0.05 0.05 0.05 0.08 1991 125.4 5.3 72.0 222.3 0.05 0.05 0.05 0.34 1992 87.6 9.4 28.9 269.3 0.05 0.05 0.05 0.38 1993 206.4 5.7 42.7 258.8 0.05 0.05 0.05 0.27 1994 175.6 13.0 53.4 117.6 0.05 0.05 0.05 0.37 1995 164.1 10.2 57.5 110.0 0.05 0.05 0.05 0.28 1996 130.0 6.2 46.2 116.8 0.05 0.05 0.05 0.50 1997 98.9 7.5 51.2 114.0 0.05 0.05 0.05 0.44 1998 78.7 8.0 26.8 193.9 0.05 0.05 0.05 0.32 1999 79.0 9.9 43.6 275.8 0.05 0.05 0.05 0.18 2000 89.2 11.4 49.4 355.6 0.05 0.05 0.05 0.24 2001 169.9 20.0 68.4 364.5 0.05 0.05 0.05 0.19 2002 158.8 22.9 70.8 304.9 0.05 0.05 0.05 0.17 2003 117.2 17.3 41.4 299.4 0.05 0.05 0.05 0.18 2004 147.5 19.2 80.3 273.9 0.05 0.05 0.05 0.16 2005 115.0 9.4 58.7 273.3 0.05 0.05 0.05 0.17 2006 79.1 4.1 41.4 271.7 0.05 0.05 0.05 0.24
21

Assessment Workshop Report South Atlantic Red Snapper
SEDAR 15 SAR 1 SECTION III
Table 2.4. Red snapper: Discards and associated coefficients of variation, as used in
assessment (base).
Discards in Numbers (1000) Coefficient of Variation (CV) Commercial Recreational Commercial Recreational Year Hook & Line Headboat MRFSS Hook & Line Headboat MRFSS
1984 7.5 8.2 108.8 0.30 0.30 0.30 1985 3.7 6.9 72.5 0.44 0.44 0.44 1986 7.1 6.0 65.7 0.51 0.51 0.51 1987 15.4 20.4 51.7 0.58 0.58 0.58 1988 7.6 16.5 58.4 0.47 0.47 0.47 1989 2.8 3.6 22.8 0.42 0.42 0.42 1990 30.5 26.2 18.7 0.47 0.47 0.47 1991 4.1 5.4 18.0 0.52 0.52 0.52 1992 18.3 3.3 50.0 0.10 0.29 0.29 1993 17.9 24.6 54.6 0.10 0.28 0.28 1994 24.5 18.6 61.8 0.10 0.29 0.29 1995 24.2 28.3 44.9 0.10 0.20 0.20 1996 32.3 10.9 28.2 0.10 0.38 0.38 1997 33.7 3.4 20.4 0.10 0.27 0.27 1998 25.5 20.6 73.6 0.10 0.33 0.33 1999 23.0 18.3 155.5 0.10 0.16 0.16 2000 21.8 24.7 216.0 0.10 0.15 0.15 2001 23.7 47.3 199.9 0.10 0.14 0.14 2002 22.1 40.4 166.5 0.10 0.18 0.18 2003 18.9 25.6 160.0 0.10 0.16 0.16 2004 15.8 43.8 157.2 0.10 0.14 0.14 2005 15.3 39.7 150.1 0.10 0.13 0.13 2006 16.9 28.7 130.4 0.10 0.18 0.18
22

Assessment Workshop Report South Atlantic Red Snapper
SEDAR 15 SAR 1 SECTION III
Table 2.5. Red snapper: Length compositions from commercial hook & line.
Year N 19 22 25 28 31 34 37 40 43 46 49 52 55 58 61 64 67 70 73 76 79 82 85 88 91 94 97 100
1984 2089 0.0000 0.0000 0.0000 0.0001 0.0058 0.0107 0.0853 0.2344 0.2018 0.1251 0.1059 0.0535 0.0397 0.0301 0.0242 0.0135 0.0200 0.0084 0.0024 0.0022 0.0044 0.0086 0.0095 0.0111 0.0022 0.0011 0.0000 0.0000
1985 3539 0.0000 0.0000 0.0006 0.0000 0.0033 0.0257 0.0809 0.1554 0.2088 0.1479 0.1023 0.0886 0.0556 0.0296 0.0187 0.0124 0.0056 0.0035 0.0034 0.0061 0.0063 0.0108 0.0101 0.0106 0.0108 0.0030 0.0000 0.0000
1986 1246 0.0000 0.0000 0.0000 0.0024 0.0059 0.0244 0.0151 0.0486 0.0970 0.1673 0.1801 0.1363 0.0680 0.0696 0.0671 0.0366 0.0224 0.0085 0.0030 0.0036 0.0096 0.0049 0.0082 0.0123 0.0040 0.0052 0.0001 0.0000
1987 1146 0.0000 0.0000 0.0000 0.0034 0.0316 0.0694 0.0520 0.0514 0.0808 0.0610 0.0973 0.1328 0.0922 0.0915 0.0680 0.0519 0.0244 0.0254 0.0122 0.0045 0.0058 0.0097 0.0078 0.0092 0.0084 0.0060 0.0033 0.0000
1988 621 0.0000 0.0000 0.0000 0.0107 0.0232 0.0716 0.1065 0.0958 0.0865 0.0795 0.1086 0.0890 0.0824 0.0550 0.0501 0.0235 0.0211 0.0209 0.0187 0.0051 0.0173 0.0119 0.0047 0.0101 0.0048 0.0029 0.0000 0.0000
1989 1191 0.0000 0.0009 0.0000 0.0002 0.0002 0.0072 0.0128 0.0388 0.0784 0.1111 0.1670 0.1918 0.1517 0.0955 0.0399 0.0267 0.0109 0.0100 0.0145 0.0120 0.0087 0.0081 0.0035 0.0025 0.0030 0.0031 0.0017 0.0000
1990 787 0.0000 0.0000 0.0000 0.0000 0.0072 0.0239 0.1023 0.1007 0.0852 0.1057 0.1304 0.1007 0.0821 0.0566 0.0565 0.0389 0.0289 0.0120 0.0149 0.0117 0.0039 0.0119 0.0042 0.0092 0.0100 0.0029 0.0000 0.0000
1991 706 0.0000 0.0000 0.0000 0.0035 0.0271 0.0857 0.0776 0.0721 0.0858 0.0474 0.1304 0.1124 0.0569 0.0459 0.0438 0.0400 0.0386 0.0356 0.0145 0.0103 0.0100 0.0170 0.0171 0.0158 0.0100 0.0013 0.0000 0.0013
1992 512 0.0000 0.0000 0.0000 0.0000 0.0000 0.0000 0.0000 0.0003 0.0003 0.0087 0.0371 0.1223 0.0808 0.0769 0.1117 0.0766 0.1163 0.0655 0.0431 0.0679 0.0273 0.0349 0.0423 0.0362 0.0430 0.0086 0.0002 0.0000
1993 1347 0.0000 0.0000 0.0000 0.0000 0.0000 0.0006 0.0000 0.0024 0.0012 0.0156 0.1845 0.3117 0.1707 0.0848 0.0440 0.0184 0.0238 0.0232 0.0177 0.0174 0.0178 0.0150 0.0137 0.0223 0.0105 0.0036 0.0012 0.0000
1994 1167 0.0069 0.0000 0.0000 0.0000 0.0000 0.0000 0.0000 0.0000 0.0000 0.0047 0.0980 0.1765 0.1832 0.1736 0.1520 0.0974 0.0381 0.0096 0.0098 0.0047 0.0056 0.0057 0.0093 0.0089 0.0110 0.0050 0.0000 0.0000
1995 1442 0.0000 0.0000 0.0000 0.0011 0.0000 0.0045 0.0034 0.0011 0.0011 0.0011 0.0289 0.1720 0.1978 0.1399 0.1000 0.0760 0.0720 0.0514 0.0333 0.0117 0.0148 0.0172 0.0295 0.0149 0.0204 0.0068 0.0011 0.0000
1996 770 0.0000 0.0000 0.0000 0.0000 0.0000 0.0000 0.0000 0.0000 0.0000 0.0031 0.0096 0.0886 0.1105 0.1475 0.1978 0.1098 0.0709 0.0710 0.0503 0.0606 0.0322 0.0150 0.0209 0.0062 0.0060 0.0000 0.0000 0.0000
1997 497 0.0000 0.0000 0.0000 0.0000 0.0000 0.0039 0.0079 0.0197 0.0394 0.0551 0.0329 0.0573 0.0455 0.1106 0.1382 0.1035 0.0828 0.0796 0.0449 0.0518 0.0504 0.0239 0.0125 0.0044 0.0160 0.0118 0.0079 0.0000
1998 428 0.0000 0.0000 0.0000 0.0000 0.0000 0.0000 0.0051 0.0101 0.0102 0.0672 0.0990 0.1076 0.1645 0.0750 0.0505 0.0426 0.0402 0.0725 0.0674 0.0400 0.0402 0.0367 0.0173 0.0166 0.0274 0.0101 0.0000 0.0000
1999 946 0.0000 0.0000 0.0000 0.0000 0.0009 0.0027 0.0060 0.0087 0.0057 0.0012 0.0997 0.2341 0.1889 0.1278 0.0693 0.0583 0.0277 0.0295 0.0192 0.0257 0.0376 0.0245 0.0080 0.0116 0.0113 0.0014 0.0003 0.0000
2000 881 0.0000 0.0000 0.0000 0.0000 0.0000 0.0000 0.0000 0.0000 0.0060 0.0139 0.1394 0.2118 0.1251 0.1022 0.0808 0.0515 0.0473 0.0375 0.0385 0.0259 0.0490 0.0287 0.0202 0.0145 0.0048 0.0020 0.0008 0.0000
2001 1408 0.0000 0.0000 0.0000 0.0000 0.0000 0.0000 0.0016 0.0016 0.0016 0.0018 0.1383 0.1935 0.1637 0.1469 0.1047 0.0748 0.0477 0.0249 0.0165 0.0189 0.0168 0.0165 0.0127 0.0049 0.0094 0.0016 0.0000 0.0016
2002 992 0.0000 0.0000 0.0000 0.0000 0.0000 0.0000 0.0000 0.0000 0.0009 0.0061 0.0504 0.2146 0.2269 0.1373 0.1180 0.0669 0.0807 0.0386 0.0229 0.0126 0.0106 0.0068 0.0017 0.0000 0.0016 0.0032 0.0000 0.0000
2003 1270 0.0000 0.0000 0.0000 0.0000 0.0006 0.0014 0.0014 0.0004 0.0011 0.0042 0.0166 0.0832 0.1314 0.1739 0.1678 0.1436 0.1067 0.0523 0.0510 0.0286 0.0113 0.0076 0.0091 0.0039 0.0010 0.0029 0.0000 0.0000
2004 795 0.0000 0.0000 0.0000 0.0000 0.0013 0.0018 0.0028 0.0021 0.0010 0.0028 0.0092 0.0405 0.1022 0.1362 0.1270 0.1453 0.1314 0.1491 0.0844 0.0336 0.0059 0.0048 0.0084 0.0061 0.0021 0.0021 0.0000 0.0000
2005 618 0.0000 0.0000 0.0000 0.0000 0.0000 0.0000 0.0000 0.0000 0.0037 0.0014 0.0087 0.0536 0.0752 0.0896 0.1260 0.0954 0.1199 0.1042 0.1728 0.0728 0.0377 0.0112 0.0163 0.0053 0.0037 0.0023 0.0001 0.0000
2006 406 0.0000 0.0000 0.0000 0.0000 0.0000 0.0000 0.0000 0.0050 0.0050 0.0200 0.0050 0.0711 0.1539 0.1281 0.0928 0.0982 0.0622 0.0693 0.0692 0.0462 0.0719 0.0363 0.0350 0.0258 0.0050 0.0000 0.0000 0.0000
23

Assessment Workshop Report South Atlantic Red Snapper
SEDAR 15 SAR 1 SECTION III
Table 2.6. Red snapper: Length compositions from commercial diving.
Year N 19 22 25 28 31 34 37 40 43 46 49 52 55 58 61 64 67 70 73 76 79 82 85 88 91 94 97 100
1999 83 0.0000 0.0000 0.0000 0.0000 0.0000 0.0000 0.0000 0.0000 0.0000 0.0000 0.0843 0.0964 0.0723 0.1687 0.0482 0.1084 0.0964 0.0723 0.0120 0.0120 0.0241 0.0602 0.0723 0.0361 0.0241 0.0120 0.0000 0.0000
2000 129 0.0000 0.0000 0.0000 0.0000 0.0000 0.0000 0.0000 0.0000 0.0000 0.0000 0.2248 0.2791 0.1473 0.0853 0.0775 0.0388 0.0233 0.0388 0.0155 0.0000 0.0155 0.0233 0.0233 0.0078 0.0000 0.0000 0.0000 0.0000
2001 87 0.0000 0.0000 0.0000 0.0000 0.0000 0.0000 0.0000 0.0000 0.0000 0.0000 0.0920 0.1954 0.1379 0.2069 0.1264 0.0690 0.0230 0.0460 0.0230 0.0230 0.0115 0.0115 0.0115 0.0230 0.0000 0.0000 0.0000 0.0000
2003 210 0.0000 0.0000 0.0000 0.0000 0.0000 0.0000 0.0000 0.0000 0.0000 0.0095 0.0571 0.1190 0.1286 0.1333 0.1095 0.0762 0.1048 0.0762 0.0714 0.0476 0.0286 0.0286 0.0000 0.0048 0.0048 0.0000 0.0000 0.0000
24

Assessment Workshop Report South Atlantic Red Snapper
SEDAR 15 SAR 1 SECTION III
Table 2.7. Red snapper: Length compositions from the headboat survey.
Year N 19 22 25 28 31 34 37 40 43 46 49 52 55 58 61 64 67 70 73 76 79 82 85 88 91 94 97 100
1978 740 0.0000 0.0112 0.0298 0.0445 0.1022 0.1129 0.1834 0.1574 0.0702 0.0397 0.0523 0.0545 0.0322 0.0159 0.0128 0.0066 0.0161 0.0062 0.0184 0.0053 0.0079 0.0046 0.0067 0.0054 0.0032 0.0004 0.0000 0.0001
1979 245 0.0000 0.0044 0.0000 0.0002 0.0748 0.1320 0.1982 0.1852 0.0495 0.0268 0.0308 0.0220 0.0180 0.0000 0.0140 0.0088 0.0440 0.0484 0.0533 0.0356 0.0264 0.0181 0.0048 0.0044 0.0002 0.0000 0.0000 0.0000
1980 258 0.0000 0.0138 0.0184 0.0417 0.1292 0.1476 0.1348 0.1627 0.0950 0.0637 0.0413 0.0239 0.0106 0.0050 0.0140 0.0050 0.0092 0.0046 0.0048 0.0094 0.0004 0.0050 0.0046 0.0046 0.0230 0.0276 0.0000 0.0000
1981 674 0.0000 0.0033 0.0033 0.0179 0.0856 0.1917 0.1895 0.1782 0.1122 0.0537 0.0330 0.0167 0.0070 0.0064 0.0049 0.0049 0.0093 0.0166 0.0119 0.0200 0.0093 0.0033 0.0106 0.0055 0.0022 0.0011 0.0000 0.0022
1982 457 0.0000 0.0032 0.0065 0.0202 0.0806 0.1180 0.0642 0.0807 0.1186 0.1516 0.1190 0.0919 0.0415 0.0256 0.0067 0.0099 0.0083 0.0047 0.0156 0.0090 0.0047 0.0117 0.0023 0.0036 0.0002 0.0017 0.0000 0.0000
1983 1006 0.0000 0.0015 0.0249 0.0561 0.1829 0.2600 0.2079 0.1265 0.0463 0.0232 0.0196 0.0049 0.0052 0.0040 0.0065 0.0038 0.0018 0.0038 0.0052 0.0039 0.0060 0.0017 0.0001 0.0032 0.0000 0.0000 0.0008 0.0000
1984 1317 0.0000 0.0026 0.0120 0.0320 0.1692 0.2333 0.1806 0.1500 0.0833 0.0420 0.0252 0.0200 0.0053 0.0031 0.0068 0.0009 0.0047 0.0039 0.0008 0.0039 0.0035 0.0008 0.0063 0.0063 0.0035 0.0000 0.0000 0.0000
1985 1190 0.0000 0.0014 0.0050 0.0307 0.1576 0.2172 0.2185 0.1747 0.0794 0.0369 0.0230 0.0130 0.0095 0.0095 0.0061 0.0018 0.0005 0.0010 0.0014 0.0001 0.0023 0.0004 0.0029 0.0041 0.0015 0.0005 0.0000 0.0008
1986 435 0.0017 0.0017 0.0080 0.0753 0.1715 0.1029 0.1032 0.1364 0.0768 0.0463 0.0670 0.0778 0.0487 0.0391 0.0113 0.0073 0.0029 0.0082 0.0017 0.0065 0.0000 0.0000 0.0000 0.0035 0.0022 0.0000 0.0000 0.0000
1987 306 0.0000 0.0200 0.0241 0.0550 0.0839 0.1351 0.1941 0.1627 0.0730 0.0711 0.0380 0.0212 0.0335 0.0127 0.0253 0.0136 0.0178 0.0109 0.0000 0.0000 0.0000 0.0000 0.0077 0.0000 0.0000 0.0000 0.0000 0.0000
1988 204 0.0000 0.0106 0.0065 0.0233 0.0573 0.1501 0.1599 0.2108 0.0636 0.0591 0.0634 0.0172 0.0223 0.0292 0.0177 0.0178 0.0186 0.0258 0.0082 0.0249 0.0000 0.0000 0.0041 0.0041 0.0053 0.0000 0.0000 0.0000
1989 374 0.0000 0.0001 0.0014 0.0168 0.1105 0.2745 0.1737 0.1522 0.0807 0.0312 0.0428 0.0261 0.0198 0.0048 0.0116 0.0035 0.0054 0.0042 0.0133 0.0031 0.0085 0.0031 0.0092 0.0000 0.0031 0.0005 0.0000 0.0000
1990 433 0.0000 0.0000 0.0000 0.0000 0.1091 0.2043 0.1864 0.1937 0.0765 0.0759 0.0297 0.0291 0.0188 0.0228 0.0306 0.0018 0.0014 0.0014 0.0014 0.0000 0.0000 0.0037 0.0118 0.0014 0.0000 0.0000 0.0000 0.0000
1991 152 0.0013 0.0000 0.0201 0.0462 0.0503 0.1830 0.1153 0.1448 0.1278 0.1027 0.0808 0.0140 0.0545 0.0070 0.0111 0.0013 0.0018 0.0117 0.0004 0.0000 0.0000 0.0075 0.0000 0.0070 0.0115 0.0000 0.0000 0.0000
1992 73 0.0000 0.0000 0.0000 0.0167 0.0000 0.0000 0.0092 0.0000 0.0000 0.0762 0.3357 0.2137 0.0042 0.0804 0.0971 0.0181 0.0210 0.0759 0.0000 0.0000 0.0120 0.0120 0.0139 0.0139 0.0000 0.0000 0.0000 0.0000
1993 203 0.0000 0.0000 0.0000 0.0000 0.0000 0.0000 0.0000 0.0024 0.0052 0.0496 0.1810 0.2957 0.1923 0.0740 0.0363 0.0659 0.0223 0.0163 0.0156 0.0152 0.0095 0.0067 0.0000 0.0000 0.0119 0.0000 0.0000 0.0000
1994 524 0.0000 0.0000 0.0000 0.0000 0.0000 0.0000 0.0000 0.0000 0.0000 0.0066 0.0549 0.2554 0.2474 0.1550 0.0333 0.0473 0.1044 0.0079 0.0378 0.0345 0.0000 0.0000 0.0039 0.0000 0.0000 0.0116 0.0000 0.0000
1995 147 0.0000 0.0000 0.0000 0.0000 0.0000 0.0000 0.0000 0.0000 0.0000 0.0096 0.0629 0.1714 0.2283 0.2275 0.0729 0.0620 0.0493 0.0628 0.0222 0.0011 0.0052 0.0005 0.0128 0.0056 0.0000 0.0056 0.0000 0.0000
1996 80 0.0000 0.0000 0.0000 0.0000 0.0000 0.0000 0.0000 0.0000 0.0000 0.0013 0.1822 0.1266 0.1862 0.1851 0.1142 0.0541 0.0355 0.0382 0.0285 0.0262 0.0013 0.0000 0.0178 0.0028 0.0000 0.0000 0.0000 0.0000
1997 68 0.0000 0.0000 0.0000 0.0000 0.0066 0.0000 0.0022 0.0000 0.0000 0.0308 0.1146 0.1152 0.0759 0.0918 0.2348 0.1279 0.0757 0.0222 0.0185 0.0000 0.0417 0.0000 0.0279 0.0144 0.0000 0.0000 0.0000 0.0000
1998 149 0.0000 0.0000 0.0003 0.0000 0.0004 0.0001 0.0028 0.0003 0.0008 0.0000 0.1144 0.3183 0.3179 0.1195 0.0567 0.0000 0.0214 0.0117 0.0143 0.0117 0.0041 0.0027 0.0027 0.0000 0.0000 0.0000 0.0000 0.0000
1999 161 0.0000 0.0000 0.0000 0.0000 0.0000 0.0013 0.0000 0.0024 0.0000 0.0114 0.1144 0.2431 0.2047 0.1850 0.1103 0.0278 0.0275 0.0370 0.0163 0.0061 0.0053 0.0013 0.0061 0.0000 0.0000 0.0000 0.0000 0.0000
2000 123 0.0000 0.0000 0.0000 0.0000 0.0000 0.0000 0.0000 0.0015 0.0000 0.0185 0.1679 0.2035 0.2394 0.1609 0.1539 0.0297 0.0107 0.0137 0.0000 0.0000 0.0000 0.0000 0.0004 0.0000 0.0000 0.0000 0.0000 0.0000
2001 254 0.0000 0.0000 0.0000 0.0000 0.0000 0.0000 0.0035 0.0000 0.0035 0.0106 0.0555 0.2450 0.2111 0.2185 0.0909 0.0658 0.0270 0.0326 0.0054 0.0089 0.0109 0.0000 0.0000 0.0000 0.0107 0.0000 0.0000 0.0000
2002 361 0.0000 0.0000 0.0000 0.0000 0.0001 0.0001 0.0000 0.0001 0.0026 0.0245 0.1438 0.2319 0.1518 0.1951 0.1116 0.0460 0.0276 0.0312 0.0137 0.0103 0.0034 0.0000 0.0065 0.0000 0.0000 0.0000 0.0000 0.0000
2003 329 0.0000 0.0000 0.0000 0.0000 0.0000 0.0000 0.0000 0.0000 0.0000 0.0000 0.1701 0.2933 0.2221 0.1076 0.0376 0.0565 0.0404 0.0188 0.0140 0.0169 0.0037 0.0072 0.0043 0.0037 0.0037 0.0000 0.0000 0.0000
2004 307 0.0000 0.0000 0.0000 0.0000 0.0000 0.0000 0.0000 0.0000 0.0000 0.0071 0.0696 0.1634 0.3416 0.2188 0.0648 0.0370 0.0331 0.0264 0.0082 0.0150 0.0000 0.0039 0.0036 0.0035 0.0000 0.0039 0.0000 0.0000
2005 193 0.0000 0.0000 0.0000 0.0000 0.0000 0.0000 0.0000 0.0000 0.0000 0.0104 0.0752 0.2107 0.2269 0.1460 0.0578 0.0713 0.0655 0.0345 0.0586 0.0138 0.0142 0.0152 0.0000 0.0000 0.0000 0.0000 0.0000 0.0000
2006 172 0.0000 0.0000 0.0000 0.0000 0.0000 0.0000 0.0000 0.0000 0.0000 0.0000 0.0323 0.1533 0.2634 0.2681 0.0993 0.0399 0.0352 0.0253 0.0177 0.0169 0.0260 0.0155 0.0010 0.0000 0.0060 0.0000 0.0000 0.0000
25

Assessment Workshop Report South Atlantic Red Snapper
SEDAR 15 SAR 1 SECTION III
Table 2.8. Red snapper: Length compositions from the Marine Recreational Fisheries Statistical Survey (MRFSS).
Year N 19 22 25 28 31 34 37 40 43 46 49 52 55 58 61 64 67 70 73 76 79 82 85 88 91 94 97 100
1981 44 0.0000 0.0042 0.2369 0.1142 0.1044 0.0000 0.0902 0.1515 0.0148 0.1419 0.0210 0.0210 0.0790 0.0210 0.0000 0.0000 0.0000 0.0000 0.0000 0.0000 0.0000 0.0000 0.0000 0.0000 0.0000 0.0000 0.0000 0.0000
1983 161 0.1298 0.1543 0.1235 0.1226 0.0783 0.1382 0.1088 0.0359 0.0119 0.0082 0.0305 0.0291 0.0000 0.0000 0.0270 0.0013 0.0006 0.0000 0.0000 0.0000 0.0000 0.0000 0.0000 0.0000 0.0000 0.0000 0.0000 0.0000
1984 370 0.0202 0.0909 0.1885 0.2526 0.1979 0.0905 0.0116 0.0302 0.0864 0.0167 0.0020 0.0056 0.0021 0.0040 0.0000 0.0000 0.0000 0.0000 0.0000 0.0000 0.0008 0.0000 0.0000 0.0000 0.0000 0.0000 0.0000 0.0000
1985 249 0.0229 0.1517 0.0981 0.0823 0.0682 0.0365 0.0267 0.0373 0.1188 0.0007 0.1741 0.0820 0.0880 0.0023 0.0053 0.0000 0.0000 0.0053 0.0000 0.0000 0.0000 0.0000 0.0000 0.0000 0.0000 0.0000 0.0000 0.0000
1986 226 0.0137 0.4728 0.0942 0.1833 0.1084 0.0839 0.0000 0.0117 0.0320 0.0000 0.0000 0.0000 0.0000 0.0000 0.0000 0.0000 0.0000 0.0000 0.0000 0.0000 0.0000 0.0000 0.0000 0.0000 0.0000 0.0000 0.0000 0.0000
1987 63 0.0000 0.1753 0.0000 0.1151 0.0897 0.1638 0.1737 0.0057 0.0190 0.1357 0.0536 0.0487 0.0000 0.0173 0.0023 0.0000 0.0000 0.0000 0.0000 0.0000 0.0000 0.0000 0.0000 0.0000 0.0000 0.0000 0.0000 0.0000
1988 87 0.0000 0.0000 0.8122 0.0722 0.0000 0.1156 0.0000 0.0000 0.0000 0.0000 0.0000 0.0000 0.0000 0.0000 0.0000 0.0000 0.0000 0.0000 0.0000 0.0000 0.0000 0.0000 0.0000 0.0000 0.0000 0.0000 0.0000 0.0000
1989 59 0.1287 0.1827 0.1338 0.0708 0.1037 0.1406 0.0730 0.0230 0.0257 0.0395 0.0011 0.0000 0.0314 0.0267 0.0193 0.0000 0.0000 0.0000 0.0000 0.0000 0.0000 0.0000 0.0000 0.0000 0.0000 0.0000 0.0000 0.0000
1999 132 0.0000 0.0000 0.0372 0.2508 0.1659 0.0887 0.0602 0.0272 0.0062 0.0419 0.0962 0.0115 0.0564 0.0577 0.0081 0.0343 0.0205 0.0081 0.0043 0.0081 0.0000 0.0000 0.0166 0.0000 0.0000 0.0000 0.0000 0.0000
2000 95 0.0000 0.0000 0.0000 0.0117 0.0209 0.0092 0.0116 0.0000 0.0044 0.0557 0.3529 0.1898 0.1086 0.0364 0.0724 0.0282 0.0124 0.0724 0.0065 0.0039 0.0000 0.0029 0.0000 0.0000 0.0000 0.0000 0.0000 0.0000
2001 120 0.0000 0.0000 0.0000 0.0000 0.0207 0.0000 0.0250 0.0207 0.0323 0.0557 0.2868 0.2028 0.0756 0.1209 0.0415 0.0330 0.0000 0.0259 0.0043 0.0021 0.0201 0.0302 0.0025 0.0000 0.0000 0.0000 0.0000 0.0000
2002 232 0.0000 0.0000 0.0000 0.0000 0.0000 0.0000 0.0003 0.0003 0.0092 0.0630 0.0991 0.2623 0.1365 0.1142 0.1107 0.1068 0.0620 0.0160 0.0100 0.0057 0.0013 0.0013 0.0013 0.0000 0.0000 0.0000 0.0000 0.0000
2003 166 0.0000 0.0000 0.0000 0.0000 0.1273 0.0565 0.0095 0.0496 0.0218 0.0306 0.1296 0.0686 0.0751 0.0321 0.1326 0.0592 0.0783 0.0738 0.0391 0.0043 0.0000 0.0000 0.0106 0.0000 0.0017 0.0000 0.0000 0.0000
2004 156 0.0000 0.0000 0.0000 0.0000 0.0000 0.0000 0.0000 0.0184 0.0594 0.0416 0.1492 0.2301 0.1117 0.1273 0.0969 0.0669 0.0189 0.0239 0.0287 0.0118 0.0053 0.0022 0.0035 0.0043 0.0000 0.0000 0.0000 0.0000
2005 83 0.0000 0.0000 0.0000 0.0000 0.0000 0.0449 0.0200 0.0000 0.0240 0.0231 0.1909 0.2898 0.0662 0.0594 0.0353 0.0216 0.1158 0.0447 0.0282 0.0108 0.0232 0.0000 0.0019 0.0000 0.0000 0.0000 0.0000 0.0000
2006 84 0.0000 0.0247 0.0123 0.0062 0.0062 0.0000 0.0000 0.0000 0.0000 0.0132 0.1886 0.2338 0.0948 0.0193 0.0639 0.0301 0.0000 0.1133 0.0541 0.0108 0.0372 0.0000 0.0265 0.0217 0.0217 0.0000 0.0000 0.0217
26

Assessment Workshop Report South Atlantic Red Snapper
SEDAR 15 SAR 1 SECTION III
Table 2.9. Red snapper: Age compositions from commercial hook & line.
Year N 1 2 3 4 5 6 7 8 9 10 11 12 13 14 15 16 17 18 19 20
1992 48 0.0000 0.0000 0.0003 0.5245 0.1156 0.1288 0.1627 0.0625 0.0000 0.0057 0.0000 0.0000 0.0000 0.0000 0.0000 0.0000 0.0000 0.0000 0.0000 0.0000
1994 49 0.0000 0.0000 0.0858 0.0404 0.2011 0.2104 0.3775 0.0827 0.0000 0.0000 0.0000 0.0000 0.0000 0.0000 0.0000 0.0000 0.0000 0.0000 0.0000 0.0022
1996 167 0.0000 0.0008 0.1367 0.0950 0.1504 0.3314 0.1966 0.0302 0.0167 0.0139 0.0114 0.0022 0.0033 0.0038 0.0022 0.0011 0.0011 0.0000 0.0000 0.0032
1997 182 0.0000 0.0146 0.1450 0.3713 0.1777 0.1843 0.0638 0.0166 0.0048 0.0026 0.0000 0.0000 0.0000 0.0000 0.0000 0.0000 0.0000 0.0000 0.0000 0.0195
1998 75 0.0000 0.0724 0.4058 0.1118 0.2132 0.0803 0.0471 0.0412 0.0062 0.0070 0.0000 0.0029 0.0000 0.0000 0.0000 0.0029 0.0000 0.0000 0.0000 0.0091
1999 147 0.0000 0.1233 0.6037 0.1903 0.0538 0.0051 0.0068 0.0095 0.0015 0.0015 0.0009 0.0022 0.0006 0.0000 0.0000 0.0000 0.0000 0.0000 0.0000 0.0008
2000 226 0.0000 0.1265 0.7345 0.0861 0.0114 0.0170 0.0038 0.0088 0.0061 0.0038 0.0000 0.0000 0.0000 0.0000 0.0010 0.0000 0.0000 0.0000 0.0000 0.0011
2001 144 0.0000 0.1590 0.6282 0.1716 0.0109 0.0160 0.0025 0.0013 0.0020 0.0035 0.0000 0.0010 0.0000 0.0000 0.0000 0.0006 0.0000 0.0000 0.0000 0.0034
2003 51 0.0000 0.1281 0.3602 0.4029 0.0671 0.0346 0.0013 0.0000 0.0000 0.0021 0.0000 0.0026 0.0000 0.0000 0.0000 0.0000 0.0000 0.0000 0.0000 0.0012
2004 103 0.0000 0.1282 0.4560 0.2686 0.1099 0.0335 0.0008 0.0015 0.0000 0.0000 0.0000 0.0000 0.0000 0.0000 0.0000 0.0000 0.0007 0.0000 0.0000 0.0008
2005 140 0.0000 0.0205 0.1922 0.2365 0.1484 0.2563 0.0918 0.0227 0.0092 0.0000 0.0000 0.0000 0.0000 0.0031 0.0154 0.0034 0.0000 0.0006 0.0000 0.0001
2006 189 0.0000 0.0104 0.2738 0.3144 0.1251 0.1124 0.1255 0.0142 0.0172 0.0000 0.0000 0.0000 0.0040 0.0000 0.0028 0.0000 0.0000 0.0000 0.0000 0.0000
Table 2.10. Red snapper: Age compositions from commercial diving.
Year N 1 2 3 4 5 6 7 8 9 10 11 12 13 14 15 16 17 18 19 20
2000 106 0.0000 0.4481 0.5120 0.0306 0.0080 0.0000 0.0000 0.0000 0.0013 0.0000 0.0000 0.0000 0.0000 0.0000 0.0000 0.0000 0.0000 0.0000 0.0000 0.0000
27

Assessment Workshop Report South Atlantic Red Snapper
SEDAR 15 SAR 1 SECTION III
Table 2.11. Red snapper: Age compositions from the headboat survey.
Year N 1 2 3 4 5 6 7 8 9 10 11 12 13 14 15 16 17 18 19 20
1977 72 0.0417 0.5278 0.1667 0.1667 0.0139 0.0417 0.0278 0.0000 0.0000 0.0000 0.0000 0.0000 0.0000 0.0000 0.0000 0.0139 0.0000 0.0000 0.0000 0.0000
1978 279 0.0215 0.4050 0.5054 0.0323 0.0179 0.0072 0.0072 0.0000 0.0000 0.0000 0.0000 0.0000 0.0000 0.0000 0.0000 0.0000 0.0000 0.0000 0.0000 0.0072
1979 47 0.0000 0.6170 0.1702 0.0426 0.0851 0.0426 0.0426 0.0000 0.0000 0.0000 0.0000 0.0000 0.0000 0.0000 0.0000 0.0000 0.0000 0.0000 0.0000 0.0000
1980 94 0.1809 0.5106 0.2340 0.0319 0.0000 0.0213 0.0000 0.0213 0.0000 0.0000 0.0000 0.0000 0.0000 0.0000 0.0000 0.0000 0.0000 0.0000 0.0000 0.0000
1981 415 0.0265 0.7012 0.1855 0.0337 0.0169 0.0120 0.0048 0.0048 0.0048 0.0000 0.0000 0.0000 0.0024 0.0000 0.0000 0.0000 0.0000 0.0000 0.0000 0.0072
1982 134 0.0448 0.4030 0.4030 0.0672 0.0299 0.0075 0.0075 0.0075 0.0075 0.0075 0.0000 0.0000 0.0000 0.0000 0.0000 0.0000 0.0000 0.0075 0.0000 0.0075
1983 754 0.3939 0.4655 0.0942 0.0186 0.0093 0.0066 0.0040 0.0027 0.0013 0.0000 0.0000 0.0000 0.0000 0.0000 0.0000 0.0000 0.0000 0.0013 0.0000 0.0027
1984 619 0.1599 0.6656 0.1018 0.0178 0.0162 0.0065 0.0048 0.0016 0.0016 0.0032 0.0048 0.0000 0.0032 0.0000 0.0000 0.0000 0.0000 0.0000 0.0000 0.0128
1985 511 0.0431 0.7652 0.1605 0.0137 0.0020 0.0039 0.0000 0.0020 0.0000 0.0000 0.0000 0.0000 0.0000 0.0000 0.0000 0.0020 0.0000 0.0020 0.0020 0.0039
1986 192 0.0521 0.4531 0.4115 0.0573 0.0104 0.0052 0.0052 0.0000 0.0000 0.0000 0.0000 0.0000 0.0000 0.0000 0.0000 0.0000 0.0000 0.0000 0.0000 0.0052
1987 93 0.1613 0.2473 0.5054 0.0645 0.0215 0.0000 0.0000 0.0000 0.0000 0.0000 0.0000 0.0000 0.0000 0.0000 0.0000 0.0000 0.0000 0.0000 0.0000 0.0000
1989 57 0.0877 0.4035 0.3860 0.0702 0.0175 0.0000 0.0000 0.0000 0.0000 0.0000 0.0000 0.0000 0.0175 0.0000 0.0000 0.0000 0.0175 0.0000 0.0000 0.0000
1996 124 0.0000 0.0081 0.2742 0.1210 0.1048 0.2419 0.1129 0.0323 0.0242 0.0161 0.0242 0.0081 0.0000 0.0081 0.0000 0.0000 0.0000 0.0000 0.0000 0.0243
Table 2.12. Red snapper: Age compositions from the Marine Recreational Fisheries Statistical Survey (MRFSS).
Year N 1 2 3 4 5 6 7 8 9 10 11 12 13 14 15 16 17 18 19 20
2001 75 0.0000 0.2533 0.5067 0.1600 0.0267 0.0267 0.0133 0.0000 0.0000 0.0000 0.0000 0.0000 0.0000 0.0000 0.0000 0.0000 0.0000 0.0000 0.0000 0.0133
2002 386 0.0000 0.2409 0.5492 0.1192 0.0440 0.0207 0.0078 0.0078 0.0026 0.0026 0.0000 0.0000 0.0000 0.0000 0.0000 0.0000 0.0000 0.0000 0.0000 0.0052
2003 389 0.0000 0.2314 0.3650 0.2622 0.0771 0.0129 0.0103 0.0026 0.0129 0.0129 0.0000 0.0000 0.0000 0.0000 0.0000 0.0000 0.0026 0.0000 0.0000 0.0104
2004 311 0.0000 0.2797 0.3859 0.1640 0.0900 0.0354 0.0032 0.0032 0.0064 0.0064 0.0000 0.0000 0.0096 0.0032 0.0000 0.0000 0.0000 0.0000 0.0000 0.0128
2005 256 0.0000 0.1055 0.4570 0.2500 0.1328 0.0273 0.0078 0.0000 0.0000 0.0000 0.0039 0.0039 0.0000 0.0078 0.0000 0.0000 0.0000 0.0000 0.0000 0.0039
28

Assessment Workshop Report South Atlantic Red Snapper
SEDAR 15 SAR 1 SECTION III
Table 2.13. Red snapper: Indices of abundance and coefficients of variation, as used in
assessment (base).
Catch per Unit Effort (CPUE) Coefficient of Variation (CV)
Logbook (Pounds WW) Recreational (Numbers)
Commercial Recreational
Year Hook & Line Headboa
t MRFS
S Hook &
Line Headboa
t MRFS
S 1976 3.13 0.05 1977 2.08 0.06 1978 2.12 0.05 1979 2.14 0.05 1980 1.13 0.08 1981 2.78 0.05 1982 1.04 0.08 1983 1.70 1.72 0.06 0.14 1984 1.55 1.57 0.06 0.12 1985 2.29 1.36 0.05 0.14 1986 0.51 0.72 0.10 0.26 1987 0.61 0.65 0.10 0.30 1988 0.56 0.70 0.10 0.20 1989 0.95 0.58 0.08 0.14 1990 0.99 0.20 0.08 0.24 1991 0.62 0.68 0.10 0.22 1992 0.08 1.07 0.30 0.12 1993 1.05 0.21 1.15 0.16 0.17 0.19 1994 0.86 0.22 0.74 0.16 0.17 0.17 1995 0.88 0.30 0.76 0.17 0.15 0.13 1996 0.69 0.20 0.66 0.20 0.20 0.23 1997 0.61 0.22 1.08 0.23 0.23 0.28 1998 0.69 0.18 0.80 0.24 0.20 0.17 1999 0.85 0.29 1.48 0.22 0.15 0.10 2000 0.87 0.39 1.34 0.24 0.13 0.10 2001 1.35 0.82 1.12 0.16 0.08 0.09 2002 1.48 1.01 0.99 0.15 0.08 0.11 2003 1.22 0.52 1.15 0.19 0.12 0.11 2004 1.52 0.97 1.29 0.20 0.08 0.09 2005 1.26 0.90 1.21 0.22 0.08 0.09 2006 0.68 0.47 0.98 0.30 0.13 0.13
29

Assessment Workshop Report South Atlantic Red Snapper
SEDAR 15 SAR 1 SECTION III
Figure 2.1. Comparison of red snapper recreational landings, including the original
interpolated values provided by the Recreational Working Group (RWG) and the
interpolation from historical reports by the Assessment Panel. Solid squares represent
landings reported in Salt-Water Angling Surveys (Clark, 1962; Deuel and Clark, 1968;
Deuel, 1973).
0
1,000
2,000
3,000
4,000
5,000
6,000
1940
1945
1950
1955
1960
1965
1970
1975
1980
1985
1990
1995
2000
2005
2010
La
nd
ing
s (
10
00
po
un
ds
WW
) Interpolated by RWG
Interpolated from HistoricalReports
30

Assessment Workshop South Atlantic Red Snapper
3 Stock Assessment Models and Results
3.1 Model 1: Catch-at-age model
3.1.1 Model 1 Methods
3.1.1.1 Overview The primary model in this assessment was a statistical catch-at-age model (Quinn andDeriso 1999), implemented with the AD Model Builder software (Otter Research 2005). In essence, a statisticalcatch-at-age model simulates a population forward in time while including fishing processes. Quantities tobe estimated are systematically varied until characteristics of the simulated populations match available dataon the real population. Statistical catch-at-age models share many attributes with ADAPT-style tuned anduntuned VPAs.
The method of forward projection has a long history in fishery models. It was introduced by Pella and Tom-linson (1969) for fitting production models and then used by Fournier and Archibald (1982), Deriso et al.(1985) in their CAGEAN model, and Methot (1989) in his stock-synthesis model. The catch-at-age model of thisassessment is similar in structure to the CAGEAN and stock-synthesis models. Versions of this assessmentmodel have been used in previous SEDAR assessments of red porgy, black sea bass, tilefish, snowy grouper,and gag grouper.
3.1.1.2 Data Sources The catch-at-age model was fit to data from each of the four primary fisheries onsoutheastern U.S. red snapper: commercial hook and line, commercial diving, general recreational, and head-boat. These data included annual landings in whole weight by fishery, annual discard mortalities by fishery(excluding commercial diving), annual length composition of landings by fishery, annual age composition oflandings by fishery, and three fishery dependent indices of abundance (commercial hook and line, generalrecreational, and headboat). These data are tabulated in §III(2) of this report. The general recreational fisheryhas been sampled since 1981 by the MRFSS, but for previous years, landings values were obtained by interpo-lating data reported in saltwater angling surveys (Clark 1962; Deuel and Clark 1968; Deuel 1973). Starting withthe headboat survey in 1972, headboat landings were separated from the general recreational fishery. Dataon annual discard mortalities, as fit by the model, were computed by multiplying total discards (tabulated in§III(2)) by the fishery-specific release mortality rates (0.9 deaths per released fish in the commercial sector and0.4 in the recreational).
3.1.1.3 Model Configuration and Equations Model equations are detailed in Table 3.1 and AD ModelBuilder code for implementation in Appendices B and C. A general description of the assessment modelfollows:
Natural mortality rate The natural mortality rate (M) was assumed constant over time, but variable with age.The form of M as a function of age was based on Lorenzen (1996). The Lorenzen (1996) approach inverselyrelates the natural mortality at age to mean weight at age Wa by the power function Ma=αWβ
a , where α is ascale parameter and β is a shape parameter. Lorenzen (1996) provided point estimates of α and β for oceanicfishes, which were used for this assessment. As in previous SEDAR assessments, the Lorenzen estimates ofMa were rescaled by a scalar multiple to provide a fraction (1.4%) of survivors at the oldest age consistent withthe findings of Hoenig (1983) and discussed in Hewitt and Hoenig (2005).
SEDAR 15 SAR 1 SECTION III 31

Assessment Workshop South Atlantic Red Snapper
Stock dynamics In the assessment model, new biomass was acquired through growth and recruitment, whileabundance of existing cohorts experienced exponential decay from fishing and natural mortality. The popula-tion was assumed closed to immigration and emigration. The oldest age class 20+ allowed for the accumula-tion of fish (i.e., plus group). The initial stock biomass was assumed to be less than the unfished (virgin) level,because moderate landings had occurred prior to the first year of the model. Initial biomass and abundanceassumed the unfished age structure but with number at age discounted by a fixed proportion.
Growth and maturity Mean size at age (total length) was modeled with the von Bertalanffy equation, andweight at age (whole weight) as a function of length. Maturity at age of females was modeled with a logisticequation. Parameters of growth, length-weight conversion, and maturity were estimated by the DW and weretreated as input to the assessment model. For fitting size composition data, the distribution of size at age wasassumed normal with CV estimated by the assessment model.
Spawning biomass Spawning biomass (in units of mt) was modeled as the mature female biomass, assuminga 50 : 50 sex ratio. It was computed each year from number at age when spawning peaks. For red snapper,peak spawning was considered to occur at the midpoint of the year.
Recruitment Recruitment was predicted from spawning biomass using a Beverton–Holt spawner-recruit model.In years when composition data could provide information on year-class strength (1974–2006), estimated re-cruitment was conditioned on the Beverton–Holt model with autocorrelated residuals. In years prior, recruit-ment followed the Beverton–Holt model precisely (similar to an age-structured production model).
Landings Time series of landing from four fisheries were modeled: commercial handline, commercial diving,headboat, and general recreational (MRFSS). Prior to 1972, the headboat fishery was considered part of thegeneral recreational fishery. Landings were modeled via the Baranov catch equation (Baranov 1918), in unitsof 1000 lb whole weight.
Discards Starting in 1984 with the implementation of size-limit regulations, time series of discard mortalities(in units of 1000 fish) were modeled for each fishery except commercial diving. As with landings, discardmortalities were modeled via the Baranov catch equation (Baranov 1918), which required estimates of discardselectivities (described below) and release mortality rates.
Fishing For each time series of landings and discard mortalities, a separate full fishing mortality rate (F ) wasestimated. Age-specific rates were then computed as the product of full F and selectivity at age.
Selectivities Selectivities were estimated using a parametric approach. For landings from commercial diving,selectivity was estimated as a double-logistic (dome-shaped) model; for landings from the other three fisheries,selectivities were estimated as a logistic model. This parametric approach reduces the number of estimatedparameters and imposes theoretical structure on the estimates. Critical to estimating selectivity parametersare age and size composition data.
Selectivity of each fishery was fixed within each period of size-limit regulations, but was permitted to varyamong the three different periods (no regulations prior to 1984, 12-inch limit during 1984–1991, and 20-inch limit during 1992–2006). The exception was commercial diving, which had composition data only inthe most recent period, and thus selectivity for this fishery was assumed constant through time. In the firstperiod, composition data were not collected from commercial fisheries and were sparse from MRFSS; in thisperiod, most composition data were collected by the headboat sampling program. Thus, selectivity in the firstperiod was assumed the same for commercial hook and line, headboat, and general recreational fisheries. Inaddition, the slope of selectivity of the general recreational fishery in the second period of regulations was notestimated, but was fixed at a value to approximate knife-edge selection.
SEDAR 15 SAR 1 SECTION III 32
Assessment Workshop South Atlantic Red Snapper
Selectivities of discards could not be estimated directly, because composition data (both age and length) ofdiscards were lacking. Instead, selectivities of discards were computed in three stages: First, a vector ofselectivity at age was computed as one minus a logistic model, with that model’s slope parameter set at theestimate from the fishery and the 50% selection parameter set at the age corresponding to the size limit.Second, the vector was rescaled to have a maximum value of one for ages 2+. Third, a value of discardselectivity at age 1 was assumed to be 0.5 (0.25 or 0.75 in sensitivity runs). This method assumed thatdiscards consisted primarily of undersized fish, and that age-1 fish were partially vulnerable to fishing gear.
Indices of abundance The model was fit to three fishery dependent indices of abundance: headboat (1976–2006), MRFSS (1983–2006), and commercial handline (1993–2006). Predicted indices were computed fromnumber at age at the midpoint of the year.
The DW and AW agreed that catchability has likely increased over time as a result of technological progress.To reflect such improvements, catchability was assumed to increase linearly with a slope of 2% per year (0% or4% in sensitivity runs). This slope and range (0–4%) was used in SEDAR10 assessments of gag grouper stocksin the U.S. Atlantic and Gulf of Mexico. The lower bound of the range was chosen to represent the status quoassumption of constant catchability; the range itself is consistent with productivity increases estimated forNew England groundfish (4.4%) and for Norwegian stocks (1.7–4.3%) (Jin et al. 2002; Hannesson 2007).
Biological reference points Biological reference points (benchmarks) were calculated based on maximum sus-tainable yield (MSY) estimates from the Beverton–Holt spawner-recruit model with bias correction, as describedin §3.1.1.5. Computed benchmarks included MSY, fishing mortality rate at MSY (FMSY), and total mature bio-mass at MSY (SSBMSY). These benchmarks are conditional on the estimated selectivity functions. The selectivitypattern used here was the effort-weighted selectivities at age, with effort from each fishery (including discardmortalities) estimated as the full F averaged over the last three years of the assessment.
Fitting criterion The fitting criterion was a maximum likelihood approach in which observed landings werefit closely, and the observed length and age compositions, abundance indices, and discards were fit to thedegree that they were compatible. Landings, discards, and index data were fit using a lognormal likelihood.Composition data were fit using a multinomial likelihood.
The total likelihood also included penalty terms to discourage (1) fully selected F greater than 3.0 in any yearand (2) large deviation from zero in recruitment residuals during the last three assessment years. In addition,a least-squares penalty term was applied to log deviations of annual recruitment (allowing for autocorrelation),permitting estimation of the Beverton–Holt spawner-recruit parameters internal to the assessment model.
Likelihood component weights The influence of each dataset on the overall model fit was determined by thespecification of the error terms in each likelihood component. In the case of lognormal likelihoods, error wasquantified by the inverse of the annual coefficient of variation, and for the multinomial components, by theannual sample sizes (§III(2)). These terms determine the influence of each year of data relative to other yearsof the same data source. However, the relative influence of different components can only be treated by re-weighting each likelihood component, including penalty terms. An objective determination of these weightsis largely an unsolved problem in statistical catch-at-age modeling.
The number of weights to be examined were reduced by grouping likelihood components based on theirtype, scale, and method of collection. For example, the four time series of landings data were grouped, sothat a single weight was applied to all four landings components. Similarly the discard components weregrouped, the index components were grouped, the age composition components were grouped, and the lengthcomposition components were grouped. Groups were separated only if necessary based on examination ofinitial model runs.
SEDAR 15 SAR 1 SECTION III 33

Assessment Workshop South Atlantic Red Snapper
The selection of likelihood component weights for the base run model involved an iterative process of modelfitting, examination of the fit, and adjustment of the weights. The performance of an individual model run wasevaluated based on a balance between biological realism and reasonable fits to the observed datasets, includingconsideration of overdispersion, model mis-specification (e.g. runs of residuals), and general reliability of thedata sources (i.e. understanding of information content). Likelihood component weights used in the basemodel are listed in Table 3.1.
Configuration of base run and sensitivity analyses A base model run was configured as described above andin Table 3.1. Sensitivity of results to the base configuration was examined through sensitivity and retrospectiveanalyses. These runs vary from the base run as follows:
• S1: Low M at age, computing by rescaling the Lorenzen estimates to provide cumulative survival to theupper bound (5%) of Hoenig (1983)
• S2: High M at age, computing by rescaling the Lorenzen estimates to provide cumulative survival to thelower bound (1%) of Hoenig (1983)
• S3: Slope of linear annual increase in catchability is 0.00 (i.e., constant catchability q)
• S4: Slope of linear annual increase in catchability is 0.04
• S5: Recruitment deviations begin in 1972
• S6: Recruitment deviations begin in 1976
• S7: Low values of recreational landings prior to 1981, as provided by the DW
• S8: Recreational landings prior to 1981 as in the base run, but scaled by an estimated parameter ofmultiplicative bias
• S9: Commercial release mortality rate of 0.7
• S10: Commercial release mortality rate of 0.8
• S11: Commercial release mortality rate of 1.0
• S12: Recreational release mortality rate of 0.2
• S13: Recreational release mortality rate of 0.6
• S14: Selectivity of age-1 discards assumed to be 0.25
• S15: Selectivity of age-1 discards assumed to be 0.75
• S16: Steepness fixed at 0.8
• S17: Steepness fixed at 0.6
• S18: Retrospective analysis with terminal year of 2005
• S19: Retrospective analysis with terminal year of 2004
• S20: Retrospective analysis with terminal year of 2003
• S21: Retrospective analysis with terminal year of 2002
• S22: Retrospective analysis with terminal year of 2001
• S23: Initial biomass relative to carrying capacity B1/K = 0.95
• S24: Initial biomass relative to carrying capacity B1/K = 0.90
• S25: Initial biomass relative to carrying capacity B1/K = 0.85
• S26: Initial biomass relative to carrying capacity B1/K = 0.80
SEDAR 15 SAR 1 SECTION III 34

Assessment Workshop South Atlantic Red Snapper
• S27: Initial biomass relative to carrying capacity B1/K = 0.70
• S28: Initial biomass relative to carrying capacity B1/K = 0.65
• S29: Initial biomass relative to carrying capacity B1/K = 0.60
• S30: Initial biomass relative to carrying capacity B1/K = 0.55
• S31: Initial biomass relative to carrying capacity B1/K = 0.50
Model testing To ensure that the assessment model produces viable estimates (i.e., that all model parametersare identifiable), test data were generated with known parameter values and then analyzed with the assessmentmodel. For simplicity, a stripped down version of the model (Table 3.1) was considered, but this versionnevertheless retained all essential components. In particular, a simulation model was used to generate datafrom one fishery and included likelihood contributions of landings, CPUE, and age composition. Selectivityat age remained the same over time, and all likelihood weights were set equal to one. The simulation model[written in R; R Development Core Team (2007)] was programmed independently of the assessment model[written in AD Model Builder; Otter Research (2005)].
Parameter identification was determined using the “analytical-numeric” approach of Burnham et al. (1987).Expected value data were generated deterministically from input parameter values, without any process orsampling error. These data were then analyzed via the assessment model in attempt to obtain the exactparameters that generated the data.
In this test, all model parameters were estimated exactly. This result provides evidence that all parameterscould be properly identified. It further suggests that the assessment model is implemented correctly andcan provide an accurate assessment. As an additional measure of quality control, the input file used by theassessment model was reviewed for accuracy by multiple analysts.
3.1.1.4 Parameters Estimated The model estimated annual fishing mortality rates of each fishery, selec-tivity parameters of each fishery in each period of fishing regulations, Beverton–Holt parameters includingautocorrelation, annual recruitment deviations, catchability coefficients associated with abundance indices,and CV of size at age. Estimated parameters are identified in Table 3.1.
3.1.1.5 Benchmark/Reference Point Methods In this assessment of red snapper, the quantities FMSY,SSBMSY, BMSY, and MSY were estimated by the method of Shepherd (1982). In that method, the point of maxi-mum yield is identified from the spawner-recruit curve and parameters describing growth, natural mortality,maturity, and selectivity.
On average, expected recruitment is higher than that estimated directly from the spawner-recruit curve, be-cause of lognormal deviation in recruitment. Thus, in this assessment, the method of benchmark estimationaccounted for lognormal deviation by including a bias correction in equilibrium recruitment. The bias cor-rection (ς) was computed from the estimated variance (σ 2) of recruitment deviation: ς = exp(σ 2/2). Then,equilibrium recruitment (Req) associated with any F is,
Req =R0 [ς0.8hΦF − 0.2(1− h)]
(h− 0.2)ΦF(1)
where R0 is virgin recruitment, h is steepness, and ΦF is spawning potential ratio given growth, maturity, andtotal mortality at age (including natural, fishing, and discard mortality rates). The Req and mortality schedule
SEDAR 15 SAR 1 SECTION III 35

Assessment Workshop South Atlantic Red Snapper
imply an equilibrium age structure and an average sustainable yield (ASY). The estimate of FMSY is the F givingthe highest ASY (excluding discards), and the estimate of MSY is that ASY. The estimate of SSBMSY followsfrom the corresponding equilibrium age structure, as does the estimate of discard mortalities (DMSY), hereseparated from ASY (and consequently, MSY).
Estimates of MSY and related benchmarks are conditional on selectivity pattern. The selectivity pattern usedhere was the effort-weighted selectivities at age estimated over the last three years (2004–2006), a period ofunchanged regulations.
The maximum fishing mortality threshold (MFMT) is defined by the SAFMC as FMSY, and the minimum stocksize threshold (MSST) as (1 −M)SSBMSY (Restrepo et al. 1998), with constant M defined here as 0.078. Over-fishing is defined as F > MFMT and overfished as SSB < MSST. Current status of the stock and fishery arerepresented by the latest assessment year (2006).
In addition to the MSY-related benchmarks, proxies were computed based on per recruit analyses. Theseproxies include Fmax, F30%, and F40%, along with their associated yields. The value of Fmax is defined as theF that maximizes yield per recruit; the values of F30% and F40% as those Fs corresponding to 30% and 40%spawning potential ratio (i.e., spawners per recruit relative to that at the unfished level). These quantitiesmay serve as proxies for FMSY, if the spawner-recruit relationship cannot be estimated reliably. Mace (1994)recommended F40% as a proxy; however, later studies have found that F40% is too high across many life-historystrategies (Williams and Shertzer 2003) and can lead to undesirably low levels of biomass and recruitment(Clark 2002).
3.1.1.6 Uncertainty and Measures of Precision The effects of uncertainty in model structure was exam-ined by applying two assessment models—the catch-at-age model and a surplus-production model—with quitedifferent mechanistic structure. For each model, uncertainty in data or assumptions was examined throughsensitivity runs.
Precision of benchmarks was computed by parametric bootstrap. The bootstrap procedure generated lognor-mal recruitment deviations, with variance and autocorrelation as estimated by the assessment model. It thenre-estimated the Beverton–Holt spawner-recruit curve and its associated MSY benchmarks. The procedurewas iterated n = 1000 times, and the 10th and 90th percentiles of each benchmark were used to indicateuncertainty.
Uncertainty in the projections was computed through Monte Carlo simulations, with time series of futurerecruitments determined by random lognormal deviation (described in §3.1.1.7). The variance of this dis-tribution was that estimated in the assessment, as was the autocorrelation of residuals. The 10th and 90th
percentiles from n = 1000 projection replicates were used to quantify uncertainty in future time series.
3.1.1.7 Projection methods Projections were run to predict stock status in years after the assessment,2007–2040. This time frame of 34 years reflects the sum of mean generation time (20 years, §III(2)) and thenumber of years for spawning biomass to reach SSBMSY under F = 0. The structure of the projection modelwas the same as that of the assessment model, and parameter estimates were those from the assessmentbase run. Time-varying quantities, such as fishery selectivity curves, were fixed to the most recent values ofthe assessment period. Fully selected F was apportioned between landings and discard mortalities accordingto the selectivity curves averaged across fisheries, using geometric mean F from the last three years of theassessment period.
SEDAR 15 SAR 1 SECTION III 36

Assessment Workshop South Atlantic Red Snapper
Initialization of projections In projections, any change in fishing effort was assumed to start in 2009, whichis the earliest year management regulations could be implemented. Because the assessment period ended in2006, the projections required a two-year initialization period (2007–2008). The initial abundance at age inthe projection (start of 2007), other than at age 0, was taken to be the 2006 estimates from the assessment,discounted by 2006 natural and fishing mortalities. The initial abundance at age 0 was computed using theestimated spawner-recruit model and the 2006 estimate of SSB. The fully selected fishing mortality rate in theinitialization period was taken to be the geometric mean of fully selected F during 2004–2006.
Annual predictions of SSB (mid-year), F , recruits, landings, and discards were represented by deterministicprojections. These projections were built on the estimated spawner-recruit relationship with bias correction,and were thus consistent with estimated benchmarks in the sense that long-term fishing at FMSY would yieldMSY from a stock size at SSBMSY. Uncertainty in future time series was quantified through Monte Carlo simu-lations.
Stochasticity of projections Projections used a Monte Carlo procedure to generate stochasticity in the spawner-recruit relationship. The Beverton–Holt model (without bias correction), fit by the assessment, was used tocompute expected annual recruitment values (Ry ). Variability was added to the expected values by choosingmultiplicative deviations at random from a lognormal distribution with first-order autocorrelation,
Ry = Ry exp(εy). (2)
Here εy was drawn from a normal distribution with mean %εy−1 and standard deviation σ , where % and σ areestimates of autocorrelation and standard deviation from the assessment model (Table 3.1).
The Monte Carlo procedure generated 1000 replicate projections, each with a different stream of stochastic re-cruitments, and each with a different annual estimate of SSB, F , recruitment, landings, and discards. Precisionof projections was represented by the 10th and 90th percentiles of the 1000 stochastic projections.
Projection scenarios Several constant-F projection scenarios were considered:
• Scenario 1: F = 0
• Scenario 2: F = Fcurrent, defined as the geometric mean F of 2004–2006
• Scenario 3: F = FMSY
• Scenario 4: F = 65%FMSY
• Scenario 5: F = 75%FMSY
• Scenario 6: F = 85%FMSY
• Scenario 7: F = Frebuild, defined as the maximum F that allows rebuilding by the recovery time horizon
In addition, several discard-only projections were considered. These projections were structured as describedabove, with two exceptions: (1) commercial diving was excluded and (2) fishery-specific values of F that wouldhave went toward landings were discounted by the release mortality rate. This approach, in which all fishcaught were modeled as released, treats the fishery as consisting of bycatch associated with targeting otherspecies. A tacit assumption is that any individual fish could be caught only once per year. The discard-onlyprojections included the following scenarios:
SEDAR 15 SAR 1 SECTION III 37

Assessment Workshop South Atlantic Red Snapper
• Scenario 8: F = Fcurrent, but all fish caught were released and subjected to release mortality rates of 0.9in the commercial sector and 0.4 in the headboat and recreational sectors
• Scenario 9: F = Fcurrent, but all fish caught were released and subjected to release mortality rates of 0.8in the commercial sector and 0.2 in the headboat and recreational sector
• Scenario 10: F = Fcurrent, but all fish caught were released and subjected to release mortality rates of 1.0in the commercial sector and 0.6 in the recreational sector
• Scenario 11: F = Frebuild, given that all fish caught were released and subjected to release mortality ratesof 0.9 in the commercial sector and 0.4 in the headboat and recreational sector
• Scenario 12: F = Frebuild, given that all fish caught were released and subjected to release mortality ratesof 0.7 in the commercial sector and 0.4 in the headboat and recreational sector
When interpreting the discard-only projections, one should keep in mind that the distribution of full F amongthe various fisheries is different from that in the assessment, which may lead to some inconsistency betweenprojections and benchmarks from the assessment (e.g., fishing at FMSY may lead to an equilibrium stock sizeother than SSBMSY).
3.1.2 Model 1 Results
3.1.2.1 Measures of Overall Model Fit Overall, the catch-at-age model fit well to the available data. Annualfits to length compositions from each fishery were reasonable in most years, as were fits to age compositions(Figure 3.1). Residuals of these fits, by year and fishery, are summarized with bubble plots; differences be-tween annual observed and predicted vectors are summarized with angular deviation (Figure 3.2–3.9). Angulardeviation is defined as the arc cosine of the dot product of two vectors.
The model was configured to fit observed commercial and recreational landings closely (Figures 3.10–3.13). Inaddition, it fit well to observed discards (Figures 3.14–3.16).
Fits to indices of abundance were reasonable (Figures 3.17–3.19). The three indices were positively corre-lated. Since the mid-1990s, indices showed an increasing trend in general, but during the last three years, adecreasing trend.
3.1.2.2 Parameter Estimates Estimates of all parameters from the catch-at-age model are shown in Ap-pendix D. The estimated coefficient of variation of length at age was CV = 11.57% (Figure 3.20).
3.1.2.3 Stock Abundance and Recruitment Estimated abundance at age shows truncation of the oldestages during the 1950s and 1960s, from which the stock has not yet recovered (Table 3.2). Annual number ofrecruits is shown in Table 3.2 (age-1 column) and in Figure 3.21. Notable strength in year classes was predictedto have occurred in 1983 and 1984, and again in 1998 and 1999.
3.1.2.4 Stock Biomass (total and spawning stock) Estimated biomass at age follows a similar pattern oftruncation as did abundance (Tables 3.3,3.4). Total biomass and spawning biomass show nearly identicaltrends—sharp decline during the 1950s and 1960s, continued decline during the 1970s, and stable but lowlevels since 1980 (Figure 3.22, Table 3.5).
SEDAR 15 SAR 1 SECTION III 38

Assessment Workshop South Atlantic Red Snapper
3.1.2.5 Fishery Selectivity Estimated selectivities of landings from commercial handline shift toward olderfish with implementation of each new minimum size regulation (12 inches in 1984 and then 20 inches in 1992)(Figure 3.23). In the most recent period, fish were estimated to be almost fully selected by age 4. Selectivityof landings from commercial diving was estimated to be dome-shaped with a peak at age 9 and 10 (Figure3.24). Similar to commercial handline, landings from headboat fishery showed a shift toward older fish, withfull selection at age 4 in the most recent period (Figure 3.25), as did landings from the general recreationalfishery, with full selection at age 3 in the most recent period (Figure 3.26).
Estimated selectivities of discard mortalities were similar across the commercial handline, headboat, andgeneral recreational fisheries (Figure 3.27 – Figure 3.29). These selectivities included age-1 and age-2 fish inthe period 1984–1991, when the 12-inch size limit was in place. They additionally included age-3 fish in theperiod 1992–2006, when the 20-inch size limit was in place.
Average selectivities of landings and of discard mortalities were computed from F -weighted selectivities in themost recent period of regulations (Figure 3.30). These average selectivities were used to compute benchmarksand in projections. All selectivities from the most recent period, including average selectivities, are presentedin Table 3.6.
3.1.2.6 Fishing Mortality The estimated time series of fishing mortality rate (F ) shows a generally increas-ing trend from the 1950s through the mid-1980s, and since 1985 has fluctuated around a mean near F = 1.02(Figure 3.31). In the most recent years, the majority of full F comprised commercial handline landings, generalrecreational landings, and general recreational discard mortalities (Figure 3.31, Table 3.7).
Full F at age is shown in Table 3.8. In any given year, the maximum F at age may be less than that year’sfully selected F . This inequality is due to the combination of two features of estimated selectivities: fullselection occurs at different ages among gears and several sources of mortality (commercial diving, discards)have dome-shaped selectivity.
Throughout most of the assessment period, estimated landings and discard mortalities in number of fishhave been dominated by the recreational sector (Figures 3.32, 3.33). Table 3.9 shows total landings at age innumbers, Table 3.10 in metric tons, and Table 3.11 in 1000 lb.
3.1.2.7 Stock-Recruitment Parameters The estimated Beverton–Holt spawner-recruit curve is shown in Fig-ure 3.34. Variability about the curve was estimated only at low levels of spawning biomass, because composi-tion data required for estimating recruitment deviations became available only after the stock was depleted.The effect of density dependence on recruitment can be examined graphically via the estimated recruits perspawner as a function of spawners (Figure 3.35). Estimated parameters were as follows: steepness h = 0.95,R0 = 604909.7, first-order autocorrelation % = 0.33, and bias correction ς = 1.1. Uncertainty in these parame-ters was estimated through bootstrap analysis of the spawner-recruit curve (Figure 3.36).
3.1.2.8 Per Recruit and Equilibrium Analyses Static spawning potential ratio (static SPR) shows a trend ofmarked decrease from the beginning of the assessment period until the late 1970’s, and since has remainedrelatively constant at levels between 1% and 3% (Figure 3.37, Table 3.5). Static SPR of each year was com-puted as the asymptotic spawners per recruit given that year’s fishery-specific Fs and selectivities, divided byspawners per recruit that would be obtained in an unexploited stock. In this form, static SPR ranges between
SEDAR 15 SAR 1 SECTION III 39

Assessment Workshop South Atlantic Red Snapper
zero and one, and represents SPR that would be achieved under an equilibrium age structure at the current F(hence the term static).
Yield per recruit and spawning potential ratio were computed as functions of F (Figure 3.38), as were equilib-rium landings and spawning biomass (Figures 3.39). Equilibrium landings and discards were also computed asfunctions of biomass B, which itself is a function of F (Figure 3.40). As in computation of MSY-related bench-marks, per recruit analyses applied the most recent selectivity patterns averaged across fisheries, weighted byF from the last three years (2004–2006). Per-recruit estimates were Fmax = 0.12, F30% = 0.10, and F40% = 0.07(Figure 3.38, Table 3.12). For this stock of red snapper, FMSY corresponded to an F that provided 28% SPR (i.e.,F28%), but of course, a proxy is unnecessary if FMSY is estimated directly.
3.1.2.9 Benchmarks / Reference Points / ABC values As described in §3.1.1.5, biological reference points(benchmarks) were derived analytically assuming equilibrium dynamics, corresponding to the estimated spawner-recruit curve with bias correction (Figure 3.34). This approach is consistent with methods used in rebuildingprojections (i.e., fishing at FMSY yields MSY from a stock size of SSBMSY). Reference points estimated were FMSY,MSY, BMSY and SSBMSY. Based on FMSY, three possible values of F at optimum yield (OY) were considered—FOY = 65%FMSY, FOY = 75%FMSY, and FOY = 85%FMSY—and for each, the corresponding yield was computed.Uncertainty of benchmarks was computed through bootstrap analysis of the spawner-recruit curve, as de-scribed in §3.1.1.6.
Estimates of benchmarks are summarized in Table 3.12. Point estimates of MSY-related quantities were FMSY =0.112/yr, MSY = 2,318,939 lb, BMSY = 11,734 mt, and SSBMSY = 5184 mt. Distributions of these benchmarksare shown in Figure 3.41.
3.1.2.10 Status of the Stock and Fishery Estimated time series of B/BMSY and SSB/SSBMSY show similarpatterns: initial status well above the MSY benchmark, steep decline during the 1950s and 1960s, continuedbut less steep decline during the 1970s, and stable at low levels since 1980 (Figure 3.42, Table 3.5). Currentstock status was estimated to be SSB2006/SSBMSY = 0.037 and SSB2006/MSST = 0.041, indicating that the stockis overfished (Table 3.12).
The estimated time series of F/FMSY shows a generally increasing trend from the 1950s through the mid-1980s, and since 1985 has fluctuated about a mean near 9.1 (Figure 3.43, Table 3.5). The time series indicatesthat overfishing has been occurring since 1960, with the current estimate at F2006/FMSY = 7.513 (Table 3.12).
3.1.2.11 Evaluation of Uncertainty Uncertainty in results of the base assessment model was evaluatedthrough sensitivity and retrospective analyses, as described in §3.1.1.3. Plotted are time series of F/FMSY andSSB/SSBMSY for sensitivity to natural mortality (Figure 3.44), increase in catchability (Figure 3.45), starting yearof recruitment deviations (Figure 3.46), recreational landings prior to 1981 (Figure 3.47), discard mortalityrates (Figure 3.48), discard selectivity of age-1 fish (Figure 3.49), steepness (Figure 3.50), retrospective error(Figure 3.51), and initial biomass relative to carrying capacity (Figure 3.52). Retrospective analyses did notshow any concerning trends, and in general, results of sensitivity analyses were qualitatively the same asthose of the base model run: the stock is overfished and is experiencing overfishing (Table 3.13).
SEDAR 15 SAR 1 SECTION III 40

Assessment Workshop South Atlantic Red Snapper
3.1.2.12 Projections Projection scenario 1, in which F = 0, predicted the stock to recover to the level ofSSBMSY in 2020 (Figure 3.53, Table 3.14). That duration plus the 20-year generation time (§III(2)) defined therebuilding time frame such that recovery occurs by the end of year 2040. Thus, all projections were runthrough the year 2040.
Projection scenario 2, in which F = Fcurrent, predicted the stock to decline even lower than estimates fromthe end of the assessment (Figure 3.54, Table 3.15). If F is reduced to FMSY, as in scenario 3, the stock waspredicted to begin recovery, but not to the level of SSBMSY within the rebuilding time frame (Figure 3.55, Table3.16). If F is reduced to 65%, 75%, or 85% of FMSY, as in scenarios 4, 5, or 6 respectively, the stock was predictedto recover in time. (Figures 3.56–3.58, Tables 3.17– 3.19). The maximum F that allowed rebuilding within thetime frame was Frebuild = 0.109, about 97 % of FMSY (Figure 3.59, Table 3.20).
Discard-only projections predicted that, under F = Fcurrent (minus commercial diving), disallowing the reten-tion of red snapper would not be sufficient to rebuild the stock, whether discard mortality rates were thoseused in the assessment (scenario 8, Figure 3.60, Table 3.21), lower than those used in the assessment (scenario9, Figure 3.61, Table 3.22), or higher than those used in the assessment (scenario 10, Figure 3.62, Table 3.23).These results suggest that to rebuild the stock, total catches of red snapper will need to be reduced, not justlandings. In discard-only projections, the maximum fishing rate that allowed rebuilding within the time framewas Frebuild = 0.262 if discard mortality rates were those used in the base assessment model (scenario 11,Figure 3.63, Table 3.24), and it was Frebuild = 0.286 if the commercial discard mortality rate was 0.7 (scenario12, Figure 3.64, Table 3.25). The fact that these values of Frebuildexceed FMSY reflects the difference betweenselectivity curves used in the discard-only projection and in computation of MSY.
3.2 Model 2: Production model
3.2.1 Model 2 Methods
3.2.1.1 Overview Assessments based on age or length structure are often favored because they incorporatemore data on the structure of the population. However, these approaches typically involve fitting a large num-ber of parameters to the data, decomposing population change into a number of processes including growth,mortality, and recruitment. A simplified approach, which may sacrifice some bias in favor of precision, is toaggregate data across age or length classes, and to summarize the relationship between complex populationprocesses by using a simple mathematical model such as a logistic population model.
A logistic surplus production model, implemented in ASPIC (Prager 2005), was used to estimate stock sta-tus of red snapper off the southeastern U.S. While primary assessment of the stock was performed via theage-structured model, the surplus production approach was intended as a complement, and for additionalverification that the age-structured approach was providing reasonable results.
3.2.1.2 Data Sources Data included total landings in weight and three abundance indices, also computedon a weight basis. The three indices were from the commercial logbook (1993–2006), headboat survey (1976–2006), and MRFSS (1983–2006) programs.
All data were input into ASPIC in units of total whole weight. To make the conversion for headboat andrecreational fisheries, mean weight per fish was computed for each year. Initial inspection of annual samplesof the weight distribution in each fishery indicated substantial variation in mean weight per landed fish from
SEDAR 15 SAR 1 SECTION III 41

Assessment Workshop South Atlantic Red Snapper
year to year (Figure 3.65, Figure 3.66). Much of this variation is likely an artifact of the sampling process(annual sample sizes ranged from 15 to 370 for the MRFSS survey and 68 to 1370 for headboat surveys).Thus annual mean weights per landed fish were smoothed using local polynomial regression (Cleveland et al.1992). Fitting was based on weighted least squares, where (statistical) weights for each observation wereset to the square root of sample size. All fitting was performed with the function loess in the statisticalprogramming language R (R Development Core Team 2007). The change in size-limit regulations in 1992resulted in higher weight per landed fish; however, no change points were considered because of low samplesizes. Nevertheless, modeled weights tracked observed weights (Figure 3.65, Figure 3.66). Although therewas a clear case for smoothing annual estimates of mean weight per fish, considerable variability was stillevident in estimates of MRFSS landings. Thus estimates of MRFSS landings in numbers were smoothed as well,which was accomplished with a three year moving average (Fig. 3.67). For MRFSS, these smoothed landings innumbers were then multiplied by the smoothed mean weights to compute landings in weight.
Several changes were made to landings to better conform to assumptions made by the primary age-structuredassessment model. The beginning of the time series was set to 1946, with extra recreational landings includedfrom 1946 to 1980 to reflect the lack of data on these substantial fisheries (§III(2)). In particular, saltwaterangling surveys indicated that recreational landings amounted to 4.1 million lb in 1960 (Clark 1962), 5.7million lb in 1965 (Deuel and Clark 1968), and 1.9 million lb in 1970 (Deuel 1973).
To include discard mortalities with total removals, total discards in number were multiplied by the discardmortality rate and were then converted to whole weight in pounds. As with the age-structured analysis, discardmortality of 0.4 and 0.9 were applied to recreational fisheries (i.e., headboat and MRFSS) and to the commercialhook and line fishery, respectively (SEDAR 2007). To arrive at a figure in whole pounds, it was necessary toestimate the mean weight of discarded fish. Two scenarios were considered. In the first (“Assumption 1”), themean weight of discards prior to 1992 (when a 20-inch size limit began) was set to the mean weight of landedfish for each fishery. The implicit assumption here is that the probability a fish was discarded before 1992did not depend on size. Starting in 1992, it was assumed that all discards were due to the size limit, and themean weight of discards was set to the mean weight of fish less than 20 inches landed prior to 1992 (Figure3.68). Discards before 1984 were assumed to be negligible.
The second possibility for mean weight of discarded fish (“Assumption 2”) involved decomposition of selec-tivity into two components reflecting gear selectivity and selectivity of fishermen (i.e., fish kept given caught).Here, selectivity of gear was assumed knife-edge, with 100% selectivity starting at 1 year of age (and 0% beforeage 1). Next, selectivity of fishermen after this age was assumed due to regulations. For the period starting in1992, this entailed assuming that fishermen released fish < 20 inches, and for previous years, that fishermenreleased fish < 12 inches (a 12 inch total length regulation was instituted the year discard estimates becameavailable). Discards before 1984 were assumed to be negligible. Using this approach, it was possible to calcu-late an average weight for fish in the population by applying a preset level of mortality to gauge the relativefrequency of different ages in the population that were subject to discarding. The mean weight associatedwith this age distribution could then be applied to each time period. The age distribution was computed fromthe total mortality rates, which included age-specific (Lorenzen) natural mortality rates, as suggested by theSEDAR-15 DW, and a fishing mortality rate of 0.2 (initial ASPIC runs indicated a level of FMSY near 0.2). Es-timated age-length relationships indicated that red snapper reach 12 inches of length at an age of 1.26 andreach 20 inches at age 3.11. Numerical integration was then used to calculate a mean weight for fish caughtbetween ages 1.0 and 1.26 for years prior to 1992 and between ages 1.0 and 3.11 for years starting in 1992,assuming that mortality events were piecewise exponentially distributed. Calculated in this manner, the meantotal weight for discards was 0.62 lb for 1984–1991 and 1.54 lb for 1992–2006.
One final adjustment was made to index data prior to analysis. To reflect improvements in technology andthe ability of fishermen to locate and catch fish, a 2% increase in catchability (q) was assumed for each year
SEDAR 15 SAR 1 SECTION III 42

Assessment Workshop South Atlantic Red Snapper
starting in 1980. This increase was incorporated by dividing catch per unit effort (CPUEt) in each fishery by alinearly increasing function, so that
CPUE∗t =CPUEt
1+ (t − 1979)× .02(3)
for every year starting in 1980 (CPUE∗t = CPUEt for t < 1980). The revised index CPUE∗t was then used inanalysis.
3.2.1.3 Model Configuration and Equations Production modeling used the model formulation and ASPICsoftware of Prager (1994; 2005). This is an observation-error estimator of the continuous-time form of theSchaefer (logistic) production model (Schaefer 1954; 1957). Modeling was conditioned on yield.
The logistic model for population growth is the simplest form of a differential equation which satisfies anumber of ecologically realistic constraints, such as a carrying capacity (a consequence of limited resources).When written in terms of stock biomass, this model specifies that
dBtdt= rBt −
rKB2t , (4)
where Bt is biomass in year t, r is the intrinsic rate of increase in absence of density dependence, and K iscarrying capacity (Schaefer 1954; 1957). This equation may be rewritten to account for the effects of fishingby introducing an instantaneous fishing mortality term, Ft :
dBtdt= (r − Ft)Bt −
rKB2t . (5)
By writing the term Ft as a function of catchability coefficients and effort expended by fishermen in differentfisheries, Prager (1994) showed how to estimate model parameters from time series of yield and effort.
Fitting was achieved through maximum likelihood, conditional on the statistical weights and constraints ap-plied. Nonparametric confidence intervals on parameters were estimated through bootstrapping.
To configure a base run of ASPIC, Assumption 2 of mean discard weight (described above) was used, as it wasconsidered the more plausible scenario. However, a sensitivity run used Assumption 1, and another sensitivityrun ignored discards entirely.
Three options for the ratio of initial biomass to carrying capacity (B1/K) were considered. The first option wasto estimate it as a parameter in the model; however, using this approach parameter estimates exceeded 1.0.As this result was somewhat implausible, base run estimates of this ratio were fixed to 0.95. A fixed value ofB1/K = 0.75, as used in the age-structure model, was also considered to examine sensitivity to this choice.The base model input file appears in Appendix E.
No projections were run using production model methods. Age-structured projections are considered morerealistic and thus a better guide for management.
SEDAR 15 SAR 1 SECTION III 43

Assessment Workshop South Atlantic Red Snapper
3.2.2 Model 2 Results
3.2.2.1 Model Fit Fits to indices from the base production model are shown in Figures 3.69, 3.70, and3.71. In general, fits were adequate, although the model predicted that abundance declined earlier than wasindicated by the headboat index.
Fits from sensitivity runs were quite similar to those of the base production model (Figures not shown). Asdescribed above, these sensitivity runs included variations in assumptions about B1/K (B1/K = 0.75 or B1/Kestimated) and about discards (no discards or Assumption 1 for mean discard weight).
3.2.2.2 Parameter Estimates and Uncertainty Parameter estimates from the base surplus production modelare printed in Table 3.26, along with estimates of bias and precision. These estimates of uncertainty were ob-tained through nonparametric bootstrapping, as implemented in ASPIC.
3.2.2.3 Stock Abundance and Fishing Mortality Rate Estimates of biomass relative to BMSY and fishingmortality rate relative to FMSY from the production model are shown in Figure 3.72. Estimates of annualbiomass have been well below BMSY since the mid-1960s, with possibly some small amount of recovery sinceimplementation of current size limits in 1992. The estimate of F2006/FMSY does not indicate severe overfishingin the terminal year; however, estimates of annual F have exceeded FMSY substantially and regularly overthe last half century. In general, the surplus production model indicates conclusions similar to those of theage-structured model regarding 2006 stock status: the stock is overfished and overfishing is occurring.
Sensitivity analyses indicated that qualitative results were invariant to assumptions about starting biomassand discards. All runs produced estimates of current stock status where B2006/BMSY was in the range 0.14–0.18, with estimates of F/FMSY > 1 for nearly all of the last 50 years.
3.2.2.4 Benchmarks, uncertainty Estimates of MSY and related quantities from the surplus productionmodel, together with estimates of uncertainty derived through the bootstrap, are given in Table 3.26.
3.3 Discussion
3.3.1 Comments on Assessment Results
Estimated benchmarks play a central role in this assessment. Values of SSBMSY and FMSY are used to gaugestatus of the stock and fishery. In rebuilding projections, SSB reaching SSBMSY is the criterion that definesa successfully rebuilt stock. Computation of benchmarks is conditional on selectivity. If selectivity patternschange in the future, for example as a result of new management regulations, estimates of benchmarks wouldlikely change as well.
The base run of the age-structured assessment model indicated that the stock is overfished (SSB2006/SSBMSY =0.037) and that overfishing is occurring (F2006/FMSY = 7.513). These results were invariant to the 31 differentconfigurations used in sensitivity runs and retrospective analyses. In addition, the same qualitative findingsresulted from the age-aggregated surplus production model and its various sensitivity runs.
SEDAR 15 SAR 1 SECTION III 44

Assessment Workshop South Atlantic Red Snapper
3.3.2 Comments on Projections
As usual, projections should be interpreted in light of the model assumptions and key aspects of the data.Some major considerations are the following:
• Initial abundance at age of the projections were based on estimates from the assessment. If thoseestimates are inaccurate, rebuilding will likely be affected.
• Fisheries were assumed to continue fishing at their estimated current proportions of total effort, usingthe estimated current selectivity patterns. New management regulations that alter those proportions orselectivities would likely affect rebuilding.
• The projections assumed no change in the selectivity applied to discards. As recovery generally beginswith the smallest size classes, management action may be needed to meet that assumption.
• The projections assumed that the estimated spawner-recruit relationship applies in the future and thatpast residuals represent future uncertainty in recruitment. The assessment results suggest that re-cruitment may be characterized by runs of high or low values, possibly due in part to environmentalconditions. If so, rebuilding may be affected.
• Discard-only projections tacitly assumed that any individual fish would be caught only once per year.To the extent that this assumption is violated, discard-only projections may overestimate the velocity ofrecovery.
• Discard-only projections allocated sources of mortality in different proportions than those used in com-puting MSY-related benchmarks. Thus discard-only projections are not consistent with benchmarks, inthe sense that fishing at FMSY may lead to an equilibrium stock size other than SSBMSY.
SEDAR 15 SAR 1 SECTION III 45

Assessment Workshop South Atlantic Red Snapper
3.4 References
References
Baranov, F. I. 1918. On the question of teh biological basis of fisheries. Nauchnye Issledovaniya Ikhtiologich-eskii Instituta Izvestiya 1:81–128.
Burnham, K. P., D. R. Anderson, G. C. White, C. Brownie, and K. H. Pollock. 1987. Design and analysis methodsfor fish survival experiments based on release-recapture. American Fisheries Society Monograph 5:1–437.
Clark, J. R., 1962. The 1960 Salt-Water Angling Survey. U.S. Department of the Interior, Bureau of SportFisheries & Wildlife, Circular 153, Washington, D. C.
Clark, W. G. 2002. F35% revisited ten years later. North American Journal of Fisheries Management 22:251–257.
Cleveland, W. S., E. Grosse, and W. M. Shyu, 1992. Local regression models. in J. M. Chambers and T. J. Hastie,editors. Statistical Models in S. Wadsworth.
Deriso, R. B., T. J. Quinn, and P. R. Neal. 1985. Catch-age analysis with auxiliary information. Canadian Journalof Fisheries and Aquatic Sciences 42:815–824.
Deuel, D. G., 1973. The 1970 Salt-Water Angling Survey. U. S. Department of Commerce Current FisheryStatistics Number 6200, Washington, D. C.
Deuel, D. G., and J. R. Clark, 1968. The 1965 Salt-Water Angling Survey. Bureau of Sport Fisheries & WildlifeResource Publication 67, Washington, D. C.
Fournier, D., and C. P. Archibald. 1982. A general theory for analyzing catch at aage data. Canadian Journalof Fisheries and Aquatic Sciences 39:1195–1207.
Hannesson, R. 2007. Growth accounting in a fishery. Journal of environmental economics and management53:364–376.
Hewitt, D. A., and J. M. Hoenig. 2005. Comparison of two approaches for estimating natural mortality basedon longevity. Fishery Bulletin 103:433–437.
Hoenig, J. M. 1983. Empirical use of longevity data to estimate mortality rates. Fishery Bulletin 81:898–903.
Jin, D., E. Thunberg, H. Kite-Powell, and K. Blake. 2002. Total factor productivity change in teh New Englandgroundfish fishery: 1964–1993. Journal of Environmental Economics and Management 44:540–556.
Lorenzen, K. 1996. The relationship between body weight and natural mortality in juvenile and adult fish: acomparison of natural ecosystems and aquaculture. Journal of Fish Biology 49:627–642.
Mace, P. M. 1994. Relationships between common biological reference points used as thresholds and targetsof fisheries management strategies. Canadian Journal of Fisheries and Aquatic Sciences 51:110–122.
Methot, R. M. 1989. Synthetic estimates of historical abundance and mortality for northern anchovy. AmericanFisheries Society Symposium 6:66–82.
Otter Research, 2005. AD Model Builder Version 7.7.1. Otter Research, Ltd., Sidney, B.C., Canada.
Pella, J. J., and P. K. Tomlinson. 1969. A generalized stock production model. Bulletin of the Inter-AmericanTropical Tuna Commission 13:419–496.
SEDAR 15 SAR 1 SECTION III 47

Assessment Workshop South Atlantic Red Snapper
Prager, M. H. 1994. A suite of extensions to a nonequilibrium surplus-production model. Fishery Bulletin92:374–389.
Prager, M. H., 2005. User’s Manual for ASPIC: A Stock-Production Model Incorporating Covariates (ver. 5) AndAuxiliary Programs. National Marine Fishery Service, Beaufort Laboratory Document BL-2004-01, Beaufort,NC.
Quinn, T. J., and R. B. Deriso. 1999. Quantitative Fish Dynamics. Oxford University Press, New York, New York.
R Development Core Team, 2007. R: A Language and Environment for Statistical Computing. R Foundation forStatistical Computing, Vienna, Austria. URL http://www.R-project.org.
Restrepo, V. R., G. G. Thompson, P. M. Mace, L. L. Gabriel, L. L. Wow, A. D. MacCall, R. D. Methot, J. E. Powers,B. L. Taylor, P. R. Wade, and J. F. Witzig, 1998. Technical guidance on the use of precautionary approahcesto implementing Natinoal Standard 1 of the Magnuson-Stevens Fishery Conservation and Management Act.NOAA Technical Memorandum-F/SPO-31.
Schaefer, M. B. 1954. Some aspects of the dynamics of populations important to the management of thecommercial marine fisheries. Bulletin of the Inter-American Tropical Tuna Commission 1:27–56.
Schaefer, M. B. 1957. A study of the dynamics of the fishery for yellowfin tuna in the eastern tropical PacificOcean. Bulletin of the Inter-American Tropical Tuna Commission 2:247–268.
SEDAR, 2007. SEDAR 15 Data Workshop Report.
Shepherd, J. G. 1982. A versatile new stock-recruitment relationship for fisheries, and the construction ofsustainable yield curves. Journal du Conseil pour l’Exploration de la Mer 40:67–75.
Williams, E. H., and K. W. Shertzer. 2003. Implications of life-history invariants for biological reference pointsused in fishery management. Canadian Journal of Fisheries and Aquatic Science 60:710–720.
SEDAR 15 SAR 1 SECTION III 48

Assessment Workshop South Atlantic Red Snapper
3.4.1 Tables
Table 3.1. General definitions, input data, population model,and negative log-likelihood components of the statistical catch-at-age model. Hat notation (∗) indicates parameters estimatedby the assessment model, and breve notation (∗) indicates esti-mated quantities whose fit to data forms the objective function.
Quantity Symbol Description or definition
General Definitions
Index of years y y ∈ {1945 . . .2006}Index of ages a a ∈ {1 . . . A}, where A = 20+
Index of size-limitperiods
r r ∈ {1 . . .3}where 1 = 1945 − 1983 (no size limit), 2 = 1984 − 1991 (12-inchlimit), and 3 = 1992− 2006 (20-inch limit)
Index of lengthbins
l l ∈ {1 . . .28}
Length bins l′ l′ ∈ {190,220, . . . ,1000}, with values as midpoints and bin sizeof 30 mm
Index of fisheries f f ∈ {1 . . .4}where 1=commercial handline, 2=commercial diving, 3=recrea-tional headboat, 4=general recreational (MRFSS)
Index of CPUE u u ∈ {1 . . .3}where 1 = commercial logbook, 2 = headboat, 3 = MRFSS
Input Data
Proportion female at age ρa,y Constant across ages and years assuming a 50:50 sex ratio
Proportion females mature atage
ma Estimated by logistic regression
Observed length compositions pλ(f ,u),l,y Proportional contribution of length bin l in year y to fishery f orindex u
Observed age compositions pα(f ,u),a,y Proportional contribution of age class a in year y to fishery f orindex u
Length comp. sample sizes nλ(f ,u),y Number of length samples collected in year y from fishery f orindex u
Age comp. sample sizes nα(f ,u),y Number of age samples collected in year y from fishery f or indexu
Observed fishery landings Lf ,y Reported landings (1000 lb whole weight) in year y from fisheryf
CVs of landings cLf ,y Annual values estimated for MRFSS; for other sectors, based onunderstanding of historical accuracy of data
SEDAR 15 SAR 1 SECTION III 49

Assessment Workshop South Atlantic Red Snapper
Table 3.1. (continued)
Quantity Symbol Description or definition
Observed abundance indices Uu,y u = 1, commercial logbook, y ∈ {1993 . . .2006}u = 2, headboat, y ∈ {1976 . . .2006}u = 3, MRFSS, y ∈ {1983 . . .2006}
CVs of abundance indices cUu,y u = {1 . . .3} as above. Annual values estimated from delta-lognormal GLM for commercial and headboat, as PSEs for MRFSS.Each time series rescaled to a maximum of 0.3
Natural mortality rate Ma Function of weight at age (wa): Ma = αwβa , with estimates of αand β from Lorenzen (1996). Lorenzen Ma then rescaled based onHoenig estimate.
Observed total discards D′f ,y Discards (1000 fish) in year y from fishery f = 1,3,4.
Discard mortality rate δf Proportion discards by fishery f that die. Base-model values fromthe DW were 0.9 for commercial, 0.4 for headboat and MRFSS.
Observed discard mortalities Df ,y Df ,y = δfD′f ,y for f = 1,3,4CVs of dead discards cDf,y Annual values estimated (for MRFSS) or assumed
Population Model
Mean length at age la Total length; la = L∞(1− exp[−K(a− t0)])where K, L∞, and t0 are parameters estimated by the DW.
CV of la cλa Estimated variation of growth, assumed constant across ages.
Age–length conversion ψa,l ψa,l = 1√2π(cλala)
exp[
−(l′l−la)2]
(
2(cλala)2) , the Gaussian density function.
Matrix ψa,l is rescaled to sum to one across ages.
Individual weight at age wa Computed from length at age bywa = θ1l
θ2a
where θ1 and θ2 are parameters estimated by the DW
Fishery selectivity sf ,a,r sf ,a,r =
11+exp[−η1,f ,r(a−α1,f ,r)] : for f = 1,3,4
(
1max sf ,a,r
)(
11+exp[−η1,f ,r(a−α1,f ,r)]
)
(
1− 11+exp[−η2,f ,r(a−[α1,f ,r+α2,f ,r])]
)
: for f = 2
where η1,f ,r , η2,f ,r , α1,f ,r , and α2,f ,r are fishery-specific parame-ters estimated for each regulation period, with the exception ofthe no-size-limit period (r = 1) in which a single selectivity curvewas assumed to apply across fisheries. Also, the slope of MRFSSselectivity in period 2 was fixed to approximate a knife-edgecurve (η1,4,2 = 10.4). Selectivity of commercial diving is assumedconstant across regulation periods. Curves were rescaled, ifnecessary, to have a maximum of one.
SEDAR 15 SAR 1 SECTION III 50

Assessment Workshop South Atlantic Red Snapper
Table 3.1. (continued)
Quantity Symbol Description or definition
Discard selectivity s′f ,a,r s′f ,a,r = 1− 11+exp[−η1,f ,r(a−α1,f ,r)] : for f = 1,3,4; r = 2,3
where η1,f ,r is the slope estimated for the fishery selectivity andα1,f ,r is fixed at the age corresponding to the size limit. s′f ,2+,rrescaled to a maximum of one, then s′f ,1,r fixed at 0.5 (0.25 or 0.75in sensitivity runs).
Fishing mortality rateof landings
Ff ,a,y Ff ,a,y = sf ,a,y Ff ,ywhere Ff ,y is an estimated fully selected fishing mortality rate byfishery and sf ,a,y = sf ,a,r for y in the years represented by r
Fishing mortality rateof discards
FDf,a,y FDf,a,y = s′f ,a,r
FDf,ywhere FDf,y is an estimated fully selected fishing mortality rate ofdiscards by fishery
Total fishing mortality rate Fy Fy =∑
f
(
Ff ,y + FDf,y)
Total mortality rate Za,y Za,y = Ma +4∑
f=1Ff ,a,y +
∑
f=1,3,4FDf,a,y
Abundance at age Na,y N1,1945 = γ R0
Na+1,1945 = Na,1945 exp(−Ma) ∀a ∈ (1 . . . A− 1)NA,1945 = NA−1,1945
exp(−MA−1)1−exp(−MA)
N0,y+1 =
0.8 R0 hSy0.2φ0 R0(1−h)+(h−0.2)Sy
ς for y + 1 < 1974
0.8 R0 hSy0.2φ0 R0(1−h)+(h−0.2)Sy
exp( Ry+1) for y + 1 ≥ 1974
Na+1,y+1 = Na,y exp(−Za,y) ∀a ∈ (1 . . . A− 1)NA,y = NA−1,y−1
exp(−ZA−1,y−1)1−exp(−ZA,y−1)
where 1945 is the initialization year and γ scales the initial abun-dance relative to the unfished level. Parameters R0 (unfishedrecruitment) and h (steepness) are estimated parameters of thespawner-recruit curve, and Ry are estimated annual recruitmentdeviations in log space for y ≥ 1974 and are zero otherwise. Biascorrection % = exp(σ 2/2), where σ 2 is the variance of recruitmentdeviations during 1974–2003. Quantities φ0 and Sy are describedbelow.
Abundance at age (mid-year) N′a,y Used to match indices of abundanceN′a,y = Na,y exp(−Za,y/2)
Abundance at age at time ofspawning
N′′a,y Assumed mid-yearN′′a,y = N′a,y
Unfished abundance at age perrecruit at time of spawning
NPRa NPR1 = 1 exp(−M1/2)NPRa+1 = NPRa exp[−(Ma +Ma+1)/2] ∀a ∈ (1 . . . A− 1)NPRA = NPRA−1 exp[−(MA−1+MA)/2]
1−exp(−MA)
Unfished mature biomass per re-cruit
φ0 φ0 =∑
aNPRawaρa,yma
SEDAR 15 SAR 1 SECTION III 51
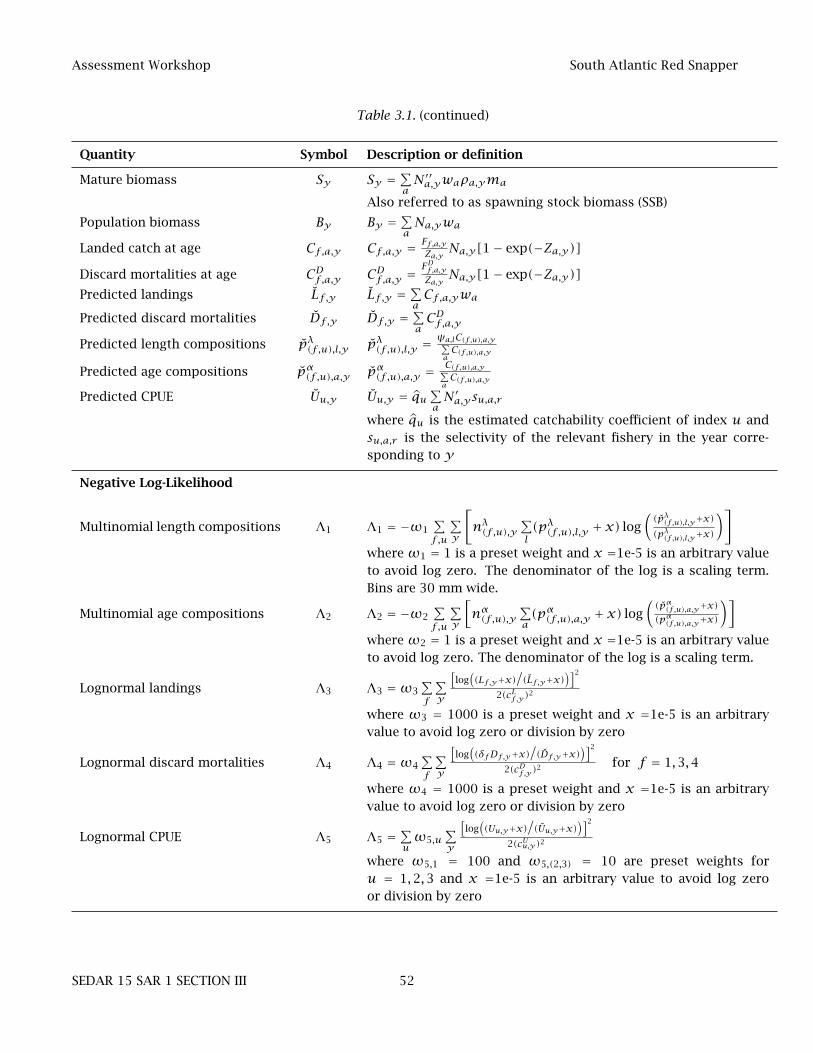
Assessment Workshop South Atlantic Red Snapper
Table 3.1. (continued)
Quantity Symbol Description or definition
Mature biomass Sy Sy =∑
aN′′a,ywaρa,yma
Also referred to as spawning stock biomass (SSB)
Population biomass By By =∑
aNa,ywa
Landed catch at age Cf ,a,y Cf ,a,y =Ff ,a,yZa,y Na,y[1− exp(−Za,y)]
Discard mortalities at age CDf,a,y CDf,a,y =FDf,a,yZa,y Na,y[1− exp(−Za,y)]
Predicted landings Lf ,y Lf ,y =∑
aCf ,a,ywa
Predicted discard mortalities Df ,y Df ,y =∑
aCDf,a,y
Predicted length compositions pλ(f ,u),l,y pλ(f ,u),l,y =ψa,lC(f ,u),a,y∑
aC(f ,u),a,y
Predicted age compositions pα(f ,u),a,y pα(f ,u),a,y =C(f ,u),a,y∑
aC(f ,u),a,y
Predicted CPUE Uu,y Uu,y = qu∑
aN′a,ysu,a,r
where qu is the estimated catchability coefficient of index u andsu,a,r is the selectivity of the relevant fishery in the year corre-sponding to y
Negative Log-Likelihood
Multinomial length compositions Λ1 Λ1 = −ω1∑
f ,u
∑
y
[
nλ(f ,u),y∑
l(pλ(f ,u),l,y + x) log
(
(pλ(f ,u),l,y+x)(pλ(f ,u),l,y+x)
)
]
where ω1 = 1 is a preset weight and x =1e-5 is an arbitrary valueto avoid log zero. The denominator of the log is a scaling term.Bins are 30 mm wide.
Multinomial age compositions Λ2 Λ2 = −ω2∑
f ,u
∑
y
[
nα(f ,u),y∑
a(pα(f ,u),a,y + x) log
(
(pα(f ,u),a,y+x)(pα(f ,u),a,y+x)
)]
where ω2 = 1 is a preset weight and x =1e-5 is an arbitrary valueto avoid log zero. The denominator of the log is a scaling term.
Lognormal landings Λ3 Λ3 =ω3∑
f
∑
y
[
log(
(Lf ,y+x)/
(Lf ,y+x))]2
2(cLf ,y )2
where ω3 = 1000 is a preset weight and x =1e-5 is an arbitraryvalue to avoid log zero or division by zero
Lognormal discard mortalities Λ4 Λ4 =ω4∑
f
∑
y
[
log(
(δfDf ,y+x)/
(Df ,y+x))]2
2(cDf,y )2for f = 1,3,4
where ω4 = 1000 is a preset weight and x =1e-5 is an arbitraryvalue to avoid log zero or division by zero
Lognormal CPUE Λ5 Λ5 =∑
uω5,u
∑
y
[
log(
(Uu,y+x)/
(Uu,y+x))]2
2(cUu,y )2
where ω5,1 = 100 and ω5,(2,3) = 10 are preset weights foru = 1,2,3 and x =1e-5 is an arbitrary value to avoid log zeroor division by zero
SEDAR 15 SAR 1 SECTION III 52

Assessment Workshop South Atlantic Red Snapper
Table 3.1. (continued)
Quantity Symbol Description or definition
Constraint on recruitment devia-tions
Λ6 Λ6 =ω6
[
R21974 +
∑
y>1974(Ry − %Ry−1)2
]
where Ry are recruitment deviations in log space, ω6 = 100 is apreset weight and % is the estimated first-order autocorrelation
Additional constraint on recruit-ment deviations
Λ7 Λ7 =ω7
(
∑
y≥2004R2y
)
where ω7 = 1000 is a preset weight
Constraint on Fy Λ8 Λ8 =ω8∑
yIy(Fy − Ψ)2
where ω8 = 1000 is a preset weight, Ψ = 3.0 is the max uncon-strained Fy , and
Iy ={
1 : if Fy > Ψ0 : otherwise
Total likelihood Λ Λ =8∑
i=1Λi
Objective function minimized by the assessment model
SEDAR 15 SAR 1 SECTION III 53

Assessment Workshop South Atlantic Red SnapperT
able
3.2
.R
edsn
ap
per
:Es
tim
ate
da
bu
nd
an
cea
ta
ge
(10
00
fish
)a
tst
art
ofye
ar
Yea
r1
23
45
67
89
10
11
12
13
14
15
16
17
18
19
20
19
45
45
3.7
36
0.3
30
8.1
27
1.8
24
3.8
22
1.1
20
1.8
18
5.1
17
0.3
15
7.2
14
5.3
13
4.5
12
4.6
11
5.6
10
7.3
99.6
92.5
86.0
79.9
10
58.2
19
46
66
1.8
36
0.0
30
6.8
27
0.7
24
2.8
22
0.1
20
1.0
18
4.3
16
9.6
15
6.5
14
4.7
13
3.9
12
4.1
11
5.1
10
6.8
99.2
92.2
85.6
79.6
10
53.9
19
47
66
1.7
52
5.1
30
6.4
26
9.5
24
1.7
21
9.2
20
0.1
18
3.5
16
8.9
15
5.8
14
4.0
13
3.3
12
3.6
11
4.6
10
6.4
98.8
91.8
85.3
79.2
10
49.1
19
48
66
1.7
52
4.4
44
4.5
26
7.7
23
9.4
21
7.0
19
8.1
18
1.7
16
7.2
15
4.3
14
2.6
13
2.0
12
2.4
11
3.5
10
5.3
97.8
90.8
84.4
78.5
10
38.8
19
49
66
1.6
52
3.7
44
1.6
38
6.2
23
6.5
21
3.7
19
5.1
17
8.9
16
4.7
15
1.9
14
0.5
13
0.0
12
0.5
11
1.7
10
3.7
96.3
89.5
83.1
77.3
10
23.0
19
50
66
1.5
52
3.1
43
8.6
38
1.5
33
9.3
21
0.0
19
1.0
17
5.2
16
1.3
14
8.8
13
7.6
12
7.3
11
8.0
10
9.4
10
1.6
94.3
87.6
81.4
75.7
10
01.9
19
51
66
1.4
52
2.4
43
5.5
37
6.8
33
3.3
29
9.6
18
6.6
17
0.6
15
7.1
14
4.9
13
3.9
12
4.0
11
4.9
10
6.6
98.9
91.9
85.3
79.3
73.7
97
5.6
19
52
66
1.3
52
1.4
43
1.4
37
1.1
32
6.5
29
1.9
26
4.1
16
5.4
15
1.7
14
0.0
12
9.4
11
9.8
11
1.0
10
2.9
95.5
88.7
82.4
76.6
71.2
94
2.4
19
53
66
1.1
52
0.9
42
9.1
36
6.3
32
0.5
28
4.9
25
6.4
23
3.2
14
6.5
13
4.7
12
4.5
11
5.3
10
6.8
99.1
92.0
85.4
79.3
73.7
68.5
90
7.1
19
54
66
0.9
52
0.0
42
6.0
36
2.0
31
4.3
27
7.9
24
8.7
22
5.0
20
5.3
12
9.3
11
9.1
11
0.3
10
2.2
94.8
88.0
81.7
75.9
70.5
65.5
86
7.6
19
55
66
0.6
51
8.7
42
1.0
35
5.8
30
7.5
26
9.8
24
0.2
21
6.0
19
6.0
17
9.3
11
3.1
10
4.4
96.7
89.7
83.3
77.3
71.8
66.8
62.0
82
1.4
19
56
66
0.2
51
7.8
41
7.6
34
9.7
30
0.5
26
2.5
23
1.9
20
7.4
18
7.2
17
0.3
15
6.1
98.6
91.1
84.5
78.4
72.8
67.6
62.9
58.4
77
3.4
19
57
65
9.7
51
6.6
41
3.6
34
4.1
29
3.1
25
4.5
22
3.9
19
8.7
17
8.3
16
1.4
14
7.1
13
5.0
85.4
78.9
73.3
68.0
63.2
58.7
54.6
72
2.6
19
58
65
9.0
51
4.3
40
5.6
33
5.0
28
3.5
24
4.0
21
3.4
18
8.6
16
7.9
15
1.1
13
7.0
12
5.0
11
4.9
72.7
67.3
62.5
58.0
53.9
50.1
66
3.5
19
59
65
8.2
51
3.1
40
1.4
32
6.6
27
4.4
23
4.6
20
3.3
17
8.7
15
8.4
14
1.5
12
7.5
11
5.8
10
5.8
97.3
61.6
57.0
53.0
49.2
45.8
60
5.7
19
60
65
7.2
51
0.9
39
5.0
31
8.9
26
3.9
22
4.0
19
2.9
16
7.9
14
8.1
13
1.6
11
7.7
10
6.3
96.6
88.3
81.3
51.5
47.7
44.3
41.2
54
5.4
19
61
65
6.0
50
8.4
38
7.2
30
8.9
25
3.5
21
2.0
18
1.2
15
6.8
13
7.0
12
1.1
10
7.8
96.6
87.3
79.4
72.7
66.9
42.4
39.3
36.5
48
3.4
19
62
65
4.4
50
4.9
37
6.5
29
5.8
24
0.0
19
9.0
16
7.6
14
3.9
12
5.0
10
9.4
96.9
86.4
77.5
70.1
63.8
58.4
53.8
34.1
31.6
41
8.6
19
63
65
2.3
50
1.5
36
6.6
28
2.0
22
5.3
18
4.7
15
4.3
13
0.5
11
2.5
97.9
85.9
76.2
68.0
61.1
55.3
50.3
46.1
42.5
26.9
35
5.5
19
64
64
9.7
49
7.0
35
4.4
26
7.3
20
9.1
16
8.8
13
9.4
11
7.0
99.3
85.8
74.8
65.7
58.3
52.1
46.8
42.4
38.6
35.4
32.6
29
3.8
19
65
64
6.0
49
0.2
33
5.8
24
7.0
18
9.5
14
9.8
12
1.8
10
1.0
85.1
72.4
62.7
54.7
48.1
42.8
38.2
34.4
31.1
28.4
26.0
23
9.8
19
66
64
0.3
48
0.1
30
9.0
21
8.4
16
3.4
12
6.6
10
0.8
82.3
68.5
57.9
49.3
42.8
37.4
32.9
29.3
26.2
23.5
21.3
19.4
18
2.2
19
67
63
2.2
47
2.1
29
1.8
19
3.7
13
9.3
10
5.3
82.2
65.7
53.9
44.9
38.0
32.5
28.2
24.6
21.7
19.3
17.3
15.5
14.1
13
3.3
19
68
62
1.0
46
0.6
27
1.8
17
3.3
11
7.1
85.0
64.7
50.7
40.7
33.5
28.0
23.7
20.3
17.6
15.4
13.6
12.1
10.8
9.7
92.3
19
69
60
5.4
44
6.8
25
0.3
15
2.4
98.8
67.4
49.3
37.7
29.7
23.9
19.7
16.5
14.0
11.9
10.4
9.1
8.0
7.1
6.4
60.3
19
70
58
6.8
43
6.3
24
4.7
14
1.5
87.6
57.4
39.4
29.0
22.2
17.5
14.1
11.7
9.8
8.3
7.1
6.2
5.4
4.8
4.2
39.7
19
71
56
9.8
42
6.0
24
7.1
14
3.0
84.1
52.6
34.7
24.0
17.7
13.6
10.7
8.7
7.2
6.0
5.1
4.4
3.8
3.3
2.9
27.1
19
72
55
5.0
41
1.6
23
5.6
14
1.0
83.0
49.3
31.1
20.6
14.3
10.5
8.1
6.4
5.2
4.3
3.6
3.1
2.6
2.3
2.0
18.0
19
73
54
0.4
39
9.4
22
4.0
13
2.3
80.5
47.9
28.6
18.1
12.1
8.4
6.2
4.8
3.8
3.1
2.5
2.1
1.8
1.6
1.4
11.9
19
74
47
8.7
38
9.0
21
7.6
12
5.9
75.6
46.5
27.8
16.7
10.6
7.1
4.9
3.7
2.8
2.2
1.8
1.5
1.3
1.1
0.9
7.8
19
75
59
5.1
33
8.9
19
6.3
11
3.3
66.7
40.5
25.1
15.1
9.1
5.8
3.9
2.7
2.0
1.5
1.2
1.0
0.8
0.7
0.6
4.8
19
76
42
7.8
41
3.4
15
6.9
93.8
55.0
32.7
20.0
12.4
7.5
4.5
2.9
1.9
1.4
1.0
0.8
0.6
0.5
0.4
0.3
2.7
19
77
44
8.2
29
6.5
18
9.3
74.1
45.0
26.7
16.0
9.8
6.1
3.7
2.2
1.4
1.0
0.7
0.5
0.4
0.3
0.2
0.2
1.5
19
78
38
7.3
30
4.9
12
4.6
82.0
32.7
20.1
12.0
7.2
4.4
2.8
1.7
1.0
0.7
0.4
0.3
0.2
0.2
0.1
0.1
0.8
19
79
23
4.2
25
9.8
12
0.1
50.6
33.9
13.6
8.4
5.1
3.1
1.9
1.2
0.7
0.4
0.3
0.2
0.1
0.1
0.1
0.1
0.4
19
80
51
3.6
15
8.8
10
7.7
51.3
22.0
14.9
6.0
3.7
2.3
1.4
0.8
0.5
0.3
0.2
0.1
0.1
0.1
0.0
0.0
0.2
19
81
14
2.6
34
8.9
66.3
46.4
22.5
9.7
6.6
2.7
1.7
1.0
0.6
0.4
0.2
0.1
0.1
0.1
0.0
0.0
0.0
0.1
19
82
27
9.9
98.1
15
4.6
30.3
21.6
10.6
4.6
3.2
1.3
0.8
0.5
0.3
0.2
0.1
0.1
0.0
0.0
0.0
0.0
0.1
19
83
54
5.9
19
3.1
44.0
71.6
14.3
10.3
5.1
2.2
1.5
0.6
0.4
0.2
0.1
0.1
0.1
0.0
0.0
0.0
0.0
0.0
19
84
75
0.1
36
7.0
76.9
18.1
29.9
6.0
4.4
2.2
1.0
0.7
0.3
0.2
0.1
0.1
0.0
0.0
0.0
0.0
0.0
0.0
SEDAR 15 SAR 1 SECTION III 54

Assessment Workshop South Atlantic Red SnapperT
able
3.2
.(c
on
tin
ued
)
Yea
r1
23
45
67
89
10
11
12
13
14
15
16
17
18
19
20
19
85
21
2.8
46
2.5
13
7.4
25.9
6.2
10.3
2.1
1.5
0.8
0.3
0.2
0.1
0.1
0.0
0.0
0.0
0.0
0.0
0.0
0.0
19
86
28
2.8
13
1.9
17
2.6
47.4
9.1
2.2
3.7
0.7
0.5
0.3
0.1
0.1
0.0
0.0
0.0
0.0
0.0
0.0
0.0
0.0
19
87
35
9.5
16
9.9
49.9
67.7
18.9
3.7
0.9
1.5
0.3
0.2
0.1
0.0
0.0
0.0
0.0
0.0
0.0
0.0
0.0
0.0
19
88
27
7.1
23
4.0
75.7
22.5
31.1
8.8
1.7
0.4
0.7
0.1
0.1
0.1
0.0
0.0
0.0
0.0
0.0
0.0
0.0
0.0
19
89
27
9.5
18
0.7
10
0.2
32.7
9.9
13.8
3.9
0.8
0.2
0.3
0.1
0.0
0.0
0.0
0.0
0.0
0.0
0.0
0.0
0.0
19
90
25
1.3
18
6.5
80.9
37.8
12.6
3.8
5.4
1.5
0.3
0.1
0.1
0.0
0.0
0.0
0.0
0.0
0.0
0.0
0.0
0.0
19
91
33
9.5
15
6.1
73.3
31.9
15.1
5.1
1.6
2.2
0.6
0.1
0.0
0.0
0.0
0.0
0.0
0.0
0.0
0.0
0.0
0.0
19
92
16
4.1
23
4.4
79.8
35.1
15.5
7.4
2.5
0.7
1.0
0.3
0.1
0.0
0.0
0.0
0.0
0.0
0.0
0.0
0.0
0.0
19
93
12
6.8
12
1.2
14
0.8
42.4
16.8
7.4
3.5
1.1
0.3
0.4
0.1
0.0
0.0
0.0
0.0
0.0
0.0
0.0
0.0
0.0
19
94
12
7.7
89.1
66.6
66.3
16.1
6.3
2.8
1.3
0.4
0.1
0.2
0.0
0.0
0.0
0.0
0.0
0.0
0.0
0.0
0.0
19
95
12
6.6
84.2
47.4
34.6
32.2
7.8
3.0
1.3
0.6
0.2
0.0
0.1
0.0
0.0
0.0
0.0
0.0
0.0
0.0
0.0
19
96
17
8.9
82.9
43.9
23.9
16.3
15.1
3.6
1.4
0.6
0.2
0.1
0.0
0.0
0.0
0.0
0.0
0.0
0.0
0.0
0.0
19
97
18
4.4
12
2.7
46.3
22.8
11.1
7.5
7.0
1.6
0.6
0.2
0.1
0.0
0.0
0.0
0.0
0.0
0.0
0.0
0.0
0.0
19
98
40
5.2
13
1.6
74.5
25.4
10.7
5.2
3.5
3.2
0.7
0.3
0.1
0.0
0.0
0.0
0.0
0.0
0.0
0.0
0.0
0.0
19
99
43
7.3
28
9.4
74.6
38.2
12.1
5.1
2.5
1.6
1.5
0.3
0.1
0.0
0.0
0.0
0.0
0.0
0.0
0.0
0.0
0.0
20
00
35
0.3
31
0.6
15
8.7
36.5
17.3
5.5
2.3
1.1
0.7
0.6
0.1
0.1
0.0
0.0
0.0
0.0
0.0
0.0
0.0
0.0
20
01
26
5.8
24
2.3
16
2.4
76.4
17.1
8.1
2.5
1.0
0.5
0.3
0.2
0.1
0.0
0.0
0.0
0.0
0.0
0.0
0.0
0.0
20
02
29
4.3
17
6.6
11
8.5
73.9
33.5
7.4
3.5
1.0
0.4
0.2
0.1
0.1
0.0
0.0
0.0
0.0
0.0
0.0
0.0
0.0
20
03
20
2.6
19
5.7
88.7
56.9
35.4
16.0
3.5
1.5
0.4
0.2
0.1
0.0
0.0
0.0
0.0
0.0
0.0
0.0
0.0
0.0
20
04
25
7.2
13
4.5
98.0
44.2
30.5
19.0
8.5
1.8
0.8
0.2
0.1
0.0
0.0
0.0
0.0
0.0
0.0
0.0
0.0
0.0
20
05
26
6.9
16
7.0
64.6
45.8
21.3
14.7
9.1
3.9
0.8
0.3
0.1
0.0
0.0
0.0
0.0
0.0
0.0
0.0
0.0
0.0
20
06
26
8.8
17
6.8
81.8
30.5
22.6
10.6
7.3
4.4
1.9
0.4
0.2
0.0
0.0
0.0
0.0
0.0
0.0
0.0
0.0
0.0
20
07
27
6.0
18
4.1
92.6
41.3
16.1
12.0
5.6
3.9
2.4
1.0
0.2
0.1
0.0
0.0
0.0
0.0
0.0
0.0
0.0
0.0
SEDAR 15 SAR 1 SECTION III 55

Assessment Workshop South Atlantic Red Snapper
Table
3.3
.R
edsn
apper
:Es
tim
ate
dbio
mass
at
age
(mt)
at
start
ofye
ar
Yea
r1
23
45
67
89
10
11
12
13
14
15
16
17
18
19
20
19
45
10
2.9
28
9.8
51
3.8
72
9.1
91
0.0
10
47.0
11
39.9
11
93.8
12
15.4
12
11.8
11
89.4
11
53.5
11
08.6
10
57.8
10
03.9
94
8.7
89
3.5
83
9.3
78
6.8
10
48
7.5
19
46
15
0.1
28
9.6
51
1.7
72
6.1
90
6.3
10
42.7
11
35.2
11
88.9
12
10.4
12
06.8
11
84.5
11
48.8
11
04.0
10
53.5
99
9.8
94
4.8
88
9.9
83
5.9
78
3.6
10
44
4.5
19
47
15
0.1
42
2.4
51
1.0
72
2.8
90
2.2
10
38.0
11
30.1
11
83.5
12
05.0
12
01.4
11
79.2
11
43.7
10
99.1
10
48.8
99
5.3
94
0.6
88
5.9
83
2.2
78
0.1
10
39
7.7
19
48
15
0.1
42
1.8
74
1.3
71
8.0
89
3.4
10
27.8
11
19.0
11
71.9
11
93.1
11
89.6
11
67.6
11
32.4
10
88.3
10
38.5
98
5.5
93
1.3
87
7.2
82
4.0
77
2.4
10
29
5.3
19
49
15
0.1
42
1.3
73
6.4
10
35.9
88
2.6
10
12.2
11
02.0
11
54.0
11
74.9
11
71.5
11
49.8
11
15.2
10
71.7
10
22.6
97
0.5
91
7.1
86
3.8
81
1.4
76
0.6
10
13
8.6
19
50
15
0.1
42
0.8
73
1.4
10
23.3
12
66.4
99
4.4
10
79.2
11
30.2
11
50.7
11
47.3
11
26.1
10
92.1
10
49.6
10
01.5
95
0.5
89
8.2
84
6.0
79
4.7
74
4.9
99
29.1
19
51
15
0.1
42
0.2
72
6.3
10
10.7
12
43.9
14
18.8
10
54.3
11
00.6
11
20.5
11
17.2
10
96.6
10
63.5
10
22.1
97
5.3
92
5.6
87
4.7
82
3.8
77
3.9
72
5.4
96
69.2
19
52
15
0.0
41
9.4
71
9.5
99
5.6
12
18.6
13
82.4
14
92.1
10
66.6
10
82.4
10
79.2
10
59.3
10
27.3
98
7.3
94
2.1
89
4.1
84
4.9
79
5.8
74
7.5
70
0.7
93
40.0
19
53
15
0.0
41
9.0
71
5.6
98
2.7
11
96.1
13
49.4
14
48.6
15
04.1
10
45.2
10
38.7
10
19.5
98
8.8
95
0.3
90
6.8
86
0.6
81
3.2
76
5.9
71
9.5
67
4.4
89
89.8
19
54
14
9.9
41
8.3
71
0.3
97
1.1
11
73.2
13
16.1
14
05.2
14
51.0
14
64.6
99
6.7
97
5.1
94
5.7
90
8.9
86
7.3
82
3.1
77
7.8
73
2.6
68
8.1
64
5.1
85
98.2
19
55
14
9.9
41
7.2
70
2.0
95
4.3
11
47.7
12
77.9
13
56.7
13
93.3
13
98.6
13
82.6
92
6.2
89
5.4
86
0.5
82
1.1
77
9.3
73
6.4
69
3.6
65
1.5
61
0.7
81
40.7
19
56
14
9.8
41
6.5
69
6.4
93
8.0
11
21.7
12
43.3
13
10.1
13
37.8
13
35.6
13
13.1
12
77.8
84
5.8
81
0.3
77
3.2
73
3.8
69
3.4
65
3.1
61
3.5
57
5.1
76
65.3
19
57
14
9.7
41
5.5
68
9.7
92
3.1
10
93.8
12
05.6
12
64.6
12
81.7
12
72.5
12
44.1
12
04.0
11
57.7
75
9.4
72
2.3
68
5.5
64
7.8
61
0.1
57
3.1
53
7.2
71
61.1
19
58
14
9.5
41
3.7
67
6.4
89
8.8
10
58.1
11
55.5
12
05.3
12
16.1
11
98.3
11
65.0
11
21.3
10
72.3
10
21.7
66
5.4
62
9.5
59
4.9
56
0.3
52
6.3
49
3.3
65
75.9
19
59
14
9.3
41
2.8
66
9.4
87
6.2
10
24.2
11
11.4
11
48.5
11
52.3
11
30.3
10
90.7
10
43.9
99
2.8
94
0.8
89
0.0
57
6.5
54
3.1
51
1.5
48
0.5
45
0.4
60
03.2
19
60
14
9.1
41
1.0
65
8.8
85
5.3
98
4.8
10
61.0
10
89.5
10
83.0
10
56.4
10
14.8
96
3.9
91
1.6
85
9.1
80
8.3
76
0.5
49
0.5
46
0.5
43
2.6
40
5.5
54
05.4
19
61
14
8.8
40
9.0
64
5.7
82
8.5
94
6.3
10
04.2
10
23.8
10
11.3
97
7.3
93
3.5
88
2.8
82
8.6
77
6.5
72
6.6
67
9.9
63
7.0
40
9.5
38
3.4
35
9.4
47
90.9
19
62
14
8.5
40
6.2
62
7.8
79
3.5
89
5.6
94
2.8
94
6.8
92
8.5
89
1.6
84
3.8
79
3.4
74
1.4
68
9.6
64
1.6
59
7.1
55
6.4
51
9.5
33
3.1
31
1.2
41
48.7
19
63
14
8.0
40
3.4
61
1.4
75
6.5
84
1.0
87
4.9
87
1.6
84
2.0
80
2.7
75
4.8
70
3.3
65
3.5
60
5.0
55
8.8
51
7.1
47
9.2
44
5.0
41
4.4
26
5.2
35
22.9
19
64
14
7.4
39
9.8
59
1.0
71
6.9
78
0.3
79
9.6
78
7.2
75
4.3
70
8.4
66
1.4
61
2.3
56
3.7
51
9.0
47
7.1
43
8.2
40
3.8
37
3.0
34
5.4
32
1.0
29
12.1
19
65
14
6.5
39
4.3
56
0.0
66
2.7
70
7.1
70
9.4
68
7.9
65
1.4
60
6.8
55
8.1
51
2.9
46
9.2
42
8.0
39
1.3
35
7.8
32
7.2
30
0.5
27
6.8
25
5.9
23
76.8
19
66
14
5.3
38
6.2
51
5.3
58
5.8
60
9.8
59
9.8
56
9.4
53
1.1
48
9.0
44
6.1
40
3.9
36
6.8
33
2.5
30
1.1
27
3.8
24
9.3
22
7.2
20
8.1
19
1.3
18
05.9
19
67
14
3.4
37
9.8
48
6.5
51
9.7
51
9.8
49
8.7
46
4.1
42
3.8
38
4.3
34
6.5
31
1.2
27
8.4
25
0.5
22
5.5
20
3.1
18
3.9
16
6.9
15
1.7
13
8.7
13
20.7
19
68
14
0.9
37
0.5
45
3.3
46
4.9
43
6.9
40
2.7
36
5.6
32
7.3
29
0.6
25
8.0
22
9.0
20
3.2
18
0.2
16
1.0
14
4.1
12
9.3
11
6.6
10
5.6
95.8
91
4.3
19
69
13
7.3
35
9.4
41
7.4
40
8.8
36
8.8
31
9.4
27
8.6
24
3.3
21
1.8
18
4.1
16
1.0
14
1.2
12
4.1
10
9.3
97.1
86.5
77.4
69.6
62.9
59
7.2
19
70
13
3.1
35
1.0
40
8.1
37
9.5
32
6.9
27
1.8
22
2.8
18
6.9
15
8.7
13
5.3
11
5.8
10
0.0
86.9
75.9
66.4
58.8
52.2
46.6
41.8
39
3.4
19
71
12
9.3
34
2.7
41
2.1
38
3.6
31
3.7
24
9.1
19
6.0
15
4.5
12
6.0
10
4.8
87.9
74.4
63.7
54.9
47.7
41.6
36.7
32.5
28.9
26
8.2
19
72
12
5.9
33
1.1
39
2.9
37
8.2
30
9.7
23
3.4
17
5.4
13
2.8
10
1.8
81.3
66.5
55.2
46.2
39.3
33.7
29.2
25.3
22.3
19.7
17
8.8
19
73
12
2.6
32
1.3
37
3.5
35
4.8
30
0.4
22
6.7
16
1.7
11
6.9
86.0
64.6
50.8
41.1
33.7
28.1
23.7
20.3
17.5
15.1
13.3
11
7.5
19
74
10
8.6
31
2.9
36
2.9
33
7.7
28
2.3
22
0.3
15
7.3
10
7.9
75.9
54.7
40.4
31.4
25.2
20.5
17.0
14.3
12.2
10.5
9.0
77.6
19
75
13
5.0
27
2.7
32
7.4
30
4.0
24
8.8
19
1.7
14
1.6
97.3
64.9
44.6
31.7
23.1
17.8
14.2
11.5
9.5
7.9
6.7
5.8
47.6
19
76
97.1
33
2.6
26
1.6
25
1.5
20
5.4
15
5.0
11
3.0
80.3
53.6
35.0
23.7
16.6
12.0
9.2
7.3
5.9
4.8
4.0
3.4
26.9
19
77
10
1.7
23
8.5
31
5.6
19
8.7
16
8.1
12
6.5
90.3
63.3
43.7
28.6
18.4
12.3
8.6
6.1
4.7
3.7
3.0
2.4
2.0
15.1
19
78
87.9
24
5.2
20
7.7
22
0.0
12
1.9
95.0
67.7
46.5
31.7
21.4
13.8
8.8
5.8
4.0
2.9
2.2
1.7
1.4
1.1
7.8
19
79
53.1
20
9.0
20
0.2
13
5.7
12
6.5
64.6
47.6
32.6
21.8
14.5
9.7
6.2
3.9
2.6
1.8
1.2
0.9
0.7
0.6
3.8
19
80
11
6.5
12
7.8
17
9.5
13
7.7
82.1
70.5
34.1
24.2
16.1
10.5
6.9
4.6
2.9
1.8
1.2
0.8
0.6
0.4
0.3
2.0
19
81
32.3
28
0.7
11
0.6
12
4.4
83.9
46.1
37.5
17.4
12.0
7.8
5.0
3.3
2.1
1.3
0.8
0.5
0.4
0.3
0.2
1.1
19
82
63.5
78.9
25
7.9
81.4
80.5
50.1
26.0
20.4
9.2
6.2
4.0
2.5
1.6
1.1
0.7
0.4
0.3
0.2
0.1
0.6
19
83
12
3.8
15
5.4
73.4
19
2.0
53.3
48.6
28.6
14.3
10.9
4.8
3.2
2.0
1.3
0.8
0.5
0.3
0.2
0.1
0.1
0.4
19
84
17
0.2
29
5.2
12
8.2
48.5
11
1.6
28.5
24.6
13.9
6.8
5.0
2.2
1.4
0.9
0.6
0.4
0.2
0.1
0.1
0.1
0.2
19
85
48.3
37
2.0
22
9.1
69.5
23.1
49.0
11.8
9.8
5.4
2.5
1.9
0.8
0.5
0.3
0.2
0.1
0.1
0.1
0.0
0.1
19
86
64.2
10
6.1
28
7.8
12
7.0
33.9
10.4
20.7
4.8
3.8
2.0
0.9
0.7
0.3
0.2
0.1
0.1
0.0
0.0
0.0
0.0
19
87
81.6
13
6.7
83.2
18
1.6
70.5
17.3
5.0
9.6
2.1
1.7
0.9
0.4
0.3
0.1
0.1
0.1
0.0
0.0
0.0
0.0
19
88
62.9
18
8.2
12
6.2
60.5
11
6.1
41.5
9.6
2.7
5.0
1.1
0.8
0.4
0.2
0.1
0.1
0.0
0.0
0.0
0.0
0.0
19
89
63.4
14
5.3
16
7.1
87.8
37.0
65.5
22.2
4.9
1.3
2.4
0.5
0.4
0.2
0.1
0.1
0.0
0.0
0.0
0.0
0.0
19
90
57.0
15
0.1
13
4.9
10
1.5
46.9
18.2
30.4
9.9
2.1
0.6
1.0
0.2
0.2
0.1
0.0
0.0
0.0
0.0
0.0
0.0
19
91
77.0
12
5.6
12
2.3
85.5
56.5
24.0
8.8
14.1
4.4
0.9
0.2
0.4
0.1
0.1
0.0
0.0
0.0
0.0
0.0
0.0
19
92
37.2
18
8.5
13
3.0
94.1
57.7
35.0
14.0
4.8
7.3
2.2
0.5
0.1
0.2
0.0
0.0
0.0
0.0
0.0
0.0
0.0
19
93
28.8
97.5
23
4.9
11
3.6
62.6
34.9
19.8
7.4
2.4
3.4
1.0
0.2
0.1
0.1
0.0
0.0
0.0
0.0
0.0
0.0
19
94
29.0
71.7
11
1.1
17
7.8
60.0
30.0
15.7
8.4
3.0
0.9
1.3
0.4
0.1
0.0
0.0
0.0
0.0
0.0
0.0
0.0
19
95
28.7
67.7
79.1
92.8
12
0.2
36.8
17.0
8.2
4.0
1.3
0.4
0.6
0.2
0.0
0.0
0.0
0.0
0.0
0.0
0.0
19
96
40.6
66.7
73.2
64.0
60.7
71.5
20.4
8.8
4.0
1.8
0.6
0.2
0.3
0.1
0.0
0.0
0.0
0.0
0.0
0.0
19
97
41.8
98.7
77.2
61.2
41.3
35.7
39.5
10.6
4.4
1.9
0.9
0.3
0.1
0.1
0.0
0.0
0.0
0.0
0.0
0.0
19
98
91.9
10
5.9
12
4.2
68.1
40.0
24.6
19.9
20.7
5.3
2.1
0.9
0.4
0.1
0.0
0.1
0.0
0.0
0.0
0.0
0.0
19
99
99.2
23
2.8
12
4.4
10
2.5
45.2
24.3
14.0
10.6
10.4
2.5
1.0
0.4
0.2
0.1
0.0
0.0
0.0
0.0
0.0
0.0
20
00
79.5
24
9.8
26
4.7
97.8
64.7
26.0
13.0
7.0
5.0
4.6
1.1
0.4
0.2
0.1
0.0
0.0
0.0
0.0
0.0
0.0
20
01
60.3
19
4.9
27
0.8
20
4.9
63.8
38.5
14.4
6.7
3.4
2.2
2.0
0.5
0.2
0.1
0.0
0.0
0.0
0.0
0.0
0.0
20
02
66.8
14
2.0
19
7.6
19
8.2
12
5.1
35.3
19.6
6.7
2.8
1.3
0.8
0.8
0.2
0.1
0.0
0.0
0.0
0.0
0.0
0.0
20
03
46.0
15
7.4
14
7.8
15
2.7
13
2.2
75.6
19.6
9.9
3.0
1.2
0.5
0.4
0.4
0.1
0.0
0.0
0.0
0.0
0.0
0.0
20
04
58.4
10
8.2
16
3.5
11
8.6
11
3.8
90.0
47.8
11.5
5.4
1.5
0.6
0.3
0.2
0.2
0.1
0.0
0.0
0.0
0.0
0.0
20
05
60.5
13
4.3
10
7.7
12
2.9
79.6
69.7
51.2
25.4
5.7
2.5
0.7
0.3
0.1
0.1
0.1
0.0
0.0
0.0
0.0
0.0
20
06
61.0
14
2.2
13
6.5
81.9
84.2
50.1
41.1
28.6
13.5
2.9
1.2
0.4
0.1
0.1
0.1
0.1
0.0
0.0
0.0
0.0
20
07
62.6
14
8.1
15
4.3
11
0.7
60.1
56.9
31.9
25.0
16.8
7.7
1.6
0.7
0.2
0.1
0.0
0.0
0.0
0.0
0.0
0.0
SEDAR 15 SAR 1 SECTION III 56

Assessment Workshop South Atlantic Red Snapper
Table
3.4
.R
edsn
apper
:Es
tim
ate
dbio
mass
at
age
(1000
lb)
at
start
ofye
ar
Yea
r1
23
45
67
89
10
11
12
13
14
15
16
17
18
19
20
19
45
22
6.9
63
9.0
11
32.7
16
07.3
20
06.3
23
08.2
25
13.1
26
31.8
26
79.4
26
71.5
26
22.2
25
43.1
24
44.0
23
32.1
22
13.3
20
91.5
19
69.9
18
50.4
17
34.6
23
12
0.9
19
46
33
1.0
63
8.4
11
28.1
16
00.7
19
98.1
22
98.7
25
02.8
26
21.0
26
68.5
26
60.6
26
11.4
25
32.7
24
34.0
23
22.6
22
04.2
20
83.0
19
61.8
18
42.9
17
27.5
23
02
6.2
19
47
33
0.9
93
1.2
11
26.6
15
93.5
19
89.1
22
88.4
24
91.5
26
09.3
26
56.5
26
48.6
25
99.7
25
21.4
24
23.1
23
12.2
21
94.3
20
73.6
19
53.0
18
34.6
17
19.7
22
92
3.0
19
48
33
0.9
93
0.0
16
34.4
15
82.9
19
69.5
22
65.9
24
67.0
25
83.6
26
30.3
26
22.6
25
74.1
24
96.5
23
99.2
22
89.4
21
72.7
20
53.2
19
33.8
18
16.5
17
02.8
22
69
7.3
19
49
33
0.9
92
8.8
16
23.4
22
83.9
19
45.8
22
31.4
24
29.4
25
44.2
25
90.3
25
82.6
25
34.9
24
58.5
23
62.7
22
54.5
21
39.7
20
22.0
19
04.4
17
88.9
16
76.9
22
35
1.7
19
50
33
0.9
92
7.6
16
12.4
22
56.0
27
91.9
21
92.3
23
79.3
24
91.7
25
36.8
25
29.3
24
82.6
24
07.7
23
13.9
22
08.0
20
95.5
19
80.2
18
65.0
17
51.9
16
42.3
21
89
0.0
19
51
33
0.8
92
6.4
16
01.3
22
28.1
27
42.3
31
28.0
23
24.4
24
26.5
24
70.4
24
63.1
24
17.6
23
44.7
22
53.3
21
50.2
20
40.6
19
28.4
18
16.2
17
06.1
15
99.3
21
31
7.0
19
52
33
0.7
92
4.6
15
86.2
21
94.8
26
86.5
30
47.6
32
89.6
23
51.4
23
86.3
23
79.2
23
35.3
22
64.9
21
76.6
20
77.0
19
71.1
18
62.7
17
54.4
16
48.0
15
44.8
20
59
1.1
19
53
33
0.6
92
3.7
15
77.5
21
66.4
26
36.9
29
74.9
31
93.6
33
15.9
23
04.2
22
90.0
22
47.7
21
80.0
20
95.0
19
99.1
18
97.2
17
92.8
16
88.6
15
86.2
14
86.9
19
81
9.1
19
54
33
0.5
92
2.2
15
66.0
21
41.0
25
86.4
29
01.6
30
97.8
31
98.9
32
28.8
21
97.3
21
49.8
20
85.0
20
03.7
19
12.0
18
14.6
17
14.7
16
15.0
15
17.1
14
22.1
18
95
5.7
19
55
33
0.4
91
9.8
15
47.7
21
04.0
25
30.3
28
17.3
29
91.0
30
71.6
30
83.5
30
48.0
20
42.0
19
74.1
18
97.1
18
10.3
17
18.0
16
23.5
15
29.1
14
36.4
13
46.5
17
94
7.3
19
56
33
0.2
91
8.3
15
35.2
20
67.9
24
72.9
27
41.0
28
88.2
29
49.4
29
44.6
28
94.8
28
17.0
18
64.8
17
86.3
17
04.6
16
17.7
15
28.7
14
39.8
13
52.5
12
67.8
16
89
9.2
19
57
32
9.9
91
6.1
15
20.6
20
35.2
24
11.4
26
57.8
27
88.0
28
25.7
28
05.3
27
42.7
26
54.4
25
52.4
16
74.2
15
92.4
15
11.3
14
28.1
13
45.1
12
63.5
11
84.4
15
78
7.4
19
58
32
9.6
91
2.0
14
91.2
19
81.4
23
32.8
25
47.5
26
57.2
26
81.1
26
41.8
25
68.4
24
72.1
23
64.1
22
52.4
14
67.0
13
87.8
13
11.4
12
35.2
11
60.3
10
87.6
14
49
7.3
19
59
32
9.2
91
0.0
14
75.9
19
31.8
22
57.9
24
50.1
25
32.1
25
40.5
24
92.0
24
04.6
23
01.5
21
88.8
20
74.1
19
62.2
12
71.0
11
97.2
11
27.6
10
59.2
99
2.9
13
23
4.9
19
60
32
8.7
90
6.1
14
52.4
18
85.7
21
71.2
23
39.0
24
01.9
23
87.7
23
28.9
22
37.2
21
25.1
20
09.8
18
94.0
17
82.0
16
76.7
10
81.5
10
15.3
95
3.7
89
4.0
11
91
6.8
19
61
32
8.1
90
1.7
14
23.6
18
26.6
20
86.2
22
13.9
22
57.1
22
29.4
21
54.5
20
58.0
19
46.2
18
26.8
17
11.9
16
01.8
14
99.0
14
04.4
90
2.8
84
5.3
79
2.4
10
56
2.1
19
62
32
7.3
89
5.4
13
84.0
17
49.3
19
74.4
20
78.4
20
87.3
20
46.9
19
65.6
18
60.2
17
49.2
16
34.5
15
20.3
14
14.6
13
16.5
12
26.6
11
45.4
73
4.4
68
6.2
91
46.4
19
63
32
6.3
88
9.4
13
47.8
16
67.7
18
54.2
19
28.9
19
21.6
18
56.2
17
69.6
16
64.1
15
50.5
14
40.6
13
33.9
12
31.8
11
40.0
10
56.4
98
1.0
91
3.6
58
4.6
77
66.8
19
64
32
4.9
88
1.4
13
02.9
15
80.6
17
20.4
17
62.9
17
35.5
16
63.0
15
61.8
14
58.1
13
49.9
12
42.7
11
44.1
10
51.9
96
6.1
89
0.3
82
2.2
76
1.6
70
7.8
64
20.0
19
65
32
3.1
86
9.3
12
34.5
14
60.9
15
58.9
15
63.9
15
16.6
14
36.1
13
37.8
12
30.4
11
30.9
10
34.5
94
3.7
86
2.7
78
8.8
72
1.4
66
2.5
61
0.3
56
4.1
52
40.0
19
66
32
0.3
85
1.4
11
36.1
12
91.6
13
44.5
13
22.3
12
55.4
11
71.0
10
78.0
98
3.5
89
0.4
80
8.6
73
3.0
66
3.9
60
3.6
54
9.6
50
0.9
45
8.9
42
1.8
39
81.3
19
67
31
6.2
83
7.2
10
72.6
11
45.8
11
45.9
10
99.4
10
23.2
93
4.4
84
7.3
76
3.9
68
6.1
61
3.8
55
2.3
49
7.1
44
7.8
40
5.4
36
7.9
33
4.5
30
5.7
29
11.6
19
68
31
0.6
81
6.9
99
9.4
10
25.0
96
3.1
88
7.7
80
6.0
72
1.6
64
0.6
56
8.9
50
4.9
44
8.1
39
7.2
35
4.9
31
7.7
28
5.0
25
7.1
23
2.7
21
1.1
20
15.7
19
69
30
2.8
79
2.3
92
0.2
90
1.2
81
3.1
70
4.2
61
4.2
53
6.4
46
6.9
40
5.9
35
4.9
31
1.2
27
3.7
24
0.9
21
4.1
19
0.8
17
0.6
15
3.5
13
8.6
13
16.6
19
70
29
3.5
77
3.8
89
9.8
83
6.5
72
0.7
59
9.3
49
1.2
41
2.1
34
9.9
29
8.2
25
5.2
22
0.5
19
1.6
16
7.3
14
6.5
12
9.6
11
5.1
10
2.6
92.2
86
7.4
19
71
28
5.0
75
5.5
90
8.4
84
5.6
69
1.6
54
9.1
43
2.1
34
0.7
27
7.9
23
1.0
19
3.9
16
4.0
14
0.3
12
1.1
10
5.2
91.7
80.8
71.6
63.7
59
1.3
19
72
27
7.6
72
9.9
86
6.3
83
3.8
68
2.8
51
4.7
38
6.7
29
2.7
22
4.3
17
9.2
14
6.7
12
1.6
10
1.9
86.6
74.3
64.3
55.8
49.1
43.4
39
4.2
19
73
27
0.3
70
8.3
82
3.4
78
2.3
66
2.4
49
9.9
35
6.6
25
7.7
18
9.7
14
2.4
11
1.9
90.5
74.4
61.9
52.3
44.7
38.5
33.4
29.3
25
9.1
19
74
23
9.4
68
9.9
80
0.1
74
4.6
62
2.3
48
5.6
34
6.8
23
8.0
16
7.2
12
0.5
89.0
69.2
55.4
45.2
37.4
31.5
26.8
23.1
19.9
17
1.0
19
75
29
7.6
60
1.1
72
1.9
67
0.2
54
8.6
42
2.6
31
2.1
21
4.4
14
3.0
98.4
69.8
51.0
39.2
31.2
25.3
20.9
17.5
14.9
12.8
10
4.9
19
76
21
4.0
73
3.2
57
6.8
55
4.5
45
2.8
34
1.6
24
9.0
17
6.9
11
8.2
77.2
52.3
36.7
26.5
20.3
16.0
13.0
10.6
8.9
7.5
59.2
19
77
22
4.2
52
5.9
69
5.8
43
8.2
37
0.5
27
8.9
19
9.1
13
9.6
96.4
63.1
40.6
27.2
18.9
13.5
10.3
8.1
6.5
5.4
4.5
33.3
19
78
19
3.7
54
0.7
45
7.9
48
5.0
26
8.7
20
9.4
14
9.2
10
2.5
69.8
47.2
30.4
19.3
12.8
8.8
6.3
4.8
3.8
3.0
2.5
17.3
19
79
11
7.1
46
0.7
44
1.4
29
9.2
27
8.8
14
2.4
10
5.0
71.9
48.0
32.1
21.4
13.6
8.6
5.6
3.9
2.7
2.1
1.6
1.3
8.5
19
80
25
6.9
28
1.7
39
5.8
30
3.6
18
1.0
15
5.5
75.1
53.3
35.5
23.2
15.3
10.0
6.3
4.0
2.6
1.8
1.3
0.9
0.7
4.4
19
81
71.3
61
8.8
24
3.8
27
4.3
18
5.1
10
1.7
82.7
38.4
26.5
17.3
11.1
7.2
4.7
2.9
1.8
1.2
0.8
0.6
0.4
2.3
19
82
14
0.0
17
4.0
56
8.5
17
9.3
17
7.5
11
0.4
57.4
44.9
20.3
13.7
8.8
5.6
3.6
2.3
1.5
0.9
0.6
0.4
0.3
1.3
19
83
27
3.0
34
2.5
16
1.8
42
3.3
11
7.5
10
7.1
63.0
31.5
24.0
10.6
7.1
4.5
2.8
1.8
1.2
0.7
0.4
0.3
0.2
0.8
19
84
37
5.2
65
0.8
28
2.6
10
6.9
24
5.9
62.9
54.3
30.7
14.9
11.1
4.8
3.2
2.0
1.3
0.8
0.5
0.3
0.2
0.1
0.4
19
85
10
6.4
82
0.1
50
5.1
15
3.3
51.0
10
8.0
26.1
21.6
11.8
5.6
4.1
1.8
1.2
0.7
0.5
0.3
0.2
0.1
0.1
0.2
19
86
14
1.5
23
3.9
63
4.5
28
0.1
74.7
22.9
45.7
10.5
8.4
4.5
2.1
1.5
0.7
0.4
0.3
0.2
0.1
0.1
0.0
0.1
19
87
17
9.8
30
1.4
18
3.4
40
0.3
15
5.4
38.2
11.0
21.2
4.7
3.7
1.9
0.9
0.7
0.3
0.2
0.1
0.1
0.0
0.0
0.1
19
88
13
8.6
41
5.0
27
8.2
13
3.3
25
5.9
91.5
21.3
5.9
11.0
2.4
1.8
1.0
0.4
0.3
0.1
0.1
0.1
0.0
0.0
0.0
19
89
13
9.8
32
0.4
36
8.5
19
3.6
81.6
14
4.4
48.8
10.9
2.9
5.4
1.2
0.9
0.4
0.2
0.1
0.1
0.0
0.0
0.0
0.0
19
90
12
5.7
33
0.8
29
7.4
22
3.8
10
3.4
40.1
67.0
21.7
4.7
1.2
2.2
0.5
0.4
0.2
0.1
0.1
0.0
0.0
0.0
0.0
19
91
16
9.8
27
6.9
26
9.5
18
8.4
12
4.6
53.0
19.4
31.0
9.7
2.0
0.5
0.9
0.2
0.2
0.1
0.0
0.0
0.0
0.0
0.0
19
92
82.1
41
5.7
29
3.2
20
7.4
12
7.2
77.2
30.8
10.7
16.1
4.8
1.0
0.3
0.5
0.1
0.1
0.0
0.0
0.0
0.0
0.0
19
93
63.4
21
4.9
51
7.8
25
0.5
13
8.0
77.0
43.5
16.2
5.2
7.5
2.2
0.5
0.1
0.2
0.1
0.0
0.0
0.0
0.0
0.0
19
94
63.9
15
8.0
24
4.9
39
2.0
13
2.3
66.0
34.5
18.5
6.5
2.0
2.8
0.8
0.2
0.1
0.1
0.0
0.0
0.0
0.0
0.0
19
95
63.3
14
9.3
17
4.3
20
4.5
26
5.0
81.0
37.5
18.1
8.9
2.9
0.9
1.3
0.4
0.1
0.0
0.0
0.0
0.0
0.0
0.0
19
96
89.5
14
7.0
16
1.5
14
1.2
13
3.9
15
7.6
44.9
19.4
8.8
4.0
1.3
0.4
0.6
0.2
0.0
0.0
0.0
0.0
0.0
0.0
19
97
92.2
21
7.6
17
0.3
13
5.0
91.1
78.8
87.0
23.4
9.6
4.2
1.9
0.6
0.2
0.3
0.1
0.0
0.0
0.0
0.0
0.0
19
98
20
2.7
23
3.5
27
3.8
15
0.1
88.3
54.3
43.9
45.7
11.6
4.6
1.9
0.9
0.3
0.1
0.2
0.0
0.0
0.0
0.0
0.0
19
99
21
8.7
51
3.1
27
4.3
22
6.1
99.7
53.5
30.8
23.4
23.0
5.6
2.1
0.9
0.4
0.2
0.0
0.1
0.0
0.0
0.0
0.0
20
00
17
5.2
55
0.8
58
3.6
21
5.7
14
2.7
57.4
28.7
15.4
11.0
10.2
2.4
1.0
0.4
0.2
0.1
0.0
0.0
0.0
0.0
0.0
20
01
13
2.9
42
9.6
59
6.9
45
1.6
14
0.7
84.9
31.7
14.8
7.4
4.9
4.5
1.1
0.5
0.2
0.1
0.0
0.0
0.0
0.0
0.0
20
02
14
7.2
31
3.2
43
5.7
43
6.9
27
5.9
77.8
43.1
14.7
6.2
2.8
1.9
1.8
0.5
0.2
0.1
0.0
0.0
0.0
0.0
0.0
20
03
10
1.3
34
7.1
32
5.9
33
6.6
29
1.5
16
6.7
43.2
21.8
6.7
2.6
1.1
0.8
0.9
0.2
0.1
0.1
0.0
0.0
0.0
0.0
20
04
12
8.7
23
8.5
36
0.4
26
1.5
25
0.8
19
8.3
10
5.3
25.4
11.9
3.4
1.3
0.6
0.4
0.5
0.1
0.1
0.0
0.0
0.0
0.0
20
05
13
3.5
29
6.1
23
7.3
27
0.9
17
5.6
15
3.6
11
2.9
55.9
12.5
5.5
1.5
0.6
0.3
0.2
0.2
0.1
0.0
0.0
0.0
0.0
20
06
13
4.5
31
3.6
30
0.9
18
0.5
18
5.7
11
0.4
90.6
63.2
29.7
6.4
2.8
0.8
0.3
0.2
0.1
0.1
0.0
0.0
0.0
0.0
20
07
13
8.1
32
6.5
34
0.3
24
4.0
13
2.6
12
5.4
70.3
55.2
37.1
17.0
3.6
1.5
0.4
0.2
0.1
0.1
0.1
0.0
0.0
0.0
SEDAR 15 SAR 1 SECTION III 57

Assessment Workshop South Atlantic Red Snapper
Table 3.5. Red snapper: Estimated time series and status indicators. Fishing mortality rate is full F , whichincludes discard mortalities. Total biomass (B) is at the start of the year, and spawning biomass (SSB) at themidpoint; B and SSB are in units mt. SPR is static spawning potential ratio.
Year F F /FMSY B B/Bunfished SSB SSB/SSBMSY SPR
1945 0.00411 0.0367 27823 0.7500 13256 2.5572 0.63451946 0.00449 0.0401 27757 0.7482 13178 2.5420 0.63201947 0.00989 0.0883 27769 0.7486 13124 2.5316 0.59831948 0.01534 0.1370 27739 0.7477 13062 2.5196 0.56661949 0.02087 0.1864 27662 0.7457 12985 2.5048 0.53651950 0.02652 0.2368 27526 0.7420 12882 2.4849 0.50771951 0.03464 0.3093 27313 0.7363 12727 2.4552 0.46981952 0.03822 0.3412 26945 0.7263 12531 2.4172 0.45421953 0.04454 0.3977 26538 0.7154 12300 2.3726 0.42821954 0.05467 0.4881 26018 0.7014 11994 2.3137 0.39041955 0.06017 0.5373 25296 0.6819 11625 2.2424 0.37161956 0.06805 0.6076 24503 0.6605 11211 2.1627 0.34671957 0.08525 0.7612 23599 0.6361 10699 2.0638 0.29951958 0.09111 0.8135 22398 0.6038 10117 1.9516 0.28541959 0.10490 0.9366 21198 0.5714 9500 1.8327 0.25541960 0.12068 1.0775 19862 0.5354 8822 1.7018 0.22601961 0.14391 1.2849 18403 0.4961 8069 1.5565 0.19051962 0.16350 1.4599 16757 0.4517 7262 1.4009 0.16621963 0.19066 1.7024 15071 0.4063 6429 1.2402 0.13911964 0.23552 2.1029 13312 0.3588 5537 1.0681 0.10631965 0.30478 2.7213 11381 0.3068 4555 0.8786 0.07401966 0.34145 3.0486 9238 0.2490 3608 0.6960 0.06241967 0.39542 3.5305 7397 0.1994 2790 0.5381 0.04961968 0.45333 4.0476 5790 0.1561 2098 0.4048 0.03971969 0.44525 3.9755 4455 0.1201 1598 0.3083 0.04091970 0.41206 3.6791 3612 0.0974 1298 0.2504 0.04641971 0.43564 3.8897 3148 0.0849 1106 0.2133 0.04241972 0.45193 4.0351 2779 0.0749 959 0.1850 0.03991973 0.45059 4.0231 2490 0.0671 852 0.1643 0.04011974 0.52713 4.7065 2278 0.0614 748 0.1443 0.03091975 0.61378 5.4801 2004 0.0540 620 0.1196 0.02371976 0.62480 5.5786 1699 0.0458 514 0.0992 0.02301977 0.71077 6.3462 1451 0.0391 419 0.0809 0.01831978 0.77541 6.9233 1194 0.0322 329 0.0634 0.01571979 0.72426 6.4666 937 0.0253 265 0.0511 0.01771980 0.71660 6.3982 820 0.0221 223 0.0430 0.01811981 0.65715 5.8674 768 0.0207 215 0.0414 0.02111982 0.64484 5.7575 685 0.0185 201 0.0388 0.02181983 0.76482 6.8288 714 0.0192 181 0.0350 0.01611984 1.07634 9.6102 839 0.0226 180 0.0347 0.01141985 1.06609 9.5187 825 0.0222 191 0.0368 0.01161986 0.99991 8.9278 663 0.0179 173 0.0335 0.01311987 0.83766 7.4791 591 0.0159 160 0.0309 0.01961988 0.85233 7.6101 616 0.0166 163 0.0313 0.01781989 0.91956 8.2104 598 0.0161 153 0.0295 0.01591990 1.03705 9.2594 553 0.0149 141 0.0271 0.01401991 0.74542 6.6555 520 0.0140 142 0.0275 0.02541992 0.89651 8.0045 575 0.0155 169 0.0326 0.03291993 1.18468 10.5775 607 0.0164 174 0.0336 0.02231994 1.16646 10.4148 509 0.0137 158 0.0305 0.02621995 1.16125 10.3683 457 0.0123 140 0.0269 0.02441996 1.02684 9.1683 413 0.0111 123 0.0237 0.02761997 0.94830 8.4670 414 0.0112 122 0.0234 0.03241998 0.93248 8.3257 504 0.0136 138 0.0266 0.02961999 1.01926 9.1005 668 0.0180 175 0.0338 0.02632000 1.05793 9.4458 814 0.0219 224 0.0432 0.02502001 1.30281 11.6322 863 0.0233 243 0.0468 0.02052002 1.22252 10.9154 797 0.0215 235 0.0452 0.02342003 1.01853 9.0941 747 0.0201 231 0.0446 0.02732004 1.16021 10.3590 720 0.0194 215 0.0414 0.02202005 1.01732 9.0832 661 0.0178 195 0.0376 0.02382006 0.84145 7.5130 644 0.0174 194 0.0373 0.02982007 . . 677 0.0182 . . .
SEDAR 15 SAR 1 SECTION III 58

Assessment Workshop South Atlantic Red Snapper
Table
3.6
.R
edsn
apper
:Se
lect
ivit
yat
age
esti
mate
dfo
rth
eper
iod
1992–2
006
Age
Len
gth
(mm
)Le
ngth
(in
)c.
hal
c.d
vh
bre
cD
.c.h
alD
.hb
D.r
ecL.
avg
D.a
vgL.
avg+D
.avg
1262.8
10.3
0.0
001
0.0
051
0.0
000
0.0
210
0.5
000
0.5
000
0.5
000
0.0
105
0.2
613
0.2
718
2395.2
15.6
0.0
052
0.0
110
0.0
000
0.6
546
1.0
000
1.0
000
1.0
000
0.3
115
0.5
226
0.8
341
3499.8
19.7
0.2
815
0.0
238
0.4
162
0.9
941
0.6
009
0.7
159
0.6
035
0.6
088
0.3
249
0.9
337
4582.5
22.9
0.9
672
0.0
510
1.0
000
0.9
999
0.0
193
0.0
001
0.0
168
0.8
886
0.0
075
0.8
962
5647.9
25.5
0.9
996
0.1
075
1.0
000
1.0
000
0.0
003
0.0
000
0.0
002
0.9
038
0.0
001
0.9
039
6699.6
27.5
1.0
000
0.2
202
1.0
000
1.0
000
0.0
000
0.0
000
0.0
000
0.9
161
0.0
000
0.9
161
7740.4
29.2
1.0
000
0.4
234
1.0
000
1.0
000
0.0
000
0.0
000
0.0
000
0.9
380
0.0
000
0.9
380
8772.7
30.4
1.0
000
0.7
225
1.0
000
1.0
000
0.0
000
0.0
000
0.0
000
0.9
701
0.0
000
0.9
701
9798.3
31.4
1.0
000
1.0
000
1.0
000
1.0
000
0.0
000
0.0
000
0.0
000
1.0
000
0.0
000
1.0
000
10
818.5
32.2
1.0
000
1.0
000
1.0
000
1.0
000
0.0
000
0.0
000
0.0
000
1.0
000
0.0
000
1.0
000
11
834.4
32.9
1.0
000
0.6
657
1.0
000
1.0
000
0.0
000
0.0
000
0.0
000
0.9
640
0.0
000
0.9
640
12
847.1
33.3
1.0
000
0.3
115
1.0
000
1.0
000
0.0
000
0.0
000
0.0
000
0.9
259
0.0
000
0.9
259
13
857.0
33.7
1.0
000
0.1
188
1.0
000
1.0
000
0.0
000
0.0
000
0.0
000
0.9
052
0.0
000
0.9
052
14
864.9
34.1
1.0
000
0.0
414
1.0
000
1.0
000
0.0
000
0.0
000
0.0
000
0.8
968
0.0
000
0.8
968
15
871.2
34.3
1.0
000
0.0
139
1.0
000
1.0
000
0.0
000
0.0
000
0.0
000
0.8
939
0.0
000
0.8
939
16
876.1
34.5
1.0
000
0.0
046
1.0
000
1.0
000
0.0
000
0.0
000
0.0
000
0.8
929
0.0
000
0.8
929
17
880.0
34.6
1.0
000
0.0
015
1.0
000
1.0
000
0.0
000
0.0
000
0.0
000
0.8
926
0.0
000
0.8
926
18
883.1
34.8
1.0
000
0.0
005
1.0
000
1.0
000
0.0
000
0.0
000
0.0
000
0.8
924
0.0
000
0.8
924
19
885.5
34.9
1.0
000
0.0
002
1.0
000
1.0
000
0.0
000
0.0
000
0.0
000
0.8
924
0.0
000
0.8
924
20
887.4
34.9
1.0
000
0.0
001
1.0
000
1.0
000
0.0
000
0.0
000
0.0
000
0.8
924
0.0
000
0.8
924
SEDAR 15 SAR 1 SECTION III 59

Assessment Workshop South Atlantic Red Snapper
Table 3.7. Red snapper: Estimated time series of fishing mortality rate for commercial handline (F.c.hal), com-mercial diving (F.c.dv), headboat (F.hb), general recreational (F.rec),commercial handline discards (F.c.hal.D),headboat discards (F.hb.D), general recreational discards (F.mrfss.D), and full F (F.full).
Year F.c.hal F.c.dv F.hb F.rec F.c.hal.D F.hb.D F.rec.D F.full
1945 0.004 0.000 0.000 0.000 0.000 0.000 0.000 0.0041946 0.004 0.000 0.000 0.000 0.000 0.000 0.000 0.0041947 0.005 0.000 0.000 0.005 0.000 0.000 0.000 0.0101948 0.005 0.000 0.000 0.010 0.000 0.000 0.000 0.0151949 0.006 0.000 0.000 0.015 0.000 0.000 0.000 0.0211950 0.006 0.000 0.000 0.020 0.000 0.000 0.000 0.0271951 0.009 0.000 0.000 0.026 0.000 0.000 0.000 0.0351952 0.007 0.000 0.000 0.031 0.000 0.000 0.000 0.0381953 0.007 0.000 0.000 0.037 0.000 0.000 0.000 0.0451954 0.011 0.000 0.000 0.044 0.000 0.000 0.000 0.0551955 0.009 0.000 0.000 0.051 0.000 0.000 0.000 0.0601956 0.009 0.000 0.000 0.059 0.000 0.000 0.000 0.0681957 0.018 0.000 0.000 0.068 0.000 0.000 0.000 0.0851958 0.013 0.000 0.000 0.078 0.000 0.000 0.000 0.0911959 0.015 0.000 0.000 0.090 0.000 0.000 0.000 0.1051960 0.017 0.000 0.000 0.104 0.000 0.000 0.000 0.1211961 0.021 0.000 0.000 0.123 0.000 0.000 0.000 0.1441962 0.018 0.000 0.000 0.146 0.000 0.000 0.000 0.1641963 0.015 0.000 0.000 0.175 0.000 0.000 0.000 0.1911964 0.020 0.000 0.000 0.216 0.000 0.000 0.000 0.2361965 0.028 0.000 0.000 0.277 0.000 0.000 0.000 0.3051966 0.039 0.000 0.000 0.302 0.000 0.000 0.000 0.3411967 0.066 0.000 0.000 0.329 0.000 0.000 0.000 0.3951968 0.097 0.000 0.000 0.356 0.000 0.000 0.000 0.4531969 0.082 0.000 0.000 0.363 0.000 0.000 0.000 0.4451970 0.092 0.000 0.000 0.320 0.000 0.000 0.000 0.4121971 0.092 0.000 0.000 0.344 0.000 0.000 0.000 0.4361972 0.091 0.000 0.020 0.340 0.000 0.000 0.000 0.4521973 0.084 0.000 0.029 0.338 0.000 0.000 0.000 0.4511974 0.155 0.000 0.021 0.351 0.000 0.000 0.000 0.5271975 0.218 0.000 0.028 0.368 0.000 0.000 0.000 0.6141976 0.216 0.000 0.043 0.366 0.000 0.000 0.000 0.6251977 0.280 0.000 0.029 0.402 0.000 0.000 0.000 0.7111978 0.330 0.000 0.038 0.407 0.000 0.000 0.000 0.7751979 0.284 0.000 0.040 0.399 0.000 0.000 0.000 0.7241980 0.321 0.000 0.050 0.346 0.000 0.000 0.000 0.7171981 0.305 0.000 0.102 0.250 0.000 0.000 0.000 0.6571982 0.290 0.000 0.099 0.255 0.000 0.000 0.000 0.6451983 0.318 0.000 0.081 0.366 0.000 0.000 0.000 0.7651984 0.357 0.014 0.087 0.517 0.013 0.006 0.082 1.0761985 0.307 0.034 0.123 0.509 0.009 0.007 0.077 1.0661986 0.264 0.010 0.063 0.484 0.033 0.012 0.135 1.0001987 0.269 0.007 0.104 0.295 0.053 0.031 0.078 0.8381988 0.236 0.005 0.156 0.320 0.025 0.024 0.086 0.8521989 0.387 0.017 0.091 0.371 0.011 0.006 0.038 0.9201990 0.352 0.027 0.091 0.362 0.124 0.047 0.034 1.0371991 0.222 0.084 0.102 0.286 0.014 0.008 0.028 0.7451992 0.223 0.140 0.068 0.336 0.057 0.004 0.069 0.8971993 0.465 0.085 0.086 0.317 0.079 0.046 0.107 1.1851994 0.347 0.194 0.099 0.164 0.148 0.048 0.166 1.1661995 0.353 0.140 0.118 0.174 0.162 0.082 0.133 1.1611996 0.335 0.081 0.114 0.213 0.185 0.027 0.072 1.0271997 0.294 0.097 0.144 0.209 0.155 0.007 0.042 0.9481998 0.234 0.105 0.073 0.322 0.075 0.027 0.096 0.9321999 0.212 0.134 0.108 0.358 0.047 0.017 0.143 1.0192000 0.197 0.154 0.097 0.349 0.044 0.022 0.195 1.0582001 0.278 0.256 0.101 0.326 0.061 0.052 0.228 1.3032002 0.232 0.267 0.096 0.287 0.066 0.052 0.222 1.2232003 0.166 0.166 0.056 0.286 0.065 0.038 0.242 1.0192004 0.219 0.157 0.113 0.282 0.059 0.070 0.260 1.1602005 0.189 0.072 0.092 0.315 0.054 0.061 0.234 1.0172006 0.142 0.030 0.070 0.316 0.055 0.040 0.188 0.841
SEDAR 15 SAR 1 SECTION III 60

Assessment Workshop South Atlantic Red SnapperT
able
3.8
.R
edsn
ap
per
:Es
tim
ate
din
sta
nta
neo
us
fish
ing
mor
tality
rate
(per
yr)
at
age,
incl
ud
ing
dis
card
mor
tality
Yea
r1
23
45
67
89
10
11
12
13
14
15
16
17
18
19
20
19
45
0.0
01
0.0
04
0.0
04
0.0
04
0.0
04
0.0
04
0.0
04
0.0
04
0.0
04
0.0
04
0.0
04
0.0
04
0.0
04
0.0
04
0.0
04
0.0
04
0.0
04
0.0
04
0.0
04
0.0
04
19
46
0.0
01
0.0
04
0.0
04
0.0
04
0.0
04
0.0
04
0.0
04
0.0
04
0.0
04
0.0
04
0.0
04
0.0
04
0.0
04
0.0
04
0.0
04
0.0
04
0.0
04
0.0
04
0.0
04
0.0
04
19
47
0.0
02
0.0
10
0.0
10
0.0
10
0.0
10
0.0
10
0.0
10
0.0
10
0.0
10
0.0
10
0.0
10
0.0
10
0.0
10
0.0
10
0.0
10
0.0
10
0.0
10
0.0
10
0.0
10
0.0
10
19
48
0.0
03
0.0
15
0.0
15
0.0
15
0.0
15
0.0
15
0.0
15
0.0
15
0.0
15
0.0
15
0.0
15
0.0
15
0.0
15
0.0
15
0.0
15
0.0
15
0.0
15
0.0
15
0.0
15
0.0
15
19
49
0.0
05
0.0
21
0.0
21
0.0
21
0.0
21
0.0
21
0.0
21
0.0
21
0.0
21
0.0
21
0.0
21
0.0
21
0.0
21
0.0
21
0.0
21
0.0
21
0.0
21
0.0
21
0.0
21
0.0
21
19
50
0.0
06
0.0
27
0.0
27
0.0
27
0.0
27
0.0
27
0.0
27
0.0
27
0.0
27
0.0
27
0.0
27
0.0
27
0.0
27
0.0
27
0.0
27
0.0
27
0.0
27
0.0
27
0.0
27
0.0
27
19
51
0.0
08
0.0
35
0.0
35
0.0
35
0.0
35
0.0
35
0.0
35
0.0
35
0.0
35
0.0
35
0.0
35
0.0
35
0.0
35
0.0
35
0.0
35
0.0
35
0.0
35
0.0
35
0.0
35
0.0
35
19
52
0.0
08
0.0
38
0.0
38
0.0
38
0.0
38
0.0
38
0.0
38
0.0
38
0.0
38
0.0
38
0.0
38
0.0
38
0.0
38
0.0
38
0.0
38
0.0
38
0.0
38
0.0
38
0.0
38
0.0
38
19
53
0.0
10
0.0
45
0.0
45
0.0
45
0.0
45
0.0
45
0.0
45
0.0
45
0.0
45
0.0
45
0.0
45
0.0
45
0.0
45
0.0
45
0.0
45
0.0
45
0.0
45
0.0
45
0.0
45
0.0
45
19
54
0.0
12
0.0
55
0.0
55
0.0
55
0.0
55
0.0
55
0.0
55
0.0
55
0.0
55
0.0
55
0.0
55
0.0
55
0.0
55
0.0
55
0.0
55
0.0
55
0.0
55
0.0
55
0.0
55
0.0
55
19
55
0.0
13
0.0
60
0.0
60
0.0
60
0.0
60
0.0
60
0.0
60
0.0
60
0.0
60
0.0
60
0.0
60
0.0
60
0.0
60
0.0
60
0.0
60
0.0
60
0.0
60
0.0
60
0.0
60
0.0
60
19
56
0.0
15
0.0
68
0.0
68
0.0
68
0.0
68
0.0
68
0.0
68
0.0
68
0.0
68
0.0
68
0.0
68
0.0
68
0.0
68
0.0
68
0.0
68
0.0
68
0.0
68
0.0
68
0.0
68
0.0
68
19
57
0.0
19
0.0
85
0.0
85
0.0
85
0.0
85
0.0
85
0.0
85
0.0
85
0.0
85
0.0
85
0.0
85
0.0
85
0.0
85
0.0
85
0.0
85
0.0
85
0.0
85
0.0
85
0.0
85
0.0
85
19
58
0.0
20
0.0
91
0.0
91
0.0
91
0.0
91
0.0
91
0.0
91
0.0
91
0.0
91
0.0
91
0.0
91
0.0
91
0.0
91
0.0
91
0.0
91
0.0
91
0.0
91
0.0
91
0.0
91
0.0
91
19
59
0.0
23
0.1
05
0.1
05
0.1
05
0.1
05
0.1
05
0.1
05
0.1
05
0.1
05
0.1
05
0.1
05
0.1
05
0.1
05
0.1
05
0.1
05
0.1
05
0.1
05
0.1
05
0.1
05
0.1
05
19
60
0.0
26
0.1
21
0.1
21
0.1
21
0.1
21
0.1
21
0.1
21
0.1
21
0.1
21
0.1
21
0.1
21
0.1
21
0.1
21
0.1
21
0.1
21
0.1
21
0.1
21
0.1
21
0.1
21
0.1
21
19
61
0.0
31
0.1
44
0.1
44
0.1
44
0.1
44
0.1
44
0.1
44
0.1
44
0.1
44
0.1
44
0.1
44
0.1
44
0.1
44
0.1
44
0.1
44
0.1
44
0.1
44
0.1
44
0.1
44
0.1
44
19
62
0.0
36
0.1
64
0.1
64
0.1
64
0.1
64
0.1
64
0.1
64
0.1
64
0.1
64
0.1
64
0.1
64
0.1
64
0.1
64
0.1
64
0.1
64
0.1
64
0.1
64
0.1
64
0.1
64
0.1
64
19
63
0.0
42
0.1
91
0.1
91
0.1
91
0.1
91
0.1
91
0.1
91
0.1
91
0.1
91
0.1
91
0.1
91
0.1
91
0.1
91
0.1
91
0.1
91
0.1
91
0.1
91
0.1
91
0.1
91
0.1
91
19
64
0.0
51
0.2
36
0.2
36
0.2
36
0.2
36
0.2
36
0.2
36
0.2
36
0.2
36
0.2
36
0.2
36
0.2
36
0.2
36
0.2
36
0.2
36
0.2
36
0.2
36
0.2
36
0.2
36
0.2
36
19
65
0.0
66
0.3
05
0.3
05
0.3
05
0.3
05
0.3
05
0.3
05
0.3
05
0.3
05
0.3
05
0.3
05
0.3
05
0.3
05
0.3
05
0.3
05
0.3
05
0.3
05
0.3
05
0.3
05
0.3
05
19
66
0.0
74
0.3
41
0.3
41
0.3
41
0.3
41
0.3
41
0.3
41
0.3
41
0.3
41
0.3
41
0.3
41
0.3
41
0.3
41
0.3
41
0.3
41
0.3
41
0.3
41
0.3
41
0.3
41
0.3
41
19
67
0.0
86
0.3
95
0.3
95
0.3
95
0.3
95
0.3
95
0.3
95
0.3
95
0.3
95
0.3
95
0.3
95
0.3
95
0.3
95
0.3
95
0.3
95
0.3
95
0.3
95
0.3
95
0.3
95
0.3
95
19
68
0.0
99
0.4
53
0.4
53
0.4
53
0.4
53
0.4
53
0.4
53
0.4
53
0.4
53
0.4
53
0.4
53
0.4
53
0.4
53
0.4
53
0.4
53
0.4
53
0.4
53
0.4
53
0.4
53
0.4
53
19
69
0.0
97
0.4
45
0.4
45
0.4
45
0.4
45
0.4
45
0.4
45
0.4
45
0.4
45
0.4
45
0.4
45
0.4
45
0.4
45
0.4
45
0.4
45
0.4
45
0.4
45
0.4
45
0.4
45
0.4
45
19
70
0.0
90
0.4
12
0.4
12
0.4
12
0.4
12
0.4
12
0.4
12
0.4
12
0.4
12
0.4
12
0.4
12
0.4
12
0.4
12
0.4
12
0.4
12
0.4
12
0.4
12
0.4
12
0.4
12
0.4
12
19
71
0.0
95
0.4
36
0.4
36
0.4
36
0.4
36
0.4
36
0.4
36
0.4
36
0.4
36
0.4
36
0.4
36
0.4
36
0.4
36
0.4
36
0.4
36
0.4
36
0.4
36
0.4
36
0.4
36
0.4
36
19
72
0.0
99
0.4
52
0.4
52
0.4
52
0.4
52
0.4
52
0.4
52
0.4
52
0.4
52
0.4
52
0.4
52
0.4
52
0.4
52
0.4
52
0.4
52
0.4
52
0.4
52
0.4
52
0.4
52
0.4
52
19
73
0.0
98
0.4
51
0.4
51
0.4
51
0.4
51
0.4
51
0.4
51
0.4
51
0.4
51
0.4
51
0.4
51
0.4
51
0.4
51
0.4
51
0.4
51
0.4
51
0.4
51
0.4
51
0.4
51
0.4
51
19
74
0.1
15
0.5
27
0.5
27
0.5
27
0.5
27
0.5
27
0.5
27
0.5
27
0.5
27
0.5
27
0.5
27
0.5
27
0.5
27
0.5
27
0.5
27
0.5
27
0.5
27
0.5
27
0.5
27
0.5
27
19
75
0.1
34
0.6
14
0.6
14
0.6
14
0.6
14
0.6
14
0.6
14
0.6
14
0.6
14
0.6
14
0.6
14
0.6
14
0.6
14
0.6
14
0.6
14
0.6
14
0.6
14
0.6
14
0.6
14
0.6
14
19
76
0.1
36
0.6
25
0.6
25
0.6
25
0.6
25
0.6
25
0.6
25
0.6
25
0.6
25
0.6
25
0.6
25
0.6
25
0.6
25
0.6
25
0.6
25
0.6
25
0.6
25
0.6
25
0.6
25
0.6
25
19
77
0.1
55
0.7
11
0.7
11
0.7
11
0.7
11
0.7
11
0.7
11
0.7
11
0.7
11
0.7
11
0.7
11
0.7
11
0.7
11
0.7
11
0.7
11
0.7
11
0.7
11
0.7
11
0.7
11
0.7
11
19
78
0.1
69
0.7
75
0.7
75
0.7
75
0.7
75
0.7
75
0.7
75
0.7
75
0.7
75
0.7
75
0.7
75
0.7
75
0.7
75
0.7
75
0.7
75
0.7
75
0.7
75
0.7
75
0.7
75
0.7
75
19
79
0.1
58
0.7
24
0.7
24
0.7
24
0.7
24
0.7
24
0.7
24
0.7
24
0.7
24
0.7
24
0.7
24
0.7
24
0.7
24
0.7
24
0.7
24
0.7
24
0.7
24
0.7
24
0.7
24
0.7
24
19
80
0.1
56
0.7
17
0.7
17
0.7
17
0.7
17
0.7
17
0.7
17
0.7
17
0.7
17
0.7
17
0.7
17
0.7
17
0.7
17
0.7
17
0.7
17
0.7
17
0.7
17
0.7
17
0.7
17
0.7
17
19
81
0.1
43
0.6
57
0.6
57
0.6
57
0.6
57
0.6
57
0.6
57
0.6
57
0.6
57
0.6
57
0.6
57
0.6
57
0.6
57
0.6
57
0.6
57
0.6
57
0.6
57
0.6
57
0.6
57
0.6
57
19
82
0.1
41
0.6
45
0.6
45
0.6
45
0.6
45
0.6
45
0.6
45
0.6
45
0.6
45
0.6
45
0.6
45
0.6
45
0.6
45
0.6
45
0.6
45
0.6
45
0.6
45
0.6
45
0.6
45
0.6
45
19
83
0.1
67
0.7
65
0.7
65
0.7
65
0.7
65
0.7
65
0.7
65
0.7
65
0.7
65
0.7
65
0.7
65
0.7
65
0.7
65
0.7
65
0.7
65
0.7
65
0.7
65
0.7
65
0.7
65
0.7
65
19
84
0.2
53
0.8
26
0.9
62
0.9
62
0.9
63
0.9
64
0.9
67
0.9
72
0.9
75
0.9
75
0.9
71
0.9
66
0.9
63
0.9
62
0.9
61
0.9
61
0.9
61
0.9
61
0.9
61
0.9
61
SEDAR 15 SAR 1 SECTION III 61

Assessment Workshop South Atlantic Red SnapperT
able
3.8
.(c
on
tin
ued
)
Yea
r1
23
45
67
89
10
11
12
13
14
15
16
17
18
19
20
19
85
0.2
48
0.8
29
0.9
40
0.9
41
0.9
43
0.9
46
0.9
53
0.9
64
0.9
73
0.9
73
0.9
62
0.9
50
0.9
43
0.9
40
0.9
39
0.9
39
0.9
39
0.9
39
0.9
39
0.9
39
19
86
0.2
79
0.8
16
0.8
11
0.8
11
0.8
11
0.8
13
0.8
15
0.8
17
0.8
20
0.8
20
0.8
17
0.8
13
0.8
12
0.8
11
0.8
11
0.8
11
0.8
10
0.8
10
0.8
10
0.8
10
19
87
0.1
99
0.6
52
0.6
69
0.6
69
0.6
69
0.6
70
0.6
72
0.6
74
0.6
76
0.6
76
0.6
73
0.6
71
0.6
69
0.6
69
0.6
69
0.6
69
0.6
69
0.6
69
0.6
69
0.6
69
19
88
0.1
97
0.6
91
0.7
13
0.7
13
0.7
13
0.7
13
0.7
14
0.7
16
0.7
17
0.7
17
0.7
15
0.7
14
0.7
13
0.7
13
0.7
12
0.7
12
0.7
12
0.7
12
0.7
12
0.7
12
19
89
0.1
74
0.6
47
0.8
49
0.8
49
0.8
50
0.8
52
0.8
55
0.8
60
0.8
65
0.8
65
0.8
59
0.8
53
0.8
50
0.8
49
0.8
49
0.8
48
0.8
48
0.8
48
0.8
48
0.8
48
19
90
0.2
46
0.7
77
0.8
06
0.8
07
0.8
09
0.8
12
0.8
17
0.8
25
0.8
32
0.8
32
0.8
23
0.8
14
0.8
09
0.8
07
0.8
06
0.8
06
0.8
06
0.8
06
0.8
06
0.8
06
19
91
0.1
40
0.5
15
0.6
12
0.6
14
0.6
19
0.6
29
0.6
46
0.6
71
0.6
94
0.6
94
0.6
66
0.6
36
0.6
20
0.6
14
0.6
11
0.6
10
0.6
10
0.6
10
0.6
10
0.6
10
19
92
0.0
73
0.3
53
0.5
07
0.6
29
0.6
42
0.6
58
0.6
86
0.7
28
0.7
67
0.7
67
0.7
20
0.6
70
0.6
44
0.6
33
0.6
29
0.6
28
0.6
27
0.6
27
0.6
27
0.6
27
19
93
0.1
23
0.4
42
0.6
28
0.8
61
0.8
77
0.8
87
0.9
04
0.9
30
0.9
54
0.9
54
0.9
25
0.8
95
0.8
78
0.8
72
0.8
69
0.8
69
0.8
68
0.8
68
0.8
68
0.8
68
19
94
0.1
86
0.4
74
0.5
30
0.6
13
0.6
30
0.6
52
0.6
91
0.7
50
0.8
03
0.8
03
0.7
39
0.6
70
0.6
32
0.6
17
0.6
12
0.6
10
0.6
10
0.6
09
0.6
09
0.6
09
19
95
0.1
93
0.4
94
0.5
61
0.6
45
0.6
59
0.6
75
0.7
04
0.7
45
0.7
84
0.7
84
0.7
38
0.6
88
0.6
61
0.6
50
0.6
46
0.6
45
0.6
45
0.6
45
0.6
45
0.6
45
19
96
0.1
47
0.4
26
0.5
29
0.6
60
0.6
70
0.6
80
0.6
96
0.7
21
0.7
43
0.7
43
0.7
16
0.6
87
0.6
71
0.6
65
0.6
63
0.6
62
0.6
62
0.6
62
0.6
62
0.6
62
19
97
0.1
07
0.3
43
0.4
76
0.6
47
0.6
58
0.6
69
0.6
89
0.7
18
0.7
45
0.7
45
0.7
13
0.6
78
0.6
59
0.6
52
0.6
49
0.6
48
0.6
48
0.6
48
0.6
48
0.6
48
19
98
0.1
06
0.4
11
0.5
42
0.6
30
0.6
41
0.6
53
0.6
74
0.7
05
0.7
34
0.7
34
0.6
99
0.6
62
0.6
42
0.6
34
0.6
31
0.6
30
0.6
30
0.6
30
0.6
30
0.6
30
19
99
0.1
12
0.4
44
0.5
90
0.6
81
0.6
93
0.7
08
0.7
35
0.7
75
0.8
12
0.8
12
0.7
68
0.7
20
0.6
94
0.6
84
0.6
80
0.6
79
0.6
79
0.6
78
0.6
78
0.6
78
20
00
0.1
38
0.4
92
0.6
06
0.6
49
0.6
60
0.6
77
0.7
08
0.7
55
0.7
97
0.7
97
0.7
46
0.6
91
0.6
62
0.6
50
0.6
45
0.6
44
0.6
44
0.6
43
0.6
43
0.6
43
20
01
0.1
78
0.5
58
0.6
62
0.7
15
0.7
33
0.7
62
0.8
14
0.8
91
0.9
62
0.9
62
0.8
76
0.7
86
0.7
36
0.7
16
0.7
09
0.7
07
0.7
06
0.7
06
0.7
06
0.7
06
20
02
0.1
78
0.5
32
0.6
08
0.6
26
0.6
44
0.6
74
0.7
28
0.8
08
0.8
82
0.8
82
0.7
93
0.6
98
0.6
47
0.6
26
0.6
19
0.6
16
0.6
16
0.6
15
0.6
15
0.6
15
20
03
0.1
79
0.5
35
0.5
70
0.5
16
0.5
25
0.5
44
0.5
78
0.6
28
0.6
74
0.6
74
0.6
18
0.5
59
0.5
27
0.5
14
0.5
10
0.5
08
0.5
08
0.5
08
0.5
08
0.5
08
20
04
0.2
02
0.5
77
0.6
36
0.6
20
0.6
30
0.6
48
0.6
80
0.7
27
0.7
70
0.7
70
0.7
18
0.6
62
0.6
32
0.6
20
0.6
16
0.6
14
0.6
14
0.6
14
0.6
14
0.6
14
20
05
0.1
81
0.5
57
0.6
24
0.5
99
0.6
05
0.6
13
0.6
27
0.6
49
0.6
69
0.6
69
0.6
45
0.6
19
0.6
06
0.6
00
0.5
98
0.5
97
0.5
97
0.5
97
0.5
97
0.5
97
20
06
0.1
48
0.4
91
0.5
59
0.5
30
0.5
32
0.5
36
0.5
42
0.5
51
0.5
59
0.5
59
0.5
49
0.5
38
0.5
33
0.5
30
0.5
30
0.5
29
0.5
29
0.5
29
0.5
29
0.5
29
SEDAR 15 SAR 1 SECTION III 62

Assessment Workshop South Atlantic Red SnapperT
able
3.9
.R
edsn
ap
per
:La
nd
ings
at
age
(10
00
fish
),a
ses
tim
ate
dby
the
ass
essm
ent
mod
el
Yea
r1
23
45
67
89
10
11
12
13
14
15
16
17
18
19
20
19
45
0.4
1.4
1.2
1.1
1.0
0.9
0.8
0.7
0.7
0.6
0.6
0.5
0.5
0.5
0.4
0.4
0.4
0.3
0.3
4.2
19
46
0.6
1.5
1.3
1.1
1.0
0.9
0.9
0.8
0.7
0.7
0.6
0.6
0.5
0.5
0.5
0.4
0.4
0.4
0.3
4.6
19
47
1.3
4.8
2.8
2.5
2.3
2.1
1.9
1.7
1.6
1.5
1.4
1.3
1.2
1.1
1.0
0.9
0.9
0.8
0.8
10.0
19
48
2.0
7.4
6.4
3.9
3.5
3.2
2.9
2.7
2.4
2.3
2.1
1.9
1.8
1.7
1.5
1.4
1.3
1.2
1.2
15.3
19
49
2.7
10.0
8.6
7.6
4.7
4.2
3.9
3.5
3.3
3.0
2.8
2.6
2.4
2.2
2.1
1.9
1.8
1.7
1.5
20.4
19
50
3.4
12.7
10.8
9.5
8.5
5.3
4.8
4.4
4.1
3.7
3.5
3.2
3.0
2.8
2.6
2.4
2.2
2.1
1.9
25.3
19
51
4.4
16.5
13.9
12.2
10.8
9.8
6.1
5.6
5.1
4.7
4.4
4.1
3.8
3.5
3.2
3.0
2.8
2.6
2.4
32.0
19
52
4.9
18.1
15.2
13.2
11.7
10.5
9.5
6.0
5.5
5.0
4.7
4.3
4.0
3.7
3.5
3.2
3.0
2.8
2.6
34.1
19
53
5.7
21.0
17.6
15.1
13.3
11.9
10.7
9.8
6.1
5.6
5.2
4.8
4.5
4.2
3.9
3.6
3.3
3.1
2.9
38.1
19
54
7.0
25.6
21.3
18.3
15.9
14.1
12.7
11.5
10.5
6.6
6.1
5.7
5.2
4.9
4.5
4.2
3.9
3.6
3.4
44.5
19
55
7.7
28.1
23.1
19.7
17.1
15.1
13.4
12.1
11.0
10.1
6.4
5.9
5.4
5.1
4.7
4.4
4.0
3.8
3.5
46.3
19
56
8.7
31.6
25.8
21.8
18.8
16.5
14.6
13.1
11.8
10.8
9.9
6.2
5.8
5.4
5.0
4.6
4.3
4.0
3.7
49.1
19
57
10.9
39.1
31.8
26.7
22.8
19.9
17.5
15.6
14.0
12.7
11.6
10.6
6.7
6.2
5.8
5.4
5.0
4.6
4.3
57.0
19
58
11.6
41.5
33.2
27.7
23.5
20.3
17.8
15.8
14.1
12.7
11.5
10.5
9.6
6.1
5.6
5.2
4.9
4.5
4.2
55.8
19
59
13.3
47.4
37.6
30.9
26.1
22.4
19.4
17.1
15.2
13.6
12.2
11.1
10.2
9.3
5.9
5.5
5.1
4.7
4.4
58.2
19
60
15.2
53.8
42.3
34.4
28.6
24.4
21.0
18.3
16.2
14.4
12.9
11.6
10.6
9.7
8.9
5.6
5.2
4.9
4.5
59.8
19
61
18.1
63.2
48.9
39.3
32.4
27.2
23.3
20.2
17.7
15.6
13.9
12.5
11.3
10.3
9.4
8.7
5.5
5.1
4.7
62.5
19
62
20.5
70.6
53.5
42.3
34.5
28.7
24.2
20.9
18.1
15.9
14.1
12.6
11.3
10.2
9.3
8.5
7.8
5.0
4.6
61.0
19
63
23.7
80.8
59.9
46.5
37.3
30.7
25.7
21.8
18.8
16.4
14.4
12.7
11.4
10.2
9.3
8.4
7.7
7.1
4.5
59.6
19
64
29.1
96.8
70.1
53.3
41.9
33.9
28.1
23.6
20.0
17.3
15.1
13.3
11.8
10.6
9.5
8.6
7.8
7.2
6.6
59.6
19
65
37.1
11
9.7
83.2
61.7
47.5
37.7
30.7
25.5
21.5
18.3
15.9
13.9
12.2
10.8
9.7
8.7
7.9
7.2
6.6
60.9
19
66
41.1
12
9.1
84.3
60.1
45.1
35.1
28.0
22.9
19.1
16.1
13.8
11.9
10.4
9.2
8.2
7.3
6.6
6.0
5.4
50.9
19
67
46.7
14
3.5
89.9
60.2
43.5
33.0
25.8
20.7
16.9
14.2
12.0
10.2
8.9
7.8
6.8
6.1
5.5
4.9
4.4
42.1
19
68
52.3
15
6.3
93.6
60.1
40.8
29.7
22.7
17.8
14.3
11.8
9.8
8.3
7.1
6.2
5.4
4.8
4.3
3.8
3.4
32.5
19
69
50.1
14
9.5
84.9
52.1
33.9
23.2
17.0
13.0
10.3
8.3
6.8
5.7
4.8
4.1
3.6
3.2
2.8
2.5
2.2
20.9
19
70
45.1
13
7.1
78.0
45.4
28.3
18.6
12.8
9.4
7.2
5.7
4.6
3.8
3.2
2.7
2.3
2.0
1.8
1.6
1.4
13.0
19
71
46.2
14
0.0
82.4
48.0
28.4
17.8
11.8
8.1
6.0
4.6
3.7
3.0
2.4
2.0
1.7
1.5
1.3
1.1
1.0
9.2
19
72
46.6
13
9.3
80.9
48.8
28.8
17.2
10.9
7.2
5.0
3.7
2.9
2.3
1.8
1.5
1.3
1.1
0.9
0.8
0.7
6.3
19
73
45.2
13
4.9
76.7
45.7
27.9
16.7
10.0
6.3
4.2
2.9
2.2
1.7
1.3
1.1
0.9
0.7
0.6
0.5
0.5
4.2
19
74
46.5
14
8.5
84.3
49.1
29.6
18.3
11.0
6.6
4.2
2.8
2.0
1.4
1.1
0.9
0.7
0.6
0.5
0.4
0.4
3.1
19
75
66.7
14
5.1
85.2
49.5
29.3
17.8
11.1
6.7
4.0
2.6
1.7
1.2
0.9
0.7
0.5
0.4
0.4
0.3
0.3
2.1
19
76
48.8
17
9.2
69.0
41.5
24.5
14.6
8.9
5.6
3.4
2.0
1.3
0.9
0.6
0.5
0.3
0.3
0.2
0.2
0.2
1.2
19
77
57.6
14
0.9
91.2
35.9
21.9
13.1
7.8
4.8
3.0
1.8
1.1
0.7
0.5
0.3
0.2
0.2
0.2
0.1
0.1
0.8
19
78
54.0
15
3.8
63.7
42.2
16.9
10.4
6.2
3.7
2.3
1.4
0.9
0.5
0.3
0.2
0.2
0.1
0.1
0.1
0.1
0.4
19
79
30.6
12
5.1
58.6
24.9
16.7
6.8
4.2
2.5
1.5
0.9
0.6
0.4
0.2
0.1
0.1
0.1
0.0
0.0
0.0
0.2
19
80
66.5
75.9
52.1
25.0
10.8
7.3
3.0
1.8
1.1
0.7
0.4
0.3
0.2
0.1
0.1
0.0
0.0
0.0
0.0
0.1
19
81
17.0
15
6.9
30.2
21.3
10.4
4.5
3.1
1.3
0.8
0.5
0.3
0.2
0.1
0.1
0.0
0.0
0.0
0.0
0.0
0.0
19
82
32.9
43.5
69.5
13.7
9.8
4.8
2.1
1.4
0.6
0.4
0.2
0.1
0.1
0.1
0.0
0.0
0.0
0.0
0.0
0.0
19
83
75.1
96.5
22.3
36.5
7.3
5.3
2.6
1.1
0.8
0.3
0.2
0.1
0.1
0.0
0.0
0.0
0.0
0.0
0.0
0.0
19
84
12
0.6
16
9.4
45.1
10.7
17.7
3.6
2.6
1.3
0.6
0.4
0.2
0.1
0.1
0.0
0.0
0.0
0.0
0.0
0.0
0.0
SEDAR 15 SAR 1 SECTION III 63

Assessment Workshop South Atlantic Red SnapperT
able
3.9
.(c
on
tin
ued
)
Yea
r1
23
45
67
89
10
11
12
13
14
15
16
17
18
19
20
19
85
34.1
21
6.5
79.4
15.1
3.6
6.1
1.2
0.9
0.5
0.2
0.1
0.1
0.0
0.0
0.0
0.0
0.0
0.0
0.0
0.0
19
86
41.9
53.6
90.9
25.1
4.8
1.2
2.0
0.4
0.3
0.1
0.1
0.0
0.0
0.0
0.0
0.0
0.0
0.0
0.0
0.0
19
87
34.4
57.1
23.0
31.5
8.8
1.7
0.4
0.7
0.1
0.1
0.1
0.0
0.0
0.0
0.0
0.0
0.0
0.0
0.0
0.0
19
88
29.2
87.7
36.5
11.0
15.2
4.3
0.8
0.2
0.3
0.1
0.1
0.0
0.0
0.0
0.0
0.0
0.0
0.0
0.0
0.0
19
89
33.7
73.6
54.4
17.9
5.4
7.6
2.2
0.4
0.1
0.2
0.0
0.0
0.0
0.0
0.0
0.0
0.0
0.0
0.0
0.0
19
90
28.6
69.4
42.4
20.0
6.7
2.1
2.9
0.8
0.2
0.0
0.1
0.0
0.0
0.0
0.0
0.0
0.0
0.0
0.0
0.0
19
91
32.5
52.8
31.7
13.9
6.7
2.3
0.7
1.0
0.3
0.1
0.0
0.0
0.0
0.0
0.0
0.0
0.0
0.0
0.0
0.0
19
92
1.1
40.9
25.3
15.5
7.0
3.4
1.2
0.4
0.5
0.1
0.0
0.0
0.0
0.0
0.0
0.0
0.0
0.0
0.0
0.0
19
93
0.8
19.2
47.9
23.3
9.4
4.2
2.0
0.7
0.2
0.3
0.1
0.0
0.0
0.0
0.0
0.0
0.0
0.0
0.0
0.0
19
94
0.5
7.3
15.0
28.7
7.2
2.9
1.3
0.7
0.2
0.1
0.1
0.0
0.0
0.0
0.0
0.0
0.0
0.0
0.0
0.0
19
95
0.5
7.3
11.1
15.5
14.9
3.7
1.5
0.6
0.3
0.1
0.0
0.0
0.0
0.0
0.0
0.0
0.0
0.0
0.0
0.0
19
96
0.7
8.9
11.4
10.9
7.6
7.2
1.7
0.7
0.3
0.1
0.0
0.0
0.0
0.0
0.0
0.0
0.0
0.0
0.0
0.0
19
97
0.8
13.5
12.3
10.3
5.1
3.5
3.3
0.8
0.3
0.1
0.1
0.0
0.0
0.0
0.0
0.0
0.0
0.0
0.0
0.0
19
98
2.5
21.4
22.8
11.3
4.9
2.4
1.7
1.6
0.4
0.1
0.1
0.0
0.0
0.0
0.0
0.0
0.0
0.0
0.0
0.0
19
99
3.0
51.5
24.7
17.9
5.8
2.5
1.2
0.9
0.8
0.2
0.1
0.0
0.0
0.0
0.0
0.0
0.0
0.0
0.0
0.0
20
00
2.4
52.9
50.3
16.5
8.0
2.6
1.1
0.6
0.4
0.3
0.1
0.0
0.0
0.0
0.0
0.0
0.0
0.0
0.0
0.0
20
01
1.8
37.7
50.7
36.9
8.5
4.2
1.4
0.6
0.3
0.2
0.1
0.0
0.0
0.0
0.0
0.0
0.0
0.0
0.0
0.0
20
02
1.8
24.5
33.3
32.5
15.2
3.5
1.7
0.6
0.2
0.1
0.1
0.0
0.0
0.0
0.0
0.0
0.0
0.0
0.0
0.0
20
03
1.1
26.8
22.9
21.6
13.8
6.4
1.5
0.7
0.2
0.1
0.0
0.0
0.0
0.0
0.0
0.0
0.0
0.0
0.0
0.0
20
04
1.4
17.8
26.9
19.3
13.6
8.7
4.0
0.9
0.4
0.1
0.0
0.0
0.0
0.0
0.0
0.0
0.0
0.0
0.0
0.0
20
05
1.5
24.9
18.5
19.5
9.3
6.5
4.1
1.8
0.4
0.2
0.0
0.0
0.0
0.0
0.0
0.0
0.0
0.0
0.0
0.0
20
06
1.5
27.1
22.8
11.9
8.9
4.2
2.9
1.8
0.8
0.2
0.1
0.0
0.0
0.0
0.0
0.0
0.0
0.0
0.0
0.0
SEDAR 15 SAR 1 SECTION III 64

Assessment Workshop South Atlantic Red SnapperT
able
3.1
0.
Red
sna
pp
er:
La
nd
ings
at
age
(mt,
wh
ole
wei
gh
t),
as
esti
ma
ted
by
the
as-
sess
men
tm
odel
Yea
r1
23
45
67
89
10
11
12
13
14
15
16
17
18
19
20
19
45
0.1
1.1
2.0
2.8
3.6
4.1
4.5
4.7
4.8
4.8
4.7
4.6
4.4
4.2
4.0
3.7
3.5
3.3
3.1
41.4
19
46
0.1
1.2
2.2
3.1
3.9
4.5
4.9
5.1
5.2
5.2
5.1
5.0
4.8
4.6
4.3
4.1
3.8
3.6
3.4
45.2
19
47
0.3
3.8
4.7
6.7
8.5
9.8
10.7
11.2
11.4
11.4
11.2
10.8
10.4
9.9
9.4
8.9
8.4
7.9
7.4
98.7
19
48
0.4
5.9
10.6
10.4
13.0
15.0
16.3
17.1
17.5
17.4
17.1
16.6
16.0
15.2
14.5
13.7
12.9
12.1
11.3
15
1.2
19
49
0.6
8.1
14.3
20.3
17.4
20.0
21.8
22.9
23.3
23.3
22.9
22.2
21.3
20.4
19.3
18.3
17.2
16.2
15.2
20
2.0
19
50
0.8
10.2
18.0
25.4
31.6
24.9
27.1
28.4
28.9
28.9
28.4
27.5
26.5
25.3
24.0
22.7
21.4
20.1
18.8
25
0.7
19
51
1.0
13.3
23.3
32.6
40.4
46.2
34.4
36.0
36.7
36.6
35.9
34.9
33.5
32.0
30.4
28.7
27.1
25.4
23.8
31
7.6
19
52
1.1
14.6
25.4
35.4
43.5
49.6
53.6
38.4
39.0
38.9
38.2
37.1
35.7
34.0
32.3
30.5
28.8
27.0
25.3
33
7.8
19
53
1.3
16.9
29.3
40.6
49.6
56.2
60.5
62.9
43.8
43.5
42.8
41.5
39.9
38.1
36.1
34.2
32.2
30.2
28.3
37
7.8
19
54
1.6
20.6
35.5
49.0
59.5
66.9
71.6
74.1
74.9
51.0
49.9
48.5
46.6
44.5
42.2
39.9
37.6
35.3
33.1
44
1.3
19
55
1.7
22.6
38.6
52.8
63.9
71.4
75.9
78.1
78.5
77.7
52.1
50.4
48.4
46.2
43.9
41.5
39.1
36.7
34.4
45
8.7
19
56
2.0
25.4
43.1
58.5
70.3
78.2
82.6
84.5
84.5
83.1
80.9
53.6
51.4
49.0
46.5
44.0
41.4
38.9
36.5
48
6.6
19
57
2.5
31.5
53.0
71.5
85.2
94.2
99.1
10
0.6
10
0.0
97.8
94.7
91.1
59.8
56.9
54.0
51.1
48.1
45.2
42.4
56
4.7
19
58
2.6
33.4
55.4
74.2
87.8
96.2
10
0.6
10
1.7
10
0.3
97.6
94.0
90.0
85.8
55.9
52.9
50.0
47.1
44.2
41.5
55
2.6
19
59
3.0
38.1
62.7
82.8
97.2
10
5.9
10
9.7
11
0.2
10
8.2
10
4.5
10
0.1
95.3
90.3
85.5
55.4
52.2
49.1
46.2
43.3
57
7.0
19
60
3.5
43.3
70.5
92.3
10
6.7
11
5.4
11
8.8
11
8.3
11
5.5
11
1.0
10
5.5
99.9
94.2
88.6
83.4
53.8
50.5
47.5
44.5
59
3.1
19
61
4.1
50.8
81.5
10
5.4
12
1.0
12
8.8
13
1.6
13
0.2
12
6.0
12
0.4
11
4.0
10
7.0
10
0.3
93.9
87.9
82.4
53.0
49.6
46.5
61
9.9
19
62
4.6
56.8
89.1
11
3.6
12
8.8
13
6.1
13
7.0
13
4.5
12
9.4
12
2.5
11
5.3
10
7.8
10
0.3
93.4
86.9
81.0
75.6
48.5
45.3
60
4.1
19
63
5.4
65.0
99.9
12
4.7
13
9.3
14
5.4
14
5.1
14
0.4
13
4.0
12
6.2
11
7.6
10
9.4
10
1.3
93.6
86.6
80.3
74.6
69.4
44.4
59
0.5
19
64
6.6
77.9
11
6.8
14
2.9
15
6.3
16
0.7
15
8.5
15
2.1
14
3.1
13
3.7
12
3.8
11
4.1
10
5.1
96.6
88.8
81.8
75.6
70.0
65.1
59
0.2
19
65
8.4
96.3
13
8.7
16
5.4
17
7.4
17
8.5
17
3.5
16
4.6
15
3.5
14
1.3
12
9.9
11
8.9
10
8.5
99.2
90.8
83.0
76.3
70.3
64.9
60
3.4
19
66
9.3
10
3.9
14
0.6
16
1.1
16
8.5
16
6.2
15
8.2
14
7.8
13
6.2
12
4.4
11
2.7
10
2.4
92.8
84.1
76.5
69.7
63.5
58.2
53.5
50
4.9
19
67
10.6
11
5.4
15
0.0
16
1.4
16
2.2
15
6.1
14
5.6
13
3.2
12
0.9
10
9.1
98.1
87.8
79.0
71.1
64.1
58.0
52.7
47.9
43.8
41
7.0
19
68
11.9
12
5.7
15
6.0
16
1.2
15
2.2
14
0.8
12
8.1
11
4.8
10
2.1
90.7
80.6
71.5
63.4
56.7
50.8
45.5
41.1
37.2
33.8
32
2.3
19
69
11.4
12
0.2
14
1.6
13
9.8
12
6.7
11
0.1
96.2
84.2
73.3
63.8
55.8
49.0
43.1
37.9
33.7
30.1
26.9
24.2
21.8
20
7.5
19
70
10.2
11
0.3
13
0.1
12
1.9
10
5.5
88.0
72.3
60.8
51.6
44.1
37.7
32.6
28.3
24.8
21.7
19.2
17.0
15.2
13.7
12
8.5
19
71
10.5
11
2.7
13
7.4
12
8.9
10
5.9
84.4
66.5
52.5
42.9
35.7
30.0
25.4
21.7
18.7
16.3
14.2
12.5
11.1
9.9
91.6
19
72
10.6
11
2.1
13
4.9
13
0.9
10
7.7
81.4
61.3
46.5
35.7
28.5
23.4
19.4
16.2
13.8
11.8
10.2
8.9
7.8
6.9
62.9
19
73
10.3
10
8.5
12
7.9
12
2.5
10
4.2
78.9
56.4
40.8
30.1
22.6
17.8
14.4
11.8
9.8
8.3
7.1
6.1
5.3
4.7
41.2
19
74
10.6
11
9.5
14
0.5
13
1.7
11
0.6
86.6
62.0
42.6
30.0
21.6
16.0
12.4
10.0
8.1
6.7
5.7
4.8
4.1
3.6
30.7
19
75
15.1
11
6.7
14
2.1
13
2.9
10
9.3
84.4
62.5
43.0
28.7
19.8
14.0
10.3
7.9
6.3
5.1
4.2
3.5
3.0
2.6
21.1
19
76
11.1
14
4.2
11
5.0
11
1.4
91.4
69.1
50.5
35.9
24.0
15.7
10.6
7.5
5.4
4.1
3.3
2.6
2.2
1.8
1.5
12.1
19
77
13.1
11
3.4
15
2.0
96.4
81.9
61.8
44.2
31.1
21.5
14.1
9.0
6.1
4.2
3.0
2.3
1.8
1.5
1.2
1.0
7.4
19
78
12.2
12
3.7
10
6.2
11
3.3
63.0
49.3
35.2
24.2
16.5
11.2
7.2
4.6
3.0
2.1
1.5
1.1
0.9
0.7
0.6
4.1
19
79
7.0
10
0.6
97.7
66.7
62.4
32.0
23.6
16.2
10.8
7.2
4.8
3.1
1.9
1.3
0.9
0.6
0.5
0.4
0.3
1.9
19
80
15.1
61.1
87.0
67.2
40.2
34.7
16.8
11.9
8.0
5.2
3.4
2.3
1.4
0.9
0.6
0.4
0.3
0.2
0.2
1.0
19
81
3.9
12
6.2
50.4
57.1
38.7
21.3
17.4
8.1
5.6
3.6
2.3
1.5
1.0
0.6
0.4
0.3
0.2
0.1
0.1
0.5
19
82
7.5
35.0
11
6.0
36.9
36.6
22.8
11.9
9.3
4.2
2.9
1.8
1.2
0.8
0.5
0.3
0.2
0.1
0.1
0.1
0.3
19
83
17.0
77.6
37.2
97.9
27.3
25.0
14.7
7.4
5.6
2.5
1.7
1.1
0.7
0.4
0.3
0.2
0.1
0.1
0.0
0.2
19
84
27.4
13
6.3
75.1
28.6
66.2
17.0
14.7
8.4
4.1
3.0
1.3
0.9
0.5
0.3
0.2
0.1
0.1
0.1
0.0
0.1
SEDAR 15 SAR 1 SECTION III 65

Assessment Workshop South Atlantic Red SnapperT
able
3.1
0.
(con
tin
ued
)
Yea
r1
23
45
67
89
10
11
12
13
14
15
16
17
18
19
20
19
85
7.7
17
4.2
13
2.5
40.5
13.5
28.9
7.0
5.9
3.2
1.5
1.1
0.5
0.3
0.2
0.1
0.1
0.0
0.0
0.0
0.1
19
86
9.5
43.1
15
1.5
67.4
18.1
5.5
11.1
2.6
2.1
1.1
0.5
0.4
0.2
0.1
0.1
0.0
0.0
0.0
0.0
0.0
19
87
7.8
46.0
38.4
84.4
32.9
8.1
2.4
4.5
1.0
0.8
0.4
0.2
0.1
0.1
0.0
0.0
0.0
0.0
0.0
0.0
19
88
6.6
70.6
60.9
29.4
56.7
20.3
4.7
1.3
2.5
0.5
0.4
0.2
0.1
0.1
0.0
0.0
0.0
0.0
0.0
0.0
19
89
7.6
59.2
90.6
48.0
20.3
36.1
12.3
2.8
0.7
1.4
0.3
0.2
0.1
0.1
0.0
0.0
0.0
0.0
0.0
0.0
19
90
6.5
55.8
70.8
53.7
24.9
9.7
16.4
5.3
1.2
0.3
0.5
0.1
0.1
0.0
0.0
0.0
0.0
0.0
0.0
0.0
19
91
7.4
42.4
52.9
37.4
25.0
10.8
4.0
6.6
2.1
0.4
0.1
0.2
0.0
0.0
0.0
0.0
0.0
0.0
0.0
0.0
19
92
0.3
32.9
42.3
41.7
26.2
16.2
6.7
2.4
3.8
1.1
0.2
0.1
0.1
0.0
0.0
0.0
0.0
0.0
0.0
0.0
19
93
0.2
15.5
79.8
62.4
35.1
19.8
11.3
4.3
1.4
2.0
0.6
0.1
0.0
0.1
0.0
0.0
0.0
0.0
0.0
0.0
19
94
0.1
5.9
24.9
77.0
26.8
13.8
7.5
4.3
1.6
0.5
0.6
0.2
0.0
0.0
0.0
0.0
0.0
0.0
0.0
0.0
19
95
0.1
5.8
18.6
41.7
55.6
17.3
8.3
4.2
2.1
0.7
0.2
0.3
0.1
0.0
0.0
0.0
0.0
0.0
0.0
0.0
19
96
0.2
7.2
19.1
29.3
28.4
33.9
9.8
4.4
2.0
0.9
0.3
0.1
0.1
0.0
0.0
0.0
0.0
0.0
0.0
0.0
19
97
0.2
10.8
20.5
27.6
19.1
16.7
18.9
5.3
2.2
1.0
0.4
0.1
0.0
0.1
0.0
0.0
0.0
0.0
0.0
0.0
19
98
0.6
17.2
38.0
30.2
18.1
11.3
9.4
10.1
2.7
1.0
0.4
0.2
0.1
0.0
0.0
0.0
0.0
0.0
0.0
0.0
19
99
0.7
41.4
41.2
48.1
21.7
11.8
7.0
5.5
5.6
1.4
0.5
0.2
0.1
0.0
0.0
0.0
0.0
0.0
0.0
0.0
20
00
0.5
42.5
83.9
44.2
29.9
12.3
6.4
3.6
2.6
2.5
0.6
0.2
0.1
0.0
0.0
0.0
0.0
0.0
0.0
0.0
20
01
0.4
30.3
84.5
99.1
31.8
19.7
7.7
3.8
2.0
1.3
1.2
0.3
0.1
0.0
0.0
0.0
0.0
0.0
0.0
0.0
20
02
0.4
19.7
55.6
87.2
56.9
16.6
9.7
3.6
1.6
0.7
0.4
0.4
0.1
0.0
0.0
0.0
0.0
0.0
0.0
0.0
20
03
0.3
21.6
38.1
58.0
51.7
30.5
8.3
4.4
1.4
0.5
0.2
0.2
0.2
0.0
0.0
0.0
0.0
0.0
0.0
0.0
20
04
0.3
14.4
44.9
51.8
50.9
41.2
22.7
5.7
2.8
0.8
0.3
0.1
0.1
0.1
0.0
0.0
0.0
0.0
0.0
0.0
20
05
0.3
20.0
30.8
52.3
34.6
30.7
23.0
11.7
2.7
1.2
0.3
0.1
0.1
0.0
0.0
0.0
0.0
0.0
0.0
0.0
20
06
0.3
21.8
38.0
31.8
33.2
19.9
16.5
11.7
5.6
1.2
0.5
0.1
0.1
0.0
0.0
0.0
0.0
0.0
0.0
0.0
SEDAR 15 SAR 1 SECTION III 66

Assessment Workshop South Atlantic Red SnapperT
able
3.1
1.
Red
sna
pp
er:
La
nd
ings
at
age
(10
00
lb,w
hol
ew
eigh
t),a
ses
tim
ate
dby
the
ass
essm
ent
mod
el
Yea
r1
23
45
67
89
10
11
12
13
14
15
16
17
18
19
20
19
45
0.2
2.4
4.4
6.2
7.8
9.0
9.9
10.3
10.5
10.5
10.3
10.0
9.6
9.2
8.7
8.3
7.8
7.3
6.9
91.4
19
46
0.3
2.6
4.8
6.8
8.5
9.8
10.7
11.3
11.5
11.5
11.3
10.9
10.5
10.0
9.5
9.0
8.5
8.0
7.5
99.6
19
47
0.6
8.5
10.4
14.9
18.7
21.5
23.5
24.7
25.1
25.1
24.6
23.9
23.0
21.9
20.8
19.7
18.5
17.4
16.3
21
7.7
19
48
1.0
13.1
23.4
22.8
28.6
33.0
36.0
37.8
38.5
38.4
37.7
36.6
35.2
33.6
31.9
30.1
28.4
26.7
25.0
33
3.3
19
49
1.3
17.8
31.5
44.7
38.3
44.1
48.1
50.4
51.4
51.3
50.4
48.9
47.0
44.9
42.6
40.3
37.9
35.6
33.4
44
5.4
19
50
1.7
22.5
39.7
56.0
69.6
54.9
59.7
62.6
63.8
63.7
62.5
60.7
58.4
55.7
52.9
50.0
47.1
44.2
41.5
55
2.7
19
51
2.2
29.2
51.3
71.9
89.0
10
1.8
75.8
79.3
80.8
80.7
79.2
76.9
73.9
70.6
67.0
63.3
59.6
56.0
52.5
70
0.2
19
52
2.5
32.1
55.9
78.0
96.0
10
9.2
11
8.2
84.6
86.0
85.8
84.3
81.8
78.6
75.1
71.3
67.3
63.4
59.6
55.9
74
4.8
19
53
2.9
37.3
64.6
89.5
10
9.5
12
3.9
13
3.3
13
8.7
96.5
96.0
94.3
91.5
87.9
83.9
79.7
75.3
70.9
66.6
62.5
83
2.9
19
54
3.5
45.4
78.3
10
8.0
13
1.1
14
7.6
15
7.9
16
3.4
16
5.1
11
2.5
11
0.1
10
6.8
10
2.7
98.1
93.1
88.0
82.9
77.9
73.0
97
2.9
19
55
3.8
49.8
85.0
11
6.5
14
0.8
15
7.3
16
7.4
17
2.2
17
3.1
17
1.3
11
4.8
11
1.0
10
6.8
10
1.9
96.7
91.4
86.1
80.9
75.9
10
11.2
19
56
4.3
56.0
95.0
12
9.0
15
5.0
17
2.4
18
2.1
18
6.3
18
6.2
18
3.2
17
8.4
11
8.2
11
3.3
10
8.1
10
2.6
97.0
91.4
85.8
80.5
10
72.7
19
57
5.4
69.4
11
6.9
15
7.7
18
7.8
20
7.7
21
8.4
22
1.7
22
0.4
21
5.7
20
8.9
20
0.9
13
1.9
12
5.5
11
9.1
11
2.6
10
6.0
99.6
93.4
12
44.9
19
58
5.8
73.6
12
2.2
16
3.6
19
3.6
21
2.2
22
1.8
22
4.2
22
1.2
21
5.2
20
7.3
19
8.3
18
9.0
12
3.2
11
6.5
11
0.2
10
3.8
97.5
91.4
12
18.2
19
59
6.7
84.0
13
8.3
18
2.5
21
4.4
23
3.4
24
1.8
24
3.0
23
8.6
23
0.5
22
0.7
21
0.0
19
9.1
18
8.4
12
2.1
11
5.0
10
8.3
10
1.8
95.4
12
72.0
19
60
7.6
95.5
15
5.4
20
3.4
23
5.3
25
4.4
26
1.8
26
0.7
25
4.6
24
4.8
23
2.7
22
0.2
20
7.6
19
5.4
18
3.9
11
8.6
11
1.4
10
4.6
98.1
13
07.6
19
61
9.1
11
2.1
17
9.6
23
2.3
26
6.7
28
3.9
29
0.1
28
7.0
27
7.7
26
5.5
25
1.3
23
6.0
22
1.2
20
7.1
19
3.8
18
1.6
11
6.8
10
9.4
10
2.5
13
66.6
19
62
10.2
12
5.3
19
6.5
25
0.4
28
4.1
30
0.0
30
2.0
29
6.6
28
5.2
27
0.1
25
4.2
23
7.6
22
1.1
20
5.8
19
1.6
17
8.5
16
6.7
10
6.9
99.9
13
31.9
19
63
11.9
14
3.3
22
0.3
27
4.8
30
7.1
32
0.5
32
0.0
30
9.6
29
5.5
27
8.2
25
9.3
24
1.1
22
3.3
20
6.3
19
1.0
17
7.0
16
4.4
15
3.1
98.0
13
01.8
19
64
14.5
17
1.7
25
7.6
31
5.0
34
4.5
35
4.2
34
9.5
33
5.4
31
5.4
29
4.7
27
3.0
25
1.5
23
1.6
21
3.0
19
5.7
18
0.4
16
6.6
15
4.3
14
3.4
13
01.2
19
65
18.6
21
2.2
30
5.8
36
4.7
39
1.1
39
3.6
38
2.5
36
2.8
33
8.4
31
1.5
28
6.5
26
2.2
23
9.3
21
8.8
20
0.1
18
3.0
16
8.1
15
4.9
14
3.2
13
30.2
19
66
20.5
22
9.0
31
0.0
35
5.1
37
1.5
36
6.5
34
8.7
32
5.8
30
0.3
27
4.2
24
8.4
22
5.7
20
4.7
18
5.4
16
8.6
15
3.6
14
0.0
12
8.3
11
7.9
11
13.0
19
67
23.4
25
4.4
33
0.6
35
5.9
35
7.6
34
4.2
32
1.1
29
3.7
26
6.6
24
0.6
21
6.2
19
3.5
17
4.2
15
6.8
14
1.3
12
8.0
11
6.1
10
5.6
96.5
91
9.3
19
68
26.2
27
7.2
34
4.0
35
5.5
33
5.6
31
0.3
28
2.4
25
3.2
22
5.0
20
0.0
17
7.6
15
7.7
13
9.9
12
5.0
11
1.9
10
0.4
90.6
82.0
74.4
71
0.5
19
69
25.1
26
5.1
31
2.2
30
8.1
27
9.3
24
2.7
21
2.1
18
5.5
16
1.7
14
0.7
12
3.1
10
8.0
95.0
83.6
74.3
66.3
59.3
53.3
48.2
45
7.5
19
70
22.6
24
3.2
28
6.8
26
8.7
23
2.6
19
4.0
15
9.4
13
3.9
11
3.8
97.1
83.2
71.9
62.5
54.6
47.8
42.3
37.6
33.5
30.1
28
3.2
19
71
23.1
24
8.4
30
2.9
28
4.1
23
3.5
18
6.0
14
6.7
11
5.8
94.6
78.7
66.1
55.9
47.9
41.3
35.9
31.3
27.6
24.5
21.8
20
1.9
19
72
23.3
24
7.1
29
7.4
28
8.5
23
7.3
17
9.5
13
5.1
10
2.5
78.6
62.9
51.5
42.7
35.8
30.4
26.1
22.6
19.6
17.3
15.3
13
8.6
19
73
22.6
23
9.2
28
2.0
27
0.0
22
9.7
17
3.9
12
4.3
90.0
66.3
49.8
39.2
31.7
26.1
21.7
18.3
15.7
13.5
11.7
10.3
90.9
19
74
23.3
26
3.4
30
9.8
29
0.5
24
3.9
19
0.9
13
6.6
93.9
66.1
47.6
35.2
27.4
22.0
17.9
14.8
12.5
10.6
9.1
7.9
67.8
19
75
33.4
25
7.2
31
3.2
29
2.9
24
0.9
18
6.1
13
7.8
94.8
63.3
43.6
30.9
22.6
17.4
13.9
11.2
9.3
7.8
6.6
5.7
46.6
19
76
24.4
31
7.9
25
3.5
24
5.5
20
1.4
15
2.4
11
1.4
79.2
53.0
34.6
23.5
16.5
11.9
9.1
7.2
5.8
4.8
4.0
3.4
26.6
19
77
28.8
24
9.9
33
5.1
21
2.6
18
0.6
13
6.3
97.5
68.5
47.4
31.0
19.9
13.4
9.3
6.7
5.1
4.0
3.2
2.6
2.2
16.4
19
78
27.0
27
2.7
23
4.0
24
9.7
13
8.9
10
8.6
77.5
53.3
36.4
24.6
15.9
10.1
6.7
4.6
3.3
2.5
2.0
1.6
1.3
9.0
19
79
15.3
22
1.8
21
5.4
14
7.1
13
7.7
70.5
52.1
35.8
23.9
16.0
10.6
6.8
4.3
2.8
1.9
1.4
1.0
0.8
0.6
4.2
19
80
33.3
13
4.6
19
1.7
14
8.1
88.7
76.4
37.0
26.3
17.5
11.5
7.5
5.0
3.1
2.0
1.3
0.9
0.6
0.5
0.4
2.2
19
81
8.5
27
8.2
11
1.1
12
6.0
85.4
47.1
38.3
17.8
12.3
8.0
5.2
3.4
2.2
1.4
0.9
0.6
0.4
0.3
0.2
1.1
19
82
16.4
77.2
25
5.6
81.2
80.8
50.4
26.3
20.6
9.3
6.3
4.0
2.6
1.7
1.1
0.7
0.4
0.3
0.2
0.1
0.6
19
83
37.6
17
1.2
82.0
21
5.9
60.2
55.1
32.5
16.3
12.4
5.5
3.6
2.3
1.5
0.9
0.6
0.4
0.2
0.1
0.1
0.4
19
84
60.3
30
0.5
16
5.7
63.1
14
5.9
37.5
32.5
18.4
9.0
6.7
2.9
1.9
1.2
0.8
0.5
0.3
0.2
0.1
0.1
0.3
SEDAR 15 SAR 1 SECTION III 67

Assessment Workshop South Atlantic Red SnapperT
able
3.1
1.
(con
tin
ued
)
Yea
r1
23
45
67
89
10
11
12
13
14
15
16
17
18
19
20
19
85
17.0
38
3.9
29
2.0
89.3
29.9
63.6
15.5
12.9
7.1
3.4
2.5
1.1
0.7
0.4
0.3
0.2
0.1
0.1
0.0
0.1
19
86
21.0
95.1
33
4.0
14
8.5
39.8
12.2
24.5
5.7
4.5
2.4
1.1
0.8
0.4
0.2
0.1
0.1
0.1
0.0
0.0
0.1
19
87
17.2
10
1.3
84.6
18
6.1
72.6
17.9
5.2
10.0
2.2
1.7
0.9
0.4
0.3
0.1
0.1
0.1
0.0
0.0
0.0
0.0
19
88
14.6
15
5.6
13
4.2
64.8
12
5.0
44.9
10.5
2.9
5.4
1.2
0.9
0.5
0.2
0.2
0.1
0.0
0.0
0.0
0.0
0.0
19
89
16.9
13
0.5
19
9.8
10
5.8
44.8
79.6
27.1
6.1
1.6
3.0
0.6
0.5
0.2
0.1
0.1
0.0
0.0
0.0
0.0
0.0
19
90
14.3
12
3.1
15
6.0
11
8.3
55.0
21.4
36.1
11.8
2.6
0.7
1.2
0.3
0.2
0.1
0.0
0.0
0.0
0.0
0.0
0.0
19
91
16.3
93.6
11
6.7
82.4
55.1
23.7
8.9
14.6
4.7
1.0
0.2
0.4
0.1
0.1
0.0
0.0
0.0
0.0
0.0
0.0
19
92
0.6
72.6
93.2
91.9
57.7
35.7
14.7
5.3
8.3
2.5
0.5
0.1
0.2
0.0
0.0
0.0
0.0
0.0
0.0
0.0
19
93
0.4
34.1
17
6.0
13
7.5
77.3
43.6
25.0
9.5
3.1
4.4
1.3
0.3
0.1
0.1
0.0
0.0
0.0
0.0
0.0
0.0
19
94
0.2
13.0
55.0
16
9.7
59.2
30.4
16.6
9.4
3.5
1.1
1.4
0.4
0.1
0.0
0.0
0.0
0.0
0.0
0.0
0.0
19
95
0.2
12.9
40.9
91.9
12
2.5
38.2
18.2
9.2
4.7
1.5
0.4
0.6
0.2
0.0
0.0
0.0
0.0
0.0
0.0
0.0
19
96
0.4
15.8
42.1
64.5
62.6
74.7
21.7
9.6
4.4
2.0
0.6
0.2
0.3
0.1
0.0
0.0
0.0
0.0
0.0
0.0
19
97
0.4
23.9
45.2
60.9
42.1
36.9
41.7
11.6
4.9
2.1
0.9
0.3
0.1
0.1
0.0
0.0
0.0
0.0
0.0
0.0
19
98
1.3
38.0
83.8
66.6
40.0
25.0
20.7
22.3
5.8
2.3
0.9
0.4
0.1
0.0
0.1
0.0
0.0
0.0
0.0
0.0
19
99
1.5
91.4
90.8
10
6.0
47.7
26.1
15.4
12.2
12.4
3.0
1.1
0.5
0.2
0.1
0.0
0.0
0.0
0.0
0.0
0.0
20
00
1.2
93.8
18
4.9
97.5
66.0
27.1
14.0
7.9
5.8
5.4
1.2
0.5
0.2
0.1
0.0
0.0
0.0
0.0
0.0
0.0
20
01
0.9
66.8
18
6.2
21
8.4
70.1
43.5
17.0
8.4
4.4
3.0
2.5
0.6
0.2
0.1
0.1
0.0
0.0
0.0
0.0
0.0
20
02
0.9
43.4
12
2.6
19
2.2
12
5.4
36.6
21.5
7.9
3.5
1.6
1.0
0.9
0.2
0.1
0.0
0.0
0.0
0.0
0.0
0.0
20
03
0.6
47.6
84.1
12
7.8
11
3.9
67.1
18.2
9.8
3.2
1.2
0.5
0.3
0.3
0.1
0.0
0.0
0.0
0.0
0.0
0.0
20
04
0.7
31.7
99.0
11
4.1
11
2.3
90.9
50.0
12.6
6.1
1.8
0.6
0.3
0.2
0.2
0.1
0.0
0.0
0.0
0.0
0.0
20
05
0.8
44.1
68.0
11
5.4
76.3
67.6
50.7
25.7
5.9
2.6
0.7
0.3
0.1
0.1
0.1
0.0
0.0
0.0
0.0
0.0
20
06
0.8
48.0
83.8
70.1
73.3
43.9
36.4
25.8
12.3
2.6
1.1
0.3
0.1
0.1
0.0
0.1
0.0
0.0
0.0
0.0
SEDAR 15 SAR 1 SECTION III 68

Assessment Workshop South Atlantic Red Snapper
Table 3.12. Red snapper: Base run: Estimated status indicators, benchmarks, and related quantities from thecatch-at-age model, conditional on estimated current selectivities averaged across fisheries. Precision is repre-sented by 10th and 90th percentiles from bootstrap analysis of the spawner-recruit curve. Estimates of yield donot include discards; DMSY represents discard mortalities expected when fishing at FMSY. Rate estimates (F) arein units of per year; status indicators are dimensionless; and biomass estimates are in units of mt or pounds, asindicated. Symbols, abbreviations, and acronyms are listed in Appendix A.
Quantity Units Estimate 10th Percentile 90th Percentile
FMSY y−1 0.112 0.110 0.11385%FMSY y−1 0.095 – –75%FMSY y−1 0.084 – –65%FMSY y−1 0.073 – –F30% y−1 0.100 – –F40% y−1 0.070 – –Fmax y−1 0.120 – –BMSY mt 11734 10539 14174SSBMSY mt 5184 4655 6267MSST mt 4779 4301 5791MSY 1000 lb 2319 2072 2785DMSY 1000 fish 55 49 66RMSY 1000 fish 644 576 774Y at 85%FMSY 1000 lb 2300 – –Y at 75%FMSY 1000 lb 2263 – –Y at 65%FMSY 1000 lb 2200 – –Y at F30% 1000 lb 2310 – –Y at F40% 1000 lb 2177 – –Y at Fmax 1000 lb 2316 – –F2006/FMSY – 7.513 7.446 7.650SSB2006/SSBMSY – 0.037 0.031 0.042SSB2006/MSST – 0.041 0.033 0.045
SEDAR 15 SAR 1 SECTION III 69

Assessment Workshop South Atlantic Red Snapper
Table
3.1
3.R
edsn
apper
:R
esu
lts
from
sen
siti
vity
run
sof
catc
h-a
t-age
mod
el.
Ru
nD
escr
ipti
on
F MSY
SSB
MSY
(mt)
MSY
(1000
lb)F 2
00
6/F
MSY
SSB
20
06/S
SBM
SYst
eep
R0(1
000)
Bas
e—
0.1
12
5184
2319
7.5
10.0
40.9
5605
S1Lo
wM
0.0
97
6112
1977
10.3
60.0
30.9
5377
S2H
igh
M0.1
12
5089
2362
7.2
50.0
40.9
5673
S3q
slop
e0.0
0.1
11
5304
2226
5.7
20.0
50.9
5603
S4q
slop
e0.0
40.1
07
5174
2355
9.2
00.0
30.9
5606
S5R
ecd
ev1972
0.1
06
5203
2299
7.8
20.0
40.9
5608
S6R
ecd
ev1976
0.1
06
5209
2302
7.7
90.0
40.9
5602
S7Lo
wre
crL
0.1
43
1729
559
11.0
90.1
10.9
5152
S8B
ias
recr
Les
t0.1
04
9024
3927
7.7
20.0
20.9
41034
S9C
om
mD
mort
0.7
0.1
05
5180
2316
7.7
20.0
40.9
5603
S10
Com
mD
mort
0.8
0.1
06
5186
2302
7.7
00.0
40.9
5604
S11
Com
mD
mort
1.0
0.1
06
5238
2289
7.7
90.0
40.9
5606
S12
Rec
rD
mort
0.2
0.1
15
4978
2424
6.0
10.0
40.9
5601
S13
Rec
rD
mort
0.6
0.1
13
5417
2176
8.5
10.0
40.9
5607
S14
Dse
lag
e1
0.2
50.1
13
5201
2295
7.9
40.0
40.9
5605
S15
Dse
lag
e1
0.7
50.1
28
5157
2381
6.6
50.0
40.9
5605
S16
stee
p=0.8
0.1
31
7648
2056
9.5
90.0
30.8
0562
S17
stee
p=0.6
0.1
18
10554
1624
7.0
90.0
50.6
0441
S18
Ret
ro2005
0.1
07
4812
2107
7.7
40.0
40.9
5559
S19
Ret
ro2004
0.1
06
4936
2150
7.8
00.0
40.9
5569
S20
Ret
ro2003
0.1
06
5020
2194
7.7
80.0
40.9
5581
S21
Ret
ro2002
0.1
06
5109
2241
7.7
60.0
40.9
5592
S22
Ret
ro2001
0.1
05
5367
2333
7.8
20.0
40.9
5619
S23
B1/K
=0.9
50.1
05
5463
2401
7.7
90.0
40.9
5633
S24
B1/K
=0.9
00.1
09
5588
2492
7.6
40.0
30.9
5649
S25
B1/K
=0.8
50.1
05
5706
2528
7.7
50.0
30.9
5664
S26
B1/K
=0.8
00.1
05
5851
2600
7.7
40.0
30.9
5682
S27
B1/K
=0.7
00.1
04
5211
2326
7.3
40.0
50.9
5606
S28
B1/K
=0.6
50.1
06
5197
2325
8.0
50.0
50.9
5605
S29
B1/K
=0.6
00.1
32
5070
2415
8.2
30.0
40.9
5604
S30
B1/K
=0.5
50.1
04
5239
2325
9.2
10.0
50.9
5600
S31
B1/K
=0.5
00.1
76
4870
2571
12.8
40.0
40.9
4601
SEDAR 15 SAR 1 SECTION III 70

Assessment Workshop South Atlantic Red Snapper
Table 3.14. Red snapper: Projection results under scenario 1—fishing mortality rate fixed at F = 0. F = fishingmortality rate (per year), SSB = mid-year spawning stock biomass (mt), R = recruits (1000 fish), L = landings(1000 lb whole weight), Sum L = cumulative landings (1000 lb), and D = discard mortalities (1000 fish). Forreference, estimated benchmarks are FMSY = 0.112, SSBMSY = 5184, RMSY = 644, MSY = 2319, and DMSY = 55,each in the same units as the relevant time series.
Year F(per yr) SSB(mt) R(1000) L(1000 lb) Sum L(1000 lb) D(1000)
2007 0.998 161 269 562 562 1302008 0.998 125 273 420 982 1232009 0.000 106 233 0 982 02010 0.000 304 208 0 982 02011 0.000 498 379 0 982 02012 0.000 755 457 0 982 02013 0.000 1100 513 0 982 02014 0.000 1537 554 0 982 02015 0.000 2060 584 0 982 02016 0.000 2657 604 0 982 02017 0.000 3313 619 0 982 02018 0.000 4013 629 0 982 02019 0.000 4742 636 0 982 02020 0.000 5486 642 0 982 02021 0.000 6233 646 0 982 02022 0.000 6973 649 0 982 02023 0.000 7697 651 0 982 02024 0.000 8401 654 0 982 02025 0.000 9080 655 0 982 02026 0.000 9731 656 0 982 02027 0.000 10,351 658 0 982 02028 0.000 10,940 659 0 982 02029 0.000 11,497 659 0 982 02030 0.000 12,023 660 0 982 02031 0.000 12,518 661 0 982 02032 0.000 12,982 661 0 982 02033 0.000 13,417 662 0 982 02034 0.000 13,824 662 0 982 02035 0.000 14,205 662 0 982 02036 0.000 14,561 663 0 982 02037 0.000 14,893 663 0 982 02038 0.000 15,203 663 0 982 02039 0.000 15,492 663 0 982 02040 0.000 15,762 663 0 982 0
SEDAR 15 SAR 1 SECTION III 71

Assessment Workshop South Atlantic Red Snapper
Table 3.15. Red snapper: Projection results under scenario 2—fishing mortality rate fixed at F = Fcurrent. F= fishing mortality rate (per year), SSB = mid-year spawning stock biomass (mt), R = recruits (1000 fish), L =landings (1000 lb whole weight), Sum L = cumulative landings (1000 lb), and D = discard mortalities (1000fish). For reference, estimated benchmarks are FMSY = 0.112, SSBMSY = 5184, RMSY = 644, MSY = 2319, andDMSY = 55, each in the same units as the relevant time series.
Year F(per yr) SSB(mt) R(1000) L(1000 lb) Sum L(1000 lb) D(1000)
2007 0.998 161 269 562 562 1302008 0.998 125 273 420 982 1232009 0.998 106 233 343 1325 1152010 0.998 93 208 299 1624 1022011 0.998 83 190 265 1889 912012 0.998 74 175 237 2126 832013 0.998 67 161 214 2340 772014 0.998 61 149 195 2535 712015 0.998 56 139 178 2714 662016 0.998 52 130 165 2878 612017 0.998 48 122 152 3030 572018 0.998 45 115 142 3172 542019 0.998 42 108 133 3305 512020 0.998 40 102 124 3429 482021 0.998 37 97 117 3546 452022 0.998 35 92 110 3656 432023 0.998 33 88 104 3761 412024 0.998 32 83 99 3859 392025 0.998 30 80 94 3953 372026 0.998 29 76 89 4043 352027 0.998 27 73 85 4128 342028 0.998 26 70 81 4209 322029 0.998 25 67 78 4287 312030 0.998 24 65 75 4362 302031 0.998 23 62 72 4433 292032 0.998 22 60 69 4502 282033 0.998 21 58 66 4568 272034 0.998 21 56 64 4632 262035 0.998 20 54 61 4693 252036 0.998 19 52 59 4752 242037 0.998 18 50 57 4809 232038 0.998 18 49 55 4864 222039 0.998 17 47 53 4917 222040 0.998 17 46 51 4968 21
SEDAR 15 SAR 1 SECTION III 72

Assessment Workshop South Atlantic Red Snapper
Table 3.16. Red snapper: Projection results under scenario 3—fishing mortality rate fixed at F = FMSY. F =fishing mortality rate (per year), SSB = mid-year spawning stock biomass (mt), R = recruits (1000 fish), L =landings (1000 lb whole weight), Sum L = cumulative landings (1000 lb), and D = discard mortalities (1000fish). For reference, estimated benchmarks are FMSY = 0.112, SSBMSY = 5184, RMSY = 644, MSY = 2319, andDMSY = 55, each in the same units as the relevant time series.
Year F(per yr) SSB(mt) R(1000) L(1000 lb) Sum L(1000 lb) D(1000)
2007 0.998 161 269 562 562 1302008 0.998 125 273 420 982 1232009 0.112 106 233 55 1037 172010 0.112 265 208 99 1136 192011 0.112 401 356 158 1294 222012 0.112 568 424 229 1523 292013 0.112 778 476 315 1838 362014 0.112 1029 517 425 2264 412015 0.112 1312 548 552 2816 442016 0.112 1615 571 690 3505 472017 0.112 1928 588 833 4338 492018 0.112 2240 600 976 5314 502019 0.112 2544 609 1117 6431 512020 0.112 2832 616 1252 7682 522021 0.112 3102 622 1377 9060 532022 0.112 3350 626 1492 10,552 532023 0.112 3575 629 1596 12,148 542024 0.112 3778 632 1689 13,837 542025 0.112 3959 634 1771 15,608 542026 0.112 4120 636 1844 17,451 542027 0.112 4262 637 1908 19,359 542028 0.112 4387 638 1964 21,323 542029 0.112 4495 639 2012 23,335 552030 0.112 4590 640 2055 25,390 552031 0.112 4673 641 2092 27,481 552032 0.112 4744 641 2123 29,605 552033 0.112 4806 642 2151 31,756 552034 0.112 4859 642 2175 33,930 552035 0.112 4905 642 2195 36,126 552036 0.112 4945 643 2213 38,338 552037 0.112 4979 643 2228 40,566 552038 0.112 5008 643 2241 42,807 552039 0.112 5033 643 2252 45,059 552040 0.112 5055 643 2262 47,320 55
SEDAR 15 SAR 1 SECTION III 73

Assessment Workshop South Atlantic Red Snapper
Table 3.17. Red snapper: Projection results under scenario 4—fishing mortality rate fixed at F = 65%FMSY. F= fishing mortality rate (per year), SSB = mid-year spawning stock biomass (mt), R = recruits (1000 fish), L =landings (1000 lb whole weight), Sum L = cumulative landings (1000 lb), and D = discard mortalities (1000fish). For reference, estimated benchmarks are FMSY = 0.112, SSBMSY = 5184, RMSY = 644, MSY = 2319, andDMSY = 55, each in the same units as the relevant time series.
Year F(per yr) SSB(mt) R(1000) L(1000 lb) Sum L(1000 lb) D(1000)
2007 0.998 161 269 562 562 1302008 0.998 125 273 420 982 1232009 0.073 106 233 37 1018 112010 0.073 278 208 67 1086 132011 0.073 432 364 111 1197 152012 0.073 627 436 165 1362 202013 0.073 878 489 232 1595 252014 0.073 1183 531 320 1915 282015 0.073 1533 561 423 2337 302016 0.073 1916 584 537 2874 322017 0.073 2320 600 657 3531 332018 0.073 2732 611 781 4312 342019 0.073 3142 620 905 5217 352020 0.073 3540 626 1026 6242 352021 0.073 3921 631 1141 7384 362022 0.073 4279 635 1249 8633 362023 0.073 4613 638 1349 9982 362024 0.073 4922 641 1440 11,422 372025 0.073 5204 643 1523 12,945 372026 0.073 5460 644 1598 14,544 372027 0.073 5692 646 1666 16,210 372028 0.073 5901 647 1727 17,937 372029 0.073 6089 648 1781 19,718 372030 0.073 6256 648 1830 21,547 372031 0.073 6406 649 1873 23,420 372032 0.073 6538 650 1911 25,331 372033 0.073 6656 650 1945 27,276 372034 0.073 6760 650 1975 29,251 372035 0.073 6853 651 2002 31,253 372036 0.073 6934 651 2025 33,278 372037 0.073 7006 651 2046 35,324 372038 0.073 7069 652 2064 37,389 372039 0.073 7125 652 2080 39,469 372040 0.073 7175 652 2095 41,563 37
SEDAR 15 SAR 1 SECTION III 74

Assessment Workshop South Atlantic Red Snapper
Table 3.18. Red snapper: Projection results under scenario 5—fishing mortality rate fixed at F = 75%FMSY. F= fishing mortality rate (per year), SSB = mid-year spawning stock biomass (mt), R = recruits (1000 fish), L =landings (1000 lb whole weight), Sum L = cumulative landings (1000 lb), and D = discard mortalities (1000fish). For reference, estimated benchmarks are FMSY = 0.112, SSBMSY = 5184, RMSY = 644, MSY = 2319, andDMSY = 55, each in the same units as the relevant time series.
Year F(per yr) SSB(mt) R(1000) L(1000 lb) Sum L(1000 lb) D(1000)
2007 0.998 161 269 562 562 1302008 0.998 125 273 420 982 1232009 0.084 106 233 42 1024 132010 0.084 274 208 77 1100 142011 0.084 423 362 126 1226 172012 0.084 609 432 185 1411 232013 0.084 848 485 259 1670 282014 0.084 1136 527 354 2024 322015 0.084 1466 558 465 2489 342016 0.084 1824 580 588 3077 362017 0.084 2199 596 717 3794 382018 0.084 2580 608 849 4643 392019 0.084 2956 617 979 5622 402020 0.084 3319 624 1107 6729 402021 0.084 3663 629 1228 7957 412022 0.084 3985 633 1339 9296 412023 0.084 4283 636 1442 10,738 412024 0.084 4556 638 1535 12,274 422025 0.084 4804 640 1620 13,893 422026 0.084 5028 642 1695 15,589 422027 0.084 5229 643 1763 17,352 422028 0.084 5409 644 1824 19,176 422029 0.084 5569 645 1877 21,053 422030 0.084 5711 646 1925 22,977 422031 0.084 5836 647 1966 24,944 422032 0.084 5947 647 2003 26,947 422033 0.084 6044 648 2036 28,983 422034 0.084 6130 648 2064 31,047 422035 0.084 6205 649 2089 33,137 422036 0.084 6271 649 2111 35,248 422037 0.084 6329 649 2131 37,378 422038 0.084 6379 649 2147 39,526 422039 0.084 6423 650 2162 41,688 432040 0.084 6462 650 2175 43,863 43
SEDAR 15 SAR 1 SECTION III 75

Assessment Workshop South Atlantic Red Snapper
Table 3.19. Red snapper: Projection results under scenario 6—fishing mortality rate fixed at F = 85%FMSY. F= fishing mortality rate (per year), SSB = mid-year spawning stock biomass (mt), R = recruits (1000 fish), L =landings (1000 lb whole weight), Sum L = cumulative landings (1000 lb), and D = discard mortalities (1000fish). For reference, estimated benchmarks are FMSY = 0.112, SSBMSY = 5184, RMSY = 644, MSY = 2319, andDMSY = 55, each in the same units as the relevant time series.
Year F(per yr) SSB(mt) R(1000) L(1000 lb) Sum L(1000 lb) D(1000)
2007 0.998 161 269 562 562 1302008 0.998 125 273 420 982 1232009 0.095 106 233 47 1029 142010 0.095 271 208 86 1115 162011 0.095 414 360 139 1254 192012 0.095 592 429 204 1458 252013 0.095 819 481 283 1740 312014 0.095 1092 523 385 2125 352015 0.095 1402 554 503 2628 382016 0.095 1737 576 633 3261 412017 0.095 2086 593 769 4030 422018 0.095 2437 605 906 4936 442019 0.095 2782 614 1042 5979 452020 0.095 3113 621 1174 7152 452021 0.095 3425 626 1298 8450 462022 0.095 3715 630 1412 9862 462023 0.095 3981 633 1516 11,378 462024 0.095 4223 636 1610 12,988 472025 0.095 4442 638 1694 14,682 472026 0.095 4638 640 1769 16,451 472027 0.095 4812 641 1836 18,287 472028 0.095 4967 642 1895 20,182 472029 0.095 5104 643 1947 22,128 472030 0.095 5224 644 1993 24,121 472031 0.095 5330 644 2033 26,154 472032 0.095 5423 645 2068 28,222 472033 0.095 5504 645 2098 30,320 472034 0.095 5574 646 2125 32,445 472035 0.095 5636 646 2148 34,593 482036 0.095 5690 646 2168 36,762 482037 0.095 5736 647 2186 38,948 482038 0.095 5777 647 2201 41,149 482039 0.095 5812 647 2215 43,364 482040 0.095 5842 647 2226 45,590 48
SEDAR 15 SAR 1 SECTION III 76

Assessment Workshop South Atlantic Red Snapper
Table 3.20. Red snapper: Projection results under scenario 7—fishing mortality rate fixed at F = Frebuild. F= fishing mortality rate (per year), SSB = mid-year spawning stock biomass (mt), R = recruits (1000 fish), L =landings (1000 lb whole weight), Sum L = cumulative landings (1000 lb), and D = discard mortalities (1000fish). For reference, estimated benchmarks are FMSY = 0.112, SSBMSY = 5184, RMSY = 644, MSY = 2319, andDMSY = 55, each in the same units as the relevant time series.
Year F(per yr) SSB(mt) R(1000) L(1000 lb) Sum L(1000 lb) D(1000)
2007 0.998 161 269 562 562 1302008 0.998 125 273 420 982 1232009 0.109 106 233 54 1036 162010 0.109 266 208 96 1132 182011 0.109 403 357 155 1287 222012 0.109 572 425 225 1512 292013 0.109 785 477 310 1821 352014 0.109 1040 518 419 2240 402015 0.109 1328 549 544 2784 432016 0.109 1636 572 680 3465 462017 0.109 1955 589 822 4287 482018 0.109 2274 601 965 5252 492019 0.109 2584 610 1105 6357 502020 0.109 2880 617 1240 7596 512021 0.109 3157 622 1365 8962 512022 0.109 3412 627 1480 10,442 522023 0.109 3644 630 1584 12,026 522024 0.109 3853 633 1677 13,703 532025 0.109 4041 635 1760 15,463 532026 0.109 4207 636 1833 17,296 532027 0.109 4354 638 1898 19,194 532028 0.109 4484 639 1954 21,148 532029 0.109 4597 640 2004 23,152 532030 0.109 4696 641 2047 25,198 532031 0.109 4782 641 2084 27,282 532032 0.109 4857 642 2117 29,399 532033 0.109 4922 642 2145 31,544 542034 0.109 4978 643 2169 33,712 542035 0.109 5026 643 2190 35,902 542036 0.109 5068 643 2208 38,110 542037 0.109 5104 644 2223 40,334 542038 0.109 5135 644 2237 42,570 542039 0.109 5161 644 2248 44,819 542040 0.109 5184 644 2258 47,077 54
SEDAR 15 SAR 1 SECTION III 77

Assessment Workshop South Atlantic Red Snapper
Table 3.21. Red snapper: Projection results under scenario 8—Discard-only projection with fishing rate fixedat F = Fcurrent minus commercial diving, and with release mortality rates of 0.9 in the commercial sector and0.4 in the headboat and general recreational sectors. F = fishing rate (per year), Fmort = fishing rate leadingto discard mortality (a portion of F), SSB = mid-year spawning stock biomass (mt), R = recruits (1000 fish), L =landings (1000 lb whole weight), and D = discard mortalities (1000 fish). For reference, the target for rebuildingis SSBMSY = 5184.
Year F(per yr) Fmort (per yr) SSB(mt) R(1000) L(1000 lb) D(1000)
2007 0.998 0.998 161 269 562 1302008 0.998 0.998 125 273 420 1232009 0.927 0.668 106 233 0 1172010 0.927 0.668 181 208 0 1262011 0.927 0.668 220 292 0 1392012 0.927 0.668 260 325 0 1642013 0.927 0.668 304 353 0 1862014 0.927 0.668 350 379 0 2062015 0.927 0.668 397 402 0 2242016 0.927 0.668 442 422 0 2402017 0.927 0.668 485 439 0 2552018 0.927 0.668 525 453 0 2672019 0.927 0.668 562 464 0 2782020 0.927 0.668 595 474 0 2872021 0.927 0.668 624 482 0 2952022 0.927 0.668 649 488 0 3022023 0.927 0.668 671 494 0 3072024 0.927 0.668 690 498 0 3122025 0.927 0.668 706 502 0 3162026 0.927 0.668 720 505 0 3192027 0.927 0.668 731 507 0 3222028 0.927 0.668 741 509 0 3242029 0.927 0.668 749 511 0 3262030 0.927 0.668 755 512 0 3272031 0.927 0.668 761 513 0 3282032 0.927 0.668 765 514 0 3292033 0.927 0.668 769 515 0 3302034 0.927 0.668 772 515 0 3312035 0.927 0.668 775 516 0 3312036 0.927 0.668 777 516 0 3322037 0.927 0.668 779 516 0 3322038 0.927 0.668 780 517 0 3322039 0.927 0.668 781 517 0 3332040 0.927 0.668 782 517 0 333
SEDAR 15 SAR 1 SECTION III 78

Assessment Workshop South Atlantic Red Snapper
Table 3.22. Red snapper: Projection results under scenario 9—Discard-only projection with fishing rate fixedat F = Fcurrent minus commercial diving, and with release mortality rates of 0.8 in the commercial sector and0.2 in the headboat and general recreational sectors. F = fishing rate (per year), Fmort = fishing rate leadingto discard mortality (a portion of F), SSB = mid-year spawning stock biomass (mt), R = recruits (1000 fish), L =landings (1000 lb whole weight), and D = discard mortalities (1000 fish). For reference, the target for rebuildingis SSBMSY = 5184.
Year F(per yr) Fmort (per yr) SSB(mt) R(1000) L(1000 lb) D(1000)
2007 0.998 0.998 161 269 562 1302008 0.998 0.998 125 273 420 1232009 0.927 0.570 106 233 0 1062010 0.927 0.570 199 208 0 1142011 0.927 0.570 256 308 0 1302012 0.927 0.570 317 350 0 1592013 0.927 0.570 387 386 0 1852014 0.927 0.570 462 418 0 2072015 0.927 0.570 540 446 0 2282016 0.927 0.570 619 468 0 2472017 0.927 0.570 696 487 0 2632018 0.927 0.570 770 503 0 2782019 0.927 0.570 839 515 0 2902020 0.927 0.570 902 526 0 3002021 0.927 0.570 959 534 0 3092022 0.927 0.570 1010 540 0 3162023 0.927 0.570 1055 546 0 3222024 0.927 0.570 1094 550 0 3282025 0.927 0.570 1128 554 0 3322026 0.927 0.570 1157 557 0 3352027 0.927 0.570 1182 559 0 3382028 0.927 0.570 1202 561 0 3412029 0.927 0.570 1220 563 0 3432030 0.927 0.570 1235 564 0 3452031 0.927 0.570 1247 565 0 3462032 0.927 0.570 1258 566 0 3472033 0.927 0.570 1266 567 0 3482034 0.927 0.570 1273 568 0 3492035 0.927 0.570 1279 568 0 3492036 0.927 0.570 1284 569 0 3502037 0.927 0.570 1288 569 0 3502038 0.927 0.570 1292 569 0 3512039 0.927 0.570 1295 569 0 3512040 0.927 0.570 1297 570 0 351
SEDAR 15 SAR 1 SECTION III 79

Assessment Workshop South Atlantic Red Snapper
Table 3.23. Red snapper: Projection results under scenario 10—Discard-only projection with fishing rate fixedat F = Fcurrent minus commercial diving, and with release mortality rates of 1.0 in the commercial sector and0.6 in the headboat and general recreational sectors. F = fishing rate (per year), Fmort = fishing rate leadingto discard mortality (a portion of F), SSB = mid-year spawning stock biomass (mt), R = recruits (1000 fish), L =landings (1000 lb whole weight), and D = discard mortalities (1000 fish). For reference, the target for rebuildingis SSBMSY = 5184.
Year F(per yr) Fmort (per yr) SSB(mt) R(1000) L(1000 lb) D(1000)
2007 0.998 0.998 161 269 562 1302008 0.998 0.998 125 273 420 1232009 0.927 0.767 106 233 0 1272010 0.927 0.767 164 208 0 1352011 0.927 0.767 190 276 0 1452012 0.927 0.767 215 300 0 1652013 0.927 0.767 242 321 0 1832014 0.927 0.767 270 341 0 1982015 0.927 0.767 297 359 0 2132016 0.927 0.767 323 375 0 2262017 0.927 0.767 347 389 0 2372018 0.927 0.767 369 401 0 2482019 0.927 0.767 389 410 0 2572020 0.927 0.767 406 419 0 2642021 0.927 0.767 422 426 0 2712022 0.927 0.767 435 432 0 2762023 0.927 0.767 447 437 0 2812024 0.927 0.767 457 441 0 2852025 0.927 0.767 466 444 0 2882026 0.927 0.767 473 447 0 2912027 0.927 0.767 479 449 0 2932028 0.927 0.767 484 451 0 2952029 0.927 0.767 488 453 0 2972030 0.927 0.767 492 454 0 2982031 0.927 0.767 495 455 0 2992032 0.927 0.767 497 456 0 3002033 0.927 0.767 499 457 0 3012034 0.927 0.767 501 457 0 3022035 0.927 0.767 502 458 0 3022036 0.927 0.767 504 458 0 3032037 0.927 0.767 505 458 0 3032038 0.927 0.767 505 459 0 3032039 0.927 0.767 506 459 0 3032040 0.927 0.767 507 459 0 304
SEDAR 15 SAR 1 SECTION III 80

Assessment Workshop South Atlantic Red Snapper
Table 3.24. Red snapper: Projection results under scenario 11—Discard-only projection with fishing rate fixedat F = Frebuild, given release mortality rates of 0.9 in the commercial sector and 0.4 in the headboat and generalrecreational sectors. F = fishing rate (per year), Fmort = fishing rate leading to discard mortality (a portion of F),SSB = mid-year spawning stock biomass (mt), R = recruits (1000 fish), L = landings (1000 lb whole weight), andD = discard mortalities (1000 fish). For reference, the target for rebuilding is SSBMSY = 5184.
Year F(per yr) Fmort (per yr) SSB(mt) R(1000) L(1000 lb) D(1000)
2007 0.998 0.998 161 269 562 1302008 0.998 0.998 125 273 420 1232009 0.262 0.189 106 233 0 372010 0.262 0.189 262 208 0 472011 0.262 0.189 394 354 0 592012 0.262 0.189 556 421 0 782013 0.262 0.189 760 473 0 992014 0.262 0.189 1003 514 0 1172015 0.262 0.189 1278 545 0 1352016 0.262 0.189 1575 568 0 1512017 0.262 0.189 1884 586 0 1662018 0.262 0.189 2195 598 0 1792019 0.262 0.189 2501 608 0 1902020 0.262 0.189 2794 615 0 2002021 0.262 0.189 3071 621 0 2092022 0.262 0.189 3329 625 0 2172023 0.262 0.189 3565 629 0 2232024 0.262 0.189 3781 632 0 2292025 0.262 0.189 3975 634 0 2342026 0.262 0.189 4148 636 0 2382027 0.262 0.189 4303 637 0 2422028 0.262 0.189 4440 638 0 2452029 0.262 0.189 4560 640 0 2482030 0.262 0.189 4666 640 0 2502031 0.262 0.189 4759 641 0 2522032 0.262 0.189 4839 642 0 2542033 0.262 0.189 4910 642 0 2562034 0.262 0.189 4971 643 0 2572035 0.262 0.189 5024 643 0 2582036 0.262 0.189 5070 643 0 2592037 0.262 0.189 5110 644 0 2602038 0.262 0.189 5145 644 0 2612039 0.262 0.189 5174 644 0 2612040 0.262 0.189 5200 644 0 262
SEDAR 15 SAR 1 SECTION III 81

Assessment Workshop South Atlantic Red Snapper
Table 3.25. Red snapper: Projection results under scenario 12—Discard-only projection with fishing rate fixedat F = Frebuild, given release mortality rates of 0.7 in the commercial sector and 0.4 in the headboat and generalrecreational sectors. F = fishing rate (per year), Fmort = fishing rate leading to discard mortality (a portion of F),SSB = mid-year spawning stock biomass (mt), R = recruits (1000 fish), L = landings (1000 lb whole weight), andD = discard mortalities (1000 fish). For reference, the target for rebuilding is SSBMSY = 5184.
Year F(per yr) Fmort (per yr) SSB(mt) R(1000) L(1000 lb) D(1000)
2007 0.998 0.998 161 269 562 1302008 0.998 0.998 125 273 420 1232009 0.286 0.195 106 233 0 402010 0.286 0.195 261 208 0 502011 0.286 0.195 390 353 0 622012 0.286 0.195 550 420 0 822013 0.286 0.195 751 471 0 1032014 0.286 0.195 990 512 0 1222015 0.286 0.195 1260 544 0 1392016 0.286 0.195 1552 567 0 1552017 0.286 0.195 1856 585 0 1702018 0.286 0.195 2163 597 0 1832019 0.286 0.195 2465 607 0 1942020 0.286 0.195 2756 615 0 2042021 0.286 0.195 3032 620 0 2122022 0.286 0.195 3289 625 0 2202023 0.286 0.195 3525 628 0 2262024 0.286 0.195 3741 631 0 2322025 0.286 0.195 3936 634 0 2372026 0.286 0.195 4111 635 0 2412027 0.286 0.195 4267 637 0 2452028 0.286 0.195 4406 638 0 2482029 0.286 0.195 4528 639 0 2502030 0.286 0.195 4636 640 0 2532031 0.286 0.195 4730 641 0 2552032 0.286 0.195 4813 642 0 2572033 0.286 0.195 4885 642 0 2582034 0.286 0.195 4948 642 0 2602035 0.286 0.195 5003 643 0 2612036 0.286 0.195 5051 643 0 2622037 0.286 0.195 5092 643 0 2632038 0.286 0.195 5128 644 0 2632039 0.286 0.195 5159 644 0 2642040 0.286 0.195 5186 644 0 265
SEDAR 15 SAR 1 SECTION III 82

Assessment Workshop South Atlantic Red Snapper
Table 3.26. Parameter estimates from fit of surplus production model applied to red snapper, including bootstrapestimates of bias and uncertainty.
ESTIMATES FROM BOOTSTRAPPED ANALYSIS------------------------------------------------------------------------------------------------
Estimated Estimated Bias-corrected approximate confidence limitsParam Point bias in pt relative ------------------------------------------------name estimate estimate bias 80% lower 80% upper 50% lower 50% upper
B1/K 9.500E-01 -5.440E-15 0.00% 9.500E-01 9.500E-01 9.500E-01 9.500E-01K 4.495E+07 4.455E+06 9.91% 4.235E+07 5.182E+07 4.235E+07 4.588E+07
q(1) 2.215E-07 -2.345E-08 -10.58% 1.574E-07 2.900E-07 2.044E-07 2.599E-07q(2) 2.455E-07 -2.882E-08 -11.74% 1.843E-07 3.636E-07 2.284E-07 3.150E-07q(3) 2.370E-07 -2.621E-08 -11.06% 1.785E-07 3.131E-07 2.155E-07 2.849E-07
MSY 3.342E+06 -2.028E+05 -6.07% 2.997E+06 3.476E+06 3.295E+06 3.476E+06Ye(2007) 1.065E+06 3.844E+04 3.61% 7.266E+05 1.465E+06 8.866E+05 1.277E+06Y.@Fmsy 5.836E+05 4.367E+04 7.48% 3.836E+05 8.455E+05 4.718E+05 7.122E+05
Bmsy 2.247E+07 2.228E+06 9.91% 2.117E+07 2.591E+07 2.117E+07 2.294E+07Fmsy 1.487E-01 -1.500E-02 -10.09% 1.157E-01 1.642E-01 1.437E-01 1.642E-01
fmsy(1) 6.713E+05 3.458E+04 5.15% 5.457E+05 7.760E+05 5.966E+05 7.186E+05fmsy(2) 6.059E+05 6.129E+04 10.12% 4.403E+05 7.689E+05 5.012E+05 6.729E+05fmsy(3) 6.275E+05 4.253E+04 6.78% 5.003E+05 7.406E+05 5.457E+05 6.756E+05
B./Bmsy 1.746E-01 3.238E-02 18.54% 9.938E-02 2.418E-01 1.268E-01 1.983E-01F./Fmsy 1.077E+00 2.464E-02 2.29% 7.586E-01 1.606E+00 8.974E-01 1.322E+00Ye./MSY 3.187E-01 4.194E-02 13.16% 1.889E-01 4.252E-01 2.375E-01 3.573E-01
q2/q1 1.108E+00 -3.390E-03 -0.31% 8.411E-01 1.497E+00 9.725E-01 1.328E+00q3/q1 1.070E+00 6.407E-03 0.60% 8.472E-01 1.340E+00 9.426E-01 1.210E+00
SEDAR 15 SAR 1 SECTION III 83

Assessment Workshop South Atlantic Red Snapper
3.4.2 Figures
SEDAR 15 SAR 1 SECTION III 84

Assessment Workshop South Atlantic Red Snapper
Figure 3.1. Red snapper: Observed (open circles) and estimated (solid line) annual length and age composi-tions by fishery. In panels indicating the data set, lcomp refers to length compositions, acomp to age composi-tions, c.hal to commercial handline, c.dv to commercial diving, hb to headboat, and rec to general recreational(MRFSS).
↓ lcomp.c.hal ↓
200 400 600 800 1000
0.0
0.1
0.2
Length bin (mm)
Pro
port
ion
N = 20891984
200 400 600 800 1000
0.0
0.1
0.2
Length bin (mm)
Pro
port
ion
N = 35391985
200 400 600 800 1000
0.0
0.1
0.2
Length bin (mm)
Pro
port
ion
N = 12461986
200 400 600 800 1000
0.0
0.1
0.2
Length bin (mm)
Pro
port
ion
N = 11461987
200 400 600 800 10000.
00.
10.
2Length bin (mm)
Pro
port
ion
N = 6211988
200 400 600 800 1000
0.0
0.1
0.2
Length bin (mm)
Pro
port
ion
N = 11911989
200 400 600 800 1000
0.0
0.1
0.2
Length bin (mm)
Pro
port
ion
N = 7871990
200 400 600 800 1000
0.0
0.1
0.2
Length bin (mm)
Pro
port
ion
N = 7061991
200 400 600 800 1000
0.0
0.1
0.2
Length bin (mm)
Pro
port
ion
N = 5121992
200 400 600 800 1000
0.0
0.1
0.2
Length bin (mm)
Pro
port
ion
N = 13471993
200 400 600 800 1000
0.0
0.1
0.2
Length bin (mm)
Pro
port
ion
N = 11671994
200 400 600 800 1000
0.0
0.1
0.2
Length bin (mm)
Pro
port
ion
N = 14421995
200 400 600 800 1000
0.0
0.1
0.2
Length bin (mm)
Pro
port
ion
N = 7701996
200 400 600 800 1000
0.0
0.1
0.2
Length bin (mm)
Pro
port
ion
N = 4971997
SEDAR 15 SAR 1 SECTION III 85

Assessment Workshop South Atlantic Red Snapper
Figure 3.1. (cont.) Red snapper: Observed (open circles) and estimated (solid line) annual length and age com-positions by fishery.
200 400 600 800 1000
0.0
0.1
0.2
Length bin (mm)
Pro
port
ion
N = 4281998
200 400 600 800 1000
0.0
0.1
0.2
Length bin (mm)
Pro
port
ion
N = 9461999
200 400 600 800 1000
0.0
0.1
0.2
Length bin (mm)
Pro
port
ion
N = 8812000
200 400 600 800 1000
0.0
0.1
0.2
Length bin (mm)
Pro
port
ion
N = 14082001
200 400 600 800 1000
0.0
0.1
0.2
Length bin (mm)
Pro
port
ion
N = 9922002
200 400 600 800 1000
0.0
0.1
0.2
Length bin (mm)P
ropo
rtio
n
N = 12702003
200 400 600 800 1000
0.0
0.1
0.2
Length bin (mm)
Pro
port
ion
N = 7952004
200 400 600 800 1000
0.0
0.1
0.2
Length bin (mm)
Pro
port
ion
N = 6182005
200 400 600 800 1000
0.0
0.1
0.2
Length bin (mm)
Pro
port
ion
N = 4062006
↓ lcomp.c.dv ↓
200 400 600 800 1000
0.0
0.1
0.2
Length bin (mm)
Pro
port
ion
N = 831999
200 400 600 800 1000
0.0
0.1
0.2
Length bin (mm)
Pro
port
ion
N = 1292000
200 400 600 800 1000
0.0
0.1
0.2
Length bin (mm)
Pro
port
ion
N = 872001
200 400 600 800 1000
0.0
0.1
0.2
Length bin (mm)
Pro
port
ion
N = 2102003
SEDAR 15 SAR 1 SECTION III 86

Assessment Workshop South Atlantic Red Snapper
Figure 3.1. (cont.) Red snapper: Observed (open circles) and estimated (solid line) annual length and age com-positions by fishery.
↓ lcomp.hb ↓
200 400 600 800 1000
0.0
0.1
0.2
Length bin (mm)
Pro
port
ion
N = 7401978
200 400 600 800 1000
0.0
0.1
0.2
Length bin (mm)
Pro
port
ion
N = 2451979
200 400 600 800 1000
0.0
0.1
0.2
Length bin (mm)
Pro
port
ion
N = 2581980
200 400 600 800 1000
0.0
0.1
0.2
Length bin (mm)
Pro
port
ion
N = 6741981
200 400 600 800 1000
0.0
0.1
0.2
Length bin (mm)P
ropo
rtio
n
N = 4571982
200 400 600 800 1000
0.0
0.1
0.2
Length bin (mm)
Pro
port
ion
N = 10061983
200 400 600 800 1000
0.0
0.1
0.2
Length bin (mm)
Pro
port
ion
N = 13171984
200 400 600 800 1000
0.0
0.1
0.2
Length bin (mm)
Pro
port
ion
N = 11901985
200 400 600 800 1000
0.0
0.1
0.2
Length bin (mm)
Pro
port
ion
N = 4351986
200 400 600 800 1000
0.0
0.1
0.2
Length bin (mm)
Pro
port
ion
N = 3061987
200 400 600 800 1000
0.0
0.1
0.2
Length bin (mm)
Pro
port
ion
N = 2041988
200 400 600 800 1000
0.0
0.1
0.2
Length bin (mm)
Pro
port
ion
N = 3741989
200 400 600 800 1000
0.0
0.1
0.2
Length bin (mm)
Pro
port
ion
N = 4331990
200 400 600 800 1000
0.0
0.1
0.2
Length bin (mm)
Pro
port
ion
N = 1521991
SEDAR 15 SAR 1 SECTION III 87

Assessment Workshop South Atlantic Red Snapper
Figure 3.1. (cont.) Red snapper: Observed (open circles) and estimated (solid line) annual length and age com-positions by fishery.
200 400 600 800 1000
0.0
0.1
0.2
Length bin (mm)
Pro
port
ion
N = 731992
200 400 600 800 1000
0.0
0.1
0.2
Length bin (mm)
Pro
port
ion
N = 2031993
200 400 600 800 1000
0.0
0.1
0.2
Length bin (mm)
Pro
port
ion
N = 5241994
200 400 600 800 1000
0.0
0.1
0.2
Length bin (mm)
Pro
port
ion
N = 1471995
200 400 600 800 1000
0.0
0.1
0.2
Length bin (mm)
Pro
port
ion
N = 801996
200 400 600 800 1000
0.0
0.1
0.2
Length bin (mm)P
ropo
rtio
n
N = 681997
200 400 600 800 1000
0.0
0.1
0.2
Length bin (mm)
Pro
port
ion
N = 1491998
200 400 600 800 1000
0.0
0.1
0.2
Length bin (mm)
Pro
port
ion
N = 1611999
200 400 600 800 1000
0.0
0.1
0.2
Length bin (mm)
Pro
port
ion
N = 1232000
200 400 600 800 1000
0.0
0.1
0.2
Length bin (mm)
Pro
port
ion
N = 2542001
200 400 600 800 1000
0.0
0.1
0.2
Length bin (mm)
Pro
port
ion
N = 3612002
200 400 600 800 1000
0.0
0.1
0.2
Length bin (mm)
Pro
port
ion
N = 3292003
200 400 600 800 1000
0.0
0.1
0.2
Length bin (mm)
Pro
port
ion
N = 3072004
200 400 600 800 1000
0.0
0.1
0.2
Length bin (mm)
Pro
port
ion
N = 1932005
200 400 600 800 1000
0.0
0.1
0.2
Length bin (mm)
Pro
port
ion
N = 1722006
SEDAR 15 SAR 1 SECTION III 88

Assessment Workshop South Atlantic Red Snapper
Figure 3.1. (cont.) Red snapper: Observed (open circles) and estimated (solid line) annual length and age com-positions by fishery.
↓ lcomp.rec ↓
200 400 600 800 1000
0.0
0.1
0.2
Length bin (mm)
Pro
port
ion
N = 441981
200 400 600 800 1000
0.0
0.1
0.2
Length bin (mm)
Pro
port
ion
N = 1611983
200 400 600 800 1000
0.0
0.1
0.2
Length bin (mm)
Pro
port
ion
N = 3701984
200 400 600 800 1000
0.0
0.1
0.2
Length bin (mm)
Pro
port
ion
N = 2491985
200 400 600 800 1000
0.0
0.1
0.2
Length bin (mm)P
ropo
rtio
n
N = 2261986
200 400 600 800 1000
0.0
0.1
0.2
Length bin (mm)
Pro
port
ion
N = 631987
200 400 600 800 1000
0.0
0.1
0.2
Length bin (mm)
Pro
port
ion
N = 871988
200 400 600 800 1000
0.0
0.1
0.2
Length bin (mm)
Pro
port
ion
N = 591989
200 400 600 800 1000
0.0
0.1
0.2
Length bin (mm)
Pro
port
ion
N = 1321999
200 400 600 800 1000
0.0
0.1
0.2
Length bin (mm)
Pro
port
ion
N = 952000
200 400 600 800 1000
0.0
0.1
0.2
Length bin (mm)
Pro
port
ion
N = 1202001
200 400 600 800 1000
0.0
0.1
0.2
Length bin (mm)
Pro
port
ion
N = 2322002
200 400 600 800 1000
0.0
0.1
0.2
Length bin (mm)
Pro
port
ion
N = 1662003
200 400 600 800 1000
0.0
0.1
0.2
Length bin (mm)
Pro
port
ion
N = 1562004
SEDAR 15 SAR 1 SECTION III 89

Assessment Workshop South Atlantic Red Snapper
Figure 3.1. (cont.) Red snapper: Observed (open circles) and estimated (solid line) annual length and age com-positions by fishery.
200 400 600 800 1000
0.0
0.1
0.2
Length bin (mm)
Pro
port
ion
N = 832005
200 400 600 800 1000
0.0
0.1
0.2
Length bin (mm)
Pro
port
ion
N = 842006
↓ acomp.c.hal ↓
5 10 15 20
0.0
0.2
0.4
Age class
Pro
port
ion
N = 481992
5 10 15 20
0.0
0.2
0.4
Age class
Pro
port
ion
N = 491994
5 10 15 20
0.0
0.2
0.4
Age classP
ropo
rtio
n
N = 1671996
5 10 15 20
0.0
0.2
0.4
Age class
Pro
port
ion
N = 1821997
5 10 15 20
0.0
0.2
0.4
Age class
Pro
port
ion
N = 751998
5 10 15 20
0.0
0.2
0.4
Age class
Pro
port
ion
N = 1471999
5 10 15 20
0.0
0.2
0.4
Age class
Pro
port
ion
N = 2262000
5 10 15 20
0.0
0.2
0.4
Age class
Pro
port
ion
N = 1442001
5 10 15 20
0.0
0.2
0.4
Age class
Pro
port
ion
N = 512003
5 10 15 20
0.0
0.2
0.4
Age class
Pro
port
ion
N = 1032004
5 10 15 20
0.0
0.2
0.4
Age class
Pro
port
ion
N = 1402005
5 10 15 20
0.0
0.2
0.4
Age class
Pro
port
ion
N = 1892006
SEDAR 15 SAR 1 SECTION III 90

Assessment Workshop South Atlantic Red Snapper
Figure 3.1. (cont.) Red snapper: Observed (open circles) and estimated (solid line) annual length and age com-positions by fishery.
↓ acomp.c.dv ↓
5 10 15 20
0.0
0.2
0.4
Age class
Pro
port
ion
N = 1062000
↓ acomp.hb ↓
5 10 15 20
0.0
0.5
Age class
Pro
port
ion
N = 721977
5 10 15 20
0.0
0.5
Age class
Pro
port
ion
N = 2791978
5 10 15 20
0.0
0.5
Age classP
ropo
rtio
n
N = 471979
5 10 15 20
0.0
0.5
Age class
Pro
port
ion
N = 941980
5 10 15 20
0.0
0.5
Age class
Pro
port
ion
N = 4151981
5 10 15 20
0.0
0.5
Age class
Pro
port
ion
N = 1341982
5 10 15 20
0.0
0.5
Age class
Pro
port
ion
N = 7541983
5 10 15 20
0.0
0.5
Age class
Pro
port
ion
N = 6191984
5 10 15 20
0.0
0.5
Age class
Pro
port
ion
N = 5111985
5 10 15 20
0.0
0.5
Age class
Pro
port
ion
N = 1921986
5 10 15 20
0.0
0.5
Age class
Pro
port
ion
N = 931987
5 10 15 20
0.0
0.5
Age class
Pro
port
ion
N = 571989
SEDAR 15 SAR 1 SECTION III 91

Assessment Workshop South Atlantic Red Snapper
Figure 3.1. (cont.) Red snapper: Observed (open circles) and estimated (solid line) annual length and age com-positions by fishery.
5 10 15 20
0.0
0.5
Age class
Pro
port
ion
N = 1241996
↓ acomp.rec ↓
5 10 15 20
0.0
0.2
0.4
Age class
Pro
port
ion
N = 752001
5 10 15 20
0.0
0.2
0.4
Age class
Pro
port
ion
N = 3862002
5 10 15 20
0.0
0.2
0.4
Age class
Pro
port
ion
N = 3892003
5 10 15 20
0.0
0.2
0.4
Age classP
ropo
rtio
n
N = 3112004
5 10 15 20
0.0
0.2
0.4
Age class
Pro
port
ion
N = 2562005
SEDAR 15 SAR 1 SECTION III 92

Assessment Workshop South Atlantic Red Snapper
Figure 3.2. Red snapper: Top panel is a bubble plot of length composition residuals from the commercial hand-line fishery; Dark represents overestimates and light underestimates. Bottom panel shows the angle (in degrees)between vectors of observations and estimates, with a reference line at 20 degrees. Error is bounded between 0and 90 degrees, with 0 indicating a perfect fit.
200
400
600
800
1000
Leng
th b
in (
mm
)E
rror
, deg
.
0
30
60
90
1985 1990 1995 2000 2005
SEDAR 15 SAR 1 SECTION III 93

Assessment Workshop South Atlantic Red Snapper
Figure 3.3. Red snapper: Top panel is a bubble plot of length composition residuals from the commercial divingfishery; Dark represents overestimates and light underestimates. Bottom panel shows the angle (in degrees)between vectors of observations and estimates, with a reference line at 20 degrees.Error is bounded between 0 and 90 degrees, with 0 indicating a perfect fit.
200
400
600
800
1000
Leng
th b
in (
mm
)E
rror
, deg
.
0
30
60
90
1999 2000 2001 2002 2003
SEDAR 15 SAR 1 SECTION III 94
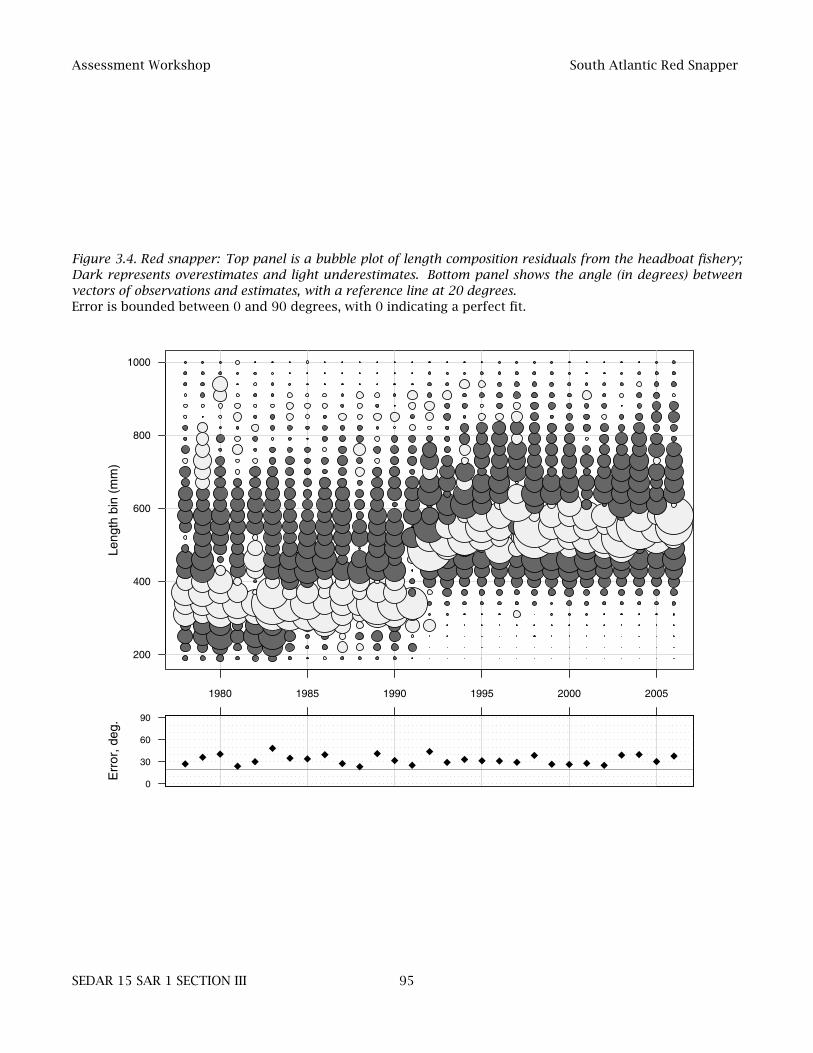
Assessment Workshop South Atlantic Red Snapper
Figure 3.4. Red snapper: Top panel is a bubble plot of length composition residuals from the headboat fishery;Dark represents overestimates and light underestimates. Bottom panel shows the angle (in degrees) betweenvectors of observations and estimates, with a reference line at 20 degrees.Error is bounded between 0 and 90 degrees, with 0 indicating a perfect fit.
200
400
600
800
1000
Leng
th b
in (
mm
)E
rror
, deg
.
0
30
60
90
1980 1985 1990 1995 2000 2005
SEDAR 15 SAR 1 SECTION III 95

Assessment Workshop South Atlantic Red Snapper
Figure 3.5. Red snapper: Top panel is a bubble plot of length composition residuals from the recreational fishery(MRFSS); Dark represents overestimates and light underestimates. Bottom panel shows the angle (in degrees)between vectors of observations and estimates, with a reference line at 20 degrees.Error is bounded between 0 and 90 degrees, with 0 indicating a perfect fit.
200
400
600
800
1000
Leng
th b
in (
mm
)E
rror
, deg
.
0
30
60
90
1980 1985 1990 1995 2000 2005
SEDAR 15 SAR 1 SECTION III 96

Assessment Workshop South Atlantic Red Snapper
Figure 3.6. Red snapper: Top panel is a bubble plot of age composition residuals from the commercial handlinefishery; Dark represents overestimates and light underestimates. Bottom panel shows the angle (in degrees)between vectors of observations and estimates, with a reference line at 20 degrees.Error is bounded between 0 and 90 degrees, with 0 indicating a perfect fit.
5
10
15
20
Age
cla
ssE
rror
, deg
.
0
30
60
90
1992 1994 1996 1998 2000 2002 2004 2006
SEDAR 15 SAR 1 SECTION III 97

Assessment Workshop South Atlantic Red Snapper
Figure 3.7. Red snapper: Top panel is a bubble plot of age composition residuals from the commercial divingfishery; Dark represents overestimates and light underestimates. Bottom panel shows the angle (in degrees)between vectors of observations and estimates, with a reference line at 20 degrees.Error is bounded between 0 and 90 degrees, with 0 indicating a perfect fit.
5
10
15
20
Age
cla
ssE
rror
, deg
.
0
30
60
90
2000 2001 2002 2003 2004
SEDAR 15 SAR 1 SECTION III 98

Assessment Workshop South Atlantic Red Snapper
Figure 3.8. Red snapper: Top panel is a bubble plot of age composition residuals from the headboat fishery;Dark represents overestimates and light underestimates. Bottom panel shows the angle (in degrees) betweenvectors of observations and estimates, with a reference line at 20 degrees.Error is bounded between 0 and 90 degrees, with 0 indicating a perfect fit.
5
10
15
20
Age
cla
ssE
rror
, deg
.
0
30
60
90
1980 1985 1990 1995
SEDAR 15 SAR 1 SECTION III 99

Assessment Workshop South Atlantic Red Snapper
Figure 3.9. Red snapper: Top panel is a bubble plot of age composition residuals from the recreational fishery(MRFSS); Dark represents overestimates and light underestimates. Bottom panel shows the angle (in degrees)between vectors of observations and estimates, with a reference line at 20 degrees.Error is bounded between 0 and 90 degrees, with 0 indicating a perfect fit.
5
10
15
20
Age
cla
ssE
rror
, deg
.
0
30
60
90
2001 2002 2003 2004 2005
SEDAR 15 SAR 1 SECTION III 100

Assessment Workshop South Atlantic Red Snapper
Figure 3.10. Red snapper: Observed (open circles) and estimated (solid line, circles) commercial handline land-ings (whole weight). Open and closed circles are indistinguishable.
1950 1960 1970 1980 1990 2000
0
200
400
600
800
Year
Land
ings
(10
00 lb
)
SEDAR 15 SAR 1 SECTION III 101

Assessment Workshop South Atlantic Red Snapper
Figure 3.11. Red snapper: Observed (open circles) and estimated (solid line, circles) commercial diving landings(whole weight). Open and closed circles are indistinguishable.
1950 1960 1970 1980 1990 2000
0
5
10
15
20
Year
Land
ings
(10
00 lb
)
SEDAR 15 SAR 1 SECTION III 102

Assessment Workshop South Atlantic Red Snapper
Figure 3.12. Red snapper: Observed (open circles) and estimated (solid line, circles) headboat landings (wholeweight). Open and closed circles are indistinguishable.
1950 1960 1970 1980 1990 2000
0
20
40
60
80
100
120
Year
Land
ings
(10
00 lb
)
SEDAR 15 SAR 1 SECTION III 103

Assessment Workshop South Atlantic Red Snapper
Figure 3.13. Red snapper: Observed (open circles) and estimated (solid line, circles) general recreational landings(whole weight). Open and closed circles are indistinguishable.
1950 1960 1970 1980 1990 2000
0
1000
2000
3000
4000
5000
Year
Land
ings
(10
00 lb
)
SEDAR 15 SAR 1 SECTION III 104

Assessment Workshop South Atlantic Red Snapper
Figure 3.14. Red snapper: Observed (open circles) and estimated (solid line, circles) commercial handline discardmortalities. Open and closed circles are indistinguishable.
1950 1960 1970 1980 1990 2000
0
5
10
15
20
25
30
Year
Dis
card
s (1
000
dead
fish
)
SEDAR 15 SAR 1 SECTION III 105

Assessment Workshop South Atlantic Red Snapper
Figure 3.15. Red snapper: Observed (open circles) and estimated (solid line, circles) headboat discard mortalities.Open and closed circles are indistinguishable.
1950 1960 1970 1980 1990 2000
0
5
10
15
Year
Dis
card
s (1
000
dead
fish
)
SEDAR 15 SAR 1 SECTION III 106

Assessment Workshop South Atlantic Red Snapper
Figure 3.16. Red snapper: Observed (open circles) and estimated (solid line, circles) general recreational discardmortalities. Open and closed circles are indistinguishable.
1950 1960 1970 1980 1990 2000
0
20
40
60
80
Year
Dis
card
s (1
000
dead
fish
)
SEDAR 15 SAR 1 SECTION III 107

Assessment Workshop South Atlantic Red Snapper
Figure 3.17. Red snapper: Fit of index of abundance from commercial handline; Observed (open circles) andestimated (solid line, circles).
1975 1980 1985 1990 1995 2000 2005
0.0
0.5
1.0
1.5
Rel
ativ
e ab
unda
nce
(CP
UE
)
1975 1980 1985 1990 1995 2000 2005
−4
−2
0
2
4
Year
Sca
led
resi
dual
SEDAR 15 SAR 1 SECTION III 108

Assessment Workshop South Atlantic Red Snapper
Figure 3.18. Red snapper: Fit of index of abundance from headboat; Observed (open circles) and estimated (solidline, circles).
1975 1980 1985 1990 1995 2000 2005
0.0
0.5
1.0
1.5
2.0
2.5
3.0
Rel
ativ
e ab
unda
nce
(CP
UE
)
1975 1980 1985 1990 1995 2000 2005
−4
−2
0
2
4
Year
Sca
led
resi
dual
SEDAR 15 SAR 1 SECTION III 109

Assessment Workshop South Atlantic Red Snapper
Figure 3.19. Red snapper: Fit of index of abundance from general recreational (MRFSS); Observed (open circles)and estimated (solid line, circles).
1975 1980 1985 1990 1995 2000 2005
0.0
0.5
1.0
1.5
Rel
ativ
e ab
unda
nce
(CP
UE
)
1975 1980 1985 1990 1995 2000 2005
−2
0
2
Year
Sca
led
resi
dual
SEDAR 15 SAR 1 SECTION III 110

Assessment Workshop South Atlantic Red Snapper
Figure 3.20. Red snapper: Mean length at age (mm) and estimated 95% confidence interval.
5 10 15 20
200
400
600
800
1000
Age
Leng
th (
mm
)
SEDAR 15 SAR 1 SECTION III 111

Assessment Workshop South Atlantic Red Snapper
Figure 3.21. Red snapper: Top panel – Estimated recruitment of age-1 fish. Bottom panel – log recruitmentresiduals.
1950 1960 1970 1980 1990 2000
0e+
002e
+05
4e+
056e
+05
Year
Rec
ruitm
ent (
num
ber
fish)
RMSY
1950 1960 1970 1980 1990 2000
−1.0
−0.5
0.0
0.5
1.0
Year
log
Rec
ruitm
ent d
evia
tions
+ lo
ess
SEDAR 15 SAR 1 SECTION III 112

Assessment Workshop South Atlantic Red Snapper
Figure 3.22. Red snapper: Top panel – Estimated total biomass (metric tons) at start of year. Bottom panel –Estimated spawning biomass (metric tons) at midpoint of year.
1950 1960 1970 1980 1990 2000
050
0010
000
1500
020
000
2500
0
Year
Tot
al b
iom
ass
(met
ric to
ns)
BMSY
1950 1960 1970 1980 1990 2000
020
0040
0060
0080
0010
000
1200
0
Year
Spa
wni
ng s
tock
(m
etric
tons
)
SSBMSY
MSST
SEDAR 15 SAR 1 SECTION III 113

Assessment Workshop South Atlantic Red Snapper
Figure 3.23. Red snapper: Estimated selectivities of commercial handline. Top panel – period 1 (prior to 1984, noregulations). Middle panel – period 2 (1984–1991, 12-inch limit). Bottom panel – period 3 (1992–2006, 20-inchlimit).
5 10 15 20
0.0
0.2
0.4
0.6
0.8
1.0
Age
Sel
ectiv
ity a
t age
5 10 15 20
0.0
0.2
0.4
0.6
0.8
1.0
Age
Sel
ectiv
ity a
t age
5 10 15 20
0.0
0.2
0.4
0.6
0.8
1.0
Age
Sel
ectiv
ity a
t age
SEDAR 15 SAR 1 SECTION III 114

Assessment Workshop South Atlantic Red Snapper
Figure 3.24. Red snapper: Estimated selectivity of commercial diving, assumed constant through time.
5 10 15 20
0.0
0.2
0.4
0.6
0.8
1.0
Age
Sel
ectiv
ity a
t age
SEDAR 15 SAR 1 SECTION III 115

Assessment Workshop South Atlantic Red Snapper
Figure 3.25. Red snapper: Estimated selectivities of the headboat fishery. Top panel – period 1 (prior to 1984, noregulations). Middle panel – period 2 (1984–1991, 12-inch limit). Bottom panel – period 3 (1992–2006, 20-inchlimit).
5 10 15 20
0.0
0.2
0.4
0.6
0.8
1.0
Age
Sel
ectiv
ity a
t age
5 10 15 20
0.0
0.2
0.4
0.6
0.8
1.0
Age
Sel
ectiv
ity a
t age
5 10 15 20
0.0
0.2
0.4
0.6
0.8
1.0
Age
Sel
ectiv
ity a
t age
SEDAR 15 SAR 1 SECTION III 116

Assessment Workshop South Atlantic Red Snapper
Figure 3.26. Red snapper: Estimated selectivities of the general recreational fishery. Top panel – period 1 (priorto 1984, no regulations). Middle panel – period 2 (1984–1991, 12-inch limit). Bottom panel – period 3 (1992–2006, 20-inch limit).
5 10 15 20
0.0
0.2
0.4
0.6
0.8
1.0
Age
Sel
ectiv
ity a
t age
5 10 15 20
0.0
0.2
0.4
0.6
0.8
1.0
Age
Sel
ectiv
ity a
t age
5 10 15 20
0.0
0.2
0.4
0.6
0.8
1.0
Age
Sel
ectiv
ity a
t age
SEDAR 15 SAR 1 SECTION III 117

Assessment Workshop South Atlantic Red Snapper
Figure 3.27. Red snapper: Estimated selectivities of discard mortalities from commercial handline. Discardswere assumed negligible in period 1, the years prior to implementation of regulations. Top panel – period 2(1984–1991, 12-inch limit). Bottom panel – period 3 (1992–2006, 20-inch limit).
5 10 15 20
0.0
0.2
0.4
0.6
0.8
1.0
Age
Sel
ectiv
ity a
t age
5 10 15 20
0.0
0.2
0.4
0.6
0.8
1.0
Age
Sel
ectiv
ity a
t age
SEDAR 15 SAR 1 SECTION III 118

Assessment Workshop South Atlantic Red Snapper
Figure 3.28. Red snapper: Estimated selectivities of discard mortalities from the headboat fishery. Discardswere assumed negligible in period 1, the years prior to implementation of regulations. Top panel – period 2(1984–1991, 12-inch limit). Bottom panel – period 3 (1992–2006, 20-inch limit).
5 10 15 20
0.0
0.2
0.4
0.6
0.8
1.0
Age
Sel
ectiv
ity a
t age
5 10 15 20
0.0
0.2
0.4
0.6
0.8
1.0
Age
Sel
ectiv
ity a
t age
SEDAR 15 SAR 1 SECTION III 119

Assessment Workshop South Atlantic Red Snapper
Figure 3.29. Red snapper: Estimated selectivities of discard mortalities from the general recreational fishery.Discards were assumed negligible in period 1, the years prior to implementation of regulations. Top panel –period 2 (1984–1991, 12-inch limit). Bottom panel – period 3 (1992–2006, 20-inch limit).
5 10 15 20
0.0
0.2
0.4
0.6
0.8
1.0
Age
Sel
ectiv
ity a
t age
5 10 15 20
0.0
0.2
0.4
0.6
0.8
1.0
Age
Sel
ectiv
ity a
t age
SEDAR 15 SAR 1 SECTION III 120

Assessment Workshop South Atlantic Red Snapper
Figure 3.30. Red snapper: Average selectivities from period 3 (1992–2006, 20-inch limit), weighted by geometricmean Fs from the last three assessment years. and used in computation of benchmarks and projections. Toppanel – Average selectivity applied to landings. Middle panel – Average selectivity applied to discard mortalities.Bottom panel – Total average selectivity.
5 10 15 20
0.0
0.2
0.4
0.6
0.8
1.0
Age
Sel
ectiv
ity a
t age
5 10 15 20
0.0
0.2
0.4
0.6
0.8
1.0
Age
Sel
ectiv
ity a
t age
5 10 15 20
0.0
0.2
0.4
0.6
0.8
1.0
Age
Sel
ectiv
ity a
t age
SEDAR 15 SAR 1 SECTION III 121

Assessment Workshop South Atlantic Red Snapper
Figure 3.31. Red snapper: Estimated instantaneous fishing mortality rate (per year) by fishery. c.hal refersto commercial handline, c.dv to commercial diving, hb to headboat, rec to general recreational, c.hal.D tocommercial discard mortalities, c.hb.D to headboat discard mortalities, and rec.D to general recreational discardmortalities.
1945 1951 1957 1963 1969 1975 1981 1987 1993 1999 2005
Year
Fis
hing
mor
talit
y ra
te
0.0
0.2
0.4
0.6
0.8
1.0
1.2
rec.Dhb.Dc.hal.Drechbc.dvc.hal
SEDAR 15 SAR 1 SECTION III 122

Assessment Workshop South Atlantic Red Snapper
Figure 3.32. Red snapper: Estimated landings by fishery from the catch-at-age model. c.hal refers to commercialhandline, c.dv to commercial diving, hb to headboat, rec to general recreational.
Year
Land
ings
in n
umbe
rs (
num
ber
fish)
0e+
001e
+05
2e+
053e
+05
4e+
055e
+05
6e+
05
1950 1960 1970 1980 1990 2000
Fishery
rechbc.dvc.hal
Year
Pro
port
ion
0.0
0.2
0.4
0.6
0.8
1.0
1950 1960 1970 1980 1990 2000
Fishery
rechbc.dvc.hal
SEDAR 15 SAR 1 SECTION III 123

Assessment Workshop South Atlantic Red Snapper
Figure 3.33. Red snapper: Estimated discard mortalities by fishery from the catch-at-age model. c.hal refersdiscard mortalities from commercial handline, hb from headboat, rec from general recreational.
Year
Dis
card
s in
num
bers
(nu
mbe
r fis
h)
020
000
4000
060
000
8000
010
0000
1200
00
1985 1990 1995 2000 2005
Fishery
rechbc.hal
Year
Pro
port
ion
0.0
0.2
0.4
0.6
0.8
1.0
1985 1990 1995 2000 2005
Fishery
rechbc.hal
SEDAR 15 SAR 1 SECTION III 124

Assessment Workshop South Atlantic Red Snapper
Figure 3.34. Red snapper: Estimated Beverton–Holt spawner-recruit curves, with and without lognormal biascorrection.
0 5000 10000 15000
0e+
002e
+05
4e+
056e
+05
Spawning stock (metric tons)
Rec
ruitm
ent (
num
ber
fish)
BH−steepBias corrected
SEDAR 15 SAR 1 SECTION III 125

Assessment Workshop South Atlantic Red Snapper
Figure 3.35. Red snapper: Top panel – Log of recruits (number fish) per spawner (mt) as a function of spawners.Bottom panel – Same as top panel, but over a narrower range.
0 2000 4000 6000 8000 10000 12000
45
67
8
Spawners (mt)
log(
Rec
ruits
/Spa
wne
r)
0 200 400 600 800 1000 1200
6.0
6.5
7.0
7.5
8.0
Spawners (mt)
log(
Rec
ruits
/Spa
wne
r)
SEDAR 15 SAR 1 SECTION III 126

Assessment Workshop South Atlantic Red Snapper
Figure 3.36. Red snapper: Probability densities of spawner-recruit parameters R0 (unfished recruitment), steep-ness, autocorrelation, and lognormal bias correction. Vertical lines represent point estimates from the assess-ment model.
400 500 600 700 800 900
0.00
00.
002
0.00
4
R0 (1000)
Pro
babi
lity
dens
ity
0.91 0.92 0.93 0.94 0.95
050
100
150
Steepness
Pro
babi
lity
dens
ity
0.0 0.2 0.4 0.6
0.0
0.5
1.0
1.5
2.0
2.5
3.0
Autocorrelation
Pro
babi
lity
dens
ity
1.05 1.10 1.15 1.20
05
1015
Biascorr
Pro
babi
lity
dens
ity
SEDAR 15 SAR 1 SECTION III 127

Assessment Workshop South Atlantic Red Snapper
Figure 3.37. Red snapper: Estimated time series of static spawning potential ratio, the annual equilibrium spawn-ers per recruit relative to that at the unfished level.
1950 1960 1970 1980 1990 2000
0.0
0.1
0.2
0.3
0.4
0.5
0.6
0.7
Year
Spa
wni
ng p
oten
tial r
atio
SEDAR 15 SAR 1 SECTION III 128

Assessment Workshop South Atlantic Red Snapper
Figure 3.38. Red snapper: Top panel – Yield per recruit, from which the maximum provides Fmax. Bottom panel– Spawning potential ratio (spawners per recruit relative to that at the unfished level), from which the 30% and40% levels provide F30% and F40%. Both curves are based on average selectivity from the end of the assessmentperiod.
0.0 0.1 0.2 0.3 0.4 0.5 0.6
0
1
2
3
Yie
ld p
er r
ecru
it (lb
)
Fmax
0.0 0.1 0.2 0.3 0.4 0.5 0.6
0
20
40
60
80
100
Fishing mortality rate (full F)
Mat
ure
biom
ass
per
recr
uit (
%)
F30F40
SEDAR 15 SAR 1 SECTION III 129

Assessment Workshop South Atlantic Red Snapper
Figure 3.39. Red snapper: Top panel – Equilibrium landings. Bottom panel – Equilibrium spawning biomass.Both curves are based on average selectivity from the end of the assessment period.
0.0 0.1 0.2 0.3 0.4 0.5 0.6
0
500
1000
1500
2000
Equ
ilibr
ium
land
ings
(10
00 lb
)
0.0 0.1 0.2 0.3 0.4 0.5 0.6
0
5
10
15
20
Fishing mortality rate
Equ
ilibr
ium
spa
wni
ng b
iom
ass
(100
0 m
t)
SEDAR 15 SAR 1 SECTION III 130

Assessment Workshop South Atlantic Red Snapper
Figure 3.40. Red snapper: Top panel – Equilibrium landings as a function of equilibrium biomass, which itself isa function of fishing mortality rate. The peak occurs where equilibrium biomass is BMSY = 11.734 1000 mt andequilibrium landings are MSY = 2319 1000 lb. Bottom panel – Equilibrium discard mortality as a function ofequilibrium biomass.
0 10 20 30 40
0
500
1000
1500
2000
Equilibrium biomass (1000 mt)
Equ
ilibr
ium
land
ings
(10
00 lb
)
0 10 20 30 40
0
20
40
60
80
100
120
140
Equilibrium biomass (1000 mt)
Equ
ilibr
ium
dis
card
mor
talit
y (1
000
fish)
SEDAR 15 SAR 1 SECTION III 131

Assessment Workshop South Atlantic Red Snapper
Figure 3.41. Red snapper: Probability densities of MSY-related benchmarks. Vertical lines represent point esti-mates.
0.106 0.108 0.110 0.112 0.114
020
040
060
0
Fmsy
Pro
babi
lity
dens
ity
4000 5000 6000 7000 8000
0e+
002e
−04
4e−
046e
−04
SSBmsy (mt)
Pro
babi
lity
dens
ity
1500 2000 2500 3000 3500
0.00
000.
0005
0.00
100.
0015
MSY (1000 lb)
Pro
babi
lity
dens
ity
40 50 60 70 80
0.00
0.02
0.04
0.06
Dmsy (1000)
Pro
babi
lity
dens
ity
SEDAR 15 SAR 1 SECTION III 132

Assessment Workshop South Atlantic Red Snapper
Figure 3.42. Red snapper: Estimated time series of biomass relative to MSY benchmarks. Top panel – B relativeto BMSY. Bottom panel – SSB relative to SSBMSY.
1950 1960 1970 1980 1990 2000
0.0
0.5
1.0
1.5
2.0
Year
BB
MS
Y
1950 1960 1970 1980 1990 2000
0.0
0.5
1.0
1.5
2.0
2.5
Year
SS
BS
SB
MS
Y
SEDAR 15 SAR 1 SECTION III 133

Assessment Workshop South Atlantic Red Snapper
Figure 3.43. Red snapper: Estimated time series of F relative to FMSY.
1950 1960 1970 1980 1990 2000
0
2
4
6
8
10
12
Year
FF
MS
Y
SEDAR 15 SAR 1 SECTION III 134

Assessment Workshop South Atlantic Red Snapper
Figure 3.44. Red snapper: Sensitivity of results to natural mortality (sensitivity runs S1 and S2). Top panel –Ratio of F to FMSY. Bottom panel – Ratio of SSB to SSBMSY.
1950 1960 1970 1980 1990 2000
0
2
4
6
8
10
12
F/F
msy
BaseM lowM high
1950 1960 1970 1980 1990 2000
0.0
0.5
1.0
1.5
2.0
2.5
SS
B/S
SB
msy
SEDAR 15 SAR 1 SECTION III 135

Assessment Workshop South Atlantic Red Snapper
Figure 3.45. Red snapper: Sensitivity of results to increase in catchability (sensitivity runs S3 and S4). Top panel– Ratio of F to FMSY. Bottom panel – Ratio of SSB to SSBMSY.
1950 1960 1970 1980 1990 2000
0
2
4
6
8
10
12
F/F
msy
Basedelta q=0.0delta q=0.04
1950 1960 1970 1980 1990 2000
0.0
0.5
1.0
1.5
2.0
2.5
SS
B/S
SB
msy
SEDAR 15 SAR 1 SECTION III 136

Assessment Workshop South Atlantic Red Snapper
Figure 3.46. Red snapper: Sensitivity of results to starting year of recruitment deviations (sensitivity runs S5 andS6). Top panel – Ratio of F to FMSY. Bottom panel – Ratio of SSB to SSBMSY.
1950 1960 1970 1980 1990 2000
0
2
4
6
8
10
12
F/F
msy
BasestyrRecResid=1972styrRecResid=1976
1950 1960 1970 1980 1990 2000
0.0
0.5
1.0
1.5
2.0
2.5
SS
B/S
SB
msy
SEDAR 15 SAR 1 SECTION III 137

Assessment Workshop South Atlantic Red Snapper
Figure 3.47. Red snapper: Sensitivity of results to recreational landings prior to 1981 (sensitivity runs S7 andS8). Top panel – Ratio of F to FMSY. Bottom panel – Ratio of SSB to SSBMSY.
1950 1960 1970 1980 1990 2000
0
2
4
6
8
10
12
F/F
msy
BaseDW rec landingsBias estimated rec landings
1950 1960 1970 1980 1990 2000
0.0
0.5
1.0
1.5
2.0
2.5
SS
B/S
SB
msy
SEDAR 15 SAR 1 SECTION III 138

Assessment Workshop South Atlantic Red Snapper
Figure 3.48. Red snapper: Sensitivity of results to discard mortality rates (sensitivity runs S9–S13). Top panel –Ratio of F to FMSY. Bottom panel – Ratio of SSB to SSBMSY.
1950 1960 1970 1980 1990 2000
0
2
4
6
8
10
12
F/F
msy
Basecom.Dmort=0.7com.Dmort=0.8com.Dmort=1.0rec.Dmort=0.2rec.Dmort=0.6
1950 1960 1970 1980 1990 2000
0.0
0.5
1.0
1.5
2.0
2.5
SS
B/S
SB
msy
SEDAR 15 SAR 1 SECTION III 139

Assessment Workshop South Atlantic Red Snapper
Figure 3.49. Red snapper: Sensitivity of results to discard selectivity of age-1 fish (sensitivity runs S14 and S15).Top panel – Ratio of F to FMSY. Bottom panel – Ratio of SSB to SSBMSY.
1950 1960 1970 1980 1990 2000
0
2
4
6
8
10
12
F/F
msy
BaseDsel1=0.25Dsel1=0.75
1950 1960 1970 1980 1990 2000
0.0
0.5
1.0
1.5
2.0
2.5
SS
B/S
SB
msy
SEDAR 15 SAR 1 SECTION III 140

Assessment Workshop South Atlantic Red Snapper
Figure 3.50. Red snapper: Sensitivity of results to steepness (sensitivity runs S16 and S17). Top panel – Ratio ofF to FMSY. Bottom panel – Ratio of SSB to SSBMSY.
1950 1960 1970 1980 1990 2000
0
2
4
6
8
10
12
F/F
msy
Basesteep=0.8steep=0.6
1950 1960 1970 1980 1990 2000
0.0
0.5
1.0
1.5
2.0
2.5
SS
B/S
SB
msy
SEDAR 15 SAR 1 SECTION III 141

Assessment Workshop South Atlantic Red Snapper
Figure 3.51. Red snapper: Retrospective analysis. Sensitivity of results to terminal year of data (sensitivity runsS18–S22). Top panel – Ratio of F to FMSY. Bottom panel – Ratio of SSB to SSBMSY.
1950 1960 1970 1980 1990 2000
0.0
0.5
1.0
1.5
2.0
full
F
Base20052004200320022001
1950 1960 1970 1980 1990 2000
0
100
200
300
400
500
600
SS
B (
mt)
SEDAR 15 SAR 1 SECTION III 142

Assessment Workshop South Atlantic Red Snapper
Figure 3.52. Red snapper: Sensitivity of results to initial stock status B1/K (sensitivity runs S23–S31). Top panel– Ratio of F to FMSY. Bottom panel – Ratio of SSB to SSBMSY.
1950 1960 1970 1980 1990 2000
0
2
4
6
8
10
12
F/F
msy
BaseB1.K=0.95B1.K=0.90B1.K=0.85B1.K=0.80B1.K=0.70B1.K=0.65B1.K=0.60B1.K=0.55B1.K=0.50
1950 1960 1970 1980 1990 2000
0.0
0.5
1.0
1.5
2.0
2.5
3.0
SS
B/S
SB
msy
SEDAR 15 SAR 1 SECTION III 143

Assessment Workshop South Atlantic Red Snapper
Figure 3.53. Red snapper: Projection results under scenario 1—fishing mortality rate fixed at F = 0. Expectedvalues represented by dotted solid lines, and uncertainty represented by thin lines corresponding to 10th and90th percentiles of 1000 replicate projections. Horizontal lines mark MSY-related quantities. Spawning stockbiomass (SSB) is at mid-year.
2010 2020 2030 2040
0
5000
10000
15000
SS
B (
mt)
2010 2020 2030 2040
0
200
400
600
800
1000
1200
Rec
ruits
(10
00 fi
sh)
2010 2020 2030 2040
0.0
0.2
0.4
0.6
0.8
1.0
Year
F (
per
yr)
2010 2020 2030 2040
0
500
1000
1500
2000
Year
Land
ings
(10
00 lb
)
SEDAR 15 SAR 1 SECTION III 144

Assessment Workshop South Atlantic Red Snapper
Figure 3.54. Red snapper: Projection results under scenario 2—fishing mortality rate fixed at F = Fcurrent. Ex-pected values represented by dotted solid lines, and uncertainty represented by thin lines corresponding to 10th
and 90th percentiles of 1000 replicate projections. Horizontal lines mark MSY-related quantities. Spawningstock biomass (SSB) is at mid-year.
2010 2020 2030 2040
0
1000
2000
3000
4000
5000
SS
B (
mt)
2010 2020 2030 2040
0
100
200
300
400
500
600
Rec
ruits
(10
00 fi
sh)
2010 2020 2030 2040
0.0
0.2
0.4
0.6
0.8
1.0
Year
F (
per
yr)
2010 2020 2030 2040
0
500
1000
1500
2000
Year
Land
ings
(10
00 lb
)
SEDAR 15 SAR 1 SECTION III 145

Assessment Workshop South Atlantic Red Snapper
Figure 3.55. Red snapper: Projection results under scenario 3—fishing mortality rate fixed at F = FMSY. Expectedvalues represented by dotted solid lines, and uncertainty represented by thin lines corresponding to 10th and90th percentiles of 1000 replicate projections. Horizontal lines mark MSY-related quantities. Spawning stockbiomass (SSB) is at mid-year.
2010 2020 2030 2040
0
1000
2000
3000
4000
5000
6000
SS
B (
mt)
2010 2020 2030 2040
0
200
400
600
800
1000
1200
Rec
ruits
(10
00 fi
sh)
2010 2020 2030 2040
0.0
0.2
0.4
0.6
0.8
1.0
Year
F (
per
yr)
2010 2020 2030 2040
0
500
1000
1500
2000
2500
Year
Land
ings
(10
00 lb
)
SEDAR 15 SAR 1 SECTION III 146

Assessment Workshop South Atlantic Red Snapper
Figure 3.56. Red snapper: Projection results under scenario 4—fishing mortality rate fixed at F = 65%FMSY.Expected values represented by dotted solid lines, and uncertainty represented by thin lines corresponding to10th and 90th percentiles of 1000 replicate projections. Horizontal lines mark MSY-related quantities. Spawningstock biomass (SSB) is at mid-year.
2010 2020 2030 2040
0
2000
4000
6000
8000
SS
B (
mt)
2010 2020 2030 2040
0
200
400
600
800
1000
1200
Rec
ruits
(10
00 fi
sh)
2010 2020 2030 2040
0.0
0.2
0.4
0.6
0.8
1.0
Year
F (
per
yr)
2010 2020 2030 2040
0
500
1000
1500
2000
2500
Year
Land
ings
(10
00 lb
)
SEDAR 15 SAR 1 SECTION III 147

Assessment Workshop South Atlantic Red Snapper
Figure 3.57. Red snapper: Projection results under scenario 5—fishing mortality rate fixed at F = 75%FMSY.Expected values represented by dotted solid lines, and uncertainty represented by thin lines corresponding to10th and 90th percentiles of 1000 replicate projections. Horizontal lines mark MSY-related quantities. Spawningstock biomass (SSB) is at mid-year.
2010 2020 2030 2040
0
2000
4000
6000
8000
SS
B (
mt)
2010 2020 2030 2040
0
200
400
600
800
1000
1200
Rec
ruits
(10
00 fi
sh)
2010 2020 2030 2040
0.0
0.2
0.4
0.6
0.8
1.0
Year
F (
per
yr)
2010 2020 2030 2040
0
500
1000
1500
2000
2500
Year
Land
ings
(10
00 lb
)
SEDAR 15 SAR 1 SECTION III 148

Assessment Workshop South Atlantic Red Snapper
Figure 3.58. Red snapper: Projection results under scenario 6—fishing mortality rate fixed at F = 85%FMSY.Expected values represented by dotted solid lines, and uncertainty represented by thin lines corresponding to10th and 90th percentiles of 1000 replicate projections. Horizontal lines mark MSY-related quantities. Spawningstock biomass (SSB) is at mid-year.
2010 2020 2030 2040
0
1000
2000
3000
4000
5000
6000
7000
SS
B (
mt)
2010 2020 2030 2040
0
200
400
600
800
1000
1200
Rec
ruits
(10
00 fi
sh)
2010 2020 2030 2040
0.0
0.2
0.4
0.6
0.8
1.0
Year
F (
per
yr)
2010 2020 2030 2040
0
500
1000
1500
2000
2500
Year
Land
ings
(10
00 lb
)
SEDAR 15 SAR 1 SECTION III 149

Assessment Workshop South Atlantic Red Snapper
Figure 3.59. Red snapper: Projection results under scenario 7—fishing mortality rate fixed at F = Frebuild. Ex-pected values represented by dotted solid lines, and uncertainty represented by thin lines corresponding to 10th
and 90th percentiles of 1000 replicate projections. Horizontal lines mark MSY-related quantities. Spawningstock biomass (SSB) is at mid-year.
2010 2020 2030 2040
0
1000
2000
3000
4000
5000
6000
SS
B (
mt)
2010 2020 2030 2040
0
200
400
600
800
1000
1200
Rec
ruits
(10
00 fi
sh)
2010 2020 2030 2040
0.0
0.2
0.4
0.6
0.8
1.0
Year
F (
per
yr)
2010 2020 2030 2040
0
500
1000
1500
2000
2500
Year
Land
ings
(10
00 lb
)
SEDAR 15 SAR 1 SECTION III 150

Assessment Workshop South Atlantic Red Snapper
Figure 3.60. Red snapper: Projection results under scenario 8—Discard-only projection with fishing mortalityrate fixed at F = Fcurrent minus commercial diving, and with release mortality rates of 0.9 in the commercialsector and 0.4 in the headboat and general recreational sectors. Expected values represented by dotted solidlines, and uncertainty represented by thin lines corresponding to 10th and 90th percentiles of 1000 replicateprojections. Spawning stock biomass (SSB) is at mid-year. In the SSB panel, solid horizontal line marks SSBMSY,the rebuilding target. In the F panel, the dashed horizontal line marks the fishing rate applied, of which only aportion (dotted solid line) leads to discard mortality. Spawning stock biomass (SSB) is at mid-year.
2010 2020 2030 2040
0
1000
2000
3000
4000
5000
SS
B (
mt)
2010 2020 2030 2040
0
200
400
600
800
Rec
ruits
(10
00 fi
sh)
2010 2020 2030 2040
0.0
0.2
0.4
0.6
0.8
1.0
Year
F (
per
yr)
2010 2020 2030 2040
0
100
200
300
400
Year
Dis
card
s (1
000
fish)
SEDAR 15 SAR 1 SECTION III 151

Assessment Workshop South Atlantic Red Snapper
Figure 3.61. Red snapper: Projection results under scenario 9—Discard-only projection with fishing mortalityrate fixed at F = Fcurrent minus commercial diving, and with release mortality rates of 0.8 in the commercialsector and 0.2 in the headboat and general recreational sectors. Expected values represented by dotted solidlines, and uncertainty represented by thin lines corresponding to 10th and 90th percentiles of 1000 replicateprojections. Spawning stock biomass (SSB) is at mid-year. In the SSB panel, solid horizontal line marks SSBMSY,the rebuilding target. In the F panel, the dashed horizontal line marks the fishing rate applied, of which only aportion (dotted solid line) leads to discard mortality.
2010 2020 2030 2040
0
1000
2000
3000
4000
5000
SS
B (
mt)
2010 2020 2030 2040
0
200
400
600
800
1000
Rec
ruits
(10
00 fi
sh)
2010 2020 2030 2040
0.0
0.2
0.4
0.6
0.8
1.0
Year
F (
per
yr)
2010 2020 2030 2040
0
100
200
300
400
500
Year
Dis
card
s (1
000
fish)
SEDAR 15 SAR 1 SECTION III 152

Assessment Workshop South Atlantic Red Snapper
Figure 3.62. Red snapper: Projection results under scenario 10—Discard-only projection with fishing mortalityrate fixed at F = Fcurrent minus commercial diving, and with release mortality rates of 1.0 in the commercialsector and 0.6 in the headboat and general recreational sectors. Expected values represented by dotted solidlines, and uncertainty represented by thin lines corresponding to 10th and 90th percentiles of 1000 replicateprojections. Spawning stock biomass (SSB) is at mid-year. In the SSB panel, solid horizontal line marks SSBMSY,the rebuilding target. In the F panel, the dashed horizontal line marks the fishing rate applied, of which only aportion (dotted solid line) leads to discard mortality.
2010 2020 2030 2040
0
1000
2000
3000
4000
5000
SS
B (
mt)
2010 2020 2030 2040
0
200
400
600
800
Rec
ruits
(10
00 fi
sh)
2010 2020 2030 2040
0.0
0.2
0.4
0.6
0.8
1.0
Year
F (
per
yr)
2010 2020 2030 2040
0
100
200
300
400
Year
Dis
card
s (1
000
fish)
SEDAR 15 SAR 1 SECTION III 153

Assessment Workshop South Atlantic Red Snapper
Figure 3.63. Red snapper: Projection results under scenario 11—Discard-only projection with fishing mortalityrate fixed at F = Frebuild, given release mortality rates of 0.9 in the commercial sector and 0.4 in the headboatand general recreational sectors. Expected values represented by dotted solid lines, and uncertainty representedby thin lines corresponding to 10th and 90th percentiles of 1000 replicate projections. Spawning stock biomass(SSB) is at mid-year. In the SSB panel, solid horizontal line marks SSBMSY, the rebuilding target. In the F panel,the dashed horizontal line marks the fishing rate applied, of which only a portion (dotted solid line) leads todiscard mortality.
2010 2020 2030 2040
0
1000
2000
3000
4000
5000
6000
SS
B (
mt)
2010 2020 2030 2040
0
200
400
600
800
1000
1200
Rec
ruits
(10
00 fi
sh)
2010 2020 2030 2040
0.0
0.2
0.4
0.6
0.8
1.0
Year
F (
per
yr)
2010 2020 2030 2040
0
50
100
150
200
250
300
350
Year
Dis
card
s (1
000
fish)
SEDAR 15 SAR 1 SECTION III 154

Assessment Workshop South Atlantic Red Snapper
Figure 3.64. Red snapper: Projection results under scenario 12—Discard-only projection with fishing mortalityrate fixed at F = Frebuild, given release mortality rates of 0.7 in the commercial sector and 0.4 in the headboatand general recreational sectors. Expected values represented by dotted solid lines, and uncertainty representedby thin lines corresponding to 10th and 90th percentiles of 1000 replicate projections. Spawning stock biomass(SSB) is at mid-year. In the SSB panel, solid horizontal line marks SSBMSY, the rebuilding target. In the F panel,the dashed horizontal line marks the fishing rate applied, of which only a portion (dotted solid line) leads todiscard mortality.
2010 2020 2030 2040
0
1000
2000
3000
4000
5000
6000
SS
B (
mt)
2010 2020 2030 2040
0
200
400
600
800
1000
1200
Rec
ruits
(10
00 fi
sh)
2010 2020 2030 2040
0.0
0.2
0.4
0.6
0.8
1.0
Year
F (
per
yr)
2010 2020 2030 2040
0
50
100
150
200
250
300
350
Year
Dis
card
s (1
000
fish)
SEDAR 15 SAR 1 SECTION III 155

Assessment Workshop South Atlantic Red Snapper
Figure 3.65. Observed (open circles) versus modeled (solid line) weight per landed fish in the headboat fisheryfor each calendar year. Sample sizes ranged from 68 to 1370 per year.
1975 1980 1985 1990 1995 2000 2005
02
46
810
Year
Wei
ght p
er s
ampl
ed fi
sh
SEDAR 15 SAR 1 SECTION III 156

Assessment Workshop South Atlantic Red Snapper
Figure 3.66. Observed (open circles) versus modeled (solid line) weight per landed fish for the MRFSS survey ineach calendar year. Sample sizes ranged from 15 to 370 per annum.
1980 1985 1990 1995 2000 2005
02
46
810
Year
Wei
ght p
er s
ampl
ed fi
sh
SEDAR 15 SAR 1 SECTION III 157

Assessment Workshop South Atlantic Red Snapper
Figure 3.67. MRFSS landings in total weight using raw numbers of fish (solid line) and three year runningaverages of numbers of landed fish. Both approaches use smoothed annual estimates of mean fish weight.
1980 1985 1990 1995 2000 2005
200
400
600
800
Year
Land
ings
in to
tal w
eigh
t (10
00’s
)
Non−smoothedSmoothed
SEDAR 15 SAR 1 SECTION III 158

Assessment Workshop South Atlantic Red Snapper
Figure 3.68. Assumptions about annual mean discard weight per fish, as used in fits of surplus production model.
1985 1990 1995 2000 2005
02
46
8
Year
Mea
n w
eigh
t/ di
scar
ded
fish
Assumption 1, CommercialAssumption 1, HeadboatAssumption 1, MRFSSAssumption 2, All Fisheries
SEDAR 15 SAR 1 SECTION III 159

Assessment Workshop South Atlantic Red Snapper
Figure 3.69. Surplus production model fit to headboat index: Observed (solid circles) and predicted CPUE (opensquares)
1950 1960 1970 1980 1990 2000
0
2
4
6
8
Year
Rel
ativ
e ab
unda
nce
DataEstim
SEDAR 15 SAR 1 SECTION III 160

Assessment Workshop South Atlantic Red Snapper
Figure 3.70. Surplus production model fit to commercial index: Observed (solid circles) and predicted CPUE (opensquares)
1950 1960 1970 1980 1990 2000
2
4
6
8
10
Year
Rel
ativ
e ab
unda
nce
DataEstim
SEDAR 15 SAR 1 SECTION III 161

Assessment Workshop South Atlantic Red Snapper
Figure 3.71. Surplus production model fit to MRFSS index: Observed (solid circles) and predicted CPUE (opensquares)
1950 1960 1970 1980 1990 2000
0
2
4
6
8
10
Year
Rel
ativ
e ab
unda
nce
DataEstim
SEDAR 15 SAR 1 SECTION III 162

Assessment Workshop South Atlantic Red Snapper
Figure 3.72. Surplus production model estimates of fishing mortality rate and biomass relative to their MSYbenchmarks.
1950 1960 1970 1980 1990 2000
0.0
0.5
1.0
1.5
2.0
2.5
3.0
Year
Rel
ativ
e st
atus
F/FmsyB/Bmsy
SEDAR 15 SAR 1 SECTION III 163

Assessment Workshop South Atlantic Red Snapper
Appendix A Abbreviations and symbols
Table A.1. Acronyms, abbreviations, and mathematical symbols used in this report
Symbol Meaning
AW Assessment Workshop (here, for red snapper)ASY Average Sustainable YieldB Total biomass of stock, conventionally on January 1rCPUE Catch per unit effort; used after adjustment as an index of abundanceCV Coefficient of variationDW Data Workshop (here, for red snapper)E Exploitation rate; fraction of the biomass taken by fishing per yearEMSY Exploitation rate at which MSY can be attainedF Instantaneous rate of fishing mortalityFMSY Fishing mortality rate at which MSY can be attainedFL State of FloridaGA State of GeorgiaGLM Generalized linear modelK Average size of stock when not exploited by man; carrying capacitykg Kilogram(s); 1 kg is about 2.2 lb.klb Thousand pounds; thousands of poundslb Pound(s); 1 lb is about 0.454 kgm Meter(s); 1 m is about 3.28 feet.M Instantaneous rate of natural (non-fishing) mortalityMARMAP Marine Resources Monitoring, Assessment, and Prediction Program, a fishery-independent data col-
lection program of SCDNRMFMT Maximum fishing-mortality threshold; a limit reference point used in U.S. fishery management; often
based on FMSY
mm Millimeter(s); 1 inch = 25.4 mmMRFSS Marine Recreational Fisheries Statistics Survey, a data-collection program of NMFSMSST Minimum stock-size threshold; a limit reference point used in U.S. fishery management. The SAFMC
has defined MSST for red snapper as (1−M)SSBMSY = 0.7SSBMSY.MSY Maximum sustainable yield (per year)mt Metric ton(s). One mt is 1000 kg, or about 2205 lb.N Number of fish in a stock, conventionally on January 1NC State of North CarolinaNMFS National Marine Fisheries Service, same as “NOAA Fisheries Service”NOAA National Oceanic and Atmospheric Administration; parent agency of NMFSOY Optimum yield; SFA specifies that OY ≤ MSY.PSE Proportional standard errorR RecruitmentSAFMC South Atlantic Fishery Management Council (also, Council)SC State of South CarolinaSCDNR Department of Natural Resources of SCSEDAR SouthEast Data Assessment and Review processSFA Sustainable Fisheries Act; the Magnuson–Stevens Act, as amendedSL Standard length (of a fish)SPR Spawning potential ratioSSB Spawning stock biomass; mature biomass of males and femalesSSBMSY Level of SSB at which MSY can be attainedSW Scoping workshop; first of 3 workshops in SEDAR updatesTIP Trip Interview Program, a fishery-dependent biodata collection program of NMFSTL Total length (of a fish), as opposed to FL (fork length) or SL (standard length)VPA Virtual population analysis, an age-structured assessment model characterized by computations
backward in time; may use abundance indices to influence the estimatesyr Year(s)
SEDAR 15 SAR 1 SECTION III 164

Assessment Workshop South Atlantic Red Snapper
Appendix B AD Model Builder implementation of catch-at-age assessment model
//##--><>--><>--><>--><>--><>--><>--><>--><>--><>--><>--><>--><>--><>//##//## SEDAR15 Assessment: Red Snapper, October 2007//##//## Kyle Shertzer, NMFS, Beaufort Lab//## [email protected]//##//##--><>--><>--><>--><>--><>--><>--><>--><>--><>--><>--><>--><>--><>
DATA_SECTION//Create ascii file for output//!!CLASS ofstream report1("rsresults.rep",ios::out); //create file for output
!!cout << "Starting Red Snapper Assessment Model" << endl;
// Starting and ending year of the model (year data starts)init_int styr;init_int endyr;
//Starting year to estimate recruitment deviation from S-R curveinit_int styr_rec_dev;
//3 periods: until ’91 no size regs, 1992-98 12inch TL, 1999-04 14inch TLinit_int endyr_period1;init_int endyr_period2;
//Total number of agesinit_int nages;
// Vector of ages for age binsinit_ivector agebins(1,nages);
//number assessment years//int styrR;number nyrs;number nyrs_rec;//this section MUST BE INDENTED!!!LOCAL_CALCS
nyrs=endyr-styr+1.;nyrs_rec=endyr-styr_rec_dev+1.;
END_CALCS
//Total number of length bins for each matrixinit_int nlenbins;
// Vector of lengths for length bins (mm)(midpoint)init_ivector lenbins(1,nlenbins);
//discard mortality constantsinit_number set_Dmort_commHAL;init_number set_Dmort_HB;init_number set_Dmort_MRFSS;
//Total number of iterations for spr calcsinit_int n_iter_spr;//Total number of iterations for msy calcsinit_int n_iter_msy;//starting index of ages for exploitation rate: if model has age-0s, ages of E are (value-1) to oldestinit_int set_E_age_st;//bias correction (set to 1.0 for no bias correction or 0.0 to compute from rec variance)init_number set_BiasCor;// Von Bert parametersinit_number set_Linf;init_number set_K;init_number set_t0;
SEDAR 15 SAR 1 SECTION III 165

Assessment Workshop South Atlantic Red Snapper
//CV of length at ageinit_number set_len_cv;
//length(mm)-weight(whole weigt in g) relationship: W=aL^binit_number wgtpar_a;init_number wgtpar_b;//weight-weight relationship:whole weight to gutted weight -- gutted=a*wholeinit_number wgtpar_whole2gutted
//Female maturity and proportion female at ageinit_vector maturity_f_obs(1,nages); //total maturity of femalesinit_vector prop_f_obs(1,nages); //proportion female at age
//#############################################################################//###################Commercial Hook and Line fishery #########################//CPUEinit_int styr_HAL_cpue;init_int endyr_HAL_cpue;init_vector obs_HAL_cpue(styr_HAL_cpue,endyr_HAL_cpue);//Observed CPUEinit_vector HAL_cpue_cv(styr_HAL_cpue,endyr_HAL_cpue); //CV of cpue
// Landings - after WW II (1000 lb whole weight)init_int styr_commHAL_L_2;init_int endyr_commHAL_L_2;init_vector obs_commHAL_L_2(styr_commHAL_L_2,endyr_commHAL_L_2); //vector of observed landings by yearinit_vector commHAL_L_cv_2(styr_commHAL_L_2,endyr_commHAL_L_2); //vector of CV of landings by year
// Discards (1000s)init_int styr_commHAL_D;init_int endyr_commHAL_D;init_vector obs_commHAL_released(styr_commHAL_D,endyr_commHAL_D); //vector of observed releases by year, multiplied by discard mortality for fittinginit_vector commHAL_D_cv(styr_commHAL_D,endyr_commHAL_D); //vector of CV of discards by year
// Length Compositions (30mm bins)init_int styr_commHAL_lenc;init_int endyr_commHAL_lenc;init_vector nsamp_commHAL_lenc(styr_commHAL_lenc,endyr_commHAL_lenc);init_matrix obs_commHAL_lenc(styr_commHAL_lenc,endyr_commHAL_lenc,1,nlenbins);// Age Compositionsinit_int nyr_commHAL_agec;init_ivector yrs_commHAL_agec(1,nyr_commHAL_agec);init_vector nsamp_commHAL_agec(1,nyr_commHAL_agec);init_matrix obs_commHAL_agec(1,nyr_commHAL_agec,1,nages);
//#############################################################################//##############################Commercial Diving fishery ########################// Landings (1000 lb whole weight)init_int styr_commDV_L;init_int endyr_commDV_L;init_vector obs_commDV_L(styr_commDV_L,endyr_commDV_L);init_vector commDV_L_cv(styr_commDV_L,endyr_commDV_L); //vector of CV of landings by year// Length Compositions (30mm bins)init_int nyr_commDV_lenc;init_ivector yrs_commDV_lenc(1,nyr_commDV_lenc);init_vector nsamp_commDV_lenc(1,nyr_commDV_lenc);init_matrix obs_commDV_lenc(1,nyr_commDV_lenc,1,nlenbins);// Age Compositionsinit_int nyr_commDV_agec;init_ivector yrs_commDV_agec(1,nyr_commDV_agec);init_vector nsamp_commDV_agec(1,nyr_commDV_agec);init_matrix obs_commDV_agec(1,nyr_commDV_agec,1,nages);
//#############################################################################//################################Headboat fishery ########################################//CPUEinit_int styr_HB_cpue;init_int endyr_HB_cpue;init_vector obs_HB_cpue(styr_HB_cpue,endyr_HB_cpue);//Observed CPUEinit_vector HB_cpue_cv(styr_HB_cpue,endyr_HB_cpue); //CV of cpue// Landings (1000 lb whole weight)init_int styr_HB_L;
SEDAR 15 SAR 1 SECTION III 166

Assessment Workshop South Atlantic Red Snapper
init_int endyr_HB_L;init_vector obs_HB_L(styr_HB_L,endyr_HB_L);init_vector HB_L_cv(styr_HB_L,endyr_HB_L);// Discards (1000s)init_int styr_HB_D;init_int endyr_HB_D;init_vector obs_HB_released(styr_HB_D,endyr_HB_D); //vector of observed releases by year, multiplied by discard mortality for fittinginit_vector HB_D_cv(styr_HB_D,endyr_HB_D); //vector of CV of discards by year// Length Compositions (10mm bins)init_int styr_HB_lenc;init_int endyr_HB_lenc;init_vector nsamp_HB_lenc(styr_HB_lenc,endyr_HB_lenc);init_matrix obs_HB_lenc(styr_HB_lenc,endyr_HB_lenc,1,nlenbins);// Age compositionsinit_int nyr_HB_agec;init_ivector yrs_HB_agec(1,nyr_HB_agec);init_vector nsamp_HB_agec(1,nyr_HB_agec);init_matrix obs_HB_agec(1,nyr_HB_agec,1,nages);
//#############################################################################//############################MRFSS landings #################################//CPUEinit_int styr_MRFSS_cpue;init_int endyr_MRFSS_cpue;init_vector obs_MRFSS_cpue(styr_MRFSS_cpue,endyr_MRFSS_cpue);//Observed CPUEinit_vector MRFSS_cpue_cv(styr_MRFSS_cpue,endyr_MRFSS_cpue); //CV of cpue// Landings (1000 lb whole weight)init_int styr_MRFSS_L;init_int endyr_MRFSS_L;init_vector obs_MRFSS_L(styr_MRFSS_L,endyr_MRFSS_L);init_vector MRFSS_L_cv(styr_MRFSS_L,endyr_MRFSS_L);// Discards (1000s)init_int styr_MRFSS_D;init_int endyr_MRFSS_D;init_vector obs_MRFSS_released(styr_MRFSS_D,endyr_MRFSS_D); //vector of observed releases by year, multiplied by discard mortality for fittinginit_vector MRFSS_D_cv(styr_MRFSS_D,endyr_MRFSS_D); //vector of CV of discards by year// Length Compositions (30mm bins)init_int nyr_MRFSS_lenc;init_ivector yrs_MRFSS_lenc(1,nyr_MRFSS_lenc);init_vector nsamp_MRFSS_lenc(1,nyr_MRFSS_lenc);init_matrix obs_MRFSS_lenc(1,nyr_MRFSS_lenc,1,nlenbins);// Age Compositionsinit_int styr_MRFSS_agec;init_int endyr_MRFSS_agec;init_vector nsamp_MRFSS_agec(styr_MRFSS_agec,endyr_MRFSS_agec);init_matrix obs_MRFSS_agec(styr_MRFSS_agec,endyr_MRFSS_agec,1,nages);
//#############################################################################//##################Parameter values and initial guesses #################################//--weights for likelihood components-------------------------------------------------------------------------------init_number set_w_L;init_number set_w_D;init_number set_w_lc;init_number set_w_ac;init_number set_w_I_HAL;init_number set_w_I_HB;init_number set_w_I_MRFSS;init_number set_w_R;init_number set_w_R_init;init_number set_w_R_end;init_number set_w_F;init_number set_w_B1dB0; // weight on B1/B0init_number set_w_fullF; //penalty for any fullF>5init_number set_w_cvlen_dev; //penalty on cv deviations at ageinit_number set_w_cvlen_diff; //penalty on first difference of cv deviations at age
//Initial guess for commercial landings bias parameterinit_number set_L_early_bias;//Initial guess for rate of increase on qinit_number set_q_rate;//Initial guesses or fixed values
SEDAR 15 SAR 1 SECTION III 167

Assessment Workshop South Atlantic Red Snapper
init_number set_steep;//init_number set_M;init_vector set_M(1,nages); //age-dependent: used in modelinit_number set_M_constant; //age-independent: used only for MSST
//--index catchability------------------------------------------------------------------------------------------------------------init_number set_logq_HAL; //catchability coefficient (log) for commercial logbook CPUE indexinit_number set_logq_HB; //catchability coefficient (log) for the headboat indexinit_number set_logq_MRFSS; //catchability coefficient (log) for MRFSS CPUE index
//--F’s--------------------------------init_number set_log_avg_F_commHAL_2;init_number set_log_avg_F_commDV;init_number set_log_avg_F_HB;init_number set_log_avg_F_MRFSS;
//--discard F’s-----------------------init_number set_log_avg_F_commHAL_D;init_number set_log_avg_F_HB_D;init_number set_log_avg_F_MRFSS_D;
//Set some more initial guesses of estimated parametersinit_number set_log_R0;init_number set_R1_mult;init_number set_B1dB0;init_number set_R_autocorr;
//Initial guesses of estimated selectivity parametersinit_number set_selpar_L50_commHAL1;init_number set_selpar_slope_commHAL1;init_number set_selpar_L502_commHAL1;init_number set_selpar_slope2_commHAL1;init_number set_selpar_L50_commHAL2;init_number set_selpar_slope_commHAL2;init_number set_selpar_L502_commHAL2;init_number set_selpar_slope2_commHAL2;init_number set_selpar_L50_commHAL3;init_number set_selpar_slope_commHAL3;init_number set_selpar_L502_commHAL3;init_number set_selpar_slope2_commHAL3;
init_number set_selpar_L50_commDV1;init_number set_selpar_L502_commDV1;init_number set_selpar_slope_commDV1;init_number set_selpar_slope2_commDV1;//init_number set_selpar_L50_commDV2;//init_number set_selpar_L502_commDV2;//init_number set_selpar_slope_commDV2;//init_number set_selpar_slope2_commDV2;
init_number set_selpar_L50_HB1;init_number set_selpar_slope_HB1;init_number set_selpar_L502_HB1;init_number set_selpar_slope2_HB1;init_number set_selpar_L50_HB2;init_number set_selpar_slope_HB2;init_number set_selpar_L502_HB2;init_number set_selpar_slope2_HB2;init_number set_selpar_L50_HB3;init_number set_selpar_slope_HB3;init_number set_selpar_L502_HB3;init_number set_selpar_slope2_HB3;
init_number set_selpar_L50_MRFSS1;init_number set_selpar_slope_MRFSS1;init_number set_selpar_L502_MRFSS1;init_number set_selpar_slope2_MRFSS1;init_number set_selpar_L50_MRFSS2;init_number set_selpar_slope_MRFSS2;init_number set_selpar_L502_MRFSS2;init_number set_selpar_slope2_MRFSS2;
SEDAR 15 SAR 1 SECTION III 168

Assessment Workshop South Atlantic Red Snapper
init_number set_selpar_L50_MRFSS3;init_number set_selpar_slope_MRFSS3;init_number set_selpar_L502_MRFSS3;init_number set_selpar_slope2_MRFSS3;
init_number set_selpar_commHAL_D_age1;init_number set_selpar_HB_D_age1;init_number set_selpar_MRFSS_D_age1;
// #######Indices for year(iyear), age(iage),length(ilen) ###############int iyear;int iage;int ilen;int E_age_st; //starting age for exploitation rate: (value-1) to oldest
init_number end_of_data_file;//this section MUST BE INDENTED!!!LOCAL_CALCS
if(end_of_data_file!=999){
for(iyear=1; iyear<=100; iyear++){
cout << "*** WARNING: Data File NOT READ CORRECTLY ****" << endl;cout << "" <<endl;
}}else{cout << "Data File read correctly" << endl;
}END_CALCS
//##--><>--><>--><>--><>--><>--><>--><>--><>--><>--><>--><>--><>--><>--><>--><>--><>--><>--><>//##--><>--><>--><>--><>--><>--><>--><>--><>--><>--><>--><>--><>--><>--><>--><>--><>--><>--><>PARAMETER_SECTION//--------------Growth---------------------------------------------------------------------------
//init_bounded_number Linf(600,1400,2);//init_bounded_number K(0.05,0.6,2);//init_bounded_number t0(-2.0,0.0,2);number Linf;number K;number t0;vector wgt_g(1,nages); //whole wgt in gvector wgt_kg(1,nages); //whole wgt in kgvector wgt(1,nages); //whole wgt in mtvector wgt_klb(1,nages); //whole wgt in 1000 lbvector meanlen(1,nages); //mean length at agenumber sqrt2pi;number g2mt; //conversion of grams to metric tonsnumber g2kg; //conversion of grams to kgnumber mt2klb; //conversion of metric tons to 1000 lb
matrix lenprob(1,nages,1,nlenbins); //distn of size at age (age-length key, 30 mm bins)init_bounded_number log_len_cv(-5,-0.3,3);//init_bounded_number log_len_cv(-4.6,-0.7,2) //cv expressed in log-space, bounds correspond to 0.01, 0.5//init_bounded_dev_vector log_len_cv_dev(1,nages,-2,2,3)vector len_cv(1,nages);
//----Predicted length and age compositionsmatrix pred_commHAL_lenc(styr_commHAL_lenc,endyr_commHAL_lenc,1,nlenbins);matrix pred_commDV_lenc(1,nyr_commDV_lenc,1,nlenbins);matrix pred_HB_lenc(styr_HB_lenc,endyr_HB_lenc,1,nlenbins);matrix pred_MRFSS_lenc(1,nyr_MRFSS_lenc,1,nlenbins);
matrix pred_commHAL_agec(1,nyr_commHAL_agec,1,nages);matrix pred_commDV_agec(1,nyr_commDV_agec,1,nages);matrix pred_HB_agec(1,nyr_HB_agec,1,nages);matrix pred_MRFSS_agec(styr_MRFSS_agec,endyr_MRFSS_agec,1,nages);
SEDAR 15 SAR 1 SECTION III 169

Assessment Workshop South Atlantic Red Snapper
//nsamp_X_allyr vectors used only for R output of comps with nonconsecutive yrsvector nsamp_commDV_lenc_allyr(styr,endyr);vector nsamp_MRFSS_lenc_allyr(styr,endyr);vector nsamp_commHAL_agec_allyr(styr,endyr);vector nsamp_commDV_agec_allyr(styr,endyr);vector nsamp_HB_agec_allyr(styr,endyr);
//-----Population-----------------------------------------------------------------------------------matrix N(styr,endyr+1,1,nages); //Population numbers by year and age at start of yrmatrix N_mdyr(styr,endyr,1,nages); //Population numbers by year and age at mdpt of yr: used for comps and SSBmatrix B(styr,endyr+1,1,nages); //Population biomass by year and agevector totB(styr,endyr+1); //Total biomass by year//init_bounded_number log_R1(5,20,1); //log(Recruits) in styrsdreport_vector SSB(styr,endyr); //Spawning biomass by yearsdreport_vector rec(styr,endyr+1); //Recruits by yearvector prop_f(1,nages); //Proportion female by agevector maturity_f(1,nages); //Proportion of female mature at agevector reprod(1,nages);
//---Stock-Recruit Function (Beverton-Holt, steepness parameterization)----------init_bounded_number log_R0(5,20,1); //log(virgin Recruitment)sdreport_number R0;init_bounded_number steep(0.25,0.95,3); //steepness//number steep; //uncomment to fix steepness, comment line directly aboveinit_bounded_dev_vector log_dev_N_rec(styr_rec_dev,endyr,-3,3,2); //log recruitment deviationsvector log_dev_R(styr,endyr+1); //used in output. equals zero except for yrs in log_dev_N_recnumber var_rec_dev; //variance of log recruitment deviations.
//Estimate from yrs with unconstrainted S-R(XXXX-XXXX)number BiasCor; //Bias correction in equilibrium recruitsinit_bounded_number R_autocorr(0,1.0,3); //autocorrelation in SR//number R_autocorrsdreport_number R_autocorr_sd;sdreport_number steep_sd; //steepness for stdev reportnumber S0; //equal to spr_F0*R0 = virgin SSBnumber B0; //equal to bpr_F0*R0 = virgin Bnumber B1dB0; //B1dB0 computed and used in constraint//init_bounded_number R1_mult(0.05,1.0,1); //R(styr)=R1_mult*R0number R1_mult; //equals B1dB0 under assumption of virgin age structurenumber R1; //Recruits in styr
sdreport_number S1S0; //SSB(styr) / virgin SSBsdreport_number popstatus; //SSB(endyr) / virgin SSB
//---Selectivity-------------------------------------------------------------------------
//Commercial hook and linematrix sel_commHAL(styr,endyr,1,nages);//init_bounded_number selpar_slope_commHAL1(0.5,12.0,1); //period 1//init_bounded_number selpar_L50_commHAL1(0.1,10.,1);//init_bounded_number selpar_slope2_commHAL1(0.0,12.0,3); //period 1//init_bounded_number selpar_L502_commHAL1(1.0,15.0,3);number selpar_slope_commHAL1; //period 1 is assumed same as HB and MRFSSnumber selpar_L50_commHAL1;number selpar_slope2_commHAL1; //period 1number selpar_L502_commHAL1;init_bounded_number selpar_slope_commHAL2(0.5,12.0,1); //period 2init_bounded_number selpar_L50_commHAL2(0.1,10.,1);//init_bounded_number selpar_slope2_commHAL2(0.0,12.0,3); //period 2//init_bounded_number selpar_L502_commHAL2(1.0,15.0,3);number selpar_slope2_commHAL2; //period 2number selpar_L502_commHAL2;init_bounded_number selpar_slope_commHAL3(0.5,12.0,1); //period 3init_bounded_number selpar_L50_commHAL3(0.1,10.,1);//init_bounded_number selpar_slope2_commHAL3(0.0,12.0,3); //period 3//init_bounded_number selpar_L502_commHAL3(1.0,15.0,3);number selpar_slope2_commHAL3; //period 3number selpar_L502_commHAL3;//init_bounded_dev_vector selpar_L50_commHAL_dev(styr_commHAL_lenc,endyr_period1,-5,5,3);vector sel_commHAL_1(1,nages); //sel in period 1vector sel_commHAL_2(1,nages); //sel in period 2vector sel_commHAL_3(1,nages); //sel in period 3
SEDAR 15 SAR 1 SECTION III 170

Assessment Workshop South Atlantic Red Snapper
//Commercial divingmatrix sel_commDV(styr,endyr,1,nages); //time invariantinit_bounded_number selpar_slope_commDV1(0.5,12.0,1);init_bounded_number selpar_L50_commDV1(0.1,10.,1);init_bounded_number selpar_slope2_commDV1(0.1,12.0,3);init_bounded_number selpar_L502_commDV1(1.0,20.0,3);vector sel_commDV_vec(1,nages); //sel vector
//Headboat: logistic, parameters allowed to vary with period defined by size restrictionsmatrix sel_HB(styr,endyr,1,nages);init_bounded_number selpar_slope_HB1(0.5,12.0,1); //period 1init_bounded_number selpar_L50_HB1(0.1,10.0,1);//init_bounded_number selpar_slope2_HB1(0.1,12.0,3); //period 1//init_bounded_number selpar_L502_HB1(1.0,20.0,3);number selpar_slope2_HB1;number selpar_L502_HB1;number selpar_slope_HB2;//period 2//init_bounded_number selpar_slope_HB2(0.5,12.0,1);init_bounded_number selpar_L50_HB2(0.1,10.,1);//init_bounded_number selpar_slope2_HB2(0.1,12.0,3); //period 2//init_bounded_number selpar_L502_HB2(1.0,20.0,3);number selpar_slope2_HB2;number selpar_L502_HB2;init_bounded_number selpar_slope_HB3(0.5,12.0,1); //period 3init_bounded_number selpar_L50_HB3(0.1,10.,1);//init_bounded_number selpar_slope2_HB3(0.1,12.0,3); //period 3//init_bounded_number selpar_L502_HB3(1.0,20.0,3);number selpar_slope2_HB3;number selpar_L502_HB3;//init_bounded_dev_vector selpar_L50_HB_dev(styr_HB_lenc,endyr_period1,-5,5,3);vector sel_HB_1(1,nages); //sel in period 1vector sel_HB_2(1,nages); //sel in period 2vector sel_HB_3(1,nages); //sel in period 3
//MRFSS:matrix sel_MRFSS(styr,endyr,1,nages);//init_bounded_number selpar_slope_MRFSS1(0.5,9.0,1); //period 1//init_bounded_number selpar_L50_MRFSS1(0.1,10.0,1);//init_bounded_number selpar_slope2_MRFSS1(0.0,12.0,3); //period 1//init_bounded_number selpar_L502_MRFSS1(1.0,15.0,3);number selpar_slope_MRFSS1; //period 1 selectivity for MRFSS is same as HBnumber selpar_L50_MRFSS1;number selpar_slope2_MRFSS1;number selpar_L502_MRFSS1;number selpar_slope_MRFSS2; //period 2//init_bounded_number selpar_slope_MRFSS2(0.5,12.0,1); //period 2init_bounded_number selpar_L50_MRFSS2(0.1,10.,1);//init_bounded_number selpar_slope2_MRFSS2(0.1,12.0,3); //period 2//init_bounded_number selpar_L502_MRFSS2(1.0,20.0,3);number selpar_slope2_MRFSS2;number selpar_L502_MRFSS2;init_bounded_number selpar_slope_MRFSS3(0.5,12.0,1); //period 3init_bounded_number selpar_L50_MRFSS3(0.1,10.,1);//init_bounded_number selpar_slope2_MRFSS3(0.1,12.0,3); //period 3//init_bounded_number selpar_L502_MRFSS3(1.0,20.0,3);number selpar_slope2_MRFSS3;number selpar_L502_MRFSS3;//init_bounded_dev_vector selpar_L50_MRFSS_dev(1981,endyr_period1,-5,5,3);vector sel_MRFSS_2(1,nages); //sel in period 2; period 1 same as HBvector sel_MRFSS_3(1,nages); //sel in period 3
//effort-weighted, recent selectivitiesvector sel_wgted_L(1,nages); //toward landingsvector sel_wgted_D(1,nages); //toward discardsvector sel_wgted_tot(1,nages);//toward Z, landings plus deads discardsnumber max_sel_wgted_tot;
SEDAR 15 SAR 1 SECTION III 171

Assessment Workshop South Atlantic Red Snapper
//-------CPUE Predictions--------------------------------vector pred_HAL_cpue(styr_HAL_cpue,endyr_HAL_cpue); //predicted HAL U (pounds/hook-hour)matrix N_HAL(styr_HAL_cpue,endyr_HAL_cpue,1,nages); //used to compute HAL indexvector pred_HB_cpue(styr_HB_cpue,endyr_HB_cpue); //predicted HB U (number/angler-day)matrix N_HB(styr_HB_cpue,endyr_HB_cpue,1,nages); //used to compute HB indexvector pred_MRFSS_cpue(styr_MRFSS_cpue,endyr_MRFSS_cpue); //predicted MRFSS U (number/1000 hook-hours)matrix N_MRFSS(styr_MRFSS_cpue,endyr_MRFSS_cpue,1,nages); //used to compute MRFSS index
//---Catchability (CPUE q’s)----------------------------------------------------------init_bounded_number log_q_HAL(-20,-5,1);init_bounded_number log_q_HB(-20,-5,1);init_bounded_number log_q_MRFSS(-20,-5,1);//init_bounded_number q_rate(-0.1,0.1,-3);number q_rate;
//---Landings Bias------------------------------------------------------------------//init_bounded_number L_early_bias(0.1,10.0,3);number L_early_bias;number L_commHAL_bias;
//---C is landings in (numbers), L is landings in wgt (mt)--------------------------------------------------matrix C_commHAL(styr,endyr,1,nages); //landings (numbers) at agematrix L_commHAL(styr,endyr,1,nages); //landings (mt) at agematrix L_commHAL_klb(styr,endyr,1,nages); //landings (1000 lb whole weight) at agevector pred_commHAL_L_2(styr_commHAL_L_2,endyr_commHAL_L_2); //post-WWII yearly landings summed over ages
matrix C_commDV(styr,endyr,1,nages); //landings (numbers) at agematrix L_commDV(styr,endyr,1,nages); //landings (mt) at agematrix L_commDV_klb(styr,endyr,1,nages); //landings (1000 lb whole weight) at agevector pred_commDV_L(styr_commDV_L,endyr_commDV_L); //yearly landings (klb) summed over ages
matrix C_HB(styr,endyr,1,nages); //landings (numbers) at agematrix L_HB(styr,endyr,1,nages); //landings (mt) at agematrix L_HB_klb(styr,endyr,1,nages); //landings (1000 lb whole weight) at agevector pred_HB_L(styr_HB_L,endyr_HB_L); //yearly landings (klb) summed over ages
matrix C_MRFSS(styr,endyr,1,nages); //landings (numbers) at agematrix L_MRFSS(styr,endyr,1,nages); //landings (mt) at agematrix L_MRFSS_klb(styr,endyr,1,nages); //landings (1000 lb whole weight) at agevector pred_MRFSS_L(styr_MRFSS_L,endyr_MRFSS_L); //yearly landings (klb) summed over ages
matrix C_total(styr,endyr,1,nages); //catch in numbermatrix L_total(styr,endyr,1,nages); //landings in mtvector L_total_yr(styr,endyr); //total landings (mt) by yr summed over ages
//---Discards (number dead fish) --------------------------------------------------matrix C_commHAL_D(styr_commHAL_D,endyr_commHAL_D,1,nages);//discards (numbers) at agevector pred_commHAL_D(styr_commHAL_D,endyr_commHAL_D); //yearly discards summed over agesvector obs_commHAL_D(styr_commHAL_D,endyr_commHAL_D); //observed releases multiplied by discard mortalitymatrix early_C_commHAL_D(styr,styr_commHAL_D-1,1,nages);//discards (numbers) at age pre-datavector early_pred_commHAL_D(styr,styr_commHAL_D-1); //yearly discards summed over ages pre-data
matrix C_HB_D(styr_HB_D,endyr_HB_D,1,nages); //discards (numbers) at agevector pred_HB_D(styr_HB_D,endyr_HB_D); //yearly discards summed over agesvector obs_HB_D(styr_HB_D,endyr_HB_D); //observed releases multiplied by discard mortalitymatrix early_C_HB_D(styr,styr_HB_D-1,1,nages);//discards (numbers) at age pre-datavector early_pred_HB_D(styr,styr_HB_D-1); //yearly discards summed over ages pre-data
matrix C_MRFSS_D(styr_HB_D,endyr_MRFSS_D,1,nages); //discards (numbers) at agevector pred_MRFSS_D(styr_MRFSS_D,endyr_MRFSS_D); //yearly discards summed over agesvector obs_MRFSS_D(styr_MRFSS_D,endyr_MRFSS_D); //observed releases multiplied by discard mortalitymatrix early_C_MRFSS_D(styr,styr_MRFSS_D-1,1,nages);//discards (numbers) at age pre-datavector early_pred_MRFSS_D(styr,styr_MRFSS_D-1); //yearly discards summed over ages pre-data
//---MSY calcs----------------------------------------------------------------------------
number F_commHAL_prop; //proportion of F_full attributable to hal, last three yrsnumber F_commDV_prop; //proportion of F_full attributable to diving, last three yrsnumber F_HB_prop; //proportion of F_full attributable to headboat, last three yrsnumber F_MRFSS_prop; //proportion of F_full attributable to MRFSS, last three yrs
SEDAR 15 SAR 1 SECTION III 172

Assessment Workshop South Atlantic Red Snapper
number F_commHAL_D_prop;//proportion of F_full attributable to hal discards, last three yrsnumber F_HB_D_prop; //proportion of F_full attributable to headboat discards, last three yrsnumber F_MRFSS_D_prop; //proportion of F_full attributable to MRFSS discards, last three yrsnumber F_temp_sum; //sum of geom mean full Fs in last yrs, used to compute F_fishery_prop
number SSB_msy_out; //SSB at msynumber F_msy_out; //F at msynumber msy_out; //max sustainable yieldnumber B_msy_out; //total biomass at MSYnumber E_msy_out; //exploitation rate at MSY (ages E_age_st plus)number R_msy_out; //equilibrium recruitment at F=Fmsynumber D_msy_out; //equilibrium dead discards at F=Fmsynumber spr_msy_out; //spr at F=Fmsy
vector N_age_msy(1,nages); //numbers at age for MSY calculations: beginning of yrvector N_age_msy_mdyr(1,nages); //numbers at age for MSY calculations: mdpt of yrvector C_age_msy(1,nages); //catch at age for MSY calculationsvector Z_age_msy(1,nages); //total mortality at age for MSY calculationsvector D_age_msy(1,nages); //discard mortality (dead discards) at age for MSY calculationsvector F_L_age_msy(1,nages); //fishing mortality (landings, not discards) at age for MSY calculationsvector F_D_age_msy(1,nages);vector F_msy(1,n_iter_msy); //values of full F to be used in per-recruit and equilibrium calculationsvector spr_msy(1,n_iter_msy); //reproductive capacity-per-recruit values corresponding to F values in F_msyvector R_eq(1,n_iter_msy); //equilibrium recruitment values corresponding to F values in F_msyvector L_eq(1,n_iter_msy); //equilibrium landings(mt) values corresponding to F values in F_msyvector SSB_eq(1,n_iter_msy); //equilibrium reproductive capacity values corresponding to F values in F_msyvector B_eq(1,n_iter_msy); //equilibrium biomass values corresponding to F values in F_msyvector E_eq(1,n_iter_msy); //equilibrium exploitation rates corresponding to F values in F_msyvector D_eq(1,n_iter_msy); //equilibrium discards (1000s) corresponding to F values in F_msy
vector FdF_msy(styr,endyr);vector EdE_msy(styr,endyr);vector SdSSB_msy(styr,endyr);number SdSSB_msy_end;number FdF_msy_end;number EdE_msy_end;
//--------Mortality------------------------------------------------------------------vector M(1,nages); //age-dependent natural mortalitynumber M_constant; //age-indpendent: used only for MSSTmatrix F(styr,endyr,1,nages);vector fullF(styr,endyr); //Fishing mortality rate by yearvector E(styr,endyr); //Exploitation rate by yearsdreport_vector fullF_sd(styr,endyr);sdreport_vector E_sd(styr,endyr);matrix Z(styr,endyr,1,nages);
init_bounded_number log_avg_F_commHAL_2(-10,0,1); //post-WW2init_bounded_dev_vector log_F_dev_commHAL_2(styr_commHAL_L_2,endyr_commHAL_L_2,-10,5,1);matrix F_commHAL(styr,endyr,1,nages);vector F_commHAL_out(styr,endyr_commHAL_L_2); //used for intermediate calculations in fcn get_mortality//number log_F_init_commHAL;
init_bounded_number log_avg_F_commDV(-10,0,1);init_bounded_dev_vector log_F_dev_commDV(styr_commDV_L,endyr_commDV_L,-10,5,2);matrix F_commDV(styr,endyr,1,nages);vector F_commDV_out(styr,endyr_commDV_L); //used for intermediate calculations in fcn get_mortality//number log_F_init_commDV;
init_bounded_number log_avg_F_HB(-10,0,1);init_bounded_dev_vector log_F_dev_HB(styr_HB_L,endyr_HB_L,-10,5,2);matrix F_HB(styr,endyr,1,nages);vector F_HB_out(styr,endyr_HB_L); //used for intermediate calculations in fcn get_mortality//number log_F_init_HB;
init_bounded_number log_avg_F_MRFSS(-10,0,1);init_bounded_dev_vector log_F_dev_MRFSS(styr_MRFSS_L,endyr_MRFSS_L,-10,5,2);matrix F_MRFSS(styr,endyr,1,nages);vector F_MRFSS_out(styr,endyr_MRFSS_L); //used for intermediate calculations in fcn get_mortality//number log_F_init_MRFSS;
SEDAR 15 SAR 1 SECTION III 173

Assessment Workshop South Atlantic Red Snapper
//--Discard mortality stuff------------------------------------------------------------------------------init_bounded_number log_avg_F_commHAL_D(-10,0,1);init_bounded_dev_vector log_F_dev_commHAL_D(styr_commHAL_D,endyr_commHAL_D,-10,5,2);matrix F_commHAL_D(styr,endyr,1,nages);vector F_commHAL_D_out(styr,endyr); //used for intermediate calculations in fcn get_mortalitynumber F_commHAL_D_ratio; //ratio of average discard F to fishery F, for projection discards back before datamatrix sel_commHAL_D(styr,endyr,1,nages);vector sel_commHAL_D_dum(1,nages); //logistic version of sel for computing discard selnumber selpar_commHAL_D_age1; //discard selectivity of age
init_bounded_number log_avg_F_HB_D(-10,0,1);init_bounded_dev_vector log_F_dev_HB_D(styr_HB_D,endyr_HB_D,-10,5,2);matrix F_HB_D(styr,endyr,1,nages);vector F_HB_D_out(styr,endyr); //used for intermediate calculations in fcn get_mortalitynumber F_HB_D_ratio; //ratio of average discard F to fishery F, for projection discards back before datamatrix sel_HB_D(styr,endyr,1,nages);vector sel_HB_D_dum(1,nages); //logistic version of sel for computing discard selnumber selpar_HB_D_age1; //discard selectivity of age 1
init_bounded_number log_avg_F_MRFSS_D(-10,0,1);init_bounded_dev_vector log_F_dev_MRFSS_D(styr_MRFSS_D,endyr_MRFSS_D,-10,5,2);matrix F_MRFSS_D(styr,endyr,1,nages);vector F_MRFSS_D_out(styr,endyr); //used for intermediate calculations in fcn get_mortalitynumber F_MRFSS_D_ratio; //ratio of average discard F to fishery F, for projection discards back before datamatrix sel_MRFSS_D(styr,endyr,1,nages);vector sel_MRFSS_D_dum(1,nages); //logistic version of sel for computing discard selnumber selpar_MRFSS_D_age1; //discard selectivity of age 1
number selpar_L50_D_2; //age at 50% discard sel assumed equal to age at size limit (12in=304.8mm)number selpar_L50_D_3; //age at 50% discard sel assumed equal to age at size limit (20in=508mm)
number Dmort_commHAL;number Dmort_HB;number Dmort_MRFSS;
////---Per-recruit stuff----------------------------------------------------------------------------------vector N_age_spr(1,nages); //numbers at age for SPR calculations: beginning of yearvector N_age_spr_mdyr(1,nages); //numbers at age for SPR calculations: midyearvector C_age_spr(1,nages); //catch at age for SPR calculationsvector Z_age_spr(1,nages); //total mortality at age for SPR calculationsvector spr_static(styr,endyr); //vector of static SPR values by yearvector F_L_age_spr(1,nages); //fishing mortality (landings, not discards) at age for SPR calculationsvector F_spr(1,n_iter_spr); //values of full F to be used in per-recruit and equilibrium calculationsvector spr_spr(1,n_iter_spr); //reporductive capacity-per-recruit values corresponding to F values in F_sprvector L_spr(1,n_iter_spr); //landings(mt)-per-recruit values corresponding to F values in F_sprvector E_spr(1,n_iter_spr); //exploitation rate values corresponding to F values in F_spr
vector N_spr_F0(1,nages); //Used to compute spr at F=0: midpt of yearvector N_bpr_F0(1,nages); //Used to compute bpr at F=0: start of yearnumber spr_F0; //Spawning biomass per recruit at F=0number bpr_F0; //Biomass per recruit at F=0
//-------Objective function components-----------------------------------------------------------------------------number w_L;number w_D;number w_lc;number w_ac;number w_I_HAL;number w_I_HB;number w_I_MRFSS;number w_R;number w_R_init;number w_R_end;number w_F;number w_B1dB0;number w_fullF;number w_cvlen_dev;number w_cvlen_diff;
number f_HAL_cpue;
SEDAR 15 SAR 1 SECTION III 174

Assessment Workshop South Atlantic Red Snapper
number f_HB_cpue;number f_MRFSS_cpue;
number f_commHAL_L_2;number f_commDV_L;number f_HB_L;number f_MRFSS_L;
number f_commHAL_D;number f_HB_D;number f_MRFSS_D;
number f_commHAL_lenc;number f_commDV_lenc;number f_HB_lenc;number f_MRFSS_lenc;
number f_commHAL_agec;number f_commDV_agec;number f_HB_agec;number f_MRFSS_agec;
number f_N_dev; //weight on recruitment deviations to fit S-R curvenumber f_N_dev_early; //extra weight against deviations before styrnumber f_N_dev_end; //extra constraint on last 3 years of recruitment variabilitynumber f_Fend_constraint; //penalty for F deviation in last 5 yearsnumber f_B1dB0_constraint; //penalty to fix B(styr)/Knumber f_fullF_constraint; //penalty for fullF>5number f_cvlen_dev_constraint; //deviation penalty on cv’s of length at agenumber f_cvlen_diff_constraint;//first diff penalty on cv’s of length at age
objective_function_value fval;number fval_unwgt;
//--Dummy arrays for output convenience --------------------------vector xdum(styr,endyr);vector xdum2(styr,endyr+1);
//--Other dummy variables ----number sel_diff_dum;number zero_dum;number dzero_dum;
//init_number x_dum; //used only during model development. can be removed.
//##--><>--><>--><>--><>--><>--><>--><>--><>--><>--><>--><>--><>--><>//##--><>--><>--><>--><>--><>--><>--><>--><>--><>--><>--><>--><>--><>INITIALIZATION_SECTION
//##--><>--><>--><>--><>--><>--><>--><>--><>--><>--><>--><>--><>--><>//##--><>--><>--><>--><>--><>--><>--><>--><>--><>--><>--><>--><>--><>GLOBALS_SECTION
#include "admodel.h" // Include AD class definitions#include "admb2r.cpp" // Include S-compatible output functions (needs preceding)
//##--><>--><>--><>--><>--><>--><>--><>--><>--><>--><>--><>--><>--><>RUNTIME_SECTIONmaximum_function_evaluations 500, 2000, 10000;convergence_criteria 1e-1, 1e-2, 1e-4;
//##--><>--><>--><>--><>--><>--><>--><>--><>--><>--><>--><>--><>--><>//##--><>--><>--><>--><>--><>--><>--><>--><>--><>--><>--><>--><>--><>PRELIMINARY_CALCS_SECTION
// Set values of fixed parameters or set initial guess of estimated parametersDmort_commHAL=set_Dmort_commHAL;Dmort_HB=set_Dmort_HB;Dmort_MRFSS=set_Dmort_MRFSS;
obs_commHAL_D=Dmort_commHAL*obs_commHAL_released;
SEDAR 15 SAR 1 SECTION III 175

Assessment Workshop South Atlantic Red Snapper
obs_HB_D=Dmort_HB*obs_HB_released;obs_MRFSS_D=Dmort_MRFSS*obs_MRFSS_released;
E_age_st=set_E_age_st; //E computed over ages E_age_st + [E_age_st-1+ if model starts with age 0]
Linf=set_Linf;K=set_K;t0=set_t0;
selpar_L50_D_2=t0-log(1.0-304.8/Linf)/K; //age at size limit: 304.8 = limit in mmselpar_L50_D_3=t0-log(1.0-508./Linf)/K; //age at size limit: 508 = limit in mm
M=set_M;M_constant=set_M_constant;steep=set_steep;log_dev_N_rec=0.0;R_autocorr=set_R_autocorr;
log_q_HAL=set_logq_HAL;log_q_HB=set_logq_HB;log_q_MRFSS=set_logq_MRFSS;q_rate=set_q_rate;
L_early_bias=set_L_early_bias;L_commHAL_bias=1.0;
w_L=set_w_L;w_D=set_w_D;w_lc=set_w_lc;w_ac=set_w_ac;w_I_HAL=set_w_I_HAL;w_I_HB=set_w_I_HB;w_I_MRFSS=set_w_I_MRFSS;w_R=set_w_R;w_R_init=set_w_R_init;w_R_end=set_w_R_end;w_F=set_w_F;w_B1dB0=set_w_B1dB0;w_fullF=set_w_fullF;w_cvlen_dev=set_w_cvlen_dev;w_cvlen_diff=set_w_cvlen_diff;
log_avg_F_commHAL_2=set_log_avg_F_commHAL_2;log_avg_F_commDV=set_log_avg_F_commDV;log_avg_F_HB=set_log_avg_F_HB;log_avg_F_MRFSS=set_log_avg_F_MRFSS;
log_avg_F_commHAL_D=set_log_avg_F_commHAL_D;log_avg_F_HB_D=set_log_avg_F_HB_D;log_avg_F_MRFSS_D=set_log_avg_F_MRFSS_D;
log_len_cv=log(set_len_cv);log_R0=set_log_R0;R1_mult=set_R1_mult;B1dB0=set_B1dB0;
selpar_L50_commHAL1=set_selpar_L50_commHAL1;selpar_slope_commHAL1=set_selpar_slope_commHAL1;selpar_L502_commHAL1=set_selpar_L502_commHAL1;selpar_slope2_commHAL1=set_selpar_slope2_commHAL1;selpar_L50_commHAL2=set_selpar_L50_commHAL2;selpar_slope_commHAL2=set_selpar_slope_commHAL2;selpar_L502_commHAL2=set_selpar_L502_commHAL2;selpar_slope2_commHAL2=set_selpar_slope2_commHAL2;selpar_L50_commHAL3=set_selpar_L50_commHAL3;selpar_slope_commHAL3=set_selpar_slope_commHAL3;selpar_L502_commHAL3=set_selpar_L502_commHAL3;selpar_slope2_commHAL3=set_selpar_slope2_commHAL3;
selpar_L50_commDV1=set_selpar_L50_commDV1;selpar_L502_commDV1=set_selpar_L502_commDV1;
SEDAR 15 SAR 1 SECTION III 176

Assessment Workshop South Atlantic Red Snapper
selpar_slope_commDV1=set_selpar_slope_commDV1;selpar_slope2_commDV1=set_selpar_slope2_commDV1;//selpar_L50_commDV2=set_selpar_L50_commDV2;//selpar_L502_commDV2=set_selpar_L502_commDV2;//selpar_slope_commDV2=set_selpar_slope_commDV2;//selpar_slope2_commDV2=set_selpar_slope2_commDV2;
selpar_L50_HB1=set_selpar_L50_HB1;selpar_slope_HB1=set_selpar_slope_HB1;selpar_L502_HB1=set_selpar_L502_HB1;selpar_slope2_HB1=set_selpar_slope2_HB1;selpar_L50_HB2=set_selpar_L50_HB2;selpar_slope_HB2=set_selpar_slope_HB2;selpar_L502_HB2=set_selpar_L502_HB2;selpar_slope2_HB2=set_selpar_slope2_HB2;selpar_L50_HB3=set_selpar_L50_HB3;selpar_slope_HB3=set_selpar_slope_HB3;selpar_L502_HB3=set_selpar_L502_HB3;selpar_slope2_HB3=set_selpar_slope2_HB3;
selpar_L50_MRFSS1=set_selpar_L50_MRFSS1;selpar_slope_MRFSS1=set_selpar_slope_MRFSS1;selpar_L502_MRFSS1=set_selpar_L502_MRFSS1;selpar_slope2_MRFSS1=set_selpar_slope2_MRFSS1;selpar_L50_MRFSS2=set_selpar_L50_MRFSS2;selpar_slope_MRFSS2=set_selpar_slope_MRFSS2;selpar_L502_MRFSS2=set_selpar_L502_MRFSS2;selpar_slope2_MRFSS2=set_selpar_slope2_MRFSS2;selpar_L50_MRFSS3=set_selpar_L50_MRFSS3;selpar_slope_MRFSS3=set_selpar_slope_MRFSS3;selpar_L502_MRFSS3=set_selpar_L502_MRFSS3;selpar_slope2_MRFSS3=set_selpar_slope2_MRFSS3;
selpar_commHAL_D_age1=set_selpar_commHAL_D_age1;selpar_HB_D_age1=set_selpar_HB_D_age1;selpar_MRFSS_D_age1=set_selpar_MRFSS_D_age1;
sqrt2pi=sqrt(2.*3.14159265);g2mt=0.000001; //conversion of grams to metric tonsg2kg=0.001; //conversion of grams to kgmt2klb=2.20462; //converstion of metric tons to 1000 lb//df=0.001; //difference for msy derivative approximationszero_dum=0.0;
//additive constant to prevent division by zerodzero_dum=0.00001;
SSB_msy_out=0.0;
maturity_f=maturity_f_obs;prop_f=prop_f_obs;
////Fill in maturity matrix for calculations for styr to styr// for(iyear=styr; iyear<=styr-1; iyear++)// {// maturity_f(iyear)=maturity_f_obs;// maturity_m(iyear)=maturity_m_obs;// prop_m(iyear)=prop_m_obs(styr);// prop_f(iyear)=1.0-prop_m_obs(styr);// }// for (iyear=styr;iyear<=endyr;iyear++)// {// maturity_f(iyear)=maturity_f_obs;// maturity_m(iyear)=maturity_m_obs;// prop_m(iyear)=prop_m_obs(iyear);// prop_f(iyear)=1.0-prop_m_obs(iyear);// }
//Fill in sample sizes of comps sampled in nonconsec yrs.//Used only for output in R object
nsamp_commDV_lenc_allyr=missing; //"missing" defined in admb2r.cpp
SEDAR 15 SAR 1 SECTION III 177

Assessment Workshop South Atlantic Red Snapper
nsamp_MRFSS_lenc_allyr=missing;nsamp_commHAL_agec_allyr=missing;nsamp_commDV_agec_allyr=missing;nsamp_HB_agec_allyr=missing;for (iyear=1; iyear<=nyr_commDV_lenc; iyear++)
{nsamp_commDV_lenc_allyr(yrs_commDV_lenc(iyear))=nsamp_commDV_lenc(iyear);
}for (iyear=1; iyear<=nyr_MRFSS_lenc; iyear++)
{nsamp_MRFSS_lenc_allyr(yrs_MRFSS_lenc(iyear))=nsamp_MRFSS_lenc(iyear);
}for (iyear=1; iyear<=nyr_commHAL_agec; iyear++)
{nsamp_commHAL_agec_allyr(yrs_commHAL_agec(iyear))=nsamp_commHAL_agec(iyear);
}for (iyear=1; iyear<=nyr_commDV_agec; iyear++)
{nsamp_commDV_agec_allyr(yrs_commDV_agec(iyear))=nsamp_commDV_agec(iyear);
}for (iyear=1; iyear<=nyr_HB_agec; iyear++)
{nsamp_HB_agec_allyr(yrs_HB_agec(iyear))=nsamp_HB_agec(iyear);
}
//fill in F’s, Catch matrices, and log rec dev with zero’sF_commHAL.initialize();C_commHAL.initialize();F_commDV.initialize();C_commDV.initialize();F_HB.initialize();C_HB.initialize();F_MRFSS.initialize();C_MRFSS.initialize();
F_commHAL_D.initialize();F_HB_D.initialize();F_MRFSS_D.initialize();
sel_commHAL_D.initialize();sel_HB_D.initialize();sel_MRFSS_D.initialize();
log_dev_R.initialize();
//##--><>--><>--><>--><>--><>--><>--><>--><>--><>--><>--><>--><>--><>//##--><>--><>--><>--><>--><>--><>--><>--><>--><>--><>--><>--><>--><>TOP_OF_MAIN_SECTION
arrmblsize=20000000;gradient_structure::set_MAX_NVAR_OFFSET(1600);gradient_structure::set_GRADSTACK_BUFFER_SIZE(2000000);gradient_structure::set_CMPDIF_BUFFER_SIZE(2000000);gradient_structure::set_NUM_DEPENDENT_VARIABLES(500);
//>--><>--><>--><>--><>//##--><>--><>--><>--><>--><>--><>--><>--><>--><>--><>--><>--><>--><>PROCEDURE_SECTION
R0=mfexp(log_R0);
//cout<<"start"<<endl;get_length_and_weight_at_age();//cout << "got length and weight transitions" <<endl;get_reprod();get_length_at_age_dist();//cout<< "got predicted length at age distribution"<<endl;get_spr_F0();//cout << "got F0 spr" << endl;
SEDAR 15 SAR 1 SECTION III 178

Assessment Workshop South Atlantic Red Snapper
get_selectivity();//cout << "got selectivity" << endl;get_mortality();//cout << "got mortalities" << endl;get_bias_corr();//cout<< "got recruitment bias correction" << endl;get_numbers_at_age();//cout << "got numbers at age" << endl;get_landings_numbers();//cout << "got catch at age" << endl;get_landings_wgt();//cout << "got landings" << endl;get_dead_discards();//cout << "got discards" << endl;get_indices();//cout << "got indices" << endl;get_length_comps();//cout<< "got length comps"<< endl;get_age_comps();//cout<< "got age comps"<< endl;
evaluate_objective_function();//cout << "objective function calculations complete" << endl;
FUNCTION get_length_and_weight_at_age//compute mean length (mm) and weight (whole and gutted) at age
meanlen=Linf*(1.0-mfexp(-K*(agebins-t0))); //length in mmwgt_g=wgtpar_a*pow(meanlen,wgtpar_b); //wgt in gramswgt_kg=g2kg*wgt_g; //wgt in gramswgt=g2mt*wgt_g; //mt of whole wgt: g2mt converts g to mtwgt_klb=mt2klb*wgt; //1000 lb of whole wgt
FUNCTION get_reprod
//product of stuff going into reproductive capacity calcsreprod=elem_prod(elem_prod(prop_f,maturity_f),wgt);
FUNCTION get_length_at_age_dist//compute matrix of length at age, based on the normal distributionfor (iage=1;iage<=nages;iage++){
//len_cv(iage)=mfexp(log_len_cv+log_len_cv_dev(iage));len_cv(iage)=mfexp(log_len_cv);for (ilen=1;ilen<=nlenbins;ilen++){
lenprob(iage,ilen)=(mfexp(-(square(lenbins(ilen)-meanlen(iage))/(2.*square(len_cv(iage)*meanlen(iage)))))/(sqrt2pi*len_cv(iage)*meanlen(iage)));
}lenprob(iage)/=sum(lenprob(iage)); //standardize to account for truncated normal (i.e., no sizes<0)
}
FUNCTION get_spr_F0//at mdyr, apply half this yr’s mortality, half next yr’sN_spr_F0(1)=1.0*mfexp(-1.0*M(1)/2.0);//at start of yrN_bpr_F0(1)=1.0;for (iage=2; iage<=nages; iage++){
//N_spr_F0(iage)=N_spr_F0(iage-1)*mfexp(-1.0*(M(iage-1));N_spr_F0(iage)=N_spr_F0(iage-1)*mfexp(-1.0*(M(iage-1)/2.0 + M(iage)/2.0));N_bpr_F0(iage)=N_bpr_F0(iage-1)*mfexp(-1.0*(M(iage-1)));
}N_spr_F0(nages)=N_spr_F0(nages)/(1.0-mfexp(-1.0*M(nages))); //plus group (sum of geometric series)N_bpr_F0(nages)=N_bpr_F0(nages)/(1.0-mfexp(-1.0*M(nages)));
spr_F0=sum(elem_prod(N_spr_F0,reprod));bpr_F0=sum(elem_prod(N_bpr_F0,wgt));
FUNCTION get_selectivity
SEDAR 15 SAR 1 SECTION III 179

Assessment Workshop South Atlantic Red Snapper
// ------- compute landings selectivities by periodselpar_L50_commHAL1=selpar_L50_HB1;selpar_slope_commHAL1=selpar_slope_HB1;
for (iage=1; iage<=nages; iage++){
//sel_commHAL_1(iage)=1./(1.+mfexp(-1.*selpar_slope_commHAL1*(double(agebins(iage))-selpar_L50_commHAL1))); //logisticsel_commHAL_1(iage)=(1./(1.+mfexp(-1.*selpar_slope_commHAL1*(double(agebins(iage))-
selpar_L50_commHAL1))))*(1-(1./(1.+mfexp(-1.*selpar_slope2_commHAL1*(double(agebins(iage))-(selpar_L50_commHAL1+selpar_L502_commHAL1)))))); //double logistic
//sel_commHAL_2(iage)=1./(1.+mfexp(-1.*selpar_slope_commHAL2*(double(agebins(iage))-selpar_L50_commHAL2))); //logisticsel_commHAL_2(iage)=(1./(1.+mfexp(-1.*selpar_slope_commHAL2*(double(agebins(iage))-
selpar_L50_commHAL2))))*(1-(1./(1.+mfexp(-1.*selpar_slope2_commHAL2*(double(agebins(iage))-(selpar_L50_commHAL2+selpar_L502_commHAL2)))))); //double logistic
//sel_commHAL_3(iage)=1./(1.+mfexp(-1.*selpar_slope_commHAL3*(double(agebins(iage))-selpar_L50_commHAL3))); //logisticsel_commHAL_3(iage)=(1./(1.+mfexp(-1.*selpar_slope_commHAL3*(double(agebins(iage))-
selpar_L50_commHAL3))))*(1-(1./(1.+mfexp(-1.*selpar_slope2_commHAL3*(double(agebins(iage))-(selpar_L50_commHAL3+selpar_L502_commHAL3)))))); //double logistic
sel_commDV_vec(iage)=(1./(1.+mfexp(-1.*selpar_slope_commDV1*(double(agebins(iage))-selpar_L50_commDV1))))*(1-(1./(1.+mfexp(-1.*selpar_slope2_commDV1*(double(agebins(iage))-(selpar_L50_commDV1+selpar_L502_commDV1)))))); //double logistic
//sel_HB_1(iage)=1./(1.+mfexp(-1.*selpar_slope_HB1*(double(agebins(iage))-selpar_L50_HB1))); //logisticsel_HB_1(iage)=(1./(1.+mfexp(-1.*selpar_slope_HB1*(double(agebins(iage))-
selpar_L50_HB1))))*(1-(1./(1.+mfexp(-1.*selpar_slope2_HB1*(double(agebins(iage))-(selpar_L50_HB1+selpar_L502_HB1)))))); //double logistic
//sel_HB_2(iage)=1./(1.+mfexp(-1.*selpar_slope_HB2*(double(agebins(iage))-selpar_L50_HB2))); //logisticsel_HB_2(iage)=(1./(1.+mfexp(-1.*selpar_slope_HB2*(double(agebins(iage))-
selpar_L50_HB2))))*(1-(1./(1.+mfexp(-1.*selpar_slope2_HB2*(double(agebins(iage))-(selpar_L50_HB2+selpar_L502_HB2)))))); //double logistic
//sel_HB_3(iage)=1./(1.+mfexp(-1.*selpar_slope_HB3*(double(agebins(iage))-selpar_L50_HB3))); //logisticsel_HB_3(iage)=(1./(1.+mfexp(-1.*selpar_slope_HB3*(double(agebins(iage))-
selpar_L50_HB3))))*(1-(1./(1.+mfexp(-1.*selpar_slope2_HB3*(double(agebins(iage))-(selpar_L50_HB3+selpar_L502_HB3)))))); //double logistic
//sel_MRFSS_2(iage)=1./(1.+mfexp(-1.*selpar_slope_MRFSS2*(double(agebins(iage))-selpar_L50_MRFSS2))); //logisticsel_MRFSS_2(iage)=(1./(1.+mfexp(-1.*selpar_slope_MRFSS2*(double(agebins(iage))-
selpar_L50_MRFSS2))))*(1-(1./(1.+mfexp(-1.*selpar_slope2_MRFSS2*(double(agebins(iage))-(selpar_L50_MRFSS2+selpar_L502_MRFSS2)))))); //double logistic
//sel_MRFSS_3(iage)=1./(1.+mfexp(-1.*selpar_slope_MRFSS3*(double(agebins(iage))-selpar_L50_MRFSS3))); //logisticsel_MRFSS_3(iage)=(1./(1.+mfexp(-1.*selpar_slope_MRFSS3*(double(agebins(iage))-
selpar_L50_MRFSS3))))*(1-(1./(1.+mfexp(-1.*selpar_slope2_MRFSS3*(double(agebins(iage))-(selpar_L50_MRFSS3+selpar_L502_MRFSS3)))))); //double logistic
}sel_commHAL_1=sel_commHAL_1/max(sel_commHAL_1); //re-normalize double logisticsel_commHAL_2=sel_commHAL_2/max(sel_commHAL_2); //re-normalize double logisticsel_commHAL_3=sel_commHAL_3/max(sel_commHAL_3); //re-normalize double logisticsel_commDV_vec=sel_commDV_vec/max(sel_commDV_vec); //re-normalize double logisticsel_HB_1=sel_HB_1/max(sel_HB_1); //re-normalize double logisticsel_HB_2=sel_HB_2/max(sel_HB_2); //re-normalize double logisticsel_HB_3=sel_HB_3/max(sel_HB_3); //re-normalize double logisticsel_MRFSS_2=sel_MRFSS_2/max(sel_MRFSS_2); //re-normalize double logisticsel_MRFSS_3=sel_MRFSS_3/max(sel_MRFSS_3); //re-normalize double logistic
//-----------fill in years--------------------------------------------
for (iyear=styr; iyear<=endyr_period1; iyear++)//period1 HAL sel assumes HB sel but shifted by that difference in L50 from period2{
sel_commHAL(iyear)=sel_commHAL_1;sel_commDV(iyear)=sel_commDV_vec;sel_HB(iyear)=sel_HB_1;sel_MRFSS(iyear)=sel_HB(iyear); //early period MRFSS same as HB
// if (iyear>=styr_HB_lenc) //selectivity in some early HB years varies// {// for (iage=1; iage<=nages; iage++)
SEDAR 15 SAR 1 SECTION III 180

Assessment Workshop South Atlantic Red Snapper
// {// //sel_HB(iyear,iage)=1./(1.+mfexp(-1.*selpar_slope_HB1*(double(agebins(iage))// // -(selpar_L50_HB1+selpar_L50_HB_dev(iyear))))); //logistic// sel_HB(iyear,iage)=(1./(1.+mfexp(-1.*selpar_slope_HB1*(double(agebins(iage))-// (selpar_L50_HB1+selpar_L50_HB_dev(iyear))))))*(1-(1./(1.+mfexp(-1.*selpar_slope2_HB1*// (double(agebins(iage))-(selpar_L50_HB1+selpar_L502_HB1)))))); //double logistic// }// sel_HB(iyear)=sel_HB(iyear)/max(sel_HB(iyear)); //re-normalize double logistic// }// sel_MRFSS(iyear)=sel_HB(iyear); //early period MRFSS same as HB
}
for (iyear=endyr_period1+1; iyear<=endyr_period2; iyear++){
sel_commHAL(iyear)=sel_commHAL_2;sel_commDV(iyear)=sel_commDV_vec;sel_HB(iyear)=sel_HB_2;sel_MRFSS(iyear)=sel_MRFSS_2;
}
for (iyear=endyr_period2+1; iyear<=endyr; iyear++){
sel_commHAL(iyear)=sel_commHAL_3;sel_commDV(iyear)=sel_commDV_vec;sel_HB(iyear)=sel_HB_3;sel_MRFSS(iyear)=sel_MRFSS_3;
}
//---Discard selectivities---------------------------------//---------------------------------------------------------
//period 1 (pre data)// for (iage=1; iage<=nages; iage++)// {// sel_commHAL_D_dum(iage)=1./(1.+mfexp(-1.*selpar_slope_commHAL1*// (double(agebins(iage))-selpar_L50_commHAL1)));// sel_HB_D_dum(iage)=1./(1.+mfexp(-1.*selpar_slope_HB1*// (double(agebins(iage))-selpar_L50_HB1)));// sel_MRFSS_D_dum(iage)=1./(1.+mfexp(-1.*selpar_slope_MRFSS1*// (double(agebins(iage))-selpar_L50_MRFSS1)));// }//// for (iyear=styr;iyear<styr_commHAL_D;iyear++)// {// sel_commHAL_D(iyear)=1.0-sel_commHAL_D_dum;// sel_commHAL_D(iyear)=(sel_commHAL_D(iyear))/(max(sel_commHAL_D(iyear)));// sel_commHAL_D(iyear,1)=selpar_commHAL_D_age1;// sel_commHAL_D(iyear)=(sel_commHAL_D(iyear))/(max(sel_commHAL_D(iyear)));// }//// for (iyear=styr;iyear<styr_HB_D;iyear++)// {// sel_HB_D(iyear)=1.0-sel_HB_D_dum;// sel_HB_D(iyear)=(sel_HB_D(iyear))/(max(sel_HB_D(iyear)));// sel_HB_D(iyear,1)=selpar_HB_D_age1;// sel_HB_D(iyear)=(sel_HB_D(iyear))/(max(sel_HB_D(iyear)));// }// for (iyear=styr;iyear<styr_MRFSS_D;iyear++)// {// sel_MRFSS_D(iyear)=1.0-sel_MRFSS_D_dum;// sel_MRFSS_D(iyear)=(sel_MRFSS_D(iyear))/(max(sel_MRFSS_D(iyear)));// sel_MRFSS_D(iyear,1)=selpar_MRFSS_D_age1;// sel_MRFSS_D(iyear)=(sel_MRFSS_D(iyear))/(max(sel_MRFSS_D(iyear)));// }
//period 2for (iage=1; iage<=nages; iage++){sel_commHAL_D_dum(iage)=1./(1.+mfexp(-1.*selpar_slope_commHAL2*
SEDAR 15 SAR 1 SECTION III 181

Assessment Workshop South Atlantic Red Snapper
(double(agebins(iage))-selpar_L50_D_2)));sel_HB_D_dum(iage)=1./(1.+mfexp(-1.*selpar_slope_HB2*
(double(agebins(iage))-selpar_L50_D_2)));sel_MRFSS_D_dum(iage)=1./(1.+mfexp(-1.*selpar_slope_MRFSS2*
(double(agebins(iage))-selpar_L50_D_2)));}
for (iyear=styr_commHAL_D;iyear<=endyr_period2;iyear++){sel_commHAL_D(iyear)=1.0-sel_commHAL_D_dum;sel_commHAL_D(iyear)(2,nages)=(sel_commHAL_D(iyear)(2,nages))/(max(sel_commHAL_D(iyear)(2,nages)));sel_commHAL_D(iyear,1)=selpar_commHAL_D_age1;//sel_commHAL_D(iyear)=(sel_commHAL_D(iyear))/(max(sel_commHAL_D(iyear)));
}
for (iyear=styr_HB_D;iyear<=endyr_period2;iyear++){sel_HB_D(iyear)=1.0-sel_HB_D_dum;sel_HB_D(iyear)(2,nages)=(sel_HB_D(iyear)(2,nages))/(max(sel_HB_D(iyear)(2,nages)));sel_HB_D(iyear,1)=selpar_HB_D_age1;//sel_HB_D(iyear)=(sel_HB_D(iyear))/(max(sel_HB_D(iyear)));
}for (iyear=styr_MRFSS_D;iyear<=endyr_period2;iyear++)
{sel_MRFSS_D(iyear)=1.0-sel_MRFSS_D_dum;sel_MRFSS_D(iyear)(2,nages)=(sel_MRFSS_D(iyear)(2,nages))/(max(sel_MRFSS_D(iyear)(2,nages)));sel_MRFSS_D(iyear,1)=selpar_MRFSS_D_age1;//sel_MRFSS_D(iyear)=(sel_MRFSS_D(iyear))/(max(sel_MRFSS_D(iyear)));
}
//period 3for (iage=1; iage<=nages; iage++){sel_commHAL_D_dum(iage)=1./(1.+mfexp(-1.*selpar_slope_commHAL3*
(double(agebins(iage))-selpar_L50_D_3)));sel_HB_D_dum(iage)=1./(1.+mfexp(-1.*selpar_slope_HB3*
(double(agebins(iage))-selpar_L50_D_3)));sel_MRFSS_D_dum(iage)=1./(1.+mfexp(-1.*selpar_slope_MRFSS3*
(double(agebins(iage))-selpar_L50_D_3)));}
for (iyear=endyr_period2+1;iyear<=endyr_commHAL_D;iyear++){sel_commHAL_D(iyear)=1.0-sel_commHAL_D_dum;sel_commHAL_D(iyear)(2,nages)=(sel_commHAL_D(iyear)(2,nages))/(max(sel_commHAL_D(iyear)(2,nages)));sel_commHAL_D(iyear,1)=selpar_commHAL_D_age1;//sel_commHAL_D(iyear)=(sel_commHAL_D(iyear))/(max(sel_commHAL_D(iyear)));
}for (iyear=endyr_period2+1;iyear<=endyr_HB_D;iyear++)
{sel_HB_D(iyear)=1.0-sel_HB_D_dum;sel_HB_D(iyear)(2,nages)=(sel_HB_D(iyear)(2,nages))/(max(sel_HB_D(iyear)(2,nages)));sel_HB_D(iyear,1)=selpar_HB_D_age1;//sel_HB_D(iyear)=(sel_HB_D(iyear))/(max(sel_HB_D(iyear)));
}for (iyear=endyr_period2+1;iyear<=endyr_MRFSS_D;iyear++)
{sel_MRFSS_D(iyear)=1.0-sel_MRFSS_D_dum;sel_MRFSS_D(iyear)(2,nages)=(sel_MRFSS_D(iyear)(2,nages))/(max(sel_MRFSS_D(iyear)(2,nages)));sel_MRFSS_D(iyear,1)=selpar_MRFSS_D_age1;//sel_MRFSS_D(iyear)=(sel_MRFSS_D(iyear))/(max(sel_MRFSS_D(iyear)));
}
FUNCTION get_mortalityfullF=0.0;////initialization F is avg of first 3 yrs of observed landings//log_F_init_commHAL=sum(log_F_dev_commHAL(styr_commHAL_L,(styr_commHAL_L+2)))/3.0;//log_F_init_commDV=sum(log_F_dev_commDV(styr_commDV_L,(styr_commDV_L+2)))/3.0;
SEDAR 15 SAR 1 SECTION III 182
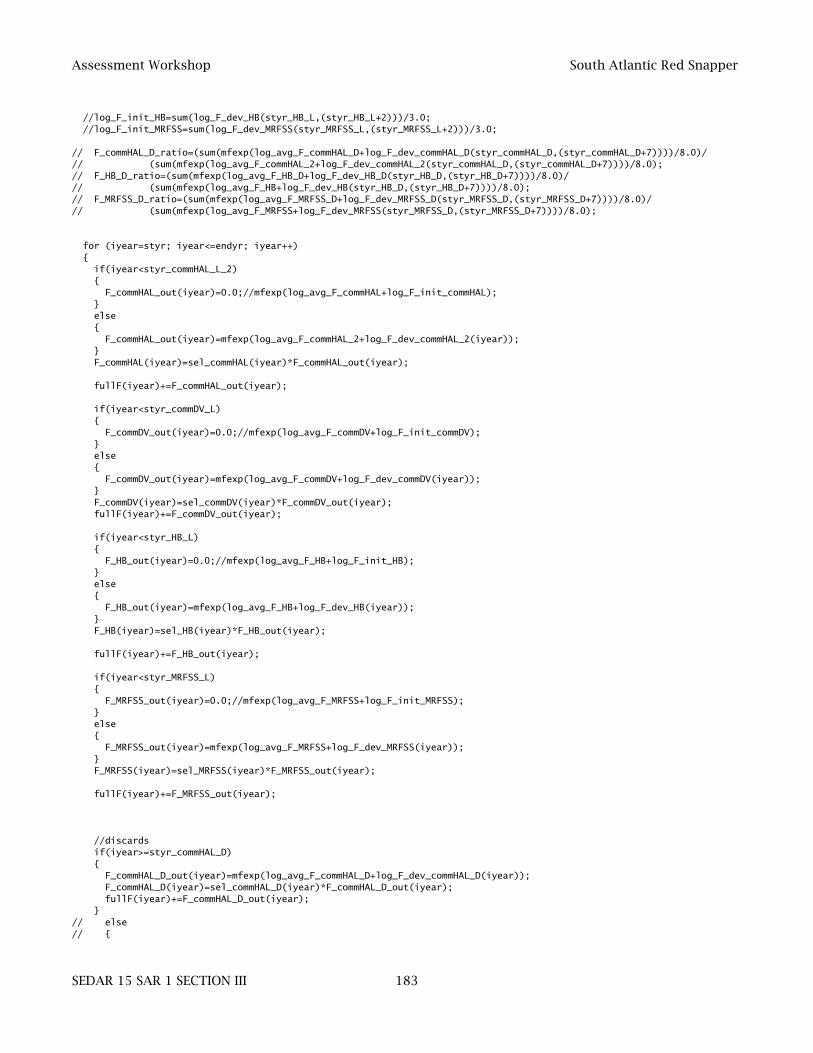
Assessment Workshop South Atlantic Red Snapper
//log_F_init_HB=sum(log_F_dev_HB(styr_HB_L,(styr_HB_L+2)))/3.0;//log_F_init_MRFSS=sum(log_F_dev_MRFSS(styr_MRFSS_L,(styr_MRFSS_L+2)))/3.0;
// F_commHAL_D_ratio=(sum(mfexp(log_avg_F_commHAL_D+log_F_dev_commHAL_D(styr_commHAL_D,(styr_commHAL_D+7))))/8.0)/// (sum(mfexp(log_avg_F_commHAL_2+log_F_dev_commHAL_2(styr_commHAL_D,(styr_commHAL_D+7))))/8.0);// F_HB_D_ratio=(sum(mfexp(log_avg_F_HB_D+log_F_dev_HB_D(styr_HB_D,(styr_HB_D+7))))/8.0)/// (sum(mfexp(log_avg_F_HB+log_F_dev_HB(styr_HB_D,(styr_HB_D+7))))/8.0);// F_MRFSS_D_ratio=(sum(mfexp(log_avg_F_MRFSS_D+log_F_dev_MRFSS_D(styr_MRFSS_D,(styr_MRFSS_D+7))))/8.0)/// (sum(mfexp(log_avg_F_MRFSS+log_F_dev_MRFSS(styr_MRFSS_D,(styr_MRFSS_D+7))))/8.0);
for (iyear=styr; iyear<=endyr; iyear++){
if(iyear<styr_commHAL_L_2){
F_commHAL_out(iyear)=0.0;//mfexp(log_avg_F_commHAL+log_F_init_commHAL);}else{
F_commHAL_out(iyear)=mfexp(log_avg_F_commHAL_2+log_F_dev_commHAL_2(iyear));}F_commHAL(iyear)=sel_commHAL(iyear)*F_commHAL_out(iyear);
fullF(iyear)+=F_commHAL_out(iyear);
if(iyear<styr_commDV_L){
F_commDV_out(iyear)=0.0;//mfexp(log_avg_F_commDV+log_F_init_commDV);}else{
F_commDV_out(iyear)=mfexp(log_avg_F_commDV+log_F_dev_commDV(iyear));}F_commDV(iyear)=sel_commDV(iyear)*F_commDV_out(iyear);fullF(iyear)+=F_commDV_out(iyear);
if(iyear<styr_HB_L){
F_HB_out(iyear)=0.0;//mfexp(log_avg_F_HB+log_F_init_HB);}else{
F_HB_out(iyear)=mfexp(log_avg_F_HB+log_F_dev_HB(iyear));}F_HB(iyear)=sel_HB(iyear)*F_HB_out(iyear);
fullF(iyear)+=F_HB_out(iyear);
if(iyear<styr_MRFSS_L){
F_MRFSS_out(iyear)=0.0;//mfexp(log_avg_F_MRFSS+log_F_init_MRFSS);}else{
F_MRFSS_out(iyear)=mfexp(log_avg_F_MRFSS+log_F_dev_MRFSS(iyear));}F_MRFSS(iyear)=sel_MRFSS(iyear)*F_MRFSS_out(iyear);
fullF(iyear)+=F_MRFSS_out(iyear);
//discardsif(iyear>=styr_commHAL_D){
F_commHAL_D_out(iyear)=mfexp(log_avg_F_commHAL_D+log_F_dev_commHAL_D(iyear));F_commHAL_D(iyear)=sel_commHAL_D(iyear)*F_commHAL_D_out(iyear);fullF(iyear)+=F_commHAL_D_out(iyear);
}// else// {
SEDAR 15 SAR 1 SECTION III 183

Assessment Workshop South Atlantic Red Snapper
// F_commHAL_D_out(iyear)=F_commHAL_D_ratio*F_commHAL_out(iyear);// F_commHAL_D(iyear)=sel_commHAL_D(iyear)*F_commHAL_D_out(iyear);// fullF(iyear)+=F_commHAL_D_out(iyear);// }
if(iyear>=styr_HB_D){
F_HB_D_out(iyear)=mfexp(log_avg_F_HB_D+log_F_dev_HB_D(iyear));F_HB_D(iyear)=sel_HB_D(iyear)*F_HB_D_out(iyear);fullF(iyear)+=F_HB_D_out(iyear);
}// else// {// F_HB_D_out(iyear)=F_HB_D_ratio*F_HB_out(iyear);// F_HB_D(iyear)=sel_HB_D(iyear)*F_HB_D_out(iyear);// fullF(iyear)+=F_HB_D_out(iyear);// }
if(iyear>=styr_MRFSS_D){
F_MRFSS_D_out(iyear)=mfexp(log_avg_F_MRFSS_D+log_F_dev_MRFSS_D(iyear));F_MRFSS_D(iyear)=sel_MRFSS_D(iyear)*F_MRFSS_D_out(iyear);fullF(iyear)+=F_MRFSS_D_out(iyear);
}
// else// {// F_MRFSS_D_out(iyear)=F_MRFSS_D_ratio*F_MRFSS_out(iyear);// F_MRFSS_D(iyear)=sel_MRFSS_D(iyear)*F_MRFSS_D_out(iyear);// fullF(iyear)+=F_MRFSS_D_out(iyear);// }
F(iyear)=F_commHAL(iyear); //first in additive series (NO +=)F(iyear)+=F_commDV(iyear);F(iyear)+=F_HB(iyear);F(iyear)+=F_MRFSS(iyear);
F(iyear)+=F_commHAL_D(iyear);F(iyear)+=F_HB_D(iyear);F(iyear)+=F_MRFSS_D(iyear);
Z(iyear)=M+F(iyear);}
FUNCTION get_bias_corrvar_rec_dev=norm2(log_dev_N_rec(styr_rec_dev,(endyr-2))-sum(log_dev_N_rec(styr_rec_dev,(endyr-2)))
/(nyrs_rec-2.0))/(nyrs_rec-3.0); //sample variance from yrs styr_rec_dev-2004if (set_BiasCor <= 0.0) {BiasCor=mfexp(var_rec_dev/2.0);} //bias correctionelse {BiasCor=set_BiasCor;}
FUNCTION get_numbers_at_age//Initial age
S0=spr_F0*R0;B0=bpr_F0*R0;R1_mult=B1dB0;R1=R1_mult*mfexp(log(((0.8*R0*steep*S0)/
(0.2*R0*spr_F0*(1.0-steep)+(steep-0.2)*S0))+dzero_dum));
//Assume equilibrium age structure for first yearN(styr,1)=R1;N_mdyr(styr,1)=N(styr,1)*mfexp(-1.*M(1)/2.0);for (iage=2; iage<=nages; iage++){
N(styr,iage)=N(styr,iage-1)*mfexp(-1.*M(iage-1));N_mdyr(styr,iage)=N(styr,iage)*mfexp(-1.*M(iage)/2.0);
}//plus group calculationN(styr,nages)=N(styr,nages)/(1.-mfexp(-1.*M(nages)));N_mdyr(styr,nages)=N_mdyr(styr,nages)/(1.-mfexp(-1.*M(nages)));
SEDAR 15 SAR 1 SECTION III 184

Assessment Workshop South Atlantic Red Snapper
SSB(styr)=sum(elem_prod(N_mdyr(styr),reprod));B(styr)=elem_prod(N(styr),wgt);totB(styr)=sum(B(styr));
//Rest of yearsfor (iyear=styr; iyear<endyr; iyear++){
if(iyear<(styr_rec_dev-1)) //recruitment follows S-R curve exactly{
//add 0.00001 to avoid log(zero)N(iyear+1,1)=BiasCor*mfexp(log(((0.8*R0*steep*SSB(iyear))/(0.2*R0*spr_F0*
(1.0-steep)+(steep-0.2)*SSB(iyear)))+dzero_dum));N(iyear+1)(2,nages)=++elem_prod(N(iyear)(1,nages-1),(mfexp(-1.*Z(iyear)(1,nages-1))));N(iyear+1,nages)+=N(iyear,nages)*mfexp(-1.*Z(iyear,nages));//plus groupN_mdyr(iyear+1)(1,nages)=elem_prod(N(iyear+1)(1,nages),(mfexp(-1.*(Z(iyear+1)(1,nages))/2.0))); //mdyrSSB(iyear+1)=sum(elem_prod(N_mdyr(iyear+1),reprod));B(iyear+1)=elem_prod(N(iyear+1),wgt);totB(iyear+1)=sum(B(iyear+1));
}else //recruitment follows S-R curve with lognormal deviation{
//add 0.00001 to avoid log(zero)N(iyear+1,1)=mfexp(log(((0.8*R0*steep*SSB(iyear))/(0.2*R0*spr_F0*
(1.0-steep)+(steep-0.2)*SSB(iyear)))+dzero_dum)+log_dev_N_rec(iyear+1));N(iyear+1)(2,nages)=++elem_prod(N(iyear)(1,nages-1),(mfexp(-1.*Z(iyear)(1,nages-1))));N(iyear+1,nages)+=N(iyear,nages)*mfexp(-1.*Z(iyear,nages));//plus groupN_mdyr(iyear+1)(1,nages)=elem_prod(N(iyear+1)(1,nages),(mfexp(-1.*(Z(iyear+1)(1,nages))/2.0))); //mdyrSSB(iyear+1)=sum(elem_prod(N_mdyr(iyear+1),reprod));B(iyear+1)=elem_prod(N(iyear+1),wgt);totB(iyear+1)=sum(B(iyear+1));
}}
//last year (projection) has no recruitment variabilityN(endyr+1,1)=mfexp(log(((0.8*R0*steep*SSB(endyr))/(0.2*R0*spr_F0*
(1.0-steep)+(steep-0.2)*SSB(endyr)))+dzero_dum));N(endyr+1)(2,nages)=++elem_prod(N(endyr)(1,nages-1),(mfexp(-1.*Z(endyr)(1,nages-1))));N(endyr+1,nages)+=N(endyr,nages)*mfexp(-1.*Z(endyr,nages));//plus group//SSB(endyr+1)=sum(elem_prod(N(endyr+1),reprod));B(endyr+1)=elem_prod(N(endyr+1),wgt);totB(endyr+1)=sum(B(endyr+1));
//Recruitment time seriesrec=column(N,1);
//Benchmark parametersS1S0=SSB(styr)/S0;popstatus=SSB(endyr)/S0;
FUNCTION get_landings_numbers //Baranov catch eqnfor (iyear=styr; iyear<=endyr; iyear++){
for (iage=1; iage<=nages; iage++){
C_commHAL(iyear,iage)=N(iyear,iage)*F_commHAL(iyear,iage)*(1.-mfexp(-1.*Z(iyear,iage)))/Z(iyear,iage);
C_commDV(iyear,iage)=N(iyear,iage)*F_commDV(iyear,iage)*(1.-mfexp(-1.*Z(iyear,iage)))/Z(iyear,iage);
C_HB(iyear,iage)=N(iyear,iage)*F_HB(iyear,iage)*(1.-mfexp(-1.*Z(iyear,iage)))/Z(iyear,iage);
C_MRFSS(iyear,iage)=N(iyear,iage)*F_MRFSS(iyear,iage)*(1.-mfexp(-1.*Z(iyear,iage)))/Z(iyear,iage);
}}
FUNCTION get_landings_wgt
//---Predicted landings------------------------
SEDAR 15 SAR 1 SECTION III 185

Assessment Workshop South Atlantic Red Snapper
for (iyear=styr; iyear<=endyr; iyear++){
L_commHAL(iyear)=elem_prod(C_commHAL(iyear),wgt); //in mtL_commDV(iyear)=elem_prod(C_commDV(iyear),wgt); //in mtL_HB(iyear)=elem_prod(C_HB(iyear),wgt); //in mtL_MRFSS(iyear)=elem_prod(C_MRFSS(iyear),wgt); //in mt
L_commHAL_klb(iyear)=elem_prod(C_commHAL(iyear),wgt_klb); //in 1000 lbL_commDV_klb(iyear)=elem_prod(C_commDV(iyear),wgt_klb); //in 1000 lbL_HB_klb(iyear)=elem_prod(C_HB(iyear),wgt_klb); //in 1000 lbL_MRFSS_klb(iyear)=elem_prod(C_MRFSS(iyear),wgt_klb); //in 1000 lb
}
for (iyear=styr_commHAL_L_2; iyear<=endyr_commHAL_L_2; iyear++){pred_commHAL_L_2(iyear)=sum(L_commHAL_klb(iyear));
}for (iyear=styr_commDV_L; iyear<=endyr_commDV_L; iyear++)
{pred_commDV_L(iyear)=sum(L_commDV_klb(iyear));
}for (iyear=styr_HB_L; iyear<=endyr_HB_L; iyear++)
{pred_HB_L(iyear)=sum(L_HB_klb(iyear));
}for (iyear=styr_MRFSS_L; iyear<=endyr_MRFSS_L; iyear++)
{pred_MRFSS_L(iyear)=sum(L_MRFSS_klb(iyear));
}
FUNCTION get_dead_discards //Baranov catch eqn//dead discards at age (number fish)
// for (iyear=styr; iyear<styr_commHAL_D; iyear++)// {// for (iage=1; iage<=nages; iage++)// {// early_C_commHAL_D(iyear,iage)=N(iyear,iage)*F_commHAL_D(iyear,iage)*// (1.-mfexp(-1.*Z(iyear,iage)))/Z(iyear,iage);// }// early_pred_commHAL_D(iyear)=sum(early_C_commHAL_D(iyear))/1000.0; //pred annual dead discards in 1000s// }
for (iyear=styr_commHAL_D; iyear<=endyr_commHAL_D; iyear++){
for (iage=1; iage<=nages; iage++){
C_commHAL_D(iyear,iage)=N(iyear,iage)*F_commHAL_D(iyear,iage)*(1.-mfexp(-1.*Z(iyear,iage)))/Z(iyear,iage);
}pred_commHAL_D(iyear)=sum(C_commHAL_D(iyear))/1000.0; //pred annual dead discards in 1000s
}
// for (iyear=styr; iyear<styr_HB_D; iyear++)// {// for (iage=1; iage<=nages; iage++)// {// early_C_HB_D(iyear,iage)=N(iyear,iage)*F_HB_D(iyear,iage)*// (1.-mfexp(-1.*Z(iyear,iage)))/Z(iyear,iage);// }// early_pred_HB_D(iyear)=sum(early_C_HB_D(iyear))/1000.0; //pred annual dead discards in 1000s// }
for (iyear=styr_HB_D; iyear<=endyr_HB_D; iyear++){
for (iage=1; iage<=nages; iage++){
C_HB_D(iyear,iage)=N(iyear,iage)*F_HB_D(iyear,iage)*(1.-mfexp(-1.*Z(iyear,iage)))/Z(iyear,iage);
}pred_HB_D(iyear)=sum(C_HB_D(iyear))/1000.0; //pred annual dead discards in 1000s
}
SEDAR 15 SAR 1 SECTION III 186

Assessment Workshop South Atlantic Red Snapper
// for (iyear=styr; iyear<styr_MRFSS_D; iyear++)// {// for (iage=1; iage<=nages; iage++)// {// early_C_MRFSS_D(iyear,iage)=N(iyear,iage)*F_MRFSS_D(iyear,iage)*// (1.-mfexp(-1.*Z(iyear,iage)))/Z(iyear,iage);// }// early_pred_MRFSS_D(iyear)=sum(early_C_MRFSS_D(iyear))/1000.0; //pred annual dead discards in 1000s// }
for (iyear=styr_MRFSS_D; iyear<=endyr_MRFSS_D; iyear++){
for (iage=1; iage<=nages; iage++){
C_MRFSS_D(iyear,iage)=N(iyear,iage)*F_MRFSS_D(iyear,iage)*(1.-mfexp(-1.*Z(iyear,iage)))/Z(iyear,iage);
}pred_MRFSS_D(iyear)=sum(C_MRFSS_D(iyear))/1000.0; //pred annual dead discards in 1000s
}
FUNCTION get_indices//---Predicted CPUEs------------------------//Hook and line Logbook cpuefor (iyear=styr_HAL_cpue; iyear<=endyr_HAL_cpue; iyear++){ //index in whole wgt (lb) units, wgt_klb in 1000 lb, but the multiplier (1000) is absorbed by q
N_HAL(iyear)=elem_prod(elem_prod(N_mdyr(iyear),sel_commHAL(iyear)),wgt_klb);pred_HAL_cpue(iyear)=mfexp(log_q_HAL)*(1+(iyear-styr_HAL_cpue)*q_rate)*sum(N_HAL(iyear));//pred_HAL_cpue(iyear)=mfexp(log_q_HAL)*sum(N_HAL(iyear));
}//Headboat cpuefor (iyear=styr_HB_cpue; iyear<=endyr_HB_cpue; iyear++){ //index in number units
N_HB(iyear)=elem_prod(N_mdyr(iyear),sel_HB(iyear));pred_HB_cpue(iyear)=mfexp(log_q_HB)*(1+(iyear-styr_HB_cpue)*q_rate)*sum(N_HB(iyear));//pred_HB_cpue(iyear)=mfexp(log_q_HB)*sum(N_HB(iyear));
}//MRFSS cpuefor (iyear=styr_MRFSS_cpue; iyear<=endyr_MRFSS_cpue; iyear++){ //index in number units
N_MRFSS(iyear)=elem_prod(N_mdyr(iyear),sel_MRFSS(iyear));pred_MRFSS_cpue(iyear)=mfexp(log_q_MRFSS)*(1+(iyear-styr_MRFSS_cpue)*q_rate)*sum(N_MRFSS(iyear));//pred_MRFSS_cpue(iyear)=mfexp(log_q_MRFSS)*sum(N_MRFSS(iyear));
}
FUNCTION get_length_comps//Commercialfor (iyear=styr_commHAL_lenc;iyear<=endyr_commHAL_lenc;iyear++){
pred_commHAL_lenc(iyear)=(C_commHAL(iyear)*lenprob)/sum(C_commHAL(iyear));}for (iyear=1;iyear<=nyr_commDV_lenc;iyear++){
pred_commDV_lenc(iyear)=(C_commDV(yrs_commDV_lenc(iyear))*lenprob)/sum(C_commDV(yrs_commDV_lenc(iyear)));
}//Headboatfor (iyear=styr_HB_lenc;iyear<=endyr_HB_lenc;iyear++){
pred_HB_lenc(iyear)=(C_HB(iyear)*lenprob)/sum(C_HB(iyear));}
//MRFSSfor (iyear=1;iyear<=nyr_MRFSS_lenc;iyear++){
pred_MRFSS_lenc(iyear)=(C_MRFSS(yrs_MRFSS_lenc(iyear))*lenprob)/sum(C_MRFSS(yrs_MRFSS_lenc(iyear)));
}
FUNCTION get_age_comps//Commercial
SEDAR 15 SAR 1 SECTION III 187

Assessment Workshop South Atlantic Red Snapper
for (iyear=1;iyear<=nyr_commHAL_agec;iyear++){
pred_commHAL_agec(iyear)=C_commHAL(yrs_commHAL_agec(iyear))/sum(C_commHAL(yrs_commHAL_agec(iyear)));
}for (iyear=1;iyear<=nyr_commDV_agec;iyear++){
pred_commDV_agec(iyear)=C_commDV(yrs_commDV_agec(iyear))/sum(C_commDV(yrs_commDV_agec(iyear)));
}//Headboatfor (iyear=1;iyear<=nyr_HB_agec;iyear++){
pred_HB_agec(iyear)=C_HB(yrs_HB_agec(iyear))/sum(C_HB(yrs_HB_agec(iyear)));
}//MRFSSfor (iyear=styr_MRFSS_agec;iyear<=endyr_MRFSS_agec;iyear++){
pred_MRFSS_agec(iyear)=C_MRFSS(iyear)/sum(C_MRFSS(iyear));}
//--------------------------------------------------------------------------------------------------------------------------------------------------------------------------------------------FUNCTION get_sel_weighted_current
F_temp_sum=0.0;F_temp_sum+=mfexp((3.0*log_avg_F_commHAL_2+sum(log_F_dev_commHAL_2(endyr-2,endyr)))/3.0);F_temp_sum+=mfexp((3.0*log_avg_F_commDV+sum(log_F_dev_commDV(endyr-2,endyr)))/3.0);F_temp_sum+=mfexp((3.0*log_avg_F_HB+sum(log_F_dev_HB(endyr-2,endyr)))/3.0);F_temp_sum+=mfexp((3.0*log_avg_F_MRFSS+sum(log_F_dev_MRFSS(endyr-2,endyr)))/3.0);F_temp_sum+=mfexp((3.0*log_avg_F_commHAL_D+sum(log_F_dev_commHAL_D(endyr-2,endyr)))/3.0);F_temp_sum+=mfexp((3.0*log_avg_F_HB_D+sum(log_F_dev_HB_D(endyr-2,endyr)))/3.0);F_temp_sum+=mfexp((3.0*log_avg_F_MRFSS_D+sum(log_F_dev_MRFSS_D(endyr-2,endyr)))/3.0);
F_commHAL_prop=mfexp((3.0*log_avg_F_commHAL_2+sum(log_F_dev_commHAL_2(endyr-2,endyr)))/3.0)/F_temp_sum;F_commDV_prop=mfexp((3.0*log_avg_F_commDV+sum(log_F_dev_commDV(endyr-2,endyr)))/3.0)/F_temp_sum;F_HB_prop=mfexp((3.0*log_avg_F_HB+sum(log_F_dev_HB(endyr-2,endyr)))/3.0)/F_temp_sum;F_MRFSS_prop=mfexp((3.0*log_avg_F_MRFSS+sum(log_F_dev_MRFSS(endyr-2,endyr)))/3.0)/F_temp_sum;F_commHAL_D_prop=mfexp((3.0*log_avg_F_commHAL_D+sum(log_F_dev_commHAL_D(endyr-2,endyr)))/3.0)/F_temp_sum;F_HB_D_prop=mfexp((3.0*log_avg_F_HB_D+sum(log_F_dev_HB_D(endyr-2,endyr)))/3.0)/F_temp_sum;F_MRFSS_D_prop=mfexp((3.0*log_avg_F_MRFSS_D+sum(log_F_dev_MRFSS_D(endyr-2,endyr)))/3.0)/F_temp_sum;
sel_wgted_L=F_commHAL_prop*sel_commHAL(endyr)+F_commDV_prop*sel_commDV(endyr)+F_HB_prop*sel_HB(endyr)+F_MRFSS_prop*sel_MRFSS(endyr);
sel_wgted_D=F_commHAL_D_prop*sel_commHAL_D(endyr)+F_HB_D_prop*sel_HB_D(endyr)+F_MRFSS_D_prop*sel_MRFSS_D(endyr);
sel_wgted_tot=sel_wgted_L+sel_wgted_D;
max_sel_wgted_tot=max(sel_wgted_tot);sel_wgted_tot/=max_sel_wgted_tot;sel_wgted_L/=max_sel_wgted_tot; //landings sel bumped up by same amount as total selsel_wgted_D/=max_sel_wgted_tot;
FUNCTION get_msy
//fill in Fs for per-recruit stuffF_msy.fill_seqadd(0,.001);
//compute values as functions of Ffor(int ff=1; ff<=n_iter_msy; ff++){
//uses fishery-weighted F’sZ_age_msy=0.0;F_L_age_msy=0.0;
SEDAR 15 SAR 1 SECTION III 188

Assessment Workshop South Atlantic Red Snapper
F_D_age_msy=0.0;
F_L_age_msy=F_msy(ff)*sel_wgted_L;F_D_age_msy=F_msy(ff)*sel_wgted_D;Z_age_msy=M+F_L_age_msy+F_D_age_msy;
N_age_msy(1)=1.0;for (iage=2; iage<=nages; iage++){
N_age_msy(iage)=N_age_msy(iage-1)*mfexp(-1.*Z_age_msy(iage-1));}N_age_msy(nages)=N_age_msy(nages)/(1.0-mfexp(-1.*Z_age_msy(nages)));N_age_msy_mdyr(1,(nages-1))=elem_prod(N_age_msy(1,(nages-1)),
mfexp((-1.*Z_age_msy(1,(nages-1)))/2.0));N_age_msy_mdyr(nages)=(N_age_msy_mdyr(nages-1)*
(mfexp(-1.*(Z_age_msy(nages-1)/2 + Z_age_msy(nages)/2) )))/(1.0-mfexp(-1.*Z_age_msy(nages)));
spr_msy(ff)=sum(elem_prod(N_age_msy_mdyr,reprod));
//Compute equilibrium values of R (including bias correction), SSB and Yield at each FR_eq(ff)=(R0/((5.0*steep-1.0)*spr_msy(ff)))*
(BiasCor*4.0*steep*spr_msy(ff)-spr_F0*(1.0-steep));if (R_eq(ff)<dzero_dum) {R_eq(ff)=dzero_dum;}N_age_msy*=R_eq(ff);N_age_msy_mdyr*=R_eq(ff);
for (iage=1; iage<=nages; iage++){
C_age_msy(iage)=N_age_msy(iage)*(F_L_age_msy(iage)/Z_age_msy(iage))*(1.-mfexp(-1.*Z_age_msy(iage)));
D_age_msy(iage)=N_age_msy(iage)*(F_D_age_msy(iage)/Z_age_msy(iage))*(1.-mfexp(-1.0*Z_age_msy(iage)));
}
SSB_eq(ff)=sum(elem_prod(N_age_msy_mdyr,reprod));B_eq(ff)=sum(elem_prod(N_age_msy,wgt));L_eq(ff)=sum(elem_prod(C_age_msy,wgt));E_eq(ff)=sum(C_age_msy(E_age_st,nages))/sum(N_age_msy(E_age_st,nages));D_eq(ff)=sum(D_age_msy)/1000.0;
}
msy_out=max(L_eq);
for(ff=1; ff<=n_iter_msy; ff++){if(L_eq(ff) == msy_out)
{SSB_msy_out=SSB_eq(ff);B_msy_out=B_eq(ff);R_msy_out=R_eq(ff);D_msy_out=D_eq(ff);E_msy_out=E_eq(ff);F_msy_out=F_msy(ff);spr_msy_out=spr_msy(ff);
}}
//--------------------------------------------------------------------------------------------------------------------------------------------------------------------------------------------FUNCTION get_miscellaneous_stuff
//compute total catch-at-age and landingsC_total=(C_HB+C_MRFSS+C_commHAL+C_commDV); //catch in number fishL_total=L_HB+L_MRFSS+L_commHAL+L_commDV; //landings in mt whole weight
//compute exploitation rate of age E_age_st +for(iyear=styr; iyear<=endyr; iyear++){
E(iyear)=(sum(C_total(iyear)(E_age_st,nages)))/sum(N(iyear)(E_age_st,nages)); //catch in 1000s
SEDAR 15 SAR 1 SECTION III 189

Assessment Workshop South Atlantic Red Snapper
L_total_yr(iyear)=sum(L_total(iyear));}
steep_sd=steep;fullF_sd=fullF;E_sd=E;
if(E_msy_out>0){
EdE_msy=E/E_msy_out;EdE_msy_end=EdE_msy(endyr);
}if(F_msy_out>0)
{FdF_msy=fullF/F_msy_out;FdF_msy_end=FdF_msy(endyr);
}if(SSB_msy_out>0)
{SdSSB_msy=SSB/SSB_msy_out;SdSSB_msy_end=SdSSB_msy(endyr);
}
//fill in log recruitment deviations for yrs they are nonzerofor(iyear=styr_rec_dev; iyear<=endyr; iyear++){log_dev_R(iyear)=log_dev_N_rec(iyear);
}
//--------------------------------------------------------------------------------------------------------------------------------------------------------------------------------------------FUNCTION get_per_recruit_stuff
//static per-recruit stuff
for(iyear=styr; iyear<=endyr; iyear++){
N_age_spr(1)=1.0;for(iage=2; iage<=nages; iage++){
N_age_spr(iage)=N_age_spr(iage-1)*mfexp(-1.*Z(iyear,iage-1));}N_age_spr(nages)=N_age_spr(nages)/(1.0-mfexp(-1.*Z(iyear,nages)));N_age_spr_mdyr(1,(nages-1))=elem_prod(N_age_spr(1,(nages-1)),
mfexp(-1.*Z(iyear)(1,(nages-1))/2.0));N_age_spr_mdyr(nages)=(N_age_spr_mdyr(nages-1)*
(mfexp(-1.*(Z(iyear)(nages-1)/2.0 + Z(iyear)(nages)/2.0) )))/(1.0-mfexp(-1.*Z_age_msy(nages)));
spr_static(iyear)=sum(elem_prod(N_age_spr_mdyr,reprod))/spr_F0;}
//fill in Fs for per-recruit stuffF_spr.fill_seqadd(0,.01);//compute SSB/R and YPR as functions of Ffor(int ff=1; ff<=n_iter_spr; ff++){
//uses fishery-weighted F’s, same as in MSY calculationsZ_age_spr=0.0;F_L_age_spr=0.0;
F_L_age_spr=F_spr(ff)*sel_wgted_L;
Z_age_spr=M+F_L_age_spr+F_spr(ff)*sel_wgted_D;
N_age_spr(1)=1.0;for (iage=2; iage<=nages; iage++){
N_age_spr(iage)=N_age_spr(iage-1)*mfexp(-1.*Z_age_spr(iage-1));}N_age_spr(nages)=N_age_spr(nages)/(1-mfexp(-1.*Z_age_spr(nages)));N_age_spr_mdyr(1,(nages-1))=elem_prod(N_age_spr(1,(nages-1)),
mfexp((-1.*Z_age_spr(1,(nages-1)))/2.0));
SEDAR 15 SAR 1 SECTION III 190

Assessment Workshop South Atlantic Red Snapper
N_age_spr_mdyr(nages)=(N_age_spr_mdyr(nages-1)*(mfexp(-1.*(Z_age_spr(nages-1)/2 + Z_age_spr(nages)/2) )))/(1.0-mfexp(-1.*Z_age_spr(nages)));
spr_spr(ff)=sum(elem_prod(N_age_spr_mdyr,reprod));L_spr(ff)=0.0;for (iage=1; iage<=nages; iage++){
C_age_spr(iage)=N_age_spr(iage)*(F_L_age_spr(iage)/Z_age_spr(iage))*(1.-mfexp(-1.*Z_age_spr(iage)));
L_spr(ff)+=C_age_spr(iage)*wgt(iage);}E_spr(ff)=sum(C_age_spr(E_age_st,nages))/sum(N_age_spr(E_age_st,nages));
}
//--------------------------------------------------------------------------------------------------------------------------------------------------------------------------------------------
FUNCTION evaluate_objective_functionfval=0.0;fval_unwgt=0.0;
//---likelihoods---------------------------//fval=square(x_dum-3.0);
//---Indices-------------------------------f_HAL_cpue=0.0;for (iyear=styr_HAL_cpue; iyear<=endyr_HAL_cpue; iyear++){
f_HAL_cpue+=square(log((pred_HAL_cpue(iyear)+dzero_dum)/(obs_HAL_cpue(iyear)+dzero_dum)))/(2.0*square(HAL_cpue_cv(iyear)));
}fval+=w_I_HAL*f_HAL_cpue;fval_unwgt+=f_HAL_cpue;
f_HB_cpue=0.0;for (iyear=styr_HB_cpue; iyear<=endyr_HB_cpue; iyear++){
f_HB_cpue+=square(log((pred_HB_cpue(iyear)+dzero_dum)/(obs_HB_cpue(iyear)+dzero_dum)))/(2.0*square(HB_cpue_cv(iyear)));
}fval+=w_I_HB*f_HB_cpue;fval_unwgt+=f_HB_cpue;
f_MRFSS_cpue=0.0;for (iyear=styr_MRFSS_cpue; iyear<=endyr_MRFSS_cpue; iyear++){
f_MRFSS_cpue+=square(log((pred_MRFSS_cpue(iyear)+dzero_dum)/(obs_MRFSS_cpue(iyear)+dzero_dum)))/(2.0*square(MRFSS_cpue_cv(iyear)));
}fval+=w_I_MRFSS*f_MRFSS_cpue;fval_unwgt+=f_MRFSS_cpue;
//---Landings-------------------------------
f_commHAL_L_2=0.0; //in 1000s gutted poundsfor (iyear=styr_commHAL_L_2; iyear<=endyr_commHAL_L_2; iyear++){
f_commHAL_L_2+=square(log((pred_commHAL_L_2(iyear)+dzero_dum)/(obs_commHAL_L_2(iyear)+dzero_dum)))/(2.0*square(commHAL_L_cv_2(iyear)));
}fval+=w_L*f_commHAL_L_2;fval_unwgt+=f_commHAL_L_2;
f_commDV_L=0.0; //in 1000s gutted poundsfor (iyear=styr_commDV_L; iyear<=endyr_commDV_L; iyear++){
f_commDV_L+=square(log((pred_commDV_L(iyear)+dzero_dum)/(obs_commDV_L(iyear)+dzero_dum)))/(2.0*square(commDV_L_cv(iyear)));
SEDAR 15 SAR 1 SECTION III 191

Assessment Workshop South Atlantic Red Snapper
}fval+=w_L*f_commDV_L;fval_unwgt+=f_commDV_L;
f_HB_L=0.0; //in 1000sfor (iyear=styr_HB_L; iyear<=endyr_HB_L; iyear++){
f_HB_L+=square(log((pred_HB_L(iyear)+dzero_dum)/(obs_HB_L(iyear)+dzero_dum)))/(2.0*square(HB_L_cv(iyear)));
}fval+=w_L*f_HB_L;fval_unwgt+=f_HB_L;
f_MRFSS_L=0.0; //in 1000sfor (iyear=styr_MRFSS_L; iyear<=1980; iyear++){
f_MRFSS_L+=square(log((pred_MRFSS_L(iyear)+dzero_dum)/(L_early_bias*obs_MRFSS_L(iyear)+dzero_dum)))/(2.0*square(MRFSS_L_cv(iyear)));
}for (iyear=1981; iyear<=endyr_MRFSS_L; iyear++){
f_MRFSS_L+=square(log((pred_MRFSS_L(iyear)+dzero_dum)/(obs_MRFSS_L(iyear)+dzero_dum)))/(2.0*square(MRFSS_L_cv(iyear)));
}fval+=w_L*f_MRFSS_L;fval_unwgt+=f_MRFSS_L;
//---Discards-------------------------------f_commHAL_D=0.0; //in 1000sfor (iyear=styr_commHAL_D; iyear<=endyr_commHAL_D; iyear++){
f_commHAL_D+=square(log((pred_commHAL_D(iyear)+dzero_dum)/(obs_commHAL_D(iyear)+dzero_dum)))/(2.0*square(commHAL_D_cv(iyear)));
}fval+=w_D*f_commHAL_D;fval_unwgt+=f_commHAL_D;
f_HB_D=0.0; //in 1000sfor (iyear=styr_HB_D; iyear<=endyr_HB_D; iyear++){
f_HB_D+=square(log((pred_HB_D(iyear)+dzero_dum)/(obs_HB_D(iyear)+dzero_dum)))/(2.0*square(HB_D_cv(iyear)));
}fval+=w_D*f_HB_D;fval_unwgt+=f_HB_D;
f_MRFSS_D=0.0; //in 1000sfor (iyear=styr_MRFSS_D; iyear<=endyr_MRFSS_D; iyear++){
f_MRFSS_D+=square(log((pred_MRFSS_D(iyear)+dzero_dum)/(obs_MRFSS_D(iyear)+dzero_dum)))/(2.0*square(MRFSS_D_cv(iyear)));
}fval+=w_D*f_MRFSS_D;fval_unwgt+=f_MRFSS_D;
//---Length comps-------------------------------f_commHAL_lenc=0.0;for (iyear=styr_commHAL_lenc; iyear<=endyr_commHAL_lenc; iyear++){
f_commHAL_lenc-=nsamp_commHAL_lenc(iyear)*sum( elem_prod((obs_commHAL_lenc(iyear)+dzero_dum),
log(elem_div((pred_commHAL_lenc(iyear)+dzero_dum),(obs_commHAL_lenc(iyear)+dzero_dum)))));
}fval+=w_lc*f_commHAL_lenc;fval_unwgt+=f_commHAL_lenc;
f_commDV_lenc=0.;
SEDAR 15 SAR 1 SECTION III 192

Assessment Workshop South Atlantic Red Snapper
for (iyear=1; iyear<=nyr_commDV_lenc; iyear++){
f_commDV_lenc-=nsamp_commDV_lenc(iyear)*sum(elem_prod((obs_commDV_lenc(iyear)+dzero_dum),
log(elem_div((pred_commDV_lenc(iyear)+dzero_dum),(obs_commDV_lenc(iyear)+dzero_dum)))));
}fval+=w_lc*f_commDV_lenc;fval_unwgt+=f_commDV_lenc;
f_HB_lenc=0.0;for (iyear=styr_HB_lenc; iyear<=endyr_HB_lenc; iyear++){
f_HB_lenc-=nsamp_HB_lenc(iyear)*sum( elem_prod((obs_HB_lenc(iyear)+dzero_dum),
log(elem_div((pred_HB_lenc(iyear)+dzero_dum),(obs_HB_lenc(iyear)+dzero_dum)))));
}fval+=w_lc*f_HB_lenc;fval_unwgt+=f_HB_lenc;
f_MRFSS_lenc=0.;for (iyear=1; iyear<=nyr_MRFSS_lenc; iyear++){
f_MRFSS_lenc-=nsamp_MRFSS_lenc(iyear)*sum(elem_prod((obs_MRFSS_lenc(iyear)+dzero_dum),
log(elem_div((pred_MRFSS_lenc(iyear)+dzero_dum),(obs_MRFSS_lenc(iyear)+dzero_dum)))));
}fval+=w_lc*f_MRFSS_lenc;fval_unwgt+=f_MRFSS_lenc;
//---Age comps-------------------------------f_commHAL_agec=0.0;for (iyear=1; iyear<=nyr_commHAL_agec; iyear++){
f_commHAL_agec-=nsamp_commHAL_agec(iyear)*sum(elem_prod((obs_commHAL_agec(iyear)+dzero_dum),
log(elem_div((pred_commHAL_agec(iyear)+dzero_dum),(obs_commHAL_agec(iyear)+dzero_dum)))));
}fval+=w_ac*f_commHAL_agec;fval_unwgt+=f_commHAL_agec;
f_commDV_agec=0.0;for (iyear=1; iyear<=nyr_commDV_agec; iyear++){
f_commDV_agec-=nsamp_commDV_agec(iyear)*sum(elem_prod((obs_commDV_agec(iyear)+dzero_dum),
log(elem_div((pred_commDV_agec(iyear)+dzero_dum),(obs_commDV_agec(iyear)+dzero_dum)))));
}fval+=w_ac*f_commDV_agec;fval_unwgt+=f_commDV_agec;
f_HB_agec=0.0;for (iyear=1; iyear<=nyr_HB_agec; iyear++){
f_HB_agec-=nsamp_HB_agec(iyear)*sum(elem_prod((obs_HB_agec(iyear)+dzero_dum),
log(elem_div((pred_HB_agec(iyear)+dzero_dum),(obs_HB_agec(iyear)+dzero_dum)))));
}fval+=w_ac*f_HB_agec;fval_unwgt+=f_HB_agec;
f_MRFSS_agec=0.0;for (iyear=styr_MRFSS_agec; iyear<=endyr_MRFSS_agec; iyear++){
f_MRFSS_agec-=nsamp_MRFSS_agec(iyear)*
SEDAR 15 SAR 1 SECTION III 193

Assessment Workshop South Atlantic Red Snapper
sum(elem_prod((obs_MRFSS_agec(iyear)+dzero_dum),log(elem_div((pred_MRFSS_agec(iyear)+dzero_dum),
(obs_MRFSS_agec(iyear)+dzero_dum)))));}fval+=w_ac*f_MRFSS_agec;fval_unwgt+=f_MRFSS_agec;
//-----------Constraints and penalties--------------------------------f_N_dev=0.0;//f_N_dev=norm2(log_dev_N_rec);f_N_dev=pow(log_dev_N_rec(styr_rec_dev),2);for(iyear=(styr_rec_dev+1); iyear<=endyr; iyear++){
f_N_dev+=pow(log_dev_N_rec(iyear)-R_autocorr*log_dev_N_rec(iyear-1),2);}fval+=w_R*f_N_dev;
// f_N_dev_early=0.0;// f_N_dev_early=norm2(log_dev_N_rec(styr_rec_dev,(styr_rec_dev+5)));// fval+=w_R_init*f_N_dev_early;
f_N_dev_end=0.0; //last 3 yrsf_N_dev_end=norm2(log_dev_N_rec(endyr-2,endyr));
fval+=w_R_end*f_N_dev_end;
// f_B1dB0_constraint=0.0;// f_B1dB0_constraint=square(totB(styr)/B0-B1dB0);// fval+=w_B1dB0*f_B1dB0_constraint;
f_Fend_constraint=0.0; //last 3 yrsf_Fend_constraint=norm2(first_difference(fullF(endyr-2,endyr)));fval+=w_F*f_Fend_constraint;
f_fullF_constraint=0.0;for (iyear=styr; iyear<=endyr; iyear++)
{if (fullF(iyear)>3.0){f_fullF_constraint+=square(fullF(iyear)-3.0);}
}fval+=w_fullF*f_fullF_constraint;
// f_cvlen_diff_constraint=0.0;// f_cvlen_diff_constraint=norm2(first_difference(log_len_cv_dev));// fval+=w_cvlen_diff*f_cvlen_diff_constraint;//// f_cvlen_dev_constraint=0.0;// f_cvlen_dev_constraint=norm2(log_len_cv_dev);// fval+=w_cvlen_dev*f_cvlen_dev_constraint;
//cout << "fval = " << fval << " fval_unwgt = " << fval_unwgt << endl;
REPORT_SECTION//cout<<"start report"<<endl;get_sel_weighted_current();//cout<<"got sel weighted"<<endl;get_msy();//cout<<"got msy"<<endl;get_miscellaneous_stuff();//cout<<"got misc stuff"<<endl;get_per_recruit_stuff();//cout<<"got per recruit"<<endl;cout << "BC Fmsy=" << F_msy_out<< " BC SSBmsy=" << SSB_msy_out <<endl;cout<<"Pop status="<<SSB(endyr)/SSB_msy_out<<endl;cout << "var_rec_resid="<<var_rec_dev<<endl;//cout << "x_dum="<<x_dum<<endl;
report << "TotalLikelihood " << fval << endl;
SEDAR 15 SAR 1 SECTION III 194

Assessment Workshop South Atlantic Red Snapper
report<<" "<<endl;
report << "Bias-corrected (BC) MSY stuff" << endl;report << "BC Fmsy " << F_msy_out << endl;report << "BC Emsy " << E_msy_out << endl;report << "BC SSBmsy " << SSB_msy_out << endl;report << "BC Rmsy " << R_msy_out << endl;report << "BC Bmsy " << B_msy_out << endl;report << "BC MSY " << msy_out << endl;report << "BC F/Fmsy " << fullF/F_msy_out << endl;report << "BC E/Emsy " << E/E_msy_out << endl;report << "BC SSB/SSBmsy " << SSB/SSB_msy_out << endl;report << "BC B/Bmsy " << totB/B_msy_out << endl;report << "BC Yield/MSY " << L_total_yr/msy_out <<endl;report << "BC F(2006)/Fmsy " << fullF(endyr)/F_msy_out << endl;report << "BC E(2006)/Emsy " << E(endyr)/E_msy_out << endl;report << "BC SSB(2006)/SSBmsy " << SSB(endyr)/SSB_msy_out << endl;report << "BC Predicted Landings(2006)/MSY " << L_total_yr(endyr)/msy_out <<endl;report << " "<<endl;
report << "Mortality and growth" << endl;report << "M "<<M<<endl;report << "Linf="<<Linf << " K=" <<K<<" t0="<< t0<<endl;report << "mean length " << meanlen << endl;
report << "cv length " << len_cv << endl;report << "wgt " << wgt << endl;report<<" "<<endl;
report << "Stock-Recruit " << endl;report << "R0= " << R0 << endl;report << "Steepness= " << steep << endl;report << "spr_F0= " << spr_F0 << endl;report << "Recruits(R) " << rec << endl;report << "VirginSSB " << S0 << endl;report << "SSB(styr)/VirginSSB " << S1S0 << endl;report << "SSB(2006)/VirginSSB " << popstatus << endl;report << "SSB " << SSB << endl;report << "Biomass " << totB << endl;report << "log recruit deviations (styr_rec_dev-2003) " << log_dev_N_rec(styr_rec_dev,2003) <<endl;report << "variance of log rec dev (select yrs) "<<var_rec_dev<<endl;report<<" "<<endl;
report << "Exploitation rate (1901-2006)" << endl;report << E << endl;report << "Fully-selected F (1901-2006)" << endl;report << fullF << endl;report << "Headboat F" << endl;report << F_HB_out << endl;report << "MRFSS F" << endl;report << F_MRFSS_out << endl;report << "commHAL F" << endl;report << F_commHAL_out << endl;report << "commDV F" << endl;report << F_commDV_out << endl;report<<" "<<endl;
report << "Headboat selectivity" << endl;report << sel_HB << endl;report << "Headboat DISCARD selectivity" << endl;report << sel_HB_D << endl;report << "MRFSS selectivity" << endl;report << sel_MRFSS << endl;report << "MRFSS DISCARD selectivity" << endl;report << sel_MRFSS_D << endl;report << "commHAL selectivity" << endl;report << sel_commHAL << endl;report << "commHAL DISCARD selectivity" << endl;report << sel_commHAL_D << endl;report << "commDV selectivity" << endl;report << sel_commDV << endl;
report << "log_q_HAL "<<log_q_HAL<<endl;
SEDAR 15 SAR 1 SECTION III 195

Assessment Workshop South Atlantic Red Snapper
report << "Obs HAL U"<<obs_HAL_cpue << endl;report << "pred HAL U"<<pred_HAL_cpue << endl;report << "log_q_HB "<<log_q_HB<<endl;report << "Obs HB U"<<obs_HB_cpue << endl;report << "pred HB U"<<pred_HB_cpue << endl;report << "log_q_MRFSS "<<log_q_MRFSS<<endl;report << "Obs MRFSS U"<<obs_MRFSS_cpue << endl;report << "pred MRFSS U"<<pred_MRFSS_cpue << endl;
report << "Obs HB landings (1000s)"<<obs_HB_L << endl;report << "pred HB landings (1000s)"<<pred_HB_L << endl;report << "Obs MRFSS landings (1000s)"<<obs_MRFSS_L << endl;report << "pred MRFSS landings (1000s)"<<pred_MRFSS_L << endl;report << "Obs commHAL landings--postWWII (1000 lb)"<<obs_commHAL_L_2 << endl;report << "pred commHAL landings--postWWII (1000 lb)"<<pred_commHAL_L_2 << endl;report << "Obs commDV landings (1000 lb)"<<obs_commDV_L << endl;report << "pred commDV landings (1000 lb)"<<pred_commDV_L << endl;
#include "rs_make_Robject6.cxx" // write the S-compatible report
SEDAR 15 SAR 1 SECTION III 196

Assessment Workshop South Atlantic Red Snapper
Appendix C Data input file for AD Model Builder implementation of catch-at-ageassessment model
##--><>--><>--><>--><>--><>--><>--><>--><>--><>--><>--><>--><>--><>## Data Input File## SEDAR15 Assessment: Red Snapper####--><>--><>--><>--><>--><>--><>--><>--><>--><>--><>--><>--><>--><>
#starting and ending year of model19452006#Starting year to estimate recruitment deviation from S-R curve1974#3 periods of size regs: 1901-83 no restrictions, 1984-91 12inch TL, 1992-06 20inch TL#ending years of regulation period19831991##Number of ages (16 classes is 1,...15,20+)20##vector of agebins, last is a plus group1 2 3 4 5 6 7 8 9 10 11 12 13 14 15 16 17 18 19 20#number length bins28#Vector of length bins (mm)(midpoint of bin)190 220 250 280 310 340 370 400 430 460 490 520 550 580 610 640 670 700 730 760 790 820 850 880 910 940 970 1000#discard mortality constant0.9 #comm HAL0.4 #headboat0.4 #MRFSS#number of iterations in spr calculations (max F examined is (value-1)/100101#number of iterations in msy calculations (max F examined is (value-1)/10001001#starting age for exploitation rate2#multiplicative bias correction (may set to 1.0 for none or negative to compute from rec variance)-1.0#starting values for VonBert params (Linf, K, t0), units in mm TL894.70.235-0.48#starting value of constant cv of length at age0.1#length-weight (whole wgt) coefficients a and b, W=aL^b, (W=g, L=mm)7.0E-063.104#weight-weight conversion (gutted wgt=a*whole weight)0.935#time-variant vector of % maturity-at-age for females (ages 1-20)0.2371 0.6435 0.9129 0.9838 0.9972 0.9995 0.9999 1.0000 1.0000 1.0000 1.0000 1.0000 1.0000 1.00001.0000 1.0000 1.0000 1.0000 1.0000 1.0000
#time-variant vector of proportion female (ages 1-16)0.5 0.5 0.5 0.5 0.5 0.5 0.5 0.5 0.5 0.5 0.5 0.5 0.5 0.5 0.5 0.5 0.5 0.5 0.5 0.5####################Commercial Hook and Line fishery landings##########################Commercial Hook and Line CPUE Index from Logbook#Starting and ending years of CPUE index19932006#Observed CPUE and assumed CVs1.0520 0.8560 0.8790 0.6910 0.6100 0.6880 0.8510 0.8690 1.3470 1.4750 1.2200 1.5230 1.2630 0.67700.1557 0.1626 0.1672 0.2015 0.2336 0.2405 0.2244 0.2382 0.1557 0.1511 0.1947 0.2015 0.2244 0.3000#Commercial Hook and Line fishery landings#Starting and ending years of post-WW2 landings time series, respectively19452006#Observed landings (1000 lb whole weight) and assumed CVs of post-WW2 period
SEDAR 15 SAR 1 SECTION III 197

Assessment Workshop South Atlantic Red Snapper
240.8728 262.6156 284.3585 306.1014 327.8442 349.5871 498.5858 374.7653 389.0775 576.8748 479.6054 469.9846843.0190 594.6620 638.3276 652.2887 770.4032 575.9120 438.5230 486.3098 571.3961 643.4580 843.6164 938.6953610.9764 559.1361 478.8710 414.2849 340.1609 555.1961 650.9209 547.3689 579.1734 545.0425 380.7316 352.8625347.1376 286.0204 289.9523 230.5490 222.9973 200.1596 172.8222 152.0031 242.5327 201.6904 125.4217 87.5517206.3708 175.6062 164.0779 129.9766 98.8793 78.7447 78.9544 89.2141 169.8753 158.7980 117.1732 147.4730114.9833 79.0658
0.1716 0.1649 0.1581 0.1514 0.1446 0.1378 0.1311 0.1243 0.1176 0.1108 0.1041 0.0973 0.0905 0.0838 0.0770 0.07030.0635 0.0500 0.0500 0.0500 0.0500 0.0500 0.0500 0.0500 0.0500 0.0500 0.0500 0.0500 0.0500 0.0500 0.0500 0.05000.0500 0.0500 0.0500 0.0500 0.0500 0.0500 0.0500 0.0500 0.0500 0.0500 0.0500 0.0500 0.0500 0.0500 0.0500 0.05000.0500 0.0500 0.0500 0.0500 0.0500 0.0500 0.0500 0.0500 0.0500 0.0500 0.0500 0.0500 0.0500 0.0500
#Starting and ending years of discards time series, respectively19842006#Observed discards (1000s) and assumed CVs7.5139 3.7113 7.0833 15.3593 7.5931 2.7985 30.5268 4.1107 18.2920 17.8600 24.4590 24.1530 32.2540 33.7250 25.524022.9590 21.8100 23.6800 22.1330 18.9370 15.8130 15.2720 16.9140
0.2950 0.4390 0.5085 0.5780 0.4730 0.4190 0.4670 0.5150 0.1000 0.1000 0.1000 0.1000 0.1000 0.1000 0.10000.1000 0.1000 0.1000 0.1000 0.1000 0.1000 0.1000 0.1000
#Starting and ending years of commercial hook and line length composition sample data19842006#sample size of commercial length comp data by year2089 3539 1246 1146 621 1191 787 706 512 1347 1167 1442 770 497 428 946 881 1408 992 1270 795 618 406#commercial length composition samples (year,lengthbin 30mm)0.000000 0.000000 0.000000 0.000085 0.005792 0.010724 0.085283 0.234352 0.201790 0.125118 0.105871 0.0535300.039652 0.030128 0.024232 0.013502 0.020044 0.008436 0.002390 0.002178 0.004441 0.008564 0.0094840.011112 0.002179 0.001068 0.000042 0.000000
0.000000 0.000000 0.000563 0.000022 0.003253 0.025697 0.080921 0.155433 0.208769 0.147857 0.102327 0.0886170.055563 0.029593 0.018731 0.012442 0.005598 0.003519 0.003433 0.006096 0.006265 0.010781 0.0100700.010632 0.010780 0.003039 0.000000 0.000000
0.000000 0.000000 0.000000 0.002393 0.005895 0.024398 0.015051 0.048590 0.096989 0.167292 0.180142 0.1362770.067977 0.069566 0.067135 0.036575 0.022352 0.008465 0.003032 0.003615 0.009620 0.004854 0.0081760.012306 0.003963 0.005229 0.000109 0.000000
0.000000 0.000000 0.000000 0.003384 0.031572 0.069420 0.051955 0.051438 0.080792 0.061041 0.097334 0.1328110.092176 0.091513 0.067967 0.051861 0.024362 0.025431 0.012224 0.004491 0.005817 0.009671 0.0078480.009161 0.008391 0.006024 0.003317 0.000000
0.000000 0.000000 0.000000 0.010683 0.023213 0.071614 0.106530 0.095847 0.086477 0.079517 0.108594 0.0890060.082381 0.055006 0.050058 0.023540 0.021137 0.020883 0.018697 0.005139 0.017254 0.011850 0.0047350.010103 0.004848 0.002886 0.000000 0.000000
0.000000 0.000867 0.000000 0.000187 0.000187 0.007207 0.012757 0.038788 0.078355 0.111119 0.167015 0.1917790.151687 0.095468 0.039852 0.026702 0.010875 0.010038 0.014467 0.011981 0.008732 0.008127 0.0035080.002457 0.002976 0.003132 0.001734 0.000000
0.000000 0.000000 0.000000 0.000000 0.007187 0.023912 0.102282 0.100680 0.085245 0.105668 0.130364 0.1007410.082120 0.056583 0.056537 0.038945 0.028926 0.012038 0.014916 0.011652 0.003930 0.011868 0.0042480.009206 0.010019 0.002940 0.000000 0.000000
0.000000 0.000000 0.000000 0.003520 0.027120 0.085704 0.077641 0.072089 0.085789 0.047421 0.130354 0.1123610.056871 0.045916 0.043770 0.039953 0.038645 0.035647 0.014464 0.010264 0.010016 0.017017 0.0170700.015797 0.010011 0.001280 0.000000 0.001280
0.000000 0.000000 0.000000 0.000000 0.000000 0.000000 0.000000 0.000290 0.000290 0.008668 0.037135 0.1223030.080777 0.076936 0.111687 0.076600 0.116283 0.065519 0.043128 0.067884 0.027342 0.034881 0.0422590.036182 0.042980 0.008633 0.000223 0.000000
0.000000 0.000000 0.000000 0.000000 0.000000 0.000580 0.000000 0.002365 0.001205 0.015594 0.184521 0.3116550.170655 0.084795 0.044039 0.018417 0.023796 0.023166 0.017725 0.017425 0.017792 0.015009 0.0136630.022304 0.010493 0.003640 0.001160 0.000000
0.006945 0.000000 0.000000 0.000000 0.000000 0.000000 0.000000 0.000000 0.000000 0.004728 0.097994 0.1764680.183151 0.173631 0.152049 0.097401 0.038121 0.009582 0.009817 0.004657 0.005623 0.005676 0.0092500.008946 0.010995 0.004964 0.000000 0.000000
0.000000 0.000000 0.000000 0.001129 0.000000 0.004517 0.003388 0.001129 0.001138 0.001138 0.028890 0.1720110.197772 0.139872 0.099993 0.076049 0.071969 0.051428 0.033255 0.011662 0.014816 0.017221 0.0294550.014914 0.020352 0.006777 0.001129 0.000000
0.000000 0.000000 0.000000 0.000000 0.000000 0.000000 0.000000 0.000000 0.000000 0.003139 0.009558 0.0885920.110470 0.147492 0.197828 0.109826 0.070920 0.071033 0.050255 0.060613 0.032182 0.015004 0.0208570.006221 0.006009 0.000000 0.000000 0.000000
0.000000 0.000000 0.000000 0.000000 0.000000 0.003936 0.007872 0.019681 0.039361 0.055107 0.032942 0.0572940.045514 0.110641 0.138206 0.103492 0.082770 0.079551 0.044944 0.051828 0.050376 0.023864 0.0125320.004418 0.015986 0.011808 0.007872 0.000000
0.000000 0.000000 0.000000 0.000000 0.000000 0.000000 0.005062 0.010124 0.010157 0.067217 0.099009 0.1076340.164492 0.074950 0.050489 0.042590 0.040164 0.072483 0.067393 0.040024 0.040156 0.036661 0.0172830.016584 0.027406 0.010124 0.000000 0.000000
0.000000 0.000000 0.000000 0.000000 0.000903 0.002710 0.006022 0.008735 0.005721 0.001204 0.099701 0.2341140.188871 0.127762 0.069294 0.058252 0.027671 0.029490 0.019167 0.025684 0.037589 0.024522 0.008000
SEDAR 15 SAR 1 SECTION III 198

Assessment Workshop South Atlantic Red Snapper
0.011553 0.011313 0.001419 0.000301 0.0000000.000000 0.000000 0.000000 0.000000 0.000000 0.000000 0.000000 0.000000 0.005970 0.013930 0.139393 0.2117930.125071 0.102238 0.080784 0.051535 0.047280 0.037462 0.038489 0.025883 0.049038 0.028726 0.0202080.014541 0.004849 0.001990 0.000818 0.000000
0.000000 0.000000 0.000000 0.000000 0.000000 0.000000 0.001565 0.001565 0.001565 0.001817 0.138333 0.1935140.163702 0.146912 0.104656 0.074774 0.047701 0.024903 0.016542 0.018905 0.016780 0.016541 0.0126680.004947 0.009388 0.001611 0.000046 0.001565
0.000000 0.000000 0.000000 0.000000 0.000000 0.000000 0.000000 0.000000 0.000868 0.006073 0.050424 0.2145970.226914 0.137309 0.118036 0.066931 0.080746 0.038634 0.022889 0.012568 0.010613 0.006841 0.0017350.000000 0.001617 0.003205 0.000000 0.000000
0.000000 0.000000 0.000000 0.000000 0.000612 0.001429 0.001448 0.000408 0.001077 0.004177 0.016606 0.0832040.131355 0.173907 0.167763 0.143618 0.106735 0.052261 0.050997 0.028555 0.011270 0.007622 0.0091240.003939 0.001007 0.002883 0.000000 0.000000
0.000000 0.000000 0.000000 0.000000 0.001293 0.001810 0.002844 0.002069 0.001034 0.002808 0.009172 0.0404710.102190 0.136158 0.127005 0.145269 0.131415 0.149071 0.084374 0.033646 0.005910 0.004825 0.0084100.006119 0.002057 0.002056 0.000000 0.000000
0.000000 0.000000 0.000000 0.000000 0.000000 0.000000 0.000000 0.000000 0.003711 0.001399 0.008714 0.0535820.075220 0.089623 0.126035 0.095390 0.119910 0.104244 0.172768 0.072808 0.037749 0.011172 0.0162870.005316 0.003711 0.002312 0.000052 0.000000
0.000000 0.000000 0.000000 0.000000 0.000000 0.000000 0.000000 0.004988 0.004988 0.019953 0.004988 0.0711360.153878 0.128064 0.092837 0.098221 0.062168 0.069339 0.069226 0.046206 0.071914 0.036278 0.0349780.025816 0.005018 0.000000 0.000000 0.000000
#Number and vector of years of age compositions for hook and line fishery121992 1994 1996 1997 1998 1999 2000 2001 2003 2004 2005 2006#sample sizes of age comps by year (minimum sample size of 45)48 49 167 182 75 147 226 144 51 103 140 189#age composition samples (year,age)0.0000 0.0000 0.0003 0.5245 0.1156 0.1288 0.1627 0.0625 0.0000 0.0057 0.0000 0.0000 0.0000 0.0000 0.0000 0.0000 0.00000.0000 0.0000 0.0000
0.0000 0.0000 0.0858 0.0404 0.2011 0.2104 0.3775 0.0827 0.0000 0.0000 0.0000 0.0000 0.0000 0.0000 0.0000 0.0000 0.00000.0000 0.0000 0.0022
0.0000 0.0008 0.1367 0.0950 0.1504 0.3314 0.1966 0.0302 0.0167 0.0139 0.0114 0.0022 0.0033 0.0038 0.0022 0.0011 0.00110.0000 0.0000 0.0032
0.0000 0.0146 0.1450 0.3713 0.1777 0.1843 0.0638 0.0166 0.0048 0.0026 0.0000 0.0000 0.0000 0.0000 0.0000 0.0000 0.00000.0000 0.0000 0.0195
0.0000 0.0724 0.4058 0.1118 0.2132 0.0803 0.0471 0.0412 0.0062 0.0070 0.0000 0.0029 0.0000 0.0000 0.0000 0.0029 0.00000.0000 0.0000 0.0091
0.0000 0.1233 0.6037 0.1903 0.0538 0.0051 0.0068 0.0095 0.0015 0.0015 0.0009 0.0022 0.0006 0.0000 0.0000 0.0000 0.00000.0000 0.0000 0.0008
0.0000 0.1265 0.7345 0.0861 0.0114 0.0170 0.0038 0.0088 0.0061 0.0038 0.0000 0.0000 0.0000 0.0000 0.0010 0.0000 0.00000.0000 0.0000 0.0011
0.0000 0.1590 0.6282 0.1716 0.0109 0.0160 0.0025 0.0013 0.0020 0.0035 0.0000 0.0010 0.0000 0.0000 0.0000 0.0006 0.00000.0000 0.0000 0.0034
0.0000 0.1281 0.3602 0.4029 0.0671 0.0346 0.0013 0.0000 0.0000 0.0021 0.0000 0.0026 0.0000 0.0000 0.0000 0.0000 0.00000.0000 0.0000 0.0012
0.0000 0.1282 0.4560 0.2686 0.1099 0.0335 0.0008 0.0015 0.0000 0.0000 0.0000 0.0000 0.0000 0.0000 0.0000 0.0000 0.00070.0000 0.0000 0.0008
0.0000 0.0205 0.1922 0.2365 0.1484 0.2563 0.0918 0.0227 0.0092 0.0000 0.0000 0.0000 0.0000 0.0031 0.0154 0.0034 0.00000.0006 0.0000 0.0001
0.0000 0.0104 0.2738 0.3144 0.1251 0.1124 0.1255 0.0142 0.0172 0.0000 0.0000 0.0000 0.0040 0.0000 0.0028 0.0000 0.00000.0000 0.0000 0.0000
###############################Commercial Diving fishery landings##################################################Starting and ending years of landings time series, respectively19842006#Observed landings (1000 lb whole weight) and CV’s1.2088 2.2732 0.5509 0.4157 0.2925 1.0968 1.6589 5.2658 9.4090 5.7426 12.9764 10.1594 6.1755 7.4878 7.9886 9.882011.3574 19.9740 22.8772 17.2723 19.2213 9.4119 4.1019
0.0500 0.0500 0.0500 0.0500 0.0500 0.0500 0.0500 0.0500 0.0500 0.0500 0.0500 0.0500 0.0500 0.0500 0.0500 0.05000.0500 0.0500 0.0500 0.0500 0.0500 0.0500 0.0500
#Number and vector of years of length compositions (comm diving)41999 2000 2001 2003#sample sizes of length comp data by year83 129 87 210#commercial diving length comp samples (year,age) (30mm length bins)0.000000 0.000000 0.000000 0.000000 0.000000 0.000000 0.000000 0.000000 0.000000 0.000000 0.084337 0.0963850.072289 0.168675 0.048192 0.108434 0.096386 0.072289 0.012048 0.012048 0.024096 0.060241 0.0722900.036144 0.024096 0.012048 0.000000 0.000000
0.000000 0.000000 0.000000 0.000000 0.000000 0.000000 0.000000 0.000000 0.000000 0.000000 0.224806 0.279069
SEDAR 15 SAR 1 SECTION III 199
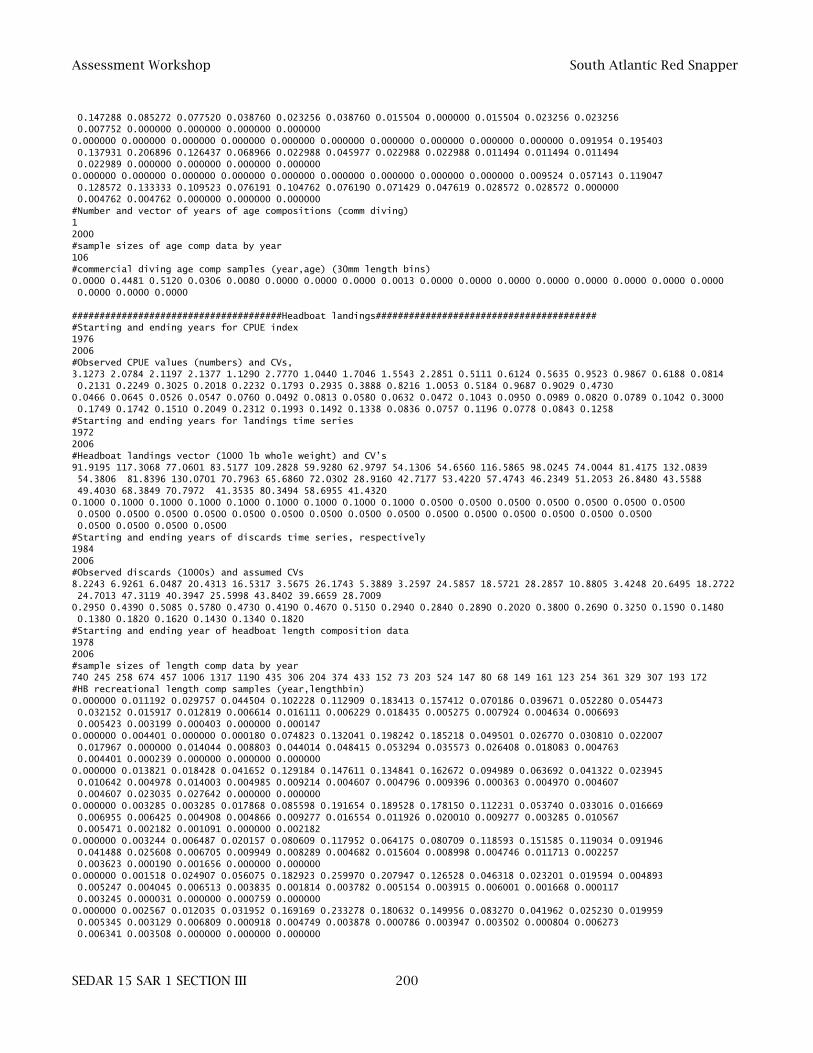
Assessment Workshop South Atlantic Red Snapper
0.147288 0.085272 0.077520 0.038760 0.023256 0.038760 0.015504 0.000000 0.015504 0.023256 0.0232560.007752 0.000000 0.000000 0.000000 0.000000
0.000000 0.000000 0.000000 0.000000 0.000000 0.000000 0.000000 0.000000 0.000000 0.000000 0.091954 0.1954030.137931 0.206896 0.126437 0.068966 0.022988 0.045977 0.022988 0.022988 0.011494 0.011494 0.0114940.022989 0.000000 0.000000 0.000000 0.000000
0.000000 0.000000 0.000000 0.000000 0.000000 0.000000 0.000000 0.000000 0.000000 0.009524 0.057143 0.1190470.128572 0.133333 0.109523 0.076191 0.104762 0.076190 0.071429 0.047619 0.028572 0.028572 0.0000000.004762 0.004762 0.000000 0.000000 0.000000
#Number and vector of years of age compositions (comm diving)12000#sample sizes of age comp data by year106#commercial diving age comp samples (year,age) (30mm length bins)0.0000 0.4481 0.5120 0.0306 0.0080 0.0000 0.0000 0.0000 0.0013 0.0000 0.0000 0.0000 0.0000 0.0000 0.0000 0.0000 0.00000.0000 0.0000 0.0000
######################################Headboat landings#########################################Starting and ending years for CPUE index19762006#Observed CPUE values (numbers) and CVs,3.1273 2.0784 2.1197 2.1377 1.1290 2.7770 1.0440 1.7046 1.5543 2.2851 0.5111 0.6124 0.5635 0.9523 0.9867 0.6188 0.08140.2131 0.2249 0.3025 0.2018 0.2232 0.1793 0.2935 0.3888 0.8216 1.0053 0.5184 0.9687 0.9029 0.4730
0.0466 0.0645 0.0526 0.0547 0.0760 0.0492 0.0813 0.0580 0.0632 0.0472 0.1043 0.0950 0.0989 0.0820 0.0789 0.1042 0.30000.1749 0.1742 0.1510 0.2049 0.2312 0.1993 0.1492 0.1338 0.0836 0.0757 0.1196 0.0778 0.0843 0.1258
#Starting and ending years for landings time series19722006#Headboat landings vector (1000 lb whole weight) and CV’s91.9195 117.3068 77.0601 83.5177 109.2828 59.9280 62.9797 54.1306 54.6560 116.5865 98.0245 74.0044 81.4175 132.083954.3806 81.8396 130.0701 70.7963 65.6860 72.0302 28.9160 42.7177 53.4220 57.4743 46.2349 51.2053 26.8480 43.558849.4030 68.3849 70.7972 41.3535 80.3494 58.6955 41.4320
0.1000 0.1000 0.1000 0.1000 0.1000 0.1000 0.1000 0.1000 0.1000 0.0500 0.0500 0.0500 0.0500 0.0500 0.0500 0.05000.0500 0.0500 0.0500 0.0500 0.0500 0.0500 0.0500 0.0500 0.0500 0.0500 0.0500 0.0500 0.0500 0.0500 0.05000.0500 0.0500 0.0500 0.0500
#Starting and ending years of discards time series, respectively19842006#Observed discards (1000s) and assumed CVs8.2243 6.9261 6.0487 20.4313 16.5317 3.5675 26.1743 5.3889 3.2597 24.5857 18.5721 28.2857 10.8805 3.4248 20.6495 18.272224.7013 47.3119 40.3947 25.5998 43.8402 39.6659 28.7009
0.2950 0.4390 0.5085 0.5780 0.4730 0.4190 0.4670 0.5150 0.2940 0.2840 0.2890 0.2020 0.3800 0.2690 0.3250 0.1590 0.14800.1380 0.1820 0.1620 0.1430 0.1340 0.1820
#Starting and ending year of headboat length composition data19782006#sample sizes of length comp data by year740 245 258 674 457 1006 1317 1190 435 306 204 374 433 152 73 203 524 147 80 68 149 161 123 254 361 329 307 193 172#HB recreational length comp samples (year,lengthbin)0.000000 0.011192 0.029757 0.044504 0.102228 0.112909 0.183413 0.157412 0.070186 0.039671 0.052280 0.0544730.032152 0.015917 0.012819 0.006614 0.016111 0.006229 0.018435 0.005275 0.007924 0.004634 0.0066930.005423 0.003199 0.000403 0.000000 0.000147
0.000000 0.004401 0.000000 0.000180 0.074823 0.132041 0.198242 0.185218 0.049501 0.026770 0.030810 0.0220070.017967 0.000000 0.014044 0.008803 0.044014 0.048415 0.053294 0.035573 0.026408 0.018083 0.0047630.004401 0.000239 0.000000 0.000000 0.000000
0.000000 0.013821 0.018428 0.041652 0.129184 0.147611 0.134841 0.162672 0.094989 0.063692 0.041322 0.0239450.010642 0.004978 0.014003 0.004985 0.009214 0.004607 0.004796 0.009396 0.000363 0.004970 0.0046070.004607 0.023035 0.027642 0.000000 0.000000
0.000000 0.003285 0.003285 0.017868 0.085598 0.191654 0.189528 0.178150 0.112231 0.053740 0.033016 0.0166690.006955 0.006425 0.004908 0.004866 0.009277 0.016554 0.011926 0.020010 0.009277 0.003285 0.0105670.005471 0.002182 0.001091 0.000000 0.002182
0.000000 0.003244 0.006487 0.020157 0.080609 0.117952 0.064175 0.080709 0.118593 0.151585 0.119034 0.0919460.041488 0.025608 0.006705 0.009949 0.008289 0.004682 0.015604 0.008998 0.004746 0.011713 0.0022570.003623 0.000190 0.001656 0.000000 0.000000
0.000000 0.001518 0.024907 0.056075 0.182923 0.259970 0.207947 0.126528 0.046318 0.023201 0.019594 0.0048930.005247 0.004045 0.006513 0.003835 0.001814 0.003782 0.005154 0.003915 0.006001 0.001668 0.0001170.003245 0.000031 0.000000 0.000759 0.000000
0.000000 0.002567 0.012035 0.031952 0.169169 0.233278 0.180632 0.149956 0.083270 0.041962 0.025230 0.0199590.005345 0.003129 0.006809 0.000918 0.004749 0.003878 0.000786 0.003947 0.003502 0.000804 0.0062730.006341 0.003508 0.000000 0.000000 0.000000
SEDAR 15 SAR 1 SECTION III 200

Assessment Workshop South Atlantic Red Snapper
0.000000 0.001374 0.005049 0.030662 0.157596 0.217217 0.218549 0.174736 0.079380 0.036921 0.023019 0.0130050.009546 0.009494 0.006095 0.001822 0.000505 0.000954 0.001374 0.000126 0.002328 0.000415 0.0028740.004122 0.001500 0.000505 0.000000 0.000828
0.001689 0.001689 0.008009 0.075292 0.171497 0.102916 0.103201 0.136420 0.076763 0.046258 0.067023 0.0777750.048677 0.039086 0.011287 0.007304 0.002941 0.008237 0.001689 0.006548 0.000000 0.000000 0.0000000.003474 0.002226 0.000000 0.000000 0.000000
0.000000 0.020030 0.024141 0.055009 0.083918 0.135126 0.194120 0.162665 0.073043 0.071123 0.038037 0.0211560.033534 0.012724 0.025297 0.013556 0.017831 0.010946 0.000000 0.000000 0.000000 0.000000 0.0077440.000000 0.000000 0.000000 0.000000 0.000000
0.000000 0.010641 0.006539 0.023320 0.057288 0.150149 0.159890 0.210842 0.063596 0.059081 0.063369 0.0171750.022272 0.029238 0.017745 0.017758 0.018587 0.025845 0.008176 0.024936 0.000000 0.000000 0.0041160.004116 0.005321 0.000000 0.000000 0.000000
0.000000 0.000062 0.001397 0.016816 0.110482 0.274537 0.173677 0.152228 0.080688 0.031175 0.042780 0.0261410.019826 0.004837 0.011557 0.003524 0.005395 0.004243 0.013270 0.003071 0.008485 0.003071 0.0092140.000000 0.003071 0.000452 0.000000 0.000000
0.000000 0.000000 0.000000 0.000000 0.109130 0.204279 0.186408 0.193689 0.076475 0.075931 0.029714 0.0290960.018826 0.022760 0.030595 0.001776 0.001440 0.001444 0.001444 0.000000 0.000000 0.003743 0.0118100.001440 0.000000 0.000000 0.000000 0.000000
0.001304 0.000000 0.020080 0.046160 0.050278 0.183048 0.115281 0.144787 0.127764 0.102726 0.080835 0.0139560.054539 0.006956 0.011053 0.001304 0.001835 0.011671 0.000405 0.000000 0.000000 0.007474 0.0000000.007000 0.011545 0.000000 0.000000 0.000000
0.000000 0.000000 0.000000 0.016674 0.000000 0.000000 0.009215 0.000000 0.000000 0.076216 0.335667 0.2137060.004226 0.080442 0.097116 0.018099 0.020976 0.075885 0.000000 0.000000 0.012015 0.012015 0.0138740.013874 0.000000 0.000000 0.000000 0.000000
0.000000 0.000000 0.000000 0.000000 0.000000 0.000000 0.000000 0.002393 0.005187 0.049647 0.180985 0.2957280.192317 0.074039 0.036253 0.065912 0.022315 0.016307 0.015594 0.015160 0.009534 0.006721 0.0000000.000000 0.011908 0.000000 0.000000 0.000000
0.000000 0.000000 0.000000 0.000000 0.000000 0.000000 0.000000 0.000000 0.000000 0.006602 0.054936 0.2553560.247441 0.155006 0.033299 0.047331 0.104350 0.007875 0.037809 0.034508 0.000000 0.000000 0.0039380.000000 0.000000 0.011550 0.000000 0.000000
0.000000 0.000000 0.000000 0.000000 0.000000 0.000000 0.000000 0.000000 0.000000 0.009608 0.062942 0.1714350.228337 0.227544 0.072940 0.062006 0.049309 0.062812 0.022220 0.001079 0.005240 0.000540 0.0127810.005604 0.000000 0.005604 0.000000 0.000000
0.000000 0.000000 0.000000 0.000000 0.000000 0.000000 0.000000 0.000000 0.000000 0.001338 0.182169 0.1266380.186246 0.185110 0.114190 0.054069 0.035506 0.038152 0.028520 0.026155 0.001338 0.000000 0.0177530.002816 0.000000 0.000000 0.000000 0.000000
0.000000 0.000000 0.000000 0.000000 0.006552 0.000000 0.002184 0.000000 0.000000 0.030757 0.114563 0.1152120.075882 0.091838 0.234829 0.127920 0.075701 0.022183 0.018465 0.000000 0.041713 0.000000 0.0278510.014350 0.000000 0.000000 0.000000 0.000000
0.000000 0.000000 0.000253 0.000000 0.000379 0.000126 0.002800 0.000253 0.000772 0.000000 0.114421 0.3183150.317866 0.119523 0.056733 0.000000 0.021398 0.011664 0.014338 0.011664 0.004148 0.002674 0.0026740.000000 0.000000 0.000000 0.000000 0.000000
0.000000 0.000000 0.000000 0.000000 0.000000 0.001251 0.000000 0.002389 0.000000 0.011424 0.114412 0.2430720.204686 0.185032 0.110314 0.027806 0.027478 0.037045 0.016337 0.006080 0.005344 0.001251 0.0060800.000000 0.000000 0.000000 0.000000 0.000000
0.000000 0.000000 0.000000 0.000000 0.000000 0.000000 0.000000 0.001538 0.000000 0.018463 0.167852 0.2034920.239393 0.160860 0.153910 0.029702 0.010665 0.013676 0.000000 0.000000 0.000000 0.000000 0.0004470.000000 0.000000 0.000000 0.000000 0.000000
0.000000 0.000000 0.000000 0.000000 0.000000 0.000000 0.003479 0.000000 0.003479 0.010598 0.055454 0.2449920.211144 0.218545 0.090924 0.065779 0.027040 0.032611 0.005435 0.008914 0.010870 0.000000 0.0000000.000000 0.010734 0.000000 0.000000 0.000000
0.000000 0.000000 0.000000 0.000000 0.000064 0.000064 0.000000 0.000064 0.002568 0.024455 0.143824 0.2319250.151848 0.195072 0.111591 0.046002 0.027558 0.031172 0.013662 0.010260 0.003402 0.000000 0.0064690.000000 0.000000 0.000000 0.000000 0.000000
0.000000 0.000000 0.000000 0.000000 0.000000 0.000000 0.000000 0.000000 0.000000 0.000000 0.170145 0.2932790.222072 0.107563 0.037570 0.056529 0.040391 0.018838 0.014042 0.016901 0.003735 0.007188 0.0042780.003735 0.003735 0.000000 0.000000 0.000000
0.000000 0.000000 0.000000 0.000000 0.000000 0.000000 0.000000 0.000045 0.000000 0.007128 0.069609 0.1634400.341638 0.218792 0.064774 0.037034 0.033085 0.026396 0.008172 0.015035 0.000000 0.003888 0.0035640.003512 0.000000 0.003888 0.000000 0.000000
0.000000 0.000000 0.000000 0.000000 0.000000 0.000000 0.000000 0.000000 0.000000 0.010350 0.075201 0.2106630.226903 0.146013 0.057810 0.071272 0.065479 0.034519 0.058648 0.013783 0.014157 0.015201 0.0000000.000000 0.000000 0.000000 0.000000 0.000000
0.000000 0.000000 0.000000 0.000000 0.000000 0.000000 0.000000 0.000020 0.000020 0.000000 0.032339 0.1532950.263444 0.268072 0.099291 0.039919 0.035151 0.025342 0.017735 0.016894 0.026023 0.015487 0.0010200.000000 0.005951 0.000000 0.000000 0.000000
#Number and vector of years of age compositions (headboat)131977 1978 1979 1980 1981 1982 1983 1984 1985 1986 1987 1989 1996#sample sizes of age comp data by year72 279 47 94 415 134 754 619 511 192 93 57 124
SEDAR 15 SAR 1 SECTION III 201

Assessment Workshop South Atlantic Red Snapper
#headboat age comp samples (year,age)0.0417 0.5278 0.1667 0.1667 0.0139 0.0417 0.0278 0.0000 0.0000 0.0000 0.0000 0.0000 0.0000 0.0000 0.0000 0.01390.0000 0.0000 0.0000 0.0000
0.0215 0.4050 0.5054 0.0323 0.0179 0.0072 0.0072 0.0000 0.0000 0.0000 0.0000 0.0000 0.0000 0.0000 0.0000 0.00000.0000 0.0000 0.0000 0.0072
0.0000 0.6170 0.1702 0.0426 0.0851 0.0426 0.0426 0.0000 0.0000 0.0000 0.0000 0.0000 0.0000 0.0000 0.0000 0.00000.0000 0.0000 0.0000 0.0000
0.1809 0.5106 0.2340 0.0319 0.0000 0.0213 0.0000 0.0213 0.0000 0.0000 0.0000 0.0000 0.0000 0.0000 0.0000 0.00000.0000 0.0000 0.0000 0.0000
0.0265 0.7012 0.1855 0.0337 0.0169 0.0120 0.0048 0.0048 0.0048 0.0000 0.0000 0.0000 0.0024 0.0000 0.0000 0.00000.0000 0.0000 0.0000 0.0072
0.0448 0.4030 0.4030 0.0672 0.0299 0.0075 0.0075 0.0075 0.0075 0.0075 0.0000 0.0000 0.0000 0.0000 0.0000 0.00000.0000 0.0075 0.0000 0.0075
0.3939 0.4655 0.0942 0.0186 0.0093 0.0066 0.0040 0.0027 0.0013 0.0000 0.0000 0.0000 0.0000 0.0000 0.0000 0.00000.0000 0.0013 0.0000 0.0027
0.1599 0.6656 0.1018 0.0178 0.0162 0.0065 0.0048 0.0016 0.0016 0.0032 0.0048 0.0000 0.0032 0.0000 0.0000 0.00000.0000 0.0000 0.0000 0.0128
0.0431 0.7652 0.1605 0.0137 0.0020 0.0039 0.0000 0.0020 0.0000 0.0000 0.0000 0.0000 0.0000 0.0000 0.0000 0.00200.0000 0.0020 0.0020 0.0039
0.0521 0.4531 0.4115 0.0573 0.0104 0.0052 0.0052 0.0000 0.0000 0.0000 0.0000 0.0000 0.0000 0.0000 0.0000 0.00000.0000 0.0000 0.0000 0.0052
0.1613 0.2473 0.5054 0.0645 0.0215 0.0000 0.0000 0.0000 0.0000 0.0000 0.0000 0.0000 0.0000 0.0000 0.0000 0.00000.0000 0.0000 0.0000 0.0000
0.0877 0.4035 0.3860 0.0702 0.0175 0.0000 0.0000 0.0000 0.0000 0.0000 0.0000 0.0000 0.0175 0.0000 0.0000 0.00000.0175 0.0000 0.0000 0.0000
0.0000 0.0081 0.2742 0.1210 0.1048 0.2419 0.1129 0.0323 0.0242 0.0161 0.0242 0.0081 0.0000 0.0081 0.0000 0.00000.0000 0.0000 0.0000 0.0243
###################################MRFSS landings ##################################Recreational MRFSS CPUE Index#Starting and ending years of CPUE index19832006#Observed CPUE and assumed CVs1.7160 1.5691 1.3622 0.7150 0.6482 0.7041 0.5839 0.2003 0.6767 1.0674 1.1483 0.7437 0.7593 0.6646 1.0756 0.80211.4787 1.3397 1.1153 0.9938 1.1537 1.2935 1.2070 0.9818
0.1426 0.1244 0.1414 0.2612 0.3000 0.2020 0.1386 0.2421 0.2215 0.1233 0.1887 0.1698 0.1282 0.2270 0.2812 0.17460.1046 0.0989 0.0928 0.1111 0.1104 0.0945 0.0896 0.1258
#Recreational Charter+Private boat landings#Starting and ending years for landings time series19472006#MRFSS landings vector (1000 lb whole weight)292.4449 584.8897 877.3346 1169.7795 1462.2243 1754.6692 2047.1141 2339.5589 2632.0038 2924.4487 3216.89353509.3384 3801.7832 4094.2281 4411.7825 4729.3369 5046.8912 5364.4456 5682.0000 4933.2000 4184.40003435.6000 2686.8000 1938.0000 1787.3110 1544.7025 1368.6262 1258.1839 1101.0373 924.5833 823.2490 669.5083527.6684 376.4540 280.4210 246.2609 329.7836 532.3594 559.5652 435.8287 247.6627 285.1564 313.7427272.7566 222.2649 269.3082 258.7844 117.5910 110.0483 116.8490 114.0103 193.9496 275.7707 355.6031364.5065 304.9288 299.4494 273.8766 273.2545 271.6663
0.2877 0.2877 0.2877 0.2877 0.2877 0.2877 0.2877 0.2877 0.2877 0.2877 0.2877 0.2877 0.2877 0.2877 0.2877 0.28770.2877 0.2877 0.2877 0.2877 0.2877 0.2877 0.2877 0.2877 0.2877 0.2877 0.2877 0.2877 0.2877 0.2877 0.2877 0.28770.2877 0.2877 0.3250 0.2720 0.2660 0.1720 0.2910 0.2730 0.2000 0.2700 0.3010 0.0790 0.3420 0.3830 0.2740 0.36700.2800 0.5020 0.4360 0.3170 0.1790 0.2390 0.1910 0.1690 0.1800 0.1640 0.1730 0.2400
#Starting and ending years of discards time series, respectively19842006#Observed discards (1000s) and assumed CVs108.7990 72.5327 65.6727 51.7003 58.3797 22.8037 18.6770 17.9965 49.9785 54.6227 61.7633 44.9027 28.1797 20.3747 73.6213155.5143 215.9903 199.8760 166.4613 159.9920 157.2377 150.1130 130.4310
0.2950 0.4390 0.5085 0.5780 0.4730 0.4190 0.4670 0.5150 0.2940 0.2840 0.2890 0.2020 0.3800 0.2690 0.3250 0.15900.1480 0.1380 0.1820 0.1620 0.1430 0.1340 0.1820
#Number and vector of years of length compositions (mrfss)161981 1983 1984 1985 1986 1987 1988 1989 1999 2000 2001 2002 2003 2004 2005 2006#sample sizes of length comp data by year44 161 370 249 226 63 87 59 132 95 120 232 166 156 83 84#mrfss length comp samples (year,age) (30mm length bins)0.000000 0.004157 0.236882 0.114186 0.104372 0.000000 0.090207 0.151488 0.014833 0.141937 0.0209700.020970 0.079028 0.020970 0.000000 0.000000 0.000000 0.000000 0.000000 0.000000 0.0000000.000000 0.000000 0.000000 0.000000 0.000000 0.000000 0.000000
0.129796 0.154287 0.123536 0.122646 0.078259 0.138223 0.108759 0.035931 0.011872 0.008151 0.030527
SEDAR 15 SAR 1 SECTION III 202

Assessment Workshop South Atlantic Red Snapper
0.029117 0.000000 0.000000 0.027014 0.001255 0.000627 0.000000 0.000000 0.000000 0.0000000.000000 0.000000 0.000000 0.000000 0.000000 0.000000 0.000000
0.020221 0.090890 0.188465 0.252555 0.197856 0.090460 0.011589 0.030233 0.086400 0.016738 0.0020210.005644 0.002095 0.004029 0.000000 0.000000 0.000000 0.000000 0.000000 0.000000 0.0008040.000000 0.000000 0.000000 0.000000 0.000000 0.000000 0.000000
0.022865 0.151662 0.098149 0.082313 0.068166 0.036538 0.026657 0.037257 0.118753 0.000710 0.1741140.081986 0.087967 0.002268 0.005297 0.000000 0.000000 0.005297 0.000000 0.000000 0.0000000.000000 0.000000 0.000000 0.000000 0.000000 0.000000 0.000000
0.013735 0.472811 0.094212 0.183259 0.108405 0.083864 0.000000 0.011697 0.032017 0.000000 0.0000000.000000 0.000000 0.000000 0.000000 0.000000 0.000000 0.000000 0.000000 0.000000 0.0000000.000000 0.000000 0.000000 0.000000 0.000000 0.000000 0.000000
0.000000 0.175341 0.000000 0.115138 0.089666 0.163768 0.173663 0.005704 0.019016 0.135747 0.0536030.048733 0.000000 0.017294 0.002327 0.000000 0.000000 0.000000 0.000000 0.000000 0.0000000.000000 0.000000 0.000000 0.000000 0.000000 0.000000 0.000000
0.000000 0.000000 0.812215 0.072169 0.000000 0.115615 0.000000 0.000000 0.000000 0.000000 0.0000000.000000 0.000000 0.000000 0.000000 0.000000 0.000000 0.000000 0.000000 0.000000 0.0000000.000000 0.000000 0.000000 0.000000 0.000000 0.000000 0.000000
0.128728 0.182724 0.133831 0.070753 0.103667 0.140636 0.073020 0.023029 0.025690 0.039460 0.0010890.000000 0.031447 0.026650 0.019275 0.000000 0.000000 0.000000 0.000000 0.000000 0.0000000.000000 0.000000 0.000000 0.000000 0.000000 0.000000 0.000000
0.000000 0.000000 0.037173 0.250817 0.165887 0.088738 0.060234 0.027233 0.006234 0.041877 0.0961740.011463 0.056369 0.057686 0.008136 0.034289 0.020465 0.008136 0.004321 0.008136 0.0000000.000000 0.016632 0.000000 0.000000 0.000000 0.000000 0.000000
0.000000 0.000000 0.000000 0.011685 0.020914 0.009220 0.011587 0.000000 0.004419 0.055707 0.3528790.189844 0.108603 0.036373 0.072400 0.028172 0.012449 0.072400 0.006509 0.003898 0.0000000.002938 0.000000 0.000000 0.000000 0.000000 0.000000 0.000000
0.000000 0.000000 0.000000 0.000000 0.020654 0.000000 0.025002 0.020654 0.032271 0.055661 0.2868020.202812 0.075627 0.120878 0.041450 0.033019 0.000000 0.025898 0.004285 0.002143 0.0201220.030176 0.002546 0.000000 0.000000 0.000000 0.000000 0.000000
0.000000 0.000000 0.000000 0.000000 0.000000 0.000000 0.000314 0.000314 0.009179 0.063032 0.0991410.262279 0.136474 0.114177 0.110730 0.106753 0.061971 0.015982 0.010021 0.005715 0.0013060.001306 0.001306 0.000000 0.000000 0.000000 0.000000 0.000000
0.000000 0.000000 0.000000 0.000000 0.127279 0.056475 0.009475 0.049574 0.021806 0.030561 0.1295710.068645 0.075096 0.032077 0.132556 0.059181 0.078273 0.073809 0.039091 0.004265 0.0000000.000000 0.010550 0.000000 0.001716 0.000000 0.000000 0.000000
0.000000 0.000000 0.000000 0.000000 0.000000 0.000000 0.000000 0.018412 0.059403 0.041620 0.1492470.230105 0.111686 0.127270 0.096927 0.066860 0.018885 0.023925 0.028698 0.011801 0.0052560.002187 0.003457 0.004260 0.000000 0.000000 0.000000 0.000000
0.000000 0.000000 0.000000 0.000000 0.000000 0.044904 0.020009 0.000000 0.023988 0.023130 0.1909000.289755 0.066240 0.059448 0.035328 0.021633 0.115822 0.044680 0.028232 0.010841 0.0232320.000000 0.001857 0.000000 0.000000 0.000000 0.000000 0.000000
0.000000 0.024675 0.012337 0.006169 0.006169 0.000000 0.000000 0.000000 0.000000 0.013208 0.1885830.233792 0.094847 0.019260 0.063917 0.030058 0.000000 0.113346 0.054149 0.010798 0.0372200.000000 0.026461 0.021671 0.021671 0.000000 0.000000 0.021671
#Starting and ending year of mrfss age composition data20012005#sample sizes of mrfss age comp data by year75 386 389 311 256#mrfss age comps (year,lengthbin)0.0000 0.2533 0.5067 0.1600 0.0267 0.0267 0.0133 0.0000 0.0000 0.0000 0.0000 0.0000 0.0000 0.0000 0.0000 0.00000.0000 0.0000 0.0000 0.0133
0.0000 0.2409 0.5492 0.1192 0.0440 0.0207 0.0078 0.0078 0.0026 0.0026 0.0000 0.0000 0.0000 0.0000 0.0000 0.00000.0000 0.0000 0.0000 0.0052
0.0000 0.2314 0.3650 0.2622 0.0771 0.0129 0.0103 0.0026 0.0129 0.0129 0.0000 0.0000 0.0000 0.0000 0.0000 0.00000.0026 0.0000 0.0000 0.0104
0.0000 0.2797 0.3859 0.1640 0.0900 0.0354 0.0032 0.0032 0.0064 0.0064 0.0000 0.0000 0.0096 0.0032 0.0000 0.00000.0000 0.0000 0.0000 0.0128
0.0000 0.1055 0.4570 0.2500 0.1328 0.0273 0.0078 0.0000 0.0000 0.0000 0.0039 0.0039 0.0000 0.0078 0.0000 0.00000.0000 0.0000 0.0000 0.0039
################Likelihood Component Weighting##################################################################################Weights in objective fcn1000.0 #landings1000.0 #discards1.0 #length comps1.0 #age comps100.0 #HAL cpue index10.0 #HB cpue index10.0 #MRFSS cpue index100.0 #S-R residuals0.0 #constrain first several years of recruitment variability
SEDAR 15 SAR 1 SECTION III 203

Assessment Workshop South Atlantic Red Snapper
1000.0 #additional constraint on variability of recruitment in last three yrs0.0 #constrain variability of F in last three years0.0 #constraint B1/B01000.0 #penalty if F exceeds 3.00.0 #penalty on deviation in CV at age0.0 #penalty on first difference in CV at age
################Parameter values and initial guesses###############################################################################bias adjustment (multiplier) for MRFSS landings1.0#annual rate of increase on all fishery dependent q’s0.02#steepness (fixed or initial guess)0.75#natural mortality at age0.2304 0.1566 0.1254 0.1085 0.0981 0.0912 0.0864 0.0830 0.0805 0.0786 0.0772 0.0761 0.07530.0746 0.0741 0.0737 0.0734 0.0732 0.0730 0.0728
#age-independent natural mortality (used only to compute MSST=(1-M)SSBmsy)0.0781#log catchabilities (initial guesses)-6.0 #commHAL-12.0 #HB-12.0 #MRFSS#log mean F’s (initial guesses)-2.0 #commHAL post-WWII-3.0 #commDV-3.0 #HB-2.0 #MRFSS#log mean F’s for discards (initial guesses)-3.0 #commHAL discards-3.0 #HB discards-2.0 #MRFSS discards#log_R0 - log virgin recruitment12.0#R1_mult: R(styr)=R1_mult*R1. R1=R0 if S1dS0=11.0#B1/B0 constraint0.75# R autocorrelation0.0#Selectivity parameters.#Initial guess must be within boundaries.
#init_bounded_number selpar_slope_commDV1(0.5,12.0,1);#init_bounded_number selpar_L50_commDV1(0.1,10.,1);#init_bounded_number selpar_slope2_commDV1(0.1,12.0,3);#init_bounded_number selpar_L502_commDV1(1.0,20.0,3);
2.0 #selpar_L50_commHAL1 b12.0 #selpar_slope_commHAL1 b310.0 #selpar_L502_commHAL1 b10.0 #selpar_slope2_commHAL1 b32.0 #selpar_L50_commHAL2 b12.0 #selpar_slope_commHAL2 b310.0 #selpar_L502_commHAL2 b10.0 #selpar_slope2_commHAL2 b34.0 #selpar_L50_commHAL3 b12.0 #selpar_slope_commHAL3 b310.0 #selpar_L502_commHAL3 b10.0 #selpar_slope2_commHAL3 b3
3.0 #selpar_L50_commDV1 b110.0 #selpar_L502_commDV1 b22.0 #selpar_slope_commDV1 b31.0 #selpar_slope2_commDV1 b4
2.0 #selpar_L50_HB1 b13.0 #selpar_slope_HB1 b310.0 #selpar_L502_HB1 b10.0 #selpar_slope2_HB1 b32.0 #selpar_L50_HB2 b1
SEDAR 15 SAR 1 SECTION III 204

Assessment Workshop South Atlantic Red Snapper
10.4 #selpar_slope_HB2 b310.0 #selpar_L502_HB2 b10.0 #selpar_slope2_HB2 b34.0 #selpar_L50_HB3 b13.0 #selpar_slope_HB3 b310.0 #selpar_L502_HB3 b10.0 #selpar_slope2_HB3 b3
2.0 #selpar_L50_MRFSS1 b13.0 #selpar_slope_MRFSS1 b310.0 #selpar_L502_MRFSS1 b10.0 #selpar_slope2_MRFSS1 b32.0 #selpar_L50_MRFSS2 b110.4 #selpar_slope_MRFSS2 b310.0 #selpar_L502_MRFSS2 b10.0 #selpar_slope2_MRFSS2 b34.0 #selpar_L50_MRFSS3 b13.0 #selpar_slope_MRFSS3 b310.0 #selpar_L502_MRFSS3 b10.0 #selpar_slope2_MRFSS3 b3
0.5 #commHAL discard selectivity of age 1: value prior to standardizing to one0.5 #HB discard selectivity of age 1: value prior to standardizing to one0.5 #MRFSS discard selectivity of age 1: value prior to standardizing to one
999 #end of data file flag
SEDAR 15 SAR 1 SECTION III 205

Assessment Workshop South Atlantic Red Snapper
Appendix D Parameter estimates from AD Model Builder implementation ofcatch-at-age assessment model
# Number of parameters = 312 Objective function value = 16451.9 Maximum gradient component = 19726.1# log_len_cv:-2.15648784892# log_R0:13.3128344188# steep:0.949859882180# log_dev_N_rec:-0.00235346720443 0.244971211035 -0.0366583783528 0.0650572572250 -0.0121136773153-0.420479893992 0.460766239921 -0.735971495785 -0.0418362285841 0.6608359315261.03648952870 -0.218685360548 0.0327555292295 0.326270090336 0.1130527025740.112544052963 0.0423009815001 0.395298770412 -0.339795984693 -0.700001570534-0.711967228540 -0.663401142407 -0.240517559991 -0.127310978501 0.6662646734580.661635094279 0.294547815266 -0.115521156760 -0.0535322293854 -0.410272657978-0.163958690852 -0.0888654462297 -0.0295467307694
# R_autocorr:0.333753438920# selpar_slope_commHAL2:11.9984819496# selpar_L50_commHAL2:2.05591477850# selpar_slope_commHAL3:4.32167562058# selpar_L50_commHAL3:3.21678138968# selpar_slope_commDV1:0.773690913760# selpar_L50_commDV1:8.91928060462# selpar_slope2_commDV1:1.11324247999# selpar_L502_commDV1:1.48787259102# selpar_slope_HB1:11.9984058155# selpar_L50_HB1:1.10646231368# selpar_L50_HB2:1.30701823180# selpar_slope_HB3:10.3201958594# selpar_L50_HB3:3.03280141155# selpar_L50_MRFSS2:1.04472365415# selpar_slope_MRFSS3:4.48100106675# selpar_L50_MRFSS3:1.85736444315# log_q_HAL:-6.30344972238# log_q_HB:-12.3683685103# log_q_MRFSS:-12.5847492845# log_avg_F_commHAL_2:-2.59687803490# log_F_dev_commHAL_2:-2.89864906942 -2.80830940126 -2.72635828847 -2.64869598225 -2.57441499487 -2.50232821790-2.13537277774 -2.40537359876 -2.34945034707 -1.93070589814 -2.08433639889 -2.06871567073-1.43815596788 -1.73172165630 -1.59871303392 -1.50383337177 -1.24929851283 -1.43633547050-1.58880274736 -1.33867627982 -0.986321252602 -0.639056871022 -0.1174937677190.265575609897 0.100857422982 0.213104090311 0.210893560976 0.202611290208 0.1186741984240.730935182130 1.07230051834 1.06270783029 1.32385732621 1.48902126813 1.33941528847
SEDAR 15 SAR 1 SECTION III 206

Assessment Workshop South Atlantic Red Snapper
1.45979487253 1.40942765223 1.36035600380 1.44978388893 1.56741923740 1.414975571071.26400203746 1.28523132671 1.15445475167 1.64660457913 1.55416107275 1.091525381621.09428764801 1.83170179112 1.53713585012 1.55423599341 1.50427098073 1.373998633611.14479239156 1.04596737485 0.973633208325 1.31759667576 1.13578043737 0.8011141339971.07838414224 0.932563255756 0.647967098714
# log_avg_F_commDV:-2.79620224579# log_F_dev_commDV:-1.45960851069 -0.574516136348 -1.85139425956 -2.15659488794 -2.60673599875 -1.29785259977-0.826310068805 0.323460161585 0.828783329469 0.336050195635 1.15755035615 0.8278721780350.286208237289 0.467339918017 0.540313138558 0.786575090210 0.925107801059 1.435399611301.47513952348 1.00105845493 0.942742869352 0.163049347689 -0.723637750897
# log_avg_F_HB:-2.63465473348# log_F_dev_HB:-1.26525519814 -0.908175089712 -1.20602780830 -0.943249974923 -0.510718510463-0.906945550769 -0.631297216274 -0.573630022233 -0.367573838887 0.3558465514060.326767813116 0.121636984852 0.197763920371 0.537842162609 -0.1288325184500.375241249298 0.778192070065 0.239027233044 0.243087608479 0.355048314005-0.0546865382767 0.180907280030 0.322173223678 0.498525331402 0.4614824122360.697386302348 0.0225669157434 0.412721969873 0.298437299631 0.3454932383020.294415731400 -0.255919396890 0.452239052873 0.253076033109 -0.0175670345521
# log_avg_F_MRFSS:-1.70225344506# log_F_dev_MRFSS:-3.59288730447 -2.89568011761 -2.48447219329 -2.18882381546 -1.95365678321-1.75574421696 -1.58302857850 -1.42447866054 -1.27551806764 -1.13412806714-0.992414031727 -0.849805104974 -0.707453851783 -0.559941950366 -0.396959387259-0.223359719540 -0.0381383359997 0.169727903754 0.418498923911 0.5053322751440.591081132131 0.669881784364 0.688459341524 0.562361689325 0.6341073845190.624750712891 0.616834148442 0.655005445702 0.702931495383 0.6974387305320.790503291153 0.803280676084 0.784606846687 0.641434154951 0.3149438895330.335675638532 0.697792447244 1.04189689670 1.02750657537 0.9759119824460.480605526705 0.562270375804 0.709494329038 0.685200969027 0.4497891533960.612966518713 0.553316540652 -0.107701870929 -0.0469192860845 0.1542333003440.137926270955 0.569636376303 0.674660774115 0.650551139644 0.5817876483930.453814585040 0.450313261331 0.435766342964 0.547898618414 0.550916246314
# log_avg_F_commHAL_D:-2.97348527107# log_F_dev_commHAL_D:-1.38998894022 -1.75687712426 -0.447513066639 0.0267971589529 -0.706703801841-1.58012319512 0.883652830166 -1.26281962918 0.102974461750 0.4297594515731.06406381592 1.15047093498 1.28522749429 1.10775528579 0.385791245350-0.0741569384813 -0.143537396604 0.172729609305 0.261476950021 0.2346529232590.141866805017 0.0462990647262 0.0682020612505
# log_avg_F_HB_D:-3.76334013483# log_F_dev_HB_D:-1.32071332223 -1.15408594337 -0.626702673318 0.291965617274 0.0503101427666-1.35826077377 0.711152683668 -1.01270400205 -1.66435725268 0.6771366943300.736582581445 1.26209162287 0.156288242317 -1.21913936928 0.133612221606-0.336360852546 -0.0677889929106 0.810343088306 0.813490429198 0.4905600817981.11097893068 0.962221549644 0.553379296250
# log_avg_F_MRFSS_D:-2.24501469505# log_F_dev_MRFSS_D:-0.256856309739 -0.322049075516 0.240913059127 -0.299914836616 -0.210750145174-1.02269191415 -1.14424230999 -1.32662189322 -0.433135371522 0.008307699357660.451389600002 0.231302928222 -0.389182192329 -0.935813878376 -0.09493541683950.299073387956 0.608752165218 0.765256439660 0.738499726078 0.8278104997610.899811230571 0.793397628835 0.571678978685
SEDAR 15 SAR 1 SECTION III 207

Assessment Workshop South Atlantic Red Snapper
Appendix E ASPIC Input: Computer input file to run base production model.
FIT Run Mode"SAFMC Red Snapper SEDAR 15 (2007), increasing q 2%/yr from 1980"LOGISTIC YLD SSE Modeltype, conditioning, loss fn112 Verbosity600 N Bootstraps1 10000 Monte Carlo1d-8 Conv (fit)3d-8 8 Conv (restart), N restarts1d-4 6 Conv (F), steps/yr for generalized4 Max F allowed1 Weight for B1>K3 Number of series1d0 1d0 1d0 Series weights (HB, CHL, MRFSS)0.95d0 B1/K guess2000000.0 MSY guess12000000.0 K guess5d-8 5d-8 5d-8 q guess0 1 1 1 1 1 Estimate flags100000.0 4000000.0 MSY bounds5000000.0 150000000.0 K bounds82184571 Random seed62 Number of years"Headboat Index (1976-2006)""CC"1945 -1 2408731946 -1 2626161947 -1 5804741948 -1 8983321949 -1 12161901950 -1 15340481951 -1 19791621952 -1 21514571953 -1 24618841954 -1 29457961955 -1 31446421956 -1 34311371957 -1 41002861958 -1 41480441959 -1 44878251960 -1 47979021961 -1 52372411962 -1 53639741963 -1 55478101964 -1 59168221965 -1 63231331966 -1 56500651967 -1 51050931968 -1 44550431969 -1 33821941970 -1 25852241971 -1 23579411972 -1 21413211973 -1 19352621974 -1 19772501975 -1 19371891976 3.644 16844701977 2.177 15227851978 2.000 13356161979 1.826 10020981980 0.880 8397881981 1.985 7560451982 0.687 5981871983 1.043 7176531984 0.900 9981001985 1.287 10804621986 0.291 802000
SEDAR 15 SAR 1 SECTION III 208

Assessment Workshop South Atlantic Red Snapper
1987 0.363 5787011988 0.354 6465301989 0.633 7274211990 0.708 6551371991 0.491 4770871992 0.071 5812581993 0.201 7063211994 0.223 4707611995 0.305 4553721996 0.206 4086051997 0.229 3740221998 0.184 4748871999 0.301 6174652000 0.396 7702632001 0.827 9146022002 0.994 8109912003 0.501 6918602004 0.910 7238242005 0.820 6631142006 0.413 594536"Commercial Logbook Index""I1"1945 -11946 -11947 -11948 -11949 -11950 -11951 -11952 -11953 -11954 -11955 -11956 -11957 -11958 -11959 -11960 -11961 -11962 -11963 -11964 -11965 -11966 -11967 -11968 -11969 -11970 -11971 -11972 -11973 -11974 -11975 -11976 -11977 -11978 -11979 -11980 -11981 -11982 -11983 -11984 -11985 -11986 -11987 -11988 -11989 -11990 -11991 -11992 -11993 0.785
SEDAR 15 SAR 1 SECTION III 209

Assessment Workshop South Atlantic Red Snapper
1994 0.6291995 0.6371996 0.4941997 0.4301998 0.4781999 0.5832000 0.5872001 0.8982002 0.9702003 0.7922004 0.9762005 0.7992006 0.423"MRFSS Index""I1"1945 -11946 -11947 -11948 -11949 -11950 -11951 -11952 -11953 -11954 -11955 -11956 -11957 -11958 -11959 -11960 -11961 -11962 -11963 -11964 -11965 -11966 -11967 -11968 -11969 -11970 -11971 -11972 -11973 -11974 -11975 -11976 -11977 -11978 -11979 -11980 -11981 -11982 -11983 0.4711984 0.3951985 0.3491986 0.2041987 0.2141988 0.2871989 0.3001990 0.1221991 0.4921992 0.9171993 1.0751994 0.6751995 0.6581996 0.5361997 0.7981998 0.5981999 1.1372000 1.067
SEDAR 15 SAR 1 SECTION III 210

Assessment Workshop South Atlantic Red Snapper
2001 0.9232002 0.8642003 1.0632004 1.2712005 1.2702006 1.109Note:This input file prepared by PBC, 15 Nov 2007
SEDAR 15 SAR 1 SECTION III 211

Assessment Workshop Report South Atlantic Red Snapper
SEDAR 15 SAR 1 SECTION III
4 Submitted Comments
4.1 None were received
212

Assessment Workshop Report South Atlantic Red Snapper
SEDAR 15 SAR 1 SECTION III
213

Review Workshop Report South Atlantic Red Snapper
SEDAR 15 SAR 1 SECTION IV
Section IV. Review Workshop Report
Contents
1. Workshop Proceedings Introduction …………….…………………...……………. 3
2. Consensus Report ………………………………..……………………..………….. 7
3. Submitted Comments ………………………………………………...……………. 15
1

Review Workshop Report South Atlantic Red Snapper
SEDAR 15 SAR 1 SECTION IV
2

Review Workshop Report South Atlantic Red Snapper
SEDAR 15 SAR 1 SECTION IV
1. Introduction
1.1. Workshop Time and Place
The SEDAR 15 Review Workshop was held at the Brownstone Holiday Inn in Raleigh,
North Carolina on January 28 through February 1, 2008.
1.2. Terms of Reference
1. Evaluate the adequacy, appropriateness, and application of data used in the assessment*.
2. Evaluate the adequacy, appropriateness, and application of methods used to assess the
stock*.
3. Recommend appropriate estimates of stock abundance, biomass, and exploitation*.
4. Evaluate the methods used to estimate population benchmarks and management parameters
(e.g., MSY, Fmsy, Bmsy, MSST, MFMT, or their proxies); provide estimated values for
management benchmarks, a range of ABC, and declarations of stock status*.
5. Evaluate the adequacy, appropriateness, and application of the methods used to project
future population status; recommend appropriate estimates of future stock condition* (e.g.,
exploitation, abundance, biomass).
6. Evaluate the adequacy, appropriateness, and application of methods used to characterize
uncertainty in estimated parameters. Provide measures of uncertainty for estimated
parameters*. Ensure that the implications of uncertainty in technical conclusions are clearly
stated.
7. Ensure that stock assessment results are clearly and accurately presented in the Stock
Assessment Report and Advisory Report and that reported results are consistent with
Review Panel recommendations**
.
8. Evaluate the SEDAR Process. Identify any Terms of Reference which were inadequately
addressed by the Data or Assessment Workshops; identify any additional information or
assistance which will improve Review Workshops; suggest improvements or identify
aspects requiring clarification.
9. Review the research recommendations provided by the Data and Assessment workshops
and make any additional recommendations warranted. Clearly indicate the research and
monitoring needs that may appreciably improve the reliability of future assessments.
Recommend an appropriate interval for the next assessment.
10. Prepare a Peer Review Consensus Summary summarizing the Panel’s evaluation of the
stock assessment and addressing each Term of Reference. Prepare an Advisory Report
summarizing key assessment results. (Reports to be drafted by the Panel during the review
workshop with a final report due two weeks after the workshop ends.)
* The review panel may request additional sensitivity analyses, evaluation of alternative assumptions, and correction of errors identified in the assessments provided by the assessment workshop panel; the
review panel may not request a new assessment. Additional details regarding the latitude given the
3

Review Workshop Report South Atlantic Red Snapper
SEDAR 15 SAR 1 SECTION IV
review panel to deviate from assessments provided by the assessment workshop panel are provided in
the SEDAR Guidelines and the SEDAR Review Panel Overview and Instructions.
** The panel shall ensure that corrected estimates are provided by addenda to the assessment report in the event corrections are made in the assessment, alternative model configurations are recommended, or
additional analyses are prepared as a result of review panel findings regarding the TORs above.
1.3. List of Participants
SEDAR 15 Review Workshop
January 28-February 1, 2008
Raleigh, NC
NAME Affiliation
Workshop Panel
Kevin Friedland, Chair...................................................................... NMFS NEFSC
Robin Cook ......................................................................................................... CIE
Vivian Haist ........................................................................................................ CIE
Joe Hightower ................................................................................................. USGS
Graham Pilling ................................................................................................... CIE
Presenters
Kyle Shertzer ..................................................................................... NMFS SEFSC
Doug Vaughan ................................................................................... NMFS SEFSC
Erik Williams ..................................................................................... NMFS SEFSC
Robert Muller .............................................................................................. FL FWC
Appointed Observers
Jeff Buckel ............................................................................... SAFMC SSC/NCSU
Brian Cheuvront ........................................................................... SAFMC/NC DMF
Rob Cheshire ..................................................................................... NMFS SEFSC
Paul Conn ........................................................................................... NMFS SEFSC
Doug Gregory ....................................................................................GMFMC SSC
Tony Iarocci ................................................................................................. SAFMC
Joe O’Hop .................................................................................................. FL FWC
Observers
Mac Currin .................................................................................................. SAFMC
Mike Waine .................................................................................................... NCSU
Will Smith ....................................................................................................... NCSU
Staff
John Carmichael........................................................................................... SAFMC
Tyree Davis ........................................................................................ NMFS SEFSC
Rachael Lindsay ........................................................................................... SEDAR
4

Review Workshop Report South Atlantic Red Snapper
SEDAR 15 SAR 1 SECTION IV
Andi Stephens .............................................................................................. SAFMC
Dale Theiling ............................................................................................... SEDAR
1.4. List of Review Workshop Working Papers & Documents
SEDAR15
South Atlantic Red Snapper & Greater Amberjack
Workshop Document List Document # Title Authors
Documents Prepared for the Data Workshop
SEDAR15-DW1 Discards of Greater Amberjack and Red Snapper
Calculated for Vessels with Federal Fishing
Permits in the US South Atlantic
McCarthy, K.
Documents Prepared for the Assessment Workshop
SEDAR15-AW-1 SEDAR 15 Stock Assessment Model - Statistical
Catch-at-Age Model
Conn, P., K.
Shertzer, and E.
Williams
Documents Prepared for the Review Workshop
SEDAR15-RW1 SEDAR 15 SAR1 (Red Snapper) Peer Review
Document
SEDAR 15
SEDAR15-RW2 SEDAR 15 SAR2 (South Atlantic Greater
Amberjack) Peer Review Document
SEDAR 15
SEDAR 15-RW3 SEDAR 15 SAR3 (South Atlantic and Florida
Mutton Snapper) Peer Review Document
SEDAR 15 (Florida
Fish & Wildlife
Research Institute)
Final Assessment Reports
SEDAR15-AR1 Assessment of Red Snapper in the US South
Atlantic
SEDAR15-AR2 Assessment of Greater Amberjack in the US South
Atlantic
Reference Documents
SEDAR15-RD01 Age, growth, and reproduction of greater
amberjack, Seriola dumerili, off the Atlantic coast
of the southeastern United States
Harris, P. ,
Wyanski, D.,
White, D. B.
SEDAR15-RD02
2007.
A Tag and Recapture study of greater amberjack,
Seriola dumerili, from the Southeastern United
States
MARMAP, SCDNR
SEDAR15-RD03 Stock Assessment Analyses on Atlantic Greater
Amberjack
Legault, C.,
Turner, S.
SEDAR15-RD04 Age, Growth, And Reproduction Of The Red
Snapper, Lutjanus Campechanus, From The
Atlantic Waters Of The Southeastern U.S.
White, D. B.,
Palmer, S.
SEDAR15-RD05 Atlantic Greater Amberjack Abundance Indices Cummings, N.,
5

Review Workshop Report South Atlantic Red Snapper
SEDAR 15 SAR 1 SECTION IV
From Commercial Handline and Recreational
Charter, Private, and Headboat Fisheries through
fishing year 1997
Turner, S.,
McClellan, D. B.,
Legault, C.
SEDAR15-RD06
2007. MS Thesis,
UNC Wilm. Dept.
Biol. & Marine Biol.
Age and growth of red snapper, Lutjanus
Campechanus, from the southeastern United States
McInerny, S.
SEDAR15-RD07
2005. CRP Grant #
NA03NMF4540416.
Characterization of commercial reef fish catch and
bycatch off the southeast coast of the United
States.
Harris, P.J., and J.A.
Stephen
SEDAR15-RD08 The 1960 Salt-Water Angling Survey, USFWS
Circular 153
Clark, J. R.
SEDAR15-RD09 The 1965 Salt-Water Angling Survey, USFWS
Resource Publication 67
Deuel, D. G. and J.
R. Clark
SEDAR15-RD10 1970 Salt-Water Angling Survey, NMFS Current
Fisheries Statistics Number 6200
Deuel, D. G.
6

Review Workshop Report South Atlantic Red Snapper
2. Consensus Report
2.1. Statements addressing each Term of Reference
1. Evaluate the adequacy, appropriateness, and application of data used in
the assessment.
Data used in the assessment consisted of landings from three fleets segments, three
fishery dependent abundance indices, age composition data and length frequency data.
All these data are subject to a relatively high degree of uncertainty. In relation to
landings, the Assessment Workshop (AW) decided to use estimates of catch in 1960,
1965 and 1970 derived from a saltwater angling survey that had been rejected by the Data
Workshop (DW). These values suggest that catches before the 1980s were of an order of
magnitude higher than DW values. The review panel discussed this at some length and
felt that on balance it was appropriate to include these values. There was some anecdotal
evidence to support the apparently unexpectedly high values.
Sample sizes for the age and length frequency data are very small in relation to the
landings and therefore may not reflect actual age and length compositions with any
precision. Age data are available only for more recent years and suggest that most fish in
the catches are around age 3. The size composition data change in response to
management regulations on minimum landing size.
The abundance indices are a crucial element of the available data but will, of course, be
subject to bias associated with changes in technology and non-random sampling by
commercial and recreational fisheries. In the model, values of abundance index
catchability were assumed to increase by 2% per year. The indices all relate to the more
recent period of the assessment and there is therefore almost no data other than catch for
the period up to the 1980s. There is some correlation between the series, which provides
some support for the view that they are measuring a common signal in the stock over
time. It would be highly desirable to invest in a fishery independent abundance index to
improve future assessments (see term of reference 9).
Red snapper has an unusual life history pattern in that they are apparently long lived
(maximum age over 50) while maturing as early as age 1. This leads to low estimates of
age specific natural mortality, yet the assessment seems to suggest the stock is highly
productive and contributes to a very high estimate of the steepness of the stock
recruitment function. The panel felt that the steepness estimate was unreliable. The life
history attributes would merit further investigation to confirm their unusual
characteristics.
Notwithstanding the limitations of available data, the panel felt that the data had been
used appropriately and that it provided an adequate basis on which to conduct an
assessment. The uncertainties in the data limit the robustness of the conclusions that can
be derived from the assessment.
7

Review Workshop Report South Atlantic Red Snapper
2. Evaluate the adequacy, appropriateness, and application of methods used
to assess the stock.
Two assessment methods were used. The principal method was an age structure model
(SCA) constructed within a stock synthetic framework using AD model builder. The
second was a much simpler surplus production model using ASPIC software, which
makes no explicit assumptions about age structure. Both of these approaches are well
established and appropriate for the data available and for the estimation of the
management indicators.
The SCA model is a complex model based on maximizing a quasi-likelihood function. In
order to fit the model, a large number of assumptions are required that relate to fishery
selectivity, discard selectivity and survival, stock recruitment function, natural mortality
by age, and other less critical factors. The panel was generally satisfied that the
assumptions made were appropriate, but while they are reasonable, it must be
remembered that many are best guesses and are not currently verifiable.
One of the main points of discussion was centered on the relative weights given to the
various likelihood components in the objective function. These had been arrived at
through trial and error by fitting the model, examining the model fit, adjusting the
weights and then refitting the model until a satisfactory fit had been achieved. The panel
was concerned that the criteria for judging goodness-of-fit were subject to individual
interpretation and may not be repeatable. The need to find a more systematic method to
select the weights was stressed, but the panel accepted the values used in the assessment
on the basis that most information on the stock trajectory lay in the landings data.
The ASPIC model was used to investigate a different model interpretation of the data and
provides a valuable alternative to exploring the uncertainty in population estimates. It
gave qualitatively similar results to the SCA model providing some reassurance that the
perceived stock decline is real and not an artifact of the assumptions on natural mortality
and stock recruitment. There still remains the possibility that poorly estimated
recreational catches in the early period exaggerate the perceived steep population decline.
The panel asked for a simple catch curve analysis to be undertaken on the age
compositions. This analysis supported the Z estimates emerging from the SCA model
(see section 2.3).
3. Recommend appropriate estimates of stock abundance, biomass, and
exploitation.
The SCA model was advocated as the basis for estimates of abundance, biomass and
exploitation. There are substantial uncertainties in the model results and the AW provides
sensitivity runs to illustrate the possible range of uncertainty. Clearly, all the runs show
the same qualitative results and indicate that the stock status is overfished and suffering
from overfishing. However, there is no unique „best estimate model run‟ that stands out
8

Review Workshop Report South Atlantic Red Snapper
as superior to other runs. Recognizing the need to use a reference run to characterize the
stock and its status, the panel suggests using the SCA base run for estimates of stock
abundance, biomass and exploitation. The values need to be interpreted as one realization
of a number of equally plausible runs and are conditioned on the particular assumptions
made about the data and the population dynamics model. Alternative assumptions could
yield equally plausible but different values as may arise in future assessments.
4. Evaluate the methods used to estimate population benchmarks and
management parameters (e.g., MSY, Fmsy, Bmsy, MSST, MFMT, or their
proxies); provide estimated values for management benchmarks, a range
of ABC, and declarations of stock status.
The most important aspect of population benchmarks and management parameters is to
be able to judge relative position of the current stock to the benchmarks. In this context,
absolute values of Fmsy, SSBmsy are less important than the ratios Fcurrent/Fmsy and
SSBcurrent/SSBmsy. In all the model sensitivity runs and the ASPIC model, the ratios
estimated the stock to be overfished and experiencing overfishing, despite the absolute
values of the individual quantities varying substantially. The conclusion of the status of
the stock therefore appears quite robust to a wide range of model configurations and the
panel felt this was the appropriate classification.
One of the principal difficulties with the SCA model estimate of the stock recruitment
parameters is that the steepness estimate appears unrealistically high. In addition, there
are no data in the assessment to adequately define the asymptote of the Beverton-Holt
function and hence estimates of MSY indicators cannot be considered reliable. It may be
preferable, as indicated above, to use the ratio indicators to evaluate stock status or use
SPR proxies. The panel suggested that F40% and SSB40% proxies may be used as limit
indicators.
Given the choice of the base SCA run as the reference case, the panel suggests that if
managers wish to use specific benchmark values they consider the estimates conditioned
on this run. The values are given in Table 1. It should be borne in mind that these values
will likely change at a future assessment given their sensitivity to equally plausible model
configurations.
Table 1. Management quantities based on F40%, a proxy for FMSY
Quantity Units Estimate
F40% y-1
0.07
BF40% mt 17347
SSBF40% mt 7891
MSSTF40% mt 7275
MSY F40% 1000 lb 2314
D F40% 1000 fish 37
R0 (bias corrected) 1000 fish 664.7
F2006/F40% 12.021
SSB2006/SSBF40% 0.025
SSB2006/MSSTF40% 0.027
9

Review Workshop Report South Atlantic Red Snapper
Note: Biomass and discard estimates corresponding to F40% assume equilibrium recruitment of bias-
corrected R0, as estimated by the base assessment model. MSST=(1-M)SSB, with M equal to the Hoenig
estimate (=0.078).
The Review Panel (RP) noted that its instructions specified that it “…shall not provide
specific management advice. Such advice will be provided by existing Council Committees,
such as the Science and Statistical Committee and Advisory Panels, following completion of
the assessment.” Given these guidelines, the RP could not provide ABCs and felt that it was
an inappropriate task for a review panel. The RP could review the methodology used by
others to arrive at an ABC if provided.
5. Evaluate the adequacy, appropriateness, and application of the methods
used to project future population status; recommend appropriate
estimates of future stock condition (e.g., exploitation, abundance, biomass).
Projections conducted by the AW are conditional on the base run. They include
stochasticity only in the stock recruitment model and this generally will underestimate the
overall uncertainty in future projections. This problem is in part due to the restricted
uncertainty incorporated into the stock-recruitment model and the assumption of fixed
values for all other quantities. In particular, the assumption of a fixed initial population
size limits the range of likely uncertainty on future stock development. The panel
therefore felt that the projections presented should be interpreted more in qualitative
terms and that the uncertainty envelope presented (10th
and 90th
percentiles) does not
provide likely probabilities. However, the relative change in rebuilding time compared to
baseline for a given F scenario is likely to be a more reliable indicator of the value of a
chosen management regime. What is clear is that rebuilding will not occur at current F
and that rebuilding times are long, generally on the order of decades.
Interpretation of rebuilding times needs to be considered in the context of the very low
current stock size. It is possible that stock dynamics at these apparently depleted levels
may not be the same as the assumed stock recruitment relationship, which has been
estimated for the whole historical time period.
The panel discussed the value of projections made beyond 5-10 years. Clearly the
uncertainty increases rapidly with time as the currently measured stock is replaced by
model values into the future. Realistically, the projections beyond the range of the
predominant age groups in the stock are highly uncertain. In this assessment, the best that
can be concluded is that rebuilding times will be very long.
An important aspect of the projection scenarios is the modeling of discards, which
consider incidental bycatch which might arise in the absence of directed fishing. This
provides a valuable metric to judge the efficacy of management measures that are unable
to prevent all catches of red snapper.
10

Review Workshop Report South Atlantic Red Snapper
6. Evaluate the adequacy, appropriateness, and application of methods used
to characterize uncertainty in estimated parameters. Provide measures of
uncertainty for estimated parameters. Ensure that the implications of
uncertainty in technical conclusions are clearly stated.
Uncertainty in the assessment has been characterized mainly by the use of sensitivity
runs. These examine the change in the assessment when certain assumptions are varied.
A large number of sensitivity runs were performed, which the panel considered. It was
felt that these offered a useful insight into the robustness of the assessment. None of the
runs altered the perception of the stock status. Estimates of Fmsy were very consistent at
around F≈0.1 while SSBmsy varied between 3189-10554mt.
The panel suggested a subset of the sensitivity runs, plus two additional runs to examine
the effect of the recreational fishery catch, as a summary of the uncertainty in the
assessment. The results are given in Table 2.
Table 2. Results of sensitivity runs characterizing the uncertainty in the assessment.
Run Description Fmsy
SSBmsy
(mt)
MSY
(1000 lb) F2006/Fmsy
SSB2006/
SSBmsy steep
R0
(1000)
Base 0.112 5184 2319 7.51 0.04 0.95 605
S1 Low M 0.097 6112 1977 10.36 0.03 0.95 377
S2 High M 0.112 5089 2362 7.25 0.04 0.95 673
S16 steep=0.8 0.131 7648 2056 9.59 0.03 0.8 562
S17 steep=0.6 0.118 10554 1624 7.09 0.05 0.6 441
S32 0.5 Early rec L 0.112 3189 1314 8.3 0.06 0.95 356
S33 1.5 Early rec L 0.104 7419 3283 7.73 0.03 0.94 858
S34 Finit=0.05 0.106 5431 2416 7.71 0.04 0.95 635
S35 Finit=0.10 0.105 6069 2696 7.74 0.03 0.95 706
S36 Finit=0.15 0.104 6600 2912 7.83 0.03 0.95 764
Surplus production 0.149 2247 3342 1.077 0.17
As might be expected, the uncertainty described above is conditioned on the structural
assumptions in the model and will only give a partial impression of overall uncertainty.
The AW also ran a surplus production model, which gives a further insight into
uncertainty. This analysis suggests that F is closer to MSY (Table 2). The analysis
provides confidence intervals on the estimates of benchmarks that are similar to the range
in the SCA sensitivity runs.
11

Review Workshop Report South Atlantic Red Snapper
7. Ensure that stock assessment results are clearly and accurately presented
in the Stock Assessment Report and Advisory Report and that reported
results are consistent with Review Panel recommendations.
The RP ensured that the stock assessment results were clearly and accurately presented in
the SEDAR Summary Report for Red Snapper and that the results were consistent with
the RP recommendations.
8. Evaluate the SEDAR Process. Identify any Terms of Reference which were
inadequately addressed by the Data or Assessment Workshops; identify
any additional information or assistance which will improve Review
Workshops; suggest improvements or identify aspects requiring
clarification.
The RP had no specific comments about the SEDAR process in regard to the review
process for red snapper. However, the RP discussed issues of relevance to the overall
SEDAR review process.
The review panel appreciated the standardized layout of the data and assessment
workshop reports, which greatly aided the reviewers in assimilating information on the
different stocks.
Panel members noted that the documents had been received approximately one week
before the review panel convened, rather than the two weeks stipulated in the Terms of
Reference. This delay hampered a more thorough review by the panel members, although
this was mitigated by the thorough presentations provided by the stock experts.
The review panel thanked the rapporteurs for their assistance in developing the consensus
summary reports, and noted that their contribution was invaluable and critical in
preparing reports prior to the closure of the Review Workshop. The panel suggested that
the process could further be improved by SEDAR helping to prepare the rapporteurs for
this task with a more detailed guide on how to prepare a rapporteur‟s report.
The panel suggested that a fisherman-friendly one-page summary of the review
proceedings be prepared for the Council. This could subsequently be disseminated at the
docks to inform fishermen of the review workshop activities and findings.
The international members of the review panel appreciated the presentation of a short
summary of US management regulations and benchmarks, which was a useful reminder
of the legislative framework in which the review panel operated.
9. Review the research recommendations provided by the Data and
Assessment workshops and make any additional recommendations
warranted. Clearly indicate the research and monitoring needs that may
appreciably improve the reliability of future assessments. Recommend an
appropriate interval for the next assessment.
12

Review Workshop Report South Atlantic Red Snapper
The RP supports the recommendations of data workshop. Of the recommendations
provided in the report, the most critical priority for stock assessment is establishment of a
fishery independent index. This could best be accomplished by adding gears to the
MARMAP survey that are more effective at catching red snapper.
Other important recommendations are:
Quantifying release mortality and length/age structure of discards, for instance by
expanding the “Headboat at Sea Observer Survey.”
Using consistent otolith ageing assumptions.
Assessing the degree to which catchability has changed over time.
Improving data collection protocols.
The recommendation to analyze stock structure using microsatellite genetic techniques,
while good science, is probably less important to improving the current assessment.
The panel felt that the procedure for choosing the weights in the likelihood function
might be improved and recommends that a more rigorous protocol be investigated to
avoid criticism of subjectivity.
Bayesian methods should be considered for inference on uncertainty. These methods
would allow priors on steepness, natural mortality, and other parameters to be chosen in
order to quantify uncertainty in stock status and benchmarks. These additional
procedures will require adequate time being afforded to assessment scientists to develop
the appropriate tools.
In order to be able to measure an improvement in the stock, the next assessment would
need to be conducted some years (5 perhaps) after any new management measures are
introduced. This implies an interval of about 6-7 years before the next assessment. If
managers are particularly concerned about the status of the stock, then a shorter interval
of 3 years might be considered to check whether any further deterioration has occurred,
but this would not be a sufficiently long time interval to be able to detect the efficacy of
management measures.
10. Prepare a Peer Review Consensus Summary summarizing the Panel’s
evaluation of the stock assessment and addressing each Term of
Reference. Prepare an Advisory Report summarizing key assessment
results.
The RP prepared a Review Panel Consensus Summary and provided comments on the
SEDAR Summary Report for Red Snapper.
Reviewer Statements
The panel attests that the Review Panel Consensus Summary for red snapper provides
and accurate and complete summary of the issues discussed during the review.
13

Review Workshop Report South Atlantic Red Snapper
2.2. Panel Comments on the SEDAR Process
See term of reference 8
2.3. Summary Results of Analytical Requests
The panel was concerned about the influence of the very large recreational catch in the
early years on the assessment. The sensitivity run (S7), which used a low estimate of
recreational landings, was considered too extreme; the panel requested additional runs
that examined the sensitivity of ±50% of the landings. The results did not alter the
perceived state of the stock and are given in Table 2.
A simple catch curve analysis using commercial handline and headboat age compositions
to estimate Z was requested. Z was primarily estimated between 0.5 and 2.0 over the
period 1975-2006, and was on the same scale as mortality estimates produced by the
statistical catch-at-age model (Figure 1). This gives extra credence to the results of the
catch-at-age model.
Figure 1. Results of catch curve analysis. Estimates of Z are consistent with the SCA
model.
A set of runs examining the assumption of initial stock depletion was requested. These
considered initial depletion of 5, 10 and 15 percent. Results were largely similar to
previous runs and are summarized in Table 2.
1992 1994 1996 1998 2000 2002 2004 2006
0.5
1.0
1.5
Catch curve analysis of commercial handline
yr
Z
1980 1985 1990 1995
0.5
1.0
1.5
Catch curve analysis of headboat
yr
Z
14

Review Workshop Report South Atlantic Red Snapper
SEDAR 15 SAR 1 SECTION IV
3. Submitted Comments
Comments were received in the following memorandum from Captain Bill Kelly
addressed to SAFMC member Captain Tony Iarocci. The four-page memorandum was
discussed at the review workshop. Comments of the review panel follow the
memorandum.
15

Review Workshop Report
South Atlantic Red Snapper
SEDAR 15 SAR 1 SECTION IV 16

Review Workshop Report
South Atlantic Red Snapper
SEDAR 15 SAR 1 SECTION IV 17

Review Workshop Report
South Atlantic Red Snapper
SEDAR 15 SAR 1 SECTION IV 18

Review Workshop Report
South Atlantic Red Snapper
SEDAR 15 SAR 1 SECTION IV 19

Review Workshop Report South Atlantic Greater Amberjack
SEDAR 15 SAR 2 SECTION IV
The review panel discussed a submission from Captain Bill Kelly that presented the opinions of
a number of fishermen from Miami down through the Islamorada area on the status of greater
amberjack and mutton snapper resources (few of the fishers had red snapper in their fisheries).
The panel welcomed the document and noted a number of points.
There was considerable consistency between the opinions of the fishermen on declines in greater
amberjack average catch weights, from 50-60 lbs to around 30 lbs. It was noted that this decline
was fully consistent with the model results, reflecting the fishing of stock from a relatively
unexploited state to one near MSY.
The panel recognized the valuable contribution that fishermen can provide, including expert
opinion and data collection. Undertaking co-operative approaches to survey resources in a
structured way, providing information that might otherwise be unavailable to stock assessments,
are extremely worthwhile, and the panel supported efforts to expand these activities.
20

Addenda and Post-Review Updates South Atlantic Red Snapper
SEDAR 15 SAR 1 Section V
Section V. Addenda and Post-Review Updates
Contents
1. Revisions or Corrections - This September 2008 report documents a re-run of the base
assessment model and projections needed due to a correction in the use of observed
recreational landings data in the stock assessment. It also updates reference points for
consistency with a recommendation of the Review Panel to use F40% as a proxy for
FMSY.
2. Estimation of Red Snapper Recruitment – This report was prepared for the SAFMC
Science and Statistics Committee for discussion in December 2008. It stems from a
review of item (1) above, which revealed that recruitment drops considerably between the
terminal year of estimates and the first year of projections. The reason for the change in
recruitment is discussed.
3. Red Snapper Projections: The SSC Alternative - This report presents further projections,
requested by the SAFMC SSC at its December 2008 meeting due to its concern for
recruitment estimates in the September 2008 projections. These projections extend from
the revised base run of the assessment model and projections described in item (1).

Addenda and Post-Review Updates South Atlantic Red Snapper
SEDAR 15 SAR 1 Section V

Addenda and updates South Atlantic Red Snapper
1 Revision and Corrections
1.1 Correction to recreational landings data
This section documents a correction to recreational landings data used in the stock assessment of SouthAtlantic red snapper.
As described in section 2.2 of the Assessment Workshop report, the assessment included observed recre-ational landings from Salt-Water Angling reports. These landings were reported to the level of species forred snapper in the years 1965 and 1970, and as unclassified snappers in 1960. Thus, the value in 1960 wasestimated as the unweighted average ratios of red snapper to all snapper from 1965 and 1970. Linear interpo-lation was used to estimate the recreational landings stream in years surrounding the 1960, 1965, and 1970point estimates.
After completion of the assessment, it was discovered that the recreational landings in 1965 and 1970 hadbeen transposed when developing the recreational landings stream. Correction of these values affected notonly the point estimates in 1965 and 1970, but also estimates in surrounding years that depended on the linearinterpolations (Figure 1.1). Using the corrected recreational landings stream, the base assessment model wasre-run, as described below.
1.2 Revised base run of the assessment model
This section describes results of the base assessment model incorporating the correction to recreational land-ings (§1.1). It also updates reference points for consistency with recommendations of the SEDAR-15 ReviewPanel.
1.2.1 Revisions
Using the corrected recreational landings stream, the base assessment model was re-run with no change in theweighting configuration of model components (methods and weighting configuration described fully in theAssessment Workshop report). Reference points were based on F40% as a proxy for FMSY, as recommended bythe SEDAR-15 Review Panel. As before, these reference points depend on average selectivity across fisheries,weighted by recent fishing mortality rates. In the previous model run, average selectivity was re-scaled to amaximum of one. Because of the high discard mortalities combined with dome-shaped discard selectivity,that re-scaling of average selectivity made it difficult to compare full F and FMSY (or its proxy). For improvedconsistency between the two, average selectivity is not re-scaled in this revised assessment. This change doesnot affect model fit to data or parameter estimates, but does affect the computation and value of FMSY (or itsproxy).
1.2.2 Results of revised base run
1.2.2.1 Comparison of estimated time series Figure 1.2 shows comparisons of estimated time series fromthe base model using either the previous recreational landings stream or the corrected recreational landingsstream. The effect of the correction on estimated time series of recruitment, fishing mortality rate, andspawning biomass was generally small. The remainder of results focus on the model run with correctedlandings.
SEDAR 15 SAR 1 SECTION V 1

Addenda and updates South Atlantic Red Snapper
1.2.2.2 Measures of Overall Model Fit Overall, the catch-at-age model fit well to the available data. Annualfits to length compositions from each fishery were reasonable in most years, as were fits to age compositions(Figure 1.3). Residuals of these fits, by year and fishery, are summarized with bubble plots; differences betweenannual observed and predicted vectors are summarized with angular deviation (Figure 1.4–1.11). Angulardeviation is defined as the arc cosine of the dot product of two vectors.
The model was configured to fit observed commercial and recreational landings closely (Table 1.1; Figures1.12–1.15). In addition, it fit well to observed discards (Table 1.2; Figures 1.16–1.18).
Fits to indices of abundance were reasonable (Figures 1.19–1.21). The three indices were positively corre-lated. Since the mid-1990s, indices showed an increasing trend in general, but during the last three years, adecreasing trend.
1.2.2.3 Parameter Estimates Estimates of all parameters from the catch-at-age model are shown in Ap-pendix A. The estimated coefficient of variation of length at age was CV = 11.56% (Figure 1.22).
1.2.2.4 Stock Abundance and Recruitment Estimated abundance at age shows truncation of the oldestages during the 1950s through 1970s, from which the stock has not yet recovered (Table 1.3). Annual numberof recruits is shown in Table 1.3 (age-1 column) and in Figure 1.23. Notable strength in year classes waspredicted to have occurred in 1983 and 1984, and again in 1998–2000.
1.2.2.5 Stock Biomass (total and spawning stock) Estimated biomass at age follows a similar pattern oftruncation as did abundance (Tables 1.4,1.5). Total biomass and spawning biomass show nearly identicaltrends—decline during the 1950s through 1970s, and stable but low levels since 1980 (Figure 1.24, Table 1.6).
1.2.2.6 Fishery Selectivity Estimated selectivities of landings from commercial handline shift toward olderfish with implementation of each new minimum size regulation (12-inch TL in 1984 and then 20-inch TLin 1992) (Figure 1.25). In the most recent period, fish were estimated to be almost fully selected by age 4.Selectivity of landings from commercial diving was estimated to be dome-shaped with a peak between ages5 and 10 (Figure 1.26). Similar to commercial handline, landings from the headboat fishery showed a shifttoward older fish, with full selection at age 4 in the most recent period (Figure 1.27), as did landings from thegeneral recreational fishery, with full selection at age 3 in the most recent period (Figure 1.28).
Selectivities of discard mortalities were similar across the commercial handline, headboat, and general rec-reational fisheries (Figure 1.29 – Figure 1.31). These selectivities included age-1 and age-2 fish in the period1984–1991, when the 12-inch TL size limit was in place. They additionally included age-3 fish in the period1992–2006, when the 20-inch TL size limit was in place.
Average selectivities of landings and of discard mortalities were computed from F -weighted selectivities in themost recent period of regulations (Figure 1.32). These average selectivities were used to compute benchmarksand in projections. All selectivities from the most recent period, including average selectivities, are presentedin Table 1.7.
SEDAR 15 SAR 1 SECTION V 2

Addenda and updates South Atlantic Red Snapper
1.2.2.7 Fishing Mortality The estimated time series of fishing mortality rate (F ) shows a generally increas-ing trend from the 1950s through the late 1970s, and since 1980 has fluctuated around a mean near F = 0.92(Figure 1.33). In the most recent years, the majority of full F comprised commercial handline landings, generalrecreational landings, and general recreational discard mortalities (Figure 1.33, Table 1.8).
Full F at age is shown in Table 1.9. In any given year, the maximum F at age may be less than that year’sfully selected F . This inequality is due to the combination of two features of estimated selectivities: fullselection occurs at different ages among gears and several sources of mortality (commercial diving, discards)have dome-shaped selectivity.
Throughout most of the assessment period, estimated landings and discard mortalities in number of fishhave been dominated by the recreational sector (Figures 1.34, 1.35). Table 1.10 shows total landings at age innumbers, Table 1.11 in metric tons, and Table 1.12 in 1000 lb.
1.2.2.8 Stock-Recruitment Parameters The estimated Beverton–Holt spawner-recruit curve is shown inFigure 1.36. Variability about the curve was estimated only at low levels of spawning biomass, because com-position data required for estimating recruitment deviations became available only after the stock was de-pleted. Estimated parameters were as follows: steepness h = 0.95, R0 = 638166.4, first-order autocorrelation% = 0.36, and bias correction ς = 1.1.
The RW Report states, “One of the principal difficulties with the SCA model estimate of the stock recruitmentparameters is that the steepness estimate appears unrealistically high.” This was a primary reason why theReview Panel recommended using F40% as a proxy for FMSY. Because the Review Panel believed that the valueof steepness estimated within the assessment model was “unrealistically high,” a value was used here forconsistency with the F40% proxy. That is, assuming that F40% is indeed the value of FMSY, one can compute thecorresponding value of steepness (Figure 1.37). The value corresponding to F40% = FMSY is h = 0.68, and thusthis value was used to compute equilibrium levels of landings and biomass.
1.2.2.9 Per Recruit and Equilibrium Analyses Static spawning potential ratio (static SPR) shows a trend ofmarked decrease from the beginning of the assessment period until the mid 1970’s, and since has remainedrelatively constant at levels between 1% and 3% (Figure 1.38, Table 1.6). Static SPR of each year was com-puted as the asymptotic spawners per recruit given that year’s fishery-specific Fs and selectivities, divided byspawners per recruit that would be obtained in an unexploited stock. In this form, static SPR ranges betweenzero and one, and represents SPR that would be achieved under an equilibrium age structure at the current F(hence the term static).
Yield per recruit and spawning potential ratio were computed as functions of F (Figure 1.39), as were equilib-rium landings and spawning biomass (Figures 1.40). Equilibrium landings and discards were also computedas functions of biomass B, which itself is a function of F (Figure 1.41). Per recruit analyses applied the mostrecent selectivity patterns averaged across fisheries, weighted by F from the last three years (2004–2006).
SEDAR 15 SAR 1 SECTION V 3

Addenda and updates South Atlantic Red Snapper
1.2.2.10 Reference Points The SEDAR-15 Review Panel did not recommend using MSY-related referencepoints, because they thought that data were not adequate for reliable estimation of the spawner-recruit func-tion. Instead, they recommended using F40% as a proxy for FMSY. To compute biomass proxies from F40%,however, one must know or assume productivity of the stock. Along these lines, the Review Panel did notreject the functional form of the Beverton–Holt spawner-recruit curve, but instead thought that the param-eters were not well estimated. As stated previously, a steepness of h = 0.68 is consistent with the ReviewPanel’s recommendation of F40%, but that proxy does not provide any information about the other key pa-rameter of the Beverton–Holt function, unfished recruitment R0. On this parameter, the RW Report providesseemingly conflicting advice. In Table 1 of the RW Report, biomass proxies assumed fixed recruitment at thebias-corrected unfished level (R0), yet the report also states, “...there are no data in the assessment to ade-quately define the asymptote of the Beverton–Holt function and hence estimates of MSY indicators cannot beconsidered reliable.” In this revision, an attempt is made to accommodate both pieces of advice in a consis-tent manner, by using the bias-corrected R0 to compute biomass proxies, while also examining the effect ofvariation in R0 by ±25%. In almost all sensitivity runs of the base assessment model, R0 falls within this range.
Assuming the Beverton–Holt spawner-recruit function, biomass proxies were computed assuming equilibriumrecruitment and age structure associated with F40%. The bias correction (ς) was computed from the estimatedvariance (σ 2) of recruitment deviation: ς = exp(σ 2/2). Then, equilibrium recruitment (Req) associated withany F is,
Req =R0 [ς0.8hΦF − 0.2(1− h)]
(h− 0.2)ΦF(1)
where R0 is recruitment at the unfished level, h is steepness, and ΦF is spawning potential ratio given growth,maturity, and total mortality at age (including natural, fishing, and discard mortality rates).
The approach described above provides reference points that are consistent with rebuilding projections (i.e.,fishing at F40% yields MSYF40% from a stock size of SSBF40% ). Reference points estimated were the proxies forFMSY, MSY, BMSY and SSBMSY. These values were computed using h = 0.68 (for which F40% = FMSY), alongwith R0 = 638166.4 and ς = 1.1 from the assessment, in addition to R0 = ±25%R0. Also, based on F40%,three possible values of F at optimum yield (OY) were considered—FOY = 65%F40%, FOY = 75%F40%, and FOY =85%F40%—and for each, the corresponding equilibrium yield and dead discards. These values depend onequilibrium recruitment expected from the age structure at FOY, given h = 0.68, R0 = 638166.4, and ς = 1.1.
Estimates of benchmarks are summarized in Table 1.13.
1.2.2.11 Status of the Stock and Fishery Estimated time series of B and SSB relative to their proxy refer-ence points show similar patterns: initial status well above the MSY proxy, decline during the 1950s through1970s, and stable at low levels since 1980 (Figure 1.42, Table 1.6). Current stock status was estimated to beSSB2006/SSBF40% = 0.029 and SSB2006/MSST = 0.031, indicating that the stock is overfished (Table 1.13).
The estimated time series of F relative to F40% shows a generally increasing trend from the 1950s through1980, and since has fluctuated about a mean near 8.86 (Figure 1.43, Table 1.6). The time series indicatesthat overfishing has been occurring without break since 1967, with the current estimate at F2006/F40% = 7.658(Table 1.13).
SEDAR 15 SAR 1 SECTION V 4

Addenda and updates South Atlantic Red Snapper
1.2.3 Comments on Assessment Results
Estimated reference points play a central role in this assessment, to gauge status of the stock and fishery. Ifselectivity patterns change in the future, for example as a result of new management regulations, estimates ofrefence points would likely change as well.
The SEDAR-15 Review Panel recommended F40% as a proxy for FMSY, and corresponding proxies for biomassreference points. Computation of reference points is conditional on the combined selectivities from all mod-eled sources of fishing mortality. In this revised assessment, the selectivity on which reference points werebased was not re-scaled to one, as it was in the previous assessment. This modification was to provide im-proved consistency between full F and F40%, in particular for computing the ratio F/F40%, and it accounts forthe bulk of the difference between the previous estimate of F40% and the revised estimate. Despite this dif-ference, however, the modification would not affect fishing mortality rates associated with F40%, because theproduct F40% times selectivity would be unchanged. Furthermore, this modification would not affect biomassreference points. Changes in those reference points are due primarily to relating recruitment to stock size(as opposed to Table 1 of the RW Report, which assumed recruitment always occurred at the unfished level,regardless of stock size). Correcting the error in early recreational landings had little effect on estimatedreference points.
The base run of the age-structured assessment model indicated that the stock is overfished (SSB2006/MSST =0.031) and that overfishing is occurring (F2006/F40% = 7.658). These results were invariant to the 31 differentconfigurations used in sensitivity runs of the AW Report, to the five additional sensitivity runs requested bythe Review Panel, and to this revised run with corrected recreational landings. In addition, the same qualitativefindings resulted from the age-aggregated surplus production model and its various sensitivity runs.
1.3 Revised projections
This section describes revised projections where population parameter estimates come from the assessmentmodel with corrected recreational landings. It also updates projections to be consistent with recommendationsof the SEDAR-15 Review Panel.
1.3.1 Revisions
The methods of projection, initialization, and inclusion of stochasticity were identical to those described in theAW Report. Revisions were threefold. First, parameter estimates used in the projection came from the revisedassessment with corrected recreational landings, with the exception of the estimate of steepness. Second,the estimate of steepness was assumed to be h = 0.68 (Figure 1.37), for consistency with the Review Panel’srecommendation that F40% is a proxy for FMSY, and so that projections are consistent with the F40% referencepoints. Third, the rebuilding time frame was based on achieving at least a 50% probability of stock recoveryto SSBF40% under F = 0 using n = 2000 Monte Carlo replications (previously, recovery was based on SSB ofthe deterministic projection). These revisions led to an increase in the allowable recovery time from 34 to 49years.
SEDAR 15 SAR 1 SECTION V 5

Addenda and updates South Atlantic Red Snapper
1.3.2 Projection scenarios
Several constant-F projection scenarios were considered:
• Scenario R1: F = 0
• Scenario R2: F = F40%
• Scenario R3: F = 65%F40%
• Scenario R4: F = 75%F40%
• Scenario R5: F = 85%F40%
In addition, several discard-only projections were considered. The discard-only projections included the fol-lowing scenarios:
• Scenario R6: F = Fcurrent excluding commercial diving, but all fish caught were released and subjected torelease mortality rates used in the assessment (0.9 in the commercial sector and 0.4 in the headboat andrecreational sectors)
• Scenario R7: F = F40%, but all fish caught were released and subjected to release mortality rates used inthe assessment (0.9 in the commercial sector and 0.4 in the headboat and recreational sectors)
• Scenario R8: F = 65%F40%, but all fish caught were released and subjected to release mortality rates usedin the assessment (0.9 in the commercial sector and 0.4 in the headboat and recreational sectors)
• Scenario R9: F = 75%F40%, but all fish caught were released and subjected to release mortality rates usedin the assessment (0.9 in the commercial sector and 0.4 in the headboat and recreational sectors)
• Scenario R10: F = 85%F40%, but all fish caught were released and subjected to release mortality ratesused in the assessment (0.9 in the commercial sector and 0.4 in the headboat and recreational sectors)
When interpreting the discard-only projections, one should keep in mind that the distribution of full F amongthe various fisheries is different from that in the assessment, which may lead to some inconsistency betweenprojections and benchmarks from the assessment (e.g., fishing at F40% may lead to an equilibrium stock sizeother than SSBF40% ).
1.3.3 Projection results
Projection scenario R1, in which F = 0, predicted at least a 50% probability of recovery in 2035 (Figure 1.44,Table 1.14). That duration plus the 20-year generation time (§III(2)) defined the rebuilding time frame suchthat recovery occurs by the end of 2055. Thus, all remaining projections were run through the year 2055.
Projection scenario R2, in which F = F40%, predicted the stock to begin, but not achieve, recovery by 2055(Figure 1.45, Table 1.15). If F is reduced to 65% or 75% of F40%, as in scenarios R3 and R4, respectively,the stock was predicted to recover within the rebuilding time frame (Figures 1.46–1.47, Tables 1.16–1.17).However, full stock recovery was not predicted if F is reduced to 85% of F40%, as in scenario R5 (Figure 1.48,Table 1.18).
Discard-only projections predicted that, under F = Fcurrent (minus commercial diving), disallowing the reten-tion of red snapper would not be sufficient to rebuild the stock (Figure 1.49, Table 1.19). These results suggestthat to rebuild the stock, total catches of red snapper will need to be reduced, not just landings. The stockwas predicted to recover in discard-only projections R7, R8, R9, and R10, with F reduced to F40%, 65% of F40%,75% of F40%, and 85% of F40%, respectively (Figures 1.50– 1.53, Tables 1.20–1.23).
SEDAR 15 SAR 1 SECTION V 6

Addenda and updates South Atlantic Red Snapper
1.3.4 Comments on Projections
As usual, projections should be interpreted in light of the model assumptions and key aspects of the data.Some major considerations are the following:
• Initial abundance at age of the projections were based on estimates from the assessment. If thoseestimates are inaccurate, rebuilding will likely be affected.
• Fisheries were assumed to continue fishing at their estimated current proportions of total effort, usingthe estimated current selectivity patterns. New management regulations that alter those proportions orselectivities would likely affect rebuilding.
• The projections assumed no change in the selectivity applied to discards. As recovery generally beginswith the smallest size classes, management action may be needed to meet that assumption.
• The projections assumed that the estimated spawner-recruit relationship applies in the future and thatpast residuals represent future uncertainty in recruitment. If changes in environmental or ecologicalconditions affect recruitment or life-history characteristics, rebuilding may be affected.
• Discard-only projections tacitly assumed that any individual fish would be caught only once per year.To the extent that this assumption is violated, discard-only projections may overestimate the velocity ofrecovery.
• Discard-only projections allocated sources of mortality in different proportions than those used in com-puting reference points. Thus discard-only projections are not consistent with reference points, in thesense that fishing at F40% may lead to an equilibrium stock size other than SSBF40% .
SEDAR 15 SAR 1 SECTION V 7

Addenda and updates South Atlantic Red Snapper
1.3.5 Tables
Table 1.1. Red snapper: Estimated time series of landings (1000 lb) for commercial handline (L.c.hal), commer-cial diving (L.c.dv), headboat(L.hb), and general recreational (L.rec). General recreational includes headboatprior to 1972.
Year L.c.hal L.c.dv L.hb L.rec Total
1945 240.87 . . . 240.871946 262.62 . . . 262.621947 284.36 . . 292.44 576.801948 306.10 . . 584.88 890.991949 327.84 . . 877.32 1205.161950 349.59 . . 1169.75 1519.341951 498.58 . . 1462.18 1960.771952 374.76 . . 1754.61 2129.371953 389.08 . . 2047.02 2436.101954 576.87 . . 2339.43 2916.311955 479.60 . . 2631.84 3111.441956 469.98 . . 2924.24 3394.221957 843.02 . . 3216.63 4059.641958 594.66 . . 3509.01 4103.671959 638.33 . . 3801.38 4439.701960 652.29 . . 4093.74 4746.021961 770.40 . . 3662.58 4432.981962 575.91 . . 3231.41 3807.321963 438.52 . . 2800.22 3238.751964 486.31 . . 2369.06 2855.371965 571.40 . . 1937.88 2509.271966 643.46 . . 2686.56 3330.021967 843.62 . . 3435.24 4278.861968 938.69 . . 4183.96 5122.661969 610.98 . . 4932.76 5543.741970 559.14 . . 5681.72 6240.851971 478.87 . . 5191.17 5670.041972 414.29 . 91.92 4608.65 5114.851973 340.16 . 117.31 4092.66 4550.121974 555.20 . 77.06 3642.53 4274.781975 650.92 . 83.52 3145.40 3879.841976 547.38 . 109.28 2631.11 3287.771977 579.15 . 59.93 2173.90 2812.981978 544.96 . 62.98 1664.41 2272.341979 380.73 . 54.13 1207.13 1641.991980 352.90 . 54.66 721.87 1129.421981 347.26 . 116.60 283.78 747.641982 286.26 . 98.05 251.61 635.921983 290.10 . 74.01 335.49 699.611984 230.64 1.21 81.43 536.37 849.641985 223.03 2.27 132.10 568.19 925.591986 200.18 0.55 54.38 439.32 694.431987 172.78 0.42 81.83 246.47 501.501988 151.94 0.29 130.03 279.73 562.001989 242.34 1.10 70.78 304.26 618.481990 201.56 1.66 65.67 272.29 541.191991 125.38 5.27 72.02 216.35 419.001992 87.53 9.41 28.91 259.22 385.061993 206.32 5.74 42.72 258.22 513.001994 175.63 12.98 53.42 118.02 360.051995 164.06 10.16 57.47 110.01 341.711996 129.97 6.18 46.23 116.83 299.211997 98.87 7.49 51.20 113.56 271.121998 78.74 7.99 26.85 193.64 307.211999 78.95 9.88 43.56 275.98 408.382000 89.22 11.36 49.40 355.77 505.752001 169.88 19.97 68.39 364.32 622.562002 158.83 22.88 70.80 305.58 558.092003 117.18 17.27 41.35 299.24 475.052004 147.47 19.22 80.35 273.79 520.832005 115.01 9.41 58.70 275.28 458.412006 79.08 4.10 41.44 274.29 398.90
SEDAR 15 SAR 1 SECTION V 8

Addenda and updates South Atlantic Red Snapper
Table 1.2. Red snapper: Estimated time series of discard mortalities (1000 fish) for commercial handline (D.c.hal),headboat(D.hb), and general recreational (D.rec). Discards were assumed zero prior to implementation of regu-lations in 1984.
Year D.c.hal D.hb D.rec Total
1984 6.76 3.29 43.56 53.611985 3.34 2.77 29.11 35.221986 6.38 2.42 26.35 35.151987 13.81 8.17 20.64 42.621988 6.82 6.60 23.24 36.661989 2.52 1.43 9.11 13.061990 27.41 10.46 7.47 45.341991 3.70 2.15 7.19 13.041992 16.46 1.30 19.96 37.731993 16.08 9.84 21.88 47.791994 22.02 7.43 24.73 54.171995 21.74 11.32 17.97 51.031996 29.03 4.35 11.28 44.661997 30.35 1.37 8.15 39.881998 22.97 8.26 29.45 60.681999 20.66 7.31 62.20 90.182000 19.63 9.88 86.36 115.872001 21.31 18.92 79.91 120.152002 19.92 16.16 66.54 102.612003 17.04 10.24 63.92 91.202004 14.23 17.54 62.96 94.742005 13.75 15.87 60.14 89.762006 15.22 11.48 52.21 78.91
SEDAR 15 SAR 1 SECTION V 9

Addenda and updates South Atlantic Red SnapperT
able
1.3
.R
edsn
ap
per
:Es
tim
ate
da
bu
nd
an
cea
ta
ge
(10
00
fish
)a
tst
art
ofye
ar
Yea
r1
23
45
67
89
10
11
12
13
14
15
16
17
18
19
20
19
45
47
8.6
38
0.1
32
5.0
28
6.7
25
7.2
23
3.2
21
2.9
19
5.3
17
9.7
16
5.8
15
3.3
14
1.9
13
1.5
12
2.0
11
3.2
10
5.1
97.6
90.7
84.3
11
16.4
19
46
70
1.7
37
9.9
32
3.8
28
5.6
25
6.2
23
2.3
21
2.1
19
4.5
17
9.0
16
5.2
15
2.7
14
1.3
13
1.0
12
1.5
11
2.7
10
4.7
97.3
90.4
84.0
11
12.0
19
47
70
1.6
55
6.9
32
3.4
28
4.4
25
5.2
23
1.3
21
1.1
19
3.7
17
8.2
16
4.5
15
2.0
14
0.7
13
0.4
12
1.0
11
2.3
10
4.2
96.8
90.0
83.6
11
07.3
19
48
70
1.5
55
6.3
47
1.7
28
2.7
25
2.8
22
9.2
20
9.2
19
1.9
17
6.6
16
2.9
15
0.6
13
9.4
12
9.2
11
9.8
11
1.2
10
3.3
95.9
89.1
82.9
10
97.0
19
49
70
1.5
55
5.8
46
8.8
41
0.1
24
9.9
22
5.9
20
6.2
18
9.1
17
4.0
16
0.6
14
8.4
13
7.4
12
7.3
11
8.1
10
9.6
10
1.8
94.6
87.9
81.7
10
81.2
19
50
70
1.4
55
5.2
46
5.9
40
5.5
36
0.7
22
2.2
20
2.1
18
5.4
17
0.6
15
7.4
14
5.5
13
4.7
12
4.9
11
5.8
10
7.5
99.8
92.7
86.1
80.1
10
60.0
19
51
70
1.3
55
4.7
46
3.0
40
0.9
35
4.8
31
9.0
19
7.8
18
0.8
16
6.4
15
3.5
14
1.9
13
1.4
12
1.8
11
2.9
10
4.8
97.3
90.4
84.0
78.1
10
33.8
19
52
70
1.2
55
3.9
45
9.1
39
5.3
34
8.1
31
1.3
28
1.8
17
5.6
16
1.1
14
8.6
13
7.4
12
7.2
11
7.9
10
9.3
10
1.5
94.2
87.5
81.3
75.6
10
00.6
19
53
70
1.1
55
3.5
45
6.9
39
0.7
34
2.2
30
4.4
27
4.2
24
9.4
15
5.9
14
3.4
13
2.5
12
2.7
11
3.7
10
5.5
97.9
90.9
84.4
78.4
72.9
96
5.3
19
54
70
0.8
55
2.8
45
3.9
38
6.6
33
6.2
29
7.5
26
6.5
24
1.2
22
0.1
13
8.0
12
7.1
11
7.7
10
9.1
10
1.1
93.9
87.2
81.0
75.2
69.9
92
5.9
19
55
70
0.6
55
1.7
44
9.1
38
0.5
32
9.6
28
9.6
25
8.1
23
2.3
21
0.9
19
3.0
12
1.2
11
1.8
10
3.6
96.1
89.2
82.8
76.9
71.5
66.5
87
9.8
19
56
70
0.2
55
1.0
44
6.1
37
4.6
32
2.8
28
2.5
24
9.9
22
3.8
20
2.2
18
4.0
16
8.7
10
6.1
98.0
90.9
84.3
78.3
72.8
67.6
62.8
83
1.9
19
57
69
9.7
55
0.1
44
2.4
36
9.5
31
5.6
27
4.7
24
2.1
21
5.3
19
3.4
17
5.1
15
9.7
14
6.6
92.3
85.3
79.2
73.5
68.3
63.5
59.0
78
1.0
19
58
69
9.1
54
8.3
43
4.8
36
0.8
30
6.4
26
4.5
23
1.8
20
5.3
18
3.1
16
5.0
14
9.7
13
6.7
12
5.6
79.1
73.2
68.0
63.1
58.7
54.5
72
2.0
19
59
69
8.4
54
7.3
43
1.3
35
2.9
29
7.8
25
5.6
22
2.1
19
5.6
17
3.8
15
5.5
14
0.3
12
7.5
11
6.5
10
7.2
67.6
62.5
58.1
54.0
50.2
66
4.3
19
60
69
7.5
54
5.6
42
5.5
34
5.9
28
7.8
24
5.4
21
2.1
18
5.2
16
3.7
14
5.8
13
0.6
11
8.1
10
7.4
98.2
90.4
57.0
52.8
49.1
45.6
60
3.9
19
61
69
6.4
54
3.7
41
8.5
33
6.7
27
8.4
23
4.1
20
1.0
17
4.5
15
2.9
13
5.5
12
0.9
10
8.5
98.1
89.3
81.8
75.3
47.5
44.0
40.9
54
1.7
19
62
69
5.2
54
2.9
41
7.1
33
1.2
27
1.0
22
6.4
19
1.7
16
5.4
14
4.1
12
6.6
11
2.4
10
0.4
90.2
81.7
74.4
68.1
62.8
39.6
36.7
48
6.0
19
63
69
4.1
54
2.9
42
0.5
33
3.3
26
9.2
22
2.6
18
7.2
15
9.3
13
7.9
12
0.4
10
6.0
94.2
84.3
75.8
68.7
62.6
57.4
52.8
33.4
44
0.3
19
64
69
3.3
54
3.0
42
5.2
33
9.8
27
4.0
22
3.6
18
6.1
15
7.3
13
4.3
11
6.5
10
2.0
89.9
80.0
71.6
64.4
58.4
53.3
48.8
45.0
40
3.5
19
65
69
2.7
54
3.1
42
8.8
34
6.4
28
1.6
22
9.4
18
8.5
15
7.7
13
3.7
11
4.4
99.5
87.2
76.9
68.5
61.4
55.3
50.1
45.7
41.9
38
5.1
19
66
69
2.3
54
3.4
43
2.5
35
2.3
28
9.5
23
7.8
19
5.0
16
1.0
13
5.2
11
4.9
98.5
85.8
75.3
66.5
59.2
53.1
47.8
43.4
39.6
36
9.8
19
67
69
1.9
54
0.8
42
2.0
34
6.5
28
7.1
23
8.3
19
7.1
16
2.5
13
4.6
11
3.3
96.5
82.8
72.2
63.4
56.0
50.0
44.8
40.4
36.6
34
5.6
19
68
69
0.8
53
7.3
40
6.2
32
7.0
27
3.1
22
8.6
19
1.1
15
8.8
13
1.3
10
9.1
92.0
78.4
67.4
58.8
51.7
45.7
40.8
36.6
32.9
31
2.2
19
69
68
8.9
53
3.0
38
8.4
30
2.9
24
8.0
20
9.3
17
6.4
14
8.2
12
3.5
10
2.4
85.2
72.0
61.5
52.9
46.1
40.6
35.9
32.0
28.7
27
1.2
19
70
68
6.1
52
8.3
37
1.9
27
9.6
22
1.8
18
3.5
15
5.9
13
2.0
11
1.3
93.0
77.3
64.4
54.4
46.5
40.0
35.0
30.8
27.2
24.3
22
7.6
19
71
68
1.6
52
0.4
34
6.2
25
1.5
19
2.3
15
4.1
12
8.4
10
9.6
93.1
78.7
65.9
54.8
45.7
38.7
33.1
28.5
24.9
21.9
19.4
17
9.5
19
72
67
5.2
51
4.9
33
2.8
22
8.4
16
8.7
13
0.3
10
5.2
88.0
75.4
64.3
54.4
45.6
38.0
31.7
26.8
23.0
19.8
17.3
15.2
13
8.3
19
73
66
7.2
50
7.6
32
0.2
21
3.5
14
9.0
11
1.2
86.5
70.1
58.9
50.6
43.2
36.6
30.7
25.6
21.4
18.1
15.5
13.4
11.7
10
3.8
19
74
46
1.3
49
9.2
30
6.9
19
9.7
13
5.4
95.5
71.8
56.1
45.7
38.4
33.1
28.3
24.0
20.2
16.8
14.1
11.9
10.2
8.8
75.9
19
75
39
9.2
34
1.6
28
4.6
18
0.5
11
9.5
81.9
58.1
43.9
34.4
28.1
23.7
20.4
17.5
14.8
12.5
10.4
8.7
7.4
6.3
52.5
19
76
46
7.7
29
1.6
17
9.8
15
4.5
99.7
66.7
46.0
32.8
24.9
19.6
16.0
13.5
11.6
10.0
8.5
7.1
6.0
5.0
4.2
33.7
19
77
60
9.6
33
6.0
13
9.4
88.7
77.5
50.5
34.0
23.6
16.9
12.8
10.1
8.3
7.0
6.0
5.2
4.4
3.7
3.1
2.6
19.7
19
78
66
8.1
42
5.0
13
5.0
57.8
37.4
33.0
21.7
14.7
10.2
7.3
5.6
4.4
3.6
3.0
2.6
2.3
1.9
1.6
1.4
9.7
19
79
37
9.3
44
8.7
13
7.5
45.0
19.6
12.8
11.4
7.5
5.1
3.6
2.6
2.0
1.5
1.3
1.1
0.9
0.8
0.7
0.6
3.9
19
80
70
3.4
25
0.1
13
0.3
41.2
13.7
6.0
4.0
3.5
2.3
1.6
1.1
0.8
0.6
0.5
0.4
0.3
0.3
0.3
0.2
1.4
19
81
15
3.9
45
6.1
65.9
35.4
11.4
3.8
1.7
1.1
1.0
0.7
0.5
0.3
0.2
0.2
0.1
0.1
0.1
0.1
0.1
0.5
19
82
31
0.3
10
7.7
18
6.6
27.8
15.2
4.9
1.7
0.7
0.5
0.4
0.3
0.2
0.1
0.1
0.1
0.1
0.1
0.0
0.0
0.2
19
83
55
6.8
21
8.2
45.4
81.2
12.3
6.8
2.2
0.8
0.3
0.2
0.2
0.1
0.1
0.1
0.0
0.0
0.0
0.0
0.0
0.1
19
84
75
2.9
38
4.8
83.2
17.9
32.5
5.0
2.8
0.9
0.3
0.1
0.1
0.1
0.1
0.0
0.0
0.0
0.0
0.0
0.0
0.1
SEDAR 15 SAR 1 SECTION V 10

Addenda and updates South Atlantic Red SnapperT
able
1.3
.(c
on
tin
ued
)
Yea
r1
23
45
67
89
10
11
12
13
14
15
16
17
18
19
20
19
85
21
2.9
46
2.8
14
4.0
27.8
6.1
11.1
1.7
1.0
0.3
0.1
0.0
0.0
0.0
0.0
0.0
0.0
0.0
0.0
0.0
0.0
19
86
28
1.1
13
1.4
17
3.3
49.8
9.7
2.1
4.0
0.6
0.3
0.1
0.0
0.0
0.0
0.0
0.0
0.0
0.0
0.0
0.0
0.0
19
87
35
2.0
16
8.4
49.9
68.5
20.0
4.0
0.9
1.6
0.3
0.1
0.0
0.0
0.0
0.0
0.0
0.0
0.0
0.0
0.0
0.0
19
88
28
1.0
22
8.6
75.3
22.8
31.8
9.4
1.9
0.4
0.8
0.1
0.1
0.0
0.0
0.0
0.0
0.0
0.0
0.0
0.0
0.0
19
89
28
3.7
18
2.6
98.0
32.7
10.1
14.2
4.2
0.8
0.2
0.4
0.1
0.0
0.0
0.0
0.0
0.0
0.0
0.0
0.0
0.0
19
90
24
7.7
18
8.9
82.0
37.1
12.6
3.9
5.5
1.7
0.3
0.1
0.1
0.0
0.0
0.0
0.0
0.0
0.0
0.0
0.0
0.0
19
91
33
4.1
15
3.7
74.7
32.5
14.9
5.1
1.6
2.3
0.7
0.1
0.0
0.1
0.0
0.0
0.0
0.0
0.0
0.0
0.0
0.0
19
92
16
9.2
23
0.1
78.7
35.8
15.7
7.3
2.5
0.8
1.1
0.3
0.1
0.0
0.0
0.0
0.0
0.0
0.0
0.0
0.0
0.0
19
93
13
0.4
12
4.3
13
7.0
41.5
17.1
7.5
3.5
1.2
0.4
0.5
0.2
0.0
0.0
0.0
0.0
0.0
0.0
0.0
0.0
0.0
19
94
12
7.6
91.2
67.7
64.1
15.8
6.5
2.9
1.3
0.5
0.1
0.2
0.1
0.0
0.0
0.0
0.0
0.0
0.0
0.0
0.0
19
95
12
9.3
84.1
48.6
34.8
30.6
7.6
3.1
1.4
0.7
0.2
0.1
0.1
0.0
0.0
0.0
0.0
0.0
0.0
0.0
0.0
19
96
17
7.7
84.6
43.8
24.2
16.1
14.3
3.5
1.5
0.7
0.3
0.1
0.0
0.1
0.0
0.0
0.0
0.0
0.0
0.0
0.0
19
97
18
4.5
12
1.5
47.0
22.5
11.1
7.5
6.6
1.7
0.7
0.3
0.1
0.1
0.0
0.0
0.0
0.0
0.0
0.0
0.0
0.0
19
98
39
4.0
13
1.3
73.3
25.3
10.5
5.2
3.5
3.1
0.8
0.3
0.1
0.1
0.0
0.0
0.0
0.0
0.0
0.0
0.0
0.0
19
99
45
4.3
27
9.4
73.5
37.2
12.0
5.0
2.5
1.7
1.5
0.4
0.2
0.1
0.0
0.0
0.0
0.0
0.0
0.0
0.0
0.0
20
00
36
5.5
32
0.8
15
1.4
35.3
16.6
5.4
2.3
1.1
0.8
0.7
0.2
0.1
0.0
0.0
0.0
0.0
0.0
0.0
0.0
0.0
20
01
25
3.7
25
2.2
16
6.7
72.0
16.3
7.7
2.5
1.1
0.5
0.4
0.3
0.1
0.0
0.0
0.0
0.0
0.0
0.0
0.0
0.0
20
02
30
2.3
16
8.1
12
2.7
75.0
30.9
7.0
3.4
1.1
0.5
0.2
0.2
0.2
0.0
0.0
0.0
0.0
0.0
0.0
0.0
0.0
20
03
21
2.7
20
0.0
83.5
58.1
35.3
14.7
3.4
1.6
0.5
0.2
0.1
0.1
0.1
0.0
0.0
0.0
0.0
0.0
0.0
0.0
20
04
25
9.5
14
1.1
99.9
41.4
30.6
18.8
7.9
1.8
0.9
0.3
0.1
0.1
0.0
0.0
0.0
0.0
0.0
0.0
0.0
0.0
20
05
27
4.2
16
8.6
67.8
46.3
19.6
14.6
9.0
3.8
0.9
0.4
0.1
0.1
0.0
0.0
0.0
0.0
0.0
0.0
0.0
0.0
20
06
27
9.6
18
1.5
82.6
32.0
22.6
9.7
7.3
4.5
1.9
0.4
0.2
0.1
0.0
0.0
0.0
0.0
0.0
0.0
0.0
0.0
20
07
28
5.9
19
1.4
95.4
42.0
17.0
12.2
5.2
3.9
2.5
1.0
0.2
0.1
0.0
0.0
0.0
0.0
0.0
0.0
0.0
0.0
SEDAR 15 SAR 1 SECTION V 11

Addenda and updates South Atlantic Red Snapper
Table
1.4
.R
edsn
apper
:Es
tim
ate
dbio
mass
at
age
(mt)
at
start
ofye
ar
Yea
r1
23
45
67
89
10
11
12
13
14
15
16
17
18
19
20
19
45
10
8.6
30
5.8
54
2.0
76
9.1
96
0.1
11
04.5
12
02.6
12
59.4
12
82.2
12
78.4
12
54.8
12
17.0
11
69.5
11
16.0
10
59.1
10
00.9
94
2.7
88
5.5
83
0.1
11
06
4.0
19
46
15
9.2
30
5.6
53
9.9
76
6.2
95
6.3
11
00.3
11
97.9
12
54.5
12
77.2
12
73.4
12
49.9
12
12.2
11
65.0
11
11.7
10
55.0
99
7.0
93
9.0
88
2.1
82
6.8
11
02
1.1
19
47
15
9.2
44
7.9
53
9.4
76
2.9
95
2.3
10
95.6
11
92.8
12
49.2
12
71.8
12
68.0
12
44.6
12
07.1
11
60.0
11
06.9
10
50.5
99
2.7
93
5.0
87
8.3
82
3.3
10
97
4.2
19
48
15
9.1
44
7.5
78
6.6
75
8.2
94
3.4
10
85.4
11
81.7
12
37.5
12
59.9
12
56.2
12
33.0
11
95.8
11
49.2
10
96.6
10
40.7
98
3.5
92
6.3
87
0.1
81
5.6
10
87
1.9
19
49
15
9.1
44
7.1
78
1.8
11
00.1
93
2.8
10
69.7
11
64.6
12
19.7
12
41.8
12
38.1
12
15.2
11
78.6
11
32.7
10
80.8
10
25.7
96
9.3
91
2.9
85
7.6
80
3.9
10
71
5.1
19
50
15
9.1
44
6.6
77
7.0
10
87.7
13
46.4
10
52.2
11
41.9
11
95.8
12
17.5
12
13.9
11
91.5
11
55.6
11
10.5
10
59.7
10
05.7
95
0.4
89
5.1
84
0.8
78
8.2
10
50
5.8
19
51
15
9.1
44
6.2
77
2.1
10
75.3
13
24.1
15
10.7
11
17.2
11
66.3
11
87.4
11
83.9
11
62.0
11
27.0
10
83.1
10
33.5
98
0.8
92
6.9
87
3.0
82
0.0
76
8.7
10
24
6.0
19
52
15
9.1
44
5.6
76
5.5
10
60.5
12
99.1
14
74.5
15
91.9
11
32.5
11
49.3
11
45.9
11
24.7
10
90.8
10
48.3
10
00.3
94
9.3
89
7.1
84
4.9
79
3.7
74
4.0
99
17.0
19
53
15
9.0
44
5.2
76
1.9
10
48.0
12
77.1
14
41.9
15
48.7
16
08.3
11
12.3
11
05.4
10
85.0
10
52.3
10
11.3
96
5.0
91
5.8
86
5.5
81
5.1
76
5.7
71
7.8
95
67.2
19
54
15
9.0
44
4.7
75
7.0
10
37.0
12
54.6
14
09.2
15
05.7
15
55.6
15
70.5
10
63.7
10
40.7
10
09.3
97
0.0
92
5.6
87
8.4
83
0.1
78
1.8
73
4.4
68
8.4
91
76.1
19
55
15
8.9
44
3.8
74
9.0
10
20.6
12
30.0
13
71.6
14
57.8
14
98.3
15
04.9
14
87.9
99
2.1
95
9.1
92
1.7
87
9.5
83
4.7
78
8.8
74
2.9
69
7.8
65
4.1
87
19.3
19
56
15
8.8
44
3.3
74
3.9
10
04.9
12
04.6
13
38.0
14
12.0
14
43.6
14
42.4
14
18.8
13
80.9
90
9.8
87
1.5
83
1.6
78
9.2
74
5.8
70
2.4
65
9.8
61
8.5
82
44.5
19
57
15
8.7
44
2.5
73
7.7
99
1.1
11
77.8
13
01.2
13
67.8
13
88.4
13
79.9
13
50.3
13
07.5
12
57.5
82
0.9
78
0.8
74
1.0
70
0.2
65
9.5
61
9.5
58
0.7
77
40.8
19
58
15
8.6
44
1.0
72
5.1
96
7.8
11
43.7
12
52.6
13
09.7
13
24.2
13
06.7
12
71.9
12
25.2
11
72.3
11
17.2
72
4.1
68
5.0
64
7.3
60
9.7
57
2.7
53
6.9
71
56.0
19
59
15
8.4
44
0.3
71
9.2
94
6.6
11
11.3
12
10.5
12
54.7
12
61.8
12
40.3
11
98.6
11
48.5
10
93.2
10
36.4
98
0.7
63
2.2
59
5.5
56
0.9
52
6.9
49
3.9
65
83.3
19
60
15
8.2
43
8.9
70
9.5
92
7.8
10
74.2
11
62.3
11
98.1
11
94.5
11
67.9
11
24.2
10
69.5
10
12.6
95
5.1
89
9.1
84
6.1
54
3.1
50
9.9
47
9.0
44
9.0
59
84.9
19
61
15
8.0
43
7.4
69
7.9
90
3.2
10
38.9
11
08.6
11
35.2
11
25.5
10
90.9
10
44.5
98
9.8
93
0.5
87
3.0
81
7.5
76
5.4
71
7.3
45
8.9
42
9.7
40
2.8
53
68.8
19
62
15
7.7
43
6.7
69
5.6
88
8.6
10
11.4
10
72.3
10
82.9
10
66.6
10
28.1
97
5.9
91
9.8
86
1.3
80
2.3
74
7.4
69
6.1
64
8.9
60
6.1
38
6.7
36
1.4
48
16.8
19
63
15
7.5
43
6.7
70
1.3
89
4.2
10
04.9
10
54.2
10
57.7
10
27.4
98
3.8
92
8.7
86
7.8
80
8.2
74
9.9
69
3.6
64
2.6
59
6.0
55
3.7
51
5.8
32
8.5
43
63.9
19
64
15
7.3
43
6.8
70
9.1
91
1.6
10
22.5
10
59.0
10
51.5
10
14.8
95
8.2
89
8.6
83
5.0
77
1.0
71
1.6
65
5.5
60
3.0
55
6.3
51
4.2
47
6.5
44
2.9
39
98.6
19
65
15
7.1
43
6.9
71
5.1
92
9.3
10
51.0
10
86.4
10
64.9
10
17.0
95
4.1
88
2.4
81
4.6
74
7.9
68
4.3
62
7.1
57
4.5
52
6.3
48
3.9
44
6.1
41
2.5
38
16.4
19
66
15
7.1
43
7.2
72
1.3
94
5.1
10
80.4
11
26.2
11
01.7
10
38.7
96
4.4
88
6.1
80
6.7
73
5.8
66
9.5
60
8.2
55
4.3
50
5.7
46
1.7
42
3.4
38
9.5
36
64.7
19
67
15
7.0
43
5.0
70
3.8
92
9.6
10
71.4
11
28.9
11
13.5
10
47.9
96
0.4
87
3.2
78
9.9
71
0.5
64
2.2
58
0.2
52
4.2
47
5.7
43
2.6
39
3.8
36
0.4
34
25.6
19
68
15
6.7
43
2.2
67
7.3
87
7.1
10
19.2
10
82.7
10
79.5
10
24.3
93
7.0
84
1.1
75
2.8
67
2.9
59
9.8
53
8.3
48
3.6
43
5.1
39
3.5
35
6.9
32
4.3
30
93.9
19
69
15
6.3
42
8.7
64
7.7
81
2.4
92
5.5
99
1.1
99
6.4
95
5.6
88
1.5
78
9.7
69
7.8
61
7.2
54
6.6
48
3.8
43
1.8
38
6.3
34
6.4
31
2.5
28
2.8
26
88.1
19
70
15
5.6
42
5.0
62
0.3
75
0.0
82
7.6
86
9.0
88
0.7
85
1.6
79
4.0
71
7.3
63
2.6
55
2.3
48
4.1
42
5.7
37
4.7
33
3.0
29
6.9
26
5.6
23
9.1
22
55.8
19
71
15
4.6
41
8.7
57
7.4
67
4.5
71
7.5
72
9.7
72
5.1
70
6.8
66
4.5
60
6.7
53
9.6
47
0.2
40
6.8
35
4.0
30
9.6
27
1.4
24
0.4
21
3.8
19
0.8
17
78.9
19
72
15
3.2
41
4.2
55
4.9
61
2.6
62
9.6
61
7.3
59
4.1
56
7.8
53
8.1
49
5.4
44
5.3
39
1.3
33
7.9
29
0.3
25
1.2
21
8.8
19
1.1
16
8.8
14
9.8
13
70.3
19
73
15
1.4
40
8.3
53
3.9
57
2.6
55
6.1
52
6.8
48
8.7
45
2.5
42
0.4
39
0.2
35
3.6
31
4.1
27
3.5
23
4.5
20
0.3
17
2.6
14
9.8
13
0.6
11
5.1
10
28.5
19
74
10
4.6
40
1.6
51
1.8
53
5.7
50
5.5
45
2.4
40
5.5
36
1.9
32
5.7
29
6.4
27
0.8
24
2.5
21
3.4
18
4.5
15
7.4
13
3.9
11
5.0
99.5
86.5
75
2.4
19
75
90.6
27
4.8
47
4.6
48
4.3
44
5.9
38
7.8
32
8.4
28
3.2
24
5.7
21
6.6
19
4.0
17
5.1
15
5.4
13
5.8
11
6.8
99.2
84.1
72.0
62.2
52
0.5
19
76
10
6.1
23
4.5
29
9.8
41
4.5
37
2.0
31
5.7
25
9.8
21
1.7
17
7.4
15
0.8
13
0.8
11
5.8
10
3.6
91.3
79.3
67.9
57.5
48.6
41.5
33
3.7
19
77
13
8.3
27
0.3
23
2.4
23
7.8
28
9.2
23
9.3
19
2.2
15
2.1
12
0.5
98.9
82.7
70.9
62.2
55.3
48.4
41.9
35.8
30.2
25.5
19
5.2
19
78
15
1.6
34
1.9
22
5.1
15
4.9
13
9.5
15
6.3
12
2.4
94.5
72.8
56.4
45.6
37.7
32.0
27.9
24.6
21.5
18.5
15.8
13.3
96.5
19
79
86.0
36
1.0
22
9.3
12
0.8
73.2
60.7
64.4
48.5
36.4
27.4
21.0
16.7
13.7
11.6
10.0
8.8
7.7
6.6
5.6
38.6
19
80
15
9.6
20
1.1
21
7.3
11
0.5
51.2
28.6
22.4
22.9
16.8
12.3
9.1
6.9
5.5
4.4
3.7
3.2
2.8
2.4
2.1
14.0
19
81
34.9
36
6.9
11
0.0
95.1
42.5
18.2
9.6
7.2
7.2
5.2
3.7
2.7
2.0
1.6
1.3
1.1
0.9
0.8
0.7
4.6
19
82
70.4
86.6
31
1.1
74.7
56.8
23.4
9.5
4.8
3.5
3.4
2.4
1.7
1.3
0.9
0.7
0.6
0.5
0.4
0.4
2.4
19
83
12
6.3
17
5.5
75.7
21
7.8
46.0
32.2
12.6
4.9
2.4
1.7
1.7
1.2
0.8
0.6
0.4
0.3
0.3
0.2
0.2
1.3
19
84
17
0.8
30
9.5
13
8.8
47.9
12
1.3
23.6
15.7
5.9
2.2
1.1
0.8
0.7
0.5
0.3
0.3
0.2
0.1
0.1
0.1
0.6
19
85
48.3
37
2.2
24
0.2
74.6
22.6
52.7
9.7
6.2
2.3
0.8
0.4
0.3
0.3
0.2
0.1
0.1
0.1
0.1
0.0
0.2
19
86
63.8
10
5.7
28
9.1
13
3.7
36.4
10.2
22.4
4.0
2.5
0.9
0.3
0.2
0.1
0.1
0.1
0.0
0.0
0.0
0.0
0.1
19
87
79.9
13
5.4
83.3
18
3.7
74.7
18.7
5.0
10.5
1.8
1.1
0.4
0.1
0.1
0.0
0.0
0.0
0.0
0.0
0.0
0.1
19
88
63.7
18
3.9
12
5.6
61.1
11
8.6
44.4
10.5
2.7
5.5
0.9
0.6
0.2
0.1
0.0
0.0
0.0
0.0
0.0
0.0
0.0
19
89
64.4
14
6.9
16
3.5
87.7
37.5
67.1
23.8
5.4
1.3
2.7
0.5
0.3
0.1
0.0
0.0
0.0
0.0
0.0
0.0
0.0
19
90
56.2
15
2.0
13
6.7
99.4
46.8
18.5
31.2
10.7
2.4
0.6
1.1
0.2
0.1
0.0
0.0
0.0
0.0
0.0
0.0
0.0
19
91
75.8
12
3.6
12
4.6
87.1
55.6
24.1
9.0
14.7
4.9
1.1
0.3
0.5
0.1
0.0
0.0
0.0
0.0
0.0
0.0
0.0
19
92
38.4
18
5.1
13
1.2
96.0
58.6
34.4
14.1
5.1
8.0
2.6
0.6
0.1
0.3
0.0
0.0
0.0
0.0
0.0
0.0
0.0
19
93
29.6
10
0.0
22
8.5
11
1.4
63.7
35.6
19.8
7.8
2.7
4.2
1.4
0.3
0.1
0.1
0.0
0.0
0.0
0.0
0.0
0.0
19
94
28.9
73.4
11
3.0
17
1.8
58.8
30.6
16.2
8.6
3.3
1.1
1.7
0.6
0.1
0.0
0.1
0.0
0.0
0.0
0.0
0.0
19
95
29.3
67.7
81.0
93.3
11
4.3
35.8
17.6
9.0
4.7
1.8
0.6
0.9
0.3
0.1
0.0
0.0
0.0
0.0
0.0
0.0
19
96
40.3
68.1
73.1
64.8
60.3
67.6
20.0
9.5
4.7
2.4
0.9
0.3
0.5
0.1
0.0
0.0
0.0
0.0
0.0
0.0
19
97
41.9
97.8
78.5
60.3
41.5
35.3
37.5
10.7
4.9
2.4
1.2
0.4
0.2
0.2
0.1
0.0
0.0
0.0
0.0
0.0
19
98
89.4
10
5.6
12
2.3
67.9
39.1
24.6
19.8
20.2
5.6
2.5
1.2
0.6
0.2
0.1
0.1
0.0
0.0
0.0
0.0
0.0
19
99
10
3.1
22
4.8
12
2.5
99.9
44.7
23.6
14.0
10.9
10.8
2.9
1.3
0.6
0.3
0.1
0.0
0.1
0.0
0.0
0.0
0.0
20
00
82.9
25
8.1
25
2.4
94.7
62.0
25.4
12.7
7.3
5.5
5.3
1.4
0.7
0.3
0.2
0.1
0.0
0.0
0.0
0.0
0.0
20
01
57.6
20
2.9
27
8.0
19
3.1
60.7
36.5
14.2
6.8
3.8
2.8
2.7
0.7
0.3
0.2
0.1
0.0
0.0
0.0
0.0
0.0
20
02
68.6
13
5.2
20
4.6
20
1.1
11
5.5
33.3
18.9
7.1
3.3
1.8
1.3
1.3
0.3
0.2
0.1
0.0
0.0
0.0
0.0
0.0
20
03
48.3
16
0.9
13
9.3
15
5.8
13
1.9
69.5
18.9
10.4
3.8
1.7
0.9
0.7
0.7
0.2
0.1
0.0
0.0
0.0
0.0
0.0
20
04
58.9
11
3.5
16
6.6
11
1.1
11
4.2
89.0
44.4
11.6
6.2
2.2
1.0
0.5
0.4
0.4
0.1
0.0
0.0
0.0
0.0
0.0
20
05
62.2
13
5.6
11
3.1
12
4.1
73.2
69.1
51.0
24.4
6.2
3.2
1.2
0.5
0.3
0.2
0.2
0.1
0.0
0.0
0.0
0.0
20
06
63.4
14
6.0
13
7.8
85.9
84.5
45.9
41.0
29.1
13.6
3.4
1.8
0.6
0.3
0.2
0.1
0.1
0.0
0.0
0.0
0.0
20
07
64.8
15
4.0
15
9.0
11
2.6
63.5
57.7
29.6
25.5
17.6
8.0
2.0
1.0
0.4
0.2
0.1
0.1
0.1
0.0
0.0
0.0
SEDAR 15 SAR 1 SECTION V 12

Addenda and updates South Atlantic Red Snapper
Table
1.5
.R
edsn
apper
:Es
tim
ate
dbio
mass
at
age
(1000
lb)
at
start
ofye
ar
Yea
r1
23
45
67
89
10
11
12
13
14
15
16
17
18
19
20
19
45
23
9.4
67
4.1
11
95.0
16
95.7
21
16.6
24
35.1
26
51.2
27
76.5
28
26.7
28
18.4
27
66.3
26
83.0
25
78.4
24
60.4
23
35.0
22
06.5
20
78.2
19
52.2
18
30.0
24
39
2.1
19
46
35
0.9
67
3.7
11
90.3
16
89.1
21
08.4
24
25.6
26
40.9
27
65.7
28
15.8
28
07.4
27
55.6
26
72.5
25
68.4
24
50.8
23
25.9
21
98.0
20
70.1
19
44.6
18
22.9
24
29
7.3
19
47
35
0.9
98
7.5
11
89.1
16
81.9
20
99.4
24
15.3
26
29.7
27
54.0
28
03.8
27
95.5
27
43.9
26
61.2
25
57.5
24
40.4
23
16.0
21
88.6
20
61.3
19
36.3
18
15.1
24
19
4.1
19
48
35
0.9
98
6.6
17
34.2
16
71.6
20
79.8
23
92.8
26
05.2
27
28.3
27
77.6
27
69.4
27
18.3
26
36.4
25
33.6
24
17.6
22
94.4
21
68.2
20
42.1
19
18.3
17
98.2
23
96
8.4
19
49
35
0.8
98
5.6
17
23.6
24
25.3
20
56.5
23
58.3
25
67.6
26
88.9
27
37.6
27
29.5
26
79.1
25
98.3
24
97.1
23
82.8
22
61.3
21
36.9
20
12.7
18
90.6
17
72.3
23
62
2.8
19
50
35
0.8
98
4.7
17
13.0
23
98.0
29
68.2
23
19.7
25
17.4
26
36.4
26
84.1
26
76.2
26
26.7
25
47.6
24
48.3
23
36.2
22
17.2
20
95.2
19
73.3
18
53.7
17
37.6
23
16
1.3
19
51
35
0.8
98
3.7
17
02.3
23
70.6
29
19.2
33
30.5
24
63.1
25
71.2
26
17.7
26
10.0
25
61.8
24
84.6
23
87.8
22
78.4
21
62.3
20
43.4
19
24.5
18
07.8
16
94.7
22
58
8.6
19
52
35
0.7
98
2.3
16
87.7
23
38.0
28
64.1
32
50.7
35
09.6
24
96.7
25
33.7
25
26.2
24
79.5
24
04.8
23
11.1
22
05.3
20
92.9
19
77.8
18
62.7
17
49.8
16
40.2
21
86
3.3
19
53
35
0.6
98
1.6
16
79.8
23
10.4
28
15.4
31
78.9
34
14.3
35
45.8
24
52.2
24
37.1
23
92.1
23
20.0
22
29.6
21
27.5
20
19.1
19
08.0
17
97.0
16
88.1
15
82.4
21
09
2.1
19
54
35
0.5
98
0.3
16
68.8
22
86.2
27
66.0
31
06.7
33
19.5
34
29.5
34
62.4
23
45.0
22
94.3
22
25.1
21
38.4
20
40.5
19
36.5
18
30.0
17
23.6
16
19.1
15
17.7
20
22
9.8
19
55
35
0.4
97
8.5
16
51.2
22
50.1
27
11.6
30
23.8
32
14.0
33
03.3
33
17.8
32
80.3
21
87.1
21
14.4
20
32.0
19
38.9
18
40.1
17
38.9
16
37.8
15
38.5
14
42.1
19
22
2.7
19
56
35
0.2
97
7.2
16
40.0
22
15.5
26
55.8
29
49.8
31
12.9
31
82.6
31
80.0
31
27.8
30
44.4
20
05.7
19
21.3
18
33.4
17
39.9
16
44.2
15
48.6
14
54.7
13
63.6
18
17
6.0
19
57
35
0.0
97
5.5
16
26.4
21
85.0
25
96.5
28
68.7
30
15.4
30
60.8
30
42.2
29
76.8
28
82.5
27
72.2
18
09.7
17
21.3
16
33.6
15
43.8
14
54.0
13
65.8
12
80.3
17
06
5.5
19
58
34
9.7
97
2.3
15
98.6
21
33.5
25
21.3
27
61.6
28
87.3
29
19.3
28
80.8
28
04.1
27
01.1
25
84.4
24
62.9
15
96.4
15
10.2
14
27.1
13
44.1
12
62.6
11
83.6
15
77
6.2
19
59
34
9.3
97
0.7
15
85.6
20
86.9
24
50.1
26
68.6
27
66.1
27
81.8
27
34.3
26
42.4
25
32.0
24
10.1
22
84.9
21
62.1
13
93.8
13
12.9
12
36.6
11
61.6
10
88.9
14
51
3.8
19
60
34
8.9
96
7.7
15
64.2
20
45.5
23
68.1
25
62.5
26
41.3
26
33.4
25
74.7
24
78.4
23
57.9
22
32.5
21
05.6
19
82.1
18
65.4
11
97.4
11
24.2
10
56.0
98
9.9
13
19
4.4
19
61
34
8.3
96
4.2
15
38.7
19
91.1
22
90.4
24
44.0
25
02.7
24
81.4
24
05.1
23
02.8
21
82.2
20
51.4
19
24.6
18
02.4
16
87.5
15
81.3
10
11.7
94
7.3
88
8.0
11
83
6.2
19
62
34
7.7
96
2.8
15
33.5
19
58.9
22
29.9
23
64.1
23
87.3
23
51.5
22
66.6
21
51.4
20
27.9
18
98.8
17
68.7
16
47.7
15
34.7
14
30.7
13
36.2
85
2.6
79
6.7
10
61
9.2
19
63
34
7.2
96
2.7
15
46.1
19
71.4
22
15.3
23
24.2
23
31.9
22
65.1
21
69.0
20
47.4
19
13.2
17
81.9
16
53.3
15
29.1
14
16.7
13
13.9
12
20.8
11
37.2
72
4.1
96
20.8
19
64
34
6.7
96
3.0
15
63.3
20
09.8
22
54.3
23
34.8
23
18.1
22
37.2
21
12.5
19
81.1
18
40.9
16
99.8
15
68.7
14
45.2
13
29.4
12
26.4
11
33.6
10
50.5
97
6.5
88
15.3
19
65
34
6.4
96
3.2
15
76.5
20
48.7
23
16.9
23
95.2
23
47.6
22
42.0
21
03.5
19
45.3
17
95.8
16
48.9
15
08.6
13
82.4
12
66.7
11
60.2
10
66.8
98
3.5
90
9.5
84
13.8
19
66
34
6.3
96
3.8
15
90.2
20
83.7
23
81.9
24
82.8
24
28.9
22
89.9
21
26.1
19
53.5
17
78.4
16
22.2
14
76.0
13
40.8
12
22.0
11
14.9
10
17.8
93
3.4
85
8.7
80
79.3
19
67
34
6.0
95
9.1
15
51.5
20
49.4
23
62.1
24
88.7
24
54.9
23
10.1
21
17.3
19
25.2
17
41.3
15
66.4
14
15.9
12
79.1
11
55.7
10
48.8
95
3.6
86
8.3
79
4.6
75
52.1
19
68
34
5.5
95
2.9
14
93.3
19
33.8
22
46.9
23
87.0
23
79.9
22
58.2
20
65.8
18
54.3
16
59.7
14
83.4
13
22.2
11
86.7
10
66.2
95
9.2
86
7.6
78
6.8
71
4.9
68
20.8
19
69
34
4.6
94
5.2
14
27.8
17
91.1
20
40.3
21
85.1
21
96.7
21
06.8
19
43.3
17
41.0
15
38.4
13
60.6
12
05.0
10
66.5
95
2.0
85
1.7
76
3.7
68
8.9
62
3.5
59
26.3
19
70
34
3.1
93
7.0
13
67.4
16
53.6
18
24.6
19
15.8
19
41.5
18
77.5
17
50.5
15
81.3
13
94.7
12
17.7
10
67.2
93
8.4
82
6.0
73
4.2
65
4.7
58
5.5
52
7.0
49
73.2
19
71
34
0.9
92
3.0
12
72.9
14
87.1
15
81.9
16
08.8
15
98.5
15
58.3
14
65.0
13
37.6
11
89.5
10
36.6
89
6.9
78
0.4
68
2.5
59
8.2
52
9.9
47
1.3
42
0.6
39
21.8
19
72
33
7.7
91
3.1
12
23.4
13
50.6
13
88.0
13
60.8
13
09.7
12
51.8
11
86.3
10
92.2
98
1.7
86
2.7
74
4.9
63
9.9
55
3.8
48
2.3
42
1.3
37
2.2
33
0.4
30
21.0
19
73
33
3.7
90
0.2
11
77.1
12
62.5
12
26.0
11
61.3
10
77.5
99
7.5
92
6.8
86
0.2
77
9.6
69
2.4
60
2.9
51
6.9
44
1.7
38
0.6
33
0.3
28
7.8
25
3.8
22
67.5
19
74
23
0.7
88
5.3
11
28.4
11
81.1
11
14.3
99
7.4
89
4.1
79
7.9
71
8.1
65
3.4
59
7.0
53
4.7
47
0.6
40
6.8
34
6.9
29
5.1
25
3.5
21
9.4
19
0.8
16
58.8
19
75
19
9.6
60
5.9
10
46.4
10
67.7
98
3.0
85
4.8
72
4.1
62
4.3
54
1.7
47
7.4
42
7.7
38
6.1
34
2.6
29
9.4
25
7.4
21
8.6
18
5.3
15
8.8
13
7.2
11
47.5
19
76
23
3.9
51
7.1
66
0.9
91
3.8
82
0.2
69
6.0
57
2.8
46
6.7
39
1.2
33
2.4
28
8.4
25
5.3
22
8.3
20
1.2
17
4.9
14
9.7
12
6.7
10
7.1
91.6
73
5.6
19
77
30
4.9
59
5.9
51
2.4
52
4.3
63
7.7
52
7.5
42
3.6
33
5.3
26
5.6
21
8.0
18
2.4
15
6.4
13
7.1
12
1.8
10
6.7
92.4
78.8
66.5
56.2
43
0.3
19
78
33
4.1
75
3.7
49
6.2
34
1.6
30
7.5
34
4.7
26
9.8
20
8.4
16
0.4
12
4.4
10
0.5
83.1
70.6
61.5
54.3
47.4
40.9
34.8
29.3
21
2.6
19
79
18
9.7
79
5.8
50
5.4
26
6.4
16
1.3
13
3.8
14
1.9
10
6.9
80.3
60.5
46.2
36.9
30.2
25.5
22.1
19.4
16.9
14.5
12.3
85.2
19
80
35
1.8
44
3.4
47
9.0
24
3.5
11
2.9
63.0
49.5
50.5
36.9
27.2
20.2
15.2
12.0
9.8
8.2
7.1
6.2
5.4
4.6
30.8
19
81
77.0
80
8.9
24
2.4
20
9.6
93.7
40.1
21.2
16.0
15.8
11.4
8.2
6.0
4.5
3.5
2.9
2.4
2.1
1.8
1.6
10.2
19
82
15
5.2
19
0.9
68
6.0
16
4.6
12
5.2
51.6
20.9
10.6
7.8
7.6
5.3
3.8
2.8
2.1
1.6
1.3
1.1
0.9
0.8
5.2
19
83
27
8.5
38
7.0
16
6.9
48
0.1
10
1.3
71.0
27.7
10.8
5.3
3.8
3.7
2.6
1.8
1.3
1.0
0.7
0.6
0.5
0.4
2.8
19
84
37
6.5
68
2.3
30
6.0
10
5.7
26
7.4
52.0
34.5
12.9
4.9
2.4
1.7
1.6
1.1
0.8
0.6
0.4
0.3
0.3
0.2
1.3
19
85
10
6.5
82
0.7
52
9.5
16
4.5
49.9
11
6.2
21.4
13.7
5.0
1.8
0.9
0.6
0.6
0.4
0.3
0.2
0.1
0.1
0.1
0.5
19
86
14
0.6
23
3.1
63
7.3
29
4.7
80.2
22.4
49.4
8.7
5.4
1.9
0.7
0.3
0.2
0.2
0.1
0.1
0.1
0.1
0.0
0.2
19
87
17
6.1
29
8.6
18
3.6
40
5.0
16
4.7
41.3
10.9
23.2
4.0
2.4
0.9
0.3
0.1
0.1
0.1
0.1
0.0
0.0
0.0
0.1
19
88
14
0.5
40
5.3
27
6.9
13
4.7
26
1.4
97.9
23.2
5.9
12.2
2.1
1.2
0.4
0.2
0.1
0.0
0.0
0.0
0.0
0.0
0.1
19
89
14
1.9
32
3.8
36
0.5
19
3.4
82.8
14
8.0
52.5
12.0
3.0
6.0
1.0
0.6
0.2
0.1
0.0
0.0
0.0
0.0
0.0
0.0
19
90
12
3.9
33
5.0
30
1.3
21
9.1
10
3.3
40.7
68.9
23.5
5.2
1.3
2.5
0.4
0.2
0.1
0.0
0.0
0.0
0.0
0.0
0.0
19
91
16
7.1
27
2.5
27
4.8
19
2.1
12
2.6
53.2
19.9
32.3
10.7
2.3
0.6
1.1
0.2
0.1
0.0
0.0
0.0
0.0
0.0
0.0
19
92
84.6
40
8.0
28
9.3
21
1.6
12
9.1
75.8
31.1
11.2
17.7
5.7
1.2
0.3
0.6
0.1
0.1
0.0
0.0
0.0
0.0
0.0
19
93
65.2
22
0.4
50
3.7
24
5.5
14
0.4
78.4
43.6
17.2
6.0
9.3
3.0
0.6
0.2
0.3
0.0
0.0
0.0
0.0
0.0
0.0
19
94
63.8
16
1.8
24
9.1
37
8.9
12
9.6
67.5
35.7
19.1
7.3
2.5
3.8
1.2
0.3
0.1
0.1
0.0
0.0
0.0
0.0
0.0
19
95
64.6
14
9.2
17
8.6
20
5.7
25
2.1
78.9
38.9
19.8
10.3
3.9
1.3
2.0
0.6
0.1
0.0
0.1
0.0
0.0
0.0
0.0
19
96
88.9
15
0.0
16
1.2
14
2.8
13
2.9
14
9.0
44.1
20.9
10.3
5.3
2.0
0.7
1.0
0.3
0.1
0.0
0.0
0.0
0.0
0.0
19
97
92.3
21
5.5
17
3.0
13
3.0
91.5
77.9
82.6
23.5
10.8
5.3
2.7
1.0
0.3
0.5
0.2
0.0
0.0
0.0
0.0
0.0
19
98
19
7.1
23
2.8
26
9.6
14
9.7
86.3
54.3
43.7
44.6
12.4
5.6
2.7
1.4
0.5
0.2
0.3
0.1
0.0
0.0
0.0
0.0
19
99
22
7.2
49
5.5
27
0.1
22
0.2
98.5
52.0
31.0
24.0
23.8
6.5
2.9
1.4
0.7
0.3
0.1
0.1
0.0
0.0
0.0
0.0
20
00
18
2.8
56
9.0
55
6.5
20
8.7
13
6.8
56.1
28.0
16.1
12.1
11.7
3.2
1.4
0.7
0.3
0.1
0.0
0.1
0.0
0.0
0.0
20
01
12
6.9
44
7.2
61
2.9
42
5.8
13
3.9
80.6
31.3
15.0
8.4
6.2
6.0
1.6
0.7
0.3
0.2
0.1
0.0
0.0
0.0
0.0
20
02
15
1.2
29
8.1
45
1.1
44
3.4
25
4.6
73.4
41.8
15.6
7.3
4.0
2.9
2.9
0.8
0.3
0.2
0.1
0.0
0.0
0.0
0.0
20
03
10
6.4
35
4.7
30
7.1
34
3.5
29
0.8
15
3.3
41.8
22.9
8.3
3.8
2.1
1.5
1.5
0.4
0.2
0.1
0.0
0.0
0.0
0.0
20
04
12
9.8
25
0.2
36
7.3
24
5.0
25
1.7
19
6.2
97.9
25.7
13.7
4.9
2.2
1.2
0.9
0.9
0.2
0.1
0.0
0.0
0.0
0.0
20
05
13
7.1
29
9.0
24
9.4
27
3.6
16
1.3
15
2.3
11
2.4
53.9
13.7
7.2
2.5
1.2
0.6
0.5
0.4
0.1
0.1
0.0
0.0
0.0
20
06
13
9.9
32
1.9
30
3.8
18
9.3
18
6.4
10
1.2
90.4
64.1
29.9
7.5
3.9
1.4
0.6
0.3
0.2
0.2
0.1
0.0
0.0
0.0
20
07
14
3.0
33
9.4
35
0.6
24
8.3
14
0.1
12
7.1
65.3
56.1
38.7
17.7
4.4
2.2
0.8
0.4
0.2
0.1
0.1
0.0
0.0
0.0
SEDAR 15 SAR 1 SECTION V 13

Addenda and updates South Atlantic Red Snapper
Table 1.6. Red snapper: Estimated time series and status indicators. Fishing mortality rate is full F , whichincludes discard mortalities. Total biomass (B) is at the start of the year, and spawning biomass (SSB) at themidpoint; B and SSB are in units mt. F40% and SSBF40% are used as proxies for MSY reference points. The MSSTis defined by MSST = (1−M)SSBF40% , with constant M = 0.078. SPR is static spawning potential ratio.
Year F F/F40% B B/Bunfished SSB SSB/SSBF40% SSB/MSST SPR
1945 0.00389 0.0374 29352 0.7500 13985 2.0424 2.2152 0.645481946 0.00426 0.0409 29290 0.7484 13907 2.0310 2.2028 0.643051947 0.00937 0.0900 29312 0.7490 13856 2.0235 2.1947 0.610291948 0.01452 0.1395 29298 0.7486 13801 2.0155 2.1860 0.579361949 0.01973 0.1896 29247 0.7473 13736 2.0060 2.1757 0.550041950 0.02504 0.2405 29141 0.7446 13647 1.9930 2.1616 0.522081951 0.03263 0.3135 28963 0.7401 13510 1.9730 2.1399 0.485051952 0.03591 0.3450 28634 0.7316 13332 1.9470 2.1117 0.470121953 0.04174 0.4010 28269 0.7223 13120 1.9161 2.0782 0.444961954 0.05107 0.4905 27792 0.7101 12836 1.8746 2.0331 0.408171955 0.05599 0.5379 27113 0.6928 12487 1.8236 1.9779 0.390311956 0.06304 0.6056 26364 0.6737 12095 1.7663 1.9158 0.366461957 0.07856 0.7546 25504 0.6517 11604 1.6947 1.8380 0.320301958 0.08340 0.8012 24348 0.6221 11044 1.6128 1.7493 0.307451959 0.09531 0.9155 23193 0.5926 10449 1.5261 1.6552 0.278661960 0.10863 1.0435 21904 0.5597 9794 1.4303 1.5513 0.250551961 0.10850 1.0423 20494 0.5237 9153 1.3367 1.4498 0.250801962 0.09873 0.9484 19263 0.4922 8634 1.2610 1.3676 0.271051963 0.08766 0.8421 18367 0.4693 8269 1.2076 1.3098 0.296721964 0.07953 0.7640 17784 0.4544 8032 1.1730 1.2723 0.317651965 0.07105 0.6825 17428 0.4453 7900 1.1537 1.2513 0.341621966 0.09630 0.9251 17277 0.4415 7731 1.1290 1.2245 0.276421967 0.12972 1.2461 16756 0.4281 7369 1.0761 1.1672 0.213351968 0.16809 1.6147 15778 0.4032 6799 0.9930 1.0770 0.162831969 0.20318 1.9518 14378 0.3674 6076 0.8874 0.9624 0.130101970 0.26607 2.5559 12751 0.3258 5207 0.7604 0.8247 0.091141971 0.29068 2.7924 10751 0.2747 4316 0.6304 0.6837 0.080401972 0.31850 3.0595 8992 0.2298 3539 0.5168 0.5606 0.070341973 0.34654 3.3290 7474 0.1910 2879 0.4205 0.4560 0.061951974 0.40527 3.8931 6157 0.1573 2296 0.3352 0.3636 0.048561975 0.48547 4.6635 4847 0.1238 1736 0.2535 0.2749 0.036241976 0.58151 5.5861 3612 0.0923 1220 0.1782 0.1933 0.026771977 0.75546 7.2570 2619 0.0669 785 0.1146 0.1243 0.017021978 0.97213 9.3384 1849 0.0472 469 0.0684 0.0742 0.010911979 1.08018 10.3764 1248 0.0319 287 0.0419 0.0454 0.009051980 1.17629 11.2997 897 0.0229 184 0.0269 0.0292 0.007781981 0.73730 7.0826 716 0.0183 178 0.0261 0.0283 0.017761982 0.70673 6.7889 656 0.0167 181 0.0264 0.0287 0.019121983 0.80713 7.7534 702 0.0179 171 0.0249 0.0271 0.015151984 1.07205 10.2982 840 0.0215 178 0.0260 0.0282 0.011221985 1.03330 9.9261 831 0.0212 193 0.0281 0.0305 0.011641986 0.98506 9.4627 669 0.0171 176 0.0257 0.0279 0.013191987 0.82464 7.9216 595 0.0152 163 0.0237 0.0257 0.019981988 0.84583 8.1252 618 0.0158 164 0.0239 0.0260 0.017901989 0.90349 8.6791 601 0.0154 154 0.0225 0.0244 0.015931990 1.00768 9.6800 556 0.0142 142 0.0207 0.0225 0.014151991 0.67271 6.4622 521 0.0133 144 0.0210 0.0227 0.025611992 0.77002 7.3970 574 0.0147 169 0.0247 0.0267 0.032831993 1.10288 10.5944 605 0.0155 174 0.0253 0.0275 0.022061994 0.99546 9.5626 508 0.0130 157 0.0230 0.0249 0.026291995 1.04026 9.9929 456 0.0117 139 0.0203 0.0220 0.024281996 0.95771 9.1999 413 0.0105 122 0.0179 0.0194 0.027201997 0.86656 8.3243 413 0.0105 121 0.0177 0.0192 0.031851998 0.84933 8.1588 499 0.0128 137 0.0199 0.0216 0.028951999 0.91163 8.7572 660 0.0169 172 0.0251 0.0272 0.025552000 0.92516 8.8872 809 0.0207 220 0.0322 0.0349 0.024662001 1.08069 10.3813 861 0.0220 241 0.0352 0.0382 0.020282002 0.99186 9.5280 793 0.0203 233 0.0340 0.0368 0.023172003 0.87289 8.3851 743 0.0190 229 0.0334 0.0362 0.027482004 1.02364 9.8333 720 0.0184 214 0.0312 0.0339 0.021902005 0.94855 9.1119 665 0.0170 196 0.0286 0.0310 0.023822006 0.79722 7.6582 654 0.0167 197 0.0288 0.0312 0.030612007 . . 696 0.0178 . . . .
SEDAR 15 SAR 1 SECTION V 14

Addenda and updates South Atlantic Red Snapper
Table
1.7
.R
edsn
apper
:Se
lect
ivit
yat
age
for
com
mer
cial
han
dlin
e(c
.hal),
com
mer
cial
div
ing
(c.d
v),
hea
dboa
t(h
b),
gen
eral
recr
eati
onal
(rec
),co
mm
erci
alh
an
dlin
edis
card
mor
taliti
es(D
.c.h
al),h
eadboa
tdis
card
mor
taliti
es(D
.hb),
gen
eralr
ecre
ati
onald
isca
rdm
orta
liti
es(D
.rec
),se
lect
ivit
yof
lan
din
gs
ave
raged
acr
oss
fish
erie
s(L
.avg
),an
dse
lect
ivit
yof
dis
card
mor
taliti
esave
raged
acr
oss
fish
erie
s(D
.avg
).
Age
Len
gth
(mm
)Le
ngth
(in
)c.
hal
c.d
vh
bre
cD
.c.h
alD
.hb
D.r
ecL.
avg
D.a
vgL.
avg+D
.avg
1262.8
10.3
0.0
001
0.0
020
0.0
000
0.0
369
0.5
000
0.5
000
0.5
000
0.0
122
0.1
803
0.1
925
2395.2
15.6
0.0
051
0.0
306
0.0
002
0.6
852
1.0
000
1.0
000
1.0
000
0.2
269
0.3
606
0.5
876
3499.8
19.7
0.2
839
0.3
279
0.5
410
0.9
920
0.6
014
0.6
814
0.5
967
0.4
397
0.2
205
0.6
602
4582.5
22.9
0.9
685
0.8
827
0.9
998
0.9
999
0.0
188
0.0
004
0.0
249
0.6
311
0.0
072
0.6
383
5647.9
25.5
0.9
996
0.9
915
1.0
000
1.0
000
0.0
002
0.0
000
0.0
004
0.6
391
0.0
001
0.6
393
6699.6
27.5
1.0
000
0.9
994
1.0
000
1.0
000
0.0
000
0.0
000
0.0
000
0.6
394
0.0
000
0.6
394
7740.4
29.2
1.0
000
1.0
000
1.0
000
1.0
000
0.0
000
0.0
000
0.0
000
0.6
394
0.0
000
0.6
394
8772.7
30.4
1.0
000
1.0
000
1.0
000
1.0
000
0.0
000
0.0
000
0.0
000
0.6
394
0.0
000
0.6
394
9798.3
31.4
1.0
000
0.9
998
1.0
000
1.0
000
0.0
000
0.0
000
0.0
000
0.6
394
0.0
000
0.6
394
10
818.5
32.2
1.0
000
0.4
576
1.0
000
1.0
000
0.0
000
0.0
000
0.0
000
0.6
304
0.0
000
0.6
304
11
834.4
32.9
1.0
000
0.0
001
1.0
000
1.0
000
0.0
000
0.0
000
0.0
000
0.6
229
0.0
000
0.6
229
12
847.1
33.3
1.0
000
0.0
000
1.0
000
1.0
000
0.0
000
0.0
000
0.0
000
0.6
228
0.0
000
0.6
228
13
857.0
33.7
1.0
000
0.0
000
1.0
000
1.0
000
0.0
000
0.0
000
0.0
000
0.6
228
0.0
000
0.6
228
14
864.9
34.1
1.0
000
0.0
000
1.0
000
1.0
000
0.0
000
0.0
000
0.0
000
0.6
228
0.0
000
0.6
228
15
871.2
34.3
1.0
000
0.0
000
1.0
000
1.0
000
0.0
000
0.0
000
0.0
000
0.6
228
0.0
000
0.6
228
16
876.1
34.5
1.0
000
0.0
000
1.0
000
1.0
000
0.0
000
0.0
000
0.0
000
0.6
228
0.0
000
0.6
228
17
880.0
34.6
1.0
000
0.0
000
1.0
000
1.0
000
0.0
000
0.0
000
0.0
000
0.6
228
0.0
000
0.6
228
18
883.1
34.8
1.0
000
0.0
000
1.0
000
1.0
000
0.0
000
0.0
000
0.0
000
0.6
228
0.0
000
0.6
228
19
885.5
34.9
1.0
000
0.0
000
1.0
000
1.0
000
0.0
000
0.0
000
0.0
000
0.6
228
0.0
000
0.6
228
20
887.4
34.9
1.0
000
0.0
000
1.0
000
1.0
000
0.0
000
0.0
000
0.0
000
0.6
228
0.0
000
0.6
228
SEDAR 15 SAR 1 SECTION V 15

Addenda and updates South Atlantic Red Snapper
Table 1.8. Red snapper: Estimated time series of fishing mortality rate for commercial handline (F.c.hal), com-mercial diving (F.c.dv), headboat (F.hb), general recreational (F.rec), commercial handline discard mortalities(F.c.hal.D), headboat discard mortalities (F.hb.D), general recreational discard mortalities (F.mrfss.D), and full F(F.full).
Year F.c.hal F.c.dv F.hb F.rec F.c.hal.D F.hb.D F.rec.D F.full
1945 0.004 0.000 0.000 0.000 0.000 0.000 0.000 0.0041946 0.004 0.000 0.000 0.000 0.000 0.000 0.000 0.0041947 0.005 0.000 0.000 0.005 0.000 0.000 0.000 0.0091948 0.005 0.000 0.000 0.010 0.000 0.000 0.000 0.0151949 0.005 0.000 0.000 0.014 0.000 0.000 0.000 0.0201950 0.006 0.000 0.000 0.019 0.000 0.000 0.000 0.0251951 0.008 0.000 0.000 0.024 0.000 0.000 0.000 0.0331952 0.006 0.000 0.000 0.030 0.000 0.000 0.000 0.0361953 0.007 0.000 0.000 0.035 0.000 0.000 0.000 0.0421954 0.010 0.000 0.000 0.041 0.000 0.000 0.000 0.0511955 0.009 0.000 0.000 0.047 0.000 0.000 0.000 0.0561956 0.009 0.000 0.000 0.054 0.000 0.000 0.000 0.0631957 0.016 0.000 0.000 0.062 0.000 0.000 0.000 0.0791958 0.012 0.000 0.000 0.071 0.000 0.000 0.000 0.0831959 0.014 0.000 0.000 0.082 0.000 0.000 0.000 0.0951960 0.015 0.000 0.000 0.094 0.000 0.000 0.000 0.1091961 0.019 0.000 0.000 0.090 0.000 0.000 0.000 0.1081962 0.015 0.000 0.000 0.084 0.000 0.000 0.000 0.0991963 0.012 0.000 0.000 0.076 0.000 0.000 0.000 0.0881964 0.014 0.000 0.000 0.066 0.000 0.000 0.000 0.0801965 0.016 0.000 0.000 0.055 0.000 0.000 0.000 0.0711966 0.019 0.000 0.000 0.078 0.000 0.000 0.000 0.0961967 0.026 0.000 0.000 0.104 0.000 0.000 0.000 0.1301968 0.031 0.000 0.000 0.137 0.000 0.000 0.000 0.1681969 0.022 0.000 0.000 0.181 0.000 0.000 0.000 0.2031970 0.024 0.000 0.000 0.242 0.000 0.000 0.000 0.2661971 0.025 0.000 0.000 0.266 0.000 0.000 0.000 0.2911972 0.026 0.000 0.006 0.287 0.000 0.000 0.000 0.3181973 0.026 0.000 0.009 0.312 0.000 0.000 0.000 0.3471974 0.053 0.000 0.007 0.345 0.000 0.000 0.000 0.4051975 0.081 0.000 0.010 0.394 0.000 0.000 0.000 0.4851976 0.097 0.000 0.019 0.465 0.000 0.000 0.000 0.5821977 0.156 0.000 0.016 0.584 0.000 0.000 0.000 0.7551978 0.233 0.000 0.027 0.712 0.000 0.000 0.000 0.9721979 0.250 0.000 0.036 0.794 0.000 0.000 0.000 1.0801980 0.368 0.000 0.057 0.752 0.000 0.000 0.000 1.1761981 0.342 0.000 0.115 0.280 0.000 0.000 0.000 0.7371982 0.318 0.000 0.109 0.280 0.000 0.000 0.000 0.7071983 0.335 0.000 0.085 0.387 0.000 0.000 0.000 0.8071984 0.365 0.003 0.087 0.517 0.012 0.006 0.080 1.0721985 0.303 0.007 0.122 0.509 0.009 0.007 0.077 1.0331986 0.260 0.001 0.062 0.481 0.033 0.012 0.136 0.9851987 0.265 0.001 0.103 0.292 0.053 0.032 0.080 0.8251988 0.234 0.001 0.155 0.319 0.025 0.025 0.087 0.8461989 0.386 0.003 0.091 0.370 0.010 0.006 0.038 0.9031990 0.350 0.005 0.090 0.358 0.124 0.047 0.034 1.0081991 0.219 0.015 0.101 0.285 0.015 0.009 0.029 0.6731992 0.218 0.023 0.063 0.334 0.057 0.004 0.069 0.7701993 0.463 0.013 0.079 0.317 0.078 0.046 0.106 1.1031994 0.350 0.027 0.096 0.163 0.146 0.048 0.164 0.9951995 0.355 0.022 0.115 0.174 0.160 0.082 0.132 1.0401996 0.336 0.016 0.110 0.211 0.184 0.027 0.072 0.9581997 0.294 0.023 0.138 0.207 0.156 0.007 0.042 0.8671998 0.234 0.024 0.069 0.320 0.077 0.027 0.099 0.8491999 0.214 0.027 0.103 0.359 0.048 0.017 0.144 0.9122000 0.202 0.025 0.091 0.351 0.043 0.021 0.191 0.9252001 0.287 0.034 0.096 0.325 0.060 0.052 0.226 1.0812002 0.234 0.035 0.092 0.287 0.067 0.053 0.224 0.9922003 0.167 0.025 0.054 0.287 0.064 0.038 0.238 0.8732004 0.223 0.029 0.110 0.281 0.057 0.069 0.254 1.0242005 0.190 0.016 0.090 0.311 0.052 0.060 0.229 0.9492006 0.140 0.007 0.066 0.308 0.053 0.039 0.182 0.797
SEDAR 15 SAR 1 SECTION V 16

Addenda and updates South Atlantic Red SnapperT
able
1.9
.R
edsn
ap
per
:Es
tim
ate
din
sta
nta
neo
us
fish
ing
mor
tality
rate
(per
yr)
at
age,
incl
ud
ing
dis
card
mor
tality
Yea
r1
23
45
67
89
10
11
12
13
14
15
16
17
18
19
20
19
45
0.0
01
0.0
04
0.0
04
0.0
04
0.0
04
0.0
04
0.0
04
0.0
04
0.0
04
0.0
04
0.0
04
0.0
04
0.0
04
0.0
04
0.0
04
0.0
04
0.0
04
0.0
04
0.0
04
0.0
04
19
46
0.0
01
0.0
04
0.0
04
0.0
04
0.0
04
0.0
04
0.0
04
0.0
04
0.0
04
0.0
04
0.0
04
0.0
04
0.0
04
0.0
04
0.0
04
0.0
04
0.0
04
0.0
04
0.0
04
0.0
04
19
47
0.0
02
0.0
09
0.0
09
0.0
09
0.0
09
0.0
09
0.0
09
0.0
09
0.0
09
0.0
09
0.0
09
0.0
09
0.0
09
0.0
09
0.0
09
0.0
09
0.0
09
0.0
09
0.0
09
0.0
09
19
48
0.0
03
0.0
15
0.0
15
0.0
15
0.0
15
0.0
15
0.0
15
0.0
15
0.0
15
0.0
15
0.0
15
0.0
15
0.0
15
0.0
15
0.0
15
0.0
15
0.0
15
0.0
15
0.0
15
0.0
15
19
49
0.0
03
0.0
20
0.0
20
0.0
20
0.0
20
0.0
20
0.0
20
0.0
20
0.0
20
0.0
20
0.0
20
0.0
20
0.0
20
0.0
20
0.0
20
0.0
20
0.0
20
0.0
20
0.0
20
0.0
20
19
50
0.0
04
0.0
25
0.0
25
0.0
25
0.0
25
0.0
25
0.0
25
0.0
25
0.0
25
0.0
25
0.0
25
0.0
25
0.0
25
0.0
25
0.0
25
0.0
25
0.0
25
0.0
25
0.0
25
0.0
25
19
51
0.0
06
0.0
33
0.0
33
0.0
33
0.0
33
0.0
33
0.0
33
0.0
33
0.0
33
0.0
33
0.0
33
0.0
33
0.0
33
0.0
33
0.0
33
0.0
33
0.0
33
0.0
33
0.0
33
0.0
33
19
52
0.0
06
0.0
36
0.0
36
0.0
36
0.0
36
0.0
36
0.0
36
0.0
36
0.0
36
0.0
36
0.0
36
0.0
36
0.0
36
0.0
36
0.0
36
0.0
36
0.0
36
0.0
36
0.0
36
0.0
36
19
53
0.0
07
0.0
42
0.0
42
0.0
42
0.0
42
0.0
42
0.0
42
0.0
42
0.0
42
0.0
42
0.0
42
0.0
42
0.0
42
0.0
42
0.0
42
0.0
42
0.0
42
0.0
42
0.0
42
0.0
42
19
54
0.0
09
0.0
51
0.0
51
0.0
51
0.0
51
0.0
51
0.0
51
0.0
51
0.0
51
0.0
51
0.0
51
0.0
51
0.0
51
0.0
51
0.0
51
0.0
51
0.0
51
0.0
51
0.0
51
0.0
51
19
55
0.0
10
0.0
56
0.0
56
0.0
56
0.0
56
0.0
56
0.0
56
0.0
56
0.0
56
0.0
56
0.0
56
0.0
56
0.0
56
0.0
56
0.0
56
0.0
56
0.0
56
0.0
56
0.0
56
0.0
56
19
56
0.0
11
0.0
63
0.0
63
0.0
63
0.0
63
0.0
63
0.0
63
0.0
63
0.0
63
0.0
63
0.0
63
0.0
63
0.0
63
0.0
63
0.0
63
0.0
63
0.0
63
0.0
63
0.0
63
0.0
63
19
57
0.0
14
0.0
79
0.0
79
0.0
79
0.0
79
0.0
79
0.0
79
0.0
79
0.0
79
0.0
79
0.0
79
0.0
79
0.0
79
0.0
79
0.0
79
0.0
79
0.0
79
0.0
79
0.0
79
0.0
79
19
58
0.0
14
0.0
83
0.0
83
0.0
83
0.0
83
0.0
83
0.0
83
0.0
83
0.0
83
0.0
83
0.0
83
0.0
83
0.0
83
0.0
83
0.0
83
0.0
83
0.0
83
0.0
83
0.0
83
0.0
83
19
59
0.0
16
0.0
95
0.0
95
0.0
95
0.0
95
0.0
95
0.0
95
0.0
95
0.0
95
0.0
95
0.0
95
0.0
95
0.0
95
0.0
95
0.0
95
0.0
95
0.0
95
0.0
95
0.0
95
0.0
95
19
60
0.0
19
0.1
09
0.1
09
0.1
09
0.1
09
0.1
09
0.1
09
0.1
09
0.1
09
0.1
09
0.1
09
0.1
09
0.1
09
0.1
09
0.1
09
0.1
09
0.1
09
0.1
09
0.1
09
0.1
09
19
61
0.0
19
0.1
08
0.1
08
0.1
08
0.1
08
0.1
08
0.1
08
0.1
08
0.1
08
0.1
08
0.1
08
0.1
08
0.1
08
0.1
08
0.1
08
0.1
08
0.1
08
0.1
08
0.1
08
0.1
08
19
62
0.0
17
0.0
99
0.0
99
0.0
99
0.0
99
0.0
99
0.0
99
0.0
99
0.0
99
0.0
99
0.0
99
0.0
99
0.0
99
0.0
99
0.0
99
0.0
99
0.0
99
0.0
99
0.0
99
0.0
99
19
63
0.0
15
0.0
88
0.0
88
0.0
88
0.0
88
0.0
88
0.0
88
0.0
88
0.0
88
0.0
88
0.0
88
0.0
88
0.0
88
0.0
88
0.0
88
0.0
88
0.0
88
0.0
88
0.0
88
0.0
88
19
64
0.0
14
0.0
80
0.0
80
0.0
80
0.0
80
0.0
80
0.0
80
0.0
80
0.0
80
0.0
80
0.0
80
0.0
80
0.0
80
0.0
80
0.0
80
0.0
80
0.0
80
0.0
80
0.0
80
0.0
80
19
65
0.0
12
0.0
71
0.0
71
0.0
71
0.0
71
0.0
71
0.0
71
0.0
71
0.0
71
0.0
71
0.0
71
0.0
71
0.0
71
0.0
71
0.0
71
0.0
71
0.0
71
0.0
71
0.0
71
0.0
71
19
66
0.0
17
0.0
96
0.0
96
0.0
96
0.0
96
0.0
96
0.0
96
0.0
96
0.0
96
0.0
96
0.0
96
0.0
96
0.0
96
0.0
96
0.0
96
0.0
96
0.0
96
0.0
96
0.0
96
0.0
96
19
67
0.0
22
0.1
30
0.1
30
0.1
30
0.1
30
0.1
30
0.1
30
0.1
30
0.1
30
0.1
30
0.1
30
0.1
30
0.1
30
0.1
30
0.1
30
0.1
30
0.1
30
0.1
30
0.1
30
0.1
30
19
68
0.0
29
0.1
68
0.1
68
0.1
68
0.1
68
0.1
68
0.1
68
0.1
68
0.1
68
0.1
68
0.1
68
0.1
68
0.1
68
0.1
68
0.1
68
0.1
68
0.1
68
0.1
68
0.1
68
0.1
68
19
69
0.0
35
0.2
03
0.2
03
0.2
03
0.2
03
0.2
03
0.2
03
0.2
03
0.2
03
0.2
03
0.2
03
0.2
03
0.2
03
0.2
03
0.2
03
0.2
03
0.2
03
0.2
03
0.2
03
0.2
03
19
70
0.0
46
0.2
66
0.2
66
0.2
66
0.2
66
0.2
66
0.2
66
0.2
66
0.2
66
0.2
66
0.2
66
0.2
66
0.2
66
0.2
66
0.2
66
0.2
66
0.2
66
0.2
66
0.2
66
0.2
66
19
71
0.0
50
0.2
91
0.2
91
0.2
91
0.2
91
0.2
91
0.2
91
0.2
91
0.2
91
0.2
91
0.2
91
0.2
91
0.2
91
0.2
91
0.2
91
0.2
91
0.2
91
0.2
91
0.2
91
0.2
91
19
72
0.0
55
0.3
18
0.3
18
0.3
18
0.3
18
0.3
18
0.3
18
0.3
18
0.3
18
0.3
18
0.3
18
0.3
18
0.3
18
0.3
18
0.3
18
0.3
18
0.3
18
0.3
18
0.3
18
0.3
18
19
73
0.0
60
0.3
47
0.3
47
0.3
47
0.3
47
0.3
47
0.3
47
0.3
47
0.3
47
0.3
47
0.3
47
0.3
47
0.3
47
0.3
47
0.3
47
0.3
47
0.3
47
0.3
47
0.3
47
0.3
47
19
74
0.0
70
0.4
05
0.4
05
0.4
05
0.4
05
0.4
05
0.4
05
0.4
05
0.4
05
0.4
05
0.4
05
0.4
05
0.4
05
0.4
05
0.4
05
0.4
05
0.4
05
0.4
05
0.4
05
0.4
05
19
75
0.0
84
0.4
85
0.4
85
0.4
85
0.4
85
0.4
85
0.4
85
0.4
85
0.4
85
0.4
85
0.4
85
0.4
85
0.4
85
0.4
85
0.4
85
0.4
85
0.4
85
0.4
85
0.4
85
0.4
85
19
76
0.1
00
0.5
81
0.5
82
0.5
82
0.5
82
0.5
82
0.5
82
0.5
82
0.5
82
0.5
82
0.5
82
0.5
82
0.5
82
0.5
82
0.5
82
0.5
82
0.5
82
0.5
82
0.5
82
0.5
82
19
77
0.1
30
0.7
55
0.7
55
0.7
55
0.7
55
0.7
55
0.7
55
0.7
55
0.7
55
0.7
55
0.7
55
0.7
55
0.7
55
0.7
55
0.7
55
0.7
55
0.7
55
0.7
55
0.7
55
0.7
55
19
78
0.1
68
0.9
72
0.9
72
0.9
72
0.9
72
0.9
72
0.9
72
0.9
72
0.9
72
0.9
72
0.9
72
0.9
72
0.9
72
0.9
72
0.9
72
0.9
72
0.9
72
0.9
72
0.9
72
0.9
72
19
79
0.1
86
1.0
80
1.0
80
1.0
80
1.0
80
1.0
80
1.0
80
1.0
80
1.0
80
1.0
80
1.0
80
1.0
80
1.0
80
1.0
80
1.0
80
1.0
80
1.0
80
1.0
80
1.0
80
1.0
80
19
80
0.2
03
1.1
76
1.1
76
1.1
76
1.1
76
1.1
76
1.1
76
1.1
76
1.1
76
1.1
76
1.1
76
1.1
76
1.1
76
1.1
76
1.1
76
1.1
76
1.1
76
1.1
76
1.1
76
1.1
76
19
81
0.1
27
0.7
37
0.7
37
0.7
37
0.7
37
0.7
37
0.7
37
0.7
37
0.7
37
0.7
37
0.7
37
0.7
37
0.7
37
0.7
37
0.7
37
0.7
37
0.7
37
0.7
37
0.7
37
0.7
37
19
82
0.1
22
0.7
07
0.7
07
0.7
07
0.7
07
0.7
07
0.7
07
0.7
07
0.7
07
0.7
07
0.7
07
0.7
07
0.7
07
0.7
07
0.7
07
0.7
07
0.7
07
0.7
07
0.7
07
0.7
07
19
83
0.1
39
0.8
07
0.8
07
0.8
07
0.8
07
0.8
07
0.8
07
0.8
07
0.8
07
0.8
07
0.8
07
0.8
07
0.8
07
0.8
07
0.8
07
0.8
07
0.8
07
0.8
07
0.8
07
0.8
07
19
84
0.2
56
0.8
26
0.9
71
0.9
73
0.9
73
0.9
73
0.9
73
0.9
73
0.9
73
0.9
71
0.9
70
0.9
70
0.9
70
0.9
70
0.9
70
0.9
70
0.9
70
0.9
70
0.9
70
0.9
70
SEDAR 15 SAR 1 SECTION V 17

Addenda and updates South Atlantic Red SnapperT
able
1.9
.(c
on
tin
ued
)
Yea
r1
23
45
67
89
10
11
12
13
14
15
16
17
18
19
20
19
85
0.2
52
0.8
25
0.9
36
0.9
40
0.9
40
0.9
40
0.9
40
0.9
40
0.9
40
0.9
37
0.9
34
0.9
34
0.9
34
0.9
34
0.9
34
0.9
34
0.9
34
0.9
34
0.9
34
0.9
34
19
86
0.2
82
0.8
11
0.8
03
0.8
04
0.8
04
0.8
04
0.8
04
0.8
04
0.8
04
0.8
03
0.8
03
0.8
03
0.8
03
0.8
03
0.8
03
0.8
03
0.8
03
0.8
03
0.8
03
0.8
03
19
87
0.2
01
0.6
48
0.6
59
0.6
60
0.6
60
0.6
60
0.6
60
0.6
60
0.6
60
0.6
59
0.6
59
0.6
59
0.6
59
0.6
59
0.6
59
0.6
59
0.6
59
0.6
59
0.6
59
0.6
59
19
88
0.2
01
0.6
90
0.7
09
0.7
09
0.7
09
0.7
09
0.7
09
0.7
09
0.7
09
0.7
09
0.7
09
0.7
09
0.7
09
0.7
09
0.7
09
0.7
09
0.7
09
0.7
09
0.7
09
0.7
09
19
89
0.1
76
0.6
44
0.8
48
0.8
49
0.8
50
0.8
50
0.8
50
0.8
50
0.8
50
0.8
48
0.8
47
0.8
47
0.8
47
0.8
47
0.8
47
0.8
47
0.8
47
0.8
47
0.8
47
0.8
47
19
90
0.2
47
0.7
71
0.8
00
0.8
03
0.8
03
0.8
03
0.8
03
0.8
03
0.8
03
0.8
01
0.7
98
0.7
98
0.7
98
0.7
98
0.7
98
0.7
98
0.7
98
0.7
98
0.7
98
0.7
98
19
91
0.1
43
0.5
13
0.6
11
0.6
19
0.6
21
0.6
21
0.6
21
0.6
21
0.6
21
0.6
13
0.6
06
0.6
06
0.6
06
0.6
06
0.6
06
0.6
06
0.6
06
0.6
06
0.6
06
0.6
06
19
92
0.0
78
0.3
62
0.5
14
0.6
32
0.6
39
0.6
39
0.6
39
0.6
39
0.6
39
0.6
26
0.6
15
0.6
15
0.6
15
0.6
15
0.6
15
0.6
15
0.6
15
0.6
15
0.6
15
0.6
15
19
93
0.1
27
0.4
50
0.6
35
0.8
61
0.8
72
0.8
73
0.8
73
0.8
73
0.8
73
0.8
66
0.8
60
0.8
60
0.8
60
0.8
60
0.8
60
0.8
60
0.8
60
0.8
60
0.8
60
0.8
60
19
94
0.1
86
0.4
74
0.5
41
0.6
29
0.6
36
0.6
36
0.6
36
0.6
36
0.6
36
0.6
22
0.6
10
0.6
10
0.6
10
0.6
10
0.6
10
0.6
10
0.6
10
0.6
10
0.6
10
0.6
10
19
95
0.1
93
0.4
95
0.5
73
0.6
59
0.6
66
0.6
66
0.6
66
0.6
66
0.6
66
0.6
54
0.6
44
0.6
44
0.6
44
0.6
44
0.6
44
0.6
44
0.6
44
0.6
44
0.6
44
0.6
44
19
96
0.1
49
0.4
30
0.5
42
0.6
67
0.6
74
0.6
74
0.6
74
0.6
74
0.6
74
0.6
66
0.6
58
0.6
58
0.6
58
0.6
58
0.6
58
0.6
58
0.6
58
0.6
58
0.6
58
0.6
58
19
97
0.1
10
0.3
49
0.4
94
0.6
54
0.6
62
0.6
62
0.6
62
0.6
62
0.6
62
0.6
50
0.6
40
0.6
40
0.6
40
0.6
40
0.6
40
0.6
40
0.6
40
0.6
40
0.6
40
0.6
40
19
98
0.1
13
0.4
24
0.5
53
0.6
40
0.6
46
0.6
46
0.6
46
0.6
46
0.6
46
0.6
34
0.6
23
0.6
23
0.6
23
0.6
23
0.6
23
0.6
23
0.6
23
0.6
23
0.6
23
0.6
23
19
99
0.1
17
0.4
56
0.6
08
0.6
98
0.7
03
0.7
03
0.7
03
0.7
03
0.7
03
0.6
89
0.6
76
0.6
76
0.6
76
0.6
76
0.6
76
0.6
76
0.6
76
0.6
76
0.6
76
0.6
76
20
00
0.1
41
0.4
98
0.6
18
0.6
66
0.6
69
0.6
69
0.6
70
0.6
70
0.6
70
0.6
56
0.6
44
0.6
44
0.6
44
0.6
44
0.6
44
0.6
44
0.6
44
0.6
44
0.6
44
0.6
44
20
01
0.1
81
0.5
64
0.6
74
0.7
36
0.7
42
0.7
42
0.7
42
0.7
42
0.7
42
0.7
24
0.7
08
0.7
08
0.7
08
0.7
08
0.7
08
0.7
08
0.7
08
0.7
08
0.7
08
0.7
08
20
02
0.1
83
0.5
43
0.6
23
0.6
44
0.6
48
0.6
48
0.6
48
0.6
48
0.6
48
0.6
29
0.6
14
0.6
14
0.6
14
0.6
14
0.6
14
0.6
14
0.6
14
0.6
14
0.6
14
0.6
14
20
03
0.1
80
0.5
38
0.5
76
0.5
32
0.5
33
0.5
34
0.5
34
0.5
34
0.5
34
0.5
20
0.5
08
0.5
08
0.5
08
0.5
08
0.5
08
0.5
08
0.5
08
0.5
08
0.5
08
0.5
08
20
04
0.2
01
0.5
76
0.6
44
0.6
40
0.6
42
0.6
43
0.6
43
0.6
43
0.6
43
0.6
27
0.6
13
0.6
13
0.6
13
0.6
13
0.6
13
0.6
13
0.6
13
0.6
13
0.6
13
0.6
13
20
05
0.1
82
0.5
56
0.6
26
0.6
06
0.6
07
0.6
07
0.6
07
0.6
07
0.6
07
0.5
98
0.5
91
0.5
91
0.5
91
0.5
91
0.5
91
0.5
91
0.5
91
0.5
91
0.5
91
0.5
91
20
06
0.1
49
0.4
87
0.5
52
0.5
23
0.5
23
0.5
23
0.5
23
0.5
23
0.5
23
0.5
19
0.5
15
0.5
15
0.5
15
0.5
15
0.5
15
0.5
15
0.5
15
0.5
15
0.5
15
0.5
15
SEDAR 15 SAR 1 SECTION V 18

Addenda and updates South Atlantic Red SnapperT
able
1.1
0.
Red
sna
pp
er:
Esti
ma
ted
tota
lla
nd
ings
at
age
(10
00
fish
)
Yea
r1
23
45
67
89
10
11
12
13
14
15
16
17
18
19
20
19
45
0.3
1.4
1.2
1.1
1.0
0.9
0.8
0.7
0.7
0.6
0.6
0.5
0.5
0.5
0.4
0.4
0.4
0.3
0.3
4.2
19
46
0.5
1.5
1.3
1.2
1.0
0.9
0.9
0.8
0.7
0.7
0.6
0.6
0.5
0.5
0.5
0.4
0.4
0.4
0.3
4.6
19
47
1.0
4.8
2.8
2.5
2.3
2.1
1.9
1.7
1.6
1.5
1.4
1.3
1.2
1.1
1.0
0.9
0.9
0.8
0.8
10.0
19
48
1.6
7.4
6.4
3.9
3.5
3.2
2.9
2.7
2.4
2.3
2.1
1.9
1.8
1.7
1.5
1.4
1.3
1.2
1.2
15.3
19
49
2.1
10.1
8.6
7.6
4.7
4.2
3.9
3.5
3.3
3.0
2.8
2.6
2.4
2.2
2.1
1.9
1.8
1.7
1.5
20.4
19
50
2.7
12.7
10.8
9.5
8.5
5.3
4.8
4.4
4.1
3.7
3.5
3.2
3.0
2.8
2.6
2.4
2.2
2.1
1.9
25.3
19
51
3.5
16.5
14.0
12.2
10.9
9.8
6.1
5.6
5.1
4.7
4.4
4.1
3.8
3.5
3.2
3.0
2.8
2.6
2.4
32.0
19
52
3.9
18.1
15.2
13.2
11.7
10.5
9.5
5.9
5.5
5.0
4.7
4.3
4.0
3.7
3.4
3.2
3.0
2.8
2.6
34.0
19
53
4.5
21.0
17.6
15.1
13.3
11.9
10.7
9.8
6.1
5.6
5.2
4.8
4.5
4.2
3.9
3.6
3.3
3.1
2.9
38.1
19
54
5.5
25.5
21.2
18.2
15.9
14.2
12.7
11.5
10.5
6.6
6.1
5.6
5.2
4.9
4.5
4.2
3.9
3.6
3.4
44.5
19
55
6.0
27.8
23.0
19.6
17.1
15.1
13.5
12.1
11.0
10.1
6.4
5.9
5.4
5.0
4.7
4.3
4.0
3.8
3.5
46.2
19
56
6.8
31.2
25.6
21.7
18.8
16.5
14.6
13.1
11.9
10.8
9.9
6.2
5.8
5.4
5.0
4.6
4.3
4.0
3.7
49.0
19
57
8.4
38.5
31.4
26.5
22.7
19.8
17.5
15.6
14.0
12.7
11.6
10.7
6.7
6.2
5.8
5.4
5.0
4.6
4.3
56.9
19
58
8.9
40.7
32.7
27.4
23.4
20.2
17.8
15.8
14.1
12.7
11.5
10.5
9.7
6.1
5.6
5.2
4.9
4.5
4.2
55.8
19
59
10.2
46.1
36.9
30.4
25.8
22.2
19.4
17.1
15.2
13.6
12.3
11.2
10.2
9.4
5.9
5.5
5.1
4.7
4.4
58.3
19
60
11.6
52.1
41.2
33.8
28.2
24.2
20.9
18.3
16.2
14.4
13.0
11.7
10.7
9.8
9.0
5.7
5.2
4.9
4.5
60.0
19
61
11.5
51.8
40.5
32.8
27.3
23.0
19.8
17.2
15.1
13.4
12.0
10.7
9.7
8.9
8.1
7.5
4.7
4.4
4.1
53.8
19
62
10.5
47.3
36.9
29.5
24.3
20.4
17.3
14.9
13.0
11.5
10.2
9.1
8.2
7.4
6.7
6.2
5.7
3.6
3.3
44.1
19
63
9.3
42.2
33.2
26.5
21.5
17.9
15.1
12.8
11.1
9.7
8.6
7.6
6.8
6.1
5.6
5.1
4.6
4.3
2.7
35.7
19
64
8.4
38.5
30.6
24.6
20.0
16.3
13.6
11.5
9.9
8.6
7.5
6.6
5.9
5.3
4.8
4.3
3.9
3.6
3.3
29.8
19
65
7.5
34.5
27.7
22.5
18.4
15.0
12.4
10.4
8.8
7.6
6.6
5.8
5.1
4.5
4.1
3.7
3.3
3.0
2.8
25.5
19
66
10.2
46.2
37.4
30.7
25.3
20.9
17.2
14.2
11.9
10.2
8.7
7.6
6.7
5.9
5.2
4.7
4.2
3.8
3.5
32.8
19
67
13.7
61.0
48.3
40.0
33.3
27.7
23.0
19.0
15.7
13.3
11.3
9.7
8.5
7.4
6.6
5.9
5.3
4.7
4.3
40.6
19
68
17.6
77.1
59.2
48.0
40.3
33.8
28.4
23.6
19.5
16.2
13.7
11.7
10.1
8.8
7.7
6.8
6.1
5.5
4.9
46.6
19
69
21.2
91.0
67.3
52.9
43.5
36.8
31.1
26.2
21.9
18.1
15.1
12.8
10.9
9.4
8.2
7.2
6.4
5.7
5.1
48.2
19
70
27.5
11
4.6
81.9
62.1
49.5
41.0
35.0
29.7
25.0
20.9
17.4
14.5
12.3
10.5
9.0
7.9
6.9
6.1
5.5
51.4
19
71
29.8
12
2.0
82.3
60.3
46.3
37.2
31.1
26.6
22.6
19.1
16.0
13.3
11.1
9.4
8.1
6.9
6.1
5.3
4.7
43.7
19
72
32.3
13
0.5
85.6
59.2
43.9
34.1
27.5
23.1
19.8
16.9
14.3
12.0
10.0
8.4
7.1
6.1
5.2
4.6
4.0
36.4
19
73
34.6
13
8.2
88.4
59.4
41.7
31.2
24.3
19.8
16.6
14.3
12.2
10.3
8.7
7.2
6.1
5.1
4.4
3.8
3.3
29.4
19
74
27.8
15
4.8
96.5
63.3
43.1
30.5
23.0
18.0
14.7
12.4
10.6
9.1
7.7
6.5
5.4
4.5
3.8
3.3
2.8
24.5
19
75
28.7
12
2.4
10
3.4
66.1
43.9
30.2
21.5
16.3
12.8
10.4
8.8
7.6
6.5
5.5
4.6
3.9
3.2
2.7
2.4
19.5
19
76
39.9
11
9.9
75.0
64.9
42.1
28.2
19.5
13.9
10.6
8.3
6.8
5.8
5.0
4.3
3.6
3.0
2.5
2.1
1.8
14.4
19
77
66.7
16
6.5
70.0
44.8
39.4
25.7
17.4
12.1
8.6
6.6
5.2
4.2
3.6
3.1
2.7
2.3
1.9
1.6
1.3
10.1
19
78
92.4
24
7.6
79.7
34.3
22.3
19.8
13.0
8.8
6.1
4.4
3.4
2.6
2.2
1.8
1.6
1.4
1.2
1.0
0.8
5.9
19
79
57.8
27
8.1
86.3
28.5
12.4
8.2
7.3
4.8
3.3
2.3
1.6
1.2
1.0
0.8
0.7
0.6
0.5
0.4
0.4
2.5
19
80
11
5.8
16
2.5
85.7
27.3
9.1
4.0
2.7
2.4
1.6
1.1
0.7
0.5
0.4
0.3
0.3
0.2
0.2
0.2
0.1
0.9
19
81
16.4
22
2.3
32.6
17.6
5.7
1.9
0.9
0.6
0.5
0.3
0.2
0.2
0.1
0.1
0.1
0.1
0.0
0.0
0.0
0.2
19
82
31.9
51.0
89.5
13.4
7.4
2.4
0.8
0.4
0.2
0.2
0.1
0.1
0.1
0.1
0.0
0.0
0.0
0.0
0.0
0.1
19
83
64.8
11
3.0
23.8
42.9
6.5
3.6
1.2
0.4
0.2
0.1
0.1
0.1
0.0
0.0
0.0
0.0
0.0
0.0
0.0
0.1
19
84
12
3.4
17
8.2
49.1
10.6
19.4
3.0
1.7
0.5
0.2
0.1
0.1
0.1
0.0
0.0
0.0
0.0
0.0
0.0
0.0
0.0
SEDAR 15 SAR 1 SECTION V 19

Addenda and updates South Atlantic Red SnapperT
able
1.1
0.
(con
tin
ued
)
Yea
r1
23
45
67
89
10
11
12
13
14
15
16
17
18
19
20
19
85
34.7
21
5.9
83.1
16.2
3.5
6.5
1.0
0.6
0.2
0.1
0.0
0.0
0.0
0.0
0.0
0.0
0.0
0.0
0.0
0.0
19
86
42.1
53.1
90.7
26.3
5.2
1.1
2.1
0.3
0.2
0.1
0.0
0.0
0.0
0.0
0.0
0.0
0.0
0.0
0.0
0.0
19
87
34.0
55.9
22.8
31.5
9.3
1.8
0.4
0.8
0.1
0.1
0.0
0.0
0.0
0.0
0.0
0.0
0.0
0.0
0.0
0.0
19
88
30.2
85.3
36.2
11.0
15.5
4.6
0.9
0.2
0.4
0.1
0.0
0.0
0.0
0.0
0.0
0.0
0.0
0.0
0.0
0.0
19
89
34.8
74.2
53.1
17.9
5.5
7.8
2.3
0.5
0.1
0.2
0.0
0.0
0.0
0.0
0.0
0.0
0.0
0.0
0.0
0.0
19
90
28.5
69.7
42.8
19.5
6.6
2.1
2.9
0.9
0.2
0.0
0.1
0.0
0.0
0.0
0.0
0.0
0.0
0.0
0.0
0.0
19
91
32.5
51.6
32.3
14.3
6.6
2.3
0.7
1.0
0.3
0.1
0.0
0.0
0.0
0.0
0.0
0.0
0.0
0.0
0.0
0.0
19
92
1.8
41.4
25.3
15.9
7.1
3.3
1.1
0.4
0.5
0.2
0.0
0.0
0.0
0.0
0.0
0.0
0.0
0.0
0.0
0.0
19
93
1.3
20.5
47.3
22.8
9.5
4.2
2.0
0.7
0.2
0.3
0.1
0.0
0.0
0.0
0.0
0.0
0.0
0.0
0.0
0.0
19
94
0.6
7.8
15.9
28.2
7.1
2.9
1.3
0.6
0.2
0.1
0.1
0.0
0.0
0.0
0.0
0.0
0.0
0.0
0.0
0.0
19
95
0.7
7.5
12.0
15.8
14.3
3.5
1.5
0.7
0.3
0.1
0.0
0.0
0.0
0.0
0.0
0.0
0.0
0.0
0.0
0.0
19
96
1.2
9.4
11.8
11.1
7.6
6.7
1.7
0.7
0.3
0.1
0.1
0.0
0.0
0.0
0.0
0.0
0.0
0.0
0.0
0.0
19
97
1.2
13.8
13.0
10.2
5.2
3.5
3.1
0.8
0.3
0.1
0.1
0.0
0.0
0.0
0.0
0.0
0.0
0.0
0.0
0.0
19
98
4.0
22.0
22.8
11.3
4.8
2.4
1.6
1.4
0.4
0.1
0.1
0.0
0.0
0.0
0.0
0.0
0.0
0.0
0.0
0.0
19
99
5.1
51.8
25.1
17.7
5.8
2.4
1.2
0.8
0.7
0.2
0.1
0.0
0.0
0.0
0.0
0.0
0.0
0.0
0.0
0.0
20
00
4.0
57.1
49.5
16.2
7.8
2.5
1.1
0.5
0.4
0.3
0.1
0.0
0.0
0.0
0.0
0.0
0.0
0.0
0.0
0.0
20
01
2.5
40.5
53.6
35.4
8.2
3.9
1.3
0.5
0.3
0.2
0.2
0.0
0.0
0.0
0.0
0.0
0.0
0.0
0.0
0.0
20
02
2.6
24.1
35.7
33.6
14.1
3.2
1.5
0.5
0.2
0.1
0.1
0.1
0.0
0.0
0.0
0.0
0.0
0.0
0.0
0.0
20
03
1.9
28.6
22.2
22.5
14.0
5.8
1.3
0.6
0.2
0.1
0.0
0.0
0.0
0.0
0.0
0.0
0.0
0.0
0.0
0.0
20
04
2.2
19.5
28.6
18.4
13.9
8.6
3.6
0.8
0.4
0.1
0.1
0.0
0.0
0.0
0.0
0.0
0.0
0.0
0.0
0.0
20
05
2.6
25.9
19.9
19.8
8.5
6.4
3.9
1.7
0.4
0.2
0.1
0.0
0.0
0.0
0.0
0.0
0.0
0.0
0.0
0.0
20
06
2.7
28.4
23.1
12.3
8.8
3.8
2.8
1.8
0.7
0.2
0.1
0.0
0.0
0.0
0.0
0.0
0.0
0.0
0.0
0.0
SEDAR 15 SAR 1 SECTION V 20

Addenda and updates South Atlantic Red SnapperT
able
1.1
1.
Red
sna
pp
er:
Esti
ma
ted
tota
lla
nd
ings
at
age
(mt)
Yea
r1
23
45
67
89
10
11
12
13
14
15
16
17
18
19
20
19
45
0.1
1.1
2.0
2.8
3.6
4.1
4.5
4.7
4.8
4.8
4.7
4.6
4.4
4.2
4.0
3.7
3.5
3.3
3.1
41.4
19
46
0.1
1.2
2.2
3.1
3.9
4.5
4.9
5.1
5.2
5.2
5.1
5.0
4.8
4.6
4.3
4.1
3.8
3.6
3.4
45.2
19
47
0.2
3.9
4.7
6.7
8.5
9.8
10.7
11.2
11.4
11.4
11.2
10.8
10.4
10.0
9.4
8.9
8.4
7.9
7.4
98.7
19
48
0.4
6.0
10.7
10.4
13.0
15.0
16.3
17.1
17.5
17.4
17.1
16.6
16.0
15.2
14.5
13.7
12.9
12.1
11.3
15
1.2
19
49
0.5
8.1
14.4
20.4
17.4
20.0
21.8
22.9
23.3
23.3
22.9
22.2
21.3
20.4
19.3
18.3
17.2
16.2
15.1
20
2.0
19
50
0.6
10.2
18.1
25.5
31.7
24.9
27.1
28.4
28.9
28.9
28.4
27.5
26.5
25.3
24.0
22.7
21.3
20.0
18.8
25
0.6
19
51
0.8
13.3
23.3
32.7
40.5
46.4
34.4
35.9
36.6
36.6
35.9
34.9
33.5
32.0
30.4
28.7
27.0
25.4
23.8
31
7.4
19
52
0.9
14.6
25.4
35.5
43.7
49.7
53.8
38.3
39.0
38.9
38.2
37.1
35.6
34.0
32.3
30.5
28.7
27.0
25.3
33
7.5
19
53
1.0
16.9
29.3
40.6
49.7
56.4
60.7
63.1
43.7
43.5
42.7
41.4
39.8
38.0
36.1
34.1
32.1
30.2
28.3
37
7.3
19
54
1.2
20.5
35.4
48.9
59.5
67.1
71.8
74.3
75.1
50.9
49.9
48.4
46.5
44.4
42.2
39.9
37.5
35.3
33.1
44
0.7
19
55
1.4
22.4
38.4
52.7
63.8
71.4
76.1
78.3
78.8
77.9
52.0
50.3
48.4
46.2
43.8
41.4
39.0
36.7
34.4
45
8.1
19
56
1.5
25.1
42.7
58.2
70.1
78.2
82.7
84.7
84.7
83.4
81.2
53.5
51.3
49.0
46.5
43.9
41.4
38.9
36.5
48
6.0
19
57
1.9
31.0
52.4
71.0
84.8
94.0
99.1
10
0.7
10
0.2
98.2
95.1
91.5
59.8
56.9
54.0
51.0
48.1
45.2
42.3
56
4.3
19
58
2.0
32.7
54.6
73.4
87.2
95.9
10
0.5
10
1.7
10
0.5
97.9
94.4
90.4
86.2
55.9
52.9
50.0
47.1
44.2
41.5
55
2.6
19
59
2.3
37.1
61.5
81.6
96.3
10
5.2
10
9.3
11
0.1
10
8.4
10
4.9
10
0.5
95.7
90.8
86.0
55.4
52.2
49.2
46.2
43.3
57
7.5
19
60
2.6
41.9
68.7
90.6
10
5.4
11
4.4
11
8.2
11
8.1
11
5.6
11
1.4
10
6.0
10
0.4
94.8
89.2
84.0
53.9
50.6
47.6
44.6
59
4.6
19
61
2.6
41.7
67.5
88.1
10
1.8
10
9.0
11
1.9
11
1.1
10
7.9
10
3.4
98.0
92.2
86.5
81.1
75.9
71.1
45.5
42.6
40.0
53
2.8
19
62
2.4
38.1
61.5
79.2
90.6
96.4
97.6
96.3
92.9
88.3
83.3
78.0
72.7
67.7
63.1
58.9
55.0
35.1
32.8
43
7.0
19
63
2.1
34.0
55.4
71.2
80.4
84.6
85.1
82.8
79.4
75.0
70.1
65.4
60.7
56.1
52.0
48.2
44.8
41.8
26.6
35
3.4
19
64
1.9
30.9
51.0
66.1
74.5
77.4
77.1
74.5
70.4
66.1
61.5
56.8
52.4
48.3
44.5
41.0
37.9
35.1
32.7
29
5.0
19
65
1.7
27.8
46.1
60.4
68.7
71.3
70.0
67.0
62.9
58.2
53.8
49.4
45.2
41.5
38.0
34.8
32.0
29.5
27.3
25
2.6
19
66
2.3
37.2
62.3
82.3
94.6
98.9
97.0
91.6
85.1
78.3
71.3
65.1
59.2
53.8
49.1
44.8
40.9
37.5
34.5
32
4.7
19
67
3.1
49.1
80.6
10
7.3
12
4.3
13
1.4
12
9.9
12
2.4
11
2.4
10
2.3
92.6
83.3
75.3
68.1
61.5
55.8
50.8
46.2
42.3
40
2.3
19
68
4.0
62.0
98.7
12
8.8
15
0.4
16
0.3
16
0.2
15
2.3
13
9.5
12
5.3
11
2.2
10
0.3
89.5
80.3
72.2
65.0
58.8
53.3
48.4
46
2.1
19
69
4.8
73.2
11
2.2
14
1.8
16
2.4
17
4.4
17
5.8
16
8.9
15
5.9
13
9.8
12
3.6
10
9.4
96.9
85.8
76.6
68.6
61.5
55.5
50.2
47
7.3
19
70
6.2
92.2
13
6.6
16
6.5
18
4.6
19
4.4
19
7.5
19
1.3
17
8.5
16
1.4
14
2.5
12
4.5
10
9.1
96.0
84.5
75.1
67.0
59.9
53.9
50
9.1
19
71
6.8
98.1
13
7.3
16
1.7
17
2.8
17
6.3
17
5.6
17
1.4
16
1.4
14
7.5
13
1.2
11
4.4
99.0
86.2
75.4
66.1
58.6
52.1
46.5
43
3.5
19
72
7.3
10
5.0
14
2.7
15
8.8
16
4.0
16
1.3
15
5.6
14
8.9
14
1.3
13
0.2
11
7.1
10
3.0
89.0
76.4
66.2
57.6
50.4
44.5
39.5
36
1.2
19
73
7.8
11
1.2
14
7.5
15
9.4
15
5.6
14
7.8
13
7.5
12
7.5
11
8.6
11
0.1
99.9
88.8
77.3
66.3
56.7
48.8
42.4
36.9
32.6
29
1.1
19
74
6.3
12
4.5
16
1.0
16
9.8
16
1.0
14
4.5
12
9.8
11
6.1
10
4.6
95.2
87.1
78.0
68.7
59.4
50.7
43.1
37.0
32.1
27.9
24
2.4
19
75
6.5
98.4
17
2.4
17
7.3
16
4.0
14
3.1
12
1.4
10
4.9
91.1
80.4
72.0
65.1
57.7
50.5
43.4
36.9
31.3
26.8
23.1
19
3.6
19
76
9.1
96.5
12
5.0
17
4.1
15
7.0
13
3.6
11
0.2
89.9
75.5
64.2
55.7
49.3
44.2
38.9
33.8
29.0
24.5
20.7
17.7
14
2.4
19
77
15.1
13
3.9
11
6.7
12
0.3
14
7.0
12
1.9
98.1
77.8
61.7
50.7
42.4
36.4
31.9
28.4
24.9
21.5
18.4
15.5
13.1
10
0.3
19
78
21.0
19
9.2
13
2.8
92.1
83.2
93.6
73.4
56.8
43.7
34.0
27.5
22.7
19.3
16.8
14.8
13.0
11.2
9.5
8.0
58.2
19
79
13.1
22
3.7
14
3.9
76.3
46.4
38.6
41.1
31.0
23.3
17.5
13.4
10.7
8.8
7.4
6.4
5.6
4.9
4.2
3.6
24.8
19
80
26.3
13
0.7
14
2.9
73.1
34.0
19.1
15.0
15.3
11.2
8.3
6.1
4.6
3.7
3.0
2.5
2.2
1.9
1.6
1.4
9.4
19
81
3.7
17
8.8
54.3
47.3
21.3
9.1
4.8
3.6
3.6
2.6
1.9
1.4
1.0
0.8
0.7
0.5
0.5
0.4
0.4
2.3
19
82
7.2
41.0
14
9.3
36.1
27.6
11.4
4.6
2.3
1.7
1.7
1.2
0.8
0.6
0.5
0.4
0.3
0.2
0.2
0.2
1.2
19
83
14.7
90.9
39.7
11
5.1
24.4
17.2
6.7
2.6
1.3
0.9
0.9
0.6
0.4
0.3
0.2
0.2
0.1
0.1
0.1
0.7
19
84
28.0
14
3.3
81.9
28.5
72.4
14.1
9.4
3.5
1.3
0.6
0.5
0.4
0.3
0.2
0.2
0.1
0.1
0.1
0.1
0.4
SEDAR 15 SAR 1 SECTION V 21

Addenda and updates South Atlantic Red SnapperT
able
1.1
1.
(con
tin
ued
)
Yea
r1
23
45
67
89
10
11
12
13
14
15
16
17
18
19
20
19
85
7.9
17
3.7
13
8.5
43.4
13.2
30.9
5.7
3.6
1.3
0.5
0.2
0.2
0.2
0.1
0.1
0.1
0.0
0.0
0.0
0.1
19
86
9.6
42.7
15
1.2
70.5
19.3
5.4
11.9
2.1
1.3
0.5
0.2
0.1
0.1
0.1
0.0
0.0
0.0
0.0
0.0
0.1
19
87
7.7
45.0
38.0
84.6
34.5
8.7
2.3
4.9
0.8
0.5
0.2
0.1
0.0
0.0
0.0
0.0
0.0
0.0
0.0
0.0
19
88
6.9
68.6
60.4
29.6
57.7
21.7
5.2
1.3
2.7
0.5
0.3
0.1
0.0
0.0
0.0
0.0
0.0
0.0
0.0
0.0
19
89
7.9
59.7
88.6
47.9
20.6
37.0
13.1
3.0
0.7
1.5
0.2
0.1
0.1
0.0
0.0
0.0
0.0
0.0
0.0
0.0
19
90
6.5
56.1
71.3
52.4
24.8
9.8
16.6
5.7
1.3
0.3
0.6
0.1
0.1
0.0
0.0
0.0
0.0
0.0
0.0
0.0
19
91
7.4
41.5
53.9
38.3
24.6
10.7
4.0
6.5
2.2
0.5
0.1
0.2
0.0
0.0
0.0
0.0
0.0
0.0
0.0
0.0
19
92
0.4
33.3
42.2
42.7
26.5
15.6
6.4
2.3
3.7
1.2
0.2
0.1
0.1
0.0
0.0
0.0
0.0
0.0
0.0
0.0
19
93
0.3
16.5
78.9
61.1
35.5
19.9
11.1
4.4
1.5
2.4
0.8
0.2
0.0
0.1
0.0
0.0
0.0
0.0
0.0
0.0
19
94
0.1
6.2
26.6
75.6
26.5
13.8
7.3
3.9
1.5
0.5
0.8
0.2
0.1
0.0
0.0
0.0
0.0
0.0
0.0
0.0
19
95
0.2
6.0
20.0
42.5
53.2
16.7
8.3
4.2
2.2
0.8
0.3
0.4
0.1
0.0
0.0
0.0
0.0
0.0
0.0
0.0
19
96
0.3
7.6
19.7
29.8
28.3
31.8
9.5
4.5
2.2
1.1
0.4
0.1
0.2
0.1
0.0
0.0
0.0
0.0
0.0
0.0
19
97
0.3
11.1
21.7
27.4
19.2
16.4
17.5
5.0
2.3
1.1
0.5
0.2
0.1
0.1
0.0
0.0
0.0
0.0
0.0
0.0
19
98
0.9
17.7
38.1
30.4
17.8
11.3
9.1
9.3
2.6
1.1
0.5
0.3
0.1
0.0
0.1
0.0
0.0
0.0
0.0
0.0
19
99
1.2
41.7
41.8
47.5
21.6
11.5
6.8
5.3
5.3
1.4
0.6
0.3
0.2
0.1
0.0
0.0
0.0
0.0
0.0
0.0
20
00
0.9
45.9
82.5
43.5
29.0
11.9
6.0
3.4
2.6
2.5
0.7
0.3
0.1
0.1
0.0
0.0
0.0
0.0
0.0
0.0
20
01
0.6
32.6
89.4
95.1
30.5
18.4
7.2
3.4
1.9
1.4
1.3
0.4
0.2
0.1
0.0
0.0
0.0
0.0
0.0
0.0
20
02
0.6
19.4
59.5
90.0
52.7
15.2
8.7
3.3
1.5
0.8
0.6
0.6
0.2
0.1
0.0
0.0
0.0
0.0
0.0
0.0
20
03
0.4
23.0
37.0
60.4
52.2
27.6
7.5
4.1
1.5
0.7
0.4
0.3
0.3
0.1
0.0
0.0
0.0
0.0
0.0
0.0
20
04
0.5
15.7
47.8
49.5
51.8
40.5
20.3
5.3
2.8
1.0
0.4
0.2
0.2
0.2
0.0
0.0
0.0
0.0
0.0
0.0
20
05
0.6
20.8
33.1
53.1
31.9
30.2
22.3
10.7
2.7
1.4
0.5
0.2
0.1
0.1
0.1
0.0
0.0
0.0
0.0
0.0
20
06
0.6
22.8
38.5
32.9
32.9
17.9
16.0
11.4
5.3
1.3
0.7
0.2
0.1
0.1
0.0
0.0
0.0
0.0
0.0
0.0
SEDAR 15 SAR 1 SECTION V 22

Addenda and updates South Atlantic Red SnapperT
able
1.1
2.
Red
sna
pp
er:
Esti
ma
ted
tota
lla
nd
ings
at
age
(10
00
lb)
Yea
r1
23
45
67
89
10
11
12
13
14
15
16
17
18
19
20
19
45
0.1
2.4
4.4
6.2
7.8
9.0
9.9
10.3
10.5
10.5
10.3
10.0
9.6
9.2
8.7
8.3
7.8
7.3
6.9
91.4
19
46
0.2
2.6
4.8
6.8
8.5
9.9
10.8
11.3
11.5
11.5
11.3
10.9
10.5
10.0
9.5
9.0
8.5
8.0
7.5
99.6
19
47
0.5
8.5
10.4
14.9
18.7
21.5
23.5
24.7
25.1
25.1
24.6
23.9
23.0
21.9
20.8
19.7
18.5
17.4
16.3
21
7.7
19
48
0.8
13.2
23.5
22.8
28.6
33.0
36.0
37.8
38.5
38.4
37.7
36.6
35.2
33.6
31.9
30.1
28.4
26.7
25.0
33
3.3
19
49
1.1
17.8
31.7
44.9
38.3
44.0
48.1
50.4
51.4
51.3
50.4
48.9
47.0
44.9
42.6
40.3
37.9
35.6
33.4
44
5.2
19
50
1.3
22.5
39.8
56.2
69.9
54.8
59.6
62.6
63.8
63.6
62.5
60.7
58.3
55.7
52.8
49.9
47.1
44.2
41.4
55
2.4
19
51
1.8
29.2
51.4
72.2
89.3
10
2.2
75.8
79.2
80.8
80.6
79.2
76.8
73.9
70.5
66.9
63.3
59.6
56.0
52.5
69
9.6
19
52
1.9
32.1
56.0
78.2
96.3
10
9.6
11
8.6
84.5
85.9
85.7
84.2
81.7
78.5
75.0
71.2
67.3
63.4
59.5
55.8
74
4.0
19
53
2.2
37.2
64.6
89.5
10
9.7
12
4.2
13
3.8
13
9.1
96.3
95.8
94.1
91.3
87.8
83.8
79.6
75.2
70.9
66.6
62.4
83
1.8
19
54
2.7
45.2
78.1
10
7.9
13
1.2
14
7.9
15
8.4
16
3.9
16
5.7
11
2.3
11
0.0
10
6.7
10
2.6
97.9
93.0
87.9
82.8
77.7
72.9
97
1.6
19
55
3.0
49.4
84.6
11
6.2
14
0.7
15
7.4
16
7.7
17
2.7
17
3.6
17
1.8
11
4.7
11
0.9
10
6.6
10
1.8
96.6
91.3
86.0
80.8
75.8
10
09.9
19
56
3.4
55.3
94.2
12
8.3
15
4.6
17
2.3
18
2.3
18
6.7
18
6.7
18
3.9
17
9.1
11
8.0
11
3.1
10
8.0
10
2.5
96.9
91.3
85.7
80.4
10
71.4
19
57
4.2
68.3
11
5.6
15
6.5
18
7.0
20
7.3
21
8.4
22
2.0
22
0.9
21
6.4
20
9.7
20
1.8
13
1.8
12
5.4
11
9.0
11
2.5
10
6.0
99.5
93.3
12
44.1
19
58
4.5
72.1
12
0.3
16
1.9
19
2.3
21
1.3
22
1.5
22
4.3
22
1.6
21
5.9
20
8.1
19
9.2
18
9.9
12
3.2
11
6.5
11
0.1
10
3.8
97.5
91.4
12
18.2
19
59
5.1
81.8
13
5.6
17
9.9
21
2.3
23
2.0
24
1.1
24
2.8
23
9.0
23
1.2
22
1.7
21
1.1
20
0.2
18
9.5
12
2.2
11
5.1
10
8.4
10
1.9
95.5
12
73.3
19
60
5.8
92.3
15
1.5
19
9.7
23
2.4
25
2.3
26
0.7
26
0.3
25
4.8
24
5.5
23
3.7
22
1.4
20
8.9
19
6.7
18
5.2
11
8.9
11
1.6
10
4.9
98.3
13
10.8
19
61
5.8
91.9
14
8.9
19
4.2
22
4.5
24
0.4
24
6.7
24
5.0
23
7.8
22
7.9
21
6.1
20
3.2
19
0.8
17
8.7
16
7.3
15
6.8
10
0.4
94.0
88.1
11
74.5
19
62
5.2
83.9
13
5.6
17
4.7
19
9.8
21
2.6
21
5.2
21
2.3
20
4.9
19
4.6
18
3.6
17
2.0
16
0.3
14
9.4
13
9.2
12
9.7
12
1.2
77.3
72.3
96
3.5
19
63
4.7
74.9
12
2.1
15
6.9
17
7.2
18
6.6
18
7.6
18
2.5
17
5.0
16
5.3
15
4.6
14
4.1
13
3.7
12
3.7
11
4.7
10
6.4
98.8
92.1
58.6
77
9.2
19
64
4.2
68.2
11
2.4
14
5.7
16
4.3
17
0.7
16
9.9
16
4.2
15
5.3
14
5.7
13
5.5
12
5.2
11
5.6
10
6.5
98.0
90.4
83.6
77.5
72.0
65
0.3
19
65
3.8
61.2
10
1.7
13
3.2
15
1.5
15
7.1
15
4.3
14
7.6
13
8.7
12
8.4
11
8.6
10
8.9
99.7
91.4
83.8
76.7
70.6
65.1
60.2
55
6.8
19
66
5.1
82.0
13
7.4
18
1.4
20
8.5
21
8.0
21
3.8
20
1.9
18
7.7
17
2.6
15
7.2
14
3.5
13
0.6
11
8.7
10
8.2
98.7
90.1
82.7
76.1
71
5.8
19
67
6.8
10
8.2
17
7.6
23
6.5
27
4.0
28
9.7
28
6.4
26
9.9
24
7.7
22
5.4
20
4.0
18
3.6
16
6.1
15
0.1
13
5.6
12
3.1
11
1.9
10
1.9
93.3
88
6.8
19
68
8.8
13
6.8
21
7.5
28
4.0
33
1.6
35
3.4
35
3.2
33
5.7
30
7.4
27
6.2
24
7.4
22
1.2
19
7.3
17
7.1
15
9.2
14
3.2
12
9.6
11
7.5
10
6.8
10
18.8
19
69
10.6
16
1.3
24
7.3
31
2.7
35
7.9
38
4.6
38
7.5
37
2.3
34
3.8
30
8.3
27
2.6
24
1.2
21
3.7
18
9.2
16
8.9
15
1.2
13
5.6
12
2.3
11
0.7
10
52.2
19
70
13.8
20
3.3
30
1.1
36
7.0
40
6.9
42
8.6
43
5.4
42
1.7
39
3.6
35
5.9
31
4.1
27
4.4
24
0.6
21
1.6
18
6.3
16
5.6
14
7.7
13
2.1
11
8.9
11
22.3
19
71
14.9
21
6.3
30
2.7
35
6.4
38
1.0
38
8.7
38
7.1
37
8.0
35
5.7
32
5.1
28
9.3
25
2.3
21
8.3
19
0.0
16
6.2
14
5.7
12
9.1
11
4.8
10
2.5
95
5.8
19
72
16.1
23
1.5
31
4.7
35
0.1
36
1.5
35
5.6
34
3.0
32
8.4
31
1.6
28
7.1
25
8.2
22
7.0
19
6.1
16
8.5
14
5.9
12
7.1
11
1.0
98.1
87.1
79
6.2
19
73
17.3
24
5.1
32
5.2
35
1.5
34
3.0
32
5.9
30
3.1
28
1.0
26
1.4
24
2.8
22
0.2
19
5.7
17
0.5
14
6.2
12
4.9
10
7.7
93.5
81.5
71.8
64
1.8
19
74
13.9
27
4.5
35
4.9
37
4.3
35
4.8
31
8.6
28
6.2
25
5.8
23
0.5
20
9.9
19
1.9
17
2.0
15
1.4
13
0.9
11
1.7
95.0
81.6
70.7
61.5
53
4.4
19
75
14.3
21
7.0
38
0.1
39
0.8
36
1.5
31
5.4
26
7.7
23
1.2
20
0.8
17
7.1
15
8.8
14
3.4
12
7.3
11
1.3
95.7
81.3
68.9
59.1
51.0
42
6.9
19
76
20.0
21
2.6
27
5.6
38
3.8
34
6.1
29
4.6
24
3.0
19
8.3
16
6.4
14
1.5
12
2.8
10
8.8
97.3
85.8
74.6
63.9
54.1
45.7
39.1
31
3.9
19
77
33.3
29
5.3
25
7.3
26
5.2
32
4.0
26
8.8
21
6.3
17
1.5
13
6.0
11
1.7
93.5
80.2
70.4
62.5
54.8
47.4
40.5
34.2
28.8
22
1.0
19
78
46.2
43
9.2
29
2.9
20
3.0
18
3.5
20
6.3
16
1.8
12
5.2
96.4
74.9
60.5
50.0
42.5
37.1
32.7
28.6
24.6
21.0
17.7
12
8.2
19
79
28.9
49
3.3
31
7.2
16
8.3
10
2.4
85.1
90.5
68.2
51.3
38.7
29.6
23.6
19.3
16.3
14.1
12.4
10.8
9.3
7.9
54.6
19
80
57.9
28
8.1
31
5.1
16
1.3
75.1
42.0
33.0
33.8
24.7
18.2
13.5
10.2
8.1
6.6
5.5
4.8
4.2
3.6
3.1
20.7
19
81
8.2
39
4.3
11
9.8
10
4.3
46.9
20.1
10.6
8.0
8.0
5.7
4.1
3.0
2.3
1.8
1.4
1.2
1.0
0.9
0.8
5.1
19
82
15.9
90.4
32
9.1
79.5
60.8
25.1
10.2
5.2
3.8
3.7
2.6
1.9
1.4
1.0
0.8
0.6
0.5
0.5
0.4
2.6
19
83
32.4
20
0.5
87.6
25
3.8
53.8
37.8
14.8
5.8
2.8
2.0
2.0
1.4
1.0
0.7
0.5
0.4
0.3
0.3
0.2
1.5
19
84
61.7
31
6.0
18
0.5
62.8
15
9.7
31.2
20.7
7.8
2.9
1.4
1.0
1.0
0.7
0.5
0.3
0.2
0.2
0.2
0.1
0.8
SEDAR 15 SAR 1 SECTION V 23

Addenda and updates South Atlantic Red SnapperT
able
1.1
2.
(con
tin
ued
)
Yea
r1
23
45
67
89
10
11
12
13
14
15
16
17
18
19
20
19
85
17.3
38
2.9
30
5.4
95.7
29.2
68.2
12.6
8.0
2.9
1.1
0.5
0.4
0.3
0.2
0.2
0.1
0.1
0.1
0.1
0.3
19
86
21.1
94.1
33
3.4
15
5.4
42.5
11.9
26.3
4.7
2.9
1.0
0.4
0.2
0.1
0.1
0.1
0.1
0.0
0.0
0.0
0.1
19
87
17.0
99.1
83.9
18
6.5
76.2
19.2
5.1
10.8
1.9
1.1
0.4
0.1
0.1
0.0
0.0
0.0
0.0
0.0
0.0
0.1
19
88
15.1
15
1.2
13
3.1
65.3
12
7.2
47.8
11.4
2.9
6.0
1.0
0.6
0.2
0.1
0.0
0.0
0.0
0.0
0.0
0.0
0.0
19
89
17.4
13
1.5
19
5.3
10
5.7
45.4
81.5
28.9
6.6
1.6
3.3
0.5
0.3
0.1
0.0
0.0
0.0
0.0
0.0
0.0
0.0
19
90
14.3
12
3.6
15
7.2
11
5.4
54.7
21.6
36.6
12.5
2.8
0.7
1.3
0.2
0.1
0.0
0.0
0.0
0.0
0.0
0.0
0.0
19
91
16.3
91.6
11
8.8
84.5
54.3
23.6
8.8
14.4
4.8
1.0
0.2
0.5
0.1
0.0
0.0
0.0
0.0
0.0
0.0
0.0
19
92
0.9
73.5
93.0
94.1
58.4
34.4
14.2
5.1
8.1
2.6
0.5
0.1
0.3
0.0
0.0
0.0
0.0
0.0
0.0
0.0
19
93
0.6
36.4
17
4.0
13
4.6
78.4
43.9
24.5
9.7
3.4
5.2
1.7
0.4
0.1
0.2
0.0
0.0
0.0
0.0
0.0
0.0
19
94
0.3
13.8
58.6
16
6.7
58.4
30.5
16.2
8.7
3.3
1.1
1.7
0.5
0.1
0.0
0.1
0.0
0.0
0.0
0.0
0.0
19
95
0.3
13.3
44.0
93.7
11
7.4
36.9
18.2
9.3
4.8
1.8
0.6
0.9
0.3
0.1
0.0
0.0
0.0
0.0
0.0
0.0
19
96
0.6
16.7
43.5
65.8
62.4
70.2
20.8
9.9
4.9
2.5
0.9
0.3
0.5
0.2
0.0
0.0
0.0
0.0
0.0
0.0
19
97
0.6
24.4
47.8
60.5
42.4
36.2
38.5
11.0
5.1
2.4
1.2
0.5
0.2
0.2
0.1
0.0
0.0
0.0
0.0
0.0
19
98
2.0
39.1
84.0
67.0
39.3
24.8
20.0
20.5
5.7
2.5
1.2
0.6
0.2
0.1
0.1
0.0
0.0
0.0
0.0
0.0
19
99
2.6
91.9
92.2
10
4.8
47.6
25.2
15.1
11.7
11.6
3.1
1.4
0.7
0.3
0.1
0.0
0.1
0.0
0.0
0.0
0.0
20
00
2.0
10
1.2
18
1.9
95.9
63.9
26.3
13.2
7.6
5.7
5.5
1.5
0.7
0.3
0.2
0.1
0.0
0.0
0.0
0.0
0.0
20
01
1.3
71.8
19
7.1
20
9.6
67.2
40.6
15.8
7.6
4.2
3.1
2.9
0.8
0.4
0.2
0.1
0.0
0.0
0.0
0.0
0.0
20
02
1.3
42.7
13
1.1
19
8.4
11
6.3
33.6
19.2
7.2
3.4
1.8
1.3
1.3
0.3
0.2
0.1
0.0
0.0
0.0
0.0
0.0
20
03
0.9
50.7
81.6
13
3.2
11
5.0
60.8
16.6
9.1
3.3
1.5
0.8
0.6
0.6
0.2
0.1
0.0
0.0
0.0
0.0
0.0
20
04
1.1
34.5
10
5.3
10
9.0
11
4.2
89.4
44.7
11.7
6.2
2.2
1.0
0.5
0.4
0.4
0.1
0.0
0.0
0.0
0.0
0.0
20
05
1.3
45.9
73.0
11
7.1
70.2
66.5
49.2
23.6
6.0
3.1
1.1
0.5
0.3
0.2
0.2
0.1
0.0
0.0
0.0
0.0
20
06
1.3
50.4
84.8
72.6
72.5
39.5
35.4
25.1
11.7
2.9
1.5
0.5
0.2
0.1
0.1
0.1
0.0
0.0
0.0
0.0
SEDAR 15 SAR 1 SECTION V 24

Addenda and updates South Atlantic Red Snapper
Table 1.13. Red snapper: Base run: Estimated status indicators, benchmarks, and related quantities from thecatch-at-age model, conditional on estimated current selectivities averaged across fisheries. Values are thoseassociated with F40%, the recommended proxy for FMSY. They are presented for the base estimate of R0, and alsofor ±25%R0. Estimates of yield (Y ) do not include discard mortalities (D); equilibrium recruitment (R) includesbias correction. The MSST is defined by MSST = (1−M)SSBF40% , with constant M = 0.078. Rate estimates (F) arein units of per year; status indicators are dimensionless; and biomass estimates are in units of mt or pounds, asindicated. SPR is spawning potential ratio and YPR is yield per recruit.
Quantity Units Base estimate +25%R0 −25%R0
F40% y−1 0.104 – –85%F40% y−1 0.089 – –75%F40% y−1 0.078 – –65%F40% y−1 0.068 – –
SSB/R at F = 0 lb/fish 64.42 – –SPR at F40% – 40.0% – –SPR at 85%F40% – 44.7% – –SPR at 75%F40% – 48.4% – –SPR at 65%F40% – 52.5% – –YPR at F40% lb 3.33 – –YPR at 85%F40% lb 3.17 – –YPR at 75%F40% lb 3.02 – –YPR at 65%F40% lb 2.84 – –
Y at F40% 1000 lb 1949 2436 1462Y at 85%F40% 1000 lb 1926 2408 1445Y at 75%F40% 1000 lb 1883 2353 1412Y at 65%F40% 1000 lb 1811 2264 1358Y at F40% 1000 fish 157 196 117Y at 85%F40% 1000 fish 150 187 112Y at 75%F40% 1000 fish 143 179 108Y at 65%F40% 1000 fish 135 169 101
D at F40% 1000 lb 62 77 46D at 85%F40% 1000 lb 55 69 41D at 75%F40% 1000 lb 50 63 38D at 65%F40% 1000 lb 45 56 34D at F40% 1000 fish 33 41 25D at 85%F40% 1000 fish 29 37 22D at 75%F40% 1000 fish 27 33 20D at 65%F40% 1000 fish 24 30 18
R bias correction – 1.104 – –R at F = 0 (R0) 1000 fish 638 798 479R at F40% 1000 fish 586 732 439R at 85%F40% 1000 fish 608 761 456R at 75%F40% 1000 fish 623 779 467R at 65%F40% 1000 fish 637 796 477
BF40% mt 15063 18829 11297SSBF40% mt 6847 8559 5136MSST mt 6313 7892 4735F2006/F40% – 7.658 – –SSB2006/SSBF40% – 0.029 0.023 0.038SSB2006/MSST – 0.031 0.025 0.042
SEDAR 15 SAR 1 SECTION V 25

Addenda and updates South Atlantic Red Snapper
Table 1.14. Red snapper: Projection results under scenario R1—fishing mortality rate fixed at F = 0. F = fishingmortality rate (per year), Pr(recover) = proportion of cases reaching SSBF40% , SSB = mid-year spawning stockbiomass (mt), R = recruits (1000 fish), L = landings (1000 lb whole weight), Sum L = cumulative landings (1000lb), and D = discard mortalities (1000 fish). For reference, estimated proxy reference points are F40% = 0.104,SSBF40% = 6847, RF40% = 586, MSYF40% = 1949, and DF40% = 33, each in the same units as the relevant time series.
Year F(per yr) Pr(recover) SSB(mt) R(1000) L(1000 lb) Sum L(1000 lb) D(1000)
2007 0.918 0 204 286 450 450 982008 0.918 0 201 61 454 904 682009 0 0 175 60 0 904 02010 0 0 323 53 0 904 02011 0 0 410 92 0 904 02012 0 0 501 113 0 904 02013 0 0 602 134 0 904 02014 0 0 718 156 0 904 02015 0 0 853 179 0 904 02016 0 0 1010 204 0 904 02017 0 0 1190 231 0 904 02018 0 0 1397 259 0 904 02019 0 0 1631 287 0 904 02020 0 0 1895 316 0 904 02021 0 0 2190 346 0 904 02022 0 0 2515 374 0 904 02023 0 0 2870 402 0 904 02024 0 0 3255 428 0 904 02025 0 0 3668 453 0 904 02026 0 0 4106 476 0 904 02027 0 0 4567 497 0 904 02028 0 0.01 5049 517 0 904 02029 0 0.04 5547 535 0 904 02030 0 0.08 6060 552 0 904 02031 0 0.14 6582 566 0 904 02032 0 0.24 7111 580 0 904 02033 0 0.35 7643 592 0 904 02034 0 0.48 8175 603 0 904 02035 0 0.61 8704 612 0 904 02036 0 0.73 9228 621 0 904 02037 0 0.82 9744 629 0 904 02038 0 0.9 10,251 636 0 904 02039 0 0.94 10,746 643 0 904 02040 0 0.96 11,228 649 0 904 02041 0 0.98 11,696 654 0 904 02042 0 0.99 12,149 659 0 904 02043 0 1 12,587 663 0 904 02044 0 1 13,009 667 0 904 02045 0 1 13,414 671 0 904 02046 0 1 13,803 674 0 904 02047 0 1 14,176 677 0 904 02048 0 1 14,532 680 0 904 02049 0 1 14,872 682 0 904 02050 0 1 15,196 684 0 904 0
SEDAR 15 SAR 1 SECTION V 26

Addenda and updates South Atlantic Red Snapper
Table 1.15. Red snapper: Projection results under scenario R2—fishing mortality rate fixed at F = F40%. F =fishing mortality rate (per year), Pr(recover) = proportion of cases reaching SSBF40% , SSB = mid-year spawningstock biomass (mt), R = recruits (1000 fish), L = landings (1000 lb whole weight), Sum L = cumulative landings(1000 lb), and D = discard mortalities (1000 fish). For reference, estimated proxy reference points are F40% =0.104, SSBF40% = 6847, RF40% = 586, MSYF40% = 1949, and DF40% = 33, each in the same units as the relevant timeseries.
Year F(per yr) Pr(recover) SSB(mt) R(1000) L(1000 lb) Sum L(1000 lb) D(1000)
2007 0.918 0 204 286 450 450 982008 0.918 0 201 61 454 904 682009 0.104 0 175 60 60 964 42010 0.104 0 293 53 83 1047 32011 0.104 0 350 84 99 1146 42012 0.104 0 403 98 114 1259 52013 0.104 0 457 111 128 1388 62014 0.104 0 517 124 145 1533 62015 0.104 0 583 138 163 1696 72016 0.104 0 656 152 183 1879 82017 0.104 0 736 167 205 2084 92018 0.104 0 824 182 230 2315 92019 0.104 0 921 199 258 2572 102020 0.104 0 1026 216 287 2860 112021 0.104 0 1139 233 319 3179 122022 0.104 0 1260 251 353 3532 132023 0.104 0 1389 269 390 3922 142024 0.104 0 1527 286 429 4351 152025 0.104 0 1671 304 470 4821 162026 0.104 0 1823 321 513 5334 172027 0.104 0 1981 338 558 5891 182028 0.104 0 2144 354 604 6495 192029 0.104 0 2311 370 652 7147 202030 0.104 0 2483 385 700 7847 212031 0.104 0 2657 399 750 8597 222032 0.104 0 2833 413 800 9397 222033 0.104 0 3009 425 850 10,247 232034 0.104 0 3186 437 901 11,148 242035 0.104 0 3361 449 951 12,099 252036 0.104 0 3534 459 1000 13,099 252037 0.104 0 3705 469 1049 14,147 262038 0.104 0 3872 478 1096 15,244 262039 0.104 0 4035 486 1143 16,387 272040 0.104 0 4193 494 1188 17,575 272041 0.104 0 4346 501 1232 18,807 282042 0.104 0.01 4494 508 1274 20,081 282043 0.104 0.01 4637 514 1315 21,396 292044 0.104 0.01 4773 520 1354 22,750 292045 0.104 0.02 4903 525 1391 24,141 292046 0.104 0.03 5028 530 1427 25,568 302047 0.104 0.04 5146 534 1461 27,029 302048 0.104 0.05 5258 539 1493 28,521 302049 0.104 0.06 5364 542 1523 30,044 302050 0.104 0.07 5465 546 1552 31,596 312051 0.104 0.09 5559 549 1579 33,174 312052 0.104 0.1 5648 552 1604 34,778 312053 0.104 0.11 5732 555 1628 36,406 312054 0.104 0.12 5811 557 1650 38,057 312055 0.104 0.13 5884 559 1672 39,729 31
SEDAR 15 SAR 1 SECTION V 27

Addenda and updates South Atlantic Red Snapper
Table 1.16. Red snapper: Projection results under scenario R3—fishing mortality rate fixed at F = 65%F40%. F =fishing mortality rate (per year), Pr(recover) = proportion of cases reaching SSBF40% , SSB = mid-year spawningstock biomass (mt), R = recruits (1000 fish), L = landings (1000 lb whole weight), Sum L = cumulative landings(1000 lb), and D = discard mortalities (1000 fish). For reference, estimated proxy reference points are F40% =0.104, SSBF40% = 6847, RF40% = 586, MSYF40% = 1949, and DF40% = 33, each in the same units as the relevant timeseries.
Year F(per yr) Pr(recover) SSB(mt) R(1000) L(1000 lb) Sum L(1000 lb) D(1000)
2007 0.918 0 204 286 450 450 982008 0.918 0 201 61 454 904 682009 0.068 0 175 60 40 943 32010 0.068 0 303 53 56 999 22011 0.068 0 370 87 68 1067 22012 0.068 0 434 103 80 1147 32013 0.068 0 504 119 92 1239 42014 0.068 0 580 135 106 1345 42015 0.068 0 666 151 121 1466 52016 0.068 0 763 169 139 1604 62017 0.068 0 871 187 158 1762 62018 0.068 0 992 207 180 1943 72019 0.068 0 1125 228 205 2148 82020 0.068 0 1272 249 232 2380 92021 0.068 0 1433 270 262 2641 92022 0.068 0 1607 292 294 2935 102023 0.068 0 1794 314 328 3263 112024 0.068 0 1995 335 365 3628 122025 0.068 0 2207 356 404 4032 122026 0.068 0 2430 376 446 4478 132027 0.068 0 2664 395 489 4967 142028 0.068 0 2906 413 534 5500 152029 0.068 0 3155 430 580 6080 152030 0.068 0 3410 447 627 6707 162031 0.068 0 3669 462 675 7382 172032 0.068 0 3931 476 724 8106 172033 0.068 0 4193 489 772 8878 182034 0.068 0 4455 501 821 9699 182035 0.068 0.01 4714 513 869 10,569 192036 0.068 0.02 4970 523 917 11,485 192037 0.068 0.03 5221 532 963 12,449 192038 0.068 0.05 5466 541 1009 13,458 202039 0.068 0.07 5705 549 1053 14,511 202040 0.068 0.1 5936 556 1096 15,608 202041 0.068 0.14 6160 563 1138 16,746 212042 0.068 0.18 6375 569 1178 17,923 212043 0.068 0.23 6581 575 1216 19,140 212044 0.068 0.28 6779 580 1253 20,393 212045 0.068 0.35 6967 584 1288 21,681 222046 0.068 0.4 7146 589 1321 23,002 222047 0.068 0.46 7316 593 1353 24,355 222048 0.068 0.51 7477 596 1383 25,738 222049 0.068 0.56 7629 599 1411 27,149 222050 0.068 0.61 7773 602 1438 28,587 222051 0.068 0.66 7908 605 1463 30,050 222052 0.068 0.7 8036 608 1487 31,536 232053 0.068 0.74 8155 610 1509 33,045 232054 0.068 0.76 8268 612 1530 34,575 232055 0.068 0.79 8373 614 1549 36,124 23
SEDAR 15 SAR 1 SECTION V 28

Addenda and updates South Atlantic Red Snapper
Table 1.17. Red snapper: Projection results under scenario R4—fishing mortality rate fixed at F = 75%F40%. F =fishing mortality rate (per year), Pr(recover) = proportion of cases reaching SSBF40% , SSB = mid-year spawningstock biomass (mt), R = recruits (1000 fish), L = landings (1000 lb whole weight), Sum L = cumulative landings(1000 lb), and D = discard mortalities (1000 fish). For reference, estimated proxy reference points are F40% =0.104, SSBF40% = 6847, RF40% = 586, MSYF40% = 1949, and DF40% = 33, each in the same units as the relevant timeseries.
Year F(per yr) Pr(recover) SSB(mt) R(1000) L(1000 lb) Sum L(1000 lb) D(1000)
2007 0.918 0 204 286 450 450 982008 0.918 0 201 61 454 904 682009 0.078 0 175 60 46 949 32010 0.078 0 300 53 63 1013 22011 0.078 0 364 86 77 1090 32012 0.078 0 425 102 90 1180 42013 0.078 0 490 117 103 1283 42014 0.078 0 561 131 118 1401 52015 0.078 0 641 147 135 1536 62016 0.078 0 730 164 153 1689 62017 0.078 0 830 181 174 1863 72018 0.078 0 941 200 197 2060 82019 0.078 0 1063 219 223 2284 92020 0.078 0 1196 239 252 2535 92021 0.078 0 1342 259 282 2818 102022 0.078 0 1499 280 316 3133 112023 0.078 0 1668 300 352 3485 122024 0.078 0 1849 321 390 3875 132025 0.078 0 2039 341 431 4306 142026 0.078 0 2240 360 473 4779 152027 0.078 0 2449 379 518 5297 152028 0.078 0 2666 396 564 5862 162029 0.078 0 2889 413 612 6474 172030 0.078 0 3117 429 661 7134 182031 0.078 0 3349 444 710 7845 182032 0.078 0 3583 458 760 8605 192033 0.078 0 3817 471 811 9416 202034 0.078 0 4051 484 861 10,277 202035 0.078 0 4283 495 911 11,187 212036 0.078 0.01 4513 505 960 12,147 212037 0.078 0.01 4738 515 1008 13,155 222038 0.078 0.02 4958 524 1055 14,210 222039 0.078 0.03 5172 532 1101 15,311 222040 0.078 0.04 5380 539 1146 16,457 232041 0.078 0.06 5580 546 1189 17,646 232042 0.078 0.09 5773 553 1230 18,876 232043 0.078 0.12 5959 558 1270 20,145 242044 0.078 0.15 6136 564 1308 21,453 242045 0.078 0.18 6305 568 1344 22,797 242046 0.078 0.22 6466 573 1379 24,176 242047 0.078 0.27 6619 577 1411 25,587 242048 0.078 0.31 6764 581 1442 27,030 252049 0.078 0.35 6900 584 1472 28,501 252050 0.078 0.4 7030 587 1499 30,001 252051 0.078 0.43 7151 590 1526 31,526 252052 0.078 0.48 7266 593 1550 33,076 252053 0.078 0.52 7373 595 1573 34,650 252054 0.078 0.56 7474 597 1595 36,244 252055 0.078 0.59 7568 599 1615 37,859 26
SEDAR 15 SAR 1 SECTION V 29
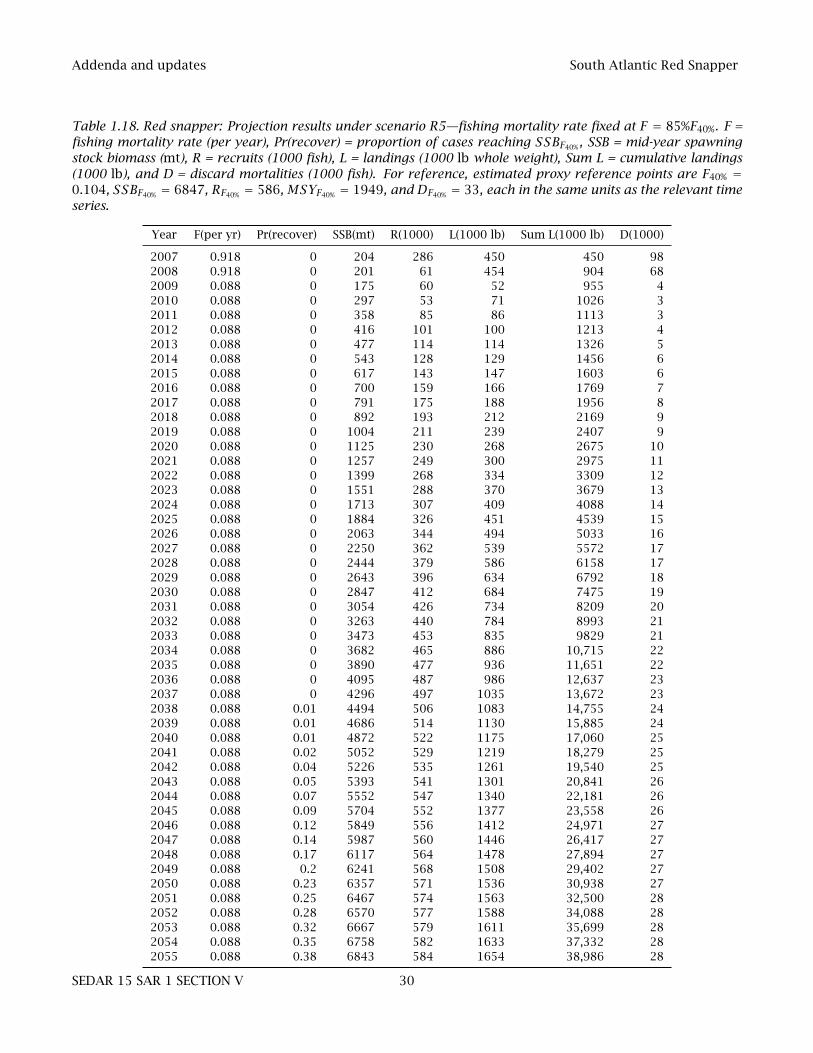
Addenda and updates South Atlantic Red Snapper
Table 1.18. Red snapper: Projection results under scenario R5—fishing mortality rate fixed at F = 85%F40%. F =fishing mortality rate (per year), Pr(recover) = proportion of cases reaching SSBF40% , SSB = mid-year spawningstock biomass (mt), R = recruits (1000 fish), L = landings (1000 lb whole weight), Sum L = cumulative landings(1000 lb), and D = discard mortalities (1000 fish). For reference, estimated proxy reference points are F40% =0.104, SSBF40% = 6847, RF40% = 586, MSYF40% = 1949, and DF40% = 33, each in the same units as the relevant timeseries.
Year F(per yr) Pr(recover) SSB(mt) R(1000) L(1000 lb) Sum L(1000 lb) D(1000)
2007 0.918 0 204 286 450 450 982008 0.918 0 201 61 454 904 682009 0.088 0 175 60 52 955 42010 0.088 0 297 53 71 1026 32011 0.088 0 358 85 86 1113 32012 0.088 0 416 101 100 1213 42013 0.088 0 477 114 114 1326 52014 0.088 0 543 128 129 1456 62015 0.088 0 617 143 147 1603 62016 0.088 0 700 159 166 1769 72017 0.088 0 791 175 188 1956 82018 0.088 0 892 193 212 2169 92019 0.088 0 1004 211 239 2407 92020 0.088 0 1125 230 268 2675 102021 0.088 0 1257 249 300 2975 112022 0.088 0 1399 268 334 3309 122023 0.088 0 1551 288 370 3679 132024 0.088 0 1713 307 409 4088 142025 0.088 0 1884 326 451 4539 152026 0.088 0 2063 344 494 5033 162027 0.088 0 2250 362 539 5572 172028 0.088 0 2444 379 586 6158 172029 0.088 0 2643 396 634 6792 182030 0.088 0 2847 412 684 7475 192031 0.088 0 3054 426 734 8209 202032 0.088 0 3263 440 784 8993 212033 0.088 0 3473 453 835 9829 212034 0.088 0 3682 465 886 10,715 222035 0.088 0 3890 477 936 11,651 222036 0.088 0 4095 487 986 12,637 232037 0.088 0 4296 497 1035 13,672 232038 0.088 0.01 4494 506 1083 14,755 242039 0.088 0.01 4686 514 1130 15,885 242040 0.088 0.01 4872 522 1175 17,060 252041 0.088 0.02 5052 529 1219 18,279 252042 0.088 0.04 5226 535 1261 19,540 252043 0.088 0.05 5393 541 1301 20,841 262044 0.088 0.07 5552 547 1340 22,181 262045 0.088 0.09 5704 552 1377 23,558 262046 0.088 0.12 5849 556 1412 24,971 272047 0.088 0.14 5987 560 1446 26,417 272048 0.088 0.17 6117 564 1478 27,894 272049 0.088 0.2 6241 568 1508 29,402 272050 0.088 0.23 6357 571 1536 30,938 272051 0.088 0.25 6467 574 1563 32,500 282052 0.088 0.28 6570 577 1588 34,088 282053 0.088 0.32 6667 579 1611 35,699 282054 0.088 0.35 6758 582 1633 37,332 282055 0.088 0.38 6843 584 1654 38,986 28
SEDAR 15 SAR 1 SECTION V 30

Addenda and updates South Atlantic Red Snapper
Table 1.19. Red snapper: Projection results under scenario R6—Discard-only projection with fishing rate fixedat F = Fcurrent minus commercial diving, and with release mortality rates of 0.9 in the commercial sector and0.4 in the headboat and general recreational sectors. F = fishing rate (per year), Fmort = fishing rate leading todiscard mortality (a portion of F), Pr(recover) = proportion of cases reaching SSBF40% , SSB = mid-year spawningstock biomass (mt), R = recruits (1000 fish), L = landings (1000 lb), D = discard mortalities (1000 fish), D.wgt =discard mortalities in weight (1000 lb). For reference, the target for rebuilding is SSBF40% = 6847.
Year F(per yr) Fmort(per yr) Pr(recover) SSB(mt) R(1000) L(1000 lb) D(1000) D.wgt(1000 lb)
2007 0.918 0.918 0 204 286 450 98 1522008 0.918 0.918 0 201 61 454 68 1362009 0.903 0.651 0 175 60 0 74 3232010 0.903 0.651 0 195 53 0 57 2982011 0.903 0.651 0 181 58 0 50 2762012 0.903 0.651 0 163 54 0 45 2512013 0.903 0.651 0 146 49 0 41 2262014 0.903 0.651 0 130 44 0 37 2022015 0.903 0.651 0 116 40 0 33 1802016 0.903 0.651 0 104 36 0 30 1612017 0.903 0.651 0 93 32 0 27 1442018 0.903 0.651 0 83 29 0 24 1292019 0.903 0.651 0 74 26 0 21 1162020 0.903 0.651 0 67 23 0 19 1042021 0.903 0.651 0 60 21 0 17 932022 0.903 0.651 0 54 19 0 16 842023 0.903 0.651 0 48 17 0 14 752024 0.903 0.651 0 43 15 0 13 682025 0.903 0.651 0 39 14 0 11 612026 0.903 0.651 0 35 12 0 10 552027 0.903 0.651 0 32 11 0 9 492028 0.903 0.651 0 28 10 0 8 442029 0.903 0.651 0 25 9 0 7 402030 0.903 0.651 0 23 8 0 7 362031 0.903 0.651 0 21 7 0 6 322032 0.903 0.651 0 19 7 0 5 292033 0.903 0.651 0 17 6 0 5 262034 0.903 0.651 0 15 5 0 4 232035 0.903 0.651 0 14 5 0 4 212036 0.903 0.651 0 12 4 0 4 192037 0.903 0.651 0 11 4 0 3 172038 0.903 0.651 0 10 4 0 3 152039 0.903 0.651 0 9 3 0 3 142040 0.903 0.651 0 8 3 0 2 132041 0.903 0.651 0 7 3 0 2 112042 0.903 0.651 0 7 2 0 2 102043 0.903 0.651 0 6 2 0 2 92044 0.903 0.651 0 5 2 0 2 82045 0.903 0.651 0 5 2 0 1 72046 0.903 0.651 0 4 2 0 1 72047 0.903 0.651 0 4 1 0 1 62048 0.903 0.651 0 3 1 0 1 52049 0.903 0.651 0 3 1 0 1 52050 0.903 0.651 0 3 1 0 1 42051 0.903 0.651 0 3 1 0 1 42052 0.903 0.651 0 2 1 0 1 42053 0.903 0.651 0 2 1 0 1 32054 0.903 0.651 0 2 1 0 1 32055 0.903 0.651 0 2 1 0 0 3
SEDAR 15 SAR 1 SECTION V 31

Addenda and updates South Atlantic Red Snapper
Table 1.20. Red snapper: Projection results under scenario R7—Discard-only projection with fishing rate fixedat F = F40% minus commercial diving, and with release mortality rates of 0.9 in the commercial sector and 0.4in the headboat and general recreational sectors. F = fishing rate (per year), Fmort = fishing rate leading todiscard mortality (a portion of F), Pr(recover) = proportion of cases reaching SSBF40% , SSB = mid-year spawningstock biomass (mt), R = recruits (1000 fish), L = landings (1000 lb), D = discard mortalities (1000 fish), D.wgt =discard mortalities in weight (1000 lb). For reference, the target for rebuilding is SSBF40% = 6847.
Year F(per yr) Fmort(per yr) Pr(recover) SSB(mt) R(1000) L(1000 lb) D(1000) D.wgt(1000 lb)
2007 0.918 0.918 0 204 286 450 98 1522008 0.918 0.918 0 201 61 454 68 1362009 0.104 0.075 0 175 60 0 10 432010 0.104 0.075 0 304 53 0 10 532011 0.104 0.075 0 373 87 0 11 642012 0.104 0.075 0 440 104 0 12 762013 0.104 0.075 0 511 120 0 14 892014 0.104 0.075 0 590 136 0 16 1032015 0.104 0.075 0 678 153 0 19 1182016 0.104 0.075 0 778 171 0 21 1352017 0.104 0.075 0 889 190 0 24 1552018 0.104 0.075 0 1014 210 0 27 1762019 0.104 0.075 0 1152 231 0 30 2002020 0.104 0.075 0 1305 253 0 34 2262021 0.104 0.075 0 1471 275 0 37 2542022 0.104 0.075 0 1652 297 0 41 2852023 0.104 0.075 0 1847 319 0 45 3182024 0.104 0.075 0 2056 340 0 49 3532025 0.104 0.075 0 2277 361 0 53 3912026 0.104 0.075 0 2510 382 0 58 4302027 0.104 0.075 0 2754 401 0 62 4712028 0.104 0.075 0 3007 420 0 66 5132029 0.104 0.075 0 3269 437 0 71 5572030 0.104 0.075 0 3536 454 0 75 6012031 0.104 0.075 0 3808 469 0 79 6462032 0.104 0.075 0 4082 483 0 83 6922033 0.104 0.075 0 4358 496 0 87 7382034 0.104 0.075 0.01 4633 509 0 91 7832035 0.104 0.075 0.01 4907 520 0 95 8292036 0.104 0.075 0.03 5177 530 0 98 8732037 0.104 0.075 0.04 5442 540 0 102 9172038 0.104 0.075 0.07 5701 548 0 105 9602039 0.104 0.075 0.1 5954 556 0 108 10012040 0.104 0.075 0.14 6200 563 0 111 10422041 0.104 0.075 0.19 6437 570 0 114 10812042 0.104 0.075 0.24 6665 576 0 117 11182043 0.104 0.075 0.3 6885 582 0 119 11552044 0.104 0.075 0.37 7095 587 0 122 11892045 0.104 0.075 0.44 7296 591 0 124 12222046 0.104 0.075 0.5 7488 596 0 126 12532047 0.104 0.075 0.56 7670 600 0 128 12832048 0.104 0.075 0.61 7842 603 0 130 13122049 0.104 0.075 0.66 8006 606 0 131 13382050 0.104 0.075 0.7 8160 609 0 133 13642051 0.104 0.075 0.75 8306 612 0 135 13882052 0.104 0.075 0.79 8443 615 0 136 14102053 0.104 0.075 0.82 8573 617 0 137 14312054 0.104 0.075 0.84 8694 619 0 139 14512055 0.104 0.075 0.87 8808 621 0 140 1470
SEDAR 15 SAR 1 SECTION V 32

Addenda and updates South Atlantic Red Snapper
Table 1.21. Red snapper: Projection results under scenario R8—Discard-only projection with fishing rate fixedat F = 65%F40%, and with release mortality rates of 0.9 in the commercial sector and 0.4 in the headboat andgeneral recreational sectors. F = fishing rate (per year), Fmort = fishing rate leading to discard mortality (aportion of F), Pr(recover) = proportion of cases reaching SSBF40% , SSB = mid-year spawning stock biomass (mt), R= recruits (1000 fish), L = landings (1000 lb), D = discard mortalities (1000 fish), D.wgt = discard mortalities inweight (1000 lb). For reference, the target for rebuilding is SSBF40% = 6847.
Year F(per yr) Fmort(per yr) Pr(recover) SSB(mt) R(1000) L(1000 lb) D(1000) D.wgt(1000 lb)
2007 0.918 0.918 0 204 286 450 98 1522008 0.918 0.918 0 201 61 454 68 1362009 0.068 0.049 0 175 60 0 6 282010 0.068 0.049 0 311 53 0 6 352011 0.068 0.049 0 385 89 0 7 432012 0.068 0.049 0 460 107 0 8 522013 0.068 0.049 0 541 125 0 10 612014 0.068 0.049 0 632 143 0 11 722015 0.068 0.049 0 735 162 0 13 832016 0.068 0.049 0 852 182 0 15 962017 0.068 0.049 0 985 204 0 17 1112018 0.068 0.049 0 1135 227 0 19 1282019 0.068 0.049 0 1302 250 0 22 1462020 0.068 0.049 0 1487 274 0 24 1672021 0.068 0.049 0 1692 299 0 27 1902022 0.068 0.049 0 1915 323 0 30 2142023 0.068 0.049 0 2157 348 0 33 2412024 0.068 0.049 0 2417 371 0 36 2692025 0.068 0.049 0 2694 394 0 40 2992026 0.068 0.049 0 2987 415 0 43 3312027 0.068 0.049 0 3293 436 0 46 3652028 0.068 0.049 0 3612 455 0 50 3992029 0.068 0.049 0 3941 473 0 53 4352030 0.068 0.049 0 4279 490 0 56 4712031 0.068 0.049 0.01 4622 505 0 59 5082032 0.068 0.049 0.01 4968 519 0 62 5452033 0.068 0.049 0.03 5316 532 0 66 5832034 0.068 0.049 0.05 5664 544 0 68 6202035 0.068 0.049 0.1 6008 555 0 71 6572036 0.068 0.049 0.14 6349 565 0 74 6932037 0.068 0.049 0.2 6683 574 0 77 7292038 0.068 0.049 0.27 7010 582 0 79 7642039 0.068 0.049 0.37 7329 590 0 81 7982040 0.068 0.049 0.46 7638 596 0 84 8312041 0.068 0.049 0.54 7937 603 0 86 8632042 0.068 0.049 0.62 8225 608 0 88 8942043 0.068 0.049 0.7 8502 613 0 90 9232044 0.068 0.049 0.76 8768 618 0 92 9512045 0.068 0.049 0.82 9021 622 0 93 9782046 0.068 0.049 0.86 9263 626 0 95 10042047 0.068 0.049 0.9 9494 630 0 96 10292048 0.068 0.049 0.92 9712 633 0 98 10522049 0.068 0.049 0.94 9920 636 0 99 10742050 0.068 0.049 0.95 10,116 639 0 100 10952051 0.068 0.049 0.97 10,302 641 0 102 11152052 0.068 0.049 0.98 10,477 643 0 103 11332053 0.068 0.049 0.99 10,642 646 0 104 11512054 0.068 0.049 0.99 10,798 647 0 105 11672055 0.068 0.049 0.99 10,944 649 0 106 1183
SEDAR 15 SAR 1 SECTION V 33

Addenda and updates South Atlantic Red Snapper
Table 1.22. Red snapper: Projection results under scenario R9—Discard-only projection with fishing rate fixedat F = 75%F40%, and with release mortality rates of 0.9 in the commercial sector and 0.4 in the headboat andgeneral recreational sectors. F = fishing rate (per year), Fmort = fishing rate leading to discard mortality (aportion of F), Pr(recover) = proportion of cases reaching SSBF40% , SSB = mid-year spawning stock biomass (mt), R= recruits (1000 fish), L = landings (1000 lb), D = discard mortalities (1000 fish), D.wgt = discard mortalities inweight (1000 lb). For reference, the target for rebuilding is SSBF40% = 6847.
Year F(per yr) Fmort(per yr) Pr(recover) SSB(mt) R(1000) L(1000 lb) D(1000) D.wgt(1000 lb)
2007 0.918 0.918 0 204 286 450 98 1522008 0.918 0.918 0 201 61 454 68 1362009 0.078 0.056 0 175 60 0 7 322010 0.078 0.056 0 309 53 0 7 402011 0.078 0.056 0 382 88 0 8 492012 0.078 0.056 0 454 106 0 9 592013 0.078 0.056 0 532 123 0 11 692014 0.078 0.056 0 620 141 0 13 812015 0.078 0.056 0 718 159 0 15 942016 0.078 0.056 0 830 179 0 17 1082017 0.078 0.056 0 957 200 0 19 1252018 0.078 0.056 0 1099 222 0 22 1432019 0.078 0.056 0 1257 245 0 24 1632020 0.078 0.056 0 1433 268 0 27 1862021 0.078 0.056 0 1626 292 0 30 2102022 0.078 0.056 0 1836 316 0 34 2372023 0.078 0.056 0 2064 339 0 37 2662024 0.078 0.056 0 2308 362 0 41 2972025 0.078 0.056 0 2568 385 0 44 3302026 0.078 0.056 0 2843 406 0 48 3642027 0.078 0.056 0 3130 426 0 51 4002028 0.078 0.056 0 3429 445 0 55 4382029 0.078 0.056 0 3737 463 0 59 4762030 0.078 0.056 0 4053 480 0 62 5152031 0.078 0.056 0 4374 495 0 66 5552032 0.078 0.056 0.01 4699 509 0 69 5962033 0.078 0.056 0.02 5024 522 0 73 6362034 0.078 0.056 0.03 5349 534 0 76 6762035 0.078 0.056 0.06 5672 545 0 79 7162036 0.078 0.056 0.1 5991 555 0 82 7562037 0.078 0.056 0.14 6304 564 0 85 7942038 0.078 0.056 0.2 6610 573 0 88 8322039 0.078 0.056 0.26 6908 580 0 90 8692040 0.078 0.056 0.35 7197 587 0 93 9052041 0.078 0.056 0.43 7477 594 0 95 9392042 0.078 0.056 0.51 7747 599 0 97 9722043 0.078 0.056 0.59 8006 605 0 99 10042044 0.078 0.056 0.66 8254 609 0 101 10342045 0.078 0.056 0.72 8491 614 0 103 10642046 0.078 0.056 0.78 8717 618 0 105 10912047 0.078 0.056 0.82 8932 621 0 107 11182048 0.078 0.056 0.86 9136 625 0 108 11432049 0.078 0.056 0.9 9329 628 0 110 11672050 0.078 0.056 0.92 9512 631 0 111 11892051 0.078 0.056 0.93 9685 633 0 112 12102052 0.078 0.056 0.95 9848 636 0 113 12302053 0.078 0.056 0.96 10,002 638 0 115 12492054 0.078 0.056 0.97 10,147 640 0 116 12672055 0.078 0.056 0.98 10,283 642 0 117 1284
SEDAR 15 SAR 1 SECTION V 34

Addenda and updates South Atlantic Red Snapper
Table 1.23. Red snapper: Projection results under scenario R10—Discard-only projection with fishing rate fixedat F = 85%F40%, and with release mortality rates of 0.9 in the commercial sector and 0.4 in the headboat andgeneral recreational sectors. F = fishing rate (per year), Fmort = fishing rate leading to discard mortality (aportion of F), Pr(recover) = proportion of cases reaching SSBF40% , SSB = mid-year spawning stock biomass (mt), R= recruits (1000 fish), L = landings (1000 lb), D = discard mortalities (1000 fish), D.wgt = discard mortalities inweight (1000 lb). For reference, the target for rebuilding is SSBF40% = 6847.
Year F(per yr) Fmort(per yr) Pr(recover) SSB(mt) R(1000) L(1000 lb) D(1000) D.wgt(1000 lb)
2007 0.918 0.918 0 204 286 450 98 1522008 0.918 0.918 0 201 61 454 68 1362009 0.088 0.064 0 175 60 0 8 372010 0.088 0.064 0 307 53 0 8 462011 0.088 0.064 0 378 88 0 9 552012 0.088 0.064 0 448 105 0 11 662013 0.088 0.064 0 524 122 0 12 772014 0.088 0.064 0 607 139 0 14 902015 0.088 0.064 0 702 157 0 16 1042016 0.088 0.064 0 809 176 0 19 1202017 0.088 0.064 0 929 196 0 21 1372018 0.088 0.064 0 1064 217 0 24 1572019 0.088 0.064 0 1214 239 0 27 1792020 0.088 0.064 0 1380 262 0 30 2032021 0.088 0.064 0 1562 285 0 33 2292022 0.088 0.064 0 1760 308 0 37 2582023 0.088 0.064 0 1974 331 0 40 2892024 0.088 0.064 0 2204 354 0 44 3212025 0.088 0.064 0 2448 375 0 48 3562026 0.088 0.064 0 2705 396 0 52 3932027 0.088 0.064 0 2974 416 0 56 4312028 0.088 0.064 0 3254 435 0 60 4712029 0.088 0.064 0 3543 453 0 64 5122030 0.088 0.064 0 3838 469 0 68 5542031 0.088 0.064 0 4139 485 0 72 5962032 0.088 0.064 0 4442 499 0 75 6392033 0.088 0.064 0.01 4747 512 0 79 6822034 0.088 0.064 0.02 5052 524 0 82 7252035 0.088 0.064 0.03 5354 535 0 86 7672036 0.088 0.064 0.06 5652 545 0 89 8092037 0.088 0.064 0.1 5945 555 0 92 8502038 0.088 0.064 0.14 6231 563 0 95 8902039 0.088 0.064 0.19 6510 571 0 98 9292040 0.088 0.064 0.25 6781 578 0 101 9672041 0.088 0.064 0.32 7043 584 0 103 10042042 0.088 0.064 0.4 7295 590 0 106 10392043 0.088 0.064 0.47 7538 596 0 108 10732044 0.088 0.064 0.55 7770 601 0 110 11052045 0.088 0.064 0.62 7991 605 0 112 11362046 0.088 0.064 0.67 8203 609 0 114 11652047 0.088 0.064 0.72 8404 613 0 116 11932048 0.088 0.064 0.77 8594 616 0 117 12202049 0.088 0.064 0.82 8775 619 0 119 12452050 0.088 0.064 0.85 8946 622 0 121 12692051 0.088 0.064 0.88 9107 625 0 122 12912052 0.088 0.064 0.9 9259 627 0 123 13122053 0.088 0.064 0.92 9403 630 0 124 13322054 0.088 0.064 0.94 9537 632 0 126 13512055 0.088 0.064 0.95 9664 634 0 127 1369
SEDAR 15 SAR 1 SECTION V 35

Addenda and updates South Atlantic Red Snapper
1.3.6 Figures
SEDAR 15 SAR 1 SECTION V 36

Addenda and updates South Atlantic Red Snapper
Figure 1.1. Red snapper: Comparison of previous and corrected recreational landings. Headboat landings areseparated from these general recreational landings starting in 1972, but are assumed included prior. The largesolid circles in 1960, 1965, and 1970 represent values from Salt-Water Angling Surveys and served as anchorpoints for linear interpolations, as documented in the Assessment Workshop report.
1950 1960 1970 1980 1990 2000
010
0020
0030
0040
0050
00
Rec
reat
iona
l lan
ding
s (1
000
lb w
hole
wei
ght)
CorrectedPrevious
SEDAR 15 SAR 1 SECTION V 37

Addenda and updates South Atlantic Red Snapper
Figure 1.2. Red snapper: Comparison of predicted time series from the base assessment model using the previousand corrected recreational landings from the Salt-Water Angling reports.
1950 1960 1970 1980 1990 2000
0e+
004e
+05
Rec
ruitm
ent (
num
ber
fish)
CorrectedPrevious
1950 1960 1970 1980 1990 2000
0.0
0.4
0.8
1.2
F
1950 1960 1970 1980 1990 2000
040
0080
0012
000
SS
B (
met
ric to
ns)
SEDAR 15 SAR 1 SECTION V 38

Addenda and updates South Atlantic Red Snapper
Figure 1.3. Red snapper: Observed (open circles) and estimated (solid line) annual length and age composi-tions by fishery. In panels indicating the data set, lcomp refers to length compositions, acomp to age composi-tions, c.hal to commercial handline, c.dv to commercial diving, hb to headboat, and rec to general recreational(MRFSS).
↓ lcomp.c.hal ↓
200 400 600 800 1000
0.0
0.1
0.2
Length bin (mm)
Pro
port
ion
N = 20891984
200 400 600 800 1000
0.0
0.1
0.2
Length bin (mm)
Pro
port
ion
N = 35391985
200 400 600 800 1000
0.0
0.1
0.2
Length bin (mm)
Pro
port
ion
N = 12461986
200 400 600 800 1000
0.0
0.1
0.2
Length bin (mm)
Pro
port
ion
N = 11461987
200 400 600 800 10000.
00.
10.
2Length bin (mm)
Pro
port
ion
N = 6211988
200 400 600 800 1000
0.0
0.1
0.2
Length bin (mm)
Pro
port
ion
N = 11911989
200 400 600 800 1000
0.0
0.1
0.2
Length bin (mm)
Pro
port
ion
N = 7871990
200 400 600 800 1000
0.0
0.1
0.2
Length bin (mm)
Pro
port
ion
N = 7061991
200 400 600 800 1000
0.0
0.1
0.2
Length bin (mm)
Pro
port
ion
N = 5121992
200 400 600 800 1000
0.0
0.1
0.2
Length bin (mm)
Pro
port
ion
N = 13471993
200 400 600 800 1000
0.0
0.1
0.2
Length bin (mm)
Pro
port
ion
N = 11671994
200 400 600 800 1000
0.0
0.1
0.2
Length bin (mm)
Pro
port
ion
N = 14421995
200 400 600 800 1000
0.0
0.1
0.2
Length bin (mm)
Pro
port
ion
N = 7701996
200 400 600 800 1000
0.0
0.1
0.2
Length bin (mm)
Pro
port
ion
N = 4971997
SEDAR 15 SAR 1 SECTION V 39

Addenda and updates South Atlantic Red Snapper
Figure 1.3. (cont.) Red snapper: Observed (open circles) and estimated (solid line) annual length and age com-positions by fishery.
200 400 600 800 1000
0.0
0.1
0.2
Length bin (mm)
Pro
port
ion
N = 4281998
200 400 600 800 1000
0.0
0.1
0.2
Length bin (mm)
Pro
port
ion
N = 9461999
200 400 600 800 1000
0.0
0.1
0.2
Length bin (mm)
Pro
port
ion
N = 8812000
200 400 600 800 1000
0.0
0.1
0.2
Length bin (mm)
Pro
port
ion
N = 14082001
200 400 600 800 1000
0.0
0.1
0.2
Length bin (mm)
Pro
port
ion
N = 9922002
200 400 600 800 1000
0.0
0.1
0.2
Length bin (mm)P
ropo
rtio
n
N = 12702003
200 400 600 800 1000
0.0
0.1
0.2
Length bin (mm)
Pro
port
ion
N = 7952004
200 400 600 800 1000
0.0
0.1
0.2
Length bin (mm)
Pro
port
ion
N = 6182005
200 400 600 800 1000
0.0
0.1
0.2
Length bin (mm)
Pro
port
ion
N = 4062006
↓ lcomp.c.dv ↓
200 400 600 800 1000
0.0
0.1
0.2
Length bin (mm)
Pro
port
ion
N = 831999
200 400 600 800 1000
0.0
0.1
0.2
Length bin (mm)
Pro
port
ion
N = 1292000
200 400 600 800 1000
0.0
0.1
0.2
Length bin (mm)
Pro
port
ion
N = 872001
200 400 600 800 1000
0.0
0.1
0.2
Length bin (mm)
Pro
port
ion
N = 2102003
SEDAR 15 SAR 1 SECTION V 40

Addenda and updates South Atlantic Red Snapper
Figure 1.3. (cont.) Red snapper: Observed (open circles) and estimated (solid line) annual length and age com-positions by fishery.
↓ lcomp.hb ↓
200 400 600 800 1000
0.0
0.1
0.2
Length bin (mm)
Pro
port
ion
N = 7401978
200 400 600 800 1000
0.0
0.1
0.2
Length bin (mm)
Pro
port
ion
N = 2451979
200 400 600 800 1000
0.0
0.1
0.2
Length bin (mm)
Pro
port
ion
N = 2581980
200 400 600 800 1000
0.0
0.1
0.2
Length bin (mm)
Pro
port
ion
N = 6741981
200 400 600 800 1000
0.0
0.1
0.2
Length bin (mm)P
ropo
rtio
n
N = 4571982
200 400 600 800 1000
0.0
0.1
0.2
Length bin (mm)
Pro
port
ion
N = 10061983
200 400 600 800 1000
0.0
0.1
0.2
Length bin (mm)
Pro
port
ion
N = 13171984
200 400 600 800 1000
0.0
0.1
0.2
Length bin (mm)
Pro
port
ion
N = 11901985
200 400 600 800 1000
0.0
0.1
0.2
Length bin (mm)
Pro
port
ion
N = 4351986
200 400 600 800 1000
0.0
0.1
0.2
Length bin (mm)
Pro
port
ion
N = 3061987
200 400 600 800 1000
0.0
0.1
0.2
Length bin (mm)
Pro
port
ion
N = 2041988
200 400 600 800 1000
0.0
0.1
0.2
Length bin (mm)
Pro
port
ion
N = 3741989
200 400 600 800 1000
0.0
0.1
0.2
Length bin (mm)
Pro
port
ion
N = 4331990
200 400 600 800 1000
0.0
0.1
0.2
Length bin (mm)
Pro
port
ion
N = 1521991
SEDAR 15 SAR 1 SECTION V 41

Addenda and updates South Atlantic Red Snapper
Figure 1.3. (cont.) Red snapper: Observed (open circles) and estimated (solid line) annual length and age com-positions by fishery.
200 400 600 800 1000
0.0
0.1
0.2
Length bin (mm)
Pro
port
ion
N = 731992
200 400 600 800 1000
0.0
0.1
0.2
Length bin (mm)
Pro
port
ion
N = 2031993
200 400 600 800 1000
0.0
0.1
0.2
Length bin (mm)
Pro
port
ion
N = 5241994
200 400 600 800 1000
0.0
0.1
0.2
Length bin (mm)
Pro
port
ion
N = 1471995
200 400 600 800 1000
0.0
0.1
0.2
Length bin (mm)
Pro
port
ion
N = 801996
200 400 600 800 1000
0.0
0.1
0.2
Length bin (mm)P
ropo
rtio
n
N = 681997
200 400 600 800 1000
0.0
0.1
0.2
Length bin (mm)
Pro
port
ion
N = 1491998
200 400 600 800 1000
0.0
0.1
0.2
Length bin (mm)
Pro
port
ion
N = 1611999
200 400 600 800 1000
0.0
0.1
0.2
Length bin (mm)
Pro
port
ion
N = 1232000
200 400 600 800 1000
0.0
0.1
0.2
Length bin (mm)
Pro
port
ion
N = 2542001
200 400 600 800 1000
0.0
0.1
0.2
Length bin (mm)
Pro
port
ion
N = 3612002
200 400 600 800 1000
0.0
0.1
0.2
Length bin (mm)
Pro
port
ion
N = 3292003
200 400 600 800 1000
0.0
0.1
0.2
Length bin (mm)
Pro
port
ion
N = 3072004
200 400 600 800 1000
0.0
0.1
0.2
Length bin (mm)
Pro
port
ion
N = 1932005
200 400 600 800 1000
0.0
0.1
0.2
Length bin (mm)
Pro
port
ion
N = 1722006
SEDAR 15 SAR 1 SECTION V 42

Addenda and updates South Atlantic Red Snapper
Figure 1.3. (cont.) Red snapper: Observed (open circles) and estimated (solid line) annual length and age com-positions by fishery.
↓ lcomp.rec ↓
200 400 600 800 1000
0.0
0.1
0.2
Length bin (mm)
Pro
port
ion
N = 441981
200 400 600 800 1000
0.0
0.1
0.2
Length bin (mm)
Pro
port
ion
N = 1611983
200 400 600 800 1000
0.0
0.1
0.2
Length bin (mm)
Pro
port
ion
N = 3701984
200 400 600 800 1000
0.0
0.1
0.2
Length bin (mm)
Pro
port
ion
N = 2491985
200 400 600 800 1000
0.0
0.1
0.2
Length bin (mm)P
ropo
rtio
n
N = 2261986
200 400 600 800 1000
0.0
0.1
0.2
Length bin (mm)
Pro
port
ion
N = 631987
200 400 600 800 1000
0.0
0.1
0.2
Length bin (mm)
Pro
port
ion
N = 871988
200 400 600 800 1000
0.0
0.1
0.2
Length bin (mm)
Pro
port
ion
N = 591989
200 400 600 800 1000
0.0
0.1
0.2
Length bin (mm)
Pro
port
ion
N = 1321999
200 400 600 800 1000
0.0
0.1
0.2
Length bin (mm)
Pro
port
ion
N = 952000
200 400 600 800 1000
0.0
0.1
0.2
Length bin (mm)
Pro
port
ion
N = 1202001
200 400 600 800 1000
0.0
0.1
0.2
Length bin (mm)
Pro
port
ion
N = 2322002
200 400 600 800 1000
0.0
0.1
0.2
Length bin (mm)
Pro
port
ion
N = 1662003
200 400 600 800 1000
0.0
0.1
0.2
Length bin (mm)
Pro
port
ion
N = 1562004
SEDAR 15 SAR 1 SECTION V 43

Addenda and updates South Atlantic Red Snapper
Figure 1.3. (cont.) Red snapper: Observed (open circles) and estimated (solid line) annual length and age com-positions by fishery.
200 400 600 800 1000
0.0
0.1
0.2
Length bin (mm)
Pro
port
ion
N = 832005
200 400 600 800 1000
0.0
0.1
0.2
Length bin (mm)
Pro
port
ion
N = 842006
↓ acomp.c.hal ↓
5 10 15 20
0.0
0.2
0.4
Age class
Pro
port
ion
N = 481992
5 10 15 20
0.0
0.2
0.4
Age class
Pro
port
ion
N = 491994
5 10 15 20
0.0
0.2
0.4
Age classP
ropo
rtio
n
N = 1671996
5 10 15 20
0.0
0.2
0.4
Age class
Pro
port
ion
N = 1821997
5 10 15 20
0.0
0.2
0.4
Age class
Pro
port
ion
N = 751998
5 10 15 20
0.0
0.2
0.4
Age class
Pro
port
ion
N = 1471999
5 10 15 20
0.0
0.2
0.4
Age class
Pro
port
ion
N = 2262000
5 10 15 20
0.0
0.2
0.4
Age class
Pro
port
ion
N = 1442001
5 10 15 20
0.0
0.2
0.4
Age class
Pro
port
ion
N = 512003
5 10 15 20
0.0
0.2
0.4
Age class
Pro
port
ion
N = 1032004
5 10 15 20
0.0
0.2
0.4
Age class
Pro
port
ion
N = 1402005
5 10 15 20
0.0
0.2
0.4
Age class
Pro
port
ion
N = 1892006
SEDAR 15 SAR 1 SECTION V 44

Addenda and updates South Atlantic Red Snapper
Figure 1.3. (cont.) Red snapper: Observed (open circles) and estimated (solid line) annual length and age com-positions by fishery.
↓ acomp.c.dv ↓
5 10 15 20
0.0
0.2
0.4
Age class
Pro
port
ion
N = 1062000
↓ acomp.hb ↓
5 10 15 20
0.0
0.5
Age class
Pro
port
ion
N = 721977
5 10 15 20
0.0
0.5
Age class
Pro
port
ion
N = 2791978
5 10 15 20
0.0
0.5
Age classP
ropo
rtio
n
N = 471979
5 10 15 20
0.0
0.5
Age class
Pro
port
ion
N = 941980
5 10 15 20
0.0
0.5
Age class
Pro
port
ion
N = 4151981
5 10 15 20
0.0
0.5
Age class
Pro
port
ion
N = 1341982
5 10 15 20
0.0
0.5
Age class
Pro
port
ion
N = 7541983
5 10 15 20
0.0
0.5
Age class
Pro
port
ion
N = 6191984
5 10 15 20
0.0
0.5
Age class
Pro
port
ion
N = 5111985
5 10 15 20
0.0
0.5
Age class
Pro
port
ion
N = 1921986
5 10 15 20
0.0
0.5
Age class
Pro
port
ion
N = 931987
5 10 15 20
0.0
0.5
Age class
Pro
port
ion
N = 571989
SEDAR 15 SAR 1 SECTION V 45

Addenda and updates South Atlantic Red Snapper
Figure 1.3. (cont.) Red snapper: Observed (open circles) and estimated (solid line) annual length and age com-positions by fishery.
5 10 15 20
0.0
0.5
Age class
Pro
port
ion
N = 1241996
↓ acomp.rec ↓
5 10 15 20
0.0
0.2
0.4
Age class
Pro
port
ion
N = 752001
5 10 15 20
0.0
0.2
0.4
Age class
Pro
port
ion
N = 3862002
5 10 15 20
0.0
0.2
0.4
Age class
Pro
port
ion
N = 3892003
5 10 15 20
0.0
0.2
0.4
Age classP
ropo
rtio
n
N = 3112004
5 10 15 20
0.0
0.2
0.4
Age class
Pro
port
ion
N = 2562005
SEDAR 15 SAR 1 SECTION V 46

Addenda and updates South Atlantic Red Snapper
Figure 1.4. Red snapper: Top panel is a bubble plot of length composition residuals from the commercial hand-line fishery; Dark represents overestimates and light underestimates. Bottom panel shows the angle (in degrees)between vectors of observations and estimates, with a reference line at 20 degrees. Error is bounded between 0and 90 degrees, with 0 indicating a perfect fit.
200
400
600
800
1000
Leng
th b
in (
mm
)E
rror
, deg
.
0
30
60
90
1985 1990 1995 2000 2005
SEDAR 15 SAR 1 SECTION V 47

Addenda and updates South Atlantic Red Snapper
Figure 1.5. Red snapper: Top panel is a bubble plot of length composition residuals from the commercial divingfishery; Dark represents overestimates and light underestimates. Bottom panel shows the angle (in degrees)between vectors of observations and estimates, with a reference line at 20 degrees. Error is bounded between 0and 90 degrees, with 0 indicating a perfect fit.
200
400
600
800
1000
Leng
th b
in (
mm
)E
rror
, deg
.
0
30
60
90
1999 2000 2001 2002 2003
SEDAR 15 SAR 1 SECTION V 48

Addenda and updates South Atlantic Red Snapper
Figure 1.6. Red snapper: Top panel is a bubble plot of length composition residuals from the headboat fishery;Dark represents overestimates and light underestimates. Bottom panel shows the angle (in degrees) betweenvectors of observations and estimates, with a reference line at 20 degrees. Error is bounded between 0 and 90degrees, with 0 indicating a perfect fit.
200
400
600
800
1000
Leng
th b
in (
mm
)E
rror
, deg
.
0
30
60
90
1980 1985 1990 1995 2000 2005
SEDAR 15 SAR 1 SECTION V 49

Addenda and updates South Atlantic Red Snapper
Figure 1.7. Red snapper: Top panel is a bubble plot of length composition residuals from the recreational fishery(MRFSS); Dark represents overestimates and light underestimates. Bottom panel shows the angle (in degrees)between vectors of observations and estimates, with a reference line at 20 degrees. Error is bounded between 0and 90 degrees, with 0 indicating a perfect fit.
200
400
600
800
1000
Leng
th b
in (
mm
)E
rror
, deg
.
0
30
60
90
1980 1985 1990 1995 2000 2005
SEDAR 15 SAR 1 SECTION V 50

Addenda and updates South Atlantic Red Snapper
Figure 1.8. Red snapper: Top panel is a bubble plot of age composition residuals from the commercial handlinefishery; Dark represents overestimates and light underestimates. Bottom panel shows the angle (in degrees)between vectors of observations and estimates, with a reference line at 20 degrees. Error is bounded between 0and 90 degrees, with 0 indicating a perfect fit.
5
10
15
20
Age
cla
ssE
rror
, deg
.
0
30
60
90
1992 1994 1996 1998 2000 2002 2004 2006
SEDAR 15 SAR 1 SECTION V 51

Addenda and updates South Atlantic Red Snapper
Figure 1.9. Red snapper: Top panel is a bubble plot of age composition residuals from the commercial divingfishery; Dark represents overestimates and light underestimates. Bottom panel shows the angle (in degrees)between vectors of observations and estimates, with a reference line at 20 degrees. Error is bounded between 0and 90 degrees, with 0 indicating a perfect fit.
5
10
15
20
Age
cla
ssE
rror
, deg
.
0
30
60
90
2000 2001 2002 2003 2004
SEDAR 15 SAR 1 SECTION V 52

Addenda and updates South Atlantic Red Snapper
Figure 1.10. Red snapper: Top panel is a bubble plot of age composition residuals from the headboat fishery;Dark represents overestimates and light underestimates. Bottom panel shows the angle (in degrees) betweenvectors of observations and estimates, with a reference line at 20 degrees. Error is bounded between 0 and 90degrees, with 0 indicating a perfect fit.
5
10
15
20
Age
cla
ssE
rror
, deg
.
0
30
60
90
1980 1985 1990 1995
SEDAR 15 SAR 1 SECTION V 53

Addenda and updates South Atlantic Red Snapper
Figure 1.11. Red snapper: Top panel is a bubble plot of age composition residuals from the recreational fishery(MRFSS); Dark represents overestimates and light underestimates. Bottom panel shows the angle (in degrees)between vectors of observations and estimates, with a reference line at 20 degrees. Error is bounded between 0and 90 degrees, with 0 indicating a perfect fit.
5
10
15
20
Age
cla
ssE
rror
, deg
.
0
30
60
90
2001 2002 2003 2004 2005
SEDAR 15 SAR 1 SECTION V 54

Addenda and updates South Atlantic Red Snapper
Figure 1.12. Red snapper: Observed (open circles) and estimated (solid line, circles) commercial handline land-ings (whole weight). Open and closed circles are indistinguishable.
1950 1960 1970 1980 1990 2000
0
200
400
600
800
Year
Land
ings
(10
00 lb
)
SEDAR 15 SAR 1 SECTION V 55

Addenda and updates South Atlantic Red Snapper
Figure 1.13. Red snapper: Observed (open circles) and estimated (solid line, circles) commercial diving landings(whole weight). Open and closed circles are indistinguishable.
1950 1960 1970 1980 1990 2000
0
5
10
15
20
Year
Land
ings
(10
00 lb
)
SEDAR 15 SAR 1 SECTION V 56

Addenda and updates South Atlantic Red Snapper
Figure 1.14. Red snapper: Observed (open circles) and estimated (solid line, circles) headboat landings (wholeweight). Open and closed circles are indistinguishable.
1950 1960 1970 1980 1990 2000
0
20
40
60
80
100
120
Year
Land
ings
(10
00 lb
)
SEDAR 15 SAR 1 SECTION V 57

Addenda and updates South Atlantic Red Snapper
Figure 1.15. Red snapper: Observed (open circles) and estimated (solid line, circles) general recreational landings(whole weight). Open and closed circles are indistinguishable.
1950 1960 1970 1980 1990 2000
0
1000
2000
3000
4000
5000
Year
Land
ings
(10
00 lb
)
SEDAR 15 SAR 1 SECTION V 58

Addenda and updates South Atlantic Red Snapper
Figure 1.16. Red snapper: Observed (open circles) and estimated (solid line, circles) commercial handline discardmortalities. Open and closed circles are indistinguishable.
1950 1960 1970 1980 1990 2000
0
5
10
15
20
25
30
Year
Dis
card
s (1
000
dead
fish
)
SEDAR 15 SAR 1 SECTION V 59

Addenda and updates South Atlantic Red Snapper
Figure 1.17. Red snapper: Observed (open circles) and estimated (solid line, circles) headboat discard mortalities.Open and closed circles are indistinguishable.
1950 1960 1970 1980 1990 2000
0
5
10
15
Year
Dis
card
s (1
000
dead
fish
)
SEDAR 15 SAR 1 SECTION V 60

Addenda and updates South Atlantic Red Snapper
Figure 1.18. Red snapper: Observed (open circles) and estimated (solid line, circles) general recreational discardmortalities. Open and closed circles are indistinguishable.
1950 1960 1970 1980 1990 2000
0
20
40
60
80
Year
Dis
card
s (1
000
dead
fish
)
SEDAR 15 SAR 1 SECTION V 61

Addenda and updates South Atlantic Red Snapper
Figure 1.19. Red snapper: Fit of index of abundance from commercial handline; Observed (open circles) andestimated (solid line, circles).
1975 1980 1985 1990 1995 2000 2005
0.0
0.5
1.0
1.5
Rel
ativ
e ab
unda
nce
(CP
UE
)
1975 1980 1985 1990 1995 2000 2005
−4
−2
0
2
4
Year
Sca
led
resi
dual
SEDAR 15 SAR 1 SECTION V 62

Addenda and updates South Atlantic Red Snapper
Figure 1.20. Red snapper: Fit of index of abundance from headboat; Observed (open circles) and estimated (solidline, circles).
1975 1980 1985 1990 1995 2000 2005
0.0
0.5
1.0
1.5
2.0
2.5
3.0
Rel
ativ
e ab
unda
nce
(CP
UE
)
1975 1980 1985 1990 1995 2000 2005
−4
−2
0
2
4
Year
Sca
led
resi
dual
SEDAR 15 SAR 1 SECTION V 63
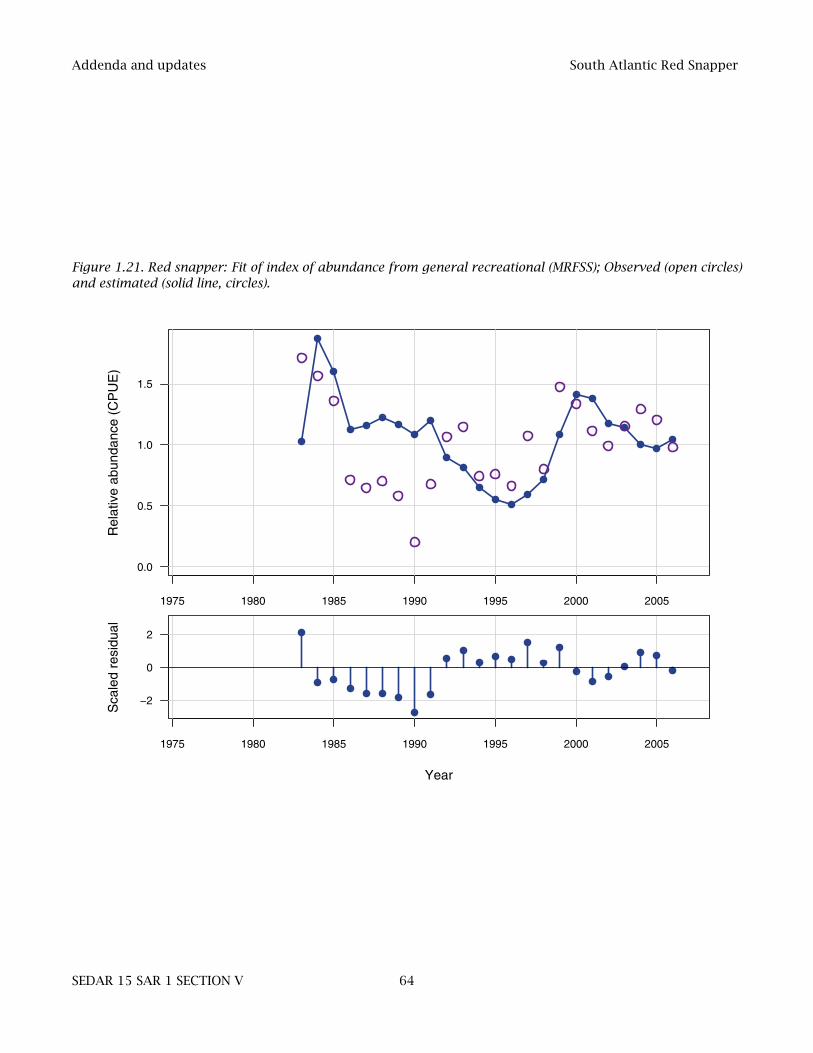
Addenda and updates South Atlantic Red Snapper
Figure 1.21. Red snapper: Fit of index of abundance from general recreational (MRFSS); Observed (open circles)and estimated (solid line, circles).
1975 1980 1985 1990 1995 2000 2005
0.0
0.5
1.0
1.5
Rel
ativ
e ab
unda
nce
(CP
UE
)
1975 1980 1985 1990 1995 2000 2005
−2
0
2
Year
Sca
led
resi
dual
SEDAR 15 SAR 1 SECTION V 64

Addenda and updates South Atlantic Red Snapper
Figure 1.22. Red snapper: Mean length at age (mm) and estimated 95% confidence interval.
5 10 15 20
200
400
600
800
1000
Age
Leng
th (
mm
)
SEDAR 15 SAR 1 SECTION V 65

Addenda and updates South Atlantic Red Snapper
Figure 1.23. Red snapper: Top panel – Estimated recruitment of age-1 fish. Bottom panel – log recruitmentresiduals.
1950 1960 1970 1980 1990 2000
0e+
002e
+05
4e+
056e
+05
Year
Rec
ruitm
ent (
num
ber
fish)
1950 1960 1970 1980 1990 2000
−1.0
−0.5
0.0
0.5
1.0
Year
log
Rec
ruitm
ent d
evia
tions
+ lo
ess
SEDAR 15 SAR 1 SECTION V 66

Addenda and updates South Atlantic Red Snapper
Figure 1.24. Red snapper: Top panel – Estimated total biomass (metric tons) at start of year. Bottom panel –Estimated spawning biomass (metric tons) at midpoint of year.
1950 1960 1970 1980 1990 2000
050
0010
000
1500
020
000
2500
030
000
Year
Tot
al b
iom
ass
(met
ric to
ns)
1950 1960 1970 1980 1990 2000
020
0040
0060
0080
0010
000
1400
0
Year
Spa
wni
ng s
tock
(m
etric
tons
)
SEDAR 15 SAR 1 SECTION V 67

Addenda and updates South Atlantic Red Snapper
Figure 1.25. Red snapper: Estimated selectivities of commercial handline. Top panel – period 1 (prior to 1984, noregulations). Middle panel – period 2 (1984–1991, 12-inch limit). Bottom panel – period 3 (1992–2006, 20-inchlimit).
5 10 15 20
0.0
0.2
0.4
0.6
0.8
1.0
Age
Sel
ectiv
ity a
t age
5 10 15 20
0.0
0.2
0.4
0.6
0.8
1.0
Age
Sel
ectiv
ity a
t age
5 10 15 20
0.0
0.2
0.4
0.6
0.8
1.0
Age
Sel
ectiv
ity a
t age
SEDAR 15 SAR 1 SECTION V 68

Addenda and updates South Atlantic Red Snapper
Figure 1.26. Red snapper: Estimated selectivity of commercial diving, assumed constant through time.
5 10 15 20
0.0
0.2
0.4
0.6
0.8
1.0
Age
Sel
ectiv
ity a
t age
SEDAR 15 SAR 1 SECTION V 69

Addenda and updates South Atlantic Red Snapper
Figure 1.27. Red snapper: Estimated selectivities of the headboat fishery. Top panel – period 1 (prior to 1984, noregulations). Middle panel – period 2 (1984–1991, 12-inch limit). Bottom panel – period 3 (1992–2006, 20-inchlimit).
5 10 15 20
0.0
0.2
0.4
0.6
0.8
1.0
Age
Sel
ectiv
ity a
t age
5 10 15 20
0.0
0.2
0.4
0.6
0.8
1.0
Age
Sel
ectiv
ity a
t age
5 10 15 20
0.0
0.2
0.4
0.6
0.8
1.0
Age
Sel
ectiv
ity a
t age
SEDAR 15 SAR 1 SECTION V 70

Addenda and updates South Atlantic Red Snapper
Figure 1.28. Red snapper: Estimated selectivities of the general recreational fishery. Top panel – period 1 (priorto 1984, no regulations). Middle panel – period 2 (1984–1991, 12-inch limit). Bottom panel – period 3 (1992–2006, 20-inch limit).
5 10 15 20
0.0
0.2
0.4
0.6
0.8
1.0
Age
Sel
ectiv
ity a
t age
5 10 15 20
0.0
0.2
0.4
0.6
0.8
1.0
Age
Sel
ectiv
ity a
t age
5 10 15 20
0.0
0.2
0.4
0.6
0.8
1.0
Age
Sel
ectiv
ity a
t age
SEDAR 15 SAR 1 SECTION V 71

Addenda and updates South Atlantic Red Snapper
Figure 1.29. Red snapper: Estimated selectivities of discard mortalities from commercial handline. Discardswere assumed negligible in period 1, the years prior to implementation of regulations. Top panel – period 2(1984–1991, 12-inch limit). Bottom panel – period 3 (1992–2006, 20-inch limit).
5 10 15 20
0.0
0.2
0.4
0.6
0.8
1.0
Age
Sel
ectiv
ity a
t age
5 10 15 20
0.0
0.2
0.4
0.6
0.8
1.0
Age
Sel
ectiv
ity a
t age
SEDAR 15 SAR 1 SECTION V 72

Addenda and updates South Atlantic Red Snapper
Figure 1.30. Red snapper: Estimated selectivities of discard mortalities from the headboat fishery. Discardswere assumed negligible in period 1, the years prior to implementation of regulations. Top panel – period 2(1984–1991, 12-inch limit). Bottom panel – period 3 (1992–2006, 20-inch limit).
5 10 15 20
0.0
0.2
0.4
0.6
0.8
1.0
Age
Sel
ectiv
ity a
t age
5 10 15 20
0.0
0.2
0.4
0.6
0.8
1.0
Age
Sel
ectiv
ity a
t age
SEDAR 15 SAR 1 SECTION V 73

Addenda and updates South Atlantic Red Snapper
Figure 1.31. Red snapper: Estimated selectivities of discard mortalities from the general recreational fishery.Discards were assumed negligible in period 1, the years prior to implementation of regulations. Top panel –period 2 (1984–1991, 12-inch limit). Bottom panel – period 3 (1992–2006, 20-inch limit).
5 10 15 20
0.0
0.2
0.4
0.6
0.8
1.0
Age
Sel
ectiv
ity a
t age
5 10 15 20
0.0
0.2
0.4
0.6
0.8
1.0
Age
Sel
ectiv
ity a
t age
SEDAR 15 SAR 1 SECTION V 74
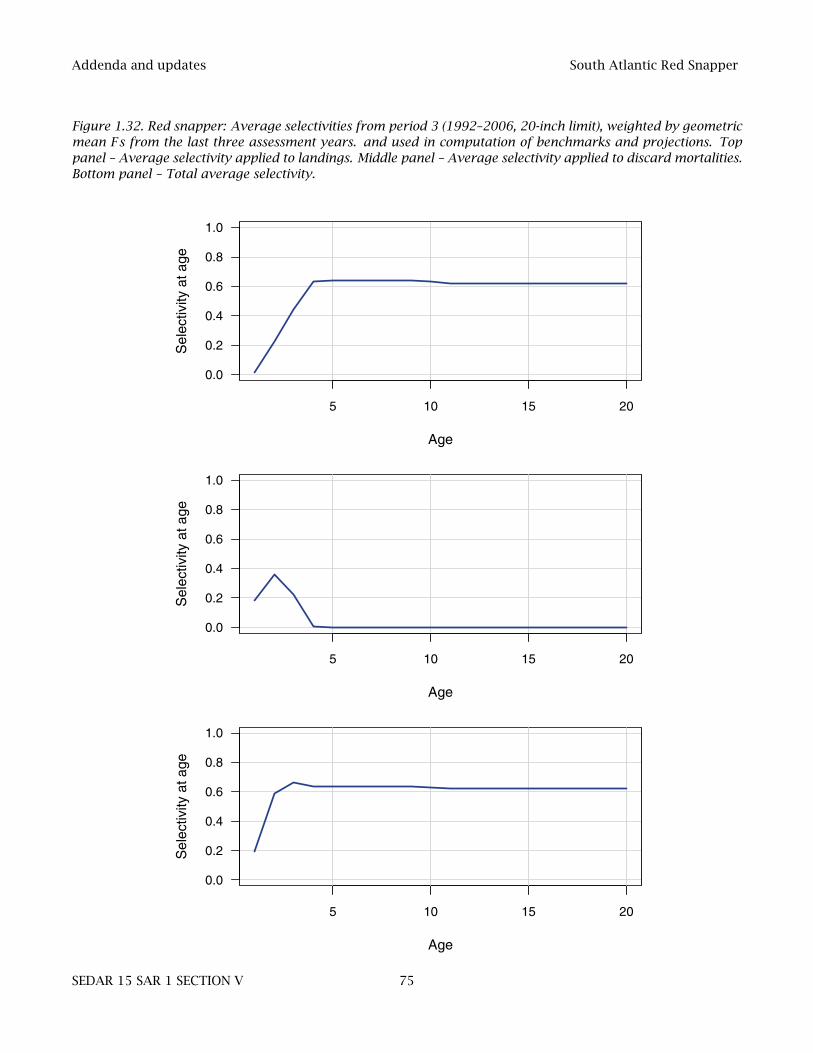
Addenda and updates South Atlantic Red Snapper
Figure 1.32. Red snapper: Average selectivities from period 3 (1992–2006, 20-inch limit), weighted by geometricmean Fs from the last three assessment years. and used in computation of benchmarks and projections. Toppanel – Average selectivity applied to landings. Middle panel – Average selectivity applied to discard mortalities.Bottom panel – Total average selectivity.
5 10 15 20
0.0
0.2
0.4
0.6
0.8
1.0
Age
Sel
ectiv
ity a
t age
5 10 15 20
0.0
0.2
0.4
0.6
0.8
1.0
Age
Sel
ectiv
ity a
t age
5 10 15 20
0.0
0.2
0.4
0.6
0.8
1.0
Age
Sel
ectiv
ity a
t age
SEDAR 15 SAR 1 SECTION V 75

Addenda and updates South Atlantic Red Snapper
Figure 1.33. Red snapper: Estimated instantaneous fishing mortality rate (per year) by fishery. c.hal refersto commercial handline, c.dv to commercial diving, hb to headboat, rec to general recreational, c.hal.D tocommercial discard mortalities, c.hb.D to headboat discard mortalities, and rec.D to general recreational discardmortalities.
1945 1950 1955 1960 1965 1970 1975 1980 1985 1990 1995 2000 2005
Year
Fis
hing
mor
talit
y ra
te
0.0
0.2
0.4
0.6
0.8
1.0 rec.Dhb.Dc.hal.Drechbc.dvc.hal
SEDAR 15 SAR 1 SECTION V 76

Addenda and updates South Atlantic Red Snapper
Figure 1.34. Red snapper: Estimated landings by fishery from the catch-at-age model. c.hal refers to commercialhandline, c.dv to commercial diving, hb to headboat, rec to general recreational.
Year
Land
ings
in n
umbe
rs (
num
ber
fish)
0e+
001e
+05
2e+
053e
+05
4e+
055e
+05
6e+
05
1950 1960 1970 1980 1990 2000
Fishery
rechbc.dvc.hal
Year
Pro
port
ion
0.0
0.2
0.4
0.6
0.8
1.0
1950 1960 1970 1980 1990 2000
Fishery
rechbc.dvc.hal
SEDAR 15 SAR 1 SECTION V 77

Addenda and updates South Atlantic Red Snapper
Figure 1.35. Red snapper: Estimated discard mortalities by fishery from the catch-at-age model. c.hal refersdiscard mortalities from commercial handline, hb from headboat, rec from general recreational.
Year
Dis
card
s in
num
bers
(nu
mbe
r fis
h)
020
000
4000
060
000
8000
010
0000
1200
00
1985 1990 1995 2000 2005
Fishery
rechbc.hal
Year
Pro
port
ion
0.0
0.2
0.4
0.6
0.8
1.0
1985 1990 1995 2000 2005
Fishery
rechbc.hal
SEDAR 15 SAR 1 SECTION V 78

Addenda and updates South Atlantic Red Snapper
Figure 1.36. Red snapper: Estimated Beverton–Holt spawner-recruit curves, with and without lognormal biascorrection.
0 5000 10000 15000
0e+
002e
+05
4e+
056e
+05
Spawning stock (metric tons)
Rec
ruitm
ent (
num
ber
fish)
Beverton−HoltBias corrected
SEDAR 15 SAR 1 SECTION V 79

Addenda and updates South Atlantic Red Snapper
Figure 1.37. Red snapper: Relationship between %SPR and implied steepness (h), given that FX% = FMSY. SPR ofX = 40% corresponds to h = 0.68.
30 40 50 60 70
0.3
0.4
0.5
0.6
0.7
0.8
0.9
1.0
% SPR
Impl
ied
stee
pnes
s
SEDAR 15 SAR 1 SECTION V 80

Addenda and updates South Atlantic Red Snapper
Figure 1.38. Red snapper: Estimated time series of static spawning potential ratio, the annual equilibrium spawn-ers per recruit relative to that at the unfished level.
1950 1960 1970 1980 1990 2000
0.0
0.1
0.2
0.3
0.4
0.5
0.6
0.7
Year
Spa
wni
ng p
oten
tial r
atio
SEDAR 15 SAR 1 SECTION V 81

Addenda and updates South Atlantic Red Snapper
Figure 1.39. Red snapper: Top panel – Yield per recruit. Bottom panel – Spawning potential ratio (spawners perrecruit relative to that at the unfished level), from which the 40% level provides F40%, the recommended proxyfor FMSY. Both curves are based on average selectivity from the end of the assessment period.
0.0 0.1 0.2 0.3 0.4 0.5 0.6
0.0
0.5
1.0
1.5
2.0
2.5
3.0
3.5
Yie
ld p
er r
ecru
it (lb
)
F40
0.0 0.1 0.2 0.3 0.4 0.5 0.6
0
20
40
60
80
100
Fishing mortality rate (full F)
Mat
ure
biom
ass
per
recr
uit (
%) F40
SEDAR 15 SAR 1 SECTION V 82

Addenda and updates South Atlantic Red Snapper
Figure 1.40. Red snapper: Top panel – Equilibrium landings. Bottom panel – Equilibrium spawning biomass.Both curves are based on average selectivity from the end of the assessment period.
0.00 0.05 0.10 0.15 0.20 0.25 0.30
0
500
1000
1500
2000
Fishing mortality rate
Equ
ilibr
ium
land
ings
(10
00 lb
)
0.00 0.05 0.10 0.15 0.20 0.25 0.30
0
5
10
15
20
Fishing mortality rate
Equ
ilibr
ium
spa
wni
ng b
iom
ass
(100
0 m
t)
SEDAR 15 SAR 1 SECTION V 83

Addenda and updates South Atlantic Red Snapper
Figure 1.41. Red snapper: Top panel – Equilibrium landings as a function of equilibrium biomass, which itselfis a function of fishing mortality rate. The peak occurs where equilibrium biomass is B = 15.06 1000 mtand equilibrium landings are 1949 1000 lb. Bottom panel – Equilibrium discard mortality as a function ofequilibrium biomass.
0 10 20 30 40
0
500
1000
1500
2000
Equilibrium biomass (1000 mt)
Equ
ilibr
ium
land
ings
(10
00 lb
)
0 10 20 30 40
0
10
20
30
40
Equilibrium biomass (1000 mt)
Equ
ilibr
ium
dis
card
mor
talit
y (1
000
fish)
SEDAR 15 SAR 1 SECTION V 84

Addenda and updates South Atlantic Red Snapper
Figure 1.42. Red snapper: Estimated time series of biomass relative to reference points. Top panel – B relativeto BMSY proxy. Bottom panel – SSB relative to SSBMSY proxy. Proxies are based on F40%.
1950 1960 1970 1980 1990 2000
0.0
0.5
1.0
1.5
2.0
Year
B/B
40
1950 1960 1970 1980 1990 2000
0.0
0.5
1.0
1.5
2.0
Year
SS
B/S
SB
40
SEDAR 15 SAR 1 SECTION V 85

Addenda and updates South Atlantic Red Snapper
Figure 1.43. Red snapper: Estimated time series of full F relative to the FMSY proxy, F40%.
1950 1960 1970 1980 1990 2000
02
46
810
Year
F/F
40
SEDAR 15 SAR 1 SECTION V 86

Addenda and updates South Atlantic Red Snapper
Figure 1.44. Red snapper: Projection results under scenario R1—fishing mortality rate fixed at F = 0. Expectedvalues represented by dotted solid lines, and uncertainty represented by thin lines corresponding to 10th and90th percentiles of 1000 replicate projections. Horizontal lines mark proxy reference points. Spawning stockbiomass (SSB) is at mid-year.
2010 2020 2030 2040 2050
0
5000
10000
15000
SS
B (
mt)
2010 2020 2030 2040 2050
0
200
400
600
800
1000
1200
Rec
ruits
(10
00 fi
sh)
2010 2020 2030 2040 2050
0.0
0.2
0.4
0.6
0.8
Year
F (
per
yr)
2010 2020 2030 2040 2050
0
500
1000
1500
2000
Year
Land
ings
(10
00 lb
)
SEDAR 15 SAR 1 SECTION V 87

Addenda and updates South Atlantic Red Snapper
Figure 1.45. Red snapper: Projection results under scenario R2—fishing mortality rate fixed at F = F40%. Ex-pected values represented by dotted solid lines, and uncertainty represented by thin lines corresponding to 10th
and 90th percentiles of 1000 replicate projections. Horizontal lines mark proxy reference points. Spawningstock biomass (SSB) is at mid-year.
2010 2020 2030 2040 2050
0
1000
2000
3000
4000
5000
6000
7000
SS
B (
mt)
2010 2020 2030 2040 2050
0
200
400
600
800
Rec
ruits
(10
00 fi
sh)
2010 2020 2030 2040 2050
0.0
0.2
0.4
0.6
0.8
Year
F (
per
yr)
2010 2020 2030 2040 2050
0
500
1000
1500
2000
Year
Land
ings
(10
00 lb
)
SEDAR 15 SAR 1 SECTION V 88

Addenda and updates South Atlantic Red Snapper
Figure 1.46. Red snapper: Projection results under scenario R3—fishing mortality rate fixed at F = 65%F40%.Expected values represented by dotted solid lines, and uncertainty represented by thin lines corresponding to10th and 90th percentiles of 1000 replicate projections. Horizontal lines mark proxy reference points. Spawningstock biomass (SSB) is at mid-year.
2010 2020 2030 2040 2050
0
2000
4000
6000
8000
10000
SS
B (
mt)
2010 2020 2030 2040 2050
0
200
400
600
800
1000
Rec
ruits
(10
00 fi
sh)
2010 2020 2030 2040 2050
0.0
0.2
0.4
0.6
0.8
Year
F (
per
yr)
2010 2020 2030 2040 2050
0
500
1000
1500
2000
Year
Land
ings
(10
00 lb
)
SEDAR 15 SAR 1 SECTION V 89

Addenda and updates South Atlantic Red Snapper
Figure 1.47. Red snapper: Projection results under scenario R4—fishing mortality rate fixed at F = 75%F40%.Expected values represented by dotted solid lines, and uncertainty represented by thin lines corresponding to10th and 90th percentiles of 1000 replicate projections. Horizontal lines mark proxy reference points. Spawningstock biomass (SSB) is at mid-year.
2010 2020 2030 2040 2050
0
2000
4000
6000
8000
SS
B (
mt)
2010 2020 2030 2040 2050
0
200
400
600
800
1000
Rec
ruits
(10
00 fi
sh)
2010 2020 2030 2040 2050
0.0
0.2
0.4
0.6
0.8
Year
F (
per
yr)
2010 2020 2030 2040 2050
0
500
1000
1500
2000
Year
Land
ings
(10
00 lb
)
SEDAR 15 SAR 1 SECTION V 90

Addenda and updates South Atlantic Red Snapper
Figure 1.48. Red snapper: Projection results under scenario R5—fishing mortality rate fixed at F = 85%F40%.Expected values represented by dotted solid lines, and uncertainty represented by thin lines corresponding to10th and 90th percentiles of 1000 replicate projections. Horizontal lines mark proxy reference points. Spawningstock biomass (SSB) is at mid-year.
2010 2020 2030 2040 2050
0
2000
4000
6000
8000
SS
B (
mt)
2010 2020 2030 2040 2050
0
200
400
600
800
1000
Rec
ruits
(10
00 fi
sh)
2010 2020 2030 2040 2050
0.0
0.2
0.4
0.6
0.8
Year
F (
per
yr)
2010 2020 2030 2040 2050
0
500
1000
1500
2000
Year
Land
ings
(10
00 lb
)
SEDAR 15 SAR 1 SECTION V 91

Addenda and updates South Atlantic Red Snapper
Figure 1.49. Red snapper: Projection results under scenario R6—Discard-only projection with fishing mortalityrate fixed at F = Fcurrent minus that of commercial diving, and with release mortality rates of 0.9 in the commer-cial sector and 0.4 in the headboat and general recreational sectors. Expected values represented by dotted solidlines, and uncertainty represented by thin lines corresponding to 10th and 90th percentiles of 1000 replicateprojections. Spawning stock biomass (SSB) is at mid-year. In the SSB panel, solid horizontal line marks SSBF40% ,the rebuilding target. In the F panel, the dashed horizontal line marks the fishing rate applied, of which only aportion (dotted solid line) leads to discard mortality.
2010 2020 2030 2040 2050
0
1000
2000
3000
4000
5000
6000
7000
SS
B (
mt)
2010 2020 2030 2040 2050
0
100
200
300
400
500
600
Rec
ruits
(10
00 fi
sh)
2010 2020 2030 2040 2050
0.0
0.2
0.4
0.6
0.8
Year
F (
per
yr)
2010 2020 2030 2040 2050
0
20
40
60
80
100
Year
Dis
card
s (1
000
fish)
SEDAR 15 SAR 1 SECTION V 92

Addenda and updates South Atlantic Red Snapper
Figure 1.50. Red snapper: Projection results under scenario R7—Discard-only projection with fishing mortalityrate fixed at F = F40%, and with release mortality rates of 0.9 in the commercial sector and 0.4 in the headboatand general recreational sectors. Expected values represented by dotted solid lines, and uncertainty representedby thin lines corresponding to 10th and 90th percentiles of 1000 replicate projections. Spawning stock biomass(SSB) is at mid-year. In the SSB panel, solid horizontal line marks SSBF40% , the rebuilding target. In the F panel,the dashed horizontal line marks the fishing rate applied, of which only a portion (dotted solid line) leads todiscard mortality.
2010 2020 2030 2040 2050
0
2000
4000
6000
8000
10000
SS
B (
mt)
2010 2020 2030 2040 2050
0
200
400
600
800
1000
Rec
ruits
(10
00 fi
sh)
2010 2020 2030 2040 2050
0.0
0.2
0.4
0.6
0.8
Year
F (
per
yr)
2010 2020 2030 2040 2050
0
50
100
150
Year
Dis
card
s (1
000
fish)
SEDAR 15 SAR 1 SECTION V 93

Addenda and updates South Atlantic Red Snapper
Figure 1.51. Red snapper: Projection results under scenario R8—Discard-only projection with fishing mortalityrate fixed at F = 65%F40%, and with release mortality rates of 0.9 in the commercial sector and 0.4 in theheadboat and general recreational sectors. Expected values represented by dotted solid lines, and uncertaintyrepresented by thin lines corresponding to 10th and 90th percentiles of 1000 replicate projections. Spawningstock biomass (SSB) is at mid-year. In the SSB panel, solid horizontal line marks SSBF40% , the rebuilding target. Inthe F panel, the dashed horizontal line marks the fishing rate applied, of which only a portion (dotted solid line)leads to discard mortality.
2010 2020 2030 2040 2050
0
2000
4000
6000
8000
10000
12000
SS
B (
mt)
2010 2020 2030 2040 2050
0
200
400
600
800
1000
Rec
ruits
(10
00 fi
sh)
2010 2020 2030 2040 2050
0.0
0.2
0.4
0.6
0.8
Year
F (
per
yr)
2010 2020 2030 2040 2050
0
20
40
60
80
100
120
Year
Dis
card
s (1
000
fish)
SEDAR 15 SAR 1 SECTION V 94

Addenda and updates South Atlantic Red Snapper
Figure 1.52. Red snapper: Projection results under scenario R9—Discard-only projection with fishing mortalityrate fixed at F = 75%F40%, and with release mortality rates of 0.9 in the commercial sector and 0.4 in theheadboat and general recreational sectors. Expected values represented by dotted solid lines, and uncertaintyrepresented by thin lines corresponding to 10th and 90th percentiles of 1000 replicate projections. Spawningstock biomass (SSB) is at mid-year. In the SSB panel, solid horizontal line marks SSBF40% , the rebuilding target. Inthe F panel, the dashed horizontal line marks the fishing rate applied, of which only a portion (dotted solid line)leads to discard mortality.
2010 2020 2030 2040 2050
0
2000
4000
6000
8000
10000
12000
SS
B (
mt)
2010 2020 2030 2040 2050
0
200
400
600
800
1000
Rec
ruits
(10
00 fi
sh)
2010 2020 2030 2040 2050
0.0
0.2
0.4
0.6
0.8
Year
F (
per
yr)
2010 2020 2030 2040 2050
0
20
40
60
80
100
120
140
Year
Dis
card
s (1
000
fish)
SEDAR 15 SAR 1 SECTION V 95

Addenda and updates South Atlantic Red Snapper
Figure 1.53. Red snapper: Projection results under scenario R10—Discard-only projection with fishing mortalityrate fixed at F = 85%F40%, and with release mortality rates of 0.9 in the commercial sector and 0.4 in theheadboat and general recreational sectors. Expected values represented by dotted solid lines, and uncertaintyrepresented by thin lines corresponding to 10th and 90th percentiles of 1000 replicate projections. Spawningstock biomass (SSB) is at mid-year. In the SSB panel, solid horizontal line marks SSBF40% , the rebuilding target. Inthe F panel, the dashed horizontal line marks the fishing rate applied, of which only a portion (dotted solid line)leads to discard mortality.
2010 2020 2030 2040 2050
0
2000
4000
6000
8000
10000
SS
B (
mt)
2010 2020 2030 2040 2050
0
200
400
600
800
1000
Rec
ruits
(10
00 fi
sh)
2010 2020 2030 2040 2050
0.0
0.2
0.4
0.6
0.8
Year
F (
per
yr)
2010 2020 2030 2040 2050
0
50
100
150
Year
Dis
card
s (1
000
fish)
SEDAR 15 SAR 1 SECTION V 96

Addenda and updates South Atlantic Red Snapper
Appendix A Parameter estimates from AD Model Builder implementation ofcatch-at-age assessment model
# Number of parameters = 312 Objective function value = 16047.2 Maximum gradient component = 0.408814# log_len_cv:-2.15769619869# log_R0:13.3663543952# steep:0.949999990955# log_dev_N_rec:-0.254996750809 -0.379623311925 -0.190213311866 0.126354890662 0.307816649257 -0.107892334307 0.708337402028-0.581067147162 0.138705887356 0.714856182239 1.05046399868 -0.236659635159 -0.00445886982242 0.2723105268450.0945005186071 0.0992925535824 0.00206039952609 0.351802375567 -0.336019242408 -0.696032633046 -0.734372395946-0.662683327319 -0.266375829826 -0.145316308582 0.619815983919 0.683780452813 0.324317778988 -0.180338786149-0.0514184989972 -0.384819830466 -0.177554030848 -0.0862797498879
-0.0182936055461# R_autocorr:0.362286381914# selpar_slope_commHAL2:11.9999994962# selpar_L50_commHAL2:2.05688914895# selpar_slope_commHAL3:4.35161494456# selpar_L50_commHAL3:3.21259302029# selpar_slope_commDV1:2.73640926278# selpar_L50_commDV1:3.26229726579# selpar_slope2_commDV1:8.65836853370# selpar_L502_commDV1:6.71805072022# selpar_slope_HB1:11.9999894790# selpar_L50_HB1:1.13072757711# selpar_L50_HB2:1.29138651377# selpar_slope_HB3:8.48970666863# selpar_L50_HB3:2.98062105069# selpar_L50_MRFSS2:1.04211026702# selpar_slope_MRFSS3:4.04022573166# selpar_L50_MRFSS3:1.80753810057# log_q_HAL:-6.29480137989# log_q_HB:-12.4528223070# log_q_MRFSS:-12.6107857200# log_avg_F_commHAL_2:-2.84382366203# log_F_dev_commHAL_2:-2.70518932319 -2.61500799099 -2.53350184153 -2.45662698816 -2.38348677013 -2.31289280525 -1.94786741593-2.22015591710 -2.16684835152 -1.75127360863 -1.90861938564 -1.89724760578 -1.27197595025 -1.57188760016-1.44630895844 -1.36056484830 -1.12709859816 -1.36023492267 -1.58998778908 -1.45785900617 -1.28019765214-1.14031084165 -0.822322652289 -0.636394842197 -0.955194934911 -0.892636888258 -0.863212050378-0.813662740763 -0.809411614239 -0.100532006040 0.336038966304 0.508870167136 0.982954023507
1.38769684924 1.45937415716 1.84291157802 1.77221077801 1.69853429937 1.74926350171 1.837003996401.65019681303 1.49532493258 1.51420897721 1.39067581853 1.89159470890 1.79320185795 1.32704705427
SEDAR 15 SAR 1 SECTION V 97

Addenda and updates South Atlantic Red Snapper
1.32251975458 2.07484047985 1.79447854864 1.80873356485 1.75461644893 1.62098781839 1.390188270351.30141332180 1.24574427330 1.59406771349 1.39218834672 1.05542767930 1.34146239414 1.18412378766 0.880611018632# log_avg_F_commDV:-4.54774369346# log_F_dev_commDV:-1.14738574738 -0.465634924257 -2.09213730068 -2.48050141546 -2.73552007943 -1.31804953092 -0.8258513086300.319346741506 0.795654092219 0.198113449162 0.928882952895 0.752092959830 0.427583741678 0.7556486375030.811687368351 0.931529871498 0.874348378219 1.16925731663 1.18122804200 0.863650862291 1.017260490310.403665484011 -0.364870081353
# log_avg_F_HB:-2.82723502465# log_F_dev_HB:-2.33589213015 -1.89062600661 -2.09185740216 -1.73388132198 -1.11890470203 -1.30206930821 -0.786860081946-0.507905201989 -0.0387359465089 0.664305064916 0.610557009507 0.366692400050 0.388186364742 0.7199674076440.0488017507856 0.552573481435 0.965683988884 0.425932167222 0.424645151336 0.539308884130 0.06284891642290.290203851827 0.484468711448 0.665993475287 0.622868715367 0.846562379817 0.152024777047 0.5578947247100.427257469431 0.488812764329 0.442468046121 -0.0894885178072 0.616539293286
0.415216573592 0.116407250062# log_avg_F_MRFSS:-1.82889351083# log_F_dev_MRFSS:-3.52039459292 -2.82405838140 -2.41408074868 -2.12002525383 -1.88688574352 -1.69138509951 -1.52141363557-1.36616247166 -1.22107346737 -1.08408758540 -0.947805187885 -0.811721397585 -0.676970953948 -0.538767735985-0.583019232799 -0.650446031321 -0.750874885589 -0.889387641294 -1.07386267968 -0.726080686875 -0.433107621276-0.156801479478 0.118471254121 0.411049192371 0.505140871659 0.580542631655 0.663188333222 0.7656471770930.896411604441 1.06396830492 1.29074013187 1.48928328334 1.59836210033
1.54363855647 0.555426488660 0.554588122376 0.879692131031 1.16983330676 1.15372321037 1.096962040950.596345365132 0.687089560507 0.835343981490 0.802372192310 0.574986139233 0.732422689915 0.6803458284270.0173439208595 0.0775096379101 0.274978650539 0.254908326554 0.689452737265 0.804832165374 0.7822499660970.704681864492 0.581922198694 0.581073360883 0.560035420655 0.661608329103 0.652241436507# log_avg_F_commHAL_D:-2.97766946971# log_F_dev_commHAL_D:-1.40799150290 -1.75393513444 -0.438016834779 0.0475354005347 -0.694119847577 -1.58857016133 0.887738654068-1.24217113320 0.116428308146 0.426033672012 1.05579387997 1.14435639249 1.28676017512 1.117636552570.412607871207 -0.0636658858339 -0.160840330972 0.168480635658 0.273231321681 0.220979040550 0.1203970382860.0294730546582 0.0418588340895
# log_avg_F_HB_D:-3.76205178550# log_F_dev_HB_D:-1.34427300878 -1.15664037253 -0.622937576792 0.306825074975 0.0574146729436 -1.37222653188 0.708786741310-0.997642455486 -1.64935214038 0.685274183198 0.733508528824 1.25887062791 0.159497679203 -1.208971139920.161081183140 -0.327045719536 -0.0806251549870 0.810843461433 0.828437051591 0.480988296661 1.093638685810.945466060770 0.529081852536
# log_avg_F_MRFSS_D:-2.24840044056# log_F_dev_MRFSS_D:-0.274705088622 -0.318487255963 0.251044389592 -0.279523416978 -0.198113186553 -1.03163945821 -1.14209736530-1.30654699330 -0.419437899856 0.00621333153448 0.442348823577 0.224773881023 -0.387693966462 -0.926095479756-0.0676756530221 0.309334664641 0.592219487605 0.761635177641 0.750368985493 0.813816000570 0.8786991702440.776132936240 0.545428915863
SEDAR 15 SAR 1 SECTION V 98

Addenda and Post-Review Updates South Atlantic Red Snapper
SEDAR 15 SAR 1 Section V
2. Estimation of Red Snapper Recruitment – An Issue Paper for SSC
Discussion (December 2008)

1
Estimation of Red Snapper Recruitment
Issue Paper for Consideration by the SAFMC SSC
December 2008
Prepared by: John Carmichael
Issue
Estimation of recruitment for red snapper projections
Background
In reviewing the addendum for red snapper (SEDAR 15) that corrects a transposition of two recreational catch observations and updates projections to account for the recommendation of F40% SPR as MFMT, it was noted that recruitment drops considerably between the terminal year of estimates and the first year of projections. The terminal year of observed data is 2006, therefore exploitation estimates are available through 2006 and abundance information is available for January 1, 2007.
Exploitation in the projections is fixed at the average of 2004-2006 for 2007 and 2008 and varies according to the particular scenario thereafter. January 1 2007 population size is taken from the model estimates of abundance at age, which gives an estimate of 286 thousand recruits in 2007. Recruitment starting in 2008 is based on the stock-recruitment relationship derived for the projection analysis and results in an estimate for recruitment in 2008 of 61 thousand fish. This value is the same across all scenarios because management changes do not become effective until 2009. It is the change in estimated recruitment from 286 thousand to 61 thousand that brought this issue to attention. For comparison, the SSB in (mid-year) 2006 that produces the 2007 recruits is 197 mt and the SSB for 2007 that produces the 2008 recruits is 204 mt. The result is that recruitment drops by about 80% in 2008, whereas the SSB that produces that recruitment increases slightly.
The reason for the change in recruitment is that steepness is necessarily different between the estimated period and the projection period. To accommodate the shift to F40% SPR as an Fmsy proxy, steepness in the projections is fixed at 0.68 to maintain consistency with yield and abundance when the stock rebuilds. By comparison, steepness estimated by the model is 0.95. As nicely stated in the addendum report (Section 1.2.2.10), fixing steepness at the value corresponding to F40%SPR provides reference points that are consistent with the rebuilding projections, and ensures that fishing a F40%SPR yields MSY(as yield at F40%SPR) from a stock size of SSBF40%SPR.
While it is important to maintain consistency with equilibrium yield, stock size, and exploitation for the projection period, the change in steepness creates a break in the recruitment estimates that is difficult to explain given the abundance and SSB estimates during the assessment period. For example, the lowest estimate of recruitment is 128 thousand fish in 1994 (Table 1.3) from a 1993 SSB of 174 mt. This is more than twice the recruitment estimated for 2008. The 1997-2006 average recruitment is 298 thousand fish, which is nearly 5 times the
Addenda and Post-Review Update South Atlantic Red Snapper
SEDAR 15 SAR 1 Section V

2
estimate for 2008. Over this period SSB increases from 122 mt in 1996 to 241 in 2000 (the highest observed since 1980) and then drops somewhat to 197 mt in 2006.
An associated issue that may influence the outcome for future recruitment estimation is what the SEDAR 15 Review Panel intended in recommending F40%SPR. Specifically, did they consider that changing the overfishing reference would lead to changes in steepness in the projections and how such changes may affect the recruitment stream? The review panel raised concerns about the high estimate of steepness provided by the model as one of their primary justifications for recommending F40%SPR as a limit reference point:
One of the principal difficulties with the SCA model estimate of the stock recruitment parameters is that the steepness estimate appears unrealistically high. In addition, there are no data in the assessment to adequately define the asymptote of the Beverton-Holt function and hence estimates of MSY indicators cannot be considered reliable. It may be preferable, as indicated above, to use the ratio indicators to evaluate stock status or use SPR proxies. The panel suggested that F40% and SSB40% proxies may be used as limit indicators.
From this statement it seems clear that the Review Panel was uncomfortable with the productivity estimated from the high steepness and felt the MSY estimates were unreliable. They don’t specifically address changing steepness in future projections that reflect the F40%SPR limit reference, perhaps because they did not consider such additional analyses during their meeting and therefore had no need to discuss such specifics. Their comments regarding rebuilding times and the dynamics at current stock levels do provide some insight that may justify an alternative approach to estimating short-term recruitment and management effects:
Interpretation of rebuilding times needs to be considered in the context of the very low current stock size. It is possible that stock dynamics at these apparently depleted levels may not be the same as the assumed stock recruitment relationship, which has been estimated for the whole historical time period. The panel discussed the value of projections made beyond 5-10 years. Clearly the uncertainty increases rapidly with time as the currently measured stock is replaced by model values into the future. Realistically, the projections beyond the range of the predominant age groups in the stock are highly uncertain. In this assessment, the best that can be concluded is that rebuilding times will be very long.
A final question concerns whether the Review Panel felt a lower steepness was a more appropriate assumption than the steepness estimated in the model. They do not specifically address this question, but there was a sensitivity analysis prepared with steepness fixed at 0.60, which is very close to the steepness of 0.68 associated with F40%SPR. On one hand it could be argued that not choosing that run indicates that they did not believe 0.60 was any more reliable than the available estimate, but on the other hand they clearly questioned the estimate and recommended a more conservative limit reference point.
Addenda and Post-Review Update South Atlantic Red Snapper
SEDAR 15 SAR 1 Section V

3
Alternatives
1. Retain the projections as currently estimated
This option maintains technical consistency between the stock productivity, yield, and reference points, but it creates an inconsistency in productivity between the estimation period and the projection period. It imposes a stock recruitment relationship which may be appropriate as the stock recovers but may not be appropriate in the near term, given the low abundance, as noted by the review panel.
2. Retain the model estimate of steepness for both periods
This option creates an inconsistency over the projection period, and would result in a mismatch between exploitation, abundance, and yield at equilibrium. It would resolve the short term issue with the sudden change in recruitment between 2007 and 2008, but imposes future productivity using stock-recruitment relationship parameters that the review panel clearly questioned and doubted. This would also not address the review panel comments that questioned whether stock dynamics under the current reduced abundance will be similar to stock dynamics once the stock recovers.
3. Apply the projection period steepness to the estimation period
This option would remove the inconsistency between terminal year and projection recruitment estimates and maintain long-term consistency in yield and the reference points. However, it imposes a stock-recruitment relationship that is different than that estimated by the model but is very similar to a run that was not chosen as preferred by the Review Panel. It also does not address the possibility that current stock dynamics are different than equilibrium stock dynamics.
4. Consider a hybrid approach
This option proposes that projections be prepared in two phases. The first phase would be used to establish the rebuilt stock condition and rebuilding time frame, and would be based on the F40%SPR steepness as currently presented in the addendum. This maintains the necessary consistency in stock dynamics as the population rebuilds and reaches equilibrium.
The second phase would be to develop short-term projections of 5 to 10 years using either average recruitment or the steepness estimated from the model. This would resolve the issue of the drastic change in estimated recruitment for the next few years and possibly provide a more realistic estimate of potential yields in the short term. It would also accommodate the Review Panel’s recommendations that projections beyond 5-10 years are highly uncertain and that current stock dynamics may be very different than equilibrium stock dynamics.
The challenge will lie in selecting the level of recruitment for the projections. If this option is chosen the SSC should provide clear guidance as to the years over which short-term recruitment will be determined.
Addenda and Post-Review Update South Atlantic Red Snapper
SEDAR 15 SAR 1 Section V

4
Table 1. SSB, Steepness, and Recruitment estimates from 2005-2009, based on the model estimation period and the projection period.
YEAR Steepness SSB
metric ton
(midyear)
Recruits
thousands
(Age 1, Jan 1)
2005 0.95 196 274
2006 0.95 197 278
2007 0.68 204 286
2008 0.68 201 61
2009 0.68 175 60
Addenda and Post-Review Update South Atlantic Red Snapper
SEDAR 15 SAR 1 Section V


Addenda and Post-Review Updates South Atlantic Red Snapper
SEDAR 15 SAR 1 Section V
3. Red Snapper Projections: The SSC Alternative (December 2008)

Red Snapper Projections: the SSC Alternative (1 December 2008)
1 Introduction
This report presents red snapper projections requested by the SAFMC SSC at the December 2008 Councilmeeting. These projections extend from the assessment described in the red snapper addendum report. Theaddendum assessment estimated the MFMT proxy of F40% = 0.104 and steepness of h = 0.95, estimates thatwere used in these projections.
2 Projection scenarios
Several constant-F projection scenarios were considered:
• Scenario R2: F = F40%
• Scenario R3: F = 65%F40%
• Scenario R4: F = 75%F40%
• Scenario R5: F = 85%F40%
3 Projection results
Projection results are tabulated in Tables 4.1 –4.4, and presented graphically in Figures 5.1– 5.4.
1

4 Tables
Table 4.1. Red snapper, SSC Alternative: Projection results under scenario R2—fishing mortality rate fixed atF = F40%. F = fishing mortality rate (per year), SSB = mid-year spawning stock biomass (mt), R = recruits (1000fish), L.klb = landings (1000 lb whole weight), Sum L = cumulative landings (1000 lb), L.knum = landings (100fish), D.klb = discard mortalities (1000 lb whole weight), and D.knum = discard mortalities (1000 fish). Forreference, the estimated proxy reference MFMT is F40% = 0.104.
Year F(per yr) SSB(mt) R(1000) L.klb(1000 lb) Sum L(1000 lb) L.knum(1000) D.klb(1000 lb) D.knum(1000)
2007 0.918 204 286 450 450 94 152 982008 0.918 207 322 455 905 96 154 1032009 0.104 213 324 67 972 14 23 152010 0.104 444 329 112 1084 22 31 182011 0.104 662 458 174 1257 31 35 212012 0.104 930 519 249 1506 41 42 252013 0.104 1254 564 338 1844 52 51 292014 0.104 1626 596 444 2288 64 57 322015 0.104 2034 619 561 2849 76 61 332016 0.104 2465 636 685 3534 88 64 35
2

Table 4.2. Red snapper, SSC Alternative: Projection results under scenario R3—fishing mortality rate fixed atF = 65%F40%. F = fishing mortality rate (per year), SSB = mid-year spawning stock biomass (mt), R = recruits(1000 fish), L.klb = landings (1000 lb whole weight), Sum L = cumulative landings (1000 lb), L.knum = landings(100 fish), D.klb = discard mortalities (1000 lb whole weight), and D.knum = discard mortalities (1000 fish). Forreference, the estimated proxy reference MFMT is F40% = 0.104.
Year F(per yr) SSB(mt) R(1000) L.klb(1000 lb) Sum L(1000 lb) L.knum(1000) D.klb(1000 lb) D.knum(1000)
2007 0.918 204 286 450 450 94 152 982008 0.918 207 322 455 905 96 154 1032009 0.068 213 324 44 949 9 15 102010 0.068 458 329 75 1024 15 21 122011 0.068 696 463 119 1143 21 24 142012 0.068 994 526 173 1316 28 28 172013 0.068 1359 571 239 1555 36 35 192014 0.068 1785 604 318 1873 45 39 212015 0.068 2259 627 406 2279 54 41 222016 0.068 2767 643 502 2781 62 43 23
3

Table 4.3. Red snapper, SSC Alternative: Projection results under scenario R4—fishing mortality rate fixed atF = 75%F40%. F = fishing mortality rate (per year), SSB = mid-year spawning stock biomass (mt), R = recruits(1000 fish), L.klb = landings (1000 lb whole weight), Sum L = cumulative landings (1000 lb), L.knum = landings(100 fish), D.klb = discard mortalities (1000 lb whole weight), and D.knum = discard mortalities (1000 fish). Forreference, the estimated proxy reference MFMT is F40% = 0.104.
Year F(per yr) SSB(mt) R(1000) L.klb(1000 lb) Sum L(1000 lb) L.knum(1000) D.klb(1000 lb) D.knum(1000)
2007 0.918 204 286 450 450 94 152 982008 0.918 207 322 455 905 96 154 1032009 0.078 213 324 51 956 11 17 112010 0.078 454 329 86 1041 17 24 132011 0.078 686 461 135 1177 24 27 162012 0.078 975 524 196 1373 32 32 192013 0.078 1328 569 269 1642 41 40 222014 0.078 1738 602 357 1998 51 44 242015 0.078 2192 625 455 2453 61 47 262016 0.078 2676 641 559 3012 70 49 27
4

Table 4.4. Red snapper, SSC Alternative: Projection results under scenario R5—fishing mortality rate fixed atF = 85%F40%. F = fishing mortality rate (per year), SSB = mid-year spawning stock biomass (mt), R = recruits(1000 fish), L.klb = landings (1000 lb whole weight), Sum L = cumulative landings (1000 lb), L.knum = landings(100 fish), D.klb = discard mortalities (1000 lb whole weight), and D.knum = discard mortalities (1000 fish). Forreference, the estimated proxy reference MFMT is F40% = 0.104.
Year F(per yr) SSB(mt) R(1000) L.klb(1000 lb) Sum L(1000 lb) L.knum(1000) D.klb(1000 lb) D.knum(1000)
2007 0.918 204 286 450 450 94 152 982008 0.918 207 322 455 905 96 154 1032009 0.088 213 324 57 962 12 20 122010 0.088 450 329 96 1059 19 27 152011 0.088 677 460 151 1209 27 30 182012 0.088 957 522 218 1427 36 36 222013 0.088 1298 567 298 1725 46 45 252014 0.088 1692 599 393 2118 56 49 272015 0.088 2127 623 500 2618 67 53 292016 0.088 2589 639 613 3231 77 55 30
5

5 Figures
6

Figure 5.1. Red snapper: Projection results under scenario R2—fishing mortality rate fixed at F = F40%. Expectedvalues represented by dotted solid lines, and uncertainty represented by thin lines corresponding to 10th and90th percentiles of 2000 replicate projections.
2008 2010 2012 2014 2016
0
1000
2000
3000
4000
5000
SS
B (
mt)
2008 2010 2012 2014 2016
0
200
400
600
800
1000
Rec
ruits
(10
00 fi
sh)
2008 2010 2012 2014 2016
0.0
0.2
0.4
0.6
0.8
Year
F (
per
yr)
2008 2010 2012 2014 2016
0
500
1000
1500
Year
Land
ings
(10
00 lb
)
7

Figure 5.2. Red snapper: Projection results under scenario R3—fishing mortality rate fixed at F = 65%F40%.Expected values represented by dotted solid lines, and uncertainty represented by thin lines corresponding to10th and 90th percentiles of 2000 replicate projections.
2008 2010 2012 2014 2016
0
1000
2000
3000
4000
5000
SS
B (
mt)
2008 2010 2012 2014 2016
0
200
400
600
800
1000
Rec
ruits
(10
00 fi
sh)
2008 2010 2012 2014 2016
0.0
0.2
0.4
0.6
0.8
Year
F (
per
yr)
2008 2010 2012 2014 2016
0
500
1000
1500
Year
Land
ings
(10
00 lb
)
8

Figure 5.3. Red snapper: Projection results under scenario R4—fishing mortality rate fixed at F = 75%F40%.Expected values represented by dotted solid lines, and uncertainty represented by thin lines corresponding to10th and 90th percentiles of 2000 replicate projections.
2008 2010 2012 2014 2016
0
1000
2000
3000
4000
5000
SS
B (
mt)
2008 2010 2012 2014 2016
0
200
400
600
800
1000
Rec
ruits
(10
00 fi
sh)
2008 2010 2012 2014 2016
0.0
0.2
0.4
0.6
0.8
Year
F (
per
yr)
2008 2010 2012 2014 2016
0
500
1000
1500
Year
Land
ings
(10
00 lb
)
9

Figure 5.4. Red snapper: Projection results under scenario R5—fishing mortality rate fixed at F = 85%F40%.Expected values represented by dotted solid lines, and uncertainty represented by thin lines corresponding to10th and 90th percentiles of 2000 replicate projections.
2008 2010 2012 2014 2016
0
1000
2000
3000
4000
5000
SS
B (
mt)
2008 2010 2012 2014 2016
0
200
400
600
800
1000
Rec
ruits
(10
00 fi
sh)
2008 2010 2012 2014 2016
0.0
0.2
0.4
0.6
0.8
Year
F (
per
yr)
2008 2010 2012 2014 2016
0
500
1000
1500
Year
Land
ings
(10
00 lb
)
10