Rowan Berries: A Potential Source for Green Synthesis ... - MDPI
18
Citation: Singh, P.; Mijakovic, I. Rowan Berries: A Potential Source for Green Synthesis of Extremely Monodisperse Gold and Silver Nanoparticles and Their Antimicrobial Property. Pharmaceutics 2022, 14, 82. https://doi.org/10.3390/ pharmaceutics14010082 Academic Editors: Jennifer Fiegel and Sanna Maria Sillankorva Received: 7 December 2021 Accepted: 24 December 2021 Published: 29 December 2021 Publisher’s Note: MDPI stays neutral with regard to jurisdictional claims in published maps and institutional affil- iations. Copyright: © 2021 by the authors. Licensee MDPI, Basel, Switzerland. This article is an open access article distributed under the terms and conditions of the Creative Commons Attribution (CC BY) license (https:// creativecommons.org/licenses/by/ 4.0/). pharmaceutics Article Rowan Berries: A Potential Source for Green Synthesis of Extremely Monodisperse Gold and Silver Nanoparticles and Their Antimicrobial Property Priyanka Singh 1, * and Ivan Mijakovic 1,2, * 1 The Novo Nordisk Foundation, Center for Biosustainability, Technical University of Denmark, DK-2800 Kogens Lyngby, Denmark 2 Systems and Synthetic Biology Division, Department of Biology and Biological Engineering, Chalmers University of Technology, SE-412 96 Gothenburg, Sweden * Correspondence: [email protected] (P.S.); [email protected] (I.M.) Abstract: Rowanberries (Sorbus aucuparia) are omnipresent in Europe. The medicinal importance of rowanberries is widely known and corresponds to the active ingredients present in the fruits, mainly polyphenols, carotenoids, and organic acids. In the current study, we explored rowanberries for the reduction of gold and silver salts into nanoparticles. Rowanberries-mediated gold nanoparticles (RB-AuNPs) formed within 5 s at room temperature, and silver nanoparticles (RB-AgNPs) formed in 20 min at 90 ◦ C. The produced nanoparticles were thoroughly characterized by UV-Vis spec- troscopy, scanning electron microscopy (SEM), energy dispersive X-ray (EDX), transmission electron microscopy (TEM), dynamic light scattering (DLS), single-particle inductively coupled plasma– mass spectrometry (sp-ICP-MS), thermogravimetric analysis (TGA), Fourier transform-infrared spectroscopy (FT-IR) and matrix-assisted laser desorption/ionization time of flight mass spectrome- try (MALDI-TOF). The characterization confirmed that the nanoparticles are highly monodisperse, spherical, stable over long periods, and exhibit a high negative zeta potential values. The produced RB-AuNPs and RB-AgNPs were 90–100 nm and 20–30 nm in size with a thick biological corona layer surrounding them, providing extreme stability but lowering the antimicrobial activity. The antimicrobials study of RB-AgNPs revealed that the nanoparticles have antimicrobial potential with an MBC value of 100 μg/mL against P. aeruginosa and 200 μg/mL against E. coli. Keywords: gold nanoparticles; silver nanoparticles; Sorbus aucuparia; rowanberries; monodisperse; stable; antimicrobial activity 1. Introduction Among all the developed methodologies for nanoparticles production, the green methodologies are considered facile, non-toxic, eco-friendly, and economical. Various green resources are available for this task, including bacteria, fungi, yeast, plants parts (roots, leaves, flowers, and fruits). This implies that the green resources contain numerous biologi- cal components, such as metabolites, sugars, proteins, polysaccharides, amino acids, which play an important role in reducing and stabilizing nanoparticles [1,2]. In addition to making stable nanoparticles, these biological components improve the synthesis rate and provide biocompatibility. Comparatively, the physio-chemical approaches are cost demanding, slow, produce hazardous byproducts, and most importantly, add toxic components on nanoparticle’s surfaces, limiting their medicinal applications. This motivates the discovery of novel green and efficient techniques for nanoparticles production [3]. Especially, the use of medicinal plants is becoming more popular because this results in the attachment of medicinal components to the biological corona, which surrounds the nanoparticles. This biological corona later helps to improve the efficacy of nanoparticles in various medical applications or provides long-term stability, sometimes both [4]. Pharmaceutics 2022, 14, 82. https://doi.org/10.3390/pharmaceutics14010082 https://www.mdpi.com/journal/pharmaceutics
-
Upload
khangminh22 -
Category
Documents
-
view
7 -
download
0
Transcript of Rowan Berries: A Potential Source for Green Synthesis ... - MDPI

�����������������
Citation: Singh, P.; Mijakovic, I.
Rowan Berries: A Potential Source for
Green Synthesis of Extremely
Monodisperse Gold and Silver
Nanoparticles and Their Antimicrobial
Property. Pharmaceutics 2022, 14, 82.
https://doi.org/10.3390/
pharmaceutics14010082
Academic Editors: Jennifer Fiegel
and Sanna Maria Sillankorva
Received: 7 December 2021
Accepted: 24 December 2021
Published: 29 December 2021
Publisher’s Note: MDPI stays neutral
with regard to jurisdictional claims in
published maps and institutional affil-
iations.
Copyright: © 2021 by the authors.
Licensee MDPI, Basel, Switzerland.
This article is an open access article
distributed under the terms and
conditions of the Creative Commons
Attribution (CC BY) license (https://
creativecommons.org/licenses/by/
4.0/).
pharmaceutics
Article
Rowan Berries: A Potential Source for Green Synthesis ofExtremely Monodisperse Gold and Silver Nanoparticles andTheir Antimicrobial PropertyPriyanka Singh 1,* and Ivan Mijakovic 1,2,*
1 The Novo Nordisk Foundation, Center for Biosustainability, Technical University of Denmark,DK-2800 Kogens Lyngby, Denmark
2 Systems and Synthetic Biology Division, Department of Biology and Biological Engineering,Chalmers University of Technology, SE-412 96 Gothenburg, Sweden
* Correspondence: [email protected] (P.S.); [email protected] (I.M.)
Abstract: Rowanberries (Sorbus aucuparia) are omnipresent in Europe. The medicinal importance ofrowanberries is widely known and corresponds to the active ingredients present in the fruits, mainlypolyphenols, carotenoids, and organic acids. In the current study, we explored rowanberries for thereduction of gold and silver salts into nanoparticles. Rowanberries-mediated gold nanoparticles(RB-AuNPs) formed within 5 s at room temperature, and silver nanoparticles (RB-AgNPs) formedin 20 min at 90 ◦C. The produced nanoparticles were thoroughly characterized by UV-Vis spec-troscopy, scanning electron microscopy (SEM), energy dispersive X-ray (EDX), transmission electronmicroscopy (TEM), dynamic light scattering (DLS), single-particle inductively coupled plasma–mass spectrometry (sp-ICP-MS), thermogravimetric analysis (TGA), Fourier transform-infraredspectroscopy (FT-IR) and matrix-assisted laser desorption/ionization time of flight mass spectrome-try (MALDI-TOF). The characterization confirmed that the nanoparticles are highly monodisperse,spherical, stable over long periods, and exhibit a high negative zeta potential values. The producedRB-AuNPs and RB-AgNPs were 90–100 nm and 20–30 nm in size with a thick biological coronalayer surrounding them, providing extreme stability but lowering the antimicrobial activity. Theantimicrobials study of RB-AgNPs revealed that the nanoparticles have antimicrobial potential withan MBC value of 100 µg/mL against P. aeruginosa and 200 µg/mL against E. coli.
Keywords: gold nanoparticles; silver nanoparticles; Sorbus aucuparia; rowanberries; monodisperse;stable; antimicrobial activity
1. Introduction
Among all the developed methodologies for nanoparticles production, the greenmethodologies are considered facile, non-toxic, eco-friendly, and economical. Various greenresources are available for this task, including bacteria, fungi, yeast, plants parts (roots,leaves, flowers, and fruits). This implies that the green resources contain numerous biologi-cal components, such as metabolites, sugars, proteins, polysaccharides, amino acids, whichplay an important role in reducing and stabilizing nanoparticles [1,2]. In addition to makingstable nanoparticles, these biological components improve the synthesis rate and providebiocompatibility. Comparatively, the physio-chemical approaches are cost demanding,slow, produce hazardous byproducts, and most importantly, add toxic components onnanoparticle’s surfaces, limiting their medicinal applications. This motivates the discoveryof novel green and efficient techniques for nanoparticles production [3]. Especially, the useof medicinal plants is becoming more popular because this results in the attachment ofmedicinal components to the biological corona, which surrounds the nanoparticles. Thisbiological corona later helps to improve the efficacy of nanoparticles in various medicalapplications or provides long-term stability, sometimes both [4].
Pharmaceutics 2022, 14, 82. https://doi.org/10.3390/pharmaceutics14010082 https://www.mdpi.com/journal/pharmaceutics

Pharmaceutics 2022, 14, 82 2 of 18
Rowanberries, also known as mountain ashes, are mainly shrubs or trees and belongto the Sorbus genus of the rose family, Rosaceae. Rowanberries contain many beneficial com-ponents used for medicinal purposes. Historically, rowanberries have been utilized as ananti-inflammatory, antidiarrheal, diuretic, and vasodilator agents. In some nations, rowan-berries have also been used to treat intestinal blockages, liver and gallbladder problems.Rowanberries have long been used in folk medicine as an appetite-improving agent andan excellent source of vitamins—ascorbic acid (vitamin C), gargle juice to treat hoarseness,a gentle laxative treatment, and a treatment for rheumatism and renal ailments. The tea,syrup, jelly, or alcoholic tincture of rowan berries have been used to treat fever, infections,colds, flu, rheumatism, and gout. In addition, rowanberries contain sorbitol which issuitable as a sweetener for diabetics [5]. The medicinal use of rowanberries is based onthe significant amounts of phytochemicals, such as phenolic acids, vitamins, carotenoids,and important minerals, such as iron, copper, zinc, potassium, and magnesium [6]. Chloro-genic and neochlorogenic acids are the main phenolic acids that constitute 56–80% ofthe total phenolics in rowanberries [7]. Other main phenolic acids (catechin, epicatechin,ferulic acid methyl ester, procyanidin B1), flavonols (quercetin, isoquercetin, hyperoside,rutin, catechin, epicatechin), anthocyanins (mainly cyanidin or pelargonidin glycosides),and proanthocyanidins are found in the aqueous extract of rowanberries [8]. Some otherwell-known phenolic acids and their derivatives found in traces in the rowanberries arecinnamic, vanillic, p-coumaric, caffeic acid, and benzoic acids [9]. The polyphenolics foundin rowanberries have revealed strong antioxidant, antidiabetic, anti-hyperlipidemic, anti-inflammatory, anticancer, antimicrobial, anti-periodontal, and anti-osteoarthritis effects [10].They also possess vasoprotective, neuroprotective, cardioprotective, hepatoprotective prop-erties, and cyclooxygenase–2 inhibitory activities [10]. In addition, many studies havereported quercetin, sexangularetin, and kaempferol glycosides in the berries. Marcotul-lio et al. demonstrated that rowanberries contain mainly polyphenols 1.34–1.47 g/100 g,carotenoids 21.65 mg/100 g, and various organic acids, such as malic and citric, andsuccinic [8]. The main carotenoids in rowanberries are zeaxanthin, β-cryptoxanthin, and all-trans-β-carotene [10]. Parasorbic acid and the cyanogenic glycoside prunasin are two toxiccomponents found in the pomace of rowanberries, which are also found in the seeds. Para-sorbic acid in excessive amounts causes indigestion and kidney damage. However, heattreatment or freezing transforms parasorbic acid into harmless sorbic acid. The cyanogenicglycoside prunasin can release hydrogen cyanide, which can induce respiratory failure andeven death if it exceeds the 2–3 mg/L limit [11]. Therefore, seeds are toxic and are mostlyconsidered waste for any purpose. In the current study, we used whole fruits, includingseeds, to extract the biomolecules and efficiently produce gold and silver nanoparticles.
Biogenic gold and silver nanoparticles are documented as biocompatible, stable, andmonodisperse [12]. Biogenic nanoparticles have been applied for many medical benefitsranging from antimicrobial, anticancer, anti-inflammatory, antioxidant, and other opticalapplications [13–16]. These applications are possible due to the tunable size and shape-dependent properties of nanoparticles [1]. Following the importance of green nanoparti-cles [17], we used rowanberries’ aqueous extract to form stable, monodisperse, and spheri-cal gold and silver nanoparticles. In addition to thorough analytical characterizations, weexplored the rowanberries mediated silver nanoparticles (RB-AgNPs) for antimicrobialapplication against two Gram-negative pathogens: P. aeruginosa and E. coli.
2. Materials and Methods2.1. Materials
Analytical grade gold(III) chloride trihydrate (HAuCl4·3H2O) and silver nitrate (AgNO3)were purchased from Sigma–Aldrich Chemicals, (St Louis, MO, USA). Fresh berries wereharvested from the tree, washed twice with distilled water to remove any dust or unwantedcomponents, and air-dried overnight. Ten grams of berries were added to a sterile flaskcontaining 90 mL of distilled water and autoclaved for 20 min at 100 ◦C. After autoclaving,the mixture was filtered to remove the particulates completely. Further purification was

Pharmaceutics 2022, 14, 82 3 of 18
done by centrifugation at 8000 rpm for 3 min, which helped to eliminate fine suspendedparticles. This liquid was considered as a stock solution and used for nanoparticle produc-tion in different dilutions. The aqueous extract was diluted with different ratios of waterand referred as a synthesis medium (SM) [2].
2.2. Green Synthesis of RB-AuNPs and RB-AgNPs
For the nanoparticle’s synthesis, the optimized concentration of gold salt (HAuCl4·3H2O)and silver salt (AgNO3) was added to the SM, which contains an aqueous extract of rowan-berries and water in an optimum ratio. The SM was further incubated at a defined timeand temperature. The nanoparticles production was first examined by the color change inthe SM, following spectral analysis [18]. Once the nanoparticles were formed, they werepurified by centrifugation at 2000 rpm for 5 min, which allowed the large particulatesto be removed, followed by centrifugation at 14,000 rpm for 15 min to collect the finenanoparticles. In addition, the nanoparticles were washed thrice with distilled water toremove the unconverted metal ions or other constituents [19]. Finally, the nanoparticleswere collected in a pellet and resuspended in water, used for analytical characterizationand application. For thermogravimetric analysis (TGA) and Fourier Transform-InfraredSpectroscopy (FT-IR), nanoparticles were air-dried to form a pellet.
2.3. Analytical Characterization of RB-AuNPs and RB-AgNPs2.3.1. UV-Vis Study
The reduction of gold and silver ions to RB-AuNPs and RB-AgNPs was initially mon-itored via visible inspection and then by scanning the SM in UV-Vis spectroscopy at aspecific interval. The UV-Vis spectrum was obtained using a 6705 UV-Vis spectrophotome-ter, JENWAY (Cole-Parmer Ltd., Stone, UK), by scanning 1 mL of the SM in the range of300–700 nm. The optimization studies for RB-AuNPs and RB-AgNPs production were alsoconducted using visible and UV-Vis spectrum analysis [20].
2.3.2. Single-Particle Inductively Coupled Plasma-Mass Spectrometry (sp-ICP-MS)
sp-ICP-MS (NexION 350D; PerkinElmer Inc., Waltham, MA, USA) was performed toknow the concentration of produced RB-AuNPs and RB-AgNPs. The stability of nanoparti-cles was examined by using the purified RB-AuNPs and RB-AgNPs solutions and keepingthem for different times, temperatures, and indifferent bacteriological media, such as tryp-tic soy broth (TSB) and Luria broth (LB). The results were taken by visible inspection ofwhich pictures are shown, UV-Vis, and sp-ICP-MS analysis before and after the definedperiod [21].
2.3.3. Thermogravimetric Analysis (TGA)
TGA (TA Instruments, New Castle, DE, USA) was performed to check the temperaturestability of nanoparticles. For analysis, the dried pellet of nanoparticles was placed in analumina pan and heated from 20 to 700 ◦C at a ramping time of 10 ◦C/min.
2.3.4. Scanning Electron Microscopy (SEM), Energy Dispersive X-ray (EDX), andElemental Mapping
SEM with EDX examination and elemental mapping was performed to study theRB-AuNPs and RB-AgNPs morphology and elemental composition. EDX analysis setupwas coupled with the SEM instrument. Sample preparation was done by dropping 5 µLof pure RB-AuNPs and RB-AgNPs solution (0.1 mg/mL) on carbon tape and air-driedat room temperature (RT) for 15 min. SEM micrographs were recorded using a QuantaFEG 200 ESEM microscope (Quorum Technologies, Hitachi High-Tech Europe GmbH,Sweden) [22,23].
Pharmaceutics 2022, 14, 82 4 of 18
2.3.5. Transmission Electron Microscopy (TEM)
TEM study using FEI Tecnai T20 G2 (FEI, Hillsboro, OR, USA) was conducted toanalyze the structural morphology and crystallographic information about RB-AuNPs andRB-AgNPs. The instrument was operated at an acceleration voltage of 200 kV. A sample ofRB-AuNPs and RB-AgNPs samples was prepared by spotting a drop of pure nanoparticlessolution suspended in water on a carbon-coated copper grid. The sample-containing gridwas completely dried before analysis [22,24].
2.3.6. Dynamic Light Scattering (DLS) Analysis
DLS measurements were performed to study the size distribution concerning intensityand zeta potential of pure RB-AuNPs and RB-AgNPs. Particle size measurement wasexecuted using a Zetasizer Nano ZS, Chuo-ku Kobe-shi, Japan. The autocorrelation func-tions of the samples were analyzed using the Contin algorithm through the Zetasizer 7.12software [25].
2.3.7. Fourier Transform Infrared Spectroscopy (FT-IR)
RB-AuNPs and RB-AgNPs were subjected to FT-IR analysis to determine the presenceof biomolecules, functional groups responsible for the reduction and capping/stabilization.The FT-IR measurements were carried out using a Nicolet iS50 (ThermoFisher Scientific,Waltham, MA, USA) by scanning the purified pellet of RB-AuNPs, RB-AgNPs, and freeze-dried rowanberries aqueous extract, (%) versus wavenumber (cm−1) [26].
2.3.8. MALDI-TOF Mass Spectrometry
MALDI-TOF was conducted as mentioned previously [4]. Briefly, purified nanopar-ticles (1 µL) were loaded onto an AnchorChipTM target plate (Bruker-Daltonics, Bremen,Germany), covered by 1 µL matrix solution (0.5 µg/µL 2,5—dihydroxybenzoic acid in90% (v/v) acetonitrile, 0.1% (v/v) trifluoroacetic acid (TFA), and washed with 0.5% (v/v)TFA. All the analyses were performed by a MALDI-TOF mass spectrometer (UltraflexII, Bruker-Daltonics, Bremen, Germany) in positive ion reflector modes with 1000 lasershots per spectrum using Flex Control v3.4. Spectra were processed by Flex Analysis v3.0(Bruker-Daltonics, Bremen, Germany), and mass calibration was performed using proteinstandards (tryptic digest of β-lactoglobulin, 5 pmol/µL) [21].
2.4. Antibacterial Activity of RB-AgNPs2.4.1. RB-AgNPs Effects on Gram-Negative Pathogens
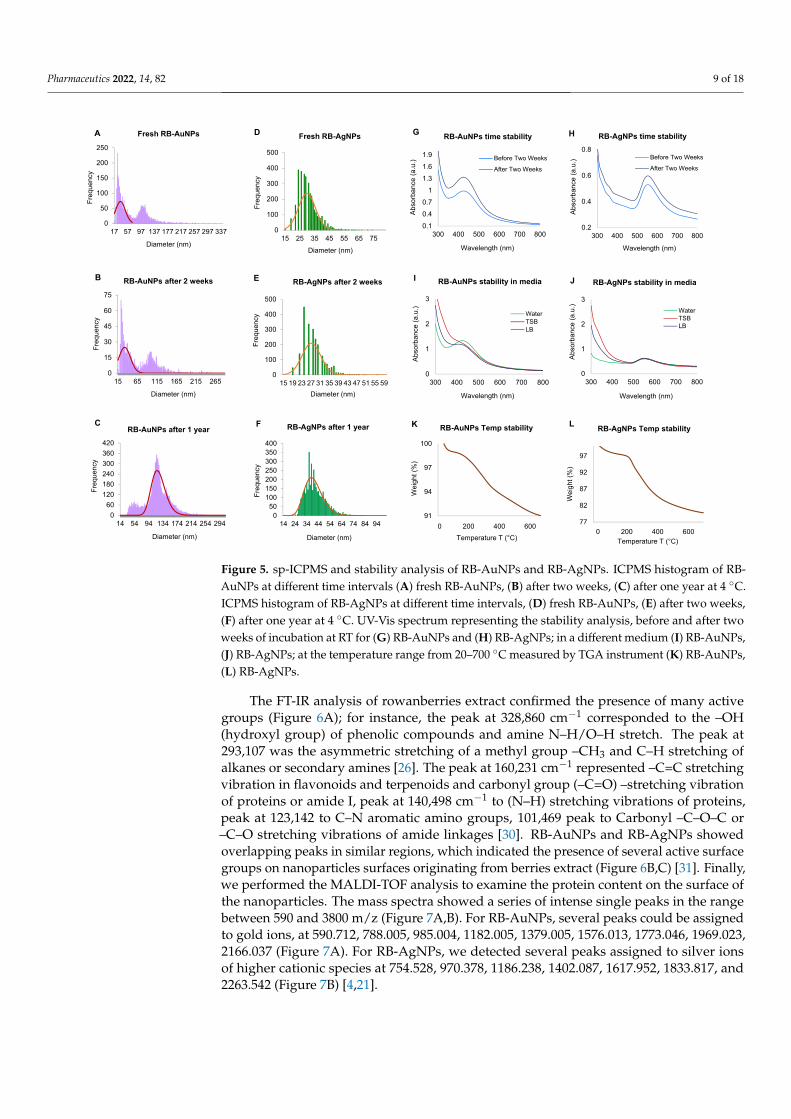
The antimicrobial activity of RB-AgNPs was evaluated against two Gram-negativepathogens: Escherichia coli UTI 89, and Pseudomonas aeruginosa PAO1. Both the strains weregrown overnight in LB medium at 37 ◦C. The overnight grown cultures were diluted toapproximately 1–2 × 10⁵ colony-forming units (CFU)/mL using LB medium. Then, theRB-AgNPs were added in concentrations ranging from 0.1 to 16 µg/mL. The LB mediumcontaining respective pathogenic bacteria and RB-AgNPs were further incubated in a shakeflask incubator at 37 ◦C, 150 rpm, for 24 h. After 24 h, the samples were analyzed bymeasuring the optical density (OD) at 550 nm. The MBC value was calculated as the lowestconcentration of RB-AgNPs required to kill the respective bacterial strain. To determinethe MBC value, 100 µL of the LB medium containing respective pathogenic bacteria andRB-AgNPs were spread on agar plates and incubated at 37 ◦C overnight, followed by aCFU count [21].
2.4.2. Live and Dead Staining
To visualize the viable and dead cells, we used the Live/Dead BacLight Viability kitL13152 (Invitrogen, Molecular Probes, Inc., Eugene, OR, USA). Control and treated cellswere stained for 20 min with a 6.0 µM SYTO 9 and 30 µM KI mixture. Fluorescence micro-scopic imaging of the cells was performed using a LEICA DM 4000 B (Leica Microsystems,Denmark) [20].

Pharmaceutics 2022, 14, 82 5 of 18
2.4.3. SEM Analysis of Treated Cells
To evaluate the drastic effects of RB-AgNPs on individual cells, SEM analysis wascarried out [25]. SEM analysis was performed by fixing the control and treated cells with 3%of glutaraldehyde overnight at 4 ◦C. The next day, samples were dehydrated with gradedseries of ethanol concentrations (40, 50, 60, 70, 80, and 90%) for 15 min and with absoluteethanol for 20 min. The dehydrated samples were placed on SEM carbon tape and left todry at room temperature. The samples were coated with gold using a quorum coater beforeSEM imaging. In addition to SEM imaging, EDX and elemental mapping of RB-AgNPstreated cells was also performed to check that the killing effects are due to the action ofRB-AgNPs only [23].
3. Results3.1. Green Synthesis of RB-AuNPs and RB-AgNPs
Green synthesis of RB-AuNPs and RB-AgNPs was monitored visibly and by takingspectrum with UV-Vis spectroscopy. Rowanberries extract reduced both gold and silversalt to RB-AuNPs and RB-AgNPs, respectively (Figure 1). The synthesis was confirmedvisibly by a change in color of the SM, i.e., the mixture of rowanberries extract, water, andsalt solution. For RB-AuNPs, the color changed to dark purple, and for RB-AgNPs, thecolor changed to brown from the whiteish color of rowanberries extract. This color changecorresponded to the surface plasmon resonance (SPR) property of the formed nanoparticles.The synthesis was further confirmed by taking a UV-Vis spectrum in the range of 300 to700 nm. For RB-AuNPs, a clear peak was formed in the region of 500–600 nm, and for RB-AgNPs, the maximum peak was noticed in the region of 400–500 nm [27]. The nanoparticlessamples were purified by three cycles of centrifugation after DI water washing and thenscanned again in UV-Vis spectroscopy. The results showed a high-intensity peak in thesame region. Thus nanoparticles formed in the solution (Figure 1).
Pharmaceutics 2022, 13, x FOR PEER REVIEW 6 of 19
Figure 1. Schematic representation and UV-Vis spectra of RB-AuNPs and RB-AgNPs formation
form an aqueous extract of rowanberries.
The optimization studies for RB-AuNPs and RB-AgNPs were also conducted by us-
ing UV-Vis spectrum analysis and visible observations [28]. For RB-AuNPs, the optimum
ratio of SM was 2:8 (Figure 2A), gold salt concentration was 4 mM (Figure 2B), and the
reaction took place at room temperature within 5 s. The synthesis was so quick that the
rowanberries extract showed complete color change at RT as soon as gold salt was added.
For RB-AgNPs, the optimized ratio of SM for nanoparticles production was 6:4 (Figure
2C), temperature 90 °C (Figure 2D), synthesis time 20 min (Figure 2E), and at 4 mM silver
salt concentration (Figure 2F).
Figure 1. Schematic representation and UV-Vis spectra of RB-AuNPs and RB-AgNPs formation forman aqueous extract of rowanberries.

Pharmaceutics 2022, 14, 82 6 of 18
The optimization studies for RB-AuNPs and RB-AgNPs were also conducted by usingUV-Vis spectrum analysis and visible observations [28]. For RB-AuNPs, the optimumratio of SM was 2:8 (Figure 2A), gold salt concentration was 4 mM (Figure 2B), and thereaction took place at room temperature within 5 s. The synthesis was so quick that therowanberries extract showed complete color change at RT as soon as gold salt was added.For RB-AgNPs, the optimized ratio of SM for nanoparticles production was 6:4 (Figure 2C),temperature 90 ◦C (Figure 2D), synthesis time 20 min (Figure 2E), and at 4 mM silver saltconcentration (Figure 2F).
Pharmaceutics 2022, 13, x FOR PEER REVIEW 7 of 19
Figure 2. Optimization studies for RB-AuNPs and RB-AgNPs production. For RB-AuNPs produc-
tion, visible picture and UV-Vis spectrum (A) synthesis medium (SM) optimization, (B), gold salt
optimization. For RB-AgNPs production, visible picture and UV-Vis spectrum (C) synthesis me-
dium (SM), (D) temperature, (E) synthesis time, (F) silver salt concentration.
3.2. Characterization of RB-AuNPs and RB-AgNPs
The purified and concentrated samples of RB-AuNPs and RB-AgNPs were studied
by SEM, EDX, elemental mapping, TEM, and SEAD [23]. SEM image analysis clearly
showed the maximum population of RB-AuNPs with spherical shape with very few tri-
angles which cause polydispersities (Figure 3A–D). In contrast, for RB-AgNPs, we found
a 100% population of nanoparticles as spherical and monodisperse (Figure 3E–H). There
was no sign of any polydispersity. Next, we performed EDX, and elemental mapping of
the selected region in the SEM scanned image of nanoparticles. The mapping results
showed a clear map of gold and silver elements in RB-AuNPs (Figure 3I–K) and RB-
AgNPs scanned images (Figure 3M–O). EDX also showed the highest and sharp peak for
gold and silver elements, which confirmed the maximum distribution of gold (Figure 3L)
and silver elements (Figure 3P) in respective samples, without any elemental contamina-
tion [29]. In addition, TEM analysis also revealed the spherical shape for RB-AuNPs and
RB-AgNPs with a core diameter of 90–100 nm (Figure 3Q,R) and 20–30 nm (Figure 3U,V),
respectively [22]. The SEAD pattern also corresponds to the crystalline nature of RB-
AuNPs (Figure 3S,T) and RB-AgNPs (Figure 3W,X), in alignment with previous reports
[24].
Figure 2. Optimization studies for RB-AuNPs and RB-AgNPs production. For RB-AuNPs produc-tion, visible picture and UV-Vis spectrum (A) synthesis medium (SM) optimization, (B), gold saltoptimization. For RB-AgNPs production, visible picture and UV-Vis spectrum (C) synthesis medium(SM), (D) temperature, (E) synthesis time, (F) silver salt concentration.
3.2. Characterization of RB-AuNPs and RB-AgNPs
The purified and concentrated samples of RB-AuNPs and RB-AgNPs were studiedby SEM, EDX, elemental mapping, TEM, and SEAD [23]. SEM image analysis clearlyshowed the maximum population of RB-AuNPs with spherical shape with very few trian-gles which cause polydispersities (Figure 3A–D). In contrast, for RB-AgNPs, we found a100% population of nanoparticles as spherical and monodisperse (Figure 3E–H). There wasno sign of any polydispersity. Next, we performed EDX, and elemental mapping of theselected region in the SEM scanned image of nanoparticles. The mapping results showed aclear map of gold and silver elements in RB-AuNPs (Figure 3I–K) and RB-AgNPs scannedimages (Figure 3M–O). EDX also showed the highest and sharp peak for gold and silver ele-ments, which confirmed the maximum distribution of gold (Figure 3L) and silver elements(Figure 3P) in respective samples, without any elemental contamination [29]. In addition,TEM analysis also revealed the spherical shape for RB-AuNPs and RB-AgNPs with a corediameter of 90–100 nm (Figure 3Q,R) and 20–30 nm (Figure 3U,V), respectively [22]. The
Pharmaceutics 2022, 14, 82 7 of 18
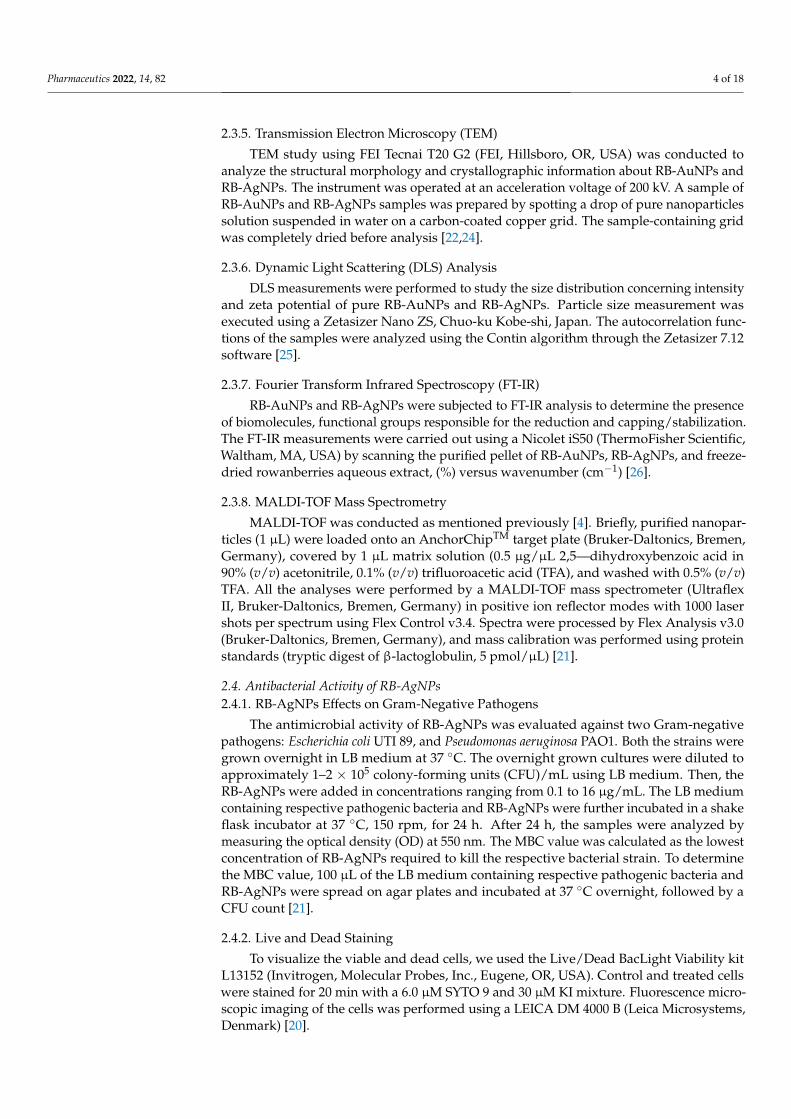
SEAD pattern also corresponds to the crystalline nature of RB-AuNPs (Figure 3S,T) andRB-AgNPs (Figure 3W,X), in alignment with previous reports [24].
Pharmaceutics 2022, 13, x FOR PEER REVIEW 8 of 19
Figure 3. Structural analysis of RB-AuNPs and RB-AgNPs. For RB-AuNPs, (A–D) SEM images of nanoparticles at different scales, (I–K) Elemental mapping of RB-AuNPs showing scanned image of NPs with gold element distribution (orange), (L) EDX spectrum of the elemental mapped region showing sharp peak for gold element. (Q,R) TEM image of RB-AuNPs, (S,T) SAED pattern. For RB-AgNPs, (E–H) SEM images of nanoparticles at different scales, (M–O) Elemental mapping of RB-AgNPs showing scanned image of NPs with silver element distribution (pink), (P) EDX spectrum of the elemental mapped region showing highest peak for silver element. (U,V) TEM image of RB-AgNPs, (W,X) SAED pattern.
Next, we examined the nanoparticles with DLS to know the hydrodynamic diameter and zeta potential values. The results indicated that RB-AuNPs had a size of 280.1 nm (Figure 4A) with a polydispersity index (PDI) 0.512, and RB-AgNPs (Figure 4B) had a size of 177.1 nm with PDI 0.193 [25]. The zeta potential value of nanoparticles also indicated a highly negative surface charge for RB-AuNPs −25.6 mV (Figure 4C) and RB-AgNPs −28.8 mV (Figure 4D).
Figure 3. Structural analysis of RB-AuNPs and RB-AgNPs. For RB-AuNPs, (A–D) SEM images ofnanoparticles at different scales, (I–K) Elemental mapping of RB-AuNPs showing scanned imageof NPs with gold element distribution (orange), (L) EDX spectrum of the elemental mapped regionshowing sharp peak for gold element. (Q,R) TEM image of RB-AuNPs, (S,T) SAED pattern. ForRB-AgNPs, (E–H) SEM images of nanoparticles at different scales, (M–O) Elemental mapping ofRB-AgNPs showing scanned image of NPs with silver element distribution (pink), (P) EDX spectrumof the elemental mapped region showing highest peak for silver element. (U,V) TEM image ofRB-AgNPs, (W,X) SAED pattern.
Next, we examined the nanoparticles with DLS to know the hydrodynamic diameterand zeta potential values. The results indicated that RB-AuNPs had a size of 280.1 nm(Figure 4A) with a polydispersity index (PDI) 0.512, and RB-AgNPs (Figure 4B) had a sizeof 177.1 nm with PDI 0.193 [25]. The zeta potential value of nanoparticles also indicateda highly negative surface charge for RB-AuNPs −25.6 mV (Figure 4C) and RB-AgNPs−28.8 mV (Figure 4D).

Pharmaceutics 2022, 14, 82 8 of 18
Size (nm)
1000 10,0001 10 100
Inte
nsity
(Per
cent
age)
5
0
0.1
10
15
Tota
l Cou
nts
Apparent Zeta Potential (mV)
0 100 200−100
200,000
400,000
600,000
800,000
0
Size distribution RB-AuNPs Size distribution RB-AgNPs
Tota
l Cou
nts
400,000
600,000
800,000
1,000,000
1,200,000
0
200,000
Apparent Zeta Potential (mV)
0 100 200−100
1,400,000
Zeta potential RB-AuNPs Zeta potential RB-AgNPs
B
C D
Size (nm)
10001 10 100
Inte
nsity
(Per
cent
age)
4
2
10
6
8
12
10,000
00.1
A
Figure 4. Dynamic light scattering analysis of RB-AuNPs and RB-AgNPs. (A) RB-AuNPs distributionconcerning size and intensity (B) RB-AgNPs distribution concerning size and intensity. Different colorrepresents technical replicates. (C) Zeta potential of RB-AuNPs and (D) RB-AgNPs, representinghighly negative surface charge.
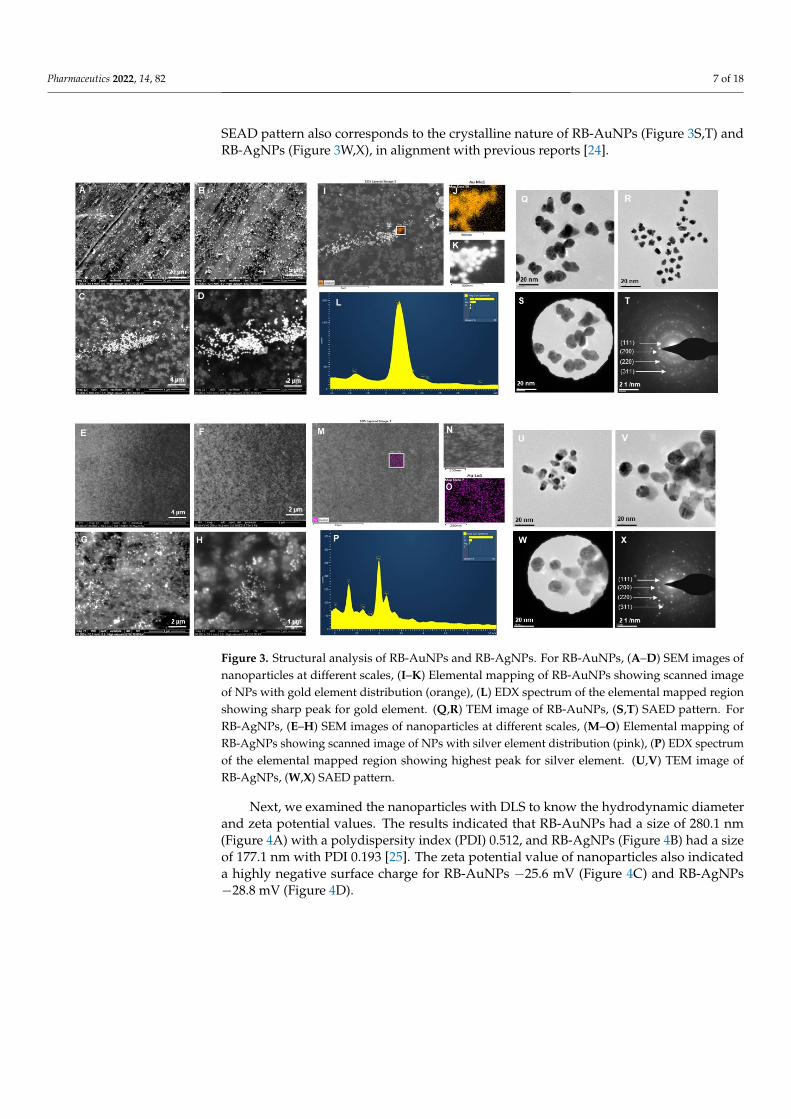
The sp-ICPMS analysis for RB-AuNPs and RB-AgNPs was performed to know theconcentration and yield of nanoparticles and their stability for different time intervals. Theresults showed that the concentration of RB-AuNPs was 0.67 µg/µL (Figure 5A), and forRB-AgNPs was 0.65 µg/µL (Figure 5D). The same samples were analyzed at a difference oftwo weeks (Figure 5B,E) and one year (Figure 5C,F). The obtained results indicated the samehistogram without any fluctuations, which demonstrated that the formed nanoparticlesremained in the same size and concentration for up to a year, i.e., highly stable. Stabilitytests were also conducted using UV-Vis spectrum analysis. The time difference scannedpattern also showed a similar and overlapping peak in a difference of two weeks forRB-AuNPs (Figure 5G) and RB-AgNPs (Figure 5H). Stability results of RB-AuNPs andRB-AgNPs in different media and aqueous solutions were also conducted, and the resultsdemonstrated that the RB-AuNPs (Figure 5I) and RB-AgNPs (Figure 5J) remain stablein all three mediums but best in water. Temperature stability analysis showed completedegradation of nanoparticles concerning increasing temperature for RB-AuNPs (Figure 5K)and RB-AgNPs (Figure 5L).
Pharmaceutics 2022, 14, 82 9 of 18
0
50
100
150
200
250
17 57 97 137 177 217 257 297 337
Freq
uenc
y
Diameter (nm)
0
100
200
300
400
500
15 25 35 45 55 65 75
Freq
uenc
yDiameter (nm)
0
15
30
45
60
75
15 65 115 165 215 265
Freq
uenc
y
Diameter (nm)
0
100
200
300
400
500
15 19 23 27 31 35 39 43 47 51 55 59
Freq
uenc
y
Diameter (nm)
A D
B E
91
94
97
100
0 20 40 60
Wei
ght (
%)
Temperature T (°C)
RB-AuNPs Temp stability
77
82
87
92
97
0 20 40 60
Wei
ght (
%)
Temperature T (°C)
RB-AgNPs Temp stability
Fresh RB-AuNPs
RB-AuNPs after 2 weeks
Fresh RB-AgNPs
RB-AgNPs after 2 weeks
060
120180240300360420
14 54 94 134 174 214 254 294
Freq
uenc
y
Diameter (nm)
RB-AuNPs after 1 year
050
100150200250300350400
14 24 34 44 54 64 74 84 94
Freq
uenc
y
Diameter (nm)
RB-AgNPs after 1 year
0
1
2
3
300 400 500 600 700 800
Abso
rban
ce (a
.u.)
Wavelength (nm)
RB-AgNPs stability in media
WaterTSBLB
0
1
2
3
300 400 500 600 700 800
Abso
rban
ce (a
.u.)
Wavelength (nm)
RB-AuNPs stability in media
WaterTSBLB
0.10.40.7
11.31.61.9
300 400 500 600 700 800
Abso
rban
ce (a
.u.)
Wavelength (nm)
RB-AuNPs time stability
Before Two Weeks
After Two Weeks
0.2
0.4
0.6
0.8
300 400 500 600 700 800
Abso
rban
ce (a
.u.)
Wavelength (nm)
RB-AgNPs time stability
Before Two Weeks
After Two Weeks
C F K
I J
G H
L
0 200 400 6000 200 400 600
Figure 5. sp-ICPMS and stability analysis of RB-AuNPs and RB-AgNPs. ICPMS histogram of RB-AuNPs at different time intervals (A) fresh RB-AuNPs, (B) after two weeks, (C) after one year at 4 ◦C.ICPMS histogram of RB-AgNPs at different time intervals, (D) fresh RB-AuNPs, (E) after two weeks,(F) after one year at 4 ◦C. UV-Vis spectrum representing the stability analysis, before and after twoweeks of incubation at RT for (G) RB-AuNPs and (H) RB-AgNPs; in a different medium (I) RB-AuNPs,(J) RB-AgNPs; at the temperature range from 20–700 ◦C measured by TGA instrument (K) RB-AuNPs,(L) RB-AgNPs.
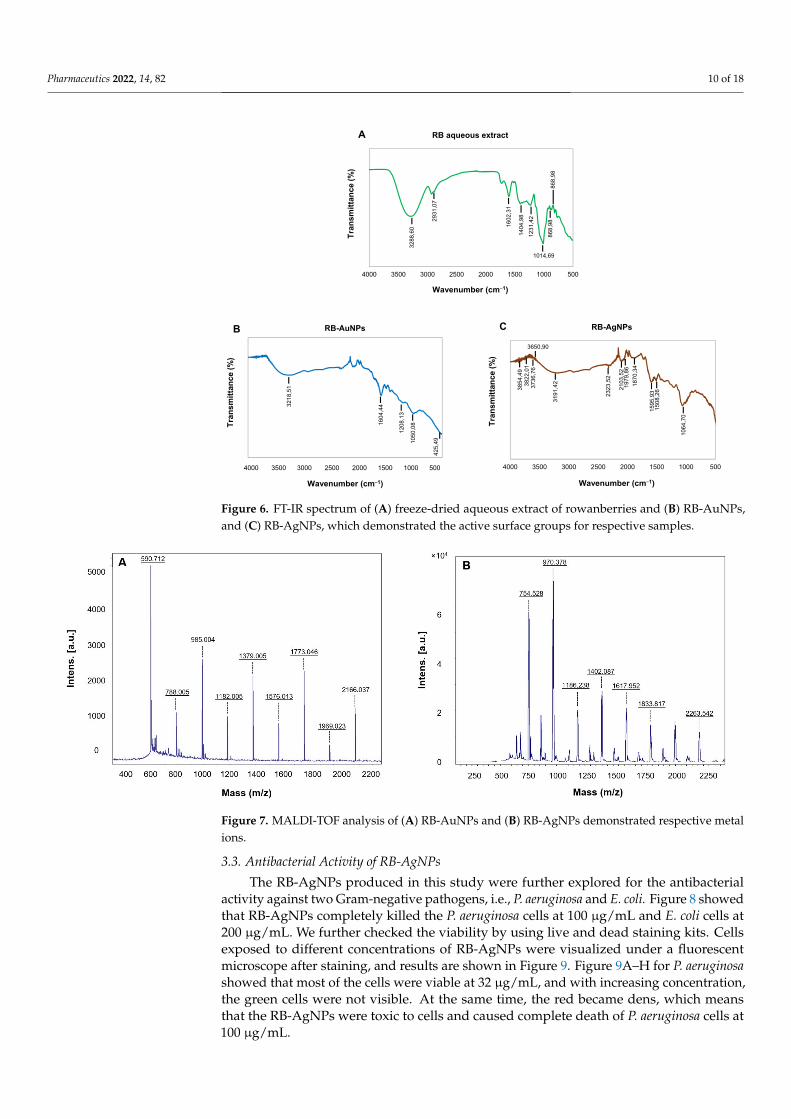
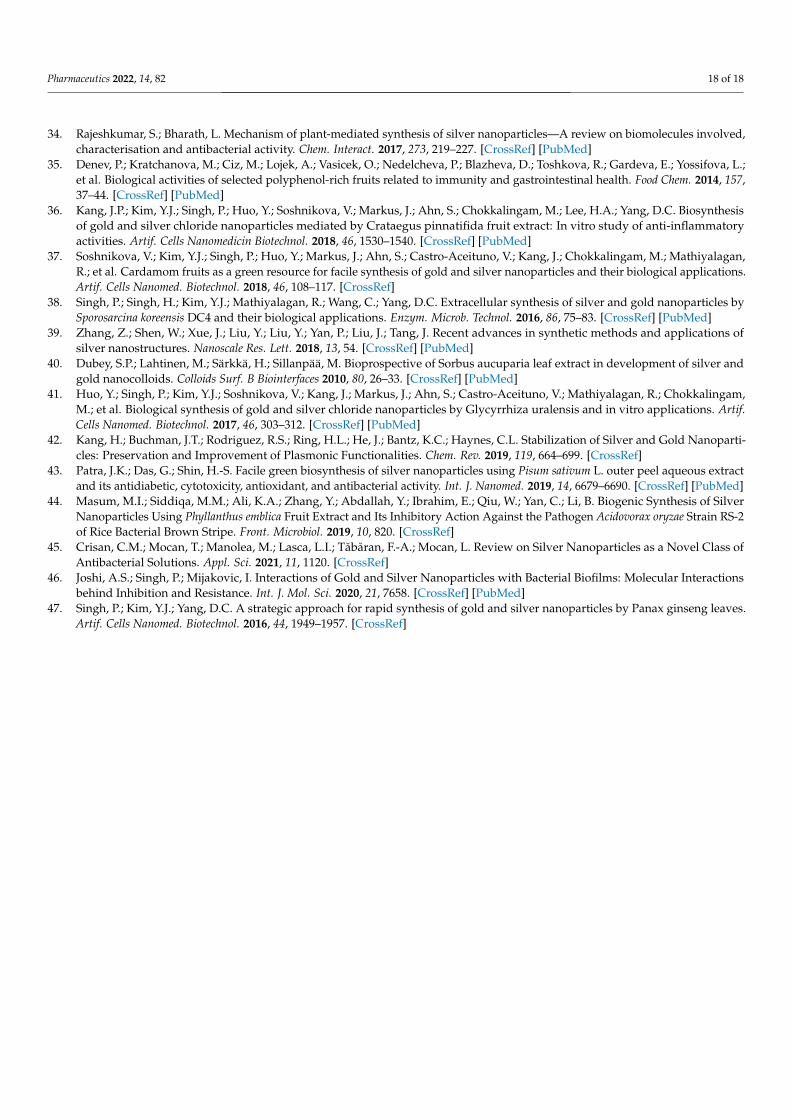
The FT-IR analysis of rowanberries extract confirmed the presence of many activegroups (Figure 6A); for instance, the peak at 328,860 cm−1 corresponded to the –OH(hydroxyl group) of phenolic compounds and amine N–H/O–H stretch. The peak at293,107 was the asymmetric stretching of a methyl group –CH3 and C–H stretching ofalkanes or secondary amines [26]. The peak at 160,231 cm−1 represented –C=C stretchingvibration in flavonoids and terpenoids and carbonyl group (–C=O) –stretching vibrationof proteins or amide I, peak at 140,498 cm−1 to (N–H) stretching vibrations of proteins,peak at 123,142 to C–N aromatic amino groups, 101,469 peak to Carbonyl –C–O–C or–C–O stretching vibrations of amide linkages [30]. RB-AuNPs and RB-AgNPs showedoverlapping peaks in similar regions, which indicated the presence of several active surfacegroups on nanoparticles surfaces originating from berries extract (Figure 6B,C) [31]. Finally,we performed the MALDI-TOF analysis to examine the protein content on the surface ofthe nanoparticles. The mass spectra showed a series of intense single peaks in the rangebetween 590 and 3800 m/z (Figure 7A,B). For RB-AuNPs, several peaks could be assignedto gold ions, at 590.712, 788.005, 985.004, 1182.005, 1379.005, 1576.013, 1773.046, 1969.023,2166.037 (Figure 7A). For RB-AgNPs, we detected several peaks assigned to silver ionsof higher cationic species at 754.528, 970.378, 1186.238, 1402.087, 1617.952, 1833.817, and2263.542 (Figure 7B) [4,21].
Pharmaceutics 2022, 14, 82 10 of 18
5001000150020002500300035004000
RB aqueous extract A
3288
,60
2931
,07
1014,69
1602
,31
1404
,98
1231
,42
868,
9886
8,98
5001000150020002500300035004000
RB-AgNPsC
3854
,49
3822
,01
2103
,52
1064
,70
3191
,42
2323
,52
1595
,93
1508
,26
3736
,76
3650,90
1870
,34
1979
,86
5.00E+021.00E+031.50E+032.00E+032.50E+033.00E+033.50E+034.00E+03
RB-AuNPsB
1604
,44
425,
491050
,08
1208
,13
4000 3500 3000 2500 2000 1500 1000 500
3218
,51
Tran
smitt
ance
(%)
Wavenumber (cm−1)
Tran
smitt
ance
(%)
Wavenumber (cm−1)Tr
ansm
ittan
ce (%
)Wavenumber (cm−1)
Figure 6. FT-IR spectrum of (A) freeze-dried aqueous extract of rowanberries and (B) RB-AuNPs,and (C) RB-AgNPs, which demonstrated the active surface groups for respective samples.
Pharmaceutics 2022, 13, x FOR PEER REVIEW 11 of 19
assigned to silver ions of higher cationic species at 754.528, 970.378, 1186.238, 1402.087, 1617.952, 1833.817, and 2263.542 (Figure 7B) [4,21].
Figure 6. FT-IR spectrum of (A) freeze-dried aqueous extract of rowanberries and (B) RB-AuNPs, and (C) RB-AgNPs, which demonstrated the active surface groups for respective samples.
Figure 7. MALDI-TOF analysis of (A) RB-AuNPs and (B) RB-AgNPs demonstrated respective metal ions.
3.3. Antibacterial Activity of RB-AgNPs The RB-AgNPs produced in this study were further explored for the antibacterial
activity against two Gram-negative pathogens, i.e., P. aeruginosa and E. coli. Figure 8 showed that RB-AgNPs completely killed the P. aeruginosa cells at 100 µg/mL and E. coli cells at 200 µg/mL. We further checked the viability by using live and dead staining kits. Cells exposed to different concentrations of RB-AgNPs were visualized under a fluorescent microscope after staining, and results are shown in Figure 9. Figure 9 (A-H) for P. aeruginosa showed that most of the cells were viable at 32 µg/mL, and with increasing concentration, the green cells were not visible. At the same time, the red became
Figure 7. MALDI-TOF analysis of (A) RB-AuNPs and (B) RB-AgNPs demonstrated respective metalions.
3.3. Antibacterial Activity of RB-AgNPs
The RB-AgNPs produced in this study were further explored for the antibacterialactivity against two Gram-negative pathogens, i.e., P. aeruginosa and E. coli. Figure 8 showedthat RB-AgNPs completely killed the P. aeruginosa cells at 100 µg/mL and E. coli cells at200 µg/mL. We further checked the viability by using live and dead staining kits. Cellsexposed to different concentrations of RB-AgNPs were visualized under a fluorescentmicroscope after staining, and results are shown in Figure 9. Figure 9A–H for P. aeruginosashowed that most of the cells were viable at 32 µg/mL, and with increasing concentration,the green cells were not visible. At the same time, the red became dens, which meansthat the RB-AgNPs were toxic to cells and caused complete death of P. aeruginosa cells at100 µg/mL.

Pharmaceutics 2022, 14, 82 11 of 18
Pharmaceutics 2022, 13, x FOR PEER REVIEW 12 of 19
concentration, the green cells were not visible. At the same time, the red became dens,
which means that the RB-AgNPs were toxic to cells and caused complete death of P. aeru-
ginosa cells at 100 µg/mL.
Figure 8. Cell viability test at different concentrations range from 32 to 300 µg/mL of RB-AgNPs for
(A) P. aeruginosa and (B) E. coli. The green background shows the MBC values of respective patho-
gens with complete growth inhibition.
Figure 9. Live and dead staining of (A–H) P. aeruginosa and (I–R) E. coli, after treatment with RB-
AgNPs at different concentrations. P. aeruginosa cells: (A,B) control without RB-AgNPs, (C,D) 32
Figure 8. Cell viability test at different concentrations range from 32 to 300 µg/mL of RB-AgNPs for(A) P. aeruginosa and (B) E. coli. The green background shows the MBC values of respective pathogenswith complete growth inhibition.
Pharmaceutics 2022, 13, x FOR PEER REVIEW 12 of 19
concentration, the green cells were not visible. At the same time, the red became dens,
which means that the RB-AgNPs were toxic to cells and caused complete death of P. aeru-
ginosa cells at 100 µg/mL.
Figure 8. Cell viability test at different concentrations range from 32 to 300 µg/mL of RB-AgNPs for
(A) P. aeruginosa and (B) E. coli. The green background shows the MBC values of respective patho-
gens with complete growth inhibition.
Figure 9. Live and dead staining of (A–H) P. aeruginosa and (I–R) E. coli, after treatment with RB-
AgNPs at different concentrations. P. aeruginosa cells: (A,B) control without RB-AgNPs, (C,D) 32
Figure 9. Live and dead staining of (A–H) P. aeruginosa and (I–R) E. coli, after treatment withRB-AgNPs at different concentrations. P. aeruginosa cells: (A,B) control without RB-AgNPs, (C,D)32 µg/mL of RB-AgNPs, (E,F) 50 µg/mL of RB-AgNPs, (G,H) 100 µg/mL of RB-AgNPs. E. coli cells:(I,J) control without RB-AgNPs, (K,L) 32 µg/mL of RB-AgNPs, (M,N) 50 µg/mL of RB-AgNPs, (O,P)100 µg/mL of RB-AgNPs, and (Q,R) 200 µg/mL of RB-AgNPs.

Pharmaceutics 2022, 14, 82 12 of 18
Figure 9I–R, showed a complete red region of dead cells at 200 µg/mL concentrationfor E. coli cells. In addition, we also checked the morphology of the dead cells by usingSEM [25]. SEM analysis of P. aeruginosa cells treated by RB-AgNPs was done at twodifferent concentrations, i.e., 50 and 100 µg/mL. Figure 10A–F showed P. aeruginosa cellswere completely covered with nanoparticles and open membrane and structures. Thesame behavior was found at 100 µg/mL concentration of RB-AgNPs, Figure 10K–P. Theelemental mapping results also indicated that the damaged cells were completely coveredwith silver nanoparticles, Figure 10G–I,Q–S, which concluded that the cause of cell lysiswas RB-AgNPs. In addition, EDX demonstrated the clear pic for silver element andFigure 10J,T, which showed the purity of RB-AgNPs in damaged cells. Figure 11 showedRB-AgNPs effects on E. coli cells at 50 µg/mL (Figure 11A–F) and 100 µg/mL (Figure 11K–P)concentrations of RB-AgNPs. The EDX and elemental mapping results indicated that thecells were covered predominantly with silver elements. Thus, the damage happened dueto the silver ions released from RB-AgNPs Figure 11G–J,Q–T.
Pharmaceutics 2022, 13, x FOR PEER REVIEW 13 of 19
µg/mL of RB-AgNPs, (E,F) 50 µg/mL of RB-AgNPs, (G,H) 100 µg/mL of RB-AgNPs. E. coli cells: (I,J) control without RB-AgNPs, (K,L) 32 µg/mL of RB-AgNPs, (M,N) 50 µg/mL of RB-AgNPs, (O,P) 100 µg/mL of RB-AgNPs, and (Q,R) 200 µg/mL of RB-AgNPs.
Figure 9(I-R), showed a complete red region of dead cells at 200 µg/mL concentration for E. coli cells. In addition, we also checked the morphology of the dead cells by using SEM [25]. SEM analysis of P. aeruginosa cells treated by RB-AgNPs was done at two different concentrations, i.e., 50 and 100 µg/mL. Figure 10A–F showed P. aeruginosa cells were completely covered with nanoparticles and open membrane and structures. The same behavior was found at 100 µg/mL concentration of RB-AgNPs, Figure 10K–P. The elemental mapping results also indicated that the damaged cells were completely covered with silver nanoparticles, Figure 10G–I,Q–S, which concluded that the cause of cell lysis was RB-AgNPs. In addition, EDX demonstrated the clear pic for silver element and Figure 10J,T, which showed the purity of RB-AgNPs in damaged cells. Figure 11 showed RB-AgNPs effects on E. coli cells at 50 µg/mL (Figure 11A–F) and 100 µg/mL (Figure 11K–P) concentrations of RB-AgNPs. The EDX and elemental mapping results indicated that the cells were covered predominantly with silver elements. Thus, the damage happened due to the silver ions released from RB-AgNPs Figure 11G–J,Q–T.
Figure 10. SEM analysis of P. aeruginosa cells after treatment with RB-AgNPs. (A–F) Control cells and RB-AgNPs treated cells with 50 µg/mL at different scales. (G) Scanned image of treated cells (H,I) elemental mapping of the selected area showing silver element in the treated cells, (J) EDX spectrum of the chosen area showing peak for silver element. (K–P) Control cells and RB-AgNPs treated cells with 100 µg/mL at different scales. (Q) Scanned image of treated cells (R,S) elemental mapping of the selected area showing silver element in the treated cells, (T) EDX spectrum of the chosen area showing peak for silver element.
Figure 10. SEM analysis of P. aeruginosa cells after treatment with RB-AgNPs. (A–F) Control cells andRB-AgNPs treated cells with 50 µg/mL at different scales. (G) Scanned image of treated cells (H,I)elemental mapping of the selected area showing silver element in the treated cells, (J) EDX spectrumof the chosen area showing peak for silver element. (K–P) Control cells and RB-AgNPs treated cellswith 100 µg/mL at different scales. (Q) Scanned image of treated cells (R,S) elemental mapping ofthe selected area showing silver element in the treated cells, (T) EDX spectrum of the chosen areashowing peak for silver element.

Pharmaceutics 2022, 14, 82 13 of 18Pharmaceutics 2022, 13, x FOR PEER REVIEW 14 of 19
Figure 11. SEM analysis of E. coli cells after treatment with RB-AgNPs. (A–F) Control cells and RB-AgNPs treated cells with 50 µg/mL at different scales. (G) Scanned image of treated cells (H,I) elemental mapping of the selected area showing silver element in the treated cells, (J) EDX spectrum of the chosen area showing peak for silver element. (K–P) Control cells and RB-AgNPs treated cells with 100 µg/mL at different scales. (Q) Scanned image of treated cells (R,S) elemental mapping of the selected area showing silver element in the treated cells, (T) EDX spectrum of the chosen area showing peak for silver element.
4. Discussion Medicinal plants are quite popular for green nanoparticle production and
stabilization, mostly resulting in monodisperse and stable nanoparticles [32,33]. These bio-reactions do not require additives because their resources or SM are adequately enriched with various biological components, which helps reduce and stabilize nanoparticles; these components are proteins, amino acids, sugars, polyphenols, flavonoids, terpenoids, polysaccharides, etc., [34]. Furthermore, the green SM usually stops the reaction after complete reduction to avoid the agglomeration of nanoparticles, hence promoting stability [33]. In the case of rowanberries, the active biological components documented were polyphenolic, primarily flavonoids and phenolic acids [6]. The extract of rowanberries reported many medicinal effects. For instance, aqueous extract of berries inhibited the growth of E. faecalis, S. aureus, and S. enterica, and the viability of C. freundii and B. cereus. Aqueous methanol extracts of rowanberries were potent antioxidants. The phenolic extracts of rowanberries had an inhibitory effect on the hemagglutination of E. coli HB101 (pRR7), which expresses the M hemagglutinin and delayed pathogenic E. coli growth. Acidified acetone extract of rowanberries demonstrated high antibacterial behavior against S. enterica, and P. aeruginosa, and weak
Figure 11. SEM analysis of E. coli cells after treatment with RB-AgNPs. (A–F) Control cells andRB-AgNPs treated cells with 50 µg/mL at different scales. (G) Scanned image of treated cells (H,I)elemental mapping of the selected area showing silver element in the treated cells, (J) EDX spectrumof the chosen area showing peak for silver element. (K–P) Control cells and RB-AgNPs treated cellswith 100 µg/mL at different scales. (Q) Scanned image of treated cells (R,S) elemental mapping ofthe selected area showing silver element in the treated cells, (T) EDX spectrum of the chosen areashowing peak for silver element.
4. Discussion
Medicinal plants are quite popular for green nanoparticle production and stabilization,mostly resulting in monodisperse and stable nanoparticles [32,33]. These bio-reactions donot require additives because their resources or SM are adequately enriched with variousbiological components, which helps reduce and stabilize nanoparticles; these componentsare proteins, amino acids, sugars, polyphenols, flavonoids, terpenoids, polysaccharides,etc., [34]. Furthermore, the green SM usually stops the reaction after complete reductionto avoid the agglomeration of nanoparticles, hence promoting stability [33]. In the case ofrowanberries, the active biological components documented were polyphenolic, primarilyflavonoids and phenolic acids [6]. The extract of rowanberries reported many medicinaleffects. For instance, aqueous extract of berries inhibited the growth of E. faecalis, S. aureus,and S. enterica, and the viability of C. freundii and B. cereus. Aqueous methanol extractsof rowanberries were potent antioxidants. The phenolic extracts of rowanberries had aninhibitory effect on the hemagglutination of E. coli HB101 (pRR7), which expresses the Mhemagglutinin and delayed pathogenic E. coli growth. Acidified acetone extract of rowan-

Pharmaceutics 2022, 14, 82 14 of 18
berries demonstrated high antibacterial behavior against S. enterica, and P. aeruginosa, andweak activity towards the two L. monocytogenes strains and P. vulgaris [35]. Rowanberriescontain proanthocyanidins, which reduce Caco-2 cell viability. Thus, due to the potentialhealth benefits of rowanberries extract, we used it for the unexplored potential of reducinggold and silver salt to form RB-AuNPs and RB-AgNPs and compared them with variousother fruit extracts also reported for similar action [36,37].
The primary observation of nanoparticles formation was supported by visual inspec-tion of the color change in the SM and simultaneous recording of the UV-Vis spectra tocheck the SPR. UV-Vis techniques provide information about nanoparticles’ reduction,shape, size, and morphology [28]. RB-AuNPs showed maximum absorbance in the regionof 500–600 nm and RB-AgNPs in 400–500 nm, consistent with the other reports. The kineticsof nanoparticles formation was monitored by recording the UV-Vis spectrum of SM atdifferent extract-to-water ratios, temperature, time for synthesis, and salt concentrations.According to the spectral analysis for RB-AuNPs, the absorbance of the SPR band increasedwith an increasing ratio up to 2:8 (extract-to-water), and then there was a slight redshiftin the wavelength. It was noticed that already the second-lowest amount of rowanber-ries aqueous extract was effective for the generation of RB-AuNPs. Further increase inthe ratio of extract to water led to the peak broadening, which indicated nanoparticlessize disturbance or polydispersity appearance [26]. According to the UV-Vis spectra ofgold salt optimization studies, the absorption peak’s sharpness depended on the goldsalt concentration used for synthesis, which further sharpened until 4 mM spectrum. Itsuggests that the nucleation and growth process occurred at 4 mM concentration within5 s. Correlation between the peak sharpness and pictures of SM color was relatable andindicated the formation of RB-AuNPs.
RB-AgNPs optimizations studies indicated the highest peak in UV-Vis in the ratio of6:4 (extract-to-water), which suggested that the complete reduction process occurred, andstable nanoparticles formed. At the lower ratios, the rate of nanoparticles formation wasslow; hence, absorbance was also weaker. The reaction temperature also had significanteffects on the size and morphology of the synthesized RB-AgNPs. Results of the UV-Visspectrum showed the variation in the absorption spectra of RB-AgNPs synthesized atdifferent temperatures, and the optimum peaks were obtained at 90 ◦C. There was nonoticeable peak in the absorption spectra until 80 ◦C, indicating no formation of RB-AgNPswithin that time. According to the literature, as the temperature rises, the kinetic energy ofthe molecules rises, and silver ions are used more quickly, leaving less room for particle sizeexpansion. At a higher temperature, smaller nanoparticles with a uniform size distributionform [26]. The optimum reaction time found was 20 min; further, an increase in timeresulted in nanoparticles agglomeration at 90 ◦C. Silver salt concentration for the optimumsynthesis of RB-AgNPs appeared to be 4 mM; on increasing the concentration of silver saltfurther, it was found that the color of the solution turned dark brown, and peaks werealmost overlapping with the 4 mM peak. Thus, the further formation of RB-AgNPs wasrestricted. In addition, the absorption peak got narrower with an increase in concentration.
The structural morphology of the nanoparticles was determined by using SEM andTEM techniques [38]. Obtained results showed that the nanoparticles were highly monodis-perse. The shape is a very important aspect of nanoparticles to define their applicationsand interest. In addition, monodispersity or uniformity in shape is highly desirable, es-pecially in green synthesis, which we achieved in the current study [39]. The uniformityof RB-AuNPs and RB-AgNPs directly corresponded to the SM and reaction parameters.The shape analysis from SEM and TEM showed spherical shapes for both RB-AuNPs andRB-AgNPs. For RB-AuNPs, the core particles range found was 90–100 nm, with uniformityin shape and size distribution, measured at a different scale [23]. RB-AuNPs also showedthe clear distribution of gold elements in elemental mapping and EDX spectrum, whichdemonstrated the absence of any surface contamination.
For RB-AgNPs, the size distribution observed was 20–30 nm with a highly monodis-perse spherical shape, clearly visible in SEM images [23]. Previously lead extract of rowan-

Pharmaceutics 2022, 14, 82 15 of 18
berries was reported to synthesize silver and gold nanoparticles within 15 min with anaverage size of 16 and 18 nm [40]. However, the nanoparticles showed polydispersity byappearing in different shapes, such as spherical, triangular, and hexagonal. In contrast, thecurrent study demonstrated high monodispersity with spherical shapes. The elementalmapping also confirmed the consistent distributions for the silver element [41]. In the EDXgraph, the presence of the elemental silver can be seen, which indicates the reduction ofsilver ions to elemental silver.
Another crucial factor to consider is the stability of the nanoparticles, which decidestheir long-term effects and application area. Nanoparticle stability varies depending on thesynthesis technique, storage circumstances, and stabilizing and capping chemicals utilizedthroughout the process. [42]. In the current study, the change in absorption spectra ofnanoparticles showed no major variation for the time and medium stability test, whichindicates that the biomolecules present in the rowanberries extract act as a strong stabilizer.Based on FT-IR analysis, it was obvious that the generated nanoparticles were surroundedby many biological components, which provided stability [43]. In addition, FT-IR analysisrevealed that the –OH of flavonoid compounds was responsible for the reduction andserved as a corona layer around nanoparticles to provide stability. The –OH group caninteract with the metal ions and reduce cationic silver (Ag+) ion to Ag0 or AgNPs. Thestability was further confirmed by ICPMS, UV-Vis, and visible observation, which showedthat the nanoparticles remained stable for more than a year when suspended in water andkept at 4 ◦C and for more than two weeks at room temperature. There was no sign of anyprecipitation or color change.
It has been noted that the antimicrobial activity or RB-AgNPs was very weak ascompared to other reported silver nanoparticles formed from different berries. For in-stance, Masum et al. reported that the Phyllanthus emblica fruit extract mediated AgNPsactivity against Acidovorax oryzae pathogen and found that 20 µg/mL concentration ofAgNPs could affect bacterial growth, cell viability, biofilm formation, and swarming abil-ity [44]. Other reports also available that aligned with our results; for instance, Patra et al.showed the MBC value of AgNPs synthesized from the outer peel of Pisum sativum was>100 µg/mL [43]. Likewise, RB-AgNPs could kill the complete cells of P. aeruginosa cellsat 100 µg/mL and E. coli cells at 200 µg/mL. The SEM images showed cells membranedamage, with open-cell structures in both the pathogens, which displayed the cell lysis.Cell lysis by membrane damaging, ROS generation, proteins, and ribosomal inactivationare very common mechanisms reported for the antibacterial activity of AgNPs [45,46]. Thereason behind the weak antibacterial activity of RB-AgNPs could be the formation of athick and strong, biocompatible corona layer around the nanoparticles, which consistedof many plant residues [47]. The thickness of the corona layer was assumed based onthe difference between the TEM size and DLS size of RB-AgNPs. TEM showed 20–30 nmcore size, and DLS displayed 177 nm for hydrodynamic diameter [25]. There is always adifference between the core and hydrodynamic size. In the case of RB-AgNPs, we proposethat this big difference corresponded to the capping layer surrounding the nanoparticles,which contributed to the DLS measurement but is likely to avoid detection in TEM due tohigh voltage. This thick corona layer provided stability and enhanced the biocompatibilityof the formed RB-AgNPs. However, it may arguably reduce antibacterial activity. Inaddition to the stability tests conducted, the RB-AgNPs stability could also be observedin SEM images of treated cells. It was visible in the SEM images that after killing thecells, RB-AgNPs retained their spherical structure and size. The nanoparticles distributionwas confirmed by EDX and elemental mapping, which showed that the maximum distri-bution was due to the silver element originating from RB-AgNPs. While the extremelythick corona layer might not favor antimicrobial applications, high biocompatibility andmonodispersity make these nanoparticles potentially suitable in designing and developingnovel and enhanced drug-delivery systems. These monodisperse nanoparticles can act asnanocarriers to deliver various therapeutic molecules for anticancer, anti-inflammatory,

Pharmaceutics 2022, 14, 82 16 of 18
antioxidant, and antimicrobial activities, where overcoming the nanoparticle’s toxicity isthe major challenge [13].
5. Conclusions
Gold and silver nanoparticles were successfully synthesized by a simple, rapid, ef-ficient, and economical method using an aqueous extract of rowanberries. Extremelymonodisperse, stable, and biocompatible nanoparticles were achieved by comparing theeffects of temperature, reaction time, and reactants concentration. The results obtainedusing different characterization techniques showed that the biological components fromrowanberries extract played a role in completely reducing and stabilizing nanoparticles.RB-AgNPs showed antimicrobial potential with an MBC value of 100 µg/mL against P.aeruginosa and 200 µg/mL against E. coli. However, more thorough research is needed tocreate practical and acceptable consumer applications for these nanoparticles in the medicalfield.
Author Contributions: P.S. designed and performed the experiments, analyzed the results and pre-pared the manuscript and Figures. I.M. supervised all experimental work and edited the manuscript.All authors have read and agreed to the published version of the manuscript.
Funding: Lundbeckfonden to P.S. (R303-2018-3499), Novo Nordisk Foundation (NNF10CC1016517)and the NordForsk (project number 105121) to I.M.
Institutional Review Board Statement: Not applicable.
Informed Consent Statement: Not applicable.
Data Availability Statement: Not applicable.
Acknowledgments: ICPMS was performed at DTU Environmental; TEM was performed at theCenter for electron microscopy; DTU and FT-IR were conducted at the Department of ChemicalEngineering, DTU. Authors acknowledge Abida Sultan for conducting the MALDI-TOF experiment.
Conflicts of Interest: The authors declare that the submitted work was not carried out in the presenceof any personal, professional, or financial relationships that could potentially be construed as aconflict of interest.
References1. Singh, P.; Kim, Y.-J.; Zhang, D.; Yang, D.-C. Biological Synthesis of Nanoparticles from Plants and Microorganisms. Trends
Biotechnol. 2016, 34, 588–599. [CrossRef] [PubMed]2. Singh, P.; Ahn, S.; Kang, J.P.; Veronika, S.; Huo, Y.; Singh, H.; Chokkaligam, M.; El-Agamy Farh, M.; Aceituno, V.C.; Kim, Y.J.;
et al. In vitroanti-inflammatory activity of spherical silver nanoparticles and monodisperse hexagonal gold nanoparticles byfruit extract of Prunus serrulata: A green synthetic approach. Artif. Cells Nanomed. Biotechnol. 2017, 46, 2022–2032. [CrossRef][PubMed]
3. Ssekatawa, K.; Byarugaba, D.K.; Kato, C.D.; Wampande, E.M.; Ejobi, F.; Nakavuma, J.L.; Maaza, M.; Sackey, J.; Nxumalo, E.;Kirabira, J.B. Green Strategy–Based Synthesis of Silver Nanoparticles for Antibacterial Applications. Front. Nanotechnol. 2021,3, 59. [CrossRef]
4. Singh, P.; Pandit, S.; Garnæs, J.; Tunjic, S.; Mokkapati, V.R.; Sultan, A.; Thygesen, A.; Mackevica, A.; Mateiu, R.V.; Daugaard,A.E.; et al. Green synthesis of gold and silver nanoparticles from Cannabis sativa (industrial hemp) and their capacity for biofilminhibition. Int. J. Nanomed. 2018, 13, 3571–3591. [CrossRef] [PubMed]
5. Bailie, A.; Renaut, S.; Ubalijoro, E.; Guerrero-Analco, J.A.; Saleem, A.; Haddad, P.; Arnason, J.T.; Johns, T.; Cuerrier, A. Phytogeo-graphic and genetic variation inSorbus, a traditional antidiabetic medicine—Adaptation in action in both a plant and a discipline.PeerJ 2016, 4, e2645. [CrossRef]
6. Sarv, V.; Venskutonis, P.R.; Bhat, R. The Sorbus spp.—Underutilised Plants for Foods and Nutraceuticals: Review on PolyphenolicPhytochemicals and Antioxidant Potential. Antioxidants 2020, 9, 813. [CrossRef]
7. Šavikin, K.P.; Zdunic, G.M.; Krstic-Miloševic, D.B.; Šircelj, H.; Steševic, D.D.; Pljevljakušic, D.S. Sorbus aucupariaandSorbus ariaasa Source of Antioxidant Phenolics, Tocopherols, and Pigments. Chem. Biodivers. 2017, 14, e1700329. [CrossRef]
8. Zymone, K.; Raudone, L.; Raudonis, R.; Marksa, M.; Ivanauskas, L.; Janulis, V. Phytochemical Profiling of Fruit Powders ofTwenty Sorbus L. Cultivars. Molecules 2018, 23, 2593. [CrossRef]
9. Kylli, P.; Nohynek, L.; Puupponen-Pimiä, R.; Westerlund-Wikström, B.; McDougall, G.; Stewart, D.; Heinonen, M. RowanberryPhenolics: Compositional Analysis and Bioactivities. J. Agric. Food Chem. 2010, 58, 11985–11992. [CrossRef]

Pharmaceutics 2022, 14, 82 17 of 18
10. Cristea, E.; Ghendov-Mosanu, A.; Patras, A.; Socaciu, C.; Pintea, A.; Tudor, C.; Sturza, R. The Influence of Temperature, StorageConditions, pH, and Ionic Strength on the Antioxidant Activity and Color Parameters of Rowan Berry Extracts. Molecules 2021,26, 3786. [CrossRef]
11. Mlcek, J.; Rop, O.; Jurikova, T.; Sochor, J.; Fišera, M.; Balla, S.; Baron, M.; Hrabe, J. Bioactive compounds in sweet rowanberryfruits of interspecific Rowan crosses. Open Life Sci. 2014, 9, 1078–1086. [CrossRef]
12. Rónavári, A.; Igaz, N.; Adamecz, D.I.; Szerencsés, B.; Molnar, C.; Kónya, Z.; Pfeiffer, I.; Kiricsi, M. Green Silver and GoldNanoparticles: Biological Synthesis Approaches and Potentials for Biomedical Applications. Molecules 2021, 26, 844. [CrossRef]
13. Burdus, el, A.-C.; Gherasim, O.; Grumezescu, A.M.; Mogoantă, L.; Ficai, A.; Andronescu, E. Biomedical Applications of SilverNanoparticles: An Up-to-Date Overview. Nanomater 2018, 8, 681. [CrossRef]
14. Gherasim, O.; Puiu, R.A.; Bîrcă, A.C.; Burdus, el, A.-C.; Grumezescu, A.M. An Updated Review on Silver Nanoparticles inBiomedicine. Nanomater 2020, 10, 2318. [CrossRef]
15. Kumar, A.; Zhang, X.; Liang, X.-J. Gold nanoparticles: Emerging paradigm for targeted drug delivery system. Biotechnol. Adv.2013, 31, 593–606. [CrossRef]
16. Singh, P.; Mijakovic, I. Advances in gold nanoparticle technology as a tool for diagnostics and treatment of cancer. Expert Rev.Mol. Diagn. 2021, 21, 627–630. [CrossRef]
17. Lee, K.X.; Shameli, K.; Yew, Y.P.; Teow, S.-Y.; Jahangirian, H.; Rafiee-Moghaddam, R.; Webster, T.J. Recent Developments in theFacile Bio-Synthesis of Gold Nanoparticles (AuNPs) and Their Biomedical Applications. Int. J. Nanomed. 2020, 15, 275–300.[CrossRef]
18. Singh, H.; Du, J.; Singh, P.; Yi, T.H. Ecofriendly synthesis of silver and gold nanoparticles by Euphrasia officinalis leaf extract andits biomedical applications. Artif. Cells Nanomed. Biotechnol. 2017, 46, 1163–1170. [CrossRef] [PubMed]
19. Singh, P.; Kim, Y.J.; Wang, C.; Mathiyalagan, R.; Yang, D.C. Microbial synthesis of Flower-shaped gold nanoparticles. Artif. CellsNanomed. Biotechnol. 2016, 44, 1469–1474. [CrossRef]
20. Singh, P.; Pandit, S.; Mokkapati, V.R.S.S.; Garnæs, J.; Mijakovic, I. A Sustainable Approach for the Green Synthesis of SilverNanoparticles from Solibacillus isronensis sp. and Their Application in Biofilm Inhibition. Molecules 2020, 25, 2783. [CrossRef][PubMed]
21. Singh, P.; Pandit, S.; Beshay, M.; Mokkapati, V.R.S.S.; Garnaes, J.; Olsson, M.E.; Sultan, A.; Mackevica, A.; Mateiu, R.V.; Lütken, H.;et al. Anti-biofilm effects of gold and silver nanoparticles synthesized by the Rhodiola rosea rhizome extracts. Artif. Cells Nanomed.Biotechnol. 2018, 46, S886–S899. [CrossRef]
22. Li, J.; Tian, B.; Li, T.; Dai, S.; Weng, Y.; Lu, J.; Xu, X.; Jin, Y.; Pang, R.; Hua, Y. Biosynthesis of Au, Ag and Au–Ag bimetallicnanoparticles using protein extracts of Deinococcus radiodurans and evaluation of their cytotoxicity. Int. J. Nanomed. 2018, 13,1411–1424. [CrossRef] [PubMed]
23. Amina, M.; Al Musayeib, N.M.; Alarfaj, N.A.; El-Tohamy, M.F.; Al-Hamoud, G.A. Antibacterial and Immunomodulatory Potentialsof Biosynthesized Ag, Au, Ag-Au Bimetallic Alloy Nanoparticles Using the Asparagus racemosus Root Extract. Nanomaterials 2020,10, 2453. [CrossRef] [PubMed]
24. Gopinath, K.; Kumaraguru, S.; Bhakyaraj, K.; Mohan, S.; Venkatesh, K.S.; Esakkirajan, M.; Kaleeswarran, P.; Alharbi, N.S.;Kadaikunnan, S.; Govindarajan, M.; et al. Green synthesis of silver, gold and silver/gold bimetallic nanoparticles using theGloriosa superba leaf extract and their antibacterial and antibiofilm activities. Microb. Pathog. 2016, 101, 1–11. [CrossRef]
25. Lomelí-Marroquín, D.; Cruz, D.M.; Nieto-Argüello, A.; Crua, A.V.; Chen, J.; Torres-Castro, A.; Webster, T.J.; Cholula-Díaz, J.L.Starch-mediated synthesis of mono- and bimetallic silver/gold nanoparticles as antimicrobial and anticancer agents. Int. J.Nanomed. 2019, 14, 2171–2190. [CrossRef]
26. Abbai, R.; Ramya Mathiyalagan, J.M.; Kim, Y.J.; Wang, C.; Singh, P.; Ahn, S.; Farh, M.E.A.; Yang, D.C. Green synthesis ofmultifunctional silver and gold nanoparticles from the oriental herbal adaptogen: Siberian ginseng. Int. J. Nanomed. 2016, 11,3131–3143. [CrossRef]
27. Singh, H.; Du, J.; Singh, P.; Yi, T.H. Role of green silver nanoparticles synthesized from Symphytum officinale leaf extract inprotection against UVB-induced photoaging. J. Nanostructure Chem. 2018, 8, 359–368. [CrossRef]
28. Lomelí-Rosales, D.A.; Zamudio-Ojeda, A.; Cortes-Llamas, S.A.; Velázquez-Juárez, G. One-step synthesis of gold and silvernon-spherical nanoparticles mediated by Eosin Methylene Blue agar. Sci. Rep. 2019, 9, 1–9. [CrossRef] [PubMed]
29. Chokkalingam, M.; Singh, P.; Huo, Y.; Soshnikova, V.; Ahn, S.; Kang, J.; Mathiyalagan, R.; Kim, Y.J.; Yang, D.C. Facile synthesis ofAu and Ag nanoparticles using fruit extract of Lycium chinense and their anticancer activity. J. Drug Deliv. Sci. Technol. 2019, 49,308–315. [CrossRef]
30. Albeladi, S.S.R.; Malik, M.A.; Al-Thabaiti, S.A. Facile biofabrication of silver nanoparticles using Salvia officinalis leaf extract andits catalytic activity towards Congo red dye degradation. J. Mater. Res. Technol. 2020, 9, 10031–10044. [CrossRef]
31. Chahardoli, A.; Karimi, N.; Sadeghi, F.; Fattahi, A. Green approach for synthesis of gold nanoparticles from Nigella arvensis leafextract and evaluation of their antibacterial, antioxidant, cytotoxicity and catalytic activities. Artif. Cells Nanomed. Biotechnol. 2017,46, 579–588. [CrossRef]
32. Aboyewa, J.A.; Sibuyi, N.R.S.; Meyer, M.; Oguntibeju, O.O. Green Synthesis of Metallic Nanoparticles Using Some SelectedMedicinal Plants from Southern Africa and Their Biological Applications. Plants 2021, 10, 1929. [CrossRef]
33. Chandra, H.; Kumari, P.; Bontempi, E.; Yadav, S. Medicinal plants: Treasure trove for green synthesis of metallic nanoparticlesand their biomedical applications. Biocatal. Agric. Biotechnol. 2020, 24, 101518. [CrossRef]
Pharmaceutics 2022, 14, 82 18 of 18
34. Rajeshkumar, S.; Bharath, L. Mechanism of plant-mediated synthesis of silver nanoparticles—A review on biomolecules involved,characterisation and antibacterial activity. Chem. Interact. 2017, 273, 219–227. [CrossRef] [PubMed]
35. Denev, P.; Kratchanova, M.; Ciz, M.; Lojek, A.; Vasicek, O.; Nedelcheva, P.; Blazheva, D.; Toshkova, R.; Gardeva, E.; Yossifova, L.;et al. Biological activities of selected polyphenol-rich fruits related to immunity and gastrointestinal health. Food Chem. 2014, 157,37–44. [CrossRef] [PubMed]
36. Kang, J.P.; Kim, Y.J.; Singh, P.; Huo, Y.; Soshnikova, V.; Markus, J.; Ahn, S.; Chokkalingam, M.; Lee, H.A.; Yang, D.C. Biosynthesisof gold and silver chloride nanoparticles mediated by Crataegus pinnatifida fruit extract: In vitro study of anti-inflammatoryactivities. Artif. Cells Nanomedicin Biotechnol. 2018, 46, 1530–1540. [CrossRef] [PubMed]
37. Soshnikova, V.; Kim, Y.J.; Singh, P.; Huo, Y.; Markus, J.; Ahn, S.; Castro-Aceituno, V.; Kang, J.; Chokkalingam, M.; Mathiyalagan,R.; et al. Cardamom fruits as a green resource for facile synthesis of gold and silver nanoparticles and their biological applications.Artif. Cells Nanomed. Biotechnol. 2018, 46, 108–117. [CrossRef]
38. Singh, P.; Singh, H.; Kim, Y.J.; Mathiyalagan, R.; Wang, C.; Yang, D.C. Extracellular synthesis of silver and gold nanoparticles bySporosarcina koreensis DC4 and their biological applications. Enzym. Microb. Technol. 2016, 86, 75–83. [CrossRef] [PubMed]
39. Zhang, Z.; Shen, W.; Xue, J.; Liu, Y.; Liu, Y.; Yan, P.; Liu, J.; Tang, J. Recent advances in synthetic methods and applications ofsilver nanostructures. Nanoscale Res. Lett. 2018, 13, 54. [CrossRef] [PubMed]
40. Dubey, S.P.; Lahtinen, M.; Särkkä, H.; Sillanpää, M. Bioprospective of Sorbus aucuparia leaf extract in development of silver andgold nanocolloids. Colloids Surf. B Biointerfaces 2010, 80, 26–33. [CrossRef] [PubMed]
41. Huo, Y.; Singh, P.; Kim, Y.J.; Soshnikova, V.; Kang, J.; Markus, J.; Ahn, S.; Castro-Aceituno, V.; Mathiyalagan, R.; Chokkalingam,M.; et al. Biological synthesis of gold and silver chloride nanoparticles by Glycyrrhiza uralensis and in vitro applications. Artif.Cells Nanomed. Biotechnol. 2017, 46, 303–312. [CrossRef] [PubMed]
42. Kang, H.; Buchman, J.T.; Rodriguez, R.S.; Ring, H.L.; He, J.; Bantz, K.C.; Haynes, C.L. Stabilization of Silver and Gold Nanoparti-cles: Preservation and Improvement of Plasmonic Functionalities. Chem. Rev. 2019, 119, 664–699. [CrossRef]
43. Patra, J.K.; Das, G.; Shin, H.-S. Facile green biosynthesis of silver nanoparticles using Pisum sativum L. outer peel aqueous extractand its antidiabetic, cytotoxicity, antioxidant, and antibacterial activity. Int. J. Nanomed. 2019, 14, 6679–6690. [CrossRef] [PubMed]
44. Masum, M.I.; Siddiqa, M.M.; Ali, K.A.; Zhang, Y.; Abdallah, Y.; Ibrahim, E.; Qiu, W.; Yan, C.; Li, B. Biogenic Synthesis of SilverNanoparticles Using Phyllanthus emblica Fruit Extract and Its Inhibitory Action Against the Pathogen Acidovorax oryzae Strain RS-2of Rice Bacterial Brown Stripe. Front. Microbiol. 2019, 10, 820. [CrossRef]
45. Crisan, C.M.; Mocan, T.; Manolea, M.; Lasca, L.I.; Tăbăran, F.-A.; Mocan, L. Review on Silver Nanoparticles as a Novel Class ofAntibacterial Solutions. Appl. Sci. 2021, 11, 1120. [CrossRef]
46. Joshi, A.S.; Singh, P.; Mijakovic, I. Interactions of Gold and Silver Nanoparticles with Bacterial Biofilms: Molecular Interactionsbehind Inhibition and Resistance. Int. J. Mol. Sci. 2020, 21, 7658. [CrossRef] [PubMed]
47. Singh, P.; Kim, Y.J.; Yang, D.C. A strategic approach for rapid synthesis of gold and silver nanoparticles by Panax ginseng leaves.Artif. Cells Nanomed. Biotechnol. 2016, 44, 1949–1957. [CrossRef]