Role of HR in Business Process Re-engineering Programs
13
International Journal of Innovative Technology and Exploring Engineering (IJITEE) ISSN: 2278-3075, Volume-8 Issue-8S2, June 2019 481 Published By: Blue Eyes Intelligence Engineering & Sciences Publication Retrieval Number: H10870688S219/19©BEIESP Abstract: Business Process Re-engineering (BPR) is a radical and transformative means to help organizations rethink their existing processes from the fundamentals to completely re-engineer or to transform or to improve them. The aim is to achieve huge cost reductions and a strategically differentiating better customer service. Banking business processes are differentiated into three key elements: Customer inquiries or requests which form the Inputs, the Processing of data through some stages and various necessary internal channels and the delivery result as expected by bank and customer forming the Outputs. BPR principally mediates in the data processing part to alter it to become time and cost effective. Information technology has been regarded as the key enabler for the radical changes as seen after BPR exercises. Majority banks in India, particularly the large private sector lenders – HDFC Bank, ICICI Bank and AXIS Bank are the biggest private sector banks in India by Market Capitalization and proud members of the Big 4 banks of India – the 4th being the State Bank of India (SBI). These banks have adopted technology advancements rapidly enough to be called the Market Leaders of BPR projects in the Indian banking sector. They have re-imagined and re-engineered their processes using the latest tech-tools viz. Chat Bots; Artificial Intelligence (AI) led engines and Robotics Software. Even though these may be in their embryonic stages, these technologies would fundamentally modify the banking scenario sooner than anyone expects. Numerous banking experts predict these technologies taking maximum five years to digitize all banking and trade eco-systems but they envision Block chain technology to be having the potential to be the real game changer which may disrupt the complete financial system. Of late, numerous Indian banks are feeling vulnerable and face a dangerous competition from the fresh bank licensees which are undeniably extremely digitally savvy competitors. Digital technology is not proving to be difficult to procure - it is usually delivered to the client (banks) which work in partnership with external tech-based firms. The Software and Apps are being developed rapidly and being installed competently, for example, digital tools like the Mobile App. Technology, by its very character, remains permeable and over a period of time reaches one and all. It is at this point that we appreciate that IT based tools are ‘enablers’ of BPR projects or of Digitization of banks. The ‘strategic differentiators’ are and will be the people - since any such project also affects the banks’ Revised Manuscript Received on May 20, 2019. Supriya Bhasin, PhD Research Scholar, Amity School of Business, Amity University, Noida, U.P., India Dr. Pratibha Garg, Assistant Professor, Amity School of Business, Amity University, Noida, U.P., India culture, behavior, structure and work-processes. Banks are going about digitization by crafting multidisciplinary teams that are jointly responsible end to end - from the design stage to full-scale roll-out of the new process. Since an entirely new set of metrics needs to be measured, employee key result areas (KRAs) are being re-calibrated. The front-end executives dealing with bank customers now have customer-centric KRAs. The performance management systems are being altered. People who have gone through a successful digitization have felt the environment during the project to be as stressful as that during a post-merger integration - in terms of obligation of efforts required and engagement of the bank employees at all levels. Many banks continue to find it extremely challenging to muster this level of vigor and enthusiasm for the on-going digital programs. Hence, it becomes vital to understand the perception and expectations of employees all through these changes. Despite the astonishing growth and achievements witnessed by the banking sector in India, most banks are now discovering that they have been pushing themselves to the extremes. There is a kind of saturation sneaking in the banking industry. Difficult consumers, the anxiety to develop more and more business and to amplify profits, hostile rivals and the need of a strong mechanism to detect and prevent banking frauds while delivering growth is making the banks take a re-look of their operations post the technological changes. Organizations are beginning to realize that organization factors and people issues are the core issues – they can either be strategic assets or the real stumbling blocks. It seems, even in the digital world, it is the human angle that makes all the difference. In this context, it becomes important to explore and evaluate whether the Human Resource Division of banks has an important role to play in the BPR programs and in what capacity. A comprehensive review of literature points out that HR’s roles in BPR programs has been largely perfunctory and restricted to being a facilitator of BPR centric training programs. Nevertheless, the literature reviewed emphasizes upon the banks to mull over a more strategic role for the HR to achieve remarkable improvement in the outputs derived from BPR programs. The purpose of this paper is to empirically analyze bank employees’ perception regarding HR’s role in BPR programs and their expectations from the HR division. A questionnaire was designed and mailed to the Operations and Front-line executives of the selected Indian Private Sector banks. Suitable hypotheses were developed to assess and evaluate the perceptions and expectations of bank employees. The data obtained from the responses was used to perform the empirical analysis. Various parametric, Role of HR in Business Process Re-engineering Programs: Changing Paradigms of Employee Expectations in the Banking Sector Supriya Bhasin, Pratibha Garg
-
Upload
khangminh22 -
Category
Documents
-
view
6 -
download
0
Transcript of Role of HR in Business Process Re-engineering Programs
International Journal of Innovative Technology and Exploring Engineering (IJITEE)
ISSN: 2278-3075, Volume-8 Issue-8S2, June 2019
481
Published By:
Blue Eyes Intelligence Engineering
& Sciences Publication Retrieval Number: H10870688S219/19©BEIESP
Abstract: Business Process Re-engineering (BPR) is a radical
and transformative means to help organizations rethink their
existing processes from the fundamentals to completely
re-engineer or to transform or to improve them. The aim is to
achieve huge cost reductions and a strategically differentiating
better customer service. Banking business processes are
differentiated into three key elements: Customer inquiries or
requests which form the Inputs, the Processing of data through
some stages and various necessary internal channels and the
delivery result as expected by bank and customer forming the
Outputs. BPR principally mediates in the data processing part to
alter it to become time and cost effective. Information
technology has been regarded as the key enabler for the radical
changes as seen after BPR exercises. Majority banks in India,
particularly the large private sector lenders – HDFC Bank,
ICICI Bank and AXIS Bank are the biggest private sector banks
in India by Market Capitalization and proud members of the Big
4 banks of India – the 4th being the State Bank of India (SBI).
These banks have adopted technology advancements rapidly
enough to be called the Market Leaders of BPR projects in the
Indian banking sector. They have re-imagined and
re-engineered their processes using the latest tech-tools viz. Chat
Bots; Artificial Intelligence (AI) led engines and Robotics
Software. Even though these may be in their embryonic stages,
these technologies would fundamentally modify the banking
scenario sooner than anyone expects. Numerous banking experts
predict these technologies taking maximum five years to digitize
all banking and trade eco-systems but they envision Block chain
technology to be having the potential to be the real game changer
which may disrupt the complete financial system. Of late,
numerous Indian banks are feeling vulnerable and face a
dangerous competition from the fresh bank licensees which are
undeniably extremely digitally savvy competitors.
Digital technology is not proving to be difficult to
procure - it is usually delivered to the client (banks) which work
in partnership with external tech-based firms. The Software and
Apps are being developed rapidly and being installed
competently, for example, digital tools like the Mobile App.
Technology, by its very character, remains permeable and over a
period of time reaches one and all. It is at this point that we
appreciate that IT based tools are ‘enablers’ of BPR projects or
of Digitization of banks. The ‘strategic differentiators’ are and
will be the people - since any such project also affects the banks’
Revised Manuscript Received on May 20, 2019.
Supriya Bhasin, PhD Research Scholar, Amity School of Business, Amity
University, Noida, U.P., India
Dr. Pratibha Garg, Assistant Professor, Amity School of Business, Amity
University, Noida, U.P., India
culture, behavior, structure and work-processes. Banks are
going about digitization by crafting multidisciplinary teams that
are jointly responsible end to end - from the design stage to
full-scale roll-out of the new process. Since an entirely new set of
metrics needs to be measured, employee key result areas (KRAs)
are being re-calibrated. The front-end executives dealing with
bank customers now have customer-centric KRAs. The
performance management systems are being altered. People who
have gone through a successful digitization have felt the
environment during the project to be as stressful as that during a
post-merger integration - in terms of obligation of efforts
required and engagement of the bank employees at all levels.
Many banks continue to find it extremely challenging to muster
this level of vigor and enthusiasm for the on-going digital
programs. Hence, it becomes vital to understand the perception
and expectations of employees all through these changes.
Despite the astonishing growth and
achievements witnessed by the banking sector in India, most
banks are now discovering that they have been pushing
themselves to the extremes. There is a kind of saturation
sneaking in the banking industry. Difficult consumers, the
anxiety to develop more and more business and to amplify
profits, hostile rivals and the need of a strong mechanism to
detect and prevent banking frauds while delivering growth is
making the banks take a re-look of their operations post the
technological changes. Organizations are beginning to realize
that organization factors and people issues are the core issues –
they can either be strategic assets or the real stumbling blocks. It
seems, even in the digital world, it is the human angle that makes
all the difference. In this context, it becomes important to
explore and evaluate whether the Human Resource Division of
banks has an important role to play in the BPR programs and in
what capacity. A comprehensive review of literature points out
that HR’s roles in BPR programs has been largely perfunctory
and restricted to being a facilitator of BPR centric training
programs. Nevertheless, the literature reviewed emphasizes upon
the banks to mull over a more strategic role for the HR to
achieve remarkable improvement in the outputs derived from
BPR programs. The purpose of this paper is to
empirically analyze bank employees’ perception regarding HR’s
role in BPR programs and their expectations from the HR
division. A questionnaire was designed and mailed to the
Operations and Front-line executives of the selected Indian
Private Sector banks. Suitable hypotheses were developed to
assess and evaluate the perceptions and expectations of bank
employees. The data obtained
from the responses was used
to perform the empirical
analysis. Various parametric,
Role of HR in Business Process
Re-engineering Programs: Changing
Paradigms of Employee Expectations
in the Banking Sector
Supriya Bhasin, Pratibha Garg
Role of HR in Business Process Re-engineering Programs: Changing Paradigms of Employee
Expectations in the Banking Sector
482
Published By:
Blue Eyes Intelligence Engineering
& Sciences Publication Retrieval Number: H10870688S219/19©BEIESP
non-parametric tests and descriptive statistics constituted the
extensive empirical analysis. The experimental analysis reveals
that even though there is a strong perception of HR playing an
important role in BPR programs, the expectations from HR
remain very high. This study is subject to the characteristic
limitations of a survey research. The research findings can make
a very significant contribution to banks and other stakeholders.
Index Terms: Perception, Expectation, Human Resource
Personnel, Business Process Reengineering, Operations
Executives, Digitization, Private Sector Banks, SPSS.
I. INTRODUCTION
The role and strategic aspects of Human Resource
Management [1] are relatively under-explored in the
Business Process Re-engineering (BPR) literature and
available documents. BPR‟s main focus is on elements such
as: the effects of BPR on the organization, the influence and
criticality of Information Technology (IT) in BPR, tools and
techniques of more effective implementation of BPR etc. At
the outset, there is scant of studies on the contribution of
people or the HR personnel towards the success of BPR
projects. BPR projects typically require organizational
restructuring and typically have a high failure rate. Many
executives who have dealt with the BPR initiatives in their
organizations have also reported that those programs had
unintended side effects and ended up creating new problems
even though they managed to achieve the intended benefits of
BPR exercises – reduction in cost, time and resources of the
particular processes which were successfully re-engineered.
In majority of the cases, such problems are caused by
almost nil involvement of the Human Resource Management
Department and or poor people-management practices which
failed to properly address the human beings‟ inherent
resistance to change or a widespread fear of change. In an era
where technological advancements are widespread and
quickly permeate organizations, Information Technology
(IT) is not and will not be the critical differentiator between a
success and a failure story of BPR projects. The major reason
for failure of BPR projects has been and will continue to be
the failure of managers to anticipate and address the human
aspects and concerns of the employees or the constructive
and strategic role played HR function in BPR programs.
These human aspects will always be more central and critical
than any technology aspects and if the organizations are
indeed serious about deriving long term strategic benefits
from their BPR initiatives (which usually involve a lot of
cost), the human side cannot be left to tend to itself.
As this study was an endeavor to analyze the role of HR
function in BPR programs of selected Indian Private Sector
banks, there was a need of studying the role played by the HR
personnel from other employees‟ point of view since the
other employees constitute the internal customers of the HR
Department Key Responsibility Areas (KRAs). Any analysis
of the role played by HR function which did not cover the
feedback of other employees would have been incomplete.
The objectives of the research:
1. To analyze the perception and expectations of other
bank employees regarding the role of HR personnel in BPR
programs.
2. To compare the selected banks on the gap between
perception and expectations from the role of HR personnel in
BPR programs.
To study the objectives, a questionnaire was designed and
mailed to the Operations and Front-line executives of the
selected Indian Private Sector banks. Suitable hypothesis
were developed to assess and evaluate the perceptions and
expectations of bank employees. The data obtained from the
responses was used to perform the empirical analysis.
Various parametric, non-parametric tests and descriptive
statistics formed the parts of the extensive analysis. The
analysis revealed that even though there is a strong
perception of HR playing an important role in BPR
programs, the expectations from HR remain very high.
II. LITERATURE REVIEW
The literature available on human resource issues related to
BPR can be discussed under the following headings:
A. Role of Managers in BPR Programs
Champy (1995) [2] focused on questions regarding what
characteristics a manager should have in a reengineered
organization, what sort of training he/she ought to go
through in order to be effective. He described the skills
necessary to overcome the resistance encountered in the
attempt to change workforce culture/mental thought process.
He also underlined the importance of a practical and an
appropriate training program which ideally should pursue
these main objectives: an ability to get the job done,
communication and reinforcement of organizational values,
ensuring that the vision and mission of the organization is
properly imbibed; increasing self-confidence in individual
abilities and fostering a climate of aspiration within the
organization. Corrigan (1997) [3] suggested
that managers in organizations that have been through a BPR
project see their role as being gradually changed, especially
middle managers. According to him, one of the difficulties
for managers remained how to define exactly what they have
to do in a wider and a more generalist role, “where they have
their own performance measured with respect to how well
they run a process rather than how well they run a
department'' [4].
Zucchi and Edwards (1999) [5] pointed out that the
managers‟ attitudes at the beginning of any BPR Project had
been usually positive and that the way the senior
management level managed to communicate the purpose of
the re-organization was fundamental in ensuring that the
project was accepted by the rest of the organization. The
reasons behind apprehensions of few managers regarding
BPR projects were connected to the modification of their own
role. Concepts like use of cross-functional teams, workforce
empowerment and increased delegation were regarded as
vague by several managers specifically those who had
occupied a particular position for a long time – insecurities
regarding the changed role and purpose inside the new
organization and other
uncertainties were reported
to be the maximum in their
case. Those organizations
International Journal of Innovative Technology and Exploring Engineering (IJITEE)
ISSN: 2278-3075, Volume-8 Issue-8S2, June 2019
483
Published By:
Blue Eyes Intelligence Engineering
& Sciences Publication Retrieval Number: H10870688S219/19©BEIESP
which had been through Total Quality Management (TQM)
programs reported experiencing fewer problems in having
BPR projects accepted. Most of the managers agreed that
their roles changed post implementation of BPR programs.
There was more concentration on process-related
performance measures and meeting assigned targets with
more emphasis on coaching and co-ordination and less direct
control. Managers opined that they were more accountable
and more visible and had an increased authority and
autonomy in carrying out their job. There was also unanimity
that the main task for managers post BPR implementation
was to assure the meeting of organizational targets and
increase process performance. The managers also had more
scope for action than before as they had the newer
responsibility and authority of embracing an entire process
crossing different functions. Wan-Jing et al. (2010) [6]
examined the impact of human resource (HR) capabilities on
internal customer satisfaction and organizational
effectiveness. By drawing on data from HR managers and
line managers, their study showed that some HR capabilities
appear to be strongly linked to internal customer satisfaction
and effectiveness of the organization. The implications for
practitioners were to modify and put emphasis on certain HR
practices, and to highlight the role of internal customers for
enhancing the efficacy of organizations.
B. Employee Perception
Robbins (2004) [7] defined perception as „a process by
which individuals organize and interpret their sensory
impressions in order to give meaning to their environment‟.
It is known that perception is not necessarily based on reality,
but is a perspective from a particular individual‟s view of a
situation. In dealing with any concept of organization culture
or organizational behavior, perception becomes extremely
important because people‟s behavior is based on their
perception of what reality is and not on the reality itself [8].
The factors which influence an employee‟s perception can be
categorized into: the situation, the perceiver and the target.
For example, the actual factors in an organizational
environment may include: time of work, the tools and
techniques required to do the work and the social setting.
Whereas the factors in the perceiver may be: attitudes,
motives, interests, experiences and expectations [7].
DeVaro et al. (2007) [9] contended that organizations use
perception management in daily internal and external
interactions as well as prior to major product/strategy
introductions and following events of crisis and that
perception affects the working relationships in numerous
ways related to the factors of organizational behavior, such
as: individual, group or structure.
International expert and consultant David Maister offered
an extremely practical and accessible guide to every
management issue at play in professional firms in his
brilliant book titled “Managing Professional Services Firm”.
According to him, professional firms (including banks) differ
from other business enterprises in two ways: first, they
provide highly customized services and thus cannot apply
many of the management principles developed for
product-based industries. Second, professional services are
highly personalized, involving the skills of individuals [10]
Drawing on more than ten years of research and consulting to
these unique and creative companies, Maister brought up a
fundamental point that while “products are consumed,
services are experienced.” The author has emphasized that
one may do solid technical work for the client
(internal/external), but if the client doesn‟t perceive it to be a
quality work, it is bad quality. Or Satisfaction = Perception –
Expectation. The author reiterated that “neither perception
nor expectation necessarily reflect reality.” (Consultant‟s
Mind, 2018) [11].
C. Resistance to Change
According to Al-Mashari and Zairi (2001) [12], BPR
fosters change and human being resists change. The authors
emphasized that this resistance is the most common barrier
of BPR and renders success difficult. Crowe et al. (2009) [13]
argued that employees resist changes because of uncertain
future initiated by BPR changes including job loss, authority
loss, skepticism about outcomes and a feeling of discomfort
regarding working in a new environment after BPR
programs have been implemented. Inadequate
communication among employees and their managers which
result in lack of motivation and clarity culminates into
resistance to change. Sturdy (2010) [14] argued that fear of
changed role of job loss combined with a sense of loss of
control and position, particularly within the middle
management can result in resistance to change. Moreover the
line managers may not be receptive to change due to a lack of
determination for radical change, and also because of a lack
of cross-functional cooperation.
Regarding the banking sector in general, it was noticed
that there is a dearth of research on:
• The impact of the HR personnel‟s role in BPR programs
on other employees of the banks – specifically those working
in the Operations or the IT Department or the Front Office
Executives.
• The perception of the bank employees regarding the role
played by the HR function in BPR programs.
• The expectations of the bank employees from the HR
team assigned to deal with multiple aspects of BPR
programs.
Most of the research on BPR in banks is devoted to the
Public Sector Banks of our country and there is a dearth of
literature on BPR in Private Banking Sector. These areas of
interest were discussed with the senior management and
senior executives of the Operations and other departments
(leaving HR) of the selected Private Sector Banks. Post
discussions, there was a consensus on the importance of
analyzing the present satisfaction level or analyzing what
employees may believe HR is doing (perception) and what
they would like the HR to do (expectations). There was an
agreement that it is vital to reduce disconnect between the
employees and the HR managers to enhance the output and
efficiency derived from the BPR programs across their
various phases. Aligning HR
realities with employee
expectations and vice versa
was recognized as the need
Role of HR in Business Process Re-engineering Programs: Changing Paradigms of Employee
Expectations in the Banking Sector
484
Published By:
Blue Eyes Intelligence Engineering
& Sciences Publication Retrieval Number: H10870688S219/19©BEIESP
of the hour.
III. RESEARCH METHODOLOGY
A. Sample
The main objective of the research was to study the impact
of the role of HR Managers in BPR programs on other
employees of the Indian private sector banks. Since the total
number of Indian private sector banks is huge, 3 banks were
selected for the study: AXIS Bank Ltd., HDFC Bank Ltd. and
ICICI Bank. The reason behind selecting these banks was
that they are the largest private sector banks in India by
market capitalization and proud members of the Big 4 banks
of India – The 4th being the State Bank of India (SBI). Apart
from being equivalent to each other in expressions of Net
Interest Income, Net Profit and Total Assets, these three
banks are at almost similar stages of digital readiness in a bid
to meet customer needs in a time when banking is becoming
more about clicks and mobile banking than the conventional
modes of banking.
The objectives specified were analyzed with the help of a
well drafted pre-tested Questionnaire. Interviews were also
considered as an excellent tool to gather information from
the Executive Managers/Officers. The bank employees –
which formed the basis of this objective of study, were
selected from amongst employees working in different
departments – Operations, Business Development, Front
Office and from different levels like the Executive Managers,
Assistant Managers, Relationship Managers, Branch
Managers, Customer Care Executives/Officers, and Front
Desk Executives etc. While interviews were mainly informal
in nature, it was requested that the questionnaire be
completed by those who had undergone specific training and
up-gradation exercises regarding BPR programs, who had
been responsible for the planning and execution of the BPR
programs, whose role and responsibilities had changed post
the implementation of the BPR programs, by top hierarchal
managers of the Operations and Business
Development/Analytics divisions or by all of them.
B. Hypothesis Formulation
The first objective of the study was to analyze the
perception and expectations of other bank employees
regarding the role of HR personnel in BPR programs. The
authors were unable to come across literature which could
explain other bank employees‟ perception of the role of HR in
BPR programs or any study which elaborated on what the
other bank employees might be expecting from the HR
Departments of their banks vis-à-vis BPR programs. The
endeavor of this paper was to study the gap between the
perception and expectations of the bank employees – whether
the difference between perception and expectations is
significant or whether the HR function performing its
expected role with aplomb. Hence the null and alternative
hypotheses developed for the first objective were:
H0a: There is no difference between the perception and
expectations of bank employees from the role of HR in BPR
programs in banks.
H1a: The difference between the perception and expectations
of bank employees from the role of HR in BPR programs in
banks is significant.
The second objective of the study was to compare the
selected banks on the difference between perception and
expectations from the role of HR in BPR programs. To
compare the selected banks with each other on the parameter
of other employees‟ perception of the role played by their
bank‟s HR in BPR programs, there was a need to compare the
3 different banks‟ respondents in terms of their perception
and expectations through minute data analysis using
descriptive statistics.
These research objectives and hypotheses were kept in
consideration before construction of the questionnaire.
C. Construction of the Questionnaire
To construct the most appropriate questionnaire, broad
literature review was done. The studies of Zucchi and
Edwards (1999) [5] and Al-Mashari et al. (2001) [12] were
used to form the primary draft of the questionnaire which was
then customized to the banking sector by discussing with
experts from academia and the top managers and executives
of the selected banks as described in the literature review
section of this paper. The questionnaire consisted of 20
statements grouped under: Perception (10 statements) and
Expectations (10 statements). These are presented in Table 1.
Table 1: Statements of the Questionnaire grouped under
different factors
Statements
Factor – Perception (Response to each on five-point
Likert Scale ranging from Strongly Agree (5 for
computation purpose) to Strongly Disagree (1 for
computation purpose)
HR Department‟s role has been limited to minimizing
resistance to change & statutory compliance by the
employees.
HR Department is well-integrated with Information
Technology Department.
Organization culture has been conducive to BPR related
changes.
The BPR programs have resulted in easy communication
among the employees and departments.
Employees‟ feedback and suggestions during BPR training
exercises have been taken in the right spirit & solutions
offered.
Employees have been made to feel empowered hence
employee commitment has improved.
Performance levels have increased and there is clarity
regarding the new roles and processes.
Performance targets are realistic thus achievable.
The BPR programs have increased the level of usage of
information technology and it has helped in improving
performance.
International Journal of Innovative Technology and Exploring Engineering (IJITEE)
ISSN: 2278-3075, Volume-8 Issue-8S2, June 2019
485
Published By:
Blue Eyes Intelligence Engineering
& Sciences Publication Retrieval Number: H10870688S219/19©BEIESP
Employees display a sense of ownership and are keener on
team-work.
Factor – Expectations (Response to each on five-point
Likert Scale ranging from Strongly Agree (5 for
computation purpose) to Strongly Disagree (1 for
computation purpose)
HR Department should play a strategic role and consult
employees for opinion before/at BPR programs‟ initiation
stage.
HR Department should be more tuned to and work more
with Information Technology division.
The management should act more actively, promote a
healthy culture and give total support to the BPR
processes.
The supervisors should discuss with their juniors about the
problem areas of the BPR processes and how to improve
them.
Employees‟ concerns about change in their job
profiles/nature of work post BPR should be addressed &
genuine efforts should be made to make them feel positive.
The suggestions from employees should be taken very
seriously so that they feel empowered and committed to
their job outcomes.
Work should be streamlined to improve productivity and
adequate clarity must be given regarding new roles and
processes.
There should be clarity regarding new targets and the
revised employee performance management plan.
The employees of the bank should be periodically
re-trained on use of IT and skills related to BPR programs
to enable them to contribute more towards BPR success.
Employees should be encouraged to give creative solutions
and make cross functional teams across different
departments to work on projects for the benefit of the
whole bank.
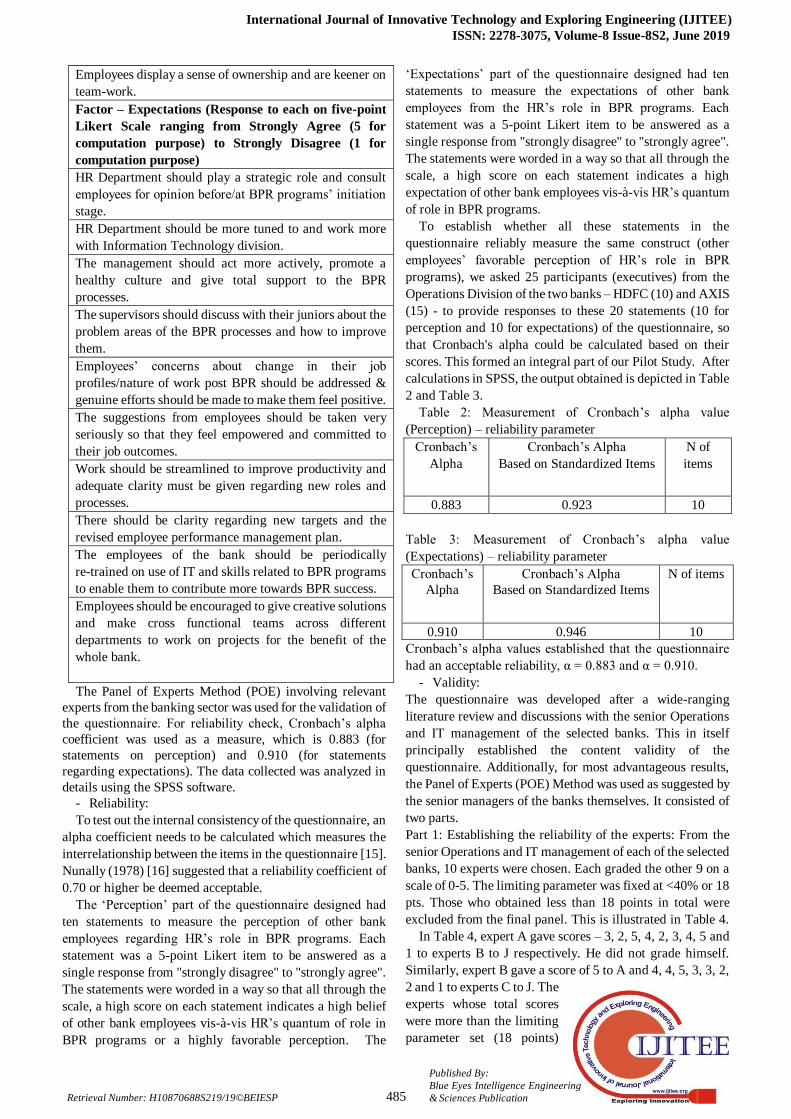
The Panel of Experts Method (POE) involving relevant
experts from the banking sector was used for the validation of
the questionnaire. For reliability check, Cronbach‟s alpha
coefficient was used as a measure, which is 0.883 (for
statements on perception) and 0.910 (for statements
regarding expectations). The data collected was analyzed in
details using the SPSS software.
- Reliability:
To test out the internal consistency of the questionnaire, an
alpha coefficient needs to be calculated which measures the
interrelationship between the items in the questionnaire [15].
Nunally (1978) [16] suggested that a reliability coefficient of
0.70 or higher be deemed acceptable.
The „Perception‟ part of the questionnaire designed had
ten statements to measure the perception of other bank
employees regarding HR‟s role in BPR programs. Each
statement was a 5-point Likert item to be answered as a
single response from "strongly disagree" to "strongly agree".
The statements were worded in a way so that all through the
scale, a high score on each statement indicates a high belief
of other bank employees vis-à-vis HR‟s quantum of role in
BPR programs or a highly favorable perception. The
„Expectations‟ part of the questionnaire designed had ten
statements to measure the expectations of other bank
employees from the HR‟s role in BPR programs. Each
statement was a 5-point Likert item to be answered as a
single response from "strongly disagree" to "strongly agree".
The statements were worded in a way so that all through the
scale, a high score on each statement indicates a high
expectation of other bank employees vis-à-vis HR‟s quantum
of role in BPR programs.
To establish whether all these statements in the
questionnaire reliably measure the same construct (other
employees‟ favorable perception of HR‟s role in BPR
programs), we asked 25 participants (executives) from the
Operations Division of the two banks – HDFC (10) and AXIS
(15) - to provide responses to these 20 statements (10 for
perception and 10 for expectations) of the questionnaire, so
that Cronbach's alpha could be calculated based on their
scores. This formed an integral part of our Pilot Study. After
calculations in SPSS, the output obtained is depicted in Table
2 and Table 3.
Table 2: Measurement of Cronbach‟s alpha value
(Perception) – reliability parameter
Cronbach‟s
Alpha
Cronbach‟s Alpha
Based on Standardized Items
N of
items
0.883 0.923 10
Table 3: Measurement of Cronbach‟s alpha value
(Expectations) – reliability parameter
Cronbach‟s
Alpha
Cronbach‟s Alpha
Based on Standardized Items
N of items
0.910 0.946 10
Cronbach‟s alpha values established that the questionnaire
had an acceptable reliability, α = 0.883 and α = 0.910.
- Validity:
The questionnaire was developed after a wide-ranging
literature review and discussions with the senior Operations
and IT management of the selected banks. This in itself
principally established the content validity of the
questionnaire. Additionally, for most advantageous results,
the Panel of Experts (POE) Method was used as suggested by
the senior managers of the banks themselves. It consisted of
two parts.
Part 1: Establishing the reliability of the experts: From the
senior Operations and IT management of each of the selected
banks, 10 experts were chosen. Each graded the other 9 on a
scale of 0-5. The limiting parameter was fixed at <40% or 18
pts. Those who obtained less than 18 points in total were
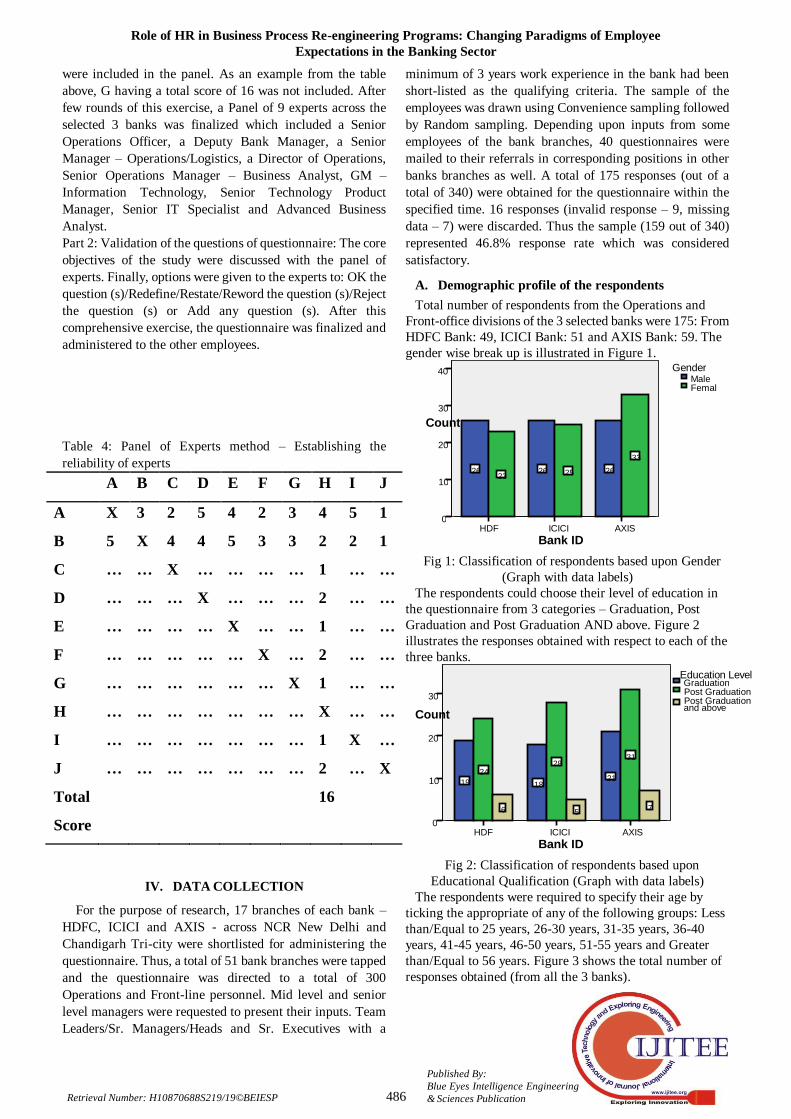
excluded from the final panel. This is illustrated in Table 4.
In Table 4, expert A gave scores – 3, 2, 5, 4, 2, 3, 4, 5 and
1 to experts B to J respectively. He did not grade himself.
Similarly, expert B gave a score of 5 to A and 4, 4, 5, 3, 3, 2,
2 and 1 to experts C to J. The
experts whose total scores
were more than the limiting
parameter set (18 points)
Role of HR in Business Process Re-engineering Programs: Changing Paradigms of Employee
Expectations in the Banking Sector
486
Published By:
Blue Eyes Intelligence Engineering
& Sciences Publication Retrieval Number: H10870688S219/19©BEIESP
were included in the panel. As an example from the table
above, G having a total score of 16 was not included. After
few rounds of this exercise, a Panel of 9 experts across the
selected 3 banks was finalized which included a Senior
Operations Officer, a Deputy Bank Manager, a Senior
Manager – Operations/Logistics, a Director of Operations,
Senior Operations Manager – Business Analyst, GM –
Information Technology, Senior Technology Product
Manager, Senior IT Specialist and Advanced Business
Analyst.
Part 2: Validation of the questions of questionnaire: The core
objectives of the study were discussed with the panel of
experts. Finally, options were given to the experts to: OK the
question (s)/Redefine/Restate/Reword the question (s)/Reject
the question (s) or Add any question (s). After this
comprehensive exercise, the questionnaire was finalized and
administered to the other employees.
Table 4: Panel of Experts method – Establishing the
reliability of experts
A B C D E F G H I J
A X 3 2 5 4 2 3 4 5 1
B 5 X 4 4 5 3 3 2 2 1
C … … X … … … … 1 … …
D … … … X … … … 2 … …
E … … … … X … … 1 … …
F … … … … … X … 2 … …
G … … … … … … X 1 … …
H … … … … … … … X … …
I … … … … … … … 1 X …
J … … … … … … … 2 … X
Total
Score
16
IV. DATA COLLECTION
For the purpose of research, 17 branches of each bank –
HDFC, ICICI and AXIS - across NCR New Delhi and
Chandigarh Tri-city were shortlisted for administering the
questionnaire. Thus, a total of 51 bank branches were tapped
and the questionnaire was directed to a total of 300
Operations and Front-line personnel. Mid level and senior
level managers were requested to present their inputs. Team
Leaders/Sr. Managers/Heads and Sr. Executives with a
minimum of 3 years work experience in the bank had been
short-listed as the qualifying criteria. The sample of the
employees was drawn using Convenience sampling followed
by Random sampling. Depending upon inputs from some
employees of the bank branches, 40 questionnaires were
mailed to their referrals in corresponding positions in other
banks branches as well. A total of 175 responses (out of a
total of 340) were obtained for the questionnaire within the
specified time. 16 responses (invalid response – 9, missing
data – 7) were discarded. Thus the sample (159 out of 340)
represented 46.8% response rate which was considered
satisfactory.
A. Demographic profile of the respondents
Total number of respondents from the Operations and
Front-office divisions of the 3 selected banks were 175: From
HDFC Bank: 49, ICICI Bank: 51 and AXIS Bank: 59. The
gender wise break up is illustrated in Figure 1.
Fig 1: Classification of respondents based upon Gender
(Graph with data labels)
The respondents could choose their level of education in
the questionnaire from 3 categories – Graduation, Post
Graduation and Post Graduation AND above. Figure 2
illustrates the responses obtained with respect to each of the
three banks.
Fig 2: Classification of respondents based upon
Educational Qualification (Graph with data labels)
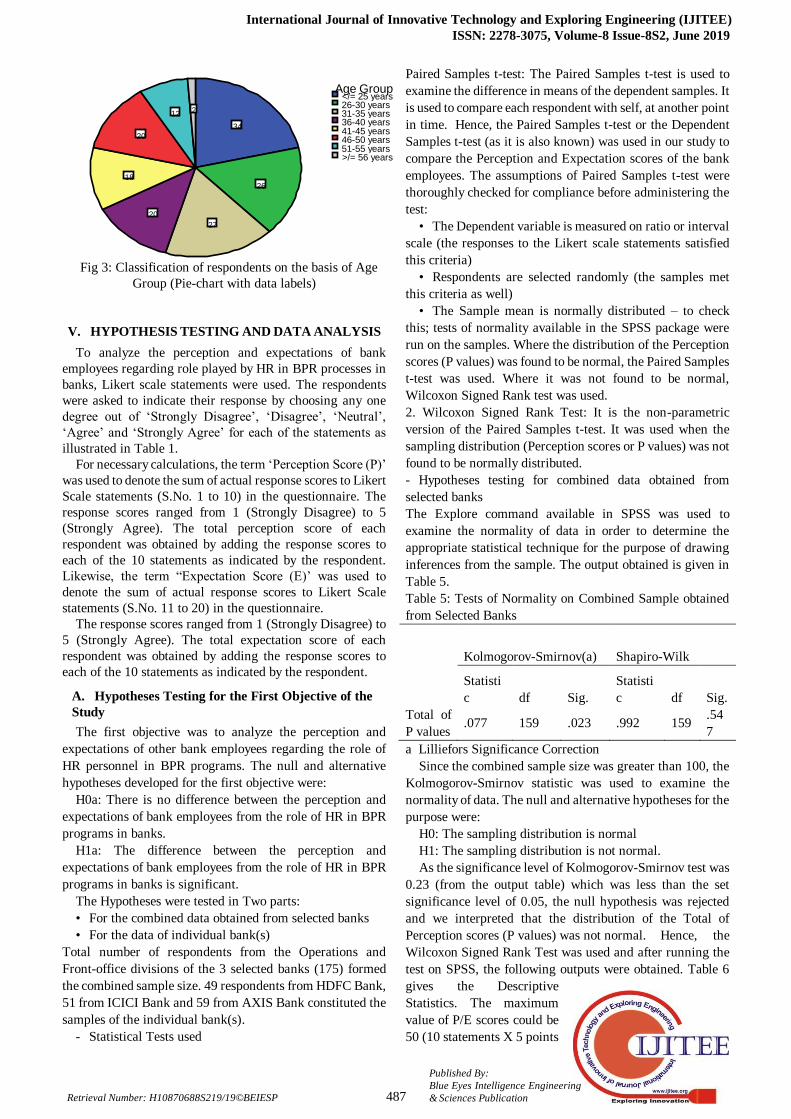
The respondents were required to specify their age by
ticking the appropriate of any of the following groups: Less
than/Equal to 25 years, 26-30 years, 31-35 years, 36-40
years, 41-45 years, 46-50 years, 51-55 years and Greater
than/Equal to 56 years. Figure 3 shows the total number of
responses obtained (from all the 3 banks).
AXIS ICICI HDF
Bank ID
30
20
10
0
Count
7 5 6
31 28
24 21
18 19
Post Graduation and above
Post Graduation Graduation
Education Level
AXIS ICICI HDF
Bank ID
40
30
20
10
0
Count
33 25 23 26 26 26
FemalMale
Gender
International Journal of Innovative Technology and Exploring Engineering (IJITEE)
ISSN: 2278-3075, Volume-8 Issue-8S2, June 2019
487
Published By:
Blue Eyes Intelligence Engineering
& Sciences Publication Retrieval Number: H10870688S219/19©BEIESP
Fig 3: Classification of respondents on the basis of Age
Group (Pie-chart with data labels)
V. HYPOTHESIS TESTING AND DATA ANALYSIS
To analyze the perception and expectations of bank
employees regarding role played by HR in BPR processes in
banks, Likert scale statements were used. The respondents
were asked to indicate their response by choosing any one
degree out of „Strongly Disagree‟, „Disagree‟, „Neutral‟,
„Agree‟ and „Strongly Agree‟ for each of the statements as
illustrated in Table 1.
For necessary calculations, the term „Perception Score (P)‟
was used to denote the sum of actual response scores to Likert
Scale statements (S.No. 1 to 10) in the questionnaire. The
response scores ranged from 1 (Strongly Disagree) to 5
(Strongly Agree). The total perception score of each
respondent was obtained by adding the response scores to
each of the 10 statements as indicated by the respondent.
Likewise, the term “Expectation Score (E)‟ was used to
denote the sum of actual response scores to Likert Scale
statements (S.No. 11 to 20) in the questionnaire.
The response scores ranged from 1 (Strongly Disagree) to
5 (Strongly Agree). The total expectation score of each
respondent was obtained by adding the response scores to
each of the 10 statements as indicated by the respondent.
A. Hypotheses Testing for the First Objective of the
Study
The first objective was to analyze the perception and
expectations of other bank employees regarding the role of
HR personnel in BPR programs. The null and alternative
hypotheses developed for the first objective were:
H0a: There is no difference between the perception and
expectations of bank employees from the role of HR in BPR
programs in banks.
H1a: The difference between the perception and
expectations of bank employees from the role of HR in BPR
programs in banks is significant.
The Hypotheses were tested in Two parts:
• For the combined data obtained from selected banks
• For the data of individual bank(s)
Total number of respondents from the Operations and
Front-office divisions of the 3 selected banks (175) formed
the combined sample size. 49 respondents from HDFC Bank,
51 from ICICI Bank and 59 from AXIS Bank constituted the
samples of the individual bank(s).
- Statistical Tests used
Paired Samples t-test: The Paired Samples t-test is used to
examine the difference in means of the dependent samples. It
is used to compare each respondent with self, at another point
in time. Hence, the Paired Samples t-test or the Dependent
Samples t-test (as it is also known) was used in our study to
compare the Perception and Expectation scores of the bank
employees. The assumptions of Paired Samples t-test were
thoroughly checked for compliance before administering the
test:
• The Dependent variable is measured on ratio or interval
scale (the responses to the Likert scale statements satisfied
this criteria)
• Respondents are selected randomly (the samples met
this criteria as well)
• The Sample mean is normally distributed – to check
this; tests of normality available in the SPSS package were
run on the samples. Where the distribution of the Perception
scores (P values) was found to be normal, the Paired Samples
t-test was used. Where it was not found to be normal,
Wilcoxon Signed Rank test was used.
2. Wilcoxon Signed Rank Test: It is the non-parametric
version of the Paired Samples t-test. It was used when the
sampling distribution (Perception scores or P values) was not
found to be normally distributed.
- Hypotheses testing for combined data obtained from
selected banks
The Explore command available in SPSS was used to
examine the normality of data in order to determine the
appropriate statistical technique for the purpose of drawing
inferences from the sample. The output obtained is given in
Table 5.
Table 5: Tests of Normality on Combined Sample obtained
from Selected Banks
Kolmogorov-Smirnov(a) Shapiro-Wilk
Statisti
c df Sig.
Statisti
c df Sig.
Total of
P values .077 159 .023 .992 159
.54
7
a Lilliefors Significance Correction
Since the combined sample size was greater than 100, the
Kolmogorov-Smirnov statistic was used to examine the
normality of data. The null and alternative hypotheses for the
purpose were:
H0: The sampling distribution is normal
H1: The sampling distribution is not normal.
As the significance level of Kolmogorov-Smirnov test was
0.23 (from the output table) which was less than the set
significance level of 0.05, the null hypothesis was rejected
and we interpreted that the distribution of the Total of
Perception scores (P values) was not normal. Hence, the
Wilcoxon Signed Rank Test was used and after running the
test on SPSS, the following outputs were obtained. Table 6
gives the Descriptive
Statistics. The maximum
value of P/E scores could be
50 (10 statements X 5 points
2 12
20
18
20 27
26
34
>/= 56 years 51-55 years 46-50 years 41-45 years 36-40 years 31-35 years 26-30 years </= 25 years
Age Group
Role of HR in Business Process Re-engineering Programs: Changing Paradigms of Employee
Expectations in the Banking Sector
488
Published By:
Blue Eyes Intelligence Engineering
& Sciences Publication Retrieval Number: H10870688S219/19©BEIESP
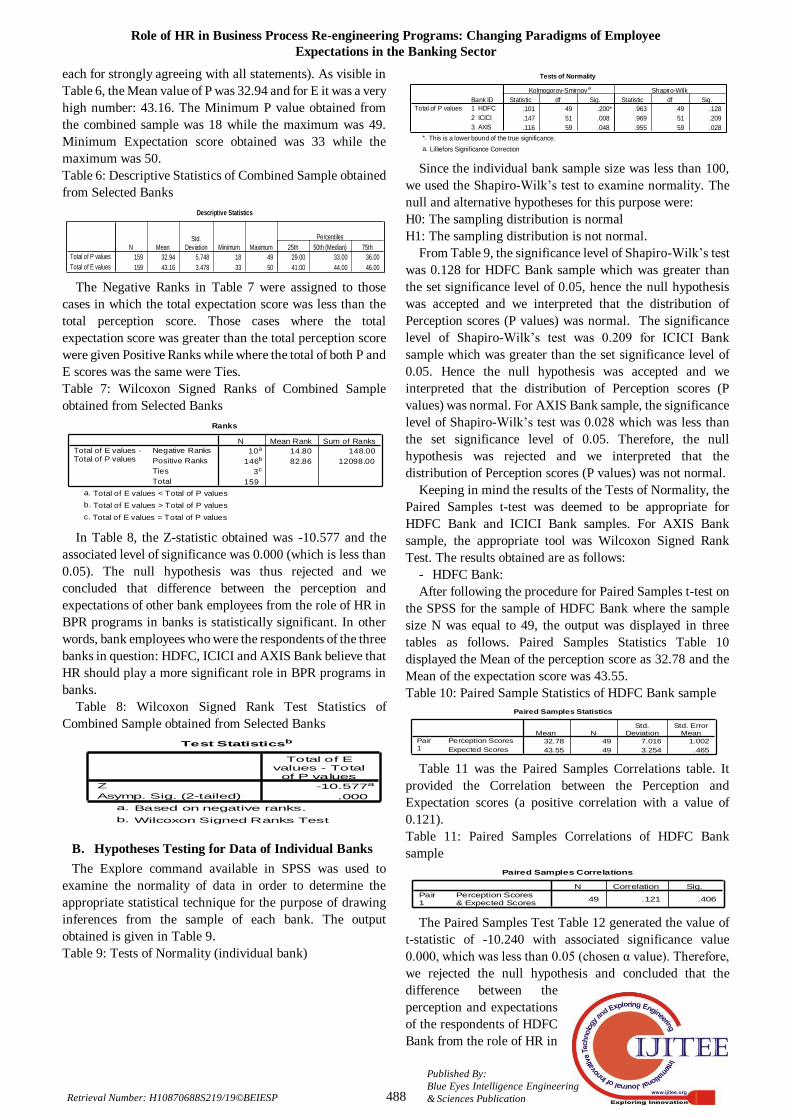
each for strongly agreeing with all statements). As visible in
Table 6, the Mean value of P was 32.94 and for E it was a very
high number: 43.16. The Minimum P value obtained from
the combined sample was 18 while the maximum was 49.
Minimum Expectation score obtained was 33 while the
maximum was 50.
Table 6: Descriptive Statistics of Combined Sample obtained
from Selected Banks
Descriptive Statistics
159 32.94 5.748 18 49 29.00 33.00 36.00
159 43.16 3.478 33 50 41.00 44.00 46.00
Total of P values
Total of E values
N MeanStd.
Deviation Minimum Maximum 25th 50th (Median) 75th
Percentiles
The Negative Ranks in Table 7 were assigned to those
cases in which the total expectation score was less than the
total perception score. Those cases where the total
expectation score was greater than the total perception score
were given Positive Ranks while where the total of both P and
E scores was the same were Ties.
Table 7: Wilcoxon Signed Ranks of Combined Sample
obtained from Selected Banks
Ranks
10a 14.80 148.00
146b 82.86 12098.00
3c
159
Negative Ranks
Positive Ranks
Ties
Total
Total of E values -Total of P values
N Mean Rank Sum of Ranks
Total of E values < Total of P valuesa.
Total of E values > Total of P valuesb.
Total of E values = Total of P valuesc.
In Table 8, the Z-statistic obtained was -10.577 and the
associated level of significance was 0.000 (which is less than
0.05). The null hypothesis was thus rejected and we
concluded that difference between the perception and
expectations of other bank employees from the role of HR in
BPR programs in banks is statistically significant. In other
words, bank employees who were the respondents of the three
banks in question: HDFC, ICICI and AXIS Bank believe that
HR should play a more significant role in BPR programs in
banks.
Table 8: Wilcoxon Signed Rank Test Statistics of
Combined Sample obtained from Selected Banks
Test Statisticsb
-10.577a
.000
Z
Asymp. Sig. (2-tailed)
Total of Evalues - Totalof P values
Based on negative ranks.a.
Wilcoxon Signed Ranks Testb.
B. Hypotheses Testing for Data of Individual Banks
The Explore command available in SPSS was used to
examine the normality of data in order to determine the
appropriate statistical technique for the purpose of drawing
inferences from the sample of each bank. The output
obtained is given in Table 9.
Table 9: Tests of Normality (individual bank)
Tests of Normality
.101 49 .200* .963 49 .128
.147 51 .008 .969 51 .209
.116 59 .048 .955 59 .028
Bank ID
1 HDFC
2 ICICI
3 AXIS
Total of P values
Statistic df Sig. Statistic df Sig.
Kolmogorov-Smirnova Shapiro-Wilk
This is a lower bound of the true significance.*.
Lilliefors Significance Correctiona.
Since the individual bank sample size was less than 100,
we used the Shapiro-Wilk‟s test to examine normality. The
null and alternative hypotheses for this purpose were:
H0: The sampling distribution is normal
H1: The sampling distribution is not normal.
From Table 9, the significance level of Shapiro-Wilk‟s test
was 0.128 for HDFC Bank sample which was greater than
the set significance level of 0.05, hence the null hypothesis
was accepted and we interpreted that the distribution of
Perception scores (P values) was normal. The significance
level of Shapiro-Wilk‟s test was 0.209 for ICICI Bank
sample which was greater than the set significance level of
0.05. Hence the null hypothesis was accepted and we
interpreted that the distribution of Perception scores (P
values) was normal. For AXIS Bank sample, the significance
level of Shapiro-Wilk‟s test was 0.028 which was less than
the set significance level of 0.05. Therefore, the null
hypothesis was rejected and we interpreted that the
distribution of Perception scores (P values) was not normal.
Keeping in mind the results of the Tests of Normality, the
Paired Samples t-test was deemed to be appropriate for
HDFC Bank and ICICI Bank samples. For AXIS Bank
sample, the appropriate tool was Wilcoxon Signed Rank
Test. The results obtained are as follows:
- HDFC Bank:
After following the procedure for Paired Samples t-test on
the SPSS for the sample of HDFC Bank where the sample
size N was equal to 49, the output was displayed in three
tables as follows. Paired Samples Statistics Table 10
displayed the Mean of the perception score as 32.78 and the
Mean of the expectation score was 43.55.
Table 10: Paired Sample Statistics of HDFC Bank sample
Paired Samples Statistics
32.78 49 7.016 1.002
43.55 49 3.254 .465
Perception Scores
Expected Scores
Pair1
Mean NStd.
DeviationStd. Error
Mean
Table 11 was the Paired Samples Correlations table. It
provided the Correlation between the Perception and
Expectation scores (a positive correlation with a value of
0.121).
Table 11: Paired Samples Correlations of HDFC Bank
sample
Paired Samples Correlations
49 .121 .406Perception Scores& Expected Scores
Pair1
N Correlation Sig.
The Paired Samples Test Table 12 generated the value of
t-statistic of -10.240 with associated significance value
0.000, which was less than 0.05 (chosen α value). Therefore,
we rejected the null hypothesis and concluded that the
difference between the
perception and expectations
of the respondents of HDFC
Bank from the role of HR in
International Journal of Innovative Technology and Exploring Engineering (IJITEE)
ISSN: 2278-3075, Volume-8 Issue-8S2, June 2019
489
Published By:
Blue Eyes Intelligence Engineering
& Sciences Publication Retrieval Number: H10870688S219/19©BEIESP
BPR programs is statistically significant.
Table 12: Paired Samples t-test of HDFC Bank sample
Paired Samples Test
-10.776 7.366 1.052 -12.891 -8.660 -10.240 48 .000Perception Scores- Expected Scores
Pair1
MeanStd.
DeviationStd. Error
Mean Lower Upper
95% ConfidenceInterval of the
Difference
Paired Differences
t df Sig. (2-tailed)
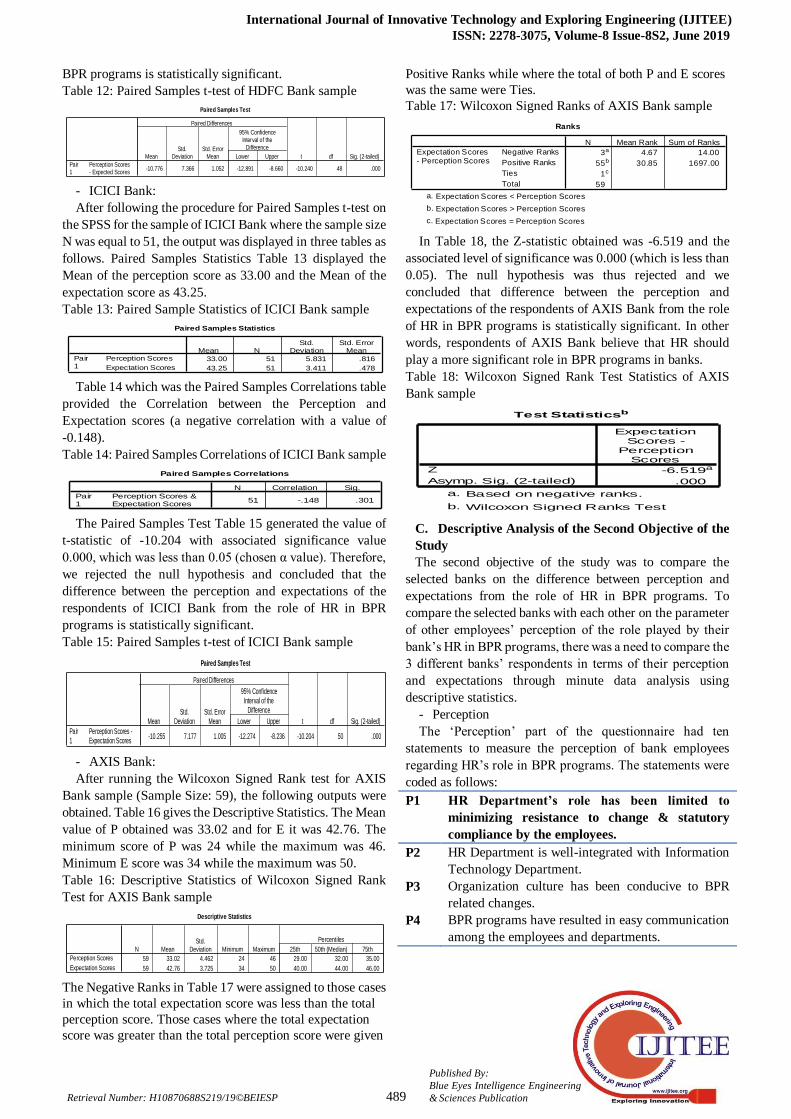
- ICICI Bank:
After following the procedure for Paired Samples t-test on
the SPSS for the sample of ICICI Bank where the sample size
N was equal to 51, the output was displayed in three tables as
follows. Paired Samples Statistics Table 13 displayed the
Mean of the perception score as 33.00 and the Mean of the
expectation score as 43.25.
Table 13: Paired Sample Statistics of ICICI Bank sample
Paired Samples Statistics
33.00 51 5.831 .816
43.25 51 3.411 .478
Perception Scores
Expectation Scores
Pair1
Mean NStd.
DeviationStd. Error
Mean
Table 14 which was the Paired Samples Correlations table
provided the Correlation between the Perception and
Expectation scores (a negative correlation with a value of
-0.148).
Table 14: Paired Samples Correlations of ICICI Bank sample
Paired Samples Correlations
51 -.148 .301Perception Scores &Expectation Scores
Pair1
N Correlation Sig.
The Paired Samples Test Table 15 generated the value of
t-statistic of -10.204 with associated significance value
0.000, which was less than 0.05 (chosen α value). Therefore,
we rejected the null hypothesis and concluded that the
difference between the perception and expectations of the
respondents of ICICI Bank from the role of HR in BPR
programs is statistically significant.
Table 15: Paired Samples t-test of ICICI Bank sample
Paired Samples Test
-10.255 7.177 1.005 -12.274 -8.236 -10.204 50 .000Perception Scores -Expectation Scores
Pair1
MeanStd.
DeviationStd. Error
Mean Lower Upper
95% ConfidenceInterval of the
Difference
Paired Differences
t df Sig. (2-tailed)
- AXIS Bank:
After running the Wilcoxon Signed Rank test for AXIS
Bank sample (Sample Size: 59), the following outputs were
obtained. Table 16 gives the Descriptive Statistics. The Mean
value of P obtained was 33.02 and for E it was 42.76. The
minimum score of P was 24 while the maximum was 46.
Minimum E score was 34 while the maximum was 50.
Table 16: Descriptive Statistics of Wilcoxon Signed Rank
Test for AXIS Bank sample
Descriptive Statistics
59 33.02 4.462 24 46 29.00 32.00 35.00
59 42.76 3.725 34 50 40.00 44.00 46.00
Perception Scores
Expectation Scores
N MeanStd.
Deviation Minimum Maximum 25th 50th (Median) 75th
Percentiles
The Negative Ranks in Table 17 were assigned to those cases
in which the total expectation score was less than the total
perception score. Those cases where the total expectation
score was greater than the total perception score were given
Positive Ranks while where the total of both P and E scores
was the same were Ties.
Table 17: Wilcoxon Signed Ranks of AXIS Bank sample
Ranks
3a 4.67 14.00
55b 30.85 1697.00
1c
59
Negative Ranks
Positive Ranks
Ties
Total
Expectation Scores- Perception Scores
N Mean Rank Sum of Ranks
Expectation Scores < Perception Scoresa.
Expectation Scores > Perception Scoresb.
Expectation Scores = Perception Scoresc.
In Table 18, the Z-statistic obtained was -6.519 and the
associated level of significance was 0.000 (which is less than
0.05). The null hypothesis was thus rejected and we
concluded that difference between the perception and
expectations of the respondents of AXIS Bank from the role
of HR in BPR programs is statistically significant. In other
words, respondents of AXIS Bank believe that HR should
play a more significant role in BPR programs in banks.
Table 18: Wilcoxon Signed Rank Test Statistics of AXIS
Bank sample
Test Statisticsb
-6.519a
.000
Z
Asymp. Sig. (2-tailed)
ExpectationScores -
PerceptionScores
Based on negative ranks.a.
Wilcoxon Signed Ranks Testb.
C. Descriptive Analysis of the Second Objective of the
Study
The second objective of the study was to compare the
selected banks on the difference between perception and
expectations from the role of HR in BPR programs. To
compare the selected banks with each other on the parameter
of other employees‟ perception of the role played by their
bank‟s HR in BPR programs, there was a need to compare the
3 different banks‟ respondents in terms of their perception
and expectations through minute data analysis using
descriptive statistics.
- Perception
The „Perception‟ part of the questionnaire had ten
statements to measure the perception of bank employees
regarding HR‟s role in BPR programs. The statements were
coded as follows:
P1 HR Department’s role has been limited to
minimizing resistance to change & statutory
compliance by the employees.
P2 HR Department is well-integrated with Information
Technology Department.
P3 Organization culture has been conducive to BPR
related changes.
P4 BPR programs have resulted in easy communication
among the employees and departments.
Role of HR in Business Process Re-engineering Programs: Changing Paradigms of Employee
Expectations in the Banking Sector
490
Published By:
Blue Eyes Intelligence Engineering
& Sciences Publication Retrieval Number: H10870688S219/19©BEIESP
P5 Employees‟ feedback and suggestions during BPR
training exercises have been taken in the right spirit
& solutions offered.
P6 Employees have been made to feel empowered hence
employee commitment has improved.
P7 Performance levels have increased and there is
clarity regarding the new roles and processes.
P8 Performance targets are realistic thus achievable.
P9 BPR programs have increased the level of usage of
information technology and it has helped in
improving performance.
P10 Employees display a sense of ownership and are
keener on team-work.
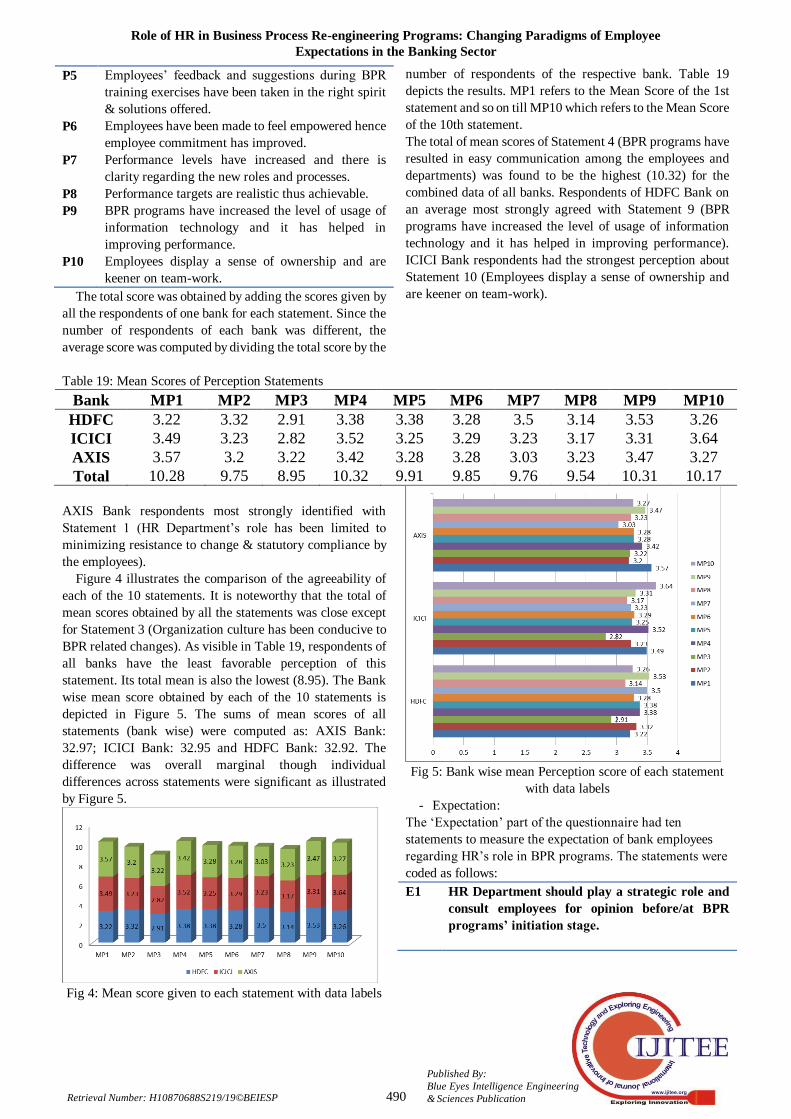
The total score was obtained by adding the scores given by
all the respondents of one bank for each statement. Since the
number of respondents of each bank was different, the
average score was computed by dividing the total score by the
number of respondents of the respective bank. Table 19
depicts the results. MP1 refers to the Mean Score of the 1st
statement and so on till MP10 which refers to the Mean Score
of the 10th statement.
The total of mean scores of Statement 4 (BPR programs have
resulted in easy communication among the employees and
departments) was found to be the highest (10.32) for the
combined data of all banks. Respondents of HDFC Bank on
an average most strongly agreed with Statement 9 (BPR
programs have increased the level of usage of information
technology and it has helped in improving performance).
ICICI Bank respondents had the strongest perception about
Statement 10 (Employees display a sense of ownership and
are keener on team-work).
Table 19: Mean Scores of Perception Statements
Bank MP1 MP2 MP3 MP4 MP5 MP6 MP7 MP8 MP9 MP10
HDFC 3.22 3.32 2.91 3.38 3.38 3.28 3.5 3.14 3.53 3.26
ICICI 3.49 3.23 2.82 3.52 3.25 3.29 3.23 3.17 3.31 3.64
AXIS 3.57 3.2 3.22 3.42 3.28 3.28 3.03 3.23 3.47 3.27
Total 10.28 9.75 8.95 10.32 9.91 9.85 9.76 9.54 10.31 10.17
AXIS Bank respondents most strongly identified with
Statement 1 (HR Department‟s role has been limited to
minimizing resistance to change & statutory compliance by
the employees).
Figure 4 illustrates the comparison of the agreeability of
each of the 10 statements. It is noteworthy that the total of
mean scores obtained by all the statements was close except
for Statement 3 (Organization culture has been conducive to
BPR related changes). As visible in Table 19, respondents of
all banks have the least favorable perception of this
statement. Its total mean is also the lowest (8.95). The Bank
wise mean score obtained by each of the 10 statements is
depicted in Figure 5. The sums of mean scores of all
statements (bank wise) were computed as: AXIS Bank:
32.97; ICICI Bank: 32.95 and HDFC Bank: 32.92. The
difference was overall marginal though individual
differences across statements were significant as illustrated
by Figure 5.
Fig 4: Mean score given to each statement with data labels
Fig 5: Bank wise mean Perception score of each statement
with data labels
- Expectation:
The „Expectation‟ part of the questionnaire had ten
statements to measure the expectation of bank employees
regarding HR‟s role in BPR programs. The statements were
coded as follows:
E1 HR Department should play a strategic role and
consult employees for opinion before/at BPR
programs’ initiation stage.
International Journal of Innovative Technology and Exploring Engineering (IJITEE)
ISSN: 2278-3075, Volume-8 Issue-8S2, June 2019
491
Published By:
Blue Eyes Intelligence Engineering
& Sciences Publication Retrieval Number: H10870688S219/19©BEIESP
E2 HR Department should be more tuned to and work
more with Information Technology division.
E3 The management should act more actively, promote
a healthy culture and give total support to the BPR
processes.
E4 The supervisors should discuss with their juniors
about the problem areas of the BPR processes and
how to improve them.
E5 Employees‟ concerns about change in their job
profiles/nature of work post BPR should be addressed
& genuine efforts should be made to make them feel
positive.
E6 The suggestions from employees should be taken
very seriously so that they feel empowered and
committed to their job outcomes.
E7 Work should be streamlined to improve productivity
and adequate clarity must be given regarding new
roles and processes.
E8 There should be clarity regarding new targets and the
revised employee performance management plan.
E9 The employees of the bank should be periodically
re-trained on use of IT and skills related to BPR
programs to enable them to contribute more towards
BPR success.
E10 Employees should be encouraged to give creative
solutions and make cross functional teams across
different departments to work on projects for the
benefit of the whole bank.
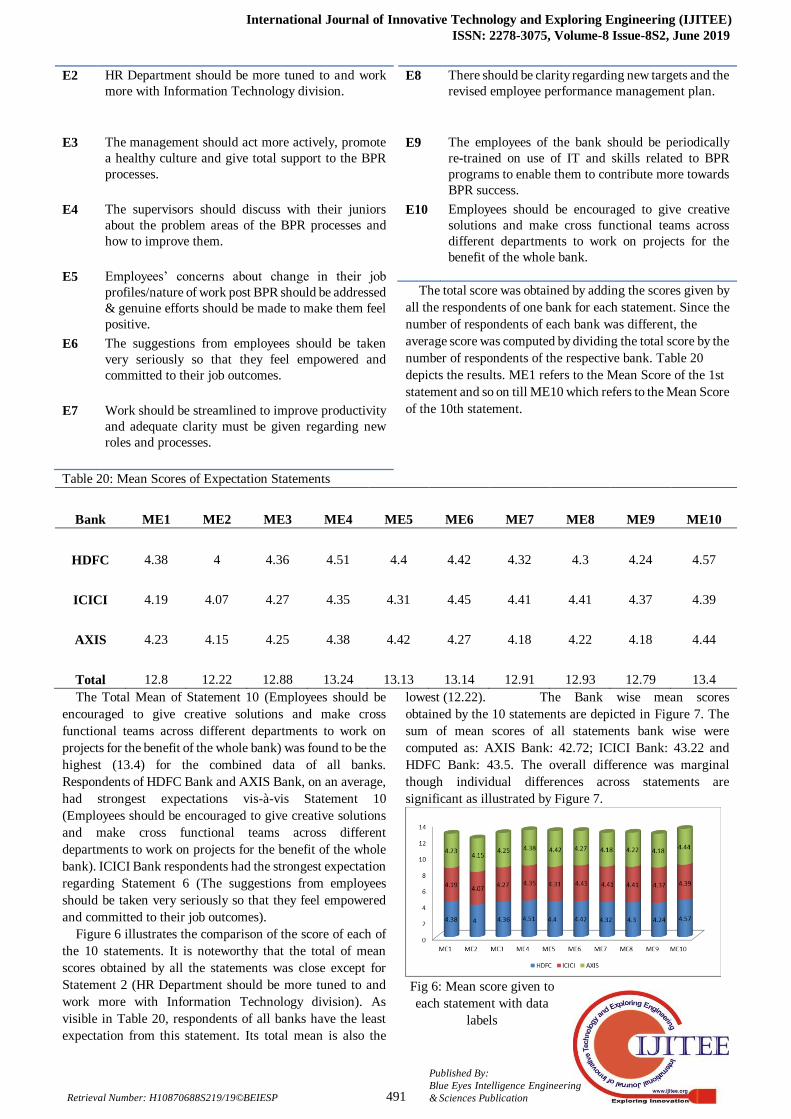
The total score was obtained by adding the scores given by
all the respondents of one bank for each statement. Since the
number of respondents of each bank was different, the
average score was computed by dividing the total score by the
number of respondents of the respective bank. Table 20
depicts the results. ME1 refers to the Mean Score of the 1st
statement and so on till ME10 which refers to the Mean Score
of the 10th statement.
Table 20: Mean Scores of Expectation Statements
Bank ME1 ME2 ME3 ME4 ME5 ME6 ME7 ME8 ME9 ME10
HDFC 4.38 4 4.36 4.51 4.4 4.42 4.32 4.3 4.24 4.57
ICICI 4.19 4.07 4.27 4.35 4.31 4.45 4.41 4.41 4.37 4.39
AXIS 4.23 4.15 4.25 4.38 4.42 4.27 4.18 4.22 4.18 4.44
Total 12.8 12.22 12.88 13.24 13.13 13.14 12.91 12.93 12.79 13.4
The Total Mean of Statement 10 (Employees should be
encouraged to give creative solutions and make cross
functional teams across different departments to work on
projects for the benefit of the whole bank) was found to be the
highest (13.4) for the combined data of all banks.
Respondents of HDFC Bank and AXIS Bank, on an average,
had strongest expectations vis-à-vis Statement 10
(Employees should be encouraged to give creative solutions
and make cross functional teams across different
departments to work on projects for the benefit of the whole
bank). ICICI Bank respondents had the strongest expectation
regarding Statement 6 (The suggestions from employees
should be taken very seriously so that they feel empowered
and committed to their job outcomes).
Figure 6 illustrates the comparison of the score of each of
the 10 statements. It is noteworthy that the total of mean
scores obtained by all the statements was close except for
Statement 2 (HR Department should be more tuned to and
work more with Information Technology division). As
visible in Table 20, respondents of all banks have the least
expectation from this statement. Its total mean is also the
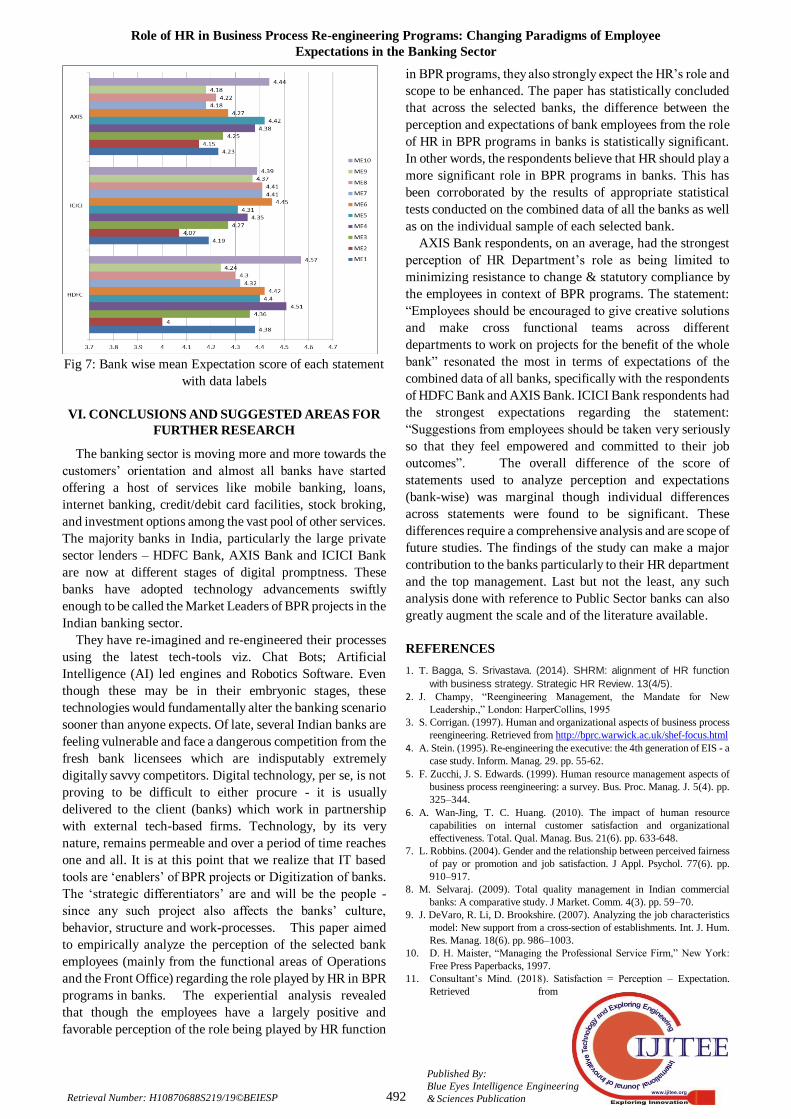
lowest (12.22). The Bank wise mean scores
obtained by the 10 statements are depicted in Figure 7. The
sum of mean scores of all statements bank wise were
computed as: AXIS Bank: 42.72; ICICI Bank: 43.22 and
HDFC Bank: 43.5. The overall difference was marginal
though individual differences across statements are
significant as illustrated by Figure 7.
Fig 6: Mean score given to
each statement with data
labels
Role of HR in Business Process Re-engineering Programs: Changing Paradigms of Employee
Expectations in the Banking Sector
492
Published By:
Blue Eyes Intelligence Engineering
& Sciences Publication Retrieval Number: H10870688S219/19©BEIESP
Fig 7: Bank wise mean Expectation score of each statement
with data labels
VI. CONCLUSIONS AND SUGGESTED AREAS FOR
FURTHER RESEARCH
The banking sector is moving more and more towards the
customers‟ orientation and almost all banks have started
offering a host of services like mobile banking, loans,
internet banking, credit/debit card facilities, stock broking,
and investment options among the vast pool of other services.
The majority banks in India, particularly the large private
sector lenders – HDFC Bank, AXIS Bank and ICICI Bank
are now at different stages of digital promptness. These
banks have adopted technology advancements swiftly
enough to be called the Market Leaders of BPR projects in the
Indian banking sector.
They have re-imagined and re-engineered their processes
using the latest tech-tools viz. Chat Bots; Artificial
Intelligence (AI) led engines and Robotics Software. Even
though these may be in their embryonic stages, these
technologies would fundamentally alter the banking scenario
sooner than anyone expects. Of late, several Indian banks are
feeling vulnerable and face a dangerous competition from the
fresh bank licensees which are indisputably extremely
digitally savvy competitors. Digital technology, per se, is not
proving to be difficult to either procure - it is usually
delivered to the client (banks) which work in partnership
with external tech-based firms. Technology, by its very
nature, remains permeable and over a period of time reaches
one and all. It is at this point that we realize that IT based
tools are „enablers‟ of BPR projects or Digitization of banks.
The „strategic differentiators‟ are and will be the people -
since any such project also affects the banks‟ culture,
behavior, structure and work-processes. This paper aimed
to empirically analyze the perception of the selected bank
employees (mainly from the functional areas of Operations
and the Front Office) regarding the role played by HR in BPR
programs in banks. The experiential analysis revealed
that though the employees have a largely positive and
favorable perception of the role being played by HR function
in BPR programs, they also strongly expect the HR‟s role and
scope to be enhanced. The paper has statistically concluded
that across the selected banks, the difference between the
perception and expectations of bank employees from the role
of HR in BPR programs in banks is statistically significant.
In other words, the respondents believe that HR should play a
more significant role in BPR programs in banks. This has
been corroborated by the results of appropriate statistical
tests conducted on the combined data of all the banks as well
as on the individual sample of each selected bank.
AXIS Bank respondents, on an average, had the strongest
perception of HR Department‟s role as being limited to
minimizing resistance to change & statutory compliance by
the employees in context of BPR programs. The statement:
“Employees should be encouraged to give creative solutions
and make cross functional teams across different
departments to work on projects for the benefit of the whole
bank” resonated the most in terms of expectations of the
combined data of all banks, specifically with the respondents
of HDFC Bank and AXIS Bank. ICICI Bank respondents had
the strongest expectations regarding the statement:
“Suggestions from employees should be taken very seriously
so that they feel empowered and committed to their job
outcomes”. The overall difference of the score of
statements used to analyze perception and expectations
(bank-wise) was marginal though individual differences
across statements were found to be significant. These
differences require a comprehensive analysis and are scope of
future studies. The findings of the study can make a major
contribution to the banks particularly to their HR department
and the top management. Last but not the least, any such
analysis done with reference to Public Sector banks can also
greatly augment the scale and of the literature available.
REFERENCES
1. T. Bagga, S. Srivastava. (2014). SHRM: alignment of HR function
with business strategy. Strategic HR Review. 13(4/5).
2. J. Champy, “Reengineering Management, the Mandate for New
Leadership.,” London: HarperCollins, 1995 3. S. Corrigan. (1997). Human and organizational aspects of business process
reengineering. Retrieved from http://bprc.warwick.ac.uk/shef-focus.html
4. A. Stein. (1995). Re-engineering the executive: the 4th generation of EIS - a
case study. Inform. Manag. 29. pp. 55-62. 5. F. Zucchi, J. S. Edwards. (1999). Human resource management aspects of
business process reengineering: a survey. Bus. Proc. Manag. J. 5(4). pp.
325–344. 6. A. Wan-Jing, T. C. Huang. (2010). The impact of human resource
capabilities on internal customer satisfaction and organizational
effectiveness. Total. Qual. Manag. Bus. 21(6). pp. 633-648. 7. L. Robbins. (2004). Gender and the relationship between perceived fairness
of pay or promotion and job satisfaction. J Appl. Psychol. 77(6). pp.
910–917.
8. M. Selvaraj. (2009). Total quality management in Indian commercial
banks: A comparative study. J Market. Comm. 4(3). pp. 59–70.
9. J. DeVaro, R. Li, D. Brookshire. (2007). Analyzing the job characteristics
model: New support from a cross-section of establishments. Int. J. Hum.
Res. Manag. 18(6). pp. 986–1003.
10. D. H. Maister, “Managing the Professional Service Firm,” New York:
Free Press Paperbacks, 1997.
11. Consultant‟s Mind. (2018). Satisfaction = Perception – Expectation.
Retrieved from

International Journal of Innovative Technology and Exploring Engineering (IJITEE)
ISSN: 2278-3075, Volume-8 Issue-8S2, June 2019
493
Published By:
Blue Eyes Intelligence Engineering
& Sciences Publication Retrieval Number: H10870688S219/19©BEIESP
https://www.consultantsmind.com/2018/04/29/satisfaction/
12. M. Al-Mashari, Z. Irani, M. Zairi. (2001). Business process
reengineering: a survey of international experience. Bus. Process Manag.
J. 7(5). pp. 437-55. 13. T. J. Crowe, P. M. Fong, J. L. Zayas-Castro. (2009). Quantitative risk
level estimation of business process reengineering efforts. Bus. Process
Manag. J. 8(5). pp. 490-511. 14. G. R. Sturdy, “Business Process Reengineering: Strategies for
Occupational Health and Safety,” Newcastle, Tyne: Cambridge Scholars
Publishing, 2010. 15. J. M. Cortina. (1993). What is coefficient alpha? J. Appl. Psychol. 78. pp.
98-104. http://dx.doi.org/10.1037/0021-9010.78.1.98
16. J. C. Nunally, “Psychometric Theory,” 2nd
Ed. New York: McGraw Hill,
1978.