Role and Rationale of Self-Help Group (SHG) Federations
122
-
Upload
khangminh22 -
Category
Documents
-
view
0 -
download
0
Transcript of Role and Rationale of Self-Help Group (SHG) Federations


* Professor Institute of Rural
Management Anand (IRMA), Gujarat
Email: [email protected]
Despite the felt needs, promotion of SHG
federations has largely been a top down
process compromising on the principle of
participatory federalism essential for their
sustainability. Their prime goal to emerge as effective microfinancial
intermediaries of the poor is found to be
severely constrained.
Key Words: Socio-Economic Empowerment, Microfinancial Intermediaries
Role and Rationale of Self-Help Group (SHG) Federations:
A Critical Assessment
- H S Shylendra*
AbstractThe country is witnessing a widespread emergence of Self-
Help Group (SHG) federations. Ensuring sustainability of SHGs apart, the federations are being seen as instruments with potential for socio-economic empowerment of the poor. The paper makes an attempt to critically examine the role and rationale of these SHG federations. Based on a review of available studies and secondary data, the paper highlights several features of the spread of SHG federations besides the prevailing perplexity as regards their role and form. The paper reveals that despite the felt needs, the promotion of federations has largely been a top down process compromising on the principle of participatory federalism essential for their sustainability. Their prime goal to emerge as effective microfinancial intermediaries of the poor is found to be severely constrained. The socio-economic backwardness of the members, weak organisational capacities, lack of clear legal framework and inadequate policy support are some of the key factors seen as restraining the SHG federations from attaining their potential strengths. Emphasising on the relevance of SHG federation, the paper concludes by identifying measures both to consolidate their spread as well as to take them forward.
IntroductionThe massive grassroots spread of informal SHGs in the
country has almost simultaneously given rise to emergence of a vast network of higher level structures called SHG federations. The SHG movement has enabled a large section of the hitherto excluded poor to access financial services like savings and credit from formal sources. Over 7.4 million SHGs have been

THE MICROFINANCE REVIEW • Volume VIII(1) January - June 20162
formed till 2014 as a part of the SHG-Bank Linkage Programme (SBLP). To consoli-date the gains of the SHG movement, attempts have been made to integrate and bring together SHGs at higher levels. The result is the organic growth of SHGs by way of federated structures. As of 2013, an estimated 1.79 lakh SHG federations were working in the country.
The paper makes an attempt to critically examine the rationale of the emergence of SHG federations, assess the role they are able to play against the expectation, and identify possible ways to take them forward. The analysis is based on a review of extant studies and available data on SHG federations in the country.
Progress of SHGs and their Federations Before analysing the various critical issues, it would be worthwhile depicting the
progress and status of SHGs and their federations (Table 1). The SHG movement which began in the 1980s has made an impressive progress with over 7.4 million SHGs having been linked with the formal financial institutions by 2014. The SHGs have an estimated outreach of nearly 90 million households hailing from socially and economically back-ward sections of the society.
Table 1: All-India Progress of SHG-Bank Linkage Programme (No. in Lakh)
Particulars 2007 2010 2014
1 Number of SHGs Savings-linked 41.6 69.5 74.32 Number of SHGs Credit-linked 29.0 48.5 42.03 Estimated Households Covered (lakh)* 583 835.0 8924 % of women SHGs (% of 1) 78.6 76.4 84.25 % of SHGs Credit-linked 69.6 69.8 56.56 % of Govt. Scheme SHGs 23.0 24.4 30.47 Total Savings (Rs Crore) 3,513 6,199 98978 Total Loan Outstanding (Rs Crore) 12,366 28,038 42,9289 Savings per SHG (Rs) 8,469 8,915 13,320
10 Loan Outstanding per SHG (Rs) 42,724 57,795 1,02,27311 Loan outstanding per member (Rs) 3052 4128 786712 Savings per member (Rs) 605 632 102513 % of Non Performing Assets - 2.9 6.8
Source: NABARD: Various reports on Status of Microfinance in India. * Estimated by the author
An overwhelming proportion (84%) of the SHGs are constituted by women signifying the gender dimension of the outreach. While all the SHGs have been savings-linked, only about 56.5% of them have credit linkages with the financial institutions. By 2014, the SHGs had mobilised Rs. 9,897 crores of savings against which they have raised Rs. 42,928 crore of loans from the formal banks and cooperatives. As a result, the SHG movement has emerged as an useful supplementary means for the poor to ac-cess formal savings and credit. However, SBLP has been faced with several constraints in its progress. As assessed by several studies the spread of SHGs in the country has

3Role and Rationale of Self-Help Group (SHG) Federations: A Critical Assessment
shown a paradox in that it is highly skewed in favour of certain regions/states. Despite the recent efforts to address the skewness, states in southern region account for nearly 50% of the total SHGs. Studies have also indicated that due to several reasons banks have remained, in general, reluctant to deal with SHGs hampering the deepening of financial inclusion.
Coming to the progress of SHG federations, there is as such no official data available about them at the all-India level. The data on SHG federations has been compiled by APMAS, a Hyderabad based sector-development organisation. The indicative pro-gress of SHG federations is depicted in Table 2. There is a rapid growth of SHG federations in the recent years along with the spread of SHGs. The total num-ber of SHG federations has increased from about 0.69 lakh in 2007 to 1.79 lakh by 2014. Broadly three types of federations based on their jurisdictional coverage have emerged under the SHG movement. These are referred as pri-mary level (PLF), secondary level (SLF) and ter tiary level federations (TLF). The PLFs are those which have been formed by SHGs existing in a village or cluster of villages. The SLFs refer to those which have been formed at sub-block or block level by the PLFs, and the TLFs are those formed at a block or district level by the SLFs. It may be noted that as one moves up the level, the units tend to become formal. PLFs consti-tute 96% of the federations in the country. The higher level federations- SLFs and TLFs, account for only about 4% of the total.
Coming to the state-wise picture of SHG federations, as may be seen from Appendix 1, the region and state-wise spread is largely according to the spread achieved by SHGs. In other words, states having relatively higher proportion of SHGs are also the ones with higher proportion of federations. Andhra Pradesh (AP) (undivided), West Bengal, Kerala, Rajasthan, Tamil Nadu, Maharashtra and Odisha are the major states which account for nearly 74% of SHG federations. In terms of regions, southern (52.5%) and eastern (27.1%) regions account for bulk of the SHG federations.
Skewness apart, the SHG federations cover only a smaller proportion of SHGs under their fold. The NCAER (2008) study of SHGs had revealed that overall only 25% of the SHGs were affiliated to SHG federations. The proportion across states varied from 12.7% to 33.5%. The study of Reddy and Reddy (2012) spread over 8 states also indicated that only 28% of SHGs have membership in a federation. However, there seems to be an improvement in the coverage of SHGs in recent years (APMAS 2014).
Table 2: Progress of SHG Federations by Type
Type 2007 2010 2013
Primary 66,310(96.2)
158,166(96.5)
171,507(96.0)
Secondary 2,571(3.7)
5,578(3.4)
7,091(4.0)
Tertiary 22
(0.03)108
(0.07)66
(0.04) Total
68,903(100)
163,852(100)
178,664(100)
SHGs 4160584 6953250 7317551Source: APMAS (2007), (Reddy and Reddy (2012), Sa-Dhan 2014.Note: Figures in brackets are percentage to total.

THE MICROFINANCE REVIEW • Volume VIII(1) January - June 20164
What is the nature of agencies promoting SHG federations? It may be seen from Table 3 that majority of the SHG federations (73%) have been promoted by govern-ment organisations (GOs). Except in two regions, government organisation promot-ed federations account for majority of the total federations in all regions. The Non- Government Organisations (NGOs) which have played a pioneering role in promoting SHGs and their federations account for about 27% of the total federations.
Table 3: Agency-wise Promotion of SHG Federations (2013)
Region Promoting Agencies % Share of Promoting Agencies Total Federations
NGOs GOs NGOs GOs
Northern 436 15,320 2.8 97.2 15,756North-Eastern 304 1,205 20.2 79.9 1,509Eastern 30,729 17,672 63.5 36.5 48,401Central 3,760 3,459 52.1 48.0 7,219Western 1,077 10,854 9.0 91.0 11,931Southern 11,727 82,121 12.5 87.5 93,848All-India 48,041 130,631 26.9 73.1 178,664Source: As in Table 2
Again, the share of NGOs and GOs in SHG federations is largely in proportion to their share in the promotion of SHGs. Many state governments have been instrumen-tal in the formation of SHGs and their federations. States like Andhra Pradesh, West Bengal, Kerala, Rajasthan, Odisha and Tamil Nadu have proactively taken steps in this regard under various poverty alleviation programmes supported by bilateral and multi-lateral donors. At the same time, a significant proportion of SHGs and their federations have been promoted under national poverty alleviation programmes like Swarnajay-anti Gram Swarojgar Yojana (SGSY) and National Rural Livelihoods Mission (NRLM). The prominent role of the state has helped in rapidly scaling up SHGs federations but may have brought to bear severe limitations typical of state-led interventions on these structures.
Some Basic Questions of Design and Role There has been fairly a vigorous debate over the nature and role of SHG federations
since their inception (Fernandez 2001, Rajagopalan 2003). Should there be federations of SHGs? When should federations be formed and what should be their structure, if found necessary? Can the structures be called as federations? What role should be played by various tiers of a federation? Can SHG federations help sustain themselves and their SHGs? Should there be a clear legal framework for SHG federations? The ensuing paras highlight the major arguments about some of the key questions on SHGs federations.
Are they really Federations?: A basic question which has created considerable confusion calling for clarity is the issue whether these multi-layered structures of SHGs are truly federations by their form? Some practitioners and scholars initially had

5Role and Rationale of Self-Help Group (SHG) Federations: A Critical Assessment
misgivings about the evolving structures and had refused to term them as federations (Fernandez 2001, FWWB 1998). In the extant legal and conceptual notions, two aspects stand out when characterising a structure as a federation. As per the provisions of cooperative law, a federal cooperative is one where individuals cannot be the members. In other words, only primary cooperative societies can be the members of a federal (secondary) cooperative with a minor exception made for certain stakeholders to be associated in nominal capacity. Second, going by the tenets of cooperative federalism, as advocated by certain scholars (Dubhashi 1970), a federal structure should evolve in a bottom-up way and that a clear hierarchy or linearity is followed in affiliation from primary to the apex level. Further, a clear demarcation is made in terms of the functions carried out by different tiers of a federal structure.
SHGs are informal cooperatives which follow many basic principles of a formal co-operative like voluntary and open membership. To be considered as a federation in the conventional sense, a federation of SHGs has to adhere to the norms as applicable to a typical a cooperative federation. As many deviations are seen in the SHG federal structures from the legally and conceptually visualised forms, there have been some level of reluctance in acknowledging these structures as federations. In many cases, given the fact that SHGs are informal associations, the secondary level structures have enrolled individuals as members in the process literally becoming a primary cooperative. Some of the tertiary structures have been dealing with individual members even bypassing the secondary level structures (Nair and Gandhe 2011). Further, unlike conventional coop-erative federations created under clear legal provisions, SHG federations have no clear provisions of any kind in the cooperative laws. Though SHGs have been recognised as eligible for (nominal) membership in a conventional primary cooperative, the laws are silent about whether SHGs as association of persons can create a secondary cooperative. Moreover, many of the secondary and tertiary structures of SHG federations have taken varied legal forms such as cooperatives, trusts and societies leading to diverse ways of affiliation by SHGs and their members. In many cases, the legal form to be taken at secondary level has been decided by the promoting agencies as per their perception of the suitability to perform a role (Government of Kerala, 2007). Even in the case of societies or trusts, the typical hierarchical membership required of primary and secondary units to avoid overlaps may not be possible while involving SHGs.
Overlaps are also seen clearly in the functions of different tiers of SHG federations violating the norm of division of functions. For example, credit and savings functions are being performed by primary and secondary units simultaneously, duplicating the efforts to a significant extent. At the same time, the diverse legal forms of the units at higher tiers have even led to variations in the common functions being offered by these higher units. While a cooperative form of organisation is able to offer savings, a society or a trust is unable to do so.

THE MICROFINANCE REVIEW • Volume VIII(1) January - June 20166
Despite such deviations, many prefer to consider these structures as federations. What lends credence to the argument is the nature of their integration and the key functions being carried out by different structures. The SHG federations are largely vertically integrated structures. The legal form of SHG and absence of a suitable law for organisations involving SHGs has compelled such deviations. To a large extent, functionally they satisfy the tenets of a federal structure. Apparently they are democratic in character and are vertically integrated to enhance the value for the members.
Should they go beyond financial services?: Diverse arguments have emerged as regards the role of the SHG federations. While some of the stakeholders have been clear that federations should emerge as community based intermediaries to facilitate financial services; others differ by arguing that financial intermediation should not be thrust upon these federations. The latter have even suggested creating them as informal structures mainly to help SHGs meeting various other needs (Fernandez 2001). It is possible to see some promoting agencies promoting federal structures which provide only non-financial services like training, audit, and market linkages to SHGs (Fernandez 2006).
Some in the discourse have even questioned the very notion of creating SHG federations (Harper 2003 as quoted in Kumar 2010) given the vast network of banks which the SHGs could access. Creation of federations would lead to an additional layer which may prove burdensome for the SHGs besides curtailing their choice of financial service provider. Further, federations may marginalise SHGs not to mention the fact that they may also get hijacked by vested interests. However, such pessimistic view is not shared by all. Many not only support SHG federations but want them to go beyond financial intermediation (APMAS 2006, Sa-Dhan 2004). Underpinning the potential of SHG federations for multiple functions, Nair (2005) had identified diverse economic and social roles for SHG federations to sustain SHGs. The economic roles identified were achievement of scale, reduction of various costs and provision of services; while the social roles included empowerment of women through capacity building. However, Nair (2015) placed emphasis that federations first develop competency in microfinance before diversifying into other areas.
APMAS in one of its assessments had expressed the concern that SHG federations are emerging more as financial intermediaries ignoring social and livelihood concerns. Sa-Dhan (2004) recognising the multiple potential of SHG federations suggested that they should evolve more as Community Based Organisations (CBOs) capable of addressing diverse needs of poor women. Many state governments like Kerala and AP (undivided) also have advanced similar role by designating SHG federations as livelihood promoting agencies under their poverty alleviation programmes. The experience of these states is being sought to be replicated nationally by NRLM.
While those arguing for financial intermediation role by SHG federations have advocated creating a suitable legal form (Salomo et.al 2012, Seibel 2006); others

7Role and Rationale of Self-Help Group (SHG) Federations: A Critical Assessment
supporting a more diversified role have emphasized on capacity building and suitable policy support for SHG federations (ILRT 2014).
Rationale of SHG FederationsWhat are the underlying factors behind the emergence of SHG federations? Are the
reasons sound enough to justify their emergence besides helping them sustain into the future? The SHG movement at its core is an intervention for financial inclusion that has been spurred by the spread of the group-based micro-credit movement globally more as an alternate mechanism. The attempt was to overcome failure of market and the state for financial inclusion. The state in India co-opted the same and has tried scaling it up using the mechanism of SBLP. The SBLP came up as a social and bankable proposition especially in the neo-liberal context where the banking sector is expected to work based on market driven principle of sustainability. National Bank for Agriculture and Rural Development (NABARD) which was given the mandate to spearhead SBLP has taken several steps to enable the linkage of informal SHGs with formal banks with due support from Reserve Bank of India (RBI) as regulator. Simultaneously, to encourage promotion of SHGs, NABARD floated the idea of self-help promoting institutions (SHPIs) which are given fund support for the purpose. With support from government, NABARD, banks, NGOs and SHPIs, the SHG movement has grown into one of the largest microfinance programmes. The federations of SHGs have emerged in taking forward this movement further. The available evidence suggests that there are diverse reasons which have con-tributed in this regard.
Needs of the SHGs: SHGs which are the primary stakeholders have felt varied needs leading to formation of federations. Initially, given the novelty of the SHG concept, the SHGs have felt the need to come together for cross-learning. The promoting agencies have facilitated such networking of SHGs which has helped them share their experi-ences and even identify common needs. Some of the common needs of SHGs so identi-fied included better management of SHGs, pooling of savings for augmenting resources, possibility of pursuing income generating activities, facilitation of bank linkage, need to interact with external agencies, and ways of sustaining SHGs when the promoting agen-cies withdraw. The study by Shylendra and Saini (2004) revealed that SHGs promoted by a NGO under various developmental schemes identified three categories of needs indicating their current and future expectations. The three broad needs were pursuing savings and credit, augmenting income generating activities, and building capacities of SHGs and the members.
Needs of the Promoting Agencies (PAs): The promoting agencies both under state and civil society have come to strongly influence issues concerning promotion of SHG federations (Kumar 2010). The promoting agencies themselves have been influenced by their own ideology institutions, the felt needs of SHGs, and agenda of donors. It would
THE MICROFINANCE REVIEW • Volume VIII(1) January - June 20168
be worthwhile to identify separately for state and civil society agencies the factors which have influenced the promotion of SHG federations.
Two common factors which have influenced civil society agencies are their own predicament about withdrawal strategy and the ideological concern of promoting community based institutions. PAs have explored SHG federations as a way to sustain project level structures like SHGs formed for socially and economically disadvantaged groups after their withdrawal. For realising their ideological goal of empowering communities both as a means and goal of development many civil society agencies have considered formation of SHG federations as a natural way forward (Shylendra 2012). The SHG federations so promoted have been encouraged by PAs to pursue variety of activities like SHG formation, savings and credit, accessing external resources/loans, help in training, SHG book-keeping and auditing, monitor loan use and repayment, take up social issues, and support livelihood promotion. Given the felt need of SHGs for these services, SHG federations have been seen by PAs as agencies which can catalyse socio-economic development besides ensuring SHG sustainability.
However, given the compulsions of NGOs as promoting agencies, in many cases they have been driven also by other reasons like aimless replication of NGO models or complying with the agenda dictated by donors/support agencies in SHG formation (Shylendra and Bhirdikar 2009). In such cases, federations would have come up more due to top-down imposition if not due to felt needs of SHGs. Again in terms of the role perceived of federations by NGOs, a certain pattern may be observed in relation to their own involvement in microfinance. Those NGOs pursuing microfinance as own activity have tended to promote federations to play mainly social intermediation role (Shylendra 2012); while others have encouraged SHGs federations to emerge as financial intermediaries. In cases where SBLP has not been found to be supportive, NGOs again have encouraged federations as financial intermediaries (Sahu and Das 2007).
As highlighted earlier, bulk of the SHGs and SHG federations have emerged under the state sector. SHGs have been promoted under varied developmental schemes of central and state governments supported by bilateral/multilateral donors. Some of the programmes where SHG based structures have emerged very significantly include the In-dira Kranthi Patham (IKP) of AP, Kudumbashree of Kerala, and Mahalir Thittam of Tamil Nadu. SHGs and higher level structures have been formed in a pre-determined way un-der these programmes. In some of the schemes like SGSY, SHGs have been formed more in a target-based way, ignoring the process approach (Shylendra and Bhirdikar 2005). Even though many of these programmes specify clear norms for a process oriented ap-proach, the pervasive top-down nature of state led interventions is bound to go against the tenets of creating self-reliant and participatory based institutions. Even NRLM which would like to follow a more decentralised approach in promoting institutions of the poor has a strategy worked out a priori: ‘Strong institutions of the poor such as SHGs and

9Role and Rationale of Self-Help Group (SHG) Federations: A Critical Assessment
their village level and higher level federations are necessary to provide space, voice and resources for the poor, and for reducing their dependence on external agencies... NRLM, therefore, would focus on setting up these institutions at various levels’ (GoI, n.d, p 6).
Thus, one can observe that diverse needs and strategies have influenced the formation of SHG federations. Despite SHGs faced with genuine needs, the interventional compulsions of promoting agencies have brought in top-down tendencies in the rise of SHG federations. This is likely to cause negative ramifications for sustainability of the SHG federations. Many studies have clearly brought out the evidence to suggest that SHG federations are burdened with several challenges of sustainability owing to the top-down approach pursued in their formations (APMAS 2006, Kumar 2010, Salomo et.al. 2012). Despite the top-down nature, the growth of SHG federations can be justified on sev-eral grounds. The horizontal spread of SHGs warranted certain level of consolidation and vertical integration to enhance sustainability. Moreover, the emergence of such institutions during neo-liberal era augurs well for strengthening the bargaining abilities of the poor.
Role of the SHG Federations The primary role being played by SHG federations seems to have emerged so as to
sustain SHGs as micro financial intermediaries for poverty alleviation. It would be useful to assess as to how far SHG federations have been able to address the needs of SHGs. SHG federations have come to take up variety of functions which are broadly categorized as financial and non-financial services.
Financial Services: Almost all federations have tried to take forward the basic savings and credit functions of SHGs to higher level. As per an estimate, more than 50% are into financial intermediation (Srinivasan 2009). This has been attempted either through bank linkage model or direct intermediation or agency approach. The federations have used varied combination of these approaches to provide access to financial services. The three basic services being provided or facilitated by SHG federations include savings, credit and micro-insurance. While the SHGs have continued their internal savings, the federa-tions working at different levels have started savings services depending on their legal framework. All those federations having the legal form of a cooperative have introduced both compulsory and voluntary savings for SHGs and their members. Savings have been introduced by federations both to enhance savings opportunities as well as pool surplus funds from members. Savings mobilisation is also necessitated as federations take-up thrift based lending similar to the SHGs. In certain cases, even those federations not having suitable legal form are involved in savings mobilisation encouraged by promot-ing agencies.
There are apparently wide variations across states in the proportion of SHGs access-ing savings services from federations. The study of Reddy and Reddy (2012) revealed that about 21% of the SHGs saved with their federations which means SHG federations

THE MICROFINANCE REVIEW • Volume VIII(1) January - June 201610
as a whole are yet to emerge as a prominent avenue of savings. Further, the savings services of SHG federations have been faced with various constraints. Invariably, the savings of SHG federations are not protected under any regulatory framework like deposit insurance. While in some of the models, SHG federations have been offering attractive rates of interest (Shylendra 2012); in many cases,members do not receive any interest on the savings. Apart from the problem in having seamless physical access, SHGs and their members face restrictions in withdrawing savings from federations. While many federations have not been able to use savings effectively for lending pur-poses (Salomo et.al. 2012); a few have tapped savings as an important source of loanable funds (Shylendra 2012).
Loan services are the most prominent of the services provided by SHG federations. The internal lending of SHGs has continued though, in a few cases, federations have restricted internal lending compromising on the autonomy of SHGs. SHGs have been using internal lending to meet many urgent needs besides earning good returns by way of interest rate. The internal lending rates of SHGs have tended to be quite expensive despite the SHGs having links with banks and federations.
Bank linkage is the most common method of facilitating loan access by SHG federations. Through grading and other processes, federations are trying to enable SHGs to successfully obtain bank loans (Kumar 2010, APMAS 2006). SHGs are charged certain fee for such linkages which serves as a source of income for the federations. The loan access through bank linkage is found to be more useful and attractive given the formal lending norms of SBLP. Some of the promoting agencies have guided their fed-erations to prominently adopt linkage model wherever banks have been forthcoming. However, SBLP in general has suffered from several constraints with hugely varied performance seen across banks and states (Shylendra 2012). For various reasons banks have been reluctant to scale-up credit linkage. The efforts of federations thus have given only modest results for credit linkage. Owing to such constraints, many federa-tions have been compelled to explore alternatives for SBLP (Kumar 2010, Salomo et.al. 2012).
Many SHG federations have been pursuing direct lending to SHGs and their members. These federations at secondary and tertiary levels have emerged prominently as on-lenders (Salomo et.al. 2012, APMAS, 2007). In some states, even primary level federations have taken up lending activities. The PAs have promoted lending by SHG federations to encourage them emerge as community based Microfinance Institutions (MFIs). Several SHG federations have been able to overcome their constraints to deepen their outreach by tapping the strengths of SHGs for social intermediation (Shylendra 2012, Nair and Gandhe 2011). They have been able to mobilise funds from varied sources to offer diverse and dependable loans besides being able to reduce cost of intermediation through economies of scale and better recovery management.

11Role and Rationale of Self-Help Group (SHG) Federations: A Critical Assessment
However, the direct lending role of SHG federations has not been without limitations. Aside from the common problems faced as MFIs, there are several constraints faced by SHG federations which are unique to them. In a way, their role as MFI intermediaries is caught between the two competing models viz., SBLP model and MFI model. While bulk of the SHGs is primarily under the SBLP umbrella, MFIs have been aggressively trying to increase their outreach in the country. Unless the SHG federations are able to offer much better service than these two competing models, their acceptance by SHGs would remain a challenge. Only 16% of SHGs had outstanding loan with SHG federations which accounted for only about 9.7% of the cumulative borrowings of the SHGs (Reddy and Reddy 2012). Given several weaknesses in their governance and management, not all SHG federations are an attractive proposition to banks for on-lending (Nair and Gandhe 2011). SHG federations in general have been unable to mobilise enough funds to meet adequately the loan needs of SHGs. Studies have indicated highly constricted lending being practiced by SHG federations (Shylendra et.al 2009, Sahu and Das 2007).
Aside from savings and credit, SHG federations are facilitating few other financial services. These include micro-insurance and remittances (APMAS, 2007). A few have experimented with in-house micro-insurance schemes. The partner-agent micro- insurance model as approved by Insurance Regulatory and Development Authority of India (IRDAI) is the prominent mechanism adopted by SHG federations. The insurance companies have identified several SHG federations as their agents for selling their products. However, given the inherent limitations of micro-insurance, SHG federations are able to play merely perfunctory role as agents without much of own say.
Overall, SHG federations are thus struggling to emerge as full-fledged financial intermediaries despite financial services being the prominent need of SHGs and their members.
Non-Financial Services: The non-financial services of SHG federations fall broadly under three categories, viz., SHG promotion, livelihood development, and those related to social issues.
The SHG promotion role encompasses several functions like promotion and revival of SHGs, training and capacity building, and SHG management. NABARD has recognised SHG federations as SHPIs for promotion of SHGs. However, SHG federations have not been able to promote SHGs very extensively (Reddy and Reddy 2012). Given resource constraints and many promoting agencies themselves acting as SHPIs, SHG federations have not been able to come up strongly as SHPIs. In fact among various SHPIs, SHG fed-erations have received the least amount of grant support provided by NABARD for SHG promotion (NABARD 2014).
Many SHG federations on their own or with the help of PAs have been providing training to SHG members on various aspects of SHG management. Even with regard to training, the role has been inadequate mainly because of the lack of resources with

THE MICROFINANCE REVIEW • Volume VIII(1) January - June 201612
SHG federations for a sustained effort. Only three federations could receive support till 2009 under the policy support announced by NABARD in 2007-08 for capacity building activities.
Another important role being played by SHG federations is management development of SHGs. Since management of SHGs in all respects is an important requirement, SHG federations have identified various needs here and are providing several services like monitoring SHG work, providing audit services, help in MIS and book-keeping. Their role in repayment monitoring has been generally appreciated as SHG leaders on insistence of federations have been taking proactive steps to ensure discipline in loan repayment by members. Regular auditing of SHG accounts is another key service being taken up by many SHG federations through creating trained audit teams or hiring professional auditors. This service has been well received by all stakeholders. Most federations charge fee to SHGs for many of these services. Evidence suggests that these functions seem to be helping SHGs overcome many of their management constraints (Kumar 2010).
Given the dire need of livelihood improvement, several SHG federations have tak-en up variety of livelihood initiatives with support from various agencies. Some of the activities pursued are skill training, dairying, marketing, input supply, extension, and veterinary services. For some of the federations these services have become their primary activities (ILRT 2014). Many SHG federations also participate in implementa-tion of government schemes like Mahatma Gandhi National Rural Employment Guaran-tee Act (MGNREGA), Public Distribution System (PDS) and nutrition service.
Resolving social issues is another activity of the federations. Some of the federations have emerged with the goal of advancing social development of their members belonging to backward communities (Ramalakshmi 2003). As per the felt needs and capacities, federations have pursued a range of social issues such as anti-liquor campaign, supply of drinking water, health education, legal counseling, conflict resolution, and awareness generation. In the process, these federations have emerged as platforms for articulating many common issues which afflict SHG members.
On livelihood and social issues, the available evidence suggests that the activities pursued by SHG federations have been more sporadic and irregular. Some studies even expressed concern over excessive focus on financial intermediation by federations ignoring livelihood development opportunities (APMAS 2007, ILRT 2014).
Sustainability of SHG FederationsSustainability of SHGs was one of the key reasons for which the SHG federations came
up. In the course of evolution, their own sustainability has become a major challenge. It is argued that any process of federating must unfold in a bottom-up way as part of organic growth of the primary units. Simultaneously, economic logic should have a significant bearing in determining the form and structure of a federation. Broadly, sustainability

13Role and Rationale of Self-Help Group (SHG) Federations: A Critical Assessment
of SHG federations has been examined in two ways – organisational sustainability and economic sustainability.
Organisational Sustainability: Most the federations exist at primary level and are unregistered except in AP where attempts have been made to register even primary level federations (APMAS 2006). Keeping bulk of these primary level federations un-registered is apparently a sound idea at least in the initial phase of their evolution. As we move up, most of the higher level federations are registered organisations. Some of the promoting agencies have been quite conscious as to not to register even higher level federations until they reach some level of maturity (Shylendra 2012). As regards the legal form of federations, ideally, it is argued that cooperative form of organisa-tion especially of the liberal kind is better suited for such structures (Nair and Gandhe 2011). However, the federations of SHGs have taken highly varied forms across states. In those states where liberal cooperative laws exist like AP or Orissa, there has been a tendency to register them under those laws. However, a glaring issue that has not been addressed even under liberal cooperative laws is the role of informal SHGs. In the ab-sence of clear clarity, many higher level structures have enrolled individual members of SHGs as their primary members creating overlaps in membership (Sahu and Das 2007; Ramalakshmi 2003). However, cooperative form has provided scope for carrying out full-fledged fi nancial intermediation by combining savings and credit. In the case of other forms like society and trust, neither there is any clarity about the position of SHG nor are they suited for financial intermediation. In view of these constraints, there has been argument for creating suitable legal framework for these unique institutions.
About governance and management, the major argument has been to ensure autonomy and capacity of the SHG federations for sustainability. The promoting agencies which have played a prominent role in the emergence of SHG federations continue to play a major role in their working. In many cases, the promoters are directly part of the governing structures influencing decisions, while in others, they are playing the role of advisors. To handhold, PAs have deputed their staff to federations especially at higher tiers, though more recently there are attempts by mature federations to recruit own staff. The presence of the deputed staff has a bearing on the issues concerning accountability as they tend to exercise enormous control over these structures. Many of the PAs rationalise the handholding in view of the extremely backward conditions of the SHG members. Social backwardness including illiteracy of the members has been a major hurdle in enhancing self-reliance of the federations. The own staff are mostly lo-cal community members often lacking in professional capacities. Further, despite throw-ing up excellent leaders, SHG federations lack second line of leadership. Dearth of qual-ity training also has affected the performance of their leadership.
In terms of management, more recently some improvements are seen in SHG federations due to initiatives of the PAs (ILRT 2014, APMAS 2014). In general, SHG federations suffer

THE MICROFINANCE REVIEW • Volume VIII(1) January - June 201614
from absence of quality management in Management Information System (MIS), book-keeping, and fund management. Even the flow of information across different tiers has been found to be unidimensional. In an assessment of SHG federations in AP (APMAS 2006), based on a multi-parameter grading tool only about 18% of the federations were found to be of high quality with the rest being of moderate or poor quality. Unless these organisational challenges of SHG federations are addressed, sustainability is at stake.
Economic Viability: The second dimension of sustainability of SHG federations relates to their economic and financial aspects. Economically the major challenges are ensuring minimum volume of business and the ability to recover costs for self-sufficiency.
About the volume of business, studies have indicated that federations focusing on financial intermediations have greater scope to attain economies of scale and operational sustainability (APMAS 2007, Kumar 2010). However, there have been many constraints for SHG federations in pursuing full-fledged financial intermediation. Even under on-lending, SHG federations are faced with higher funding and operating costs not to mention the worsening asset qualities leading to higher default cost. To attain economies of scale, many SHG federations have not been able to ensure the required minimum scale due to predetermined design structures. There has been high level of variations in the size of their membership. The APMAS study of 2007 showed that the member-ship size varied from 50 to 2,980 with the average being 70 SHGs for the secondary federation. A more recent study (ILRT 2014) revealed that the size of federations varied from 13 to 1,050 SHGs with the average being 293. For break-even, it is argued that SHG federations must have a minimum membership size of 300 SHGs (Kumar 2010).
Certain categories of SHG federations like those promoted by NGOs or pursuing non-financial services have faced far greater challenges in this regard owing to their inability to receive support like interest subsidy, common funds and even bank finance. Such federations have been compelled to explore other ways of revenue generation like fee-based services and charging relatively higher rate of interest on loans. The APMAS study of SHG federations (2007) had revealed that only about 65% of the SHG federations were able to attain operating self-sustainability through basic cost recovery. Grant support, lower salaries, and handholding by PAs have helped federations considerably in attaining such sustainability (Kumar 2010).
ConclusionIndia in the recent past has witnessed widespread emergence of SHG federations as
a corollary of the growth of the SHG movement. Sustainability of the SHGs apart from these federations have been seen as instruments having potential for socio- economic empowerment of their members. However, the formation of SHGs federations has neither been uniform across the country nor free of perplexity as regards their role. Despite the genuine felt needs of SHG, the promotion of federations has largely been a top down

15Role and Rationale of Self-Help Group (SHG) Federations: A Critical Assessment
process compromising on the principle of participatory federalism. Lack of clear legal framework has further undermined their organisational and functional effectiveness. In spite of performing diverse functions, the prime goal to emerge as effective finan-cial intermediaries of the poor has been severely constrained. The socio-economic backwardness of the members, weak organisational capacities and inadequate policy support are some of the factors identified in restraining federations from attaining func-tional effectiveness and sustainability. Despite the general dismal performance, there is evidence of the thriving of quite a few well-organised SHG federations promoted both by state and civil society agencies. Some of these successes have demonstrated well, both the relevance and potential of the SHG federations.
Given the acute need of financial inclusion amidst the continued failure of the main-stream institutions, the SHG federations assume added relevance. Enabling condi-tions have to be created to help them emerge as CBOs capable of delivering on the felt needs of their members. There is a need for consolidation in the existing spread and structure of SHG federations for effective integration and functioning. Such consolida-tion, wherever necessary, may include suitable realignment of the structures at various levels. Promoting agencies in partnership with SHGs may have to explore ways by which consolidation can be enabled in a participatory way. The support of NRLM may be en-listed for such an effort without undermining the bottom-up process.
Suitable legal and regulatory frameworks which recognize the uniqueness of SHGs and SHG federations need to be put in place. A clear legal provision has to be made to recognise the informal SHGs and their federations as association of persons so as to enable them to play a clear role as collective entities. In the long run, there is scope for SHG federations to possibly emerge as alternative financial intermediaries. Promoting agencies and support organisations have to partner with federations to empower them by investing in capacity building.
With regard to role and activity profile of the federations, it would be better to identify them purely based on the felt needs. No function be imposed per se on these federations as they are essentially community based structures.
Acknowledgement This is a revised version of the paper presented at the 4th National Seminar on
Microfinance held at BIRD, 16-17 October, 2015. The author is thankful to NABARD for the invitation and to Dr. Gyanendra Mani for the encouragement in preparing the paper. Thanks to Rani Jayapalan for the word processing help. The usual disclaimers apply.
ReferencesAPMAS (2006): “Status of SHG Federations in Andhra Pradesh: Quality Assessment”, 2nd
Report, Hyderabad: Mahila Abhivrudhi Society, Andhra Pradesh (APMAS).APMAS (2007): “SHG Federations in India – A Perspective”, New Delhi: Access Development
Services.APMAS (2014): “Quality and Sustainability of SHGs in Bihar and Orissa”, Hyderabad: APMAS.

THE MICROFINANCE REVIEW • Volume VIII(1) January - June 201616
Dubhashi, P R (1970): “Principles and Philosophy of Cooperation”, Vaikunth Mehta National Institute of Cooperative Management, Pune.
Fernandez, A P (2001): “A Concept Paper on Federations of Self-help Groups”, Rural Management Systems – Paper 32, in Putting Institutions First – Even in Microfinance, MYRADA, Bangalore.
Fernandez, A P (2006): “Sustainability of Self-Help Affinity Groups as understood by MYRADA”, in Towards a Sustainable Microfinance Outreach in India – Experiences and Perspectives, NABARD, New Delhi, GTZ.
FWWB (1998): “India’s Emerging Federations of Women’s Savings and Credit Groups, A Compilation of Case Studies, A Comparative Analysis”, Workshop Proceedings and Profiles of Some Leaders of Federations, Ahmedabad: Friends of Women’s World Banking.
GoI (n.d) “National Rural Livelihood Mission: Mission Document”, Ministry of Rural Development, New Delhi: Government of India.
GoK (2007): “Kudumbashree: A Planned Women Oriented Onslaught on Poverty”, in Successful Experiments in Rural Development Livelihoods, Amitabh Bhatnagar (ed.), Vol.1, New Delhi, Zenith Books International.
ILRT (2014): “SHG Federations as Livelihood Supporting Organisations”, Report submitted to NABARD, Hyderabad: Institute of Livelihood Research and Training (ILRT).
Kumar, Sunil (2010): “Study of SHG Federations: Challenges and Opportunities”, Research Report, Bankers Institute of Rural Development, Lucknow.
NABARD (2014): “Status of Microfinance in India 2013-14”, NABARD, Mumbai.Nair, Ajai (2005): “Sustainability of Microfinance Self Help Groups in India: Would
Federating Help?” World Bank Policy Research Working Paper 3516. Nair, Tara S and R Gandhe (2011): “Liberal cooperatives and microfinance in India: Diagnostic
Study of a Cooperative Federation”, Journal of Rural Cooperation, 39(1), pp 19-34.NCAER (2008): “Impact and Sustainability of SHG Bank Linkage Programme”, National
Council of Applied Economic Research, New Delhi. Rajagopalan, S (2003): “Designing Secondary Institutions of Self-Help Groups (SHGs)”,
Discussion Paper at APMAS Workshop of 20-21 June, Hyderabad.Rama Lakshmi, S (2003): “The Nandipet SHG Federation”, in Cases in Microfinance
edited by H S Shylendra, Prabla K Sen and Smita Mishra Panda, Report submitted to SIDBI Foundation for Micro Credit, Lucknow, Institute of Rural Management, Anand.
Reddy K R and C S Reddy (2012): “Self Help Groups in India A Study on Quality and Sustainability”, Enable Publication, Hyderabad.
Sa-Dhan (2004): “A Study Report On SHG Federations In India Emerging Structures and Practices”, Sa-Dhan, New Delhi.
Sa-Dhan (2014): “The Bharat Microfinance Report 2014”, Sa-Dhan, New Delhi.Sahu, G B and Biswaroop Das (2007): “Self-Help Co-operatives and Microfinance:
Lessons from Oriss”, Friends of Women’s World Banking, Ahmedabad.Salomo, Wolfgang, G Bhaskara Rao, N Naveen Kumar. (2012): “A Study of SHG Federation
Structures in India – Core Elements for Achieving Sustainability”, GIZ NABARD Rural Financial Institutions Programme, New Delhi.
Seibel, H D (2006): “APMAS: Ensuring Quality in Self-Help Banking An Assessment”, APMAS, Hyderabad.
Shylendra H S (2012): “Community-Based Enabling Models of Microfinance: Praxis and Lessons from India” Millennial Asia, 3(2), July-December, 2012, 139-68.
Shylendra, H S and Kishore B (2009): “Microfinance-Based Disaster Mitigation: A Study of Two Donor-Supported Projects in Kutch”, Gujarat, Journal of Social and Economic Development, Gujarat, 11(1).
- (2005): “Good Governance and Poverty Alleviation Programmes: A Critical Analysis of

17Role and Rationale of Self-Help Group (SHG) Federations: A Critical Assessment
Swarnjayanti Gram Swarozgar Yojana (SGSY)”, Working Paper 190, Institute of Rural Management, Anand.
Shylendra, H S and Harmeet Saini (2004): “Taking Forward the Self-Help Groups of an NGO on the Path of Microfinance’: Some Possible Strategies for SWDF”, Working Paper 184, Institute of Rural Management, Anand.
Shylendra, H S, Samapti Guha and Veerashekharappa (2009): “The Role of Self-Help Groups (SHGs) as Microfinancial Intermediaries: A Study in Sabarkantha District of Gujarat (India)”, Working Paper 211. Institute of Rural Management, Anand.
Srinivasan N (2009): “Micro Finance India : State of the Sector Report- 2008”, Sage Publications, New Delhi.
Appendix 1: State-wise Spread of SHGs and SHG Federations (2013)
StatesFederations SHGs
Number % Share Number % Share
Himachal Pradesh 6 0.0 53,242 0.7Rajasthan 15,743 8.8 2,31,763 3.2Haryana 7 0.0 42,580 0.6Northern Region 15,756 8.8 3,72,837 5.1Assam 1,339 0.8 2,71,072 3.7Meghalaya 80 0.0 9,573 0.1Manipur 90 0.0 12,656 0.2Nagaland 0 0.0 8,478 0.1N-E Region 1,509 0.8 3,23,896 4.4Odisha 11,356 6.4 5,22,837 7.1Bihar 6,646 3.7 2,70,890 3.7Jharkhand 588 0.3 85,334 1.2West Bengal 29,811 16.7 5,86,821 8.0Eastern Region 48,401 27.1 14,71,099 20.1Madhya Pradesh 4,260 2.4 1,59,457 2.2Chattisgarh 62 0.0 98,493 1.4Uttar Pradesh 2,723 1.5 4,03,932 5.5Uttarakhand 174 0.1 40,316 0.6Central Region 7,219 4.0 7,02,198 9.6Gujarat 257 0.1 2,08,410 2.9Maharashtra 11,674 6.5 6,87,717 9.4Western Region 11,931 6.7 9,06,016 12.4Andhra Pradesh 51,909 29.1 14,21,393 19.4Karnataka 7,892 4.4 6,45,695 8.8Kerala 21,060 11.8 5,81,325 7.9Tamil Nadu 12,979 7.3 8,73,012 11.9Southern Region 93,848 52.5 35,41,505 48.4Grand Total 178,664 100.0 73,17,551 100.0Source: As in Table 1 and 2

* Assistant Professor Department of Economics
St. Thomas College, Kerala. Email: [email protected]
This study highlights the immense potentialities
opened up by the microfinance programmes
in Kerala and their ability to address
poverty, exclusion and marginalisation through women empowerment, social interaction and
participatory development. Microfinance programme in Kerala has achieved remarkable success in reaching the poor and
bringing banking services to their
door-steps.
Key Words: Women Empowerment, Microfinance Programme
Microfinance in Kerala: Impact and Emerging Issues
- Biju K C*
AbstractThe study is an attempt to assess impact of micro-
finance programme and its emerging issues. Microfinance programme in Kerala has achieved remarkable success in reaching the poor and bringing banking services to their door-steps. It has succeeded in making the poor economi-cally active by way of raising their level of employment and income as well as the asset base. The econometric results indicate that a 10% increase in average borrowing by the beneficiary households from microfinance programme enhances household monthly income by 7.9%, per capita monthly income by 2% and household per capita monthly total consumption expenditure by 1.3%. The microfinance intervention has also become a vital channel for reducing under-nourishment and poverty and promoting human cap-ital investment. The rate of poverty alleviation is significant through this programme as 27% of the beneficiary house-holds feel themselves to be non-poor. This study, there-fore, acknowledges the ability of microfinance to promote economic and social development based on grass-root strategies. The emerging issues of microfinance identified by the study are categorised into four, namely, organisational problem, financial problem, production problem and marketing problem.
IntroductionPoverty is the greatest development challenge in India.
Exclusion of a large number of people from any access to formal financial services is one of the major reasons identified for high incidence of poverty in India. Access to finance by the poor, disadvantaged and underprivileged

19Microfinance in Kerala: Impact and Emerging Issues
group is a prerequisite of poverty alleviation, on one hand, and the economic growth on the other. Having access to credit facilitates liquidity constraints faced by the poor and provides capital to undertake some income generating activities that can boost employ-ment, leading to the eradication of poverty. Thus, enabling poor to have access to finan-cial services has been regarded as one of the most powerful weapons to bring them into the mainstream of development. Financial inclusion, therefore, has become key strategy for poverty alleviation in India.
Faster and more inclusive growth is now recognised as the key development paradigm. Financial inclusion is the most important tool for achieving inclusive growth. Financial inclusion, the delivery of banking services at an affordable cost to the vast sections of disadvantaged and low-income groups, is an effective instrument for making growth more inclusive.
Microfinance is a major route for promoting financial inclusion and inclusive growth. The group-based approach of microfinance facilitates the poor to accumulate capital by way of small savings and enables them to have easy access to formal credits for taking up income generating activities (IGAs). In Kerala, microfinance has emerged as a vital tool for poverty alleviation. There exists, side by side, microfinance programmes initi-ated by both the Government and the Non-Government Organisations (NGOs). They work along with the poor to find ways to alleviate poverty.
The relevance of this study lies in the fact that, though the microfinance programme made phenomenal strides in Kerala, no serious study has so far been undertaken in the state related to its poverty-alleviation potential. Further, this study attempts to unveil the various problems faced by the poor in participating in microfinance programme, in running their IGAs, and recommend suitable measures to overcome them.
Review of LiteratureAccess to finance has been seen as a critical factor in enabling people to transform
their production and employment activities. The non-targeted group members in the microfinance programme borrowed significantly larger amounts compared to targeted group members in terms of average loan size. Sex and occupation of the head of the family, presence of other credit delivering agencies, electrification, and duration of membership were the factors identified as the major determinants of the depth of participation (Zaman, 1996). The eligible households’ participation was only 25% and that rates of participation were higher among the poorer. The study identified lack of female education, small household size, and landlessness, as the risk factors responsible for the non-participation in micro-credit programmes (Timothy, 1999).
The impact of group-lending on physical asset, saving, production, employment, expenditure on health care and education was insignificant due to small size of the loan. This in turn adversely impacted the ability of members to invest in income- generating

THE MICROFINANCE REVIEW • Volume VIII(1) January - June 201620
programme and forced them to use loan for consumption (Coleman, 1999). The participation in the microcredit programme created positive impact on both economic and social indicators of welfare as well as IGAs, especially for the very poor partici-pants in the programme (Montgomery, 2006). The microfinance interventions helped in smoothing consumption and, to some extent, generating income of the participants. No significant difference between borrowers and non-borrowers was found with regard to the expenditure on education, health and also girls’ schooling (Jamal, 2008). The Self-Help Group Bank Linkage Programme (SBLP) substantially improved the access to financial services of the rural poor, produced positive impact on their socio-economic conditions and reduced poverty of SHG members and their households. The participa-tion in microfinance programme also empowered women members significantly and led to increased self-confidence and positive behavioural changes (NCAER, 2008).
Objectives of the Study1. To examine the depth of outreach and levels of participation of the poor in the
microfinance programmes in Kerala and to identify the factors influencing their levels of participation.
2. To explore the impact of microfinance programmes upon the poor households in Kerala.
3. To identify the emerging issues of microfinance programmes in Kerala and to sug-gest measure to resolve them.
Theoretical Framework This study has been carried out within the theoretical framework of the Baker-Hopkin
credit model (1969) which deals with the relationship between equity capital and credit. The access of credit will facilitate the poor people to take up productive investment which leads to an increase in their household income and accumulation of capital. The Baker-Hopkin credit model is based on the following equation:
( ) ( )crirG −
+−
= 1
ED
where, G = growth of the firmE = the amount of equity capital, i.e. the difference between the value of assets and loan D = the amount of loan r = the rate of return on assets i = the rate of interest paid on loans c = the rate of consumption out of the income earned from assets

21Microfinance in Kerala: Impact and Emerging Issues
As per this equation, as long as the return on assets (r) is greater than the rate of inter-est paid on loans (i), credit will help to increase the income of the borrower who received the loan. The larger the share of loan to total capital (D+E), the higher would be the growth of borrower’s income. Marginal propensity to consume being less than one, the higher the borrower’s income, the larger would be the borrower’s capital accumulation.
This increase in income will generate positive impact on socio-economic condition and living standard of the borrowing households. Many studies have found that credit is the binding constraint for the poor to get out of their poverty situation. Microfinance has emerged to alleviate this capital constraint of poor households by delivering credit facilities to them for investing in productive enterprises and thereby enabling them to improve their livelihood and level of welfare.
MethodologyThe study is chiefly based on primary data collected from 375 randomly selected
households from Kottayam, Idukki and Wayanad districts of Kerala, where microfinance programmes are deeply rooted. The sample households (375) consists of 180 Kudum-bashree households, 120 NGO households, and 75 non-participant households. Data col-lection was done using a pre-tested and structured interview schedule. Among the vari-ous NGOs, the best performing NGO has been selected from each district based on its commitment and involvement in microfinance programme. Accordingly, Changanassery Social Service Society (CHASS) from Kottayam, Peermedu Development Society (PDS) from Idukki and Shreyas from Wayanad, were chosen for the study.
The impact of microfinance was analyzed by comparing both the socio-economic con-ditions of the participant households before and after the microfinance intervention and also by comparing the participant households with the non-participant households. The study used econometric models to analyze the data. The level of participation in micro-finance programme was investigated by using the econometric model adopted by Pitt and Khandker (1998):
Cij = ⍺c Xij +∑ijc ---------------- (1)
where, Cij means the total amount of borrowings from microfinance programme.Xij is the vector of household characteristics such as age, level of education,
caste, family size, Below Poverty Line (BPL)/Above Poverty Line (APL) family, women-headed family, and duration of participation in the mi-crofinance programme.
αc is the unknown parameter.∑ijc means the random error.

THE MICROFINANCE REVIEW • Volume VIII(1) January - June 201622
Seven dummy variables are introduced in the regression model to represent the level of education and caste of the respondents. The four dummies representing the level of education are:
1. edudum 1 (1 to 4 years of schooling), 2. edudum 2 (5 to 10 years of schooling), 3. edudum 3 (+2/pre-degree), and 4. edudum 4 (Degree and above).
The caste of the respondents is given by:1. scdum (Scheduled Caste/ Scheduled Tribe, SC/ST category), 2. obcdum (Other Backward Community, OBC category), and 3. gendum (General category).
The impact of microfinance programme on various outcomes is estimated by employ-ing the econometric model of Kondo et al. (2008):
Yi j = F [β1 Xi j+ β2 Mi j+ β3 Ti j+ εi j] ---------------- (2)
Where, Yi j is the household outcome of interest.
Xi j is the vector of household characteristics namely age, level of education, caste, family size, BPL family and women-headed family
Mi j is the membership dummy; 1, if participant household; 0, otherwise.
β1, β2, and β3 are unknown parametersTi j means the treatment variable
Three treatment variables are used to assess the impact of microfinance on household welfare. They are:
(a) Take up programme loan (1 = yes, o = otherwise)(b) Duration of participation(c) Average borrowing per year of membership
The impact of microfinance intervention is estimated with reference to the following outcome variables (Yi j), which are employed as dependent variables in the above impact estimation model:
(i) Household monthly income and(ii) Per capita total monthly consumption expenditure.
Microfinance Initiatives in KeralaMicrofinance has evolved as a key strategy of poverty alleviation in Kerala. Both
state government and NGOs have been actively involved in the promotion and growth of micro finance programme in the state. The success of microfinance interventions of NGOs in other parts of the world inspired many NGOs in the state to launch micro-finance programme even before the entry of the state government in the programme.

23Microfinance in Kerala: Impact and Emerging Issues
They aimed at the socio-economic upliftment of the poor through provision of credit. Hence, NGOs act both as facilitators and a connecting link between SHGs and banks. They organise the poor into SHGs, undertake capacity building programmes for them and equip them to initiate IGAs to pull them out of poverty. They play a crucial role in popularising and spreading microfinance programme throughout the state.
The Government of Kerala launched a microfinance programme called ‘Kudumbashree’ (Prosperity of the Family) in 1998, with the active support of Government of India and National Bank for Agriculture and Rural Development (NABARD) for alleviating all forms of poverty from the state within a period of ten years. Kudumbashree is a participatory, women-oriented, poverty eradication programme, implemented by the State Poverty Eradication Mission. It identifies the poor and organises them into a community based organisations with the help of local self-governments. This programme seeks to achieve overall development of the poor families through self-help, people’s participation and group action. This programme is highly acclaimed at national and international levels as the best and workable participatory poverty-reduction model.
Kudumbashree is a three-tier community-based organisation with National Health Groups (NHGs) at the grass root level, Area Development Society (ADS) at the ward level and Community Development Society (CDS) at the Panchayat level. The aspirations of the poor along with their genuine demands voiced out in the NHG meeting constitute the ‘Micro Plan’ and they are scrutinised and prioritised to form a ‘Mini Plan’ at the ADS level. The ‘CDS Plan’ is prepared after consolidating the mini plans of the ADSs by judicious prioritisation process at the CDS level. The CDS Plan becomes the “anti- poverty sub-plan” of the local self-government. By 2001, the programme was implemented in all Grama Panchayats and later to all urban local self-governments of the state. Kudum-bashree is today one of the largest women-empowering projects in the country. The pro-gramme has 41 lakh members and covers more than 50% of the households in Kerala.
Kudumbashree functions as sub-system of local self-governments and acts as con-vergence of activities of several departments at the local level. Therefore, it undertakes a wide range of activities and programmes for the socio-economic empowerment of the poor women. Thrift and credit societies, linkage banking, lease land farming and group farming, individual and group micro enterprises, etc., are some of the major ini-tiatives taken up by it to improve the livelihood of the poor. Kudumbashree has been actively participating in the implementation of various poverty alleviation programmes and socio-economic developmental programmes of local self-governments and gov-ernment departments. It also oversees and monitors the implementation of Mahatma Gandhi National Rural Employment Guarantee (MGNREG) Scheme and other major centrally sponsored urban poverty alleviation programmes, namely, Swarna Jayanthi Shahari Rozgar Yojana (SJSRY), Integrated Housing and Slum Development Programme (IHSDP) and basic services to the urban poor.

THE MICROFINANCE REVIEW • Volume VIII(1) January - June 201624
Thus, the participatory and group approach of Kudumbashree and its multi-faceted activities gave new experiences to the poor women of Kerala. It has created new avenues for their socio-economic empowerment.
Impact of Microfinance in Kerala: Findings
Depth of Outreach of Microfinance ProgrammeOutreach of microfinance programme signifies the number of persons now served by
the microfinance programme who were previously denied access to formal financial ser-vices. Under the depth of outreach, the study examines the ability of microfinance pro-grammes to reach various economic and social sections of the society. The study finds that the majority of the participant households did not have access to formal banking services in the pre-microfinance period. It is also evident that SC/ST and OBC families constitute half of the microfinance clients, reflecting the active participation of weaker sections of the society in the programme. The ability of microfinance programme to reach the poor is apparent as all the participant households belonged to BPL category before the intervention of microfinance programme.
Determinants of Participation in Microfinance ProgrammeThe extent of participation by members in the microfinance programme is represent-
ed by the cumulative amount of borrowings availed from microfinance programme. The variables such as age and caste of the client, BPL family and duration of par-ticipation are found to be significant among the various determinants of the level of participation of the clients in the microfinance programme. The regression co-efficient of age turned out to be negative reflecting that the higher age of clients re-duced total borrowings from microfinance programme. The caste of the participants appeared to be a constraint to the volume of their borrowings. The borrowings of SC/ST (scdum) and OBC (obcdum) households are substantially less than those of the households be-longing to general category. The borrowing of the BPL family is less than the APL family. It signifies that the economically better-off clients derived greater benefits from the programme. Finally, a one year in-crease in the participation of micro-finance programme enhanced the total borrowing from microfinance by Rs. 7,569 (Table 1).
Table 1: Determinants of Participation in Microfinance ProgrammeExplanatory Variables Regression ‘t’ value Significance Co-efficient
Constant 101317.3 5.164 .000Age -554.8 -2.027 .043edudum1 -4620.9 -.342 .733edudum2 -6789.1 -.541 .589edudum3 -287.3 -.022 .983scdum -39197.3 -5.534 .000obcdum -27590.9 -5.464 .000BPL family -25380.9 -4.608 .000Family size -1885.6 -1.019 .309Women-headed family 1000.5 .155 .877Duration of participation 7568.6 12.497 .000R2 .591No. of observations 300Source: Primary data.

25Microfinance in Kerala: Impact and Emerging Issues
Savings in SHGs/NHGsAll the participant members have some savings in their respective groups. Nearly 65%
of the participant members have savings of more than Rs. 5,000 in their groups. The majority of the members (39.3%) are reported to have weekly savings of Rs. 10 to Rs.20. An overwhelming majority of the members (86.7%) found their weekly saving fund out of their earnings.
Borrowing from MicrofinanceThe clients can avail themselves of mainly three sources of loans, namely thrift loan
disbursed out of the pooled savings of the group, bank linkage loan and loan taken from banks for undertaking IGAs. All microfinance clients made use of both thrift and IGA loans. Among the borrowers, the highest number of them have taken loans in the range of Rs. 20,001 – 40,000 from all the above three sources. The average household loan per year of the microfinance clients is estimated to be Rs. 11,751. The average number of loans taken by the participant household is 13.
However, there are some clients who have not yet obtained bank linkage loan on account of the failure of their groups to fulfil the eligibility conditions put forward by NABARD for linkage loan. The vast majority of them belong to the Kudumbashree group. The interest rates imposed on microfinance loans ranged between 5 to 13% per annum. The interest rate on thrift loan is 12% both for the NGOs and Kudumbashree borrowers.
There is a drastic change in the borrowing pattern of the participant households during the post-microfinance period where SHGs/NHGs became major source of borrowing. In the pre-microfinance period, money-lender was the principal source of borrowing and now their dependence on money-lenders has been eliminated almost completely.
More than half of the clients utilised both thrift and linkage loans for productive pur-poses. The IGAs undertaken by the clients are grouped into four namely, agriculture, ani-mal husbandry, manufacturing and service. Majority of the clients (46.7%) are engaged in animal husbandry followed by manufacturing (23.7%). The number of clients working in the agriculture is the lowest with 11%. Unproductive use of thrift and linkage loans is quite high (67.2%) among the members of the Kudumbashree group. Chi-square test was employed to test the association between taking productive loans and microfinance type. The value of chi-square statistic is 68.986 which is significant at 1% level of significance. Hence, taking productive loans and microfinance type are associated. Nearly 95% of the clients made prompt repayment of their loans availed. A default on the repayment of loans was reported to be the highest among the Kudumbashree clients.
Impact of Microfinance Programme on HouseholdsThe impact of microfinance programme is assessed by comparing the living condi-
tions of participant households with non-participant households and also by a com-

THE MICROFINANCE REVIEW • Volume VIII(1) January - June 201626
parison of socio-economic conditions of households of microfinance clients during the pre and post microfinance situations. The study also fitted a multiple regression model adopted by Kondo et al. (2008) to estimate the impact of microfinance.
EmploymentThe major objective of the microfinance programme is to create employment for the
poor and the weaker sections of the society by empowering them to take up economic activities. It views IGAs as opportunities for providing gainful employment to the poor by which they can improve their income and standard of living. Majority of the micro-finance participants (63.3%) were unemployed during the pre-microfinance period. However, in the post-microfinance period, all of them could find some employment. The employment generation capacity of microfinance is more evident as more than half of the non-participants (53.3%) have no employment at all. As much as 81% of the partici-pant clients got employment for more than 21 days in a month (Table 2).
Household IncomeMicrofinance aims at helping the poor to achieve greater levels of income by starting
economic activities mainly through the provision of credit. The extent of income generation relies upon the type of the activity undertaken and its market potential. More than 40% of the participant households have monthly income of above Rs. 4,000. However, an overwhelming majority of the non-participant households earn income less than Rs. 2,000 per month.
The positive impact of microfinance on household income is indicated by the statistically significant co-efficient of average amount of borrowing per year, indicating that a 10% rise in borrowing per year from microfinance programme enhances the household monthly income of the client by 7.9% and per capita monthly income by
Table 2: Days of Employment per MonthDays of Employment No. of Participants Employedper Month Pre-microfinance Period Post-microfinance Period NGO Kudumbashree Total NGO Kudumbashree Total
Nil 77 113 190 Nil Nil Nil (64.2%) (62.8%) (63.33%) 1 - 7 11 13 24 Nil Nil Nil (9.17%) (7.2%) (8%) 8 -14 28 45 73 4 14 18 (23.33%) (25%) (24.33%) (3.33%) (7.78%) (6%)15 - 21 4 9 13 26 13 39 (3.33%) (5%) (4.33%) (21.6%) (7.22%) (13%)22 - 28 Nil Nil Nil 90 153 243 (75%) (85%) (81%)Total 120 180 300 180 180 300 (100%) (100%) (100%) (100%) (100%) (100%)Source: Primary data.

27Microfinance in Kerala: Impact and Emerging Issues
2%. Moreover, the clients with higher education are likely to contribute more to their household income compared to the clients having less education. The APL households are predicted to have Rs. 3,400 more monthly income compared to the BPL households (Table 3).
Consumption The food intake of majority of the
households of microfinance clients has been more than three times per day. It is very low in the case of non-participant households. The benefit of microfinance intervention became more evident as 15% of the participat-ing households were able to access only two square meals per day in the pre-microfinance period and nobody was found in this category during the post-microfinance period.
The regression estimates show that variables such as average borrowing per year, microfinance participation, age, edudum 1 (1 to 4 years of schooling), edudum 2 (5 to 10 years of schooling), BPL family, and family size are found to be significant. The findings indicate that per capita monthly total consumption expendi-ture of the participant household is greater by Rs.376 in comparison with the non-participant household. Positive and significant regression co-efficient has been found for family size. This im-plies that as family size increases by one unit, per capita monthly consumption expendi-ture of household is expected to rise by Rs. 180. The value of regression co-efficient also indicated that an increase of average borrowing per year by 10% will lead to a 1.3% rise in the per capita monthly total consumption expenditure of the participant household (Table 4).
Table 3: Effect of Microfinance on Household Monthly IncomeExplanatory Variables Regression ‘t’ value Significance Co-efficient
Constant 5699.179 6.687 .000Average amount of borrowing per year .079 5.660 .000Duration of participation -17.079 -.408 .683Age 29.980 2.689 .008Edudum1 -2037.160 -3.986 .000Edudum2 -1779.492 -3.833 .000Edudum3 -1542.090 -3.141 .002Scdum -33.695 -.106 .916Obcdum 990.372 4.957 .000BPL family -3400.07 -16.182 .000Family size 135.210 1.871 .062Women-headed family 143.884 .580 .562R2 .605Number of observations 375Source: Primary data.
Table 4: Impact of Microfinance on Household Per capita Monthly Consumption Expenditure - Regression Estimates
Explanatory Variables Regression ‘t’ value Significance Co-efficient
Constant 101317.3 5.164 .000Constant 1636.0 9.7 .000Average amount of borrowing per year 0.0 4.6 .000Microfinance participation 376.4 5.4 .000Duration of participation 5.0 0.6 .546Age 6.8 3.1 .002Edudum1 -275.0 -2.7 .007Edudum 2 -198.8 -2.2 .032Edudum 3 -142.6 -1.5 .144Scdum -20.1 -0.3 .751Obcdum -151.3 -3.8 .000BPL family -361.6 -8.7 .000Women-headed family 30.1 0.6 .541Family size 180.3 12.6 .000R2 .554No. of observations 375Source: Primary data.

THE MICROFINANCE REVIEW • Volume VIII(1) January - June 201628
SavingsMicrofinance programme inculcated a habit of regular savings among its clients. All the
participant households have some savings in the post microfinance period, while almost 99% of them had no savings in the pre-microfinance period. The average total savings of the participant household is Rs. 20,380. More than 62% of the clients have savings in post office or chitty or both, apart from the savings in SHGs/NHGs. The positive role of microfinance programme in the promotion of savings is more visible as the number of the non-participant households with savings is substantially low with 6.7%. There is a significant increase in the number of clients with insurance policy (51.3%) during the post microfinance period and majority of them have the policy amount of above Rs.25,000. Among the non-participants only 4% of them have insurance policy.
Acquisition of Assets Microfinance programme is intended to strengthen the asset base of its clients. The
possession of durable assets and livestock enhances the livelihood resource base of the poor households. The participation in microfinance programme enables its members to acquire various assets namely livestock (cow, goat and pig), gold, and consumer dura-bles such as television, mixer, electric iron, gas stove, sewing machine, refrigerator, CD/DVD player, furniture etc., by using both the earnings from their econom-ic activities and availing themselves of loans from their group. The asset holdings of participant households en-hanced significantly. Majority of the clients acquired various assets such as livestock (46.7%), gold and jewellery (45%) and various consumer durables (68%) (Table 5). Further, the participant households out-numbered those of the non-participant households with respect to the possession of all the consumable durables.
PovertyThe ultimate goal of microfinance is to empower the poor by providing them collat-
eral free loans so that they can generate productive self-employment by organising eco-nomic enterprises. In conformity with this, the present study finds that microfinance has contributed to alleviation of poverty substantially. The subjective and objective poverty approaches have been used to determine the poverty status of the participant house-holds. The objective poverty status of participating households is examined on the basis of the state BPL list by comparing as to how many of the participating households are in the state BPL list before and after joining the microfinance programme. The subjective poverty status of households is determined on the basis of the answers of respondents
Table 5: Assets Acquired through MicrofinanceType of Assets No. of Households Acquired Assets NGO Kudumbashree Total
No asset 7 20 27 (5.8%) (11.1%) (9%)Livestock 61 79 140 (50.83%) 43.89%) (46.67%)Gold jewellery 47 88 135 (39.17%) (48.89%) (45%)Consumer durables 87 117 204 (72.5%) (65%) (68%)Source: Primary data.

29Microfinance in Kerala: Impact and Emerging Issues
in response to a question - “Do you consider your family as BPL on the basis of current annual income?” The answer of the respondents would be either “yes’ or ‘no’. Dubnoff, et al. (1981) also employed this type of approach to determine the poverty status of households.
The results of both techniques indicate that the incidence of poverty among participat-ing households is significantly less than that of non-participant households. All partici-pant households were in the state BPL list before joining the microfinance programme. However, in the post-microfinance period, 22% of participating house-holds could come out of the poverty trap owing to microfinance interven-tion (Table 6). Hence, it indicates that microfinance programme contributes to poverty reduction.
The subjective poverty estimate has revealed that 27% of participant families are APL (Table 7). As much as 27% of families among participants felt APL, whereas all non-participants families felt BPL. Kudumbashree has dominance in the proportion of par-ticipant households feeling APL and number of households who turned into APL as per state poverty estimate.
Children’s EducationThe new income from the economic activity enables microfinance clients to provide
quality education to their children. It facilitates them to send their children to good schools and also enables them to provide higher education, better study aid and more facilities to their children. The microfinance intervention helped 79% of the clients to provide better education to their children. The conclusion derived from two sample ‘t’ test was that the monthly mean expenditure on children’s education is significantly higher in the case of families participating in microfinance programmes than non- participant households. It signifies that microfinance programmes enhance entitlement of clients on education through raising capability to spend more on the education of their children.
HealthHouseholds of microfinance clients seem to have better nutrition, health practices
and health outcomes with the help of increased earnings and provision of health educa-tion by the microfinance organisation. All participant households made improvement
Table 6: Poverty Status of Participating Households during Pre and Post Microfinance Periods
Category No. of Households Pre-Microfinance Post-Microfinance Period Period NGO Kudumbashree Total
BPL 300 97 137 234 (100%) (80.8%) (76.1%) (78%)APL Nil 23 43 66 (19.2%) (23.9%) (22%)Total 300 120 180 300 (100%) (100%) (100%) (100%)Source: Primary data.
Table 7: Subjective Poverty Status of Sample HouseholdsCategory No. of Households Participant Non-Participant NGO Kudumbashree Total
Feel APL 28 53 81 Nil (23.3%) (29.4%) (27%) Feel BPL 92 127 219 75 (76. 7%) (70.6%) (73%) (100%)Total 120 180 300 75 (100%) (100%) (100%) (100%)Source: Primary data.

THE MICROFINANCE REVIEW • Volume VIII(1) January - June 201630
in health care especially by prompt treatment of health problems in good hospitals. There is also substantial improvement in the nutrition level of about 91.7% of house-holds of microfinance clients. Almost 80% of participant clients took medical treat-ment from government hospitals in the pre microfinance period, where medical treat-ment was free. In the post-microfinance period an overwhelming majority of clients (67.7%) availed themselves of medical treatment from private hospitals, where patients get better medical treatment. In contrast, most of non-participant households (89.3%) rely on government hospitals for medical treatment. The t-test result shows that partici-pant households spend significantly higher amount of money on health care than non- participant households.
Emerging Issues of Microfinance Programme in KeralaThe study identified four major categories of problems confronted by the clients
while participating in the microfinance programme and in running their IGAs. They are organisational problem, financial problem, production problem, and marketing problem (Table 8).
The major organisational problems faced by the clients are lack of encourage-ment to IGAs and poor monitoring and follow-up action, followed by politicisation of the programme. All organisational problems except that of the lack of encouragement to IGAs are more acute in Kudumbashree groups than in the NGO groups of three districts. The po-liticisation of the programme is prev-alent only in Kudumbashree group. Drop-out and lack of co- operation and unity among members are also more prevalent in Kudumbashree group.
Among the various financial problems, major problems cited by clients are high interest rate on loans and low income-generation from a ctivities undertaken (Table 9). Insufficient financial assistance and subsidy, high interest rate on loans and low income-generation from IGAs are more acute among the NGO groups.
The analysis of production problem shows that high cost of production is
Table 8: Organisational Problems Type of Problem No. of Clients NGO Kudumbashree Total
Politicisation Nil 55 55 (30.6%) (18.3%)Drop out 5 32 37 (4.2%) (17.8%) (12.3%)Lack of Co-operation and 13 35 48 unity among members (10.8%) (19.4%) (16.0%)Lack of encouragement to IGA 60 41 101 (50%) (22.8%) (33.7%)Poor monitoring and 26 73 99 follow-up action (21.7%) (40.6%) (33.0%)Source: Primary data.
Table 9: Financial Problems Type of Problem No. of Clients NGO Kudumbashree Total
Insufficient financial 90 100 190 assistance and subsidy (75.0%) (55.6%) (63.3%)High interest rate on loan 83 151 234 (69.2%) (50.3%) (78.0%)Inadequate loan 15 40 55 (12.5%) (22.2%) (18.3%)Low income generation 87 109 196 from IGA (72.5%) (60.6%) (65.3%)Problem in repayment of debt 9 19 28 (7.5%) (10.6%) (9.3%)Source: Primary data.

31Microfinance in Kerala: Impact and Emerging Issues
the main problem of clients of both groups (Table 10). The proportion of clients facing production problems is found to be more in the Kudumbashree groups than in the NGO groups. High cost of production and difficulty in getting raw materials are the major problems common to Kudumbashree groups.
The major marketing problem is the lack of demand for products manufactured, followed by the lack of market information (Table 11). The marketing problems are noticeable in the Kudumbashree groups compared to the NGO groups. Kudumbashree groups by and large face all problems of marketing.
RecommendationsBoth Kudumbashree and NGO
groups should extend further their depth of outreach to the poor and vulnerable sec-tions of the society since SC/ST and OBC families still remain among non-participant groups.
There is a need for a strict monitoring-mechanism under the microfinance programme to reap better results. Regular internal monitoring by the group, ADS and CDS members and external monitoring by banks and promoting agencies at the district/regional level would ensure proper utilisation of the loan and flowing of benefits to deserving clients as per stipulated norms of each scheme. It would also help the IGA units to tide over their temporary difficulties and to sustain the initial increase in income over a long period of time. Moreover, a tight monitoring system can improve the recovery of loans, promote unity and co-operation among clients by settling their conflicts and reduce the drop-outs.
The State Kudumbashree Mission and NGOs should evolve some products and services catering to the needs of the core and the moderate poor for deriving greater benefits by them.
The political interventions under the Kudumbashree programme create adverse impact on the smooth operations of the programme and also in achieving its professed goals. Hence, the State Kudumbashree Mission must take positive steps to free Kudumbashree
Table 10: Production ProblemsType of Problem No. of Clients NGO Kudumbashree Total
Inadequate production 18 31 49 (15%) (17.2%) (16.3%)High cost of production 41 6 117 (34.2%) (42.2%) (39.0%)Difficulty in getting 12 32 44 raw materials (10.0%) (17.8%) (14.7%)Lack of training 19 28 47 (15.8%) (15.6%) (15.7%)Source: Primary data.
Table 11: Marketing Problems Type of Problem No. of Clients NGO KDS Total
Lack of market Information 19 35 54 (15.8%) (19.4%) (18%)Competition 13 33 46 (10.8%) (18.3%) (15.3%)Lack of demand for 20 48 68 the product produced (11.7%) (26.7%) (22.7%)Inadequate transportation 11 24 35 facilities (9.2%) (13.3%) (11.7%)Involvement of middle men 7 10 17 (5.8%) (5.6%) (5.7%)Source: Primary data.

THE MICROFINANCE REVIEW • Volume VIII(1) January - June 201632
from politicisation by framing and administering strict objective criteria for the selection of beneficiaries for various schemes as well as in disbursing financial assistance and other benefits.
More training programmes should be organised to raise the awareness level of clients on technical know-how, consumer preferences, marketing of products and for widening skills of clients and their up-gradation which will result in the better management of IGAs and generation of more income.
Many IGAs undertaken by the clients are not remunerative and hence they are on the verge of closure. Therefore, state government and local level bodies and NGOs should take serious efforts to enhance their earnings by providing supporting facilities such as marketing opportunities, ready availability of raw-materials and strengthening monitoring mechanism.
The State Kudumbashree Mission and NGOs must encourage the clients to utilise thrift and linkage loans for productive purposes in order to facilitate easy and prompt repayment of these loans.
The debt-liability of participating households is increasing alarmingly. Moreover, some of the clients have dual or multiple memberships in various microfinance programmes promoted by communal outfits and NGOs and also made use of these sources for bor-rowing. These trends may pose serious problem in the near future with respect to the repayment of loan and can become a great social issue. Hence, there is a need for co-ordination among various microfinance groups in order to put some ceiling on the vol-ume of borrowing from various SHGs. Further, state government should take necessary measures to control the multiple memberships.
High interest rate of the loan given to the poor under microfinance programme is also a cause of concern. Therefore, government and NGOs should make available low inter-est bearing loans to clients which would make the enterprises more remunerative and reduce their repayment burden.
State governments, local level bodies and NGOs should ensure ample market for the products produced by the clients. They should also support clients for improving the quality, packaging and branding of the product. State government can support clients by making departmental purchases from these enterprises and can provide avenues to market their products through the supply-co outlets of State Civil Supplies Corporation. Further, Local Self-Government should organise weekly or monthly market to sell the products of the clients.
Lease land farming and group farming especially of pure vegetables, plantains, bananas, and even paddy, have immense potential for income generation and to make every Panchayat self-reliant as there is large area of uncultivated land in the state. Hence, state government in collaboration with the Agricultural Department should evolve a scheme for the clients and implement it through the help of ‘Krishi Bhavan’.

33Microfinance in Kerala: Impact and Emerging Issues
ConclusionThis study highlights the immense potentialities opened up by the microfinance
programmes in Kerala and their ability to address poverty, exclusion and marginalisation through women empowerment, social interaction and participatory development. How ever, microfinance can serve as a still better instrument of poverty alleviation and of promoting household welfare if the state government and NGOs focus greater attention to widen economically viable self-employment choices and skill base of clients, to assist clients in getting low interest-bearing loans and in improving quality of their products. Otherwise, the potential benefits of microfinance cannot be realised on a sustainable basis.
References
Baker, C B and Hopkin, J A (1969): “Concept of Finance Capital for a Capital using Agriculture”, American Journal of Agricultural Economics, Vol. 51, No. 5.
Coleman, B E (1999): “The Impact of Group – lending in North-East Thailand”, Journal of Development Economics, Vol. 60.
Dubnoff, St., Vaughan D and Lancaster C (1981): “Income Satisfaction Measures in Equivalence Scale Applications”, In: American Statistical Association, Proceedings of the Business and Economic Statistics Section, Washington, 348-352.
Government of Kerala, Economic Reviews 1999, 2003 and 2014, State Planning Board, Trivandrum.
Jamal, H (2008): “Exploring the Impact of Microfinance in Pakistan”, Research Report No. 77, Social Policy and Development Centre, Pakistan.
Kondo, T, Aniceto O, Jr., Clarence D and Christine I (2008): “Impact of Microfinance on Rural Households in the Philippines”, Network of Networks on Impact Evaluation (NONIE), Working Paper No. 4, January.
Montgomery, H (2006): “Serving the Poorest of the Poor: The Poverty Impact of the Khushhali Bank’s Microfinance Lending in Pakistan”, In John Weiss and Haider A. Khan, “Poverty Strategies in Asia. A Growth Plus Approach”, A joint Publication of the ADB Institute and Edward Elgar Publishing, Cheltenhan. U.K.
National Council of Applied Economic Research, (2008): Study Report on Impact and Sustainability of SHG-Bank Linkage Programme, New Delhi.
Pitt, Mark M and Khandker S R (1998), “The Impact of Group-Based Credit Programs on Poor Households in Bangladesh: Does the Gender of Participants Matter?” Journal of Political Economy, Vol. 106 (5).
Timothy, E G (1999): “Demystifying Non-participation in Micro-credit: A Population-based Analysis”, World Development, Vol 27, pp 419-430.
Zaman, H (1996): “Micro-credit Programmes Who Participates and to What Extent?”, BRAC-ICDDRB, Working Paper No. 12.

* Research Scholar JK Lakshmipat University Jaipur
RajasthanEmail: bhawanirathore15081979 @gmail.comThe author is currently with Cen-
tre for Microfinance Research (CMR) at BIRD, Lucknow
In this study depth of outreach, access, usage and appropriateness of products
and services were used for measuring the social performance of MFIs in
Rajasthan. The main findings of
the study are that with the introduction of RBI
guidelines post 2010 crisis and later modifications, the sector has witnessed several
positive changes in terms of client satisfaction and
protection.
Key Words: Social Performance, Microfinance Institutions
Social Bottom Line of Micro finance Institutions: Evidences from Rajasthan
- Bhawani Singh Rathore*
AbstractMost of the Micro finance Institutions (MFIs) have a
social mission. Social Performance or the social bottom line is about making an organisation’s social mission a re-ality. Social Performance includes analysis of the declared objectives of institutions, the effectiveness of their systems and services in meeting these objectives, related outputs and success in effecting positive changes in the lives of clients. Social Performance Assessment (SPA) is a measure of how well an institution uses its systems and operations to generate positive social benefits. Using data from five MFIs selected from different legal categories, this paper attempts to measue social performance on the dimesions of depth of outreach, access and usage, and appropriateness of finan-cial services. The study finds that with the introduction of Reserve Bank of India (RBI) guidelines post 2010 crisis and later modifications, the sector has witnessed several posi-tive changes in terms of client satisfaction and protection. However, there are several violations of these guidelines in the field, requiring strict monitoring. RBI also has to make its guidelines more practical so that correct reporting is done in the field. Co-operative institutions should also be brought under the RBI regulation so as to give level playing field to all the institutions and protection to the poor.
“To argue that banking cannot be done with the poor because they do not have collateral is the same as arguing that men cannot fly because they do not have wings”
- Muhammad Yunus, Nobel Laureate and Founder of Grameen Bank
35Social Bottom Line of Microfinance Institutions: Evidences from Rajasthan
IntroductionMicrofinance refers to the provision of a broad range of financial services, such as
small loans, saving deposits, money transfers, and insurance to poor and low income households and their microenterprises. However, globally the sector has been domi-nated by the provision of microcredit services, namely small loans to the poor with or without collateral. Schreiner and Colombet (2001) define microfinance as “the attempt to improve access to small deposits and small loans for poor households neglected by banks”. Microfinance involves the provision of financial services such as savings, loans and insurance to poor people, living in both urban and rural settings, who are unable to obtain such services from the formal financial sector. Microfinance has evolved with this background and since late 1970s it has given poor households some hope to get out of the clutches of poverty.
The Grameen Bank, established in Bangladesh in 1976 by Dr. Muhammad Yunus, developed highly innovative techniques for lending to the poor. These were based on techniques such as taking services to the village level, promoting and motivating groups of the poor, use of group guarantees (social collateral), compulsory savings mobilisation, transparency of credit transactions, intensive supervision of borrowers, and decentralised and cost effective operations. Rathore (2015) has presented the systematic review of the literature on the role of social capital in enhancing the performance of the microfinance contract. Other institutions such as BancoSol in Bolivia and the unit desa system of Bank Rakyat Indonesia (BRI) also developed innovative techniques for lending to poor or low income clients. Such institutions providing financial services to the poor or low income clients by employing innovative techniques later came to be known as Microfinance Institutions (MFIs).
Most of the MFIs have a social mission. They may be working, for example, to broaden access to financial services, reduce poverty, empower women, build community solidarity, or promote economic development. Social Performance (SP) refers to the extent of their success in meeting these goals. Social Performance, or the social bottom line, is about making an organisation’s social mission a reality. The Social Performance Task Force (SPTF)i defines social performance as, “The effective translation of an institution’s social mission into practice in line with accepted social values.” This mission may include serving larger numbers of poor and excluded people; delivering high- quality and appropriate financial services; creating benefits for clients; and improving the social responsibility of an MFI (Hashemi, 2007). This notion of social performance (“do good”), goes beyond the concept of client protection and social responsibility (“do no harm”). Social responsibility applies to all economic sectors and refers to an organisation’s responsibility for the impact of its decisions and activities on society and the environment through trans parent and ethical behaviour (Gendron, 2009).

THE MICROFINANCE REVIEW • Volume VIII(1) January - June 201636
The concept of social performance focuses not only on the final impact but also provides a framework to understand the process by which social objectives are achieved (as sum-marised in Figure 1). Social performance looks at the entire process by which impact is created. It therefore includes analysis of the declared objectives of institutions, the effectiveness of their systems and services in meeting these objectives, related outputs (for example, reaching larger numbers of very poor households), and success in effecting positive changes in the lives of clients. SPA is a measure of how well an institution uses its systems and operations to generate positive social benefits. SPA has dramatically evolved during the past few years with the development of social audits, social ratings and report-ing standards. Social Performance Management (SPM) is the use of this measure to make decisions and improve practices. SPM is an institutionalised process of translating social mission into practice. It involves setting clear goals, monitoring and assessing progress towards those goals and using this information to improve performance and practice.
The MFIs are aware that strong social performance may improve financial performance. Indeed, in an increasingly competitive environment, improving relationships with clients can limit delinquency and reduce client exits, as well as attract new investors and partners. Microfinance Information Exchange (MIX) cites the top ranked social goals of Indian MFIs. Financial service access is top ranked social goal for 58% of MFIs and poverty reduction for 45% of MFIs (Srinivasan, 2015). In this context, this paper looks at the social bottom line of MFIs from three perspectives related to financial service access and poverty reduction goals of MFIs. These perspectives are discussed below.
Figure 1: Social Performance Framework
INTENT AND DESIGN What is the mission of the institution?
Does it have clear social objectives?
INTERNAL SYSTEMS & ACTIVITIES What activities will the institution undertake to achieve its social mission?
Are systems designed and in place to achieve those objectives?
OUTPUT Does the institution serve poor and very poor people?
Are the products designed to meet their needs?
OUTCOME Have clients experienced social and economic improvements?
IMPACT
Can these improvements be attributed to institutional activities?
Source: Social Performance Task Force (SPTF)

37Social Bottom Line of Microfinance Institutions: Evidences from Rajasthan
Depth of OutreachDepth of outreach refers to the social value of extending microfinance to a particular
client group. It is generally argued that it is socially more valuable to extend microfinance to the poorest clients. Direct measurement of depth through income or wealth is diffi-cult. Indirect proxies used for measurement of depth can be loan size, sex, marital status and education level. In this study, depth of outreach is measured using the following variables:
● Averageloansize● Averagetotalindebtedness● Proportionofclientswhoaredivorced/widows● Averagehouseholdincome● Averagepercapitaincome
Lower the average loan size, total client indebtedness, average household income and average per capita income, higher the depth of outreach and higher the social performance of the MFI. Higher the proportion of clients who are divorced or widows, higher is the depth of outreach and higher the social performance of MFI.
Access and Usage of ServicesAccess of services refers to the provision of financial and non-financial services to
the client viz., loans, deposits, insurance, pension and social development programmes. Access of services is measured using following variables.
● Proportion of clients using deposit services through MFI● Proportion of clients using insurance services through MFI● Proportion of clients using loans from other Bank/MFI●Number of other loan per client●Number of MFI loan per client●Number of total loan per client●Amount of other loan as a proportion of MFI loan● Total indebtedness per client● Proportion of clients with indebtedness more than Rs. 50,000● Proportion of clients with loans from more than 2 MFIs● Proportion of clients having Bank Accounts● Proportion of clients having Insurer/Bank insurance● Proportion of clients using informal loans● Proportion of clients having multiple loans of same type from the MFI● Client indebtedness as a proportion of household income
Higher the proportion of clients using deposit services, insurance services, bank accounts, insurer insurance, higher is the social performance of MFI. Lower is the proportion of clients using loans from other Bank/MFI, other loan as a proportion of MFI loan and the proportion of clients using informal loans, higher is the social perfor mance.

THE MICROFINANCE REVIEW • Volume VIII(1) January - June 201638
Usage of Services refers to how the clients use the loan. It is measured using the following variables:
●Proportion of clients using the loan themselves●Proportion of clients using the loan only for the income generating activity●Proportion of clients using the loan for purposes other than the income generating
activityHigher the proportion of clients using the loan themselves, proportion of clients using
the loan for income generating activity, higher is the social performance of MFI.
Appropriateness of Products and ServicesAppropriateness of products and services refers to the provision of product and
services designed as per the needs and preferences of the clients to benefit them in line with the institution’s social goals. It is measured using the following variables:
●Client Satisfaction on the product parameters like product variety, loan cost, loan amount, maturity, repayment frequency, linked products etc.
●Client Satisfaction on the customer service parameters like treatment by program staff, timeliness of service, ease of use of service, availability of service, transparency in service, customer feedback etc.
Higher the client satisfaction score, higher the social performance of MFI.
ObjectivesThis study uses these three dimestions of social performance, which are related to the
goals of MFIs, to undertake SPA of MFIs working in Rajasthan.
Methodology
The StudyThe study is based on a survey conducted with the existing clients. Client
level information was drawn using a questionnaire designed for this purpose. The questionnaire focused on basic client profiling and indicators for measur-ing the depth of outreach, access, usage and appropriateness of financial ser-vices. Most of the questions used are dichotomous, barring the questions used for measuring the client satisfaction levels where Likert scale with five levels (1-5) is used.
The SampleFirstly, five MFIs operational in Rajasthan were selected from different legal categories
of MFIs. Two were For-Profit NBFCs (SKS Microfinance Ltd. and Ujjivan Financial Services Ltd.), two were Not-For-Profit companies registered under Section 25 of the Companies Actii, 1956 (PSC and Humana) and the remaining one was a Cooperative

39Social Bottom Line of Microfinance Institutions: Evidences from Rajasthan
Society (Astha). These MFIs were selected from the respective categories using simple random sampling. A sample of 500 clients was selected from these five MFIs (Table 1) on the basis of geographical distribution of the sample across top four districts of Rajasthan in terms of Gross Loan Port-folio (GLP). The geographic distribution of clients in the sample is approximately in the same proportion as the proportion of microfinance clients in those districts.
The sample size and sam-pling techniques used at the different levels of data collection and analysis are men-tioned in Table 2. Out of the 500 sampled clients only 462 questionnaire were found to be complete for data analysis.
Results The sample consists of 462 existing clients of five MFIs of Rajasthan working on
different regulatory models (Table 3). About 50% of the clients in the sample are from For-Profit model, 39% are from Not-For-Profit model and 11% are from a Cooperative Society. Clients from urban area constitutes 68% and the remaining come from rural areas. As much as 62% of clients are part of Joint Liability Groups (JLGs), 28% part of Self-Help Groups (SHGs) and 10% are getting loans individually. In terms of clientage, 15% of clients are taking loans from the MFI for a period less than one year, 22% of clients are taking loans for a period greater than 1 year but less than 2 years and 63% of the clients are taking loans for more than 2 years.
As far as the purposes for which the loans are used, 87% clients are using loans for income generating activity, 44% for acquiring household assets, 42% for education of children, 20% for medical expenses, 14% for household consumption, 13% for hous-ing and 4% for marriages. In terms of the type of income generating activities, 51% clients are using loans in service, 32% in trade/retail, 14% in animal husbandry, 10% in manufacturing and 5% in agriculture.
Table 1: Geographical Distribution of the Sample across 5 MFIs and Top 4 districtsMFI/Districts Jaipur Alwar Ajmer Jodhpur No. of Clients
SKS Microfinance 21 – 58 45 124Ujjivan Financial Services 110 – – – 110Planned Social Concern (PSC) 101 – – – 101Humana Microfinance – 77 – – 77Astha Credit Coop. Soc. – – – 50 50Sample 232 77 108 95 462
Table 2: Sample Size and Sampling Techniques UsedSample MFIs Districts Branches Centers Clients
Sample Size 5 4 11 44 500 existing clients (2 NBFCs, 2 Section (30 Urban and 25 Companies, 14 Rural) 1 Coop. Soc.) Sampling Simple Random Top 4 districts Simple Random Judgmental All the clients of Technique Sampling within out of 33 districts Sampling Sampling the selected legal categories in terms of GLP centers

THE MICROFINANCE REVIEW • Volume VIII(1) January - June 201640
Table 3: Description of the Client Level Data
Sample Characteristics (N=462) Value Percentage
Regulatory Models For-Profit NBFCs 234 50% Not-For-Profit Companies/Societies/Trusts 178 39% Cooperative Societies 50 11%Area of Operation Rural 148 32% Urban 314 68%Lending Methodology JLG 288 62% SHG 127 28% Individual 47 10%Client Age Clients with < 1 year in the program 71 15% Clients with 1-2 year in the program 99 22% Clients with > 2 years in the program 292 63%Loan Size (Rs.) Average 23459 Median 15000 Mode 14959 User of Loan Client 234 50% Spouse 104 23% Both 111 24% Other household member 13 3%Clients with loans from other MFI/Bank 309 67% Loan Usage Clients using loan only for IG Activity 160 35% Clients using loan for both IG Activity and other purposes 241 52% Clients using loan only for other purposes 61 13%Activity wise Loan Usage Education 194 42% Household Assets 203 44% Income Generating Activity 401 87% Housing 61 13% Marriage 19 4% Medical 93 20% Household consumption 66 14%Household Income (Rs.) Average 219009 Median 204000 Per capita Income (Rs.) Average 48757 Median 45000 Total Client Indebtedness (Rs.) Average 45497 Median 42000 Type of Income Generating Activities Service 236 51% Trade/Retail 148 32% Animal Husbandry 64 14% Manufacturing 47 10% Agriculture 21 5%
(Continued)

41Social Bottom Line of Microfinance Institutions: Evidences from Rajasthan
As for user of the loan, 50% are clients themselves, 23% are spouse of the clients, 24% by both and 3% are other household members. As per loan usage, 35% clients are using the loan only for income generating activity, 52% clients are using loan for both income generating activity and other purposes and 13% clients are not using loans for the income generating activity.
In terms of reasons for unsatisfaction on loan parameters (with score of 1 or 2 on Likert scale of 1-5), 26% clients are not satisfied with the product variety claiming that the product variety is not enough to satisfy all their requirements, 60% clients are not satisfied with the loan amounts finding it too low, 10% of clients are not satisfied with
Table 3: Description of the Client Level Data (Continued)
Sample Characteristics (N=462) Value Percentage
Reasons for Unsatisfaction on Loan parameters Product Variety 1. Not enough to satisfy all requirements 122 26% 2. Too high to confuse Loan Amount 1. Very low 277 60% 2. Minimum loan amount is high Cost 1. High interest rate 24 5% 2. High additional charges 23 5%Maturity 1. Loan duration is too short 2 0% 2. Minimum Loan duration is very long 28 6%Repayment Frequency 1. Very high 176 38% 2. Low Guarantee/Guarantor requirement 1. Very strict 11 2% 2. Is inconvenient Disbursement 1. Takes lot of time 107 23% 2. Is inconvenient 7 2%Availability 1. Approval is cumbersome 118 26% 2. Lot of paperwork involved 2 0% 3. Difficult to approach Compatibility with your income 1. No flexibility in repayment as required in case of generating activity seasonal business 1 0% 2. No flexibility in repayment as required in case of business disaster 3. Not enough cash flows to repay 126 27%Lending methodology 1. Risk involved in group lending (group) 33 7% 2. Group lending is time consuming (group) 21 5% 3. Loan process is cumbersome (individual) 2 0%Prepayment condition 1. Not allowed 1 0% 2. Is costly 3. Makes it difficult to renew a loan Linked product/conditions 1. Compulsory savings 37 8% 2. Compulsory trainings 3. Compulsory meetings 12 3% 4. Compulsory insurance Collection practices 1. Abusive 4 1% 2. Inconvenient 42 9% 3. Irregular
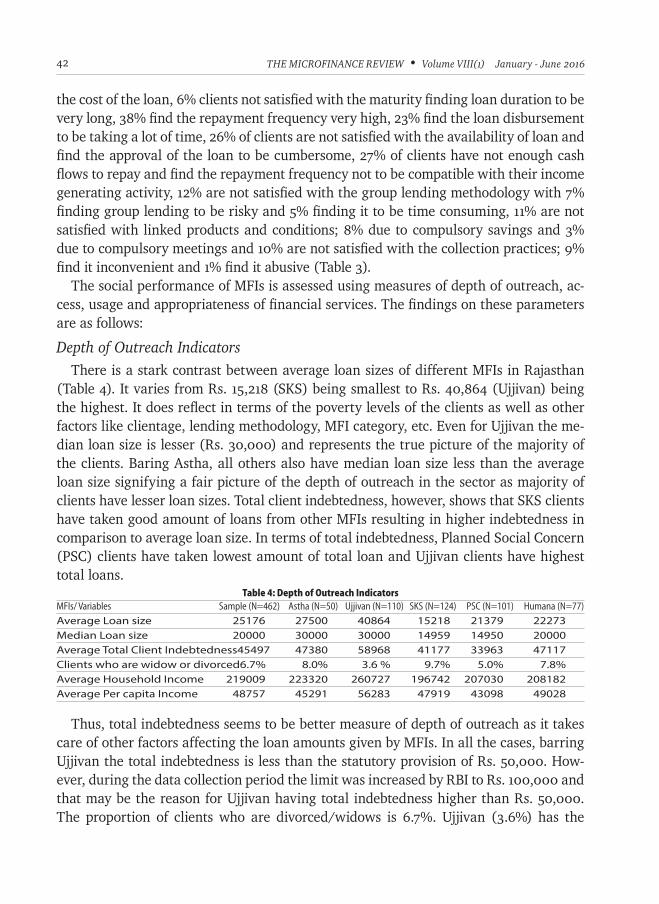
THE MICROFINANCE REVIEW • Volume VIII(1) January - June 201642
the cost of the loan, 6% clients not satisfied with the maturity finding loan duration to be very long, 38% find the repayment frequency very high, 23% find the loan disbursement to be taking a lot of time, 26% of clients are not satisfied with the availability of loan and find the approval of the loan to be cumbersome, 27% of clients have not enough cash flows to repay and find the repayment frequency not to be compatible with their income generating activity, 12% are not satisfied with the group lending methodology with 7% finding group lending to be risky and 5% finding it to be time consuming, 11% are not satisfied with linked products and conditions; 8% due to compulsory savings and 3% due to compulsory meetings and 10% are not satisfied with the collection practices; 9% find it inconvenient and 1% find it abusive (Table 3).
The social performance of MFIs is assessed using measures of depth of outreach, ac-cess, usage and appropriateness of financial services. The findings on these parameters are as follows:
Depth of Outreach IndicatorsThere is a stark contrast between average loan sizes of different MFIs in Rajasthan
(Table 4). It varies from Rs. 15,218 (SKS) being smallest to Rs. 40,864 (Ujjivan) being the highest. It does reflect in terms of the poverty levels of the clients as well as other factors like clientage, lending methodology, MFI category, etc. Even for Ujjivan the me-dian loan size is lesser (Rs. 30,000) and represents the true picture of the majority of the clients. Baring Astha, all others also have median loan size less than the average loan size signifying a fair picture of the depth of outreach in the sector as majority of clients have lesser loan sizes. Total client indebtedness, however, shows that SKS clients have taken good amount of loans from other MFIs resulting in higher indebtedness in comparison to average loan size. In terms of total indebtedness, Planned Social Concern (PSC) clients have taken lowest amount of total loan and Ujjivan clients have highest total loans.
Thus, total indebtedness seems to be better measure of depth of outreach as it takes care of other factors affecting the loan amounts given by MFIs. In all the cases, barring Ujjivan the total indebtedness is less than the statutory provision of Rs. 50,000. How-ever, during the data collection period the limit was increased by RBI to Rs. 100,000 and that may be the reason for Ujjivan having total indebtedness higher than Rs. 50,000. The proportion of clients who are divorced/widows is 6.7%. Ujjivan (3.6%) has the
Table 4: Depth of Outreach IndicatorsMFIs/ Variables Sample (N=462) Astha (N=50) Ujjivan (N=110) SKS (N=124) PSC (N=101) Humana (N=77)
Average Loan size 25176 27500 40864 15218 21379 22273Median Loan size 20000 30000 30000 14959 14950 20000Average Total Client Indebtedness 45497 47380 58968 41177 33963 47117Clients who are widow or divorced 6.7% 8.0% 3.6 % 9.7% 5.0% 7.8%Average Household Income 219009 223320 260727 196742 207030 208182Average Per capita Income 48757 45291 56283 47919 43098 49028

43Social Bottom Line of Microfinance Institutions: Evidences from Rajasthan
lowest proportion and SKS (9.7%) has the highest proportion of such clients. Average Household Income (Rs. 2,19,009) is higher than the statutory limitiii and this seems to be violation of the RBI guidelines. It is higher for all the MFIs. Ujjivan (Rs. 2,60,727) serve the clients with highest household income and SKS (Rs. 1,96,742) serve the clients with lowest income. This shows that the methods used by MFIs for assessing the household income are not proper and self-declaration used is not authentic source as there is scope for under-reporting of income by the clients or the loan officers so as to clear the loans.
Overall, in terms of the depth of outreach, MFIs in Rajasthan are not serving the client base as prescribed by RBI. Thus, MFIs serve low income clients rather than poor clients. However, still in terms of total client indebtedness and loan sizes it can be said that MFIs follow the RBI guidelines. But RBI has to work upon revising the household income limits to some practical levels so as to allow the correct reporting of income.
Access and Use of Service IndicatorsMost of the MFIs are not able to offer deposit services to their clients as they are not
allowed under the regulation (Table 5). Astha being a cooperative society can offer de-posit service to its members. Humana is a Business Correspondent (BC) of Yes Bank and hence is offering saving service on its behalf. All the MFIs offer loan insurance to their clients as a security. Only PSC does not offer insurance to the clients with loan amounts less than Rs. 15,000. In terms of loan usage by the clients themselves there is huge variation. On one hand, 60% of Ujjivan clients and on other hand 89.6% of Humana clients are using the loan themselves. This may be the result of rural and urban effect as
Table 5: Access and Use of Service IndicatorsMFIs/ Variables Sample Astha Ujjivan SKS PSC Humana
(N=462) (N=50) (N=110) (N=124) (N=101) (N=77)
Clients using deposit services through MFI 27.5% 100.0% 0% 0% 0% 100.0%Clients using insurance services through MFI 87.5% 100.0% 100.0% 100.0% 42.6% 100.0%Clients using the loan themselves 74.7% 72.0% 60.0% 84.7% 68.3% 89.6%Clients using loans from Other MFI/Bank 66.9% 68.0% 65.5% 67.7% 56.4% 80.5%# Other loans per client 0.7 0.8 0.7 0.7 0.6 1.0# MFI loans per client 1.2 1.0 1.0 1.7 1.0 1.1# Total loans per client 1.9 1.8 1.7 2.4 1.6 2.1Amount of other Loan as a proportion of MFI Loan 0.8 0.7 0.6 0.8 0.7 1.0Total indebtedness per client 45497 47380 58967 41177 33963 47117Clients with total indebtedness more than 50000 30.1% 36.0% 51.8% 21.8% 9.9% 35.1%Clients with loan from more than 2 MFIs 5.8% 12.0% 2.7% 5.7% 2.0% 11.7%Clients using Loan only for the IGA 34.4% 32.0% 44.6% 32.3% 30.7% 29.9%Clients using Loan not for IGA 13.2% 26.0% 12.7% 8.1% 11.9% 15.6%Clients having Bank Accounts 95.2% 80.0% 93.6% 96.0% 100% 100%Clients having Bank/Insurer Insurance 55.6% 62.0% 76.4% 53.2% 32.7% 55.8%Clients using Informal Loans 29.7% 32.0% 16.4% 35.5% 25.7% 42.9%Clients having multiple Loans of the same type from the MFI 17.3% 2.0% 0.0% 56.5% 0.0% 11.7%Client indebtedness as a proportion of household income 23.0% 22.9% 23.3% 23.9% 18.6% 27.1%

THE MICROFINANCE REVIEW • Volume VIII(1) January - June 201644
Ujjivan clients are all in urban areas and most of the Humana clients are in rural areas and women in rural areas mostly use the loan themselves for cattle rearing, unlike in urban areas where loans are mostly used for retail and trading.
Two in every three clients (66.9%) from the entire sample are using loans from other MFIs or banks. This is highest for Humana (80.5%) and lowest for PSC (56.4%). This may be the result of the concentration of MFIs in a particular region. Humana is working in Alwar district where the concentration of MFIs is very high and PSC is working in ar-eas where population is spread out and not many MFIs are working. For Humana other loan amount is almost similar to the MFI loan amount. For the entire sample there are around two loan accounts per client with total indebtedness of Rs. 45,497. Ujjivan clients are having only 1.68 loan accounts per clients but their total indebtedness is highest at Rs. 58,967 while SKS with 2.39 loan accounts per client is having total indebtedness of only Rs. 41,030. PSC clients with lowest loan accounts per client (1.6) are also having the lowest total indebtedness (Rs. 33,963).
MFI loan accounts per client are highest for SKS (1.7) and lowest for Ujjivan (1) and PSC (1). This is due to the fact that SKS mostly give smaller loan amounts to clients and then provide any additional top-up loans if they require. PSC is having a policy of single loan and Ujjivan provides sufficient loan amounts for the satisfaction of clients. 30.1% of clients from the sample have total indebtedness higher than Rs. 50,000 which was the statutory limit at the time of data collection. This may be the result of increase in the limit to Rs. 1,00,000 by RBI during the data collection period in April 2015 or may also be the result of clients able to overcome the credit bureau check by using different identities for taking loans from various MFIs. 5.8% of the clients are having loans from more than two MFIs which is again a violation as per RBI guideline where a client can take loans from only two MFIs at any time. However, again the results vary with PSC having only 2.0% and Astha having 12% of clients with loans from more than two MFIs. Astha being a coopera-tive society, however, does not directly come under the regulation of the RBI guidelines.
As many as 34.4% of the clients are using loans only for the income generating activity. Thus, around two in every three clients are using loan for other activities; 13.2% of clients are using loans not-for- income generating activity. All the loans which were covered as part of the study were income generating loans and hence it can be said that MFIs are not serious in loan utilisation checks (LUCs). About 95.2% of clients are having bank accounts and 55.6% of clients have bank/insurer insurance other than the loan insurance.
However, the most distressing finding is that 29.7% of clients are using informal loans which are not recorded in the credit bureau data. However, Ujjivan has only 16.4% of clients with informal loans which is due to the fact that it offers diversity of loan products and sufficient loan amounts. Usually the loans from informal sources are taken for marriage, house construction or for medical expenses. 17.3% of clients are having

45Social Bottom Line of Microfinance Institutions: Evidences from Rajasthan
multiple loans of the same type from the MFI. Two MFIs, Humana and SKS have the policy of multiple loans for income generation. Client indebtedness as a proportion of household income (23.0) for the sample is good and looks as if clients will not have difficulty in repayments.
Thus, in terms of ‘access of services’, all the MFIs, barring Ujjivan, offer only income generation loans, all the MFIs offer compulsory insurance and barring Astha and Hu-mana most of the MFIs do not offer deposit service. Clients are having access to loans from multiple MFIs in order to fulfill their demand. The other loan amount is also sig-nificant with total loan amount not exceeding the limit of Rs. 50,000. However, some of the clients have total loan amount exceeding Rs. 50,000 and some have taken loans from more than two MFIs. Almost all the clients of microfinance have bank accounts and around half of them have some sort of insurance other than loan insurance. Still, a significant proportion of clients rely on the informal sources of credit. They may take such loans for emergency requirements, for events or if they require larger loans for longer duration as they can pay back such loans as per their convenience. The practice of multiple loans is very rare with only two MFIs giving multiple loans for the same purpose. The amount of the loans given by the MFIs is not very high as reflected by the low value of client indebtedness as a proportion of household income. This shows that either the loan limits are very strict or that the MFIs under-report the household income of the clients.
In terms of ‘usage of services’, two in every three clients are using loan for purposes other than income generation, when loans are given only for the income generation. This reflects poorly on the loan utilisation checks (LUCs) adopted by the MFIs. They conduct it merely as a formality. Three in every four clients are using the loan them-selves which is a good practice showing women empowerment and their involvement in income generation.
Appropriateness of Products and Services Client satisfaction scores are high on cost of loan, maturity of loan, guarantee/guaran-
tor requirements, lending methodology, prepayment condition and collection practices (Table 6). However, Astha performs very low on cost of the loan (2.4) and collection practices (2.8). Client satisfaction scores are not so high on product variety with only ex-ception being Ujjivan (3.8) which offers different types of loans as per the requirements of the clients. MFIs perform very low in terms of client satisfaction on loan amount (2.8) again the exception is Ujjivan (3.4) with loan amounts as high as Rs. 1,00,000. Client satisfaction scores are not so high on repayment frequency with SKS (2.8) and Humana (2.7) having low scores. Client satisfaction scores are not so high on disbursement and availability of loan with Humana (2.2) performing very low. MFIs also perform not so well on compatibility of repayment with income generation, again with Humana (2.7) having major problems.

THE MICROFINANCE REVIEW • Volume VIII(1) January - June 201646
Thus, it is seen that with the introduction of RBI guidelines in the sector post 2010 cri-sis, clients are satisfied with the cost of the loan, maturity of loan, prepayment condition and collection practices. The sector now has a rate of interest which is linked to the cost of funds. This has resulted in a series of voluntary reductions in the interest rate by MFIs. The loan maturity varying from 1-2 years depending upon the amount of loan is also de-fined by RBI. RBI guidelines mandate MFIs not to charge prepayment penalties and not to adhere to any sort of abusive and exploitative collection practices. These guidelines have resulted into better operational practices and satisfaction level among clients. The only exception being Astha cooperative society which does not fall under the RBI regula-tion and hence clients are not satisfied on the cost of loan and collection practices.
The sector as a whole needs to improve itself on providing product variety, options of repayment frequency, faster disbursement and availability of loan. It was found that none of the MFIs give the clients the option to choose the repayment frequency which is against the RBI guidelines. During the data collection period RBI has increased the maximum loan amount from Rs. 50,000 to Rs. 1,00,000 giving the clients a hope to get bigger loan for fulfilling their demands.
Client satisfaction scores are high on treatment by program staff, reliability of service and transparency in service. However, the exception being Astha which performs low on all these customer service parameters. MFIs perform not so high on timeliness and avail-ability of service with Humana performing very low on these parameters. Overall, MFIs perform very low on customer feedback and cost/conditions of service. However, Ujjivan and SKS are the exceptions. In terms of overall service experience, For- Profit MFIs, SKS and Ujjivan, performs much better than Not-For-Profit MFIs and Astha Cooperative Society (Table 7).
With the increasing competition and introduction of uniform code of conduct, the sector has seen improvement in customer service standards and practices. However, Co-
Table 6: Client Satisfaction on Product Parameters (on a scale of 1-5)MFIs Sample (N=462) Astha (N=50) Ujjivan (N=110) SKS (N=124) PSC (N=101) Humana (N=77)
Product Parameters Client Satisfaction scores on the product parametersProduct Variety 3.3 3.0 3.8 3.2 3.1 3.1Loan Amount 2.8 3.1 3.4 2.7 2.6 2.2Cost of Loan 3.7 2.4 3.9 4.1 3.8 3.8Maturity of Loan 3.9 3.9 3.7 4.0 3.7 4.0Repayment Frequency 3.2 4.1 3.8 2.8 3.1 2.7Guarantee/Guarantor requirement 3.9 3.4 4.0 4.0 3.6 4.0Disbursement of Loan 3.5 4.0 3.7 3.6 3.8 2.2Availability of Loan 3.5 3.8 3.6 3.6 4.1 2.2Compatibility of repayment with income generation 3.4 3.9 3.9 3.1 3.5 2.7Lending methodology 3.7 3.5 3.8 3.9 3.4 4.0Prepayment condition 4.1 3.9 4.1 4.3 4.0 4.0Linked products 3.7 2.4 3.9 3.9 3.7 4.0Collection practices 3.8 2.8 3.8 4.1 4.1 3.8

47Social Bottom Line of Microfinance Institutions: Evidences from Rajasthan
operative Societies being different entities not falling under RBI regulation and sector code of conduct are found short on such practices as shown by the client satisfaction scores of Astha.
ConclusionIn this study depth of outreach, access, usage and appropriateness of products and
services were used for measuring the social performance of MFIs in Rajasthan. Five MFIs from Rajasthan were taken as a representative sample of different categories of MFIs viz., For-Profit, Not-For-Profit and Co-operative Society. The data of 462 clients from these MFIs was analyzed. The main findings of the study are as follows:● Majority of clients are not satisfied with the loan amounts as they find it inad-
equate to fulfill their requirements. Clients are having access to loans from mul-tiple MFIs in order to fulfill their demands. The other loan amount is also signifi-cant. However, some of the clients have total loan amount exceeding Rs. 50,000 and some have taken loans from more than 2 MFIs. This was a clear violation of RBI guidelines prior to increase in the credit limit to Rs. 1,00,000. This shows that some of the clients have been successful in overcoming the credit bureau check by using multiple identities.
● Clients looking for loans for requirements other than income generation like marriages, funeral or medical expenses do not get such loans in the micro finance sector and hence resort to informal sources of loans. They need higher loans for such purposes with flexible repayment options. This is also reflected in many clients been dissatisfied with the product variety, loan amounts and repayment frequency offered by MFIs.
● The microfinance sector has seen repayment frequency moving from weekly mode to monthly mode with many clients finding weekly and fortnightly repayment frequency to be very high and not compatible with their income generating activity. Though there is a provision of choice of repayment frequency to the clients mandated by the RBI, none of the MFIs are following this.
Table 7: Client Satisfaction on Customer Service Parameters (on a scale 1-5)
MFIs Sample (N=462) Astha (N=50) Ujjivan (N=110) SKS (N=124) PSC (N=101) Humana (N=77)
Customer Service Parameters Client Satisfaction scores on the customer service parametersTreatment by program staff 3.8 3.5 3.9 3.9 3.9 3.6Timeliness of service 3.5 3.3 3.7 3.7 3.5 2.9Ease of use of service 3.6 3.4 3.8 3.8 3.6 3.1Availability of service 3.5 2.9 3.8 3.7 3.7 2.8Cost of service/conditions necessary to obtain the service 3.1 2.8 3.3 3.3 2.7 3.1Customer feedback 3.0 2.1 3.5 3.3 2.5 2.9Transparency in service 3.7 2.5 3.8 4.0 3.9 3.9Reliability of service 3.8 3.2 3.8 4.0 3.9 3.9Overall Experience 3.6 3.2 3.7 3.8 3.7 3.6

THE MICROFINANCE REVIEW • Volume VIII(1) January - June 201648
● The microfinance sector has seen interest rates declining with the deregulation of interest rates linking them to the cost of funds. Also there is limit by RBI on the processing fees to be charged to the clients. Only one in every ten clients find the cost of loan to be high.
● The microfinance sector still has procedural delays in loan approval and disbursement. MFIs have to work upon reducing the loan approval and disbursement period as many clients are not satisfied with this. Also there are instances of MFI staff not properly communicating to the clients about rejection of their loans owing to the negative credit bureau results. In some of the cases the loan disbursement is made after one month of the loan application.
● Not many MFIs in the sector have the provision of individual loans and hence the regular clients requiring higher loans find it difficult to continue and have to resort to loans from multiple MFIs. Some of the clients also find the group loans to be risky and compulsory meetings to be time consuming.
● With the increasing competition and introduction of uniform code of conduct, the sector has seen improvement in customer service standards and practices. However, Cooperative Societies not falling under the regulation resort to practices which are prohibited by RBI like compulsory deposits, processing fees higher than 1% of the loan amount, interest rate in the range of 30-40% and even higher, no code of conduct, no sharing of client data with credit bureaus, etc.
● Majority of the clients are using loan for purposes other than income genera-tion when loans are given only for the income generation purposes. This reflects poorly on the loan utilisation checks (LUCs) adopted by the MFIs. Majority of clients are using the loan themselves which is a good practice showing women empowerment and their participation in the household income generation.
● Almost all the clients of microfinance have bank accounts and around half of them have some sort of insurance other than loan insurance. This shows financial awareness of the microfinance clients and the need for MFIs to provide non-credit services.
● The amount of the loans taken by clients in the sector is not very high as reflected by the low value of client indebtedness as a proportion of household income. This may be the result of under-reporting of income by the clients or loan officers.
● MFIs in Rajasthan are not serving the client base as prescribed by RBI, i.e., rural households with income below Rs. 1,00,000 and urban households with income below Rs. 1,60,000. Thus, MFIs serve low income clients rather than poor clients. RBI has to work upon revising the household income limit to some practical levels that would allow the correct reporting of income.

49Social Bottom Line of Microfinance Institutions: Evidences from Rajasthan
Policy ImplicationsRegulation of MFIs has been a topic of debate ever since the microfinance crisis
erupted in Andhra Pradesh. Since then, a lot has been done for the protection of cli-ents and the development of the sector. However, still the sector is plagued with many wrong practices such as violation of the RBI guidelines related to repayment frequency, total loan amount, loans from number of MFIs, loan utilisation, etc. The self-regulatory organisations (SROs), Microfinance Institutions Network (MFIN) and Sa-Dhan can play a crucial role in controlling such practices. There is a need for regulatory framework for the sector which allows for saving products to be offered by MFIs and all categories of institutions, including Cooperative Societies to be brought under the supervision of the regulator. In addition to this, the system of credit check should be made fool proof as some of the clients are able to bypass it using multiple identity cards. The role of Aad-haar card as a unique identifier will be very crucial in overcoming such problems.RBI also needs to revise its guidelines related to the maximum client indebtedness, house-hold income limit and income generation criteria regularly so as to make it relevant for the poor who needs access to financial services.
Notesi. The Social Performance Task Force (SPTF) is a non-profit membership organization
with more than 2,700 members from all over the world. In 2012, the SPTF released the Universal Standards for Social Performance Management (USSPM), a comprehensive manual of best SPM practices, to serve as a resource for all financial service providers with social goals.
ii. As per the new Companies Act 2013, Section 25 has now become Section 8iii. The statutory limits revised by RBI in April’2015 are Rs. 1,00,000 for rural areas and
1,60,000 for urban areas.
ReferencesGendron, C (2009): “Towards a Social Definition of (Corporate) Social Responsibility”,
ISA’s 50th Annual Convention Exploring the Past, Anticipating the Future, New York Marriott Marquis, New York City, February 15.
Hashemi, S (2007): “Beyond Good Intentions: Measuring the Social Performance of Microfinance Institutions”, CGAP, Washington DC.
Rathore, B S (2015): “Social Capital: Does it Matter in a Microfinance Contract?”, International Journal of Social Economics, Vol. 42, No. 11, pp 1035-1046.
Schreiner, M and H H Colombet (2001): “From Urban to Rural: Lessons for Microfinance from Argentina”, Development Policy Review, Vol. 19, No. 3, pp 339–354.
Srinivasan, G (2015): Microfinance India: The Social Performance Report 2014, Access Development Services, New Delhi.
https://rbi.org.in/scripts/FAQView.aspx?Id=102, viewed on March 3, 2016.http://sptf.info/get-started/what-is-spm, viewed on March 1, 2016.http://mixmarket.org/mfi/country/Rajasthan, viewed on February 23, 2016.http://www.sa-dhan.net/Inner.aspx?Others/ResourceCentre.htm, viewed on March 5, 2016.http://mfinindia.org/relevant-regulatory-guidelines, viewed on March 5, 2016.http://www.indiafilings.com/learn/section-8-company, viewed on March 9, 2016.

* Manager Regional Office NABARD, West BengalEmail: [email protected] ** Professor Department of Humanities
and Social Sciences IIT BombayEmail: [email protected]
Microfinance through SHG - Bank Linkage Model can provide an alternative mechanism
to extend financial outreach to unbanked
rural masses.This paper attempts
to examine the role of microfinance through
SHGs on financial inclusion across the
states of India. And also this paper tries
to look into the role of other socio-economic factors in achieving financial inclusion.
Key Words: Financial Inclusion, Self-Help Group Bank Linkage, Panel Data Analysis
Self-Help Group - Bank Linkage Model and Financial Inclusion:
Analysis of Indian States
- Smita Nirbachita Badajena* Haripriya Gundimeda**
AbstractFinancial inclusion facilitates efficient allocation of resources
through minimisation of informal sources of credit. Adoption of appropriate technologies with effective credit delivery mechanism enables the financial institutions to provide financial services to unbanked poor at an affordable cost. Further, it also enables financial institutions to increase overall competitiveness of the economy and productivity through efficient allocation of resources. Microfinance through Self-Help Group (SHG) bank linkage model can provide an alternative mechanism to extend financial outreach to unbanked rural masses. In India, the Microfinance sector started getting recognition after the launch of the SHG linkage model in the year 1992.
The present paper attempts to examine the role of microfi-nance through SHGs on financial inclusion across 25 states of India for the period of 2006 to 2010. This paper also tries to look into the role of other socio-economic factors in achieving financial inclusion through empirical analysis. The results ob-tained from panel data analysis demonstrates a positive impact of SHG-Bank linkage model on financial inclusion. Besides, the results also shed light about the role of other socio-economic factors which act as facilitators for achieving higher level of financial inclusion.
IntroductionIndian economy continues to suffer from the problems of
poverty, sectoral divergences in growth, unemployment and a poor progress of various socio-economic indicators, despite of higher economic growth in the recent past. Attaining full

51Self-Help Group - Bank Linkage Model and Financial Inclusion: Analysis of Indian States
financial inclusion is today one of the biggest challenges for Indian formal banking system. ‘Financial inclusion’ is the process of ensuring access to financial services, time-ly and adequate credit whereever needed by vulnerable groups at an affordable cost. Financial inclusion also facilitates efficient allocation of resources and enables the econ-omy to maximise welfare by reducing the spread of informal source of avenues. Greater financial inclusion is a catalyst for accelerating the inclusive growth (economic growth with equity), which was one of the major objectives of Eleventh Five Year Plan. Without an inclusive financial system, poor individuals and small enterprises have to rely on their limited savings and earnings to invest in their education and entrepreneurship to take advantages of growth opportunities. Hence, financial development is considered as one of the important determinants of economic growth. In fact, the strong relationship between financial development and economic growth is also well documented in many literatures (King and Levine, 1993; Beck et al, 2000; Beck et al, 2004; Levine, 2005; Demirgüç-Kunt et al, 2008). Studies like Beck et al (2004) and Demirgüç-Kunt et al (2008) also had a favourable view on the role of a developed financial system in mobi-lisation of resources, facilitating capital formation, improving investment efficiency and promoting technological innovations. On the other hand, economic growth also creates demand for financial services and thereby, leads to greater financial sector development. In this perspective, many empirical studies have been conducted and they have opined that there may be a bi-directional causal relationship between economic growth and financial sector develop ment. Keeping in view the relevance of financial inclusion in the context of inclusive growth, there is a rapid thrust for financial inclusion, more so in emerging economies, such as, India. In more recent years the debate has expanded to include the notion of financial “exclusion” as a barrier to economic development and the need to build inclusive financial systems (Beck et al., 2008). Accordingly, financial sector reforms that promote financial inclusion are increasingly at the core of the development agenda for policy makers and development institutions at national and international level. In fact, there is a severe gap between the prevailing and desired levels of financial access which needs special attention. Financial inclusion is not just a socio-political imperative but also an economic one. Therefore, financial inclusion assumes greater importance in a developing country like India. The overall strategy for financial inclusion, especially amongst the poor and unbanked segments of the population should design ways and means to fine tune the existing business delivery mechanism, as well as endeavour for evolution of new models for extending financial outreach. In this context, microfinance has developed as an alternative channel to provide financial services to large sections of the society. In India, the microfinance sector started getting recognition after the launch of the SHG-Bank linkage model in the year 1992. SHG-Bank Linkage Programme (SBLP) has evolved to become the larg-est microfinance model in India.

THE MICROFINANCE REVIEW • Volume VIII(1) January - June 201652
The present paper aims to 1) look into the role of SBLP in achieving financial inclusion across various states of the country and 2) examine the role of other socio-economic fac-tors in achieving financial inclusion through empirical analysis.
Background of the StudyAs per the Global Partnership for Financial Inclusion (GPFI) Report (2013), half of all
adults globally (an estimated 2.5 billion people) are still excluded from formal financial services in terms of having a savings or credit account with a formal institution. In emerging markets, the challenge is even greater: almost three in four adults do not have an account at a formal financial institution. The relationship between inclusive growth and financial inclusion has been well recognised in India’s development strategy. Financial inclusion can create win-win environment for both customer as well as financial institution in an economy (Thorat, 2006). It not only enables clients in availing various kinds of financial products for productive purposes but also enables government to use the bank accounts of people for providing various social security services to the vulnerable sections of society. As per population census 2011, only 58.7% of households are availing banking services in India. In terms of availing banking services, there has been significant improvement in comparison to 2001 census data (Figure 1).
In spite of Indian banking sector having witnessed a spectacular progress in spread of banking network and extending financial outreach across the country in the recent past, the relative decline in the supply of credit in rural areas poses the biggest chal-
0
10
20
30
40
50
60
70
80
Rural Urban Total
per
cent
Figure 1: Percentage of Population Availing Banking Services in India
census 2001census 2011
Source: Reports on Trend and Progress of Banking in India, RBI 2013

53Self-Help Group - Bank Linkage Model and Financial Inclusion: Analysis of Indian States
lenge to achieve hundred percent financial inclusion for the Indian formal financial system. Impediments and higher cost of access to adequate financial services like credit, insurances, and remittances to majority of the population are major roadblocks for the growth of primary sectors like agriculture. In this context, microfinance can be con-ceived as an alternative model to bridge the gap which could not be filled up by formal banking system. In India, the SHG bank linkage model has emerged as the dominant model in terms of number of borrowers and loan outstanding. In terms of coverage, this model is considered to be the largest microfinance programme in the world. The microfinance sector started getting recognition in India after the launch of the SBLP in early 1990’s. Internationally, however, a lot of groundwork and efforts were made since the 1980s, which set a backdrop for microfinance efforts in India. SHG linkage model is one of the indigenously developed and successfully operated models of microfinance in India. On an average SHG consists of 15-20 members. It has been demonstrated that group lending rather than individual lending ensures high rate of repayment as the other members of group act as a catalyst for repayment of loans. Hence, SHG also acts as a form of “social collateral.” So far as financial strategies of SHGs are concerned, com-mercial banks, regional rural banks and cooperative banks primarily fund the SBLP, and National Bank for Agriculture and Rural Development (NABARD) in turn re-finances them. The SHG model also facilitates to reduce transaction costs, facilitates proper mon-itoring of funds by group members, economic empowerment of SHG members by collec-tive decision making. In fact, previously various studies highlighted the positive impact of the SHG bank linkage on poverty reduction (Khandker, 2005; Aghion and Morduch, 2000; Imai et.al, 2010), favourable impact on household income, education and health (Puhazhendi and Satyasai, 2000; Puhazhendi and Badatya, 2002; Sanghwan, 2006; De Silva 2012), reduction of vulnerability (Swain and Floro, 2007) and improving access to finance (Shetty and Veerashekharappa, 2009).
Considering the wide coverage and success of SBLP, this study aims at focusing on the role of SHG bank linkage model for achieving financial inclusion. Initially, the role of SBLP on the level of financial inclusion has been examined by taking into account the cross sectional data for one year, i.e., 2008 covering 18 major states. Other than SHG variables, the impact of various important socio economic parameters, viz., primary literacy, branch density, tele density has also been assessed using ordinary least squares method. The result obtained through ordinary least squares method for the cross sec-tional data exhibited a positive and significant impact of SBLP on financial inclusion in India. The result also revealed a positive impact of technological progress and financial literacy on financial inclusion whereas branch density (population per branch) exhibited an inverse relationship with financial inclusion. The results obtained from cross sectional data analysis led to further investigate the impact of SHG led microfinance on the level of financial inclusion over a period of time. Keeping in view of the importance of credit

THE MICROFINANCE REVIEW • Volume VIII(1) January - June 201654
from the developmental perspective and spectacular progress of microfinance through SHG Bank linkage and based upon pilot study results, the role of SBLP on financial inclusion of 25 states has been studied. In the cross sectional data analysis, four major independent variables were considered whereas in panel data analysis, the impact of other independent factors, viz, banking presence, infrastructure, socio-economic char-acteristics on financial inclusion has been captured. The analysis gives a better insight into the role of microfinance along with other socio-economic parameters on the level of financial inclusion. The study primarily relies on secondary sources of data. Secondary data for the study have been collected from various sources like Census of India, various reports published by Reserve Bank of India (RBI), NABARD, Ministry of Statistics and Programme Implementation (MOSPI).
Previously, Kumar (2013) attempted to study the determinants of financial inclusion for Indian states using panel data approach. The study had utilised state level panel data spanning over a period of 1995 to 2008 for measuring the role of various determinants of financial inclusion in Indian states. The study observed a beneficial impact of average population per branch and level of income on deposit and credit penetration. Besides it also validated the importance of prevailing regional economic conditions on financial inclusion. To the best of author’s knowledge, this is the first panel data study conducted to examine the determinants of financial inclusion with special reference to the role of SHG bank linkage across Indian states. Since, access to credit plays a vital role in under-taking income generating activities, wealth creation and smoothening of consumption patterns, the credit aspect of financial inclusion has been considered as dependent vari-able. Besides, the study has focused upon both widening and deepening aspect of credit with reference to only small borrower accounts. In view of the relevance of various socio economic factors, various exogenous variables have been incorporated while studying the role of SHG Bank linkage model on financial inclusion. The detailed explanation on data and results are given in the following sections.
Econometric Model and MethodologyOwing to limitations in pooled data analysis, observations of an individual year may
not be independent and the ordinary least squares method may provide biased estimates. Hence, panel data technique has been employed to control for the fixed or random in-dividual differences. Using data for 25 states and five years, the hypothesis that SBLP has a positive impact on financial inclusion has been tested. Further, Hausman test is conducted to find the appropriateness of the fixed or the random effect model. The basic functional form of panel data equation is as follows.
Cwit=a+bXit+ eit + mi ......................... [1]Cdit=a+bXit+ eit + mi ......................... [2]

55Self-Help Group - Bank Linkage Model and Financial Inclusion: Analysis of Indian States
Here Cwit (credit widening) and Cdit(credit deepening) are endogenous variables for ith state and t time period. “a” stands for the intercept term and Xit is the matrix of exogenous variables. b is the vector of associated parameters of exogenous variable. imis treated as a random variable with a specified probability distribution (usually normal, homoskedastic, and independent of all measured variables) in case of random effects model, whereas a set of fixed parameters in case of fixed effects model. eit is the usual stochastic disturbance term following normal distribution with mean 0 and variance σ2.
Separate regressions are carried out for credit widening and credit deepening. The common set of exogenous variables are branch density, geographical branch penetrations, postal area served, degree of road density, tele density, etc. Infrastructure development is the key to economic development. Besides banking parameters, the model has incorporated the role of infrastructure factors like road, postal network, and technological progress (tele-density) upon the progress of financial inclusion. This study is different from other studies as it has considered both banking as well as socio- economic factors like literacy, road density and postal density to study the effects of determinants of financial inclusion across various Indian states. The detailed descriptions of variables are given in Table 1.
Description of VariablesThe selection of independent variables is based on the earlier studies (Sharma
2008, Kumar 2013) pertaining to Microfinance and financial inclusion. The num-ber of small credit accounts in rural areas per 1,000 persons and average amount of loan outstanding (pertaining to small borrowers in rural areas) have been taken
Table 1: Description of VariablesVariables Notation used Source of data Expected Sign
No. Of credit accounts per 1000 persons RBI, Census of India population projection (Pertaining to small borrowers) in rural areas. Cw (2008) Amount of loan disbursed per 1000 persons. RBI, Census of India population projection (Pertaining to small borrowers) in rural areas. Cd (2008). Branch density(population per branch) B_d RBI, Census of India population projection (2008). –No of SHGs having access to credit accounts Report on status of Microfinance in India, per 1000 persons Shg_w NABARD, India Stat +Tele density (No of telecom subscribers MOSPI, GOI + per 100 persons) T_d Average amount of outstanding for SHG loans Report on status of Microfinance in India, per 1000 persons. Shg_d NABARD, India Stat +Postal area served per square kilometre p_d MOSPI,GOI -Natural log of Road Density per 1000 Km2 Lnroad MOSPI,GOI +Credit–Nsdp ratio c_ gdp RBI +Geographic branch penetration g_ bp RBI -Literacy rate Lit MOSPI,GOI +Credit deposit ratio C_d RBI +Source: Banking Statistical Returns (BSR), Reserve Bank of India (RBI).

THE MICROFINANCE REVIEW • Volume VIII(1) January - June 201656
as two dependent variables in the model. Figure 2 depicts a wide variation with respect to progress of small borrowers account across various states from the years 2006 to 2010. Assam, Madhya Pradesh, Chhattisgarh, Bihar, West Bengal have relatively lesser number of small borrower accounts per 1000 persons in rural areas compared to states like Karnataka, Andhra Pradesh, Orissa, Tamil Nadu.
Figure 2: Trend in Number of Small Borrower Accounts in Rural Areas per 1000 Persons across Various States over the Period 2006 to 2010
Source: BSR Report, RBI
Figure 3: Comparison of the Number of Small Borrower Accounts Vs Average Loan Outstanding for Small Borrower Accounts in Rural Areas in a Few Selected States as on March 2013
Source: BSR Reports, RBI.
‐2000
3000
8000
13000
18000
23000
28000
Tamil Nadu
Kerala
And
hra Pradesh
Delhi
Karnataka
Goa
Maharashtra
Him
achal Prade
sh
Haryana
Punjab
Uttarakhand
Rajasthan
Odisha
Madhya Pradesh
Gujarat
Uttar Prade
sh
Assam
West B
engal
Bihar
Chhattisgarh
small loan per capita for march 2013
small borrowal account per 1 lac person for march 2013

57Self-Help Group - Bank Linkage Model and Financial Inclusion: Analysis of Indian States
Further, from Figure 3, it is observed that the states having higher number of small bor-rower accounts, also witnessed a better performance with respect to the amount of loan outstanding. States like Assam and Bihar which have a lower number of small borrower accounts per 1,000 people have lesser amount of loan outstanding per 1,000 people.
The independent factors considered for analysis include tele density, number of SHGs provided with credit per 1,000 persons, demographic branch penetrations, and geographic branch penetrations, postal area served per square kilometre, Credit-Net State Domestic Product (NSDP) ratio and road density. Tele-density has been considered for evaluating the effect of technological progress across various states. The share of credit to total NSDP of the state is explained by Credit-Gross Domestic Product (GDP) ratio. This is commonly used as a measure of financial sector development. Levine (1999) and Calderon and Liu (2003) used credit to GDP ratio as a measure of financial sector development. Assuming higher credit NSDP ratio may lead to better financial sector development and thereby create better environment for financial inclusion, the same is chosen as one of the variables for the model. Geographical branch penetrations and demographic branch density are calculated in terms of population per branch and number of rural branches per square kilometer respectively. With regard to branch density, it can be observed that over the years 2006 to 2010, the population per branch
for various states has decreased which indicates that more number of bank branches are being set up to cater to the needs of the existing population (Figure 4). The declining
Figure 4: Trend of Population per Bank Branch in Selected States over the Period 2006 to 2010
Source: BSR Reports, RBI.
0
5000
10000
15000
20000
25000
30000
2006 2007 2008 2009 2010

THE MICROFINANCE REVIEW • Volume VIII(1) January - June 201658
trend in population per branch is an indication of improvement in the level of financial inclusion.
Number of SHGs provided with loan per 1,000 persons represents the proxy variable for microfinance, as SHG bank linkage model is considered as the largest microfinance model in the world. The variables like the road density are used to study the role of infrastructure in enhancing the accessibility of financial services to common masses. Further, the study also factored in the role of postal services in providing financial ser-vices by taking postal area served per square kilometre as an independent variable in the model. The logic behind considering postal area network as an independent vari-able is that in India, many rural areas are still deprived of formal banking facilities and people avail the financial services which are provided by their local post offices. Even it has been noticed that rural masses are more comfortable to keep their savings in post offices rather than in banks. In the recent years, Government of India has taken various initiatives to extend financial outreach to unbanked population through post offices. Therefore, significant proportions of rural population continue to avail the financial services provided by the post offices.
Empirical ResultsBefore running the econometric model, the correlation between various independent
variables has been examined. In fact, no significant correlation between various inde-pendent variables was observed (Table 2).
The empirical results of two models are given in Tables 3 and 4. For choosing the appropriate fixed effect or random effects model for (1) and (2), the Hausman test was used (Greene, 2002; Baltagi, 2005; Gujarati and Sangeetha, 2007). Based on the Hausman test result, the random effect model was selected for model (1). The F test indicates that the overall model is significant at 1%. The results depict a positive and significant im-pact (at 1% level) of the number of SHGs having access to credit upon credit widening. As expected, branch density has a negative impact on financial inclusion (significant at 1% level). Branch density is considered as one of the important determinants of financial inclusion. The inverse relationship between credit widening (Cw) and popu-
Table 2: Correlation Matrix B_d C_gdp p_d T_d Lit Shg_w lnroad C_d g_bp
B_d 1 C_gdp -0.414 1 p_d 0.082 -0.298 1 T_d -0.545 0.678 -0.262 1 Lit -0.453 0.312 -0.18 0.431 1 Shg_w -0.192 0.069 -0.223 0.074 -0.009 1 Lnroad -0.035 0.455 -0.696 0.478 0.391 0.158 1 C_d -0.335 0.550 -0.363 0.250 0.145 0.471 0.185 1 g_bp -0.131 0.464 -0.628 0.476 0.108 -0.115 0.685 0.070 1

59Self-Help Group - Bank Linkage Model and Financial Inclusion: Analysis of Indian States
lation per branch shows that expansion of branches leads to greater level of financial inclusion. Since, financial literacy possesses a prime role in financial inclusion drive, literacy has been used as the proxy variable for financial literacy. This has a positive and significant impact on financial inclusion. With respect to credit deposit ratio, there exists a positive relationship with credit widening. Besides, the infrastructure variables like tele density and road density indicates a positive (though not significant) impact on credit widening. The geographical penetration (g_bp)t is expected to have positive impact on credit widening but the random effects model witnessed an inverse relation-ship between geographic branch penetration (g_bp) and credit widening (Cw). This may be attributed to host of other factors. In absolute terms, the number of branch-es and number of credit accounts for small borrowers are observed to be increasing across various states over a period of time. However, the ratio of number of small bor-rower’s credit accounts to number of branches witnessed a declining trend for various states (Figure 5). The lower growth of small credit accounts compared to number of branches may be one of the factors leading to negative relationship between geographi-cal branch density and credit widening. Modified Wald test for group-wise heterosce-dasticity test and Wooldridge test for autocorrelation were carried out for both models to test for heteroscedasticity and autocorrelation in the model. Since there is a pres-ence of heteroscedasticity and autocorrelation, FGLS method was used to correct the heteroscedasticity and autocorrelation problems. After remediation of heteroscedasticity and autocorrelation, both credit deepening and literacy showed a positive and significant
Figure 5: Trend of Ratio of Number of Small Borrower Accounts in Rural Branches and the Number of New Bank Branches in Terms of Geographic Area
Source: BSR Reports, RBI
0.00
1.00
2.00
3.00
4.00
5.00
6.00
Andhra Pradesh
Karnataka Orissa Rajasthan Madhya Pradesh
Tamil Nadu Uttar Pradesh
West Bengal
2006 2007 2008 2009 2010

THE MICROFINANCE REVIEW • Volume VIII(1) January - June 201660
impact at 10% level whereas spread of SHGs (shg_w) showed positive and significant impact on credit widening. These results confirm that proliferation in the number of SHGs with access to credit has the potential to speed up the level of financial inclusion across states. Besides, it also indicates that higher credit deposit ratio facilitates better financial inclusion through increase in credit penetrations. Similarly, larger the degree of literacy, greater the improvement in the level of financial inclusion.
Model 2 estimates the determinants of financial inclusion in terms of credit deepening. In case of equation (2), R2 is 0.81. This shows that the 81% of the variation in dependent variable is explained by independent variables. Here, the amount of loan disbursed per 1000 persons is taken as the measure of credit deepening (Cd).To find out appropriate model, similar approach (Hausman test) as followed in model 1 was used. The Hausman test results indicated that fixed effects models is more appropriate. As mentioned in the Table 4, average loan outstanding per SHG member (Shg_d) and teledensity have a posi-tive and significant impact on the variable credit deepening (Cd). Since there is a pres-ence of heteroscedasticity, FGLS was used to correct the problem. As expected branch density (B_d) has a negative and significant impact on the dependent variable, credit deepening. After correction of heteroscedasticity through FGLS, the credit–NSDP ratio, though not significant, exhibited negative relationship in credit widening model. This may be due to continuous decline in ratio of small credit outstanding to total credit out-standing in rural area (Figure 6). That means that in spite of government effort in prior-
Table 3: Dependent Variable: Number of Small Credit Accounts per 1000 PersonsIndependent Variables Pooled Fixed Effects Random Effects GLS Corrected for Hetroscedasticity
g_bp -2.09e-06 -.0000168 -.0000118 -.0019088 (.0000162) (7.18e-06)** (6.65e-06) *** (.0009471)**T_d .00004 000043 .0000325 .0000261 (.0000553) (.0000222)*** (.0000184)*** (.000059)p_d -.0000704 .0055721 -.0001132 -.0011341 (.0000365)*** (.0045998) .0000793 (.0006883)***C_gdp -.0066557 .0020844 .0000589 -.0008374 (.0033361)** (.0023103) (.0022676) (.0043393)B_d -6.91e-07 -4.98e-07 -6.99e-07 -2.63e-06 (2.11e-07)* (4.18e-07) (3.14e-07)** (2.03e-06)Shg_w .0073692 .000814 .0009879 .0035218 (.0009316)* (.0003366)** (.0003457)* (.0019087)***C_d .0003123 .0083328 .0098115 -.0177555 (.0069348) (0047768) (.0044938) (.0143175)Lit -.0001976 -.0002498 -.0002557 -.0001438 (.0001413) (.0002166) (.0001808) (.0009269)Road (ln) -5.09e-07 -4.20e-06 -9.93e-07 .0000241 (1.04e-06) (2.04e-06)** (6.66e-07) (.0000112)**Intercept .050005 -.1331024 .0538012 .1344296 (.0123518)* (.1552687) (.0170695) (.0660627)**F-Test/ Wald Chi2(8) 19.4* 7.10* 70.53* 29.41*Hausman Test 0.7810 Notes: Significance at *1%,** 5%, *** 10 %. The standard errors are mentioned in Parenthesis.

61Self-Help Group - Bank Linkage Model and Financial Inclusion: Analysis of Indian States
ity sector lending, the share of credit being extended to small borrowers in rural areas has been decreasing since 2006 to 2010. The Wald chi square/F test values indicates that both models are significant at 1% level.
Summary of the Study
Table 4: Dependent Variable: Amount of Credit (Small Credit) Disbursed per 1000 PersonsIndependent Variables Pooled Fixed Effects Random Effects GLS Corrected for Hetroscedasticity
g_bp .005787 -.0204127 -.0175786 -.0238134 (.0049246) (.0034092)* (.0030288)* (.0098819)**T_d .0584785 .0553991 .0571049 .0088552 (.0174611)* (.0104699)* (.0082352)* (.0208293)p_d -.032331 5.714728 -.0113342 -.1024253 (.0113548)* (2.164451)* (.0271605) (.0576084)***C_gdp -1.85578 2.49119 1.387996 13.03062 (1.040971)*** (1.084773) (1.00122) (5.566028)**B_d -.0004403 -.0004026 -.0004527 -.0001898 (.0000653) (.0001963)** (.0001226)* (.0001998)Shg_d 1.742463 .8846811 -.0004527 1.761104 (.2912855)* (.1733077)* (.0001226)* (.7264123)**C_d -2.094674 2.636206 2.276188 -19.86861 (2.156025) (2.269458) (1.992387) (7.03568)*Lit -.1104967 -.0410724 -.1402908 -.2848294 (.0437388) (.1019954) (.0733109)*** (.2587259)Road -.001074 -.0009987 .0001858 -.0004894 (.0003182) .0009598) (.0002608) (.000413)Intercept 26.22847 -174.0882 23.26279 44.48508 (3.815743)* (72.9696) (6.838472)* (24.61639)F-Test/ Wald Chi2(8) 28.47* 48.96* 415.65* 545.73*Hausman Test 15.97* Notes: Significance at *1%,** 5%, *** 10 %.The standard errors are mentioned in Parenthesis.
Figure 6: Ratio of Small Credit Outstanding to Total Credit Outstanding in Rural Area
Source: BSR Reports, RBI
0.60
0.57 0.57
0.54
0.52
0.48
0.50
0.52
0.54
0.56
0.58
0.60
0.62
2006 2007 2008 2009 2010
Ratio of small credit outstanding to Total credit outstanding in Rural areas

THE MICROFINANCE REVIEW • Volume VIII(1) January - June 201662
This paper attempts to study the role of SBLP in achieving financial inclusion across 25 states. Initially, a pilot study taking cross sectional data for one year with four exog-enous variables was conducted and a positive and significant impact of SHG-Bank link-age on financial inclusion and a positive and significant impact of technology and finan-cial literacy on financial inclusion was observed. Subsequently, in order to strengthen the conclusion that microfinance through SHG model is really playing a prominent role in accessing financial services and to test the hypothesis further, a five year panel data was used to study its role across states from 2006 to 2010. Aanalysis showed a positive and significant impact of SBLP on the level of financial inclusion in terms of both credit deepening and credit widening in India. The results reveal that the demographic bank density has a negative and significant impact on financial inclusion in terms of both credit deepening and credit widening. Similar kind of study was conducted by Kumar (2013) to find out the determinants of financial inclusion. It revealed a negative impact of population per branch on deposit penetration. Hence, this study, result is in conso-nance with Kumar’s findings. This confirms that higher the population served by the branch, lower shall be the level of financial inclusion. Thus, the number of branches needs to be expanded in those states where population served by branch is very high. It is to be noted that none of the studies carried out earlier evaluated the impact of SHG on financial inclusion in India using panel data. Our analysis revealed a positive and significant impact of SBLP on financial inclusion in terms of both credit deepening and credit widening in India. Hence, government should take initiatives to extend the financial outreach through SBLP as it has the potential to increase absorptive capacity of common masses and strengthen the viability of financial services provided to large unbanked sections of the society. The analysis also reflects a positive impact of tech-nological progress in achieving financial inclusion in terms of credit deepening across various states. Hence, recent initiatives by the government for technological innovation in banking sector will definitely help in promoting financial inclusion in the long run.
To conclude, microfinance through SHG bank linkage approach aided with adoption of technological innovations and augmentation of more number of branches has a potential to strengthen the availability of financial services while simultaneously increasing the credit absorptive capacity of common masses.
Acknowledgement The views expressed in the paper are those of the authors and need not necessarily
belong to the organisation to which they belong. All the errors and omissions, if any, are the responsibility of the authors.
The Authors are thankful to the Editor of the journal for his insightful comments on

63Self-Help Group - Bank Linkage Model and Financial Inclusion: Analysis of Indian States
this paper.
ReferencesAghion, B A and Morduch, J (2000): “Microfinance Beyond Group Lending”, Economics
of Transition,Vol. 8 (2), July, pp 401-420.Badajena, S and Gundimeda, H (2010): “SHG Bank Linkage Model and Financial Inclusion
in India”, A Cross Sectional Study published in the proceedings of International Conference of Strategic Management Forum on the theme - “Challenges to Inclusive Growth in the Emerging Economies” held on 15-17 December, IIM, Ahmedabad.
Baltagi, B H (2005): “Econometric Analysis of Panel Dauta” (third ed.), John Wiley and Sons.
Beck, T, Kunt, A Demirguc and Peria, M (2008): World Bank Economic Review, Vol. 22 (3), December, pp 397-430.
Beck, T and Levine, R (2004): “Stock Markets, Banks and Growth: Panel Evidence\”, Journal of Banking and Finance, 28(3), pp 423-442.
Beck T, Levine R and Norman L (2000): “Finance and the Sources of Growth”, Journal of Financial Economics, 58 (1), pp 261-300.
Calderon, C and Liu, L, (2003): “The Direction of Causality between Financial Development and Economic Growth”, Journal of Development Economics, Vol. 72, pp 321-34.
Chavan, P and Kumar, R (2002): “Micro-Credit and Rural Poverty: An Analysis of Empirical Evidence”, Economic and Political Weekly, Vol. 37 (10), March, pp 955-965.
De Silva, I (2012): “Evaluating the Impact of Microfinance on Savings and Income in Sri Lanka: Quasi Experimental Approach using Propensity Score Matching”, The Journal of Applied Economic Research, February, Vol. 6 (1), pp 47-74.
Demirgüç-Kunt, A, Beck T and Honohan P (2008): “Finance for All? Policies and Pitfalls in Expanding Access”, Policy Research Report, Washington, DC, World Bank.
Gujarati, D and Sangeetha, N (2007): Basic Econometrics, Fourth Edition, Tata McGraw-Hill, New Delhi.
Government of India (2008): Report of the Committee on Financial Inclusion in India, New Delhi.
(2001): Census of India Report.Imai, Katsushi S, Thankom, A and Samuel, K A (2010): “Microfinance and Household
Poverty Reduction: New Evidence from India. World Development, 38, pp. 1760-74.Khandker, S R (2005): “Microfinance and Poverty: Evidence Using Panel Data from
Bangladesh”, The World Bank Economic Review.Kumar, N (2013): “Financial Inclusion and its Determinants: Evidence from India”, Journal
of Financial Economic Policy, Vol. 5 (1), pp 4-19.Levine, R (1999): “Law, Finance and Economic Growth”, Journal of Financial
Intermediation, Elsevier, Vol. 8 (1-2), pp 8-35, January.(2004): “Finance and Growth: Theory and Evidence”, NBER Working Paper No. 10766.Levine, R, Loayza, N and Beck, T (2000): “Financial Intermediation and Growth:
Causality and Causes”, Journal of Monetary Economics, 46, 31-77.Puhazhendi, V and Satyasai K J S (2000): “Micro-finance for Rural People: An Impact
Evaluation”, NABARD.Puhazhendi, V and Badatya, K C (2002): “Self-Help Group - Bank Linkage Programme
for Rural Poor in India - An Impact Assessment”, NABARD, New Delhi. Reserve Bank of India (2005): “Report of the Internal Group to Examine Issues Relating
to Rural Credit and Microfinance”, RBI, Mumbai.Reserve Bank of India: Banking Statistical Returns (BSR), Various issues, RBI, Mumbai.

THE MICROFINANCE REVIEW • Volume VIII(1) January - June 201664
Robert G King and Ross L (1993): “Finance and Growth: Schumpeter Might be Right”, The Quarterly Journal of Economics, Vol. 108 (3), August, pp 717-737.
Sanghwan S S (2008): “Financial Inclusion and Self-Help Groups”, NABARD.Sharma, M (2008): “Index of Financial Inclusion”, ICRIER Working Paper 215.Shetty, N K and Veerashekharappa (2009): “The Microfinance Promise in Financial
Inclusion: Evidence from India”, The IUP Journal of Applied Economics, Vol. VIII (5 and 6).
Swain, R and Floro, M (2012): “Assessing the Effect of Microfinance on Vulnerability and Poverty among Low Income Households’, Journal of Development Studies, Vol. 48 (5), May, pp 605-618.
Thorat, Usha (2006): “Financial Inclusion and Millennium Development Goals”, Speech at the 4th Programme on Human Development and State Finances, at CAB, Pune, January 16.
NABARD: Microfinance Report, Various issues.NSSO 59th Round Reports.

* Ph.D Scholar Department of Economics School of Social Sciences Sikkim Central University SikkimEmail: [email protected]
The study was conducted to understand financial
inclusion at district/village level by analyzing
both service providers and user side of financial
inclusion. More thrust to weaker states/districts by expanding semiformal institutions in rural areas
would contribute to increased access to financial
services by all.
Key Words: Semiformal Institutions, Financial Inclusions
Financial Inclusion in Assam: Evidences from District/ Village
Level Data
- Tiken Das*
AbstractThe present study was conducted in Assam with the aim
to measure financial inclusion at district/village level by examining both; service providers and user side indicators. The study was carried out by constructing three compos-ite financial inclusion indices separately for interstate, inter- district and inter-village analysis. Findings show a lot of variation across states/districts and between rural and urban regions. Still within a state, differences are evident between rural and urban areas for the different indicators considered. From village-level analysis. A dominant role of semiformal organisations with the declining role of infor-mal lenders was found. The paper emphasises the need to expand semiformal institutions in rural areas of Assam.
Introduction Finance is an essential component of an economy.
Interest ingly, there occurred a two-way causation between the development of financial system and growth of real sec-tor. The real growth of an economy happens by the devel-oped financial system, whereas financial sector advance-ment occurred by the growing economy’s demand (Kumar and Mishra 2011).
Furthermore, finance plays a constructive role in poverty eradication. It was argued that Indian rural branch expan-sion programme extensively impacted rural poverty, and lead to a rise in non-farm employment (Pande and Burgess 2003). Neverthe less, a developed financial system reacha-ble to everyone reduces information and transaction costs, and positively influences saving rates, investment decisions,

THE MICROFINANCE REVIEW • Volume VIII(1) January - June 201666
tech nological innovation, and long run growth rates (Beck, et al. 2009). There is a direct and indirect impact of finance on poverty eradication.
Financial exclusion is a situation that deprives an individual or a group from ac-cessing and benefiting from financial services. Indeed, financial exclusion may be of any type like access-exclusion, condition-exclusion, price-exclusion, marketing exclu-sion or self-exclusion. Many social and economic factors like low household incomes, expensive source of credit, no savings and no insurance coverage leads to financial ex-clusion (Carbo, et al. 2007). Financial inclusion has assumed public policy relevance in recent years. Many countries like India (Government of India 2008) and the United Kingdom (2006) and International organisations like the United Nations (2006), World Bank (2008, 2009) have set up task force or committees to understand financial inclu-sion and to improve its scope. Various aspects of financial inclusion have been identified through these studies, but the measurement aspect of financial inclusion has, so far, not widely been covered by these reports and studies. As India is a diversified economy and society, it is essential to give adequate interest to the measurement of financial inclusion by policy makers and researchers.
Few scholars attempted to measure various aspects of financial inclusion in differ-ent times. Honohan (2007) by using the information on the number of banks and mi-crofinance institutions in more than 160 countries evaluated the fraction of the adult population using formal financial intermediaries and then correlated with inequality and poverty. Sarma (2008) developed an Index for financial inclusion using aggregate banking variables like the number of the account, the number of bank branches and total credit and deposit as the proportion of GDP for 55 countries. However, the majority of the studies discussed about the measurement of financial inclusion used the financial depth as a measure rather than actual outreach or access measures. Earlier studies cover availability and accessibility elements to a large extent and usage to a certain extent. Service provider’s information presents only one side of the overall picture. In this pa-per, an attempt has been made to fill this gap by analyzing both service providers and user side of financial inclusion.
With the objective to bring as many people within the bank coverage, the banking network has been augmented by opening new branches in Assam, a state in the geo-graphically and economically peripheral but strategically significant northeast region of India. Accordingly, the number of reporting bank offices of all scheduled commercial banks in Assam has reached 1,940 in the year 2013-14 (State Level Banker Committee 2014). Despite that, more than 95% households are financially excluded from the formal sources in this region. The bulk of these excluded households belonged to the small and marginal farmers. At a disaggregated level, the condition is much more sensitive to more than 70% districts of Assam having an exclusion which ranges from 96.1% to 98.5% (Rangarajan 2008). Nevertheless, it was found the ascendancy of some informal tradi-

67Financial Inclusion in Assam: Evidences from District/Village Level Data
tional community-based organisation in the region (Sharma 2011; Singh 2009; Singh 2011; Sharma and Mathews 2009). Given this background, the study aims to estimate and understand the depth of financial inclusion. Novelty of the present study lies (a) in providing an interstate analysis of financial inclusion, (b) in assessing the probable differences among districts concerning financial inclusion in Assam, and (c) in outlining village-level financial inclusion in selected districts of Assam.
Methodology and Data BasesThe study was conducted by using both primary and secondary data. The secondary
data were collected from Banking Statistical Returns (BSR) published by Reserve Bank of India (RBI), Quarterly Statistics on Deposits and Credit of Scheduled Commercial Banks (SCBs) and Census of India 2011. For estimating village-level financial inclusion,
Figure 1: Study Area Showing the Sample Districts and Development Blocks in Assam

THE MICROFINANCE REVIEW • Volume VIII(1) January - June 201668
Household level survey was conducted Assam during September 2014 to December 2014 in the Lower Brahmaputra Valley of Assam. Figure 1 presents a map of Assam showing the study districts and development blocks. For primary data collection, a multistage sampling design was adopted as structured in Figure 2. In the first stage, three districts, namely, Nalbari, Barpeta, and Baksa were selected purposefully among eight districts of the region; one district from each of high, average and below average performing districts to gather all types of potential users of different credit source (Table 1). In the second stage, two development blocks (DB) from each district were selected. Since all the three districts have more or less equal numbers of blocks (Barpeta: 11, Baska: 7 and Nalbari: 8), same numbers of blocks have been chosen from each district. Altogether, six development blocks have been chosen for study and in selecting these blocks, some of the factors such as population, locations etc. have been taken to avoid the heterogene-ous characters of blocks. In the third stage, from each block, two villages were chosen to keep in view, representation of variations in socioeconomic conditions. Therefore, 12 villages were chosen to undertake the study. In the fourth stage, from each village, 6 to 9% households were selected at random for study, and thus per village (PV), 20 households chosen for the interview. In this way, a sample of 240 households (HHs) were interviewed.
Figure 2: Selection Process of the Household’s Sample

69Financial Inclusion in Assam: Evidences from District/Village Level Data
The study used following six indicators for measuring financial inclusion at the state level:
h Number of deposit accounts per person (as access or penetration or outreach) h Number of credit accounts per person (as access or penetration or outreach) h Number of offices of SCBs per one lakh population (as availability) h Average saving amount per deposit account (as usage/depth of the financial
system) h Average credit amount per credit account (as usage/depth of the financial system) h Average credit amount per credit account of small borrower (as usage/depth of
the marginalised groups) First three indicators are normalised by population size and the remaining three
indicators by their respective numbers of accounts. The following 14 indicators have been used for measuring financial inclusion at
district level in Assam:h Average population per bank offices (APPBO) h Average population per rural bank offices (APPRBO) h Average deposit per bank offices (ADPBO) (in Million) h Average credit per bank offices (ACPBO) (in Million) h Average credit outstanding per credit accounts (ACOPCA) (in ‘000) h No. of credit account per thousand population (NCAPTP) h Per capita credit outstanding (PCCO) (in ‘000) h Average deposit per thousand deposit account (ADPTDA) (in Million) h Per capita deposit (PCD) (in ‘000) h Average deposit per thousand deposit account in rural areas (ADPTDARA) (in Million) h Per capita deposit amount in rural areas (PCDARA) (in ‘000)h Credit deposit ratio (CDR) (%)h Households availing banking services (HABS) (%)h Rural households availing banking services (RHABS) (%)
Further, distance-from-average method was used for constructing financial inclusion index for both state/district level. First, for each indicator I, the actual value is divided by the overall average of that indicator.
Iq = Ytqs / Ytqs*
where, Ytqs is the actual value of indicator q for the states/districts ‘s’ at time ‘t’ Ytqs* is the mean value of indicator q for all the states/districts at time ‘t’ q = 1, 2,……., 6 for states, and 1,2,….,14 for districtsSubsequently, the average of all the indicators gives us the proposed composite
financial inclusion index.

THE MICROFINANCE REVIEW • Volume VIII(1) January - June 201670
State-level Financial Inclusion Index = ∑Iq /6, and District-level Financial Inclusion Index = ∑Iq /14 Indeed, for measuring village-level financial inclusion (FI) at selected district/village
three indicators for formal sector were used. These are:h Proportion of people having formal credith Proportion of people having formal savingh Proportion of people having formal insurance
Financial inclusion index was computed as follows: Formal Sector Financial Inclusion Index = ∑Ytqs /3 where, Ytqs is the value of indicator q for the district/village at time t q = formal saving, credit and insuranceHowever, for semiformal and informal sectors two indicators were used namely,
h Proportion of people having semiformal/informal credit h Proportion of people having semiformal/informal saving
Semiformal Sector Financial Inclusion Index = ∑Ytqs /2 where, Ytqs is the value of indicator q for the district/village at time t q = semiformal saving and credit Informal Sector Financial Inclusion Index = ∑Ytqs /2 where, Ytqs is the value of indicator q for the district/village at time t q = informal saving and credit Here formal sector includes all scheduled commercial banks operating in the respective
districts. Likewise, semiformal sector includes Self-Help Groups (SHGs) linked with banks and microfinance institutions (MFIs) basically BANDHAN which even though now got bank license, and informal sector includes money lenders and various private saving groups exists in the village. Moreover, informal saving includes savings of people with various Chit Fund Companies.
In village-level financial inclusion index, as the indicators are all in percentages, they are already normalised with a minimum of zero and maximum of hundred. Equal weighted average of the indicators to calculate a composite financial inclusion index of the village-level, separately for formal, semiformal and informal sources were used. The index is the average of these three components (in case of formal sources) and an aver-age of two components – saving and credit only (in case of semiformal and informal sources), which indicates the status of availed financial services. It serves as a proxy of demand for these services.
Further, after calculation of index value, one criterion for measuring the status of financial inclusion in the respective states/districts were used as mentioned in Table 1.

71Financial Inclusion in Assam: Evidences from District/Village Level Data
Since equal weighted average method to measure village-level financial inclusion were applied, same criteria as structured in Table 1 can’t be followed. The criterion for measuring village-level financial inclusion is structured in Table 2.
Results and DiscussionDelivering financial services to people
requires institutional provision. The existence of financial services is characterised by the de-mand for these services and cost of these service providers. These are major consid-erations for selecting a location of an institution. After normalizing, the availability of institutions (bank branches) by population does not reveal the real penetration of these services. To get away from this dilemma, the author made an attempt to exam-ine the outreach of the financial services separately for rural and urban, besides from the overall state level investigation. As the distance from the average method has been used to construct the index (Table 3), the average or India as a whole value of the index will be unity. Consequently, the actual value of indicators provide us a clear picture of the overall country (Appendix A and B for rural and urban respectively). The study indicates an uneven development of financial systems within India. It is apparent from the fact that the financial inclusion index of the banking outreach value of the top state (Chandigarh) is more than five times that of the bottom state (Bihar). In rural areas, the difference between the top (Chandigarh) and bottom (Daman & Diu) is close to 13 times and in urban areas the difference between the top (Chandigarh) and bottom (Ma-nipur) is nearly three times. As compared to the economic development of the state (in terms of per capita income) vis-à-vis the outreach of the banking services, it is observed that states Chandigarh, Delhi, Punjab, Haryana, Sikkim, Goa, Karnataka, Kerala, Tamil Nadu, Pondicherry have performed better on both the parameters. This reflects a larger spread of services among people in the states which are better developed. In outreach of financial services from banks, one observes wide disparity between rural and urban areas with the latter performing better in almost all the cases. Compared to other states, Chandigarh, Delhi, Sikkim, Goa and Lakshadweep are performing better in rural areas compared to urban areas.
In some situations, it has been observed that the outreach of financial service is concentrated among a smaller segment of the population. This is evident from the number of deposit and credit accounts being very low than the average, but the average deposit and credit amount per account being substantially higher than the average, for instance, Assam, Bihar, Jharkhand, Odisha for credit and Arunachal Pradesh,
Table 2: Criteria for Measuring Status of Village-Level Financial Inclusion
Criteria Status0.60 ≤ Index Value Top Performer0.35 ≤ Index Value ≤ 0.60 Average Performer0.34 ≥ Index Value Low PerformerSource: Authors’ own development.
Table 1: Criteria for Measuring Status of State/District Level Financial Inclusion
Criteria Status
1 ≤ Index Value Top Performer0.75 ≤ Index Value ≤ 1 Average Performer0.75 ≥ Index Value Low PerformerSource: Authors’ own development.

THE MICROFINANCE REVIEW • Volume VIII(1) January - June 201672
Table 3: Financial Inclusion Index across States (Overall, Rural and Urban) and their Ranks and Status using Six Indicators of Banking Outreach
StatesOverall States Rural Urban
Index Rank Status Index Rank Status Index Rank Status
Haryana 1.14 6 TOP 0.87 8 AVERAGE 1.18 7 TOPHimachal Pradesh 1.04 10 TOP 1.01 7 TOP 1.42 3 TOPJammu & Kashmir 0.82 17 AVERAGE 0.72 11 LOW 0.86 21 AVERAGEPunjab 1.19 5 TOP 1.01 7 TOP 1.19 6 TOPRajasthan 0.76 19 AVERAGE 0.56 18 LOW 0.89 19 AVERAGEChandigarh 2.81 1 TOP 4.74 1 TOP 1.95 1 TOPDelhi 2.49 2 TOP 3.21 3 TOP 1.73 2 TOPArunachal Pradesh 0.73 21 LOW 0.75 10 AVERAGE 0.87 20 AVERAGEAssam 0.59 27 LOW 0.41 26 LOW 0.93 17 AVERAGEManipur 0.56 28 LOW 0.48 23 LOW 0.58 30 LOWMeghalaya 0.74 20 LOW 0.61 17 LOW 0.93 17 AVERAGEMizoram 0.78 18 AVERAGE 0.67 12 LOW 0.67 29 LOWNagaland 0.69 23 LOW 0.49 22 LOW 0.76 26 AVERAGETripura 0.65 24 LOW 0.56 18 LOW 0.72 28 LOWBihar 0.48 29 LOW 0.38 27 LOW 0.79 24 AVERAGEJharkhand 0.6 26 LOW 0.44 25 LOW 0.75 27 AVERAGEOdisha 0.7 22 LOW 0.51 21 LOW 0.98 14 AVERAGESikkim 1.07 8 TOP 4.22 2 TOP 1.15 8 TOPWest Bengal 0.82 17 AVERAGE 0.48 23 0.97 15 AVERAGEAndaman & Nicobar Islands 0.96 14 AVERAGE 0.84 9 AVERAGE 0.9 18 AVERAGEChhattisgarh 0.69 23 LOW 0.44 25 LOW 0.89 19 AVERAGEMadhya Pradesh 0.7 22 LOW 0.51 21 LOW 0.81 22 AVERAGEUttar Pradesh 0.62 25 LOW 0.47 24 LOW 0.78 25 AVERAGEUttarakhand 0.97 13 AVERAGE 0.62 16 LOW 1.01 13 TOPGoa 1.9 3 TOP 1.76 5 TOP 1.18 7 TOPGujarat 0.96 14 AVERAGE 0.64 14 LOW 0.95 16 AVERAGEMaharashtra 1.03 11 TOP 0.53 20 LOW 1.33 4 TOPDadra & Nagar Haveli 0.87 16 AVERAGE 0.63 15 LOW 0.78 25 AVERAGEDaman & Diu 1.03 11 TOP 0.36 28 LOW 0.8 23 AVERAGEAndhra Pradesh 0.99 12 AVERAGE 0.65 13 LOW 1.1 11 TOPKarnataka 1.08 7 TOP 0.65 13 LOW 1.12 10 TOPKerala 1.05 9 TOP 0.53 20 LOW 1.22 5 TOPTamil Nadu 1.22 4 TOP 0.75 10 AVERAGE 1.13 9 TOPLakshadweep 1.07 8 TOP 2.14 4 TOP 0.72 28 LOWPondicherry 1.22 4 TOP 1.02 6 TOP 0.89 19 AVERAGEAll India 0.9 15 AVERAGE 0.55 19 LOW 1.03 12 TOPSource: Based on Banking Statistical Returns of Scheduled Commercial Bank in India 2012-13, RBI and Census of India 2011
Meghalaya, Goa for deposit. Furthermore, Sikkim is the fairly better performer than other north eastern states in terms of some of the indicators like higher density of bank offices and the high average amount of deposit per account mainly due to relatively better performance in its rural areas. Moreover, according to the stated financial inclusion criteria overall, only 40% states secured top performer status. However, 22.9% states are the top performer in rural areas while 37.1% in urban areas.

73Financial Inclusion in Assam: Evidences from District/Village Level Data
Table 4 reveals a skewed expansion of the financial system among districts within Assam. It is apparent from the fact that the financial inclusion index of the banking out-reach value of the top district (Kamrup Metro) is more than four times that of the bot-tom district (Dhubri). The same picture arises from the absolute figure of each indicator (Appendix C). Moreover, only 25.9% districts are the top performer while 40.7% are the average performer.
The above discussed financial inclusion index help us to gain insights on the performances of the states/districts with respect to the outreach of the financial services for banks. This investigation used various dimensions of financial inclusion like availability, accessibility and usage. But, some other dimensions like affordability and timelines may not be captured by using the existing data sets. The datasets also not revealed information about its users with regard to their social groups, wealth, and any other relevant aspects. Moreover, another important weakness using supply side indicators is the unavailability of data or information pertaining to financial services provided by the informal sector, which plays a very crucial role in the financial services market.
In order to have a comprehensive measurement, it is imperative to look into the demand for financial services at a village/district level. None of the villages have secured top performance ranks in the formal sector, while in semiformal and informal sector, 33% and 25% villages are top performers respectively (Table 5). As Table 5 indicates Baksa has a dominant position in all the three sources, is found to be smallest, while in Barpeta district all three are doing well. In Baksa district, access to formal sources is one out of every three households, one out of every two households in the case of both semi-final and informal sources. Indeed, in Barpeta district access to formal sources is one out of every three households, while all households are engaged in semiformal sources. But, access to informal sources is one out of every two households. Thus, a very poor picture of financial inclusion in Baksa district emerges and this raises question where do the rural people go for their financial needs.
Apart from that, the dominance of all the three sources in Barpeta district indicates the integration of formal, semiformal and informal sources in rural areas. In all the three districts, dominance of semiformal sector is found to be singificant followed by the informal sector. Thus it can be point out that semiformal institutions are successful in replacing the informal institutions in rural areas. In the same way, the performance of formal sector is found to be most ineffective in Baksa district followed by Nalbari dis-trict. Equally, the dominance of semiformal and informal institutions is found to be high in Barpeta district followed by Nalbari district. A moot question here is: why the Nalbari district could not be successful as much as Barpeta district, despite its impressive devel-opment indicators like high per capita income, literacy rate, work rate participation etc.

THE MICROFINANCE REVIEW • Volume VIII(1) January - June 201674Ta
ble
4: In
dex
Valu
e ac
ross
Dis
tric
ts o
f Ass
am a
nd th
eir R
anks
and
Sta
tus
usin
g Fo
urte
en In
dica
tors
of B
anki
ng O
utre
ach
Dist
ricts
IND
1IN
D 2
IND
3IN
D 4
IND
5IN
D 6
IND
7IN
D 8
IND
9IN
D 10
IND
11IN
D 12
IND
13IN
D 14
Ove
rall
Inde
xRa
nkSt
atus
UD
ALG
URI
0.46
0.64
0.64
1.09
0.30
0.98
0.48
0.44
0.46
0.59
0.47
1.55
0.82
0.87
0.70
21L
DA
RRA
NG
0.89
0.74
0.71
0.94
0.42
0.87
0.60
0.61
0.64
0.53
0.33
1.29
0.81
0.85
0.73
18L
SON
ITPU
R1.
151.
130.
871.
040.
871.
041.
490.
820.
990.
790.
681.
160.
900.
900.
998
AN
AG
AO
N0.
840.
871.
061.
040.
420.
980.
670.
730.
850.
630.
591.
001.
001.
040.
8415
AM
OR
0.83
0.78
0.58
0.96
0.35
0.95
0.55
0.43
0.53
0.43
0.43
1.44
1.05
1.09
0.74
17L
DH
UBR
I0.
250.
040.
780.
770.
360.
530.
310.
640.
490.
660.
340.
880.
520.
480.
5023
LKO
K0.
500.
241.
320.
860.
430.
650.
460.
870.
930.
830.
490.
650.
830.
830.
7120
LBO
N1.
100.
740.
970.
960.
560.
860.
790.
891.
100.
820.
520.
901.
311.
350.
9212
AG
OA
L0.
770.
920.
740.
710.
380.
670.
420.
650.
640.
880.
630.
931.
140.
920.
7417
LBA
KSA
0.52
1.09
0.56
0.65
0.34
0.43
0.24
0.44
0.36
0.83
0.84
0.99
0.74
0.82
0.63
22L
CHIR
AN
G0.
791.
051.
291.
010.
450.
710.
530.
861.
031.
701.
730.
710.
820.
860.
979
ABA
RPET
A0.
840.
910.
800.
990.
430.
770.
540.
640.
700.
880.
861.
090.
820.
830.
7916
AN
ALB
ARI
1.21
1.31
0.74
0.88
0.41
1.21
0.81
0.68
0.98
0.87
0.12
1.19
0.84
0.80
0.86
13A
KAM
RUP
1.13
1.36
0.63
0.98
1.18
1.66
3.20
0.71
0.96
1.24
1.81
1.01
1.25
1.24
1.31
4T
KAM
M)
1.81
1.75
2.80
2.61
1.53
2.70
6.76
5.11
1.78
4.12
5.94
0.80
1.01
1.06
2.84
1T
LAKH
1.06
1.10
0.64
1.06
0.40
1.14
0.75
0.60
0.72
0.71
0.74
1.48
0.75
0.75
0.85
14A
DIB
R1.
471.
341.
671.
200.
641.
511.
581.
712.
881.
191.
270.
771.
171.
141.
402
TD
HEM
AJI
0.48
0.36
0.74
1.14
0.38
0.91
0.56
0.57
0.50
0.73
0.50
1.56
0.79
0.81
0.72
19L
TIN
SUKI
A1.
371.
201.
100.
970.
700.
911.
041.
231.
721.
050.
810.
871.
091.
031.
086
TSI
BSA
GA
R1.
271.
221.
081.
100.
051.
200.
111.
001.
441.
041.
181.
071.
131.
191.
017
TJO
RHA
T1.
401.
271.
331.
320.
611.
481.
481.
232.
010.
961.
131.
041.
561.
731.
333
TG
OL
1.24
1.35
0.93
0.86
0.38
1.22
0.76
0.72
0.95
0.88
1.07
1.13
0.74
0.74
0.93
11A
NCH
1.41
1.58
0.74
0.43
0.46
0.74
0.56
1.20
0.15
1.42
1.59
0.49
1.24
1.32
0.95
10A
KA1.
171.
350.
610.
590.
480.
360.
280.
920.
950.
620.
690.
691.
771.
450.
8514
ACA
CHA
R1.
181.
121.
341.
070.
591.
010.
971.
411.
671.
141.
150.
840.
910.
871.
095
TH
AIL
0.85
0.54
0.89
0.75
0.35
0.84
0.49
0.72
0.08
0.68
0.45
0.82
1.11
1.17
0.70
21L
KAR
0.84
0.91
1.13
0.75
0.49
0.66
0.53
0.82
0.79
0.86
0.76
0.72
0.92
0.91
0.79
16A
ASS
AM
1.18
1.07
1.30
1.26
0.67
1.03
1.08
1.34
1.71
0.92
0.86
0.90
0.98
0.95
1.09
5T
No
te: B
ON
= B
on
gai
gao
n, D
IBR
= D
ibru
gar
h, G
OA
L= G
oal
par
a, G
OL=
Go
lag
hat
, HA
IL=
Hai
laka
nd
i, K
AM
(M) =
Kam
rup
Me
tro
po
litan
, KA
= K
arb
i An
glo
ng
,K
AR
= K
arim
gan
j, K
OK
= K
okr
ajh
ar, L
AK
H=
Lak
him
pu
r, M
OR
= M
ori
gao
n, N
CH
= N
ort
h C
ach
ar H
ills,
IND
= In
dic
ato
r 1
to1
4; L
=LO
W, A
=A
VER
AG
E, T
=TO
P,V
alu
e o
f IN
D 1
an
d IN
D 2
are
su
btr
acte
d b
y ‘2
’ to
mak
e it
sam
e d
ire
ctio
n w
ith
oth
er
ind
icat
ors
. S
ou
rce
: Au
tho
rs’ e
stim
atio
n b
ase
d o
n B
asic
Sta
tist
ical
Re
turn
s of S
CB
s in
Ind
ia R
BI 2
015;
Qu
arte
rly
Stat
isti
cs o
n D
ep
osi
ts a
nd
Cre
dit
of S
CB
s 201
5; C
en
sus o
f In
dia
201
1

75Financial Inclusion in Assam: Evidences from District/Village Level Data
Table 5: Financial Inclusion Index across Selected Districts/Villages of Assam
Districts/VillagesFormal Semiformal Informal
Index Status Index Status Index Status
Baksa 0.36 A 0.43 A 0.41 AJengrengpara 0.32 L 0.35 A 0.15 LBunmajhar Pam 0.52 A 0.45 A 0.45 ABagariguri 0.47 A 0.45 A 0.4 LSalbari 0.15 L 0.48 A 0.63 TBarpeta 0.46 A 0.72 T 0.59 ABamundi 0.45 A 0.73 T 0.65 TBamunkuchi 0.57 A 0.65 T 0.43 AGaremari 0.48 A 0.7 L 0.73 TBhare Gaon 0.35 A 0.8 L 0.58 ANalbari 0.45 A 0.64 T 0.52 ABar Makhibaha 0.45 A 0.8 L 0.6 LNamati 0.47 A 0.63 T 0.4 LBamunbari 0.48 A 0.45 A 0.28 LBaralkuchi 0.4 L 0.65 T 0.8 LTotal 0.42 A 0.59 A 0.51 AA = AVERAGE, L = LOW, T = TOPSource: Authors’ own estimation based on field survey
ConclusionsThe present study was conducted to understand financial inclusion at district/village
level by analyzing both service providers and user side of financial inclusion. From the discussion of financial inclusion indices, one observes a lot of variation across states/ districts, in both rural and urban regions in the state of Assam. Still within a state, differences are noticed between rural and urban areas in different indicators measured. The analysis of demand side indices reveals the dominant role of semiformal institutions in rural Assam and reduced role of informal lenders. From policy point of view, therefore, if more thrust is given to weak states/districts in terms of expanding semiformal insti-tutions in rural areas, it can contribute to enhancing access to financial services by all.
Note Literature (Sharma and Mathews, 2009; Das, 2010; Sharma, 2011) found the highest
concentration of informal and semiformal microfinance setups in this region.
ReferencesBeck, Thorsten, Demirguc-Kunt, Asli and Levine, Ross (2004): “Finance, Inequality and
Poverty: Cross-Country Evidence”, World Bank Policy Research Working Paper 3338, World Bank.
Burgess, Robin and Pande, Rohini (2003): “Do Rural Banks Matter? Evidence From The Indian Social Banking Experiment”, London School of Economics and Political Science, London, Discussion Paper No. DEDPS/40.
Carbo, Santigo, Gardener, Edward PM and Molyneux, Philip (2007): “Financial

THE MICROFINANCE REVIEW • Volume VIII(1) January - June 201676
Exclusion”, Palgrave MacmillanDas, D (2009): “Informal Microfinance in Assam: Empirical Evidence from Nalbari and
Baksa districts”, IFMR, Centre for MicrofinanceGovernment of India (2007): “Report of the Expert Group on Agriculture Indebtedness”,
Ministry of Finance, Chairman R Radhakrishna. - (2008): “Report of the Committee on Financial Inclusion”, Chairman C RangarajanHonohan, Patrick (2007): “Cross Country Variation in Household Access to Financial
Services”, Paper prepared for the World Bank Conference on Access to FinanceKumar, Chandan and Mishra, Srijit (2011): “Banking Outreach and Household level
Access: Analyzing Financial Inclusion in India”, Presented at the 13th Annual Conference on Money and Finance in the Indian Economy
Rangarajan, C (2008): “Report on the Committee on Financial Inclusion”, Government of India.
Sarma, Mandira (2008): “Index of Financial Inclusion”, Indian Council for Research on International Economic Relations, Working Paper No. 215
Sharma, A (2011): “An Exploratory Study on Traditional Financial Institutions of Lower Assam”, Centre for Microfinance Research, Bankers’ Institute of Rural Development & Indian Institute of Bank Management, Guwahati.
Sharma, A and Mathews, B H (2009): “Village Financial Systems in North East India”, Focus Note 21, Lucknow: MicroSave.
Singh, E. N (2011): “Rural Savings and its Investment in Manipur: A Case Study of Formal Finance vis-à-vis Marups”, Management Convergence, Vol. 2. No. 2, pp. 10-30
Singh, W. C. (2009): “Informal Financial Sector: The Case of State of Manipur”, International Review of Business Research Papers Vol. 5 No. 5 pp 160‐168
State Level Banker Committee, Assam (2014): Background Paper Quarterly. United Nations (2006): “Building Inclusive Financial Sectors for Development”,
Department of Economic and Social Affairs, United Nations.World Bank (2008): “Finance for All? Policies and Pitfalls in Expanding Access”, World
Bank Policy Research Paper, World Bank. -- (2009): “Banking the Poor: Measuring Banking Access in 54 Economies”, World Bank,
Washington DC.

77Financial Inclusion in Assam: Evidences from District/Village Level Data
Appe
ndix
A: I
ndic
ator
s of
Ban
king
Out
reac
h an
d th
eir R
anks
acr
oss
Stat
es (R
ural
) (Am
ount
in ₹)
Stat
esDe
posit
a/c
per
pe
rson
Rank
Cred
it a/
c per
pe
rson
Rank
Ave
Depo
sit
per a
/cRa
nkAv
e Cr
edit
per a
/cRa
nkAv
e cr
edit
per a
/c S
mal
l bo
rrow
erRa
nkNo
of o
ffice
s per
la
kh P
opul
atio
nRa
nk
Har
yana
0.35
170.
0411
3045
316
3126
0232
8113
11
5.66
15H
imac
hal P
rade
sh0.
896
0.08
736
859
916
9935
2958
608
1013
.86
6Ja
mm
u &
Kas
hmir
0.51
110.
0312
3090
915
1598
8728
6146
36
6.89
12Pu
njab
0.53
100.
0411
3918
58
3888
7333
7553
42
8.29
11Ra
jast
han
0.23
250.
0312
1926
228
1127
4020
6737
54
3.8
26Ch
andi
garh
6.14
10.
382
1072
751
1418
363
3470
500
382
.76
2D
elhi
2.33
50.
0510
5010
34
2886
684
3553
700
1418
.85
5A
runa
chal
Pra
desh
0.36
160.
0312
5129
43
1315
0024
5840
911
5.07
19A
ssam
0.31
200.
0312
1378
935
6609
25
3954
128
3.05
31M
anip
ur0.
1129
0.01
1428
010
1910
2640
1957
631
122.
4234
Meg
hala
ya0.
2823
0.03
1240
060
710
0050
1843
164
265.
5316
Miz
oram
0.31
200.
0510
3015
917
9037
013
4613
022
11.0
57
Nag
alan
d0.
1228
0.02
1328
390
1896
875
1753
076
152.
9132
Trip
ura
0.39
140.
078
2493
820
5867
94
3030
333
4.98
20Bi
har
0.21
260.
0312
1767
031
4634
91
3534
330
2.76
33Jh
arkh
and
0.32
190.
0411
2089
224
5421
02
2793
734
4.33
22O
dish
a0.
4213
0.06
917
871
3057
580
332
884
325.
1918
Sikk
im5.
622
0.48
145
190
522
0636
3061
428
713
0.43
1W
est B
enga
l0.
3815
0.04
1120
055
2777
819
1134
211
314.
0824
And
aman
& N
icob
ar Is
land
s0.
648
0.06
933
980
1114
7642
2659
300
99.
2810
Chha
ttis
garh
0.3
210.
0312
1824
329
6743
87
3883
429
3.77
27M
adhy
a Pr
ades
h0.
2524
0.03
1215
164
3396
336
1662
114
53.
5129
Utt
ar P
rade
sh0.
3914
0.04
1114
410
3468
106
844
461
253.
5328
Utt
arak
hand
0.58
90.
069
3147
013
1249
6222
4969
359.
798
Goa
2.4
40.
116
5587
42
2223
4431
5477
513
36.5
94
Guj
arat
0.29
220.
0411
3308
712
1296
1223
5123
317
4.96
21M
ahar
asht
ra0.
2325
0.03
1223
910
2213
8729
2545
385
243.
8525
Dad
ra &
Nag
ar H
avel
i0.
3418
0.01
1434
967
1015
8000
2752
000
166.
0114
Dam
an &
Diu
0.07
300
2400
021
03.
3330
And
hra
Prad
esh
0.39
140.
125
1346
336
6722
46
4315
027
4.96
21Ka
rnat
aka
0.44
120.
087
1750
732
9508
915
4818
420
6.4
13Ke
rala
0.14
270.
0312
3123
414
1231
5921
4935
719
235
Tam
il N
adu
0.44
120.
134
2086
825
7749
010
5044
818
5.43
17La
ksha
dwee
p2.
833
0.21
342
525
685
666
1259
666
857
.14
3Po
ndic
herr
y0.
767
0.21
321
546
2371
535
948
063
219.
629
All
Indi
a0.
3418
0.05
1020
248
2692
547
1445
804
234.
3123
So
urc
e: S
ame
as
Ap
pe
nd
ix A

THE MICROFINANCE REVIEW • Volume VIII(1) January - June 201678Ap
pend
ix B
: Ind
icat
ors
of B
anki
ng O
utre
ach
and
thei
r Ran
ks a
cros
s St
ates
(Urb
an) (
Amou
nt in
Rs)
Stat
esDe
posit
a/c
pe
r per
son
Rank
Cred
it a/
c pe
r per
son
Rank
Ave
Depo
sit
per a
/cRa
nkAv
e Cr
edit
per
a/c
Rank
Ave
cred
it pe
r a/c
Sm
all
borr
ower
Rank
No o
f offi
ces
per l
akh
Popu
latio
nRa
nk
Har
yana
2.21
80.
1514
6567
520
7298
725
6806
74
23.6
7H
imac
hal P
rade
sh2.
754
0.18
1192
524
1056
5295
1159
310
1244
.79
1Ja
mm
u &
Kas
hmir
1.59
210.
1118
6505
521
3184
2422
6507
56
16.6
21Pu
njab
2.73
50.
1548
232
3170
0366
661
167
1127
.95
5Ra
jast
han
1.68
180.
1415
4482
732
4752
2214
5894
714
17.4
717
Chan
diga
rh2.
357
0.25
615
5237
217
0915
52
7961
32
33.0
43
Del
hi3.
541
0.22
811
6724
418
2451
61
4265
030
17.0
919
Aru
nach
al P
rade
sh1.
0829
0.12
1710
9968
725
0947
2666
952
513
.25
30A
ssam
1.89
130.
219
6632
519
2145
3329
5143
321
18.6
712
Man
ipur
0.7
310.
0821
6038
923
1518
8032
6323
97
6.23
35M
egha
laya
1.22
260.
1217
1153
045
2978
5524
5924
413
17.8
215
Miz
oram
0.57
320.
0920
8813
212
1968
3330
6165
78
9.28
33N
agal
and
0.97
300.
1316
9540
89
1670
0031
5640
315
11.7
332
Trip
ura
1.38
240.
1712
5886
025
1386
1234
4070
731
14.1
528
Biha
r1.
9911
0.16
1344
607
3314
8181
3344
428
2817
.914
Jhar
khan
d1.
3225
0.09
2067
872
1833
5378
1848
099
2513
.829
Odi
sha
1.71
170.
210
8221
414
3206
0221
4561
127
21.4
98
Sikk
im1.
2127
0.09
2015
3166
356
0266
1281
142
118
.83
11W
est B
enga
l1.
8814
0.08
2159
787
2495
0326
343
294
2912
.12
31A
ndam
an &
Nic
obar
Isla
nds
1.49
220.
1316
6986
417
2982
6323
7408
33
16.7
820
Chha
ttis
garh
1.13
280.
0920
8575
213
6200
338
5187
020
14.4
326
Mad
hya
Prad
esh
1.67
190.
1217
4386
134
3278
6119
6141
59
14.7
425
Utt
ar P
rade
sh1.
8913
0.1
1940
865
3632
6574
2053
056
1714
.86
24U
ttar
akha
nd1.
7815
0.13
1680
068
1537
7907
1761
210
1024
.96
6G
oa2.
82
0.2
1011
4301
634
283
3650
065
2335
.17
2G
ujar
at2.
0910
0.1
1949
938
2975
6978
447
784
2614
.86
24M
ahar
asht
ra2.
793
0.46
210
5646
858
6929
1017
874
3614
.24
27D
adra
& N
agar
Hav
eli
1.74
160.
0423
4896
430
6384
287
2625
035
18.0
113
Dam
an &
Diu
1.59
210.
0324
7037
116
5933
339
3400
034
17.4
916
And
hra
Prad
esh
2.56
60.
314
4363
635
3830
5316
4945
424
19.6
310
Karn
atak
a2.
566
0.24
763
099
2246
0968
1553
211
1620
.05
9Ke
rala
2.11
90.
413
5735
127
2240
3727
5243
618
29.2
14
Tam
il N
adu
1.9
120.
481
5499
328
2533
1425
3993
132
16.0
922
Laks
hadw
eep
0.48
330.
0622
1646
251
9700
035
5200
019
834
Pond
iche
rry
1.43
230.
265
5805
526
2185
0228
5049
722
15.5
923
All
Indi
a1.
6420
0.24
788
772
1149
2697
1339
800
3317
.218
Sour
ce: S
ame
as A
ppen
dix
A

79Financial Inclusion in Assam: Evidences from District/Village Level Data
Appe
ndix
C: D
istr
ict-
wis
e Ab
solu
te N
umbe
rs o
f Ban
king
Per
form
ance
Par
amet
ers
in A
ssam
(Am
ount
in ₹)
Dist
ricts
IND
1IN
D 2
IND
3IN
D 4
IND
5IN
D 6
IND
7IN
D 8
IND
9IN
D 10
IND
11IN
D 12
IND
13IN
D 14
APPB
OAP
PRBO
ADPB
OAC
PBO
ACO
PCA
NCAP
TPPC
COAD
PTDA
PCD
ADPT
DARA
PCDA
RACD
RHA
BSRH
ABS
BAKS
A25
677.
725
346.
818
8.7
87.2
76.6
29.8
2.3
12.7
5.6
12.7
5.7
41.0
33.6
33.3
BARP
TA20
162.
230
319
268.
313
2.3
96.4
54.1
5.2
18.5
11.0
13.4
5.8
45.2
36.9
33.4
BON
1571
9.2
3494
4.1
326.
112
8.9
126.
459
.87.
625
.617
.312
.63.
537
.558
.954
.3CA
CHA
R14
234.
624
502.
644
9.0
143.
313
2.4
70.3
9.3
40.8
26.2
17.5
7.8
35.0
41.0
35CH
I20
963.
626
283.
843
2.7
135.
610
1.9
49.8
5.1
24.8
16.3
26.0
11.7
29.6
36.9
34.8
DA
RR19
343.
834
920.
223
7.4
126.
595
.160
.65.
817
.810
.18.
12.
253
.836
.534
.5D
HE
2638
9.7
4556
0.6
247.
715
2.7
84.9
63.2
5.4
16.6
7.9
11.6
3.4
65.0
35.7
32.7
DH
UBR
I30
457.
254
548.
726
110
3.5
80.4
36.8
3.0
18.6
7.7
10.1
2.3
36.8
23.3
19.3
DIB
R92
10.7
1834
9.2
557.
216
1.0
143.
310
5.8
15.2
49.6
45.3
18.2
8.6
32.0
5346
.2G
OA
L21
450.
730
004.
224
7.4
95.9
85.1
47.0
4.0
18.8
10.1
13.5
4.3
38.8
51.3
37.2
GO
L13
171.
517
947.
231
0.7
114.
985
.384
.97.
220
.915
.013
.57.
347
.033
.330
.0H
AIL
1997
8.7
4074
3.7
298.
210
1.0
79.4
58.6
4.7
20.8
1.2
10.4
3.0
34.3
50.2
47.2
JOR
1040
2.4
2027
2.6
445.
917
7.2
136.
810
3.4
14.1
35.6
31.7
14.7
7.6
43.5
70.3
69.7
KAM
1517
5.4
1785
9.1
211.
913
1.3
264.
211
6.2
30.7
20.5
15.2
18.9
12.3
42.1
56.2
49.9
KAM
(M)
3317
.369
97.6
936.
835
0.1
343.
718
8.5
64.8
147.
428
.063
.140
.133
.445
.442
.9KA
1448
9.6
1794
3.6
202.
779
.610
8.0
24.8
2.7
26.6
15.0
9.6
4.7
28.7
8058
.4KA
R20
142.
430
242.
937
6.5
100.
811
0.7
46.0
5.1
23.6
12.5
13.2
5.1
30.1
41.7
36.7
KOK
2609
2.4
4895
344
3.2
116.
096
.845
.24.
425
.114
.612
.83.
326
.937
.533
.5LA
KH16
283.
425
021.
221
5.4
142.
590
.279
.37.
217
.411
.410
.95.
061
.733
.730
.4M
OR
2037
0.7
3400
4.8
193.
412
9.2
78.9
66.3
5.2
12.4
8.3
6.6
2.9
60.0
47.4
43.9
NA
G20
169.
831
464.
535
3.6
139.
894
.368
.16.
421
.113
.49.
74.
041
.745
.142
.1N
AL
1377
9.3
1913
6.4
246.
811
7.5
91.5
84.5
7.7
19.7
15.5
13.3
0.8
49.5
37.8
32.3
NCH
1019
5.3
1166
2.5
247.
857
.710
3.3
51.8
5.4
34.6
2.4
21.7
10.8
20.6
55.8
53.2
SIB
1264
8.9
2168
6.5
361.
214
7.1
12.1
84.1
1.0
29.0
22.6
16.0
8.0
44.4
51.0
48.0
SON
1480
0.8
2430
9.2
292.
213
9.3
195.
372
.914
.223
.615
.512
.14.
648
.140
.736
.3TI
N10
974.
622
149.
736
6.4
130.
515
6.4
63.7
10.0
35.4
27.1
16.1
5.5
36.2
49.0
41.6
UD
A26
828
3781
421
5.3
145.
967
.368
.84.
612
.67.
39.
03.
264
.637
.035
.3A
SSA
M14
177.
925
751.
243
5.2
168.
914
9.6
71.7
10.4
38.7
26.9
14.1
5.8
37.3
44.1
38.3
No
te: B
ON
= B
on
gai
gao
n, C
HI=
Ch
iran
g, D
AR
R=
Dar
ran
g, D
HE=
Dh
emaj
i, DIB
R=
Dib
rug
arh
, GO
AL=
Go
alp
ara,
GO
L= G
ola
gh
at, H
AIL
= H
aila
kan
di, J
OR
= Jo
rhat
, KA
M=
Kam
rup
, KA
M (M
) =
Kam
rup
Met
rop
olit
an, K
A=
Kar
bi A
ng
lon
g, K
AR
= K
arim
gan
j, KO
K= Ko
kraj
har
, LA
KH
= La
khim
pu
r, MO
R=
Mo
rigao
n, N
AG
= N
agao
n, N
AL=
Nal
bar
i, NC
H=
No
rth
Cac
har
Hill
s, SI
B=
Sib
sag
ar,
SO
N=
So
nit
pu
r, T
IN=
Tin
suki
a,
UD
A=
Ud
alg
uri
; IN
Dj=
Ind
icat
or
1……
….1
4.
Sou
rce:
Au
tho
rs’ e
stim
atio
n b
ase
d o
n B
asic
Stat
isti
cal R
etu
rns o
f SC
Bs i
n In
dia
, RB
I, 201
5; Q
uar
terl
y Sta
tist
ics o
n D
epo
sits
and
Cre
dit
of S
CB
s, M
arch
201
5; C
ensu
s of I
nd
ia, 2
011

* Assistant Professor Forman Christian College
Lahore, Punjab, PakistanE-Mail: [email protected]
Women would experience more holistic well-being with the support of their
community.
Key Words: Microfinance, Women Borrowers, Well-being, Community
Microfinance Loan Services, Community and Well-being - A Case of
Women Borrowers from Pakistan
- Sara Rizvi Jafree*
AbstractThis study aims to investigate how additional support from
the microfinance provider and community could facilitate the holistic well-being of Pakistan’s women microfinance borrowers. Five different microfinance providers were sampled randomly from Lahore. Questionnaires, developed with the help of loan-officers, were administered to 149 women borrowers belonging to both rural and urban zones. Descriptive statistics and multivariate regression analysis was used to show the socio-demographic characteristics of women borrowers and the odds of improved well-being, respectively. Findings revealed that women could attain improved well-being if they received additional social development features as part of their loan portfolio such as monthly meetings, health insurance schemes and flexible loan designs for repeat clients. It was also found that women had higher odds of experiencing well-being when husband and in-laws shared domestic responsibilities, provided emotional support for paid-work participation and encouraged the involvement of women in decision-making for the home and family.
IntroductionOne quarter of the world’s population is living below
poverty lines (Okin, 2003); of which an overwhelming 70% are women (Schreiner, 2002). Reasons for the feminisation of poverty include a complex interplay of lower employability, reproductive and home-management burdens, less owner-ship of resources and structural inadequacies (Delisle, 2008; Okin, 2003; Pressman, 2003). Microfinance providers offer

81Microfinance Loan Services, Community and Well-being - A Case of Women Borrowers from Pakistan
loans to poor clients for small business mobilisation without the prerequisite of bank saving accounts or assets for mortgage (Bradbury and Reason, 2003; Vonderlack and Schreiner, 2002). Approximately 73% of the world microfinance borrowers are women (D’espallier, et al., 2011) and it is believed that they benefit from business mobilisation and financial autonomy (Schreiner, 2002).
However, empirical statistics for the holistic well-being in women borrowers of microfinance is heavily contested (Haile, et al. 2012). Some scholars have concluded that women gain some level of financial independence (Goldberg, 2005; Swain and Wallentin, 2009), but do not attain holistic well-being due to regressive community norms (Swain and Wallentin, 2009) and limited loan portfolio features (Gough and McGregor, 2007; McGregor and Sumner, 2010). Well-being is a socio-cultural construction derived from individual interpretations and it is advised that its measurement is best captured through region-specific studies (DiCicco-Bloom and Crabtree, 2006). In consideration of this, women borrowers of microfinance must not be assumed ‘privileged’ and the investiga-tion of their ‘silent voices’ must be pursued (Ackerly, 2000; Nussbaum, 2003; Sen, 1985), to better understand their experiences in attempting to attain well-being (Fossey, et al. 2002; Robeyns, 2003).
The objective of this study was to identify how the well-being of women borrowers of microfinance could be improved through support from microfinance providers and the community. Findings from this study will be of interest to microfinance policy makers and women development agents, who are planning initiatives for the social development of disadvantaged women in the region through microfinance and socio-cultural initiatives.
Background of Microfinance in PakistanPakistan has a majority Muslim population, with a strongly conservative and
patriarchal cultural constitution (PES, 2013). A staggering 64% of the Pakistani women are living below poverty lines (Lister, 2005). The known challenges faced by Pakistani women include lack of access to education, restrictions in labor participation (Latif, 2009), inadequate health conditions, lower life expectancy (Winkvist and Akhtar, 2000), high rates of violence (Niaz, 2004), and the absence of state and legal support (Hussain, 2008).
There are 30 microfinance providers operating in the country, providing loans to 2.5 million borrowers (IFAD, 2013), of which 60% are women (PMN, 2013). Three types of microfinance providers are licensed to operate in the country- institutes, banks and non-governmental organisations (NGO’s). The banks are regulated by the State Bank of Pakistan, whereas the institutes and NGO’s are regulated by the Securities and Exchange Commission of Pakistan. About 67% of the country’s microfinance borrowers are from the Punjab province (Burki, 2009). Lahore is the capital of the Punjab province and it is described as having high urban and rural poverty, structural shortfalls, and informal

THE MICROFINANCE REVIEW • Volume VIII(1) January - June 201682
employment sector opportunities, especially for women (Zaidi, 2011). Microfinance providers deliver services to low-income borrowers with the help of individual loan-officers. Loan-officers have front-line and frequent interaction with borrowers and are responsible for recruitment of client, dispatching of loan, maintenance of client-file and holding regular meetings with the client to monitor business dealings, loan return and personal issues (Bradbury and Reason, 2003; Cheston and Kuhn, 2002; Jordan, 2004). Microfinance providers in Pakistan employ women loan-officers to manage the loan-portfolio of women clients (Safavian and Haq, 2013), as the interaction between men and women who are not related by blood or marriage is prohibited. Each microfinance provider branch-office has one female site-manager who is responsible for the site loan-portfolio and the individual women loan-officers.
Methodology
Study DesignThis paper is part of a dissertation by the author titled: ‘The association between quality
of life improvements and loan-taking in women borrowers of microfinance in Pakistan’, of which two papers have already been published (Jafree and Ahmad, 2013a; 2013b). The study was reviewed and approved by the Institutional Review Board, University of the Punjab. Permission for data collection was also taken from the executive heads of each microfinance provider. Respondents were requested for answering the survey and made aware of the research objectives. They were also assured of confidentiality, anonymity and that they could withdraw from the interview at any time during proceedings.
Sample A total of five different microfinance providers were selected through stratified
random sampling, across different geographical regions of Lahore. The aim was to in-clude at least one of each type of MFI from the three types of microfinance providers. The sampled microfinance providers included: Kashf, Khushaali Bank Ltd. (KBL), First Microfinance Bank Ltd. (FMBL), Damen, and Center for Women’s Cooperation and De-velopment (CWCD). Kashf and Damen are institutes, KBL and FMBL are banks and CWCD is an NGO. The selection criteria for respondents included women borrowers of microfinance who had completed at least one year of loan-cycle or more. The respond-ents were selected based on random arrival for monthly loan installment repayment from both rural and urban Lahore. A total 149 women were interviewed; 30 each from Kashf, KBL, Damen and CWCD, and 29 from FMBL.
SurveySurvey questions related to support needed for women borrowers, to attain holistic
well-being, support needed from microfinance provider and community, were developed using help from women loan officers and site managers. It was important to itemise

83Microfinance Loan Services, Community and Well-being - A Case of Women Borrowers from Pakistan
these questions specifically, instead of leaving them open-ended, as majority women borrowers of microfinance are illiterate or semi-literate and support was needed to assist them to respond (Robeyns, 2003). Other researchers have also adopted the process of holding meetings with loan-officers, to ascertain and corroborate difficulties faced by women borrowers (Haq and Safavian, 2013; Kantor and Andersen, 2007). Meetings with 4 women loan-officers and 2 site-managers who had more than three years of working experience with women borrowers were held. Given their busy schedules, loan-officers and site-managers were recruited purposively based on availability from Kashf and KBL.
In all, the survey included questions related to: (i) the socio-demograph-ic profile of respondents, (ii) the quality of life (reported in another paper) and iii) 13 questions related to support needed from microfinance provider and community in order for women borrowers to attain holistic well-being. The questions related to support from microfinance provider included the following 8 items, availability of: (i) savings scheme, (ii) health insurance schemes, (iii) non-business loans, (iv) group borrowing, (v) skill and development training, (vi) monthly meetings with loan provider, (vii) flexible loan design for repeat clients (prompts listed: larger loan and lower inter-est rates), and (viii) home collection of monthly installments. Questions related to sup-port needed for women borrowers from the community included 5 items: (i) domestic assistance for home and child care, (ii) affordable cost and safety in public transport, (iii) emotional and verbal encouragement from husbands and in-laws, (iv) support to make autonomous small decisions within household for family well-being (prompts listed: sending children to school and buying things for the household) , and (v) support to contribute in large decisions within household for family well-being (prompts listed: the marriage of children and family investments). The prompts for the last two questions were generated from previous research (Acharya, et al., 2010; Jayachandran, 2014).
Data CollectionThe questionnaires were filled by the researcher with the help of two research as-
sistants. Each interview lasted 45-60 minutes. The survey questions were asked in Urdu and Punjabi, the native language of respondents. Interviews were conducted in a private room at the microfinance disbursement center with only the respondent and interviewer present. After the interview, respondents were given a free gift-bag, in appreciation for their time and effort.
Data AnalysisThe data was analyzed using SPSS 17.0. Descriptive statistics were used to identify
frequencies and percentages of the socio-demographic characteristics of respondents and multivariate regression was used to assess the odds of improved well-being for women borrowers. Other researchers have also used regression analysis to assess the influence of microfinance on women’s lives (Goldberg, 2005; Hashemi, et al., 1996). Odds

THE MICROFINANCE REVIEW • Volume VIII(1) January - June 201684
ratio and 95% confidence intervals were calculated and multivariate logistic regression was applied to all variables that had at least a marginal univariate predictive value of p < 0.05. The 13 item list for support needed to attain well-being was compounded into one variable and for each respondent a dummy variable was assigned of the following nature- ‘1’ for support needed from provider and community to attain improvement in well-being and ‘0’ for support not needed from provider and community to attain im-provement in well being. Age (as a continuous variable), literacy and household income were held constant and a p value of <0.05 level was considered statistically significant.
Findings
Socio-Demographic CharacteristicsTable 1 describes the respondent’s socio-demographic characteristics. A total of 149 re-
spondents were surveyed; of which all were female Muslims who had successfully com-pleted more than one annual cycle of loan utilisation. Their ages ranged from 20 to 57 years, with a mean age of 34 years. A majority of women were married and living with spouse (N=116, 77.9%). As many as 58 women were illiterate, meaning they did not know how to read or write and they had never received any formal education in an academic institution (77.9%). A majority of 91 women had attained either primary or secondary level literacy (22.1%). A total of 82 women were self-employed in small enterprise, including: (i) embroidery and stitching work from home (N=72, 48.3%) and (ii) retail sale of ware-house purchases from rented shop or from home (N=10, 6.7%). It was found that 67 women had abandoned attempts to mobilise small businesses and were retaining private occupa-tions to be able to generate income and repay loans. The privately employed respondents were occupied in embroidery and stitching work (N=53, 35.6%), beauty parlor work (N=5, 3.4%), as teachers in small private schools (N=5, 3.4%), and as domestic servants performing housekeeping duties (N=4, 2.7%). All respondents belonged to the informal sector of employment characterised by low-income, irregular pay and the absence of labor contracts and pension.
Table 1: Socio-Demographic Characteristics of the Respondents (N=149)
Category f (%)
Age-group 20-29 years 48 (32.2) 30-57 years 101 (67.8) Marital Status Currently married 116 (77.9) Never married/ Widowed/ Divorced/ Separated 33 (22.1) Literacy Status Illiterate 58 (38.9) Primary or secondary literacy 91 (61.1) Nature of Employment Self-employed in small enterprise Embroidery and stitching (from home) 72 (48.3) Retail sale of warehouse purchases 10 (6.7) Private employee Embroidery and stitching (for employer) 53 (35.6) Working at a beauty parlour 5 (3.4) Teacher 5 (3.4) Domestic servant 4(2.7)
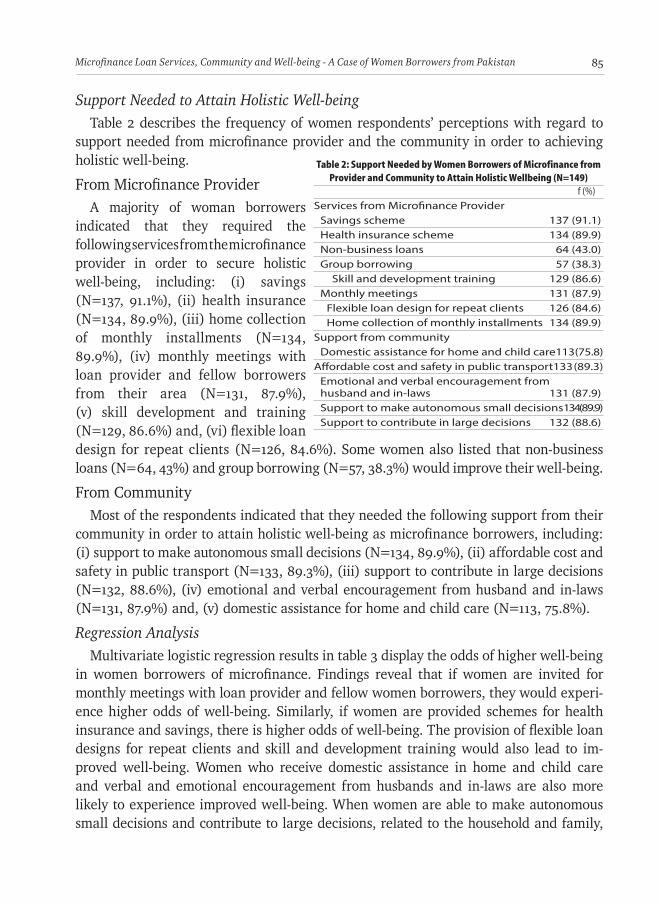
85Microfinance Loan Services, Community and Well-being - A Case of Women Borrowers from Pakistan
Support Needed to Attain Holistic Well-beingTable 2 describes the frequency of women respondents’ perceptions with regard to
support needed from microfinance provider and the community in order to achieving holistic well-being.
From Microfinance ProviderA majority of woman borrowers
indicated that they required the follo wing services from the microfinance provider in order to secure holistic well-being, including: (i) savings (N=137, 91.1%), (ii) health insurance (N=134, 89.9%), (iii) home collection of monthly installments (N=134, 89.9%), (iv) monthly meetings with loan provider and fellow borrowers from their area (N=131, 87.9%), (v) skill development and training (N=129, 86.6%) and, (vi) flexible loan design for repeat clients (N=126, 84.6%). Some women also listed that non-business loans (N=64, 43%) and group borrowing (N=57, 38.3%) would improve their well-being.
From CommunityMost of the respondents indicated that they needed the following support from their
community in order to attain holistic well-being as microfinance borrowers, including: (i) support to make autonomous small decisions (N=134, 89.9%), (ii) affordable cost and safety in public transport (N=133, 89.3%), (iii) support to contribute in large decisions (N=132, 88.6%), (iv) emotional and verbal encouragement from husband and in-laws (N=131, 87.9%) and, (v) domestic assistance for home and child care (N=113, 75.8%).
Regression AnalysisMultivariate logistic regression results in table 3 display the odds of higher well-being
in women borrowers of microfinance. Findings reveal that if women are invited for monthly meetings with loan provider and fellow women borrowers, they would experi-ence higher odds of well-being. Similarly, if women are provided schemes for health insurance and savings, there is higher odds of well-being. The provision of flexible loan designs for repeat clients and skill and development training would also lead to im-proved well-being. Women who receive domestic assistance in home and child care and verbal and emotional encouragement from husbands and in-laws are also more likely to experience improved well-being. When women are able to make autonomous small decisions and contribute to large decisions, related to the household and family,
Table 2: Support Needed by Women Borrowers of Microfinance from Provider and Community to Attain Holistic Wellbeing (N=149)
f (%)
Services from Microfinance Provider Savings scheme 137 (91.1) Health insurance scheme 134 (89.9) Non-business loans 64 (43.0) Group borrowing 57 (38.3) Skill and development training 129 (86.6) Monthly meetings 131 (87.9) Flexible loan design for repeat clients 126 (84.6) Home collection of monthly installments 134 (89.9)Support from community Domestic assistance for home and child care 113 (75.8)Affordable cost and safety in public transport 133 (89.3) Emotional and verbal encouragement from husband and in-laws 131 (87.9) Support to make autonomous small decisions 134 (89.9) Support to contribute in large decisions 132 (88.6)

THE MICROFINANCE REVIEW • Volume VIII(1) January - June 201686
they are more likely to experience im-proved well-being. Also, the following loan-portfolio changes would ensure improved well-being for women: (i) affordable cost and safety of public transport, (ii) provision of non-busi-ness loans, (iii) availability of group borrowing, and (iv) home collection of monthly installments. Finally, the socio-demographic characteristics of being self-employed women in small enterprise has higher odds of well-being for women borrowers.
ConclusionThis study attempts to identify chal-
lenges to well-being for women mi-crofinance borrowers from a regional perspective. With regard to socio-de-mographic association, it was found that women using loans for small business mobilisation had higher like-lihood of experiencing well-being. Other research confirms that many women are using microfinance loans for basic necessities instead of small business mobilisation and this pre-vents their empowerment and auto-nomy (Hulme, 2000; Sinclair, 2012).
It was highlighted that women borrowers need additional support from the microfinance provider in terms of improvement in the loan service portfolio. Women borrowers would benefit from the inclusion of social development features by the provider, including group borrow-ing, skill development and training, savings and healthcare insurance,
Table 3: Multivariate Logistic Odds Ratio of Additional Services and Support from Microfinance Provider and Community Respectively and its Association with Higher Odds of Wellbeing for Women Borrowers
Odds of Higher Wellbeing AOR (95% CI)
Marital Status Currently Married 0.75 (0.14-2.65) Currently not married 1Business Type Self-employed 1.57 (0.14-3.65)** Private employee 1Savings scheme Needed 2.54 (1.57-4.87)** Not needed 1Health insurance scheme Needed 6.75 (3.14-8.65)** Not needed 1Non-business loans Needed 1.77 (0.92-3.42)* Not needed 1Group borrowing Needed 1.08 (0.55-2.09)* Not needed 1Skill and development training Needed 2.76 (1.12-3.21)*** Not needed 1Monthly meetings with loan provider Needed 3.76 (7.15-11.81)*** Not needed 1Flexible loan design for repeat clients Needed 3.30 (1.96-4.84)*** Not needed 1Home collection of monthly installments Needed 1.75 (0.89-2.14)* Not needed 1Domestic assistance for home and child care Needed 2.85 (0.81-4.32)*** Not needed 1Affordable cost and safety in public transport Needed 1.87 (0.32-3.01)** Not needed 1Emotional and verbal encouragement from husband and in-laws Needed 2.34 (0.67-3.87)*** Not needed 1Support to make autonomous small decisions Needed 2.14 (1.03-4.50)*** Not needed 1Support to contribute in large decisions Needed 2.55 (1.04-3.57)*** Not needed 1P-value significance: ***p < 0.01, **p < 0.05, *p < 0.1Abbreviations: 1, reference category; AOR, adjusted odds ratio; CI, confidence intervalNotes: Multivariate logistic regression analysis was carried out to obtain AOR after controlling for respondent illiteracy, low household income and age (continuous variable)

87Microfinance Loan Services, Community and Well-being - A Case of Women Borrowers from Pakistan
monthly meetings, flexible design for repeat clients, home collection of monthly install-ments and the provision of non-business loans (Bateman and Chang, 2009; McIntosh and Wydick, 2005; Sriram, 2010). Previous studies have confirmed that microfinance providers have stopped providing social development services (Asquith, et al., 2005; Yunus, et al., 2010), in order to survive in a commercially competitive market (Duven-dack et al., 2011; Nair, 2011). Women from developing regions require more support for savings and health insurance (Basu and Srivastava, 2005), especially in the absence of state provision and formal sector employment (Barrientos, et al., 2003). Also, successful repeat clients who receive lower interest rates and larger loan sizes are able to expand business and emerge from poverty (D’Espallier, et al., 2009). Microfinance providers need funding and assistance from the state, welfare bodies and international agents to maintain the provision of social development features in their loan portfolio to support women adequately in developing regions (Rankin, 2002).
Findings also suggest that women would experience more holistic well-being from the support of their community, in terms of symmetrical domestic assistance for home and child care, emotional and verbal encouragement from spouse and in-laws, affordable cost and safety in public transport, and the ability to make small decisions and contrib-ute to large decisions for the household and family.
Acknowledgements Author wishes to thank Mr. Kamran Azim (Manager Operations, Kashf), Ms. Salimah
Shiraz (Communications Head, First Microfinance Bank Ltd), Mr. Shahid Chaudhry (Regional Operations Manager, at Khushhali Bank Ltd.), Mr. Naveed Aslam (Operations Manager CWCD) and Ms. Naghma Rashid (Country Director, Damen); and also, the individual branch and site managers Ms. Faeza Ashraf and Ms. Saira Yusuf (Kashf), Mr. Nadeem Suleiman (First Microfinance Bank Ltd) Mr. Asif Mansha (Khushhali Bank Ltd.) Mr. Imran Ali (CWCD) and Mr. Rana Khurram Subhani (Damen).
ReferencesAcharya, D R, Bell, J S, Simkhada, P, van Teijlingen, E. R and Regmi, P R (2010): “Research
Women’s Autonomy in Household Decision-making: A Demographic Study in Nepal”, Reproductive Health, 7(15), 1-12.
Ackerly, B A (2000): “Political Theory and Feminist Social Criticism”, Cambridge University Press.
Asquith, S, Clark, C L, Waterhouse, L and Britain, G (2005): “The Role of the Social Worker in the 21st century: A Literature Review”, Scottish Executive Education Department.
Barrientos, A, Gorman, M and Heslop, A (2003): “Old Age Poverty in Developing Countries: Contributions and Dependence in Later Life”, World Development, 31(3), 555-570.
Basu, P and Srivastava, P (2005): “Scaling-up Microfinance for India’s Rural Poor”. Bateman, M and Chang, H J (2009): “The Microfinance Illusion”, Unpublished
Manuscript, Cambridge, University of Cambridge, www.econ.cam.ac.uk/faculty/chang/pubs/ Microfinance.pdf.
Bradbury, H and Reason, P (2003): Action Research An Opportunity for Revitalising

THE MICROFINANCE REVIEW • Volume VIII(1) January - June 201688
Research Purpose and Practices, Qualitative Social Work, 2(2), 155-175. Burki, H B (2009): Unraveling the Delinquency Problem (2008/2009) in Punjab-
Pakistan, Pakistan Microfinance Network, MicroNote (10). Cheston, S and Kuhn, L (2002): “Empowering Women through Microfinance”, Draft,
Opportunity International. D’espallier, B, Guérin, I and Mersland, R (2009): “Women and Repayment in Microfinance”. - (2011): “Women and Repayment in Microfinance: A Global Analysis”, World Development,
39(5), 758-772. Delisle, H F (2008): “Poverty Annals of the New York Academy of Sciences”, 1136(1),
172-184. DiCicco-Bloom, B and Crabtree, B F (2006): The Qualitative Research Interview, Medical
Education, 40(4), 314-321. Duvendack, M, Palmer-Jones, R, Copestake, J G, Hooper, L, Loke, Y and Rao, N (2011):
What is the Evidence of the Impact of Microfinance on the Well-being of Poor People? Fossey, E, Harvey, C, McDermott, F and Davidson, L (2002): “Understanding and
Evaluating Qualitative Research”, Australian and New Zealand Journal of Psychiatry, 36(6), 717-732.
Goldberg, N (2005): Measuring the Impact of Microfinance: Taking Stock of What we know. Grameen Foundation USA Publication Series.
Gough, I and McGregor, J A (2007): “Well-being in Developing Countries: From Theory to Research”, Cambridge University Press.
Haile, H B, Bock, B and Folmer, H (2012): “Microfinance and Female Empowerment: Do Institutions Matter? Paper presented at the Women’s Studies International Forum.
Haq, A and Safavian, M (2013): Are Pakistan’s Women Entrepreneurs Being Served by the Microfinance Sector?, Are They Being Served by the Microfinance Sector?, World Bank Publications.
Hulme, D (2000): “Impact Assessment Methodologies for Microfinance: Theory, Experience and Better Practice”, World Development, 28(1), 79-98.
Hussain, I (2008): “Problems of Working Women in Karachi, Pakistan”, Cambridge Scholars Publishing.
IFAD (2013): “The Pakistan Microfinance Industry - A Showcase of Actors, Factors, Ttriggers and Drivers of its Growing Success, International Fund for Agricultural Development, Rome, Italy.
Jafree, S R and Ahmad, K (2013a): “Women Borrowers of Microfinance: An Urban Lahore Study”, Journal of Third World Studies, 30(2), 151.
- (2013b): “Women Microfinance Users and Their Association with Improvement in Quality of Life: Evidence from Pakistan. Asian Women, 29(4), 73-105.
Jayachandran, S (2014): “The Roots of Gender Inequality in Developing Countries”, National Bureau of Economic Research.
Jordan, B (2004): “Emancipatory Social Work? Opportunity or Oxymoron, British Journal of Social Work, 34(1), 5-19.
Kantor, P and Andersen, E (2007): “Microcredit, Informal Credit and Rural Livelihoods: A Village Case Study in Kabul Province”, Afghanistan Research and Evaluation Unit.
Latif, A (2009): “A Critical Analysis of School Enrollment and Literacy Rates of Girls and Women in Pakistan, Educational Studies, 45(5), 424-439.
Lister, R (2005): Women’s and Children’s Poverty: Making the links. McGregor, A and Sumner, A (2010): Beyond Business as Usual: What Might 3-D Well-
being Contribute to MDG Momentum?, IDS Bulletin, 41(1), 104-112. McIntosh, C and Wydick, B (2005): Competition and Microfinance, Journal of Development
Economics, 78(2), 271-298.

89Microfinance Loan Services, Community and Well-being - A Case of Women Borrowers from Pakistan
Nair, T (2011): “Microfinance: Lessons from a Crisis”, Economic and Political Weekly, 5, 23-26.
Niaz, U (2004): “Women’s Mental Health in Pakistan”, World Psychiatry, 3(1), 60. Nussbaum, M (2003): “Capabilities as Fundamental Entitlements: Sen and Social Justice,
Feminist Economics, 9(2-3), 33-59. Okin, S M (2003): “Poverty, Well-being and Gender: What Counts, Who’s Heard?”,
Philosophy and Public Affairs, 31(3), 280-316. PES (2013): Pakistan Economic Survey 2011-12, Finance Division, Government of Pakistan,
Islamabad.PMN (2013): “Microfinance Summit Pakistan 2013”, Conference Report: Summary and
Key Insights, Pakistan Microfinance Network, Islamabad, Pakistan.Pressman, S (2003): “Feminist Explanations for the Feminization of Poverty”, Journal of
Economic Issues, 353-361. Rankin, K N (2002): “Social Capital, Microfinance and the Politics of Development”,
Feminist Economics, 8(1), 1-24. Robeyns, I (2003): “Sen’s Capability Approach and Gender Inequality: Selecting Relevant
Capabilities”, Feminist Economics, 9(2-3), 61-92. Safavian, M and Haq, A (2013): “Are Pakistan’s Women Entrepreneurs Being Served by
the Microfinance Sector?”Schreiner, M (2002): “Aspects of Outreach: A Framework for Discussion of the Social
Benefits of Microfinance”, Journal of International Development, 14(5), 591-603. Sen, A (1985): “Well-being, Agency and Freedom: the Dewey Lectures 1984”, The Journal
of Philosophy, 82(4), 169-221. Sinclair, H (2012): “Confessions of a Microfinance Heretic: How Microlending Lost its
Way and Betrayed the Poor”, Berrett-Koehler Publishers.Sriram, M S (2010): “Microfinance: A Fairy Tale Turns into a Nightmare”, Economic and
Political Weekly, 45(43), 10-13. Swain, R B and Wallentin, F Y (2009): “Does Microfinance Empower Women? Evidence
from Self-Help Groups in India”, International Review of Applied Economics, 23(5), 541-556.
Vonderlack, R M and Schreiner, M (2002): “Women, Microfinance and Savings: Lessons and Proposals”, Development in Practice, 12(5), 602-612.
Winkvist, A and Akhtar, H Z (2000): “God should give Daughters to Rich Families only: Attitudes Towards Childbearing among Low-income Women in Punjab, Pakistan, Social Science and Medicine, 51(1), 73-81.
Yunus, M, Moingeon, B and Lehmann-Ortega, L (2010): “Building Social Business Models: Lessons from the Grameen Experience”, Long Range Planning, 43(2), 308-325.
Zaidi, S H (2011): Urban Poverty in Pakistan.

* Assistant Professor Department of Economics Presidency University, Kolkata E-mail: [email protected]
Group-centric lending has now been recognised as a
well known instrument to provide access to formal credit to the poor section across the globe. With
the framework of SHG-PACCS linkage model in India this study analyse
how recurrent savings and peer monitoring ensure
the access to formal credit for the poor and thereby improve social welfare.
Key Words: Group-centric lending, Self-Help Groups, Social Welfare
Microcredit-Microsavings Interlinkage: An Explanation
- Supravat Bagli*
AbstractGroup-centric lending has now been recognised as a well
known instrument to provide access to formal credit to the poor section across the globe. A series of theoretical studies have tried to explain how the joint liability aspect of group lending mitigates the problems of asymmetric information and thereby expand access to affordable formal credit for the poor. However, study relating to the role of other features of the group-centric lending like direct monitoring by the lender, recurrent savings, peer monitoring, peer selection on over all welfare are less common in literature. With the framework of SHG-PACCS linkage model in India this study analyse how recurrent savings and peer monitoring ensure the access to formal credit for the poor and thereby improve social welfare. This study has also shown that intensity of borrowing in this model excessively depend on cumulative savings of the parti cular borrower.
IntroductionIn most of the developing countries financial institutions
apply group-centric microfinance programme to facilitate lending to the poor. However, the features of group-centric microfinance programmes differ from country to country even these vary across the different programmes within a country. In India group centric microfinance is very much popular for extending microfinance to the poor. The group of the microfinance programmes in India are commonly called Self-Help Group (SHG). The distinct feature of the Indian SHG is that the participation in SHG is voluntary. Although SHGs have common objectives and working philosophy, based on the modes of formation, nurturing

91Microcredit-Microsavings Interlinkage: An Explanation
and credit linkage, there are mainly two types of SHG models in India – models un-der the non- governmental organisations (NGOs) and models under the governmental organisations (GOs). NGO involved models are divided into three types. In type I, NGO acts as facilitator. In II & III it acts as intermediary and as micro financial institution respectively. Models under GOs are of three types also. In the first type, SHGs are en-rolled as members of Primary Agricultural Credit Co-operative Societies (PACCS) for saving and credit linkages with the cooperative bank. In the second type, SHGs are or-ganised under the state sponsored programs and linked with banks for credit and other financial supports. In the third model SHGs are promoted and financed by the banks directly. In this paper the main features of the SHG-PACCS linkages are model in India are mentioned. It analyse how the SHG-PACCS linkage model ensures the access to for-mal credit for the rural poor and thereby improved social welfare. Finally, this analysis helps to explain the interlinkage between micro-credit and micro-savings under this scheme for a typical collateral poor borrower.
Features of SHG-PACCS Linkage Model in IndiaThe concept of formal microfinance for rural poor exclusively was coined in India just
after passing of the Co-operative Credit Societies Act, 1904. Since then, cooperatives have been working for extending formal credit to the farmers in the rural areas. Satisfy-ing the performances of the credit delivery system of cooperatives the All India Rural Credit Survey Committee (1954) had recommended for establishing a three-tier strong and stable cooperative framework across the country. As a result a large number of Pri-mary Agricultural Credit Cooperatives Societies (PACCS) at the village level (first-tier), many District Central Cooperative Banks at the district level (second-tier) and a few State Cooperative Banks at the state level (third-tier) were established for providing the institutional loan to the farmers. In India, the co-operative movement had emerged as alternative development strategy in 1960s based on the assumption that it will be better for a mixed economy. However, the movement did not continue actively as an alterna-tive rural development strategy in India.
The common criticisms against cooperative movement were as follows. In most of the co-operatives, the non-poor members dominate management process which may neglect interests of poor. Mismanagement often made the co-operatives bureaucratic and sometimes corrupted. In the pre liberalisation it has ignored the requirement of loan for unproductive purpose and relevancy of the other components of microfinance. Due to negligence of gov-ernment, dedicated and efficient worker avoided joining rural credit-cooperatives. That is why many credit-cooperatives could not function efficiently.
In spite of these weaknesses, co-operatives have been functioning as financial institu-tions all over India, especially in rural areas. In individual lending system, poor people became member of the PACCS but could not avail loan due to lack of collateral assets

THE MICROFINANCE REVIEW • Volume VIII(1) January - June 201692
like land. This rendered PACCS is meaningless to the poors to don’t have collateral. To this end many central cooperative banks in India have changed their business plan and had turned-around with SHG lending through PACCS. During the liberalisation era, PACCS have taken several strategies to make its existence meaningful to the poors lack-ing collateral. Lending to such poors less poor through the channel of SHG is prime one. In the era of SHG movement these are acting as organiser, supervisor, and lender of SHGs. Among the existing SHG linkage models in India, the SHGs-Cooperatives linkage is the latest one, which is known as cooperative under the cooperative (Bandyopadhyay, 2002).
It is well known that cooperative societies in different states in India have an official mandate to promote the SHG-Cooperative bank linkage. On acquiring SHG as clients, District Central Cooperative Banks (DCCBs) decide whether the group will be the cli-ent of PACCS or the cooperative bank. Both forms of linkage – SHG with PACS and SHG with DCCB branch - are prevalent in our country. It is fact that network of PACCS is more extensive in West Bengal as compared to number of branches per DCCB. Thus linking a SHG with PACCS will be time saving for SHG. As most of the PACCS do not have power to extend savings facility to the customer, the savings of SHGs with PACCS do not get the benefit of deposit insurance. However, now-a-days savings facility with PACCS is familiar in West Bengal. The type of membership of SHGs to the PACCS differs from state to state. In West Bengal SHG members by virtue of their SHG membership can enjoy individual loan.
SHGs under PACCS is a voluntary group where 5-20 members, particularly poor women, come from homogeneous socio-economic background and under-take some common economic activities like savings, borrowings and undertaking entrepreneurship development, etc., and social activities such as awareness genera-tion programs. Participating in these activities members of the SHGs can improve their economic and social status and thereby living conditions. Once the group is formed, the group opens a savings account with the PACCS/cooperative bank in the name of group or separate account for each member’s name. SHG or the staff of the coopera-tive starts collecting a fixed amount of money from each member of the group for savings in a recurrent basis. From the initial phase, members deposit money equally per month/week/daily as convenient in the group/individual account with the coop-erative. However, a group member can withdraw his/her savings if needed; but he/she is not entitled to get any loan before the completion of successive recurrent savings for at least six months. After the continuation of savings for six months the PACCS starts lending to individual SHG members if the group certifies the needs of the member. The PACCS may lend to all member simultaneously. Loans may be for consumption needs, for health care or undertaking petty business. The PACCS lend usually 3-5 times of the cumulative savings of the borrower. This decision depends on the resolution of the

93Microcredit-Microsavings Interlinkage: An Explanation
group meeting. Juxtaposed with recurrent savings, regular meeting among members removes
misunderstanding about the capability of borrowers and repayment habit of borrowers. It makes the borrower to understand the importance of credit and repayment. In the meetings peers of the group understand creditworthiness of the co-peers. This under-standing helps the peers to fame required peer monitoring and peer pressure for par-ticular peer borrower. Peer monitoring and pressure at the group level is main feature of the SHG under co-operatives. It ensures that the individual borrower will not abscond with the borrowed fund. It means that the SHG under PACCS has social power that can control abscond of the member borrower with the borrowed fund. More than 95% recovery of group-centric loans for the PACCSs in West Bengal confirms the existence of this social power. In addition to this, regular meetings are helpful to inculcate leader-ship power and decision-making power, broadly, empowerment of poor women in and outside their families. Over and above, such a movement ensures freedom of the SHG members and their families from the clutches of moneylenders.
In this model PACCS provides loan to individual group members refinancing sup-port from Central Cooperative Bank. In the sense, Central Cooperative Banks become microfinance institutions and PACCSs act as financial intermediaries. Loan repayment schedule of the individual borrower is also settled in accordance with decision of the group. It may vary from borrower to borrower. But rate of interest on loan and savings are decided by the PACCS or Central Cooperative Bank. In loan contract PACCS agree with limited liability. The borrowers cannot repay more than their current income. It means that the borrower who fails to realise the project earns zero and cannot repay the loan. There is no joint liability among the group members. If a member borrower fails to repay loan, the co-members are not liable to repay it. But in case of failure the coopera-tive may seize the volume of defaulter’s savings with the group or cooperative.
Table 1: Progress of SHG-Cooperative Bank Linkage in India, West Bengal and Burdwan DistrictRegion/Bank No. of SHGs Saving Amount No. of SHG Loans Disbursed No. of SHG Loan Outstanding (Rs. Lakh) during Current FY (Rs. Lakh) (Rs. Lakh)
(2011-12)
India 1014703 96080.3 204221 1227556.4 346269 136361.9West Bengal 130891 7972.1 42951 6869.4 56530 9173.6Burdwan District 535 52.2 78 18.2 396 167.0
(2012-13)India 1011364 102015.9 138546 117433.8 389529 151891.4West Bengal 120689 11863.4 44239 13805.9 81390 19505.9Burdwan District 13464 1465.9 335 385.2 9474 1337.6
(2013-14)India 1094769 112724.6 5884 142918.6 362994 183971.6West Bengal 168353 22467.0 131667 24042.6 119956 31279.5Burdwan District 14414 1494.0 9515 604.9 9511 1354.1Source: Compiled from Status of Microfinance in India, 2011–12, 2012–13 and 2013–14, NABARD.

THE MICROFINANCE REVIEW • Volume VIII(1) January - June 201694
Although this type of model is not popular throughout India but in West Bengal cooperatives have the major share in total existing SHGs. According to Harper, et al. (2005), strong political support behind the cooperatives plays vital role for its tremendous success to the implementation of SHG programme in West Bengal.
Table 1 shows that SHG-cooperative bank linkage is a common form of SHG in India, particularly in West Bengal. In West Bengal, District Central Cooperative Banks of Bankura, Burdwan, Nadia, Malda are the dominant player of forming SHGs through PACCS. Table-1, show the number of savings linked SHGs, loan disbursement and loan outstanding during 2011-12 to 2013-14. It should be noted that in 2012-13 no of coopera-tive linkage SHG reduced due to expansion of subsidy based Government sponsored SHGs in India. Due the attraction of subsidy many SHGs shifted to SGSY groups. Howev-er, in the next year again number of cooperative linked SHGs increased. There are some states like Himachal Pradesh and Punjab where overall SHG linkage is poor relative to their rural poor population, but the cooperative banks have performed relatively well. In northeast states, Bihar and Uttar Pradesh overall SHG linkage as well as cooperative’s performance are relatively weak.
The ModelIn literature it is found that joint liability, limited liability, peer pressure, peer
monitoring, direct monitoring by the institution, lending with training programme, etc., are the important aspects of group lending approach across the world. A series of studies (Stiglitz and Weiss, 1981; Stiglitz, 1990; Hoff and Stiglitz 1990; Ghatak and Guinnane, 1999) have shown that joint liability aspects of group lending mitigates adverse selection problem, moral hazard and thereby reduces borrowing cost and increases borrowers’ welfare. In the context of the recent Eurozone financial crisis Basu and Stiglitz (2013) have argued that joint liability of the government and the private investors on borrowed fund can improve overall welfare of the economy. However, how the group lending ap-proach without joint liability can improve social welfare is not common in literature.
Usually, the loan contract is a bilateral relation between two parties – the lender and the borrower. In this bilateral contract, the lender lends to borrower who promises to repay loan subject to a limited liability condition. We know that the adverse selection and moral hazard problems make the equilibrium of this bilateral contract in rural credit market inefficient. At this equilibrium safe borrowers face high interest rate and they could not avail affordable loan for their desirable project. Further, resource poor cannot avail loan due to lack of collateral. However, using the power of a third party like SHG all can do better. In order to analyse the aspect of welfare in the context of SHG-PACCS linkage peer monitoring, a simple model is developed.
In order to serve the collateral poor PACCS asks a few poor persons to form a group where group members save recurrently as convenient. After continuous savings for at

95Microcredit-Microsavings Interlinkage: An Explanation
least six months the PACCS lends to the SHG member borrower who promises to repay loan subject to a limited liability condition. Suppose that an individual wants to under-take a project borrowing L amount of money from the PACCS for one year. If the project is successful, it yields a return of f (L). Let the probability of success of the project be p. Further, if the project succeeds there is a probability q that the borrower can abscond with the money. However, the SHG has the power to control abscond. So q=0 for the SHG member borrowers.
The following assumptions are made in the line of SHG-PACCS linkage model.1. The PACCS is a competitive lender who maintains break even solution for interest. 2. It is assumed that the cooperative has sufficient amount of fund for lending. So,
it has no cost of lending. 3. If the probability of abscond is zero the lender find positive expected net return.4. The borrower will repay the loan just after one year if his project is successful.
Suppose the gross interest rate on loan is R and gross interest rate on savings of the SHG members is I. Then in case for bilateral credit contract the expected net return of the lender is
p(l – q) f (L) – RL
The lender will lend up to the situation where p(l – q) f (L) - R >0. Therefore, the bi-lateral contract will not take place if the lender finds finds RL > p(l – q) f (L) . However, it is assumed that pf (L) > RL, i.e., if the probability of abscond is zero the lender find positive expected net return and he will lend. So, if the lender is guaranteed that the borrower will not abscond with the borrowed fund, the bilateral loan contact will take place on demand for loan. But question is that who will give this guarantee to the lender. In India, since late 1970 to late 1990 the Governments implementing several programs like Integrated Rural Development Programme (IRDP) acted as guarantor of the com-mon borrowers or private investors. However, such a guarantee adds nothing to the gov-ernment revenue immediately rather it may create some burden on the Government’s budget. There is always a probability that the guaranteed projects will fail in the future. For this reason, the governments were repeatedly warned by the international bodies not to give guarantee on borrowed fund to the private investors. In this circumstance, SHG may play an imperative role to ensure microcredit to the collateral poor. Now it can be observed that how the introduction of group lending approach makes an overall benefit for lender, borrower and guarantor in our society.
Let us consider the loan contract under the SHG-PACCS linkage programme. The group members resolute that, the group as an entity, will act as guarantor for individual loan; such that no one absconds with the borrowed fund if the project is successful. In these groups, peer monitoring and social dignity of the group members ensures the lender that the borrower will not abscond with borrowed fund. It is supposed that our potential borrower is a member of voluntary savings group which has the power to put

THE MICROFINANCE REVIEW • Volume VIII(1) January - June 201696
off the borrower from absconding. The group can act as a guarantor of loan such that if the borrower fails to repay the loan, in case of wilful default the cooperative can forfeit the cumulative savings of the particular borrower. However, if the project of the member borrower fails the group as a whole and the particular borrower will not be liable for loan. In that case SHG helps the cooperative to understand whether the project
really fails. Thus, the loan contract under SHG-PACCS linkage is a trilateral relation if the borrowing takes place. This may be shown in chain diagram as follows in figure 1.
In this trilateral loan contract, the borrower’s expected net returns isp[f (L) – RL]
In order to keep the lender at the break even solution i.e. to make sure the repay of the loan the group have to have an expected loss (l – p) RL. From this contract the borrower has been benefited by amount p[f(L) – RL, the lender earns normal profit, but the group the guarantor of the loan, loses amount (l – p) RL. Therefore, aggregate gain from the trilateral contract of loan is (expected net gain of the member borrower + gain of the PACCS + expected gain of the group)
P[f(L) – RL ]+0 – (l – p) RL = pf (L) – RL > 0.
It shows that the three agents involve in the loan contract are collectively better off. Therefore, it is establish that group lending approach increases over all welfare of the agents.
The group, however, have no separate fund for meeting the loss; it meets the loss from the savings fund of the members. The group can want gross savings (l – p) RL at the time of repayment from the particular member borrower for standing guarantee against loan amount L. Therefore, ultimately the group gains or lose nothing, the lender earns normal profit and the borrower earns pf (L) – RL. It should be noted that the group can become guarantor of maximum amount of loan L up to SI /(l – p) R where S is the amount of gross savings of the member at the time of borrowing. It refers that the amount of loan availed by the borrower would linearly depend on his cumulative savings as we find in practice. As volume of cumulative savings increases the availability of formal loan will increase. If a person fails to cumulate a reasonable volume of sav-
Figure 1: Trilateral Interaction in Credit Contract
Source: Author’s self explanatory
PACCS/Formal Financial Institution
SHG Member/Borrower Self-Help Group

97Microcredit-Microsavings Interlinkage: An Explanation
ings he would not be eligible to get a reasonable volume of loan. For example suppose R=1.1, I=1.04 and p=0.8, then the collateral poor borrower can avail loan Rs. 5,000 if he become a member of SHG and can save Rs. 1,058 at the time of borrowing. Therefore, the expansion of microcredit is led by micro savings of the group members. Note that although in this model group size does not matter the PACCS try to limit the group 5-10 members for administrative and legal expediency. The model with a lending cost in the context of strategic behaviour of the lenders can be extended.
Conclusion It can be concluded that the SHG-PACCS linkage programme, which has no joint lia-
bility problem, makes easy the access to formal credit for the persons without collateral. Ultimately it improves the social welfare defined as the sum of expected gains of the agents involved in credit contract. However, the extent of borrowing is limited by the extent of savings of the borrowers. As a result of this micro savings and micro credit interlinkage, the extreme poor persons who are unable to save or can save very small amount cannot avail affordable amount of loan under the SHG-PACCS model for their desired project or for their urgent situation. It is indicative that savings linked micro credit through existing SHGs is not suitable for the extreme poor. Therefore, it is impera-tive to search a special type of SHG where one fifth of member will be extreme poor who are unable to save recurrently. However, in the time of peer selection the other group members will select their extreme poor peers. In this group four-fifth members will save equally as per their capability and extreme poor member save as per their capability. Finally, each member will avail same amount of loan from bank or cooperatives as per the recommendation of the group as a whole. In this way real financial inclusion of the extreme poor can be made.
ReferencesBandyopadhyay A (2002): “Swayambharata ‘O’ Samabaye Peshadaritwa” Natun Chiti 62
B C Road, Burdwan, West Bengal.Basu, Koushik, and J E Stiglitz (2013): “International Lending, Sovereign Debt and Joint
Liability: An Economic Theory Model for Amending the Treaty of Lisbon”, World Bank Policy Research Paper 6555.
Ghatak, M and Guinnane, T W (1999): “The Economics of Lending with Joint Liability: Theory and Practice” Journal of Development Economics, Vol. 60, pp 195-228.
Harper, M, A Berkhof and R V Ramakrishna (2005): “SHG-Bank Linkage: A Tool for Reforms in Cooperatives?”, Economic and Political Weekly, April 23, 2005.
Hoff, K and J E Stiglitz (1990): “Introduction: Imperfect Information and Rural Credit Markets—Puzzles and Policy Perspectives”, The World Bank Economic Review, Vol. 4, No.3, pp 235-250.
NABARD (2011-12, 12-13, 13-14): “Status of Microfinance in India”, Micro Credit Innovations Department, Mumbai, available at www.nabard.org
Stiglitz, J E (1990): “Peer Monitoring and Credit Markets”, The World Bank Economic Review, Vol.-4, No. 3, pp 351-366.
Stiglitz, J E, and Weiss, A (1981): “Credit Market with Imperfect Information”, American Economic Review, Vol. 71, pp 393-410.

* Senior Research Fellow Department of Economics University of Lucknow Lucknow Email:[email protected]
SBLP was started by NABARD in 1992 to facilitate the financial inclusion among the vulnerable groups.
Increased focus towards training and capacity building of the SHGs
will strengthen them and improve the performance of
SBLP.
Key Words: Self-Help Group-Bank Linkage Programme, Financial Inclusion
Performance Evaluation of Self-Help Group-Bank Linkage
Programme: A State Level Analysis
- Santosh Singh*
AbstractSelf-Help Group-Bank Linkage Programme (SBLP)
was started by National Bank for Agriculture and Rural Development (NABARD) in 1992 to facilitate financial inclusion among vulnerable groups. But the spread of the programme and its performance across the states is noticed to be uneven. There are sufficient disparities in the spread of SBLP across different states of India. The purpose of this paper is to examine the performance of SBLP at state level which will facilitate in ascertaining the performance of dif-ferent states over time.
IntroductionThe SBLP was started as an Action Research Project in
1989 which was the offshoot of a NABARD initiative during 1987 through sanctioning Rs. 10 lakh to MYRADA
1 as seed
money assistance for experimenting Credit Management Groups. In 1987, there were 300 SHGs in MYRADA’s Projects. These SHGs were group of 15-20 members who used to contact MYRADA’s officials for their financial assist-ance. These SHGs achieved immense success. In the same year Ministry of Rural Development provided financial support to PRADAN
2 to establish SHGs in Rajasthan. The
experiment of these early efforts led to the approval of a pilot project on SBLP by NABARD in 1992. Subsequently, it picked up in the other states of India.
Initially, there was a slow progress in the SBLP up to 1999 as only 32,995 groups were linked during the period 1992 to 1999. Since then the SBLP has been growing rapidly

99Performance Evaluation of Self-Help Group-Bank Linkage Programme: A State Level Analysis
and the number of SHGs linked with banks increased from 81,780 in 1999-2000 to more than 93.05 lakh in 2014-15. Despite this there have been sufficient disparities in the spread of SBLP across different states of India. The purpose of this paper is to examine the performance of SBLP at state level which will facilitate in ascertaining the perform-ance of different states over time.
Objectives, Hypothesis, Methodology and Scope of StudyThe main objective of this paper is to evaluate the performance of SBLP on the basis
of savings per SHG, average loan amount per SHG and average non performing assets (NPAs) per SHG, across different states of India.
Savings are amount of income left after consumption. Therefore states with higher savings imply higher income and hence their repaying capacity is better than the others. Thus it can hypothesized that “states having higher accumulation of savings per SHG should have lower NPAs per SHG that is., there is a negative relationship between the savings per SHG and NPAs per SHG”.
The SBLP was a step towards bringing unbanked poor into the mainstream. As finan-cial inclusion became a serious issue several initiatives were taken by the Government of India, Reserve Bank of India (RBI) and NABARD to enhance the performance of SBLP to ensure greater financial inclusion.
In this paper three parameters are used to evaluate the performance of SBLP:1. Savings per SHG measures the viability of SHGs. Because savings are a part of
income, which is left after consumption. Therefore, especially in the case of poors, the savings amount is more important. Because it is natural that people in low in-come group have higher propensity to consume. Thus an increase in the savings of the SHGs, represent increasing income generation activities and viability of the SHGs.
2. Loan per SHG measures the extension and outreach of the SBLP. The higher amount of bank loan against SHG s denotes higher extension and outreach of the SBLP.
3. NPAs per SHG measures the level of deterioration in the functioning of SBLP. Higher amount of NPAs per SHG denotes deep deterioration in the functioning of the programme.
Thus, based on the above three parameters the study focuses on the viability, outreach and deterioration level in the functioning of the SBLP to evaluate its overall performance.
Moreover to test the hypothesis of negative relationship between the savings per SHG and NPAs per SHG coefficient of rank correlation is computed.
AnalysisTo evaluate the performance of SBLP the data regarding aforementioned three
parameters were collected from various publications of NABARD which have reported the data of these parameters from 2007-08 to 2014-15.

THE MICROFINANCE REVIEW • Volume VIII(1) January - June 2016100
State-wise Performance of the SBLPTo analyze the state-wise performance of SBLP, 14 major states have been considered,
based on the geographical area they cover and the population. The names of the sample states along with the region they belong to are given in the Table 1.
Table 1: List of Sample States
Region States
Northern Region Haryana, Punjab and Rajasthan North East Region Bihar, Odisha and West Bengal Central Region Madhya Pradesh and Uttar Pradesh Western Region Gujarat and Maharashtra Southern Region Andhra Pradesh, Karnataka, Kerala and Tamil Nadu
The state-wise average saving per SHG, average loan outstanding per SHG and average NPAs per SHG is calculated and shown in the Table 2, along with their national average.
Table 2: State-wise Average Savings per SHG, Average Loan per SHG and Average NPAs per SHG
States Average Savings per SHG (in Rs.)
Average Loan Outstanding per
SHG (in Rs.)
Average NPAs per SHG (in Rs.)
Average Savings to Average Loan Outstanding (%)
Average NPAs to Average Loan Outstanding (%)
Haryana 13490.5 46466.8 4324.1 29.0 9.3Punjab 9910.2 23477.5 2343.3 42.2 10.0Rajasthan 6157.3 24522.9 2176.1 25.1 8.9Bihar 6328.7 36026.1 2169.6 17.6 6.0Odisha 7661.9 30935.2 3342.5 24.8 10.8West Bengal 12347.9 24731.1 1225.5 49.9 5.0Madhya Pradesh 7121.6 22699.2 3533.3 31.4 15.6
Uttar Pradesh 8012.5 40596.1 5791.3 19.7 14.3Gujarat 9227.3 9876.3 696.0 93.4 7.1Maharashtra 8620.3 22240.5 1487.3 38.8 6.7Andhra Pradesh 14847.2 100556.4 3348.8 14.8 3.3Karnataka 14519.7 50957.1 1733.2 28.5 3.4Kerala 8522.2 28386.7 1802.0 30.0 6.4Tamil Nadu 9709.0 48560.1 3792.9 20.0 7.8India 10260.4 46394.3 2564.7 22.1 5.5Source: Based on the data collected from the reports of various years entitled, ‘Status of Microfinance in India’, NABARD, Mumbai.
The most important parameter of the analysis of the performance of SBLP across states is the NPAs of bank loan outstanding against SHGs. A scrutiny of the Table 2 shows that NPAs are highest in Madhya Pradesh, Uttar Pradesh and Odisha (respectively 15.6%, 14.3% and 10.8%). This basically indicates extremely weak performance of SBLP in these states and chances of recovery of loan outstanding from SHGs in these states are very thin. Any further advances to SHGs in these states should be given with utmost caution.

101Performance Evaluation of Self-Help Group-Bank Linkage Programme: A State Level Analysis
Figure 1: State-wise Percentage of Average Savings and Average NPA against Average Loan Outstanding
It is to mention that these states rank among the bottom five with regard to the sav-ings per SHG. These states, Madhya Pradesh, Uttar Pradesh and Odisha are ranked on 12th, 10th and 11th position, respectively, in terms of average savings per SHG (Table 3). This clearly reveals extremely non satisfactory performance of the SBLP in these states and any further lending to SHGs in these states should be on certain strict principles since chances of default of loans in these states are very high.
Punjab, Haryana, Rajasthan, Tamil Nadu, Gujarat, Maharashtra, Kerala and Bihar have relatively low NPAs (10.0%, 9.3%, 8.9%, 7.8%, 7.1%, 6.7%, 6.4% and 6.0%, respec-tively) but it is still higher than the national average of 5.5%, which reflects not a very satisfactory performance of the SBLP and the banks should be cautious in lending to SHGs in these states. Hence, these states are also required to be checked out over the ways they are getting the advances and using them.
It may further be pointed out that in some of these states like Haryana, Punjab, Tamil Nadu and Gujarat, average savings per SHG is fairly high. The rank of these states in terms of average savings per SHG is respectively 5th, 3rd, 6th and 7th (Table 3). There-fore these states can bear relatively moderate NPAs and there is a need for giving SHGs in these states a proper direction so that they can improve their further performance and lower their NPAs.
However in Rajasthan, Maharashtra, Kerala and Bihar lower average savings per SHG and higher Average NPAs per SHG require thorough investigation of SHGs in these states and only those which are viable, be allowed to function.
There are only three states, having percentage of average NPAs against average loan outstanding lower than the national average of 5.5%. These states are Andhra Pradesh, Karnataka and West Bengal having respectively 3.3%, 3.4% and 5.0% average NPAs

THE MICROFINANCE REVIEW • Volume VIII(1) January - June 2016102
against average loan outstanding. This atleast reflects that the performance of SBLP is good in these states and sets an example which other states should emulate.
It may further be mentioned that in these three states average savings per SHG is quite high and they rank among the top five states which have high average savings per SHG. In terms of average savings per SHG, the rank of these three states Andhra Pradesh, Karnataka and West Bengal is respectively, 1st, 2nd and 4th.
Thus based on the above analysis of the performance of SBLP in terms of average savings per SHG and average NPAs per SHG the states can broadly be categorised into three types:
1. Best performing states, having average NPAs, below the national average and ranked among top five states in terms of average savings per SHG. Andhra Pradesh, Karnataka and West Bengal come into this category.
2. Moderately performing states, having less than 10% of NPAs but higher than the national average of 5.5% and whatever the rank they hold in terms of average savings per SHG: Punjab, Haryana, Rajasthan, Tamil Nadu, Gujarat, Maharashtra, Kerala and Bihar.
3. Poorly performing states, having NPAs higher than 10% and ranked among bot-tom five states in terms of average savings per SHG: Madhya Pradesh, Uttar Pradesh and Odisha.
Table 3 provides state-wise average savings per SHG and average NPAs per SHG. In fact value of the coefficient of Rank Correlation (r’) which is -0.495 and this suggests a negative relationship between average savings and NPAs per SHG.
Table 3: State-wise Average Savings per SHG and Percentage of Average NPAs
States Average Savings per SHG (in Rs.)
R1 Average NPAs to Average Loan Outstanding (%)
R2
Haryana 13490.5 3 9.3 5
Punjab 9910.2 5 10.0 4
Rajasthan 6157.3 14 8.9 6
Bihar 6328.7 13 6.0 11
Odisha 7661.9 11 10.8 3
West Bengal 12347.9 4 5.0 12Madhya Pradesh 7121.6 12 15.6 1
Uttar Pradesh 8012.5 10 14.3 2
Gujarat 9227.3 7 7.1 8
Maharashtra 8620.3 8 6.7 9
Andhra Pradesh 14847.2 1 3.3 14
Karnataka 14519.7 2 3.4 13
Kerala 8522.2 9 6.4 10
Tamil Nadu 9709.0 6 7.8 7
Source: Same as Table 2

103Performance Evaluation of Self-Help Group-Bank Linkage Programme: A State Level Analysis
Conclusion and SuggestionsThe SBLP started by NABARD in 1992 to facilitate the financial inclusion among the
vulnerable groups. Since the launch of the programme more than 93.05 lakh SHGs have now been linked with banks.
1. Among the 14 sample states considered in this study, performance of SBLP in Andhra Pradesh, Karnataka and West Bengal is found best because of the low percentage of average NPAs against average loan outstanding per SHG and high amount of average savings per SHG in these states as compared to the national average of both these parameters respectively.
2. Punjab, Haryana, Rajasthan, Tamil Nadu, Gujarat, Madhya Pradesh, Kerala and Bihar are in the moderate category in terms of the performance of SBLP, since in these states average NPAs per SHG are in the moderate range, that is, greater than the national average of 5.5% but less than 10%. The average savings per SHG in these states is also in the moderate range except Haryana.
3. Madhya Pradesh, Uttar Pradesh and Odisha are in the category of poorly performing states. Average NPAs per SHG is highest in these states and is over 10% of the average loan outstanding, while average savings per SHG in these states is extremely low as they are ranked among the bottom five states in terms of average savings per SHG.
4. An inverse relationship between average savings per SHG and average NPAs against average loan outstanding per SHG was observed.
Based on the above analysis of the functioning of SBLP the following suggestions may be useful to improve the performance in the weak performing states:
● Loans should be given especially to viable SHGs only. One measure to ascertain their viability is the amount of savings by SHGs. This is because savings are the part of income that is not consumed and especially in the case of those who are poor these savings are more important because the propensity to consume in the low income groups is relatively high and hence increased amount of savings of SHGs represent increased income generation activities and viability of the SHGs.
● States where percentage of average NPAs per SHG is very high require an audit of their functioning so that the reasons of bad recovery performance could be recognised and suitable measures could be taken to overcome the problem of high NPAs.
● Further strategies may focus towards training and capacity building of the SHGs in order to strengthen them and improve their performance. This will ensure viability of SHGs in the long-term.

THE MICROFINANCE REVIEW • Volume VIII(1) January - June 2016104
Notes1. MYRADA (Mysore Resettlement and Development Agency) is an NGO operating
in the Southern India. 2. PRADAN (Professional Assistance for Development Action) is an NGO in which
professionals are working to help poors through various of its Microfinance Programmes
ReferencesAgarwal, Pankaj K and Sinha, S K (2010): “Financial Performance of Microfinance
Institutions in India”, Delhi Business Review, Vol 11, No. 2, pp 37-46.Bansal, H (2003) “SGH-Bank Linkage Program in India: An Overview,” Journal of
Microfinance / ESR Review: Vol 5, No 1, pp 22-49.Dasgupta, R (2006): “An Architectural Plan for a Microfinance Institutional Network”,
Economic and Political Weekly, Vol 41, No 11, pp 1095-1100Dev, S Mahendra (2006): “Financial Inclusion: Issues and Challenges”, Economic and
Political Weekly, Vol 41, No 41, pp 4310-4313Karmakar, K G (2009): “Emerging Trends in Microfinance”, Economic and Political Weekly,
Vol 44, No 13, pp 21-24.Kochhar, S, Chakrabarty K C and Rangarajan C (2009): “Speeding Financial Inclusion”,
Academic Foundation Publications.NABARD (2008): “Report of the Committee on Financial Inclusion”, NABARD, Mumbai,
January.NABARD: “Status of Microfinance in India” (various years), NABARD, Mumbai.Sinha, Frances (2005): “Access, Use and Contribution of Microfinance in India: Findings
from a National Study”, Economic and Political Weekly, Vol. 40, No 17, pp 1714-1719.

* Professor Department of Economics,
Gokhale Institute of Politics and Economics, Pune
Email: [email protected]
Microfinance can help the poor to increase income, build viable
businesses, and decrease their vulnerability to
external shocks and also a powerful device for self-
empowerment by enabling the poor, particularly
women, to become economic agents of change.
Micro-credit empowers women in terms of their
ability to make large and small purchases, involvement in major
family decision making, and participation in public
action.
Key Words: Self-Help Groups (SHGs), Microfinance, Rural Women Empowerment
Microfinance in Empowering Women: Evidences from
Villages of Odisha
- S N Tripathy*
AbstractThis study seeks to explore the impact of women’s
participation in Self-Help Groups (SHGs) on their empowerment. To supplement the data collected from secondary sources, the primary study was conducted through interview schedule and focus group discussion in one of the backward districts of the state of Odisha (Sam-balpur) to analyze the performance of microfinance through the SHGs.
IntroductionMicrofinance is the prerequisite of a broad range of
financial services such as deposits, loans, payment services, money transfers and insurance to poor and low-income households and their micro-enterprises. The poor and underprivileged need a range of financial instruments to build assets, stabilize consumption and protect themselves against risks. The typical microfinance clients are low- income persons who do not have access to formal financial institutions. Experience shows that microfinance can help the poor to increase income, build viable businesses, and decrease their vulnerability to external shocks. It can also be a powerful device for self-empowerment by enabling the poor, particularly women, to become economic agents of change.
Women constitute nearly half of the total population in India, but majority of them are not empowered. Most of the women are economically dependent. Study in past reveals that due to disparity between men and women in educa-tion, health, employment and income opportunity, control

THE MICROFINANCE REVIEW • Volume VIII(1) January - June 2016106
over assets, personal security and participation in political process, women are deprived and less empowered which limits the country’s ability to achieve its full potential (Bis-was and Kabeer, 2001). The Word Bank has suggested that empowerment of women should be a key aspect of social development programmes (World Bank, 2001).
Many practitioners and research experts opine that livelihood approach of microfi-nance would be a better approach for elimination of poverty. But empowerment ap-proach makes them to live independently in society without any influence. Further, many studies demonstrated the link between women empowerment and credit programmes especially micro credit with mobility, decision making and family planning, which has positive outcomes (Rahman, 1986). Studies pertaining to measuring the income, gender outcome and empowerment dimension through credit programme are limited.
In the promotion of self-employment, lack of credit has been a major constraint espe-cially for rural women. Being economically vulnerable, rural women often fall into the clutches of exploitative money lenders. Microfinance and the SHG-Bank Linkage Pro-gramme (SBLP) was the appropriate remedy for mitigating the problems of the poverty-stricken people by their own way of self-help and collective action. A comprehensive approach to poverty reduction by providing credit along with primary health and educa-tion create positive synergies that are more likely to break the cycle of impoverishment.
Objectives of the StudyIn the backdrop of above facts the study has the following objectives:1. To focus on the role of SHGs in empowering the rural women through microfi-
nance in terms of increase of income, employment, productivity and linkage ef-fects in Sambalpur district of western Odisha.
2. To examine the reasons for the spread of the SBLP and to find out the living con-dition of rural women engaged in income generating activities in rural villages of Odisha.
3. To suggest some policy prescription on the basis of the study.
MethodologyIn order to collect field data with the help of interview schedules and focus group dis-
cussion, we have selected Maneswar and Dhankauda blocks were selected purposively on basis of their accessibility from Sambalpur district.
For analysis and interpretations, primary data were collected from a total of 40 wom-en SHGs consisting of 80 members covering 20 sample women SHGs from each select-ed sample block with the help of stratified random sampling exclusively to investigate the role of SHGs in empowering the women and thereby, alleviating their poverty. In our field study, the self-help promoting institutions (SHPIs) play catalytic role in promoting SHGs. As there are a series of SHGIs working in Orissa for the promotion of SHGs, thus,
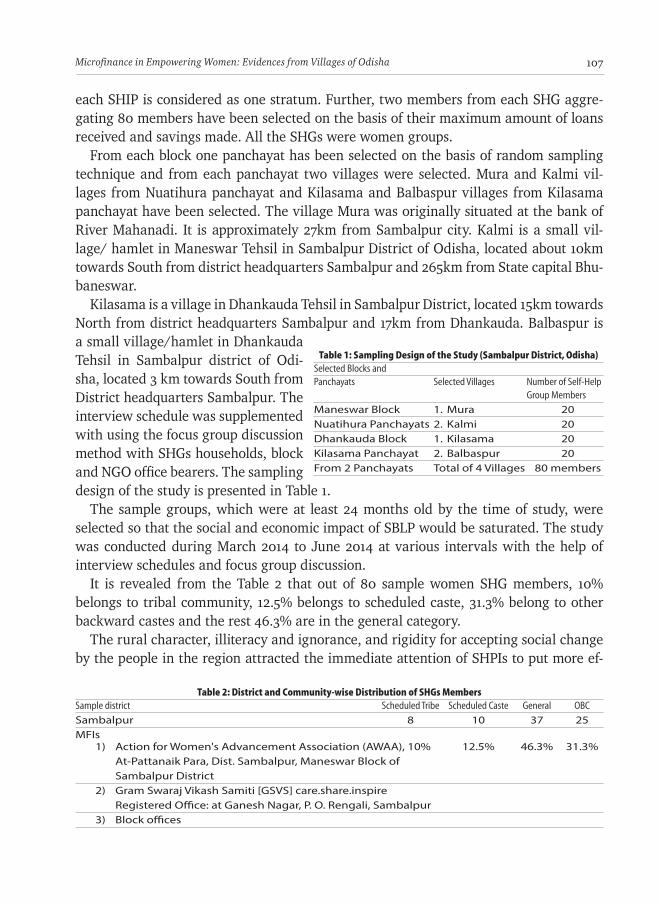
107Microfinance in Empowering Women: Evidences from Villages of Odisha
each SHIP is considered as one stratum. Further, two members from each SHG aggre-gating 80 members have been selected on the basis of their maximum amount of loans received and savings made. All the SHGs were women groups.
From each block one panchayat has been selected on the basis of random sampling technique and from each panchayat two villages were selected. Mura and Kalmi vil-lages from Nuatihura panchayat and Kilasama and Balbaspur villages from Kilasama panchayat have been selected. The village Mura was originally situated at the bank of River Mahanadi. It is approximately 27km from Sambalpur city. Kalmi is a small vil-lage/ hamlet in Maneswar Tehsil in Sambalpur District of Odisha, located about 10km towards South from district headquarters Sambalpur and 265km from State capital Bhu-baneswar.
Kilasama is a village in Dhankauda Tehsil in Sambalpur District, located 15km towards North from district headquarters Sambalpur and 17km from Dhankauda. Balbaspur is a small village/hamlet in Dhankauda Tehsil in Sambalpur district of Odi-sha, located 3 km towards South from District headquarters Sambalpur. The interview schedule was supplemented with using the focus group discussion method with SHGs households, block and NGO office bearers. The sampling design of the study is presented in Table 1.
The sample groups, which were at least 24 months old by the time of study, were selected so that the social and economic impact of SBLP would be saturated. The study was conducted during March 2014 to June 2014 at various intervals with the help of interview schedules and focus group discussion.
It is revealed from the Table 2 that out of 80 sample women SHG members, 10% belongs to tribal community, 12.5% belongs to scheduled caste, 31.3% belong to other backward castes and the rest 46.3% are in the general category.
The rural character, illiteracy and ignorance, and rigidity for accepting social change by the people in the region attracted the immediate attention of SHPIs to put more ef-
Table 1: Sampling Design of the Study (Sambalpur District, Odisha)Selected Blocks andPanchayats Selected Villages Number of Self-Help Group Members
Maneswar Block 1. Mura 20Nuatihura Panchayats 2. Kalmi 20Dhankauda Block 1. Kilasama 20Kilasama Panchayat 2. Balbaspur 20From 2 Panchayats Total of 4 Villages 80 members
Table 2: District and Community-wise Distribution of SHGs MembersSample district Scheduled Tribe Scheduled Caste General OBC
Sambalpur 8 10 37 25MFIs 1) Action for Women's Advancement Association (AWAA), 10% 12.5% 46.3% 31.3% At-Pattanaik Para, Dist. Sambalpur, Maneswar Block of Sambalpur District 2) Gram Swaraj Vikash Samiti [GSVS] care.share.inspire Registered Office: at Ganesh Nagar, P. O. Rengali, Sambalpur 3) Block offices

THE MICROFINANCE REVIEW • Volume VIII(1) January - June 2016108
fort for formation of SHGs. The Non-Government Organisations (NGOs) like Action for Women’s Advance-ment Association (AWAA) is active in Maneswar Block of Sambalpur Dis-trict. The other SHPIs are Gram Swaraj Vikash Samiti (GSVS) and Block offices.
Table 3 depicts that among the 40 SHGs, 50% are having 10-15 members, 40% are less than 10 members and remaining 10% had 15+ members.
Table 4 demonstrates the socio-economic profile of the group members in our study. The occupation structure of the SHG members reveals that 25 members (31.3%) are engaged in agriculture; 22 members (27.5%) in allied activities such as dairy, fisheries, others and selling of these products; 20 members (25%) depend on house hold industries/crafts and 10 (12.5%) members de-pend on wage earning. Thus, next to agriculture and allied activi-ties, main source of employment is basically the handloom sector.
It was further found that 40% of group members are in the age group of 30-35 years. Illiteracy is rampant in the study area as 35% of the group members are illiter-ate and 37.5% are only able to put their signature by practice. With regard to marital status 70% are married and 30% of group members are unmarried.
Table 5 reveals the position of monthly income generated by the SHGs. Out of 40 SHGs, 18 (45%) SHGs generated incomes up to Rs. 2,000. There are 16 SHGs (40%) which revealed about generating a month-ly income in the range of Rs. 2,001 to Rs. 3,000. Thus, 85% of SHGs have reported their monthly income below Rs. 3,000. Only 6 SHGS (15%) SHGs are capable to earn an income level up to Rs. 3,001 and above.
Table 3: Group Structure According to the Size of Sample SHGsSize of the Group Number of SHGs Percentage
Less than 10 Members 16 4010-15 Members 20 5015+ 4 10Total 40 100
Table 4: Socio-Economic Profile of the Group MembersSocio-Economic Profile Number of Percentage Members
Occupational Structure Agriculture 25 31.3 Allied activities (Dairy, fisheries, others and selling of these products) 22 27.5 Collection of minor forest products 3 3.8 House hold industries/ crafts 20 25.0 Labour /wage earning /others 10 12.5 Total 80 100Age-group 18-30 22 27.5 30-35 32 40.0 35-40 14 17.5 40 and above 12 15.0 Total 80 100Level of Literacy Illiteracy 28 35.0 Knowing only signature 30 37.5 Read and write 22 27.5 Total 80 100Marital Status Married 56 70.0 Unmarried 24 30.0 Total 80 100
Table 5: Distribution of SHGs According to their Average Monthly Income
Average monthly income Number of SHGs Percentage
Up to Rs. 2,000 18 45Rs. 2,001 to Rs. 3,000 16 40Rs. 3,001 and above 06 15Total 40 100

109Microfinance in Empowering Women: Evidences from Villages of Odisha
Linkage with BankUnder the linkage projects the main advantages to the banks would be the
externalisation on the part of the work items of the credit-cycle assessment of credit needs, appraisal, disbursal, supervision and repayment reduction in the transaction costs. For the groups the advantages lies in the access to a large quantum of resources as compared to their meager corpus generated through thrift, access to better technology and skill upgradation through different schemes of the banking sector and a general improvement in the nature and scale of operation that would accelerate economic development (Tripathy, 2004). The first step for linkage of an SHG with the bank is to open a savings bank account with any of the banking institution. Only 20 SHGs opened savings bank account within a week of the formation of the group. Rest 20 SHGs opened account within 2-3 weeks.
Savings and BorrowingIt is revealed from the field data that over the period, 30% of sample groups enhanced
their regular savings at various levels, which exemplifies gain in their financial position. About 80% members paid their monthly contributions in time.
In case of exigencies the group members borrow money from the corpus of the group for petty consumption, medical expenses, purchase of farm inputs, undertaking small business activity.
The members were borrowing according to their requirements and repayment capac-ity. About 70% of the lending was below Rs. 5,000, while another 15% between Rs. 5,001 and 8,000. Five per cent borrowed above Rs. 8,000 who spent the amount on medical expenses, purchase of draught animals and land, and in larger business activities. The group decided loan amount considering priorities of borrowing members and corpus on hand.
Lack of opportunities for income generating activities were deterrent for availing bank loan. In case of SHGs under Model I availing bank credit was relatively early since the banks themselves had promoted and nurtured groups and were closely monitoring their performances.
It is further found that out of 40 groups availed second loan 20 (50%) had availed it within one year of their first loan. Availing a higher amount of loan in the second dose prompted the groups to repay the first loan much ahead of the scheduled repayment period. SHGs under model III had availed second and subsequent loans quickly in order to get a larger loan amount.
Rate of InterestRate of interest charged to borrowing members was a unanimous choice of the group.
It was between 24% and 60% per annum for borrowings from the corpus. While 24

THE MICROFINANCE REVIEW • Volume VIII(1) January - June 2016110
SHGs kept it 24% per annum 12 SHGs kept at 36%, and 4 SHGs at 48%. But the group members were highly satisfied to borrow among themselves as the moneylenders charge exorbitant rate of interest of 120%. Interest on bank credit to the group was between 8.5% and 12% per annum varying as per the lending rate of concerned financing bank. But the rate of interest charged by NGOs in case of indirect linkages ranged between 18% and 36% per annum.
Repayment of LoanGenerally SHGs were having predetermined terms and conditions for repayment of
the finance availed by them from banks. The borrower had to declare whether she would repay the loan annually or in a few months. In case of annual borrowing, borrower had to pay the principal and interest at the end of a year. A few groups also allowed conces-sions in interest for annual borrowers. Borrowers under monthly terms had to pay inter-ests regularly every month. It is found that most members were regular in repayment of interest, and principal is usually paid after harvesting season. The borrowers invested the money in animal husbandry activities like sheep, goat, ducks, poultry birds and so on. To repay the loans they were selling one or two animals or a few birds. Those bor-rowers defaulting repayments were charged with penalty. All members expressed their views about overcoming financial stringencies after formation of group. Credit became easily accessible to members.
Since consumption was the urgent need of most SHG members’, asset creation was not a priority among a majority of them. However, 10 SHGs constituting 25% of the mem-bers reported regarding their addition to their animal property (sheep, goat and cow) and birds (poultry and ducks). Some of them could be able to repay their old debt (10%) and some others could repair their houses (20%).
SHG movement empowered rural women with dignity, identification, recognition and respect. The women came out of the conservative attitudes. The savings exhibited the sense of thrift, speculation and self-sufficiency among the members. Thirty per cent of the members expressed that prior to SHG they were not saving, even though they had some potential but there was no opportunity for it.
Although it was difficult to exactly quantify the impact of microfinance through SHGs on the participating members in Sambalpur (Orissa), a qualitative improvement in their life has been remarkably manifested among the SHG members.
It is apparent from the study that because of a paramount importance accorded to the SHGs by the funding agencies and the government, the vulnerable sections of the so-ciety especially the poor women, widows, female-headed households’ destitute women are mostly benefited.
The analysis clearly demonstrates that microfinance through SHGs is a viable alter-native to achieve the objectives of rural development and get community participation
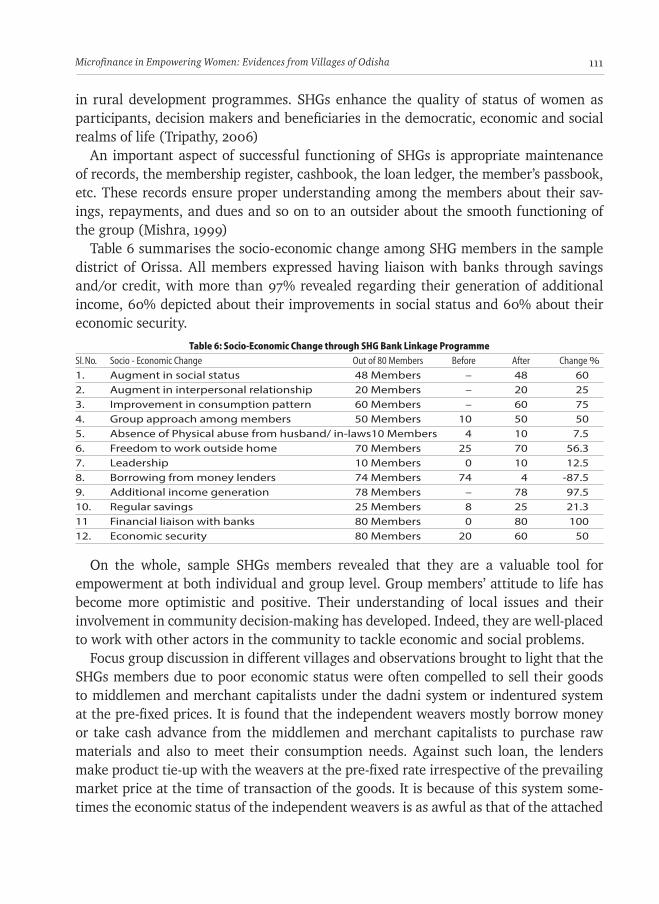
111Microfinance in Empowering Women: Evidences from Villages of Odisha
in rural development programmes. SHGs enhance the quality of status of women as participants, decision makers and beneficiaries in the democratic, economic and social realms of life (Tripathy, 2006)
An important aspect of successful functioning of SHGs is appropriate maintenance of records, the membership register, cashbook, the loan ledger, the member’s passbook, etc. These records ensure proper understanding among the members about their sav-ings, repayments, and dues and so on to an outsider about the smooth functioning of the group (Mishra, 1999)
Table 6 summarises the socio-economic change among SHG members in the sample district of Orissa. All members expressed having liaison with banks through savings and/or credit, with more than 97% revealed regarding their generation of additional income, 60% depicted about their improvements in social status and 60% about their economic security.
On the whole, sample SHGs members revealed that they are a valuable tool for empowerment at both individual and group level. Group members’ attitude to life has become more optimistic and positive. Their understanding of local issues and their involvement in community decision-making has developed. Indeed, they are well-placed to work with other actors in the community to tackle economic and social problems.
Focus group discussion in different villages and observations brought to light that the SHGs members due to poor economic status were often compelled to sell their goods to middlemen and merchant capitalists under the dadni system or indentured system at the pre-fixed prices. It is found that the independent weavers mostly borrow money or take cash advance from the middlemen and merchant capitalists to purchase raw materials and also to meet their consumption needs. Against such loan, the lenders make product tie-up with the weavers at the pre-fixed rate irrespective of the prevailing market price at the time of transaction of the goods. It is because of this system some-times the economic status of the independent weavers is as awful as that of the attached
Table 6: Socio-Economic Change through SHG Bank Linkage Programme
Sl. No. Socio - Economic Change Out of 80 Members Before After Change %1. Augment in social status 48 Members – 48 602. Augment in interpersonal relationship 20 Members – 20 253. Improvement in consumption pattern 60 Members – 60 754. Group approach among members 50 Members 10 50 505. Absence of Physical abuse from husband/ in-laws 10 Members 4 10 7.56. Freedom to work outside home 70 Members 25 70 56.37. Leadership 10 Members 0 10 12.58. Borrowing from money lenders 74 Members 74 4 -87.59. Additional income generation 78 Members – 78 97.510. Regular savings 25 Members 8 25 21.311 Financial liaison with banks 80 Members 0 80 10012. Economic security 80 Members 20 60 50

THE MICROFINANCE REVIEW • Volume VIII(1) January - June 2016112
weavers. But the formation of SHGs and flow of bank finance to the group facilitated by NGOs and block officials have ameliorated their conditions.
Table 7 reveals the distribution of SHGs households in the sample villages on the basis of their economic activities. Some of the important activities of the SHGs members are: animal hus-bandry, poultry, weaving/hand-loom, fishery, vegetable culti-vation, food pro-cessing, etc. But the majority of the house-holds (32.5%) are engaged in weaving/ handloom sector and 8 households (30.7%) are exclu-sively found in Kilasama village. Similarly, ‘food processing’ and ‘poultry’ as economic activities have been accepted by 7 (8.8%) and 11 (13.8%) households respectively.
Prior to formation of SHGs, the members were performing manual labour, agricultural operations and even migrating to other parts of the state for laying roads, earth cutting etc. In such works, the payment was irregular and even the promises made to the labourers were violated. But the formation of such SHGs and their involvement in different economic activities provided a new direction in their life to utilise their labour for collective and better output.
It was found that domestic violence against women borrowers had been reduced and possibly this was a consequence of women being regarded as more valuable economic members of the family, once they start generating income via their micro-credit loans. Studies have confirmed these findings: female borrowing increases female control of non-land assets, increases their role in household decision making, and elicits greater acceptance by their husbands of their participation in market-based economic activities. During our focus group discussion, it was revealed that most members have preferred to save their money in the bank through SHG for following reasons:
1. They can invest it for petty business activities or for cultivation, to increase their income level,
2. Members opined that it is convenient to save through SHG, which is very secure.3. They are free to spend this amount at the time of any emergency, particularly, to
meet the medical expenses of the family members at the time of need.4. Once they deposit the money in bank through SHG, they feel it is secured because
if the money was outside of the home there would be less temptation to use the money for avoidable expenses.
5. Members were mainly women as their husbands didnot save money due to alcohol consumption. Women members need to save part of their additional income for their children.
Table 7: Distribution of SHGs Households in the Sample Villages on the Basis of their Economic Activities
Activities Mura Kalmi Kilasama Balbaspur Total
Animal husbandry 02 04 03 02 11 (13.8)Poultry 04 03 02 02 11 (13.8)Fishery 04 03 04 02 13 (16.3)Weaving /handloom 06 06 08 06 26 (32.5)Vegetable cultivation 02 – 02 03 07 (8.8)Food Processing 02 02 01 02 07 (8.8)Others – 02 – 03 05 (.3)Total 20 20 20 20 80 (100)Source: Compiled from primary data.

113Microfinance in Empowering Women: Evidences from Villages of Odisha
ConclusionFrom the foregoing analysis, it can be inferred that micro-credit empowers women in
terms of their ability to make large and small purchases, involvement in major family decision making, and participation in public action, mobility, and political and legal awareness.
Thus, the perusal of the study in Sambalpur (Orissa) highlights that, there has been significant dent on poverty due to the successful functioning of the SHGs. The reduction in the level of poverty has been manifested in terms of increase in income, employment, productivity and linkage effects.
ReferencesBiswas, T and Kabeer, M (2001): “Rural Credit and Women Empowerment”, Journal of
Rural Development, Bangladesh, July 2001, pp.85-95Rahman, R I (1986): “Impact of Grameen Bank on the Situation of Poor Rural Women”,
BIDS Working Paper No. 1, Grameen Evaluation Project, Dhaka, Bangladesh, Institute of Development Studies.
Tripathy, S N (2004): “Evaluating Women Self-Help Groups in Tribal Orissa, in Self-Edited ‘Tribal Women in India’, Dominant Publishers and Distributors, New Delhi.
- (2006): “Rural Finance and Self-Help Groups”, in R K.Sahoo and Tripathy, S N edited book, Self- Help Group and Women Empowerment, Anmol Publishing House,
New Delhi.World Bank (2001): “Engendering Development: Through Gender Equality in Rights,
Resources, and Voice”, New York: Oxford University Press.

THE MICROFINANCE REVIEW - Subscription Form To The Editor THE MICROFINANCE REVIEW Bankers Institute of Rural Development (BIRD) Sector-H, LDA Colony, Kanpur Road Lucknow-226012, Uttar Pradesh, India Tel No. +91-522-2421954/1923/1136, [email protected] I wish to subscribe to THE MICROFINANCE REVIEW Journal for the period as below :(Please √)
Particulars Inland (`) Foreign (US $) Individual Membership For One Year 500 60 Life Membership 5000 500 Institutional Membership For One Year 1000 120 For Five Year 4500 500
Subscriber Details Name (Individual/Organisation):---------------- ---------------------------------------------------------
Address:---------------------------------------------------------------------------------------------------------
--------------------------------------------------------------------------------------------------------------------
E-mail ID :----------------------------------------------------------------------------------------- ------------
Telephone No.---- ----------------------(M)--------- -----------------------Fax No.-------------------- ---
Payment Details
Payment may be made either through DD in favour of Bankers Institute of Rural Development payable atLucknow or through online payment in favour of Bankers Institute of Rural Development, SB A/C No.-053010100132930, at Axis Bank, Lucknow Main Branch, IFSC Code- UTIB0000053. DD No.--------------------------------------Date------------------Bank-----------------------------------------
NEFT details. ………………………………..………..................…………………………………………………………..
Amount ` / $ ------------------------------- (In words) -------------------------------------------------------
(Signature with date) Applicant / Authorised Person
Received ……………………………………………....……………………...............………………....…………… from
……………………………………………………………………………………………………………................…towards
subscription of THE MICROFINANCE REVIEWfor the period of………………………..................……
BIRD, Lucknow