
Risk expert George Backus' attached report - Climate Response
308
Risk expert George Backus’ attached report - Climate Response: Too Much and Too Little, is a valuable addition to the climate risk literature. You can download the report here and start digging in! That said, the report weighs in at more than 300 pages. If you want to take advantage of the three days the Climatographers spent going through the report and integrating it into the Climate Web, here’s how: 1. There’s our 1,200 word Substack blog summarizing the report’s approach and conclusions, and pointing to a compilation of the study’s most relevant graphics. Access it here – and don’t forget to subscribe to our Substack! 2. We’ve extensively extracted ideas and materials from the report here in the Climate Web. Our primary goal in doing so is not to substitute for reading the report itself, but to integrate the report’s insights throughout the Climate Web. But if you click around the extracted materials via the link, you’ll get a pretty good sense of the report. If you’re not familiar with it, the Climate Web is the closest thing today to a collective climate intelligence for climate change, integrating and building upon the work of thousands of experts. You can learn more through the Climate Web’s general website, or through our dedicated Topical Roadmaps website. The Climatographers “Evidence-based strategies for navigating a path to climate success without the benefit of a map.”
-
Upload
khangminh22 -
Category
Documents
-
view
0 -
download
0
Transcript of Risk expert George Backus' attached report - Climate Response

Risk expert George Backus’ attached report - Climate Response: Too Much and Too Little, is a valuable addition to the climate risk literature. You can download the report here and start digging in!
That said, the report weighs in at more than 300 pages. If you want to take advantage of the three days the Climatographers spent going through the report and integrating it into the Climate Web, here’s how:
1. There’s our 1,200 word Substack blog summarizing the report’s approach and conclusions, and pointing to a compilation of the study’s most relevant graphics. Access it here – and don’t forget to subscribe to our Substack!
2. We’ve extensively extracted ideas and materials from the report here in the Climate Web. Our primary goal in doing so is not to substitute for reading the report itself, but to integrate the report’s insights throughout the Climate Web. But if you click around the extracted materials via the link, you’ll get a pretty good sense of the report.
If you’re not familiar with it, the Climate Web is the closest thing today to a collective climate intelligence for climate change, integrating and building upon the work of thousands of experts. You can learn more through the Climate Web’s general website, or through our dedicated Topical Roadmaps website.
The Climatographers
“Evidence-based strategies for navigating a path to climate success without the benefit of a map.”
Climate Risk and Response July 2021
George Backus (Material is free to use with attribution.) 1
Climate Risk and Response: Too Much and Too Little
George Backus, D.Engr
International Security-Dynamics Research
Broomfield, Colorado
July 2021
Key Points
• It is inappropriate to deal with an unfolding, actualized threat by assuming optimistic outcomes based on idealized, optimal responses.
• Human behavioral dynamics and socio-climatic feedback effects will make it improbable that temperatures can be kept below 3.5 C° – and this outcome is only possible if full global mitigation is maintained over decades, in the absence of earth-system tipping point responses.
o Global governments do not have the ability to coordinate and complete the GHG transition to net-zero before 2065, although they can complete the carbon-fuel transition by 2057.
o It is not possible to physically and socially produce the mitigation trajectory that the optimization studies of the GHG transition portray.
o The GHG transition is a multi-generation problem. Fully executing even the single-program approach (“renewably electrify everything”) proposed herein will likely be politically problematic.
• Socioeconomic impact uncertainty is more important than climate uncertainty for determining mitigation levels that trade off lives and economic costs.
• All the mitigation activities produce economic multipliers that make the net cost to society and the economies, although large and impactful, much less than what the raw investment costs noted in other studies would suggest.
• The long energy payback period of renewable-energy sources produces feedback effects that create the greatest hurdle for a successful GHG transition.
• Climate is a threat multiplier and new technologies produce a confluence of threats that will interfere with climate mitigation efforts.
o There will be inadequate mitigation and adaptation in the devastated developing countries. World governments will be forced to prioritize safeguard responses.
o Even though it is rejected in this study, extreme geoengineering is inevitable, along with the counter-geoengineering conflicts it entails.
• Realizable policy execution will make conditions better than they would otherwise be.
Each of these points are substantiated through the analyses presented in the Sections that follow.
Climate Risk and Response July 2021
George Backus (Material is free to use with attribution.) 2
Reading Guidance
There is no need to read more than a small fraction of the report. The top of each section and subsection contains a very short Overview paragraph stating the purpose of the section, followed by a shorter Bottom Line paragraph stating the relevant implications. Reading the section or subsection is only useful if there in an interest in exploring the Overview concepts more deeply or in evaluating the legitimacy of the Bottom Line.
This report is not as intimidatingly large as it might appear. The page count is monopolized by graphics, footnotes, endnotes, and the appendices. The main explanatory text is quite limited in extent, albeit not in scope.
Given the unconventional approach to climate policy in this study, there is an abundance of references justifying and supporting it. References come from a legitimate, but wide selection of sources, not just scientific journals, because 1) many of the issues are socioeconomic and geopolitical in nature and 2) most of the news articles hyperlink to primary references. Numerous footnotes provide background content or refer to data. All elements of the simulation rely exclusively on peer-reviewed studies. Footnotes (Arabic numbering) will only contain bibliographic information. Endnotes (Roman numbering) contain clarifying information or peripheral commentary. Appendices provide detailed analyses, explanations, and interpretations. There is a glossary at the end of the document.
The study is essentially just a synthesis of others studies, but it uniquely focuses on the causal feedback among all the relevant elements.i Due to the counterintuitive impact of feedback dynamics, it produces results and perspectives that are very different from current expectations. Some results will at first look fatally flawed or nonsensical. See Appendix 3 for clarification.
Organizational Map
This study is a global, regionalized analysis of climate change policy that illustrates the intertwined dynamics and impacts among macroeconomic, demographic, energy demand, energy supply, and climate elements at various intensities of mitigation action. In an effort to present multiple perspectives, some appearance of redundancy is unavoidable.
Section 1 describes how idealized assumptions currently used to design climate policy lead to unrealistic outcomes.
Section 2 explores how the reconsideration of those assumptions requires a rethink of climate policy criteria.
Section 3 defines the Policy Package used in this study and explains how inevitable delays in the mobilization of mitigation activities will affect the adequate response to climate change.
Section 4 provides background information on the simulation approach as an aid to interpret the results of Section 5.
Section 5 shows the unexpected consequences of policy feedback interactions.
Section 6 notes that climate change will compete with and magnify other challenges that demand governmental priority.
Section 7 summarizes those critical conclusions that remain unaltered despite variations in assumptions and quantifications.
Climate Risk and Response July 2021
George Backus (Material is free to use with attribution.) 3
Table of Contents
Key Points ...................................................................................................................................................... 1
Reading Guidance ......................................................................................................................................... 2
Organizational Map ....................................................................................................................................... 2
Section 1. Context ......................................................................................................................................... 6
1.1 Uncertainty ......................................................................................................................................... 8
1.2 Non-Optimality ................................................................................................................................. 10
1.3 Incapacity .......................................................................................................................................... 15
1.4 Content ............................................................................................................................................. 20
Section 2. Tradeoff of Values ...................................................................................................................... 23
2.1 Uncertainty and Response Intensity ................................................................................................. 23
2.2 Cost Metrics ...................................................................................................................................... 31
Section 3. Mitigation Mobilization .............................................................................................................. 39
3.1 Mitigation Package ............................................................................................................................ 39
3.2 Mitigation Delays .............................................................................................................................. 42
3.3 Markets and Growth ......................................................................................................................... 46
Section 4. Socio-Climatic Feedback............................................................................................................. 49
4.1 Referent and Base Forecast .............................................................................................................. 53
4.1.1 Referent Forecast Quantification ............................................................................................... 54
4.1.2 Base Case Forecast Quantification ............................................................................................. 63
4.2 Economy and Demographic Dynamics ............................................................................................. 67
4.3 Energy Supply and Demand .............................................................................................................. 77
4.3.1 Energy Demand Dynamics ......................................................................................................... 78
4.3.2 Energy Supply to Demand Feedback ......................................................................................... 83
4.3.3 Energy Supply ............................................................................................................................. 84
4.4 Climate Dynamics .............................................................................................................................. 90
4.5 Direct Air Capture ............................................................................................................................. 95
Section 5. Uncertain Assessments .............................................................................................................. 98
5.1 An Almost Conventional Transition .................................................................................................. 98
5.2 A Bumpy-Road Transition ............................................................................................................... 105
5.3 The Core Analysis ............................................................................................................................ 109
Climate Risk and Response July 2021
George Backus (Material is free to use with attribution.) 4
5.4 UQ Effects on the Transition ........................................................................................................... 117
Section 6. Confluence Competition .......................................................................................................... 121
Section 7. Invariant Implications ............................................................................................................... 131
Endnotes ................................................................................................................................................... 134
Appendix 1: Supplemental Graphs .......................................................................................................... A1.1
A1.1 Referent Projection...................................................................................................................... A1.2
A.1.2 Base Case Projection ................................................................................................................. A1.11
A1.3 Base (100% Mobilization, w/o Own-Use) .................................................................................. A1.19
A1.4 Core Analysis (Base, 100% Mobilization, w /Own-Use, 50% Burden) ....................................... A1.28
A1.5 Mean (0% Mobilization, w/Own-Use, 0% Burden) .................................................................... A1.41
A1.6 Mean (100% Mobilization, w/Own-Use, 0% Burden) ................................................................ A1.41
A1.7 5% Climate (0% Mobilization, w/Own-Use, 0% Burden) ........................................................... A1.46
A1.8 5% Climate (100% Mobilization, w/Own-Use, 0% Burden) ....................................................... A1.51
A1.9 95% Climate (0% Mobilization, w/Own-Use, 0% Burden) ......................................................... A1.55
A1.10 95% Climate (100% Mobilization, w/Own-Use, 0% Burden) ................................................... A1.60
A1.11 5% Impact (0% Mobilization, w/Own-Use, 0% Burden) .......................................................... A1.64
A1.12 5% Impact (100% Mobilization, w/Own-Use, 0% Burden) ...................................................... A1.69
A1.13 95% Impact (0% Mobilization, w/Own-Use, 0% Burden) ........................................................ A1.72
A1.14 95% Impact (100% Mobilization, w/Own-Use, 0% Burden) .................................................... A1.76
A1.15 95% Impact (100% Mobilization, w/Own-Use, 50% Burden) .................................................. A1.81
A1.16 Effect of Mobilization Levels .................................................................................................... A1.85
A1.16.1 Mean (0% Mobilization, w/Own-Use, 0% Burden) ........................................................... A1.85
A1.16.2 Mean (10% Mobilization, w/Own-Use, 0% Burden) ......................................................... A1.86
A1.16.3 Mean (20% Mobilization, w/Own-Use, 0% Burden) ......................................................... A1.88
A1.16.4 Mean (30% Mobilization, w/Own-Use, 0% Burden) ......................................................... A1.91
A1.16.5 Mean (40% Mobilization, w/Own-Use, 0% Burden) ......................................................... A1.93
A1.16.6 Mean (50% Mobilization, w/Own-Use, 0% Burden) ......................................................... A1.97
A1.16.7 Mean (60% Mobilization, w/Own-Use, 0% Burden) ....................................................... A1.101
A1.16.8 Mean (70% Mobilization, w/Own-Use, 0% Burden) ....................................................... A1.105
A1.16.9 Mean (80% Mobilization, w/Own-Use, 0% Burden) ....................................................... A1.108
A1.16.10 Mean (90% Mobilization, w/Own-Use, 0% Burden) ..................................................... A1.112
A1.16.11. Mean (100% Mobilization, w/Own-Use, 0% Burden) .................................................. A1.116
Appendix 2: Model Documentation......................................................................................................... A2.1
Climate Risk and Response July 2021
George Backus (Material is free to use with attribution.) 5
Appendix 3: Troublesome GHG Transition Dynamics .............................................................................. A3.1
A3.1 Capacity Expansion ...................................................................................................................... A3.1
A3.2 Steady-State Production Energy .................................................................................................. A3.2
A3.3 Dynamic Production Energy ........................................................................................................ A3.5
A3.4 The Bottom Line ........................................................................................................................ A3.10
A3.5 Simplified versus Actual Model Calculations ............................................................................. A3.10
A3.6 Production-Energy Model Pseudocode ..................................................................................... A3.11
Endnotes ............................................................................................................................................ A3.13
Appendix 4: Evaluating the Climate Simulation ....................................................................................... A4.1
A4.1 Impulse-Based Differential Equations ......................................................................................... A4.1
A4.2 Base Comparison ......................................................................................................................... A4.8
A4.3 Sudden Zeroing of Emissions ..................................................................................................... A4.11
A4.4 IPCC SR1.5 Emission Reduction ................................................................................................. A4.12
A4.5 Net-Zero in 2050 Pathway Reductions ...................................................................................... A4.13
Appendix 5: Problematic Geoengineering Interactions ........................................................................... A5.1
Appendix 6: Counterproductive Biomass Energy and Offsets ................................................................. A6.1
A6.1 Biomass for Energy ...................................................................................................................... A6.1
A6.2 Biomass for Sequestration ........................................................................................................... A6.5
Endnotes ............................................................................................................................................ A6.10
Appendix 7: Glossary ............................................................................................................................... A7.1
Climate Risk and Response July 2021
George Backus (Material is free to use with attribution.) 6
Section 1. Context
Overview: Current approaches to climate policy contain limiting assumptions that have a dramatic impact on the efficacy of climate mitigation. Considerations of uncertainty in climatic conditions and in the associated socioeconomic impacts are more important than the conventional use of best-estimates for designing effective policy. In an imperfect world, the promotion of optimal policy is inconsistent with realizable outcomes. Governments have limitations that affect their ability to meet policy goals. These problematic issues have many interlinked facets that still allow governments to pursue beneficial policy.
Bottom Line: Recognizing and working with these realities rather than against them is the only way to produce practicable climate mitigation. _________________________________________________________________________
The rapid transition away from anthropogenic greenhouse gases (the GHG transition) is often discussed in terms of a “Moon Shot,” in reference to the U.S. Apollo program. That program was judged on one metric with a single endpoint, which still took ten years to accomplish,1 and was in response to the escalation of the perceived existential threat from the then Soviet Union.
The GHG transition is a much more complicated task requiring sustained global coordination over decades and has costs a thousand times larger than the Apollo program. The Manhattan Project and the Apollo Programs were trivial compared to a global GHG transition program.
Risk is the combination of uncertainty and consequence. A high consequence condition with a low, but realizable probability, is more important than a low-consequence condition with an almost certain probability of occurrence. The Apollo Program contained many risks; yet its human and technical risks pale in comparison to the risks of unsuccessfully mitigating climate change. Just as in the Apollo program, the GHG Transition will inevitably experience devastating setbacks, unanticipated complications, and obstructive unintended consequences.ii
After the end of the program, some Apollo engineers worked for the nuclear energy industry bringing with them the concept that: “It is important to design a system that works as planned when things go as planned, but it’s more important to design a system that still succeeds when things don’t go as planned. Things never go as planned.”2
The current policy dialogue notes that there’s “still a chance”3 or that “it is not too late” 4 to avoid catastrophic climate change, or that there remains a “narrow possibility”5 and that
1 https://en.wikipedia.org/wiki/Apollo_program 2 Personal communications. General Atomics, San Diego, CA. 1974 3 UNEP: Still a chance to put out 'climate fire' — here's what we need to do. https://www.dw.com/en/unep-still-a-chance-to-put-out-climate-fire-heres-what-we-need-to-do/a-46455650 4 Report says not too late to avoid a 3 °C warmer world. https://phys.org/news/2021-04-late-warmer-world.html, https://www.science.org.au/files/userfiles/support/reports-and-plans/2021/risks-australia-three-deg-warmer-world-report.pdf 5 Net Zero by 2050: A Roadmap for the Global Energy Sector, International Energy Agency, Paris May 2021, https://iea.blob.core.windows.net/assets/ad0d4830-bd7e-47b6-838c-40d115733c13/NetZeroby2050-ARoadmapfortheGlobalEnergySector.pdf
Climate Risk and Response July 2021
George Backus (Material is free to use with attribution.) 7
humanity needs to be optimistic.6,7 Current policies are based on optimization analyses that depend on the perfect, immediate, full-scale execution of efforts requiring complete political, financial, and technical coordination of numerous complicated programs, with global scope, within the highest levels of government. From the perspective of the Apollo mission principles, these concepts would seem unacceptable.8 The risk of climate action failure is the worst risk reported in both the World Economic Forum’s 20209 and 202110 Risk Assessment Reports, having the greatest combination of likelihood and impact. Separately, extreme weather (induced by climate change) has the greatest likelihood,11,12,13 and infectious diseases (made more ubiquitous by climate change) has the greatest impact.14 Starting in 1992,15 all historical pleas to avoid catastrophic climate change have assumed the immediate, full-scale deployment of mitigation options, all with negligible results.iii
Observations note the lack of progress toward even achieving the modest Paris Accord reduction and an estimated need for current mitigations efforts to be 45 times greater.16,17,18,19 The evidence inescapably demonstrates that governments and societies will not or cannot
6 Climatologist Michael E Mann: 'Good people fall victim to doomism. I do too sometimes.’ https://www.theguardian.com/environment/2021/feb/27/climatologist-michael-e-mann-doomism-climate-crisis-interview 7 Mann, M., 2021. The new climate war. Public Affairs, 2021 8 Apollo Engineers Discuss What It Took to Land on the Moon https://www.smithsonianmag.com/science-nature/apollo-engineers-discuss-what-it-took-land-moon-180972580/ 9 The Global Risks Report 2020,World Economic Forum. http://www3.weforum.org/docs/WEF_Global_Risk_Report_2020.pdf 10 The Global Risks Report 2021, World Economic Forum. http://www3.weforum.org/docs/WEF_The_Global_Risks_Report_2021.pdf 11 The Guardian view on the heat dome: burning through the models https://www.theguardian.com/commentisfree/2021/jul/08/the-guardian-view-on-the-heat-dome-burning-through-the-models 12 Why North America's killer heat scares me https://www.bbc.com/news/world-us-canada-57729502 13 Extreme temperatures kill 5 million people a year with heat-related deaths rising, study finds https://www.theguardian.com/world/2021/jul/08/extreme-temperatures-kill-5-million-people-a-year-with-heat-related-deaths-rising-study-finds 14 Climate crisis ‘may put 8bn at risk of malaria and dengue’ https://www.theguardian.com/global-development/2021/jul/08/climate-crisis-may-put-8bn-at-risk-of-malaria-and-dengue 15 United Nations Framework Convention On Climate Change, United Nations, 1992. https://unfccc.int/resource/docs/convkp/conveng.pdf 16 If This Task Was Urgent Before, It’s Crucial Now.' U.N. Says World Has 10 Months to Get Serious on Climate Goals. https://time.com/5942546/un-emissions-targets-climate-change/ 17 SEI, IISD, ODI, E3G, and UNEP. (2020). The Production Gap Report: 2020 Special Report. http://productiongap.org/2020report 18 NDC Synthesis Report: Nationally determined contributions under the Paris Agreement, https://unfccc.int/process-and-meetings/the-paris-agreement/nationally-determined-contributions-ndcs/nationally-determined-contributions-ndcs/ndc-synthesis-report 19 Global Action Is ‘Very Far’ From What’s Needed to Avert Climate Chaos https://www.nytimes.com/2021/02/26/climate/paris-agreement-emissions-targets.html
Climate Risk and Response July 2021
George Backus (Material is free to use with attribution.) 8
adequately mitigate climate change.20,21,22 Governments and societies will be forced to deal with the extensive damage and societal tensions induced by climate change. It is realistically impossible to imagine the successful execution of an intricate program that “requires immediate and massive deployment of all available clean and efficient energy technologies” whereby “all stakeholders – governments, businesses, investors and citizens – take action this year and every year” for decades.23 This study quantitatively reviews the basis for climate policy proposals and finds that their failure to consider the feedback among the technological, social, and climate processes paints an unachievable picture of the future outcomes. The divergence between what is theoretically possible and pragmatically probable stems from ignoring uncertainty, trusting optimality, and overestimating governance. The next subsections discuss each of these elements in turn. Because the processes are intertwined, the feedback among them causes counterintuitive phenomena that require a reassessment of climate policy complications and outcomes. The effect of feedback on policy design and execution is the subject of the subsequent Sections. It is too late to adequately mitigate climate change. Coping with the more dire consequences of climate change will necessarily take a larger share of government and societal resources worldwide. This study attempts a pragmatic look at policy dynamics, outcomes, and implications.
1.1 Uncertainty
Overview: Uncertainty has a large impact on the climate risk that climate policy is designed to mitigate. It is easy to misinterpret the implications of uncertainty. Neglecting uncertainty affects policy justification, design, and effectiveness in many ways.
Bottom Line: Uncertainty contains much more useful and relevant information for policy design than do best estimates. _________________________________________________________________________
Current policy postures assume a known and nearly ideal world, where expected future economic, energy, and climate conditions readily yield to mitigation policy. They neglect other factors that may hamper the mitigation process and emergent crises that would redirect societal resources.
20 Climate scientists: concept of net zero is a dangerous trap https://theconversation.com/climate-scientists-concept-of-net-zero-is-a-dangerous-trap-157368 21 Tollefson, J., 2015. The 2 °C dream. Nature, 527(7579), pp.436-439. https://www.nature.com/news/polopoly_fs/1.18868!/menu/main/topColumns/topLeftColumn/pdf/527436a.pdf?origin=ppub 22 Unlocking the Inclusive Growth Story of the 21st Century: Accelerating Climate Action in Urgent Times. New Climate Economy, Washington, DC, https://newclimateeconomy.report/2018/wp-content/uploads/sites/6/2018/09/NCE_2018_FULL-REPORT.pdf 23 Net Zero by 2050: A Roadmap for the Global Energy Sector, International Energy Agency, Paris May 2021, https://iea.blob.core.windows.net/assets/ad0d4830-bd7e-47b6-838c-40d115733c13/NetZeroby2050-ARoadmapfortheGlobalEnergySector.pdf
Climate Risk and Response July 2021
George Backus (Material is free to use with attribution.) 9
Uncertainty is the source of the greatest risk and it is that risk that justifies climate mitigation policies.24 Some would argue that if you don’t know for sure, there is no need to respond,25 but because the “more the uncertainty the more the risk,”26,27 “it is the uncertainty associated with climate change that validates the need to act protectively and proactively.”28 Basing policy on best estimates, biased toward hoped-for outcomes is specious. Appropriate policy recognizes uncertainty as more relevant than certainty. This study shows that the impacts of climate change are more uncertain than the estimate of climate change.29 Scientific, business, and political communities seek to minimize uncertainty, thereby giving added assurance for expected outcomes. There is no time to wait until new studies doubtfully reduce or eliminate the uncertainty. Accommodating uncertainty has long been a part of risk management.
The response to uncertainty from an engineering perspective is the opposite of that from a science perspective.30,31,32 Conservative science strives to make statements where facts provide strong statistical evidence for accuracy or validity.33 Conservative engineering strives to avoid undesirable consequences and includes contingencies for what is not known, until evidence justifies using reduced uncertainty. The concern is not with the consequence of correctly estimating the most likely values, but with the consequence of misestimating the unlikely ones. Until any diminished uncertainty about the climatic future is verified, existing estimates of uncertainty remain an indispensable part of any risk assessment. Risk, as used here, is explicitly the relevant summation of occurrence probabilities multiplied by quantified measures of occurrence consequences.
24 https://archive.thinkprogress.org/sandia-labs-study-it-is-the-uncertainty-associated-with-climate-change-that-validates-the-need-to-427023cb0724/ referencing (link now broken) Backus, G.A., Lowry, T.S. and Warren, D.E., 2013. The near-term risk of climate uncertainty among the US states. Climatic Change, 116(3), pp.495-522. 25 Unsettled: What Climate Science Tells Us, What It Doesn’t, and Why It Matters, Steven E. Koonin , 2021, BenBella Books, Dallas, TX 26 Backus, George A., Thomas S. Lowry, Drake E. Warren, et al., "Assessing the Near-Term Risk of Climate Uncertainty: Interdependencies among the U.S. States," SAND Report, April 2010. https://cfwebprod.sandia.gov/cfdocs/CompResearch/docs/Climate_Risk_Assessment.pdf 27 A critical review of Steven Koonin’s ‘Unsettled’, Mark Boslough. https://yaleclimateconnections.org/2021/05/a-critical-review-of-steven-koonins-unsettled/ 28 The Wall Street Journal Publishes Long-Debunked Myths To Promote Climate Inaction https://archive.thinkprogress.org/the-wall-street-journal-publishes-long-debunked-myths-to-promote-climate-inaction-dca350d5cc4c/ 29 van der Wijst, K.I., Hof, A.F. and van Vuuren, D.P., 2021. On the optimality of 2° C targets and a decomposition of uncertainty. Nature communications, 12(1), pp.1-11. https://www.nature.com/articles/s41467-021-22826-5.pdf 30 Boslough M 2019 Uncertainty and risk at the catastrophe threshold, Chapter 13 in Planetary Defense Global Collaboration for Saving Earth from Asteroids and Comets, ed N Schmidt and M Thangavelu (New York: Springer International Publishing) 31 Backus, George A., Thomas S. Lowry, and Drake E. Warren. "The near-term risk of climate uncertainty among the US states." Climatic Change 116, no. 3 (2013): 495-522. https://link.springer.com/article/10.1007%2Fs10584-012-0511-8 32 Boslough, Mark, George Backus, and Martin Carr. "Global Situational Awareness and Early Warning of High-Consequence Climate Change." https://citeseerx.ist.psu.edu/viewdoc/download?doi=10.1.1.505.4366&rep=rep1&type=pdf 33 You should not be surprised that climate predictions may have been too conservative https://www.washingtonpost.com/politics/2021/07/19/you-should-not-be-surprised-that-climate-predictions-may-have-been-too-conservative/

Climate Risk and Response July 2021
George Backus (Material is free to use with attribution.) 10
A house is not designed to accommodate only the average wind, nor a plane the average flight conditions, nor a dam the average runoff. Policies and concerns that rely on a patently unachievable goal (1.5° C) are unhelpful guides for meaningful action. In war, when planning to overcome an adversary, what is unknown is more important than what is known. It is never acceptable to underestimate the enemy and assume that the best outcome will occur with the least preparedness.
Mitigation policy is to avoid unacceptable outcomes with unacceptable probabilities of realization, consistent with the (financial and political) viability to do so. Even in limiting an outcome, such as by using a seatbelt for automobile-accident risks, it is important to recognize that a future outcome may still be undesirable. Mitigation simply make outcomes from actualized risks better than they would otherwise be. When it is clear that the outcome will not be, for example, the avoidance of cancer, it is essential to quickly prepare for dealing with the actual reality rather than a hoped for one. The cancerous climate change is a reality. While climate denial remains rampant, those most concerned about the consequences of climate change are in diagnostic denial. There is no choice but to manage the cancer, rather than continue trying to avoid getting cancer.
This study addresses the ramifications of societal, climate, and impact uncertainty on policy success. It analyzes how different levels of mitigation affect the relevant dynamics and ultimate outcomes. It quantifies the effect of the uncertainty on the impacts for given climatic conditions and the uncertainty in the climate driver of those impacts.34 The uncertainty quantification (UQ) of impacts and of climate are adequately known to enable such an analysis. A unique aspect of this study is that it addresses the unexpected repercussions due to interaction among all the impacts. It analyzes consequences at the 5% exceedance probabilityiv (low impact effects or low climate conditions), the mean response (mean impact response and mean climate conditions), and the 95% exceedance probability (high impact effects or high climate conditions)v as a way to understand the implications over the full range of probabilities. vi
1.2 Non-Optimality
Overview: The use of optimization analyses for creating public and political expectations, and for prompting policy options is misleading. Optimization only indicates what is theoretically possible, and not what is realistically probable. The real world cannot optimally execute policies. Causally simulating the impact of policy in an imperfect, uncertain world better establishes a basis for sound, effective climate policy.
Bottom Line: Optimization should not form the basis for climate policy. _________________________________________________________________________
34 Stoerk, T., Wagner, G. and Ward, R.E., 2018. Policy brief—Recommendations for improving the treatment of risk and uncertainty in economic estimates of climate impacts in the sixth Intergovernmental Panel on Climate Change assessment report. Review of Environmental Economics and Policy, 12(2), pp.371-376. https://gwagner.com/wp-content/uploads/Stoerk-Wagner-Ward-IPCC-Policy-Brief.pdf https://gwagner.com/wp-content/uploads/Stoerk-Wagner-Ward-IPCC-Policy-Brief.pdf
Climate Risk and Response July 2021
George Backus (Material is free to use with attribution.) 11
For the IPCC Assessment Reports,35 the economic, demographics and energy determinants of GHG emissions came from Integrated Assessment Models (IAM).36,37,38 These models are also used to evaluate policy options.39 The IAM models and the methods they use are widely critiqued for their lack of realism.40,41,42,43,44,45 All of the more recent studies and policy
35 https://www.ipcc.ch/reports/ 36 How ‘integrated assessment models’ are used to study climate change https://www.carbonbrief.org/qa-how-integrated-assessment-models-are-used-to-study-climate-change 37 Nikas, A., Doukas, H. and Papandreou, A., 2019. A detailed overview and consistent classification of climate-economy models. Understanding risks and uncertainties in energy and climate policy, pp.1-54. https://library.oapen.org/bitstream/handle/20.500.12657/22907/1007254.pdf?sequence=1#page=16 38 IPCC, 2013: Climate Change 2013: The Physical Science Basis. Contribution of Working Group I to the Fifth Assessment Report of the Intergovernmental Panel on Climate Change [Stocker, T.F., D. Qin, G.-K. Plattner, M. Tignor, S.K. Allen, J. Boschung, A. Nauels, Y. Xia, V. Bex and P.M. Midgley (eds.)]. Cambridge University Press, Cambridge, United Kingdom and New York, NY, USA, 1535 pp. https://www.ipcc.ch/report/ar5/wg1/ 39 Special Report on Global Warming of 1.5°C (SR1.5). Intergovernmental Panel on Climate Change, 2018. https://www.ipcc.ch/sr15/ 40 Heard, B.P., Brook, B.W., Wigley, T.M. and Bradshaw, C.J., 2017. Burden of proof: A comprehensive review of the feasibility of 100% renewable-electricity systems. Renewable and Sustainable Energy Reviews, 76, pp.1122-1133. https://www.sciencedirect.com/science/article/pii/S1364032117304495/pdfft?md5=32f7987911550c314d73080b6aece068&pid=1-s2.0-S1364032117304495-main.pdf 41 Clack, C.T., Qvist, S.A., Apt, J., Bazilian, M., Brandt, A.R., Caldeira, K., Davis, S.J., Diakov, V., Handschy, M.A., Hines, P.D. and Jaramillo, P., 2017. Evaluation of a proposal for reliable low-cost grid power with 100% wind, water, and solar. Proceedings of the National Academy of Sciences, 114(26), pp.6722-6727. https://www.pnas.org/content/pnas/114/26/6722.full.pdf 42 Keen, S., 2020. The appallingly bad neoclassical economics of climate change. Globalizations, pp.1-29. https://www.researchgate.net/profile/Steve-Keen/publication/344034609_The_appallingly_bad_neoclassical_economics_of_climate_change/links/5f73b637a6fdcc0086484210/The-appallingly-bad-neoclassical-economics-of-climate-change.pdf 43 Asefi-Najafabady, S., Villegas-Ortiz, L. and Morgan, J., 2020. The failure of Integrated Assessment Models as a response to ‘climate emergency’and ecological breakdown: the Emperor has no clothes. Globalizations, pp.1-11. https://www.tandfonline.com/doi/pdf/10.1080/14747731.2020.1853958?needAccess=true 44 Stanton, E.A., Ackerman, F. and Kartha, S., 2009. Inside the integrated assessment models: Four issues in climate economics. Climate and Development, 1(2), pp.166-184. http://frankackerman.com/publications/climatechange/Inside_Integrated_Assessment%20Model.pdf 45 The economics of climate change: no action not an option, Swiss Re, 2021, https://www.swissre.com/dam/jcr:e73ee7c3-7f83-4c17-a2b8-8ef23a8d3312/swiss-re-institute-expertise-publication-economics-of-climate-change.pdf
Climate Risk and Response July 2021
George Backus (Material is free to use with attribution.) 12
proposals46,47,48,49,50,51,52 that claim the ability to achieve net zero conditions by 2050 are also exclusively based on least-cost optimization analyses53,54 that assume optimal responses by governments and populations. Most studies are country-centric and are oblivious to international interactions or consequences.vii The optimization determines mathematically feasible solutions typically based on cost minimization.55 This approach is a value judgment56 of what is important, primarily from a theoretical economic (least-costs) perspective. These normative analyses are inappropriate for deciding policy.57 Governments and individuals use additional
46 Solving The Climate Crisis: The Congressional Action Plan for a Clean Energy Economy and a Healthy, Resilient, and Just America, U.S. Congress, June 2020, Washington, DC https://climatecrisis.house.gov/report 47 E. Larson, C. Greig, J. Jenkins, E. Mayfield, A. Pascale, C. Zhang, J. Drossman, R. Williams, S. Pacala, R. Socolow, EJ Baik, R. Birdsey, R. Duke, R. Jones, B. Haley, E. Leslie, K. Paustian, and A. Swan, Net-Zero America: Potential Pathways, Infrastructure, and Impacts, interim report, Princeton University, Princeton, NJ, December 15, 2020. https://environmenthalfcentury.princeton.edu/sites/g/files/toruqf331/files/2020-12/Princeton_NZA_Interim_Report_15_Dec_2020_FINAL.pdf 48 Jacobson, M.Z., Delucchi, M.A., Bazouin, G., Bauer, Z.A., Heavey, C.C., Fisher, E., Morris, S.B., Piekutowski, D.J., Vencill, T.A. and Yeskoo, T.W., 2015. 100% clean and renewable wind, water, and sunlight (WWS) all-sector energy roadmaps for the 50 United States. Energy & Environmental Science, 8(7), pp.2093-2117. https://pubs.rsc.org/am/content/getauthorversionpdf/C5EE01283J 49 National Academies of Sciences, Engineering, and Medicine, 2021. Accelerating Decarbonization of the US Energy System. https://www.nap.edu/download/25932 50 Williams, J. H., Jones, R. A., Haley, B., Kwok, G., Hargreaves, J., Farbes, J., & Torn, M. S. (2021). Carbon‐neutral pathways for the United States. AGU Advances, 2, e2020AV000284. https://doi.org/10.1029/2020AV000284 51 D’Aprile, P. et.al (2020), Net-Zero Europe: Decarbonization pathways and socioeconomic implications, McKinsey & Company, Europe. https://www.mckinsey.com/~/media/mckinsey/business%20functions/sustainability/our%20insights/how%20the%20european%20union%20could%20achieve%20net%20zero%20emissions%20at%20net%20zero%20cost/net-zero-europe-vf.pdf 52 Riahi, K., Dentener, F., Gielen, D., Grubler, A., Jewell, J., Klimont, Z., Krey, V., McCollum, D.L., Pachauri, S., Rao, S. and van Ruijven, B., 2012. Energy pathways for sustainable development. http://pure.iiasa.ac.at/id/eprint/10065/1/GEA%20Chapter%2017%20Energy%20Pathways%20for%20Sustainable%20Development.pdf 53 Net Zero by 2050: A Roadmap for the Global Energy Sector, International Energy Agency, Paris May 2021, https://iea.blob.core.windows.net/assets/ad0d4830-bd7e-47b6-838c-40d115733c13/NetZeroby2050-ARoadmapfortheGlobalEnergySector.pdf 54 Parson, E.A. and Fisher-Vanden, A.K., 1997. Integrated assessment models of global climate change. Annual Review of Energy and the Environment, 22(1), pp.589-628. http://pure.iiasa.ac.at/id/eprint/15214/1/paper%20%281%29.pdf 55 Stanton, E.A., Ackerman, F. and Kartha, S., 2009. Inside the integrated assessment models: Four issues in climate economics. Climate and Development, 1(2), pp.166-184. http://frankackerman.com/publications/climatechange/Inside_Integrated_Assessment%20Model.pdf 56 Schneider, S.H., 1997. Integrated assessment modeling of global climate change: Transparent rational tool for policy making or opaque screen hiding value‐laden assumptions?. Environmental Modeling & Assessment, 2(4), pp.229-249. http://acdc2007.free.fr/schneider97.pdf 57 Normative Economics https://www.investopedia.com/terms/n/normativeeconomics.asp
Climate Risk and Response July 2021
George Backus (Material is free to use with attribution.) 13
tastes and preferences of self-interest58,59,60,61 to make decisions.62,63,64 Implementation of the suggested pathways to the year 2050 would require complete and perfect coordination among essentially all the world governments. In general, governments and all institutions are subject to realities that only enable them to iteratively and slowly achieve policy goals via muddling,65,66 even in war time.67 The delays of muddling are captured in the mobilization delay discussed in Section 3.2. It will be many years before climate policy produces adequate action.
Scientific ability does not mean technical or institutional capability. A mathematical description of what is theoretically possible is not a measure of what is pragmatically feasible. Centralized optimization is only meaningful with full control of all required resources. There is no central control of the world’s distrustful governments, limited global resources, and disparate international populations. Even at the country level, let alone the global level, there is no historical example of a country successfully pursuing an optimal plan, and no optimal plan has ever made it through political debate. It is unwarranted to promote such an approach as the remedy for the threats of climate change.
Many of the previously noted studies have a large number of measures that, for success, must be fully implemented globally at the time of the study release. Even complex single-goal programs such as the race to the moon and the Manhattan Project were short term efforts, involving a small part of a single nation’s population. No country, its government or population, has even been able to efficiently mobilize a straightforward policy toward the direct-threat and short-duration COVID-19 response.68,viii It is implausible that any optimally calculated global-
58 De Mesquita, Bruce Bueno, Alastair Smith, Randolph M. Siverson, and James D. Morrow. The logic of political survival. MIT press, 2005. 59 North, D.C., Wallis, J.J. and Weingast, B.R., 2009. Violence and social orders: A conceptual framework for interpreting recorded human history. Cambridge University Press. 60 Why isn’t government policy more preventive? by Paul Cairney and Emily St Denny, Oxford, Oxford University Press, 2020, 304 pp. https://oxford.universitypressscholarship.com/view/10.1093/oso/9780198793298.001.0001/oso-9780198793298 61 Olson, M., 2000. Power and prosperity: Outgrowing communist and capitalist dictatorships (No. 338.9 Ol84p Ej. 1 025107). Basic Books,. 62 McFadden, D., 2001. Economic choices. American economic review, 91(3), pp.351-378. https://www.researchgate.net/profile/Daniel-Mcfadden-3/publication/23544680_Economic_Choices/links/0a85e534d371185c7c000000/Economic-Choices.pdf 63 Kahneman, D., Slovic, S.P., Slovic, P. and Tversky, A. eds., 1982. Judgment under uncertainty: Heuristics and biases. Cambridge University Press and Gilovich, T., Griffin, D. and Kahneman, D. eds., 2002. Heuristics and biases: The psychology of intuitive judgment. Cambridge University Press. 64 Simon, Herbert A. (1979). "Rational decision making in business organizations". The American Economic Review. 69 (4): 493–513. http://www.ask-force.org/web/Discourse/Simon-Rational-Business-1979.pdf 65 Charles, Lindblom. "The science of muddling through." Public administration review 19, no. 2 (1959): 79-88. mmmmmhttp://urban.hunter.cuny.edu/~schram/lindblom1959.pdf 66 Behn, Robert D. "Management by groping along." Journal of policy analysis and management 7, no. 4 (1988): 643-663. http://ice.org.br/wp-content/uploads/pdfs/groping_along%20.pdf 67 What Life Was Like In Britain During The Second World War, Imperial War Museum, UK. https://www.iwm.org.uk/history/what-life-was-like-in-britain-during-the-second-world-war 68 Crane MA, Shermock KM, Omer SB, Romley JA. Change in Reported Adherence to Nonpharmaceutical Interventions During the COVID-19 Pandemic, April-November 2020. JAMA. Published online January 22, 2021. doi:10.1001/jama.2021.0286
Climate Risk and Response July 2021
George Backus (Material is free to use with attribution.) 14
level GHG mitigation policy can ever be realistically implemented. The IPCC Special Report on Global Warming of 1.5 °C (SR1.5) 69 entails well over 100 measures and notes concerns whether there is the institutional and governance capability to adequate implement them. The world’s societies are not capable of jointly agreeing to follow an optimal path and no country’s government is capable of successfully managing a diverse portfolio of intense, complicated projects over decades.
Lastly, climate change mitigation represents the ultimate megaproject. If the policies were pursued, cost and timing will be far different than assumed because of overruns and other unrecognized issues of megaprojects.70,71,72 In the presence of government corruption, the cost will be much higher.73 The SR1.5 report noted concern over the unprecedented scale of its proposed effort, but believed it might be possible because there was not then the need for speed of execution.74 Now there is. Even the recent and highly-respected International Energy Agency report75 again involves over 400 measures76 and notes the extreme difficulty in achieving what it considers the most doable pathway to Net-Zero GHG emissions. The design of a GHG transition will only succeed if it ignores idealized best estimates and optimal strategies
https://jamanetwork.com/journals/jama/articlepdf/2775686/jama_crane_2021_ld_210005_1614619888.59631.pdf 69 Allen, M., Antwi-Agyei, P., Aragon-Durand, F., Babiker, M., Bertoldi, P., Bind, M., Brown, S., Buckeridge, M., Camilloni, I., Cartwright, A. and Cramer, W., 2019. Global warming of 1.5° C. An IPCC Special Report on the impacts of global warming of 1.5° C above pre-industrial levels and related global greenhouse gas emission pathways, in the context of strengthening the global response to the threat of climate change, sustainable development, and efforts to eradicate poverty. World Meteorological Organization, Geneva, Switzerland. https://www.ipcc.ch/sr15/ 70 Flyvbjerg, B., 2014. What you should know about megaprojects and why: An overview. Project management journal, 45(2), pp.6-19. https://arxiv.org/ftp/arxiv/papers/1409/1409.0003.pdf 71 Sovacool, B.K., Nugent, D. and Gilbert, A., 2014. Construction cost overruns and electricity infrastructure: an unavoidable risk? The Electricity Journal, 27(4), pp.112-120. https://d1wqtxts1xzle7.cloudfront.net/60463977/Sovacool-et-al-EJ-Overruns20190902-114884-1copy49.pdf?1567431544=&response-content-disposition=inline%3B+filename%3DConstruction_Cost_Overruns_and_Electrici.pdf&Expires=1621623669&Signature=MGGk6NREDOwbVVdUdTLgY9sZPkY0X8t~3~cE713DHZYINAHgb3xkUVS8yxFiGElsblCMw9WSmxkKkZNfkSOTVqmqF6zasIAksbePieR1XkHDzXYN~tBk5Me925WOLksYEQdE7PVPgzVOQR7YozMG6Lb4fkt8RhnzmJ-K3pEwH7YksMtZvEBrhtMyYTxUpQErNR7yQf32C0fCrmXL27vudGcAZro9wYL12r8n-Lhv0nSWsH41tdp3H4HDJP~S0RMTpYOfm5QaC1RxT4ls-gFt0V8eXYs9WXXAjyMgPnzEW6HMyIzMnUoryM97rzHc9iYyebbgtQrVQlO7mSMNrbyvBQ__&Key-Pair-Id=APKAJLOHF5GGSLRBV4ZA 72 Sovacool, B.K., Gilbert, A. and Nugent, D., 2014. An international comparative assessment of construction cost overruns for electricity infrastructure. Energy Research & Social Science, 3, pp.152-160. https://www.qualenergia.it/sites/default/files/articolo-doc/1-s2.0-S2214629614000942-main%281%29.pdf 73 d’Agostino, G., Dunne, J.P. and Pieroni, L., 2012. Corruption, military spending and growth. Defence and Peace Economics, 23(6), pp.591-604. https://www.researchgate.net/profile/Giorgio-Dagostino-2/publication/230859653_Corruption_Military_Spending_and_Growth/links/0912f50b8e2a7947c9000000/Corruption-Military-Spending-and-Growth.pdf 74 Special Report on Global Warming of 1.5°C (SR1.5). Intergovernmental Panel on Climate Change, 2018. https://www.ipcc.ch/sr15/ 75 Net Zero by 2050: A Roadmap for the Global Energy Sector, International Energy Agency, Paris May 2021, https://iea.blob.core.windows.net/assets/ad0d4830-bd7e-47b6-838c-40d115733c13/NetZeroby2050-ARoadmapfortheGlobalEnergySector.pdf 76 IEA Roadmap to Net-Zero by 2050 Includes Over 400 Milestones, https://sdg.iisd.org/news/iea-roadmap-to-net-zero-by-2050-includes-over-400-milestones/
Climate Risk and Response July 2021
George Backus (Material is free to use with attribution.) 15
and concentrates on practicable options. Being overly optimistic will have negative macroeconomic consequences.77 Business risk assessments78 do not utilize optimization, consequently, there is an incompatibility with using optimization for developing risk-mitigation policies.
The analyses described in the Sections below uses causal, descriptive analyses based on feedback dynamics.79,80, ix It is more akin to policy-relevant, positive rather the normative economic analyses81 It acknowledges the enduring historical realities that societies and governments are necessarily imperfect and limited. As such, it assumes that at best there can be a single-metric Policy Package, rather than one containing hundreds of ungovernable programs.
1.3 Incapacity
Overview: Governments and societies have a limited ability to maintain prioritization on a single concern. Other pressures and future crises will intervene. Delays inherent to pollical processes indicate that proposed policy regimes will not adequately mitigate climate change. Self-interest is an important consideration for establishing a workable policy implementation.
Bottom Line: Climate policy can no longer adequately limit the impact of climate change, but effective policy can make outcomes much better than they would otherwise be _________________________________________________________________________
Many countries take credit for ordinary economic change, such as offshoring manufacturing, the economically-motivated switch to natural gas, the decreasing marginal costs of wind and solar generation, and exporting pollution82 through trade. These situations do not constitute the execution of GHG policy. Many net-zero projects are not net zero at the global level.83 Changes in new investments alone, via altered economic conditions or restrictive policy, are inadequate for a successful transition.
Most optimalization analyses assume the discrete lifetime of capital and equipment. At the end of that lifetime, the GHG-producing articles retire. Retirement is a stochastic process where the actual in-service life is often much greater than the average lifetime. In reality, many of the
77 Beaudry, P. and Willems, T., 2018. On the macroeconomic consequences of over-optimism (No. w24685). National Bureau of Economic Research. https://www.nber.org/system/files/working_papers/w24685/w24685.pdf 78 Woetzel, J., Pinner, D. and Samandari, H., 2020. Climate Risk and response. McKinsey Global Institute. https://www.mckinsey.com/~/media/mckinsey/business%20functions/sustainability/our%20insights/climate%20risk%20and%20response%20physical%20hazards%20and%20socioeconomic%20impacts/mgi-climate-risk-and-response-full-report-vf.pdf 79 Sterman, J., 2010. Business Dynamics. Irwin/McGraw-Hill. 80 Forrester, J.W., 1997. Industrial dynamics. Journal of the Operational Research Society, 48(10), pp.1037-1041. 81 Positive Economics https://www.investopedia.com/terms/p/positiveeconomics.asp 82 Fuchs, R., Brown, C. and Rounsevell, M., 2020. Europe’s Green Deal offshores environmental damage to other nations. Nature https://media.nature.com/original/magazine-assets/d41586-020-02991-1/d41586-020-02991-1.pdf 83 Net-zero carbon pledges must be meaningful to avert climate disaster, Nature, https://media.nature.com/original/magazine-assets/d41586-021-00864-9/d41586-021-00864-9.pdf
Climate Risk and Response July 2021
George Backus (Material is free to use with attribution.) 16
fossil-using purchases made today will still be in service in the year 205084 – unless policies force their early retirement. These policies, even if they entail payments for lost-use, will entail societal resistance.
Governments work in their own self-interest85 and global agreement is unrealistic.86 It is hard to find an example of global governments reaching any unified goal.87 Many countries are still unwilling or unable to completely transition from fossil fuels.88,89,90,91,92,93,94,95,96,97,98,99,100 Thus, any realizable goal of climate policy can only be predicated on making conditions better than they would otherwise be. It is not possible to achieve desired conditions within any acceptable
84 Lifespan of New U.S. Gas Plants Exceeds Net-Zero Climate Goals, https://www.bloomberg.com/news/features/2021-05-21/lifespan-of-new-u-s-gas-plants-exceeds-net-zero-climate-goals 85 De Mesquita, Bruce Bueno, Alastair Smith, Randolph M. Siverson, and James D. Morrow. The logic of political survival. MIT press, 2005. 86 Bradshaw, C.J., Ehrlich, P.R., Beattie, A., Ceballos, G., Crist, E., Diamond, J., Dirzo, R., Ehrlich, A.H., Harte, J., Harte, M.E. and Pyke, G., 2021. Underestimating the challenges of avoiding a ghastly future. Frontiers in Conservation Science, 1, p.9. https://www.frontiersin.org/articles/10.3389/fcosc.2020.615419/pdf 87 World fails to meet a single target to stop destruction of nature – UN report https://www.theguardian.com/environment/2020/sep/15/every-global-target-to-stem-destruction-of-nature-by-2020-missed-un-report-aoe 88 The world is moving away from fossil fuels, while in Australia, it’s all systems go for coal and gas https://www.theguardian.com/commentisfree/2021/may/20/the-world-is-moving-away-from-fossil-fuels-while-in-australia-its-all-systems-go-for-coal-and-gas 89 India may build new coal plants due to low cost despite climate change https://www.reuters.com/world/india/exclusive-india-may-build-new-coal-plants-due-low-cost-despite-climate-change-2021-04-18/ 90 Coal use set to surge in India despite renewables boom https://www.energyvoice.com/renewables-energy-transition/300058/coal-use-set-to-surge-in-india-despite-renewables-boom/ 91 India Will Have to Leapfrog Every Major Economy to Reach Net Zero by 2050 https://www.bloomberg.com/news/articles/2021-03-22/india-will-have-to-leapfrog-every-major-economy-to-reach-net-zero-by-2050 92 China has ‘no other choice’ but to rely on coal power for now https://www.cnbc.com/2021/04/29/climate-china-has-no-other-choice-but-to-rely-on-coal-power-for-now.html 93 China Tempers Climate Change Efforts After Economic Officials Limit Scope https://www.wsj.com/articles/chinas-economic-officials-temper-climate-efforts-11623241401 94 The world is kicking its coal habit. China is still hooked https://www.economist.com/graphic-detail/2021/04/07/the-world-is-kicking-its-coal-habit-china-is-still-hooked 9595 Why China is still clinging to coal https://www.vox.com/2021/4/6/22369284/china-coal-power-economy-climate-change 96 Saudis Dismiss Call to End Oil Spending as ‘La La Land’ Fantasy https://www.bloomberg.com/news/articles/2021-06-01/saudis-dismiss-call-to-end-oil-spending-as-la-la-land-fantasy 97 Asia disputes IEA’s call to curb new oil, gas, coal investments https://www.aljazeera.com/economy/2021/5/19/asia-disputes-ieas-call-to-curb-new-oil-gas-coal-investments 98 Asia Pacific’s oil demand to fall in 2020 but could rise 25% by 2040 https://www.woodmac.com/press-releases/asia-pacifics-oil-demand-to-fall-in-2020-but-could-rise-25-by-2040/ 99 China is facing its worst power shortage in a decade. That's a problem for the whole world https://www.cnn.com/2021/06/30/economy/china-power-shortage-intl-hnk/index.html 100 Happy Talk Vs Hard Truth — Why Fossil Fuel Production Cuts Are So Not Happening https://cleantechnica.com/2020/12/06/happy-talk-vs-hard-truth-why-fossil-fuel-production-cuts-are-so-not-happening/
Climate Risk and Response July 2021
George Backus (Material is free to use with attribution.) 17
timeframe. An inadequate, but essential, policy package would still require economically sustained and politically consistent efforts over multiple generations.
Climate change has a disproportional financial101 and human-hardship102,103 impact on Disadvantaged (developing) countries.104,105 (See Section 5). These impacts lead to increased regional tensions that spill over to affect the Advantaged (developed) countries.106 When populations undergo increased socioeconomic stress/threats, myopic populism and nationalism interfere with maintaining a focused resource-allocation on earlier priorities.107 Political counter-pressures to climate change policy will cause political setbacks, and assuming sustained policy over the decades is idealistic.108 More intense climate volatility that produces severe outcomes may be the only way to remind populations and politicians of need for sustained efforts.109,110
Political and societal priorities do and will change as conditions change. Climate is a threat multiplier111 and creates a confluence of security issues.112,113 (See Section 6.) There will inevitably be erupting crises that demand immediate attention. There will be future pandemics, wars, coups, financial meltdowns, social unrest, and a myriad of other, as yet unimagined crises. Real world geopolitics makes it unreasonable to assume that a sustained prioritization on
101 Countries most exposed to climate change face higher costs of capital https://www.economist.com/finance-and-economics/2019/08/15/countries-most-exposed-to-climate-change-face-higher-costs-of-capital 102 Sanderson, B.M., Xu, Y., Tebaldi, C., Wehner, M., O'Neill, B.C., Jahn, A., Pendergrass, A.G., Lehner, F., Strand, W.G., Lin, L. and Knutti, R., 2017. Community climate simulations to assess avoided impacts in 1.5 and 2 C futures. Earth System Dynamics, 8(3), pp.827-847. https://www.research-collection.ethz.ch/bitstream/handle/20.500.11850/191578/2/esd-8-827-2017.pdf 103 "The geographic disparity of historical greenhouse emissions and projected climate change" Science Advances (2021). https://advances.sciencemag.org/content/advances/7/29/eabe4342.full.pdf 104 Unprecedented Impacts of Climate Change Disproportionately Burdening Developing Countries, Delegate Stresses, as Second Committee Concludes General Debate https://www.un.org/press/en/2019/gaef3516.doc.htm 105 Formetta, G. and Feyen, L., 2019. Empirical evidence of declining global vulnerability to climate-related hazards. Global Environmental Change, 57, p.101920. https://www.sciencedirect.com/science/article/pii/S0959378019300378/pdfft?md5=c192b4c2244259a42a054190ed1e4002&pid=1-s2.0-S0959378019300378-main.pdf 106 Naugle, A.B., Backus, G.A., Tidwell, V.C., Kistin-Keller, E. and Villa, D.L., 2019. A regional model of climate change and human migration. International Journal of System Dynamics Applications (IJSDA), 8(1), pp.1-22. https://www.osti.gov/servlets/purl/1487419 107 Acemoglu, D. and Robinson, J.A., 2006. Economic origins of dictatorship and democracy. Cambridge University Press. 108 De Mesquita, Bruce Bueno, Alastair Smith, Randolph M. Siverson, and James D. Morrow. The logic of political survival. MIT press, 2005. 109 Backus, George A., Thomas S. Lowry, Drake E. Warren, et al., "Assessing the Near-Term Risk of Climate Uncertainty: Interdependencies among the U.S. States," SAND Report, April 2010. https://cfwebprod.sandia.gov/cfdocs/CompResearch/docs/Climate_Risk_Assessment.pdf 110 Calel, R., Chapman, S.C., Stainforth, D.A. and Watkins, N.W., 2020. Temperature variability implies greater economic damages from climate change. Nature communications, 11(1), pp.1-5. https://www.nature.com/articles/s41467-020-18797-8.pdf 111 Climate change is 'threat multiplier' https://www.politico.com/story/2013/02/climate-change-is-threat-multiplier-087338 112 Global Trends 2040: A More Contested World, The National Intelligence Council, March 2021, Report: NIC 2021-02339, ISBN 978-1-929667-33-8. www.dni.gov/nic/globaltrends 113 National Intelligence Council (US) ed., 2012. Global Trends 2030: Alternative Worlds: a Publication of the National Intelligence Council. US Government Printing Office. www.dni.gov/nic/globaltrends
Climate Risk and Response July 2021
George Backus (Material is free to use with attribution.) 18
one problem is possible. Governments cannot simultaneously deal with all evolving crises.114 It is idealistic to expect the politically and financially intense GHG-mitigation policies to always successfully compete with other cascading priorities (crises) for limited resources. Governments will not have the luxury of dealing with climate as if it is an independent problem isolated from its geopolitical and socioeconomic consequences.
A close look at corporate115,116,117,118,119 and government120,121 pledges for mitigating climate change shows they inadequately reduce emissions.122,123,124 Mitigation responses remain nearly two orders of magnitude of what is needed.125,126
Therefore, an analysis such as the one here must make a distinction between consensus and mobilization. (See Section 3.) Mobilization is the level of action that actually produces an adequate GHG transition. Unenforced pledges and commitments denote the degree of
114 Kennedy, P., 2010. The rise and fall of the great powers: economic change and military conflict from 1500 to 2000. Vintage. 115 Kenneth P. Pucker. Overselling Sustainability Reporting: We’re confusing output with impact. Harvard Business Review, May–June 2021. https://hbr.org/2021/05/overselling-sustainability-reporting 116 Auden Schendler. The Complicity of Corporate Sustainability, April 7, 2021, Stanford Social Innovation Review https://ssir.org/articles/entry/the_complicity_of_corporate_sustainability 117 Global oil companies have committed to 'net zero' emissions. It's a sham https://www.theguardian.com/commentisfree/2021/mar/03/global-oil-companies-have-committed-to-net-zero-emissions-its-a-sham 118 New Report Shows Gap Between Utility Carbon Pledges and Climate Change Imperatives https://www.greentechmedia.com/articles/read/new-report-highlights-gap-between-utility-carbon-pledges-and-climate-change-imperatives 119 New report suggests corporate climate change pledges aren’t that valuable https://www.theverge.com/2021/7/13/22575651/corporate-climate-change-pledges-lobbying-report-s-p-100-index 120 CO2 emissions: nations' pledges 'far away' from Paris target, says UN https://www.theguardian.com/environment/2021/feb/26/co2-emissions-nations-pledges-far-away-from-paris-target-says-un 121 State Of Climate Action: Assessing Progress toward 2030 and 2050, World Resources Institute, 2020, https://wriorg.s3.amazonaws.com/s3fs-public/state-climate-action-assessing-progress-toward-2030-and-2050.pdf 122 United Nations Environment Programme (2019). Adaptation Gap Report 2019. Nairobi. https://wedocs.unep.org/bitstream/handle/20.500.11822/30797/EGR2019.pdf 123 United Nations Environment Programme (2020). Emissions Gap Report 2020. Nairobi. http://productiongap.org/2020report 124 Climate Progress Needs to Be 10 Times Faster to Avoid Catastrophe https://www.bloomberg.com/news/articles/2021-03-03/not-fast-enough-countries-need-to-speed-up-climate-progress 125 If This Task Was Urgent Before, It’s Crucial Now.' U.N. Says World Has 10 Months to Get Serious on Climate Goals. https://time.com/5942546/un-emissions-targets-climate-change/ 126 NDC Synthesis Report: Nationally determined contributions under the Paris Agreement, https://unfccc.int/process-and-meetings/the-paris-agreement/nationally-determined-contributions-ndcs/nationally-determined-contributions-ndcs/ndc-synthesis-report
Climate Risk and Response July 2021
George Backus (Material is free to use with attribution.) 19
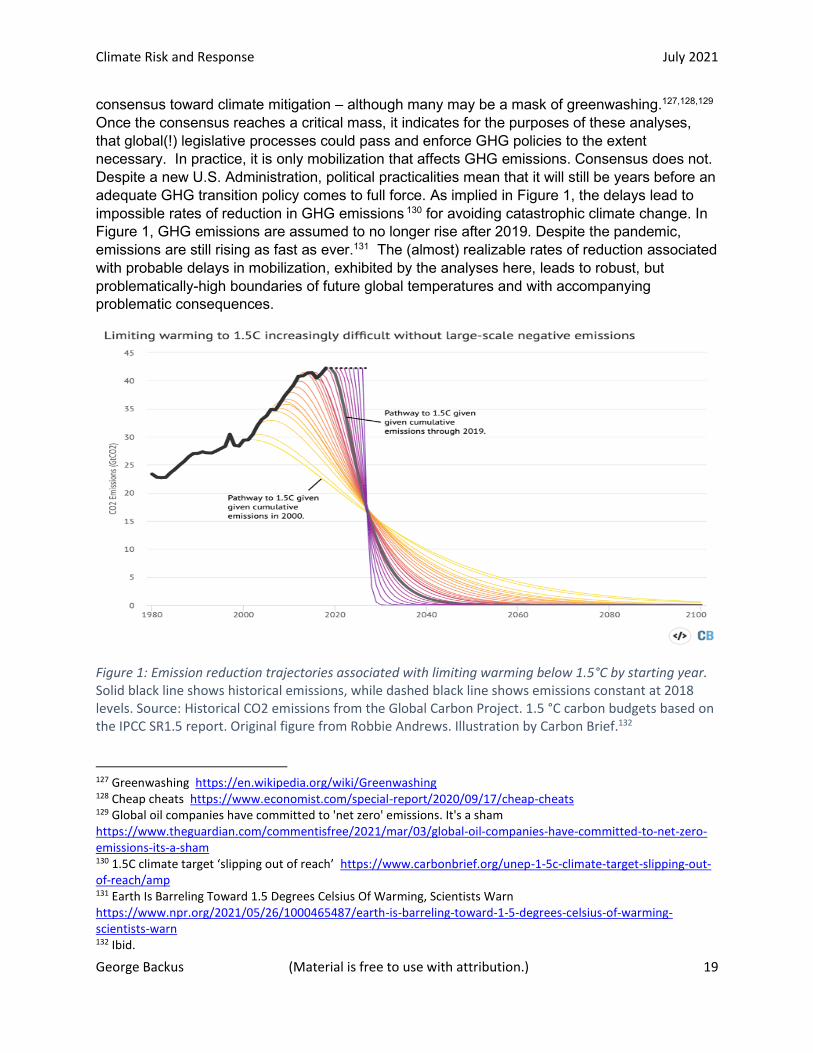
consensus toward climate mitigation – although many may be a mask of greenwashing.127,128,129 Once the consensus reaches a critical mass, it indicates for the purposes of these analyses, that global(!) legislative processes could pass and enforce GHG policies to the extent necessary. In practice, it is only mobilization that affects GHG emissions. Consensus does not. Despite a new U.S. Administration, political practicalities mean that it will still be years before an adequate GHG transition policy comes to full force. As implied in Figure 1, the delays lead to impossible rates of reduction in GHG emissions 130 for avoiding catastrophic climate change. In Figure 1, GHG emissions are assumed to no longer rise after 2019. Despite the pandemic, emissions are still rising as fast as ever.131 The (almost) realizable rates of reduction associated with probable delays in mobilization, exhibited by the analyses here, leads to robust, but problematically-high boundaries of future global temperatures and with accompanying problematic consequences.
Figure 1: Emission reduction trajectories associated with limiting warming below 1.5°C by starting year. Solid black line shows historical emissions, while dashed black line shows emissions constant at 2018 levels. Source: Historical CO2 emissions from the Global Carbon Project. 1.5 °C carbon budgets based on the IPCC SR1.5 report. Original figure from Robbie Andrews. Illustration by Carbon Brief.132
127 Greenwashing https://en.wikipedia.org/wiki/Greenwashing 128 Cheap cheats https://www.economist.com/special-report/2020/09/17/cheap-cheats 129 Global oil companies have committed to 'net zero' emissions. It's a sham https://www.theguardian.com/commentisfree/2021/mar/03/global-oil-companies-have-committed-to-net-zero-emissions-its-a-sham 130 1.5C climate target ‘slipping out of reach’ https://www.carbonbrief.org/unep-1-5c-climate-target-slipping-out-of-reach/amp 131 Earth Is Barreling Toward 1.5 Degrees Celsius Of Warming, Scientists Warn https://www.npr.org/2021/05/26/1000465487/earth-is-barreling-toward-1-5-degrees-celsius-of-warming-scientists-warn 132 Ibid.
Climate Risk and Response July 2021
George Backus (Material is free to use with attribution.) 20
1.4 Content
Overview: This study looks at the overlooked feedback aspects of climate policy and socioeconomic impacts. Macroeconomics, demographics, energy supply and demand, and climate system dynamics all interact to generate future conditions and the response to climate policy. To illustrate these dynamics, the study uses a single-goal “renewably electrify everything” Policy Package.
Bottom Line: The later Sections will show controversial results that validly illustrate critical considerations for realistic policy design. _________________________________________________________________________
This study considers one category of (still not fully) realizable GHG transition policy packages. The Policy Package specified here can be completely specified as a single concept: Renewably Electrify Everything.
This study looks at variations among realizable levels of global mobilization centered on the electrification of all economic activities. It demonstrates how feedback interactions assuredly disrupt the currently envisioned GHG transition. In so doing, it attempts to realistically depict critical dynamics among the economic, societal, energy, and climate components between the Advantagedx (developed) and Disadvantaged (developing) countries from 2020 to 2100. It quantitatively addresses migration and deaths as part of the feedback process. It highlights the implications of the historical realities and invariantxi dynamics that characterize the future socio-climatic environment. Such knowledge can help redefine existing policy postures to prioritize viable and effective policy implementation.
The study examines climate change from several unconventional perspectives. The study contains many controversial elements, but none can be readily dismissed, and certainly not as a whole. The feedback phenomena are real. These phenomena are not readily captured in the optimization methods typical of the IAMs, nor can they be captured in analyses that take multiyear snapshots of equilibrium conditions, or via simulations that update over multiyear periods. The analyses here reveal unrecognized ramifications of impact responses and mitigation policy.
The study endogenously considers physical-climate uncertainty and human-impact uncertainty. In the effort to highlight key issues, the choice of policy instruments as well as their implementation justifies many objections, but the essential takeaways are valid, regardless. Despite the unsatisfying outcomes of the analyses, all relevant impacts and phenomena are understated. That is, the impacts, given the specification of the Policy Package, would be greater than those calculated here.
For the sake of understandability, the study is simplified through 1) the level of geographical aggregation,xii 2) the abstraction of policy measures, and 3) the omission of many secondary dynamics.
As detailed in Section 3, this study explores a plausibly defined but unlikely scenario of pure-electrification. It necessarily also includes direct-air-capture of CO2 (DAC) in an attempt to further reduce global temperatures. The study varies the climate-change mitigation efforts from
Climate Risk and Response July 2021
George Backus (Material is free to use with attribution.) 21
doing nothing to 100% of the maximum physically possible. It further considers the uncertainty in outcomes to show that information contained in mean-estimates are inadequate for establishing policy trade-offs, compared to the richness of using the uncertainty information.
The study also shows that human behavior will continue to delay sufficient progress in climate change mitigation. The delay not only leads to greater economic damage, hardship, and deaths, it also increases the cost and reduces the effectiveness of policy to bring climate change under control. Even with the Advantaged countries paying for a large share of Disadvantaged countries’ mitigation costs, the extreme disparity between the impacts of climate change on the Advantaged countries compared to the Disadvantaged countries indicates that the Disadvantaged countries will never achieve any form of economic parity with the Advantaged countries. (See Section 5.) Without financial aid, the economic well-being, in addition to physical well-being, of the Disadvantaged countries declines continuously in the later part of the century. With help,133 the decline is stopped but at a cost resulting in an acceptable, but lesser economic well-being in the Advantaged countries. Disadvantaged countries will have many sources of grievances with the Advantaged countries -and with their own subpopulations. (See Section 6.) Extensive climate impacts will minimally require large internal displacement of peoples, most likely measured in the billions. It is unlikely, if not impossible for Advantaged countries to accept even a modest share of these immigrants. Much of the internal displacement will swell urban areas already filled with destitute populations. Many of these megacities are coastal and at the mercy of sea-level rise.134,135 Acute social tensions will present severe security challenges for local and international governments.136 The excessive climate impacts caused by insufficient mitigation, implies that from a humanitarian perspective, limited resources may nonetheless need to be redirected to safeguard responses, causing an even greater impairment to mitigation. Safeguard responses are those preparedness and counteractions to contain cascading climate-induced crises as they occur.xiii While the specification of the analyses, their justification, and added implications will be discussed in detail, the concept of the climate change trade-off in the next section (Section 2) frames what follows. The societal concerns for climate change come down to two elements: human life and macroeconomic well-being. The climate-induced transformation of temperature, precipitation, sea-level, etc. conditions are only relevant in that context.xiv Transnational companies would trade off risk of economic-damage loss versus cost of adaptation. Although this discussion limits itself to the societal issue, the logic is readily applicable to other
133 Emissions will hit record high by 2023 if green recovery fails, says IEA https://www.theguardian.com/environment/2021/jul/20/emissions-record-high-by-2023-if-green-recovery-fails-says-iea 134 Edmonds, D.A., Caldwell, R.L., Brondizio, E.S. and Siani, S.M., 2020. Coastal flooding will disproportionately impact people on river deltas. Nature communications, 11(1), pp.1-8. https://www.nature.com/articles/s41467-020-18531-4.pdf 135 Climate change is making ocean waves more powerful, threatening to erode many coastlines https://phys.org/news/2021-06-climate-ocean-powerful-threatening-erode.html 136 Harris, M., Dixon, R., Melin, N., Hendrex, D., Russo, R. and Bailey, M., 2014. Megacities and the United States Army: Preparing for a complex and uncertain future. Chief Of Staff Of The Army Strategic Studies Group Arlington Va. https://apps.dtic.mil/sti/pdfs/ADA608826.pdf
Climate Risk and Response July 2021
George Backus (Material is free to use with attribution.) 22
viewpoints. Necessarily, the trade-off is relative to a Base case (See Section 4.) that does not include the implementation of climate policy.
Section 4 describes the modeled socio-climatic phenomena that produce the physical conditions for each level of mobilization and uncertainty with Section 5 presenting the detailed picture of the dynamics. Section 6 describes the interaction of climate with other security threats that require government responses. Finally, Section 7 summarizes the invariant implications of the analyses. That is, the key conclusions remain unchanged independent of alternative (realistic) assumptions. Appendices provide additional explanations of critical phenomena.

Climate Risk and Response July 2021
George Backus (Material is free to use with attribution.) 23
Section 2. Tradeoff of Values
Overview: The discussion of limiting assumptions in Section 1 calls into question the criteria for deciding climate policy purpose and goals. Climate change affects human well-being. The extent of climate policy mobilization is a tradeoff between the economic impacts of mitigation and the human impact of reduced deaths. Uncertainty significantly changes the gains from mitigation but insignificantly changes the economic costs. The recycling of mitigation costs within the economy reduces the overall impact on the economy.
Bottom Line: A “dollars and deaths” perspective on climate policy universally justifies intense, even if not fully effective, mitigation efforts. _________________________________________________________________________
From a human response perspective, climate change boils down to a question of dollars and deaths. The justification for any level of mitigation, including none, hinges on the tradeoff between these elements, not in terms of the calculated value but in the subjective value societies use to judge the importance of action. Additionally, the uncertainty is critical to judging whether to act on future possibilities, as insurance to avoid an unacceptable outcome.137
2.1 Uncertainty and Response Intensity
Overview: Mitigation benefits vary dramatically by region. Advantaged countries have little choice but to help Disadvantaged countries mitigate the impact of climate change. Impact uncertainty has a much larger consequence than climate uncertainty.
Bottom Line: Uncertainty justifies aggressive mitigation efforts. _________________________________________________________________________
The tradeoff curve below shows the ratio of cumulative lives-saved through mitigation activities compared to the cumulative losses to the economy through the year 2100 for different levels of mitigation. All costs are in 2010 U.S. dollarsxv and generally not discounted138 unless otherwise specified.139 This ratio is not adjusted for the commonly-used present-value of future losses because it depicts a metric for the cost to save a life. A mobilization of 1.0 (100%) is the maximum intensity of mitigation activity that is possible to reduce atmospheric GHG concentrations (and corresponding emissions). A 30% mobilization levels signifies that the global community only puts into practice those actions that correspond to 30% of the maximum
137 King, D., Schrag, D., Zhou, D., Ye, Q. and Ghosh, A., 2015. Climate change: a risk assessment. Centre for Social Science and Policy, London, https://www.csap.cam.ac.uk/media/uploads/files/1/climate-change--a-risk-assessment-v11.pdf 138 Stern, N., 2013. The structure of economic modeling of the potential impacts of climate change: grafting gross underestimation of risk onto already narrow science models. Journal of Economic Literature, 51(3), pp.838-59. https://personal.lse.ac.uk/sternn/128NHS.pdf 139 Weitzman, M.L., 2009. On modeling and interpreting the economics of catastrophic climate change. The Review of Economics and Statistics, 91(1), pp.1-19. https://dash.harvard.edu/bitstream/handle/1/3693423/Weitzman_OnModeling.pdf
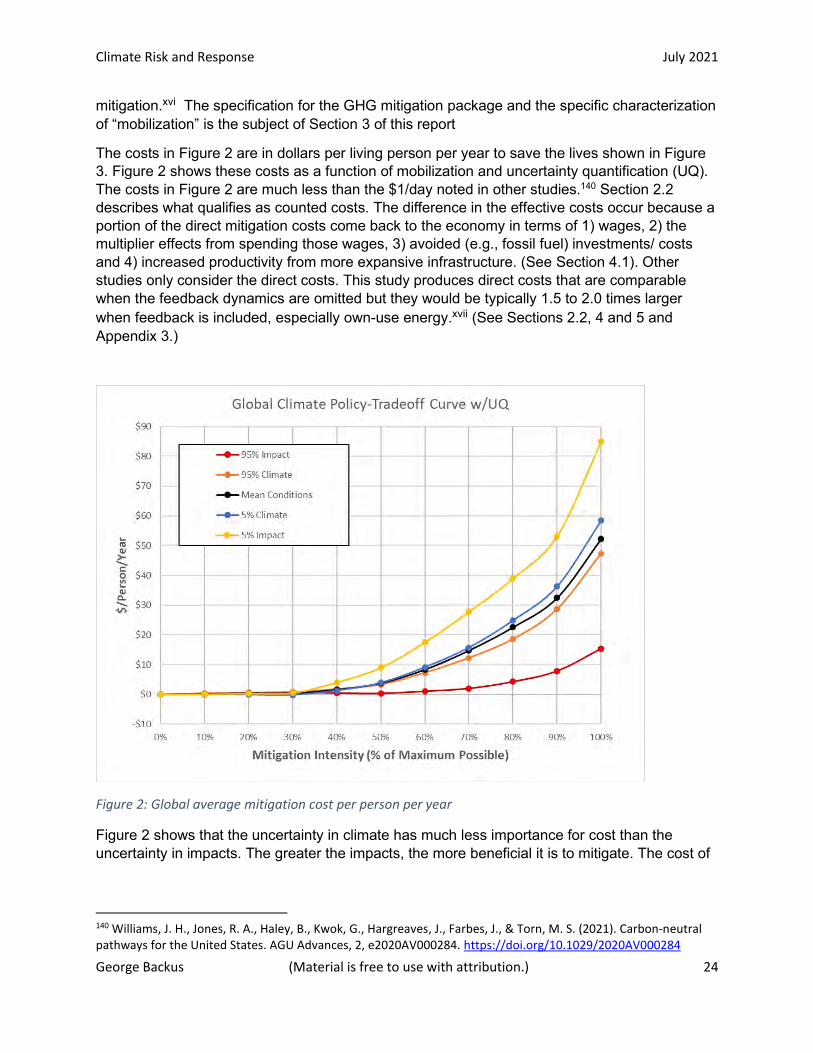
Climate Risk and Response July 2021
George Backus (Material is free to use with attribution.) 24
mitigation.xvi The specification for the GHG mitigation package and the specific characterization of “mobilization” is the subject of Section 3 of this report
The costs in Figure 2 are in dollars per living person per year to save the lives shown in Figure 3. Figure 2 shows these costs as a function of mobilization and uncertainty quantification (UQ). The costs in Figure 2 are much less than the $1/day noted in other studies.140 Section 2.2 describes what qualifies as counted costs. The difference in the effective costs occur because a portion of the direct mitigation costs come back to the economy in terms of 1) wages, 2) the multiplier effects from spending those wages, 3) avoided (e.g., fossil fuel) investments/ costs and 4) increased productivity from more expansive infrastructure. (See Section 4.1). Other studies only consider the direct costs. This study produces direct costs that are comparable when the feedback dynamics are omitted but they would be typically 1.5 to 2.0 times larger when feedback is included, especially own-use energy.xvii (See Sections 2.2, 4 and 5 and Appendix 3.)
Figure 2: Global average mitigation cost per person per year
Figure 2 shows that the uncertainty in climate has much less importance for cost than the uncertainty in impacts. The greater the impacts, the more beneficial it is to mitigate. The cost of
140 Williams, J. H., Jones, R. A., Haley, B., Kwok, G., Hargreaves, J., Farbes, J., & Torn, M. S. (2021). Carbon‐neutral pathways for the United States. AGU Advances, 2, e2020AV000284. https://doi.org/10.1029/2020AV000284
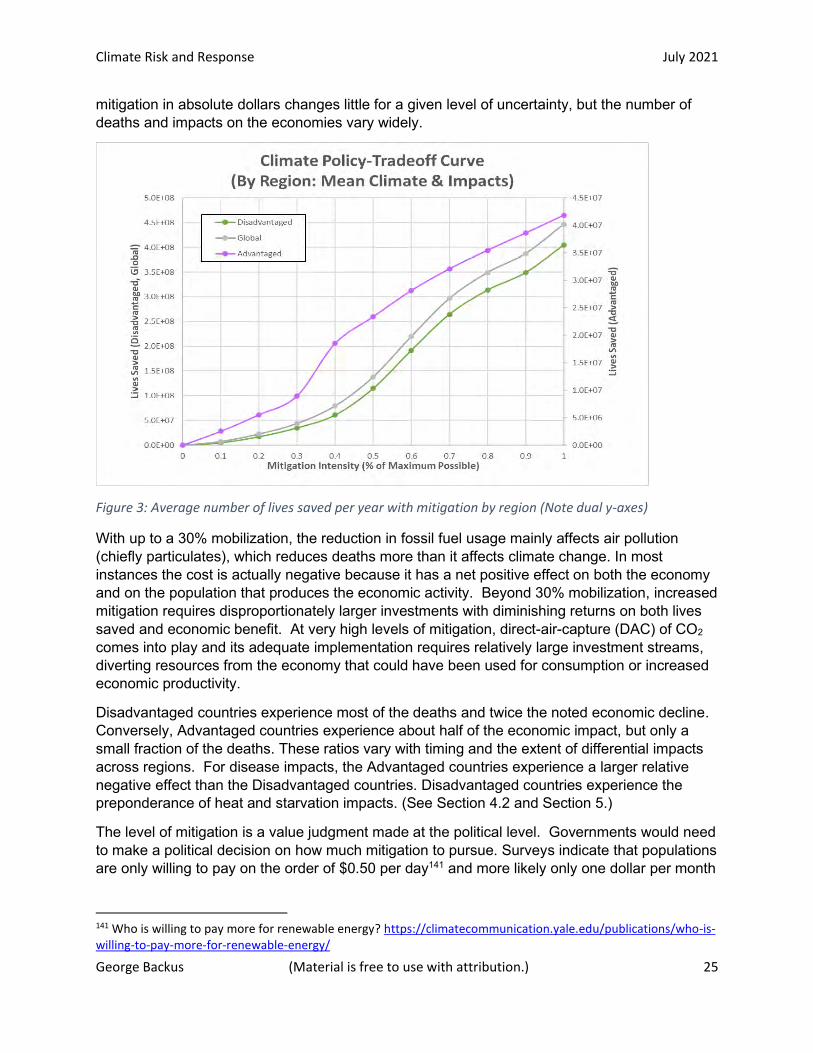
Climate Risk and Response July 2021
George Backus (Material is free to use with attribution.) 25
mitigation in absolute dollars changes little for a given level of uncertainty, but the number of deaths and impacts on the economies vary widely.
Figure 3: Average number of lives saved per year with mitigation by region (Note dual y-axes)
With up to a 30% mobilization, the reduction in fossil fuel usage mainly affects air pollution (chiefly particulates), which reduces deaths more than it affects climate change. In most instances the cost is actually negative because it has a net positive effect on both the economy and on the population that produces the economic activity. Beyond 30% mobilization, increased mitigation requires disproportionately larger investments with diminishing returns on both lives saved and economic benefit. At very high levels of mitigation, direct-air-capture (DAC) of CO2
comes into play and its adequate implementation requires relatively large investment streams, diverting resources from the economy that could have been used for consumption or increased economic productivity.
Disadvantaged countries experience most of the deaths and twice the noted economic decline. Conversely, Advantaged countries experience about half of the economic impact, but only a small fraction of the deaths. These ratios vary with timing and the extent of differential impacts across regions. For disease impacts, the Advantaged countries experience a larger relative negative effect than the Disadvantaged countries. Disadvantaged countries experience the preponderance of heat and starvation impacts. (See Section 4.2 and Section 5.)
The level of mitigation is a value judgment made at the political level. Governments would need to make a political decision on how much mitigation to pursue. Surveys indicate that populations are only willing to pay on the order of $0.50 per day141 and more likely only one dollar per month
141 Who is willing to pay more for renewable energy? https://climatecommunication.yale.edu/publications/who-is-willing-to-pay-more-for-renewable-energy/

Climate Risk and Response July 2021
George Backus (Material is free to use with attribution.) 26
to avoid (perceived) climate change impacts.142 These results of a no-consequence/no-obligation survey often overstate what participants would really pay, when the actual decision arises, by a factor of two to four.143,144,145
If the climate conditions or impacts are less than at the mean value, the higher costs to the economy, which result in reduced GDP per capita (GDPPC), make the decision more politically problematic. (See Section 5.) However, if the impact or climate conditions are worse than the mean, all mobilizations up to or exceeding 90% are beneficial. As noted in Section 1, houses and airplanes are not designed to only withstand average conditions. It is not the mean risk, but the higher risk levels that determine safety criteria on the building of airplanes. The same is true for the design of climate change policy. The level of risk to accept is again a political decision based on (uncertain) scientific information.
For the Mean situation (mean climate and impact dynamics), Figure 4 and Figure 5 show the difference in cost for each region. The Disadvantaged countries bear the brunt of climate change impacts.
Figure 4: Advantaged countries' average number of lives saved per year w/UQ.
142 Americans willing to pay to fight climate change (but only a little) https://www.cbsnews.com/news/americans-money-to-fight-global-warming-climate-change/ 143 Wardman, M., 1988. A comparison of revealed preference and stated preference models of travel behaviour. Journal of transport economics and policy, pp.71-91. http://www.bath.ac.uk/e-journals/jtep/pdf/Volume_XX11_No_1_71-91.pdf 144 Morikawa, T., Ben-Akiva, M. and Yamada, K., 1991. Forecasting intercity rail ridership using revealed preference and stated preference data. Transportation Research Record, 1328, pp.30-35. https://jamanetwork.com/journals/jama/articlepdf/2775686/jama_crane_2021_ld_210005_1614619888.59631.pdf 145 Acquiescence bias https://en.wikipedia.org/wiki/Acquiescence_bias
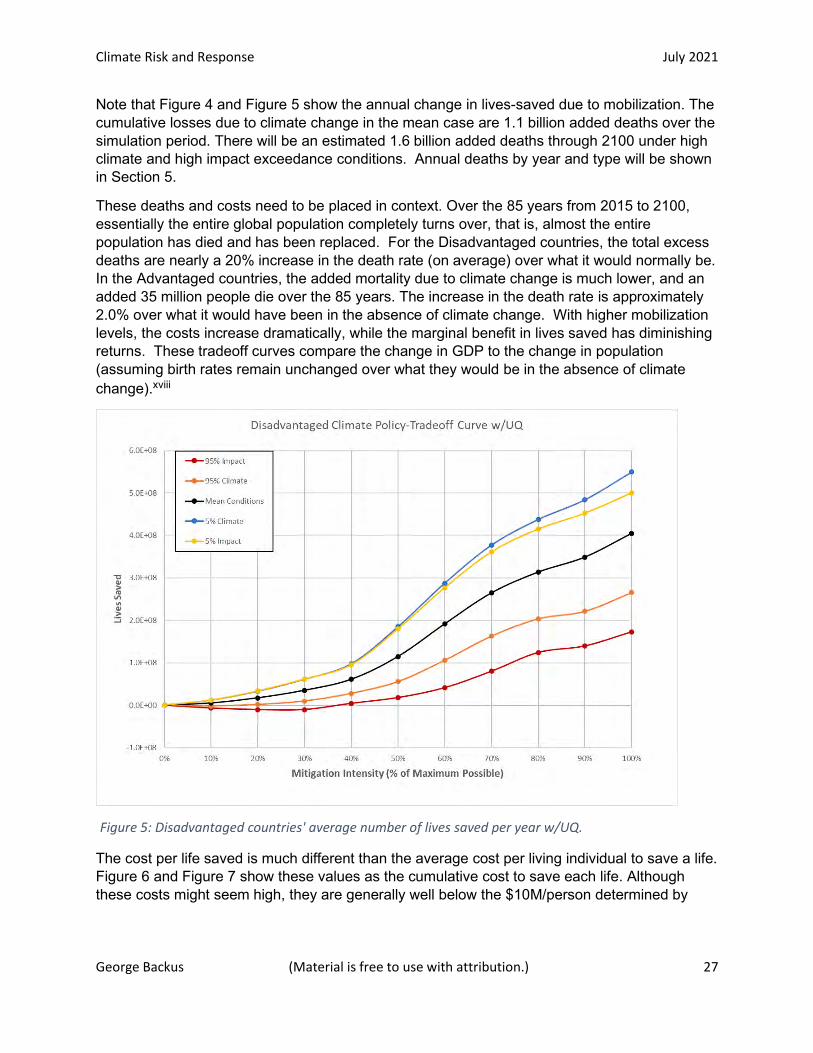
Climate Risk and Response July 2021
George Backus (Material is free to use with attribution.) 27
Note that Figure 4 and Figure 5 show the annual change in lives-saved due to mobilization. The cumulative losses due to climate change in the mean case are 1.1 billion added deaths over the simulation period. There will be an estimated 1.6 billion added deaths through 2100 under high climate and high impact exceedance conditions. Annual deaths by year and type will be shown in Section 5.
These deaths and costs need to be placed in context. Over the 85 years from 2015 to 2100, essentially the entire global population completely turns over, that is, almost the entire population has died and has been replaced. For the Disadvantaged countries, the total excess deaths are nearly a 20% increase in the death rate (on average) over what it would normally be. In the Advantaged countries, the added mortality due to climate change is much lower, and an added 35 million people die over the 85 years. The increase in the death rate is approximately 2.0% over what it would have been in the absence of climate change. With higher mobilization levels, the costs increase dramatically, while the marginal benefit in lives saved has diminishing returns. These tradeoff curves compare the change in GDP to the change in population (assuming birth rates remain unchanged over what they would be in the absence of climate change).xviii
Figure 5: Disadvantaged countries' average number of lives saved per year w/UQ.
The cost per life saved is much different than the average cost per living individual to save a life. Figure 6 and Figure 7 show these values as the cumulative cost to save each life. Although these costs might seem high, they are generally well below the $10M/person determined by
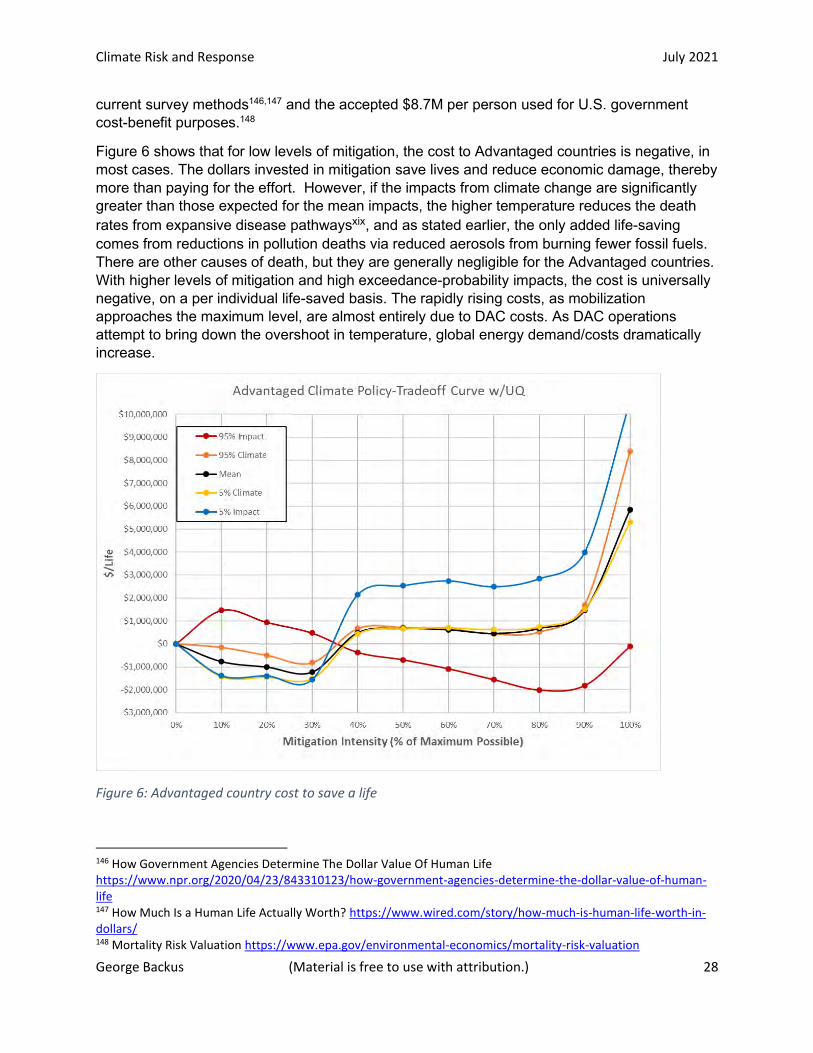
Climate Risk and Response July 2021
George Backus (Material is free to use with attribution.) 28
current survey methods146,147 and the accepted $8.7M per person used for U.S. government cost-benefit purposes.148
Figure 6 shows that for low levels of mitigation, the cost to Advantaged countries is negative, in most cases. The dollars invested in mitigation save lives and reduce economic damage, thereby more than paying for the effort. However, if the impacts from climate change are significantly greater than those expected for the mean impacts, the higher temperature reduces the death rates from expansive disease pathwaysxix, and as stated earlier, the only added life-saving comes from reductions in pollution deaths via reduced aerosols from burning fewer fossil fuels. There are other causes of death, but they are generally negligible for the Advantaged countries. With higher levels of mitigation and high exceedance-probability impacts, the cost is universally negative, on a per individual life-saved basis. The rapidly rising costs, as mobilization approaches the maximum level, are almost entirely due to DAC costs. As DAC operations attempt to bring down the overshoot in temperature, global energy demand/costs dramatically increase.
Figure 6: Advantaged country cost to save a life
146 How Government Agencies Determine The Dollar Value Of Human Life https://www.npr.org/2020/04/23/843310123/how-government-agencies-determine-the-dollar-value-of-human-life 147 How Much Is a Human Life Actually Worth? https://www.wired.com/story/how-much-is-human-life-worth-in-dollars/ 148 Mortality Risk Valuation https://www.epa.gov/environmental-economics/mortality-risk-valuation
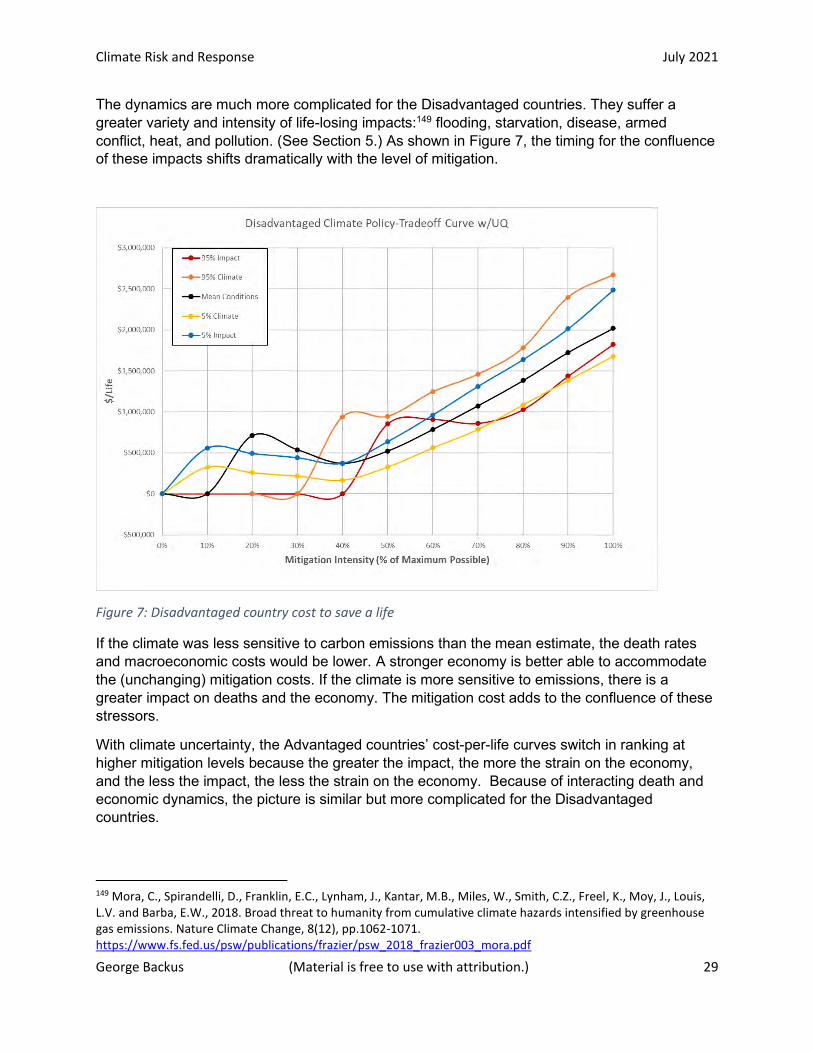
Climate Risk and Response July 2021
George Backus (Material is free to use with attribution.) 29
The dynamics are much more complicated for the Disadvantaged countries. They suffer a greater variety and intensity of life-losing impacts:149 flooding, starvation, disease, armed conflict, heat, and pollution. (See Section 5.) As shown in Figure 7, the timing for the confluence of these impacts shifts dramatically with the level of mitigation.
Figure 7: Disadvantaged country cost to save a life
If the climate was less sensitive to carbon emissions than the mean estimate, the death rates and macroeconomic costs would be lower. A stronger economy is better able to accommodate the (unchanging) mitigation costs. If the climate is more sensitive to emissions, there is a greater impact on deaths and the economy. The mitigation cost adds to the confluence of these stressors.
With climate uncertainty, the Advantaged countries’ cost-per-life curves switch in ranking at higher mitigation levels because the greater the impact, the more the strain on the economy, and the less the impact, the less the strain on the economy. Because of interacting death and economic dynamics, the picture is similar but more complicated for the Disadvantaged countries.
149 Mora, C., Spirandelli, D., Franklin, E.C., Lynham, J., Kantar, M.B., Miles, W., Smith, C.Z., Freel, K., Moy, J., Louis, L.V. and Barba, E.W., 2018. Broad threat to humanity from cumulative climate hazards intensified by greenhouse gas emissions. Nature Climate Change, 8(12), pp.1062-1071. https://www.fs.fed.us/psw/publications/frazier/psw_2018_frazier003_mora.pdf
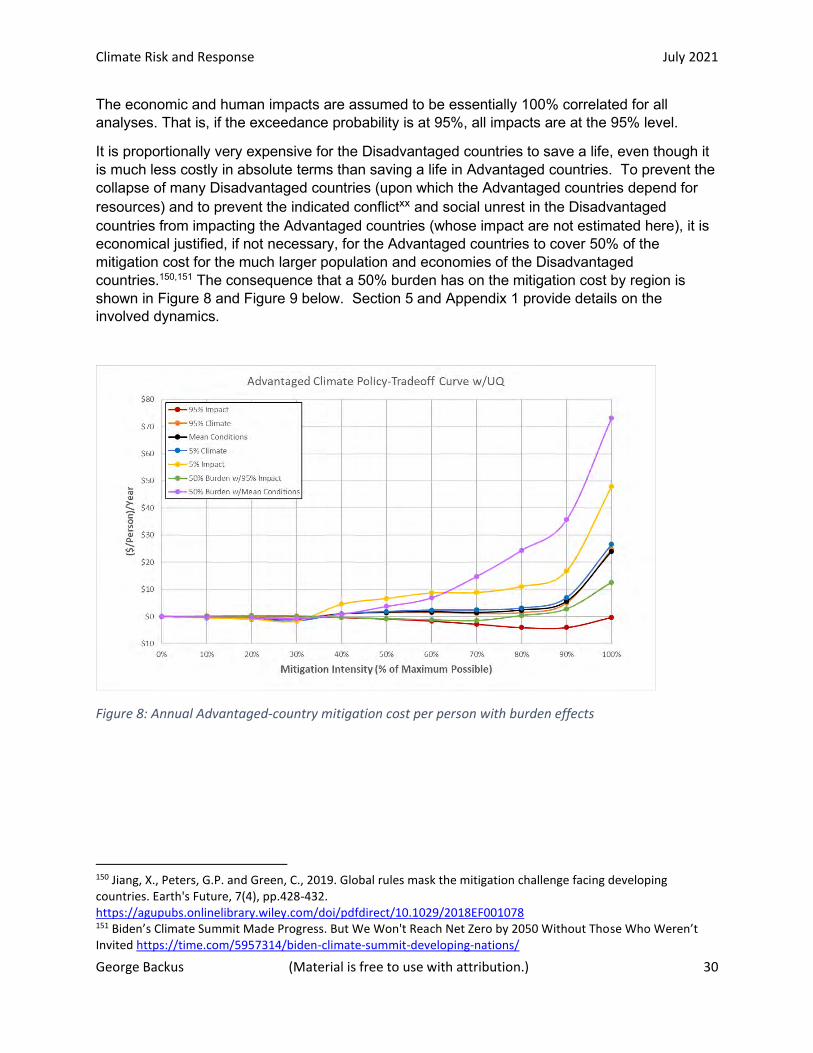
Climate Risk and Response July 2021
George Backus (Material is free to use with attribution.) 30
The economic and human impacts are assumed to be essentially 100% correlated for all analyses. That is, if the exceedance probability is at 95%, all impacts are at the 95% level.
It is proportionally very expensive for the Disadvantaged countries to save a life, even though it is much less costly in absolute terms than saving a life in Advantaged countries. To prevent the collapse of many Disadvantaged countries (upon which the Advantaged countries depend for resources) and to prevent the indicated conflictxx and social unrest in the Disadvantaged countries from impacting the Advantaged countries (whose impact are not estimated here), it is economical justified, if not necessary, for the Advantaged countries to cover 50% of the mitigation cost for the much larger population and economies of the Disadvantaged countries.150,151 The consequence that a 50% burden has on the mitigation cost by region is shown in Figure 8 and Figure 9 below. Section 5 and Appendix 1 provide details on the involved dynamics.
Figure 8: Annual Advantaged-country mitigation cost per person with burden effects
150 Jiang, X., Peters, G.P. and Green, C., 2019. Global rules mask the mitigation challenge facing developing countries. Earth's Future, 7(4), pp.428-432. https://agupubs.onlinelibrary.wiley.com/doi/pdfdirect/10.1029/2018EF001078 151 Biden’s Climate Summit Made Progress. But We Won't Reach Net Zero by 2050 Without Those Who Weren’t Invited https://time.com/5957314/biden-climate-summit-developing-nations/
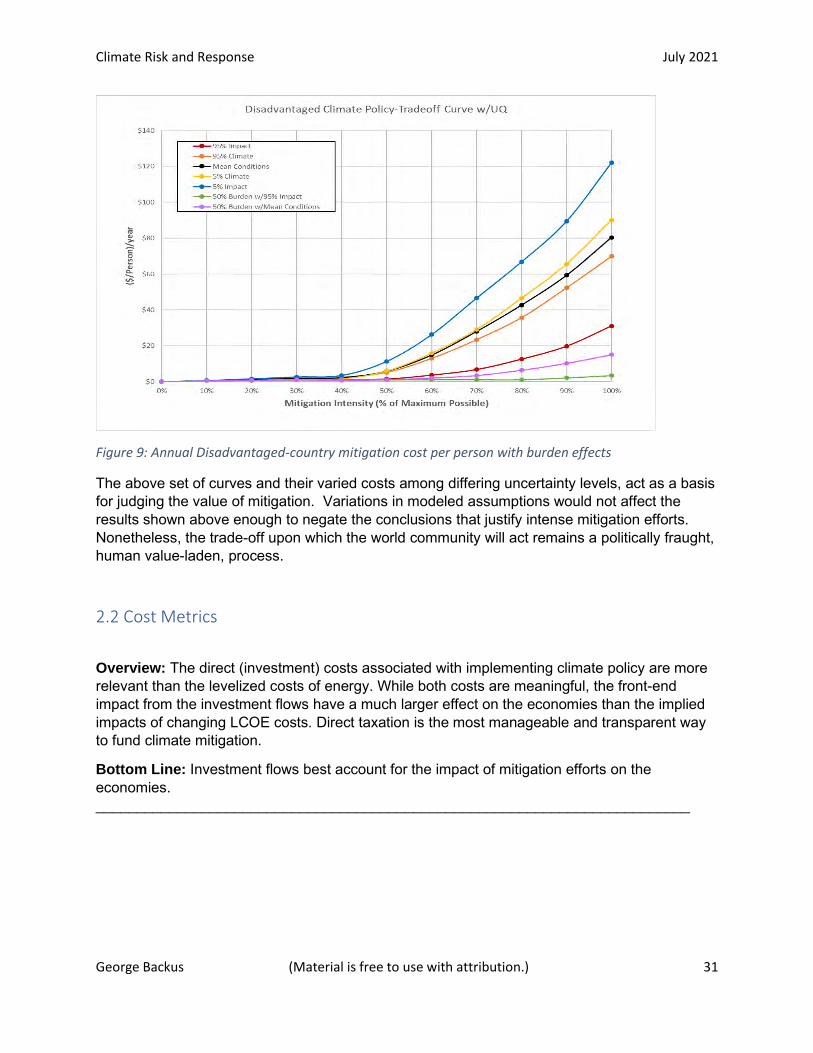
Climate Risk and Response July 2021
George Backus (Material is free to use with attribution.) 31
Figure 9: Annual Disadvantaged-country mitigation cost per person with burden effects
The above set of curves and their varied costs among differing uncertainty levels, act as a basis for judging the value of mitigation. Variations in modeled assumptions would not affect the results shown above enough to negate the conclusions that justify intense mitigation efforts. Nonetheless, the trade-off upon which the world community will act remains a politically fraught, human value-laden, process.
2.2 Cost Metrics
Overview: The direct (investment) costs associated with implementing climate policy are more relevant than the levelized costs of energy. While both costs are meaningful, the front-end impact from the investment flows have a much larger effect on the economies than the implied impacts of changing LCOE costs. Direct taxation is the most manageable and transparent way to fund climate mitigation.
Bottom Line: Investment flows best account for the impact of mitigation efforts on the economies. _________________________________________________________________________
Climate Risk and Response July 2021
George Backus (Material is free to use with attribution.) 32
Many studies calculate the added investment in energy supply and energy-using capital and equipment,152,153,154 From a macroeconomic standpoint, this study concentrates exclusively on those investment costs, comparing the regional investment stream with mitigation to those in the absence of any mitigation. Thus, reduced fossil fuel investments partially compensate for added renewable energy investments, the forced replacement of fossil-using capital, energy efficiency improvements, increased R&D, and DAC investments. (For macroeconomic and human costs due to climate change induced impacts see Section 4.1)
The studies that consider the costs of GHG transition pathways don’t include the feedback of climate and these investments on the economy.155 Studies that do address the feedback on the economy use the Levelized Cost of Energy (LCOE) and often only quantify the gross benefits to jobs and the economy, rather than net benefits.156 The shift in consumption costs that include the capitalized investment costs for energy, affect the economic growth. The LCOE emphasis on the consumption or expense side of GDP suggests that the impacts on the energy portion of the GDP from a GHG transition are minimal.
With renewable energy costs presently being competitive with conventional sources, the LCOE-based calculations cause only a small increase or a significant decrease in the energy share of the GDP, while required annual investment rates for successful GHG transition can represent 10% or more of the GDP. In the studies noted previously, even when investments are deemed on-average a small percentage of the GDP, the outcomes are highly dependent on extremely favorable reductions of renewable energy costs. These reductions are assumed to be accomplished by continued economies of scale or learning-by-doing. This work does not address size-scaling and commercialization issues, but instead assumes renewable technology will be accessible and market competitive or better. The marginal cost of renewable energy is essentially zero. Any reduction in energy costs would precipitate take-back effects that lead to increased requirements for capacity157. Therefore, take-back effects would eliminate a substantial fraction of the energy reductions used in these analyses.
This study disregards this dynamic by implicitly assuming that the use of renewable energy will not increase energy costs. Further, it assumes that the complete electrification of the global economies does not affect the cost of any other product. Lastly, it neglects the non-energy
152 Gielen, D., Gorini, R., Leme, R., Prakash, G., Wagner, N., Janeiro, L., Collins, S., Kadir, M., Asmelash, E., Ferroukhi, R. and Lehr, U., 2021. World Energy Transitions Outlook: 1.5° C Pathway. IRENA https://www.irena.org/-/media/Files/IRENA/Agency/Publication/2021/March/IRENA_World_Energy_Transitions_Outlook_2021.pdf 153 Making Clean Electrification Possible, Energy Transitions Commission https://www.energy-transitions.org/wp-content/uploads/2021/04/ETC-Global-Power-Report-.pdf 154 Decarbonization: The Race to Net Zero https://www.morganstanley.com/ideas/investing-in-decarbonization 155 IRENA (2016), ‘Renewable Energy Benefits: Measuring The Economics’. IRENA, Abu Dhabi. https://www.irena.org/-/media/Files/IRENA/Agency/Publication/2016/IRENA_Measuring-the-Economics_2016.pdf 156 Wiser, R., G. Barbose, J. Heeter, T. Mai, L. Bird, M. Bolinger, A. Carpenter, G. Heath, D. Keyser, J. Macknick, A. Mills, and D. Millstein. 2016. A Retrospective Analysis of the Benefits and Impacts of U.S. Renewable Portfolio Standards. Lawrence Berkeley National Laboratory and National Renewable Energy Laboratory. NREL/TP-6A20-65005. http://www.nrel.gov/docs/fy16osti/65005.pdf 157 Brockway, P.E., Sorrell, S., Semieniuk, G., Heun, M.K. and Court, V., 2021. Energy efficiency and economy-wide rebound effects: A review of the evidence and its implications. Renewable and Sustainable Energy Reviews, p.110781. https://www.sciencedirect.com/science/article/pii/S1364032121000769
Climate Risk and Response July 2021
George Backus (Material is free to use with attribution.) 33
operating costs of DAC carbon removal from the atmosphere. Thereby, it underestimates possibly significant secondary impacts affecting the GHG transition.
While cheap, advanced technologies may limit the levelized costs to the economy of an all-electric GHG transition, the investments and implementation delays will diminish economic growth during the transition. Suppose an energy source only used capital and had a lifetime of 20 years. If there were no interest costs, the annual cost (or the LCOE on a unit energy basis over the year) would be one-twentieth the capital cost. Conversely the investment cost is 20 times larger than the annual cost. These front-end investments costs are what inordinately affect a substantial fraction of economic activity.
The simulation pays for mitigation through taxation because no country has the ability to accommodate that level of deficits on a year over year basis for decades, especially given other problems causing deficits.158,159,160,161,162 Such large, sustained deficit funding would cause inflation.163 The cost of servicing the debt for Disadvantaged countries would then be too high and would reduce further access to debt instruments.164
The investments to mitigate GHG emissions are largely non-productive in the economic sense. They do not directly add to economic productivity, but merely replace one energy supply for another. New end-use technologies produce no new net goods or services, but simply replace existing ones. There are new jobs associated with these investments, but labor incomes economy-wide may change little or even decline.165,166 The mitigation investments represent money diverted from more productive uses and, in the extreme, crowd out conventional
158 Bivens, J., 2014. The short-and long-term impact of infrastructure investment on employment and economic activity in the US economy. EPI briefing paper, 374. https://files.epi.org/2014/impact-of-infrastructure-investments.pdf 159 Mian, A., Straub, L. and Sufi, A., 2021. A Goldilocks Theory of Fiscal Policy. June 2021, NBER, https://scholar.harvard.edu/files/straub/files/goldilocks.pdf 160 New Data on World Debt: A Dive into Country Numbers https://blogs.imf.org/2019/12/17/new-data-on-world-debt-a-dive-into-country-numbers/ 161 Pace your Debts https://www.economist.com/finance-and-economics/2021/06/05/what-are-the-limits-to-government-borrowing 162 How Covid Fuels Debt Crisis Among Global Have-Nots https://www.washingtonpost.com/business/how-covid-fuels-debt-crisis-among-global-have-nots/2021/06/24/53f174e0-d4cb-11eb-b39f-05a2d776b1f4_story.html 163 Conditions are ripe for repeat of 1970s stagflation and 2008 debt crisis https://www.theguardian.com/business/2021/jul/02/1970s-stagflation-2008-debt-crisis-global-economy 164 Countries most exposed to climate change face higher costs of capital https://www.economist.com/finance-and-economics/2019/08/15/countries-most-exposed-to-climate-change-face-higher-costs-of-capital 165 Replacing High Paying Oil Jobs With Clean Energy Jobs Is Not So Easy https://www.forbes.com/sites/neiledwards/2021/03/10/replacing-high-paying-oil-jobs-with-clean-energy-jobs-is-not-so-easy/?sh=6505001514f8 166 Green vs. Blue: Biden's climate plans face labor concerns https://www.nbcnews.com/politics/white-house/green-vs-blue-biden-s-climate-plans-face-labor-concerns-n1259732

Climate Risk and Response July 2021
George Backus (Material is free to use with attribution.) 34
investments.167,168,169,170,171,172 Nonetheless there are some productivity benefits from added infrastructure.173,174 In this study, the investment impact is reduced by 25% for developing countries under an assumption that these countries will benefit from the infrastructure creation. Even for the developed countries the impact is reduced to 15% under an assumption that increased electrification will increase productivity in some industries.175,176 The higher initial economic growth in the Disadvantaged countries make the GHG transition easier because little new investment is used in replacing old fossil-fueled capital. The estimates of investment impacts on the economy also explicitly include the 90% (5% to 95%) confidence interval for uncertainty.
The transition investments, as paid for through taxation, have a noticeable impact, but it is smaller than what might be expected.177,xxi A significant portion of the investments recycle productively back into the economy directly through jobs and indirectly through reduced deaths. The use of a revenue-balanced tax process also limits the secondary effect on financial markets, other than indirectly through stock market price effects and reduced economic growth.178
167 Christina D. Romer & David H. Romer, 2010. "The Macroeconomic Effects of Tax Changes: Estimates Based on a New Measure of Fiscal Shocks," American Economic Review, American Economic Association, vol. 100(3), pages 763-801, June. https://www.nber.org/papers/w13264 168 Alinaghi, N. and Reed, W.R., 2018. Taxes and Economic Growth in OECD Countries: A Meta-analysis. Public Finance Review, https://journals.sagepub.com/doi/abs/10.1177/1091142120961775 169 Huang, Yi; Panizza, Ugo; Varghese, Richard (2018) : Does public debt crowd out corporate investment? International evidence, Working Paper, No. 08-2018, Graduate Institute of International and Development Studies, Geneva https://www.econstor.eu/bitstream/10419/201691/1/HEIDWP201808.pdf 170 Salotti, S. and Trecroci, C., 2012. Even worse than you thought: The impact of government debt on aggregate investment and productivity. Economica, 83(330), pp.356-384. https://www.unibs.it/sites/default/files/ricerca/allegati/Discussion%20Paper%20n.%201203.pdf 171 Traum, N. and Yang, S.C.S., 2015. When does government debt crowd out investment?. Journal of Applied Econometrics, 30(1), pp.24-45. https://core.ac.uk/download/pdf/6518515.pdf 172 Clements, Benedict, Rina Bhattacharya, and Toan Quoc Nguyen. "External debt, public investment, and growth in low-income countries." (2003): 1-25. Working Paper WP/03/249. International Monetary Fund, https://papers.ssrn.com/sol3/papers.cfm?abstract_id=880959 173 Michael Grubb, et al., Induced innovation in energy technologies and systems: a review of evidence and potential implications for CO2 mitigation, (2021) Environmental Research Letters, Volume 16, Number 4 https://iopscience.iop.org/article/10.1088/1748-9326/abde07/pdf 174 Economic Impacts of Energy Infrastructure Investments, Michael Lahr, Erin Coughlin, Frank Felder. Rutgers, New Jersey, July 2010 http://ceeep.rutgers.edu/wp-content/uploads/2013/11/2010NJNG_Economic_Impact_Report.pdf 175 Bivens, J., 2017. The potential macroeconomic benefits from increasing infrastructure investment. Washington, DC, USA: Economy Policy Institute. https://files.epi.org/pdf/130111.pdf 176 Morrissey, J., 2018. Linking electrification and productive use. Oxfam Research Backgrounder Series. https://webassets.oxfamamerica.org/media/documents/Electrification-Morrissey-final.pdf?_gl=1*1hj4yqv*_ga*MTgzOTg1MzczOC4xNjI0MDUzNjQ5*_ga_R58YETD6XK*MTYyNDA1MzY0OS4xLjEuMTYyNDA1NDE4MC4w 177 Alinaghi, N., & Reed, W. R. (2020). Taxes and Economic Growth in OECD Countries: A Meta-Analysis. Public Finance Review, 1091142120961775. https://osf.io/za684/download 178 Why climate change threatens your retirement savings https://www.cbsnews.com/news/climate-change-saving-for-retirement-risks/
Climate Risk and Response July 2021
George Backus (Material is free to use with attribution.) 35
This study does not consider the revenue from the government being paid back for its investment by charging for energy because, on an economy-wide basis, those flows are already accounted for in the net GDP impacts and such considerations would amount to double counting. This study, as do all others, ignores the reality of government corruption in many countries that would increase the cost and negative impact of mitigation on the economics.179
In developed countries, the top 50% of income earners pay 97% of the taxes; the lower 50% pay 3% of the taxes.180 Those with incomes below 75% of the median income pay no taxes and cannot afford to pay significant taxes.181 In this study, climate change impacts prevent the Disadvantaged countries from ever even achieving a GDPPC that is 30% of the Advantaged countries’ GDPPC. From a tax perspective, it is reasonable for the Advantaged countries to pay a disproportionate fraction of the mitigation costs (i.e., taxes). Existing support for the Disadvantaged countries is an order of magnitude below the cost of mitigation.182,183,184 It would appear that any substantial support, even far below 50%, is highly unlikely.185
This study does not consider using a carbon-tax186 instead of direct taxation. Carbon taxes have the feature of collection first and spending thereafter. They represent a revenue flow that political forces can easily divert. Secondly, the tax is typically considered in terms of a hypothesized equilibrium market of supply and demand (often with the inclusion of carbon credits), where supply is again a political decision and demand a regulatory one. This study also does not consider an equivalent use of a Social Cost of Carbon (SCC). The SCC is considered in terms of an equilibrium long term value that balances climate impacts to the cost of preventing them.187 In an economy, prices play the role of an economic control function and the price must be dynamically determined as a function of progress toward
179 d’Agostino, G., Dunne, J.P. and Pieroni, L., 2012. Corruption, military spending and growth. Defence and Peace Economics, 23(6), pp.591-604. https://www.researchgate.net/profile/Giorgio-Dagostino-2/publication/230859653_Corruption_Military_Spending_and_Growth/links/0912f50b8e2a7947c9000000/Corruption-Military-Spending-and-Growth.pdf 180 T18-0066 - Baseline Distribution of Income and Federal Taxes, All Tax Units, by Expanded Cash Income Percentile, 2019 https://www.taxpolicycenter.org/model-estimates/baseline-distribution-income-and-federal-taxes-august-2018/t18-0066-baseline 181 Central government personal income tax rates and thresholds https://stats.oecd.org/Index.aspx?DataSetCode=TABLE_I6 182 Least Developed Countries Fund https://climatefundsupdate.org/the-funds/least-developed-countries-fund-2/ 183 True value of climate finance is just a third of that reported by developed countries – Oxfam https://reliefweb.int/report/world/true-value-climate-finance-just-third-reported-developed-countries-oxfam 184 U.N. chief calls for more climate finance for poor nations as 2020 goal slips https://www.reuters.com/article/us-climate-change-summit-finance/u-n-chief-calls-for-more-climate-finance-for-poor-nations-as-2020-goal-slips-idUSKBN28M0Y5 and Rich failing to help fund poor countries' climate fight, warns UN secretary general https://www.theguardian.com/environment/2020/dec/09/rich-failing-help-fund-poor-countries-climate-fight-warns-un-chief-antonio-guterres 185 UN blasts world leaders for failing to seal £72bn-a-year deal on climate https://www.theguardian.com/environment/2021/jun/20/un-blasts-world-leaders-for-failing-to-seal-72bn-a-year-deal-on-climate 186 Carbon Tax, Beloved Policy to Fix Climate Change, Is Dead at 47 https://www.theatlantic.com/science/archive/2021/07/obituary-carbon-tax-beloved-climate-policy-dies-47/619507/ 187 Stern, N. and Stiglitz, J.E., 2021. The social cost of carbon, risk, distribution, market failures: An alternative approach (No. w28472). National Bureau of Economic Research. https://www.nber.org/papers/w28472
Climate Risk and Response July 2021
George Backus (Material is free to use with attribution.) 36
decarbonization. That said, evidence to-date indicates that a carbon tax is less efficient in causing effective mitigation decisions.188,189,190,191 Part of the problem is that the prices are currently too low, but adequately-high prices192 will face a high political hurdle. The mitigation tax, as proposed here, is a “spend and then charge” process with the requirement that the tax revenues cover costs. Thus, there is no political ability to redirect the revenues. This study does not include the economic and human-welfare impact of migration, climate-induced disasters,193 or conflict.194 It purposely neglects the possibility of tipping points or abrupt climate change.195,196 The study does not include the economic losses of the manufacturers who enable the GHG transition, all of whom endure the painfully rapid ramp-up in capacity only to then shut down most of that capacity in under a decade. Including these considerations would all make matters much worse than those reported here. Despite the appearance that the results of this study selectively portray a grim future, the literature will show that (within the assumptions of the Core analysis) the simulated future is likely optimistic compared to what will actually take place. The analyses are not meant to act as a prediction of the future, but rather as a reality check on the expectations of international climate-policy benefits.
In the absence of own-use energy feedback phenomena (see Appendix 3), this study produces expected (investment) total-costs and costs-per-person-per-day comparable to those in other studies. If own-use energy is neglected, mitigation costs are $232T (2010USD) through the year 2100 for an average cost of $1.00 per person per day undiscounted, and $0.50 per person per
188 Rosenbloom, D., Markard, J., Geels, F.W. and Fuenfschilling, L., 2020. Opinion: Why carbon pricing is not sufficient to mitigate climate change—and how “sustainability transition policy” can help. Proceedings of the National Academy of Sciences, 117(16), pp.8664-8668. https://www.pnas.org/content/pnas/117/16/8664.full.pdf 189 Riots and trade wars: Why carbon taxes will not solve climate crisis https://www.rechargenews.com/transition/riots-and-trade-wars-why-carbon-taxes-will-not-solve-climate-crisis/2-1-694555 190 Carbon Pricing Isn’t Effective at Reducing CO2 Emissions https://www.ineteconomics.org/perspectives/blog/carbon-pricing-isnt-effective-at-reducing-co2-emissions 191 The carbon tax fallacy https://www.washingtonpost.com/blogs/all-opinions-are-local/wp/2018/06/25/the-carbon-tax-fallacy/ 192 Mercure, J.F., Pollitt, H., Viñuales, J.E., Edwards, N.R., Holden, P.B., Chewpreecha, U., Salas, P., Sognnaes, I., Lam, A. and Knobloch, F., 2018. Macroeconomic impact of stranded fossil fuel assets. Nature Climate Change, 8(7), pp.588-593. http://oro.open.ac.uk/55387/1/mercure_StrandedAssets_v16_with_Methods.pdf 193 Forced from Home: Climate-fuelled displacement, Oxfam, 2019, https://oxfamilibrary.openrepository.com/bitstream/handle/10546/620914/mb-climate-displacement-cop25-021219-en.pdf 194 Addressing the human cost in a changing climate, Policy Forum, Nature, June 18, 2021, https://science.sciencemag.org/content/sci/372/6548/1284.full.pdf 195IPCC steps up warning on climate tipping points in leaked draft report https://www.theguardian.com/environment/2021/jun/23/climate-change-dangerous-thresholds-un-report 196 Studies add to concern about climate tipping https://phys.org/news/2021-07-climate.html
Climate Risk and Response July 2021
George Backus (Material is free to use with attribution.) 37
day when discounted at 2%.197,198,199 This cost of only the direct transition (as used in other studies) sums to $150T undiscounted and $81T when discounted. Because of the delay in mobilization contained in this study (See Section 3.2), the cost comparison is through the year 2065 rather the year 2050 used in other studies. This cost is comparable to the earlier analysis with non-discounted costs of $115T ($80T-$159T) non-discounted and $82T discounted,200,201,202,203,xxii but the values in this study are much larger than recent analyses204,205 of $50T, discounted. Some of these studies use the levelized costs and others only use the investment costs over the time period. This study only considers net investment costs relative to the Base case. All things considered, the comparison indicates that the analyses here have costs, and the accounting of them, which are consistent with other efforts. If the own-use feedback is included, the cost of the transition through the year 2065 is $262T without discounting and $130 with discounting. Through the year 2100, the costs are $349T-$408T with the cost per day $1.15 (over 85 years) undiscounted and $0.79 with discounting. While seemingly acceptable within Advantaged countries, such daily costs represent 50% to 100% of the entire personal income per day for a large segment of the Disadvantaged countries’
197 US could be carbon neutral by 2050 – and it would cost $1 per citizen per day https://www.zmescience.com/science/us-could-be-carbon-neutral-by-2050-and-it-would-cost-1-per-citizen-per-day/ 198 Goulder, L.H. and Williams III, R.C., 2012. The choice of discount rate for climate change policy evaluation. Climate Change Economics, 3(04), p.1250024. https://www.nber.org/system/files/working_papers/w18301/w18301.pdf 199 The Social cost of Carbon https://www.carbonbrief.org/qa-social-cost-carbon 200 McCollum, D.L., Zhou, W., Bertram, C., De Boer, H.S., Bosetti, V., Busch, S., Després, J., Drouet, L., Emmerling, J., Fay, M. and Fricko, O., 2018. Energy investment needs for fulfilling the Paris Agreement and achieving the Sustainable Development Goals. Nature Energy, 3(7), pp.589-599. https://dspace.library.uu.nl/bitstream/handle/1874/369043/Energy.pdf?sequence=1 201 Riahi, K., Dentener, F., Gielen, D., Grubler, A., Jewell, J., Klimont, Z., Krey, V., McCollum, D.L., Pachauri, S., Rao, S. and van Ruijven, B., 2012. Energy pathways for sustainable development., 2012. in Global Energy Assessment. Cambridge Books. p.1203-1306 http://pure.iiasa.ac.at/id/eprint/10065/1/GEA%20Chapter%2017%20Energy%20Pathways%20for%20Sustainable%20Development.pdf 202 Riahi, K., Dentener, F., Gielen, D., Grubler, A., Jewell, J., Klimont, Z., Krey, V., McCollum, D.L., Pachauri, S., Rao, S. and van Ruijven, B., 2012. Energy pathways for sustainable development. http://pure.iiasa.ac.at/id/eprint/10065/1/GEA%20Chapter%2017%20Energy%20Pathways%20for%20Sustainable%20Development.pdf 203 IPCC, 2018: Global warming of 1.5°C. An IPCC Special Report on the impacts of global warming of 1.5°C above pre-industrial levels and related global greenhouse gas emission pathways, in the context of strengthening the global response to the threat of climate change, sustainable development, and efforts to eradicate poverty [V. Masson-Delmotte, P. Zhai, H. O. Pörtner, D. Roberts, J. Skea, P.R. Shukla, A. Pirani, W. Moufouma-Okia, C. Péan, R. Pidcock, S. Connors, J. B. R. Matthews, Y. Chen, X. Zhou, M. I. Gomis, E. Lonnoy, T. Maycock, M. Tignor, T. Waterfield (eds.)] https://www.ipcc.ch/site/assets/uploads/sites/2/2019/06/SR15_Full_Report_High_Res.pdf 204 “Decarbonization: The Race to Net Zero" (Oct 21, 2019). Morgan Stanley, https://www.morganstanley.com/ideas/investing-in-decarbonization 205 Williams, J.H., Jones, R.A., Haley, B., Kwok, G., Hargreaves, J., Farbes, J. and Torn, M.S., 2021. Carbon‐neutral pathways for the United States. AGU Advances, 2(1), p.e2020AV000284. https://agupubs.onlinelibrary.wiley.com/doi/pdf/10.1029/2020AV000284

Climate Risk and Response July 2021
George Backus (Material is free to use with attribution.) 38
populations.206 These “daily costs” are the estimated value at the global level.xxiii Delays in the full implementation of effective GHG policy can dramatically increase the total cost of the GHG transition.207
206 World Bank. 2020. Poverty and Shared Prosperity 2020. https://openknowledge.worldbank.org/bitstream/handle/10986/34496/9781464816024.pdf Reversals of Fortune. Washington, DC: World Bank. doi: 10.1596/978-1-4648-1602-4. 207 Sanderson, B.M. and O’Neill, B.C., 2020. Assessing the costs of historical inaction on climate change. Scientific reports, 10(1), pp.1-12. https://www.nature.com/articles/s41598-020-66275-4.pdf
Climate Risk and Response July 2021
George Backus (Material is free to use with attribution.) 39
Section 3. Mitigation Mobilization
Overview: This section describes the specification of the mitigation package used for all analyses and identifies three critical limitations affecting the speed and timing of policy mobilization.
Bottom Line: Physical and behavioral limitations will prevent the expected mitigation of climate change. _________________________________________________________________________
This analysis uses a singular and focused approach of complete electrification to produce the global GHG transition. While the IPCC and other studies use an array of measures, the ability of governments to successfully and sustainably manage complex programs is historically nonexistent. This study considers one category of (still not fully) realizable GHG transition policy packages. The Policy Package defined here can be completely specified as a single concept: Renewably Electrify Everything.208 Three considerations govern the ability for any realizable GHG transition policy package to maintain temperatures at acceptable levels: 1) the long energy-payback period for renewable energy sources, 2) realistic delays in the time until complete mobilization of effective climate policy, and 3) the inability to maintain the necessary GHG transition growth-rate then required because of the delays. These three considerations cause dynamics that robustly prevent mitigation efforts from keeping temperatures below 3.5 °C by the year 2100 (See Section 5.). Commercialization delays, supplier growth rate limits, and the time delay to turn over capital with a “game changing” technological advance, imply that fresh technologies will have little impact on the conclusions of this study.
A refined, still practicable, variant of the somewhat abstract policy-package used here for illustrative purposes could reduce some of the most troubling aspects of the Core analysis. (See Section 5.) However, the results herein do reflect the credible outcomes from implementing the defined Policy Package. Because the analyses were designed to highlight limiting phenomena, they are not meant to represent the only possible envelope of future conditions. Nonetheless, it is closer to describing the future than the results from conventionally envisioned policy implementation.
3.1 Mitigation Package
Overview: To illustrate critical, overlooked dynamics that will hamper the GHG transition, this section details an exemplifying Policy Package.
Bottom Line: A practicable policy package disregards many accepted mitigation strategies. _________________________________________________________________________
208 Bogdanov, D., Farfan, J., Sadovskaia, K., Aghahosseini, A., Child, M., Gulagi, A., Oyewo, A.S., Barbosa, L.D.S.N.S. and Breyer, C., 2019. Radical transformation pathway towards sustainable electricity via evolutionary steps. Nature communications, 10(1), pp.1-16. https://www.nature.com/articles/s41467-019-08855-1.pdf
Climate Risk and Response July 2021
George Backus (Material is free to use with attribution.) 40
A 100% implementation of the package below, in the context of the narrow specification above, reflects the maximum possible action to mitigate climate change. It is designed to maximally attempt a complete transition, globally, by the year 2050. For example, a 60% implementation (mobilization) implies that the global level GHG transition activities only grow to and do not exceed 60% of the difference between the Base case actions and the maximum actions. Appendix 1 shows the effects of global implementation at partial levels of mobilization.
The 100% mobilization of electrification includes the following components or absence thereof:
1. Complete conversion of the electric supply system to using non-carbon-based fuels. a. Forced retirement of fossil fuels generation using a 15-year time constant.
Stranded-assets become a cost of the program. b. Hydropower is allowed to maintain historical capacity levels but not significantly
expand because of the need to use dams to manage floods and agricultural needs, plus there is the issue of weaponizing water storage as climate change affects the water cycle.209,210,211
c. Nuclear power is not expanded due to its slow ramp up time and fears of proliferation in a much more turbulent world212,213,214,215
d. Biomass is phased out because any increased usage adds GHG emissions into the present even if it is possible, in principle, to sustainably grow and harvest biomass in the future (See Appendix 6). Adding carbon capture unacceptably increases the total cost of the GHG transition.
e. As defined by the level of mobilization, wind and solar generation with batteries become the sole form of capacity expansion.
f. Legal and social issues prevent any form of an optimal national or international grid system. Therefore, regional grids must have adequate energy and peaking resources to handle their local demands. (See Section 4.3.2)
g. Hydrogen use is very limited because of the interim need to use fossil fuels directly or indirectly. Even in an electrified system, it is more efficient to just directly use electricity. There is also the question of the cost of converting the market infrastructure (e.g., “petrol” stations) to provide retail hydrogen.
209 Drought is Leading to Instability and Water Weaponization in the Middle East and North Africa https://climateandsecurity.org/2021/04/drought-is-leading-to-instability-and-water-weaponization-in-the-middle-east-and-north-africa/ 210 Nile Be Dammed: Toxic Water Politics Threaten Democracy and Regional Stability https://www.foreignaffairs.com/articles/africa/2020-08-10/nile-be-dammed 211 Special Report on Drought 2021, United Nations Office For Disaster Risk Reduction, New York. https://www.undrr.org/media/49370/download 212 Nuclear Energy Will Not Be the Solution to Climate Change https://www.foreignaffairs.com/articles/2021-07-08/nuclear-energy-will-not-be-solution-climate-change 213 Ford, M.J. and Abdulla, A., 2021. New Methods for Evaluating Energy Infrastructure Development Risks. Risk Analysis. https://onlinelibrary.wiley.com/doi/epdf/10.1111/risa.13727 214 “Advanced” Isn’t Always Better, Edwin Lyman, March 2021, Union of Concerned Scientists. https://www.ucsusa.org/sites/default/files/2021-03/advanced-reactors-full.pdf 215 Brazil: A Climate, Nuclear, and Security Hotspot, Briefer No. 11, Council on Strategic Risks, 2020 https://climateandsecurity.org/wp-content/uploads/2020/10/Brazil-A-Climate-Nuclear-and-Security-Hotspot_BRIEFER-11_2020_10_26.pdf
Climate Risk and Response July 2021
George Backus (Material is free to use with attribution.) 41
2. Complete conversion of all end-use energy demands to electricity and all industrial process requirements to electricity-based synthesized chemicals.
a. Steel production uses hydrogen instead of coke or other carbon-based processes.216,217
b. Concrete is replaced by composites of steel and non-GHG-producing materials. c. Chemicals are produced with the use of fossil fuels.218 d. Only intercontinental ocean-shipping and air-transport use liquid fuels (primarily
ammonia); all other transportation is electric powered. e. To minimize cost, there in only utility scale solar and wind capacity expansion,
with application to large industrial processes, but not to individual residential installations.
f. Fossil-fuel using capital equipment is phased out by reducing the useable life time by a factor of two through mandates. The cost to replace the equipment is included in the cost of the GHG transition.
g. Stranded assets in the fossil-fuel industry are not included in GHG transition costs.
3. R&D programs double the rate of growth in energy efficiency. 4. Renewable energy costs decline to the minimum values (factor of 3.33) supported by the
literature – along with the critical assumption that these improvements reduce the energy-payback period in a one-to-one relationship. This questionable assumption is necessary for there to be any viable GHG transition. (See Section 4.3.2 and Appendix 3.) Battery costs are reduced by a factor of 10, exploiting flow-batteries for long-duration uses/flexibility.
5. Global governments coordinate to enable renewable energy growth and end-use electrification at a rate up to 45% per year and sustained over many decades. (See Section 3.3.)
6. Oil, coal, and natural gas are phased out as renewable energy becomes able to serve demand.
a. Fugitive emissions from abandoned wells and mines are reduced with the level of policy mobilization.
b. Natural gas is the backstop energy source when renewable energy supplies are inadequate. (See Section 4.3.2, Section 5, and Appendix 3.)
7. There is no use of offsets. (See Appendix 6.) a. Aspirations of afforestation and soil sequestering under more intense agriculture
and worsening climate appear to be much more limited than originally envisioned. Current expectations of offsets not only exceed previously assumed
216 Decarbonization challenge for steel. McKinsey & Company (2020) https://www.mckinsey.com/~/media/McKinsey/Industries/Metals%20and%20Mining/Our%20Insights/Decarbonization%20challenge%20for%20steel/Decarbonization-challenge-for-steel.pdf 217 The potential of hydrogen for decarbonising steel production. (2020) European Union Panel for the Future of Science and Technology https://www.europarl.europa.eu/RegData/etudes/BRIE/2020/641552/EPRS_BRI(2020)641552_EN.pdf 218 Can the world make the chemicals it needs without oil? Nature, doi:10.1126/science.aaz5517 https://www.sciencemag.org/news/2019/09/can-world-make-chemicals-it-needs-without-oil
Climate Risk and Response July 2021
George Backus (Material is free to use with attribution.) 42
resources, the accounting for them does not capture their actual value in reducing GHG emissions.
8. Only direct air capture with mineralization is used to remove CO2 from the atmosphere. (See Section 4.5.)
a. DAC costs decline to the minimum amount (factor of 6) supported by the literature, with an important assumption that unit energy requirements and the energy-payback period decline with cost in a one-to-one relationship. (See Section 4.5)
b. Intense DAC efforts begin when temperatures exceed 1.5 °C. 9. The historically-observed time from initial mobilization to full policy execution is reduced
from 10 years to 5 years. (See Section 3.2.) 10. Geoengineering is not included in the single-goal Policy Package.219 (See Appendix 5.)
Nonetheless, the invariant results of this study indicate its extensive use in later years will be necessary.
To aid comprehension, the analyses only consider synchronized world-wide mitigation, albeit across two weakly interacting regions.xxiv Globally, it will be extremely difficult for nations to successfully coordinate an abundance of mitigation efforts. They might be able to communicate a single message (electrify) and mobilize resources to do so. Certainly, all other efforts at reducing emissions, as noted in the SR1.5 report,220 are useful, but herein considered supplementary. This and any other package can help, but not solve the climate crisis.
3.2 Mitigation Delays
Overview: Physical and behavioral delays in the mobilization (full execution) of mitigation activities are an unignorable feature of the transition.
Bottom Line: They will dangerously delay the benefits of climate policy. _________________________________________________________________________
The year 2015 saw the passage of the Paris accord. If actual commitments made then are acted upon, it would provide about 10% of the mitigation required to adequately manage climate change.221 The consensus in 2015 only corresponded to a 10% acceptance for strong mitigation
219 Pasztor, J., Nicholson, S. and Morrow, D., 2016. Briefing Paper on Climate Engineering. Carnegie Council for Ethics in International Affairs. https://www.carnegiecouncil.org/publications/articles_papers_reports/969/_res/id=Attachments/index=0/Briefing_on_Climate_Engineering.pdf 220 Special Report on Global Warming of 1.5°C (SR1.5). Intergovernmental Panel on Climate Change, 2018. https://www.ipcc.ch/sr15/ 221 Climate Progress Needs to Be 10 Times Faster to Avoid Catastrophe https://www.bloomberg.com/news/articles/2021-03-03/not-fast-enough-countries-need-to-speed-up-climate-progress
Climate Risk and Response July 2021
George Backus (Material is free to use with attribution.) 43
policy.222 As with all the other UNFCC (UN Framework on Climate Change) agreements,xxv the actual adherence (mobilization) to the accord has been minor and best approximated globally as none.223 Current UN reports fear the lack of progress in meeting any type of climate goal or claimed pledge.224 The continued delays in adequate commitments and the further delays in their enforced implementation bode poorly for adequately limiting climate or its consequences.
Acting on climate change entails two types of delay. The first is the consensus to act on adequately consequential policy measures. The second is the mobilization and execution of those policy measures. These physical or behavioral delays imply that: 1) full implementation of a really meaningful global climate policy will not occur in 2021 or within the next few years, 2) the delay dictates that more aggressive implementation of climate change policy will be necessary. (See Figure 1.)
Historically, it takes 10 years from the scientific recognition of a problem to the formal international consensus on a comprehensive policy response,225 such as experienced globally for the Montreal Protocolxxvi and Non-Proliferation Treaty,226 and the U.S. Clean Air Act.227 Additionally, once there is a consensus for a sufficient response and a program is authorized, the ramp time is typically 10 years, such as was experienced in the Space program and Manhattan project. Note that these historical examples represent “one goal” programs with a defined completion point. In this study, the 10 years of mobilization ramp-up is aspiringly reduced to 5 years, independent of the level of mobilization. Countries and politically influential parts of their population are far from agreement on an expensive climate change mitigation effort.228
Using 2014 as the year when countries first seriously attempted to address meaningful climate change policy (vis-à-vis the Paris Accord), a majority threshold (50%) is crossed in the year 2023. In the analyses here, mobilization begins when consensus reaches 50%. The current 65% acknowledgement of there being a climate emergency229 is not the same as a 65% agreement to act at the levels required.230 Reaching a threshold consensus would infer that the Biden Administration and essentially ALL other world leaders can now achieve agreement for
222 Climate Progress Needs to Be 10 Times Faster to Avoid Catastrophe https://www.bloomberg.com/news/articles/2021-03-03/not-fast-enough-countries-need-to-speed-up-climate-progress 223 https://climateactiontracker.org/countries/ 224 United Nations Environment Programme (2020). Emissions Gap Report 2020. Nairobi. https://wedocs.unep.org/bitstream/handle/20.500.11822/34438/EGR20ESE.pdf 225 List of treaties by number of parties https://en.m.wikipedia.org/wiki/List_of_treaties_by_number_of_parties 226 Background Information History of the Treaty. 2015 Review Conference of the Parties to the Treaty on the Non-Proliferation, https://www.un.org/en/conf/npt/2015/pdf/background%20info.pdf 227 History of the Clean Air Act https://en.wikipedia.org/wiki/Clean_Air_Act_(United_States) 228 Lamb, W.F., Mattioli, G., Levi, S., Roberts, J.T., Capstick, S., Creutzig, F., Minx, J.C., Müller-Hansen, F., Culhane, T. and Steinberger, J.K., 2020. Discourses of climate delay. Global Sustainability, 3. https://www.cambridge.org/core/services/aop-cambridge-core/content/view/7B11B722E3E3454BB6212378E32985A7/S2059479820000137a.pdf/discourses_of_climate_delay.pdf 229 Ripple, W., Wolf, C., Newsome, T., Barnard, P., Moomaw, W. and Grandcolas, P., 2019. World scientists' warning of a climate emergency. BioScience. https://hal.archives-ouvertes.fr/hal-02397151/document 230 Climate change is a ‘global emergency’, people say in biggest ever climate poll https://news.un.org/en/story/2021/01/1083062

Climate Risk and Response July 2021
George Backus (Material is free to use with attribution.) 44
the extensive spending levels, associated tax increases, and on undertaking the management (via the equivalent invoking of a defense production act) of complex logistical and production tasks for a multidecadal climate program. The U.S. is but one of many countries discussing new, although still grossly inadequate, climate policy. Yet, there is nowhere the required societal and political consensus for sufficient action.231 The 2023 date232 might be realistic for the time when global governments actually agree on an effective GHG transition program.233 Most likely there will not be sufficient global commitment, let alone a practicable program for adequate mobilization/action.234 Thus, the analyses almost certainly overstate global governments actually committing to and sustainably acting upon adequate policy measures. It must also be acknowledged that just as in historical energy policy, or even COVID policy, initial attempts at execution falter and require multiple iterations at improvement that still fall far short of any ideal response.
The analysis results are very sensitive to these delay times. In the interim, emissions continue to accumulate, making mitigation that much harder (and expensive), as well as leading to a higher temperature trajectory for the year 2100. A one year added delay in either the consensus response or mobilization adds 0.05 °C to the year 2100 result.
Figure 10 below shows the timing of delay dynamics for achieving global consensus startingxxvii with the Paris accord and assuming that a 50% consensus is sufficient to legislate and execute an effective GHG transition program. It depicts the ramping-up to achieve full mobilization. Note that the pains of full mobilization will occur before the unanimous consensus supporting (tolerating) such programs. Political challenges from negatively affected individuals, corporations, and countries will be an enduring aspect of the GHG transition.235,236,237
231 What if American Democracy Fails the Climate Crisis? https://www.nytimes.com/2021/06/22/magazine/ezra-klein-climate-crisis.html 232 CO2 emissions set to hit record levels in 2023 and there’s ‘no clear peak in sight,’ IEA says https://www.cnbc.com/2021/07/20/co2-emissions-will-hit-record-levels-in-2023-iea-says.html 233 Key climate talks are headed for trouble after G7 wrangling https://www.carbonbrief.org/daily-brief/key-climate-talks-are-headed-for-trouble-after-g7-wrangling and UN climate talks: Key outcomes from the June 2021 virtual conference https://www.carbonbrief.org/un-climate-talks-key-outcomes-from-the-june-2021-virtual-conference 234 The World Speeds Up—and We Slow Down https://www.newyorker.com/news/annals-of-a-warming-planet/the-world-speeds-up-and-we-slow-down 235 What the rise of fuel riots means for our failed climate politics https://www.washingtonpost.com/opinions/2020/02/10/what-rise-fuel-protests-means-our-failed-climate-politics/ 236 Robert A. Huber (2020) The role of populist attitudes in explaining climate change skepticism and support for environmental protection, Environmental Politics, 29:6, 959-982, DOI: 10.1080/09644016.2019.1708186 https://www.tandfonline.com/doi/full/10.1080/09644016.2019.1708186 237 Jylhä, K.M. and Hellmer, K., 2020. Right‐Wing Populism and Climate Change Denial: The Roles of Exclusionary and Anti‐Egalitarian Preferences, Conservative Ideology, and Antiestablishment Attitudes. Analyses of Social Issues and Public Policy. https://spssi.onlinelibrary.wiley.com/doi/full/10.1111/asap.12203
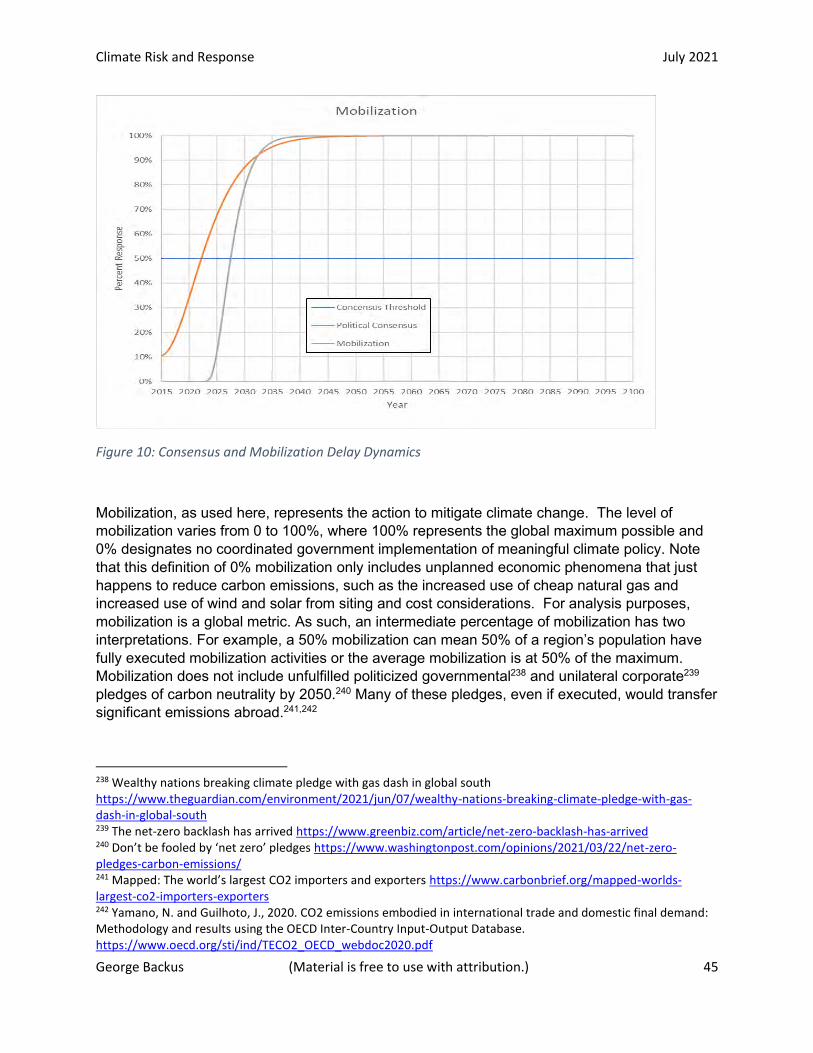
Climate Risk and Response July 2021
George Backus (Material is free to use with attribution.) 45
Figure 10: Consensus and Mobilization Delay Dynamics
Mobilization, as used here, represents the action to mitigate climate change. The level of mobilization varies from 0 to 100%, where 100% represents the global maximum possible and 0% designates no coordinated government implementation of meaningful climate policy. Note that this definition of 0% mobilization only includes unplanned economic phenomena that just happens to reduce carbon emissions, such as the increased use of cheap natural gas and increased use of wind and solar from siting and cost considerations. For analysis purposes, mobilization is a global metric. As such, an intermediate percentage of mobilization has two interpretations. For example, a 50% mobilization can mean 50% of a region’s population have fully executed mobilization activities or the average mobilization is at 50% of the maximum. Mobilization does not include unfulfilled politicized governmental238 and unilateral corporate239 pledges of carbon neutrality by 2050.240 Many of these pledges, even if executed, would transfer significant emissions abroad.241,242
238 Wealthy nations breaking climate pledge with gas dash in global south https://www.theguardian.com/environment/2021/jun/07/wealthy-nations-breaking-climate-pledge-with-gas-dash-in-global-south 239 The net-zero backlash has arrived https://www.greenbiz.com/article/net-zero-backlash-has-arrived 240 Don’t be fooled by ‘net zero’ pledges https://www.washingtonpost.com/opinions/2021/03/22/net-zero-pledges-carbon-emissions/ 241 Mapped: The world’s largest CO2 importers and exporters https://www.carbonbrief.org/mapped-worlds-largest-co2-importers-exporters 242 Yamano, N. and Guilhoto, J., 2020. CO2 emissions embodied in international trade and domestic final demand: Methodology and results using the OECD Inter-Country Input-Output Database. https://www.oecd.org/sti/ind/TECO2_OECD_webdoc2020.pdf
Climate Risk and Response July 2021
George Backus (Material is free to use with attribution.) 46
3.3 Markets and Growth
Overview: Eventually, there are always growth rate constraints on increasing the capacity of secondary/supply industries.
Bottom Line: The growth rate limitations will delay the transition, cause secondary dynamics, and lead to higher temperature/impacts. _________________________________________________________________________
Historically, high growth rates are possible when an industry is small, under $120 – $150 Billion/Year (2010 USD) which is why renewable energy supply is occasionally able to obtain 36% growth rates per year.xxviii The mature capitalization (MC) occurs at around $150B/Year. After the support industry (for new capacity) reaches a size of MC, these industries cannot ordinarily sustain growth rates exceeding 15% per year. High growth rates are very rare243 and invariably only occur when the industry is small. Companies from Amazon to Apple to Facebook, to Google, to Microsoft follow the growth limitations. In some instances, there is the question of market saturation, such as for Apple and Microsoft, but the transition from high to mature growth rates occurred well before any such constraints were evident.244 The highest growth rate of an energy technology (nuclear power in the 1980s) reached 30%, but a closer look indicates that the growth rate was only 19%,245 at a time when the industry had not yet reached $150B per year. The historical growth of renewable energy was in the 9%-15% range246,247 with future growth estimates staying well within that range.248 Such growth rates are too low to affect an energy transition within required time frames.249, To enable a successful transition, per the Policy Package specification used here, renewable energy must sustain growth rates of 45%/year over several decades. The analyses here assume the Base case limit for a mature industry is 15%/year, but increases with the level of policy mobilization. For example, a 50% mobilization implies a 30% per year growth rate limit. Many
243 Neuhoff, K., 2008. Learning by doing with constrained growth rates: an application to energy technology policy. The Energy Journal, 29(Special Issue# 2). http://www.eprg.group.cam.ac.uk/wp-content/uploads/2008/11/eprg0809.pdf 244 https://www.macrotrends.net/, https://www.statista.com/ 245 Laue, H.J., 1981. Nuclear energy: Facing the future. IAEA BULLETIN. https://www.iaea.org/sites/default/files/publications/magazines/bulletin/bull24-0/24004781016su.pdf ) 246 IRENA (2019), Global energy transformation: A roadmap to 2050 (2019 edition), International Renewable Energy
Agency, Abu Dhabi. https://www.irena.org/publications/2019/Apr/Global-energy-transformation-A-roadmap-to-2050-2019Edition 247 Net capacity additions of renewable energy worldwide from 2000 to 2018
https://www.statista.com/statistics/1004700/global-renewable-capacity-additions/ 248 IRENA (2018), Global Energy Transformation: A roadmap to 2050, International Renewable Energy Agency, Abu
Dhabi. www.irena.org/publications. 249 Renewable not growing adequately Renewables, I.E.A., 2019. Market Analysis and Forecast from 2019 to 2024. IEA: San Francisco, USA. https://webstore.iea.org/download/direct/2854?fileName=Renewables_2019.pdf
Climate Risk and Response July 2021
George Backus (Material is free to use with attribution.) 47
analyses/simulations have used growth rate limits on energy technology since the mid-1970s250 including the most recent work on proposed U.S. “Green” policy251,252 The 45% rate under 100% mobilization overstates what is realistically sustainable. Given the delays in mobilization, only allowing a 30% per year maximum growth rates implies that it would be substantially impossible to keep the Global Surface Average Temperature (GSAT) below 4.0 °C by the year 2100. The own-use-energy dynamics explained in Appendix 3, which present the greatest hurdle to a successful transition, would be untenable with allowed growth rates in excess of 45% per year. Allowing a higher growth rate would also be without physical-resource, financial market, or historical justification. Every percentage reduction in the maximum growth rate causes a 0.02 °C increase in the year 2010 temperature. A 15% growth rate is more realistic than 45%.253 The study maintains the assumption of declining renewable energy, battery, and DAC costs, but high growth rates affect supplier prices, and the decline in renewable energy costs are likely overestimated.254 The growth constraints are in the manufacturing industries that make renewable energy and in the secondary supply/raw-material industries supporting them.255,256,xlvi NREL reports that at even low growth rates, the need for raw material, especially minerals, is possible, but notes the challenges involved.257 The analyses here are optimistic in assuming substitution and global coordination among world governments will enable such rapid growth in raw material supplies and secondary industry growth.
When the growth in renewable energy, due to rapid electrification, is inadequate, natural gas must fill the gap. (See Appendix 3.) Additionally, even though renewable energy is growing
250 Gazalet, E.G., 1977. Generalized equilibrium modeling: the methodology of the SRI-Gulf energy model. Final report (No. DOE/EIA/70313-1). Decision Focus, Inc., Palo Alto, CA (USA); Stanford Research Inst., Menlo Park, CA (USA). https://www.osti.gov/servlets/purl/5901905 251 https://energypolicy.solutions/ 252 Statement On U.S. House Select Committee On The Climate Crisis’ Climate Action Plan, https://energyinnovation.org/2020/06/30/statement-on-u-s-house-select-committee-on-the-climate-crisis-climate-action-plan/ 253 Is any country installing renewables fast enough to reach climate goals? https://arstechnica.com/science/2021/07/renewable-growth-rates-arent-high-enough-to-reach-climate-goals/ 254 The bottlenecks which could constrain emission cuts https://www.economist.com/briefing/2021/06/12/the-bottlenecks-which-could-constrain-emission-cuts 255 How green bottlenecks threaten the clean energy business https://www.economist.com/leaders/2021/06/12/how-green-bottlenecks-threaten-the-clean-energy-business 256 The bottlenecks which could constrain emission cuts https://www.economist.com/briefing/2021/06/12/the-bottlenecks-which-could-constrain-emission-cuts 257 Exploration of High-Penetration Renewable Electricity Futures. Vol. 4 of Renewable Electricity Futures Study. NREL/TP-6A20-52409-4. Golden, CO: National Renewable Energy Laboratory. https://www.nrel.gov/docs/fy12osti/52409-4.pdf

Climate Risk and Response July 2021
George Backus (Material is free to use with attribution.) 48
rapidly and representing the largest share of new capacity investments,258 the actual use of fossil fuel as a percentage of total energy remains essentially unchanged.259
In the absence of societal or political pushback, the first few countries to aggressively address climate change could achieve net zero early because their actions do not hit the global growth constraints. Increased collective action at a global level will hit the physical growth limits and cause other cross-country feedback responses that slow down or reduce mobilization effectiveness.
258 World Adds Record New Renewable Energy Capacity in 2020 https://www.irena.org/newsroom/pressreleases/2021/Apr/World-Adds-Record-New-Renewable-Energy-Capacity-in-2020#:~:text=IRENA's%20annual%20Renewable%20Capacity%20Statistics,per%20cent%20of%20new%20renewables. 259 Renewables 2021 Global Status Report, REN21 Secretariat, UN Environment Programme, Paris. https://www.ren21.net/wp-content/uploads/2019/05/GSR2021_Full_Report.pdf
Climate Risk and Response July 2021
George Backus (Material is free to use with attribution.) 49
Section 4. Socio-Climatic Feedback
Overview: There are many feedback phenomena that affect the outcomes of mitigation policy. This section describes the approach for simulating macroeconomic, demographic, energy supply and demand, climate, and carbon-capture dynamics. The simulation is entirely based on peer-reviewed literature and data, adding only the closure of feedback loops.
Bottom Line: The results from the feedback simulation are robust to uncertainty and appropriate for assessing climate policy. _________________________________________________________________________
The key feature of this study is that it incorporates the causal feedback processes among the regions of the world over time as varied elements of climate-change act on all the economies, populations, energy systems, GHG emissions, human tolls, and human responses. This feedback encompasses the physical delays and the causal flow of information. Economic activity and its use of energy is based on the concept of stock-and-flow.260 The same is true for climate and the accumulation of emissions in the atmosphere and oceans. Stocks are elements, such as buildings and the atmosphere, that cannot quickly change their status even under policy mandates. Flows are the entities that enter (such as new capital from investments) and leave (such as retirements) the stock. Every feedback loop must contain one or more stocks, each of which is interconnected via flows from other stocks. This study uses stock-and-flow feedback to assess the impacts of pursuing realizable GHG policies.
The study does not use the idealized assumptions typical of optimization analyses. Optimization is only appropriate when there is complete control of all resources. Globally, the great diversity of intense self-interest within populations makes the assumption of having control invalid. In general, human behavior does not allow optimality because 1) there is a lack of sufficient knowledge, 2) decision makers employ a variety of alternative value-systems, 3) policymakers do not make decisions based on costs alone, and 4) uncertainty guarantees that it is impossible to clairvoyantly plan for future conditions.
Two major faults of this study are the use of a single climate metricxxix (GSAT) to determine impacts, and the use of only two geographics regions to capture world-wide impacts. The regions are not geographically contiguous, nor uniform in economic, societal, energy, or climate characteristics. To compensate for these limitations, the impact equations are calibrated to the results of geographically-detailed studies – which all contain summarized impacts at a level of aggregation compatible with those used here and which are based on the relative Representative Concentration Pathway (RCP)261 scenarios that use the single GSAT summary variable. Thus, the impact equations inherently correct for the varied aspects of the impacts.
Figure 11 illustrates the considerations and connectivity within the simulation model used in the analyses. All parameters and relationships used in the model are based on peer-reviewed
260 Sterman, J., 2010. Business Dynamics. Irwin/McGraw-Hill. 261 van Vuuren, D. P., Edmonds, J., Thomson, A., Riahi, K., Kainuma, M., Matsui, T., Hurtt, G. C., Lamarque, J.-F., Meinshausen, M., Smith, S., Granier, C., Rose, S. K., and Hibbard, K. A.: The Representative Concentration Pathways: an overview, Climatic Change, 109, 5–31, 2011. https://link.springer.com/content/pdf/10.1007/s10584-011-0148-z.pdf
Climate Risk and Response July 2021
George Backus (Material is free to use with attribution.) 50
literature. Impact and climate related concepts 1) are selected for quality, 2) are based on the CMIP5262 data used in the IPCC AR5, 263 and 3) contain uncertainty quantification. For the sake of timeliness, results are being reported despite model documentation text not being completed. (See Appendix 2.)
All of the considerations noted below have been addressed separately or independently within the IPCC studies.264,265,266 This study evaluates how the combined interactions of those concerns suggest a much different perspective for policy effects. The overall simulation model contains interacting component models that simulate socioeconomic, energy, climate, or DAC dynamics.
Other than policy implementation specifications, all elements of the simulation are endogenous and calculated each year based on the conditions and interactions occurring during that year. The arrows show the direction of causality and the polarity of the influence. A positive sign denotes that a change in the variable at the tail of the arrow has a reinforcing (the more the more or the less the less) effect on the variable at the head of the arrow. A negative sign designates a balancing effect (the more the less, or the less the more) whereby the change in the value of a variable at the end of the tail has a countering or opposite directional effect on the variable at the head of the arrow. The sequence of arrows that go from one variable to another and then return to the initiating arrow represents a feedback loop. Some of these loops are dominated by positive relationships or positive feedback, denoting that there is a vicious cycle of the variable causing yet more change in the direction of the initial change. Loops dominated by negative relationships are controlling feedback loops that counter the effects of the initial change.
262 Coupled Model Intercomparison Project 5 (CMIP5) https://esgf-node.llnl.gov/projects/cmip5/ 263 IPCC, 2013: Climate Change 2013: The Physical Science Basis. Contribution of Working Group I to the Fifth Assessment Report of the Intergovernmental Panel on Climate Change [Stocker, T.F., D. Qin, G.-K. Plattner, M. Tignor, S.K. Allen, J. Boschung, A. Nauels, Y. Xia, V. Bex and P.M. Midgley (eds.)]. Cambridge University Press, Cambridge, United Kingdom and New York, NY, USA, 1535 pp. https://www.ipcc.ch/report/ar5/wg1/ 264 Ibid. 265 Allen, M., Antwi-Agyei, P., Aragon-Durand, F., Babiker, M., Bertoldi, P., Bind, M., Brown, S., Buckeridge, M., Camilloni, I., Cartwright, A. and Cramer, W., 2019. Global warming of 1.5° C. An IPCC Special Report on the impacts of global warming of 1.5° C above pre-industrial levels and related global greenhouse gas emission pathways, in the context of strengthening the global response to the threat of climate change, sustainable development, and efforts to eradicate poverty. World Meteorological Organization, Geneva, Switzerland. https://www.ipcc.ch/sr15/ 266 IPCC, 2019: Climate Change and Land: an IPCC special report on climate change, desertification, land degradation, sustainable land management, food security, and greenhouse gas fluxes in terrestrial ecosystems [P.R. Shukla, J. Skea, E. Calvo Buendia, V. Masson-Delmotte, H.-O. Pörtner, D. C. Roberts, P. Zhai, R. Slade, S. Connors, R. van Diemen, M. Ferrat, E. Haughey, S. Luz, S. Neogi, M. Pathak, J. Petzold, J. Portugal Pereira, P. Vyas, E. Huntley, K. Kissick, M. Belkacemi, J. Malley, (eds.)]. https://www.ipcc.ch/site/assets/uploads/2019/08/Fullreport-1.pdf
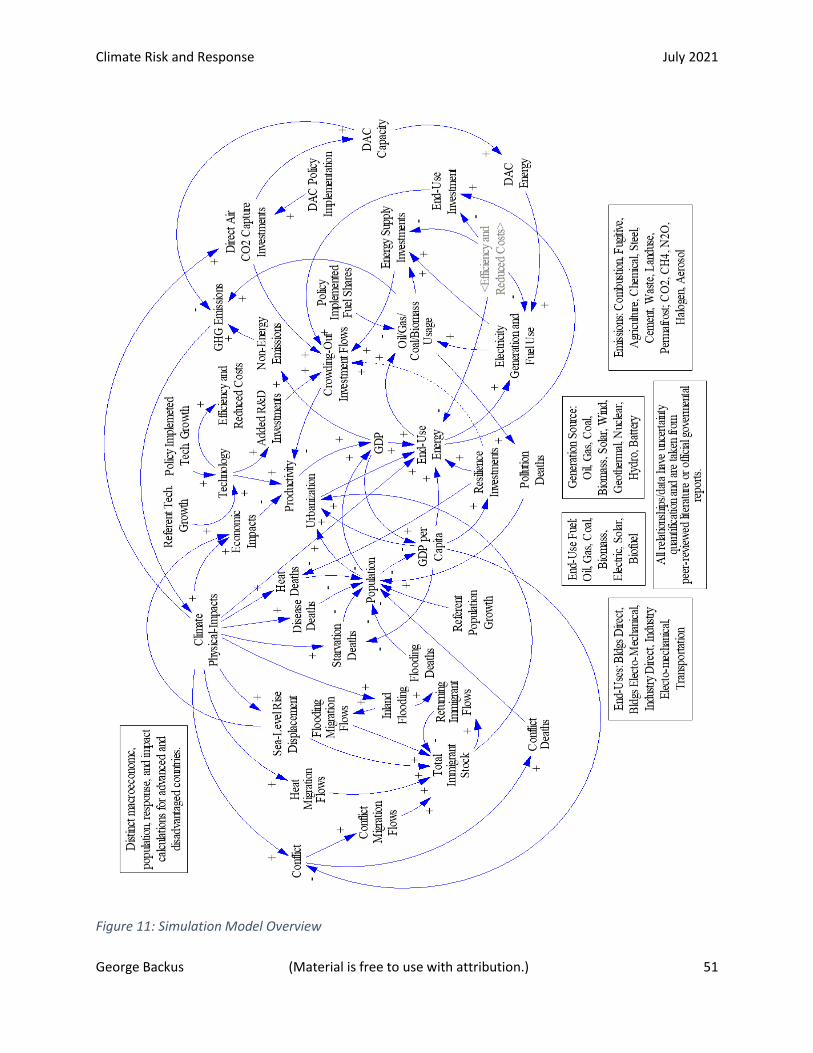
Climate Risk and Response July 2021
George Backus (Material is free to use with attribution.) 51
Figure 11: Simulation Model Overview
Climate Risk and Response July 2021
George Backus (Material is free to use with attribution.) 52
The boxes in Figure 11 indicate the level of detail associated with each relationship. Geographically, the model is at the global level.xxx Climate and human impacts occur at the local level and vary widely across regions. Although the model calibration matches a Referent energy, economic, demographic, and climate forecast, it does not simulate the disaggregated information to meaningfully forecast the conditions of any specific country. This aggregated model at best only provides a broad-brush picture of climate and human interactions. Nonetheless, it does illustrate a set of considerations often overlooked in those conventional analyses that stress details within a siloed academic field rather than emphasizing the humanitarian, global whole.
Real-world systems are largely dominated by negative feedback processes that limit the effectiveness and timing of policy initiatives, not the least of which is feedback from human behavior. Despite large uncertainty, the use of feedback analysis can assess the critical dynamics affecting real-world outcomes. Ignoring the feedback, or explicitly assuming a value of “zero” for uncertainty parameters, invariably leads to unjustified (optimistic) underestimates of risk more than the larger uncertainty leads to (alarmist) overestimates of risk. Again, there is no intent to create or promote doomism.267,268 The objective is to 1) adequately ensure adaptation, 2) address security concerns, and 3) rethink mitigation in the context of constraints and consequences. A robust response to climate change requires an open-eye realization of uncertainty and risks, along with determining options to accommodate them with achievable policy measures.
The causal model used for the analyses is based on the system dynamics paradigm. In the analyses here, variables are a function of other variables, with differential equations representing the feedback structure of their interactions. As a result of feedback, well-intentioned policies often produce unintended consequences and the feedback itself leads to counterintuitive behaviors.269,270 The human mind cannot comprehend these phenomena without the help of a causal simulation model,271 such as the one utilized here. Every physical condition that exists does so due to feedback dynamics. The structure of the feedback, in terms of how one variable affects another, robustly determines the dynamics and outcomes much more than precise parameter specification.
267 Climatologist Michael E Mann: 'Good people fall victim to doomism. I do too sometimes' Interview with Jonathan Watts https://www.theguardian.com/environment/2021/feb/27/climatologist-michael-e-mann-doomism-climate-crisis-interview 268 The New Climate War: The Fight to Take Back Our Planet, 2021by Michael E. Mann, Hachette Book Group, NY. 269 Forrester, Jay W. "Some basic concepts in system dynamics." Sloan School of Management, Massachusetts Institute of Technology, Cambridge 9 (2009). https://www.cc.gatech.edu/classes/AY2018/cs8803cc_spring/research_papers/Forrester-SystemDynamics.pdf 270 Sterman, J.D., 2006. Learning from evidence in a complex world. American journal of public health, 96(3), pp.505-514. https://ajph.aphapublications.org/doi/pdfplus/10.2105/AJPH.2005.066043 271 Forrester, J.W., 1971. Counterintuitive behavior of social systems. Theory and decision, 2(2), pp.109-140. https://ocw.mit.edu/courses/sloan-school-of-management/15-988-system-dynamics-self-study-fall-1998-spring-1999/readings/behavior.pdf
Climate Risk and Response July 2021
George Backus (Material is free to use with attribution.) 53
4.1 Referent and Base Forecast
Overview: This study uses and accepts a Referent forecast as its basis and determines how mitigation efforts affect the macroeconomic, demographic, energy, and climate outcomes.
Bottom Line: The feedback effects produce a more consistent forecast that is very different from those possible in other studies. _________________________________________________________________________
This study uses a Referent forecast for which the model is calibrated to exactly reproduce the values for relevant energy, macroeconomic, and population variables. That Referent forecast is a compositexxxi of the 2017 EIA International Outlook Forecast (IEO)272 and the 2018 IEA World Energy Outlook (WEO) 273. The numerical values of any stated energy variable equate to those of the adjusted IEO data. The WEO and IEO forecasts were primarily chosen as an alternative to the IPCC Shared Socioeconomic Pathways (SSP)274,275 forecasts.276 Both the WEO and IEO forecasts use descriptive models that apply historical dynamics and relationships, developed by international energy experts, and concentrate more on making an energy forecast than establishing an economic climate forecast. They are inherently different from the IAM forecasts that cannot capture the imperfections and inefficiency of societal human behavior and policy execution. The 2017/2018 reports contain forecasts developed prior to 2018 and based on earlier historical data. They are used because they do not contain the implied impacts of the Paris accord. The effort here considers the impact of policy implementation and does not, a priori, assume the effect of as yet unfulfilled pledges.
While both the IEO and WEO projections generate outcomes only through the year 2050, the relationships contained in them are stable throughout their forecast period and are maintained to produce a 2100 forecast. A comparison of results between the IEA versus WEO forecast, even when extended to 2100, shows no more than a 4% difference. Surprisingly, rather than having many erratic time-dependent parameters, the descriptive energy, climate, and impact equations are composed of simple tautologies and of parameters that are constant or that smoothly approach asymptotic values over the 2015-2100 time period. Annual growth rates for the economies and population do vary annually to reproduce the exact historical values. The use of a Referent places the onus of defensibility on the institution providing the forecast, with the analysis here only needing to be defended on its own merits relative to the primary interest of the analysis.
272 International Energy Outlook 2017 (IEO 2017) . U.S. Energy Information Administration (EIA), Report Number: DOE/EIA-0484(2017) https://www.eia.gov/outlooks/archive/ieo17/ 273 World Energy Outlook 2018 (WEO 2018) International Energy Agency (IEA), Paris. https://www.iea.org/reports/world-energy-outlook-2018 274 B. O’Neill, E. Kriegler, K. Riahi, K. Ebi, S. Hallegatte, T. Carter, R. Mathur, D. van Vuuren A new scenario framework for climate change research: the concept of shared socioeconomic pathways Clim. Change, 122 (2013), pp. 387-400 https://link.springer.com/content/pdf/10.1007/s10584-013-0905-2.pdf 275 Kriegler, E., Edmonds, J., Hallegatte, S., Ebi, K.L., Kram, T., Riahi, K., Winkler, H. and Van Vuuren, D.P., 2014. A new scenario framework for climate change research: the concept of shared climate policy assumptions. Climatic Change, 122(3), pp.401-414. https://link.springer.com/content/pdf/10.1007/s10584-013-0971-5.pdf 276 SSP Database (Shared Socioeconomic Pathways) - Version 2.0 https://tntcat.iiasa.ac.at/SspDb/dsd?Action=htmlpage&page=10

Climate Risk and Response July 2021
George Backus (Material is free to use with attribution.) 54
The IEA and EIA energy forecasts do not contain feedback phenomena whereby climate change would affect energy use, energy supply, the economic drivers of energy use, or the population drivers of the economics. The economic and population forecasts are exogenous to the energy forecasts. See Section 4.2 on establishing the appropriate exogenous macroeconomic and demographic conditions between the years 2050 and 2100.
For use here, the Referent forecast is further modified to produce a Base case forecast. The Base case starts with the Referent forecast and closes the feedback loops to create a self-consistent forecast that recognizes the climatic impacts. The Base case forecast also includes cooling load dynamics as a function of temperature – in concert with macroeconomic and demographics dynamics. In the Base case, populations and regional GDP are lower than in the Referent. (See Section 4.1.2.) Energy demand per unit of economic activity and per person is higher because of cooling277 and urbanization dynamics. The Referent and Base case forecasts neglect the pandemic’s economic and energy-use transients as short-term phenomena.278 Important features of the Referent forecast and the Base case forecast are shown in turn.
4.1.1 Referent Forecast Quantification
Overview: The Referent forecast is based on pre-Paris Accord assumptions so that the analyses can simulate the effects of policy rather than assume those effects. This section shows the basic characterization of the Referent forecast.
Bottom Line: The Referent is an RCP 8.5 energy scenario producing a temperature identical to the mean of the CMIP5 experiments. Estimated death and migration dynamics show a problematic future. _________________________________________________________________________
The Referent case generates a GSAT (Global Surface Average Temperature) anomaly of 4.86 °C in 2100 consistent with the IPCC AR5279 projections for the (sans policy) RCP 8.5. Although some commentaries state the RCP 8.5 Base is not appropriate,280 the variation from it is not statistically significant and it remains the business-as-usual path in the absence of effective
277 Whatever Climate Change Does to the World, Cities Will Be Hit Hardest, April 18, 2021. https://www.bloomberg.com/graphics/2021-cities-climate-victims/ 278 Earth Is Barreling Toward 1.5 Degrees Celsius Of Warming, Scientists Warn https://www.npr.org/2021/05/26/1000465487/earth-is-barreling-toward-1-5-degrees-celsius-of-warming-scientists-warn 279 Rogelj, J., Meinshausen, M. and Knutti, R., 2012. Global warming under old and new scenarios using IPCC climate sensitivity range estimates. Nature climate change, 2(4), pp.248-253. https://ethz.ch/content/dam/ethz/special-interest/usys/iac/iac-dam/documents/group/climphys/knutti/publications/rogelj12natcc.pdf 280 Emissions – the ‘business as usual’ story is misleading https://www.nature.com/articles/d41586-020-00177-3
Climate Risk and Response July 2021
George Backus (Material is free to use with attribution.) 55
GHG policy.281,282,283 It is therefore the appropriate Referent for a simulation with a jumping off point of 2015.284,285
The graphs below show the end-use demand by type and fuel, generation capacity and dispatch by fuel, and total energy consumption at the global level,xxxii as the sum of Advantaged and Disadvantaged values. More information at the regional level is supplied in Appendix 1. Forecasted global demand is somewhat higher than recent data would indicate, but many countries continue to increase their dependence on fossil fuels286,287,288,289,290 and it is too soon to have high confidence that the future (sans policy) trajectory would be substantially altered.
281 Jackson, R.B., Le Quéré, C., Andrew, R.M., Canadell, J.G., Peters, G.P., Roy, J. and Wu, L., 2017. Warning signs for stabilizing global CO2 emissions. Environmental Research Letters, 12(11), p.110202. https://iopscience.iop.org/article/10.1088/1748-9326/aa9662/pdf 282 Earth Is Barreling Toward 1.5 Degrees Celsius Of Warming, Scientists Warn https://www.npr.org/2021/05/26/1000465487/earth-is-barreling-toward-1-5-degrees-celsius-of-warming-scientists-warn 283 'They just kept on rising': data reveals alarming greenhouse gas increase https://phys.org/news/2021-06-reveals-alarming-greenhouse-gas.html 284 Christopher R. Schwalm, Spencer Glendon, Philip B. Duffy. RCP8.5 tracks cumulative CO2 emissions. Proceedings of the National Academy of Sciences, 2020; 202007117 DOI: 10.1073/pnas.2007117117 https://www.pnas.org/content/pnas/117/33/19656.full.pdf 285 'Worst-case' CO2 emissions scenario is best for assessing climate risk and impacts to 2050 https://www.sciencedaily.com/releases/2020/08/200804085912.htm 286 For Mexico’s president, the future isn’t renewable energy — it’s coal. https://www.latimes.com/world-nation/story/2021-04-12/mexico-is-edging-out-renewable-energy-in-favor-of-coal-and-other-dirty-fossil-fuels 287 Cui, R.Y., Hultman, N., Edwards, M.R., He, L., Sen, A., Surana, K., McJeon, H., Iyer, G., Patel, P., Yu, S. and Nace, T., 2019. Quantifying operational lifetimes for coal power plants under the Paris goals. Nature communications, 10(1), pp.1-9. https://www.nature.com/articles/s41467-019-12618-3 288 Boom and Bust 2021: Tracking The Global Coal Plant Pipeline. Global Energy Monitor (2021). https://globalenergymonitor.org/wp-content/uploads/2021/04/BoomAndBust_2021_final.pdf 289 BA CEO: Zero Carbon Aviation Solutions Will Take 30 Years, https://simpleflying.com/zero-carbon-aviation-30-years/ 290 What ‘energy transition’? Global fossil fuel use is accelerating and set to get even worse. https://www.cnbc.com/2021/04/14/climate-global-fossil-fuel-use-accelerating-and-set-to-get-even-worse.html
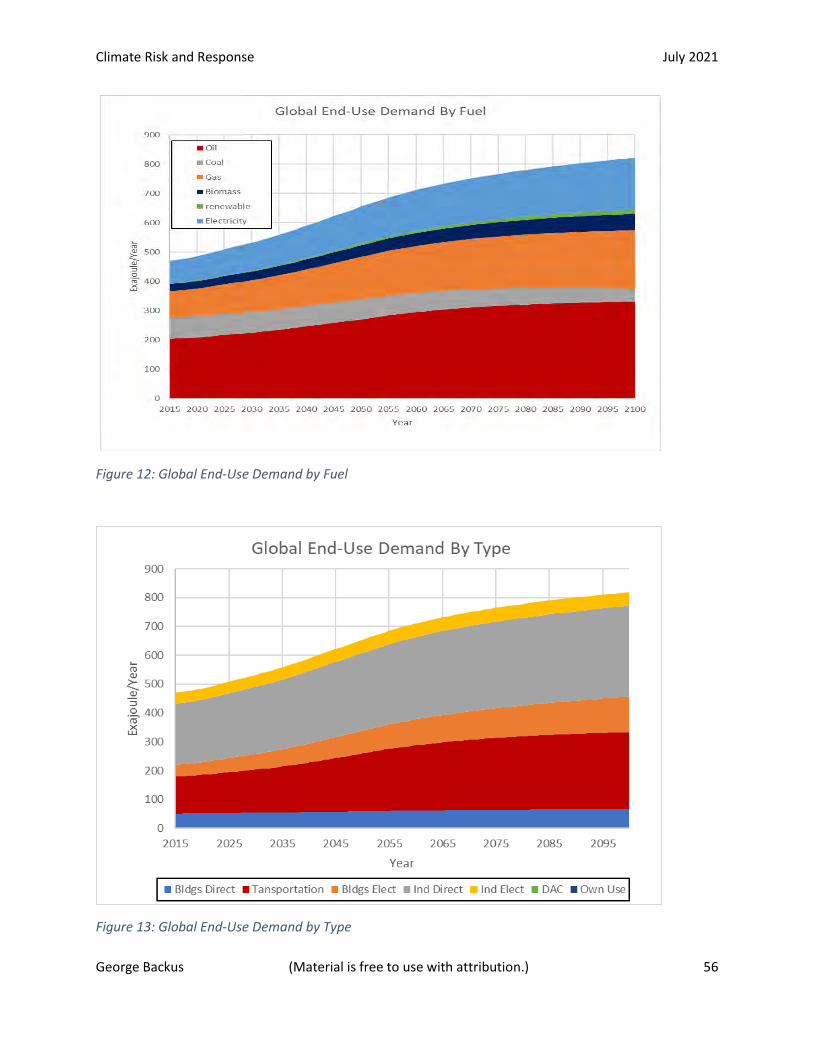
Climate Risk and Response July 2021
George Backus (Material is free to use with attribution.) 56
Figure 12: Global End-Use Demand by Fuel
Figure 13: Global End-Use Demand by Type
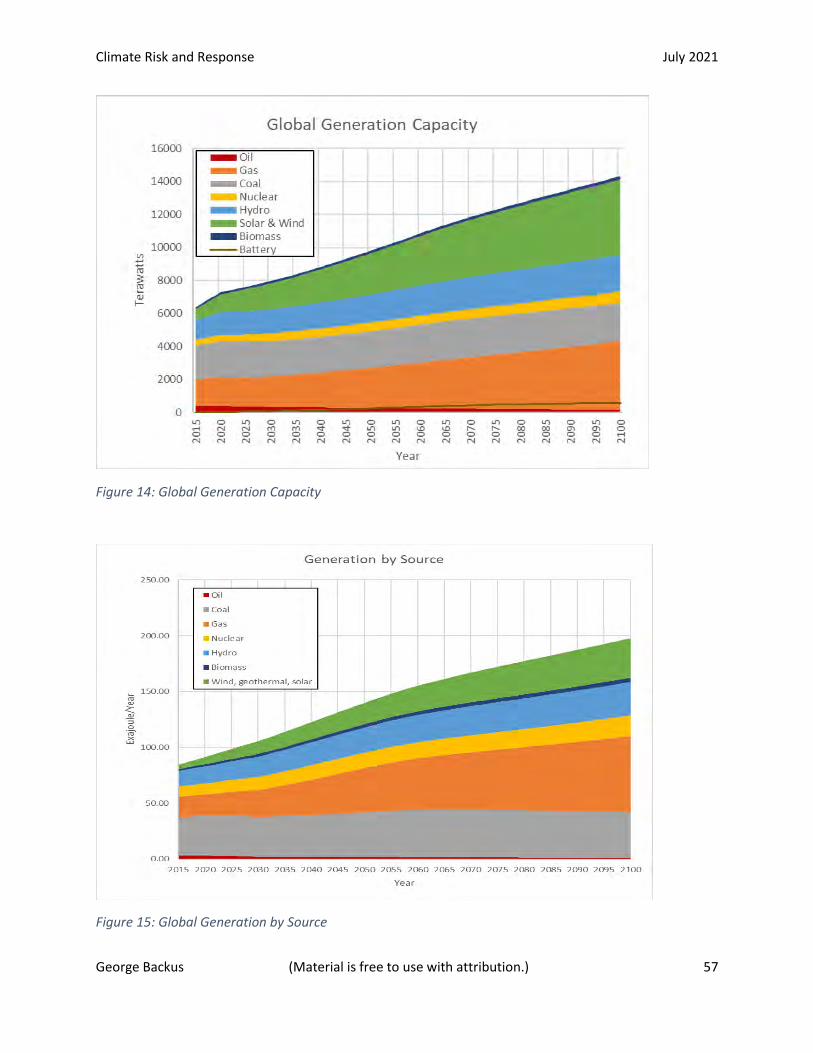
Climate Risk and Response July 2021
George Backus (Material is free to use with attribution.) 57
Figure 14: Global Generation Capacity
Figure 15: Global Generation by Source
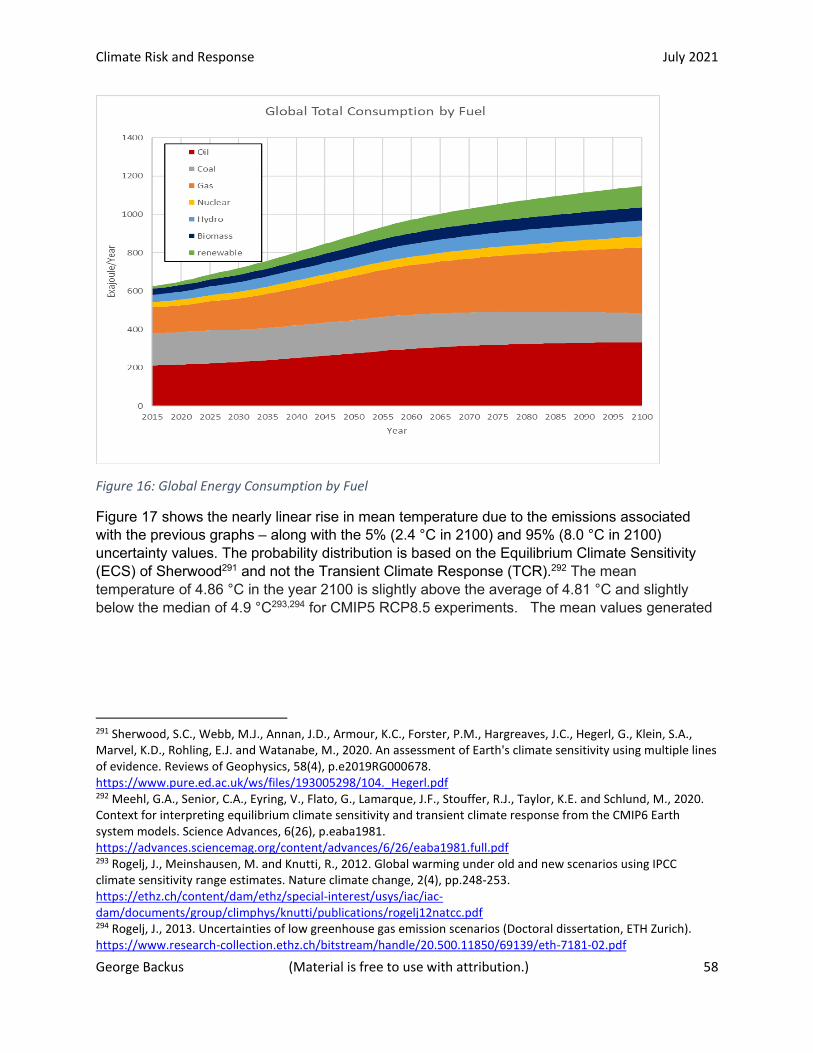
Climate Risk and Response July 2021
George Backus (Material is free to use with attribution.) 58
Figure 16: Global Energy Consumption by Fuel
Figure 17 shows the nearly linear rise in mean temperature due to the emissions associated with the previous graphs – along with the 5% (2.4 °C in 2100) and 95% (8.0 °C in 2100) uncertainty values. The probability distribution is based on the Equilibrium Climate Sensitivity (ECS) of Sherwood291 and not the Transient Climate Response (TCR).292 The mean temperature of 4.86 °C in the year 2100 is slightly above the average of 4.81 °C and slightly below the median of 4.9 °C293,294 for CMIP5 RCP8.5 experiments. The mean values generated
291 Sherwood, S.C., Webb, M.J., Annan, J.D., Armour, K.C., Forster, P.M., Hargreaves, J.C., Hegerl, G., Klein, S.A., Marvel, K.D., Rohling, E.J. and Watanabe, M., 2020. An assessment of Earth's climate sensitivity using multiple lines of evidence. Reviews of Geophysics, 58(4), p.e2019RG000678. https://www.pure.ed.ac.uk/ws/files/193005298/104._Hegerl.pdf 292 Meehl, G.A., Senior, C.A., Eyring, V., Flato, G., Lamarque, J.F., Stouffer, R.J., Taylor, K.E. and Schlund, M., 2020. Context for interpreting equilibrium climate sensitivity and transient climate response from the CMIP6 Earth system models. Science Advances, 6(26), p.eaba1981. https://advances.sciencemag.org/content/advances/6/26/eaba1981.full.pdf 293 Rogelj, J., Meinshausen, M. and Knutti, R., 2012. Global warming under old and new scenarios using IPCC climate sensitivity range estimates. Nature climate change, 2(4), pp.248-253. https://ethz.ch/content/dam/ethz/special-interest/usys/iac/iac-dam/documents/group/climphys/knutti/publications/rogelj12natcc.pdf 294 Rogelj, J., 2013. Uncertainties of low greenhouse gas emission scenarios (Doctoral dissertation, ETH Zurich). https://www.research-collection.ethz.ch/bitstream/handle/20.500.11850/69139/eth-7181-02.pdf
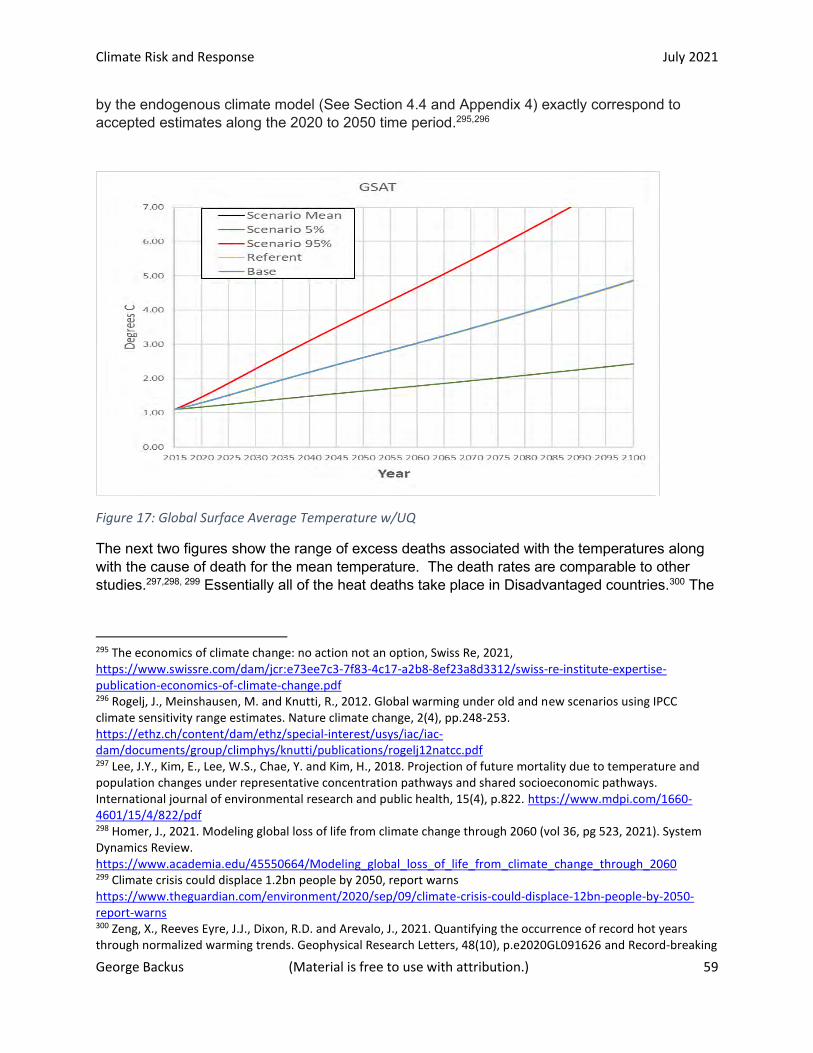
Climate Risk and Response July 2021
George Backus (Material is free to use with attribution.) 59
by the endogenous climate model (See Section 4.4 and Appendix 4) exactly correspond to accepted estimates along the 2020 to 2050 time period.295,296
Figure 17: Global Surface Average Temperature w/UQ
The next two figures show the range of excess deaths associated with the temperatures along with the cause of death for the mean temperature. The death rates are comparable to other studies.297,298, 299 Essentially all of the heat deaths take place in Disadvantaged countries.300 The
295 The economics of climate change: no action not an option, Swiss Re, 2021, https://www.swissre.com/dam/jcr:e73ee7c3-7f83-4c17-a2b8-8ef23a8d3312/swiss-re-institute-expertise-publication-economics-of-climate-change.pdf 296 Rogelj, J., Meinshausen, M. and Knutti, R., 2012. Global warming under old and new scenarios using IPCC climate sensitivity range estimates. Nature climate change, 2(4), pp.248-253. https://ethz.ch/content/dam/ethz/special-interest/usys/iac/iac-dam/documents/group/climphys/knutti/publications/rogelj12natcc.pdf 297 Lee, J.Y., Kim, E., Lee, W.S., Chae, Y. and Kim, H., 2018. Projection of future mortality due to temperature and population changes under representative concentration pathways and shared socioeconomic pathways. International journal of environmental research and public health, 15(4), p.822. https://www.mdpi.com/1660-4601/15/4/822/pdf 298 Homer, J., 2021. Modeling global loss of life from climate change through 2060 (vol 36, pg 523, 2021). System Dynamics Review. https://www.academia.edu/45550664/Modeling_global_loss_of_life_from_climate_change_through_2060 299 Climate crisis could displace 1.2bn people by 2050, report warns https://www.theguardian.com/environment/2020/sep/09/climate-crisis-could-displace-12bn-people-by-2050-report-warns 300 Zeng, X., Reeves Eyre, J.J., Dixon, R.D. and Arevalo, J., 2021. Quantifying the occurrence of record hot years through normalized warming trends. Geophysical Research Letters, 48(10), p.e2020GL091626 and Record-breaking

Climate Risk and Response July 2021
George Backus (Material is free to use with attribution.) 60
total deaths per year decline in the long term from reduced particulate (aerosol) pollution and from (ultimately) reduced disease (due to adverse temperatures). All the impacts are those in excess of what would be in the absence of climate change. Also, the impact curves only reflect the added impact due to climate change relative to the 2015 values.
Figure 18: Excess Global Deaths per Year w/UQ
temperatures more likely in populated tropics https://phys.org/news/2021-06-record-breaking-temperatures-populated-tropics.html

Climate Risk and Response July 2021
George Backus (Material is free to use with attribution.) 61
Figure 19: Excess Global Deaths by Cause
The next two figures show the range of excess migration associated with the temperatures along with the causes of migration301,302 for the mean temperature. Much of the heat migration implicitly includes that from water stress.303 The total death rate stabilizes in the long term as incomes allow resilience. Note again that this is the Referent case which has no feedback of climate change on the economy or populations. The lack of feedback in defining the Referent is representative of most Climate Change impact analyses. Again, all the impacts are those in excess of what would be in the absence of climate change. (See Section 4.1 for an explanation of the migration and death calculations.)
301 Czaika, M. and Reinprecht, C., 2020. Drivers of migration. A synthesis of knowledge. IMI Work. Pap. Ser, 163, pp.1-45. https://www.migrationinstitute.org/publications/drivers-of-migration-a-synthesis-of-knowledge/@@download/file 302 Mercandalli, S., Losch, B., Belebema, M.N., Bélières, J.F., Bourgeois, R., Dinbabo, M.F., Freguin-Gresh, S., Mensah, C. and Nshimbi, C., 2019. Rural migration in sub− Saharan Africa: Patterns, drivers and relation to structural transformation. https://agritrop.cirad.fr/595727/1/2019_FAO_RuralMigration_WorkingPaper_EN.pdf 303 Wrathall, D.J., Hoek, J., Walters, A. and Devenish, A., 2018. Water stress and human migration: a global, georeferenced review of empirical research. FAO Land and Water Discussion Paper, (11). http://www.fao.org/3/I8867EN/i8867en.pdf.
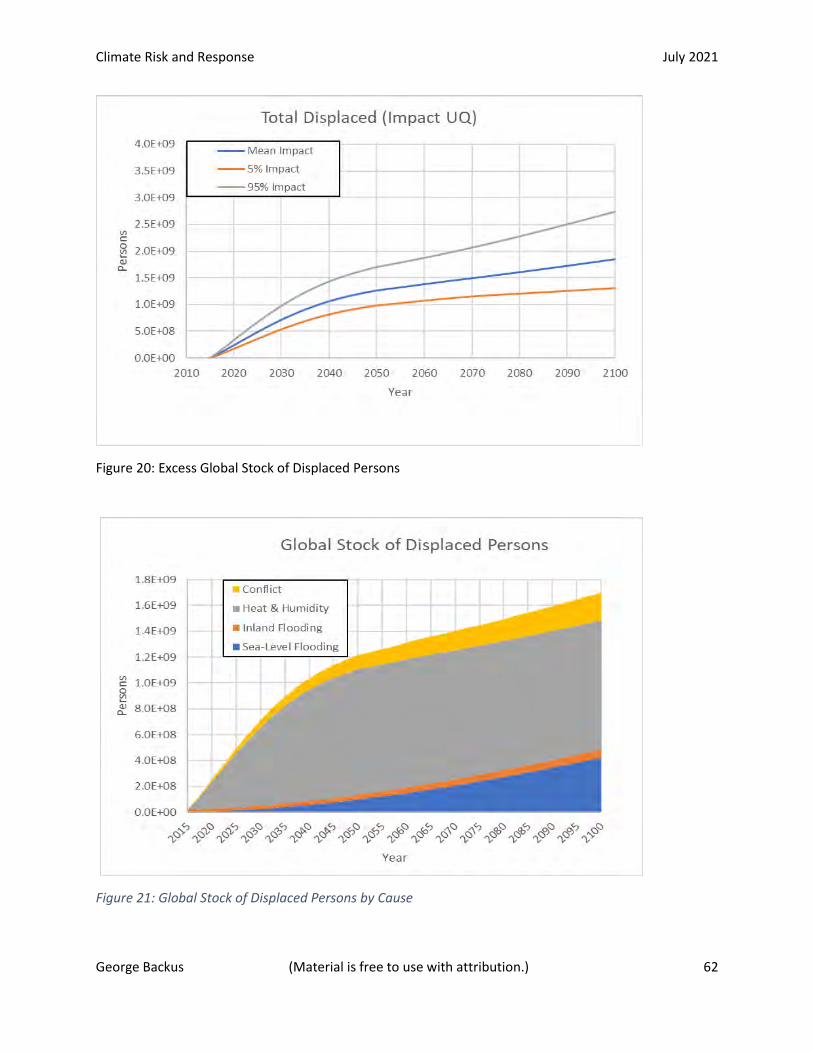
Climate Risk and Response July 2021
George Backus (Material is free to use with attribution.) 62
Figure 20: Excess Global Stock of Displaced Persons
Figure 21: Global Stock of Displaced Persons by Cause
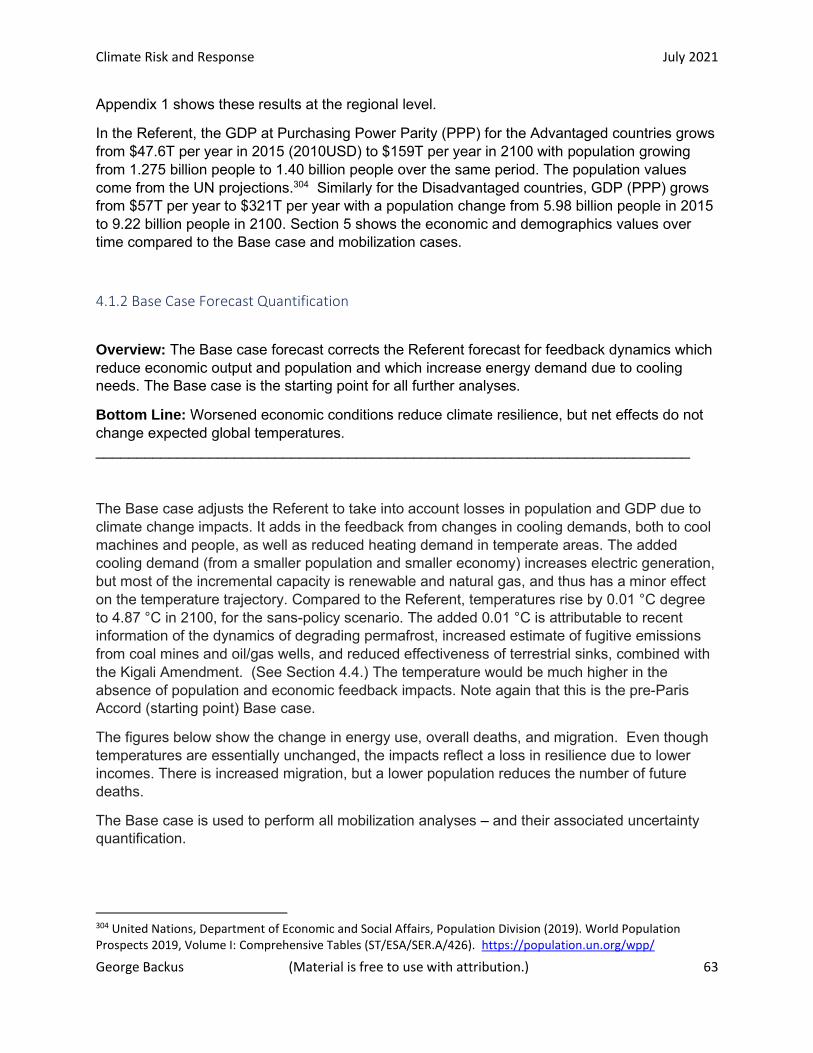
Climate Risk and Response July 2021
George Backus (Material is free to use with attribution.) 63
Appendix 1 shows these results at the regional level.
In the Referent, the GDP at Purchasing Power Parity (PPP) for the Advantaged countries grows from $47.6T per year in 2015 (2010USD) to $159T per year in 2100 with population growing from 1.275 billion people to 1.40 billion people over the same period. The population values come from the UN projections.304 Similarly for the Disadvantaged countries, GDP (PPP) grows from $57T per year to $321T per year with a population change from 5.98 billion people in 2015 to 9.22 billion people in 2100. Section 5 shows the economic and demographics values over time compared to the Base case and mobilization cases.
4.1.2 Base Case Forecast Quantification
Overview: The Base case forecast corrects the Referent forecast for feedback dynamics which reduce economic output and population and which increase energy demand due to cooling needs. The Base case is the starting point for all further analyses.
Bottom Line: Worsened economic conditions reduce climate resilience, but net effects do not change expected global temperatures. _________________________________________________________________________
The Base case adjusts the Referent to take into account losses in population and GDP due to climate change impacts. It adds in the feedback from changes in cooling demands, both to cool machines and people, as well as reduced heating demand in temperate areas. The added cooling demand (from a smaller population and smaller economy) increases electric generation, but most of the incremental capacity is renewable and natural gas, and thus has a minor effect on the temperature trajectory. Compared to the Referent, temperatures rise by 0.01 °C degree to 4.87 °C in 2100, for the sans-policy scenario. The added 0.01 °C is attributable to recent information of the dynamics of degrading permafrost, increased estimate of fugitive emissions from coal mines and oil/gas wells, and reduced effectiveness of terrestrial sinks, combined with the Kigali Amendment. (See Section 4.4.) The temperature would be much higher in the absence of population and economic feedback impacts. Note again that this is the pre-Paris Accord (starting point) Base case.
The figures below show the change in energy use, overall deaths, and migration. Even though temperatures are essentially unchanged, the impacts reflect a loss in resilience due to lower incomes. There is increased migration, but a lower population reduces the number of future deaths.
The Base case is used to perform all mobilization analyses – and their associated uncertainty quantification.
304 United Nations, Department of Economic and Social Affairs, Population Division (2019). World Population Prospects 2019, Volume I: Comprehensive Tables (ST/ESA/SER.A/426). https://population.un.org/wpp/
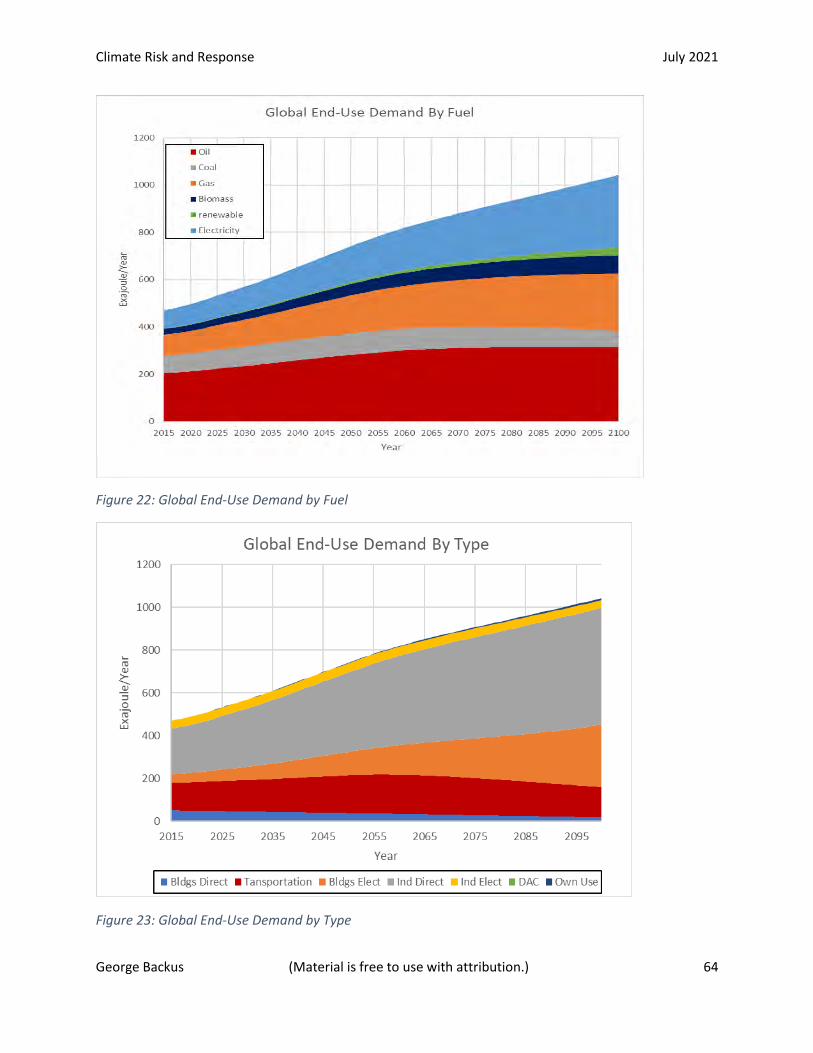
Climate Risk and Response July 2021
George Backus (Material is free to use with attribution.) 64
Figure 22: Global End-Use Demand by Fuel
Figure 23: Global End-Use Demand by Type

Climate Risk and Response July 2021
George Backus (Material is free to use with attribution.) 65
Figure 24: Global Generation Capacity
Figure 25: Global Generation by Source
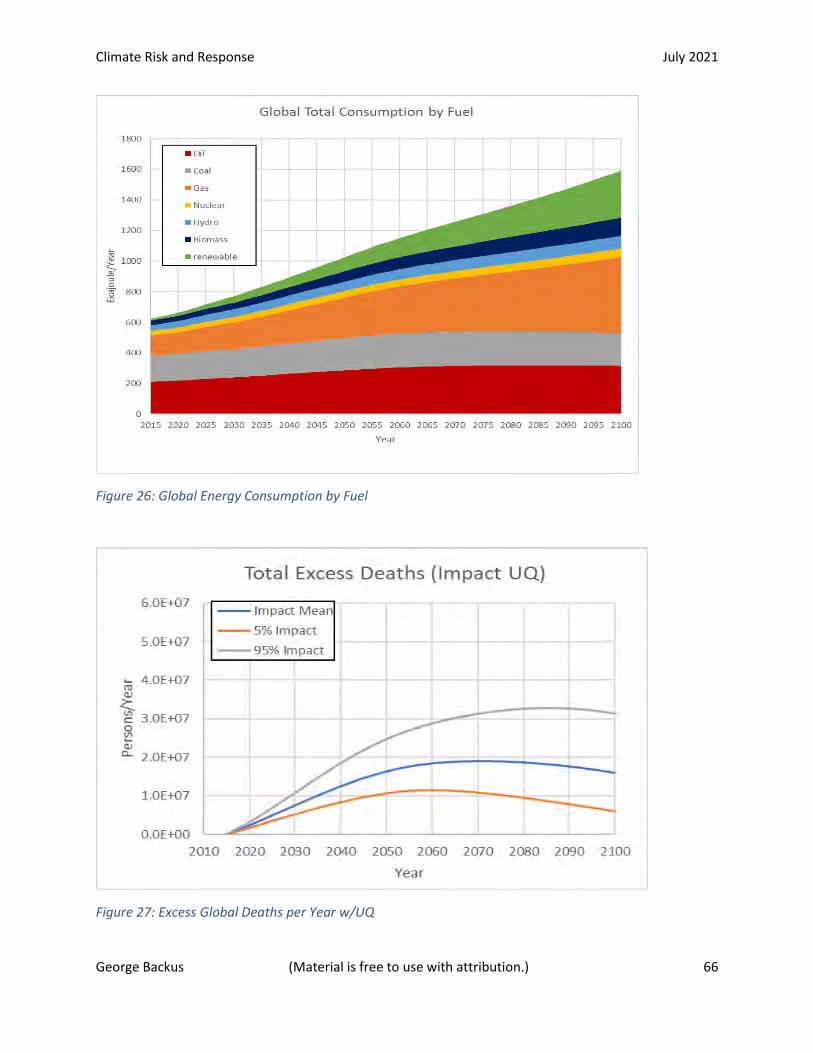
Climate Risk and Response July 2021
George Backus (Material is free to use with attribution.) 66
Figure 26: Global Energy Consumption by Fuel
Figure 27: Excess Global Deaths per Year w/UQ
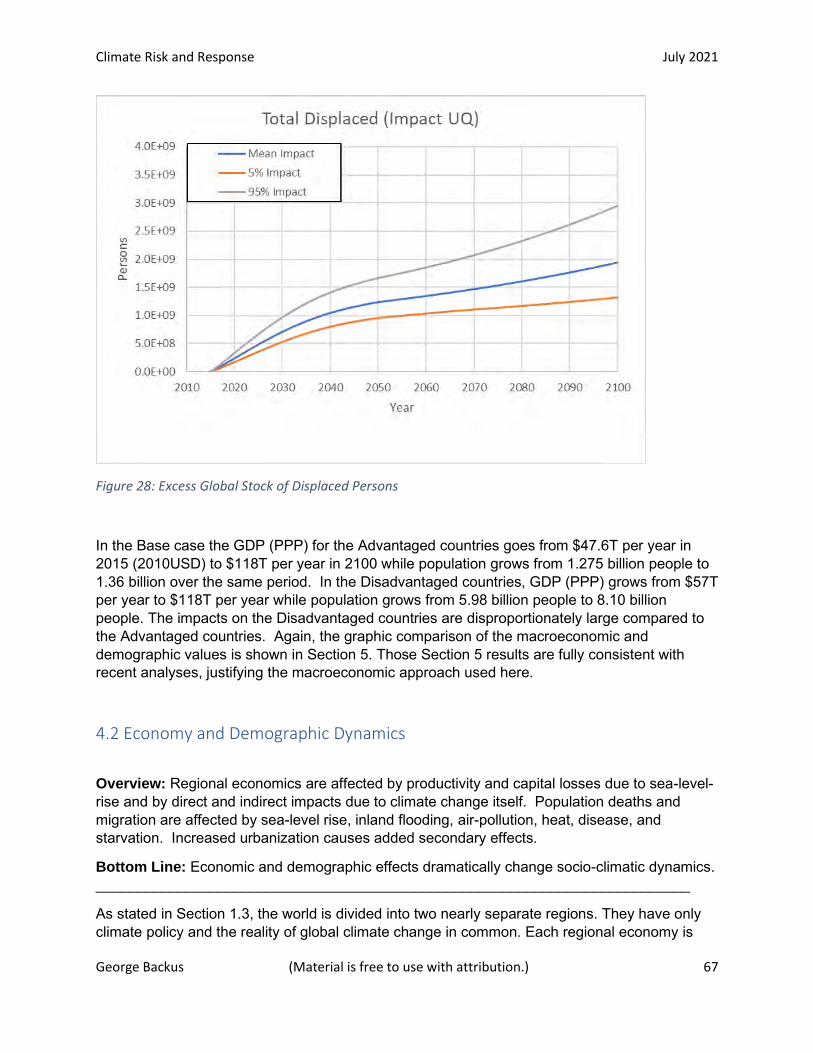
Climate Risk and Response July 2021
George Backus (Material is free to use with attribution.) 67
Figure 28: Excess Global Stock of Displaced Persons
In the Base case the GDP (PPP) for the Advantaged countries goes from $47.6T per year in 2015 (2010USD) to $118T per year in 2100 while population grows from 1.275 billion people to 1.36 billion over the same period. In the Disadvantaged countries, GDP (PPP) grows from $57T per year to $118T per year while population grows from 5.98 billion people to 8.10 billion people. The impacts on the Disadvantaged countries are disproportionately large compared to the Advantaged countries. Again, the graphic comparison of the macroeconomic and demographic values is shown in Section 5. Those Section 5 results are fully consistent with recent analyses, justifying the macroeconomic approach used here.
4.2 Economy and Demographic Dynamics
Overview: Regional economics are affected by productivity and capital losses due to sea-level-rise and by direct and indirect impacts due to climate change itself. Population deaths and migration are affected by sea-level rise, inland flooding, air-pollution, heat, disease, and starvation. Increased urbanization causes added secondary effects.
Bottom Line: Economic and demographic effects dramatically change socio-climatic dynamics. _________________________________________________________________________
As stated in Section 1.3, the world is divided into two nearly separate regions. They have only climate policy and the reality of global climate change in common. Each regional economy is
Climate Risk and Response July 2021
George Backus (Material is free to use with attribution.) 68
simply represented by a GDP changing with population and productivity. Climate affects population through deaths and economic productivity through the direct and indirect impact on economic activity. The non-sea-level-rise (SLR) impact on economies is based on the work of Burke305,306 and Kulkuhl.307,xxxiii The sea-level risk impact that Burke excluded is based on the work of Jevrejeva.308 The model simulates SLR based on recent studies and their uncertainty.309,310 New concerns indicate that even with the large uncertainty included, the impacts of coastal and inland flooding are understated.311,312,313,314 Populations are affected by a host of climate-induced risks.315 Human well-being and macroeconomic impacts are simulated
305 Burke, M., Hsiang, S.M. and Miguel, E., 2015. Global non-linear effect of temperature on economic production. Nature, 527(7577), pp.235-239. https://web.stanford.edu/~mburke/climate/BurkeHsiangMiguel2015.pdf 306 Burke, M., Davis, W.M. and Diffenbaugh, N.S., 2018. Large potential reduction in economic damages under UN mitigation targets. Nature, 557(7706), pp.549-553. https://web.stanford.edu/~mburke/papers/BurkeDavisDiffenbaugh2018.pdf 307 Kalkuhl, M. and Wenz, L., 2020. The impact of climate conditions on economic production. Evidence from a global panel of regions. Journal of Environmental Economics and Management, 103, p.102360. https://www.sciencedirect.com/science/article/pii/S0095069620300838/pdfft?md5=31d87dd955151483c5ae25476056ef4f&pid=1-s2.0-S0095069620300838-main.pdf 308 Jevrejeva, S., Jackson, L.P., Grinsted, A., Lincke, D. and Marzeion, B., 2018. Flood damage costs under the sea level rise with warming of 1.5 C and 2 C. Environmental Research Letters, 13(7), p.074014. https://iopscience.iop.org/article/10.1088/1748-9326/aacc76/pdf 309 Kulp, S.A. and Strauss, B.H., 2019. New elevation data triple estimates of global vulnerability to sea-level rise and coastal flooding. Nature communications, 10(1), pp.1-12. https://www.nature.com/articles/s41467-019-12808-z.pdf 310 Kirezci, E., Young, I.R., Ranasinghe, R., Muis, S., Nicholls, R.J., Lincke, D. and Hinkel, J., 2020. Projections of global-scale extreme sea levels and resulting episodic coastal flooding over the 21st Century. Scientific reports, 10(1), pp.1-12. https://www.nature.com/articles/s41598-020-67736-6.pdf 311 Three times more people at risk from yearly coastal flooding than previously thought https://phys.org/news/2019-10-people-yearly-coastal-previously-thought.html 312 Taherkhani, M., Vitousek, S., Barnard, P.L., Frazer, N., Anderson, T.R. and Fletcher, C.H., 2020. Sea-level rise exponentially increases coastal flood frequency. Scientific reports, 10(1), pp.1-17. https://www.nature.com/articles/s41598-020-62188-4.pdf 313 Siegert, M., Alley, R.B., Rignot, E., Englander, J. and Corell, R., 2020. Twenty-first century sea-level rise could exceed IPCC projections for strong-warming futures. One Earth, 3(6), pp.691-703. https://www.researchgate.net/profile/Martin-Siegert/publication/347464638_Twenty-first_century_sea-level_rise_could_exceed_IPCC_projections_for_strong-warming_futures/links/5ff85428a6fdccdcb83be1e2/Twenty-first-century-sea-level-rise-could-exceed-IPCC-projections-for-strong-warming-futures.pdf?_sg%5B0%5D=7mqFMbyGaTuQvqo1HaJXhchH0dFRTtgl68znEQfw-E3FTnCeA21qwF1u8b3N2upAFQpU6WvQ54e43_tfrT0Few.dHYD9uplfEoib_rbNBq7zp6-CoA66ygI5wcBU7g6Un01MZ_heL-BwPPSBJTwZT3lDJovsx4yj3ZYGc3gLljRYg&_sg%5B1%5D=fWrGHf2vlTRhRfyiJtTyEzQdiMyXKi528TBFuHazM_GogJCD-v-Ntl-eFRMGvwQIzuLE76rhyznwYhlbZruLAlle60_0i7nHwtBKnrHudIN5.dHYD9uplfEoib_rbNBq7zp6-CoA66ygI5wcBU7g6Un01MZ_heL-BwPPSBJTwZT3lDJovsx4yj3ZYGc3gLljRYg&_iepl= 314 Rao, M.P., Cook, E.R., Cook, B.I., D’Arrigo, R.D., Palmer, J.G., Lall, U., Woodhouse, C.A., Buckley, B.M., Uriarte, M., Bishop, D.A. and Jian, J., 2020. Seven centuries of reconstructed Brahmaputra River discharge demonstrate underestimated high discharge and flood hazard frequency. Nature communications, 11(1), pp.1-10. https://www.nature.com/articles/s41467-020-19795-6.pdf 315 Mora, C., Dousset, B., Caldwell, I.R., Powell, F.E., Geronimo, R.C., Bielecki, C.R., Counsell, C.W., Dietrich, B.S., Johnston, E.T., Louis, L.V. and Lucas, M.P., 2017. Global risk of deadly heat. Nature climate change, 7(7), pp.501-506. https://www.researchgate.net/profile/Farrah-Powell/publication/318173438_Global_risk_of_deadly_heat/links/59d34762a6fdcc181ad908dd/Global-risk-of-
Climate Risk and Response July 2021
George Backus (Material is free to use with attribution.) 69
with differential or algebraic equations that are curve fits of the data and associated dynamics presented in the noted studies. In the absence of feedback, the AR5 provides comparable results.xxxiv Many of the human-welfare impacts will be compound events.316,317 The economic impacts shown in Section 5 are compatible with the recent Swiss Re study,318 but are slightly larger due to the added consideration of deaths in this work. The economic impacts are not as large as those estimated in the Moody’s study319 because that study applied the Burke impact as an algebraic approximation rather than a differential equation one.
Impact calculations reference the historical deaths,320,321,322 displacement migration,323,324,325 and urbanization.326 The calculations increase deaths and migration in proportion to the increasing risks (or number of individuals affected) that the referenced studies establish as a function of climate change defined by the GSAT.
Many of the studies determine the increased risk (R) of death or migration rather than the actual or the fraction of the population-at-risk (FAR) number of deaths. For any region at any time, the number (N) of deaths or the amount of migration is conceptually calibrated as:
deadly-heat.pdf?_sg%5B0%5D=29VRZVhGTuTapWvfvU2A5RAlbPmTdH_v6n0LdNKzKpuzMwZhdpc8pofumpsD55tr9yJ2WElt5AY6g0WAENkcEQ.gBjzWGEmqohwjVKBusXXz0ulvMZuyt61SGj3U6aeQUnAKNYrL9u70GAeUoRecoHiPuihFfrrufqhbFsdNmeAUw&_sg%5B1%5D=7NnsFMpcPoTYXgw34yLiYcGG4iSdW8M5SnW2yGal1qTpMrec0nZUc66Yqc8ixE3Ai1vByjrYWlkQXMmQ4c6p81qXA4S82KjUNQMZp4ewciR5.gBjzWGEmqohwjVKBusXXz0ulvMZuyt61SGj3U6aeQUnAKNYrL9u70GAeUoRecoHiPuihFfrrufqhbFsdNmeAUw&_iepl= 316 Zscheischler, J., Westra, S., Van Den Hurk, B.J., Seneviratne, S.I., Ward, P.J., Pitman, A., AghaKouchak, A., Bresch, D.N., Leonard, M., Wahl, T. and Zhang, X., 2018. Future climate risk from compound events. Nature Climate Change, 8(6), pp.469-477. https://research.vu.nl/ws/files/120150277/Future_climate_risk_from_compound_events.pdf 317 Reichstein, M., Riede, F. and Frank, D., 2021. More floods, fires and cyclones—plan for domino effects on sustainability goals. Nature, https://media.nature.com/original/magazine-assets/d41586-021-00927-x/d41586-021-00927-x.pdf 318 The economics of climate change: no action not an option, Swiss Re, 2021, https://www.swissre.com/dam/jcr:e73ee7c3-7f83-4c17-a2b8-8ef23a8d3312/swiss-re-institute-expertise-publication-economics-of-climate-change.pdf 319 The Economic Implications of Climate Change by Chris Lafakis, Laura Ratz, Emily Fazio, Maria Cosma. Moody’s Analytics June 2019 https://www.moodysanalytics.com/-/media/article/2019/economic-implications-of-climate-change.pdf 320 Global Health Data Exchange http://ghdx.healthdata.org/gbd-results-tool 321 International Disaster Database https://www.emdat.be/database 322 https://www.theworldcounts.com/challenges/people-and-poverty/hunger-and-obesity/how-many-people-die-from-hunger-each-year/story 323 Global Report On Internal Displacement 2018, Internal Displacement Monitoring Centre, Switzwerland. https://www.internal-displacement.org/global-report/grid2018/downloads/2018-GRID.pdf 324 UNHCR Data, UNHCR, the UN Refugee Agency, https://www.unhcr.org/en-us/data.html 325 Feng, S., Krueger, A.B. and Oppenheimer, M., 2010. Linkages among climate change, crop yields and Mexico–US cross-border migration. Proceedings of the national academy of sciences, 107(32), pp.14257-14262. https://www.pnas.org/content/pnas/107/32/14257.full.pdf 326 United Nations, Department of Economic and Social Affairs, Population Division (2019). World Urbanization Prospects: The 2018 Revision (ST/ESA/SER.A/420). New York: United Nations. https://population.un.org/wup/Publications/Files/WUP2018-Report.pdf and https://population.un.org/wup/

Climate Risk and Response July 2021
George Backus (Material is free to use with attribution.) 70
𝑁 = 𝑁0 ∗𝑅
𝑅0− 𝑁0 Equation 1
Or
𝑁 = 𝑁0 ∗𝐹𝐴𝑅
𝐹𝐴𝑅0− 𝑁0 Equation 2
The N0 is the number of deaths or amount of migration that would occur in the absence of climate change.xxxv
The “N” is only the added or excess amount that is solely associated with climate change. The causes of death327 that the model simulates are heat, 328,329,330,331
327 World Health Organization. "Quantitative risk assessment of the effects of climate change on selected causes of death, 2030s and 2050s." (2014). https://apps.who.int/iris/bitstream/handle/10665/134014/9789241507691_eng.pdf 328 Xu, C., Kohler, T.A., Lenton, T.M., Svenning, J.C. and Scheffer, M., 2020. Future of the human climate niche. Proceedings of the National Academy of Sciences, 117(21), pp.11350-11355. https://www.pnas.org/content/pnas/117/21/11350.full.pdf 329 Coffel, E.D., Horton, R.M. and de Sherbinin, A., 2017. Temperature and humidity based projections of a rapid rise in global heat stress exposure during the 21st century. Environmental Research Letters, 13(1), p.014001. https://iopscience.iop.org/article/10.1088/1748-9326/aaa00e/pdf 330 Carleton, T.A., Jina, A., Delgado, M.T., Greenstone, M., Houser, T., Hsiang, S.M., Hultgren, A., Kopp, R.E., McCusker, K.E., Nath, I.B. and Rising, J., 2020. Valuing the global mortality consequences of climate change accounting for adaptation costs and benefits (No. w27599). National Bureau of Economic Research. http://www.impactlab.org/wp-content/uploads/2020/08/CIL_NBER_MortalityPaper_3Aug2020.pdf 331 Vicedo-Cabrera, A.M., Scovronick, N., Sera, F., Royé, D., Schneider, R., Tobias, A., Astrom, C., Guo, Y., Honda, Y., Hondula, D.M. and Abrutzky, R., 2021. The burden of heat-related mortality attributable to recent human-induced climate change. Nature climate change, 11(6), pp.492-500. https://boris.unibe.ch/156585/
Climate Risk and Response July 2021
George Backus (Material is free to use with attribution.) 71
pollution,332,333 inland-flooding,xxxvi conflict,334,335,336,337 disease,338,339,340,341,xxxvii and starvation.342,343,xxxviii
332 Cohen, A.J., Brauer, M., Burnett, R., Anderson, H.R., Frostad, J., Estep, K., Balakrishnan, K., Brunekreef, B., Dandona, L., Dandona, R. and Feigin, V., 2017. Estimates and 25-year trends of the global burden of disease attributable to ambient air pollution: an analysis of data from the Global Burden of Diseases Study 2015. The Lancet, 389(10082), pp.1907-1918. https://www.thelancet.com/journals/lancet/article/PIIS0140-67361730505-6/fulltext 333 https://ourworldindata.org/grapher/absolute-number-of-deaths-from-outdoor-air-pollution 334 Hsiang, S.M., Burke, M. and Miguel, E., 2013. Quantifying the influence of climate on human conflict. Science, 341(6151). http://users.clas.ufl.edu/prwaylen/geo3280articles/Climate%20Change%20and%20Conflict.pdf 335 World Development Indicators, World Bank, Battle-related Deaths. https://datatopics.worldbank.org/world-development-indicators/#:~:text=The%20WDI%20helps%20data%20users,%2C%20regional%2C%20and%20global%20estimates. 336 Peace Research Institute Oslo, Battle Deaths Data https://www.prio.org/Data/Armed-Conflict/Battle-Deaths/ 337 Climate and Conflict, Marshall Burke, Solomon M. Hsiang, Edward Miguel Annual Review of Economics 2015 7:1, 577-617 https://www.annualreviews.org/doi/pdf/10.1146/annurev-economics-080614-115430 338 Ryan, S.J., Carlson, C.J., Mordecai, E.A. and Johnson, L.R., 2019. Global expansion and redistribution of Aedes-borne virus transmission risk with climate change. PLoS neglected tropical diseases, 13(3), p.e0007213. https://storage.googleapis.com/plos-corpus-prod/10.1371/journal.pntd.0007213/1/pntd.0007213.pdf?X-Goog-Algorithm=GOOG4-RSA-SHA256&X-Goog-Credential=wombat-sa%40plos-prod.iam.gserviceaccount.com%2F20210619%2Fauto%2Fstorage%2Fgoog4_request&X-Goog-Date=20210619T212521Z&X-Goog-Expires=86400&X-Goog-SignedHeaders=host&X-Goog-Signature=81bb96ed3e4c5395e7b992637395ad3a9f77c004a0a3da32f3d25a0658e36e04904b881ace7a36d90bd58774b1f61055fc9315846f222c589aa49fa1c9e9f03cf1d8e2ef59248d0d128ced58708c0065c5fc9e360f82de58bb24728afd115d62d8d799ba88e7ae2f1b4eaaf7cb8c7e58eb2c4fcd2542138e3311ff33cb80335031ffe6fb747776bf6c0a21ca5a91282ae9ef525e10ab19d071147f4c88ddc36bbe49b4d75bbcd9244b62069acb3fa4b0fed1bd3c93cbc46e076ab0311cd65e84c9b634735cd07660499f355b830d4e6c887d417234786f183ddab7b809d55c9b8cda35af1214f2afbc8dc4fb4de7f79b35ad1edb169158e54ac49c4ec12b191f 339 The 2019 report of The Lancet Countdown on health and climate change: ensuring that the health of a child born today is not defined by a changing climate Nick Watts, et al. 394:10211, P1836-1878, NOVEMBER 16, 2019 https://doi.org/10.1016/S0140-6736(19)32596-6 https://www.thelancet.com/journals/lancet/article/PIIS0140-6736(19)32596-6/fulltext 340 Special Report on Global Warming of 1.5°C (SR1.5). Intergovernmental Panel on Climate Change, 2018. https://www.ipcc.ch/sr15/ 341 IPCC, 2014: Climate Change 2014: Impacts, Adaptation, and Vulnerability. Part A: Global and Sectoral Aspects. Contribution of Working Group II to the Fifth Assessment Report of the Intergovernmental Panel on Climate Change [Field, C.B., V.R. Barros, D.J. Dokken, K.J. Mach, M.D. Mastrandrea, T.E. Bilir, M. Chatterjee, K.L. Ebi, Y.O. Estrada, R.C. Genova, B. Girma, E.S. Kissel, A.N. Levy, S. MacCracken, P.R. Mastrandrea, and L.L. White (eds.)]. Cambridge University Press, Cambridge, United Kingdom and New York, NY, USA, 1132 pp. https://www.ipcc.ch/report/ar5/wg2/ 342 Zhao, C., Liu, B., Piao, S., Wang, X., Lobell, D.B., Huang, Y., Huang, M., Yao, Y., Bassu, S., Ciais, P. and Durand, J.L., 2017. Temperature increase reduces global yields of major crops in four independent estimates. Proceedings of the National Academy of Sciences, 114(35), pp.9326-9331. https://www.pnas.org/content/pnas/114/35/9326.full.pdf?ftag=MSFd61514f 343 Springmann, M., Mason-D'Croz, D., Robinson, S., Garnett, T., Godfray, H.C.J., Gollin, D., Rayner, M., Ballon, P. and Scarborough, P., 2016. Global and regional health effects of future food production under climate change: a modelling study. The Lancet, 387(10031), pp.1937-1946. https://ora.ox.ac.uk/catalog/uuid:6cac6d6f-d5a2-4f45-9dbf-8ebf22ab7a9a/download_file?file_format=pdf&safe_filename=Global%2Band%2Bregional%2Bhealth%2Beffects%2Bof%2Bfuture%2Bfood%2Bproduction%2Bunder%2Bclimate%2Bchange2.pdf&type_of_work=Journal+article
Climate Risk and Response July 2021
George Backus (Material is free to use with attribution.) 72
Agricultural344,345 and aquaculture346,347 productivity will not be able to keep up with food demand.348,349,350 Climate change will reduce agricultural productivity351,352,353,354 and increase
344 Iizumi, T., Furuya, J., Shen, Z., Kim, W., Okada, M., Fujimori, S., Hasegawa, T. and Nishimori, M., 2017. Responses of crop yield growth to global temperature and socioeconomic changes. Scientific reports, 7(1), pp.1-10. https://www.nature.com/articles/s41598-017-08214-4.pdf 345 Schleussner, C.F., Lissner, T.K., Fischer, E.M., Wohland, J., Perrette, M., Golly, A., Rogelj, J., Childers, K., Schewe, J., Frieler, K. and Mengel, M., 2016. Differential climate impacts for policy-relevant limits to global warming: the case of 1.5 C and 2 C. Earth system dynamics, 7(2), pp.327-351. https://esd.copernicus.org/articles/7/327/2016/esd-7-327-2016.pdf 346 Lam, V.W., Allison, E.H., Bell, J.D., Blythe, J., Cheung, W.W., Frölicher, T.L., Gasalla, M.A. and Sumaila, U.R., 2020. Climate change, tropical fisheries and prospects for sustainable development. Nature Reviews Earth & Environment, 1(9), pp.440-454. http://labpesq.io.usp.br/images/publicacoes/_Lam_et_al_2020.pdf 347 Lotze, H.K., Tittensor, D.P., Bryndum-Buchholz, A., Eddy, T.D., Cheung, W.W., Galbraith, E.D., Barange, M., Barrier, N., Bianchi, D., Blanchard, J.L. and Bopp, L., 2019. Global ensemble projections reveal trophic amplification of ocean biomass declines with climate change. Proceedings of the National Academy of Sciences, 116(26), pp.12907-12912. https://www.pnas.org/content/pnas/116/26/12907.full.pdf 348 Arora, N.K. Impact of climate change on agriculture production and its sustainable solutions. Environmental Sustainability 2, 95–96 (2019). https://doi.org/10.1007/s42398-019-00078-w https://link.springer.com/content/pdf/10.1007/s42398-019-00078-w.pdf 349 https://globalagriculturalproductivity.org/wp-content/uploads/2019/01/GHI_2018-GAP-Report_FINAL-10.03.pdf 350 World Health Organization, 2020. The state of food security and nutrition in the world 2020: transforming food systems for affordable healthy diets (Vol. 2020). Food & Agriculture Org.. http://www.fao.org/3/ca9692en/ca9692en.pdf 351 Kummu, M., Heino, M., Taka, M., Varis, O. and Viviroli, D., 2021. Climate change risks pushing one-third of global food production outside the safe climatic space. One Earth, 4(5), pp.720-729. https://www.sciencedirect.com/science/article/pii/S2590332221002360/pdfft?md5=bea084bd1260d42d34c379ce565896ee&pid=1-s2.0-S2590332221002360-main.pdf and Third of global food production at risk from climate crisis https://www.theguardian.com/environment/2021/may/14/third-of-global-food-production-at-risk-from-climate-crisis 352 Ortiz-Bobea, A., Ault, T.R., Carrillo, C.M., Chambers, R.G. and Lobell, D.B., 2021. Anthropogenic climate change has slowed global agricultural productivity growth. Nature Climate Change, 11(4), pp.306-312. https://arxiv.org/ftp/arxiv/papers/2007/2007.10415.pdf 353 Seven Years of Agricultural Productivity Growth Lost Due to Climate Change https://woods.stanford.edu/news/seven-years-agricultural-productivity-growth-lost-due-climate-change 354 US corn and soybean maladapted to climate variations https://www.sciencedaily.com/releases/2021/07/210716112519.htm
Climate Risk and Response July 2021
George Backus (Material is free to use with attribution.) 73
agricultural disasters.355,356,357 Heat will make many areas uninhabitable.358,359,360,361,362 Conflict is mitigated by increases in GDPPC.363 Improvement in GDPPC also allows improved resilience responses that reduce flooding impacts364 and reduce heat deaths through electric air conditioning and non-electric solutions to added heat loads.365 (See Section 4.3) The model simulates migration stocks,366 exodus, and return flows367,368,369 due to heat,370,371 inland
355 Intruder Pests May Drain Trillions From Africa’s Economies, Study Finds https://www.nytimes.com/2021/05/19/climate/africa-agriculture-invasive-species.html 356 Climate change is remaking South Asia’s monsoon https://www.economist.com/asia/2021/06/19/climate-change-is-remaking-south-asias-monsoon 357 Shi, Z., Huang, H., Wu, Y., Chiu, Y.H. and Qin, S., 2020. Climate change impacts on agricultural production and crop disaster area in China. International Journal of Environmental Research and Public Health, 17(13), p.4792. https://www.mdpi.com/1660-4601/17/13/4792/pdf 358 Climate change: More than 3bn could live in extreme heat by 2070 https://www.bbc.com/news/science-environment-52543589 359 Global Warming’s Deadly Combination: Heat and Humidity https://www.nytimes.com/2021/03/08/climate/climate-change-heat-tropics.html 360 Zhang, Y., Held, I. and Fueglistaler, S., 2021. Projections of tropical heat stress constrained by atmospheric dynamics. Nature Geoscience, 14(3), pp.133-137. https://meetingorganizer.copernicus.org/EGU21/EGU21-1587.html?pdf 361 Saeed, F., Schleussner, C.F. and Ashfaq, M., 2021. Deadly heat stress to become commonplace across South Asia already at 1.5 C of global warming. Geophysical Research Letters, 48(7), p.e2020GL091191. https://agupubs.onlinelibrary.wiley.com/doi/pdfdirect/10.1029/2020GL091191 362 Zittis, G., Hadjinicolaou, P., Almazroui, M., Bucchignani, E., Driouech, F., El Rhaz, K., Kurnaz, L., Nikulin, G., Ntoumos, A., Ozturk, T. and Proestos, Y., 2021. Business-as-usual will lead to super and ultra-extreme heatwaves in the Middle East and North Africa. npj Climate and Atmospheric Science, 4(1), pp.1-9. https://www.nature.com/articles/s41612-021-00178-7.pdf 363 Humphreys, M., 2003. Economics and violent conflict. Cambridge, MA. https://www.condevcenter.org/Portals/0/22.pdf 364 Kellenberg, D.K. and Mobarak, A.M., 2008. Does rising income increase or decrease damage risk from natural disasters?. Journal of urban economics, 63(3), pp.788-802. https://spinup-000d1a-wp-offload-media.s3.amazonaws.com/faculty/wp-content/uploads/sites/45/2019/06/rising-income.pdf 365 Rapson, D., 2014. Durable goods and long-run electricity demand: Evidence from air conditioner purchase behavior. Journal of Environmental Economics and Management, 68(1), pp.141-160. https://www.researchgate.net/profile/Robert_Margo/publication/267791826_Durable_Goods_and_Long-Run_Electricity_Demand_Evidence_from_Air_Conditioner_Purchase_Behavior/links/568bc7aa08ae8f6ec7522e96.pdf 366 2018 Global Agricultural Productivity Report, Global Harvest Initiative, Washington, D.C., October 2018 https://migrationdataportal.org/data?i=stock_abs_&t=2019 367 Global Trends: Forced Displacement in 2018, UNHCR, the UN Refugee Agency, https://www.unhcr.org/5d08d7ee7.pdf 368 Global Report On Internal Displacement; GRID 2018, Internal Displacement Monitoring Centre, Switzerland. https://www.internal-displacement.org/global-report/grid2018/downloads/2018-GRID.pdf 369 Global Trends: Forced Displacement in 2015, UNHCR, the UN Refugee Agency, https://www.unhcr.org/576408cd7.pdf 370 https://migrationdataportal.org/data?i=stock_abs_&t=2020 371 Xu, C., Kohler, T.A., Lenton, T.M., Svenning, J.C. and Scheffer, M., 2020. Future of the human climate niche. Proceedings of the National Academy of Sciences, 117(21), pp.11350-11355. https://www.pnas.org/content/pnas/117/21/11350.full.pdf

Climate Risk and Response July 2021
George Backus (Material is free to use with attribution.) 74
flooding,372,373,374 SLR flooding,375 and conflict.376,377 The simulation of SLR flooding includes some limited resilience activity378,379 (e.g., sea walls380,xxxix), but adaptation to most environmental and climatic changes thus far is minimal or nonexistent381,382,383,xl
When migration is due to a disaster, such as flooding or conflict, a large percentage of migrants eventually return to their homes afterwards.384,385 Given the extremely large estimated migration flows (See Section 5), it is assumed that the Advantaged countries can at best only allow a
372 Kam, P.M., Aznar-Siguan, G., Schewe, J., Milano, L., Ginnetti, J., Willner, S., McCaughey, J.W. and Bresch, D.N., 2021. Global warming and population change both heighten future risk of human displacement due to river floods. Environmental Research Letters, 16(4), p.044026. https://iopscience.iop.org/article/10.1088/1748-9326/abd26c/pdf 373 Assessing the impacts of climate change on flood displacement risk (2019) Internal Displacement Monitoring Center, Switzerland. https://www.internal-displacement.org/publications/assessing-the-impacts-of-climate-change-on-flood-displacement-risk 374 Kam, P.M., Aznar-Siguan, G., Schewe, J., Milano, L., Ginnetti, J., Willner, S., McCaughey, J.W. and Bresch, D.N., 2021. Global warming and population change both heighten future risk of human displacement due to river floods. Environmental Research Letters, 16(4), p.044026. https://iopscience.iop.org/article/10.1088/1748-9326/abd26c/pdf 375 Kulp, S.A. and Strauss, B.H., 2019. New elevation data triple estimates of global vulnerability to sea-level rise and coastal flooding. Nature communications, 10(1), pp.1-12. https://www.nature.com/articles/s41467-019-12808-z.pdf 376 Global Trends: Forced Displacement in 2015, UNHCR, the UN Refugee Agency, https://www.unhcr.org/576408cd7.pdf 377 Global Report On Internal Displacement; GRID 2018, Internal Displacement Monitoring Centre, Switzerland. https://www.internal-displacement.org/global-report/grid2018/downloads/2018-GRID.pdf 378 Hinkel, J., Aerts, J. C. J. H., Brown, S., Jiménez, J. A., Lincke, D., Nicholls, R. J., Scussolini, P., Sanchez-Arcilla, A., Vafeidis, A., & Addo, K. A. (2018). The ability of societies to adapt to twenty-first-century sea-level rise. Nature Climate Change, 8(7), 570-578. https://doi.org/10.1038/s41558-018-0176-z https://research.vu.nl/ws/files/105033827/The_ability_of_societies_to_adapt_to_twentyfirstcentury_sealevel_rise.pdf 379 One in four cities cannot afford climate crisis protection measures – study https://www.theguardian.com/environment/2021/may/12/one-in-four-cities-cannot-afford-climate-crisis-protection-measures-study 380 Oppenheimer, M., B.C. Glavovic , J. Hinkel, R. van de Wal, A.K. Magnan, A. Abd-Elgawad, R. Cai, M. Cifuentes-Jara, R.M. DeConto, T. Ghosh, J. Hay, F. Isla, B. Marzeion, B. Meyssignac, and Z. Sebesvari, 2019: Sea Level Rise and Implications for Low-Lying Islands, Coasts and Communities. In: IPCC Special Report on the Ocean and Cryosphere in a Changing Climate [H.-O. Pörtner, D.C. Roberts, V. Masson-Delmotte, P. Zhai, M. Tignor, E. Poloczanska, K. Mintenbeck, A. Alegría, M. Nicolai, A. Okem, J. Petzold, B. Rama, N.M. Weyer (eds.)]. UN IPCC. https://www.ipcc.ch/site/assets/uploads/sites/3/2019/11/08_SROCC_Ch04_FINAL.pdf 381 Burke, M. and Emerick, K., 2016. Adaptation to climate change: Evidence from US agriculture. American Economic Journal: Economic Policy, 8(3), pp.106-40. https://web.stanford.edu/~mburke/papers/Burke_Emerick_2015.pdf 382 We’re Not Ready for the Next Big Climate Disasters https://www.nytimes.com/2021/05/14/opinion/climate-disasters.html 383 United Nations Environment Programme (2021). Adaptation Gap Report 2020. Nairobi. https://wedocs.unep.org/xmlui/bitstream/handle/20.500.11822/34747/AGR20_An.pdf?sequence=3&isAllowed=y 384 Migration Data Portal https://migrationdataportal.org/data?i=flows_abs_immig1&t=2013 385 The International Disasters Database, Centre for Research on the Epidemiology of Disasters, https://www.emdat.be/
Climate Risk and Response July 2021
George Backus (Material is free to use with attribution.) 75
negligible fraction of the Disadvantaged population to migrate into their areas. Further, Advantaged countries will have to devote significant amounts of money to prevent or limit migration. These costs are not included.
Almost 80% of migration is from rural areas to urban areas.386,387,388 Urban areas are typically coastal and thus migration increases the population affected by SLR.389 Pollution is greater in urban areas and therefore urban migration also increases the air-pollution (from fossil fuel use) death rate. Additionally, urban residence requires more energy390 than in rural environments,391,392 which makes the GHG transition more demanding. There are obviously many non-fatal impacts due to climate conditions and events. These are not estimated, but are implicitly included in the estimate of economic impacts.
The forecast from the IEA and EIA only go out to the year 2050. The post 2050 forecast uses the UN population forecast for the Referent growth rates over the subsequent years.393,xli Productivity growth rates asymptotically use the long-term value noted by Gordon394,395 to extend the macroeconomic forecasts. The long-term productivity growth rate values are 1.3%/year for the Advantaged countries and 0.6 %/year for Disadvantaged countries by the year 2100. Gordon396 argues that innovations which radically change productivity have reached a point of diminishing returns and that Disadvantaged countries cannot achieve the education or physical infrastructure required for the impoverished populations to uniformly take advantage of
386 UNHCR2018 Global Trends Forced Displacement In 2018, the UN Refugee Agency, New York. https://www.unhcr.org/globaltrends2018/ 387 IOM 2020 World Migration Report 2020, International Organization for Migration, Geneva. www.iom.int/wmr 388 Mercandalli S., Losch B. (eds.), Belebema M.N., Bélières J.-F., Bourgeois R., Dinbabo M.F., Fréguin-Gresh S., Mensah C., Nshimbi C.C. 2019. Migration in sub−Saharan Africa: Patterns, drivers and relation to structural transformation. Rome, FAO and CIRAD. http://www.fao.org/documents/card/en/c/ca7404en 389 Geisler, C. and Currens, B., 2017. Impediments to inland resettlement under conditions of accelerated sea level rise. Land Use Policy, 66, pp.322-330. https://isiarticles.com/bundles/Article/pre/pdf/95420.pdf 390 Urbanization and rising energy consumption https://www.reuters.com/article/us-global-energy-kemp-column-idUSKBN1XN239 391 Zhang, H. and Lahr, M.L., 2018. Households’ energy consumption change in China: A multi-regional perspective. Sustainability, 10(7), p.2486. https://www.mdpi.com/2071-1050/10/7/2486/pdf 392 Dong, F., Yu, B., Hua, Y., Zhang, S. and Wang, Y., 2018. A Comparative Analysis of Residential Energy Consumption in Urban and Rural China: Determinants and Regional Disparities. International journal of environmental research and public health, 15(11), p.2507. https://www.mdpi.com/1660-4601/15/11/2507/pdf 393 United Nations, Department of Economic and Social Affairs, Population Division (2019). World Population Prospects 2019, Volume I: Comprehensive Tables (ST/ESA/SER.A/426). https://population.un.org/wpp/ 394 Gordon, R.J., 2012. Is US economic growth over? Faltering innovation confronts the six headwinds (No. w18315). National Bureau of Economic Research. https://www.nber.org/system/files/working_papers/w18315/w18315.pdf 395 Gordon, R.J., 2014. The demise of US economic growth: restatement, rebuttal, and reflections (No. w19895). National Bureau of Economic Research. https://www.nber.org/system/files/working_papers/w19895/w19895.pdf 396 Gordon, R.J., 2016. The rise and fall of American growth. Princeton University Press.

Climate Risk and Response July 2021
George Backus (Material is free to use with attribution.) 76
niche, high-growth, high-tech advance.397,398,399 Harari400401 argues that the innovation of artificial intelligence will remove the need for cheap labor and thus shut the door on future industrialization402,403 beyond those countries that have already achieved it.404 The pandemic has made the challenges of growth yet more problematic.405 As noted in Sections 5 and 6, the impacts of climate change are significant enough to prevent even China from reaching sustained industrialization.406,407
The estimated economic losses due to climate are less than those of other “high-end-impact” studies.408,409
397 Engel, Jakob, Deeksha Kokas, Gladys Lopez-Acevedo, and Maryla Maliszewska. 2021. The Distributional Impacts of Trade: Empirical Innovations, Analytical Tools, and Policy Responses. Trade and Development. Washington, DC: World Bank. doi: 10.1596/978-1-4648-1704-5. https://openknowledge.worldbank.org/handle/10986/35552 398 Global Competitiveness Report Special Edition 2020: How Countries are Performing on the Road to Recovery. World Economic Forum, 2020, http://www3.weforum.org/docs/WEF_TheGlobalCompetitivenessReport2020.pdf 399 The Future of Jobs Report 2020. World Economic Forum, 2020, http://www3.weforum.org/docs/WEF_Future_of_Jobs_2020.pdf 400 The rise of the useless class https://ideas.ted.com/the-rise-of-the-useless-class/ 401 Harari, Y.N., 2016. Homo Deus: A brief history of tomorrow. Random House; and Harari, Y.N., 2014. Sapiens: A brief history of humankind. Random House. 402 Global Futures: Demographic & Economic Divergence, Global Futures Series, Sandia National Laboratories, NM. 2015 https://www.osti.gov/servlets/purl/1365006 403 World Bank. 2021.: Human Capital in the Time of COVID-19. Washington, DC: World Bank. doi:10.1596/978-1-4648-1552-2. https://openknowledge.worldbank.org/bitstream/handle/10986/34432/9781464815522.pdf?sequence=4&isAllowed=y 404 When Will China Rule the World? Maybe Never https://www.bloomberg.com/news/features/2021-07-05/when-will-china-s-economy-beat-the-u-s-to-become-no-1-why-it-may-never-happen 405 Africa’s recovery from covid-19 will be slow. The Economist. https://www.economist.com/middle-east-and-africa/2021/02/06/africas-recovery-from-covid-19-will-be-slow 406 China’s sea-level rise raises threat to economic hubs to extreme https://www.ft.com/content/4dd9860b-664e-4ca0-86a4-5a935d2a22f1 407 Global Futures: Demographic & Economic Divergence, Global Futures Series, Sandia National Laboratories, NM. 2015 https://www.osti.gov/servlets/purl/1365006 408 The Economic Implications of Climate Change by Chris Lafakis, Laura Ratz, Emily Fazio, Maria Cosma. Moody’s Analytics June 2019 https://www.moodysanalytics.com/-/media/article/2019/economic-implications-of-climate-change.pdf 409 Roson, Roberto and Sartori, Martina, Estimation of Climate Change Damage Functions for 140 Regions in the Gtap9 Database (June 23, 2016). World Bank Policy Research Working Paper No. 7728, Available at SSRN: https://ssrn.com/abstract=2811376
Climate Risk and Response July 2021
George Backus (Material is free to use with attribution.) 77
4.3 Energy Supply and Demand
Overview: The model supply and demand sectors consider a wide variety of dynamics that capture the relevant feedback processes, match the referent forecast, and ensure the self-consistent outcomes from policy dynamics. To aid in the understanding of results, this section discusses each aspect of the energy simulation.
Bottom Line: The inability to fully synchronize demand and supply dynamics will lead to a GHG transition that is far different than conventional expectations. _________________________________________________________________________
Energy supply and demand is calibrated to exactly match the Referent case. Surprisingly, the calibration does not require parameters that jump from year to year. 98% of the calculated parameters are constants throughout the simulation timeframe 2015 to 2100, while the others change monotonically and smoothly to an asymptotic value occurring by 2040.
Energy supply and demand simulations are based on methods used for U.S. and international energy policy410 and which successfully reproduce the 1950 through 2000 conditions.411,412,413 The energy model is a simplified variant of those models built for the purposes here. The model here was historically tested and verified using a year 2000 start date. Historical validation is not a characteristic (or capability) of optimization analyses. If a model cannot even reproduce the historical dynamics, (without fudging) how can there be any confidence it can adequately portray future dynamics?
The energy demand comes from the use of capital stocks, as does the supply of energy. These stocks increase with investment and decline with retirement. They have qualities such as efficiency, capital costs, energy requirements, and lifetimes. The stocks cannot change quickly and the retirements from the stock occurs stochastically rather that discretely.414,415,416,417,418
410 Naill, R.F. and Backus, G.A., 1977. Evaluating the national energy plan. Technol. Rev.;(United States), 79(8). 411 Radzicki, M.J. and Taylor, R.A., 1997. Introduction to system dynamics. A Systems Approach to Understanding Complex Policy Issues, US Department of Energy’s. https://web.nmsu.edu/~lang/files/mike.pdf 412 National Research Council, 1992. The national energy modeling system. National Academies Press. https://www.nap.edu/cart/download.cgi?record_id=1997 413 Backus, G. and Amlin, J., 2009. A history of making energy policy. In The 27th International Conference of the System Dynamics Society. Albuquerque, New Mexico: System Dynamics Society. https://proceedings.systemdynamics.org/2009/proceed/papers/P1377.pdf 414 Lutz, J.D., Hopkins, A., Letschert, V., Franco, V.H. and Sturges, A., 2011. Using national survey data to estimate lifetimes of residential appliances. HVAC&R Research, 17(5), pp.726-736. https://www.osti.gov/servlets/purl/1182737 415 Weymar, E., Finkbeiner, M. Statistical analysis of empirical lifetime mileage data for automotive LCA. Int J Life Cycle Assess 21, 215–223 (2016). https://doi.org/10.1007/s11367-015-1020-6 416 Zhou, W., Moncaster, A., Reiner, D.M. and Guthrie, P., 2019. Estimating lifetimes and stock turnover dynamics of urban residential buildings in China. Sustainability, 11(13), p.3720. https://link.springer.com/article/10.1007/s11367-015-1020-6 417 Erumban, A.A., 2008. Lifetimes of machinery and equipment: evidence from Dutch manufacturing. Review of Income and Wealth, 54(2), pp.237-268. http://roiw.org/2008/2008-11.pdf 418 Lu, S., 2006. Vehicle survivability and travel mileage schedules (No. HS-809 952). U.S. Department of Transportation, Washington, DC 20590 https://crashstats.nhtsa.dot.gov/Api/Public/ViewPublication/809952
Climate Risk and Response July 2021
George Backus (Material is free to use with attribution.) 78
With a discrete lifetime assumption, all capital of a given age retire after a specified number of years. In reality, a significant fraction of the investment in fossil fuel-using equipment made today will still be in service in the year 2050 (and beyond) unless forcibly retired.
4.3.1 Energy Demand Dynamics
Overview: Energy demand is based on capital stocks’ need for energy services. Changes in fuel shares and energy efficiency take time. Full electrification of the economy has many facets.
Bottom Line: The energy demand side of GHG transition takes longer than the energy supply transition. _________________________________________________________________________
Energy-use is the consequence of demanding an economic service requiring energy, such as heating, light, social media, and transportation. In the model, energy demand is a function of the GDP (at Market Exchange Rates - MER), the GDP (PPP) per capita, and technological conditions (efficiency).419
Model parametrization is different for Advantaged countries and the Disadvantaged countries, as well as for regional urban versus rural settings. Parameterization is also different for each end-use decision. End-use is categorized as 1) direct energy used in buildings for heat and cooling), 2) direct energy used in industry for process, heating and cooling, 3) electromechanical use in buildings for lights, computers, equipment, appliances, etc., 4) electromechanical use in industry for processes, motors, etc., and 5) transportation. Cooling requirements will increase dramatically with climate change.420, 421,422,423 In buildings, the cooling is mostly for people;424
419 Brockway, P.E., Sorrell, S., Semieniuk, G., Heun, M.K. and Court, V., 2021. Energy efficiency and economy-wide rebound effects: A review of the evidence and its implications. Renewable and Sustainable Energy Reviews, p.110781. https://www.sciencedirect.com/science/article/pii/S1364032121000769 420 Yalew, S.G., van Vliet, M.T., Gernaat, D.E., Ludwig, F., Miara, A., Park, C., Byers, E., De Cian, E., Piontek, F., Iyer, G. and Mouratiadou, I., 2020. Impacts of climate change on energy systems in global and regional scenarios. Nature Energy, 5(10), pp.794-802. https://dspace.library.uu.nl/bitstream/handle/1874/402144/s41560-020-0664-z.pdf?sequence=1 421 Volume 3: End-Use Electricity Demand Hostick, D.; Belzer, D.B.; Hadley, S.W.; Markel, T.; Marnay, C.; Kintner-Meyer, M. (2012). End-Use Electricity Demand. Vol. 3 of Renewable Electricity Futures Study. NREL/TP-6A20-52409-3. Golden, CO: National Renewable Energy Laboratory. https://www.nrel.gov/docs/fy12osti/52409-3.pdf Appendix G 422 De Cian, E. and Sue Wing, I., 2016. Global energy demand in a warming climate. Fondazione Eni Enrico Mattei , Italy https://ageconsearch.umn.edu/record/232222/files/NDL2016-016_nuovo.pdf 423 van Ruijven, B.J., De Cian, E. and Wing, I.S., 2019. Amplification of future energy demand growth due to climate change. Nature communications, 10(1), pp.1-12. https://www.nature.com/articles/s41467-019-10399-3?stream=top 424 Kjellstrom, T., Kovats, R.S., Lloyd, S.J., Holt, T. and Tol, R.S., 2009. The direct impact of climate change on regional labor productivity. Archives of Environmental & Occupational Health, 64(4), pp.217-227. https://www.econstor.eu/bitstream/10419/50035/1/584380003.pdf
Climate Risk and Response July 2021
George Backus (Material is free to use with attribution.) 79
while in industry it is mostly for equipment.425,426,427 Half of the cooling demand is assumed to be met by non-electric techniques,428 such as direct water cooling,429 more non-daylight work hours, and architectural changes.430,431 Per the Referent forecast data, there are strong structural shifts in economic activity as Advantaged countries utilize the cheaper labor and material costs of Disadvantaged countries for energy intensive and labor-intensive industries.
The actual energy demand is the service energy demand allocated to different fuels. Each fuel has a different thermal efficiency.432,433,434,435,436,437,438,439,440,441 The fuels for direct-use are: oil, gas, coal, bioenergy, and electricity. Electromechanical demands only use electricity but some of the electricity can be produced by on-site renewable energy sources.
425 Goetzler, W., Guernsey, M., Young, J., Fujrman, J. and Abdelaziz, A., 2016. The future of air conditioning for buildings (No. DOE/EE-1394). Navigant Consulting, Burlington, MA (United States). https://www.osti.gov/servlets/purl/1420235 426 Jakubcionis, M. and Carlsson, J., 2017. Estimation of European Union residential sector space cooling potential. Energy Policy, 101, pp.225-235. https://www.sciencedirect.com/science/article/pii/S030142151630653X 427 Jakubcionis, M. and Carlsson, J., 2017. Estimation of European Union residential sector space cooling potential. Energy Policy, 101, pp.225-235. Figure 7. https://www.sciencedirect.com/science/article/pii/S030142151630653X 428 Blimpo, Moussa P., and Malcolm Cosgrove-Davies. 2019. Electricity Access in Sub-Saharan Africa: Uptake, Reliability, and Complementary Factors for Economic Impact. Africa Development Forum series. Washington, DC: World Bank. doi:10.1596/978-1-4648-1361-0. https://openknowledge.worldbank.org/bitstream/handle/10986/31333/9781464813610.pdf 429 Laine, H.S., Salpakari, J., Looney, E.E., Savin, H., Peters, I.M. and Buonassisi, T., 2019. Meeting global cooling demand with photovoltaics during the 21st century. Energy & Environmental Science, 12(9), pp.2706-2716. https://pubs.rsc.org/en/content/articlepdf/2019/ee/c9ee00002j 430 Can you cool a house without air conditioning? https://www.bbc.com/future/article/20190822-are-there-alternatives-to-air-conditioning 431 To Offset Climate Change, Scientists Tout City Trees And Ultra-White Paint https://www.wsj.com/articles/to-offset-climate-change-scientists-tout-city-trees-and-ultra-white-paint-11622822424 432 Furnaces and Boilers https://www.energy.gov/energysaver/home-heating-systems/furnaces-and-boilers 433 Fairey, P., D.S. Parker, B. Wilcox and M. Lombardi, "Climate Impacts on Heating Seasonal Performance Factor (HSPF) and Seasonal Energy Efficiency Ratio (SEER) for Air Source Heat Pumps." ASHRAE Transactions, American Society of Heating, Refrigerating and Air Conditioning Engineers, Inc., Atlanta, GA, June 2004. http://www.fsec.ucf.edu/en/publications/html/FSEC-PF-413-04/ 434 Johnson, R.K., 2013. Measured performance of a low temperature air source heat pump (No. NREL/SR-5500-56393; DOE/GO-102013-3788). National Renewable Energy Lab.(NREL), Golden, CO (United States). https://www.nrel.gov/docs/fy13osti/56393.pdf 435 Energy Conservation Program: Energy Conservation Standards for Electric Motors, A Proposed Rule by the Energy Department, https://www.federalregister.gov/documents/2020/05/21/2020-09989/energy-conservation-program-energy-conservation-standards-for-electric-motors 436 Wuenning J.G., “Clean and Efficient Gas Heating of Industrial Furnaces”, Industrial Heating, 2014, summarized in https://www.heattreat.net/blogs/martin-schoenfelder/2016/02/22/efficient-gas-heating-industrial-furnaces 437 Industrial Combustion Boilers, Technology Brief I01 – May 2010, International Energy Agency’s Energy Technology Systems Analysis Program, https://iea-etsap.org/E-TechDS/PDF/I01-ind_boilers-GS-AD-gct.pdf 438 The Safer Affordable Fuel-Efficient (SAFE) Vehicles Rule for Model Years 2021-2026 Passenger Cars and Light Trucks , Federal Register, 2020. https://www.govinfo.gov/content/pkg/FR-2020-04-30/pdf/2020-06967.pdf 439 Thiruvengadam, A., Pradhan, S., Thiruvengadam, P., Besch, M., Carder, D. and Delgado, O., 2014. Heavy-duty vehicle diesel engine efficiency evaluation and energy audit. West Virginia University https://theicct.org/sites/default/files/publications/HDV_engine-efficiency-eval_WVU-rpt_oct2014.pdf 440 Record efficiency for a gas engine https://phys.org/news/2019-06-efficiency-gas.html 441 Where the Energy Goes: Electric Vehicles https://www.fueleconomy.gov/feg/atv-ev.shtml

Climate Risk and Response July 2021
George Backus (Material is free to use with attribution.) 80
In both the supply and demand parts of the simulation, decisions are based on the PPP values of economic conditions while costs/investments are based on MER values.
Urban migration notably affects energy demand.442 Urbanites use nearly 1.8 times more energy than their rural counterparts.443,444
Historical fuel shares are from the Referent forecast with the policy options replacing all carbon-based fuels with electricity (everywhere) or direct renewable energy supply (for industry only) as quickly as possible.
Transportation is disaggregated into the components of Land-Based transportation (oil, natural gas, coal, biofuel, and electricity), and Marine & Aircraft transportation (oil, electricity, electro-synfuel).
The energy use of local and coastal Marine and Aircraft445,446,447,448 is assumed to be all electric in the policy cases, but intercontinental or long-haul transportation would still require liquid fuels (primarily. ammonia produced using electricity).449,450,451 Oil-based products, natural gas, coal, and biofuel are phased out as quickly as possible at high levels of mobilization. Again, biofuels are not used because of the demand they place on a heavily challenged agriculture system and on land use.452 (See Appendix 6.)
442 Li, K. and Lin, B., 2015. Impacts of urbanization and industrialization on energy consumption/CO2 emissions: does the level of development matter?. Renewable and Sustainable Energy Reviews, 52, pp.1107-1122. https://www.sciencedirect.com/science/article/abs/pii/S1364032115008321 443 Dong, F., Yu, B., Hua, Y., Zhang, S. and Wang, Y., 2018. A Comparative Analysis of Residential Energy Consumption in Urban and Rural China: Determinants and Regional Disparities. International journal of environmental research and public health, 15(11), p.2507. https://www.mdpi.com/1660-4601/15/11/2507/pdf 444 Zhang, H. and Lahr, M.L., 2018. Households’ energy consumption change in China: A multi-regional perspective. Sustainability, 10(7), p.2486. https://www.mdpi.com/2071-1050/10/7/2486/pdf 445 National Ocean Economics Program, Middlebury Institute of International Studies, https://oceaneconomics.org/Market/. 446 Olmer, N., Comer, B., Roy, B., Mao, X. and Rutherford, D., 2017. Greenhouse Gas Emissions from Global Shipping, 2013–2015 Detailed Methodology. International Council on Clean Transportation: Washington, DC, USA, pp.1-38. https://theicct.org/sites/default/files/Global-shipping-GHG-emissions-2013-2015_Methodology_17102017_vF.pdf 447 Appendix 1. Tables Relating to The World Of Air Transport In 2015, https://www.icao.int/annual-report-2015/Documents/Appendix_1_en.pdf and Annual Report.2019 Air Transport Statistics https://www.icao.int/annual-report-2019/Documents/ARC_2019_Air%20Transport%20Statistics.pdf 448 Why electric planes haven't taken off yet https://www.businessinsider.com/electric-planes-future-of-aviation-problems-regulations-2020-3 and 449 IRENA (2019), Navigating to a renewable future: Solutions for decarbonising shipping, Preliminary findings, International Renewable Energy Agency, Abu Dhabi https://irena.org/-/media/Files/IRENA/Agency/Publication/2019/Sep/IRENA_Renewable_Shipping_Sep_2019. 450 Hydrogen in aviation: how close is it? Airbus. https://www.airbus.com/newsroom/stories/hydrogen-aviation-understanding-challenges-to-widespread-adoption.html 451 Vezina, G., 2017, November. Comprehensive Evaluation of NH 3 Production and Utilization Options for Clean Energy Applications. In 2017 AIChE Annual Meeting. AIChE. http://www.nh3fuel.com/images/documents/2017-03-25%20-%20MITACS-Final-Report-P3-IT08015.pdf 452 Creutzig, F., Erb, K.H., Haberl, H., Hof, C., Hunsberger, C. and Roe, S., 2021. Considering sustainability thresholds for BECCS in IPCC and biodiversity assessments. https://onlinelibrary.wiley.com/doi/pdf/10.1111/gcbb.12798

Climate Risk and Response July 2021
George Backus (Material is free to use with attribution.) 81
The demand for hydrogen due to carbon-free steel production is added to industrial process demands.453,454,455
There is no price response in the demand model. It is assumed that the use of renewable energy does not increase overall energy costs, and therefore its intensified use does not increase the cost of the transition. The mitigation policies tested here rapidly expand the use of electricity and renewable sources independent of price. Lastly, as discussed in Section 2.2, the model does not assume that low energy prices (possibly due to really inexpensive renewable energy) lead to a rebound effect in demand which requires the building of more generation.456
In transitioning to an electrified economy, the IEA457 notes that the conversion of end-use demand takes longer than it does for electric generation (energy supply). The Core analysis shown in Section 5 naturally exhibits this dynamic.
453 Gardner, D., 2009. Hydrogen production from renewables. Renewable Energy Focus, 9(7), pp.34-37. http://www.renewableenergyfocus.com/view/3157/hydrogen-production-from-renewables/ 454 Hydrogen production from renewables, 01 January 2009, Dale Gardner. http://www.renewableenergyfocus.com/view/3157/hydrogen-production-from-renewables/ 455 Cost reduction and performance increase of PEM electrolysers. FCH: Fuel Cells and Hydrogen Joint Undertaking (2016) https://www.fch.europa.eu/sites/default/files/Nov22_Session3_Panel%205_Slot%202_NOVEL-MEGASTACK_Thomassen%20%28ID%202891376%29.pdf 456 Brockway, P.E., Sorrell, S., Semieniuk, G., Heun, M.K. and Court, V., 2021. Energy efficiency and economy-wide rebound effects: A review of the evidence and its implications. Renewable and Sustainable Energy Reviews, p.110781. https://www.sciencedirect.com/science/article/pii/S1364032121000769 457 Net Zero by 2050: A Roadmap for the Global Energy Sector, International Energy Agency, Paris May 2021, https://iea.blob.core.windows.net/assets/ad0d4830-bd7e-47b6-838c-40d115733c13/NetZeroby2050-ARoadmapfortheGlobalEnergySector.pdf
Climate Risk and Response July 2021
George Backus (Material is free to use with attribution.) 82
R&D programs increase energy efficiency, but the new efficiency improves energy demand only as stocks turnover.458,459,460,461,462,463,464,465,466,467 Lifetimes of equipment are getting longer and thereby making the transition take longer.468 R&D programs are assumed to maintain the historical 10 year development cycle from concept to product. That time period plus the long time for technology commercialization and investment to have an appreciable consequence means that new “breakthrough” technologies469,470 will have a minimal impact on the conclusions drawn from the analyses here.471
458 Tankless or Demand-Type Water Heaters https://www.energy.gov/energysaver/tankless-or-demand-type-water-heaters 459 Energy Conservation Program: Energy Conservation Standards for Commercial Water Heating Equipment. Department Of Energy, 10 CFR Parts 429 and 431, https://www.energy.gov/sites/prod/files/2016/04/f30/Commercial%20Water%20Heating%20Equipment%20ECS%20NOPR.pdf 460 Overview of Capital Inputs for the BLS Multifactor Productivity Measures (2017), Bureau of Labor Statistics (BLS). https://www.bls.gov/mfp/mprcaptl.pdf 461 Lutz, J.D., Hopkins, A., Letschert, V., Franco, V.H. and Sturges, A., 2011. Using national survey data to estimate lifetimes of residential appliances. HVAC&R Research, 17(5), pp.726-736., https://www.osti.gov/servlets/purl/1182737 462 Ibid. BLS (2017) 463 Williams, T.A., 2006. Technical background and Issues of Gas Interchangeability. AGA Staff Paper. American Gas Association. https://www.aga.org/sites/default/files/legacy-assets/SiteCollectionDocuments/KnowledgeCenter/OpsEng/CodesStandards/0604GASINTERCHANGEABILITYSTAFFPAPER.pdf 464 Ibid. BLS (2017) 465 Erumban, A.A., 2008. Lifetimes of machinery and equipment: evidence from Dutch manufacturing. Review of Income and Wealth, 54(2), pp.237-268. http://roiw.org/2008/2008-11.pdf 466 Average Age of Cars and Light Trucks in U.S. Rises Again in 2019 to 11.8 Years, HIS 2019, https://news.ihsmarkit.com/prviewer/release_only/slug/automotive-average-age-cars-and-light-trucks-us-rises-again-2019-118-years-ihs-markit- 467 Average age of U.S. light and heavy trucks in operation in 2015, https://www.statista.com/statistics/185216/age-of-us-light-trucks/ 468 Ibid. IHS (2019) 469 Society is right on track for a global collapse, new study of infamous 1970s report finds https://www.livescience.com/collapse-human-society-limits-to-growth.html 470 Half of emissions cuts will come from future tech, says John Kerry https://www.theguardian.com/environment/2021/may/16/half-of-emissions-cuts-will-come-from-future-tech-says-john-kerry 471 Herrington, G., 2021. Update to limits to growth: Comparing the World3 model with empirical data. Journal of Industrial Ecology, 25(3), pp.614-626. https://advisory.kpmg.us/content/dam/advisory/en/pdfs/2021/yale-publication.pdf
Climate Risk and Response July 2021
George Backus (Material is free to use with attribution.) 83
4.3.2 Energy Supply to Demand Feedback
Overview: The energy payback time for renewable energy sources is the most problematic element of the energy transition. As the GHG transition nears completion, the capacity requirements for renewable generation and battery backup grow dramatically to maintain supply reliability. This dynamic causes a cascading problem because of the added energy needed to make new capacity. These dynamics nearly double the required generating capacity and increase the GHG transition cost by over 50%.
Bottom Line: Reducing the energy payback time is critical to a viable GHG transition. _________________________________________________________________________
With the current mix of energy sources, only a small fraction of total energy is used to make new energy sources. Most conventional energy sources have very short energy payback times (EPBT). The EPBT is the length of time it takes for the operation of a new (for example, a power plant) facility to pay back the energy used in making it. The EPBT of a natural gas power plant (depending on design) is on the order of days to a few weeks. The same is true for the extraction and refining of crude oil, natural gas and coal.472 For renewable sources, the EPBT is on the order of a couple of years.473 When the portfolio of energy sources is diverse, the rapid early growth of renewable energy has an insignificant impact on the total amount of energy used to make new energy. However, as renewable energy becomes dominant, the dynamics change. In a conventional steady state (static) assessment,xlii the consequences are still minor and inconsequential, but if there is growth, as is necessary to quickly electrify the entire global economy by 2050, the impacts are surprising. Much of the unusual “optics” of the analysis-results stem from these dynamics. Because the feedback dynamics are so dramatic and counterintuitive, Appendix 3 breaks down the basic concepts, explains, and illustrates the phenomena. If the growth in renewable energy demand is fast and sustained, it is not possible to build renewable supply fast enough, and, as a least-worse response, new natural gas generation facilities can be constructed to meet energy demand and avoid blackouts or shortages.474
Compared to what might be expected, the final stages of the transition to completely renewable resources involve dramatically increased renewable capacity, The resulting economic consequences stem from either the added climate impacts caused by not building capacity, or through reduced economic growth by building it. This end-game capacity transient is additionally a consequence of reliability and storage requirements for all intermediate, renewable energy-based electrical systems. It is not possible to produce adequate generation, let alone a grid that
472 Hall, Charles AS, Jessica G. Lambert, and Stephen B. Balogh. "EROI of different fuels and the implications for society." Energy policy 64 (2014): 141-152. https://www.sciencedirect.com/science/article/pii/S0301421513003856 473 Weißbach, D., Ruprecht, G., Huke, A., Czerski, K., Gottlieb, S. and Hussein, A., 2013. Energy intensities, EROIs (energy returned on invested), and energy payback times of electricity generating power plants. Energy, 52, pp.210-221. http://citeseerx.ist.psu.edu/viewdoc/download?doi=10.1.1.1056.1818&rep=rep1&type=pdf 474 Desing, H. and Widmer, R., 2021. Reducing climate risks with fast and complete energy transitions: applying the precautionary principle to the Paris agreement. https://osf.io/5wf64/download
Climate Risk and Response July 2021
George Backus (Material is free to use with attribution.) 84
would allow the minimal renewable capacity generation and storage reserves and that could still accommodate climate extremes and human responses to the climate threat.
The energy requirements of DAC operation are also significant, adding large new demands for renewable energy. See Section 4.5.
In the context of energy demand dynamics, the own-use energy becomes part of the total energy demand. Economic accelerator/multiplier effects on energy investment and growth make the problem worse.475 Relatedly, although geothermal is tokenly included as a renewable energy source for historical purposes, it is not included as a source for new capacity in the future because of its long payback time.
4.3.3 Energy Supply
Overview: Climate policy rapidly changes the mix of generation sources. The growth in renewable energy changes the dynamics of capacity expansion and system operation. Pragmatic limitations to transmission improvements further affect renewable energy capacity requirements and resulting loads.
Bottom Line: The energy supply transition will be much different than currently imagined _________________________________________________________________________
The supply model simulates the utility-based supply of electricity. Fossil fuels are assumed to be available if and when needed. The end-use electric demands are converted to electric loads based on transmission losses and any battery storage losses476,477 related to managing intermittent wind and solar supply fluctuations. The model applies end-use load shapes478,479,480,481,482 to determine the peak demands associated with the annual energy demands. Based on dynamically changing reserve margin requirementsxliii, the model
475 https://en.m.wikipedia.org/wiki/Accelerator_effect 476 Mongird, K., Viswanathan, V.V., Balducci, P.J., Alam, M.J.E., Fotedar, V., Koritarov, V.S. and Hadjerioua, B., 2019. Energy storage technology and cost characterization report (No. PNNL-28866). Pacific Northwest National Lab.(PNNL), Richland, WA (United States). https://www.osti.gov/servlets/purl/1573487 477 Cole, Wesley, & Frazier, A. Will. (2019). Cost Projections for Utility-Scale Battery Storage (No. NREL/TP-6A20-73222). Retrieved from National Renewable Energy Laboratory website: https://www.nrel.gov/docs/fy19osti/73222.pdf 478 Electric Power Research Institute, Load Shape Library 8.0, https://loadshape.epri.com/enduse 479 Savvidou, G., 2016. Developing a method for dynamic (EU) electricity demand simulation (Doctoral dissertation, Faculty of Science and Engineering). University of Groningen. http://193.51.120.252/IMG/pdf/d2_georgiasavvidou.pdf 480 Air Conditioning, Peak Demand, And Public Goods Funds Proctor Engineering Group, Ltd. San Rafael, CA March 2005, https://www.proctoreng.com/dnld/D101.pdf 481 Starke, M., Alkadi, N. and Ma, O., 2013. Assessment of industrial load for demand response across US regions of the western interconnect (No. ORNL/TM-2013/407). Oak Ridge National Laboratory (ORNL), Oak Ridge, TN (United States). https://info.ornl.gov/sites/publications/files/Pub45942.pdf 482 Electric Power Research Institute (2018) Electric Vehicle Driving, Charging, and Load Shape Analysis: A Deep Dive Into Where, When, and How Much Salt River Project (SRP) Electric Vehicle Customers Charge. EPRI, Palo Alto, CA: 2018. 3002013754. http://mydocs.epri.com/docs/PublicMeetingMaterials/ee/000000003002013754.pdf
Climate Risk and Response July 2021
George Backus (Material is free to use with attribution.) 85
determines the need for new capacity. The capacity type (fuel) and amount of capacity matches the Base case forecast in the absence of policy. When applying the Policy Package, there is that rapid switch to renewable energy which must consider a rising need for battery storage483,484,485,486,487 as renewable energy becomes the primary source of supply.xliv As noted earlier, conventional (fossil capacity) retires early by mandating a reduced lifetime for that capacity.488,489,490,491,492,493,494,495,496,497 The model dispatch utilizes renewable sources first to serve direct demand and to charge battery storage and then conventional sources to make up any energy gaps. The Policy Package quickly restricts carbon-fueled generation over time, with remaining immediate energy or peak demands met by batteries. Any existing oil and coal capacity is simply assumed to meet demand, when needed.
The capacity is represented as a capital stock with investment (its inflow) and retirement (its outflow) used to determine the change in energy system investment costs among the UQ and
483 Solomon, A.A., Child, M., Caldera, U. and Breyer, C., 2017. How much energy storage is needed to incorporate very large intermittent renewables? Energy Procedia, 135, pp.283-293. https://www.sciencedirect.com/science/article/pii/S1876610217346258 484 Child, M. and Breyer, C., 2016. The role of energy storage solutions in a 100% renewable Finnish energy system. Energy Procedia, 99, pp.25-34. https://www.sciencedirect.com/science/article/pii/S1876610216310554 485 Vanadium redox flow battery for utility-scale applications, microgrids https://www.pv-magazine.com/2020/12/14/vanadium-redox-flow-battery-for-utility-scale-applications-microgrids/ 486 Mulder, F.M., 2014. Implications of diurnal and seasonal variations in renewable energy generation for large scale energy storage. Journal of Renewable and Sustainable Energy, 6(3), p.033105. https://aip.scitation.org/doi/pdf/10.1063/1.4874845 487 Hybrid redox-flow battery with a long cycle life https://techxplore.com/news/2021-05-hybrid-redox-flow-battery-life.html 488 Projected Costs of Generating Electricity (2020). International Energy Agency, Paris. https://www.iea.org/reports/projected-costs-of-generating-electricity-2020 489 Cui, R.Y., Hultman, N., Edwards, M.R., He, L., Sen, A., Surana, K., McJeon, H., Iyer, G., Patel, P., Yu, S. and Nace, T., 2019. Quantifying operational lifetimes for coal power plants under the Paris goals. Nature communications, 10(1), pp.1-9. https://www.nature.com/articles/s41467-019-12618-3 490 Plans For New Reactors Worldwide https://www.world-nuclear.org/information-library/current-and-future-generation/plans-for-new-reactors-worldwide.aspx 491 IRENA. 2012. Renewable energy technologies: cost analysis series: hydropower. https://www.irena.org/-/media/Files/IRENA/Agency/Publication/2012/RE_Technologies_Cost_Analysis-HYDROPOWER.pdf and Hydropower. 2003. National Renewable Energy Laboratory. https://www.nrel.gov/docs/fy04osti/34916.pdf 492 Projected Costs of Generating Electricity (2020). International Energy Agency, Paris. https://www.iea.org/reports/projected-costs-of-generating-electricity-2020 493 Jordan, D.C. and Kurtz, S.R., 2013. Photovoltaic degradation rates—an analytical review. Progress in photovoltaics: Research and Applications, 21(1), pp.12-29. https://www.nrel.gov/docs/fy12osti/51664.pdf 494 Hamilton, S.D., Millstein, D., Bolinger, M., Wiser, R. and Jeong, S., 2020. How does wind project performance change with age in the United States?. Joule, 4(5), pp.1004-1020. https://www.sciencedirect.com/science/article/pii/S2542435120301744/pdfft?md5=3f15f4b3e66fe9fb9dce15bd2db808f9&pid=1-s2.0-S2542435120301744-main.pdf 495 Byrne, R., Astolfi, D., Castellani, F. and Hewitt, N.J., 2020. A Study of Wind Turbine Performance Decline with Age through Operation Data Analysis. Energies, 13(8), p.2086. https://www.mdpi.com/1996-1073/13/8/2086/pdf 496 Walker, H.A., Desai, J.D. and Heimiller, D.M., 2020. Performance of Photovoltaic Systems Recorded by Open Solar Performance and Reliability Clearinghouse (oSPARC) (No. NREL/TP-5C00-75162). National Renewable Energy Lab.(NREL), Golden, CO (United States). https://www.nrel.gov/docs/fy20osti/75162.pdf 497 Energy Analysis, National Renewable Energy Laboratory https://www.nrel.gov/analysis/tech-footprint.html

Climate Risk and Response July 2021
George Backus (Material is free to use with attribution.) 86
mobilization scenarios. The dispatch of carbon-fueled generation results in a primary demand for carbon-based fuels
The own-use energy dynamics noted in the previous section (and in Appendix 3) cause a severe overshoot in capacity. This study neglects investment in and the loss/overshoot of support industries and mining, as well as neglecting resource constraints498 and any associated increase in costs.499,500,501 The model considers the reduction in renewable capacity over time from the physical to sensitivity to heat and ageing.502,503,504,505,506 It also neglects the ecological/climate impact of intense renewable energy expansion,507 as well as the effect of
498 The Role of Critical World Energy Outlook Special Report Minerals in Clean Energy Transitions, 20210 IEA, Paris https://iea.blob.core.windows.net/assets/24d5dfbb-a77a-4647-abcc-667867207f74/TheRoleofCriticalMineralsinCleanEnergyTransitions.pdf 499 How green bottlenecks threaten the clean energy business https://www.economist.com/leaders/2021/06/12/how-green-bottlenecks-threaten-the-clean-energy-business and The bottlenecks which could constrain emission cuts https://www.economist.com/briefing/2021/06/12/the-bottlenecks-which-could-constrain-emission-cuts 500 The Worst Setback For The Solar Boom In A Decade https://oilprice.com/Energy/Energy-General/The-Worst-Setback-For-The-Solar-Boom-In-A-Decade.html 501 Solar Power's Decade of Falling Costs Is Thrown Into Reverse https://www.bloomberg.com/news/articles/2021-05-23/solar-power-s-decade-of-falling-costs-is-thrown-into-reverse 502 Peters, I.M. and Buonassisi, T., 2019, June. The impact of global warming on silicon PV energy yield in 2100. In 2019 IEEE 46th Photovoltaic Specialists Conference (PVSC) (pp. 3179-3181). IEEE. http://arxiv.org/pdf/1908.00622 503 Walker, H.A., Desai, J.D. and Heimiller, D.M., 2020. Performance of Photovoltaic Systems Recorded by Open Solar Performance and Reliability Clearinghouse (oSPARC) (No. NREL/TP-5C00-75162). National Renewable Energy Lab.(NREL), Golden, CO (United States). https://www.nrel.gov/docs/fy20osti/75162.pdf 504 Hamilton, S.D., Millstein, D., Bolinger, M., Wiser, R. and Jeong, S., 2020. How does wind project performance change with age in the United States?. Joule, 4(5), pp.1004-1020. https://www.sciencedirect.com/science/article/pii/S2542435120301744/pdfft?md5=3f15f4b3e66fe9fb9dce15bd2db808f9&pid=1-s2.0-S2542435120301744-main.pdf 505 Peters, I.M. and Buonassisi, T., 2021. How changes in worldwide operating conditions affect solar cell performance. Solar Energy, 220, pp.671-679. https://www.sciencedirect.com/science/article/abs/pii/S0038092X21000335 506 Byrne, R., Astolfi, D., Castellani, F. and Hewitt, N.J., 2020. A Study of Wind Turbine Performance Decline with Age through Operation Data Analysis. Energies, 13(8), p.2086. https://www.mdpi.com/1996-1073/13/8/2086/pdf 507 Lu, Z., Zhang, Q., Miller, P.A., Zhang, Q., Berntell, E. and Smith, B., 2021. Impacts of large‐scale Sahara solar farms on global climate and vegetation cover. Geophysical Research Letters, 48(2), p.e2020GL090789. https://agupubs.onlinelibrary.wiley.com/doi/pdf/10.1029/2020GL090789
Climate Risk and Response July 2021
George Backus (Material is free to use with attribution.) 87
climate on the renewable energy implementation.508 Further, it neglects the degradation of conventional capacity due to heat and water constraints on generation.509,510,511,512
The energy analyses referenced in Section 1.2, assume capital costs decrease as the consequence of learning curves. The application of learning curves with their ambiguous parametrization is misleading when used to determine optimal paths through the GHG transition.513,514,515 When technologies mature, costs cease to drop as the diminishing innovations have been found and incorporated. For climate mitigation, these innovations will come from R&D, with little time for secondary learning-effects.xlv Under the modeled assumption of stable R&D as a percentage of GDP, one innovation builds upon another and the effect can be accurately represented by an exponential decline in cost down to the mature cost
508 da Silva, S.R.S., Hejazi, M.I., Iyer, G., Wild, T.B., Binsted, M., Miralles-Wilhelm, F., Patel, P., Snyder, A.C. and Vernon, C.R., 2021. Power sector investment implications of climate impacts on renewable resources in Latin America and the Caribbean. Nature communications, 12(1), pp.1-12. https://www.nature.com/articles/s41467-021-21502-y.pdf 509 Dumas, M., Kc, B. and Cunliff, C.I., 2019. Extreme weather and climate vulnerabilities of the electric grid: a summary of environmental sensitivity quantification methods (No. ORNL/TM-2019/1252). Oak Ridge National Lab.(ORNL), Oak Ridge, TN (United States). https://www.energy.gov/sites/prod/files/2019/09/f67/Oak%20Ridge%20National%20Laboratory%20EIS%20Response.pdf 510 Byers, E.A., Coxon, G., Freer, J. and Hall, J.W., 2020. Drought and climate change impacts on cooling water shortages and electricity prices in Great Britain. Nature communications, 11(1), pp.1-12. https://www.nature.com/articles/s41467-020-16012-2.pdf 511 Macknick, J., Zhou, E., O'Connell, M., Brinkman, G., Miara, A., Ibanez, E. and Hummon, M., 2016. Water and climate impacts on power system operations: the importance of cooling systems and demand response measures (No. NREL/TP-6A20-66714). National Renewable Energy Lab.(NREL), Golden, CO (United States). https://www.nrel.gov/docs/fy17osti/66714.pdf 512 Backus, George A., Thomas S. Lowry, Drake E. Warren, et al., "Assessing the Near-Term Risk of Climate Uncertainty: Interdependencies among the U.S. States," SAND Report, April 2010. https://cfwebprod.sandia.gov/cfdocs/CompResearch/docs/Climate_Risk_Assessment.pdf 513 Grafström, J. and Poudineh, R., 2021. A critical assessment of learning curves for solar and wind power technologies. OIES Paper: EL 43. Oxford Institute for Energy Studies, UK https://www.oxfordenergy.org/wpcms/wp-content/uploads/2021/02/A-critical-assessment-of-learning-curves-for-solar-and-wind-power-technologies-EL-43.pdf 514 Yeh, S., Rubin, E., Hounshell, D.A. and Taylor, M.R., 2007. Uncertainties in technology experience curves for integrated assessment models. Available at SSRN 1154762. https://kilthub.cmu.edu/articles/Uncertainties_in_Technology_Experience_Curves_for_Integrated_Assessment_Models/6073628/files/10943090.pdf 515 Rubin, E.S., Azevedo, I.M., Jaramillo, P. and Yeh, S., 2015. A review of learning rates for electricity supply technologies. Energy Policy, 86, pp.198-218. https://www.cmu.edu/epp/iecm/rubin/PDF%20files/2015/A%20review%20of%20learning%20rates%20for%20electricity%20supply%20technologies.pdf
Climate Risk and Response July 2021
George Backus (Material is free to use with attribution.) 88
(MCost).516,517 The historically-estimated quantification (used in the absence of policy) is shown below, and its results closely match historical and short-term-forecasted photovoltaic costs.518,519 𝐶𝑜𝑠𝑡 = (𝐶𝑜𝑠𝑡0 − 𝑀𝐶𝑜𝑠𝑡) ∗ 𝑒𝜆∗𝑡𝑖𝑚𝑒 + 𝑀𝐶𝑜𝑠𝑡 Equation 3
Future costs and efficiency changes for renewable sources are based on NREL estimates,520 that are also comparable to Lazard estimates.521 These trajectories also correspond to the exponential-maturity representation. An equivalent parameterization captures the cost reduction and asymptotic behavior in utility-scale lithium batteries.522,523,524,525 The implicit flow-batteries526,527 used in this study to handle the future grid environment employ the NREL lithium-battery cost reduction curve. To make the GHG transition feasible, the own-energy demand (the EPBT) of renewable resource and batteries are assumed to decline in proportion to reduced costs.xlvi
Because the simulation also assumes limited transmission expansion due to legal challenges to transmission, there is a need for more storage than estimated in other analyses. The analyses
516 Wilson, C., 2012. Up-scaling, formative phases, and learning in the historical diffusion of energy technologies. Energy Policy, 50, pp.81-94. https://ueaeprints.uea.ac.uk/id/eprint/39127/1/Wilson_EnPol_Learning-Upscaling_Nov12.pdf 517 Wilson, C., 2009. Meta-analysis of unit and industry level scaling dynamics in energy technologies and climate change mitigation scenarios., International Institute for Applied Systems Analysis, Laxenburg, Austria http://pure.iiasa.ac.at/id/eprint/9120/1/IR-09-029.pdf 518 BNEF says solar and wind are now cheapest sources of new energy generation for majority of planet https://www.renewableenergyworld.com/wind-power/bnef-says-solar-and-wind-are-now-cheapest-sources-of-new-energy-generation-for-majority-of-planet/#gref 519 The falling costs of US solar power, in 7 charts https://www.vox.com/2016/8/24/12620920/us-solar-power-costs-falling 520 Annual Technology Baseline https://atb.nrel.gov/electricity/2020/data.php 521 Levelized Cost of Energy and Levelized Cost of Storage – 2020 https://www.lazard.com/perspective/levelized-cost-of-energy-and-levelized-cost-of-storage-2020/ 522 A Behind the Scenes Take on Lithium-ion Battery Prices https://about.bnef.com/blog/behind-scenes-take-lithium-ion-battery-prices/ 523 Lithium-ion battery pack price https://www.bloomberg.com/toaster/v2/charts/f96b5014fb25488dbe58d7d57dab9547.html 524 Annual Technology Baseline https://atb.nrel.gov/electricity/2020/data.php 525 Lithium-ion battery pack price https://www.bloomberg.com/toaster/v2/charts/f96b5014fb25488dbe58d7d57dab9547.html 526 ‘All-iron’ flow battery maker ESS Inc launches ‘configurable’ megawatt-scale product. https://www.energy-storage.news/news/all-iron-flow-battery-maker-ess-inc-launches-configurable-megawatt-scale-pr#:~:text=It%20has%20a%20claimed%2025,Craig%20Evans%20told%20Energy%2DStorage. Asia Pacific’s oil demand to fall in 2020 but could rise 25% by 2040 https://www.woodmac.com/press-releases/asia-pacifics-oil-demand-to-fall-in-2020-but-could-rise-25-by-2040/ The world is kicking its coal habit. China is still hooked https://www.economist.com/graphic-detail/2021/04/07/the-world-is-kicking-its-coal-habit-china-is-still-hooked 527 Mongird, K., Viswanathan, V.V., Balducci, P.J., Alam, M.J.E., Fotedar, V., Koritarov, V.S. and Hadjerioua, B., 2019. Energy storage technology and cost characterization report (No. PNNL-28866). Pacific Northwest National Lab.(PNNL), Richland, WA (United States). https://www.energy.gov/sites/prod/files/2019/07/f65/Storage%20Cost%20and%20Performance%20Characterization%20Report_Final.pdf
Climate Risk and Response July 2021
George Backus (Material is free to use with attribution.) 89
assume that it is not possible to make an optimized national grid. xlvii The declining LCOE for renewable energy could theoretically reduce the net cost of the GHG transition to zero or less. While such a possibility might be true when offsets allow significant non-renewable capacity, the transition to a completely carbon free economy using the Policy Package of Section 3.1 requires extensive battery backup with excess generation capacity for reliability,528, 529,530,531,532 and weather contingencies.533 There is no need for any added battery storage when the market penetration of renewable generation is 25% or less because the conventional (fossil) sources can accommodate the intermittency of renewable generation.534 However, when the penetration reaches 80%-90%, storage and generation-capacity requirements increase dramatically.535,536, 537,538,539
The studies referenced in Section 1.2 note the high costs of a truly renewable-energy electric system. Although the optimal implementation of transmissions might substantially reduce these costs, the transmission costs would still be significant.540 Providing such transmission is most
528 Grid Modernization https://www.nrel.gov/grid/ 529 Krakauer, N.Y. and Cohan, D.S., 2017. Interannual variability and seasonal predictability of wind and solar resources. Resources, 6(3), p.29. https://www.mdpi.com/2079-9276/6/3/29/pdf 530 Logan, J., Marcy, C., McCall, J., Flores-Espino, F., Bloom, A., Aabakken, J., Cole, W., Jenkin, T., Porro, G., Liu, C. and Ganda, F., 2017. Electricity generation baseline report (No. NREL/TP-6A20-67645). National Renewable Energy Lab.(NREL), Golden, CO (United States). https://www.osti.gov/servlets/purl/1342379 531 Wan, Y.H., 2012. Long-term wind power variability (No. NREL/TP-5500-53637). National Renewable Energy Lab.(NREL), Golden, CO (United States). https://www.nrel.gov/docs/fy12osti/53637.pdf 532 Dragoon, K. and Milligan, M., 2003. Assessing wind integration costs with dispatch models: a case study of PacifiCorp (No. NREL/CP-500-34022). National Renewable Energy Lab.(NREL), Golden, CO (United States). https://www.nrel.gov/docs/fy03osti/34022.pdf 533 A Glimpse of America’s Future: Climate Change Means Trouble for Power Grids. https://www.nytimes.com/2021/02/16/climate/texas-power-grid-failures.html?action=click&module=Spotlight&pgtype=Homepage 534 Bethany Frew, Brian Sergi, Paul Denholm, Wesley Cole, Nathaniel Gates, Daniel Levie, Robert Margolis, The curtailment paradox in the transition to high solar power systems,Joule,2021,ISSN 2542-4351, https://doi.org/10.1016/j.joule.2021.03.021 or https://www.sciencedirect.com/science/article/pii/S2542435121001446 535 Child, M. and Breyer, C., 2016. The role of energy storage solutions in a 100% renewable Finnish energy system. Energy Procedia, 99, pp.25-34. https://www.sciencedirect.com/science/article/pii/S1876610216310554 536 Solomon, A.A., Child, M., Caldera, U. and Breyer, C., 2017. How much energy storage is needed to incorporate very large intermittent renewables?. Energy Procedia, 135, pp.283-293. https://www.sciencedirect.com/science/article/pii/S1876610217346258 537 Bolinger, M., Seel, J. and Robson, D., 2019. Utility-scale solar: Empirical trends in project technology, cost, performance, and PPA pricing in the United States–2019 Edition. https://eta-publications.lbl.gov/sites/default/files/lbnl_utility_scale_solar_2019_edition_final.pdf 538 Denholm, P. and Margolis, R.M., 2007. Evaluating the limits of solar photovoltaics (PV) in traditional electric power systems. Energy policy, 35(5), pp.2852-2861. https://www.nrel.gov/docs/fy17osti/68737.pdf 539 Amol Phadke, Umed Paliwal, Nikit Abhyankar, Taylor McNair, Ben Paulos, David Wooley, Ric O’Connell, (2021) “The 2035 Report: Plummeting Solar, Wind, and Battery Costs Can Accelerate our Clean Electricity Future.” White Paper. Goldman School of Public Policy. https://www.2035report.com/ 540 Fares, R.L. and King, C.W., 2017. Trends in transmission, distribution, and administration costs for US investor-owned electric utilities. Energy Policy, 105, pp.354-362. https://energy.utexas.edu/sites/default/files/UTAustin_FCe_TDA_2016.pdf and https://energy.utexas.edu/policy/fce
https://eta-publications.lbl.gov/sites/default/files/lbnl_utility_scale_solar_2019_edition_final.pdf
Climate Risk and Response July 2021
George Backus (Material is free to use with attribution.) 90
likely politically and contractually infeasible given land rights and local NIMBY authority. Thus, any workable grid will be clearly suboptimal.
Out of local self-interest, the analyses also assume that batteries will be located near load-centers rather than near the wind or solar-panel farms. The load centers can then opportunistically take full advantage of any source available and ensure their own reliable electricity supply. This approach further prevents the development of an optimal transmission system.
This study assumes that, due to the long mobilization delays, advanced technologies will be actually available when needed.
4.4 Climate Dynamics
Overview: To capture climate conditions adequately, the climate model simulates the dynamics of all natural and anthropogenic GHG emissions (CO2, CH4, N2O, halogens, and aerosols), from energy use, agriculture,xlviii chemical production, steel production, cement production, permafrost degradation, and land-use changes. It also includes the uncertainty in resulting climate conditions – which in turn affects economic and demographic consequences.
Bottom Line: Climate generates an abundance of feedback dynamics that change the trajectory of the GHG transition. _________________________________________________________________________
The climate model is based on an Impulse-Derived Differential Equation (IDDE) representation. It is similar to the Impulse Function (IPF) commonly used in the reduced-form simulation of climate conditions. However, those applications use algebraic formulations541,542,543,544 with limiting assumptions relative to capturing year-to-year dynamics and dramatically varying emissions from multiple non-CO2 GHGs. This simulation uses a set of differential equations to
541 Gasser, T., Peters, G.P., Fuglestvedt, J.S., Collins, W.J., Shindell, D.T. and Ciais, P., 2017. Accounting for the climate–carbon feedback in emission metrics. Earth System Dynamics, 8(2), pp.235-253. https://esd.copernicus.org/articles/8/235/2017/esd-8-235-2017.pdf 542 Myhre, G., Shindell, D., Breìon, F.-M., Collins, W., Fuglestvedt, J., Huang, J., Koch, D., Lamarque, J.-F., Lee, D., Mendoza, B., Nakajima, T., Robock, A., Stephens, G., Takemura, T., and Zhang, H.: Anthropogenic and Natural Radiative Forcing, in: Climate Change 2013: The Physical Science Basis. Contribution Change 2014: Mitigation of Climate Change, Contribution of Working Group III to the Fifth Assessment Report of the Intergovernmental Panel on Climate Change, edited by: Edenhofer, O., Pichs-Madruga, R., Sokona, Y., Farahani, E., Kadner, S., Seyboth, K., Adler, A., Baum, I., Brunner, S., Eickemeier, P., Kriemann, B., Savolainen, J., Schlömer, S., von Stechow, C., Zwickel, T., and Minx, J. C., Cambridge University Press, Cambridge, UK and New York, NY, USA, 2014. https://www.ipcc.ch/report/ar5/wg1/anthropogenic-and-natural-radiative-forcing/ 543 Millar, R.J., Nicholls, Z.R., Friedlingstein, P. and Allen, M.R., 2017. A modified impulse-response representation of the global near-surface air temperature and atmospheric concentration response to carbon dioxide emissions. Atmospheric Chemistry and Physics, 17(11), pp.7213-7228. https://acp.copernicus.org/articles/17/7213/2017/acp-17-7213-2017.pdf 544 Hooß, G., Voss, R., Hasselmann, K., Maier-Reimer, E. and Joos, F., 2001. A nonlinear impulse response model of the coupled carbon cycle-climate system (NICCS). Climate Dynamics, 18(3-4), pp.189-202. https://pure.mpg.de/rest/items/item_995488/component/file_3189174/content

Climate Risk and Response July 2021
George Backus (Material is free to use with attribution.) 91
replicate the impulse response for each GHG type and enable full dynamics. It can mirror the IPF response, but is very different from the IPF algebraic approach. (See Appendix 4.) The model has been validated against the CMIP5 results. To ensure consistency with natural emissions, ocean responses, and AFOLUxlix responses, the model was initialized in the year 1750 and executed through the year 2018 using historical anthropogenic and natural emissions to reproduce historical temperatures.545,546,547,548
The model is purposely linear and does not simulate tipping points. Given the high temperatures that this study produces, with even 100% mobilization, including the tipping points could produce potentially extreme results that would be distracting and only worsen impacts.549,550 As is, the model neglects extreme conditions551,552,l and likely understates the average climate conditions,553 along with the consequent the impacts. It explicitly simulates the accumulation and radiative forcing of the different GHG species to determine atmospheric conditions. (See Appendix 4.)
The model endogenously simulates all the emissions necessary to reflect a complete picture of atmospheric forcing. Fugitive emissions are a function of energy production, production capacity
545 Paris Reality Check: PRIMAP-hist https://www.pik-potsdam.de/paris-reality-check/primap-hist/ 546 Hyde (History database of the Global Environment) https://www.pbl.nl/en/image/links/hyde 547 Allen, M., Antwi-Agyei, P., Aragon-Durand, F., Babiker, M., Bertoldi, P., Bind, M., Brown, S., Buckeridge, M., Camilloni, I., Cartwright, A. and Cramer, W., 2019. Global warming of 1.5° C. An IPCC Special Report on the impacts of global warming of 1.5° C above pre-industrial levels and related global greenhouse gas emission pathways, in the context of strengthening the global response to the threat of climate change, sustainable development, and efforts to eradicate poverty. World Meteorological Organization, Geneva, Switzerland. https://www.ipcc.ch/sr15/ 548 Climate Change 2013: The Physical Science Basis. Contribution Change 2014: Mitigation of Climate Change, Contribution of Working Group III to the Fifth Assessment Report of the Intergovernmental Panel on Climate Change, edited by: Edenhofer, O., Pichs-Madruga, R., Sokona, Y., Farahani, E., Kadner, S., Seyboth, K., Adler, A., Baum, I., Brunner, S., Eickemeier, P., Kriemann, B., Savolainen, J., Schlömer, S., von Stechow, C., Zwickel, T., and Minx, J. C., Cambridge University Press, Cambridge, UK and New York, NY, USA, 2014. https://www.ipcc.ch/report/ar5/wg1/anthropogenic-and-natural-radiative-forcing/ 549 IPCC steps up warning on climate tipping points in leaked draft report https://www.theguardian.com/environment/2021/jun/23/climate-change-dangerous-thresholds-un-report 550 Wunderling, N., Donges, J.F., Kurths, J. and Winkelmann, R., 2020. Interacting tipping elements increase risk of climate domino effects under global warming. Earth System Dynamics Discussions, pp.1-21. https://esd.copernicus.org/preprints/esd-2020-18/esd-2020-18.pdf 551 King, A.D., Lane, T.P., Henley, B.J. and Brown, J.R., 2020. Global and regional impacts differ between transient and equilibrium warmer worlds. Nature Climate Change, 10(1), pp.42-47. https://minerva-access.unimelb.edu.au/bitstream/handle/11343/241666/TransientVsEquil_Main_SecondRevision_v1_Accepted.pdf?sequence=2 552 World ‘must step up preparations for extreme heat’ https://www.theguardian.com/science/2021/jul/07/world-must-step-up-preparations-for-extreme-heat 553 Global satellite data shows clouds will amplify global heating https://phys.org/news/2021-07-global-satellite-clouds-amplify.html
Climate Risk and Response July 2021
George Backus (Material is free to use with attribution.) 92
(both retired and operating wells and mines), and policy.554,555,556 The model includes recent estimates that increase the historical fugitive emissions.557,558 Carbon-fuel emissions are a function of fuel use and fuel type.559 Economy-based emissions (𝐸𝐸) from cement560,561,562,563,564
554 World Energy Model Documentation (2020). Paris: OECD/IEA. https://iea.blob.core.windows.net/assets/bc4936dc-73f1-47c3-8064-0784ae6f85a3/WEM_Documentation_WEO2020.pdf 555 Hmiel, B., Petrenko, V.V., Dyonisius, M.N., Buizert, C., Smith, A.M., Place, P.F., Harth, C., Beaudette, R., Hua, Q., Yang, B. and Vimont, I., 2020. Preindustrial 14 CH 4 indicates greater anthropogenic fossil CH 4 emissions. Nature, 578(7795), pp.409-412. https://escholarship.org/content/qt77682176/qt77682176.pdf 556 Maasakkers, J.D., Jacob, D.J., Sulprizio, M.P., Scarpelli, T.R., Nesser, H., Sheng, J., Zhang, Y., Lu, X., Bloom, A.A., Bowman, K.W. and Worden, J.R., 2021. 2010–2015 North American methane emissions, sectoral contributions, and trends: a high-resolution inversion of GOSAT observations of atmospheric methane. Atmospheric Chemistry and Physics, 21(6), pp.4339-4356. https://www.researchgate.net/profile/Xiao-Lu-5/publication/344313235_2010-2015_North_American_methane_emissions_sectoral_contributions_and_trends_a_high-resolution_inversion_of_GOSAT_satellite_observations_of_atmospheric_methane/links/5f669def458515b7cf417f37/2010-2015-North-American-methane-emissions-sectoral-contributions-and-trends-a-high-resolution-inversion-of-GOSAT-satellite-observations-of-atmospheric-methane.pdf 557 Kholod, N., Evans, M., Pilcher, R.C., Roshchanka, V., Ruiz, F., Coté, M. and Collings, R., 2020. Global methane emissions from coal mining to continue growing even with declining coal production. Journal of Cleaner Production, 256, p.120489. https://www.sciencedirect.com/science/article/pii/S0959652620305369/pdfft?md5=8c4c55dfc1e6831cd28fca434c4217d1&pid=1-s2.0-S0959652620305369-main.pdf 558 Methane emissions from abandoned oil and gas wells underestimated https://www.sciencedaily.com/releases/2021/01/210121092828.htm 559 How much carbon dioxide is produced when different fuels are burned? https://www.eia.gov/tools/faqs/faq.php?id=73&t=11 560 Cement Statistics and Information, USGS, https://www.usgs.gov/centers/nmic/cement-statistics-and-information 561 Ravikumar, D., Zhang, D., Keoleian, G., Miller, S., Sick, V. and Li, V., 2021. Carbon dioxide utilization in concrete curing or mixing might not produce a net climate benefit. Nature communications, 12(1), pp.1-13. https://www.nature.com/articles/s41467-021-21148-w 562 National Research Council, 2010. America's energy future: technology and transformation. National Academies Press. https://www.nap.edu/catalog/12091/americas-energy-future-technology-and-transformation 563 National Academies of Sciences, Engineering, and Medicine. 2021. Accelerating Decarbonization of the U.S. Energy System. Washington, DC: The National Academies Press. https://www.nap.edu/catalog/25932/accelerating-decarbonization-of-the-us-energy-system 564 Baker, S. et al. Getting to Neutral: Options for Negative Carbon Emissions in California, January, 2020, Lawrence Livermore National Laboratory, LLNL-TR-796100 https://www-gs.llnl.gov/content/assets/docs/energy/Getting_to_Neutral.pdf

Climate Risk and Response July 2021
George Backus (Material is free to use with attribution.) 93
and steel production, 565 halogen use,566 chemical production,567 agriculture,568 and waste569 are historically estimated functions of GDP and GDPPC:
𝐸𝐸 = 𝐸𝐸0 ∗ 𝐺𝐷𝑃 ∗ 𝐺𝐷𝑃𝑃𝐶𝛾 Equation 4
where γ is an estimated income elasticity and 𝐸𝐸0 is the initial (year 2015) 𝐸𝐸. The 𝐸𝐸 are by year, emission type, and region. Equation 4 is actually disaggregated to first determine, for example, the annual production of steel or cement in tonnes per year, and then the GHG emissions from GHG intensity per unit of production
Aerosols are a function of combustions by fuel570 and natural emissions. Steel and cement are affected by the electrification initiatives of Section 3.1. Natural emissions of N2O and CH4 remain constant in the future, although they might actually increase from land use changes.571 The historical simulation indicates that due to high temperatures, changed rainfall, deforestation,572 and more intense agriculture practices,573 the AFOLU system changes from being an increasing sink for CO2 emissions growing at 0.3% per year, to declining and becoming a sink at a rate of 1.2% per year. (See Appendix 6.) As such, the limitations and uncertainty of biomass capabilities make it a poor choice574 for assumed offsets when ensuring
565 World Steel In Figures 2019, World Steel Association, https://www.worldsteel.org/steel-by-topic/statistics/steel-statistical-yearbook.html 566 Velders, G.J., Fahey, D.W., Daniel, J.S., Andersen, S.O. and McFarland, M., 2015. Future atmospheric abundances and climate forcings from scenarios of global and regional hydrofluorocarbon (HFC) emissions. Atmospheric Environment, 123, pp.200-209. https://www.sciencedirect.com/science/article/pii/S135223101530488X/pdfft?md5=c659f454750543e1fad72da09dc10fff&pid=1-s2.0-S135223101530488X-main.pdf 567 Paris Reality Check: PRIMAP-hist https://www.pik-potsdam.de/paris-reality-check/primap-hist/ 568 Ibid. 569 Ibid 570 Estimating Particulate Matter Emissions for eGRID, U.S. EPA 2020. https://www.epa.gov/sites/production/files/2020-07/documents/draft_egrid_pm_white_paper_7-20-20.pdf 571 https://www.epa.gov/ghgemissions/overview-greenhouse-gases#nitrous-oxide 572 Deforestation is driven by global markets https://theconversation.com/deforestation-is-driven-by-global-markets-161049 573 Tubiello, F.N., Rosenzweig, C., Conchedda, G., Karl, K., Gütschow, J., Xueyao, P., Obli-Laryea, G., Wanner, N., Qiu, S.Y., De Barros, J. and Flammini, A., 2021. Greenhouse gas emissions from food systems: building the evidence base. Environmental Research Letters, 16(6), p.065007. https://iopscience.iop.org/article/10.1088/1748-9326/ac018e/pdf 574 Environmentalists cast doubt on carbon offsets https://www.ft.com/content/81d436c2-79f1-4a43-ab52-cbbcddb149df
Climate Risk and Response July 2021
George Backus (Material is free to use with attribution.) 94
acceptable climatic outcomes are the preeminent criteria. (See Appendix 6). The permafrost simulation is based on Natali.575,576,577,578,579
Halogen emissions decline in the future with the assumed ratification of and expected adherence to the Kigali Amendment.580 Aerosols are assumed to decline through the continued implementation of clean-air regulations across the globe. Based on the difference between goals and accomplishments,581,582,583,584 aerosol generation per unit of burned-fuel is reduced at a rate 1.5% per year.
The model includes the conversion of CH4 to CO2. With full mobilization, fugitive emissions are reduced in proportion to the simulated mobilization level using a 10 year time constant (lag time).585 Steel production is converted to be carbon-free and to use only hydrogen. Cement is replaced by steel or other functional (GHG-less) materials.
575 Natali, S.M., Watts, J.D., Rogers, B.M., Potter, S., Ludwig, S.M., Selbmann, A.K., Sullivan, P.F., Abbott, B.W., Arndt, K.A., Birch, L. and Björkman, M.P., 2019. Large loss of CO 2 in winter observed across the northern permafrost region. Nature Climate Change, 9(11), pp.852-857. https://munin.uit.no/bitstream/10037/17795/3/article.pdf 576 Anthony, K.W., von Deimling, T.S., Nitze, I., Frolking, S., Emond, A., Daanen, R., Anthony, P., Lindgren, P., Jones, B. and Grosse, G., 2018. 21st-century modeled permafrost carbon emissions accelerated by abrupt thaw beneath lakes. Nature communications, 9(1), pp.1-11. https://www.nature.com/articles/s41467-018-05738-9.pdf 577 Gasser, T., Kechiar, M., Ciais, P., Burke, E.J., Kleinen, T., Zhu, D., Huang, Y., Ekici, A. and Obersteiner, M., 2018. Path-dependent reductions in CO 2 emission budgets caused by permafrost carbon release. Nature Geoscience, 11(11), pp.830-835. http://pure.iiasa.ac.at/id/eprint/15453/1/permafrost%26budgets_v11_main_final.pdf 578 MacDougall, A.H., Zickfeld, K., Knutti, R. and Matthews, H.D., 2015. Sensitivity of carbon budgets to permafrost carbon feedbacks and non-CO2 forcings. Environmental Research Letters, 10(12), p.125003. https://iopscience.iop.org/article/10.1088/1748-9326/10/12/125003/pdf 579 Natali, S.M., Holdren, J.P., Rogers, B.M., Treharne, R., Duffy, P.B., Pomerance, R. and MacDonald, E., 2021. Permafrost carbon feedbacks threaten global climate goals. Proceedings of the National Academy of Sciences, 118(21). https://www.pnas.org/content/pnas/118/21/e2100163118.full.pdf 580 Kigali Amendment to the Montreal Protocol, United Nations Environment Programme https://ec.europa.eu/clima/sites/clima/files/faq_kigali_amendment_en.pdf 581 Is India’s national clean air plan on track? https://india.mongabay.com/2020/01/is-indias-national-clean-air-plan-on-track/ 582 China target to allow air pollution to rise slightly in 2021 - environment ministry https://www.reuters.com/article/us-china-pollution/china-target-to-allow-air-pollution-to-rise-slightly-in-2021-environment-ministry-idUSKBN2AP0BH 583 Ganguly, T., Selvaraj, K.L. and Guttikunda, S.K., 2020. National Clean Air Programme (NCAP) for Indian cities: Review and outlook of clean air action plans. Atmospheric Environment: X, p.100096. https://www.sciencedirect.com/science/article/pii/S2590162120300368/pdfft?md5=021df926a9848b2e362562d70646ee50&pid=1-s2.0-S2590162120300368-main.pdf 584 China's air quality continues to improve in 2020, extreme weather occurs: report https://www.globaltimes.cn/page/202105/1224560.shtml 585 Ocko, I.B., Sun, T., Shindell, D., Oppenheimer, M., Hristov, A.N., Pacala, S.W., Mauzerall, D.L., Xu, Y. and Hamburg, S.P., 2021. Acting rapidly to deploy readily available methane mitigation measures by sector can immediately slow global warming. Environmental Research Letters, 16(5), p.054042. https://iopscience.iop.org/article/10.1088/1748-9326/abf9c8/pdf

Climate Risk and Response July 2021
George Backus (Material is free to use with attribution.) 95
Climate uncertainty is based on Sherwood586 by using a Gumbel distribution approximation. Although the model contains the capability to use the CMIP6587 results, those analyses are not included here.li Note that the uncertainty noted in the AR5 for climate is based on the variance among the CMIP5 runs themselves.lii The UQ here is the estimated uncertainty in the actual climate response.
4.5 Direct Air Capture
Overview: Direct air capture (DAC) is a control process that attempts to reduce temperature to an acceptable level. There is a delaying measurement process to determine what the DAC is doing and how much more capacity is required. DAC is investment and energy intensive. If there is temperature overshoot, ocean out-gassing occurs, which reduces the expected capability and consequences of DAC.
Bottom Line: DAC dominates climate mitigation costs in the later part of the century. _________________________________________________________________________
Because the model does not allow the use of biomass offsets (see Appendix 6), it aggressively initiates Direct Air Capture (DAC) investments to reduce atmospheric CO2 concentration588,589,590 when the GSAT exceeds 1.5 °C. DAC is more consistent with a GHG transition591 than BECCS.592 Indicated DAC capacity is determined by the maximum of either the gap between desired equilibrium CO2 and existing CO2 concentrations or as an error-correction process (control system) measuring the actual effect of DAC capacity in removing CO2 concentrations. The investments are constrained by maximum growth rates as discussed in Section 3.1, and
586 Sherwood, S.C., Webb, M.J., Annan, J.D., Armour, K.C., Forster, P.M., Hargreaves, J.C., Hegerl, G., Klein, S.A., Marvel, K.D., Rohling, E.J. and Watanabe, M., 2020. An assessment of Earth's climate sensitivity using multiple lines of evidence. Reviews of Geophysics, 58(4), p.e2019RG000678. https://www.pure.ed.ac.uk/ws/files/193005298/104._Hegerl.pdf 587 Tebaldi, C., Debeire, K., Eyring, V., Fischer, E., Fyfe, J., Friedlingstein, P., Knutti, R., Lowe, J., O'Neill, B., Sanderson, B. and van Vuuren, D., 2020. Climate model projections from the Scenario Model Intercomparison Project (ScenarioMIP) of CMIP6. Earth System Dynamics Discussions, pp.1-50. https://esd.copernicus.org/articles/12/253/2021/esd-12-253-2021.pdf 588 Creutzig, F., Breyer, C., Hilaire, J., Minx, J., Peters, G.P. and Socolow, R., 2019. The mutual dependence of negative emission technologies and energy systems. Energy & Environmental Science, 12(6), pp.1805-1817. https://pubs.rsc.org/en/content/articlepdf/2019/ee/c8ee03682a 589 Clearing The Air: Technological Carbon Dioxide Removal RD&D Initiative 2019 , Energy Futures Initiative https://energyfuturesinitiative.org/efi-reports, https://www.dropbox.com/s/2y36ngfrcbpv37f/EFI%20Clearing%20the%20Air%20Full%20Report.pdf?dl=0 590 Larsen, J., Herndon, W., Grant, M. and Marsters, P., 2019. Capturing leadership: Policies for the US to advance direct air capture technology. Rhodium Group. https://rhg.com/wp-content/uploads/2019/05/Rhodium_CapturingLeadership_May2019-1.pdf 591 Creutzig, F., Breyer, C., Hilaire, J., Minx, J., Peters, G.P. and Socolow, R., 2019. The mutual dependence of negative emission technologies and energy systems. Energy & Environmental Science, 12(6), pp.1805-1817. https://pubs.rsc.org/en/content/articlepdf/2019/ee/c8ee03682a 592 Fajardy, M. and Mac Dowell, N., 2017. Can BECCS deliver sustainable and resource efficient negative emissions?. Energy & Environmental Science, 10(6), pp.1389-1426. https://pubs.rsc.org/en/content/articlepdf/2017/ee/c7ee00465f
Climate Risk and Response July 2021
George Backus (Material is free to use with attribution.) 96
are limited to no more than 5% of the GDP.593, Because of the large overshoot in temperatures, DAC investments and energy-use are substantial.594 In the Core analysis, DAC capacity is on track to bring temperatures back to 1.5 °C by 2100, but it will take another 25-30 years before the temperatures actually reach tolerable levels.
The model does include the out-gassing of ocean CO2, when the CO2 concentration drops below previous levels.595,596,597,598 Because of other anthropogenic GHGs in the atmosphere, the DAC withdrawal of CO2 has to overcompensate. The implications for resources usage,599 ecosystems600 and weather601 are not addressed here. Recovered CO2 is assumed to be mineralized with costs from the NAS.602
593 Hanna, R., Abdulla, A., Xu, Y. et al. Emergency deployment of direct air capture as a response to the climate crisis. Nat Commun 12, 368 (2021). https://doi.org/10.1038/s41467-020-20437-0 594 Creutzig, F., Breyer, C., Hilaire, J., Minx, J., Peters, G.P. and Socolow, R., 2019. The mutual dependence of negative emission technologies and energy systems. Energy & Environmental Science, 12(6), pp.1805-1817. https://pubs.rsc.org/en/content/articlepdf/2019/ee/c8ee03682a 595 Jones, C.D., Ciais, P., Davis, S.J., Friedlingstein, P., Gasser, T., Peters, G.P., Rogelj, J., van Vuuren, D.P., Canadell, J.G., Cowie, A. and Jackson, R.B., 2016. Simulating the Earth system response to negative emissions. Environmental Research Letters, 11(9), p.095012. https://iopscience.iop.org/article/10.1088/1748-9326/11/9/095012/pdf 596 Tokarska, K.B. and Zickfeld, K., 2015. The effectiveness of net negative carbon dioxide emissions in reversing anthropogenic climate change. Environmental Research Letters, 10(9), p.094013. https://iopscience.iop.org/article/10.1088/1748-9326/10/9/094013/pdf 597 Cao, L. and Caldeira, K., 2010. Atmospheric carbon dioxide removal: long-term consequences and commitment. Environmental Research Letters, 5(2), p.024011. https://iopscience.iop.org/article/10.1088/1748-9326/5/2/024011/pdf 598 Vichi, M., Navarra, A. and Fogli, P.G., 2013. Adjustment of the natural ocean carbon cycle to negative emission rates. Climatic Change, 118(1), pp.105-118. https://link.springer.com/article/10.1007/s10584-012-0677-0 599 Hepburn, C., Adlen, E., Beddington, J., Carter, E.A., Fuss, S., Mac Dowell, N., Minx, J.C., Smith, P. and Williams, C.K., 2019. The technological and economic prospects for CO 2 utilization and removal. Nature, 575(7781), pp.87-97. https://eprints.whiterose.ac.uk/154677/1/Hepburn%20et%20al%202019%20CO2%20Utilisation%20-%20in%20press.pdf 600 Fuhrman, J., McJeon, H., Patel, P., Doney, S.C., Shobe, W.M. and Clarens, A.F., 2020. Food–energy–water implications of negative emissions technologies in a+ 1.5 C future. Nature Climate Change, 10(10), pp.920-927. https://www.nature.com/articles/s41558-020-0876-z 601 Zickfeld, K., Azevedo, D., Mathesius, S. et al. Asymmetry in the climate–carbon cycle response to positive and negative CO2 emissions. Nat. Clim. Chang. (2021). https://doi.org/10.1038/s41558-021-01061-2 https://www.nature.com/articles/s41558-021-01061-2 602 National Academies of Sciences, Engineering, and Medicine 2019. Negative Emissions Technologies and Reliable Sequestration: A Research Agenda. Washington, DC: The National Academies Press. https://doi.org/10.17226/25259.

Climate Risk and Response July 2021
George Backus (Material is free to use with attribution.) 97
DAC costs are assumed to decline by a factor of 6 over the simulation period.603,604,605,606 It is aspirationally assumed that reduced costs result in reduced energy demand607,608 for operations and for building the facilities.609 DAC investments have a large negative impact on the economy which are consistent with reported concerns.610 Nonetheless, there is adequate DAC by the end of the century, reducing temperatures by 0.4 to 0.6 °C over what they would be in the absence of DAC investments. (See Section 5 and Appendix 1.)
603 Keith, D.W., Holmes, G., Angelo, D.S. and Heidel, K., 2018. A process for capturing CO2 from the atmosphere. Joule, 2(8), pp.1573-1594. https://www.sciencedirect.com/science/article/pii/S2542435118302253/pdfft?md5=510ab5ad75794b92508e981547eebb05&pid=1-s2.0-S2542435118302253-main.pdf 604 Fasihi, M., Efimova, O. and Breyer, C., 2019. Techno-economic assessment of CO2 direct air capture plants. Journal of cleaner production, 224, pp.957-980. https://www.sciencedirect.com/science/article/pii/S0959652619307772 605Realmonte, G., Drouet, L., Gambhir, A., Glynn, J., Hawkes, A., Köberle, A.C. and Tavoni, M., 2019. An inter-model assessment of the role of direct air capture in deep mitigation pathways. Nature communications, 10(1), pp.1-12. https://www.nature.com/articles/s41467-019-10842-5 606 Breyer, C., Fasihi, M. and Aghahosseini, A., 2020. Carbon dioxide direct air capture for effective climate change mitigation based on renewable electricity: a new type of energy system sector coupling. Mitigation and Adaptation Strategies for Global Change, 25(1), pp.43-65. https://link.springer.com/content/pdf/10.1007/s11027-019-9847-y.pdf 607 Babacan, O., De Causmaecker, S., Gambhir, A., Fajardy, M., Rutherford, A.W., Fantuzzi, A. and Nelson, J., 2020. Assessing the feasibility of carbon dioxide mitigation options in terms of energy usage. Nature Energy, 5(9), pp.720-728. https://spiral.imperial.ac.uk/bitstream/10044/1/82471/2/babacan_2019_natenergy_SUBMITTED_Nov13.pdf 608 Fuhrman, J., McJeon, H., Patel, P., Doney, S.C., Shobe, W.M. and Clarens, A.F., 2020. Food–energy–water implications of negative emissions technologies in a+ 1.5 C future. Nature Climate Change, 10(10), pp.920-927. https://www.nature.com/articles/s41558-020-0876-z 609 Chatterjee, S. and Huang, K.W., 2020. Unrealistic energy and materials requirement for direct air capture in deep mitigation pathways. Nature Communications, 11(1), pp.1-3. https://www.nature.com/articles/s41467-020-17203-7.pdf 610 Hansen, J. and Kharecha, P., 2018. Cost of carbon capture: can young people bear the burden?. Joule, 2(8), pp.1405-1407. https://www.sciencedirect.com/science/article/pii/S2542435118303465
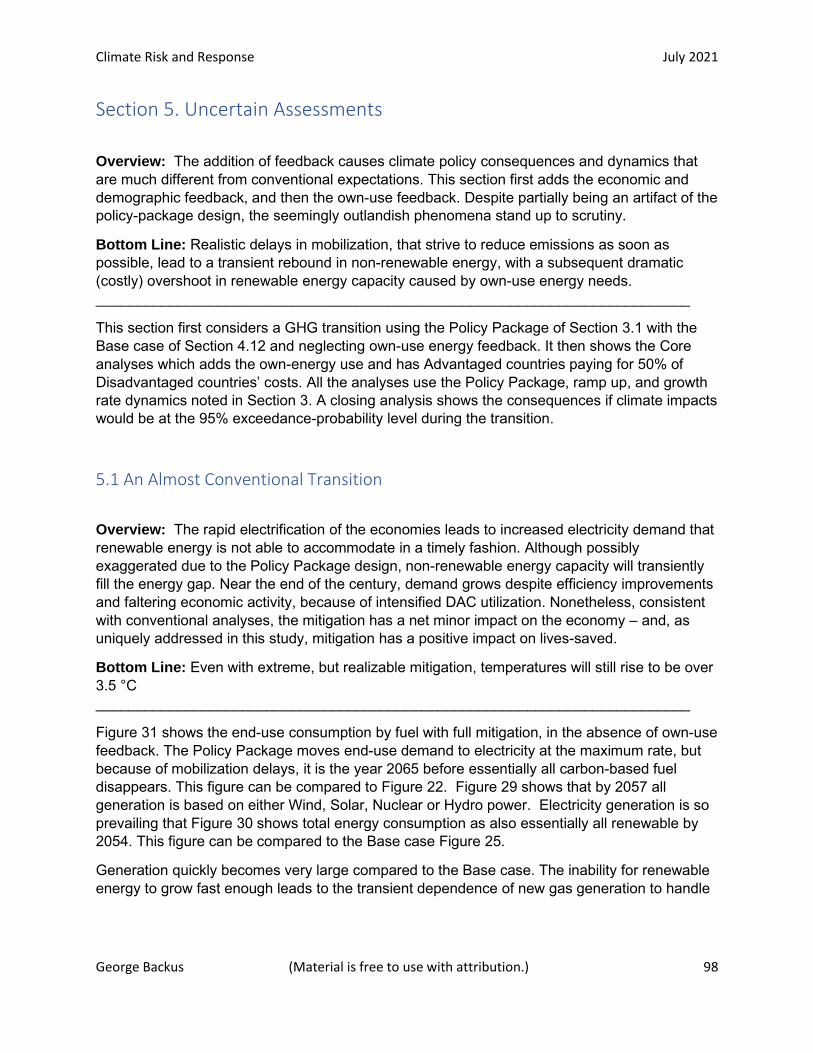
Climate Risk and Response July 2021
George Backus (Material is free to use with attribution.) 98
Section 5. Uncertain Assessments
Overview: The addition of feedback causes climate policy consequences and dynamics that are much different from conventional expectations. This section first adds the economic and demographic feedback, and then the own-use feedback. Despite partially being an artifact of the policy-package design, the seemingly outlandish phenomena stand up to scrutiny.
Bottom Line: Realistic delays in mobilization, that strive to reduce emissions as soon as possible, lead to a transient rebound in non-renewable energy, with a subsequent dramatic (costly) overshoot in renewable energy capacity caused by own-use energy needs. _________________________________________________________________________
This section first considers a GHG transition using the Policy Package of Section 3.1 with the Base case of Section 4.12 and neglecting own-use energy feedback. It then shows the Core analyses which adds the own-energy use and has Advantaged countries paying for 50% of Disadvantaged countries’ costs. All the analyses use the Policy Package, ramp up, and growth rate dynamics noted in Section 3. A closing analysis shows the consequences if climate impacts would be at the 95% exceedance-probability level during the transition.
5.1 An Almost Conventional Transition
Overview: The rapid electrification of the economies leads to increased electricity demand that renewable energy is not able to accommodate in a timely fashion. Although possibly exaggerated due to the Policy Package design, non-renewable energy capacity will transiently fill the energy gap. Near the end of the century, demand grows despite efficiency improvements and faltering economic activity, because of intensified DAC utilization. Nonetheless, consistent with conventional analyses, the mitigation has a net minor impact on the economy – and, as uniquely addressed in this study, mitigation has a positive impact on lives-saved.
Bottom Line: Even with extreme, but realizable mitigation, temperatures will still rise to be over 3.5 °C _________________________________________________________________________
Figure 31 shows the end-use consumption by fuel with full mitigation, in the absence of own-use feedback. The Policy Package moves end-use demand to electricity at the maximum rate, but because of mobilization delays, it is the year 2065 before essentially all carbon-based fuel disappears. This figure can be compared to Figure 22. Figure 29 shows that by 2057 all generation is based on either Wind, Solar, Nuclear or Hydro power. Electricity generation is so prevailing that Figure 30 shows total energy consumption as also essentially all renewable by 2054. This figure can be compared to the Base case Figure 25.
Generation quickly becomes very large compared to the Base case. The inability for renewable energy to grow fast enough leads to the transient dependence of new gas generation to handle
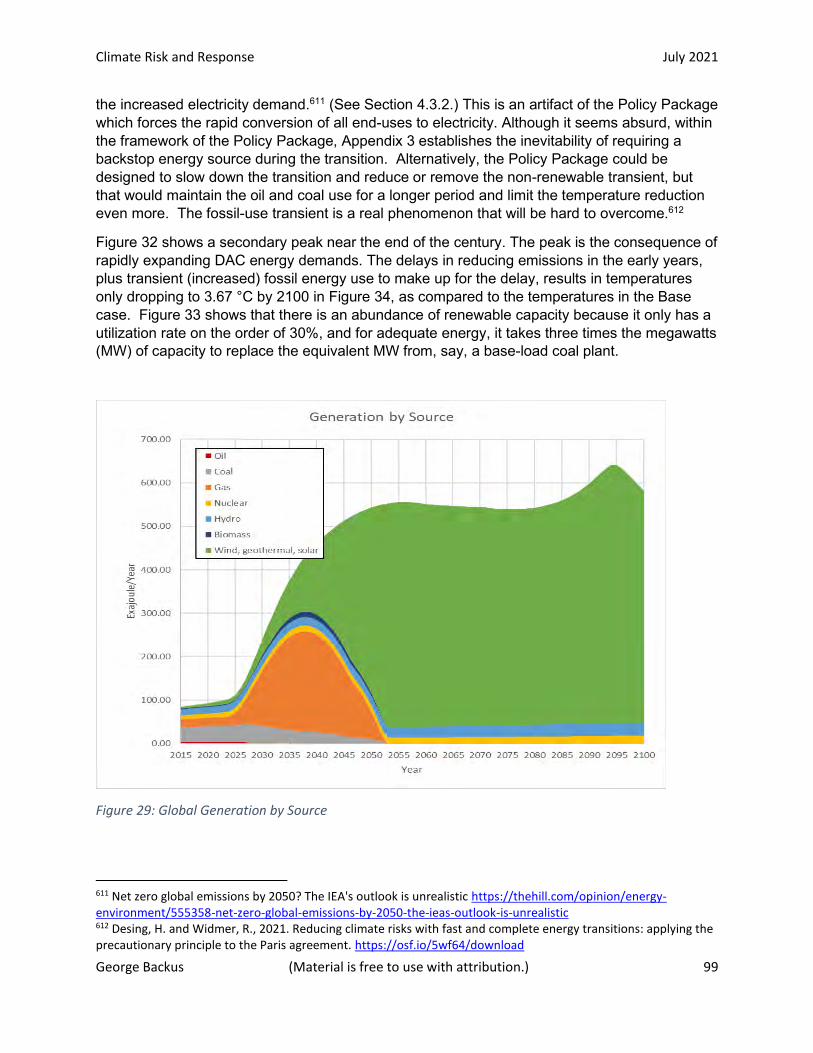
Climate Risk and Response July 2021
George Backus (Material is free to use with attribution.) 99
the increased electricity demand.611 (See Section 4.3.2.) This is an artifact of the Policy Package which forces the rapid conversion of all end-uses to electricity. Although it seems absurd, within the framework of the Policy Package, Appendix 3 establishes the inevitability of requiring a backstop energy source during the transition. Alternatively, the Policy Package could be designed to slow down the transition and reduce or remove the non-renewable transient, but that would maintain the oil and coal use for a longer period and limit the temperature reduction even more. The fossil-use transient is a real phenomenon that will be hard to overcome.612
Figure 32 shows a secondary peak near the end of the century. The peak is the consequence of rapidly expanding DAC energy demands. The delays in reducing emissions in the early years, plus transient (increased) fossil energy use to make up for the delay, results in temperatures only dropping to 3.67 °C by 2100 in Figure 34, as compared to the temperatures in the Base case. Figure 33 shows that there is an abundance of renewable capacity because it only has a utilization rate on the order of 30%, and for adequate energy, it takes three times the megawatts (MW) of capacity to replace the equivalent MW from, say, a base-load coal plant.
Figure 29: Global Generation by Source
611 Net zero global emissions by 2050? The IEA's outlook is unrealistic https://thehill.com/opinion/energy-environment/555358-net-zero-global-emissions-by-2050-the-ieas-outlook-is-unrealistic 612 Desing, H. and Widmer, R., 2021. Reducing climate risks with fast and complete energy transitions: applying the precautionary principle to the Paris agreement. https://osf.io/5wf64/download

Climate Risk and Response July 2021
George Backus (Material is free to use with attribution.) 100
Figure 30: Global Energy Consumption by Fuel
Figure 31: Global End-Use Demand by Fuel

Climate Risk and Response July 2021
George Backus (Material is free to use with attribution.) 101
Figure 32: Global End-Use Demand by Type
Figure 33: Global Generation Capacity

Climate Risk and Response July 2021
George Backus (Material is free to use with attribution.) 102
Figure 34: Global Surface Average Temperature w/UQ
The next set of graphs address the GDP and population impacts across the Referent, Base, and this initial (conventional) mitigation scenario, first in absolute terms and then proportionally. The “Scenario” curve will always correspond to the subject analysis being reviewed. For compactness “Adv” designates the values for Advantaged countries, and “Dis” designates the values for the Disadvantaged countries. The impacts on the Disadvantaged countries are dramatic.
Figure 35: Population by Region and Scenario
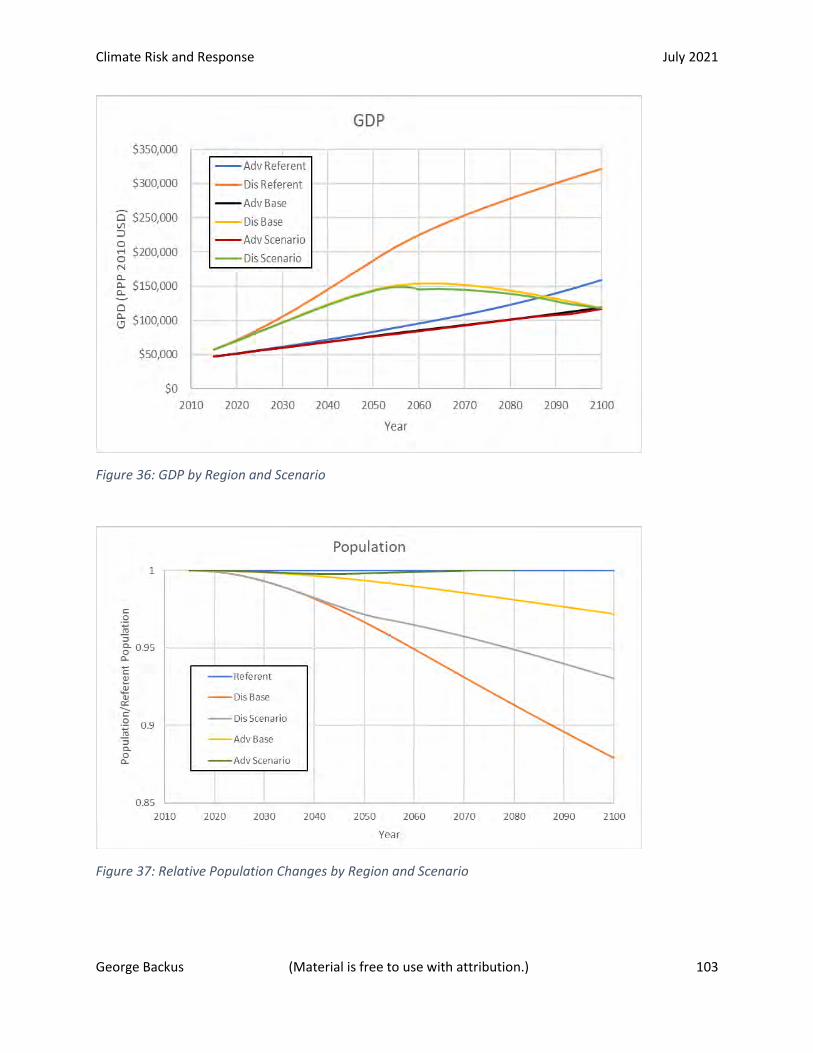
Climate Risk and Response July 2021
George Backus (Material is free to use with attribution.) 103
Figure 36: GDP by Region and Scenario
Figure 37: Relative Population Changes by Region and Scenario
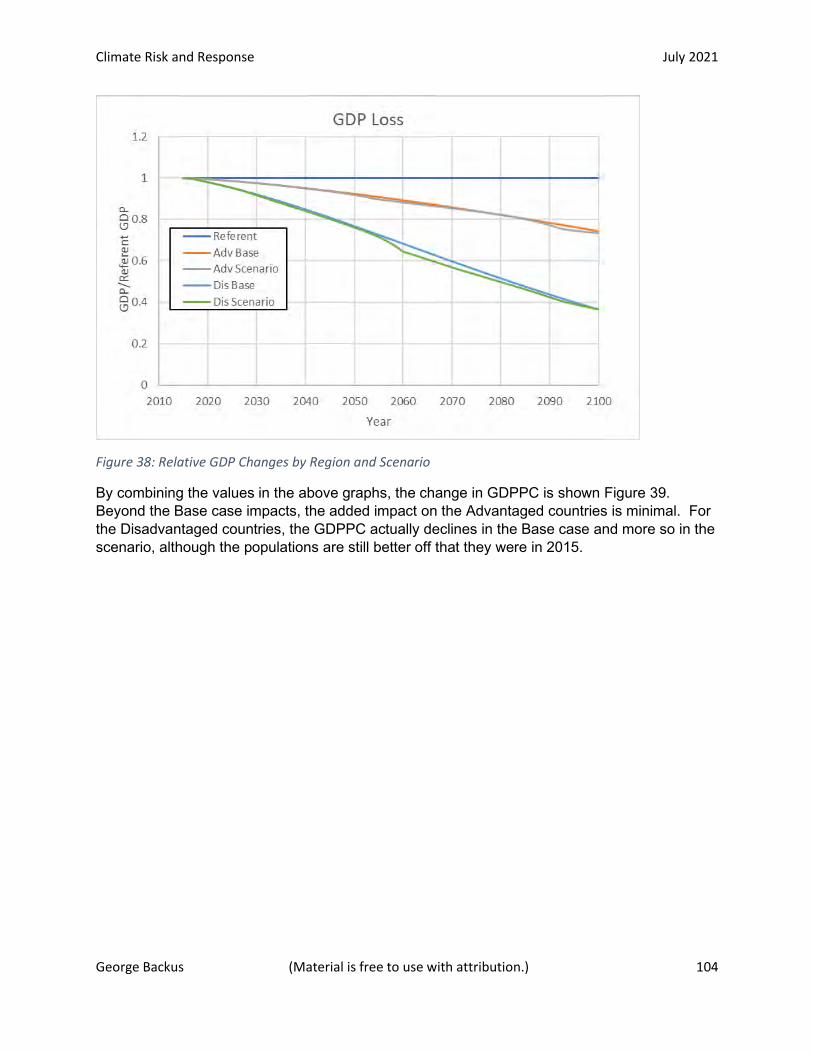
Climate Risk and Response July 2021
George Backus (Material is free to use with attribution.) 104
Figure 38: Relative GDP Changes by Region and Scenario
By combining the values in the above graphs, the change in GDPPC is shown Figure 39. Beyond the Base case impacts, the added impact on the Advantaged countries is minimal. For the Disadvantaged countries, the GDPPC actually declines in the Base case and more so in the scenario, although the populations are still better off that they were in 2015.
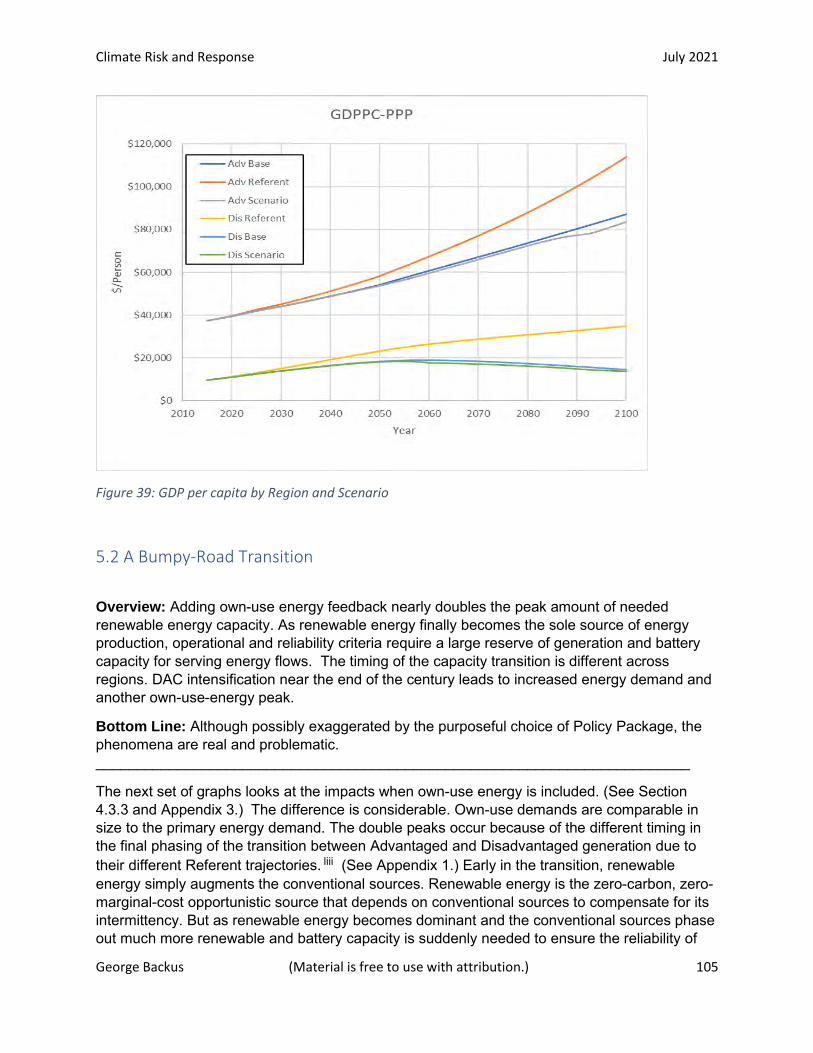
Climate Risk and Response July 2021
George Backus (Material is free to use with attribution.) 105
Figure 39: GDP per capita by Region and Scenario
5.2 A Bumpy-Road Transition
Overview: Adding own-use energy feedback nearly doubles the peak amount of needed renewable energy capacity. As renewable energy finally becomes the sole source of energy production, operational and reliability criteria require a large reserve of generation and battery capacity for serving energy flows. The timing of the capacity transition is different across regions. DAC intensification near the end of the century leads to increased energy demand and another own-use-energy peak.
Bottom Line: Although possibly exaggerated by the purposeful choice of Policy Package, the phenomena are real and problematic. _________________________________________________________________________
The next set of graphs looks at the impacts when own-use energy is included. (See Section 4.3.3 and Appendix 3.) The difference is considerable. Own-use demands are comparable in size to the primary energy demand. The double peaks occur because of the different timing in the final phasing of the transition between Advantaged and Disadvantaged generation due to their different Referent trajectories. liii (See Appendix 1.) Early in the transition, renewable energy simply augments the conventional sources. Renewable energy is the zero-carbon, zero-marginal-cost opportunistic source that depends on conventional sources to compensate for its intermittency. But as renewable energy becomes dominant and the conventional sources phase out much more renewable and battery capacity is suddenly needed to ensure the reliability of
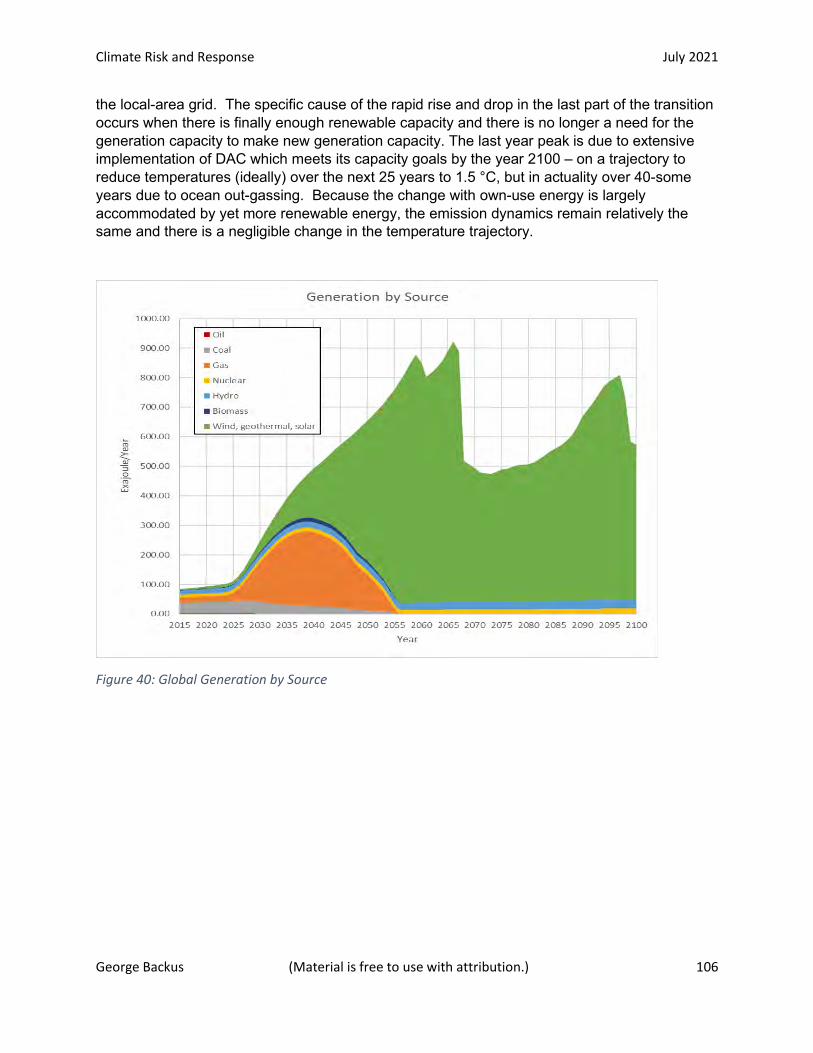
Climate Risk and Response July 2021
George Backus (Material is free to use with attribution.) 106
the local-area grid. The specific cause of the rapid rise and drop in the last part of the transition occurs when there is finally enough renewable capacity and there is no longer a need for the generation capacity to make new generation capacity. The last year peak is due to extensive implementation of DAC which meets its capacity goals by the year 2100 – on a trajectory to reduce temperatures (ideally) over the next 25 years to 1.5 °C, but in actuality over 40-some years due to ocean out-gassing. Because the change with own-use energy is largely accommodated by yet more renewable energy, the emission dynamics remain relatively the same and there is a negligible change in the temperature trajectory.
Figure 40: Global Generation by Source
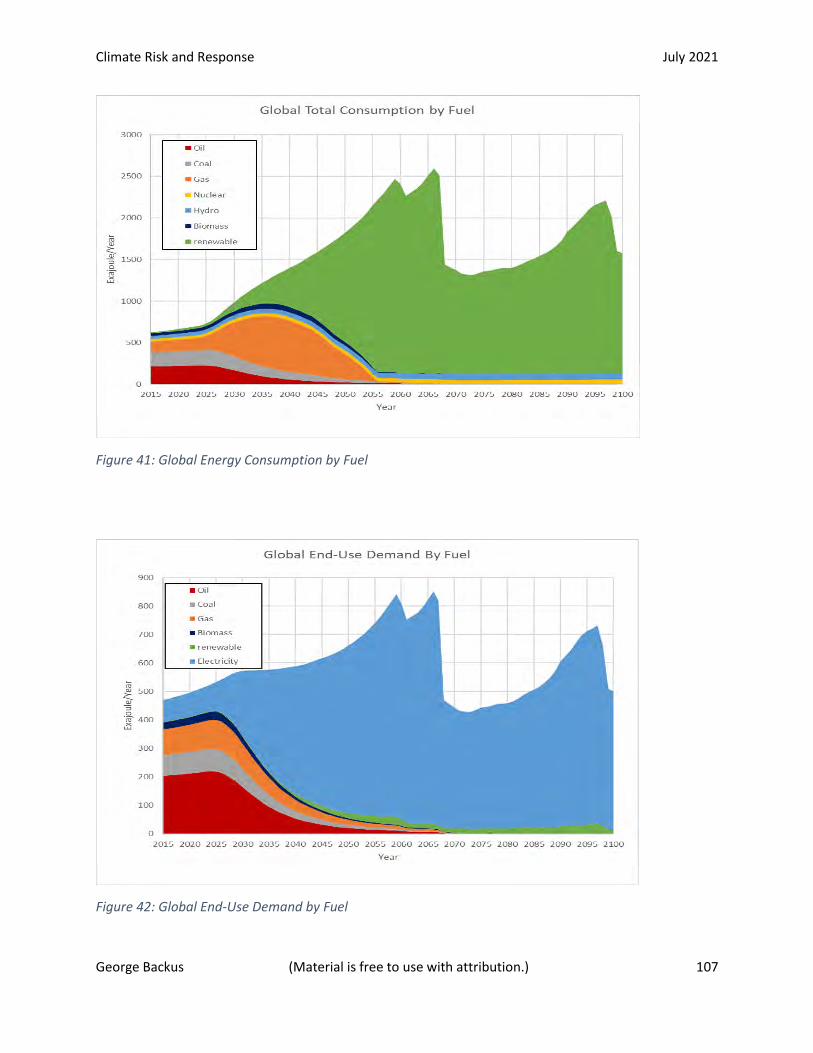
Climate Risk and Response July 2021
George Backus (Material is free to use with attribution.) 107
Figure 41: Global Energy Consumption by Fuel
Figure 42: Global End-Use Demand by Fuel
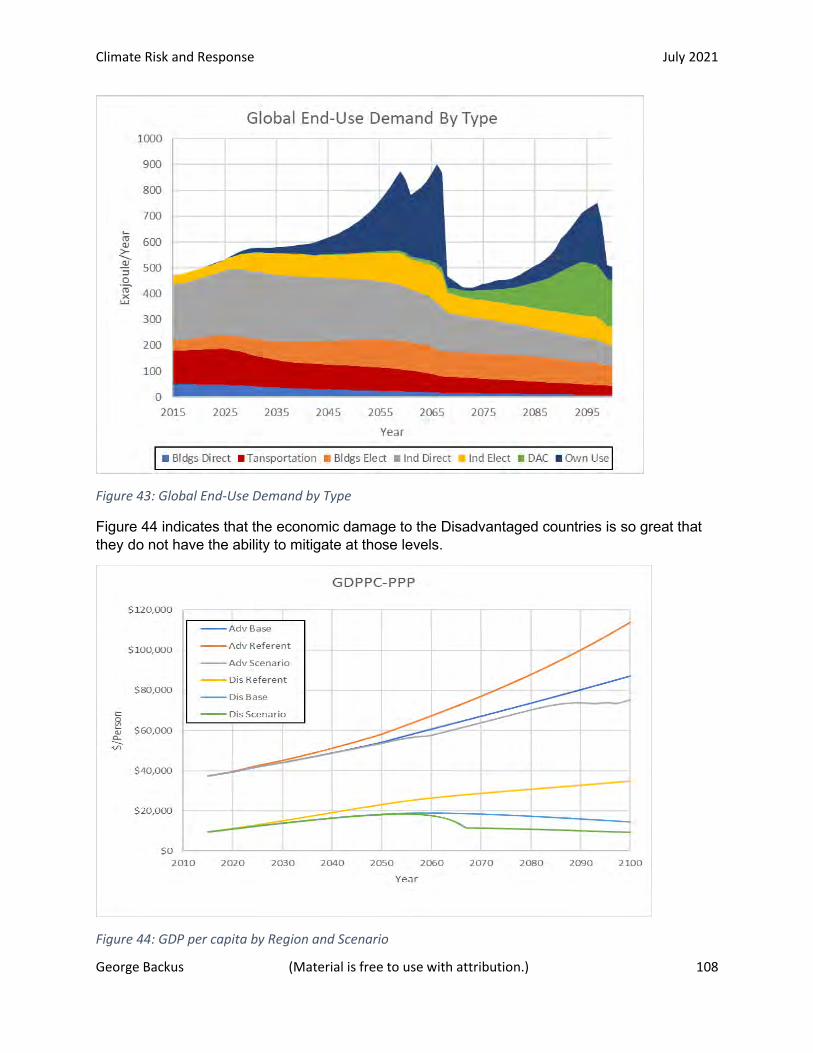
Climate Risk and Response July 2021
George Backus (Material is free to use with attribution.) 108
Figure 43: Global End-Use Demand by Type
Figure 44 indicates that the economic damage to the Disadvantaged countries is so great that they do not have the ability to mitigate at those levels.
Figure 44: GDP per capita by Region and Scenario

Climate Risk and Response July 2021
George Backus (Material is free to use with attribution.) 109
5.3 The Core Analysis
Overview: It is not possible for the Disadvantaged countries to make the GHG transition on their own. Advantaged countries will need to pay for 50% of the mitigation cost for the economically larger and more populous Disadvantaged region. It is not possible for the Advantaged countries to provide more support without unacceptable economic damage to themselves. This section shows some added detail for the GHG transition.
Bottom Line: The reduction in Disadvantaged country incomes suggests intense social-unrest and geopolitical tensions which could derail mitigation efforts. _________________________________________________________________________
The next set of graphs looks in more detail at what is considered the Core analysis. It uses the mean climate and mean impact conditions (the same as those above), but the Advantaged countries also pay 50% of the mitigation costs.liv Energy use and emissions are comparable to the previous analysis except that total energy use and transition costs are higher because Disadvantaged countries have higher incomes that lead to fewer deaths and a larger population. The Advantaged countries have lower energy use because of reduced incomes. If the Advantaged countries attempted to pay for more than 50% of the Disadvantaged mitigation costs, their incomes would drop to levels comparable to those of the Disadvantaged countries. If the Advantaged countries pay less than 50%, the Disadvantaged countries, if they pursue full mitigation, would have incomes reduced to levels below those of 2020 along with up to a 20% drop in population over what it would otherwise be.
Figure 45: Global Generation by Source
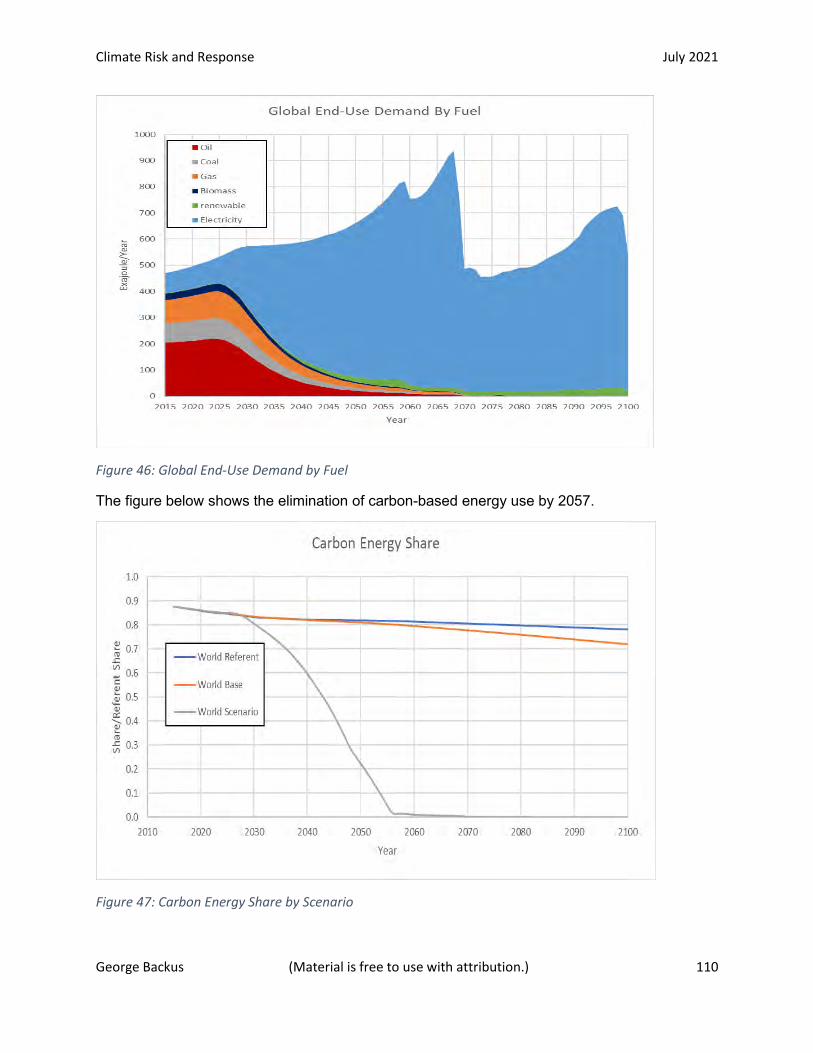
Climate Risk and Response July 2021
George Backus (Material is free to use with attribution.) 110
Figure 46: Global End-Use Demand by Fuel
The figure below shows the elimination of carbon-based energy use by 2057.
Figure 47: Carbon Energy Share by Scenario

Climate Risk and Response July 2021
George Backus (Material is free to use with attribution.) 111
In the figure below, CO2 emissions (and other GHG emissions, not shown) decline to natural levels by about 2067. There is a slight increase in intermediate-term emissions due to the necessary transient use of more non-renewable energy. It is not until the late 2070s before DAC capacity is large enough to significantly reduce the concentration of CO2 in the atmosphere. The DAC capacity overshoots around 2090 because of the inability to immediately measure its effect. DAC has to overcompensate for other GHG emission impacts on temperature. The year 2100 would, in the absence of ocean out-gassing, return concentrations to the 1.5 C level in 25 years.
Figure 48: CO2 Emissions by Scenario
By the year 2100, partially paying for the Disadvantaged mitigation costs ultimately makes the economic damage no worse off than climate change would have otherwise produced. Still there will be many upset, angry people in the Disadvantaged countries.613 The Disadvantaged countries would be fully aware that their climate crisis is the result of the Advantaged countries’ historical disregard of GHG emissions.
613 World Bank, 2011. World development report 2011: Conflict, security, and development. The World Bank. https://openknowledge.worldbank.org/bitstream/handle/10986/4389/589880PUB0WDR0000public00BOX358355B.pdf?sequence=1&isAllowed=y
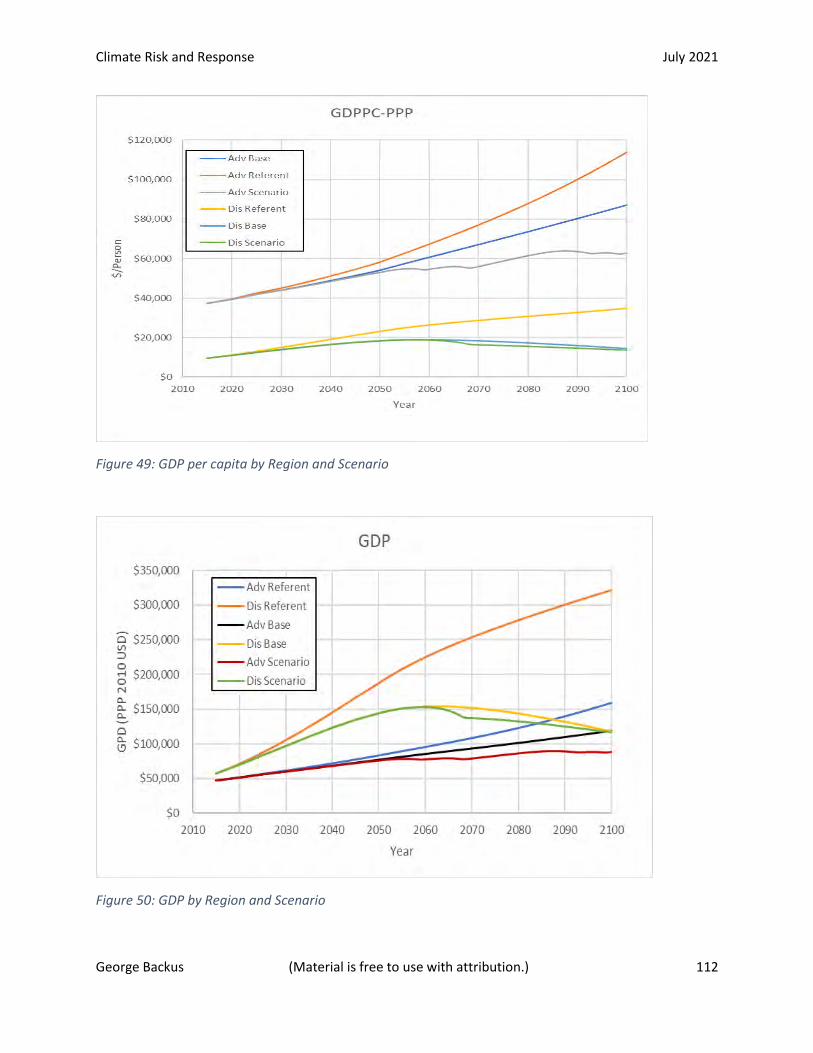
Climate Risk and Response July 2021
George Backus (Material is free to use with attribution.) 112
Figure 49: GDP per capita by Region and Scenario
Figure 50: GDP by Region and Scenario

Climate Risk and Response July 2021
George Backus (Material is free to use with attribution.) 113
Figure 51: Relative GDP Changes by Region and Scenario
Figure 52: Population by Region and Scenario
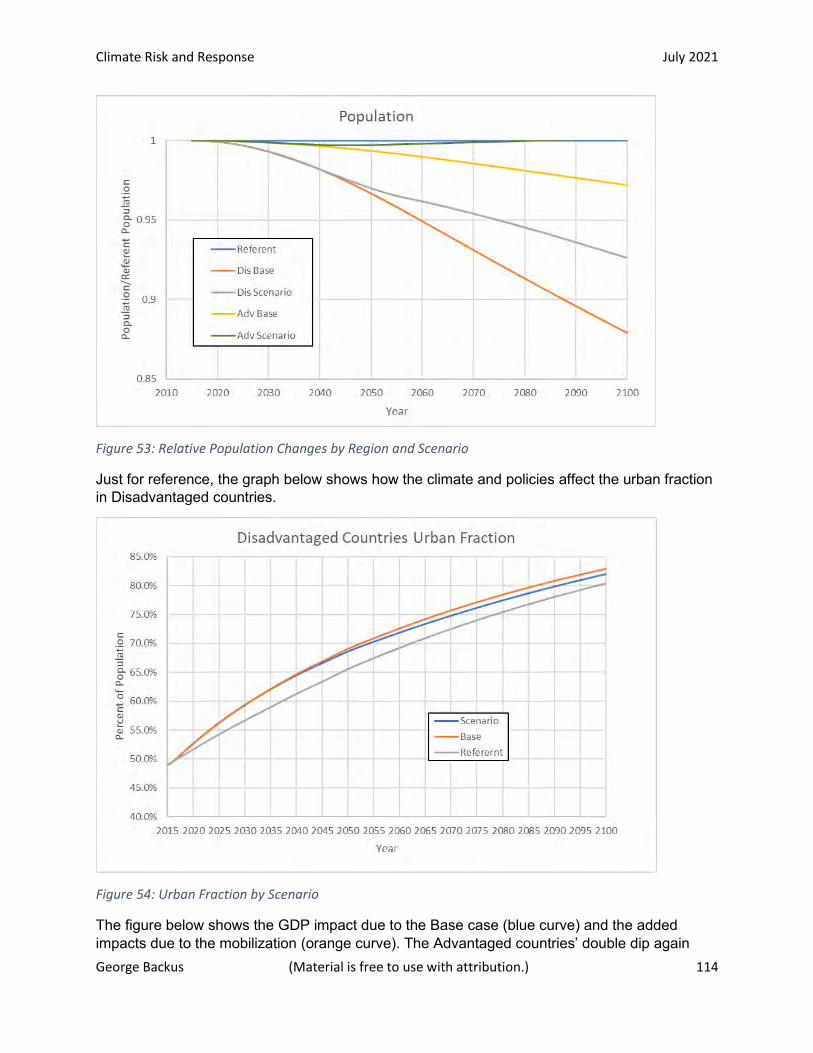
Climate Risk and Response July 2021
George Backus (Material is free to use with attribution.) 114
Figure 53: Relative Population Changes by Region and Scenario
Just for reference, the graph below shows how the climate and policies affect the urban fraction in Disadvantaged countries.
Figure 54: Urban Fraction by Scenario
The figure below shows the GDP impact due to the Base case (blue curve) and the added impacts due to the mobilization (orange curve). The Advantaged countries’ double dip again

Climate Risk and Response July 2021
George Backus (Material is free to use with attribution.) 115
results from the differing transition times across the regions, with the Advantaged countries paying for both. The double dip at the end is due to the overshoot of DAC. By 2100 the transition is completely over with no more economic impacts.
Figure 55: Advantaged GDP Growth Impacts by Scenario
With the help of the Advantaged countries, the Disadvantaged countries still see a 2.5%/Year additional “peak” GDP loss, but this is much better than the 10%/year loss they would otherwise experience.
Figure 56: Disadvantaged GDP Growth Impacts by Scenario
The next two figures detail the investment flows during the GHG transition.
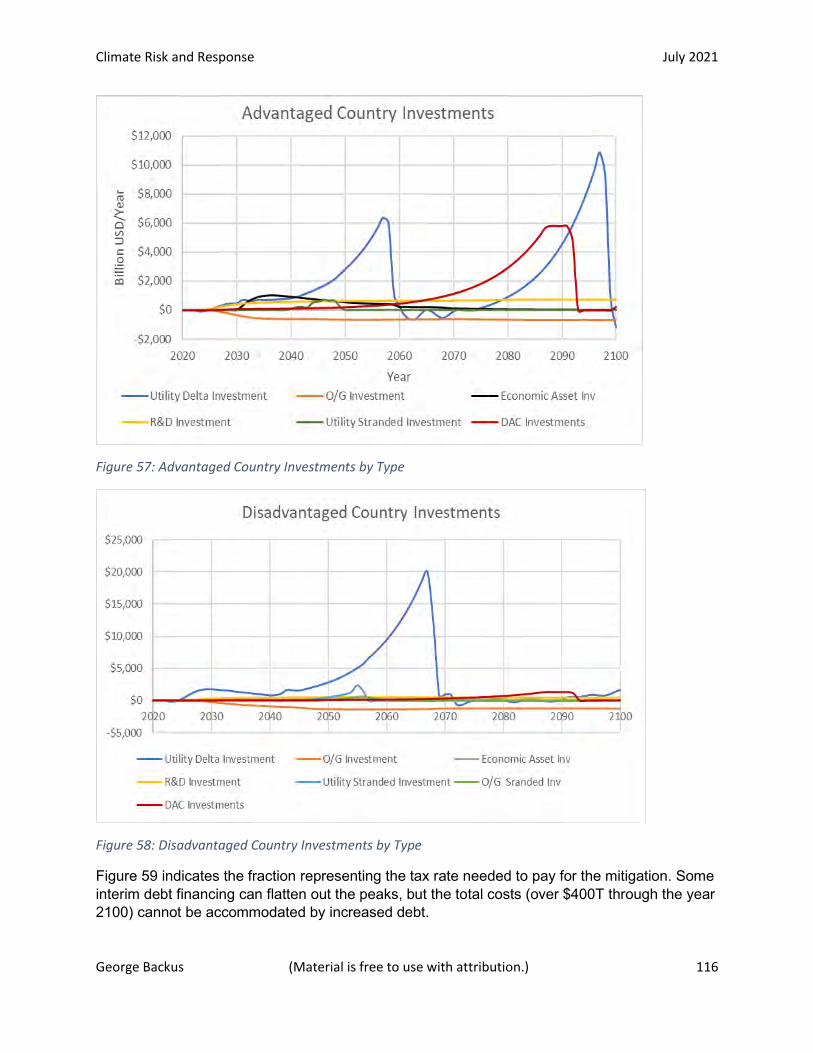
Climate Risk and Response July 2021
George Backus (Material is free to use with attribution.) 116
Figure 57: Advantaged Country Investments by Type
Figure 58: Disadvantaged Country Investments by Type
Figure 59 indicates the fraction representing the tax rate needed to pay for the mitigation. Some interim debt financing can flatten out the peaks, but the total costs (over $400T through the year 2100) cannot be accommodated by increased debt.
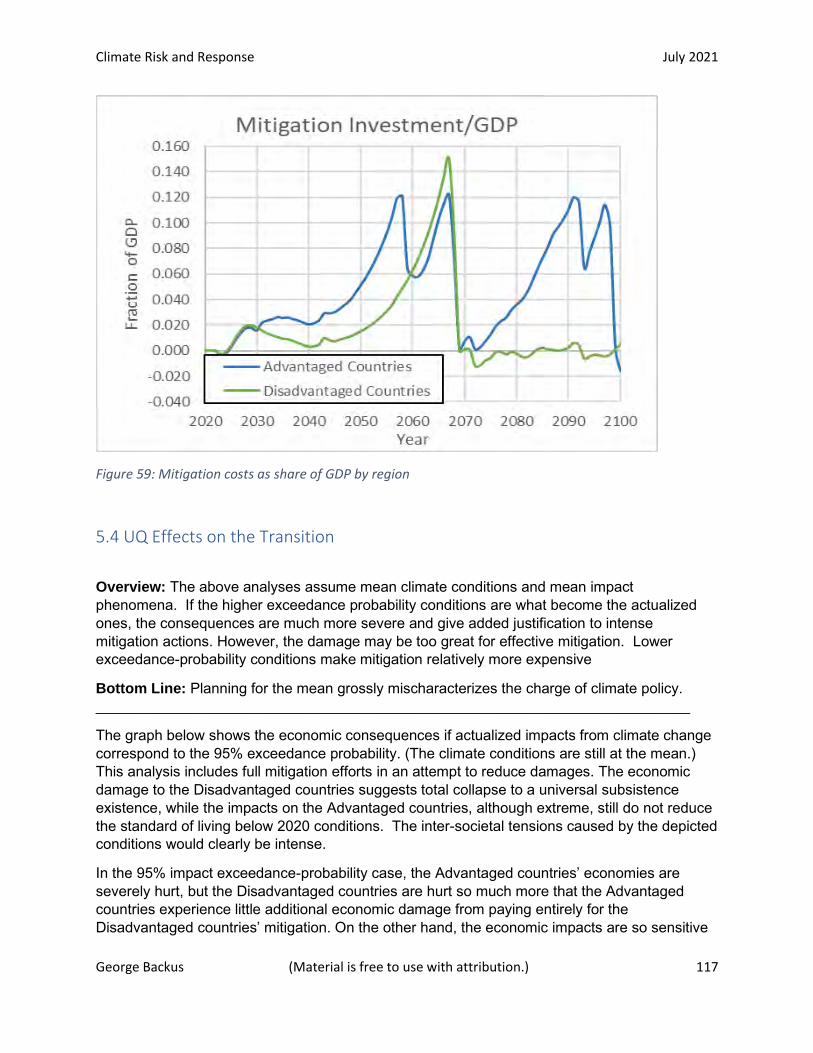
Climate Risk and Response July 2021
George Backus (Material is free to use with attribution.) 117
Figure 59: Mitigation costs as share of GDP by region
5.4 UQ Effects on the Transition
Overview: The above analyses assume mean climate conditions and mean impact phenomena. If the higher exceedance probability conditions are what become the actualized ones, the consequences are much more severe and give added justification to intense mitigation actions. However, the damage may be too great for effective mitigation. Lower exceedance-probability conditions make mitigation relatively more expensive
Bottom Line: Planning for the mean grossly mischaracterizes the charge of climate policy. _________________________________________________________________________
The graph below shows the economic consequences if actualized impacts from climate change correspond to the 95% exceedance probability. (The climate conditions are still at the mean.) This analysis includes full mitigation efforts in an attempt to reduce damages. The economic damage to the Disadvantaged countries suggests total collapse to a universal subsistence existence, while the impacts on the Advantaged countries, although extreme, still do not reduce the standard of living below 2020 conditions. The inter-societal tensions caused by the depicted conditions would clearly be intense.
In the 95% impact exceedance-probability case, the Advantaged countries’ economies are severely hurt, but the Disadvantaged countries are hurt so much more that the Advantaged countries experience little additional economic damage from paying entirely for the Disadvantaged countries’ mitigation. On the other hand, the economic impacts are so sensitive
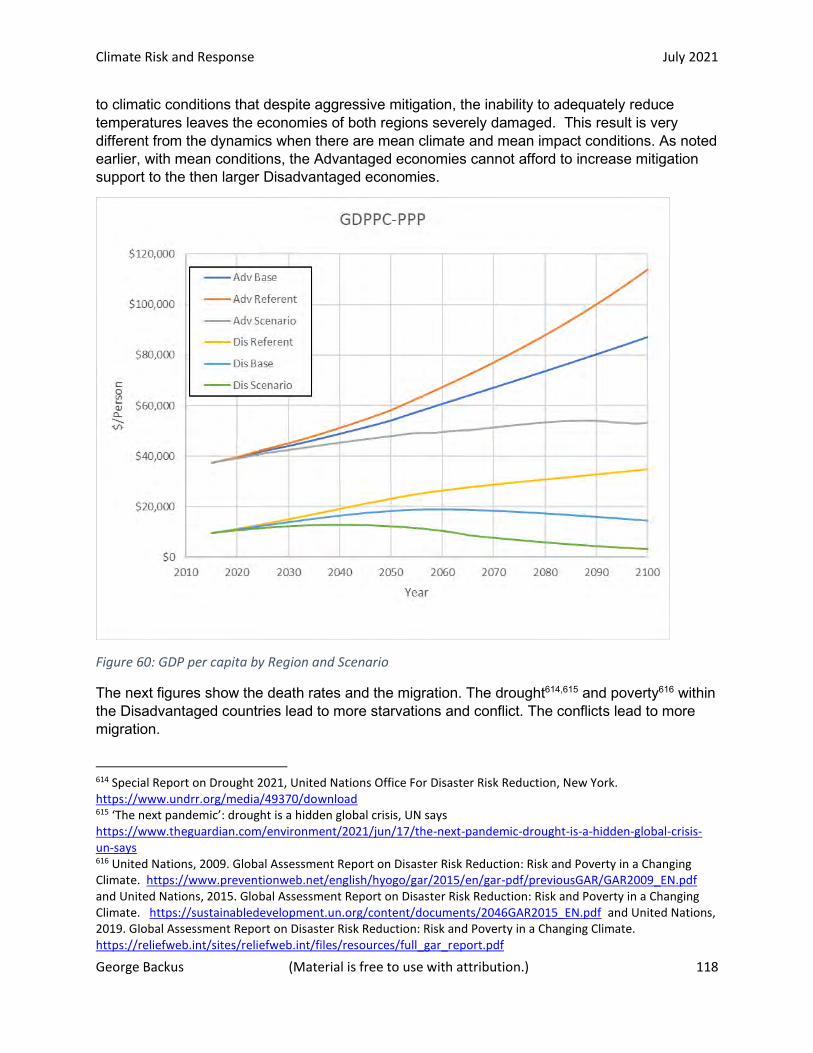
Climate Risk and Response July 2021
George Backus (Material is free to use with attribution.) 118
to climatic conditions that despite aggressive mitigation, the inability to adequately reduce temperatures leaves the economies of both regions severely damaged. This result is very different from the dynamics when there are mean climate and mean impact conditions. As noted earlier, with mean conditions, the Advantaged economies cannot afford to increase mitigation support to the then larger Disadvantaged economies.
Figure 60: GDP per capita by Region and Scenario
The next figures show the death rates and the migration. The drought614,615 and poverty616 within the Disadvantaged countries lead to more starvations and conflict. The conflicts lead to more migration.
614 Special Report on Drought 2021, United Nations Office For Disaster Risk Reduction, New York. https://www.undrr.org/media/49370/download 615 ‘The next pandemic’: drought is a hidden global crisis, UN says https://www.theguardian.com/environment/2021/jun/17/the-next-pandemic-drought-is-a-hidden-global-crisis-un-says 616 United Nations, 2009. Global Assessment Report on Disaster Risk Reduction: Risk and Poverty in a Changing Climate. https://www.preventionweb.net/english/hyogo/gar/2015/en/gar-pdf/previousGAR/GAR2009_EN.pdf and United Nations, 2015. Global Assessment Report on Disaster Risk Reduction: Risk and Poverty in a Changing Climate. https://sustainabledevelopment.un.org/content/documents/2046GAR2015_EN.pdf and United Nations, 2019. Global Assessment Report on Disaster Risk Reduction: Risk and Poverty in a Changing Climate. https://reliefweb.int/sites/reliefweb.int/files/resources/full_gar_report.pdf

Climate Risk and Response July 2021
George Backus (Material is free to use with attribution.) 119
Figure 61: Excess Global Deaths by Region and Scenario
Figure 62: Excess Global Stock of Displaced Persons

Climate Risk and Response July 2021
George Backus (Material is free to use with attribution.) 120
Appendix 1 shows the dynamics of the GHG transition under all varied uncertainty conditions and various mobilization levels. It shows that low exceedance probabilities of climate change and impact reduce the efficacy of mitigation efforts from a tradeoff perspective. The mitigation costs are higher because the economies and populations are larger than in the Base case. In the high exceedance climate and impact cases, anything that can reduce the damage makes a big difference. Low levels of mitigation have apparent benefits, but only high levels of mitigation can have a meaningful impact. GHG transition policies that hedge against “all-in” mitigation are not much better than doing nothing.
In all but the 5% (low) climate exceedance probability case, no scenario is able to reduce the 2100 temperatures below 3.5 °C. (See Appendix 1.)
Electrification adds more pollution by forcing more generation before renewable energy can adequately replace fossil-fuels generation. Thus, there can initially be more deaths with low mobilization (low rates of renewable energy-supply implementation). Low mobilization paths (such as the original Paris accord), are largely counterproductive compared to say, 90% or better mobilization.
For Advantaged countries, as the temperature increases, they initially experience increased disease loads, but as the temperatures increase even more, disease pathways decrease.617 Advantaged countries then primarily only experience reduced deaths from reduced pollution levels. Therefore, there is not much benefit from low levels of mitigation. As conflict increases in the Disadvantaged countries, there is a very slight increase in battle deaths from the Advantaged countries’ efforts to contain the conflicts.
For the Disadvantaged countries, there are fewer deaths when the Advantaged countries provide financial support for mitigation because Disadvantaged GDPPC is then higher.
617 Lafferty, K.D. and Mordecai, E.A., 2016. The rise and fall of infectious disease in a warmer world. F1000Research, 5. https://www.ncbi.nlm.nih.gov/pmc/articles/PMC4995683/pdf/f1000research-5-9435.pdf
Climate Risk and Response July 2021
George Backus (Material is free to use with attribution.) 121
Section 6. Confluence Competition
Overview: Climate is a threat multiplier that interacts with new technologies and societal pressures to produce a confluence and convergence of complex crises. These threats will compete with each other for governmental prioritization.
Bottom Line: Safeguard responses will be a significant part of climate policy, interfering with mitigation and adaptation efforts. _________________________________________________________________________
Unsurprisingly, analyses of the GHG transition concentrate on mitigating climate change in the absence of any other considerations. This section catalogues a variety of climate and threat interactions.618 Climate change is a threat multiplier619 and it will interact with other emerging threats620,621,622 Climate couples with the other threats and boosts the likelihood of joint occurrence,623 while amplifying the joint consequences.624,625 The confluence of threats might not transpire, but the escalating risk justifies considerations of preparedness and safeguard responses.626
There are many quickly maturing technologies that democratize technology – whereby individuals with limited budgets can acquire the capabilities normally associated with nations.627,628 These technological advances can converge together with climate impacts to produce additional, and possibly unintended, but troublesome capabilities.629 These
618 A Security Threat Assessment Of Global Climate Change, February 2020, Council on Strategic Risks https://climateandsecurity.org/wp-content/uploads/2020/03/a-security-threat-assessment-of-climate-change.pdf 619 Why climate change is a ‘threat multiplier’ https://yaleclimateconnections.org/2019/06/why-climate-change-is-a-threat-multiplier/ 620 National Intelligence Council (US) ed., 2012. Global Trends 2030: Alternative Worlds. National Intelligence Council. US Government Printing Office. https://www.dni.gov/files/documents/GlobalTrends_2030.pdf 621 Global Trends 2040: A More Contested World, The National Intelligence Council, March 2021, Report: NIC 2021-02339, ISBN 978-1-929667-33-8. www.dni.gov/nic/globaltrends 622 Dunlop, Ian, and David Spratt. "Disaster Alley: Climate Change, Conflict, and Risk." Melbourne, Australia (2017). https://docs.wixstatic.com/ugd/148cb0_1d614b99bd734626a0deba96f8d843d4.pdf 623 Ide, T., Brzoska, M., Donges, J.F. and Schleussner, C.F., 2020. Multi-method evidence for when and how climate-related disasters contribute to armed conflict risk. Global Environmental Change, 62, p.102063. https://www.sciencedirect.com/science/article/pii/S0959378019307307/pdfft?md5=5c446760b9daeb8e0304c233bd3e90f1&pid=1-s2.0-S0959378019307307-main.pdf 624 How climate change could lead to more wars in the 21st century https://www.vox.com/world/2017/11/14/16589878/global-climate-change-conflict-environment 625 Why Spy Agencies Say the Future Is Bleak https://www.nytimes.com/2021/04/15/opinion/global-trends-intelligence-report.html 626 Global Catastrophic Risks, 2018. Global Challenges Foundation, Stockholm. https://globalchallenges.org/wp-content/uploads/GCF-Annual-report-2018-1.pdf 627 Strategic futures Overview, Elizabeth Keller 2017, Sandia National Laboratories, Albuquerque, NM, https://www.osti.gov/servlets/purl/1429302 628 Caves Jr, J.P. and Carus, W.S., 2014. The future of weapons of mass destruction: their nature and role in 2030. National Defense Univ Fort Mcnair Dc Center For The Study Of Weapons Of Mass Destruction. https://apps.dtic.mil/sti/pdfs/ADA617232.pdf 629 National Security Futures for Strategic Thinking Sandia Report SAND2018-0205 R, Sandia National Laboratories, NM, https://www.academia.edu/35921475/National_Security_Futures_for_Strategic_Thinking
Climate Risk and Response July 2021
George Backus (Material is free to use with attribution.) 122
technologies include: artificial intelligence (and related autonomous weapons), additive manufacturing, synthetic biology, and nuclear proliferation.630
• Artificial intelligence (AI)631 can make the transition more efficient and reduce costs. It can strand labor, destabilize commodity markets, crash financial markets, overwhelm the best cybersecurity, paralyze infrastructure, turn inexpensive 3D printed drones into effective weapon delivery systems,632,633,634 or assist synthetic biology to create and produce new toxins or pathogens. Quantum computing can greatly amplify the capacities of AI.635,636
• Additive Manufacturing (3D printing) enables individuals and countries to produce whatever can be physically imagined.637,638,639 Additive manufacturing and artificial intelligence can be used to threaten Advantaged countries into either assisting Disadvantaged countries or being reduced to an equal footing with them.640,641 Artificial intelligence and 3D printing leads to a future that could only need raw materials rather than finished ones and thus give the Advantaged countries’ economies the ability to partially deglobalize (isolate themselves) while avoiding the need for finished products from the Disadvantaged countries. The Disadvantaged countries would lose any ability to improve economically and some form of coercive involvement would be the only means to preserve the Advantaged countries’ access to raw materials. AI-enabled,642
630 Potential Game Changers Through 2035, United States Department of Defense All Partners Access Network, https://community.apan.org/wg/tradoc-g2/mad-scientist/m/articles-of-interest/257943 631 Expect an Orwellian future if AI isn't kept in check, Microsoft exec says https://www.livescience.com/orwellian-artifical-intelligence-future.html 632 Russia Is Building an Army of Robot Weapons, and China's AI Tech Is Helping https://www.newsweek.com/russia-building-army-robot-weapons-chinas-ai-tech-helping-1594362 633 Drones may have attacked humans fully autonomously for the first time, https://www.newscientist.com/article/2278852-drones-may-have-attacked-humans-fully-autonomously-for-the-first-time/ 634 A thought-provoking reflection on how AI will change conflict, https://www.economist.com/books-and-arts/2021/07/03/a-thought-provoking-reflection-on-how-ai-will-change-conflict 635 Quantum Artificial Intelligence in 2021: in-Depth Guide https://research.aimultiple.com/quantum-ai/ 636 Liu, Y., Arunachalam, S. & Temme, K. A rigorous and robust quantum speed-up in supervised machine learning. Nat. Phys. (2021). https://doi.org/10.1038/s41567-021-01287-z https://arxiv.org/pdf/2010.02174 637 3-D Printers Could Help Spread Weapons of Mass Destruction https://www.scientificamerican.com/article/3-d-printers-could-help-spread-weapons-of-mass-destruction/ 638 Daase, C., Christopher, G., Dalnoki-Veress, F., Pomper, M. and Shaw, R., 1908. WMD Capabilities Enabled by Additive Manufacturing. Negotiation Design and Strategy Report, 2019. https://www.nonproliferation.org/wp-content/uploads/2019/09/NDS_Report_1908_WMD_AM_2019.pdf 639 Fabricating fully functional drones https://news.mit.edu/2021/fabricating-fully-functional-drones-0208 640 3D Printing: Bringing Missile Production to a Neighborhood Near You, The Nuclear Threat Initiative, 2017. https://www.nti.org/analysis/articles/3dprinting-bringing-missile-production-neighborhood-near-you/ 641 Technology Empowerment: Security Challenges, Global Futures Series, Sandia National Laboratories, NM. 2015 https://www.osti.gov/servlets/purl/1514658 642 Robot soldiers could make up quarter of British army by 2030s' https://www.theguardian.com/uk-news/2020/nov/08/third-world-war-a-risk-in-wake-of-covid-pandemic-says-uk-defence-chief
Climate Risk and Response July 2021
George Backus (Material is free to use with attribution.) 123
autonomous weapons,643 directed energy weapons,644 space weapons,645,646,647 and hypersonic weapons648,649,650,651 make the response to threats more volatile and dangerous652 – and more rapid that humans can manually manage.653
• Synthetic Biology: CRISPR654 and autonomous machines will enable industrialization of agriculture, further impeding the Disadvantaged countries’ economies. CRISPR and mRNA technologies improve daily.655,656,657 They can make better crops, improved biological carbon sequestering, can stop insect infestations,658 can cure diseases, can cause irreparable environmental damage, and can be weaponized659 to create disease
643 I, Warbot. By Kenneth Payne. Oxford University Press 644 Feickert, A., 2018. US Army Weapons-Related Directed Energy (DE) Programs: Background and Potential Issues for Congress (p. 35). Washington, DC: Congressional Research Service. https://crsreports.congress.gov/product/pdf/R/R45098/4 645 Defense Against the Dark Arts in Space: Protecting Space Systems from Counterspace Weapon, The Center for Strategic and International Studies, 2021, https://csis-website-prod.s3.amazonaws.com/s3fs-public/publication/210225_Harrison_Defense_Space.pdf?N2KWelzCz3hE3AaUUptSGMprDtBlBSQG 646 US military officials eye new generation of space weapons https://www.ft.com/content/d44aa332-f564-4b4a-89b7-1685e4579e72 647 Pentagon Sees China’s Offensive Space Technology ‘On the March’ https://www.bloomberg.com/news/articles/2021-07-10/pentagon-sees-china-s-offensive-space-technology-on-the-march 648 Wilkening, D., 2019. Hypersonic weapons and strategic stability. Survival, 61(5), pp.129-148. https://www.tandfonline.com/doi/abs/10.1080/00396338.2019.1662125?journalCode=tsur20; John Hopkins Applied Physics Laboratory https://nsiteam.com/social/wp-content/uploads/2020/01/200115-Wilkening-Slides.pdf 649 Sayler, H.M., 2019. Hypersonic weapons: Background and issues for Congress. Congressional Research Service. https://fas.org/sgp/crs/weapons/R45811.pdf 650 New High-Speed Propulsion System Paves Way for Hypersonic Flight up to Mach 16 https://interestingengineering.com/new-high-speed-propulsion-system-paves-way-for-hypersonic-flight-up-to-mach-16 651 Hypersonic Weapons: A Challenge And Opportunity For Strategic Arms Control, United Nations Office For Disarmament Affairs 2019. https://www.un.org/disarmament/wp-content/uploads/2019/02/hypersonic-weapons-study.pdf 652 The Coming Revolution in Intelligence Affairs, By Anthony Vinci, Foreign Affairs, August 31, 2020 https://www.foreignaffairs.com/articles/north-america/2020-08-31/coming-revolution-intelligence-affairs 653 An ‘Arms Race in Speed’: Hypersonic Weapons and the Changing Calculus of Battle https://www.armscontrol.org/act/2019-06/features/arms-race-speed-hypersonic-weapons-changing-calculus-battle 654 CRISPR: Can we control it? https://bigthink.com/videos/crispr-can-we-control-it 655 A New Gene Editing Tool Could Rival CRISPR, and Makes Millions of Edits at Once https://singularityhub.com/2021/05/11/a-new-gene-editing-tool-rivals-crispr-and-can-make-millions-of-edits-at-once/ 656 CRISPR milestone pushes gene editing toward its promise https://www.axios.com/crispr-milestone-gene-editing-2306ad31-4548-4a70-b60d-91379f7722e5.html 657 CRISPR gene-editing treatment could reach patients ‘very, very soon’ https://www.cnbc.com/2021/07/02/crispr-gene-editing-could-reach-patients-very-soon-intellia-ceo.html 658 New and Improved CRISPR 3.0 System for Highly Efficient Gene Activation in Plants https://scitechdaily.com/new-and-improved-crispr-3-0-system-for-highly-efficient-gene-activation-in-plants/ 659 Haddal, C.C., Bull, D.L., Hernandez, P.M.P. and Foley, J.T., 2017. Reducing Future International Chemical and Biological Dangers (No. SAND-2017-13569). Sandia National Lab.(SNL-NM), Albuquerque, NM (United States). https://www.researchgate.net/profile/Chad-
Climate Risk and Response July 2021
George Backus (Material is free to use with attribution.) 124
or alter human functions660 Even if done without malice, there can be unintended consequences, especially if, for example, crop alterations are undertaken out of desperation by countries not considering the downwind ecosystems.661
• Nuclear proliferation: The poorest country in the worldlv has nuclear weapons. New technologies will make it cheaper and faster to develop and acquire nuclear weapons662,663,664 – providing lesser-developed countries leverage against the Advantaged countries.665 Climate will add the stressors to increase the likelihood of proliferation666 and escalating conflicts.667,668
Additionally, many physical trends converge with climate to produce new problematic dynamics, such as 1) social media and identity politics, 2) migration and urbanization, 3) surveillance societies and the technologies that empower them, and 4) climate mitigation (including geoengineering).
• Migration and Urbanization: Climate-induced669 urban migration will cause many disparate groups to compete in close contact to one another, mostly in growing slum environments.670 The loss of GDPPC among Disadvantaged populations, independent of
Haddal/publication/321781508_Reducing_Future_International_Chemical_and_Biological_Dangers/links/5a31b26d458515afb684af75/Reducing-Future-International-Chemical-and-Biological-Dangers.pdf 660 Experiment Uses CRISPR To Edit Genes While They Are Still Inside A Person's Body, https://www.npr.org/sections/health-shots/2021/05/10/993656603/blind-patients-hope-landmark-gene-editing-experiment-will-restore-their-vision 661 Biotechnology: A Bio-Empowered World, Global Futures Series, Sandia National Laboratories, NM. 2015 https://www.osti.gov/servlets/purl/1428023 662 Darekar, M., Chaurasiya, R.K., Singh, K.K., Mukhopadhyay, S. and Shenoy, K.T., 2020. In-line phase separator for microfluidic solvent extraction of uranium. Journal of Radioanalytical and Nuclear Chemistry, pp.1-11. https://inis.iaea.org/search/search.aspx?orig_q=RN:51083044 663Kroenig, M. and Volpe, T., 2015. 3-D printing the bomb? The nuclear nonproliferation challenge. The Washington Quarterly, 38(3), pp.7-19. https://csis-website-prod.s3.amazonaws.com/s3fs-public/legacy_files/files/attachments/151105_Presentation_Volpe.pdf 664 Module 3.0: Laser Enrichment Methods (Avlis And Mlis), https://www.nrc.gov/docs/ML1204/ML12045A051.pdf 665 National Security Futures for Strategic Thinking Sandia Report SAND2018-0205 R, Sandia National Laboratories, NM, https://www.academia.edu/35921475/National_Security_Futures_for_Strategic_Thinking 666 Who will go nuclear next The world is facing an upsurge of nuclear proliferation January 30th 2021. https://www.economist.com/leaders/2021/01/30/the-world-is-facing-an-upsurge-of-nuclear-proliferation 667 Increasing Concern over Climate and Security Trends in Nuclear Weapon Capable States, Briefer No. 2, Council on Strategic Risks, 2019 https://councilonstrategicrisk.files.wordpress.com/2019/05/increasing-concern-over-climate-and-security-trends-in-nuclear-weapon-capable-states_briefer-2_2019_03_07.pdf 668 Melting Mountains, Mounting Tensions, Woodwell Climate Research Center, MA, 2021, https://climateandsecurity.org/wp-content/uploads/2021/06/Melting-Mountains-Mounting-Tensions_Climate-Change-and-the-India-China-Rivalry_2021_05_13.pdf 669 Kumari Rigaud, Kanta, Alex de Sherbinin, Bryan Jones, Jonas Bergmann, Viviane Clement, Kayly Ober, Jacob Schewe, Susana Adamo, Brent McCusker, Silke Heuser, and Amelia Midgley. 2018. Groundswell: Preparing for Internal Climate Migration. Washington, DC: The World Bank. https://openknowledge.worldbank.org/bitstream/handle/10986/29461/WBG_ClimateChange_Final.pdf 670 Climate Migrant Megacity https://news.sky.com/story/climate-change-bangladesh-migrant-megacity-crumbling-under-pressure-with-warning-that-same-issues-will-later-hit-uk-12344685
https://www.economist.com/leaders/2021/01/30/the-world-is-facing-an-upsurge-of-nuclear-proliferation
Climate Risk and Response July 2021
George Backus (Material is free to use with attribution.) 125
climate effect, will make survival in urban areas challenging.671 Sea level rise will further add tensions from local population dislocations.672,673 Heat will reduce infrastructure capacities and likely reduce water availability.674,675 The resulting sanitation issues will lead to a combination of disease stressors676 that increase rotavirus, Cryptosporidium, Shigella, Campylobacter, Salmonella typhi, and Vibrio cholera, among others.677,678 Climate change will reduce local food production, and incomes will be too low to import adequate supplies.679 Tensions will be difficult to control in megacity settings680,681,682,683,684
• Fragmentation: Climate change can induce, enhance, and complicate social unrest, hostility, vulnerabilities, and conflict. When it is perceived as the best survival strategy, people seek to maintain status-quo, positional hierarchies, counter failed expectations, and use emotion/beliefs over fact. The consequence is an upsurge in paranoia and associated racial, ethnic, and religious prejudices.685 Social media can readily
671Ignoring climate change will lead to unprecedented, societally disruptive heat extremes in the Middle East https://phys.org/news/2021-03-climate-unprecedented-societally-disruptive-extremes.html 672 Hinkel, J., Aerts, J.C., Brown, S., Jiménez, J.A., Lincke, D., Nicholls, R.J., Scussolini, P., Sanchez-Arcilla, A., Vafeidis, A. and Addo, K.A., 2018. The ability of societies to adapt to twenty-first-century sea-level rise. Nature Climate Change, 8(7), pp.570-578. https://research.vu.nl/ws/files/105033827/The_ability_of_societies_to_adapt_to_twentyfirstcentury_sealevel_rise.pdf 673 Climate change creates a new migration crisis for Bangladesh https://www.nationalgeographic.com/environment/article/climate-change-drives-migration-crisis-in-bangladesh-from-dhaka-sundabans 674 Water and the global climate crisis https://www.unicef.org/stories/water-and-climate-change-10-things-you-should-know 675 High and Dry: Climate Change, Water, and the Economy, World Bank, , 2016. https://openknowledge.worldbank.org/bitstream/handle/10986/23665/K8517.pdf?sequence=3&isAllowed=y 676 Climate change affects increasing urbanization https://www.dhakatribune.com/bangladesh/2021/05/19/study-climate-change-affects-increasing-urbanization 677 The, L., 2017. Health in slums: understanding the unseen. Lancet (London, England), 389(10068), p.478. https://www.thelancet.com/journals/lancet/article/PIIS0140-6736(17)30266-0/fulltext 678 Ross, A.G., Rahman, M., Alam, M., Zaman, K. and Qadri, F., 2020. Can we ‘WaSH’infectious diseases out of slums?. International Journal of Infectious Diseases, 92, pp.130-132. https://www.sciencedirect.com/science/article/pii/S1201971220300163/pdfft?md5=5deee7e0f2c68f1d172b3d24b93f24f3&pid=1-s2.0-S1201971220300163-main.pdf 679 To what extent does climate change affect food insecurity? What we found in Lesotho https://theconversation.com/to-what-extent-does-climate-change-affect-food-insecurity-what-we-found-in-lesotho-156527 680 Megacity Global Futures (2015), Sandia National Laboratories, https://www.osti.gov/servlets/purl/1514657 681 Harris, M., Dixon, R., Melin, N., Hendrex, D., Russo, R. and Bailey, M., 2014. Megacities and the United States Army: Preparing for a complex and uncertain future. Chief Of Staff Of The Army Strategic Studies Group Arlington Va. https://apps.dtic.mil/sti/pdfs/ADA608826.pdf 682 Them and Us. By Philippe Legrain. Oneworld Publications, NY ; 2020 683 Konaev, M., 2019. The future of urban warfare in the age of megacities. Institut français des relations internationales. https://www.ifri.org/sites/default/files/atoms/files/konaev_urban_warfare_megacities_2019.pdf 684 Wretched Refuse? By Alex Nowrasteh and Benjamin Powell. Cambridge University Press, NY 2020 685 Schleussner, C.F., Donges, J.F., Donner, R.V. and Schellnhuber, H.J., 2016. Armed-conflict risks enhanced by climate-related disasters in ethnically fractionalized countries. Proceedings of the National Academy of Sciences, 113(33), pp.9216-9221. https://www.pnas.org/content/pnas/113/33/9216.full.pdf
Climate Risk and Response July 2021
George Backus (Material is free to use with attribution.) 126
consolidate such perspectives and radicalize adherents. The distrust of “them” and the perceived need to protect “us” intensifies the negative aspects of identity politics686,687,688,689,690 These conditions in turn can cause feedback phenomena to fragment nations691,692,693 and thwart mitigation, as well as adaptation efforts.
• Spillover effects: Some countries will experience detrimental effects from climate that are significantly worse than those of the neighboring countries.694 The problems in one country spill over to become the problems of the neighboring countries, whether it be emigrants from Central American to the U.S. or Mali rebels affecting Burkina Faso.695,696,697 Spillover dynamics will be a serious concern for many countries.698,699 In response, countries will likely (attempt to) enforce “no-migration” regimes to limit the spread of negative impacts, with a resulting further build-up of regional tensions.
• Surveillance: With a need to monitor and manage the volatile consequences of climate enhanced threats, many countries will have to dramatically increase surveillance,700,701 possibly to the point of becoming dictatorial surveillance countries or police states. The
686 Mishra, P., 2017. Age of anger: A history of the present. Macmillan. 687 https://stanford.library.sydney.edu.au/archives/win2019/entries/identity-politics/ 688 Piketty Piketty, Thomas. "Brahmin Left vs Merchant Right: Rising Inequality and the Changing Structure of Political Conflict." WID. World Working Paper 7 (2018). http://piketty.pse.ens.fr/files/Piketty2018.pdf 689 Piketty, T., 2020. Capital and ideology. Harvard University Press. 690 Piketty, T., 2015. The economics of inequality. Harvard University Press. 691 Global Trends 2040: A More Contested World, The National Intelligence Council, March 2021, Report: NIC 2021-
02339, ISBN 978-1-929667-33-8. www.dni.gov/nic/globaltrends 692 The Future of Global Governance Dynamics, Global Futures Series, Sandia National Laboratories, NM. 2017. https://www.academia.edu/41656428/The_Future_of_Global_Governance_Dynamics 693 Moffett, M.W., 2019. The human swarm: How our societies arise, thrive, and fall. Basic Books. 694 IPCC, 2013: Climate Change 2013: The Physical Science Basis. Contribution of Working Group I to the Fifth Assessment Report of the Intergovernmental Panel on Climate Change [Stocker, T.F., D. Qin, G.-K. Plattner, M. Tignor, S.K. Allen, J. Boschung, A. Nauels, Y. Xia, V. Bex and P.M. Midgley (eds.)]. Cambridge University Press, Cambridge, United Kingdom and New York, NY, USA, 1535 pp. https://www.ipcc.ch/report/ar5/wg1/ 695 The impact of the Malian crisis on the Group of Five Sahel countries. https://www.sipri.org/commentary/topical-backgrounder/2020/impact-malian-crisis-group-five-sahel-countries-balancing-security-and-development-priorities 696 Reuveny, R., 2007. Climate change-induced migration and violent conflict. Political geography, 26(6), pp.656-673. https://www.almendron.com/tribuna/wp-content/uploads/2017/03/climate-change-induced-migration-and-violent-conflict.pdf 697 Central Sahel Crisis Response Plan 2021, https://crisisresponse.iom.int/response/central-sahel-crisis-response-plan-2021 698 Naugle, A.B., Backus, G.A., Tidwell, V.C., Kistin-Keller, E. and Villa, D.L., 2019. A regional model of climate change and human migration. International Journal of System Dynamics Applications (IJSDA), 8(1), pp.1-22. https://www.osti.gov/servlets/purl/1487419 699 Beyond Borders: Our changing climate – its role in conflict and displacement. The Environmental Justice Foundation 2017 https://reliefweb.int/sites/reliefweb.int/files/resources/BeyondBorders-2.pdf 700 The Age of Surveillance Capitalism by Shoshana Zuboff review – we are the pawns https://www.theguardian.com/books/2019/feb/02/age-of-surveillance-capitalism-shoshana-zuboff-review 701 Zuboff, S., 2019. The Age of Surveillance Capitalism: The Fight for a Human Future at the New Frontier of Power, 2019. New York: Hachette Book Group.
Climate Risk and Response July 2021
George Backus (Material is free to use with attribution.) 127
convergence of AI and 3D printing (drones) augments already powerful surveillance (sensor) technology702,703,704,705
• Geoengineering: This study focused exclusively on successfully completing a GHG transition. It left out geoengineering primarily for that reason, but also for the numerous reasons stated in Appendix 5. This section introduces some relevant geoengineering implications that can interact with other threats. According to this study, geoengineering will necessarily be intense by the end of the century. It will not bring climate back to year 2000 conditions.706,707 There will be distortions in local climatic conditions with winning and losing countries. The Advantaged countries will try to make their areas as well-off as possible. Geoengineering is relatively inexpensive. Negatively-affected Disadvantaged countries will pursue counter-engineering, if not direct interference with the primary geoengineering. The coordinated injection points for geoengineering are easily victims of budget cuts, local wars, and simple failures. Geoengineering can create conflict situations just as much as climate-affected water management can,708,709,710 including among nuclear neighbors.711 (See Appendix 5.)
702 Hongladarom, S., 2020. Shoshana Zuboff, The age of surveillance capitalism: the fight for a human future at the new frontier of power. Hatchette Books, NY 703 China's Surveillance State Should Scare Everyone , Anna Mitchell Larry Diamond February 2, 2018, The Atlantic, https://www.theatlantic.com/international/archive/2018/02/china-surveillance/552203/ 704 Scientists Create Injectable Swarm Of Brain Reading Nanosensors https://futurism.com/neoscope/injectable-swarm-brain-reading-nanosensors 705 Paralyzed man’s brain waves turned into sentences on computer in medical first https://www.theguardian.com/science/2021/jul/15/paralyzed-man-brain-waves-sentences-computer-research 706 Solar geoengineering could cause unwanted changes in climate, new modelling suggests https://physicsworld.com/a/solar-geoengineering-could-cause-unwanted-changes-in-climate-new-modelling-suggests/ 707 Robock, A., Oman, L. and Stenchikov, G.L., 2008. Regional climate responses to geoengineering with tropical and Arctic SO2 injections. Journal of Geophysical Research: Atmospheres, 113(D16). https://agupubs.onlinelibrary.wiley.com/doi/full/10.1029/2008JD010050 708 Sudan and Egypt hold breath as GERD filling allegedly begins https://www.middleeasteye.net/news/sudan-egypt-ethiopia-gerd-dam-filling-began 709 Water-related conflicts set to rise amid demand growth and climate impacts https://news.trust.org/item/20200902202142-ku0o2 710 Climate Change, Water Conflicts And Human Security: Regional Assessment And Policy Guidelines For The Mediterranean, Middle East And Sahel, 2013, United Nations University, Institute for Environment and Human Security https://www.researchgate.net/profile/Niklas-Baumert/publication/256364789_CLIMATE_CHANGE_WATER_CONFLICTS_AND_HUMAN_SECURITY_REGIONAL_ASSESSMENT_AND_POLICY_GUIDELINES_FOR_THE_MEDITERRANEAN_MIDDLE_EAST_AND_SAHEL/links/004635225d140589fb000000/CLIMATE-CHANGE-WATER-CONFLICTS-AND-HUMAN-SECURITY-REGIONAL-ASSESSMENT-AND-POLICY-GUIDELINES-FOR-THE-MEDITERRANEAN-MIDDLE-EAST-AND-SAHEL.pdf?_sg%5B0%5D=26Ie5qUtQo3AG4-zd8Wk8Pb0SjbPfvtTMJQO_3_9QCGegFntVs0xARk1xmFQcbbhzKy3oJ58Sn6_ihh1Yf46Kg.5R5C-6wtS1uuFbTlaiVsRRZdw_bYZ3B-4E-9Qoa16hJfRKc1uK0ePsEY4JCh2Hq0K1AA4gcoHTz0o0Sk7L_knA&_sg%5B1%5D=-lGqikpfeztWEpyRC0VtwfEVVFmtXqYvaeUmpfi6NJ9rYp8C2TNQgqEC9L-1KqLSDfOtYCkUPZBljT54BjQxLaSaOylmtH8cP2j_RUNZE5YT.5R5C-6wtS1uuFbTlaiVsRRZdw_bYZ3B-4E-9Qoa16hJfRKc1uK0ePsEY4JCh2Hq0K1AA4gcoHTz0o0Sk7L_knA&_iepl= 711 Climate Change and the India-Pakistan Rivalry, Briefer No. 4, 2020, The Council on Strategic Risks, DC, https://councilonstrategicrisks.org/wp-content/uploads/2020/02/ShidoreJan23ClimatePakistan.pdf

Climate Risk and Response July 2021
George Backus (Material is free to use with attribution.) 128
• Climate mitigation: To be successful, full mobilization for GHG mitigation must be sustained for over 100 years. Government imposed restrictions and requirements will be considered oppressive by many and likely require police/militarily enforcement. Avoidance of conflict will require the maintenance of global collective memory, continued societal reaffirmation of purpose, and enduring political reconfirmation of actions. Conflict patterns reported here are only based on history and do not include the further destabilization of the Middle East and other Petrol States because there is no longer a need for the resource.712,713,714 This study does not include potential conflicts over the control and use of raw materials required for the GHG transition.715,716,717 There may also be the rise of new mineral cartels that serve the renewable energy industries.718,719
Financial markets may have a hard time dealing with the investment flows and damages.720
Climate physically affects historical disease prevalence, water supply, access to other necessary resources,721 and human well-being.
• Disease: As temperatures rise, water cycles accelerate, and humans are forced to pursue resources and possible sanctuary, in new environments. Accelerated mutation rates will likely, at least in the mid-term, increase the emergence rates and distribution of new diseases.722 Emergent diseases are not included in this study.
712 Petrostates See Dire Consequences If World Rejects Oil Too Fast https://www.bloomberg.com/news/articles/2021-06-03/petrostates-see-dire-consequences-if-world-rejects-oil-too-fast 713 Rapid Energy Transition Could Doom Oil Exporting Countries https://oilprice.com/Energy/Crude-Oil/Rapid-Energy-Transition-Could-Doom-Oil-Exporting-Countries.html 714 Africa’s Oil Nations Will Be Doomed If Exploration Is Halted https://oilprice.com/Energy/Energy-General/Africas-Oil-Nations-Will-Be-Doomed-If-Exploration-Is-Halted.html 715 What Countries Will Fight Over When Green Energy Dominates https://www.bloomberg.com/news/features/2021-03-16/what-countries-will-fight-over-when-green-energy-dominates 716 Will there be resource wars in our renewable energy future? https://www.salon.com/2021/05/31/will-there-be-resource-wars-in-our-renewable-energy-future_partner/ 717 The Future of Nonrenewable Resource Security, Sandia Report SAND2019-3598, 2017, Global Futures Series, Sandia National Laboratories, NM. https://www.osti.gov/servlets/purl/1761983 718 The Role of Critical World Energy Outlook Special Report Minerals in Clean Energy, IEA, Paris 2020 https://iea.blob.core.windows.net/assets/24d5dfbb-a77a-4647-abcc-667867207f74/TheRoleofCriticalMineralsinCleanEnergyTransitions.pdf 719 Transitions Will there be resource wars in our renewable energy future? https://www.salon.com/2021/05/31/will-there-be-resource-wars-in-our-renewable-energy-future_partner/ 720 Climate change could ignite a financial crisis, IMF official says https://www.cnn.com/2021/06/03/investing/climate-change-financial-crisis-imf/index.html 721 Natural Resources in 2020, 2030, and 2040: Implications for the United States. National Intelligence Council Report NICR 2013-05, 25 July 2013 https://www.dni.gov/files/documents/NICR%202013-05%20US%20Nat%20Resources%202020,%202030%202040.pdf 722 Braide, W., Justice-Alucho, C.H., Ohabughiro, N. and Adeleye, S.A., 2020. Global climate change and changes in disease distribution: a review in retrospect. Int J Adv Res Biol Sci, 7(2), pp.32-46. https://www.researchgate.net/profile/Samuel-Adeleye-
https://www.salon.com/2021/05/31/will-there-be-resource-wars-in-our-renewable-energy-future_partner/
https://www.salon.com/2021/05/31/will-there-be-resource-wars-in-our-renewable-energy-future_partner/
Climate Risk and Response July 2021
George Backus (Material is free to use with attribution.) 129
• Water: Changing water cycles and demand for raw material will empower the weaponization of those resources.723,724,725 Water stress726 will also increase migration pressures727 and conflict tensions.728
• Inequality: Climate-induced economic inequality729 promotes other inequalities such as in food,730 access to resources, health care, human rights, etc. The resulting social unrest could destabilize countries and limit or prevent a successful response to climate change.731 There will be added social unrest from failed expectations and grievances toward the Advantaged countries. The need to industrialize farming732,733 in Disadvantaged countries and to automate the massive solar construction734 therein, will further suppress Disadvantaged labor markets.
• Resources and Supply Chains: The Advantaged countries will continue to need the raw resources from the Disadvantaged countries. That and any carbon-offset markets raise
2/publication/339541048_International_Journal_of_Advanced_Research_in_Biological_Sciences_Global_Climate_Change_and_Changes_in_Disease_Distribution_A_Review_in_Retrospect/links/5e583fe0a6fdccbeba079c24/International-Journal-of-Advanced-Research-in-Biological-Sciences-Global-Climate-Change-and-Changes-in-Disease-Distribution-A-Review-in-Retrospect.pdf 723 Drought is leading to instability and water weaponization in the Middle East and North Africa https://www.preventionweb.net/news/view/77581 724 China Is Turning Its Water-Scarcity Crisis into a Weapon https://www.nationalreview.com/2021/06/china-is-turning-its-water-scarcity-crisis-into-a-weapon/ 725 Werrell, C.E. and Femia, F., 2017. Epicenters of climate and security: The new geostrategic landscape of the Anthropocene. Washington, DC: Center for Climate and Security. https://climateandsecurity.files.wordpress.com/2017/06/8_water-weaponization.pdf 726 ‘The next pandemic’: drought is a hidden global crisis, UN says https://www.theguardian.com/environment/2021/jun/17/the-next-pandemic-drought-is-a-hidden-global-crisis-un-says 727 Wrathall, D.J., Hoek, J., Walters, A. and Devenish, A., 2018. Water stress and human migration: a global, georeferenced review of empirical research. FAO Land and Water Discussion Paper, (11). http://www.fao.org/3/I8867EN/i8867en.pdf. 728 Running Dry: Competing for water on a thirsty planet https://packages.trust.org/running-dry/index.html 729 Global warming has increased global economic inequality, Noah S. Diffenbaugh, Marshall Burke, Proceedings of the National Academy of Sciences May 2019, 116 (20) 9808-9813; DOI: 10.1073/pnas.1816020116 https://www.pnas.org/content/pnas/116/20/9808.full.pdf 730 Recurring Storms: Food Insecurity, Political Instability, and Conflict, https://csis-website-prod.s3.amazonaws.com/s3fs-public/publication/170124_Simmons_RecurringStorms_Web.pdf Simmons, Emmy, and Kimberly Flowers. (2017). Center for Strategic and International Studies, 731 Global Trends 2040: A More Contested World, The National Intelligence Council, March 2021, Report: NIC 2021-02339, ISBN 978-1-929667-33-8. www.dni.gov/nic/globaltrends 732 Rosa, L., Rulli, M.C., Ali, S., Chiarelli, D.D., Dell’Angelo, J., Mueller, N.D., Scheidel, A., Siciliano, G. and D’Odorico, P., 2021. Energy implications of the 21 st century agrarian transition. Nature Communications, 12(1), pp.1-9. https://www.nature.com/articles/s41467-021-22581-7.pdf 733 Farmers have more mouths to feed. Bring in the robots. https://www.washingtonpost.com/technology/2021/04/22/tech-in-farming-growth/ 734 Check out these robots made specifically for the solar industry https://www.solarpowerworldonline.com/2021/05/check-out-these-robots-made-specifically-for-the-solar-industry/
Climate Risk and Response July 2021
George Backus (Material is free to use with attribution.) 130
neocolonialism issues.735,736,737 Many of the raw materials will be associated with the GHG transition itself. The Advantaged countries, as well as China, will likely demand the scarce food supplies of Disadvantaged countries. SLR and storm surge will affect Chinese trade,738 with southern hemisphere instability increasing Arctic shipping and geopolitical tensions.739,740
Summary: Governments will not have the luxury of maintaining top prioritization on climate change mitigation. Political and social priorities come and go. New crises emerge routinely. Governments will have no choice but to often re-allocate priorities and resources. The geopolitical challenges and spread of human suffering will not honor national borders. The threat multiplier effect of climate will pull in and entangle the other threats with it. The ever-increasing welfare gap between the Advantaged countries (who caused climate change) and Disadvantaged countries (who bear the consequences) questions any possibility of easy resolution. In the extreme, will the 8.5 billion people of the Disadvantaged countries let the 1.4 billion people of the Advantaged countries remain unscathed? “There is no situation so bad that human nature can’t make worse.”741 At a minimum, it will be necessary to manage crisis containment (Safeguard responses) in both regions.
735 Climate colonialism and the EU’s Green Deal https://www.aljazeera.com/opinions/2021/6/23/the-eus-green-deal-could-propagate-climate-colonialism 736 Lyons, K. and Westoby, P., 2014. Carbon colonialism and the new land grab: Plantation forestry in Uganda and its livelihood impacts. Journal of Rural Studies, 36, pp.13-21. https://isiarticles.com/bundles/Article/pre/pdf/42125.pdf 737 Avoiding 'carbon colonialism': Developing nations can't pay the price for pollution https://thehill.com/opinion/energy-environment/550313-avoiding-carbon-colonialism 738 Why sea level rise is a big deal for China https://news.cgtn.com/news/3d3d674e344d544d35457a6333566d54/index.html 739 Backus, G., 2012. Arctic 2030: What are the consequences of climate change? The US response. Bulletin of the Atomic Scientists, 68(4), pp.9-16. https://journals.sagepub.com/doi/full/10.1177/0096340212451568 740 Romig Jr, A.D., Backus, G.A. and Baker, A.B., 2010. A deeper look at climate change and national security. Sandia Report SAND2011-0039, Sandia National Laboratories NM. https://digital.library.unt.edu/ark:/67531/metadc836207/m2/1/high_res_d/1010413.pdf 741 Personal communications, undercover narcotic’s agent, 1985
Climate Risk and Response July 2021
George Backus (Material is free to use with attribution.) 131
Section 7. Invariant Implications
Overview: While there are many realizable, climate policy packages, all of them will have to confront the phenomena and limitations presented within this study. There are several invariant conclusions, whereby, the key phenomena remain unchanged, independent of alternative (realistic) assumptions, model parametrizations, and policy specifications.
Bottom Line: The outcomes described herein understate the actual dynamics. Problematic phenomena will occur with certainty. Realistic climate policy can always make matters better than they would otherwise be. Expectations for proposed climate policy are illusory and claiming the ability to solve the climate problem is imprudent. _________________________________________________________________________
Although there can be many objections to the content of the Policy Package and abstractions used to simulate it, the upbeat assumptions of those abstractions connote that incorporating more precisely defined, realistic, substitute policy measures would not improve the results. While the specific choices in the Policy Package were design to purposefully highlight critical phenomena, they affect overall results to a very limited extent. The shown outcomes will not go away by practicable modifications to the alterable parts of the Policy Package, especially when the relevant feedback phenomena are included. This study, although controversial in many senses, is much more realistic than the currently espoused policy packages of Section 1.2 that assume global optimality of mobilization starting immediately with full potency and fully coordinated action, often with hundreds of measures, pursued over decades. The study points out the delays that still face global action. It considers various average levels of realizable mobilization, but assumes a Core analysis where all countries ramp up as quickly as possible and maximally mobilize a single-focus, narrow, set of measures (the Policy Package of Section 3.1), which government and societies might be actually able to orchestrate and maintain.
As noted earlier, there is no historical evidence of any nation ever responding optimally to even a well-defined, immediate societal crisis. There is no evidence that the historical realities of political and societal responses to threats will be different in the future. To depend on and promote climate mitigation pathways that have no chance of success, and that disregard the possibility of its failure to perform, is neither rational or responsible. A responsible approach concentrates on making things better than they would otherwise be to the extent pragmatically doable. In the current policy environment, “We cause, predict, and ignore our own demise.“742,743 It is always possible to pursue workable contingencies that reduce the consequences of a non-optimal future.
742 Anonymous 743 Sixty years of climate change warnings: the signs that were missed (and ignored) https://www.theguardian.com/science/2021/jul/05/sixty-years-of-climate-change-warnings-the-signs-that-were-missed-and-ignored

Climate Risk and Response July 2021
George Backus (Material is free to use with attribution.) 132
This study does not include the costs of dealing with climate disasters744,745 – the problems in Texas, California, the Pacific Northwest being a recent indicator of future examples in the U.S.746,747,748,749,750 And consistent with political realities, nor does it include aid to provide adaptation support for other countries.751 Although it is possible to assess the impact on the population in the absence of any adaptation, it is beyond the scope of this work to assess the variation in adaptation measures between urban and rural population among the widely economically, demographically, and climatically varied countries.752
Given the accepted studies utilized,753 which are the only source data for this study, the omitted factors all point to this study understating the impacts and interacting consequences. It shows that it is unrealistic to plan for 2.0 °C. The more likely 3.5+ C° realities entail significant challenges and globally intertwined crises that will require extensive security interventions to minimize cascading repercussions.
This work evaluates the consequence of climate change risks and assesses the credible constraints on human response. It attempts to set a stage for more credible policy packages that also go beyond mitigation and adaptation and into the realm of Safeguard preparedness to adequately contain unacceptable conditions.
Specifically, the study establishes 4 invariant phenomena.
1. Full mobilization toward climate mitigation will still take years. The consequence of the delays will dramatically change the dynamics of the GHG transition and its outcome.
2. The required rapidity of the GHG transition limits the ability for renewable energy to fully accommodate shifting energy demands and power generation needs. Non-renewable energy sources will be needed for transient backstop usage.
3. The energy pay-back time (EPBT) for renewable energy sources leads to very problematic dynamics that indicate reducing the EPBT for renewable sources is one of
744 Risks posed by natural disasters: Economic losses caused by natural catastrophes are trending upwards, Munich RE,(2020) https://www.munichre.com/en/risks/natural-disasters-losses-are-trending-upwards.html#-1624621007 745 Natural Disasters on the Rise Around the Globe, Statista (August 25, 2020). https://www.statista.com/chart/22686/number-of-natural-disasters-globally/ 746 Why Texas was not prepared for Winter Storm Uri, https://www.pbs.org/wgbh/nova/article/texas-winter-storm-uri/ 747 Drought-plagued California and western U.S. may see another devastating fire season. https://www.washingtonpost.com/weather/2021/04/10/drought-wildfires-california-west/ 748 As people flee climate change on the coasts, this Midwest city is trying to become a safe haven, https://www.cnn.com/2021/04/12/opinions/climate-migration-in-america-california-duluth-sutter/index.html 749 'Heat Dome' Over Pacific Northwest a Sign of the Future, Says Global Warming Expert https://www.newsweek.com/heat-dome-over-pacific-northwest-sign-future-says-global-warming-expert-1604477 750 Hundreds of deaths reported across Canada and the Pacific Northwest amid unrelenting heat wave https://www.cnn.com/2021/07/01/weather/pacific-northwest-extreme-heat-thursday/index.html 751 The Real Migration Crisis Is in Central America. https://reader.foreignaffairs.com/2021/04/13/the-real-migration-crisis-is-in-central-america/content.html 752 Kottek, M., Grieser, J., Beck, C., Rudolf, B. and Rubel, F., 2006. World map of the Köppen-Geiger climate classification updated. Meteorologische Zeitschrift, 15(3), pp.259-263. https://opus.bibliothek.uni-augsburg.de/opus4/frontdoor/deliver/index/docId/40083/file/metz_Vol_15_No_3_p259-263_World_Map_of_the_Koppen_Geiger_climate_classification_updated_55034.pdf 753 For more information on any topic presented here see, https://www.theclimateweb.com/

Climate Risk and Response July 2021
George Backus (Material is free to use with attribution.) 133
the most critical priorities for energy R&D – being of much greater consequence than cost and efficiency improvements, per se.
4. Advantaged countries have no choice but to pay for a large amount of Disadvantaged country mitigation. There are limits to what the Advantaged countries’ economics can tolerate, and Disadvantaged countries will still suffer greatly – and recognize their plight as unjust.
5. Uncertainty better defines climate risk than the mean, best-estimates. Uncertainty best justifies intense policy and guides its effective design.
Climate Risk and Response July 2021
George Backus (Material is free to use with attribution.) 134
Endnotes
i With feedback, the interactions among the elements are more important to the conclusions than the values of elements themselves. While all other studies calculate the idealized “what” of an outcome (a metaphorical “noun” perspective), this study causally generates the dynamic “why” of the outcome (a metaphorical verb perspective). ii During the OPEC crisis, the then president Carter inquired about passing legislation to restrict the growth in oil demand. To many politicians it was shock to realize that actual policy had to act many layers back. For example, it was not possible to pass meaningful legislation to simply reduce oil use by 50%. It wasn’t even possible to restrict vehicle sales or travel per car. There could be politically problematic cost-based disincentives to reduce both.
Requiring manufactures to improve fleet efficiency was possible, but the consequences were far from clear. Improved efficiency meant lower operating costs in terms of $/Mile traveled. The “take-back” effect resulted in increased travel per vehicle, reducing much of the expected savings. Further, reduced car weight led to reduced cars costs and increased car sales. Lastly, the legal language opened the door for the addition of new classes of vehicles (such as Utility Vehicles) that would be exempt from the rules. Such dynamics existed in all parts of the energy demand chain.
These same phenomena affect the ability to reduce GHG emissions. The pledges are intentions. The details to implement effective policy are difficult to determine, politically tedious, lengthy to establish, and unlikely to produce the desired results until iterative experience determines changes that enable the achievement of the goal. The inability of legislation to meet policy intent, or worse that the legislation has counterproductive impacts, will make required follow-on legislation ever more difficult to enact. iii The primary message of scientists and the UN is that ALL humanity simply HAS to immediately and dramatically reduce GHG emission. No matter how unrealistic that position has been since the first COP (Conference of the Parties) of 1992 in Rio de Janeiro, its repetition becomes more frantic each year. There is now an acceptance of the need for adaptation, but only to the limited extent of accommodating a 1.5 °C world. To a large degree, the actual elements of adaptation, or the more ambiguous resilience, remain largely academic studies. It is unacceptable to only acknowledge more than one successful outcome. Countries and governments have a moral obligation to prepare for the globally interconnected consequence of not adequately mitigating climate change. The delay in pursuing intense mitigation has consequences where adequate adaptation is no longer possible – either due to the extreme conditions or the neglect of aggressively pursuing adaptation solution while there still were resources to do so. iv The extent of uncertainty is described with a probability distribution (called the probability density function - PDF) having the typical hill-shape (called the bell-curve for a normal distribution). This work uses a variety of distributions, each determined as appropriate for the variable in question. It is the cumulative probability distribution (CDF) that determines the value of the variable at a given exceedance probability. The area under the PDF is unity (100%). The CDF is an integral of the PDF over the range of probabilities. At a given exceedance probability level, such a 90% (which indicate that there is a 90% chance the value is lower than that value), the CDF determines the value of the variable at the exceedance probability. v Most climate analyses use 90% confidence intervals for defining impacts uncertainty. Some studies note the standard deviation when using a normal distribution to capture UQ. A 90% confidence interval is equivalent to a percentage range of 5% through 95%. The endpoints of the range also designate an exceedance probability, as used here. The 5% indicates there is only 5% chance the outcome are better
Climate Risk and Response July 2021
George Backus (Material is free to use with attribution.) 135
than noted. A 95% indicate that there is a 95% chance the outcome is less severe than noted. Conversely, at a 95% probability, there is a 5% they are worse. Some studies use 95% confidence interval. Those reported ranges have been modified to reflect results over a 90% confidence rages, Similarly, uncertainty reported in terms of standard deviation have similarly been restated, for consistency, to cover the 90% interval. vi The impacts as noted here are strongly correlated. If sea level rise increases due to temperature, so do heat related deaths. For tractability, the quantified impact use 100% correlation among them. That is, all are at the mean, 5% exceedance probability, or all are at the 95% probability. If climate varies, the values for the impacts are noted. If the extreme values for impacts are varied, the mean climate value act as the basis. The UQ of impacts are independent of the UQ for climate uncertainty. The impact is a function of climatic conditions, but it is deterministic in that regard. How severe the impacts are for a given climate condition is determined in the absence of joint uncertainty. A combined 95% exceedance probability impact with a 95% exceedance probability climate, if assumed to be independent occurrences, has only a 0. 0.25% chance of happening and is thus not of meaningful or self-consistent consequence to include the joint probability assessment. vii Minimally, a country needs to consider how mitigation efforts in other countries affect them and their efforts. It would be useful for a country to consider how their mitigation efforts affect other countries. viii There were numerous reported riots over COVID-19 restrictions despite extensive and obvious death rates. Countries struggled to protect the economic status-quo to the extent possible despite greater benefit in quickly bringing the pandemic under control. Country governments were unable to manage even the single logistics problem of vaccinations. Yet, the world anticipates that burdensome, complicated, adverse, and enduring climate mitigation will immediately and successfully take place. ix This work utilizes the system dynamics paradigm to address the feedback phenomena affecting the GHG transition. Due to feedback, well-intentioned policies often produce unintended consequences and the feedback itself leads to counterintuitive behaviors. The human mind is unable to deal with the inherent dynamic complexity without the help of a causal simulation model, such as the one utilized here. (Radzicki, M.J. and Taylor, R.A., 1997. Introduction to system dynamics. A Systems Approach to Understanding Complex Policy Issues, US Department of Energy’s. https://web.nmsu.edu/~lang/files/mike.pdf and Forrester, J.W., 1993. System dynamics and the lessons of 35 years. In A systems-based approach to policymaking (pp. 199-240). Springer, Boston, MA. http://matema.ujaen.es/jnavas/web_master/archivos/articulos%20forrester/forrester1.pdf ) x The determination of what country should be associated with what region came from the UN definition of 2008, or equivalently in Human Development Index terms for 2020 the determination was based on an HDI>.854, sans Saudi Arabia. (Social Council. Committee for Development Policy, Dept. of Economic, and Social Affairs Staff. Handbook on the Least Developed Country Category: Inclusion, Graduation, and Special Support Measures. Vol. 7. United Nations Publications, 2008. https://www.un.org/en/development/desa/policy/cdp/cdp_publications/2008cdphandbook.pdf and Human Development Report 2020 The Next Frontier: Human Development and the Anthropocene. United Nations Development Programme. 15 December 2020 http://hdr.undp.org/sites/default/files/hdr2020.pdf ) xi The term invariant is used here in the broad mathematical sense. While parameters changes can alter the specific outcome of an analysis, the critical phenomena continue to exist, and the conclusions drawn from the body of analyses remain unchanged. xiiThis study separates the world into Advantaged and Disadvantaged population to make a stark
distinction of vulnerability. In reality, the Advantaged nations are those of the OECD and the
Disadvantaged being the much larger, remaining population. This is a controversial stance because it
Climate Risk and Response July 2021
George Backus (Material is free to use with attribution.) 136
then includes China among the Disadvantaged countries. While history has shown China to be resilient
to all the challenges it has faced over the past 30 years, climate change can easily derail its aspirations.
Climate change will badly affect China both from inland impacts and from coastal impacts due to sea
level rise and storm surge. Thus, it is threatened in in a manner comparable to lesser developed
countries. (Sall, C., 2013. Climate Trends and Impacts in China. World Banks,
https://openknowledge.worldbank.org/bitstream/handle/10986/17558/850550WP0P130400Impacts0i
n0China0EN.pdf?sequence=1 and Zhou, X., Ma, W., Echizenya, W. and Yamazaki, D., 2021. The
uncertainty of flood frequency analyses in hydrodynamic model simulations. Natural Hazards and Earth
System Sciences, 21(3), pp.1071-1085. https://nhess.copernicus.org/articles/21/1071/2021/nhess-21-
1071-2021.pdf and Kirezci, E., Young, I.R., Ranasinghe, R., Muis, S., Nicholls, R.J., Lincke, D. and Hinkel,
J., 2020. Projections of global-scale extreme sea levels and resulting episodic coastal flooding over the
21st Century. Scientific reports, 10(1), pp.1-12. https://www.nature.com/articles/s41598-020-67736-
6.pdf and Yong-Jian, D., Chen-Yu, L., Wang, X., Yan, W., Sheng-Xia, W., Ya-Ping, C., Jia, Q., Shao-Ping, W.,
Qiu-Dong, Z. and Zeng-Ru, W., 2021. An overview of climate change impacts on the society in China.
Advances in Climate Change Research.
https://www.sciencedirect.com/science/article/pii/S1674927821000411/pdfft?md5=f7505c5523297410
8f474b9a11559e0e&pid=1-s2.0-S1674927821000411-main.pdf )
More importantly, including China in the Disadvantaged category improves the apparent
conditions within the region. Moving China to the Advantaged countries would make the apparent
impacts much worse for all parties.
The ability to withstand climate is to a large extent a function of GDP per capita. A higher GDP
per capita provides economic flexibility to accommodate climate impacts as well as the ability to counter
them. Qualitatively, climate change commentary often qualitatively notes how less-developed countries
will suffer the brunt of climate change. This study used the limited number of studies available on
impacts to quantitatively (with uncertainty) depict what that differential burden entails. xiii In the 1990s, the concern was whether climate change was important enough to worry about. Governments never seriously pursued, the then possibly adequate, low-level mitigation. In the 2000s, climate was not important enough and the mitigation response was the central, while adaptation response was a bad word that corresponded to the unthinkable failure to mitigation. There was a failure to mitigate. The 2010s, in light of governmental and societal resistance to even limited mitigation responses, and in the realization of unavoidable significant climate change, adaptation response became an important consideration. There was only the storyline of imminent government mitigation policies and modest adaptation needs. Any other talk was deemed alarmist. Now in the 2020s, there has been very little action on either mitigation or adaptation. (Climate scientists: concept of net zero is a dangerous trap https://theconversation.com/climate-scientists-concept-of-net-zero-is-a-dangerous-trap-157368) Facing a future where temperatures may be well beyond 2 °C with highly consequential climate impacts, perhaps it is time to seriously address safeguard responses xiv Some might argue that the natural environment is more important than the human one. This study did not directly estimate the loss of biodiversity, but it is partially subsumed as the loss of ecological services affecting macroeconomic conditions. xv The cost in 2021 dollars would be approximately 1.2 times larger than those reported in 2010 dollars. xvi Mobilization is at the global level. A mobilization of 50% may mean that 100% of the countries have mobilization activities equal to 50% on average. Implicitly it means 50% for Advantaged and 50% for Disadvantaged countries. A 50% mobilization might also imply that half of the Disadvantaged economies are mobilizing at 100% and half at 0%. It does not imply that all countries are at 50%. It may
Climate Risk and Response July 2021
George Backus (Material is free to use with attribution.) 137
also mean that some early adapter countries are 75% along in mobilization while other laggards are at 25%. There is a need to think of international global compliance to make sure transnational corporations are part of the response. xvii Own-Use energy is the energy needed to make the renewable energy capacity. xviii The analyses indicate that economic and social conditions will be much worse than in the Base case.
As such the expected education (and the improved plight) of women may not materialize. The result
would likely be higher birthrates and more conflict. (Kebede, E., Goujon, A. and Lutz, W., 2019. Stalls in
Africa’s fertility decline partly result from disruptions in female education. Proceedings of the National
Academy of Sciences, 116(8), pp. 2891-2896. https://www.pnas.org/content/pnas/116/8/2891.full.pdf )
Niger has the world’s highest birth rate and that may be a recipe for unrest
(https://theconversation.com/niger-has-the-worlds-highest-birth-rate-and-that-may-be-a-recipe-for-
unrest-108654 and Demographic Security Comes of Age
https://www.wilsoncenter.org/sites/default/files/media/documents/publication/ecspr10_C-cincotta.pdf
and The Effects of ‘Youth Bulge’ on Civil Conflicts https://www.cfr.org/backgrounder/effects-youth-
bulge-civil-conflicts ) xix The impact of disease in the Advantaged countries assumes current levels of medical intervention. Although medical advances to respond to disease prevalence can reduce death rates for that disease, the estimated dynamics used here leave out many nascent disease pathways. (Deadly Fungi Are the Newest Emerging Microbe Threat All Over the World. https://www.scientificamerican.com/article/deadly-fungi-are-the-newest-emerging-microbe-threat-all-over-the-world/ ) and reducing overall deaths due to assumed medical advances to fight the emergent afflictions would be overly optimistic relative to the totality of the threat xx Conflict patterns are only based on history and do not include conflict in the rest of the Middle East or in other petrol states due to the collapse of fossil-fuel revenue. xxi The effective elasticity of the net impact is only on the order of -0.05 (Alinaghi, N., & Reed, W. R. (2020). Taxes and Economic Growth in OECD Countries: A Meta-Analysis. Public Finance Review, 1091142120961775. https://osf.io/za684/download). Yet, given the large investment flows, it can reduce economic growth by several percent. See Section 5. xxii The estimated investment cost from the SR1.5 report analysis is $122T xxiii In some scenarios, the incomes of the Disadvantaged populations are reduced to subsistence levels. (FAO, 2002. The Role of Agriculture in the Development of Least-Developed Countries and Their Integration into the World Economy. Commodities and Trade Division. http://www.fao.org/3/y3997e/y3997e.pdf and Angus Maddison (2007) The World Economy Volume 1: A Millennial Perspective Volume 2: Historical Statistics. Academic Foundation. p. 260. ISBN 9788171886135. https://www.stat.berkeley.edu/~aldous/157/Papers/world_economy.pdf ) xxiv Climate feedbacks from regional mitigation affect both regions, but changes in international trade and finance processes, international supply chains, and off-shoring dynamics are disregarded. xxv Rio De Janeiro Earth summit of 1992, the Kyoto Protocol of 1997, the Bali Action Plan of 2007, the Copenhagen Accord of 2009, the Cancún agreements of 2010, the Durban Platform for Enhanced Action of 2012, and the Paris Accord of 2015. Similarly, the IPCC reports have painted an urgent picture for needed responses to climate change since 1990 in its Assessment Reports (https://www.ipcc.ch/assessment-report/ ) xxvi The political acceptance CFC impacts on ozone, resulting in the Montreal protocol, took 11 years (1976-1987), with detractors fighting it through 1985. It took another 28 years (1987-2015) for all nations to implement (and fund) the Protocol (with significant violations still evident to this day).
Climate Risk and Response July 2021
George Backus (Material is free to use with attribution.) 138
xxvii The simulation and the consensus delays are initialized in the year 2014, as corresponding to the consensus already in progress that produced the Paris accord. Thus, the mobilization initiation date of 2023 data is an output, not an input to the model. xxviiiSome recent (2021) articles note a 45% growth rates for renewable generation.
(https://www.npr.org/2021/05/11/995849954/renewable-energy-capacity-jumped-45-worldwide-in-
2020-iea-sees-new-
normal#:~:text=Despite%20the%20pandemic%2C%20the%20growth,rate%20of%20increase%20since%
201999 and https://www.cnbc.com/2021/05/11/renewables-grew-at-fastest-rate-in-two-decades-last-
year-iea-says-in-new-report.html ) A review of the data source shows that these claims are misleading
(IEA Renewable Report 201021. Renewable Energy Market Update: Outlook for 2021 and 2022,
International Energy Agency, Paris, May 2021 https://iea.blob.core.windows.net/assets/18a6041d-
bf13-4667-a4c2-8fc008974008/RenewableEnergyMarketUpdate-Outlookfor2021and2022.pdf ). But on
the other hand, neither the global utility-wind or utility-solar industries are at the mature threshold,
albeit they will exceed it in the next few years. xxix A concern of this analysis might be the use of the Global Surface air temperature (GSAT) which reflects the average of the land and ocean values. It is not only used as a surrogate for the Global Mean Land Temperature (GMLT) in estimating land-relevant impacts, the analyses use this global average equally across all regions and simplistically ties all impacts to the change in that temperature. In essence, the impact analysis is assuming that all phenomena, everywhere, are adequately represented as a function of the GSAT. To partially compensate, all impact equations are normalized to reproduce the results of the referenced studies in relation to the change in GSAT. The emphasis here is to illustrate the consequence of feedback dynamics on relative impacts and climate mitigation. The analysis must be heavily aggregated and simplified to unravel the critical aspects of the phenomena. Testing indicates that the GSAT approach is adequate for that purpose.
The aggregation of the entire globe into two non-geographically contiguous regions disregards very dramatic differences in local impacts, government effectiveness, and adaptation capacities. Nonetheless, because the model is calibrated to produce the published results aggregated to the respective region, the relative change in outcomes due to policy changes are qualitatively valid for illustrating the phenomena quantitatively and meaningfully as proportional changes.
On one hand, the land (GMLT) and average surface (GSAT) temperatures are diverging, which would imply that the impacts noted here are dramatically underestimated. On the other hand, the studies upon which the impacts are based, themselves use the GSAT as the basis for estimating impacts. This work does attempt to correct the long terms impact for GSAT versus GMLT. It assumes that the estimation process used by the researcher corrects for that divergence. (Pfleiderer, P., Schleussner, C.F., Mengel, M. and Rogelj, J., 2018. Global mean temperature indicators linked to warming levels avoiding climate risks. Environmental Research Letters, 13(6), p.064015. https://iopscience.iop.org/article/10.1088/1748-9326/aac319 ) xxx The regional analyses produce average results as if there are uniform impacts and responses everywhere – despite policy and climate actually affecting individual countries in a highly varied manner. Still, the response is representative and the consequence meaningful. The aggregation is a necessary simplification for better comprehension and highlighting the concern. xxxi The EIA data are free to use. The IEA data have constraints on publicly revealing detailed values from the analysis (https://www.iea.org/terms ). IEA data were only used to disaggregate EIA data as necessary, primarily in the areas of biomass and renewable energy. The EIA analysis omitted non-market energy such as biomass and end-use demand for renewable energy
Climate Risk and Response July 2021
George Backus (Material is free to use with attribution.) 139
xxxii Energy is measured in Exajoules/Year, electricity capacity is measured in Terawatts, electricity usage in Terawatt-hours/Year, and emissions are measured in Tonnes/Year. xxxiii While Burke attributes essentially all the impacts to the Disadvantaged countries, the analyses here use Kalkuhl’s estimates that would, for example, attribute 66.6% of the current impacts to the Disadvantaged countries. The attribution is largely based on geographical vulnerability rather than on a GDP per Capita based ability to mitigate damages. xxxiv See AR5 WGII (https://www.ipcc.ch/report/ar5/wg2/ ), Chapter 12 pg 722 for Flood deaths, pg 772 for Conflicts and pg 766 for Migration. xxxv N0 is a function of population and GDP-per-capita based on the literature. xxxvi The deaths are calculated as the ratio of historical-flood-deaths/historical-flood-displacement flows multiplied by current flood displacement flows. Income levels do not affect the death rate. (Ferreira, S., 2011. Nature, socioeconomics and flood mortality. Georgia Institute of Technology. http://www.gwri.gatech.edu/sites/default/files/files/docs/2011/7.4.1Ferreira.pdf ) xxxvii Dengue Fever has a negligible impact. (Messina, J.P., Brady, O.J., Golding, N., Kraemer, M.U., Wint, G.W., Ray, S.E., Pigott, D.M., Shearer, F.M., Johnson, K., Earl, L. and Marczak, L.B., 2019. The current and future global distribution and population at risk of dengue. Nature microbiology, 4(9), pp.1508-1515. https://www.nature.com/articles/s41564-019-0476-8.pdf ) xxxviii Food costs will likely rise due to the impacts of climate change on agriculture - while the most affected economies simultaneously deteriorate. The simulation does not consider an increase in starvation due to being too poor to buy (import) food. xxxix Coastal flooding will be pervasive, with a need for replacement construction. Due to sand constraints on future cement production and the assumed transition away from cement as a function of mobilization intensity, adaptation via the use of sea-walls is considered minimal. (A sand shortage? The world is running out of a crucial — but under-appreciated — commodity https://www.cnbc.com/2021/03/05/sand-shortage-the-world-is-running-out-of-a-crucial-commodity.html and Bring me a nightmare: Asia’s hunger for sand is harmful to farming and the environment https://www.economist.com/asia/2020/01/18/asias-hunger-for-sand-is-harmful-to-farming-and-the-environment and Why the world is running out of sand https://www.bbc.com/future/article/20191108-why-the-world-is-running-out-of-sand?utm_source=pocket-newtab and Yes, it’s true, the world is running out of sand https://asiatimes.com/2021/05/yes-its-true-the-world-is-running-out-of-sand/ and How Sand Mining Could Destabilize the World https://gizmodo.com/how-sand-mining-could-destabilize-the-world-1846937160 an dScientists consider true costs of sand, call for sustainability effort https://www.upi.com/Science_News/2021/05/21/global-sand-use-sustainability-problems/2351621607802/ and Torres, A., Simoni, M.U., Keiding, J.K., Müller, D.B., zu Ermgassen, S.O., Liu, J., Jaeger, J.A., Winter, M. and Lambin, E.F., 2021. Sustainability of the global sand system in the Anthropocene. One Earth, 4(5), pp.639-650. https://www.sciencedirect.com/science/article/pii/S259033222100230X/pdfft?md5=945a9b34d16e2833bacb72cc2b1dafaa&pid=1-s2.0-S259033222100230X-main.pdf ) xl The Global Environment Facility https://www.thegef.org/ is a multiagency, UN-authorized program for developed countries to provide climate related aid to developing countries. Part of the aid is for adaptation and part is for the mitigation burden-sharing noted in Section 2.1. The efforts to-date are local and limited, underfunded, and have produced minimal benefits.( https://www.thegef.org/topics/climate-change-adaptation Also see: Dobardzic, S., Moore, R., Iqbal, F., Sundstrom, K.R., Luo, A.C., Schinn, D.S., Dixon, R.K., Laperriere, A., Yang, M., Severin, C.H. and Hofer, C., 2016. Time to adapt: insights from the global environment facility’s experience in adaptation to climate
Climate Risk and Response July 2021
George Backus (Material is free to use with attribution.) 140
change (No. 107515, pp. 1-188). The World Bank. and see https://www.thegef.org/sites/default/files/publications/GEF_Adaptation2016_final_0_0.pdf ) xli Recent studies indicate that the global population might decline sooner and faster due to forever-chemicals. (Swan, S., Count Down: How Our Modern World Is Threatening Sperm Counts, Altering Male and Female Reproductive Development, and Imperiling the Future of the Human Race. Simon and Schuster (2021) and Plummeting sperm counts, shrinking penises: toxic chemicals threaten humanity. 18 Mar 2021, https://www.theguardian.com/commentisfree/2021/mar/18/toxic-chemicals-health-humanity-erin-brokovich ) A population reduction is then associated with a loss of technological advances and relative loss of GDP due to reduced population. (The economics of falling populations, Mar 27th 2021, https://www.economist.com/finance-and-economics/2021/03/27/the-economics-of-falling-populations ) Both effects reduce the ability to mitigate climate change: reduced capability to pay for mitigation and reduced capability to reduce emissions per dollar of GDP. xlii In optimization models or model with large time steps, each reported time period is a static snapshot of calculated equilibrium conditions. xliii Because of the relatively low capacity factor of renewable generation capacity and the extent of battery storage, as the renewable energy becomes dominant on the grid, there is no concern for meeting peak load. There is however increased concern for meeting energy needs under highly variable climatic conditions. xliv This study does not consider the use of GHG-neutral carbon-based biofuels nor the extensive use of hydrogen due to the net loss in efficiency (EROI) and the added capital costs. This is contrary to recent studies. (Cole et al., Quantifying the challenge of reaching a 100% renewable energy power system for the United States, Joule (2021), https://doi.org/10.1016/j.joule.2021.05.011 https://www.sciencedirect.com/science/article/pii/S2542435121002464/pdfft?md5=a85d347fa65e0cde0a331986d605f7e9&pid=1-s2.0-S2542435121002464-main.pdf ) xlv The logic here more captures the Nth plant cost. The Nth plant is the cost of the mature technology. Although there is significant learning by doing, it generally occurs in the middle phase of industry growth – before the industry reaches mature levels ($150B/year). Further it happens over a relatively short time period and is a critical dynamic relative to the climate transition. Lastly, the long-term changes in costs are due to R&D breakthroughs that occur essentially independently of experience. The NREL R&D advances have had a large effect on PV and wind technology over the years. The time constant on such advances are a function of not only government spending but also on the current level of research and the time it takes to fund, implement, and complete R&D programs. It is assumed that the exponential decline toward the Nth plant cost, as a function of time (R&D), provides a good representation of those costs. Nonetheless, this work uses the time trajectory inherent in the technology curve presented by NREL (https://atb.nrel.gov/electricity/2020/data.php ) xlvi The study does not reduce the cost of fossil fuel generation. The larger fossil-fuel investment costs more offset the costs of renewable energy sources substituting for them. The study does not include excess growth and overshoot in the secondary industries, nor from mining constraints, both of which may strongly and adversely affect the costs and growth rate of renewable capacity in the future. (The Role of Critical World Energy Outlook Special Report Minerals in Clean Energy, IEA, Paris 2020 https://iea.blob.core.windows.net/assets/24d5dfbb-a77a-4647-abcc-667867207f74/TheRoleofCriticalMineralsinCleanEnergyTransitions.pdf and Transitions Will there be resource wars in our renewable energy future? https://www.salon.com/2021/05/31/will-there-be-resource-wars-in-our-renewable-energy-future_partner/ ) It is assumed that the recovery of all cost associated with the support industries are
https://www.theguardian.com/commentisfree/2021/mar/18/toxic-chemicals-health-humanity-erin-brokovich
https://www.theguardian.com/commentisfree/2021/mar/18/toxic-chemicals-health-humanity-erin-brokovich

Climate Risk and Response July 2021
George Backus (Material is free to use with attribution.) 141
contained within the cost of the renewable capacity. While the study does use the NREL cost trajectory, those average costs are higher than the cheapest cost often equated in news releases (BNEF says solar and wind are now cheapest sources of new energy generation for majority of planet https://www.renewableenergyworld.com/wind-power/bnef-says-solar-and-wind-are-now-cheapest-sources-of-new-energy-generation-for-majority-of-planet/#gref ). Further, the study assumes the technologies mature, and after the expected cost reduction, there is not a continuation of further reduction in the future. Lastly, the study uses time and R&D expenditures to determine the rate of cost decline and efficiency improvements. While learning by doing is real, there is little solid empirical data to support it. (See Section 4.3.3). The exponential decline in costs is due to R&D efforts (such as those implied in the mitigation package here). R&D will govern any cost reductions compared to separate learning-by-doing impacts. xlvii Optimally expanding transmissions will be difficult. There will be an abundance of new renewable capacity whose location might be more dictated by public debate than by least-cost. During the GHG transition there is a natural change in the loading of the grid as conventional capacity retires. Due to climate impacts, there will be significant demographic movement and macroeconomic structural change which will modify the location and characteristics of load centers. It will be impossible to clairvoyantly plan for the resulting load and source topology, or for the transition dynamics.
With the increase in electric vehicles and an implemented policy of electrification, there will be dramatically increased electric demand. Because of the low capacity factors for renewable generation, there will be an even greater increase in renewable generation capacity than there would be using conventional capacity. All these considerations lead to required upgrades to the distribution and transmission system. These costs are included in the analyses. The distribution costs are obviously local, but likely underestimated because of shifts in load centers from the changing demographic movements. Climate change causes distribution and transmission in one locale to be abandoned, while requiring replacement, modification, plus growth investments in a new location. Other than to connect PV and wind farms to the grid, where the location of the farms will often depend on the ability to achieve transmission rights, the expansion of the transmission system will be piecemeal and far from the optimal configuration assumed in essentially all transition analyses. (Volume 4: Bulk Electric Power Systems: Operations and Transmission Planning, Milligan, M.; Ela, E.; Hein, J.; Schneider, T.; Brinkman, G.; Denholm, P. (2012). https://www.nrel.gov/docs/fy12osti/52409-4.pdf Exploration of High-Penetration Renewable Electricity Futures. Vol. 4 of Renewable Electricity Futures Study. NREL/TP-6A20-52409-4. Golden, CO: National Renewable Energy Laboratory. https://www.nrel.gov/docs/fy12osti/52409-4.pdf) If mandated, there could be high cost for forced transmission land rights. Policies to nationalize or “take” the land to build the transmission are not politically viable. There is no international grid or a national one because is it politically too difficult to obtain all the approvals.
With transmission, one locale can compensate for another with capacity, but energy is still on average. Thus, excess capacity in other locales cannot necessarily compensate to serve coincident diversity. Because of climate change, there is 1) less water for conventional capacity, 2) high water temperature reduce output, and 3) the shift in wind and cloud-cover affects the renewable capacity mix. xlviii After the electric-supply portion of the GHG transition, in theory, enclosed vertical farming (agriculture) with GHG-recycle could be emissions-free. xlix Agriculture, Forestry and Other Land Use l The analyses here assume that the historical relationship between average and extreme conditions remain constant. This relationship is also implicit to the impact studies used for the analyses. Recent evidence indicates that the extremes are increasing at a rate that is much faster than the average conditions are increasing.
Climate Risk and Response July 2021
George Backus (Material is free to use with attribution.) 142
li The model does have the option for compatibility with the CMIP6 instead of CMIP5 data, but does not
show those results because of the 1) controversy surrounding CMIP6’s high estimated temperatures,
and 2) that the 95% exceedance probability values produce economic damages so great that adequate
mitigation is not economically possible. (Tebaldi, C., Debeire, K., Eyring, V., Fischer, E., Fyfe, J.,
Friedlingstein, P., Knutti, R., Lowe, J., O'Neill, B., Sanderson, B. and van Vuuren, D., 2020. Climate model
projections from the Scenario Model Intercomparison Project (ScenarioMIP) of CMIP6. Earth System
Dynamics Discussions, pp.1-50. https://esd.copernicus.org/articles/12/253/2021/esd-12-253-2021.pdf
and Wang, C., Soden, B. J., Yang, W., & Vecchi, G. A. (2021). Compensation between cloud feedback and
aerosol‐cloud interaction in CMIP6 models. Geophysical Research Letters, 48, e2020GL091024. CMIP6:
the next generation of climate models explained. https://doi.org/10.1029/2020GL091024 and
https://www.carbonbrief.org/cmip6-the-next-generation-of-climate-models-explained ) Nonetheless,
the disregard for the more problematic temperature, and the rebuff of improvements with the new
models, seems to stem form some level of confirmation bias were critiques note correctable issues as if
they are a fatal flaw. (Williams, K. D., Hewitt, A. J., & Bodas‐Salcedo, A. (2020). Use of short‐range
forecasts to evaluate fast physics processes relevant for climate sensitivity. Journal of Advances in
Modeling Earth Systems, 12, e2019MS001986. https://doi.org/10.1029/2019MS001986 )
All the CMIP5 climate models, and their updated CMIP6 versions exhibit an extraordinary
amount of linearity. The new cloud and aerosol dynamics begin to make the actual non-linearities more
evident. Expected model improvements that should rectify the discrepancy in northern and southern
hemisphere temperatures. (Meehl, G.A., Senior, C.A., Eyring, V., Flato, G., Lamarque, J.F., Stouffer, R.J.,
Taylor, K.E. and Schlund, M., 2020. Context for interpreting equilibrium climate sensitivity and transient
climate response from the CMIP6 Earth system models. Science Advances, 6(26), p.eaba1981.
https://advances.sciencemag.org/content/advances/6/26/eaba1981.full.pdf ) To maintain global
consistency, the results would be lower temperatures then currently estimated in some areas, at the
expense of even higher (detrimental) temperatures in other areas. Nonlinear phenomena lead to path
dependent behaviors. Assessments that focus on the shortcoming of the new approach, all though
informative, do not negate the ongoing research associated with the new models. The current time
period is unique with emission growth rates far in excess of those paleontologically experienced, and
with atmospheric chemistry different from those historically experienced. The CMIP6 results still present
legitimate concerns (risks), that are illegitimate to disregard simply because they produce problematic
results. (Haynes, L.L. and Hönisch, B., 2020. The seawater carbon inventory at the Paleocene–Eocene
Thermal Maximum. Proceedings of the National Academy of Sciences, 117(39), pp.24088-24095
https://www.pnas.org/content/117/39/24088 . Szopa, S., Thiéblemont, R., Bekki, S., Botsyun, S. and
Sepulchre, P., 2019. Role of the stratospheric chemistry–climate interactions in the hot climate
conditions of the Eocene. Climate of the Past, 15(4), pp.1187-1203.
https://cp.copernicus.org/articles/15/1187/2019/cp-15-1187-2019.pd f. Zhu, J., Otto‐Bliesner, B. L.,
Brady, E. C., Poulsen, C. J., Tierney, J. E., Lofverstrom, M., & DiNezio, P. (2021). Assessment of
equilibrium climate sensitivity of the Community Earth System Model version 2 through simulation of
the Last Glacial Maximum. Geophysical Research Letters, 48, e2020GL091220.
https://doi.org/10.1029/2020GL091220 .) lii In this context, the IPCC concepts of likelihood and confidence can be misleading (Mastrandrea, M.D., Mach, K.J., Plattner, GK. et al. The IPCC AR5 guidance note on consistent treatment of uncertainties: a common approach across the working groups. Climatic Change 108, 675 (2011).

Climate Risk and Response July 2021
George Backus (Material is free to use with attribution.) 143
https://doi.org/10.1007/s10584-011-0178-6 ). Conceptually, the confidence concept is an ill-formed combination of second-order uncertainty (qualitatively, how certain is a conclusion) and consensus (judgmental agreement of a conclusion). Here the concern is with credible uncertainty. Is there enough knowledge to bound the range of uncertainty? In a Bayesian sense, observation and expert judgment define the range of the possible. Unsupported conjectures do not constitute information (e.g., global coordinated telekinesis could send all CO2 into outer space), and do not affect the bounds of uncertainty. Evidence based on observation or on physically meaningful theoretical analyses do necessitate the inclusion of that uncertainty until subsequent information modifies the assessment (Charney, J.G., Arakawa, A., Baker, D.J., Bolin, B., Dickinson, R.E., Goody, R.M., Leith, C.E., Stommel, H.M. and Wunsch, C.I., 1979. Carbon dioxide and climate: a scientific assessment (p. 22). National Academy of Sciences, Washington, DC. http://www.cs.toronto.edu/~sme/CSC2602/CharneyReportPresentation_Pif.pdf and Lowry, T.S. and G.A. Backus, 2021, Using Climate Uncertainty for Functional Resilience, Climate Services, in press)
A large body of cross-disciplinary information can generate a compelling characterization of the uncertainty. (Sherwood, S.C., Webb, M.J., Annan, J.D., Armour, K.C., Forster, P.M., Hargreaves, J.C., Hegerl, G., Klein, S.A., Marvel, K.D., Rohling, E.J. and Watanabe, M., 2020. An assessment of Earth's climate sensitivity using multiple lines of evidence. Reviews of Geophysics, 58(4), p.e2019RG000678. https://www.pure.ed.ac.uk/ws/files/193005298/104._Hegerl.pdf). If credibility is categorized into the three possibilities of 1) conjectural (without credibility), 2) tenable (currently irrefutable) and 3) compelling (fully credible), anything that is tenable and above requires acceptance within the context of a risk assessment. In many instances, the assumption is that the compelling uncertainty distribution has a smaller range (or reduced variance) than the tenable one, but that needs not be the case. An underestimate of known-unknowns could shift the mean or tails of the distribution, and the confirmed identification of previously unknown-unknowns would move neglected conjectural considerations into the tenable category. Nonetheless, further research can often determine that negative-feedback interactions lead to a process having negligible net effects on system outcomes. Likelihood is generally conceived as the first-order probability associated with a climate outcome.
A probability of less than 33% is considered unlikely and one less than 10% very unlikely. Yet the analyses herein note the consequences of the lower probabilities are easy construed as being unacceptable. Just as the world concerns itself with protection against catastrophic asteroid impact and nuclear accidents, and even airplane failures. The concept of unlikely only has meaning in terms of risk (probability x consequence). No one would place a family member on a newly designed untested airplane, even if 9 out of 10 experts think it would not catastrophically fail. liii This is a seeming inefficient use of resources. If the Advantaged countries have to build up excess capacity and then suddenly don’t need it, why not use it to produce the new capacity for the Disadvantaged countries? It is only possible to execute optimal strategy if there is complete control over all resource procurement. Countries will underestimate the impacts or take the risk rather than endure immediate, possibly unnecessary, costs. The global-level self-interest and the inability to coordinate across sovereign rights, suggest that when unforeseen problems occur, countries or companies will use the market to obtain resources to the extent possible. Countries will shift supply chains to other unprepared manufacturers. This transfers the burden, but also adds more uncertainty to system planning and response. With regulation, local peak demands, and limited government control, it is not possible to execute an optimal solution at the global level.
Many countries will not have the ability or desire to insure against future risks, the cost being too high, the political consensus impossible to achieve, and other more immediate pressures competing for already limited financial and societal resources. The analyses here largely treat the Disadvantaged and Advantaged countries separately 1) for tractability and 2) from a realization of the tensions and
Climate Risk and Response July 2021
George Backus (Material is free to use with attribution.) 144
mistrust that could limit cooperation. The countries cannot foresee supply-reliability issues. The countries will wait until supplies are needed rather than coordinate globally to spend early and intensely in anticipation.
Lastly, both regions are simultaneously attempting to increase capacity at the maximum growth rate possible (45%). With this rate of change and the inevitable complications that will generate noise about the trajectory, it is impossible for the involved parties to even establish what is happening on the ground, let alone coordinate an optimal international supply-chain program. Globally redundant capacity will be built. liv The analyses must assume that the Disadvantaged countries provide renewable energy for the rural areas or else end up paying for direct air capture. This energy is a small fraction of the total because it’s mostly replacing biomass heating – that is largely carbon-neutral because the regional growth, and therefore the use of biomass is self-limiting. lv North Korea
Climate Risk and Response July 2021
George Backus (Material is free to use with attribution.) A1.1
Appendix 1: Supplemental Graphs
Contents Appendix 1: Supplemental Graphs .......................................................................................................... A1.1
A1.1 Referent Projection.......................................................................................................................... A1.2
A.1.2 Base Case Projection ..................................................................................................................... A1.11
A1.3 Base (100% Mobilization, w/o Own-Use) ...................................................................................... A1.19
A1.4 Core Analysis (Base, 100% Mobilization, w /Own-Use, 50% Burden) ........................................... A1.28
A1.5 Mean (0% Mobilization, w/Own-Use, 0% Burden) ........................................................................ A1.41
A1.6 Mean (100% Mobilization, w/Own-Use, 0% Burden) .................................................................... A1.41
A1.7 5% Climate (0% Mobilization, w/Own-Use, 0% Burden) .............................................................. A1.46
A1.8 5% Climate (100% Mobilization, w/Own-Use, 0% Burden) .......................................................... A1.51
A1.9 95% Climate (0% Mobilization, w/Own-Use, 0% Burden) ............................................................ A1.55
A1.10 95% Climate (100% Mobilization, w/Own-Use, 0% Burden) ...................................................... A1.60
A1.11 5% Impact (0% Mobilization, w/Own-Use, 0% Burden) .............................................................. A1.64
A1.12 5% Impact (100% Mobilization, w/Own-Use, 0% Burden) .......................................................... A1.69
A1.13 95% Impact (0% Mobilization, w/Own-Use, 0% Burden) ............................................................ A1.72
A1.14 95% Impact (100% Mobilization, w/Own-Use, 0% Burden) ........................................................ A1.76
A1.15 95% Impact (100% Mobilization, w/Own-Use, 50% Burden) ...................................................... A1.81
A1.16 Effect of Mobilization Levels ........................................................................................................ A1.85
A1.16.1 Mean (0% Mobilization, w/Own-Use, 0% Burden) ............................................................... A1.85
A1.16.2 Mean (10% Mobilization, w/Own-Use, 0% Burden) ............................................................. A1.86
A1.16.3 Mean (20% Mobilization, w/Own-Use, 0% Burden) ............................................................. A1.88
A1.16.4 Mean (30% Mobilization, w/Own-Use, 0% Burden) ............................................................. A1.91
A1.16.5 Mean (40% Mobilization, w/Own-Use, 0% Burden) ............................................................. A1.93
A1.16.6 Mean (50% Mobilization, w/Own-Use, 0% Burden) ............................................................. A1.97
A1.16.7 Mean (60% Mobilization, w/Own-Use, 0% Burden) ........................................................... A1.101
A1.16.8 Mean (70% Mobilization, w/Own-Use, 0% Burden) ........................................................... A1.105
A1.16.9 Mean (80% Mobilization, w/Own-Use, 0% Burden) ........................................................... A1.108
A1.16.10 Mean (90% Mobilization, w/Own-Use, 0% Burden) ......................................................... A1.112
A1.16.11. Mean (100% Mobilization, w/Own-Use, 0% Burden) ...................................................... A1.116
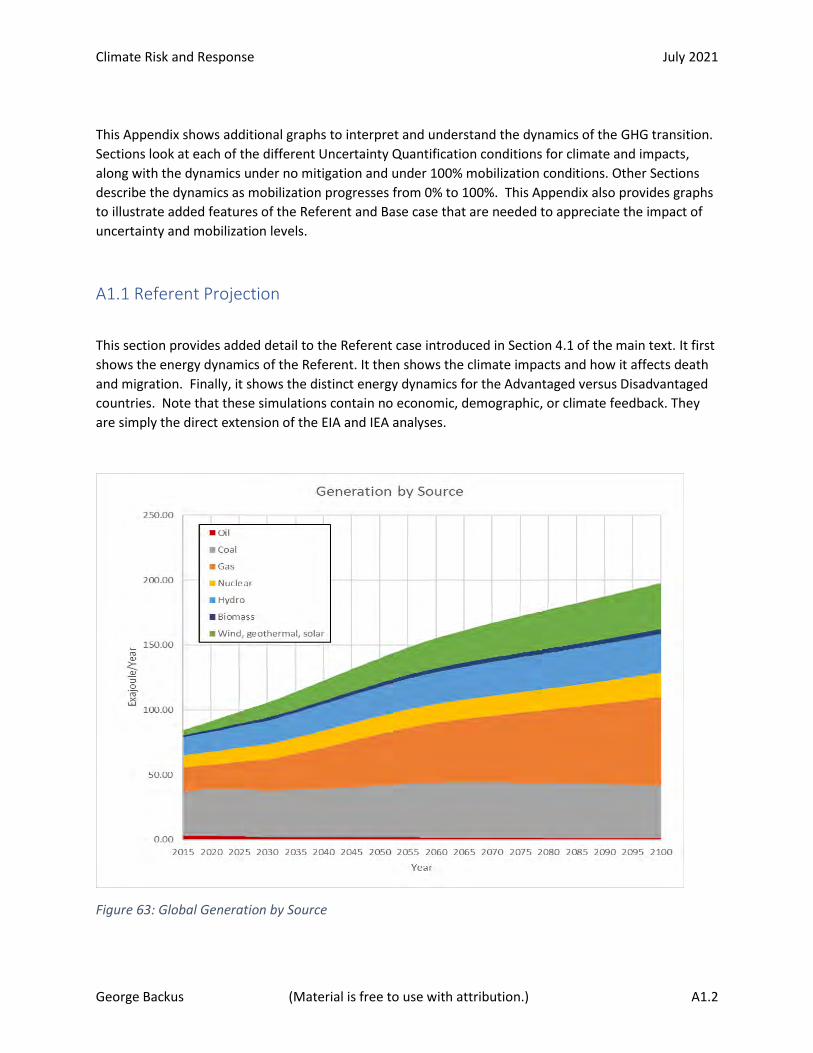
Climate Risk and Response July 2021
George Backus (Material is free to use with attribution.) A1.2
This Appendix shows additional graphs to interpret and understand the dynamics of the GHG transition.
Sections look at each of the different Uncertainty Quantification conditions for climate and impacts,
along with the dynamics under no mitigation and under 100% mobilization conditions. Other Sections
describe the dynamics as mobilization progresses from 0% to 100%. This Appendix also provides graphs
to illustrate added features of the Referent and Base case that are needed to appreciate the impact of
uncertainty and mobilization levels.
A1.1 Referent Projection
This section provides added detail to the Referent case introduced in Section 4.1 of the main text. It first
shows the energy dynamics of the Referent. It then shows the climate impacts and how it affects death
and migration. Finally, it shows the distinct energy dynamics for the Advantaged versus Disadvantaged
countries. Note that these simulations contain no economic, demographic, or climate feedback. They
are simply the direct extension of the EIA and IEA analyses.
Figure 63: Global Generation by Source
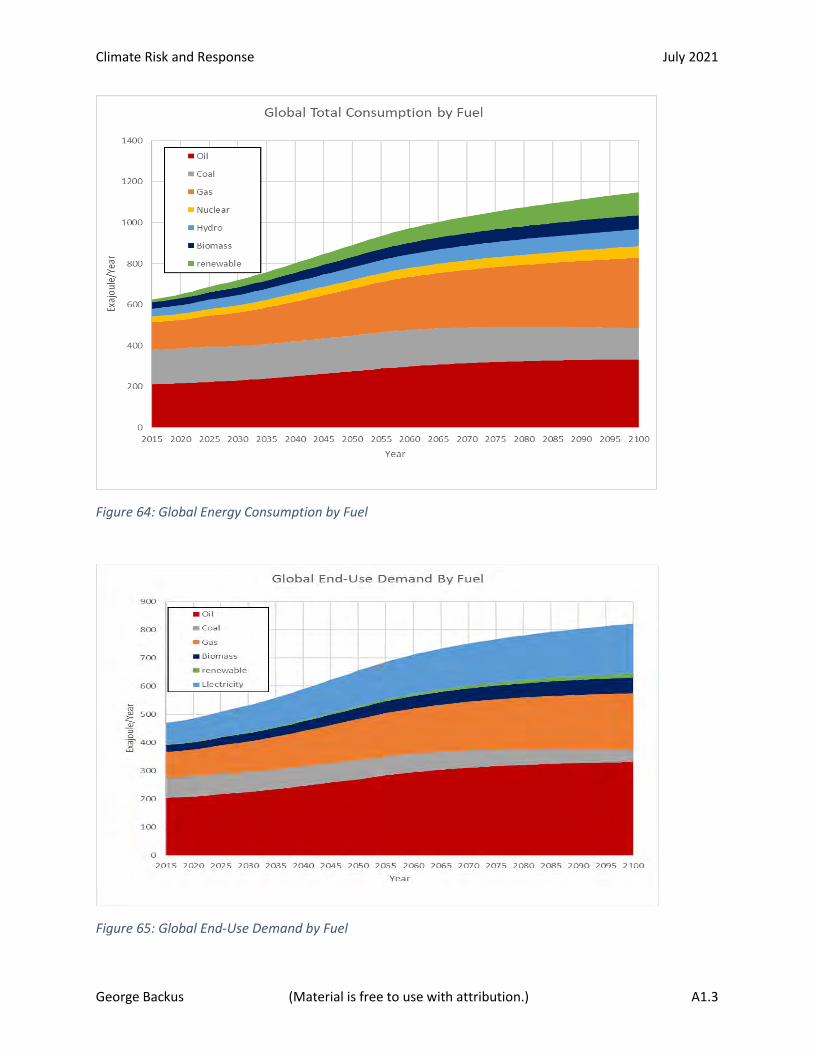
Climate Risk and Response July 2021
George Backus (Material is free to use with attribution.) A1.3
Figure 64: Global Energy Consumption by Fuel
Figure 65: Global End-Use Demand by Fuel
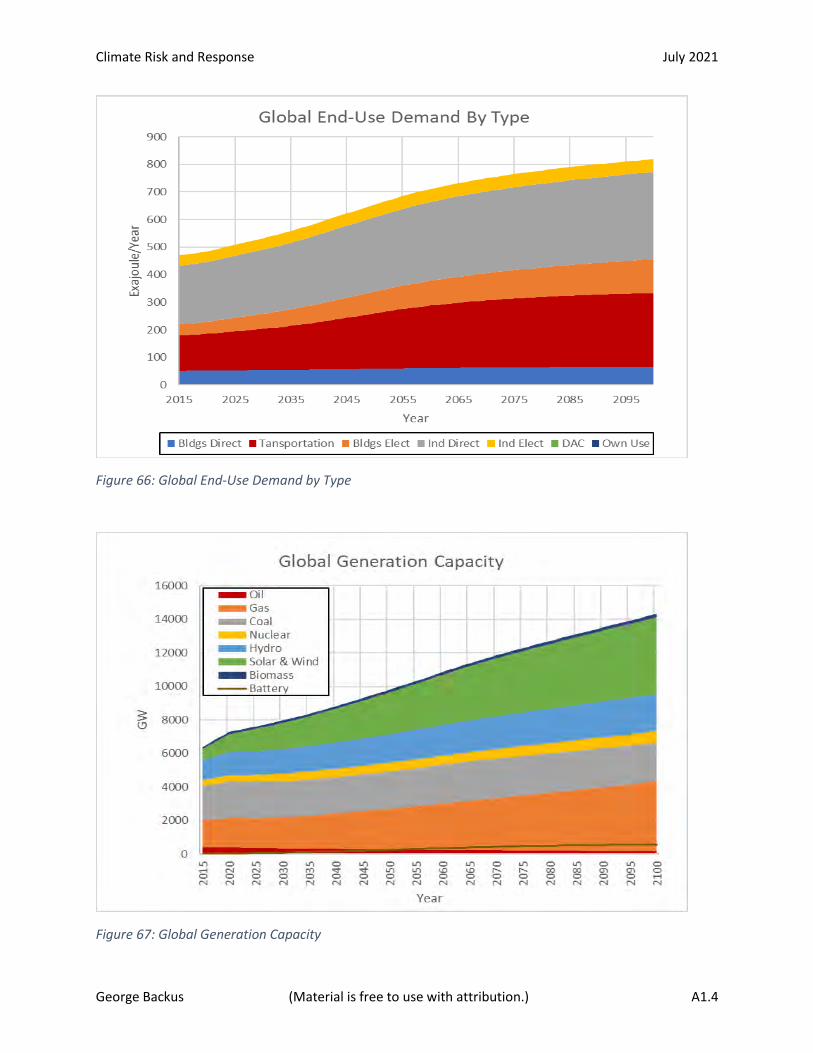
Climate Risk and Response July 2021
George Backus (Material is free to use with attribution.) A1.4
Figure 66: Global End-Use Demand by Type
Figure 67: Global Generation Capacity
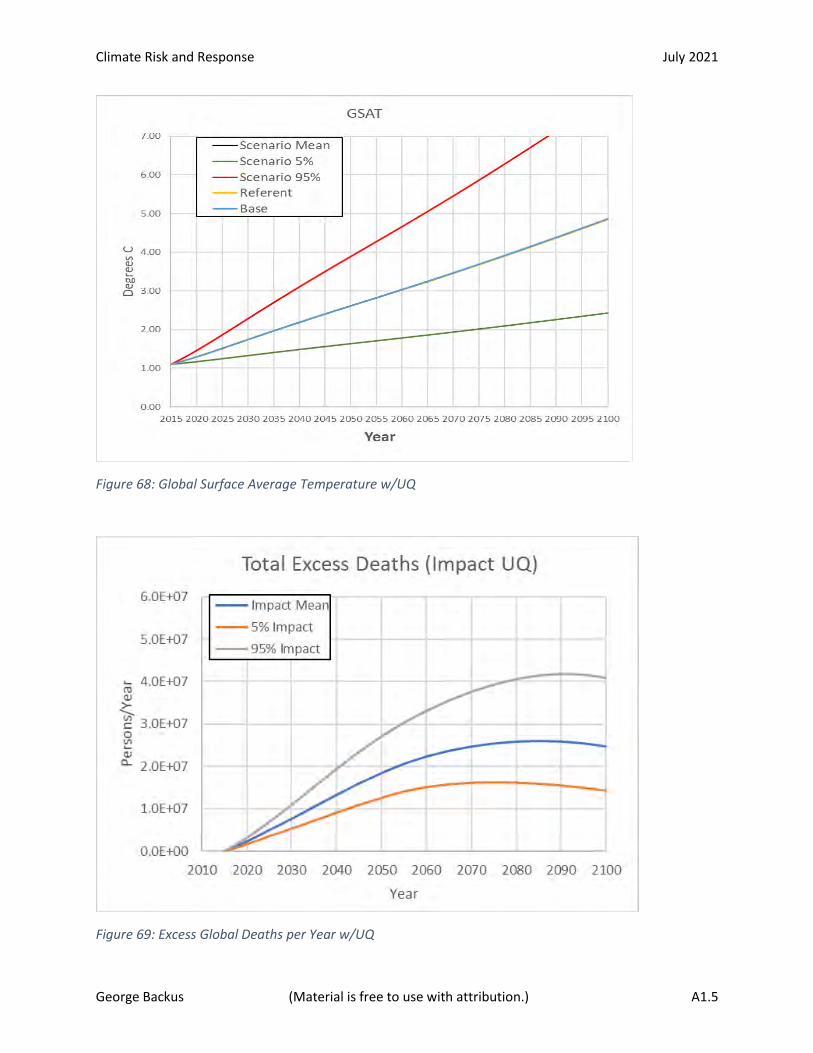
Climate Risk and Response July 2021
George Backus (Material is free to use with attribution.) A1.5
Figure 68: Global Surface Average Temperature w/UQ
Figure 69: Excess Global Deaths per Year w/UQ
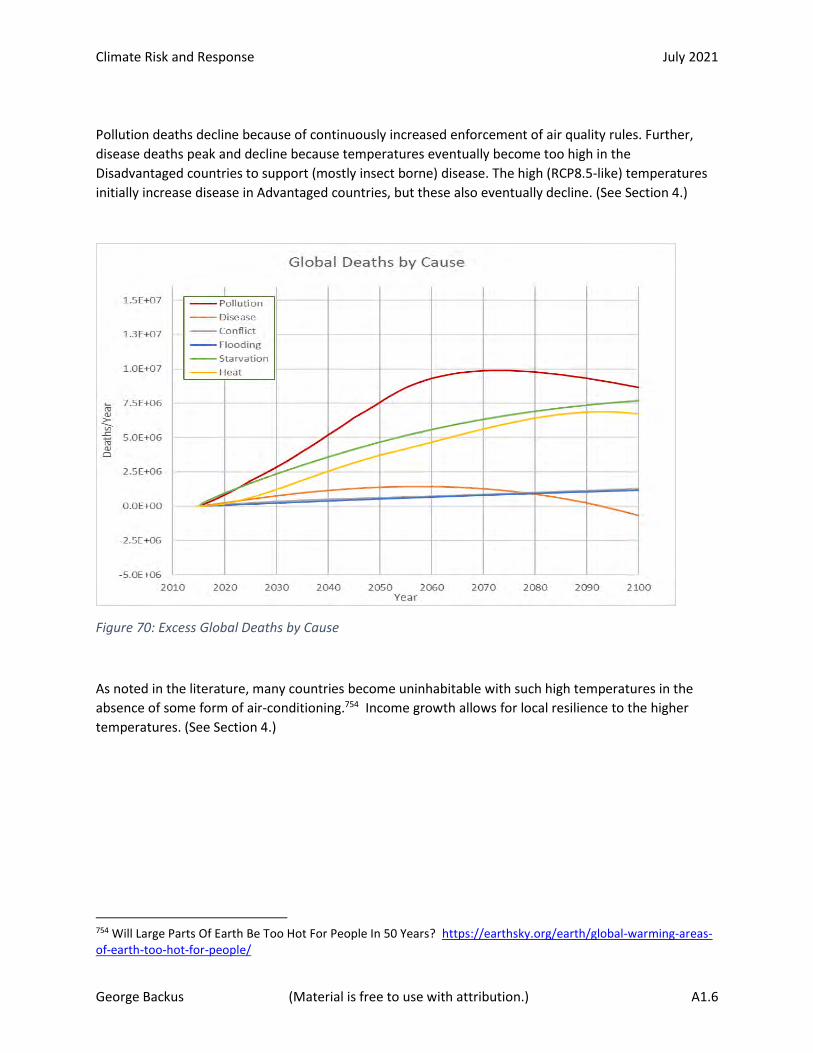
Climate Risk and Response July 2021
George Backus (Material is free to use with attribution.) A1.6
Pollution deaths decline because of continuously increased enforcement of air quality rules. Further,
disease deaths peak and decline because temperatures eventually become too high in the
Disadvantaged countries to support (mostly insect borne) disease. The high (RCP8.5-like) temperatures
initially increase disease in Advantaged countries, but these also eventually decline. (See Section 4.)
Figure 70: Excess Global Deaths by Cause
As noted in the literature, many countries become uninhabitable with such high temperatures in the
absence of some form of air-conditioning.754 Income growth allows for local resilience to the higher
temperatures. (See Section 4.)
754 Will Large Parts Of Earth Be Too Hot For People In 50 Years? https://earthsky.org/earth/global-warming-areas-of-earth-too-hot-for-people/

Climate Risk and Response July 2021
George Backus (Material is free to use with attribution.) A1.7
Figure 71: Excess Global Stock of Displaced Persons
Figure 72: Global Stock of Displaced Persons by Cause
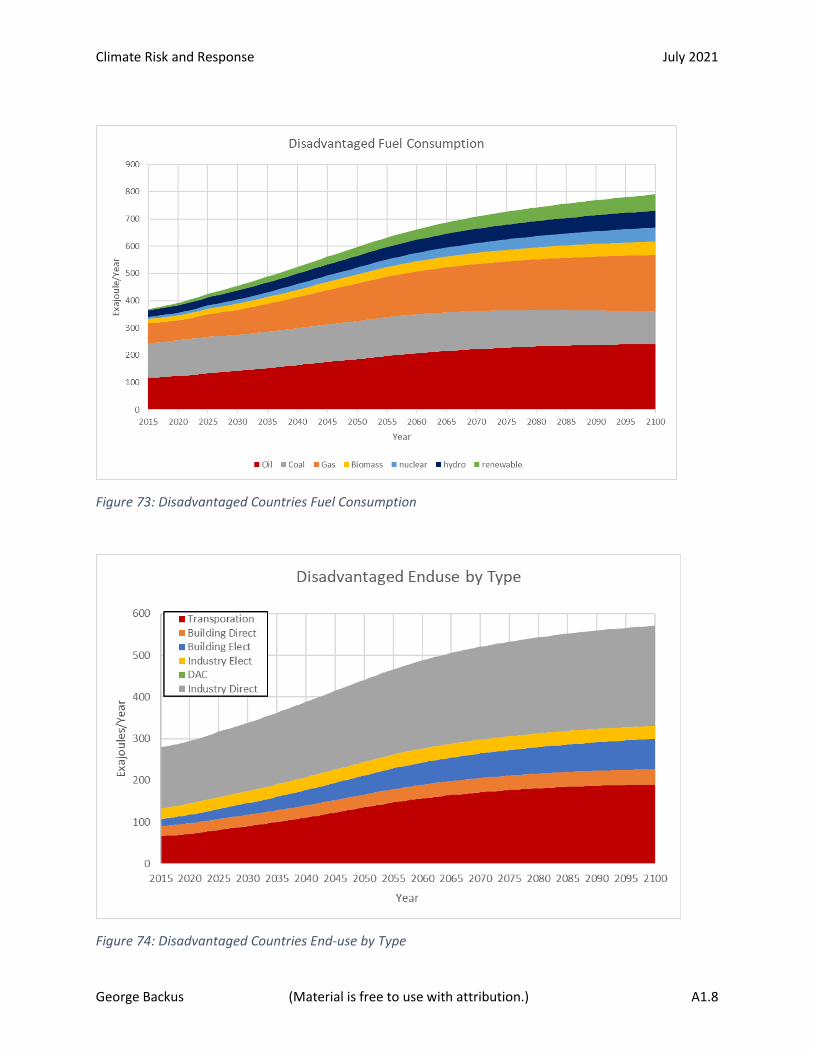
Climate Risk and Response July 2021
George Backus (Material is free to use with attribution.) A1.8
Figure 73: Disadvantaged Countries Fuel Consumption
Figure 74: Disadvantaged Countries End-use by Type

Climate Risk and Response July 2021
George Backus (Material is free to use with attribution.) A1.9
Figure 75: Disadvantaged Countries Generation
Figure 76:: Advantaged Countries Fuel Consumption

Climate Risk and Response July 2021
George Backus (Material is free to use with attribution.) A1.10
Figure 77: Advantaged Countries End-use by Type
Figure 78:: Advantaged Countries Generation
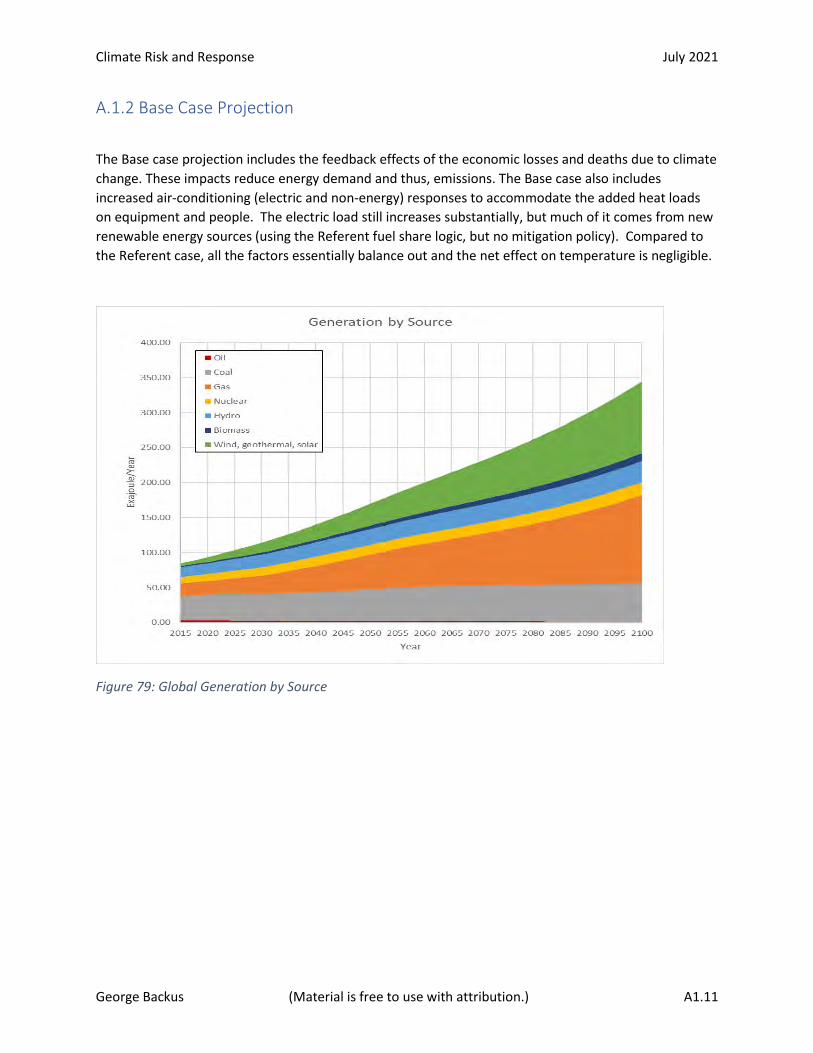
Climate Risk and Response July 2021
George Backus (Material is free to use with attribution.) A1.11
A.1.2 Base Case Projection
The Base case projection includes the feedback effects of the economic losses and deaths due to climate
change. These impacts reduce energy demand and thus, emissions. The Base case also includes
increased air-conditioning (electric and non-energy) responses to accommodate the added heat loads
on equipment and people. The electric load still increases substantially, but much of it comes from new
renewable energy sources (using the Referent fuel share logic, but no mitigation policy). Compared to
the Referent case, all the factors essentially balance out and the net effect on temperature is negligible.
Figure 79: Global Generation by Source
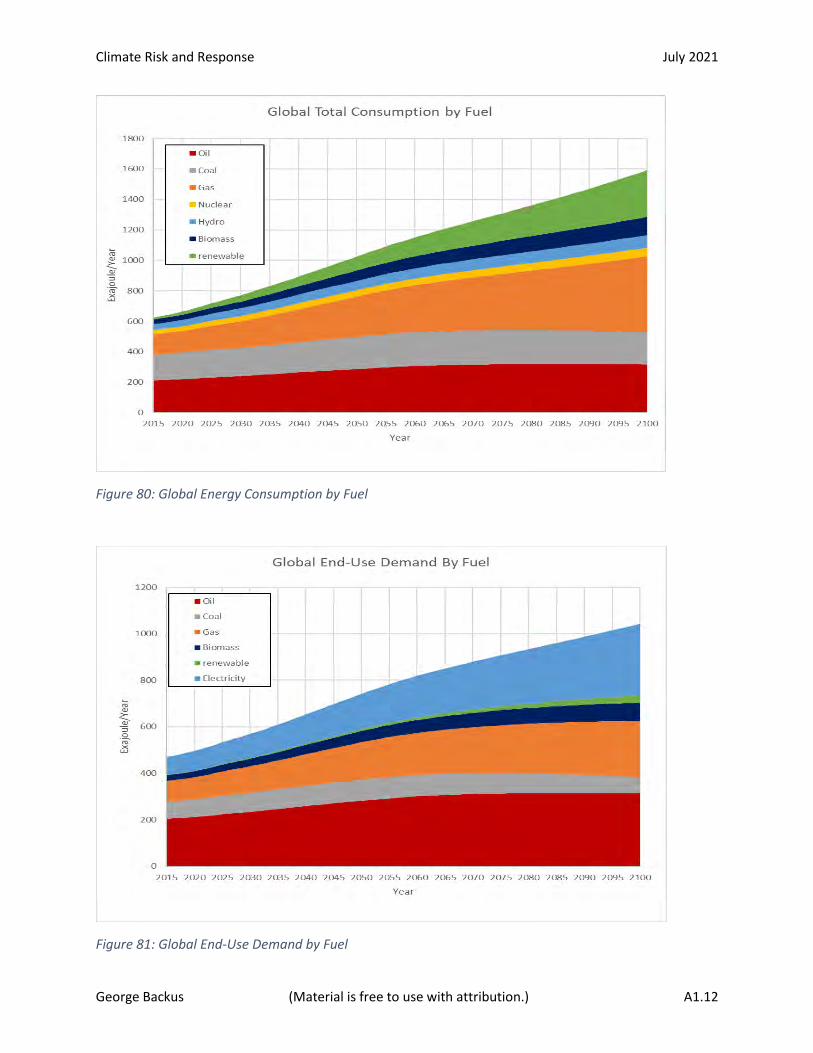
Climate Risk and Response July 2021
George Backus (Material is free to use with attribution.) A1.12
Figure 80: Global Energy Consumption by Fuel
Figure 81: Global End-Use Demand by Fuel
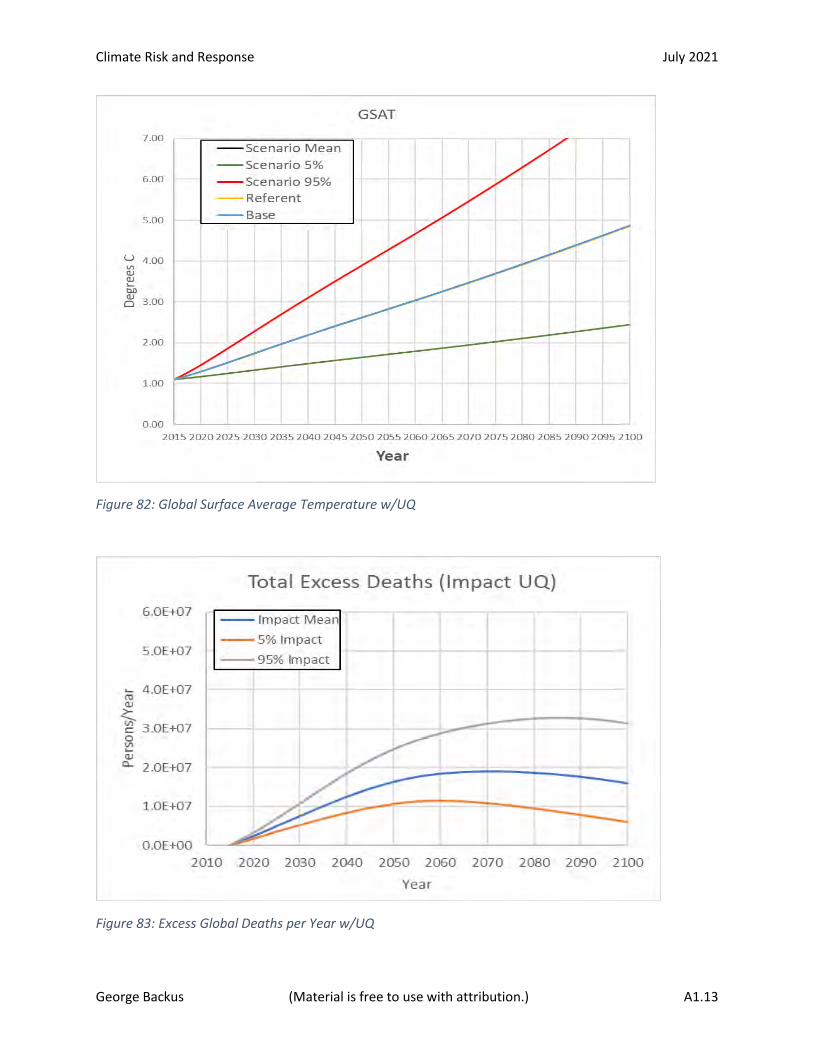
Climate Risk and Response July 2021
George Backus (Material is free to use with attribution.) A1.13
Figure 82: Global Surface Average Temperature w/UQ
Figure 83: Excess Global Deaths per Year w/UQ
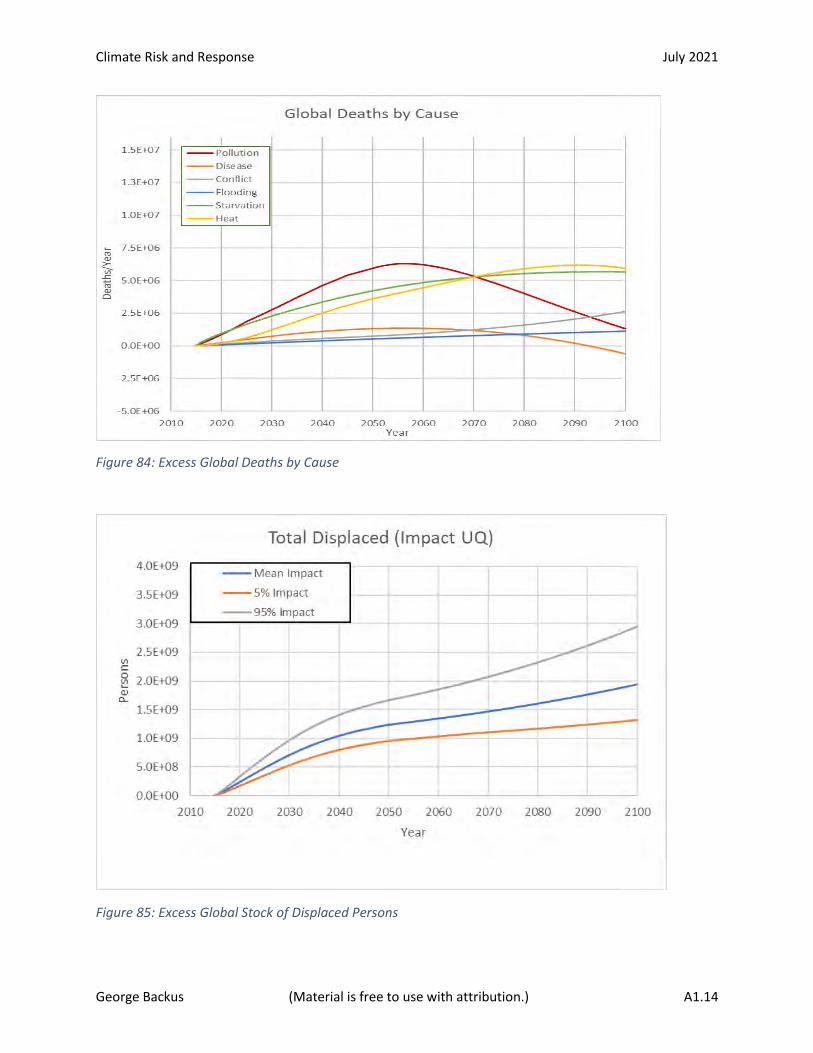
Climate Risk and Response July 2021
George Backus (Material is free to use with attribution.) A1.14
Figure 84: Excess Global Deaths by Cause
Figure 85: Excess Global Stock of Displaced Persons

Climate Risk and Response July 2021
George Backus (Material is free to use with attribution.) A1.15
Figure 86: Global Stock of Displaced Persons by Cause
Figure 87: Global Generation Capacity
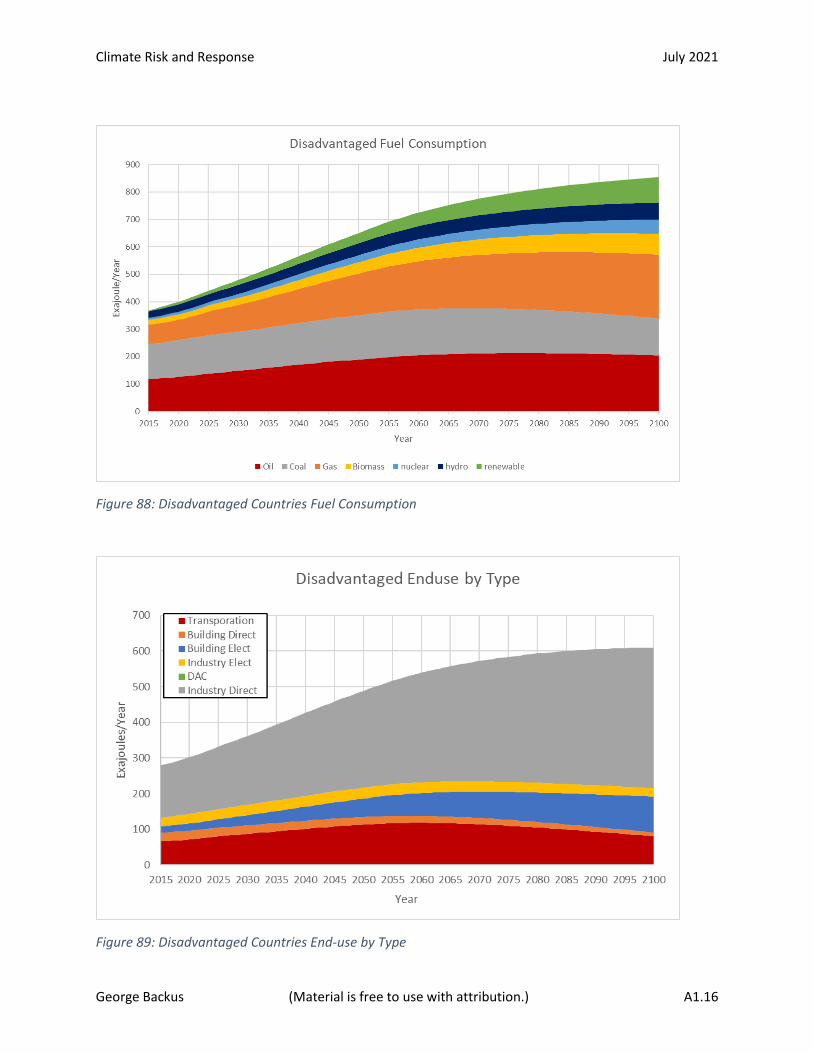
Climate Risk and Response July 2021
George Backus (Material is free to use with attribution.) A1.16
Figure 88: Disadvantaged Countries Fuel Consumption
Figure 89: Disadvantaged Countries End-use by Type
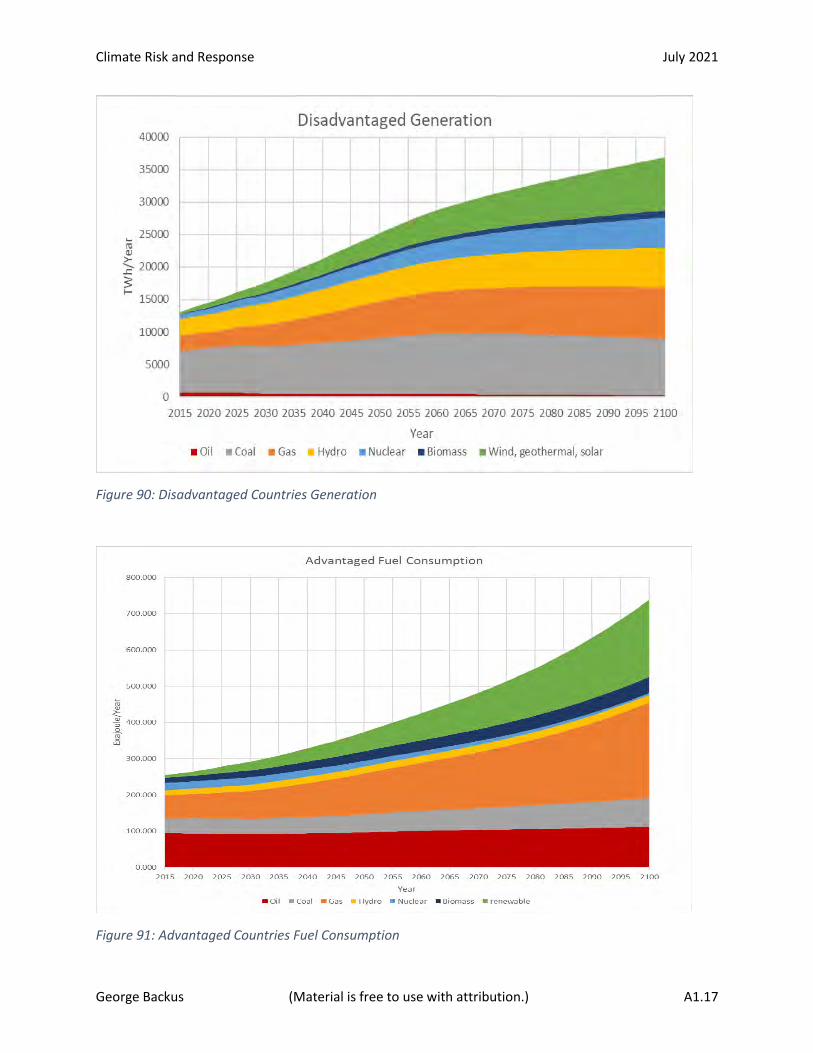
Climate Risk and Response July 2021
George Backus (Material is free to use with attribution.) A1.17
Figure 90: Disadvantaged Countries Generation
Figure 91: Advantaged Countries Fuel Consumption
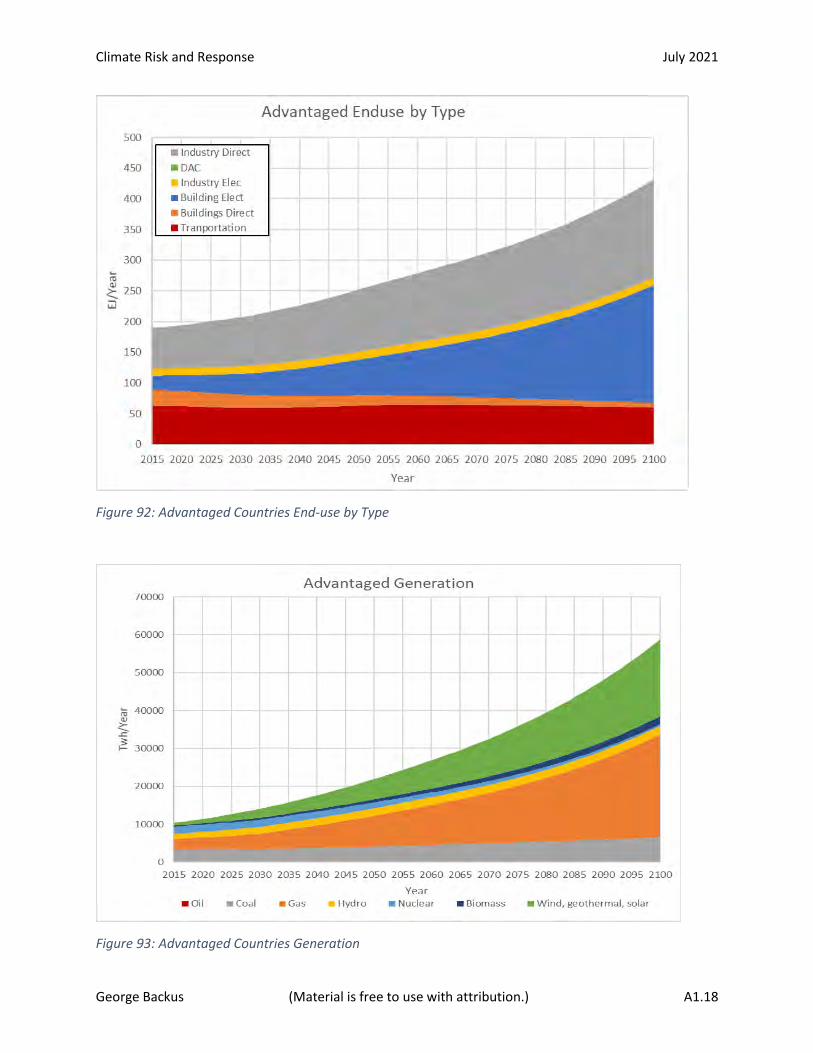
Climate Risk and Response July 2021
George Backus (Material is free to use with attribution.) A1.18
Figure 92: Advantaged Countries End-use by Type
Figure 93: Advantaged Countries Generation
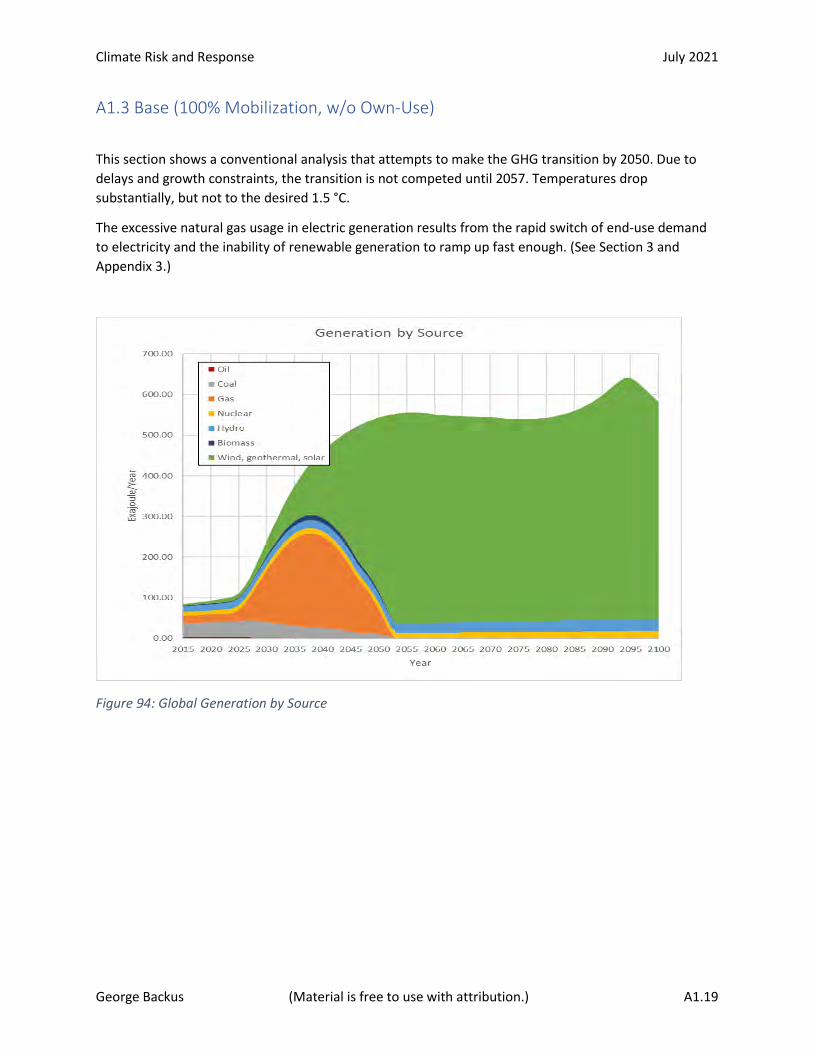
Climate Risk and Response July 2021
George Backus (Material is free to use with attribution.) A1.19
A1.3 Base (100% Mobilization, w/o Own-Use)
This section shows a conventional analysis that attempts to make the GHG transition by 2050. Due to
delays and growth constraints, the transition is not competed until 2057. Temperatures drop
substantially, but not to the desired 1.5 °C.
The excessive natural gas usage in electric generation results from the rapid switch of end-use demand
to electricity and the inability of renewable generation to ramp up fast enough. (See Section 3 and
Appendix 3.)
Figure 94: Global Generation by Source
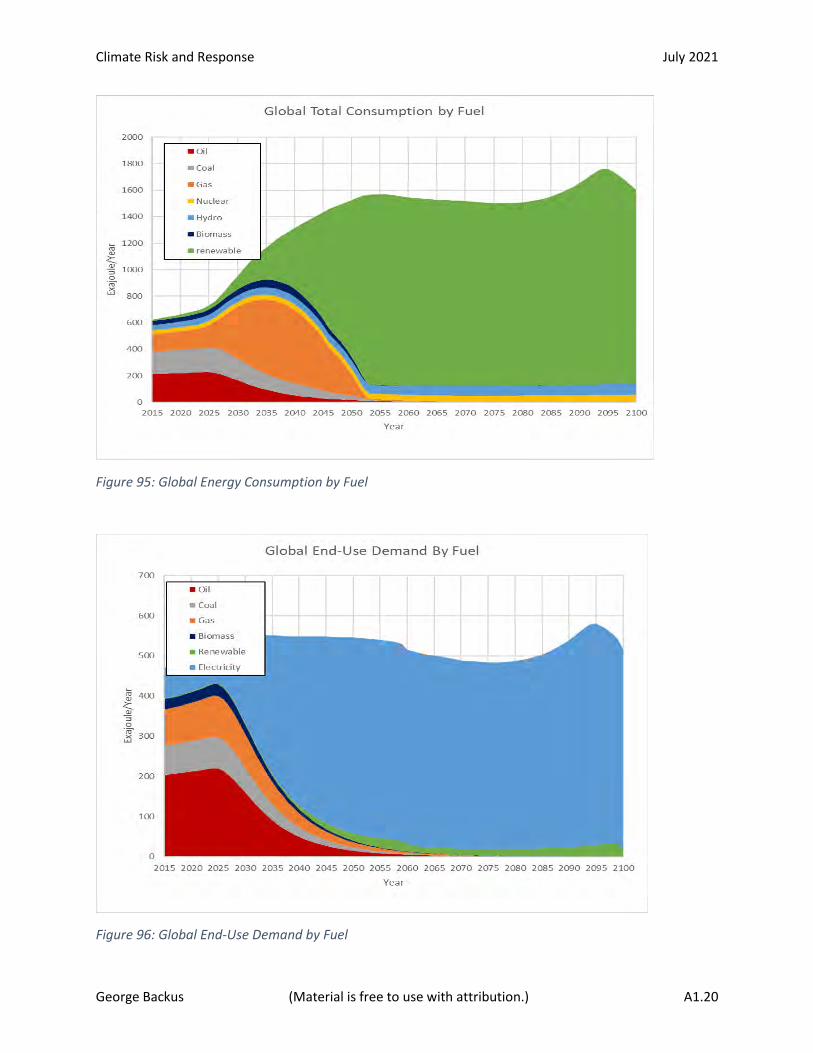
Climate Risk and Response July 2021
George Backus (Material is free to use with attribution.) A1.20
Figure 95: Global Energy Consumption by Fuel
Figure 96: Global End-Use Demand by Fuel
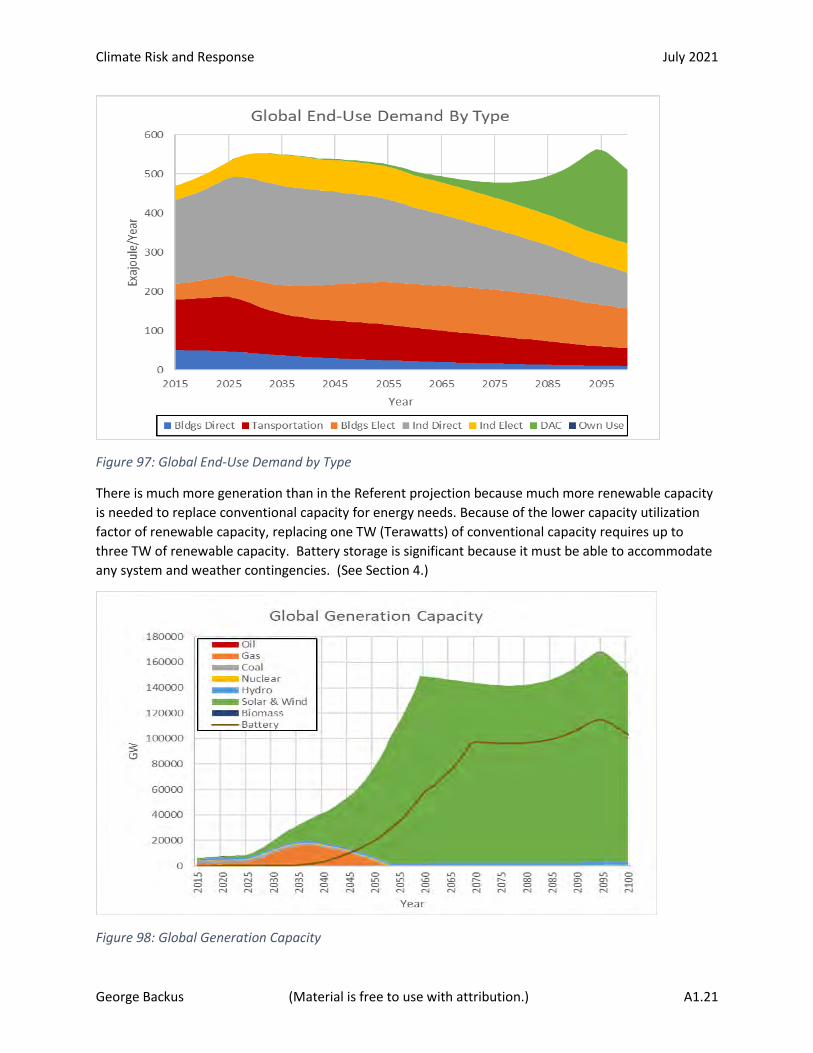
Climate Risk and Response July 2021
George Backus (Material is free to use with attribution.) A1.21
Figure 97: Global End-Use Demand by Type
There is much more generation than in the Referent projection because much more renewable capacity
is needed to replace conventional capacity for energy needs. Because of the lower capacity utilization
factor of renewable capacity, replacing one TW (Terawatts) of conventional capacity requires up to
three TW of renewable capacity. Battery storage is significant because it must be able to accommodate
any system and weather contingencies. (See Section 4.)
Figure 98: Global Generation Capacity

Climate Risk and Response July 2021
George Backus (Material is free to use with attribution.) A1.22
Figure 99: Global Surface Average Temperature w/UQ
GDP and population are dramatically affected by climate change. The mitigation scenario here results in
the impacts being no worse than they would otherwise be. Still, there is an overshoot and decline in the
Disadvantaged countries’ income levels.
Figure 100: GDP per capita by Region and Scenario
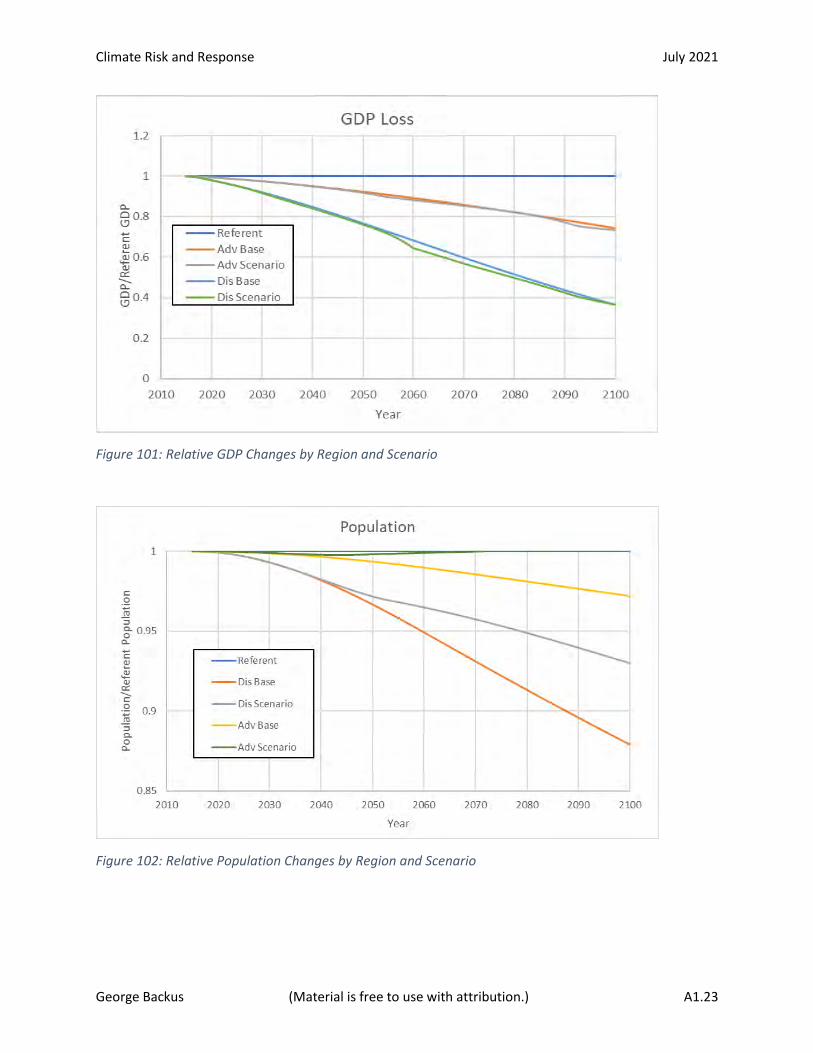
Climate Risk and Response July 2021
George Backus (Material is free to use with attribution.) A1.23
Figure 101: Relative GDP Changes by Region and Scenario
Figure 102: Relative Population Changes by Region and Scenario
Climate Risk and Response July 2021
George Backus (Material is free to use with attribution.) A1.24
Figure 103: Excess Global Deaths per Year w/UQ
Figure 104: Excess Global Stock of Displaced Persons
The figures below show the economic factors of the mitigation. They spike around 2055, at the end of
the energy transition, because of the rapid increase in the capacity (of renewable generation and
battery storage), to ensure grid reliability. As a consequence of region-specific economic and energy
0.0E+00
1.0E+07
2.0E+07
3.0E+07
4.0E+07
5.0E+07
6.0E+07
2010 2020 2030 2040 2050 2060 2070 2080 2090 2100
Per
son
s/Ye
ar
Year
Total Excess Deaths (Impact UQ)
Impact Mean
5% Impact
95% Impact
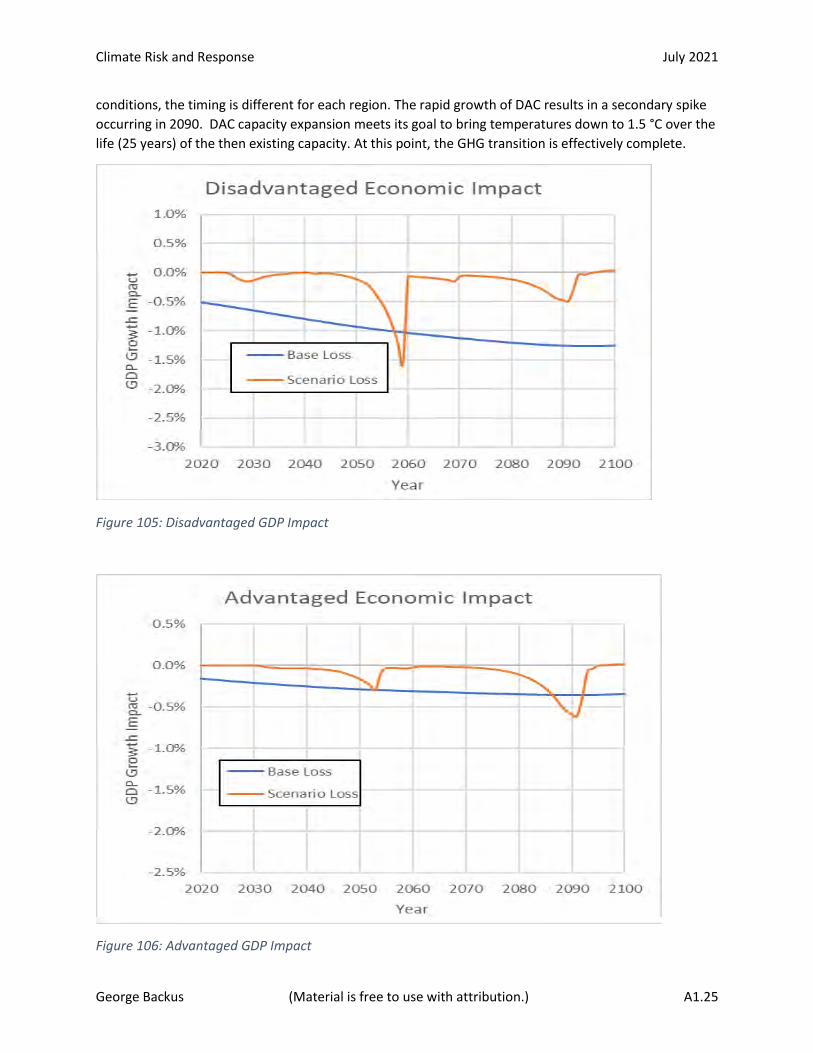
Climate Risk and Response July 2021
George Backus (Material is free to use with attribution.) A1.25
conditions, the timing is different for each region. The rapid growth of DAC results in a secondary spike
occurring in 2090. DAC capacity expansion meets its goal to bring temperatures down to 1.5 °C over the
life (25 years) of the then existing capacity. At this point, the GHG transition is effectively complete.
Figure 105: Disadvantaged GDP Impact
Figure 106: Advantaged GDP Impact

Climate Risk and Response July 2021
George Backus (Material is free to use with attribution.) A1.26
The next two figures show the investment flows for various factors. With mitigation, the foregoing of
Base case oil and coal investments (a negative value) reduces the impact of the other investments. Fossil
fuel asset-losses go directly to the stockholders. The methods used here do not allow an estimate of
possibly substantial GDP impacts.755 Stranded electric utility investments are recovered, as are
consumer losses due to the early retirement of fossil-fuel-using equipment. The biggest cost is the
investment in renewable energy sources. These costs may generate Levelized cost of Energy (LCOE)
lower than that of the conventional source, but the front-end impact of the investment is much larger
than the annualized cost and has a large impact on the economy.
Figure 107: Advantaged Country Investments by Type
755 Mercure, J.F., Pollitt, H., Viñuales, J.E., Edwards, N.R., Holden, P.B., Chewpreecha, U., Salas, P., Sognnaes, I., Lam, A. and Knobloch, F., 2018. Macroeconomic impact of stranded fossil fuel assets. Nature Climate Change, 8(7), pp.588-593. http://oro.open.ac.uk/55387/1/mercure_StrandedAssets_v16_with_Methods.pdf

Climate Risk and Response July 2021
George Backus (Material is free to use with attribution.) A1.27
Figure 108: Disadvantaged Country Investments by Type
The last two figures show the drop in carbon-based energy sources and the reduction in GHG emissions.
Emissions become negative as DAC capacity ramps up. Note that the emissions plot includes over 20
Gigatonnes/Year of natural CO2e emissions.
Figure 109: Carbon Energy Share by Scenario
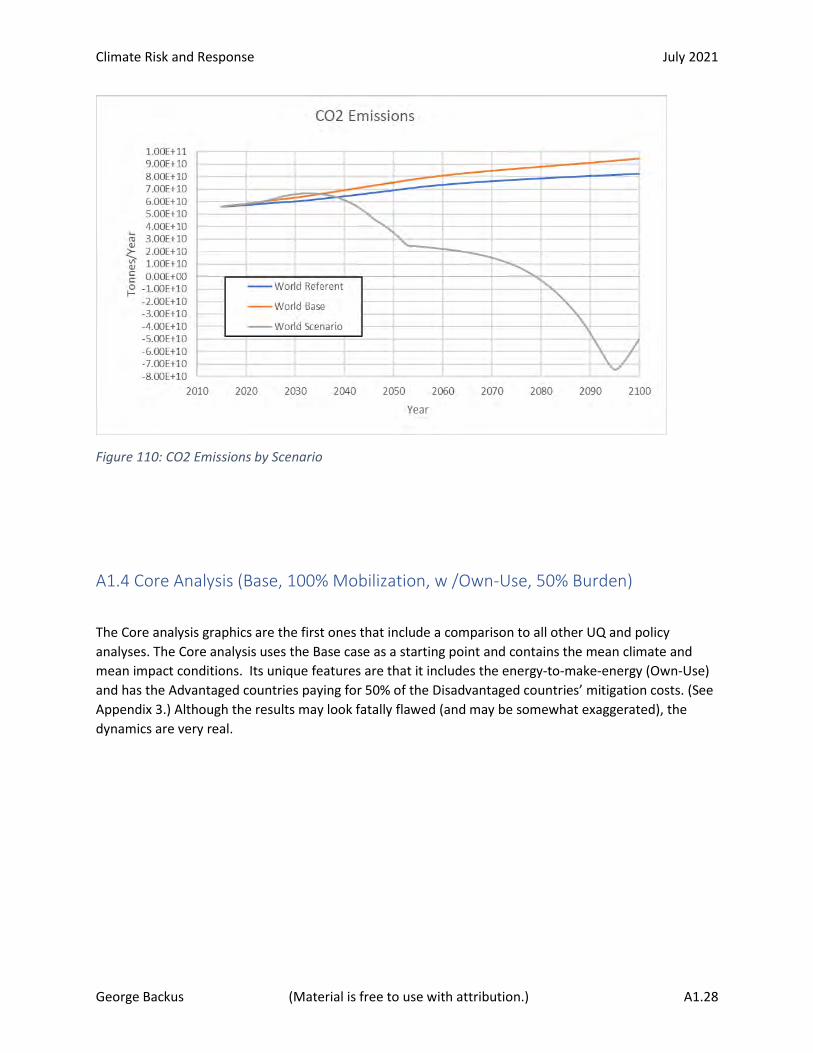
Climate Risk and Response July 2021
George Backus (Material is free to use with attribution.) A1.28
Figure 110: CO2 Emissions by Scenario
A1.4 Core Analysis (Base, 100% Mobilization, w /Own-Use, 50% Burden)
The Core analysis graphics are the first ones that include a comparison to all other UQ and policy
analyses. The Core analysis uses the Base case as a starting point and contains the mean climate and
mean impact conditions. Its unique features are that it includes the energy-to-make-energy (Own-Use)
and has the Advantaged countries paying for 50% of the Disadvantaged countries’ mitigation costs. (See
Appendix 3.) Although the results may look fatally flawed (and may be somewhat exaggerated), the
dynamics are very real.
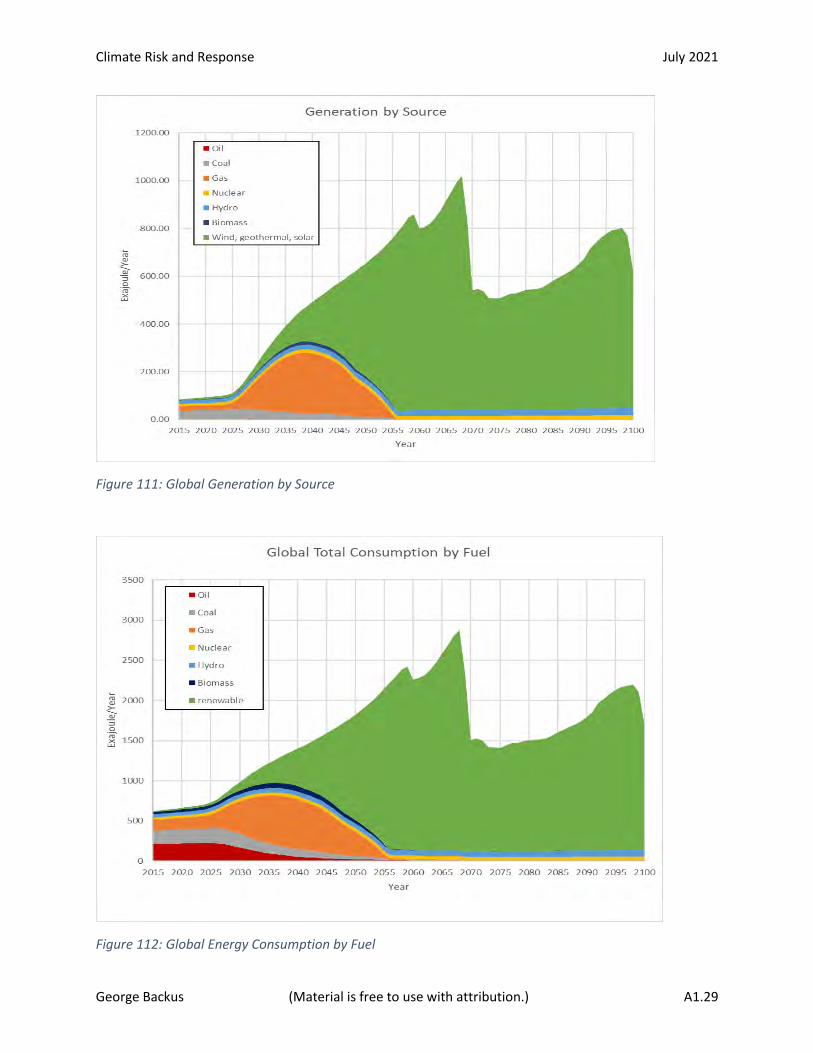
Climate Risk and Response July 2021
George Backus (Material is free to use with attribution.) A1.29
Figure 111: Global Generation by Source
Figure 112: Global Energy Consumption by Fuel
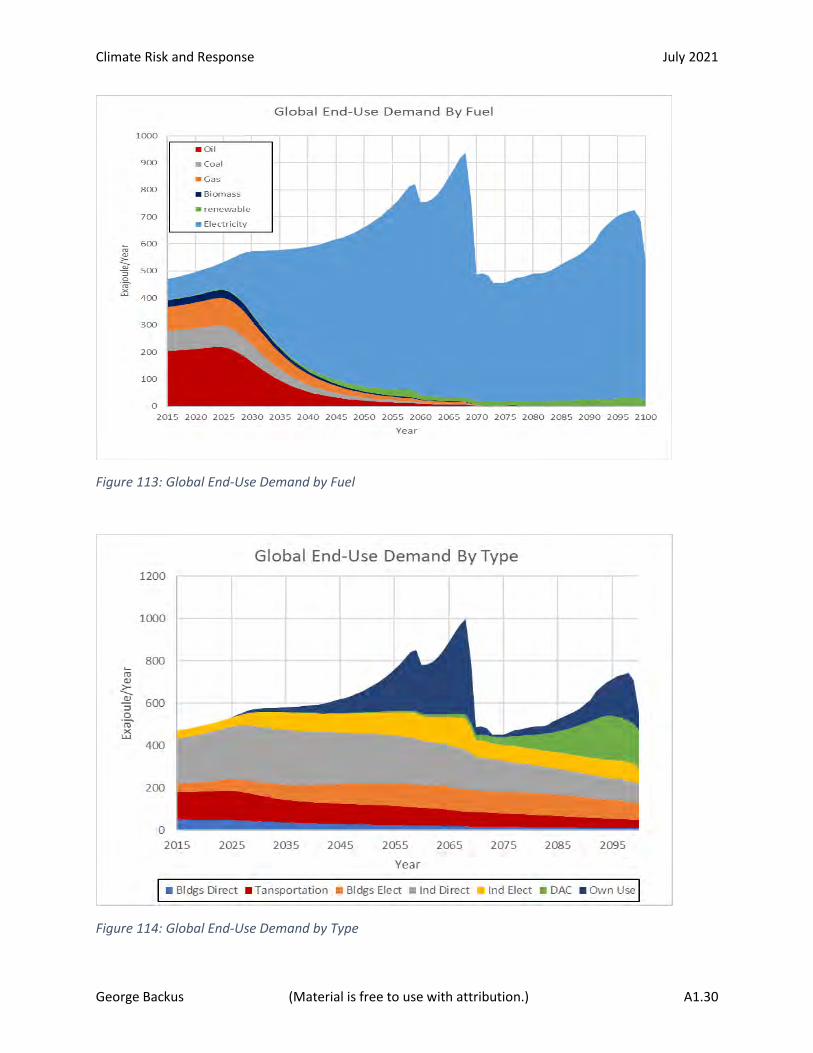
Climate Risk and Response July 2021
George Backus (Material is free to use with attribution.) A1.30
Figure 113: Global End-Use Demand by Fuel
Figure 114: Global End-Use Demand by Type
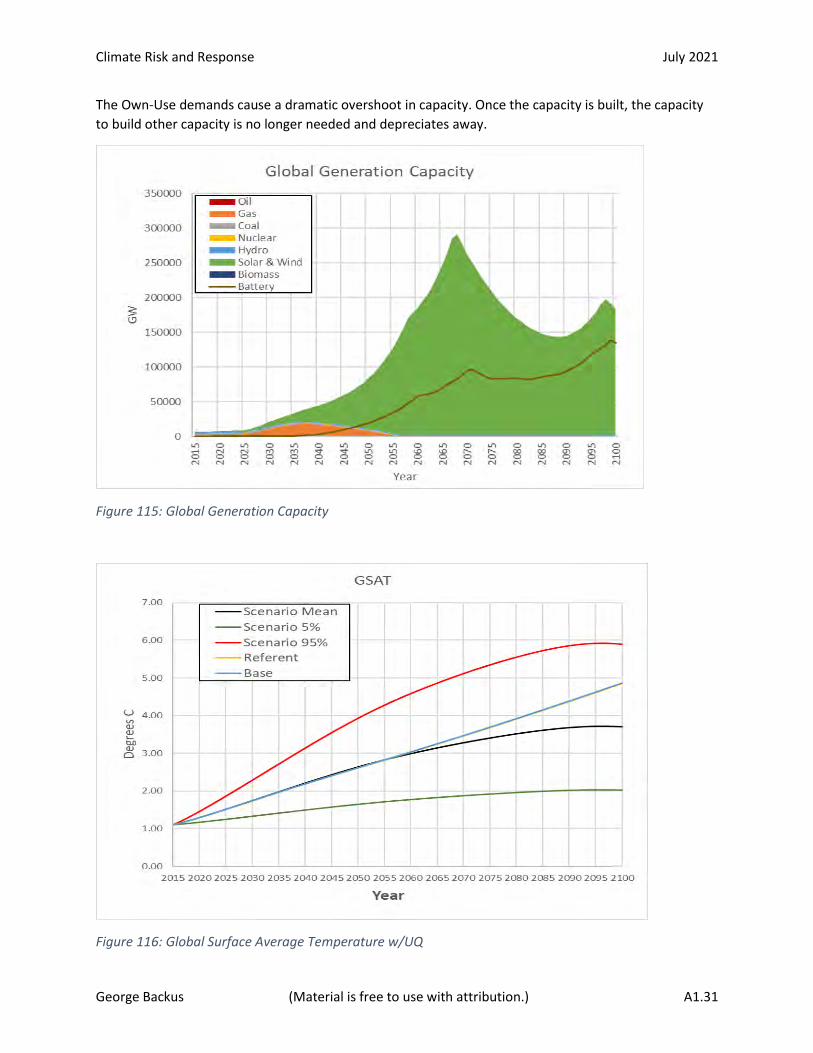
Climate Risk and Response July 2021
George Backus (Material is free to use with attribution.) A1.31
The Own-Use demands cause a dramatic overshoot in capacity. Once the capacity is built, the capacity
to build other capacity is no longer needed and depreciates away.
Figure 115: Global Generation Capacity
Figure 116: Global Surface Average Temperature w/UQ
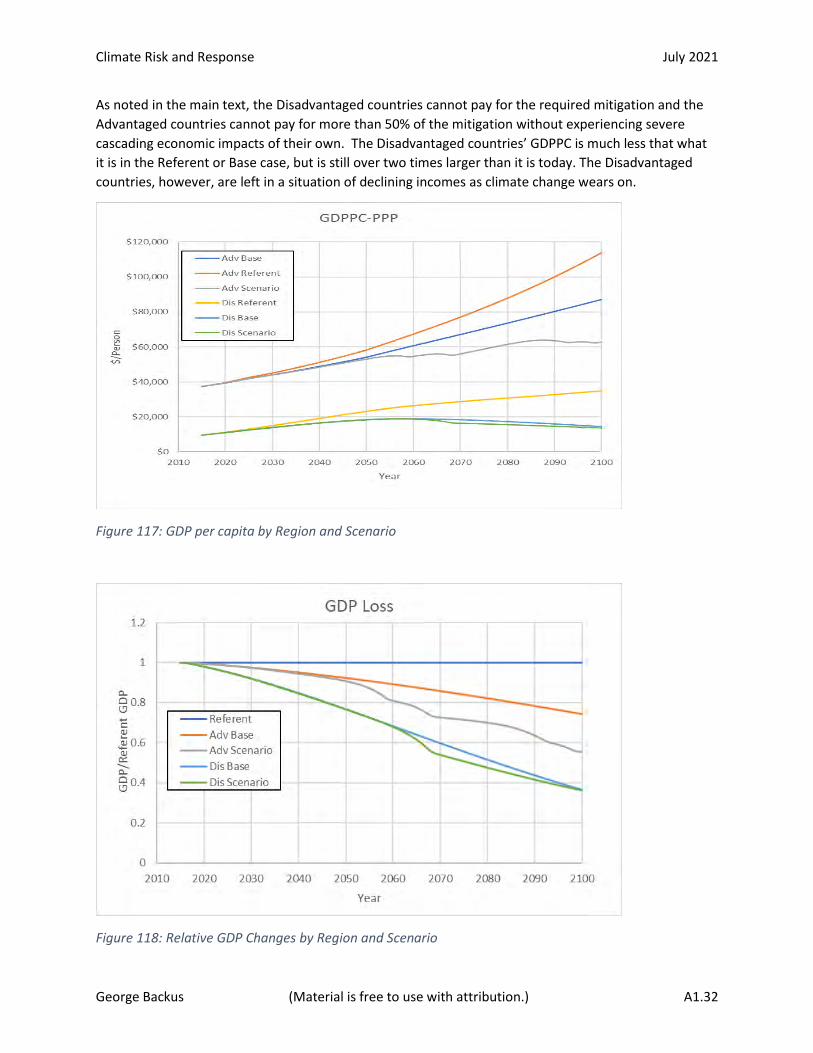
Climate Risk and Response July 2021
George Backus (Material is free to use with attribution.) A1.32
As noted in the main text, the Disadvantaged countries cannot pay for the required mitigation and the
Advantaged countries cannot pay for more than 50% of the mitigation without experiencing severe
cascading economic impacts of their own. The Disadvantaged countries’ GDPPC is much less that what
it is in the Referent or Base case, but is still over two times larger than it is today. The Disadvantaged
countries, however, are left in a situation of declining incomes as climate change wears on.
Figure 117: GDP per capita by Region and Scenario
Figure 118: Relative GDP Changes by Region and Scenario
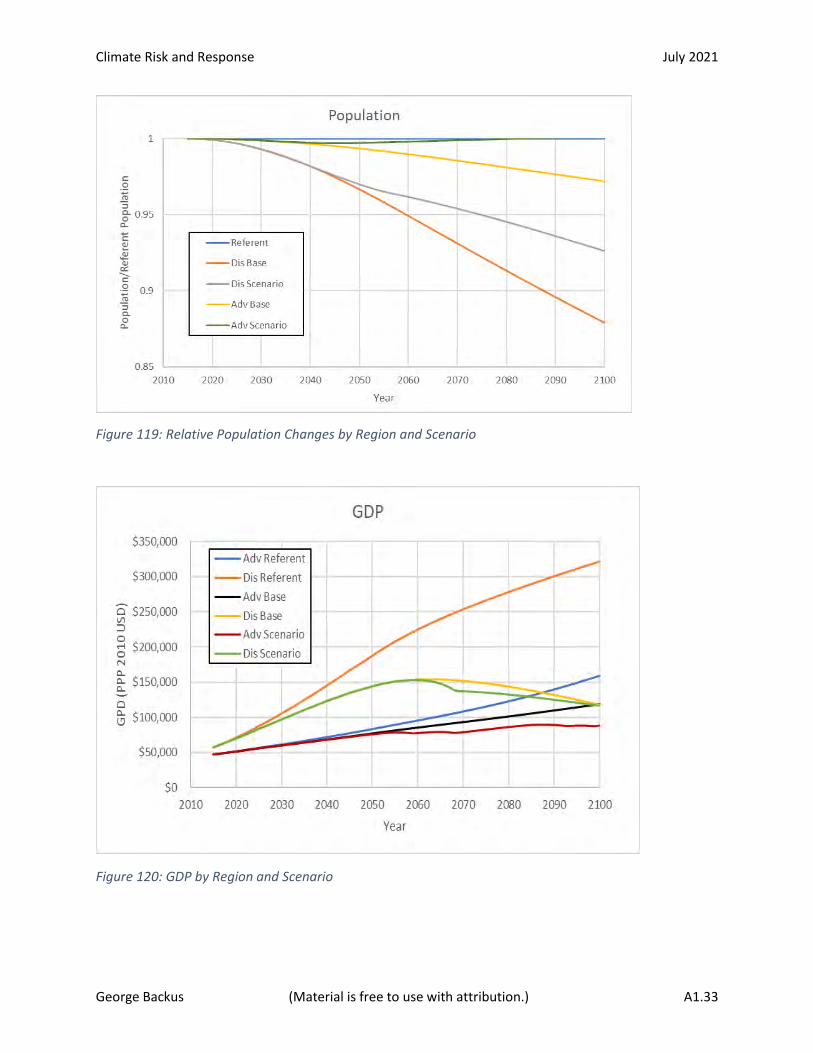
Climate Risk and Response July 2021
George Backus (Material is free to use with attribution.) A1.33
Figure 119: Relative Population Changes by Region and Scenario
Figure 120: GDP by Region and Scenario
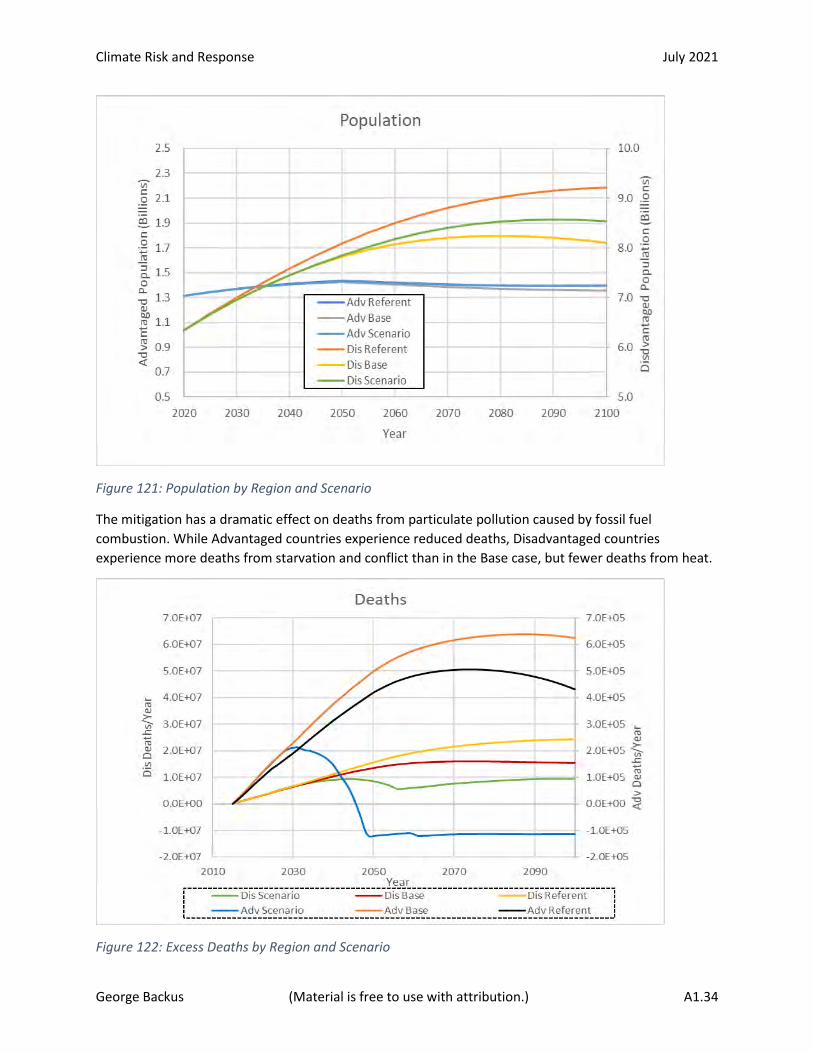
Climate Risk and Response July 2021
George Backus (Material is free to use with attribution.) A1.34
Figure 121: Population by Region and Scenario
The mitigation has a dramatic effect on deaths from particulate pollution caused by fossil fuel
combustion. While Advantaged countries experience reduced deaths, Disadvantaged countries
experience more deaths from starvation and conflict than in the Base case, but fewer deaths from heat.
Figure 122: Excess Deaths by Region and Scenario
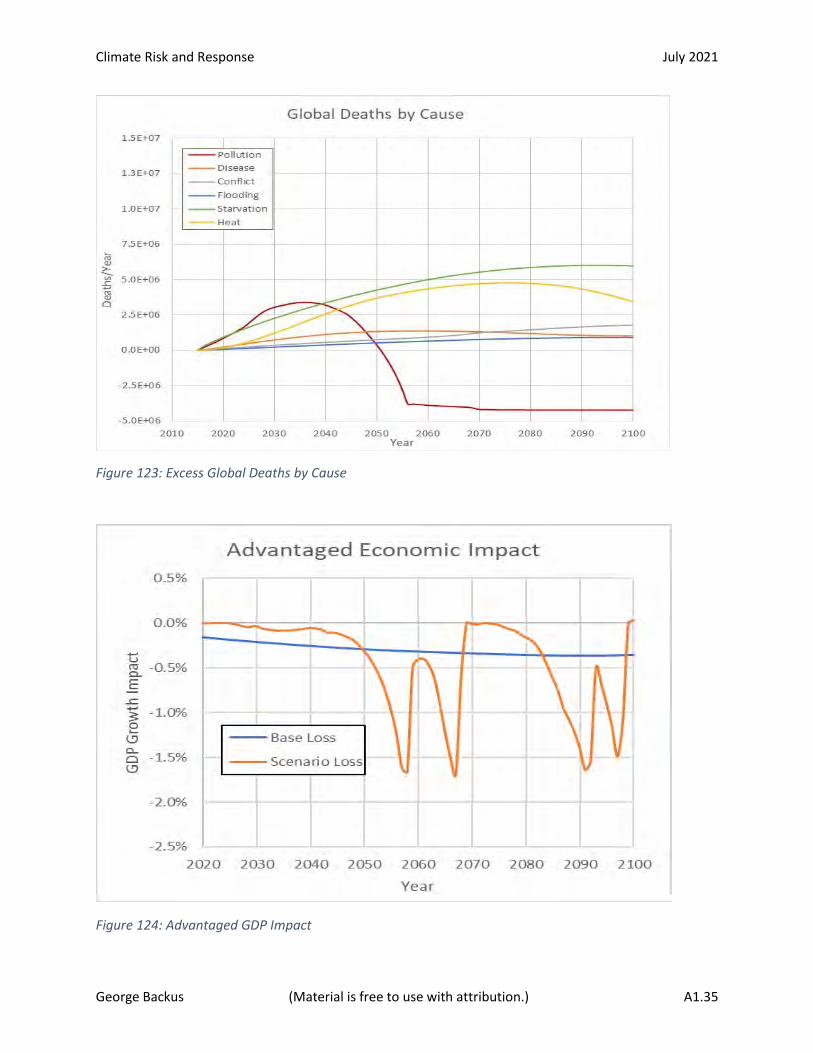
Climate Risk and Response July 2021
George Backus (Material is free to use with attribution.) A1.35
Figure 123: Excess Global Deaths by Cause
Figure 124: Advantaged GDP Impact
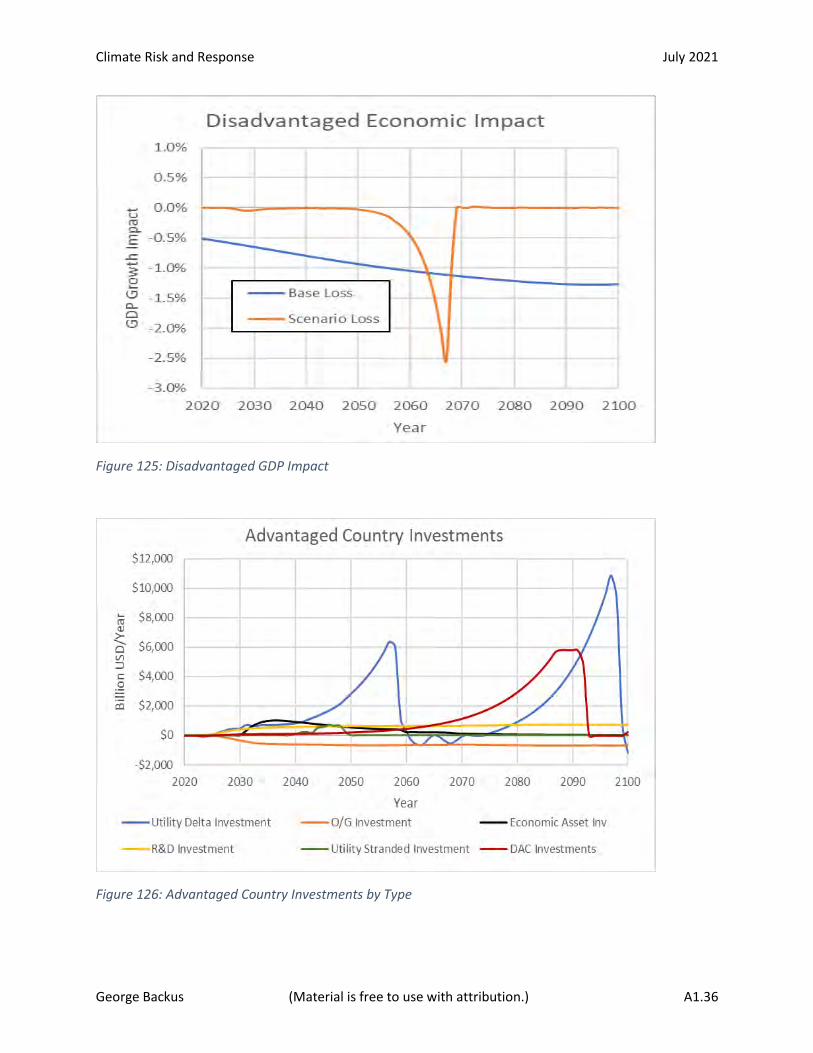
Climate Risk and Response July 2021
George Backus (Material is free to use with attribution.) A1.36
Figure 125: Disadvantaged GDP Impact
Figure 126: Advantaged Country Investments by Type

Climate Risk and Response July 2021
George Backus (Material is free to use with attribution.) A1.37
Figure 127: Disadvantaged Country Investments by Type
Figure 128: Mitigation Tax Rate
For reference, the figures below show the change in the urban fraction in Disadvantaged countries
across the Referent, Base, and mitigation cases. The “Scenario” label designates the case being
analyzed. In this case, the Core Analysis.
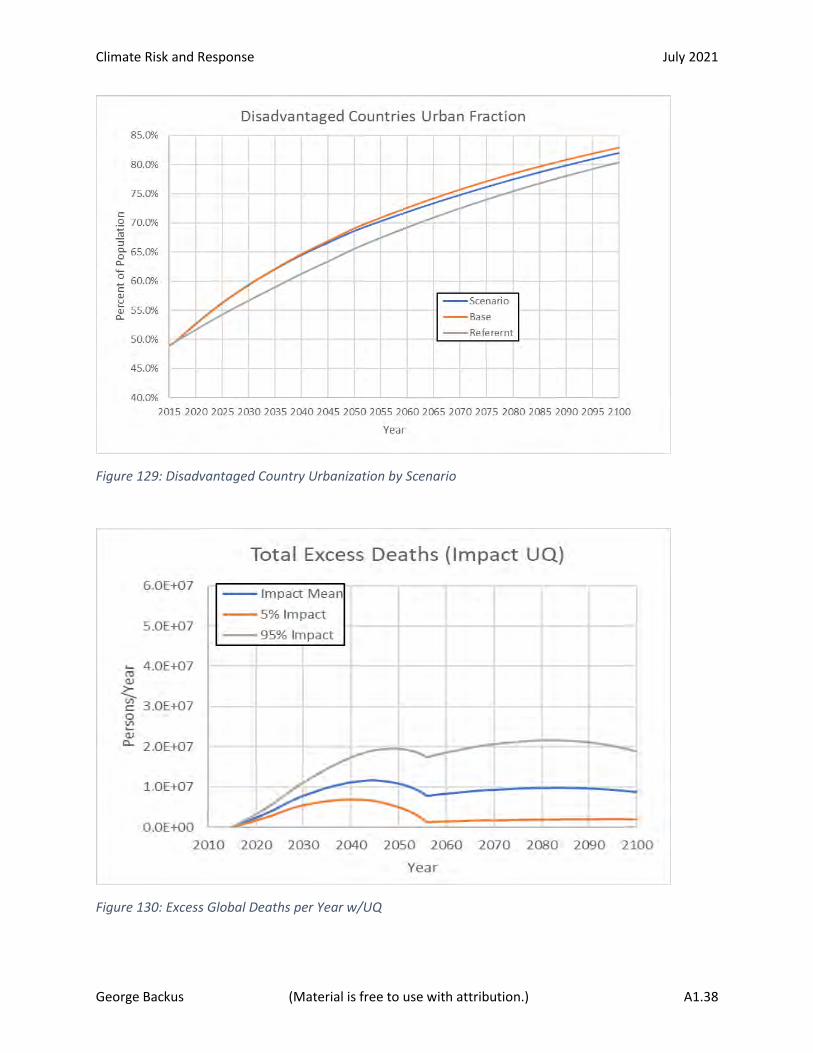
Climate Risk and Response July 2021
George Backus (Material is free to use with attribution.) A1.38
Figure 129: Disadvantaged Country Urbanization by Scenario
Figure 130: Excess Global Deaths per Year w/UQ
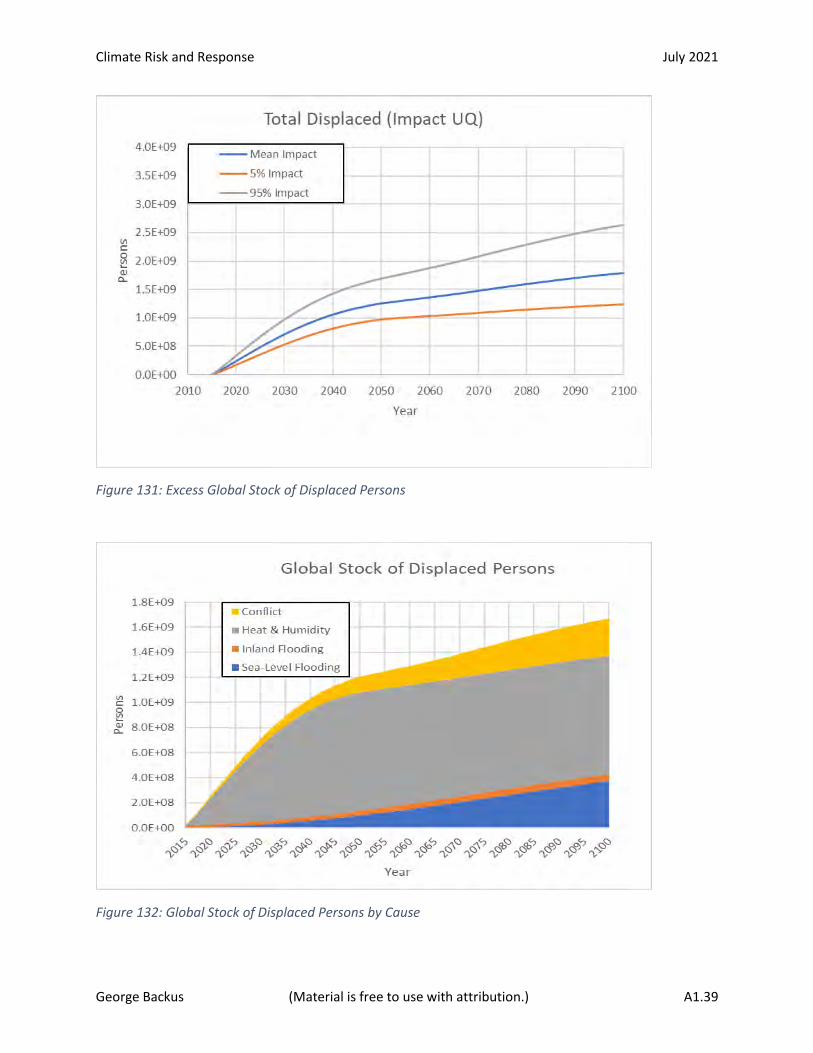
Climate Risk and Response July 2021
George Backus (Material is free to use with attribution.) A1.39
Figure 131: Excess Global Stock of Displaced Persons
Figure 132: Global Stock of Displaced Persons by Cause
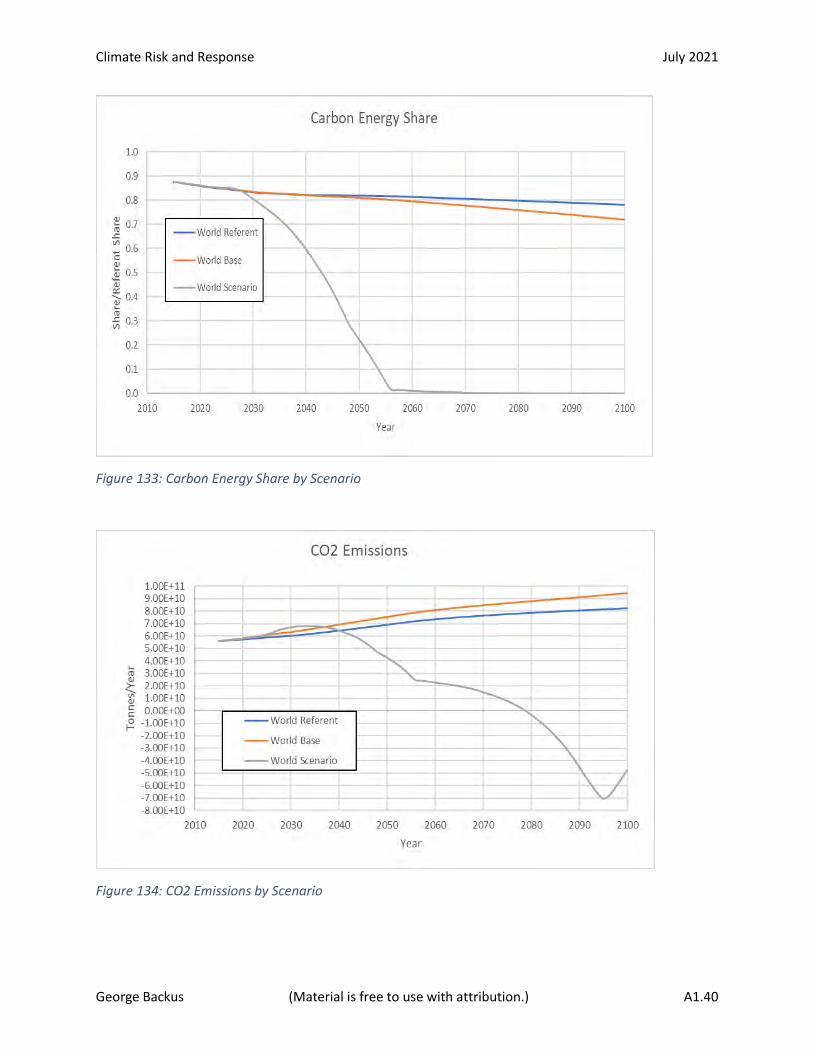
Climate Risk and Response July 2021
George Backus (Material is free to use with attribution.) A1.40
Figure 133: Carbon Energy Share by Scenario
Figure 134: CO2 Emissions by Scenario
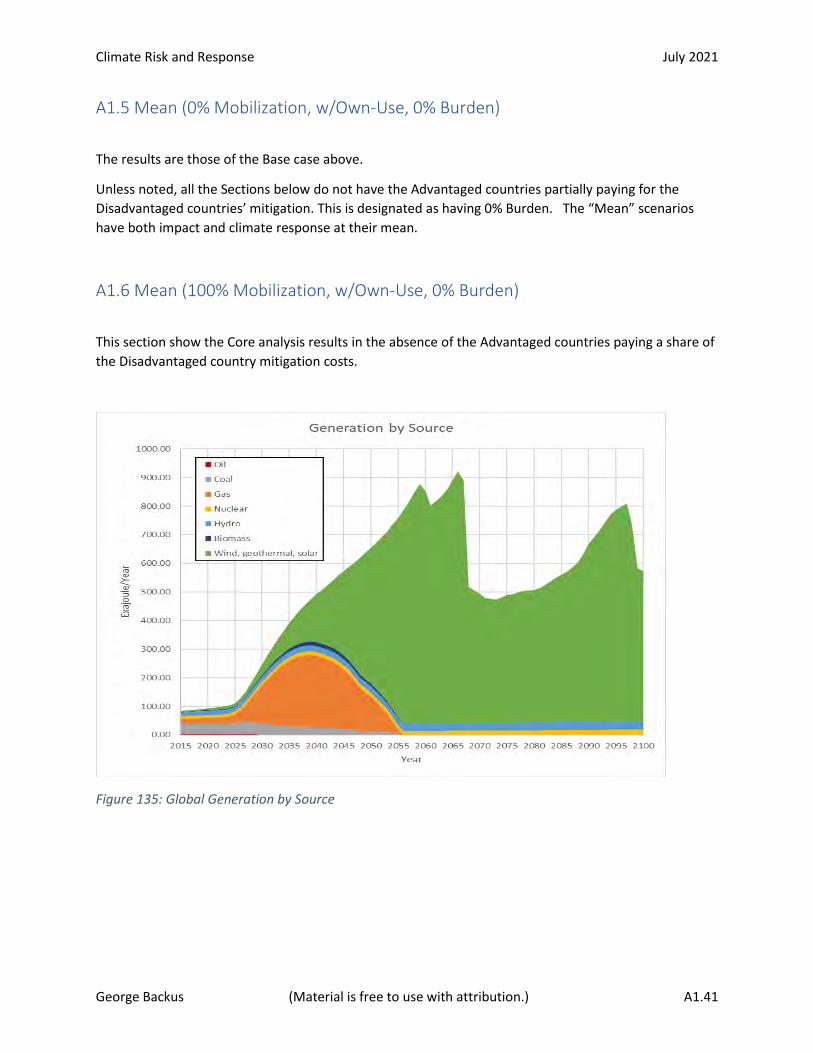
Climate Risk and Response July 2021
George Backus (Material is free to use with attribution.) A1.41
A1.5 Mean (0% Mobilization, w/Own-Use, 0% Burden)
The results are those of the Base case above.
Unless noted, all the Sections below do not have the Advantaged countries partially paying for the
Disadvantaged countries’ mitigation. This is designated as having 0% Burden. The “Mean” scenarios
have both impact and climate response at their mean.
A1.6 Mean (100% Mobilization, w/Own-Use, 0% Burden)
This section show the Core analysis results in the absence of the Advantaged countries paying a share of
the Disadvantaged country mitigation costs.
Figure 135: Global Generation by Source
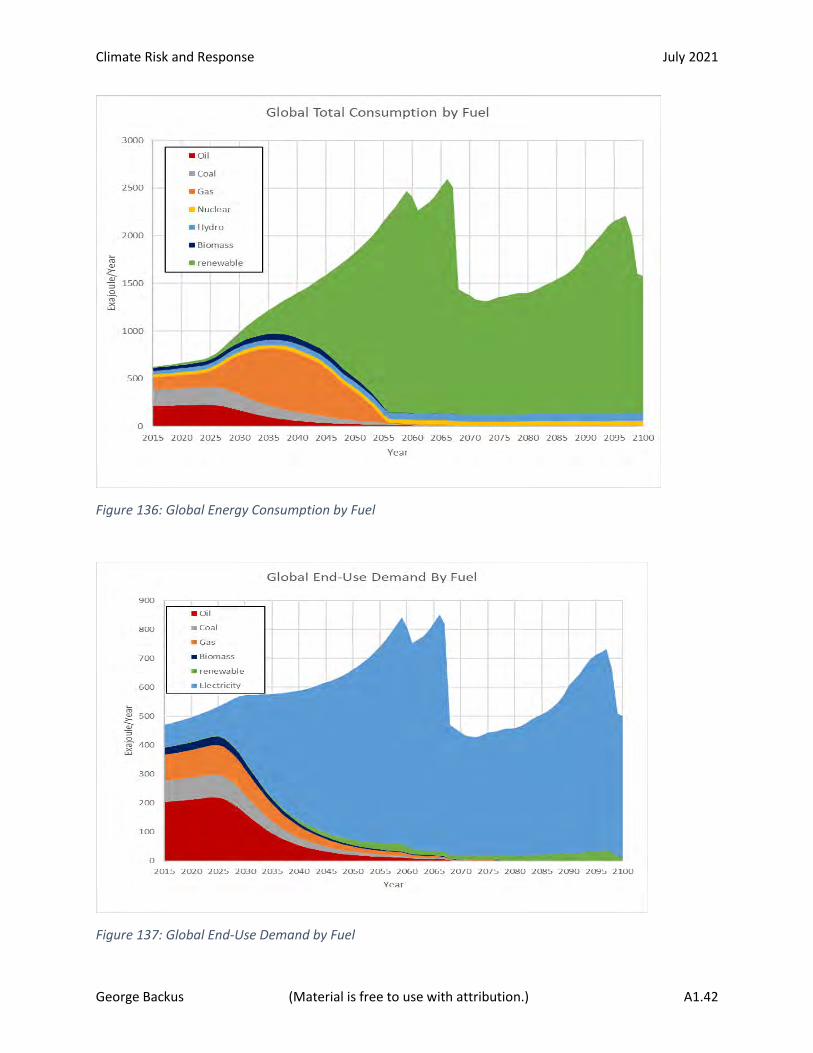
Climate Risk and Response July 2021
George Backus (Material is free to use with attribution.) A1.42
Figure 136: Global Energy Consumption by Fuel
Figure 137: Global End-Use Demand by Fuel

Climate Risk and Response July 2021
George Backus (Material is free to use with attribution.) A1.43
Figure 138: Global End-Use Demand by Type
Figure 139: Global Surface Average Temperature w/UQ

Climate Risk and Response July 2021
George Backus (Material is free to use with attribution.) A1.44
The impact of paying the mitigation costs is more than the already devastated, Disadvantaged
economies can handle.
Figure 140: GDP per capita by Region and Scenario
Figure 141: Relative GDP Changes by Region and Scenario

Climate Risk and Response July 2021
George Backus (Material is free to use with attribution.) A1.45
Figure 142: Relative Population Changes by Region and Scenario
For reference, the next figure shows how large the mitigation investments are relative to the GDP of the
region.
Figure 143: Mitigation Tax Rate

Climate Risk and Response July 2021
George Backus (Material is free to use with attribution.) A1.46
Figure 144: Excess Deaths by Region and Scenario
A1.7 5% Climate (0% Mobilization, w/Own-Use, 0% Burden)
This section shows the consequences if climate does not have as great as anticipated impact on deaths
and on the economies. There is no mitigation in this section’s analysis. All subsequent analyses contain
the Own-Use energy feedback. In all the UQ analyses, all impacts are assumed to be highly correlated,
and for simplicity, without much effect on results, treated as if they are all 100% correlated with each
other. That is, for any given UQ analysis, all impacts are at the designated exceedance probability. This
analysis produces un-mitigated temperatures of only 2.5 °C. The impact uncertainty is set at the mean.
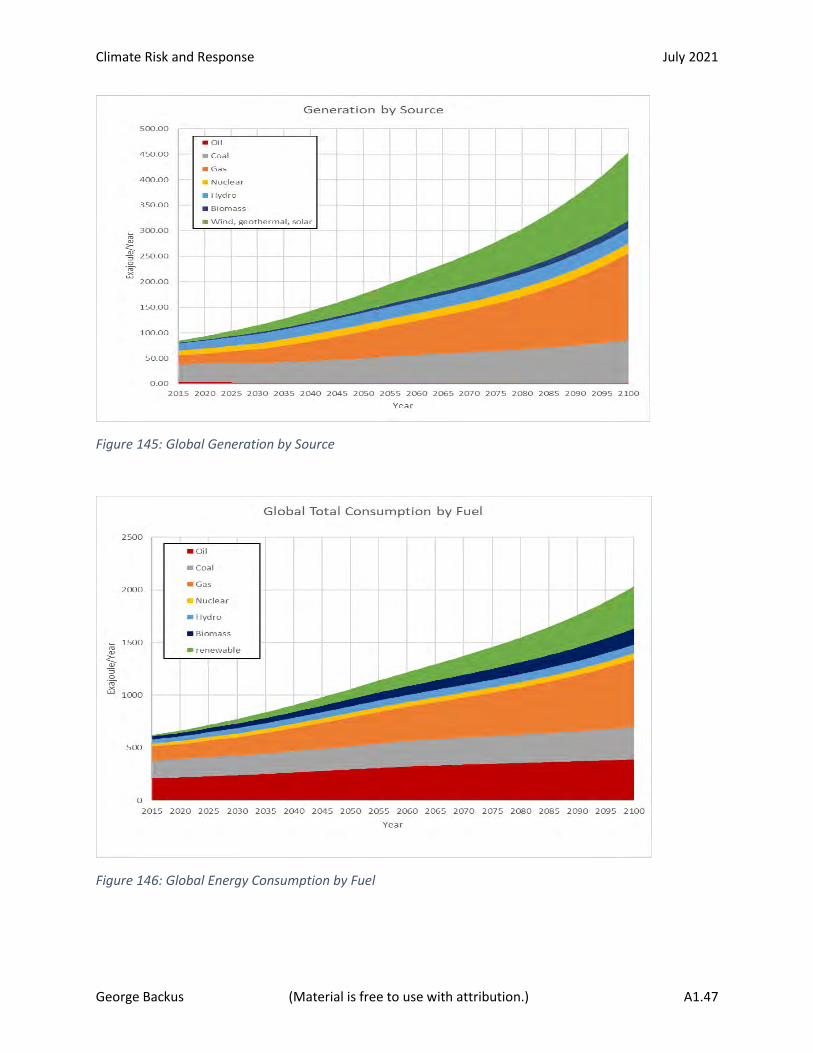
Climate Risk and Response July 2021
George Backus (Material is free to use with attribution.) A1.47
Figure 145: Global Generation by Source
Figure 146: Global Energy Consumption by Fuel
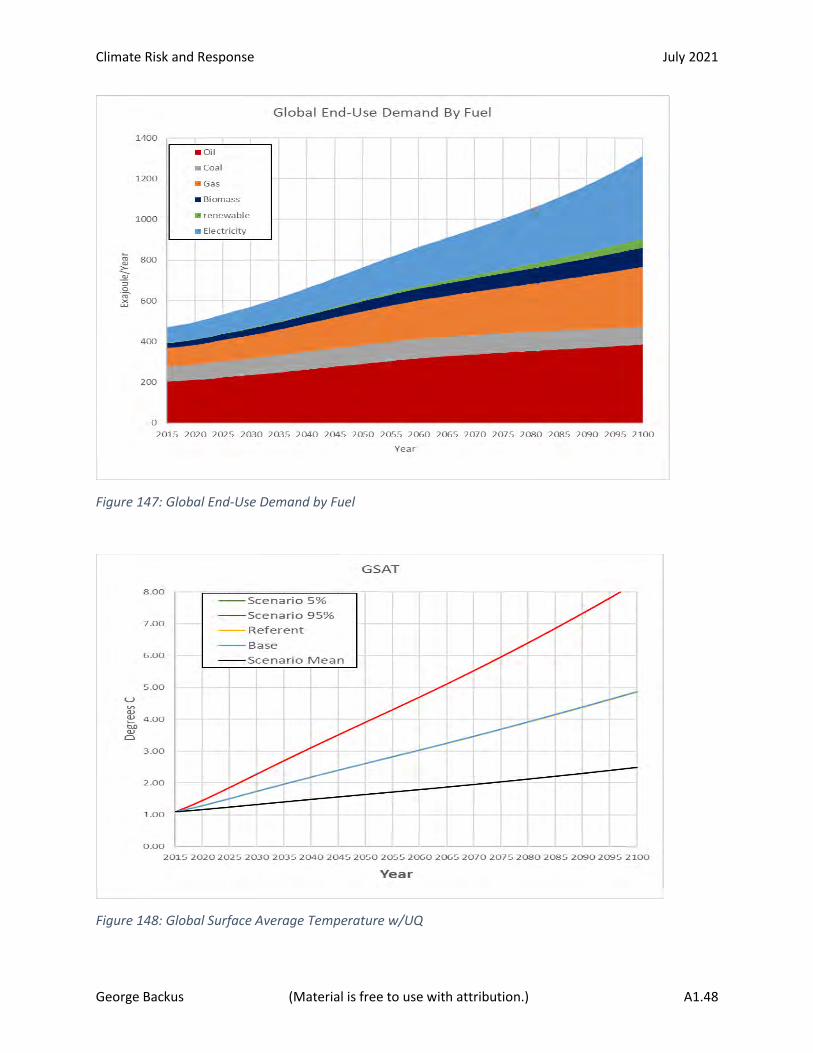
Climate Risk and Response July 2021
George Backus (Material is free to use with attribution.) A1.48
Figure 147: Global End-Use Demand by Fuel
Figure 148: Global Surface Average Temperature w/UQ
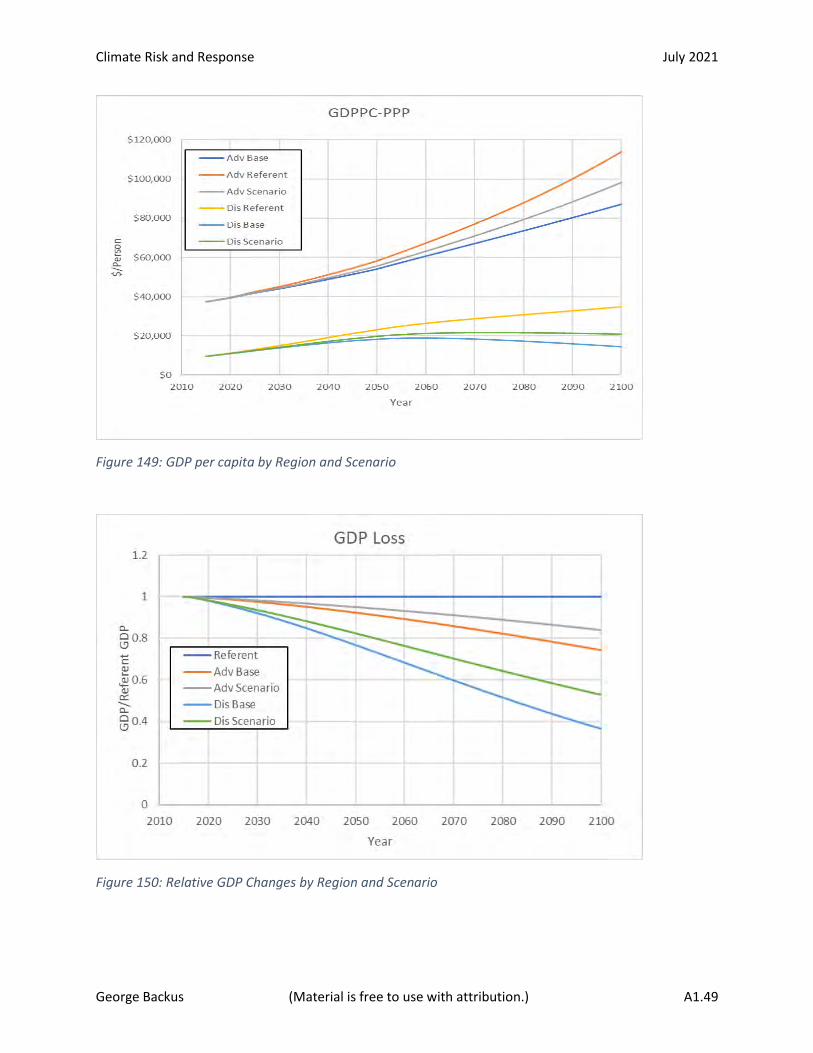
Climate Risk and Response July 2021
George Backus (Material is free to use with attribution.) A1.49
Figure 149: GDP per capita by Region and Scenario
Figure 150: Relative GDP Changes by Region and Scenario
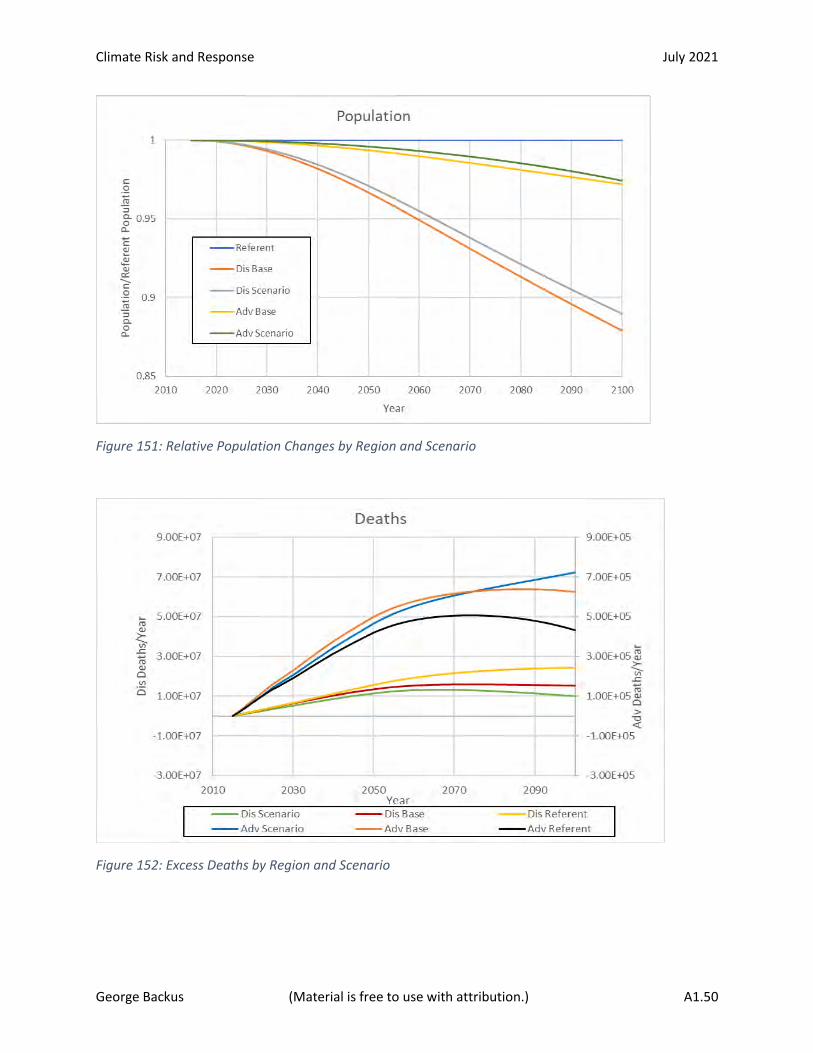
Climate Risk and Response July 2021
George Backus (Material is free to use with attribution.) A1.50
Figure 151: Relative Population Changes by Region and Scenario
Figure 152: Excess Deaths by Region and Scenario
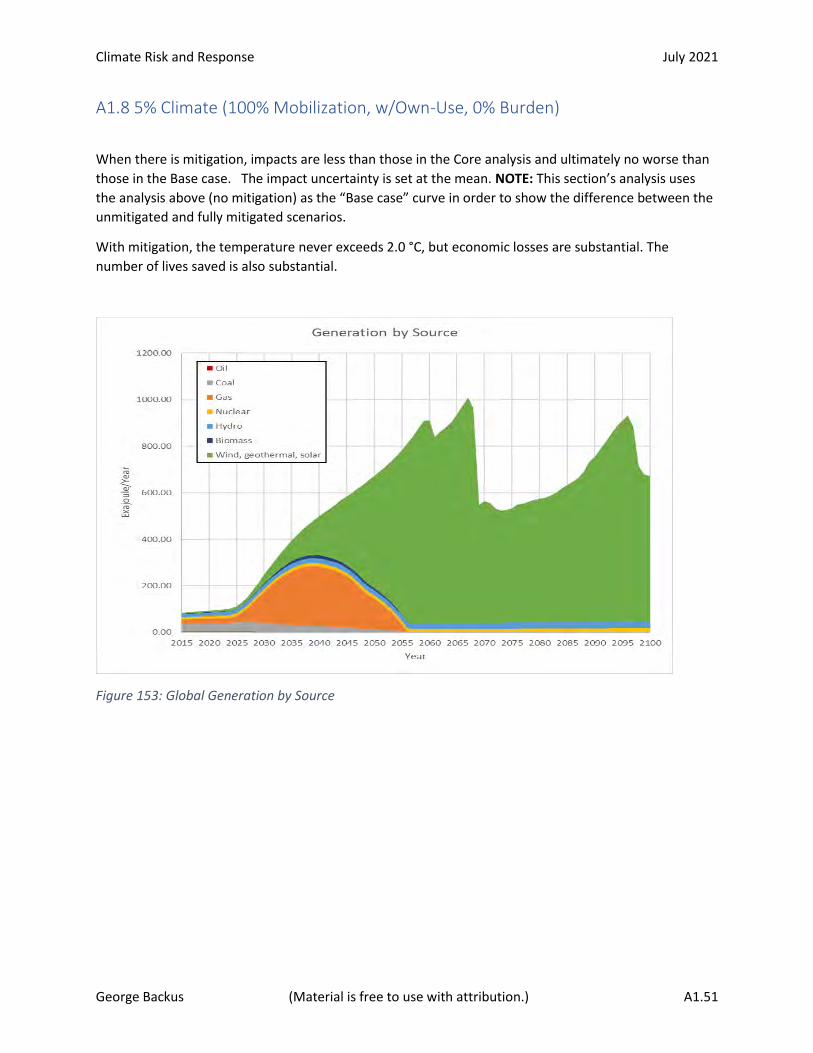
Climate Risk and Response July 2021
George Backus (Material is free to use with attribution.) A1.51
A1.8 5% Climate (100% Mobilization, w/Own-Use, 0% Burden)
When there is mitigation, impacts are less than those in the Core analysis and ultimately no worse than
those in the Base case. The impact uncertainty is set at the mean. NOTE: This section’s analysis uses
the analysis above (no mitigation) as the “Base case” curve in order to show the difference between the
unmitigated and fully mitigated scenarios.
With mitigation, the temperature never exceeds 2.0 °C, but economic losses are substantial. The
number of lives saved is also substantial.
Figure 153: Global Generation by Source

Climate Risk and Response July 2021
George Backus (Material is free to use with attribution.) A1.52
Figure 154: Global Energy Consumption by Fuel
Figure 155: Global End-Use Demand by Fuel
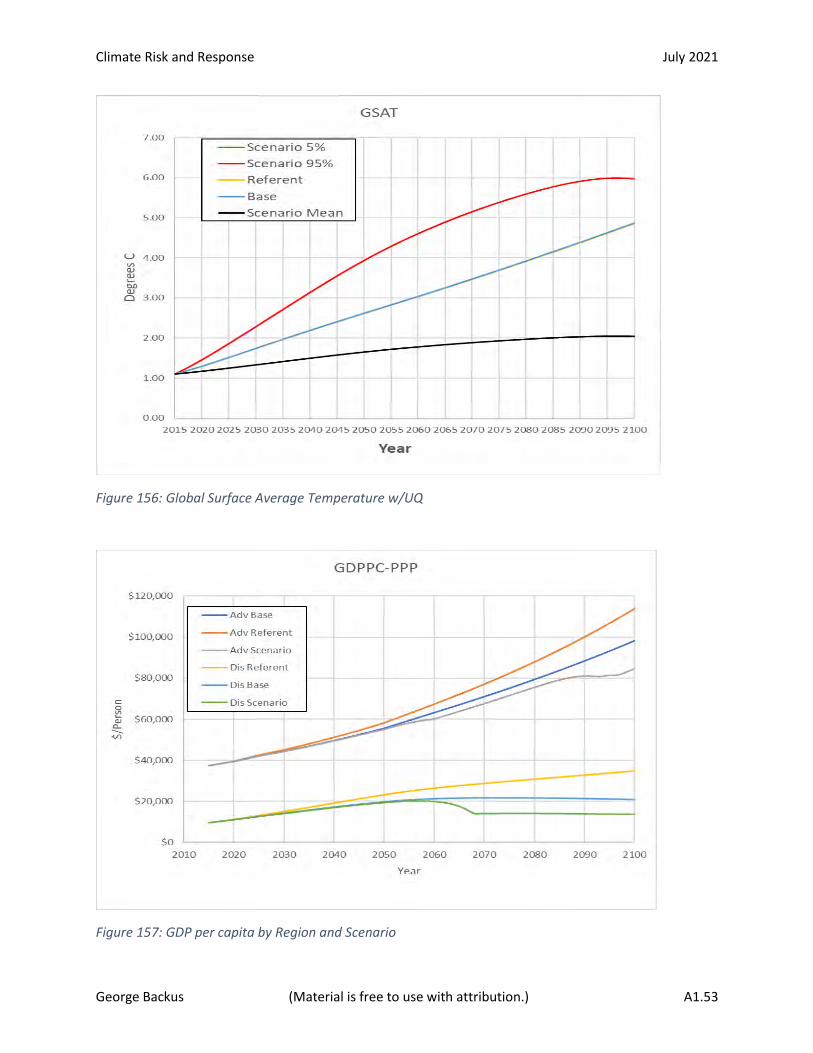
Climate Risk and Response July 2021
George Backus (Material is free to use with attribution.) A1.53
Figure 156: Global Surface Average Temperature w/UQ
Figure 157: GDP per capita by Region and Scenario
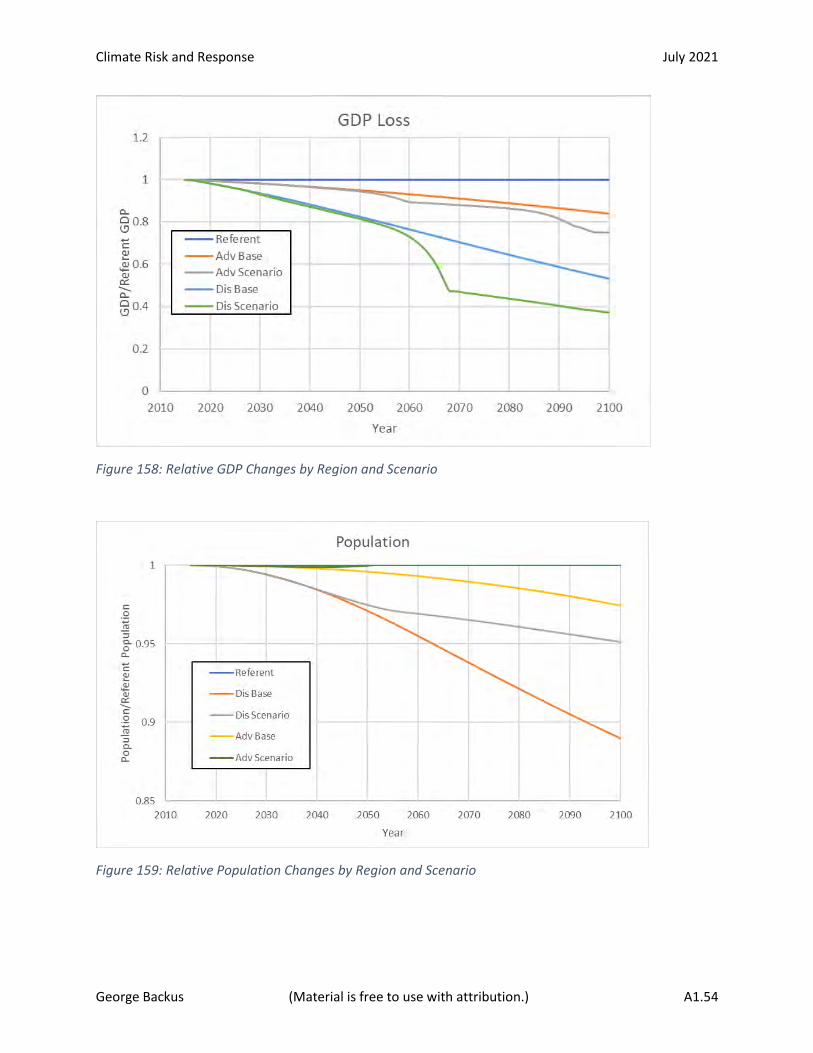
Climate Risk and Response July 2021
George Backus (Material is free to use with attribution.) A1.54
Figure 158: Relative GDP Changes by Region and Scenario
Figure 159: Relative Population Changes by Region and Scenario

Climate Risk and Response July 2021
George Backus (Material is free to use with attribution.) A1.55
Figure 160: Excess Deaths by Region and Scenario
A1.9 95% Climate (0% Mobilization, w/Own-Use, 0% Burden)
The more intense climatic conditions have a large effect on the economies and death rates, thereby
reducing emissions in the out-years. This section’s analysis understates the impacts because there would
be large nonlinear (tipping-point) responses at these very high temperatures (~7.5 °C in 2100). The
impact uncertainty is set at the mean.
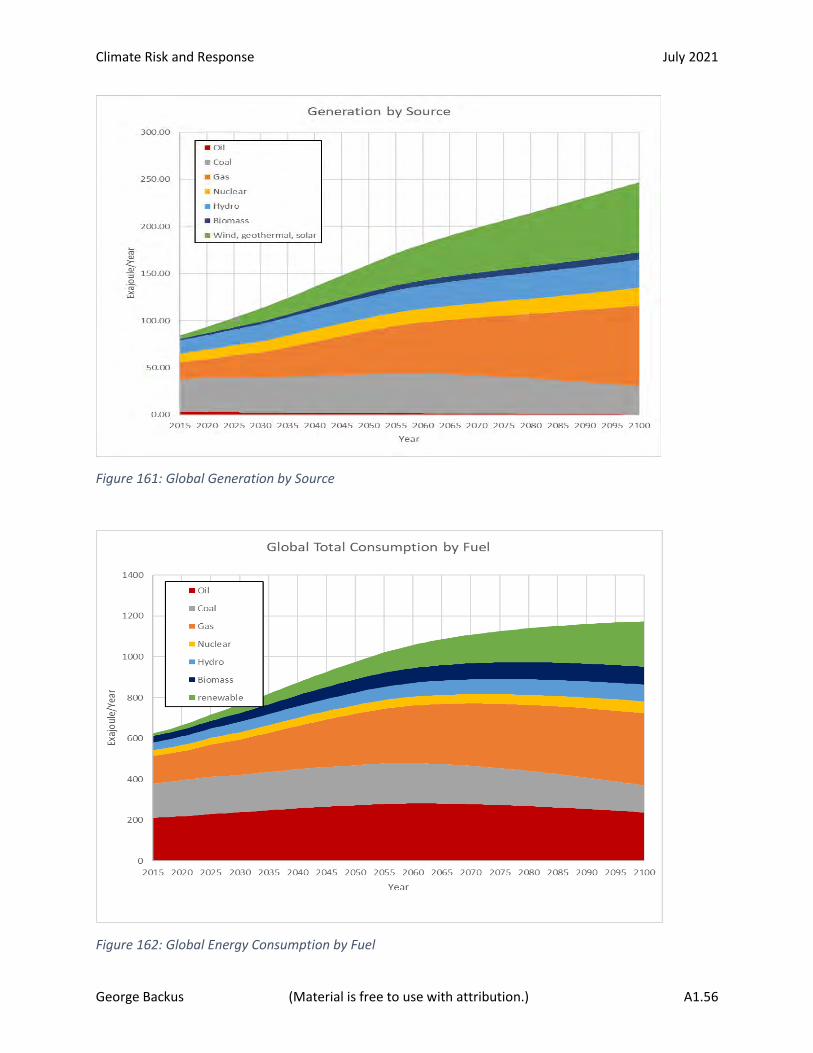
Climate Risk and Response July 2021
George Backus (Material is free to use with attribution.) A1.56
Figure 161: Global Generation by Source
Figure 162: Global Energy Consumption by Fuel
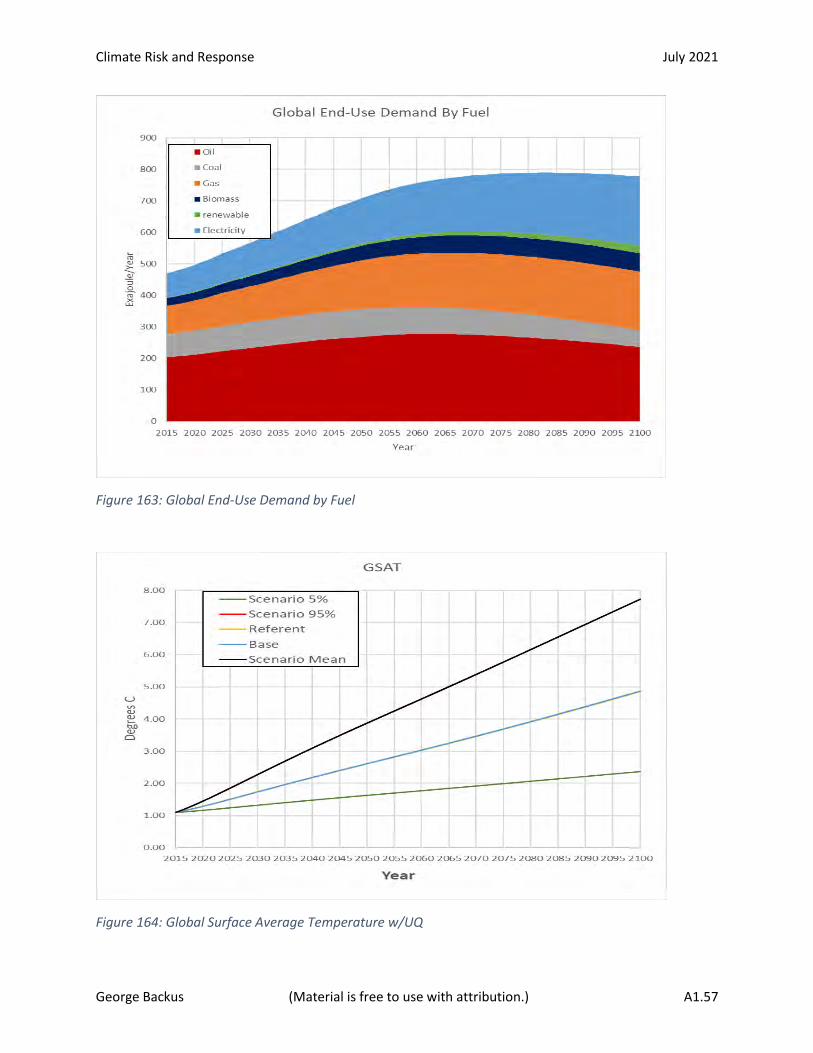
Climate Risk and Response July 2021
George Backus (Material is free to use with attribution.) A1.57
Figure 163: Global End-Use Demand by Fuel
Figure 164: Global Surface Average Temperature w/UQ
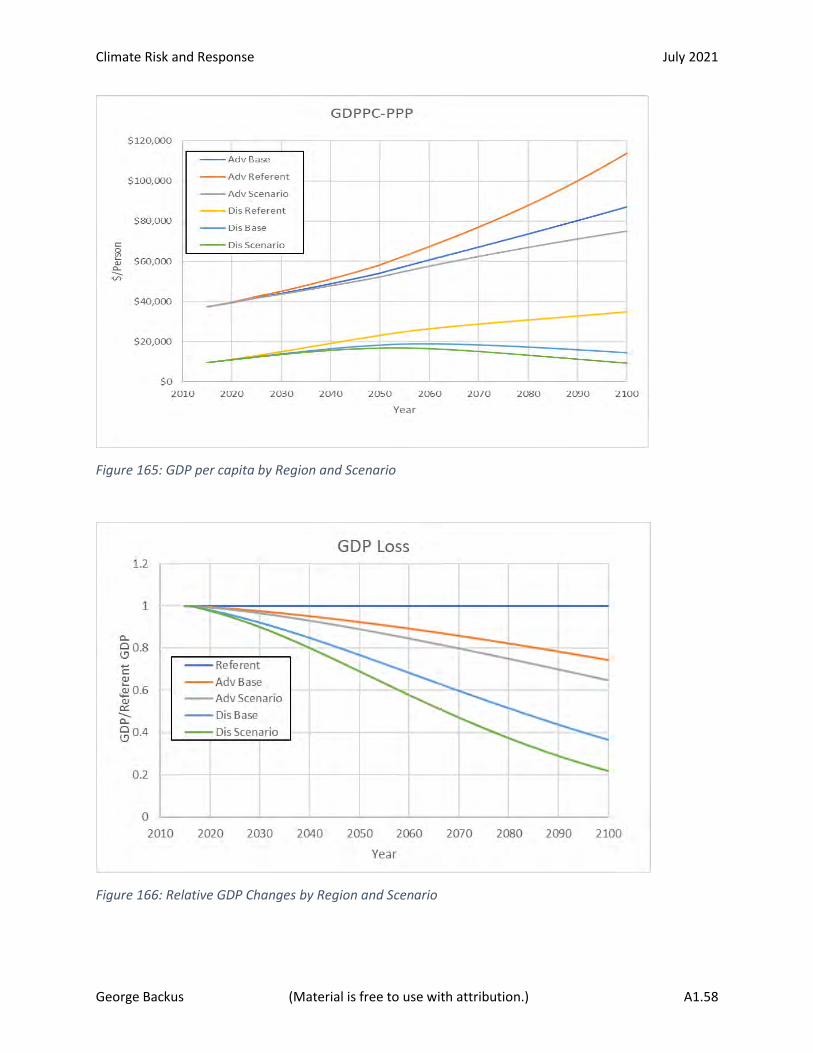
Climate Risk and Response July 2021
George Backus (Material is free to use with attribution.) A1.58
Figure 165: GDP per capita by Region and Scenario
Figure 166: Relative GDP Changes by Region and Scenario
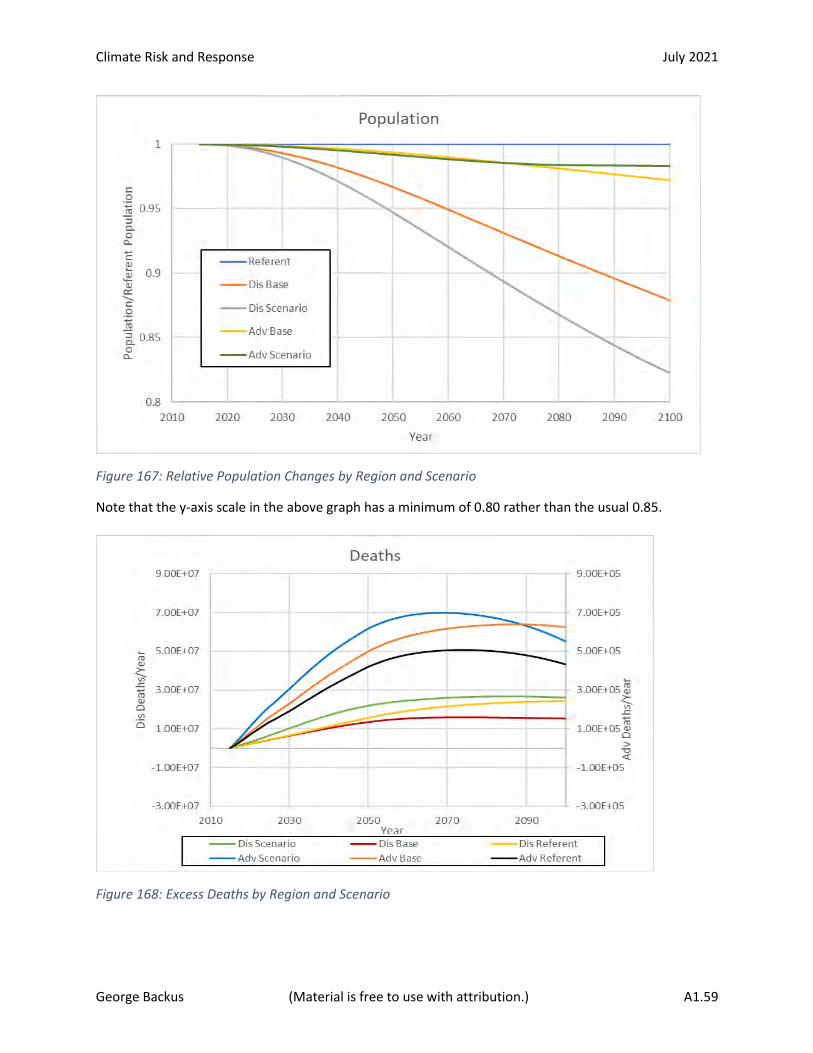
Climate Risk and Response July 2021
George Backus (Material is free to use with attribution.) A1.59
Figure 167: Relative Population Changes by Region and Scenario
Note that the y-axis scale in the above graph has a minimum of 0.80 rather than the usual 0.85.
Figure 168: Excess Deaths by Region and Scenario

Climate Risk and Response July 2021
George Backus (Material is free to use with attribution.) A1.60
A1.10 95% Climate (100% Mobilization, w/Own-Use, 0% Burden)
Even with high mobilization, it is nearly impossible, with the 95% exceedance probability climate, to
reduce temperatures to tolerable levels. The impact on the Disadvantaged countries is extreme.
Mitigation without support from the Advantaged countries, worsens economic impacts and reduces
death rates, but mitigation has less of a negative effect than in the 5% exceedance probability scenarios.
Note again that the “Base case” curve used for comparison is the no-mitigation case shown in the
previous section. The impact uncertainty is set at the mean.
Figure 169: Global Generation by Source
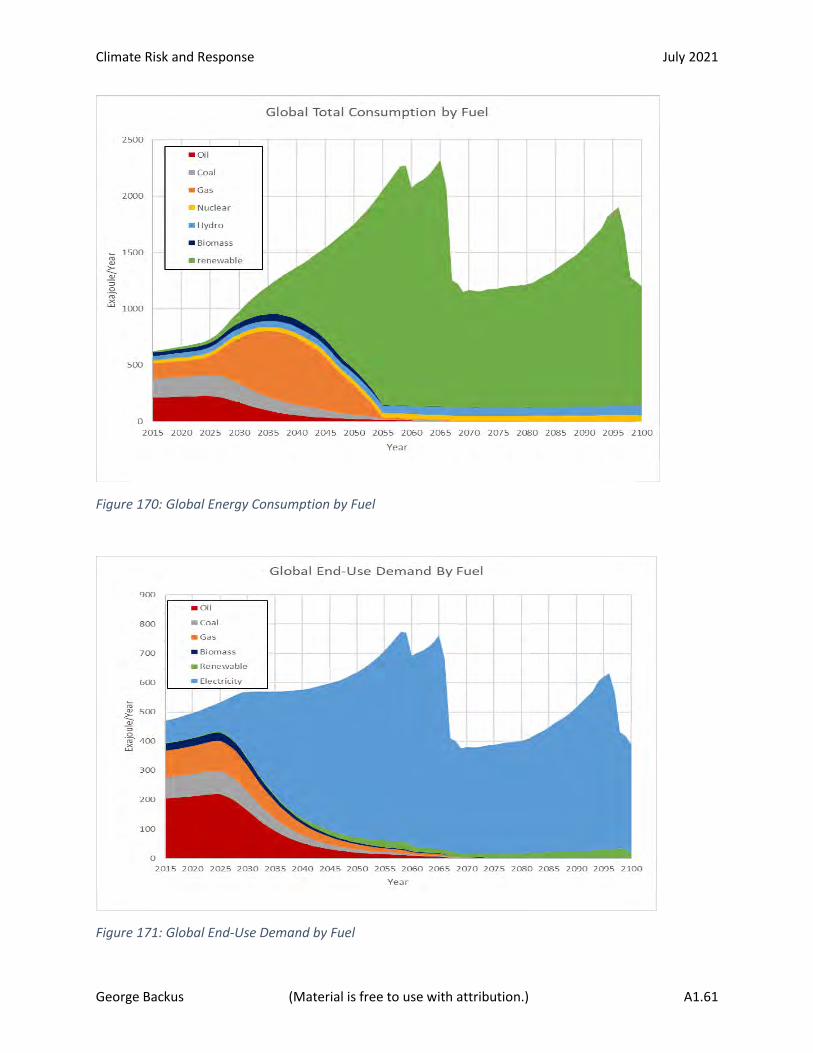
Climate Risk and Response July 2021
George Backus (Material is free to use with attribution.) A1.61
Figure 170: Global Energy Consumption by Fuel
Figure 171: Global End-Use Demand by Fuel
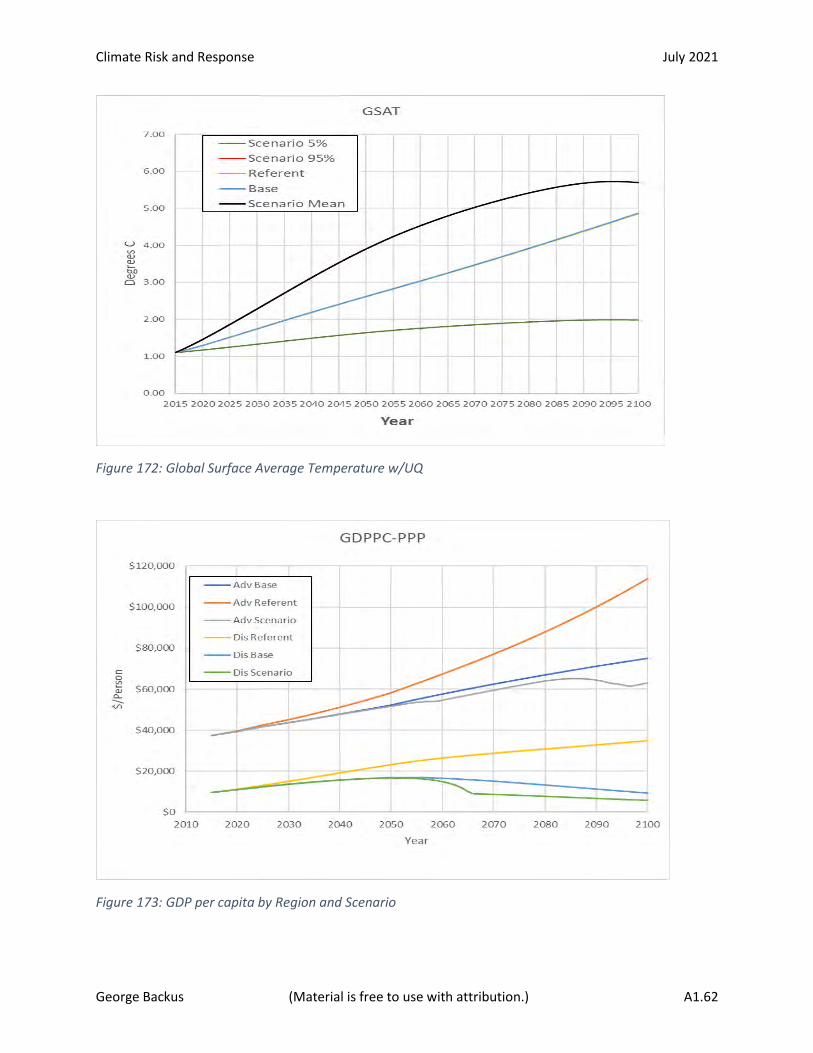
Climate Risk and Response July 2021
George Backus (Material is free to use with attribution.) A1.62
Figure 172: Global Surface Average Temperature w/UQ
Figure 173: GDP per capita by Region and Scenario

Climate Risk and Response July 2021
George Backus (Material is free to use with attribution.) A1.63
Figure 174: Relative GDP Changes by Region and Scenario
Figure 175: Relative Population Changes by Region and Scenario

Climate Risk and Response July 2021
George Backus (Material is free to use with attribution.) A1.64
Figure 176: Excess Deaths by Region and Scenario
A1.11 5% Impact (0% Mobilization, w/Own-Use, 0% Burden)
The next series of runs holds climate uncertainty at the mean while changing the exceedance probability
of the impacts. In the low impact case, economic and population impacts are less. Emissions are higher,
but they only slightly increase the year 2100 temperatures compared to the original Base case.
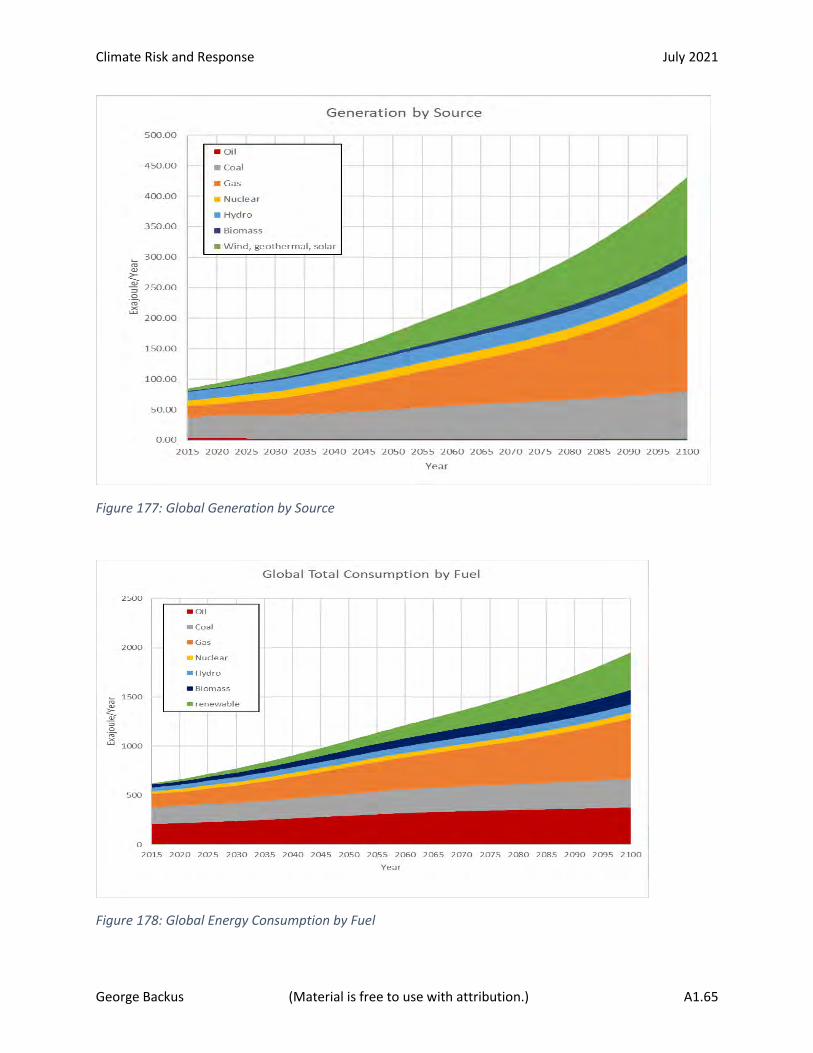
Climate Risk and Response July 2021
George Backus (Material is free to use with attribution.) A1.65
Figure 177: Global Generation by Source
Figure 178: Global Energy Consumption by Fuel
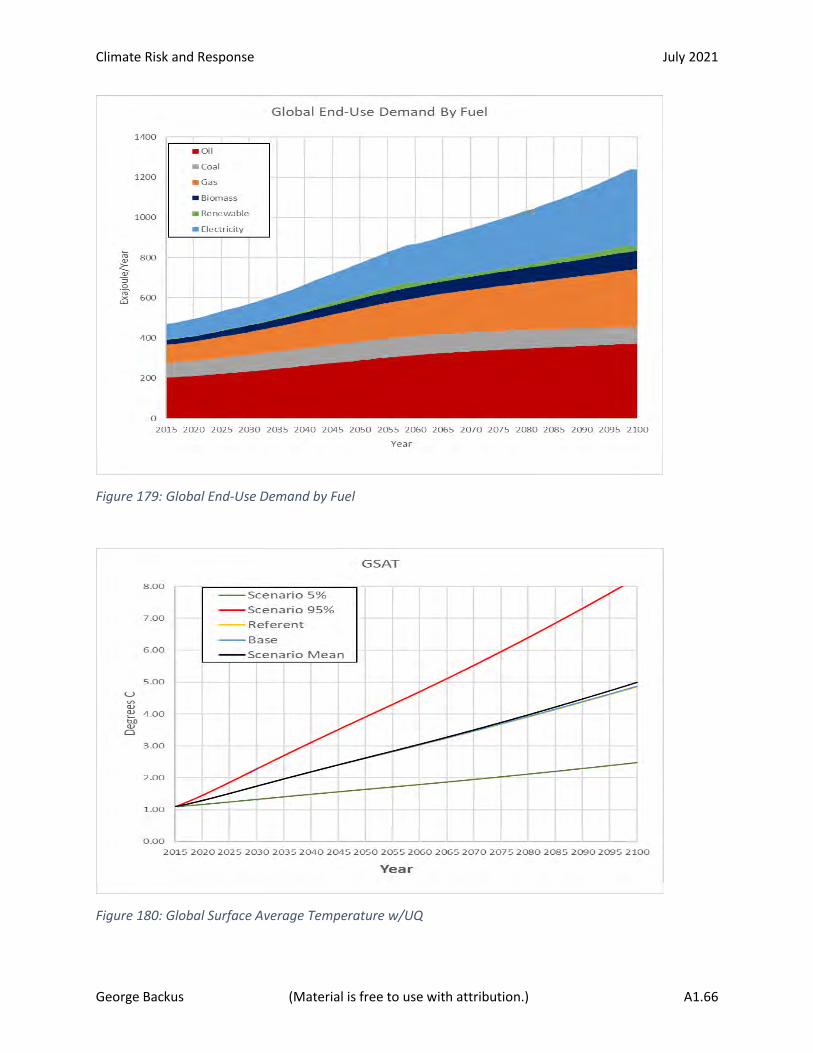
Climate Risk and Response July 2021
George Backus (Material is free to use with attribution.) A1.66
Figure 179: Global End-Use Demand by Fuel
Figure 180: Global Surface Average Temperature w/UQ
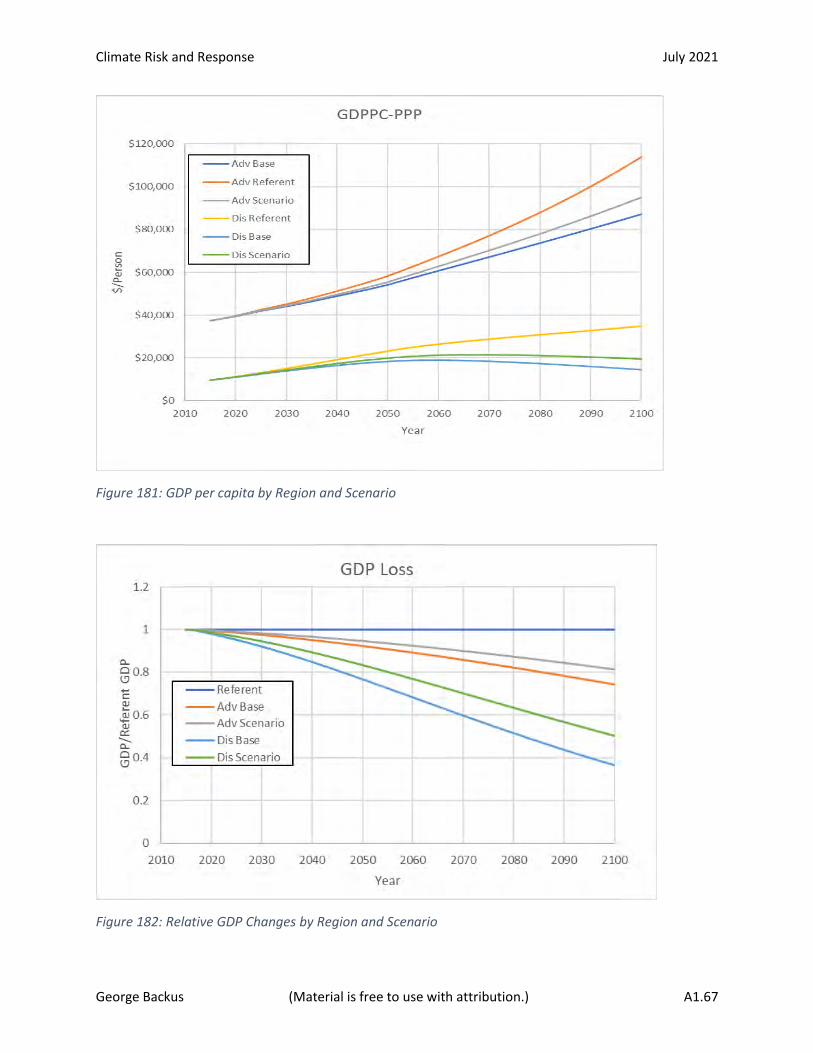
Climate Risk and Response July 2021
George Backus (Material is free to use with attribution.) A1.67
Figure 181: GDP per capita by Region and Scenario
Figure 182: Relative GDP Changes by Region and Scenario
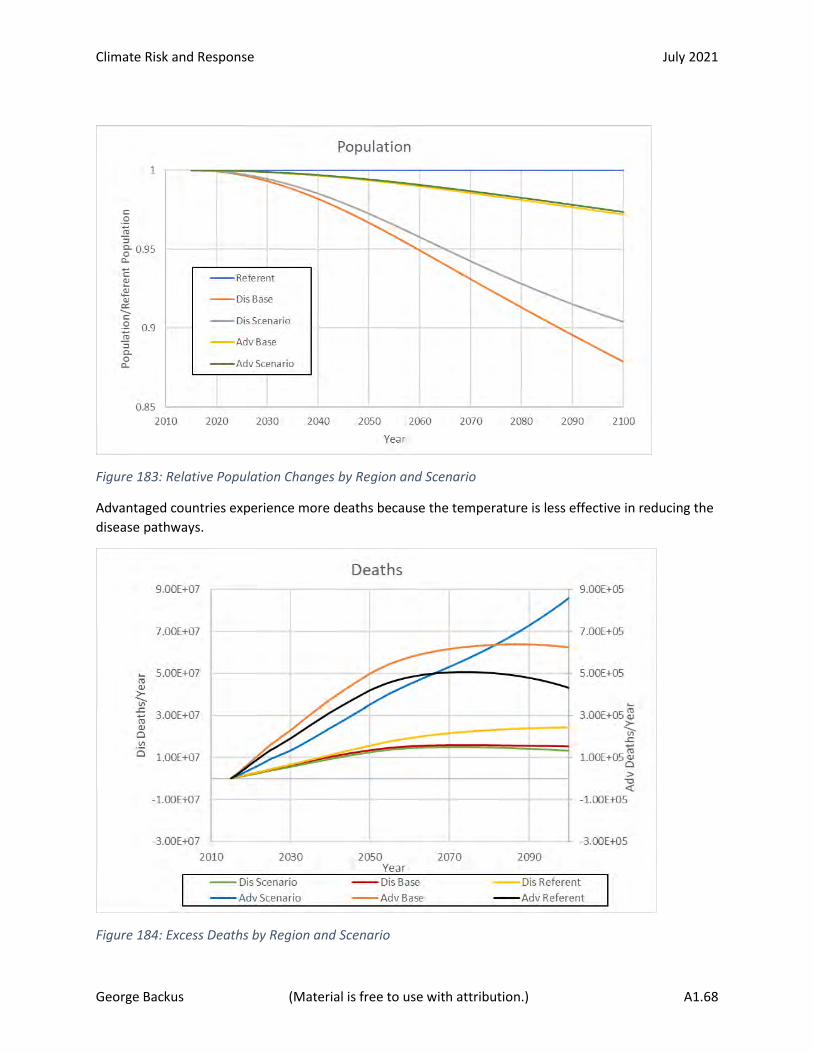
Climate Risk and Response July 2021
George Backus (Material is free to use with attribution.) A1.68
Figure 183: Relative Population Changes by Region and Scenario
Advantaged countries experience more deaths because the temperature is less effective in reducing the
disease pathways.
Figure 184: Excess Deaths by Region and Scenario
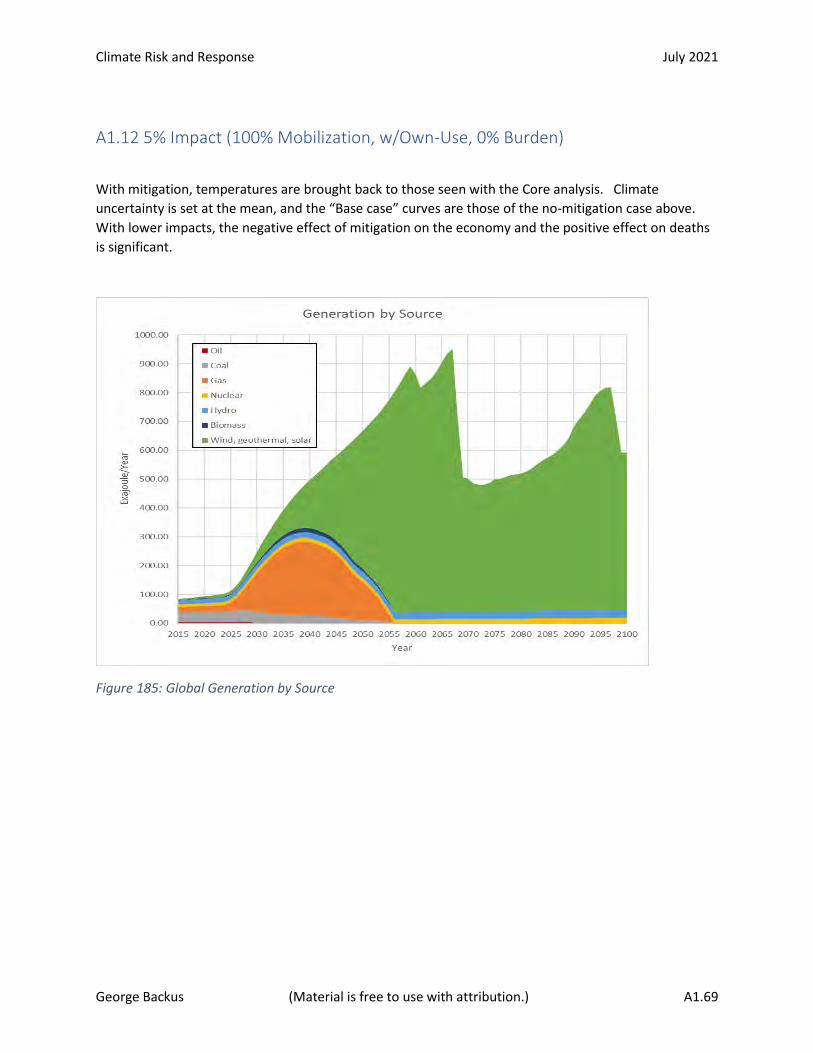
Climate Risk and Response July 2021
George Backus (Material is free to use with attribution.) A1.69
A1.12 5% Impact (100% Mobilization, w/Own-Use, 0% Burden)
With mitigation, temperatures are brought back to those seen with the Core analysis. Climate
uncertainty is set at the mean, and the “Base case” curves are those of the no-mitigation case above.
With lower impacts, the negative effect of mitigation on the economy and the positive effect on deaths
is significant.
Figure 185: Global Generation by Source
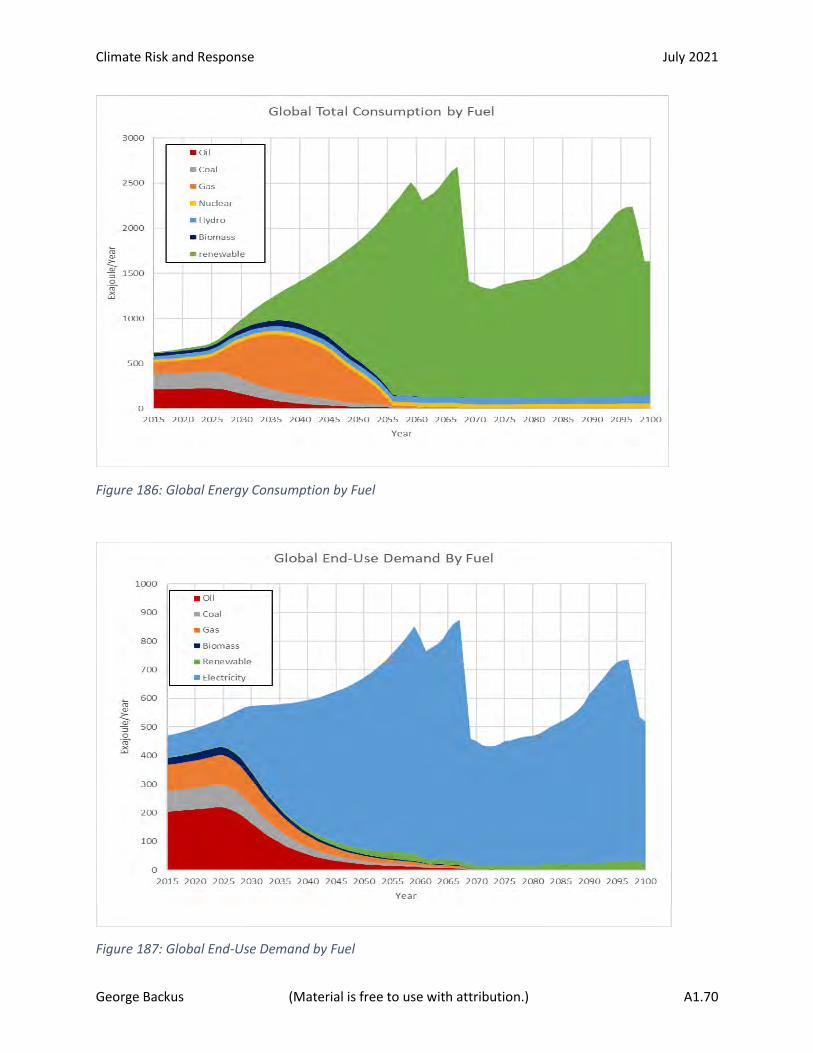
Climate Risk and Response July 2021
George Backus (Material is free to use with attribution.) A1.70
Figure 186: Global Energy Consumption by Fuel
Figure 187: Global End-Use Demand by Fuel
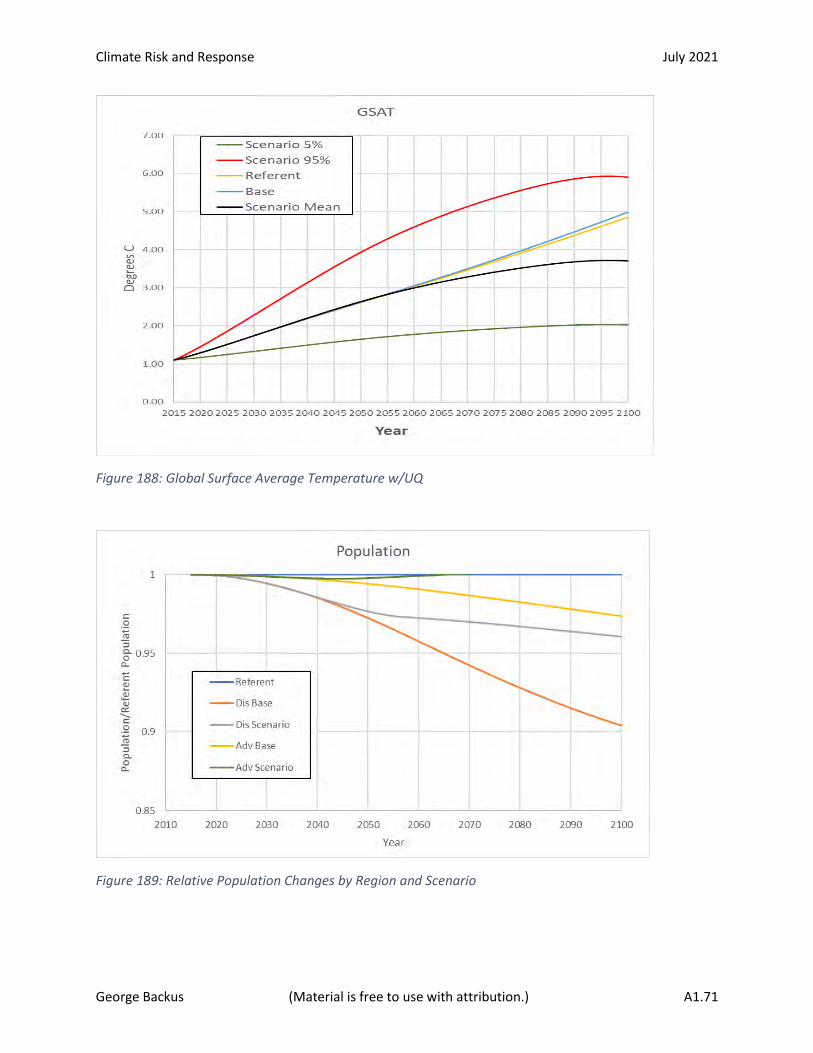
Climate Risk and Response July 2021
George Backus (Material is free to use with attribution.) A1.71
Figure 188: Global Surface Average Temperature w/UQ
Figure 189: Relative Population Changes by Region and Scenario
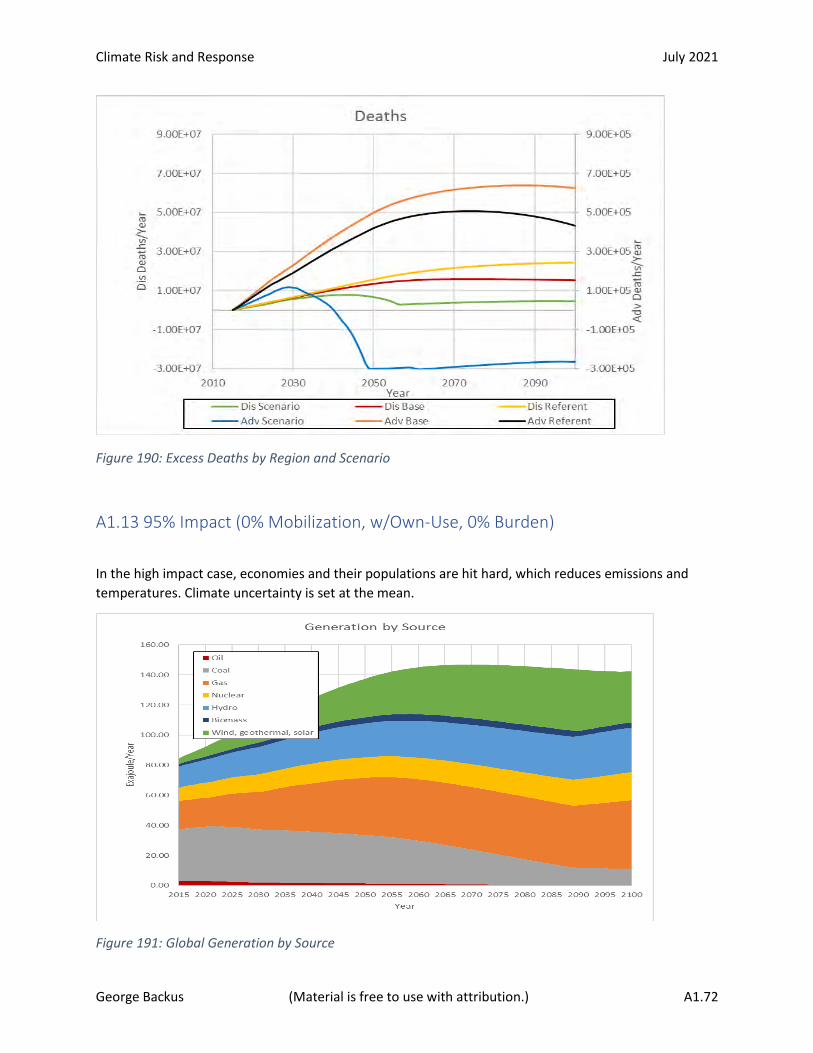
Climate Risk and Response July 2021
George Backus (Material is free to use with attribution.) A1.72
Figure 190: Excess Deaths by Region and Scenario
A1.13 95% Impact (0% Mobilization, w/Own-Use, 0% Burden)
In the high impact case, economies and their populations are hit hard, which reduces emissions and
temperatures. Climate uncertainty is set at the mean.
Figure 191: Global Generation by Source

Climate Risk and Response July 2021
George Backus (Material is free to use with attribution.) A1.73
Figure 192: Global Energy Consumption by Fuel
Figure 193: Global End-Use Demand by Fuel
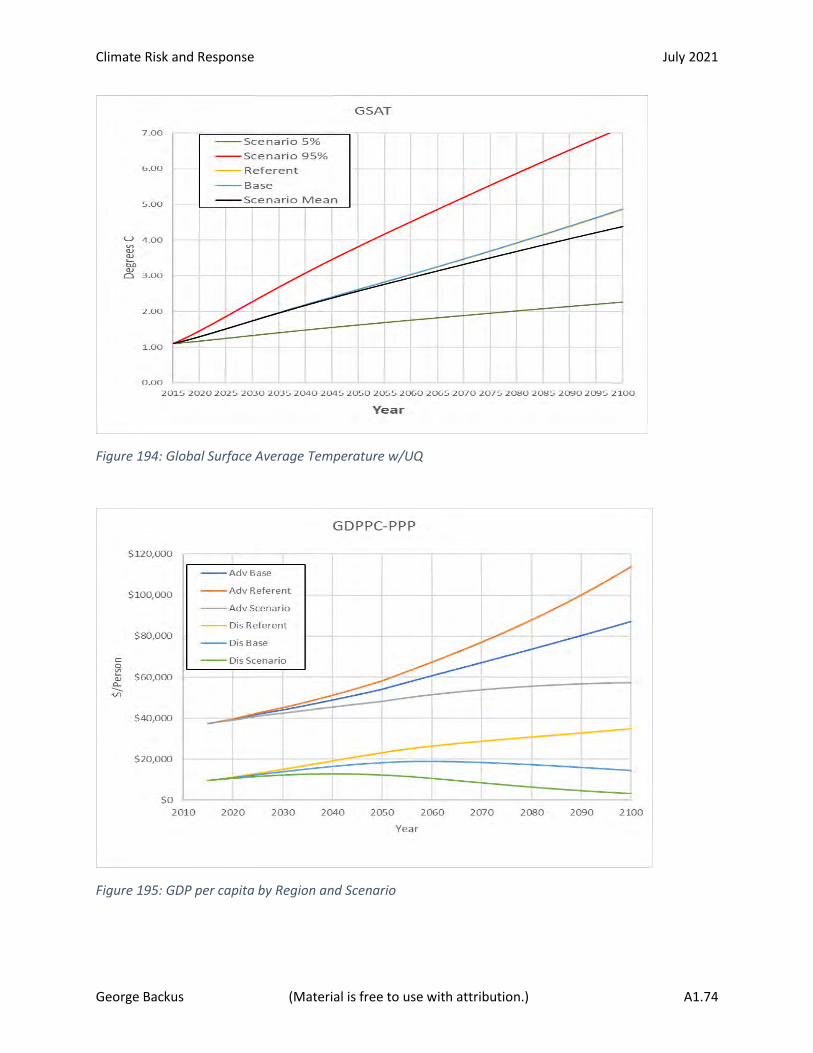
Climate Risk and Response July 2021
George Backus (Material is free to use with attribution.) A1.74
Figure 194: Global Surface Average Temperature w/UQ
Figure 195: GDP per capita by Region and Scenario
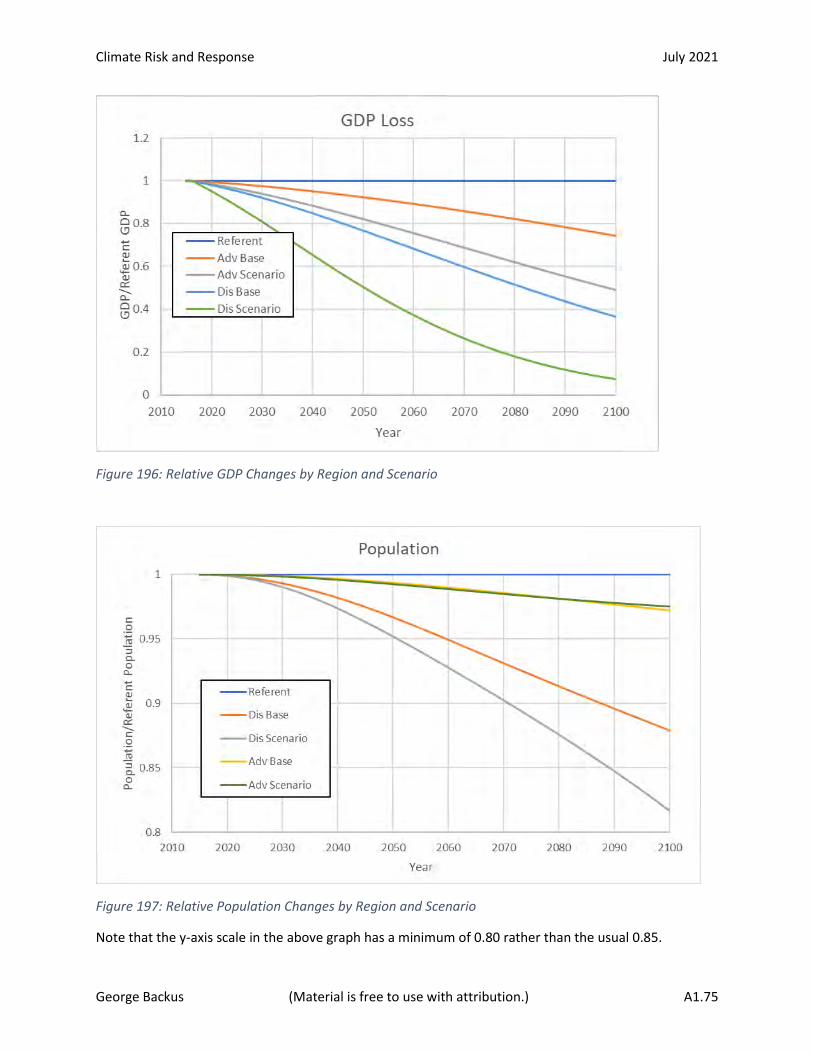
Climate Risk and Response July 2021
George Backus (Material is free to use with attribution.) A1.75
Figure 196: Relative GDP Changes by Region and Scenario
Figure 197: Relative Population Changes by Region and Scenario
Note that the y-axis scale in the above graph has a minimum of 0.80 rather than the usual 0.85.
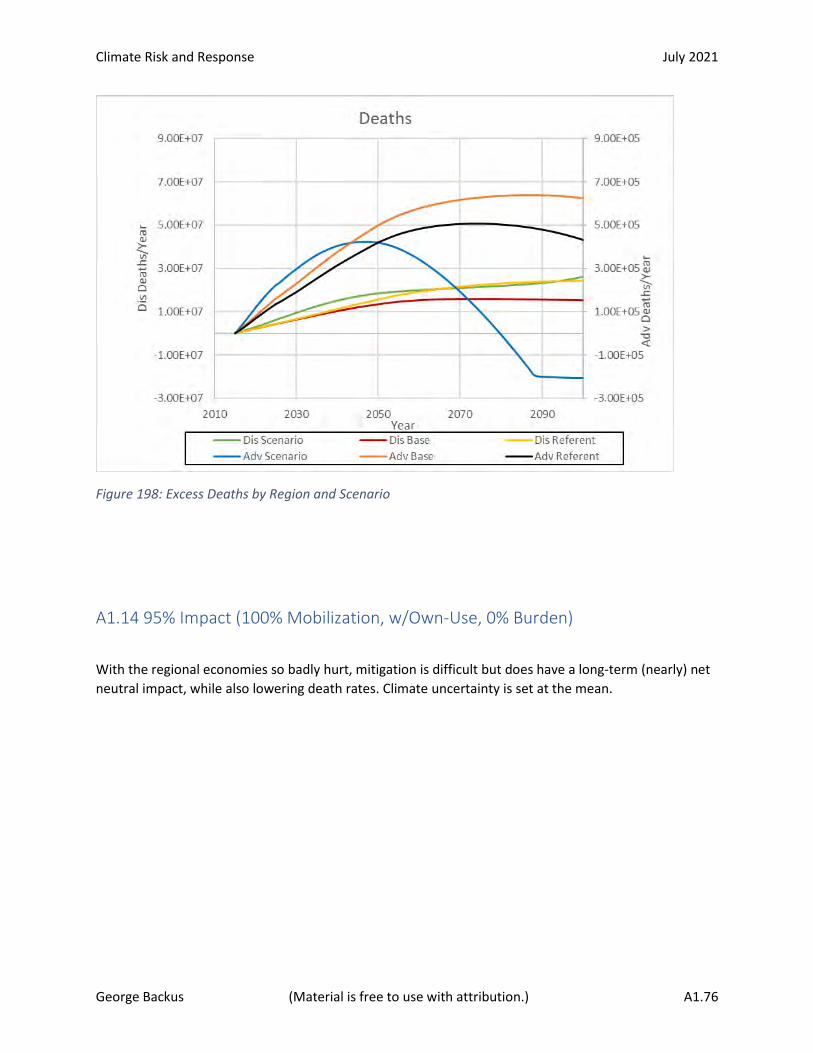
Climate Risk and Response July 2021
George Backus (Material is free to use with attribution.) A1.76
Figure 198: Excess Deaths by Region and Scenario
A1.14 95% Impact (100% Mobilization, w/Own-Use, 0% Burden)
With the regional economies so badly hurt, mitigation is difficult but does have a long-term (nearly) net
neutral impact, while also lowering death rates. Climate uncertainty is set at the mean.

Climate Risk and Response July 2021
George Backus (Material is free to use with attribution.) A1.77
Figure 199: Global Generation by Source
Figure 200: Global Energy Consumption by Fuel
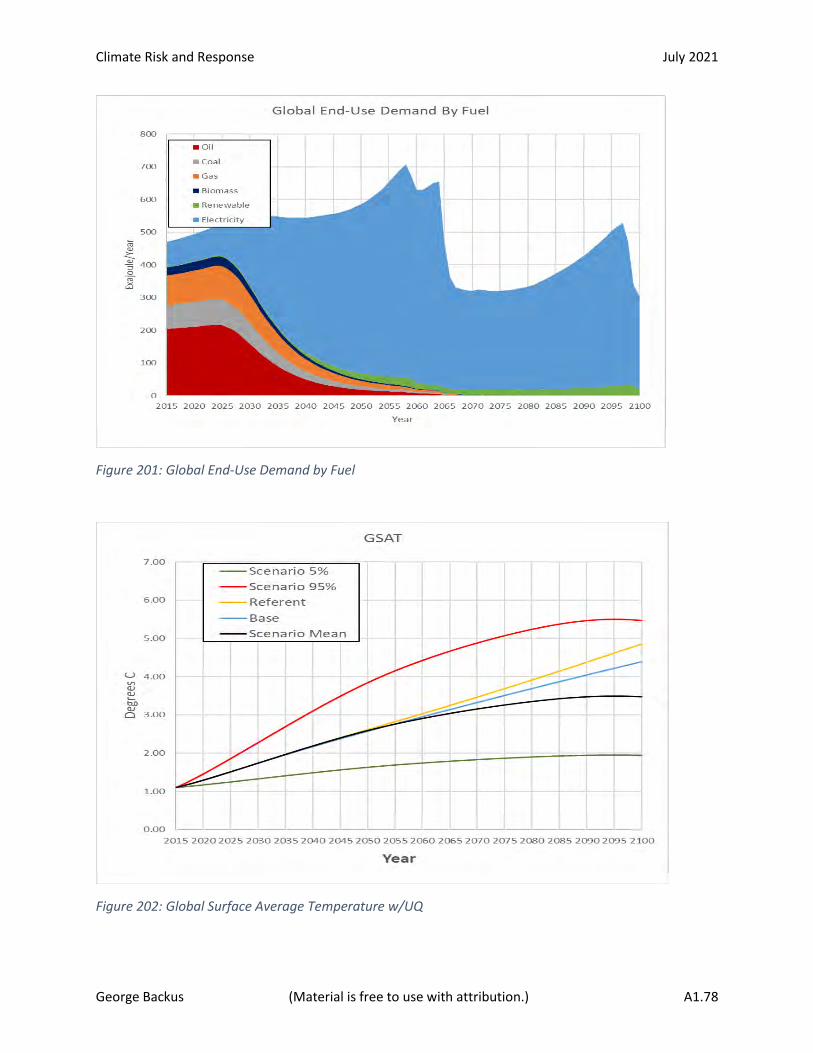
Climate Risk and Response July 2021
George Backus (Material is free to use with attribution.) A1.78
Figure 201: Global End-Use Demand by Fuel
Figure 202: Global Surface Average Temperature w/UQ

Climate Risk and Response July 2021
George Backus (Material is free to use with attribution.) A1.79
Figure 203: GDP per capita by Region and Scenario
Figure 204: Relative GDP Changes by Region and Scenario
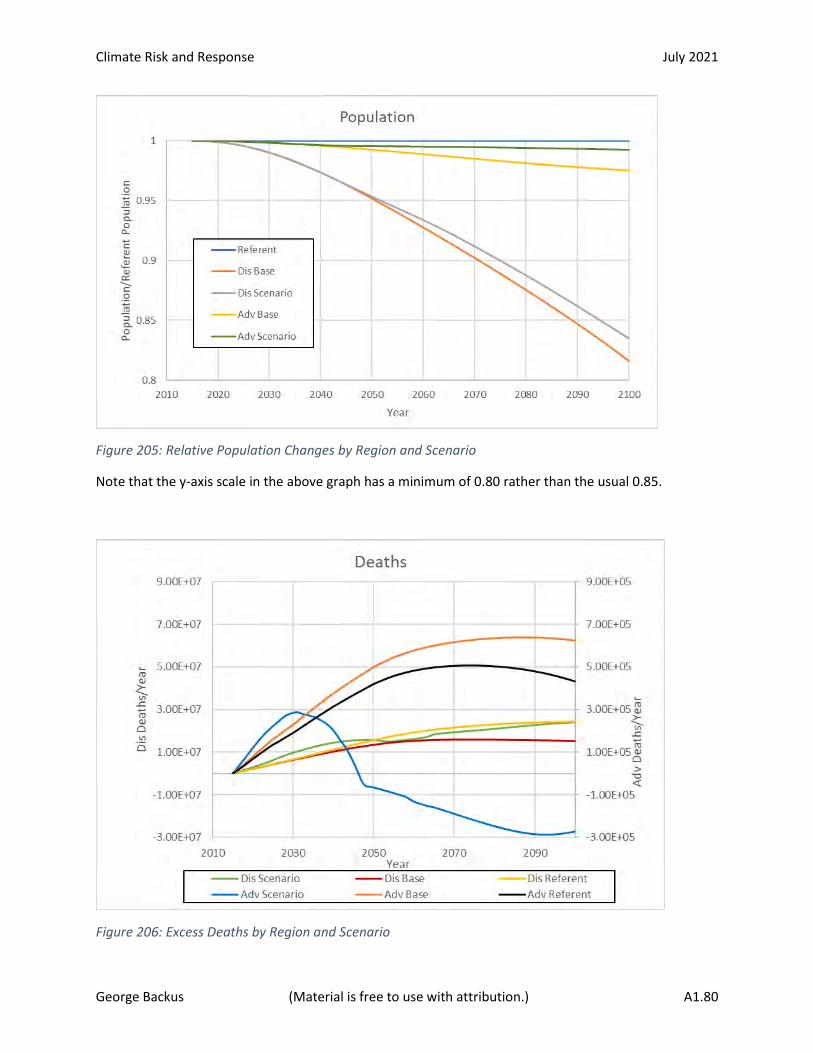
Climate Risk and Response July 2021
George Backus (Material is free to use with attribution.) A1.80
Figure 205: Relative Population Changes by Region and Scenario
Note that the y-axis scale in the above graph has a minimum of 0.80 rather than the usual 0.85.
Figure 206: Excess Deaths by Region and Scenario
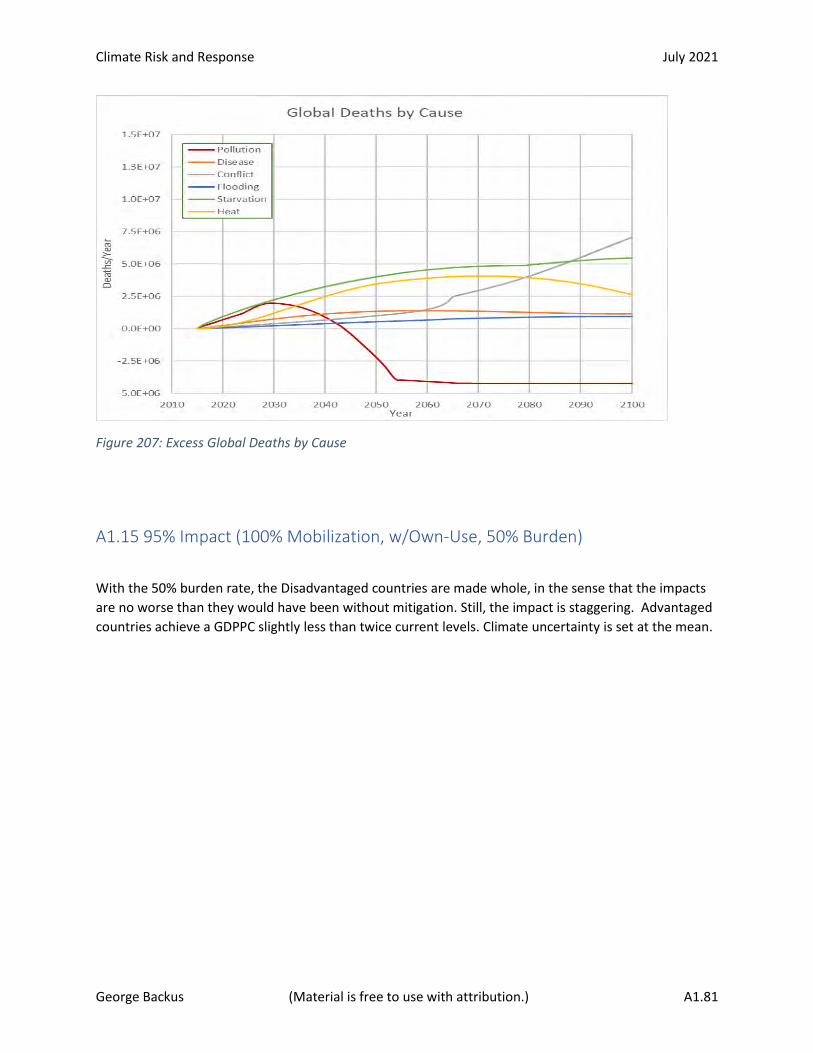
Climate Risk and Response July 2021
George Backus (Material is free to use with attribution.) A1.81
Figure 207: Excess Global Deaths by Cause
A1.15 95% Impact (100% Mobilization, w/Own-Use, 50% Burden)
With the 50% burden rate, the Disadvantaged countries are made whole, in the sense that the impacts
are no worse than they would have been without mitigation. Still, the impact is staggering. Advantaged
countries achieve a GDPPC slightly less than twice current levels. Climate uncertainty is set at the mean.

Climate Risk and Response July 2021
George Backus (Material is free to use with attribution.) A1.82
Figure 208: Global Generation by Source
Figure 209: Global Energy Consumption by Fuel
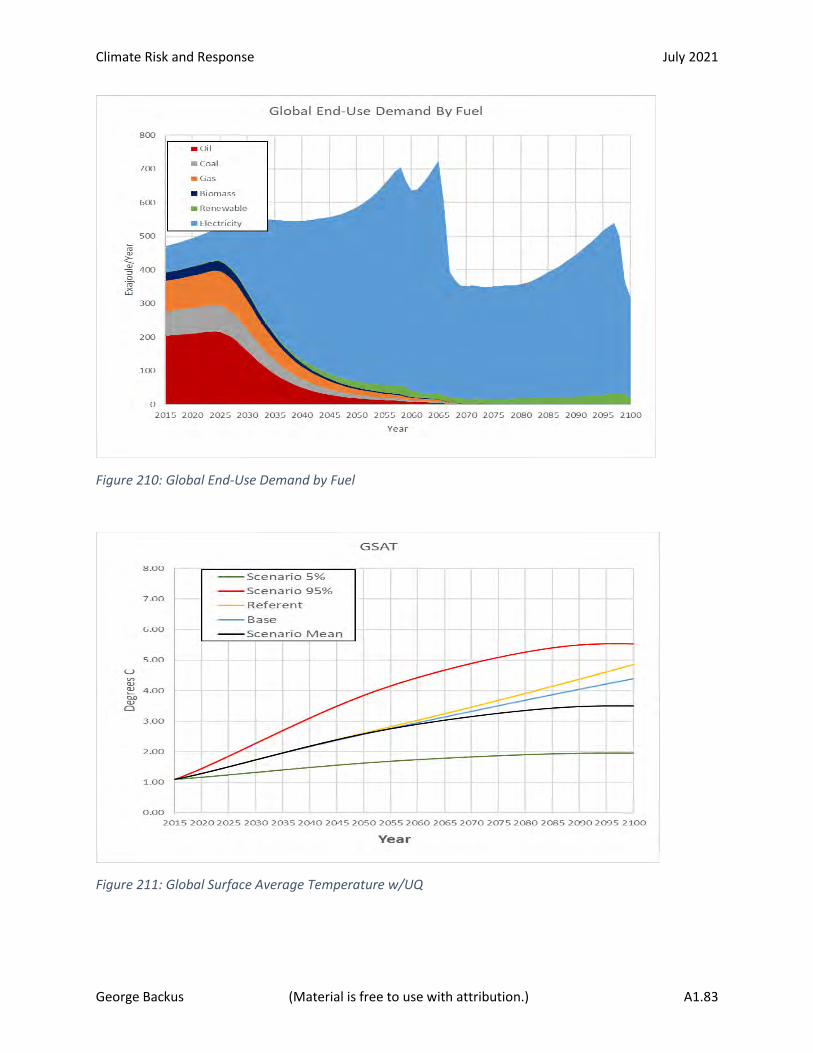
Climate Risk and Response July 2021
George Backus (Material is free to use with attribution.) A1.83
Figure 210: Global End-Use Demand by Fuel
Figure 211: Global Surface Average Temperature w/UQ
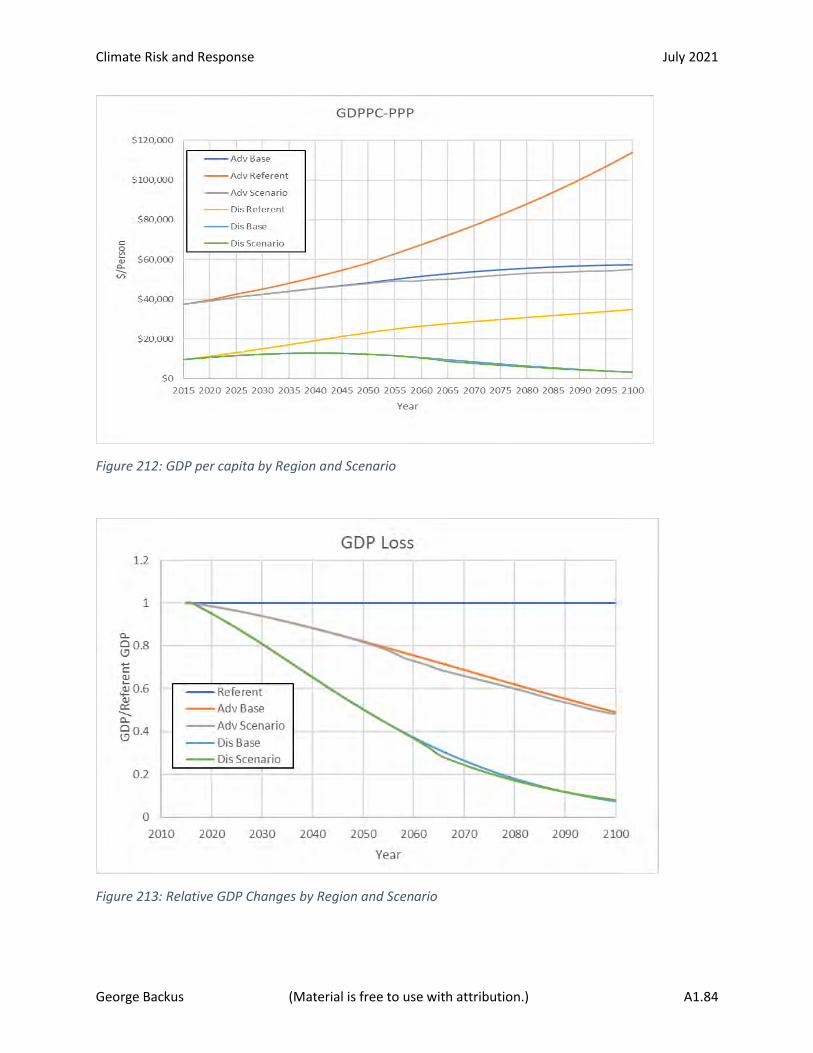
Climate Risk and Response July 2021
George Backus (Material is free to use with attribution.) A1.84
Figure 212: GDP per capita by Region and Scenario
Figure 213: Relative GDP Changes by Region and Scenario
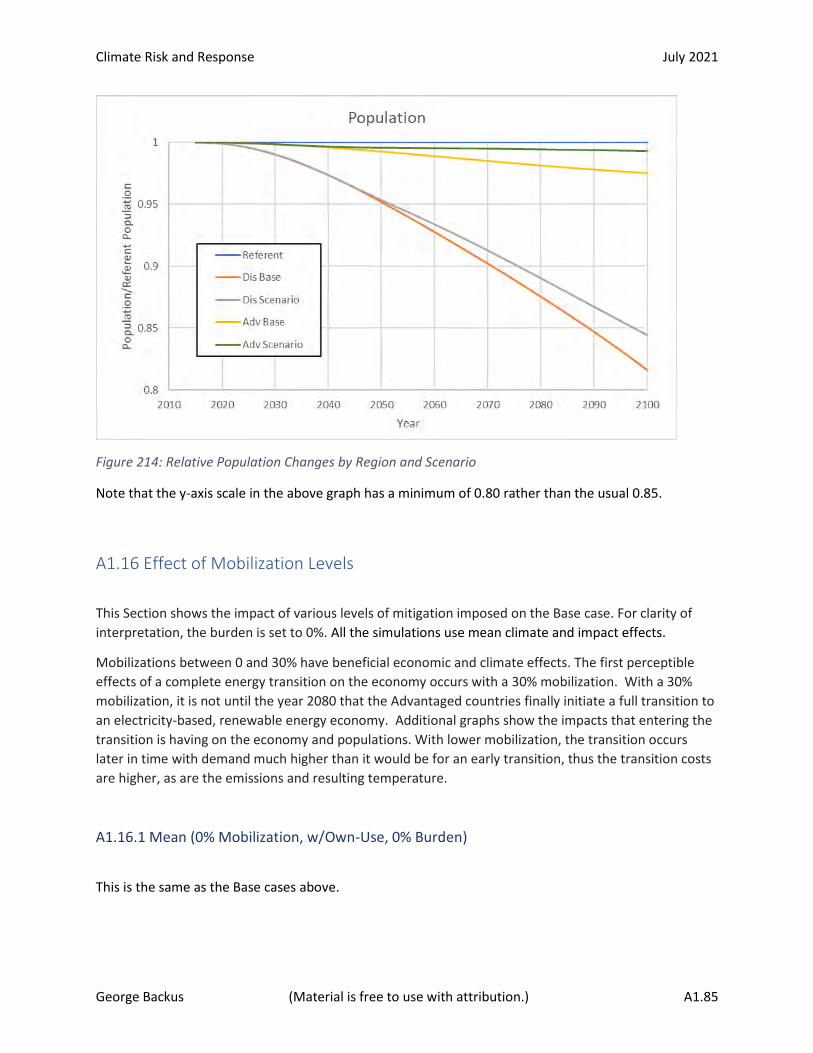
Climate Risk and Response July 2021
George Backus (Material is free to use with attribution.) A1.85
Figure 214: Relative Population Changes by Region and Scenario
Note that the y-axis scale in the above graph has a minimum of 0.80 rather than the usual 0.85.
A1.16 Effect of Mobilization Levels
This Section shows the impact of various levels of mitigation imposed on the Base case. For clarity of
interpretation, the burden is set to 0%. All the simulations use mean climate and impact effects.
Mobilizations between 0 and 30% have beneficial economic and climate effects. The first perceptible
effects of a complete energy transition on the economy occurs with a 30% mobilization. With a 30%
mobilization, it is not until the year 2080 that the Advantaged countries finally initiate a full transition to
an electricity-based, renewable energy economy. Additional graphs show the impacts that entering the
transition is having on the economy and populations. With lower mobilization, the transition occurs
later in time with demand much higher than it would be for an early transition, thus the transition costs
are higher, as are the emissions and resulting temperature.
A1.16.1 Mean (0% Mobilization, w/Own-Use, 0% Burden)
This is the same as the Base cases above.
Climate Risk and Response July 2021
George Backus (Material is free to use with attribution.) A1.86
A1.16.2 Mean (10% Mobilization, w/Own-Use, 0% Burden)
There is no non-negligible change compared to the Base case, other than a barely perceptible reduction
in fuel use due to improved energy efficiency (which is independent of mobilization, once there is any
mobilization).
Figure 215: Global Generation by Source
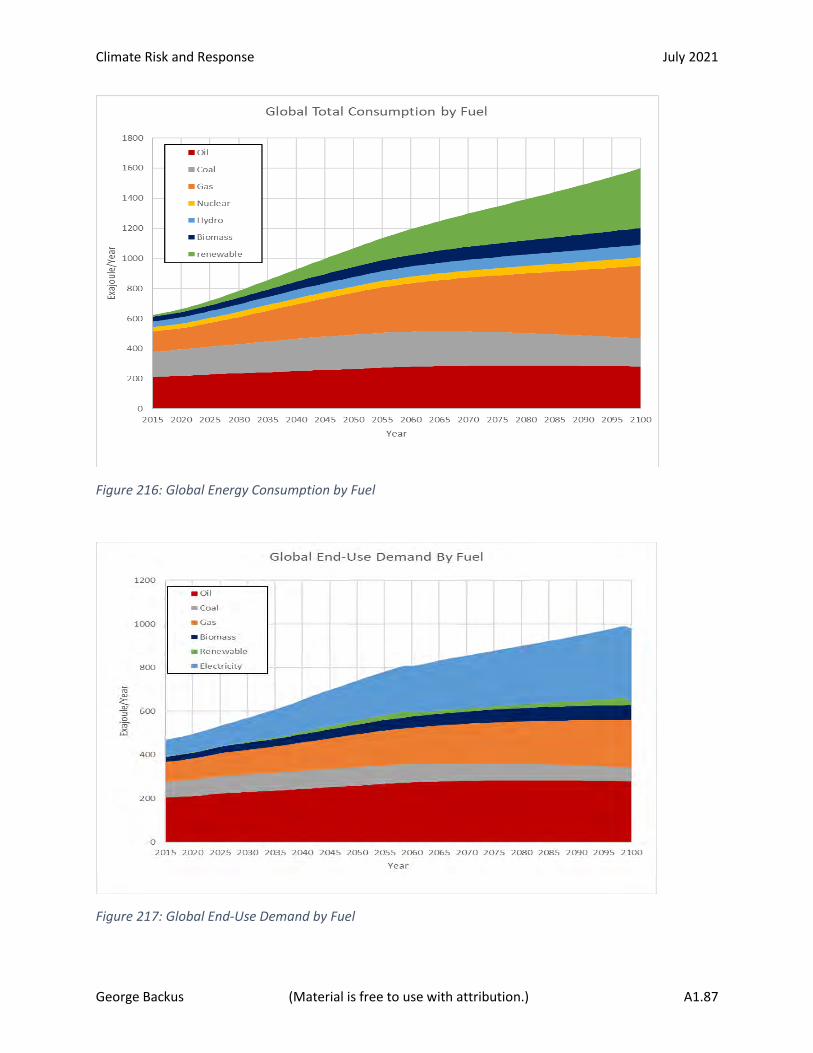
Climate Risk and Response July 2021
George Backus (Material is free to use with attribution.) A1.87
Figure 216: Global Energy Consumption by Fuel
Figure 217: Global End-Use Demand by Fuel
Climate Risk and Response July 2021
George Backus (Material is free to use with attribution.) A1.88
Figure 218: Global Surface Average Temperature w/UQ
A1.16.3 Mean (20% Mobilization, w/Own-Use, 0% Burden)
At 20 % mobilization, fossil fuel use is down slightly. Death rates are improved enough to be noticed.
However, in the short term, they rise slightly in the Disadvantaged countries because the shift to electric
on the end-use side implies more fossil-fuel generation. Renewable energy use increases noticeably.
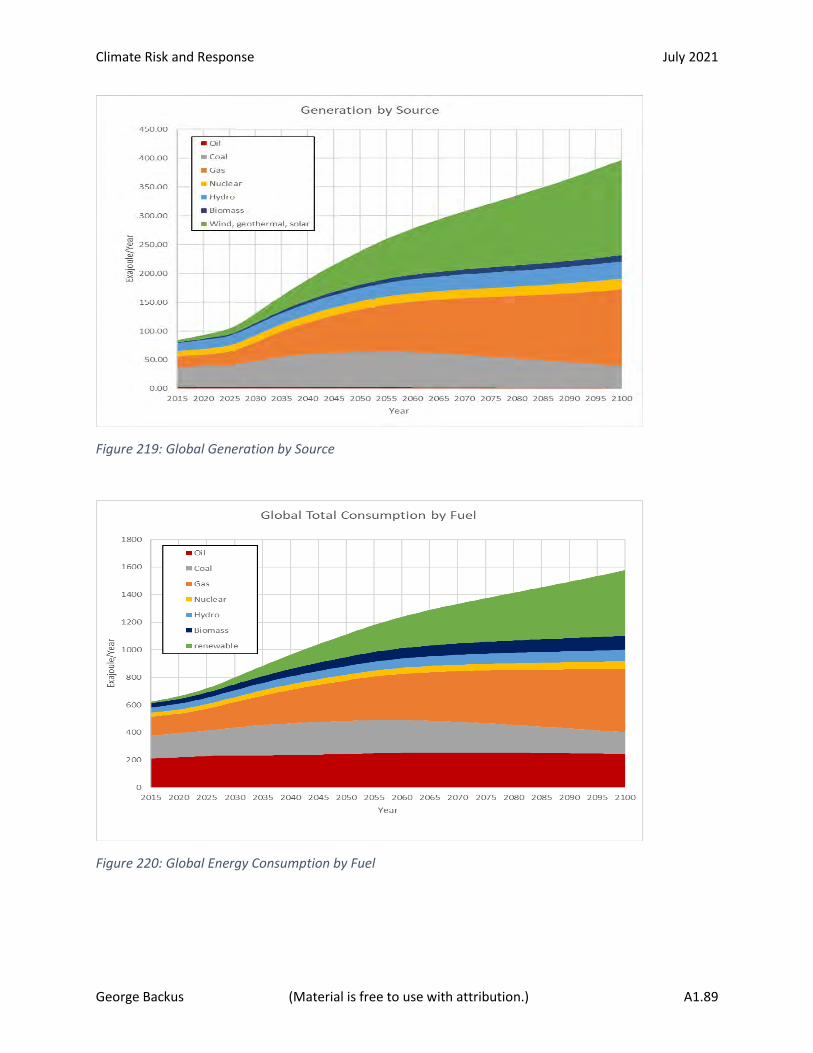
Climate Risk and Response July 2021
George Backus (Material is free to use with attribution.) A1.89
Figure 219: Global Generation by Source
Figure 220: Global Energy Consumption by Fuel
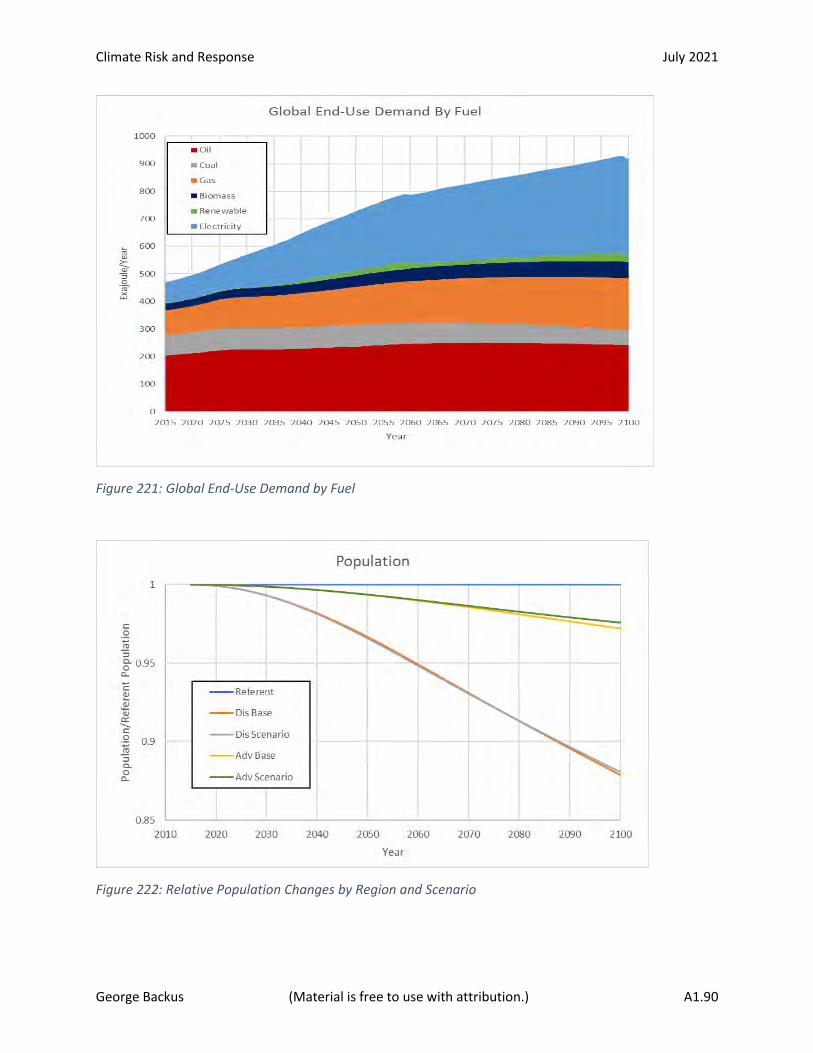
Climate Risk and Response July 2021
George Backus (Material is free to use with attribution.) A1.90
Figure 221: Global End-Use Demand by Fuel
Figure 222: Relative Population Changes by Region and Scenario
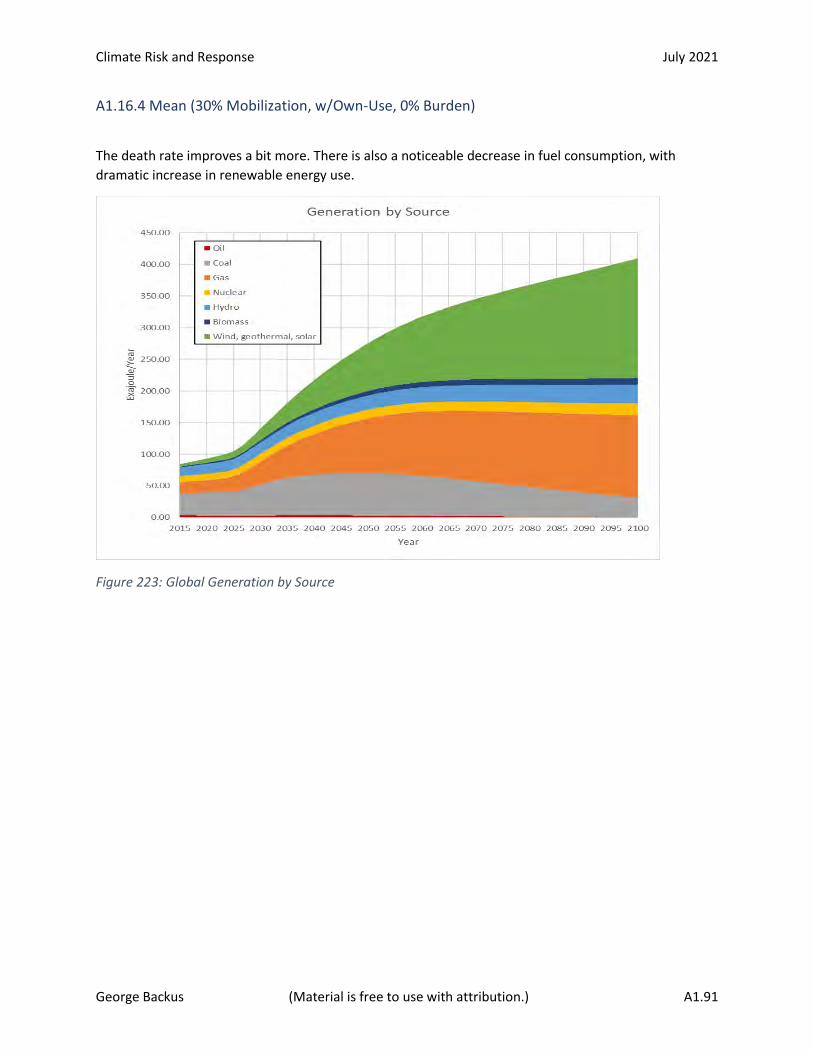
Climate Risk and Response July 2021
George Backus (Material is free to use with attribution.) A1.91
A1.16.4 Mean (30% Mobilization, w/Own-Use, 0% Burden)
The death rate improves a bit more. There is also a noticeable decrease in fuel consumption, with
dramatic increase in renewable energy use.
Figure 223: Global Generation by Source
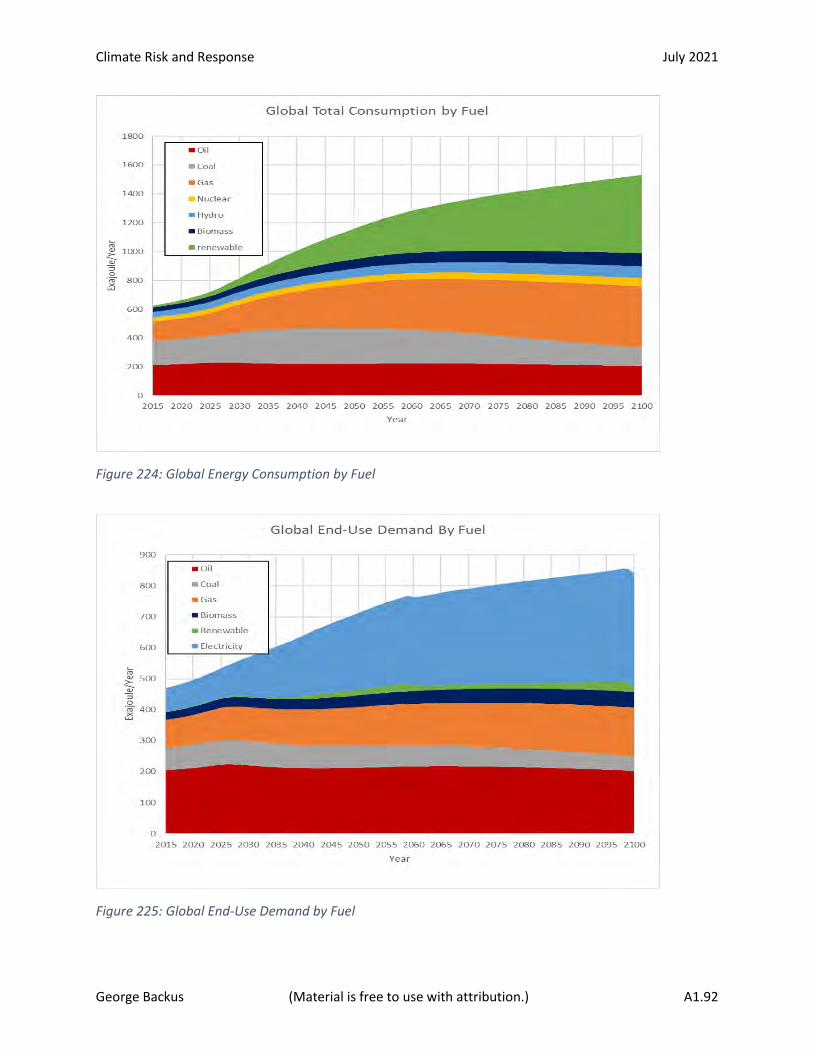
Climate Risk and Response July 2021
George Backus (Material is free to use with attribution.) A1.92
Figure 224: Global Energy Consumption by Fuel
Figure 225: Global End-Use Demand by Fuel
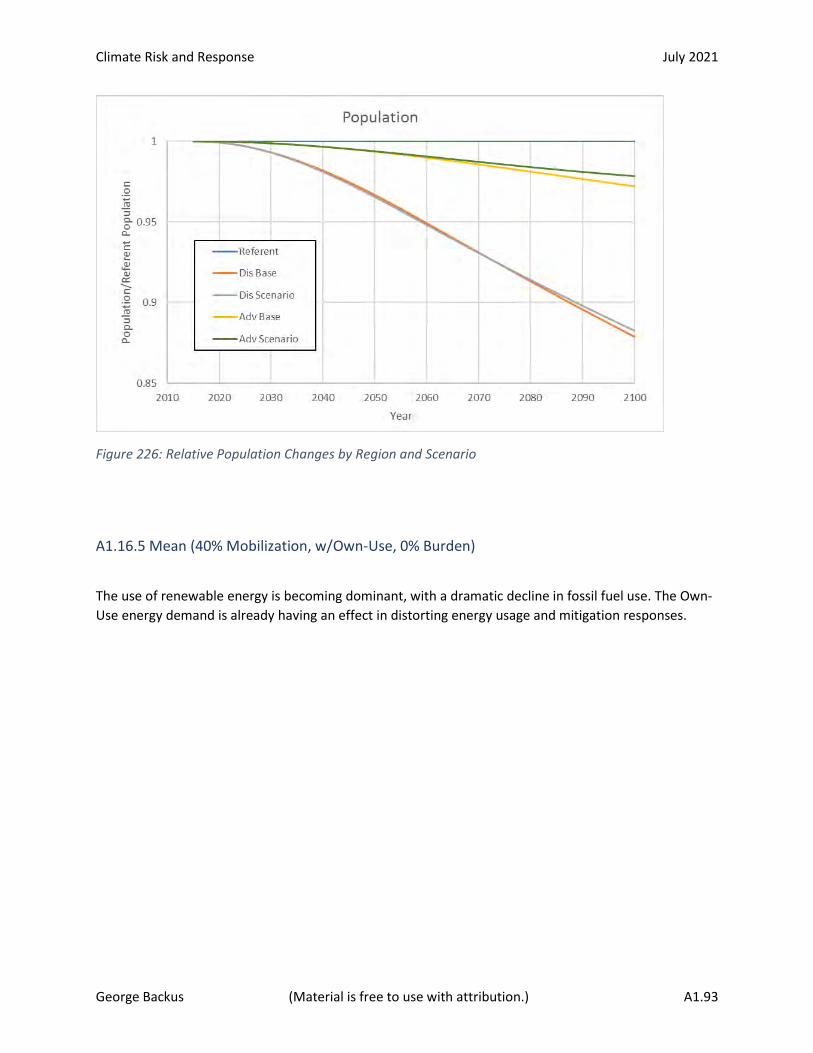
Climate Risk and Response July 2021
George Backus (Material is free to use with attribution.) A1.93
Figure 226: Relative Population Changes by Region and Scenario
A1.16.5 Mean (40% Mobilization, w/Own-Use, 0% Burden)
The use of renewable energy is becoming dominant, with a dramatic decline in fossil fuel use. The Own-
Use energy demand is already having an effect in distorting energy usage and mitigation responses.

Climate Risk and Response July 2021
George Backus (Material is free to use with attribution.) A1.94
Figure 227: Global Generation by Source
Figure 228: Global Energy Consumption by Fuel
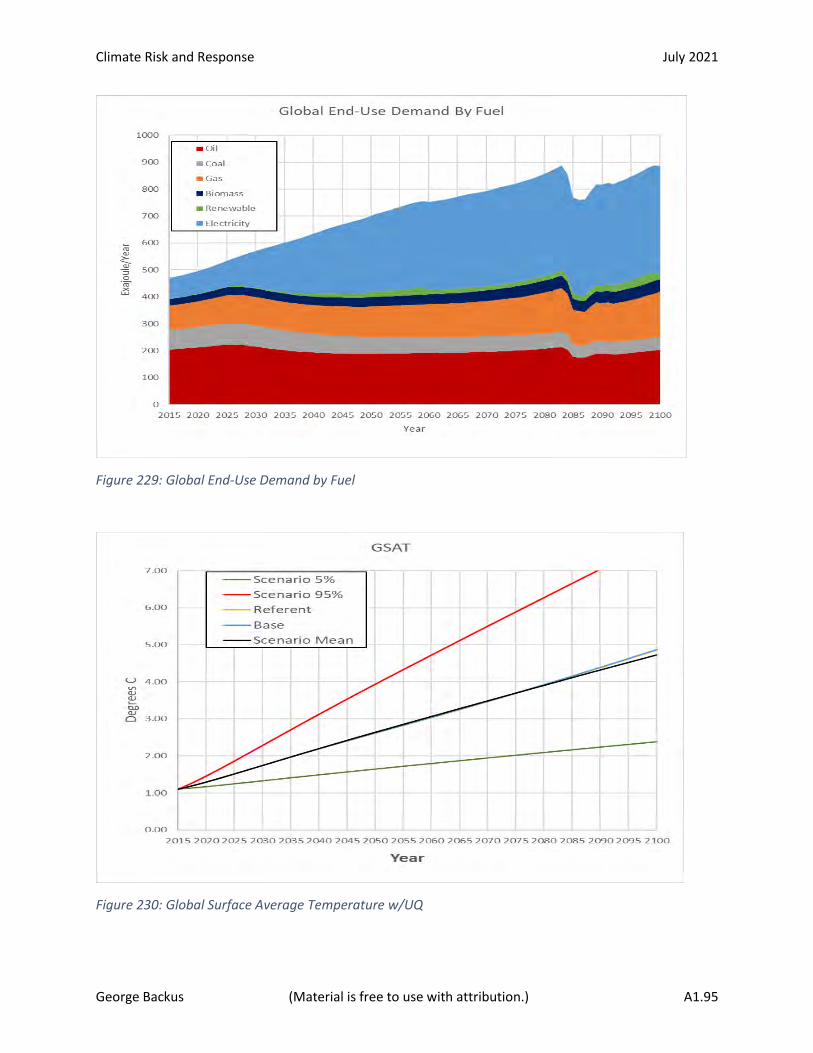
Climate Risk and Response July 2021
George Backus (Material is free to use with attribution.) A1.95
Figure 229: Global End-Use Demand by Fuel
Figure 230: Global Surface Average Temperature w/UQ
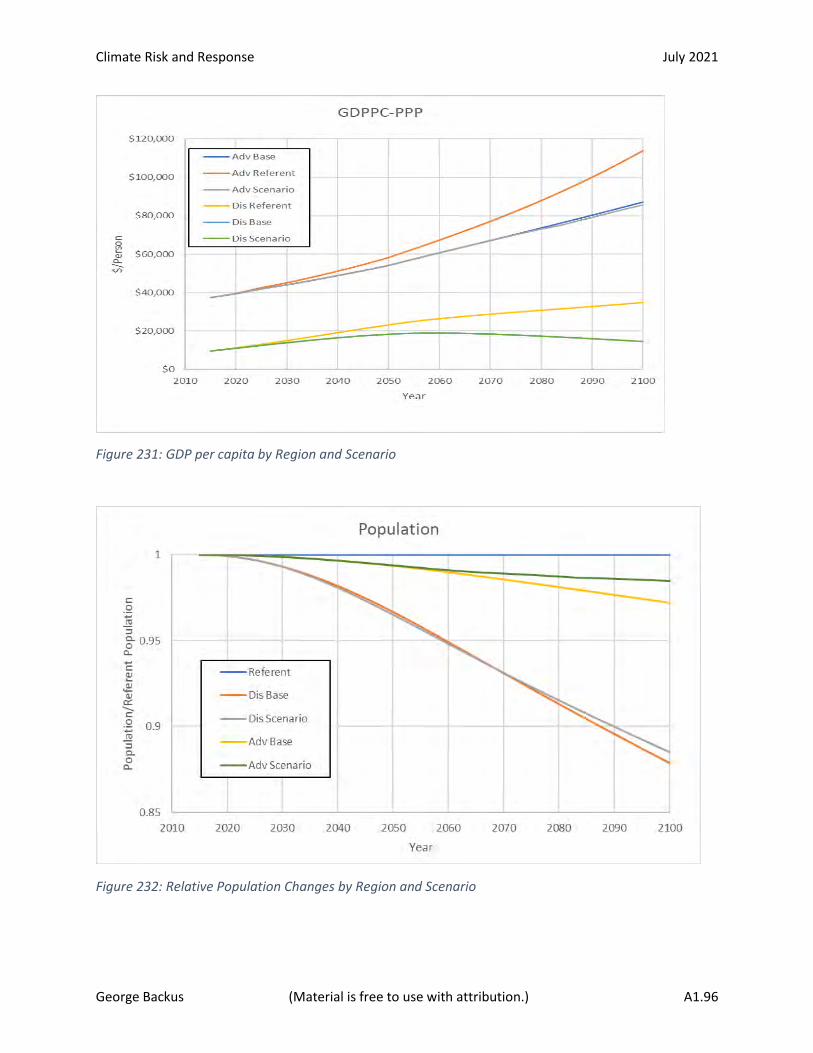
Climate Risk and Response July 2021
George Backus (Material is free to use with attribution.) A1.96
Figure 231: GDP per capita by Region and Scenario
Figure 232: Relative Population Changes by Region and Scenario
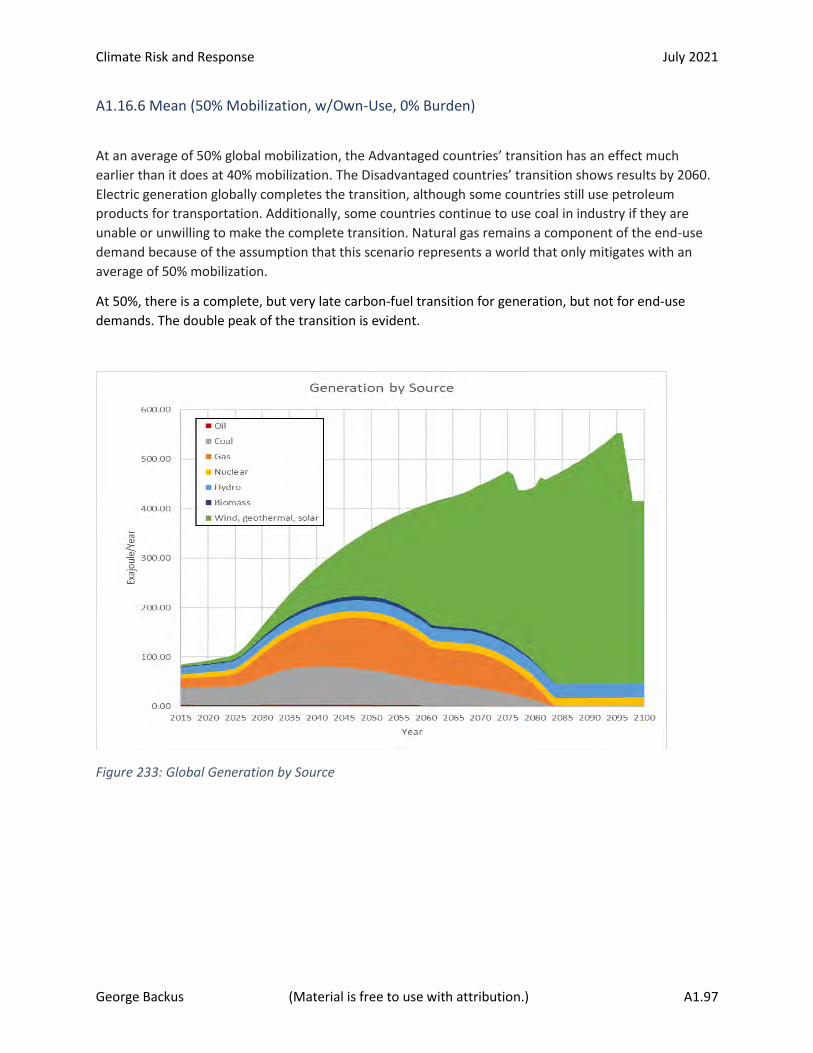
Climate Risk and Response July 2021
George Backus (Material is free to use with attribution.) A1.97
A1.16.6 Mean (50% Mobilization, w/Own-Use, 0% Burden)
At an average of 50% global mobilization, the Advantaged countries’ transition has an effect much
earlier than it does at 40% mobilization. The Disadvantaged countries’ transition shows results by 2060.
Electric generation globally completes the transition, although some countries still use petroleum
products for transportation. Additionally, some countries continue to use coal in industry if they are
unable or unwilling to make the complete transition. Natural gas remains a component of the end-use
demand because of the assumption that this scenario represents a world that only mitigates with an
average of 50% mobilization.
At 50%, there is a complete, but very late carbon-fuel transition for generation, but not for end-use
demands. The double peak of the transition is evident.
Figure 233: Global Generation by Source

Climate Risk and Response July 2021
George Backus (Material is free to use with attribution.) A1.98
Figure 234: Global Energy Consumption by Fuel
Figure 235: Global End-Use Demand by Fuel
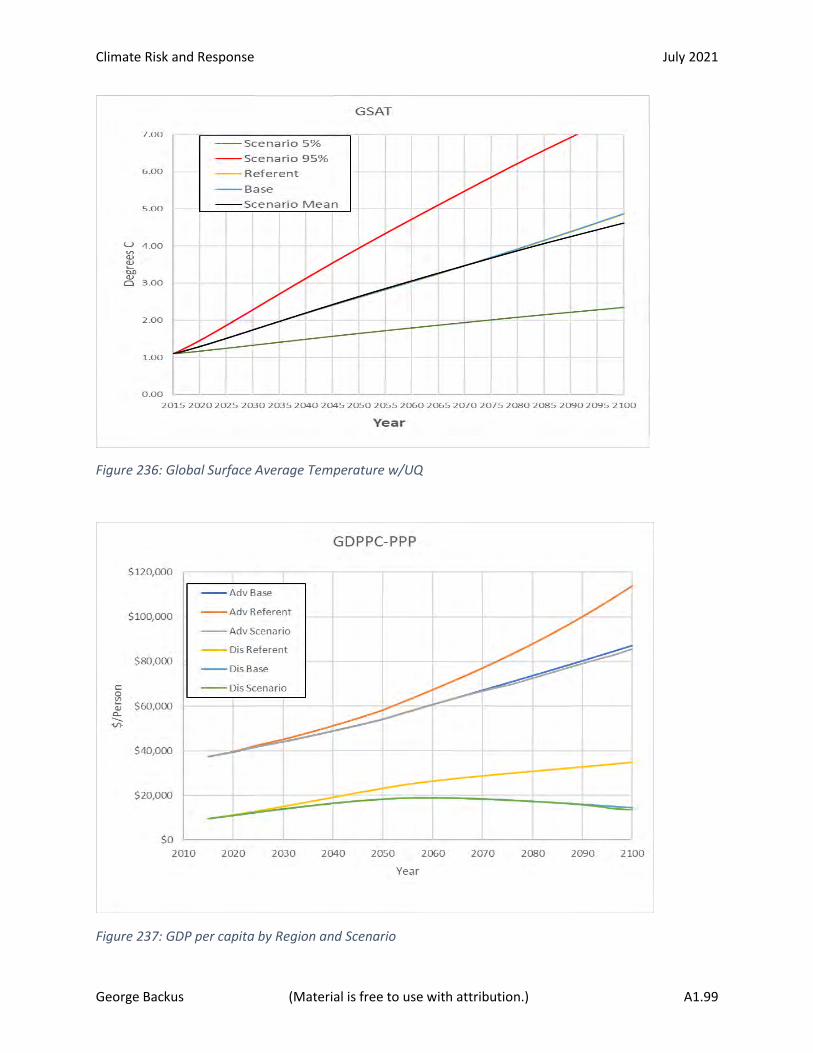
Climate Risk and Response July 2021
George Backus (Material is free to use with attribution.) A1.99
Figure 236: Global Surface Average Temperature w/UQ
Figure 237: GDP per capita by Region and Scenario
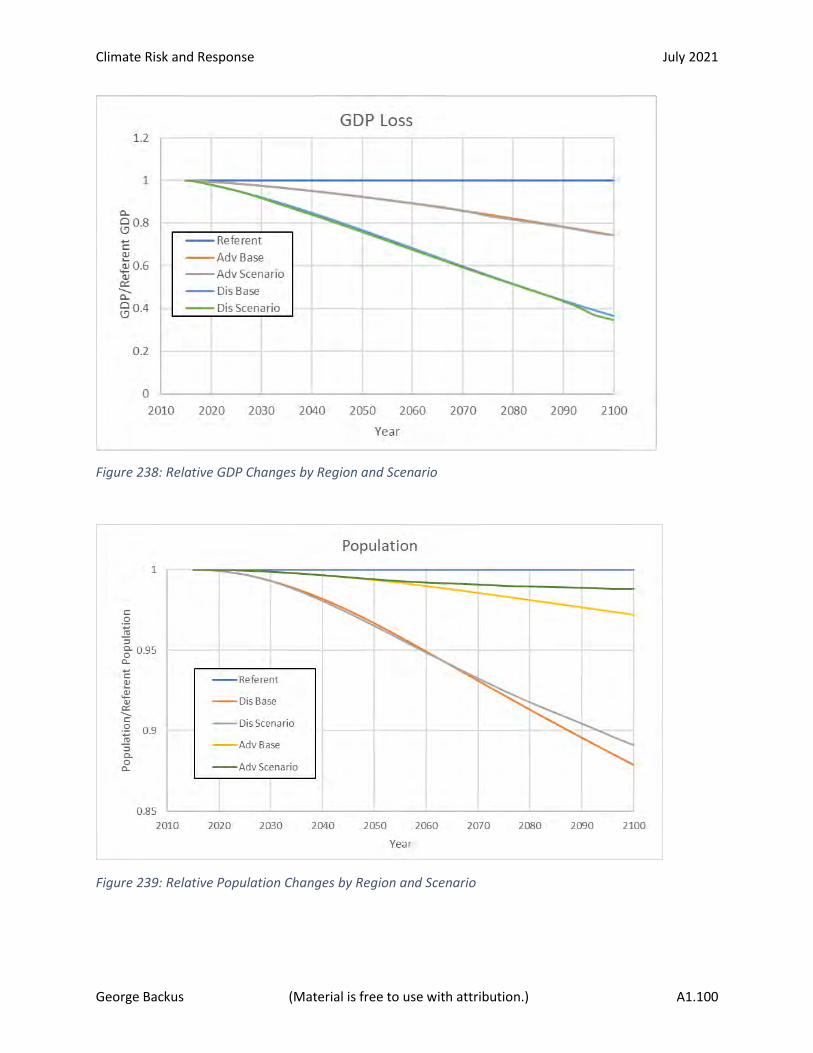
Climate Risk and Response July 2021
George Backus (Material is free to use with attribution.) A1.100
Figure 238: Relative GDP Changes by Region and Scenario
Figure 239: Relative Population Changes by Region and Scenario
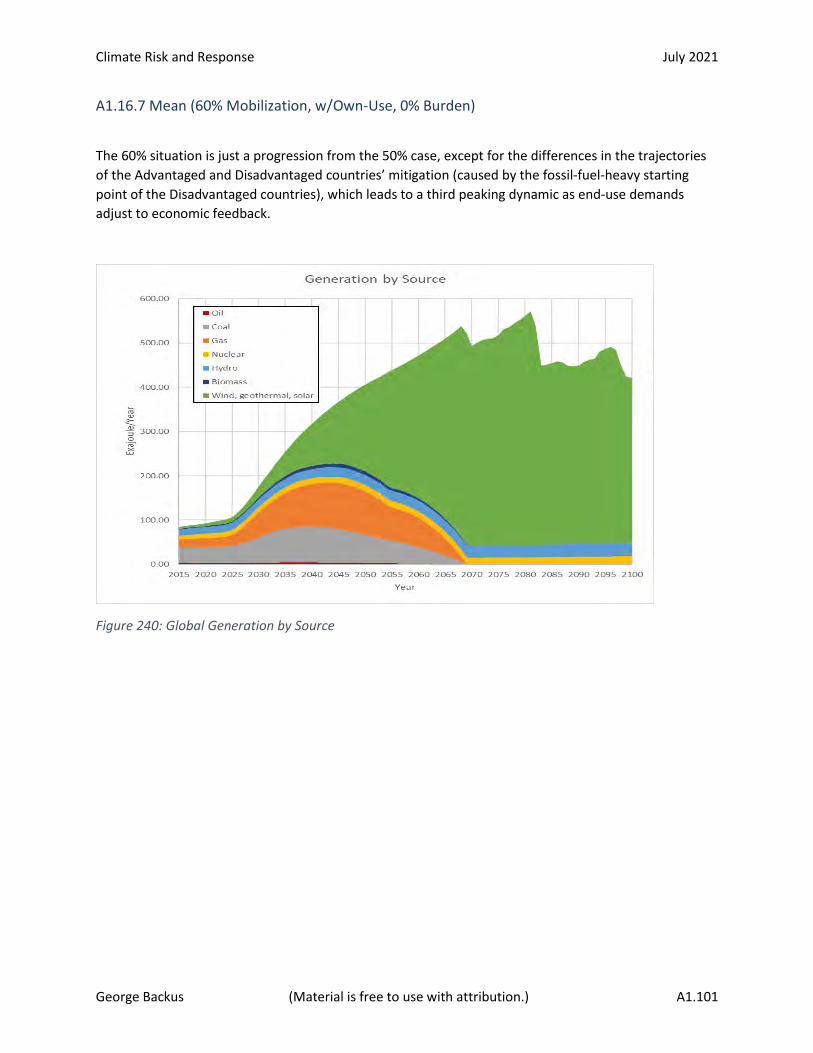
Climate Risk and Response July 2021
George Backus (Material is free to use with attribution.) A1.101
A1.16.7 Mean (60% Mobilization, w/Own-Use, 0% Burden)
The 60% situation is just a progression from the 50% case, except for the differences in the trajectories
of the Advantaged and Disadvantaged countries’ mitigation (caused by the fossil-fuel-heavy starting
point of the Disadvantaged countries), which leads to a third peaking dynamic as end-use demands
adjust to economic feedback.
Figure 240: Global Generation by Source
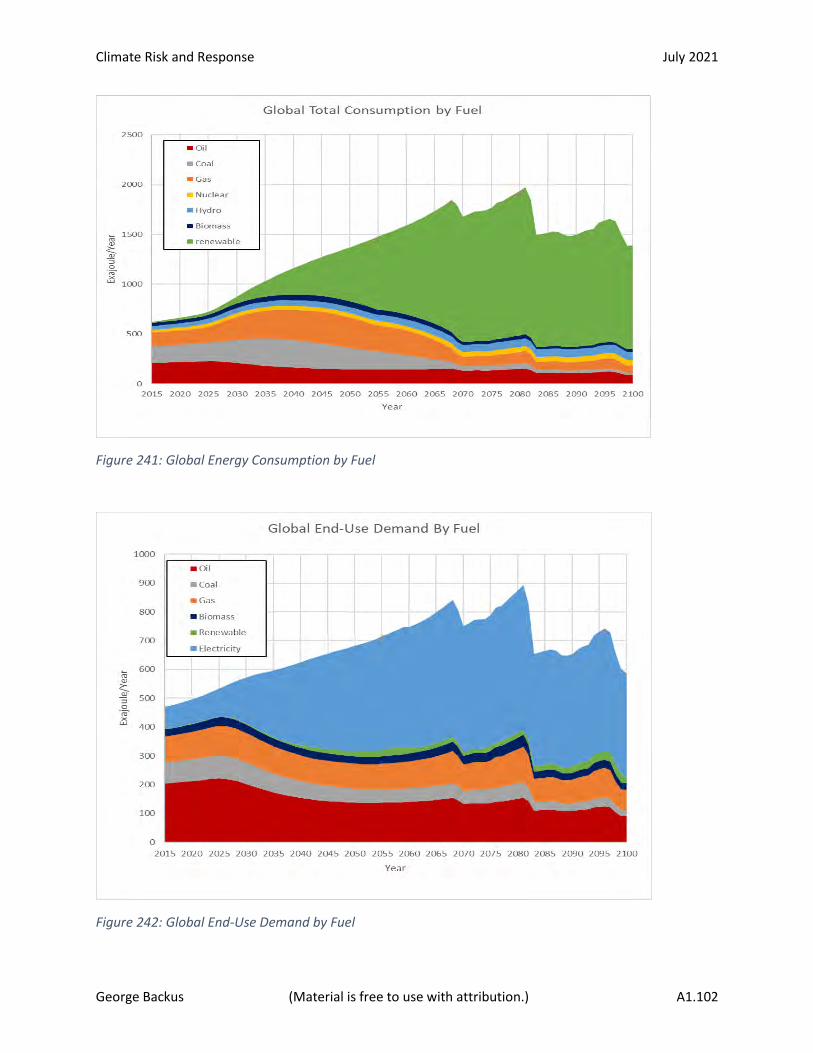
Climate Risk and Response July 2021
George Backus (Material is free to use with attribution.) A1.102
Figure 241: Global Energy Consumption by Fuel
Figure 242: Global End-Use Demand by Fuel
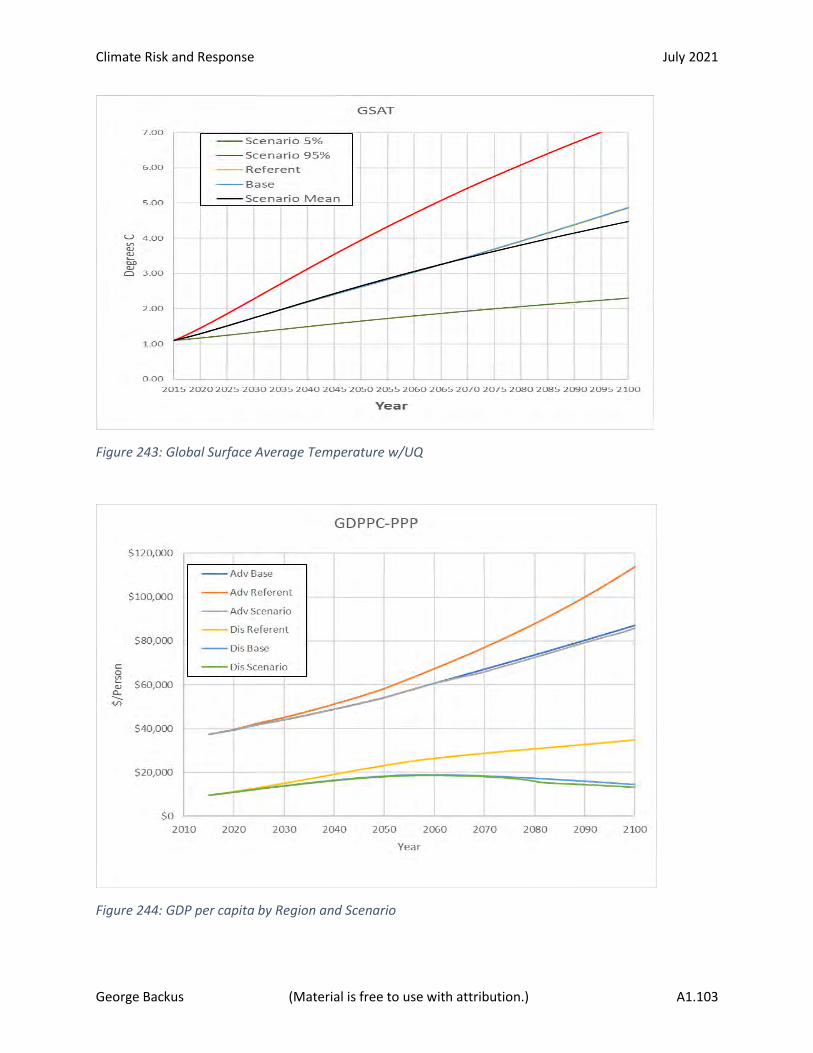
Climate Risk and Response July 2021
George Backus (Material is free to use with attribution.) A1.103
Figure 243: Global Surface Average Temperature w/UQ
Figure 244: GDP per capita by Region and Scenario

Climate Risk and Response July 2021
George Backus (Material is free to use with attribution.) A1.104
Figure 245: Relative GDP Changes by Region and Scenario
Figure 246: Relative Population Changes by Region and Scenario
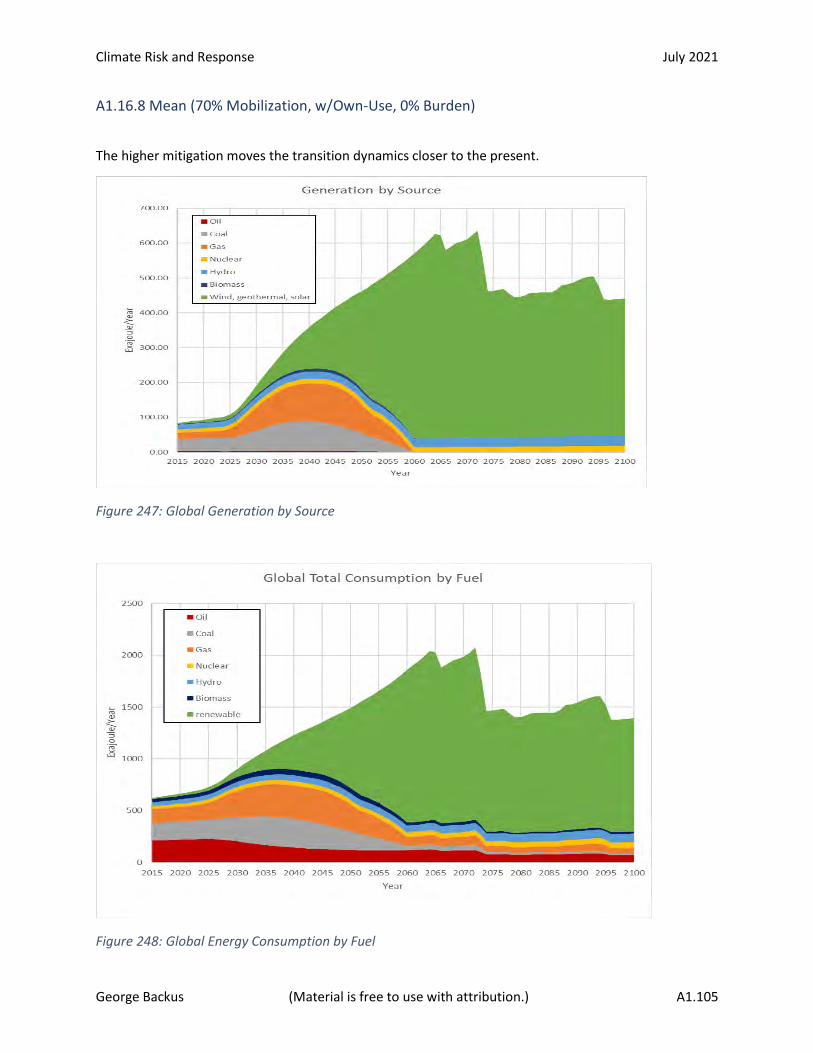
Climate Risk and Response July 2021
George Backus (Material is free to use with attribution.) A1.105
A1.16.8 Mean (70% Mobilization, w/Own-Use, 0% Burden)
The higher mitigation moves the transition dynamics closer to the present.
Figure 247: Global Generation by Source
Figure 248: Global Energy Consumption by Fuel
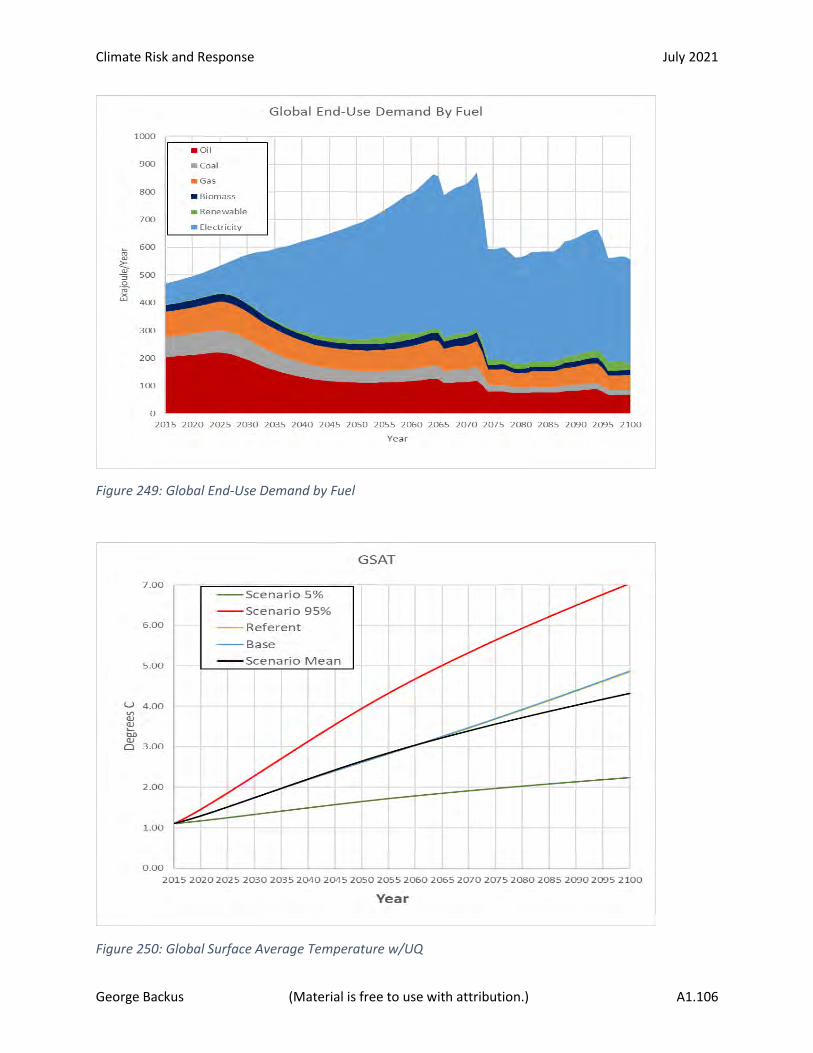
Climate Risk and Response July 2021
George Backus (Material is free to use with attribution.) A1.106
Figure 249: Global End-Use Demand by Fuel
Figure 250: Global Surface Average Temperature w/UQ

Climate Risk and Response July 2021
George Backus (Material is free to use with attribution.) A1.107
Figure 251: GDP per capita by Region and Scenario
Figure 252: GDP per capita by Region and Scenario

Climate Risk and Response July 2021
George Backus (Material is free to use with attribution.) A1.108
Figure 253: Relative Population Changes by Region and Scenario
A1.16.9 Mean (80% Mobilization, w/Own-Use, 0% Burden)
The 80% case highlights the impact of having 20% of the countries failing to finish the transition.
Figure 254: Global Generation by Source
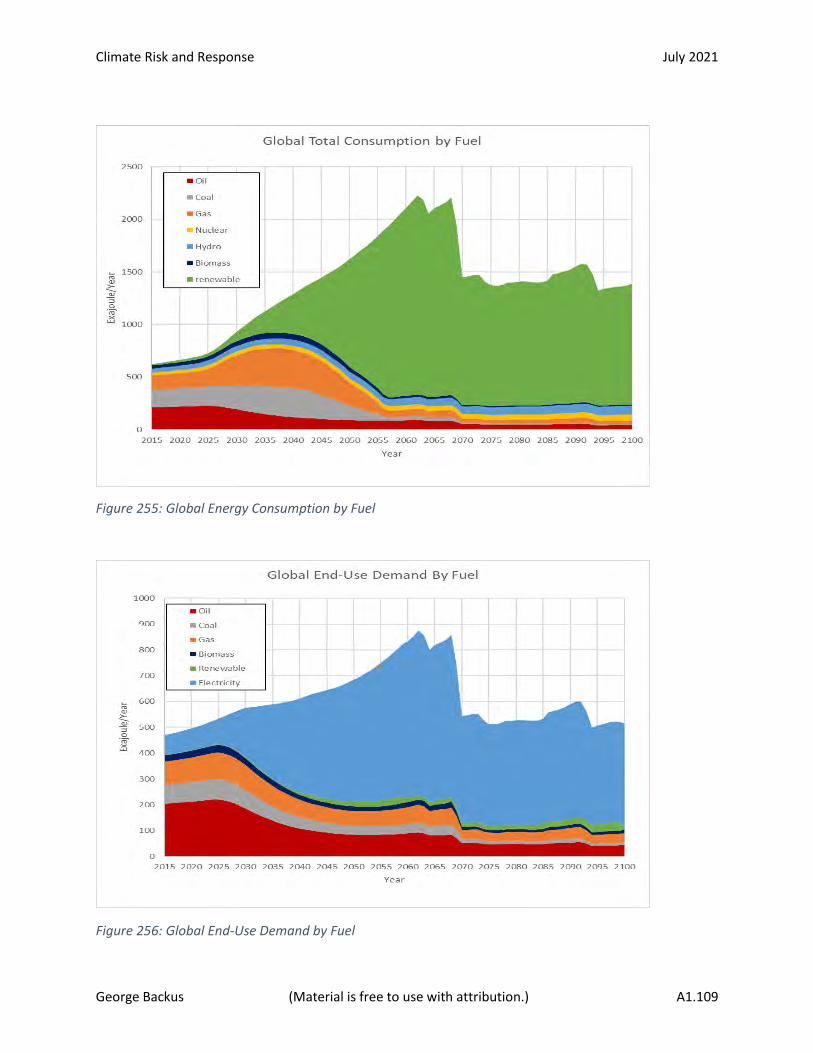
Climate Risk and Response July 2021
George Backus (Material is free to use with attribution.) A1.109
Figure 255: Global Energy Consumption by Fuel
Figure 256: Global End-Use Demand by Fuel
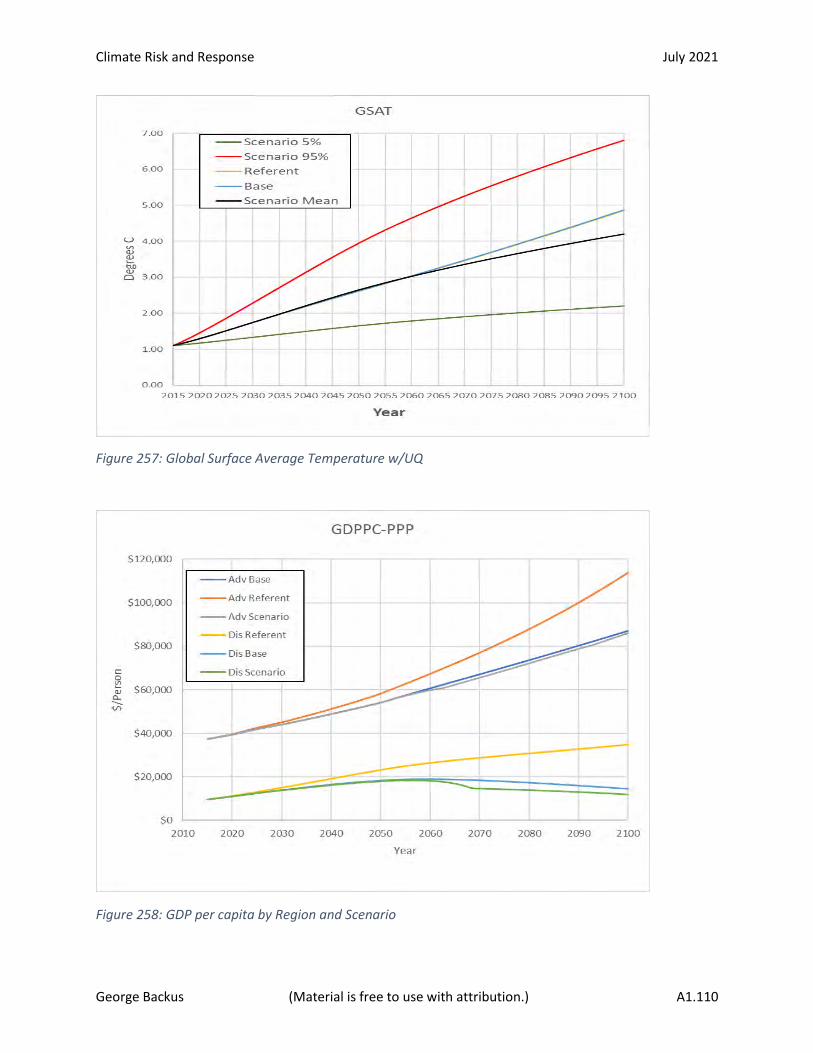
Climate Risk and Response July 2021
George Backus (Material is free to use with attribution.) A1.110
Figure 257: Global Surface Average Temperature w/UQ
Figure 258: GDP per capita by Region and Scenario

Climate Risk and Response July 2021
George Backus (Material is free to use with attribution.) A1.111
Figure 259: Relative GDP Changes by Region and Scenario
Figure 260: Relative Population Changes by Region and Scenario

Climate Risk and Response July 2021
George Backus (Material is free to use with attribution.) A1.112
A1.16.10 Mean (90% Mobilization, w/Own-Use, 0% Burden)
The 90% case essentially enables a complete transition, but does not provide adequate DAC capacity to
significantly reduce the concentration of CO2 in the atmosphere.
Figure 261: Global Generation by Source
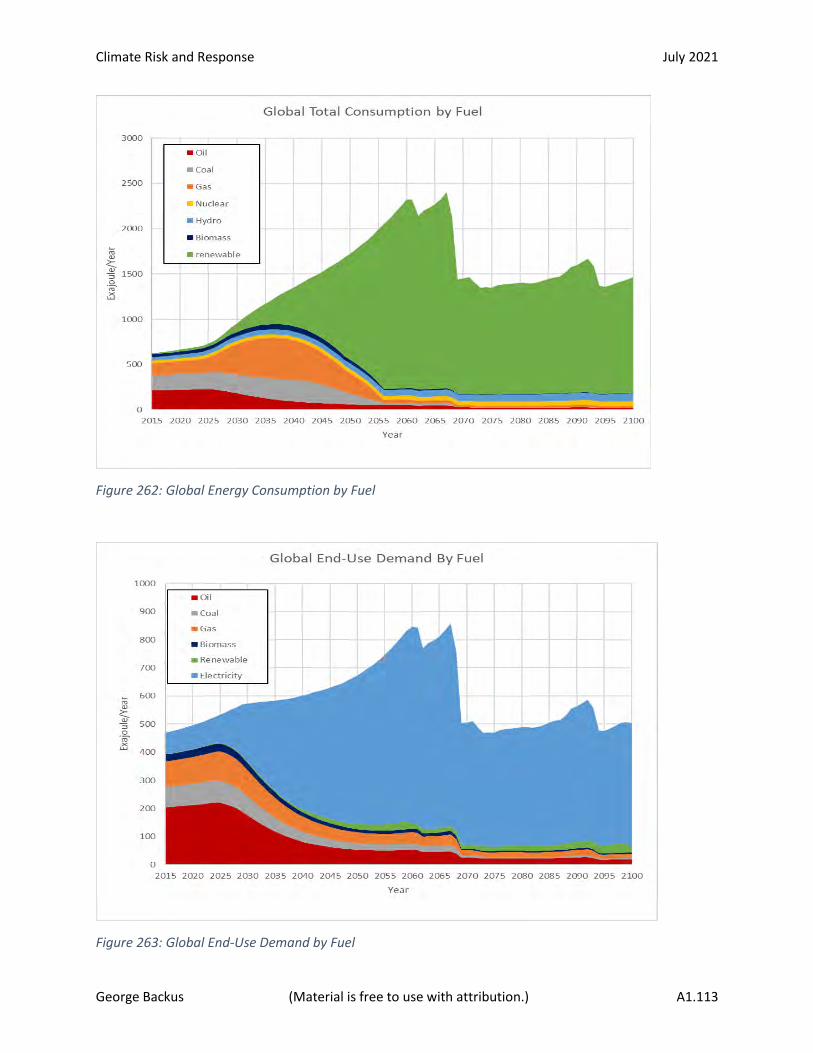
Climate Risk and Response July 2021
George Backus (Material is free to use with attribution.) A1.113
Figure 262: Global Energy Consumption by Fuel
Figure 263: Global End-Use Demand by Fuel
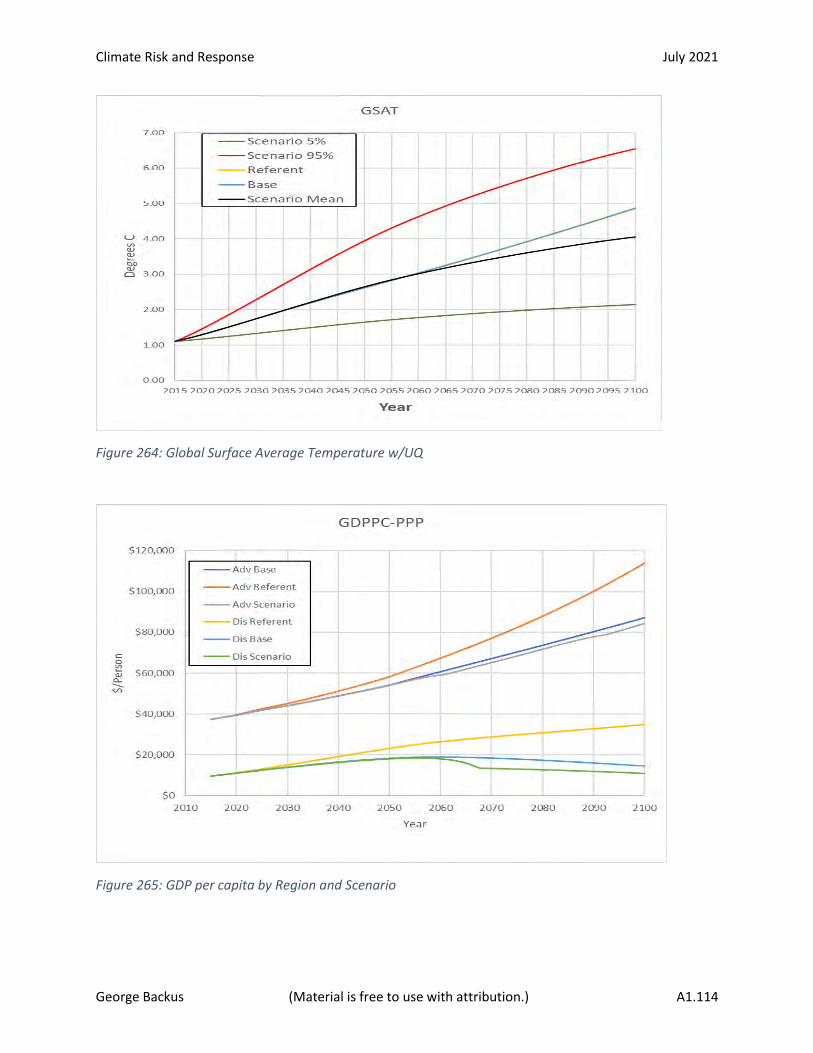
Climate Risk and Response July 2021
George Backus (Material is free to use with attribution.) A1.114
Figure 264: Global Surface Average Temperature w/UQ
Figure 265: GDP per capita by Region and Scenario
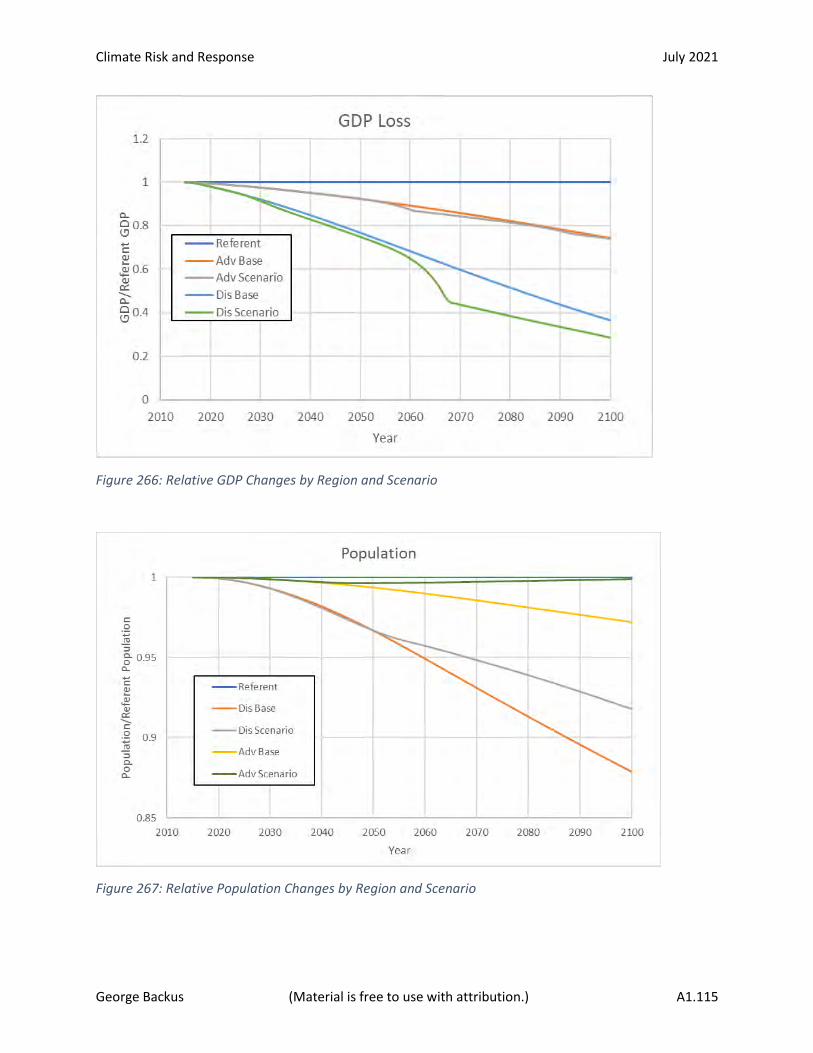
Climate Risk and Response July 2021
George Backus (Material is free to use with attribution.) A1.115
Figure 266: Relative GDP Changes by Region and Scenario
Figure 267: Relative Population Changes by Region and Scenario

Climate Risk and Response July 2021
George Backus (Material is free to use with attribution.) A1.116
A1.16.11. Mean (100% Mobilization, w/Own-Use, 0% Burden)
See Mean with “100% Mobilization, Own-Use and 0% Burden” case, above.
Climate Risk and Response July 2021
George Backus (Material is free to use with attribution.) A2.1
Appendix 2: Model Documentation
The text for this section is not completed.
Table of Contents
Appendix 2: Model Documentation......................................................................................................... A2.1
A2.1 Methodology ............................................................................................................................... A2.2
A2.2 Distributions and Delays .............................................................................................................. A2.4
A2.2.1 Normal Distribution .............................................................................................................. A2.5
A2.2.2 Gumbel Distribution ............................................................................................................. A2.5
A2.2.3 Erlang Distribution ................................................................................................................ A2.6
A2.2.4 Material and Information Delays .......................................................................................... A2.7
A2.3 Variable Subscript Notation and Units of Measure .................................................................. A2.10
A2.4 Mobilization and Constraints ..................................................................................................... A2.11
A2.4.1 Mobilization Dynamics ....................................................................................................... A2.12
A2.4.2 Change Rate Constraints .................................................................................................... A2.14
A2.5 Macroeconomics and Demographics ........................................................................................ A2.16
A2.5.1 Population ........................................................................................................................... A2.16
A2.5.2 Gross Domestic Product ..................................................................................................... A2.16
A2.5.3 Subsistence Income ............................................................................................................ A2.18
A2.5.4 Mitigation Investments and Impacts .................................................................................. A2.18
A2.5.5 Adaptation and Resilience .................................................................................................. A2.23
A2.6 Urbanization .............................................................................................................................. A2.24
A2.7 Energy Demand ......................................................................................................................... A2.27
A2.7.1 Service Energy ..................................................................................................................... A2.28
A2.7.2 End-Use Technological Improvement ................................................................................. A2.29
A2.7.3 End-Use Income Elasticity ................................................................................................... A2.32
A2.7.4 Fuel Shares .......................................................................................................................... A2.33
A2.7.5 Energy Own-Use ................................................................................................................. A2.38
A2.7.6 Climate Impact on Energy Use ............................................................................................ A2.42
A2.7.7 DAC Energy Demands ......................................................................................................... A2.44
A2.8 Electricity Supply........................................................................................................................ A2.45
Climate Risk and Response July 2021
George Backus (Material is free to use with attribution.) A2.2
A2.8.1 Peak and Load ..................................................................................................................... A2.46
A2.8.2 Generation Capacity....................................................................................................... A2.50
A2.8.3 Renewable/Storage Capacity Decisions ............................................................................. A2.53
A2.8.4 Dispatch and Fuel Use ........................................................................................................ A2.58
A2.8.5 Generation Costs ................................................................................................................ A2.61
A2.9 Climate Emulation ..................................................................................................................... A2.65
A2.9.1 Climate Dynamics ............................................................................................................... A2.66
A2.9.2 Climate Uncertainty ............................................................................................................ A2.69
A2.9.3 Energy Use Emissions ......................................................................................................... A2.72
A2.9.4 Energy Fugitive Emissions ................................................................................................... A2.73
A2.9.5 Steel, Concrete, Chemical, Agriculture, and Waste Emissions ........................................... A2.74
A2.9.6 Methane Conversion .......................................................................................................... A2.75
A2.9.7 Halogen and Aerosol Emissions .......................................................................................... A2.76
A2.9.8 Land-use Emissions ............................................................................................................. A2.77
A2.9.9 Permafrost Emissions ......................................................................................................... A2.78
A2.9.10 Non-Anthropogenic Emissions ......................................................................................... A2.79
A2.9.11 CO2e Emissions ................................................................................................................. A2.80
A2.9.12 Atmospheric Temperature Accounting ............................................................................ A2.81
A.2.9.13 Climate Model Validation Tests. ...................................................................................... A2.82
A2.10 Direct Air Capture .................................................................................................................... A2.88
A2.10.1 DAC Capacity, Cost, and Energy Use ................................................................................. A2.89
A2.10.2 CO2 Removal and Ocean Take-Back ................................................................................. A2.93
A2.11 Climate Impacts ....................................................................................................................... A2.94
A2.11.1 Population Displacement .................................................................................................. A2.94
A2.11.2 Excess Deaths ................................................................................................................. A2.101
A2.11.3 Macroeconomic Damage ................................................................................................ A2.109
A2.12 Policy Values .......................................................................................................................... A2.117
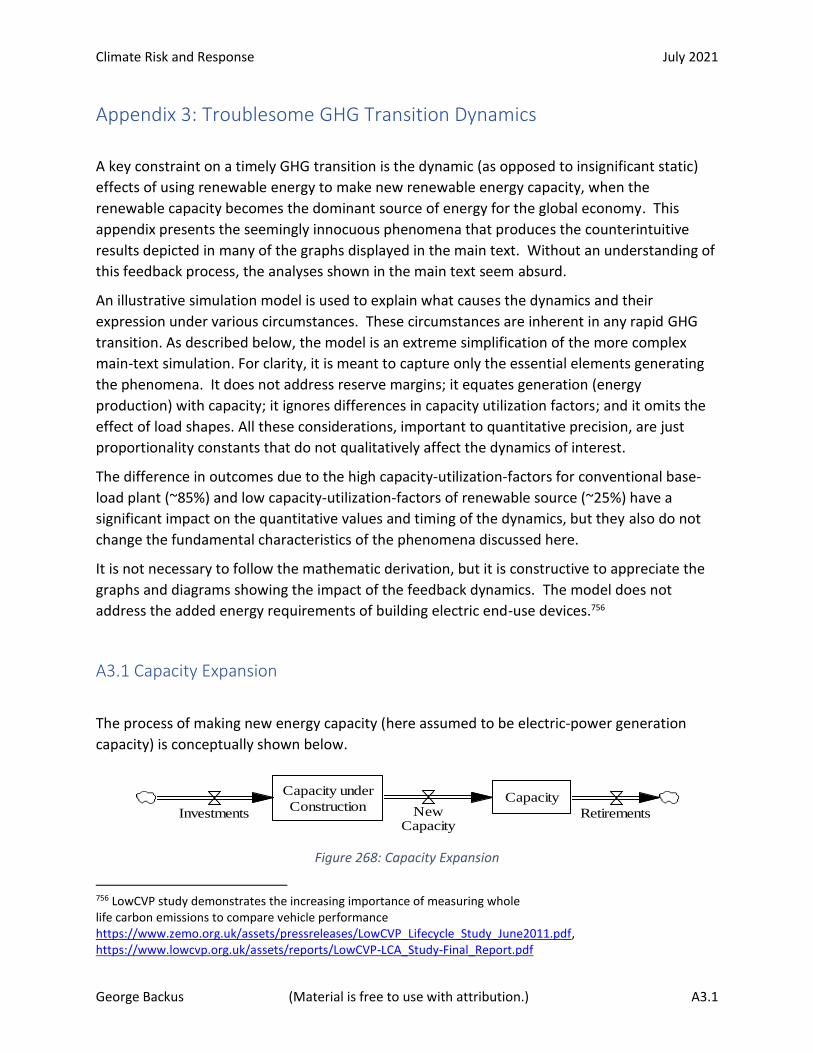
Climate Risk and Response July 2021
George Backus (Material is free to use with attribution.) A3.1
Appendix 3: Troublesome GHG Transition Dynamics
A key constraint on a timely GHG transition is the dynamic (as opposed to insignificant static)
effects of using renewable energy to make new renewable energy capacity, when the
renewable capacity becomes the dominant source of energy for the global economy. This
appendix presents the seemingly innocuous phenomena that produces the counterintuitive
results depicted in many of the graphs displayed in the main text. Without an understanding of
this feedback process, the analyses shown in the main text seem absurd.
An illustrative simulation model is used to explain what causes the dynamics and their
expression under various circumstances. These circumstances are inherent in any rapid GHG
transition. As described below, the model is an extreme simplification of the more complex
main-text simulation. For clarity, it is meant to capture only the essential elements generating
the phenomena. It does not address reserve margins; it equates generation (energy
production) with capacity; it ignores differences in capacity utilization factors; and it omits the
effect of load shapes. All these considerations, important to quantitative precision, are just
proportionality constants that do not qualitatively affect the dynamics of interest.
The difference in outcomes due to the high capacity-utilization-factors for conventional base-
load plant (~85%) and low capacity-utilization-factors of renewable source (~25%) have a
significant impact on the quantitative values and timing of the dynamics, but they also do not
change the fundamental characteristics of the phenomena discussed here.
It is not necessary to follow the mathematic derivation, but it is constructive to appreciate the
graphs and diagrams showing the impact of the feedback dynamics. The model does not
address the added energy requirements of building electric end-use devices.756
A3.1 Capacity Expansion
The process of making new energy capacity (here assumed to be electric-power generation
capacity) is conceptually shown below.
Figure 268: Capacity Expansion
756 LowCVP study demonstrates the increasing importance of measuring whole life carbon emissions to compare vehicle performance https://www.zemo.org.uk/assets/pressreleases/LowCVP_Lifecycle_Study_June2011.pdf, https://www.lowcvp.org.uk/assets/reports/LowCVP-LCA_Study-Final_Report.pdf
Capacity under
ConstructionCapacity
NewCapacity
RetirementsInvestments
Climate Risk and Response July 2021
George Backus (Material is free to use with attribution.) A3.2
There is an investment flow (normally stated in units of $/Year, but here in units of
Energy/Year). It takes time to build the new capacity. During this time the Investment is a stock
called Capacity-under-Construction. As the construction is completed over the Construction
Time (CT) there is a flow of new capacity to the stock of operational Capacity. After a Lifetime
(LT) of use, Capacity flows out of the Capacity stock as Retirements.
In equilibrium, (for this initial discussion):
𝐶𝑎𝑝𝑎𝑐𝑖𝑡𝑦 = 𝐷𝑒𝑚𝑎𝑛𝑑 Equation 5
To maintain the Capacity and Demand equality, Investments must be exactly equal to
Retirements. As an example, assume that Demand is equal to 100 units and the lifetime is 20
years.lvi Retirements are then equal to 5 (e.g., 100/20) units of energy per year.
𝑅𝑒𝑡𝑖𝑟𝑒𝑚𝑒𝑛𝑡 =𝐶𝑎𝑝𝑎𝑐𝑖𝑡𝑦
𝐿𝑇 Equation 6
And
𝐼𝑛𝑣𝑒𝑠𝑡𝑚𝑒𝑛𝑡𝑠 = 𝑅𝑒𝑡𝑖𝑟𝑒𝑚𝑒𝑛𝑡 Equation 7
A3.2 Steady-State Production Energy
While everything above is true, there are added complications when dealing with energy used
to make energy capacity. The construction process requires energy - from mining the metal ore,
to manufacturing the equipment, to assembling the parts on-site. Once the generation capacity
is operational, it quickly produces more energy than it took to build it. For example, the energy
payback time for a natural gas, combined-cycle plant is a few days.757 This time period is called
the energy payback time (EPBT). For renewable generation, the payback time is considerably
longer.
If the EPBT is significant, say, 0.5 years, the story above has added twists. The first (initiating)
level of energy (Production Energy) to produce the power plant at a given level of investment
would be:
𝑃𝑟𝑜𝑑𝑢𝑐𝑡𝑖𝑜𝑛 𝐸𝑛𝑒𝑟𝑔𝑦1 = 𝐼𝑛𝑣𝑒𝑠𝑡𝑚𝑒𝑛𝑡0 ∗ 𝐸𝑃𝐵𝑇 Equation 8
To keep things clear, the first investment is noted as Investment0.
In the steady state case:
𝑃𝑟𝑜𝑑𝑢𝑐𝑡𝑖𝑜𝑛 𝐸𝑛𝑒𝑟𝑔𝑦1 = 𝑅𝑒𝑡𝑖𝑟𝑒𝑚𝑒𝑛𝑡 ∗ 𝐸𝑃𝐵𝑇 Equation 9
757 Weißbach, D., Ruprecht, G., Huke, A., Czerski, K., Gottlieb, S. and Hussein, A., 2013. Energy intensities, EROIs (energy returned on invested), and energy payback times of electricity generating power plants. Energy, 52, pp.210-221. http://citeseerx.ist.psu.edu/viewdoc/download?doi=10.1.1.1056.1818&rep=rep1&type=pdf
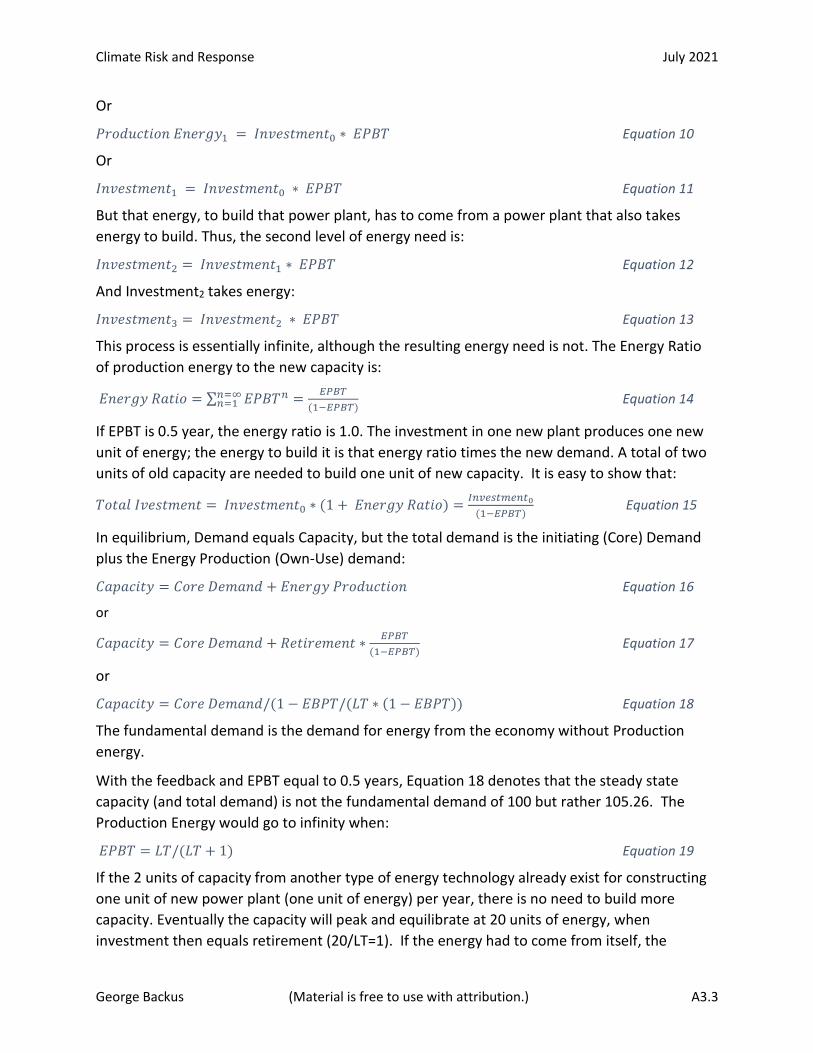
Climate Risk and Response July 2021
George Backus (Material is free to use with attribution.) A3.3
Or
𝑃𝑟𝑜𝑑𝑢𝑐𝑡𝑖𝑜𝑛 𝐸𝑛𝑒𝑟𝑔𝑦1 = 𝐼𝑛𝑣𝑒𝑠𝑡𝑚𝑒𝑛𝑡0 ∗ 𝐸𝑃𝐵𝑇 Equation 10
Or
𝐼𝑛𝑣𝑒𝑠𝑡𝑚𝑒𝑛𝑡1 = 𝐼𝑛𝑣𝑒𝑠𝑡𝑚𝑒𝑛𝑡0 ∗ 𝐸𝑃𝐵𝑇 Equation 11
But that energy, to build that power plant, has to come from a power plant that also takes
energy to build. Thus, the second level of energy need is:
𝐼𝑛𝑣𝑒𝑠𝑡𝑚𝑒𝑛𝑡2 = 𝐼𝑛𝑣𝑒𝑠𝑡𝑚𝑒𝑛𝑡1 ∗ 𝐸𝑃𝐵𝑇 Equation 12
And Investment2 takes energy:
𝐼𝑛𝑣𝑒𝑠𝑡𝑚𝑒𝑛𝑡3 = 𝐼𝑛𝑣𝑒𝑠𝑡𝑚𝑒𝑛𝑡2 ∗ 𝐸𝑃𝐵𝑇 Equation 13
This process is essentially infinite, although the resulting energy need is not. The Energy Ratio
of production energy to the new capacity is:
𝐸𝑛𝑒𝑟𝑔𝑦 𝑅𝑎𝑡𝑖𝑜 = ∑ 𝐸𝑃𝐵𝑇𝑛𝑛=∞𝑛=1 =
𝐸𝑃𝐵𝑇
(1−𝐸𝑃𝐵𝑇) Equation 14
If EPBT is 0.5 year, the energy ratio is 1.0. The investment in one new plant produces one new
unit of energy; the energy to build it is that energy ratio times the new demand. A total of two
units of old capacity are needed to build one unit of new capacity. It is easy to show that:
𝑇𝑜𝑡𝑎𝑙 𝐼𝑣𝑒𝑠𝑡𝑚𝑒𝑛𝑡 = 𝐼𝑛𝑣𝑒𝑠𝑡𝑚𝑒𝑛𝑡0 ∗ (1 + 𝐸𝑛𝑒𝑟𝑔𝑦 𝑅𝑎𝑡𝑖𝑜) =𝐼𝑛𝑣𝑒𝑠𝑡𝑚𝑒𝑛𝑡0
(1−𝐸𝑃𝐵𝑇) Equation 15
In equilibrium, Demand equals Capacity, but the total demand is the initiating (Core) Demand
plus the Energy Production (Own-Use) demand:
𝐶𝑎𝑝𝑎𝑐𝑖𝑡𝑦 = 𝐶𝑜𝑟𝑒 𝐷𝑒𝑚𝑎𝑛𝑑 + 𝐸𝑛𝑒𝑟𝑔𝑦 𝑃𝑟𝑜𝑑𝑢𝑐𝑡𝑖𝑜𝑛 Equation 16
or
𝐶𝑎𝑝𝑎𝑐𝑖𝑡𝑦 = 𝐶𝑜𝑟𝑒 𝐷𝑒𝑚𝑎𝑛𝑑 + 𝑅𝑒𝑡𝑖𝑟𝑒𝑚𝑒𝑛𝑡 ∗𝐸𝑃𝐵𝑇
(1−𝐸𝑃𝐵𝑇) Equation 17
or
𝐶𝑎𝑝𝑎𝑐𝑖𝑡𝑦 = 𝐶𝑜𝑟𝑒 𝐷𝑒𝑚𝑎𝑛𝑑/(1 − 𝐸𝐵𝑃𝑇/(𝐿𝑇 ∗ (1 − 𝐸𝐵𝑃𝑇)) Equation 18
The fundamental demand is the demand for energy from the economy without Production
energy.
With the feedback and EPBT equal to 0.5 years, Equation 18 denotes that the steady state
capacity (and total demand) is not the fundamental demand of 100 but rather 105.26. The
Production Energy would go to infinity when:
𝐸𝑃𝐵𝑇 = 𝐿𝑇/(𝐿𝑇 + 1) Equation 19
If the 2 units of capacity from another type of energy technology already exist for constructing
one unit of new power plant (one unit of energy) per year, there is no need to build more
capacity. Eventually the capacity will peak and equilibrate at 20 units of energy, when
investment then equals retirement (20/LT=1). If the energy had to come from itself, the

Climate Risk and Response July 2021
George Backus (Material is free to use with attribution.) A3.4
capacity could only grow to 10 units. Half of the investment would be used for production
energy, such that the effective additions drop to only 0.5 units, causing the retirement to equal
investment at 10 units.
The EPBT must be less than the value of Equation 19 if and only if the same type of capacity
must also produce new capacity. The EPBT for photovoltaic, wind turbine, and geothermal
sources are estimated to be anywhere from slightly below 1.0 to 3.0.2 The higher value
corresponds to end-user-applications (e.g., residential) and the lower value to large-scale
electric-utility applications. Therefore, new end-user photovoltaics are not included in this
analysis. Other analyses indicate an EPBT of slightly less than 1.0.758 Because the EPBT must be
less than 1.0 for a viable GHG transition, the analyses of the main text use 1.0 as the 2015 value
and reduces it in the out-years in the same proportion as the capital-cost reductions from
technological advances. This is likely overly optimistic and possibly untrue. It should be noted
that Hydropower has a EPBT between 2 and 3 years. Thus, it is not a viable choice within the
GHG transition. Nonetheless, main-text analyses adhere to the Referent expansion trend under
the justification that additional dams will be needed for water management due to climate
change, and will likely have energy production capabilities. Because power generation is then a
secondary consideration, the hydropower will also have reduced capacity unitization compared
to current facilities. Similarly, Geothermal has an unacceptable EBPT of 2.0 and is only included
within the renewable category in the token sense and having negligible future capacity.
With a 20-year lifetime for renewable generation and an EPBT of 6 months (0.5 years), capacity
is only 5% larger than the fundamental demand. At an EPBT of 0.75, capacity is 17% larger, and
at an EPBT of 0.9 years, it rises to a significant, but still manageable, 1.8 times larger. Battery
storage makes matters worse,759,760 but minimally so in equilibrium – which is why studies of
Direct-Air- Capture of CO2 (DAC) using photovoltaics and storage give reasonable results.761,762
Note that even with an EPBT of 2 years, the EROI (Energy Return on Investment) is 10. Thus,
after 20 years of use, the renewable source has paid back the energy to make it 10 times over.
758 Raugei, M., Sgouridis, S., Murphy, D., Fthenakis, V., Frischknecht, R., Breyer, C., Bardi, U., Barnhart, C., Buckley, A., Carbajales-Dale, M. and Csala, D., 2017. Energy Return on Energy Invested (ERoEI) for photovoltaic solar systems in regions of moderate insolation: A comprehensive response. Energy Policy, 102, pp.377-384. https://www.sciencedirect.com/science/article/pii/S0301421516307066 759 Carbajales-Dale, M., Barnhart, C.J. and Benson, S.M., 2014. Can we afford storage? A dynamic net energy analysis of renewable electricity generation supported by energy storage. Energy & Environmental Science, 7(5), pp.1538-1544. https://pubs.rsc.org/am/content/articlehtml/2014/ee/c3ee42125b 760 Kurland, S.D. and Benson, S.M., 2019. The energetic implications of introducing lithium-ion batteries into distributed photovoltaic systems. Sustainable Energy & Fuels, 3(5), pp.1182-1190. https://pubs.rsc.org/fi/content/articlehtml/2019/se/c9se00127a 761 Sgouridis, S., Carbajales-Dale, M., Csala, D., Chiesa, M. and Bardi, U., 2019. Comparative net energy analysis of renewable electricity and carbon capture and storage. Nature Energy, 4(6), pp.456-465. https://eprints.lancs.ac.uk/id/eprint/133171/1/5890_4_art_0_pnk0xh.pdf 762 Ghiassi-Farrokhfal, Y., Keshav, S. and Rosenberg, C., 2014, June. An EROI-based analysis of renewable energy farms with storage. In Proceedings of the 5th international conference on Future energy systems (pp. 3-13). https://www.cl.cam.ac.uk/research/srg/netos/e-energy2014/docs/p3.pdf

Climate Risk and Response July 2021
George Backus (Material is free to use with attribution.) A3.5
As will be demonstrated shortly, as long as there are low EPBT (high EROI) conventional energy
sources available, an EPBT of 2, or more, is of little consequence.
A3.3 Dynamic Production Energy
The consequence of the EPBT is much more complicated when there is demand growth. If
there is only one technology (e.g., photovoltaics) available to produce more energy (again with
many details omitted) the process is sketched in Figure 269.
Figure 269: Capacity Expansion with Own Production Energy
The top of Figure 269 depicts the connectivity of the terms discussed above. The arrows in the
Figure 269 flow-diagram indicate the direction of influence that one term has on the
subsequent term.
Intact capacity (IC) is the capacity that will be available in the future in the absence of new
investments. If demand is growing, the new investments need to be large enough to ensure
that there is always enough generation capacity to meet demand. Because of the construction
delay, the investments must compare the existing capacity to what is needed one construction-
time in the future. Thus, the investment must be based on a forecast of future demands (DF).
The comparison of DF to the IC (along with a few omitted details) determines those
Investments.
During the transition, the goal is to achieve the GHG transition within the 2050 timeframe,
roughly the 30 years from 2020. To achieve this, renewable energy must grow from a small
percentage of total energy production to 100% of it, in 30 years. For simplicity, assume that the
Capacity under
ConstructionCapacity
NewCapacity
RetirementsInvestments
Core Demand
Production
Energy
Energy Payback Time
Renewable Source
Intact Capacity
Total Demand
Forecasted
Demand
Construction Time
Lifetime<Construction
Time>
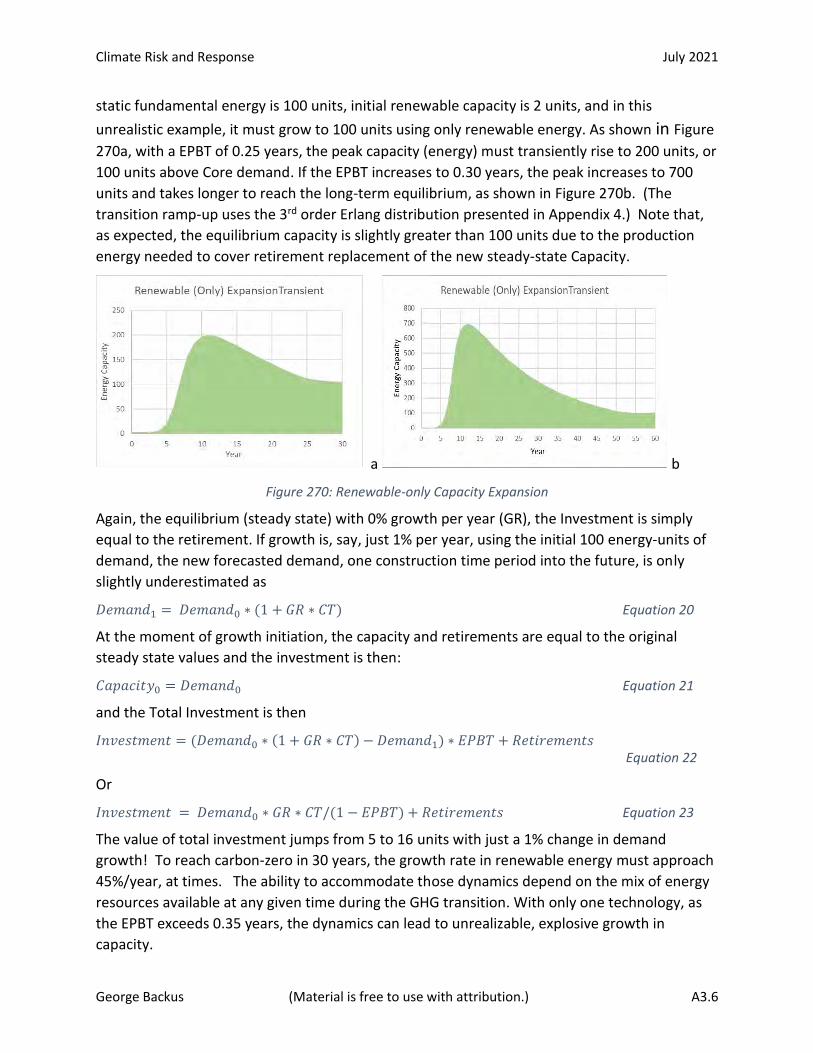
Climate Risk and Response July 2021
George Backus (Material is free to use with attribution.) A3.6
static fundamental energy is 100 units, initial renewable capacity is 2 units, and in this
unrealistic example, it must grow to 100 units using only renewable energy. As shown in Figure
270a, with a EPBT of 0.25 years, the peak capacity (energy) must transiently rise to 200 units, or
100 units above Core demand. If the EPBT increases to 0.30 years, the peak increases to 700
units and takes longer to reach the long-term equilibrium, as shown in Figure 270b. (The
transition ramp-up uses the 3rd order Erlang distribution presented in Appendix 4.) Note that,
as expected, the equilibrium capacity is slightly greater than 100 units due to the production
energy needed to cover retirement replacement of the new steady-state Capacity.
a b
Figure 270: Renewable-only Capacity Expansion
Again, the equilibrium (steady state) with 0% growth per year (GR), the Investment is simply
equal to the retirement. If growth is, say, just 1% per year, using the initial 100 energy-units of
demand, the new forecasted demand, one construction time period into the future, is only
slightly underestimated as
𝐷𝑒𝑚𝑎𝑛𝑑1 = 𝐷𝑒𝑚𝑎𝑛𝑑0 ∗ (1 + 𝐺𝑅 ∗ 𝐶𝑇) Equation 20
At the moment of growth initiation, the capacity and retirements are equal to the original
steady state values and the investment is then:
𝐶𝑎𝑝𝑎𝑐𝑖𝑡𝑦0 = 𝐷𝑒𝑚𝑎𝑛𝑑0 Equation 21
and the Total Investment is then
𝐼𝑛𝑣𝑒𝑠𝑡𝑚𝑒𝑛𝑡 = (𝐷𝑒𝑚𝑎𝑛𝑑0 ∗ (1 + 𝐺𝑅 ∗ 𝐶𝑇) − 𝐷𝑒𝑚𝑎𝑛𝑑1) ∗ 𝐸𝑃𝐵𝑇 + 𝑅𝑒𝑡𝑖𝑟𝑒𝑚𝑒𝑛𝑡𝑠 Equation 22
Or
𝐼𝑛𝑣𝑒𝑠𝑡𝑚𝑒𝑛𝑡 = 𝐷𝑒𝑚𝑎𝑛𝑑0 ∗ 𝐺𝑅 ∗ 𝐶𝑇/(1 − 𝐸𝑃𝐵𝑇) + 𝑅𝑒𝑡𝑖𝑟𝑒𝑚𝑒𝑛𝑡𝑠 Equation 23
The value of total investment jumps from 5 to 16 units with just a 1% change in demand
growth! To reach carbon-zero in 30 years, the growth rate in renewable energy must approach
45%/year, at times. The ability to accommodate those dynamics depend on the mix of energy
resources available at any given time during the GHG transition. With only one technology, as
the EPBT exceeds 0.35 years, the dynamics can lead to unrealizable, explosive growth in
capacity.
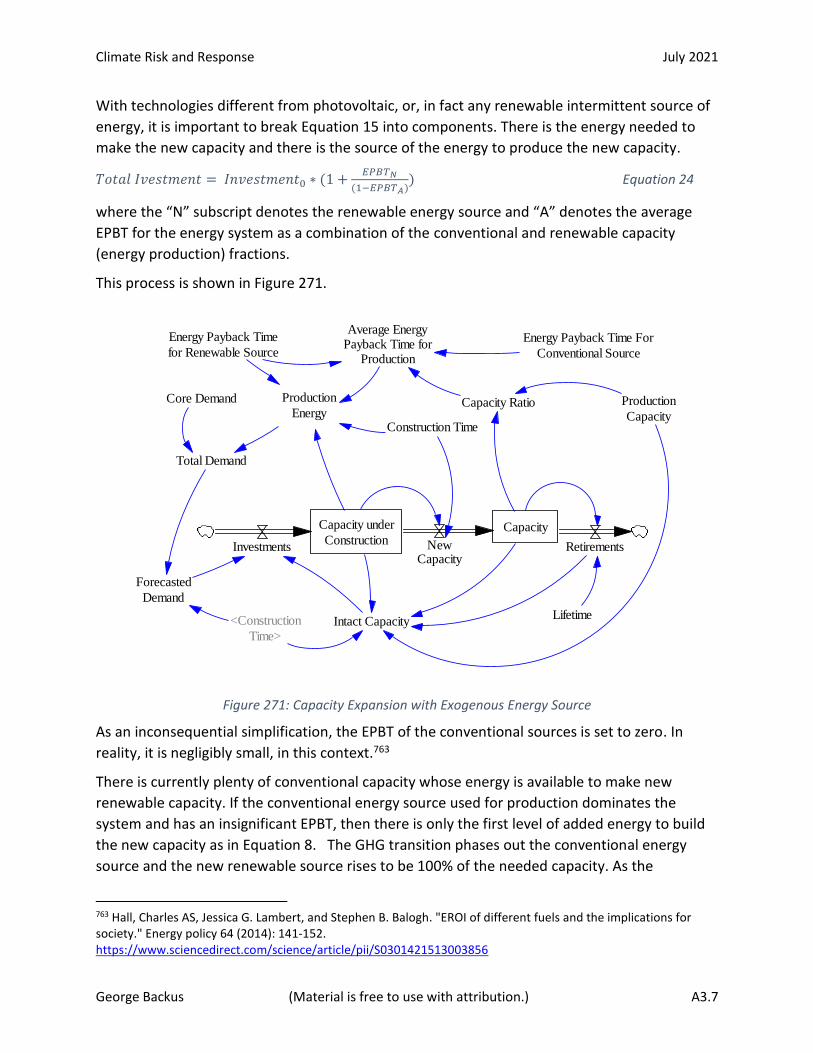
Climate Risk and Response July 2021
George Backus (Material is free to use with attribution.) A3.7
With technologies different from photovoltaic, or, in fact any renewable intermittent source of
energy, it is important to break Equation 15 into components. There is the energy needed to
make the new capacity and there is the source of the energy to produce the new capacity.
𝑇𝑜𝑡𝑎𝑙 𝐼𝑣𝑒𝑠𝑡𝑚𝑒𝑛𝑡 = 𝐼𝑛𝑣𝑒𝑠𝑡𝑚𝑒𝑛𝑡0 ∗ (1 +𝐸𝑃𝐵𝑇𝑁
(1−𝐸𝑃𝐵𝑇𝐴)) Equation 24
where the “N” subscript denotes the renewable energy source and “A” denotes the average
EPBT for the energy system as a combination of the conventional and renewable capacity
(energy production) fractions.
This process is shown in Figure 271.
Figure 271: Capacity Expansion with Exogenous Energy Source
As an inconsequential simplification, the EPBT of the conventional sources is set to zero. In
reality, it is negligibly small, in this context.763
There is currently plenty of conventional capacity whose energy is available to make new
renewable capacity. If the conventional energy source used for production dominates the
system and has an insignificant EPBT, then there is only the first level of added energy to build
the new capacity as in Equation 8. The GHG transition phases out the conventional energy
source and the new renewable source rises to be 100% of the needed capacity. As the
763 Hall, Charles AS, Jessica G. Lambert, and Stephen B. Balogh. "EROI of different fuels and the implications for society." Energy policy 64 (2014): 141-152. https://www.sciencedirect.com/science/article/pii/S0301421513003856
Capacity under
ConstructionCapacity
NewCapacity
RetirementsInvestments
Core Demand Production
Energy
Energy Payback Time For
Conventional Source
Intact Capacity
Total Demand
Forecasted
Demand
Construction Time
Lifetime
Energy Payback Time
for Renewable Source
<Construction
Time>
Production
CapacityCapacity Ratio
Average EnergyPayback Time for
Production
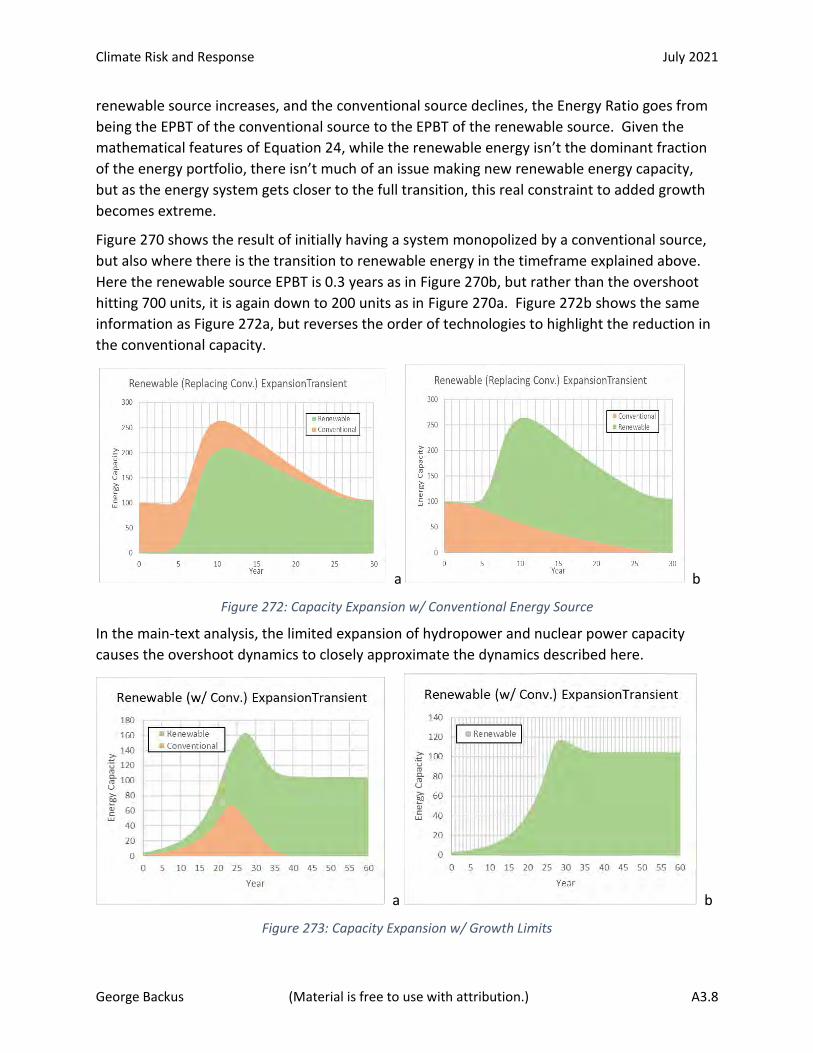
Climate Risk and Response July 2021
George Backus (Material is free to use with attribution.) A3.8
renewable source increases, and the conventional source declines, the Energy Ratio goes from
being the EPBT of the conventional source to the EPBT of the renewable source. Given the
mathematical features of Equation 24, while the renewable energy isn’t the dominant fraction
of the energy portfolio, there isn’t much of an issue making new renewable energy capacity,
but as the energy system gets closer to the full transition, this real constraint to added growth
becomes extreme.
Figure 270 shows the result of initially having a system monopolized by a conventional source,
but also where there is the transition to renewable energy in the timeframe explained above.
Here the renewable source EPBT is 0.3 years as in Figure 270b, but rather than the overshoot
hitting 700 units, it is again down to 200 units as in Figure 270a. Figure 272b shows the same
information as Figure 272a, but reverses the order of technologies to highlight the reduction in
the conventional capacity.
a b
Figure 272: Capacity Expansion w/ Conventional Energy Source
In the main-text analysis, the limited expansion of hydropower and nuclear power capacity
causes the overshoot dynamics to closely approximate the dynamics described here.
a b
Figure 273: Capacity Expansion w/ Growth Limits
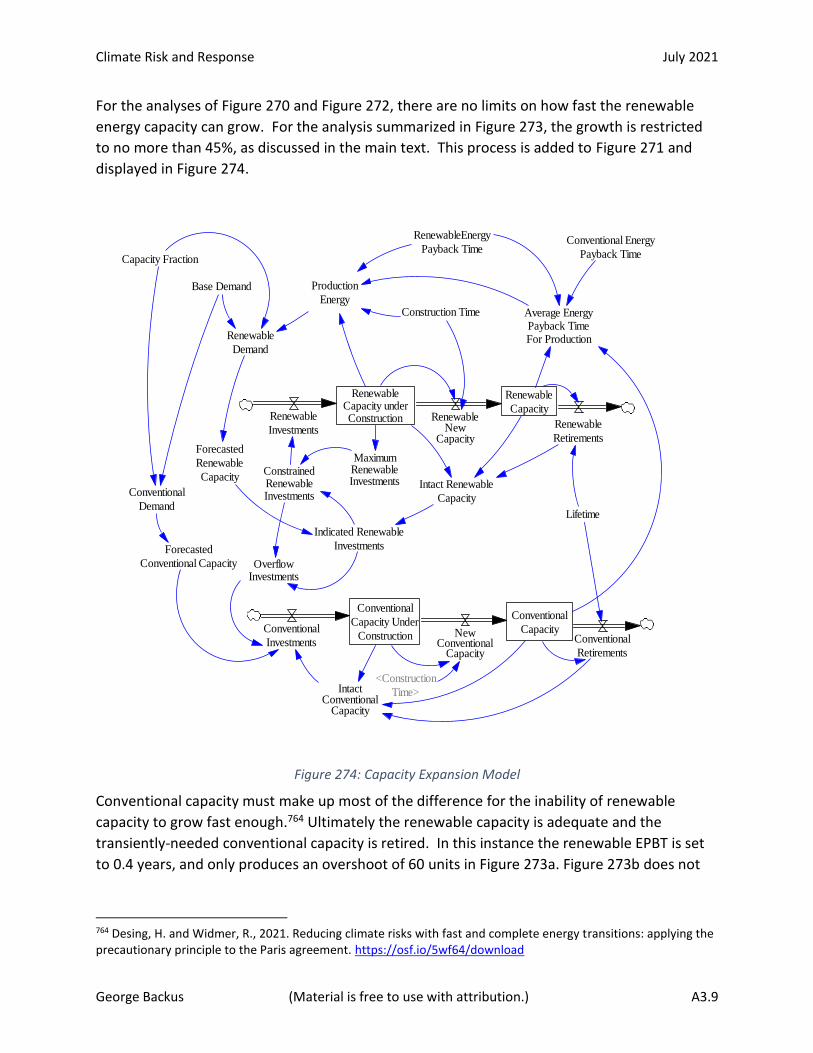
Climate Risk and Response July 2021
George Backus (Material is free to use with attribution.) A3.9
For the analyses of Figure 270 and Figure 272, there are no limits on how fast the renewable
energy capacity can grow. For the analysis summarized in Figure 273, the growth is restricted
to no more than 45%, as discussed in the main text. This process is added to Figure 271 and
displayed in Figure 274.
Figure 274: Capacity Expansion Model
Conventional capacity must make up most of the difference for the inability of renewable
capacity to grow fast enough.764 Ultimately the renewable capacity is adequate and the
transiently-needed conventional capacity is retired. In this instance the renewable EPBT is set
to 0.4 years, and only produces an overshoot of 60 units in Figure 273a. Figure 273b does not
764 Desing, H. and Widmer, R., 2021. Reducing climate risks with fast and complete energy transitions: applying the precautionary principle to the Paris agreement. https://osf.io/5wf64/download
RenewableCapacity underConstruction
Renewable
CapacityRenewable
NewCapacity
Renewable
Retirements
Renewable
Investments
Base Demand Production
Energy
Conventional Energy
Payback Time
Intact Renewable
Capacity
Renewable
Demand
Forecasted
Renewable
Capacity
Construction Time
Lifetime
RenewableEnergy
Payback Time
Average EnergyPayback TimeFor Production
Conventional
CapacityConventional
Investments Conventional
Retirements
Indicated Renewable
Investments
MaximumRenewableInvestments
ConstrainedRenewableInvestments
Capacity Fraction
Conventional
Demand
Conventional
Capacity Under
Construction NewConventional
Capacity
Forecasted
Conventional Capacity OverflowInvestments
<Construction
Time>IntactConventional
Capacity
Climate Risk and Response July 2021
George Backus (Material is free to use with attribution.) A3.10
show the conventional capacity and illustrates the relatively smooth ramp-up of renewable
capacity with a slight overshoot when the transitional growth is below the growth constraint.
A3.4 The Bottom Line
Global intentions are for renewable capacity to complete the transition to serving 100% of
economic demand (along with meeting future DAC facility energy and the production energy
demand) within 30 years. To produce a viable transition path, the analysis must assume that
the advanced technology description incorporated in NREL capital-cost estimates765 comes to
fruition and that the EPBT is proportional to the technological advances reducing the capital-
costs for all renewable technologies. Conveniently, in that case, the result is a drop below a
0.35 EPBT, the minimum required to allow a viable transition, given the necessity of the 45%
maximum growth rate.
The phenomena described in this appendix and the apparent consequence it has on the GHG
transition, indicates that reducing the EPBT for renewable sources is one of the more critical
priorities for energy R&D, being of much greater consequence than levelized costs, operating
costs, and efficiency, per se.
Even with a 0.35 year EPBT, the energy peaks and transients caused by the production-energy
excess capacity, results in the total costs for the GHG transition process being 50% larger and
economic impacts being 20% more severe than they would otherwise be. (See the main text.)
Reducing the renewable source EPBT further would greatly improve the viability of the GHG
transition.
A3.5 Simplified versus Actual Model Calculations
The construction time for both renewable and conventional sources in these analyses is set to
two years. Using the same value for both energy sources is unrealistic, but is peripheral in
describing the underlying phenomena of interest. For the purposes here, the model includes
Capacity-under-Construction simply to maintain causality within the Production Energy
feedback loop. For causal consistency, each feedback loop requires the presence of a stock
(e.g., a state-variable).766
The actual simulation model used in the main-text analyses are designed to exactly reproduce
the Referent forecast discussed in the main text. As such, it must use a discrete, implicit,
construction time of one year to match the data. To avoid simultaneity, the calculations for the
765 Electricity Annual Technology Baseline for 2020, NREL. https://atb.nrel.gov/electricity/2020/data.php 766 Sterman, J., 2010. Business Dynamics. Irwin/McGraw-Hill.

Climate Risk and Response July 2021
George Backus (Material is free to use with attribution.) A3.11
current simulated-year use the Production Energy from the previous year as an approximation
to the current year value. This process results in an understatement of the actual energy-
system impact. Therefore, the analyses discussed in the main text portray blunted dynamics
compared to those presented in this appendix.
As shown in Appendix 2, the actual model includes all the relevant elements of accurate
energy-supply simulation, such as the reserve margin, load shapes, technology choice, dynamic
generation dispatch, capacity availability factors, technology specific lifetimes, energy
efficiency, investment costs, fuel use, etc.
A3.6 Production-Energy Model Pseudocode
The model depicted in Figure 274 is the model used for the appendix analyses and for
generating all the graphs. The Pseudocode for the model, based on the VENSIMlvii simulation
system is provided below. The self-consistent determination of constants and initial conditions
noted below is beyond the scope of this appendix. (See Sterman,767 Chapter 18 for that
information.)
Core Demand: CD=Exogenous
Renewable Demand: RD=BD*RCF+PE
Renewable Capacity Fraction: RCF=DELAY3I(1,TT,ICF) (Used for phasing out conventional
capacity)
Transition Time: TT=Constant
Initial Capacity Fraction ICF=Constant
Forecasted Renewable Capacity: FRC=FORECAST(RD,CT,ST,AT)
Smoothing Time ST=Constant
Average EPBT: AEPBT=(REPBT*RCAP+CEPBT*CCAP)/(RCAP+CCAP)
Renewable Energy Pay Back Time: REPBT=Constant
Conventional Energy Payback Time: CEPBT=Constant
Production Energy PE=CUC/CT*REPBT/(1-AEPBT)
Indicated Renewable Investment: IRINV=max(0,(FRCF-IRC)/AT)
Adjustment Time AT=Constant
Intact Renewable Capacity IRC=RCAP-RCUC+RR*(1+CT)))
767 Ibid. Sterman 2010

Climate Risk and Response July 2021
George Backus (Material is free to use with attribution.) A3.12
Maximum Investments: MINV=RCUC/CT*(1+MGR))
Maximum Growth Rate: MGR (See main text.)
Constrained Renewable Investments: CRINV=min(MINV,IRINV)
Renewable Investments: RINV=CRINV
Renewable Capacity Under Construction: RCUC=Integral(RINV-RNC,RCCI)
Initial RCUC: RCCI+Constant
Renewable New Capacity: RNC=CUC/CT
Construction Time: CT= Constant
Renewable Capacity: RCAP=Integral(RNC-RR, RCAPI)
Initial RCAP: RCAPI=Constant
Renewable Retirements: RR=RCAP/LT
Capital Lifetime; LT=Constant
Overflow Investments: OINV=IRINV-CRINV
Conventional Investments: CINV= max(-CCAP/PT, (OINV+FCC-ICC)/AT)
Intact Conventional Capacity ICC=CCAP-CCUC+CR*(1+CT)))
Conventional Demand: CD=BD*(1-RCF)
Forecasted Conventional Capacity: FCC=FORECAST(DC,CT,ST,AT)
Information Smoothing Time: ST=Constant
Conventional Capacity Under Construction: CCUC=Integral(CINV-CNC,CCUCI)
Initial CCUC: CUCCI=Constant
Conventional New Capacity: CNC=CCUC/CT
Conventional Capacity: CCAP=Integral(CNC-CR,CCAPI)
Initial CCAP: CCPAI=Constant
Conventional Retirements: CR=CCAP/LT
Phaseout Time: PT=Constant (Used for early retirement)
Forecasting Macro: This code is an adequate-for-purpose, over-simplification of the forecasting
method presented in Chapter 7 of Sterman.768
FD=FORECAST(D,CT,SD,AT)
768 Sterman, J., 2010. Business Dynamics. Irwin/McGraw-Hill.

Climate Risk and Response July 2021
George Backus (Material is free to use with attribution.) A3.13
Smoothed Demand: SD=integral((D-SD)/ST,SDI)
Initial SDI: SDI=Constant
Smoothed SD: SSD=Integral((SD-SSD)/ST,SSDI)
SSDI Initial SSD: SSDI=Constant
Growth Rate: GR=(SD/SSD-1)/ST
Forecast Demand: FD=SD*exp(GR*(CT+ST+AT)
In the above equations, CT is needed to make sure there is enough capacity after the CT delay;
the AT is the time to adjust the investment flow to match the desired capacity; and the ST
brings the SD value to the present.
Endnotes
lvi To streamline the discussion, the precise use of time in units of measure for energy are ignored. That is, Demand should be in units of GWh/Year and Capacity in GW. This inconsistency is resolved if Capacity is defined as the units of energy it can produce in a year –GWh/Year. lvii Based on VENSIM syntax. See http://VENSIM.com
Climate Risk and Response July 2021
George Backus (Material is free to use with attribution.) A4.1
Appendix 4: Evaluating the Climate Simulation
This section describes and evaluates the climate simulation used in this study. The climate system is essentially linear. Adding the non-linearities associated with tipping points would only make matters worse. Leaving them out, as this study does, biases the analyses toward underestimates of the actual impacts. Another area of non-linearity is associated with ocean and Arctic feedbacks which would reduce the absorption of atmospheric CO2 and decrease the albedo respectively, again leading to a possible underestimate of temperatures.769 Therefore, a linear representation is appropriate and adequate for the analyses undertaken here.
Several confidence tests show the legitimacy of the simulation approach. None of these are pure apple-to-apple comparisons, given differing publication dates, policy timing, and Base-case emission dynamics of sinks and sources.
A4.1 Impulse-Based Differential Equations
For a linear or quasi-linear system, once its impulse response function (IPF) is known, the condition of the system for any variation of input is known.770 Further, each element of response, due to the different Greenhouse gases, is additive and can be treated separately. These functions are typically represented as a sum of (algebraic) exponential terms.771,772,773,774
769 Loeb, N. G., Johnson, G. C., Thorsen, T. J., Lyman, J. M., Rose, F. G., & Kato, S. (2021). Satellite and ocean data reveal marked increase in Earth's heating rate. Geophysical Research Letters, 48, e2021GL093047. https://agupubs.onlinelibrary.wiley.com/doi/pdfdirect/10.1029/2021GL093047 770 Feynman, R.P., Leighton, R.B. and Sands, M., 2011. The Feynman lectures on physics, Vol. I: The new millennium edition: mainly mechanics, radiation, and heat (Vol. 1). Basic books. Chapter 25. https://www.feynmanlectures.caltech.edu/I_25.html 771 Gasser, T., Peters, G.P., Fuglestvedt, J.S., Collins, W.J., Shindell, D.T. and Ciais, P., 2017. Accounting for the climate–carbon feedback in emission metrics. Earth System Dynamics, 8(2), pp.235-253. https://esd.copernicus.org/articles/8/235/2017/esd-8-235-2017.pdf 772 Chapter 8: Anthropogenic and Natural Radiative Forcing. Myhre, G., Shindell, D., Breìon, F.-M., Collins, W., Fuglestvedt, J., Huang, J., Koch, D., Lamarque, J.-F., Lee, D., Mendoza, B., Nakajima, T., Robock, A., Stephens, G., Takemura, T., and Zhang, H.: Anthropogenic and Natural Radiative Forcing, in: Climate Change 2013: The Physical Science Basis. Contribution Change 2014: Mitigation of Climate Change, Contribution of Working Group III to the Fifth Assessment Report of the Intergovernmental Panel on Climate Change, edited by: Edenhofer, O., Pichs-Madruga, R., Sokona, Y., Farahani, E., Kadner, S., Seyboth, K., Adler, A., Baum, I., Brunner, S., Eickemeier, P., Kriemann, B., Savolainen, J., Schlömer, S., von Stechow, C., Zwickel, T., and Minx, J. C., Cambridge University Press, Cambridge, UK and New York, NY, USA, 2014. https://www.ipcc.ch/report/ar5/wg1/anthropogenic-and-natural-radiative-forcing/ 773 Millar, R.J., Nicholls, Z.R., Friedlingstein, P. and Allen, M.R., 2017. A modified impulse-response representation of the global near-surface air temperature and atmospheric concentration response to carbon dioxide emissions. Atmospheric Chemistry and Physics, 17(11), pp.7213-7228. https://acp.copernicus.org/articles/17/7213/2017/acp-17-7213-2017.pdf 774 Hooß, G., Voss, R., Hasselmann, K., Maier-Reimer, E. and Joos, F., 2001. A nonlinear impulse response model of the coupled carbon cycle-climate system (NICCS). Climate Dynamics, 18(3-4), pp.189-202. https://pure.mpg.de/rest/items/item_995488/component/file_3189174/content
Climate Risk and Response July 2021
George Backus (Material is free to use with attribution.) A4.2
The approach here is to look for a set of differential equations (shown in integral form) that causally produce the impulse response and simulates all the dynamic responses of the system with continuously changing input values. The impulse response for the system is very closely approximated by cascading first-order exponential delays, one following the accumulation and flows of GHG emissions and the other following the accumulated radiative forcing from (positive or negative) changes in the GHG concentration that leads to a temperature change. The impulse response remarkably corresponds to an unbalanced 2nd-order Erlang distribution. Any order of Erlang distribution is produced by a combination of exponential delays calculated using differential equations. Therefore, the climate simulation applied here is a set of impulse-derived differential equations (IDDE) that use the GHG emissions as inputs and produce the GSAT as the output.
Figure 275 below shows the Probability Density Functions (PDF) for Erlang distributions of order one to three. The curve is also the impulse response of exponential filtering delay. Figure 275 additionally shows the Cumulative Distribution Function (CDF). These curves correspond to the step response of exponential filtering. Each has a characteristic time constant, which in the Figure 275 example, is 10 years. For the balanced second-order distributions shown in Figure 275, the two differential equations creating the distribution both have the same time constants. Figure 275 can be compared to the standard view of the Erlang distribution.775
The next three figures show the concentration and temperature impulse response for CH4, N2O, and CO2. The curves show a strong connection to the Erlang distribution. To exactly match the response, the time constant of the first-order distribution, (which corresponds to the first of the differential equations) has a different time constant than its associated second-order distribution (that is the output of the second of the differential equations). The unbalanced aspect of the distribution stems from the fact that the two time constants are unequal, i.e., out of balance. To capture the CO2 response, two sets of differential equations are needed – one for land-based removal of CO2 from the atmosphere and the other for ocean-based removal. In general, the data and model response exactly overlap.
Not shown is the response curve for radiative forcing (RF). It looks similar to the first-order concentration curve but drops more sharply and is a composite of the first and second-order responses.776,777,778 Therefore, although it is readily doable, it is not necessary to simulate
775 https://en.wikipedia.org/wiki/Erlang_distribution 776 Kirschbaum, M.U., 2014. Climate-change impact potentials as an alternative to global warming potentials. Environmental Research Letters, 9(3), p.034014. https://iopscience.iop.org/article/10.1088/1748-9326/9/3/034014/pdf 777 Kirschbaum, M.U., Saggar, S., Tate, K.R., Thakur, K.P. and Giltrap, D.L., 2013. Quantifying the climate-change consequences of shifting land use between forest and agriculture. Science of the Total Environment, 465, pp.314-324. https://www.sciencedirect.com/science/article/abs/pii/S0048969713000351 778 Anthropogenic and Natural Radiative Forcing Supplementary Material (8SM). Myhre, G., D. Shindell, F.-M. Bréon, W. Collins, J. Fuglestvedt, J. Huang, D. Koch, J.-F. Lamarque, D. Lee, B. Mendoza, T. Nakajima, A. Robock, G. Stephens, T. Takemura and H. Zhang, 2013: Anthropogenic and Natural Radiative Forcing Supplementary Material. In: Climate Change 2013: The Physical Science Basis. Contribution of Working Group I to the Fifth Assessment Report of the Intergovernmental Panel on Climate Change [Stocker, T.F., D. Qin, G.-K. Plattner, M. Tignor, S.K. Allen, J. Boschung, A. Nauels, Y. Xia, V. Bex and P.M. Midgley (eds.)]. Available from https://www.ipcc.ch/site/assets/uploads/2018/07/WGI_AR5.Chap_.8_SM.pdf
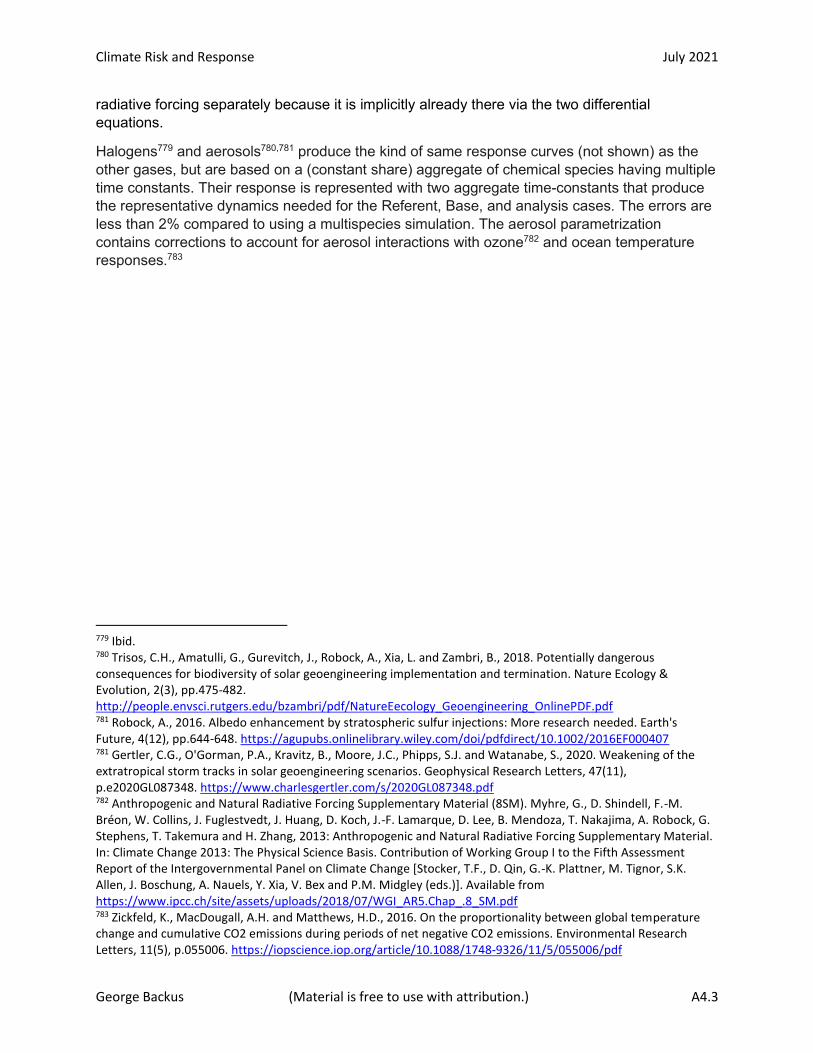
Climate Risk and Response July 2021
George Backus (Material is free to use with attribution.) A4.3
radiative forcing separately because it is implicitly already there via the two differential equations.
Halogens779 and aerosols780,781 produce the kind of same response curves (not shown) as the other gases, but are based on a (constant share) aggregate of chemical species having multiple time constants. Their response is represented with two aggregate time-constants that produce the representative dynamics needed for the Referent, Base, and analysis cases. The errors are less than 2% compared to using a multispecies simulation. The aerosol parametrization contains corrections to account for aerosol interactions with ozone782 and ocean temperature responses.783
779 Ibid. 780 Trisos, C.H., Amatulli, G., Gurevitch, J., Robock, A., Xia, L. and Zambri, B., 2018. Potentially dangerous consequences for biodiversity of solar geoengineering implementation and termination. Nature Ecology & Evolution, 2(3), pp.475-482. http://people.envsci.rutgers.edu/bzambri/pdf/NatureEecology_Geoengineering_OnlinePDF.pdf 781 Robock, A., 2016. Albedo enhancement by stratospheric sulfur injections: More research needed. Earth's Future, 4(12), pp.644-648. https://agupubs.onlinelibrary.wiley.com/doi/pdfdirect/10.1002/2016EF000407 781 Gertler, C.G., O'Gorman, P.A., Kravitz, B., Moore, J.C., Phipps, S.J. and Watanabe, S., 2020. Weakening of the extratropical storm tracks in solar geoengineering scenarios. Geophysical Research Letters, 47(11), p.e2020GL087348. https://www.charlesgertler.com/s/2020GL087348.pdf 782 Anthropogenic and Natural Radiative Forcing Supplementary Material (8SM). Myhre, G., D. Shindell, F.-M. Bréon, W. Collins, J. Fuglestvedt, J. Huang, D. Koch, J.-F. Lamarque, D. Lee, B. Mendoza, T. Nakajima, A. Robock, G. Stephens, T. Takemura and H. Zhang, 2013: Anthropogenic and Natural Radiative Forcing Supplementary Material. In: Climate Change 2013: The Physical Science Basis. Contribution of Working Group I to the Fifth Assessment Report of the Intergovernmental Panel on Climate Change [Stocker, T.F., D. Qin, G.-K. Plattner, M. Tignor, S.K. Allen, J. Boschung, A. Nauels, Y. Xia, V. Bex and P.M. Midgley (eds.)]. Available from https://www.ipcc.ch/site/assets/uploads/2018/07/WGI_AR5.Chap_.8_SM.pdf 783 Zickfeld, K., MacDougall, A.H. and Matthews, H.D., 2016. On the proportionality between global temperature change and cumulative CO2 emissions during periods of net negative CO2 emissions. Environmental Research Letters, 11(5), p.055006. https://iopscience.iop.org/article/10.1088/1748-9326/11/5/055006/pdf
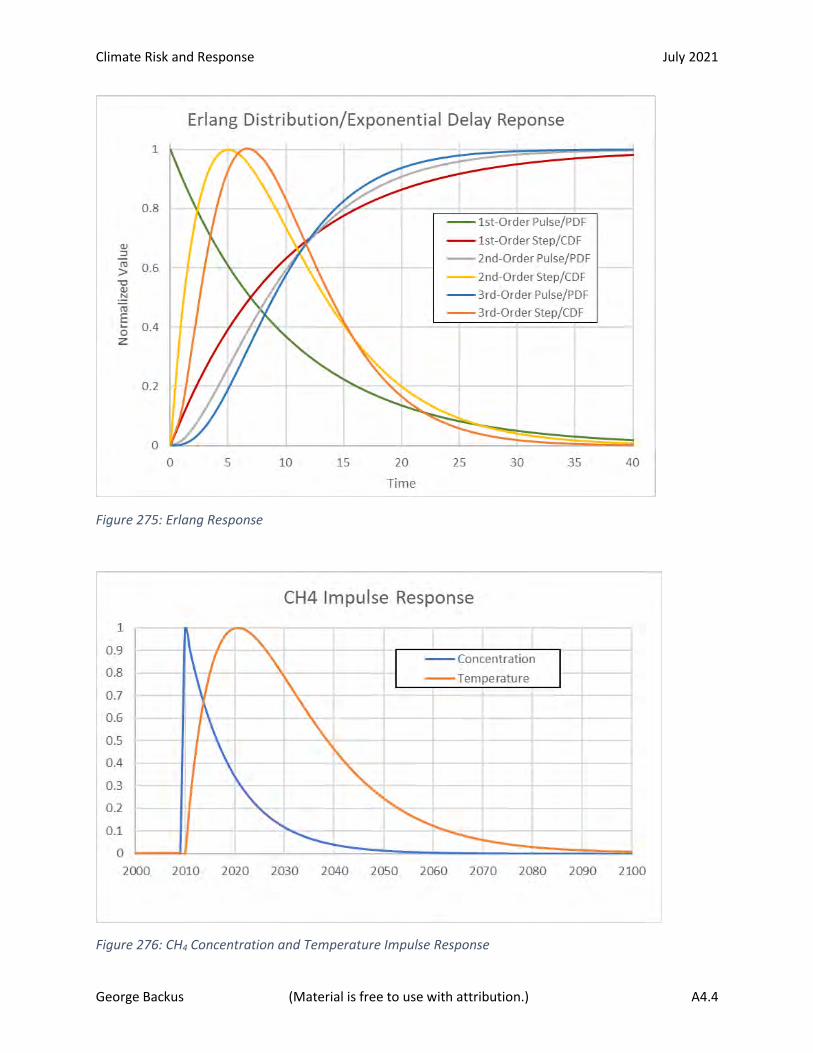
Climate Risk and Response July 2021
George Backus (Material is free to use with attribution.) A4.4
Figure 275: Erlang Response
Figure 276: CH4 Concentration and Temperature Impulse Response
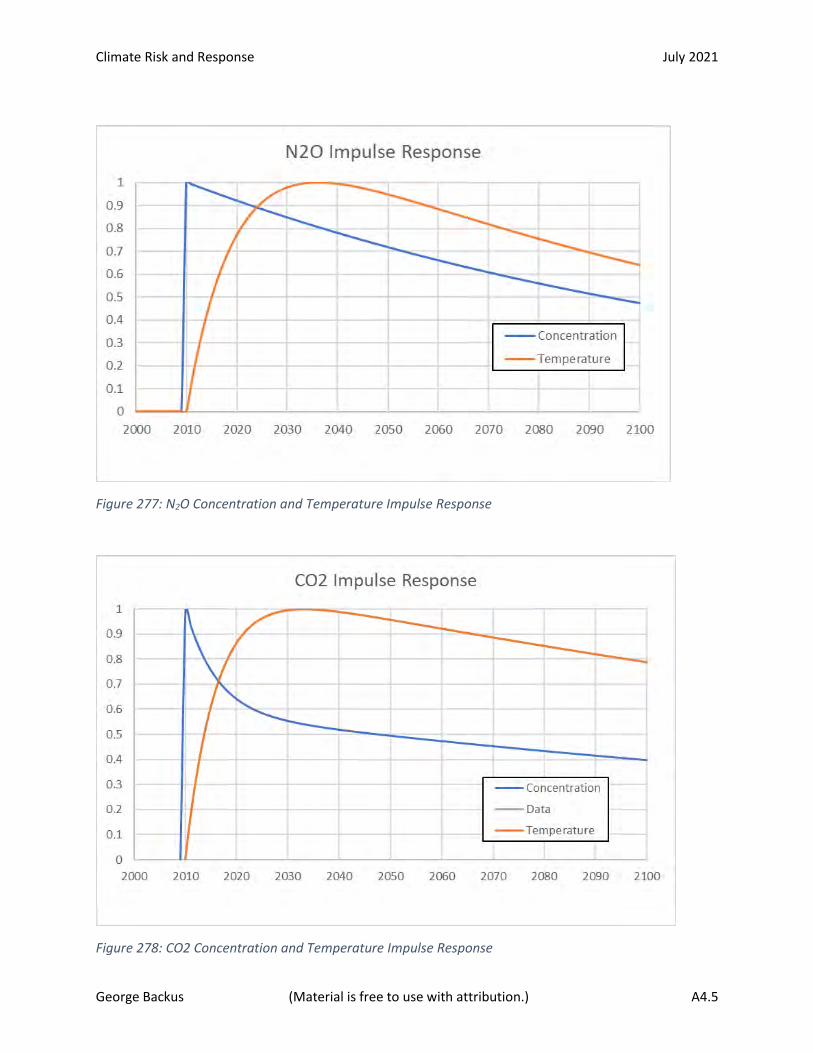
Climate Risk and Response July 2021
George Backus (Material is free to use with attribution.) A4.5
Figure 277: N2O Concentration and Temperature Impulse Response
Figure 278: CO2 Concentration and Temperature Impulse Response

Climate Risk and Response July 2021
George Backus (Material is free to use with attribution.) A4.6
The actual equations and their parameterization are shown below. The simulation begins at steady state in the year 1750, but the “initial” values of the integrals in the tables below are given for the year 2015, so that anyone interested can immediately use the equations. Although the equations appear to be very simple,784 they robustly reproduce the temperature dynamics because differential equations produce much richer behaviors with fewer parameters than do algebraic equations The first set of “concentration” equations represents material delays and the second “Temperature forcing” set represents smoothing delays.785
Concentration Equations
𝑃𝐶𝑀𝑔,𝑟,𝑡 = ∫ (𝐹𝑟,𝑔 ∗ 𝐸𝑔,𝑡 ∗ 𝐸𝑅𝑔 −𝜏
0
𝑃𝐶𝑀𝑔,𝑟,𝑡/𝐿𝑇𝑟) ∗ 𝑑𝑡
𝐶𝑀𝑔,𝑟,𝑡 = ∑ 𝑃𝐶𝑀𝑔,𝑟,𝑡
𝑟
where CM is the Concentration Metric, E is Emissions, PCM is the Partial CM, LT is the GHG specie Life Time, F is the fraction split of concentration dynamics by region, and ER is the Emission Radiative Equivalent (relative to CO2).
The “g” subscript is for the type of GHG, “t’ is time, “r” is the region (land or ocean), and “dt” is the time differential.
GHG Type Process Type
Fractional Split (F)
Concentration Constant (LT Years)
Pulse year CO2e Equivalent (ER)
Year 2015 Partial Concentration Metric (PCM -tonnes)
CO2 Land 0.4063 6.5 1 1.35E+11
CO2 Ocean 0.5937 230 1 2.98E+12
CH4 Land 1.0 9.85 120 6.00E+11
N2O Land 1.0 121 268 6.7665E+11
Halogens (Aggregate) Land 1.0 45 1* 1.82E+10
Aerosols (w/Ozone) Land 1.0 26.5 1* 1.52E+08
Table 1: Concentration Parameterization
*Aerosols and halogens emissions are only noted in aggregate tonnes and with the temperature equation constant (K) correcting for the underdefined CO2e response.
The CH4 and N2O emissions are converted to CO2 equivalents (CO2e) at the time of emission. Their RF response decays with time due to natural absorption or chemical breakdown. CH4 to
784 Simpler models may be better for determining some climate risk https://phys.org/news/2020-09-simpler-climate.html 785 Sterman, J., 2010. Business Dynamics. Irwin/McGraw-Hill.

Climate Risk and Response July 2021
George Backus (Material is free to use with attribution.) A4.7
CO2 conversion is explicitly considered elsewhere and just becomes a new CO2 emission input term.
Temperature Equations
𝑇𝑀𝐶𝑂2 = ∫ (ln(𝐶𝑀𝐶𝑂2) − 𝑇𝑀𝐶𝑂2
𝑅𝑇𝐶𝑂2) ∗ 𝑑𝑡
𝜏
0
𝑇𝑀𝐶𝐻4 = ∫√𝐶𝑀𝐶𝐻4 − 𝑇𝑀𝐶𝐻4
𝑅𝑇𝐶𝐻4
𝜏
0
∗ 𝑑𝑡
𝑇𝑀𝑁2𝑂 = ∫√𝐶𝑀𝑁2𝑂 − 𝑇𝑀𝑁2𝑂
𝑅𝑇𝑁2𝑂∗ 𝑑𝑡
𝜏
0
𝑇𝑀𝐻 = ∫𝐶𝑀𝐻 − 𝑇𝑀𝐻
𝑅𝑇𝐻∗ 𝑑𝑡
𝜏
0
𝑇𝑀𝐴 = ∫𝐶𝑀𝐴 − 𝑇𝑀𝐴
𝑅𝑇𝐴∗ 𝑑𝑡
𝜏
0
𝑇𝑔 = 𝐾𝑔 ∗ (𝑇𝑀𝑔 − 𝑇𝑀𝑔,0)
Where TM is the Temperature Metric, RT is the Temperature Response Time, K is the Temperature contribution of each species 2015, T is the GSAT estimate. The TM0 is the raw temperature contribution relative to the year 1750. The difference between using a year 1880 base and a year 1750 Base is 0.05 °C to 0.15 °C.786 This work uses 1.1 °C as the global surface average Temperature (GSAT) anomaly in 2015.787 See NOAA data 788 for the 2015 value using the 1880 Base period.
GHG Type 2015 Raw Temperature
Contribution (K)
Year 2015 Temperature
Metric (TM)
Response Time
Constant (RT Years)
Year 1750 Forcing Metric (TM0 Tonnes)
CO2 9.33E+00 2.85E+01 105 2.84E+01
CH4 1.04E-06 7.52E+05 12.7 4.92E+05
N2O 1.19E-06 8.12E+05 10 7.45E+05
Halogens (Aggregate) 1.51E-11 1.12E+10 10 0.00E+00
Aerosols (w/Ozone) -2.84E-09 2.85E+01 7 5.09E+06
Table 2: Temperature Parameterization
The equations are numerically simulated over time using Euler integration. As such, the
786 https://climate.nasa.gov/faq/12/whats-the-difference-between-climate-change-and-global-warming/ 787 https://phys.org/news/2020-01-hottest-year-eu.html 788 https://www.ncdc.noaa.gov/sotc/global/201513
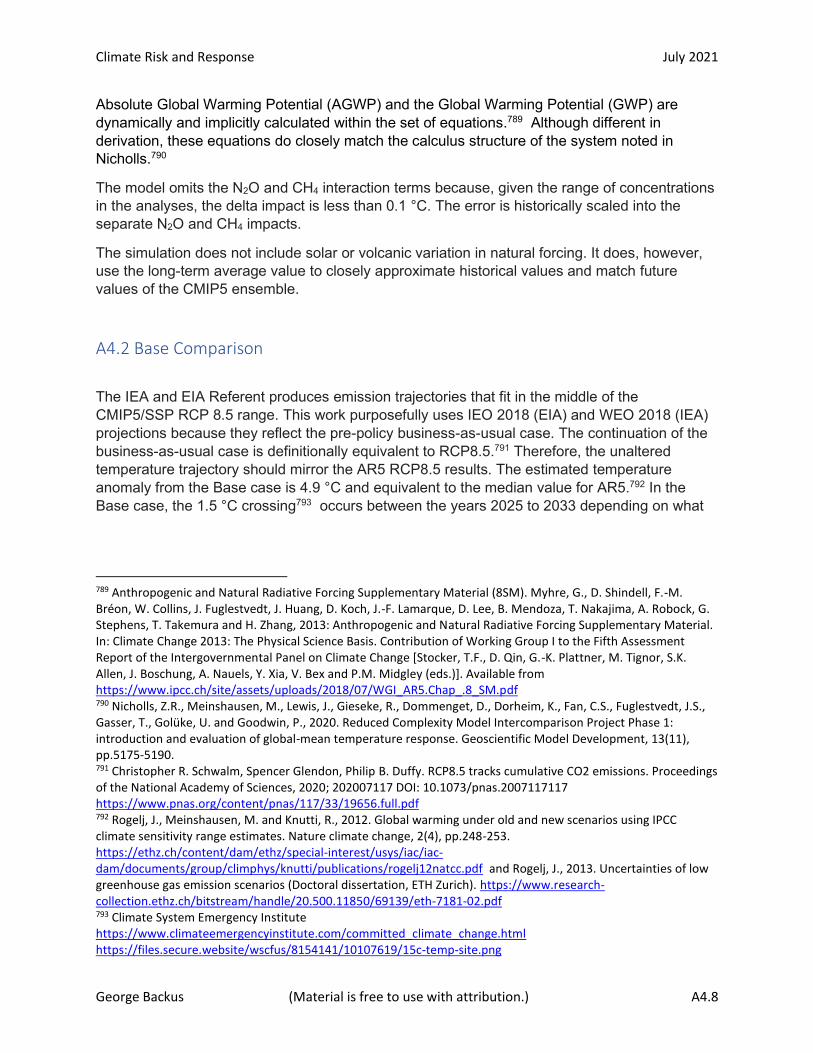
Climate Risk and Response July 2021
George Backus (Material is free to use with attribution.) A4.8
Absolute Global Warming Potential (AGWP) and the Global Warming Potential (GWP) are dynamically and implicitly calculated within the set of equations.789 Although different in derivation, these equations do closely match the calculus structure of the system noted in Nicholls.790
The model omits the N2O and CH4 interaction terms because, given the range of concentrations in the analyses, the delta impact is less than 0.1 °C. The error is historically scaled into the separate N2O and CH4 impacts.
The simulation does not include solar or volcanic variation in natural forcing. It does, however, use the long-term average value to closely approximate historical values and match future values of the CMIP5 ensemble.
A4.2 Base Comparison
The IEA and EIA Referent produces emission trajectories that fit in the middle of the CMIP5/SSP RCP 8.5 range. This work purposefully uses IEO 2018 (EIA) and WEO 2018 (IEA) projections because they reflect the pre-policy business-as-usual case. The continuation of the business-as-usual case is definitionally equivalent to RCP8.5.791 Therefore, the unaltered temperature trajectory should mirror the AR5 RCP8.5 results. The estimated temperature anomaly from the Base case is 4.9 °C and equivalent to the median value for AR5.792 In the Base case, the 1.5 °C crossing793 occurs between the years 2025 to 2033 depending on what
789 Anthropogenic and Natural Radiative Forcing Supplementary Material (8SM). Myhre, G., D. Shindell, F.-M. Bréon, W. Collins, J. Fuglestvedt, J. Huang, D. Koch, J.-F. Lamarque, D. Lee, B. Mendoza, T. Nakajima, A. Robock, G. Stephens, T. Takemura and H. Zhang, 2013: Anthropogenic and Natural Radiative Forcing Supplementary Material. In: Climate Change 2013: The Physical Science Basis. Contribution of Working Group I to the Fifth Assessment Report of the Intergovernmental Panel on Climate Change [Stocker, T.F., D. Qin, G.-K. Plattner, M. Tignor, S.K. Allen, J. Boschung, A. Nauels, Y. Xia, V. Bex and P.M. Midgley (eds.)]. Available from https://www.ipcc.ch/site/assets/uploads/2018/07/WGI_AR5.Chap_.8_SM.pdf 790 Nicholls, Z.R., Meinshausen, M., Lewis, J., Gieseke, R., Dommenget, D., Dorheim, K., Fan, C.S., Fuglestvedt, J.S., Gasser, T., Golüke, U. and Goodwin, P., 2020. Reduced Complexity Model Intercomparison Project Phase 1: introduction and evaluation of global-mean temperature response. Geoscientific Model Development, 13(11), pp.5175-5190. 791 Christopher R. Schwalm, Spencer Glendon, Philip B. Duffy. RCP8.5 tracks cumulative CO2 emissions. Proceedings of the National Academy of Sciences, 2020; 202007117 DOI: 10.1073/pnas.2007117117 https://www.pnas.org/content/pnas/117/33/19656.full.pdf 792 Rogelj, J., Meinshausen, M. and Knutti, R., 2012. Global warming under old and new scenarios using IPCC climate sensitivity range estimates. Nature climate change, 2(4), pp.248-253. https://ethz.ch/content/dam/ethz/special-interest/usys/iac/iac-dam/documents/group/climphys/knutti/publications/rogelj12natcc.pdf and Rogelj, J., 2013. Uncertainties of low greenhouse gas emission scenarios (Doctoral dissertation, ETH Zurich). https://www.research-collection.ethz.ch/bitstream/handle/20.500.11850/69139/eth-7181-02.pdf 793 Climate System Emergency Institute https://www.climateemergencyinstitute.com/committed_climate_change.html https://files.secure.website/wscfus/8154141/10107619/15c-temp-site.png
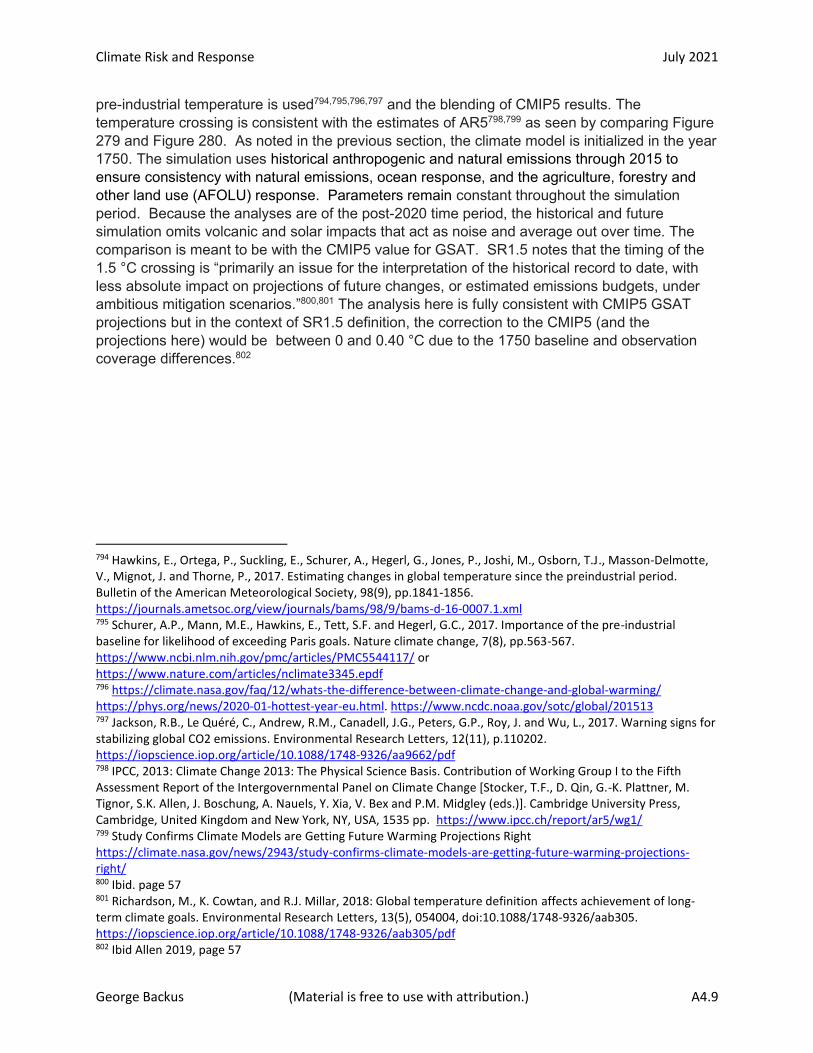
Climate Risk and Response July 2021
George Backus (Material is free to use with attribution.) A4.9
pre-industrial temperature is used794,795,796,797 and the blending of CMIP5 results. The temperature crossing is consistent with the estimates of AR5798,799 as seen by comparing Figure 279 and Figure 280. As noted in the previous section, the climate model is initialized in the year 1750. The simulation uses historical anthropogenic and natural emissions through 2015 to ensure consistency with natural emissions, ocean response, and the agriculture, forestry and other land use (AFOLU) response. Parameters remain constant throughout the simulation period. Because the analyses are of the post-2020 time period, the historical and future simulation omits volcanic and solar impacts that act as noise and average out over time. The comparison is meant to be with the CMIP5 value for GSAT. SR1.5 notes that the timing of the 1.5 °C crossing is “primarily an issue for the interpretation of the historical record to date, with less absolute impact on projections of future changes, or estimated emissions budgets, under ambitious mitigation scenarios.”800,801 The analysis here is fully consistent with CMIP5 GSAT projections but in the context of SR1.5 definition, the correction to the CMIP5 (and the projections here) would be between 0 and 0.40 °C due to the 1750 baseline and observation coverage differences.802
794 Hawkins, E., Ortega, P., Suckling, E., Schurer, A., Hegerl, G., Jones, P., Joshi, M., Osborn, T.J., Masson-Delmotte, V., Mignot, J. and Thorne, P., 2017. Estimating changes in global temperature since the preindustrial period. Bulletin of the American Meteorological Society, 98(9), pp.1841-1856. https://journals.ametsoc.org/view/journals/bams/98/9/bams-d-16-0007.1.xml 795 Schurer, A.P., Mann, M.E., Hawkins, E., Tett, S.F. and Hegerl, G.C., 2017. Importance of the pre-industrial baseline for likelihood of exceeding Paris goals. Nature climate change, 7(8), pp.563-567. https://www.ncbi.nlm.nih.gov/pmc/articles/PMC5544117/ or https://www.nature.com/articles/nclimate3345.epdf 796 https://climate.nasa.gov/faq/12/whats-the-difference-between-climate-change-and-global-warming/ https://phys.org/news/2020-01-hottest-year-eu.html. https://www.ncdc.noaa.gov/sotc/global/201513 797 Jackson, R.B., Le Quéré, C., Andrew, R.M., Canadell, J.G., Peters, G.P., Roy, J. and Wu, L., 2017. Warning signs for stabilizing global CO2 emissions. Environmental Research Letters, 12(11), p.110202. https://iopscience.iop.org/article/10.1088/1748-9326/aa9662/pdf 798 IPCC, 2013: Climate Change 2013: The Physical Science Basis. Contribution of Working Group I to the Fifth Assessment Report of the Intergovernmental Panel on Climate Change [Stocker, T.F., D. Qin, G.-K. Plattner, M. Tignor, S.K. Allen, J. Boschung, A. Nauels, Y. Xia, V. Bex and P.M. Midgley (eds.)]. Cambridge University Press, Cambridge, United Kingdom and New York, NY, USA, 1535 pp. https://www.ipcc.ch/report/ar5/wg1/ 799 Study Confirms Climate Models are Getting Future Warming Projections Right https://climate.nasa.gov/news/2943/study-confirms-climate-models-are-getting-future-warming-projections-right/ 800 Ibid. page 57 801 Richardson, M., K. Cowtan, and R.J. Millar, 2018: Global temperature definition affects achievement of long-term climate goals. Environmental Research Letters, 13(5), 054004, doi:10.1088/1748-9326/aab305. https://iopscience.iop.org/article/10.1088/1748-9326/aab305/pdf 802 Ibid Allen 2019, page 57
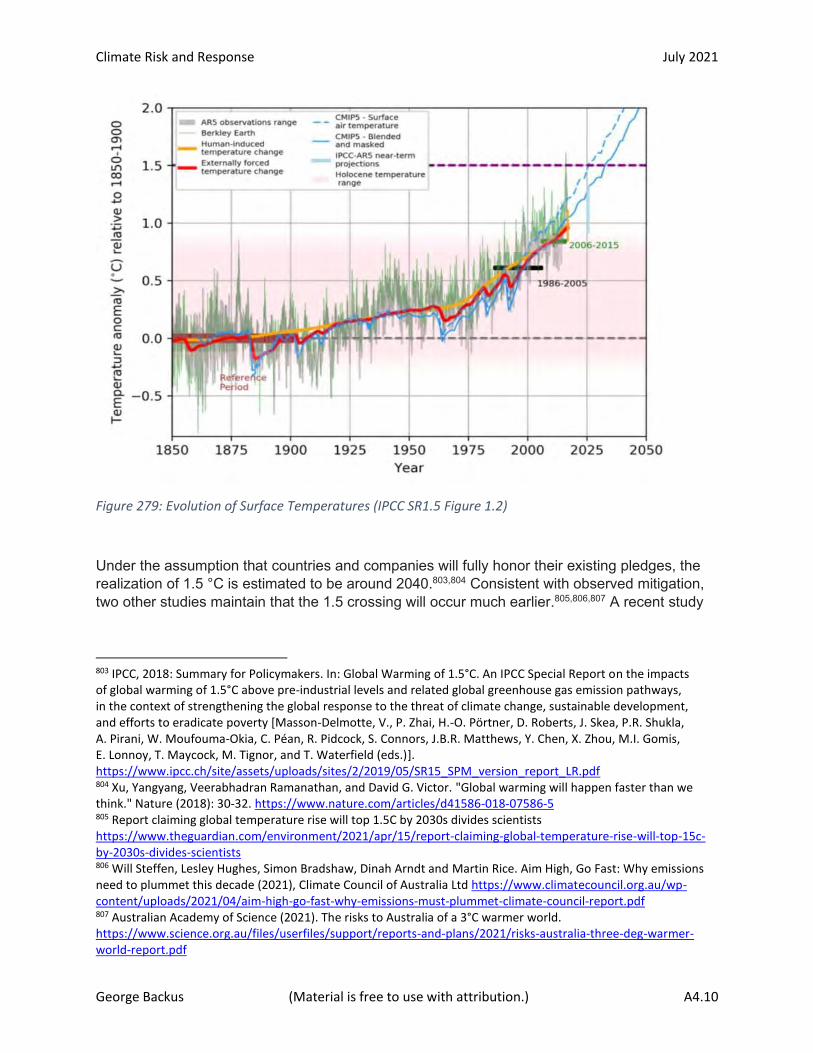
Climate Risk and Response July 2021
George Backus (Material is free to use with attribution.) A4.10
Figure 279: Evolution of Surface Temperatures (IPCC SR1.5 Figure 1.2)
Under the assumption that countries and companies will fully honor their existing pledges, the realization of 1.5 °C is estimated to be around 2040.803,804 Consistent with observed mitigation, two other studies maintain that the 1.5 crossing will occur much earlier.805,806,807 A recent study
803 IPCC, 2018: Summary for Policymakers. In: Global Warming of 1.5°C. An IPCC Special Report on the impacts of global warming of 1.5°C above pre-industrial levels and related global greenhouse gas emission pathways, in the context of strengthening the global response to the threat of climate change, sustainable development, and efforts to eradicate poverty [Masson-Delmotte, V., P. Zhai, H.-O. Pörtner, D. Roberts, J. Skea, P.R. Shukla, A. Pirani, W. Moufouma-Okia, C. Péan, R. Pidcock, S. Connors, J.B.R. Matthews, Y. Chen, X. Zhou, M.I. Gomis, E. Lonnoy, T. Maycock, M. Tignor, and T. Waterfield (eds.)]. https://www.ipcc.ch/site/assets/uploads/sites/2/2019/05/SR15_SPM_version_report_LR.pdf 804 Xu, Yangyang, Veerabhadran Ramanathan, and David G. Victor. "Global warming will happen faster than we think." Nature (2018): 30-32. https://www.nature.com/articles/d41586-018-07586-5 805 Report claiming global temperature rise will top 1.5C by 2030s divides scientists https://www.theguardian.com/environment/2021/apr/15/report-claiming-global-temperature-rise-will-top-15c-by-2030s-divides-scientists 806 Will Steffen, Lesley Hughes, Simon Bradshaw, Dinah Arndt and Martin Rice. Aim High, Go Fast: Why emissions need to plummet this decade (2021), Climate Council of Australia Ltd https://www.climatecouncil.org.au/wp-content/uploads/2021/04/aim-high-go-fast-why-emissions-must-plummet-climate-council-report.pdf 807 Australian Academy of Science (2021). The risks to Australia of a 3°C warmer world. https://www.science.org.au/files/userfiles/support/reports-and-plans/2021/risks-australia-three-deg-warmer-world-report.pdf
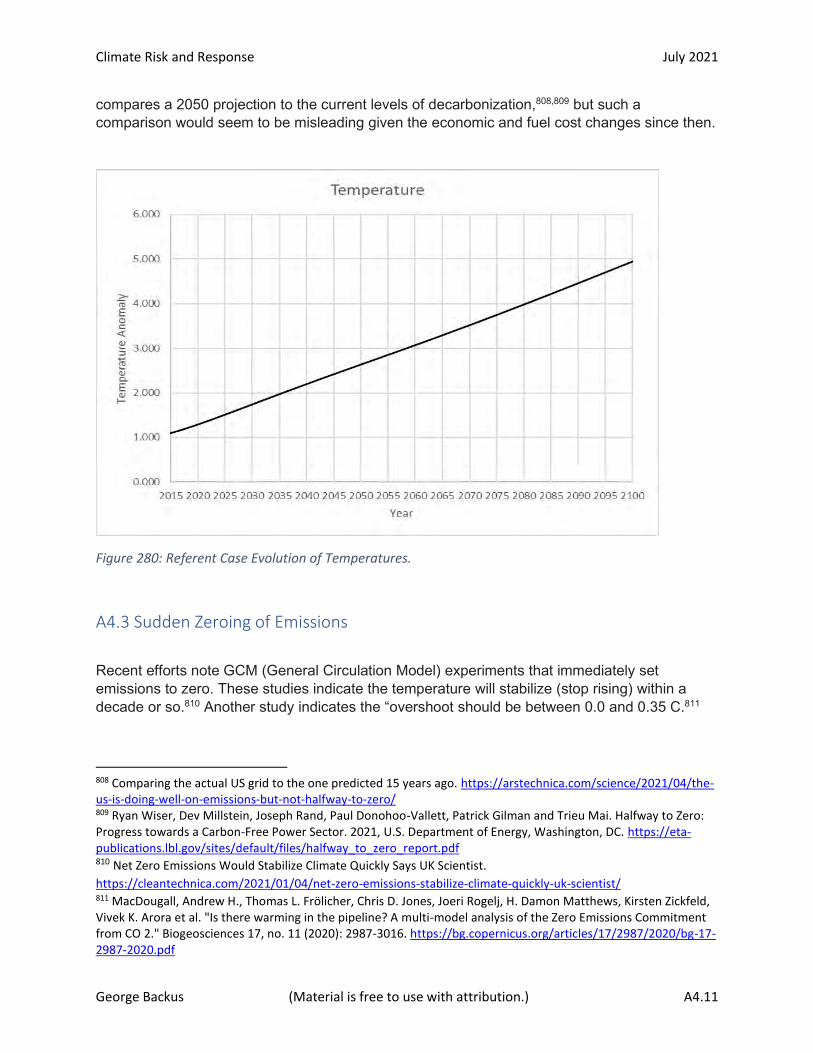
Climate Risk and Response July 2021
George Backus (Material is free to use with attribution.) A4.11
compares a 2050 projection to the current levels of decarbonization,808,809 but such a comparison would seem to be misleading given the economic and fuel cost changes since then.
Figure 280: Referent Case Evolution of Temperatures.
A4.3 Sudden Zeroing of Emissions
Recent efforts note GCM (General Circulation Model) experiments that immediately set emissions to zero. These studies indicate the temperature will stabilize (stop rising) within a decade or so.810 Another study indicates the “overshoot should be between 0.0 and 0.35 C.811
808 Comparing the actual US grid to the one predicted 15 years ago. https://arstechnica.com/science/2021/04/the-us-is-doing-well-on-emissions-but-not-halfway-to-zero/ 809 Ryan Wiser, Dev Millstein, Joseph Rand, Paul Donohoo-Vallett, Patrick Gilman and Trieu Mai. Halfway to Zero: Progress towards a Carbon-Free Power Sector. 2021, U.S. Department of Energy, Washington, DC. https://eta-publications.lbl.gov/sites/default/files/halfway_to_zero_report.pdf 810 Net Zero Emissions Would Stabilize Climate Quickly Says UK Scientist.
https://cleantechnica.com/2021/01/04/net-zero-emissions-stabilize-climate-quickly-uk-scientist/ 811 MacDougall, Andrew H., Thomas L. Frölicher, Chris D. Jones, Joeri Rogelj, H. Damon Matthews, Kirsten Zickfeld, Vivek K. Arora et al. "Is there warming in the pipeline? A multi-model analysis of the Zero Emissions Commitment from CO 2." Biogeosciences 17, no. 11 (2020): 2987-3016. https://bg.copernicus.org/articles/17/2987/2020/bg-17-2987-2020.pdf
Climate Risk and Response July 2021
George Backus (Material is free to use with attribution.) A4.12
The figure below shows such a test when the emissions drop to zero in 2020. The simulated overshoot is 0.2 C and with the peak occurring 12 years after the emissions cessation.
Figure 281: Emission Zeroing Response
A4.4 IPCC SR1.5 Emission Reduction
The SR1.5 report notes the need to reduce emissions by 45% (down to 55% of current levels) by the year 2030 and to zero by 2050.812 The original intent in the SR1.5 report was to initiate the reduction by the year 2010, but that date has passed. For convenience, the analysis uses the now past date of 2020 to initiate the aggressive reduction in GHG emission. The figure below is comparable to Figure 1 in SR1.5.813 Table 2 in the Chapter 1 of the SR1.5 Report Supplement814 shows the results of a high-temperature overshoot that is comparable to the analyses here. The peak year is 2043 (versus 2046 here, and the peak is 1.6 °C with a range of
812 Allen, M., Antwi-Agyei, P., Aragon-Durand, F., Babiker, M., Bertoldi, P., Bind, M., Brown, S., Buckeridge, M., Camilloni, I., Cartwright, A. and Cramer, W., 2019. Global warming of 1.5° C. An IPCC Special Report on the impacts of global warming of 1.5° C above pre-industrial levels and related global greenhouse gas emission pathways, in the context of strengthening the global response to the threat of climate change, sustainable development, and efforts to eradicate poverty. World Meteorological Organization, Geneva, Switzerland. https://www.ipcc.ch/sr15/ 813 Ibid FAQ 2.1 814 Ibid. https://report.ipcc.ch/sr15/pdf/sr15_chapter2_supplementary_materials.pdf
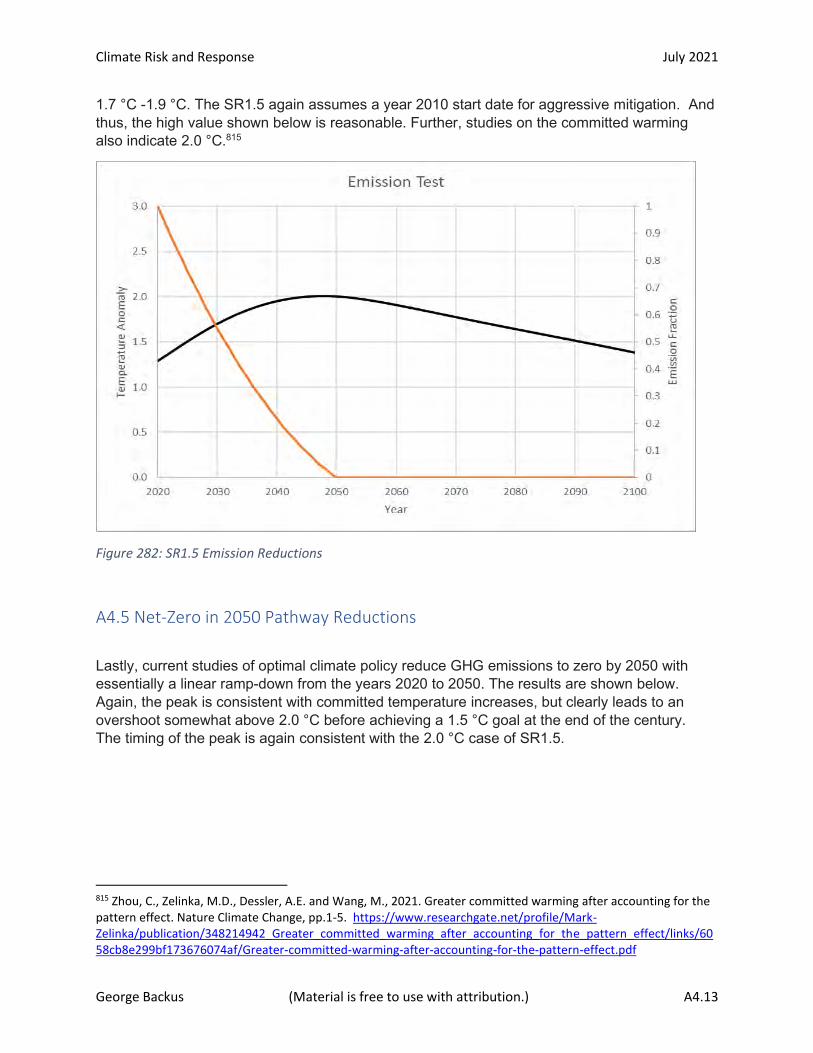
Climate Risk and Response July 2021
George Backus (Material is free to use with attribution.) A4.13
1.7 °C -1.9 °C. The SR1.5 again assumes a year 2010 start date for aggressive mitigation. And thus, the high value shown below is reasonable. Further, studies on the committed warming also indicate 2.0 °C.815
Figure 282: SR1.5 Emission Reductions
A4.5 Net-Zero in 2050 Pathway Reductions
Lastly, current studies of optimal climate policy reduce GHG emissions to zero by 2050 with essentially a linear ramp-down from the years 2020 to 2050. The results are shown below. Again, the peak is consistent with committed temperature increases, but clearly leads to an overshoot somewhat above 2.0 °C before achieving a 1.5 °C goal at the end of the century. The timing of the peak is again consistent with the 2.0 °C case of SR1.5.
815 Zhou, C., Zelinka, M.D., Dessler, A.E. and Wang, M., 2021. Greater committed warming after accounting for the pattern effect. Nature Climate Change, pp.1-5. https://www.researchgate.net/profile/Mark-Zelinka/publication/348214942_Greater_committed_warming_after_accounting_for_the_pattern_effect/links/6058cb8e299bf173676074af/Greater-committed-warming-after-accounting-for-the-pattern-effect.pdf

Climate Risk and Response July 2021
George Backus (Material is free to use with attribution.) A4.14
Figure 283: Optimal Emissions Reduction

Climate Risk and Response July 2021
George Backus (Material is free to use with attribution.) A5.1
Appendix 5: Problematic Geoengineering Interactions
Although these analyses do not include geoengineering for the reasons noted in Section 3.1, the results of the analyses are so problematic that there will be no choice except to heavily use geoengineering as climate change become unacceptable.816,817 Although the international-security consequences and risks of applying geoengineering will be excessive,818 they will be less than the certain consequences of high atmospheric temperatures. Nonetheless, the safeguard responses to extreme climate conditions will be financially and societally expensive, with likely destabilizing consequences. This appendix’s discussion of geoengineering is limited to the concept of Solar Radiation Management (SRM),819,820 primarily in terms of aerosol injection because of accessible cost.821
Geoengineering raises two important issues: 1) The required intensive geoengineering cannot bring the climate back to the way it was; 2) It will necessarily make winners and losers across the globe.822,823,824 Its use, with continued GHG emissions, strongly affects/distorts local rain and
816 Xu, Yangyang, Veerabhadran Ramanathan, and David G. Victor. "Global warming will happen faster than we think." Nature (2018): 30-32. https://media.nature.com/original/magazine-assets/d41586-021-01243-0/d41586-021-01243-0.pdf 817 Tilmes, S., Sanderson, B.M. and O'Neill, B.C., 2016. Climate impacts of geoengineering in a delayed mitigation scenario. Geophysical Research Letters, 43(15), pp.8222-8229. https://agupubs.onlinelibrary.wiley.com/doi/pdf/10.1002/2016GL070122 818 Pasztor, J., Nicholson, S. and Morrow, D., 2016. Briefing Paper on Climate Engineering. Carnegie Council for Ethics in International Affairs. https://www.carnegiecouncil.org/publications/articles_papers_reports/969/_res/id=Attachments/index=0/Briefing_on_Climate_Engineering.pdf 819 National Research Council. 2015. Climate Intervention: Reflecting Sunlight to Cool Earth. Washington, DC: The National Academies Press. https://doi.org/10.17226/18988. https://www.nap.edu/download/18988 820 National Academies of Sciences, Engineering, and Medicine. 2021. Reflecting Sunlight: Recommendations for Solar Geoengineering Research and Research Governance. Washington, DC: The National Academies Press. https://doi.org/10.17226/25762. https://www.nap.edu/download/25762 821 Smith, W., 2020. The cost of stratospheric aerosol injection through 2100. Environmental Research Letters, 15(11), p.114004. https://iopscience.iop.org/article/10.1088/1748-9326/aba7e7/pdf 822 Robock, A., Oman, L. and Stenchikov, G.L., 2008. Regional climate responses to geoengineering with tropical and Arctic SO2 injections. Journal of Geophysical Research: Atmospheres, 113(D16). https://agupubs.onlinelibrary.wiley.com/doi/full/10.1029/2008JD010050 823 Robock, A., 2016. Albedo enhancement by stratospheric sulfur injections: More research needed. Earth's Future, 4(12), pp.644-648. https://agupubs.onlinelibrary.wiley.com/doi/pdfdirect/10.1002/2016EF000407 824 Gertler, C.G., O'Gorman, P.A., Kravitz, B., Moore, J.C., Phipps, S.J. and Watanabe, S., 2020. Weakening of the extratropical storm tracks in solar geoengineering scenarios. Geophysical Research Letters, 47(11), p.e2020GL087348. https://www.charlesgertler.com/s/2020GL087348.pdf

Climate Risk and Response July 2021
George Backus (Material is free to use with attribution.) A5.2
temperature patterns,825 biosystem diversity,826,827,828 and ocean productivity.829,830 Given the enduring history of politics and human nature, the Advantaged countries, who are initially the primary drivers of doing the geoengineering, will pursue self-interests831 without adequate regard for unintended outcomes.832,833,834 The 9 billion people In the Disadvantaged countries of 2050 will be at the developed world’s (limited) mercy. Resulting political tension will lead to
825 Robock, A., Oman, L. and Stenchikov, G.L., 2008. Regional climate responses to geoengineering with tropical and Arctic SO2 injections. Journal of Geophysical Research: Atmospheres, 113(D16). https://agupubs.onlinelibrary.wiley.com/doi/full/10.1029/2008JD010050 826 Trisos, Christopher H., Giuseppe Amatulli, Jessica Gurevitch, Alan Robock, Lili Xia, and Brian Zambri. "Potentially dangerous consequences for biodiversity of solar geoengineering implementation and termination." Nature Ecology & Evolution 2, no. 3 (2018): 475-482. http://people.envsci.rutgers.edu/bzambri/pdf/NatureEecology_Geoengineering_OnlinePDF.pdf 827 Dagon, K., & Schrag, D. P. (2019). Quantifying the effects of solar geoengineering on vegetation. Climatic Change, 153(1), 235-251. https://geoengineering.environment.harvard.edu/files/sgrp/files/dagon-schrag2019_article_quantifyingtheeffectsofsolarge.pdf 828 Zarnetske, P.L., Gurevitch, J., Franklin, J., Groffman, P.M., Harrison, C.S., Hellmann, J.J., Hoffman, F.M., Kothari, S., Robock, A., Tilmes, S. and Visioni, D., 2021. Potential ecological impacts of climate intervention by reflecting sunlight to cool Earth. Proceedings of the National Academy of Sciences, 118(15). https://www.pnas.org/content/pnas/118/15/e1921854118.full.pdf 829 Lauvset, S.K., Tjiputra, J., Muri, H. and Grini, A., 2017, April. How would the ocean carbon cycle be affected by radiation management geoengineering?. In EGU General Assembly Conference Abstracts (p. 12177). https://ui.adsabs.harvard.edu/abs/2017EGUGA..1912177L/abstract 830 Lam, V.W., Allison, E.H., Bell, J.D., Blythe, J., Cheung, W.W., Frölicher, T.L., Gasalla, M.A. and Sumaila, U.R., 2020. Climate change, tropical fisheries and prospects for sustainable development. Nature Reviews Earth & Environment, 1(9), pp.440-454. http://labpesq.io.usp.br/images/publicacoes/_Lam_et_al_2020.pdf 831 The high-stakes game of geoengineering aims to mitigate impending climate disasters https://phys.org/news/2021-03-high-stakes-game-geoengineering-aims-mitigate.html 832 Kolbert, E. (2021), Under a White Sky: The Nature of the Future, Crown Publishing, NY 833 Abatayo, A.L., Bosetti, V., Casari, M., Ghidoni, R. and Tavoni, M., 2020. Solar geoengineering may lead to excessive cooling and high strategic uncertainty. Proceedings of the National Academy of Sciences, 117(24), pp.13393-13398.https://www.pnas.org/content/pnas/117/24/13393.full.pdf 834 Stephens, J.C. and Surprise, K., 2020. The hidden injustices of advancing solar geoengineering research. Global Sustainability, 3. https://www.cambridge.org/core/services/aop-cambridge-core/content/view/F61C5DCBCA02E18F66CAC7E45CC76C57/S2059479819000280a.pdf/hidden_injustices_of_advancing_solar_geoengineering_research.pdf

Climate Risk and Response July 2021
George Backus (Material is free to use with attribution.) A5.3
counter-geoengineering and likely outright conflict.835,836,837,838,839,840 Geoengineering also might not work.841
Second, despite “humans will do the right thing” arguments, the moral hazard of geoengineering is irresistible842 and not easily dismissed.843,844 It is a very slippery slope: as climate worsens due to societal inaction, do more geoengineering. In a divisive world, any political action will lead to political backlash causing more limited mitigation and more geoengineering. If “loser” countries physically try to stop or counter the (now intense) geoengineering (which is easy enough to do), the temperature bounce-back/distortions will be problematic.845
Geoengineering would need to be maintained for decades. Weary populations would likely slide back into pre-mitigation ways, forcing yet more geoengineering. A hypothetical, sudden and sustained termination846 of SRM causes a rapid increase in global warming with many consequences.847,848 The coordinated injection points for geoengineering are easily victims of
835 Geoengineering: A war on climate change? Andrew Lockley - Journal of Evolution and Technology, 2016 - https://discovery.ucl.ac.uk/id/eprint/10069470/1/war%20on%20climate%20change.pdf 836 Heyen, D., Horton, J. and Moreno-Cruz, J., 2019. Strategic implications of counter-geoengineering: Clash or cooperation?. Journal of Environmental Economics and Management, 95, pp.153-177. https://www.sciencedirect.com/science/article/pii/S0095069618305035/pdfft?md5=9aa3ceeac0e28f6ccaa6a68f5615bc74&pid=1-s2.0-S0095069618305035-main.pdf 837 Will rogue nations alter the atmosphere? Experts are looking, February 21, 2020, https://www.eenews.net/stories/1062405391 838 A rogue country could take planet-hacking into its own hands to alter the climate — and some experts worry it could lead to war, June 13, 2019, https://www.stamfordadvocate.com/technology/businessinsider/article/A-rogue-country-could-take-planet-hacking-into-13987325.php 839 Lockley, A., 2019. Security of solar radiation management geoengineering. Frontiers of Engineering Management, 6(1), pp.102-116. https://link.springer.com/content/pdf/10.1007/s42524-019-0008-5.pdf 840 Could geoengineering cause a climate war? https://www.sciencefocus.com/planet-earth/could-geoengineering-cause-a-climate-war/ 841 Geoengineering Might Not Save Us From a Cloud Apocalypse https://gizmodo.com/geoengineering-might-not-save-us-from-a-cloud-apocalyps-1845690617 842 Lin, A.C., 2013. Does geoengineering present a moral hazard. Ecology Law Quarterly, 40(3), p.673. https://escholarship.org/content/qt7th0d0pd/qt7th0d0pd.pdf 843 Gunderson, R., Stuart, D. and Petersen, B., 2019. The political economy of geoengineering as plan B: Technological rationality, moral hazard, and new technology. New Political Economy, 24(5), pp.696-715. https://www.cssn.org/wp-content/uploads/2020/11/The-Political-Economy-of-Geoengineering-as-Plan-B.pdf 844 Shayegh, S., Geoengineering is no climate fix. But calling it a moral hazard could be counterproductive. Bulletin of the Atomic Scientists, 2019. https://thebulletin.org/2019/12/geoengineering-is-no-climate-fix-but-calling-it-a-moral-hazard-could-be-counterproductive/ 845 Goes, M., Tuana, N. and Keller, K., 2011. The economics (or lack thereof) of aerosol geoengineering. Climatic change, 109(3), pp.719-744. https://personal.ems.psu.edu/~kzk10/Goes_cc_11.pdf 846 Parker, A. and Irvine, P.J., 2018. The risk of termination shock from solar geoengineering. Earth's Future, 6(3), pp.456-467. https://agupubs.onlinelibrary.wiley.com/doi/pdfdirect/10.1002/2017EF000735 847 Trisos, C.H., Amatulli, G., Gurevitch, J., Robock, A., Xia, L. and Zambri, B., 2018. Potentially dangerous consequences for biodiversity of solar geoengineering implementation and termination. Nature Ecology & Evolution, 2(3), pp.475-482. http://people.envsci.rutgers.edu/bzambri/pdf/NatureEecology_Geoengineering_OnlinePDF.pdf 848Plazzotta, M., Séférian, R. and Douville, H., 2019. Impact of solar radiation modification on allowable CO2 emissions: What can we learn from multimodel simulations?. Earth's Future, 7(6), pp.664-676. https://agupubs.onlinelibrary.wiley.com/doi/pdfdirect/10.1029/2019EF001165
Climate Risk and Response July 2021
George Backus (Material is free to use with attribution.) A5.4
budget cuts, local wars, and simple failures. The International stability needed to smoothly manage global geoengineering over the decades of implementation seems unlikely.849
There is significant uncertainty associated with effects of geoengineering that affect the ability to execute it,850,851 control it,852,853 and measure its consequence.854 This uncertainty increases political and societal tensons affecting its use.855,856 The high temperature outcomes of the analyses here, imply that studies which assumed restricted usage of geoengineering having minimal adverse impacts are inapplicable.857,858
Geoengineering may not be as effective as hoped859,860 and, even without moral hazard, it is an inappropriate initial response to climate change.861 Once initiated, geoengineering easily
849 Parker, A. and Irvine, P.J., 2018. The risk of termination shock from solar geoengineering. Earth's Future, 6(3), pp.456-467. https://agupubs.onlinelibrary.wiley.com/doi/pdfdirect/10.1002/2017EF000735 850 Tilmes, S., Richter, J.H., Mills, M.J., Kravitz, B., MacMartin, D.G., Vitt, F., Tribbia, J.J. and Lamarque, J.F., 2017. Sensitivity of aerosol distribution and climate response to stratospheric SO2 injection locations. Journal of Geophysical Research: Atmospheres, 122(23), pp.12-591. https://agupubs.onlinelibrary.wiley.com/doi/pdfdirect/10.1002/2017JD026888 851 Tilmes, S., Richter, J.H., Mills, M.J., Kravitz, B., MacMartin, D.G., Garcia, R.R., Kinnison, D.E., Lamarque, J.F., Tribbia, J. and Vitt, F., 2018. Effects of different stratospheric SO2 injection altitudes on stratospheric chemistry and dynamics. Journal of Geophysical Research: Atmospheres, 123(9), pp.4654-4673. https://agupubs.onlinelibrary.wiley.com/doi/pdf/10.1002/2017JD028146 852 Abatayo, Anna Lou, Valentina Bosetti, Marco Casari, Riccardo Ghidoni, and Massimo Tavoni. "Solar geoengineering may lead to excessive cooling and high strategic uncertainty." Proceedings of the National Academy of Sciences 117, no. 24 (2020): 13393-13398.https://www.pnas.org/content/pnas/117/24/13393.full.pdf 853 Persad, G.G. and Caldeira, K., 2018. Divergent global-scale temperature effects from identical aerosols emitted in different regions. Nature communications, 9(1), pp.1-9. https://www.nature.com/articles/s41467-018-05838-6.pdf 854 MacMartin, D.G., Wang, W., Kravitz, B., Tilmes, S., Richter, J.H. and Mills, M.J., 2019. Timescale for detecting the climate response to stratospheric aerosol geoengineering. Journal of Geophysical Research: Atmospheres, 124(3), pp.1233-1247. https://agupubs.onlinelibrary.wiley.com/doi/pdfdirect/10.1029/2018JD028906%4010.1002/%28ISSN%292169-8996.WACCM1 855 Kelly, D.L., Heutel, G., Moreno-Cruz, J.B. and Shayegh, S., 2021. Solar Geoengineering, Learning, and Experimentation (No. w28442). National Bureau of Economic Research. https://www.nber.org/system/files/working_papers/w28442/w28442.pdf 856 Shepherd, J.G., 2009. Geoengineering the climate: science, governance and uncertainty. Royal Society. https://eprints.soton.ac.uk/156647/1/Geoengineering_the_climate.pdf 857 Tilmes, S., MacMartin, D.G., Lenaerts, J., Kampenhout, L.V., Muntjewerf, L., Xia, L., Harrison, C.S., Krumhardt, K.M., Mills, M.J., Kravitz, B. and Robock, A., 2020. Reaching 1.5 and 2.0° C global surface temperature targets using stratospheric aerosol geoengineering. Earth System Dynamics, 11(3), pp.579-601. https://esd.copernicus.org/articles/11/579/2020/esd-11-579-2020.pdf 858 Bickel, J.E. and Agrawal, S., 2013. Reexamining the economics of aerosol geoengineering. Climatic change, 119(3), pp.993-1006. https://www.researchgate.net/profile/J_Bickel/publication/228764370_Reexamining_the_economics_of_aerosol_geoengineering/links/00b4952b0aeec9787d000000.pdf 859 Solar geoengineering may not prevent strong warming from direct effects of CO2 on stratocumulus cloud cover. Tapio Schneider, Colleen M. Kaul, Kyle G. Pressel. Proceedings of the National Academy of Sciences Nov 2020, 202003730; DOI: 10.1073/pnas.2003730117 https://www.pnas.org/content/pnas/117/48/30179.full.pdf 860 Shepherd, J.G., 2009. Geoengineering the climate: science, governance and uncertainty. Royal Society. https://eprints.soton.ac.uk/156647/1/Geoengineering_the_climate.pdf 861 Ibid. Kolbert

Climate Risk and Response July 2021
George Backus (Material is free to use with attribution.) A5.5
becomes locked-in and hinders the ability for future technologies to counter earlier decisions.862,863
862 McKinnon, C., 2019. Sleepwalking into lock-in? Avoiding wrongs to future people in the governance of solar radiation management research. Environmental Politics, 28(3), pp.441-459. https://ore.exeter.ac.uk/repository/bitstream/handle/10871/38913/Final%20submitted%20Feb%2028.pdf?sequence=2 863 Cairns, R.C., 2014. Climate geoengineering: issues of path‐dependence and socio‐technical lock‐in. Wiley Interdisciplinary Reviews: Climate Change, 5(5), pp.649-661. https://core.ac.uk/download/pdf/30608720.pdf
Climate Risk and Response July 2021
George Backus (Material is free to use with attribution.) A6.1
Appendix 6: Counterproductive Biomass Energy and Offsets
This Appendix justifies why biomass-for-energy and bio-sequestering offsets are not included in the Policy Package of Section 3.1
A6.1 Biomass for Energy
Biomass, when burned, emits CO2. Although using bioenergy is claimed to be carbon-neutral, there are many aspects of it that are not.864,865,866,867,868,869,870 The two most important elements have to do with the timing of bioenergy cycle dynamics871 and with the partially related energy payback period. Each will be discussed below.
New biomass growth can ultimately absorb the emissions of burning biomass for energy, but the timing is detrimental to the immediate need to reduce emissions.872,873
864 Stop burning trees for energy, hundreds of scientists tell EU leaders https://www.euronews.com/green/2021/02/12/stop-burning-trees-for-energy-hundreds-of-scientists-tell-eu-leaders 865 Vaughan, N.E. and Gough, C., 2016. Expert assessment concludes negative emissions scenarios may not deliver. Environmental research letters, 11(9), p.095003. https://iopscience.iop.org/article/10.1088/1748-9326/11/9/095003/pdf 866 Booth MS, 2011, Carbon emissions from burning biomass for energy, Partnership for Policy Integrity, Pelham, MA https://www.pfpi.net/wp-content/uploads/2011/04/PFPI-biomass-carbon-accounting-overview_April.pdf 867 Is burning wood for power carbon-neutral? Not a chance https://www.latimes.com/opinion/story/2020-12-28/wood-burning-power-plants-clean-energy 868 Ter-Mikaelian, M.T., Colombo, S.J. and Chen, J., 2015. The burning question: does forest bioenergy reduce carbon emissions? A review of common misconceptions about forest carbon accounting. Journal of Forestry, 113(1), pp.57-68. https://www.researchgate.net/profile/Michael-Ter-Mikaelian/publication/271224456_The_Burning_Question_Does_Forest_Bioenergy_Reduce_Carbon_Emissions_A_Review_of_Common_Misconceptions_about_Forest_Carbon_Accounting/links/59550f2daca2729e74bc1cd3/The-Burning-Question-Does-Forest-Bioenergy-Reduce-Carbon-Emissions-A-Review-of-Common-Misconceptions-about-Forest-Carbon-Accounting.pdf 869 Booth, M.S., 2018. Not carbon neutral: Assessing the net emissions impact of residues burned for bioenergy. Environmental Research Letters, 13(3), p.035001. https://iopscience.iop.org/article/10.1088/1748-9326/aaac88/pdf 870 'Carbon-neutrality is a fairy tale': how the race for renewables is burning Europe's forests https://www.theguardian.com/world/2021/jan/14/carbon-neutrality-is-a-fairy-tale-how-the-race-for-renewables-is-burning-europes-forests 871 The Case Against Carbon Capture: False Claims and New Pollution https://foodandwaterwatch.org/wp-content/uploads/2021/04/ib_2003_carboncapture-web.pdf 872 Searchinger, T.D., Beringer, T., Holtsmark, B., Kammen, D.M., Lambin, E.F., Lucht, W., Raven, P. and van Ypersele, J.P., 2018. Europe’s renewable energy directive poised to harm global forests. Nature communications, 9(1), pp.1-4. https://www.nature.com/articles/s41467-018-06175-4.pdf 873 Brienen, R.J., Caldwell, L., Duchesne, L., Voelker, S., Barichivich, J., Baliva, M., Ceccantini, G., Di Filippo, A., Helama, S., Locosselli, G.M. and Lopez, L., 2020. Forest carbon sink neutralized by pervasive growth-lifespan trade-offs. Nature communications, 11(1), pp.1-10. https://www.nature.com/articles/s41467-020-17966-z.pdf
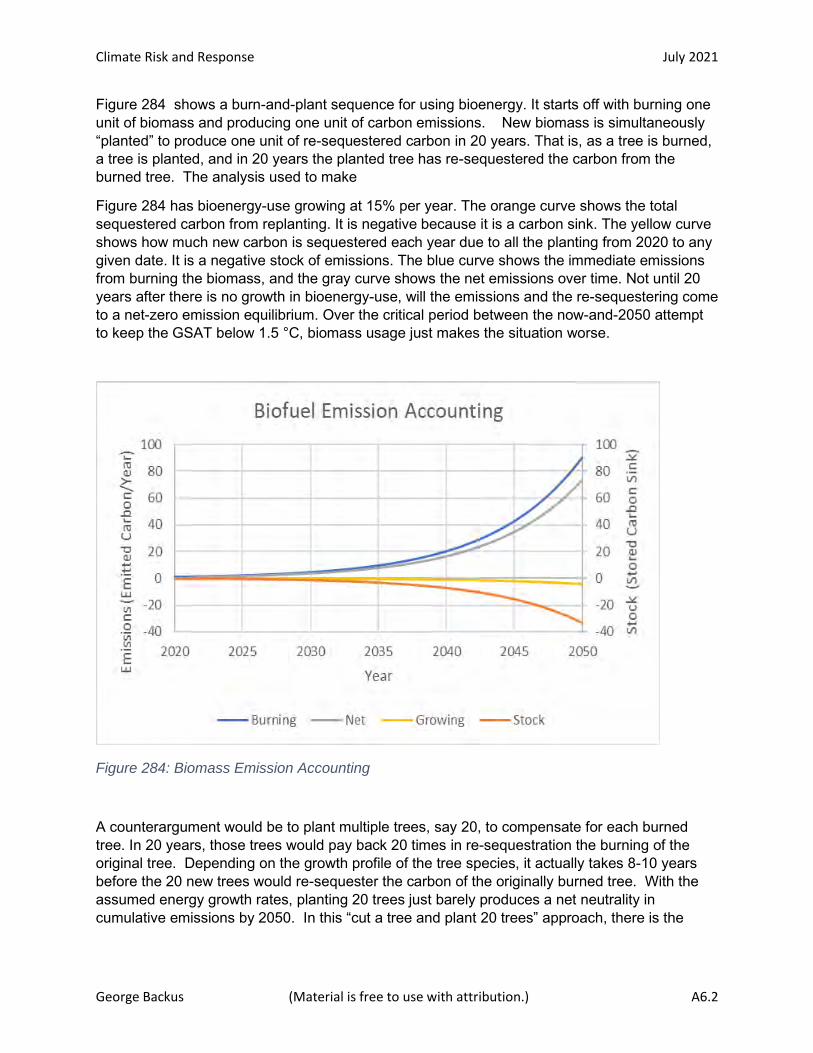
Climate Risk and Response July 2021
George Backus (Material is free to use with attribution.) A6.2
Figure 284 shows a burn-and-plant sequence for using bioenergy. It starts off with burning one unit of biomass and producing one unit of carbon emissions. New biomass is simultaneously “planted” to produce one unit of re-sequestered carbon in 20 years. That is, as a tree is burned, a tree is planted, and in 20 years the planted tree has re-sequestered the carbon from the burned tree. The analysis used to make
Figure 284 has bioenergy-use growing at 15% per year. The orange curve shows the total sequestered carbon from replanting. It is negative because it is a carbon sink. The yellow curve shows how much new carbon is sequestered each year due to all the planting from 2020 to any given date. It is a negative stock of emissions. The blue curve shows the immediate emissions from burning the biomass, and the gray curve shows the net emissions over time. Not until 20 years after there is no growth in bioenergy-use, will the emissions and the re-sequestering come to a net-zero emission equilibrium. Over the critical period between the now-and-2050 attempt to keep the GSAT below 1.5 °C, biomass usage just makes the situation worse.
Figure 284: Biomass Emission Accounting
A counterargument would be to plant multiple trees, say 20, to compensate for each burned tree. In 20 years, those trees would pay back 20 times in re-sequestration the burning of the original tree. Depending on the growth profile of the tree species, it actually takes 8-10 years before the 20 new trees would re-sequester the carbon of the originally burned tree. With the assumed energy growth rates, planting 20 trees just barely produces a net neutrality in cumulative emissions by 2050. In this “cut a tree and plant 20 trees” approach, there is the

Climate Risk and Response July 2021
George Backus (Material is free to use with attribution.) A6.3
need for a tremendous amount of new land.874,875,876 And there is the need to maintain and ensure the sequestering capacity of that silviculture. After all the effort, the result is only a net zero in carbon emissions. If solar or wind would have been used to make power, all those new forests would have a strong net positive impact on emissions reduction. Forgetting the secondary emission dynamics of the changing land use emissions, bioenergy does not directly help the energy transition.877 It is not really a substitute for fossil fuel energy. Wind and solar can do that. Biomass energy is either a net carbon producer or it wastes the direct benefits of reforestation.
The IPCC Special report on Climate Change and Land (SRCCL)878 notes the land issues associated with biomass use. Bioenergy and afforestation compete with food concerns.879 Agricultural intensity due to climate change will challenge the ability to maintain land uses880 for sequestering and the ability to prevent future deforestation.881,882,883
The complications above lead to a second counter argument for bioenergy use: the use of biomass should include direct carbon capture from the stack of the power plant (BECCS).884 The capturing and sequestration process requires a great deal of energy and a great deal of
874 Hanssen, Daioglou, Steinmann et al, 2020. The climate change mitigation potential of bioenergy with carbon capture and storage. Nature Climate Change. DOI: 10.1038/s41558-020-0885-y https://www.nature.com/articles/s41558-020-0885-y 875 Creutzig, F., Erb, K.‐H., Haberl, H., Hof, C., Hunsberger, C. and Roe, S. (2021), Considering sustainability thresholds for BECCS in IPCC and biodiversity assessments. GCB Bioenergy, 13: 510-515. https://doi.org/10.1111/gcbb.12798 https://onlinelibrary.wiley.com/doi/pdf/10.1111/gcbb.12798 876 Luderer, G., Pehl, M., Arvesen, A., Gibon, T., Bodirsky, B.L., de Boer, H.S., Fricko, O., Hejazi, M., Humpenöder, F., Iyer, G. and Mima, S., 2019. Environmental co-benefits and adverse side-effects of alternative power sector decarbonization strategies. Nature communications, 10(1), pp.1-13. https://www.nature.com/articles/s41467-019-13067-8.pdf 877 Bioresources within a Net-Zero Emissions Economy, 2021. https://www.energy-transitions.org/publications/bioresources-within-a-net-zero-emissions-economy/ 878 IPCC, 2019: Climate Change and Land: an IPCC special report on climate change, desertification, land degradation, sustainable land management, food security, and greenhouse gas fluxes in terrestrial ecosystems [P.R. Shukla, J. Skea, E. Calvo Buendia, V. Masson-Delmotte, H.-O. Pörtner, D. C. Roberts, P. Zhai, R. Slade, S. Connors, R. van Diemen, M. Ferrat, E. Haughey, S. Luz, S. Neogi, M. Pathak, J. Petzold, J. Portugal Pereira, P. Vyas, E. Huntley, K. Kissick, M. Belkacemi, J. Malley, (eds.)]. https://www.ipcc.ch/site/assets/uploads/2019/08/Fullreport-1.pdf 879 Peña-Lévano, L.M., Taheripour, F. and Tyner, W.E., 2019. Climate change interactions with agriculture, forestry sequestration, and food security. Environmental and Resource Economics, 74(2), pp.653-675. https://link.springer.com/content/pdf/10.1007/s10640-019-00339-6.pdf 880 Winkler, K., Fuchs, R., Rounsevell, M. and Herold, M., 2021. Global land use changes are four times greater than previously estimated. Nature communications, 12(1), pp.1-10. https://www.nature.com/articles/s41467-021-22702-2.pdf 881 Reid, W.V., Ali, M.K. and Field, C.B., 2020. The future of bioenergy. Global Change Biology, 26(1), pp.274-286. https://onlinelibrary.wiley.com/doi/pdf/10.1111/gcb.14883 882 Creutzig, F., Erb, K.‐H., Haberl, H., Hof, C., Hunsberger, C. and Roe, S. (2021), Considering sustainability thresholds for BECCS in IPCC and biodiversity assessments. GCB Bioenergy, 13: 510-515. https://doi.org/10.1111/gcbb.12798 https://onlinelibrary.wiley.com/doi/pdf/10.1111/gcbb.12798 883 Deforestation in Brazil Amazon rainforest soars 67 percent https://www.aljazeera.com/news/2021/6/11/deforestation-in-brazil-amazon-rainforest-soars-67-percent 884 Creutzig, F., Breyer, C., Hilaire, J., Minx, J., Peters, G.P. and Socolow, R., 2019. The mutual dependence of negative emission technologies and energy systems. Energy & Environmental Science, 12(6), pp.1805-1817. https://pubs.rsc.org/en/content/articlepdf/2019/ee/c8ee03682a

Climate Risk and Response July 2021
George Backus (Material is free to use with attribution.) A6.4
front-end investment. The increased energy demand not only comes from the reduced heat-rate of the power plant885 but also from the harvesting, processing, and transportation of the now much increased wood volume used at the power plant. The DAC used here (See Section 4.5). is much more effective than BECCS.886 Without carbon capture, the energy payback time for a biomass plant (and for biogas) is around 3.2 years.887,888,889 This is worse than that of wind and solar generation (See Appendix 3). The involved dynamics are different than those of wind/solar due to the timing of energy use with biomass facilities, but the overall consequences are the same as those in Appendix 3. If carbon capture is added, the payback period rises to over 5 years.890,lviii Payback periods of even one year are too long to enable a successful GHG transition by even 2060. (See Section 4.3.3) BECCS is one example of where the concept of Net-Zero fails to accomplish adequate climate change policy.891
The logic above also applies to supposed net-neutral liquid biofuels and why they are excluded from the Policy Package.
885 The Case Against Carbon Capture: False Claims and New Pollution https://foodandwaterwatch.org/wp-content/uploads/2021/04/ib_2003_carboncapture-web.pdf 886 Creutzig, F., Breyer, C., Hilaire, J., Minx, J., Peters, G.P. and Socolow, R., 2019. The mutual dependence of negative emission technologies and energy systems. Energy & Environmental Science, 12(6), pp.1805-1817. https://pubs.rsc.org/en/content/articlepdf/2019/ee/c8ee03682a 887 Wang, C., Zhang, L., Chang, Y. and Pang, M., 2015. Biomass direct-fired power generation system in China: An integrated energy, GHG emissions, and economic evaluation for Salix. Energy Policy, 84, pp.155-165. https://www.sciencedirect.com/science/article/abs/pii/S0301421515001755 888 Arif, M., 2012. Energy analysis and carbon credit earned by bio gas system. Int. J. Res. Eng. Applied Sci, 2, pp.999-1010. https://citeseerx.ist.psu.edu/viewdoc/download?doi=10.1.1.465.174&rep=rep1&type=pdf 889 Prananta, W. and Kubiszewski, I., 2021. Assessment of Indonesia’s Future Renewable Energy Plan: A Meta-Analysis of Biofuel Energy Return on Investment (EROI). Energies, 14(10), p.2803. https://www.mdpi.com/1996-1073/14/10/2803/pdf 890 Sgouridis, S., Carbajales-Dale, M., Csala, D., Chiesa, M. and Bardi, U., 2019. Comparative net energy analysis of renewable electricity and carbon capture and storage. Nature Energy, 4(6), pp.456-465. https://eprints.lancs.ac.uk/id/eprint/133171/1/5890_4_art_0_pnk0xh.pdf 891 Climate scientists: concept of net zero is a dangerous trap https://theconversation.com/climate-scientists-concept-of-net-zero-is-a-dangerous-trap-157368

Climate Risk and Response July 2021
George Backus (Material is free to use with attribution.) A6.5
A6.2 Biomass for Sequestration
There are potentially many options for the sequestration of carbon via agriculture practices.892 However, all are either too slow,893 too ambiguous,894 too limited,895 too uncertain,896,897 have counterproductive side effects,898,899 or their combined use violates the premise here that the number of climate initiatives have to be minimized for governments to have a chance at successful implementation. (See Section 1.3). The uncertainty implies that their lack of reliability makes them an unacceptable option when effective carbon sequestering is critical to successful climate policy.900 Because this work indicates that mitigation will still lead to unacceptable temperatures, the resulting changes in extreme environmental conditions, the ability to maintain soil-based carbon sequestration901,902 or even preventing it from becoming a carbon
892 Hepburn, C., Adlen, E., Beddington, J., Carter, E.A., Fuss, S., Mac Dowell, N., Minx, J.C., Smith, P. and Williams, C.K., 2019. The technological and economic prospects for CO 2 utilization and removal. Nature, 575(7781), pp.87-97. http://eprints.whiterose.ac.uk/154677/1/Hepburn%20et%20al%202019%20CO2%20Utilisation%20-%20in%20press.pdf 893 Zhang, Mingfang, and Xiaohua Wei. "Deforestation, forestation, and water supply." Science 371, no. 6533 (2021): 990-991. https://ok-watersheds.sites.olt.ubc.ca/files/2021/03/Deforestation-forestation-and-water-supply-Science.pdf 894 10 myths about net zero targets and carbon offsetting, busted https://www.climatechangenews.com/2020/12/11/10-myths-net-zero-targets-carbon-offsetting-busted/ 895 Fuss, S., Lamb, W.F., Callaghan, M.W., Hilaire, J., Creutzig, F., Amann, T., Beringer, T., de Oliveira Garcia, W., Hartmann, J., Khanna, T. and Luderer, G., 2018. Negative emissions—Part 2: Costs, potentials and side effects. Environmental Research Letters, 13(6), p.063002. https://iopscience.iop.org/article/10.1088/1748-9326/aabf9f/pdf 896 Covey, K., Soper, F., Pangala, S., Bernardino, A., Pagliaro, Z., Basso, L., Cassol, H., Fearnside, P., Navarrete, D., Novoa, S. and Sawakuchi, H., 2021. Carbon and Beyond: The Biogeochemistry of Climate in a Rapidly Changing Amazon. Frontiers in Forests and Global Change, 4, p.11. https://www.frontiersin.org/articles/10.3389/ffgc.2021.618401/pdf 897 Humphrey, V., Berg, A., Ciais, P., Gentine, P., Jung, M., Reichstein, M., Seneviratne, S.I. and Frankenberg, C., 2021. Soil moisture–atmosphere feedback dominates land carbon uptake variability. Nature, 592(7852), pp.65-69. https://www.nature.com/articles/s41586-021-03325-5.pdf 898 Mulligan, James, Gretchen Ellison, Rebecca Gasper, and Alex Rudee. "Carbon removal in forests and farms in the United States." (2018). https://www.wri.org/publication/land-carbon-removal-usa 899 Sustainable Bioenergy: A Framework for Decision Makers, United Nations 2007 http://www.fao.org/docrep/pdf/010/a1094e/a1094e00.pdf 900 Doelman, J.C., Stehfest, E., van Vuuren, D.P., Tabeau, A., Hof, A.F., Braakhekke, M.C., Gernaat, D.E., van den Berg, M., van Zeist, W.J., Daioglou, V. and van Meijl, H., 2020. Afforestation for climate change mitigation: Potentials, risks and trade‐offs. Global change biology, 26(3), pp.1576-1591. https://dspace.library.uu.nl/bitstream/handle/1874/394618/Doelman_et_al_2020_Global_Change_Biology.pdf?sequence=1 901 Borrelli, P., Robinson, D.A., Panagos, P., Lugato, E., Yang, J.E., Alewell, C., Wuepper, D., Montanarella, L. and Ballabio, C., 2020. Land use and climate change impacts on global soil erosion by water (2015-2070). Proceedings of the National Academy of Sciences, 117(36), pp.21994-22001. https://www.pnas.org/content/pnas/117/36/21994.full.pdf 902 Yuan, W., Cai, W., Chen, Y., Liu, S., Dong, W., Zhang, H., Yu, G., Chen, Z., He, H., Guo, W. and Liu, D., 2016. Severe summer heatwave and drought strongly reduced carbon uptake in Southern China. Scientific Reports, 6(1), pp.1-12. https://www.nature.com/articles/srep18813.pdf
Climate Risk and Response July 2021
George Backus (Material is free to use with attribution.) A6.6
source,903,904,905 will be quite limited.906, 907 Land-use changes reduce the sequestering ability as well.908,909 The intensification of agriculture to maintain food supplies to the extent possible will reinforce detrimental climate effects.910,911
There is also concern that deforestation912 and the reversion to tillage farming913 will also limit biological sequestration. Therefore, this study does not explicitly include land-management as part of the primary mitigation process although reduced emissions from agricultural activity are directly included.
It is unreasonable for countries and companies to make offset-intensive, net carbon zero pledges that can never be realized. There are not enough carbon credits available to match the intent,914 many of those are over-counted,915 many are used to avoid taking actual GHG-
903 Elevated warming, ozone have detrimental effects on plant roots, promote soil carbon loss https://phys.org/news/2021-07-elevated-ozone-detrimental-effects-roots.html 904 Amazon rainforest now emitting more CO2 than it absorbs https://www.theguardian.com/environment/2021/jul/14/amazon-rainforest-now-emitting-more-co2-than-it-absorbs 905 NASA Study Finds Tropical Forests' Ability to Absorb Carbon Dioxide Is Waninghttps://climate.nasa.gov/news/3102/nasa-study-finds-tropical-forests-ability-to-absorb-carbon-dioxide-is-waning/ 906 Climate intervention: carbon dioxide removal and reliable sequestration. National Academies Press, 2015. https://www.nap.edu/cart/download.cgi?record_id=18805 907 Nottingham, A.T., Meir, P., Velasquez, E. and Turner, B.L., 2020. Soil carbon loss by experimental warming in a tropical forest. Nature, 584(7820), pp.234-237. https://www.pure.ed.ac.uk/ws/files/145391781/208._Nottingham_Meir.pdf 908 Li Lai et al, “Carbon emissions from land-use change and management in China between 1990 and 2010,” Science Advances, 2016. https://advances.sciencemag.org/content/2/11/e1601063 909 Lei Deng et al, “Global patterns of the effects of land-use changes on soil carbon stocks,” Global Ecology and Conservation, January 2016. https://www.sciencedirect.com/science/article/pii/S2351989415300226 910 Climate Change and Agriculture https://www.ucsusa.org/resources/climate-change-and-agriculture 911 Up-trending farming and landscape disruptions threaten Paris climate agreement goals https://phys.org/news/2021-01-up-trending-farming-landscape-disruptions-threaten.html 912 Deforestation and Climate Change, Congressional Research Services, 2010 http://forestindustries.eu/sites/default/files/userfiles/1file/R41144.pdf 913 Claassen, R., Bowman, M., McFadden, J., Smith, D. and Wallander, S., 2018. Tillage intensity and conservation cropping in the United States (No. 1476-2018-5723). https://www.ers.usda.gov/webdocs/publications/90201/eib-197.pdf?v=7027.1 914 Toensmeier, E.; Garrity, D. The Biomass Bottleneck, Strategies for drawing down carbon dioxide depend on more trees, grasses and crop residues than the planet can spare. Sci. Am. 2020, 66–71. https://www.scientificamerican.com/article/how-climate-change-strategies-that-use-biomass-can-be-more-realistic/ 915 The math isn’t adding up on forests and CO2 reductions https://www.theverge.com/2021/4/29/22410367/forest-offsets-trees-carbon-dioxide-accounting

Climate Risk and Response July 2021
George Backus (Material is free to use with attribution.) A6.7
reduction measures,916 and many are misstated greenwashing.917,918,919 Expected climate conditions and competing economic interests indicate that soil-based offsets won’t be maintained and that sequestering will have a much shorter lifetime than advertised.920 Disadvantaged countries, which are seen as the major source of the offsets, will not have the economic or governance capability to honor offset agreements. The trade in offsets along with the need to import other goods (e.g., food) could affect the stability of the Disadvantaged countries.921 Failure to maintain soil sequestering activities quickly leads to the re-emission of carbon.922 With climate change the challenge to produce adequate food will be extreme.923,924 The growth in agricultural activity increases land-based CO2 emission925 The new agricultural activity itself entails added N2O emissions.926,927 Afforestation negatively impacts watersheds and reducing ecosystem carbon-sequestration.928,929
916 Environmentalists cast doubt on carbon offsets https://www.ft.com/content/81d436c2-79f1-4a43-ab52-cbbcddb149df 917 The truth behind companies' 'net zero' climate commitments https://thehill.com/opinion/energy-environment/547410-the-truth-behind-companies-net-zero-climate-commitments 918 Why ‘100% renewable energy’ pledges are not enough https://www.ft.com/content/d75f49d0-103f-11ea-a225-db2f231cfeae 919 The climate crisis can't be solved by carbon accounting tricks https://www.theguardian.com/commentisfree/2021/mar/03/climate-crisis-carbon-accounting-tricks-big-finance 920 Is carbon sequestration on farms actually working to fight climate change? https://www.greenbiz.com/article/carbon-sequestration-farms-actually-working-fight-climate-change 921 Li, Q. and Reuveny, R., 2011. Does trade prevent or promote interstate conflict initiation?. Journal of Peace Research, 48(4), pp.437-453. https://www.researchgate.net/profile/Quan-Li/publication/227574742_Does_Trade_Prevent_or_Promote_Interstate_Conflict_Initiation/links/0c9605361b83b1268f000000/Does-Trade-Prevent-or-Promote-Interstate-Conflict-Initiation.pdf 922 Plazzotta, M., Séférian, R. and Douville, H., 2019. Impact of solar radiation modification on allowable CO2 emissions: What can we learn from multimodel simulations?. Earth's Future, 7(6), pp.664-676. https://agupubs.onlinelibrary.wiley.com/doi/pdfdirect/10.1029/2019EF001165 923 Godfray, H.C.J., Beddington, J.R., Crute, I.R., Haddad, L., Lawrence, D., Muir, J.F., Pretty, J., Robinson, S., Thomas, S.M. and Toulmin, C., 2010. Food security: the challenge of feeding 9 billion people. science, 327(5967), pp.812-818. https://www.researchgate.net/profile/Sherman-Robinson/publication/41173771_Food_Security_The_Challenge_of_Feeding_9_Billion_People/links/0fcfd51390602ae00a000000/Food-Security-The-Challenge-of-Feeding-9-Billion-People.pdf 924 Zhao, C., Liu, B., Piao, S., Wang, X., Lobell, D.B., Huang, Y., Huang, M., Yao, Y., Bassu, S., Ciais, P. and Durand, J.L., 2017. Temperature increase reduces global yields of major crops in four independent estimates. Proceedings of the National Academy of Sciences, 114(35), pp.9326-9331. https://www.pnas.org/content/pnas/114/35/9326.full.pdf?ftag=MSFd61514f 925 Hannah, L., Roehrdanz, P.R., KC, K.B., Fraser, E.D., Donatti, C.I., Saenz, L., Wright, T.M., Hijmans, R.J., Mulligan, M., Berg, A. and van Soesbergen, A., 2020. The environmental consequences of climate-driven agricultural frontiers. PloS one, 15(2), p.e0228305. https://journals.plos.org/plosone/article/file?id=10.1371/journal.pone.0228305&type=printable 926 https://www.epa.gov/ghgemissions/sources-greenhouse-gas-emissions 927 The world's forgotten greenhouse gas https://www.bbc.com/future/article/20210603-nitrous-oxide-the-worlds-forgotten-greenhouse-gas 928 Holl, K.D. and Brancalion, P.H., 2020. Tree planting is not a simple solution. Science, 368(6491), pp.580-581. https://www.researchgate.net/profile/Pedro-Brancalion/publication/341226573_Tree_planting_is_not_a_simple_solution/links/5ec54013458515626cb89c32/Tree-planting-is-not-a-simple-solution.pdf 929 Zhang, M. and Wei, X., 2021. Deforestation, forestation, and water supply. Science, 371(6533), pp.990-991. https://ok-watersheds.sites.olt.ubc.ca/files/2021/03/Deforestation-forestation-and-water-supply-Science.pdf

Climate Risk and Response July 2021
George Backus (Material is free to use with attribution.) A6.8
Afforestation is a major part of many biological sequestering discussions. Deforestation is accelerating,930,931,932 and as will be noted shortly, the ability for the natural ecosystem to absorb CO2 is deteriorating.933,934 The high temperatures in this study indicate that afforestation will not be as efficient as hoped.935,936,937,938 It may even be counterproductive.939 As increased agricultural land use940 works against soil sequestration,941 the increased land-use also works
930 FAO. 2020. Global Forest Resources Assessment 2020: Main report. Rome. https://doi.org/10.4060/ca9825en 931 Deforestation Estimates https://rainforests.mongabay.com/general_tables.htm https://www.bbc.com/future/article/20210603-nitrous-oxide-the-worlds-forgotten-greenhouse-gas 932 Naill, R.F. and Backus, G.A., 1977. Evaluating the national energy plan. Technol. Rev.;(United States), 79(8). https://www.downtoearth.org.in/news/climate-change/climate-crisis-deforestation-in-southeast-asia-mountains-on-the-rise-77920 933 Harris, N.L., Gibbs, D.A., Baccini, A., Birdsey, R.A., De Bruin, S., Farina, M., Fatoyinbo, L., Hansen, M.C., Herold, M., Houghton, R.A. and Potapov, P.V., 2021. Global maps of twenty-first century forest carbon fluxes. Nature Climate Change, 11(3), pp.234-240. https://www.nature.com/articles/s41558-020-00976-6.epdf 934 Nisbet, E.G., Dlugokencky, E.J., Manning, M.R., Lowry, D., Fisher, R.E., France, J.L., Michel, S.E., Miller, J.B., White, J.W.C., Vaughn, B. and Bousquet, P., 2016. Rising atmospheric methane: 2007–2014 growth and isotopic shift. Global Biogeochemical Cycles, 30(9), pp.1356-1370. https://agupubs.onlinelibrary.wiley.com/doi/pdfdirect/10.1002/2016GB005406?download=true 935 Wang, S., Zhang, Y., Ju, W., Chen, J.M., Ciais, P., Cescatti, A., Sardans, J., Janssens, I.A., Wu, M., Berry, J.A. and Campbell, E., 2020. Recent global decline of CO2 fertilization effects on vegetation photosynthesis. Science, 370(6522), pp.1295-1300. https://ore.exeter.ac.uk/repository/bitstream/handle/10871/124090/Combined_manuscript_v8_clean.pdf?sequence=1&isAllowed=y 936 2 °C of Warming Could Open The Floodgates For 230 Billion Tons of Carbon to Escape https://www.sciencealert.com/2-c-of-warming-could-open-the-floodgates-for-billions-of-tons-of-soil-carbon 937 Fiercer, more frequent fires may reduce carbon capture by forests https://www.theguardian.com/environment/2021/feb/25/fiercer-more-frequent-fires-may-reduce-carbon-capture-forests 938 Li, R., Zheng, H., O’Connor, P., Xu, H., Li, Y., Lu, F., Robinson, B.E., Ouyang, Z., Hai, Y. and Daily, G.C., 2021. Time and space catch up with restoration programs that ignore ecosystem service trade-offs. Science Advances, 7(14), p.eabf8650. https://advances.sciencemag.org/content/advances/7/14/eabf8650.full.pdf 939 Climate change: Planting new forests 'can do more harm than good' https://www.bbc.com/news/science-environment-53138178 940 Zabel, F., Delzeit, R., Schneider, J.M., Seppelt, R., Mauser, W. and Václavík, T., 2019. Global impacts of future cropland expansion and intensification on agricultural markets and biodiversity. Nature communications, 10(1), pp.1-10. https://www.nature.com/articles/s41467-019-10775-z.pdf 941 Qiu, C., Ciais, P., Zhu, D., Guenet, B., Peng, S., Petrescu, A.M.R., Lauerwald, R., Makowski, D., Gallego-Sala, A.V., Charman, D.J. and Brewer, S.C., 2021. Large historical carbon emissions from cultivated northern peatlands. Science advances, 7(23), p.eabf1332. https://advances.sciencemag.org/content/7/23/eabf1332
Climate Risk and Response July 2021
George Backus (Material is free to use with attribution.) A6.9
against preservation of forested land.942,943 Agriculture and DAC compete with afforestation and other biological sequestering approaches.944
While the (Shared Socioeconomic Pathways) SSP simulations used in AR5 have the terrestrial sinks increasing at a rate of 0.3% per year, this study has them decreasing at a rate of 1.2% per year. This value was obtained by simulating the temperature and CO2 GHG concentration through 2019.lix Several studies have noted the potential for the terrestrial carbon sink to become a GHG source.945 One concern comes from the change in photosynthesis as a function of temperature and precipitation.946,947 Temperature as used in this context is to some degree a surrogate for other land use changes. This work makes the change in terrestrial carbon contribution a function of time rather than temperature but it generates an average 1.2%/year reduction the same as does Maia.948 A study of tree life also indicates a loss in terrestrial sink capabilities, but it is much harder to assess appropriate values through 2100.949 Studies of the 1) combined tropical rain forest degradation,950,951 2) northern (Boreal Forest) insect infestation
942 Kreidenweis, U., Humpenöder, F., Stevanović, M., Bodirsky, B.L., Kriegler, E., Lotze-Campen, H. and Popp, A., 2016. Afforestation to mitigate climate change: impacts on food prices under consideration of albedo effects. Environmental Research Letters, 11(8), p.085001. https://iopscience.iop.org/article/10.1088/1748-9326/11/8/085001/pdf 943 Pendrill, F., Persson, U.M., Godar, J., Kastner, T., Moran, D., Schmidt, S. and Wood, R., 2019. Agricultural and forestry trade drives large share of tropical deforestation emissions. Global Environmental Change, 56, pp.1-10. https://www.sciencedirect.com/science/article/pii/S0959378018314365/pdfft?md5=669f578997fbbb4b02f39ae3c99216ee&pid=1-s2.0-S0959378018314365-main.pdf 944 Fuhrman, J., McJeon, H., Patel, P., Doney, S.C., Shobe, W.M. and Clarens, A.F., 2020. Food–energy–water implications of negative emissions technologies in a+ 1.5 C future. Nature Climate Change, 10(10), pp.920-927. https://www.nature.com/articles/s41558-020-0876-z 945 First study of all Amazon greenhouse gases suggests the damaged forest is now worsening climate change https://www.nationalgeographic.com/environment/article/amazon-rainforest-now-appears-to-be-contributing-to-climate-change 946 Duffy, K.A., Schwalm, C.R., Arcus, V.L., Koch, G.W., Liang, L.L. and Schipper, L.A., 2021. How close are we to the temperature tipping point of the terrestrial biosphere?. Science advances, 7(3), p.eaay1052. https://advances.sciencemag.org/content/advances/7/3/eaay1052.full.pdf 947 Wang, S., Zhang, Y., Ju, W., Chen, J.M., Ciais, P., Cescatti, A., Sardans, J., Janssens, I.A., Wu, M., Berry, J.A. and Campbell, E., 2020. Recent global decline of CO2 fertilization effects on vegetation photosynthesis. Science, 370(6522), pp.1295-1300. https://ore.exeter.ac.uk/repository/bitstream/handle/10871/124090/Combined_manuscript_v8_clean.pdf?sequence=1&isAllowed=y 948 Maia, V.A., Santos, A.B.M., de Aguiar-Campos, N., de Souza, C.R., de Oliveira, M.C.F., Coelho, P.A., Morel, J.D., da Costa, L.S., Farrapo, C.L., Fagundes, N.C.A. and de Paula, G.G.P., 2020. The carbon sink of tropical seasonal forests in southeastern Brazil can be under threat. Science Advances, 6(51), p.eabd4548. https://advances.sciencemag.org/content/advances/6/51/eabd4548.full.pdf 949 Brienen, R.J., Caldwell, L., Duchesne, L., Voelker, S., Barichivich, J., Baliva, M., Ceccantini, G., Di Filippo, A., Helama, S., Locosselli, G.M. and Lopez, L., 2020. Forest carbon sink neutralized by pervasive growth-lifespan trade-offs. Nature communications, 11(1), pp.1-10. https://www.nature.com/articles/s41467-020-17966-z.pdf 950 First study of all Amazon greenhouse gases suggests the damaged forest is now worsening climate change https://www.nationalgeographic.com/environment/article/amazon-rainforest-now-appears-to-be-contributing-to-climate-change 951 Unchecked climate change will cause severe drying of the Amazon forest https://phys.org/news/2021-06-unchecked-climate-severe-amazon-forest.html
Climate Risk and Response July 2021
George Backus (Material is free to use with attribution.) A6.10
and wildfire impacts,952,953 and 3) the subsequent impact on watersheds and regrowth,954 make a global application of those results reasonable for the purposes here. The temperature variation evident in this study, does not dramatically change the indicated loss, albeit largely because this work does not independently assess precipitation changes. Thus, for the purposes here, 1.2% per year is a reasonable value. The bottom-line impact is that biosystem sequestering is very limited and unreliable. Making it a cornerstone of policy to meet 1.5 °C goals is unreasonable and dangerous. Endnotes
lviii The references use the Energy Return on Investment (EROI) and the Energy Pay Back Time (EPBT), although definition can vary, typically, EROI=LT/EPBT, where LT is the service life of the facility. lix This is with consideration for the impact of deforestation and wildfire trends on the carbon sink-source relationship. The terrestrial sink variation was the only phenomenon capable of reproducing the observed historical values. Although this effectively made the change a function of a threshold or limit on deforestation levels, those dynamics are highly uncertain and any attempt at a detailed simulation of those phenomena are outside the scope of this effort.
952 Williams, C.A., Gu, H., MacLean, R., Masek, J.G. and Collatz, G.J., 2016. Disturbance and the carbon balance of US forests: A quantitative review of impacts from harvests, fires, insects, and droughts. Global and Planetary Change, 143, pp.66-80. https://wordpress.clarku.edu/cwilliams/files/2016/06/WilliamsCA_GlobalAndPlanetaryChange_2016_Review_USForest_Disturbances_CarbonBalance.pdf 953 Kurz, W.A., Stinson, G., Rampley, G.J., Dymond, C.C. and Neilson, E.T., 2008. Risk of natural disturbances makes future contribution of Canada's forests to the global carbon cycle highly uncertain. Proceedings of the National Academy of Sciences, 105(5), pp.1551-1555. https://www.pnas.org/content/pnas/105/5/1551.full.pdf 954 Ice, G.G., Neary, D.G. and Adams, P.W., 2004. Effects of wildfire on soils and watershed processes. Journal of Forestry, 102(6), pp.16-20. https://www.researchgate.net/publication/233499137_Effects_of_Wildfire_on_Soils_and_Watershed_Processes

Climate Risk and Response July 2021
George Backus (Material is free to use with attribution.) A7.1
Appendix 7: Glossary
AFOLU Agriculture, Forestry and Other Land Use
AI Artificial Intelligence
AR5 Fifth Assessment Report (from IPCC)955
B Billion
BECCS Bioenergy with Carbon Capture and Storage
C Centigrade (temperature)
CDF Cumulative Distribution Function
CH4 Methane
CMIP5 Coupled Model Intercomparison Project Phase 5956,957
CMIP6 Coupled Model Intercomparison Project Phase 6958,959
CO2 Carbon Dioxide
CO2e Carbon Dioxide Equivalent
COP Conference of the Parties960
CRISPR Clustered regularly interspaced short palindromic repeats (gene editing Technology)
DAC Direct Air Captures (of CO2)
ECS Equilibrium Climate Sensitivity
EIA Energy Information Administration (U.S.)
EJ Exajoule
EPBT Energy Pay Back Time (Years)
FAO Food and Agriculture Organization of the United Nations
955 Climate Change 2013: The Physical Science Basis. Contribution Change 2014: Mitigation of Climate Change, Contribution of Working Group III to the Fifth Assessment Report of the Intergovernmental Panel on Climate Change, edited by: Edenhofer, O., Pichs-Madruga, R., Sokona, Y., Farahani, E., Kadner, S., Seyboth, K., Adler, A., Baum, I., Brunner, S., Eickemeier, P., Kriemann, B., Savolainen, J., Schlömer, S., von Stechow, C., Zwickel, T., and Minx, J. C., Cambridge University Press, Cambridge, UK and New York, NY, USA, 2014. 956 Taylor, K.E., Stouffer, R.J. and Meehl, G.A., 2012. An overview of CMIP5 and the experiment design. Bulletin of the American meteorological Society, 93(4), pp.485-498. https://journals.ametsoc.org/downloadpdf/journals/bams/93/4/bams-d-11-00094.1.pdf 957 Coupled Model Intercomparison Project 5 (CMIP5) https://esgf-node.llnl.gov/projects/cmip5/ 958O'Neill, B.C., Tebaldi, C., Vuuren, D.P.V., Eyring, V., Friedlingstein, P., Hurtt, G., Knutti, R., Kriegler, E., Lamarque, J.F., Lowe, J. and Meehl, G.A., 2016. The scenario model intercomparison project (ScenarioMIP) for CMIP6. Geoscientific Model Development, 9(9), pp.3461-3482. https://gmd.copernicus.org/articles/9/3461/2016/gmd-9-3461-2016.pdf 959 WCRP Coupled Model Intercomparison Project (Phase 6) https://esgf-node.llnl.gov/projects/cmip6/ 960 https://unfccc.int/process/bodies/supreme-bodies/conference-of-the-parties-cop
Climate Risk and Response July 2021
George Backus (Material is free to use with attribution.) A7.2
GCM General Circulation Model
GDP Gross Domestic Product in PPP terms, 2010 USD
GDPPC GDP per capita in MER terms, 2010 USD
GHG Greenhouse Gases
GMLT Global Mean Land Temperature
GSAT Global Surface Average Temperature
HDI Human Development Index
IAM Integrated Assessment Model961
IDDE Impulse-Derived Differential Equation
IEA International Energy Agency (European Union)
IEO International Energy Outlook (from EIA)962
IIASA International Institute for Applied Systems Analysis
IPCC Intergovernmental Panel on Climate Change (UN)
LCOE Levelized Cost of Energy
M Million
MER Market Exchange Rate963
mRNA messenger ribonucleic acid (cell modification technology)
MW Megawatt
MWh Megawatt-hour
N2O Nitrous Oxide
NAS National Academy of Sciences (U.S.)
NIMBY Not in My Back Yard
NREL National Renewable Energy Laboratory
OECD Organization for Economic Co-operation and Development
OPEC Organization of the Oil Exporting Countries
PDF Probability Density Function
PPP Purchasing Power Parity964
R&D Research & Development
961 How ‘integrated assessment models’ are used to study climate change https://www.carbonbrief.org/qa-how-integrated-assessment-models-are-used-to-study-climate-change 962 https://www.eia.gov/outlooks/archive/ieo17/ 963 https://www.investopedia.com/articles/forex/090314/how-calculate-exchange-rate.asp 964 https://www.investopedia.com/updates/purchasing-power-parity-ppp/
Climate Risk and Response July 2021
George Backus (Material is free to use with attribution.) A7.3
RCP Representative Concentration Pathways965
SLR Sea-Level Rise
SSP Shared Socioeconomic Pathways966,967
SR1.5 Special Report on Global Warming of 1.5 °C (from IPCC)968
SRCCL Special Report on Climate Change and Land (from IPCC)969
SRM Solar Radiation Management
T Trillion
TCR Transient Climate Response
TW Terawatt
TWh Terawatt-hour
UN United Nations
UQ Uncertainty Quantification
USD U.S. Dollars
WEO World Energy Outlook (from IEA)970
Yr Year
965 van Vuuren, D. P., Edmonds, J., Thomson, A., Riahi, K., Kainuma, M., Matsui, T., Hurtt, G. C., Lamarque, J.-F., Meinshausen, M., Smith, S., Granier, C., Rose, S. K., and Hibbard, K. A.: The Representative Concentration Pathways: an overview, Climatic Change, 109, 5–31, 2011. https://link.springer.com/content/pdf/10.1007/s10584-011-0148-z.pdf 966 B. O’Neill, E. Kriegler, K. Riahi, K. Ebi, S. Hallegatte, T. Carter, R. Mathur, D. van Vuuren A new scenario framework for climate change research: the concept of shared socioeconomic pathways Clim. Change, 122 (2013), pp. 387-400 https://link.springer.com/content/pdf/10.1007/s10584-013-0905-2.pdf 967 Kriegler, E., Edmonds, J., Hallegatte, S., Ebi, K.L., Kram, T., Riahi, K., Winkler, H. and Van Vuuren, D.P., 2014. A new scenario framework for climate change research: the concept of shared climate policy assumptions. Climatic Change, 122(3), pp.401-414. https://link.springer.com/content/pdf/10.1007/s10584-013-0971-5.pdf 968 Special Report on Global Warming of 1.5°C (SR1.5). Intergovernmental Panel on Climate Change, 2018. https://www.ipcc.ch/sr15/ 969 IPCC, 2019: Climate Change and Land: an IPCC special report on climate change, desertification, land degradation, sustainable land management, food security, and greenhouse gas fluxes in terrestrial ecosystems [P.R. Shukla, J. Skea, E. Calvo Buendia, V. Masson-Delmotte, H.-O. Pörtner, D. C. Roberts, P. Zhai, R. Slade, S. Connors, R. van Diemen, M. Ferrat, E. Haughey, S. Luz, S. Neogi, M. Pathak, J. Petzold, J. Portugal Pereira, P. Vyas, E. Huntley, K. Kissick, M. Belkacemi, J. Malley, (eds.)]. https://www.ipcc.ch/site/assets/uploads/2019/08/Fullreport-1.pdf 970 World Energy Outlook, IEA https://www.iea.org/topics/world-energy-outlook