rights of diplomats: a comparison of islamic law
147
© ICBTS Copyright by Author(s) The 2018 International Academic Research Conference in Zurich 178 RIGHTS OF DIPLOMATS: A COMPARISON OF ISLAMIC LAW AND PUBLIC INTERNATIONAL LAW: THE VIENNA CONVENTION ON DIPLOMATIC RELATIONS 1961, FROM ISLAMIC PERSPECTIVE Muhammad Moin U Deen International Islamic University Islamabad, Astana Aalia shahjamalia Mana Ahmadani, D.G.KHAN, Punjab, Pakistan Pakistan ABSTRACT Religious laws dominated diplomatic relations long before the development and evolution of international law. Therefore, diplomatic and consular law is the outcome of civilizations and religions. Islām also recognized diplomatic rights in Arabia 1400 years ago. The Holy Prophet‘s (PBUH) dealings with representative and envoys from other nations and ethnicities show that Islām acknowledges the respect for representatives and ambassadors as a code of conduct. The Vienna convention on diplomatic relations 1961(VCDR) is an international treaty which provides framework for establishment and maintenance of diplomatic relations between independent states. This forms the basis of diplomatic immunities. Its articles are considered cornerstone of modern diplomatic relation. This paper aims to present a comparison between diplomatic rights in Islām and in VCDR 1961. It attempts to explore the origin and development of diplomatic immunities and privileges in Islām and as well as their sources. This work equally examines the compatibility of Islāmic diplomatic law and international diplomatic law. It concludes that the Qurān and the Sunnah, the two basic sources of Islāmic law and the consistent practice of Muslim heads of state, a secondary source, clearly establish the privileges and immunities of diplomats in Islāmic law and also in practice. Keywords: Rights of diplomats, diplomacy in Islām, Vienna convention, diplomatic immunities, diplomatic law
-
Upload
khangminh22 -
Category
Documents
-
view
0 -
download
0
Transcript of rights of diplomats: a comparison of islamic law

© ICBTS Copyright by Author(s) The 2018 International Academic Research Conference in Zurich 178
RIGHTS OF DIPLOMATS: A COMPARISON OF ISLAMIC LAW
AND PUBLIC INTERNATIONAL LAW: THE VIENNA
CONVENTION ON DIPLOMATIC RELATIONS 1961, FROM
ISLAMIC PERSPECTIVE
Muhammad Moin U Deen
International Islamic University Islamabad, Astana Aalia shahjamalia Mana Ahmadani,
D.G.KHAN, Punjab, Pakistan Pakistan
ABSTRACT
Religious laws dominated diplomatic relations long before the development and evolution of
international law. Therefore, diplomatic and consular law is the outcome of civilizations and religions. Islām
also recognized diplomatic rights in Arabia 1400 years ago. The Holy Prophet‘s (PBUH) dealings with
representative and envoys from other nations and ethnicities show that Islām acknowledges the respect for
representatives and ambassadors as a code of conduct. The Vienna convention on diplomatic relations
1961(VCDR) is an international treaty which provides framework for establishment and maintenance of
diplomatic relations between independent states. This forms the basis of diplomatic immunities. Its articles
are considered cornerstone of modern diplomatic relation. This paper aims to present a comparison between
diplomatic rights in Islām and in VCDR 1961. It attempts to explore the origin and development of
diplomatic immunities and privileges in Islām and as well as their sources. This work equally examines the
compatibility of Islāmic diplomatic law and international diplomatic law. It concludes that the Qurān and the
Sunnah, the two basic sources of Islāmic law and the consistent practice of Muslim heads of state, a
secondary source, clearly establish the privileges and immunities of diplomats in Islāmic law and also in
practice.
Keywords: Rights of diplomats, diplomacy in Islām, Vienna convention, diplomatic immunities, diplomatic
law

© ICBTS Copyright by Author(s) The 2018 International Academic Research Conference in Zurich 179
RESPONSIBLE INNOVATION: THE CASE OF ETHIC
TECHNOLOGY ASSESSMENT OF FINANCIAL TECHNOLOGY
Lo, Chih-Cheng, Associate professor
Industrial Educaiton and technology, National Changhua University of Education, Taiwan
Cho, Hsin-Chuan, PhD student
Industrial Educaiton and technology, National Changhua University of Education, Taiwan
ABSTRACT
Financial technology has brought new challenges for technology and risk assessment, particularly
relating to the influence of interactions among complex technologies, social institutions and critical
infrastructures. This project basically regards FinTech as an Ethical foundation for the notion of technological
readiness. When will the FinTech be ready to meet some financial service industry use or applications goal?
How are stakeholders perceived before undergoing FinTech, how the outcomes of FinTech evaluated are and
how are the responsibilities of users and financial service industry at large balanced. The framework of
responsible innovation will be developed to form policy suggestion by examining the short-and long-term
social consequences of the application or use of technology; and Ethic relevant to the implementation of
Fintech is to further discuss of how we can optimize the delicate balance between innovation and regulation.
This project provide an integraed frameowrk of reposposible innovation and argue that an earlier awareness
and understanding of what might be the social, economic, ethical and other consequences of the introduction
of a financial technology into the society is needed when blockchain technology is likely to apply to any
innovation in how people transact business and in a broad variety of technological interventions into personal
and commercial finance.
The further contribution of this paper will add up the value of a framework for responsible innovation.
Reflecting on insights developed in the philosophy of eTA and drawing on examples of financial technologies,
which will be analysed and evaluated in a potentially dynamic way, rather than against a set of given ethical
principles. First year we explore the patent analysis in terms of Non-Practicing Entities (here after as NPE) to
come to grip with ethical issues in financial technological innovation. Second year, based on the social
construction, we will employ the new method of the two-grids matrix of stakeholder analysis in order to
disclose the dynamics and co-evolution of financial technology among industries, society and ethics as well
as to suggest for multidisciplinary future research in the responsible innovation.
Keywords: Financial technology, technology assessment, ethic technology assessment, patent analysis
© ICBTS Copyright by Author(s) The 2018 International Academic Research Conference in Zurich 180
FACTORS AFFECTING CONSUMER CHOICE OF MOBILE
PHONES IN DUSIT DISTRICT
Sulawan Pansri* & Chatcharin Sadserm*
*Arts and Culture Office, Suan Sunandha Rajabhat University, Bangkok, Thailand
**Faculty of Management Science, Suan Sunandha Rajabhat University, Bangkok, Thailand
E-mail: *[email protected], **[email protected]
ABSTRACT
The research of Factors Affecting Consumer Choice of Mobile Phones in Dusit District was aimed;
1) To study the factors affecting consumer choice of mobile phones in Dusit district and 2) To study the
consumer behavior of using mobile phones in Dusit district. The sample groups were 400 consumers, the data
was compiled using the questionnaire, and SPSS was used for the statistical analysis and processing.
The findings revealed that;
Most of them were male (4 3 .30%) and female (5 6 .70% ) , the age was 21 – 30 years old, the average
income was not over 10,000 baht per month, the educational attainment was undergraduate degree, the
occupation was business owner, the marital status was single and the family members were 3 – 4 persons.
The consumer behavior of using mobile phones; most of them were using AIS, DTAC, pre-paid
account, monthly account, more than 3 years of the usage, 501 baht and above of the expense. They normally
bought it from the service center, decided by their own decision, decided from the incoming – outgoing calls
and the perception of TV advertisement.
The factors affecting consumer choice of mobile phones; they were in the high and highest level,
when it was considered by ordering from the high to low average, it revealed that; the channel of refilling or
payment was in the highest level, the large number of service centers, and the inexpensive service fee was in
the lowest level. Additionally, when it was considered by factors affecting consumer choice of mobile phones
entirely, it revealed that; the place had the highest average, the product, and the price had the lowest average.
Keywords: Factors, Choice, Mobile Phones
INTRODUCTION
From the past until nowadays, the communication is very important for people both of their daily
living and occupation as it is another one essential factor besides the 4 requisites. If the communication
technology of Thailand is up- to-date, it would be a significant basis for the country development which leads
to the prosperity basis. The communication technology now is very up- to-date for the extremely convenience
such as internet, basic phone, mobile phone and social networks etc. Mobile phone is an up-to-date and popular
technology for all ages due to it could communicate anytime, anywhere and rapidly including with it could do
everything; interpersonal communication, business dealing, financial transaction, messaging, music and
entertainment and internet linkage etc. As to many utilities of mobile phone, it becomes popular for all people
now.
The market of mobile phone in Thailand has grown continuously, the 1st quarter of 2015, there were
93,299,705 accounts; 80,091,132 accounts of pre-paid or 85.80% and 13,208,573 accounts of post-paid or
14.20% (source: National Broadcasting and Telecommunication Commission: NBTC). From this popularity of
using mobile phone in the large number of consumers now, it affects to a strongly competition of the mobile
phone providers and tends to the maturity stage of Product Life Cycle (PCL) which the consumer’s need is
getting declined. Due to most of the consumers are using mobile phones, the providers have improved the
© ICBTS Copyright by Author(s) The 2018 International Academic Research Conference in Zurich 181
marketing strategies for this competition such as free account, changing the service provider, free mobile
phone, a mobile phone including with an account and discount and the various advertisement etc. For the
purpose that, not only they desire to extend the market share for the larger number of consumers but also
improve the strategy of increasing the average income per person by emphasizing on the income from 3G and
4G services and considering on the changing of consumer behavior which it tends to use phone less but social
networks; Facebook and Line application. In consequence, they have to improve the strategy which is
consistent with the changing of behavior and technology that would lead to the competitive advantage of their
business.
From the important of mobile phone for daily living and occupation of the consumer, the consumer
behavior of using mobile phones and the factors affecting consumer choice of mobile phones are the issues
which the researcher had studied the Factors Affecting Consumer Choice of Mobile Phones in Dusit District for defining a guideline of developing and improving the production and marketing which is consistent with
the consumer’s need afterwards.
METHODOLOGY
The population of this research was the consumers in Dusit district, Bangkok, the sample groups were
400 consumers by using accidental sampling as the method and the data was compiled using the questionnaire
which it was divided into 3 parts as following; Part 1 – the general information which it was the multiple choices question consisted of gender, age,
level of educational attainment, occupation and number of family members.
Part 2 – the consumer behavior of using mobile phones which it was the multiple choices question.
Part 3 – the factors affecting consumer choice of mobile phones which it was the rating scale consisted
of 4Ps; Product, Price, Place and Promotion SPSS was used for the statistical analysis and processing; Frequency, Percentage, Mean and Standard
Deviation.
RESULTS
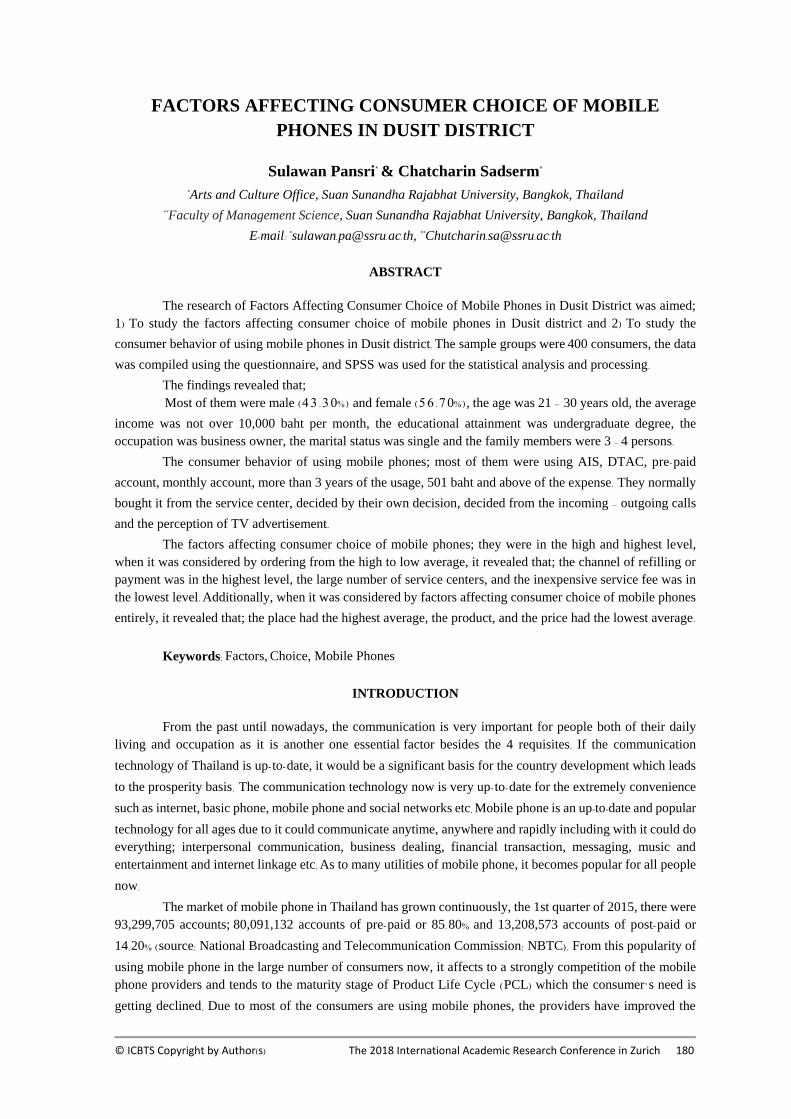
The factors affecting consumer choice of mobile phones; they were in the high and highest level, when it was
considered by ordering from the high to low average, it revealed that; the channel of refilling or payment was
in the highest level, the large number of service center, and the inexpensive service fee was in the lowest level.
Additionally, when it was considered by factors affecting consumer choice of mobile phones entirely, it
revealed that; the place had the highest average, the product, and the price had the lowest average as shown in
Table 1.
Table 1
Factors Affecting Consumer Choice of Mobile Phones
Factors Affecting Consumer Choice of
Mobile Phones
Level
(X ) (S.D) Result
Product
Price
Place
Promotion
4.07
3.96
4.25
4.05
0.48
0.62
0.55
0.59
high level
high level
highest level
high level

© ICBTS Copyright by Author(s) The 2018 International Academic Research Conference in Zurich 182
From Table 1, the findings revealed that factors affecting consumer choice of mobile phones; they
were in the high and highest level, when it was considered by ordering from the high to low average, it revealed
that; the place had the highest average, the product, and the price had the lowest average.
CONCLUSION AND FUTURE WORK
The sample groups were 400 consumers, most of them were male (173, 4 3 .3 0% ) and female (227,
56.70%), the age was 21 – 30 years old, the average income was not over 10,000 baht per month, the educational
attainment was undergraduate degree, the occupation was business owner, the marital status was single and
the family members were 3 – 4 persons.
The consumer behavior of using mobile phones; most of them were using AIS (179, 44.80%), DTAC
(123, 30.80%), pre-paid account (209, 52.30%), monthly account (191, 47.70%), more than 3 years of the usage
(235, 58.80%), 501 baht and above of the expense (140, 35.00%). They normally bought it from the service center
(185, 46.30%), decided by their own decision (226, 66.50%), decided from the incoming – outgoing calls (158,
39.40%) and the perception of TV advertisement (140).
It should study in other areas to cover the various groups which it would be the good advantage for
all users.
ACKNOWLEDGEMENT
The researcher would like to thank the Institute of Research and Development, Suan Sunandha
Rajabhat University, Bangkok, Thailand for financial support and would also like to thank the President for
supporting this achievement.
REFERENCES
[1] Arisara Waijaroen.(2014). TYPES OF ADVERTISING ON MOBILE PHONES INFLUENCING
THE BUYING DECISION MAKING OF CONSUMERS IN BANGKOK. Bangkok: Faculty of
Communication Arts, Dhurakij Pundit University.
[2] Benjaporn Khwansomkid and Nanthawan Phanjam. ( 2 012) . THE USAGE OF SMARTPHONE
AND TIME SPENDING OF THE FACULTY OF MANAGEMENT SCIENCE, SILPAKORN
UNIVERSITY PHETCHABURI IT CAMPUS. Mini thesis, Bachelor of Business Administration
(B.B.A.). Phetchaburi: Faculty of Management Science, Silpakorn University.
[3] Chattayaporn Samerjai and Thitinan Wareewanit. ( 2008) . PRINCIPLE OF MARKETING.
Bangkok: SE-Education
[4] Jittiwa Tianpitak and Anchalee Thongmak. (2012). BEHAVIOR OF SILPAKORN UNIVERSITY
( PHETCHABURI IT CAMPUS) STUDENTS WHEN USING 3G ( THIRD GENERATION)
MOBILE SYSTEM. Mini thesis, Bachelor of Business Administration ( B. B. A. ) . Phetchaburi:
Faculty of Management Science, Silpakorn University.
[5] National Broadcasting and Telecommunication Commission: NBTC. ( 2 015) . MARKET OF
MOBILE PHONE SERVICE. Retrieved June 1, 2017, from: http://www.nbtc.go.th.
[6] Siriwan Serirat et al. (1998). MARKETING STRATEGY. Bangkok: Teera Film and Scitex.
[7] Supasek Prajaksuvitee. (2011). THE ATTITUDES TOWARDS DOWNLOADING GAMES ON
MOBILE PHONE IN BANGKOK AREA. Independent study, Master of Business Administration
(M.B.A.). Bangkok: Graduate School, Srinakharinwirot University
[8] Thanawich Jaiklieng. HISTORY OF MOBILE PHONE. Retrieved June 1, 2017, from
:http://smartphoneie13.blogspot.com/2013/04/blog-post.html.

© ICBTS Copyright by Author(s) The 2018 International Academic Research Conference in Zurich 183
[9] Warinda Boonpitak. (2011) .FACTORS AFFECTING THE CONSUMER BUYING DECISION
TOWARD IPHONE4S IN RANGSIT. Independent study, Master of Business Administration
(M.B.A. ) . Bangkok: Faculty of Business Administration, Rajamangala University of Technology
Thanyaburi
[10] Supattra Kanchanopast. ( 2009) . THE INFLUENCE FACTORS TO CUSTOMER TRUST AND
LOYALTY E-COMMERCE WEBSITE. Bangkok: Suan Sunandha Rajabhat University.

© ICBTS Copyright by Author(s) The 2018 International Academic Research Conference in Zurich 184
CULTURAL CAPITAL DEVELOPMENT AND MANAGEMENT OF
FOLK PLAY WITH PARTICIPATION OF WAT
DHUSITHTHARAM COMMUNITY TO BECOME CULTURAL
ATTRACTIONS
Phusit Phukamchanoad*, Khanittha Plubkaew** & Suwaree Yordchim***
*,*** Lecturer, Faculty of Humanities and Social Sciences, Suan Sunandha Rajabhat University, Bangkok,
Thailand **Researcher, Institution for Research and Development, Suan Sunandha Rajabhat University, Bangkok,
Thailand
E-mail: *[email protected], **[email protected], ***[email protected]
ABSTRACT
The objectives of this research were determined to collect and search for the prototype of local
amusement cultural capital, management of local amusement cultural capital by the people’s participation
process, and development local amusement cultural capital to be learning resource and demonstration, by
collecting data through 400 sets of questionnaire and interview to the president group/city community
leaders or community committees which peoples pay respect and 20 government officers. The researcher
moved toward the area to conduct survey using social context index questionnaires. It was found from the
results that this Wat Dhusiththaram community also called Pak Klong Bangkok Noi which is ancient
community with above 100 years of its age. Many generations of people have been living here inheritably
and the existed areas were orchards such as rambutan, durian, coconut, mango, banana and many more,
particularly “Rambutan is the famous fruit. The Bang Yee Khan Rambutan is sweet, much pulp, lean seed
and its pulp and seed is detachable”. There are various folk amusements such as Phi Lob, Mae Sri, Ling Lom,
sword play, tom-tom, which are played in festival, particularly in Songkran festival. But currently, these areas
have been changed according to city development in the way of road construction, adopting public utilities
and assistances to the area which are trading, business and quarters, houses, temples, schools and
government sectors (existed dock) of royal ceremony ship. When social areas are changed, the peoples in
social are also changed such as migration in and out of peoples in community for occupation. The former
peoples started to move out but peoples who love their abode and the owners will live in smaller size of area.
The community became congested city community. As well, it affected to the cultures which peoples run the
stories to make the birth and death of cultures. Local amusement cultures are left just traceable trails such as
Phi Lob, Mae Sri, Ling Lom which related to spirit belief, but swordplay and tom-tom are systematically
inherited from a generation to another customarily. Currently, these amusements are clearly revealed and
inherited in many groups such as Sri Dusit, LukThonburi and they currently changed the name according to
remaining disciple which is the house of “SorLukThonburi”. Even though, currently, the inheritance could be
continued difficultly because the participation level of peoples in community is very low. The majority
factors affecting participation derived from personal characteristics such as gender, age, occupation,
marriage status and monthly income. As the factors changed, participation also changed. In addition, the
management to transform local amusement cultural capital to be tourism attraction became difficulty
because the community potential supporting tourism was in moderate level and there was high conflict in the
idea of hoe to develop community, included with personal issue, responsible duties, working outside of
community, no time to work for community and disharmony of community committees, lacking of unity.

© ICBTS Copyright by Author(s) The 2018 International Academic Research Conference in Zurich 185
Therefore, developing and managing local amusement cultural capital in Dusitaram community,
Bangkok
Noi District, Bangkok have been conducted in the aspect of to retain and conserve in the forms of manuals,
publications and knowledge plates, which are suitable and sustainable in the future.
Keywords: Management, Cultural Capital, Folk Play, Participation
INTRODUCTION
Social changes in Thailand reflecting the new customs and traditions have officially taken place
since the launch of the first National Economic Development Plan (1961-1966 A.D.). Especially the urban
areas, the changes in the social structure led to the changes or the disappearance of the community culture.
Some communities were forgotten. The folk plays that used to be a part of traditions or festivals passing
down from grandfathers, grandmothers, fathers, and mothers’ era were no longer played or seen in the
today’s era. The folk play is regarded as a significant folk wisdom inherited from generation to generation.
The folk wisdom refers to the foundational knowledge of people which includes some abstract features like
the world view and the life view. It is a philosophy of life revolving the natural process of birth, old-age,
sickness, and death as well as the value of everything in daily life; it also explains the concrete concepts in
some specific fields, for example, livelihood, agriculture, handicraft, art, music, and others (Pongpit, 1986:
145-146). Usually, people in urban areas before the area-based development in 1932 traditionally had honest
professions, a sufficient way of life, a low amount of exploitation, and self-realization. They did not
excessively invest beyond their abilities, but adhered and behaved according to their religious moral
principles. They mutually depended on each other and significantly relied on local wisdom (Phukamchanoad,
2012: 164). In order to sustain of the existence of traditional wisdom, it is necessary to raise awareness of
conservation and development that can promote cultural tourism in the Dhusiththaram community, Bangkok.
This is because in the past, people in this area had used knowledge and folk play wisdom to play and to share
their knowledge in their free time after farming; in addition, they also performed during the festivals; for
example, swordplay, tom-tom play, Phi Lob play, Mae Sri play, and Ling Lom play. These plays were
inherited from older generations and had become the cultural identities of people in Wat Dhusiththaram area.
From 1941 to 1945, there was the Great East Asia War when people did not admire these plays; because of
this reason, many plays were extinct due to the lack of conservation. Therefore, if these cultures continue
disappearing or have the lack of support or appropriate preservation methods, the researcher believes that
they will unavoidably become extinct across time.
RESEARCH OBJECTIVE
To observe the cultural capital of the folk plays, including the public participatory management
which is important for the development of cultural tourism areas.
RESEARCH METHODOLOGY
This study combines both qualitative and quantitative research methodologies. The researcher set
the samples for the analysis process as follows:
1) Group 1: 400 people in the community (Taro Yamane, 1973: 125)
2) Group 2: 9 community leaders who were community chairmen or official community
committee
3) Group 3: staff members at the governmental agencies that are related to folk play activity
management, community developers, and staff members in the field of tourism and sports in
Bangkok Noi district
4) Group 4: 10 unofficial leader people in local area, such as both male and female elders and
knowledgeable people of community
5) Group 5: at least 10 role models of folk play culture
© ICBTS Copyright by Author(s) The 2018 International Academic Research Conference in Zurich 186
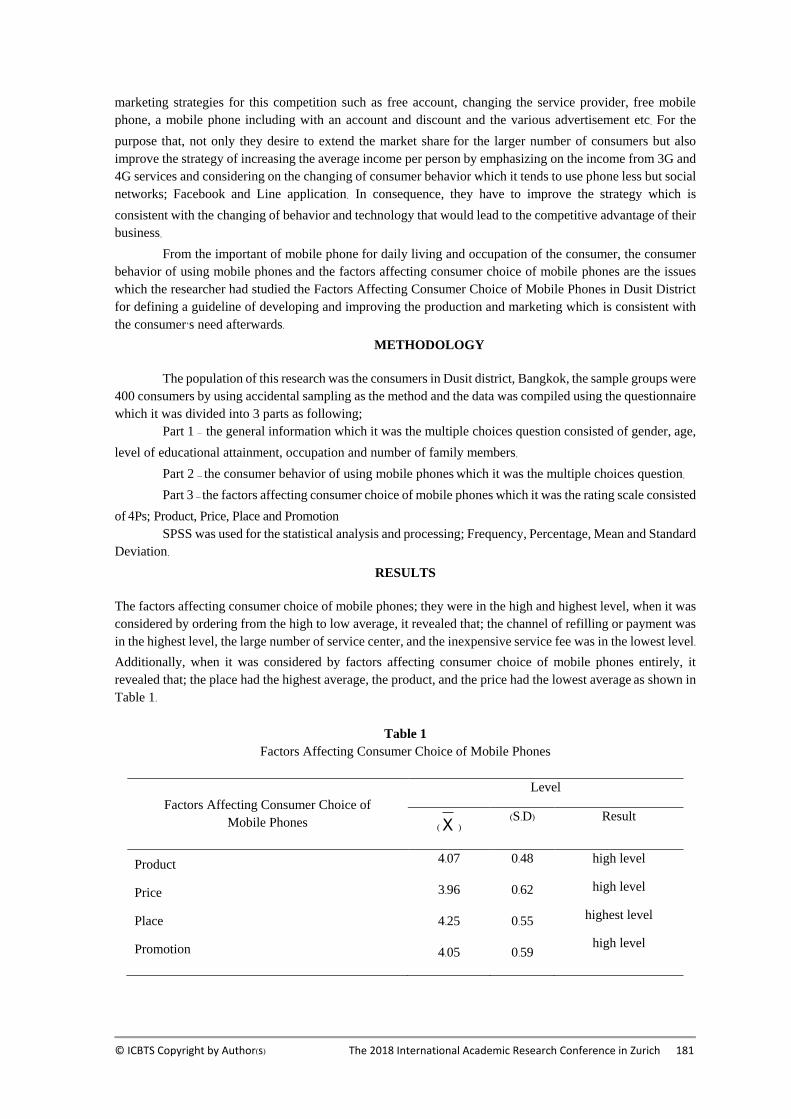
The researcher collected data by using questionnaires and interviews. Data was analyzed by the
evaluation of frequency, percentage, arithmetic mean, and standard deviation in order to describe the general
information of the samples. The researcher used descriptive analysis for analyzing interview data based on
the fixed content structure. The evaluation of citizens’ satisfaction towards their residences, relationships,
participation in cultural capital management, and community potential as a tourist attraction was divided into
5 levels as follows: 4.21 – 5.00 averages (highest level), 3.41 – 4.20 averages (high level), 2.61 – 3.40 (medium
level), 1.81 – 2.60 averages (low level), and 1.00 – 1.80 averages (lowest level). This is shown in the research
framework as illustrated below:
Figure 1: Shows The Conceptual Framework on The Community-Based Cultural Capital Development and
Management of Folk Plays in Wat Dhusiththaram Community in Regards to Cultural Tourism.
To collect the cultural capital of folk
play under the community context
The participation of community
- Mutual recognition and
understanding
- Mutual thinking and showing their
opinions
- Mutual consideration and decision
- Mutual operation
- Mutual following, investigation,
assessment - Mutual receiving a benefit
- Mutual taking responsibilities
Making tourism route by
community
The Suitable Approach for Cultural Capital Development/ Management of Folk Play in
Wat Dhusiththaram Community, Bangkok Noi District, Bangkok
PAR
Community Potential in Cultural Tourism
Development and Management
- Accession
- Attraction
- Security
- Facilities
- Tourism carrying capacity
Way of life of people in the
community
Participation in activities
Satisfaction and relationship
Researcher
People
Community
committee/ Government
agency
© ICBTS Copyright by Author(s) The 2018 International Academic Research Conference in Zurich 187
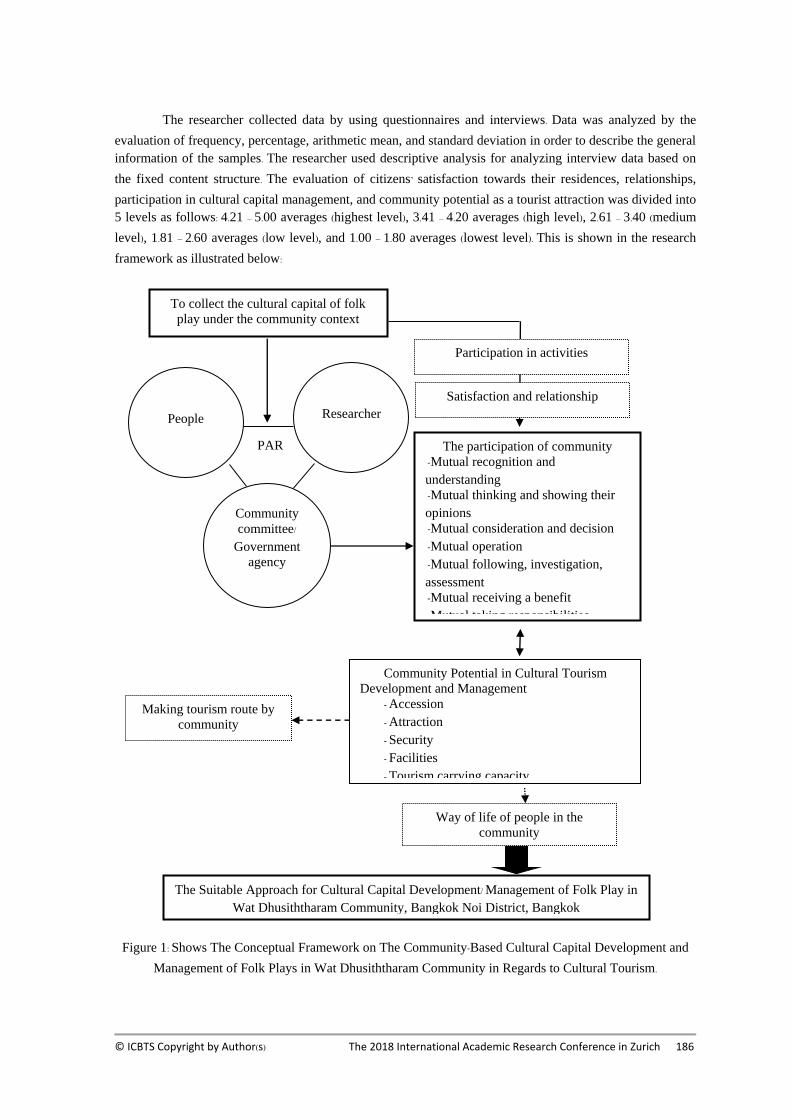
RESEARCH RESULTS
“Wat Dhusittharam community” is located in Arum Ammarin sub-district, Bangkok Noi district,
Bangkok. It has a total area of 4.8 -odd acres owned by the Treasury Department, Department of Religious
Affairs, and the private sector. One of the main characteristics of this community is its urban slum nature; the
landowners can be divided into three categories as follows:
Type 1: 50% of lands were owned by the independent landowners
Type 2: 30% of lands were rented by the private sector and temples which belonged to the
Department of Religious Affairs and the Treasury Department.
Type 3: 20% were rented houses and row houses.
Presently, the cultural capital in the important tourist attractions of the community are identified in
the map below:
Figure 2: The Map of Important Places of Cultural Capital in the Wat Dhusiththaram Community
Moreover, the researcher found out that the cultural capital of folk plays still remained in the
community. The examples of the folk plays from fifty years ago are listed below:
1) The Phi Lob play is a play related to the belief of spirit and ghost; it also demonstrates the
public participation in the community activities.
2) The Mae Sri play is popular among women. With the purpose of entertainment, they have to
dress beautiful traditional Thai costumes. It shows a cultural identity and the way of life of
community people; it also presents the public participation in the community.
3) The Ling Lom play is a play that summons ‘Ling Lom ghost’ to the medium man; it aims to
entertain people who are exhausted from works. This play builds the harmony inside the
community. It is an activity allowing teenagers to meet one other.
These three folk plays are popular during Songkran festival. They enhance harmony and unity of
people in the community where, in the past, most families were farmers. Nowadays, the obviously remained
cultural capital includes swordplay and tom-tom play. There are appointed inheritors and a training center

© ICBTS Copyright by Author(s) The 2018 International Academic Research Conference in Zurich 188
which is ‘Sit Look Thonburi Group’ led by Prachuap Thongkamsuk (Jun) and Vithaya Nuchraksa (Go) who
are the 70-odd-year-old inheritors at the moment. Mr. Go is the role model of the folk players who still
practice the play and teach the youth in the community as well as anyone who are interested.
Figure 3: Sword Sets Figure 4: Club Sets
Figure 5: Playing Tom-Tom Worshipping the
Teacher Spirit
Figure 6: Guru Worship and Indoctrination of
Students
Moreover, there is some training for the youth and children who are interested by using Wat
Dusitaram School as a teaching center. In addition, the researcher also carried out the fieldwork to collect
more data about the folk wisdom of the folk play as illustrated below:
Figure 7: Youth Training
Nevertheless, the researcher found out that the cultural capital development of the folk plays still
remained for the next generations. It provided the learning and demonstration center. The demonstration
usually started after class at school. The temple court was used if there was the permission from the abbot.
However, the location was not permanently selected. Moreover, the research team had to contact only the
© ICBTS Copyright by Author(s) The 2018 International Academic Research Conference in Zurich 189
main inheritor, Vithaya Nuchraksa (Go), who was the only remaining demonstrator of swordplay and tom-
tom play. If the community would like to promote the sustainability of these folk plays, there must be the
participation of every stakeholder, including the inheritors, local people, local community, schools, temples,
and the government agency (in this case, Bangkok Noi District Office). In order to promote sustainability at
the initial stage, it is necessary to record the history and the dance moves as the documentary evidence or
handbook for students, youth, and people who are interested in studying and researching about the folk plays.
At the same time, the government agency should promote it by inviting those who are interested to do some
activities of Bangkok Noi District Office. Furthermore, the temple should organize some folk play activities
during the temple fairs all the year round.
For the public participation in Dhusiththaram community, Bangkok Noi district, Bangkok, most of
the local people always participated in Songkran festival, but they rarely participated in the traditional
activities of the community temples. Additionally, the local people never participated in ‘Home Police Group’
activity’. Furthermore, people were mostly satisfied in the water supply services in the community following
by the electrical services, transportation or communication with others, easy access to the community, and
telephone services, respectively. In addition, the fact that most people were very attached to the location,
especially to devotedly take care their houses in the community, was rated at the highest level. Secondarily,
they believed that homes and other places inside the community were important in terms of increasing the
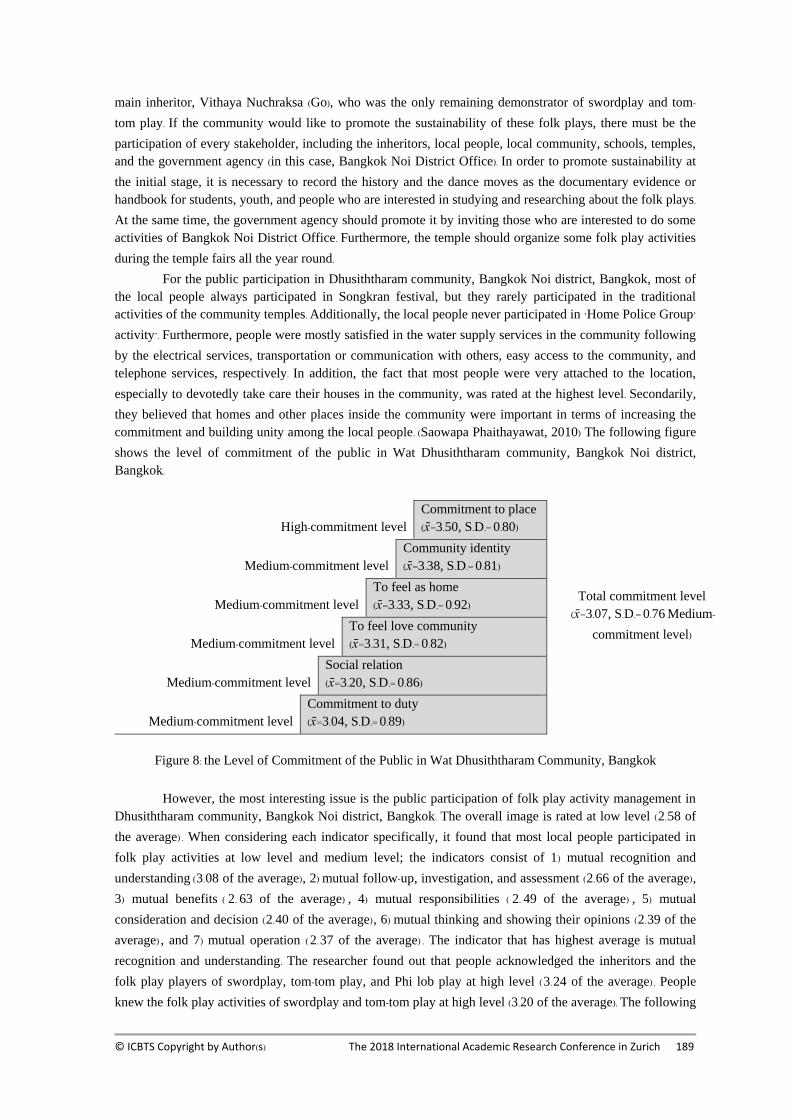
commitment and building unity among the local people. (Saowapa Phaithayawat, 2010) The following figure
shows the level of commitment of the public in Wat Dhusiththaram community, Bangkok Noi district,
Bangkok.
High-commitment level
Commitment to place
(x̄=3.50, S.D.= 0.80)
Total commitment level
(x̄=3.07, S.D.= 0.76 Medium-
commitment level)
Medium-commitment level
Community identity
(x̄=3.38, S.D.= 0.81)
Medium-commitment level
To feel as home
(x̄=3.33, S.D.= 0.92)
Medium-commitment level
To feel love community
(x̄=3.31, S.D.= 0.82)
Medium-commitment level
Social relation
(x̄=3.20, S.D.= 0.86)
Medium-commitment level
Commitment to duty
(x̄=3.04, S.D.= 0.89)
Figure 8: the Level of Commitment of the Public in Wat Dhusiththaram Community, Bangkok
However, the most interesting issue is the public participation of folk play activity management in
Dhusiththaram community, Bangkok Noi district, Bangkok. The overall image is rated at low level (2.58 of
the average) . When considering each indicator specifically, it found that most local people participated in
folk play activities at low level and medium level; the indicators consist of 1) mutual recognition and
understanding (3.08 of the average), 2) mutual follow-up, investigation, and assessment (2.66 of the average),
3) mutual benefits ( 2. 63 of the average) , 4) mutual responsibilities ( 2. 49 of the average) , 5) mutual
consideration and decision (2.40 of the average), 6) mutual thinking and showing their opinions (2.39 of the
average) , and 7) mutual operation ( 2.37 of the average) . The indicator that has highest average is mutual
recognition and understanding. The researcher found out that people acknowledged the inheritors and the
folk play players of swordplay, tom-tom play, and Phi lob play at high level (3.24 of the average) . People
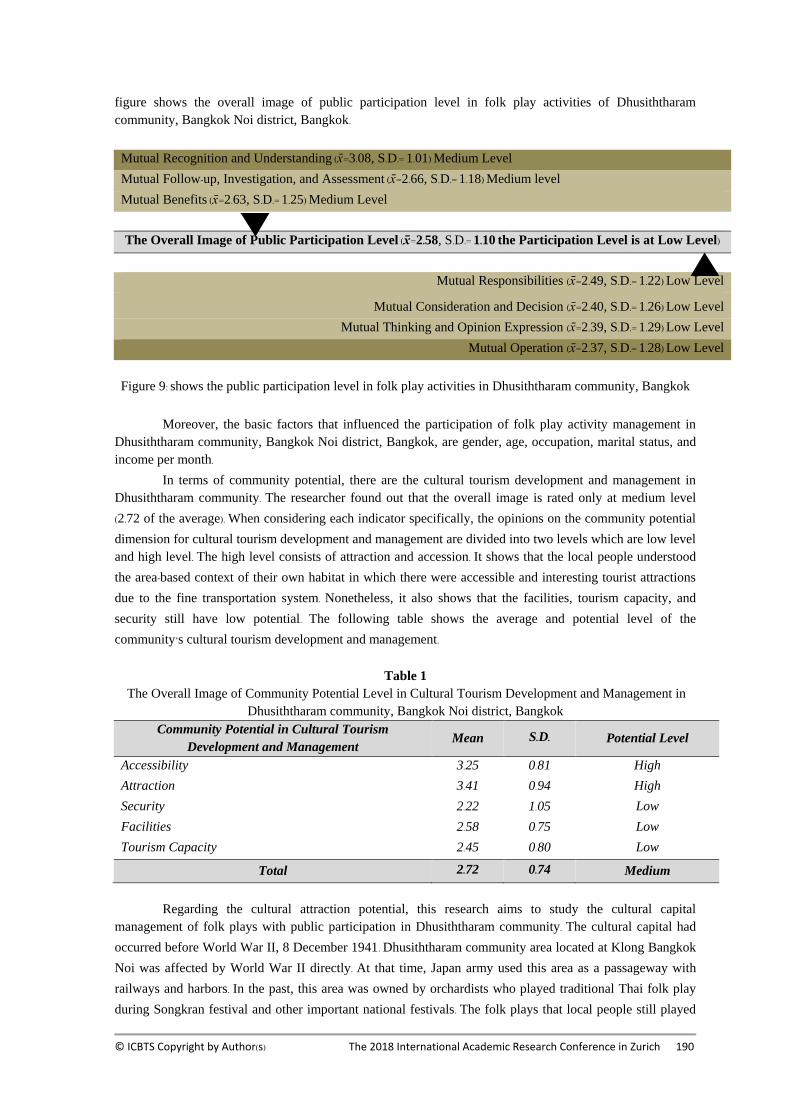
knew the folk play activities of swordplay and tom-tom play at high level (3.20 of the average). The following
© ICBTS Copyright by Author(s) The 2018 International Academic Research Conference in Zurich 190
figure shows the overall image of public participation level in folk play activities of Dhusiththaram
community, Bangkok Noi district, Bangkok.
Mutual Recognition and Understanding (x̄=3.08, S.D.= 1.01) Medium Level
Mutual Follow-up, Investigation, and Assessment (x̄=2.66, S.D.= 1.18) Medium level
Mutual Benefits (x̄=2.63, S.D.= 1.25) Medium Level
The Overall Image of Public Participation Level (x̄=2.58, S.D.= 1.10 the Participation Level is at Low Level)
Mutual Responsibilities (x̄=2.49, S.D.= 1.22) Low Level
Mutual Consideration and Decision (x̄=2.40, S.D.= 1.26) Low Level
Mutual Thinking and Opinion Expression (x̄=2.39, S.D.= 1.29) Low Level
Mutual Operation (x̄=2.37, S.D.= 1.28) Low Level
Figure 9: shows the public participation level in folk play activities in Dhusiththaram community, Bangkok
Moreover, the basic factors that influenced the participation of folk play activity management in
Dhusiththaram community, Bangkok Noi district, Bangkok, are gender, age, occupation, marital status, and
income per month.
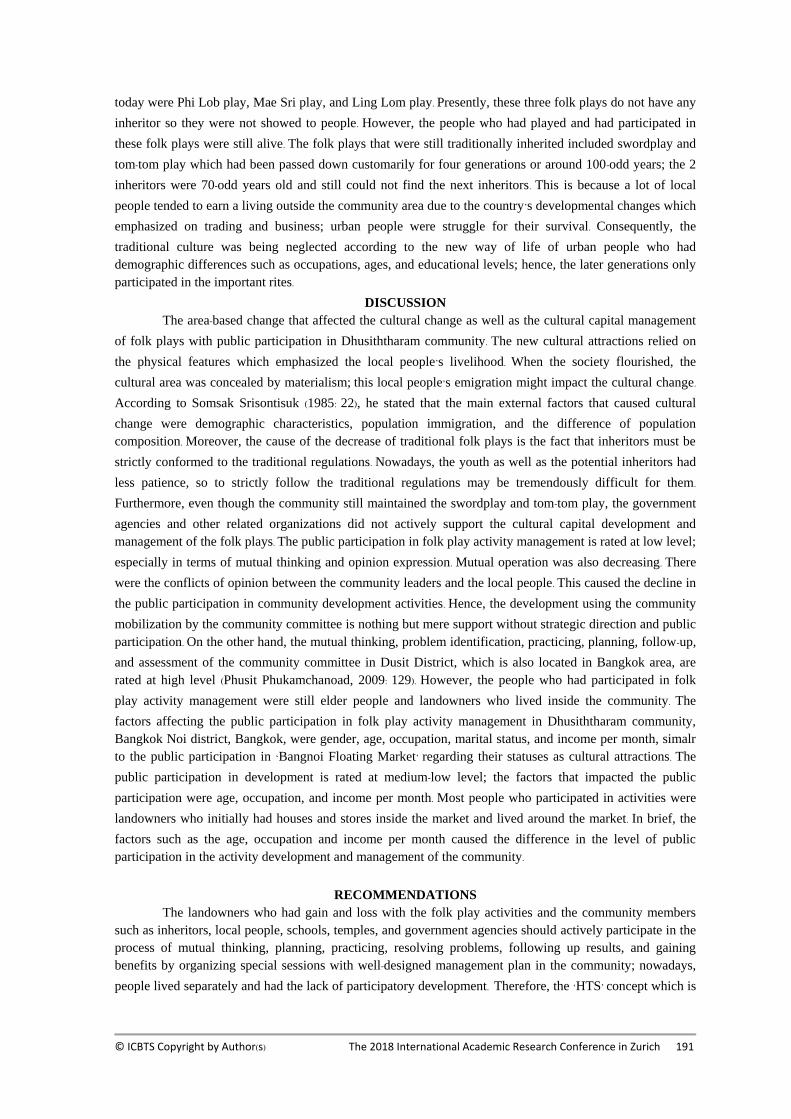
In terms of community potential, there are the cultural tourism development and management in
Dhusiththaram community. The researcher found out that the overall image is rated only at medium level
(2.72 of the average). When considering each indicator specifically, the opinions on the community potential
dimension for cultural tourism development and management are divided into two levels which are low level
and high level. The high level consists of attraction and accession. It shows that the local people understood
the area-based context of their own habitat in which there were accessible and interesting tourist attractions
due to the fine transportation system. Nonetheless, it also shows that the facilities, tourism capacity, and
security still have low potential. The following table shows the average and potential level of the
community’s cultural tourism development and management.
Table 1
The Overall Image of Community Potential Level in Cultural Tourism Development and Management in
Dhusiththaram community, Bangkok Noi district, Bangkok
Community Potential in Cultural Tourism
Development and Management Mean S.D. Potential Level
Accessibility 3.25 0.81 High
Attraction 3.41 0.94 High
Security 2.22 1.05 Low
Facilities 2.58 0.75 Low
Tourism Capacity 2.45 0.80 Low
Total 2.72 0.74 Medium
Regarding the cultural attraction potential, this research aims to study the cultural capital
management of folk plays with public participation in Dhusiththaram community. The cultural capital had
occurred before World War II, 8 December 1941. Dhusiththaram community area located at Klong Bangkok
Noi was affected by World War II directly. At that time, Japan army used this area as a passageway with
railways and harbors. In the past, this area was owned by orchardists who played traditional Thai folk play
during Songkran festival and other important national festivals. The folk plays that local people still played
© ICBTS Copyright by Author(s) The 2018 International Academic Research Conference in Zurich 191
today were Phi Lob play, Mae Sri play, and Ling Lom play. Presently, these three folk plays do not have any
inheritor so they were not showed to people. However, the people who had played and had participated in
these folk plays were still alive. The folk plays that were still traditionally inherited included swordplay and
tom-tom play which had been passed down customarily for four generations or around 100-odd years; the 2
inheritors were 70-odd years old and still could not find the next inheritors. This is because a lot of local
people tended to earn a living outside the community area due to the country’s developmental changes which
emphasized on trading and business; urban people were struggle for their survival. Consequently, the
traditional culture was being neglected according to the new way of life of urban people who had
demographic differences such as occupations, ages, and educational levels; hence, the later generations only
participated in the important rites.
DISCUSSION
The area-based change that affected the cultural change as well as the cultural capital management
of folk plays with public participation in Dhusiththaram community. The new cultural attractions relied on
the physical features which emphasized the local people’s livelihood. When the society flourished, the
cultural area was concealed by materialism; this local people’s emigration might impact the cultural change.
According to Somsak Srisontisuk (1985: 22), he stated that the main external factors that caused cultural
change were demographic characteristics, population immigration, and the difference of population
composition. Moreover, the cause of the decrease of traditional folk plays is the fact that inheritors must be
strictly conformed to the traditional regulations. Nowadays, the youth as well as the potential inheritors had
less patience, so to strictly follow the traditional regulations may be tremendously difficult for them.
Furthermore, even though the community still maintained the swordplay and tom-tom play, the government
agencies and other related organizations did not actively support the cultural capital development and
management of the folk plays. The public participation in folk play activity management is rated at low level;
especially in terms of mutual thinking and opinion expression. Mutual operation was also decreasing. There
were the conflicts of opinion between the community leaders and the local people. This caused the decline in
the public participation in community development activities. Hence, the development using the community
mobilization by the community committee is nothing but mere support without strategic direction and public
participation. On the other hand, the mutual thinking, problem identification, practicing, planning, follow-up,
and assessment of the community committee in Dusit District, which is also located in Bangkok area, are
rated at high level (Phusit Phukamchanoad, 2009: 129). However, the people who had participated in folk
play activity management were still elder people and landowners who lived inside the community. The
factors affecting the public participation in folk play activity management in Dhusiththaram community,
Bangkok Noi district, Bangkok, were gender, age, occupation, marital status, and income per month, simalr
to the public participation in ‘Bangnoi Floating Market’ regarding their statuses as cultural attractions. The
public participation in development is rated at medium-low level; the factors that impacted the public
participation were age, occupation, and income per month. Most people who participated in activities were
landowners who initially had houses and stores inside the market and lived around the market. In brief, the
factors such as the age, occupation and income per month caused the difference in the level of public
participation in the activity development and management of the community.
RECOMMENDATIONS
The landowners who had gain and loss with the folk play activities and the community members
such as inheritors, local people, schools, temples, and government agencies should actively participate in the
process of mutual thinking, planning, practicing, resolving problems, following up results, and gaining
benefits by organizing special sessions with well-designed management plan in the community; nowadays,
people lived separately and had the lack of participatory development. Therefore, the ‘HTS’ concept which is
© ICBTS Copyright by Author(s) The 2018 International Academic Research Conference in Zurich 192
home, temple, and school for area-based development plays a big role in the social context at present. Wat
Dhusiththaram community fortunately consists of the three important elements.
REFERENCES
[1] Phusit Phukamchanoad. (2009). The Participation of Community Committee in Sub-community
Development in Dusit District, Bangkok. Suan Sunandha Rajabhat University. [2] Phusit Phukamchanoad. (2014). Guideline for Happy Living According to Sufficiency Economy
Philosophy of People and Community Leaders in Urban Communities. Suan Sunandha Rajabhat
University. [3] Somsak Srisontisuk. (1985). Characteristic change in Thai society. (Unit 2. Problems of rural
development in Thailand). Bangkok: Sukhothai Thammathirat Open University. [4] Saowapa Phaithayawat. (2010). Changes of Social Urban Life and a Model of the Faithful
Participation in Buddhism and Thai Culture Preservation: Marble Temple Case Study. Suan
Sunandha Rajabhat University. [5] Surichai Wangaeo. (1995). Culture and the Establishment of Thai Culture. Bangkok: Institute of Thai
Studies, Chulalongkorn University. [6] Seri Pongpit. (1986). Back to the Roots: Choice and Point of View of Folk Wisdom. Bangkok:
Tianwan. [7] Yamane, Taro. )1973(. Statistics: An Introductory Analysis. 3 rd ed., Tokyo: Harper.

© ICBTS Copyright by Author(s) The 2018 International Academic Research Conference in Zurich 193
SATISFACTION OF THE SERVICES AVAILABLE ON NEW
STUDENTS’ SELF - REPORTING DAY, SUAN SUNANDHA
RAJABHAT UNIVERSITY, ACADEMIC YEAR 2018
Aphichart Kampoomprasert* & Chontiya Ledanan**
*,**Academic Services Division, Suan Sunandha Rajabhat University, Bangkok, Thailand
E-Mail: *[email protected], **[email protected]
ABSTRACT
The purpose of this study is to study the students’ satisfaction of services available on the new
students’ self- reporting day, Suan Sunandha Rajabhat University, academic year 2018. The 4 aspects of the
satisfaction include process, officers, place, and operation at self-reporting point. Samples include 333 first
year students gaining service at the point taken from 2,139 new students passing the screen test by using
portfolio presentation. Research tools include a 5-scale Likert questionnaire, and statistics employed for data
analysis are Percentage, Mean, and Standard Deviation.
The research finding are as follows:
The overall students’ satisfaction of services available on new students self-reporting day is in
highest level. However, in terms of aspect analysis, only one aspect with high level includes process while
the others are in highest level. The aspect with highest mean scores at 4.42 includes officers followed by the
aspect of place with mean scores at 4.37, operation at various points at 4.25, and process at 4.17,
respectively.
The results of the item analysis based on each aspect are as follows:
1. In terms of process, the students’ satisfaction in high level with highest mean scores at 4.25
includes the quality and modernity of equipment and tools used in providing services followed by mean
scores at 4.24; the service based on the queue. However, the item with lowest mean scores at 4.05 includes
the suitability and the speed of service.
2. In terms of officers, the students’ satisfaction is in highest level. The item with highest mean
scores at 4.45 includes the well-dressed officers, the officers’ politeness and friendliness, followed by mean
scores at 4.43; the officers’ willingness and care. However, the item with lowest mean scores at 4.38 is the
clear response of the inquiry and the officers’ enthusiasm.
3. In terms of place, the students’ satisfaction is in highest level. The item with highest mean scores
at 4.45 includes the place is wide and suitable, followed by mean scores at 4.44; the cleanliness, the lighting
and the tidiness of the place. However, the item with lowest mean scores at 4.26 is the availability of signs
showing location and points of various services.
4. In terms of operation at self-reporting point, the students’ satisfaction is in highest level. The
item with highest mean scores at 4.31 includes point 1 – preliminary checking of the document and proof,
followed by mean scores at 4.27; point 6 – getting the university document and itinerary. The item with
lowest mean scores at 4.18 is paying for the registration and first admission fees.
Keyword : Satisfaction , Service of new student self-reporting, Suan Sunandha Rajabhat University
INTRODUCTION
At present Suan Sunandha Rajabhat University comprises office of University Council, Graduate
School, Institute of Research and Development, and Institute of Creation and Life Long Learning with 6
faculties, 7 colleges and 3 learning centers, 6 divisions of office of the President with 4 offices including 4
additional unit. (Policy and Planning Division, 2560)
Since Suan Sunandha Rajabhat University has operated the educational institution with 6 faculties
and 7 colleges, based on the statistics from the student’s enrollment plan from academic year 2016 to 2018,
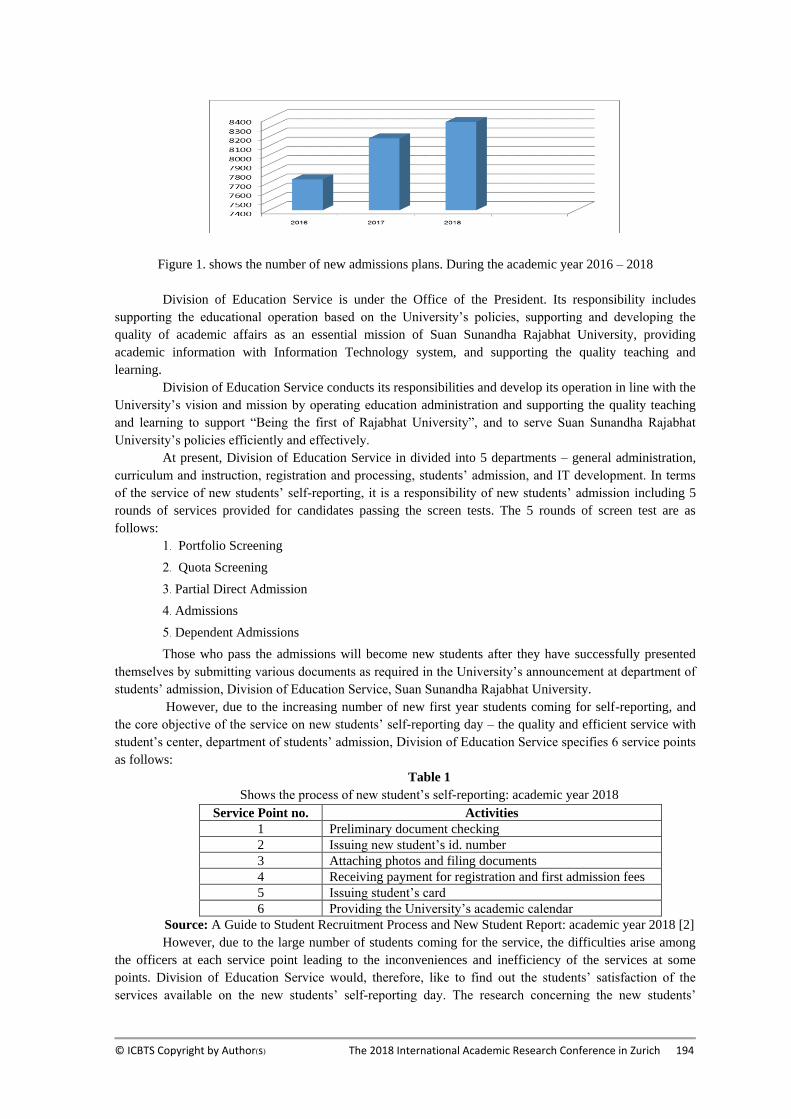
the total number of new students reaches 7,735, 8,182 and 8,360 respectively.
The statistics show that the number of new students during the past 3 years is increasing
continuously (Admission Section, Suan Sunandha Rajabhat University : 2561) as shown in Figure 1 [1].
© ICBTS Copyright by Author(s) The 2018 International Academic Research Conference in Zurich 194
Figure 1. shows the number of new admissions plans. During the academic year 2016 – 2018
Division of Education Service is under the Office of the President. Its responsibility includes
supporting the educational operation based on the University’s policies, supporting and developing the
quality of academic affairs as an essential mission of Suan Sunandha Rajabhat University, providing
academic information with Information Technology system, and supporting the quality teaching and
learning.
Division of Education Service conducts its responsibilities and develop its operation in line with the
University’s vision and mission by operating education administration and supporting the quality teaching
and learning to support “Being the first of Rajabhat University”, and to serve Suan Sunandha Rajabhat
University’s policies efficiently and effectively.
At present, Division of Education Service in divided into 5 departments – general administration,
curriculum and instruction, registration and processing, students’ admission, and IT development. In terms
of the service of new students’ self-reporting, it is a responsibility of new students’ admission including 5
rounds of services provided for candidates passing the screen tests. The 5 rounds of screen test are as
follows:
1. Portfolio Screening
2. Quota Screening
3. Partial Direct Admission
4. Admissions
5. Dependent Admissions
Those who pass the admissions will become new students after they have successfully presented
themselves by submitting various documents as required in the University’s announcement at department of
students’ admission, Division of Education Service, Suan Sunandha Rajabhat University.
However, due to the increasing number of new first year students coming for self-reporting, and
the core objective of the service on new students’ self-reporting day – the quality and efficient service with
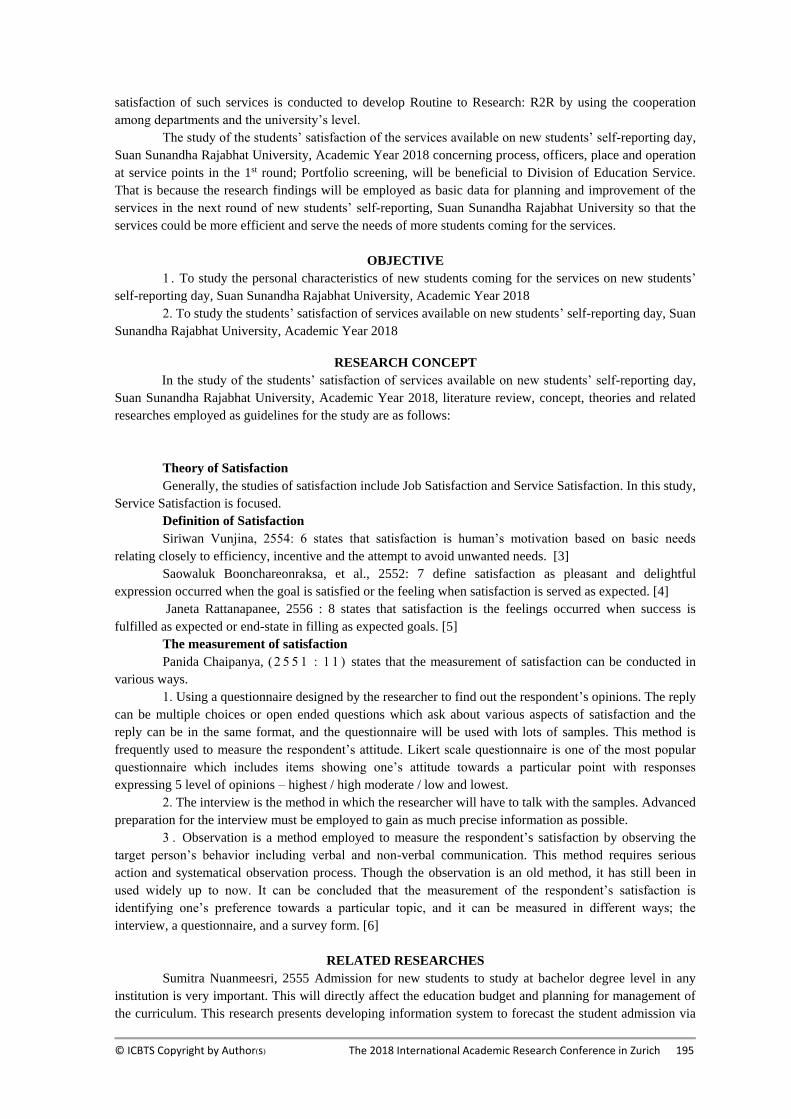
student’s center, department of students’ admission, Division of Education Service specifies 6 service points
as follows:
Table 1
Shows the process of new student’s self-reporting: academic year 2018
Service Point no. Activities
1 Preliminary document checking
2 Issuing new student’s id. number
3 Attaching photos and filing documents
4 Receiving payment for registration and first admission fees
5 Issuing student’s card
6 Providing the University’s academic calendar
Source: A Guide to Student Recruitment Process and New Student Report: academic year 2018 [2]
However, due to the large number of students coming for the service, the difficulties arise among
the officers at each service point leading to the inconveniences and inefficiency of the services at some
points. Division of Education Service would, therefore, like to find out the students’ satisfaction of the
services available on the new students’ self-reporting day. The research concerning the new students’
© ICBTS Copyright by Author(s) The 2018 International Academic Research Conference in Zurich 195
satisfaction of such services is conducted to develop Routine to Research: R2R by using the cooperation
among departments and the university’s level.
The study of the students’ satisfaction of the services available on new students’ self-reporting day,
Suan Sunandha Rajabhat University, Academic Year 2018 concerning process, officers, place and operation
at service points in the 1st round; Portfolio screening, will be beneficial to Division of Education Service.
That is because the research findings will be employed as basic data for planning and improvement of the
services in the next round of new students’ self-reporting, Suan Sunandha Rajabhat University so that the
services could be more efficient and serve the needs of more students coming for the services.
OBJECTIVE
1 . To study the personal characteristics of new students coming for the services on new students’
self-reporting day, Suan Sunandha Rajabhat University, Academic Year 2018
2. To study the students’ satisfaction of services available on new students’ self-reporting day, Suan
Sunandha Rajabhat University, Academic Year 2018
RESEARCH CONCEPT
In the study of the students’ satisfaction of services available on new students’ self-reporting day,
Suan Sunandha Rajabhat University, Academic Year 2018, literature review, concept, theories and related
researches employed as guidelines for the study are as follows:
Theory of Satisfaction
Generally, the studies of satisfaction include Job Satisfaction and Service Satisfaction. In this study,
Service Satisfaction is focused.
Definition of Satisfaction
Siriwan Vunjina, 2554: 6 states that satisfaction is human’s motivation based on basic needs
relating closely to efficiency, incentive and the attempt to avoid unwanted needs. [3]
Saowaluk Boonchareonraksa, et al., 2552: 7 define satisfaction as pleasant and delightful
expression occurred when the goal is satisfied or the feeling when satisfaction is served as expected. [4]
Janeta Rattanapanee, 2556 : 8 states that satisfaction is the feelings occurred when success is
fulfilled as expected or end-state in filling as expected goals. [5]
The measurement of satisfaction
Panida Chaipanya, (2 5 5 1 : 1 1 ) states that the measurement of satisfaction can be conducted in
various ways.
1. Using a questionnaire designed by the researcher to find out the respondent’s opinions. The reply
can be multiple choices or open ended questions which ask about various aspects of satisfaction and the
reply can be in the same format, and the questionnaire will be used with lots of samples. This method is
frequently used to measure the respondent’s attitude. Likert scale questionnaire is one of the most popular
questionnaire which includes items showing one’s attitude towards a particular point with responses
expressing 5 level of opinions – highest / high moderate / low and lowest.
2. The interview is the method in which the researcher will have to talk with the samples. Advanced
preparation for the interview must be employed to gain as much precise information as possible.
3 . Observation is a method employed to measure the respondent’s satisfaction by observing the
target person’s behavior including verbal and non-verbal communication. This method requires serious
action and systematical observation process. Though the observation is an old method, it has still been in
used widely up to now. It can be concluded that the measurement of the respondent’s satisfaction is
identifying one’s preference towards a particular topic, and it can be measured in different ways; the
interview, a questionnaire, and a survey form. [6]
RELATED RESEARCHES
Sumitra Nuanmeesri, 2555 Admission for new students to study at bachelor degree level in any
institution is very important. This will directly affect the education budget and planning for management of
the curriculum. This research presents developing information system to forecast the student admission via
© ICBTS Copyright by Author(s) The 2018 International Academic Research Conference in Zurich 196
the internet by rule of decision and tree classification techniques to predict accurately and precisely student
admission.
In the experiment, operation of a special issue made use of modeling and testing via model
prediction for new students. Rules using decision tree techniques: k-fold cross-validation 3 models,
percentage split 3 models, and a model from training set and test set were employed. The model was built
and tested with 7 kinds of modeling. The experimental results for forecasting new students via rules using
decision tree techniques, the model from training sets and test set which showed higher efficiency than the
other model with correctly classified instant equal to 94%, precision was 94.30%, recall was 94% and F-
measure was 93.70%. In conclusion, the model calculated data from each test accurately and forecasted
efficiently the student admission.
Researchers have taken the decision tree classification rules to develop the information system to
forecast the student admission via the internet. The efficient system was tested to use means and standard
deviations by four specialists and forty personals. The results of the efficient system testing were averaged
by the specialist 4.17 and the value of the personnel 4.34. The system performance is good satisfactory and
can be applied to forecast the student admission. [7]
DEFINITION OF TECHNICAL TERMS
Portfolio Screen Test can be defined as the method of screening students to further their study in
the university without having to take written test. The students are required to submit the application form to
the university, and the students will take practice test relating to the program requirement. Criterion for
passing the test will be specified by the university. Those who pass such test will be allowed to further their
study at the university, and report themselves as new students of Suan Sunandha Rajabhat University.
Quota Screen Test can be defined as the admission system available for those studying in High
School level or Grade 12 (not available for those studying in Non-formal education and vocational education
level). Moreover, the candidates for academic ability are required to gain not less than 2.50 GPA, and for
special abilities are required to gain not less than 2.00 GPA. (From High School grade 10 to the first
semester of High School grade 12)
Co-direct Admission can be defined as University Admission system operated by Thailand
University Presidents’ Meeting, in which students are allowed to choose 4 programs of study without
specifying the rank of the program. The entrance exam will be conducted on the same day using the central
exam paper while each university can independently set up its own criterion.
Admission is defined as the university admission system for general students, in which Thailand
University Presidents Meeting (TUPM) will be central unit responsible for university application. The
students are allowed to choose 4 programs of study with sequence ranking using the criterion announced 3
years in advance. Suan Sunandha Rajabhat University will submit information concerning the number of
students required, the students’ specific qualification, the university location to the TUPM so that the TUPM
will conduct the entrance exam, and after that the lists of students passing the exam will be sent to the
university so that the university can conduct the interview test and later announce the names of students
getting the right to further their study at the university.
Independent Admission can be defined as the university admission operated directly by the
university using its own process including the interview exam and the announcement of the names of
students gaining the right to further their study at the university.
METHODOLOGY
Population and Samples
This research, which is the study of students’ satisfaction of services available on new student’s
self-reporting day, Suan Sunandha Rajabhat University, academic year 2018, includes research scope as
follows;
Population
Population of this study includes 2,139 full time students in post graduate level who pass Portfolio
Screen Test, academic year 2018. (Admission Section, Suan Sunandha Rajabhat University : 2561)
Samples
© ICBTS Copyright by Author(s) The 2018 International Academic Research Conference in Zurich 197
Samples include 333 full time students who pass Portfolio Screen Test and are allowed to further
their study and present themselves as full time students in post graduate level. Samples are selected by using
Taro Yamane table with sample discrepancy at 95 percent. (Taro Yamane,2007, P.46)
Research Scope
The study of student’s satisfaction of services available on new student’s self-reporting day, Suan
Sunandha Rajabhat University, academic year 2018 includes 4 aspects as follows:
1. Satisfaction of process
2. Satisfaction of officers
3. Satisfaction of place
4. Satisfaction of operation at self-reporting points
Time and Location of the study
This study is conducted from October 2017 to February 2018 at Health and Sports Center Building,
Suan Sunandha Rajabhat University.
Research Tools
A questionnaire with 3 parts as follows;
Part 1 Personal Characteristics of the respondents includes 3 items as follows:
1. Gender
2. Education Background
3. Faculty or Collage applied
Part 2 Questions concerning student’s satisfaction of services available on new student’s self-
reporting day written based on concepts, theories, and researches relating to factors affecting satisfaction of
services include open-ended questions and Likert 5 Rating Scale questions with 5 interval scales – highest,
high, moderate, low, and lowest. The questions cover 4 aspects of satisfaction as follows:
1. Satisfaction of process
2. Satisfaction of officers
3. Satisfaction of place
4. Satisfaction of operation at self-reporting points
Part 3 Open-ended questions include suggestion, comments for improvement and development.
ANALYSIS CONCLUSION
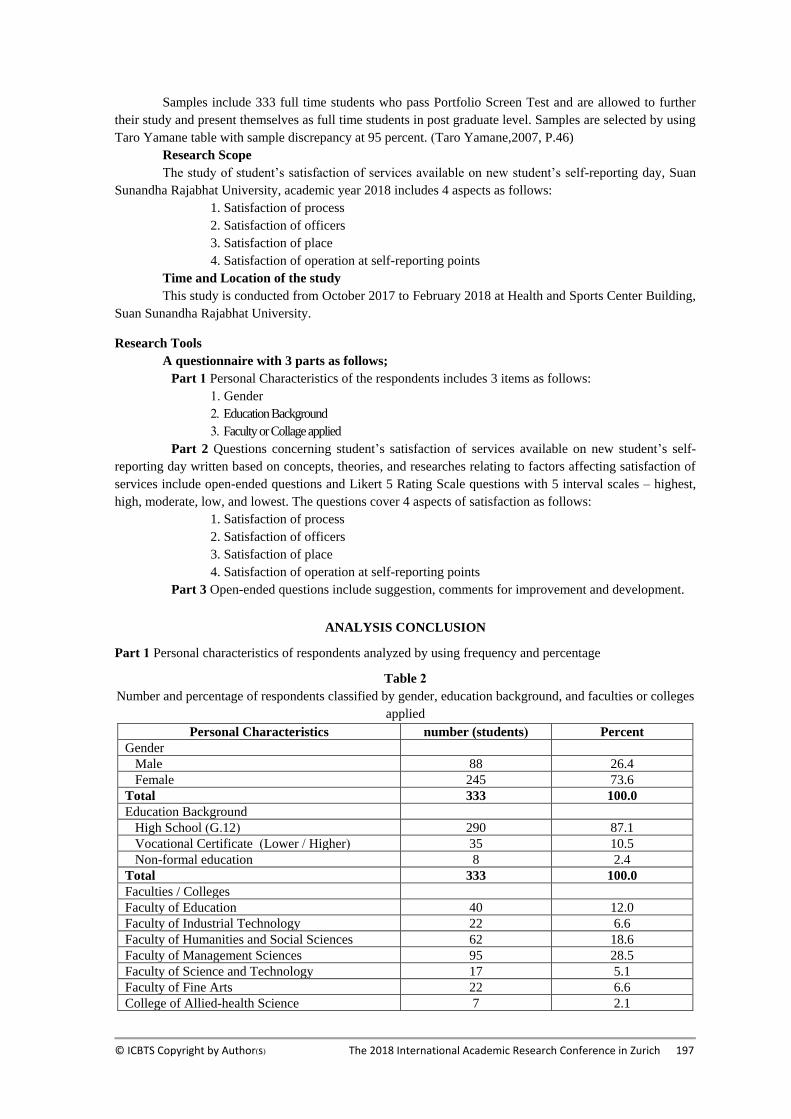
Part 1 Personal characteristics of respondents analyzed by using frequency and percentage
Table 2
Number and percentage of respondents classified by gender, education background, and faculties or colleges
applied Personal Characteristics number (students) Percent
Gender
Male 88 26.4
Female 245 73.6
Total 333 100.0
Education Background
High School (G.12) 290 87.1
Vocational Certificate (Lower / Higher) 35 10.5
Non-formal education 8 2.4
Total 333 100.0
Faculties / Colleges
Faculty of Education 40 12.0
Faculty of Industrial Technology 22 6.6
Faculty of Humanities and Social Sciences 62 18.6
Faculty of Management Sciences 95 28.5
Faculty of Science and Technology 17 5.1
Faculty of Fine Arts 22 6.6
College of Allied-health Science 7 2.1
© ICBTS Copyright by Author(s) The 2018 International Academic Research Conference in Zurich 198
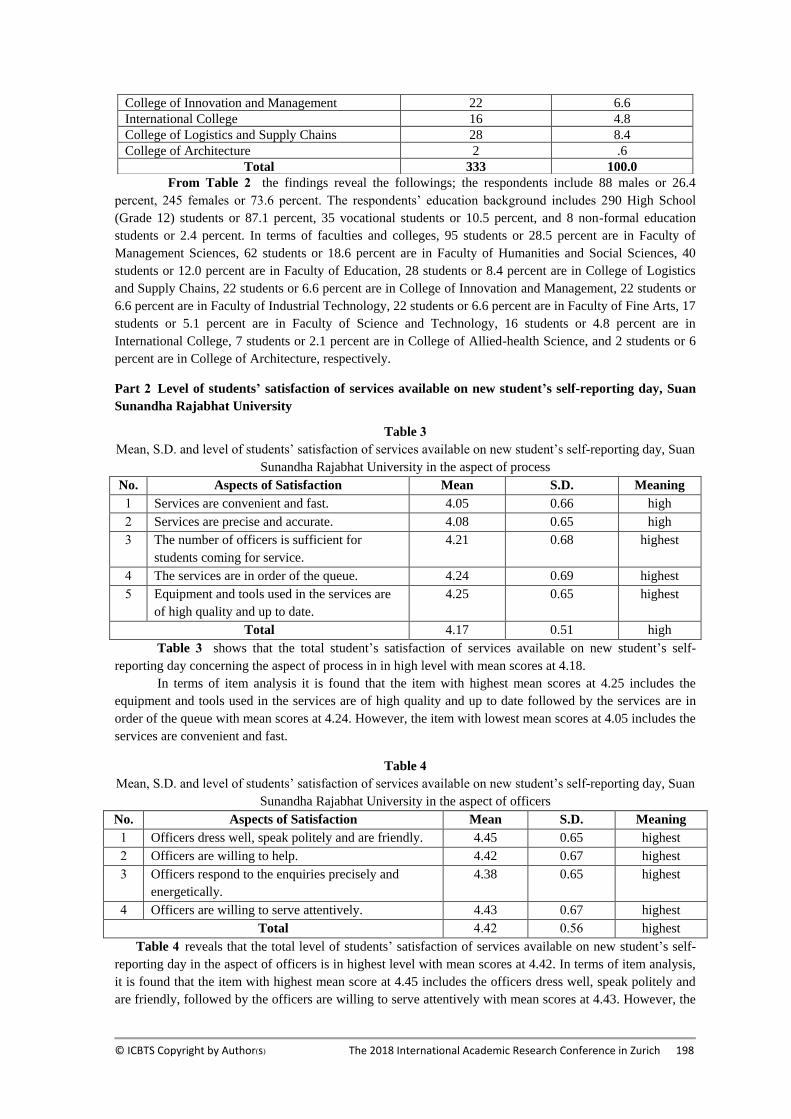
From Table 2 the findings reveal the followings; the respondents include 88 males or 26.4
percent, 245 females or 73.6 percent. The respondents’ education background includes 290 High School
(Grade 12) students or 87.1 percent, 35 vocational students or 10.5 percent, and 8 non-formal education
students or 2.4 percent. In terms of faculties and colleges, 95 students or 28.5 percent are in Faculty of
Management Sciences, 62 students or 18.6 percent are in Faculty of Humanities and Social Sciences, 40
students or 12.0 percent are in Faculty of Education, 28 students or 8.4 percent are in College of Logistics
and Supply Chains, 22 students or 6.6 percent are in College of Innovation and Management, 22 students or
6.6 percent are in Faculty of Industrial Technology, 22 students or 6.6 percent are in Faculty of Fine Arts, 17
students or 5.1 percent are in Faculty of Science and Technology, 16 students or 4.8 percent are in
International College, 7 students or 2.1 percent are in College of Allied-health Science, and 2 students or 6
percent are in College of Architecture, respectively.
Part 2 Level of students’ satisfaction of services available on new student’s self-reporting day, Suan
Sunandha Rajabhat University
Table 3
Mean, S.D. and level of students’ satisfaction of services available on new student’s self-reporting day, Suan
Sunandha Rajabhat University in the aspect of process
No. Aspects of Satisfaction Mean S.D. Meaning
1 Services are convenient and fast. 4.05 0.66 high
2 Services are precise and accurate. 4.08 0.65 high
3 The number of officers is sufficient for
students coming for service.
4.21 0.68 highest
4 The services are in order of the queue. 4.24 0.69 highest
5 Equipment and tools used in the services are
of high quality and up to date.
4.25 0.65 highest
Total 4.17 0.51 high
Table 3 shows that the total student’s satisfaction of services available on new student’s self-
reporting day concerning the aspect of process in in high level with mean scores at 4.18.
In terms of item analysis it is found that the item with highest mean scores at 4.25 includes the
equipment and tools used in the services are of high quality and up to date followed by the services are in
order of the queue with mean scores at 4.24. However, the item with lowest mean scores at 4.05 includes the
services are convenient and fast.
Table 4
Mean, S.D. and level of students’ satisfaction of services available on new student’s self-reporting day, Suan
Sunandha Rajabhat University in the aspect of officers
No. Aspects of Satisfaction Mean S.D. Meaning
1 Officers dress well, speak politely and are friendly. 4.45 0.65 highest 2 Officers are willing to help. 4.42 0.67 highest
3 Officers respond to the enquiries precisely and
energetically.
4.38 0.65 highest
4 Officers are willing to serve attentively. 4.43 0.67 highest
Total 4.42 0.56 highest
Table 4 reveals that the total level of students’ satisfaction of services available on new student’s self-
reporting day in the aspect of officers is in highest level with mean scores at 4.42. In terms of item analysis,
it is found that the item with highest mean score at 4.45 includes the officers dress well, speak politely and
are friendly, followed by the officers are willing to serve attentively with mean scores at 4.43. However, the
College of Innovation and Management 22 6.6
International College 16 4.8
College of Logistics and Supply Chains 28 8.4
College of Architecture 2 .6
Total 333 100.0
© ICBTS Copyright by Author(s) The 2018 International Academic Research Conference in Zurich 199
item with lowest mean score at 4.38 includes the officers respond to the enquiries precisely and
energetically.
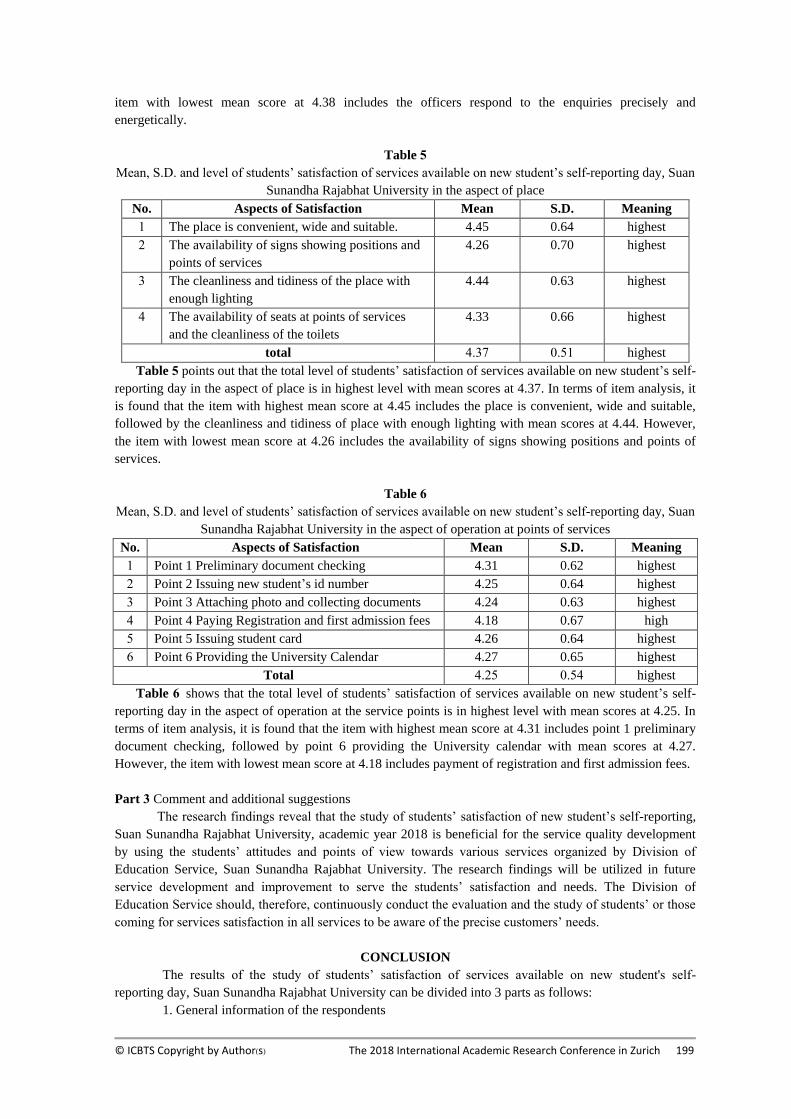
Table 5
Mean, S.D. and level of students’ satisfaction of services available on new student’s self-reporting day, Suan
Sunandha Rajabhat University in the aspect of place
No. Aspects of Satisfaction Mean S.D. Meaning
1 The place is convenient, wide and suitable. 4.45 0.64 highest
2 The availability of signs showing positions and
points of services
4.26 0.70 highest
3 The cleanliness and tidiness of the place with
enough lighting
4.44 0.63 highest
4 The availability of seats at points of services
and the cleanliness of the toilets
4.33 0.66 highest
total 4.37 0.51 highest
Table 5 points out that the total level of students’ satisfaction of services available on new student’s self-
reporting day in the aspect of place is in highest level with mean scores at 4.37. In terms of item analysis, it
is found that the item with highest mean score at 4.45 includes the place is convenient, wide and suitable,
followed by the cleanliness and tidiness of place with enough lighting with mean scores at 4.44. However,
the item with lowest mean score at 4.26 includes the availability of signs showing positions and points of
services.
Table 6
Mean, S.D. and level of students’ satisfaction of services available on new student’s self-reporting day, Suan
Sunandha Rajabhat University in the aspect of operation at points of services
No. Aspects of Satisfaction Mean S.D. Meaning
1 Point 1 Preliminary document checking 4.31 0.62 highest
2 Point 2 Issuing new student’s id number 4.25 0.64 highest
3 Point 3 Attaching photo and collecting documents 4.24 0.63 highest
4 Point 4 Paying Registration and first admission fees 4.18 0.67 high
5 Point 5 Issuing student card 4.26 0.64 highest
6 Point 6 Providing the University Calendar 4.27 0.65 highest
Total 4.25 0.54 highest
Table 6 shows that the total level of students’ satisfaction of services available on new student’s self-
reporting day in the aspect of operation at the service points is in highest level with mean scores at 4.25. In
terms of item analysis, it is found that the item with highest mean score at 4.31 includes point 1 preliminary
document checking, followed by point 6 providing the University calendar with mean scores at 4.27.
However, the item with lowest mean score at 4.18 includes payment of registration and first admission fees.
Part 3 Comment and additional suggestions
The research findings reveal that the study of students’ satisfaction of new student’s self-reporting,
Suan Sunandha Rajabhat University, academic year 2018 is beneficial for the service quality development
by using the students’ attitudes and points of view towards various services organized by Division of
Education Service, Suan Sunandha Rajabhat University. The research findings will be utilized in future
service development and improvement to serve the students’ satisfaction and needs. The Division of
Education Service should, therefore, continuously conduct the evaluation and the study of students’ or those
coming for services satisfaction in all services to be aware of the precise customers’ needs.
CONCLUSION
The results of the study of students’ satisfaction of services available on new student's self-
reporting day, Suan Sunandha Rajabhat University can be divided into 3 parts as follows:
1. General information of the respondents
© ICBTS Copyright by Author(s) The 2018 International Academic Research Conference in Zurich 200
The respondents include 88 males or 26.4 percent, 245 females or 73.6 percent. The respondents’
education background includes 290 High School (Grade 12) students or 87.1 percent, 35 vocational students
or 10.5 percent, and 8 non-formal education students or 2.4 percent. In terms of faculties and colleges, 95
students or 28.5 percent are in Faculty of Management Sciences, 62 students or 18.6 percent are in Faculty
of Humanities and Social Sciences, 40 students or 12.0 percent are in Faculty of Education, 28 students or
8.4 percent are in College of Logistics and Supply Chains, 22 students or 6.6 percent are in College of
Innovation and Management, 22 students or 6.6 percent are in Faculty of Industrial Technology, 22 students
or 6.6 percent are in Faculty of Fine Arts, 17 students or 5.1 percent are in Faculty of Science and
Technology, 16 students or 4.8 percent are in International College, 7 students or 2.1 percent are in College
of Allied-health Science, and 2 students or 6 percent are in College of Architecture, respectively.
2. The total satisfaction of the services
The total of students’ satisfaction of the services are in highest level with mean scores at 4.30. In
terms of item analysis, it is found that the aspect of satisfaction with highest mean scores at 4.42 includes the
aspects of officers, followed by the aspect of place with mean scores at 4.37, the aspect of operation at
service points with mean scores at 4.25, and the aspect of process with mean scores at 4.17, respectively.
3. Comments and suggestions for service development
The impressive service points includes point 1 preliminary document checking. At this point the
officers serves well, impressively, kind. The officers welcome impressively with speedy steps of service.
The officers’ instruction is clear, understandable. The officers are available until the next point to limit
confusion.
Point 3 Taking photos. The officers take care very well with kindness and speedy services. The
officers dress well, and provide good instruction. The officers are lovely, and speak well with very good
instruction.
The service point needed to be improved includes point 4 payment of registration and first
admission fees. That is because it takes long time at this point, and more officers are needed at this point.
To increase the efficiency of services, much more attention should be placed on the aspects of
satisfaction with less mean scores comparing to other aspects, such as the aspect of process in terms of the
suitability and speed of service. The aspect of officers in terms of the precise of responses to enquiries, the
aspect of place in terms of signs showing position and points of services, should also be improved.
ACKNOWLEDGMENTS
The author would like to thank the Research and Development Institute, Suan Sunandha Rajabhat
University, Bangkok, Thailand for the financial support.
REFERENCE
[1] Office of Student Enrollment, Department of Education 2561 Number of Students During the
academic year 2559-2561 Suan Sunandha Rajabhat University.
[2] Education Service Division, 2561. A Guide to Student Recruitment Process and New Student
Report, Suan Sunandha Rajabhat University pp. 10
[3] Siriwan Woonjina, 2554. The Satisfaction of the Teaching and Learning of Human Resource
Management Course, Full Time Students, 4th year Undergraduate Level, Pranakornsee
Ayudhaya pp. 6
[4] Saowaluk Boonchareon, and et all., 2552. The Study of the Satisfaction of Undergraduate
Level Students, Bachelor and Master Degree, Bilingual Program, Faculty of Economics;
Chiangmai University pp. 7
[5] Janta Rattanapanee, 2556. The Study of the Students’ Satisfaction of the Operation of Thai
Chamber of Commerce University: Thai Chamber of Commerce University pp. 8
[6] Pranida Chaipunya, 2551. Measure satisfaction pp.11
[7] Sumitra Nuanmeesri, 2555. Developing Information System to Forecast the Student
Admission via the Internet.
© ICBTS Copyright by Author(s) The 2018 International Academic Research Conference in Zurich 201
THE TECHNIC OF MILITARY TROOP INSPECTING DANCE IN
THAI CLASSICAL DANCE
Assoc. Prof. Supavadee Potiwetchakul
Faculty of Fine and Applied Arts, Suan Sunandha Rajabhat University, Bangkok, Thailand,
E-Mail: [email protected]
ABSTRACT
This research aims to study the components, main steps and principles of military troop inspecting
dance in 3 of the Thai classical dance theatres which are Inao, Khun Chang Khun Phaen and Phaya Pha
Nong. The methods of study involve documentary research, in-depth interview, observation and practicing
with Thai dance artists and experts from The Fine Arts Department of Thailand. The research findings show
that military troop inspecting dance has 5 important components which are performers, costumes, music,
dance moves and indispensable show equipment, weapons. The dance composed of 5 main steps which are
the dance of the flag bearer as the symbol of the troop, the display of strength, the display of the
commander’ s mastery, the confirmation of the troop’ s readiness and the marching. The research shows 2
dance methods which are solo dance and the dance interacting with flag bearers and soldiers in the troop.
Keywords: Technic, Military troop inspecting dance, Thai classical dance
INTRODUCTION
Military troop inspecting dance is an imitation of the military troop inspection which is a tradition
that has been passing on since the old time. In Thailand, military troop inspection started in the reign of King
Rama 5 at the Royal Cremation Ground in 1908 which King Rama 5 inspected the 6 military parade troops
himself. Troop inspection's purposes are to prepare the troop and display the strength. Normally, troop
inspection done together with military parade, is called “military parade inspection.” It is divided into 2 types
which are the annual troop inspection and the special troop inspection. The main purposes are to display the
strength of the army and the devotion towards His Majesty the King, the commander of the Royal Thai
Army. Military troop inspection is rarely mentioned in literature and play with war or battle plots, only
described in the way of troop preparation, the process, troop movement and the battle. This leads to the way
it is portrayed in Thai dance, having lyrics only before or after troop inspection or no lyrics. It is considered a
part of Thai classical dance theatre. Military troop inspecting dance is graceful Thai classical dance performance which shows
one of the identities of dance theatre related to war and battle . The dance is done together with Pleng
Naphat, music for troop inspection scene . The music is divided into 4 types by the characters in the
scene. Pleng Krawnok is used in the inspection of human and monkey troop
Pleng Krawklang is used in the inspection of human troop in the play
Pleng Krawnai is used in the inspection of giant troop
Pleng Pathom is used in the inspection of monkey, giant and human troop
Later, when military troop inspecting dance appears in the play that presented different
nationalities of the characters, Pleng Kraw Ok Pasa or the accent Kraw music was used in the play for
example, Kraw Laos and Kraw Khmer. The music uses the front rhythms overlaying technic as same as
Pleng Krawnok but the melody is changed to show different accents of the nationalities of the character that
performs military troop inspecting dance and is called by different names.
Military troop inspecting dance emphasizes the performer’ s skill and expertise in using
weapon as dance equipment. Therefore, the performer must train well in order to express beautiful and
elegant dance moves. In dance theatre, military troop inspecting dance marks the scene where war and battle
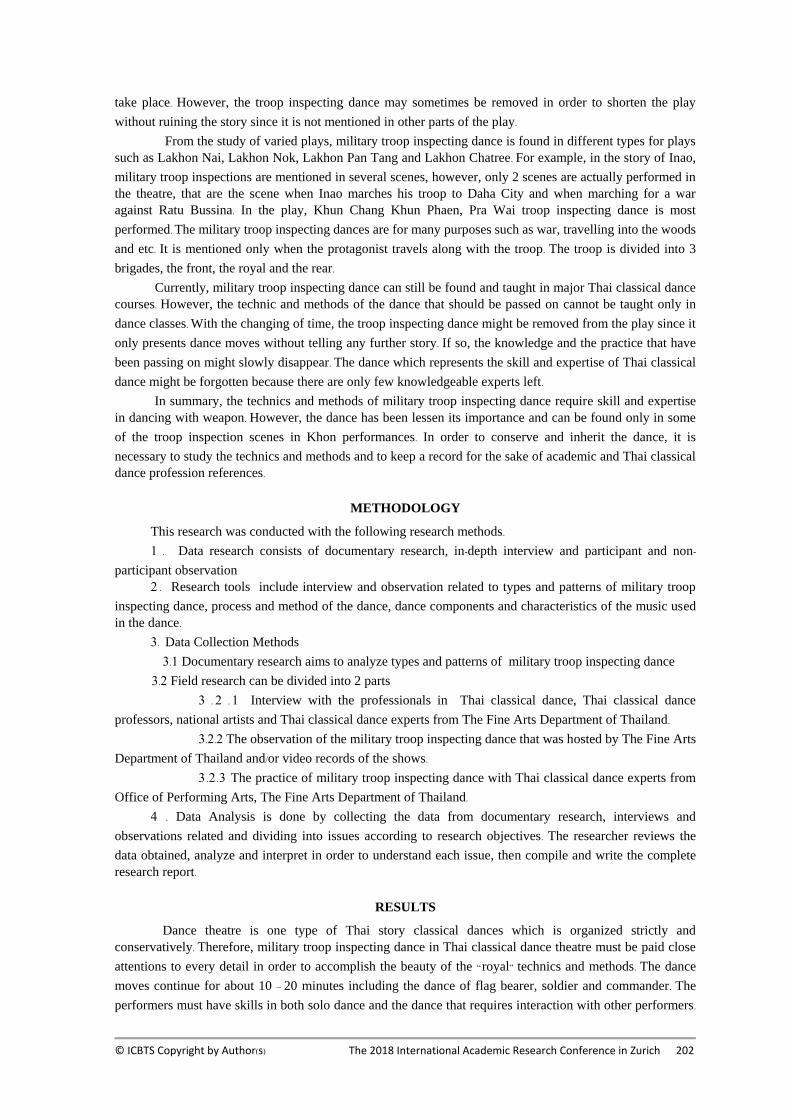
© ICBTS Copyright by Author(s) The 2018 International Academic Research Conference in Zurich 202
take place. However, the troop inspecting dance may sometimes be removed in order to shorten the play
without ruining the story since it is not mentioned in other parts of the play. From the study of varied plays, military troop inspecting dance is found in different types for plays
such as Lakhon Nai, Lakhon Nok, Lakhon Pan Tang and Lakhon Chatree. For example, in the story of Inao,
military troop inspections are mentioned in several scenes, however, only 2 scenes are actually performed in
the theatre, that are the scene when Inao marches his troop to Daha City and when marching for a war
against Ratu Bussina. In the play, Khun Chang Khun Phaen, Pra Wai troop inspecting dance is most
performed. The military troop inspecting dances are for many purposes such as war, travelling into the woods
and etc. It is mentioned only when the protagonist travels along with the troop. The troop is divided into 3
brigades, the front, the royal and the rear. Currently, military troop inspecting dance can still be found and taught in major Thai classical dance
courses. However, the technic and methods of the dance that should be passed on cannot be taught only in
dance classes. With the changing of time, the troop inspecting dance might be removed from the play since it
only presents dance moves without telling any further story. If so, the knowledge and the practice that have
been passing on might slowly disappear. The dance which represents the skill and expertise of Thai classical
dance might be forgotten because there are only few knowledgeable experts left. In summary, the technics and methods of military troop inspecting dance require skill and expertise
in dancing with weapon. However, the dance has been lessen its importance and can be found only in some
of the troop inspection scenes in Khon performances. In order to conserve and inherit the dance, it is
necessary to study the technics and methods and to keep a record for the sake of academic and Thai classical
dance profession references.
METHODOLOGY
This research was conducted with the following research methods.
1 . Data research consists of documentary research, in-depth interview and participant and non-participant observation
2 . Research tools include interview and observation related to types and patterns of military troop
inspecting dance, process and method of the dance, dance components and characteristics of the music used
in the dance. 3. Data Collection Methods
3.1 Documentary research aims to analyze types and patterns of military troop inspecting dance
3.2 Field research can be divided into 2 parts
3 . 2 . 1 Interview with the professionals in Thai classical dance, Thai classical dance
professors, national artists and Thai classical dance experts from The Fine Arts Department of Thailand.
3.2.2 The observation of the military troop inspecting dance that was hosted by The Fine Arts
Department of Thailand and/or video records of the shows.
3 .2 .3 The practice of military troop inspecting dance with Thai classical dance experts from
Office of Performing Arts, The Fine Arts Department of Thailand.
4 . Data Analysis is done by collecting the data from documentary research, interviews and
observations related and dividing into issues according to research objectives. The researcher reviews the
data obtained, analyze and interpret in order to understand each issue, then compile and write the complete
research report.
RESULTS
Dance theatre is one type of Thai story classical dances which is organized strictly and
conservatively. Therefore, military troop inspecting dance in Thai classical dance theatre must be paid close
attentions to every detail in order to accomplish the beauty of the “royal” technics and methods. The dance
moves continue for about 10 – 20 minutes including the dance of flag bearer, soldier and commander. The
performers must have skills in both solo dance and the dance that requires interaction with other performers.
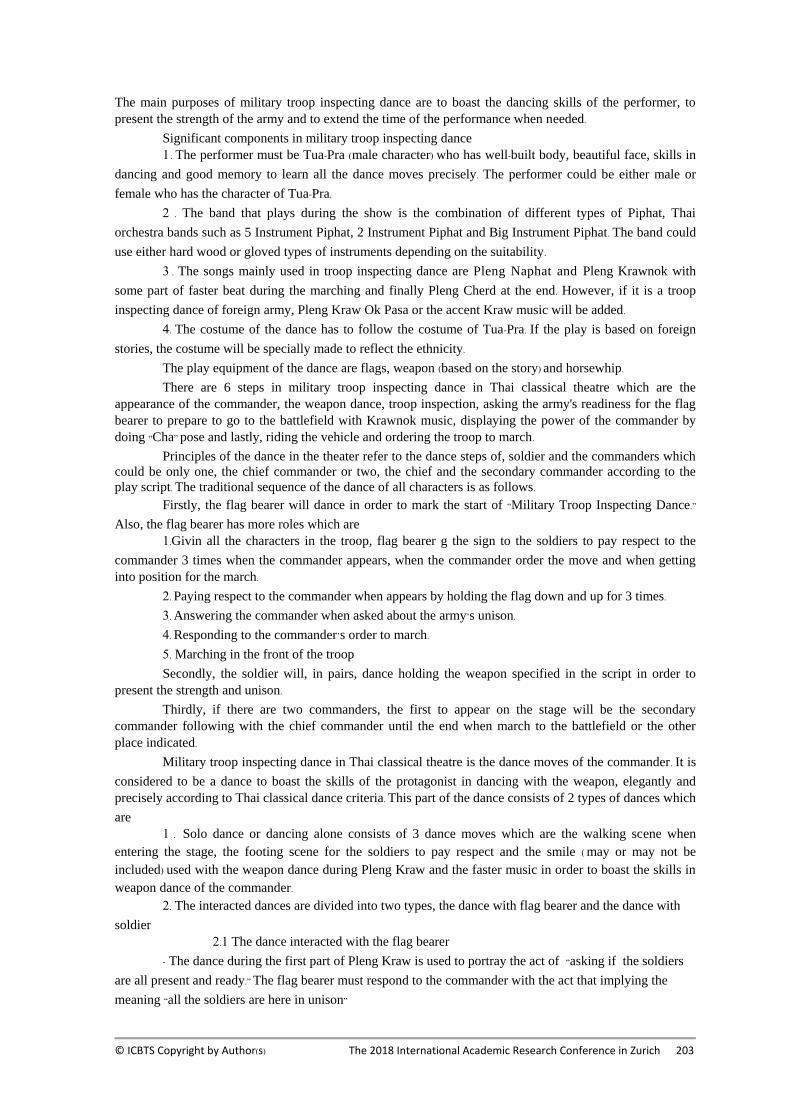
© ICBTS Copyright by Author(s) The 2018 International Academic Research Conference in Zurich 203
The main purposes of military troop inspecting dance are to boast the dancing skills of the performer, to
present the strength of the army and to extend the time of the performance when needed. Significant components in military troop inspecting dance
1 . The performer must be Tua-Pra (male character) who has well-built body, beautiful face, skills in
dancing and good memory to learn all the dance moves precisely. The performer could be either male or
female who has the character of Tua-Pra. 2 . The band that plays during the show is the combination of different types of Piphat, Thai
orchestra bands such as 5 Instrument Piphat, 2 Instrument Piphat and Big Instrument Piphat. The band could
use either hard wood or gloved types of instruments depending on the suitability.
3 . The songs mainly used in troop inspecting dance are Pleng Naphat and Pleng Krawnok with
some part of faster beat during the marching and finally Pleng Cherd at the end. However, if it is a troop
inspecting dance of foreign army, Pleng Kraw Ok Pasa or the accent Kraw music will be added.
4. The costume of the dance has to follow the costume of Tua-Pra. If the play is based on foreign
stories, the costume will be specially made to reflect the ethnicity.
The play equipment of the dance are flags, weapon (based on the story) and horsewhip. There are 6 steps in military troop inspecting dance in Thai classical theatre which are the
appearance of the commander, the weapon dance, troop inspection, asking the army's readiness for the flag
bearer to prepare to go to the battlefield with Krawnok music, displaying the power of the commander by
doing “Cha” pose and lastly, riding the vehicle and ordering the troop to march. Principles of the dance in the theater refer to the dance steps of, soldier and the commanders which
could be only one, the chief commander or two, the chief and the secondary commander according to the
play script. The traditional sequence of the dance of all characters is as follows. Firstly, the flag bearer will dance in order to mark the start of “Military Troop Inspecting Dance.”
Also, the flag bearer has more roles which are
1.Givin all the characters in the troop, flag bearer g the sign to the soldiers to pay respect to the
commander 3 times when the commander appears, when the commander order the move and when getting
into position for the march.
2. Paying respect to the commander when appears by holding the flag down and up for 3 times. 3. Answering the commander when asked about the army’s unison.
4. Responding to the commander’s order to march.
5. Marching in the front of the troop
Secondly, the soldier will, in pairs, dance holding the weapon specified in the script in order to
present the strength and unison. Thirdly, if there are two commanders, the first to appear on the stage will be the secondary
commander following with the chief commander until the end when march to the battlefield or the other
place indicated.
Military troop inspecting dance in Thai classical theatre is the dance moves of the commander. It is
considered to be a dance to boast the skills of the protagonist in dancing with the weapon, elegantly and
precisely according to Thai classical dance criteria. This part of the dance consists of 2 types of dances which
are
1 . Solo dance or dancing alone consists of 3 dance moves which are the walking scene when
entering the stage, the footing scene for the soldiers to pay respect and the smile ( may or may not be
included) used with the weapon dance during Pleng Kraw and the faster music in order to boast the skills in
weapon dance of the commander. 2. The interacted dances are divided into two types, the dance with flag bearer and the dance with
soldier
2.1 The dance interacted with the flag bearer
- The dance during the first part of Pleng Kraw is used to portray the act of “asking if the soldiers
are all present and ready.” The flag bearer must respond to the commander with the act that implying the
meaning “all the soldiers are here in unison”
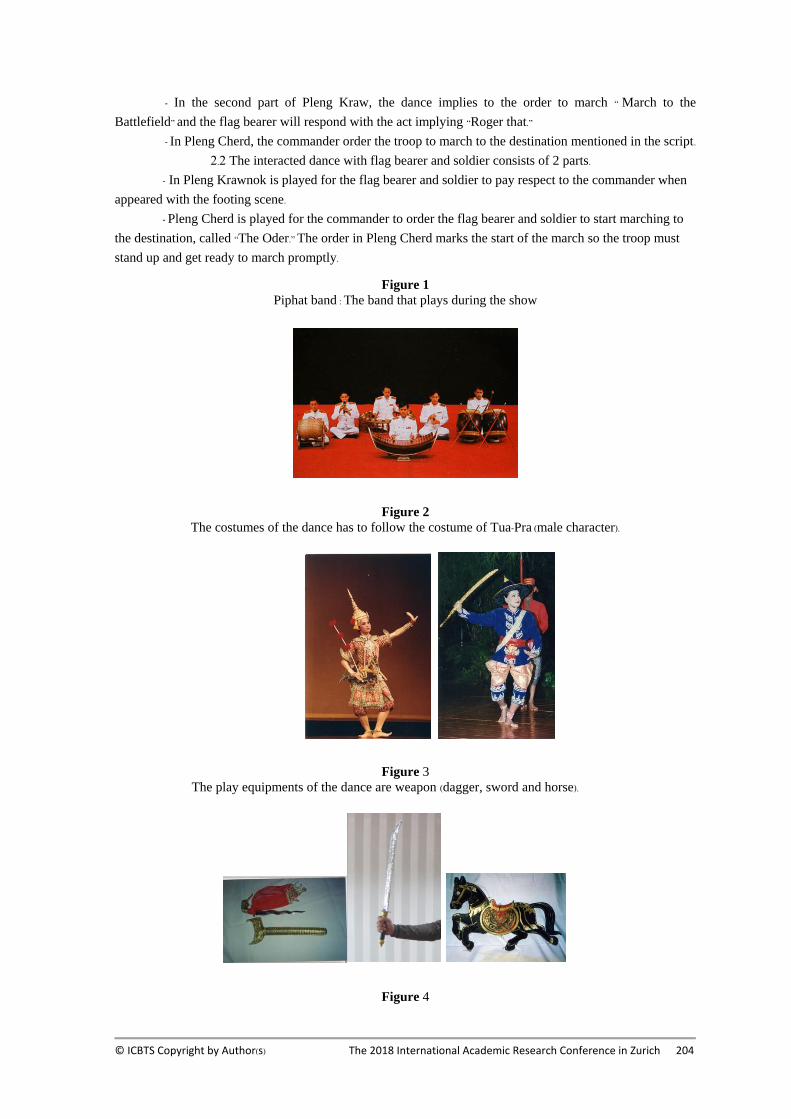
© ICBTS Copyright by Author(s) The 2018 International Academic Research Conference in Zurich 204
- In the second part of Pleng Kraw, the dance implies to the order to march “ March to the
Battlefield” and the flag bearer will respond with the act implying “Roger that.”
- In Pleng Cherd, the commander order the troop to march to the destination mentioned in the script.
2.2 The interacted dance with flag bearer and soldier consists of 2 parts.
- In Pleng Krawnok is played for the flag bearer and soldier to pay respect to the commander when
appeared with the footing scene.
- Pleng Cherd is played for the commander to order the flag bearer and soldier to start marching to
the destination, called “The Oder.” The order in Pleng Cherd marks the start of the march so the troop must
stand up and get ready to march promptly.
Figure 1
Piphat band : The band that plays during the show
Figure 2
The costumes of the dance has to follow the costume of Tua-Pra (male character).
Figure 3
The play equipments of the dance are weapon (dagger, sword and horse).
Figure 4
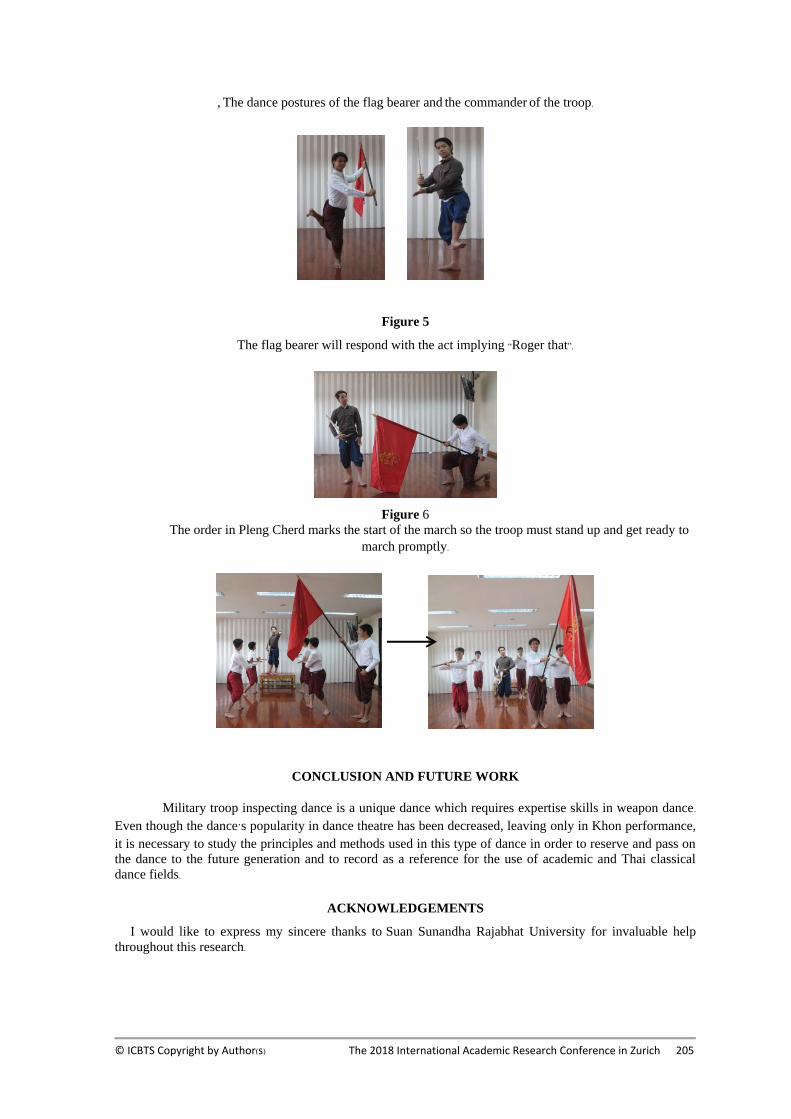
© ICBTS Copyright by Author(s) The 2018 International Academic Research Conference in Zurich 205
, The dance postures of the flag bearer and the commander of the troop.
Figure 5
The flag bearer will respond with the act implying “Roger that”.
Figure 6 The order in Pleng Cherd marks the start of the march so the troop must stand up and get ready to
march promptly.
CONCLUSION AND FUTURE WORK
Military troop inspecting dance is a unique dance which requires expertise skills in weapon dance. Even though the dance’s popularity in dance theatre has been decreased, leaving only in Khon performance,
it is necessary to study the principles and methods used in this type of dance in order to reserve and pass on
the dance to the future generation and to record as a reference for the use of academic and Thai classical
dance fields.
ACKNOWLEDGEMENTS
I would like to express my sincere thanks to Suan Sunandha Rajabhat University for invaluable help
throughout this research.
© ICBTS Copyright by Author(s) The 2018 International Academic Research Conference in Zurich 206
REFERENCES
[1] Kongtaworn,K.(2005). The troop reviewing dance of male characters in Inao court drama [in
Thai]. Bangkok: Chulalongkorn University.
[2] Jitrkul,K.(2005). Troop reviewing of monkey commanders in Khon [in Thai]. Bangkok:
Chulalongkorn University.
[3] Potiwetchakul,S.(1996). The traditional uses of dance props in Lakon Inao[in Thai]. Bangkok:
Chulalongkorn University.
[4] . (2009). Solo and Duo Dance [in Thai].. Bangkok: Faculty of Fine and Applied Arts, Suan
Sunandha Rajabhat University,
© ICBTS Copyright by Author(s) The 2018 International Academic Research Conference in Zurich 207
POWER CHARACTERISTICS IN THAI DRAMA
Kusuma Teppharak
Department of Performing Arts, Faculty of Fine and Applied Arts,
Suan Sunandha Rajabhat University, Bangkok, Thailand
E-Mail: [email protected]
ABSTRACT
According to the study of TV series in Thailand, there are power characteristics in Thai drama with
2 ways: 1. The power types through character relationships; 1.1 Vertical Power ; 1.1.1 through family
relationships because of gratitude belief to parents in Thai society with having the power beyond children,
such as beating , yelling , using violence and hurting inside houses and public places with the domination on
speaking and body, 1.1.2 through workplace relationships with foreman pictures to show the totalitarianism
even for position arrangement in offices and meeting rooms plus using of dominance and making surveys
from employee’s life in simple ways and 1.1.3 through mind-body and genders relationships which are
mostly found in Thai drama by using power and bargaining; 1.2 Horizontal power ; 1.2.1 through co-worker
relationships by performers in workplaces , such as in the meeting between colleagues or having meals with
friends.
2. The methods to use the power in 2 characteristics; 2.1 through Verbal language and Non-Verbal
language with 7 ways , such as faces , sights , body languages , area ; namely, positions and levels , distances
, sounds and things with character requirements and 2.2 through resistance and acting against power.
According to the result, it was found that there were proportions of using the power more than using the
resistance and the acting against the power. Similarly, the tools used in bargaining in most way is bodies.
Then, the repetitive broadcasting and the production from this authoritarianism in Thai drama are resulting in
the juvenile cultivation to grow with imitating this behavior.
Keywords: Power , Performing , Characteristics , Thai Drama
INTRODUCTION
In Thailand, drama is an entertainment form that reaches people of all walks of life and of all ages
and seizes all areas. So, drama is seen as a learning media and can form behaviors of people in one way or
another. Though not mainstream, it aids and abets in forming behaviors, both favorable and un favorable.
Communications come in many ways. Among them is drama. Roland Barthes(cited in Vallaya
Vivatsorn 2538 :123) defined “drama” as the machine of communication of one type. When dormant, it is
hidden behind the curtain. But when operated, it will immediately send out messages to us. This kind of
messages is specific in such a way that the messages are concomitantly sent out, but with different rhythms,
depending on the period of the show. We, as an audience, will receive 6 or 7 kinds of messages at the same
time ( from settings, costumes, lights, actors’ positions, manners, mimes, to verbal languages). Some are
constant, like lights, while others are variable, like manners. This is somewhat a genuine coordination of
messages and this is a characteristic of drama.
If this kind of media has been tainted with idea of power, teenagers and audience will be
behaviorally molded with authoritarianism. We cannot escape from the concept of power. We are, if not
rulers, subjects or vice versa, as power is in all societal aspects.
In analysis, events, behaviors, or relationships, should be given an attention.
Henceforth, the reproduction of an action of power through characteristics is cliché, as can be seen
on Thai TV shows, making people more authoritative in daily life.
© ICBTS Copyright by Author(s) The 2018 International Academic Research Conference in Zurich 208
In this article, the authors present the traits of power found in Thai drama, relating to both power
exertion and resistance to it. It is found that the proportion of power exertion exceeds the resistance to it.
OBJECTIVE
To study the traits of power through Thai characters, with an emphasis on the presentation of non-
verbal languages the characters use through the roles they play.
LITERATURE REVIEW
Drama seems like the media to bring the concept idea of creator to the audience. In addition, there
are several of dramas in the world no matter of tragedy ,comedy , melodrama , realist , surrealist and others ,
Chutima Maneewattana , A.D. 2007.
Sodsai Phanthumkomon (A.D.1988, page 3-4) claimed about the drama objectives in 3 levels:
1. Emotional level: it is believed that every pattern of drama or performing still has the objective to
entertain people. Besides, most audiences requires to watch drama or the performing to make relaxation as
well as making the good mood to be ready for live in their tough daily life which is called as the pleasure.
2. Brain level: apart from responding to the emotion drama or performing has the role as the brain
food to the audiences in order to think and use the intelligence. Then, this brain level is not only to response
to the emotion , drama or performing but it also has the role as the brain food to the audiences for thinking
and using the intelligence. Therefore, the perceiving in this brain level can improve the intelligence of the
audiences as another way.
3. Spirit level: the second objective is to give the value on spirit or the soul of human that is to
enlighten the new experience for human to know and understand the world and the nature. Therefore, it is in
the way of washing the soul to be pure. Similarly, the last step of perceiving is called as the way to bring the
soul onto the audiences in the highest level.
In this case, it can represent to the tool for bringing the emotions , the feelings and the thoughts of
the actors to the audiences , Treedaew Aphaiwong , A.D. 2008. However, in this day there are several
influencing Medias to become as the communication tool for everyone increasingly. Thus, the word as actor
isn’t limited in only television medias , movies or stage play only. On the other hand, everyone can be the
performers in every time and one of this character is called as the medium with showing of the outstanding
role for being the actor of belief or the leader in soul. Therefore, in this case it shouldn’t not only for hoping
anyone to make the pleasure in this field , but it also aims to develop the intelligence and bring the souls of
some people in the group to be as the targeted goal. As the result, in other words we might find this power
hidden with these acting which the researcher will claim in the next section.
METHODOLOGY
This is called as the documentary research with the steps ; namely, studying from documents ,
studying from TV series named “Deceitful Love”, a Club Friday’s series, based on true story. This series
was popular and aired on GMM 25 and using the content analysis with arrangement and descriptive
presentation.
OUTCOME
According to the research, power traits on Thai drama can be categorized into 2 types which are:
1. The types of power
There are 2 types of power, vertical and horizontal, expressed through relationships of characters.
© ICBTS Copyright by Author(s) The 2018 International Academic Research Conference in Zurich 209
1.1 Vertical power
1) Power manifested through family relationships
-Power manifestation from father to son
As, in Thai society, children must express gratitude to their parents, making the latter
superior over the former. This becomes, de facto, legitimate. When the parents yell at, batter, or scold at their
children in public, there would be no one to forbid this act, or warn, as he thinks that it is the family’s right
to do so, which, in fact, it is not.
In “Deceitful Love”, the relationships between father and child are complicated in that
they are interdependent and sexual in some ways. As the character of child is not a biological offspring,
father exerts vertical power on child, like scolding, pulling, hugging, or distance tightening. The child has no
bargaining power to make and he allows father to act in such ways.
Sometimes, when the child wants to make a bargaining power, other characters will be
involved, like mistress, or the use of body will be considered.
-Power manifestation from husband to wife
In the past, male-dominated culture was prevalent and still remains in the present. This
series reflects this kind of culture. The use of vertical power can be found in husband-wife relationships,
namely husband-first wife and husband-mistress and son relationships
The use of vertical power with the first wife can be found through threats to break up and
apathetic attitude. Husband views the wife as his own pet, only to boost his image in the society and she will
do anything to keep this status as first wife.
The use of vertical power with the mistress can be found through words, full of deceits,
lies, and sliminess to keep the mistress as long as he wishes, without caring for the mistress and ethics. With
love, she, first, succumbs to men’s power, but then she can escape from this relationship.
2) Power manifestation through relationships at work
-Power manifestation from boss to subordinates
This can be generally seen as position comes with power. Therefore, boss will show his
superiority over subordinates through orders, assignments, and dissuasion.
In “Deceitful Love”, the male character works as a manger in the openings. He orders his
subordinates under time limits, but ,sometimes, with it, takes away personal times from them. He lets them
work overnights, but, in authoritarian society, they keep working without complaints and do not want to
make a bargaining power with the boss.
Besides, when the subordinates learn that their boss has misbehaved by adulterating at the
department, they cannot put a warning, but only turn to gossiping. When the boss has found out, he only
dissuades and gets them back to work.
Moreover, the first wife, in some ways, orders the mistress to arrange flowers as a birthday
surprise to the boss, which the latter actually does not need to do so, but she does it due to the power she
cannot deny.
And, when the mistress faces the gossip crisis with colleagues, the first wife will convince
the mistress to relocate to other branches to avoid problems, citing this as suitable. This makes mistress
hesitant and perplexing, and finally stressed out.
© ICBTS Copyright by Author(s) The 2018 International Academic Research Conference in Zurich 210
-Power manifestation between colleagues
This can be found in the horizontal power type. Michelle Fougot (cited in Teerayuth
Bunmee, 2551) said that the power is something unstable, so it can be with anyone. So, inherent power can
be observed among friends.
In “ Deceitful Love”, when colleagues found one of them becomes boss’s mistress, they
start to exert power through discourses, like gossips, inventing stories, making her looked bad in the eyes of
others.
Moreover, they try to turn the mistress to be other thing by not socializing, talking to,
dining with. In worst case, she is treated as a “disease”
In one communication theory, called “Group think”, which describes the collective
behavior, the mistress’s friends gather and act in a certain way.
Finally, the closest friend of mistress has fought against this “dark power” with words, and
taking down all barricades and distance between her and mistress so as to protect her against this kind of
power
-Power manifestation to body and gender
The power manifestation to body and gender has been found for long time ago in world
drama. We found the power manifestation with using body as the machine with four main characters ;
namely, males , first wife , mistress and children as these details:
(1) Power manifestation from husband to wife
It is the cliché picture viewing in the story of a Club Friday’s series, based on true
story. This series was showed the concept of family love and passion. The character of males in this Series
was showed of the power manifestation to body and gender with the requirement.
(2) Power manifestation from wife to husband
The first wife always uses the body to bargain and keep for the wife status as long
as possible. In this scene, it was showed of the character’s action obviously represent to using of superior
body power over male as the controller although happen only in the short times.
(3) Power manifestation between male status and female status in workplace
This power can be found in the drama through the sexual harassment with
speaking and using eye sights. In this story, the male colleague knows about the mistress status of the
mistress character. He came to the secret place to be closed with the female and spoke unfavorably for
showing of the male power to the female colleague.
1.2 Horizontal Power
1) It manifest through the relationships in workplace
-Horizontal power manifestation of colleague
In the first part, the colleague doesn’t know that his friend has used the horizontal power as being
the mistress of the boss because everyone still shows the good relationship in the same level. In this case, it
was showed of not varied level of the power seen from the walking together and sitting in the same level of
seat position.
© ICBTS Copyright by Author(s) The 2018 International Academic Research Conference in Zurich 211
In summary, It is shown that most of the horizontal power results through 1) the family
relationships; namely, father to child , husband to wife and 2) the relationships in workplace ; namely, boss
to subordinates , colleague to colleague and 3) the relationships between body and gender
2. Method of Using Power
There are 2 characteristics to use the power in drama with details as follows:
2.1 The Manifestation of Power
The method to use the power , the using of character through verbal and non-verbal language with
gaining for the power in the good requirement. This article emphasizes on the presenting of non-verbal part
consisting of these details as follows:
Face : The using of power through face with showing of varieties emotions ; namely, smiling
broadly, giggling , showing of angriness , feeling disgusting and etc. It was found much in character
manifestation. Thai actors and Thai actresses are popularly to show for the face more than other non-verbal
language, especially between female characters to manifest in this part at most way.
Eye Sight : It is obviously seen that most of the characters use their eye sights to act with each other
and bargain for the power that is to use for the aggressive eye contacts as they show their statuses and
bargain the power to each other. These characters have used the broad smile to show of the superiority.
Body Language : Most of the characters use the expressions on the body for showing of superiority
or try to use the bargaining of power to other people. These characters use the body power of themselves to
communicate with their requirements that is to show of the superiority with act in aggressive manners ;
namely, slapping , pushing , pinching the hair , flinging , squeezing with hand , pointing on the face ,
hugging too tight. This expression can be found at most way in this drama series , and it may be claimed that
this is the important characteristic for our Thai melodrama found in most of Thai drama. It is mostly found
the slapping scene , the using of forces for the characters to show of superiority , the forcing power and the
controlling power and others.
Area in Position and Level : The using for area in position and level with manifesting of the power
and the bargaining of the power character can be found as these details with follows:
1) The using of area to manifest of the power
In most of drama series, It is shown that the male character always sits at the head of the table to
manifest the power to the subordinate as seen in several dramas and the real life of us. This is the official
position of the boss in the meeting room to reflect of the authoritarian power since we don’t have the verbal
language. Thus, the boss always speak and use the body language as well as doing everything with showing
of the power or use the same power level between the colleague inside the meeting room and people sitting
in the same level reflecting for their same power level and others.
It includes with the using of area to manifest the power and when the characters have their closed
table to watch and supervise for each other, Michael Fuko referring to Theerayut Bunmee , 2008. There is
the claim about the using of area by the well-known sociologists with using the theory of power. It is said
that the power in charge and examining based on the charging area to show in schools and workplaces and
etc. Then, this subject reflects to the fact , so the male knows about the action of this
favorite character including of watching for his movement and activities all the times.
2)Using of level to manifest the power
The standing in different positions has contributed to the good power relationships , such as
standing over one’s head , walking by knee and others.
© ICBTS Copyright by Author(s) The 2018 International Academic Research Conference in Zurich 212
Distance : People use the distance to bargain the power and keep the level of power between each
other. In this research, it is mostly found that males always has the superiority on other females’ body and
life though the females try to resist and bargain the power with the male all the times. Most of the times, he
has his superiority over the females by standing closed to the females’ body and face until the females have
given in. On the contrast, the female characters always use the closed area to bargain the male power as well.
Sound : Sometimes, the male characters use the power through the sound , such as yelling at the
female dormitory to make apologize as one of all bargaining for the power due to not appearing of the
female. For another example, there is a female yelling to another female after she can’t accept for the
condition of her husband. For last example, there is a female yelling to another female after she isn’t
satisfied for hearing his lady girlfriend to talk with another male at the late of the night. All of these
examples are showing of the superiority over another person and over the standard.
Thing : The using of power through things which the characters apply in the acting consisting of
these details as follows:
-The power manifestation through using the weapons , such as cutters , glass pieces , mango rhino
in symbol to speak sarcastically over the same gender or female and etc.
-The power manifestation through the valuable things , such as rings , diamond necklaces to
manifest for the power while using these things as seen in the roles of several characters in Thai dramas.
Mostly, It is shown of the financial power of males sharing to females. Sometimes, the older female
characters always bargain the power to their fond males also.
Therefore, the proportions to manifest the power with general resistance have more ratios than the
power resistance. In “Deceitful Love”, a Club Friday’s series, the main male actor has showed of the male
dominance as seen in the using of the power method more than else ways.
Furthermore, it is shown that there is the bargaining of power between the females for their desired
males. Most of the contents in dramas always have the fighting to gain the power with using the gender
power.
2.2 The Resistance and the Bargaining of Power
Although most of the details with the acting of the characters are showing of the manifestation to
each other , sometimes, some characters are resisting and have the resistance to the superior characters. For
example, the character as a child does everything for seeing his father again. For another example, the first
wife has planned to do everything for keeping her status. For last example, the mistress yelled by the close
friend to have the resistance to the male character by making appointment to the first wife and persuading
her to divorce with her husband and etc.
In summary, it was shown that there are the proportions to use with the manifestation power in this
drama more than using the general resistance and the power resistance. Besides, it was found that the
machine used in the bargaining of power is the human body.
CONCLUSION
Cultural factors and social class factors
Powers are pervasive and ubiquitous in all actions, in all relationships in our lives, at work, and also
in bodies and sex.
But, the power itself is not stable; therefore, the power bargaining, resistance to it, and disobedience
are found, from time to time. The proportion of these varies, depending upon the environmental conditions
and social discourses.
© ICBTS Copyright by Author(s) The 2018 International Academic Research Conference in Zurich 213
As in this drama, the mistress has no chance to make a bargaining power with the masses who have
known her story, due to being labeled as a culprit. Though in the drama, the male characters are guilty by
lying and deceiving, female counterparts, who are passive, have been blamed, to the greater degree than
males.
The status of first wife and mistress is socially divided under norms. The action carried out by
mistress is less legitimate than the one done by the first wife and family members.
In addition, sex is another factor for superiority. Male characters get used to sweet-talking and
being gentle, while being aggressive, at the same time to centralize the power to himself.
Physically, male is stronger than female. This fact has been emphasized by the male acting towards
female, like hugging tightly, pulling, and yelling at.
Social status, like work position and money, is the factor that the principle character uses to
sexually attract the opposite sex, and as a bargaining power to gain upper hand over others
Drama as a communication tool has unintentionally reproduced the same images of the male-
dominated culture. This determines the behaviors of audience, making it legitimate for domination of males
who can do anything to females. It becomes cycles, time after time.
Additionally, we have found that the females on the show use their bodies as a power bargaining
with the males. This has been passed on to young generations with which we cannot change the idea of male
domination and can create the meaningfulness in females. This has become an all familiar scene. The
reproduced image that females use their bodies for their desires can be confirmed by several series. Juveniles
will absorb this kind of thought and will follow the same path.
Therefore, this research reflects the authoritarianism in the society, which has been passed on from
the roles the characters play to the audience through absorption and may put it into practice, later
Suggestions for the next research to be conducted
1.It may make a comparison with characters abroad to present less authoritarianism or promote
democracy.
2.It may study the awarded drama that stands out at promoting democracy through the roles its
characters play.
ACKNOWLEADGEMENT
This research was conducted under the policy of Suan Sunandra Rajabhat University in promoting
and enhancing the faculty member’s potential in term of research. The budget was allocated through the
Research and development Institute and granted to researcher qualified. The researcher wished to thank all
bodies concerned for your kind consideration.
REFERENCES
[1] Chutima Maneewattana. (2007). Teaching Document of Directing. Suansunandha Rajabhat
University.
[2] Treedeaw Aphaiwong (2007). Acting, Nopphamat Waewhong, Review of Dramatic Arts
[3] (Page 87-104). Bangkok : Department of Dramatic Arts , Faculty of Arts , Chulalongkorn
University.
[4] Theerayut Boonmee. (2008). Michel Foucault. Bangkok: Wiphasa Publishing.
[5] Wallaya Wiwatsorn. (2005). Franch Drama in eighteenth century. Bangkok: Chulalongkorn
University.
[6] Sodsai Phanthumkomon. (1988). Teaching Document of Review in Dramatic Arts.
[7] Bangkok: Faculty of Arts , Chulalongkorn University.
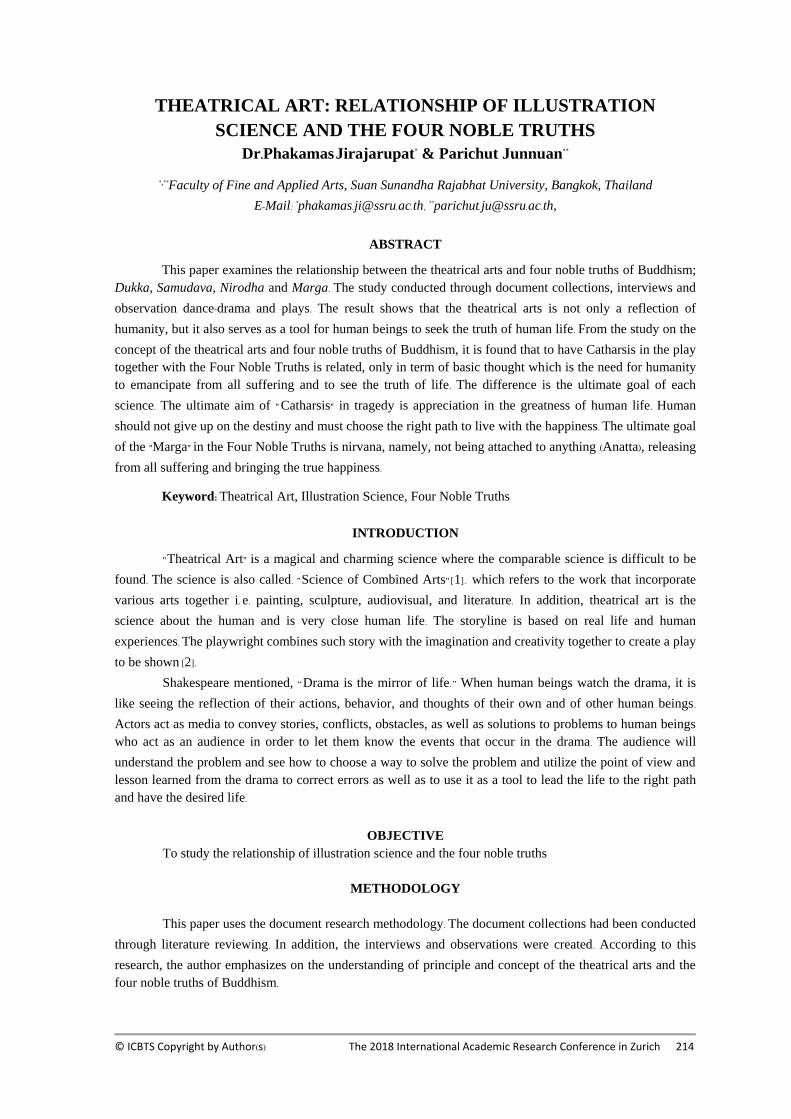
© ICBTS Copyright by Author(s) The 2018 International Academic Research Conference in Zurich 214
THEATRICAL ART: RELATIONSHIP OF ILLUSTRATION
SCIENCE AND THE FOUR NOBLE TRUTHS
Dr.Phakamas Jirajarupat* & Parichut Junnuan**
*,**Faculty of Fine and Applied Arts, Suan Sunandha Rajabhat University, Bangkok, Thailand
E-Mail: *[email protected], **[email protected],
ABSTRACT
This paper examines the relationship between the theatrical arts and four noble truths of Buddhism;
Dukka, Samudava, Nirodha and Marga. The study conducted through document collections, interviews and
observation dance-drama and plays. The result shows that the theatrical arts is not only a reflection of
humanity, but it also serves as a tool for human beings to seek the truth of human life. From the study on the
concept of the theatrical arts and four noble truths of Buddhism, it is found that to have Catharsis in the play
together with the Four Noble Truths is related, only in term of basic thought which is the need for humanity
to emancipate from all suffering and to see the truth of life. The difference is the ultimate goal of each
science. The ultimate aim of " Catharsis" in tragedy is appreciation in the greatness of human life. Human
should not give up on the destiny and must choose the right path to live with the happiness. The ultimate goal
of the "Marga" in the Four Noble Truths is nirvana, namely, not being attached to anything (Anatta), releasing
from all suffering and bringing the true happiness.
Keyword: Theatrical Art, Illustration Science, Four Noble Truths
INTRODUCTION
"Theatrical Art" is a magical and charming science where the comparable science is difficult to be
found. The science is also called. "Science of Combined Arts" [1] . which refers to the work that incorporate
various arts together i. e. painting, sculpture, audiovisual, and literature. In addition, theatrical art is the
science about the human and is very close human life. The storyline is based on real life and human
experiences. The playwright combines such story with the imagination and creativity together to create a play
to be shown [2].
Shakespeare mentioned, “Drama is the mirror of life.” When human beings watch the drama, it is
like seeing the reflection of their actions, behavior, and thoughts of their own and of other human beings.
Actors act as media to convey stories, conflicts, obstacles, as well as solutions to problems to human beings
who act as an audience in order to let them know the events that occur in the drama. The audience will
understand the problem and see how to choose a way to solve the problem and utilize the point of view and
lesson learned from the drama to correct errors as well as to use it as a tool to lead the life to the right path
and have the desired life.
OBJECTIVE
To study the relationship of illustration science and the four noble truths
METHODOLOGY
This paper uses the document research methodology. The document collections had been conducted
through literature reviewing. In addition, the interviews and observations were created. According to this
research, the author emphasizes on the understanding of principle and concept of the theatrical arts and the
four noble truths of Buddhism.
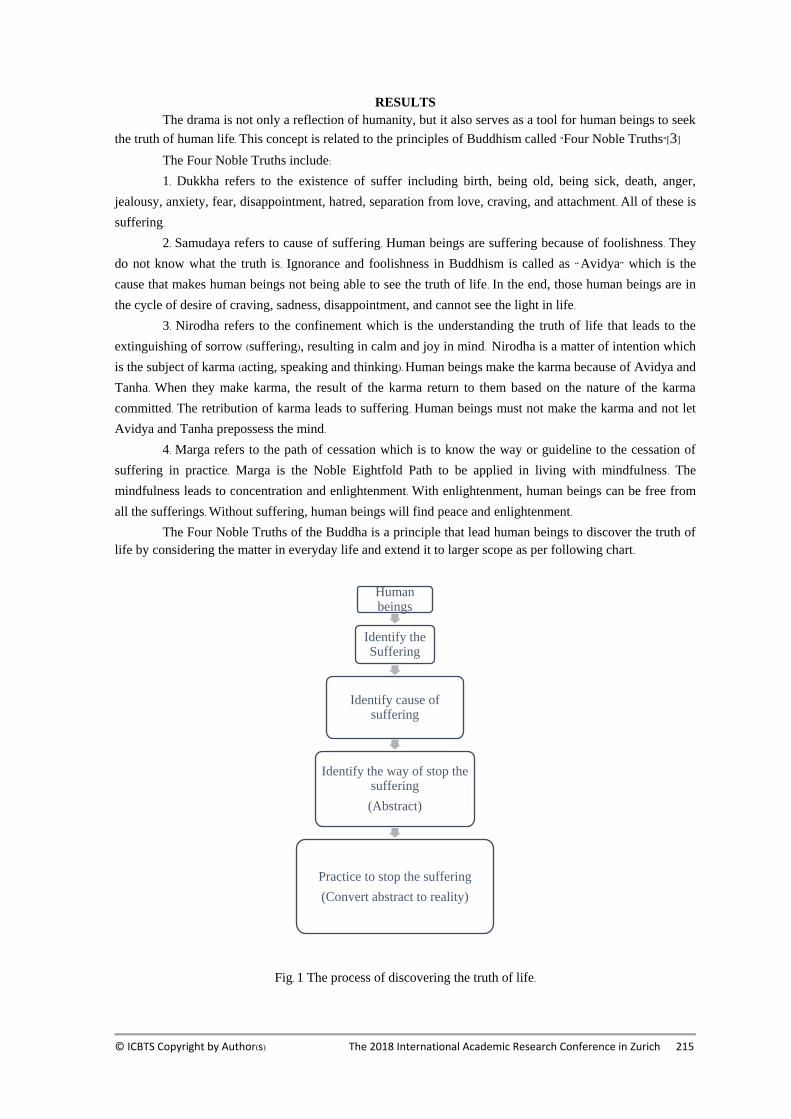
© ICBTS Copyright by Author(s) The 2018 International Academic Research Conference in Zurich 215
Human beings
Identify the Suffering
Identify cause of suffering
Identify the way of stop the suffering
(Abstract)
Practice to stop the suffering
(Convert abstract to reality)
RESULTS
The drama is not only a reflection of humanity, but it also serves as a tool for human beings to seek
the truth of human life. This concept is related to the principles of Buddhism called "Four Noble Truths"[3]
The Four Noble Truths include:
1. Dukkha refers to the existence of suffer including birth, being old, being sick, death, anger,
jealousy, anxiety, fear, disappointment, hatred, separation from love, craving, and attachment. All of these is
suffering.
2. Samudaya refers to cause of suffering. Human beings are suffering because of foolishness. They
do not know what the truth is. Ignorance and foolishness in Buddhism is called as “ Avidya” which is the
cause that makes human beings not being able to see the truth of life. In the end, those human beings are in
the cycle of desire of craving, sadness, disappointment, and cannot see the light in life.
3. Nirodha refers to the confinement which is the understanding the truth of life that leads to the
extinguishing of sorrow (suffering), resulting in calm and joy in mind. Nirodha is a matter of intention which
is the subject of karma (acting, speaking and thinking). Human beings make the karma because of Avidya and
Tanha. When they make karma, the result of the karma return to them based on the nature of the karma
committed. The retribution of karma leads to suffering. Human beings must not make the karma and not let
Avidya and Tanha prepossess the mind.
4. Marga refers to the path of cessation which is to know the way or guideline to the cessation of
suffering in practice. Marga is the Noble Eightfold Path to be applied in living with mindfulness. The
mindfulness leads to concentration and enlightenment. With enlightenment, human beings can be free from
all the sufferings. Without suffering, human beings will find peace and enlightenment.
The Four Noble Truths of the Buddha is a principle that lead human beings to discover the truth of
life by considering the matter in everyday life and extend it to larger scope as per following chart.
Fig. 1 The process of discovering the truth of life.
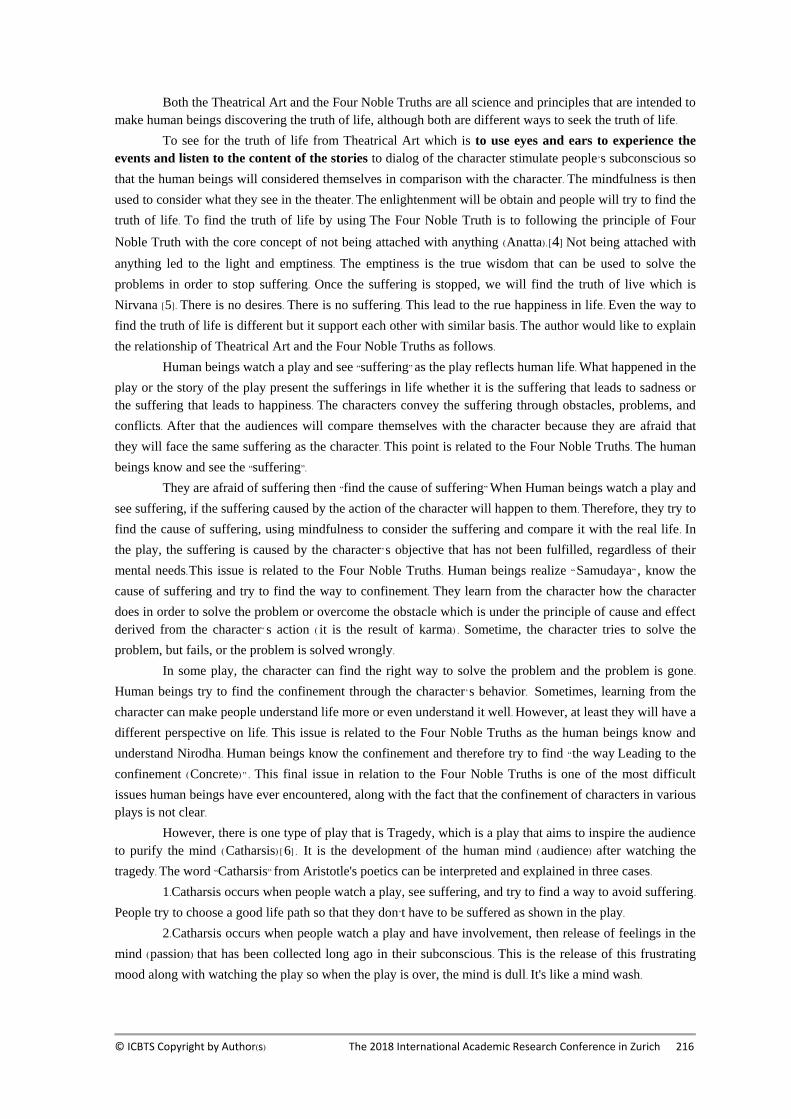
© ICBTS Copyright by Author(s) The 2018 International Academic Research Conference in Zurich 216
Both the Theatrical Art and the Four Noble Truths are all science and principles that are intended to
make human beings discovering the truth of life, although both are different ways to seek the truth of life.
To see for the truth of life from Theatrical Art which is to use eyes and ears to experience the
events and listen to the content of the stories to dialog of the character stimulate people’s subconscious so
that the human beings will considered themselves in comparison with the character. The mindfulness is then
used to consider what they see in the theater. The enlightenment will be obtain and people will try to find the
truth of life. To find the truth of life by using The Four Noble Truth is to following the principle of Four
Noble Truth with the core concept of not being attached with anything (Anatta).[4] Not being attached with
anything led to the light and emptiness. The emptiness is the true wisdom that can be used to solve the
problems in order to stop suffering. Once the suffering is stopped, we will find the truth of live which is
Nirvana [5]. There is no desires. There is no suffering. This lead to the rue happiness in life. Even the way to
find the truth of life is different but it support each other with similar basis. The author would like to explain
the relationship of Theatrical Art and the Four Noble Truths as follows.
Human beings watch a play and see “suffering” as the play reflects human life. What happened in the
play or the story of the play present the sufferings in life whether it is the suffering that leads to sadness or
the suffering that leads to happiness. The characters convey the suffering through obstacles, problems, and
conflicts. After that the audiences will compare themselves with the character because they are afraid that
they will face the same suffering as the character. This point is related to the Four Noble Truths. The human
beings know and see the “suffering”.
They are afraid of suffering then “find the cause of suffering” When Human beings watch a play and
see suffering, if the suffering caused by the action of the character will happen to them. Therefore, they try to
find the cause of suffering, using mindfulness to consider the suffering and compare it with the real life. In
the play, the suffering is caused by the character’s objective that has not been fulfilled, regardless of their
mental needs.This issue is related to the Four Noble Truths. Human beings realize “ Samudaya” , know the
cause of suffering and try to find the way to confinement. They learn from the character how the character
does in order to solve the problem or overcome the obstacle which is under the principle of cause and effect
derived from the character’ s action ( it is the result of karma) . Sometime, the character tries to solve the
problem, but fails, or the problem is solved wrongly.
In some play, the character can find the right way to solve the problem and the problem is gone.
Human beings try to find the confinement through the character’s behavior. Sometimes, learning from the
character can make people understand life more or even understand it well. However, at least they will have a
different perspective on life. This issue is related to the Four Noble Truths as the human beings know and
understand Nirodha. Human beings know the confinement and therefore try to find “the way Leading to the
confinement (Concrete) ” . This final issue in relation to the Four Noble Truths is one of the most difficult
issues human beings have ever encountered, along with the fact that the confinement of characters in various
plays is not clear.
However, there is one type of play that is Tragedy, which is a play that aims to inspire the audience
to purify the mind ( Catharsis) [ 6] . It is the development of the human mind ( audience) after watching the
tragedy. The word “Catharsis” from Aristotle's poetics can be interpreted and explained in three cases.
1.Catharsis occurs when people watch a play, see suffering, and try to find a way to avoid suffering.
People try to choose a good life path so that they don’t have to be suffered as shown in the play.
2.Catharsis occurs when people watch a play and have involvement, then release of feelings in the
mind (passion) that has been collected long ago in their subconscious. This is the release of this frustrating
mood along with watching the play so when the play is over, the mind is dull. It's like a mind wash.
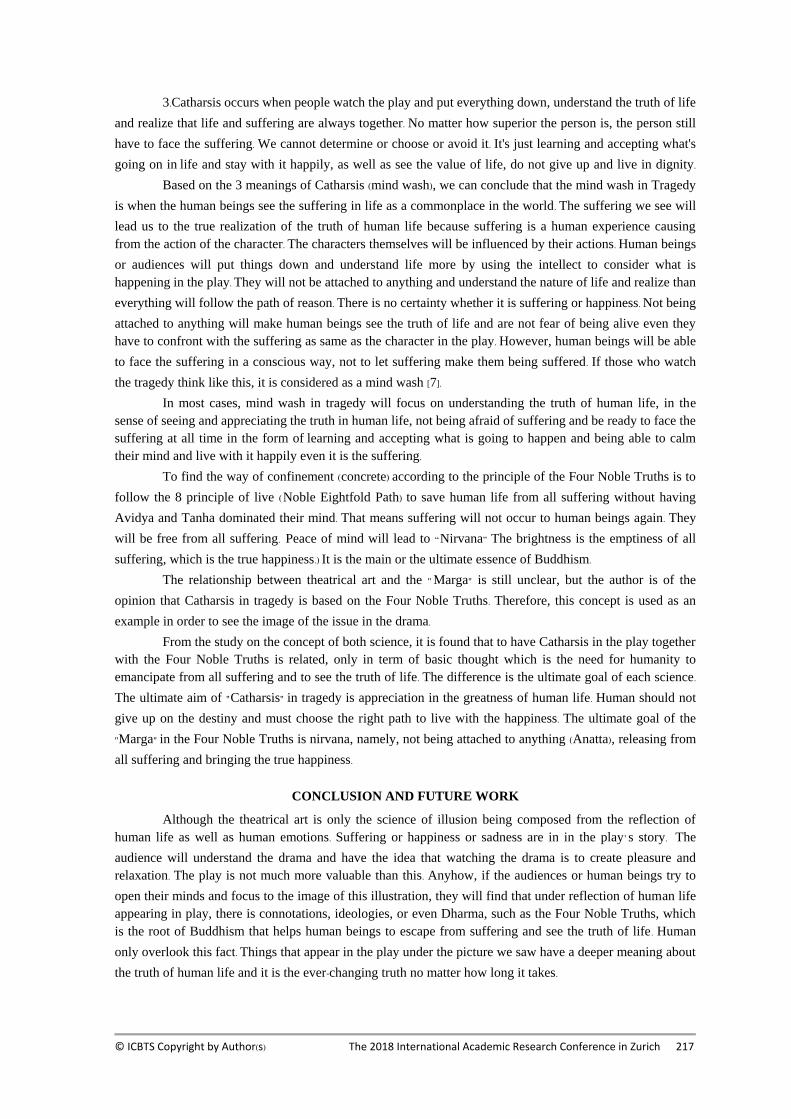
© ICBTS Copyright by Author(s) The 2018 International Academic Research Conference in Zurich 217
3.Catharsis occurs when people watch the play and put everything down, understand the truth of life
and realize that life and suffering are always together. No matter how superior the person is, the person still
have to face the suffering. We cannot determine or choose or avoid it. It's just learning and accepting what's
going on in life and stay with it happily, as well as see the value of life, do not give up and live in dignity.
Based on the 3 meanings of Catharsis (mind wash), we can conclude that the mind wash in Tragedy
is when the human beings see the suffering in life as a commonplace in the world. The suffering we see will
lead us to the true realization of the truth of human life because suffering is a human experience causing
from the action of the character. The characters themselves will be influenced by their actions. Human beings
or audiences will put things down and understand life more by using the intellect to consider what is
happening in the play. They will not be attached to anything and understand the nature of life and realize than
everything will follow the path of reason. There is no certainty whether it is suffering or happiness. Not being
attached to anything will make human beings see the truth of life and are not fear of being alive even they
have to confront with the suffering as same as the character in the play. However, human beings will be able
to face the suffering in a conscious way, not to let suffering make them being suffered. If those who watch
the tragedy think like this, it is considered as a mind wash [7].
In most cases, mind wash in tragedy will focus on understanding the truth of human life, in the
sense of seeing and appreciating the truth in human life, not being afraid of suffering and be ready to face the
suffering at all time in the form of learning and accepting what is going to happen and being able to calm
their mind and live with it happily even it is the suffering.
To find the way of confinement (concrete) according to the principle of the Four Noble Truths is to
follow the 8 principle of live (Noble Eightfold Path) to save human life from all suffering without having
Avidya and Tanha dominated their mind. That means suffering will not occur to human beings again. They
will be free from all suffering. Peace of mind will lead to “Nirvana” The brightness is the emptiness of all
suffering, which is the true happiness.) It is the main or the ultimate essence of Buddhism.
The relationship between theatrical art and the " Marga" is still unclear, but the author is of the
opinion that Catharsis in tragedy is based on the Four Noble Truths. Therefore, this concept is used as an
example in order to see the image of the issue in the drama.
From the study on the concept of both science, it is found that to have Catharsis in the play together
with the Four Noble Truths is related, only in term of basic thought which is the need for humanity to
emancipate from all suffering and to see the truth of life. The difference is the ultimate goal of each science.
The ultimate aim of "Catharsis" in tragedy is appreciation in the greatness of human life. Human should not
give up on the destiny and must choose the right path to live with the happiness. The ultimate goal of the
"Marga" in the Four Noble Truths is nirvana, namely, not being attached to anything (Anatta), releasing from
all suffering and bringing the true happiness.
CONCLUSION AND FUTURE WORK
Although the theatrical art is only the science of illusion being composed from the reflection of
human life as well as human emotions. Suffering or happiness or sadness are in in the play’ s story. The
audience will understand the drama and have the idea that watching the drama is to create pleasure and
relaxation. The play is not much more valuable than this. Anyhow, if the audiences or human beings try to
open their minds and focus to the image of this illustration, they will find that under reflection of human life
appearing in play, there is connotations, ideologies, or even Dharma, such as the Four Noble Truths, which
is the root of Buddhism that helps human beings to escape from suffering and see the truth of life. Human
only overlook this fact. Things that appear in the play under the picture we saw have a deeper meaning about
the truth of human life and it is the ever-changing truth no matter how long it takes.
© ICBTS Copyright by Author(s) The 2018 International Academic Research Conference in Zurich 218
“In life, we have to face both suffering and happiness. It is unavoidable and we cannot select what
we want to face. The matter is only how much we, as a person who will face them can learn and accept what
is going to happen and how we can have the confinement among all the changes in our life (Live and Learn).
ACKNOWLEDGEMENTS
I would like to express my sincere thanks to Suan Sunandha Rajabhat University for invaluable help
throughout this research.
REFERENCE
[1] Chutima Maneewattana, 2010. Meaning and Theatrical Devices of Samuel Beckett’Plays in the
context of Buddhism. Bangkok: Silapakam Journal, Konkaen University, Vol 1 No.2,PP 89-109.
[2] Phakamas Jirajarupat, 2014. Seri Wangnaitham’s Phuchanasibtid and the Modernization of
Thai Traditional Theatre. Asian Theatre Journal,University of Hawai’I Press, Vol 31, No.2,
Special Issue on Global Encounters In Southeast Asian Performing Arts (Fall2014)’ PP.417-
438.
[3] Noppamas Sirikaya,(N.D), Theatre History.Bangkok: Faculty of Art, Chulalongkorn University.
[4] Phrapromkunaporn (Prayutto),2001. Phuttathum.Bangkok : Duangkaew.
[5] Phrapromkunaporn (Prayutto),2003. Potchananukrom Phuttasart.Bangkok : Duangkaew.
[6] PhrathumKosajarn (Buddhadhapiu), 2005. Kaen Buddha Sadsana. Bangkok: Tarueta
Publication.
[7] Sodsai Phamthumkomol, 1992. Introduction to Theatre Arts. Bangkok: Faculty of Art,
Chulalongkorn University.
© ICBTS Copyright by Author(s) The 2018 International Academic Research Conference in Zurich 219
A SURVEY OF NEEDS OF THE LABOR MARKET IN VISUAL
COMMUNICATION DESIGN
Dr.Nataporn Rattanachaiwong*, Marut Pichetvit**, Chantana Insra*** & Phattanan Kritsanakarn****
*,**,***,****Faculty of Fine and Applied Arts, Suan Sunandha Rajabhat University, Bangkok, Thailand
E-Mail: *[email protected], **[email protected], ***[email protected], ****[email protected]
ABSTRACT
The objective of this survey research was to study the labor market in visual communication design.
The analysis assessed the educational administration of visual communication design programmer whether
the curriculum provides sufficient knowledge for students.
The population was 30 companies in Bangkok who hired student from Visual Communication
Department, Suan Sunandha Rajabhat University . A questionnaires and a field study were used as research
tools. The questionnaires assessed the performances of students in five areas : 1) Ethics 2) knowledge 3)
intelligence 4) interpersonal skills 5) communicative skills.
The data was analyzed by using mean scores, percentages and standard deviations (SD). The results
showed that the mean score for ethical category was 4 .36 and SD was 0.24. The mean score for knowledge
was 4.40 and SD was 0.48 . For intelligence category, the mean score was 4 .54 while SD was 0.30 . In the
category of interpersonal skills, the mean score was 4.53 and SD was 0.29 . For the last area, communicative
skills, the mean scoore was 4.24 and SD was 0.47.
The conclusion found that the labor market satisfied with the quality of students who graduated
from the deoartment of all the five areas.
Keywords: Labor market, Visual communication design, Satisfaction
INTRODUCTION
It was first established in 1973 with only the department of Liberal Art, Music, and Dancing Arts in
the Faculty of Humanities and Social Science in Suan Sunandha Teachers College that also count as the 40
years of development from past to present.
Until 1999, Associate Professor Dr. Dilok Boonrod, the Chancellor of Suan Sunandha Rajabhat
University, had the initiative to gather the outstanding of arts, music, dancing, and drama within the “Suan
Sunandha” perimeter and strengthen them to become the one of the leader of Liberal Arts in the country so
the “ Liberal Arts faculty establishment project” was organized by separating all of Art programs from the
Faculty of Humanities and Social Science and divided the academic operation into 3 programs which
consisted of
1. Liberal Art program
2. Music program
3. Dancing Arts program ( by merging with Dramatic Arts group)
And also appointed Assistant Professor Dr. Krissada Krudthong, the Vice Chancellor of special
activity division who was in charge of Chancellor. Later, there were added curriculums that caused the
establishment of Liberal Arts faculty became successful with well supports and encourages from the former
chancellor and associate chancellor including many other personnel.
© ICBTS Copyright by Author(s) The 2018 International Academic Research Conference in Zurich 220
On March 1, 2005, the university council had announced in Royal Government Gazette to establish
the “ Liberal Arts faculty” successfully and officially originated in Suan Sunandha Rajabhat University and
also the only faculty in all of 41 Rajabhat Universities all over the country.
Nowadays, the faculty of Liberal Arts of Suan Sunandha Rajabhat University had the program
opening for teaching in normal Bachelor degree for 6 courses as follows, 1) Bachelor of Communication
Arts, Visual Communication Design department, 2) Bachelor of Communication Arts, Fashion design
department, 3) Bachelor of Communication Arts, Creative product design department, 4) Bachelor of
Communication Arts, Painting department, 5) Bachelor of Communication Arts, Performing arts department (
Dramatic art, Dancing art) , and 6) Bachelor of Communication Arts, Music department that the faculty of
Liberal arts had still developed the courses continuously and one of the significant part that affected the
courses development was the labor market requirement survey in order to use the result for courses
development. In this research, the researcher would conduct the survey of Visual Communication Design
labor market requirement which was one of the course in the Faculty of Liberal Arts of Suan Sunandha
Rajabhat University.
Nowadays, the data of labor requirement in labor market and the satisfaction in enterprises were still
shortly collected and covered the whole content especially the data collecting or labor requirement survey in
each specific career that still few gathered result that may affect to the education system or recruiting labors
in each career among the labor market. In order to meet the requirement in Visual Communication Design in
conducting the survey of labor market requirement in Visual Communication Design to answer the specific
result and caused the labor expansion towards the market requirement.
The researcher had seen the necessity in providing mentioned data then the research of surveying
Visual Communication Design labor market requirement in order to survey the labor requirement in labor
market then analyzed the effected result to the curriculum of Visual Communication Design or related
courses and also forwarding the quality improvement in each side.
Besides, this research was the survey of labor requirement of the enterprises in Visual
Communication Design or related careers about basic information and the satisfaction towards the selecting
and recruitment and career related matters.
Satisfaction is the significant factor that affects the work success that effectively according to the plan
which is caused by the responded incentives or desired individual demands. The researcher had studied about
the definition of satisfaction that there are many given definitions such as
Somyod Navykarn (1979) had defined the satisfaction as the intensity of the demand for any of the
result.
Jaras Pojan ( 1984) had mentioned the satisfaction that it is the personal feelings towards the
department which could be positive, neutral, or negative. These feelings affect the operation effectiveness. It
could say that if the feeling tends to be positive, the operation effectiveness would be high. But if the feeling
tends to be negative, the operation effectiveness would be low.
Pin Kongpoon (1986) said that the satisfaction is the passion, appreciation, or good attitude of the
people who had received from his own act.
Kittima Preedeedilok (1989) said that the satisfaction is the appreciation which has the composition and
incentives in each way and he is responded towards his demands.
Preeyaporn Wonganutararoj (1992) said about working satisfaction that it is the overall positive feelings
of a person towards the work which is the happiness of a person that happens from the operation and
receives the reward. That means the satisfied result causes a person to feel enthusiastic and eager to work
with good morale. These have effects to the working performance and effectiveness including the success
and sticking to the organization goals.
© ICBTS Copyright by Author(s) The 2018 International Academic Research Conference in Zurich 221
Anek Kanlayanee (1999) said that the satisfaction means the feeling or attitude towards the performing
job.
Manee Pothisen (2000) had given the definition of satisfaction that it is the pleasure and good attitude of
a person when his demand is responded that causes good feelings towards that thing.
Krairop Charoensopa ( 2011) said that satisfaction means the thought of a person in pleasure or the
attitude of a person towards the operation which could be both positive and negative. If it is positive, this
causes benefit to the working operation. But if it is negative, this could cause damage to the operation.
Frenc (1964) said that a person would satisfy in his work if it is in a good condition which means the
good position, sufficient income, and career stability that cause the high social status and also cause a person
to change his personality along with the social condition.
D e v i s ( 1964) referred in Kornchakorn Chawati ( 2001) said that the satisfaction is the relationship
between the expectation and acquired benefits.
Office of the National Primary Education Commission ( 2000) had concluded the definition of
satisfaction that it is the good feeling or impression towards the act of a person or specific work.
From mentioned definitions, it could be concluded that satisfaction means the good feeling,
impression, or having good attitude towards the act of a person or specific work.
OBJECTIVE
1. To survey the labor requirement in labor market in visual communication design career.
2. To analyze the survey result towards the curriculum of visual communication design.
3. To improve the labor efficiency that met the labor market requirement.
METHODOLOGY
This research was the Survey Research which proceeded in steps as follows
1. Research population
2. Research sample group
3. Researching tools
4. Data collecting period
5. Data collecting method
6. Data analysis
7. Statistics used in data analysis
Research population The population in this research were the group of enterprises, companies, stores, and shops in visual
communication design career or related career in Bangkok area.
Research sample group
The sample group in this research were the group of enterprises, companies, stores, and shops in
visual communication design career or related career for 30 places in Bangkok area by using Simple Random
Sampling.
Researching tools
The tool in this research was the questionnaire that divided into 2 parts as follows
Part 1 Department status
was the general information of enterprise such as name and address
Part 2 labor requirement and satisfaction evaluation
that the topic were divided as follows; 1) moral and ethics, 2) knowledge, 3) intelligent, 4)
interpersonal skills, 5) communication and information technology skills

© ICBTS Copyright by Author(s) The 2018 International Academic Research Conference in Zurich 222
N
XX
=
Data collecting period the project period was 45 days
Data collection method
This research was the field study in the actual enterprises area in the career by letting the related
person of visual communication design to answer the survey questionnaire and spent about 1 month in field
study.
Data analysis
When the questionnaires were retrieved, the researcher had analyzed the data as follows
1. Examined the amount and completion of every retrieved questionnaires
2. Analyzed and gathered data that was the general information of the contributors.
3. Analyzed the data from evaluation question in each side then calculated the mean (X), standard
deviation (S.D.), and percentage
The scoring of the survey about requirement and satisfaction of labor market in visual communication design
was measured by 5 levels of weight score as follows 5 means the most satisfy
4 means very satisfy
3 means moderate satisfy
2 means few satisfy
1 means the least satisfy
The criteria of mean score leveling are as follows (referred the principles of Best.1981: 179-187)
Mean score from 4.50-5.00 means the most satisfy
Mean score from 3.50-4.49 means very satisfy
Mean score from 2.50-3.49 means moderate satisfy
Mean score from 1.50-2.49 means few satisfy
Mean score from 1.00-1.49 means the least satisfy
Statistics used in the analysis
Basic statistics were consisted of
1.Mean (Boonchom Srisar-ard.2541:56)
When X means the sample mean
X means sum of total score
N means the number of target group members
2. Standard deviation (Boonchom Srisar-ard 2541:87)
© ICBTS Copyright by Author(s) The 2018 International Academic Research Conference in Zurich 223
n
)(
)(..
1NN
XXNDS
22
−
−=
When ..DS means the standard deviation
X means each person’s score
2X means squared sum of each person’s score
2X )( means squared sum of total score
N means the number of studying target group members
3. Percentage
P = F × 100
When P means percentage
F means the frequency that needs to convert to percentage
n means the number of total frequencies
DISCUSSION
From the survey conclusion and analysis, the survey result in each side were as follows
1 . Moral and ethics, from the analysis result, total mean score was 4.36 and total standard deviation
was 0. 24 which could interpret that Visual Communication Design labor market had demand and the
satisfaction of moral and ethnics of labors in high level.
2 . Knowledge, from the analysis result, total mean score was 4.40 and total standard deviation was
0.48 which could interpret that Visual Communication Design labor market had demand and the satisfaction
of the knowledge of labors in high level.
3 . Intelligent, from the analysis result, total mean score was 4.54 and total standard deviation was
0.30 which could interpret that Visual Communication Design labor market had demand and the satisfaction
of the intelligent of labors in the highest level.
4. Interpersonal skills and responsibility, from the analysis result, total mean score was 4.53 and total
standard deviation was 0. 29 which could interpret that Visual Communication Design labor market had
demand and the satisfaction of the interpersonal skills and responsibility of labors in the highest level.
5. Communication and information technology skills, from the analysis result, total mean score was
4.24 and total standard deviation was 0.47 which could interpret that Visual Communication Design labor
market had demand and the satisfaction of the communication and information technology skills of labors in
high level.
From the conclusion of the survey, it was found that Visual Communication Design labor market
had demand and the satisfaction of the labor who had good qualification and was able to effectively perform
in term of knowledge, intelligent, responsibility, getting along well with co-worker, good behaves, and also
fully performing jobs, do not be the burden of the organization, well communicate, and be proactive in their
uptake of new technologies.
ACKNOWLEDGEMENTS
I would like to express my sicere thanks to Suan Sunandha Rajabhat University for invaluable help
throughout this research.

© ICBTS Copyright by Author(s) The 2018 International Academic Research Conference in Zurich 224
REFERENCE
[1] Kornchakorn Chawati. (2001). Satisfaction of students’ parent towards the education
management. Master of education thesis. Education research department. Graduate school.
Mahasarakham university (in Thai)
[2] Kittima Preedeedilok. (1989). Basic educational management and supervision. Bangkok:
Bundit (in Thai)
[3] Jaras Pojan. (1984). Working satisfaction of teachers in the institute of physical education
in northern region. Master of education thesis. Education Management department.
Srinakharinwirot University Phitsanulok campus. (in Thai)
[4] Preeyaporn Wonganutararoj. (1992). Human Resource Management psychology. Bangkok:
Technique Center Publishing House Bangkok. (in Thai)
[5] Manee Pothisen. (2543). Satisfaction of students’ parent and school personnel towards the
education management of Pothisenwittaya School, Tha Bo district, Nong Khai province.
Master of education independent study. Education Management department. Graduate school.
Mahasarakham university (in Thai)
[6] Muslim Thai Post. Labor Market. [online]. Source: http://truepanya.muslimthaipost.com. Access
date August 4, 2017 (in Thai)
[7] Suan Sunandha Rajabhat University. Visual Communication Design department. [online].
Source: http://www.ssru.ac.th/. Access date September 22, 2016. (in Thai)
[8] Wichai Condominium (alias). What is Visual Communication Design? [online]. Source:
http://kailyart-1.blogspot.com/. Access date August 4, 2017. (in Thai)
[9] Somyod Navykarn (1979). Basic Management. Bangkok: Duangkamol. (in Thai)
[10] Krairip Charoensopa (2011). E-Book of digital printing subject for undergraduate student
of Suan Sunandha Rajabhat University. Research report. Printing technology department.
Faculty of industrial technology. Suan Sunandha Rajabhat University (in Thai)
[11] Office of the National Primary Education Commission. (2000). Research report about the
satisfaction of clients towards the services of OPEC. Bangkok: TTC Ladprao. (in Thai)
[12] Office of the National Economic and Social Development Board. (1997). Thai labor crisis and
the sustainable development. Social and economy journal. (January-April 1997) : 22-28. (in
Thai)
[13] French, Wendell. (1964). The Personnel Management Process : Human Resource
Administration. Boston : Houghton.
© ICBTS Copyright by Author(s) The 2018 International Academic Research Conference in Zurich 225
WHEN VICES DESERVE TO BE LAUGHED: MOLIERE’S
THE MISER
Asst. Prof. Dr. Chutima Maneewattana* & Saranphat Sangthong** *,**Faculty of Fine and Applied Arts, Suan Sunandha Rajabhat University, Bangkok,Thailand
Email: *[email protected], **[email protected]
ABSTRACT
The essay explores one of Moliere’s funniest and darkest plays, The Miser. Theories of humor are
applied to analyze the play’s mood and tone. Moliere’s theatrical techniques are discussed in order to explain
how seriousness in his comedy deserves to be laughed: how tragic is equivalent to comic; What was Moliere’s
intention? and how he made vices laughable.
Keywords: Moliere, The Miser, Theories of humor
INTRODUCTION
When use the word “comedy”, people tend to think about ‘a dramatic genre that is intended to amuse’.
As Mel Gordon states: “comedy is associated with humorous behavior, wordplay, pleasurable feeling, release
of tension, and laughter” [1]. However, if a comedy deals with a serious issue, could it still release tension and
incite laughter? And, if laughter is successfully aroused then, why do we still laugh at a harsh situation?
Furthermore, why do poets utilize somberness in their comic works, despite it seems incompatible? This essay
examines one of Moliere’s darkest plays, The Miser, as a case study for the above questions in order to pinpoint
what are the appropriate answers.
While The Miser is often classified as one of the “high comedies” of Moliere along with The Misanthrope
and Tartuffe,[2] the play has become controversial: is it comedy or not? It is because the play deals with defects
of human nature -- vices, selfishness, avarice, and greed -- which prevailed throughout the story by the main
character, Harpagon. As G.J. Mallinson states: “many have viewed it as an acutely disturbing play in which the
intensity of the miser’s obsession, the fragile relationship of father and son.[3]” For example, Goethe regarded
the play as deeply tragic for there is a tragic greatness, which ‘destroys the affection which usually unite a
father and a son’[4]. Nevertheless, The Miser has still become one of Moliere’s most popular comedies and it
can still make an audience laugh successfully, as Eustis utters: “The Miser is one of Moliere’s funniest plays
[5]”. In the following examination, the attention will be paid to it’s techniques and reasons for employing
seriousness in his ‘comedy’, The Miser.
Tragic and comic
According to Henri Bergson, the famous French philosopher who attributed laughter to the 'mechanical
encrusted on something living'[6], his theory of humor testifies that Moliere’s The Miser is far from tragedy or
drama and it is laughable. Bergson argues that automatism, absentmindedness, and unsociability are
ingredients to the making up of the comic in character[7]. We can find such comic ingredients in Harpagon’s
behavior. Due to the obsessiveness in money, Harpagon seems puppet-like rather than a real man and always
doing things absentmindedly. For example, he automatically blows out one of the two candles in his house (in
Act V), checks his moneybox day and night, (mis)interprets everything by relating them to his money ( e.g. in
his conversation with Valere, in Act V) and so forth. Consequently, such behavior make Harpagon seem
unsociable and to be capable of being comic. Besides, apart from the mechanical characterization, Moliere also
applied the ‘automatism’ through other theatrical elements, such as the mechanical choreography (e.g. when
Maitre Jacques moves back and forth crossing the stage pretending to reconcile Hapagon and Cleante, in Act
© ICBTS Copyright by Author(s) The 2018 International Academic Research Conference in Zurich 226
IV), the repetitive rhythm of conversation. Bergson concludes that such comic elements will alienate our
sympathy (from taking him seriously), as he states “how can we put ourselves in tune with a soul which is not
in tune with itself?”[8]
Moreover, Mallinson reinforces Bergson’s theory by arguing that, The Miser is prepared to laugh because
of its stylization [9]. He contends that although Moliere offers ‘a portrait of everyday life’, the play is not
necessarily to produce reality. On the contrary, Moliere enormously employed the stylized theatrical devices,
such as invraisemblance, exaggeration and disproportion, which make the play stylistically far from real. By
this, he convinces that such stylization is ‘an antidote to the tension and pathos potential in the plot [10]’.
My first impression, after reading the play, was to agree with Goethe’s perspective and some other critics
that the play is too bleak to laugh and conveyed a deep tragic element. While I did agree with Mallinson and
Bergson that such comic elements had alienated my sympathy effectively and found that many details of
Harpagon’s miserliness lighten the seriousness of his vice [11]”, there were some exceptions.
Although it seemed laughable with the avaricious characteristic that Hapagon obsessively deals with the
safety of his moneybox, his household matters, his servants and so on, an audience could not seem able to
laugh when in the moment that his loathsome father image goes too extreme in these following two scenes.
The first scene is when Harpagon still insists on being his son’s rival, even after he knows that Cleante
loves Mariane and wishes to marry her (in Act IV), that moment I was 'forgetting to laugh'. It is because, even
though he does not truly love the girl for he hesitates to make a decision due to the problem of her dowry (in
Act II, P 299), he still does not want to lose her. Therefore, when he still insists not giving Mariane to his son,
his monstrous father image overcame my feeling at that moment.
Another intolerable scene is the climax scene: when Harpagon is accusing Valere of being a thief and
wants him to be punished. The conversation is more than dramatic when Elise implores Hapagon on her knees
to spare Valere’s life by explaining that he is the one who saved her life. But Hapagon replies to her heartlessly
and even says that it would have been better Valere left her die than stealing his money. (Act V, 339-340).
Again, I found the way he treats his daughter is too evil to laugh.
Although I agree that comedy requires an intellectual response, which is opposite to emotional response
in tragedy [12], I still responded to these scenes emotionally. Although I laughed at some of his funny behavior,
when he becomes too bad I could not laugh. Although I had been aware that he is just a caricature, such the
moment I hated him. Therefore, I wondered why I took him seriously with the awareness that he is a buffoon
in comedy.
Let me compare this to the fundamental humor of slapstick comedy. We tend to laugh when a clown
stumbles and falls, but we would never laugh if that clown is bleeding. Even if we are aware he is ‘a clown’, it
is ‘fake blood’ and it is not ‘real hurt’, we could not help ourselves feeling hurt for him at the certain moment.
It is because, I would argue, the blood is an embodiment of ‘reality’: if you are not really ‘real’, you should not
have blood. Suffice it to say that, whenever we believe a character is real, we are likely to ‘feel’ the play. In
other words, the closer (or the more details) the character is portrayed as a human being, the greater chance we
believe he is ‘real’. Likewise, perhaps in The Miser, the characters were portrayed with enough details of
realistic level that make me believe they are human beings. Especially, when we believe that Harpagon's vice
are as real as human's vices, we regard he is 'real', then we do not laugh. That is the reason why I felt the feeling
from the play (by reading).
Therefore, it seems to me that whatever comic elements Moliere employed, the play does not
completely prevent me from becoming sympathetically involved. Perhaps this issue (the relationship between
parent and children) is too real and too sensitive to arouse laughter by any comic elements? Besides, if comic
elements in the play can ‘unanimously’ alienate people from reality and feelings, why the play has been
controversial in such issue, then? That means we could not deny there are some people have been, somehow,
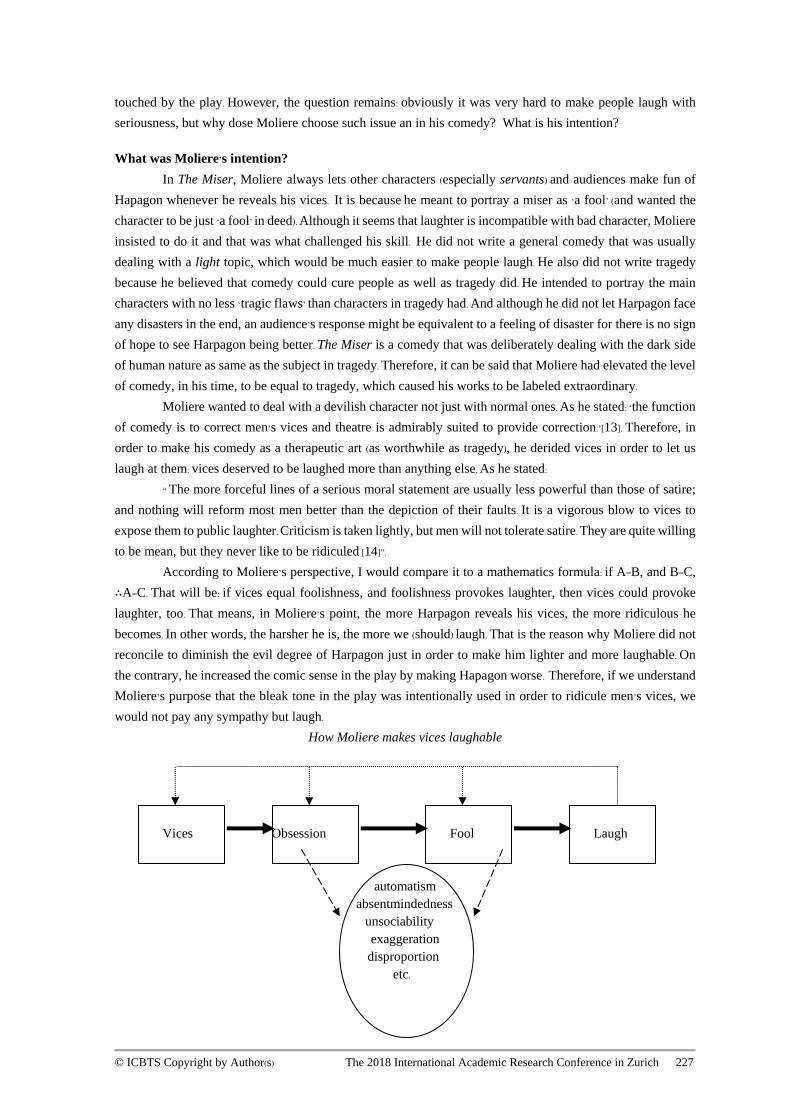
© ICBTS Copyright by Author(s) The 2018 International Academic Research Conference in Zurich 227
touched by the play. However, the question remains: obviously it was very hard to make people laugh with
seriousness, but why dose Moliere choose such issue an in his comedy? What is his intention?
What was Moliere’s intention?
In The Miser, Moliere always lets other characters (especially servants) and audiences make fun of
Hapagon whenever he reveals his vices. It is because he meant to portray a miser as ‘a fool’ (and wanted the
character to be just ‘a fool’ in deed). Although it seems that laughter is incompatible with bad character, Moliere
insisted to do it and that was what challenged his skill. He did not write a general comedy that was usually
dealing with a light topic, which would be much easier to make people laugh. He also did not write tragedy
because he believed that comedy could cure people as well as tragedy did. He intended to portray the main
characters with no less ‘tragic flaws’ than characters in tragedy had. And although he did not let Harpagon face
any disasters in the end, an audience’s response might be equivalent to a feeling of disaster for there is no sign
of hope to see Harpagon being better. The Miser is a comedy that was deliberately dealing with the dark side
of human nature as same as the subject in tragedy. Therefore, it can be said that Moliere had elevated the level
of comedy, in his time, to be equal to tragedy, which caused his works to be labeled extraordinary.
Moliere wanted to deal with a devilish character not just with normal ones. As he stated: ‘the function
of comedy is to correct men’s vices and theatre is admirably suited to provide correction.’[13]. Therefore, in
order to make his comedy as a therapeutic art (as worthwhile as tragedy), he derided vices in order to let us
laugh at them: vices deserved to be laughed more than anything else. As he stated:
“ The more forceful lines of a serious moral statement are usually less powerful than those of satire;
and nothing will reform most men better than the depiction of their faults. It is a vigorous blow to vices to
expose them to public laughter. Criticism is taken lightly, but men will not tolerate satire. They are quite willing
to be mean, but they never like to be ridiculed [14]”.
According to Moliere’s perspective, I would compare it to a mathematics formula: if A=B, and B=C,
∴A=C. That will be: if vices equal foolishness, and foolishness provokes laughter, then vices could provoke
laughter, too. That means, in Moliere’s point, the more Harpagon reveals his vices, the more ridiculous he
becomes. In other words, the harsher he is, the more we (should) laugh. That is the reason why Moliere did not
reconcile to diminish the evil degree of Harpagon just in order to make him lighter and more laughable. On
the contrary, he increased the comic sense in the play by making Hapagon worse. Therefore, if we understand
Moliere’s purpose that the bleak tone in the play was intentionally used in order to ridicule men’s vices, we
would not pay any sympathy but laugh.
How Moliere makes vices laughable
Vices Obsession Fool Laugh
automatism
absentmindedness
unsociability
exaggeration
disproportion
etc.
© ICBTS Copyright by Author(s) The 2018 International Academic Research Conference in Zurich 228
Over to me, after examining Moliere’s intention, I found that my first impression of the play was
quite against his objective. However, I would say that now I understand the point and do appreciate it. Another
practical thing that intrigued me by Moliere’s works is the message that showing how to deal with men’s vices
in the real life. What I could imagine Moliere wanted to tell people is: “if you happen to deal with mean people,
it is a good idea if you just feel nothing but laugh at them and their vices.”
CONCLUSION
As the above mention that while The Miser has been controversial about its bitter tone, the play is, perhaps,
the funniest of Moliere’s comedies. However, it seems to me that responses and assessments are individual and
uncontrollable. It is less important whether the play is laughable or not; the message of the play, which
conveyed Moliere’s objective, is more important. Why did Moliere insist to offer a portrait of Harpagon in
such a harsh way in comedy? The answer is that is why Moliere has become the world-class dramatist and his
works have been immortal until now.
ACKNOWLEDGEMENTS
I would like to express my sincere thanks to Suan Sunandha Rajabhat University for invaluable help
throughout this research.
REFERENCES
[1] Nataporn Rattanachaiwong. 2017.Maintaining Significance of Realia in Translated Play.Suan
Sunandha Rajabhat University
[2] Bergson, Henri, ‘Laughter’, in W. Sypher (ed.) Comedy, Doubleday Anchor, 1956
[3] Fowlie, Wallace, Moliere: The Miser, Barron’s Educational Series, New Yoke, 1964
[4] Mallinson, G.J., Moliere: L’Avare, Grant & Cutler, 1988
[5] Peacock, Noel, Moliere: L’ Ecole des femmes, University of Glasgow, 1988
[6] Worthen, W.B., The Harcourt Brace Anthology of Drama (3rd edn.), Harcourt College, Orlando, 2000
[7] Comedy, (Software: Microsoft ® Encarta ® Encyclopedia 2002. © 1993-2001 Microsoft
Corporation)
[8] Theories of Humor, (http://www.scriptmag.com/pages/Classes/instructions/humor/humor2.html)
© ICBTS Copyright by Author(s) The 2018 International Academic Research Conference in Zurich 229
RACINE’S PHÈDRE: A MASTERPIECE OF
PSYCHOLOGICAL DRAMA
Asst. Prof. Dr. Chutima Maneewattana* & Phanchita Thanaphongsirabhas**
*,**Faculty of Fine and Applied Arts, Suan Sunandha Rajabhat University, Bangkok, Thailand
Email: *[email protected], ** [email protected]
ABSTRACT
Racine’s Phèdre is a tragedy that reflects human’s destructive nature, the play is regarded as a
psychological play. This leads to the assumption that Racine not only reveals his knowledge of psychology in
his characters, but he also utilized the theatrical techniques to his audience psychologically. This essay
examines physical metaphors in the play by explaining them in terms of their psychological meanings:
Complexity of the Characters’ Inner Conflicts, Internalized Gods, Eros and Thanatos.
Keywords: Racine, Phèdre, psychology, psychological drama
INTRODUCTION
Racine’s Phèdre was labeled by Voltaire as “the masterpiece of the human mind[1]” and is believed to
be the masterpiece of Racine’s works himself. As such, the play shows the profound impact on the author’s
Jansenist beliefs: sin is unavoidable [2]; ‘the human soul is too corrupt to seek salvation actively’[3]. The most
significant feature that makes the play is the demonstration of human being’s destructive force caused by
sexual passion while its spiritual honors still exist. In other words, Phèdre is a perfect tragedy for the heroine
who is portrayed as a complex and conflicting mixture of both good and bad. As Racine stated: “Phaedre is, in
fact, neither entirely guilty nor totally innocent [4]”. Another remarkable feature of the play is the psychological
value that predominates through the protagonists’ character and behavior. The play deals with clear motivation
and psychological actions which can be illustrated in psychology. In view of the above observations, this essay
attempts to apply a psychological theory to the analysis of Racine’s Phèdre.
According to Freud’s principle of psychological determinism: no aspect of human behavior is
accidental [5], this can be clearly illustrated Racine’s Phèdre’s actions too. Her tragic behaviors are purposeful
and could be explained by these psychological interpretations: Complexity of the Characters’ Inner Conflicts,
Internalized Gods, Eros and Thanatos.
Complexity of the Characters’ Inner Conflict
The most complex inner conflict of the characters is the hallmark of Racine’s Phèdre. Seemingly,
Racinian heroes, who are destroyed by their own destructive force of passion, are distinct from ‘human
greatness’ which become the basis of tragedy. There is a hidden opposite aspect in that Phèdre has a lesser
dignity than Ximena of Corneille’s Le Cid. The difference lies in Ximena’s overcoming ideally, whereas Phèdre
is realistically defeated without being less noble. Racine adored human dignity but still believed in unavoidable
punishment of the gods. This can be an implication that, while ‘Corneille had painted men as they should be,
Racine painted them as they were[6]’. Racine believed that human beings are born to succumb to their sins but
they are reasonable enough to hate such sins. Therefore, the audience feels more than pain as they view
Racine’s heroine trying hard to fight against the unbeatable foe -- her passion -- just ‘to lose’. In this sense, human
© ICBTS Copyright by Author(s) The 2018 International Academic Research Conference in Zurich 230
dignity does not mean to emerge as winner. In turn, its value is in ‘the process of struggling’. That is why the
play is considered as highly tragic.
Consequently, all of the heroes in Phèdre are portrayed very realistically, with ‘inner conflict’ between
innocence and guilt, rather than idealistically. Rather than being black or white, they are in the very gray area.
No one is free from imperfections, nor virtue. Aricia and Hippolytus have the same inner conflicts in the form
of ‘forbidden love’ – loving the archenemy of their parents. They both have to ‘feel the bitter-sweet torments of
love [7]’ for the struggling between their hearts (their passion for each other) and their heads (their guilt towards
parents). Hippolytus is the character that Racine intentionally contaminated his purification from the perfect
portrayal of Euripides. As he states: “I felt I should give him some weakness that would make him slightly
guilty towards his father, without however detracting in any way from that largeness spirit”[8]. Moreover, it is
interesting to note that, such conflict is the same as Corneille’s conflict - love versus duty. When Racine
juxtaposed this conflict to his main conflict, passion and moral, the young couple’s story seems much less
painful than Phèdre’s. Besides, it seems that Racine’s conflict is more universal and timeless than Corneille’s.
It is because Corneille’s idea of ‘duty’ is socially constructed and time-dependent whereas Racine’s theme of
passion is in human nature across time and cultures.
Secondly, the inner conflict of Theseus does not seem to bother him that much, for he is too quick to
curse his son after hearing that Hippolytus intends to rape his wife. Nevertheless, although his action is filled
with outrage rather than reason, Theseus comes to his senses right after that as he utters: “My bowels writhe
inside me. Must you die? Yes; I am too deep now to draw back [9]”.
Finally, Phèdre has the most complicated inner conflict for she is an extraordinary passionate woman
who is conscious of her guilt almost all the time. In other words, she is a sinner who hates her sin [10]. From
the very beginning, Phèdre wants to die and mentions it countless times throughout the play. Her longing for
death embodies her consciousness of guilt, for she too hates herself to live. In other words, the more she
mentions death, the more her inner conflict is revealed. Besides, self-hatred is also expressed as she never
wants to see the light, the things surrounding her (as she believes they accuse her of her sin), and always relates
her sin to the monster blood in herself. Furthermore, according to her speech, behaviors and her action, it can
be said that she is never willing to reveal her reprobate passion. As she seems very confused and reluctant,
from the very beginning, to break the silence of her secret love even to her confident nurse: “You’ll die of
horror when you hear. I love…I can’t say this name without shivering[11]”. But once the secret is uttered, she
has to face the painful inner conflict within herself until she dies. She never blinds herself to total passion but
she does it consciously – which is more painful.
Racine scrupulously counterbalanced the two forces between passion (natural destiny) and moral
(spiritual destiny) inside Phèdre by never letting her find the moderate solution between the two extremities.
The axis of her forbidden love is developed from her passion to the confession of her love, to the illusive hope
(at this stage she becomes more self-centered as she tries to win over Hippolytus by alluring him to the crown),
and the final indecent fulfillment (if she could achieve it). On the other hand, the axis of her moral is functioning
in the opposite way. She still embraces her knowledge and consciousness of guilt tightly. Therefore in the end,
when she fails her indecent fulfillment, her honor demands self- punishment from her (Figure 1). In short, she
is painfully struggling between ‘the corruption she feels and the uncorrupted ideals she never can achieve [12]’
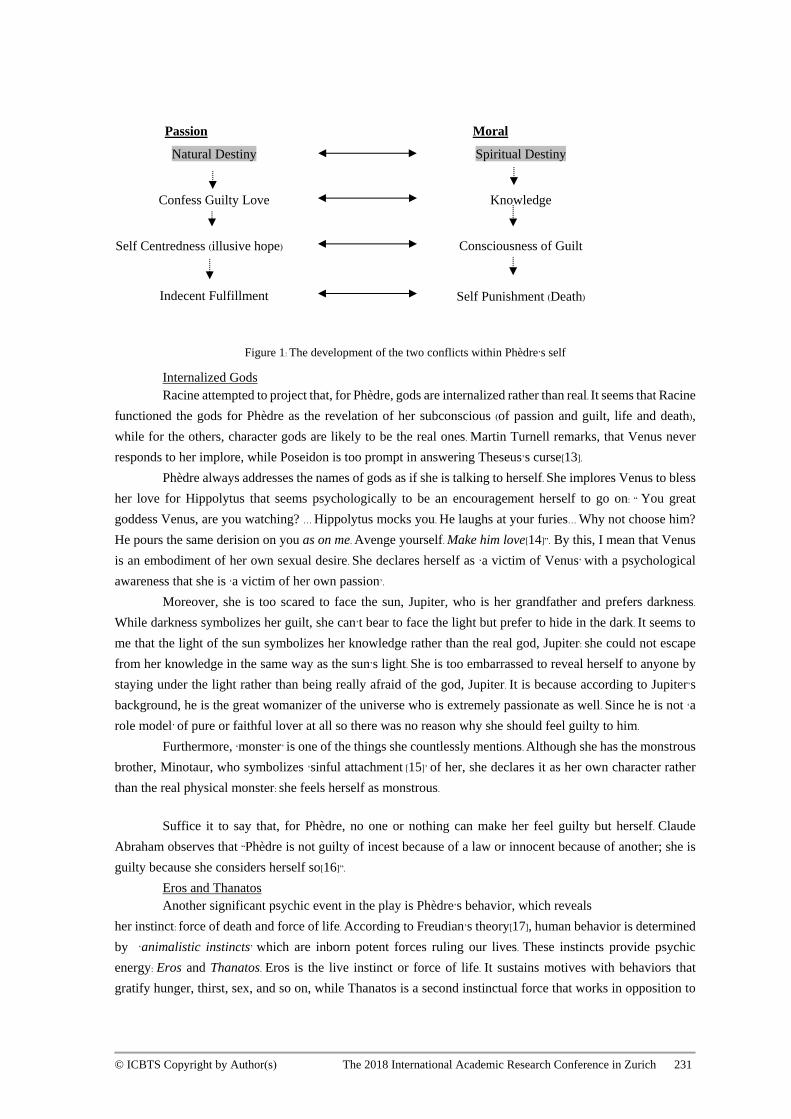
© ICBTS Copyright by Author(s) The 2018 International Academic Research Conference in Zurich 231
Figure 1: The development of the two conflicts within Phèdre’s self
Internalized Gods
Racine attempted to project that, for Phèdre, gods are internalized rather than real. It seems that Racine
functioned the gods for Phèdre as the revelation of her subconscious (of passion and guilt, life and death),
while for the others, character gods are likely to be the real ones. Martin Turnell remarks, that Venus never
responds to her implore, while Poseidon is too prompt in answering Theseus’s curse[13].
Phèdre always addresses the names of gods as if she is talking to herself. She implores Venus to bless
her love for Hippolytus that seems psychologically to be an encouragement herself to go on: “ You great
goddess Venus, are you watching? … Hippolytus mocks you. He laughs at your furies… Why not choose him?
He pours the same derision on you as on me. Avenge yourself. Make him love[14]”. By this, I mean that Venus
is an embodiment of her own sexual desire. She declares herself as ‘a victim of Venus’ with a psychological
awareness that she is ‘a victim of her own passion’.
Moreover, she is too scared to face the sun, Jupiter, who is her grandfather and prefers darkness.
While darkness symbolizes her guilt, she can’t bear to face the light but prefer to hide in the dark. It seems to
me that the light of the sun symbolizes her knowledge rather than the real god, Jupiter: she could not escape
from her knowledge in the same way as the sun’s light. She is too embarrassed to reveal herself to anyone by
staying under the light rather than being really afraid of the god, Jupiter. It is because according to Jupiter’s
background, he is the great womanizer of the universe who is extremely passionate as well. Since he is not ‘a
role model’ of pure or faithful lover at all so there was no reason why she should feel guilty to him.
Furthermore, ‘monster’ is one of the things she countlessly mentions. Although she has the monstrous
brother, Minotaur, who symbolizes ‘sinful attachment [15]’ of her, she declares it as her own character rather
than the real physical monster: she feels herself as monstrous.
Suffice it to say that, for Phèdre, no one or nothing can make her feel guilty but herself. Claude
Abraham observes that “Phèdre is not guilty of incest because of a law or innocent because of another; she is
guilty because she considers herself so[16]”.
Eros and Thanatos
Another significant psychic event in the play is Phèdre’s behavior, which reveals
her instinct: force of death and force of life. According to Freudian’s theory[17], human behavior is determined
by ‘animalistic instincts’ which are inborn potent forces ruling our lives. These instincts provide psychic
energy: Eros and Thanatos. Eros is the live instinct or force of life. It sustains motives with behaviors that
gratify hunger, thirst, sex, and so on, while Thanatos is a second instinctual force that works in opposition to
Passion
Natural Destiny
Confess Guilty Love
Self Centredness (illusive hope)
Indecent Fulfillment
Moral
Spiritual Destiny
Knowledge
Consciousness of Guilt
Self Punishment (Death)
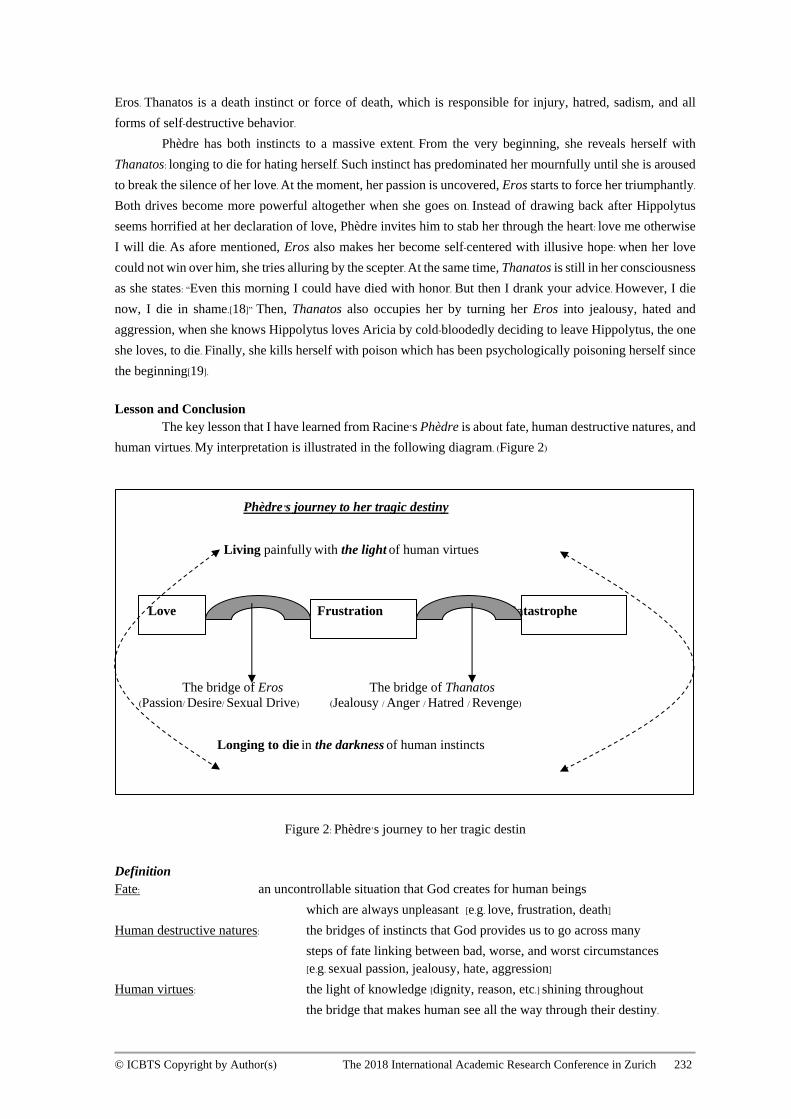
© ICBTS Copyright by Author(s) The 2018 International Academic Research Conference in Zurich 232
Eros. Thanatos is a death instinct or force of death, which is responsible for injury, hatred, sadism, and all
forms of self-destructive behavior.
Phèdre has both instincts to a massive extent. From the very beginning, she reveals herself with
Thanatos: longing to die for hating herself. Such instinct has predominated her mournfully until she is aroused
to break the silence of her love. At the moment, her passion is uncovered, Eros starts to force her triumphantly.
Both drives become more powerful altogether when she goes on. Instead of drawing back after Hippolytus
seems horrified at her declaration of love, Phèdre invites him to stab her through the heart: love me otherwise
I will die. As afore mentioned, Eros also makes her become self-centered with illusive hope: when her love
could not win over him, she tries alluring by the scepter. At the same time, Thanatos is still in her consciousness
as she states: “Even this morning I could have died with honor. But then I drank your advice. However, I die
now, I die in shame.[18]” Then, Thanatos also occupies her by turning her Eros into jealousy, hated and
aggression, when she knows Hippolytus loves Aricia by cold-bloodedly deciding to leave Hippolytus, the one
she loves, to die. Finally, she kills herself with poison which has been psychologically poisoning herself since
the beginning[19].
Lesson and Conclusion
The key lesson that I have learned from Racine’s Phèdre is about fate, human destructive natures, and
human virtues. My interpretation is illustrated in the following diagram. (Figure 2)
Phèdre’s journey to her tragic destiny
Living painfully with the light of human virtues
Love Frustration Catastrophe
The bridge of Eros The bridge of Thanatos (Passion/ Desire/ Sexual Drive) (Jealousy / Anger / Hatred / Revenge)
Longing to die in the darkness of human instincts
Figure 2: Phèdre’s journey to her tragic destin
Definition
Fate: an uncontrollable situation that God creates for human beings
which are always unpleasant [e.g. love, frustration, death]
Human destructive natures: the bridges of instincts that God provides us to go across many
steps of fate linking between bad, worse, and worst circumstances
[e.g. sexual passion, jealousy, hate, aggression]
Human virtues: the light of knowledge [dignity, reason, etc.] shining throughout
the bridge that makes human see all the way through their destiny.
© ICBTS Copyright by Author(s) The 2018 International Academic Research Conference in Zurich 233
Thierry Maulnier states that “Phèdre is the most beautiful human subject treated by Racine[20]” Racine
has been ‘made people excuse the greatest crimes[21]’ through his aesthetic works. Phèdre is the heroine who
has one of the most agonies any human being could ever have. She has a high sense of dignity but she is also
guilty of a severe crime that she has to face one of the most difficult situations. She has one of the most tragic
catastrophes one could ever experience.
Maintaining Significance of Realia in Translated Play
ACKNOWLEDGEMENTS
I would like to express my sincere thanks to Suan Sunandha Rajabhat University for invaluable
help throughout this research.
REFERENCES [1] Nataporn Rattanachaiwong. 2017.Maintaining Significance of Realia in Translated Play.Suan Sunandha
Rajabhat University
[2] Claude Abraham, Jean Racine, (Boston: G.K.Hall&Co., 1977)
[3] Martin, Turnell, Jean Racine Dramatist, (New York: New Directions Books, 1972)
[4] Racine, Jean, Britannicus Phèdre Athaliah, trans. by C.H. Sisson, (New York: Oxford University Press,
1987)
[5] Racine, Jean, Phèdre, trans. by John Cairncross, (Paris: Librairie, 1958)
[6] Racine, Jean, Phèdre, trans. by Julie Rose, (London: Nick Hern Books Limited, 2001)
[7] Racine, Jean, Phèdre, ed. and trans. by R.C.Knight, (Chicago: Edinburge University Press, 1971)
[8] Racine, Jean, Phèdre, trans. by Robert Lowell, (London: Faber and Faber, 1963)
[9] Racine, Jean, Phèdre (ed. and trans. by Ted Hughes), (London: Faber,1998)
[10] Racine, Jean, Phèdre, trans. by Tim Chilcott, (Hertfordshire: Wordsworth Editions Limited, 2000)
[11] Worthen, W.B., The Harcourt Brace Anthology of Drama (3rd edn), (Orlando: Harcourt College, 2000)
Internet Resources
Freud:Psychodynamics, http://www.geocities.com/oneill_g/freud1.html
Note on Jansenism, http:// 65.123.25.208/ home/ plays / 0203 / Phèdre / playnotes.shtml,
Psychoanalytic Theory,http://www.psychlinks.ca/psy2303/lec2-4.htm
Histoire de la littrature franaise Les grands auteurs tragiques (2), www.la-
litterature.com/images/17s_Racine.jpg
Le théâtre français au XVIIème siècle, www.ddec.nc/blaise-pascal/theatre/phedre1.jpg
The Enigma of a Legend: Jean Racine, www.amrep.org/images/phaedra/phaedra.gif
© ICBTS Copyright by Author(s) The 2018 International Academic Research Conference in Zurich 234
FACTORS AFFECTING THE ACCEPTANCE OF USING M-
LEARNING MEDIA
Aphichart Kampoomprasert* & Thitirat Thajeen**
Academic Services Division, Suan Sunandha Rajabhat University, Bangkok, Thailand
E-Mail: *[email protected], **[email protected]
ABSTRACT
Nowadays various kinds of Information Communication Technology play vital roles in every part
of the society including in education. Most educational institutions use these innovative new technologies in
assisting the management and provision of information, supporting instruction as well as facilitating learners
to access to academic sources, and exchange knowledge and communication among one another. The
purposes of this research are to study factors and guidelines to create the acceptance of using M-learning for
instructional purposes by using M-learning in learning through application, which is the application of the
advantage of these portable tools as the sixth human’ s need to support instruction more effectively than
traditional classroom instruction. Samples include 400 students and the research tool is a questionnaire. The
research findings point out that factors affecting the acceptance of using M-learning include the perceived
ease of use of the application, the attractiveness of the contents of the lessons, and the Internet quality. It can
be concluded that most important factors motivating the this kind of technology acceptance for instructional
purposes are the development of attractive contents and application, and the development of quality
Information Technology and the Internet system to attract learners to use this application to increase their
learning achievements.
Keywords: E-learning, M-learning and the technology acceptance
INTRODUCTION
The increasing popularity of the implementation of new and up-to-date technology into the
management and provision of information including the use of innovative Medias to support instruction
facilitates learning and communication among students, personnel and instructors in terms of the access to
data and lessons, and the knowledge exchanging purposes. Moreover, since nowadays there are strong needs
in business competition to attract customers or students to buy products or body of knowledge as capital for
their future career after their graduation, it is, therefore, more advantageous for the educational institution to
provide innovative tools as supportive factors to attract learners to continue their studies at the university
than those without these new technologies. For example, E-learning Mode enables learners to study by
themselves at anyplace and anytime they are convenient without having to go to the university [1]. At present
students in a country can further their studies in oversea universities through Electronic Learning ( E-
Learning), in which they can choose the topics based on their preference and interests by studying contents,
doing exercises or completing tasks via online learning systems while instructors will provide praises or
comments for improvement or corrections based on the standard quality measurement and evaluation of the
universities. This kind of learning methods is available in post graduate and graduate and doctorate levels [2].
The continuous changes of technologies leading to the development of new innovation make it
unavoidable for people in today world to depend on Information Communication Technology in their daily
life more and more including in educational purposes. Lots of students and faculty members depend on
equipments such as notebooks and tablets, etc. to support more effective learning and instruction. However,
the implementation of this innovative tools and equipments to increase the efficiencies of learning and
instruction will not fully be beneficial and efficient if users lack skills and good attitudes to learn to use the
new technologies. All these affect the innovation acceptance. The study of the behaviors and factors affecting
the acceptance of M-learning medias for instructional purposes is, therefore, conducted. In this study, M-
learning is Mobile Learning for educational purposes in today world in which learners and users can access
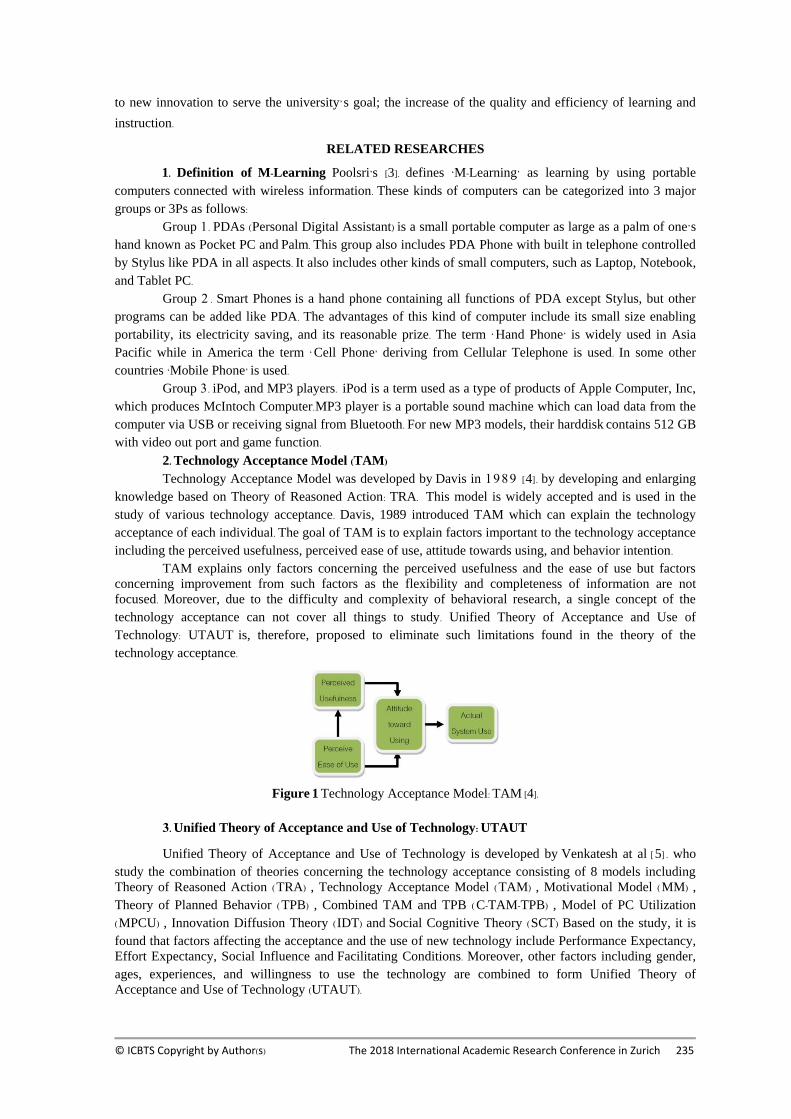
© ICBTS Copyright by Author(s) The 2018 International Academic Research Conference in Zurich 235
to new innovation to serve the university’s goal; the increase of the quality and efficiency of learning and
instruction.
RELATED RESEARCHES
1. Definition of M-Learning Poolsri’s [3]. defines ‘M-Learning’ as learning by using portable
computers connected with wireless information. These kinds of computers can be categorized into 3 major
groups or 3Ps as follows: Group 1 . PDAs (Personal Digital Assistant) is a small portable computer as large as a palm of one’s
hand known as Pocket PC and Palm. This group also includes PDA Phone with built in telephone controlled
by Stylus like PDA in all aspects. It also includes other kinds of small computers, such as Laptop, Notebook,
and Tablet PC. Group 2 . Smart Phones is a hand phone containing all functions of PDA except Stylus, but other
programs can be added like PDA. The advantages of this kind of computer include its small size enabling
portability, its electricity saving, and its reasonable prize. The term ‘ Hand Phone’ is widely used in Asia
Pacific while in America the term ‘ Cell Phone’ deriving from Cellular Telephone is used. In some other
countries ‘Mobile Phone’ is used. Group 3 . iPod, and MP3 players. iPod is a term used as a type of products of Apple Computer, Inc,
which produces McIntoch Computer.MP3 player is a portable sound machine which can load data from the
computer via USB or receiving signal from Bluetooth. For new MP3 models, their harddisk contains 512 GB
with video out port and game function. 2. Technology Acceptance Model (TAM) Technology Acceptance Model was developed by Davis in 1989 [4]. by developing and enlarging
knowledge based on Theory of Reasoned Action: TRA. This model is widely accepted and is used in the
study of various technology acceptance. Davis, 1989 introduced TAM which can explain the technology
acceptance of each individual. The goal of TAM is to explain factors important to the technology acceptance
including the perceived usefulness, perceived ease of use, attitude towards using, and behavior intention. TAM explains only factors concerning the perceived usefulness and the ease of use but factors
concerning improvement from such factors as the flexibility and completeness of information are not
focused. Moreover, due to the difficulty and complexity of behavioral research, a single concept of the
technology acceptance can not cover all things to study. Unified Theory of Acceptance and Use of
Technology: UTAUT is, therefore, proposed to eliminate such limitations found in the theory of the
technology acceptance.
Figure 1 Technology Acceptance Model: TAM [4].
3. Unified Theory of Acceptance and Use of Technology: UTAUT
Unified Theory of Acceptance and Use of Technology is developed by Venkatesh at al [ 5] . who
study the combination of theories concerning the technology acceptance consisting of 8 models including
Theory of Reasoned Action (TRA) , Technology Acceptance Model (TAM) , Motivational Model (MM) , Theory of Planned Behavior ( TPB) , Combined TAM and TPB ( C-TAM-TPB) , Model of PC Utilization
(MPCU) , Innovation Diffusion Theory (IDT) and Social Cognitive Theory (SCT) Based on the study, it is
found that factors affecting the acceptance and the use of new technology include Performance Expectancy,
Effort Expectancy, Social Influence and Facilitating Conditions. Moreover, other factors including gender,
ages, experiences, and willingness to use the technology are combined to form Unified Theory of
Acceptance and Use of Technology (UTAUT).
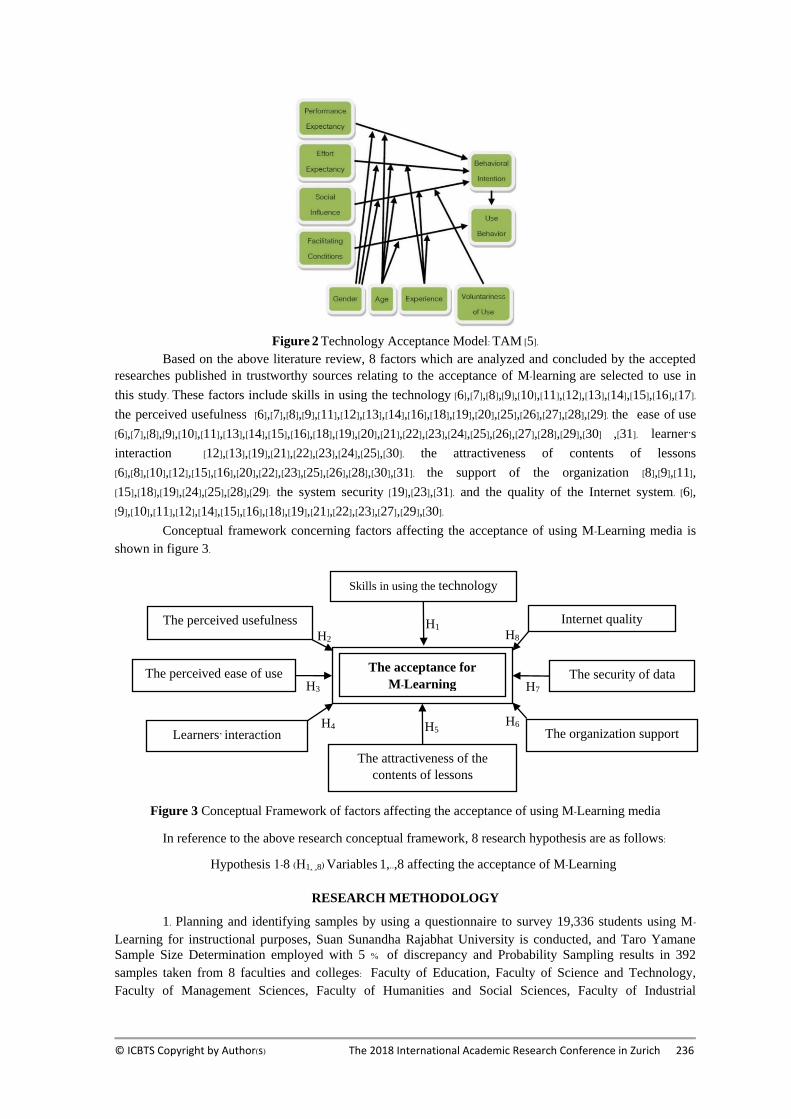
© ICBTS Copyright by Author(s) The 2018 International Academic Research Conference in Zurich 236
Figure 2 Technology Acceptance Model: TAM [5].
Based on the above literature review, 8 factors which are analyzed and concluded by the accepted
researches published in trustworthy sources relating to the acceptance of M-learning are selected to use in
this study. These factors include skills in using the technology [6],[7],[8],[9],[10],[11],[12],[13],[14],[15],[16],[17].
the perceived usefulness [6],[7],[8],[9],[11],[12],[13],[14],[16],[18],[19],[20],[25],[26],[27],[28],[29]. the ease of use
[6],[7],[8],[9],[10],[11],[13],[14],[15],[16],[18],[19],[20],[21],[22],[23],[24],[25],[26],[27],[28],[29],[30] ,[31]. learner’s
interaction [12],[13],[19],[21],[22],[23],[24],[25],[30]. the attractiveness of contents of lessons
[6],[8],[10],[12],[15],[16],[20],[22],[23],[25],[26],[28],[30],[31]. the support of the organization [8],[9],[11],
[15],[18],[19],[24],[25],[28],[29]. the system security [19],[23],[31]. and the quality of the Internet system. [6],
[9],[10],[11],[12],[14],[15],[16],[18],[19],[21],[22],[23],[27],[29],[30]. Conceptual framework concerning factors affecting the acceptance of using M-Learning media is
shown in figure 3.
Figure 3 Conceptual Framework of factors affecting the acceptance of using M-Learning media
In reference to the above research conceptual framework, 8 research hypothesis are as follows:
Hypothesis 1-8 (H1,..,8) Variables 1,..,8 affecting the acceptance of M-Learning
RESEARCH METHODOLOGY
1. Planning and identifying samples by using a questionnaire to survey 19,336 students using M-Learning for instructional purposes, Suan Sunandha Rajabhat University is conducted, and Taro Yamane
Sample Size Determination employed with 5 % of discrepancy and Probability Sampling results in 392
samples taken from 8 faculties and colleges: Faculty of Education, Faculty of Science and Technology,
Faculty of Management Sciences, Faculty of Humanities and Social Sciences, Faculty of Industrial
H7
H8 H1
H3
H4 H5 H6
H2
The acceptance for
M-Learning
The perceived usefulness
The perceived ease of use
Learners’ interaction
The attractiveness of the
contents of lessons
The organization support
Skills in using the technology
The security of data
Internet quality
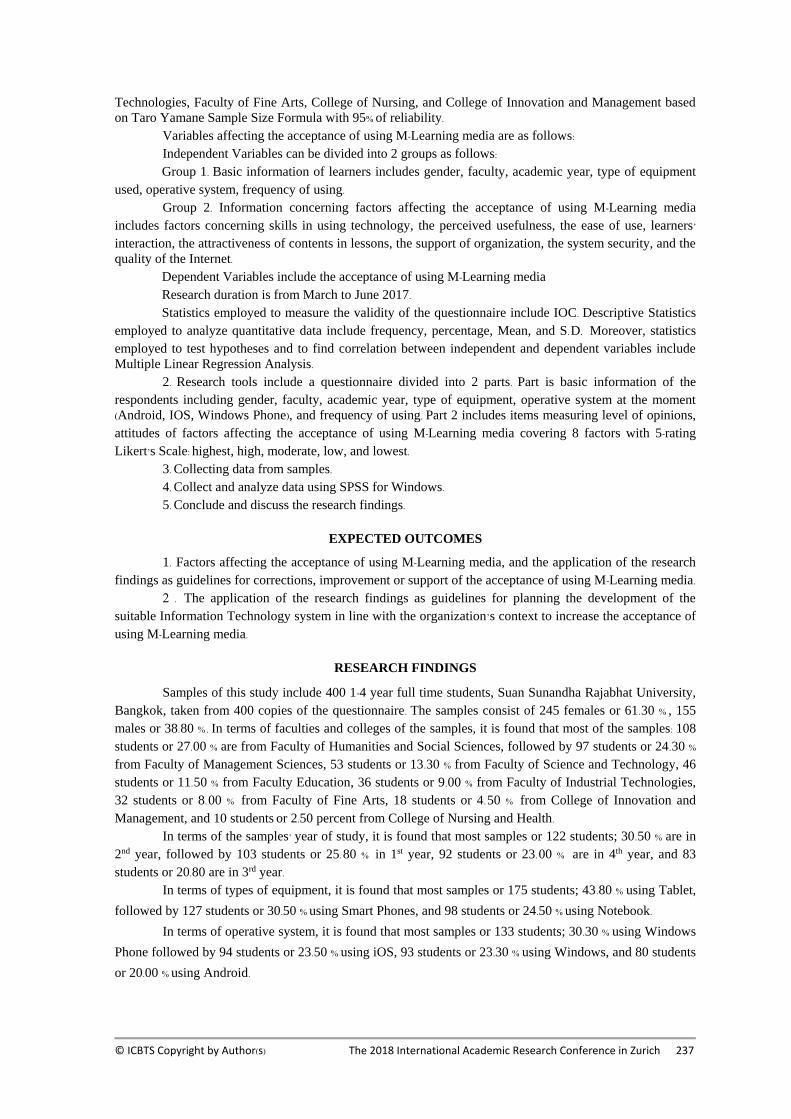
© ICBTS Copyright by Author(s) The 2018 International Academic Research Conference in Zurich 237
Technologies, Faculty of Fine Arts, College of Nursing, and College of Innovation and Management based
on Taro Yamane Sample Size Formula with 95% of reliability. Variables affecting the acceptance of using M-Learning media are as follows: Independent Variables can be divided into 2 groups as follows:
Group 1. Basic information of learners includes gender, faculty, academic year, type of equipment
used, operative system, frequency of using. Group 2. Information concerning factors affecting the acceptance of using M-Learning media
includes factors concerning skills in using technology, the perceived usefulness, the ease of use, learners’ interaction, the attractiveness of contents in lessons, the support of organization, the system security, and the
quality of the Internet. Dependent Variables include the acceptance of using M-Learning media Research duration is from March to June 2017. Statistics employed to measure the validity of the questionnaire include IOC. Descriptive Statistics
employed to analyze quantitative data include frequency, percentage, Mean, and S.D. Moreover, statistics
employed to test hypotheses and to find correlation between independent and dependent variables include
Multiple Linear Regression Analysis. 2. Research tools include a questionnaire divided into 2 parts. Part is basic information of the
respondents including gender, faculty, academic year, type of equipment, operative system at the moment
(Android, IOS, Windows Phone), and frequency of using. Part 2 includes items measuring level of opinions,
attitudes of factors affecting the acceptance of using M-Learning media covering 8 factors with 5-rating
Likert’s Scale: highest, high, moderate, low, and lowest. 3. Collecting data from samples. 4. Collect and analyze data using SPSS for Windows. 5. Conclude and discuss the research findings.
EXPECTED OUTCOMES
1. Factors affecting the acceptance of using M-Learning media, and the application of the research
findings as guidelines for corrections, improvement or support of the acceptance of using M-Learning media. 2 . The application of the research findings as guidelines for planning the development of the
suitable Information Technology system in line with the organization’s context to increase the acceptance of
using M-Learning media.
RESEARCH FINDINGS
Samples of this study include 400 1-4 year full time students, Suan Sunandha Rajabhat University,
Bangkok, taken from 400 copies of the questionnaire. The samples consist of 245 females or 61.30 % , 155
males or 38.80 % . In terms of faculties and colleges of the samples, it is found that most of the samples: 108
students or 27.00 % are from Faculty of Humanities and Social Sciences, followed by 97 students or 24.30 % from Faculty of Management Sciences, 53 students or 13.30 % from Faculty of Science and Technology, 46
students or 11.50 % from Faculty Education, 36 students or 9.00 % from Faculty of Industrial Technologies,
32 students or 8.00 % from Faculty of Fine Arts, 18 students or 4.50 % from College of Innovation and
Management, and 10 students or 2.50 percent from College of Nursing and Health. In terms of the samples’ year of study, it is found that most samples or 122 students; 30.50 % are in
2nd year, followed by 103 students or 25.80 % in 1st year, 92 students or 23.00 % are in 4th year, and 83
students or 20.80 are in 3rd year. In terms of types of equipment, it is found that most samples or 175 students; 43.80 % using Tablet,
followed by 127 students or 30.50 % using Smart Phones, and 98 students or 24.50 % using Notebook.
In terms of operative system, it is found that most samples or 133 students; 30.30 % using Windows
Phone followed by 94 students or 23.50 % using iOS, 93 students or 23.30 % using Windows, and 80 students
or 20.00 % using Android.
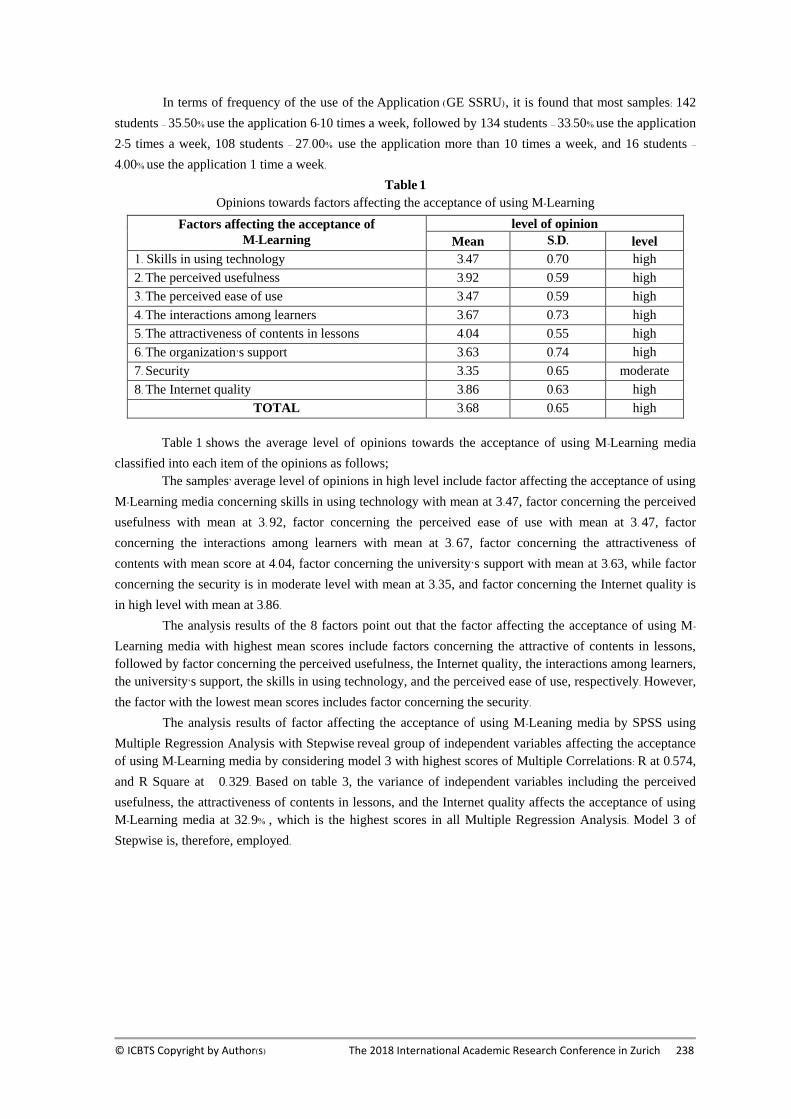
© ICBTS Copyright by Author(s) The 2018 International Academic Research Conference in Zurich 238
In terms of frequency of the use of the Application (GE SSRU), it is found that most samples: 142
students – 35.50% use the application 6-10 times a week, followed by 134 students – 33.50% use the application
2-5 times a week, 108 students – 27.00% use the application more than 10 times a week, and 16 students –
4.00% use the application 1 time a week.
Table 1
Opinions towards factors affecting the acceptance of using M-Learning
Factors affecting the acceptance of
M-Learning
level of opinion
Mean S.D. level
1. Skills in using technology 3.47 0.70 high
2. The perceived usefulness 3.92 0.59 high
3. The perceived ease of use 3.47 0.59 high
4. The interactions among learners 3.67 0.73 high
5. The attractiveness of contents in lessons 4.04 0.55 high
6. The organization’s support 3.63 0.74 high
7. Security 3.35 0.65 moderate
8. The Internet quality 3.86 0.63 high
TOTAL 3.68 0.65 high
Table 1 shows the average level of opinions towards the acceptance of using M-Learning media
classified into each item of the opinions as follows;
The samples’ average level of opinions in high level include factor affecting the acceptance of using
M-Learning media concerning skills in using technology with mean at 3.47, factor concerning the perceived
usefulness with mean at 3. 92, factor concerning the perceived ease of use with mean at 3. 47, factor
concerning the interactions among learners with mean at 3. 67, factor concerning the attractiveness of
contents with mean score at 4.04, factor concerning the university’s support with mean at 3.63, while factor
concerning the security is in moderate level with mean at 3.35, and factor concerning the Internet quality is
in high level with mean at 3.86.
The analysis results of the 8 factors point out that the factor affecting the acceptance of using M-
Learning media with highest mean scores include factors concerning the attractive of contents in lessons,
followed by factor concerning the perceived usefulness, the Internet quality, the interactions among learners,
the university’s support, the skills in using technology, and the perceived ease of use, respectively. However,
the factor with the lowest mean scores includes factor concerning the security.
The analysis results of factor affecting the acceptance of using M-Leaning media by SPSS using
Multiple Regression Analysis with Stepwise reveal group of independent variables affecting the acceptance
of using M-Learning media by considering model 3 with highest scores of Multiple Correlations: R at 0.574,
and R Square at 0.329. Based on table 3, the variance of independent variables including the perceived
usefulness, the attractiveness of contents in lessons, and the Internet quality affects the acceptance of using
M-Learning media at 32.9% , which is the highest scores in all Multiple Regression Analysis. Model 3 of
Stepwise is, therefore, employed.
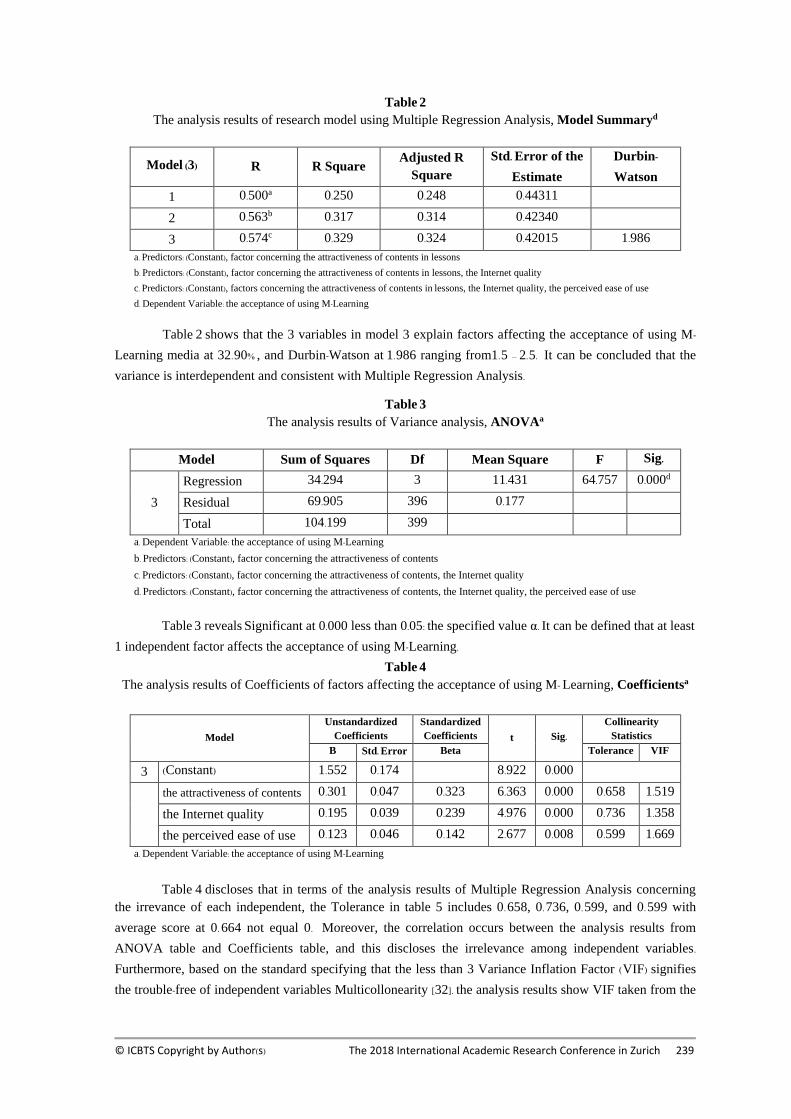
© ICBTS Copyright by Author(s) The 2018 International Academic Research Conference in Zurich 239
Table 2
The analysis results of research model using Multiple Regression Analysis, Model Summaryd
Model (3) R R Square Adjusted R
Square
Std. Error of the
Estimate
Durbin-
Watson
1 0.500a 0.250 0.248 0.44311
2 0.563b 0.317 0.314 0.42340
3 0.574c 0.329 0.324 0.42015 1.986
a. Predictors: (Constant), factor concerning the attractiveness of contents in lessons
b. Predictors: (Constant), factor concerning the attractiveness of contents in lessons, the Internet quality
c. Predictors: (Constant), factors concerning the attractiveness of contents in lessons, the Internet quality, the perceived ease of use
d. Dependent Variable: the acceptance of using M-Learning
Table 2 shows that the 3 variables in model 3 explain factors affecting the acceptance of using M-
Learning media at 32.90% , and Durbin-Watson at 1.986 ranging from1.5 – 2.5. It can be concluded that the
variance is interdependent and consistent with Multiple Regression Analysis.
Table 3
The analysis results of Variance analysis, ANOVAa
Model Sum of Squares Df Mean Square F Sig.
3
Regression 34.294 3 11.431 64.757 0.000d
Residual 69.905 396 0.177
Total 104.199 399
a. Dependent Variable: the acceptance of using M-Learning
b. Predictors: (Constant), factor concerning the attractiveness of contents
c. Predictors: (Constant), factor concerning the attractiveness of contents, the Internet quality
d. Predictors: (Constant), factor concerning the attractiveness of contents, the Internet quality, the perceived ease of use
Table 3 reveals Significant at 0.000 less than 0.05: the specified value α. It can be defined that at least
1 independent factor affects the acceptance of using M-Learning.
Table 4
The analysis results of Coefficients of factors affecting the acceptance of using M- Learning, Coefficientsa
Model
Unstandardized
Coefficients
Standardized
Coefficients t Sig. Collinearity
Statistics
B Std. Error Beta Tolerance VIF
3 (Constant) 1.552 0.174 8.922 0.000
the attractiveness of contents 0.301 0.047 0.323 6.363 0.000 0.658 1.519
the Internet quality 0.195 0.039 0.239 4.976 0.000 0.736 1.358
the perceived ease of use 0.123 0.046 0.142 2.677 0.008 0.599 1.669
a. Dependent Variable: the acceptance of using M-Learning
Table 4 discloses that in terms of the analysis results of Multiple Regression Analysis concerning
the irrevance of each independent, the Tolerance in table 5 includes 0.658, 0.736, 0.599, and 0.599 with
average score at 0. 664 not equal 0. Moreover, the correlation occurs between the analysis results from
ANOVA table and Coefficients table, and this discloses the irrelevance among independent variables.
Furthermore, based on the standard specifying that the less than 3 Variance Inflation Factor (VIF) signifies
the trouble-free of independent variables Multicollonearity [32]. the analysis results show VIF taken from the
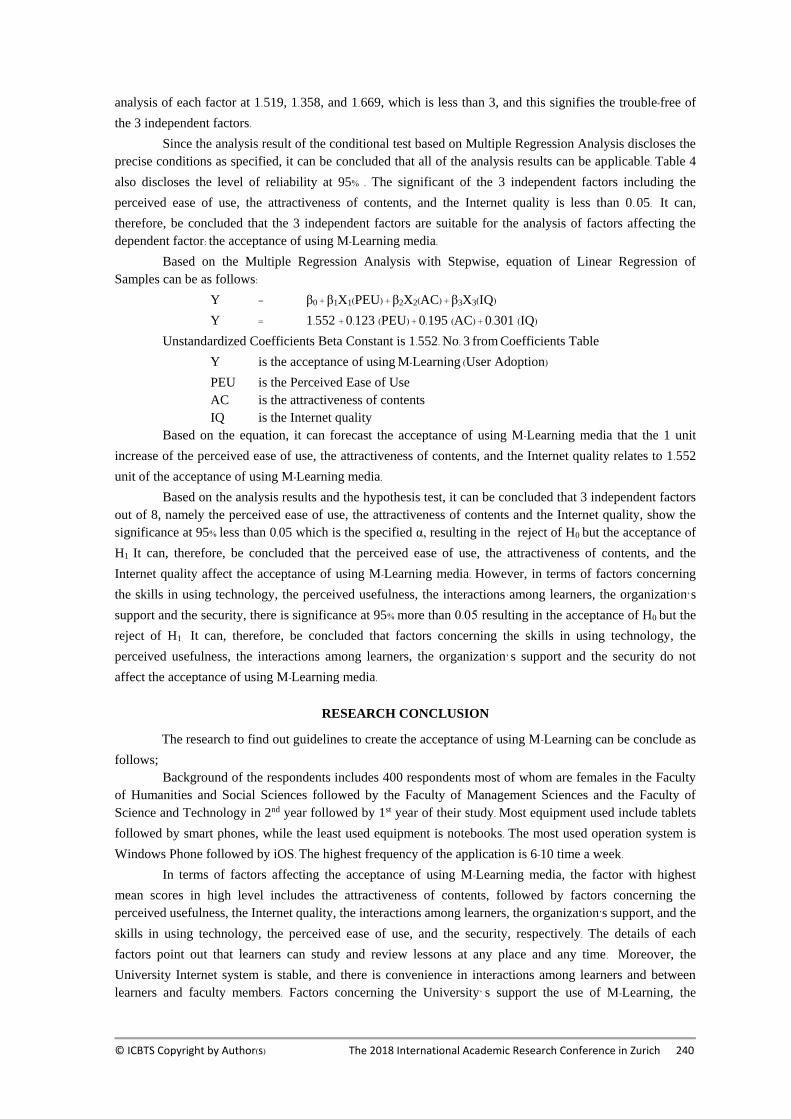
© ICBTS Copyright by Author(s) The 2018 International Academic Research Conference in Zurich 240
analysis of each factor at 1.519, 1.358, and 1.669, which is less than 3, and this signifies the trouble-free of
the 3 independent factors.
Since the analysis result of the conditional test based on Multiple Regression Analysis discloses the
precise conditions as specified, it can be concluded that all of the analysis results can be applicable. Table 4
also discloses the level of reliability at 95% . The significant of the 3 independent factors including the
perceived ease of use, the attractiveness of contents, and the Internet quality is less than 0. 05. It can,
therefore, be concluded that the 3 independent factors are suitable for the analysis of factors affecting the
dependent factor: the acceptance of using M-Learning media.
Based on the Multiple Regression Analysis with Stepwise, equation of Linear Regression of
Samples can be as follows:
Y = β0 + β1X1(PEU) + β2X2(AC) + β3X3(IQ)
Y = 1.552 + 0.123 (PEU) + 0.195 (AC) + 0.301 (IQ)
Unstandardized Coefficients Beta Constant is 1.552. No. 3 from Coefficients Table
Y is the acceptance of using M-Learning (User Adoption)
PEU is the Perceived Ease of Use
AC is the attractiveness of contents
IQ is the Internet quality Based on the equation, it can forecast the acceptance of using M-Learning media that the 1 unit
increase of the perceived ease of use, the attractiveness of contents, and the Internet quality relates to 1.552
unit of the acceptance of using M-Learning media.
Based on the analysis results and the hypothesis test, it can be concluded that 3 independent factors
out of 8, namely the perceived ease of use, the attractiveness of contents and the Internet quality, show the
significance at 95% less than 0.05 which is the specified α, resulting in the reject of H0 but the acceptance of
H1. It can, therefore, be concluded that the perceived ease of use, the attractiveness of contents, and the
Internet quality affect the acceptance of using M-Learning media. However, in terms of factors concerning
the skills in using technology, the perceived usefulness, the interactions among learners, the organization’s
support and the security, there is significance at 95% more than 0.05 resulting in the acceptance of H0 but the
reject of H1. It can, therefore, be concluded that factors concerning the skills in using technology, the
perceived usefulness, the interactions among learners, the organization’ s support and the security do not
affect the acceptance of using M-Learning media.
RESEARCH CONCLUSION
The research to find out guidelines to create the acceptance of using M-Learning can be conclude as
follows;
Background of the respondents includes 400 respondents most of whom are females in the Faculty
of Humanities and Social Sciences followed by the Faculty of Management Sciences and the Faculty of
Science and Technology in 2nd year followed by 1st year of their study. Most equipment used include tablets
followed by smart phones, while the least used equipment is notebooks. The most used operation system is
Windows Phone followed by iOS. The highest frequency of the application is 6-10 time a week.
In terms of factors affecting the acceptance of using M-Learning media, the factor with highest
mean scores in high level includes the attractiveness of contents, followed by factors concerning the
perceived usefulness, the Internet quality, the interactions among learners, the organization’s support, and the
skills in using technology, the perceived ease of use, and the security, respectively. The details of each
factors point out that learners can study and review lessons at any place and any time. Moreover, the
University Internet system is stable, and there is convenience in interactions among learners and between
learners and faculty members. Factors concerning the University’ s support the use of M-Learning, the
© ICBTS Copyright by Author(s) The 2018 International Academic Research Conference in Zurich 241
perceived ease of use of M-Learning, the easy steps of use, and the submission through the system leading to
the limitation of the loss of information also relates to the acceptance of using M-Learning media.
The total level of samples’ opinions concerning the acceptance of using M-Learning media is in high
level with average mean at 3.95.
Based on the research hypothesis test, it can be concluded that factors relating to the acceptance of
using M-Learning include 3 items; the perceived ease of use, the attractiveness of contents, and the Internet
quality. It can, therefore, be concluded that 1 unit increase of the perceived ease of use ( PEU) , the
attractiveness of contents (AC), and the Internet quality (IQ) leads to 1.552 unit and 32.90% of the acceptance
of using M-Learning media.
DISCUSSION
Based on the analysis results to find factors affecting the acceptance of using M-Learning media,
these factors correlate with Unified Theory of Acceptance and Use of Technology: UTAUT. That is to say 3
factors affecting the acceptance of using M-Learning media, namely the perceived ease of use of technology,
can be implemented as a guideline for organizing training for the faculty members, and this is consistent with
Orathai’ s [ 31] . Comments stating that it’ s necessary for an institution to organize training about new
technology to continuously facilitate the faculty members to effectively use the new system with the
purposes of increasing their perceived ease of use of the new technology. Moreover, in terms of factors
concerning the context supporting the use of technology such as the attractiveness of contents and the
Internet quality, it is important for the organization to develop the faculty members’ skills, and to invest by
allocating budget for the production of contents in the form of various multi medias by instructors or team
responsible for designing effective E-Learning lessons supporting learners’ self-study. This correlates with the
concepts stating that M-Learning media with update data, attractive lessons, clear explanation of knowledge,
the ease to access and use in the forms of multi-medias with colorful images, moving pictures, and sound
will attract learners to learn anywhere and anytime comfortably.
Moreover, the quick response of computer with colorful graphic, motion pictures and sound will not
make the students bored. This correlates with Suthiwan’s [15]. comments stating that the Internet quality is an
external factor attracting users to choose the media for learning because the clear benefit of M-Learning is
the access to the lessons anywhere and anytime. M-Learning context should, therefore, be created so that
learning can be satisfied anywhere and anytime [33] . However, there is no correction among other factors
concerning gender, and ages because there are no problems for current users in terms of the acceptance of
innovation including skills in using M-Learning. However, the most important thing is the process of
awareness building and experience passing on from person to person. This leads to the consumption that
‘Learning’ is core of M-Learning [3]. That is because M-Learning is the use of wireless technology for learning
like E-Learning in 21st century.
SUGGESTION
Based on the research results, suggestions for further study are as follows:
1. Due to the low rate of Adjusted R Square, to increase this rate, it is advisable to study other
factors gained from the stakeholders’ suggestions, such as external factors – factors concerning the
organization, its size, and the budget allocated from the government, and internal factors – learners’ attitudes,
etc.
2. The research results of this study provide factors concerning the acceptance of M-Learning. The
guidelines to produce effective M-Learning media based on factors affecting the acceptance of using M-
Learning should, therefore, be conducted.
© ICBTS Copyright by Author(s) The 2018 International Academic Research Conference in Zurich 242
ACKNOWLEDGMENTS
The author would like to thank the Research and Development Institute, Suan Sunandha Rajabhat
University, Bangkok, Thailand for the financial support.
REFERENCE
[ 1] Bowless, M. S. ( 2004) . Relearning to E-Learning: Strategic for Electronic Learning and
Knowledge. Australia : Melbourne University Publishing.
[ 2] Srisak Jamonman. ( 2 007) . “ Computer Report on eEverything. ” International Journal of the
Computer, the Internet and Management. Vol.15 No.4 : 1-12.
[3] Poolsri Vaetulan. (2008). [online]. Mobile Learning (mLearning). [cited March 18 2017]. Available
from : URL : http://thaim-learn-ing.blogspot.com/
[4] Davis, F. D. ( 1989) . “ Perceived usefulness, perceived ease of use, and end user acceptance of
Information technology.” MIS Quarterly. Vol.13 No.3 : 319-340.
[5] Venkatesh, V., Morris, M., Davis, G. B. and Davis, F. D. (2003). “User Acceptance Of Information
Technology : Toward A Unified View.” MIS Quarterly. Vol.27 No.3 : 425-478.
[6] Alrasheedi, M. and Capretz, L. F. (2013) . “ A meta-analysis of critical success factors affecting
mobile learning. ” In 2013 IEEE International Conference on Teaching, Assessment and
Learning for Engineering (TALE). Indonesia, (262-267).
[7] Liu, Y., Han, S. and Li, H. (2010) . “ Understanding the factors driving m-learning adoption : A
literature review.” Campus - Wide Information Systems. Vol.27 No.4 : 210-226.
[8] Bhatiasevi, V. and Naglis, M. (2015). “Investigating the structural relationship for the determinants
of cloud computing adoption in education.” Education and Information Technologies. Vol.21
No.5 : 1197-1223.
[ 9] Mohammadi, H. ( 2015) . “ Social and individual antecedents of m-learning adoption in Iran. ”
Computers in Human Behavior. Vol.49 : 191-207.
[10] Alrasheedi, M. and Capretz, L. F. (2015) . “ An Empirical Study of Critical Success Factors of
Mobile Learning Platform from the Perspective of Instructors. ” Procedia - Social and
Behavioral Science. Vol.176 : 211-219.
[11] Althunibat, A. (2015). “Determining the factors influencing students’ intention to use m-learning
in Jordan higher education.” Computers in Human Behavior. Vol.52 : 65-71.
[ 12] Williams, P. W. ( 2009) . Assessing mobile learning effectiveness and acceptance. Ph. D.
Dissertation, (Information Systems and Technology Management), The Faculty of The School of
Business, George Washington University.
[13] Gupta, N. (2008). Mobile Communities: Importance of Mobile Learning in Indian Education
Systems. Master Thesis, ( Electrical and Computer Engineering) , Faculty of Science, Purdue
University.
[ 14] Patravadee Vongsumaet. ( 2013) . “ Factors Influencing the Adoption of. Web-Based Learning
System.” Executive Journal. Vol.33 No.3 : 10-12. [15] Suttiwan Tuntirojanawong. (2014) . “Factors Affecting to Students’ Readiness for E-learning: A
Case Study of Graduate Students in Educational Administration Department, School of
Educational Studies, Sukhothai Thammathirat Open University. ” Journal of Education
Sukhothai Thammathirat Open University. Vol.7 No.1 : 51 - 64
[ 16] A-porn Molee. ( 2015) . “ Factors influencing the adoption of e-learning system case study :
Buchelor degree student in Suratthani Rajabhat University. ” Journal of Education Taksin
University. Vol.18 No.2 : 19 - 27.
© ICBTS Copyright by Author(s) The 2018 International Academic Research Conference in Zurich 243
[17] Piyanut Sujit. (2010). “Information literacy skills of Bachelor’s Student from Suan Sunandha
Rajabhat University.” Suan Sunandha Rajabhat University Academic Research.
[18] Hsia J. (2016). “The effects of locus of control on university students’ mobile learning adoption.”
Journal of Computing in Higher Education. Vol.28 No.1 : 1-17.
[19] Lee, J. Choi, M. and Lee, H. (2015) . “Factors affecting smart learning adoption in workplaces :
comparing large enterprises and SMEs. ” Information Technology and Management. Vol.16
No.4 : 291-302.
[20]Cheng, Y. (2015) . “ Towards an understanding of the factors affecting m-learning acceptance :
Roles of technological characteristics and compatibility. ” Asia Pacific Management Review.
Vol.20 No.3 : 109-119.
[21]Lee, W. and Chang Y. (2008). “A SWOT Analysis of m-Learning Diffusion in China and Taiwan.”
In WMUTE 2008. Fifth IEEE International Conference. Texas, USA, (219-221).
[22]Picek, R. and Grcic, M. (2013). "Evaluation of the potential use of m-learning in higher education"
In Information Technology Interfaces ( ITI) 2013 35th Interna-tional Conference. Cavtat,
Croatia, (63-68).
[23]Kim, G. and Ong, S. M. (2005). “AN EXPLORATORY STUDY OF FACTORS INFLUENCING
M-LEARNING SUCCESS.” The Journal of Computer Information Systems. Vol.46 No.1 : 92-
97.
[24] Ibrahim, E. N. M. and Walid, N. (2014). “Trust Contributing Factors in M-Learning Technology.”
Procedia - Social and Behavioral Sciences. Vol.129 : 554-561.
[ 25] Alzaza, N. S. , and Yaakub, A. R. ( 2011) . “ Students' awareness and requirements of mobile
learning services in the higher education environment.” American Journal of Economics and
Business Administration. Vol.3 No.1 : 95-100.
[ 26] Mathur, R. ( 2011) . Students' Perceptions of a Mobile Application for College Course
Management Systems. Ph.D. Dissertation, (Doctor of Philosophy Management) , Management
Faculty, Walden University.
[27] Al-Ani, M. F., Hameed, S. M. and Faisai, L. (2013). "Students' Perspectives in Adopting Mobile
Learning at University of Bahrain. " In 2013 Fourth International Conference. Manama,
Bahrain, (86-89).
[28] Arthit Kiatkamjorn. (2014). Factors Influencing in Acceptance Technology: A Case Study of
Using Interactive Whiteboard in Faculty of Medicine Siriraj Hospital. Master Thesis,
(Information Technology), College of Innovation, Thammasat University. [29] Jongsuk Kongsen and Pornthip Intro (2010) . “ Adoption of m-Learning System and Guide the
Development of Teacher use m-Learning in. Walailak University. ” In 2 0 1 0 1 st PULINET
Conference. Nakonpathom, Thailand : Silpakorn University Central Library, (60-67).
[30] Marut Klongklew. (2014). The study of needed factor for mobile learning at graduate school
of eLearning, Assumption University. Master Thesis, ( Educational Technology) , Graduate
School, Silpakorn University.
[ 31] Panuwat Sammaworakit and Anna Jumpolsathaen ( 2 014) . Factors Influencing Decision
Making in Smart Phone Application among Consumer in Bangkok. Master Thesis, (Mass
Commu-nication Administration), Faculty of Journalism and Mass Communication, Thammasat
University.
[32]Orathai Luanwan. (2012). Factors affecting information technology acceptance : a case study
of conmunity development department, government complex chaeng watthana.
© ICBTS Copyright by Author(s) The 2018 International Academic Research Conference in Zurich 244
Independent Study, ( General Management) , Faculty of Business Administration, Rajamangala
University of Technology Thanyaburi.
[33] Bai, R. and Lee, G. (2003). "Organizational factors influencing the quality of the IS/IT strategic
planning process" Industrial Management & Data Systems. Vol. 103 No.8 : 622-632.
[34] Geddes, S. (2004). [online]. Mobile learning in the 21st century : Benefit for learners. [cited
March 20, 2017]. Available from : URL : http://knowledgetree.flexible. learning .net.au/edition
06/download /geddes.pdf
© ICBTS Copyright by Author(s) The 2018 International Academic Research Conference in Zurich 245
SOLUTIONS OF SIMULTANEOUS TO ACCESS AUDIOVISUAL
MEDIA USERS AT SUAN SUNANDHA RAJABHAT UNIVERSITY
Thanachat Akechat*& Ganratchakan Ninlawan**
*,** Academic Resource and Information Technology, Suan Sunandha Rajabhat University, Bangkok,
Thailand,
E-Mail: *[email protected], **[email protected]
ABSTRACT
This research is to propose the solution for solve the congestion problem of audiovisual material users
at Suan Sunandha Rajabhat University. Statistics from the usage of audiovisual media, a population of 400
people, a number of teachers and staff 12.5 percentage, and the percentage of students in the first year to
fourth year of 87.5. Therefore, to provide users with access to audiovisual material at the same time, we offer
2 solutions to solve the problem of audiovisual users, this is an information to decision support system in the
future. 1) Increasing the space in the audiovisual room of the group users and reduction of individual service
area. 2) The service model configuration is divided into 3 types: ( 1) Given the right to watch movies and
increase channels to lend the film. (2) Determine the maximum number of visitors in each movie room. (3)
Schedule movie screenings and titles.
Keywords:, SOLUTIONS OF SIMULTANEOUS, AUDIOVISUAL MEDIA, USERS
INTRODUCTION
Academic Resource and Information Technology is the institution that encourage student’s knowledge
apart from in class study. The audiovisuals service is necessary and there must be improvement in some area
according to user’s need. Physical Structure at Academic Resource and Information Technology: The
service of audiovisual on the fourth floor consists of Video playing service at theatre room for 6-12 people
per room with the total of 2 rooms, Video playing service at sofa corner for 3-5 people with the total of 4
sofa sets, and 26 Video individually watching service, Group study room service for 4-8 people per 2 hours
with the total of 2 rooms. The audiovisual service is consist of 2 types of service which are: 1) The
audiovisual service inside the Academic Resource and Information Technology and 2) The take home
service. [1]. The advance in technologies is aimed to provide facilities for people and there are also varieties of the
technology equipment which includes television, radio, mobile phone and online application. This becomes a
curtail part of people’s lives and affects how people use audiovisual [2]. The literature of usage behaviors to the audiovisual material room of human resource the same as
research about Foreign students' needs for services and usage behaviors at The Center for Library Resources
and Educational Media, Suranaree University of Technology. The analysis results of the research subjects’
general information revealed that the majority were male. They were under the Institute of Social
Technology studying for a doctoral degree and residing on campus. Regarding their utilization behaviors on
the services provided by the CLREM, it was found that the research subjects utilized library services for
textbook searches and reading. They went to the library on their accord. Their frequency of library service
utilization was 2-3 times/week. They mostly went to the library at 08.00-12.00 a.m. and 12.01-16.00 p.m. and,
in average, for more than five hours/week. The Audiovisual Media Services Directive [3].
The study of access to audiovisual media of all university is similar such as Users’ Satisfaction in
Audio-Visual Services of Central Library, Srinakharinwirot University, this study were to investigate and to
compare in four aspects, service processes, service staff, facilities and service quality. Users’ Satisfaction in
audio-visual services, about were that: internet service area is in order, beautiful and suitable for service and
providing up-to-date computer for internet. and : up-to-date audio-visual media, enable to search for audio-
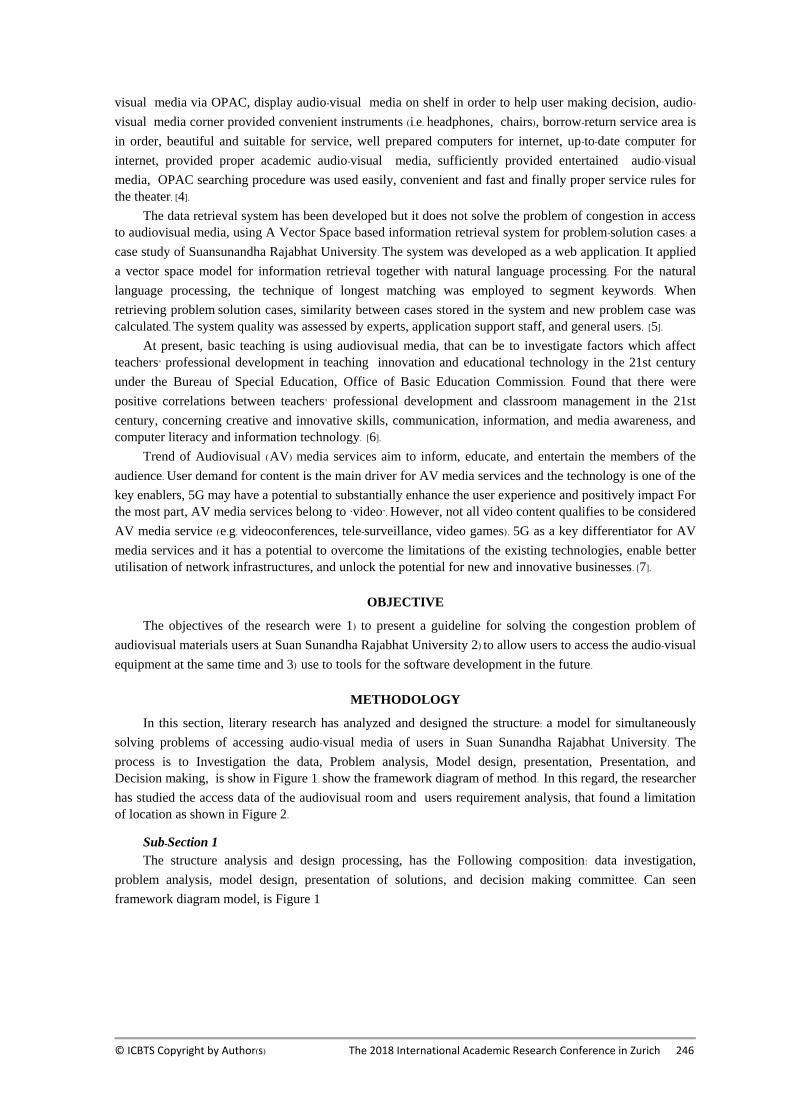
© ICBTS Copyright by Author(s) The 2018 International Academic Research Conference in Zurich 246
visual media via OPAC, display audio-visual media on shelf in order to help user making decision, audio-
visual media corner provided convenient instruments (i.e. headphones, chairs), borrow-return service area is
in order, beautiful and suitable for service, well prepared computers for internet, up-to-date computer for
internet, provided proper academic audio-visual media, sufficiently provided entertained audio-visual
media, OPAC searching procedure was used easily, convenient and fast and finally proper service rules for
the theater. [4]. The data retrieval system has been developed but it does not solve the problem of congestion in access
to audiovisual media, using A Vector Space based information retrieval system for problem-solution cases: a
case study of Suansunandha Rajabhat University. The system was developed as a web application. It applied
a vector space model for information retrieval together with natural language processing. For the natural
language processing, the technique of longest matching was employed to segment keywords. When
retrieving problem solution cases, similarity between cases stored in the system and new problem case was
calculated. The system quality was assessed by experts, application support staff, and general users. [5]. At present, basic teaching is using audiovisual media, that can be to investigate factors which affect
teachers’ professional development in teaching innovation and educational technology in the 21st century
under the Bureau of Special Education, Office of Basic Education Commission. Found that there were
positive correlations between teachers’ professional development and classroom management in the 21st
century, concerning creative and innovative skills, communication, information, and media awareness, and
computer literacy and information technology. [6].
Trend of Audiovisual (AV) media services aim to inform, educate, and entertain the members of the
audience. User demand for content is the main driver for AV media services and the technology is one of the
key enablers, 5G may have a potential to substantially enhance the user experience and positively impact For
the most part, AV media services belong to ‘video’. However, not all video content qualifies to be considered
AV media service (e.g. videoconferences, tele-surveillance, video games). 5G as a key differentiator for AV
media services and it has a potential to overcome the limitations of the existing technologies, enable better
utilisation of network infrastructures, and unlock the potential for new and innovative businesses. [7].
OBJECTIVE
The objectives of the research were 1) to present a guideline for solving the congestion problem of
audiovisual materials users at Suan Sunandha Rajabhat University 2) to allow users to access the audio-visual
equipment at the same time and 3) use to tools for the software development in the future.
METHODOLOGY
In this section, literary research has analyzed and designed the structure: a model for simultaneously
solving problems of accessing audio-visual media of users in Suan Sunandha Rajabhat University. The
process is to Investigation the data, Problem analysis, Model design, presentation, Presentation, and
Decision making, is show in Figure 1. show the framework diagram of method. In this regard, the researcher
has studied the access data of the audiovisual room and users requirement analysis, that found a limitation
of location as shown in Figure 2.
Sub-Section 1
The structure analysis and design processing, has the Following composition: data investigation,
problem analysis, model design, presentation of solutions, and decision making committee. Can seen
framework diagram model, is Figure 1
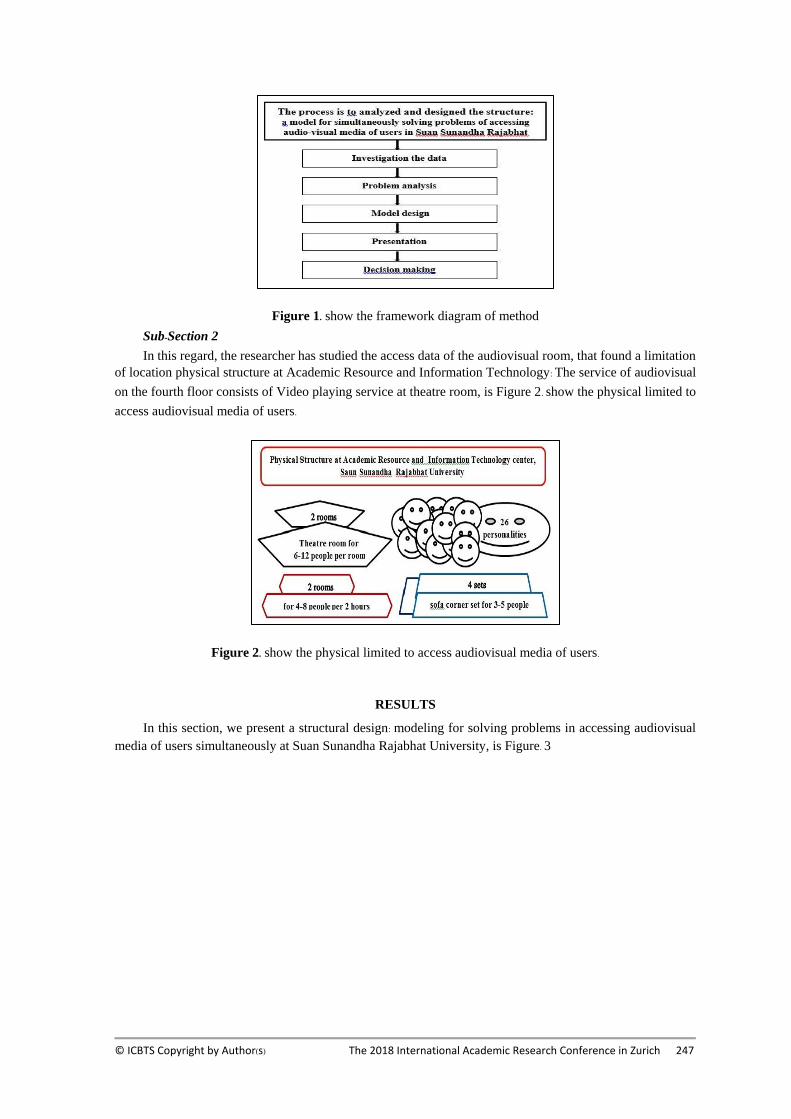
© ICBTS Copyright by Author(s) The 2018 International Academic Research Conference in Zurich 247
Figure 1. show the framework diagram of method
Sub-Section 2
In this regard, the researcher has studied the access data of the audiovisual room, that found a limitation
of location physical structure at Academic Resource and Information Technology: The service of audiovisual
on the fourth floor consists of Video playing service at theatre room, is Figure 2. show the physical limited to
access audiovisual media of users.
Figure 2. show the physical limited to access audiovisual media of users.
RESULTS
In this section, we present a structural design: modeling for solving problems in accessing audiovisual
media of users simultaneously at Suan Sunandha Rajabhat University, is Figure. 3
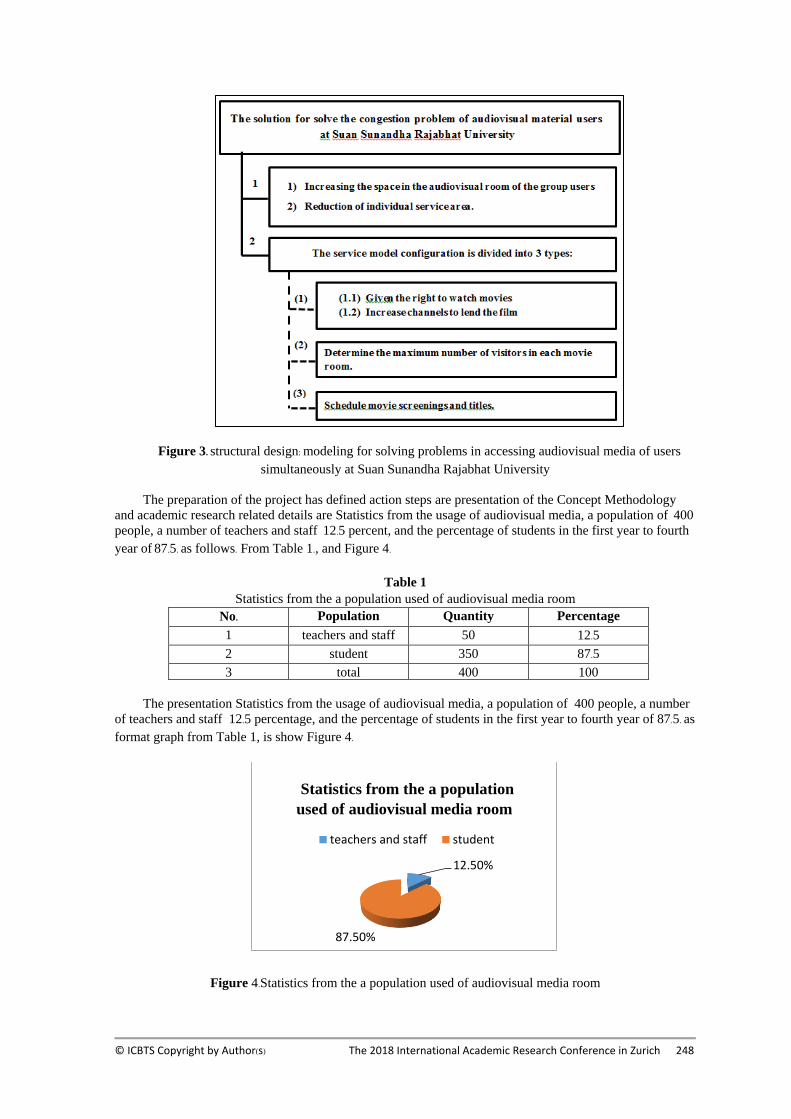
© ICBTS Copyright by Author(s) The 2018 International Academic Research Conference in Zurich 248
Figure 3. structural design: modeling for solving problems in accessing audiovisual media of users
simultaneously at Suan Sunandha Rajabhat University
The preparation of the project has defined action steps are presentation of the Concept Methodology
and academic research related details are Statistics from the usage of audiovisual media, a population of 400
people, a number of teachers and staff 12.5 percent, and the percentage of students in the first year to fourth
year of 87.5. as follows. From Table 1., and Figure 4.
Table 1
Statistics from the a population used of audiovisual media room
No. Population Quantity Percentage
1 teachers and staff 50 12.5
2 student 350 87.5
3 total 400 100
The presentation Statistics from the usage of audiovisual media, a population of 400 people, a number
of teachers and staff 12.5 percentage, and the percentage of students in the first year to fourth year of 87.5. as
format graph from Table 1, is show Figure 4.
Figure 4.Statistics from the a population used of audiovisual media room
12.50%
87.50%
Statistics from the a population
used of audiovisual media room
teachers and staff student
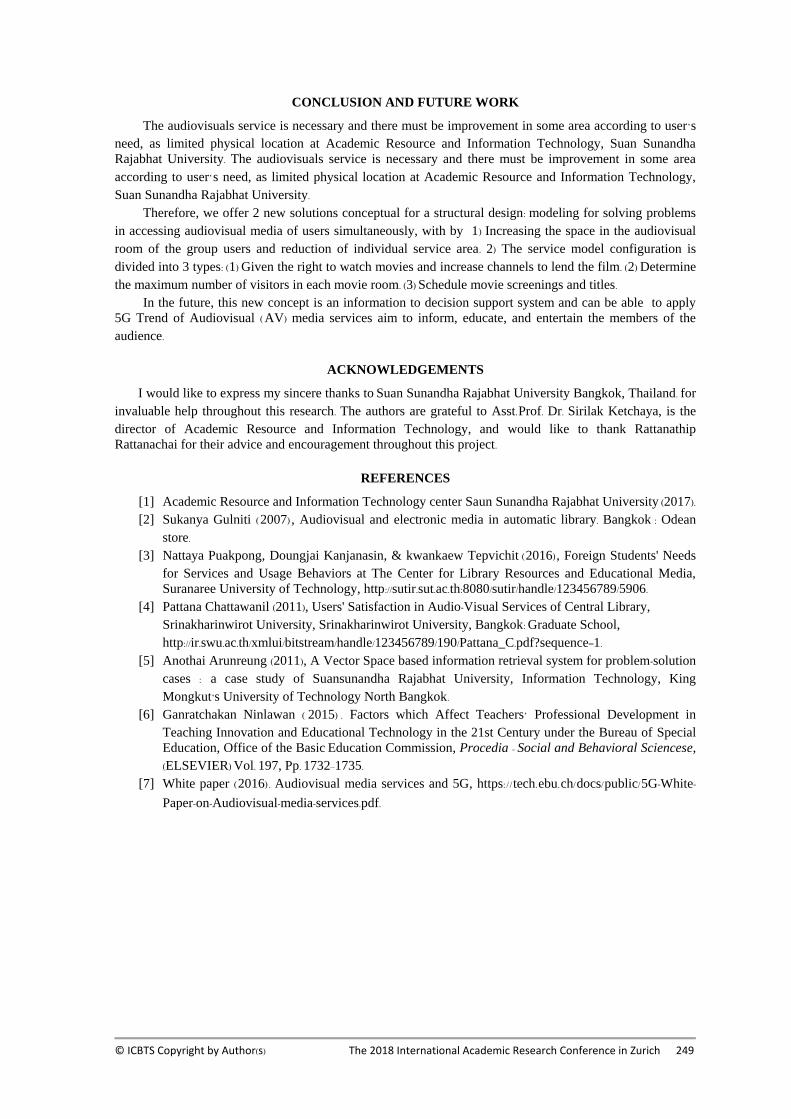
© ICBTS Copyright by Author(s) The 2018 International Academic Research Conference in Zurich 249
CONCLUSION AND FUTURE WORK
The audiovisuals service is necessary and there must be improvement in some area according to user’s
need, as limited physical location at Academic Resource and Information Technology, Suan Sunandha
Rajabhat University. The audiovisuals service is necessary and there must be improvement in some area
according to user’s need, as limited physical location at Academic Resource and Information Technology,
Suan Sunandha Rajabhat University. Therefore, we offer 2 new solutions conceptual for a structural design: modeling for solving problems
in accessing audiovisual media of users simultaneously, with by 1) Increasing the space in the audiovisual
room of the group users and reduction of individual service area. 2) The service model configuration is
divided into 3 types: (1) Given the right to watch movies and increase channels to lend the film. (2) Determine
the maximum number of visitors in each movie room. (3) Schedule movie screenings and titles. In the future, this new concept is an information to decision support system and can be able to apply
5G Trend of Audiovisual ( AV) media services aim to inform, educate, and entertain the members of the
audience.
ACKNOWLEDGEMENTS
I would like to express my sincere thanks to Suan Sunandha Rajabhat University Bangkok, Thailand. for
invaluable help throughout this research. The authors are grateful to Asst.Prof. Dr. Sirilak Ketchaya, is the
director of Academic Resource and Information Technology, and would like to thank Rattanathip
Rattanachai for their advice and encouragement throughout this project.
REFERENCES
[1] Academic Resource and Information Technology center Saun Sunandha Rajabhat University (2017). [2] Sukanya Gulniti (2007) , Audiovisual and electronic media in automatic library. Bangkok : Odean
store. [3] Nattaya Puakpong, Doungjai Kanjanasin, & kwankaew Tepvichit (2016), Foreign Students' Needs
for Services and Usage Behaviors at The Center for Library Resources and Educational Media,
Suranaree University of Technology, http://sutir.sut.ac.th:8080/sutir/handle/123456789/5906. [4] Pattana Chattawanil (2011), Users' Satisfaction in Audio-Visual Services of Central Library,
Srinakharinwirot University, Srinakharinwirot University, Bangkok: Graduate School,
http://ir.swu.ac.th/xmlui/bitstream/handle/123456789/190/Pattana_C.pdf?sequence=1. [5] Anothai Arunreung (2011), A Vector Space based information retrieval system for problem-solution
cases : a case study of Suansunandha Rajabhat University, Information Technology, King
Mongkut’s University of Technology North Bangkok. [6] Ganratchakan Ninlawan ( 2015) . Factors which Affect Teachers’ Professional Development in
Teaching Innovation and Educational Technology in the 21st Century under the Bureau of Special
Education, Office of the Basic Education Commission, Procedia - Social and Behavioral Sciencese,
(ELSEVIER) Vol. 197, Pp. 1732–1735. [7] White paper (2016) . Audiovisual media services and 5G, https: / /tech.ebu.ch/docs/public/5G-White-
Paper-on-Audiovisual-media-services.pdf.
© ICBTS Copyright by Author(s) The 2018 International Academic Research Conference in Zurich 250
DEVELOPMENT OF MATHEMATICS COMPETENCY TEST
UNDER THE THAILAND 4.0 POLICY
KITISAK DEEPUEN*, SOMPOCH ANEGASUKHA ** & NATKRITA NGAMMEERITH ***
*KITISAK DEEPUEN, Ph.D.Student , Research Measurement and Statistics,
Burapha University, Chonburi, Thailand, E-Mail: [email protected]
**SOMPOCH ANEGASUKHA, Lecturer, Research Measurement and Statistics,
Burapha University, Chonburi, Thailand, E-Mail: [email protected]
***NATKRITA NGAMMEERITH, Lecturer, Research Measurement and Statistics,
Burapha University, Chonburi, Thailand, E-Mail: [email protected]
ABSTRACT
This article is aimed to develop the mathematics competency test for level 9 of Thai students under
the Thailand 4.0 policy. The test focus on (1) Communication (2) Productivity & Innovation ( 3) Critical
Thinking and Evaluation (4) Creativity (5) Problem Solving ( 6) Asian & International and (7) Ethic &
Responsibility which based on Ministry of Education policy, The institute for the Promotion of Teaching
Science and Technology, Competency of 21st Century skill, Competency of PISA. The sample consisted of
1,650 level 9 students in the secondary educational service area 8, during the 2nd semester of the academic
year 2017, selected by the two-stage random sampling technique. The instruments consisted of 1) a 43 item
mathematics competency test and 2) Scale on factors affecting achievement with 5 parts are Attitude
Learning of Mathematics , Achievement Motivation of Mathematics , Teaching Behaviors of Mathematics
Teacher , Atmosphere in the Mathematics Classroom and Parents learning support of Mathematics. The data
were analyzed by frequency, percentages by using SPSS for WINDOWS and the confirmatory factor analysis
by M Plus 7.0 program.
Results were as follow:
1) The Mathematics Competency about Thailand 4.0 Policy of level 9 students consists 7
Competency are (1) Communication (2) Productivity & Innovation (3) Critical Thinking
and Evaluation (4) Creativity (5) Problem Solving (6) Asian & International and (7) Ethic &
Responsibility. The statistical values are
257.1/,25.0,10,57.12 22 ==== dfpdf ,RMSEA = 0.016, CFI = 1,TLI=1,
SRMR = 0.014
2) 7 factors affecting on Mathematics Competency about Thailand 4.0 Policy of level 9
students in the secondary educational service area 8 consists Background Knowledge,
Attitude Learning of Mathematics , Achievement Motivation of Mathematics , Teaching
Behaviors of Mathematics Teacher , Atmosphere in the Mathematics Classroom , Parents
learning support , Experience of Mathematics Teacher.
Keyword: Mathematics Competency, Thailand 4.0 policy, The factors affecting Mathematics
INTRODUCTION
Mathematics is highly important to development of the human mind. It enables a person to acquire
skills in creativity, logic and systematic and methodical thinking, and allows one to carefully and thoroughly
analyse various problems or situations, anticipate, plan, make decisions, solve problems and accurately and
appropriately apply mathematics in daily life. Mathematics serves as a tool for learning science, technology
and other disciplines. It is therefore useful to one’s life, enhances quality of life and enables a person to live
in harmony with others.
The learning area for mathematics is aimed at enabling all children and youths to continuously learn
this subject in accord with their potentiality. The contents prescribed for all learners are Numbers and
Operations,Measurement,Geometry,Algebra,Data Analysis and Probability and Mathematical Skills and
Processes
Thai students need to pass the O-NET (Ordinary National Educational Test) to graduate at the
lower secondary (M.3) school levels. O-NET is organized by the National Institute of Educational Testing
Service (NIETS). Ever Mathematics O-NET has been implemented 2-3 years ago, it has been criticized for
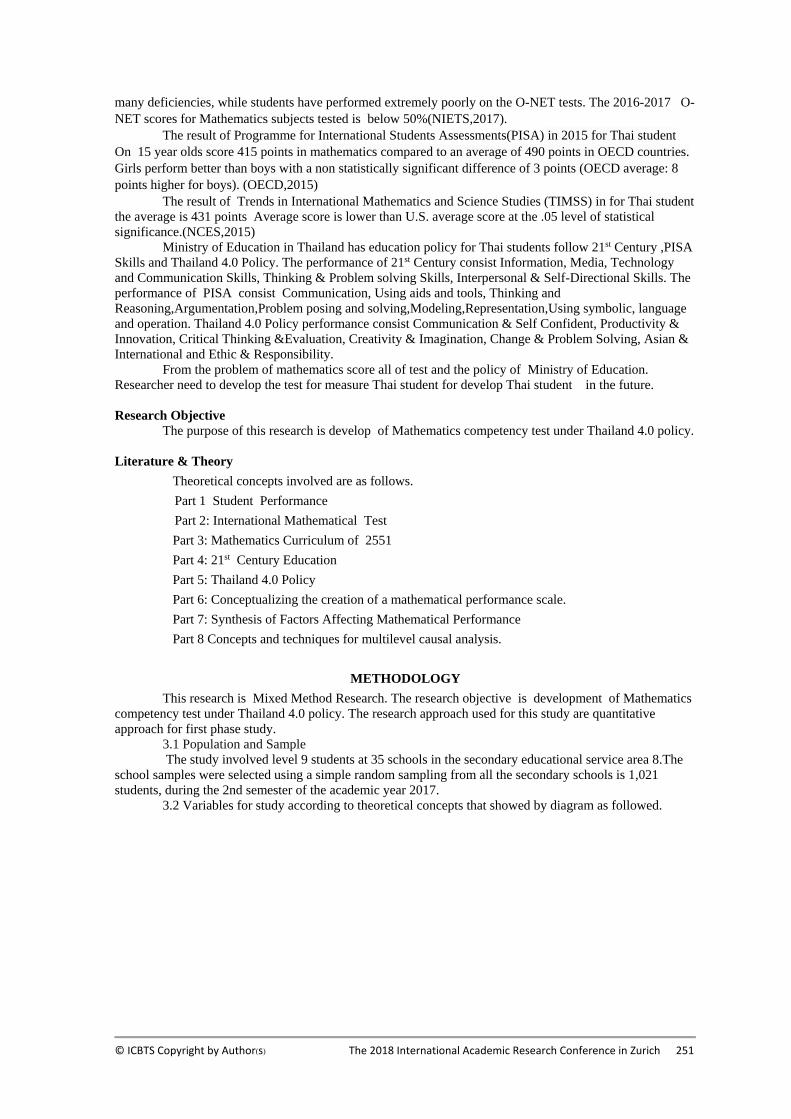
© ICBTS Copyright by Author(s) The 2018 International Academic Research Conference in Zurich 251
many deficiencies, while students have performed extremely poorly on the O-NET tests. The 2016-2017 O-
NET scores for Mathematics subjects tested is below 50%(NIETS,2017).
The result of Programme for International Students Assessments(PISA) in 2015 for Thai student
On 15 year olds score 415 points in mathematics compared to an average of 490 points in OECD countries.
Girls perform better than boys with a non statistically significant difference of 3 points (OECD average: 8
points higher for boys). (OECD,2015)
The result of Trends in International Mathematics and Science Studies (TIMSS) in for Thai student
the average is 431 points Average score is lower than U.S. average score at the .05 level of statistical
significance.(NCES,2015)
Ministry of Education in Thailand has education policy for Thai students follow 21st Century ,PISA
Skills and Thailand 4.0 Policy. The performance of 21st Century consist Information, Media, Technology
and Communication Skills, Thinking & Problem solving Skills, Interpersonal & Self-Directional Skills. The
performance of PISA consist Communication, Using aids and tools, Thinking and
Reasoning,Argumentation,Problem posing and solving,Modeling,Representation,Using symbolic, language
and operation. Thailand 4.0 Policy performance consist Communication & Self Confident, Productivity &
Innovation, Critical Thinking &Evaluation, Creativity & Imagination, Change & Problem Solving, Asian &
International and Ethic & Responsibility.
From the problem of mathematics score all of test and the policy of Ministry of Education.
Researcher need to develop the test for measure Thai student for develop Thai student in the future.
Research Objective
The purpose of this research is develop of Mathematics competency test under Thailand 4.0 policy.
Literature & Theory
Theoretical concepts involved are as follows.
Part 1 Student Performance
Part 2: International Mathematical Test
Part 3: Mathematics Curriculum of 2551
Part 4: 21st Century Education
Part 5: Thailand 4.0 Policy
Part 6: Conceptualizing the creation of a mathematical performance scale.
Part 7: Synthesis of Factors Affecting Mathematical Performance
Part 8 Concepts and techniques for multilevel causal analysis.
METHODOLOGY
This research is Mixed Method Research. The research objective is development of Mathematics
competency test under Thailand 4.0 policy. The research approach used for this study are quantitative
approach for first phase study.
3.1 Population and Sample
The study involved level 9 students at 35 schools in the secondary educational service area 8.The
school samples were selected using a simple random sampling from all the secondary schools is 1,021
students, during the 2nd semester of the academic year 2017.
3.2 Variables for study according to theoretical concepts that showed by diagram as followed.
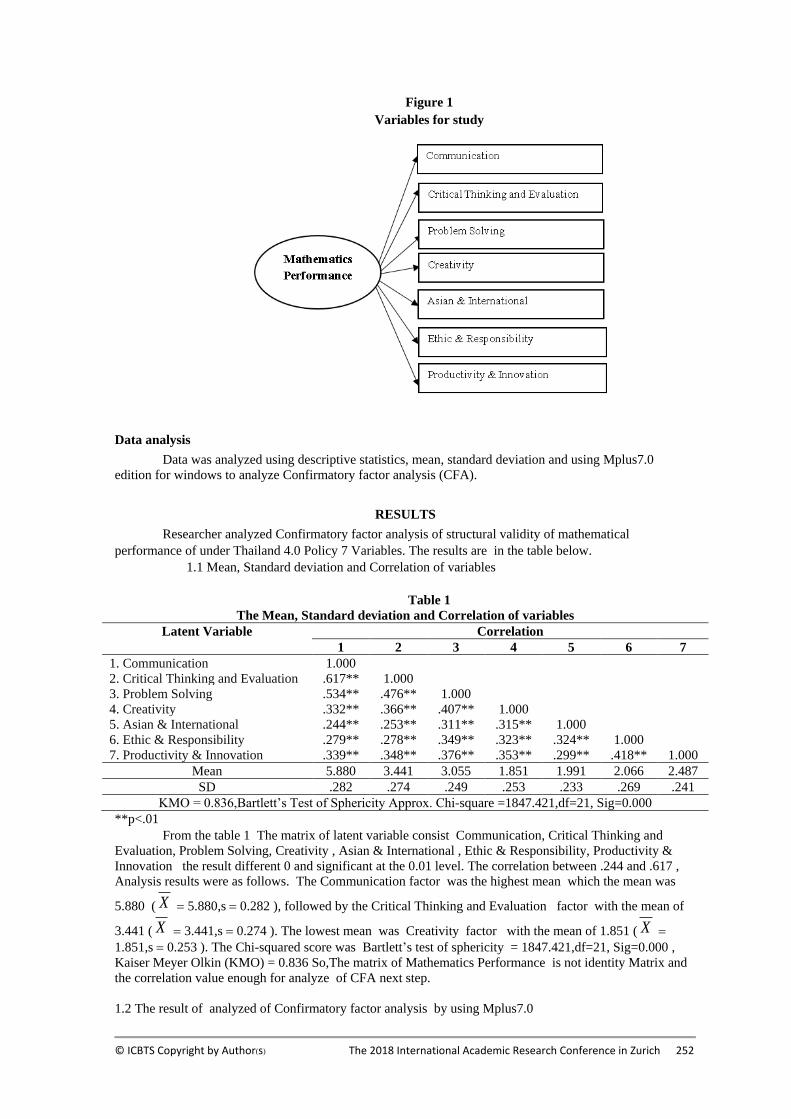
© ICBTS Copyright by Author(s) The 2018 International Academic Research Conference in Zurich 252
Figure 1
Variables for study
Data analysis
Data was analyzed using descriptive statistics, mean, standard deviation and using Mplus7.0
edition for windows to analyze Confirmatory factor analysis (CFA).
RESULTS
Researcher analyzed Confirmatory factor analysis of structural validity of mathematical
performance of under Thailand 4.0 Policy 7 Variables. The results are in the table below.
1.1 Mean, Standard deviation and Correlation of variables
Table 1
The Mean, Standard deviation and Correlation of variables
Latent Variable Correlation
1 2 3 4 5 6 7
1. Communication 1.000
2. Critical Thinking and Evaluation .617** 1.000
3. Problem Solving .534** .476** 1.000
4. Creativity .332** .366** .407** 1.000
5. Asian & International .244** .253** .311** .315** 1.000
6. Ethic & Responsibility .279** .278** .349** .323** .324** 1.000
7. Productivity & Innovation .339** .348** .376** .353** .299** .418** 1.000
Mean 5.880 3.441 3.055 1.851 1.991 2.066 2.487
SD .282 .274 .249 .253 .233 .269 .241
KMO = 0.836,Bartlett’s Test of Sphericity Approx. Chi-square =1847.421,df=21, Sig=0.000
**p<.01
From the table 1 The matrix of latent variable consist Communication, Critical Thinking and
Evaluation, Problem Solving, Creativity , Asian & International , Ethic & Responsibility, Productivity &
Innovation the result different 0 and significant at the 0.01 level. The correlation between .244 and .617 ,
Analysis results were as follows. The Communication factor was the highest mean which the mean was
5.880 ( X = 5.880,s = 0.282 ), followed by the Critical Thinking and Evaluation factor with the mean of
3.441 ( X = 3.441,s = 0.274 ). The lowest mean was Creativity factor with the mean of 1.851 ( X =
1.851,s = 0.253 ). The Chi-squared score was Bartlett’s test of sphericity = 1847.421,df=21, Sig=0.000 ,
Kaiser Meyer Olkin (KMO) = 0.836 So,The matrix of Mathematics Performance is not identity Matrix and
the correlation value enough for analyze of CFA next step.
1.2 The result of analyzed of Confirmatory factor analysis by using Mplus7.0
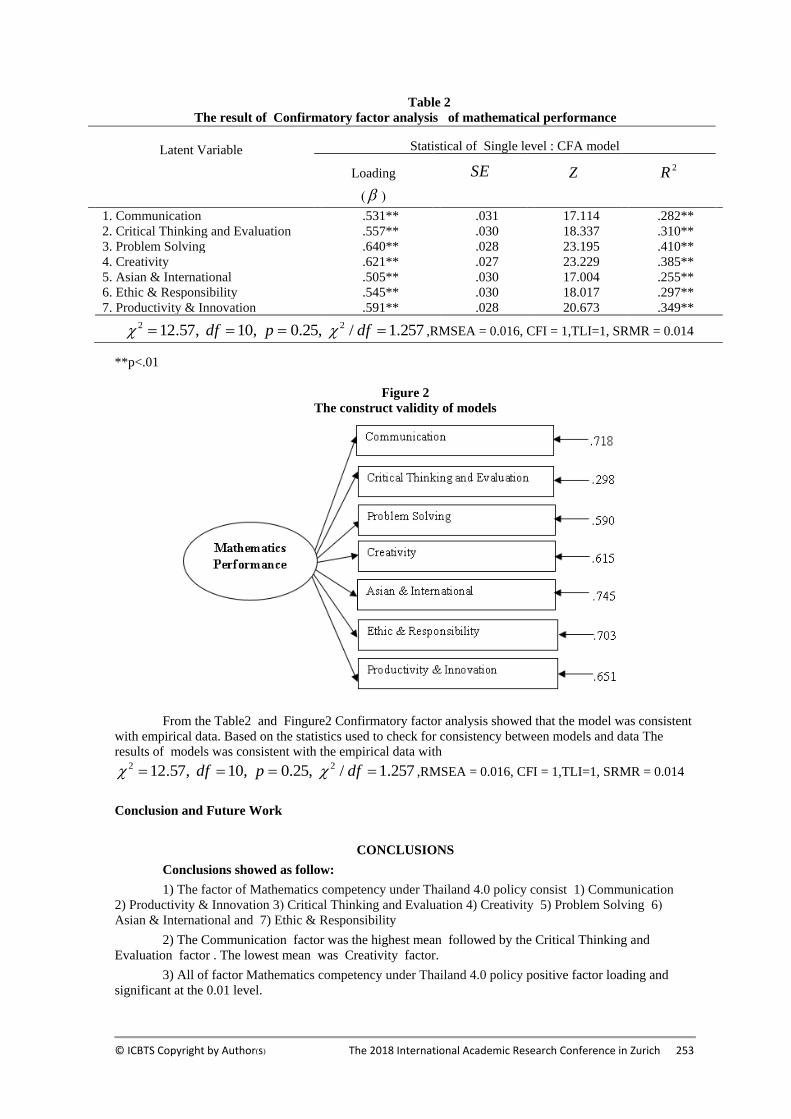
© ICBTS Copyright by Author(s) The 2018 International Academic Research Conference in Zurich 253
Table 2
The result of Confirmatory factor analysis of mathematical performance
Latent Variable Statistical of Single level : CFA model
Loading
( )
SE Z 2R
1. Communication .531** .031 17.114 .282**
2. Critical Thinking and Evaluation .557** .030 18.337 .310**
3. Problem Solving .640** .028 23.195 .410**
4. Creativity .621** .027 23.229 .385**
5. Asian & International .505** .030 17.004 .255**
6. Ethic & Responsibility .545** .030 18.017 .297**
7. Productivity & Innovation .591** .028 20.673 .349**
257.1/,25.0,10,57.12 22 ==== dfpdf ,RMSEA = 0.016, CFI = 1,TLI=1, SRMR = 0.014
**p<.01
Figure 2
The construct validity of models
From the Table2 and Fingure2 Confirmatory factor analysis showed that the model was consistent
with empirical data. Based on the statistics used to check for consistency between models and data The
results of models was consistent with the empirical data with
257.1/,25.0,10,57.12 22 ==== dfpdf ,RMSEA = 0.016, CFI = 1,TLI=1, SRMR = 0.014
Conclusion and Future Work
CONCLUSIONS
Conclusions showed as follow:
1) The factor of Mathematics competency under Thailand 4.0 policy consist 1) Communication
2) Productivity & Innovation 3) Critical Thinking and Evaluation 4) Creativity 5) Problem Solving 6)
Asian & International and 7) Ethic & Responsibility
2) The Communication factor was the highest mean followed by the Critical Thinking and
Evaluation factor . The lowest mean was Creativity factor.
3) All of factor Mathematics competency under Thailand 4.0 policy positive factor loading and
significant at the 0.01 level.
© ICBTS Copyright by Author(s) The 2018 International Academic Research Conference in Zurich 254
4) The statistical of model are 257.1/,25.0,10,57.12 22 ==== dfpdf ,
RMSEA = 0.016, CFI = 1,TLI=1, SRMR = 0.014
Future Work
For the future work, researcher will use the data analyzed results to analyze The factors affecting
Mathematics performance under Thailand 4.0 in student level and School level.
REFERENCES
Alexander, C. (2004). Does Teacher Certification Matter? Teacher Certification and Middle School
Mathematics Achievement in Texas[Online]. Available from:
http://www.sedl.org/pubs/policyresearch/resources/AERA-2004.pdf[2017, September 3].
Anastasios Karakolidis.(2016). Mathematics low achievement in Greece: A multilevel analysis of the
Programme for International Student Assessment (PISA) 2012 data.University of Ioannina,
Greece.
Astin, F., Closs, S. J. & Hughes, N. (2006). The self-reported learning style preferences of female
Macmillan clinical nurse specialists. Nurse Education Today 26.
Boyatzis, R.E. (1982) . The Competent Manager: A model of Effective Performance. New York : John
Wiley and Sons Inc. Joreskog, Karl G. and Sorbom. (1993). LISREL 8 Structural Equation Modeling with the SIMPLIS
Command Language. Chicago : Scientific Software International.
Marzano, R.J. (2003). Teacher-level factors & student-level factors. What works inSchools: Translating
Research into Action. U. S. A.: Association for Supervision and Curriculum Development (ASCD).
Maykut, P.S. (1984). November. The relationship between family variables and children’s developmental
performance. Dissertation Abstracts international.
McClelland, David C. (1961). Human Motivation. New York: Cambridge University. Sparks, K. (1959). The effect of teacher certification on student achievement [Online].
Available from: http://handle.tamu.edu/1969.1/2229 [2017, September2].
Spencer, LM. and Spencer, SM. (1993) . Competence at Work : Models for Superior Performance.
Retrieved September 2, 2017, from www.joe.org.
Tabachnick, B. G., & Fidell, L. S. (2001). Using Multivariate Statistics. Boston: Allyn and Bacon. The National Center for Education Statistics.(2015).The Nation’s Report Card: 2015 Mathematics and
Reading
Assessments.URL: https://nces.ed.gov/pubsearch/pubsinfo.asp?pubid=2015136.
The National Institute of Educational Testing Service.(2017).Report Mathematics O-net Score.URL: http://www.niets.or.th/en/.
The Organization for Economic Co-operation and Development.(2015). PISA 2015 Results EXCELLENCE
AND EQUITY IN EDUCATION.URL:www.oecd.org/pisa/aboutpisa/Golden_e-
book_1_example.pdf.

© ICBTS Copyright by Author(s) The 2018 International Academic Research Conference in Zurich 255
A REASEARCH ON ENGLISH LEARNING FOR
UNDERGRADUATES USING THE NINTENDO DS
Hiromi Ban*, Haruhiko Kimura** & Takashi Oyabu***
*Hiromi Ban, Graduate School of Engineering, Nagaoka University of Technology,
Nagaoka, Niigata, Japan, E-Mail: [email protected]
**Haruhiko Kimura, Graduate School of Natural Science and Technology, Kanazawa University,
Kanazawa, Japan,E-Mail: [email protected]
***Takashi Oyabu, Kokusai Business Gakuin College, Kanazawa, Ishikawa, Japan,
E-Mail: [email protected]
ABSTRACT
Abstract—The Nintendo DS handheld game console, which was developed by Nintendo and has been
sold worldwide since 2004, is a game console which features/incorporates dual touch screens, voice-
recognition features and innovative controls, and has been used not only as a video game device but also in
the fields of education and as an education tool. In this study, research regarding Nintendo DS software for
learning English was conducted with the objective of exploring the possibility of introducing and utilizing
such software as an education tool in universities. The latest Nintendo 3DS LL console was leased out to
university students, and one software cartridge was assigned to be used freely at home. An anonymous
survey was conducted using questionnaire sheets. The result was that when not only the students who were
proficient in English, but also the students who initially displayed little interest in learning English using the
Nintendo DS, actually started using it, they began to realize that it was fun and helpful to work with.
Keywords—e-Learning, English education, Nintendo DS
INTRODUCTION
The Nintendo DS, which was developed by Nintendo and has been sold worldwide since 2004,
exceeded 30 million units in the total number of consoles sold in Japan in 2010, and its successor device
named the Nintendo 3DS also appeared [1]. The Nintendo DS is such an innovative game console as
features/incorporates dual touch screens, voice-recognition features and so on, and as Nintendo had stated its
intention for it to become a “machine that enriches the livelihood of its owner,” it has been used not only as a
video game console but also in the fields of education and as an education tool [2][3].
In recent years, as globalization progresses, the need for English communication abilities has become
more and more important. In addition to countless paper-based exercise books as educational materials,
various educational software has been released as a form of e-learning.
In this study, research regarding Nintendo DS software for learning English was conducted with the
objective to explore the possibility of introducing and utilizing such software as an education tool in
universities.
RESEARCH
The following two types of research were conducted on university undergraduates with regard to the use
of the Nintendo DS for English education.
1.1. Research 1
First, research was conducted on whether there were any differences in attitudes towards using the
Nintendo DS for education between students that were proficient in English and those who were not, and
also between the different year groups.
1.1.1. Research Method
An anonymous survey was conducted using questionnaire sheets.
[Subject] Engineering faculty of F University located in Fukui prefecture
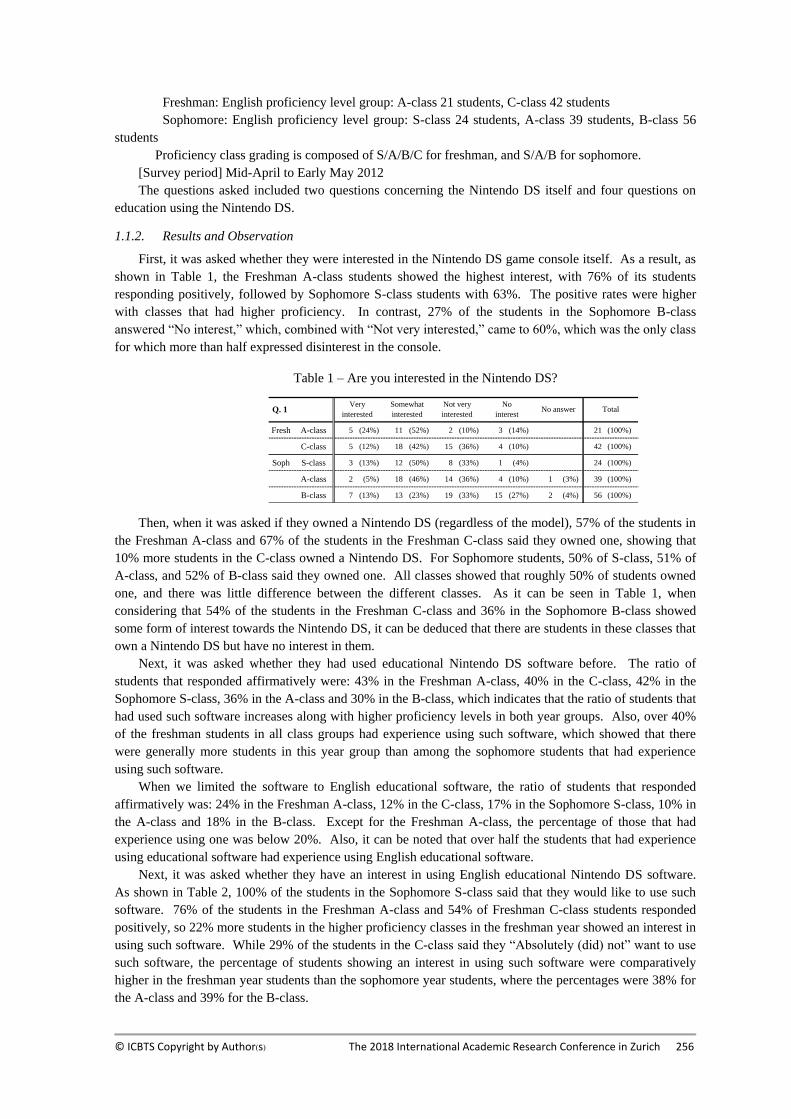
© ICBTS Copyright by Author(s) The 2018 International Academic Research Conference in Zurich 256
Freshman: English proficiency level group: A-class 21 students, C-class 42 students
Sophomore: English proficiency level group: S-class 24 students, A-class 39 students, B-class 56
students
Proficiency class grading is composed of S/A/B/C for freshman, and S/A/B for sophomore.
[Survey period] Mid-April to Early May 2012
The questions asked included two questions concerning the Nintendo DS itself and four questions on
education using the Nintendo DS.
1.1.2. Results and Observation
First, it was asked whether they were interested in the Nintendo DS game console itself. As a result, as
shown in Table 1, the Freshman A-class students showed the highest interest, with 76% of its students
responding positively, followed by Sophomore S-class students with 63%. The positive rates were higher
with classes that had higher proficiency. In contrast, 27% of the students in the Sophomore B-class
answered “No interest,” which, combined with “Not very interested,” came to 60%, which was the only class
for which more than half expressed disinterest in the console.
Then, when it was asked if they owned a Nintendo DS (regardless of the model), 57% of the students in
the Freshman A-class and 67% of the students in the Freshman C-class said they owned one, showing that
10% more students in the C-class owned a Nintendo DS. For Sophomore students, 50% of S-class, 51% of
A-class, and 52% of B-class said they owned one. All classes showed that roughly 50% of students owned
one, and there was little difference between the different classes. As it can be seen in Table 1, when
considering that 54% of the students in the Freshman C-class and 36% in the Sophomore B-class showed
some form of interest towards the Nintendo DS, it can be deduced that there are students in these classes that
own a Nintendo DS but have no interest in them.
Next, it was asked whether they had used educational Nintendo DS software before. The ratio of
students that responded affirmatively were: 43% in the Freshman A-class, 40% in the C-class, 42% in the
Sophomore S-class, 36% in the A-class and 30% in the B-class, which indicates that the ratio of students that
had used such software increases along with higher proficiency levels in both year groups. Also, over 40%
of the freshman students in all class groups had experience using such software, which showed that there
were generally more students in this year group than among the sophomore students that had experience
using such software.
When we limited the software to English educational software, the ratio of students that responded
affirmatively was: 24% in the Freshman A-class, 12% in the C-class, 17% in the Sophomore S-class, 10% in
the A-class and 18% in the B-class. Except for the Freshman A-class, the percentage of those that had
experience using one was below 20%. Also, it can be noted that over half the students that had experience
using educational software had experience using English educational software.
Next, it was asked whether they have an interest in using English educational Nintendo DS software.
As shown in Table 2, 100% of the students in the Sophomore S-class said that they would like to use such
software. 76% of the students in the Freshman A-class and 54% of Freshman C-class students responded
positively, so 22% more students in the higher proficiency classes in the freshman year showed an interest in
using such software. While 29% of the students in the C-class said they “Absolutely (did) not” want to use
such software, the percentage of students showing an interest in using such software were comparatively
higher in the freshman year students than the sophomore year students, where the percentages were 38% for
the A-class and 39% for the B-class.
Table 1 – Are you interested in the Nintendo DS?
Fresh A-class 5 (24%) 11 (52%) 2 (10%) 3 (14%) 21 (100%)
C-class 5 (12%) 18 (42%) 15 (36%) 4 (10%) 42 (100%)
Soph S-class 3 (13%) 12 (50%) 8 (33%) 1 (4%) 24 (100%)
A-class 2 (5%) 18 (46%) 14 (36%) 4 (10%) 1 (3%) 39 (100%)
B-class 7 (13%) 13 (23%) 19 (33%) 15 (27%) 2 (4%) 56 (100%)
TotalNot very
interested
No
interestNo answer Q. 1
Very
interested
Somewhat
interested
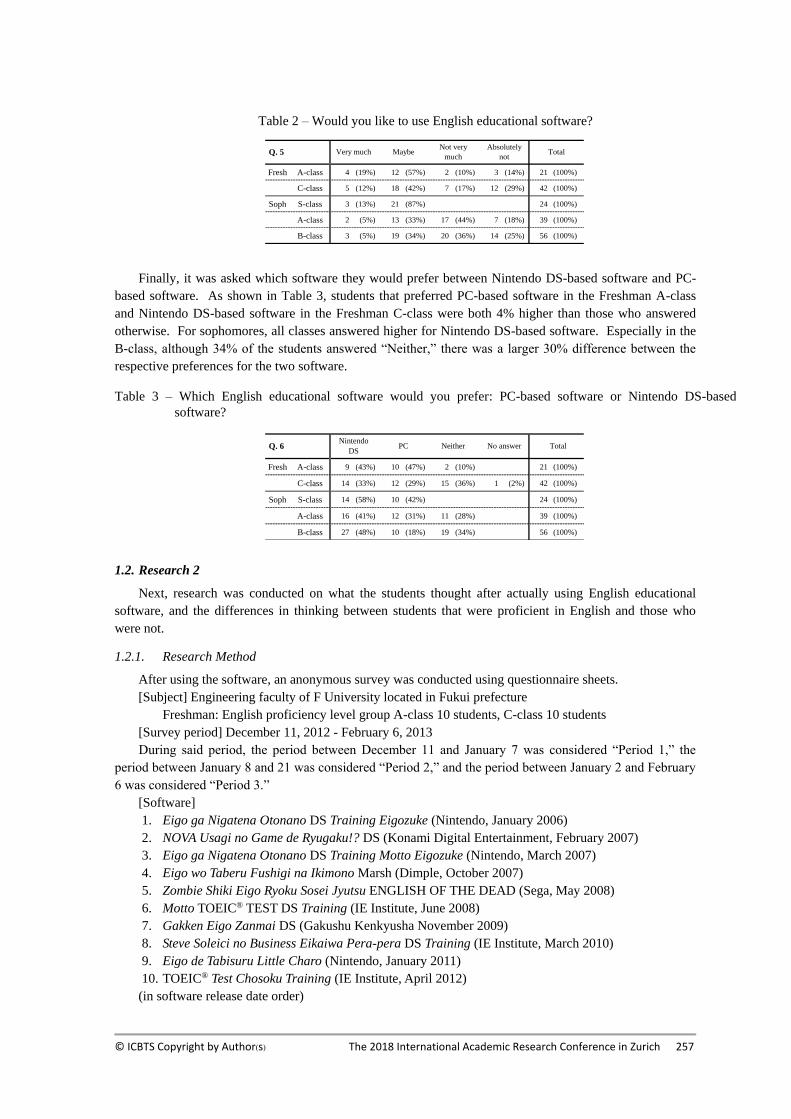
© ICBTS Copyright by Author(s) The 2018 International Academic Research Conference in Zurich 257
Finally, it was asked which software they would prefer between Nintendo DS-based software and PC-
based software. As shown in Table 3, students that preferred PC-based software in the Freshman A-class
and Nintendo DS-based software in the Freshman C-class were both 4% higher than those who answered
otherwise. For sophomores, all classes answered higher for Nintendo DS-based software. Especially in the
B-class, although 34% of the students answered “Neither,” there was a larger 30% difference between the
respective preferences for the two software.
1.2. Research 2
Next, research was conducted on what the students thought after actually using English educational
software, and the differences in thinking between students that were proficient in English and those who
were not.
1.2.1. Research Method
After using the software, an anonymous survey was conducted using questionnaire sheets.
[Subject] Engineering faculty of F University located in Fukui prefecture
Freshman: English proficiency level group A-class 10 students, C-class 10 students
[Survey period] December 11, 2012 - February 6, 2013
During said period, the period between December 11 and January 7 was considered “Period 1,” the
period between January 8 and 21 was considered “Period 2,” and the period between January 2 and February
6 was considered “Period 3.”
[Software]
1. Eigo ga Nigatena Otonano DS Training Eigozuke (Nintendo, January 2006)
2. NOVA Usagi no Game de Ryugaku!? DS (Konami Digital Entertainment, February 2007)
3. Eigo ga Nigatena Otonano DS Training Motto Eigozuke (Nintendo, March 2007)
4. Eigo wo Taberu Fushigi na Ikimono Marsh (Dimple, October 2007)
5. Zombie Shiki Eigo Ryoku Sosei Jyutsu ENGLISH OF THE DEAD (Sega, May 2008)
6. Motto TOEIC® TEST DS Training (IE Institute, June 2008)
7. Gakken Eigo Zanmai DS (Gakushu Kenkyusha November 2009)
8. Steve Soleici no Business Eikaiwa Pera-pera DS Training (IE Institute, March 2010)
9. Eigo de Tabisuru Little Charo (Nintendo, January 2011)
10. TOEIC® Test Chosoku Training (IE Institute, April 2012)
(in software release date order)
Table 2 – Would you like to use English educational software?
Fresh A-class 4 (19%) 12 (57%) 2 (10%) 3 (14%) 21 (100%)
C-class 5 (12%) 18 (42%) 7 (17%) 12 (29%) 42 (100%)
Soph S-class 3 (13%) 21 (87%) 24 (100%)
A-class 2 (5%) 13 (33%) 17 (44%) 7 (18%) 39 (100%)
B-class 3 (5%) 19 (34%) 20 (36%) 14 (25%) 56 (100%)
Absolutely
notTotal Q. 5 Very much Maybe
Not very
much
Table 3 – Which English educational software would you prefer: PC-based software or Nintendo DS-based
software?
Fresh A-class 9 (43%) 10 (47%) 2 (10%) 21 (100%)
C-class 14 (33%) 12 (29%) 15 (36%) 1 (2%) 42 (100%)
Soph S-class 14 (58%) 10 (42%) 24 (100%)
A-class 16 (41%) 12 (31%) 11 (28%) 39 (100%)
B-class 27 (48%) 10 (18%) 19 (34%) 56 (100%)
Q. 6Nintendo
DSPC Neither No answer Total

© ICBTS Copyright by Author(s) The 2018 International Academic Research Conference in Zurich 258
The latest Nintendo 3DS LL console (the latest model at the time of this research) was leased out to
each subject, and assigned one software cartridge chosen arbitrarily from the 10 listed in the above to be
used freely at home for each class and each period. At the end of each period, an anonymous survey was
conducted using questionnaire sheets. The same questionnaire sheet was used for all three periods. The
questions asked included one question concerning handheld game consoles, and one question on education
using the Nintendo DS, and nine questions on the Nintendo DS software that was assigned.
Software No. 10 supported 3D, so it was notified that the subjects using this not to use it continually for
an extended period of time.
1.2.2. Results and Observation
First, it was asked whether they had interest in handheld game consoles such as the Nintendo DS and
PSP (PlayStation Portable). As can be seen in Table 4, the result was that 94% of students in the A-class and
83% in the C-class answered positively, which showed a high degree of interest for both classes. Especially
notable was the A-class, where 61% of the students answered “Very much.” On the other hand, 10% of the
students in the C-class answered “None.”
Then, it was asked if they had interest in education (not limited to English) using the Nintendo DS. As
is seen in Table 5, 77% of students in the A-class and 60% in the C-class expressed interest. Especially
notable was the A-class, where 33% of the students answered “Very much.” However, both classes showed
lower interest for the use of the Nintendo DS for education in comparison to their interest in handheld game
consoles shown in Table 4.
Next, asking whether they knew of the software that was assigned to them, there were seven cases
where the subject replied that they already “Knew” about it. On how they came to know about the software,
six cases said they came to “Know of it by themselves through the internet/magazines,” and there was one
case where it became known “Through hearing from friends.”
Then, it was asked whether they had actual experience using the assigned software before, and only one
subject in the A-class answered positively, and it was for “Software for personal use at places such as
home.”
Next, it was asked whether they had interest in the assigned software before actually using it. As it can
be seen in Table 6, that the result was that 64% of students in the A-class and 50% in the C-class expressed
interest in it beforehand. Although those that answered “Very much” were 10% higher in the C-class than in
the A-class, 27% in the C-class said they had “Not at all (no)” interest towards it.
The results of whether they enjoyed using the software are given in Table 7. 60% of students in the A-
class and 57% in the C-class said they “Enjoyed” using the software. Although the A-class has 3% more
students saying they enjoyed it, the ratio of students that answered “Very” were 6% higher in the C-class.
Table 4 – Do you have interest in handheld game consoles?
Q. 1
A-class 18 (61%) 10 (33%) 1 (3%) 1 (3%) 30 (100%)
C-class 13 (43%) 12 (40%) 2 (7%) 3 (10%) 30 (100%)
None TotalVery much Somewhat NeitherNot very
much
Table 5 – Do you have interest in education using the Nintendo DS?
Q. 2
A-class 10 (33%) 13 (44%) 6 (20%) 1 (3%) 30 (100%)
C-class 4 (13%) 14 (47%) 9 (30%) 3 (10%) 30 (100%)
None TotalVery much Somewhat NeitherNot very
much
Table 6 – Did you have interest in the assigned software beforehand?
Q. 5
A-class 2 (7%) 17 (57%) 4 (13%) 7 (23%) 30 (100%)
C-class 5 (17%) 10 (33%) 6 (20%) 1 (3%) 8 (27%) 30 (100%)
None TotalVery much Somewhat Neither Not very
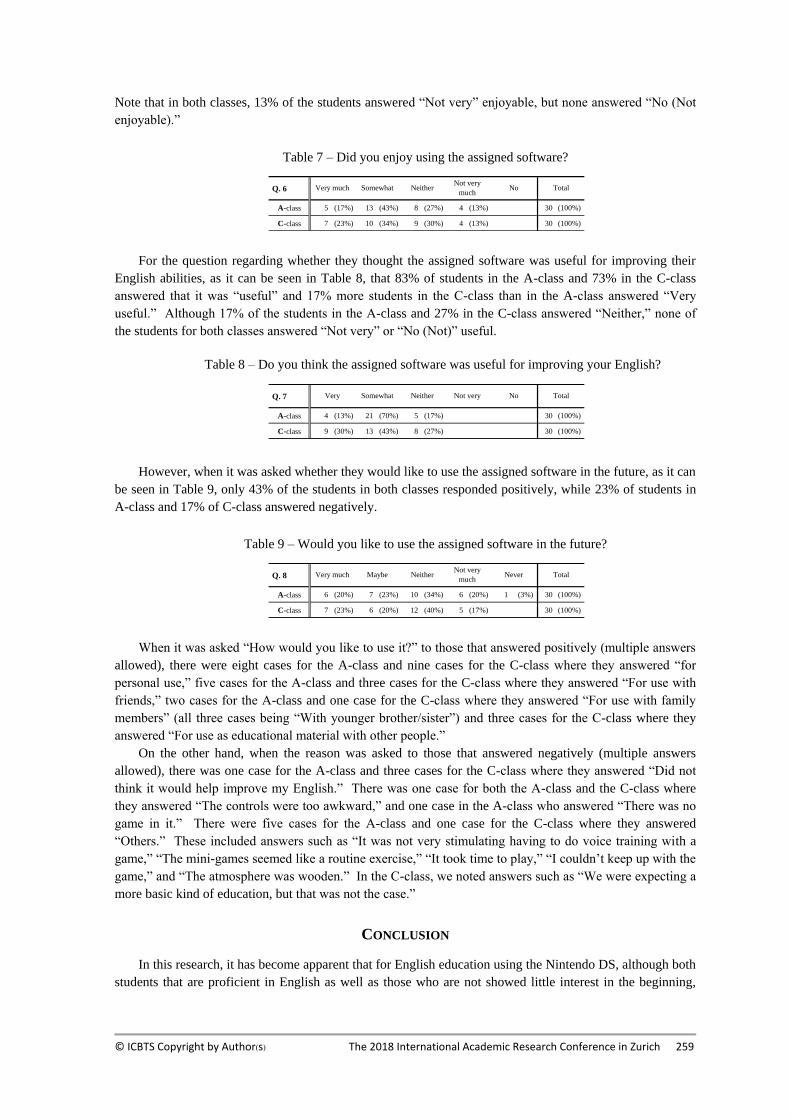
© ICBTS Copyright by Author(s) The 2018 International Academic Research Conference in Zurich 259
Note that in both classes, 13% of the students answered “Not very” enjoyable, but none answered “No (Not
enjoyable).”
For the question regarding whether they thought the assigned software was useful for improving their
English abilities, as it can be seen in Table 8, that 83% of students in the A-class and 73% in the C-class
answered that it was “useful” and 17% more students in the C-class than in the A-class answered “Very
useful.” Although 17% of the students in the A-class and 27% in the C-class answered “Neither,” none of
the students for both classes answered “Not very” or “No (Not)” useful.
However, when it was asked whether they would like to use the assigned software in the future, as it can
be seen in Table 9, only 43% of the students in both classes responded positively, while 23% of students in
A-class and 17% of C-class answered negatively.
When it was asked “How would you like to use it?” to those that answered positively (multiple answers
allowed), there were eight cases for the A-class and nine cases for the C-class where they answered “for
personal use,” five cases for the A-class and three cases for the C-class where they answered “For use with
friends,” two cases for the A-class and one case for the C-class where they answered “For use with family
members” (all three cases being “With younger brother/sister”) and three cases for the C-class where they
answered “For use as educational material with other people.”
On the other hand, when the reason was asked to those that answered negatively (multiple answers
allowed), there was one case for the A-class and three cases for the C-class where they answered “Did not
think it would help improve my English.” There was one case for both the A-class and the C-class where
they answered “The controls were too awkward,” and one case in the A-class who answered “There was no
game in it.” There were five cases for the A-class and one case for the C-class where they answered
“Others.” These included answers such as “It was not very stimulating having to do voice training with a
game,” “The mini-games seemed like a routine exercise,” “It took time to play,” “I couldn’t keep up with the
game,” and “The atmosphere was wooden.” In the C-class, we noted answers such as “We were expecting a
more basic kind of education, but that was not the case.”
CONCLUSION
In this research, it has become apparent that for English education using the Nintendo DS, although both
students that are proficient in English as well as those who are not showed little interest in the beginning,
Table 7 – Did you enjoy using the assigned software?
Q. 6
A-class 5 (17%) 13 (43%) 8 (27%) 4 (13%) 30 (100%)
C-class 7 (23%) 10 (34%) 9 (30%) 4 (13%) 30 (100%)
Very much Somewhat NeitherNot very
muchNo Total
Table 8 – Do you think the assigned software was useful for improving your English?
Q. 7
A-class 4 (13%) 21 (70%) 5 (17%) 30 (100%)
C-class 9 (30%) 13 (43%) 8 (27%) 30 (100%)
No TotalVery Somewhat Neither Not very
Table 9 – Would you like to use the assigned software in the future?
Q. 8
A-class 6 (20%) 7 (23%) 10 (34%) 6 (20%) 1 (3%) 30 (100%)
C-class 7 (23%) 6 (20%) 12 (40%) 5 (17%) 30 (100%)
Never TotalVery much Maybe NeitherNot very
much
© ICBTS Copyright by Author(s) The 2018 International Academic Research Conference in Zurich 260
when they started actually using it, they began to realize that it was fun and helpful to work with. We would
like to introduce this in our lectures, and to conduct research on its effect.
ACKNOWLEDGMENT
This study is part of the results based on the Fukui University of Technology in-campus special study
budget for FY2012. We would like to express our deep appreciation with this mention here.
Also, we would like to express our utmost appreciation to the students that participated in our research.
REFERENCES
[1] “Famitsu.com,” http://www.famitsu.com/game/news/1233252_1124.html.
[2] “Full transcript of the speech by Satoru Iwata, President and CEO of Nintendo Co., Ltd. during the
Corporate strategy meeting/Semi-annual financial settlement meeting on October 26, 2007 (Fri.),”
http://www.nintendo. co.jp/ir/library/events/071026/07.html.
[3] “Sankei Shimbun ENAK,” http://www.sankei.co.jp/enak/2007/may/kiji/21life_nintendo.html.
© ICBTS Copyright by Author(s) The 2018 International Academic Research Conference in Zurich 261
RELATIONSHIP BETWEEN SIGNIFICANT FACTORS OF
BUSINESS ENVIRONMENT OF SMEs AND THE AGE OF
ENTREPRENEURS
Jaroslav Belás*, Aleksandr Ključnikov**
* Prof. Jaroslav Belás, PhD., Department of Enterprise Economics, Faculty of Management and Economics,
Tomas Bata University in Zlin, Zlin, Czech Republic,
E-mail: [email protected]
**Ing. Aleksandr Ključnikov, PhD, Department of Managerial Economics, University of Business and Law,
Prague, Czech Republic,
E-mail: [email protected]
ABSTRACT
This article explores significant factors of quality of business environment of small and medium-sized
enterprises (SMEs). The aim of the article is to define and quantify the relationship between such important
factors of business environment as motives for starting a business and the perception of selected types of
business risks on the age of entrepreneur. The survey of the quality of business environment was carried out
in 2015 through a questionnaire on a sample of 1,141 respondents (business owners) in the Czech Republic.
Statistically significant differences between the designated social groups were compared through Pearson
statistics at the significance level of 5%. We found that there are statistically significant differences in the
approach of the entrepreneurs. According to our research making money is the most important motive for
starting a business in the SME segment. Younger entrepreneurs more frequently in comparison to their older
counterparts present this opinion. We also found that the perception of the market and financial risks does not
depend on the age of the entrepreneur. On the other hand, entrepreneurs under 35 years less intensively
perceive credit risk exposure than older entrepreneurs, and present lower perception of the overall effect of
business risk than older entrepreneurs. Our findings may help in the innovation approaches of commercial
banks in the area of the management of credit risk.
Keywords: credit risk, financial risk, market risk, motives, Small and Medium-sized Enterprises.
INTRODUCTION
Small and medium-sized enterprises (SMEs) are an important part of the economic system in each country.
Most of the experts agree that SMEs significantly contribute to the growth of the employment, Gross Domestic
Product and carry out other duties (Shuying and Mei, 2014; International Finance Corporation, 2013; European
Commission, 2011; Karpak and Topcu, 2010, Henderson and Weiler, 2010; OECD, 2006).
The research of SMEs business environment is a current topic of scientific research worldwide.
Researchers focus their interest on various areas of SMEs’ activities. Such authors as Soininen, Martikainen,
Puumalainen & Kyläheiko (2012), Eggers, Kraus Hughes laraway & Snycerski (2013) Avlonitis & Salavat
(2007), and Keh, Nguyen & Ng (2007) examine the significant attributes of entrepreneurial orientation SMEs
and its impact on business performance.
Ardic (2012), Casey and O.Toole (2014), Kundin and Erecgovac (2011), and Ozturk and Mrkaic (2014)
examine the impact of the financial crisis on SMEs financing.
Other authors focus their research on such attributes of the activities of SMEs, as personal characteristics
of the entrepreneur, gender and age of the entrepreneur, the age of the company in context of company's
financial performance etc.
The aim of the article is to define and quantify the relationship between such important factors of business
environment as motives for starting a business and the perception of selected types of business risks on the
age of entrepreneur. Authors’ own methodology allows defining and quantifying of the differences in the
attitudes of entrepreneurs depending on their age.
© ICBTS Copyright by Author(s) The 2018 International Academic Research Conference in Zurich 262
This article has a following structure. The first section presents the views of the experts on the age of
entrepreneurs in context of business environment. The second section presents the research methodology and
data. Results of the empirical research and a brief discussion are presented in the third part of the article. The
final section summarizes obtained results.
LITERATURE & THEORY
Researchers in the field of business environment usually focus on the most suitable time for starting a
business in relation to the age of the entrepreneur, and present different results.
According to Arenius and Minniti (2005) age is negatively related to entrepreneurship, and
entrepreneurship is a game of young men. On the other side Bonte, Falck, and Heblich (2007) found that, the
belonging to the groups aged between 20-30 and 40-59 has a positive effect on the startup of hi-tech businesses.
They have also stated that, people who belong to the group aged from 30 to 39 years old are more risk averse,
do not want to take any entrepreneurship initiative, and are entrepreneurially passive. According to these
authors people in the age between 40 and 49 are the prime group for starting a new business. In this age people
usually have some accumulated experience from their previous jobs and also have the startup capital, which
is not the case for the age group of 20-29. In this context Levesque and Minniti (2011) state that older people
are less motivated to take any business initiatives. They have shown that the age between 32 and 35 can be a
good start up point to become an entrepreneur, however, the probability to become an entrepreneur decreases
after the specified age.
Brunow, and Hirte (2006) found although age group from 30-44 adds significant value to the overall
economic growth, individuals from the age group from 45-59 are the most productive.
Levesque and Minniti (2006) state that when a person gets older and more experienced she/he rather wants
to have a more stable life with a regular source of income, which is not possible in case of doing business;
because the earnings are unstable for any new company, and are much more uncertain than the earnings of the
employee. However, regardless of age people when the risk aversion decreases, they begin to desire to try for
their own business, in order to be more independent. On top of that, it is also found that, wealth is positively
related to entrepreneurship, whereas, earning of the high wage is negatively related with entrepreneurships.
So it is suggested that, those who are already working as a highly paid worker don’t want to start new business
due to the high opportunity cost for leaving the job. Lastly, the value of leisure is higher for older people
because they have already worked a lot of years, due to that reason they do not want to devote more time to
the opening of a new company. And this is not the case for a younger employee, who wants to have a try
something new by working hard by reducing the value of leisure time.
The desire to become an entrepreneur increases with age due to higher wealth accumulation during the life
cycle and and wider range of gathered knowledge from previous experience or educational background (Velez,
2009).
Lafuente and Vaillant (2013) found that pre-startups coefficient is positive for individuals at the age of 30.
However, the value of startups decreases when they include post startups (those are already in business, at
least for the last 36 months) to the evaluation process.
METHODS AND DATA
This article is based on the survey of the quality of business environment carried out in 2015 in Czech
Republic on a sample of 1141 small and medium sized enterprises, out of a total number of 1650 randomly
selected companies. The questionnaire available at https://docs.google.com/forms/d/1U9coaC5JRL0N2
QOOO6Xb8j3mnaZXdSM47Kugt4EDGFo/viewform?usp=send_form, which consisted of 52 questions, was
presented to the companies, selected from Albertina database. 740 out of 1141 respondents belonged to the
category of microenterprises according to the EU definition of SMEs stated by the EU recommendation
#2003/ 361, where the main factor determining the category of the enterprise is staff headcount, when
microenterprises should employ up to 9 employees. The respondents of the survey represented all 14 regions
of the Czech Republic.
The structure of the respondents from the group of microenterprises was as follows: 73% men, 27%
women; 71% of respondents reported to have secondary education, 29% had the university degree; 53% of
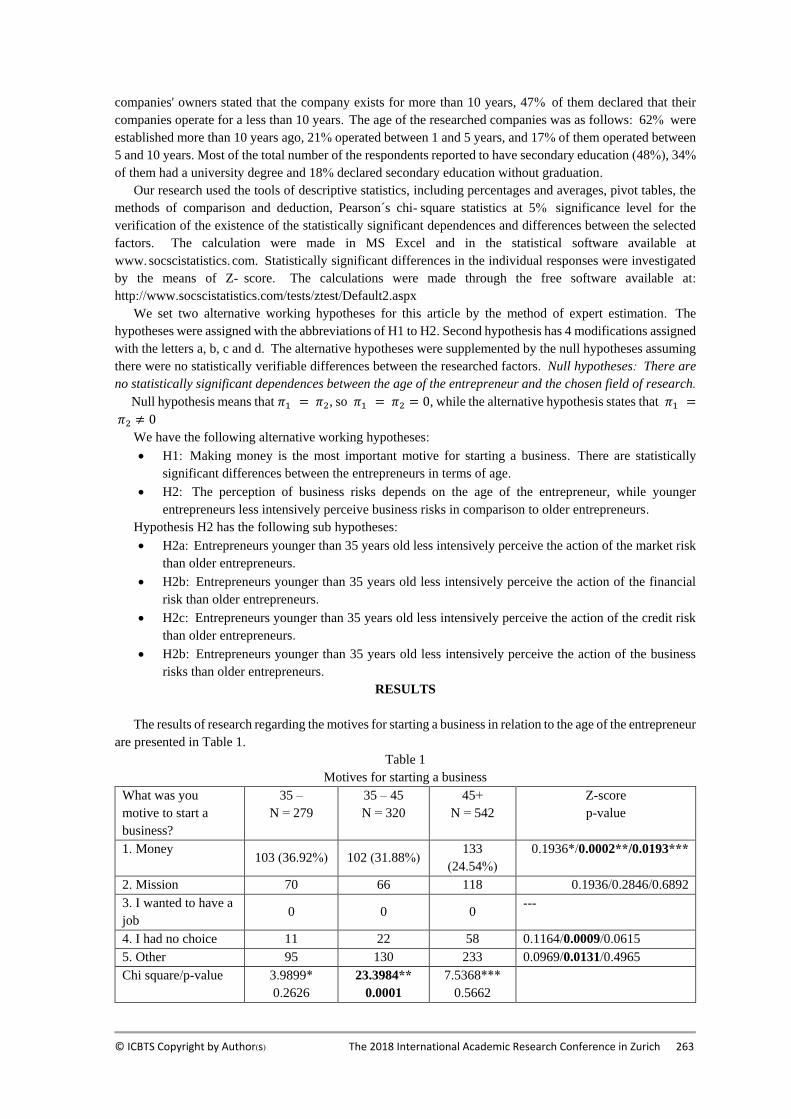
© ICBTS Copyright by Author(s) The 2018 International Academic Research Conference in Zurich 263
companies' owners stated that the company exists for more than 10 years, 47% of them declared that their
companies operate for a less than 10 years. The age of the researched companies was as follows: 62% were
established more than 10 years ago, 21% operated between 1 and 5 years, and 17% of them operated between
5 and 10 years. Most of the total number of the respondents reported to have secondary education (48%), 34%
of them had a university degree and 18% declared secondary education without graduation.
Our research used the tools of descriptive statistics, including percentages and averages, pivot tables, the
methods of comparison and deduction, Pearson´s chi- square statistics at 5% significance level for the
verification of the existence of the statistically significant dependences and differences between the selected
factors. The calculation were made in MS Excel and in the statistical software available at
www. socscistatistics. com. Statistically significant differences in the individual responses were investigated
by the means of Z- score. The calculations were made through the free software available at:
http://www.socscistatistics.com/tests/ztest/Default2.aspx
We set two alternative working hypotheses for this article by the method of expert estimation. The
hypotheses were assigned with the abbreviations of H1 to H2. Second hypothesis has 4 modifications assigned
with the letters a, b, c and d. The alternative hypotheses were supplemented by the null hypotheses assuming
there were no statistically verifiable differences between the researched factors. Null hypotheses: There are
no statistically significant dependences between the age of the entrepreneur and the chosen field of research.
Null hypothesis means that 𝜋1 = 𝜋2, so 𝜋1 = 𝜋2 = 0, while the alternative hypothesis states that 𝜋1 =
𝜋2 ≠ 0
We have the following alternative working hypotheses:
• H1: Making money is the most important motive for starting a business. There are statistically
significant differences between the entrepreneurs in terms of age.
• H2: The perception of business risks depends on the age of the entrepreneur, while younger
entrepreneurs less intensively perceive business risks in comparison to older entrepreneurs.
Hypothesis H2 has the following sub hypotheses:
• H2a: Entrepreneurs younger than 35 years old less intensively perceive the action of the market risk
than older entrepreneurs.
• H2b: Entrepreneurs younger than 35 years old less intensively perceive the action of the financial
risk than older entrepreneurs.
• H2c: Entrepreneurs younger than 35 years old less intensively perceive the action of the credit risk
than older entrepreneurs.
• H2b: Entrepreneurs younger than 35 years old less intensively perceive the action of the business
risks than older entrepreneurs.
RESULTS
The results of research regarding the motives for starting a business in relation to the age of the entrepreneur
are presented in Table 1.
Table 1
Motives for starting a business
What was you
motive to start a
business?
35 –
N = 279
35 – 45
N = 320
45+
N = 542
Z-score
p-value
1. Money 103 (36.92%) 102 (31.88%)
133
(24.54%)
0.1936*/0.0002**/0.0193***
2. Mission 70 66 118 0.1936/0.2846/0.6892
3. I wanted to have a
job 0 0 0
---
4. I had no choice 11 22 58 0.1164/0.0009/0.0615
5. Other 95 130 233 0.0969/0.0131/0.4965
Chi square/p-value 3.9899*
0.2626
23.3984**
0.0001
7.5368***
0.5662
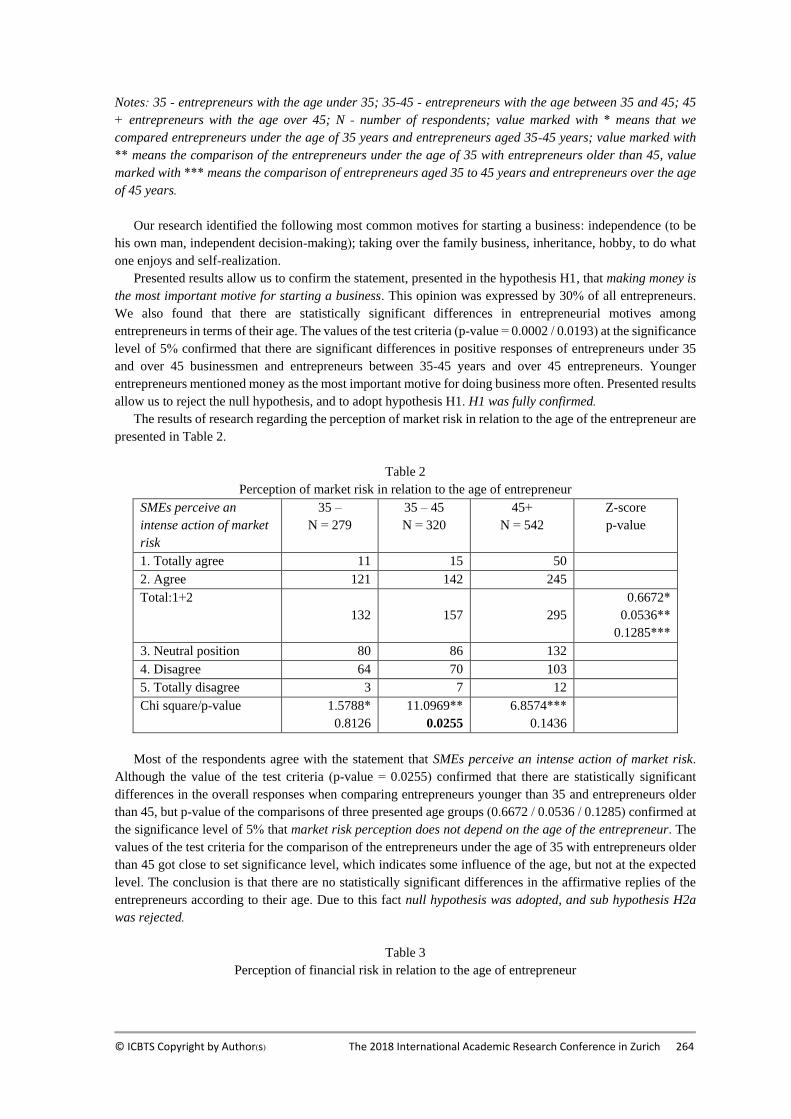
© ICBTS Copyright by Author(s) The 2018 International Academic Research Conference in Zurich 264
Notes: 35 - entrepreneurs with the age under 35; 35-45 - entrepreneurs with the age between 35 and 45; 45
+ entrepreneurs with the age over 45; N - number of respondents; value marked with * means that we
compared entrepreneurs under the age of 35 years and entrepreneurs aged 35-45 years; value marked with
** means the comparison of the entrepreneurs under the age of 35 with entrepreneurs older than 45, value
marked with *** means the comparison of entrepreneurs aged 35 to 45 years and entrepreneurs over the age
of 45 years.
Our research identified the following most common motives for starting a business: independence (to be
his own man, independent decision-making); taking over the family business, inheritance, hobby, to do what
one enjoys and self-realization.
Presented results allow us to confirm the statement, presented in the hypothesis H1, that making money is
the most important motive for starting a business. This opinion was expressed by 30% of all entrepreneurs.
We also found that there are statistically significant differences in entrepreneurial motives among
entrepreneurs in terms of their age. The values of the test criteria (p-value = 0.0002 / 0.0193) at the significance
level of 5% confirmed that there are significant differences in positive responses of entrepreneurs under 35
and over 45 businessmen and entrepreneurs between 35-45 years and over 45 entrepreneurs. Younger
entrepreneurs mentioned money as the most important motive for doing business more often. Presented results
allow us to reject the null hypothesis, and to adopt hypothesis H1. H1 was fully confirmed.
The results of research regarding the perception of market risk in relation to the age of the entrepreneur are
presented in Table 2.
Table 2
Perception of market risk in relation to the age of entrepreneur
SMEs perceive an
intense action of market
risk
35 –
N = 279
35 – 45
N = 320
45+
N = 542
Z-score
p-value
1. Totally agree 11 15 50
2. Agree 121 142 245
Total:1+2
132 157 295
0.6672*
0.0536**
0.1285***
3. Neutral position 80 86 132
4. Disagree 64 70 103
5. Totally disagree 3 7 12
Chi square/p-value 1.5788*
0.8126
11.0969**
0.0255
6.8574***
0.1436
Most of the respondents agree with the statement that SMEs perceive an intense action of market risk.
Although the value of the test criteria (p-value = 0.0255) confirmed that there are statistically significant
differences in the overall responses when comparing entrepreneurs younger than 35 and entrepreneurs older
than 45, but p-value of the comparisons of three presented age groups (0.6672 / 0.0536 / 0.1285) confirmed at
the significance level of 5% that market risk perception does not depend on the age of the entrepreneur. The
values of the test criteria for the comparison of the entrepreneurs under the age of 35 with entrepreneurs older
than 45 got close to set significance level, which indicates some influence of the age, but not at the expected
level. The conclusion is that there are no statistically significant differences in the affirmative replies of the
entrepreneurs according to their age. Due to this fact null hypothesis was adopted, and sub hypothesis H2a
was rejected.
Table 3
Perception of financial risk in relation to the age of entrepreneur

© ICBTS Copyright by Author(s) The 2018 International Academic Research Conference in Zurich 265
Financial risk intensively
influences the business
environment
35 –
N = 279
35 – 45
N = 320
45+
N = 542
Z-score
p-value
1. Totally agree 41 57 83
2. Agree 166 199 339
Total:1+2
207 256 422
0.0910*
0.2380**
0.4593***
3. Neutral position 53 35 72
4. Disagree 18 24 46
5. Totally disagree 1 5 2
Chi square/p-value 10.0421*
0.0397
5.2517*
0.2624
5.4411***
0.2450
The prevailing opinion of all respondents is that financial risk intensively influences the business
environment. Although the value of the test criteria (p-value = 0.0397) confirmed that there are statistically
significant differences in the overall responses when comparing entrepreneurs younger than 35 and
entrepreneurs aged 35-45 years, but p-value of the comparisons of three presented age groups (0.0910 / 0.2380
/ 0.4593) confirmed at the significance level of 5% that perception of financial risk does not depend on the
age of the entrepreneur. We found that there are no statistically significant differences in the affirmative replies
of the entrepreneurs regarding financial risk according to their age. Due to this fact null hypothesis was
adopted, and sub hypothesis H2b was rejected.
Table 3
Perception of credit risk in relation to the age of entrepreneur
The importance of
credit risk grew during
the crisis
35 –
N = 279
35 – 45
N = 320
45+
N = 542
Z-score
p-value
1. Totally agree 13 21 67
2. Agree 139 194 290
Total:1+2
152 (54.48%) 215 (69.19%) 357 (65.87)
0.0015*
0.0015**
0.6892***
3. Neutral position 98 73 143
4. Disagree 25 29 39
5. Totally disagree 4 3 3
Chi square/p-value 12.3119*
0.0152
18.8965**
0.0008
10.7838***
0.0291
The prevailing opinion of all respondents is that the importance of credit risk grew during the crisis. Values
of the test criteria for all three age groups (p-value = 0.0152*/0.0008**/0.0291***) confirmed that there are
statistically significant differences in the overall responses of each of them. P-values of the comparison of
three presented age groups (entrepreneurs under the age of 35 years vs. entrepreneurs aged 35-45 years,
entrepreneurs under the age of 35 vs. entrepreneurs older than 45, and entrepreneurs aged 35 to 45 years vs.
entrepreneurs over the age of 45 years) which were 0.0015*, 0.0015** and 0.6892*** confirmed at the
significance level of 5% that perception of credit risk does depend on the age of the entrepreneur.
Entrepreneurs under 35 more intensively perceive the influence of the credit risk in comparison to the older
entrepreneurs. Our conclusion is that there are statistically significant differences in the affirmative replies of
the entrepreneurs regarding the credit risk according to their age. Due to this fact null hypothesis was rejected,
and sub hypothesis H2c was adopted instead.
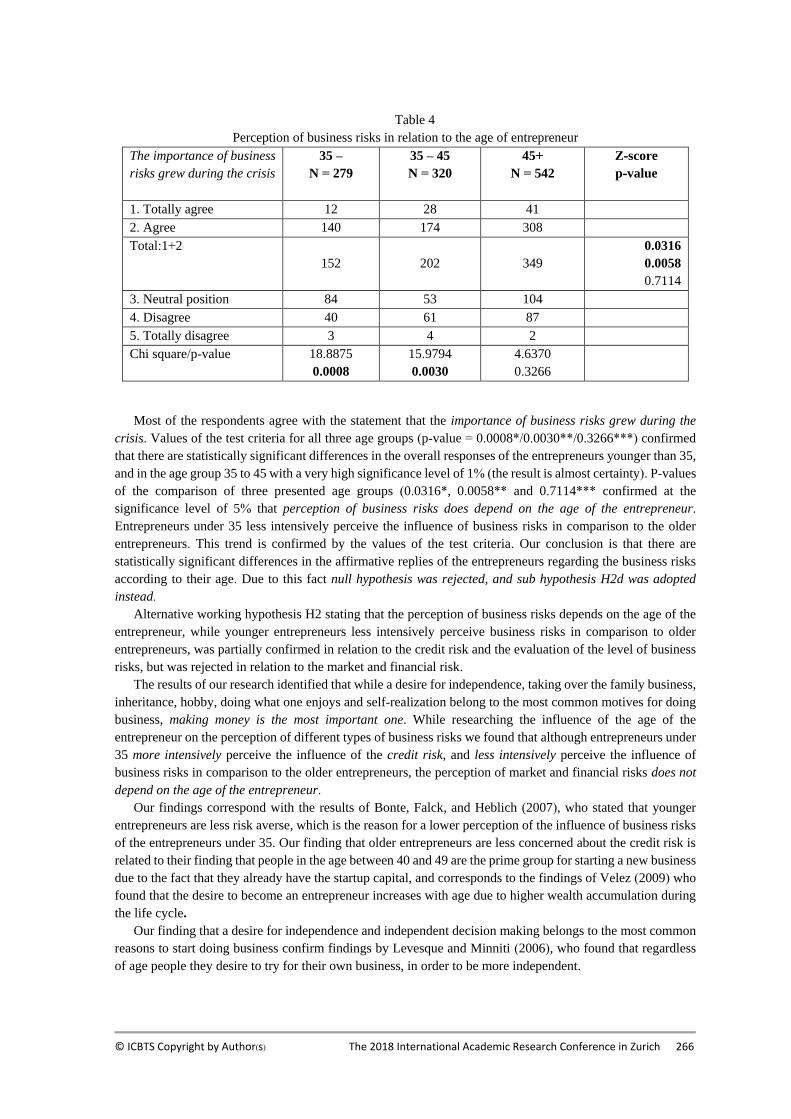
© ICBTS Copyright by Author(s) The 2018 International Academic Research Conference in Zurich 266
Table 4
Perception of business risks in relation to the age of entrepreneur
The importance of business
risks grew during the crisis
35 –
N = 279
35 – 45
N = 320
45+
N = 542
Z-score
p-value
1. Totally agree 12 28 41
2. Agree 140 174 308
Total:1+2
152 202 349
0.0316
0.0058
0.7114
3. Neutral position 84 53 104
4. Disagree 40 61 87
5. Totally disagree 3 4 2
Chi square/p-value 18.8875
0.0008
15.9794
0.0030
4.6370
0.3266
Most of the respondents agree with the statement that the importance of business risks grew during the
crisis. Values of the test criteria for all three age groups (p-value = 0.0008*/0.0030**/0.3266***) confirmed
that there are statistically significant differences in the overall responses of the entrepreneurs younger than 35,
and in the age group 35 to 45 with a very high significance level of 1% (the result is almost certainty). P-values
of the comparison of three presented age groups (0.0316*, 0.0058** and 0.7114*** confirmed at the
significance level of 5% that perception of business risks does depend on the age of the entrepreneur.
Entrepreneurs under 35 less intensively perceive the influence of business risks in comparison to the older
entrepreneurs. This trend is confirmed by the values of the test criteria. Our conclusion is that there are
statistically significant differences in the affirmative replies of the entrepreneurs regarding the business risks
according to their age. Due to this fact null hypothesis was rejected, and sub hypothesis H2d was adopted
instead.
Alternative working hypothesis H2 stating that the perception of business risks depends on the age of the
entrepreneur, while younger entrepreneurs less intensively perceive business risks in comparison to older
entrepreneurs, was partially confirmed in relation to the credit risk and the evaluation of the level of business
risks, but was rejected in relation to the market and financial risk.
The results of our research identified that while a desire for independence, taking over the family business,
inheritance, hobby, doing what one enjoys and self-realization belong to the most common motives for doing
business, making money is the most important one. While researching the influence of the age of the
entrepreneur on the perception of different types of business risks we found that although entrepreneurs under
35 more intensively perceive the influence of the credit risk, and less intensively perceive the influence of
business risks in comparison to the older entrepreneurs, the perception of market and financial risks does not
depend on the age of the entrepreneur.
Our findings correspond with the results of Bonte, Falck, and Heblich (2007), who stated that younger
entrepreneurs are less risk averse, which is the reason for a lower perception of the influence of business risks
of the entrepreneurs under 35. Our finding that older entrepreneurs are less concerned about the credit risk is
related to their finding that people in the age between 40 and 49 are the prime group for starting a new business
due to the fact that they already have the startup capital, and corresponds to the findings of Velez (2009) who
found that the desire to become an entrepreneur increases with age due to higher wealth accumulation during
the life cycle.
Our finding that a desire for independence and independent decision making belongs to the most common
reasons to start doing business confirm findings by Levesque and Minniti (2006), who found that regardless
of age people they desire to try for their own business, in order to be more independent.
© ICBTS Copyright by Author(s) The 2018 International Academic Research Conference in Zurich 267
CONCLUSION AND FUTURE WORK
This article explores significant factors of quality of business environment of small and medium-sized
enterprises (SMEs). The aim of the article was to define and quantify the relationship between such important
factors of business environment as motives for starting a business and the perception of selected types of
business risks on the age of entrepreneur.
The results of our research identified that while a desire for independence, taking over the family business,
inheritance, hobby, doing what one enjoys and self-realization belong to the most common motives for doing
business, making money is the most important one, especially for younger people.
The prevailing opinions of all respondents of our research, carried out in the Czech Republic in 2015 on a
sample of 1,141 respondents (business owners) are that financial risk intensively influences the business
environment, that SMEs perceive an intense action of market risk and that the importance of business and
credit risks grew during the crisis. While researching the influence of the age of the entrepreneur on the
perception of different types of business risks we found that although entrepreneurs under 35 more intensively
perceive the influence of the credit risk, and less intensively perceive the influence of business risks in
comparison to the older entrepreneurs, the perception of market and financial risks does not depend on the age
of the entrepreneur. The values of the test criteria for the comparison of the entrepreneurs regarding market
risk under the age of 35 with entrepreneurs older than 45 got close to set significance level, which indicates
some influence of the age, but not at the expected level.
Presented findings may help the commercial banks in the field of innovation of their approaches the area
of the management of credit risk in order to support younger people in starting a new business. Our further
research will be focused on the influence of other factors on small and medium sized enterprises and business
environment.
REFERENCES
[1] Ardic, O.P., Mylenko, N., & Saltana, V. (2012), “Access to finance by Small and Medium enterprises:
a cross-country analysis with a new data set“, Pacific Economic Review, Vol. 17(4), Pp. 491–513.
[2] Arenius, P. & Minniti, M. (2005), “Perceptual Variables and Nascent Entrepreneurs”, Small Business
Economics, Vol. 24, Pp. 233–247.
[3] Avlonitis, G. J. , & Salavou, H. E. ( 2007) , “ Entrepreuneurial orientation of SMEs, product
innovativeness, and performance”, Journal of Business Research, 60: 566–575.
[4] Bonte, W. , Falck, O. and Heblich, H. ( 2007) , “Demography and Innovative Entrepreneurship” , The
Jena Economic Research papers, 2007–084.
[5] Brunow, S. and Hirte, G. (2006). Age Structure and Regional Economic Growth. Review of Regional
Research, Vol. 26, pp. 3-26.
[6] Casey, E. and O.Toole, C.M., (2014), “Bank lending constraints, trade credit and alternative financing
during the financial crisis: Evidence from European SMEs“, Journal of Corporate Finance, Vol. 2, Pp.
173–193.
[7] Eggers, F., Kraus, S., Hughes, M., Laraway, E., & Snycerski, S. (2013), “Implications of customer and
entrepreneurial orientations for SME growth“, Management Decision, 51 (3): 524–546.
[8] Evropská komise. (2011) “Velké záměry pro malé podniky – co dělá EU pro MSP“, Lucemburk: Úřad
pro publikace EU.
[9] Henderson, J. & Weiler, S. (2010) , “Entrepreneurs and job growth: probing the boundaries of time
and space“, Economic Development Quarterly, 24(1): 23–32.
[10] International Finance Corporation. (2013) , “ IFC Jobs Study: Assessing Private Sector Contributions
To Job Creation And Poverty Reduction“.
[11] Karpak, B. , & Topcu, I. ( 2010) , “Small medium manufacturing enterprices in Turkey: an analytic
network process framework for prioritizing factors affecting success“ , International Journal of
Production Economics, 125: 60–70.
[12] Keh, H. T. , Nguyen, T. T. M. , & Ng, H. P. ( 2007) , “The effect of entrepreneurial orientation and
marketing information on the performance of SMEs“, Journal of Business Venturing, 22: 592–611.
© ICBTS Copyright by Author(s) The 2018 International Academic Research Conference in Zurich 268
[13] Kundin, A. & Erecgovac, R. (2011), “Credit Rationing in Financial Distress: Croatia’s SMEs Finance
Approach“, International Journal of Law and Management, Vol. 53(1), Pp. 62–84.
[14] Lafuente, E. M. & Vaillant, Y. (2013), "Age Driven Influence of Role-Models on Entrepreneurship in
a Transition Economy", Journal of Small Business and Enterprise Development, Vol. 20(1), Pp. 181–
203.
[15] Levesque, M. & Minniti, M. ( 2011) , “ Age Matters: How Demographics Influence Aggregate
Entrepreneurship”, Strategic Entrepreneurship Journal, Vol. 5, Pp. 255–284.
[16] Levesque, M. & Minniti, M. (2006) , “The Effect of Aging on Entrepreneurial Behavior” , Journal of
Business Venturing, Vol. 21, pp. 177–194.
[17] OECD. (2006) , “The SME Financing Gap. Theory and Evidence. Volume I. “ , OECD Publications:
Paris.
[18] Ozturk, B & Mrkaic, M. ( 2014) , “Access to Finance by SMEs in the Euro Area. What Helps or
Hampers“, IMF Working Paper, European Department.
[19] Shuying, Z., & Mei, Z. (2014), ‘Theory of SMEs financial risk prevention and control’, International
Conference on Education, Management and Computing Technology (ICEMCT 2014), Pp. 514–517.
[20] Soininen, J., Martikainen, M., Puumalainen, K., & Kyläheiko, K. (2012), “Entrepreneurial orientation:
Growth and profitability of Finnisch small- and medium- sized enterprises“ , Int. J. Production
Economics, 140: 614–621.
[21] Velez, C.M. (2009), "The Probability of Transition to Entrepreneurship Revisited: Wealth, Education
and Age", Annals of Finance, Vol. 5, Pp. 421–441.
© ICBTS Copyright by Author(s) The 2018 International Academic Research Conference in Zurich 269
INDUSTRIAL HERITAGE AND NATURAL & CULTURAL TOURISM
OF LIMESTONES
Dr. Masaaki OKADA
Kinki University, Osaka, Japan
ABSTRACT
Nowadays industrial tourism is obtaining certain popularity in Japan and participants enjoy being in touch
with the local industrial productions, its present role, history, or even the landscape of the factories itself. On
the other hand, limestone generates characteristic natural landscape, such as canyons, limestone caves, springs
with rich minerals, or lapies fields which are enjoyed by tourists who are inclined to love natural landscapes.
This paper attempts to collect the landscape properties which are unique in limestone cities, and discuss on
their potentials as tourists’ attractions, exemplifying limestone cities in Japan.
In addition to the already-known attractions of nature, limestone invites lime or cement industry and has built
industrial town. Limestone production has change the small villages into developed city with tower of
suspension kilns, cement silos, huge limestone conveyers on high-quality infrastructure and urban
entertainments, such as wide roads, community centres, movie theatres or pubs. It is found out that recent
stream of “Industrial Tourism” started inviting new layers of tourists there, such as enthusiasts or even general
people. Cement or lime production companies introduces the tours at working limestone mine sites not only
for understanding of company’s activities or social contributions, but also for enjoying the panoramic canyon
of quarries. On the other hand, abolished industrial sites are converted into history museums and increasing
numbers of enthusiasts are visiting the reminiscence of past, i.e. industrial heritage. Some limestone cities still
keep the unique local festivals which worships the traditional god of limestones, or local restaurants create
new method to emphasize the character of the city, offering menus warmed with quicklime, which produce
enough heat to boil the cuisine. It is found out that those excellent tourist’s attractions are almost individually
carried out, without “stories” which may connect each other as “limestones-originated pleasures”. (295 words)
© ICBTS Copyright by Author(s) The 2018 International Academic Research Conference in Zurich 270
FACTORS AFFECTING THE PERFORMANCE OF
INTERNAL QUALITY ASSURANCE OF UNDERGRADUATE
INSTITUTION OF NATIONAL DEFENCE STUDIES
INSTITUTE, ROYAL THAI ARMED FORCES
HEADQUARTERS
CHOTE CHANWANG*, PONGTHEP JIRARO** & SAEKSAN THONGKHUMBUNCHONG ***
* CHOTE CHANWANG, Ph.D.Student , Research Measurement and Statistics,
Burapha University, Chonburi, Thailand, E-Mail: [email protected]
** PONGTHEP JIRARO, Lecturer, Research Measurement and Statistics,
Burapha University, Chonburi, Thailand, E-Mail: [email protected]
*** SAEKSAN THONGKHUMBUNCHONG, Lecturer, Research Measurement and Statistics,
Burapha University, Chonburi, Thailand, E-Mail: [email protected]
Abstract
The purpose of this research was to analyze factors that affect the performance of educational
quality assurance of undergraduate institution of National Defence Studies Institute, Royal Thai Armed
Forces Headquarters. The samples were staffs member of National Defence Studies Institute, Royal Thai
Armed Forces Headquarters and 402 people were used in this study. The research instrument was
questionnaire about factors affecting the performance of internal quality assurance: organizational context,
administrator, staff, internal quality assurance system and database and information systems . Factors were
divided into 12 sub-components that consist total of 28 observed variables and the questionnaire was
designed as a 5-level scale. Data was analyzed using descriptive statistics, mean, standard deviation, and
using Lisrel 8.72 edition for windows to analyze Structural Equation Model (SEM).
Results were as follow:
1) The internal quality assurance system factor was the highest mean ( 47.0,96.3 == sx ) followed
by the organizational context ( 39.0,94.3 == sx ) and the lowest mean was database and information systems
factor
( 53.0,87.3 == sx ). The average of all factors is very high.
2) The performance of internal quality assurance factor was directly effected by organizational
context and the internal quality assurance system factors with the direct effect of 0.39 and 0.20,
respectively and coefficient of determination was 0.29.
3) The internal quality assurance system factor was directly effected by organizational context and
staff factors which the size of effects were 0.30 and 0.43, respectively and coefficient of determination was
0.47.
4) The database and information system factor was directly effected by organizational context and
administrator factors which the size of effects were 0.52 and 0.36, respectively and coefficient of
determination was 0.64.
Keyword: Factors affecting performance of internal quality assurance
INTRODUCTION
For almost 20 years, Thailand has adopted the quality assurance system for education, but the
academic achievement of Thai students has not been successful. Based on the results of the national
examinations in 2009-2017, the average score was lower than 50% in Mathematics, Science, English, as well
as Thai language(except year 2016). In addition, almost all subjects have lower score on higher educational
level. This is because educational institutions can not handle the educational standards and indicators, there
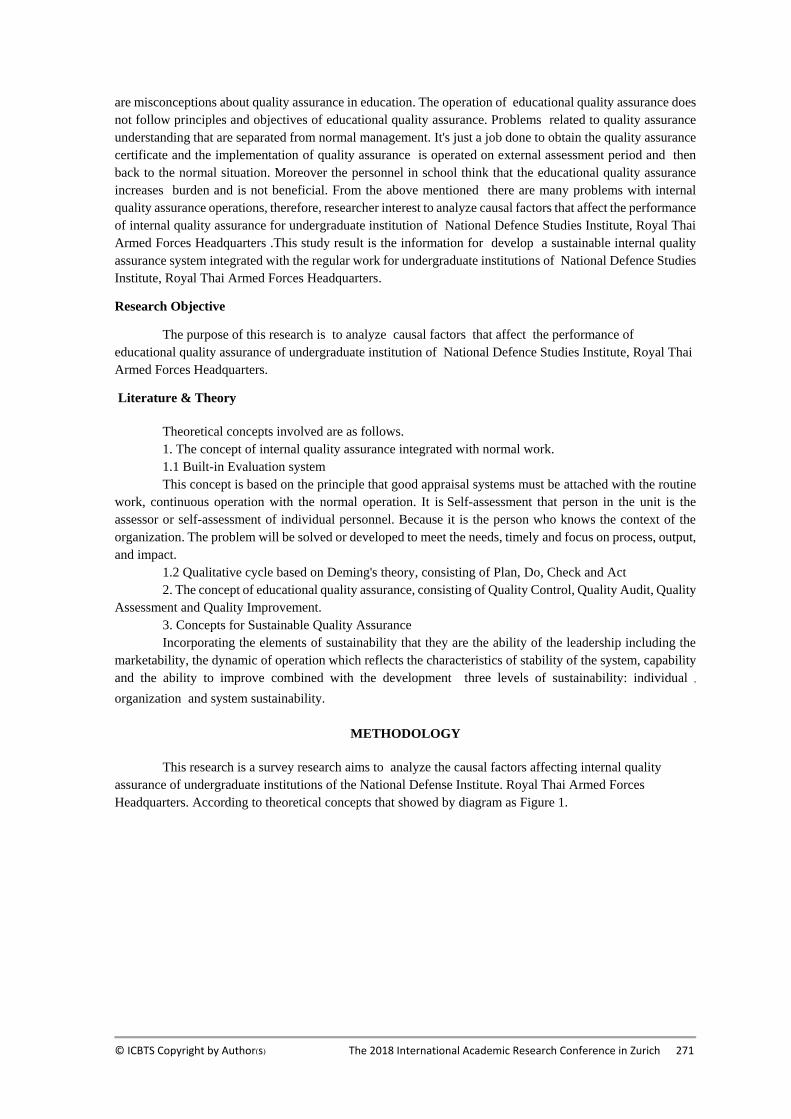
© ICBTS Copyright by Author(s) The 2018 International Academic Research Conference in Zurich 271
are misconceptions about quality assurance in education. The operation of educational quality assurance does
not follow principles and objectives of educational quality assurance. Problems related to quality assurance
understanding that are separated from normal management. It's just a job done to obtain the quality assurance
certificate and the implementation of quality assurance is operated on external assessment period and then
back to the normal situation. Moreover the personnel in school think that the educational quality assurance
increases burden and is not beneficial. From the above mentioned there are many problems with internal
quality assurance operations, therefore, researcher interest to analyze causal factors that affect the performance
of internal quality assurance for undergraduate institution of National Defence Studies Institute, Royal Thai
Armed Forces Headquarters .This study result is the information for develop a sustainable internal quality
assurance system integrated with the regular work for undergraduate institutions of National Defence Studies
Institute, Royal Thai Armed Forces Headquarters.
Research Objective
The purpose of this research is to analyze causal factors that affect the performance of
educational quality assurance of undergraduate institution of National Defence Studies Institute, Royal Thai
Armed Forces Headquarters. Literature & Theory
Theoretical concepts involved are as follows.
1. The concept of internal quality assurance integrated with normal work.
1.1 Built-in Evaluation system
This concept is based on the principle that good appraisal systems must be attached with the routine
work, continuous operation with the normal operation. It is Self-assessment that person in the unit is the
assessor or self-assessment of individual personnel. Because it is the person who knows the context of the
organization. The problem will be solved or developed to meet the needs, timely and focus on process, output,
and impact.
1.2 Qualitative cycle based on Deming's theory, consisting of Plan, Do, Check and Act
2. The concept of educational quality assurance, consisting of Quality Control, Quality Audit, Quality
Assessment and Quality Improvement.
3. Concepts for Sustainable Quality Assurance
Incorporating the elements of sustainability that they are the ability of the leadership including the
marketability, the dynamic of operation which reflects the characteristics of stability of the system, capability
and the ability to improve combined with the development three levels of sustainability: individual ,
organization and system sustainability.
METHODOLOGY
This research is a survey research aims to analyze the causal factors affecting internal quality
assurance of undergraduate institutions of the National Defense Institute. Royal Thai Armed Forces
Headquarters. According to theoretical concepts that showed by diagram as Figure 1.
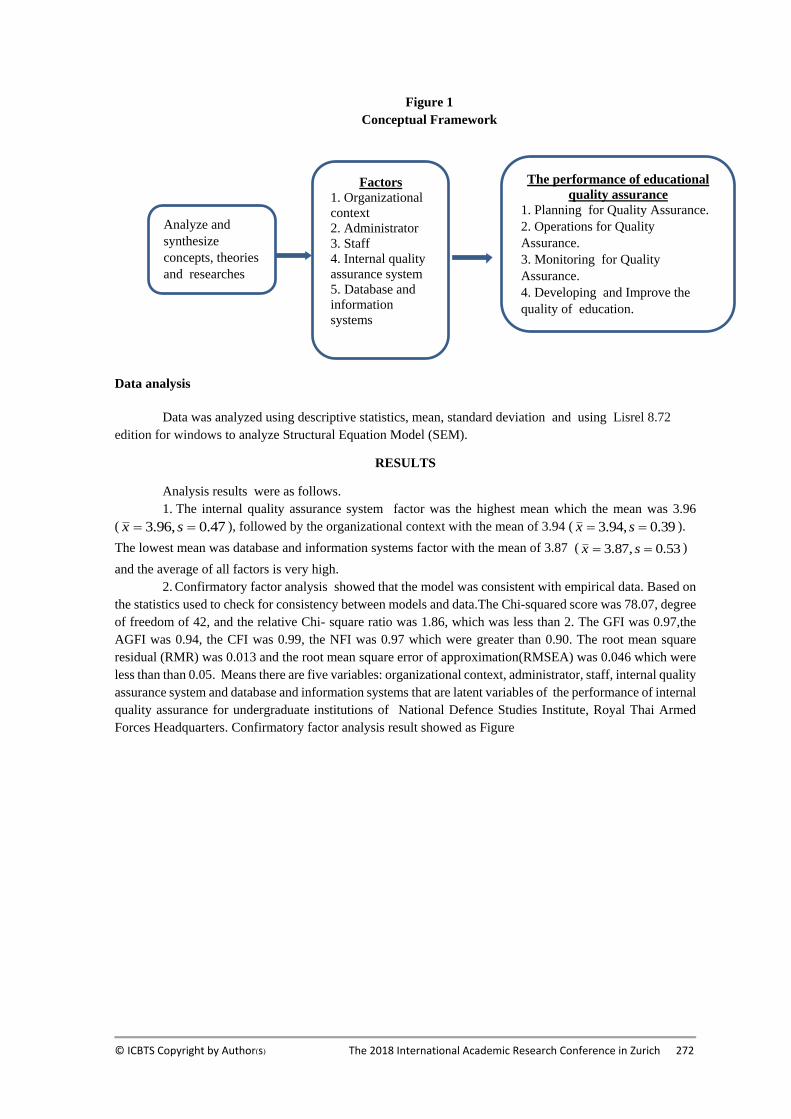
© ICBTS Copyright by Author(s) The 2018 International Academic Research Conference in Zurich 272
Figure 1
Conceptual Framework
Data analysis
Data was analyzed using descriptive statistics, mean, standard deviation and using Lisrel 8.72
edition for windows to analyze Structural Equation Model (SEM).
RESULTS
Analysis results were as follows.
1. The internal quality assurance system factor was the highest mean which the mean was 3.96
( 47.0,96.3 == sx ), followed by the organizational context with the mean of 3.94 ( 39.0,94.3 == sx ).
The lowest mean was database and information systems factor with the mean of 3.87 ( 53.0,87.3 == sx )
and the average of all factors is very high.
2. Confirmatory factor analysis showed that the model was consistent with empirical data. Based on
the statistics used to check for consistency between models and data.The Chi-squared score was 78.07, degree
of freedom of 42, and the relative Chi- square ratio was 1.86, which was less than 2. The GFI was 0.97,the
AGFI was 0.94, the CFI was 0.99, the NFI was 0.97 which were greater than 0.90. The root mean square
residual (RMR) was 0.013 and the root mean square error of approximation(RMSEA) was 0.046 which were
less than than 0.05. Means there are five variables: organizational context, administrator, staff, internal quality
assurance system and database and information systems that are latent variables of the performance of internal
quality assurance for undergraduate institutions of National Defence Studies Institute, Royal Thai Armed
Forces Headquarters. Confirmatory factor analysis result showed as Figure
Analyze and
synthesize
concepts, theories
and researches
The performance of educational
quality assurance
1. Planning for Quality Assurance.
2. Operations for Quality
Assurance.
3. Monitoring for Quality
Assurance.
4. Developing and Improve the
quality of education.
Factors
1. Organizational
context
2. Administrator
3. Staff
4. Internal quality
assurance system
5. Database and
information
systems
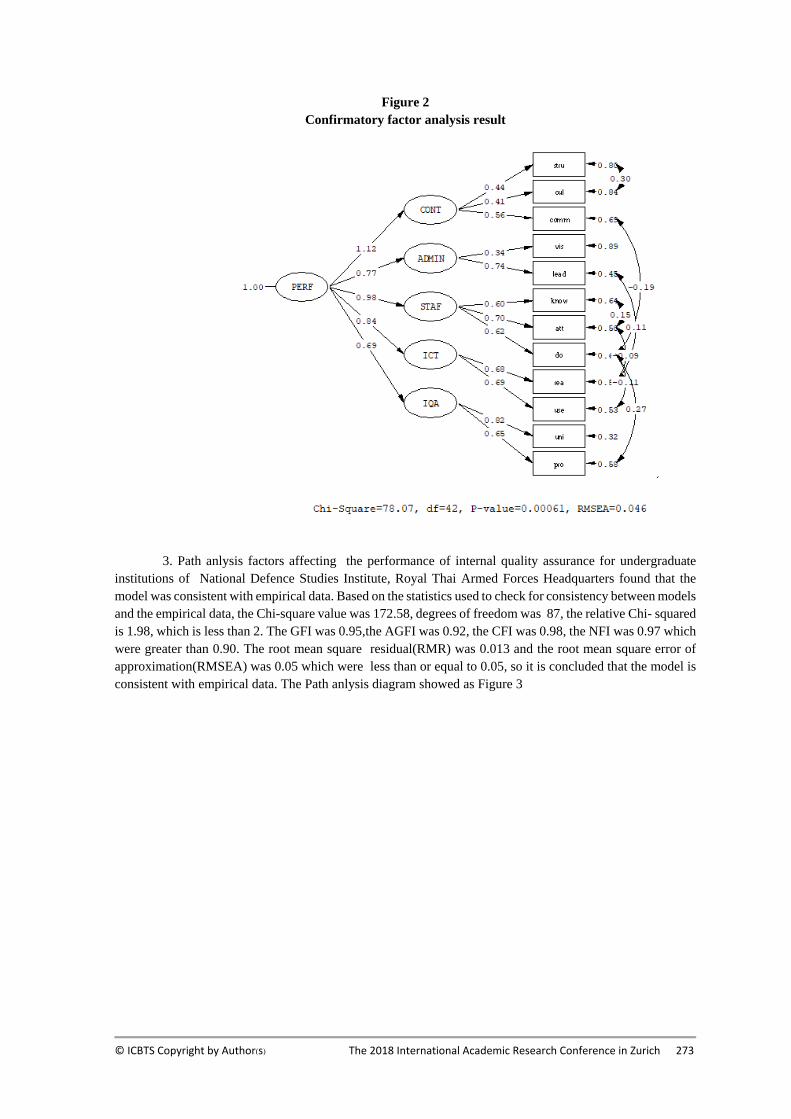
© ICBTS Copyright by Author(s) The 2018 International Academic Research Conference in Zurich 273
Figure 2
Confirmatory factor analysis result
3. Path anlysis factors affecting the performance of internal quality assurance for undergraduate
institutions of National Defence Studies Institute, Royal Thai Armed Forces Headquarters found that the
model was consistent with empirical data. Based on the statistics used to check for consistency between models
and the empirical data, the Chi-square value was 172.58, degrees of freedom was 87, the relative Chi- squared
is 1.98, which is less than 2. The GFI was 0.95,the AGFI was 0.92, the CFI was 0.98, the NFI was 0.97 which
were greater than 0.90. The root mean square residual(RMR) was 0.013 and the root mean square error of
approximation(RMSEA) was 0.05 which were less than or equal to 0.05, so it is concluded that the model is
consistent with empirical data. The Path anlysis diagram showed as Figure 3
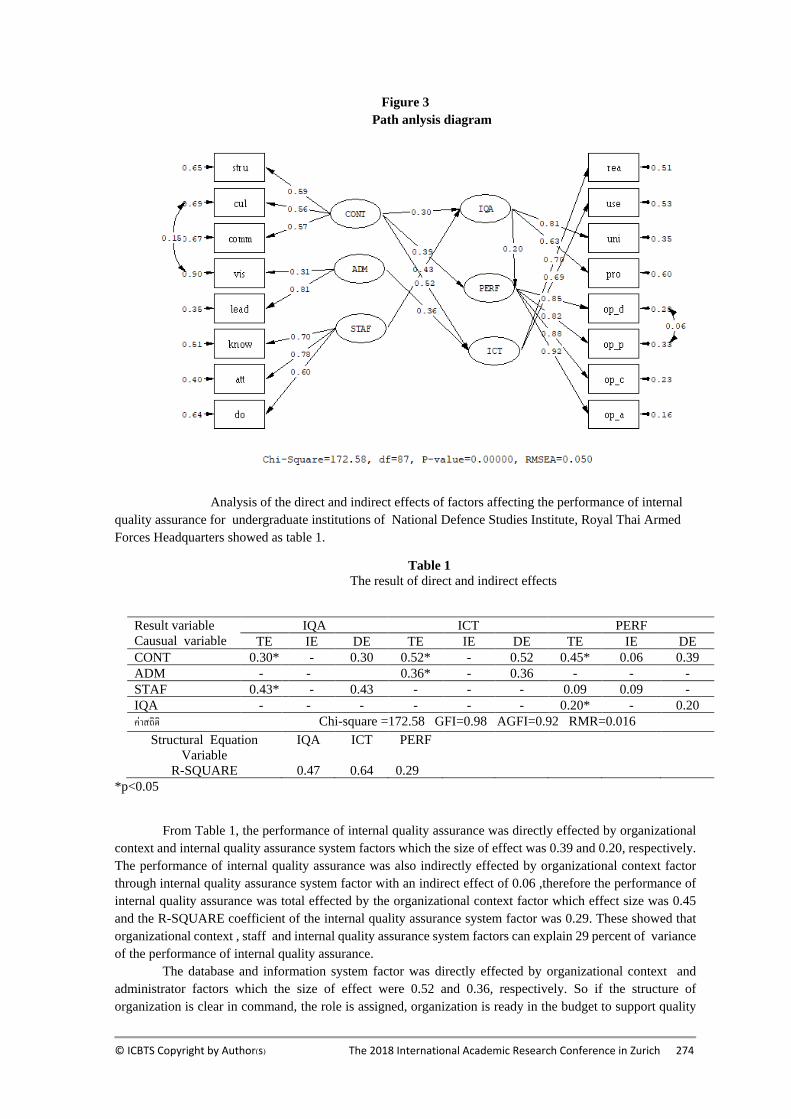
© ICBTS Copyright by Author(s) The 2018 International Academic Research Conference in Zurich 274
Figure 3
Path anlysis diagram
Analysis of the direct and indirect effects of factors affecting the performance of internal
quality assurance for undergraduate institutions of National Defence Studies Institute, Royal Thai Armed
Forces Headquarters showed as table 1.
Table 1
The result of direct and indirect effects
Result variable
Causual variable
IQA ICT PERF
TE IE DE TE IE DE TE IE DE
CONT 0.30* - 0.30 0.52* - 0.52 0.45* 0.06 0.39
ADM - - 0.36* - 0.36 - - -
STAF 0.43* - 0.43 - - - 0.09 0.09 -
IQA - - - - - - 0.20* - 0.20
ค่าสถิติ Chi-square =172.58 GFI=0.98 AGFI=0.92 RMR=0.016
Structural Equation
Variable
IQA ICT PERF
R-SQUARE 0.47 0.64 0.29
*p<0.05
From Table 1, the performance of internal quality assurance was directly effected by organizational
context and internal quality assurance system factors which the size of effect was 0.39 and 0.20, respectively.
The performance of internal quality assurance was also indirectly effected by organizational context factor
through internal quality assurance system factor with an indirect effect of 0.06 ,therefore the performance of
internal quality assurance was total effected by the organizational context factor which effect size was 0.45
and the R-SQUARE coefficient of the internal quality assurance system factor was 0.29. These showed that
organizational context , staff and internal quality assurance system factors can explain 29 percent of variance
of the performance of internal quality assurance.
The database and information system factor was directly effected by organizational context and
administrator factors which the size of effect were 0.52 and 0.36, respectively. So if the structure of
organization is clear in command, the role is assigned, organization is ready in the budget to support quality
© ICBTS Copyright by Author(s) The 2018 International Academic Research Conference in Zurich 275
assurance education and administrator has vision that recognize the value and importance of quality
assurance and can lead subordinates to perform various tasks and always monitor the performance of internal
quality assurance, then the database and information system factor will more effective in quality assurance .
The R-SQUARE coefficient of database and information system factor was 0.64, therefore the factors of
organizational context and administrator can describe the variance of database and information system by 64
percent.
The internal quality assurance system factor was directly effected by organizational context and staff
factors which the size of effect were 0.30 and 0.43, respectively. So if the structure of organization is clear in
command, the role is assigned, organization is ready in the budget to support quality assurance education and
the personnel have knowledge, ability, understanding, realize value and good attitude toward educational
quality assurance and participate in educational quality assurance, then the internal quality assurance system
will more effective. The R-SQUARE coefficient of the internal quality assurance system factor was 0.47 that
indicate organizational context and staff factors can describe the variance of internal quality assurance system
factor by 47 percent.
Conclusion and Future Work
CONCLUSIONS
Conclusions showed as follow:
1) The internal quality assurance system factor was the highest mean followed by the
organizational context and the lowest mean was database and information systems factor. The average of all
factors is very high.
2) The performance of internal quality assurance factor was directly effected by organizational
context and the internal quality assurance system factors with the direct effect of 0.39 and 0.20,
respectively and coefficient of determination was 0.29.
3) The internal quality assurance system factor was directly effected by organizational context and
staff factors which the size of effects were 0.30 and 0.43, respectively and coefficient of determination was
0.47.
4) The database and information system factor was directly effected by organizational context and
administrator factors which the size of effects were 0.52 and 0.36, respectively and coefficient of
determination was 0.64.
Future Work
For the future work, researcher will use the data analysis results to develop a sustainable internal
quality assurance system integrated with the regular work for undergraduate institutions of National
Defence Studies Institute, Royal Thai Armed Forces Headquarters.
REFERENCES
Ayeni, A. J. & Adepoju, T. L.(2012). Functional primary education for sustainable quality
assurance in human capital development in Nigeria. International Journal of Research Studies in
Management, No.1, 43-52.
Bhola, H. S.(1984). Building a Built-in Evaluation System: A Case in Point.
URL: https://files.eric.ed.gov/fulltext/ED256779.pdf.
Gbemi Peter Moye. (2014). Effects of School Variables on the Assurance of Quality Learning
Outcomes in Schools. International Journal of Learning, Teaching and Educational Research. Vol
9,No 1.
Grant, H.(1996). Quality Assurance For Higher Education: Developing and managing quality
assurance for higher education system and institutions in ASIA and THE PACIFIC. Bangkok.
Jame, L., Ratcliff, Edward, S., Lubinescu & Maureen, A. G.(2001). How to Accreditation
Influences Assessment. San Francisco: Jossey-Bass.
Kittipong Seekjitjit. (2007). A study of factors affecting the implementation of quality assurance in
education.
of elementary school under The Udon Thani Educational Service Area. Master degree of Education.
Educational Administration. Rajabhat Udon Thani University.
© ICBTS Copyright by Author(s) The 2018 International Academic Research Conference in Zurich 276
Khalid Al Safi Al Haribi.(2005). The effect of external quality assurance on students’ learning
experience Theme: Track 4- Effectiveness of quality assurance. INQAAHE Biennial. Conference
29 March- April 2005 Quality, Assurance & Diversity Willington, New Zealand.
URL:
https://www.uned.ac.cr/academica/images/igesca/materiales/documentos/KAlSafiAlHaribi.pdf
Lionel, S.(1993). Quality Assurance: The route to efficiency and competitiveness(3rd ed.).
New York: Ellis Horwood.
Madeleine, S.(2002). Built-in, not bolt-on: engaging young people in evaluation.
URL: www.biglotteryfund.org.uk/er_res_engaging_young_people_report.pdf.
Mahdee Waedramae (2008). Factors Affecting the Success of Work- Integrated Internal Quality
Assurance.
Journal of Education Prince of Songkla University, September 3 - December 2013.Pp 59-79.
Mark A. Fryman.(2002). Quality and Process Improvement. New York: Delmar.
Pongthep Jiraro.(2003). Development of internal quality assurance system for specific education of The
Royal Thai
Navy. Ph.D. dissertation. Department of Educational Measurement and Evaluation, Faculty of
Education,
Chulalongkorn University.
Roy I. Miller & David E. Sahn. Built-in evaluation systems for supplementary feeding
programmes why and how.
URL:http://www.archive.unu.edu/unupress/unupbooks/80473e/80473E0p.htm.
Rungnapa Chantra. (2011). Development of quality assurance systems for individual department level in
nursing college under the ministry of public health. Ph.D. dissertation. Department of Research
and Applied Psychology. Faculty of Education, Burapa University.
Simon Z. & Peter R.(2004). The future of sustainability assurance. The Association of
Chartered Certified Accountants Research Report No.86.
Svetlana E. Starostinaa, Natalia A. Kazacheka & Julia S. Tokarevaa.(2016). The Development of
the Education Quality Assurance System in the Context of Socio-Economic Growth of the
Cross-Border Region. IEJME— Matematics Education. Vol. 11, No. 9, 3289-3300.
Shuiyun Liu, Minda Tan and Zhaorui Meng(2015). Impact of Quality Assurance on Higher Education
Institutions:
A Literature Review . Higher Education Evaluation and Development 9:2 (December 2015).
© ICBTS Copyright by Author(s) The 2018 International Academic Research Conference in Zurich 277
A SUSTAINABLE TOURISM FRAMEWORK FOR SOUTH AFRICA
ADDRESSING KEY TOURISM CONCERNS
*Danie Ferreira,
Lecturer, Department of Business Management,
Nelson Mandela Metropolitan University, Port Elizabeth,
Eastern Cape, South Africa. Email: [email protected]
**Sandra Perks,
Professor, Department of Business Management
Nelson Mandela Metropolitan University, Port Elizabeth,
Eastern Cape, South Africa South Africa. Email: [email protected]
ABSTRACT
For a country’s tourism industry to survive, it needs to be sustainable. Sustainable tourism entails planning
and management of tourism in a holistically manner by addressing environmental-, financial and local
community concerns. The primary objective of this study was to develop a framework for sustainable tourism
in South Africa utilising internet research. The desktop research structure followed were to assess current
information, develop an analytical framework, conducting a contextual analysis and finally to integrate the
findings. The sustainable tourism framework contained eight pillars whereby the first five pillars are country
specific and the last three pillars are tourism specific. Country specific concerns to address include the political
climate, economic status, socio cultural demographics, technological development, ecological protection,
whereas tourism specific concerns include tourism policy, market dynamics and global relations. The
framework can be empirically tested and the extent of importance of the concerns can be established to indicate
which are critical and which not as important to ensure sustainable tourism in South Africa.
Keywords Concerns, Sustainable, Tourism
INTRODUCTION AND PROBLEM STATEMENT
For a country’s tourism industry to survive, it needs to be sustainable (Keyser, 2009:25). George (2007:360)
defines sustainable tourism as considering current and future economic, social and environmental impacts,
addressing the needs of visitors, the industry, the environment and host communities (The United Nations
World Tourism Organisation 2015:1). Sustainable tourism is thus a form of planning and management that
looks at tourism holistically and addresses different interests such as environmental, financial, local
community and tourism interests (World Economic Forum, 2014:22). According to the World Economic
Forum (2015:4), an enabling environment, the travel and tourism policy, infrastructure and natural and cultural
resources of a country influence sustainable tourism.
Tourism represents one of the biggest economic industries in the world (Hall, 2008:1), is seen as a major player
in international commerce, and is one of the main income sources for many developing countries (The United
Nations World Tourism Organisation, 2015:1). Over the past six decades, tourism has experienced continued
growth and diversification to become one of the fastest growing economic sectors worldwide (Dwyer & Spurr,
2011:1). The tourism industry is directly responsible for one out of every twelve jobs in advanced and emerging
economies worldwide, and for every job created within the tourism industry on average, two more jobs are
created within tourism related sectors (UNEP, 2015:1).
© ICBTS Copyright by Author(s) The 2018 International Academic Research Conference in Zurich 278
Tourism is not just an industry, but a complex system with many interrelated components, and involves various
stakeholders (Van Mai & Bosch, 2010:1). Furthermore, the tourism industry in all its complexity, literally
involves thousands of organisations; these organisations plan, develop, and promote the functions within
destinations (Goeldner & Ritchie, 2012:71). Stakeholders in tourism include tourists (as the demand), tourism
industries and national government organisations (as the supplier) and the local communities as the hosts
(Pavlovich, 2003:205; Timur, 2012:12).
The successful political transformation in South Africa has virtually unlocked the country's tourism potential
to the rest of the world. It has a population of approximately 41 million people and a land area of nearly five
times the size of the United Kingdom. South Africa’s tourism attractiveness lies in its diversity with a variety
of impressive scenery, diverse cultures and moderate sunny and hot climate. It also has well-established sport
facilities with good communication and medical infrastructure services. Although South Africa is well-known
for its already well-established network of national parks and is regarded as a global leader in ecotourism, it
has not been able to realise its full potential in tourism. (Government of South Africa, 2015:1).
The above discussion indicates that South Africa has the potential to grow its tourism potential. The potential
for tourism growth is substantiated in that tourists can combine their South African visit with other nearby
tourism destinations internationally known for their attractions such as the Victoria Falls and Okavango
swamps (Government of South Africa, 2015:1). The increasing potential for tourism is confirmed by Dwyer
and Spurr (2011:2) who state that tourism has grown to become a major socioeconomic activity world-wide
due to several influencing factors, amongst others: greater disposable income available for travel; fewer
working hours, paid holidays and annual vacations; rapid and dispersed economic development leading to
greatly increased business travel and major improvements in transportation including air travel services and
highway networks. Page and Connell (2006:4) remind us that the tourism industry is characterised by
continuous change and development.
This discussion leads to the research question to be addressed in this paper: Which concerns must be taken into
consideration when developing a sustainable South African tourism framework?
In this paper, background is provided to the role that tourism plays in the global and South African economic
environment. The objectives and the research methodology are then outlined. Thereafter desktop research of
the key concerns (factors) for a sustainable tourism framework will form part of the empirical research. These
results will then be concluded by discussing the important concerns to take cognisance in the development of
a sustainable tourism framework for South Africa. Guidelines will be provided on how these concerns should
be addressed and the issues to be considered to ensure sustainable tourism in South Africa.
© ICBTS Copyright by Author(s) The 2018 International Academic Research Conference in Zurich 279
OBJECTIVES
The primary objective of this study is therefore to develop a framework for sustainable tourism in South Africa.
To give effect to the primary objective of this study, the following secondary research objectives have been
formulated:
• To highlight the importance of tourism and its contribution to economic growth;
• To explore the role of using desktop research as a research approach;
• To examine literature on the concerns influencing sustainable tourism in South Africa, and
• To develop a framework for sustainable tourism in South Africa addressing the concerns influencing
sustainable tourism.
In the following section, the methodology of this paper, desktop research, is discussed.
DESKTOP RESEARCH
Desktop research is also known as secondary research (Hague & Wilcock, 2015:1) whereby secondary data is
obtained from various sources and analysed (Crouch & Housden, 2012:22). It includes accessing non-published
sources (Hague & Wilcock, 2015:1), prior research reports, newspapers, magazines, journals, government and
non-governmental organisation statistics (Schutt, 2009:453) and the internet as a source of information (Benson,
2009:1). According to several authors (Benson, 2009:1; Crouch & Housden, 2012:22; Cude, 2004:32; Marvist
Consulting, 2005:1), the advantages of online research are:
• It is more economical and saves money;
• It is available in an electronic format;
• Large amounts of information can be retrieved quickly;
• Published data can be leveraged from many sources;
• A researcher can rule out irrelevant information faster;
• It provides a preliminary assessment and a more in-depth analysis of current issues;
• It produces both a contemporary- and historical framework;
• A quick reference can be made to the already existing information without much effort; and
• It assists in primary research to gain background to the study under investigation and provide an
additional dimension to primary research.
Reports are then created based on the information sourced (Marvist Consulting, 2005:1). Further value is added
when reports are compared and analysed and set within a particular context or are critically reviewed (Schutt,
2009:453). For this paper, secondary information were sourced and analysed to identify the key success factors
necessary for a sustainable tourism framework for South Africa.
© ICBTS Copyright by Author(s) The 2018 International Academic Research Conference in Zurich 280
However, Prescott (2008:1) warns about the pitfalls of internet research such as lack of overall quality control,
incomplete information and small samples to generate results. In spite of these drawbacks, desktop research
is useful as it helps determine whether there are findings, which could be built upon, which could be further
tested, or establish speedily whether further research is in fact needed (Crouch & Housden, 2012:22). The
researchers followed the following structure as recommended by Hague and Wilcock (2015:1)
• Assessment of current information;
• Development of analytical framework;
• Contextual analysis; and
• Integration of findings.
The researchers firstly utilised internet research as a starting point, and then completed a comprehensive
review of national and international secondary sources in the form of textbooks and journal articles to enhance
and verify the information. This approach ensured quality control and verification of information sourced. The
researchers evaluated the information to determine if information gathered was applicable within the South
African context. Thereafter, an analytical framework was developed for sustainable tourism in South Africa.
The content was then further refined and contextualise. Finally, the findings were integrated into a summary
to provide guidelines to what should be included within the framework for sustainable tourism in South Africa.
It is envisaged that due to the limited information regarding sustainable tourism success factors in the South
African context, the results of the study could assist government and tourism decision-makers alike how to
market South Africa as a tourism destination leading to increased tourism income and economic growth.
ASSESSMENT OF CURRENT INFORMATION
Various South African authors (Du Plessis, 2002; Du Plessis, Saayman & Van der Merve, 2015; Jonker, Heath
& Du Toit, 2004; Keyser, 2009) debate tourism sustainability. Keyser (2009:54) states that various destinations
face the dilemma of tourism economic growth with the less desirable social and environmental impacts within
the destination. Du Plessis et al. (2015:10) propose that South African tourism role-players should develop
policies and marketing strategies that include sustainable aspects
In the following section an overview is provided of the key concerns relating to sustainable tourism in South
Africa. Firstly, a PESTE analysis was conducted to compile Table 1 indicating the specific general country
concerns that influence sustainable tourism as found in literature and elaborated on by several authors.
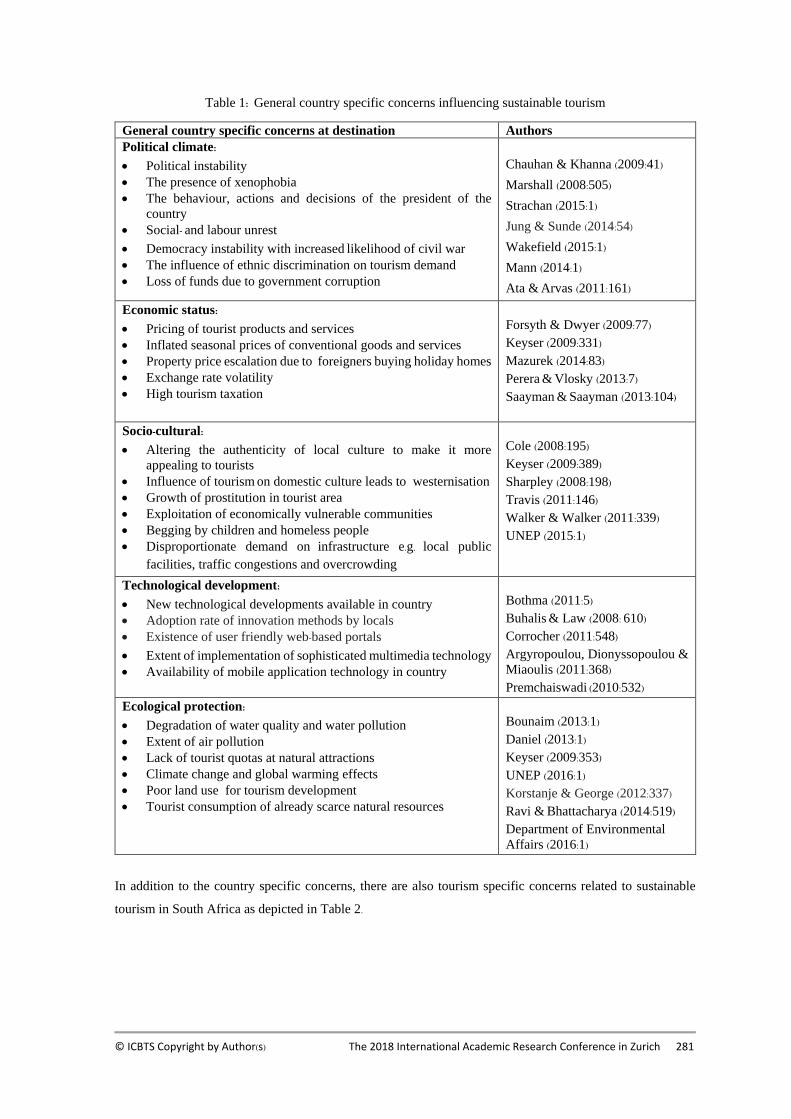
© ICBTS Copyright by Author(s) The 2018 International Academic Research Conference in Zurich 281
Table 1: General country specific concerns influencing sustainable tourism
General country specific concerns at destination Authors
Political climate:
• Political instability
• The presence of xenophobia
• The behaviour, actions and decisions of the president of the
country
• Social- and labour unrest
• Democracy instability with increased likelihood of civil war
• The influence of ethnic discrimination on tourism demand
• Loss of funds due to government corruption
Chauhan & Khanna (2009:41)
Marshall (2008:505)
Strachan (2015:1)
Jung & Sunde (2014:54)
Wakefield (2015:1)
Mann (2014:1)
Ata & Arvas (2011:161)
Economic status:
• Pricing of tourist products and services
• Inflated seasonal prices of conventional goods and services
• Property price escalation due to foreigners buying holiday homes
• Exchange rate volatility
• High tourism taxation
Forsyth & Dwyer (2009:77) Keyser (2009:331) Mazurek (2014:83) Perera & Vlosky (2013:7) Saayman & Saayman (2013:104)
Socio-cultural:
• Altering the authenticity of local culture to make it more
appealing to tourists
• Influence of tourism on domestic culture leads to westernisation
• Growth of prostitution in tourist area
• Exploitation of economically vulnerable communities
• Begging by children and homeless people
• Disproportionate demand on infrastructure e.g. local public
facilities, traffic congestions and overcrowding
Cole (2008:195) Keyser (2009:389) Sharpley (2008:198) Travis (2011:146) Walker & Walker (2011:339) UNEP (2015:1)
Technological development:
• New technological developments available in country
• Adoption rate of innovation methods by locals
• Existence of user friendly web-based portals
• Extent of implementation of sophisticated multimedia technology
• Availability of mobile application technology in country
Bothma (2011:5) Buhalis & Law (2008: 610) Corrocher (2011:548) Argyropoulou, Dionyssopoulou &
Miaoulis (2011:368) Premchaiswadi (2010:532)
Ecological protection:
• Degradation of water quality and water pollution
• Extent of air pollution
• Lack of tourist quotas at natural attractions
• Climate change and global warming effects
• Poor land use for tourism development
• Tourist consumption of already scarce natural resources
Bounaim (2013:1) Daniel (2013:1) Keyser (2009:353) UNEP (2016:1) Korstanje & George (2012:337) Ravi & Bhattacharya (2014:519) Department of Environmental
Affairs (2016:1)
In addition to the country specific concerns, there are also tourism specific concerns related to sustainable
tourism in South Africa as depicted in Table 2.
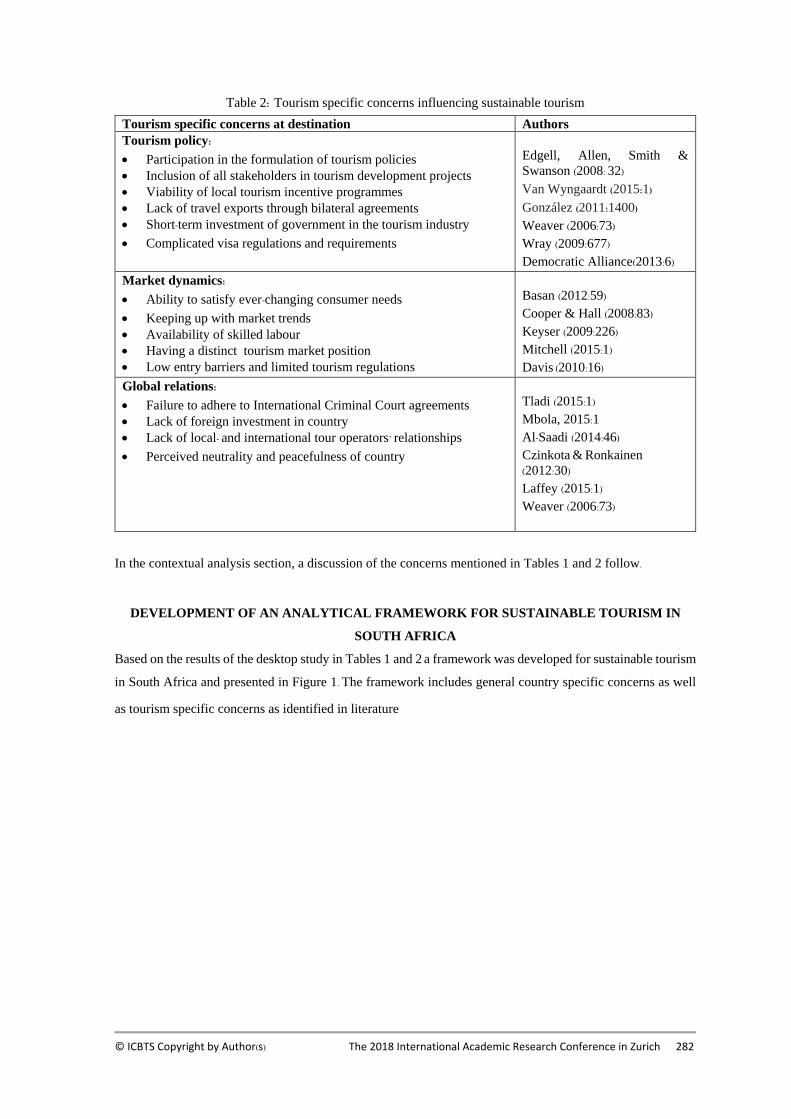
© ICBTS Copyright by Author(s) The 2018 International Academic Research Conference in Zurich 282
Table 2: Tourism specific concerns influencing sustainable tourism
Tourism specific concerns at destination Authors
Tourism policy:
• Participation in the formulation of tourism policies
• Inclusion of all stakeholders in tourism development projects
• Viability of local tourism incentive programmes
• Lack of travel exports through bilateral agreements
• Short-term investment of government in the tourism industry
• Complicated visa regulations and requirements
Edgell, Allen, Smith &
Swanson (2008: 32) Van Wyngaardt (2015:1) González (2011:1400) Weaver (2006:73) Wray (2009:677) Democratic Alliance(2013:6)
Market dynamics:
• Ability to satisfy ever-changing consumer needs
• Keeping up with market trends
• Availability of skilled labour
• Having a distinct tourism market position
• Low entry barriers and limited tourism regulations
Basan (2012:59) Cooper & Hall (2008:83) Keyser (2009:226) Mitchell (2015:1) Davis (2010:16)
Global relations:
• Failure to adhere to International Criminal Court agreements • Lack of foreign investment in country
• Lack of local- and international tour operators’ relationships
• Perceived neutrality and peacefulness of country
Tladi (2015:1) Mbola, 2015:1
Al-Saadi (2014:46) Czinkota & Ronkainen (2012:30) Laffey (2015:1) Weaver (2006:73)
In the contextual analysis section, a discussion of the concerns mentioned in Tables 1 and 2 follow.
DEVELOPMENT OF AN ANALYTICAL FRAMEWORK FOR SUSTAINABLE TOURISM IN
SOUTH AFRICA
Based on the results of the desktop study in Tables 1 and 2 a framework was developed for sustainable tourism
in South Africa and presented in Figure 1. The framework includes general country specific concerns as well
as tourism specific concerns as identified in literature
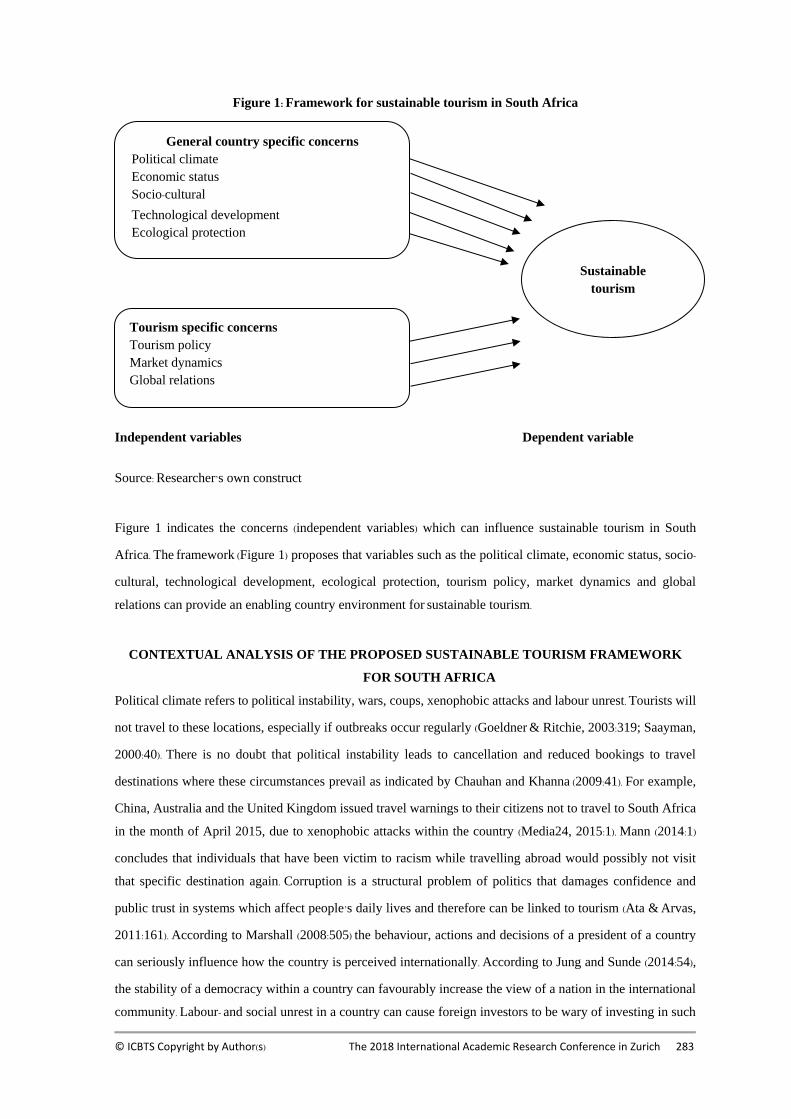
© ICBTS Copyright by Author(s) The 2018 International Academic Research Conference in Zurich 283
Figure 1: Framework for sustainable tourism in South Africa
Independent variables Dependent variable
Source: Researcher’s own construct
Figure 1 indicates the concerns (independent variables) which can influence sustainable tourism in South
Africa. The framework (Figure 1) proposes that variables such as the political climate, economic status, socio-
cultural, technological development, ecological protection, tourism policy, market dynamics and global
relations can provide an enabling country environment for sustainable tourism.
CONTEXTUAL ANALYSIS OF THE PROPOSED SUSTAINABLE TOURISM FRAMEWORK
FOR SOUTH AFRICA
Political climate refers to political instability, wars, coups, xenophobic attacks and labour unrest. Tourists will
not travel to these locations, especially if outbreaks occur regularly (Goeldner & Ritchie, 2003:319; Saayman,
2000:40). There is no doubt that political instability leads to cancellation and reduced bookings to travel
destinations where these circumstances prevail as indicated by Chauhan and Khanna (2009:41). For example,
China, Australia and the United Kingdom issued travel warnings to their citizens not to travel to South Africa
in the month of April 2015, due to xenophobic attacks within the country (Media24, 2015:1). Mann (2014:1)
concludes that individuals that have been victim to racism while travelling abroad would possibly not visit
that specific destination again. Corruption is a structural problem of politics that damages confidence and
public trust in systems which affect people’s daily lives and therefore can be linked to tourism (Ata & Arvas,
2011:161). According to Marshall (2008:505) the behaviour, actions and decisions of a president of a country
can seriously influence how the country is perceived internationally. According to Jung and Sunde (2014:54),
the stability of a democracy within a country can favourably increase the view of a nation in the international
community. Labour- and social unrest in a country can cause foreign investors to be wary of investing in such
General country specific concerns
Political climate
Economic status
Socio-cultural
Technological development
Ecological protection
Sustainable
tourism
Tourism specific concerns
Tourism policy
Market dynamics
Global relations
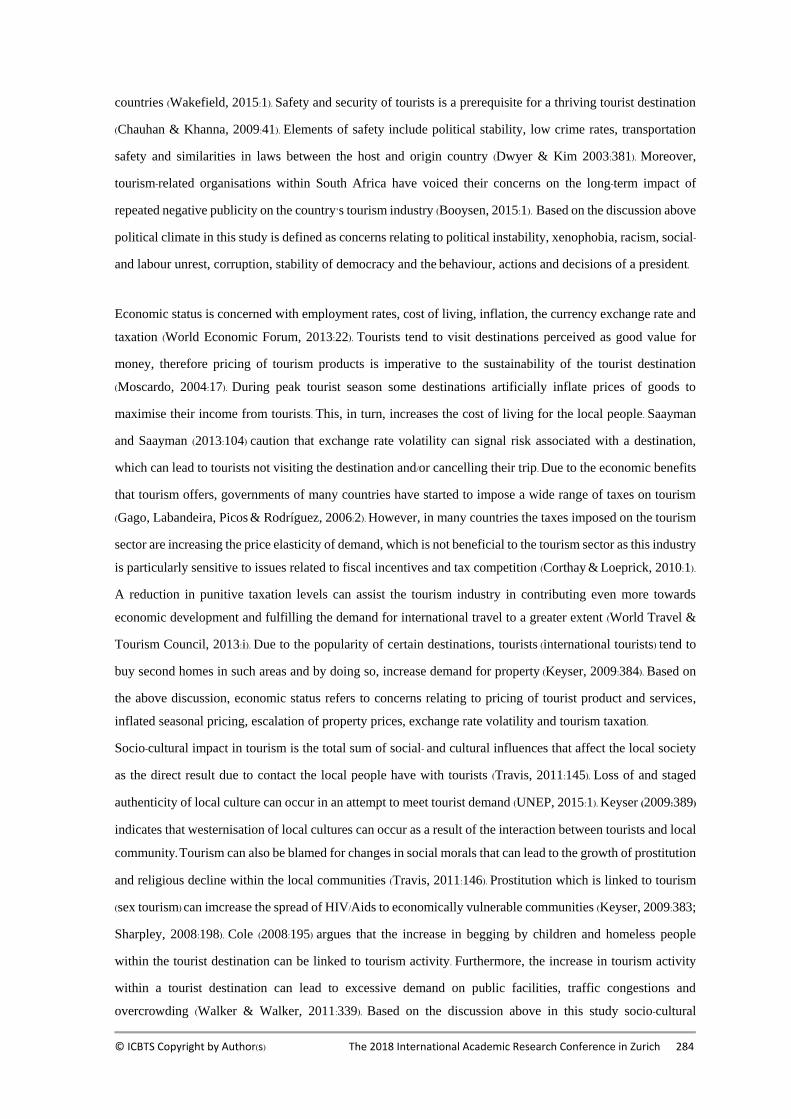
© ICBTS Copyright by Author(s) The 2018 International Academic Research Conference in Zurich 284
countries (Wakefield, 2015:1). Safety and security of tourists is a prerequisite for a thriving tourist destination
(Chauhan & Khanna, 2009:41). Elements of safety include political stability, low crime rates, transportation
safety and similarities in laws between the host and origin country (Dwyer & Kim 2003:381). Moreover,
tourism-related organisations within South Africa have voiced their concerns on the long-term impact of
repeated negative publicity on the country’s tourism industry (Booysen, 2015:1). Based on the discussion above
political climate in this study is defined as concerns relating to political instability, xenophobia, racism, social-
and labour unrest, corruption, stability of democracy and the behaviour, actions and decisions of a president.
Economic status is concerned with employment rates, cost of living, inflation, the currency exchange rate and
taxation (World Economic Forum, 2013:22). Tourists tend to visit destinations perceived as good value for
money, therefore pricing of tourism products is imperative to the sustainability of the tourist destination
(Moscardo, 2004:17). During peak tourist season some destinations artificially inflate prices of goods to
maximise their income from tourists. This, in turn, increases the cost of living for the local people. Saayman
and Saayman (2013:104) caution that exchange rate volatility can signal risk associated with a destination,
which can lead to tourists not visiting the destination and/or cancelling their trip. Due to the economic benefits
that tourism offers, governments of many countries have started to impose a wide range of taxes on tourism
(Gago, Labandeira, Picos & Rodríguez, 2006:2). However, in many countries the taxes imposed on the tourism
sector are increasing the price elasticity of demand, which is not beneficial to the tourism sector as this industry
is particularly sensitive to issues related to fiscal incentives and tax competition (Corthay & Loeprick, 2010:1).
A reduction in punitive taxation levels can assist the tourism industry in contributing even more towards
economic development and fulfilling the demand for international travel to a greater extent (World Travel &
Tourism Council, 2013:i). Due to the popularity of certain destinations, tourists (international tourists) tend to
buy second homes in such areas and by doing so, increase demand for property (Keyser, 2009:384). Based on
the above discussion, economic status refers to concerns relating to pricing of tourist product and services,
inflated seasonal pricing, escalation of property prices, exchange rate volatility and tourism taxation.
Socio-cultural impact in tourism is the total sum of social- and cultural influences that affect the local society
as the direct result due to contact the local people have with tourists (Travis, 2011:145). Loss of and staged
authenticity of local culture can occur in an attempt to meet tourist demand (UNEP, 2015:1). Keyser (2009:389)
indicates that westernisation of local cultures can occur as a result of the interaction between tourists and local
community. Tourism can also be blamed for changes in social morals that can lead to the growth of prostitution
and religious decline within the local communities (Travis, 2011:146). Prostitution which is linked to tourism
(sex tourism) can imcrease the spread of HIV/Aids to economically vulnerable communities (Keyser, 2009:383;
Sharpley, 2008:198). Cole (2008:195) argues that the increase in begging by children and homeless people
within the tourist destination can be linked to tourism activity. Furthermore, the increase in tourism activity
within a tourist destination can lead to excessive demand on public facilities, traffic congestions and
overcrowding (Walker & Walker, 2011:339). Based on the discussion above in this study socio-cultural
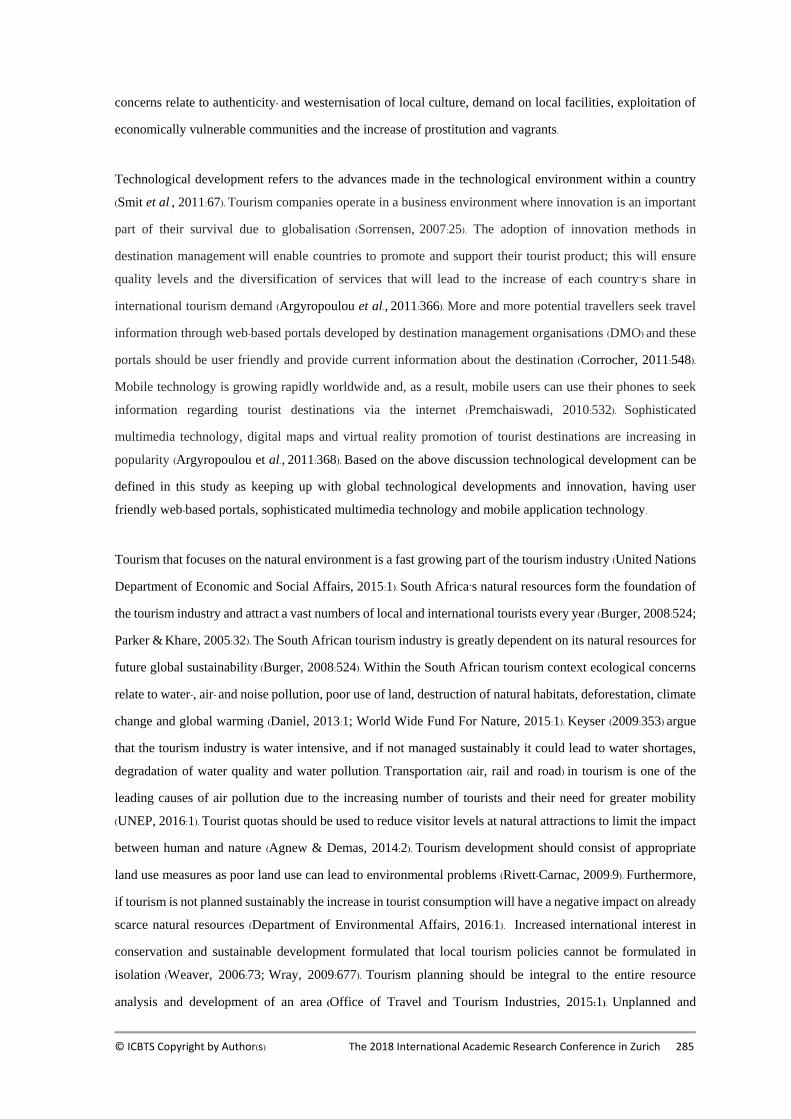
© ICBTS Copyright by Author(s) The 2018 International Academic Research Conference in Zurich 285
concerns relate to authenticity- and westernisation of local culture, demand on local facilities, exploitation of
economically vulnerable communities and the increase of prostitution and vagrants.
Technological development refers to the advances made in the technological environment within a country
(Smit et al., 2011:67). Tourism companies operate in a business environment where innovation is an important
part of their survival due to globalisation (Sorrensen, 2007:25). The adoption of innovation methods in
destination management will enable countries to promote and support their tourist product; this will ensure
quality levels and the diversification of services that will lead to the increase of each country’s share in
international tourism demand (Argyropoulou et al., 2011:366). More and more potential travellers seek travel
information through web-based portals developed by destination management organisations (DMO) and these
portals should be user friendly and provide current information about the destination (Corrocher, 2011:548).
Mobile technology is growing rapidly worldwide and, as a result, mobile users can use their phones to seek
information regarding tourist destinations via the internet (Premchaiswadi, 2010:532). Sophisticated
multimedia technology, digital maps and virtual reality promotion of tourist destinations are increasing in
popularity (Argyropoulou et al., 2011:368). Based on the above discussion technological development can be
defined in this study as keeping up with global technological developments and innovation, having user
friendly web-based portals, sophisticated multimedia technology and mobile application technology.
Tourism that focuses on the natural environment is a fast growing part of the tourism industry (United Nations
Department of Economic and Social Affairs, 2015:1). South Africa’s natural resources form the foundation of
the tourism industry and attract a vast numbers of local and international tourists every year (Burger, 2008:524;
Parker & Khare, 2005:32). The South African tourism industry is greatly dependent on its natural resources for
future global sustainability (Burger, 2008:524). Within the South African tourism context ecological concerns
relate to water-, air- and noise pollution, poor use of land, destruction of natural habitats, deforestation, climate
change and global warming (Daniel, 2013:1; World Wide Fund For Nature, 2015:1). Keyser (2009:353) argue
that the tourism industry is water intensive, and if not managed sustainably it could lead to water shortages,
degradation of water quality and water pollution. Transportation (air, rail and road) in tourism is one of the
leading causes of air pollution due to the increasing number of tourists and their need for greater mobility
(UNEP, 2016:1). Tourist quotas should be used to reduce visitor levels at natural attractions to limit the impact
between human and nature (Agnew & Demas, 2014:2). Tourism development should consist of appropriate
land use measures as poor land use can lead to environmental problems (Rivett-Carnac, 2009:9). Furthermore,
if tourism is not planned sustainably the increase in tourist consumption will have a negative impact on already
scarce natural resources (Department of Environmental Affairs, 2016:1). Increased international interest in
conservation and sustainable development formulated that local tourism policies cannot be formulated in
isolation (Weaver, 2006:73; Wray, 2009:677). Tourism planning should be integral to the entire resource
analysis and development of an area (Office of Travel and Tourism Industries, 2015:1). Unplanned and
© ICBTS Copyright by Author(s) The 2018 International Academic Research Conference in Zurich 286
uncontrolled tourism can destroy the resources in a country (UNEP, 2016:1). Based on the above discussion
ecological concern in this study can be defined as degradation of water quality, water- and air pollution, the
increase of climate change and global warming, poor land use that leads to environmental problems, the lack
of tourist quotas at natural attractions and the consumption of scarce natural resources.
The purpose of a tourism policy is to provide a framework that guides the development and management of
the tourism industry in order to achieve its goals (Hall, 2009:42; Saayman & Swart, 2004:16). Policy-making is
of particular importance to tourism, whether on international-, national-, provincial- or local scale, because of
its role in governing the tourism industry and its associated activities (Hall, 2009:42). A tourism policy should
promote the growth of travel exports through bilateral agreements with other countries (Office of Travel and
Tourism Industries, 2015:1). Tourism policy formulation is unique to each tourist destination, and therefore
should be destination specific and the participants in the formulation of such policies should be carefully
considered (Edgell et al., 2008: 32). Tourism policies are becoming central to tourism planning and cannot be
made in isolation, it is imperative that all stakeholders be included in tourist development projects (Weaver,
2006:73; Wray, 2009:677). South Africa was criticised over its latest visa requirements legislation in 2015, and
was warned that these new visa regulations could seriously affect its tourism industry (Booysen, 2015:1).
Therefore, due to the scope of tourism as a global economic sector, governments need to realise its potential
for long-term investment and to achieve sustainable economic, social and environmental objectives when
formulating tourism policies (George, 2007:147). In 2015, the South African Department of Tourism launched
a Tourism Incentive Programme (TIP) to ensure the country attracts more tourists; the TIP will also include a
subsidy for tourism businesses to participate in trade exhibition and marketing road shows both locally and
internationally (Van Wyngaardt, 2015:1). The impact of this programme on tourism in South Africa remains to
be seen. Based on the discussion above concerns relating to tourism policy includes: the participation in the
formulation of tourism policies as well as ensuring all stakeholders is involved in tourism development; the
viability of tourism incentive programmes; the short-term investment of government in the tourism industry;
the lack of bilateral travel export agreements and the implementation of complicated visa requirements.
Market dynamics refer to non-marketing activities that can influence the tourism competitiveness of a country;
and pose opportunities or threats to a country (Smit et al., 2011:67; Tait & Tait, 2015:70). According to Cooper
and Hall (2008:83), the ability of destinations (countries) to keep up to date with the ever changing needs of the
consumer is crucial to their sustainability. Furthermore, destination managers must also keep track of market
trends within the industry to ensure that their product offering is not out dated (Horgan, 2015:1; Mitchell,
2015:1). The availability of skilled labour can influence how effective a countries’ tourism industry operates
(Keyser, 2009:226). Furthermore, it is vital for tourist destinations to clearly identify their market position as
this will result in successful performance within the market place (Basan, 2012:59). Additionally, low entry
barriers and limited restrictions and regulations imposed in the tourism industry encourage the explosion of
© ICBTS Copyright by Author(s) The 2018 International Academic Research Conference in Zurich 287
small firms (Davis, 2010:16). Based on the above discussion market dynamics can be defined as keeping up
with changing consumer needs and market trends, having a clearly identified market position and the
availability of skilled labour as well as barriers to entry into the tourism industry.
Global relations refer to the relationship between nations and/or countries and their foreign policies (Merriam-
Webster, 2015:1). According to Al-Saadi (2014:46), tourism can contribute to closer global relations between
countries, especially neighbouring countries. International travel agents develop contact with South African
travel agents to arrange specialised package deals, such as golfing tours, nature activities, and also with regard
to special needs of their clients, such as language or physical challenges (Republic of South Africa, 2016:1)
Furthermore, a country’s membership to international organisations can promote international cooperation and
peaceful governmental behaviour (Czinkota & Ronkainen, 2012:30; Voeten, 2014:285). The South African
government failed to arrest Sudanese President Omar Al-Bashir, The International Criminal Court (ICC) issued
a warrant of arrest for President Al-Bashir on “seven counts of war crimes and crimes against humanity
committed in Sudan's Western region of Darfu” (Mbola, 2015:1; Tladi, 2015:1). South Africa was obligated to
comply with the interdict as the country is a member of the ICC (Mbola, 2015:1). Furthermore, tourists prefer
to visit tourist destinations which are synonymous with peace or neutral countries such as Switzerland and
Sweden (Laffey, 2015:1; Potapkina, 2010:1). Other issues pertaining to international relations are foreign
investment in the tourism section and investment opportunities for South African companies in other countries
and for development for the partner countries (Wakefield, 2015:1). The ability of a national economy to profit
from tourism depends on the availability of investment to develop the necessary infrastructure and its ability
to supply to the needs of tourists (Agaraj & Murati, 2009:83). Based on the discussion above global relations is
concerned with relationships between countries in the form of adhering to ICC proclamations, foreign
investment due to relationships, the peacefulness and neutrality of a country and the relationship building
between local- and international tour operators.
Table 3 provides a summary of the contextual analysis of concerns relating to sustainable tourism in South
Africa.
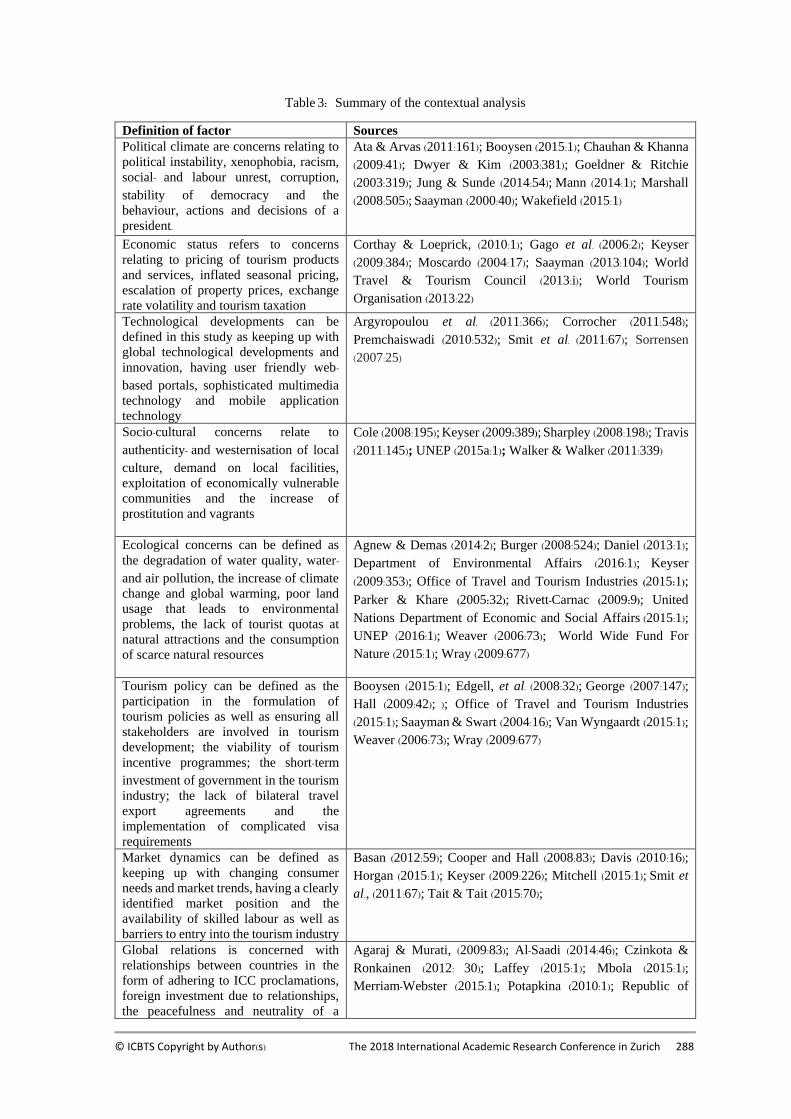
© ICBTS Copyright by Author(s) The 2018 International Academic Research Conference in Zurich 288
Table 3: Summary of the contextual analysis
Definition of factor Sources
Political climate are concerns relating to
political instability, xenophobia, racism,
social- and labour unrest, corruption,
stability of democracy and the
behaviour, actions and decisions of a
president.
Ata & Arvas (2011:161); Booysen (2015:1); Chauhan & Khanna
(2009:41); Dwyer & Kim (2003:381); Goeldner & Ritchie
(2003:319); Jung & Sunde (2014:54); Mann (2014:1); Marshall
(2008:505); Saayman (2000:40); Wakefield (2015:1)
Economic status refers to concerns
relating to pricing of tourism products
and services, inflated seasonal pricing,
escalation of property prices, exchange
rate volatility and tourism taxation
Corthay & Loeprick, (2010:1); Gago et al. (2006:2); Keyser
(2009:384); Moscardo (2004:17); Saayman (2013:104); World
Travel & Tourism Council (2013:i); World Tourism
Organisation (2013:22)
Technological developments can be
defined in this study as keeping up with
global technological developments and
innovation, having user friendly web-based portals, sophisticated multimedia
technology and mobile application
technology
Argyropoulou et al. (2011:366); Corrocher (2011:548); Premchaiswadi (2010:532); Smit et al. (2011:67); Sorrensen
(2007:25)
Socio-cultural concerns relate to
authenticity- and westernisation of local
culture, demand on local facilities,
exploitation of economically vulnerable
communities and the increase of
prostitution and vagrants
Cole (2008:195); Keyser (2009:389); Sharpley (2008:198); Travis
(2011:145); UNEP (2015a:1); Walker & Walker (2011:339)
Ecological concerns can be defined as
the degradation of water quality, water- and air pollution, the increase of climate
change and global warming, poor land
usage that leads to environmental
problems, the lack of tourist quotas at
natural attractions and the consumption
of scarce natural resources
Agnew & Demas (2014:2); Burger (2008:524); Daniel (2013:1); Department of Environmental Affairs (2016:1); Keyser
(2009:353); Office of Travel and Tourism Industries (2015:1); Parker & Khare (2005:32); Rivett-Carnac (2009:9); United
Nations Department of Economic and Social Affairs (2015:1); UNEP (2016:1); Weaver (2006:73); World Wide Fund For
Nature (2015:1); Wray (2009:677)
Tourism policy can be defined as the
participation in the formulation of
tourism policies as well as ensuring all
stakeholders are involved in tourism
development; the viability of tourism
incentive programmes; the short-term
investment of government in the tourism
industry; the lack of bilateral travel
export agreements and the
implementation of complicated visa
requirements
Booysen (2015:1); Edgell, et al. (2008:32); George (2007:147); Hall (2009:42); ); Office of Travel and Tourism Industries
(2015:1); Saayman & Swart (2004:16); Van Wyngaardt (2015:1); Weaver (2006:73); Wray (2009:677)
Market dynamics can be defined as
keeping up with changing consumer
needs and market trends, having a clearly
identified market position and the
availability of skilled labour as well as
barriers to entry into the tourism industry
Basan (2012:59); Cooper and Hall (2008:83); Davis (2010:16); Horgan (2015:1); Keyser (2009:226); Mitchell (2015:1); Smit et
al., (2011:67); Tait & Tait (2015:70);
Global relations is concerned with
relationships between countries in the
form of adhering to ICC proclamations,
foreign investment due to relationships,
the peacefulness and neutrality of a
Agaraj & Murati, (2009:83); Al-Saadi (2014:46); Czinkota &
Ronkainen (2012: 30); Laffey (2015:1); Mbola (2015:1); Merriam-Webster (2015:1); Potapkina (2010:1); Republic of
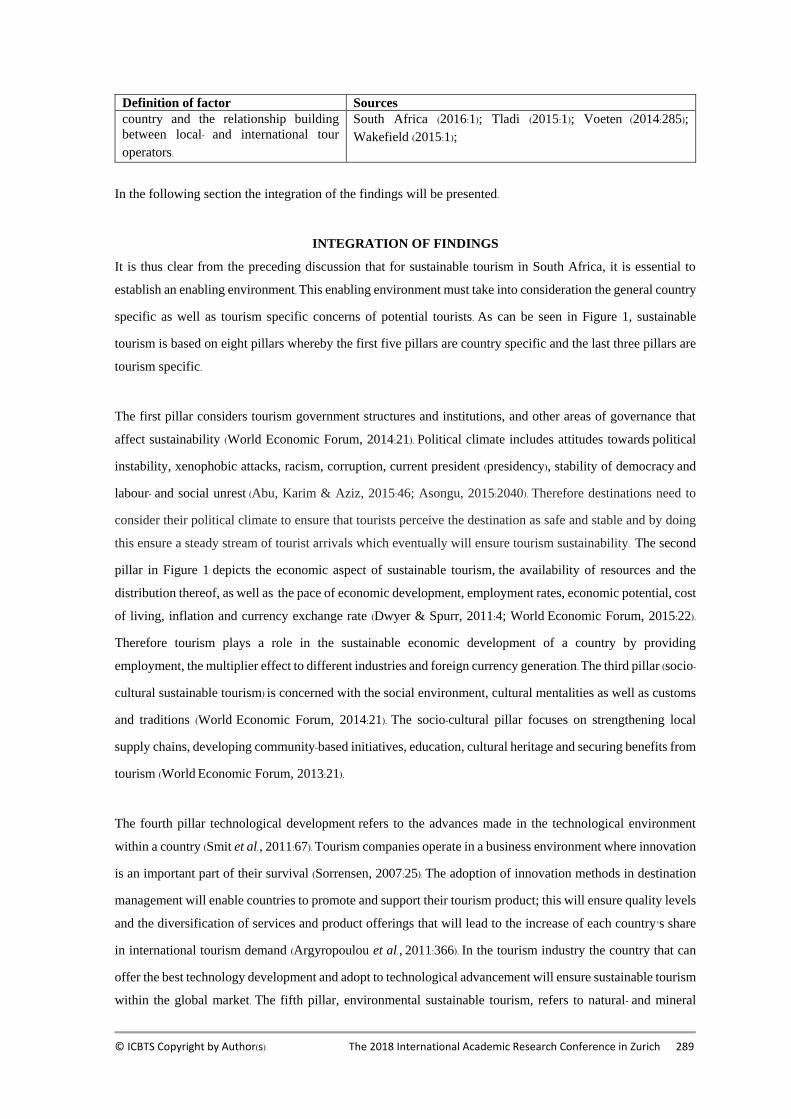
© ICBTS Copyright by Author(s) The 2018 International Academic Research Conference in Zurich 289
Definition of factor Sources
country and the relationship building
between local- and international tour
operators.
South Africa (2016:1); Tladi (2015:1); Voeten (2014:285); Wakefield (2015:1);
In the following section the integration of the findings will be presented.
INTEGRATION OF FINDINGS
It is thus clear from the preceding discussion that for sustainable tourism in South Africa, it is essential to
establish an enabling environment. This enabling environment must take into consideration the general country
specific as well as tourism specific concerns of potential tourists. As can be seen in Figure 1, sustainable
tourism is based on eight pillars whereby the first five pillars are country specific and the last three pillars are
tourism specific.
The first pillar considers tourism government structures and institutions, and other areas of governance that
affect sustainability (World Economic Forum, 2014:21). Political climate includes attitudes towards political
instability, xenophobic attacks, racism, corruption, current president (presidency), stability of democracy and
labour- and social unrest (Abu, Karim & Aziz, 2015:46; Asongu, 2015:2040). Therefore destinations need to
consider their political climate to ensure that tourists perceive the destination as safe and stable and by doing
this ensure a steady stream of tourist arrivals which eventually will ensure tourism sustainability. The second
pillar in Figure 1 depicts the economic aspect of sustainable tourism, the availability of resources and the
distribution thereof, as well as the pace of economic development, employment rates, economic potential, cost
of living, inflation and currency exchange rate (Dwyer & Spurr, 2011:4; World Economic Forum, 2015:22).
Therefore tourism plays a role in the sustainable economic development of a country by providing
employment, the multiplier effect to different industries and foreign currency generation. The third pillar (socio-
cultural sustainable tourism) is concerned with the social environment, cultural mentalities as well as customs
and traditions (World Economic Forum, 2014:21). The socio-cultural pillar focuses on strengthening local
supply chains, developing community-based initiatives, education, cultural heritage and securing benefits from
tourism (World Economic Forum, 2013:21).
The fourth pillar technological development refers to the advances made in the technological environment
within a country (Smit et al., 2011:67). Tourism companies operate in a business environment where innovation
is an important part of their survival (Sorrensen, 2007:25). The adoption of innovation methods in destination
management will enable countries to promote and support their tourism product; this will ensure quality levels
and the diversification of services and product offerings that will lead to the increase of each country’s share
in international tourism demand (Argyropoulou et al., 2011:366). In the tourism industry the country that can
offer the best technology development and adopt to technological advancement will ensure sustainable tourism
within the global market. The fifth pillar, environmental sustainable tourism, refers to natural- and mineral
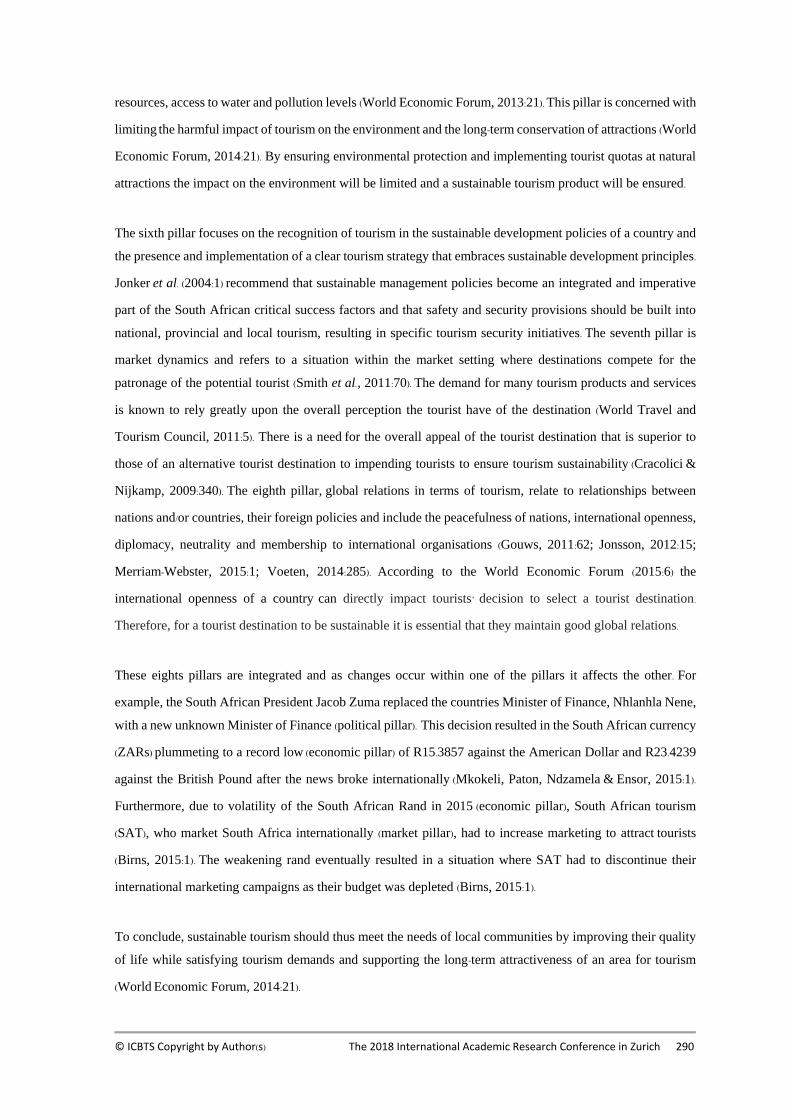
© ICBTS Copyright by Author(s) The 2018 International Academic Research Conference in Zurich 290
resources, access to water and pollution levels (World Economic Forum, 2013:21). This pillar is concerned with
limiting the harmful impact of tourism on the environment and the long-term conservation of attractions (World
Economic Forum, 2014:21). By ensuring environmental protection and implementing tourist quotas at natural
attractions the impact on the environment will be limited and a sustainable tourism product will be ensured.
The sixth pillar focuses on the recognition of tourism in the sustainable development policies of a country and
the presence and implementation of a clear tourism strategy that embraces sustainable development principles.
Jonker et al. (2004:1) recommend that sustainable management policies become an integrated and imperative
part of the South African critical success factors and that safety and security provisions should be built into
national, provincial and local tourism, resulting in specific tourism security initiatives. The seventh pillar is
market dynamics and refers to a situation within the market setting where destinations compete for the
patronage of the potential tourist (Smith et al., 2011:70). The demand for many tourism products and services
is known to rely greatly upon the overall perception the tourist have of the destination (World Travel and
Tourism Council, 2011:5). There is a need for the overall appeal of the tourist destination that is superior to
those of an alternative tourist destination to impending tourists to ensure tourism sustainability (Cracolici &
Nijkamp, 2009:340). The eighth pillar, global relations in terms of tourism, relate to relationships between
nations and/or countries, their foreign policies and include the peacefulness of nations, international openness,
diplomacy, neutrality and membership to international organisations (Gouws, 2011:62; Jonsson, 2012:15;
Merriam-Webster, 2015:1; Voeten, 2014:285). According to the World Economic Forum (2015:6) the
international openness of a country can directly impact tourists’ decision to select a tourist destination.
Therefore, for a tourist destination to be sustainable it is essential that they maintain good global relations.
These eights pillars are integrated and as changes occur within one of the pillars it affects the other. For
example, the South African President Jacob Zuma replaced the countries Minister of Finance, Nhlanhla Nene,
with a new unknown Minister of Finance (political pillar). This decision resulted in the South African currency
(ZARs) plummeting to a record low (economic pillar) of R15.3857 against the American Dollar and R23.4239
against the British Pound after the news broke internationally (Mkokeli, Paton, Ndzamela & Ensor, 2015:1).
Furthermore, due to volatility of the South African Rand in 2015 (economic pillar), South African tourism
(SAT), who market South Africa internationally (market pillar), had to increase marketing to attract tourists
(Birns, 2015:1). The weakening rand eventually resulted in a situation where SAT had to discontinue their
international marketing campaigns as their budget was depleted (Birns, 2015:1).
To conclude, sustainable tourism should thus meet the needs of local communities by improving their quality
of life while satisfying tourism demands and supporting the long-term attractiveness of an area for tourism
(World Economic Forum, 2014:21).
© ICBTS Copyright by Author(s) The 2018 International Academic Research Conference in Zurich 291
CONTRIBUTION OF THIS RESEARCH STUDY
The paper has provided insight into concerns influencing sustainable tourism in South Africa. A
comprehensive literature review was undertaken on concerns that may influence sustainable tourism in South
Africa. The framework in this paper is all-inclusive as it covers country specific and tourism specific concerns
that influence sustainable tourism in South Africa. The framework can be empirically tested and the extent of
importance of the concerns can be established to indicate which are critical and which are not as important to
ensure sustainable tourism in South Africa. Based on the framework (Figure 1) the concerns that can possibly
influence sustainable tourism can be tested by means of the following eight hypotheses:
• H1.1: There is a relationship between the political climate in a country and sustainable tourism.
• H1.2: There is a relationship between the economic status of a country and sustainable tourism.
• H1.3: There is a relationship between socio-cultural variables in a country and sustainable tourism.
• H1.4: There is a relationship between technological development in a country and sustainable tourism.
• H1.5: There is a relationship between ecological concerns in a country and sustainable tourism.
• H1.6: There is a relationship between tourism policies prevalent in a country and sustainable tourism.
• H1.7: There is a relationship between market dynamics in a country and sustainable tourism.
• H1.8: There is a relationship between global relations of a country and sustainable tourism.
Based on the findings of the tested framework and hypotheses, strategies to limit or overcome the concerns for
sustainable tourism in South Africa could be provided.
LIMITATIONS TO RESEARCH STUDY
The concerns relating to sustainable tourism in South Africa was mainly obtained by desktop research and was
not supported by empirical research. The research was highly dependent on published data relating to concerns
regarding sustainable tourism in South Africa. The perceptions and opinions of the researchers based the
current concerns relating to sustainable tourism in South Africa determined which concerns were included in
the study. A variety of internet sources was used in this study due to the fact that the study aims to provide
current concerns and these concerns have not been explored in academic journals. In spite of these limitations
useful and current information was presented relating to the concerns of sustainable competitive tourism in
South Africa.
REFERENCES
Abu, N., Karim, M.Z.A & Aziz, M.I.A. 2015. Corruption, political instability and economic development in the
Economic Community of West African States (ECOWAS): is there a causal relationship? Contemporary
economics, 9(1): 45-60.
Agaraj, X. & Murati, M. 2009. Tourism an important sector of economy development. Annals of the Constantin
Brâncuşi University of Târgu Jiu: economy series issue, 1(2009): 83-90.
© ICBTS Copyright by Author(s) The 2018 International Academic Research Conference in Zurich 292
Agnew, N. & Demas, M. 2014. Visitor management and carrying capacity at World Heritage Sites in China.
United States of America: The Getty conservation institute.
Al-Saadi, H. 2014. The role of international relations in the development of the tourism sector. Germany: Lap
Lambert academic publishing.
Argyropoulou, A., Dionyssopoulou P. & Miaoulis, G. 2011. Tourist destination marketing and management
using advanced ICTs technologies. In Giannakopoulos, G.A. & Sakas, D.P. (Eds.). Advances on information
processing and management. Greece: Emerald group publishing limited.
Asongu, S.A. 2015. A good turn deserves another: political stability, corruption and corruption control.
Economics bulletin, 35(4): 2037-2048.
Ata, A.Y & Arvas, M.A. 2011. Determinants of economic corruption: a cross-country data analysis.
International journal of business and social science, 2(13): 161-169.
Basan, L. 2012. Marketing macro-environmental factors: an opportunity for or threat to the travel agency
business. Proceedings of the 2nd advances in hospitality and tourism marketing and management
conference. Corfu: Greece.
Benson, C. 2009. Internet most popular information source. [online]. Available:
http://www.reuters.com/article/us-media-internet-life-idUSTRE55G4XA20090618. [Accessed: 3 December
2014].
Booysen, J. 2015. New visa legislation can dent tourism. [online]. Available: http://iolmobile.co.za/#!/article/new-
visa-legislation-can-dent-tourism-1.18487 38. [Accessed: 27 June 2015].
Bothma, C. 2011. Introduction to international marketing. In Bothma, C & Burgess, S. (Eds). International
marketing. 2nd Edition. Cape Town; Oxford University Press.
Bounaim, N. 2013. Africa faces some serious environmental problems. [online]. Available:
http://www.sabc.co.za/news/a/ef45eb804fe3d1dab97cfb0b5d39e4bb/Africa-facessome-serious-
environmental-problems:-Greenpeace-20130606. [Accessed: 27 June 2015].
Birns, H. 2015. Weak Rand hurts SA tourism. [online]. Available:
http://www.tourismupdate.co.za/article/102838/Weak-rand-hurts-SA-Tourism. [Accessed: 19 March 2016].
Buhalis, D. & Law, R. 2008. Progress in information technology and tourism management: 20 years on and 10
years after the internet – the state of e-tourism research. Tourism management, 29(4): 609–623.
Burger, D. 2008. SA yearbook 2008/2009: Tourism. [online]. Available:
http://www.gcis.gov.za/docs/publications/yearbook/. [Accessed: 27 June 2015].
Chauhan, V. & Khanna, S. 2009. Tourism: A tool for crafting peace process in Kashmir, J&R, India. Tourismos:
an international multidisciplinary journal of tourism, 4(2): 29-45.
Cole, S. 2008. Tourism, culture and development: hopes, dreams and realities in East Indonesia. Canada:
Channel View Publications.
© ICBTS Copyright by Author(s) The 2018 International Academic Research Conference in Zurich 293
Cooper, C & Hall, C.M. 2008. Contemporary tourism: an international approach. Oxford: Elsevier.
Corrocher, N. 2011. The adoption of web 2.0 services: an empirical investigation. Technological forecasting
and social change, 78(1): 547- 558.
Cracolici, M.F. & Nijkamp, P. 2009. The attractiveness and competitiveness of tourist destinations: A study of
Southern Italian regions. Tourism management, 30(3): 336‐344.
Corthay, L. & Loeprick, J. 2010. Taxing tourism in developing countries: principles for improving the
investment climate through simple, fair, and transparent taxation. Investment climate in practice, 1(1):
1-8.
Crouch, S. & Housden, M. 2012. Marketing research for managers; the marketing series. 3rd Edition. London:
Butterworth-Heinemann.
Cude, B. 2004. Collecting research online: A primer for extension, research, and instruction. In J. Fox (Ed.),
Proceedings of the Eastern Family Economics and Resource Management Association, Tampa, Florida.
Czinkota, M.R. & Ronkainen, I.A. 2012. International marketing. 10th Edition. United States of America: South
Werstern.
Daniel, H. 2013. Environmental issues facing South Africa. [online]. Available: http://www.hope-
project.org/climate-change/environmental-issues-facing-south-africa/. [Accessed: 27 June 2015].
Davis, K. 2010. The state of entrepreneurship in South Africa. [online]. Available:
https://www.fnb.co.za/downloads/commercial/State-of-Entrepreneurship-in-South-Africa.pdf. [Accessed: 27
June 2015].
Democratic Alliance. 2013. South Africa: the world in one DA policy on tourism. Cape Town: Democratic
Alliance.
Department of Environmental Affairs. 2016. State of the environment. [online].
Available:http://soer.deat.gov.za/Printpage.aspx?m=610. [Accessed: 3 March 2016].
Du Plessis, E. 2002. Competitive advantages of South Africa as a tourism
destination. Unpublished Master’s Thesis, Potchefstroom University.
Du Plessis, E., Saayman, M. &Van der Merve, A. 2015. What makes South African tourism competitive?
African journal of hospitality, tourism and leisure, 4(2): 1- 14.
Dwyer, L. & Kim, C. 2003. Destination competitiveness: determinants and indicators. Current issues in tourism,
6(5): 369-414.
Dwyer, L. & Spurr, R. 2011. Tourism economics summary. Australia: CRC for sustainable tourism Pty. Ltd.
Edgell, D.L., Allen, M.D., Smith, G. & Swanson, J.R. 2008. Tourism policy and planning yesterday, today, and
tomorrow. 1st Edition. Great Britain: Elsevier.
Forsyth, P. & Dwyer, L. 2009. The travel and tourism competitiveness report 2009.Geneva: World Economic
Forum.
© ICBTS Copyright by Author(s) The 2018 International Academic Research Conference in Zurich 294
Gago, A., Labandeira, X., Picos, F. & Rodríguez, M. 2006. Taxing tourism in Spain: results and
recommendations. [online]. Available:
http://www.feem.it/userfiles/attach/Publication/NDL2006/NDL2006-040.pdf. [Accessed: 3 June 2015].
George, R. 2007. Managing tourism in South Africa. 1st Edition. Cape Town: Oxford University Press.
Goeldner, C.R. & Ritchie, J.R.B. 2003. Tourism principles, practices, philosophies. 9th Edition. New Jersey:
John Wiley & Sons, Inc.
Goeldner, C.R. & Ritchie, J.R.B. 2012. Tourism principles, practices, philosophies. 12th Edition. New Jersey:
John Wiley and sons.
González, S. 2011. Bilbao and Barcelona in motion, how urban regeneration ‘models’ travel and mutate in the
global flows of policy tourism. Urban studies, 48(7): 1397–1418.
Government of South Africa. 2015. Development and promotion of tourism in South Africa White Paper. [online].
Available: http://www.gov.za/documents/development-and-promotion-tourism-south-africa-white-paper.
[Accessed: 10 September 2015].
Gouws, A. 2011. International trade theory. In Bothma, C & Burgess, S. (Eds). International marketing. 2nd
Edition. Cape Town; Oxford University Press.
Hague, P. & Wilcock, C. 2015. How to get information for next to nothing. [online]. Available:
https://www.b2binternational.com/publications/desk-research/. [Accessed: 27 June 2015].
Hall, M.C. 2009. Tourism policy and politics in Southern Africa. In Saarinen, J., Becker, F., Manwa, H. &
Wilson, D. Sustainable tourism in Southern Africa: local communities and natural resources in transition.
Ontario: Channel View Publishers.
Horgan, R. 2015. What is the definition of marketing trends? [online]. Available:
http://www.sophisticatededge.com/what-is-the-definition-of-a-marketing-trend.html. [Accessed: 27 June
2015].
Jonsson, C. 2012. Theorising diplomacy. In McKercher, B.J.C. (Ed). Routlegde handbook of diplomacy and
statecraft. Oxon: Routledge.
Jonker, J.A., Heath, E.T. & Du Toit, C.M. 2004. The identification of management-process critical success
factors that will achieve competitiveness and sustainable growth for South Africa as a tourism destination.
Southern African business review, 8(2): 1-15.
Jung, F & Sunde, U. 2014. Income, inequality, and the stability of democracy - another look at the Lipset
hypothesis. European journal of political economy, 35(1): 52-72.
Keyser, H. 2009. Developing tourism in South Africa. 1st Edition. Cape Town: Oxford University Press.
Korstanje, M.E. & George, B. 2012. Global warming and tourism: chronicles of apocalypse? Worldwide
hospitality and tourism themes, 4(4): 332 – 355.
© ICBTS Copyright by Author(s) The 2018 International Academic Research Conference in Zurich 295
Laffey, C. 2015. Why is Switzerland the happiest country in the world? [online]. Available:
http://www.flightcentre.com.au/travel-news/destinations/switzerland-happiest-country/. [Accessed: 27 June
2015].
Mann, R. 2014. Racism in tourism. [online]. Available: http://www.travel-
conference.co.uk/commentries.php?paper=273#.VrH5l-195dg. [Accessed: 27 June 2015].
Marshall, W.P. 2008. Eleven reasons why presidential powers inevitably expand and why it matters. Boston
university law review, 88(5): 505-522.
Marvist Consulting. 2005. Online desk research – the new tool in market research. [online]. Available:
http://www.articlesbase.com/internet-marketing-articles/online-desk-research. [Accessed: 27 June 2015].
Mazurek, M. 2014. Competitiveness in tourism – models of tourism competitiveness and their application: case
study Austria and Switzerland. European journal of tourism, hospitality, and recreation, Special issue
(2014): 73-94.
Mbola, B. 2015. South Africa is obliged to arrest Al-Bashir, says Ntsaluba. [online]. Available:
http://www.sanews.gov.za/south-africa/sa-obliged-arrest-al-bashir-says-ntsaluba. [Accessed: 27 June 2015].
Media24. 2015. China, UK, Australia issue travel warnings for South Africa. [online]. Available:
http://iolmobile.co.za/#!/article/new-visa-legislation-can-dent-tourism-1.1848738. [Accessed: 27 June 2015].
Merriam-Webster. 2015. International relations. [online]. Available. http://www.merriam-
webster.com/dictionary/international%20relations. [Accessed: 27 June 2015].
Mitchell, C. 2015. Four factors that shape market trends. [online]. Available:
http://www.investopedia.com/articles/trading/09/what-factors-create-trends.asp. [Accessed: 27 June 2015].
Mkokeli, S., Paton,C., Ndzamela, P. & Ensor, L. 2015. Rand crashes after Zuma fires Nene. [online]. Available:
http://www.bdlive.co.za/markets/2015/12/10/rand-crashes-after-zuma-fires-nene. [Accessed: 27 June 2015].
Moscardo, G. 2004. Shopping as a destination attraction: An empirical examination of the role of shopping in
tourists’ destination choice and experience. Journal of vacation marketing, 18(4): 1-19.
Office of Travel and Tourism Industries, 2015. Tourism Policy. [online]. Available:
http://travel.trade.gov/about/tourism_policy.html. [Accessed: 27 June 2015].
Page, J.S. & Connell, J. 2006. Tourism a modern synthesis. 2nd Edition. China: C&C Printing Press.
Parker, S. & Khare, A. 2005. Understanding success factors for ensuring
sustainability in ecotourism development in Southern Africa. Journal of ecotourism, 4(1): 32-46.
Pavlovich, K. 2003. The evolution and transformation of a tourism destination network: The Waitomo Caves,
New Zealand. Tourism management, 24(1), 203-216.
Perera, P & Vlosky, R. 2013. How previous visits shape trip quality, perceived value, satisfaction, and future
behavioural intentions: the case of forest-based ecotourism in Sri Lanka. International journal of sport
management, recreation and tourism, 11(1): 1-24.

© ICBTS Copyright by Author(s) The 2018 International Academic Research Conference in Zurich 296
Potapkina, V. 2010. Ukraine’s neutrality: a myth or reality? [online]. Available: http://www.e-
ir.info/2010/11/30/ukraine%E2%80%99s-neutrality-a-myth-or-reality/.[Accessed: 27 June 2015].
Premchaiswadi, W. 2010. An image search for tourist information using a mobile phone. Transactions on
information science and applications journal, 7(4): 532-541.
Prescott, A. 2008. Advantages and disadvantages of secondary research. [online]. Available:
http://prosandconsofsecondaryresearch.blogspot.co.za/. [Accessed: 27 June 2015].
Ravi, S. & Bhattacharya, A.K. 2014. Mass tourism as a potential noise pollution threat- A case study of Bhojpur
tourism destination in Madhya Pradesh, India. International journal of environmental sciences, 5(3): 515-
521.
Republic of South Africa. 2016. The role of the Department of International Relations and Cooperation in the
promotion of tourism in South Africa. [online]. Available: http://www.gov.za/about-sa/international-
relations. [Accessed: 28 September 2015].
Rivett-Carnac, K. 2009. Local economic development, tourism and land use choices. Development planning
division working paper, Series No.4. Midrand: Development Bank of Southern Africa Limited.
Saayman, A. & Saayman, M. 2013. Exchange rate volatility and tourism - revisiting the nature of the
relationship. European journal of tourism research, 6(2): 104-121.
Saayman, M. 2000. En route with tourism. 2nd Edition. Potchefstroom: Leisure Consultants and Publishers.
Saayman, M. & Swart, S. 2004. An introduction to tourism law. Potchefstroom: Leisure Consultants and
Publications.
Schutt, R.K. 2009. Investigating the social world: the process and practice of research. 6th Edition. Boston: Pine
Press.
Sharpley, R. 2008. Tourism, tourists and society. 4th Edition. Cambridge: ELM Publishers.
Smith, P.J., Cronje, G.J., Brevis, T. &Vrba, M.J. 2011. Management principles: A contemporary edition for
Africa. 5th Edition. Cape Town: Juta.
Sorrensen, F. 2007. The geographies of social networks and innovation in tourism. Tourism geographies, 9(1):
22-48.
Strachan, M. 2015. Xenophobia: South Africa's instability is killing its tourism industry. [online]. Available:
http://www.bizcommunity.com/Article/196/595/128490.html. [Accessed: 3 June 2015].
Tait, M. & Tait, M. 2015. Defining marketing and the marketing process. In Kotler, P., Armstrong, G. & Tait,
M. (Eds). Principles of marketing: global and southern African perspectives. 2nd Edition. South Africa:
Pearson Prentice Hall.
Tassiopoulos, D. 2011. New tourism ventures. 2nd Edition. Cape Town: Juta.
© ICBTS Copyright by Author(s) The 2018 International Academic Research Conference in Zurich 297
Tladi, D. 2015. The duty on South Africa to arrest and surrender Al-Bashir under South African and
international law: attempting to make a collage from an incoherent framework. [online].
Available:http://papers.ssrn.com/sol3/papers.cfm?abstract_id=2626490. [Accessed: 27 June 2015].
Timur, S. 2012. Analyzing urban tourism stakeholder relationships: A network perspective. [online]. Available:
http://citeseerx.ist.psu.edu/viewdoc/download?doi=10.1.1.110.2329&rep=rep1&type=pdf. [Accessed: 27
June 2015].
Travis, A.S. 2011. Host cultures and tourism: Is a culture sustainable? In Travis, T. (Ed.). Planning for tourism
leisure and sustainability: international case studies. India: Cabi.
UNEP. 2016. Tourism's three main impact areas. [online]. Available:
http://www.unep.org/resourceefficiency/Business/SectoralActivities/Tourism/FactsandFiguresaboutTouri
sm/ImpactsofTourism/EnvironmentalImpacts/TourismsThreeMainImpactAreas/tabid/78776/Default.asp
x. [Accessed: 27 June 2015].
UNEP. 2015. Negative socio-cultural impacts of tourism. [online]. Available:
http://www.unep.org/resourceefficiency/Default.aspx?tabid=78781. [Accessed: 27 June 2015].
United Nations Department of Economic and Social Affairs. 2015. Sustainable tourism. [online]. Available:
https://sustainabledevelopment.un.org/topics/sustainabletourism. [Accessed: 27 June 2015].
United Nations World Tourism Organisation. 2015. Tourism – an economic and social phenomenon . [online].
Available: http://www2.unwto.org/content/why-tourism. [Accessed: 27 June 2015].
Van Mai, T. & Bosch, O. 2010. Systems thinking approach as a unique tool for sustainable tourism
development: a case study in the CAT BA Biosphere reserve in Vietnam [online]. Available:
http://journals.isss.org/index.php/ proceedings54th/article/viewFile/ 1457/509. [Accessed: 3 August 2015].
Van Wyngaardt, M. 2015. South Africa launches R600m tourism incentive programme to advance industry.
Available: http://www.polity.org.za/article/s-africa-launches-r600m-tourism-incentive-programme-to-
advance-industry-2015-03-10. [Accessed: 27 June 2015].
Voeten, E. 2014. Does participation in international organizations increase cooperation? Review of
international Organisations, 9(1): 285-308.
Wakefield, A. 2015. Phosa: South Africa's instability scares away investors. [online]. Available:
http://mg.co.za/article/2015-05-20-south-africas-instability-scares-away-investors-anc-stalwart. [Accessed:
27 June 2015].
Walker, J.R. & Walker, J.T. 2011. Tourism concepts and practises. New Jersey: Prentice Hall.
Weaver, D. 2006.Sustainable tourism. Oxford: Butterworth-Heinemann.
World Economic Forum. 2013. The travel and tourism competitiveness report 2013.Geneva: World Economic
Forum.
World Economic Forum. 2014. Global competitiveness report 2014–2015. Geneva: World Economic Forum.
© ICBTS Copyright by Author(s) The 2018 International Academic Research Conference in Zurich 298
World Economic Forum. 2015. Travel and tourism competitiveness Report 2015. Geneva: World Economic
Forum.
World Travel and Tourism Council. 2011. Economic Impact data and forecasts. [online]. Available:
http://www.wttc.org/eng/Tourism_Research/Economic_ Research/. [Accessed: 3 June 2015].
World Travel and Tourism Council. 2013. The economic impact of travel and tourism 2013. London: WTTC.
World Wide Fund For Nature. 2015. Environmental problems in South Africa. [online]. Available:
http://wwf.panda.org/who_we_are/wwf_offices/south_africa/environmental_problems__in_south_africa/.
[Accessed: 23 June 2015].
Wray, M. 2009. Policy communities, networks and issue cycles in tourism destination. Journal of sustainable
development, 17(6): 673-690.

© ICBTS Copyright by Author(s) The 2018 International Academic Research Conference in Zurich 299
WOMEN ENTREPRENEURSHIP IN THE UAE: FACTORS OF
MOTIVATION AND DRIVE
Almaz Sandybayev
Higher Colleges of Technology, United Arab Emirates
ABSTRACT
Women's entrepreneurship is a topic that has acquired special relevance recent years in the United Arab
Emirates. More and more often UAE mass media mention successful female entrepreneurs, businesswomen,
owners of companies, outstanding managers. There are a number of organizations across the UAE that unite
active business women and company female executives. Undoubtedly, women's entrepreneurship along with
the general characteristics of the whole entrepreneurial process in the region has its own distinctive features at
the present time.
This paper is both qualitative and quantitative in nature tries to examine the role of women in the UAE’s
modern society by presenting collected empirical evidences from the target group to validate the claim that
female entrepreneurship has extensive economic value. Thus, the paper argues on scientific analysis of existing
theoretical approaches to the development of women's entrepreneurship; comparing socio-economic
motivation and factors of women entrepreneurs and assessing the prospects for the development of mass
women's entrepreneurship in the UAE.
Based on SPSS factor, regression and correlation analysis, the study proved and expanded a validated model
that with impeccable tactical and strategic approach, identified influential and motivational factors, the female
entrepreneurship can be more encouraged with larger statistics of innovations and more active role in the
society for adoption of innovations.
Key words: Women's entrepreneurship, female entrepreneurship, motivation, UAE
INTRODUCTION
The formation of private business of women in modern UAE is slow, encountering many social, economic
and legal barriers. A woman, as a subject of entrepreneurial activity faces a special class of social problems:
conflicts of roles performed in public and private life, mass consciousness, deformation towards the
patriarchate. In the context of the contemporary radical reform of social relations in the United Arab Emirates,
the role of women in society is radically changing and its social functions are differently defined. A woman is
actively involved in various types of life activities, conditioned by the needs of a market economy including
in the system of entrepreneurship. As demonstrated by (Acs et al., 2005; Langowitz and Minniti, 2007), female
entrepreneurship has captivated growing attention in recent years considering the significance of new business
creation for economic growth and development. Female entrepreneurship not only contributes to economic
growth and employment creation but also significantly intensifies the diversification of entrepreneurship in
any economic system (Verheul et al., 2006) and implements channels for female expression and potential
realization (Eddleston and Powell, 2008).
Davis and Long (1999) argues that to start an entrepreneurial firm, women and men have, typically the same
set of needs: innovative ideas, entrepreneurial personality characteristics, business plans and long-term
strategies. However, women, in comparison with male entrepreneurs are focused on sustainable business
strategies and conduct their business more responsibly and cautiously; women more often view business as an
opportunity for self-realization and self-achievement. Women-entrepreneurs achieve success in business due
to certain personal characteristics: it is a variation of personal structure, increased psychological tempo-
rhythm, high level of efficiency and effectiveness. As described by Bennett and Dann (2000) and Walker and
Webster (2007), the desire for self-fulfillment or independence, greater wealth or being one’s own boss is one
of the key motivational factors. The gender aspect of current market economic relations becomes significantly
important due to the fact that females not only continue to be one of the decisive factors of social production
in general but also by the reason of women’s entrepreneurship deployment that creates today opportunities for
building up the innovative potential of the modern UAE economy.
In this context, the research paper seeks to explore more opportunities and factors affecting on motivation and
driving power facing by the women in the United Arab Emirates utilizing different multi-level frameworks.
© ICBTS Copyright by Author(s) The 2018 International Academic Research Conference in Zurich 300
LITERATURE REVIEW
The phenomenon of women's entrepreneurship: feminist myth or social reality?
The conceptual basis of the author's position on the essence of women's entrepreneurship is an understanding
of the fact that this is a special kind of economic activity of a person performed by women, directed, in contrast
to the activities of men and mainly to realize their social qualities, self-affirmation in society, proof of one's
abilities through the creation of new forms and improvement of previous types of production, by independently
selected risk despite the difference (in comparison with men) of starting positions and various prerequisites
for doing business (education, capital and power), and the continuing need to implement specific female
family-household oriented functions.
As explained by DeTienne and Chandler (2007), men and women may have unique and differentiated stocks
of human capital that suggests that women have less human capital to bring to self-employment which
negatively impacts their opportunity identification and exploitation potential.
Thus, in author’s opinion, women's entrepreneurship has a special structure of motivations for doing business
which differs from the motivations of men. This gender difference allows us to consider women's
entrepreneurship as a special type of entrepreneurial activity. The motives for pursuing entrepreneurship
received an organized attention, with various authors referring to gender inequality as a push factor for female
entrepreneurship in developed and developing economies (Aidis et al., 2007; Baughn et al., 2006). Thus, for
many female entrepreneurs, self-employment may reflect the restricted structure of opportunities and
challenges in the labor market like discrimination or glass ceiling issues. In this regards, self-employment is
significantly important motivational factor (Baughn et al., 2006). Pull factors are also crucial opportunities for
initiative, challenge, independence and success collected through entrepreneurship (Hughes, 2003; Baughn et
al., 2006). Eddleston and Powell, 2008 suggest that different sets of career satisfiers for men and women
entrepreneurs focus on status attainment for the former and social relationships and goals.
It is also meaningful to specify that, first, women have a different hierarchy of ranks in the system of
entrepreneurial orientation. The first place in their hierarchy is precisely the desire for social self-realization
and achievement of an independent position. Secondly, women prefer to choose the areas of business in which
inherently use their personal characteristics and social behavior that gives them a certain advantage.
Apparently, as a result of this, women are more successful than men in such sectors of economy as trade,
consumer services (beauty salons, hairdressers, public catering, etc.). Even if these enterprises are owned by
men, in practice the operational management and technology of these spheres of the national economy is
carried out by women. Thirdly, at the initial stage, women had originally a ‘weak starting position’. This is
due to the fact that they might had mainly pedagogical, humanitarian, and not technical education, and as a
result had no opportunity to manage production and technical cycles. Finally, and unavoidable important
element in the implementation of entrepreneurship by women, as the need of a balanced combination of
business activities with the implementation of the social and family functions, with the traditional roles of the
wife and mother.
Gender inequality and barriers in the development of women's entrepreneurship
As discussed, women entrepreneurship is formed with some contradictories and difficulties. At the same time,
women's entrepreneurship needs further development and improvement, therefore, it is necessary to develop
measures to implement the relevant state policy in this area. Meyer (2009) argues that women entrepreneurs
impact significantly to the economic development by contributing to employment creation, but they also
contributing to the diversity of entrepreneurship in the economic process. According to the authors, financial
resources is a serious obstacle for women entrepreneurs in comparison with their male entrepreneurs (Bruni,
Gherardi and Poggio, 2004; Coleman, 2000; Winn 2005). Women entrepreneurs may have complex structural
barriers such as discrimination from suppliers, buyers and even their business associates (Godwin, Stevens
and Brenner, 2006). Davis (2011) explored the role that women entrepreneurs play to survive through different
barriers and challenges during the life and growth of their entrepreneurial venture.
Thus, the problem of women's entrepreneurship needs to be studied particularly in terms of state support for
women's entrepreneurship in the interests of economic prosperity of the country. The reasons of that are clear,
first, women's entrepreneurship itself is an important factor in the evolution of the domestic economy and
contributes to its stabilization and dynamic growth. Secondly, the scale of development of women's business
in the UAE, according to statistics, is still lagging behind the corresponding indicators of the highly developed
countries of the world. Based on Glass (2007), the contribution of women in the UAE‘s business increased in
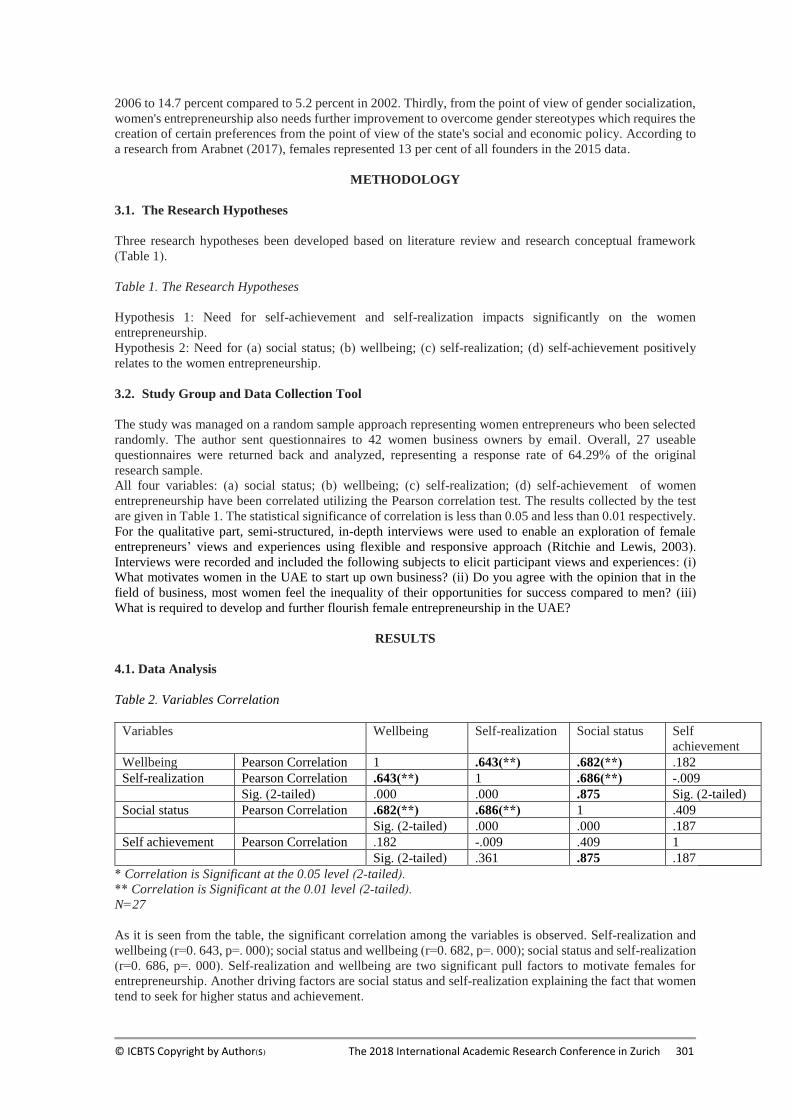
© ICBTS Copyright by Author(s) The 2018 International Academic Research Conference in Zurich 301
2006 to 14.7 percent compared to 5.2 percent in 2002. Thirdly, from the point of view of gender socialization,
women's entrepreneurship also needs further improvement to overcome gender stereotypes which requires the
creation of certain preferences from the point of view of the state's social and economic policy. According to
a research from Arabnet (2017), females represented 13 per cent of all founders in the 2015 data.
METHODOLOGY
3.1. The Research Hypotheses
Three research hypotheses been developed based on literature review and research conceptual framework
(Table 1).
Table 1. The Research Hypotheses
Hypothesis 1: Need for self-achievement and self-realization impacts significantly on the women
entrepreneurship.
Hypothesis 2: Need for (a) social status; (b) wellbeing; (c) self-realization; (d) self-achievement positively
relates to the women entrepreneurship.
3.2. Study Group and Data Collection Tool
The study was managed on a random sample approach representing women entrepreneurs who been selected
randomly. The author sent questionnaires to 42 women business owners by email. Overall, 27 useable
questionnaires were returned back and analyzed, representing a response rate of 64.29% of the original
research sample.
All four variables: (a) social status; (b) wellbeing; (c) self-realization; (d) self-achievement of women
entrepreneurship have been correlated utilizing the Pearson correlation test. The results collected by the test
are given in Table 1. The statistical significance of correlation is less than 0.05 and less than 0.01 respectively.
For the qualitative part, semi-structured, in-depth interviews were used to enable an exploration of female
entrepreneurs’ views and experiences using flexible and responsive approach (Ritchie and Lewis, 2003).
Interviews were recorded and included the following subjects to elicit participant views and experiences: (i)
What motivates women in the UAE to start up own business? (ii) Do you agree with the opinion that in the
field of business, most women feel the inequality of their opportunities for success compared to men? (iii)
What is required to develop and further flourish female entrepreneurship in the UAE?
RESULTS
4.1. Data Analysis
Table 2. Variables Correlation
Variables Wellbeing Self-realization Social status Self
achievement
Wellbeing Pearson Correlation 1 .643(**) .682(**) .182
Self-realization Pearson Correlation .643(**) 1 .686(**) -.009
Sig. (2-tailed) .000 .000 .875 Sig. (2-tailed)
Social status Pearson Correlation .682(**) .686(**) 1 .409
Sig. (2-tailed) .000 .000 .187
Self achievement Pearson Correlation .182 -.009 .409 1
Sig. (2-tailed) .361 .875 .187
* Correlation is Significant at the 0.05 level (2-tailed).
** Correlation is Significant at the 0.01 level (2-tailed).
N=27
As it is seen from the table, the significant correlation among the variables is observed. Self-realization and
wellbeing (r=0. 643, p=. 000); social status and wellbeing (r=0. 682, p=. 000); social status and self-realization
(r=0. 686, p=. 000). Self-realization and wellbeing are two significant pull factors to motivate females for
entrepreneurship. Another driving factors are social status and self-realization explaining the fact that women
tend to seek for higher status and achievement.

© ICBTS Copyright by Author(s) The 2018 International Academic Research Conference in Zurich 302
4.2. Interview Results
According to the results of a survey of women wishing to start up a business in 2018, answering question
"What is the reason for the desire to do business?” The majority of respondents (65%) pointed out that the
main motive for doing business is the need for self-fulfillment and self-realization. The desire to become a
successful entrepreneur was expressed by 49% of the respondents. 42% of female respondents are ready to
take risks. The remaining motives were distributed as follows: the desire to have a job - 13%; provide need to
the family and children - 13%.
Based on the results of some other regional studies conducted, women, from the point of view of their self-
esteem, come to business primarily not to improve their financial situation. Their main goal is to fulfill oneself
(including making a career), acquire a high level of independence from men and develop their own ways of
socialization.
As it is seen, the reasons that determine the industrial and labor activity of women in the current market
economy are mainly related to the factor of gender self-realization of women, the desire to achieve an
independent financial position, professional level and social status in general. This, most likely, manifests the
desire of a woman to ‘stop to be a shadow of a man’ and to have own trajectory of social evolution.
This conclusion is confirmed by the results of sociological research not only in the MENA region but also the
results of a comparative analysis of survey materials in many countries of Eastern Europe. At the same time,
approximately 33-40% of women confirmed that the desire to prove their own worth to their husbands or
partners was a decisive factor in the aspiration to start up own business.
There is an established opinion, that in the field of entrepreneurship, most women feel the inequality of their
opportunities to achieve success in comparison with men.
Thus considering the question "Do you agree with the opinion that in the field of business, most women feel
the inequality of their opportunities for success compared to men?" (%). Distribution of answers is the
following:
Opinions/ Expert
interview*
No, I believe that this is just a stereotype, men and women have the same opportunities 51,6
Yes, since most men do not treat a woman as an equal partner, and women constantly
have to prove that they are no worse than men
29,9
Yes, since a woman carries a double burden - a house and a job which hinders her 33,1
Yes, since in society a woman entrepreneur is treated as an abnormal phenomenon 2,5
Yes, because women are less professional and less qualified -
Difficult to answer -
* In the expert survey it was suggested to select several, but not more than three variants of answers, therefore
the total amount of answers exceeds 100%.
As it is observed from the table, (51.6%) of respondents agree that females and males have equal rights. At
the same time, (29.9%) of women significantly recognize gender stereotypes which women constantly have
to overcome as the main obstacle to the development of women's entrepreneurship. In addition, the
development of women's business, according to all interviewed women is hampered by the "objective
difficulties" associated with the family and work (33.1%).
It is interesting to note that if there are still cases of low self-esteem among women in general, then this trend
is not generally observed among women entrepreneurs. Thus, starting up business, the woman disconnects
with the complexes and stereotypes caused by the "muscular ideology", the woman has a higher level of self-
esteem and a sense of independence from men.
The results of sociological studies of women's entrepreneurship in European countries also indicate that
significant barriers to the development of business among women exist in most countries with a transitional
economy. Thus, according to empirical studies conducted in Albania, Poland, Bulgaria, Ukraine, Lithuania
and Hungary, obstacles to the development of women's entrepreneurship in countries with economies in
transition can be divided into three types:
1. Economic barriers: vague and often changing legal provisions concerning the opening and development
of business; newly introduced VAT tax; insufficient start-up capital and complexity of access to financial
resources; low demand as a result of high unemployment and low economic growth; competition from large
© ICBTS Copyright by Author(s) The 2018 International Academic Research Conference in Zurich 303
domestic or foreign companies; limited access to foreign markets due to non-compliance with standards set
by more developed countries; high costs necessary to promote business in these markets.
2. Educational barriers: limited access to the consulting services of the centers for those who wish to open
their own business or promote it; limited access to knowledge and information; high price of professional
training provided on the market (only a few countries are developing programs to refinance the costs of
participation in trainings for entrepreneurs, among them Poland); limited opportunities for continuing
education.
3. Cultural barriers: incomplete adoption of private economic activity by society; lack of respect for
entrepreneurs; lack of traditions concerning the training of people in business; fears about future changes;
gender discrimination in business. Cultural barriers become even more severe for women from the moment
they decide to start up their own business. That reason is the fact that entrepreneurship has always been
associated with men. Women are not part of informal networks that contribute to winning positions in business,
so they are more likely than men to be helpless, unprotected and insecure in their success.
CONCLUSION AND IMPLICATIONS
Proceeding from the foregoing, it is necessary to draw the following conclusion: the improvement of women's
business should be carried out precisely in those directions where it has undeniable advantages and is based
on specific "female" features of behavior, psychology, mentality, etc. It is not necessary to follow the path of
balancing the spheres of business activity of women and men. The development of women's business should
be a response to the peculiarities of rapid business development in the UAE in the initial period, when
entrepreneurship, it is necessary to recognize this, was largely a "muscular" phenomenon. It is important to
stress that, women's entrepreneurship itself is an important factor in the evolution of the domestic economy
and greatly contributes to its stabilization and dynamic growth.
The paper tried to evaluate the role of female entrepreneurship in the UAE by testing four variables and asking
interview questions. The study developed an empirical approach and analysis of different points of view which
allows to divide the following reasons limiting further development of female entrepreneurship in the UAE:
- Political and legal reasons that have a legal nature (lack of the necessary legislative framework,
special acts regulating women's business, and government programs to support women's
entrepreneurship).
- Ideological obstacles and socio-cultural barriers to the deployment of women's businesses. These are
the traditional processes of socialization for women, stereotypes about the role of women in business
and society and the socio-psychological attitudes of women themselves about this. The same group
includes, in author’s opinion, various educational and information problems: lack of consulting
services, limited access to knowledge and information, high cost of professional training, etc.
Based on the identification and systematization of the above obstacles in the development of women's
entrepreneurship, it is possible to conclude that it needs further appropriate improvement. In this sense,
management activities should be systematic covering all the main areas of management on the one hand and
on the other hand, be aimed at solving problems in the development of entrepreneurship which are specific for
women's business.
REFERENCES
1. Acs, Z., Arenius, P., Hay, M. and Minniti, M. (2005). 2004 Global Entrepreneurship Monitor – Exclusive
Report, London Business School, London and Babson College, Babson Park, MA.
2. Attila, B., Gherardi, S., and Pogachi, B. (2004). Entrepreneur-mentality, gender and the study of women
entrepreneurs. Journal of Organizational Change Management 17(3): 256-268.
3. Aidis, R., Welter, F., Smallbone, D. and Isakova, N. (2007). Female entrepreneurship in transition
economies: the case of Lithuania and Ukraine, Feminist Economics, 13(2): 157-183.
4. Arabnet, retrieved from: https://arabnet.me/conference/summit/
5. Baughn, C., Chua, B.L. and Neupert, K. (2006). The normative context for women’s participation in
entrepreneurship: a multi-country study, Entrepreneurship Theory and Practice, 30(5): 687-708.
6. Bennett, R., and S. Dann. (2000). The changing experience of Australian female entrepreneurs. Gender,
Work and Organization 7(2): 75-83.
© ICBTS Copyright by Author(s) The 2018 International Academic Research Conference in Zurich 304
7. Coleman, S. (2000). Access to capital and terms of credit: A comparison of men-and women-owned small
businesses. Journal of Small Business Management 38(3): 37-42.
8. Davis, S.E.M., and D.D. Long. (1999). Women entrepreneurs: What do they need? Business and
Economic Review 45(4): 25-26.
9. DeTienne, D. and Chandler, G. (2007). The role of gender in opportunity identification, Entrepreneurship
Theory and Practice, 31(3): 365-386.
10. Eddleston, K. and Powell, G. (2008). The role of gender identity in explaining sex differences in business
owners career satisfier preferences, Journal of Business Venturing, 23: 244-256.
11. Godwin, L.N., Stevens, C.E. and Brenner L. (2006). Forced to play by the rules? Theorizing how mixed‐sex founding teams benefit women entrepreneurs in male‐dominated contexts. Entrepreneurship Theory
and Practice 30(5): 623-642.
12. Glass, A. (2007). Working Women Contribute US$3.4bn to the UAE‘s Economy. Retrieved from
http://www.arabinbusiness.com/working-women-contribute-us-3-4bn-the-uae-s-economy-157854.htm.
13. Hughes, K. (2003). Pushed or pulled: women’s entry into self-employment and small business ownership,
Gender, Work and Organization, 10(4): 433-454.
14. Langowitz, N. and Minniti, M. (2007). The entrepreneurial propensity of women, Entrepreneurship
Theory and Practice, 31(3): 341-64.
15. Meyer, N. (2009). An investigation into the determinants of women entrepreneurship, Master in Business
Administration. Mini-dissertation. North-West University, Potchefstroom. Women In Action: Challenges
Facing Women Entrepreneurs In The Gauteng Province Of South Africa (PDF Download Available).
Available from:
https://www.researchgate.net/publication/283714674_Women_In_Action_Challenges_Facing_Women_
Entrepreneurs_In_The_Gauteng_Province_Of_South_Africa [accessed Mar 19 2018].
16. Ritchie J, Lewis J. (2003). Qualitative Research Practice. A Guide for Social Science Students and
Researchers. London: Sage.
17. Verheul, I., Van Stel, A. and Thurik, R. (2006). Explaining female and male entrepreneurship at the
country level, Entrepreneurship and Regional Development, 18: 151-183.
18. Winn, J. (2005). Women entrepreneurs: can we remove the barriers? The International Entrepreneurship
and Management Journal 1(3): 381-397.
19. Walker, E.A., and B.J. Webster. 2007. Gender, age and self-employment: Some things change, some stay
the same. Women in Management Review 22(2): 122-135.
© ICBTS Copyright by Author(s) The 2018 International Academic Research Conference in Zurich 305
EFFECTS OF PROJECT CHANGES IN CONSTRUCTION
PROJECTS AN RFFORT OF EMPIRICAL INVESTIGATION
Rashid Maqbool
School of Economics and Management, Beijing Jiaotong University
Beijing, China
ABSTRACT
Abstract—Projects are considered successful if they are completed within their scope, schedule and budget constraints
ensuring the desired quality and satisfaction of all stakeholders. In case of construction industry, projects mainly overshoot
the schedule that affects the allocated budget and result in many other detrimental effects. The main objective of this study
was to explore the consequences of the project changes in construction projects of Pakistan. Using a sample of 108
construction firms working in Pakistan, we applied structural equation modeling (SEM) to test and verify our hypothesis.
It was found that cost associated effects were the most critical consequences in the construction projects and their intensity
was more than other change factors. However, it was surprise observation that project changes do not play significant role
towards reputation associated negative effects in the construction industry of Pakistan. The study is expected to provide
significant insights to the project managers so that they can formulate the strategies to address the changes and its effects
in construction projects. The study also aims to contribute towards and widen up the existing knowledge base for the
project performance by adding on the findings regarding impact of project changes.
Keywords—changes; construction; time overrun; cost overrun; productivity degradation; risk
I. INTRODUCTION
Changes are the most important factor in the performance of any construction project which results in cost overrun, time overrun and decreases in Labor productivity of the project. Project Changes also become the reason of rework and demolition of the project. Some safety cases are also having much concern because of project changes. Changes in projects are common and may be deleterious or beneficial—whether people see a change as a conflict or a valuable lesson depends only on their prospective [1]. According to Ibbs et al. [2] changes almost always occur in construction projects. Among other things, they can hurt labor productivity. According to Pesaran et al. [3], no one can completely over-come the severity of project variations however their impacts can be minimized if their origins are identified. Lehmann [4] described that change management as conceptually, the management of changes as projects is a real challenge. A huge gap exists between conceptualization in change management and in project management.
The construction projects and infrastructure development of any country are considered as key indicator of its development and economic growth [5]. Many construction projects in Pakistan have been facing serious problems due to which construction projects cannot be completed on time [6]. Most of construction projects are suffering delay or in some cases postponement or abandonment. Such projects include reconstruction of earth quake and flood affected roads and infrastructure, including Gwadar Port, Port Tower Complex KPT, Motorways and Highways, Sheikh Zayed Business Shopping complex, Bhasha Dam, Kalabagh Dam and Development of Chinese industrial cities in all provinces of Pakistan. According to Azhar et al. [7], delays in construction projects of Pakistan are due to the changes in prices of raw material, cost of manufactured materials, and cost of machineries, bidding procurement procedure, project management, design, planning, and government policies. The infrastructure development plays vital role in order to improve the development and progress of any country. On the other side, changes in construction projects leave negative impact such as time and cost overrun, litigation and abandonment of whole project which results in poor growth of construction industry of the country.
This study aims to investigate the important effects of the project changes in the construction projects and mention those effects which are not prominent in the construction industry of Pakistan. It will not only fill up the literary gap as already discussed above; but will also help Pakistani project managers in weighing the project performance from a different perspective that has not been touched upon hitherto.
II. LITERATURE REVIEW
Motawa et al. [8] reported their findings after analysis of construction industry of UK. This research has focused on identifying and forecasting potential changes at the early stage of the project for their corrective actions. According to this study if the changes will analyze at the earlier stages of the project then there will be less chances for their negative impacts on the project and corrective actions will easily be implemented. Enshassi et al. [9] conducted their study in Gaza Strip, they found their findings about variation orders in construction projects. This study specified the important factors that become the reason of project changes. These factors are
© ICBTS Copyright by Author(s) The 2018 International Academic Research Conference in Zurich 306
lack of materials and equipment spare parts due to closure, change in design by consultant, lack of consultant’s knowledge regarding available material, errors and omission in design, conflicts between contract documents, owner’s financial problems, lack of coordination among project parties, using inadequate specification for local markets by international consultant, internal politics, and change in specification by owners. Lehmann [4] conducted his study in Canada. He introduced two canvases for project changes management. First Canvas is about historical perspective. The Second canvas is about a new conceptual frame for investigating the management of changes. Through this there are maximum chances to lower down the problems occurred by project changes. When there is change in construction project, they are either expedited or the scheduled time for the completion of project, is extended. The result is cost overrun in both the cases.
A. Time Associated Change Effects
According to Kaming et al. [10], the significant causes of time associated effects in construction projects are design changes, poor productivity of labor, insufficient planning, and shortage of resources. Ibbs [11] also discussed the project variations as the key source of schedule delays. The study of Anees et al. [12] described that the increase of average schedule time overrun is from 10% to 20% due to variations in construction projects. Moreover, this study explains that these figures are very critical for the total performance of the projects that must be overlooked by all the project associated parties. Assaf et al. [13] conducted their study on Saudi Arabian construction projects. According to them the significant reasons behind project delays are detrimental variations of the projects. Pesaran et al. [3] depicts that major project delays are done due to variations orders done by owner which is 55.4% of the total time overruns of the construction projects. Moreover, this study highlights some other factors of additional works, design amendments and unexpected site conditions are also the major reasons for time delays in these projects. According to Burati et al. [14], projects variations gradually disturbs the project at various stages and finally they lead the project towards time delay, cost overrun and poor quality. Mostly external factors of unforeseeable natural conditions, governmental and legislative changes, and economic and legal issues become the hurdles in successful and timely completion of the project [15].
B. Cost Associated Change Effects
Contractors and the subcontractors often require extra money and time for implementing the change orders, especially required by the clients [16]. Clough & Sears [17] demonstrated that rework and demolition are the facts that occur frequently. Delay in payment can lead to the increased in project cost due to increased interest rates. The side effects of project variations can be minimized if timely and sufficient available resources must be implemented, communication and coordination must be done to accomplish the pre-decided project date with systematic way, and changes in cost must be done according to the project’s nature [18]. Analysis done by Pesaran et al. [3] reveals that variation orders caused the inclination of cost by 7% of the original project cost. Zou & Lee [19] documented that project cost is too much sensitive aspect of the project as it is the first thing to be changed as the result of decision taking whether to take certain management approaches or not. According to Anees et al. [12], the cost overrun due to variations in the project is between 11 and 15 percent of the original contract value in large building constructions. Akpan & Igwe [20] reported that causes of project variations are common and the methodology to handle these is not sufficient. The reason for the cost overrun, they think are inflation, inadequate analysis and information. It is obvious that change orders are the basic source for cost and time overruns. Reasons for change order may differ in different countries, these may be technical and political reasons of the developing countries with compared to the developed countries [21].
C. Productivity Associated Change Effects
Bower [22] depicted that productivity degradation is the change caused by reprogramming, loss of tempo and unbalanced gangs. Managerial pressure and working overtime are considered as the major reasons behind loss of staff morale and staff fatigue which ultimately lead to productivity degradation [23]. Project changes are almost always the part of construction projects, usually these project changes are responsible for labour productivity degradation [24]. Serag et al. [25] quantified the major causes of loss of productivity in piping projects. They distributed the reasons of productivity degradation into two categories; first category was about those variables which owner and contractor both are responsible whereas in second category, they measured the only those reasons which are related to owner. As much as the variations arises in the project, that much productivity degradation will have to face by the project [26]. The study of Ibbs [27] predicted some statistical values which can retain the productivity in the projects. He explained that productivity of the labours can be exceeded up-to 20% planned rate if the project changes were limited to 5%. Moreover, he explained that if the change exceeded than 20% then the planned rate of productivity can never be attained. Thomas & Napolitan [28] explained disruptions caused by project variations effect on labour productivity degradation. Moreover, the rate of productivity degradation rose up to 30% when the project changes are performed in the construction projects. The major reasons behind such disruptions considered the shortage of materials, lack of information and work out of sequence and these disruptions resulted in 25% to 50% of on average daily productivity degradation. Moselhi et al. [29] considered that labour productivity mostly disturbed by intensity of the change orders, timings of the change orders, work types for change orders, type of change impact and site supervision.
© ICBTS Copyright by Author(s) The 2018 International Academic Research Conference in Zurich 307
D. Risk Associated Change Effects
Haseeb et al. [5] explained the major reasons of the project total abandonment to organizational changes, finances and payment problems, regulatory changes, and natural disasters or unforeseeable conditions etc. Moreover, they explained that, in Pakistan, the major reasons behind abandonment of projects are financial crisis, natural disasters, and organizational changes. According to Wei [30] the risk of abandonment is stand at number 4 among other effects of the project changes. Moreover, he explained that the major reason for risk of abandonment is the project delays which are usually caused by consultant and contractor related factors. The study of Aibinu & Odeyinka [31] also described the risk of total abandonment ranked at number 4 in the overall effects of delay with RII value 0.456. The studies of Bower [22] and Anderson et al. [26] described that with the effect of project changes risk of disruptions increased, as some tasks are accelerated while others lead to floats in the original schedule. Sun & Ming [32] described that the major project risks are arise because of lack of systematic review and early identification of project risks. Moreover, they suggested that the framework of risk reviews during project should be used in order to minimize the major risks. The study of Love et al. [33], depicted that various tools and techniques such risk management should be used for risk identification, risk analysis, and risk response. Project changes considered as the major risks for safety regulations and they effect on the performance of the projects [34]. Bröchner & Badenfelt [35] considered the external causes as the major threats for projects in the form of unexpected natural conditions, unexpected legal changes, or political interference. Inclement weather especially rainy or stormy seasons are not suitable for work. Work continuity in inclement weather can be a big risk for workers injuries [15].
E. Reputation Associated Change Effects
Arain & Pheng [36] considered the major reasons of the reputation associated effects are poor professional relations, claims and disputes, and damage to reputation. Project changes lead the alterations in the contractual terms and conditions, moreover this can lead the reason of claims, counter claims and disputes among the project associated parties and thus lead to the reputation associated change effects [37]. Project changes can have tarnishing effects on the reputation of project associated parties. Usually changes arise in the execution phase of the projects. These are considered as the critical for the project management and relationship of the project associated parties [38]. Variations in the projects become the reason of acceleration of the project work, which may result in accidents. Furthermore, delay in meeting the construction deadline, failure in meeting the quality requirements, and increased rates of accidents may tarnish a firm’s reputation. It may lead to poor professional relationship and moreover it may cause conflicts and disputes among professional project associated parties [39]. William et al. [40] considered the disputes as inevitable in construction project, moreover they described the major reasons for conflicts and disputes to project changes. Alnuaimi et al. [21] depicted that work-rework and delays are the major reasons of disturbance in project planning. Moreover, it put pressure on the client and contractor and in some cases, it may have reasoned in disputes and conflicts. Ibbs et al. [1] considered the detrimental nature of project changes as the factors which lower down the value of the owner and thus these must be minimized in the projects. Variations lead professional disputes and problems among parties involved in the construction projects. Negotiation is suggested to be the best solution of resolving disputes instead of litigation among construction associated parties [41].
III. THEORETICAL MODEL AND HYPOTHESES
After reviewing the relevant literature and to fulfill the objectives of the current study, the theoretical model in Fig 1 and hypotheses have been developed to be tested in this study.
The hypotheses thereon are appended below: -
Hypothesis 1: Project Change has positive significant effect on Time associated effects.
Hypothesis 2: Project Change has positive significant effect on Cost associated effects
Hypothesis 3: Project Change has positive significant effect on productivity degradation of the projects and its associated effects.
Hypothesis 4: Project Change has positive significant effect on Risk associated effects.
© ICBTS Copyright by Author(s) The 2018 International Academic Research Conference in Zurich 308
Hypothesis 5: Project Change has positive significant effect on Reputation associated negative effects.
Fig 1 Hypothesized Research Model.
IV. RESEARCH DESIGN
We pursued process suggested by Saunders et al. [42] for research design, which consists of seven steps: post-positivism was draw on as epistemological stance, because it intends to objectivity as an ideal, but is aware of the subjectivity stemming from the subjects marked for collecting the data. Post-positivism recognizes trends as a substitute of generalizations [43]. A deductive approach was drawn for a vigorous design that comprises of new empirical evidence along-with existing theory. A survey design was used to gather quantitative data in a cross-sectional way from a large range of respondents, so as to achieve the
extensive coverage of the resulting theory.
A. Population, Sample and Sampling Technique
The target population for this study was construction-based firms in Pakistan. Target population for this study was the construction companies registered with the Constructors Association of Pakistan (CAP). There were 324 companies registered with CAP which were working in construction sector of Pakistan. The businesses of these companies were ranges from construction of household and commercial buildings to road, underpass, fly-over and working both in public and private sectors. Out of total companies, 108 companies (33%) were selected for data collection through systematic random sampling. After selecting the firms, a well-structured questionnaire served to each key position holder like project director, project manager, operation manager, procurement manager, marketing manager, HR manager etc. On average, there were 4 key positions in construction organization from which data is collected. Out of 432 questionnaires, 296 were received. So, the response rate was 68.52%. During data entry, it is found 253 questionnaires completed in all respect and seemed to be useful for the study so the useful response rate for useful questionnaires was 58.56%. Respondents’ demographic information is given in the TABLE I.
TABLE I. RESPONDENTS DEMOGRAPHICS
Characteristics Category Frequency Percentage
Type of
respondents
Contractor 133 52.57%
Consultant 95 37.55%
Owner 25 9.88%
Field of
working
Buildings 105 41.50%
Infrastructure 57 22.53%
Both 91 35.97%
Educational-
background
PhD/Master 89 35.18%
Bachelor 111 43.87%
<Bachelor 53 20.95%
Experience >15 Years 130 51.38%
10 – 15 Years 104 41.11%
5 – 10 Years 26 10.28%
Designation Project director 34 13.44%
Project manager 63 24.90%
Functional- manager 77 30.43%
Team leader 57 22.53%
Other 22 8.70%
Project changes
Internal changes
Client related
Design related
Project related
Contractor related
External changes
H1: +ve
=
H2: +ve
H3: +ve
H4: +ve
H5: +ve
Reputation related effects
Risk related effects
Productivity related
effects
Cost related effects
Time related effects
Consequences of project
changes
© ICBTS Copyright by Author(s) The 2018 International Academic Research Conference in Zurich 309
B. Measurement and Instrumentation
Previously developed and used scales were adopted in this study to gather the data from construction organizations of Pakistan as shown in TABLE II. In order to check the intensity and occurrence of deleterious project changes 3 items scale was administrated. The contents of these items have been validated by 3 PhD level researchers. The items of project changes variable included “Intensity of detrimental project changes occurrence”, “change in project scope due to project changes”, and “occurrence of unpredictable and unavoidable project changes”. Whereas, the details of the other variables and their items are given in the TABLE
II. All of these items were measured on five-point Likert-type scale i.e. Rarely (1); Never (2); Occasionally (3); Mostly (4); Always (5).
TABLE II. VARIABLES AND INFORMATION OF SCALES ADOPTED
Variable Author of Scale No. of Items
Time overrun effects Arain & Pheng [36] 5
Cost overrun effects Bower [22] 4
Productivity- degradation Bower [22] 6
Risk related effects Bower [22] 4
Reputation related- effects Arain & Pheng [36] 3
Project change Self-developed 3
V. RESULTS AND DISCUSSIONS
A. Validity Analysis-Fitness Indicators of CFA Model
Validity analysis of the data has been conducted through Confirmatory Factory Analysis while using AMOS according to previous studies of Karriker & Williams [44], Paré & Tremblay [45], and Slaughter et al. [46]. A set of validity indicators were found which clearly reported in TABLE III. Those items which have factor loading (<0.40) were considered to be abnormal and dropped from the data. The other prominent validity indicators were CMIN/DF, P-Value, TLI, GFI, CFI, and RMSEA. The value of Chi-Square (CMIN) divided by Degree of freedom (DF) was measured as 1.098 which fall between 3 to 1 which supports the data as valid according to the study of Carmines et al. [47]. The other model fit indicators indicator was TLI which was 0.969, according to Brown [48], TLI should be equal to 1 but it can be 0 to 1. The other model fitness indicator was RMSEA which should be less than 0.05 as suggested by Arbuckle & Wothke [49]. So, the value of RMSEA is 0.032 which clearly indicate the model fitness.
TABLE III. FITNESS INDICATORS OF CFA MODEL
CMIN DF CMIN/DF P-Value TLI GFI CFI RMSEA
890.15 810 1.098 0.000 .969 .834 .99 .032
B. Reliability and Validity Analysis
APPENDIX highlights the factor loading and Cronbach’s alpha value for the current data. It is clearly shown that data is reliable and valid according to model fitness indicators.
C. Common Method Variance and Multi-collinearity
Exploratory factor analysis was done while using Varimax rotation through SPSS. It is noted that variance of all the items towards one factor is 28.8%. This value highlights that there is no problem of common method variance in the data as suggested by Zeitoun & Oberlender [50], Harman’s test of one factor. Multi-collinearity has also been checked while using Variance Inflation Factor (VIF) through SPSS. It is observed that highest value of VIF is 1.098 which is less than cut-off value of 5 as recommended by Ibbs [11] and 10 suggested by Jensen [51]. So, there is no problem of Common method variance and Multi-collinearity in the data.
D. Hypothesis Testing
Structural Equation Model (SEM) was used to find relationship between “project change” and “Time associated effects”, Cost associated effects”, “Productivity associated effects”, “Risk associated effects”, and “Reputation associated effects”. Hypothesis decisions are made through the results of Structural equation model given in the TABLE IV.

© ICBTS Copyright by Author(s) The 2018 International Academic Research Conference in Zurich 310
TABLE IV. HYPOTHESES DECISIONS
No
.
Independent
Variable
Dependent
Variable
Co-efficient P-
Value
Decision
1 Project
Change
“Time associated
effects”
0.42** 0.01 Accepted
2 Project
Change
“Cost associated
effects”
0.43*** 0.00 Accepted
3 Project
Change
“Productivity
associated effects”
0.26* 0.07 Accepted
4 Project
Change
“Risk Associated
effects”
0.22** 0.03 Accepted
5 Project
Change
“Reputation
associated effects”
0.16 0.19 Rejected
***Significant at the 0.01 level, ** Significant at the 0.05 level, * Significant at the 0.10 level.
• Hypothesis 1 for the relationship between “Time Associated Effects” and “Project Change” is accepted at 95% level of confidence. The results of the previous studies are of Arain & Pheng [36], Hanna et al. [52], Anderson et al. [26]; Hanna et al. [23], and Fodha et al. [53], and Bower [22] are aligned with the results of the current study in this relationship between “Project Change”, and “Time Associated Effects”. The findings of the current study are contradictory to that of prior ones. Assaf et al. [13] report that “Time Associated Effects” are generally arises due to weather in Saudi Arabia as an external factor. However, in Pakistan the weather is not considered as the big problem for construction projects.
• Cost is very important factor for the construction associated parties. According to SEM results, Hypothesis 2 for the relationship between “Project Change” and “Cost Associated Effects” is positive significant at 99% level of confidence. The results of the previous studies are of Arain & Pheng [36]; Hanna et al. [52], Anderson et al. [26], Hanna et al. [23], Fodha et al. [53], and Bower [22] are aligned with the results of the current study in this relationship between “Project Change”, and “Cost Associated Effects”. The studies conducted in the construction industries of Nigeria by Aibinu & Jagboro [54] and Malaysia by Sambasivan & Soon [55] reveal the impact of Project Change in increasing overall project cost. Rework costs are important part of cost overruns inflating the original estimated project cost by 10-15% [32].
• It is observed from the SEM value for the relationship between “Project Change” and “Productivity Associated Effects” that there is a positive relationship. This Hypothesis 3 for this relationship is accepted at 90% level of confidence. The significant results of productivity related effects are “Schedule Compression”, Out-of-sequence work”, trade stacking”, over manning”, loss of learning curve”, and “multiple shift work”. Previous studies of Arain & Pheng [36]; Hanna et al. [52], Anderson et al. [26], Hanna et al. [23], Fodha et al. [53], and Bower [22] are aligned with the results of the current study in this relationship between “Project Change”, and “Productivity Associated Effects”.
• The relationship between “Project Change” and “Risk Associated Effects” is positively significant at 95% level of confidence. So, the Hypothesis 4 for this relationship is accepted at 95% level of confidence. The study for Malaysian construction projects explains that project changes are associated with risks of litigation incidents [55]. According to Wei [30], consultant related, and contractor related factors are responsible for effects of project change and causing litigation risks. The results of previous studies of Arain & Pheng [36]; Hanna et al. [52], Anderson et al. [26], Hanna et al. [23], Fodha et al. [53], and Bower [22] are aligned with the results of the current study in this relationship between “Project Change”, and “Risk Associated Effects”.
• According to SEM results the relationship between “Project Change” and “Reputation Associated Effects” is not significant. The results of the present study are not aligned with previous studies of Arain & Pheng [36]; Hanna et al. [52], Anderson et al. [26], Hanna et al. [23], Fodha et al. [53], and Bower [22]. There are many possibilities for this insignificant relationship between “Project Change” and “Reputation Associated Effects”. As in the context of Pakistan’s projects mostly project associated parties are ready for the upcoming project changes, and contingency reserves do not let the project to abandon. Mostly respondents explained that project changes do not disturb their reputation and upcoming project, as this varies from project to project and mostly they tackle can them easily.
VI. CONCLUSION AND RECOMMENDATIONS
The objective of this study was to explore the consequences of the most common project changes in construction projects of Pakistan. For data collection structured questionnaires were sent to 108 construction firms of the Pakistan, which were choose by systematic random sampling from the members list of Constructors Association of Pakistan. The statistical tools that were used for the analysis of data included reliability and validity analysis, confirmatory factor analysis, common method variation, multi co-linearity, and structural equation model.
© ICBTS Copyright by Author(s) The 2018 International Academic Research Conference in Zurich 311
The most significant project change consequences were found to be cost associated effects which were the reasons of variations in the project. The items for the cost associated effects were, “loss of earnings”, “increased time and material related charges”, “increased overheads”, “change in cash flow”. Moreover, it is observed that project change does not have positive significant role towards reputation associated effects. Thus, the findings of this study can assist the project associated parties to be well aware about variations and uncertainties observed in their projects. This study is one step ahead than all of the previous studies as no researcher has used these techniques for analyzing consequences of project changes in construction projects. The study also aims to contribute towards and widen up the existing knowledge base for the project performance by adding on the findings regarding impact of project changes.
A. Implications of the findings
A little change can lead to bigger disturbance which can even affect the scope of the project. Client should also cooperate and coordinate in each matter to assist for running project activities; also, they should understand the limitations of the contractors. Timely payment should ensure for contractors, which will lead to flow of work and timely completion for the project. Contractors past history, track record, work areas, performance, and capacity of the work should be understood while bidding process. Careful selection of contractor will insure the minimum intensity of project variations and performance according to the plan. Very little mistake in drawing can lead to bigger disaster so designer should be any experienced designer. Design should be freeze for avoiding any work fluctuation against the baseline. Each decision and update should be shared and participated by each member which is associated with the running project especially client, contractor, consultant, designer, and engineers. Careful data record keeping for the project variations will insure the risk control system and moreover it will lead the project on its track without any threat of rework and abandonment.
B. Future Researches
Those areas where socio-economic conditions are similar with the Pakistan, the findings of the study can also be generalized. New variables can also be used in the future for findings the grey areas of the detrimental project changes and most relevant solutions for them. This research can also be extended to find out the root causes of project changes while using cause-and-effect techniques such as Ishikawa diagram. Decision Tree Model can also be used in future researches for quantifying the impact of project changes and respective change orders.
REFERENCES
[1] Ibbs, C William, Wong, Clarence K, & Kwak, Young Hoon. (2001). Project change management system. Journal of Management
in Engineering, 17(3), 159-165.
[2] Ibbs, William, Nguyen, Long D, & Lee, Seulkee. (2007). Quantified impacts of project change. Journal of Professional Issues in Engineering Education and Practice, 133(1), 45-52.
[3] Pesaran, M Hashem, Shin, Yongcheol, & Smith, Richard J. (2001). Bounds testing approaches to the analysis of level relationships. Journal of applied econometrics, 16(3), 289-326.
[4] Lehmann, Valérie. (2010). Connecting changes to projects using a historical perspective: Towards some new canvases for researchers. International Journal of Project Management, 28(4), 328-338.
[5] Haseeb, M, Bibi, A, & Rabbani, W. (2011). Problems of Projects and Effects of Delays in the Construction Industry of Pakistan. Australian Journal of Business and Management Research, 1(5), 41-50.
[6] Shaikh, A.W., Muree, M. R., & Soomro, A.S. (2010). Identification of Critical Delay Factors in Construction. Sindh University Resource Journal, 42(2), 11-14.
[7] Azhar, Nida, Farooqui, Rizwan U, & Ahmed, Syed M. (2008). Cost overrun factors in construction industry of Pakistan. Paper presented at the Proceeding of 1st International Conference on Construction in Developing Countries (ICCIDE-1), "Advancing and Integrating Construction Education, Reseach & Practice", Karachi, Pakistan.
[8] Motawa, Ibrahim A, Anumba, Chimay J, & El-Hamalawi, Ashraf. (2006). A fuzzy system for evaluating the risk of change in construction projects. Advances in Engineering Software, 37(9), 583-591.
[9] Enshassi, Adnan, Arain, Faisal, & Al‐Raee, Sadi. (2010). Causes of variation orders in construction projects in the Gaza Strip. Journal of Civil Engineering and Management, 16(4), 540-551.
[10] Kaming, Peter F, Olomolaiye, Paul O, Holt, Gary D, & Harris, Frank C. (1997). Factors influencing construction time and cost overruns on high-rise projects in Indonesia. Construction Management & Economics, 15(1), 83-94.
[11] Ibbs, C William. (1997). Quantitative impacts of project change: size issues. Journal of Construction Engineering and Management, 123(3), 308-311.
[12] Anees, Mohamed M, Mohamed, Hossam E, & Abdel Razek, Mohamed E. (2013). Evaluation of change management efficiency of construction contractors. HBRC Journal, 9(1), 77-85.
[13] Assaf, Sadi A, & Al-Hejji, Sadiq. (2006). Causes of delay in large construction projects. International Journal of project management, 24(4), 349-357.
[14] Burati, J., Farrington, J., & Ledbetter, W. (1992). Causes of Quality Deviations in Design and Construction. Journal of Construction Engineering and Management, 118(1), 34-49.
[15] Hwang, Bon-Gang, & Low, Lee Kian. (2012). Construction project change management in Singapore: Status, importance and impact. International Journal of Project Management, 30(7), 817-826.
[16] Li, H, Love, PED, & Drew, DS. (2000). Effects of overtime work and additional resources on project cost and quality. Engineering, Construction and Architectural Management, 7(3), 211-220.
© ICBTS Copyright by Author(s) The 2018 International Academic Research Conference in Zurich 312
[17] Clough, R.H., & Sears, G.A. (1994). Construction Contracting (2nd ed.). New York: Wiley-Interscience.
[18] Almasi, Ghazal, Moradianmina, Roya, & Zavari, Setareh. (2011, August 12-14). Changes and Their Main Causes and Effects in Iranian Projects. Paper presented at the The 5th International Conference on Management and Service Sciences (MASS), Wuhan, China.
[19] Zou, Yi, & Lee, Sang‐Hoon. (2008). The impacts of change management practices on project change cost performance. Construction Management and Economics, 26(4), 387-393.
[20] Akpan, Edem OP, & Igwe, Odinaka. (2001). Methodology for determining price variation in project execution. Journal of Construction Engineering and Management, 127(5), 367-373.
[21] Alnuaimi, Ali S, Taha, Ramzi A, Al Mohsin, Mohammed, & Al-Harthi, Ali S. (2009). Causes, effects, benefits, and remedies of change orders on public construction projects in Oman. Journal of Construction Engineering and Management, 136(5), 615-622.
[22] Bower, Denise. (2000). A systematic approach to the evaluation of indirect costs of contract variations. Construction Management & Economics, 18(3), 263-268.
[23] Hanna, Awad S, Russell, Jeffrey S, Gotzion, Timothy W, & Nordheim, Erik V. (1999). Impact of change orders on labor efficiency for mechanical construction. Journal of Construction Engineering and Management, 125(3), 176-184.
[24] Apergis, Nicholas, & Payne, James E. (2009). CO< sub> 2</sub> emissions, energy usage, and output in Central America. Energy Policy, 37(8), 3282-3286.
[25] Serag, Engy, Oloufa, Amr, & Malone, Linda. (2008). Reconciliation of owner and contractor views in heavy construction projects. Journal of Professional Issues in Engineering Education and Practice, 134(1), 128-137.
[26] Andersson, Roland, Quigley, John M, & Wilhelmsson, Mats. (2009). Urbanization, productivity, and innovation: Evidence from investment in higher education. Journal of Urban Economics, 66(1), 2-15.
[27] Ibbs, William. (2011). Construction Change: Likelihood, Severity, and Impact on Productivity.
[28] Thomas, H Randolph, & Napolitan, Carmen L. (1995). Quantitative effects of construction changes on labor productivity. Journal of Construction Engineering and Management, 121(3), 290-296.
[29] Moselhi, Osama, Assem, Ihab, & El-Rayes, Khaled. (2005). Change orders impact on labor productivity. Journal of Construction Engineering and Management, 131(3), 354-359.
[30] Wei, Kang Sik. (2010). Causes, Effects and Methods of Minimizing Delays in Construction Projects: Bachelor, Universiti Teknologi Malaysia, Skudai.
[31] Aibinu, A.A., & Odeyinka, H.A. (2006). Construction delays and their causative factors in Nigeria. Journal of Construction Engineering and Management, 132(7), 667-677.
[32] Sun, Ming, & Meng, Xianhai. (2009). Taxonomy for change causes and effects in construction projects. International Journal of Project Management, 27(6), 560-572.
[33] Love, PED, Wood, BM, Picken, D, & Confoy, B. (2000). The privatization of correctional facilities in Australia. Facilities, 18(1/2), 56/65.
[34] Williams, TM. (2000). Safety regulation changes during projects: the use of system dynamics to quantify the effects of change. International Journal of project management, 18(1), 23-31.
[35] Bröchner, Jan, & Badenfelt, Ulrika. (2011). Changes and change management in construction and IT projects. Automation in Construction, 20(7), 767-775.
[36] Arain, Faisal Manzoor, & Pheng, Low Sui. (2005). The potential effects of variation orders on institutional building projects. Facilities, 23(11/12), 496-510.
[37] Goodacre, Peter E, & Hunter, Audrey A. (1987). Delays and Disruptions in Construction: Ascertaining the Cost: a Case Study in Assessing a Contractor's Claim (2nd ed.): Chartered Institute of Building.
[38] Fisk, Edward R, & Reynolds, Wayne D. (2013). Construction project administration (10th ed.): Prentice Hall.
[39] O'Brien, J.J. (1998). Construction Change Orders: Impact, Avoidance, Documentation: McGraw-Hill.
[40] C. William, Ibbs, & Ashley, David B. (1987). Impact of various construction contract clauses. Journal of Construction Engineering and Management, 113(3), 501-521.
[41] Arain, Faisal Manzoor, Assaf, Sadi, & Pheng, Low Sui. (2004). Causes of discrepancies between design and construction. Architectural Science Review, 47(3), 237-249.
[42] Saunders, M.N., Saunders, M., Lewis, P., Thornhill, A. (2015). Research Methods for Business Students, 5/e. Pearson Education, India; pp. 168–276, 1292016647, 9781292016641.
[43] Biedenbach, T., & Müller, R. (2011). Paradigms in project management research: examples from 15 years of IRNOP conferences. International Journal of Managing Projects in Business, 4(1), 82-104. https://doi.org/10.1108/17538371111096908
[44] Karriker, Joy H, & Williams, Margaret L. (2009). Organizational justice and organizational citizenship behavior: A mediated multifoci model. Journal of Management, 35(1), 112-135.
[45] Paré, Guy, & Tremblay, Michel. (2004). The Influence of High-Involvement Human Resources Practices, Procedural Justice, Organizational Commitment and Citizenship Behaviors on Information Technology Professionals’ Turnover Intentions. Cahier du GReSI no, 4, 17.
[46] Slaughter, Jerel E, Zickar, Michael J, Highhouse, Scott, & Mohr, David C. (2004). Personality trait inferences about organizations: development of a measure and assessment of construct validity. Journal of Applied Psychology, 89(1), 85.
[47] Carmines, Edward G, & McIver, John P. (1981). Analyzing models with unobserved variables: Analysis of covariance structures (1st ed.): Beverly Hills: Sage Publications, Inc.
[48] Brown, Timothy A. (2006). Confirmatory factor analysis for applied research (1st edition ed.): The Guilford Press.
[49] Arbuckle, James L, & Wothke, Werner. (1999). Amos 4.0 user's guide: Marketing Department, SPSS Incorporated.
[50] Zeitoun, Alaa Ahmed, & Oberlender, Garold D. (1993). Early warning signs of project changes (1st ed.). University of Texas at Austin: Construction Industry Institute.
[51] Jensen, Vidar MH. (1996). Trade and environment: the pollution haven hypothesis and the industrial flight hypothesis; some perspectives on theory and empirics: University of Oslo, Centre for Development and the Environment.
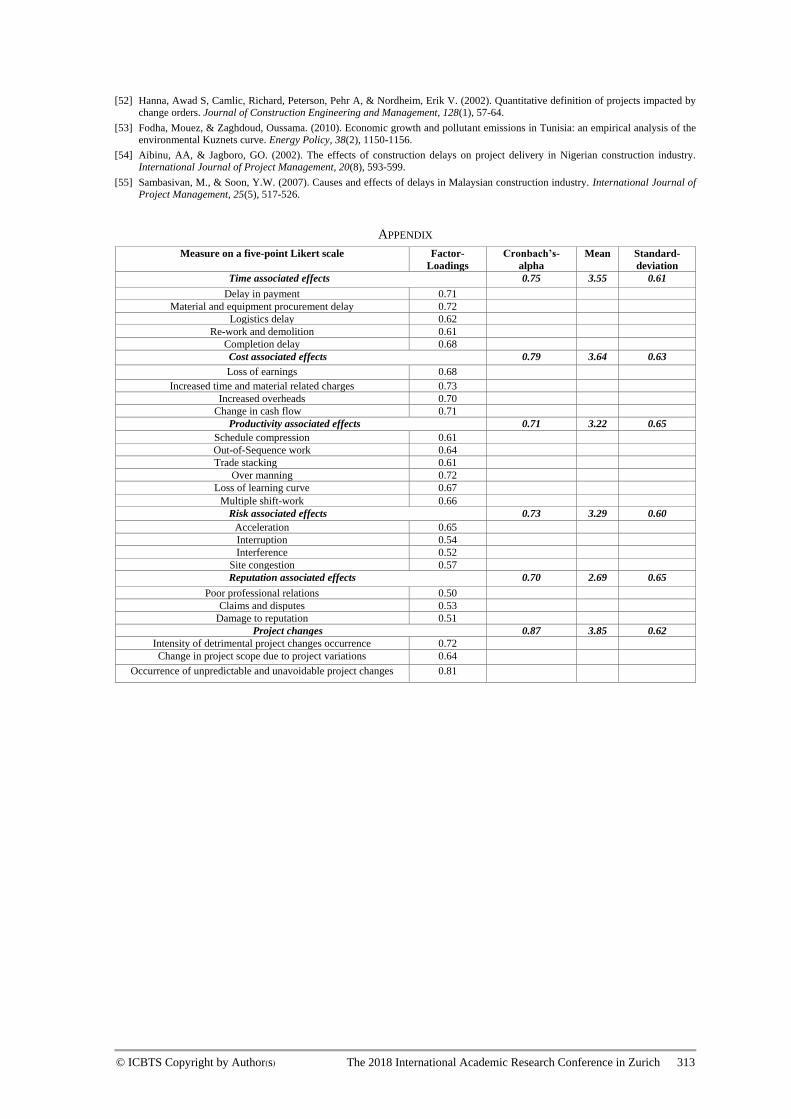
© ICBTS Copyright by Author(s) The 2018 International Academic Research Conference in Zurich 313
[52] Hanna, Awad S, Camlic, Richard, Peterson, Pehr A, & Nordheim, Erik V. (2002). Quantitative definition of projects impacted by change orders. Journal of Construction Engineering and Management, 128(1), 57-64.
[53] Fodha, Mouez, & Zaghdoud, Oussama. (2010). Economic growth and pollutant emissions in Tunisia: an empirical analysis of the environmental Kuznets curve. Energy Policy, 38(2), 1150-1156.
[54] Aibinu, AA, & Jagboro, GO. (2002). The effects of construction delays on project delivery in Nigerian construction industry. International Journal of Project Management, 20(8), 593-599.
[55] Sambasivan, M., & Soon, Y.W. (2007). Causes and effects of delays in Malaysian construction industry. International Journal of Project Management, 25(5), 517-526.
APPENDIX
Measure on a five-point Likert scale Factor-
Loadings
Cronbach’s-
alpha
Mean
Standard-
deviation
Time associated effects 0.75 3.55 0.61
Delay in payment 0.71
Material and equipment procurement delay 0.72
Logistics delay 0.62
Re-work and demolition 0.61
Completion delay 0.68
Cost associated effects 0.79 3.64 0.63
Loss of earnings 0.68
Increased time and material related charges 0.73
Increased overheads 0.70
Change in cash flow 0.71
Productivity associated effects 0.71 3.22 0.65
Schedule compression 0.61
Out-of-Sequence work 0.64
Trade stacking 0.61
Over manning 0.72
Loss of learning curve 0.67
Multiple shift-work 0.66
Risk associated effects 0.73 3.29 0.60
Acceleration 0.65
Interruption 0.54
Interference 0.52
Site congestion 0.57
Reputation associated effects 0.70 2.69 0.65
Poor professional relations 0.50
Claims and disputes 0.53
Damage to reputation 0.51
Project changes 0.87 3.85 0.62
Intensity of detrimental project changes occurrence 0.72
Change in project scope due to project variations 0.64
Occurrence of unpredictable and unavoidable project changes 0.81
© ICBTS Copyright by Author(s) The 2018 International Academic Research Conference in Zurich 314
THE EMPLOYABILITY SKILLS PERFORMANCE OF BUSINESS
GRADUATES IN MALAYSIA: DO EMPLOYERS, GRADUATES,
AND ACADEMICIANS SPEAK THE SAME LANGUAGE?
Erni Tanius
University Selangor, Jalan Zirkon 7/A,
Malaysia
ABSTRACT
Employability skills may implicate and reflect the employment opportunity especially among the new
graduates. This study aims to compare the performance of employability skills among new business
graduates in Malaysia base on stakeholder perceptions; they are the employer, academician and new
graduate. Besides, is to identify if there is any significant difference between their opinions. 607 employers,
301 academicians and 1235 new graduates involved in this study. The result revealed applied skill is the
most performed according to academicians and new graduates. It contradicts with employer claimed, the
new graduate mainly performed in basic skill. The result also indicated that there is a significant difference
on stakeholder opinion on employability skills required by industry. Accordingly, recommendations and
limitations are highlighted in this study.
Keywords: Higher Education, Employer, Business Graduates, Employability Skills, Malaysia

© ICBTS Copyright by Author(s) The 2018 International Academic Research Conference in Zurich 315
RELIGIOUS AND CULTURAL DIVERSITY IN THE
ORGANISATIONS: AN UPLIFTMENT OF THE SOCIETY
MANSI BABBAR
Research Scholar, Department of Commerce, University of Delhi, India
ABSTRACT
The fading of national boundaries and stereotypical thinking necessitates the need to study diversity and
inclusiveness in the organisation and the society at large. This paper focusses on studying the impact of
religious and cultural diversity in the organisation on organisational effectiveness. Also, this study presents a
shift in the employee’ s behaviour from scepticism to absorption, understanding and promotion of
inclusiveness in and around their workplace. Since the organisations are considered a microcosm of the
society, therefore the inclusiveness in society and organisation are much inter-related. The primitive belief of
‘ taking and giving back to the society’ needs to be re-established in the organisations so as to make
employees understand that inclusiveness leads to enhanced productivity that further helps in achieving the
one single goal of the organisation. Also, it is believed that organisation is a sub-system of a larger system
i.e. society and therefore promotion and acceptance of such diversity in the organisation would lead to more
diverse society. This paper further explores the effects of managing diversity in the workplace and findings
conclude that religious diversity make employees feel freedom to express their religious affiliations which
makes them more satisfied and committed to the organisation. On similar lines, it is found that assimilation
and acculturation also leads to positive employee outcomes whereby the employees feel satisfied and the
overall organisational effectiveness increases.
KEYWORDS- religion, culture, diversity, organisation, society
© ICBTS Copyright by Author(s) The 2018 International Academic Research Conference in Zurich 316
A BIRD’S EYE VIEW ON THE TECHNICAL EFFICIENCY OF
PRIVATE BANKS OF PAKISTAN: A DATA ENVELOPMENT
ANALYSIS
Aamir Shahzad, Dr. Tahir Mahmood
Aamir Shahzad: M.Phil Scholar, UVAS Business School, University of Veterinary and Animal Sciences,
Lahore.
Dr. Tahir Mahmood: Associate Professor, UVAS Business School, University of Veterinary and Animal
Sciences, Lahore
ABSTRACT
The banking industry is one of the vital pillars on which the building of an economy is saturated. In case of
developing countries, like Pakistan, where there is a lack of established saving and capital markets, mostly
all the transactions of monetary nature are executed through banks. To enjoy the best banking services, the
general public and the businessman of the era, mostly like to approach the private banks. Numerous studies
have discussed the efficiency of the banking sector in different ways; however, this study is specially
decorated to measure the technical efficiency of private banks for the period of 2007 to 2016 to fill the
significant gap which has not been adequately addressed yet. With the said intention, the panel data of 20
private banks registered under Banking Company Ordinance, 1962 along with major macroeconomic
indicator is being gathered for two-stage analysis. A justified intermediation approach is used for the
selection of two inputs and three outputs. The data obtained from the financial statements of the individual
banks and from the SBP Official Statistics. A nonparametric DEA approach is being used, which have a
strong link to production theory, to find out the best frontier achievers using DEAP 2.1. The results from the
CCR input-oriented model measure 85.9% average technical efficiency of private banks of Pakistan during
the first stage of analysis. The study also contributed to the existing literature with the finding in the second
stage of analysis that the return on assets (ROA) and Earning per share EPS have a significant positive but
the size of the bank influenced negatively on the technical efficiency. The dynamics of the findings also
capture a positive impact of GDP on technical efficiency but a significant negative impact of the rest of
macroeconomic indicator used in the study. The recommendations have been made for the policymakers
and higher controlling authorities to reduce the inefficiency through optimal use of resources.
Keywords Efficiency, DEA, CCR
© ICBTS Copyright by Author(s) The 2018 International Academic Research Conference in Zurich 317
GENDER-ROLE REFERENCES IN THE SOCCER CONTEXT
Faezeh Zamanian 1٭, Majid Vesalinaseh2
University of Art, Tehran, Iran, [email protected] ٭1
2 Sport Organization of Tehran Municipality, Tehran, Iran, [email protected]
ABSTRACT
It has been observed most of female soccer players in Iranian society enact the masculinity gender- role and
try to be recognized as a boy. What happen to them with their entrance in the soccer? The aim of the present
study was to answer this question by exploring the criteria and reference group in the Soccer context and the
way that female soccer player accept them. 8 elite female soccer players on Iran Super League 2014, 2 head
Soccer coaches, and 1 Soccer coach were interviewed by a qualitative research. The results indicated that
there are numerous gender-role references in the soccer which is conflict with the Iranian society's gender-
role references for women. These references divided into two categories as 1- General Gender-role
References and 2- Special Gender-role References. It seems "special masculinity gender-role references"
developed in soccer by their participants.
Keywords Female athlete, Gender-role behavior, Reference group, Soccer
INTRODUCTION
Sports can be ranked as the degree to which participants display the qualities of the masculine or feminine
gender role. Sports like gymnastics, cheerleading and ice-skating were identified as feminine. Sports like
rugby, boxing and football were identified as highly masculine. In Iran, some sports like swimming,
badminton, walking, physical fitness, aerobics and running are favorite for women traditionally
(Tondnevis, 1996; Zaree, 2001) while the favorite sports for men are football, swimming, body
building (Tondnevis, 1996; Zaree, 2001; Safania, 2001; Mozafari, & Safania, 2002), martial art sports and
climbing (Zaree, 2001; Safania, 2001). Female athletes who participate in masculine sports are required to
depict a high number of traits associated with the masculine gender role. For example, soccer players are
required to tackle opponents and fight aggressively over the ball. Female soccer players may be seen as
violatingsocial expectations for women, especially feminine expectations such as tenderness, compassion,
gentleness, soft-spoken manner and sensitivity to the needs of others. When women adopt the more
masculine qualities required in athletic participation, they act in opposition to many of the feminine
behaviors expected for women. It has been observed most of female soccer players in Iranian society enact
the masculinity gender- role and try to be recognized as a boy. Some authors suggested most of women
player in man's sport violate ascribed gender roles for women (Desertrain & Weiss, 1988; Sage &
Loudermilk, 1979). Fallon and Jome (2007) wrote rugby is perceived to be a traditionally masculine sport,
and women who play rugby are assumed to enact the masculine gender role (Fallon & Jome, 2007).
Women's participation in sports is sometimes seen as a social aberration (Disch & Kane, 2000) and women
who play masculine's sports are sexually suspect (Lenskyi, 1999). Signs of some research on the status of
female athletes have shown that women's sports participation is usually associated with the negative beliefs
from the community (Miller & Levy, 1996). Because the traditional images of sports are incompatible with
the traditional role of women (Desertrain & Weiss, 1988; Miller & Levy, 1996). For example, a woman may
© ICBTS Copyright by Author(s) The 2018 International Academic Research Conference in Zurich 318
be directed to engage in aggressive acts by her coach, but her parents or partner may send her messages that
they expect her to display nurturing and sensitive behaviors. Thus an athlete can hear expectations for her
behavior from the important people in her life, which she can choose to fulfill or disregard. This issue has
several negative consequences for athletic women, such as conflicts with parents and spouses, and even
doubts about the sexual orientation (Lenskyi, 1999), which in some cases even leads to the collapse of the
family. Additionally, female athletes appear to differ from non-athletes in their (norm) role of femininity
attitudes (Miller & Levy, 1996; Marsh & Jackson, 1986; Hall & et.al, 1986; Burke, 1986; Salisbury &
Passer, 1982). In the other words, their attitudes about the norm of femininity and gender are different from
those of other women in the society. The scope of effect of the norms extends to all aspects and social life of
individuals. In all these cases, the norm in different formats plays the role ofreference for assessing the
status, action, evolution, as well as the detection of the degree of deviation. Hence, the existence of
references is required for the understanding the current situation and activity and also to diagnosis if their
course has been distorted (Bagheri, 2016). Reference group (norm) guides the personal and social actions of
a person (Bagheri, 2016). As a result, the choice of norm is the basis for defining normality and abnormality
properties. Normative realization is carried out by social institutions in family, educational and health
system, macro social and cultural policies (Bagheri, 2016). However, most of Iranian female soccer players
show masculinity gender-role that is discrepant with their femininity characteristics. It seems these behaviors
are abnormal as a result of they try to demonstrate they are like a boy. Therefore, it is important to find the
reasons of these abnormal gender-role behaviors. A new theory was developed by Bagheri (2014 & 2016)
about the role of reference group on behavior which is titled "a three functional model of norm"(Bagheri,
2016; Bagheri, 2014). Regarding this theory reference group (norm) has the role of criterion for three task 1-
evaluation, 2- judgment and 3- guide the actions. The references are essentially for the perception of
behaviors and activities. In fact, the importance of references as a criterion is salience for guiding the actions
and reference groups have important role for guidance and destiny of people (Bagheri, 2016; Bagheri, 2014).
In addition, according to Baghery (2014 & 2016) reference or criterion is selected from contexts, cultural
and social networks and environments (Bagheri, 2016; Bagheri, 2014). According to the "Context Effects in
Perception"1 law (Hagendorf & et.al, 2011), the norm (criteria or references group) in the field of human
communication includes various contexts, such as peer, cultural, political, occupational, educational,
recreational groups, consumer and cultural goods styles, media, tendencies to patterns, or people who are
reference like the stars, heroes and lovers (Bagheri, 2016). As explained, the kind of selected context as a
reference influences the way of evaluation and judgment. Evaluation is in the form of emotions such as sense
of aversion, hate, attraction, humiliation, admiration, Modernity, honor, shyness, and all other states.
Judgment is in the form of the distinction between friend and enemy, insider and stranger, opportunity and
threat, perfect and non-perfect, patient and healthy, about objects, other people, self, and about beliefs,
cultures, groups, books and values (Bagheri, 2016; Bagheri, 2014). Therefore, what are the references
attributed by context of soccer which female soccer players violate the ascribed gender roles for women?
Why the women enact the masculinity gender-role when they pursue soccer? Is there any reference group in
soccer which effects on the perception of women soccer players and then their gender- role behaviors? In the
1 Context contingent
© ICBTS Copyright by Author(s) The 2018 International Academic Research Conference in Zurich 319
current study, the "a three functional model of norm" (Bagheri, 2016; Bagheri, 2014)was used to answer
these questions.
METHODOLOGY
The findings of Zamanian and et al. (2014) about classify the masculinity of some sports from perspective of
Iranian society gave the soccer the first place in masculinity characteristics (Zamanian & et. al, 2014).
Therefore, Soccer was chosen as the sport of investigation because it represents a very masculine and
nontraditional sport for women in Iran [18]. 8 Women soccer players who played on Iran Super League
2014, 2 head Soccer coaches, and 1 Soccer coach voluntary were interviewed. Criteria for inclusion in the
study were: (a) the player had been playing soccer for the two seasons immediately prior to the interview, (b)
the player was on the current team roster for 2 years and this team was in the super league roster in this 2
years, (c) the player had no major injuries that prevented her from participating in team matches, and (d) In
order to gain deep and accurate experiences, athletes must practice at least 10 hours per week during the
matches' season (Safania, 2001), (e) their health have been approved by the physical health and hormonal
tests which are conducted by the 2013 Medical Committee and (f) the coaches had been committing for
these 2 season in the current team.
Data collection was finished until getting the theoretical saturation. At the first, every woman soccer teams
asked a general question: "how soccer effects on female soccer players' femininity and their gender-roles".
Then, a deep interview in form of semi-structured continues based on participants' answers. Interview
guidelines were design for every participants regarding to the previous interviews and based on literature and
Bagheri's theory (Bagheri, 2016). The interviews were between 60 to 90 minutes in length. All interviews
were recorded and then written word by word. Finally, interviews were analyzed by qualitative method in
concepts, constructs and categories.
ETHICAL CONSIDERATIONS
Information about the research was provided both verbally and in writing through the consent letter which
was given to the participants. Their interviews would be recorded if they allowed the researcher. It was told
interviewees that they could withdraw from participation at any stage of the study and assured them that
their words will be completely confidential.
RESULTS
Based on interviews, the behavior of female soccer players is influenced by the gender-role references in the
soccer. Numerous gender-role references have emerged in the female soccer context. According to the
findings, these references were classified into two groups: 1- General Gender-role References (criteria) 2-
Special Gender-role References (criteria).
Soccer gender-role references which refer directly to the characteristics of soccer is known as "general
gender-role references". Because all soccer players need these references to succeed in soccer and they must
follow them to win.
Other gender-role references related indirectly to the soccer is called as "special gender-role references".
Because it is unique and is created by female soccer players. Each players chooses all or some of these
references based on his personality traits.
© ICBTS Copyright by Author(s) The 2018 International Academic Research Conference in Zurich 320
Participant (number 10) expressed about the "general gender-role references":
"Soccer is attributed to the men and it is a masculinity sport. Therefore, success in the soccer needs to have
the masculine characteristics such as fighter, brave, courageous, strong, powerful, fearless. As well as, the
masculinity stereotypes about soccer lead to change in the gender-role by female soccer players". Hence, the
general criteria for the success in the soccer are "create horror", "rough", and "mannish and masculine".
Participants (number 8) said about "especial gender-role references":"Coaches and spectators admire the
female players who have short hair. Often, coaches believe that the "short hairs" play soccer better than the
players with long hair. Short hairs' play is flashed better in the eyes. On the other hand, Players usually
worry to face to the opponents with short hair in the competitions. Because of this thinking, most of female
soccer players try to cut their hair and change their femininity for accepted by coaches and fans and for
create fear and horror to the opponents". Gradually, female soccer players produce criteria which lead to
show them more masculinity; as the participant number 9 explained:
"A female soccer player, who tries to have a boy style, does some things. At the first, she cut her hair. Then
she wears like a boy and hides her breasts. She changes the way that she speaks and her gait. Gradually, she
feels she is a boy. She thinks like a boy and changes her femininity to the masculinity gender roles.
Progressively, these behaviors become reference (criteria) in the female soccer context.
Since these special gender-role references (criteria) are similar to the male gender role, gradually develop a
new phenomenon among female soccer players that in this study was called "changed gender role".
Some objective indicators of "special gender-role references" as were interpreted by participants included:
Short hair, wearing like boys, without any make up, Thicken the sound and tone of the speaking, doing gait
and hand movements like the boys, use the male hormones, use the Smoking, indulge in boyish behavior
several times more that of a regular guy, deny their gender as a girl, select the boy names for herself, hid the
breasts, deny the female menstruation, exhibit the men's manner and behaviors and so on.
DISCUSSION
The questions addressed in this study were:
1- What are the references attributed by context of soccer?
2- Why the women enact the masculinity gender-role when they pursue soccer?
3- Is there any reference group in soccer which effects on the perception of women soccer players?
Regarding the Bagheri Theory (Bagheri, 2016), selecting the references is done through the contexts,
communities, social networks and culturalnetworks; and it can effect on the individuals' perception of him/
his self and objects (Bagheri, 2016). Therefore, when a woman enters to a social context like soccer, she
involves the new references related to the masculinity gender-role which violate ascribed gender roles for
women in the community of Iran.
For answer to the question one, this research finds two groups of references in the soccer context: 1-
"General Gender-role References" and 2- "Special Gender-role References". The references are necessary
for the success in the soccer, directly related to playing soccer that named as "general gender-role
references". For instance, she should be rough, harsh and strong to make opponents' feel of horror, should
show the men' zeal when the coaches shout or punish her during the competitions and training sessions.
Because soccer is masculinity sport which needs masculinity characteristics not femininity behaviors such as
© ICBTS Copyright by Author(s) The 2018 International Academic Research Conference in Zurich 321
Yielding, Tender, frustration and offend (Bem, 1974). Other references which are named "special gender-
role references" indirectly related to the playing soccer that created in the soccer context by participants. For
example, masculinity stereotypes about soccer and attention to the female soccer players with short hair by
fans and coaches lead to women soccer players internalize the masculinity gender-roles. With the slight
changes in their gender-roles, the masculine gender-roles start to produce by female soccer players and
become larger, more and more extreme every moment. Therefore, by pursuing soccer, these references are
accepted gradually by players or are induced by their teammates, coaches, spectators and fans in their minds.
Then, they try to exhibit male gender roles as an excellent soccer player. Experienced participants believe:
"these days changes in the gender-role in the female soccer context are going to become worse. At the first,
when Iranian women enter to the soccer, they just cut their hair". Regarding to the age of female soccer in
Iran (8 years), we can understand how quickly the special gender-role references are grown and produced by
women soccer players. Most female soccer players think that they could be confirmed if they accept the
special gender-role reference and act in the boyish manner and masculinity behaviors. Hence, they progress
and grow their masculinity characteristics and create the new boyish behaviors. For example, beside of
cutting their hair, they wearlike boys, hid their breasts, deny their female menstruation and so on. Female
soccer players called these people as "boy style". It is one of the reasons that female soccer players enact the
masculinity gender-role when they pursue soccer. To answer the question two about the occurrence of these
gender role change behaviors in female soccer players and question three about the effects of gender-role
references group on their perception can be also described based on the theoretical model of "A three
functions model of norm" (Bagheri, 2016). According to Bagheri (2014 & 2016), references (criteria) guide
the behavior (Bagheri, 2016; Bagheri, (2014). This means, perception on based on three duties of criteria
(evaluation, judgment and guidance of human actions) does its three tasks including: 1- object recognition,
2- spatial localization and 3- perceptual constancy. In fact, perception carry out its object recognition task by
evaluation according to the criterion and two tasks of spatial localization and perceptual constancy by
judgment and guidance in accordance with the criterion respectively (Bagheri, 2016). Selecting the
references is done through the contexts, communities, social networks and cultural networks (Bagheri,
2016). Therefore, when a woman enters the social soccer community, she will pass a process for choosing
this social context as a criterion or reference. In the first step, when a woman enters in the soccer, she faces
expectations and criteria of the group. The objective indicators of these criteria are haircuts, the type of
cover, the shape of behaviors, and more; these players should be more violent, masculine, and horrific to
create a sense of fear in the opponent. In fact, violent, masculine, horrific and the creation a sense of fear are
criteria (references) in the group. In result, criteria of this social context create "normality" and
"abnormality". For example, if a female soccer player behaves very feminine, she is considered as
"abnormal" in the soccer team.
Choosing the criteria is the basis for defining a characteristic of "normality" and "abnormality" in which
guides the individual acts specially and socially. The analytic studies of Michle Foucault M. about power,
one of the most influential thoughts about the role of normal and abnormal concepts, points to the
importance of the norm for the fate of a community and its people (Link, 1998). According to Foucault's
view, any society tends to normalize its social space by dividing the normal from abnormalto a
homogeneous and hierarchical space. Because of this normality of the social space, people choose between
© ICBTS Copyright by Author(s) The 2018 International Academic Research Conference in Zurich 322
the two tendencies of conformity or divergence and deviation of criterion (Link, 1998). In the second step,
they must do conformity or divergence with the criteria (references) of the group. Since individuals must
internalize their criteria for admission to the group (Moradi, 2008), Most of female soccer players begin to
conform to the gender-role references in the soccer team. Conformity makes her as a part of the soccer
group. Actually, in this way, a female soccer player could be accepted by the group of soccer players. Then
she can progress more easily her soccer career and without any ban or trouble from her teammate or others
in this social context.
Through these processes, the third step is the process of setting herself with the references of group and its
criteria. Therefore, with the institutionalization the references group and criteria, the feelings, thoughts, ideas
of soccer women are gradually being influenced (Bagheri, 2016). In the other words, the evaluation,
judgment and guidance of the individual are affected; the individual's evaluation of him/ his self is changed,
and him/ her actions and behaviors are done differently (Bagheri 2014 & 2016). Hence, according to Bagheri
(2014 & 2016), seemingly stable concepts like gender can be changed by selecting the type of context, and
changing in its standard criteria. In this situation, individual can not perceive him/his self as different from
the norm, in spite of intense changes (Bagheri 2014 & 2016). For example, in the perception recognition,
when she evaluate his self by soccer criteria, She feels she needs for success in the soccer to shorten her hair,
Wears like boys, be rough to create a sense of fear in the opponents. In addition, In order to increase self-
esteem and acceptability in the group, she should do as boys' behaviors; because soccer is a masculine sport.
Another task of perception is judgment. Judgment shows the emotional outputs in the form of aversion,
tendency, avoidance, disdain, pride, and pride (Bagheri, 2016).
For example, when she wears girly dresses, she has a sense of being dissatisfaction, but she feels good when
she wears a boys' dress. She hates feminine makeup and elegant girlish behavior. She has a sense of
humiliation in her breasts and menstrual period. They hate of her girly name, and when theyare called boys,
they are filled with joy and pleasure. Therefore, in addition to the evaluation, her judgment has also changed,
and as a result, she guides her actions in a different way attributed to a girl.
CONCLUSION
Overall, female soccer context of Iran act as a reference and now it is image of girls who change ascribe
gender- roles for women. Soccer context is trying to make a homogenous environment and become a norm.
Based on the theoretical model of Bagheri (2016), this condition can change the perception of some women
soccer players and then their gender- role behaviors (Bagheri, 2016). Since individuals learn quickly and
internalize behaviors and actions in the friendship groups like sport, this issue needs more and up-to-date
investigations.
REFERENCES
[1] Tondnevis, F. (1996). Method of spending the leisure time by students in all universities in Iran
with emphasizing on sport activities, phD thesis, Tehran university, physical fitness field.
[2] Zaree, A. (2001). Method of spending the leisure time by students in medicine science universities
with emphasizing on sport activities and comparing it with other universities in Iran, a collection
of leisure time articles, 19 -20.
[3] Safania, AM. (2001). Method of spending the leisure time by students at Islamic Azad university of
area 8 with emphasizing on sport activities, motion season paper, No 9.
© ICBTS Copyright by Author(s) The 2018 International Academic Research Conference in Zurich 323
[4] Mozafari, S.AM. & Safania AM. (2002). Method of passing the leisure time by students in Azad
universities with emphasizing on sport activities, Olympic season paper (1&2): 125-117.
[5] Desertrain, G.S. Weiss, M.R. (1988). Being female and athletic: A cause for conflict? Sex Roles, 18,
567-582.
[6] Sage, G.H. & Loudermilk, S. (1979). The female athlete and role conflict. Research Quarterly, 50, 88-
96.
[7] Fallon, M. A. & Jome, L.M. (2007). An exploration of gender-role expectations andconflict among
women Rugby players. Psychology of women quarterly. 31: 311-321.
[8] Disch, L. & Kane M.J. (2000). When a looker is really a bitch: Lisa Olson, sport and the heterosexual
matrix. In Birrell, S. & McDonald, M.G. (Eds.), Reading sport: Critical essays on power and
representation (pp. 108-143). Boston, MA: Northeastern University Press.
[9] Lenskyi, H.J. (1999). Women, sport and sexualities: Breaking the silences. In White, P. & Young, K.
(Eds), Sport and gender in Canada, pp. 170-181. Ontario, Canada: Oxford University Press.
[10] Miller, J.L. & Levy G.D. (1996). Gender role conflict, gender typed characteristics, self-concepts
and sport socialization in female athletes and nonathletes. Sex Roles, 35, 111-122.
[11] Marsh, H. W., & Jackson, S. A. (1986). Multidimensional selfconcepts, masculinity, and femininity as a
function of women’s involvement in athletics.Sex Roles, 15, 391– 415.
[12] Hall, E. G., Durborow, B., & Progen, J. L. (1986). Self esteem of female athletes and nonathletes
relative to sex role type and sport type.Sex Roles, 15,379–390.
[13] Burke, K. L. (1986). Comparison of psychological androgyny within a sample of female college athletes
who participate in sports traditionally appropriate and traditionally inappropriate for competition by
women.Perceptual and Motor Skills, 63,779–782.
[14] Salisbury, J. & Passer M.W. (1982). Gender role attitudes and participation in competitive
activities of varying stereotypic femininity. Personality and Social Psychology Bulletin, 8, 486-493.
[15] Bagheri, F. (2016). Conceptual study and norm functions. Biannual Journal, Educational Science from
Islamic Point of View. 2 (3). 51-70.
[16] Bagheri, F. (2014). A semantic analysis of the concept "norm" and a critical review of the normality and
abnormality in western psychology. Biannual Journal, Islamic Studies and Educational Science.
[17] Hagendorf, Herbert; Krummenacher, Joseph; Mueller, Hermann-Josef; Schubert, Torsten (2011).
Wahrnehmung und Aufmerksamkeit, Allgemeine Psychologie fue Bachelor, Springer, Berlin.
[18] Zamanian, F., Sabbaghian, L., Mozafari, SAA., (2014). The masculinity- gender characteristics of some
sports in Iran. International Journal of Current Life Science. Vol.4, Issue 9. PP. 5956-5958.
[19] Bem, S.L. (1974). The measurement of psychological androgyny. Journal of Consulting and Clinical
Psychology, 42, 155-162.
© ICBTS Copyright by Author(s) The 2018 International Academic Research Conference in Zurich 324
[20] Link, J. (1998). Von der ›Macht der Norm‹ zum ›flexiblen Normalismus‹: Überlegungen nach Foucault.
In: Jurt, Joseph. (1998). Zeitgenössische französische Denker. Eine Bilanz, Rombach, Freiburg im
Breisgau.
[21] Moradi, M. (2008). Socialization in sport with an emphasis on the role of family (15-25 year old
adolescents in Ahwaz). Master's thesis OF sociology. University of Tehran.