RGMA and IL21R show association with experimental inflammation and multiple sclerosis
15
ORIGINAL ARTICLE RGMA and IL21R show association with experimental inflammation and multiple sclerosis R Nohra 1 , AD Beyeen 1 , JP Guo 2 , M Khademi 1 , E Sundqvist 1 , MT Hedreul 1 , F Sellebjerg 3 , C Smestad 4 , AB Oturai 3 , HF Harbo 4,5 , E Wallstro ¨m 1 , J Hillert 6 , L Alfredsson 7 , I Kockum 1 , M Jagodic 1 , J Lorentzen 2 and T Olsson 1 1 Department of Clinical Neuroscience, Neuroimmunology Unit, Karolinska Institutet, Stockholm, Sweden; 2 Department of Biochemistry and Biophysics, Medical Inflammation Research, Karolinska Institutet, Stockholm, Sweden; 3 Danish Multiple Sclerosis Center Copenhagen University Hospital, Rigshospitalet, Copenhagen, Denmark; 4 Department of Neurology, Oslo University Hospital, Ulleva ˚l, Oslo, Norway; 5 Department of Neurology, Faculty Division Ulleva ˚l, Oslo University Hospital, University of Oslo, Oslo, Norway; 6 Department of Clinical Neuroscience, Division of Neurology, Karolinska Institutet, Stockholm, Sweden and 7 Department of Cardiovascular Epidemiology, Institute of Environmental Medicine, Karolinska Institutet, Stockholm, Sweden Rat chromosome 1 harbors overlapping quantitative trait loci (QTL) for cytokine production and experimental models of inflammatory diseases. We fine-dissected this region that regulated cytokine production, myelin oligodendrocyte glycoprotein (MOG)-induced experimental autoimmune encephalomyelitis (EAE), anti-MOG antibodies and pristane-induced arthritis (PIA) in advanced intercross lines (AILs). Analysis in the tenth and twelfth generation of AILs resolved the region in two narrow QTL, Eae30 and Eae31. Eae30 showed linkage to MOG-EAE, anti-MOG antibodies and levels of interleukin-6 (IL-6). Eae31 showed linkage to EAE, PIA, anti-MOG antibodies and levels of tumor necrosis factor (TNF) and IL-6. Confidence intervals defined a limited set of potential candidate genes, with the most interesting being RGMA, IL21R and IL4R. We tested the association with multiple sclerosis (MS) in a Nordic case–control material. A single nucleotide polymorphism in RGMA associated with MS in males (odds ratio (OR) ¼ 1.33). Polymorphisms of RGMA also correlated with changes in the expression of interferon-g (IFN-g) and TNF in cerebrospinal fluid of MS patients. In IL21R, there was one positively associated (OR ¼ 1.14) and two protective (OR ¼ 0.87 and 0.68) haplotypes. One of the protective haplotypes correlated to lower IFN-g expression in peripheral blood mononuclear cells of MS patients. We conclude that RGMA and IL21R and their pathways are crucial in MS pathogenesis and warrant further studies as potential biomarkers and therapeutic targets. Genes and Immunity advance online publication, 14 January 2010; doi:10.1038/gene.2009.111 Keywords: multiple sclerosis; experimental autoimmune encephalomyelitis; autoimmunity; RGMA; IL21R Introduction Common inflammatory autoimmune disorders, such as multiple sclerosis (MS), type 1 diabetes and rheumatoid arthritis (RA) are complex chronic diseases with poorly understood etiologies. We are particularly interested in MS that is a chronic inflammatory disease of the central nervous system. Both environmental and genetic factors contribute to its etiology. 1 The human leukocyte antigen complex is a major genetic regulator of MS, 2–4 whereas non-human leukocyte antigen genes are numerous and have low odds ratios (ORs). 5,6 Only recently, with analysis of very large cohorts, non-human leukocyte antigen MS genes are starting to be unambiguously identified. 7–14 Another important concept is the sharing of risk genes between inflammatory diseases, 15 as now demonstrated for type 1 diabetes and MS genes. 12 Therefore, cross-disciplinary genetics may be rewarding. Discovery of additional genes contributing to MS and their disease regulatory mechanisms may allow the development of more selective therapies and biomarkers in MS. There are many obstacles in studying genetic regula- tion of autoimmune disorders in human cohorts, includ- ing limited possibility of functional studies and an uncontrolled contribution of environmental factors. Positioning of disease regulating loci can also be achieved using animal models in rodents mimicking the human diseases in which both genetic and environ- mental factors can be controlled. Numerous quantitative trait loci (QTL) have previously been mapped using crosses between inbred rodent strains with diverse susceptibilities to autoimmune inflammatory diseases. 16 Recent progress suggests that this strategy is productive in revealing susceptibility genes and functional path- ways shared between experimental models and complex human disorders. 17 Experimental autoimmune encephalomyelitis (EAE), a model for MS, has defined pathogenic mechanisms Received 9 June 2009; revised 27 November 2009; accepted 30 November 2009 Correspondence: Dr R Nohra, Department of Clinical Neuroscience, Neuroimmunology Unit, Neuroimmunology Unit, CMM, L8:04, Karolinska University Hospital, Stockholm SE-171 76, Sweden. E-mail: [email protected] Genes and Immunity (2010), 1–15 & 2010 Macmillan Publishers Limited All rights reserved 1466-4879/10 $32.00 www.nature.com/gene
Transcript of RGMA and IL21R show association with experimental inflammation and multiple sclerosis

ORIGINAL ARTICLE
RGMA and IL21R show association with experimentalinflammation and multiple sclerosis
R Nohra1, AD Beyeen1, JP Guo2, M Khademi1, E Sundqvist1, MT Hedreul1, F Sellebjerg3, C Smestad4,AB Oturai3, HF Harbo4,5, E Wallstrom1, J Hillert6, L Alfredsson7, I Kockum1, M Jagodic1, J Lorentzen2
and T Olsson1
1Department of Clinical Neuroscience, Neuroimmunology Unit, Karolinska Institutet, Stockholm, Sweden; 2Department of Biochemistryand Biophysics, Medical Inflammation Research, Karolinska Institutet, Stockholm, Sweden; 3Danish Multiple Sclerosis CenterCopenhagen University Hospital, Rigshospitalet, Copenhagen, Denmark; 4Department of Neurology, Oslo University Hospital, Ulleval,Oslo, Norway; 5Department of Neurology, Faculty Division Ulleval, Oslo University Hospital, University of Oslo, Oslo, Norway;6Department of Clinical Neuroscience, Division of Neurology, Karolinska Institutet, Stockholm, Sweden and 7Department ofCardiovascular Epidemiology, Institute of Environmental Medicine, Karolinska Institutet, Stockholm, Sweden
Rat chromosome 1 harbors overlapping quantitative trait loci (QTL) for cytokine production and experimental models ofinflammatory diseases. We fine-dissected this region that regulated cytokine production, myelin oligodendrocyte glycoprotein(MOG)-induced experimental autoimmune encephalomyelitis (EAE), anti-MOG antibodies and pristane-induced arthritis (PIA)in advanced intercross lines (AILs). Analysis in the tenth and twelfth generation of AILs resolved the region in two narrow QTL,Eae30 and Eae31. Eae30 showed linkage to MOG-EAE, anti-MOG antibodies and levels of interleukin-6 (IL-6). Eae31 showedlinkage to EAE, PIA, anti-MOG antibodies and levels of tumor necrosis factor (TNF) and IL-6. Confidence intervals defined alimited set of potential candidate genes, with the most interesting being RGMA, IL21R and IL4R. We tested the association withmultiple sclerosis (MS) in a Nordic case–control material. A single nucleotide polymorphism in RGMA associated with MS inmales (odds ratio (OR)¼ 1.33). Polymorphisms of RGMA also correlated with changes in the expression of interferon-g (IFN-g)and TNF in cerebrospinal fluid of MS patients. In IL21R, there was one positively associated (OR¼ 1.14) and two protective(OR¼ 0.87 and 0.68) haplotypes. One of the protective haplotypes correlated to lower IFN-g expression in peripheral bloodmononuclear cells of MS patients. We conclude that RGMA and IL21R and their pathways are crucial in MS pathogenesis andwarrant further studies as potential biomarkers and therapeutic targets.Genes and Immunity advance online publication, 14 January 2010; doi:10.1038/gene.2009.111
Keywords: multiple sclerosis; experimental autoimmune encephalomyelitis; autoimmunity; RGMA; IL21R
Introduction
Common inflammatory autoimmune disorders, such asmultiple sclerosis (MS), type 1 diabetes and rheumatoidarthritis (RA) are complex chronic diseases with poorlyunderstood etiologies. We are particularly interested inMS that is a chronic inflammatory disease of the centralnervous system. Both environmental and genetic factorscontribute to its etiology.1 The human leukocyte antigencomplex is a major genetic regulator of MS,2–4 whereasnon-human leukocyte antigen genes are numerous andhave low odds ratios (ORs).5,6 Only recently, withanalysis of very large cohorts, non-human leukocyteantigen MS genes are starting to be unambiguouslyidentified.7–14 Another important concept is the sharingof risk genes between inflammatory diseases,15 as now
demonstrated for type 1 diabetes and MS genes.12
Therefore, cross-disciplinary genetics may be rewarding.Discovery of additional genes contributing to MS andtheir disease regulatory mechanisms may allow thedevelopment of more selective therapies and biomarkersin MS.
There are many obstacles in studying genetic regula-tion of autoimmune disorders in human cohorts, includ-ing limited possibility of functional studies and anuncontrolled contribution of environmental factors.Positioning of disease regulating loci can also beachieved using animal models in rodents mimickingthe human diseases in which both genetic and environ-mental factors can be controlled. Numerous quantitativetrait loci (QTL) have previously been mapped usingcrosses between inbred rodent strains with diversesusceptibilities to autoimmune inflammatory diseases.16
Recent progress suggests that this strategy is productivein revealing susceptibility genes and functional path-ways shared between experimental models and complexhuman disorders.17
Experimental autoimmune encephalomyelitis (EAE),a model for MS, has defined pathogenic mechanisms
Received 9 June 2009; revised 27 November 2009; accepted 30November 2009
Correspondence: Dr R Nohra, Department of Clinical Neuroscience,Neuroimmunology Unit, Neuroimmunology Unit, CMM, L8:04,Karolinska University Hospital, Stockholm SE-171 76, Sweden.E-mail: [email protected]
Genes and Immunity (2010), 1–15& 2010 Macmillan Publishers Limited All rights reserved 1466-4879/10 $32.00
www.nature.com/gene
underlying neuroinflammation, and has alloweddevelopment of treatments for MS.18 Experimentalautoimmune encephalomyelitis induced with myelinoligodendrocyte glycopreotein (MOG) in rats closelymimics clinical and pathological features of human MS.19
Furthermore, the cytokine orchestration in MS and EAEcorrelate well.20–22 Similarly, various animal models forRA have been used, with pristane-induced arthritis (PIA)being the model of choice for studies on erosive RA andacute-phase responses in arthritis.23 It best fulfills thecriteria for diagnosis of RA24 and is characterizedby pronounced bone and cartilage erosions, presenceof serum rheumatoid factors and T-cell infiltrationsin joints.25
In this study, we investigate a quantitative trait locuson rat chromosome 1, originally identified in a(LEW.1AV1�PVG.1AV1) F2 cross (Lewis�Piebald-Viral-Glaxo), which carries variants of gene(s) regulating levelsof tumor necrosis factor (TNF), interleukin (IL)-6 and IL-1b.26 Interestingly, the QTL overlaps loci that regulate EAEand PIA.27,28 Defining genes behind this region mighttherefore unravel genetically controlled pathways thatregulate inflammation in general. Here we aimed first tofine-map candidate genes responsible for the regulation ofEAE and PIA in vivo, as well as for in vitro cytokineproduction after stimulation with lipopolysaccharide(LPS), and secondly to determine whether any of thehuman homologous genes associate with MS or ex vivocytokine production. We have refined this large80-MbQTL into two narrow loci: Eae30 and Eae31/Pia32 using thetenth (G10) and twelfth (G12) generation of advancedintercross line (AIL) subjected to EAE and PIA, respec-tively. Subsequent investigation of candidate genes fromEae30 and Eae31 in a Nordic MS case–control cohortdemonstrated association of RGMA and IL21R with MS.
Results
A locus on rat chromosome 1 resolves into two independentQTL that regulate expression of TNF and IL-6A region on rat chromosome 1 was previously linkedto LPS-induced TNF responses in an F2 cross betweenthe EAE-resistant PVG.1AV1 and EAE-susceptible LE-W.1AV1 strains.26 To confirm and refine this region,peripheral blood from 465 rats of the twelfth generation(G12) of an AIL was stimulated with LPS and screened forTNF and IL-6 production. The linkage analysis definedtwo distinct loci regulating IL-6 production, whereasTNF production only linked to the distal locus(Figure 1a). Higher TNF and IL-6 levels were driven bythe susceptible dark Agouti (DA) alleles at the distalQTL, whereas higher IL-6 levels were driven by theresistant PVG.1AV1 alleles at the proximal QTL. The G12
AIL thus confirmed and considerably refined previouslyreported linkage26 and provided evidence for at least twodistinct genes that regulate levels of TNF and IL-6.
Refined TNF and IL-6 QTL also regulate susceptibility toexperimental encephalomyelitis and arthritisWe next sought to determine whether these loci control-ling cytokine production also regulate experimentalinflammatory diseases. We performed a linkage analysisin 794 (DA�PVG.1AV1) rats of an AIL-G10 subjected to
MOG-induced EAE (MOG-EAE)29 and in 465 (DA�PVG.1AV1) rats of AIL-G12 subjected to PIA.
Linkage analysis in EAE confirmed two separate QTLoverlapping with the loci controlling TNF and IL-6production (Figure 1b). The first QTL, hereafter namedEae30, spans 6 Mb between the markers D1Rat217 andD1Rat270, and showed significant linkage to all clinicalphenotypes in addition to a linkage to the production ofanti-MOG IgG2b (Supplementary Table S1; Figures 1band c). Disease susceptibility and increased anti-MOGIgG2b levels were conferred by the EAE-susceptible DAalleles. The second QTL, Eae31, covering a region ofB10 Mb between D1Rat193 and D1Rat68, was linked toall clinical phenotypes and to anti-MOG IgG1, IgG2b andtotal IgG titers (Supplementary Table S1; Figures 1b andc). The PVG allele drove more severe disease and higherlevels of anti-MOG IgGs. For both QTL, there wereeffects of sex as an interactive covariate for all linkeddisease and immune sub-phenotypes in a complexmanner. On analysis of female and male rats separatelyin Eae30, female rats displayed significant linkage to allclinical phenotypes, but not to anti-MOG IgGs, whereasmale rats displayed significant linkage to incidence, dayof onset and anti-MOG IgGs. For the Eae31 locus, femalerats also displayed significant linkage to all clinicalphenotypes, but not to the IgG response. In males, therewas no linkage to clinical phenotypes, but instead to theanti-MOG IgGs (Supplementary Table S1).
In an analogous linkage study on PIA, we identifiedPia32, spanning B2.1 Mb from D1Rat193 to D1Got334and overlapping with Eae31 and the QTL of IL-6 andTNF. Pia32 linked to disease incidence, onset and diseaseseverity (Supplementary Table S2; Figure 1d). Collec-tively, the Eae31/Pia32 defines a narrow locus controllingtwo different organ-specific inflammatory diseases.
Confirmation of linkage data in a congenic strainOn the basis of data from the F2 cross, we developed acongenic rat strain, PVG.LEW-D1Rat270-D1Rat68 (here-after called PVG.LEW) by selectively breeding a frag-ment from the EAE-susceptible LEW.1AV1 into a geneticbackground of the major histocompatibility complex-identical, but EAE-resistant, PVG.1AV1. We used AIL topredict how the congenic strain should behave. Interest-ingly, in an interactive two-QTL model, we couldidentify additional influences in the region from aninteractive QTL, intQTL, with Eae30 at marker D1Rat131(Supplementary Table S3; Figure 2a). The allelic combi-nation at different QTL present in the congenic strainshould drive a more severe disease and higher levels ofTNF and IL-6 (Supplementary Table S4; Figure 2b).Accordingly, in vitro experiments with LPS stimulationon peripheral blood mononuclear cells (PBMCs) fromnaive PVG.LEW congenics and PVG have demonstratedthat PVG.LEW produced higher levels of TNF comparedwith the parental PVG.1AV1 strain (Table 1; Figure 3a).Furthermore, IL-6 production was elevated in PVG.LEWcompared with PVG.1AV1 (Table 2; Figure 3b). Severalexperiments with different MOG batches were per-formed, in which the PVG.LEW congenic displayed ahigher incidence and mortality and a more severedisease course displayed by a higher maximum andcumulative EAE score (Table 3; Figure 3c). Thus, thecongenic strain confirmed the influence of the region onEAE, TNF and IL-6 in accordance with linkage analysis
RGMA and IL21RR Nohra et al
2
Genes and Immunity
in AIL, associating disease susceptibility and severitywith elevated levels of TNF and IL-6.
Definition of candidate genesWe hypothesized that the linked phenotypes for eachQTL were controlled by the same genetic variation ineach of the QTL. On the basis of the combined data on
AIL-G10 and AIL-G12, the shared regulatory regionbetween Eae30, the QTL for IgG2b and IL-6, was reducedto less than 2.4 Mb, spanning 127.9–130.3 Mb on ratchromosome 1. This locus is gene sparse, harboring onlya few genes and transcripts, including Apolipoprotein AIregulatory protein 1, the repulsive guidance moleculeRGMA, chromodomain helicase DNA-binding protein 2
Figure 1 Log-likelihood (LOD: logarithm of the odds) plots for the quantitative trait loci (QTL) identified regulating myelin oligodendrocyteglycoprotein-induced experimental autoimmune encephalomyelitis (MOG-EAE), pristane-induced arthritis (PIA), anti-MOG antibodies andcytokine levels in rats of advanced intercross line (AIL)-G10 and AIL-G12. All markers used for this linkage are not depicted in these plots. Fulllist of used markers can be found in the Materials and methods section. (a) Linkage to tumor necrosis factor (TNF; thick black line) andinterleukin-6 (IL-6; thick gray line) production after WB-LPS stimulation in rats of AIL-G12 (data for IL-6 is from the female subset).Significance threshold for respective phenotype is depicted with the corresponding color and line type as the phenotype itself. (b) Linkageanalysis on AIL-G10 rats with cumulative EAE score in MOG-EAE in G10 with sex as an interactive covariate (thick black line). Significancethreshold is depicted as a dotted black line. (c) Linkage to total IgG (dashed black line), IgG1 (thick black line) and IgG2b (thick gray line)production on day 12 of MOG-EAE in G10 with sex as an interactive covariate. Significance threshold for respective phenotype is depictedwith the corresponding color and line type as the phenotype itself. (d) Linkage analysis on cumulative score in PIA-G12 with sex as aninteractive covariate (thick black line). Significance threshold is depicted as a dotted black line.
RGMA and IL21RR Nohra et al
3
Genes and Immunity

(Chd2), alpha-2,8-sialyltransferase 8B (ST8SiaII) andsolute carrier organic anion transporter family member3A1 (Slco3a1) (Figure 4).
The 10-Mb region of Eae31 is more gene dense, withmany genes having immunoregulatory functions. Im-plementing the same strategy, as used for Eae30, wefocused on the common region shared among Eae31,Pia32 and the QTL for IL-6, TNF and the anti-MOGantibodies. We thus defined a combined confidenceinterval smaller than 2.1 Mb. This region contains thegene for 60S ribosomal protein L13, JmjC domain-containing protein 5 (Jumonji domain-containingprotein 5), gene of interleukin-4 receptor alpha (IL4R),
interleukin-21 receptor (IL21R), general transcriptionfactor 3C polypeptide 1 (Gtf3c1), GSG1-like, Xpo6 andserine/threonine protein kinase SBK1 (src homology 3domain-binding kinase 1). A more exhaustive list ofgenes in these QTL can be retrieved from EnsemblGenome browser (Ensembl genome browser, release 50,July 2008; positions 127.9–131 Mb and 183.3–185.3 Mb)
Association of RGMA, IL-4 receptor alpha and IL-21 receptorwith MSInitially, we performed single nucleotide polymorphism(SNP) genotyping of tagSNPs in RGMA being candidatefrom Eae30, IL4R and IL21R being candidates from Eae31/
Figure 2 (a) Interaction analysis using a two-dimensional scan for a two-quantitative trait loci (QTL) model between Eae30 and the epistaticintQTL. The matrix (genomic position�genomic position) depicts incidence in experimental autoimmune encephalomyelitis (EAE)-G10 withthe lower triangle representing the interactive LOD (logarithm of the odds) scores and the upper one showing additive LOD values. The redareas indicate higher LOD values resulting from the interaction between D1Mit17 in the upper triangle and D1Rat131 in the lower triangle.The scale to the right of the matrix shows the additive LOD values (the right side of the scale ranging 1–10) and the epistatic LOD values (theleft side of the scale ranging 1–5). (b) Effect plot illustrating the influence of the interaction between Eae30 and intQTL on incidence. On a scalebetween 0 to 1, where 0 means no disease incidence and 1 is for complete penetrance of disease with 100% incidence in a treated group.A PVG allele at D1Mit17 (Eae30) in combination with a dark Agouti (DA) allele at D1Rat131 (intQTL) leads to a higher EAE incidence (460%).
Table 1 TNF ELISA data after LPS stimulation of PBMCs in PVG.LEW congenics and PVG
Experiment Strain TNF (pg ml)a Distribution by sex Mean TNF (pg ml) by sex
Females Males Females Males
1 PVG 655.5±31.8 15 0 655.5±31.8 –PVG.LEW 865.9±69.0** 20 0 865.9±69.0** –
2 PVG 268.8±9.4 35 21 262.0±11.9 280.3±15.4PVG.LEW 391.9±20.7*** 27 18 503.3±25.2*** 450.7±31.1***
3 PVG 251.3±18.0 17 17 169.0±12.7 333.7±18.0PVG.LEW 299.1±19.4* 10 9 264.9±21.7** 337.2±29.1
4 PVG 266.7±14.6 38 26 258.2±13.5 293.7±19.9PVG.LEW 368.4±16.0*** 18 16 376.2±28.2*** 375.1±26.5**
Abbreviations: ELISA, enzyme-linked immunosorbent assay; LEW, Lewis; LPS, lipopolysaccharide; PBMCs, peripheral blood mononuclearcells; PVG, Piebald-Viral-Glaxo; TNF, tumor necrosis factor.aTNF concentrations represented as mean values±s.e.m. as measured in the supernatants of PBMCs stimulated with LPS for 18 h. Differencebetween PVG.LEW congenics vs PVG parental strains was tested using Kruskal–Wallis and Mann–Whitney’s ranking tests with *, ** and ***corresponding to Po0.05, Po0.01 and Po0.001, respectively. In the first experiment, no male rats were used.
RGMA and IL21RR Nohra et al
4
Genes and Immunity

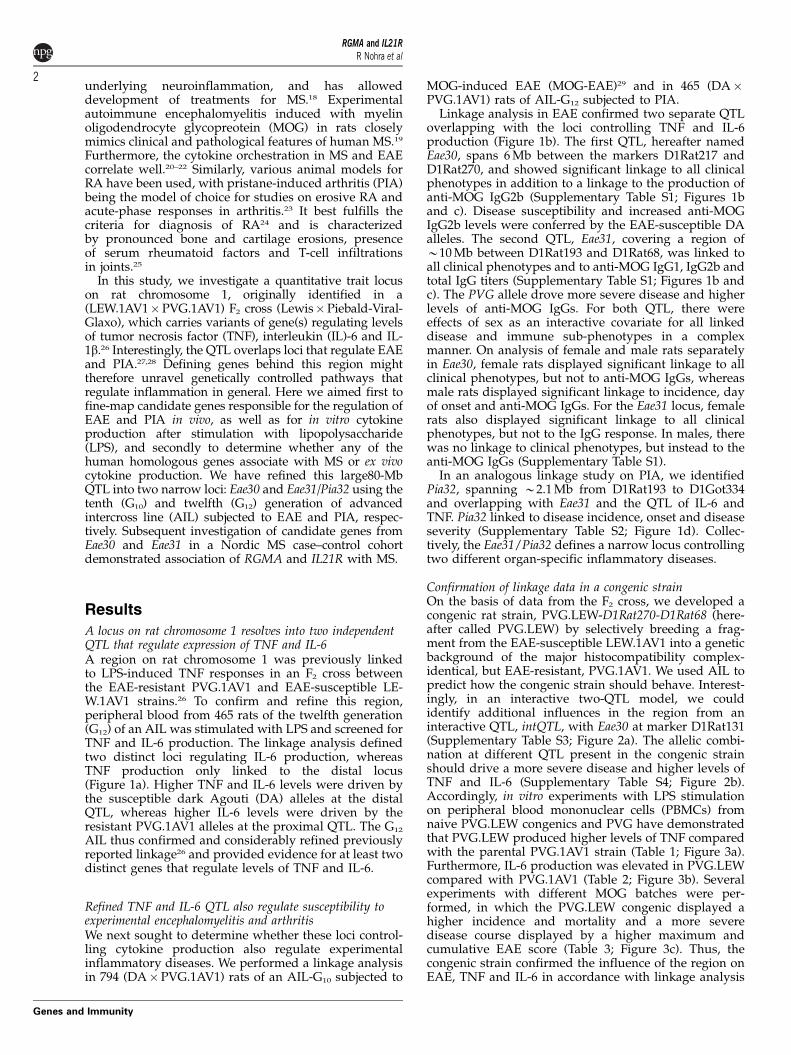
Pia32, in a Swedish case–control study (SWE I) consistingof 1018 MS patients and 1215 controls. The associationanalysis identified some nominally significant associa-tions in all genes (Supplementary Table S5). We alsofound certain haplotypes modestly associated (Supple-mentary Figure 1). We therefore pursued genotyping ofthe markers in these haplotypes in additional cases andcontrols from Sweden (SWE II), Norway (NOR) andDenmark (DEN), a total of 2353 additional cases and1770 controls (see Supplementary Table S6).
For the RGMA gene, the results of single markerassociation studies in the different cohorts are shown inTable 4. In view of the gender influence observed in therat experiments for Eae30, we also stratified the humanmaterial for gender. We then observed that the differencein allele frequency is mainly apparent for male and not forfemale patients. In fact, in the combined material (SWE I,SWE II and DEN), we observed a significant heterogeneityin the association between males and females for thers34925346 marker with Po0.04. The C allele of thismarker was more frequent in male patients (13%) than incontrols (9.7%; OR¼ 1.33 95% confidence interval (CI):1.04–1.69; Po0.005), whereas no difference in the fre-quency of this allele was noticed in females (11%; Figure 5).Further, there is a significant interaction between thers34925346 marker and sex, as judged by estimatingrelative excess risk due to interaction,30 which was 2.45(95% CI¼ 0.44–4.99) in an analysis of all cohorts exceptNOR. To evaluate the significance of our findings, we haveestimated the false positive report probability (FPRP) forthis reported association, which is a function of the priorprobability of association and the power of the study (seeSupplementary Information and see Supplementary TableS7). For prior odds ranging from 0.01 to 0.002, the FPRP isless than 0.06 (see Supplementary Table S8), which is lessthan the FPRP used for genome-wide significance ingenome-wide association (GWA) studies.31
For IL4R, the rs2234897, rs1805011, rs1805015 andrs1801275 markers that were part of the associated IL4Rhaplotype in the SWE I material and rs12102586, whichalso showed nominal association in SWE I, were typed inthe SWE II material. The rs1805011 marker replaced thers2234900 marker that did not work in the TaqMan assay,these markers were in complete linkage disequilibriumwith each other in the HapMap data, in our material;r2¼ 0.86. These tested IL4R markers did not show anysignificant association in the SWE II material (data notshown). The rs1801275 marker that was part of theassociated haplotype in the SWE I cohort, and has beenanalyzed in several published investigations,32–34 wasgenotyped in the NOR and SWE II materials and anoverall association analysis was performed includingreports in the literature. There was no association for thisIL4R marker, nor was there significant heterogeneitybetween the materials (Figure 6). Further, given aprevious report that suggested that the IL4R associationis mainly observed among DR2-positive MS patients,32
we repeated the meta-analysis stratified for DR2 for theSWE I, SWEII and NOR materials, but no significantassociation for rs1801275 was observed (data not shown).
For the IL21R gene, the markers of the rs2107357–rs80603688–rs2214537–rs961914–rs12934152 haplotypewere typed in SWE II, NOR and DEN materials(Table 5). The T allele of rs8060368 marker was lessfrequent among patients than controls in both SWE I
Figure 3 (a) Mean levels of tumor necrosis factor (TNF) asmeasured in supernatant of peripheral blood mononuclear cells(PBMCs) stimulated with lipopolysaccharide (LPS) for 18 h. Thefigure represents data from experiment two in Table 1. The TNFprotein levels are significantly higher in the PVG.LEW (Piebald-Viral-Glaxo.Lewis) strain compared with PVG. This is also observedin both females and males when analysis was segregated for thedifferent sex subsets. (b) Mean levels of interleukin-6 (IL-6) asmeasured in supernatant of PBMCs stimulated with LPS for 18 h.The figure represents data from experiment 1 as shown in 2. IL-6levels are significantly higher in the PVG.LEW strain comparedwith PVG. When segregated for sex the effect was only observed infemales with a weak tendency towards the same effect in males.(c) Clinical experimental autoimmune encephalomyelitis (EAE)course in PVG.LEW congenic strains compared with PVG rats. TheLEW.1AV1 allele in the PVG.LEW congenic rats confers increasedsusceptibility and severity to myelin oligodendrocyte glycoprotein-induced experimental autoimmune encephalomyelitis (MOG-EAE)compared with PVG rats. Data shown are from the secondexperiment as shown in Table 3. Threshold for significance*** corresponds to Po0.001.
RGMA and IL21RR Nohra et al
5
Genes and Immunity

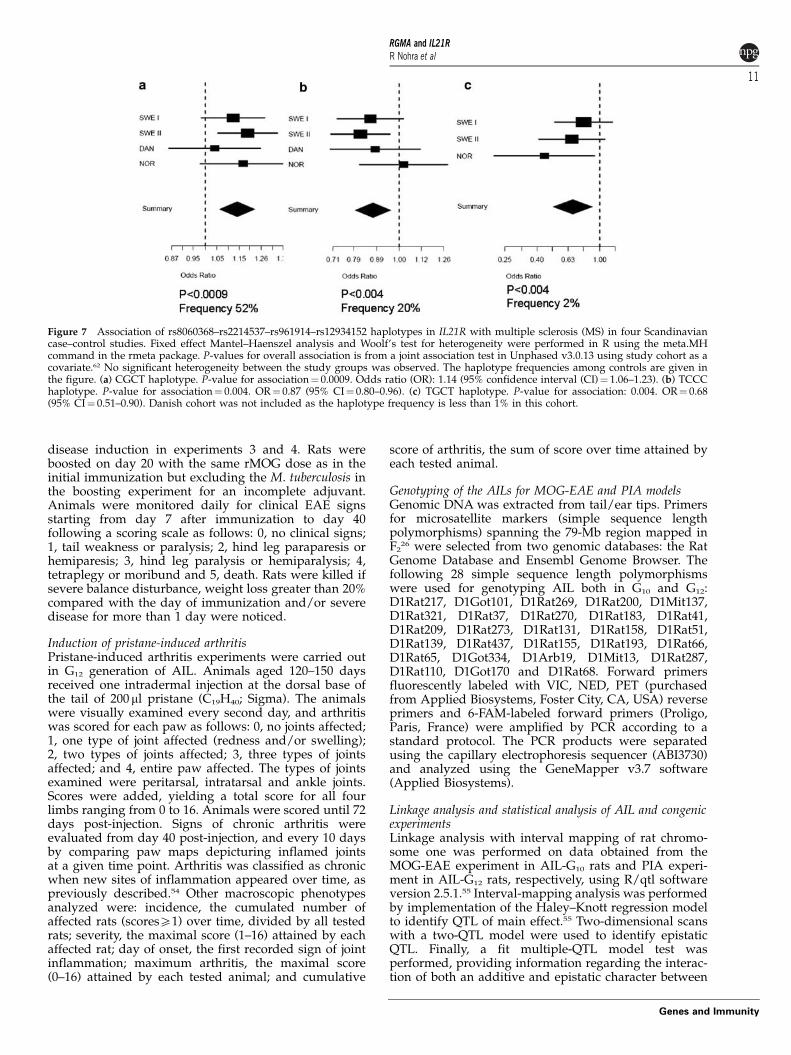
and SWE II. The rs2107357–rs80603688–rs2214537–rs961914–rs12934152 GCCCT haplotype that was asso-ciated in SWE I was not associated in the othermaterials, whereas the GTCCC haplotype was asso-ciated in SWE II and GCGCT haplotype in the NORmaterial (Table 6). The rs8060368–rs2214537–rs961914–rs12934152 CGCT haplotype was positively associated(OR¼ 1.14 95% CI¼ 1.06–1.23; Po0.0009) with MS in ajoint analysis including the SWE I, SWE II, NOR andDEN materials, whereas the TCCC and TGCT haplo-types with the same markers was negatively associatedwith MS (OR¼ 0.87 95% CI 0.80–0.96; Po0.004, andOR¼ 0.68 95% CI 0.51–0.90; Figure 7). Allelic frequencyfor the CGCT haplotype was 55.1% in patients and51.9% in controls, and for the TCCC haplotype 18.4%in patients and 20.4% in controls. For prior oddsranging from 0.01 to 0.002, the FPRP is less than 0.04(see Supplementary Information and see Supplemen-tary Table S9).
Correlation of RGMA and IL21R with cytokine expressionAs expression of certain cytokines may representimportant immune sub-phenotypes in MS, we deter-mined whether there were any correlations between thedisease-associated genotypes and expression levels ofthose studied in the rat, that is, TNF and IL6. In addition,the T helper 1-associated cytokine interferon-g (IFN-g)was included in view of its central roles in neuroin-flammation. We thus tested for a correlation between thegenotype of RGMA, IL4R and IL21R and expressionlevels of TNF, IL-6, IFN-g in cerebrospinal fluid (CSF)and PBMCs of MS patients and in patients with othernon-inflammatory neurological diseases.
For RGMA, we found no correlation between allelesof the disease-associated rs34925346 marker andIFN-g expression in the CSF of MS patients (Supple-mentary Figure 2). However, two markers in thedisease-associated region of RGMA correlated tohigher IFN-g expression: the G allele of rs6497019
Table 2 IL-6 ELISA data after LPS stimulation of PBMCs in PVG.LEW congenics and PVG
Experiment Strain IL-6 (pg ml)a Distribution by sex Mean IL-6 (pg/ml) by sex
Females Males Females Males
1 PVG 133.6±9.7 17 17 104.8±8.4 162.5±14.7PVG.LEW 192.5±9.9*** 11 8 187.3±11.3*** 199.5±18.5
2 PVG 171.9±19.6 5 8 116.4±22.1 206.5±21.3PVG.LEW 142.6±8.7 6 8 133.3±19.1 149.6±5.9LEW 377.2±28.0 12 0 377.2±28.0 –
Abbreviations: Il, interleukin; LEW, Lewis; LPS, lipopolysaccharide; PBMCs, peripheral blood mononuclear cells; PVG, Piebald-Viral-Glaxo.aIL-6 concentrations represented as mean values±s.em. as measured in the supernatants of PBMCs stimulated with LPS for 18 h. Differencebetween PVG.LEW congenics vs PVG parental strains was tested using Kruskal–Wallis and Mann–Whitney’s ranking tests with *, ** and ***corresponding to Po0.05, Po0.01 and Po0.001, respectively. In the first experiment, no male rats were used. In experiment 1, significancenoticed in the whole group of animals is most probably conferred by females in this experiment, as no statistical significance was noticed inmales but only a small tendency towards the same direction as for females. Experiment 2 showed the same tendency of higher IL-6production in females but not in males. The group of animals used in this experiment was too small for a clear effect to be noticed.
Table 3 Clinical data in congenics
Experiment Strain Number (Males/females) Incidence (Males/females) Cumulative scorea Maximum scorea Mortalitya (%)
1 PVG 16 (8/8) 1/16 (0/1) 1.2±1.2 0.1±0.1 0/16 (0)PVG.LEW 23 (12/11) 16/23 (7/9)*** 12.9±4.1*** 1.3±0.2*** 0/23 (0)
2 PVG 21 (12/9) 5/21 (1/4) 12.3±6.2 0.5±0.3 1/21 (5)PVG.LEW 18 (8/10) 16/18 (6/10)*** 81.3±12.7*** 3.4±0.4*** 8/18 (44)**
3 PVG 35 (19/16) 20 (10/10) 8.4±2.1 1.2±0.2 1/35 (3)PVG.LEW 22 (8/14) 18/22 (7/11)* 25.1±5.3** 2.6±0.4** 10/22 (46)***
4 PVG 10 (0/10) 6/10 7.9±3.0 2.2±0.6 2/10 (20)PVG.LEW 10 (0/10) 9/10 37.3±7.6** 4.1±0.5** 7/10 (70)*LEW 10 (0/10) 10/10** 80.8±2.8*** 5.0±0.0** 10/10 (100)**
Abbreviations: LEW, Lewis; PVG, Piebald-Viral-Glaxo.For experiments 1 and 2, experimental autoimmune encephalomyelitis (EAE) was induced with a simple immunization with recombinant ratMOG (rMOG) in complete Freund’s adjuvant (MOG/CFA: 150mg experiment 1; 200mg experiment 2). In experiments 3 and 4, a primaryimmunization with MOG/CFA (MOG/CFA: 60 mg in experiment 3; 40mg in experiment 4) was followed by a boosting with rMOG inincomplete Freund’s adjuvant (MOG/IFA: 150mg experiment 1; 200mg experiment 2) at day 20 after the original immunization. Differences inEAE outcome between PVG.LEW congenic, the EAE-susceptible LEW.1AV1 and the EAE-resistant PVG.1AV1 parental strains weremonitored on a daily basis for 40 days from. Only females were used in experiment 4.aValues are for the whole group of animals in each experiment, both affected and unaffected, of each strain. Values represented are meanvalues±s.e.m. Statistical analysis for incidence of EAE and mortality were tested using Fisher’s exact test. Cumulative and maximum scoreswere analyzed with Kruskal–Wallis and Mann–Whitney’s test. Threshold for significance is depicted as * where *, ** and *** correspond toPo0.05, Po0.01 and Po0.001, respectively.
RGMA and IL21RR Nohra et al
6
Genes and Immunity

and C allele of rs725458 (Po6� 10�3 and Po2.0� 10�2,respectively; data not shown). These expressioncorrelations were acting in an additive manner andwere only observed for female MS patients (Supple-mentary Figure 2).
In contrast to the positive impact on IFN-g expression,lower IL-6 expression in CSF of MS patients wasassociated with the G allele of rs6497019 (Po0.05), againthis correlation is only significant among female MSpatients (Po0.04, data not shown).
No correlation was found between markers of IL4Rand expression of any of the cytokines mentioned above(data not shown).
For IL21R, the rs8060368–rs2214537–rs961914–rs12934152TGCT haplotype that was negatively associatedwith MS, displayed a reduced IFN-g expression inPBMCs of MS patients (Po0.02; Supplementary Figure3). Carriers of the CCTT haplotype showed increasedexpression of INF-g and reduced expression of TNF(Po0.02 and Po5� 10�5, respectively; SupplementaryFigure 3). This haplotype was not significantly associatedwith MS.
Discussion
We here demonstrate two narrow QTL: Eae30, linked toMOG-EAE, and Eae31/Pia32, linked to both MOG-EAEand PIA. This suggests central nervous system-specificmechanisms for Eae30 and disease-shared mechanismsfor Eae31/Pia32. Furthermore, effects of Eae30 and Eae31/Pia32 on disease correlate with regulation of cytokineproduction, implicating underlying mechanisms thatinvolve differential production of cytokines. We couldconfirm this in the PVG.LEW congenic strain that has ahigher incidence, higher mortality rate and more severedisease course together with higher TNF and IL-6production compared with the parental PVG.1AV1strain. Despite the high resolution obtained by the AILapproach, formal proof for single genes controlling theseimportant phenotypes is still lacking in the rat, and willrequire further experimentation. However, limited sets ofgenes allow association studies in the human population.Thus, findings from the experimental models allowedthe formation of hypotheses on the underlying diseasegenes. We here provide evidence for an association ofRGMA and IL21R with MS. The influence of these genesin human MS put them in focus in the rat system also.Breeding of minimal congenic strains are now focused onthese genes, which will allow in vivo functional studiesand testing of therapeutic strategies in rat models.
Eae30 is a newly defined QTL. Of the few genes withinEae30, our interest was focused on member A of thefamily of repulsive guidance molecule domains (RGMA),because of its role in the nervous system. The RGMAprotein is a membrane-bound molecule originally de-fined as an axonal guidance molecule in the visualsystem.35 The RGMA protein and its receptor, neogenin,have thus mainly been implicated in nervous systemdevelopment.36–39 The role of RGMA in the nervoussystem and the fact that Eae30 showed linkage exclu-sively to EAE and not PIA, made it a particularlyinteresting candidate for studies of association with MS;however, as discussed below variants of the gene maywell differentially regulate immune mechanisms. Inaddition, RGMA is not only expressed in neural cells,but also in macrophages and/or microglia and infiltrat-ing leukocytes, as demonstrated in a spinal cord injurymodel.40 Owing to the observed gender influence inEAE, we also stratified our MS material for gender.A meta-analysis showed an association in males with asingle marker within RGMA (OR¼ 1.33) and an associa-tion with a CA haplotype (OR¼ 1.31). Interestingly, SNPsin the associated region of RGMA are in potentialtranscription binding sites. Despite the extensive dataon RGMA in neural cells, our data in EAE and MS thussuggest that variants of RGMA differentially affectimmunoregulation, associated with proinflammatorycytokines and antibody responses. The linkage of theEae30 region to anti-MOG IgG2b suggests that the samegene variant increasing disease susceptibility, also causesa T helper 1 bias of the immune response.41 It isinteresting that SNPs in the disease-associated region ofRGMA show association even with expression of INFgand IL6 in CSF. However, at this point, the role of thisobservation is unclear given that disease association iswith rs34925346 among male patients and the expressioncorrelation is mainly for rs6497019 among femalepatients. Downstream events of RGMA may be consid-
Pia32
RN
O1
Eae30
Eae31 TNF
intQTL
IL6
PV
G.L
EW
IL4Rec.alpha- 184.62 IL-21 Rec.- 184.62
Gtf3c1- 184.70Xpo6- 185.18Sbk1- 185.34
RGMa (NP_001100994.1)-128.56Chd2 (NP_001100993.1)-128.61
ST8SiaII-129.02Slco3a1-129.57
120
124
160
130
140
150
170
180
190
200
193
185
153
183
128
135
IgG2b
IL-6IgGIgG1IgG2b
Figure 4 A summarizing figure showing rat chromosome 1(RNO1) with all quantitative trait loci (QTL) depicted along thechromosome. Shadowed regions symbolize the shared areasbetween different QTL at respective position. Thick dashed lineshows the region covered by the PVG.LEW (Piebald-Viral-Glax-o.Lewis) congenic. A list of the most important genes harboredwithin shared QTL is shown to the right (check appendix I for acomplete list of genes and transcripts).
RGMA and IL21RR Nohra et al
7
Genes and Immunity

ered mechanistically. The RGMA protein acts throughthe activation of a RhoA/Rho kinase-dependent path-way activation of myosin II.42–44 Inhibition of Rho familyfunctions has been shown to ameliorate EAE in rats,associated with promotion of myelin repair, inhibition ofleukocyte infiltration into the central nervous system anda reduced axonal damage.45–47 The strong expression ofRhoA in active MS lesions and low expression in chronicMS lesions suggest that RhoA also has a role in MS.47 Wecan thus hypothesize that variants of RGMA throughdifferential regulation of RhoA result in differentimmune activation and disease outcome.
In contrast to Eae30, Eae31/Pia32 showed linkage withtwo organ-specific diseases, EAE and PIA. The Eae31/Pia32 QTL also displayed linkage to total anti-MOGantibody, IgG1, IgG2b, TNF and IL-6 levels. Thisprobably reflects an overall quantitative effect of theresponsible gene(s) on the pathogenic autoimmuneresponse. A remarkable overlap between QTL-affectingclinical phenotypes of both EAE and PIA, along with theproduction of pro-inflammatory cytokines and MOGantibodies, indicates the presence of shared geneticfactors acting on each disease. In the 2.1-Mb regionshared among Eae31, Pia32, IL-6, TNF and anti-MOGantibody QTL, we concentrated on two particular genes:the interleukin-4 receptor alpha (IL4R) and interleukin-21
receptor (IL21R). Both in rats and humans, these tworeceptors are positioned close together (Ensembl genomebrowser, release 50, July 2008).
Although an initial study of SNPs in IL4R suggested adisease association, additional screening in SWE II, NORand DEN did not confirm any association of this gene,neither on a haplotype nor on a single marker level.Neither did meta-analysis of all Nordic materials andprevious reports of IL4R associations with MS33,34,48
reveal any association. Nor did we find any correlationbetween expression levels of TNF, IL-6 and IFN-g and theIL4R genotype. We therefore conclude that there is nocontribution of IL4R variants to the susceptibility of MS.
Variants of IL21R displayed association with MSin a meta-analysis of all four Nordic cohorts witha susceptible CGCT haplotype (P-value o9� 10�4;OR¼ 1.14) and two protective haplotypes: TCCC(P-value o4� 10�3; OR¼ 0.87) and TGCT (P-valueo4� 10�3; OR¼ 0.68). In addition, the disease-protectiveTGCT haplotype also showed an association with lowerexpression of IFN-g in PBMCs of MS patients. Aspotential molecular mechanism for these effects, severalof the SNPs in the associated region of IL21R canpotentially affect the transcription factor-binding sites.Interestingly, after submission of this paper, and con-sistent with the disease gene-sharing theme, as observed
Table 4 Test of association RGMA markers to MS in four different Scandinavian case–control materials
SNP Minorallele
Majorallele
Patients Controls p alleleictest
Malepatients
Malecontrols
p allelictest
Femalepatients
Femalecontrols
p allelictest
Test ofhetero-
MAF n MAF n MAF n MAF n
male
MAF n MAF n
female geneity P
SWE Irs1881842 G A 13.1 1986 0.7 1999.1 0.025 12.7 314 14.9 872 0.347 13.2 1672 15.9 1474 0.031 0.867rs34925346 C G 11 1880 0.6 1891 0.254 10.2 294 9.9 842 0.865 11.2 1586 10 1376 0.289 0.727rs997941 G A 6.4 1966 0.3 1972.4 0.336 6.1 312 6.9 858 0.634 6.4 1654 7.2 1452 0.364 1rs6497019 A G 45.3 1982 2.2 2027.3 0.489 49.4 312 43 872 0.053 44.5 1670 44.9 1494 0.812 0.070rs10520720 A G 20 1994 1 2014 0.139 23 322 21.6 878 0.620 19.4 1672 22 1498 0.080 0.196rs725458 T C 31.9 1972 1.6 2003.9 0.073 34.8 316 34.4 838 0.888 31.4 1656 34.6 1490 0.055 0.295
SWE IIrs1881842 G A 16.2 2172 15.2 1968 0.372 15.6 674 14.5 498 0.597 16.5 1498 15.4 1470 0.437 0.960rs34925346 C G 12.2 2124 11.5 1920 0.503 14.2 664 11 498 0.117 11.3 1460 11.7 1422 0.754 0.137rs997941 G A 5.7 2186 7.4 1980 0.027 4.5 682 9.1 504 0.002 6.3 1504 6.8 1476 0.513 0.021rs6497019 A G 44.5 2136 45.5 1928 0.516 40 662 44.9 486 0.103 46.5 1474 45.8 1442 0.677 0.107rs10520720 A G 22.3 2136 22.1 1908 0.871 21.8 664 22.2 478 0.892 22.6 1472 22.1 1430 0.768 0.787rs725458 T C 32.9 2112 32.6 1858 0.842 30.2 658 32.9 462 0.346 34 1454 32.4 1396 0.367 0.202
DENrs1881842 G A 17.4 864 14 1004 0.049 15.8 272 13.1 464 0.317 18.1 592 14.8 540 0.141 0.934rs34925346 C G 11.7 856 9.3 766 0.115 13.3 270 7.5 358 0.017 10.9 586 10.8 408 0.946 0.067rs997941 G A 5.7 892 3.8 1034 0.044 7.6 276 3.1 480 0.006 4.9 616 4.3 554 0.662 0.066rs6497019 A G 44.5 848 46 980 0.504 46.6 266 46.8 440 0.959 43.5 582 45.4 540 0.523 0.727rs725458 T C 31.9 908 31.2 994 0.725 35.3 272 31.6 446 0.310 30.5 636 30.8 548 0.901 0.379
NORrs1881842 G A 15.6 1068 15.8 1028 0.939 15.1 298 15.8a 1028a 15.9 768 15.8a 1028a 0.95 NArs34925346 C G 11.9 1060 11.4 1012 0.711 12.8 298 11.4a 1012a 11.6 760 11.4a 1012a 0.89 NArs997941 G A 6.7 1086 5.4 1042 0.193 5.9 304 5.4a 1042a 6.9 780 5.4a 1042a 0.17 NArs6497019 A G 47.7 1068 45.1 1028 0.247 44.4 302 45.1a 1028a 49.0 764 45.1a 1028a 0.11 NArs725458 T C 34.9 1012 30.4 974 0.033 34.1 284 30.4a 974a 35.1 726 30.4a 974a 0.04 NA
Abbreviations: DEN, Denmark; MAF, mutation analysis facility; NOR, Norway; SNP, single nucleotide polymorphism; SWE, Sweden.aAs the sex of the Norwegian controls was not known all controls have been included in the comparison with both male and femaleNorwegian patients.
RGMA and IL21RR Nohra et al
8
Genes and Immunity

in the rat experiments, an association of polymorphismsin IL21R with systemic lupus erythematosus wasrecently published.49 The reported association withsystemic lupus erythematosus is not in the same regionof the IL21R gene as the association with MS, however,only one marker has been tested in the region we reportassociated in this investigation. The downstream me-chanisms for the genetic influence remain to be demon-strated. However, a differential effect on disease, asobserved here, is plausible in view of the pleiotropiceffects of the IL21–IL21R pathway on numerous immunemechanisms, including effects on both CD4þ and CD8þ
T cells, T1/T2 bias, IL-17 production, and B cells andantibody production.50 Thus, our data on EAE/PIA andMS, and those on systemic lupus erythematosus49
strongly implicate IL21R variants in the regulation ofinflammatory processes in general. Further functionalstudies on the congenic strain will help our under-standing of how IL21R regulates chronic inflammation.
Neither RGMA, IL4R nor IL21R has been identified asthe gene that is involved in autoimmune diseases inGWA scans.7,11,14,31,51,52 The region that we reportassociated in the RGMA region has reasonable coverageof markers in these scans, although rs34925346 markerwas not included in any of the scans, nor wasstratification-based sex performed in all GWA scans.For IL21R, the poor marker coverage in GWA scans in theregion we identified as associated with MS may explainwhy this gene has not associated with autoimmunediseases in GWA studies.
To the best of our knowledge, this is the first evidenceof association of RGMA and IL21R with MS, supportedby data from experimental models. Furthermore, ourdata suggest a new immunomodulatory role of RGMAin neuroinflammatory disease. The IL21R gene can be
placed on the growing list of shared disease genespotentially relevant for the regulation of inflammationand inflammatory diseases in general. Both RGMAand IL21R need reproducibility studies in largermaterials of MS patients, as is ongoing in large GWAstudies. Characterization of RGMA- and IL21R-drivenpathways both experimentally and in human materialmight help in the development of selective therapies andbiomarkers.
Materials and methods
Experimental animalsDark Agouti and Lewis (LEW.1AV1) rats, originallyobtained from the Zentralinstitut fur Versuchstierzucht(Hannover, Germany), and Piebald-Viral-Glaxo(PVG.1AV1) rats from Harlan UK (Blackhon, UK) werebred in the animal facility at the Center for MolecularMedicine at Karolinska Hospital. Advanced intercrossline breeding was established starting with two pairs ofthe major histocompatibility complex-identical DA andPVG.1AV1 female founders, respectively, producing F1
rats. Seven couples of F1 rats with both DA andPVG.1AV1 founders were then used to produce the F2
generation. The G3–G12 generations were created byrandomly mating 50 pairs of rats from the previousgeneration avoiding brother–sister mating. Three litterswith 794 AIL-G10 animals were included in MOG-EAEexperiments and 463 AIL-G12 animals were collectedfrom two litters and included in the PIA experiment.
Breeding of the PVG.LEW-D1Rat270-D1Rat68 con-genic rat strain (here named PVG.LEW congenic) was
Figure 5 Association of rs34925346 in RGMA with multiplesclerosis (MS) among (a) males and (b) females. Fixed effectMantel–Haenszel analysis and Woolf’s test for heterogeneity wereperformed in R using the meta.MH command in the rmeta package,P-values were estimated in Unphased with study group as acovariate.62 The analysis was performed using the frequency of theC allele of rs34925346 in males and females separately. Nosignificant heterogeneity between the study groups was observed.Odds ratio (OR)¼ 1.33 among males (95% confidence interval (CI):1.04–1.69; Po0.006), among females OR¼ 1.04 (95% CI¼ 0.89–1.21).The frequency of this haplotype was 9.7% among male controls. Assex was not available for the Norwegian (NOR) controls, this cohortwas not included in the sex stratified analysis.
Figure 6 Association of rs1801275 in IL4R with multiple sclerosis (MS)in eight patient cohorts. Fixed effect Mantel–Haenszel analysis andWoolf’s test for heterogeneity were performed in R using the meta.MHcommand in the rmeta package. The analysis was performed usingfrequency of the G allele for rs1801275 (also called Q576R and Q551R).The data have been collected from the studies by Suppaih et al.,33
Quirico-Santos et al.,34 and Hackstein et al.48 No significant hetero-geneity between studies was detected. The overall odds ratio (OR) was0.99 (95% confidence interval (CI): 0.91–1.07).
RGMA and IL21RR Nohra et al
9
Genes and Immunity
generated by selective transfer of an approximately63-Mb fragment from LEW.1AV1 (donor strain) intoa background of the major histocompatibility complex-identical PVG.1AV1 (recipient) rat strain. Initially,(PVG.1AV1�LEW.1AV1) F1 rats were backcrossed toPVG.1AV1 females to produce the N2 generation. Ratsfrom the N2 generation were genotyped with 11 markerson chromosome 1 spanning from D1Rat270 to D1Rat68.For each backcross, one male rat containing this fragmentfrom LEW.1AV1 was selected and crossed to two
PVG.1AV1 females. After the tenth generation, ratsheterozygous for the whole region were intercrossed toproduce homozygotes for this region. The congenicstrain, PVG.LEW-D1Rat270-D1Rat68 (N10F1), was usedin all MOG-EAE and in vitro experiments described.
Animals were kept in a pathogen-free and climate-controlled environment in polystyrene cages containingaspen wood shavings with free access to standard rodentchow and water with regulated 12-h light/dark cycles.Rats were continuously tested according to a health-monitoring program at the National Veterinary Institute(Statens Veterinarmedicinska Anstalt) in Uppsala,Sweden. All animal experiments were approved by thelocal ethics committee of Northern Stockholm.
Induction of EAE and clinical evaluationRecombinant rat MOG (rMOG) corresponding to aminoacids 1–125 of the N-terminus was expressed inEscherichia coli and purified to homogeneity by chelatechromatography.53 Rats were anesthetized with isoflur-ane (Forane; Abbott Laboratories, North Chicago, IL,USA) before immunization. In total, 794 AIL-G10 ratswere immunized subcutaneously in the dorsal tail basewith a 200-ml inoculum containing 20 mg rMOG in saline,emulsified 1:1 with incomplete Freund’s adjuvant(Sigma-Aldrich, St Louis, MO, USA). Congenic rats usedin clinical MOG-EAE experiments were age-matchedand were aged between 12 and 20 weeks. Congenic ratsand control rats were immunized using the sameinduction protocol as for AIL rats and complementedwith 20 mg ml�1 of Mycobacterium tuberculosis, strain 37RA (Difco Laboratories, Detroit, MI, USA).
Different rMOG concentrations were used for congenicimmunizations depending on the rMOG batch used forthe particular experiment. Rats in experiments 1 and 2(Table 3) were immunized with the same rMOG batchusing recombinant rMOG in complete Freund’sadjuvant, with the concentrations 150 and 200mg perrat, respectively. Rats used in experiment 4 wereimmunized with a second rMOG batch with 40 mg rMOGin complete Freund’s adjuvant per rat. In experiment 1,we used 60mg rMOG in complete Freund’s adjuvant perrat of a third rMOG batch. A single immunization wasperformed in experiments 1 and 2 as described above.Owing to the variation of potency among different MOGbatches, a boosting of immunization was required for
Table 5 Test of association of MS to IL21R in four differentScandinavian case-control materials
SNP Minor Major Patients Controls p allelicallele allele
MAF n MAF n
test
SWE Irs2107357 A G 14.4 1866 13 2266 0.211rs8060368 T C 36 1960 41.3 2332 0.045rs2214537 C G 43.2 1966 45.5 2384 0.44rs961914 T C 15.7 1798 17.6 2174 0.203rs12934152 C T 21.4 1952 24.3 2336 0.113
SWE IIrs2107357 A G 14.6 2100 13.1 1948 0.16rs8060368 T C 38.7 2174 45.5 1968 0.019rs2214537 C G 45.1 2170 52.6 1964 0.02rs961914 T C 16.6 2166 17 1956 0.817rs12934152 C T 25.2 2164 29.8 1954 0.025
DENrs2107357 A G 11.2 954 13.2 1060 0.174rs8060368 T C 40.7 948 46.9 1050 0.146rs2214537 C G 50.5 936 51.3 1056 0.868rs961914 T C 16.1 910 15.2 1044 0.686rs12934152 C T 25.7 884 29.1 1034 0.275
NORrs2107357 A G 14 1040 14.2 1024 0.937rs8060368 T C 37.9 1044 43.9 1030 0.133rs2214537 C G 47 1042 49.9 1040 0.524rs961914 T C 15.3 1060 17.7 1018 0.259rs12934152 C T 24.6 1062 26 1022 0.621
Abbreviations: DEN, Denmark; MAF, mutation analysis facility;NOR, Norway; SNP, single nucleotide polymorphism; SWE,Sweden.
Table 6 Test of association of IL21R haplotypes to MS in four different Scandinavian case–control materials
Haplotype SWE I SWE II DEN NOR
Frequencypatients
Frequencycontrols
P Frequencypatients
Frequencycontrols
P Frequencypatients
Frequencycontrols
P Frequencypatients
Frequencycontrols
P
GTCCC 17.1 19.4 0.058 19.4 22.6 0.033 20.2 22.5 0.203 19.3 19.8 0.757GCCTT 3.1 3.1 0.997 1.6 2 0.403 2 1.7 0.592 2.6 2.8 0.787GCGTT 10.7 12 0.195 12.5 12.2 0.782 11.7 11.6 0.974 10.7 12.2 0.278GTCCT 7.3 7.2 0.875 7.4 7.7 0.791 7.6 7.4 0.855 7.5 9 0.21GCCCT 3 1.7 0.007 2.7 3.1 0.511 3.1 2.3 0.266 2.5 1.7 0.25GTGCT 2.1 2.6 0.326 1.5 2 0.359 1.7 2.2 0.428 1.3 2.2 0.099ACGCT 14.3 13 0.204 14.4 13 0.287 11.4 13.1 0.234 13.6 13.9 0.863GCGCT 42.4 41.2 0.401 40.5 37.4 0.091 42.5 39.3 0.148 42.7 38.4 0.049
Abbreviations: DEN, Denmark; MS, multiple sclerosis; NOR, Norway; SNP, single nucleotide polymorphism; SWE, Sweden.The markers included in the haplotypes are rs2107357, rs8060368, rs2214537, rs961914, rs12934152.
RGMA and IL21RR Nohra et al
10
Genes and Immunity
disease induction in experiments 3 and 4. Rats wereboosted on day 20 with the same rMOG dose as in theinitial immunization but excluding the M. tuberculosis inthe boosting experiment for an incomplete adjuvant.Animals were monitored daily for clinical EAE signsstarting from day 7 after immunization to day 40following a scoring scale as follows: 0, no clinical signs;1, tail weakness or paralysis; 2, hind leg paraparesis orhemiparesis; 3, hind leg paralysis or hemiparalysis; 4,tetraplegy or moribund and 5, death. Rats were killed ifsevere balance disturbance, weight loss greater than 20%compared with the day of immunization and/or severedisease for more than 1 day were noticed.
Induction of pristane-induced arthritisPristane-induced arthritis experiments were carried outin G12 generation of AIL. Animals aged 120–150 daysreceived one intradermal injection at the dorsal base ofthe tail of 200ml pristane (C19H40; Sigma). The animalswere visually examined every second day, and arthritiswas scored for each paw as follows: 0, no joints affected;1, one type of joint affected (redness and/or swelling);2, two types of joints affected; 3, three types of jointsaffected; and 4, entire paw affected. The types of jointsexamined were peritarsal, intratarsal and ankle joints.Scores were added, yielding a total score for all fourlimbs ranging from 0 to 16. Animals were scored until 72days post-injection. Signs of chronic arthritis wereevaluated from day 40 post-injection, and every 10 daysby comparing paw maps depicturing inflamed jointsat a given time point. Arthritis was classified as chronicwhen new sites of inflammation appeared over time, aspreviously described.54 Other macroscopic phenotypesanalyzed were: incidence, the cumulated number ofaffected rats (scoresX1) over time, divided by all testedrats; severity, the maximal score (1–16) attained by eachaffected rat; day of onset, the first recorded sign of jointinflammation; maximum arthritis, the maximal score(0–16) attained by each tested animal; and cumulative
score of arthritis, the sum of score over time attained byeach tested animal.
Genotyping of the AILs for MOG-EAE and PIA modelsGenomic DNA was extracted from tail/ear tips. Primersfor microsatellite markers (simple sequence lengthpolymorphisms) spanning the 79-Mb region mapped inF2
26 were selected from two genomic databases: the RatGenome Database and Ensembl Genome Browser. Thefollowing 28 simple sequence length polymorphismswere used for genotyping AIL both in G10 and G12:D1Rat217, D1Got101, D1Rat269, D1Rat200, D1Mit137,D1Rat321, D1Rat37, D1Rat270, D1Rat183, D1Rat41,D1Rat209, D1Rat273, D1Rat131, D1Rat158, D1Rat51,D1Rat139, D1Rat437, D1Rat155, D1Rat193, D1Rat66,D1Rat65, D1Got334, D1Arb19, D1Mit13, D1Rat287,D1Rat110, D1Got170 and D1Rat68. Forward primersfluorescently labeled with VIC, NED, PET (purchasedfrom Applied Biosystems, Foster City, CA, USA) reverseprimers and 6-FAM-labeled forward primers (Proligo,Paris, France) were amplified by PCR according to astandard protocol. The PCR products were separatedusing the capillary electrophoresis sequencer (ABI3730)and analyzed using the GeneMapper v3.7 software(Applied Biosystems).
Linkage analysis and statistical analysis of AIL and congenicexperimentsLinkage analysis with interval mapping of rat chromo-some one was performed on data obtained from theMOG-EAE experiment in AIL-G10 rats and PIA experi-ment in AIL-G12 rats, respectively, using R/qtl softwareversion 2.5.1.55 Interval-mapping analysis was performedby implementation of the Haley–Knott regression modelto identify QTL of main effect.55 Two-dimensional scanswith a two-QTL model were used to identify epistaticQTL. Finally, a fit multiple-QTL model test wasperformed, providing information regarding the interac-tion of both an additive and epistatic character between
Figure 7 Association of rs8060368–rs2214537–rs961914–rs12934152 haplotypes in IL21R with multiple sclerosis (MS) in four Scandinaviancase–control studies. Fixed effect Mantel–Haenszel analysis and Woolf’s test for heterogeneity were performed in R using the meta.MHcommand in the rmeta package. P-values for overall association is from a joint association test in Unphased v3.0.13 using study cohort as acovariate.62 No significant heterogeneity between the study groups was observed. The haplotype frequencies among controls are given inthe figure. (a) CGCT haplotype. P-value for association¼ 0.0009. Odds ratio (OR): 1.14 (95% confidence interval (CI)¼ 1.06–1.23). (b) TCCChaplotype. P-value for association¼ 0.004. OR¼ 0.87 (95% CI¼ 0.80–0.96). (c) TGCT haplotype. P-value for association: 0.004. OR¼ 0.68(95% CI¼ 0.51–0.90). Danish cohort was not included as the haplotype frequency is less than 1% in this cohort.
RGMA and IL21RR Nohra et al
11
Genes and Immunity
two loci by making an association between all pairs ofmarkers and inter-marker positions along the investi-gated region of a chromosome. We constructed a fitmodel to confirm the linkage to Eae30 and Eae31 and theobserved interactive intQTL using the following formulaof variance in R/qtl software: y BEae30þ intQTLþEae31þEae30: intQTL. On dropping the effect of eachQTL and the interaction at a time, an impact of theparticular QTL is determined.
Permutation analysis could not be used for thedetermination of significance levels due to the structureof the AIL. Therefore, a residual threshold approach,in which each animal’s value for a phenotype wassubtracted from the mean value of this particularphenotype for the family of origin, was applied.Confidence intervals in linkage studies have previouslybeen defined by a 1-LOD (logarithm of the odds) dropfrom the peak marker in a quantitative trait locus.56
In our case, we applied a more stringent confidenceinterval of 2-LOD drop from respective peak marker toinsure a full coverage of potential candidate genes, ascompared to the previously suggested 1.8-LOD drop forintercrosses.57
Data for ELISA, expression analysis and differences incumulative and maximum EAE scores in the EAEexperiments were analyzed using Kruskal–Wallis andMann–Whitney ranking tests (JMP, version 7, SASInstitute, Cary, NC, USA). The binomial clinical EAEphenotypes, that is, EAE incidence and mortality,were analyzed using Fisher’s exact test. The thresholdsfor statistical significance were set as follows:*P-valuep0.05; **P-valuep0.01; ***P-valuep0.001.
Anti-MOG antibody measurementLevels of MOG antibodies, IgG1, IgG2b and total IgGwere determined by ELISA in blood sera from rats ofAIL-G10 collected on day 12 post immunization withMOG. The 96-well ELISA plates (Nunc, Roskilde, Den-mark) were coated with 10mg ml�1 of rMOG (100 ml perwell) overnight at 4 1C and then washed with phosphatebuffered saline/0.05% Tween 20. A solution of 5% fat-free milk in phosphate buffered saline/0.05% Tween 20was used to block free binding sites in the ELISA platesfor 1 h at room temperature. The diluted blood sera andcontrol sera, previously determined from pilot studies ascontaining high concentration of respective isotype to beused for standard curves, were added after washing andincubated for 1 h at room temperature. An additionalwash was performed before incubation of rabbit anti-ratIgG (1:2000), IgG1 (1:1000) or IgG2b (1:2000) (Nordic,Tilburg, The Netherlands) for 1 h at room temperature.Unbound antibodies were washed away and platesincubated with peroxidase-conjugated goat anti-rabbitantiserum (Nordic) (1:10000) for 30 min at roomtemperature. A final wash was carried out beforevisualizing the bound antibodies with 3,30,5,50-tetra-methylbenzidine (Sigma). Reactions were stopped byincubation with 1 M HCl for 15 min in darkness andoptical density was read at 450 nm.
Stimulation of peripheral blood mononuclear cells with LPSBlood samples from rat-tail tips were collected in lithiumHeparin Microtainer tubes (Falcon; Becton-Dickinson,Franklin Lakes, NJ, USA). Stimulation with LPS wasthen performed as reported previously.26 Supernatants
from whole blood stimulations were collected after 18 hand stored at �70 1C. Protein quantifications for TNF andIL-6 were performed using ELISA.
Protein quantificationWe used commercially available ELISA kits for TNF(Eli-pair, Biosite, San Diego, CA, USA) and IL-6(Biosource, Camarillo, CA, USA) protein quantifications.For TNF ELISA, 96-well flat-bottom ELISA plates (Nunc)were coated overnight at 4 1C with a capture anti-TNFantibody and saturated with phosphate buffered saline/5% bovine serum albumin. Pre-coated and saturatedplates were used to measure rat IL-6 protein levels.Assays were performed according to manufacturers’recommendation. Cytokine levels from supernatants ofnon-stimulated samples were below detectable levels inall ELISA assays.
MS patients and healthy controls for association studiesThe first Swedish multiple sclerosis case–control study(SWE I) consisted of 1018 MS patients (84% females) and1215 blood donor controls (63% females), all originatingfrom Sweden or other Nordic countries. The patientsfulfilled the McDonald criteria58 for definite multiplesclerosis and were recruited by neurologists at theKarolinska University Hospital Huddinge and Solnasites in Stockholm, Sweden. The patients were between22 and 91 years of age (median: 53 years) and the controlswere between 21 and 76 years (median: 47 years). Forfurther details see the study by Roos et al.59
In a follow-up study, three new cohorts were usedfrom Sweden, Norway and Denmark. The secondSwedish case–controls study (SWE II) consisted of 705newly diagnosed MS patients and 663 age- and sex-matched controls from Sweden, and additional 588 MScases. The median age at onset for the SWE II cases was31.5 years with a range of 11–64 years of age; median ageat sampling was 37 years. About 67% of the SWE II casesand 77% of the controls were female.
The Norwegian cohort (NOR) of 548 MS patients (72%females) and 554 blood donor controls (54% females) hada median age of 54 years (range 22–90 years) and 46.6years for the blood donor controls (range: 34–58 years).
The Danish cohort (DEN) consisted of 512 MS patients(56% females) between 20 and 80 years of age (median:43 years), and 553 blood donor controls (39% females)between 20 and 78 years of age (median: 40 years).
Oral and/or written consent was given by allindividuals involved in the study. All human experi-ments were approved by the local ethics committees ofStockholm, Denmark and Norway.
Haplotype taggingTagging SNPs (tSNPs) were identified using genotypesavailable at the HapMap database on Caucasian familiesfor SNPs covering the investigated genes. We usedTAGGER in Haploview v3.32 for identifying tSNPs withr2X0.8 and allowing aggressive two and three marker
tagging. A total of 97 tSNPs were used for the mappingof RGMA (36 tSNPs), IL4R (25 tSNPs) and IL21R (36tSNPs) in SWE I. In addition, nine markers were selectedin regions in which there were large gaps between themarkers in the HapMap data, and in which there did notseem to be strong linkage disequilibrium. Furthermore,two non-synonymous SNPs or markers in potential
RGMA and IL21RR Nohra et al
12
Genes and Immunity
transcription binding sites, as judged by an analysisusing the RAVEN program, were included. For a total of14 markers our genotype assay did not work or was ofpoor quality (success rate o80% or did not followHardy–Weinberg equilibrium; Po0.01). Thus, 36 markersin RGMA, 24 markers in IL4R and 32 markers in IL21Rwere analyzed in the SWE I material (see SupplementaryTable S1 and Supplementary Figure 1). The follow-upstudies in SWE II, NOR and DAN were only genotypedwith the associated tSNPs from SWE I screening,either through single marker association or haplotypeassociations. The RGMA region was genotypedwith rs1881842, rs34925346, rs997941, rs6497019, rs105-20720 and rs725458. The IL4R region was mapped withrs2234897, rs1805011, rs2234900, rs1805015, rs1801275and rs12102586, whereas IL21R was mapped withrs2107357, 8060368, rs2214537, rs961914 and rs12934152.
Genotyping of the human materialGenotyping of the SWE I cohort took place at theMutation Analysis Facility, Karolinska Institutet, on aSequenom MassARRAY SNP Genotyping Platform thatuses matrix-assisted laser desorption/ionization time-of-flight60 for detection of allelic variants. Extension assayswere based on the IPLEX technique. Primer sequencesare available upon request, for further details regardingthe genotyping see the study by Roos et al.59 A total of92 out of 106 initially considered SNPs passed qualitycontrol. The quality control requirements were Hardy–Weinberg P40.01 and success rate 480%. The genotyp-ing was further validated using a set of 14 trio families(42 individuals) with genotype data available throughthe HapMap consortium; concordance analysis with theHapMap data (97.7% concordance). The follow-upstudies on SWE II, NOR and DEN were genotypedwith TaqMan SNP genotyping assays using a 7900 HTFast Real-time PCR system (Applied Biosystems), aspreviously described.61 The rs2234900 assay could notbe designed for TaqMan and was thus replacedwith rs1805011, a nearby SNP in complete linkagedisequilibrium.
Association analysis and genotype-expression correlationsDifferences in allele frequencies between MS patientsand controls were tested through single marker associa-tion analysis using the model commands in PLINK v1.04. Haplotype association analyses in blocks with highlinkage disequilibrium were performed in Haploview3.32. A joint meta-analysis test of association for all testedMS populations with the study cohort, as a covariatein Unphased62 was performed using the softwareUnphased v3.0.13. Evidence of association was alsoconfirmed in Unphased and the software PLINK v1.04(for the haplotype analysis) resulting in similar results.
Differences in expression levels between carriers ofdifferent alleles were assessed in Unphased programafter transformation, if necessary, to achieve normaldistribution of the expression levels. Association be-tween haplotypes and expression levels was analyzed inthe haplo.stats package in R using an additive model.Correlation between single marker alleles and expressionlevels was also confirmed in GraphPad Prism softwareVersion 5.01 using a non-parametric Mann–Whitney test.
Preparation of PBMCs and CSF cellsPeripheral blood from patients with MS (n¼ 370; meanage: 39 years; range: 16–77 years; 68.1% females and31.9% males; 94% with and 6% without IgG oligoclonalbands in CSF) and individuals with other neurologicaldiseases (n¼ 90; mean age: 39 years; 72.2% females and27.8% males; all without IgG oligoclonal bands in CSF)were used for our expression studies. Paired CSF cellsfrom MS (n¼ 322; mean age: 39 years; range: 16–77 years;71.1% females and 28.9% males; 94% with and 6%without IgG oligoclonal bands in CSF) and otherneurological diseases (n¼ 74; mean age: 39 years; 68.9%females and 31.1% males; all without IgG oligoclonalbands in CSF) were also included. All MS patientsfulfilled the McDonald criteria. The CSF was collected insiliconized glass tubes or polypropylene tubes, andimmediately centrifuged to recover the pellet and storedat �80 1C until use for RNA preparation. The peripheralblood was sampled in sodium citrate-containing cellpreparation tubes (Vacutainer CPT, Becton-Dickinson).Peripheral blood mononuclear cells were separated bydensity gradient centrifugation. Cells from the inter-phase were collected and washed twice with phosphatebuffered saline. More than 95% of the cells were viable.Finally, cells were pelleted, frozen on dry ice and storedat �80 1C until use. All human experiments wereapproved by the local ethics committee of NorthernStockholm.
Relative quantification of mRNA by real-timequantitative PCRTotal RNA was extracted from cell pellets using PicoPureRNA isolation kit (Arcturus Bioscience, Mount View, CA,USA) according to the manufacturer’s instructions. Sam-ples were treated for 15 min with DNase (Qiagen Rnase-free DNase set, Hilden, Germany) to eliminate contamina-tion of genomic DNA. Preparation of complementaryDNA was carried out with 10ml of total RNA, randomhexamer primers (0.1mg; Gibco BRL, Life Technologies,Taby, Sweden) and Superscript Reverse Transcriptase(200 U; Gibco BRL). Quantitative analysis of messengerRNA expression was performed with iQSYBR greenSupermix (Bio-Rad Laboratories, Hercules, CA, USA)using the iCycler thermal cycler, iQ5 Real-Time PCRdetection system. We used Beacon Designer 6.0 software(PREMIER Biosoft International, Palo Alto, CA, USA) todesign the primers for glyceraldehyde-3-phosphate dehy-drogenase, TNF, IFN-g and IL-6 (primer sequences andPCR protocols can be provided on request). Sequencing ofthe different bands (Cybergene AB, Huddinge, Sweden)confirmed homology with the reported sequences for thehuman genes. Relative quantification of messenger RNAwas calculated by the standard curve method using theBio-Rad iQ5 Optical System Software Version 2.0 withendogenous glyceraldehyde-3-phosphate dehydrogenaseas a background expression control. The standard curveswere created using five serial dilutions (1:10, 1:102, 1:103,1:104 and 1:105) of either tested amplicons for each targetor complementary DNA from human blood cells stimu-lated with ConA.
Estimation of the false positive report probabilityWe have estimated the probability that the associationbetween MS and Eae30 and Eae31 is false by estimatingthe FPRP as suggested by Wacholder et al.63 The FPRP
RGMA and IL21RR Nohra et al
13
Genes and Immunity
depends on the prior probability of association, thepower of the study and the significance threshold:
FPRP ¼ 1=ð1 þ posterior odds for true associationÞ
Posterior odds for true association¼ prior odds�power=significance threshold
The estimation of these measures is given in theSupplementary Information.
Conflict of interest
The authors declare no conflict of interest.
Acknowledgements
This study was supported by grants from the SwedishResearch council; the Swedish foundation for neuro-logically handicapped (NHR), Bibbi and Nils JensensFoundation, Montel Williams Foundation, SoderbergsFoundation, the fp 6 EU programs Neuropromise(LSHM-CT-2005-018637 and Euratools (LSHG-CT-2005-019015). The Norwegian part of the study was supportedby Norwegian Foundation for Health and Rehabilitation(2004/2/0125) and Odd Fellow MS society, Norway. TheNorwegian Bone Marrow Donor Registry is thanked forits collaboration in the establishment of the Norwegiancontrol material.
References
1 Ebers GC. Environmental factors and multiple sclerosis. LancetNeurol 2008; 7: 268–277.
2 Chao MJ, Barnardo MC, Lincoln MR, Ramagopalan SV,Herrera BM, Dyment DA et al. HLA class I alleles tag HLA-DRB1*1501 haplotypes for differential risk in multiplesclerosis susceptibility. Proc Natl Acad Sci U S A 2008; 105:13069–13074.
3 Lincoln MR, Montpetit A, Cader MZ, Saarela J, Dyment DA,Tiislar M et al. A predominant role for the HLA class II regionin the association of the MHC region with multiple sclerosis.Nat Genet 2005; 37: 1108–1112.
4 Olerup O, Hillert J. HLA class II-associated genetic suscept-ibility in multiple sclerosis: a critical evaluation. TissueAntigens 1991; 38: 1–15.
5 Olsson T, Hillert J. The genetics of multiple sclerosis and itsexperimental models. Curr Opin Neurol 2008; 21: 255–260.
6 Sawcer S. The complex genetics of multiple sclerosis: pitfallsand prospects. Brain 2008; 131(Part 12): 3118–3131.
7 Hafler DA, Compston A, Sawcer S, Lander ES, Daly MJ, DeJager PL et al. Risk alleles for multiple sclerosis identified by agenomewide study. N Engl J Med 2007; 357: 851–862.
8 Lundmark F, Duvefelt K, Iacobaeus E, Kockum I, Wallstrom E,Khademi M et al. Variation in interleukin 7 receptor alphachain (IL7R) influences risk of multiple sclerosis. Nat Genet2007; 39: 1108–1113.
9 Weber F, Fontaine B, Cournu-Rebeix I, Kroner A, Knop M,Lutz S et al. IL2RA and IL7RA genes confer susceptibility formultiple sclerosis in two independent European populations.Genes Immun 2008; 9: 259–263.
10 International Multiple Sclerosis Genetics Consortium(IMSGC). Refining genetic associations in multiple sclerosis.Lancet Neurol 2008; 7: 567–569.
11 Australia New Zealand Multiple Sclerosis Genetics Consor-tium (ANZgene). Genome-wide association study identifies
new multiple sclerosis susceptibility loci on chromosomes 12and 20. Nat Genet 2009; 41: 824–828.
12 International Multiple Sclerosis Genetics Consortium(IMSGC). The expanding genetic overlap between multiplesclerosis and type I diabetes. Genes Immun 2009; 10: 11–14.
13 Rubio JP, Stankovich J, Field J, Tubridy N, Marriott M,Chapman C et al. Replication of KIAA0350, IL2RA, RPL5and CD58 as multiple sclerosis susceptibility genes inAustralians. Genes Immun 2008; 9: 624–630.
14 De Jager PL, Jia X, Wang J, de Bakker PI, Ottoboni L, AggarwalNT et al. Meta-analysis of genome scans and replicationidentify CD6, IRF8 and TNFRSF1A as new multiple sclerosissusceptibility loci. Nat Genet 2009; 41: 776–782.
15 Vyse TJ, Todd JA. Genetic analysis of autoimmune disease.Cell 1996; 85: 311–318.
16 Jagodic M, Kornek B, Weissert R, Lassmann H, Olsson T,Dahlman I. Congenic mapping confirms a locus on ratchromosome 10 conferring strong protection against myelinoligodendrocyte glycoprotein-induced experimental autoim-mune encephalomyelitis. Immunogenetics 2001; 53: 410–415.
17 Aitman TJ, Critser JK, Cuppen E, Dominiczak A, Fernandez-Suarez XM, Flint J et al. Progress and prospects in rat genetics:a community view. Nat Genet 2008; 40: 516–522.
18 Steinman L. Assessment of animal models for MS anddemyelinating disease in the design of rational therapy.Neuron 1999; 24: 511–514.
19 Weissert R, Wallstrom E, Storch MK, Stefferl A, Lorentzen J,Lassmann H et al. MHC haplotype-dependent regulation ofMOG-induced EAE in rats. J Clin Invest 1998; 102: 1265–1273.
20 Issazadeh S, Lorentzen JC, Mustafa MI, Hojeberg B, MussenerA, Olsson T. Cytokines in relapsing experimental autoimmuneencephalomyelitis in DA rats: persistent mRNA expression ofproinflammatory cytokines and absent expression of inter-leukin-10 and transforming growth factor-beta. J Neuro-immunol 1996; 69: 103–115.
21 Olsson T, Zhi WW, Hojeberg B, Kostulas V, Jiang YP, AndersonG et al. Autoreactive T lymphocytes in multiple sclerosisdetermined by antigen-induced secretion of interferon-gam-ma. J Clin Invest 1990; 86: 981–985.
22 Olsson T. Cytokine-producing cells in experimental auto-immune encephalomyelitis and multiple sclerosis. Neurology1995; 45: S11–S15.
23 Olofsson P, Nordquist N, Vingsbo-Lundberg C, Larsson A,Falkenberg C, Pettersson U et al. Genetic links between theacute-phase response and arthritis development in rats.Arthritis Rheum 2002; 46: 259–268.
24 Arnett FC, Edworthy SM, Bloch DA, McShane DJ, Fries JF,Cooper NS et al. The American Rheumatism Association 1987revised criteria for the classification of rheumatoid arthritis.Arthritis Rheum 1988; 31: 315–324.
25 Vingsbo-Lundberg C, Nordquist N, Olofsson P, Sundvall M,Saxne T, Pettersson U et al. Genetic control of arthritis onset,severity and chronicity in a model for rheumatoid arthritis inrats. Nat Genet 1998; 20: 401–404.
26 Xu H, Wallstrom E, Becanovic K, Dahlman I, Lorentzen JC.Identification of rat quantitative trait loci that regulateLPS-induced pro-inflammatory cytokine responses. ScandJ Immunol 2002; 56: 248–253.
27 Bergsteinsdottir K, Yang HT, Pettersson U, Holmdahl R.Evidence for common autoimmune disease genes controllingonset, severity, and chronicity based on experimental modelsfor multiple sclerosis and rheumatoid arthritis. J Immunol2000; 164: 1564–1568.
28 Lu S, Nordquist N, Holmberg J, Olofsson P, Pettersson U,Holmdahl R. Both common and unique susceptibility genes indifferent rat strains with pristane-induced arthritis. Eur J HumGenet 2002; 10: 475–483.
29 Jagodic M, Becanovic K, Sheng JR, Wu X, Backdahl L,Lorentzen JC et al. An advanced intercross line resolves Eae18into two narrow quantitative trait loci syntenic to multiplesclerosis candidate loci. J Immunol 2004; 173: 1366–1373.
RGMA and IL21RR Nohra et al
14
Genes and Immunity

30 Zou GY. On the estimation of additive interaction by use of thefour-by-two table and beyond. Am J Epidemiol 2008; 168: 212–224.
31 Wellcome Trust Case Control Consortium. Genome-wideassociation study of 14,000 cases of seven common diseasesand 3,000 shared controls. Nature 2007; 447: 661–678.
32 Mirel DB, Barcellos LF, Wang J, Hauser SL, Oksenberg JR,Erlich HA. Analysis of IL4R haplotypes in predisposition tomultiple sclerosis. Genes Immun 2004; 5: 138–141.
33 Suppiah V, Goris A, Alloza I, Heggarty S, Dubois B, Carton Het al. Polymorphisms in the interleukin-4 and IL-4 receptorgenes and multiple sclerosis: a study in Spanish-Basque,Northern Irish and Belgian populations. Int J Immunogenet2005; 32: 383–388.
34 Quirico-Santos T, Suppiah V, Heggarty S, Caetano R, Alves-Leon S, Vandenbroeck K. Study of polymorphisms in theinterleukin-4 and IL-4 receptor genes in a population ofBrazilian patients with multiple sclerosis. Arq Neuropsiquiatr2007; 65: 15–19.
35 Monnier PP, Sierra A, Macchi P, Deitinghoff L, Andersen JS,Mann M et al. RGM is a repulsive guidance molecule forretinal axons. Nature 2002; 419: 392–395.
36 Matsunaga E, Chedotal A. Repulsive guidance molecule/neogenin: a novel ligand-receptor system playing multipleroles in neural development. Dev Growth Differ 2004; 46:481–486.
37 Matsunaga E, Nakamura H, Chedotal A. Repulsive guidancemolecule plays multiple roles in neuronal differentiation andaxon guidance. J Neurosci 2006; 26: 6082–6088.
38 Yamashita T, Mueller BK, Hata K. Neogenin and repulsiveguidance molecule signaling in the central nervous system.Curr Opin Neurobiol 2007; 17: 29–34.
39 De Vries M, Cooper HM. Emerging roles for neogenin andits ligands in CNS development. J Neurochem 2008; 106:1483–1492.
40 Schwab JM, Monnier PP, Schluesener HJ, Conrad S, Beschor-ner R, Chen L et al. Central nervous system injury-inducedrepulsive guidance molecule expression in the adult humanbrain. Arch Neurol 2005; 62: 1561–1568.
41 Gracie JA, Bradley JA. Interleukin-12 induces interferon-gamma-dependent switching of IgG alloantibody subclass.Eur J Immunol 1996; 26: 1217–1221.
42 Hata K, Fujitani M, Yasuda Y, Doya H, Saito T, Yamagishi Set al. RGMa inhibition promotes axonal growth and recoveryafter spinal cord injury. J Cell Biol 2006; 173: 47–58.
43 Conrad S, Genth H, Hofmann F, Just I, Skutella T. Neogenin-RGMa signaling at the growth cone is bone morphogeneticprotein-independent and involves RhoA, ROCK, and PKC.J Biol Chem 2007; 282: 16423–16433.
44 Kubo T, Endo M, Hata K, Taniguchi J, Kitajo K, Tomura S et al.Myosin IIA is required for neurite outgrowth inhibitionproduced by repulsive guidance molecule. J Neurochem 2008;105: 113–126.
45 Paintlia AS, Paintlia MK, Singh AK, Singh I. Inhibition of rhofamily functions by lovastatin promotes myelin repair inameliorating experimental autoimmune encephalomyelitis.Mol Pharmacol 2008; 73: 1381–1393.
46 Walters CE, Pryce G, Hankey DJ, Sebti SM, Hamilton AD,Baker D et al. Inhibition of Rho GTPases with proteinprenyltransferase inhibitors prevents leukocyte recruitmentto the central nervous system and attenuates clinical signs ofdisease in an animal model of multiple sclerosis. J Immunol2002; 168: 4087–4094.
47 Zhang Z, Schittenhelm J, Meyermann R, Schluesener HJ.Lesional accumulation of RhoA(+) cells in brains of experi-mental autoimmune encephalomyelitis and multiple sclerosis.Neuropathol Appl Neurobiol 2008; 34: 231–240.
48 Hackstein H, Bitsch A, Bohnert A, Hofmann H, Weber F, OhlyA et al. Analysis of interleukin-4 receptor alpha chain variantsin multiple sclerosis. J Neuroimmunol 2001; 113: 240–248.
49 Webb R, Merrill JT, Kelly JA, Sestak A, Kaufman KM,Langefeld CD et al. A polymorphism within IL21R confersrisk for systemic lupus erythematosus. Arthritis Rheum 2009;60: 2402–2407.
50 Spolski R, Leonard WJ. Interleukin-21: Basic biology andimplications for cancer and autoimmunity. Annual Review ofImmunology 2008; 26: 57–79.
51 Plenge RM, Seielstad M, Padyukov L, Lee AT, Remmers EF,Ding B et al. TRAF1-C5 as a risk locus for rheumatoidarthritis—a genomewide study. N Engl J Med 2007; 357:1199–1209.
52 Baranzini SE, Wang J, Gibson RA, Galwey N, Naegelin Y,Barkhof F et al. Genome-wide association analysis of suscept-ibility and clinical phenotype in multiple sclerosis. Hum MolGenet 2009; 18: 767–778.
53 Amor S, Groome N, Linington C, Morris MM, Dornmair K,Gardinier MV et al. Identification of epitopes of myelinoligodendrocyte glycoprotein for the induction of experimen-tal allergic encephalomyelitis in SJL and Biozzi AB/H mice.J Immunol 1994; 153: 4349–4356.
54 Carlson BC, Jansson AM, Larsson A, Bucht A, Lorentzen JC.The endogenous adjuvant squalene can induce a chronicT-cell-mediated arthritis in rats. Am J Pathol 2000; 156:2057–2065.
55 Broman KW, Wu H, Sen S, Churchill GA. R/qtl: QTL mappingin experimental crosses. Bioinformatics 2003; 19: 889–890.
56 Lander ES, Botstein D. Mapping mendelian factors underlyingquantitative traits using RFLP linkage maps. Genetics 1989;121: 185–199.
57 Manichaikul A, Dupuis J, Sen S, Broman KW. Poor perfor-mance of bootstrap confidence intervals for the location of aquantitative trait locus. Genetics 2006; 174: 481–489.
58 McDonald WI, Compston A, Edan G, Goodkin D,Hartung HP, Lublin FD et al. Recommended diagnostic criteriafor multiple sclerosis: guidelines from the International Panelon the diagnosis of multiple sclerosis. Ann Neurol 2001; 50:121–127.
59 Roos IM, Kockum I, Hillert J. The interleukin 23 receptor genein multiple sclerosis: a case-control study. J Neuroimmunol2008; 194: 173–180.
60 Isler JA, Vesterqvist OE, Burczynski ME. Analytical validationof genotyping assays in the biomarker laboratory. Pharmaco-genomics 2007; 8: 353–368.
61 Ekelund E, Saaf A, Tengvall-Linder M, Melen E, Link J, BarkerJ et al. Elevated expression and genetic association links theSOCS3 gene to atopic dermatitis. Am J Hum Genet 2006; 78:1060–1065.
62 Dudbridge F. Likelihood-based association analysis for nucle-ar families and unrelated subjects with missing genotype data.Hum Hered 2008; 66: 87–98.
63 Wacholder S, Chanock S, Garcia-Closas M, El Ghormli L,Rothman N. Assessing the probability that a positive report isfalse: an approach for molecular epidemiology studies. J NatlCancer Inst 2004; 96: 434–442.
Supplementary Information accompanies the paper on Genes and Immunity website (http://www.nature.com/gene)
RGMA and IL21RR Nohra et al
15
Genes and Immunity