Revisionary Test Paper_Final_Syllabus 2012_Jun2014 - ICmai
76
Revisionary Test Paper_Final_Syllabus 2012_Jun2014 Academics Department, The Institute of Cost Accountants of India (Statutory Body under an Act of Parliament) Page 1 Paper 15 - Business Strategy & Strategic Cost Management Section A – Business Strategy 1. G is a multinational company that designs, manufactures and sells consumer electronic products, such as portable media players (PMP), tablet computers (TAB), smartphones, personal computers (PC) and computer software packages. G has its own retail outlets and also sells its products in other stores as well as online. The G brand and logo is recognised internationally and G has successfully applied a brand extension strategy for a number of years. Every time G launches a new product it publicises this widely to generate a high degree of enthusiasm amongst the public and its potential customers. G‘s product launches are highly effective: thousands of customers queue outside the stores, some even camping outside for several days, just to experience a product launch by G. Customers perceive G‘s products to offer higher value than those marketed by its competitors, but they are also more expensive. This has proved to be a highly profitable strategy to date for G and has been difficult for competitors to copy. G is organised into four strategic business units (SBU‘s), each responsible for a particular product group. The PC SBU - G was one of the first developers of personal computers in the 1980s and its unique software and quality design was popular with early PC customers. G‘s first product was the G PC with its own unique software and operating system. Despite G‘s early success in the PC market, it has failed to maintain its market share in recent years. PCs with software developed and sold by G‘s main rivals now dominate the PC market. However, the PC market is highly profitable and has huge potential for growth but competition is intense. The PMP SBU - The G PMP products have experienced massive growth in the market but now sales are stagnant and predicted to decline. The PMP‘s can be used as external data storage devices and through the use of G‘s own developed software, can be used to transfer music, photos an d games. G continuously rolls - out extension strategies, updating its PMP products with more features, colours, larger memory and faster processors. The cumulative effect is that these updates have increased the life cycle of its PMP products and its long-term sales potential, beyond that forecast a few years ago. G‘s PMP products have a high share of the PMP market and are popular amongst a wide range of customers. The Smartphone SBU -The G smartphone products include all of the features that the G PMP products have as well as telephone technology. G‘s retail outlets are becoming more and more focussed on its G smartphone customers and potential new customers. The smartphone products also have a high market share and are growing in popularity. The TAB SBU - The G TAB has a high share of the rapidly growing tablet computer market. However, the G TAB is beginning to lose its initial high market share advantage as other manufacturers have launched their own tablet products with increasingly sophisticated features. G recognises that the combination of its overall competitive strategy and the strength of its brand must be maintained across its business portfolio in order to maintain and grow its market share. Required (a) Explain the benefits of a 'brand extension strategy' for G. Your answer should include a definition of the term 'brand extension'.
-
Upload
khangminh22 -
Category
Documents
-
view
2 -
download
0
Transcript of Revisionary Test Paper_Final_Syllabus 2012_Jun2014 - ICmai

Revisionary Test Paper_Final_Syllabus 2012_Jun2014
Academics Department, The Institute of Cost Accountants of India (Statutory Body under an Act of Parliament) Page 1
Paper 15 - Business Strategy & Strategic Cost Management
Section A – Business Strategy
1. G is a multinational company that designs, manufactures and sells consumer electronic
products, such as portable media players (PMP), tablet computers (TAB), smartphones, personal
computers (PC) and computer software packages.
G has its own retail outlets and also sells its products in other stores as well as online. The G brand
and logo is recognised internationally and G has successfully applied a brand extension strategy
for a number of years. Every time G launches a new product it publicises this widely to generate a
high degree of enthusiasm amongst the public and its potential customers. G‘s product launches
are highly effective: thousands of customers queue outside the stores, some even camping
outside for several days, just to experience a product launch by G. Customers perceive G‘s
products to offer higher value than those marketed by its competitors, but they are also more
expensive. This has proved to be a highly profitable strategy to date for G and has been difficult for
competitors to copy.
G is organised into four strategic business units (SBU‘s), each responsible for a particular product
group.
The PC SBU - G was one of the first developers of personal computers in the 1980s and its unique
software and quality design was popular with early PC customers. G‘s first product was the G PC
with its own unique software and operating system. Despite G‘s early success in the PC market, it
has failed to maintain its market share in recent years. PCs with software developed and sold by
G‘s main rivals now dominate the PC market. However, the PC market is highly profitable and has
huge potential for growth but competition is intense.
The PMP SBU - The G PMP products have experienced massive growth in the market but now sales
are stagnant and predicted to decline. The PMP‘s can be used as external data storage devices
and through the use of G‘s own developed software, can be used to transfer music, photos and
games. G continuously rolls - out extension strategies, updating its PMP products with more
features, colours, larger memory and faster processors. The cumulative effect is that these updates
have increased the life cycle of its PMP products and its long-term sales potential, beyond that
forecast a few years ago. G‘s PMP products have a high share of the PMP market and are popular
amongst a wide range of customers.
The Smartphone SBU -The G smartphone products include all of the features that the G PMP
products have as well as telephone technology. G‘s retail outlets are becoming more and more
focussed on its G smartphone customers and potential new customers. The smartphone products
also have a high market share and are growing in popularity.
The TAB SBU - The G TAB has a high share of the rapidly growing tablet computer market. However,
the G TAB is beginning to lose its initial high market share advantage as other manufacturers have
launched their own tablet products with increasingly sophisticated features. G recognises that the
combination of its overall competitive strategy and the strength of its brand must be maintained
across its business portfolio in order to maintain and grow its market share.
Required
(a) Explain the benefits of a 'brand extension strategy' for G. Your answer should include a
definition of the term 'brand extension'.

Revisionary Test Paper_Final_Syllabus 2012_Jun2014
Academics Department, The Institute of Cost Accountants of India (Statutory Body under an Act of Parliament) Page 2
(b) Evaluate G's separate product SBUs, using the Boston Consulting Group Growth/Share
Matrix.
(c) Discuss the impact that G's generic competitive strategy has had on the management of
its product portfolio.
Answer.
(a) G's brand would be expected to have three elements:
•A name and a logo that is the G name and associated logo;
• A colour scheme associated with G;
• Associated attributes and benefits of the brand, such as high quality and unique product
features.
A brand extension strategy refers to where an existing and recognised brand is applied to
products across a wider portfolio, as G has successfully done with its PMPs, smartphones, PCs and
tabs.
The same G logo and features have been used for all of these products to associate them all with
the same overall G brand and brand features.
The benefits to G of following a brand extension strategy are that firstly, the products become
associated with each other and a clear identity is formed, with which customers can identify and
is easily recognisable.
Secondly, when a new product is launched, the product will have an immediate advantage as
customers will feel an instant familiarity with it.
Thirdly, it is an excellent marketing tool for G as the logo is associated with the whole range of
products and customers who have purchased one product are likely to be instantly attracted to
another product within the brand when it is launched.
Therefore, existing customers will have brand loyalty and will be attracted to newly launched
electronic products.
This reduces the marketing and branding costs required to bring new products to the market.
The assumption will be that they will be of equal or better quality and will be innovative products
of the standard expected of that brand.
Brand loyalty could help G to win back customers in the lucrative PC market, as for example wners
of tablets might want a compatible PC under the same brand umbrella.
(b) Relative Market Share
High Low
High
Low
G PMP: High MS Low MG = Cash cow
Stars
TAB
Smartphone
Question mark
PC
Cash cow
PMP
Dog
None
Ma
rke
t G
row
th

Revisionary Test Paper_Final_Syllabus 2012_Jun2014
Academics Department, The Institute of Cost Accountants of India (Statutory Body under an Act of Parliament) Page 3
The PMP is a highly popular product that has enjoyed massive growth and is in a mature market
with an increased life cycle.
The PMP is cash generating with no massive investment required, with the forecast of long-term
sales potential following recent updates and increased features.
To increase the life of the PMP will require further brand extension strategies, which have been
successful in the past.
The cash generated by the PMP products can be used to develop and launch other G
branded products.
This could be particularly important to support the smartphone as a direct follow on.
G Smartphone: High MS High MG = Star
The smartphone has a good market share in a growing market.
However, G needs to invest further in the smartphone if it is to continue growth and retain
market position.
The smartphone is in a highly competitive market and therefore further investment is critical to
its survival and growth.
G could consider a range of extension strategies which have previously been successful for the
PMP.
G TAB: High MS High MG = Star
The TAB has a high market share in a high growth market and there is large potential for further
development.
However the TAB is in a very competitive market.
G needs to decide if further investment will be successful as the expected investment needed
to grow this market is likely to be very high but the rewards equally high.
G PC: Low MS High MG = Question mark
G has lost market share to competitors and its ability to compete is under question.
G could invest more to gain a higher proportion of the market, but the market is very
competitive.
Therefore G needs to decide if it wants to remain in the PC market sector.
The PC is complementary to other products so it may be unlikely that G will want to remove
itself from the PC market but the costs of remaining in the market and developing the product
further are likely to be high.
However, in due course the Question Mark could become a Dog. G‘s management should
decide to divest the product, or invest in it further, so that it could move to being a Star and
ultimately a Cash Cow. Although rapid technological innovation is likely to prevent this from
happening.
Overall G has a strong product portfolio. It will require careful management, in that the failure of
one product could affect the whole brand. Notably G does not have any dogs in its portfolio and
this may be because G takes action to prevent its products falling into this category.
(c) G has a clearly defined premium strategy. A firm‘s scope can be either to target a niche
market (narrow scope) or a mass market (broad scope); and their strategy can be based on low-
cost or differentiation. G has been very clever with its choice of strategy, depending on the
position of the product in its life cycle. Initially G used a Differentiation Focus strategy while G only
sold PC‘s. G‘s PCs were niche and this strategy was appropriate whilst it was targeting the ‗Early
Adopters‘ of personal computing technology.

Revisionary Test Paper_Final_Syllabus 2012_Jun2014
Academics Department, The Institute of Cost Accountants of India (Statutory Body under an Act of Parliament) Page 4
Those who adopt new technological products act as opinion leaders who spread word-of-mouth
promotion about the product. Good word-of-mouth then attracts the ‗Early Majority‘, where the
bulk of sales come from. By launching the G-TAB, G Smartphone and G software products to the
same audience, G has built up integrated customer relationship across multiple products, and
therefore created brand loyalty. This increases the likelihood of new products being a success and
the ability to move away from a niche focus towards a pure differentiation strategy.
As such, G appears to have moved towards a differentiation strategy as a wider range of
customers are now more aware of and are buying the G brand. This is evidenced by the PMP and
G Smartphone being bought by a wide range of consumers who are still prepared to pay a higher
price that that charged by G‘s competitors. G now operates using a differentiation strategy, using
the G brand as a way to market all of its products at a premium price compared to its rivals. G‘s
brand differentiates its products through various ways including superior design, by giving
customers additional features, colours and faster processing that sets its products a[art form those
of its competitors.
G customers are happy to pay a premium for quality and are likely to buy all of the products in the
range. If you have a G TAB you are also likely to have a G smartphone or a G PMP.
In terms of the product portfolio G must make sure that it focuses upon quality and premium price
to ensure that all products support each other in the portfolio. Levels of quality and brand
expectations must be the same for each product and their extensions. This sets G apart from its
rivals and gives it portfolio a competitive advantage and is also likely to allow it to extend the life
cycle of the products. This is critical in a highly competitive market where life cycles are short and
quality expectations are high.
By operating a differentiation strategy, G needs to continually invest in innovative designs, features
and benefits so that G‘s increasingly demanding customers can stay loyal to the G brand and not
switch to competitors. Similarly G needs to effectively market the new features it offers in order to
attract new customers and increase its market share. In today‘s highly technological world, with
sophisticated electronic products, many customers are loyal to a brand once they have selected
their first product. So marketing needs to be aimed at the younger generation so that brand
loyalty can be built and maintained for these young purchasers of electronic equipment.
Furthermore, G‘s managers need to continually manage its SBU‘s so as to try to move them all to
be cash cows, or to divest them when they have become problem children, before they
deteriorate further. Products in a long SBU would not be suitable for a differentiation strategy.
The need for investment, and cash usage, for developing new innovative products, or new
features for existing products, is the key to maintaining market share. G‘s management needs to
focus on the needs of its target customers and what this category of customer wants or thinks it
wants. Marketing is about creating perceived desires. Many people who own high technology
products, purchase a particular brand because of certain features, which they often do not even
use but are prepared to pay a premium for.
There is a need for G‘s management to be able to communicate and understand the trends and
desires of young consumers, as they will be G‘s future customers, and G should aim to gain brand
loyalty with them as early as possible.
By launching the TAB product, G has been enabled to move into the new and growing tablet
computer market. This may also enable it to build the G brand and to encourage some customers
to switch their PC‘s to a G PC. G‘s management needs to ensure that there are clear

Revisionary Test Paper_Final_Syllabus 2012_Jun2014
Academics Department, The Institute of Cost Accountants of India (Statutory Body under an Act of Parliament) Page 5
distinguishing features between its products and those of its competitors. This differentiation may
be through design rather than just features/ functions such as colour, computer-screen technology
or weight of the product.
Overall the management of the G portfolio of products requires investment in innovative designs,
carefully targeted marketing, and careful management of its products portfolio and continuous
monitoring of competitor‘s products.
2. Read the following case and answer the questions given at the end :
The ripple efforts of the 2008 Global Economic meltdown had begun to hurt the Rupees 1,268 crore
J. K. Paper Ltd. also. Like all other business houses in India, J. K. Paper Ltd. was also finding the
going though. The general trend of soaring prices and contraction in demand had started
affecting the sale of J. K. Paper Ltd. products also. Its customers were focusing on correcting their
inventory positions (using existing stocks of materials to keep production lines and marketing
activities rolling). Consequently, they were not buying much from J. K. Paper Ltd. Even the investors did not like what they saw – J. K. Paper Ltd. stock fell from `57.20 on 1 January, 2008 to a low of
`14.12 on 12 March, 2009. The company was in the midst of Economic crisis. Mr. Harshpati
Singhania, Managing Director of the Company, realised that some strong measures must be taken
to extricate the Company from its present crisis. To this end, Mr. Singhania held several
brainstorming sessions with the top management team and finally identified the focus areas :
Managing working capital flows, cutting costs and paying attention to employee productivity.
Moving away from the traditional approach one usually follows during the recessionary periods,
Mr. Singhania instead of shutting down company‘s plants and cutting production, decided to
continue to operate the Company‘s two plants at Gujarat and Orrisa at 100% capacity. To match
sales with production, he planned to reach out to newer customers by widening Company‘s
distribution network. He identified packaging boards to be marketed in rural areas where the
meltdown had minimal effect. As the market conditions were still difficult, the company also
decided to cut the prices by 2 to 3 per cent. Alongwith the price cut, its marketing thrust in rural
areas ensured that the sales were not impacted much. Net sales remained flat throughout 2008-09,
though the profitability of the Company suffered because of the lower margins it received from its
rural thrust.
For raising capital, the Company did not approach banks and investors, rather it intensified it
efforts to recover its debits from its clients. The efforts resulted in fast recovery of crores of rupees.
Disputed debts were also settled expeditiously to raise more cash.
To cut costs further, the Company took steps to improve productivity and reduce its wage bill.
Inefficient employees were asked to leave. No new appointments were made unless they were
critically important. In addition, employees received lower increments for 2008-09; even Mr.
Singhania did not take any increment.
When the global slowdown sent the international prices of the pulp, the main raw material for the paper industry, crashing from `36,960 per tonne in April, 2008 to `18,240 per tonne in September,
2008 the company bought enough pulp to last for about 9 months as against its policy of buying, in
the normal course, pulp for about 2-3 months. According to Mr. Singhania, this decision also
resulted in a huge saving.
Mr. Singhania and his senior management team also re-evaluated the organisational structure to
improve efficiency in the organisation. When all the above strategic decisions had been
successfully implemented, Mr. Singhania knew that the worst for the company was over. This was
Revisionary Test Paper_Final_Syllabus 2012_Jun2014
Academics Department, The Institute of Cost Accountants of India (Statutory Body under an Act of Parliament) Page 6
also reflected in gradual increase in the quarterly profits of the company, Mr. Singhania however
sounded very modest about his stewardship of the Company while appreciating his Senior
management team for the great job done to ride out the slowdown.
Answer the following questions:
(a) Where did the recession hit J. K. Paper Ltd.?
(b) Explain with reasoning the corporate strategy the Company had adopted for its survival.
(c) What functional strategies were undertaken by the Company to overcome its crisis?
(d) State the basic responsibilities of a strategic leader in a business house. Explain whether or not
Mr. Singhania provided strategic leadership to the Company.
(e) What lessons are learnt from the experience of J. K. Paper Ltd. to ride out the economic
meltdown?
Answer:
(a) The economic recession of 2008 hit J. K. Paper Ltd. primarily in three areas: (i) contraction in
demand for its products due to general trend of soaring prices all over, (ii) financial crunch, and
(iii) fall in its share prices.
The customers of the company were not buying much and they started focusing on correcting
their inventory. This led to decrease in demand and reduction in funds for their working capital
needs.
(b) The company had followed the stability strategy to tide out the economic crisis. It decided to
maintain its production at pre-melt down period. It reflected in the decision of the top
management to operate its two plants in Gujarat and Orissa at 100% capacity. It also decided to
widen its distribution network to counter the challenge of contraction in demand. It identified rural
sector to market aggressively its packing boards. The company had rightly decided against
divestment or liquidation strategies as it knew that the meltdown was only a passing phase, so the
need of the hour was to' stay afloat and then to wait for the appropriate time to plan for
expansion, if needed.
(c) The top management team of the company under the leadership of Mr. Harshpati Singhania,
Managing Director of the company decided to adopt various functional 'strategies to ride out the
slowdown. After several rounds of brainstorming sessions with the top management Mr. Singhania
identified the focus areas and took initiatives on the following functional strategies: Production Strategy: In the face of contracting demand, Mr. Singhania took a bold decision to
play a contrarian card. Instead of shutting down plants and cutting production he decided to
operate the company's two plants in Gujarat and Orissa at 100% capacity. Moreover, he also took
another unusual decision to buy pulp - the main raw material for the paper industry, when its
prices crashed substantially, in huge quantity to build up its massive stock pile to last for about 9
months as against the usual practice of buying pulp stock for about 3 months in the normal
course. This resulted in a huge saving for the company. Marketing strategy: To maintain the production and subsequent sales, the company decided to
identify new customers and widen its distribution networks to reach out to new customers. The
thrust was laid to push the sales of its packaging boards material to consumers in the rural areas
where the effects of meltdown were minimum. Prices were reduced by 2-3% to give thrust to sales. Financial strategy: For managing working capital, the company again took an unusual step of not
approaching banks and investors. Instead the company decided a unique strategy to intensify its
efforts to collect its debits from the clients. The company succeeded in collecting crores of rupees
in a very short period through debt recoveries. It even decided to settle its disputed debts outside
the court very expeditiously. This also fetched a good amount of cash to the company. The
company also took decisions that led to cost reduction. It reduced its work force and reduces to
Revisionary Test Paper_Final_Syllabus 2012_Jun2014
Academics Department, The Institute of Cost Accountants of India (Statutory Body under an Act of Parliament) Page 7
expenditure on account of wages. It also made bulk purchase of pulp, main raw material to
reduce the costs and improve Human Resources Management Strategy: The company took steps to improve employees
productivity and reduction in wage bill. The top management also gave to all its employees lower
increments. Even Mr. Singhania did not accept any increment for himself. Non performing
employees were asked to leave the company. New recruitment of employees was stopped unless
it was critically important. Review of Organization Structure: For the successful implementation of company's strategies to
ride out the slow down, the organisational structure of the company was reevaluated and
reviewed. It was directed towards improving efficiency within the organisation.
(d) In the company a strategic leadership is provided by its managing director who discharges his
responsibility through the following well thought out strategies –
(i) To manage the employees of all classes for effective and efficient working
(ii) Sustaining high performance over a time
(iii) Willingness to take candid, bold and, at times, unusual and contrarian decisions
(iv) Taking such decision making responsibilities which can not be delegated
(v) Effective feedback through face to face communication
When J. K. Paper Ltd. was in the midst of financial crises due to economic meltdown its Managing
Director realized that it was the time to bury down the hatchets and prepare for a long haul. Like a
truly effective leader, he took some contrarian decisions to put company back on its track. Some
of the important decisions were: to operate the company's plants in Gujarat and Orissa at their 100% capacity so that
production remains at pre-melt down period levels. to match sales with production and to overcome the effects of recession on the company's
sales it was decided to widen the distribution network to reach out to new customers. he also refrained from easy decision to approach banks and investors for funds to manage
working capital requirements. Instead, he initiated steps for speedy recovery of debts from its
clients including recovery of disputed debts through negotiated settlements. All this resulted in
collecting crores of rupees in a short period. he also set an example before employees by refusing to accept any increment in his own
salary. Employees also accepted lower increments for 2008-09. decision to buy pulp in bulk when its prices crashed so that the stock of pulp lasts for a much
longer period resulting in huge savings in costs. thus Mr. Singhania provided an effective strategic leadership by taking some bold,
convergent and contrarian decisions which had helped the company to come out of its
crisis.
(e) There are lessons to be learnt from any crisis. The lessons learned from the J. K. Papers can be
summarized as follows: Do not Panic: There is no need to panic even if the company is facing difficult times such as
contraction in demand or is facing liquidity crunch. On the contrary, one should look towards
the strong points of the organization to convert threats into opportunities. Consult others: During recession when the company is facing crisis, Managing Director of J.K.
Paper Ltd. held several brainstorming sessions. The issues were discussed with the team to
identify ways and means to overcome the situation. Through the process, the company
identified focus areas such as managing working capital flows, cost cutting and improving
employees productivity. Go to micro level: While analyzing different aspects of the crisis, consider all relevant aspects
of the business. Novel ideas may emerge in the process. Identify major areas of improvement
and then break them into micro plans and decisions.

Revisionary Test Paper_Final_Syllabus 2012_Jun2014
Academics Department, The Institute of Cost Accountants of India (Statutory Body under an Act of Parliament) Page 8
Take bold decisions: When the situation is not as desired the company should take bold
decisions for its sustainability. Identifying new markets or asking unproductive employees to
leave are some of the bold decisions taken by J.K. Ltd. Leaders should set an example: The virtues reflected in the behaviour of the leaders are often
imbibed by the followers. Hard work, dedication and commitment also trickle down in the
organisational hierarchy. Individuals in an organisation can also accept decisions better if
they are uniformly applicable. In the given case, employees can accept the low increments
better as the leader has also decided to forgo increments.
3. Describe the four criteria for an organization‘s competence. Explain how core
competences can be identified and leveraged to develop strategies. Give example(s) to support
your argument.
Answer:
Key success factors in industry for survival – Support activities in a Value chain.
Critical success factors for competitive advantage – on basis of primary activities, competitive
advantage can be derived.
Resource based -
Competences
Threshold – Minimum – Find out with help of key success factors.
Unique – VRHN – Critical success factors.
Core competences are the skills and abilities by which resources are deployed through an
organization‘s activities and process such as to achieve competitive advantage in ways that
others cannot imitate or obtain.
Core competencies are always a balance between the unique capabilities that we have already
demonstrated and those we need to acquire to maintain or gain competitive advantage.
Core competencies save as a source of competitive advantages. But core competencies create
competitive advantages on long-term. So, we can also look at Hanson‘s model that uses 4 criteria
to identify long term competitive advantages:
Valuable – it refers to swot analysis because it always using opportunities and or disabling
threats.
Rare
Costly to imitate
Non-substitutable
These 4 elements are equivalent to the previous points that describe core competencies.
Core competencies don‘t only concern R&D and final products. It could also be a process, an
organization evolution, and human resources methods and so on.
Core competency lead to competitive advantage when:
They relate to an activity that underpins the value in the product features;
They lead to levels of performance that are significantly better than competitors ;
They are difficult for competitors to imitate.

Revisionary Test Paper_Final_Syllabus 2012_Jun2014
Academics Department, The Institute of Cost Accountants of India (Statutory Body under an Act of Parliament) Page 9
Strategic capability is the resources and the competency of a firm to survive and prosper.
The four criteria for core-competency are –
Resources
Competency
Threshold capabilities
Capabilities for competitive advantage
Resources Competences
Threshold capabilities Threshold resources
Tangible
Intangible
Threshold competences
Capabilities for competitive advantage Unique resources
Tangible
Intangible
Core competences
Resources:
This includes tangible and intangible resources of the company. Tangible resources are the
physical assets of the company like the labour, plant etc. intangible includes the intellectual
properties, reputation etc.
Again, the resources can be classified in four categories:
Physical resources – e.g. Plant
Financial resources – e.g. Cash
Human resources – e.g. People in the firm
Intellectual capital – e.g. Patents
Competencies:
Competency means the skills and abilities by which resources are deployed effectively through an
organization‘s activities and resources.
Threshold capabilities:
These are those capabilities needed for an organization to meet the necessary requirement‘s to
compete in a given market.
Identifying and managing threshold capabilities raises at least two significant challenges:
Threshold levels of capability changes as critical success factors change or through the
activities of competitors and new entrants.
Trade-offs may need to be made to achieve the threshold capability required for different
sorts of customers.
Packages by sun DTH
Threshold Resources:
Set up box, antenna, firm infrastructure, and logistics.
Capabilities for competitive advantage include:
Unique resources
Core competences
Unique resources:

Revisionary Test Paper_Final_Syllabus 2012_Jun2014
Academics Department, The Institute of Cost Accountants of India (Statutory Body under an Act of Parliament) Page 10
This includes those resources that strengthen the competitive advantage and those that cannot
be imitated by others.
HD Services
Core competences:
Core competences includes the skills and capabilities by which resources are deployed through
an organization‘s activities and processes, so as to achieve competitive advantage in ways that
others cannot imitate and obtain.
Putting these concepts together, to survive in the changing environment the firm has to address
the challenges that it faces. The strategic capabilities to face these challenges are dependent on
the resources and the competencies a firm has. The further challenge is to achieve competitive
advantage and this can be achieved by developing strategic capabilities that the competitors
find difficult to obtain or imitate. This could be attained through the unique resources that the firm
has.
Low cost, Understanding market and needs of people. In different languages.
Sun DTH:
Resources – Set Top Box, Antenna, Firm Infrastructure, Logistics, Channels, Radio Stations
Threshold – Set Top Box, Antenna, Firm Infrastructure, Channels, Ratio Stations.
Unique – HD Set Top Box, Logistics, Strategic Alliance and Bundling of products.
4. (a) Strategic control, financial control, and strategic planning are three ways of dividing
responsibilities between corporate centre and its business units. Discuss these three ways and
contrast them.
Answer:
The responsibilities for strategic decision making between business units and corporate centre are
divided in the following three ways:
Strategic planning: It refers to the particular style of relationship between the centre and business
units. This is the most centralized form in among all the three styles. The centre is the master planner
recommending detailed roles for departments and business units, whose roe is basically limited to
the operational delivery of the plan. The centre orchestrates, coordinates and controls all of
business unit activities through the extensive use of the formal planning and control system. The
centre also directly manages the infrastructure and provides many corporate services.
Financial Control: It is the most extreme form of decentralization, dissolving the organization into
highly independent business units. In this style, the role of the centre is limited to setting financial
targets, allocating resources, appraising performance and dominant to avoid or correct poor
performance. These involvements would usually be replacing business unit managers rather than
dictating changes in strategies. Therefore, the dominant processes are performance targets and
business unit managers and held strictly responsible for meeting these targets.
Strategic control: This style is mostly operates in the organizations. It lies between the two extremes
of the strategic planning and financial control styles. The relationship between the centre and the
business units is one of a parent who behaves as a strategic shaper. Influencing the behavior in
business units and forming the context within which manages are operating.
Contrast:

Revisionary Test Paper_Final_Syllabus 2012_Jun2014
Academics Department, The Institute of Cost Accountants of India (Statutory Body under an Act of Parliament) Page 11
Strategic planning is more appropriate where corporate managers have a detailed working
knowledge of each business units whereas financial control is more appropriate to
organizations operating in suitable where the centre has little knowledge about business unit
strategies and operations.
Strategic planning is more suitable where business unit strategies are of a size of sensitivity that
can have major implication for the whole corporate whereas financial control is only a short
time lag between management decisions and the financial consequences. Similarly strategic
control is built through the processes of supportive strategic with business units but within
central boundaries and guidelines.
In strategic planning, there are bureaucratic costs of centralization and de-motivating effects
on business unit manager who may feel little commitment to strategies handed down from the
centres but in financial control, the business units are focused on meeting tough short term
target set by a centre that does not have the resources or the competences to manage the
knowledge creations and integration process. In strategic control the biggest risk would be the
centre which tries to shape strategies without being clear about the corporate logic or having
the competencies essentially to add value in these ways.
(b) The competitive (positioning) and competence (resource-based) views are two dominant
theoretical perspectives in strategic management. Compare and contrast these two perspectives.
Give examples to support your arguments.
Answer:
When a firm sustains profits that exceed the average for its industry, the firm is said to process
competitive advantage over its rivals. The goal of business strategy is to achieve sustainable
competitive advantage.
There are two basic types of competitive advantage:
1. Cost advantage
2. Differentiation advantage
A resource based view emphasizes that a firm utilizes it resources and capabilities to create a
competitive advantage that ultimately results in superior value creation.
In order to develop distinctive capabilities a firm should have both resources and capabilities. In
absence of any one of them the competitors can replicate and any prevailing advantage would
disappear.
Resources can be described as the firm‘s specific assets which are useful for creating a cost or
differentiation advantage which only few competitors can acquire, whereas capabilities are the
firms ability to utilize the available resources in an effective manner. Capabilities are not
documented; indeed they are embedded in the routine process of the organization which makes
it difficult for the competitors to replicate. E.g. the ability of the organization is to bring a product
to the market faster than the competitors. The competitive advantage usually is a fall out of the
resource based competencies held by the organization.
A firm is said to be in a competitive position when it implements a value creating strategy which is
simultaneously not being implemented by its competitors and also is Valuable, Rare, Hard to
Imitate and Non-Substitutable.

Revisionary Test Paper_Final_Syllabus 2012_Jun2014
Academics Department, The Institute of Cost Accountants of India (Statutory Body under an Act of Parliament) Page 12
Further, an organization can position itself in the market on the basis of cost or differentiation
strategy. A cost advantage can be created by the effective use of available resources in order to
reduce the cost of the product so as to compete in the market with the products of the
competitors on the basis of low cost. Whereas, the competitive edge can be also be achieved by
differentiation strategy, where the product is differentiate by a competitor‘s product on certain
features which are not easily replicable.
A competitive edge or a competence cannot add value to an organization alone. This is due to
the fact that a competitive positioning of an organization is completely dependent on the
resource based competence possessed by the firm.
5. What are the steps involved in formulating diversification strategy?
Answer: The following steps are entailed in the development of diversification strategy:
Awareness of Diversification Opportunity: This is the first step of diversification strategy. Top
managers generally become aware of or sense a need for diversification planning when they find
inconsistencies between the enterprise‘s current position and its objectives based on some
perception of its future environment. A firm is assumed to have a level of performance - in Ansoffs
case based on rate of return on capital invested - and if it now appears that this cannot be
achieved on the basis of existing activities, then the firm has two options. The first is to accept a
lowered target; the second is to assess the gap and then to proceed to cover this by changed
tactics in existing activities and markets, and also by diversification. Thus, the trigger for
diversification operates when there is a threat of under-achievement. Diversification strategy may,
at times, be pursued in order to avoid current instability in sales and profits. Sometimes, the need
to achieve higher utilisation of resources motivates the management to diversify the current product-market combinations of the firm.
Once the rationale of the diversification move has been established, the next issue before the
management is to delineate the major areas for diversification. This requires penetrating search of
new business opportunities which are usually derived from market needs. These needs change
due to technological, economic, political and social developments and variations in attitudes
and preferences of customers. Thus, diversification must start in the business environment, with special attention to any observable novel trends and exceptional growth areas.
A detailed environmental appraisal may result in a number of diversification opportunities which
may be closely related to the firm‘s present technology, ethos and market contact or which
may be sharply divergent. Thus, a firm may have before it a large number of options clustering
around vertical diversification, horizontal diversification, concentric and conglomerate diversification.
Selecting the Most Promising Opportunities: For selecting the most promising diversification
opportunities, top managers must examine first of all the product life cycle. Diversification into an
already mature market will hold very limited promise of success because of the already depressed
profit margins and the vigorous defence of the market shares held by the already established
firms. Furthermore, certain criteria will have to be established so as to screen identified alternatives
and select a handful of the most promising portfolios. One such criterion could be entry into a new
market, whether at home or abroad. An enterprise considering diversification into a new product
line must prognosticate the potential value of that market, opportunity for the company‘s product
taking into account design, performance, price, availability, etc. and the cost of the minimum
scale of entry that appears necessary if any impact is to be made. Critical mass is another
important criterion which aids in limiting a large number of options to a handful of the most
promising ones. Thus, alternatives promising larger than critical mass are picked up for further

Revisionary Test Paper_Final_Syllabus 2012_Jun2014
Academics Department, The Institute of Cost Accountants of India (Statutory Body under an Act of Parliament) Page 13
feasibility testing. The management must also determine the maximum investment for purposeful entry and maximum time needed from the decision stage to the first order.
Profitability is another important condition which a diversification opportunity must fulfill. Besides,
there are some other criteria such as acceptable geographical markets, allowable kinds and
volume of needed R and D, acceptable license arrangements, maximum allowable influence on
physical environment, and maximum numbers of skilled workers to be needed and minimum
estimated time for product line to reach maturity. Once the opportunities have been selected, it
may also be desirable to place weights on the more significant factors.
Feasibility Testing of Chosen Opportunities: Once a handful of diversification opportunities are
chosen, their feasibility study must be made in detail. Feasibility test of alternatives is done by
matching their resource requirements with the resources available with the enterprise. Such a
study will decide in what direction the contemplated product-market posture will diversify -
internal development or acquisition. Strategic requirements of each move should be compared
with the existing financial, technological, marketing and managerial resources of the firm. In
general, preconditions for any type of diversification are solid financial situation, flexible ownership
structure, rich marketing experience and good customer relations in given areas, production
flexibility in some plants, well developed management systems of certain kinds, experienced R
and D personnel in special sciences, availability of raw materials at cheaper rate, transportation facilities, etc.
Thus, the choice of any diversification move must be made taking into consideration its strategic
requirements and strengths. Consideration of synergistic factor further helps in making a useful
choice. An alternative promising greater scope of synergistic advantage has an edge over others.
Thus, vertical and horizontal types of diversification will have synergistic advantages since the
enterprise continues to sell through established marketing channels and hence should be
preferred to conglomerate diversification. However, it must be noted that both vertical and
horizontal diversification contribute little toward improvement of stability of the enterprise.
A firm planning to diversify its current operations for the sake of minimisation of instability is very
sensitive to instabilities and will offer less assurance of flexibility. In fact, by putting more eggs into
the same end-product basket, vertical diversification increases the firm‘s dependence on a
particular segment of economic demand. Thus, both vertical and horizontal diversification vectors
offer only a limited potential for objectives. Their contribution to flexibility and stability objectives is
limited. They will be making useful contribution to the profitability objective if the present
economic environment of the firm is healthy and growing.
As regards the concentric and conglomerate diversification, both have the potential for meeting
all of the objectives of the firms if the firm has the requisite resources. However, a concentric path,
which is comparable to a conglomerate diversification in economic prospects and flexibility, will
usually be more profitable and less risky because of synergy. While this is true that conglomerate
diversification does not offer any synergistic advantage, a well-planned and developed
conglomerate strategy does have a sense of direction expressed through competitive
advantage, product-market scope and objectives.

Revisionary Test Paper_Final_Syllabus 2012_Jun2014
Academics Department, The Institute of Cost Accountants of India (Statutory Body under an Act of Parliament) Page 14
The above process of selection of promising opportunities has been exhibited in above figure. In
this figure an attempt has been made to portray the interplay between new business opportunities, corporate strengths and diversification criteria.
Since the above strategic decision is being made under the conditions of partial ignorance, a risk
analysis must be made, particularly for the one involving large investment. For each of the
strategic variables (total market potential within chosen geographic area, the market share,
net price per unit, raw marketing cost per unit, production cost per unit, marketing cost per unit,
total overhead and total investments) uncertainty ranges are estimated on the basis of the best
judgment available, and probabilities are assigned to each range on a subjective basis. Different
opportunities, of course, result in differing profitability ranges. The most probable centre value is then calculated for each of them. The one promising the highest profitability value is chosen.
6. Consider Porter‘s three generic strategies. In your opinion, how cost-based advantages can be
sustained? Give example to support your argument.
Answer.
Porters Generic Strategies – These three generic strategies are defined along two dimensions;
strategic scope and strategic strength, strategic scope is a demand-side dimension and looks at
the size and composition of the market you intend to target. Strategic strength is a supply-side
dimension and looks at the strength or core competency of the firm. In particular he identified two
competencies that he felt were most important: product differentiation and product cost
(efficiency). 1. Cost Leadership Strategy (Air Deccan, Tata Nano)
This strategy involves the firm wining market share by appealing to cost-conscious or price-
sensitive customers. This is achieved by having the lowest prices in the largest market segment,
or at least the lowest price to value ratio. To succeed at offering the lowest price while still
achieving profitability and a high return on investment, the firm must be able to operate at a
lower cost than its rivals. There are three main ways to achieve this.
The first approach is achieving a high asset turnover: In service Industries, this may mean for
example a restaurant that turns tables around very quickly, or an airline that turns around
flights very fast. In manufacturing, it will involve production of high volumes of output. These
approaches mean fixed costs are spread over a large number of units of the product or
service, resulting in a lower unit cost, i.e., the firm hopes to take advantage of economies of

Revisionary Test Paper_Final_Syllabus 2012_Jun2014
Academics Department, The Institute of Cost Accountants of India (Statutory Body under an Act of Parliament) Page 15
scale and experience curve effects. For industrial firms, mass production becomes both a
strategy and an end in itself. Higher levels of output both required and result in high market
share, and create an entry barrier to potential competitors, who may be unable to achieve
the scale necessary to match the firms low costs and price.
The second dimension is achieving low direct and indirect operating costs: This is achieved by
offering high volumes of standardized products, offering basic no-frills products and limiting
customization and personalization of service. Production costs are kept low by using fewer
components, suing standard components, and limiting the number of models produced to
ensure larger production runs. Overheads are kept low by paying low wages, locating
premises in low rent areas, establishing a cost-conscious culture, etc. Maintaining this strategy
requires a continuous search for cost reductions in all aspects of the business. This will include
outsourcing, controlling production costs, increasing asset capacity utilization, and minimizing
other costs including distribution, R & D and advertising. The associated distribution strategy is
to obtain the most extensive distribution possible. Promotional strategy often involves trying to
make a virtue out of low cost product features.
The third dimension is control over the supply/procurement chain to ensure low costs: This
could be achieved by bulk buying to enjoy quantity discounts, squeezing suppliers on price,
instituting competitive bidding for contracts, working with vendors to keep inventories low
using methods such as Just-in-Time purchasing. Wal-Mart is famous for squeezing its suppliers to
ensure low prices for its goods. Dell Computer initially achieved market share by keeping
inventories low and only mkaing computers to order. Other procurement advantages could
come from preferential access to raw materials or backward integration.
2. Differentiation Strategy
Can be in Production Differentiation
Differentiation is aimed at the broad market that involves the creation of a product or services
that is perceived throughout its industry as unique. The company or business unit may then charge
a premium for its product. This specialty can be associated with design, Brand image, technology,
features, dealers, network, or customers service. Differentiation is a viable strategy for earning
above average returns in a specific business because the resulting brand loyalty lowers customers‘
sensitivity to price. Increased costs can usually be passed on to the buyers. Buyers loyalty can also
serve as an entry barrier-new firms must develop their own distinctive competence to differentiate
their products in some way in order to compete successfully. Examples of the successful use of a
differentiation strategy are Hero Honda, Asian Paints, HLL, Nike athletic shoes, Perstorp BioProducts, Apple Computer and Mercedes Benz automobiles.
A differentiation strategy is appropriate where the target customer segment is not price-sensitive,
the market is competitive or saturated, customers have very specific needs which are possibly
underserved, and the firm has unique resources and capabilities which enable it to specify these
needs in ways that are difficult to copy. These could include patents or other Intellectual Property
(IP), unique technical expertise (e.g. Apple‘s design skills or Pixar‘s animation prowess), talented
personnel (e.g. a sports team‘s star players or a brokerage firm‘s star traders), or innovative
processes. Successful brand management also results in perceived uniqueness even when the
physical product is the same as competitors. This way, Chiquita was able to brand bananas.
Starbucks could brand coffee, and Nike could brand sneakers. Fashion brands rely heavily on this form of image differentiation.
Variants on the Differentiation Strategy

Revisionary Test Paper_Final_Syllabus 2012_Jun2014
Academics Department, The Institute of Cost Accountants of India (Statutory Body under an Act of Parliament) Page 16
The shareholder value model holds that the timing of the use of specialized knowledge can
create a differentiation advantage as long as the knowledge remains unique. This model suggests
that customers buy products or services from an organization to have access to its unique
knowledge. The advantage is static, rather than dynamic, because the purchase is a one-time event.
The unlimited resources model untilizes a large base of resources that allows an organization to
outlast competitors by practicing a differentiation strategy. An organization with greater resources
can manage risk and sustain losses more easily than one with fewer resources. This deep-pocket
strategy provides a short-term advantage only. If a firm lacks the capacity for continual
innovation, it will not sustain its competitive position over time.
3. Focus or Strategic Scope
Can target mass market-broad market
Can target niche-narrow-BMW
This dimension is not a separate strategy per se, but describes the scope over which the company
should compete based on cost leadership or differentiation. The firm can choose to compete in
the mass market (like Wal-Mart) with a broad scope, or in a defined, focused market segment with
a narrow scope. In either case, the basis of competition will still be either cost leadership or
differentiation.
In adopting a narrow focus, the company ideally focuses on a few target markets (niche
strategy). There should be distinct groups with specialized needs. The choice of offering low prices
or differentiated products services should depend on the needs of the selected segment and the
resources and capabilities of the firm. It is hoped that by focusing your marketing efforts on one or
two narrow market segments and tailoring your marketing mix to these specialized markets, you
can better meet the needs of that target market. The firm typically looks to gain a competitive
advantage through product innovation or brand marketing rather than efficiency. It is most
suitable for relatively small firms but can be used by any company. A focused strategy should
target market segments that are less vulnerable to substitutes or where a competition is weakest to earn above-average return on investment.
Examples of firm using a focus strategy include Southwest Airlines, which provides short-haul point-
to-point flights in contract to the hub-and spoke model of mainstream carriers, and Family Dollar,
which targets poor urban American families who cannot drive to Wall-Marts in the suburbs because they do not own a car.
How cost-based advantages can be sustained?
Cost leadership strategies are only viable for large firms with the opportunity to enjoy economies
of scale and large production volumes. However, this takes a limited industrial view of strategy.
Small businesses can also be cost leaders if they enjoy any advantages conducive to low costs.
For example, a local restaurant in a low rent location can attract price-sensitive customers if it
offers a limited menu, rapid table turnover and employees staff on minimum wage. Innovation of
products or processes may also enable a startup or small company to offer a cheaper product or
service where incumbents‘ costs and prices have become too high. An example is the success of
low-cost budget airlines who despite having fewer planes than the major airlines, were able to
achieve market share growth by offering cheap, no-frills services at prices much cheaper than
those of the larger incumbents.

Revisionary Test Paper_Final_Syllabus 2012_Jun2014
Academics Department, The Institute of Cost Accountants of India (Statutory Body under an Act of Parliament) Page 17
7. What do we mean by the nature of environment and how can we improve our understanding of
it?
Answer:
The formulation of strategy is concerned with matching the capabilities of the organization to its
environment. But the word environment encapsulates different influences and it is difficult to
understand its diversity.
There are two responses which are dangerous in their limitations. The first is the balance sheet
approach, which consists of listing all the conceivable environmental influences under what
amount to plus and minus headings. So, this list may be very long for most organizations. However,
if environmental analysis consists of this long list and nothing more, then the limitations are
significant. The second piecemeal which means understand the environment from overall impact.
In practice, managers cope with range of influences by evolving, overtime, accepted wisdom
about their industry, its environment and what are sensible responses to different situations.
No organization can exist without interact with the external environment, so external environment
is very important.
Managers have always to deal with change, but there are two ways in which environmental
change is becoming more problematic:
First: the speed and frequency of change is accelerating, and this raises two major problems, (1)
the speed of change may be difficult to cope with and (2) environmental change is not always
predicted by organization and when it occurs may induce paralysis which prevent managers
coping with such change.
Second: structure of many modern organizations, which may hinder strategic awareness of
capability. So, perceived changes in environmental influences signal to the possible need for
changes in strategy. Managers also have to cope with uncertainty, they have to reduce the
uncertainty and to do this they have to ask how uncertain is the environment? What are the
reasons for that uncertainty? And how should the uncertainty be dealt with?
Environmental uncertainty increases the more conditions are dynamic or the more they are
complex. The degree of dynamism is to do with frequency of change. Complexity may result in
different ways. (a) May result from the sheer diversity of environmental influences faced by an
organization. (b) May also arise because of the amount of knowledge required to handle
environmental influences. (c) Complexity may increase if the different environmental influences
are in themselves interconnected. The lowest the uncertainty exists where conditions are static
and simple.
Understating Simple/Static Conditions:
In simple/static conditions an organization is faced with an environment which is not too difficult to
understand and is not undergoing significant change. Such organizations can cope with
understanding their environment by seeking for understanding of the environment on an historical
basis. An historical pattern, once identified might well be expected to continue overtime, or at last
be sensibly refined systematically. The aim is to understand such complexity as does exist. This can
be done by concentrating on detailed analysis of the past to be used as a basis for forecasting
the future. In static condition, whether they be simple or complex, environmental scanning is likely
to be more continuous, systematic exercise than in dynamic situations. Since there is more
likelihood of being able to use the past as a predictor of the future it is worth investing
management time in systematic scanning.

Revisionary Test Paper_Final_Syllabus 2012_Jun2014
Academics Department, The Institute of Cost Accountants of India (Statutory Body under an Act of Parliament) Page 18
Another sensible of dealing with situations of low complexity is to seek for some predictor of
environmental change that might take place. Problems of historical approach, some of these
predictors will create a problem if there are other influences also management become bound
by their own recipe.
Understanding Dynamic Conditions:
In dynamic condition the environment is changing. Organizations faced by technological
advances or sophistication of customers make difficult to the managers to predict from the past.
We need to follow more future orientation approaches for dynamic conditions. To cope with
uncertainty there are organizational responses and there are information gathering responses.
Organizational responses involve ensuing that the structure of the organization is such that it can
sense efficiently what is going on in the environment and be flexible enough to respond to such
changes.
As the dynamic conditions increase the interpretation of these conditions becomes more
inspirational. Managers sensibly address themselves to considering the environment of the future,
not just of the past. There are structured ways of trying to understand and deal with the future.
Some forms of scenarios might be taken, this could involve identify possible major environmental
future change by a methods such as Delphi Technique and based on these projections, building
alternatives scenarios of the future. The aim would be to evolve different strategies for different
possible futures. It would be then possible to monitor environmental change to see which of these
scenarios is most appropriate. So, you need to keep your eyes in the future.
There are dangers of course. Both a reliance on individuals‘ sensitivity to trends and the more
formal approach of scenario planning suffer from the risk of myopic perception and response. It is
sometimes difficult to get managers to conceive of markedly different scenarios and responses
than those already familiar to them – a problem of recipes again. Another danger is that possible
scenarios cease to be thought of as possibilities and start to be thought of as real. Managers may
build inflexible strategies and organizational structures around mere possibilities rather than
creating the flexibility in strategy and structure that would allow speedy responses to
environmental change as it actually occurs.
Understanding Complex Conditions:
Organizations in complex situations are faced with environmental influences difficult in themselves
to comprehend organization facing complexity may also face dynamic conditions. How, then, do
organizations facing complexity cope with their conditions? There are organizational and
information processing approach the organizational approach the may involve ensuring that
complexity as a result of a high knowledge requirement is handled by specialists. Complexity as a
result of diversity might be dealt with by ensuring that different parts of the organization
responsible for different aspects of diversity are separate and given the resources and authority to
handle their own part of the environment (differentiation).
As for information processing and analysis, the organization faces the problem of comprehension.
It may have devolved responsibility to specialists or part of the organization, but how does it
obtain information to make sensible strategic decision? Typically there may be two responses:
First: the specialists become very powerful in that they relied upon not only to make operational
decisions but are trusted to present information in such a way that a sensible strategic decisions
can be made, or indeed they themselves become responsible for the strategic decisions.

Revisionary Test Paper_Final_Syllabus 2012_Jun2014
Academics Department, The Institute of Cost Accountants of India (Statutory Body under an Act of Parliament) Page 19
Second: some attempt is made to model the complexity. This may be done through a financial
model. The danger in complex situations are directly linked to the problem of comprehension.
Specialists themselves may not be able to understand the conditions they face, or more
commonly, non-specialist, perhaps general managers, fail to create system which can cope with
the complexity.
8. Explain the strategic option that takes the organization away from its existing products and
markets showing its main advantages and disadvantages and the appropriate methods for its
implementation?
Answer:
Diversification as a description of strategy is used in different ways by different people. It will be
used in a fairly general way to identify all directions of development which take the company
away from its present products and market at the same time. However, it is convenient to divide
the consideration of diversification into two types; related diversification and unrelated
diversification.
Related diversification:
It represents development beyond the present product and market but still within which the
company operates. It is important to be clear what is meant by industry and to understand some
terminology which is commonly used:
Industry: refers to all steps of manufacturing, distribution, and servicing which go into the
production and marketing of a company‘s products and any other products of which they
form apart.
Backward integration: refers to development into activities which are concerned with the
inputs into the company‘s present business. For example, raw materials, machinery, and labor
are all important inputs.
Forward integration: refers to the development into activities which are concerned with a
company‘s outputs, like transport and distribution.
Vertical integration: it is used to describe either backward or forward integration (or both
together).
Horizontal integration: refers to development into activities which are either competitive with,
or directly complementary to, a company‘s present activities.
The major advantages of related diversification are:
Control of suppliers because of quality, quantity, and price.
Control of market.
Access to information because of technological change and market trends.
Cost saving.
Profit or growth.
Indirect competition.
Spreading risk.
Resources utilization.
The major disadvantages of related diversification are:
Management control: the recipe for success in managing a manufacturing company may
not
be transferable to a supplier or distribution company.
Inefficiencies: in declining industries companies may need to dis-integrate as the scale of
production declines.
Revisionary Test Paper_Final_Syllabus 2012_Jun2014
Academics Department, The Institute of Cost Accountants of India (Statutory Body under an Act of Parliament) Page 20
Unrelated diversification:
It refers to development beyond the present industry into products/markets which, at face value,
bear no clear relationship to the present product/market. The reasons for unrelated diversification
are:
Synergy is a commonly quoted reason for unrelated diversification. Synergy can occur in situation
where two or more activities or processes complement each other to the extent that their
combined effect is greater than the sum of the parts. Also synergy may result for financial reasons
(financial surplus) where are activities generates a short-term positive cash flow and another
needs such source of cash. Equally, the good image of a company may be used as a platform to
develop into a new line of business which might have proved very difficult without such support.
Advantages of unrelated diversification:
Values and aspiration of decision making.
The opportunity to employ existing under-utilized resources in a new field.
The desire to move into different area of activity perhaps because the present one is decline.
Disadvantages of unrelated diversification:
Diversification as related or unrelated is not straightforward matter.
Strategies of diversification can raise many of the problems for product development:
- The process of creating a broad product line is expensive and potentially unprofitable.
- Product development is likely to require a commitment to high levels of spending on R&D.
The Appropriate Methods for Implementation:
We can divide these methods into three types:
1- Internal development (from within).
2- Acquisition (from without – buying another company).
3- Joint development (with another company).
1- Internal Development:
It has always been the primary method by which strategy has developed and there are some
reasons why this should be so:
With products which are highly technical in design or method of manufacture companies will
choose to develop new products themselves since the process of development is seen as the
best way of acquiring the necessary skills and knowledge to exploit the product and
compete successfully in the market place.
The final cost of developing new activities internally may be greater than by acquiring other
companies the spread of cost may be more favorable and realistic. Its strong argument in
favor of internal development for small companies who simply do not have the resources
available, in the short-term, to develop in any other way.
Minimizing disruption to other activities.
Company may, in reality, have no choice on how new products are developed. Companies
that are breaking new ground are not in position to develop by acquisition or joint
development since they are the only in the field.
2- Acquisition:
The most compelling reason to develop by acquisition is the speed with which it allows the
company to enter new product/market area.
Another common reason for acquisition is the lack of knowledge and resources to develop
certain strategies internally.
The overall cost of developing by acquisition may, in certain circumstances be particularly
advantageous. Companies going into liquidation may be a good buy.

Revisionary Test Paper_Final_Syllabus 2012_Jun2014
Academics Department, The Institute of Cost Accountants of India (Statutory Body under an Act of Parliament) Page 21
The competitive situation may influence a company to choose acquisition if the new
company chooses to enter the market by acquisition, the risk of competitive reaction is
reduced.
The reasons of cost efficiency which would make acquisition more favorable. It could arise
from the fact that a company which is already established and running may already be a
long way down the learning curve and have achieved efficiencies which would be difficult
to integrate.
The problem associated with acquisition is the overriding problem which lies in the ability to
integrate the new company into the activities of the old.
3- Joint Development (combination of internal and external):
There are different types of joint development:
Franchising: (combining resources together when both have limited resources). Franchising
arising from the fact that each of the parties to the agreement only has an interest in part of
the development process and that those two interests are complementary.
Licensing: arrangements are a form of franchising which is common in science-based
industries like chemicals. It is used as a mean of developing overseas markets without being
involved in local manufacture or exporting from that country.
Agents: (used for distribution) many companies develop overseas markets by use of local
agents not only on the ground of their better local knowledge but also because this is the
most cost efficient way to operate.
9. Strategy of an enterprise is defined by answers of two questions:
(i) Where does the firm compete (Domain selection)
(ii) How does it compete (Domain navigation)
Explain this statement from perspective of corporate level and business level strategy with
examples?
Answer:
(i) Domain Selection:
(a) Mission:
Mission statement aims to provide employees and stakeholders with clarity about overall
purpose. Strategy should be according to mission statement and it has to according to
fulfillment of mission of organization.
Vision: to set out a view for future
Objectives: a quantified term which explain how an organization will achieve its vision.
(b) Deliberate Chosen Direction
I would like to explain different directions than can an organization choose through Ansoff
Matrix
Market Penetration:
An organization can choose market penetration if it wants to go with its existing products in
existing market. This can be done due to achieve market share. This means increasing our
revenue by promoting the product, repositioning the brand, and so on. Other ways include

Revisionary Test Paper_Final_Syllabus 2012_Jun2014
Academics Department, The Institute of Cost Accountants of India (Statutory Body under an Act of Parliament) Page 22
attracting non-users of your product or convincing current clients to use more of your
product/service, with advertising or other promotions. Market penetration is the least risky
way for a company to grow.
Product Development:
An organization will come under product development segment if it will choose to go with
new product in existing market. For example, McDonald‘s is always within the fast-food
industry, but frequently markets new burgers. Frequently, when a firm creates new
products, it can gain new customers for these products. Hence, new product
development can be a crucial business development strategy for firms to stay competitive.
Market Development:
If a company is going with existing product in new market, this option called market
development. This is for existing customers.
For example, Lucozade was first marketed for sick children and then rebranded to target
athlete. This is a good example of developing a new market for an existing product. Again,
the market need not be new in itself, the point is that the market is new to the company.
Diversification:
If a company choose to go with new product in new market, it will come under
diversification. Two types of diversifications are:
(a) Related diversification means that we remain in a market or industry with which we are
familiar. For example, a soup manufacturer diversifies into cake manufacture (i.e., the
food industry).
(b) Unrelated diversification is where we have neither previous industry nor market
experience.
For example a soup manufacture invests in the rail business.
Virgin Cola, Virgin Megastores, Virgin Airlines, Virgin Telecommunications are examples
of new products created by the Virgin Group of U.K. to leverage the Virgin brand. This
resulted in the company entering new markets where it had no presence before.
Corporate Level Strategy:
It is strategy which will be made according to whole organization. This strategy could indlude
geographical expansion diversity of products services or business units. For instance Yahoo can sell
its SBU Yahoo Music if it wants. So on basis of whole organization which strategy will be made that
will corporate level strategy. While preparing this strategy organization has to keep in mind that it
will not affect even its single SBU. It also concerned with shareholders and can affect stock market
of that company.
Corporate level strategy is concerned with:
Reach - Defining the issues that are corporate responsibilities. These might include identifying
the overall vision, mission, and goals of the corporation, the type of business your
corporation should be involved, and the way in which business will be integrated and
managed.
Competitive Contact – defining where in your corporation competition is to be localized.

Revisionary Test Paper_Final_Syllabus 2012_Jun2014
Academics Department, The Institute of Cost Accountants of India (Statutory Body under an Act of Parliament) Page 23
Managing Activities and Business Interrelationships – corporate strategy seeks to develop
synergies by sharing and coordinating staff and other resources across business units,
investing financial resources across business units, and using business units to complement
other corporate business activities.
Management Practices – corporations decide how business units are to be governed;
through direct corporate intervention (centralization) or through autonomous government
(decentralization).
(ii) Domain Navigation:
BUSINESS LEVEL STRATEGY:
This strategy is made by SBU‘s of an organization for themselves individually. This is called
competitive strategy also. How SBU‘s can provide best services is a decision under business level
strategy. SBU will make strategy according to its internal and external environment. SBU‘ business
level strategy should not affect the other SBU‘s of same organization and corporate level strategy
should be according to SBU‘s.
Porter generic strategies
1. RED OCEAN STRATEGY
In red ocean strategy a firm compete in existing market space with the existing competitors and
focus on the existing customers and the firm is catering to the same demand and does not create
new demand. To survive in this environment the firm needs to create greater value for the
customers at a higher cost or create reasonable value at a lower cost.
Compete in existing market space
Beat the competition
Focus on existing customers
Exploit existing demand
Make the value-cost trade off
Align the whole system of a firm‘s activities with its strategic choice of differentiation or low cost
Tata Doccomo
2. BLUE OCEAN STRATEGY
In blue ocean strategy a firm compete in new market by offering product/service that is unique in
market, where there is no competitor, thus making competition irrelevant. This is to create and
develop new demand for its products and services.
Create uncontested market space
Make the competition irrelevant
Focus on non-customers
Create and capture new demand
Break the value-cost trade off
(Seek greater value to customers and low cost simultaneously)
Align the whole system of a firm‘s activities in pursuit of differentiation and low cost.
Airtel, Sun DTH, Air Deccan
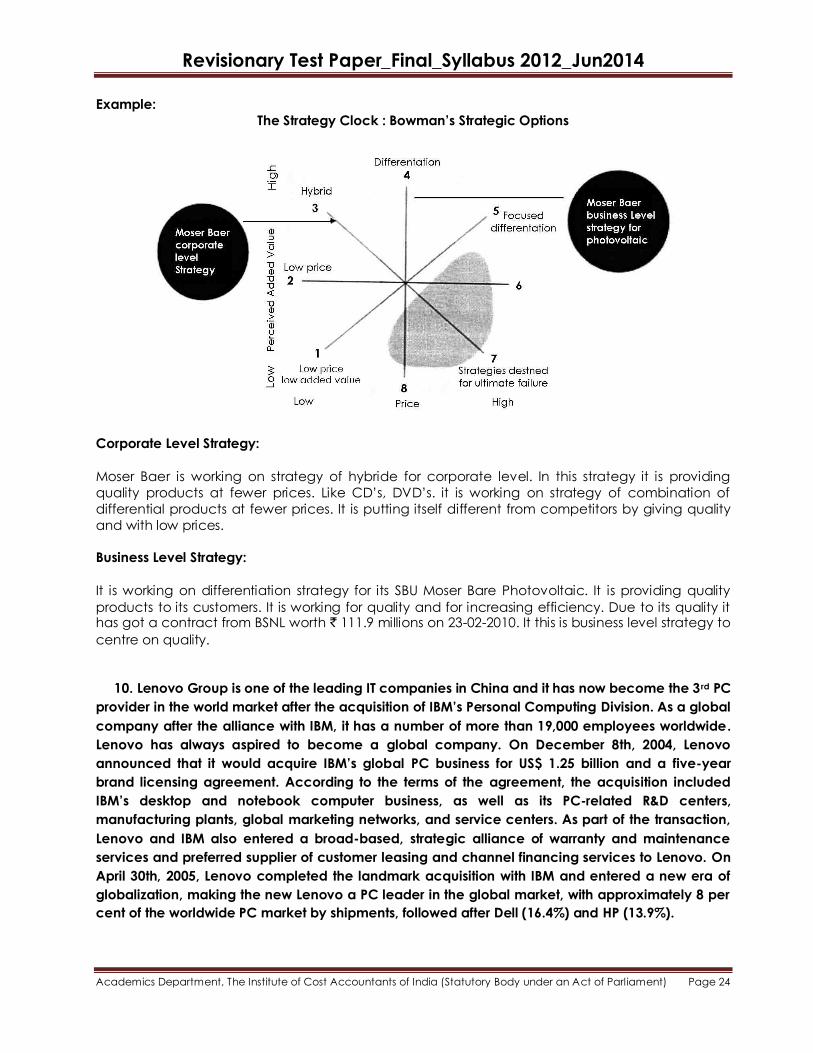
Revisionary Test Paper_Final_Syllabus 2012_Jun2014
Academics Department, The Institute of Cost Accountants of India (Statutory Body under an Act of Parliament) Page 24
Example:
The Strategy Clock : Bowman‘s Strategic Options
Corporate Level Strategy:
Moser Baer is working on strategy of hybride for corporate level. In this strategy it is providing
quality products at fewer prices. Like CD‘s, DVD‘s. it is working on strategy of combination of
differential products at fewer prices. It is putting itself different from competitors by giving quality
and with low prices.
Business Level Strategy:
It is working on differentiation strategy for its SBU Moser Bare Photovoltaic. It is providing quality
products to its customers. It is working for quality and for increasing efficiency. Due to its quality it has got a contract from BSNL worth ` 111.9 millions on 23-02-2010. It this is business level strategy to
centre on quality.
10. Lenovo Group is one of the leading IT companies in China and it has now become the 3 rd PC
provider in the world market after the acquisition of IBM‘s Personal Computing Division. As a global
company after the alliance with IBM, it has a number of more than 19,000 employees worldwide.
Lenovo has always aspired to become a global company. On December 8th, 2004, Lenovo
announced that it would acquire IBM‘s global PC business for US$ 1.25 billion and a five-year
brand licensing agreement. According to the terms of the agreement, the acquisition included
IBM‘s desktop and notebook computer business, as well as its PC-related R&D centers,
manufacturing plants, global marketing networks, and service centers. As part of the transaction,
Lenovo and IBM also entered a broad-based, strategic alliance of warranty and maintenance
services and preferred supplier of customer leasing and channel financing services to Lenovo. On
April 30th, 2005, Lenovo completed the landmark acquisition with IBM and entered a new era of
globalization, making the new Lenovo a PC leader in the global market, with approximately 8 per
cent of the worldwide PC market by shipments, followed after Dell (16.4%) and HP (13.9%).

Revisionary Test Paper_Final_Syllabus 2012_Jun2014
Academics Department, The Institute of Cost Accountants of India (Statutory Body under an Act of Parliament) Page 25
Answer the following questions —
(a) Describe the motives of a company toward Strategic Alliances.
(b) What are reasons can be considered for the failure of strategic alliance among different
companies? State in details.
(c) What was the necessity to form the strategic alliance between Lenovo and IBM? Also state
the motives toward Lenovo & IBM‘s Strategic Alliance.
Answer:
(a) Motives toward Strategic Alliances:
Most important reason for the surge in strategic alliance has been under the recognition of the
fact that no corporation has enough capital to acquire all of the companies and assets
needed to compete everywhere in the world. While with alliances, companies can access
global markets and contribute to economic development without steep exposure to market
and political turmoil. The motivations for the formation of an alliance can range from purely
economic reasons (e.g., search for scale, efficiency, or risk sharing) to more complex strategic
ones (e.g., learning new technologies, seeking political advantage).
Forces that drive the formation of strategic alliances can be categorized into three aspects.
Firstly, companies are seeking for co-option during its globalizing process. Co-option turns
potential competitors into allies and providers the complementary goods and services that
allow new business to develop and usually multinational companies seek partners with similar
products who have a good knowledge of local market and channels of distribution in order to
share the risk during the expansion of the global market. The privileged market access of some
countries sometimes can be a reason for MNC to search for alliance under the globalization
movement.
Secondly, co-specialization has become a more and more attractive force behind the
strategic alliance. It is the synergistic value creation that results from the combination of
previously separate resources, positions, skills and knowledge sources. By bringing the
resources of two or more companies together, strategic alliances often provide the most
efficient size to conduct a particular business. Through the way of alliances, partners can
contribute their unique and differentiated resources to the success of their allies, i.e. skills, R&D,
brands, networks, as well as tangible and intangible assets.
Alliance may also be an avenue for learning and internalizing new skills from its partners, in
particular those that are tacit, collective and embedded. Therefore, it is self-evident that
strategic alliance is central to the corporate strategy and it is significant and unavoidable for
the global reaching step in the world economy. To international managers, the strategic
benefits are compelling under the synergy effects among partners; and it is a flexible and
efficient channel to crack new markets, to gain skills, know-how, or products, and to share risks
or resources.
(b) Reasons for the failure of strategic alliance —
The initial stage of an alliance is a critical shakeout period fraught with uncertainties and
ambiguities, managers need to find ways to tackle the early shown or potential problems to
lay the foundation for a good relationship later. Studies have shown that two thirds of all
alliances experience severe leadership and financing problems during the first two years.

Revisionary Test Paper_Final_Syllabus 2012_Jun2014
Academics Department, The Institute of Cost Accountants of India (Statutory Body under an Act of Parliament) Page 26
There are many reasons for the high rate alliance failures. An inadequate capability to
manage the alliance is the main reason. Leadership played a key role to the success of
alliances. Drawing specially trained strategic alliance leaders from outside the organization, as
many companies do, can be problematic; strategic alliance managers need the knowledge,
relationship and credibility that only an insider can bring to the table. Another frequently cited
reason is poor selection of alliance partners; due to competitive pressures, many firms rush into
alliances without adequate preparation or understanding of their needs, the in compatibility
of partners will lead to insurmountable problems. Other reasons that are often cited for the
alliances failure include lack of trust between partners, cultural conflicts, incompatible
chemistry, and unique risks inherent in strategic alliances, and lastly focusing on alliance
formation rather than sustaining the alliance.
International alliances are increasingly central to the corporate success; however, they often
end up in divorce. In many cross-border alliances, the failure stems from the deal maker‘s
concentration on strategies, financial, and legal complexities, while largely ignoring issues of
―cultural compatibility‖ among the alliance partners. Therefore, cultural differences could
become a barrier to success, especially at the initial stage. Besides that, the failure to build
trust between partners in the early stage of the alliance could be detrimental to further
development to the next stage. Trust building is also closely linked to the cultural compatibility
between partners. If partners lack compatible cultures and expectations, the trust between
partners employees may not materialized, which will lead to inter-partner employee conflicts.
(c) The necessity to form the strategic alliance between Lenovo and IBM:
Lenovo was known as one of China‘s most promising companies in the early 1990s. Before the
declaration of the alliance with IBM, the company had encountered with obstacles for its
further expansion and development. Though Lenovo is the largest PC maker in China with
more than a quarter of the market share, it does little business outside the country. The
increasing fierce competition from aggressive foreign rivals such as Dell and HP in the past few
years in Chinese market has put further pressures on Lenovo‘s margins. Apart from that, the
company might also suffer financial problems and its performance over the past years might
have fallen short of internal targets.
The motives toward Lenovo & IBM‘s Strategic Alliance:
Lenovo‘s takeover of IBM‘s PC division has been described as ―snake ate the elephant‖, and
the deal pulls Lenovo to the third-largest just behind Dell and HP. The two computer firms have
formed a strategic alliance in PC business worldwide. The motivations that drive the formation
of the strategic alliance between Lenovo and IBM can be analyzed from three perspectives.
For Lenovo‘s aspect, though Lenovo is the largest IT Company in China, its products are mainly
within China. Lenovo‘s distribution network is its biggest problem, and it is not well adapted to
serving the small and medium-sized companies who usually buy directly. Thus, in the first place,
with an intention to expand its business globally, the firm needs a well-developed worldwide
distribution network, which happens to be the advantage of IBM. As what has been
announced by Lenovo, the agreement between the two firms includes broad-based strategic
alliance under which Lenovo‘s products will be integrated into IBM‘s global service offerings,
which also became the impetus to the deal.
Secondly, as a world-leading company like IBM, it has specialized and advanced skills in sales
and marketing functions, for Lenovo, the sales and marketing support, as well as the R&D
support are significant and of a necessity in its way to a multinational enterprise, which is also

Revisionary Test Paper_Final_Syllabus 2012_Jun2014
Academics Department, The Institute of Cost Accountants of India (Statutory Body under an Act of Parliament) Page 27
part of the agreement. Lenovo could get access to some of the world‘s most popular laptop
designs, access to the U.S. market, and technological centers as advanced as any of its rivals
after the establishing the alliance with IBM. Strategic alliance comes along with the learning
from its partners and the internalization of the new knowledge, thereby benefits the firm. In this
case, IBM provides such model and as an iconic enterprise for Lenovo, who is heading its way
globally.
Thirdly, the use of IBM‘s globally recognized brand is an impetus to accelerate the alliance.
The local brand ‗Lenovo‘ will become more valuable in the market after its association with
the IBM. And also, Lenovo‘s right to use the IBM brand on the computers for five years adds
more value and trustworthiness to the brand.
Through acquiring IBM‘s global PC business and forming a strategic alliance with IBM, Lenovo
would absorb and integrate the skills from both sides and acquire global brand recognition, an
international and diversified customer base, a world-class distribution network with global
reach, more diversified product offerings, enhanced operational excellence and leading-
edge technology. The alliance with IBM would also help establish Lenovo‘s international
recognition by leveraging IBM‘s powerful global brand through a five-year brand licensing
agreement.
For IBM‘s aspect, it expects that the deal with Lenovo, China‘s largest PC maker will further
consolidate its presence in the world‘s fastest growing IT market. The strategic alliance with
Lenovo might become a move towards the shifting of demographics. As a market, China is a
tough nut to crack especially for outsiders. Much of the competition comes from Lenovo,
which is far and away the market leader in China in order to expand Chinese market and
enjoy a slice of Lenovo ownership, IBM chooses Lenovo as its strategic partner. Therefore, the
driving forces behind the alliance reflect the two company‘s desires of seeking for co-option,
co-specialization during its globalizing process, with an attempt to learn and internalize within
its own organization, which are also the main three motivations for strategic alliances.
11. Arunachal Horticultural Processing Industrial Limited (AHPIL) at Nigmoi (in Arunachal
Pradesh) which is located near Doji and Bagra area which is the main fruit producing centre of
west siang district. The orange and pineapple orchards located in the vicinity of the plant supplied
good quality raw materials which were supplemented by other adjacent circles like Basar,
Kamba, Aalo, Kaying, Rumgong, Dari, Tirbin etc. Moreover it is located very near the highway. As
such the localisation of the processing unit at Nigmoi proved to be very idle. The various
processed products like orange juice, squash, pineapple squash, slice jam, tit bits etc become
very much visible in the market owing to the successful operation. During the initial years of
operation the plant (coal based boiler, Coal was procured from Assam) proved to be a successful
undertaking. But gradually the plant started to become sick and finally in 1995, it stopped its
operations and its productions. Now it is being revived jointly by Arunachal Pradesh Infrastructural
Development Corporation Ltd (APIDCoL), and Arunachal Pradesh Industrial Development and
Financial Corporation Ltd (APIDFC). The union minister for food processing Shri S. K. Sahai has
visited the State on 1st May 2010 and held investors meet at Itanagar. He disclosed that a separate
food processing policy for entire NE region would be initiated and sufficient funds would made
available for the region. The union government is very much committed towards making
Arunachal a major fruit processing state.

Revisionary Test Paper_Final_Syllabus 2012_Jun2014
Academics Department, The Institute of Cost Accountants of India (Statutory Body under an Act of Parliament) Page 28
Answer the following questions:
(a) ―Value chain analysis is a strategic managerial tool to assess and review the various business
functions in which utility is added to the products or services.‖ — Enumerate the concept of
Value Chain Analysis.
(b) Describe the value chain activities comprising the interrelated primary and secondary
activities which were classified by Porter.
(c) What do you think the possible causes for failure of the plant at initial stage? Also list the
objectives which might being considered appropriate by Arunachal Pradesh Infrastructural
Development Corporation Ltd. (APIDCoL), and Arunachal Pradesh Industrial Development and
Financial Corporation Ltd. (APIDFC) for reviving the Plant.
Answer:
(a) The value chain approach was developed by Michael Porter in the 1980s in his book
―Competitive Advantage: Creating and Sustaining Superior Performance.‖
―Value chain‖, is a strategic tool designed in order to gain competitive advantage by the
creating and sustaining superior performance. It can be achieved through five primary areas:
inbound logistics, operations, out-bound logistics, marketing and sales. Further these influence
upon support activities such as procurement, technology development, human resource
management, and infrastructure. The value-chain concept has been extended beyond
individual firms.
It can apply to whole supply chain and distribution networks. The delivery of a mix products
and services to the end customer will mobilize different economic factors, each managing its
own value chain. The industry wide synchronized interactions of those local value chains
create an extended value chain, sometimes global in extent. Porter terms this larger
interconnected system of value chain as the "value system." A value system includes the value
chains of a firm's supplier (and their suppliers all the way back), the firm itself, the firm
distribution channels, and the firm's buyers (and presumably extended to the buyers of their
products, and so on).
Value chain analysis is defined as ―a means of segregating various activities of a business and
identify them with respect to their contribution towards value generation by identifying the
cost i.e. inputs consumed by that activity and output generated by that activity.‖
The various business functions include research and development, design of products, services
or process, production, marketing, distribution, customer service and strategy and
administration. Value chain analysis not only describes these as an essential and valued
contributor but also integrates and coordinates the efforts of all these business functions in
addition to developing the capabilities of each individual business function. By this way value
chain analysis helps the management towards proper planning, operation, performance
evaluation and decision making.
(b) Porter classified the full value chain into nine interrelated primary and support activities.
Primary activities can be related to actions which the organization performs to satisfy external
demands while secondary activities are performed to serve the needs of internal ‗customers‘.

Revisionary Test Paper_Final_Syllabus 2012_Jun2014
Academics Department, The Institute of Cost Accountants of India (Statutory Body under an Act of Parliament) Page 29
(i) Primary activities are the fundamental activities performed by an organization in order to
be operative. They are: (a) Inbound logistics, (b) Operations, (c) Outbound logistics, (d)
Marketing and sales and (e) Service.
(ii) Secondary activities are support activities, i.e. those activities required to ensure the
efficient performance of the primary activities. Support activities are: (a) Infrastructure,
(b) Human resources management, (c) Technology development, and (d) Procurement.
Primary Activities —
1. Inbound Logistics — Inbound logistics cover all the activities performed to have goods
and services available for the operational processes as and when they will be required. This may include buying, transport, receiving, inspection, storage, etc.
2. Operations — These are the operations the organization performs to convert its raw
materials or products into a state for resale. In the case of a manufacturing concern
these may be various production-related activities such as production control,
machining, finishing, etc. For a retail business these maybe the merchandising and display activities used to offer goods to customers for sale.
3. Outbound Logistics — These are the activities performed to move merchandise
between the seller and the purchaser. They may include selection, scheduling,
transport, etc. of deliveries. Some businesses such as cash-and-carry wholesalers may not have such activities as these tasks are performed by the customer.
4. Marketing — This includes all the activities performed to create demand for the
organization‘s products and services and includes advertising, sales, market research, etc.
5. Service — It pertains to the services rendered to the customer. These include financing
services such as financing the outstanding balance, or after-sales service to products,
or services to handle customer queries and complaints, etc.
Support Activities —
1. Infrastructure — This consists of the management structure which services the whole
organization as well as structures such as reception, general postal services,
messengers, financial accounting and other general activities. The cost of the physical
infrastructure (plant, equipment, etc.) is considered part of the cost of activities where
the infrastructure is used.
2. Human Resources Management — This is the basic activity of overseeing the
acquisition, maintenance and severance of staff and principally services the primary
activities. Personnel departments, in-house medical services and even sports clubs may
be part of this major activity.
3. Technology Development — The development of technology today may require large
sums of money take place over a lengthy period of time and ultimately benefit a
multitude of users in the organization. Technology development cost could thus be
capitalised and expensed to users over the useful life of the project. Cost of operating
technology must, however, be traced to users on a usage basis.
4. Procurement — The procurement activity services the organization as a whole by
acquiring all necessary goods and services which the organization may require. If the
activity is specifically related to the acquisition of, say, raw materials it could be seen as
part of the inbound logistics process, i.e. a primary activity. If, however, the

Revisionary Test Paper_Final_Syllabus 2012_Jun2014
Academics Department, The Institute of Cost Accountants of India (Statutory Body under an Act of Parliament) Page 30
procurement activity cannot be linked to purchases for primary activities, it will be
considered a secondary (support) activity.
(c) The possible causes for failure of the plant at initial stage:
The following may be some of the reasons because of which the food processing unit could
not sustain —
Delay in execution of work;
Shortage of skilled man power – food technologist, marketing expert etc.;
Use of coal based boiler. Coal was procured from Assam involving huge transportation
cost;
Absence of any formal contract or understanding with the farmers and collectors;
Poor marketing strategy. Majority of the people are not aware of Nigmoi and its products;
Poor coordination with Government Departments like Horticulture, agriculture etc.;
Lack of visionary leadership for further expansion and growth;
Lack of database on the actual production statistics and area under total cultivation.
The plant is being revived jointly by Arunachal Pradesh Infrastructural Development
Corporation Ltd. (APIDCoL), and Arunachal Pradesh Industrial Development and Financial
Corporation Ltd. (APIDFC) with the following objectives —
To undertake and carry out production/manufacture, processing, storing, transporting and
marketing of orange, pineapple and their products and other fruits & vegetable products.
To carry on the business of standardisation, grading, sorting, packing, branding,
investigation, market research, storing, warehousing, cold storage, distributing, and
rendering assistance and services of all kind of any description including buying, selling
and dealing in horticultural produce and operation.
To conduct wholesale and/or on retail, the business of sale and purchase of orange,
pineapple and other fruits and vegetables and their processed products.
To boost production of processed food/drinks in a hilly and backward area and to bring
the area at par with the other areas.
To generate employment opportunities to the people of Arunachal both direct and
indirect. Direct employment means providing employment to the people in the plant. And
indirect employment means helping those indigenous horticultural crop growers by
procuring their fruits and providing remuneration for it.
To improve the nutritional standard of the people of Arunachal Pradesh.
The AHPIL could be used as tool for bringing socio economic changes among the farming
community.
12. Corporate growth requires strategic direction and conscientious management. Throughout the
growth process, management is faced with complex problems and has to take various strategic
decisions relative to products, markets, operations and resources – In this context,
(a) Explain the term ‗growth strategy‘, and
(b) Identify and discuss some of the strategies adopted in the pursuit of corporate growth.

Revisionary Test Paper_Final_Syllabus 2012_Jun2014
Academics Department, The Institute of Cost Accountants of India (Statutory Body under an Act of Parliament) Page 31
Answer:
(a) According to Ansoff and Stewart, ‗a growth strategy is one that an enterprise pursues when it
increases its level of objectives upward in a significant increment. Much higher than an
extrapolation of its past achievement level. The most frequent increase indicating a growth
strategy is to raise the market share and/or sales objective upward significantly‘. They are of
the view that at least three reasons are dominant in the pursuit of a growth strategy:
1. In volatile industries, growth is a necessity for survival;
2. To many executives, growth is equated with effective performance; and
3. As an objective, growth is the important one.
A company pursuing a growth strategy will always strive for better results every year than the
previous year in the areas of production, sales and profits.
(b) Strategies in pursuit of corporate growth :
The growth strategies listed below are relevant in the early stage of potential development:
1. Hold relative position in high-growth product/ markets.
The growth associated with the strategy is directly attributable to the growth in demand for the
product/ service being produced by the firm. Ability to remain competitive in terms of product
development, promotion and advertising and distribution as well as in terms of productive
capacity is the key to this strategic choice. A principal risk inherent in this strategy is that a
competitor may embark on a preemptive strategy designed to capture market share. This risk
is relatively high when the product is in about the mid-range of the growth stage of product
life cycle. Those firms which have the greatest capacity to assume the financial risks
associated with preemptive capacity expansion are most likely to adopt this strategy.
2. Increase market share in high-growth market.
This strategy is highly suitable for commodity –type products. Essential to the success of this
strategy is ‗getting there first‘. This strategy demands management‘s ability to significantly
differentiate the products from those of competitors, associated with aggressive investment in
advertising and distribution etc.
3. Increase market share in mature markets.
Two major approaches are seen to be employed to capture market share in slow-growth
markets. These are as follows –
a. Rationalizing production in a way that will achieve cost leadership, and thereby yielding
higher margins than those enjoyed by competitors. Reducing the number of models in the
product line and taking market-related competitive moves such as ‗price-cut‘ are
envisaged in this approach.
b. Segmenting the market in search for high growth potential segments and reallocating
resources to those segments that will result in a product-mix - which in the aggregate is
superior to that of competitors in terms of growth potential.

Revisionary Test Paper_Final_Syllabus 2012_Jun2014
Academics Department, The Institute of Cost Accountants of India (Statutory Body under an Act of Parliament) Page 32
4. Hold strong relative position in mature market, use ‗excess‘ cash flow, funds capacity and
other resources to support penetration of multinational markets with existing product line.
Any management deciding on this strategy typically expose its firm to a wide variety of
patterns of opportunity and risk. For most Indian managements, moving their firm‘s resources
into the multinational market arena opens a bewildering array of new uncertainties including
complexities of international money markets and global politics.
5. Hold strong relative position in maturing market; use ‗excess‘ cash flow, external funds
capability, and other resources to support penetration of new product/ market areas
domestically.
The management of a firm deciding to follow this strategy can do so either by developing new
products internally or by acquiring firms with already developed products and perhaps,
market positions. The latter approach is typically the faster and less risky. It, however, requires
larger initial investment.
6. Hold strong relative position in multinational markets with present product line; use ‗excess‘
cash flow, funds capability, and other resources to diversify products.
This strategy leads to the formulation of the multi-market/multi – product strategies. The
approach of it is that: having already achieved geographic market diversification, managers
striving for further growth for their firms must begin to think about product diversification.
7. Hold strong relative position in diversified product – line domestically; use ‗excess‘ cash flow,
funds capability, and other resources to diversify markets.
With this strategy, corporate managers view each of the product lines as in growth strategy 4
above. Several product lines instead of one product line pose additional complexity here.
Thus, plans for geographic expansion in relation to one product line must be carefully
integrated from all functional and geographic perspective with such plans for the other
product lines.
13. (a) ―In maturity stage of product life cycle the market becomes saturated, price competition
intensifies, and the rate of sales growth slows down.‖ — Suggest strategic choices in such
situations.
Answer:
Marketing and distribution strategic choices for maturity stage of product life cycle :
The following is the list of alternative marketing and distribution strategies available before the
marketing management to face the situations characterized by the maturing stage of the Product
Life Cycle:
(i) Intensification of brand promotion by means of –
a. More intensive and brand-stressing advertising;
b. Heavier point-of-sale effort;
c. More attractive design and functional packaging;
Revisionary Test Paper_Final_Syllabus 2012_Jun2014
Academics Department, The Institute of Cost Accountants of India (Statutory Body under an Act of Parliament) Page 33
d. Advertising messages and media for different market segments;
e. More after-sales service for the product; and
f. Increase in sales promotion expenditure rather than advertising to hold customer loyalty
rather than seek out new buyers.
(ii) Trading down through –
a. Entering a ‗fighting brand‘ on the market at a lower price to avoid jeopardizing an
established premium brand;
b. Introduction of low-priced models of an established brand;
c. Lowering of prices of the entire product line and keeping prices close to private levels;
and
d. Production for private levels.
(iii) Proliferation, exclusive or radical, by –
a. Offering more variety in features and designs, etc.;
b. Seeking more exclusive and innovative features;
c. Creating more radical and distinct package designs; and
d. Making more options available in accessories, and design, etc.
(iv) Trading up (strategy opposite to item 2) through -
a. Improvement of quality, appearances, etc. to offer better product;
b. Use of prestige packages, brand name, etc.; and
c. Increase of prices to cream market labels (in order to increase penetration of markets
willing to pay higher prices, earn more margin on possibly lower sales, and keep greater
differentiation over competitive products).
(v) Increase of product availability and point-of-sale service through -
a. More distribution centers closer to the point of use or sale;
b. Longer channels to make the product more available at wholesale level;
c. More outlets and different channels; and
d. Improvement of services offered by dealers (where applicable) or establishment of
own service centers.
(b) Discuss how ‗Gap Analysis‘ might be applied to a product/market situation.
Answer:
If ‗gap analysis‘ is applied to a product/market situation, the organisation will consider its targets
for different types of products it wants to manufacture and different types of markets/ market
segments where it wants sell its products.
The product/market targets may be quantified —
(i) The organisation should have targets (quantitative) for its products it wants to sell, classified
into—
Those in the introductory stage of their life, those in the growth stage, those in the maturity
stage and those in the decline stage (PLC classification);
Cash cows, stars, dogs and question marks (BCG classification);
What sort of products the organisation wants to sell, e.g. does it want a more diversified
range of products?

Revisionary Test Paper_Final_Syllabus 2012_Jun2014
Academics Department, The Institute of Cost Accountants of India (Statutory Body under an Act of Parliament) Page 34
(ii) There should also be targets for markets/market segments that the organisation would like to be
in and targets for —
Market share or market segment share (both in the existing markets and the markets it
would likely to enter into);
Market positioning - positioning is concerned with such matters as product quality, image
and reliability, price, outlets, types of customers.
A projection of the organisation‘s products and the market shares and market positioning for each
of its products would be made on the assumption that:—
No new products are developed.
The market mix for the existing products remains the same.
The gap could be analysed in terms of -
What products the organisation will be missing from the product range?
What markets/market segments it is failing to enter into?
How far out of position in the market will the product be?
Strategies to close the gap would include -
new product development strategies or new market development strategies;
a strategy of product and market diversification through a takeover policy;
a marketing mix strategy to gain the required position in target markets.
14. (a) What are the strategies adopted to combat hostile take-over?
Answer:
A target company which faces the threat of a hostile take-over can adopt the following
strategies:
i. Poison pill tactics
ii. Green mail tactics
iii. White knight tactics
iv. Golden parachute tactics
v. Divestiture tactics
vi. Crown jewel tactics and
vii. Legal tactics.
Poison pill tactics: This strategy aims at initiating action against the predator destroying the
attractiveness of the firm. The following are some methods of doing this :
The acquiring company may issue substantial amount of convertible debentures to its
existing shareholders.
The target firm may either sell off or mortgage or lease some of its precious assets.
The target firm may dispose of its liquidity by acquiring some asset.
The target company may grant its employees stock options that immediately vests if the
company is taken over.
Green mail tactics: the target firm can purchase its own stocks at a premium to avert a takeover
bid. The incentive is offered by the management of the target company to the potential bidder
for not pursuing the takeover bid.
White knight tactics: The target company‘s management may seek out a friendlier potential
acquiring company, who could offer a higher offer price, which would eventually drive away the
original bidder. The purpose of ‗white Knight Strategy‘ is to seek to find a bidder. The objective is to
make the take-over exercise as much unviable and unprofitable as possible for the original bidder.

Revisionary Test Paper_Final_Syllabus 2012_Jun2014
Academics Department, The Institute of Cost Accountants of India (Statutory Body under an Act of Parliament) Page 35
Golden parachute tactics: This is adopted by the target company by offering hefty
compensations to its managers if they manage to get ousted due to takeover. This is pursued to
reduce their resistance to takeover.
Divestiture tactics: The target company arranges to divest or spin off some of its businesses in the
form of an independent subsidiary company, thus reducing the attractiveness of the existing
business to the predator.
Crown jewel tactics: In this, the target company arranges to sell of its crown jewel, namely highly
profitable part of the business or ones which the market values better in order to dissuade the
predator.
Legal tactics: A target firm can forestall the possible takeover bid through legal mode. It takes the
form of ‗legal strategy‘ for guarding against hostile take-over. In this case, it is possible for the
target firm to move a court of law for obtaining injunction against the offer.
(b) State the steps involved in the process of Strategic Management.
Answer:
Steps in the process of Strategic Management:
Strategic management is the implementation and control of an agreed strategy. According to
Ward, it is an ‗integrated management approach drawing together all the elements involved in
planning integrating and controlling a business strategy‘. Accordingly, strategic management
covers the entire cycle of planning and control, at a strategic level.
1. Strategic Analysis: It is concerned with understanding the strategic position of the organisation.
The stages in strategic analysis are as follows:
(i) Mission: A mission might be expressed in a mission statement. It can serve three functions; it
can be the fount of the organisation‘s value system; it can indicate the firm‘s long-term
approach to business and its commercial rationale for existing; it can be used for public
relations. A mission rarely changes.
(ii) Goals: Are not necessarily quantified, but they interpret the mission to the needs of different
stakeholders (e.g. customers, employees, shareholders), who might have conflicting interests.
(iii) Objectives: Should embody mission. Generally, they are quantitative measures, against which
actual performance can be assessed. Objectives to change.
(iv) Environment Analysis (External Appraisal): Is the scanning of the business environment for
factor relevant to the organisation‘s current and future activities.
(v) Position Audit: (incorporating an Internal Appraisal) examines the current state of the entity in
respect of resources of tangible and intangible assets and finance, products, brands and
markets, operating systems such as production and distribution; internal organisation; current
results; return to stakeholders.
(vi) Corporate Appraisal: Is a critical assessment of the SWOT in relation to the internal and
environmental factors affecting an entity in order to establish its position prior to the
preparation of a long term plan. This is also called SWOT analysis.

Revisionary Test Paper_Final_Syllabus 2012_Jun2014
Academics Department, The Institute of Cost Accountants of India (Statutory Body under an Act of Parliament) Page 36
(vii) Gap Analysis: Arises from a projection of current activities into the future to identify if there is a
difference between the firm‘s objectives and the results from its continuation of current
activities.
2. Strategic Planning: Choice of strategies: Is based on strategic analysis. It involves:
(i) Strategic option generation - A variety of alternatives are considered, relating to the firm‘s
product and markets, its competitors and so forth. Examples of strategies might be:
Increase market shares?
International growth?
Concentration or core competencies?
Acquisition?
(ii) Strategic options evaluation - Each option is then examined on its merits.
Does it increase existing strengths?
Does it alleviate existing weaknesses?
Is it suitable for the firm‘s existing position?
Is it acceptable to stakeholders?
(iii) Strategic selection - involves choosing between the alternative strategies. (This process is
strongly influenced by the values of the managers in selecting the strategies).
(a) The competitive strategies are the generic strategies for competitive advantages in
organisation will pursue (a condition which is a proof against erosion by competitor behaviour
or industry evolution). They determine how you compete.
(b) Product market strategies (which market you should enter or leave) determine where you
compete and the direction of growth.
(c) Institutional strategies (i.e., relationship with other organisations) determine the method of
growth.
3. Strategy Implementation: Implementation of strategy has to be planned. This is the conversion
of the strategy into detailed plans or objectives for operating units.
(i) Some plan specifies in detail how the activities should be carried over.
(ii) Others specify targets which managers are expected to reach, using their own initiatives as to
how they may reach them.
The planning of implementation has several aspects —
Resource planning (i.e., finance, personnel) - This involves assessing the key tasks, and the
resources to be allocated to them.
Operation planning
Organisation structure and control system
Sub-strategies are needed for products and markets, human resources and so on. The process is
multi-layered.
(a) Corporate strategy: In the words of Johnson and Scholes corporate strategy is concerned with
what type of business, the company as a whole should be in and is therefore concerned with
decisions of scope. Corporate strategy involves issues such as:
diversifying or limiting the activities of the business;
investing in existing units, or buying new business;
surviving

Revisionary Test Paper_Final_Syllabus 2012_Jun2014
Academics Department, The Institute of Cost Accountants of India (Statutory Body under an Act of Parliament) Page 37
(b) Business strategy: For example, this can involve decisions as to whether in principle a company
should:
segment the market and specialise in particularly profitable
Complete by offering a wider range of products.
(c) Operational and functional strategies - Involve decisions of strategic importance, but which
are made or determined at operational levels. These decisions include product pricing,
investment in plants, personnel policy and so forth. The contribution of these different functions
determines the success of the strategy as effectively, a strategy is only implemented at this
level.
4. Review and control; Assess actual performance in the light of plans, etc.
15. (a) ―The SWOT (Strengths, Weakness, Opportunities, Threats) analysis provides information that
is helpful in matching the firm‘s resources and capabilities to the competitive environment in which
it operates.‖ —Write down the basic objectives of conducting SWOT analysis. Also point out the
advantages and criticisms of SWOT analysis.
Answer:
The internal and external environment is an important part of the strategic planning process.
Environmental factors internal to the firm usually can be classified as strengths (S) or weaknesses
(W), and those external to the firm can be classified as opportunities (O) or threats (T). Such an
analysis of the strategic environment is referred to as a SWOT analysis.
The basic objectives of conducting SWOT analysis are:
1. to identify the shortcomings in the company‘s present skills and resources.
2. to exploit the strengths of the company to achieve its objectives.
3. to focus on profit-making opportunities in the business environment and for identifying threats.
4. to highlight areas within the company, which are strong and which might be exploited more
fully and weaknesses, where some defensive planning might be required to prevent the
company from downfall.
SWOT analysis is useful at corporate, functional and competitive strategy levels as it addresses the
current fit between the organization and its environment, and considers the potential impact of
strategy changes. A decision taken in the light of a sound and thorough SWOT analysis can be
informative to the extent that the organization becomes proactive, the basic aim of any strategic
planning, and seeks to manage environment rather being reactive i.e. responding to changes
that managers have failed to foresee. The organizational analysis, being part of SWOT analysis
should cover each major element like leadership, organizational structure, production, marketing,
finance, personnel, company image and standing etc. SWOT analysis should include economic
factors, political factors, social factors, state of competition, state of technology, emerging trend
of consumer needs, import, export, foreign exchange position etc.
SWOT analysis maybe undertaken effectively through a ‗brainstorming‘ session, which should be
attended by all key executives and functional heads. SWOT analysis enables a manager to

Revisionary Test Paper_Final_Syllabus 2012_Jun2014
Academics Department, The Institute of Cost Accountants of India (Statutory Body under an Act of Parliament) Page 38
present a picture of the company before it chooses any strategy. Such assessment clarifies the
perspective of the company at a given point of time. SWOT analysis offers a static picture of the
company in relation to some specific environmental condition.
Advantages of SWOT Analysis:
i) It provides a logical framework to be used for systematic discussion of various issues bearing on the business situation, alternative strategies and finally the choice of strategy.
ii) Another application of SWOT analysis is the structured approach whereby key external
threats and opportunities may be systematically compared with internal strengths and weakness.
iii) A business may have several opportunities but also face some serious threats in the
environment. It may have likewise several weaknesses along with one or two major strength.
In such situations, the SWOT analysis guides the strategist to visualise the overall position of
the firm, and helps to identify the major purpose of the grand strategy being considered.
Criticisms of SWOT Analysis:
i) It is subjective in nature and varying from person to person.
ii) It places verities problem in terms of S,W,O,T, without stating solutions.
iii) There is no method to increase the accuracy of measurement.
iv) There is no method of verifying the information.
(b) ―PEST Analysis is a scan of the external macro-environment in which the firm operates.‖ —
Enumerate PEST Analysis with the help of its four perspectives.
Answer:
A PEST analysis is an analysis of the external macro-environment that affects all firms. P.E.S.T. is an
acronym for the Political, Economic, Social, and Technological factors of the external macro-
environment. Such external factors usually are beyond the firm‘s control and sometimes present
themselves as threats.
PEST analysis is concerned with the key external environmental influences on a business. Identifying
PEST influences is a useful way of summarising the external environment in which a business
operates. However, it must be followed up by consideration of how a business should respond to
these influences.
1. Political Analysis - The first element of a PEST analysis is a study of political factors. Political
factors influence organisations in many ways. Political factors can create advantages and
opportunities for organisations. Conversely they can place obligations and duties on
organisations. Political factors include the following types of instrument:
• Political stability
• Risk of military invasion
• Legal framework for contract enforcement
• Intellectual property protection
• Trade regulations & tariffs
• Favored trading partners
• Anti-trust laws
• Pricing regulations
Revisionary Test Paper_Final_Syllabus 2012_Jun2014
Academics Department, The Institute of Cost Accountants of India (Statutory Body under an Act of Parliament) Page 39
• Taxation - tax rates and incentives
• Wage legislation - minimum wage and overtime
• Work week
• Mandatory employee benefits
• Industrial safety regulations
• Product labeling requirements
2. Economic Analysis - The second element of a PEST analysis involves a study of economic
factors.
All businesses are affected by national and global economic factors. National and global
interest rate and fiscal policy will be set around economic conditions. The climate of the
economy dictates how consumers, suppliers and other organisational stakeholders such as
suppliers and creditors behave within society.
A truly global player has to be aware of economic conditions across all borders and needs to
ensure that it employs strategies that protect and promote its business through economic conditions throughout the world. Examples of Economic factors are as follows :
• Type of economic system in countries of operation
• Government intervention in the free market
• Comparative advantages of host country
Exchange rates & stability of host country currency
• Efficiency of financial markets
• Infrastructure quality
• Skill level of workforce
• Labor costs
• Business cycle stage (e.g. prosperity, recession, recovery)
• Economic growth rate
• Discretionary income
• Unemployment rate
• Inflation rate
• Interest rates
3. Social Analysis - The third aspect of PEST focuses its attention on forces within society such as
family, friends, colleagues, neighbours and the media. Social forces affect our attitudes,
interests and opinions. These forces shape who we are as people, the way we behave and
ultimately what we purchase. Population changes also have a direct impact on organisations. Changes in the structure of a
population will affect the supply and demand of goods and services within an economy.
Falling birth rates will result in decreased demand and greater competition as the number of
consumers fall. Conversely an increase in the global population and world food shortage
predictions are currently leading to calls for greater investment in food production.
If organisations do not respond to changes in society they will lose market share and demand for their product or service.
• Demographics
• Class structure
• Education
• Culture (gender roles, etc.)

Revisionary Test Paper_Final_Syllabus 2012_Jun2014
Academics Department, The Institute of Cost Accountants of India (Statutory Body under an Act of Parliament) Page 40
• Entrepreneurial spirit
• Attitudes (health, environmental consciousness, etc.)
• Leisure interests
4. Technological Analysis -
Organisations use technology in many ways, they have
1. Technology infrastructure such as the internet and other information exchange systems
including telephone
2. Technology systems incorporating a multitude of software which help them manage their
business.
3. Technology hardware such as mobile phones, Blackberrys, laptops, desktops, Bluetooth
devices, photocopiers and fax machines which transmit and record information.
Section B – Strategic Cost Management
16. (a) P Ltd. has two divisions, S and T. S transfers all its output to T, which finishes the work. Costs
and revenues at various levels of capacity are as follows :
Output (Units) Division S - costs (`)
Division T net revenues
(i.e. revenue minus
costs incurred in T)
Profit
600 600 2,950 2,350
700 700 3,250 2,550
800 840 3,530 2,690
900 1,000 3,780 2,780
1,000 1,200 4,000 2,800
1,100 1,450 4,200 2,750
1,200 1,800 4,350 2,550
Company profits are maximized at ` 2,800 with output of 1,000 units. If P Ltd. wish to select a
transfer price in order to establish S and T as profit centres, what transfer price would motivate the
managers of S and T together to produce 1,000 units, no more and no less ?
P Ltd. wants that the transfer price should be set a ` 2.10 per unit. Comment on this proposal.
Answer.
Division S will continue to produce more and more output until the costs of further production
exceeds the revenue from transfer price. Further, Division T will continue to receive more and more
output from Division S until the net revenue from further processing is insufficient to cover the
incremental costs. This can be explained by the following table: `
Output Division S (Incremental
cost)
Division T (Incremental
cost)
600 - -
700 100 300
800 140 280
900 160 250
1,000 200* 220*

Revisionary Test Paper_Final_Syllabus 2012_Jun2014
Academics Department, The Institute of Cost Accountants of India (Statutory Body under an Act of Parliament) Page 41
1,100 250 200
1,200 350 150
*Since Division S will continue to produce additional units provided the transfer price exceeds the incremental costs of production, a price of atleast ` 2 per unit (i.e. ` 200 / 100 units) is enough
attractive to Division S to produce as many as 1,000 units.
However a price in excess of ` 2.50 per unit (i.e. ` 250 / 100 units) would motivate the manager of
Division S to produce, 1,100 units or more than 1,100 units.
On the similar analogy, Division T will continue require more output from Division S if the
incremental revenue exceeds the transfer costs from Division S. In case, Division T required 1,000 units, the transfer price must be less than ` 2.20 per unit (i.e. ` 220 / 100 units). However, if the
transfer price is lower than that of ` 2 per unit (i.e. ` 200 / 100 units), Division T will negotiate for
1,100 units from Division S in order or improve the divisional profits.
To summarise : i. The total company profit (` 2,800) is maximized at 1,000 units.
ii. Division S wish to produce 1,000 units, no more no less, if the transfer price is between ` 2 per
unit and ` 2.50 per unit (i.e. ` 200 and ` 250 for 100 units).
iii. Division T wish to receive and process 1,000 units, no more no less, if the transfer price is between ` 2 per unit and ` 2.20 per unit.
iv. A transfer price should therefore, be selected in the range of ` 2.00 per unit to ` 2.20 per unit.
Further it is given that transfer price should be set at ` 2.10 per unit. If a price of ` 2.10 per unit is
selected profit at 1,000 units of output would be : `
Division S Division T Total
Sales/ Net Revenue 2,100 4,000 4,000
Costs 1,200 2,100 1,200
Profit 900 1,900 2,800
At a transfer price of ` 2.10 any increase in output above 1,000 units, or any shortfall in output
below this would not only reduce the profits of the company as a whole but also the divisional
profits of Division S and T.
(b) Prepare a report to the management setting out the areas and techniques of cost reduction
that can be employed.
Answer.
For preparing of report on the subject, following areas of cost reduction will be examined and
techniques to be applied will be considered. Precise finding and recommendation would depend
upon the conditions prevalent in each case.
Areas of cost reduction :
(i) Introduction of new design of the product to achieve saving material usage.
(ii) Improvement of existing design to effect savings in materials by reduction of materials,
substitution of cheaper materials etc.
(iii) Standardisation and simplification of parts and components to improve productivity
and reduce inventory.
(iv) Production planning to reduce costs through better layout, change of location etc.
(v) Tool design and its standardisation to eliminate materials wastage‘s and reduce
labour time.

Revisionary Test Paper_Final_Syllabus 2012_Jun2014
Academics Department, The Institute of Cost Accountants of India (Statutory Body under an Act of Parliament) Page 42
(vi) Efficient use of support services.
(vii) Look out for alternate sources to type of materials.
(viii) Undertake energy saving schemes by reducing use of steam and power and
undertaking improvements for recovery of heart or eliminating dissipation there of.
(ix) Control transmission losses of power and steam by better insulation‘s.
(x) Look out for technical innovations and technological improvement to cut down on
process step or to effect economic in yield or enable to increase production.
(xi) Try to achieve lower cost by better economics of scale.
Techniques to be employed for cost reduction :
(i) Value analysis to identify unnecessary costs.
(ii) Work and Time and Motion Study to eliminate wasteful movements and procedures.
(iii) ABC analysis to control inventory.
(iv) Vendor rating for better deals or trapping new sources.
(v) Economic Order Quantity and other methodolgy for minimum /maximum quantity
and improvement upon lead time.
(vi) Operation Research Techniques like linear programming, PERT / CPM simulations etc.
(vii) Use of marginal costing technique in all marginal decisions on buy or make or
exploration of new markets or improvements etc.
17. (a) N.A. Fabricators Ltd. Have procured an order from the Railways for supply of 2,40,000
pieces of metal case-bonds of a special design. The supply is to be completed in not more than 12 months at the rate of 20,000 to 25,000 pieces per month at a price of ` 75 per piece with a
bonus/ penalty of ` 2.75 per piece for supplies in excess/ short of 20,000 pieces per month.
It has promptly purchased a special machine with capacity to produce 20,000 + 5% pieces per month. The machine which has cost ` 2 lakhs is expected to fetch a residual value of ` 50,000 on
completion of the contract job. The cost details of the piece is estimated as follows : Material (`/unit) 50.00
Labour (`/unit) 5.00
Variable production overheads – 40% of labour (`/unit) 2.00
Variable selling overhead (`/unit) 0.25
Fixed production and selling/ delivery expenses (Total) ` 3 lakhs
A week before starting the job the suppliers of machine offer an advanced version of the same
capable of 20% more output per hour. There will however be a material loss of 0.5%. This new machine costs ` 1.50 lakhs with no residual value. The supplier has agreed to take back the
original machine for ` 1.50 lakhs. Fixed cost, by way of maintenance, will increase by ` 1,000 per
month. Entire job can be completed in 10 months.
Advise whether they should go in for the improved model of the special purpose machine.
Answer: `
Existing machine Advanced version
machine
Raw material cost per unit 50 50.25 (Note 1)
Labour cost per unit 5 4.17 (Note 2)
Variable production overhead per unit 2 1.67 (Note 3)
Total variable cost per unit 57.00 56.09
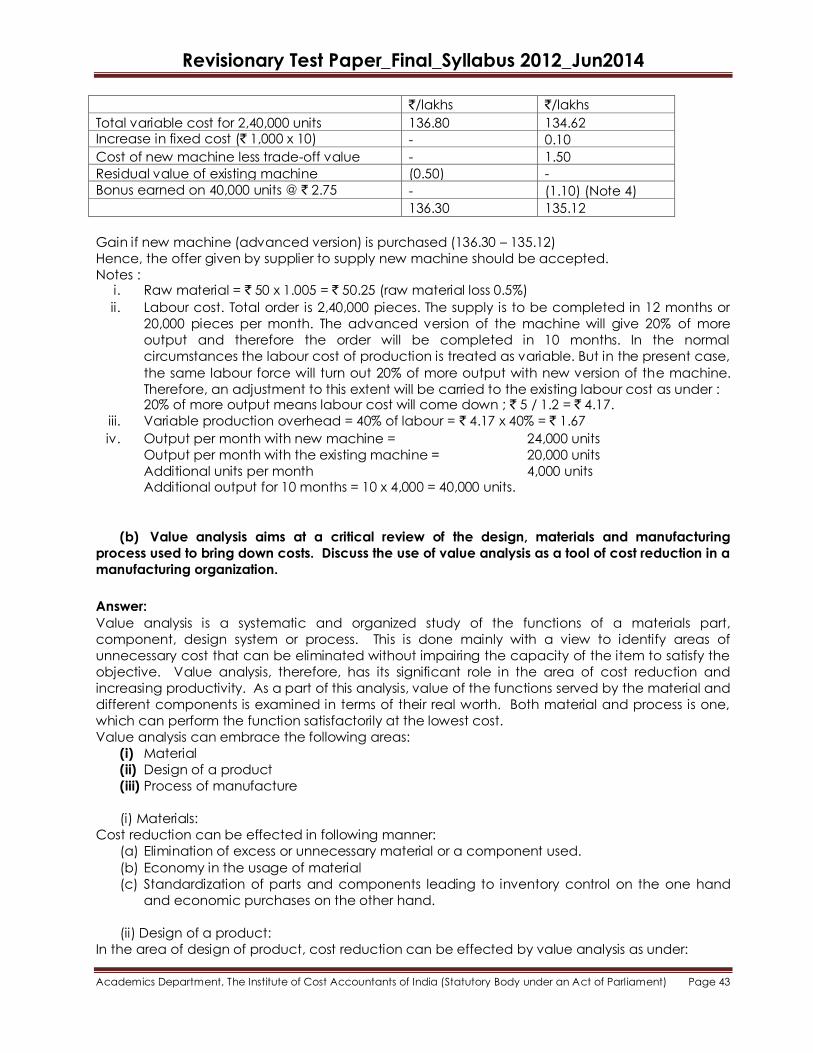
Revisionary Test Paper_Final_Syllabus 2012_Jun2014
Academics Department, The Institute of Cost Accountants of India (Statutory Body under an Act of Parliament) Page 43
`/lakhs `/lakhs
Total variable cost for 2,40,000 units 136.80 134.62 Increase in fixed cost (` 1,000 x 10) - 0.10
Cost of new machine less trade-off value - 1.50
Residual value of existing machine (0.50) -
Bonus earned on 40,000 units @ ` 2.75 - (1.10) (Note 4)
136.30 135.12
Gain if new machine (advanced version) is purchased (136.30 – 135.12)
Hence, the offer given by supplier to supply new machine should be accepted.
Notes : i. Raw material = ` 50 x 1.005 = ` 50.25 (raw material loss 0.5%)
ii. Labour cost. Total order is 2,40,000 pieces. The supply is to be completed in 12 months or
20,000 pieces per month. The advanced version of the machine will give 20% of more
output and therefore the order will be completed in 10 months. In the normal
circumstances the labour cost of production is treated as variable. But in the present case,
the same labour force will turn out 20% of more output with new version of the machine.
Therefore, an adjustment to this extent will be carried to the existing labour cost as under : 20% of more output means labour cost will come down ; ` 5 / 1.2 = ` 4.17.
iii. Variable production overhead = 40% of labour = ` 4.17 x 40% = ` 1.67
iv. Output per month with new machine = 24,000 units
Output per month with the existing machine = 20,000 units
Additional units per month 4,000 units Additional output for 10 months = 10 x 4,000 = 40,000 units.
(b) Value analysis aims at a critical review of the design, materials and manufacturing
process used to bring down costs. Discuss the use of value analysis as a tool of cost reduction in a
manufacturing organization.
Answer:
Value analysis is a systematic and organized study of the functions of a materials part,
component, design system or process. This is done mainly with a view to identify areas of
unnecessary cost that can be eliminated without impairing the capacity of the item to satisfy the
objective. Value analysis, therefore, has its significant role in the area of cost reduction and
increasing productivity. As a part of this analysis, value of the functions served by the material and
different components is examined in terms of their real worth. Both material and process is one,
which can perform the function satisfactorily at the lowest cost.
Value analysis can embrace the following areas:
(i) Material
(ii) Design of a product
(iii) Process of manufacture
(i) Materials:
Cost reduction can be effected in following manner:
(a) Elimination of excess or unnecessary material or a component used.
(b) Economy in the usage of material
(c) Standardization of parts and components leading to inventory control on the one hand
and economic purchases on the other hand.
(ii) Design of a product:
In the area of design of product, cost reduction can be effected by value analysis as under:

Revisionary Test Paper_Final_Syllabus 2012_Jun2014
Academics Department, The Institute of Cost Accountants of India (Statutory Body under an Act of Parliament) Page 44
(a) Simplification of the design so as to consume lesser quantity of material and avoid
wastages.
(b) Redesigning products to allow for the standardization of components.
(c) Redesigning to improve productivity or control defectives.
(iii) Process of manufacture:
Value analysis can help in cost reduction as under:
(a) Unnecessary operation can be eliminated.
(b) Standardization to cope with operation so that simplification in process and long run
benefits can be achieved.
(c) Improvements in productivity.
(d) Savings in energy cost as well as achieving better yield from the material used.
(e) Better quality of product.
Value analysis is a continuous exercise and is an important element to be emphasized while
preparing budget for cost reduction.
18. The Accountant of a company has presented the following operating statement to the
General Manager of Department ‗P‘ for the month of May 2013.
Budget Actual Variance
May 2013
` ` `
—————————————————————————————————————————————
Sales 24,00,000 22,00,000 2,00,000
—————————————————————————
Direct Materials 6,00,000 5,20,000 80,000
Direct Labour 8,00,000 7,56,000 44,000
Factory Overheads (V) 2,00,000 1,84,000 16,000
Factory Overheads (F) 1,00,000 1,16,000 (16,000)
Selling Overheads (V) 3,00,000 2,88,000 12,000
Selling Overheads (F) 2,00,000 1,84,000 16,000
—————————————————————————
Total 22,00,000 20,48,00 1,52,000
——————————————————————————
Profit 2,00,000 1,52,000 (48,000)
——————————————————————————
Direct Labour Hours 1,00,000 95,000
Units of Production and Sale 20,000 18,000
————————————————————————————————————————————
The General Manager was surprised to see that his operation have resulted in an adverse profit variance of ` 48,000 for the month. On the basis of the budgeted profit of ` 10/- per unit, he

Revisionary Test Paper_Final_Syllabus 2012_Jun2014
Academics Department, The Institute of Cost Accountants of India (Statutory Body under an Act of Parliament) Page 45
expected that he would make a profit of ` 1,80,000 on a sale of 18,000 units of production in May
1991 instead of the budgeted profit of ` 2,00,000 resulting in an adverse profit of ` 20,000 only.
You are required to :
(i) Redraft the above statement to show the original budget, flexible budget, actual expenses
incurred and variation for May 2013.
(ii) Calculate all variance relating to sales, direct materials, direct labour and overheads.
Answer:
(i) Flexible Budget for May 2013
Original Budget Flexible Budget Actuals Variance
For May 2013 May 2013
Units 20,000 18,000 18,000
` ` ` `
Sales Variable Cost 24,00,000 21,60,000 22,00,000 40,000 F
———————————————————————————————
Direct materials 6,00,000 5,40,000 5,20,000 20,000 F
Direct labour 8,00,000 7,20,000 7,56,000 36,000 A
Factory overheads 2,00,000 1,80,000 1,84,000 4,000 A
Selling overhead 3,00,000 2,70,000 2,88,000 18,00 A
———————————————————————————————
Total 19,00,000 17,10,000 17,48,000 38,000
————————————————————————————————
Contribution 5,00,000 4,50,000 4,52,000 2,000 F
———————————————————————————————
Fixed costs
Factory overheads 1,00,000 1,00,000 1,16,000 16,000 A
Selling overheads 2,00,000 2,00,000 1,84,000 16,000 F
———————————————————————————————
Total 3,00,000 3,00,000 3,00,000 -----
———————————————————————————————
Profit 2,00,000 1,50,000 1,52,000 2,000 F
Volume variance 50,000 A
————
Net loss (48,000)
————
(ii) Variance Analysis :
(1) Sales Std. Price = ` 24 lakhs 20,000 = ` 120
Std. Profit = ` 2 lakhs 20,000 = ` 10

Revisionary Test Paper_Final_Syllabus 2012_Jun2014
Academics Department, The Institute of Cost Accountants of India (Statutory Body under an Act of Parliament) Page 46
Actual quantity = 18,000 and standard price= ` 120
Turnover on Std. Price = 18,000 x 120 = ` 21,60,000
Actual turnover is given at ` 22 lakhs
Price Variance = ` 40,000 (F)
Std. Qty. x Std. Profit = 20,000 x 10 = ` 2 lakhs
Actual Qty. x Std. Profit = 18,000 x 10 = ` 1.80 lakhs
Quantity variance = ` 20,000 (A)
(2) Direct Materials :
Std. Cost = ` 6,00,000 20,000 = ` 30
Actual Qty = 18,000 AQ x SC = 18,000 x 30 = ` 5,40,000
Total Actual cost = ` 5,20,000
Materials Price Variance = ` 20,000 (F)
(3) Direct Wages :
Std. Times per unit = 1,00,000 20,000 = 5 hours
Std. hourly rate = 8,00,000 1,00,000 = ` 8 /hr.
Std. Hours produced = 18,000 units x 5 hrs = 90,000 hrs.
Std. Hours = 90,000 Actual Hours = 95,000 Std. Rate ` 8
(a) Std. Hrs. x Std. Rate = 90,000 x 8, that is ` 7,20,000
(b) Actual Hrs. x Actual Rate = ` 7,56,000
(c) Actual Hrs. x Std. Rate = 95,000 x 8 that is ` 7,60,000
Efficiency variance = (a) – (c) = ` 40,000 (A)
Rate variance = (c) – (b) = ` 4,000 (F)
(4) Factory Variance overheads :
Std. Rate = ` 2,00,000 1,00,000 hrs. = ` 2 /hrs.
(a) Charged to production = 90,000 x 2 = ` 1,80,000
(b) Std. cost of actual hours = 95,000 x 2 = ` 1,90,000
(c) Actual overheads ` 1,84,000
Revisionary Test Paper_Final_Syllabus 2012_Jun2014
Academics Department, The Institute of Cost Accountants of India (Statutory Body under an Act of Parliament) Page 47
(a) -- (b) = ` 10,000 (A) being efficiency variance
(b) -- (c) = ` 8,000 (F) being expense variance.
(5) Selling variable overheads:
Std. Rate = ` 300,000 20,000 = ` 15 /unit
(a) Std. cost of output = 18,000 x 15 = ` 270,000
(b) Actual overheads = ` 288,000
Adverse variance = ` 18,000
(6) Factory overhead -- Fixed :
Std. Rate = ` 100,000 100,000 = Re. 1/hr.
(a) Std. cost of output of 90,000 = ` 90,000
(b) Std. cost of actual hours (95,000) = ` 95,000
(c) Budgeted = ` 100,000
(d) Actual = ` 116,000
Efficiency variance : (a) – (b) = ` 5000 (A)
Capacity variance: (b) – (c) = ` 5000 (A)
Expense variance : (c) – (d) = ` 16000 (A)
(7) Selling overheads : Fixed :
Standard : ` 2 lakhs 20000 ` 10 per unit
(a) Std. cost of output = 18000 x 10 = ` 1,80,000
(b) Budget = ` 2,00,000
(c) Actual = ` 1,84,000

Revisionary Test Paper_Final_Syllabus 2012_Jun2014
Academics Department, The Institute of Cost Accountants of India (Statutory Body under an Act of Parliament) Page 48
Volume Variance = (a) – (b) = ` 20,000 (A)
Expense Variance = (b) – (c) = ` 16,000 (F)
19. A production department of a large manufacturing organisation has furnished the following
data for May 2013 :
Budget Actual
` `
Direct Materials 4,00,000 5,10,000
Direct wages 2,50,000 3,25,000
Repairs and Maintenance (` 1,00,000 Fixed) 2,00,000 2,20,000
Supervision (Fixed) 1,00,000 1,10,000
Consumable stores (Variable) 75,000 95,000
Factory Rent (Fixed) 50,000 50,000
Depreciation (Fixed) 1,00,000 1,00,000
Tools (Variable) 25,000 30,000
Power and Fuel (Variable) 1,50,000 1,80,000
Administration (Fixed) 2,50,000 2,65,000
The department has 50 identical machines. During May 2013 the budgeted and actual production
of the department are 10,000 and 12,500 units respectively. However, if the department was closed
and the machine production services were hired from outside, the cost of hiring the services of similar machines would be ` 150 per unit.
(i) You are required to present reports showing the evaluation of the performance of the
department based on the concept of (a) Cost Centre (b) Profit Centre and (c) Responsibility
Centre.
(ii) It is felt that since the total budgeted cost of production per unit is greater than the cost of
hired services, the possibility of closing down the department and use of hired services
should be explored if the budgeted production cannot be increased in June 2013. Assuming
that the budgeted expenses and level of output planned for May 2013 will hold for June 2013
also, calculate the volume of output required to justify the continuance of the department.
Answer:
(i) Report showing evaluation of Department Performance on different concepts
(a) Cost centre basis Budget Allowed Actual
Cost
Output 1000 12500 12500
` ` `
Variable
Direct materials 400000 500000 150000
Direct Labour 250000 312530 325000
Repairs and Maintenance 100000 125000 120000

Revisionary Test Paper_Final_Syllabus 2012_Jun2014
Academics Department, The Institute of Cost Accountants of India (Statutory Body under an Act of Parliament) Page 49
Consumable stores 75000 93750 95000
Tools 25000 31250 30000
Power and Fuel 150000 187500 180000
———— ———— ————
Total 1000000 1250000 1260000
Fixed
Repairs and Maintenance 100000 125000 120000
Consumable stores 75000 93750 95000
Tools 25000 31250 30000
Power and Fuel 150000 187500 180000
———— ———— ————
Total 1000000 1250000 1260000
Fixed
Repairs and Maintenance 10000 100000 100000
Supervision 100000 100000 110000
Factory Rent 50000 50000 50000
Depreciation 100000 100000 100000
Administration 250000 250000 265000
———— ———— ————
Total 600000 600000 625000
Grand Total 1600000 1850000 1885000
Expense variance 1850000 – 1885000 = ` 35000 A.
Volume variance 000,10
000,00,6 125000 – 600000 = ` 150000 F.
(b) Profit Centre Basis
`
Cost of Production on hired machine services 12500 150 1875000
Actual 1885000
————
Profit variance 10000 A
(c) Responsibility centre Controllable
Budget Actual Variance
Direct Materials 500000 510000 1000 A
Direct wages 312500 325000 12500 A
Repairs & Maintenance 225000 220000 5000 F

Revisionary Test Paper_Final_Syllabus 2012_Jun2014
Academics Department, The Institute of Cost Accountants of India (Statutory Body under an Act of Parliament) Page 50
Consumable stores 93750 95000 1250 A
Tools 31050 30000 1250 F
Power & Fuel 187500 180000 7500 F
Supervision 100000 110000 10000 A
1450000 1470000 20000 A
Non controllable
Budget Actual Variance
` ` `
Factory Rent 50000 50000 —
Depreciation 100000 100000 —
Administration 250000 265000 15000 A
400000 415000 15000 A
(ii) Volume of output required to justify continuance of Department
Variable cost of Making on own Machine as per budget = 000,10
000,00,10 = ` 100
Variable cost of making on hired services ` 150
Saving if manufactured on own machines ` 50
Fixed Costs ` 600000
Minimum No. of units to justify continuance of the Dept. = 50
000,00,6 = 12000 unit
20. (a) Write short note on Pricing Strategies.
Answer:
Pricing a product requires a lot of considerations according to different situations. In effect pricing is
a very complex game played with regard to (i) pricing policy laid down by the organisation,
pricing objectives, and (ii) external constraints. Various strategies for pricing are prevalent:
1. Different pricing – based on quantities purchased, terms of payment, status of the buyers,
bargaining power, location of the buyers. This policy is resorted only when the number of
manufacturers and direct customers are limited and the demand and supply position is more or less
balanced. It should be seen that a customer buying at a cheaper rate does no compete with the
manufacturer
2. Skimming price – while introducing a new product, its price may be fixed at a high level. Large
promotional expenses are needed at this stage. At a later stage with more competitors coming
into the market, both the price and the promotional expenses may be reduced. Skimming pricing is

Revisionary Test Paper_Final_Syllabus 2012_Jun2014
Academics Department, The Institute of Cost Accountants of India (Statutory Body under an Act of Parliament) Page 51
possible for a new product where there are a few producers, demand is inelastic and/or the
product appeals to the rich and affluent customers.
3. Penetration pricing – Penetration price is a low price that appeals to the mass as quickly as
possible. Sometimes for a new product the company may fix a low price only to increase it when it
has captured the market. For the goods requiring heavy initial investment, the low price fixed by
the introducing company will work as a deterrent to otherwise likely competitor producers. The
product should have high price elasticity of demand and the volume of production should be high.
4. Target costing – to enter a new market, a manufacturer has to consider the prices of the
competitors‘ products. The estimated long run cost of the product which will enable a company to
enter or to remain in the market competing with its competitors successfully is called target cost.
Japanese producers of consumer goods often use target cost in their pricing strategies.
5. Cost plus price is used when long-term cost cannot be predicted accurately e.g. in a
government contract for bulk purchases.
6. Marginal cost pricing is resorted to for entering a new market e.g. in dumping goods to a
foreign market where the company wants to gain a foothold. It is a short-run measure in as much
as no company can continue for long with prices which will not recover fixed overheads.
(b) Watchwell T.V. Company ,manufacturing various components in their machine shop which are
assembled along-with purchased components in an assembly shop. It is proposed by the
production manager that an aluminium bracket which is manufactured in Machine shop should
be procured from outside party as the cost of production is very high date of rejections and
also due to the recent wages agreement.
The purchase department called quotations for this item. Two parties submitted their quotations as
under.
Mr. Black : Basic Price ` 5 per 1000 nos.
Excise duty at 12% advalorem.
Sales Tax 15% Transport at ` 1.10 per 1000 nos.
Octroi at 2% on total bill.
Mr. White: Basic Price 0.75 per 1000 nos., ( labour charges only.)
Material to be supplied by Watchwell .
Scrap generated in process will not be returned. Transport at ` 0.40 per 1000 nos.
Octroi at 2% on total price excluding materials cost.
Rejection allowance at 2% of gross materials cost.
The company gives you that following cost details the bracket presently being
manufactured.
Materials cost per 1000 nos. ` 6.00
Less: scrap allowance., ` 2.00
————— Net materials cost for 1000 nos. ` 4.00
Conversion cost : The part is manufacturing on a small press-having machine hour rate of ` 30
per hour of which 10% is fixed cost. The standard time for production 100 brackets is 0.6 minutes.
Rejection is about 3% on works cost, Administration and selling overheads are 10% of works cost.
The production Manager has assured that the released press as well as the labour will be

Revisionary Test Paper_Final_Syllabus 2012_Jun2014
Academics Department, The Institute of Cost Accountants of India (Statutory Body under an Act of Parliament) Page 52
employed on alternative job. It is understood from purchase department that the excise duty paid
on purchase component will be set-off against excise duty payable on T.V. Sets.
You are required to evaluate to both the quotations and compare them with current costs
assuming that purchasing and storing as well as handling efforts are same in each case. Also give
your recommendation as to the source of supply of the components. If the released capacity of
press only is not utilised will your recommendation change ?
Give your comments and assumptions in the evaluation wherever necessary.
Answer:
PRESENT COSTS OF MANUFACTURE ` for 1000 nos.
Cost of materials 6.00
Less: Scrap allowance 2.00
———
Net matl. Cost 4.00
Conversion cost 0.6 x 30 x 10/60 3.00
———
Works cost 7.00
Rejection 3% 0.21
———
Total present cost 7.21 ———
QUOTATION FROM MR. BLACK
Basic price 5.00
Excess duty 12% 0.60
——— TOTAL 5.60
Sales tax @ 15% 0.84
———
6.44
Transport cost 1.10
———
7.54
Octroi 2% 0.15
———
7.69
Less: Excise duty credit 0.60
———
Total price 7.09
QUOTATION FROM MR. WHITE :
Materials cost (scrap not returned) 6.00
Labour charges 0.75
Transportation 0.40
———— TOTAL 7.15

Revisionary Test Paper_Final_Syllabus 2012_Jun2014
Academics Department, The Institute of Cost Accountants of India (Statutory Body under an Act of Parliament) Page 53
Octroi 2% on (Labour + transport) 0.02
———
7.17 Rejection 2% of ` 6/- 0.12
———
Total price 7.29 ———
The administration and selling overheads being common to all the alternative and therefore do
not come into the decision making criteria.
Quotation from Mr. Black is the lowest and also lower than present cost of manufacture and
therefore recommended. If the released press is not utilised, than fixed cost i.e. 10% of conversion cost (10% of ` 3) i.e. 0.30 is a loss and purchase from Mr. Black, can not be recommended since
gain is only ` 0.12 (` 7.21 less ` 7.09).
21. RH Ltd. is a new Company which has planned to produce two products as detailed below :--
SULOHI UNIBLA ` / unit ` /unit
Direct materials 40 20
Direct wages 30 15
Variable Overheads (excluding sales commission ) 14 7
—— ——
Total variable costs 84 42
—— ——
Selling Price 100 50
Fixed expenses excluding interest on blank overdrafts amount to ` 6,00,000 per annum and are
expected to be incurred in equal amount from 1st June 2013. The financial year commences
from 1st July 2013 and the sales for June 2013 and the first four months of the year 2013-14 are as
under :---
Month Unit of Sales budgeted
————————————
Sulohi Unibla
June 2013 4,400 2,100
July 2013 4,200 2,100
August 2013 4,600 2,300
September 2013 3,600 1,800
October 2013 4,000 2,000
Production : 75% of each month‘s sales will be produced in the month of sales and 25% of sales
are produced in the previous month.
Sales : In the case of Sulohi the pattern of sales realisation will be as under :
(a) One –third on cash basis on which a cash discount of 2% is allowed ;
(b) One –third on document against payment through bank . Such bills are discounted
with the bank and credit is received in the month of sales itself.
(c) One-third on document against acceptance and collection through bank. The cash
under the scheme will be received in the third month. For example the value of goods
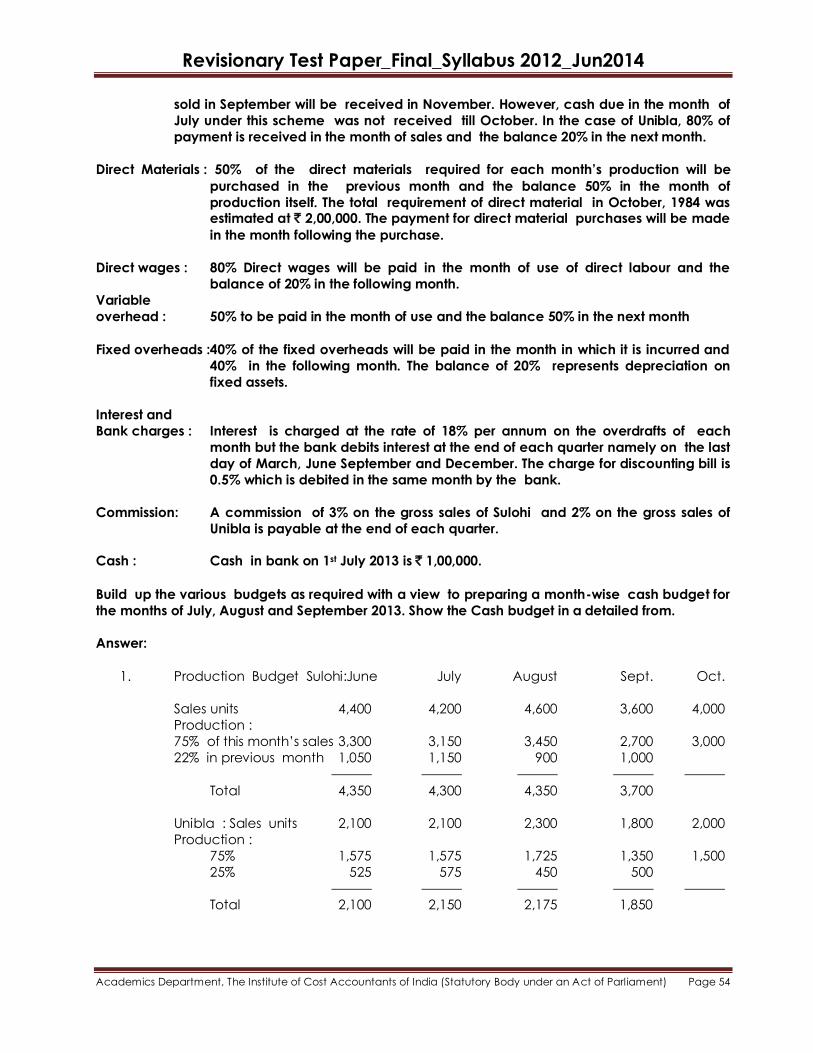
Revisionary Test Paper_Final_Syllabus 2012_Jun2014
Academics Department, The Institute of Cost Accountants of India (Statutory Body under an Act of Parliament) Page 54
sold in September will be received in November. However, cash due in the month of
July under this scheme was not received till October. In the case of Unibla, 80% of
payment is received in the month of sales and the balance 20% in the next month.
Direct Materials : 50% of the direct materials required for each month‘s production will be
purchased in the previous month and the balance 50% in the month of
production itself. The total requirement of direct material in October, 1984 was estimated at ` 2,00,000. The payment for direct material purchases will be made
in the month following the purchase.
Direct wages : 80% Direct wages will be paid in the month of use of direct labour and the
balance of 20% in the following month.
Variable
overhead : 50% to be paid in the month of use and the balance 50% in the next month
Fixed overheads :40% of the fixed overheads will be paid in the month in which it is incurred and
40% in the following month. The balance of 20% represents depreciation on
fixed assets.
Interest and
Bank charges : Interest is charged at the rate of 18% per annum on the overdrafts of each
month but the bank debits interest at the end of each quarter namely on the last
day of March, June September and December. The charge for discounting bill is
0.5% which is debited in the same month by the bank.
Commission: A commission of 3% on the gross sales of Sulohi and 2% on the gross sales of
Unibla is payable at the end of each quarter.
Cash : Cash in bank on 1st July 2013 is ` 1,00,000.
Build up the various budgets as required with a view to preparing a month-wise cash budget for
the months of July, August and September 2013. Show the Cash budget in a detailed from.
Answer:
1. Production Budget Sulohi:June July August Sept. Oct.
Sales units 4,400 4,200 4,600 3,600 4,000
Production :
75% of this month‘s sales 3,300 3,150 3,450 2,700 3,000
22% in previous month 1,050 1,150 900 1,000
——— ——— ——— ——— ———
Total 4,350 4,300 4,350 3,700
Unibla : Sales units 2,100 2,100 2,300 1,800 2,000
Production :
75% 1,575 1,575 1,725 1,350 1,500
25% 525 575 450 500
——— ——— ——— ——— ———
Total 2,100 2,150 2,175 1,850

Revisionary Test Paper_Final_Syllabus 2012_Jun2014
Academics Department, The Institute of Cost Accountants of India (Statutory Body under an Act of Parliament) Page 55
2. Direct material costs budget
Sulohi @ ` 40 1,74,000 1,72,000 1,74,000 1,48,000
Unibla @ ` 20 42,000 43,000 43,500 37,000
———— ———— ———— ————
Total 2,16,000 2,15,000 2,17,500 1,85,000 2,00,000
3. Purchase Budget
50% same month 1,08,000 1,07,500 1,08,750 92,500 1,00,000
50% next month 1,07,500 1,08,750 92,500 1,00,000
———— ———— ———— —————
Total 2,15,500 2,16,250 2,01250 1,92,500
Payment next month 2,15,500 2,16,250 2,01,250
4. Direct Wages Budget Sulohi @ ` 30 1,30,500 1,29,000 1,30,500 1,11,000
Unibla @ ` 15 31,500 32,250 32,625 27,750
———— ———— ———— ————
Total 1,62,000 1,61,250 1,63,125 1,38,750
Payment
80% same month 1,29,600 1,29,000 1,30,500 1,11,000
20% previous month 32,400 32,250 32,625 27,750
———— ———— ———
Total monthly payment 1,61,400 1,62,750 1,43,625
5. Variable Overhead Budget Sulohi @ ` 14 60,900 60,200 60,900 51,800
Unibla @ ` 7 14,700 15,050 15,225 12,950
——— ——— ——— ————
Total 75,600 75,250 76,125 64,750
Payment :
50% same month 37,800 37,625 31,063 32,375
50% next month 37,800 37,625 38,062 32,375
——— ——— ———
Total payment 75,425 75,688 70,437
6. Fixed Overheads Budget
40% same month 20,000 20,000 20,000 20,000
40% next month 20,000 20,000 20,000 20,000
———— ——— ——— ———
Total payment 40,000 40,000 40,000
7. Sales Budget
Sulohi 4,40,000 4,20,000 4,60,000 3,60,000
Unibla 1,05,000 1,05,000 1,15,000 90,000
———— ———— ———— ————
5,45,000 5,25,000 5,75,000 4,50,000

Revisionary Test Paper_Final_Syllabus 2012_Jun2014
Academics Department, The Institute of Cost Accountants of India (Statutory Body under an Act of Parliament) Page 56
Computation of Receipts :
Sulohi: 1/3 3rd sales less 2%
Cash discount 1,37,200 1,50,266 1,17,600
1/3 3rd discount 1,40,000 1,53,334 1,20,000
1/3 3rd against acceptance 1,46,667 1,40,000
Unibla : 80% 84,000 92,000 72,000
20% 21,000 21,000 23,000
——— ———— ————
Total Receipts 3,82,200 5,63,267 4,27,600
Discount charges @ 0.5% 700 767 600
Commission : Sulohi sales for 3 months ` 12,40,000 @ 3 % = 37,200
Unibla sales for 3 month ` 3,10,000 @ 2 % = 6,200
——— ` 43,400
CASH BUDGET
For the Quarter ending September, 2013
July August September ` ` `
Opening Balance 1,00,000 56,987
Receipts 3,82,200 5,63,267 4,72,600
———— ———— ————
4,82,200 5,63,267 5,29,587
———— ———— ————
Payment:
Direct Materials 2,15,500 2,16,250 2,01,250
Direct Wages 1,61,400 1,62,750 1,43,625
Variable Overheads 75,425 75,688 70,437
Fixed Overheads 40,000 40,000 40,000
Bank Charges 700 767 600
Commission 43,400
Interest 1,209
———— ———— ————
4,93,025 4,95,455 6,00,621
———— ——— ————
Surplus/Deficit (--) 10,825 67,812 (--) 1,28,021
Cumulative Surplus/Deficit 10,825 56,987 (--) 71,034
Calculation of interest :
Total payment before interest 4,93,025 4,95,455 4,99,312
Surplus/Deficit (--) 10,825 67,812 (--) 1,26,712
Cumulative Surplus/Deficit (--) 10,825 56,987 (--) 69,825
Interest 18% (1.5% per month) 162 1,047 1,209

Revisionary Test Paper_Final_Syllabus 2012_Jun2014
Academics Department, The Institute of Cost Accountants of India (Statutory Body under an Act of Parliament) Page 57
22. A Cement Company transports its requirements of limestone from a quarry situated at a
distance of 6 km from the factory. Presently the company engages transport contractors for the
purpose. The company has invited tenders from transport contractors and the lowest quotation received ` 18 per tonne of limestone.
The management is concerned about the increasing cost of transport and has therefore, under its
consideration, a proposal for the purchase of a fleet of trucks for being used departmentally for
the transport of limestone. You have been furnished with the following data to examine the
feasibility of the proposal.
(i) The company has two options regarding of trucks. They are (a) buy 10 tonne capacity
trucks or (b) buy 8 tonne capacity trucks.
(ii) Operating cost data :
10 Tonne 8 Tonne
capacity capacity
Trucks Trucks
———— ————
Purchase price of each truck Rs 4,30,000 4,00,000
Life in years 5 5
Scrap value at the end of 5th year of life ` 82,000 40,000
Km. Per litre of diesel 3 4
Repairs and maintenance Per annum per truck ` 47,100 38,400
Road tax per quarter per truck ` 600 600
Miscellaneous fixed expenses Per month ` 3,000 3,000
Oil and sundries per 100 km run ` 10 10
(iii) Each truck will make 5 trips (to and for) on an average for 24 days per month.
(iv) Cost of diesel ` 10 per litre.
(v) Salary of drivers ` 1,600 per month.
Two extra drivers will be employed to work as relievers.
(vi) Other staff required One Mechanic @ ` 2,000 per month
One Fitter @ ` 1,600 per month
One Supervisor @ ` 3,200 per month.
(vii) The capacity of the cement plant is 24,000 tonnes per month of limestone crush.
Required :
(i) Present a comparative cost sheet on the basis of the aforesaid data showing the transport
cost per tonne of operating 10 tonne and 8 tonne capacity trucks at full capacity utilisation
of the cement plant for an average month by classifying the expenses into (a) varying with
Km run (b) varying with number of trucks and (c) fixed, and suggest the best alternative out
of the three choices available namely (a) selection from two capacity trucks and (b) hiring
of transportation.
(ii) Apart from cost analysis as in (i) above, what other factors may be considered by the
management before accepting the proposal for purchase of trucks.
Answer:
10 Tonne 8 Tonne
capacity capacity
Trucks Trucks
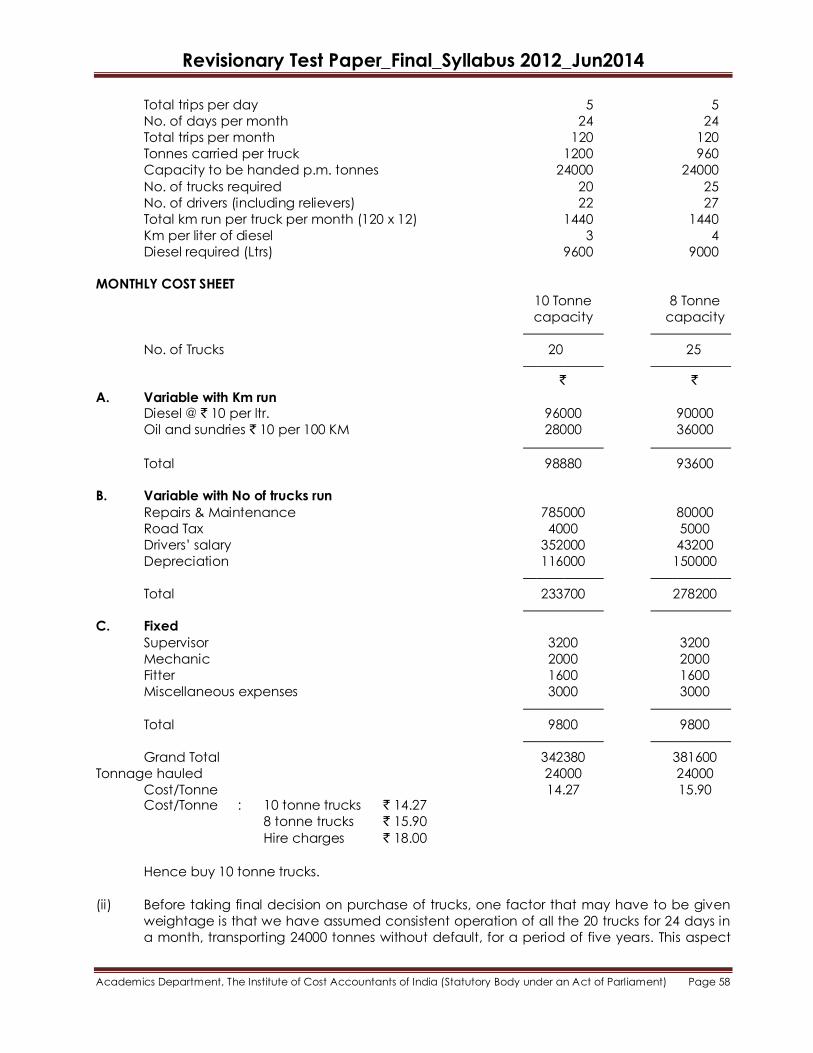
Revisionary Test Paper_Final_Syllabus 2012_Jun2014
Academics Department, The Institute of Cost Accountants of India (Statutory Body under an Act of Parliament) Page 58
Total trips per day 5 5
No. of days per month 24 24
Total trips per month 120 120
Tonnes carried per truck 1200 960
Capacity to be handed p.m. tonnes 24000 24000
No. of trucks required 20 25
No. of drivers (including relievers) 22 27
Total km run per truck per month (120 x 12) 1440 1440
Km per liter of diesel 3 4
Diesel required (Ltrs) 9600 9000
MONTHLY COST SHEET
10 Tonne 8 Tonne
capacity capacity
—————— ——————
No. of Trucks 20 25
—————— —————— ` `
A. Variable with Km run Diesel @ ` 10 per ltr. 96000 90000
Oil and sundries ` 10 per 100 KM 28000 36000
—————— ——————
Total 98880 93600
B. Variable with No of trucks run
Repairs & Maintenance 785000 80000
Road Tax 4000 5000
Drivers‘ salary 352000 43200
Depreciation 116000 150000
—————— ——————
Total 233700 278200
—————— —————— C. Fixed
Supervisor 3200 3200
Mechanic 2000 2000
Fitter 1600 1600
Miscellaneous expenses 3000 3000
—————— ——————
Total 9800 9800
—————— ——————
Grand Total 342380 381600
Tonnage hauled 24000 24000
Cost/Tonne 14.27 15.90 Cost/Tonne : 10 tonne trucks ` 14.27
8 tonne trucks ` 15.90
Hire charges ` 18.00
Hence buy 10 tonne trucks.
(ii) Before taking final decision on purchase of trucks, one factor that may have to be given
weightage is that we have assumed consistent operation of all the 20 trucks for 24 days in
a month, transporting 24000 tonnes without default, for a period of five years. This aspect

Revisionary Test Paper_Final_Syllabus 2012_Jun2014
Academics Department, The Institute of Cost Accountants of India (Statutory Body under an Act of Parliament) Page 59
must be considered on the basis of past record of hiring trucks on day to day basis over a
three years period so that optimum calculations on saving get properly weighed down.
Second issue is that an immediate investment of ` 86 lakhs in purchase of 20 trucks has to
be made. This could be totally from own resources or totally out of borrowings or could be
partly either way. For own investment technique of discounted cash flow is to be applied
while in case of borrowings, recurrent interest cost as also initial cost of procuring the same
has to be provided out of savings from year to year apart from meeting normal schedule of loan repayments. Net savings works out to ` 10.74 lakhs per annum on hauling of 24000
tonnes for 12 months, in comparison to hiring of trucks
Third issue is to compare return on investment of own funds made for procurement of
trucks either fully or in part vis-à-vis return in alternate outlets. That is opportunity costs of
capital will have to be given consideration.
Decision will be made after considering all the above factors.
23. A Large manufacturing Company engages itself in producing of basic chemicals. The capacity
of its plant is 75,000 tonnes per annum but it operates at 80% level in view of paucity of demands.
In past the Company ventured to raise production and export the same; but found it not profitable.
The Company is required to import certain chemicals and maintenance spares, the annual requirements in foreign exchange being ` 6 crores on a production of 60,000 tonnes. This cost is
totally variable. So long Company did not face any problem in procurement of these materials as
foreign exchange was always available following normal licensing procedures.
However, on account of recent Government policy it is not possible at all to get foreign exchange
for imports. The company has either to export and get entitled to 30% foreign exchange earned to
finance its imports or to buy Exim scrips in open market. The Company excepts the premia
payable at 50% of the value of the Exim scrips.
Since there is ample scope to produce additional 15,000 tonnes and export the same the
management is considering the possibility thereof to finance its imports.
Based on the detailed analysis and behaviour of different cost elements, following cost profile is
available:
Cost element Behaviour of `/Tonne
cost elements
Raw materials and Chemicals Fully variable 12,500
Packing/Forwarding Fully variable 500
Steam, power and other utilities 60% variable 1,500
Wages and Salaries 50% variable 400
Stores, Spares and Maintenance 2/3rd Fixed 600
Overheads 20% variable 500
Depreciation Fixed 900
Total 16,900
Gross Margin before Interest/Taxes 3,100
Selling Price 20,000

Revisionary Test Paper_Final_Syllabus 2012_Jun2014
Academics Department, The Institute of Cost Accountants of India (Statutory Body under an Act of Parliament) Page 60
In view of the recent adjustment in Dollar/Rupee Parity, the export price that can be realised FOB Bombay is placed at ` 14,000/tonne. Other costs on interest, special export packing and other
incidental costs is estimated at ` 1,000 per tonne, showing the net realisation on export at `
13,000/tonne.
You are required to advice the management whether (a) to export additional 15,000 tonnes and
to entitled to 30% foreign exchange so as to finance its import requirements or (b) to buy Exim
scrips at a premium of 50% and continue to operate at 80% capacity as hitherto.
Indicate comparative economics and cost/benefit analysis of both the alternatives. Ignore foreign
exchange rate fluctuations.
Also suggest the adjustment to be effected in local prices to retain the same gross margin.
Answer:
Cost Data for 2 capacities
Cost elements 60,000MT 75000T Basis for
(as Given) as adjusted 75000 T `/tonne `/tonne
Raw materials and chemicals 125000 125000 Fully variable
Packing forwarding 500 500 - do –
Steam, power, utilities 1500 1380 900 V + 0.8 X 600
Wages & salaries 400 360 200 V + 0.8 X 200
Stores, spares and maintenance 600 520 200 V + 0.8 X 400
Overheads 500 420 100 V + 0.8 X 400
Depreciation 900 720 0.8 x 900
Total 16900 16400
Total cost for 75000 tonnes @ ` 16400 = 12,300 lakhs
Total cost for 60000 tones @ ` 16900 = 10,140 lakhs
Total cost for 15000 tonnes = 2,160 lakhs
`/Tonne
Cost for export 14400 (2160 15000)
Add specific cost as given 1000
Total Costs 15400
FOB realisation on export ` 14000/tonne
Loss on export ` 1400/tonne
Total Loss on 15000 tonnes to be exported ` 210 lakhs
Foreign exchange required for 60,000 tonnes ` 600 lakhs
Foreign exchange required for 75,000 tonnes ` 750 lakhs
Foreign exchange required for 15,000 tonnes ` 150 lakhs
Exim scrips that can be earned is 30% of ` 14000
equalling to ` 4200/tonne exported.
Exim scrips that can be earned on 15000 T @ ` 4200 ` 630 lakhs
Exim scrips that would be used in production for export of 15000 T @ ` 1000/T. ` 150 lakhs
Balance exim scrips available for financing imports for

Revisionary Test Paper_Final_Syllabus 2012_Jun2014
Academics Department, The Institute of Cost Accountants of India (Statutory Body under an Act of Parliament) Page 61
production for local market. ` 480 lakhs
If the company was not to export, the aforesaid exim scrips of ` 480 lakhs would have been
bought at 50% premium. This would have costed ` 240 lakhs additionally. The loss on export being
` 210 lakhs, there is an apparent saving of ` 30 lakhs. The proposed quantity may therefore be
exported. Price to be Adjusted `/lakhs
(a) Loss on exports 210
(b) (i) Foreign exchange required for production to be sold in India 600
(ii) Less available now through exports 480
(iii) Balance to be procured 120
(iv) 50% premia would cost 60
Total Loss (a) + (b) 270
Sale in the country 60000 tonnes Price revision to be effected ` 450/tonne
24. (a) A Ltd. has a choice between three projects, X, Y and Z. The following information
has been estimated: Market Demand (Profit) (` ‗000)
Projects D1 D2 D3
X 190 50 15
Y 110 200 160
Z 150 140 110
Probabilities are D1 = 0.6, D2 = 0.2, D3 = 0.2
Which project should be undertaken if decision is made by expected value approach?
Calculate the expected value of perfect information?
Answer:
The elements of the material should be identified–profits, demand, probabilities, action
(Projects X, Y or Z) and outcomes (Expected values).
Profit (` ‗000) Probability (` ‗000)
Project X D1 190 0.6 114
D2 50 0.2 10
D3 15 0.2 3
——–——
EV = 127
————–
Project Y D1 110 0.6 66
D2 200 0.2 40
D3 160 0.2 32
———–—

Revisionary Test Paper_Final_Syllabus 2012_Jun2014
Academics Department, The Institute of Cost Accountants of India (Statutory Body under an Act of Parliament) Page 62
EV = 138
————–
Project Z D1 150 0.6 90
D2 140 0.2 28
D3 110 0.2 22
————–
EV = 140
————– Project Z should be chosen because it has the highest EV of ` 1,40,000.
Perfect information:
In order to obtain perfect information about futures states of demand from market
researchers, a company has to pay for the information. The maximum value of this
perfect information will be equal the EV with the information less the EV without the
information. Demand Choose Profit (` ‗000) Probability EV (` ‗000)
———— ———— ——————— ————— ——————–
D1 X 190 0.6 114
D2 Y 200 0.2 40
D3 Y 160 0.2 32
————
EV with perfect information 186
Therefore, EV of the perfect information = 186 – 140 = ` 46 i.e. ` 46,000
(b) What are the various stages/steps to be taken in the implementation of TQM? How does
TQM facilitate value addition in an organization?
Answer:
Stage Description
1 Identification of customers/customer groups.
2 Identification of customer expectations
3 Identification of customer decision-making requirements and product utilities
4 Identification of perceived problems in decision making process and product utilities.
5 Comparison with other organizations and Benchmarking
6 Customer Feedback
7 Identification of improvement opportunities
8 Quality Improvement Process through – a) Determination of new strategies, b) Elimination
of deficiencies, and c) Identifying solutions.
1. Stage 1: Identification of customers / customer groups: Through a team approach (a
technique called Multi – Voting), the firm should identify major customer groups. This helps
in generating priorities in the identification of customers and critical issues in the provision of
decision – support information. 2. Stage 2: Identifying customer expectations: Once the major customer groups are
identified, their expectations are listed. The question to be answered is – What does the
customer expect from the Firm? 3. Stage 3: Identifying customer decision-making requirements and product utilities: By
identifying the need to stay close to the customers and follow their suggestions, a decision
– support system can be developed, incorporating both financial and non-financial
information, which seeks to satisfy used requirements. Hence, the Firm finds out the answer
to – What are the customer‘s decision-making requirements and product utilities? The

Revisionary Test Paper_Final_Syllabus 2012_Jun2014
Academics Department, The Institute of Cost Accountants of India (Statutory Body under an Act of Parliament) Page 63
answer is sought by listing out managerial perceptions and not by actual interaction with
the customers. 4. Stage 4: Identifying perceived problems in decision-making process and product utilities:
Using participative processes such as brainstorming and multi-voting, the firm seeks to list
out its perception of problem areas and shortcomings in meeting customer requirements.
This will list out areas of weakness where the greatest impact could be achieved through
the implementation of improvements. The firm identifies the answer to the question – What
problem areas do we perceive in the decision-making process? 5. Stage 5: Comparison with other Firms and benchmarking: Detailed and systematic internal
deliberations allow the Firm to develop a clear idea of their own strengths and weaknesses
and of the areas of most significant deficiency. Benchmarking exercise allows the Firm to
see how other Companies are coping with similar problems and opportunities. 6. Stage 6: Customer Feedback: Stages 1 to 5 provide a information base developed without
reference to the customer. This is rectified at Stage 6 with a survey of representative
customers, which embraces their views on perceived problem areas. Interaction with the
customers and obtaining their views helps the Firm in correcting its own perceptions and
refining its process. 7. Stage 7 & 8: Identification of improvement opportunities and implementation of Quality
Improvement Process: The outcomes of the customer survey, benchmarking and internal
analysis, provides the inputs for stages 7 and 8. i.e., the identification of improvement
opportunities and the implementation of a formal improvement process. This is done
through a six-step process called PRAISE, for short.
25. (a) Detail the areas in accounting and finance where linear programming may be
used with advantage.
(b) Nuton Ltd. manufactures 5 products A B C D & E and the following information is
supplied to you. Per unit of product in `
A B C D E
Selling Price 48 42 38 31 27
Material Costs 15 14 16 15 16
Direct Labour 18 16 6 4 4
Fixed Overheads
(50% of Direct Labour) 9 8 3 2 2
Total Costs 42 38 25 21 22
Expected maximum unit demand per month for each product at the prices indicated:
A B C D E
1,500 1,200 900 600 600 Costs of materials include a special component X which is in short supply. It costs ` 3 per
unit. Only 5,800 units will be available in the company during the month. The number of
units X needed for a unit of each product is.
A B C D E
1 1 3 4 5 Labour is paid at a rate of ` 1.50 per hour at only 20,000 hours will be available in month.
The management, for working capital reasons have decided the expenditure on materials should not exceed ` 30,000 in a month.

Revisionary Test Paper_Final_Syllabus 2012_Jun2014
Academics Department, The Institute of Cost Accountants of India (Statutory Body under an Act of Parliament) Page 64
In order to select the best mix of the products A B C D & E, you are asked to formulate
Linear Programming Model with all details, with the help of the above information, in the
usual standardised manner. No solution of the problem is required.
Answer:
a) Linear programming can be used in solving resource allocation problems in area.
Specific examples in the accounting and finance areas include.
(i) Capital investment and project appraisal particularly relating to capital
rationing problems.
(i i) Maximising contribution or minimising cost decisions involving production
planning, product mix and similar problems;
(i ii) Transfer pricing problems and elements of corporate strategy formulation;
(b) L P in standard format :
Step 1: Establish the objective function
Product A B C D E Contribution (`) 15 12 16 12 7
Let ABCDE represent the number of products per month
Objective function
Maximise 15A + 12B + 18C + 12D + 7E
Step 2:
Establish the constraints, Constraints exists regarding Demand, Labour and materials.
Demand constraint:
A 15000 B 1200 C 900 D 600 E 600
Labour constraint
2 2 2 12 A + 10.——B + 4C + 2.——D + 2.——E 20,000
3 3 3
This is in respect to Labour Hours.
In terms of Labour cost, the constraint is 18A + 16B + 6C + 4D + 4E 30,000
Material constraint
As regards special component
A + B+ 3C + 4D + 5E 5,800
The expenditure constraint is 15A + 14B + 16C + 15D + 16E 30,000

Revisionary Test Paper_Final_Syllabus 2012_Jun2014
Academics Department, The Institute of Cost Accountants of India (Statutory Body under an Act of Parliament) Page 65
The non-negative constraint A, B, C, D, E 0
The full LP formulation is as under:
Maximising 15A + 12B + 16C + 12D + 7E
Subject to A 1,500
B 1,200
C 900
D 900
E 600
18A + 16B + 6C + 4D + 4E 30,000
A + B+ 3C + 4D + 5E 5,800
15A + 14B + 16C + 15D + 16E 30,000 abd A, B, D, D, E < 0
26. (a) What do you understand by the concept of Learning Curve ? Explain its relevance in
planning for profit.
Answer:
Learning Curve is a mathematical expression of the fact that labour time will decrease at a
constant percentage over double output. This rate of improvement is regular and predictable. It is
a ratio between the time to produce first unit and the cumulative time for two units. It is formula
particularly useful for forcasting future outputs and cost. It has now become an accepted tool in
industry for projecting shop loads, determining manpower requirement and negotiating
subcontracts.
The model indicates that the learning curve will continue on its onward slope indefinitely. But the
major problem confronting the management when an innovation is introduced is the
determination of
(a) the rate of learning
(b) the length of training period.
Both (a) and (b) could be estimated but useful, reliable data can only be collected by
consistently recording the pattern of learning whenever a new process is started or an old one
modified. A learning rate of 80% is standard but a learning rate of 100% would indicate that there
is no learning at all and the rate above 100% would imply that instead of improvement in
efficiency, there is a deterioration and increase in cost.
The following are the factors affecting learning curve :
1. Setting up a very high initial labour cost so as to show a high learning curve. Such
information is useless and misleading.
2. In high mechanised enterprise, the learning curve is of practically of no use.
3. There should be uninterrupted flow of work,
4. If the charges are frequent there may be no learning at all.
5. Labour strikes, lockouts and etc. influence the learning curve. The effects of these factors
should be carefully represented from the actual costs used to measure the performance.

Revisionary Test Paper_Final_Syllabus 2012_Jun2014
Academics Department, The Institute of Cost Accountants of India (Statutory Body under an Act of Parliament) Page 66
The application of learning curve model is relevant in cost volume profit analysis for the purpose
of establishing target profit, budgeting materials quantities and cost, labour and overhead costs,
This will be all the more prominent in the case of new product line and with the application of
new technology when learning takes place. Many other costs such as indirect labour, power etc.
costs depend on the amount of time required and as learning takes place, these costs tend to
decline. Learning curve theory thus allows projection of the final average unit cost at any stage
of production. The efforts of the learning curve on costs related to budgeted Volume should be
incorporated in the budget plan. At the early stages rate of return will be low but it will pick up as
the production volume increases. By taking into account the learning curve over a budget
period, the profit can be correctly forecasted.
(b) Define ‗Learning Curve Ratio‘. What are the limitations of Learning Curve.
Answer:
Learning curve ratio is also called experience ratio or improvement ratio. It is a relation between
average labour cost of first 2 units and the average labour cost of first units. If the average labour cost for first 500 units f a product is ` 25 and average labour cost of first 1000
units is ` 20. The ratio will be =
L C Ratio = 25.Rs
100 x 20 .Rs = 80%
Limitations —
1. All activities in manufacturing environment are not subject to learning effect i.e. work done
by new and inexperienced workmen.
2. Considerable difficulty arises in obtaining valid data that will form basis for computation of
learning effect.
3. Even slight change in circumstances quick renders the learning curve obsolete.
4. It is unlike that average time to manufacture a product will continue to decrease in the long
run due to some uncontrollable factors.
(c) Engine Ltd. manufacture engine mountings for wide-bodied airliners. They have been asked to
bid on a prospective contract for 90 engine mountings for the Jumbo jet aircraft. They have just
completed an initial run of 30 of these mountings at the following costs : `
Direct materials 20,000
Direct labour 24,000
Tooling Cost ( re—usable) 3,000 Variable Overhead ( ` 0.50 per labour hour) 3,000
Fixed Overhead ( Re. 1 per labour hour) 6,000
———— ` 56,000
————
An 80% learning curve is through to be pertinent in this case. The marketing directors believes that
the quote is unlikely to be accepted if it exceeds ` 1,10,000 and as the Company are short of
Work, he believes the contracts to be vital. You are required to comment whether is it worth accepting at ` 1,10,000. State your
assumptions clearly.
Answer:
Labour hours required:

Revisionary Test Paper_Final_Syllabus 2012_Jun2014
Academics Department, The Institute of Cost Accountants of India (Statutory Body under an Act of Parliament) Page 67
Cumulative quantity Cumulative Cumulative average
Manufactured Hours hours per unit
————————— —————— —————————— (i) 30 6000 200 ( 6000 30)
(ii) 60 9600 (60 x 160) 160 ( 200 x 80%)
(iii) 120 15360 (120 x 128) 128 ( 160 x 80%)
Additional Hours for 90 = hours required for 120 less the hours required for the original 30
= 15360 – 6000 = 9360 hours.
Therefore incremental costs for 90 engines are : `
Direct Material 60,000 Direct labour ( 9360 @ ` 4) 37,440
Tooling cost nil Variable overhead (9360 @ ` 0.50 ) 4,680
Fixed overhead nil
——————
1,02,120
————
The contract is worth accepting, provided more profitable work is not being turned away, as it yields a contribution of ` 7,880.
27. New Horizons Ltd is considering the introduction of a new product and has supplied
you following information:
Expected Standard
Deviation
Sales Quantity 5,000 400 Selling Price per unit (`) 300 5
Fixed Costs (`) 5,80,000 10,000
Variable Costs per unit (`) 175 7.5
You are required:
(a) to calculate the expected Break Even volume and the expected profit for the per iod.
(b) to explain how you would carry out a simulation to arrive at an approximate
distribution of profits. Illustrate your answer by using the cumulative distribution, an
abstract which has been given and using the following random number 20, 96, 68, 5 9
for the four variables receptively to obtain one simulated figure for profit.
For simplicity, assume that all the random variables are independent and that the
probability distributions are normal.
Abstract from the cumulative Normal Distribution Table.
Random No. No. of Deviations Random No. of Deviations
From Mean No. from Mean
00 —2.5 62—65 0.3
01 —2.3 66—68 0.4
02 —2.0 69—72 0.5
17—18 —0.9 84—85 1.0

Revisionary Test Paper_Final_Syllabus 2012_Jun2014
Academics Department, The Institute of Cost Accountants of India (Statutory Body under an Act of Parliament) Page 68
19—21 —0.8 86—87 1.1
22—24 —0.7 88—89 1.2
47—53 0.0 96 1.8
54—57 0.1 97 1.9
58—61 0.2 98 2.0
99 2.3
Answer: (a) Break Even Volume ` 5,80,000
= ` 300 – ` 175
= 4,640 Units
Expected Profit = 5,000 ` 125 – ` 5,80,000 = ` 45,000
(b) To perform a simulation, it is necessary to identify objectives and identify the
critical variables and then relationship to the logic of the model. Thus for this
simulation, the objectives is to determine an approximate distribution of profits for
New Horizons Ltd. The critical variables are sales volume, sales price, fixed cost
and variable cost. The relationship of the variable and the logic of the model can
be, in the case shown as a simple— Profit = sales volume (sales price –variable
cost) – Fixed Cost. The simulation would then be carried out by randomly selecting
a value for each of the four variables, calculating the resultant profit and
repeating the process, say a 100 times. Using the data given the question the
simulated profit figure is calculated as under:
Variable Expected Standard Random Deviations Simulated
Value Deviations No. from mean variable
Sales (unit) 5,000 400 20 –0.8 4,680 Price (`) 300 5 96 1.8 309
Fixed costs 5,80,000 10,000 68 0.4 5,84,000 Variable cost ` 175 7.5 59 0.2 176.5
The simulated sales figure is calculated as follow:
5,000 – 0.8 (400) = 4680
Similarly other variables are calculated.
Profit = 4,680 (309 – 176.5) – 5,84,000 = ` 36,100
The process would be repeated say 100 times to get an approximated profit distribution.
28. (a) What is Value Engineering ? Could you draw a brief distinction in between value analysis
and the values assigned to an industrial product. List the steps involved in the operation of value
engineering and its advantages.
Answer:
Value Engineering and Value Analysis are more or less synonymously used, though there is a thin
distinction in between them.

Revisionary Test Paper_Final_Syllabus 2012_Jun2014
Academics Department, The Institute of Cost Accountants of India (Statutory Body under an Act of Parliament) Page 69
To be specific, value engineering concentrates mainly on indirect Costs and may be applied in
the pre-production stage, i.e. in the design and development stage but value analysis is applied
to existing products already being marketed.
Both may be defined as ― a systematic analysis and evaluation of the techniques and functions
in the various spheres of an organisation with a view to exploring channels of performances
improvement so that the value in a particular product can be bettered‖ Value analysis aims at
cost reduction techniques, i.e. reducing costs by economising expenditure and increasing
productivity. Value analysis probes into economic attributes of value and though continuous
process of planned action aims to improve performance, and increase the value in a product
and thereby reduce costs. Value analysis can be applied to all types of cost. Value engineering
is said to be mainly concerned with use value and to some of cost. Value engineering is said to
be mainly concerned with use value and to some extent with esteem value. Value may be
considered as the least amount for money that should be spent for creating the use esteem
factors of a product.
Steps involved in the operation value engineering techniques.
1. Identification and definition of the problem involved ; This is done with a view to ascertain
whether the customer is being given the full use or esteem values, for the product he
buys; otherwise, action is required to increase the product value. In the case of raw
materials and components, the question asked would be whether they gives satisfactory
performance, satisfaction in production for subsequent process.
2. Collecting information : Function of items of a product or each operation process is
considered and all information and relevant facts like drawing and design, tolerance
specification, direct and other costs, market, etc. are obtained.
3. Exploring and evaluating alternatives : All potential value alternatives are considered and
the related cost determined to find out the best method of performing the work at the
lowest cost. This involves a continuous search for utilisation of alternative or substitute
materials, components and process so as to better the performance.
4. Development and Planning : The effective value alternatives a function and its value and
cost may be expressed as Value = Function/Cost.
Value can be improved by improving function, cost remaining constant, and by reducing
cost --- function remaining constant and by improving function as well as reducing cost .
Advantages :
1. It ensures and maintains the desired quality of products and suggests the
manufacture of most suitable products.
2. It assists in cost reduction.
3. It makes possible full use of all resources.
4. Improve methods of production and use of latest manufacturing techniques have the
effect of rising productivity and minimising cost.
5. By a continuing search for improvement, value engineering creates the proper
climate for increased efficiency.
(b) The following table gives the result of inspection of 20 samples of 100 items each taken on
working days. Draw a P-chart. What conclusion would you draw from the chart?
Sample No. 1 2 3 4 5 6 7 8 9 10
No. of Defectives 0 2 4 6 6 4 0 2 4 8
Sample No. 11 12 13 14 15 16 17 18 19 20
No. of Defectives 8 0 4 6 14 0 2 2 6 2

Revisionary Test Paper_Final_Syllabus 2012_Jun2014
Academics Department, The Institute of Cost Accountants of India (Statutory Body under an Act of Parliament) Page 70
Answer:
Given sample size n = 100
Sample No. di pi = di/100
1 0 0
2 2 0.02
3 4 0.04
4 6 0.06
5 6 0.06
6 4 0.04
7 0 0
8 2 0.02
9 4 0.04
10 8 0.08
11 8 0.08
12 0 0
13 4 0.04
14 6 0.06
15 14 0.14
16 0 0
17 2 0.02
18 2 0.02
19 6 0.06
20 2 0.02
Total -- 0.80
We have = 0.8/20 = 0.04
= 1 - = 0.96
Therefore, the 3σ control limits for P – chart are
Therefore Central Line C.L = = 0.04
Lower Control Limit (L.C.L) =
=
= 0.104 – 0.05879
= - 0.01879 0
Upper Control Limit (U.C.L) =
=
= 0.04 + 0.05879
= 0.09879

Revisionary Test Paper_Final_Syllabus 2012_Jun2014
Academics Department, The Institute of Cost Accountants of India (Statutory Body under an Act of Parliament) Page 71
We observe that from P chart the 15th sample value lies above U.C.L. Hence the production
process is not in the state of statistical quality control.
29. (a) Average time taken by an operator on a specific machine is tabulated below. The
management is considering replacing one of the old machines by a new one and the estimated
time for operation by each operator on the new machine is also indicated.
Machines
Operation M1 M2 M3 M4 M5 M6 New
01 2 3 2 1 4 5 6
02 4 4 6 3 2 5 1
03 6 10 8 4 7 6 1
04 8 7 6 5 3 9 4
05 7 3 4 5 4 3 12
06 5 5 6 7 8 1 6
(i) Find out an allocation of operators to the old machines to achieve a minimum operation time.
(ii) Reset the problem with the new machine and find out the allocation of the operators to
each machine and comment on whether it is advantageous to replace an old machine to
achieve a reduction in operating time only.
(iii) How will the operators be reallocated to the machines after replacement?
Answer:

Revisionary Test Paper_Final_Syllabus 2012_Jun2014
Academics Department, The Institute of Cost Accountants of India (Statutory Body under an Act of Parliament) Page 72
Operation M1 M2 M3 M4 M5 M6 New
01 2 3 2 1 4 5 6
02 4 4 6 3 2 5 1
03 6 10 8 4 7 6 1
04 8 7 6 5 3 9 4
05 7 3 4 5 4 3 12
06 5 5 6 7 8 1 6
i)
Row Operation
2 3 2 1 4 5
4 4 6 3 2 5
6 10 8 4 7 6
8 7 6 5 3 9
7 3 4 5 4 3
5 5 6 7 8 1
Column Operation Improved matrix
0 2 0 0 3 4
1 2 3 1 0 3
1 6 3 0 3 2
4 4 2 2 0 6
3 0 0 2 1 0
3 4 4 6 7 0
01 M3 - 2
02 M1 - 4
03 M4 - 4
04 M5 - 3
05 M2 - 3
06 M6 - 1
17 Hours Minimum Operation
Time
1 2 1 0 3 4
2 2 4 1 0 3
2 6 4 0 3 2
5 4 3 2 0 6
4 0 1 2 1 0
4 4 5 6 7 0
0 2 0 1 4 5
0 1 2 1 0 3
0 5 2 0 3 2
3 3 1 2 0 6
3 0 0 3 2 1
2 3 3 6 7 0

Revisionary Test Paper_Final_Syllabus 2012_Jun2014
Academics Department, The Institute of Cost Accountants of India (Statutory Body under an Act of Parliament) Page 73
Ii & iii)
Row Operation
2 3 2 1 4 5 6
4 4 6 3 2 5 1
6 10 8 4 7 6 1
8 7 6 5 3 9 4
7 3 4 5 4 3 12
5 5 6 7 8 1 6
0 0 0 0 0 0 0
Improved Matrix
0 1 0 0 3 4 5
2 2 4 2 1 4 0
4 8 6 3 6 5 0
4 3 2 2 0 6 1
4 0 1 3 2 1 10
3 3 4 6 7 0 5
0 0 0 1 1 1 1
In Place of M3 new machine is to be replaced.
0 2 0 0 4 5 6
1 2 3 1 1 4 0
3 8 5 2 6 5 0
3 3 1 1 0 6 1
3 0 0 2 2 1 10
2 3 3 5 7 0 5
0 1 0 1 2 2 2
(b) Why is Lean Accounting Needed?
Answer:
There are positive and negative reasons for using Lean Accounting. The positive reasons include
the issues addressed in the ―Vision for Lean Accounting‖ shown above. Lean Accounting provides
accurate, timely and understandable information that can be used by managers, sales people,
operations leaders, accountants, lean improvement teams and others. The information gives clear
insight into the company‘s performance; both operational and financial. The Lean accounting
reporting motivates people in the organization to move lean improvement forward. It is often
stated that ―What you measure is what will be improved.‖ Lean accounting measures the right
things for a company that wants to drive forward with lean transformation.
Lean Accounting is also itself lean. The information, reports, and measurements can be provided
quickly and easily. It does not require the complex systems and wasteful transactions that are
usually used by manufacturing Companies. The simplicity of lean Accounting frees up the time of
the financial people and the operational people so that they can become more actively involved
1 2 1 0 3 4 5
2 2 4 1 0 3 0
2 6 4 0 3 2 0
5 4 3 2 0 6 1
4 0 1 2 1 0 9
4 4 5 6 7 0 5
0 0 0 0 0 0 0
01 M1 - 2
02 M4 - 3
03 New - 1
04 M5 - 3
05 M2 - 3
06 M6 - 1
07 M3 - 0
13 Hours Minimum
time
0 2 0 0 5 6 7
0 1 2 0 1 4 0
2 7 4 1 6 5 0
2 2 0 0 0 6 1
3 0 0 2 3 2 11
1 2 2 4 7 0 5
0 1 0 1 3 3 3

Revisionary Test Paper_Final_Syllabus 2012_Jun2014
Academics Department, The Institute of Cost Accountants of India (Statutory Body under an Act of Parliament) Page 74
in moving the Company forward towards its strategic goals. The role of the financial professional
moves away from bookkeeper and reporter and towards strategic partnering with the Company
leaders.
At a deeper level Lean accounting matches the cultural goals of a lean organization. The simple
and timely information empowers people at all levels of the organization. The financial and
performance measurement information is organized around Value streams and thereby honors
the lean principle of Value stream management. The emphasis on Customer Value is also derived
from the principles of lean thinking. The way a Company accounts and measures its business is
deeply rooted in the culture of organization. Lean Accounting has an important role to play in
developing a lean culture within an organization.
30. (a) A company manufacturing television sets has four plants with a capacity of 125, 250, 175
and 100 units respectively. The company supplies T.V. sets to its four show rooms which have
demand of 100,400,90 and 60 units respectively. Due to the differences in the raw material cost and the transportation cost, the profit per unit (in `) differ which are given in the following table:
Showroom
I II III IV
I 90 100 120 110
Plants II 100 105 130 117
III 111 109 110 120
IV 130 125 108 113
By using Vogel‘s approximation method, plan the production programme so as to maximise the
profit. Also determine the maximum total profit.
Answer:
Profit matrix
Show Room
Plants
I II III IV
I 90 100 120 110 125
II 100 105 130 117 250
III 111 109 110 120 175
IV 130 125 108 113 100
100 400 90 60 650 Loss Matrix:
40
30 10 20
125/0 10/10/10 40 40
0 8 4 13 250/160/100/0 13/13*/12*
110 60
5 10 4 10 175/0 9/10/11
20 130
6 6 6 17 100/0 5
40
100 400 130 60
0 225 0 0
125
0
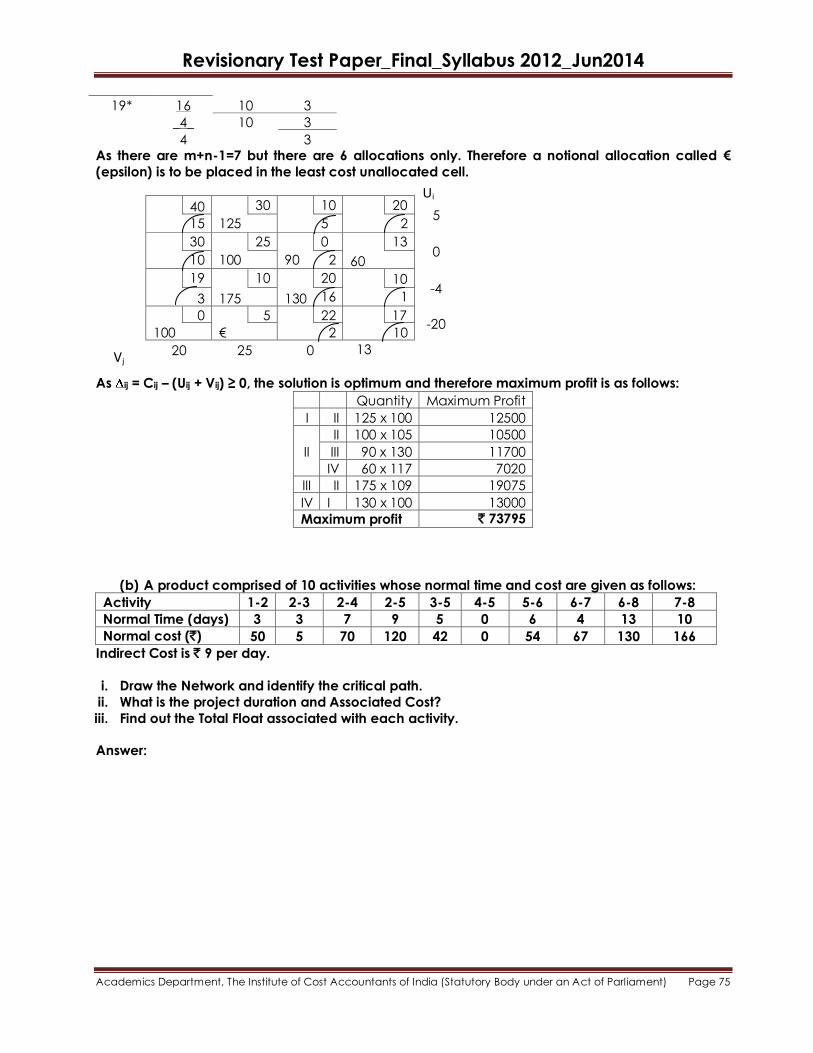
Revisionary Test Paper_Final_Syllabus 2012_Jun2014
Academics Department, The Institute of Cost Accountants of India (Statutory Body under an Act of Parliament) Page 75
19* 16 10 3
_4_ 10 3
4 3 As there are m+n-1=7 but there are 6 allocations only. Therefore a notional allocation called €
(epsilon) is to be placed in the least cost unallocated cell.
As ij = Cij – (Uij + Vij) ≥ 0, the solution is optimum and therefore maximum profit is as follows:
Quantity Maximum Profit
I II 125 x 100 12500
II
II 100 x 105 10500
III 90 x 130 11700
IV 60 x 117 7020
III II 175 x 109 19075
IV I 130 x 100 13000
Maximum profit ` 73795
(b) A product comprised of 10 activities whose normal time and cost are given as follows:
Activity 1-2 2-3 2-4 2-5 3-5 4-5 5-6 6-7 6-8 7-8
Normal Time (days) 3 3 7 9 5 0 6 4 13 10
Normal cost (`) 50 5 70 120 42 0 54 67 130 166
Indirect Cost is ` 9 per day.
i. Draw the Network and identify the critical path.
ii. What is the project duration and Associated Cost?
iii. Find out the Total Float associated with each activity.
Answer:
40 30 10 20 5
15 125 5 2
30 25 0 13 0
10 100 90 2 60
19 10 20 10 -4
3 175 130 16 1
0 5 22 17 -20
100 € 2 10
20 25 0 13
Ui
Vj
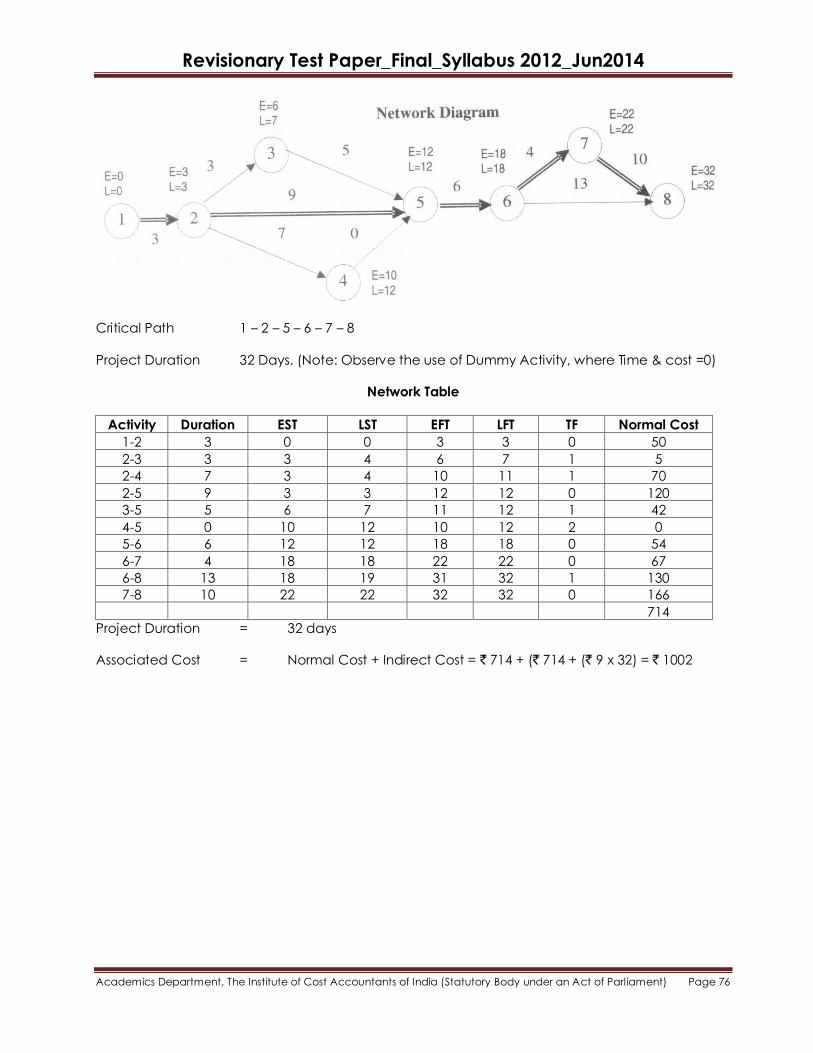
Revisionary Test Paper_Final_Syllabus 2012_Jun2014
Academics Department, The Institute of Cost Accountants of India (Statutory Body under an Act of Parliament) Page 76
Critical Path 1 – 2 – 5 – 6 – 7 – 8
Project Duration 32 Days. (Note: Observe the use of Dummy Activity, where Time & cost =0)
Network Table
Activity Duration EST LST EFT LFT TF Normal Cost
1-2 3 0 0 3 3 0 50
2-3 3 3 4 6 7 1 5
2-4 7 3 4 10 11 1 70
2-5 9 3 3 12 12 0 120
3-5 5 6 7 11 12 1 42
4-5 0 10 12 10 12 2 0
5-6 6 12 12 18 18 0 54
6-7 4 18 18 22 22 0 67
6-8 13 18 19 31 32 1 130
7-8 10 22 22 32 32 0 166
714
Project Duration = 32 days
Associated Cost = Normal Cost + Indirect Cost = ` 714 + (` 714 + (` 9 x 32) = ` 1002