Review of Policies in the Traditional Energy Sector
110
r S I6OI3 Review of Policies in the Traditional EnergySector Discussion Paper Series FILE Directed by The World Bank, Africa Region Supported by DirectorateGeneralfor IntemationalCooperation The Netherlands Public Disclosure Authorized Public Disclosure Authorized Public Disclosure Authorized Public Disclosure Authorized
-
Upload
khangminh22 -
Category
Documents
-
view
9 -
download
0
Transcript of Review of Policies in the Traditional Energy Sector
r S I6OI3
Review of Policies in the Traditional Energy Sector
Discussion Paper Series
FILE Directed byThe World Bank, Africa Region
Supported byDirectorate General for Intemational Cooperation
The Netherlands
Pub
lic D
iscl
osur
e A
utho
rized
Pub
lic D
iscl
osur
e A
utho
rized
Pub
lic D
iscl
osur
e A
utho
rized
Pub
lic D
iscl
osur
e A
utho
rized

b
RPTES Program Staff
Boris Utria, Task ManagerMax Wilton, Senior Adviser
Azedine Ouerghi, Energy EconomistSuzanne Roddis, Projects Assistant
For additional information on the RPTES program or the Discussion Paper series, please contact:
RPTES ProgramWestern Africa Department
The World Bank1818 H Street, NW
Washington, DC 20433
tel: (202) 473-4488 J 473-0719fax: (202) 473-5143

RE_VEW OF POLICIES IN THE TRADITIONALENERGYSECTOR
RPTES
REGIONAL REPORT
Burkina Faso - Mali - Niger - Senegal - The Gambia
2nd. EditionMay 1996
THIS REPORT IS NOT AN OFFICIAL DOCUMENT OF THE WORLD BANK. IT CONTAINS THERESULTS OF COUNTRY- AND REGIONAL ANALYSES THAT ARE PRESENTED FORDISCUSSION AND COMMENTS. THE FINDINGS, INTERPRETATIONS AND CONCLUSIONSARE ENTIRELY THOSE OF THE AUTHORS.

Review of Policies in the Traional Eneap Sector - RPTESRegional Rqport
TABLE OF CONTENTS
PrefaceExecutive Summary
L Introduction
1.1 Plan of the Report 11.2 Physiography and Population 11.3 The Sub-regional and National Economies 31.4 The Energy Sector 5
H. Profile of the existing Traditional Energy Sector
2.1 General 92.2 A critical Evaluation of the Biomass Resource Base 10
a. Agro-ecological Zones in the RPTES Countries 10b. The Genesis of Action Programs in the traditional
Energy Sector 13c. Overview of the RPTES Data Bases 13d. Key Issues in Data Collection and Management 18e. Key issues in biomass Supply-Demand Balances 23
2.3 Fuelwood Supply and Denand in Rural Areas 262.4 Urban Markets for Fuelwood and Charcoal .. 272.5 Commercial Supply of Urban Markets 292.6 The Role of Institutions 332.7 Main Sector Issues 34
m. The outlook to the year 2020
3.1 The traditional Energy sector from a NEXUS Perspective 373.2 Population Growth, Migration and Urbanization 383.3 Demand for Food, Energy and corresponding Land Use 393.4 Scenarios for Demand for Traditional Energy 413.5 The Supply Potential 423.6 The Implications of economic Growth for Sector Policy 46

Ji
TABLE OF CONTENTS (Continuation)
IV. Towards improved Sector Management
4.1 Options for Interventionsa. Non-price Demand Management 47b. Demand Substitution 48c. Promotion of sutinable Supply 53d. Priorities for Action 55
4.2 Implementation Tools for Supply-side Actionsa Forest Management 56b. Fiscal and Pricing policies in the traditional Energy Sector 62c. Institutional Adaptation and Management of Change 70
4.3 Integration of Fuelwood Management schemes in overallrural development 71
4.4 Human Resources Development 724.5 Orientaion of Extenal Aid 73
V. Country-specific Overviews
5.1 Senegal 775.2 Gambia 805.3 Burkina Faso 835.4 Mali 855.5 Niger 87
Annex
List of the RPTES thematic studies 91

Hi
Tables
1-1 Population and Urbanization 31-2 Selected Economiic Statistics 51-3 Condensed Energy balance 7
2-1 Agroecological Zones in the RPTES Countries (part I) 12Agro-ecological Zones by Country (part II) 12
2-2 Compaison of Results of two regional Inventories 162-3 Main Results of national Inventories 172-4 Summary of Analyses of national RPTES Reports 202-5 Major Urban Woodfuel Markets 282-6 Fuelwood and Charcoal Prices 32
3-1 Population Projection for 2020 383-2 Estimated Evolution of Land Use (Scenario n) 403-3 Comparison of Demand and potentialy sustainable Supply ofWoodfuels 43
4-1 Markets and Price Structure for Petroleum Fuels 544-2 Financial Resources 64
Figures
4-1 Energy Consumption by Fuel Mix: 50- Total energy (part I)- Useful energy (Part II)
4-2 Cost of Wood and Charcoal and distances to production Sites 62

Iv
Acronyms
ASG African Support GroupAVBRR Advanced Very High Resolution RadiometryCIF Cost, insurance and freightCFMA Community Forest Management AgreementCILSS Permanent Inter-State Committee for Drought Control in the SahelCINERGIE Cellule internationale d'itude et de recherches pour la gestion de
l'information sur les echangesCONACILSS Cordination National du CILSSCRES Centre Regional de l'Energie SolaireDGIS Directorate General of International CooperationECU European Currency UnitEEC European Economic CommunityENDA-TM Environnement et d6veloppement du tiers mondeE/DI Energy Development InternationalESMAP Energy Sector Managenent Assistance ProgrammeFAO Food and Agricultural Organization of the United NationsFCFA Franc de la communaute financiere africaineFD (Gambian) Forestry DepartmentGBA Greater Banjul AreaGEAP Gambia Environmental Action ProgramGGFP Gambian-German Forestry ProjectRMF International Monetary FundLPG Liquid petroleum gasMAI Mean Annual IncrementM MinistTy of Trade, Industry and Employment (The Gambia)
NGO Non-governmental OrganizationNOAA (The US) National Oceanic and Atmospheric AdministrationRPTES Review of Policies in the Traditional Energy SectorSAR Societe Africaine de RaffinageSED Strategie Energie DomestiqueSEED Strategie Energie Environnement DeveloppementSIR Societe Ivoirieme de RaffinageSONICHAR Societe Nigerierme de CharbonnageUSAID United States Agency for Intemational DevelopmentUNDP United Nations Development ProgramUNEP United Nations Enviromnent ProgramUNIFSTD United Nations Interim Fund on Science and Technology for
DevelopmentWALTPS West Africa Long Term Perspective Study

v
PREFACE
The search for sustainable development in Sub-Saharan Africa has created agrowing awareness of the multi-sectorial nature of problems in the field of traditionalenergy. This became especially evident in the course of the World Bank research on theso-called NEXUS of population, agriculture and enviromnent, which links populationpressure on natural resources to food security, poverty and environmental degradation.The supply of energy from biomass resources constitutes an important subset of theseissues needing special attention. Rural populations using traditional production methodsmake growing demands on the limited land- and forest resources. In parallel, rapidurbanization creates large concentrated markets for commercialized woodfuels which, inturn, has a significant influence on the exploitation of biomass resources and on thedevelopment of the rural economy.
Against this backdrop, the perception arose that a "Review of Policies, Strategiesand Programs in the Traditional Energy Sector" (RPTES) would be essential to orient in amore systematic manner the actions of governments, of external aid donors and of othereconomic agents. With the agreement of the respective national authorities, a group of fiveSahelian countries was chosen to implemnent a first phase ofthe RPTES Program.
Given the nature of a policy review, country ownership of the conclusions isindispensable to a credible follow-up effort that should translate broad outlines intoconcrete action on the ground. It is with this perspective in mind that the RPTES optedfor maximizing the African contribution through an intensive inter-active process ofAfrican and expatriate experts working together. Multi-disciplinary national teams wereset up in each courtry under the leadership of a national coordinator. National teamstypically include officials from the different ministries in charge of energy, environment,forestry and water resources, social and women affiirs, the national CILSS comnmission(CONACELSS) and, in some cases, NGO's. An ad hoc "African Support Group (ASG)",composed by the five national coordinators and a representative from CILSS, was alsoestablished to assure regional communication and the coordination of cross-countrysupport activities. The review progressed in stages marked by three workshops (Bamakio.May 1993; Ouagadougou, February 1994; and Dakar, November 1994) where participantsevaluated each other's contributions, comprising African country reports and specializedstudies, thematic study reports by external consultants, and regional synthesis reportsprepared by the World Bank Team that coordinated the work.
It should be emphasized that the participatory approach has resulted in dualoutputs comprising on the one hand five national reports by teams of counterparts in eachcountry, and on the other hand a regional report by the RPTES coordinating teamThroughout the study it was clearly understood that the views of the national teams andthose of the coordinating team need not converge in every respect. Although the Reviewwas instrumental in forging a consensus on major policy issues, any differences notedamong the end products should be accepted as consistent with the spirit of the RPTES

vi
The regional report and the five national assessments by the African teams werepresented for discussion and evaluation to a meeting with donor experts held from May15-17, 1995 in Maastricht, and sponsored by the Govermment of The Netherlands. Thisvolume is a re-issue of the final regional report as an RPTES Discuion Paper. It takesinto account the valuable comments, received after the Maastricht meeting, from manyexperts inside and outside the World Bank Group, including the contributions by YoubaSokona and Souleymane Diallo of ENDA-Dakar, Miguel Trossero and Mori Keita ofFAO, John Hall of the Agriculture and Environment Division of the Westem AfiicaDepartment, Simon Rietbergen and Christian Taupiac of the Africa Technical Department,and the collective contnbution of colleagues in the Industry and Energy Department.
Following the Maastricht conference, the RPTES has continued to evolve. Withinthe original five-country group, preparation of new investments in the traditional energysector totaling US $40 million is well advanced, and elsewhere the Program has beeninstrumental in accelerating the implementation of projects totaling US $15 million. So far,at least six new countries in various regions of Africa have indicated their interest inpursuing a similar activity with assistance from RPTES staff These developments willgenerate new information to be included in future publications. At present, the report aspresented in Maastricht constitutes a benchmark that, hopefilly, will stimulate reflectionand action throughout the Africa Region.
The World Bank Team gratefully acknowledges the cooperation and support oftheir many African counterparts and the steady encouragement and guidance of theSteering Committee. Finally, sincere thanks are due to the Government of TheNetherlands which, through the Directorate General of International Cooperation (DGIS),provided the trust fund financing that made the original RPTES Program and its currentextension possible, and to the Danish Government for its support to several forestry sectorstudies undertaken by Program with funding from the Danish Consultant Trust Fund at theWorld Bank.
Sihvia B. SagariChief
Industry and Energy DivisionWestern Africa Department

vIl
R P T E S PROGRAM
Steering Committee
Dennis Anderson, Senior Energy Advisor, The World Bankllama Arba Dialo, Executive Director, Interim Secretariat of the Convention to Combat
DesertificationFranvois FaBoux, Environmental Advisor, The World Bank
Eric Ferguson, Consultant, Directorate General for International Cooperation - DGIS,The Netherlands
Youba Sokona, Coordonnateur du Progranime Energie, ENDA TM, Dakar
World Bank Team
Boris Utria, Task ManagerMax Wilton, Senior AdviserAzedine Ouerghi, Economist
Suzanne Roddis, Project Assistant
African Support Group
Saidou Ouiminga, Directeur Gtn6ral de l'Energie, Burkina FasoIsmail Toure, Coordonnateur de la Strategie Energie Domestique, Mali
Kiri Tounao, Directeur Adjoint du Projet Energie IU, NigerOmar Sallah, Director of Energy, The GambiaAlioune Fall, Directeur de l'Energie, Senegal
Ide Bana, Conseiller, Gestion des Ressources Naturelles, CILSS

Jx
EXECUTIVE SUMMARY
General Characteristics of the Region
1. The study region comprises S6n6gal, The Gambia, Burkina Faso, Mali and Niger.The total territory measures almost three nillion square kilometers, of which two-thirds ismade up by the vast desert areas of Mali and Niger. The inhabited parts form a band ofland stretching 3300 km from the Atlantic Ocean in the West to the border of Chad in theheart of Africa. Within this zone, average annual rainfalls vary widely as a function oflatitude. The total population in 1992 was about 35 million, of which 25 % urban. Theeconomies of all five countries are classified as low-income, with Sendgal having abouttwice as much GNP per capita as the other four countries. Agriculture contributes from 20% to 50 % to GDP but as much as 80 % in terms of employment.
2. Per capita final energy demand (of the order of 200 kg of petroleum equivalent) isamong the lowest by world standards. The structure of energy end use is markedlydifferent for the coastal and the land-locked countries. In Senegal and The Gambia theshare of household energy consumption is about 60 % and the transport component(hydrocarbons) ranges from 20 to 24 %. In the interior, the household share rises to 88 %.In al five countries, traditional fuels account for about 90 % or more of all householdenergy consumption.
Profile of the Traditional Energy Sector
3. The analyses of the traditional energy sector developed in the last 20-25 yearswere pattemed after the methods used in the modern sector. Biomass supply and demandwere projected, the role of prices and institutions examrnned, and forecasts (in manycountries of impending shortages) induced action by governments and the donorcommnunity. Although an impressive volume of research at the microeconomic level hasbecome available, the results are less satisfactory for planning and policy making. At themacro level, much information must be inferred from a weak database and extrapolation ofsurvey data, and unwarranted aggregation can undermine the credibility of conclusions atthe national level.
4. The standing stock of forest resources and the annual productivity of the areaunder vegetative cover varies strongly with climatic zone and rainfall. From the NorthernSahelo-Saharan zones to the Sudano-Guinean areas in the extreme South, the averagestanding stock ranges from 4-30 in3 /hectare, and the estimated productivity from 0.1-1.5m3/hectare/year. These orders of magnitude hide considerable uncertainties. Theexamination of available data revealed important differences in the diagnoses and results.Generally speaking it appears that the unit productivity of the land has beenunderestimated and that the biomass stock was not completely assessed. As a result, somepessimistic predictions of the 1980s concerning deforestation have not materialized.

x
5. In 1990, the estimated total demand in the five countries was about 15 milliontons, of which 11 million tons in rural areas. Out of the four million tons of urban demand,about three rnillion was concentrated in the capital cities and major secondary centers witha total population of about six million in 1990. At that time, the best estimate of theavailable aggregate supply was 37 million tons.
6. Urban interests dorninate the commercial forest exploitation and the woodfudlstrade. Since the fuelwood at source is practically a free good, partial or complete verticalintegration of woodcutting, charcoaling and trnsportation can bring large profits to theoperators. The system was sanctioned by forestry codes and enforced by the forestryservices, much to the detriment of ecological protection of the land and of the socialwelfare of the rural population.
7, Taxation of fuelwood and charcoal dates back to colonial days. The economicrationale in later years was based on the perception that private exploitation and pricing donot recognize the replacement value of the resource. The imposition of a stumpage feewas supposed to rectify the price signal to the consumer and also induce a shift tosubstitute fuels like butane and kerosene. However, actual taxation levels, equivalent to 3to 11 % of the retail price, are too small to make much difference in consumer behavior.Because of the poor tax collection record the effect is even more diluted, and the totalsums collected are insignificant relative to total national tax revenues.
S. In contrast with the long standing national preferences for State-ownedenterprises, the production and trade of traditional fuels is essentially a private businessstraddling the border of the formal and informal sectors. Intervention in the traditionalenergy sector is the preoccupation of many government agencies active in forestry,agriculture and environment, energy, commerce and finance. Each interested group bringsits own perspective, inter-agency cooperation is poor and the regulation imposed has notbeen highly effective.
The Outlook to the Year 2020
9. Within the context of the policy study objectives, the RPTES undertook ananalysis of potential future developments that integrated the so-called NEXUS ofpopulation growth, agriculture and environment with the traditional energy sector. Theanalytical approach consisted of examining first the possible settlement pattems ofpopulation, the spatial development of agriculture, and the demand for food and energy.Based on the needs for staple foods, future land use was estimated and next thecorresponding capacity of the land to supply woodfiuels. The accessibility of the resourceswas also considered, taking into account road infrastructure, transportation costs,distribution of resources and market size. The results depend on many assumptions,including the advance of agricultural technology. At this stage, the operational value lies inthe definition of a multi-disciplinary framework for thinking about policy, in the

xl
development of at least some orders of magnitude for the expected changes, and inidentifying priorities for research to firm up the data bases.
10. The underlying population projection was based on a regional study of 19countries in West Africa, of which the RPTES group is a subset. Two scenarios of highand low economic growth were postulated, and each case was associated with acontinuation of inter-regional population movements observed since 1930, generally fromthe countries in the interior to the coast. The greater mobility and more urbanization areexpected to occur under the higher economic growth scenario. In that case the totalpopulation in the RPTES countries would reach 63 million by 2020, of which 43 % urban,compared to 25 % in 1990.
11. The needs for domestically grown staple foods and the accompanying agriculturalexpansion would result in land use shifting from forestry to cultivation, but withoutleading to total loss of forest land. In terms of annual rates of deforestation, the strongestpressure would occur in The Gambia, with Niger a close second.
12. The long-term projection of demand for traditional energy was made separately forrural and urban populations. For rural areas where fuelwood is mostly collected bywomen and children on a subsistence basis rather than traded, the quantities were based onobserved per capita uses that appear to be strongly related to relative availability. Evenwithout price signals, more wood is used where supply is stil plentiful (e.g. SouthernMali), on the other hand, in areas where walking distances for collection become everlarger, per capita use tends to decrease eventually to the minimum physical needs (e.g.Niger). Projections of urban household energy use suggest that a gradual changeoverfrom faelwood to charcoal will take place but that a large-scale substitution of petroleumfuels for woodfuels is not likely to happen.
13. The most striking challenge in the 30-year period would occur in urban demand forwoodfuels. For the five countries taken together, the urban share in the total consumptionrises from about 25 % in 1990 to over 50 % at the end of the period. The change is mostpronounced in the .ountries with the highest urbanization and - presumably - the fastestTransition to charcoal use. In rough numbers, the projected trend is towards a quadrsplingof urban woodfiels consumption while rural consumption increases by only one half overthe period.
14. Any scenario looking 25 to 30 years ahead is full of uncertainties on both thedemand - and the supply side. Macro-economic growth and its effect on householdincomes is a major factor in the development of substitution of modem fuels in the cities.To the extent that they can be influenced by policy, there is nothing deterministic about theprojections However, the fact that many pessimistic predictions of the 1970s have notcome true should not lead to complacency. What was predicted for 1990 may well happenin the next century unless a clear policy direction emerges now and corresponding actions-e taken with reference to two time frames:

xii
* Over the intermediate term (say a horizon to 2005), a more thorough analysisof future land use should be made, folowing the general principles outlinedabove. Since a projection for a shorter period is subject to fewer uncertainties,the results can be more readily interpreted against the existing knownoperational environment.
* With respect to the short term, reforms are clearly necessary regardless of thephysical dimensions of fuitre developments, and they should be undertakennow. They cover a broad spectrum of traditional energy activities that havebeen explored as part of the RPTES Program.
A Review of past Interventions
Demand Intervention through Efficiency Improvement.
15. The use of traditional energy for cooking, the major component of energy demandin the RPTES countries, is inefficient. Efforts to improve the process by promotion ofimproved woodstoves have met miced success. The projects in the Sahel have had animportant social impact in terms of improving household cooking environments,improving health conditions and introducng technical change at the household level.Furthermore, improved stove programs have played a most useful role in the identificationof critical gender issues and in the mobilization of grass-roots women's groups. However,energy savings have been mediocre or poor in relation to the resources expended. Thedisappointing record can be largely traced to a narrow, technology-based approach datingback to the l970s. Projects of more recent date combine socio-economic and earliertechnical experience. On balance, the RPTES review concluded that (i) improved stovesperform a valuable function and should be continued, while incorporating the lessonslearned; (i) since the demonstrated net energy savings are small, stove promotion cannotbe a high priority of energy entities with their limited resources; and (iii) given theimportance of the social dimensions, non-energy organizations are best placed to take alead role, bearing in mind that ultimately the sustainability depends on a full commitmentof the private sector. In summnary, future demand managernent should reflect, at bothtechnical and institutional levels, the evolution from a strongly technological, efficiency-oriented approach to welfare improvement in the broader sense.
Demand Substitution
16. Governments in the RPTES countries are all active in attempting to replaceligneous fuels (fuelwood and charcoal) by petroleum products (Liquid Petroleum Gas -LPG - and kerosene)- However, success basically depends on economic growth and thecorresponding increase of personal incomes that would permit consumers to switch fuels.LPG penetration is farthest advanced in S6negal and to a lesser extent in The Gambia. Thedissemination in the land-locked RPTES countries is hampered by high import costscaused by inefficient procurement of small quantities, and large transportation distances.
xiii
17. The experience with a regional LPG Promotion Program, now discontinued,shows that the means utilized to accelerate the substitution process have not beeneffective. The woodfuel savings are well below the values suggested by straightforwardfuelswitching because consumers tend to change first to multiple fiuel use. Kerosene,already widely used for lighting in non-electrified households, is ordy in Niger beingactively promoted as a cooking fuel but the rate of penetration is still low. The merits ofgovernment subsidies to accelerate substitution are debatable. Whether intended are not,part of the public sector funds tends to benefit higher income strata and commercialestab'shments. Stn6gal operates a cross-subsidy program that clearly has had an impacton consumer demand, but the economic costs are not negligible, and they may be even lesssupportable for countries having only half of Senegal's GDP per capita. These conclusionsapply mainly to fuel subsidies. There may be cases where temporary subsidies of newapplances are desirable to overcome initial marketing problems.
Promotion of Sustainable upply
18. Like woodstove programs targeting the demand side of the market, efforts toimprove supply in the Sahel have gone through a history of trial and error before viablesolutions began to emerge. Three courses of action may be distinguished:
* Large-scale woodfuel plantations have been least successfil, and they seem tomerit consideration only if woodfuels are a byproduct of growing trees fortimber, subject to marketing opportunies.
D Most farming systems in the Sahel are agroforestry systems where trees andannual crops grow together. However, in most cases development has notreached the stage that trees are planted intentionally. This has proven to be aviable option in other parts of Africa and there is a growing body ofencouraging infornation on its potental, provided that constrants related toland- and tree tenure are lifted.
* Meanwhile, better management of the existing forests with participation of therural population appears to offer the best near-term prospects of increasing thesustainable supply of fuelwood. Coincidentally, many experimental projectsstarted up in all RPTES countries at the same time as a drive fordecentralization of the public sector. In its most elementary form, participationmeans that subsistence farmers can earn cash from controlled exploitation ofnearby forests, which would mean the beginning of monetization of theeconomy in the impoverished rural areas and thus provide some financialresources for further developments. This option is strategically closely linkedto agroforestry, because bringing open-access resources under conmnuritymanagement is a precondition for more intensive tree-planting activities.

xiv
It should be recognized that, whatever the option chosen, teir long-run viability, dependson the opportnity cost of land as detemined by its optimum use.
Priorities for Action
19. Priorities for action should flow from a clear defi&ihion of the desired objectivesand targets. The desired developmental objective is the establishmnent of economicallystable, socially equitable and ecologically sustainable traditional energy markets. Therecommendatons for action, without negatng the validity of previous interventions,shoud take into account the existing hman, financial and instittional resourceconstaints in the RPlES counties. Furthermore, any one of the three options outlinedabove (demand-side-, substituton- and supply-side interventions) requires closecooperation of public- and private sector agents In weighing the merits of each potentialaction, the limitations of the public sector need to be clearly recognized. Public sectorresources are scarce; therefore, unless policy is focused, much human effort and resourcescan be dissipated on legislation, fiscal measures, reorganization of institutions and lawenforcement serving different or even contradictory objectives.
20. Viewed from these perspectives, the priorities for government action in theRPTES countries become clearer As discussed, non-price demand interventions(essentially improved stoves) are helpfiul, but are not likely to reduce the pressure onnatural biomass resources significantly in the face of the rapidly growing demand.Substitution is driven essentially by growth of household incomes, and the existing weakeconomies do not have the fiscal means to accelerate this process by subsidizing fi.els(although temporary equipment subsidies may be appropriate in specific situations). Thethird option, pmmotion of sustainable supply through participatory management of thenatural forests and - by extension - agroforestry. has emerged as offerng the best prospectto attain, if not a solution, at least a rapid improvement.
Implementation Instruments
Forestry Management
21. Legislative reforms are necessary to redefine the rights of rural populations byletting them participate in the commercial exploitation of the forests and share the benefits.Senegal and Mali have enacted legislation to that effect, while in the other RPTEScountries new laws are being drafted Regardless of the state of advancement oflegislation, the subject is being examined everywhere in the light of experience alreadygained with pilot projects. Within the legislative framework, the basic implementationinstrument is a management contract between the authorities and villagers spelling out theconditions of sustainable exploitation. the mutual obligations and the sharing of thebenefits. Significant issues remain to be resolved with regard to the security of the rightsgranted, the representation of villate populations, the role of traditional authorities and the

xv
links of village-based production with transportation and marketing operations. It isimportant to foresee the organization of charcoal production in these schemes to avoid thedevelopment of uncontrolled and new ecologically danaging forest exploitation practices.
Fiscal- and Pricing Policies
22. Fiscal policy has lacked clear objectives and coherence and, on balance, theimplementation has been ineffective or worse, counterproductive. A re-orientation alongthe following lines is recommended:
d Supporting sustainable woodfuel supply and evironmental protection, by localcommunities managing the existing natural forests and woodlands undercontracts;
* Providing adequate incentives to secure the cooperation of the local ruralpopulations by exempting village-based production from all centrally imposedcommodity taxes (to be distinguished from levies that financially support themanagement schemes and that are collected and spent under local control);
* Protecting the new producers against unfair competition from existingcommercial interests by establishing nimum producer prices until such timethat the woodfuels trade has been successfully restructured;
= Penalizing non-sustainable exploitation by levymg a significant tax on non-managed production; and
a Transforming the forestry services from law-enforcement to ectensionagencies, financed out of general governent revenue rather than earmarkedwoodfuel taxes.
Institutional Adaation and Ma-nanement of Change
23. Public sector regulation of activities in the traditional energy sector has beenlargely ineffective because of uncoordinated interventions of many interested agencies.Central to a solution is the close cooperation of forestry and energy departments. It wasfound that forestry departments are generally better organized and equipped than energydepartments to deal with the crucial traditional energy issues on the supply side. Theacceleration of iitiatives in this area (through development of community-basedmanagement of forests) is creating a dichotomy between ministries with the nsk thatenergy depanments focusing on the demand side will fall more and more behind unlessthey are strengthened in the process. They need no large increases in staff, but rather thecreation of a small core of experts in traditional energy who are capable of working acrossdepartmental boundaries. Regional cooperation is also seen as an important aspect of theneeded capacity building tasks, through exchange of experiences in interdepartmentalcooperation and by peer reviews of project preparation work.

xv
Integation in Overall Rural Development
24. Fuelwood management schemes should be integrated in overall rural development.Future projects could consider as comple cmponents the introduction ofphotovoltaic solar power (for village water pumps, clinics, telecommunications,community TV and distance education), maintenance of feeder roads, schoolsimprovement, etc. A strong case should be made for an explicit recognition of the role ofwomen through their own organizations in the drawing up of local management plans, inthe approval process and in the subsequent implementation, including the use by thecommunity of net profits of fiaeiwood sales.
Development of Human Resources
25. The ongoing experimental work shows already that the re-orientation of thewoodfiuel supply industry requies training and re-training of virtually all economic agentsVillagers need to learn techniques of sustainable production, elementary management skillsand at a later stage marketing. Special attention should be given to ensure an adequateaccess for women in all capacity building activities. The training requirements for theforestry services are no less demanding. Agents need to change their approach frompolice-oriented protection of the forests to support services for the rural populationFinally, where urban oligopolies dominate the markets, the controlling interests, asconcerned elemnents of civic society, should be implicated in the dialogue.
)rientation of External Aid
26. Past external aid has been driven mostly by the project approach which may yieldonly localized results with lite impact on the sector as a whole. Without a well-articulatedpolicy, goverments lacked a screening device to judge where donor aid would be mostappropriate. The relative availability of aid gave rise to the search for projects toperpetuate local structures, thus dispersing scarce African human resources. In the contextof communmty-managed woodfuel production schemes, the RPlES review makes thefollowing recommendations:
* Reach a clear understanding between recipients and donors on the principles.processes and fiscal incentives for forestry management by rural communities.
* Identify local solutions that are considered replicable and that establish anfastructure of human and material resources sufficient to create a multiplier
effect;
* Determine a phased implementation plan, if opportune combined with theintroduction of other forms of renewable energy; and

xvii
Plan for advance training of ecmonoic agents at all levels (including training ofinstructors), in anticipation of long-term needs.
Recapitulation of Country-Specific Recommendations
Sinial
(1) The Govenmment should conmmission a comprehensive inventory of forestry- andother biomass resources, in conjunctic with a survy of land use; this work shouldbe set up with a view to periodic updating that will permit monitoring of standingstocks. (RPTES has been supporting some initial efforts by the Centre de SuiviEcologique in Dakar).
(2) In paralel with resource inventorization, forest lands should be unambiguouslyassigned to the State (forits class6es) and the local communities (foretsprotegees), which would have the option to participate in the exploitation of theresource.
(3) The "Decrets d'Application" that will implement the new forestry code shouldprovide for de-cenraized co-management of forest resources by the localcommunities, including the right to retain resource revenues for local use, underthe provisions of an approved local forest mnangement plan
(4) Whereer local populations assume responsibility for forest management, thequotas should be abandoned and replaced by sustinable annual production ceilingsfixed by the management plan.
(5) As one of the tansition measures, the immediate vicinity of the villages in non-managed zones could be protected from indiscriminate cutting by an exclusionzone (e.g. a radius of several Icm).
(6) The merits of tree plantations for commercial timber should be examined anddiscussed wih the charcoal operators and other prvate interests as a way todiversify their business.
(7) Standard weights and measures should be mandated and enforced initially for thewholesale trade and next for the retail trade (at present a 50 kg bag sold at theofficial price holds 42 kg).
(8) Retail price controls on charcoal should be lifted as soon as enforceable standardweights have been established and more competition has been introduced.

xviii
The Gambia
(1) Without revoking the ban on domestic production of charcoal, the legalization ofthe import and trade of charcoal should be examined, in conjunction with themeans needed to exercise effective monitoring.
(2) There is no official restriction on fiuelwood imports. However, statistics should bekept at border entry points.
(3) Government should legalize the transfer of management responsibility for foreststo local population, thus permitting the multiplication of the present demonstrationprojects.
(4) Harvesting of green trees for woodfuel should be permitted in zones that havebeen brought under community management, under the provisions of agreedmanagement plans between the communities and the Forestry Department.
(5) It is recommended to make a second biomass inventory, which will permit theanalysis of land use change since 1980, and the establishment of permanent sampleplots to measure productivity regularly.
(6) To maintain a broad spectrum of consumer choice of fuels, every effort should bemade by the private sector to reduce the cost of hydrocarbon fuels as substitutes,in particular by attempting to lower the cost of importing, storing and bottlingLPG. The prospects of kerosene should be further examined.
(7) The Energy Division in MTE should be adequately staffed and trained to takecare of minimwn requirements for coordination and liaison, and to supervise theestablishment of a central energy documentation center.
Burkina Faso
(1) The available elements of a master plan (at present focused on supplyingOuagadougou) should be updated and integrated as quickly as possible to define amulti-year program that would assure a virtually 100 % supply of the nationalcapital region and other major urban centers from rural woodfuel productioncenters in community managed forests.
(2) In conjunction with this master plan, the transportation infrastructure in the CentralPlateau should be examined for potential bottlenecks in the road network thatwould impede woodfuel supplies. The trucking industry should be closelyassociated with this aspect of the planning.
(3) Selection of new forest areas for village management should take into account thepossibility of introducing other forms of renewable energy in rural areas (e.g.

x)x
photovoltaic solar energy for water pumping, health centers, distance education,etc.).
(4) The threat of mushroonming inefficient charcoal production should be contained byorganizing and mobilizing private sector operators, and by promoting energy-efficient charcoaling practices.
(5) For the longer tern, existing biomass inventories and land use mapping datashould be reviewed and a systematic information basis for the future established.
(6) The present, more or less improvised Direction de l'Energie should be reinforced,made permanent and given well-defined responsibilities in the traditional energysector, in conjunction with a clear delineation of the functions of other entities.
Mali
(1) Govermment and donors should reflect on the incentive structure to be associatedwith villagers' responsibility for resource management.
(2) The role of woodfuel taxation merits re-exaniination in relation to budgetallocations for the traditional energy sector.
(3) Based on the existing inventory data, master plans for woodflzel supply to all majorurban centers should be developed
(4) A survey of the possibility to exploit stocks of deadwood in the Niger Delta tosupply remote markets like Mopti, Gao and Timbouctou.
(5) Extension of the forest inventory to biomass stocks on cultivated land.
(6) An assessment of the capacities or the Forestry Services to deliver extensionactivities, and of the associated needs for retraining, in conjunction with areflection on the future responsibilities and organization of law enforcementagencies.
Niier
(1) Localized inventories of forestry and biomass resources need to be either started orcompleted (including resources in non-forested areas), and mechanisms are to beestablished to monitor regularly the slate of the resources in all land use classes.There is an urgent need to resolve existing doubts about the sustainable yields.
(2) Reported large stocks of deadwood (left over after droughts) are said to beinaccessible because of transponation problems. Verification of these reports isnecessary to see if deadwood is indeed an unexplored resource.

(3) The role of the State in resource management should be reviewed in the sense ofmore selective use of taxes and avoidance of earmarking revenues from woodfueltaxes to support the budget of the public forestry services.
(4) In view of Niger's scarce natural biomass resources, the promotion of plannedagroforestry has a high priority.
(5) The prospects of large-scale substitution of domestic carbonized coal for fuelwoodshould be properly investigated for their relevance to fiuture energy policy and tothe regional economy of North-Central Niger.
(6) The policies with respect to replacement of fuelwood by petroleum fuels should ber-ammined. After the abandonment of LPG subsidies, fiuther LPG promotion atmarket prices may be left to the private sector. With respect to kerosene, twoaspects need attention: (1) The consumer's choice of stoves should be broadenedand the stove suppl'y secured; and (2) Kerosene storage facilities may be needed tosupport the activities of private traders and to ensure a reasonably reliable fuelsupply at a stable price.

I
L INTRODUCTION
1.I Plan ofthe Report
1. This report begins with a broad outline of the main characteristics of the samplegroup of five RPTES countries. It provides background information on their physiographyand population, and on their position within the larger West Afiica Region. After a briefoverview of the structure of the national economies, the focus shifts to the energy sector.
2. The topic of traditional energy sector policies is presented in two parts:
* Chapters l-IV provide a regional overview of study results that is based on the fivedraft reports prepared by the country teams and on draft reports by consultants thatare concerned with specific policy themes. After a sketch of the traditional energysector as it exists today (Chapter 1I), the report discusses future supply-demandscenarios in the context of the population-agriculture-environment NEXUS (ChapterIII). Against this background, Chapter IV examines Government policies, the role ofother economic agents in the sector, donor responses and options for future action.
* Chapter V gives for each country an overview of the most significant characteristicsthat have a bearing on the functioning of the traditional energy sector; each generalsection is followed by tentative policy recommendations for the specific countrysituation.
1.2 Phvsiography and Population
3 The reasons for choosing the RPTES sample group of countries to launch a policyreview have been explained in previous project documents: (1) A reasonablyhomogeneous group of countries with regard to resource base, state of development,climate and structure of the economy; (2) a significant volume of previous sector workwith complementing data bases; and (3) geographic continuity facilitating communicationsamong African team members. Most of these expectations have been confirmed in thecourse of study implementation. Moreover, the inclusion of Gambia as part of a spatiallycontinuous countny group also added Anglo-Saxon elements to a diversity of institutionaltraditions that is of considerable interest to the study.
4 The RPTES group comprises a more or less horizontal band that stretches roughlySouth of the Sahara over a distance of about 3300 kan and occupies a land area of almostthree mnillion square kilometers. The climatic zones, going from North to South, arebroadly Saharan, Sahelian and Soudano-Guinean. Annual rainfalls range from 200 mm inthe Northern Sahelian zone to 1000-1200 mm in the Southern Regions.
5 It is already evident from this description that any countTy group selection has itslimitations, and this is also true of the RPTES group when its position in the West AfTica

2
Sub-Region is considered. A glance at .the map suffices to see that the mostly land-lockedbelt stretching East-West cannot be considered in isolation from the coastal countries tothe South. The CINERGIE Group in the African Development Bank', looldng at the Sub-Region as a whole, divides the area in three economic-geographic spaces: (1) The Westernspace comprising broadly Sn6gal, Guinea and Western Mali; (2) A central space made upby CMte d'Ivoire, Ghana, Togo, Burkina Faso and Southeastern Mali; and (3) The Easternspace of Nigeria, Beniin and Southern Niger.
6. These distinctions are useful for the RPTES from three angles:
* The economic interdependence of the coastal countries and the Sahelian hinterlandhas resulted, among others, in a strong migratory movement of the populations fromthe interior to the coast. The population prognosis for the RPTES countries takesthis factor into account;
* Migratory movements have an important effect on urbanization and hence on thesize of concentrated woodfulel markets; they also influence the development of maintransportation networks and thus the accessibility of biomass resources; and
* The land-locked RPTES countries are totally dependent on their neighbors on thecoast for petroleum products. From a sub-regional standpoint, the main sources arethe refineries of SAR (Dakar), Tema (Ghana), SIR (Abidjan), Port Harcourt(Nigeria) and Kaduna (Nigeria). The patterns of sub-regional product trade are animportant factor in the import costs incurred by Burkina Faso, Mali and Niger.
7. The existing data on population and urbanization of the five countries are compiledin Table 1-1. Their estimated total population in 1992 was about 35 nillion, of which 25% was urbanized. It should be noted that urbanization figures are often based on differentnational census definitions, which can produce inconsistent statistics. The tabulated dataare obtained from the data base of the West Africa Long Term Perspectives Studv(WALTPS)2 , which employs a uniform definition of urban settlements (over 5000). Acrosscountries, Sbn6gal leads with the highest urbanization (43%) and Niger is at the otherextreme (16%).
8. The projected natural growth rates of the population vary little from country tocountry. On the other hand, the net growth rates after migration diverge considerably Therange shown in the table represents two scenarios: (1) Economic recovery after years ofstagnation and continuation of the present migration trends with fairly open borders, and(2) Relative economic stagnation and tightening imnigration controls. The projected netgrowth rates show that under the optimistic, high-migration scenario (1), Senegal andGambia are the net winners with growth of 2.9 and 3.3 %, while the other three countries
'¶Intgrauion Rfgionale cn Afriquc de l'Oucsr. CINERGIE. mars 1993.
2 "Elemcints t'conomie spacialc des cncrgies raditiormelleeC. RPTES- Benoit Nmmn. janvier 1995

3
would see growti at only 1.9 %. Under the pessimistic, low-migration scenario (2), themigration effect on Senegal becomes zero, Gambia still would show a significant net gain;the land-locked countries would continue to lose population by migration but at a muchlower rate.
9. The thematic study of demographic development assumes that most migration isessentially directed towards urban areas. Therefore, the range of net growth rates for thetotal population carries over into a range of urban growth rates. It should be noted thatthese projections cover the entire urban population rather than the existing largemetropolitan centers. Within the five-country group, the land-locked countries losemigrants to Sendgal and Gambia. Therefore, in the lines for net growth and urban growth,the high end of the range for the coastal countries corresponds to the low end of the rangefor the land-locked countries.
Table 1-1Population and Urbanization (1992)
Category Unit SE)gal Gambia Burkina Mali Niger Total
Area hm2 x 103 197 12 274 1241 1267 2991Population
Total millions 7.8 0.9 9.5 9.0 8.2 35.4Urban millions 3.4 0.3 2.1 2.0 1.3 9.1Urban share % 43 32 22 22 16 25
Growth ratesTotal natural OM=ea 2.5 2.4 2.5 2.5 2.6 2.5Total net °l/yu 2.9-2.5 3.3-3.0 1.9-2.3 1.9-2.3 1.9-2A 2.2-2.4Urban Va/year 4.2-3.0 4.7-3.7 3.1-3.8 2.9-3.7 3.3-4.0 3.1-4.0
Density Inha.lan 2 40 75 35 7.2 6.5 12
Sources:Area: Countzy reports.Total population (1992): 1993 Annua Rport Global Coalition forAfiicaUrbanization: West Afica Long Term Perspectives Study (WALTPS).Grwth Rates: WALTPS Scenarios.
1.3 The Sub-regional and National Economies
10. Table 1-2 shows some selected economic statistics of the five countries; in the caseof the FCFA countries they pre-date the January 1994 devaluation. In terms of registeredGNP per capita, all countries except Senegal fall in the category of the poorest in theworld. The infonnal sector may cany considerable weight but is not likely to change therelative ranking among the group of five.
11. Economic growth from 1988 to 1992 lagged definitely behind population increasesin Senegal, Burkina and Niger. The heavy dependence on external financing shows up in

4
the gap between savings and investments, especially in Gambia, Burldna Paso and Mali. Inview of the close relationship of the traditional energy sector with issues of land use andfood security, the table includes some specifics on the agricultural sector. The importanceof agricultre is evident from its contribution to GDP, varying from 20 % for S6n6gal to50 % for Mali. The social significance of the agricultural sector is much more pronounced:Agricultural employment as a percentage of the total economically active population is ata high and fairly unifornm level in all five countries, ranging from 78 to 87 %.
12. The external trade data also include a large contribution of agriculture: Onaverage, agricultural products in 1990 accounted for 30 % of imports (with Senegal andGambia showing the largest proportions) and 45 % of exports (with Burkina Faso andMali in the lead). All countries have a negative overall trade balance; relative to GNP,GCambia had the largest deficit and Mali and Niger the smallest. Imports of petroleumproducts are in part estimated; in 1990 they represented on average about 18 % of exportearnings but for Gambia this proportion rises to 45 %.
13. In view of the known large business tumover of woodfiuel sales, it would be ofinterest to know the contribution of this sector to GDP and, in that context, in the relativecontributions of traditional and modem energy. This review has attempted to producesome data with inconclusive results. Two major problems arise:
* The macro aggregates do not isolate energy subsectors. The electricity componentof the modern energy sector is included in utilities (power, water, gas). A large partof the traditional energy activity fills under the forestry sector, which also includesmany non-energy outputs.
* Almost by definition, the real traditional energy contribution to GDP includes a largeunrecorded component.
14. It was noted that the contribution of forests and fisheries in the national accounts isof the order of four to five percent in all RPTES countries. As a broad judgment aneconomic study concluded that the traditional energy contribution may be in the 1.5 to 2.0percent range. This would indicate a contnbution of the same order of magnitude as themodem energy sector in a non-oil producing country.

S
Table 1-2Sdected Economic Statistics
Category Unit S6nagaI Gambia Burlina Mali Niger Total
Popuation 1992 nillion 7.8 0.9 9.5 9.0 8.2 35.4GDP Growth '88-!92 % per year 2,2 3.2 2.5 3.0 1.2Av. GNP '90-' 92 S x 106 5,062 269 2,356 2,043 2,435 1.2165GNP/Cap.'90-'92 1987 S 649 299 248 227 297 344
Gros Domestic lnvett % GDP 13.1 19.1 21.8 22.1 13.01988-92Gross Domestic Savings % GDP 8.2 8.6 2.2 5.1 10.81988-'92GDP in Agricult. % 20 30 31 50 36Labor Force % 78 81 84 B0 87Agricultue
Trade Balance 1990 S x 106 - 551 -159 - 384 .94 - 106 - 1294imports
Total 1.292 199 536 432 389 2848Agricultual 454 68 102 116 129 869Petr. Products 120 18 59 53 33 283
ExportsTotal 741 40 152 338 283 1554Agricultur 219 14 142 254 74 703
Source:Population and national accouit items: 1993 Annual Rcport Global Coalition for AfricaApicultural Sector and Trade figures: World Agiculture. Trends and Indicators 1977-91, US Dpt of Agnculture
1 4 The Eners Sector
15. The national country teams have analyzed the more recent performance of theentire energy sector (i.e. traditional and modem) in their respective countnres The salientstatistical information is found in energy balances for the year 1992, which are presentedin an abbreviated forn in Table 1-3 Although some numbers need further verification(mostly for Gambia), the overall pattern confirms findings for earlier years
16. Energy end use per capita (in kg of oil equivalent) is about the same for Senegal,Burkina Faso and Mali, i.e. in the 180-200 kg range, the average for Gambia (280 kg) ismuch higher, possibly because petroleum products for re-export are included in thenational consumption; Niger is lowest (137 kg). which may be attributable to the low rateof urbanization and to unrecorded supplies from Nigeria.

6
17. With regard to the structure of end use, within the five countries there is a cleardivide between the two maritime and the three land-locked countries. The former have amuch higher transport component (20-24 %) and a corresponding lower share ofhouseholds (62-68%). Only Senegal has a significant industrial component (18%),although in this category the numbers are probably influenced by differences inclassification.
18. The share of traditional energy in total end use shows again a marked differencebetween coastal countries (56-60 %) and the others (all 88 %/6). The ratios of traditionalenergy to all household energy are indicative of the lovw percentage of the populationhaving access to electricity and petroleum fuels: The shares of traditional energy rangefrom 88-91 % for Gambia and Sen6gal to 98-99 % in the interior.
19. Finally, the total losses, expressed as a percentage of all primary energy supplied,provide an interesting insight in the nature of the energy sector. Seinigal, with 35 % losses,leads the group of five and the reasons are obvious from the breakdown of losses bycategory: It has the highest charcoal consumption per capita and also the highest rate ofelectrification, both energy forms having very high transformation losses. Niger, with II%, holds second place, clearly because of the cvonversion losses associated with theSONICHAR power generation in the uranium district (Arlit-Agadez). The losses in Mali,(7 %), although not far ahead of Burlina Faso and Gambia, show the effect of growingcharcoal consmption. The loss percentages should not be interpreted as measures ofenergy efficiency. The countnes having the lowest losses are the heaviest users offuelwood. This component is recorded as "End Use" in the energy balance but it should benoted that it is in reality pimary input for cooking devices with efficiencies of only 15-20%.

7
Table 1-3Condensed Energy Balances
Cm thousands of Tons of Oil Equivalent)- 1992 -
Country Singal Gambia Burkina Mali Niger
1. Primary Energ
Woodfuels 1446 179 1605 1754 946Petoleum Fuels 860 87 202 198 128Other 2 - 2 23 153
Total 2308 266 1809 1975 1267
2. Lomes
Charcoal Conversion 559 - 30 127Electricity Thermal) 224 lOc 53 15 145Other 20 3 2 2 -
Total 803 13 85 144 145
3. End Uses
Households 931 172 1538 1638 1005(ofwhich traditional) (847) (152) (1512) (1617) (986)
Transport 310 62 117 132 79Industry 264 10 28 47 33Other - 9 41 14 5Total 1505 253 1724 1831 1122
4. Shares of End Uses
Households 62 68 89 89 89Transport 20 24 7 7 7Industry '8 4 2 3 3Other - 4 2 1 1
5. Ratios
Population (millions) 7.8 0.9 9.5 9.0 8.2End use pcr capita (kg) 193 280 181 203 137Trad./total (0%e) 56 60 88 88 88Traditotal household use 91 88 98 99 98Loss as % of Primary 35 5 5 7 11

9
IL PROFIE OF THE EXISTING TRADMONAL ENERGY SECTOR
2.1 General
1. Woodfiuel problems became promient especially after eruption of the petroleumpricing crises in the 1970's. This section begins with some comments on the analyticalapproach to the sector that developed, because it has important implications for futureaction.
2. In many reports of an earlier date one recognizes that the methods to analyze themodem sector were adopted for traditional energy. Assessments of the resource base,demand projections, nationwide aggregation of supply and demand, and energy balancesused as indicators of "crisis" years. Often, the conclusions carried over into predictions ofprogressive deforestation, and the recommended solutions tended to focus on the demandside with a strong technological bias. In brieC the result was the now widely discredited"Gap Theory" in woodfuel analysis.
3. The reservatons about the value of this work arose in part from the practicalobservation that certain pessimistic predictions simply have not come true, in part from thegrowing awareness of data problems. On the demand side, consumer behavior, unitconsumption of fuelwood and retail prices can only be studied by sample surveys, andaggregate consumption depends basically on population census data of variable qualityand uncertain extrapolations thereof. A better indication of demand could be obtained bymeasuring transport flows at major entry points of urban markets, but the results aredistorted if this work is also done on a sample basis, and without coordination withdemand surveys. Continuous records are rarely reliable because tax evasion distorts thestatistics. On the suRply side, the inventorization of the resource base leaves much to bedesired, not because good work canot be found but rather because it is not managed insuch a manner as to provide consistent methodology and time series giving an insight inthe changing use of land over time. Common to all activities in the sector is the difficultyof capturing seasonal variation and the lack of standardization and control of weights andmeasures.
4. Nevertheless, the defects of the "Gap Theory" should not be exaggerated. Themain problems are unwarranted aggregation (which is a pitfall in any market in whichtransportation distances are large) and data (which also must be dealt with in anymethodology). After all, econonmics is about scarcity and hence about "Gaps". It wouldseem that in disaggregated markets it is quite appropriate to use the conventional tools ofmicroeconomic analysis which trace the factors behind supply- and demand schedules andintroduce the behavior of economic agents in the fiuelwood chain as an essential input(examples: monopolies, oligopolies, vertical integration, taxation effects, regulation).Better a priori theoretical analysis will probably lead to better planning andimplementation of data collection.

10
5. Notwithstanding cerain reservations about the applicability of methods borrowedfrom the modem sectors of the economy, the subject of traditional energy is no different inthat it can be grouped under the headings of supply, demand, pricing and the worldngs ofinstitutions. This presentation contains the same fbur elements, but the approach has beenadapted to some special characteristics of the traditional energy sector.
6. It should be noted that the sector covers both the modern, monetized and mostlyurban sector of the economy and the essentially mral subsistence sector, with someexceptions such as the groundnut basin in Central-Eastern Senigal and the cotton growingareas of Southern Mali. The biomass supply is of rural origin, but demand is foundeverywhere: (1) concentrated in urban markets where the traded commodity is obviouslymonetized; and (2) dispersed throughout the rural areas. Therefore, it is convenient tolook at the supply potential of ural areas in conjunction with subsistence demand, and toevaluate the excess supply that will be available for urban markets, and the role that suchexcess supply could play in the monetization ofthe rural economy.
7. Despite some severe data limitations, the urban markets for fuelwood and charcoalcan be evaluated with more or less elaborate surveys. However, the seemingly simple nextstep of balancing demand and supply over time, and inferring the evolution of prices,becomes much more complex in the traditional energy sector. Rural excess supply andurban markets are linked by a variety of means of transportation and trading channels thatare difficult to analyze adequately, and this weakness carries over into the understandingof the price formation process.
8. Based on these perceptions, the presentation begins with an overview of thebiomass resource base, an assessment of the quality of available information and of itsusefiilness for energy studies. Summaries of rural and urban markets and of factorsinfluencing consumer behavior follow. The next section combines a discussion of thecommercial chain (filiere) Lnldng nural production areas with the cities, and the relatedpricing issues. After discussion of the role of the - mostly public - sector institutions, thechapter concludes with a sumning up of the main issues.
2-2 A critical Evaluation of the Biomass Resource Base
a. Agro-ecological Zones in the RPTES Countries
9. The total area of the five RPTES countries amounts to almost-3 million km2, witha population estimated at 35.4 million in 1992. The agro-ecological zones fall into fourbroad categories:
The scarcely populated Saharan/Sahelo-Saharan zone which receives less than 300mm of rain per year. Most of the biomass in the Saharan part is in the root systemsof drought-resistant plants. ln the Sahelo-Saharan areas, the vegetation is mainly

II
composed of grassland with bushes and small bushy trees. The grassland isephemeral except where shaded by large trees (Millington et a]. 94). This zoneincludes over three quarters of Mali and Niger, the largest Sahelian countries.
* The Sahel and the Sudano-Sahelian areas receive up to 600 mm of rainfall a yearand provide the habitat for a large proportion of the population. The landscape isdomninated by wooded bushland and a herbaceous layer of mainly anmal grass(Millington et al. 1994). Processes such as agricultural and pastoral intensificationand overgrazing around tube wells have destroyed a great deal of woody biomass(Graham, 1969). Over three quarters of Burkina Faso, half of The Gambia andabout one quarter of Niger fall in this zone.
* The Sudanian zone receives up to 900 mm of rainfal a year. The vegetation ismainly an open tree savanna of 15 to 25 meters high, or shrub savanna Perennialand annual grasses at the ground layer are subject to easy burning during the dryseason (Mfllington et al., 94). It covers the southern half of SenegaL half of TheGambia and southern areas of Mali and Burkina Faso.
D Finally, the Sudano-Guinean zone receives rainfall of over 900 mm per year. Muchof the area may be described as derived savanna, ranging from closed canopysavanna woodlands to thicket savanna (MlLington et al. 1994). The zone coversGuinea-Bissau, Guinea and Cote dIvoire, and extends only in the southemmostareas of Mali and Sdn6gal.
10. Table 2-1 summarizes in Part I the geographic distnbution of the RPTES studyarea of 2.8 million km2 according to the four agro-ecological zones descnbed above, withsome very approximate indications of standing stock and annual productivity of woodybiomnass. It should be noted that the more productive areas (excluding the Sahelo-Saharanzone) cover only 38 % of the total territory. Standing stock and productivity increaserapidly with the annual rainfalls. Part II of the Table provides a more detailed breakdownof climatic zones, rainfalls and the corresponding areas in each RPTES country.

12
Table 2-1Agro-ecological Zones in the RITES Countries
Part I: Main Features of the RPTES Study Area
Climatic Zone RainfaZ Area Distribution Standing Stock Productivitynon $ (*) m3 hbctare m3lha/year
1- Sahelo-Sahaan <300 62 - 3.9 0.13
2-SahclSudano/Sahelian <600 21 56 8.0 0.4
3- Sudanian <900 11 32 15.0 0.9
4- Sudano-Guincan >900 6 12 30.0 1.5
Tolal - 100 100
Source: Zone (1) ESMAP. Mali 1992Zone (2), (3) and (4) extrapolated fomtbeNational Forestynvcw of Mali 1987
Note: () Sabelo- aea discounted for illustation pwos due to low pmductivty and standg volune.
Part [I Agro-ecological Zones by CountryCm thousands of square kilometers)
Rainfan Senegl Gambia Bmina Mali Niger TOrALMMNzm Faso RPTES
(1) (2) (3)AGRO-ECOLOGICAL ZONES
SahanmSaelo-Sahan <300 894 975 1,869
Sahel 300400 39 69 152 260
Sudano-Sahel 40 00 6 136 87 127 359
Sidanian 600-900 119 6 69 111 13 318
Sudano-Guinean >0 39 149 188
Total Area (DkmZ) 197 12 274 1.241 1.267 2,991
Source: - Compiled from RPTES National rpons- (1) S. Amous: UNEP Greenhouse Gas Abatement Costing Studies- (2) RPTES estUnate- (3) Les Atlas Jecue Afriquc: Burkina Faso

13
b. The Genesis of Action Programs in the traditional Energy Sector
11. The importance of establishing a reliable data base fbr biomass is illustrated by thepolicy experience in the Sahel. In the eighties, policies in the traditional energy andforestry sectors were very much influenced by the conclusions of an FAO reportpublished in 19823. The study examined the outlook by the year 2000 for fiuelwood supplyand demand in seven countries (the five RPTES countries plus Mauritania and Chad). Thebalance of sustainable biomass supply and demand, as developed in the study, indicatedthat only Chad would still have a surplus by the year 2000. According to the report, theestimated total annual demand of 22.4 million m3 of fuelwood in 1980 had already causeda deficit of 4.2 milion m3, and the shorffail was predicted to reach 18 million m3 by theyear 2000, Although the report is silent regarding the total resource base, theextrapolation of these figures to another decade or so could have led to the prediction ofthe total disappearance of the forest area in the RPTES countTies. Put in the context ofdesertification, especially with vivid memories of the severe droughts of the seventies, thisapparentl alarming situation prompted govrerments to take actions and it also generatedsignificant donor attention. The declared main objective was to stop and reverse thedesertification process through, among others, filling the perceived gap between demandand sustainable supply of fuelwood. This has resulted in the implementation of a largenumber of projects to control the demand (improved cooking stoves, inter-fuelsubstitution) and to enhance the supply (afforestation and industrial plantations). Pricingm-echanisms were also used to influence consumer behavior and to motivate producers
12. In parallel with the execution of specific projects, several forest inventories wereundertaken. This work, intended to firm up the data base, has revealed new contradictions,thus creating more confusion among potential users (e.g. energy planners). The causes canbe traced to different approaches used to conduct the inventories, the complexity of forestdynamics, and lack of knowledge of the practical behavior of producers and consumersin the woodfuels sector. Given the persistence of so much uncertainty and the risk ofcommitting costly policy mistakes, the upgrading of the information base remains a highpriority. The remainder of this Section 2.2 assesses the available supply data and identifieshow the situation could be improved quickly and at the least cost.
c. Overview of the R1PTES Data Bases
c.l Information Sources
13. The inforrnation sources available at present fai in four major categories:
* Regional assessments covering a number of countries or parts of countries;* National inventories extending to the entire country;
3 Les disponibilites de bois de feu ca region Saheliennc de f'Aikique Occidentalc Siwauton et perspectives".M.N. Kcata, consultant FAO. 1982.

14
* Local inventories; and* Updates and syntheses in the RPTES reports of the national teams, mainly based on
the data bases listed above.
14. The following subsections c.2 through c.5 recapitulate the information provided ineach category. As will be seen, many unexplained discrepancies exist and they are notlikey to be resolved until the systematic collection of field data is further advanced.Subsection c.6 provides a - mostly qualitative - evaluation of the field work already done,with recommendations on priorities for confinuation.
c.2 Regional Assessments
15. During the 19B0's, two experts made comprehensive assessments of the resowucesin the Sahel at the regional level, including parts of the five RPTES countries: Keita forFAO in 1980 and Mfllington et al. for the ESMAP program of UNDP/World Bank in19864.
16. Keita used the FAO general map of the distnbution of forestry resources inAfrica5 . As noted above, his study addressed the supply-demand balance in the fiveRPTES countries plus Mauritania and Chad. However, the assessment covered only partsof these countries, basically excluc2ing the non-productive desert areas. The total areacoverage was about one miilion kIn . The assessment focused on sustainable productivityof forestry resources and corrected the results for physical accessibility of fuelwood toestimate the utiizable supply. Given the scope of the study, it provides no estimates ofstanding stock. Because of the lack of field data in the countries covered, the productivitywas estimated using the "Clement" formula that is based on empirical data in othercountries having similar agro-ecological conditions. In this formula, productivity is afunction of rainfall, and an adjustment factor is used to reflect the conditions of resourcemanagement. ApaiL from the fact that the estimated productivities have proven to beunderesimated, the assessment excluded nearly all the cultivated land with trees andcovered only trees with diameters larger than 10 cm at 1.3 meter of height (DBH).Although this kind of measurement is useful for assessing the potential for timberproducts, it is certainly too restrictive in an estimation of the natural stock of fiuelwood.Therefore, the assessment is likely to have underestimated the available resources.
17. Millington et al. conducted a biomass resource assessment in Sub-Saharan Africabased on the interpretation of AVHRR satellite imagery from NOAA His study coveredall territory, which for the seven countries of the Keita study adds up to 5.3 million km2.The initial resolution of the imagery is 1.1 km. However, the final resolution used forinterpretation after re-sampling was 8 km (6,400 ha.). Apart from this limitation, thereport acknowledges that for West Africa it was not possible to "distinguish between
4 "Esimating Woody Biomass in Sub-Sabaran Africa ", A. Millington et al., thc World Bank. 1994
S"Les ressources foresiiercs de rAfnique Tropicalc'- Part I and Pan D (citcd m Jensen. RPn-S 94)

I5
herbaceous and woody biomass. In a region like the Sahel, which includes areas ofseasonal grassland, this is obviously significant" (llington et al. page 30). The difficultyin discriminating between seasonal crops and natural wooded grassland requiredaggregation of these two land use classes. Because the estimated productivity was derivedfrom forested land, it is likely that the 1986 assessment has yielded an overestimation ofthe resources available in the five RPTES countries. As was the case in the Keitaassessment, this study had also to resort to productivity estimates based on data compiledfrom other countries.
18. Table 2-2 below compares the results of the two assessments in the sevencountries. The interpretation of the results should take into account that the Keita studycovered only parts of the seven countries (19%) whereas Mllington provided fullcoverage. If the desert areas in each study are excluded, the Keita study covered 37 % ofthe area in the Millington study. Since the study resuts do not permit their segregation bycounty, the comparson in Table 2-2 applies to various land use classes'. Theproductivities estimated by the 1980 assessment were invariably lower than those used inthe 1986 study, except for the sylvo-pastoral bush land. The largest discrepancies (over100 %) are seen in the categories of wooded savanna and wooded land. On average,Keita's sustainable yield was 31 % below Mlllington's, if desert areas are excluded fromboth studies; even so, the comparison of the total areas surveyed is biased by the differentweights of each land category.
c.3 National Inventories
19. All RPTES countries, except Niger have national irventories7, of which the mainresults are presented in Table 2-3. They all relied on satellite imagery of variousresolutions to conduct the initial mapping and land cover classification. The volumes ofstanding stocks were assessed through sample measurements in Burldna Faso, Gambiaand Mali. In Senegal the standing volume was estimated by multiplying the areas ofidentified land use classes by corresponding stocldng units (m3/ha.) derived from theliterature. In some cases (Mali and Senegal-1978), the inventories excluded the biomassresources on cultivated land9 and focused on standing trees with certain minimumdiameters. Only the Mali inventory took into consideration all trees taller than one meterregardless of their diameters. The Gambian assessment counted the small trees andconsidered them as part of the regeneration process but did not include their biomasscontent. All these elements suggest that as far as fiuelwood is concerned the available
6 The way the results wer preseted doe not permit to islatc the five RPIES countrics.
7 TIM national inventory of Mali coven:d only the pmovnces orKayes, KIoulikom, Sikasso, Sgou and Mopti. Theseprovinces cover about 47% of the total area ofthe country and housc about 75% of the population (RPTES.Mali 94). The excluded areas ae mainlv the desert puts of the Eastern and Northen areas of the countrv.
E In Burkina Faso, the estimate of ihe standing stock has a significant and high statistical mar.
9 The National Forest Inventory of Mali mav have included cultivated areas. However, the resources were notmcluded m the reported available biomass.

16
resources have certainly been underestimated. The investigation also illustrates thedivergence in method that hamper cross-country comparisons.
Table 2-2Comparison of Results of two regional Inventories
1936 ASSESSMENT 190 ASSESSMENT COMPARATIVE(Millington et Rl) (Keita) PRODUCTIlTY
Area Volume Total Area Total 19R6 1980'000 ha OOOm3 Productivity WDO ha Productivity m3/hfyear
00Om3/year WOm3/yearLAND USE
Desert 259,034 0 0 4,700 412 0.00 0.09
Sylvo-Pastoral 102,208 556,227 17,069 20,840 3,809 0.17 0.138Bush land
Wooded Savanna 87,996 213,520 51,307 16,600 4290 0.58 026
Wooded land 74,138 3,396,910 98,183 59,310 33,458 1.32 0.56
TOTAL 534,426 4,171,727 166,559 101,450 41.969
Total Admin area 530,000
Total ss desert) 264,392 4,171,727 166.559 96,750 41,557 0.62 0.43
Source: Jense, RPTES 94.
20. The productivity, or sustainable yicld. is the most crucial element in natural forestmanagement in general and traditional energy issues in particular. The values in thenational inventories are based on assumptions derived from research undertakenelsewhere, using the Clement formula alreadv employed by Keita. The RPTES evaluationof available information on biomass resources (Jensen 1994) gathered - still anecdotal -evidence suggesting that the productVit has been underestimated. Apart fromdeficiencies in terms of coverage. there is no logical explanation for the fact that theunitary productivity in Burkina Faso and Gambia is about half of the productivityestimated in Mali as shown in Table 2-3
21. The comparison of national inventories u-th regional assessments for similar yearscasts more doubt on the reliability of information on the resource base. The results of thethree inventories conducted around the same time (Burkina Faso -1980, Gambia -1980and Senegal -1978) showed that the Keita study underestimated the sustainable yield byabout 50%. On the other hand, the results of the later assessments conducted for Senegal(1985) and Mali (1987) showed that, compared to the national inventories, the Millingtonstudy overestimated the standing stock by about two thirds and the sustainable yield byabout one-third

17
Table 2-3Main Results of national Inventories
YEAR AREA VOLUME PRODUCTIVITY COVERAGEAdmin Covered ToWa Unimuy Famland Size
COUNTRY vOO ha '0D0m3 m3fha )00m3/yea m3halyear (1) (2)
Senegal 197B 19,700 13,845 194,845 14.0 8.297 0.6 Excl. d>10crn1985 18,915 31S,779 16.9 13,353 0.7 lncl. dt40cm
Gambia 1980 1,200 846 16,542 19.6 407 0.5 Inci. d>l10cm
Buritna 1980 27,400 24,190 502,199 20.8 10,279 OA bncl. d>7.5cm
Mali 1987 124,100 48,199 532,728 16.2 28,299 0.9 Excl. All tes>lm high
(1) Indicates whotdu tres on farm land were mncluded in the mventory(2) Indicates the size of tes included m the assessment
Soume: Jensen, RPTES 94
c.4 Localized Inventories
22. Localized inventories were also conducted in the context of the preparation offorest management plans. The most interesting survey was done in Burkina Faso where,10 years after the first national mnventoTy, the exercise was repeated for 15% of thecountry area located around Ouagadougou. After correcting for differences in themethodologies used, it appears that the forested areas regressed from 52% to 38% of thetotal area covered (or a yearly rate of 3%). However, this change in land cover did notaffect very much the overall standing stock because of the significant and high number oftrees left on the cleared land, and the increase of density in the remaining forest area (atthe rate of 1% per year). If the interpretation of these results is correct, we are witnessinga use of agricultural as well as forestry resources without a net loss of biomass in an areaknown to be under exceptional pressure exerted by high population growth.
23. The resource information on Niger falls also in the category of localizedinventories. As part of a scheme to promote sustainable supply of the major urbanmarkets, the potential production areas around Niamey, Tahoua, Maradi and Zinder weresurveyed within a radius of 150 km, in conjunction with urban demand.
c.5 RPTES Countly Reports
24. The RPTES national country reports have diagnosed the woodfiels sector on thebasis of the primary resources descnrbed above, and additional national studies available,including - by definition - the localized inventories. Table 2-4 summarizes the availableinformation on the resources and their productivity from primary sources when available(national forest inventories). Some countries, such as Senegal and Burkina Faso,

i8
attempted to update the information by extrapolating the results of primary sources. It isof interest to note that the national tenms continue to use the "Accessibility Ratio"estimated by Keita over a decade aja to translate the estimated sustainable yields intousable supply. The problems of access are discussed in greater detail in Section 2.2.d(Physical access) and in Section 3.4 (Econonmic access).
d. Key Issues in Data Collection and Management
d. I Inventories
25. As shown in subsection c.2, the comparison of regional and national inventoriesindicates that major regional inventories either under- or overestimated sustainable yields.However, even the national inventories are difficult to compare among themselvesbecause of differences in coverage of areas and type of vegetation (see Table 2-3). In thefiraework of monitoring of forestry resources, standardized measures and models forestimating the biomass content of standing trees should be used to be able to compareinventories.
26. It should be noted that resource assessments based on visual interpretation of high-resolution SPOT images seem more suited to the needs for inventories in the countriesconcerned than digital analyses of LANDSAT TM images. Of course, aerial photographsare always best.
27. Time series of inventories are desirable to monitor the state of woody vegetationover time. However, satellite imagery as such is not suitable for continuous monitoringof woody biomass resources, since it is not possible to distinguish on satellite imagesbetween trees and herbaceous vegetation. Indirectly they can be separated because treestranspire longer than herbaceous growth. However, since transpiration depends on rainfall,the variations from one year to the other would be measures of rainfall variation ratherthan evolution of vegetation. On LANDSAT TM images it is possible to identifycultivated land, but one cannot distinguish fallow land from forestry fornations. Since theextent of cultivated land also depends on the rainfall in the year, the determination offorest areas remains uncertain.
28. A periodic repetition of national inventories using exactly the same methodologycould be a valid solution. In the case of localized inventories made to identify suitablesupply zones of major cities, the methodology could be adjusted in such a manner, that theresults become more comparable with the mapping and with preceding inventonies.
29. In cases where the inventory of woody biomass serves a longer term objective, itshould include an evaluation of the resources in cultivated and fallow land. This part of thestock will grow in importance for several reasons: (1) Conversion of forests toagricultural lands will shift the composition of biomass towards cultivated areas; (2) evenas urban dwellers switch to modem fuels, the rural demand will steadily increase andcontinue to exercise pressure on the available woodfuel resources. Moreover, judging

19
from inspection of scattered results it would appear that woody vegetation on cultivatedland is much more productive than assumed until now, and this impression should beverified by establishing test plots as soon as possible.
d.2 Monitoring of woody Vegeign
30. The evolution of vegetation cover under the influence of natural or man-madechanges deserves also attention. In those cases where it has been possible, on the basis ofrelevant measurements, to determine the behavior of forcstry resources during periods ofdrought, one can notice a slow movement towards less dense growth in the standingstocks. However, it cannot be assumed that the yield has been affected to the same extentas the standing stock. In Burldna Faso, woodlands have been transformed into woodedcultivated land. In the forest reserves of Faya and Monts Mandingue in Mali, part of thegallery forest has changed to tree savanma of which, in turn, a part has changed to shrubsavanna. In Burkina the density of the standing stock of the forest has increased, and as aresult the total volume of woody biomass has not changed. In the case of Faya and MontsMandingue, the cleared sections of the forest have been replanted, and the growth in thewooded parts has remained stable. In these two cases taken from the Mali experience, thetendency of the forests towards degradation appears to have been arrested. In Gambia, themost reliable assessment of land use confirms this finding whereas another studycontradicts it. The national inventory in Gambia (under consideration), if implemented,could throw new light on these questions. Other contributing factors to degradation arebush fires in the Guinean and Southern Soudanian zone, and grazing in the Sahelian zone.
d.3 Assessment of Product of Forests and agricultural Land
31. There is no doubt about the importance of knowledge of the state of biomassresources. However, it is the klowledge of sustainable yield or productivity that iscrucial for the definition of a policy aimed at environmentally and economically optirnumuse of the resources of traditional energy in the five countries concerned. Although thekmowledge of the yields is very fragmentary, they seem higner than hitherto assumed.Nevertheless, to stay on the conservative side it seems best for the moment to retain yieldsderived from the formula by Clement (1982) as a basis for decisions on exploitation ofbiomass resources
32. It is possible to fill this data void by surveying all the te.st plots already establishedto measure yields. Many were started years ago but that have not been monitoredregularly. There are three such plots in Mali and two in Niger; the results for the four plotsin Burkina Faso are being compiled. In view of the age of these test plots, it snould bepossible to obtain rather reliable results towards the end of 1995. In Senegal, the Centrede Suivi Ecologique has installed a total of 140 permanent test plots to monitor the woodyvegetation. It is of utmost importance to take advantage of the measurements alreadymade, especially to 'mow the yield of mhe woody biomass in the driest parts of the zonewith which this study is concemed.

20
Table 2-4Summary of Analyses of national RPTES Reports
Sinagal Gambia Burkdon Faso Mall Niger1990-92 1910 1990 1987 1996
(1) (2) (3) (4) (5)
L Land Use (6) 19,670 1,062 27,420 49,100 3,765(M00 ha)
- Natural Forae 12,000 559 14,920 32,780 3,765- CulivatedFallow 4,520 274 9270 15,320 ?-Other 3.150 229 3,230 - -
II. Resorted Deforestation 80 9 60 400 90('000 bayear) (7)
[I Resources i03410 16,620 500,000 S12,200 13,500(rO)oa3)
-Natuml Forest 205,300 13,407 340,000 512,200 13,550-CultivatediFallow ? 3,213 160,000 ? 7
-Oth -e r _
IV. Productiviv 8,644 412 10,120 27,550 466('O0Om3/yr.)
Natural Fore 3,644 356 8,360 27,550 466Cultivated/Falow - 56 1,760 - -Other - - - -
V. 'Accessibiiitv rate" (31 36% 93% 33% 52% 33%
VrL "Accessible, Resource 3,130 335 3,390 14,326 154('000 m3/yr.)
Source: (1) Extrpolation made by the National report based on the 1987 assessn t of the resouwr andESMAP findings on the demand side. 31 was deived from the reported OA% MAI.
(2) National Inventory for the resources and the ORGATEC study for the conumption estimate.[3) National Report: xtrapolated from Parkan (1986) based on 1930 National Inventory. I was
derived frm MAI in 111.(4) National Inventory for the resources and ESMAP for the consumption estimate. The consumption
is estimated for the whole of the country. For the supply see note (6) below.(5) ESMAP: the resources re estimated for the catchment areas (1OD km radius) of the 4 major
cities as weUl as the consumption. U was derived from the reported stckg ratio of 3.6 tons/ha(6) The total of land covaed does not add up to the administaive total area for Mali and Niger
because the assessnent covered only pardally tese counries.(7) As reported in the literature and cited in the National Reports(3) As estimated bv Keita Some countries (Senegal and Burkina Faso) adjusted these ratios later on.

21
33. Another area where it is important to catch up quickly is the growth of trees inthe cultivated 5idds and shrub fallows, for which no comprehensive measurements areavailable yet. Areas of cultivated land were generally excluded when forestry resourceswere assessed, for reasons that reflect the perceptions of the various professions. Foresterstend to see expansion of agricultural land as detrimental to the forest because it is viewedas a permanent conversion of land use, whereas agronomists would view the change as anupgrading of resources to meet a grovwng demand for food. As mentioned above, the1990 localized inventory around Ouagadougou showed that there is a substantial numberof trees left on cleared land and that increased density in the remaining forest appears tohave compensated for the lost trees. According to Jensen (RPTES 94), the analysis of thespatial distrbution of the biomnass resources indicates that trees on cultivated land appearto be better preserved in areas dominated by agricultural activities than in forested land.
34. The amount of trees left on cultivated land is not negligible. For example, in TheGambia and Burkina Faso it has been estimated that cultivated lands have a standing stockof 8.1 and 9.2 m3/ha, respectively; these numbers represent about 40 % of the averagestanding stock of about 20 m3/ha in each country (see Table 2-3). However, in areaswhere the density is much higher (for example in zones of The Gambia with 58.3m3/ha. inwoodland and 15.5m3/ha. in bush land), land clearance can result in substantial local lossof standing stock.
35. On the rare occasions where trees growing on cultivated land were included innational inventories, the estimate of their productivity raised some doubts about thevalidity of these estinates. For instance, the analysis of the 1980 national inventory ofBurkina Faso conducted by Parkan (1986) showed that trees growing on forested land hada productivity over two times higher than trees on cultivated and fallow land (2.5%versus 1. 1%'). There is no logical explanation for this result. In fact, trees on cultivatedland benefit from a better care such as weeding, manure, etc. There are even reasons tobelieve that under certain circumstances their productivity may be higher. Jensen (RPTES94) cited some measurements undertaken in various cultivated areas in the region whichshowed productivities varying from 1.8 to 4.7 m3/ha/year. If the validity of the cited casesis proven, the potential production of biomass resources could, at times, be higher incultivated areas than in some forested lands.
36. The discrepancies underline the urgency of obtaining representative field data.Sample plots should be established (preferably under a regional coordination mechanism)to measure the diameters of the most widespread tree species in the area. Pending theavailability of suilts, a rapid survey of the age of the trees, followed by dendrometricmeasurements, may provide useflul indications to guide a coherent policy in the sector. Theyield of shrub fallows can also be assessed with a survey to determine the age of thesefallows, followed by an in"entory of the resources.
' Exprcssed in tarms of umtary productivitv (m3ha/vcar) divided by the standig stock (mn3/ha)

22
d.4 Models of the Exploitation of Forests and agncultural Zones
37. Since ten years, different management models for forest exploitation have beendeveloped in the countries covered by tis study. Although the results obtained so far areencouraging, important obstacles threaten the durability of these schemes. Among others,one could mention the competition of non-managed zones and the reluctance of sometransportation oligopolies to cooperate. Besides these institutional factors (discussed atgreater length in Chapter IV), there are technical aspects that need further investigation.
38. The technique of selective tree felling, generally practiced in managed forest areas,should be based on rational criteria. Some experiments in Niger indicated that clear-cutting of areas that are later protected against bush fires results in a larger number ofstems per hectare and in an increased biodiversity. Protection against wandering animalsseems less important. The few controlled experiments with selective feUling have givenresults far inferior to those with clear-cutting but, in view of the fragility of the resourcebase, there is considerable hesitation to opt for clear-utting without more conclusiveevidence. In the Northern Soudanian zone where fires are accidental, there seems to be acase for using more productive and easier methods of exploitation such as clear-cutting. Inthe Southern Soudanian and Guinean zones, where uncertainties persist about the controlof bush fires, selective tree felling may be justified. For these zones it is recommended toexperiment with clear-cutting while preserving trees for timber on about ten percent of thesurface harvested annually. In brief, comparative models testing selective felling andclear-cutting should be pursued.
39. Until now, no model whatsoever has been cnvisaged to study the exploitation ofbiomass resources in agricultural zones The exploitation of woody resources oncltivated land is based on traditional techniques This issue is especially relevant in theSoudanian zone, where land clearing has B strong impact on the forestry resources. In thepresent demographic situation, this development is difficult to reverse. It is anticipated thatin the future cultivated land will become the main source of woody energy for the ruralpopulation. Therefore, it is suggested that preparafions should be made accordingly,specifically, by establishing pilot developments for managing woody biomass resources inagricultural zones. Such projects should include the testing of different pruningtechniques and in-depth research on regeneration and rotation in wooded cultivatedlands. Furthermore, the Centre de Suivi Ecologique in Sdnegal should consider expandingits network of permanent observation plots in agricultural, pastoral and sylvo-pastoralzones, preferably throughout the RPTES studv area, under international cooperativearrangements.
d.5 atulationofPriodtis
* Future biomass inventories in the Recion could be much more useful if the workwould be preceded by establishing clear standards of measurements andinterpretation, employing comparable and well-documented models and commonsources of satellite imagery The methodology should also take into account the

23
need for periodic repetition of the inventory to track the evolution of land use overtime. In view of the growing importance of the biomass potential of cultivated landand fallows, these categories should be included in futue inventories.
* Changes in vegetation cover should be more systematically monitored to evaluatethe effects of drought, deforestation and replanting, bush fires and grazing.
* There is an urgent need to firm up forest productivity estimates on the basis ofmeasurements of exsting test plots, augmented by establishing new plots, instead ofrelying on formulas that have not been tested direcdy for their applicability toconditions in the Region. An assessment of the productivity of agricultural land isalso becoming a priority, in view of the indications that its potential has beenunderestimated. Since the scarce evidence is conflicting, the network of test plotsshould as soon as possible include agricultural land.
* Good management models of biomass exploitation are lacking. More work isrequired on the issues of selective felling versus clear-cutting of forests in thedifferent climatic zones. The research on exploitation of woody cultivated land,which has hardly begun, should gather information on yields, optimum rotation,regeneration and prumning techniques.
* Finally, many of the activities listed above could be taken up more effectively byinternational cooperation and exchange of experience, within the fiamework of aregional project.
e. Key issues in biomass Supply-Demand Balances
el. General
40. The uncertainties regarding the resource base, the lack of reliable information onsustainable yields, and the involvement of experts from different disciplines at variousstages constitute a major obstade towards sound planning in the traditional energy sector.Foresters, responsible for assessing the resources, generally focused on forests andexcluded a substantial volume of biomass which in reality represents a major source ofenergy for a large proportion of the population. On the other hand, energy planners usedthe supply information provided without realizing its non-compatibility with data on thedemand generated through surveys that also had their limitations as far as traditionalenergy is concerned (e.g. measurement units, lack of time series etc.). Misunderstandingsof certain concepts contributed to firther problems in diagnosing the real situation on theground. The most important technical issues, closely related to gathering andinterpretation of biomass data, are discussed below. Broader economic aspects arecovered in Section 3.5.

24
e.2 Accessibilitv of the esources
41. Often, the spatial distribution of the biomass resources does not coincide with thatof the population and it is obvious in such situations that not all the resources are easilyavailable for use. Therefore, it is logical to include in the analysis a correction that reducesthe gross biomass supply to the quantity available to meet demand of woodfuel users.Keita introduced an accessibility factor in his assessment of the sustainable resources thatcould be used in enrgy balances. The factor takes into account the existence of roads, thepopulation density, endemic diseases etc; it varies from 5% to 80%/e in the seven countriesstudied. By using overlays, the accessible sustainable supply was compared with thedemand to identify the critical areas". The pessimistic outlook at the time (1980) isevident from the report observing that 96%/ of the total population in the five RPTEScountries had to cope with a less than satisfactory supply situation (which, according tothe definition of the study would mean criticaL crisis or shortage).
42. All surveys conducted so far in the region indicate that fiuelwood is rarely traded inrural areas. Generaly it is collected by women and children from areas within walkingdistances of their villages. If woodfuel becmes scarce within manageable walkingdistances, rural households generally resort to lower quality fuels such as crop residues.bushes and shrubs as well as cow dung12. This experience suggests that the accessibility istotal for rural population. Taking into account the fact that 45 to 85% of traditionalenergy is consumed in rural areas, the use of a uniform accessibility factor is a source ofsignificant underestimation of the quantity of woodlifel available to nural householdsUrban woodfuels supply is indeed affected by accessibility. However, the existence of aroad is not a sufficient condition to providing greater access. The cost of transporuingftuelwood over long distances is an important deterrent to exploitation of remote areas andcontributes to overharvesting of resources in catcbment areas of major urban centers Inthis context a case by case approach is required (for instance, by preparing regionalizedsupply master plans as was done for Ouagadougou and Niamey). The basic flaw in theuniform accessibility factor is that the reports failed to link the physical accessibilitv toeconomic variables.
43. In an attempt to forecast future consumption pattems and their impact onsustainable supply, Keita!s study indicated some improvement in accessibility. His factors.mainly based on assumptions, were widely used in most estimates and influenccdtraditional energy policies in the countries covered. However, the accessibility critenaapphied in some cases can lead to implausible results. For instance, in the province ofOudalan in Burldna Faso, the accessibility of forest resources was estimated at 15%16 in
Four levels refleting the acsible sustainable supply/demand balance situation werc identified satisfactorn.critical, crisis and shortage
In a second stage and as rural economy becoes monetized, woodfue] imported &om surplus areas stans beiniraded. Evenualy users swtch to modem fs as mome ris. %- that tm the village is becoming an uhtr.
center.

25
1983 and was expected to improve to 20% in 1995". This low accessibility rate wassimply based on the low population density of the province (10.6 inhabitants/kan2).Although the resources, estimated at 8.6 m3/ ha. for the whole area, are inaccessible forcommercial purposes, it is difficult to imagine how a widely scattered rural populationcould cause a supply deficit equivalent to 0.5 m3 per capita.
e.3 Utilization ratio
44. The utilization ratio reflects the proportion of sustainable yield that is actualy used(or usable) as woodfuel. The estimation of this adjustment factor depends essentially ontwo variables:
45. First, one needs to know how the productivity was derived. If, as is usually thecase, it was estimated in terms of standing green wood, one has to take into account themoisture content and the eventual shrinkage of the wood, which may cause a specificweight reduction of about 12%. This is a solid argument for the need to adjust the resultsof the available inventories before using them in woodfuel energy studies.
46. Second, various surveys and studies have established that the quality ofcommercial fuelwood and consumer preferences affect very much the actual quantities ofwood harvested in order to meet a certain urban demand. The proportion of standingstock that is harvested varies from one country to another and even within a particularcountry. In Gambia, wood cutters select only high quality trees and sometimes leavebehind branches of diameters as large as 10 cm. Similarly, in Maradi (Niger), until recentlyonly large size branches were sold. On the other hand, in Niamey it is common to seesmall size logs traded in the market Jensen (RPTES 94) estimated that the presentutilization ratio could be as low as one third in Gamnbia and as high as 9O% in thecatchment areas of Niamey'4. However, the losses in the field should not be estimatedexclusively from observing the practices of commercial operators supplying the cities. Aproportion of the leftovers is eventaly collected by rural population for their own use.One should also consider that in most cases the rural population is not supplied from largetrees. Thev tend to collect dead wood, bushes and shrubs and lop small branches. It isunusual to see women (who are the main fuelwood collectors in the subsistence sector)involved in felling large trees for energy purposes. Besides the considerable effort requiredto fell, split and transport green trees, the wood needs several weeks before it dries outand becomes suitable for cooking.
47. Utilization ratios are used in some inventories to take into account the optimumuse of trees (timber, ftelwood, fruits or, on the negative side, useless trees). Some trees
3 'BUa et cvolution des disponibilitts en bois. Aitmatives de productions foresti6res et Suction swr lacosanumation". Burkina Fam 19861995. Parkam 1986 (FAO).
14 One has also to acunt for the losses occuag during felling and cutting of the tres. This could represent 1O to15% under the prcsent harvestng practicas

26
are excluded from the available sustainable yield for religious/traditional reasons orbecause of biological constrais 5 . Other high quality species and large trees areconsidered more valuable as timber for commercial purposes and therefore excluded fromthe available resource for fiaelwood. In doing so, one assumes that these resources areactually being used for timber products. However, wood-based industries in the fiveRPTES countries are not yet sufficiently developed to absorb these resources. Similarlyfiuit trees on cultivated land have been excluded, ignoring the fact that they are generallypruned on a regular basis and they will eventually be felled and potentially replaced oncethey reach a certain age. These examples illustrate that inventory results should bedocumented and considered in conjuncton with actual markets for forest products.
48. In sumnary, for this provisional review the assumed ufilization factor is based on12 % moisture loss of green wood and 15 % loss of harvested wood, for a compound lossof 25 % of the gross supply of green wood. In terms of specific gravity, this implies thatone cubic meter of green wood harvested and weighing 800 kg provides about 600 kg ofwoodfuel to the urban consumer.
2.3 Fuelwood supply and Demand in rural Areas
49. As will be illustrated in Chapter III, rural demand accounts still for about threeqnarters of all woodfiuel consumption in the RPTES countries, with the exception ofSinegaL where the changeover to charcoal has tilted the balance towards urban demand.
50. From the discussion in the preceding Section 2.2 it is clear that, with goodmanagement practices, many rural areas will be able to look after their local needs forfuelwood without major supply problems. Of course, no assessment is complete withouttaking account of social implications. Distances to gather wood may still become longer,and free "surplus" labor of women and children should not be taken for granted if theobjective is to advance the rural economy. On the other hand, it is reassuring to find notonly that the threat of total depletion of fuelwood resources is not as imninent as feared20 years ago, but also that for the time being a surplus remains for sale in the urbanwoodfuel markets.
51. Beyond the narrow perspective of biornass energy supply, one must consider thefuture of the forestry and agricultural sectors. Preserving the forests for the sake ofenvironmental protection is a valid concem, but it remains a rather abstract concept unlessthese issues are addressed through a holistic approach. Demographic pressures anddemand for food lead inevitably to changing land use. The key issue becomes how tomanage this process and the associated resources in a dynamic environment and ensuringthat the interests of all actors (users) are preserved in a sustainable manner.
1 lThe Baobab is not suitable for firewood because of its texture.

27
52. Inspection of the - still scattered - available field data suggests that a significantstanding stock on cultivated land and fanows exists and that the productivity may besimilr or even higher than some customauy values assigned to forested land. If this findingis confirmed by further research, it will be hard to support that expanding agriculture byitself is a major threat to woodfuel supply. There is every indication that the prospects ofagro-forestry in the RPTES countries are good and in a decade or two, this practiceshould be sufficiently advanced to provide a significant part of nual fuelwood supply, andthus stabilize the area of the remaining forest reserves.
53. The positive outlook for technical solutions does not guarantee that land- andforestry use will indeed evolve in an environmentally benign manner. If the ruralpopulation were in control of its natural land resources, it would take care of its ownneeds before seling woodfuel surpluses to the cities. Actually, it is urban demand andurban commercial interests that encroach on the resources with two negative effects: Inthe short run it deprives villagers from income that would stimulate further ruraldevelopment, and in the longer run it threatens the sustainable supply to villagers. Thecritical element in the process of managing change will be reforn of the legislative andinstitutional framework.
2.4 Urban Markets for Woodfuels and Charcoal
54. Based on the analyses in the draft reports of the national teams, the estimateddemand in twenty-one major urban centers in the RPTES countries is presented in Table2-5. The bottom line (sum total of all markets) provides two interesting pieces ofinformation: (1) The total urban population of six million accounts for two-thirds of thetotal urban population given in Table I -1. showing the extent of urban concentration; and(2) the equivalent woodfuel demand of about three million tons per year compares to anestimated supply potential (available to both urban and rural dwellers) of 37 million tons.Despite the stated reservations about the accuracy of inventories, accessibility and therisks of aggregation, the orders of magnitude indicate that the supply of traditional energyto the major centers of economic activity is still a relatively small part of the resourcepotential.
55. The breakdown by countries and cities is also quite rvealing. About 80 % of alcharcoal consumption in the group is used in Scnegal, with Dakar-Thies being thedominant market. In Burkina, the carbonization of fuelwood cleared from the Kompiengaand Bagre reservoir areas made charcoal available in non-negligible quantities, withevident success: Charcoal use in Ouagadougou is beginning to take off, and is already atabout the same level as Bamako. The extent of charcoal use in Banjul is still difficult toverify; FAO estimates 54,000 tons in 1992 in all of Gambia", and presumably a large partwould be consumed in the capital area
16 FAO Yearbook 1992, page 32 The number ma bc an c'arapolation of the 40.000 tons reported for 1981.

28
Table 2-5:Major Urban Woodfuel Markets
(in thousands of tons)-1992-
Center Fueiwood Charcoal Woodfuel EsL Pop.(1) Equivalent (thousands)
GambiaGBA/Brikama 65 0 (2) 65 (2) 350
StzngalDakar-Thies 54 176 1032 1890St Louis 24 23 152 190Kaolack 28 17 122 200Kolda 24 6 57 66Ziguinchor 21 18 121 164Total 151 240 1484 2510
Burkina FasoOuagadougou 152 16 230 634Bobo Diolasso 87 2 97 269Banfoa 22 - 22 61Koudougou 21 - 21 59Ouahigouya 20 - 20 55Total 302 18 466 1078
NigerNiamey 146 - 146 500DossoTahouaMaradi 39 39Zinder 25 - 25Totil 220 - 220 1003
MaliBamako 305 15 388 712Segou 79 2 90 95Mopti 75 2 86 80Koutiala 34 1 40 53Gao 21 10 76 59Total 514 30 680 999
All Markets 1252 288 2915 5940
(1) Assumed conversion efficiency of! 8% (National Reports).(2) No reliable esLimate of charcoal consumpuon is available.

29
56. The distribution of charcoal consumption within each country provides someinsight in the dynamics of the "Fuel Ladder", i.e. the evolving consumer preference fromfiuelwood to LPG via improved woodstoves, charcoal and kerosene as intennediate steps.Sen6gal is in an advanced stage of conversion to charcoal; Dakar is almost 100%converted and secondary centers and even rural areas have fast developing charcoalmarkets. Mali is entering this stage, with charcoal markets developing in all urban centers,notably in Gao.
57. The consumer switch from fuelwood to charcoal is widely regarded with greatconcern because one ton of charcoal requires about five tons of fuelwood as input andreplaces around 3 tons of end-use consumption. Many consultants and policy makers havesuggested that a leap on the fuel ladder from fuelwood directly to kerosene is desirable toavoid an acceleration of deforestation. In practice, only in Niger there seems a reasonablechance that the charcoal phase will be skipped because it shows no signs yet of taking offin the first place. It remains to be seen if instead kerosene or mineral coal will become thefuel of the future. Elsewhere, consumer preferences develop clearly in the direction ofcharcoal, and the real problem is how this can be avoided as long as personal incomesremain low. By way of comparison, it should be noted that in Latin America theprevailing incomes of the lower income classes in the cities are low, but still significantlyhier than in Sub-Saharan Africa. Consequently, most migrants to the cities abandontraditional fuel and switch to kerosene and LPG. In the RPTES countries, middle- andlower-income urban dwellers do not have the money yet to buy petroleum fuels as themain fuel for cooking, which leaves them with cnarcoal as the only affordable alternativeto advance their standard of living.
58. If the re-evaluation of biomass stocks were to show that with responsible resourcemanagement much greater quantities can be made available than thought before, thechances of stopping conversion to charcoal are not good. Actualy, the question arises if itis even desirable to stop such a conversion if an affordable fuel can be made available untilthe time that rising incomes induce people to change to modern fuels. Of course, such apolicy decision could be taken only if there is no doubt about the sustainability of thesupply without permanent damage to the resource base, until such time that demand fortraditional fuel begins to stabilize or decrease.
2.5 Commnercial Suply of Urban Markets
59. As will be seen in greater detail in section 4.2, the organization and operation ofthe woodfuels supply industry is to a large extent shaped by legislation of the colonialperiods and modifications thereof afler Independence. In colonial days the State laid claimto all unoccupied land. The indigenous population was granted only usufruct rights overnatural resources, whereas comrnmercial operations were reserved for urban citizens. After

30
Independence these principles were retained, thus reinforcing in the forestry sector theurban bias that pervaded the economy.
60. In practice, urban interests dominated the forest exploitation and woodfuels trade,and consequently the rural populations gained nothing from the resources with which theywere traditionally associated. Forestry codes provided the legal means to establish thecontrolling mechanisms, which were enforced by Forestry Departments with wide-rangingpolicing powers.
61. The market structures that evolved are analyzed by country in the thematic studyof forestry policy. Notwithstanding the variations, one can see certain common patternsthat underlie the functioning of the markets. In principle, the traditional way of exploitingthe forests is for the urban merchant to hire his own woodcutters and cut trees or collectwood from the zones where rural people have no commercial rights. Transporters may beindependent operators or associated with the merchant. Similarly, in the cities merchantsmay have their own retailing networks or resell their supplies wholesale. Since thefuietwood at source is practically a fiee good, partial or complete vertical integration canbring large profits to the operators.
62. Forestry Departments have the administrative tools to make this system workAccess to the resource is controlled by issuing cutting permits and in some cases bydesignating parcels for cutting and quotas. Access to markets can be controlled bytransportalu3n and retailing permits. Since official pe2nits must be paid in advance beforewood can be harvested and sold, the interests with cash reserves dominate the business,while impoverished rural dwellers do not have the means to gain a foothold. Otherregulations may promote the formation of cooperatives (effectively merchant oligopolies,e.g. Senegal) or, alternatively, try to break up vertical integration by issue of professionallicenses (e.g. Burkina Faso).
63. Taxation in the sector dates back to colonial days and has evolved into systems ofvarying complexity. The economic rationale for fuelwood taxation is rooted in theperception that, to the community, trees are a scarce good that has a replacement costSince private operators practice indiscriminate partial or complete deforestation and Lhusmake the tree financially a free good, the replacement cost should be reflected in a stale-imposed stumpage fee. It was also expected that raising the price of fuelwood wouldinduce demand for substitutes like Liquid Petroleum Gas (LPG) and kerosene.
64. In practice, the effect of these taxes on tne retail price is too small to make muchdifference to consumer behavior. The total collectible amount of the tax is also small, andthe poor collection rate mak:s it insignificant in relation to the total national revenucsEven so, the moneys collected are not negligible relative to the costs of running iheForestry Service. Moreover, the woodfuel business has a large turnover (sometimes asmuch as one third of the revenue of the national power utility), which means that throughpayoffs in exchange for tax evasion and other breaches of regulations the Govemmentagents can gain access to a large cash flow, usually at the expense of the rural populations

3)
65. In various degrees, the prevailing production and marketing systems havedisenfranchised the rural population. They have only usufructuary rights and see thenationalized natural resources invaded by strangers to the village who cut the trees andtake the fuielwood away for sale by urban traders. Breaking into the commerce of vestedeconomic interests requires money that villagers do not have. Entering production isdifficult enough by itself, and the barriers to transportation and marketing are even moredifficult to overcome. Pilot schemes to change this situation in favor of the ruralpopulation are underway everywhere, but the experience is still too recent to have had adecisive impact. One common problem emerged wherever these projects were set up: Thecompetition of already existing production- and marketing circuits puts pressure on theirselling prices.
66. Table 2-6 summarizes available elements on the price structure of 1993 and 1994obtained from the various country reports and other relevant available documents. Theprices are those observed in the capital cities and they may be different elsewhere in thecountry. Senegal has a complete update of the structure of charcoal prices after theJanuary 1994 devaluation. For the other countries of the FCFA zone, the only additionalinfonnation for mid-1994 were updated end-user prices.
67. Fuelwood prices in Gambia, Burkdna Faso and Mali appear to be remarkablyuniforn, around FCFA 20/kg. Before the firnc devaluation, the same level prevailed inNiamey; from which observation one could conclude that there is no greater physicalshortage in Niamey. Of course this begs the question whether resources are less scarcethan thought, or whether they are simply mined. Long transport distances to productioncites may explain the reasons for the high price in Dakar. In smaller towns such asKaolack and Fatick the firewood prices are closer to the prices observed in the capitals ofthe other four RPTES countries.
68. To the end users, charcoal is worth approximately three times as much asfuelwood in terms of heat value, if stove efficiency differences are considered. This ratiowould suggest that charcoal is the cheaper fuel in Dakar and Banjul whereas in Bamakocharcoal is more expensive.
69. The amounts of taxation ("redevance ferestike" plus, in the case of Burkina Fasoand Gambia, the cost of the transport permit) illustrate the small part of the retail pricethat they represent: The fiscal component varies from 3 % in Gambia to 11 % in BurlinaFaso. However, it should be kept in mind that these are unitary taxes that affect retailprices as shown only if they are filly collected. Because of the poor collectionperformance (except for Senegal, less than a third is collected), the aIready practical effectis even more diluted.

32
Table 2-6Fuelwood and Charcoal Prices (per kg)
Dakar Greater Banjul Ouagadougou Bamnako NiameyyCurrency FCFA DalasiIFCFA FCFA FCFA FCFA
1. FuelwoodProduction 5.0 0.09/12.8 4 3 2.1Taxes 1/1 0.02/0.6 2.4 0.7 1
Transport 12.0 0.18/5.5 3 4 5
Wholesale Price 24.5 0.40/12.0 12 7 9-l1
Retail Price 30/45 0.70/21.0 21/21 15/19 20/30
2. CharcoalProduction 17/23 - - 23 -
Taxes 515 - 2.5
Transport 16/21 - - 8Wholesale Price 50/31 - - 56
Retail Price 58/95 0.9-1.6 /27-48 82-100 75187
Notes:I)FCFA Exchange rates 1993 FCFA275=USSI.OO
As of JanL 1994 FCFA 547= USSI.OO2) Bold-face numbers are post-devaluation prices in mnid-19943) Dalasi exchage rakte 1993 FCFA30=DI.00 (this rate was used to allow a meaningf comparison)
As of Jan. 1994 FCFA60=DI.004) - nol available or not applicable
70. The table also shows that the taxation systems in Mali favor charcoal overfuelwood. A conversion efficiency of about 20 % would suggest that charcoal taxesshould be FCFA 3.5 in Mali (instead of 2.5). Because of the absence of regulation inBurkina Faso the tax on woodfuel (FCFA 2.4 per kg) is equivalent to less than FCFA 0.5per kg of charcoal produced. Furthermore, in the case of Senegal it is important to notethat the increase of the charcoal price after devaluation (from FCFA 58 to FCFA 95 perkg) mostly benefited the oligopoly of charcoal merchants. Whereas the tax remainedunchanged at FCFA 5 per kg, they saw their markup increase from FCFA 11 to FCFA 30per kg. The margin is even higher for those merchants (a majority) who have their ownmeans of transport.
71. The updated prices were collected for the middle of 1994, only six months afterthe devaluation. It is still too early to tell if the new prices represent stable vwalues.Considering that woodfuels are a domestic product, the final prices should remain below

33
the amount of the devaluation, and thus decrease in real terms vis-&-vis petroleum fuels attheir full economic cost. Since the parity change of the FCFA also has reduced urbanincomes in real terms, a slowdown of the switch to modem fuels is likely in the short run,urdess the prices of replacement fuels are held down by subsidies, as is still the case inSenegal.
2.6 The Role of Institutions
72. African countries still have the reputation of being burdened by excessive Stateownership of enterprises. In contrast to this prevailing phenomenon, the traditional energysector is essentially a large private-sector activity straddling the boundaries of the formaland informal sector. This fact does not imply that the public sector has remained idle. It isa paradox that, owing to the many multi-sectorial dimensions of sector activities, Stateagencies are attempting to regulate an essentially private business.
73. Thus far, in the absence of a coherent and well-articulated public policy, eachgovernment agency is approaching the issues with its own perspective: Foresters wish toprotect the trees, agriculturists are concerned with food supply and land use, energyofficials want to safeguard the supply of traditional fuels to the cities, finance departmentsare interested in tax revenue from the commercial segment of the market, etc.
74. Given the traditional and largely informal nature of the sector, it is difficult tojudge how effective public sector intervention has been on balance. Despite indications ofgrowing problems on the horizon, there is little evidence of an imminent crisis. The mostvisible intervention (of an ad hoc nature) occurred during transporters strikes in BurkinaFaso and Niger, where Government directed the army to take ove: temporarily thefuelwood supply of Ouagadougou and Niamey The realization that the larger problemsare long term may explain both the lack of coordinated actions and the small share of thenational budgets dedicated to the sector
75. The meager resources of the public sector have not prevented many agencies fromtrying to play a very active role. Fiscal policy and price controls seem central to many ofthe practical problems of public sector management In the forefront are, or were, theforestry services in the fancophone countries with their para-military tradition.Regulations, taxes and fines often become the instrument of law enforcement agents notjust to protect the forests, but also to provide their departments and themselves withsupplementary revenues. More tax revenue means more money for the service, collectionproblems require more controls, controls require more personnel and equipment, etc. Ifpan of the sectoral tax revenues is reserved for the public services, the system begins tofeed oni itself. These problems will be discussed more extensively in Chapter IV, in thecontext of options for reform.

34
2.7 Main Sector Issues
76. The foregoing sketch of the existing traditional energy sector points to four majorissues:
(a) The Need to firm up the Data Bases.
Self-evident as recormnendations in this sense may seem, it is a fact that many predictionsof disaster have not materialized, and without a sounder foundation for sector analysis,decision-makers are not likely to act on what they may consider speculation orexaggeration.
(b) Redefinition of Resource OwnmersMp.
Nationalization of forest land has not prevented private urban interests fromoverexploiting the resource at the expense of the ecological equilibrium and of the welfareof the rural population. Ownership rights must be redefined io redress the imbalance ofsocial equity and to protect the natural resource endowment.
(c) Reorganization of commercial Woodfiuel Supply to urban Markets.
This is the core issue flowing from redefined resource ownership and encompassing thefollowL;g aspects:
* Definition of exploitation rights with regard to wood cutting and, as the case may be,transformation to charcoal;
e Rights, responsibilities and benefits of the local population-;
- Management structure of rural producers, their representation and, in that context,the role of traditional and elected authorities;
* The linkage between organization of rural producers and the introduction of localadministrative and fiscal autonomy,
* The linkages of rurl producers with urban markets, including the issues ofcompeting commercial supply channels (e.g. private transporters who are gettingfree supplies elsewhere, forestry services, arny units);
* Access to transport, vertical integration, information; and
* Sector financing, pricing and taxation.

35
(d) The future Role of Governments
Under this heading one can identiiy the following focal points:
* Legislative, institutional and fiscal reform to support the solutions of the precedingissues;
* Integrating traditional energy sector policy in the broader context of population,agriculture and environment; and
* Articulaing a national policy serving as a framework to channel external aid topriorny needs.
37
m. THE OUTLOOK TO THE YEAR 2020
3.1 The traditional Energy Sector from a NFfXUS Perspective
1. Population growth is a major driving force in overall economic development, butnot the only one, and simple models that try to capture the linkages between demographyand the use of natural resources may represent only part of the reality. Nevertheless, thereare direct causal relations among population growth, settlement patterns, minimumdemand for domesrically grown food and a minimum demand for cooking fuels. Even ifseveral feedback loops of the real world are left out of this "first-order" approach, somevaluable insights may be gained in the multi-sectorial dimensions of energy policy. In thecontext of traditional energy, the key questions are: (a) What is the rate of expansion ofcultivated areas to meet a growing domestic and international demand for agriculturalproducts? (b) Which agricultural production systems will develop along with thisexpansion, and how do they affect the ratio of crop land to fallows? and (c) How willagricultural expansion affect the woodfuel supply potential?
2. It is against this background that the RPTES Program included in the thematicstudies an analysis of the spatial aspects of traditional energy supply and demand. Thisstudy" (Ninnin, 1995) has examined the sector by attempting to quantify a series ofrelationships and the ensuing problems, in the following order:
• Evolution of urban and total population from 1990 to 2020 under two scenarios ofeconomic growth;
* Spatial development of agriculture in relation to markets;
- The competition for land between the agriculture and forestry sectors;
* Possible evolution of demand for food and the implications for land use,
* Potential sustainable woodfuels supply in relation to demand in 1990;
* Supply scenarios for the period 1990 - 2020; and
* Demand for traditional energy (rural and urban) towards 2020.
3. Ninnin (1995) provides some interesting illustrations of the importance of theseevEluations One of them uses a hypothetical country (but based on averaged shares offoxests, cropland and fallows within the Sahelian region) to show how land use couldevolve under two extreme assumptions: (1) agricultural land expands while preserving the
17 'EIlements d'econofue spatiale des energies traditionnelles', RPTES- Benoit Ninmn. Janvier 1995

38
existing ratio of productive land to fallows; and (2) all new cultivated land is obtained byreducing the existing falows. In the first case, doubling of the cukivated area leads to areduction of 50% of the existing forests, whereas in the second case the forests aretotally preserved.
4. To lend some time perspective to the policy analyses in Chapter IV, the followingsections present the main results of the study (Ninnin, 1995) that attempts to trace theevolution of population, land use and potential demand for traditional energy. The timeperiod of 30 years (1990-2020) is long enough to permit some reflection on the long-termoutlook. On the other hand, over such a horizon the analysis is bound to contain manyspeculative elements. At this stage, the operational value lies in the definition of a multi-disciplinary framework for thirking about policy, in the development of at least someorders of magnitude for the expected changes, and in identifying priorities for research tofirm up the data bases.
3.2 Population Growth. Migration and Urbanization
5. Since today's age pyramid is the main determinant for population growth in thenext 25 years, demographic development is probably one of the more stable inputs into amodel exploring the NEXUS variables. The projected totals for the year 2020 arepresented in Table 3-1 for the two regional economic scenarios described in Section 1.2:
* higher econoriic growth of the West Africa region resulting in accelerated loss ofpopulation due to emigration out of the RPTES group as a whole, and a quitepronounced migration within the RPTES Group from the land-locked to the coastalcountries; and
- slow economic growth with larger retention of the natural population increase in thecountries of origin.
Table 3-1Population Projection for 2020
(in millions)Category Senegal Gambia Burlina Mali Niger RegionScenario I
Urban 10.7 1.2 5.8 5.4 3.9 27.0Rural 6.2 1.2 9.6 9.1 9.7 35.8Total 16.9 2.4 15.4 14.5 13.6 62.8Uzban % 63 50 38 37 29 43
Scenario 2Urban 7.6 0.9 4.7 4.3 32 20.7Rural 7.7 1.3 12.6 11.9 12.4 45.9Total 15.3 2.2 17.3 16.2 15.6 66.6Urban% 50 41 27 27 21 31

39
6. The interpretation of these numbers should take into account that the projectedpopulation figures are taken from a global study of 19 countries in West Africa, of whichthe five RPTES countries are a sub-group. The distribution by country reflects theassumption that higher economic growth will induce higher emigration from the land-locked countries to the coast. However, the direction of the migration movement is notonly towards Senegal and Gambia, but also to Ghana, C6te d'Ivoire, Nigeria andCameroon. This explains the -at first sight paradoxical- phenomenon of the totalpopulation being lower under the higher economic growth Scenario 1.
7. As noted in the introductory Chapter I, the intensity of migration is assumed tocorrespond to different degrees of urbanization (defined as concentrations of over 5000people). This hypothesis is reflected in the tabulated numbers: Whereas the totalpopulation in the region under the high-migration Scenario I is 6 % less than in Scenario2, the urban populations are as much as 40 and 33 % higher for Senegal and The Gambia,both coastal countries assumed to experience a net gain from immigration.
S. Within the urban totals of Table 3-1, the populations of the capital cities wouldreach the following levels in 2020 (in millions):
city Population 1990 Populaion 2020Scenario 1 Scenario 2
Dakar 1.56 4.62 3.30Banjul (GBA) 0.22 0.95 0.74Ouagadougou 0.47 1.43 0.89Bamako 0.74 198 1.16Niamey 0.44 1.61 1.03
3.3 Demand for Food Ene and corresponding Land Use
9. To quantify the effects of population pressure on natural resources, the thematicstudy (Ninnin, 1995) estimated a series of intervening variables and parameters such as:Population settlement pattems, per capita food consumption, share of imported vesusdomestically grown staple foods, productivity of potentially agricultural land, ratio ofcultivated land versus fallows, etc. The end result translates population growth and needfor staple foods into land use, and its potential effect on the forest reserves. The availableinformation in the spatial data bank is still far from complete. To make up for the existinggaps, the thematic study attempts to infer fiUture development of land use from comparisonof existing areas at different stages of development The results are summarized in Table3-2 by country, for the (high-growth) economic 'Scenario 1'.
10. The total area of agricultural land in 1990 was still wel below the potential asmeasured by available "non-marginal" land. Because of the assumed low productivity ofthe soils, Niger needs over twice as much land per capita as Burkina Faso and Mali to feed

40
Table 3-2Estimated Evolution of Land Use (Scemario 1)
(in square kilometers)
Category S96f6p Gambia Burkina Mali Niger
1. ResourcesNon-terle land 184,800 9,800 262,500 434,00D 312,000Potential for agriculure 115,900 8,500 256,700 205,900 234,000of which non-marginal (1) 82,800 7,200 164,000 118,200 167,000
L Land Uses in 1990Total agric. land (2) 45,500 4,000 105,100 65,200 122,100Percentage (3) 55 55 64 55 73Forest and woodland 131,600 4,500 140,700 261,500 143,900
3. Projected uses in 2020Total agricultural land 63,400 5,900 134,600 B4,60D 159,000Percntagc 77 82 82 72 95Forest and woodlands 113,720 2,500 111,200 242,100 107,000
4. Annual change '90-20(paet)
Total agricultural land 2.00 4.63 2.47 2.40 2.22Forest and woodland -).48 -1.19 -0.79 -0.26 -0.99
Nates:(l) Non-marginal land Estimate based on productivity atainable by traditional tecnology(2) Total agriculital land = Cultivated + Fallows(3) Thc percentages relate ancultnal land to available total "non-magipar la,ud but it shold be noted that
cventually marginal land may be brought undr caltivation as wen.
its population and 73 % of its potential "non-marginal" land is already under cultivationcompared to 55-64 % for the other countries. The projection for 2020 reinforces thistrend. The projected agricultural land in Niger would at that time occupy 95 % of thetotal 'non-marginal" land available, and the range for the other four countries has shiftedto the 72-82 % range. The agricultural expansion reduces the areas of forest andwoodlands everywhere, however without leading to total deforestation. One contnbutingpositive factor is the projected increase in the ratio of cultivated land to fallows. Relativeto 1990, the largest reductions of forest land would take place in Gambia (44%) wheredense population exerts considerable pressure on the land, and in Niger (26%0), where highpopulation growth is accompanied by a disproportionately large increase in the arearequired for cultivation.
11. The fourth section of Table 3-2 illustrates the nature of the problem in terms ofgrowth rates over the 30-year period: Population growth induces the need for growingmore food, and agricultural lands are projected to expand at annual rates of 2.00 % for

41
Senegal and as high as 4.63 % for Gambia. This change of land use would entail averageannual deforestation rates varying between 0.26 % (Mali) and 1.19 % (Gambia). It shouldbe noted that this result is only one of several possible outcomes if the underlyingassumptions hold. More intensive agriculture combined with changes of technology, orhigher food imports could change the picture. However, unless one assumes a priori thatfurther reduction of the forestry stock is not acceptable (e.g. based on local environmentalconsiderations or concen about global warming), there is clearly a competition betweenagriculture and forestry for the avaiable land.
3.4 Scenarios for Demand for Traditional Energy
12. Accepting the trade-off of Table 3-2 as a working hypothesis concerning thedevelopment of land use, the thematic study (Ninnin, 1995) pursued the anysis byintroducing the energy dimension. On the demand side, population projections serve as abasis for esfimating future demand for traditional energy. Specifically, the projection takesthe following factors into account:
• The estimated future demand in ural areas is based on the empirical finding that thequantity of wood collected and used up is a function of the biomass density. Wherethe standing stock degrades, the demand gradually diminishes to an assumedminimum of 0.6 kg per person per day, the level observed in near-desertic conditionsfound in much of Niger and in Eastern Mali. At the other extreme, the ruralconsumption in Southern Mali, a well-stocked zone, is about two kg per person perday. As was done in the assessment of land use, future evolution of demand wasestimated by transposition of the characteristics of typical eisting situations.
* The projection of urban demand assumes that the gradual changeover to charcoalwill continue for at least two reasons: (i) In metropolitan areas with increasingdensity of habitat, cooling habits will change to avoid the problems of smoke, dirtand handling of bulky fuelwood, and replacing fizelwood by charcoal is one of theways of doing so ; and CQi) Growing distances between woodfuel supply areas andurban markets will induce more competition from charcoal because of lowertransportation costs (higher calorific value per ton offsets the low efficiency ofconverting wood into charcoal).
* Rising incomes will induce the adoption of petroleum products, first as secondarnfuels for auiliary cooking and eventually they will displace charcoal as the maincooking fuel. It is assumed that during the projection period the use of petroleumfuels will remain secondary, and therefore that the quantity of woodfuels substitutedmay be neglected.
13. Table 3-3 summarizes the demand estimates in 1990 and 2020. The levels at thebeginning of the period are obtained from the country diagnoses of the national RPTESteams; the forward look to 2020 is based on the thematic study of the spatial economr of

42
the sector (Ninnin, 1995). The most strildng change in the 30-year period is evident fromthe numbers on woodfuel equivalents, which combine direct fiiewood consumption andthe primary input of fuelwood converted to charcoal. For the five countries takentogether, the urban share in the total consumption (4.4 million tons) rises from about 25% in 1990 to over 50 % at the end of the period. The change is most pronounced in thecountries with the highest urbanization and - presumably - the fastest transition to charcoaluse. This is evident especially in the case of Stn6gal, where the urban demand wouldaccount for as much as 78 % of the national total in 2020.
14. In rough numbers, the trend is towards a quadrupling of urban consumption while,except in Gambia, rural consumption increases by only one half over the period. In termsof average annual growth, the total use in the five countries increases at a rate of 2.6 %,but this total masks that the rural growth is only 1.3 % whereas the urban demand expandsat a rate of 4.6 %. The exercise illustrates what has been frequently noted in the literature-In rapidly urbanizing countries, environmental pressure on natwral resources originates inthe cities, and exploitation of the overwhelming part of those resources by urban interestsis likely to become a growing source of conflict with the rural populations unless legal andinstitutional reforms guide the process in new directions. To assess these risks, one of thekey questions is whether the land, allocated between agriculture and forestry as shown inTable 3-2, can produce the woodfuel demand of Table 3-3 on a sustainable basis. In otherwords, are the projected demands for food and for woodfiuel compatible?
3.5 The Supply Potential
15. The available information on land use in 1990 and the projection to 2020 (Table3-2) has been used to estimate the standing stock and sustainable yield or productivity ineach country. The results are also presented in Table 3-3. Given the state of dataavailability, this part of the analysis should be considered as a byproduct of the projectionof changing land use and especially of the resulting deforestation. The reliability af suchestimates depends essentially on the quality of a disaggregated spatial analysis indicatingwhere the agricultural expansion is likely to take place.
16. The compilation of demand and supply estimates in Table 3-3 permits a firstassessment of the future risks of woodfuel scarcity. However, it should be noted that thetable deliberately is not called an energy balance. According to the thematic study (Ninnin,1995), with regard to the national totals only demand-supply differences over 30 % arestatistically meaningfiul, and the margin of error in geographic subdivisions may rise to50%. Even so, it is worth noting that the national totals are based on spatiallydisaggregated analysis, which is a significant advance relative to much work of an earlierdate.

43
Table 3-3Comparison of Demand and potentially sustainable Supply of Woodfuels
(in thousands of tons of woodfulel equivalent)
SEnfgal Gambia Buridn. Mali Niger Total1. Demand 1990
Urban 2,000 130 800 1.100 400 4,400Rural 1,500 320 3,600 3,600 2,100 11,200Totad 3,500 450 4,400 4,700 2Z 00 15,600
2. EsL Supply 1990thousands of cu. m 10,500 500 14,800 28,500 7,800 62,100thousands of tons 6,300 300 8,900 17,100 4,700 37,300
3D Demand 2020Urban 8,300 80C 3,000 3.700 1,400 17,200Rural 2.400 600 5,000 5,500 3,300 16,700Total 10,700 1,400 8,000 9,200 4,700 33,900
Ave growth '90-'20Urban 4.9 6.0 4.3 4.2 4.5 4.6Rural 1.4 2.1 1.2 1.3 1.4 1.3Total 3.8 3.8 2.1 2.2 2.1 2.6
4. EtsL Supply 2020thousands of cu. m 9,600 400 13,300 27,600 7,200 58,100thousands of tons 5,700 240 8,000 16,500 4,300 34,800
S. Stock reductionAs%ofl99Ostock 9.5 20.9 11.7 4.6 8.0 8.2Total in m3xl03 22,400 2,700 45,800 23,000 9,800 103,700Total in tons x103 13,400 1,600 27,500 13,800 5,800 62,200
Notes:1. Conversion from cubic. metes to ions basd on 800 kgfsolid cubic meter, additional 12 % weight loss of
green wood, and 15 % loss in the field. These assumptions result in an cEfective conversion fctor of 600 kgutilizable air dried woodfiuel per cubic mer of green wood.
2. Chamroal convered to equivalent fuelwood assuming 18 % efficiency.
17. At face value, on the assumption that all the potential supply can be collectedand/or marketed, it would appear from Table 3-3 that no problems existed for 1990conditions except in Gambia; however, it should be taken into account that the data basein Gambia is highly uncertain and that supplies across the open borders with Senegalwould mask any evidence of a national deficit. With respect to the year 2020, theindications are that, on an aggregate basis, the demand in Senegal, Gambia and Nigerwould be well in excess of sustainable supply, and any gaps would have to be filled, albeittemporary, by further encroachment on forest land. Burkina Faso would have reached thelimit and Mali is the only country that would still have a comfortable margin

44
18. Finally, Part 5 of Table 3-3 illustrates the stock changes that would occur as aresult of clearing forests to make room for agriculture. Reltive to the estimated standingstock in 1990, the reduction over a 30-year period is modest (4.6 to 11.7 %), except inGambia where the loss reaches over 20%. The cumulative woodfiiul quantity obtainedfrom clearing adds up to 62 million tons or, on average, about two million tons per year.Since the large volumes of wood produced by land clearing are likely to end up in urbanmarkets, it is of interest to compare these quantities to urban demand. The numberssuggest that, in the aggregate, fuelwood obtained by land clearing is significant in thebeginning of the period, but in later years the importance of this factor diminishes verymuch because of the rapid increase of urban demand.
19. Interesting as these results may seem, they suffer from the classical problem ofaggregation that tends to obscure local problems. The crucial question is how to proceedfrom potentially sustainable supply to an operational estimate of actual marketablequantities of woodfiels. As noted in Chapter II, often demand-supply comparisons areflawed by ignoring differences between moisture content of harvested green wood andmarketed fuetwood, and by failure to allow for the loss of a cerain percentage ofharvested biomass left in the field. Beyond these more elementary considerations (takeninto account in Table 3-3), it is the notion of accessible supply that is most elusive. Sincein most rural areas villagers collect wood from nearby areas at a cost in time rather thanmoney, the following discussion focuses on access problems in the context of supply ofurban markets.
20. As demonstrated in Chapter 11. the reduction of stocks by percentages to accountfor access problems does little more than recognize the problem; as a guide to action, theapproach is likely to mislead decision-mak;ers The thematic study (Ninnin, 1995) identifiesfive contributing factors:
* The road network. Paved primary and secondary roads provide easy access toforests, but they can also cause severe degradation of bands of land up to about 10kan wide bordering the roads Actually, the effect is more diffuse depending on thedensity of tertiary unpaved roads and trails that pernit a deeper and more diversepenetration.
* Cost of market access, essentially transponation costs. No matter how good theroads are, distance will impose limits on the extent of economic exploitation offorests.
* The size of the market. The larger the urban market, the larger the required supplyarea; furthermore, for the same reason the cost of market access is affected byeconomies of scale.
* The distribution of resources relaiive to mark-ets Low-productivity land close to themarket may be exploited in preference to more distant high-yielding zones. This can

45
often be seen from the deforested immediate surroundings of both small and largeurban centers.
Seasonalitv. Seasonal variation is specific to the Saheian country group, andespecially to Senegal and Mali. During the rainy season the forests in the Southemregions are less accessible, transportation costs rise and exploitation (often toexcess) shifts to the drier and more fragile Northern zones. Price fluctuations may bekept in the 15-20 % range depending on traders' stocks.
21. These determinants of accessibility are typically a reflection of the interests ofurban transporters in maximizing their profits. If left to their own devices, they willoverexploit zones close to the markets and move to more remote areas when the cheapestresources are exhausted. Therefore, access is to a large extent a function of man-madeinfrastructure and of profit-seeking behavior. It is not constant over time and it can bechanged by deliberate policy actions, among which the most important ones are:
* Improving and extending the road network. This is a public sector activity that maybe undertaken for many reasons. For example, extension of feeder roads to provideoutlets for agricultural production is often accompanied by better access to forestsbordering new agricultural land. Some experts will argue that new roads cause onlyfurther deforestation; however, it should be recognized that, with proper resourcemanagernent, new roads providing access to under-exploited areas will relievepressure on over-exploited zones.
* Taxation as a function of zones of origin. This device changes the access costs asseen by private interests to a structure that would favor productive remote areasover ecologically threatened zones closer to the urban markets. The chances ofsuccess are closely linked to tax structure, tax collection administration and thestructure of the transportation industry, factors that are further discussed in Section4.2.
* Organization of rural woodfiuel markets. Urban transporters having free access torural resources will reap "location rents" from exploiting areas where they incur thelowest transportation costs. When villagers organize themselves to take theexploitation in their own hands, they are likely to become the new beneficiaries ofthese rents, and the cost of access to transporters will change accordingly.
22. It is clear from this summary discussion that access is at the core of the supplyproblem and of the associated policy options. As such, it is affected by forestry legislation,fiscal measures, decentralized resource management, institutions and infrtucturedevelopment. These elements are further discussed in Chapter IV.

46
3.6 The Implications of econonuc Growth for Sector Policy
23. The foregoing analysis is based on sectoral models of population and land use thatin the macro-economic sense are open. The simplification has produced some manageableand transparent results which now should be viewed in a broader context.
24. On the demand side, the basic question is how long the trend projection ofwoodfiuels consumption will hold, especially for the urban component. lf economic growthis accompanied by rising urban household incomes, one can expect an accelerationtowards substitution of modem fujels for biomass as has happened in other parts of theworld. Table 3-3 illustrates that total urban substitution by the year 2020 would produce awoodfuel situation that at first sight seems more reassuring. If only rural demand were toremain, the estimated sustainable yield in 2020 would exceed the requirements by asignificant margin in all countries except Gambia.
25. The evolution of woodfuels spply is closely related to the expected developmentof the agricultural sector under the assumption that ultimately the land use will be drivenby population growth and demand for food. However, wealth and income created in othersectors of the economy may permit a higher level of imports of food, or fuel or both, thusalleviating the pressure on natural resources. In the final analysis, many unpredictablevariables outside the energy sector determine the opportunity cost that will orient futureland use (see section 4.2).
26. Any scenario looking 25 to 30 years ahead (including the one presented in thischapter) is full of uncertainties on both the demand- and the supply side. The fact thatmany pessinistic predictions of the 1970's have not come true should not lead tocomplacency. What was predicted for 1990 (without coming true) may we[l happen in2010 unless a clear policy direction emerges now and corresponding actions are takenwith reference to two -rme frames:
e Analysis of future land use along the lines sketched above, focusing on anintermediate time horizon of say ten years hence (2005) and disaggregating the database. Since a projection for a shorter period is subject to fewer uncertainties, theresults can be more readily interpreted against the existing known operationalenvironment.
* Reforms that are clearly necessary regardless of the physical dimensions of futuredevelopments, and that should be undertaken now. They cover a broad spectrum oftraditional energy sector activities, some of which are already underway. Thefollowing Chapter IV examines the options and priorities.

47
IV. TOWADS IMPROVED SECTOR MANAGEMENT
4.1 Options for Interventions
a. Non-Price Demand Management
1. One of the earliest interventions in the traditional energy sector was the effort toslow down demand for fuelwood by development and promotion of improvedwoodstoves. In tracing this development over time, a recent publication" distinguishes apattern of three project generations: The very first group, dating back to the 1960's anddesignated as the 'classical" phase, aimed at improving the living conditions of the poorestpeople and emphasized socio-economic and health aspects. The second group evolved inthe 1970's under the impetus of the petroleum pricing crises and, appropriately, it isdesignated as the 'energy" phase. The work of this period has a strong technologicalorientation and features quite definite quantitative dissemination targe.s, to be achievedwith the inputs of energy-oriented experts. The third generation, taking off in the 1980's,combines the socio-economic and technical experience of earlier days; it builds on abroader base of local support organizations, the dissemination targets are less rigid, andother objectives are added, like improvement of living and working conditions forhousewives and development of artisanal stove fabrication facilities.
2. A thematic study of the five RPTES countries"9 has examined the work in the fieldsince the early 1980's, thus covering effectively the second and third phases of thedevelopment sketched above. Altogether, the consultant reviewed nine projectsrepresenting an expenditure of$ 10-12 million, virtually all financed by external aid. Morefuel-efficient woodstoves were developed and tested overseas and locally, and foreign aidfinanced local manufacture, promotion and trining for the users through Governmentsand pnvate (NGO) counterpart or ons.
3. The basic technology of improved stoves comprises two elements: Shielding thefire and improving the heat transfer between fire and pan. In the Sahel, CILSS wasinstranental in recommending the cylindrical metal stove (the "Ouaga metallique") forurban use and the improved three-stone clay stove ("Trois pierres ameliorees" or 3PA) forrural use20. Owing to the CILSS initiative, the setup and organization of improved stoveprojects was very similar among the member countries. However, at first sight the resultsare not encouraging. Contrary to expectations, the fuel savings of 30 % and more found inlaboratory tests were never realized on the ground. For example, in Niger, which appearsto have the best monitoring systm, the savings in the field are estimated at only 7%
18FocuS Kitchen Design - A Study of Housing in Hanoi", Maria Nystrom. Lund University 1994.
9 'Review of lbproved Stove and Fuel Substitution Projects", BTG Biomass Technology Group, Univcrsitn ofTwcnte, Enschede, The Netherlands, October 1994.
2 oThr CILSSIENIFSTD international Seminar on Research and Dissemination Stratcgics of improved Stoves for theSahel Region", CUSS, Ouagadougou, November 1954.

48
relative to the traditional metal stove (the "Malgache") in use in urban areas2 Initial stovepenetration rates appeared encouraging, but the replacement rate has been consistentlylow and often acceptance dropped drastically after foreign project financing wasexhausted.
4. The low savings rate, if representative, would go a long way to explain whyimproved stoves find no universal consumer acceptance. There is little hard evidence toexplain the discrepancy between controlled laboratory tests and field observations. BTGconcluded that a large part of the problem stems from inadequate disseminationtechniques. Contrary to kerosene and LPG stoves, improved woodstoves whle in usecannot be left unattended for a long time; therefore, it is essential that users learn propertechniques to realize fuel savings. Besides insufficient trairing of the users, conditions inthe woodfuel markets must have contributed to the low success rate of stove projects.Fuelwood prices have remained rather stable over the years or even declined in real terms.If the perceived energy savings mean little in terms of money, there is not much of anincentive to buy or replace an improved stove.
S. On the other hand, field verification tests that consider only the final woodfuelconsumption of the household, miss out on positive changes in consumer behavior thatmay result from the introduction of an improved stove. If households use a better kitchenappliance, part of the fuel savings may be used up by more diverse or frequent cooking,and such a benefit is not readily evident from the tests. Furthermore, cleaner kitchens andless smoke should definitely be counted as a health benefit. Finally, improved woodstovesare for households the first step on the fuel ladder towards modem cooking appliances andmodem fuels. This benefit, although it can be valued only qualitatively, should not beunderestimated.
6. Based on the facts available so far, three conclusions emerge: (I) Improved stovesperform a useful social function in African households; (2) since the demonstrated netenergy savings are small, stove promotion work cannot be a high priority for energyagencies with their limited resources; and (3) given the importance of the socialdimensions, stove development and disseniination may be more efficiently handled byother organizations such as government departments of social affairs, women's groups,NGO's and commercial groups of artisans and vendors. In summary, future demandmanagement should reflect, at both technical and institutional levels, the evolution from astrongly technological, efficiency-oriented approach to welfare improvement in thebroader sense.
b. Demand Substitution
7. Public concerns about the threat to the forests, mentioned in Section 2.2.b,provided the stimulus to several programs aimed at promoting the substitution of LiquidPetroleum Gas (LPG) and kerosene for woodfuels. Given the almost total dependence of
21 'Enqu&te CDnsommations Energies Donmestiques a Nianry"Projet Energie, jum 1993.

49
the Sahel on imports for petroleum fuels, there are balance of payments implications thatat some point must be considered. However, in the short and medium term, the moreimmediate problem has been (and still is) the identification of a substitute fuel that wouldbe both acceptable and affordable to a broad segment of the household sector as the maincooking fuel. Thlis qualification is most important because - except in case of sudden majorprice changes - households do not abruptly switch fuels. Rather they tend to diversify fueluses via the purchase of new kitchen appliances and gradually, as a function of householdincome and changing cooking habits, a new fuel may take over the dominant role in theenergy budget.
8. This process is illustrated in Figure 4-1, which is based on results of a householdenergy survey in S6n6gal conducted in 199222. The analysis depicts the energyconsumption levels of seven categories of households on several levels of the familiar "fuelladder", from the all-fuelwood household to the all-LPG household. Along the ladder, thetotal primary energy consumed per household and per day is seen to decrease fromalmost 160 MJ to less than 30 MJ, owing to the progressive increase of stove efficiencies,from 10 % for the three-stone fire to 60 % for the LPG stove. In terms of useful (end-use)energy, the trend is quite different: Energy use tends to increase or remain stable as thehousehold diversifies amnong several fuels, and it drops rather abruptly as the householdreaches the point of using a new single fuel (charcoal, in stage 4, and next LPG, in stage7). Interestingly, at the end of the process the useful energy consumed is about the sameas in the beginning.
9. These findings have important implications for substitution policies. The points onthe fuel ladder, although taken from a cross section, are also indicative of the trends ofhousehold choices over time. For example, a household in the charcoal-wood group of thesample (point 3) will at some future date have moved into the LPG-charcoal group (point6). The results illustrate that the first stage of substiution is diversification. Althoughabrupt changes in fuel availability and prices could produce different household behavior,the indications are that normally the promotion of new fuels does not necessarily producerapid energy savings. The experience with substitution programs in the Sahel confirinsthis conclusion.
10. With regard to acceptability, there is no question that LPG (butane) is preferred asa fuel, and initial fears of explosions can be overcome with proper supervision of bottlingoperations and customer education. Furthermore, the use of LPG in commercialestablishments acts as demonstration process. However, at flee market prices it is also themost costly option when the costs of gas stoves and bottles is added to the fuel cost. LPGfor use as the main cooking fuel tends to be purchased only by higher income households,whereas for lower income groups it is initially a secondary fuel for limited uses.
2, Sourwc: LVbscratoire des combustibles domesciques. No. 2. fvier 1993.

Usetul MJi4HoadIday Total MJHIldfday
(A N Mt 0 tl 0 0 0 C0 0o en o u o gn o o o o o o~~~~ C2 3 C cm a Co O3 O
Wood W . . . . Wood . . . . I . . .
Wood- Wood-
Charcoal c Charcoal
Charcoal- m Charcoal- rnWood Wood a
a0n/no .
*Chwcul ! a Charcoal -
* 3~~~~~~~~~~m CharcoalO Charcoal-
$ P
LPG- _ PGr- Charcoal Charcoal/
__ ALP

5)
11. It is instructive to examine the experience with the butane promotion program inthe nine CILSS countries, implemented between 1989 and the end of 1993 with EECfinancing (ECU 8.26 million). The development objective of the program was tocontribute to the efforts being deployed to combat desertification by initiating a drive tosubstitute LPG for woodfuels. In terms of direct quantitative targets, the program aimedat raising the LPG consumption level in the nine countries from 27,000 tons in 1987 to66,000 tons in 1992 and to 92,000 tons by the year 1996, in the expectation that theadditional consumption would displace 673,000 tons of wood (7.5 tons of wood per tonof LPG). Although the LPG consumption in 1992 almost reached the planned levels(65,278 against 66,000 tons), the donor decided to discontinue the program afterreceiving the findings of an external evaluation mission3, which not only focused onperformance during the implementation, but also exanned retroacively the basicobjectives.
12. The evaluation revealed that over 90% of the total LPG consumption achieved in1992 was concentrated in three countries (Senegal, Maurtania and Cabo Verde) with so-caled confirmed LPG markets, and where substitution efforts sted well before theregional program was introduced. It is most likely that the 1992 level of conseumptionwould have been achieved even in the absence of the intervention. Furthermore, theevaluation pointed out that "subsidies were generaLly not well targeted and have benefitedwithout distinction established consumers, wealthy households and even hotels? (SEEDpage 28). The individual country programs also lacked coherence as in most cases theywere not integrated into an overall national energy strategy.
13. It appears that the program had little impact on the levels of woodfuelconsumption, and even less on counteracting desertification. The evaluation reportestimated that only less than a third of the targeted amount of wood may have been savedby the additional LPG consumption because of multiple use of fuels and the gradual natureof the substitution process. Clearly, the substitution estimates adopted by the LPGprogram, which led to an expected 50%/o internal rate of return, were too optimistic evenin a country like Senegal with a Icng tradition of inter-fuel substitution efforts. Thesefindings are an independent confirmation of the trends illustrated in Figure 4-1.Furthermore, supply logistics, equipm. ent constraints and the reported rather passive roleof the LPG suppliers hampered the implementation. Under these circumstances it was tooambitious to aim at achieving comprehensive fiscal and forest policy reforms, and atmaking LPG more competitive than woodfiel within the three year duration of theprogram.
14. Table 4-1 summarizes available data on quantities and prices in the RPTEScountries. Sen6gal leads with the highest per capita urban consumption, followed by TheGambia. The higher levels for the coastal countries are probably related to urbanization
23 Evaluation du Trogranune Regional Gaz Butane dans lcs Pays du CILSS., SEED, avril 1994.
2 It should be noted that in the largest mwaket (Sinigal), the programrnme commenced in 1990 and did not provideany new mncentives at the level of retail prices that could have influencd consumr behavior.

52
rates, household incomes and to some extent the size of the expatriate community. Thethree landlocked countries are handicapped by high transportation costs, and especiany inNiger and Mali the LPG consumption has remained very low.
15. The retail prices in Senegal, Burkina Faso and Mali are subsidized; the price inNiger was the same as in Mali until the FCFA devaluation in January 1994, whichprompted the Govenment of Niger to discontinue their subsidy. As a result, prices acrossthe fiancophone RPTES countries now range from about $ 320/ton in Senegal (for 3- and6 kg bottles) to about S goo/ton in Niger. Burldna Faso and Mali are at an intermediateprice level of $ 650/ton (for 2.6 kg bottles). Gambia practices free market pricing,resulting also in a level of $ 650/ton. However, it is estimated that the market price inGambia could be reduced to perhaps S 520 by building suitable storage ficilities .
16. The effectiveness and desirability of subsidies remain points of contention amongthe experts. In Sen6gal, with an LPG market that appears to approach 50,000 tons peryear, the issue is most significant. Consumption of subsidized LPG increased graduallysince 1974, and accelerated sharply in 1987 when the controlled price was reducedsignificantly. Growth between 1987 and 1992 averaged 17 % per year and appears to haveleveled off to about 10 %, which is stll well above average growth of household energyconsumption. In addition to subsidization, relative pricing plays a role: In mid-1994, thecontrolled retail price in Senegal had increased only 30 /%, whereas the actua price ofcharcoal went up by 80 % (see Table 2-7).
17. The burden imposed on the Senegalese economy can be estimated roughly bycomparing the subsidized price in Senegal ($3201ton) with the estimated free market pricein Gambia ($520/ton) indicating a subsidy to small consumers of about $ 200/tonTherefore, the current subsidy cost to Sdn6gal is of the order of $ 10 million per yearDisplacing all present urban charcoal consumption of about 300,000 tons by LPG wouldrequire at least another 50,000 tons of LPG, and thus potentially double the subsidy to S20 million per year. Keeping down the consumer price in the land-locked countries likeMali and Burkina Faso would cost even more in proportion to the size of their economiesThese costs are not necessarily visible items on the Government budget; within a systemof administered prices of petroleum products they could be cross-subsidies financed byother users (electric utilities, industry and transporters) and thus increase the cost ofproduction elsewhere in the economy. Whether the financing channels are direct orindirect, it is a debatable use of public fimds that tends to benefit groups that were nottargeted and, as seen in the evaluation of the Regional Program, subsidies do notnecessarily attain rapid displacement of woodfuels.
18. In Gambia, the free market retail price for small bottles (D6.71kg) is equivalent toabout FCFA 350/kg, or almost double the current price in Seinigal (FCFA 158/kg) Theprice difference suggests that overland imports from Sen6gal could account for asignificant share of consumption in the Greater Banjul Area. Although charcoal is availablein that market, the official ban on its manufacture and trading may also have stimulatedhigher LPG consumption.

53
19. In summary, LPG seems to find the widest acceptance in the maritime countries,with or without govermnent intervention. In the interior, mass acceptance is unlikelyurness prices come down, and subsidies appear fiscally unsustainable, a conclusion alreadyreached by Niger. One logical improvement over the present situation would be thecoordination of procurement, transport and storage among Burldna Faso, Mali and Niger.The idea is not new but has not been vigorously pursued either.
20. Kerosene is well-known and used widely as a lighting fuel wherever there is noelectricity. Kerosene stoves cost less than gas stoves, the fuel is less expensive than LPGand it can be bought in small quantities; therefore the "kerosene solution" ought to bemore affordable to a large part of the population. In Niger, the RPTES country with thehighest transportation costs for LPG, kerosene has been systematically promoted. Despiteconsiderable publicity, LPG has a higher penetration rate than kerosene used for cookdngpurposes. In 1992, 6% of the households in Niamey were found to use LPG (along withwood) to cook whereas, only 3% used kerosene (along with wood)5. Assumniing thathouseholds equipped with improved stoves are more amenable to the use of kerosene thanhouseholds using traditional stoves, the substitution would reduce the wood consumptionby merely 2 to 4% at the early stages. Nevertheless, when kerosene is used as principalfuel one liter displaces on average 3 kg of wood and, in the aggregate, kerosene couldreduce fuelwood consumption by 60%o.
21. Besides continuing experimentation wi the kerosene and LPG alternatives,Niger has introduced domestic carbonized coal in the Arlit-Agadez region. Under theRPTES, a special study was commissioned to review the present status of the project andthe perspectives for its continuation.2? Thus far, it has been established that the product istechnically proven and well tied in the one thousand households and several commercialestablishments that use it regularly. The economics of mass production and long-distancetransportation need more investigation. In parallel, as soon as security conditions pernit,the exploration of coal closer to Niamey (roughy on the axis Tahoua-Filingu6) should beresumed.
c. Promotion of sustainable Supply
22. Interventions on the supply side have gone through their own evolution. Theconcems in the late 1970's and early 1980's led to experiments with fiuelwood plantationson State land, but the Sahel fared no better than many other areas of Africa. Both plantingand maintenance turned out to be so expensive that no large-scale follow-up is envisaged(an example is the Gonz6 plantation East of Ouagadougou, descnibed in the RPTESCountry Report on Burkina Faso). However, success or fifilure canfiot be separated fromthe choice of the plantation sites. Good land has its opportunity cost in agricultural uses,
2s "Entque Consommations Energies Dmnestiques & Niame" Projet Energic II. juin 1993.
-'Review of the Niger Coal Carboniion Projec- RPTES- Erkli Korpijaakko October 1994-

54
and if consequently, marginal land is selected to plant trees one can hardly expect ahighly performing project.
23. Furthermore, it should be noted that the economics of tree plantations couldchange significantly if future timber needs are taken into account. Experience elsewhere inthe world (e.g. Pakistan) shows that some tree species at maturity produce 50%o timber(having a value of over S 300 per ton in world markets) and 50% fuelwood (in the Sahelworth $ 5-15 per ton on the roadside). Trees for timber take longer to grow but it isobvious that including timber as a plantation product would change revenues by an orderof magnitude, even after discounting future earnings over the waiting time for trees togrow to maturity. Of course, for private sector operators (including rural populations) itwould be essential first to settle the land tenure issues.
Table 4-1Markets and Price Structure for Petroleum Fuels
Country S6nlu Gambia Burkina Manl Niger
LPG
Consumption in 1992 (tons) 42.000 1860 2950 1440 670
Urban consumption.0Wgpp./yr) 12.0 4.6 1.4 0.7 0.5
CIF Port orEnty 96t162 100/203 122 79Transpot to Border 36
CIP Border 213 158 130
Duties,levies. domestic tansport 85/l38 98
Wholesale price 181300 222 172
Retail Price per kg 121/158 D 6.7 250312 240J320 240/410
Kerosene
Retail Price per liner 225 D 3.27 1601 225 100-130/200
Notes: (1) Exchange rates FCFA: Before January 1994 275/USSAfter " 1994 547/US
D 9.l = SUS 1.00(2) Bold-face numbars ae post-devaluation prices in mid-1994 (except Mali - January 1995)
24. Agroforestry has proven to be a viable option in other parts of Africa. It has notyet been as widely promoted and accepted in the Sahel but, as shown in Section 2.2.d,there is a growing body of encouraging information on its potential. The present andpotential agroforestry contribution in the biomass energy balance should definitely betaken into account in future evaluations.

55
25. Meanwhile, beter management of the existing forests offers the best near-tennprospects of securing sustainable supplies of fuelwood. Coincidentally, many experimentalprojects started up at the same time as the drive for administive decetralization. Thescale of the environmental problemn of forestry mnagement and the limited resources ofthe public sector suggest that broad particpation of the rural population wIll be a decisivefactor in the ultimate solution. In its most elementary form, participation means thatsubsistence farmers can earn cash from controlled exploitation of nearby forests, whichwould mean the beginning of monetization of the economy in impoverished rural areas andthus provide some financial resources for further developments.
26. The national RPTES teams have examined and compared the most interestingexamples in the five-coundry group. Case studies are found in the RPTES Workshop nIProceedings for Nazinon (Burkina Faso), Kita (Mali) and Tientiergou (Niger). Althoughthey follow certain common principles, the examples also illustrate the latitude fordifferent ways of organizing and managing such schemes. In Mali and Burkina Faso theywere started at a time that new forestry legislation was being prepared. In The Gambiaand in Niger, regulation has opened the door for community-based fuelwood supplyprojects, and the experience gained is expected to help in the formulation of futurelegislation. These country situations illustrate that, to multiply successfil pilot projects, itis necessary either to have a well-defined new legal framework or to have the flexibility tolaunch experiments until the legal framework can be adjusted to a new situation that hasbeen found viable. Whichever route is followed, it is important at this stage to lookforward to the institutional fiamework of the future as it develops in several countries(see Section 4.2.a), and to incorporate the lessons learned everywhere in action plans. Inthe meantime, it is essential that the rights of villagers already involved in ongoing projectsbe protected under long-tenm contracts with the central or regional authorities.
d. Priorities for Action
27. Any one of the three options outlined above (demand-side-, substitution- andsupply-side interventions) requires close cooperation of public- and private sector agents.In weighing the merits of each potential action. the limitations of the public sector shouldbe clearly recognized. Public sector resources are scarce; therefore, unless policy isfocused, much human effort and resources can be dissipated on legislation, fiscalmeasures, reorganization of institutions and law enforcement serving different orcontradictory objectives.
28. As illustrated in Chapter III. future demand for traditional fuels will be drivenmainly by population growth and the resulting urban demand. At the same time, ruraldemand by itself will eventually become so large that one can expect increased conflictsabout access to and use of the natural resource base. Given sufficient time, economic
'7 Notablv the initiatives of CILSS and the Club de Sahle. through the conrereces orStgou (I 989) and Cabo Verde(1994) on land tenure and decentralization

56
growth may produce rising household incomes, first of all in the cities, and thus providethe means to replace fuelwood and charcoal by modem fuels. Once the urban demand fortraditional fuel stabilizes and then declines, the risk of conflict wil gradually diminish.
29. However, within any short- to medium time frame, neither population growth noreconomic growth are variables that governments can control effectively. Consequently,there is no guarantee that there will indeed be sufficient time to reach a gradualequilibrium of biomass demand and supply without major social struggles between urbanand rural interest groups and without the risk of considerable environmental damage.
30. Viewed from this perspective, the priorities for government action in the RPTEScountries become clearer. As illustrated in Section 4.1.a, non-price demand interventions(essentially improved stoves) are helpful, but are not likely to reduce the pressure onnatural biomass resources significantly in the face of growing demand. Substitution (seeSection 4.1.b) is driven essentially by growth of household incomes, and the existing weakeconomies do not have the fiscal means to accelerate this process by subsidies of fuelsand equipment. The third option, promotion of sustainable supply (see Section 4.1 .c) hasemerged as offering the best prospect to attain, if not a solution, at least a rapidimprovement. This option also entails the most complex issues. Whereas the prevailingdemand interventions and substitution measures are to a large extent technically orientedand applied in an urban context, policies for sustainable supply are interwoven with theeconomic, social and political dimensions of rural development. Nevertheless, sinceactions in this area deal with the core problem of urban-rural relations, they are morelikely to bring lasting benefits.
4.2 Implementation Tools for Supoly-side Actions
a. Forest Management
a. I Forestry Legislation in Retrospect
31. The four francophone RPTES countries share the colonial heritage of French WestAfrica, under which the first property and forestry dispositions were legislated. Followingthe model of the French Code Civil, the colonial administration decreed in 1904 that alllands vacant and without master belonged to the State. In 1906 a system of registration ofoccupied lands was put into effect, thus introducing private property in West Africa. Thislegislation appears to be at the root of the erosion of indigenous systems of land tenureand forest management that in later years became a source of conflict.
32 A succession of forestry codes has limited the rights of the indigenous populationto exploitation for subsistence uses only. The simplest code, dating from 1900, gave theright to usufruct of the forests to the local populations while requiring permits forcommercial exploitation of all forest products. The code of 1935 extended State

57
ownership and control over forests and forestry products and outlined limited non-commercial usufructuary rights for indigenous populations. Commercial rights werereserved for urban merchants.
33. After Independence, national legislatiorn in the four countries began to diverge butmany common elements were preserved. Virtually all land was nationalized and theforested domain put under control of the para-military forestry departnents. In Senegalthe economic power of urban commercial interests and the police powers of the forestryservices combined to establish an oligopolistic structure in the charcoal industry. In Malithe outcome was a confrontation between forestry senrices and rural populations in 1991that spelled the end of repression but it also meant the suspension of any environmentalprotection of the forests unless it was voluntarily accepted by the villagers.
34. Gambian forestry legislation developed quite different from the surroundingfrancophone countries. In 1950, the Gambian Forestry Service was established under theMinistry of Agriculture. The service concentrated initially on the establishment of ForestParks or reserves which at present comprise only three percent of the national territory;outside these areas, much of the forest land is rather dense secondary growth. AfterIndependence in 1965, the Service received new powers extending beyond the forestryreserves, including the administration of permits for timber exploitation and charcoalmanufacture, and prevention of bush fires.
35. In 1976, the Forestry Service was upgraded to a Department within the Ministry ofNatural Resources and the Environment, and its responsibilities were spelled out in theForestry Act of 1977 and the Forestry Regulations of 1978. Under the Act, all forestproducts, including the trees, are State property. Any party other than the Governmentcan only have tenure of trees if they are the product of the claimants' labor.
36. Govermment has taken several measures to protect Gambia's forests. Under the1977/78 Regulations, only deadwood may be collected for ftuelwood supply; the felling ofgreen trees is allowed only for timber harvesting and requires a permit. Furthermore, afterthe Banjul Declaration of 1980, Government banned the manufacture and trading ofcharcoal.
37. Traditionally, and in contrast with the francophone countries, the GambianForestry Department has enjoyed reasonably good relations with the nrral population.However, rapid population growth results in increasing pressure on the natural resources,and their protection poses many problems for the small number of foresters. The ban oncharcoal manufacturing appears to be widely respected, but the ban on felling live trees toobtain ftuelwood has induced people to kill trees first, among others by deliberatelystarting bushfires.

58
a.2 Elements of Legislative Reform
38. At the end of the 1980's, the trend to more pluralistic societies and the clamor fordecentralization resulted in revision of forestry codes and regulations ("Decretsd'application'), among others to make room for mnanagement of natural resources by thelocal communities. Senegal and Mali have adopted new forestry codes, Gambia has anadvanced draft, in Burkina Faso the code is under study, and Niger is examining forestlegislation in the context of a broader "Code Rural'. Within the framework of the RPTESreview, a thematic study has been completed and documented in a Regional Report onforestry policy (covering all firve countries), and supported by two country reportsanalyzing in detail the situations in Sen6gal and in Mali2n.
39. The legislative changes in Senigal and Mali are not as extensive and unambiguousas would be desirable. The State retains many of its former powers and the law, instead ofconferring rights on the local communities, provides merely the option for the State totransfer responsibility to the local communities. Consequently, processes remain undefinedand legal recourse is not really applicable if no clearly defined rights are at stake.
40. With respect to the productive activities in the sector, the key questions areownership and access to the forest resources. In the francophone countries, the State asowner of all the land has set aside forest reserves ("forets classees"), but the rest of theforest lands ("for&s prot6gees") are also under State supervision. National parks willcontinue to be a direct State responsibility, on the other hand, the "Forets Protegees" arecentral to a solution involving the local communities. If they are allocated to ruralpopulations, the road is open to decentralized management of the natural resource, tolocal decision-making on woodfuiels production and marketing, and to a transfer of thefinancial benefits of woodfuel and charcoal production from urban merchant oligopolies tothe communities that traditionally were associated with the forest resources.
41 It should be recognized that the implementation of these principles at legislativeand executive levels is confronted with many issues that are far from having been resolved,for example:
* How is the "local community" defined? (Is it the village, or a group of villages, andhow do they relate to existing administrative entities?)
2t Tlis RYrES thematic study was done by Jessc Ribot. Centaer for Population and Development Studies of HarvardUniversity; tie results were presented under the following titles:
a) Local Forest Control in Burkina Faso, Mali, Niger, Senega and The Gambia: A Review and Cntiquc of nc%%participatory Policies, Januiary 1995.
b) Local Forest Access Control in Sencgal: Touards participatory Forestr Policies. Januar% 1995
c) Forestry Sector Policn Report - Mali, January 1995.

59
* How is the right to exploit the forests linked to usufiuct rights? (In Niger onlycommunities with traditional usufiuct rights receive the right to commercialexploitation through the establishment of nrual markets ('Marchds Ruraux").
* Who represents the local community? Locally elected representatives, offshoots ofpolitical parties, traditional chiefs, or a combination? (In Gambia and Burkina Fasothe prerogatives of traditional authorities are recognized).
* Does the State confer permanent rights or only temporary privileges that can berevoked at wUl?
* How are the costs and benefits of forest exploitation shared and administered?
* What are the respective roles of the State agencies (notably the Forestry Service)and of the communities with regard to law enforcement and resource protection?
42. Most of the woodfuel produced by organized rural communities is destined fc-urban markets. The establishment of a new trading channel opens up further questionsfor the legislator:
* How can communities be protected from unfair competition by merchants gettingtheir supplies from unprotected areas at lower costs?
* What should be done to end woodfuel seling activities by Government agents? (e.g.Forestry Services exploiting forestry reserves for their own account, or army unitsthat have transfonned temporary mterventions into a permanent presence in thesector)
* Should woodfiuel transportation be left to competing private interests or deliberatelyorganized?
* Should rural communities be encouraged to sell directly in urban markets byorganizing their own transportation and access to retail outlets? In other words,should vertical integration of the newcomers in the market be promoted?
43 The thematic study referred to above (footnote 28) examines the progress made onthese issues in all five RPTES countries. The overall impression is mixed: Often new ideasare introduced but not corsistently incorporated in legislation and regulation. However,since the application of the existing laws left much to be desired, it should be expected thatnew provisions will also go through a period of trial and error, followed by morelegislative adaptations. In the immediate future, the most practical approach is to make thebest of the reforms already approved, taking advantage of any flexibility left by the newlaws and using the discretionaTy powers of "Decrets d'application0 to compensate forshortcomings. Where no legislation has been enacted yet (Gambia, Niger, Burkina Faso),

60
there is still time to take advantage of the lessons learnt elsewhere. In summary, theRPTES recommends to put reforms to the test by beginning or continuing the transfer ofresponsibility for forest management to the local communities. The resulting operationalschemes should become part of a leaming process that eventually will produce a viablelegislative and fiscal regime.
a.3 The Forestry Management Plan
44. The most important instrument to bring forests under local management is themanagement plan, in effect a contract between the local community and the nationalforesty service. The management plan is a document that is designed to ensure protectionand sustainable production of a particular tract of forest allocated to the community. Themain provisions should cover the fbllowing aspects:
* Ecological protection (limited access, rotation plan, annual production ceilings)
* Mutual obligations of public authorities and the villagers (extension support,supervision, maintenance, fire fighting, self-policing)
e An administrative structure including appropriate financial incentives (cost recovery,reserve finds, profit sharing)
* Provisions to ensure financial self-sufficiency of the project after the start-up phase
* Relations with transporters and merchants
* A management structure representative of the community (mcluding women'sinterests)
45. The experience with schemes already in operation shows the importance offinancial provisions in the management plan. They have a direct bearing on incentives toparticipate, on the degree of complexity of the administration, the extent of controls and inthe longer run on the evolution of local government with a certain fiscal autonomy.Section 4.2.b examines these issues in more detail.
a.4 The Charcoal Issue
46. In the literature on traditional energy, charcoal as a household fuel is viewed as apositive step on the energy ladder from smoky, bulky fuels towards a more convenientproduct, better adapted to urban use and the last step in a transition to modern fuels. Froma resource use standpoint, the high transfonnation losses in charcoal manufacture make itan inefficient fuel. Large-scale changeover from fulelwood to charcoal, as has occurred inSenegal, can only accelerate the demand for primary woodfuels. The high growth rates inprojected urban demand (see Table 3-3) illustrate this phenomenon.

61
47. As noted in Section 2.4, it is an open question if the consumer preference forcharcoal can be stopped if there are no affordable altematives. However, from thesuppliers side the economics of delivery of energy to the end user enters the picture. Theuseful energy delivered by charcoal, after allowing for different stove efaicincies, is aboutthree times that of fuelwood, which implies that at some point the inefficiency ofconversion in the charcoal production stage is offset by lower transportation costs. Thisknown general conclusion is corroborated by analysis of available data for the RPTEScountries.
48. The results are graphically illustrated in Figure 4-2. Reported production costs atsite were combined with estimates of fixed- and variable truck transportation costs toobtain the cost of delivered energy per Megajoule as a finction of distance. Productioncosts at site plus fixed transportation costs are higher for charcoal, but incrementaltransportation costs are substantially lower due to the higher heat content per kg ofcnarcoal. The comparison for S6negal is complicated by the fact that the fuelwood marketin Dakar-Thies has been practically overtaken by charcoal. Therefore the comparison isbased on woodfuel prices in The Gambia (which in any case differ little from those in theFCFA zone outside Dakar and could be taken as a proxy for the price of fuelwood fromTambacounda) and charcoal prices in Senegal before and after devaluation. The results inFigure 4-2 show that the break-even distance moved from 200 km before devaluation to360 km amter devaluation. Since the change of FCFA parity is comparable to a taxincrease, the graph also illustrates the potential effect of fiscal policy on the economics ofcharcoal supply. It should be noted though, that the price increase shown in Figure 4-2reflects a large increase in private profits while the tax on charcoal did not change.
49. Although the quality of the data base does not suggest any great accuracy, theorders of magnitude for transportation distances are the same as those observed inpractice. Charcoal is transported over large distances (400-500 km in Senegal, 500 kIn inSudan, over 300 kan in Ethiopia), which seems to confirm that the analysis explainsprivate entrepreneurial behavior. The implication is that, if markets in Bamako andOuagadougou were to fbllow the trend in Daklar, charcoal manufacture in remote areas ofMali and Burkina Faso could quickly develop in tandem with expansion of agriculture andthe highway infiastructure. Although this conclusion is tentative, it would be prudent toanticipate such developments and attempt to guide the industry before uncontrolleddevelopment does substantial damage to the forests
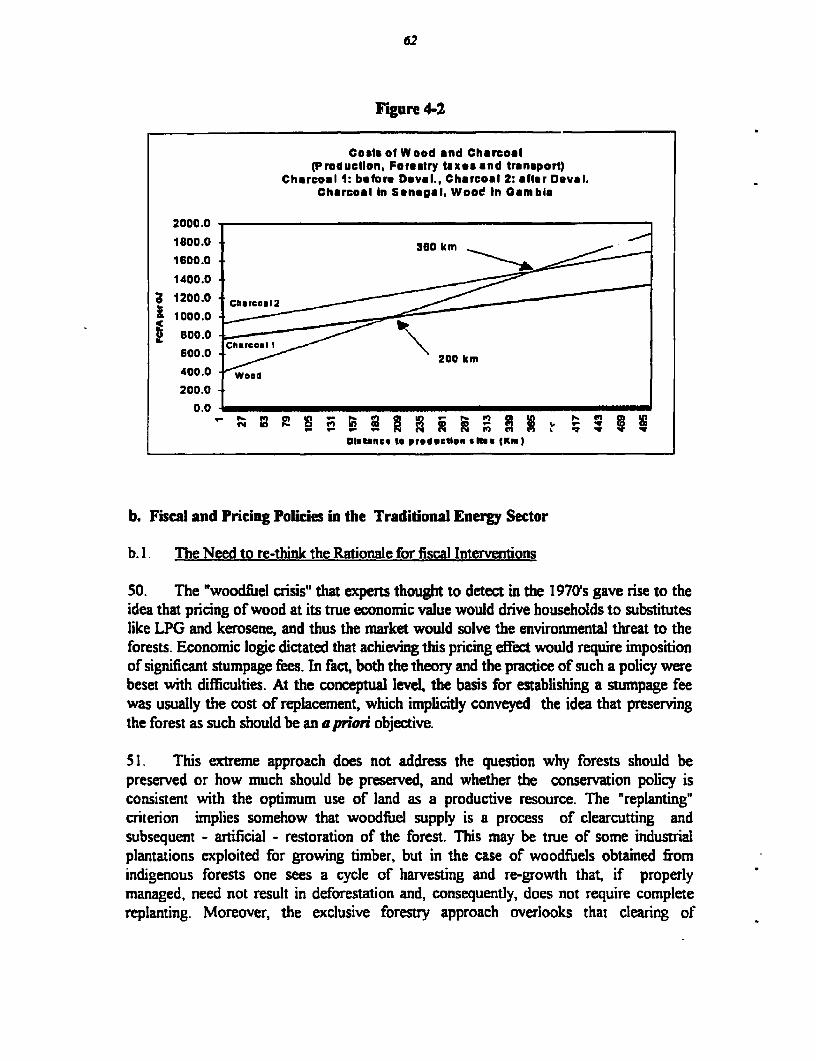
62
Figure 4-2
Coats of Wood and Charcoal(Production, Forestry taxes and transport)
Charcoal 1: before Deval., Chercoal 2: after Deval.Charcoal In Senegal, Wood In Cambis
2000.01800.0 380 km1600.01400.01200.0 Chrca12 __
E1000 0 -800.0
600.0 ~ ~ ~ ~ ~ ~~00k400.0 Word
200.00.0
DiEtanee e pr.dt"elign $temn fkm)
b. Fiscal and Pricing Policies in the Traditional Energy Sector
b. 1. The Need to re-think the Rationale for fiscal Interventions
50. The "woodfuel crisis" that experts thought to detect in the 1970's gave rise to theidea that pricing of wood at its true economic value would drive households to substituteslike LPG and kerosene, and thus the market would solve the environmental threat to theforests. Economic logic dictated that achieving this pricing effect would require impositionof significant stumpage fees. In fact, both the theory and the practice of such a policy werebeset with difficulties. At the conceptual level, the basis for establishing a stumpage feewas usually the cost of replacement, which implicitly conveyed the idea that preservingthe forest as such should be an a prion objective.
51. This extreme approach does not address the question why forests should bepreserved or how much should be preserved, and whether the conservation policy isconsistent with the optimum use of land as a productive resource. The 'replanting"criterion implies somehow that woodfuel supply is a process of clearcutting andsubsequent - artificial - restoration of the forest. This may be true of some industrialplantations exploited for growing timber, but in the case of woodfuels obtained fromindigenous forests one sees a cycle of harvesting and re-growth that, if properlymanaged, need not result in deforestation and, consequently, does not require completereplanting. Moreover, the exclusive forestry approach overlooks that clearing of

63
agricultural land puts extra supplies on the market and the productive capacity of openwoodlands and fallows has been consistently underestimated.
52. Because of the high investment cost in reforestation, the "replanting" criterionresults in very high stumpage fies. Govemrnments somewhat reluctantly took the first stepsto increase taxes, often at donor insistence, but they found themselves in a dilemma: In thedeteriorating economy of the late I980 's (especially in the countries of the franc zone)governments did not wish to add to the difficulties of houselholds by raising taxes onwoodfuels, and going too far would entail unacceptable social consequences; on the otherhand the notion took hold that taxes on woodfuel, similar to those in the petroleum sector,could become an important source of public sector revenues. Actually, fiscal policy wasambiguous, woodfuel taxes and -prices remained low, tax collection perfomiance waspoor and the market solution through substitution did not materialize.
53. Furthermore, the trend towards decentralization of forestry management andtowards community participation rzt's new questions concerning the role of the State,the structure of incentives for villagers, transporters and merchants, and the financialmanagenent of the forestry services. In brief, there is an urgent need to re-think thetaxation issue, not narrowly with respect to the appropriate level of taxation, but ratherwith respect to taxation objectives and implementation.
b.2 The fiscal Experience in the Sector
54. After 1986 the (controlled) domestic prices of petroleum products did not followthe drop in international prices because governments, already in severe fiscal difficulties,kept the windfall profits. In this situation of low woodfuiel prices and high-pricedsubstitutes, woodfuel taxation has remained at such a low level that it makes littledifference to consumer behavior. However, in an effbrt to make public forestrymanagement self-financing, it has become common practice of governments to ea: .narkpart or all of the prr-eeds of woodfuel taxation to pay for the forestry service.
55. In the aggregate, revenues from woodfiuels taxation are puny. Table 4-2 comparesfor the RPTES countries the total govermment revenues of domestic origin Ci.e. excludingexternal aid), the estimated amount of collectible taxes and the actual revenue producedThe available country data show that only 5 to 45 % of the theoretical amount is actuallycol!cted, and these sums represent 0.05 to 0.28 % of total government revenues. Thetable also shows that the estimated goverrnent budget outlays for the forestTy senrices areat best (the case of Mali) only 0.7 % of all tax revenues. The budgetary allocations forenergy departments related to woodfuels are negligible because most of their funds aredestined for management of the power and petroleum sectors.
56. Despite its negligible share of total revenues, the forestry tax intake represenms aconsiderable sum of money for the small group of civil servants involved. The paradoxicalresult is that a fiscaI measure of little significance for a country has produced aninstitutional situation of endless complexity. As demonstrated in the thematic study of

64
forestry policy, at every major link of the trading chain there is evidence of tax evasion andcomuption, of earmarked taxes and fines that, in fact, have provided perverse incentivesfor law enforcement by agents of the forestry service, have created credit problems forwoodcutters. and given rise to cumbersome controls. The often fiaudulent records on taxcollection also tend to distort statistics on the woodfiuels trade.
Table 4-2Financial Resources
Country S6n6ga Gambia Burkina Mali Niger
Ref. Year 1992 1992 1992 1992 1993Currency Units FCFA Dalasi FCFA FCFA FCFA
Tota Revenue Collected (109) 293.5 0.767 97.4 100.7 51
Dqartmental Budgs (106)
Foresuy Depament 389.5 1.60 667Energy Deprment - - - 184 -
Taxable Woodfuel Tonnag(l) 2,170 65 472 1.470 220( 103 tons of wood equiv.)
Forestry Revenues (Mlons)
Collectible 2,170 1.365 1,133 955 324Achtally Collected 812.5 0.427 71 47 97
% compliance 45 31 6 5 30Forest revenues as % of total 0.28 0.06 0.07 0.05 0.06
(1) Charcoal included in trms of wood eqwuvaleatSource: RPIES National repts
b.3 The economic Basis for Woodfuel Pricing
57. The most widely used yardstick to measure the replacement cost of woodfuels isthe cost of reforestation. Using this criterion implies that wood harvesting is essentially aclear-cutting operation, after which the stock can only be replaced by replanting,preferably of fast-growing species. Reforestation costs for projects in RPTES countrieshave ranged from $ 250 to as high as $ 900 per hectare. The levelized cost of fuelwood2"
29The sparse liteature on this subject includes a notewonrhy study Tree Plantation Reviewv, by Shll/World WideFederation of Nature. June 1993.

65
in dollars per ton is given below on the assumption of two eight-year harvesting cyclesafter planting and a maintenance cost of S 20 per hectare per year:
Investment Cost (S/ha) Cost of Fuelwood (Sit)for Discount Rates of
10% 15%500 50 70750 70 100
58. These evaluations of replacement cost are multiples of the actual prices toproducers at the roadside as reported in Table 2-7, which range from a maximum of S 15per ton in Burkina Faso to as little as $ 4 per ton in The Gambia Clearly, there is not theslightest private sector incentive to start woodfuel plantations as long as wood iscommercially available in rural areas for essentially the cost of labor.
59. The movement in recent years towards community management of existing forestsshows that many markets still can be supplied by the sustainable yield from managedforests, in which case the replacement cost option of reforestation is no longer relevantbecause forests would be preserved. In that case the production cost of woodfiuels isbetter measured by the cost of maintaining the productive capacity of the resource plus thecost of harvesting. In Burkina Faso the initial cost of bringing natural forests undermanagement (the Nazinon model) runs at about $ 40 per hectare, including all the up-front preparation of management plans. The funds reserved for annual maintenance areequivalent to about $ 1O per hectare. The quoted initial costs for Niger are only about $10/ha under the assumption that the management plan is already available. In bothcountries bhe viDagers engaged in sustainable exploitation charged the transporters a pre-devaluation price (including taxes) of about $ 201ton. Even if these costs increase incoming years to take into account new factors outside the experience of pilot projects, it isdear from the numbers that woodfuel from managed natural forests can be produced atmuch lower costs than woodfuel plantations. Therefore, as long as part or all of thedemand can be met from sustainable yield of the natural resources, the objective shouldbe to supply woodfuels at the lowest possible economic cost; the viability would beassured as long as there is a market segment where woodfuels are perceived to becompetitive.
60. It should be recognized that energy supply is only part of the problem. Ultimately,even if the sustainable woodfiuel yield is not exceeded, the real measure of economic valueof woodfuels is the opportunity cost of the land and labor in alternative uses. Thisquestion defies generalizations because of the many local variables that enter the analysis.Deforestation near urban centers may be quite justified if trees are replaced by high-valueproduce and woodfuels are replaced by imported petroleum products. On the other hand,the growing needs for construction timber and the value of other forest products (wildfruits, medicinal uses, etc.) could favor preservation and expansion of existing stands.

66
Ecological aspects, much more difficult to qutffy but not to be neglected, may tip thejudgmnent one way or the other.
61. Rough calculations have been made of the value of forested land for either low-yield subsistence agriculture ( yielding 0.5 tons/ha of cereals, value $ 180/ton, fallowscycle three years) or woodfuel production (yield 0.6 tons/year). Under theseassumptions the (annualized) opportunity cost of land as measured by food production isabout $ 30 per hectare, whereas the value of the fuelwood production per hectare wouldbe at best $ 10. These orders of magnitude suggest that, without intervention, fiiture landuse will be detemiined by demand for food rather than for bio-energy. Of course, actualchoices are more subtle: Provided that some trees remain on cleared agricultural land,both fiuelwood and food will be grown, seasonality affects production decisions, and adeliberate move towards agroforestry will affect the food/energy trade-offs. However, onbalance it may be expected that population growth and the resulting fbod demand willincrease the pressure on the forests (encroachments) and thus put the developed models ofcommunity management at risk.
62. The opportunity and the need for fiscal interventions should be viewed against thisbackground of resource exploitation and two other salient facts: (1) As can be gleanedfrom Table 2-7, the (pre-devaluation) retail price of fiielwood in the cities was about $ 80per ton, of which three quarters was made up by costs of transport and trading; therefore,the impact of taxes on the production stage becomes very mitigated at the retail level; and(2) At present, the effectiveness of tax collection (see Table 4-2) is so low that thepractical effect on prices and consumer behavior becomes even weaker.
63. Based on the resource costs developed above, there is no poin in taxing fuelwoodanyrwhere between $ 40 and S 60 per ton to bring the price to transporters up to the costof plantation wood, in situations where properly managed natural forests can supplywoodfuels at much lower economic cost. The clearest case for taxation can be made fornon-managed supplies that are underpriced by a margin of $ 10-15 per ton because theyderive from operations that mine the resources rather than presenre them. Longer termpolicies must look beyond these considerations of energy pricing to overall ruraldevelopment and natural resource management. Forest lands cannot be preserved in theface of growing pressure by agriculture unless their value increases vis-a-vis alternativeuses. Future sustainable development will require a hoListic approach to the ruraleconomy, and commnunity-based management for woodfiuel supply should be seen as oneof several options to diversify economic activities.
b.4 Principles of a Policy Alternative
64. The foregoing discussion substantially weakens the case for a wide-ranging largecommodity tax on woodfuels. The need for significant increases is not obvious, and theamount collected is minuscule in comparison to the total national revenue from domesticsources. There is a clear need to re-think the function of woodfuels taxation, starting withsome elementary questions: What should be taxed, who should be taxed, where in the

67
trading chain should any tax be applied, why tax at all? Fiscal measures should be clearlyrelated to the policy objectives set for the traditional energy sector if they are to achievethe desired results. The results of the thematic study on forestry policy (Section 4.2.a)suggest that fiscal policy should be based on the following three principles:
* Support of sustainable energy supply and environmental protection, by responsibleexploitation of the existing natural forests and woodlands;
* Provision of adequate incentives to secure the cooperation of the local ruralpopulations;
* Penalization of non-sustainable exploitation.
65. In all five RPTES countries, legslative and institutional reforms are underway toimplement the first principle. These measures would be aimed at creating a generalizedpolicy enviromnent in which local communities can take over the 'Forts protegees" at arapid pace, under the termis of management contracts.
66. The crux of the implementation problem is the second principle, i.e. the provisionof workable incentives. It is important to recognize that local communities enter the fieldOf WOdfiUel supply as newcomer fcing important, urban-based vested interests. As smaloperators that are neither experienced nor organized, they will need taining, protection,and above al a sense of ownership derived from seeing the benefits remaining in the areaswhere they are generated. The most direct incentive can be provided under the terns ofmanagement contracts stipulaing that proceeds of woodfuel sales accrue as much aspossible to the rural population, with safeguards to ensure proper forestry maintenanceand payment of the woodcutters and other viLlage operators.
67. Maximizing the financial benefits of the viDagers implies that the public sectorshould be most careful in making any prior claims on revenues from woodfuels harvestedunder management contracts. In many countries it has become almost standard policy topay for support and extension (including law enforcement and control) out of salesproceeds; indeed, it has been claimed that these actvities should be filly self-financing.The sector diagnoses of the five countries demonstrate that this policy iscounterproductive and should be abandoned (as has happened in Mali by force of internaland external circumstances).
68. Achieving sustainable management of existing forestry resources is a prioritybeyond doubt. To attain this objective rapidly, the rural populations should be trained forresponsible management, which especially in the initial stages requires support ofextension services. The financing of these services should be viewed in the broader contextof the need for investing in long-term sustainability and the historical imbalance betweengovernment services provided to urban and rural populations. Many authors have arguedover the years that neglect of rural development is at the heart of the economic stagnationof Sub-Saharan Africa. Although fuelwood production seems a small part of this problem

68
compared to agriculture issues, it should be noted that as an additional activity ofsubsistence farmers, fuelwood sales often bring the first cash into a rural community andthus provide a growing basis fo: further development. It is suggested that, as a matter ofnational interest, governments should provide extension services free to the ruralpopulation and finance them out of general revenues. The cost is a small fraction of thefunds spent on public services in urban areas on a non-recovery basis.
69. The question whether woodfuels should be taxed at all should be viewed incoqjunction with the re-structuring of the trading chains. Wherever woodfiuel supplyprojects are started up under village management, they finds themselves in competitionwith established transporters and merchants who are accustomed to getting their suppliesat practically zero cost from non-managed forests. Since environmentally responsibleexploitation has a cost, fuelwood supplied by villagers tends to be more expensive, and thenatural tendency of existing suppliers is to obtain their fuelwood elsewhere. Otherpotential competitors are the forestry services themselves as long as they have the freedomto exploit "Forets classees" for their own account. If these practices force vilagers tolower their pnces, the likely result is lack of money for forest maintenance, and theviability of the management scheme is put in jeopardy.
70. To minimize these risks to the villagers, their projects can be supported by tworelated tools:
e Establishing controls of minimum producer prices on the roadside, via the provisionsof the management contract Such a minimum is necessary simply to ensure thatcosts of woodcutting, maintenance, protection, administration, etc. are covered, andthat a sufficient margin remains for local community development. It is evident thataddition of a tax component would raise the minimum price and make it moredifficult for villagers to compete';
* Taxing production for the sole purpose of supporting the fuelwood prices chargedby local communities that manage natural forests under contract. In practice such ameasure would be implemented by (i) exempting from taxes all operations based onapproved management plans of forestry tracts; and (ii) imposing a significant tax onwoodflbels obtained from non-managed areas.
71. As has been noted under community management schemes, taxation is alreadybecoming more sophisticated by differentiating managed and non-managed supply areas.Although the principle is sound, the effectiveness will depend both on the efficacy of theexisting administration and on the actual differentials in comparison to differences intransportation costs. Niger is farthest advanced in that regard, but it is also recognized thatthe actual differentials are not sufficient to direct transporters to more distant zones.
30 Same African experts argue tat taxation is essetWial to ensure maintenmce of the forest under direction of thentional foestry service. However. if the proceeds of the tax arc used within the commuiity, the difference
wit villagers using their tax-free sales revenue for the same purpose is mostly one of Lernuinologv.

69
Moreover, the administration and control become complex when distinctions must bemade among three classes of supply zones and transportation distances within these zones.
72. The scheme recommended in this report is, in fct, ar. simplified variant ofdifferential taxation. The only criterion for taxation is whether the wood originates frommanaged or non-managed areas. TaNing the wood from ecologically threatened zones wfllserve to protect the minimum selling price from the areas under village management.
73. So far, this discussion has dealt with a tax on production. Some existing schemeslevy a separate transportation tax, or they combine the two. The rationale for a specifictransportation tax is not evident. Why should fielwood transportation be taxed if othercommodities are exempt? All truckers need vehicle permits, they already pay tax on theirfuel and they may pay additional road taxes in the form of toils. Apart from thequestionable principle of a transportation tax on woodfuels, there are severe collectionproblems related to the structure of the trucking industry. If fuelwood transport isspecialized, as in Burkina Faso and Niger, the tax is easier collected. However, wheretransport is accessible to anyone wishing to transport wood as well as other merchandise,a large quantity of fuelwood would escape taxation anyway.
74. Apart from the issue of transportation taxes, the problems of woodfuels transportneed attention for different reasons. As distances to supply areas grow, motorizedtransport in large trucks is taking over from donkey carts and camels. A well-organizedand independent transport industry could be a valuable partner of government in theimplementation of decentralized forest management, by directing the trucks to designatedproduction areas. How relations can be built depends also on the degree of verticalintegration. Where merchants are allies or patrons of the transporters, they are not likelyto shift supply sources without a mix of incentives, sanctions and new competition. Inthese situations, rural producers must carve out a growing market share, whichi they cando only if protected by producer price controls combined with the fiscal measuressuggested above On their part, the villagers should take initiatives by organizingthemselves, by securing their own transport services (either owned or rented) and bygaining direct access to urban markets.
75. The suggested alternative fiscal approach has also implications for lawenforcement. With the right incentives in the management contracts and proper training.the community efforts should be largely self-policing, and in the "Forets prot6g6es" theforestry departments should concentrate on extension services. Since taxation would bereserved for wood from non-managed areas, the logical agency for enforcement would bethe highway police. The shift of taxation from a universal regime to an exception regime islikely to bring an immense simplification of administration and to remove the manyexisting incentives to break the rules for private monetary gain.
76. No scheme is likely to be satisfactory forever. At a later stage of development. thequestion may well arise why prospering rural populations should be tax-exempt Thisreport would argue that at such a stage the govenment could always consider broadenins

70
the base for income taxes. The present risk is that a commodity tax on fuelwood will robthe ural dwellers of an important incentive and thus choke off an opportunity for povertyalleviation and initial rua development.
c. Institutional Adaptation and Management of Change
77. As part of the RPTES Program, the structure and management of the traditionalsector has been examined by one of the thematic studiee3. The need for such a study wasevident from the muti-sectorial nature of the sector and the resulting dispersion ofactivities over several government departments and private sector agents. The principalfindings of the study that are common to the five countries and the comments on regionalactivities are summarized below32.
78. None of the five countries were found to have energy institutions performingadequately in matters Df planning, policy formulation, monitoring of implementation, andequipped with proper analytical tools and information systems. Internal contradictions inenergy policies are seldom analyzed and the work of institutions dealing with the variousenergy subsectors is poorly integrated. Ex post evaluation of the cost-effectiveness ofresources applied in the sector is weak or non-existent. Although nominally the EnergyDepartnents are given the lead role in pricing measures, in practice the ministries chargedwith commerce, economy or finance are in charge and, especially in the traditional energysector, the rules are poorly implemented because the institutions concerned were notinvolved in their formulation.
79. The experience in many countries (not limited to the RPTES group) shows thatenergy ministries, with inadequate staffs and low budgets, have difficulty in finding ameaningfuil role vis-i-vis autonomous electricity- and petroleum companies. Thesesubsectoral organisms may have their defects, but usually they are much better equippedand staffed than the supervising ministry. Furthermore, there is a large gap between theweakness of public sector institutions and the actual powers acquired by special-interestgroups such as the Groupement des Professionnels du Petrole (GPP) in the francophonecountries and the organized charcoal merchants in Sen6gal. This situation leaves thesubsectors of traditional and renewable energy as a residual field of government activity,with little support of high-level decision-makers.
80. Despite their limited means, central government institutiDns have a tendency toappropriate for themselves functions that would be better fulfilled by NGO' s and lowerlevel local organizations. A pervasive obstacle to greater efficiency is the lack ofcommunication among organisms dealing with energy, forestry, agric.ulture and livestock.
31 Insttutims d c a epns en oeuvre des politiques dens le secteur des *nergies tradcutonnclics-.RPTES- Soulfrnanc Dialo, rrogranme Enc-gic ENDA, Janvier 1995.
3' Cou.mn-specific issucs are covered in Chapter V.

71
This problem is most pertinent in the field of traditional energy, where forestry andagriculture departments (often also charged with environment) play a key role on thesupply side, while eneW departments occupy themselves with demand, energy efficiencyand pricing. Organizationally, agencies working on the supply side appear to be betterstaffed and coherent in comparison with dispersed and weakly coordinated groupsworking on the demand side. The acceleration of initiatives on the supply side (throughdevelopment of community-based management of forests) is creating a dichotomybetween government departments with the risk that energy departnents focusing on thedemand side will fal more and more behind unless they are strengthened in the process.
81. Regional cooperation can play an important role in improving the functio'ing ofnational agencies. CILSS has been active for a long time in the field of traditional energyand related disciplines. In the early 1980's it was CILSS that took the initiative torecommend general standards for the development of improved stoves in urban and ruralareas. Programs focusing on substitution (the Regional Butane Program) and renewables(the Regional Solar Energy Program) were also launched. Towards the end of the decade,CILSS, with the support of the Club du Sahel, organized the dialogue in the membercountries on the issues of natural resource management, land tenure and administrativedecentralization, resulting in the conferences of Segou (1989) and Cabo Verde (1994).Regionally-based support of national institutions should be promoted through: (1) Jointrainig programs for staff worlkng with tritonal energy; (2) Results-oriented reser.bchin existing instutions, and especially by activatng the unused potential of the CentreRtegional de IEnergie Solaire (CRES) in Mali; and (3) Establishment of a joint data basewith easy electronic access.
4.3 Integration of Fuelwood Management Schemes in overall rumral Development
82. It has been known for a long time that development of rural communities is helpedgreatly when several things happen at the same time3. The existing pilot schemes of forestmanagement by local communities already show the possibilities. Many small developmentprojects are eligible for extenal aid provided that the local population carries a minorityshare of the investment or guarantees to pay at least the maintenance expenses. Woodfiuelsales are often the first source of cash to support other ways of building up a localinfrastructure. Examples are the Burkdna and Mali case studies reported in the RPTESProceedings of Workshop I.
83. Future projects could consider as complementary components the introduction ofphotovoltaic solar power (for village water pumps, clinics, telecommunications,community TV and distance education), maintenance of feeder roads, schoolsimprovement, etc.
33 Secror example Opponunities for sustaincd Developent'. E/DI Report for USAID. October 1985

72
84. At the management level a strong case can be made for an explicit recognition ofthe role of women, who are usually the collectors of fuclwood for their own needs. Whenforestry management and local production are introduced and fuelwood becomes acommercial business, the men take over. Women should be implicated through their ownorganizations in the drawing up of local management plans, in the approval process and inthe subsequent implementation, including the use by the community of net profits offuelwood sales.
85. Finally, apart from all the elements noted above that contribute to successfulimplementation, there is the important issue of timing and speed. As discussed in thesection on fiscal measures, fuelwood from managed areas is more expensive than fromnon-managed areas where the land after cutting is simply abandoned. Therefore, whencommunities bring forest lands under local control, transporters tend to go to non-managed areas to get their supplies at a lower cost, a phenomenon noted wherever pilotprojects were started up. The perverse result is that ecological protection in one area cancause accelerated degradation elsewhere. This example illustrates that dispersed smallprojects will not lead to a permanent change on the ground. Clearly, there is a need foraction on a broad front to ensure that villagers, with the cooperation of transporters andthe help of fiscal incentives, acquire a significant share of fuelwood production andmarketing in the shortest possible time.
4.4 Human Resources Development
86. The ongoing experimental work shows already that the re-orientation of thewoodfuel supply industry requires training and re-training of virtually all economic agents.At the production level, villagers need to learn techniques of plot and tree selection,methods of harvesting, maintenance, firefighting, and at a later stage the development andmarketing of other forestry products At the management level, they need elementaryskills of literacy, accounting, organization and communication with the forestry services.As projects take off, information about pnrces, contacts with transporters, marketing andavailability of credit become important Integrated development along the lines sketched inSection 4.3 requires both leadership and leIltimate representation of all interested groups.
87. The training requirements for the forestry services are no less demanding. Agentsneed to change their approach from police-onented protection of the forests to supportservices for the rural population. With the recommended changes in the fiscal regime,they will lose some counterproductive incentives , which may need replacement byother forms of participation to make the management schemes a success.
88. Finally, where urban oligopolies dominate the markets, the controlling interestsshould be implicated in the dialogue Since to a large extent they have shaped the existingtrading systems and the application of existing legislation, there is no reason to expect thattheir role will change suddenly because new laws are being put on the books. The

73
woodfiels trade is essentially a private sector activity that badly needs better and moretransparent regulation, and the implementation of reforms should involve all concernedelements of civic society.
4.5 The Orientation of External Aid
89. As an introduction to comments on external assistance, it is usefil to recall theperceived problems that led to undertaking the RPTES. It had been noticed that in most ofSub-Saharan Africa traditional energy accounts for 70-9D percent of all energyconsumption, but that it demands probably less than 5 percent of all energy investment,and this amount includes the "soft" component of technical assistance. Foreign aid in thisfield held in principle little atraction for large donor agencies with overhead expenses thatweigh heavily on small projects. On the other hand, for small agencies (including NGO's)the combination of small investments and substantial technical assistance was much bettertailored to their resources. Moreover, they have often the flexibility to work moreeffectively than large agencies in a multi-sectorial context.
90. The result has been a proliferation of small projects that contributed valuableexperience but, even if successful, had no more than a localized effect. Other authors havenoticed the same problems, and since the mid-1980's an inceasing number of publicationsreport on retrospective reviews of project experience34. Although such compendiums aremost useful as a guide to preparing better projects, they often stop short of loo'-ing at theenergy sector as a whole and of providing national objectives against which theeffectiveness of projects and programs can be assessed. The RPTES was planned tocontribute to this missing element, while recognizing that it should be very much a nationaleffort of the recipients rather than the donors.
91. The ex post examination of interventions made during the current phase of theRPTES has brought into focus many weak points of all partners involved in developingthe sector". On the side of the donors, the petroleum pricing crises of 1973 and 1978triggered accelerated promotion of renewable energies, and in the Sahel the drought in thesame period provided further impetus for action. In retrospect, one can identify a numberof common factors behind the donor approach:
34 Examples: 'Beyond the Fuelwood Cnsis". Garald Leach and Robin Nlearms, 1988; Brngming Stoves to the People",by S Joseph, K. Krishna Prasad and H.B. van der Zaan, 1990; 'The Environment and Sahelian Realities:Potential for Impmrovemnt in Aid Policies and Projeca Managemen- by Rogcr Pons, Club du Sahel. November1992.
35 For a comprehmsive approach to the subject. see for cxamplc: "egic et d&veloppemcnt dans rAfrique au sud duSahara". by Jacques Giri. Notes ct Etudes No 38. Catsse Ccntrale de Coopuation Econonuquc Janvier 1991-and 'Les agences daide a lernvironnemint - A la recherche dun dvcloppement durable pour le Sahel', Clubdu Sahel Repon SAH/D(91)384. Novembre 1991.

74
* An initial overreaction to the threat of desertification, which added a sense ofurgency to evaluations of the overall situation, which at the time bad to make thebest of a very incomplete data base;
* A global approach to the problems that was inspired by the analytical tools of themodem sector but that, because of inappropriate application and flawed data, didnot provide convincing operational results ("The Gap Theory"); and
* A tendency to focus on those aspects where familiar tools of the engineer and theeconomist could be employed, such as imprnving end use efficiency, planting trees,promoting fuel substitution and devising pricing interventions. It was only in morerecent years that attention shifted to the multi-sectorial dimensions of the supplyside, specifically the linkages with population growth, agriculture and environmant"1.
92- The aid recipients, mosty Govermments, faced the task of managing a significantinflow of external assistance. However, they lacked a truly domestic policy to test donorproposals against perceived national needs and to ensure a critical evaluation of aid offers.The relatively easy availability of foreign aid to some countries produced the "projectshopping" syndrome, seen in the efforts of local insitions to ensure their survival byobtaining implementation responsibility for a succession of aid projects. Since in such aneavironment the national priorities run the risk of becoming a secondary consideration,one of the side-efiects can be a dispersion of scarce African human resources among theprojects most lucrative from an expert's point of view, while other essential needs may beleft unattended for lack of competent staff. The institutional thematic study shows amongothers the long lasting negative effects of that trend in some RPTES countries: The realsector structure beneath the formai organization is often a conglomerate of residual donor-financed project structures that continue to operate without much coordination.
93. The most urgent sector need is the formulation of coherent national policies thatprovide benchmarks for both donors and African institutions Although their application isbound to be country-specific, the findings of this study point to supply-side actions in ruralareas as a priority everywhere in the study region. Within that context, one can distinguishthe following key elements:
* Reach an understanding between recipients and donors on the principles, processesand fiscal incentives for forestry management by rural communities;
* Identify local solutions that are considered replicable;
36 T he World Bank resh on this subject has been published as 'Reversing the Spiral - The Population.Agriclture, and Envronment Nexus in Sub-Sahar Afinca, by Kevin M. Cleaver and Got A. Schreiber.1994.

75
* Establish an infrastructure of human and material resources that is sufficient tocreate a multiplier effect;
* Detenmine a phased irnplementation plan;
* Coordinate implementation priorities with the introduction of other forms ofrenewable energy;
* Plan for training of national economic agents at all levels, including training ofinstructors.
94. On the demand side, a careful distinction should be made between actions thatdirectly affect the energy sector and others that have much broader implications. Thecounterpart executing agents should be selected accordingly, to avoid distraction fromcental energy agency objectives and dispersion of the human resources available in thesector.
95. Institutional strengthening is always laudable but it should be recognized that thevalue of streamlining, reorganization and training is severely limited if there is, in fa,ct, apolicy vacuum. On the other hand, a well-articulated policy can in itself become apowerful instrument of coordination and traimng. At times, the synchronization of actionsin existing structures, in response to a common theeme, is more effective than forciblechanges of organizations for reasons that are not widely understood.
96. Coordination among donors themselves is obviously an essential factor in therealization of institutional objectives. Provided that they have a definite policy agenda, therecipient governments themselves are in the best position to take initiatives in that regard.

77
V. COUNTRY-SPECIFIC OVERVIEWS
5 1. Senegal
1. Between Independence and the late 1970's, Senegal was one of the moreprosperous Sahelian countries, with higher GDP per capita and higher personal incomesthan the other RPTES countries. In terms of household energy demand, this economicsituation translated in a strong movement towards substitution of charcoal for fuelwood,initially in the Dakar-Thies region and later in secondary urban centers and even in ruralareas. Charcoal use has reached about 330,000 tons per year, of which 200,000 tons isconsumed in the Dakar-Thies area.
2. Because of the low conversion efficiency, the move to charcoal has accelerated thedemand for primary f*jelwood and the depletion of standing stocks. After large-scaledeforestation of the territories closer to Dakar (in part caused by land-clearing foragricltture rather than charcoal manufacturing), exploitation is now concentrated in theTambacounda area of Southeastern Senegal, and permits have been issued to exploit theforests as far as Kolda. Unconfirmed reports mention imports especially from neighboringGuinea-Bissau. Overland transportation distances have lengthened to 500 mn.
3. The country is being served by an efficient supply- and distribution network,tightly controlled by economic interests groups that dominate a large part of the businessand that are known to be cooperating closely with the forestry services of theGovernment. This situation is an outgrowth of forestry legislation going back to thecolonial period, which declared all forests property of the State, and essentially confidedthe exploitation of the resource to urban dwellers. Over the years, commnercial interestshave worked closely with the forestry services of the Government, and in the processprevailed over environmentally responsible consenration policies and over the traditionalrights of the rural population. The ecological and social problems are complicated bypopulation growth and demand for agricultural land. In the more densely populated ruralareas, denuded forests have no chance to recover if agriculturists occupy the land afterdeparture of the woodcutters. The exclusion of the rural population from decisions ontheir resources is aggravated by the employment of foreign migrant labor fci lvood cuttingand charcoaling. Only the Western Casamance Region seems to be still relatively free fromintrusion and resource destruction by outsiders.
4. The dwindling forestry resource base is beginning to cause Government concern,and the first steps are being taken, if not to halt, at least to put a brake on the systematicclearing of the remaining forest lands. The absence of a reliable biomass inventoryhampers the identification of longer-term actions, but rough estimates tend to show thatbetter management of the forests could substantially slow down the pace of degradation.
5. In the past, another obstacle to reforn has been the lack of open dialogue with thedominant private economic interests that control the production, transport and

78
wholesaling of charcoal. Over half of the charcoal business, having an annual turnover ofat least $40 million, is controlled by less then twenty charcoal merchants and a similarnumber of wholesalers. The forestry services operate a system of annual allocation offorestry parcels for exploitation, combined with the issue of tradable production quotasthat after resale end up in the hands of a small nber of merchant cooperatives. From apractical standpoint, the system can be said to work well, and there is an understandablereluctance to make radical changes that may jeopardize the supply of charcoal, which hasbecome an essential household fuel in the large urban centers. On the other hand, the lackof transparency of the process is a source of conflict with villagers who see theirtraditional surroundings invaded by strangers. A lasting solution of the resourceexploitation problem requires the fill cooperation of the rural population, and it should bepromoted by a system of incentives that implies a transfer of resource rents from the urbancommercial interests to the villagers. The political weight of the existing operators isillustrated by the fact that the controlled charcoal price doubled after the FCFAdevaluation, while the price increase of subsidized LPG was about 30 %.
6. It is encouraging that all major interested parties in the sector recognize the needfor a better comunon understanding of the national interest in sustainable natural resourcemanagement. It is in this spirit that a First Charcoal Seminar was held in July 1994, undersponsorship of the Government Departments of Energy and Forestry and supported byRPTES. This fonrn brought together a broad cross-section of experts from Governmentand the private sector, including commercial charcoal operators. An ad hoc commissionformed during the seminar is continuing itm wcrk
7. A promising scheme to enhance energy efficiency is in the planning stage. Thetransportation of brittle charcoal over long distances entails losses by pulverization thatbetween origin and destination may reach 15 % of the tonnage produced. This waste,accumulated at the depots, represents an important loss of energy and an environmentalnuisance. A private entrepreneur in Dakar intends to start up a briquetting plant usingcharcoal dust as feedstock.
8. On the demand side, the Government has alleviated pressure on biomass resourcesby subsidizing LPG. The subsidy is financed out of taxes on other petroleum products(notably heavy fuel oil), which raises at least two questions: (1) Is an ever increasingsubsidy sustainable? and (2) To what extent is the excess taxation on other productshurting the competitiveness of Senegalese industrvn
Recommendations
(1) The Government should commission a comprehensive inventory of forestiy- Lidother biomass resources, in conjunction viith a survey of land use, this work shouldbe set up with a view to penrodic updating that will permit monitoring of standingstocks. (RPTES has been supporting some initial efforts by the Centre de SuiviEcologique in Dakar).
79
(2) In parallel withi resource inventorization, forests lands should be unambiguouslyassigned to the State (Nfor8ts classues") and the local comnunities ("for8tsprotdg6es"), which would'have the option to become involved in the exploitationof the resource.
(3) The "Decrets dApplication" that will implement the new forestry code shouldprovide for de-centralzed co-management of forest resources by the localcommunities, including the right to retain resource revenues for local use, underthe provisions of an approved local forest management plan.
(4) Wherever local populations assume responsibility for forest management, thequotas should be abandoned and replaced by sustainable annual production ceilingsfixed by the management plan.
(5) As one of the transition measures, the immediate vicinity of the villages in non-managed zones could be protected from indiscriminate cutting by an exclusionzone (e.g. a radius of several Ian).
(6) The merits of tree plantations for commercial tinber should be examined anddiscussed with the charcoal operators and other private interests as a way todiversify their business.
(7) Standard weights and measures should be mandated and enforced initially for thewholesale trade and next for the retail trade (at present a 50 kg bag sold at theofficial price holds 42 kg).
(8) Retail price controls on charcoal should be lifted as soon as enforceable standardweights have been established and more competition has been introduced.

80
5.2. The Gambia
9. Gambia's unusual geogaphy is fundamental to the perception of its woodfuelproblems: A river valley about 40 km wide, surrounded by Sen6gal from the coast untilsome 400 kn upstream, with only fowu major ferry crossings as the means ofcommnunication between the North and South banks. East-West land communications onthe South bank are assured by a single highway, of which the Western 150 km are beingreconstructed, but are still in poor condition. The secondary urban centers in the interiorare, economically speaking, small islands separated by long rural stretches that have theshortest communications links with Sen6gal. It is inconceivable that the long porousborder should constitute a barrier to nrual people fending for themselves, regardless ofwhat governments say or do.
10. This being the case, the energy demand-supply situation in the secondary centersand in the rural areas is neither critical nor controllable in a strictly Gambian context. Onthe other hand, in the Greater Banjul Area (GBA) the size of the population relative to thelocal biomass resource base would suggest severe pressure on the land and the forestsActually, it is difficult to get a handle on demand and supply figures for two majorreasons:
F First, the official ban on charcoal production and trade, in force since 1980, hashindered the collecton of reliable statics on woodfiiel demand. During surveys,householders are not likely to reveal activities that may be construed as illegal, butthere appears to be widespread use of charcoal and LPG as either the main or thesupplementary cooldng fuel. In that connection it should be noted that in 1980, whenthe prohibition went into effect, households in the GBA used already a significantquantity of charcoal, and the Govemment measure as such did not provide forimmediate substitutes. Since there is not much evidence of charcoal manufacturewihin The Gambia, the legal situation is ambiguous.
a Second, the GBA shares the geographic factor mentioned above with the rest of thecountry, and consequently the regional economy is bound to be quite open. If thereis a significant consumption of charcoal, it is probably imported from the nearbywestern Casamance, and part of the fiuelwood supplied to Banjul may originate fromthe same area. This unrecorded trade would hamper any estimates of total quantitiesconsumed and of the breakdown between fuelwood and charcoal consumption.
11. The Greater Banjul Area is a natural entry point for imports and re-exports to theneighboring countries. Transit of merchandise is likely to contribute substantially to thelocal economy, and higher than recorded personal incomes would go some way to explaindemand for charcoal and also the unsatisfied demand for LPG in the GBA. However.given Banjul's position as an accessible port, it is still an open question if kerosene wouldnot have a better future than LPG as a large-scale substitute for woodfuels.

8i
12. The Government has attempted to protect the environment by not only prohibitingthe manufacture of charcoal in The Gambia and but also by making the cutting of greentrees for use as fiielwood illegal. However, it is not evident that woodfiel supply as suchhas played a major role in the degradation of the forests. The more significant factorsappear to be population growth and demand for agricultural land. Burning the vegetationcover is a well-established method of land clearing, and it is also a way of kIlling trees firstto make their subsequent harvesting legal. These traditional practices are responsible forthe disappearance of much of the natural forests, but large areas are covered again bysecondary growth. Repeated buming is a serious obstacle to better regeneration of treecover.
13. The Gambian-German Forestry Project (GGFP) aims at preserving the fewremaining original forests by the central forestry services in the public sector, and atpromoting sustainable exploitation of forestry resources (which eventually would includefielwood) by rural communities. The GGFP project started in 1980 with a land-usemapping and forest inventory, in cooperation with the Gambian Forestry Departnent(FD). The project will be phased out over the coming three years: The Trainingcomponent in May 1995, the Forest Parks component at the end of 1995, the Policy andLegislation conmponent in March 1997 and finally the Community component in June1997. However, plans exst for another German-financed project comprising a Forest Parkand Community Forestry Mangement Scheme in the Division of MacCarthy Island, to beimplemented between 1996 and 2000.
14. The USAID-financed natural resource management project, which did not includea specific woodfuel component, was discontinued following the events of August 1994.This project took a comprehensive approach to forestry-, agriculture- and environmentalproblems, with transfer of management responsibilities to the local communities as acentral element. Before the interruption, a national land use mapping was completed onthe basis of 1993 aerial photography, and an environment information system was set up inthe National Environment Agency. The program also included study of land tenure issuesand a study of the bush fire problem. There seems an urgent need for a bridgng programthat would build on the achievements of the GGFP, while takdng advantage of the newdimensions introduced by the USAID program as well the substantial amount ofknowledge gathered, and utilizing the technical equipment left behind.
15. By applying the 1980 methodology of the GGPF to the data base developed underthe USAID program, it would be possible to obtain an up-to-date inventory and to tracehow land use has changed over the last 14 years Such a project would be of considerablebenefit to plan future sector developments. The FDIGGFP gained extensive experience incommunity forest management and appear to have had some positive impact oncontrolling bush fires. As a pre-condition to a Community Forest Managemnent Agreement(CFMA), a community has to demonstrate its capabilities in controlling bush fires over aperiod of two years. At the initial stages of the project, grazing was not allowed in forestsunder managernent. The agreement waives all taxes otherwise imposed on revenuesgenerated from managed forests, and normally payable by holders of private permits. At

82
present only harvesting of deadwood is allowed. However, felling of live trees is nowforeseen in the first FD/GGFP areas where the stock of dead wood has been exiausted.There is no information available yet on the actual revenues that villagers are able togenerate under this scheme. The approach followed by GGFP needs to address in a moreexplicit way how villagers can maximize the benefits of forestry exploitation whileresponsibly managing the resource. The monetary incentive and the production orientationappear to be still somewhat missing.
16. The review of institutional aspects may need updating after recent changes inGovernment. Regardless of current circumstances, the small size of the country and of theeconomy are conducive to informal ways of doing business and of coordinating activities.In this environment one should avoid costly and heavy formal structures. Nevetheless,there is room for some strengthening and a more precise task division among thedepartnents of Trade & Industry, Agriculture, Environment & Natural Resources,Community Development and the newly formed National Environmental Agencyresponsible for the Gambia Environmental Action Program (GEAP).
Recommendations:
(1) Without revoking the ban on domestic production of cnarcoal, the legalization ofthe import and trade of charcoal should be examined.
(2) There is no official restriction on fuelwood imports. However, statistics should bekept at border entry points.
(3) Government should legalize the transfer of management responsibility for foreststo local population, thus permitting the multiplication of the present demonstrationprojects.
(4) Harvesting of green trees for woodfuel should be permitted in zones that havebeen brought under community management, under the provisions of agreedmanagement plans between the communities and the Forestry Department.
(5) It is recommended to make a second biomass inventory, which will permit theanalysis of land use change since 1980, and the establishment of permanent sampleplots to measure productivity regularly.
(6) To maintain a broad spectrum of consumer choices of fuels, every effort should bemade by the private sector to reduce the cost of hydrocarbon fuels as substitutes,in particular by attempting to lower the cost of importing, storing and bottlingLPG. The prospects of kerosene should be firther examined.
(7) The Energy Division in MTIE should be adequately staffed and trained to takecare of minimum requirements for coordination and liaison, and to supervise theestablishment of a central energy documentation center.

83
5.3. Burkina Faso
17. Owing to its location in the more Southem zone of the Sahel, Burkina still cancount on a significant biomass resource base, in most of the country sustained by rainfallsin the 600-1000 mm range. The efficient utilization is hampered by:
' The uneven distribution of resources relative to population and markets.Degradation and deforestation are found mostly in the heavily populated CentalPlateau around Ouagadougou, especially to the North and East of the capital. Theurban market of Ouagadougou alone accounts for about 150,000 tons of fielwoodper year;
* The poor condition of many roads preventing or discouraging the fuielwood tradersfrom exploiting the more remote areas;
* Population pressure in the better endowed Western and Southwestern regions,where undefined land tenure is a source of conflicts;
* A strong centralist tradition of Government combined with institutional dispersion ofresponsibility and authority. There is a tendency towards central controls while theresponsibility for project implementation is spread over many agencies. As theBurkina country report points out, scarce management talent is diverted from policy-making tasks to project tasks that could be delegated or contracted out.
18. Following the drought of the 1970's, the fuelwood situation was analyzed with adata base that turned out to be inadequate In retrospect, the severity of the '"fuelwoodgap' was exaggerated, and misperceptions gave rise to a proliferation of poorlycoordinated donor actions on the supply- and demand side, spread over many localinstitutions.
19. As in other countries, wood stove projects have a mixed track record, and theoverall energy benefits to the sector (in conmrast with benefits to sample groups and non-energy social benefits) remain to be demonstrated A totally different kind of donor-financed activity had an unexpected success Woodfuel cleared from lands flooded by theKompienga and Bagre reservoirs was carbonized. and the resulting stock of charcoal wasreadily sold. The introduction of a new household fuel is stimulating demand and is likelyto result in accelerated demand for fuelwood as a primary input for charcoal making..
20. On the supply side, some fuelwwood plantations were tried and found to be toocostly to pursue as a solution to the supplv problem In contrast to these problematicearlier efforts, Burkina has made considerable progress in promoting sustainable forestmanagement by the local population Beginning in 1986, a pilot project has beensuccessfully pioneered and gradually extended in the Nazinon region and a few otherdistricts South of Ouagadougou. The project. financed by UNDP and implemented withFAO assistance, now supplies bout 10-15 % of Ouagadougou's needs from about 1 00,000

J
84
hectares of managed forests. On June 1, 1994, the UNDP approved financing of a foliow-up project also coveing 100,000 hectares and the European Community is financinganother 70,000 hectares. Inventory work has advanced sufficiently to identify otherregions (totaling about 300,000 hectares) around major urban centers that are suitable forsimilar schemes. The development scheme, described in the Proceedings of Workshop II,has many features that merit study with a view to application elsewhere. It seems to havesucceeded particularly in the financial area, on the one hand by mimizing the role ofState agencies and revenue retention by the State, and on the other hand by creatingworkable incenfives for villagers to participate. Nevertheless, no scheme is exactlyreplicable, and some problems with Nazinon shoud be recognized as well. Examples arelack of training in marketing of fiielwood and other forestry products, and the secondaryrole of women in forest management. In fact, they provide fuelwood as long as it is asubsistence acfivity for their families; as soon as fuelwood becomes a monetized business,the men take over.
Reconmmendations
(1) The available elements of a master plan (at present focused on supplyingOuagadougou) should be updated and integrated as quicldy as possible to define amulti-year program that would assure a virtualy 100 % supply of the nationalcapital regicn and other major urban centers from rural woodfuel markets incommunity maaged forests.
(2) In conjunction with this master plan, the transportation infrastructure in the CentralPlateau should be amned for potential bottlenecks in the road network thatwould impede woodfuel supplies. The truckdng industry should be closelyassociated with this aspect of the planning.
(3) Selection of new forest areas for village managenent should take irnto account thepossibility of introducing other forns of renewable energ in rural areas (e-gphotovoltic solar energy for water pumping, health centers, distance education,etc.).
(4) The tbreat of mushrooming inefficient charcoal production should be contained byorganizing and mobilizing private sector operators, and by promoting energy-efficient charcoaling practices.
(5) For the longer term, existing biomass inventories and land use mapping datashould be reviewed and a systematic information basis for the future established.
(6) The present, more or less improvised Direction c- :'Energie should be reinforced,made permanent and given well-defined responsibilities in the traditional energysector, in conjunction uith a clear delineation of the frnctions of other entities.

85
5.4. Mali
21. Mali's vast territory (1.2 million krn2) includes all the climatic zones found in theRegion (Saharian, Sahelian and Soudano-Guinean) and traditional energy sector problemsvary accordingly. The Western and Southwestem areas are well endowed with forestryresoarces but this relative abundance is threatened by clearance for agriculture (especiallyin the cotton-growing South) and the accelerating demand for charcoal in the BamakoRegion. Farther eastwards in the Niger Valley, towards Segou and the Mopti Delta,fielwood becomes more scarce, but some temporary relief could be bought by exploitingdeadwood reserves in the Mopti Delta, left over from the 1970's drought and estimated toamount to 200,000 tons. The most difficult conditions prevail in the Eastern part towardsthe border with Niger, where biomass is scarce and transportation distances to Nigeria areso large that substitution of petroleum fuels, notably kerosene, is not an evident solution.
22. Compared to the other countries, Mali has a reasonably accurate biomassinventory and the available maps, once enlarged, can be utilized to prepare communityforestry management plans. The most important supply zones and transport routes to thefive major cities have been surveyed in 1989/90. On the demand side, donors have donemuch to assist wood stove promotion and dissemination, helped by Governmentintervention making stove ownership obligatory. It is far from dear whether stoveprograms have done much in terms of energy conservation. However, Mali provides aninteresting example of an enlarged scope of the promotional work on woodstoves: Theimplementation of ongoing programs is centered in the Deparument of Social Affairs ratherthan an energy agency.
23. The work on both the supply- and demand side resulted in the formulation of aHousehold Energy Strategy (Strategie Energie Domestique - SED) in 1991, which issupported by a significant donor constituency. Meanwhile, the political events of March1991 intervened, with a profound impact on the traditional energy sector because of thereaction of the rural populations against the practices of the national Forestry Service. Asystem of sanctions and fines, supposed to protect the environment, had been widelyabused as a tool to generate revenues for the responsible officials. A key donor conditionto implement the SED is the passage of enabling legislation to transfer the responsibility ofnatural resource management to the local communities. In December 1994 the NationalAssembly passed new legislation to that effect which since then has been signed into lawby the President.
24. The new texts are a mix of promising elements and potential sources of futuretrouble. They follow certain principles of decentralization, and provide for allocation offorest lands to local communities, but the process is not specified and far from transparentin its application. Transfer of responsibility is more of an option open to the State than anobligatory reform measure. Attached to the legislative texts are the proposedimplementation measures, which still seem encumbered with new complications oftaxation and a myriad of controls. Throughout the documents, it is not clear what will bethe future finction of the Forestry Service: Extension workers, police, or both?

86
25. Despite these critical observations, it should be kept in ndnd that in most countriesneither old nor new laws are fully respected. Many experimental forestry managementschemes have been set up either by ignoring the letter of existing laws or by legalizingexceptions to the law. The events of March 1991 in Mali have produced a certain degreeof anarchy in rural areas but they have also resulted in a laudable stimulus to grassrootsreform. Therefore, any final judgment on fornal legislation should take into account thelikely practical effects in view of what has happened already on the ground.
26. Despite the progress made, some internal obstacles remain. First, it is an openquestion if an extension role for the forestry services is compatible with a policing functionoutside the forets class6es'. Second, the intended future fiscal management of the sectorappears to be at variance with the approach recommended in this report. The Mali SEDstresses the prior need not only of devolution of management responsibility to thevillagers, but also a fiscal regime of differential taxation of fuelwood and access control ofall major urban markets. The attempt by the new laws to provide incentives for the ruralpopulations (traditionally distrustful of any lind of taxation by the successors of thecolonial powers in the cities) is combined with a web of controls that is supposed to befinanced out of woodfuel taxes. This proposal seems a reversal of the abandonment of theearmarked Fonds Forestier, within the fiamework of the IMF Structural AdjustmentProgram. The positions of the other donors do not seem dearly defined, which is notgoing to be helpful in the dialogue with the Government on SED implementation.
Recommendations
(1) A common reflection of Government and donors on the incentive structure to beassociated with villagers' responsibility for resource management.
(2) A re-examination of the role of woodfuel taxation in relation to budget allocationsfor the traditional energy sector.
(3) Based on the existing inventory data, development of master plans for woodfuelsupply to all major urban centers.
(4) A survey of the possibility to exploit stocks of deadwood in the Niger Delta tosupply remote markets like Gao and Timbouctou.
(5) Extension of the forest inventory to biomass stocks on cultivated land.
(6) An assessment of the capacities of the Forestry Services to deliver extensionactivities, and of the associated needs for retraining, in conjunction with areflection on the future responsibilities and organization of law enforcementagencies.

87
5.5. Ml=
27. Of all Sabelian countries in the RPTES group, Niger has the most fragile biomassresource basis, found in the relatively small non-desert areas of the national territory.These same regions contain also the centers of a rapidly growing population exertingpressure on the scarce agricultural and forested lands. The remaining "forests" oftencontain large denuded areas ('forets tigries") which facilitate access by nomadic herdersand increase the risk of conflicts with sedentary populations.
28. Despite much evidence of environmental deterioration, fuelwood prices haveremained relatively stable, suggesting that there is no imuninent supply crisis. Althoughefforts are being made to establish systematic monitoring, there is no obvious explanationfor the observed market behavior. On the demand side, much donor money has been spenton improved woodstoves, but from a purely energy standpoint these programs have onlybought some time. According to the report by the Niger country team, the aggregatesavings of fuelwood consumption under field conditions are 7 percent relative to theperformance of the traditional urban metal stove, which represents less than two years ofgrowth in urban demand, assuming fill penetration. On the supply side, the organizationof rural woodfuel markets is moving out of the experimental stage (Tientiergou - 30,000ha), but data on the impact on the market do not yet seem readily available. .
29. Niger has had considerable difficulties in defining a workable scheme to involve therural population in forest management responsibilities. The climate is not conducive togrowth of dense forests and, therefore, accessibility to different user groups must benegotiated. Unresolved land tenure issues can block solutions. Like Mali, the country hasa tradition of repression by the forestry services, the organization and the fiscal schemesappear complex and heavily slated towards Govarmment interventions and the pricing- andtaxation schemes are difficult to administer.
30. Given Nigeres scarce forestry resources, it is the country where the search foraffordable substitutes is most urgent. Unfortunately, large transportation distances makeimported petroleum fuels a costly alternative. Nigeria is best placed owing to the locationof the Kaduna refinery; Cotonou-Parakou-Niamey constitutes a second supply route forimports from overseas. In the past, products from Nigeria were the least costly but theFCFA devaluation has changed their competitive position. Moreover, diversified sourcesare a necessity because of the risk of unexpected supply disruptions. In any case, LPGremains an expensive proposition with limited impact on woodfuel demand.
31. The large-scale introduction of kerosene in Niger is favored by the long porousborder with Nigeria allowing relatively cheap imports by private operators. Paradoxically,the actual penetration rate is higher for LPG than for kerosene (for cooking purposes), butespecially after the FCFA devaluation it has become clear that LPG subsidies are notsustainable and LPG penetration in the household sectoT will probably stagnate. TheGovernment has recognized realities by terminating LPG subsidies and by completelyliberalizing the import and- trade of kerosene. The potential drawback is the risk of rupture
88
in supplies, triggered by either production problems or occasional border closures. Thebest protection against these events is ample storage capacity, which until now is missing.Another major unresolved problem is the lack of a well-accepted stove. The wickstovethat is being promoted found initially limited acceptance but subsequently the program raninto difficulties, as demonstrated by the dissemination record (9,000 actual versus 80,000targeted). A case can be made for broadening the consumer choice, specifically byimporting a pressurized kerosene stove that has proved to perform in other countries.
32. In the North-Central part of the country, Niger has some important deposits ofpoor quality coal, part of which is used in a 32 MW power plant using fluidized bedcombustion, and supplying electric power to the uranium mines. Experiments with coalfrom the open-pit nine have produced a slow-buring carbonized coal that has been wellreceived in the Arlit-Agadez Region. It is being used by some 1,000 households, a hospitaland military barracks as a cooking fuec. The technically successful introduction of coal hasgiven rise to expectations that may be warranted or not. The economics and financing of alarger scheme, including a significant ransportation component, have not been adequatelyinvestigated. Indeed, a conclusive answer may well depend on the prospects of findingcoal closer to Niamey. An exploration program that started in 1989 in zones frequented byTouaregs came to a standstill because of civil unrest. Poor management by sonie of theparticipants has tended to discredit the prospect before it has been fully investigated.
Recommendations
(1) Localized inventories of forestry and biomass resources need to be either started orcompleted ( including resources in non-forested areas), and mechanisms are to beestablished to monitor regularly the state of the resources in all land use classes.There is an urgent need to resolve existing doubts about the sustainable yields.
(2) Reported large stocks of deadwood (eft over after droughts) are said to beinaccessible because of transportation problems. Verification of these reports isnecessary to see if deadwood is indeed an unexplored resource.
(3) The role of the State in resource management should be reviewed in the sense ofmore selective use of taxes and avoidance of earmarking revenues from woodfueltaxes to support the budget of the public forestry services.
(4) In view of Niger's scarce natural biomass resources, the promotion of agroforestryhas a high priority.
(5) The prospects of large-scale substitution of domestic carbonized coal for fiuelwoodshould be properly investigated for their relevance to future energy policy and tothe regional economy of North-Central Niger.

89
(6) The policies with respect to replacement of fielwood by petroleum fuels should bere-examined. After the abandonment of LPG subsidies, further LPG promotion atmarket prices may be left to the private sector. With respect to kerosene, twoaspects need attention: (1) The consumer's choice of stoves should be broadenedand the stove supply secured; and (2) Kerosene storage facilities may be needed tosupport the activities of private traders and to ensure a reasonably reliable fuelsupply at a stable price.

91
ANNEX
The RPTES thematic studies
Evaluation des svstemes d'information du secteur de 1'6nergie traditionnelle: BurkinaFaso. Niger, Mali et Senegal, Bahjat Achikbache, AFTHR/The World Bank, Fevrier1995.
Local Forest Control in Burkina Faso. Mali. Niger. Senegal and The Gambia:A Review and Critique of New Participatory Policies, Jesse C. Ribot, Center forPopulation and Development Studies, Harvard University, January 1995.
Local Forest Access Control in Senegal: Towards Participatory Forestry Policies, Jesse C.Ribot, Center for Population and Development Studies, Harvard University, January 1995
Forestnr Sector Policy Report: Mali, Jesse C. Ribot, Center for Population andDevelopment Studies, Harvard University, January 1995.
Evaluation des donnees sur les ressources ligneuses:Burkina Faso. Gambie, Mali, Niger et Senegal, Axel Martin Jensen, Danagro Adviser A/S.Janvier 1995.
Institutions et capacites de mise en oeuvre des politiques dans le secteur des energiestraditionnelles, Souleymane Diallo, ENDA-TM, Dakar, Janvier 1995.
The Traditional Energy Sector and the Economy: The Case of Mali. Burkina Faso. Theambia, Niger and Senegal, Isaac Castillo, September 1994.
Elements d'econornie slpatiale des energies traditionnelles: Application au cas de cing payssaheliens: Burkina Faso. Gambie. Mali. Niger. Senegal, Benoit Ninnin, Octobre 1994
Review of Improved Stove and Fuel Substitution Projects, Biomass Technology Group(BGT), October 1994.
Review of the Niger Coal Carbonization Project, Erkki Korpijaakko, October 1994

I