Responsibility for Product Quality Problems in Sequential Manufacturing: A Case Study from the Meat...
16
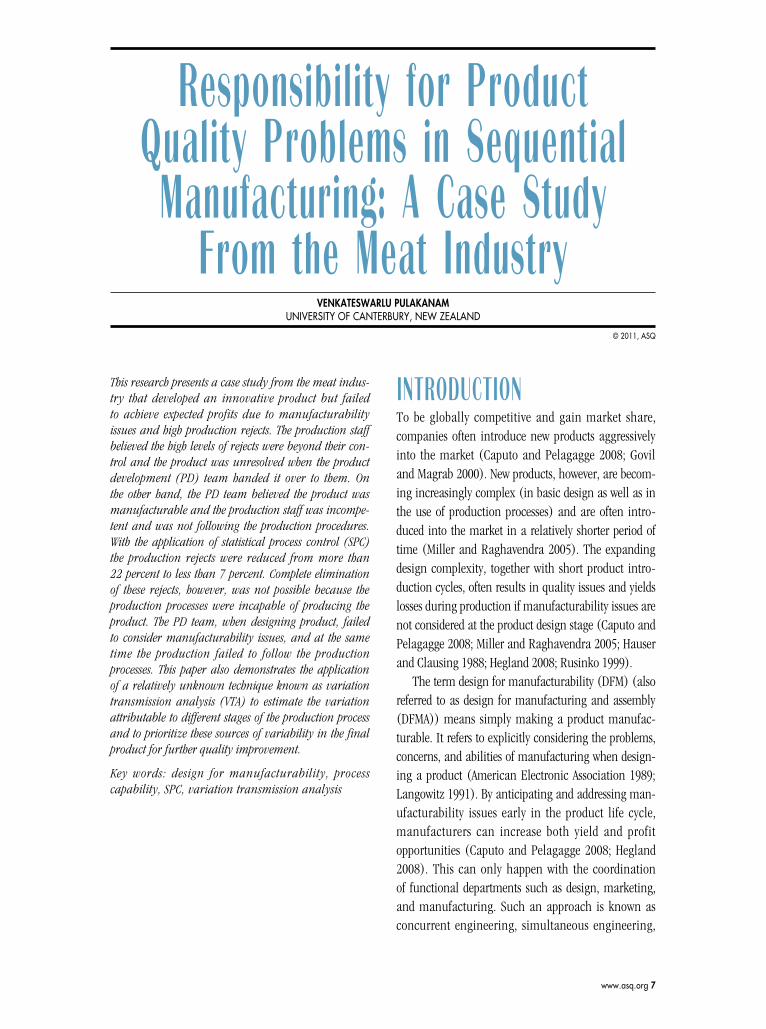
www.asq.org 7 Responsibility for Product Quality Problems in Sequential Manufacturing: A Case Study From the Meat Industry VENKATESWARLU PULAKANAM UNIVERSITY OF CANTERBURY, NEW ZEALAND © 2011, ASQ This research presents a case study from the meat indus- try that developed an innovative product but failed to achieve expected profits due to manufacturability issues and high production rejects. The production staff believed the high levels of rejects were beyond their con- trol and the product was unresolved when the product development (PD) team handed it over to them. On the other hand, the PD team believed the product was manufacturable and the production staff was incompe- tent and was not following the production procedures. With the application of statistical process control (SPC) the production rejects were reduced from more than 22 percent to less than 7 percent. Complete elimination of these rejects, however, was not possible because the production processes were incapable of producing the product. The PD team, when designing product, failed to consider manufacturability issues, and at the same time the production failed to follow the production processes. This paper also demonstrates the application of a relatively unknown technique known as variation transmission analysis (VTA) to estimate the variation attributable to different stages of the production process and to prioritize these sources of variability in the final product for further quality improvement. Key words: design for manufacturability, process capability, SPC, variation transmission analysis INTRODUCTION To be globally competitive and gain market share, companies often introduce new products aggressively into the market (Caputo and Pelagagge 2008; Govil and Magrab 2000). New products, however, are becom- ing increasingly complex (in basic design as well as in the use of production processes) and are often intro- duced into the market in a relatively shorter period of time (Miller and Raghavendra 2005). The expanding design complexity, together with short product intro- duction cycles, often results in quality issues and yields losses during production if manufacturability issues are not considered at the product design stage (Caputo and Pelagagge 2008; Miller and Raghavendra 2005; Hauser and Clausing 1988; Hegland 2008; Rusinko 1999). The term design for manufacturability (DFM) (also referred to as design for manufacturing and assembly (DFMA)) means simply making a product manufac- turable. It refers to explicitly considering the problems, concerns, and abilities of manufacturing when design- ing a product (American Electronic Association 1989; Langowitz 1991). By anticipating and addressing man- ufacturability issues early in the product life cycle, manufacturers can increase both yield and profit opportunities (Caputo and Pelagagge 2008; Hegland 2008). This can only happen with the coordination of functional departments such as design, marketing, and manufacturing. Such an approach is known as concurrent engineering, simultaneous engineering,
-
Upload
canterbury-nz -
Category
Documents
-
view
4 -
download
0
Transcript of Responsibility for Product Quality Problems in Sequential Manufacturing: A Case Study from the Meat...
www.asq.org 7
Responsibility for Product Quality Problems in Sequential Manufacturing: A Case Study
From the Meat IndustryVenkateswarlu Pulakanam
University of CanterbUry, new Zealand
© 2011, asQ
This research presents a case study from the meat indus-try that developed an innovative product but failed to achieve expected profits due to manufacturability issues and high production rejects. The production staff believed the high levels of rejects were beyond their con-trol and the product was unresolved when the product development (PD) team handed it over to them. On the other hand, the PD team believed the product was manufacturable and the production staff was incompe-tent and was not following the production procedures. With the application of statistical process control (SPC) the production rejects were reduced from more than 22 percent to less than 7 percent. Complete elimination of these rejects, however, was not possible because the production processes were incapable of producing the product. The PD team, when designing product, failed to consider manufacturability issues, and at the same time the production failed to follow the production processes. This paper also demonstrates the application of a relatively unknown technique known as variation transmission analysis (VTA) to estimate the variation attributable to different stages of the production process and to prioritize these sources of variability in the final product for further quality improvement.
Key words: design for manufacturability, process capability, SPC, variation transmission analysis
INTRODUCTIONTo be globally competitive and gain market share, companies often introduce new products aggressively into the market (Caputo and Pelagagge 2008; Govil and Magrab 2000). New products, however, are becom-ing increasingly complex (in basic design as well as in the use of production processes) and are often intro-duced into the market in a relatively shorter period of time (Miller and Raghavendra 2005). The expanding design complexity, together with short product intro-duction cycles, often results in quality issues and yields losses during production if manufacturability issues are not considered at the product design stage (Caputo and Pelagagge 2008; Miller and Raghavendra 2005; Hauser and Clausing 1988; Hegland 2008; Rusinko 1999).
The term design for manufacturability (DFM) (also referred to as design for manufacturing and assembly (DFMA)) means simply making a product manufac-turable. It refers to explicitly considering the problems, concerns, and abilities of manufacturing when design-ing a product (American Electronic Association 1989; Langowitz 1991). By anticipating and addressing man-ufacturability issues early in the product life cycle, manufacturers can increase both yield and profit opportunities (Caputo and Pelagagge 2008; Hegland 2008). This can only happen with the coordination of functional departments such as design, marketing, and manufacturing. Such an approach is known as concurrent engineering, simultaneous engineering,
Responsibility for Product Quality Problems in Sequential Manufacturing: A Case Study From the Meat Industry
8 QMJ vol. 18, no. 1/© 2011, asQ
control (SPC) and variation transmission analysis (VTA) techniques to reduce process variability.
OVERVIEW OF OBAN FOODS AND COOKED PORK Oban Foods is a medium-size pork processing company that makes a wide variety of fresh, frozen, and cooked meat products. These products are sold to supermar-kets and fast-food restaurants. Cooked pork (CP) was an innovative new product that was successful in the market. It is a precooked meat that customers can buy off the shelf and reheat before eating. Unfortunately, the production reject rates of this product were over 20 percent from the time the product was first intro-duced into the market, costing the company more than $250,000 per year, and the product, although successful in the market, was becoming unprofitable. The CP production process and the problem-solving methodologies used to investigate and reduce the rejects are described in the following sections.
Cooked Pork Production ProcessAs with all new products, CP was developed by Oban’s product development (PD) team in their experi-mental kitchen. After the product was approved by sales and marketing, the PD team worked with the
or design-manufacturing integration (DMI) (Youssef 1994; Rusinko 1999). DFM and efficient coordination of design and production activities are key challenges faced by all manufacturing companies (Riedel and Pawar 1997; Tirpak 2000).
DFM is extensively discussed in relation to discrete-part manufacturing industries such as engineering and electronics. There is a complete absence of literature, however, on DFM-related topics in the meat processing industry and in the general food industry. There are two reasons for this. First, meat processing is relatively simple, although getting the “recipe” may be dif-ficult. Second and most important, safety and hygiene considerations are of paramount importance in food processing industries, even more so than production efficiencies. All production methods and processes in meat processing industries are primarily designed around meeting safety and hygiene requirements. Even so, as processed meat products are often unique to spe-cific regions and countries (British Food Journal 1995), it is difficult to anticipate manufacturing issues at the product development stage. Yet even in meat processing industries, ignorance of manufacturability issues can have a major adverse impact on down-stream costs and the profitability of new products.
The case study from a meat processing industry discussed in this paper demonstrates the need for an understanding of manufacturability and process capability issues when introducing a new product. It also illustrates the application of statistical process
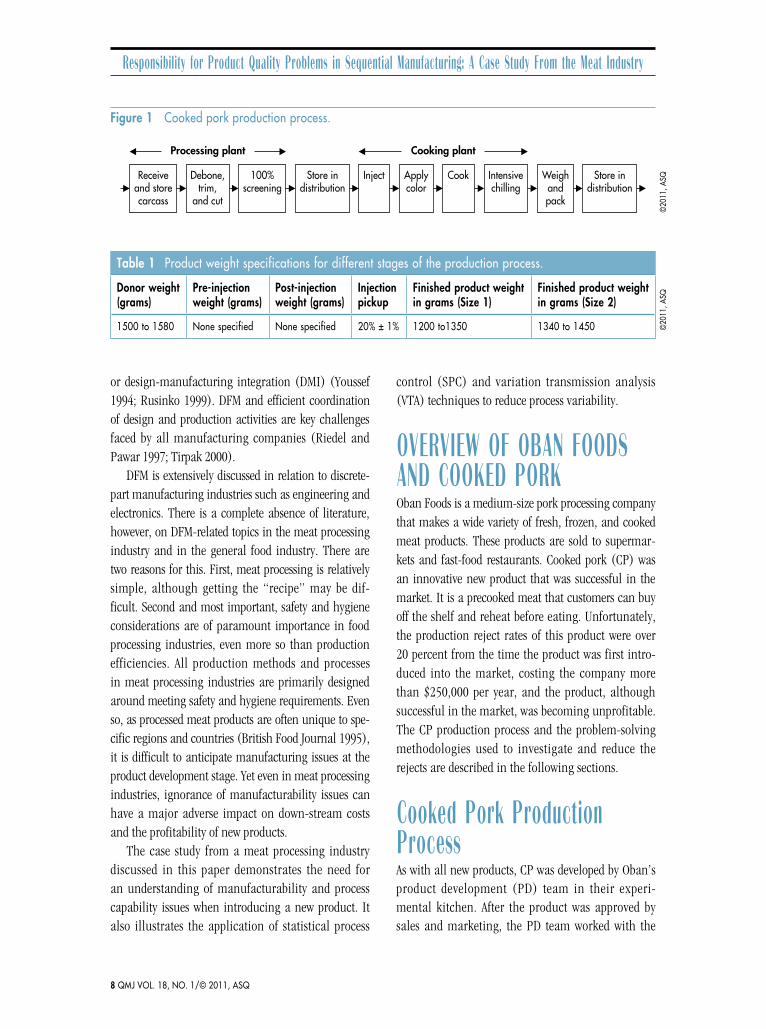
table 1 Product weight specifications for different stages of the production process.
Donor weight (grams)
Pre-injection weight (grams)
Post-injection weight (grams)
Injection pickup
Finished product weight in grams (size 1)
Finished product weight in grams (size 2)
1500 to 1580 none specified none specified 20% ± 1% 1200 to1350 1340 to 1450 ©20
11, a
sQ
Processing plant Cooking plant
Receiveand storecarcass
Debone,trim,
and cut
100%screening
Store indistribution
Inject Applycolor
Cook Intensivechilling
Weighandpack
Store indistribution
Figure 1 Cooked pork production process.
©20
11, a
sQ
Responsibility for Product Quality Problems in Sequential Manufacturing: A Case Study From the Meat Industry
www.asq.org 9
and packed in one of two different size bags: size 1 (1200 grams to 1350 grams) and size 2 (1340 grams to 1450 grams). The instructions on size 1 bags are different from those on size 2 bags, which require lon-ger reheating. The overlap in weight specifications is meant to give flexibility to the production department, so they can classify a product in the overlapped weight range into either size 1 or size 2 depending on the demand. At the time this study was conducted, the esti-mated demand ratio for these two sizes was 75 percent (size 1) to 25 percent (size 2). While the product is weighed and packed it is also inspected for any visual defects such as color and skin tear.
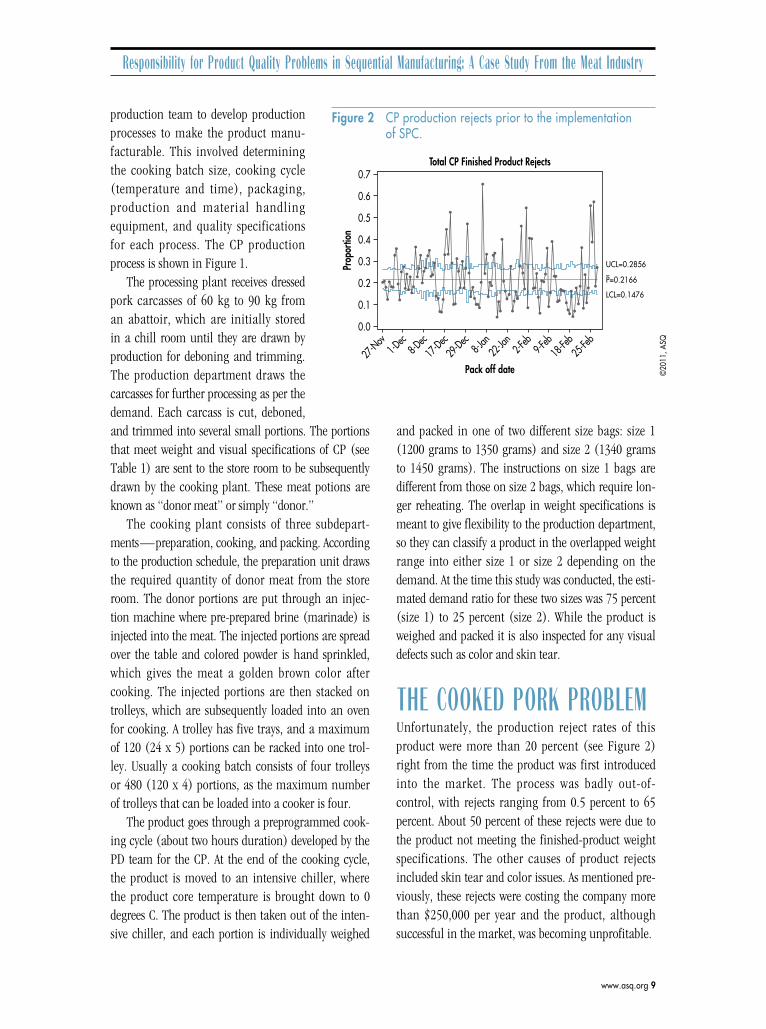
THE COOKED PORK PROBLEM Unfortunately, the production reject rates of this product were more than 20 percent (see Figure 2) right from the time the product was first introduced into the market. The process was badly out-of-control, with rejects ranging from 0.5 percent to 65 percent. About 50 percent of these rejects were due to the product not meeting the finished-product weight specifications. The other causes of product rejects included skin tear and color issues. As mentioned pre-viously, these rejects were costing the company more than $250,000 per year and the product, although successful in the market, was becoming unprofitable.
production team to develop production processes to make the product manu-facturable. This involved determining the cooking batch size, cooking cycle (temperature and time), packaging, production and material handling equipment, and quality specifications for each process. The CP production process is shown in Figure 1.
The processing plant receives dressed pork carcasses of 60 kg to 90 kg from an abattoir, which are initially stored in a chill room until they are drawn by production for deboning and trimming. The production department draws the carcasses for further processing as per the demand. Each carcass is cut, deboned, and trimmed into several small portions. The portions that meet weight and visual specifications of CP (see Table 1) are sent to the store room to be subsequently drawn by the cooking plant. These meat potions are known as “donor meat” or simply “donor.”
The cooking plant consists of three subdepart-ments—preparation, cooking, and packing. According to the production schedule, the preparation unit draws the required quantity of donor meat from the store room. The donor portions are put through an injec-tion machine where pre-prepared brine (marinade) is injected into the meat. The injected portions are spread over the table and colored powder is hand sprinkled, which gives the meat a golden brown color after cooking. The injected portions are then stacked on trolleys, which are subsequently loaded into an oven for cooking. A trolley has five trays, and a maximum of 120 (24 x 5) portions can be racked into one trol-ley. Usually a cooking batch consists of four trolleys or 480 (120 x 4) portions, as the maximum number of trolleys that can be loaded into a cooker is four.
The product goes through a preprogrammed cook-ing cycle (about two hours duration) developed by the PD team for the CP. At the end of the cooking cycle, the product is moved to an intensive chiller, where the product core temperature is brought down to 0 degrees C. The product is then taken out of the inten-sive chiller, and each portion is individually weighed
Total CP Finished Product Rejects
UCL=0.2856–P=0.2166
LCL=0.1476
Prop
ortio
n
Pack off date
0.7
0.6
0.5
0.4
0.3
0.2
0.1
0.0
27-Nov
1-Dec
8-Dec
17-Dec
29-Dec
8-Jan
22-Ja
n2-F
eb9-F
eb18
-Feb
25-Fe
b
Figure 2 CP production rejects prior to the implementation of sPC.
©20
11, a
sQ
Responsibility for Product Quality Problems in Sequential Manufacturing: A Case Study From the Meat Industry
10 QMJ vol. 18, no. 1/© 2011, asQ
Although the production staff was initially sup-portive, they were increasingly frustrated with the mindless data collection (weights of 24 meat por-tions five times per batch over several months) with no apparent improvements. The production staff believed most of the finished product weight varia-tion and the high rejection rates were beyond their control and that the product was unresolved when it was handed over to them. On the other hand, the PD team believed the product was manufacturable and the production staff was incompetent and was not following the production procedures. Senior man-agement was concerned that it was taking too long to resolve the production and quality issues and that the product was turning out to be unprofitable.
Having realized the situation was not going to improve, five months after the introduction of the product (seven months after the initial production tri-als), the company’s regional manager formed a project team with the objective of reducing the CP rejects to less than 5 percent within six weeks. The project team consisted of the respective plant production manager, the food technologist, a few production staff mem-bers, and the author (a management consultant with extensive SPC background) as project manager. In addition to actually reducing the reject levels, man-agement and the project team wanted answers to the following questions: Why were the production reject rates so high? Was it a product design prob-lem or was it the incompetence of production? Were
As the company continued to experience quality problems with the product, they assigned a food tech-nologist to help with the production and quality issues. During the first few months, the food technologist and production team collected huge amounts of data and made frequent changes to a number of produc-tion processes hoping to improve the situation. For example, the production staff was asked to tag 24 por-tions in the processing plant and track their weights through the production process (24 x 5 process stages x 5 days a week). To control portion weights, 100 per-cent inspection was added before and after injection. This inspection required weighing 480 meat portions twice every weekday. Unfortunately, these changes only increased handling of the product and production costs with no tangible improvements to product quality.
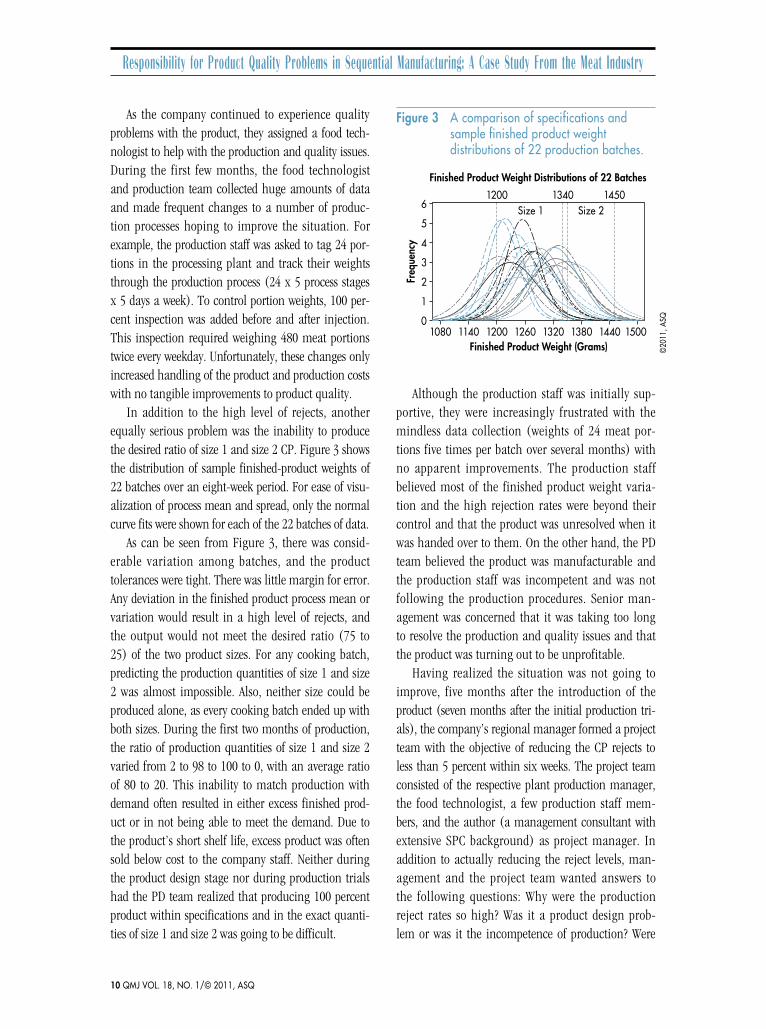
In addition to the high level of rejects, another equally serious problem was the inability to produce the desired ratio of size 1 and size 2 CP. Figure 3 shows the distribution of sample finished-product weights of 22 batches over an eight-week period. For ease of visu-alization of process mean and spread, only the normal curve fits were shown for each of the 22 batches of data.
As can be seen from Figure 3, there was consid-erable variation among batches, and the product tolerances were tight. There was little margin for error. Any deviation in the finished product process mean or variation would result in a high level of rejects, and the output would not meet the desired ratio (75 to 25) of the two product sizes. For any cooking batch, predicting the production quantities of size 1 and size 2 was almost impossible. Also, neither size could be produced alone, as every cooking batch ended up with both sizes. During the first two months of production, the ratio of production quantities of size 1 and size 2 varied from 2 to 98 to 100 to 0, with an average ratio of 80 to 20. This inability to match production with demand often resulted in either excess finished prod-uct or in not being able to meet the demand. Due to the product’s short shelf life, excess product was often sold below cost to the company staff. Neither during the product design stage nor during production trials had the PD team realized that producing 100 percent product within specifications and in the exact quanti-ties of size 1 and size 2 was going to be difficult.
Freq
uenc
y
Finished Product Weight (Grams)
Finished Product Weight Distributions of 22 Batches
6
5
1080 1140 1200
1200Size 1 Size 2
1340 1450
1260 1320 1380 1440 1500
4
3
2
1
0
Figure 3 a comparison of specifications and sample finished product weight distributions of 22 production batches.
©20
11, a
sQ
Responsibility for Product Quality Problems in Sequential Manufacturing: A Case Study From the Meat Industry
www.asq.org 11
the production processes capable of producing 100 percent products within the tolerance range? The focus of this paper is on rejects due to the product being under or overweight, which at the start of this study accounted for more than 50 percent of the rejects.
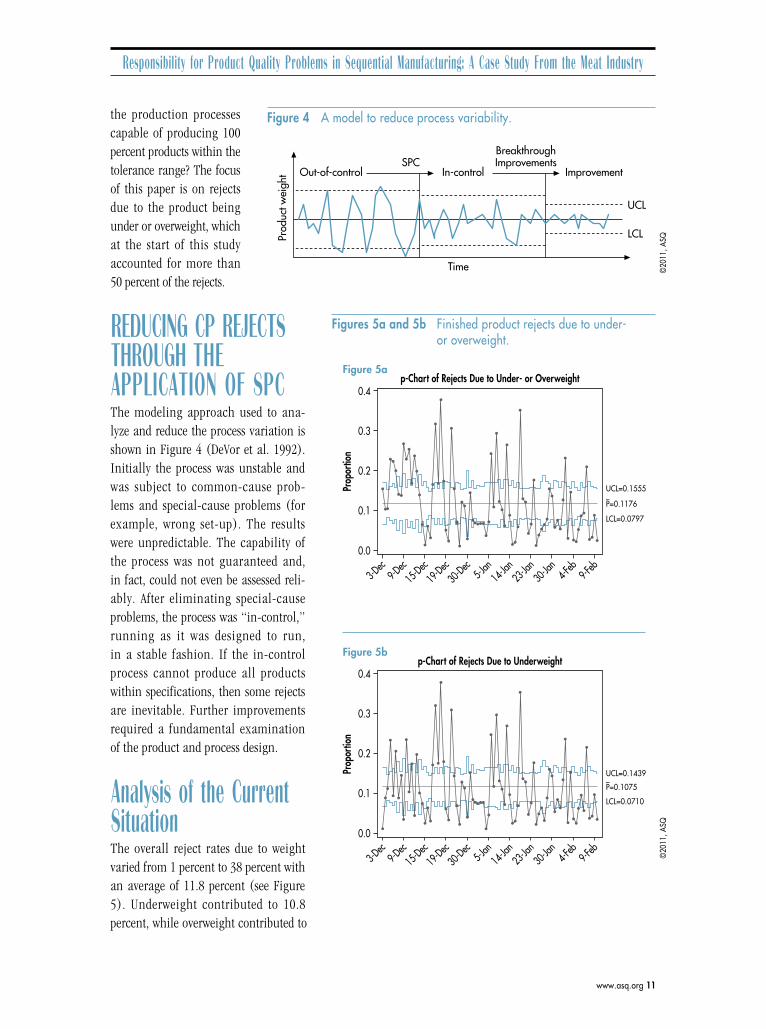
REDUCING CP REJECTS THROUGH THE APPLICATION OF SPC The modeling approach used to ana-lyze and reduce the process variation is shown in Figure 4 (DeVor et al. 1992). Initially the process was unstable and was subject to common-cause prob-lems and special-cause problems (for example, wrong set-up). The results were unpredictable. The capability of the process was not guaranteed and, in fact, could not even be assessed reli-ably. After eliminating special-cause problems, the process was “in-control,” running as it was designed to run, in a stable fashion. If the in-control process cannot produce all products within specifications, then some rejects are inevitable. Further improvements required a fundamental examination of the product and process design.
Analysis of the Current SituationThe overall reject rates due to weight varied from 1 percent to 38 percent with an average of 11.8 percent (see Figure 5). Underweight contributed to 10.8 percent, while overweight contributed to
Prod
uct w
eigh
t
UCL
LCL
SPCIn-control ImprovementOut-of-control
BreakthroughImprovements
Time
Figure 4 a model to reduce process variability.
©20
11, a
sQ
Figure 5ap-Chart of Rejects Due to Under- or Overweight
Figure 5bp-Chart of Rejects Due to Underweight
UCL=0.1555–P=0.1176
LCL=0.0797
Prop
ortio
n
0.4
0.3
0.2
0.1
0.0
3-Dec
9-Dec
15-Dec
19-Dec
30-Dec
5-Jan
14-Ja
n23
-Jan
30-Ja
n4-F
eb9-F
eb
UCL=0.1439–P=0.1075
LCL=0.0710
Prop
ortio
n
0.4
0.3
0.2
0.1
0.0
3-Dec
9-Dec
15-Dec
19-Dec
30-Dec
5-Jan
14-Ja
n23
-Jan
30-Ja
n4-F
eb9-F
eb
Figures 5a and 5b finished product rejects due to under- or overweight.
©20
11, a
sQ
Responsibility for Product Quality Problems in Sequential Manufacturing: A Case Study From the Meat Industry
12 QMJ vol. 18, no. 1/© 2011, asQ
Samp
le M
ean
Sample
After ImprovementsBefore ImprovementsXbar-S Chart of CP Finished Product WeightsFigure 6a
Tests performed with unequal sample sizes
1350
1300
1250
1200
1150
Nov-Jan Feb-Apr May-Jun Jul-Aug
1 12 23 34 45 56 67 78 89 100
Samp
le St
Dev
Sample
100
75
50
25
0
1 2 3 4
1 12 23 34 45 56 67 78 89 100
Samp
le M
ean
Sample
After ImprovementsBefore ImprovementsXbar-S Chart of Post Injection WeightsFigure 6b
Tests performed with unequal sample sizes
1900
1900
1700
Nov-Jan Feb-Apr May-Jun Jul-Aug
1 12 23 34 45 56 67 78 89 100
Samp
le St
Dev
Sample
80
60
40
0
1 2 3 4
1 12 23 34 45 56 67 78 89 100
1
11 1 1 1
1
11
11
1
UCL=1309.8
=X=1275.6
LCL=1241.4
UCL=78.6
–S=54.0
LCL=29.5
UCL=1348.6
=X=1280.5
LCL=1212.5
UCL=99.6
–S=47.7
LCL=0
UCL=1345.9
=X=1284.9
LCL=1223.9
UCL=93.3
–S=47.4
LCL=1.4
UCL=1346.3
=X=1290.5
LCL=1234.7
UCL=85.4
–S=43.3
LCL=1.3
UCL=1816.2=X=1781.6
LCL=1747.1
UCL=80.6
–S=55.8
LCL=31.0
UCL=1838.0
=X=1779.6
LCL=1721.1
UCL=85.5
–S=40.9
LCL=0
UCL=1849.0
=X=1792.7
LCL=1736.3
UCL=86.2
–S=43.8
LCL=1.3
UCL=1848.1
=X=1797.4
LCL=1746.6
UCL=77.7
–S=39.4
LCL=1.2
1
1 11
11
11
11
1 11
1
1
1 11
1 11
1
11 1
1
1
1
1 1 11
1
1 1
11
1 1 11
11 1 1
11
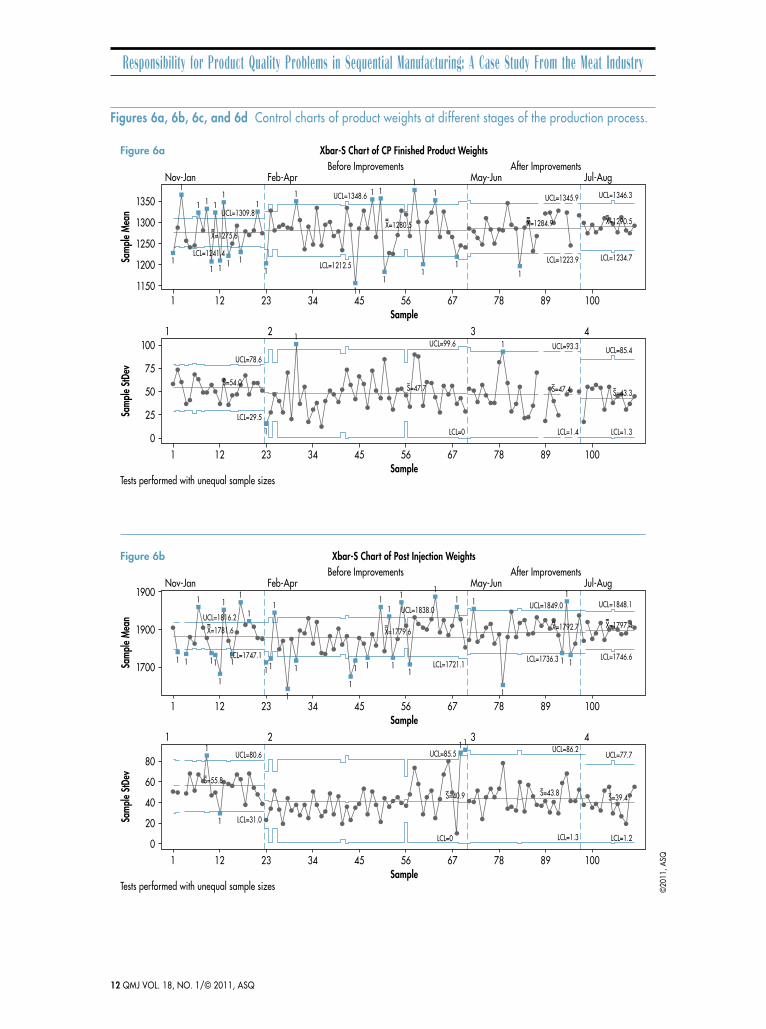
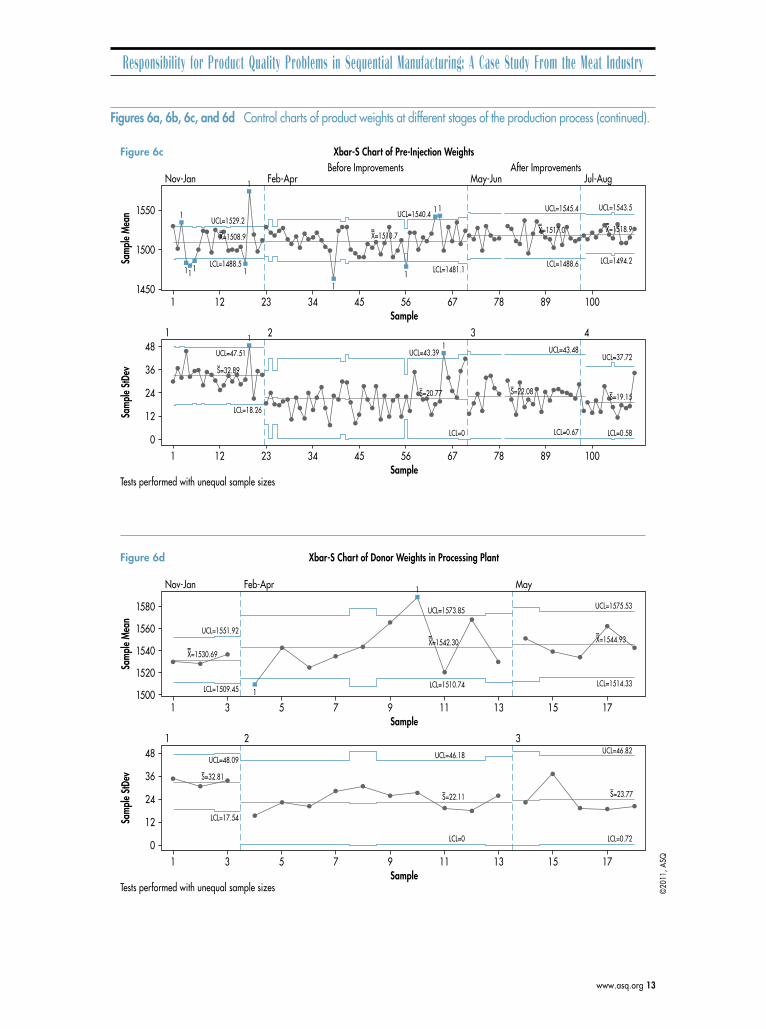
Figures 6a, 6b, 6c, and 6d Control charts of product weights at different stages of the production process.
©20
11, a
sQ
Responsibility for Product Quality Problems in Sequential Manufacturing: A Case Study From the Meat Industry
www.asq.org 13
Samp
le M
ean
Sample
After ImprovementsBefore ImprovementsXbar-S Chart of Pre-Injection WeightsFigure 6c
Tests performed with unequal sample sizes
1550
1500
1450
Nov-Jan Feb-Apr May-Jun Jul-Aug
1 12 23 34 45 56 67 78 89 100
Samp
le St
Dev
Sample
48
36
24
12
0
1 2 3 4
1 12 23 34 45 56 67 78 89 100
Samp
le M
ean
Sample
Xbar-S Chart of Donor Weights in Processing PlantFigure 6d
Tests performed with unequal sample sizes
1580
1560
1540
1520
Nov-Jan Feb-Apr May
Samp
le St
Dev
Sample
48
36
24
12
0
1 2 3
1 3 5 7 9 11 13 15 17
1 3 5 7 9 11 13 15 17
UCL=1529.2=X=1508.9
LCL=1488.5
UCL=47.51–S=32.89
LCL=18.26
UCL=1540.4
=X=1510.7
LCL=1481.1
UCL=43.39
–S=20.77
LCL=0
UCL=1545.4
=X=1517.0
LCL=1488.6
UCL=43.48
–S=22.08
LCL=0.67
UCL=1543.5
=X=1518.9
LCL=1494.2
UCL=37.72
–S=19.15
LCL=0.58
UCL=1551.92
=X=1530.69
LCL=1509.45
UCL=48.09–S=32.81
LCL=17.54
UCL=1573.85
=X=1542.30
LCL=1510.74
UCL=46.18
–S=22.11
LCL=0
UCL=1575.53
=X=1544.93
LCL=1514.33
UCL=46.82
–S=23.77
LCL=0.72
1
11 1 1
11
1 1
11
1
1
1
Figures 6a, 6b, 6c, and 6d Control charts of product weights at different stages of the production process (continued).
©20
11, a
sQ
Responsibility for Product Quality Problems in Sequential Manufacturing: A Case Study From the Meat Industry
14 QMJ vol. 18, no. 1/© 2011, asQ
Bringing Processes Into Statistical ControlAs the finished product weight depended on donor weight and other up-stream processes, a control chart and process capability analysis of all process stages was undertaken. For each of these process stages, improvements were identified and implemented. These are discussed next.
Donor weights
All donor portions met the specifications, as each meat portion was weighed individually before being considered as donor for CP. There were no measure-ment errors, as the scales were calibrated every day. The donor weights were largely in statistical control (see Figure 6d). The question was what should be the optimal specifications for this stage? Were the target and tolerances set correctly? These issues are addressed later in the paper.
Donor weights prior to injection
Donor meat supplied by the processing plant is further processed through the injector. The preparation unit orders donor meat each day, but the quantity ordered
1 percent (see Figure 5) of all rejects. Rejects due to underweight and overweight, and total rejects were hardly in statistical control. Due to high reject rates, the production department unilaterally decided to increase the upper limit by another 20 grams from 1430 grams to 1450 grams. They also made changes to the donor weight specifications. This immediately reduced the reported rejects due to overweight.
Analysis of average and standard deviation con-trol charts for finished product weight as well as all weights at all upstream process stages showed that all processes, except for donor meat, were out-of-control (samples 1 to 70, see Figure 6a, 6b, and 6c, and samples 1 to 13, see Figure 6d). For all process stages, the standard deviation charts remained close to statistical control, while the aver-age charts were consistently out-of-control. Clearly there were erratic process shifts in process mean at pre-injection, post-injection, and after cooking. The only process that was largely in-control was the donor weight in the process plant (see Figure 6d). As there were no process control issues with donor meat, minimal data were collected from this stage of the process. A detailed analysis of each of the process stages and improvements made is presented in the next section.
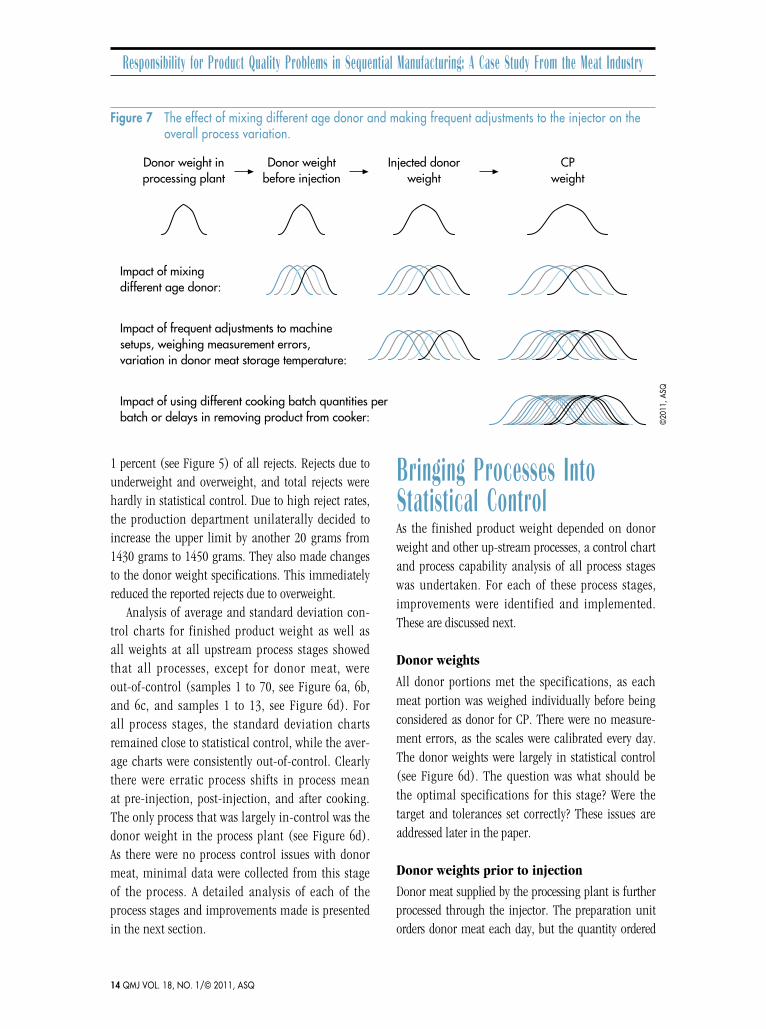
Impact of using different cooking batch quantities perbatch or delays in removing product from cooker:
Impact of frequent adjustments to machinesetups, weighing measurement errors,variation in donor meat storage temperature:
Impact of mixingdifferent age donor:
Donor weight inprocessing plant
Donor weightbefore injection
Injected donorweight
CPweight
Figure 7 the effect of mixing different age donor and making frequent adjustments to the injector on the overall process variation.
©20
11, a
sQ
Responsibility for Product Quality Problems in Sequential Manufacturing: A Case Study From the Meat Industry
www.asq.org 15
the main causes of the out-of-control situation was the mixing of different-age donor into one cooking batch (see Figure 7).
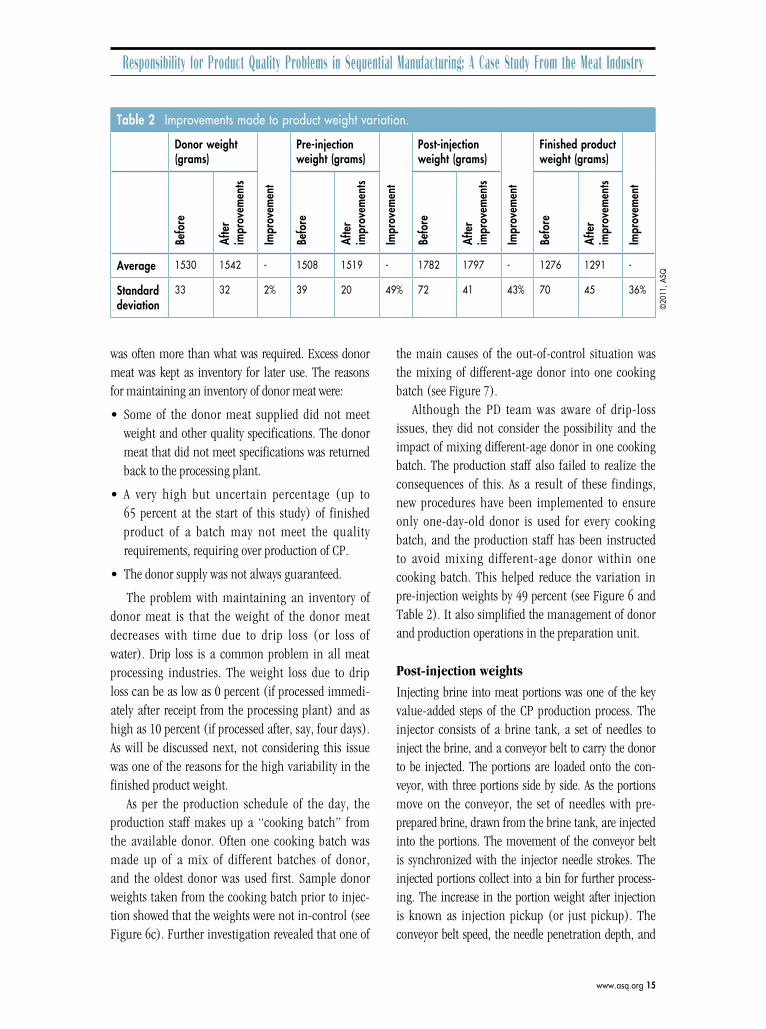
Although the PD team was aware of drip-loss issues, they did not consider the possibility and the impact of mixing different-age donor in one cooking batch. The production staff also failed to realize the consequences of this. As a result of these findings, new procedures have been implemented to ensure only one-day-old donor is used for every cooking batch, and the production staff has been instructed to avoid mixing different-age donor within one cooking batch. This helped reduce the variation in pre-injection weights by 49 percent (see Figure 6 and Table 2). It also simplified the management of donor and production operations in the preparation unit.
Post-injection weights
Injecting brine into meat portions was one of the key value-added steps of the CP production process. The injector consists of a brine tank, a set of needles to inject the brine, and a conveyor belt to carry the donor to be injected. The portions are loaded onto the con-veyor, with three portions side by side. As the portions move on the conveyor, the set of needles with pre-prepared brine, drawn from the brine tank, are injected into the portions. The movement of the conveyor belt is synchronized with the injector needle strokes. The injected portions collect into a bin for further process-ing. The increase in the portion weight after injection is known as injection pickup (or just pickup). The conveyor belt speed, the needle penetration depth, and
was often more than what was required. Excess donor meat was kept as inventory for later use. The reasons for maintaining an inventory of donor meat were:
• Some of the donor meat supplied did not meet weight and other quality specifications. The donor meat that did not meet specifications was returned back to the processing plant.
• A very high but uncertain percentage (up to 65 percent at the start of this study) of finished product of a batch may not meet the quality requirements, requiring over production of CP.
• The donor supply was not always guaranteed.
The problem with maintaining an inventory of donor meat is that the weight of the donor meat decreases with time due to drip loss (or loss of water). Drip loss is a common problem in all meat processing industries. The weight loss due to drip loss can be as low as 0 percent (if processed immedi-ately after receipt from the processing plant) and as high as 10 percent (if processed after, say, four days). As will be discussed next, not considering this issue was one of the reasons for the high variability in the finished product weight.
As per the production schedule of the day, the production staff makes up a “cooking batch” from the available donor. Often one cooking batch was made up of a mix of different batches of donor, and the oldest donor was used first. Sample donor weights taken from the cooking batch prior to injec-tion showed that the weights were not in-control (see Figure 6c). Further investigation revealed that one of
table 2 improvements made to product weight variation.
Donor weight (grams)
Impr
ovem
ent
Pre-injection weight (grams)
Impr
ovem
ent
Post-injection weight (grams)
Impr
ovem
ent
Finished product weight (grams)
Impr
ovem
ent
Befo
re
afte
r im
prov
emen
ts
Befo
re
afte
r im
prov
emen
ts
Befo
re
afte
r im
prov
emen
ts
Befo
re
afte
r im
prov
emen
ts
average 1530 1542 - 1508 1519 - 1782 1797 - 1276 1291 -
standard deviation
33 32 2% 39 20 49% 72 41 43% 70 45 36%
©20
11, a
sQ
Responsibility for Product Quality Problems in Sequential Manufacturing: A Case Study From the Meat Industry
16 QMJ vol. 18, no. 1/© 2011, asQ
(Grant and Leavenworth 1988; Joiner 1994). The injector was relatively new and was regularly cleaned and maintained. If the production staff had used the same machine settings, it was unlikely that the mean pickup would change from batch to batch. The best approach in this case would be to find the optimal machine settings and make machine adjustments only if there is enough evidence that the pickup has changed. Second, for the level of pickup variation, a sample size of three was too small to detect shifts in process mean or variance. Third, getting one pickup value from three portions was an inefficient method. Weighing the three portions individually and calcu-lating three pickup values provided more information about the process mean and variation.
Further investigation revealed a more serious problem — measurement error — making most of the data collected during the previous months unre-liable. The method of weighing injected portions was incorrect and, therefore, the weight and the pickup measurements were inaccurate and unreli-able. After injection, the excess brine, being gluey, was taking time to drain away from the portions. Some operators weighed the portions immediately after injection, while others weighed them after the excess brine had completely drained. With the first approach, the calculated pickup was often higher than the true pickup by up to 5 percent. This often led to a machine setting that gave much lower true pickup, causing high rejects due to underweight at packing. Because the production staff was aware that the rejects due to being underweight were usually high, some of the operators tried to improve the situ-ation by adjusting the setup to achieve a measured (albeit inaccurate) pickup of about 22 percent. They were also aware that they needed to be careful not to over-correct, as this could lead to more size 2 CP products (ideally, the ratio of size 1 to size 2 should be 75 percent to 25 percent within any production batch) and higher rejects due to overweight. For the production staff, it was a fine balance getting the injector set up correctly.
As a result of these findings, the following three improvements were made to this stage of the produc-tion process.
the brine pumping pressure can be adjusted to the desired pickup and production rate. Factors that affect pickup include pumping pressure, needle maintenance (cleaned and not bent), and product and brine tem-perature. For example, if the donor is below 2 degrees C, the meat is like a brick and it is difficult to pump brine into the meat. The result is lower pickup.
The injection pickup specifications were 20 percent ± 1 percent (see Table 1). Actual pickups, however, varied from 4 percent to 35 percent, with only a small fraction meeting specifications. The pickup was not in statistical control and neither was the weight of the portions after the injection (see Figure 6b). The opera-tors used the nominal specifications of 20 percent as a target to set the machine. The product, however, is not 100 percent inspected at this stage and hence it is not rejected at this stage. Actual observation of the setup procedure used by different operators provided insights into the causes of some of the variation at injection. The out-of-control situations at this stage of the pro-cess were often the result of using an incorrect injector setup method. Between-operator variation further con-tributed to the process variation for this stage of the production. The operators used the following procedure at the start of each batch.
1. Collect three donor portions (before injection) into a tray and weigh them together.
2. Using the settings used for the last batch, inject these three portions.
3. Once again weigh these three portions together and calculate the injection pickup.
4. If, in the operator’s judgement, the pickup was considerably higher or lower than 20 percent, adjust the machine settings and repeat the afore-mentioned procedure once again on another set of three donor portions.
5. Repeat the previous procedure until the operator is satisfied with the pickup.
There were three problems with this method. First, it required unnecessary and frequent adjustments to the machine settings, which was a reaction to common-cause variation (tinkering with a stable process) and would only increase process variation
Responsibility for Product Quality Problems in Sequential Manufacturing: A Case Study From the Meat Industry
www.asq.org 17
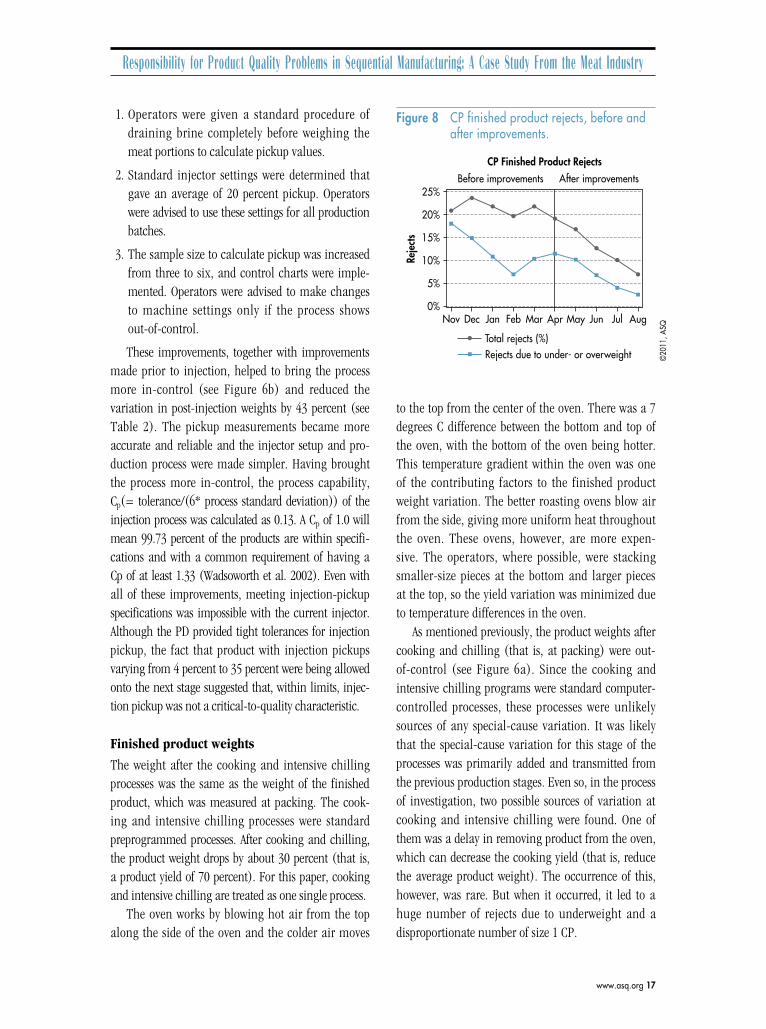
to the top from the center of the oven. There was a 7 degrees C difference between the bottom and top of the oven, with the bottom of the oven being hotter. This temperature gradient within the oven was one of the contributing factors to the finished product weight variation. The better roasting ovens blow air from the side, giving more uniform heat throughout the oven. These ovens, however, are more expen-sive. The operators, where possible, were stacking smaller-size pieces at the bottom and larger pieces at the top, so the yield variation was minimized due to temperature differences in the oven.
As mentioned previously, the product weights after cooking and chilling (that is, at packing) were out-of-control (see Figure 6a). Since the cooking and intensive chilling programs were standard computer-controlled processes, these processes were unlikely sources of any special-cause variation. It was likely that the special-cause variation for this stage of the processes was primarily added and transmitted from the previous production stages. Even so, in the process of investigation, two possible sources of variation at cooking and intensive chilling were found. One of them was a delay in removing product from the oven, which can decrease the cooking yield (that is, reduce the average product weight). The occurrence of this, however, was rare. But when it occurred, it led to a huge number of rejects due to underweight and a disproportionate number of size 1 CP.
1. Operators were given a standard procedure of draining brine completely before weighing the meat portions to calculate pickup values.
2. Standard injector settings were determined that gave an average of 20 percent pickup. Operators were advised to use these settings for all production batches.
3. The sample size to calculate pickup was increased from three to six, and control charts were imple-mented. Operators were advised to make changes to machine settings only if the process shows out-of-control.
These improvements, together with improvements made prior to injection, helped to bring the process more in-control (see Figure 6b) and reduced the variation in post-injection weights by 43 percent (see Table 2). The pickup measurements became more accurate and reliable and the injector setup and pro-duction process were made simpler. Having brought the process more in-control, the process capability, Cp(= tolerance/(6* process standard deviation)) of the injection process was calculated as 0.13. A Cp of 1.0 will mean 99.73 percent of the products are within specifi-cations and with a common requirement of having a Cp of at least 1.33 (Wadsoworth et al. 2002). Even with all of these improvements, meeting injection-pickup specifications was impossible with the current injector. Although the PD provided tight tolerances for injection pickup, the fact that product with injection pickups varying from 4 percent to 35 percent were being allowed onto the next stage suggested that, within limits, injec-tion pickup was not a critical-to-quality characteristic.
Finished product weights
The weight after the cooking and intensive chilling processes was the same as the weight of the finished product, which was measured at packing. The cook-ing and intensive chilling processes were standard preprogrammed processes. After cooking and chilling, the product weight drops by about 30 percent (that is, a product yield of 70 percent). For this paper, cooking and intensive chilling are treated as one single process.
The oven works by blowing hot air from the top along the side of the oven and the colder air moves
CP Finished Product Rejects
Reje
cts
Before improvements After improvements25%
20%
15%
10%
5%
0%AugJulJunMayAprMarFebJanDecNov
Rejects due to under- or overweight Total rejects (%)
Figure 8 CP finished product rejects, before and after improvements.
©20
11, a
sQ
Responsibility for Product Quality Problems in Sequential Manufacturing: A Case Study From the Meat Industry
18 QMJ vol. 18, no. 1/© 2011, asQ
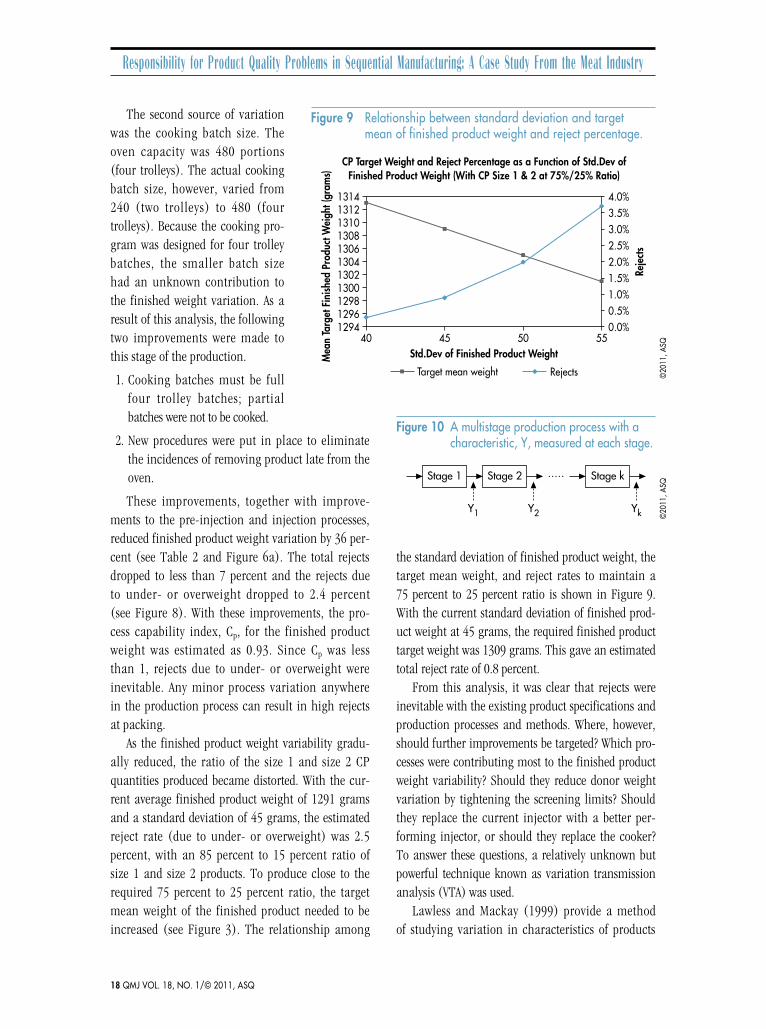
the standard deviation of finished product weight, the target mean weight, and reject rates to maintain a 75 percent to 25 percent ratio is shown in Figure 9. With the current standard deviation of finished prod-uct weight at 45 grams, the required finished product target weight was 1309 grams. This gave an estimated total reject rate of 0.8 percent.
From this analysis, it was clear that rejects were inevitable with the existing product specifications and production processes and methods. Where, however, should further improvements be targeted? Which pro-cesses were contributing most to the finished product weight variability? Should they reduce donor weight variation by tightening the screening limits? Should they replace the current injector with a better per-forming injector, or should they replace the cooker? To answer these questions, a relatively unknown but powerful technique known as variation transmission analysis (VTA) was used.
Lawless and Mackay (1999) provide a method of studying variation in characteristics of products
The second source of variation was the cooking batch size. The oven capacity was 480 portions (four trolleys). The actual cooking batch size, however, varied from 240 (two trolleys) to 480 (four trolleys). Because the cooking pro-gram was designed for four trolley batches, the smaller batch size had an unknown contribution to the finished weight variation. As a result of this analysis, the following two improvements were made to this stage of the production.
1. Cooking batches must be full four trolley batches; partial batches were not to be cooked.
2. New procedures were put in place to eliminate the incidences of removing product late from the oven.
These improvements, together with improve-ments to the pre-injection and injection processes, reduced finished product weight variation by 36 per-cent (see Table 2 and Figure 6a). The total rejects dropped to less than 7 percent and the rejects due to under- or overweight dropped to 2.4 percent (see Figure 8). With these improvements, the pro-cess capability index, Cp, for the finished product weight was estimated as 0.93. Since Cp was less than 1, rejects due to under- or overweight were inevitable. Any minor process variation anywhere in the production process can result in high rejects at packing.
As the finished product weight variability gradu-ally reduced, the ratio of the size 1 and size 2 CP quantities produced became distorted. With the cur-rent average finished product weight of 1291 grams and a standard deviation of 45 grams, the estimated reject rate (due to under- or overweight) was 2.5 percent, with an 85 percent to 15 percent ratio of size 1 and size 2 products. To produce close to the required 75 percent to 25 percent ratio, the target mean weight of the finished product needed to be increased (see Figure 3). The relationship among
13141312131013081306130413021300129812961294
4.0%3.5%3.0%2.5%2.0%1.5%1.0%0.5%0.0%
40 45 50 55M
ean
Targ
et F
inish
ed P
rodu
ct W
eigh
t (gr
ams)
Reje
cts
CP Target Weight and Reject Percentage as a Function of Std.Dev ofFinished Product Weight (With CP Size 1 & 2 at 75%/25% Ratio)
Std.Dev of Finished Product Weight
Target mean weight Rejects
Figure 9 relationship between standard deviation and target mean of finished product weight and reject percentage.
©20
11, a
sQ
Y1 Y2 Yk
Stage 1 Stage 2 ..... Stage k
Figure 10 a multistage production process with a characteristic, y, measured at each stage.
©20
11, a
sQ
Responsibility for Product Quality Problems in Sequential Manufacturing: A Case Study From the Meat Industry
www.asq.org 19
The component of variance b2k b
2k-1 … b2
i-1s2i A
can be interpreted as the amount of variation in Yk that is added at stage i and then transmitted through the remaining stages. The term s2
kA is the amount
that move through a multistage manufacturing pro-cess. They suggest simple regression and analysis of variance tools to study the amount of variation attributable to different stages of the process and to identify opportunities for variation reduction. A brief description of this model is described next followed by the application of this method to CP production.
VARIATION TRANSMISSION ANALYSIS Suppose a characteristic Y is measured at each of k pro-cess stages and denote the measurement at stage i as Yi (see Figure 10). The final product characteristic is Yk.
The model makes the following assumptions:
1. Y1 ~ N (µ1,s12). That is, Y1 follows normal distri-
bution with mean µ1 and variance s12.
2. The distribution of Yi, given the history of the item up to stage i-1, depends only on Yi-1. This means that any stage of the process has no “memory” of its distant past beyond the previous stage.
3. The relationship between Yi and Yi-1 is given by the following regression equation.
4. Yi = αi + bi Yi-1 + ei, i = 2, … k, where αi and bi are regression coefficients and ei’s are independent with ei ~ N(0, s2
iA).
Given the previous model assumptions, the varia-tion in Yk can be decomposed into components attributed to each stage i = 1, 2, ..k as follows
s2k = s2
kA + b2k s
2k-1,A + … + b2
k b2k-1 … b2
2 s21
Figure 12a
Figure 12b
Figure 12c
1600156015201480
1580Slope = 1.0Res. Std. Dev. = 5.4
1540
1500
1460Pre-
inje
ctio
n w
eigh
t (gr
ams)
Donor weight (grams)
1580154015001460
1840
1800
1760
1720
1680
Slope = 1.2
Res. Std. Dev. = 26.4
1640Post-
inje
ctio
n w
eigh
t (gr
ams)
Pre-injection weight (grams)
18201660 1700 1740 1780
1380
1350
1300
1260
1220
1180
Slope = 0.7Res. Std. Dev. = 29.7
1140Fina
l pro
duct
wei
ght (
gram
s)
Post-injection weight (grams)
Figure 12a, b, and c scatter plots of product weights between pairs of consecutive processes.
©20
11, a
sQ
Prod
uct w
eigh
t (gr
ams)
CookingInjectionPre-injectionDonor
190018001700160015001400130012001100
Figure 11 weights of meat portions as they move through different stages of production.
©20
11, a
sQ
Responsibility for Product Quality Problems in Sequential Manufacturing: A Case Study From the Meat Industry
20 QMJ vol. 18, no. 1/© 2011, asQ
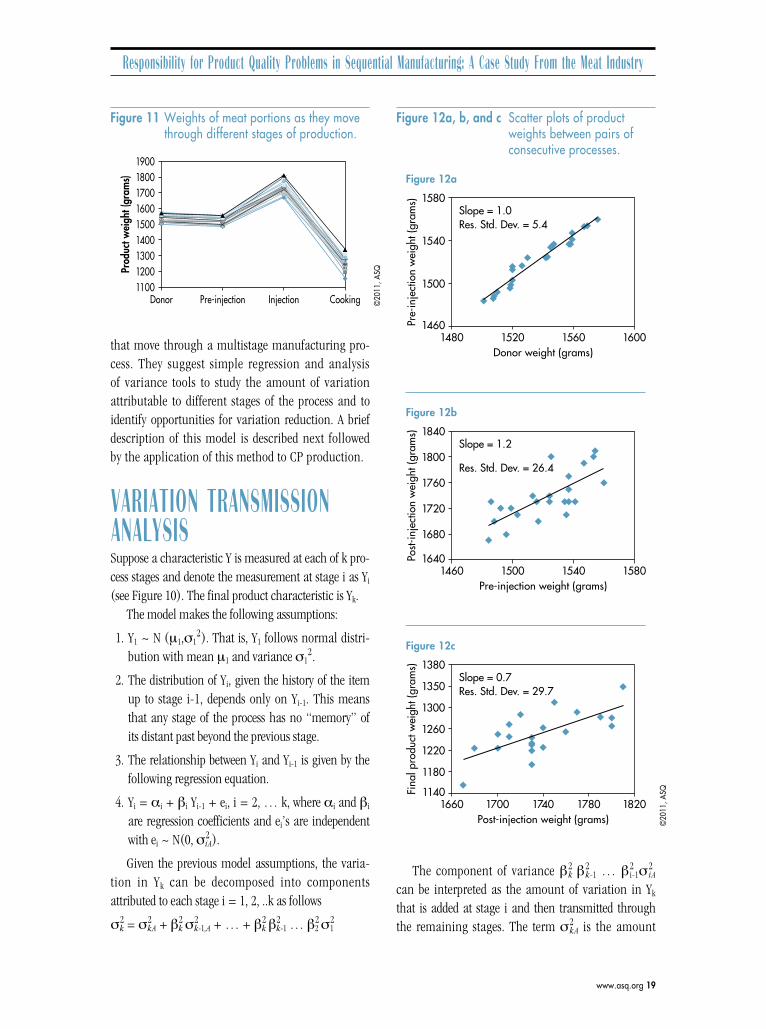
weight and pre-injection weight support this finding. Between pre-injection and post-injection some lines are parallel and others have splayed out indicating transmission of variation as well as some magnifica-tion of variation (see Figure 11). These findings were supported by regression analysis, which gave a regres-sion slope of 1.2 and a residual standard deviation of 26.4. Referring to Figure 11 again, between injection and cooking, some lines are parallel and others are criss-crossed, indicating some level of transmission of variation and some added variation (some small values became large and some large values became small). Again, a regression slope of 0.72 and a residual variance of 29.7 support this finding.
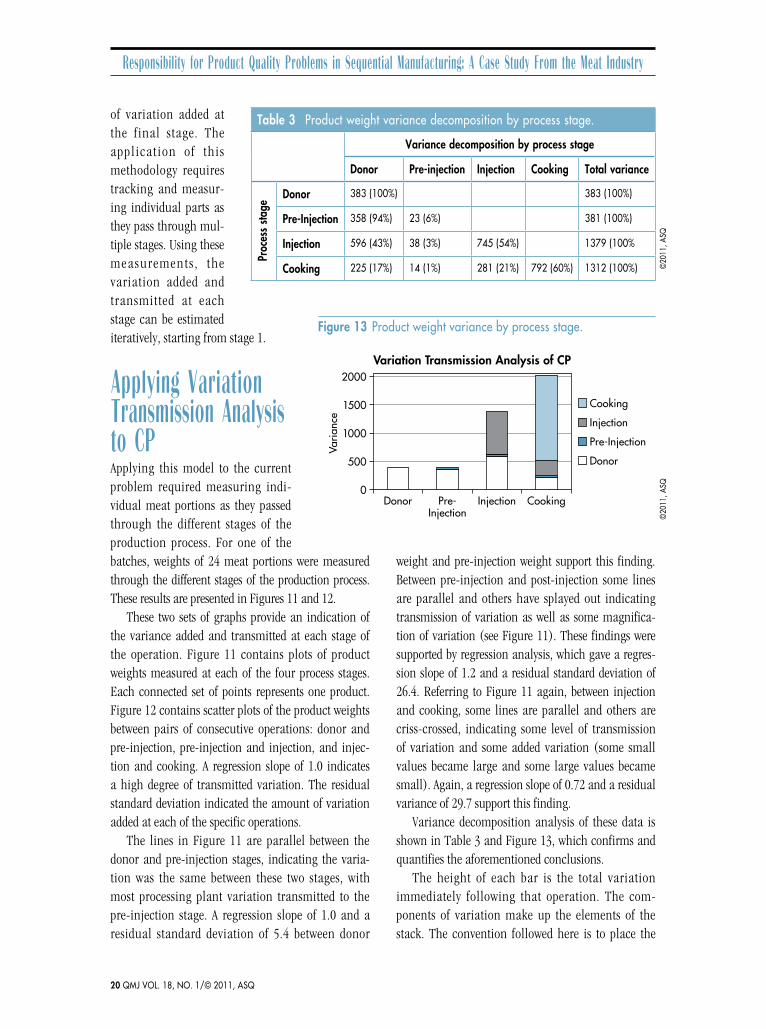
Variance decomposition analysis of these data is shown in Table 3 and Figure 13, which confirms and quantifies the aforementioned conclusions.
The height of each bar is the total variation immediately following that operation. The com-ponents of variation make up the elements of the stack. The convention followed here is to place the
of variation added at the final stage. The appl icat ion of this methodology requires tracking and measur-ing individual parts as they pass through mul-tiple stages. Using these measurements , the variation added and transmitted at each stage can be estimated iteratively, starting from stage 1.
Applying Variation Transmission Analysis to CPApplying this model to the current problem required measuring indi-vidual meat portions as they passed through the different stages of the production process. For one of the batches, weights of 24 meat portions were measured through the different stages of the production process. These results are presented in Figures 11 and 12.
These two sets of graphs provide an indication of the variance added and transmitted at each stage of the operation. Figure 11 contains plots of product weights measured at each of the four process stages. Each connected set of points represents one product. Figure 12 contains scatter plots of the product weights between pairs of consecutive operations: donor and pre-injection, pre-injection and injection, and injec-tion and cooking. A regression slope of 1.0 indicates a high degree of transmitted variation. The residual standard deviation indicated the amount of variation added at each of the specific operations.
The lines in Figure 11 are parallel between the donor and pre-injection stages, indicating the varia-tion was the same between these two stages, with most processing plant variation transmitted to the pre-injection stage. A regression slope of 1.0 and a residual standard deviation of 5.4 between donor
Variation Transmission Analysis of CP2000
1500
1000
500
0Donor Pre-
InjectionInjection Cooking
Cooking
Injection
Pre-Injection
Donor
Varia
nce
Figure 13 Product weight variance by process stage.
©20
11, a
sQ
table 3 Product weight variance decomposition by process stage.
Variance decomposition by process stage
Donor Pre-injection Injection Cooking total variance
Proc
ess s
tage
Donor 383 (100%) 383 (100%)
Pre-Injection 358 (94%) 23 (6%) 381 (100%)
Injection 596 (43%) 38 (3%) 745 (54%) 1379 (100%
Cooking 225 (17%) 14 (1%) 281 (21%) 792 (60%) 1312 (100%) ©20
11, a
sQ
Responsibility for Product Quality Problems in Sequential Manufacturing: A Case Study From the Meat Industry
www.asq.org 21
cooking cycles or replacing the current oven with a better one that cooks the products more uniformly. Any changes to cooker or cooking cycles would require the involvement of the PD team and follow-ing the new product development protocol, which the company was not keen to consider when this study was conducted.
CONCLUSIONSAlthough CP was considered to be an innovative prod-uct by the company and its customers, the product design and production processes were flawed from the manufacturability considerations. The production processes were incapable of producing the product. The PD team failed to consider the process capabil-ity of the injector and the oven when determining the product weight specifications. During the pre-production trials the PD team should have realized that rejects were inevitable and that there was very little control on the production quantities of size 1 and size 2. Unfortunately, at the same time, the pro-cess was failing to realize its full potential because of poor design and implementation of production methods. The production staff was unaware that they were adding more process variation through mixing different batches of product and frequent machine adjustments. Using SPC methods and work-ing with production teams, finished product rejects were reduced from more than 20 percent to less than 7 percent and, in particular, rejects due to under- or overweight were reduced from about 11 percent to 2.4 percent. Complete elimination of these rejects, however, was not possible. Through the application of the VTA technique, it was determined that 60 per-cent of the variation in the final product weight was contributed by the final production stage, namely cooking. The remaining variation was transmitted from previous production stages, with the injector contributing 20 percent and donor meat contributing 19 percent. Any significant reduction in final product weight variation could only be achieved by undertak-ing experimentation with alternative cooking cycles or replacing the current oven with a better one that cooks the products more uniformly.
component corresponding to the first operation at the bottom and then proceed upward in order, so the top component corresponds to the variation “added” at the operation. More than 60 percent of the finished product weight variation was added at the final stage of the production process, namely cooking. Almost all of the remaining variation was transmitted from the two upstream operations, with 21 percent from injection process and 17 percent from raw materials (donor). As it was to be expected, the variation transmitted from pre-injection stage was negligible (just 1 percent).
The cooking process is a very highly controlled and programmed process and any further reduc-tion in process variation contributed by this process required significant changes to the cooking cycle or replacing the current oven with a better one. It may be possible to make minor improvements to the injection process, such as making changes to machine settings and more regular machine main-tenance. According to the PD team, however, any further significant reduction in variation added by this process can only be achieved by replacing the injector with a better-performing injector. VTA anal-ysis, however, indicated that only one-fifth of the total variation in the finished product weight was contributed by the injector. At the time the study was conducted, the donor weight tolerance was 100 grams. To reduce the finished product variation, it was possible to marginally tighten the donor weight tolerance. Given only 17 percent of the finished prod-uct variation was due to the donor weight variation, however, tightening the donor specs was unlikely to make any significant reduction in finished product variation. Also, the tighter the specifications, the more difficult it is to meet the donor demand. Even with the existing specifications, there were some days when the processing plant was unable to meet the donor demand for CP.
It is clear from the previous analysis that unless the company reviews the finished product specifica-tions, any major improvements in final product weight variation can only be achieved by making changes to the cooking process. This almost cer-tainly involves experimentation with alternative
Responsibility for Product Quality Problems in Sequential Manufacturing: A Case Study From the Meat Industry
22 QMJ vol. 18, no. 1/© 2011, asQ
Grant, e. l., and r. s. leavenworth. 1988. Statistical quality control, 6th edition. new york: McGraw-Hill.
Hauser, J. r., and d. Clausing. 1988. the house of quality. Harvard Business Review 66, no. 3: 63-73.
Hegland, d. 2008. dfMa cuts downstream costs. Assembly 51, no. 6:46-49.
Joiner, b. l. 1994. Fourth generation management: The new busi-ness consciousness. new york: McGraw-Hill.
langowitz, n. 1991. becoming competitive through design for manufacturing. Industrial Management 33, no. 4:29-31.
lawless, J. f., and r. J. Mackay. 1999. analysis of variation transmission in manufacturing processes—Part i. Journal of Quality Technology 3, no. 2:131-142.
Miller, M., and s. raghavendra. 2005. designing for manufac-turing spreads. Solid State Technology 48, no. 2:80-81.
rusinko, C. a. 1999. exploring the use of design-manufacturing integration (dMi) to facilitate product development: a test of some practices. IEEE Transactions of Engineering Management 46, no. 1:56-71.
riedel, J. C. K. H., and K. s. Pawar. 1997. the consideration of production aspects during product design stages. Integrated Manufacturing Systems 8, no. 4:208-214.
tirpak, t. M. 2000. design-to-manufacturing information man-agement for electronics assembly. International Journal of Flexible Manufacturing Systems 12, no. 2 and 3:189.
youssef, M. a. 1994. design for manufacturability and time-to-market (Part 1). International Journal of Operations and Production Management 14, no. 12:6-21.
BIOGraPHY
Venkateswarlu Pulakanam has more than 30 years of academic and industry experience. He is currently a senior lecturer in the College of business and economics at University of Canterbury, Christchurch, new Zealand. Prior to moving to new Zealand, he was an academic staff member at the University of stirling, scotland, and national institute of industrial engineering, Mumbai, india. His teaching and research interests include quality, operations, and project management. Pulakanam has more than 30 peer-reviewed research publications. He was Mba director for three years at University of Canterbury and has worked in industry as process improvement manager and as a management consultant. He is a senior member of asQ and is an asQ Certified six sigma black belt.
This case underlines the need for DFM and DMI, and the consequences of ignoring manufac-turability considerations and poor DMI practices. Manufacturing and design need to cooperate in anticipating manufacturing issues earlier in the product development cycle. Product yield is not the responsibility of manufacturing alone. While the PD team was capable of designing new innova-tive products, they also need adequate training in manufacturing processes and the basic concepts of statistical variability and process capability. Product specifications must be determined based on a good understanding of product requirements and process capabilities.
The VTA is a relatively unknown but powerful process improvement technique with the potential for wide application in manufacturing industries involv-ing multistage production, particularly the chemical processing and engineering industries. This tech-nique can be used, as is demonstrated in this case, to understand the sources of variation and determine how much variation is added at different stages and how much of it is transmitted downstream. This information is useful to prioritize areas for process improvement.
reFerenCes
american electronic association. 1989. 1989 Productivity survey. santa Clara, Calif.: KPMG Peat Marwick.
british food Journal. 1995. European overview: Processed meat industry 97 no. 2:39-42.
Caputo, a. C., and P. M. Pelagagge. 2008. effects of product design on assembly lines performances: a concurrent engineer-ing approach. Industrial Management & Data Systems 108, no. 6:726-749.
devor, r. e., t. Chang, and J. w. sutherland. 1992. Statistical quality control design and control: Contemporary concepts and methods. englewood Cliffs, n.J.: Prentice Hall.
Govil, M. K., and e. b. Magrab. 2000. incorporating product concerns in conceptual product design. International Journal of Production Research. 38, no. 16:3823-43.