Residential Solar Energy in Flagstaff, Arizona: Practicality ...
76
Residential Solar Energy in Flagstaff, Arizona: Practicality, Progression, and Barriers By: Anna Alisse Highley Report of a Practicum Submitted in Partial Fulfillment of the Requirements for the Degree of Master of Science in Applied Geospatial Sciences Department of Geography, Planning and Recreation Northern Arizona University May 2014 Dawn Hawley, Ph.D., Committee Chair _________________________________________________ Alan Lew, Ph.D., Committee Member _________________________________________________ Hadassah Ziegler, Director of Operations at Rooftop Solar, Committee Member _________________________________________________
-
Upload
khangminh22 -
Category
Documents
-
view
0 -
download
0
Transcript of Residential Solar Energy in Flagstaff, Arizona: Practicality ...

Residential Solar Energy in Flagstaff, Arizona: Practicality, Progression, and Barriers
By: Anna Alisse Highley
Report of a Practicum Submitted in Partial Fulfillment
of the Requirements for the Degree of Master of Science in Applied Geospatial Sciences
Department of Geography, Planning and Recreation Northern Arizona University
May 2014
Dawn Hawley, Ph.D., Committee Chair
_________________________________________________
Alan Lew, Ph.D., Committee Member
_________________________________________________
Hadassah Ziegler, Director of Operations at Rooftop Solar, Committee Member
_________________________________________________

2
TABLE OF CONTENTS
ACKNOWLEDGEMENTS ........................................................................................................................................ 4 ABSTRACT ................................................................................................................................................................... 5 LETTERS OF SIGNIFICANT CONTRIBUTION ................................................................................................ 6 INTRODUCTION ........................................................................................................................................................ 7 PURPOSE AND OBJECTIVES .............................................................................................................................. 11 PRACTICUM TIMELINE ....................................................................................................................................... 13 LITERATURE REVIEW ......................................................................................................................................... 14 Understanding of climate barriers ............................................................................................................. 14 Realities of financing ........................................................................................................................................ 16 Purchasing options (cash & lease) ........................................................................................................ 16 Current incentives ........................................................................................................................................ 17 Net metering in Arizona ............................................................................................................................ 19
Possible evaluation of future solar practices ........................................................................................ 20 Elimination of subsidies and/or net metering ................................................................................. 21 Reflection on past technology transitions (home phones) ........................................................ 22
METHODOLOY ......................................................................................................................................................... 24 Background Research ...................................................................................................................................... 24 Stakeholders ........................................................................................................................................................ 25 Solar Survey ......................................................................................................................................................... 26
RESULTS, SURVEY & ANALYSIS ....................................................................................................................... 31 Solar Process ....................................................................................................................................................... 31 Process Explained (Figure 7) ....................................................................................................................... 33 Results .................................................................................................................................................................... 35
Summary of Results .............................................................................................................................................. 41 RECOMMENDATIONS .......................................................................................................................................... 42 LIST OF APPENDICES ........................................................................................................................................... 44 Practicum Hours ................................................................................................................................................ 54 City of Flagstaff 2012 .................................................................................................................................. 54 Rooftop Solar 2013 ...................................................................................................................................... 55
LIST OF FIGURES .................................................................................................................................................... 63 LIST OF TABLES ...................................................................................................................................................... 67 REFERENCE .............................................................................................................................................................. 73 Other Contributing Resources ..................................................................................................................... 75

3
LIST OF FIGURES LIST OF FIGURES .................................................................................................................................................... 63 Figure 1 ....................................................................................................................................................................... 63 Figure 2 ....................................................................................................................................................................... 63 Figure 3 ....................................................................................................................................................................... 64 Figure 4 ....................................................................................................................................................................... 64 Figure 5 ....................................................................................................................................................................... 65 Figure 6 ....................................................................................................................................................................... 65 Figure 7 ....................................................................................................................................................................... 66
LIST OF TABLES LIST OF TABLES ...................................................................................................................................................... 67 Table 1 ......................................................................................................................................................................... 67 Table 2 ......................................................................................................................................................................... 68 Table 3 ......................................................................................................................................................................... 69 Table 4 ......................................................................................................................................................................... 70 Table 5 ......................................................................................................................................................................... 70 Table 6 ......................................................................................................................................................................... 71 Table 7 ......................................................................................................................................................................... 71 Table 8 ......................................................................................................................................................................... 72
LIST OF APPENDICES LIST OF APPENDICES ........................................................................................................................................... 44 Appendix A ................................................................................................................................................................ 44 Appendix B ................................................................................................................................................................ 45 Appendix C ................................................................................................................................................................ 47 Appendix D ................................................................................................................................................................ 49 Appendix E ................................................................................................................................................................ 51 Appendix F ................................................................................................................................................................ 54 Appendix G ................................................................................................................................................................ 57 Appendix H ................................................................................................................................................................ 61

4
ACKNOWLEDGEMENTS I would first like to thank my committee members Dr. Dawn Hawley, Dr. Alan Lew
and Hadassah Ziegler for their support and guidance throughout this practicum process. I
would also like to acknowledge all the survey participants for their time and efforts. Their
responses greatly contributed to my project. Lastly, I’d like to thank Rooftop Solar for
giving me the necessary work experience to understand and be involved in the solar
industry in Flagstaff.

5
ABSTRACT
Solar is a renewable energy source that allows homeowners to generate electricity
through absorption of the sun’s rays. This industry has recently been experiencing
significant media exposure, policy changes, and technological advancements. Residential
Flagstaff is no exception to this forward thinking movement, with installations occurring at
an all time high.
The purpose of this practicum is to bring awareness to and educate the Flagstaff
community on current solar practices. The primary goals are to view solar processes,
acknowledge solar barriers, and address financial implications in residential Flagstaff.
Understanding these elements can help homeowners get the facts about solar happenings
in their area and what to expect if they are interested in converting.
Before coming to a conclusion on the solar education needs of Flagstaff community
members, a number of steps were taken to analyze and understand the process of solar and
the community outlook. Conducting extensive research in federal, state, and local solar
applications provided a more in-‐depth understanding of solar. Surveys from solar
stakeholders around the community of Flagstaff were done to identify roles, barriers, and
opinions. The results of the survey indicate that the largest barrier for solar in Flagstaff is
lack of updated educational information and financial commitment. Secondary findings
indicate that negative publicity and “slow” processes contributed to Flagstaff’s barriers. A
course of action guide was created based on the need for public solar education and a
model for what customers should expect. This guide is available to the public at City Hall
and Rooftop Solar.

6
LETTERS OF SIGNIFICANT CONTRIBUTION
Waiting on letter from the city

7
INTRODUCTION
Solar PV (photovoltaic) was discovered in 1839 by French scientist Edmond
Becquerel (ENow Blog 2012). Contributions were made to the technology in years
following such as the invention of silicon PVs and commercial licensing. It wasn’t until
1958 that a major milestone was reached; a weather space satellite was launched into the
atmosphere powered by silicon PVs. The next fifty years were a steady advancement in the
production, cost, and efficiency of solar systems. More recently, advanced technologies,
increased energy demands, decline in fossil fuel availability, and government support for
the solar industry has greatly grown this industry and attracted attention to its cause.
Solar energy is energy source which is considered renewable and sustainable
because little or no harm is done to the environment and sunlight is unlimited source.
Solar energy relies on actual sunlight not temperature; this makes it appealing to most of
the world. Germany and Sweden are excellent supporting examples of colder climates with
extreme winters and plenty of snow that are leading the world in solar production and
installation.
How solar works is fairly simple, photovoltaic panels absorb the sunlight and
convert it to energy. This energy is then hooked up to the electrical portion of the home
and the product results in energy (Figure 1). Depending on the azimuth, or direction your
roof is facing to the sun, determines the expected sunlight exposure. South facing, or as
close to the 180-‐degree azimuth as possible is preferred and provides the greatest
potential of solar energy production because of constant exposure to sun (Figure 2). The
pitch of the roof also plays a large role in energy production (Figure 3). A pitched roof with
a tilt of approximately 30 degrees is optimal for a south facing roof. The combination of the

8
tilt and pitch will determine how many panels, and ultimately the cost, to make a home
solar sustainable. Homebuilders are now recognizing this demand and building new
homes accordingly.
Figure 1. How Does Solar Work. Energy Farm, Source: Energy Farm Australia (2013).

9
Figure 2. Various Azimuth’s on Solar Figure 3. South Facing Panels & Solar. Production. Pierrosolar, Source: Pierro (2012) Pierrosolar, Source: Pierro (2012)
Arizona is ranked number two in the nation for solar energy use. The average
household in Arizona spends $116.07 dollars per month in electricity costs (myenergy
2014) which is around 5,000 kilowatt-‐hours per year (The Solar Company 2014). In order
to offset this cost completely a home would need to install a 4-‐kilowatt AC size system.
These numbers are based on state averages. Solar systems are designed to meet personal
needs and are unique in price, size and demand. One percent of Flagstaff energy is now
solar energy.
This is well under what it could potentially be. California has driven the solar
market from the beginning, experts believe their high cost of utilities and large dense
populations are prime for solar installation (Sunnucks 2014). California can be used as a
model for what is to come in the future as utility costs rise and natural resources are
depleted.
Flagstaff, Arizona city limits were the study site for this practicum. Flagstaff’s
unique 7,000-‐elevation climate is very different from the desert surroundings of most of
the state (Figure 4). Flagstaff is home to a large ponderosa pine population along with
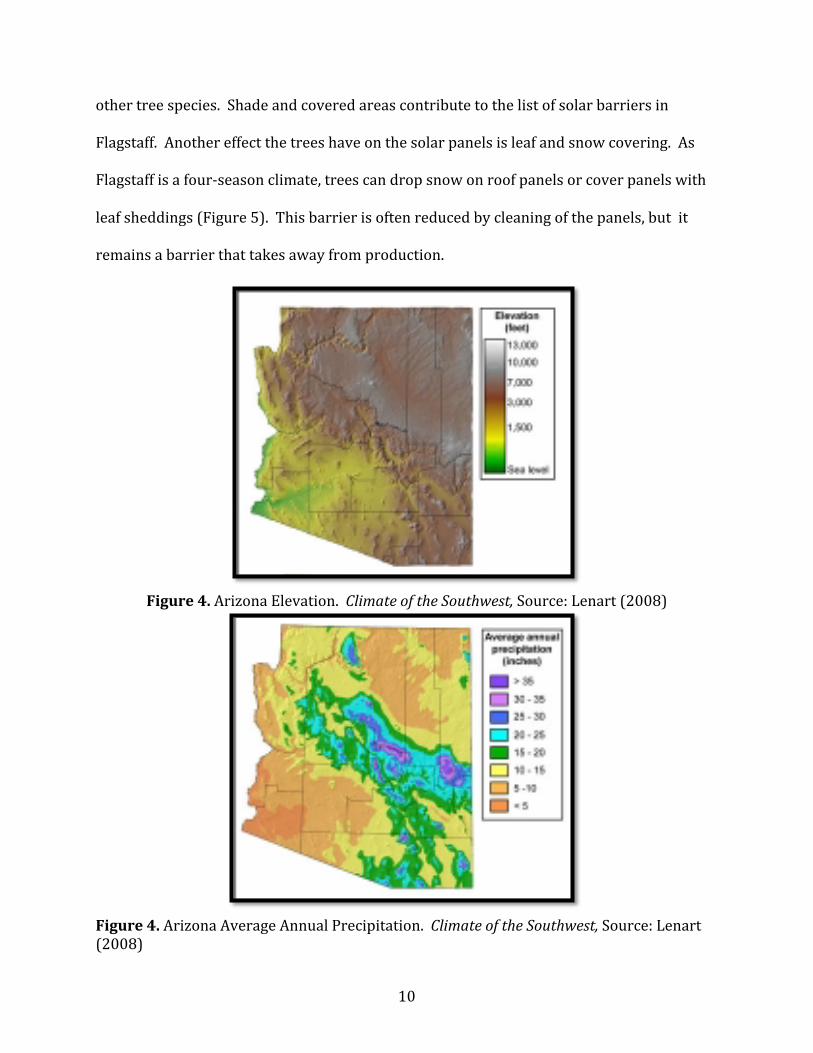
10
other tree species. Shade and covered areas contribute to the list of solar barriers in
Flagstaff. Another effect the trees have on the solar panels is leaf and snow covering. As
Flagstaff is a four-‐season climate, trees can drop snow on roof panels or cover panels with
leaf sheddings (Figure 5). This barrier is often reduced by cleaning of the panels, but it
remains a barrier that takes away from production.
Figure 4. Arizona Elevation. Climate of the Southwest, Source: Lenart (2008)
Figure 4. Arizona Average Annual Precipitation. Climate of the Southwest, Source: Lenart (2008)

11
PURPOSE AND OBJECTIVES
The purpose of this practicum is to understand the solar “landscape” of Flagstaff,
Arizona, and provid information to the public about solar in Flagstaff. Rumors and
opinions are heard around the community about how solar works but someone’s
experience two years ago will be different than today’s. This practicum provides a free
reference for the public who are interested in the Flagstaff solar process and wish to
educate themselves about how solar in their city is currently installed and whether it’s cost
effective. The objectives of this practicum are the following:
• Provide a baseline view of solar in Flagstaff
Understanding and evaluating the many components of solar installation, city
permits, and Flagstaff’s current process is included. This information can then be
used to clarify and define the process to the community.
• Review climate and cover barriers to solar energy in Flagstaff
Recognizing Flagstaff’s tree density and climate helps evaluate if solar is optimal in
this area. Understanding installation protocol will contribute to the knowledge of
how barriers are reduced.
• Review current solar financial commitments and potential upcoming changes
The financial commitment to solar is constantly changing. Bookmarking financing
options, rebates, incentives and material costs to the public will provide guidance
and also be the starting point to measure progress in years to come.

12
• Consolidate information into a course of action guide that can be used in solar
implantation as well as to advertise possibilities.
The course of action deliverable will be a visual display of the solar process in
Flagstaff. It will stand as a model for the community, potential solar customers, and
even officials in the industry.

13
PRACTICUM TIMELINE
Fall 2011-‐ Began working at the City of Flagstaff, Sustainability &
Community Development Departments
Spring 2012-‐ Researched practicum topics
Fall 2012-‐ Began solar research for Practicum Proposal
Spring 2013-‐ Researched for literature review
Summer 2013-‐ Wrote Practicum Proposal
Fall 2013-‐ Started working at Rooftop Solar
Formed committee and had first committee meeting
Winter 2013-‐ IRB approval
Solar survey interviews began
Spring 2014-‐ Completed solar survey interviews
Finished Practicum
Course of Action Brochure
Practicum Defense and graduation

14
LITERATURE REVIEW
Understanding the climate, financing, incentives and future of solar is important
when deciding whether to switch to solar as an alternative energy source. The following
information includes research and examples of solar power in areas that are facing the
same challenges as Flagstaff, and those that have been successful.
Understanding of climate barriers
Northern Arizona’s four-‐season climate is unique to the rest of the state. Unlike the
central and southern parts of Arizona, Flagstaff experiences snowfall about 34 days a year
accumulating approximately 104 inches of snow (Current Results 2014). While it may
seem that Flagstaff is not solar practical, the city experiences an average of 264 days of sun
exposure (Current Results 2014). Flagstaff is in an environment that includes tree cover
that can be a shading barrier to a sun based energy system. While cold weather and plant
life seem to be major climate obstacles to Flagstaff, experts from around the world have
created ways to maximize sun potential in mountain climates.
Professionals in the solar industry have minimized climate variables by structurally
altering a system to personalize and maximize sun intake for every home. Most installers
conduct a shade report to optimize residents’ solar systems. A critical part of this report is
calculating the azimuth angle. This process determines the sun’s directional relationship to
the roof. Another step in the shade report is to find the optimal angle for the panel
mounting. The information in shade reports contributes to the design, location, and
amount of panels.

15
Outdoor technology is a constantly changing element that works differently in every
climate. Like electric car batteries and wind turbine blades, cold weather is often an
obstacle for developers to overcome when creating alternative energy for far Northern or
far Southern hemisphere climates. While solar energy’s ideal climate would be in sunshine
year round with mild weather, Canada has taken a positive view on solar energy and
provides an example of how extreme weather doesn’t affect a willingness to install solar
systems. Ontario, Canada has over 25,000 solar projects completed, reinforcing this theory.
“According to the researchers, and to my surprise, nearly three-‐quarters of all solar PV
panels installed globally in 2009 were in countries that experience some snowfall. This
reflects solar subsidy programs in places such as Germany, Japan, the Czech Republic and
Ontario. If cold climates keep resorting to solar it must be worth the investment”
(Hamilton 2011: 2).
Hamilton goes on to explain the albedo effect of the panels on snow and ice. “Albedo
is the reflective power or a surface” (2011: 2). When snow reflects light from the sun, dark
surfaces absorb this light. “While snow on the panels reduced their power output, snow on
the ground increased albedo, and thus increased solar irradiation onto the panels”
(Hamilton 2011). Having snow surrounding the panels, but not covering, ensures the panel
is hit will more light, therefore, producing more electricity. Hamilton ends his article with
suggesting other possible methods that could increase energy in cold climate solar projects.
Some of these methods are applying slippery coatings to panels, optimal panel placement,
and snow removal methods. (Hamilton 2011: 2).

16
Germany is also another country making strides in PV solar installations despite
snowfall and long winters. “Twenty-‐two percent of Germany’s power is generated with
renewables. Solar provides close to a quarter of that. The southern German state of Bavaria,
population 12.5 million, has three photovoltaic panels per resident, which adds up to more
installed solar capacity than in the entire United States” (Curry 2013:1).
Experts are spreading the word that PV solar panels operate on sun exposure, not
temperature. In fact panels installed in areas of extreme heat experience a shorter life
expectancy than those in milder climates. The climate where you live no longer is a
deterrent in solar PV installation in most cases. Engineers and manufacturers have worked
with technology to create a product and process that allows for practical solar energy
almost anywhere despite climate.
Realities of financing
Purchasing options (cash & lease)
Despite the decreasing cost of materials, solar systems are still expensive
investments for many homeowners. The average residential system in Arizona is about 6
kwh and costs approximately $20,000 in early 2014. This money is usually paid in
increments throughout the installation period but customers are expected to pay the
balance in full by the end of installation, about two months. The financial burden of solar is
a major barrier for many people, but other financing options are becoming more common.
Solar leasing is an alternative payment option that is becoming popular. Leases can
be offered from the installer or a third party company. Investors front a sum of money to
purchase materials for the install the system. Once the system is installed, the homeowner
17
pays a monthly fee to the leasing company for a negotiated amount of time. Twenty-‐five
years is a common duration. Once this time passes, the homeowner owns the system on
the house.
Leasing is beneficial to investors because they receive money from tax incentives,
rebates, and monthly payments. The homeowner receives a guaranteed production rate,
reduced utility bills, and payment and ownership of a solar system over an extended
amount of time.
Current incentives
Current solar incentives, credits, deductions, rebates, and programs are difficult to
pin point because there are many offered, a variety of hosts, and they are constantly
changing. The system type, size, and location are most commonly used to decide what type
of cost reductions can be received. Federal incentives, local rebates, and tax credits are
usually the big players for incentives in today’s market. Although, there are many smaller
rebates and incentives, this is a review of the top several that are available to the widest
range of projects in Arizona as of March 2014. These top incentives are said to motivate
the solar market and encourage investment in the sun.
The federal tax credit or Residential Renewable Energy Tax Credit for solar was a
program created as part of the national financial bail out bill. This credit was implemented
to create jobs as well as to create a billion dollar market for solar power, which could
potentially generate over 20 gigawatts of clean energy. This specific incentive is for
residential renewable technologies, including photovoltaics (PV), solar water heaters,
wind, etc… The owner of the system is to receive a 30% personal tax credit from the
installation of any clean power system. This system does not have to be the taxpayer’s

18
principal residence and there is no maximum credit for systems installed after 2008. This
incentive was first enacted in 2006 and is on track to expire December 31, 2016. The
Residential Renewable Energy Tax Credit is known as a huge motivator to those
homeowners on the fence about making the switch to solar. Many professionals in the
solar industry wonder how the solar industry will fare after this large federal incentive
ends (Cinnamon, 2013).
Local rebates and incentives have also been a contributor to solar’s success. Arizona
Public Service (APS) is a major utility provider in Arizona and until recently has offered a
percentage based incentive for all solar projects from funds received from the Federal
Department of Energy (DOE). Funding levels are set annually with the Arizona Corporation
Commission (ACC). This up front incentive (UFI) topped out at $75,000 or 40% of the total
system. In mid October 2013, installation companies across Arizona were told that the APS
incentive fund had dried up, and new projects would not be eligible for the Interconnection
Incentive. This incentive was last recorded in 2013 at $0.10/watt for grid-‐tied projects that
were residential or commercial.
Additional information is available online, at the Database of State Incentives for
Renewables and Efficiency (DSIRE) is a website that provides updated financial
information by state for renewables. This website is a great source for customers to
research personal incentives for their specific needs and stay updated and educated on
changes and regulations.

19
Figure 6. APS Rebate Information. APS Renewables, Source: APS (2013).
Net metering in Arizona
Net metering is a special billing arrangement made between the utility provider and
the homeowner. The homeowner is connected to the utility grid and has access to standard
energy if their PV system does not create enough energy to sustain them, for example
multiple cloudy winter days. If the homeowner’s panels create more energy than needed,
common in summer months, their utility account would be credited. An optimal solar
system would create enough energy in the summer months to offset winter electricity,
giving the homeowner a zero balance.
This zero balance has now become a myth because depending on the system’s
location and size, monthly taxes are added. Over the years these tax rates have varied. A
few of the larger ones are city, state and environmental taxes. With today’s tax rates, an
average size home with typical energy use in Flagstaff would pay about twenty to thirty
dollars per month in solar specific energy taxes if not completely off grid.
In the United States there are five tiers of net metering. Net metering tiers are
determined by the states’ involvement in the program and what their specific program

20
guidelines are. Highly effective programs that generate loads of solar energy and which are
highly beneficial to solar customers are chosen as top tier programs. Arizona is currently
ranked in the highest tier along with Hawaii, Colorado, and Nevada as one of the best net
metering programs. This could all be drastically changing within the upcoming year
because of APS’s potential changes (SEIA, 2014).
Possible evaluation of future solar practices
Many myths and rumors fly about what will become of solar technology in the
future. Some experts believe the industry will shrink into insignificance after government
incentives are abandoned. Others say that solar is the way of the future and is a sustainable
and plausible way to produce energy. We are approaching a time when government
support is slowly declining and the industry is rising, but resistance from political parties
and utility companies aren’t making the transition an easy one.
Material technology and progression are at an all time high. The most efficient
panels are being installed at the most reasonable cost (PARC 2013). The solar module
industry has uniform panel creation and has specific and limited required materials.
Racking, panels, inverters, and meters are the only materials that are needed to switch to
solar energy. The materials industry has standardized production thereby and minimizing
confusion for installers.
Installers are concerned with consistent installation demand and keeping expenses
and time allocation to minimum. It is not unreasonable to assume that an installation crew
can fully install a system in one day. This quickness and efficiency supports solar
installation and will improve as time goes on.

21
Elimination of subsidies and/or net metering
In Arizona, APS has now created a use deadline on net metering solar energy. This
means that customers are not able to transfer “energy credits” from year to year. Net
metering is limited to the calendar year, which means credits that are left over on
customer’s account at the end of December will be bought back by APS at their chosen rate.
Currently the rate is set at 3 cents per watt.
In September 2013, APS publically notified customers and installers that they are
proposing to amend their solar terms. APS believes that solar customers are using the grid
for free while traditional energy customers are picking up the financial slack. APS’s new
terms would almost double solar homes’ energy bills, with new costs they claim are user
fees for using the grid. They are also proposing to eliminate the net metering program
along with other changes. A net metering deadline was set for mid October 2013, by which
only solar applicants could apply for consideration for net metering benefits. These
customers and current solar customers are forever guaranteed net metering standards.
But although APS set this deadline, the ACC still must deliberate and vote on policy changes
(Randazzo, 2013).
This potential change has sparked great controversy across the state. Campaigns
such as 60 Plus and Prosper are promotions financially backed by APS with conservative
lobbyist influence. These advertisements make accusations such as “giving our tax dollars
to their wealthy customers” and “solar customers get paid over five times market rate.”
Larger installers like SolarCity and TASC have responded to these allegations by creating
ads claiming, “utility companies are monopolies that don’t want to take profit hit”
(SolarCity 2013). So why is this controversy surfacing now? Experts say that the high

22
number of solar installations this past year and the projected amounts for upcoming years
is bringing solar energy into the spot light. APS is concerned with the projected solar
numbers because there is a potential for homeowners to no longer need regular electricity
and/or the grid. This will greatly affect their utility market and profit margins. Change is
amongst us, and Arizona’s response to this net metering threat will stand as an example for
all of net metering states decisions to participate. (Trabish 2013).
On November 14, 2013 the ACC announced their decision on net-‐metering in
Arizona. Starting January 1, 2014 solar customers will pay an additional fee, based on the
system size of the home. Most residential customers will experience an additional 5-‐10
dollar monthly bill increase. Solar advocates considered this a victory over APS’s proposed
50-‐100 dollar increase. The ACC is saying this is a trial year and the policy may need to be
altered in upcoming years. APS recently released positive and supporting information
about solar and their role in the upcoming technology. A list of “myths and facts” is
available online (APS 2014).
Reflection on past technology transitions (home phones)
Experts are comparing this utility backlash to solar as similar to one that happened
with main line phone companies and cell phones. Phones operate through telephone lines.
Similarly solar uses an electric grid. These physical structures need maintenance that is
paid for by the users. When these structures are no longer in such high demand, we
shouldn’t still be obligated to pay for them. Society should be able to gradually move
forward with technology.
Another similarity between solar and landline phones is the monopoly utility
companies and telecommunication services had on that specific market. AT&T was a

23
company that was forward thinking and recognized that changes were inevitable. It built a
wireless phone business before the landline market depleted. Some utility companies in
California are recognizing this and investing resources in building a solar department so
their customer base may switch but they won’t lose customers.
“…Some argue the government should step aside and allow the marketplace to keep
moving toward digital standards (France-‐Presse 2013). This statement comes from an
article talking about landlines being disconnected because new technology has made them
no longer relevant. “Almost everyone will be off this network in the next four years. It is a
dead model walking.” (France-‐Presse 2013). These comments about landlines could be the
precursor for what type of energy is used in the future.

24
METHODOLOY
Background Research
The Flagstaff community did not have a single information source that would
explain the solar development steps, results, and progression in the local area prior to this
practicum. Although there are many resources, Flagstaff has yet to release information on
where to go and how to have a solar system installed locally.
The project first began with research at the federal, state and local levels. This was
done to set parameters of where we are as a nation, a state, and locally in terms of mindset
financial resources, and technology. This research was also done to find out what is offered
at different levels and compare progression standards. Next, understanding solar
incentives and local knowledge was important for laying a basis for this project. In order to
effectively address and advertise opportunities, there must be an understanding of what’s
available, what the application process is, and what are the success rates. Stakeholders
were then surveyed for a range of understanding, participation, personal barriers, changes
witnessed, and overall effectiveness of the current solar process. After analyzing the facts
at all levels, surveying local people who are involved helped gauge where Flagstaff is in
relationship to the rest of the state and nation.
After the initial research was completed, information was analyzed. The results of
the research indicated an area of educational need solar implantation, process and financial
commitment. This educational need is supported by a practicum deliverable, a local
distribution of solar course of action brochures, made available at the City of Flagstaff. This
deliverable provides education on process for those interested in solar.

25
Stakeholders
The stakeholders identified for this research project are the groups of people who
contribute to the installation, process, cost of solar, and use and provision. These groups
are the following:
APS-‐ Arizona’s utility provider and more specifically their “Renewables”
department that deals with all solar projects from installation to monitoring. Their
role is monitored by the ACC, and possibly the most powerful because they dictate
how energy will be delivered if needed and pricing for buy back.
Installers-‐ Solar installers have processes of installation that are constantly
becoming more efficient and reliable. The installers may also deal with financing
and incentives/rebate applications. Their role is adjusting and researching new
products and procedures to better suit their customers and installing and marketing
the product.
Manufacturers-‐ The manufacturers of the materials are in involved in new
technology and production of enhanced materials. Their advancements and pricing
influence the market prices and production. New manufacturing companies are
becoming more common which also increases variety and drives down costs.
Past/Potential Customers-‐ The public also influences the solar market because of
their influence on the ACC and willingness to support solar in the community. Many
customers expressed their views on the net metering policy in 2013.
City of Flagstaff-‐ The City of Flagstaff’s permit application and approval process
regulates the type, size, and number of systems installed throughout the city. They

26
also have a voice throughout the community, making their opinion of solar a strong
influence on the public and policies.
Solar Survey
The solar survey was done to get the stakeholders’ experiences and opinion of solar
is Flagstaff. This information was valuable to the research to test the knowledge, process,
and opinions of those who affect or were affected. One of the most significant things taken
away from this survey is how we can improve solar in flagstaff.
Questions on the survey were designed to be open ended so participants could
responsed and expand on questions. The IRB process was completed before interviews to
ensure questions were appropriate and confidential. Each participant was given a consent
sheet and the option to be interviewed on the phone or in person.
The solar questions were created based on professional working experience, typical
questions asked in initial stages, and topics in the media that are controversial, such as
financial commitment. These questions were carefully worded to ensure fair and
nonbiased responses. They were also developed to ask each stakeholder his/her opinion
and their role as well as that of. This allowed for and analyzing other the communication
and relationships.
Four groups of stakeholders were surveyed with three participants from each
group, for a total of twelve people. Multiple positions and project situations were covered
to give a broad conclusion. Three of the four stakeholder groups were surveyed through
an in person or a phone interview. The fourth stakeholder (APS) could not be reached for
comment so secondary sources were used to represent its views. Solar customers from
different installation times, city current planners and building inspectors, as well as

27
architects and construction managers from an installer were interviewed. A few questions
allowed for nominal or ordinal comparisons. Every participants’ name and occupation is
kept confidential as part of the IRB’s request. The following are the questions for each
stakeholder type from the surveys:
APS SURVEY Question Why it was asked
1. Q1-‐How does APS participate in solar installations and what is your business process?
Understanding of utility role and inside process and reasoning
2. Q2-‐What do you require from installers, customers and City to switch?
Understand what information they are interested in and who they are in contact with
3. Q3-‐What financial options do you provide or advertise for patrons (incentives/or types of payment)?
See how company is promoting or advertising financial options
4. Q4-‐What is the biggest barrier you believe solar in Flagstaff has (financial, climate, implementation, etc.)?
A perspective of working in the industry and acknowledging challenges
5. Q5-‐What changes (positive or negative) have you seen in solar the past 10 years (ex. Lease vs. cash)? And where do you see solar going in the future?
Ability to measure progress and different sectors and an educated guess to where trends are going now
6. Q6-‐Are there any existing inefficiencies that you think exist in the current system and how could this be changed?
Understanding of where individual sees problems or where advancements could be made.

28
CITY SURVEY Question Why it was asked
1. Q1-‐ What is your role in solar installations?
Understanding of where in the process that person works and what they do to contribute
1. Q2-‐ What financial options do you provide or advertise for patrons (incentives/or types of payment)?
See how individual is promoting or advertising financial options
2. Q3-‐ What is the biggest barrier you believe solar in Flagstaff has (financial, climate, implementation, etc.)?
A perspective of working in the industry and acknowledging challenges
3. Q4-‐ What changes (positive or negative) have you seen in solar the past 10 years? And where do you see solar going in the future?
In the government sector, what changes have been made and are changes expected to be made in the future
4. Q5-‐ Are there any existing inefficiencies that you think exist in the current system and how could this be changed?
Understanding of where individual sees problems or where advancements could be made.

29
CUSTOMER SURVEY Question Why it was Asked
Q1-‐When was your system installed? How current installation was to understand and compare advancements made in processes.
Q2-‐How did you participate in your solar installations and what was that process with APS, the City, and installer?
Understanding of the “Workload” or knowledge needed to install a solar system
Q3-‐Where did you find out about solar and what convinced you to install?
Note advertisement opportunities out there and which ones appeal to the customer
Q4-‐How many different businesses/parties did you contact to get your system installed?
What length was the customer required to go to, to get system installed
Q5-‐What is the biggest barrier you believe solar in Flagstaff has (financial, climate, implementation, etc.)?
After going through the process what did they struggle with or find as the biggest barrier.
Q6-‐What source of financial incentives did you benefit from (federal, state, local, etc.)?
See if/what financial incentives the customer knew about of was eligible for.
Q7-‐ How important was financial assistance in your decision to go solar?
Find out if personal system made financial sense or something they financially benefitted from
Q8-‐Why did you choose to install, and why did you choose that time period?
Understand why that time period specifically impacted their switch
Q9-‐On a scale from 1-‐5 how would you rate your solar experience? (1-‐ terrible 5-‐ perfect) and are there any existing inefficiencies that you think exist in the current system and how could this be changed?
Overall understanding of process satisfaction and where could there be improvement

30
INSTALLER SURVEY
Question Why it was asked 7. Q1-‐How do you participate in solar
installations and what is your businesses process?
Understanding of where in the process that person works and what they do to contribute
8. Q2-‐What do you require from APS, customers and City to install solar?
Understand what information they are interested in and who they are in contact with
9. Q3-‐What financial options do you provide or advertise for patrons (incentives/or types of payment)?
See how individual is promoting or advertising financial options
10. Q4-‐What is the biggest barrier you believe solar in Flagstaff has (financial, climate, implementation, etc.)?
A perspective of working in the industry and acknowledging challenges
11. Q5-‐What changes (positive or negative) have you seen in solar the past 10 years (ex. Lease vs. cash)? And where do you see solar going in the future?
Ability to measure progress and different sectors and an educated guess to where trends are going now
12. Q6-‐Are there any existing inefficiencies that you think exist in the current system and how could this be changed?
Understanding of where individual sees problems or where advancements could be made.
Question 1 was asked to all stakeholders except the customer to understand what
position the response was coming from. Those three stakeholder groups were all asked questions two, three, four, five, and six so an equal comparison and analysis could be done. Questions that were different from other surveys, were questions two, three, four, six, seven, eight, and nine from the customer survey. These questions were more about the experience as apposed to the working process. All surveys asked the opinion of barriers from personal perspective. A simple analysis was done to the survey results. This process was chosen to determine what factors have lead to a specific response and compare those similar and different responses.

31
RESULTS, SURVEY & ANALYSIS
Solar Process
The solar process (Figure 7) in Flagstaff was found through working experience, local,
state, national, and international research, and multiple interviews with local stakeholders.
This process represents cash purchased. If the project is a leased system, the timeline is
longer and includes another 3rd party and some additional paperwork as leasing companies
usually request pre/post installation photos, additional paper work, utility
correspondence, etc…

32
Figure 7. Solar Installation Process
6 months-‐2 years
83 Days Post Decision

33
Process Explained (Figure 7)
Customer-‐ contacts solar installer (6months-‐2 year “thinking period”)
These come from, but are not limited to, referrals and marketing events like home
shows.
Installer-‐ Builds quote (based on customer needs and financing), Sets up APS
Renewables account, sets up financing (lease/cash) (5 days)
An individual quote is based off an annual electricity bill from APS. The homeowner
has the option to increase the size if they estimate electricity needs will increase
(having an electric car, another person in the house, hot tub, etc…) The homeowner
is then offered the cash and lease purchasing quotes. Once the contract is signed,
the installer creates a Renewables account for the project by filling out online
application about the home and system.
APS-‐ Approves Reservation & Interconnection Agreement and in past rebate (5 days)
An executed contract, APS Disclaimer, and W9 (if eligible for rebate) form are signed
by the homeowner and uploaded for the reservation to be approved, the installer is
given a rebate number. The Interconnection Agreement is approved once a site
plane and 3-‐line diagram are uploaded and fit the needs of APS. (See Appendix G)
Installer-‐ site analysis, structural approval, submit to permit, order materials (20
days)
A site analysis is done to confirm initial system sizing, system placement,
surrounding environment (trees), azimuth, tilt, shading report, and structural
analysis. A full set of designs (seven pages) is then designed based on these notes.

34
Once the designs are complete a building permit is filled out and taken to the City
for permit submittal. (See appendix D and E)
City-‐ Approves permit (30 days)
The City reviews the plans and spec sheets. Notes are made if the project does not
meet code or is approved and sent back with permit. (See appendix H)
Installer-‐ Installs system (2 days)
Materials are ordered and once they arrive construction begins. Reroofing is done
first if needed, otherwise racking and inverters are installed. The panels are then
connected to the racking. Lastly, electrical and meters are wired.
City-‐ Does City inspection and uploads to APS (9 days)
Calling the city and making an appointment with a building inspector will trigger the
City inspection. This person compares the system to the permit and tapes a card of
approval to the meter. The City then uploaded their approval to the APS renewable
portal.
APS-‐ Does final inspection and turns system on and replaces meter, bills/pays
homeowner based on monthly electricity use (12 days)
APS is triggered to schedule an inspection once they see the City has approved it. At
the inspection the APS employee checks the system for safety and replaces the old
meter with an APS “solar meter.” The switch is then flipped and the customer is
producing solar power.
TOTAL AVERAGE TIME IN 2013 (83 days post customer installation decision)

35
Results
The survey was created to gain information and knowledge and solar procedures
and opinions of stakeholders in the community. The survey results met the baseline view
objective as well as acknowledgment of solar barriers objective. The results from this
survey will be consolidated into a course of action guides, which also meets a practicum
objective.
APS did not respond, therefore secondary resources were used to voice the utility
companies views.

36
APS RESULTS (Information based on secondary resources)
Question 1 News and Press Released Information Q1-‐How does APS participate in solar installations and what is your business process?
“APS has helped make Arizona a national leader in solar development. Our company is spending nearly $1 billion on solar projects throughout the state, while providing a stable electric grid. In 2012, APS added a record-‐breaking 148 megawatts of clean solar energy, which is enough electricity to serve more than 35,000 customers. We expect to more than double that number in 2013.” (APS 2013).
Q2-‐What do you require from installers, customers and City to switch?
Customer online utility account, executed contract, disclaimer form, lessor acknowledgment (if leased), City/County approval.
Q3-‐What financial options do you provide or advertise for patrons (incentives/or types of payment)?
APS also is supporting an increase in the up-‐front cash incentive that makes rooftop solar a more affordable option for customers who want to “go solar.” “We support an incentive program for rooftop solar that is transparent, reviewed frequently by the ACC, and shared fairly among customers,” said Mark Schiavoni, APS executive vice president of Operations (APS 2013).
Q4-‐What is the biggest barrier you believe solar in Flagstaff has (financial, climate, implementation, etc.)?
“As we get more rooftop solar customers … what we want is a system that’s fair for all of our customers.” (O’Donnell, 2013)
Q5-‐What changes (positive or negative) have you seen in solar the past 10 years (ex. Lease vs. cash)? And where do you see solar going in the future?
Paperwork, requirements, process, taxes and rates.
Q6-‐Are there any existing inefficiencies that you think exist in the current system and how could this be changed?
“Of course, having determined that a problem exists (net metering cost shift), we would have preferred for the ACC to fix it. The proposal adopted by the ACC, and surprisingly championed by the state’s consumer advocate RUCO, falls well short of protecting the interests of the one million residential customers who do not have solar panels. We will continue to advocate forcefully for the best interests of our customers and for a sustainable solar policy for Arizona.” Dan Brandt (APS 2013).
• Type of stakeholder-‐APS is a utility stakeholder, making them a powerful voice in the survey.
• Why the question was asked-‐The first questions was asked to understand at what level we are getting a representation from. The second question was to analyze the communication between the stakeholders and their understand of roles in the
37
process. Next, financial options are important to advertise correctly and see how if/how they contribute on that level. Question four was understand what barriers APS faces and what feedback they get from customers. The fifth question was asked to gage how long the person had been in the position and to measure the successes/drawbacks of solar. The last question allowed the person to voice opinions about inefficiencies in their positions or overall things that could be made better.
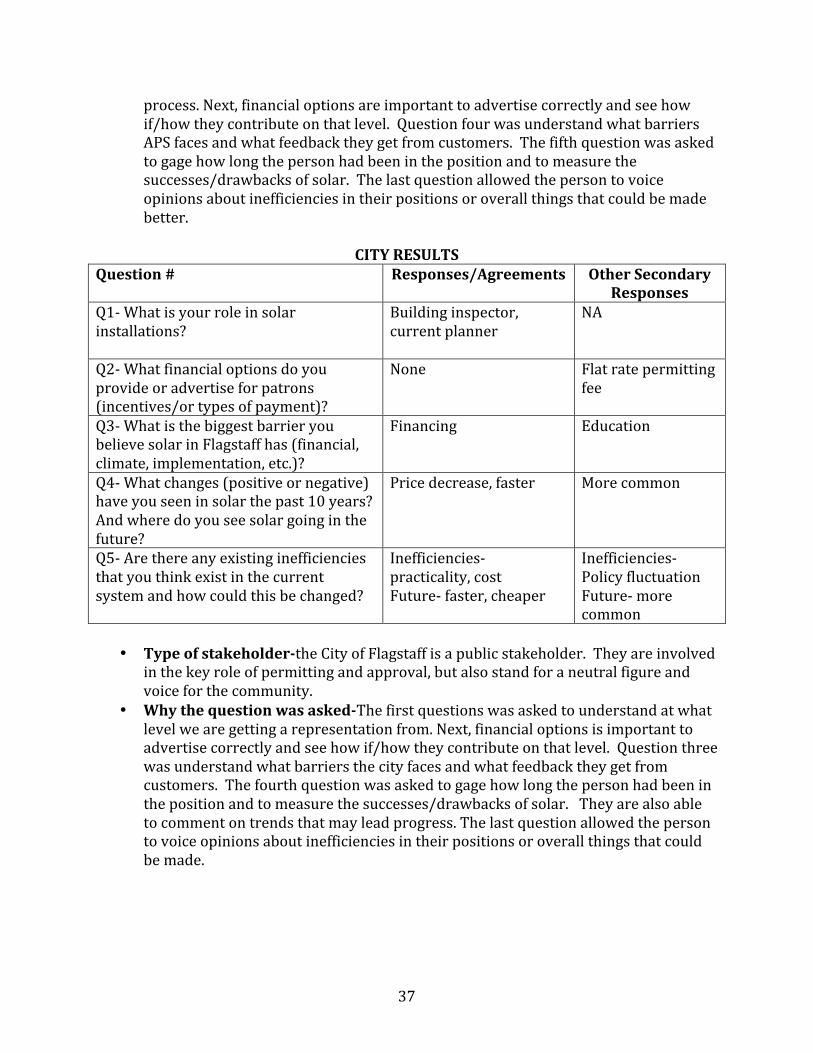
CITY RESULTS
Question # Responses/Agreements Other Secondary Responses
5. Q1-‐ What is your role in solar installations?
Building inspector, current planner
NA
2. Q2-‐ What financial options do you provide or advertise for patrons (incentives/or types of payment)?
None Flat rate permitting fee
6. Q3-‐ What is the biggest barrier you believe solar in Flagstaff has (financial, climate, implementation, etc.)?
Financing Education
7. Q4-‐ What changes (positive or negative) have you seen in solar the past 10 years? And where do you see solar going in the future?
Price decrease, faster More common
Q5-‐ Are there any existing inefficiencies that you think exist in the current system and how could this be changed?
Inefficiencies-‐ practicality, cost Future-‐ faster, cheaper
Inefficiencies-‐ Policy fluctuation Future-‐ more common
• Type of stakeholder-‐the City of Flagstaff is a public stakeholder. They are involved
in the key role of permitting and approval, but also stand for a neutral figure and voice for the community.
• Why the question was asked-‐The first questions was asked to understand at what level we are getting a representation from. Next, financial options is important to advertise correctly and see how if/how they contribute on that level. Question three was understand what barriers the city faces and what feedback they get from customers. The fourth question was asked to gage how long the person had been in the position and to measure the successes/drawbacks of solar. They are also able to comment on trends that may lead progress. The last question allowed the person to voice opinions about inefficiencies in their positions or overall things that could be made.

38
CUSTOMER RESULTS Question # Responses/Agreements Other Secondary
Responses Q1-‐When was your system installed?
Within the past 2 years NA
Q2-‐How did you participate in your solar installations and what was that process with APS, the City, and installer?
Contacted Installation Company
After installation had correspondence with APS
Q3-‐Where did you find out about solar and what convinced you to install?
Informed-‐ Media Why-‐ Personal obligation
Informed-‐ Home show Why-‐ Overall financial saving, uncertainty of fuels in the future, keeping energy money in USA
Q4-‐How many different businesses/parties did you contact to get your system installed?
2-‐ Installer, APS Leasing company, ACC
Q5-‐What is the biggest barrier you believe solar in Flagstaff has (financial, climate, implementation, etc.)?
Financing, lack of education Media/publicity, peer support
Q6-‐What source of financial incentives did you benefit from (federal, state, local, etc.)?
APS rebate, state and federal tax rebate
Leasing incentive, installer promotion
Q7-‐ How important was financial assistance in your decision to go solar?
Top priority Significant
Q8-‐Why did you choose to install, and why did you choose that time period?
Right time in life financially, home, electricity usage, personally.
ACC net metering deadline
Q9-‐On a scale from 1-‐5 how would you rate your solar experience? (1-‐ terrible 5-‐ perfect) and are there any existing inefficiencies that you think exist in the current system and how could this be changed?
Rate-‐ 4 Improvements-‐ pace, truth, unity, stability
Improvements-‐ consistency, process outline, uniformed payments system

39
• Type of stakeholder-‐The customer is a personal stakeholder that represents the public and poses as standard for installation and process.
• Why the question was asked-‐The first question was to date how old their system was and identify under what process they installed under. Then, asking how the homeowner was involved was asked to see how much time and effort was expected of that person. The third question was to understand where the community is going to get solar information. Question four was asked to see what the process was like finding an installer in the Flagstaff area and if they knew of or was in communication with any of the other stakeholders. Question five was seeing what barriers the homeowner experienced or what they thought were drawbacks. The sixth question was seeing if the homeowner knew of incentives and if so which applied to their project. Question seven confronts the homeowner on their financial commitment and to find their motive for installation. Understanding when and why the homeowner installed was addressed in question eight. This is important to see motivators and target audiences. Lastly, rating the experience on a scale give satisfaction numbers that are measurable.

40
INSTALLER RESULTS Question # Responses/Agreements Other Secondary Responses Q1-‐How do you participate in solar installations and what is your businesses process?
Construction Site analysis, design
Q2-‐What do you require from APS, customers and City to install solar?
APS-‐ IA, inspection, rebate, reservation City-‐ Permit, inspection Customer-‐ contract, funds, utility bill
Structural engineering approval, leasing paperwork
Q3-‐What financial options do you provide or advertise for patrons (incentives/or types of payment)?
Cash, lease, tax incentive, APS rebate
In house promotions, manufacturer promotions, leasing incentives
Q4-‐What is the biggest barrier you believe solar in Flagstaff has (financial, climate, implementation, etc.)?
APS-‐ negative advertisement, inconsistent procedures
Education, financing, cost of traditional energy costs aren’t very high in Flagstaff
Q5-‐What changes (positive or negative) have you seen in solar the past 10 years (ex. Lease vs. cash)? And where do you see solar going in the future?
Cost decrease, consistency, incentive decrease, new technology
Acceptance of solar, less materials needed, industry responses to problems, more jobs
Q6-‐Are there any existing inefficiencies that you think exist in the current system and how could this be changed?
Inefficiencies-‐ Pace, consistency in parties/materials/cost Future-‐ Solar becomes more common, grid defection
Inefficiencies-‐ national uniformity, lack of experience, renewable have “bad” image Future-‐ battery storage improvements
• Type of stakeholder-‐ The Installer is a stakeholder that represents the
construction aspect of solar projects. In this case the installer was also a local installer, so local jobs were also represented.
• Why the question was asked-‐ The first questions was asked to understand at what level we are getting a representation from. The second question was to analyze the communication between the stakeholders and their understand of roles in the process. Next, financial options is important to advertise correctly and see how if/how they contribute on that level. Question four was understand what barriers

41
APS faces and what feedback they get from customers. The fifth question was asked to gage how long the person had been in the position and to measure the successes/drawbacks of solar. The last question allowed the person to voice opinions about inefficiencies in their positions or overall things that could be made better.
Summary of Results
The APS surveys, based on secondary sources, indicated that APS is a utility has
provided that supports solar installation across the state and will continue to grow it’s
involvement. Learning that while rebates are no longer available through APS, they still
honor the net-‐metering policy. They acknowledged that while paperwork and processes
have changed over the years, they see solar growing in Arizona. Cost shifts in still remain
as an improvement for APS but they expect the ACC will correct this eventually.
City surveys showed their permit and inspection roles in the solar process. In the
future they believe solar will become more popular, efficient and less expensive.
Inefficiencies that they acknowledged were policy regulation and practicality. Code
compliance and city process was not seen as a barrier by any of the participants.
Customers surveyed had systems installed in the past two years. These
homeowners made contact with two of the other stakeholder groups and learned about
solar through media. Their personal obligation and financial situations made the decision
to install solar. They believed the biggest barrier for Flagstaff solar was the lack of
education and negative press. APS, state, and federal incentives were accepted on behalf of
these people because they all identified the financial commitment as significant decision.
An average of four rating was given to the overall process and they believed improvement
in timeline consistency, unity, and stability would benefit the future of solar.

42
The installers’ survey indicated that they had correspondence with all stakeholder
groups. They provide alternative financing and tax incentive/APS rebate assistance. As a
group they believe inconsistencies, education, and negative media all contribute to barriers
of Flagstaff. Technology advances, increase of jobs, and total cost decreases have all be
changes they’ve witnessed in the last ten years. Installers believe inefficiencies consist of
consistency and lack of experience.
Based on local research and interview surveys, Flagstaff shows a need for easy and
accessible information what solar is, practicality of energy in Flagstaff, pros vs. cons, where
the industry stands, financing options, and how to get started. Stakeholders like APS, the
City of Flagstaff, and local installers could also benefit from this information because of the
advertising benefits as well as public feedback.
RECOMMENDATIONS Based on the defined process, interviews, and professional experience working as a
solar project manager I recommend Flagstaff update solar incentives and financing
information annually to inform the public of new and expired options. Also maintaining
and increasing alternative energy education in the community would be beneficial. One
way they could incorporate this goal is by holding annual or bi annual stakeholder
education opportunities. A short workshop where the community could come and be
informed of city and installer processes would keep communication and ease installation in
the future. I also recommend the publication of the solar process and who to contact for
complete details. Bringing this awareness will create unity throughout the community and
potentially convert more homes solar. The ultimate goal is to increase Flagstaff’s

43
sustainability, support local business by creating more jobs, and creating an educated
community.

44
LIST OF APPENDICES Appendix A
Appendix A-‐ IRB
- 1 - Generated on IRBNet
�
��������� ��������������������������������������������������������
��������� ������� ��� ���������������������� ��!��"�##�����
$%��&%'��'��$%��&%'�#��&����
((()����*)��+),+-�.�-/0�
���� �����1 ��� ���� 2�����3��,4��!""���� �#���� 5��+����'# �%�#�� ��������� 6��������*� *+7��������$����� &&���%�#������%���&��'(��� %8�6+����.��*,+��� �
9�+������*�.����*������4���..���,�4����1+7���6+4:*���;�77 ��-/��� �+� �����0� (�����,</0�8��������+�,����*����������=>=?�@)�@ ��*�������7����������+��/0���..����������� ��.��:*�,��������������. ��� ���,�� ����.� �, *���(�������..������ �������*������+����������*����� ����+��.��:*���������*��������+�)
/����+��.��:*������&��� ������(�� ���+�7+���� ����0���*��7�,7������7���� ��4�������.�A--((()����*)��+),+-*�7.� ��*- �4-���7�)��.���0/�0�@�� 7.�7�� �������*����)�9�+�7������ 7.�7�����*�����+�� ����+����(� �����..������������*�������7���/0� �+�������*��� ���*���������� 7 ���� 77, �������,�����.��� * .����)��� �+�����,�����( �����+��� �����*�7.� ��*��,�.��� 4���+�.�� ��������7 ��� ��������+������*�.��:*�)
����+���� * .��,�.��4�7�����+��.*�,����������������7+���4��.���,������/0��( � ��&4+� ����,����<( � ��%���+��������� �+���,��������8������+��4*�7 ����(������������4��� �� ���+������,����0�*� ������=����0.��� ������7�<�������� ��4�����(4� ���4��8)
�����+�*��,+*����+������* �.�����774�����A#)������ * .�����������+����������� �����,� ����+����,+*�� �����.�����7�B�������������( �,��(���7�������*��������� 7�( ��+��.�����)���%)����������+����+� ���� �� ���,��� ����� * .�����7+���4� ����7,����������*�.��:*�����+�(� �������������.����� �����,�7+���� �������..�����*���� *����������4�������� ����7,�*���������7<����7 �������,�* �,�����.���������+��, ���7+���� ��8)���')����������.��� * .��������,�������������� ��������7�� ���.��� * .����C������7 �����,*��� ,�� �� ���7+���4�.���*�,)�@����+�,�����4��4�����4� ,�� � ,����+������.����)�@.������ ��������,������+�,�����.+���7����� �D������������ ��*���E+�*�)��**��������,���� ��.* � ,���,����� *�,�4��������*����,���,.���7��)
�,, � �����/0�� ����7�� ���7���4���+�,������.�A--((()����*)��+),+-*�7.� ��*- �4- �,�)��.�)

45
Appendix B
Appendix B-‐ IRB
NAU Human Subject Informed Consent
Department of Geography, Planning and Recreation Northern Arizona University, Flagstaff, Arizona 86011-5016, USA
Tel: +1 208 724 1759 (in USA)
Project Title: Solar Energy in Flagstaff, Arizona- Practicality, Progression and Barriers
Dear Participant, You are being asked to participate in a project conducted through the Department of Geography, Planning and Recreation at Northern Arizona University by Anna Alisse Highley that involves research. The researcher is required to receive your informed consent before you participate in this project. Anna Highley will explain to you in detail: (1) the purpose of the project; (2) what you will be asked to do and how long your participation will last; (3) how your personal information, if collected, will be kept confidential; (4) if you will receive any compensation; (5) the possible risks; and (6) potential benefits of participation. Your participation in research is voluntary. If you refuse to participate, there are no penalties or loss of benefits or services that you are otherwise entitled. If you decide to participate and then withdraw or skip a question there are also no penalties or loss of benefits or services. Whether or not you choose to participate in this project will have no effect on your relationship with NAU now or in the future. A basic explanation of the project is written below. Please read this explanation and discuss it with the Anna Highley. Feel free to ask questions to help you understand the project. After any questions you may have are answered and you decide to participate in the research, please sign on the last page of this form in the presence of the person who explained the project to you. A copy of this form will be given to you to keep. 1. PROJECT PURPOSE: To identify what the solar processes are in Flagstaff, how they relate to each other, and gage current understanding. 2. EXPLANATION OF PROCEDURES: There will be several questions for you to answer in an open discussion format. Interviews can be done over the phone or done in-person. The approximate time to complete this interview is one hour.

46
Appendix B-‐ IRB (Continued)
3. CONFIDENTIALITY: Your name will not be associated with your responses and you will not be identified as a participant. 4. COMPENSATION: You will not receive any compensation by participating in this interview. 5. BENEFITS: This interview will help us to better understand the role and understanding of PV solar in the Flagstaff community. 6. RISKS: There are no known risks to you in participating in this interview. You may refuse to answer any questions and you can stop the interview at any time. 7. CONSENT: I have read the above information about Solar Energy in Flagstaff and have been given an opportunity to ask questions. I agree to participate in this project, and I have been given a copy of this consent document. 8. AUDIO CONSENT: I agree to be audio recorded ____yes ____no. The dated approval stamp in the header of this consent form indicates that this project has been reviewed and approved by the Northern Arizona University Institutional Review Board (IRB) for the Protection of Human Subjects in Research. Contact the Human Research Protections Office at 928-523-4236 if you have any questions about: (1) the conduct of the project, or (2) your rights as a research participant, or (3) a research-related injury. Any other questions about the research project should be directed to: Investigator: Anna Alisse Highley Department of Geography, Planning and Recreation Northern Arizona University, Flagstaff, Arizona 86011-5016, USA Tel: +1 208 724 1759

47
Appendix C SOLAR PRACTICUM QUESTIONS
APS
1. How does APS participate in solar installations and what is your businesses
process?
2. What do you require from installers, customers and City to switch?
3. What financial incentives do you provide or advertise for patrons, if any?
4. What is the biggest barrier you believe solar in Flagstaff has (financial, climate,
implementation, etc.)?
5. What changes (positive or negative) have you seen in solar the past 10 years? And
where do you see solar going in the future?
6. Are there any existing inefficiencies that you think exist in the current system and
how could this be changed?
INSTALLERS
13. How do you participate in solar installations and what is your businesses process?
14. What do you require from APS, customers and City to switch?
15. What financial options do you provide or advertise for patrons (incentives/or types
of payment)?
16. What is the biggest barrier you believe solar in Flagstaff has (financial, climate,
implementation, etc.)?
17. What changes (positive or negative) have you seen in solar the past 10 years (ex.
Lease vs. cash)? And where do you see solar going in the future?
18. Are there any existing inefficiencies that you think exist in the current system and
how could this be changed?
Appendix C-‐ Solar Survey

48
CITY
8. What is your role in solar installations?
9. What financial options do you provide or advertise for patrons (incentives/or types
of payment)?
10. What is the biggest barrier you believe solar in Flagstaff has (financial, climate,
implementation, etc.)?
11. What changes (positive or negative) have you seen in solar the past 10 years? And
where do you see solar going in the future?
12. Are there any existing inefficiencies that you think exist in the current system and
how could this be changed?
SOLAR PARTICIPANTS
1. When was your system installed?
2. How did you participate in your solar installations and what is was that process with
APS, the City, and installer?
3. Where did you find out about solar and what convinced you to install?
4. How many different businesses/parties did you contact to get your system installed?
5. What is the biggest barrier you believe solar in Flagstaff has (financial, climate,
implementation, etc.)?
6. What source of financial incentives did you benefit from (federal, state, local, etc.)?
7. How important was financial assistance in your decision to go solar?
8. Why did you choose to install, and why did you choose that time period?
9. On a scale from 1-‐5 how would you rate your solar experience? (1-‐ terrible 5-‐ perfect)
and are there any existing inefficiencies that you think exist in the current system and
how could this be changed?
Appendix C-‐ Solar Survey (continued

49
Appendix D
Appendix D-‐ Rooftop Solar
Sheet1
Page 1
CASH SOLAR TIMELINE/CHECKLISTInitiated/Sent Completed/Approved Date
Hand-Off A (Sales to PM)
RS Name
Contract Date
System Size
Payment 1 of 3
APS Executed Contract
Rebate Reservation
Reservation # and $
W9
Comments
Hand-Off B (PM to SA)
RS Site Analysis Date/Time
Structural Analysis
Hand-Off C (SA to PM)
Upgrades/Conditions
Comments
Hand-Off D (Design to PM)
RS
AHJ Permit
Parts list
APS Upload Site Plan
IA
Comments
Hand-Off E (PM to Construction)
RS Confirm Parts List
Parts Delivery Date
Scheduled/Actual Installation
Installation Complete
Put in Total Install Sheet
Payment 2 of 3
Comments
3rd pg. Contract to Books
APS login/password
Drawings in Dropbox
Specs in Dropbox

50
Appendix D-‐ Rooftop Solar (Continued)
Sheet1
Page 2
Hand-Off F (Construction to PM)
RS Market Canvassing
APS AHJ Inspection Upload
APS Inspection (Flip Switch)
Comments
Final Completion
RS Payment 3 of 3
System Care Packet
System Tutorial
Homeowner Acceptance
Update Total Install Sheet
APS Upload Final Invoice Receipt
Comments
Project Accounting
RS APS Rebate Check
Project Projections
Project Closeout
Comments
Hand-Off G (PM to Sales)
RS Installation Party
Flowers
Issues
Date Problem Resolved by
Date
Pre/Post Photos
Weekly Updates (Track in Pipedrive)

51
Appendix E
Appendix E-‐ Rooftop Solar
Sheet1
Page 1
LEASE SOLAR TIMELINE/CHECKLISTInitiated/Sent Completed/Approved Date
Lease Hand-Off A (Sales to PM)
RS Name
Contract Lease Date
System Size
APS Executed Contract
Rebate Reservation
Reservation # and $
5A
6A
W9
ORE MILESTONE 1
Lease Counter Sign
W9 if Required
Utility Bill (2 Months)
Voided Check or ACH Signed
Proof of Income Statement
M1 Payment Received
Comments
Lease Hand-Off B (PM to SA)
RS Site Analysis Date/Time
Structural Analysis
Lease Hand-Off C (SA to PM)
RS Upgrades/Conditions
ORE
Upload APS Rebate Application
Upload APS IA
Comments
3rd pg. Contract to Books
APS login/password
Upload Pre-Shading

52
Appendix E-‐ Rooftop Solar (Continued)
Sheet1
Page 2
Lease Hand-Off D (Design to PM)
RS
AHJ Permit
Schedule Design Signing
Parts list
APS Upload Site Plan
IA
ORE Upload Initialed Final Designs
Receive Kitting Approval
Comments
Lease Hand-Off E (PM to Construction)
RS Confirm Parts List
Parts Delivery Date
Scheduled/Actual Installation
Installation Complete
Input into Total Install Sheet
Comments
Lease Hand-Off F (Construction to PM)
RS Market Canvassing
ORE MILESTONE 2
Upload QA
Upload Installation Photos
Upload Maximizer Map
Upload Post Shading
Upload HO Final Accept
Locate/Upload Monitoring
Request/Upload BOS
Locate/Upload Installation Cert.
Request/Upload Lien Waiver
M2 Payment Received
Comments
Drawings in Dropbox
Specs in Dropbox

53
Appendix E-‐ Rooftop Solar (Continued)
Sheet1
Page 3
Lease Final Completion
RS Update Total Install Sheet
APS AHJ Inspection Upload
APS Inspection (Flip Switch)
ORE Receive/Upload AHJ Sign off
PTO
Request/Upload Lien Waiver
Upload APS Rebate Claim Stat.
M3 Payment Received
Comments
Lease Project Accounting
RS
Project Projections
Project Closeout
Comments
Hand-Off G (PM to Sales)
RS Installation Party
Flowers
Issues
Date Problem Resolved by
Date
All Lease Payments Recieved
Weekly Updates (Track in Pipedrive)

54
Appendix F
Practicum Hours
City of Flagstaff 2012 Week 1-‐2 (August 19-‐ September 1) 50 TOTAL HOURS Roger Eastman The first week of my internship I was introduced to the basic processes of the Community Development Department. This included becoming familiar with Flagstaff’s new Zoning Code and future amendments that were planned to be made. Into the second week, I started filing and organizing staff and community comments for the Zoning Code. Each comment was put into the correct chapter which it applied to; this was a tedious task that was useful in educating me on the Zoning Code and what each chapter had to offer. Week 3-‐4 (September 3-‐16) 21.5 TOTAL HOURS Roger Eastman During this time frame I continued working on filing comments into the appropriate chapter, after this was done; I interrupted the comments into “Zoning Code language.” This process was challenging because trying to extract the information from peoples’ comments and relating it to the zoning code was very time consuming. The last days of this week were spent compiling this information and adding to a document with future Zoning Code amendments. The layout of this information was critical to follow and learning how to format the information is a useful skill. Week 5-‐6 (September 16-‐29) 28 TOTAL HOURS Roger Eastman The sixth week I aided Roger in finding exceptions to signage in bus stop areas. This is usually not accepted because of pedestrians’ right-‐of-‐way, but Roger wanted to make an exception to promote NAIPTA’s buses. These signs would be located on/nearby bus shelters. I looked through other Arizona cities’ Zoning Code to look for examples of possible exemption solutions. (6 Hours) Kim Sharp During week five I assisted Andrew in compiling and summarizing Regional Plan documents into a background report. I was looking for this information in chapter binders and in data file resources; I would then summarize the information and provide a hyperlink. I worked on the Circulation, Bike and Community Character Chapters this gave me an insight into these areas and what makes them successful and unsuccessful. (13 Hours) Nicole Woodman I began working for Nicole the sixth week, we first discussed her project and the role that I would play in helping her organize a DOE Sunshot Initiative Seminar. My job this week was
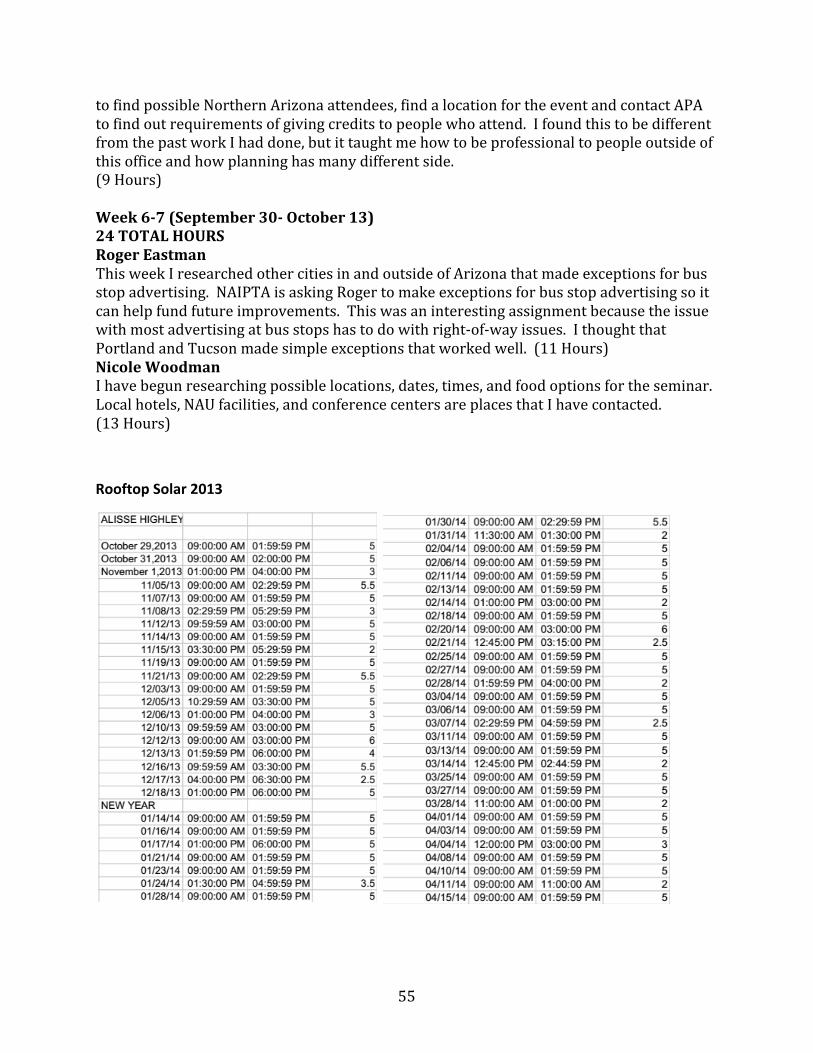
55
to find possible Northern Arizona attendees, find a location for the event and contact APA to find out requirements of giving credits to people who attend. I found this to be different from the past work I had done, but it taught me how to be professional to people outside of this office and how planning has many different side. (9 Hours) Week 6-‐7 (September 30-‐ October 13) 24 TOTAL HOURS Roger Eastman This week I researched other cities in and outside of Arizona that made exceptions for bus stop advertising. NAIPTA is asking Roger to make exceptions for bus stop advertising so it can help fund future improvements. This was an interesting assignment because the issue with most advertising at bus stops has to do with right-‐of-‐way issues. I thought that Portland and Tucson made simple exceptions that worked well. (11 Hours) Nicole Woodman I have begun researching possible locations, dates, times, and food options for the seminar. Local hotels, NAU facilities, and conference centers are places that I have contacted. (13 Hours)
Rooftop Solar 2013

56
Over the past nine months I have worked with solar customers, APS and installers to installed solar systems around Flagstaff. This experience has taught me what is required to install solar and the processes behind it. Understanding the requirements has given me an inside look at why regulations and stakeholders are in place.

57
Appendix G Appendix G. APS Program Guide
1 RENEWABLE ENERGY RESIDENTIAL PROGRAM GUIDE AND APPLICATION PROCESS | March 2014
Process Guide (Effective on March 3rd 2014)
:: residential renewable energy program guide and application process :: Thank you for your interest in the APS Renewable Energy Program. This guide will help you navigate the process to interconnect a residential solar photovoltaic (PV) system, and to complete residential incentive applications for solar water heaters. For document requirements, please see the Document Requirements Guide (the last page of this document). Each step of the process must be completed and approved before moving to the next step. APPLICATION PROCESS FOR GRID-TIED SYSTEMS WHERE CUSTOMER IS NOT SEEKING AN INCENTIVE Step 1: Customer application (Customer) � Register for an aps.com account, if you do not currently have one � Be sure that your installer, dealer, and lessor (if applicable) are registered with aps.com prior to starting an application � Disable pop up blockers, then log in to your APS account � Select “my rebates and renewables” � Select “renewable energy applications” � Profile page: be sure to completely fill out this page before continuing � Navigate through the pre-validation page and the online application by either clicking
on the page names on the top or by scrolling down and selecting “previous” or “continue” – very important: do not use your browser’s back button
� Submit and print out the summary of your application – your Interconnect Agreement is signed in conjunction with submitting your application, so please keep a copy for your records
� When you submit your application, a hand-signed Disclaimer and signed Executed Contract must be uploaded. We will dismiss the application if we do not receive these documents and you will be asked to reapply when ready
Step 2: Installer application (Installer) � Prior to installation, submit the online installer application and upload any required
design documents, such as the Site Plan and 3-Line Diagram � Once APS confirms that your grid-tied system is designed in conformance with our interconnection requirements, you will
receive notification and may proceed with installation Step 3: Clearance (Installer and/or Customer) and Lessor Agreement online if applicable (Lessor) � The City or County may send Clearance to APS, but a copy of the clearance/green tag may also be uploaded to the
application by you or your installer � For leased systems, after the lessor has issued you or your installer with their notice to proceed (NTP), the lessor must log
into their aps.com portal to sign the lessor agreement for your application Step 4: Certifications (Installer) � Installer will upload the Installer Checklist and submit the Certifications Step 5: Inspection / Meter Set (APS) � Your electric billing meter will be swapped out for a bi-directional meter � At no cost to you, your “test” production meter will also be swapped out for an APS production meter, if you are in AMI
territory Process Complete
The Disclaimer
As of December 1st, 2013, a hand-signed disclaimer must be signed by the APS customer for every application.

58
Appendix G. APS Program Guide (Continued)
2 RENEWABLE ENERGY RESIDENTIAL PROGRAM GUIDE AND APPLICATION PROCESS | March 2014
APPLICATION PROCESS FOR GRID-TIED SYSTEMS WHERE CUSTOMER IS SEEKING AN INCENTIVE Continue here for application submitted before March 3rd 2014 that did not have clearance verified or lessor acknowledgements completed by March 3rd 2014. Step 3: Clearance (Installer and/or Customer) and Lessor Agreement online if applicable (Lessor) � The City or County may send Clearance to APS, but a copy of the clearance/green tag
may also be uploaded to the application by you or your installer
� For leased systems, after the lessor has issued you or your installer with their notice to
proceed (NTP), the lessor must log into their aps.com portal to sign the lessor agreement
for your application
Step 4: Certifications (Installer) � Installer will upload the Installer Checklist and submit the Certifications
Step 5: Inspection / Meter Set (APS) � Your electric billing meter will be swapped out for a bi-directional meter
� At no cost to you, your “test” production meter will also be swapped out for an APS
production meter, if you are in AMI territory
Step 6: Payment (Installer / Dealer and / or Customer) � A Final Paid Invoice must be uploaded.
� The IRS considers utility incentives a reportable income. Prior to payment a W-9 form
must be submitted to APS. If you have purchased your system, the W-9 should be
provided by you. If you are leasing a system, the lessor must provide a W-9 since they
are the system owner. W-9 forms are available online at the IRS website. If you have any
questions regarding the W-9 requirement, please contact your tax advisor or contact the IRS directly at 1-800-829-1040.
� APS can issue the incentive check only once all requirements are met and all documents
are reviewed and verified.
� Incentive checks are automatically sent to the installer (in the case of customer-owned
application) or the lessor (in case of a leased application) to buy down the cost of the
system.
Process Complete
We’re here to help! Our processes have changed slightly for applications submitted before March 3rd 2014. We have a new process for applications submitted on or after March 3rd 2014. Please be sure to read the correct process guides to help you. For assistance with your aps.com account or to ask general questions about your application, call 602-328-1924. To troubleshoot the online application, email [email protected].

59
Appendix G. APS Program Guide (Continued)
3 RENEWABLE ENERGY RESIDENTIAL PROGRAM GUIDE AND APPLICATION PROCESS | March 2014
APPLICATION PROCESS FOR SOLAR WATER HEATING SYSTEMS WHERE CUSTOMER IS SEEKING AN INCENTIVE
Please note that the entire process must be completed within 180 days of the application being reserved. Also,
customers not seeking an incentive for solar water heating systems do not need to notify APS about their installation.
Step 1: Customer application (Customer) � Register for an aps.com account, if you do not currently have one
� Be sure that your installer, dealer, and lessor (if applicable) are registered with aps.com prior to starting an application
� Disable pop up blockers, then log in to your APS account
� Select “my rebates and renewables”
� Select “renewable energy applications”
� Profile page: be sure to completely fill out this page before continuing
� Navigate through the pre-validation page and the online application by either clicking
on the page names on the top or by scrolling down and selecting “previous” or
“continue” – very important: do not use your browser’s back button
� Submit and print out the summary of your application – your APS Agreement is
signed in conjunction with submitting your application, so please keep a copy for your
records
� Upload a signed Executed Contract and W9 when you submit the application. We will
dismiss the application if we do not receive these documents when the application is
submitted.
� The IRS considers utility incentives as reportable income. Prior to payment a W-9 form
must be submitted to APS. If you have purchased your system, the W-9 should be
provided by you. If you are leasing a system, the lessor must provide a W-9 since they
are the system owner. W-9 forms are available online at the IRS website. If you have
any questions regarding the W-9 requirement, please contact your tax advisor or
contact the IRS directly at 1-800-829-1040.
Step 2: Installer Application (Installer)
� Prior to installation, your installer submits the online installer application. No documents are required.
Step 3: Clearance (Installer and/or Customer) and Lessor Agreement online if applicable (Lessor)
� The City or County may send Clearance to APS, but a copy of the clearance/green tag may also be uploaded to the
application by you or your installer
� For leased systems, after the lessor has issued you or your installer with their notice to proceed (NTP), the lessor must log
into their aps.com portal to sign the lessor agreement for your application
Step 4: Certifications (Installer)
� Submit the certifications and upload a Final Paid Invoice.
Step 5: Inspection (Arizona Solar Center and Installer)
� APS will require an inspection for every SWH system installed seeking an incentive. The Arizona Solar Center will
schedule the inspection, if leased we must have the leased documents before we can send to Arizona Solar Center
� If the system fails the first inspection, the installer is responsible for the cost of all re-inspections until it passes.
� Installer must email [email protected] when ready for the re-inspection stating: “application #______ has been
paid and is ready for re-inspection”
Step 6: Payment (Installer / Dealer and / or Customer)
� Incentive checks are automatically sent to the installer to buy down the cost of the system.
� APS only issues payment once all required documents are received.
� Process Complete
Reminder:
The System must be tested and certified to the OG-300 by an APS-approved certifying organization and have a rating that is accompanied by the certified system design schematic. This will be verified before we reserve the application.

60
Appendix G. APS Program Guide (Continued)
4 RENEWABLE ENERGY RESIDENTIAL PROGRAM GUIDE AND APPLICATION PROCESS | March 2014
:: Document Requirements Guide ::
Document: Requirements: Executed Contract � Must be on a company letter head
� Customer name
� Site address
� Equipment (recommended)
� Total System Cost (recommended)
� Signatures of customer and company
Click her for a sample Executed Contract
Disclaimer (Grid Tied Systems Only) � Must be the most current revision
� Signed and dated by the APS customer
Click here for the Disclaimer
Site plan, 3-line Diagram, and other Diagrams
(Grid Tied Systems Only)
• Interconnection Webpage
Click here for sample Site Plan and Diagrams (Line Side)
Click here for sample Site Plan and Diagrams (Load Side)
Installer Checklist (Grid Tied Systems Only) Click here for Installer Checklist for PV & Wind Interconnections
Clearance � Show which City or County the Clearance is from
� Site address
� Indicate PV (Electric and Solar) or SWH (Solar Plumbing)
� Indicate pass / final / approved
� Date
W9 (Incentive Only) Click here for forms at IRS.GOV
� Clearly printed customer name, address and Social Security Number
� Name needs to be the same as it appears on your income tax returns
� Customer signature and date
Final Paid Invoice (Incentive Only) � Must be on a company letter head
� Customer name
� Site address
� Equipment
• Major equipment detailed (manufacturer, model, and
quantity)
� Total System Cost
� Estimated incentive amount deducted from total system cost (required
for SWH)
� Show zero balance / paid in full
� Customer Signature (required for SWH)
Landlord / Tenant Rider* Click here for Landlord / Tenant Rider form
* If you are a landlord wanting to install solar on your rental property, be sure to log in with your own user name and
password. If you do not currently have an active APS account, you may create one. Do not use your tenants log in information. If you are a tenant installing the solar on a property you rent, then fill out the application using your login and fill
out the Tenant / Landlord Rider.
Please email questions about the documents to [email protected].
Duration of the application process varies. Installers are advised to inform customers that timeframes are looked at on a project to project basis.

61
Appendix H
Appendix H. City Permit

62
Appendix H. City Permit (Continued)

63
LIST OF FIGURES
Figure 1. How Does Solar Work. Energy Farm, Source: Energy Farm Australia (2013).
Figure 2. Various Azimuth’s on Solar Production. Pierrosolar, Source: Pierro (2012)

64
Figure 3. South Facing Panels & Solar. Production. Pierrosolar, Source: Pierro (2012)
Figure 4. Arizona Elevation. Climate of the Southwest, Source: Lenart (2008)

65
Figure 5. Arizona Average Annual Precipitation. Climate of the Southwest, Source: Lenart (2008)
Figure 6. APS Rebate Information. APS Renewables, Source: APS (2013).

66
Figure 7. Solar Installation Process
83 Days Post Decision
6 months-‐2 years

67
LIST OF TABLES
CUSTOMER SURVEY Question Why it was Asked
Q1-‐When was your system installed? How current installation was to understand and compare advancements made in processes.
Q2-‐How did you participate in your solar installations and what was that process with APS, the City, and installer?
Understanding of the “Workload” or knowledge needed to install a solar system
Q3-‐Where did you find out about solar and what convinced you to install?
Note advertisement opportunities out there and which ones appeal to the customer
Q4-‐How many different businesses/parties did you contact to get your system installed?
What length was the customer required to go to, to get system installed
Q5-‐What is the biggest barrier you believe solar in Flagstaff has (financial, climate, implementation, etc.)?
After going through the process what did they struggle with or find as the biggest barrier.
Q6-‐What source of financial incentives did you benefit from (federal, state, local, etc.)?
See if/what financial incentives the customer knew about of was eligible for.
Q7-‐ How important was financial assistance in your decision to go solar?
Find out if personal system made financial sense or something they financially benefitted from
Q8-‐Why did you choose to install, and why did you choose that time period?
Understand why that time period specifically impacted their switch
Q9-‐On a scale from 1-‐5 how would you rate your solar experience? (1-‐ terrible 5-‐ perfect) and are there any existing inefficiencies that you think exist in the current system and how could this be changed?
Overall understanding of process satisfaction and where could there be improvement
Table 1. Customer Solar Survey

68
CUSTOMER RESULTS Question # Consensuses Notable Findings Q1 Within the past 2 years NA Q2 Contacted Installation Company After installation had correspondence
with APS Q3 Informed-‐ Media
Why-‐ Personal obligation Informed-‐ Home show Why-‐ Overall financial saving, uncertainty of fuels in the future, keeping energy money in USA
Q4 2-‐ Installer, APS Leasing company, ACC Q5 Financing, lack of education Media/publicity, peer support Q6 APS rebate, state and federal tax
rebate Leasing incentive, installer promotion
Q7 Top priority Significant Q8 Right time in life financially,
home, electricity usage, personally.
ACC net metering deadline
Q9 Rate-‐ 4 Improvements-‐ pace, truth, unity, stability
Improvements-‐ consistency, process outline, uniformed payments system
Table 2. Customer Results from Solar Survey

69
INSTALLER SURVEY Question Why it was asked
19. Q1-‐How do you participate in solar installations and what is your businesses process?
Understanding of where in the process that person works and what they do to contribute
20. Q2-‐What do you require from APS, customers and City to install solar?
Understand what information they are interested in and who they are in contact with
21. Q3-‐What financial options do you provide or advertise for patrons (incentives/or types of payment)?
See how individual is promoting or advertising financial options
22. Q4-‐What is the biggest barrier you believe solar in Flagstaff has (financial, climate, implementation, etc.)?
A perspective of working in the industry and acknowledging challenges
23. Q5-‐What changes (positive or negative) have you seen in solar the past 10 years (ex. Lease vs. cash)? And where do you see solar going in the future?
Ability to measure progress and different sectors and an educated guess to where trends are going now
24. Q6-‐Are there any existing inefficiencies that you think exist in the current system and how could this be changed?
Understanding of where individual sees problems or where advancements could be made.
Table 3. Installer Solar Survey

70
INSTALLER RESULTS Question # Consensuses Notable Findings Q1 Construction Site analysis, design Q2 APS-‐ IA, inspection, rebate,
reservation City-‐ Permit, inspection Customer-‐ contract, funds, utility bill
Structural engineering approval, leasing paperwork
Q3 Cash, lease, tax incentive, APS rebate
In house promotions, manufacturer promotions, leasing incentives
Q4 APS-‐ negative advertisement, inconsistent procedures
Education, financing, cost of traditional energy costs aren’t very high in Flagstaff
Q5 Cost decrease, consistency, incentive decrease, new technology
Acceptance of solar, less materials needed, industry responses to problems, more jobs
Q6 Inefficiencies-‐ Pace, consistency in parties/materials/cost Future-‐ Solar becomes more common, grid defection
Inefficiencies-‐ national uniformity, lack of experience, renewable have “bad” image Future-‐ battery storage improvements
Table 4. Installer Results from Solar Survey
CITY SURVEY Question Why it was asked
13. Q1-‐ What is your role in solar installations?
Understanding of where in the process that person works and what they do to contribute
3. Q2-‐ What financial options do you provide or advertise for patrons (incentives/or types of payment)?
See how individual is promoting or advertising financial options
14. Q3-‐ What is the biggest barrier you believe solar in Flagstaff has (financial, climate, implementation, etc.)?
A perspective of working in the industry and acknowledging challenges
15. Q4-‐ What changes (positive or negative) have you seen in solar the past 10 years? And where do you see solar going in the future?
In the government sector, what changes have been made and are changes expected to be made in the future
16. Q5-‐ Are there any existing inefficiencies that you think exist in the current system and how could this be changed?
Understanding of where individual sees problems or where advancements could be made.
Table 5. City Solar Survey

71
CITY RESULTS Question # Consensuses Notable Findings Q1 Building inspector, current
planner NA
Q2 None Flat rate permitting fee Q3 Financing Education Q4 Price decrease, faster More common Q5 Inefficiencies-‐ practicality, cost
Future-‐ faster, cheaper Inefficiencies-‐ Policy fluctuation Future-‐ more common
Table 6. City Results from Solar Survey
APS SURVEY Question Why it was asked
25. Q1-‐How does APS participate in solar installations and what is your business process?
Understanding of utility role and inside process and reasoning
26. Q2-‐What do you require from installers, customers and City to switch?
Understand what information they are interested in and who they are in contact with
27. Q3-‐What financial options do you provide or advertise for patrons (incentives/or types of payment)?
See how company is promoting or advertising financial options
28. Q4-‐What is the biggest barrier you believe solar in Flagstaff has (financial, climate, implementation, etc.)?
A perspective of working in the industry and acknowledging challenges
29. Q5-‐What changes (positive or negative) have you seen in solar the past 10 years (ex. Lease vs. cash)? And where do you see solar going in the future?
Ability to measure progress and different sectors and an educated guess to where trends are going now
30. Q6-‐Are there any existing inefficiencies that you think exist in the current system and how could this be changed?
Understanding of where individual sees problems or where advancements could be made.
Table 7. APS Solar Survey

72
APS RESULTS (Information based on secondary resources)
Question # News and Press Released Information Q1 “APS has helped make Arizona a national leader in solar
development. Our company is spending nearly $1 billion on solar projects throughout the state, while providing a stable electric grid. In 2012, APS added a record-‐breaking 148 megawatts of clean solar energy, which is enough electricity to serve more than 35,000 customers. We expect to more than double that number in 2013.” (APS, 2013).
Q2 Customer online utility account, executed contract, disclaimer form, lessor acknowledgment (if leased), City/County approval.
Q3 APS also is supporting an increase in the up-‐front cash incentive that makes rooftop solar a more affordable option for customers who want to “go solar.” “We support an incentive program for rooftop solar that is transparent, reviewed frequently by the ACC, and shared fairly among customers,” said Mark Schiavoni, APS executive vice president of Operations (APS, 2013).
Q4 “As we get more rooftop solar customers … what we want is a system that’s fair for all of our customers.” (O’Donnell, 2013)
Q5 Paperwork, requirements, process, taxes and rates. Q6 “Of course, having determined that a problem exists (net metering
cost shift), we would have preferred for the ACC to fix it. The proposal adopted by the ACC, and surprisingly championed by the state’s consumer advocate RUCO, falls well short of protecting the interests of the one million residential customers who do not have solar panels. We will continue to advocate forcefully for the best interests of our customers and for a sustainable solar policy for Arizona.” Dan Brandt (APS, 2013). Table 8. APS Results from Solar Survey

73
REFERENCE
1. "Days of Sunshine Per Year in Arizona." Annual Days of Sunshine in Arizona. Current
Results, 2014. Web. 30 Mar. 2014.
<http://www.currentresults.com/Weather/Arizona/annual-‐days-‐of-‐sunshine.php>.
2. "Factors in Solar Production." Pierrosolar.com. Pierro, 2012. Web. 02 Apr. 2014.
<http://www.pierrosolar.com/why/about-‐solar-‐panels/variables>.
3. "Findthe Average Electric Bill in Your AreaPowered by MyEnergy.com." Average
Electric Bill by City, State or Zip Code. My Energy, n.d. Web. 30 Mar. 2014.
<http://calc.myenergy.com/>.
4. "Flagstaff Snowfall Totals & Accumulation Averages." Flagstaff AZ Snowfall Totals &
Snow Accumulation Averages. Current Results, 2014. Web. 30 Mar. 2014.
<http://www.currentresults.com/Weather/Arizona/Places/flagstaff-‐snowfall-‐
totals-‐snow-‐accumulation-‐averages.php>.
5. "How Does It Work." Energy Farm. Energy Farm Australia, 2013. Web. 02 Apr. 2014.
<http://www.energyfarm.com.au/why-‐solar-‐energy-‐perth/how-‐does-‐it-‐work-‐
solar-‐power/>.
6. "How Long Has Solar Power Been around and Does It Work?" How Long Has Solar
Power Been around and Does It Work? -‐ An ENow Blog Article. Enow, 14 Oct. 2012.
Web. 30 Mar. 2014. <http://www.enowenergy.com/blog/post/how-‐long-‐has-‐solar-‐
power-‐been-‐around-‐and-‐does-‐it-‐work>.
7. "Myth vs. Fact." Arizona's Energy Future. APS, n.d. Web. 31 Mar. 2014.
<http://www.azenergyfuture.com/info/myth-‐versus-‐fact/>.
8. "News Archive." APS News Archive. APS, n.d. Web. 31 Mar. 2014.
<http://www.aps.com/en/ourcompany/news/pressreleasearchive/Pages/home.as
px>.
9. "SEIA Net Metering by State." Net Metering by State. SEIA, n.d. Web. 31 Mar. 2014.
<http://www.seia.org/research-‐resources/net-‐metering-‐state>.
10. "Solar Leadership." Arizona's Energy Future. APS, 2013. Web. 31 Mar. 2014.
<http://www.azenergyfuture.com/solar-‐leadership/>.

74
11. "Solar Power Works in Arizona -‐-‐ So Why Do Utilities Want to Kill It?" YouTube.
Solar City, 13 Sept. 2013. Web. 02 Apr. 2014.
<http://www.youtube.com/watch?v=0E-‐nazYOC3A>.
12. "What Size Solar Power System Do I Need?" Solar 101. The Solar Company, 2014.
Web. 30 Mar. 2014. <http://www.thesolarco.com/solar-‐energy/solar-‐power-‐
systems/what-‐size-‐solar-‐system-‐do-‐i-‐need/>.
13. “Technology Advances in Delivering Cost-‐ Competitive Solar Energy.” Rep. PARC,
2006. Web. 2 Apr. 2014. <http://www.parc.com/content/attachments/Whitepaper-‐
SolarEnergyTech.pdf>.
14. Cinnamon, Barry. "Solar Incentives Are Dead, Long Live Solar." Greentech Solar.
Greentech Media, 8 May 2013. Web. 31 Mar. 2014.
<http://www.greentechmedia.com/articles/read/Solar-‐Incentives-‐are-‐Dead-‐Long-‐
Live-‐Solar>.
15. Curry, Andrew. "Germany's Solar-‐Power Success: Too Much of a Good Thing." Grist.
Grist, 2013. Web. 30 Mar. 2014. <http://grist.org/business-‐technology/germanys-‐
solar-‐power-‐success-‐too-‐much-‐of-‐a-‐good-‐thing/>.
16. France-‐Presse, Agence. "Are U.S. Phone Landlines in Danger of Being Disconnected?"
The Raw Story. N.p., 28 Nov. 2013. Web. 31 Mar. 2014.
<http://www.rawstory.com/rs/2013/11/28/are-‐u-‐s-‐phone-‐landlines-‐in-‐danger-‐
of-‐being-‐disconnected/>.
17. Hamilton, Tyler, (2011). “Overcoming Solar Panels’ Winter Problem.” Toronto Star
Newspapers Ltd. (August 2013).
http://www.thestar.com/business/2011/02/24/overcoming_solar_panels_winter_
problem.html
18. Lenart, Melanie. "Climate of the Southwest." Southwest Climate Change Network.
University of Arizona, 2008. Web. 02 Apr. 2014.
<http://www.southwestclimatechange.org/climate/southwest/introduction>.
19. O'Donnell, Kyle. "Corporation Commission Approves Monthly Charge for APS Solar
Users." Cronkite News. N.p., 14 Nov. 2013. Web. 31 Mar. 2014.
<http://cronkitenewsonline.com/2013/11/corporation-‐commission-‐approves-‐
monthly-‐charge-‐for-‐aps-‐solar-‐users/>.

75
20. Randazzo, Ryan. "APS Seeks Higher Bills for New Solar Customers." Azcentral.com.
AZCentral, 12 July 2013. Web. 31 Mar. 2014.
<http://www.azcentral.com/business/consumer/articles/20130712aps-‐seeks-‐
higher-‐bills-‐new-‐solar-‐customers.html>.
21. Sunnucks, Mike. "Why California Rules the Solar Industry (and Arizona Doesn't)."
Phoenix Business Journal. Energy Inc, 10 Mar. 2014. Web. 30 Mar. 2014.
<http://www.bizjournals.com/phoenix/blog/energy-‐inc/2014/03/why-‐california-‐
rules-‐the-‐solar-‐industry-‐and.html>.
22. Trabish, Herman. "Arizona Utility Funds Solar Smear Campaign, Saying It Is
‘Obligated to Fight’." Greentech Solar. Greentech Media, 22 Oct. 2013. Web. 31 Mar.
2014. <http://www.greentechmedia.com/articles/read/arizona-‐utility-‐admits-‐
funding-‐anti-‐solar-‐ad-‐campaign>.
Other Contributing Resources
1. "Energy Realities -‐ A Visual Guide to Global Energy Needs." Energy Realities -‐ A
Visual Guide to Global Energy Needs. N.p., n.d. Web. 15 Aug. 2013.
2. Arizona Public Service secures approval for Community Power Project in Flagstaff.
(2010). Corporate IT Update (M2), Section 2. Energy Consumption by Sector. (2004).
Monthly Energy Review, 23.
3. Berkooz, Corry. “Let the Sun Shine In.” Cline Library Research Resource. Vol. 74 Issue
6. June 2008. 12/27/12.
4. City of Flagstaff (former) Land Development Code. (adopted 1991). City of Flagstaff.
http://www.flagstaff.az.gov/index.aspx?NID=2316
5. City of Flagstaff Regional Plan. (adopted 2001). City of Flagstaff.
6. City of Flagstaff Zoning Code. (adopted 11/1/11). City of Flagstaff.
7. City of Flagstaff, (2009). Regional Plan 2012 Energy Cliff Notes. (2013, July).
http://www.flagstaff.az.gov/DocumentCenter/Home/View/9708
8. Eastman, R. E., Parolek, D., & Wise, L. (2012). Going Hybrid. Planning, 78(2), 24-‐31.

76
9. Frick, R. (2012). Your Own Solar System, No Money Down. Kiplinger's Personal
Finance, 66(7), 49-‐50.
10. Green Logic Energy, (2011). Solar Electric How it Works. (August 2013).
http://www.greenlogic.com/Solar-‐Electric/#How-‐It-‐Works
11. International Energy Agency (2013). FAQs: Renewable Energy. (2013, August).
http://www.iea.org/topics/solarpvandcsp/
12. International Energy Agency (2013). Solar (PV and CSP). (2013, August).
http://www.iea.org/topics/solarpvandcsp/
13. Leone, Christopher (2013). “Sunset for Solar? APS Proposal Threatens
Sustainability.” Daily Sun. August 28, 2013.
http://azdailysun.com/news/local/sunset-‐for-‐solar-‐aps-‐proposal-‐threatens-‐
sustainability/article_3bca3c02-‐0d4c-‐11e3-‐be93-‐0019bb2963f4.html
14. Pennsylvania Historical & Museum Commission (2013). Introduction to Major
Energy Sources. Commonwealth of Pennsylvania. (2013, August).
http://www.portal.state.pa.us/portal/server.pt/community/types_of_energy/4568
15. Pietras, M. M., & Netzel, P. P. (2012). The method of assessment of solar potential for
selected area with use Geographical Information Systems. EPJ Web Of Conferences,
(33), 01010-‐p.1-‐01010-‐p.8. doi:10.1051/epjconf/20123301010
16. Timilsina, G. R., Kurdgelashvili, L., & Narbel, P. A. (2012). Solar energy: Markets,
economics and policies. Renewable & Sustainable Energy Reviews, 16(1), 449-‐465.
doi:10.1016/j.rser.2011.08.009
17. U.S Energy Information Administration (EIA), (2013). Environment Overview.
http://www.eia.gov/environment/. 5/1/13.
18. Zahran, S., Brody, S. D., Vedlitz, A., Lacy, M. G., & Schelly, C. (2008). Greening Local
Energy: Explaining the Geographic Distribution of Household Solar Energy Use in
the United States. Journal Of The American Planning Association, 74(4), 419-‐434.
doi:10.1080/01944360802310594