
Research on Risk Management for Healthcare Supply Chain ...
427
Research on Risk Management for Healthcare Supply Chain in Hospital Lei Wang A thesis submitted in partial fulfilment of the requirements of Liverpool John Moores University for the Degree of Doctor of Philosophy May 2018
-
Upload
khangminh22 -
Category
Documents
-
view
3 -
download
0
Transcript of Research on Risk Management for Healthcare Supply Chain ...

Research on Risk Management for
Healthcare Supply Chain in Hospital
Lei Wang
A thesis submitted in partial fulfilment of the requirements of
Liverpool John Moores University for the Degree of Doctor of
Philosophy
May 2018

i
Abstract
Purpose: Unlike the commercial industries, the risks arising from the healthcare industry’s
internal system and the surrounding environment may cause serious consequences, even the
patients’ health. Concerning the increasing emphasis on risk management in the healthcare
supply chain environment, there is an urgent demand for a novel decision support method
that supports supply chain risk management in the hospital setting. As the topic is still in the
early stage and only a few systematic academic studies on this topic can be found over the
last decades. This research aims to propose a novel comprehensive framework and integrated
risk management model that takes explicit account of multiple types of risk factors in aiding
decision-making as well as compares and ranks the current implemented alternative risk
mitigation strategies using fuzzy set theory and multiple criteria decision analysis (MCDA)
methods.
Methodology: In pursuit of meeting the requirements of the research objectives, this
research conducts empirical studies from both China and UK healthcare industries and follows
three steps of risk management procedure based on the proposed framework to conduct risk
factors identification, assessment and risk mitigation strategies identification. In order to
ensure that the analysis is systematic and inclusive, various types of risk factors are identified
through a related systematic literature review and are validated through a set of empirical
studies. Risk assessment is conducted through two stages of questionnaire surveys and
evaluated through Fuzzy Analytic Hierarchy Process (AHP) and Interpretive Structural
Modelling (ISM). Thereafter, risk mitigation strategies are identified through conducted
empirical studies and evaluated through Fuzzy Technique for Order Preference by Similarity
to Ideal Solution (TOPSIS).
Research Implications: This is the first study which has developed a comprehensive risk
management framework in the healthcare supply chain that effectively integrates supply
chain risk factors identification, risk assessment as well as mitigation strategy identification
and evaluation. The novelty of the developed framework lies in the fact that a systematic and
practical decision making tools are proposed supporting hospital managers making strategic
decisions on healthcare supply chain risk management. Furthermore, compared with several

ii
studies using secondary data, this thesis uses empirical data to conduct the identification and
evaluation of risk mitigation strategies, enabling the results closes to the reality of the
situation in the healthcare setting.
Practical Implications: The profile of risk sources, the priority weighting and inter-relationship
among these risks and, the ranking of mitigation strategies provide a guideline for hospital
managers to anticipate and proactively deal with potential risks. The proposed framework
applies to both the UK and China healthcare industries, the finding can also be applied in other
countries and regions.
Keywords: Supply Chain Risk Management (SCRM), Healthcare Industry, Hospital,
Pharmaceutical/Medicine/Drugs Supply Chain, Multiple Criteria Decision Analysis (MCDA),
Fuzzy Set theory, ISM.

iii
Acknowledgements
Despite all the challenges and sufferings during my three-year PhD course, I have finally
reached the moment for which I have desired. Since it was a long journey, intellectually and
emotionally, I would not have stood here without kind supports and inspiration from the
people around me. In particular, I would like to take this opportunity to express my deep
appreciation to:
Dr Jun Ren, Prof Jin Wang and Prof Charles Morecroft for providing me with
illuminating ideas, constructive comments and encouraging me to keep going with
confidence. Indeed I am lucky enough to be the student under their supervision for
three years. I could not have imagined having better guidance for my PhD study.
Prof Haiyan Wang, Prof Duangpun Kritchanchai, Dr Dimitrios Paraskevadakis, Dr
Trakarn Prapaspongsa, Dr Dongmei Cao, Dr Di Zhang and Dr Wirachchaya
Chanpuypetch for contributing their valuable suggestions and time to the quality of
my research.
Mr Steve Begley, Mr Ye Yang, Ms Sue Donaldson, Mrs Trudy Bown, Mr Jianwei Yang,
Mr Bo Zhang, Mr Gang Yao, Mr Renshun Zhang, Mr Xiaoguo Yang, Mr Xuebin Xia, Mr
Yanchao Sun, Ms Jie Fei, Mr Zong Yu and Ms Yuanyuan Tian for supporting me to
conduct the empirical studies and collect the data from their organizations.
Dr Zhisen Yang, Dr Chengpeng Wan, Dr Chaoyu Li, Ms Shiqi Fan, Mr Jun Hu, Dr
Chengchun Li, Mr Haonan Cheng, Ms Jingjing Li, Mr Yuan Li for being my best friends
whom I can lean on during the PhD journey.
My colleagues in LOOM Research Institute and other researchers at Liverpool John
Moores University for giving me wonderful times at Liverpool.
Dr Robert Mason at Cardiff University and Mr Len Bird at Coventry University for
providing me with confidence to finish this thesis.
Lastly, but not least by no means, I would like to extend my honest appreciation to my
parents, my partner, Dr Xiao Yang, and her parents, uncle Yang and aunt Dong, for their

iv
continuous support, encouragement and understanding throughout my doctoral research.
Patience, sacrifice and love, intangible and invaluable assets provided by them kept me going
during tough times in my life.

v
Table of Contents
Abstract ................................................................................................................................................... i
Acknowledgements ............................................................................................................................... iii
Table of Contents ................................................................................................................................... v
List of Figures ........................................................................................................................................ viii
List of Tables ........................................................................................................................................... x
Abbreviations ........................................................................................................................................ xii
1. CHAPTER ONE – INTRODUCTION ....................................................................................................... 2
1.1 INTRODUCTION ............................................................................................................................ 2
1.2 RESEARCH BACKGROUND ...................................................................................................... 2
1.3 RESEARCH AIM AND OBJECTIVES .......................................................................................... 7
1.4 RESEARCH SCOPE.................................................................................................................... 8
1.5 RESEARCH METHODS ........................................................................................................... 10
1.6 STRUCTURE OF THE THESIS .................................................................................................. 11
2. CHAPTER TWO: LITERATURE REVIEW .............................................................................................. 14
2.1 INTRODUCTION .......................................................................................................................... 14
2.2 HEALTHCARE SUPPLY CHAIN MANAGEMENT (HCSCM) ............................................................ 15
2.2.1 HCSCM research methodology ........................................................................................... 17
2.2.2 Results of HCSCM literature review ................................................................................... 20
2.3 SUPPLY CHAIN RISK MANAGEMENT .......................................................................................... 51
2.3.1 SCRM literature review research methodology ................................................................. 52
2.3.2 Data analysis ........................................................................................................................ 55
2.3.3 Status of risk management in the healthcare supply chain .............................................. 80
2.4 LITERATURE GAPS IDENTIFIED ................................................................................................... 95
2.5 CONCLUSION .............................................................................................................................. 96
3. CHAPTER THREE - RESEARCH METHODOLOGY ................................................................................ 99
3.1 INTRODUCTION .......................................................................................................................... 99
3.2 RESEARCH DESIGN .................................................................................................................... 101
3.3 RESEARCH PHILOSOPHY ........................................................................................................... 102
3.4 RESEARCH APPROACH .............................................................................................................. 103
3.5 RESEARCH STRATEGIES AND CHOICES ..................................................................................... 105
3.5.1 Exploratory and explanatory study .................................................................................. 105

vi
3.5.2 Mixed methods approach ................................................................................................. 105
3.6 METHODOLOGY FOR DATA COLLECTION AND ANALYSIS ....................................................... 107
3.6.1 Data collection methods ................................................................................................... 109
3.6.2 Data analysis methods ...................................................................................................... 113
3.7 CONCLUSION ............................................................................................................................ 113
4. CHAPTER FOUR - CONCEPTUAL FRAMEWORK AND INTEGRATED RISK MANAGEMENT MODEL 114
4.1 INTRODUCTION ........................................................................................................................ 114
4.2 CONCEPTUAL FRAMEWORK ..................................................................................................... 114
4.2.1 Risk drivers and sources .................................................................................................... 118
4.2.2 Decision makers ................................................................................................................ 123
4.2.3 Risk management process ................................................................................................ 124
4.2.4 Supply chain risk management strategies ........................................................................ 125
4.2.5 Performance outcomes ..................................................................................................... 126
4.3 DEVELOPMENT OF INTEGRATED RM MODEL IN HCSC ............................................................ 126
4.3.1 Phase 1 - Risk factors identification.................................................................................. 128
4.3.2 Phase 2 - Risk assessment ................................................................................................. 130
4.3.3 Phase 3 - Risk mitigation ................................................................................................... 139
4.4 CONCLUSION ............................................................................................................................ 141
5. CHAPTER FIVE - HEALTHCARE SUPPLY CHAIN RISK FACTORS IDENTIFICATION ........................... 142
5.1 INTRODUCTION ........................................................................................................................ 142
5.2 HEALTHCARE SUPPLY CHAIN RISK FACTORS IDENTIFICATION AND CLASSIFICATION ........... 142
5.2.1 Process risks ...................................................................................................................... 152
5.2.2 Control risks ....................................................................................................................... 157
5.2.3 Demand risks ..................................................................................................................... 159
5.2.4. Supply risks ....................................................................................................................... 161
5.2.5. Environmental risks .......................................................................................................... 164
5.3 RISK FACTORS IDENTIFICATION DATA ANALYSIS AND TAXONOMIC DIAGRAM VALIDATION
........................................................................................................................................................ 167
5.3.1 Procedure for questionnaire design and pilot study ....................................................... 167
5.3.2 Selection of experts for validation ................................................................................... 172
5.3.3 Data analysis and description ........................................................................................... 174
5.4 CONCLUSION ............................................................................................................................ 187
6. CHAPTER SIX – HEALTHCARE SUPPLY CHAIN RISK ASSESSMENT ................................................. 188
6.1 INTRODUCTION ........................................................................................................................ 188
6.2 METHODOLOGY FOR RISK ASSESSMENT IN HEALTHCARE SUPPLY CHAIN ............................. 188
6.3 RISK ASSESSMENT WITH FUZZY ANALYTIC HIERARCHY PROCESS (FUZZY AHP) .................... 191

vii
6.4 AN EMPIRICAL STUDY ON THE APPLICABILITY OF THE FUZZY AHP METHOD ........................ 199
6.4.1 Conducting the Fuzzy AHP-based questionnaire survey .................................................. 199
6.4.2 Numerical illustration ....................................................................................................... 202
6.4.3 Testing the robustness of the proposed Fuzzy AHP approach ........................................ 212
6.4.4 Findings from Fuzzy AHP method ..................................................................................... 219
6.5 RISK ASSESSMENT WITH INTERPRETIVE STRUCTURAL MODELLING (ISM) ............................ 224
6.6 AN EMPIRICAL STUDY ON THE APPLICABILITY OF THE ISM MODEL ....................................... 228
6.6.1 Conducting the ISM-based questionnaire survey ............................................................ 228
6.6.2 Interpretive structural modelling (ISM) and MICMAC analysis ....................................... 230
6.6.3 Finding from ISM model .................................................................................................... 242
6.7 CONCLUSION ............................................................................................................................ 248
7. CHAPTER SEVEN – IDENTIFICATION AND EVALUATION OF RISK MITIGATION STRATEGIES ....... 249
7.1 INTRODUCTION ........................................................................................................................ 249
7.2 METHODOLOGY FOR RISK MITIGATION STRATEGY IDENTIFICATION AND EVALUATION ..... 249
7.3 IDENTIFICATION OF RISK MITIGATION STRATEGIES FROM EMPIRICAL STUDIES .................. 251
7.3.1 Description of the procedure of conducting the empirical studies ................................. 252
7.3.2 Overview of identified implemented mitigation strategies in hospital setting .............. 255
7.4 EVALUATION OF RISK MITIGATION STRATEGIES .................................................................... 276
7.5 AN EMPIRICAL STUDY ON THE APPLICABILITY OF THE FUZZY TOPSIS METHOD ................... 282
7.5.1 Conducting the Fuzzy TOPSIS-based questionnaire survey ............................................. 282
7.5.2 Evaluation of identified risk mitigation strategies ........................................................... 284
7.5.3 Sensitivity analysis ............................................................................................................ 292
7.6 DISCUSSION AND MANAGERIAL IMPLICATIONS ..................................................................... 295
7.7 CONCLUSION ............................................................................................................................ 298
8. CHAPTER EIGHT - CONCLUSION ..................................................................................................... 300
8.1 INTRODUCTION ........................................................................................................................ 300
8.2 RESEARCH FINDINGS ................................................................................................................ 300
8.3 RESEARCH CONTRIBUTION TO KNOWLEDGE .......................................................................... 306
8.4 RESEARCH LIMITATION ............................................................................................................ 307
8.5 RECOMMENDATION AND FUTURE RESEARCH ........................................................................ 308
REFERENCES ........................................................................................................................................ 310
APPENDIX ONE ................................................................................................................................... 350
APPENDIX TWO .................................................................................................................................. 369
APPENDIX THREE ................................................................................................................................ 386
APPENDIX FOUR ................................................................................................................................. 395
APPENDIX FIVE ................................................................................................................................... 398

viii
List of Figures
Figure 1-1: Health care value chain ....................................................................................................... 3
Figure 1-2: The structure of the thesis ................................................................................................. 13
Figure 2-1: Three key areas of the literature review .......................................................................... 15
Figure 2-2: Flowchart of the HCSCM literature review methodology ................................................ 18
Figure 2-3: Distribution of the number of journal articles between 1995 and 2016 (369)................ 18
Figure 2-4: Distribution of contributing countries in HCSCM in the world ........................................ 23
Figure 2-5: Taxonomy of HCSCM literature ......................................................................................... 28
Figure 2-6: Healthcare supply chain structure .................................................................................... 29
Figure 2-7: Stages of supply chain integration .................................................................................... 30
Figure 2-8: Hospital supply chain process for patient flow ................................................................ 38
Figure 2-9: Historical development of research in lean healthcare ................................................... 41
Figure 2-10. Healthcare delivery pipelines and location of the main DP ........................................... 43
Figure 2-11: Flowchart of the SCRM research methodology for the present systematic literature
review ................................................................................................................................................... 53
Figure 2-12: Distribution of the publication years .............................................................................. 56
Figure 2-13: Distribution of the contributing countries ...................................................................... 57
Figure 2-14: Distribution of research methodologies ......................................................................... 65
Figure 2-15: Distribution of quantitative and qualitative methods over the last decades ............... 66
Figure 2-16: Number of categories of papers by the associated research areas ............................... 68
Figure 3-1: Proposed methodology of Healthcare Supply Chain Risk Management ....................... 100
Figure 3-2: Research onion................................................................................................................. 102
Figure 4-1: Healthcare supply chain risk management conceptual framework by author ............. 116
Figure 4-2: Conceptual model ............................................................................................................ 121
Figure 4-3: A risk management framework for sustainability-related risks .................................... 122
Figure 4-4: Proposed integrated risk management model in healthcare supply chain ................... 129
Figure 4-5: A typical Fuzzy Logic control – Fuzzy control system schema ........................................ 134
Figure 4-6: ISM-logic ........................................................................................................................... 137
Figure 5-1: Proposed methodology for healthcare SC risk factors identification ............................ 143
Figure 5-2: Sources of risks in the healthcare supply chain .............................................................. 144
Figure 5-3: A schematic classification of sources of the process risks ............................................. 152
Figure 5-4: A schematic classification of sources of the control risks .............................................. 157
Figure 5-5: A schematic classification of sources of the demand risks ............................................ 159
Figure 5-6: A schematic classification of sources of the supply risks ............................................... 162
Figure 5-7: A schematic classification of sources of environmental risks ........................................ 165
Figure 5-8: The preliminary hierarchical structure of healthcare supply chain risks ....................... 168
Figure 5-9: The preliminary External to the hospital but internal to the supply chain network risks
hierarchical structure for healthcare SC ............................................................................................ 169
Figure 5-10: The preliminary Internal to the hospital risks hierarchical structure for healthcare SC
............................................................................................................................................................ 170
Figure 5-11: The preliminary External to the supply chain network risks hierarchical structure for
healthcare SC ...................................................................................................................................... 171
Figure 5-12: Comparison the results based on Mean and Weighted Average ................................. 180
Figure 5-13: The modified hierarchical structure of healthcare supply chain risks ......................... 181

ix
Figure 5-14: The modified External to the hospital but internal to the supply chain network risks
hierarchical structure for healthcare SC ............................................................................................ 182
Figure 5-15: The modified Internal to the hospital risks hierarchical structure for healthcare SC . 183
Figure 5-16: The modified External to the supply chain network risks hierarchical structure for
healthcare SC ...................................................................................................................................... 184
Figure 5-17: Final hierarchical structure of healthcare supply chain risks ....................................... 186
Figure 6-1: Proposed Fuzzy AHP and ISM based risk assessment model for healthcare SC ............ 190
Figure 6-2: Membership function of TFN .......................................................................................... 192
Figure 6-3: The intersection between 𝑴𝟏and 𝑴𝟐............................................................................ 196
Figure 6-4: The membership functions of the triangular fuzzy numbers ......................................... 199
Figure 6-5: Hierarchical structure of healthcare supply chain risks ................................................. 204
Figure 6-6: Results in relation to Arithmetic Mean Method ............................................................ 210
Figure 6-7: Results in relation to Geometric Average Method ......................................................... 211
Figure 6-8: Comparison of the results from Arithmetic Mean and Geometric Average methods .. 215
Figure 6-9: Results of the sensitive analysis (multiplication) ........................................................... 216
Figure 6-10: Results of the sensitive analysis (division) .................................................................... 217
Figure 6-11: ISM-based hierarchy model ........................................................................................... 241
Figure 6-12: Driving power and dependence diagram ...................................................................... 242
Figure 7-1: A generic risk mitigation model for healthcare supply chain ........................................ 250
Figure 7-2: Summary of the identified risk mitigation strategies ..................................................... 256
Figure 7-3: GS1 Global Data Synchronization Network in NHS system ............................................ 268
Figure 7-4: the architecture of PEPPOL messaging platform ............................................................ 270
Figure 7-5: Fuzzy membership function for linguistic expressions ................................................... 279
Figure 7-6: Distribution of respondents ............................................................................................ 284
Figure 7-7: Decision hierarchy for the performance of implemented risk mitigation strategies .... 286
Figure 7-8: Sensitivity analysis: computation of the relative closeness to the ideal solution for each
evaluated combination ...................................................................................................................... 293

x
List of Tables
Table 2.1: HCSCM literature review classification framework ........................................................... 20
Table 2.2: List of journals publishing HCSCM research to date .......................................................... 21
Table 2.3: Definitions of HSC given by researchers ............................................................................. 24
Table 2.4: Approaches to definitions of HCSCM ................................................................................. 26
Table 2.5: Articles classified by theory ................................................................................................ 45
Table 2.6: Articles classified by research methods ............................................................................. 47
Table 2.7: Summary of literature review in HCSCM research methods and findings ........................ 48
Table 2.8: Number of articles in alphabetical order (appearing at least twice) ................................ 56
Table 2.9: Supply chain risk types identified by researchers .............................................................. 62
Table 2.10: Summary of reviewed risk mitigation strategies ............................................................. 74
Table 2.11: Summary of 12 selected research papers ........................................................................ 82
Table 2.12: Classification of the SCRM process in the healthcare setting ......................................... 86
Table 2.13: Summary of HSC risk factors from previous studies ........................................................ 90
Table 2.14: Summary of HSC risk mitigation strategies ...................................................................... 93
Table 3.1: Methodologies used in the Positivist and Interpretivism Philosophies .......................... 103
Table 3.2: Major differences between deductive and inductive research approaches ................... 104
Table 3.3: Summaries of the research methods for data collection and analysis ........................... 108
Table 4.1: Nine-point pairwise comparison scale (Saaty, 2008) ...................................................... 132
Table 5.1: Classification of healthcare supply chain risk factors identified by researchers ............ 146
Table 5.2: Summary of the identified healthcare supply chain risk factors ..................................... 150
Table 5.3: Experts’ Weighting Criteria(expert evaluation) .......................................................... 173
Table 5.4: Research expert weighting respondents’ profile ............................................................. 174
Table 5.5: The reliability test for the questionnaire survey ............................................................. 175
Table 5.6: Results of the significance of healthcare supply chain risks (Questionnaire Survey) ..... 176
Table 5.7: Ranking of the significance of healthcare supply chain risks (Questionnaire Survey) ... 178
Table 6.1: Linguistic scales for difficulty and importance ................................................................. 198
Table 6.2: Questionnaires return detail ............................................................................................ 201
Table 6.3: respondents’ profile .......................................................................................................... 202
Table 6.4: Linguistic judgements for Fuzzy AHP ................................................................................ 203
Table 6.5: Linguistic scales for difficulty and importance ................................................................. 205
Table 6.6: The fuzzy pair-wise comparison matrix of three criteria ................................................. 205
Table 6.7: Average random index value ............................................................................................ 206
Table 6.8: The fuzzy pair-wise comparison matrix of three criteria (Arithmetic Mean method) ... 207
Table 6.9: The fuzzy pair-wise comparison matrix of three criteria (Geometric Average method) 207
Table 6.10: The fuzzy pair-wise comparison matrix of three criteria (Geometric average method)
............................................................................................................................................................ 209
Table 6.11: Summary of results from Arithmetic Mean and Geometric Average methods ............ 213
Table 6.12: Sensitivity analysis for weight obtained by pairwise comparison ................................ 218
Table 6.13: respondents’ profile ........................................................................................................ 229
Table 6.14: Structural self-interaction matrix (SSIM) of risk factors in healthcare supply chain .... 232
Table 6.15: Initial Reachability Matrix ............................................................................................... 233
Table 6.16: Final Reachability Matrix ................................................................................................ 234
Table 6.17: Iterations of the partition of reachability matrix to arrive at ISM diagram .................. 235
Table 6.18: Iterations of the partition of reachability matrix to arrive at ISM diagram .................. 236

xi
Table 6.19: Iterations of the partition of reachability matrix to arrive at ISM diagram .................. 236
Table 6.20: Iterations of the partition of reachability matrix to arrive at ISM diagram .................. 237
Table 6.21: Iterations of the partition of reachability matrix to arrive at ISM diagram .................. 237
Table 6.22: Iterations of the partition of reachability matrix to arrive at ISM diagram .................. 238
Table 6.23: Iterations of the partition of reachability matrix to arrive at ISM diagram .................. 238
Table 7.1: Respondents’ profile ......................................................................................................... 254
Table 7.2: Linguistic variables for the importance weight of each criterion and sub-criteria ......... 278
Table 7.3: Linguistic variables for the ratings ................................................................................... 278
Table 7.4: The profile of survey respondents .................................................................................... 283
Table 7.5: Linguistic variables for the ratings ................................................................................... 287
Table 7.6: The ratings of alternatives by three experts under sub-criteria counterfeiting risks (S1)
............................................................................................................................................................ 287
Table 7.7: Fuzzy evaluation matrix for the implementation of risk mitigation strategies .............. 287
Table 7.8: Aggregate fuzzy decision matrix for the implementation of risk mitigation strategies . 289
Table 7.9: Normalized fuzzy decision matrix for the implementation of risk mitigation strategies
............................................................................................................................................................ 289
Table 7.10: Weighted normalized fuzzy decision matrix for the implementation of risk mitigation
strategies ............................................................................................................................................ 290
Table 7.11: Fuzzy TOPSIS results and final ranking for the implementation of risk mitigation
strategies ............................................................................................................................................ 292
Table 7.12: Results of the sensitivity analysis ................................................................................... 294

xii
Abbreviations
AHP Analytic Hierarchy Process AIDC Automatic identification and Data Capture B2B Business-to-Business CBA Cost Benefit Analysis CPD Continuous Professional Development CPFR Collaborative Planning Forecasting and Replenishment C.I. Consistency Index C.R. Consistency Ratio DEA Data Envelopment Analysis DH Department of Health DHL Deutsche Post DHL ED Emergency Department EDI Electronic Data Interchange EFPIA European Federation of Pharmaceutical Industries and
Associations EPA Environmental Protection Agency ERP Enterprise Resource Planning ETA Event Tree Analysis EUC European Union Commission FAHP Fuzzy Analytic Hierarchy Process FEAHP Fuzzy Extended Analytic Hierarchy Process FFP Fuzzy Failure Probability FMEA Failure Mode and Effect Analysis FNIS Fuzzy Negative Ideal Solution FPIS Fuzzy Positive Ideal Solution FST Fuzzy Set Theory FTA Fault Tree Analysis FTOPSIS Fuzzy Technique for Order Preference by Similarity to Ideal
Solutions GDP Gross Domestic product GDSS Global Data Synchronization Standards GMP Good Manufacturing Practice GP General Practice GPO Group Purchasing Organization GSP Good Supply Practice GTINs Global Trade Item Numbers HAZID HAZard Identification HAZOP HAZard and Operability HCSCRM Healthcare Supply Chain Risk Management HL7 Health Level Seven HTP Hazard Totem Pole ICT Information Communication Technology IDS Intelligence Decision System

xiii
IDSs Integrated Delivery Systems IRM Institute of Risk Management ISM Interpretive Structural Modelling ISO The International Organization for Standardisation IT Information Technology IS Information System JIT Just-in-Time KPI Key Performance Indicator MADA Multi-Attribute Decision-Analysis MADM Multi-Attribute Decision-Making MCDM Multi Criteria Decision-Making MICMAC Matriced’Impacts Croisés Multiplication Appliquéea’un
Classement NHS National Health Service PEPPOL Pan European Public Procurement On Line QSAM Quick-Scan Audit Methodology RFID Radio Frequency IDentification RM Risk Management R.I. Random Index S.D. Standard Deviation SEM Structural Equation Modelling SCM Supply Chain Management SCOR Supply Chain Operations Reference SCRM Supply Chain Risk Management SLR Systematic Literature Review SMEs Small and Medium-size Enterprises SWOT Analysis Strengths, Weakness, opportunities and Threats analysis TFN Triangular Fuzzy Numbers TOPSIS Technique for Order Preference by Similarity to Ideal Solutions UCM Uncertainty Circle Model VMI Vendor Managed Inventory WHO World Health Organization

2
1.CHAPTER ONE – INTRODUCTION
1.1 INTRODUCTION
This chapter introduces a general research background and specific research questions,
followed by the research aims and objectives, scope of the research as well as the research
methods. The thesis outline is provided to present different stages in the healthcare supply
chain risk management process, including risk factors identification, risk assessment, risk
mitigation strategies identification and evaluation.
1.2 RESEARCH BACKGROUND
In the past two or three decades, the expenditure in the healthcare sector across the globe
has increased tremendously. UK National Health Service (NHS) is one of the largest
employers in the world (Towill and Christoper, 2005), UK healthcare costs are expected to
increase at a faster rate than the growth of the GDP, reaching about $4.6 trillion (equate to
£2.95 trillion) and accounting for more than 19% of the GDP by 2019 (Centers for Medicare
and Medicaid Services, 2010). More recent data indicates that supply chain related
expenses, including the cost of all activities, assets, information, infrastructure, and labour
related to the accurate procurement, delivery, storage, return, and disposal of products and
materials necessary to provide healthcare services, account for 33% of the average
healthcare provider’s annual operating expense (Nachtmann and Pohl, 2009). It shows that
though the delivery of services has generally improved, the cost incurred in providing the
high quality is still high (Chandra et al., 2009).
Research has revealed that the healthcare cost has soared to unprecedented levels
threatening the sustainability of hospitals and the healthcare system in general (Vincent,
2006). Therefore, healthcare institutes and hospitals have been forced to adopting new
models of operations (Bourlakis, 2011; Chakraborty, 2014). In particular, similar to other
3
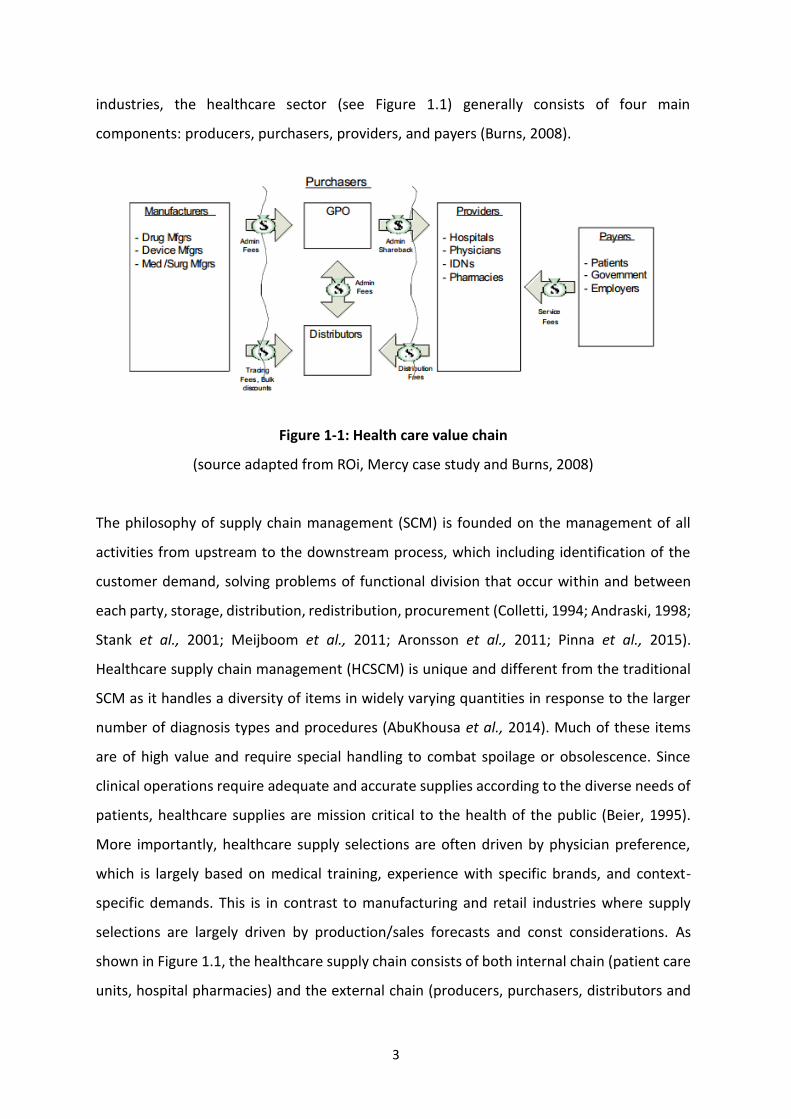
industries, the healthcare sector (see Figure 1.1) generally consists of four main
components: producers, purchasers, providers, and payers (Burns, 2008).
Figure 1-1: Health care value chain
(source adapted from ROi, Mercy case study and Burns, 2008)
The philosophy of supply chain management (SCM) is founded on the management of all
activities from upstream to the downstream process, which including identification of the
customer demand, solving problems of functional division that occur within and between
each party, storage, distribution, redistribution, procurement (Colletti, 1994; Andraski, 1998;
Stank et al., 2001; Meijboom et al., 2011; Aronsson et al., 2011; Pinna et al., 2015).
Healthcare supply chain management (HCSCM) is unique and different from the traditional
SCM as it handles a diversity of items in widely varying quantities in response to the larger
number of diagnosis types and procedures (AbuKhousa et al., 2014). Much of these items
are of high value and require special handling to combat spoilage or obsolescence. Since
clinical operations require adequate and accurate supplies according to the diverse needs of
patients, healthcare supplies are mission critical to the health of the public (Beier, 1995).
More importantly, healthcare supply selections are often driven by physician preference,
which is largely based on medical training, experience with specific brands, and context-
specific demands. This is in contrast to manufacturing and retail industries where supply
selections are largely driven by production/sales forecasts and const considerations. As
shown in Figure 1.1, the healthcare supply chain consists of both internal chain (patient care
units, hospital pharmacies) and the external chain (producers, purchasers, distributors and

4
payers). Many researchers assert that implementing SCM would reduce organizational costs
and cycle time as well as leading to higher performance without compromising quality of
services. An efficient, user-friendly supply chain can also impact the healthcare provider’s
revenues by engendering physician loyalty and staff retention. However, studies have shown
that the healthcare industry consistently lags commercial industry in adopting supply chain
management. The topic of healthcare supply chain management is still in the early stage and
its operational performance is immature, fragmented and more problematic (Kumar et al.,
2008; Mustaffa and Potter, 2009; Kwon et al., 2016). D. Elmuti et al., (2013) completed a
survey of 700 organizations in the United States according to their familiarity and utilization
of HCSCM initiatives. The results indicated that about 62% of the respondents reported that
they did not have an existing HCSCM program. About 38% of the organizations surveyed
reported that they were familiar with the HCSCM concept. The remaining organizations
reported the duration of their HCSCM programs to be less than 1 year. Most of these
companies are working to improve on only one aspect of the area of the total supply chain.
Kwon et al., (2016) indicated that the healthcare supply chain is struggling with
misunderstanding of the fundamentals of supply chain concepts. The functions of the
healthcare supply chain have been mistakenly identified as merely purchasing and contract
management. Moreover, other hindrances for implementing SCM in the healthcare industry
include the lack of standard nomenclature for healthcare products and the clinicians’
preferences create further uncertainties (McKone-Sweet et al., 2005), and lack of trust
between hospitals and suppliers (Mustaffa and Potter, 2009). Despite the above, it is still
perceived that there is significant scope for improving the overall performance of the supply
chain in healthcare sector. Since 2005, there is a dramatically increasing number of
publications about this topic. A number of different SCM tools have been also applied in
practice, such as Just-In-Time (JIT), Vendor managed inventory (VMI) as well as Collaborative
Planning, Forecasting and Replenishment (CPFR), etc.
Risks existing in the supply chain are referred to as the unexpected events which interrupt the
operational process and have a negative impact on the whole system performance (Ho et al.,
2015). As a matter of fact, there is a growing number of disruptive cases with negative
consequences on the performance of companies in recent years. There have been
many cases of when disruption has paralysed the supply chain. For example, a fire

5
which lasted for only ten minutes in a Phillips semiconductor plant disrupted Ericsson’s
delivery of microchips for more than one month, which eventually led to a $400 million
loss (Chopra and Sodhi 2004).The bankruptcy of a UK-based supplier, UPF-Thompson,
forced Land Rover to make 1,400 workers redundant (Tang 2006). Similarly, nearly 420
KFC stores around UK were forced to close due to the delivery problems incurred by
its delivery partner, a UK based food delivery special ist Bidvest Logistics in 2018. It is
still possible to recall how the earthquake, tsunami and the subsequent nuclear crisis
occurred in Japan in 2011 caused Toyota’s production to drop by 55,000 vehicles,
costing $72 million in profits per year (Pettit et al., 2010). For the last decade, few
areas of management interest have risen to prominence as rapidly as supply chain risk
management (SCRM) (Colicchia and Strozzi, 2012).
From the hospital or healthcare perspective, Harris (2000) investigated the ultimate
objective of managing risks as the ability to identify, assess, reduce and control risks to staff,
patients and visitors. Essentially, the risks can be considered broadly as anything that
compromise service delivery (Rafele et al., 2005), for example, scarce service provision
caused by inadequate resources or inefficient material management (Tomlin, 2009). The
impact of risks accounts for the big proportion of hospital budgets hence risks management
is a significant strategy to minimize expenditure and increase the service quality. Similarly,
supply chain management must take account of risk management in hospital as there are
many suppliers and customers with close interconnectivity. This often increases the risks in
hospital supply chain because a disruption in one member may affect others. Usually, the
supply chain capacity is decided by demand and supply (Tang, 2006) that are ever uncertain
thus increasing the risk especially in healthcare where the resources are constrained.
Organizations across supply chains may only focus on a given subset which is likely uncertain
(Chopra et al., 2004).
This thesis focuses on the risks in relation to the pharmaceutical products (i.e. medicine) in
the hospital supply chain. It generally associated with medicine discontinuity, medicine
shortages, poor performance, patient safety/dispensing errors, expiration and technological
errors (e.g. causing stock shortages in pharmacies), all of which incur risk through disruption
to the system. It is vital as medicines are a core input into healthcare treatment and are
critical products (Breen, 2008). To tackle those risks, it is essential for the healthcare

6
providers (i.e. hospital) to understand what these risks are and how they affect the supply
chain operations. Unless there is infinite resource that could be used to reduce such risks,
healthcare providers will always have to prioritise their resources to deal with those risks
that are most significant and imminent. This makes it important to evaluate the extent to
which each risk factor affects the performance of the hospital supply chain and also to
identify the relative importance of each risk factor. For the purpose of control and mitigation
of the negative effects caused by multiple types of risks, a significant number of works in this
field were undertaken in both practitioner and academic circles (Ho et al., 2015). In essence,
the SCRM process often includes risk factor identification, risk assessment and mitigation.
The existing studies reveal that at least one of these processes are covered in the
research to analyse SC risks and their management while taking various SC contexts
into account (Blackhurst et al., 2011; Christopher et al., 2011). However, the findings
of previous SCRM studies provide valuable insights, but little in a complete and
systematic approach for the healthcare industry. According to the literature review,
there are a small number of studies specifically focused on the healthcare supply chain risk
management (HCSCRM), especially in hospital setting (Breen, 2008; Aguas et al., 2013; Illie
and virgil, 2013; Kanyoma et al., 2013; Enyinda et al., 2014; Elleuch et al., 2014; Kim et al.,
2016; Zepeda et al., 2016). Nevertheless, the finding of literature review reveals that the
current healthcare systems’ SCRM models are not capable of meeting challenges faced by
hospitals (Mckinsey&Company, 2013). The risks and uncertainties in the healthcare supply
chain network have yet to be fully explored. In addition, no research has been published to
develop a thorough and sound risk management framework for evaluating integrated SCRM
performance across the whole chain in the public healthcare sector, especially in respect of
the medicine perspective. Furthermore, the attention that is given to systematic risk factors
identification is fairly limited and needs further investigation. Currently, no published studies
have examined the efficiency of currently implemented supply chain risk mitigation
strategies in the public healthcare organizations. These issues will be further discussed in the
literature review in Chapter two and will be addressed in this thesis.
This thesis, therefore, raises the following research questions and will answer them at the
end of this research.

7
RQ1. What is the most effective HCSCRM framework that can be implemented to deal
with the HCSC risks?
RQ2. What are the main sources of risk factors causing public sector healthcare supply
chains vulnerable and how to address those risks?
RQ3. Which risk factors are relatively more significant to a hospital’s supply chain
management performance?
RQ4. How are these risk factors interacting with each other?
RQ5. How can the hospitals from both UK and China effectively manage their supply
chain related risks?
RQ6. What are the main risk mitigation strategies to be considered?
1.3 RESEARCH AIM AND OBJECTIVES
In light of this, to address the practical needs and fulfil those research gaps, this thesis aims
to propose a novel comprehensive framework and integrated risk management model that
takes explicit account of multiple types of risk factors in aiding decision-making as well as
comparing and ranking the current implemented alternative risk mitigation strategies using
fuzzy set theory and multiple criteria decision analysis (MCDA) methods. The specific research
objectives are:
To review the existing and current status of implementation of risk management
technology/theory in hospital supply chain, to explore the characteristics of the
healthcare supply chain and review supply chain risk management methods.
To develop a conceptual framework to identify, evaluate the risk level and mitigate
the interrelated risk factors in the hospital supply chain operations.
To develop an integrated supply chain risk management model to support the
proposed framework using fuzzy set theory and multiple criteria decision analysis
(MCDA) methods.

8
To examine the applicability of the proposed model through empirically based cases
in order to find out the best solution to manage the risk in hospital supply chain
operations.
To conduct case studies to justify and demonstrate applicability of the proposed
model.
1.4 RESEARCH SCOPE
The diverse entities involved in the healthcare supply chain network, such as various flows
(i.e. information, cash, service, material flow) and numerous stakeholders (i.e. manufacturers,
suppliers, distributors, retailers, hospitals, governments and patients), are interweaved into
a complex system, on the other hand, supply chain risk management is a broad topic that
encompasses various aspects from which to look at the SC process. Therefore, it is essential
to set the boundaries of the research at the early stage for the purpose of developing valuable
insights.
Existing literature reveals that most studies have focused on the upstream of the healthcare
supply chain, especially on pharmaceutical companies. Instead, the context of this thesis is
confined to the general medicine flow in public hospital supply chain risk management. The
major difference between the public and private healthcare providers is their main goals. The
private hospital is profit oriented while the public sector is oriented toward quality service
delivery. Furthermore, the enablers of supply chain management (SCM) (which include
integration, collaboration, coordination and information systems) are applicable both to the
private and public sectors. However, the rate of application in the public hospital in limited
due to complex rules and procedures. Despite the comprehensive legislation and measures
implemented by the public hospital, there are always challenges to manage the risks of fraud
and corruption in the supply chain. Incidence of financial mismanagement which includes the
SCM process remains prevalent in the public hospital. Korosec (2003) states “SCM is a
procurement tool that, strategically integrates the whole procurement process.” Thus, SCM
is thought to be narrow in a functional sense, an element of procurement rather than
spanning multiple functional areas in the public hospital. By contrast, in the private hospital
context, Mason-Jones (2004) argues that “procurement is a crucial central element of SCM”

9
and SCM covers “all functions throughout organizations, from marketing and production to
procurement.” Therefore, a system of comtinuously monitoring and improvement of the
supply chain is crucial for the success of the public hospital.
The research is mainly focusd on how to manage risks occurring from the upstream (i.e.
manufacturer and distributor) to the downstream, end user (i.e. patients). More especially, it
presumes that all supply chain activities (i.e. sourcing, distribution, storing, etc) within the
interactions of different parties are carried out in association with material, finance and
information flows to provide the medicine products to patients. Therefore, the risk types
covered in this thesis are related to (1) the risks that are internal to the hospitals, (2) the risks
external to the hospitals but internal to the supply chain networks and (3) the risks external
to the supply chain networks. Comparing with other studies which only focus on one of the
specific SCRM process, this thesis proposes an integrated method to identify the healthcare
SC related risks, measure and analyse the risks, and evaluate the implemented risk mitigation
strategies.
The geographical focus of the research within this thesis is both the United Kingdom (UK) and
China. The UK provides a good case for the research relating to healthcare industry, as the
NHS and its commercial partners are internationally renowned for running the world’s largest
integrated health system. At the same time, healthcare reforms have been initiated by the
Chinese government for seeking the development of a new system, which providing “safe,
effective, convenient and affordable” healthcare to both rural and urban residents by 2020.
Thus, the UK’s experience of providing high quality hospitals and efficient SC are capable to
assist China to develop new systems for meeting the urgent needs for healthcare reforms.
China has learned UK healthcare model since 2013 and spearheaded a series of initiatives to
promote the international co-operation in healthcare education and information exchange
between both countries. Although this is beneficial for sharing the experience among each
other, it also means that both healthcare industries would face the same issues. Moreover,
what is true of the analysis of supply chain related risks is becoming more imperative to both
countries’ healthcare industries which pursue effectiveness and value in supply chain
operations.

10
1.5 RESEARCH METHODS
This thesis follows a deductive research approach using data triangulation of both qualitative
and quantitative research methods. The research mainly aims to develop a comprehensive
framework and an integrated risk management model for identifying and assessing the risk
factors in hospital supply chains. Particularly, it explores the efficiency of currently
implemented risk mitigation strategy in the hospital setting. Thus, the empirical study was
chosen to enhance the understanding of this complex healthcare supply chain system and to
support the researcher as well as practitioner retain an in-depth analysis of this real-life
situation.
Reporting of empirical in-depth studies on managing the medicine supply chain related risks
in the hospital setting is rather scarce in scholarly work. Therefore, the empirical studies were
conducted in both China and UK healthcare industries and data was collected via reviewing
literature articles, official documentation and other published materials, direct observations,
a series of interviews from industrial experts, consultants as well as academics with rich
knowledge and experience of risk management, and questionnaire surveys. The
questionnaires were pilot tested, with the results being used to modify the contents. In
addition, the questionnaires were sent out via either email or web-link (i.e. eSurveyCreator)
with a cover letter and content form to the targeted experts. The participant experts such as:
Head of Procurement, Director of Hospital, Stock Manager, General Manager in
Pharmaceutical Company, Chief Pharmacy Procurement IT Manager, Head of Supply Chain
and E-commerce and academicians with industry experience are the knowledgeable
individuals who are able to provide the valuable comments to all aspects of the survey.
Relevant literature review was used as a base to identify risk sources and risk mitigation
strategies. A risk-factor questionnaire survey and semi-structured interviews with participant
experts from both academic and industrial fields were conducted to validate the identified
risk factors and relevant risk mitigation strategies that were extracted from the existing
resources and explore other risk factors and mitigation strategies that have not been
mentioned in the literature and other documentation. Moreover, a series of email and face-
to-face interviews were distributed and conducted to further explore the appropriateness of
the developed hierarchy model where the identified risk factors were summarized. For the
purpose of assessing the risk factors, it is essential to measure the risks by determining their

11
priority weighting and evaluating their inter-relationships. Other questionnaire surveys
(termed risk assessment survey) were conducted and analysed using Fuzzy Analytic Hierarchy
Process (AHP) and Interpretive Structural Modelling (ISM). In order to better understand the
significance of the identified risk mitigation strategies with regard to different risk factors,
further questionnaire surveys was conducted to collect the relevant primary data. Fuzzy
TOPSIS (Technique for Order Preference by Similarity to Ideal Solution) was then used to
analyse the data and rank the relative importance of those mitigation strategies with respect
to the performance under different risk contexts.
1.6 STRUCTURE OF THE THESIS
The thesis consists the following eight chapters:
Chapter One – Introduction: This chapter states a general overview of the research
background, aim, objectives, the generated research questions, the scope of research, and
methodological approach and structure of this thesis. It briefly reviews the requirement for
this research and outlined how the research will be conducted.
Chapter Two – Literature review: This chapter extensively reviews the literature on the
concepts of healthcare supply chain management, the status of risk management in the
healthcare supply chain context and their development as well as definitions. This chapter
discusses the current existing studies in association with supply chain risk management and
assess the current knowledge on SCRM. Eventually, some research gaps are find out,
particularly concerning the medicine supply chain related risks in the hospital sector.
Chapter Three – Research methodology: This chapter explains the methodology, philosophy,
approach, strategies and choices that established the foundation for the research work. After
defining the overall research design, the chapter looks to justify the methodological choices
to meet the research objectives by outlining the application of data collection and analysis
methods.
Chapter Four – Conceptual famework and integrated risk management model: This chapter
presents the novel risk management conceptual framework as a platform that attempts to
incorporate the five main components, namely risk drivers and sources, decision-making, SC

12
strategies, supply chain risk management process and performance outcomes to address the
industrial needs for practical decision support methodology. Based on the proposed
framework, the integrated risk management model is developed by following three main risk
management steps through organising and refining the previous methods.
Chapter Five – Healthcare supply chain risk factors identification: This chapter presents the
first step of the risk management process, i.e. risk factors identification. In order to expand
the coverage of the risk factors identification and classify the unstructured risk factors, this
chapter reviewes relevant literature and other published materials. The questionnaire
surveys is developed to make inferences about the attitudes and opinions from participant
academic and industrial experts. Based on the survey results, the developed hierarchical
structure of identified risk factors are modified and further validated through a serial of email
and face-to-face interviews with the experts.
Chapter Six – Healthcare supply chain risk assessment: This chapter focuses on the
assessment of identified risk factors in the hospital setting. It illustrates second-round
questionnaire surveys conducted by empirical studies, where the data collected are analysed
using Fuzzy AHP and ISM methods. This is carried out to determine the relative significance
and highlight the interactions between each risk leading to the supply chain disruption.
Chapter Seven – Identification and evaluation of risk mitigation strategies: Instead of
identifying the mitigation strategies based on the literature review, this research focuses on
the current implemented strategies in the real-time context and identifies them through the
empirical studies in both UK and China healthcare industries. The significant levels of risk
mitigation strategies are evaluated through conducting the five-point Likert scale
questionnaire survey and ranked by using a Fuzzy TOPSIS method. The chapter ends with the
discussion and managerial implications.
Chapter Eight – Conclusion: This chapter summarises the findings on the risk factors
identification, risk assessment and risk mitigation in the previous chapters. It also suggests
the limitations of this thesis and provides the direction and recommendations for further
research agenda. Figure 1.2 illustrates the overall thesis structure.

13
Figure 1-2: The structure of the thesis
CHAPTER ONE: Introduction
CHAPTER TWO: Literature review
CHAPTER THREE: Research methodology
CHAPTER FOUR: Conceptual framework and integrated
risk management model
CHAPTER FIVE: Healthcare supply chain risk factors
identification
CHAPTER SIX: Healthcare supply chain risk assessment
CHAPTER SEVEN: Identification and evaluation of risk
mitigation strategies
CHAPTER EIGHT: Conclusion
Emp
irical stud
ies

14
2.CHAPTER TWO: LITERATURE REVIEW
2.1 INTRODUCTION
This chapter provides details of how the rigorous systematic literature review are conducted,
highlights the gaps allowing to clarify the research problems in the proposed study. The
review of the literature comprises of three key areas, which are critical to the research
including: healthcare supply chain management (HCSCM), supply chain risk management
(SCRM) and healthcare supply chain risk management (HCSCRM) as shown in Figure 2.1.
It begins with the review of the current status of healthcare supply chain management and
an introduction of the systematic review methodology. This is followed by the results section.
The discussions of conceptual and research methodological issues are presented.
Thereafter, this chapter reviews the previous research on SCRM and identifies the research
gaps, particularly with respect to the healthcare supply chain risk management (HCSCRM) in
the hospital setting. Due to the lack of in-depth studies on HCSCRM, it leads to this literature
review focusing on how SCRM knowledge has been built up in order for the findings to be
applied to healthcare supply chain contexts. To understand the existing body of literature, the
overview of conventional SCRM literature, SCRM methodologies as well as the status of
supply chain risk management in the healthcare sector are presented.
The chapter concludes by summarising the key findings of the review, highlighting the
contributions this study makes to the body of healthcare SCM and SCRM knowledge, and
identifying the implications of the findings for practitioners and scholars. Thus, a future
research agenda can be derived from the research gaps identified.

15
Figure 2-1: Three key areas of the literature review
2.2 HEALTHCARE SUPPLY CHAIN MANAGEMENT (HCSCM)
In recent years, healthcare and hospitals have been under increasing pressure to find ways of
improving services and reducing costs. This is owing to the fact that competition in the
healthcare sector has increased due to globalisation (Carter and Rogers, 2008), differentiation
in customer demands, and resource pressure faced by private and public-service providers.
Furthermore, the reforms have forced hospitals to find new ways to cut the costs of operation.
Currently, statistics show that the healthcare sector loses approximately $5 billion annually in
the implantable device supply chain due to waste, inefficiency, and sometimes inadequate
visibility (Seuring and Müller, 2008).
In most healthcare institutions, supply chain cost is the second highest cost after labour. As a
result, most hospitals are looking for ways to reduce their supply chain costs while improving
their efficiency (Kumar et al., 2009). There is evidence showing several opportunities where
new thinking in commercial and industrial logistics and service supply chain management
(SSCM) are being transformed into healthcare delivery to advantageous effect (Towill and
Healthcare Supply Chain
Management
Healthcare Supply Chain Risk
Management
Supply Chain Risk Management
Research gaps

16
Christopher, 2003). Supply chain management (SCM) is a systematic approach to create a
seamless and continuous process in supply chain operations (Mentzer et al., 2001).
Harland (1997) suggested that the term supply chain management can be used to describe
several concepts: the processes inside a manufacturing organisation, purchasing and supply
management occurring within dyadic relationships, the total chain, and finally, a total firm
network. Healthcare service providers are utilising SCM to reduce operation costs by
automating manual processes, creating efficient trading partner’s relationships, reducing
waste and excess product, capturing all supply data for business requirements, and enabling
automation among regional care networks (Seuring and Müller, 2008; Aronsson et al., 2011).
As an organisation, the hospital operations under certain supply chains are not only meant to
increase the productivity of the hospitals but also to manage the risk associated with
healthcare. There is no doubt that today’s healthcare supply chain is more complex, and it
involves technology, partnerships, and consolidation within the supply chain community
(Haszlinna et al., 2009). Healthcare and hospital operations are delivering goods and services
from many suppliers to patients with a wide range of health requirements due to the need
for hospitals to provide both planned and emergency care (Fenies et al., 2006; MacVaugh,
2007). For example, some drugs require special temperature conditions for storing and
delivery. Furthermore, a zero-defect condition is necessary for the healthcare delivery
process to patients. Lillrank et al., (2011) examined straightforward applications of
manufacturing methodologies that fail to capture some essential features of healthcare.
In practice, performance measurement and process redesign have been proved as the two
main approaches to improve hospital supply chain operation performance within the
healthcare sector (Trautmann et al., 2009). It is, however, important for researchers and
practitioners to fully understand the process involved to benefit from the chosen methods.
Likewise, it is essential to be knowledgeable about the associated issues inherent in the
service delivery processes and the supply chain because, in business planning, quality,
quantity, cost, and risk are all closely interrelated (Chakraborty et al., 2014). In general, there
is a vast and rapid change in the events in a hospital supply chain. It is vital to develop
solutions that optimise profit by minimising wastage, while remaining flexible to the changing
trends in the healthcare sector (Mustaffa and Potter, 2009). The objective of this section is
two-fold. First, existing healthcare SCM research work between 1995 and 2016 is presented.

17
Second, a detailed review is undertaken associated with research developments in healthcare
SCM.
2.2.1 HCSCM research methodology
A literature review is a major contribution to a research project, and it will provide a historical
perspective of the different research areas and an in-depth account of independent research
endeavors (Mentzer and Kahn, 1995). A systematic review procedure for retrieving and
selecting the reviewed articles has been applied following Tranfield et al., (2003) to avoid bias
and improve the validity of the outcomes. The flowchart of the systematic research
methodology outlines the review procedure step by step as illustrated in Figure 2.2 (Ho et al.,
2015).
2.2.1.1 Sourcing articles
The search strings used in the review, such as ‘healthcare/hospital/pharmaceutical supply
chain’, ‘healthcare service delivery’, ‘patient flow’, ‘logistics’, and ‘healthcare’, and the search
were directed to ‘all fields’, which does not limit the search to the title or keywords. In view
of this, reviewed journal articles were selected being published between 1995 and 2016. The
academic databases that were used to identify journal articles included Emerald insight,
IEEExplore, ProQuest, ScienceDirect, Taylor and Francis, Web of Science, and ResearchGate.
In addition, the literature search was supplemented by Google Scholar and OpenAuthors to
improve completeness. Choosing these established databases also helped in minimising any
form of publication bias or reviewer prejudices. Cronin et al., (2008) maintained that some
reviewers may refuse to publish some primary studies, particularly when they report findings
that do not conform to their expectations. To achieve the highest level of relevance, as Moher
et al., (2009) suggested, peer-reviewed journal articles provide credible information because,
for an article to be published in a journal, it must be reviewed by a team of specialised
personnel to ascertain its authenticity. Journal articles also provide sources of up-to-date
information as compared to books (Moher et al., 2009). Thus, the peer-reviewed journal
articles written in English were focused exclusively, whereas conference papers, master and
doctoral dissertations, textbooks, book chapters, and notes were excluded in this review.

18
Figure 2-2: Flowchart of the HCSCM literature review methodology (source adapted from Ho et al., 2015).
The primary purpose for targeting databases was the fact that these databases contain a huge
volume of peer-reviewed papers. A systematic review of the references cited in the resultant
articles was also undertaken. The search retrieved a total of 369 papers. All the abstracts of
the articles were examined to validate whether they covered one or more of the healthcare
SCM topics, including material management, patient pathways, logistics, and research gap
identification. Figure 2.3 illustrates a continuous increase in the number of papers focusing
on the development of the healthcare supply chain in the past 20 years.
Figure 2-3: Distribution of the number of journal articles between 1995 and 2016 (369)
Define the
search strings
Identify the
database
Determine and
apply criteria
for inclusion
and exclusion
Refer to the
reference lists
of the
shortlisted
articles
Ensure that the
resulting
articles are
representative
Extracting and documenting information
from the selected papers
1 2 2 0 2 5 37 7
1419
10
2734
19
3328
49 51
38
12
0
20
40
60
Chart Title
1996 1997 1998 1999 2000 2001 2002 2003 2004 2005 2006
2007 2008 2009 2010 2011 2012 2013 2014 2015 2016

19
2.2.1.2 Screening articles
The retrieved articles were subjected to three stages of screening:
The term healthcare supply chain is used to describe the flow of goods and services
from the supplier to the end user (i.e. patients). Because the research only focused
on the downstream supply chain of the healthcare industry, especially in the hospital
setting, the papers related to the upstream part of the healthcare industry will be
excluded. This reduced the number of articles from 369 to 227.
Second, the retrieved articles based on the citations and the impact factor of each
published journal were checked in order to ensure a high quality of articles. After this
stage, a total of 87 papers were retained.
Third, the reference lists of the shortlisted articles were also carefully cross-checked
to ensure that there were no other articles of relevance that were omitted in the
research. In all, 87 articles met the inclusion criteria for healthcare SCM. Furthermore,
because SCM can be considered as the processes inside an organisation, some studies
in terms of lean healthcare used for healthcare service delivery could also be included
for the review. In the end, this analysis resulted in 87 articles.
2.2.1.3 Analysis and coding
Finally, this stage involved extracting and documenting information from each of the 87
sources. The seven dimensions along with the articles were analysed and integrated into a
literature review framework suggested by Burgess et al., (2006). As Table 2.1 shows, the
classification framework is structured by four main components that enable a holistic and
systematic literature review. More specifically, Grouping 1 conducted an analysis of the
selected articles used and examined the trends of the research on healthcare SCM.
Grouping 2 provided an evaluation of the consistent and various definitions in healthcare SCM
from different researcher perspectives.

20
Table 2.1: HCSCM literature review classification framework
(source adapted from Burgess et al., 2006)
Grouping Content Covered Rationale
1. Descriptive features of healthcare SCM literature
Time distribution of publications, journal names, contributing country
Describe characteristics of sample of articles
2. Definitional issues Approaches to definitions and taxonomy for healthcare SCM
Explore consistency or variation in healthcare SCM definitions by researchers on a range of dimensions. Define the territory that the researchers claim falls within healthcare SCM
3. Theoretical concerns Theoretical perspectives
Determine the range of theories that are used to inform healthcare SCM and the ends to which they are applied
4. Research methodological issues
Research methods Determine the types of research methods that are used to explore healthcare SCM
Moreover, it classified the taxonomy of healthcare SCM from both physical and patient
service views. Grouping 3 also classified the articles but dealt with issues within the
theoretical bases. Finally, Grouping 4 examined issues associated with research methodology
that are used to explore healthcare SCM. The framework was designed to assist in establishing
a clear ‘line of sight’ from information sources to definitional matters, and then through to
theoretical concerns and research approaches (Burgess et al., 2006).
2.2.2 Results of HCSCM literature review
2.2.2.1 Descriptive features of HCSCM literature (grouping 1)
2.2.2.1.1 Time distribution of publication of articles
Owing to the limitation for exploring the trend of publication for healthcare SCM using the
selected 87 papers, it provides an overview of the total retrieved 369 papers published in the
last two decades, as shown in Figure 2.3. The first articles appeared in 1995. Until 2005, there

21
was a gradual increase in publications, with 334 out of 369 articles published between 2005
and mid-2016. The year 2014 represented a promising year in healthcare SCM research,
contributing the most in the volume of papers published.
2.2.2.1.2 Journal titles
The 87 selected articles were reviewed to identify the journals and the number of articles
published in each journal. As shown in Table 2.2, a total of 55 journals covering diverse
perspectives of healthcare SCM were captured in the review. Three journals, Production
Planning and Control: The Management of Operations (5), International Journal of Health
Care Quality Assurance (4), and Supply Chain Management: An International Journal (11),
accounted for 23% of the publications. The remaining 77% of articles were ‘thinly’ spread over
the remaining 52 journals.
2.2.2.1.3 Contributing country
Descriptive analysis of countries contributing to healthcare SCM showed that US academics
researchers contributed the most healthcare SCM papers, which comprise 88% in America
and 28% in the world (Figure 2.4). The UK followed with 41% in Europe and 14% in the world.
In Asia, India dominated one-third of the published articles compared to other countries. In
Oceania, the Middle East, and Africa, the countries of Australia, Iran, and Ghana comprised
34%, 20%, and 34%, respectively, in those regions. In addition, there is collaborative research
among co-authors representing more than two countries (e.g., Laureani et al., 2012; Aronsson
et al., 2011; Chireu et al., 2014).
Table 2.2: List of journals publishing HCSCM research to date
Journal No. of papers
Journal No. of papers
Academy of Taiwan Business Review 1 Journal of Service, Science and Management
1
African Journal of Business and Economic Research
1 Journal of Business Logistics 2
Business Process Management Journal 2 Journal of Risk Research 1
Computers in Biology and Medicine 1 Journal of Operations Management
2
Computers and Operations Research 1 Journal of Health Organization and Management
3

22
Clinical Governance: An International Journal
1 Journal of Management in Medicine
1
Health Policy 1 Journal of Purchasing and Supply Management
1
Health Care Management Science 2 Journal of Industrial Engineering and Management
1
Health Marketing Quarterly 1 Journal of Management and Strategy
1
Health Care Management Review 2 Journal of Health Service Research and Policy
1
Healthcare Financial Management 1 Journal of Healthcare Information Management
1
Health Affairs 1 Journal of Marketing Management
1
International Journal for Quality in Health Care
1 Leadership in Health Services 3
International Journal of Innovation and Technology Management
1 Management Review: An International Journal
1
International Journal of Operations and Production Management
3 Operations Research for Health Care
2
International Journal of Logistics Management
2 Production Planning & Control: The Management of Operations
5
International Journal of Production Economics
2 Public Money and Management 1
International Journal of Health Care Quality Assurance
4 Public Management Review 1
International Journal of Value Chain Management
1 Procedia Economics and Finance 1
International Journal of Logistics Systems and Management
1 Quality Management in Healthcare
1
International Journal of Productivity and Performance Management
2 Research Journal of Recent Sciences
1
International Journal of Quality and Reliability Management
1 Research in Social and Administrative Pharmacy
1
International Journal of Physical Distribution and Logistics Management
2 Supply Chain Management: An International Journal
11
International Journal of Six Sigma and Competitive Advantage
1 Strategic Outsourcing: An International Journal
2
Ingenieria e Investigacion 1 The International Journal of Human Resource Management
1
Technology and Health Care 1 The International Journal of Accounting
1
The Journal of Applied Business Research
1

23
Figure 2-4: Distribution of contributing countries in HCSCM in the world
87%
8%
1% 3% 1%
America
USA Canada Panama Brazil Colombia
41%
3%2%2%
8%
9%5%
8%
3%
2%
1%
10%
4% 2%
Europe
UK
Spain
Finland
Germany
France
Sweden
Denmark
Netherland
14%
31%
17%
14%
2%10%
2% 4% 2% 2% 2%
Asian
Taiwan Indian China
Malaysia Indonesia Singapore
Sri Lanka Thailand Vietnam
Bangladesh Korea
34%
13%7%20%
17%
3% 3% 3%
Oceania and Middle East
Australia
New Zealand
Israel
Iran
UAE
Pakistan
Qatar
Jordan
34%
11%33%
11%11%
Africa
Ghana Morocco Tunisia
Malawi Uganda Oman
US28%
Canada3%
Italy4%
Indian4%
Australia3%
UK14%
China2%
Malaysia2%
France3%
Sweden3%
Others25%
Taiwan2%
Portugal1%
PUBLICATIONS OF THE WORLD

24
2.2.2.2 Definitional Issues (grouping 2)
2.2.2.2.1 Definition of healthcare supply chain management
As indicated in Figure 2.3, it appears that the development of the healthcare SCM is still in its
early stage. The specific definition of the healthcare supply chain has emerged in the literature
with diverse perspectives, as summarised in Table 2.3. It indicated that there is no consensus
on the concepts of the healthcare supply chain. However, without a mutual understanding
and clear definition, it will become difficult for researchers to communicate with practitioners
and gain access to the industry to conduct empirical studies (Ho et al., 2015).
It is impossible to build one’s own definitions subjectively without any foundations based on
the literature. Thus, a conservative approach has been suggested by Burgess et al., (2006)
who proposed that a definition must be explicitly stated, not merely implied, to be useful. As
shown in Table 2.4, the literature has been classified into existing, modified, or original
definitions. According to Table 2.4, about two-thirds of the articles (58) did not provide
definitions. Moreover, 18 out of 87 used existing definitions. However, little consistency was
found in the specific definitions used. Four of the 18 articles utilised the definition proposed
by Burns (2008), who suggested the four main components in the healthcare supply chain
(producer, purchaser, provider, and payer). The remaining articles only focus on the supply
chain partially or on a specific aspect, such as the healthcare service delivery process. Only
eight papers developed their own definitions in healthcare SCM. However, most of these have
not been utilised or developed by other researchers.
Table 2.3: Definitions of HSC given by researchers
AUTHORS Definitions of Healthcare SC Scopes
Brennan (1998) The supply chain is the chain of activities, information, and flow of funds that extends from manufacturers to the customer or patient.
Integrated delivery systems
Rivard-Royer et al., (2002)
A major characteristic of the healthcare sector supply chain is the simultaneous presence of two chains: one external and the other internal. From the multitude of different supplies used by the institutions and the myriad distribution channels through which they flow, these supplies may come directly from the manufacturer or through a distributor. The healthcare institutions are not the end
Supply chain integrating

25
customers. Hospitals must deploy their own logistics networks for delivering suppliers to the patient care units and users.
Lina et al., (2005) Healthcare SCM is considered more problematic compared to the industrial sector. This is because the volume of diverse support services required to deliver the product (patient care) is unique, and the decision maker must consider information, material, and cash flows in the system.
Inventory management
Christopher and Towill (2005)
The authors defined the healthcare supply chain as the healthcare delivery pipelines, which refers to the flow of patients in pursuance of all phases of their treatment from referral to full recovery. In that sense, ‘patient flow’ is analogous to ‘product flow’ with corresponding value-added activities in the pipeline and similar valid concerns regarding quality management and delivery cycle times.
Pipeline differentiation
Kitsiou et al., (2007)
The current healthcare supply chain is a multifaceted system consisting of several processes, tasks, intermediaries, and interfaces, where numerous responsibilities are highly segregated from the manufacturer to the end user: the patient.
Information systems
Samuel et al., (2008)
The supply chain process is the essential link for all programs and services offered by a hospital. Hence, any improvement in managing the supply chain can positively affect the bottom line profitability of any hospital operations.
Performance improvement
Jan and Robert
(2011)
The healthcare supply chain refers to the information, supplies, and finances involved with the acquisition and movement of goods and services from the supplier to the user to enhance clinical outcomes while controlling costs.
Integrated health supply chain
Shou (2013) Healthcare SCM processes have three types of flows: physical product flow, information flow, and financial flow. The physical product flow manages customised products and services for the treatment of patients and their needs. Information and financial flows are related to supply chain design decisions for effective product flow and improved organisational performance.
Application of healthcare SCM in
developing countries

26
Tillmann et al., (2013)
Healthcare supply chains can be considered the ‘value stream’, which is defined as the special activities required to design, order, and provide a specific service to patients.
Performance measurement
Daniel et al., (2013)
Hospital supply chains are unique and different from the typical industrial supply chains in many aspects, such as requiring accurate supplies, requiring special handling conditions for supplies, supply driven by physician preference, and rapid development of technology.
IT investment and hospital-supplier
integration
Umang and Ramesh (2015)
Healthcare SCM is a set of approaches to link medicines, equipment, laundry, food, supplies, vendors, hospitals, and transport for efficient and effective use of resources to achieve total quality management.
Performance measurement
Abu et al., (2015) Hospital SCM ensures control of product flow through participation of three major stakeholders: producers, purchasers, and providers.
Value healthcare supply chain
integrated hospital management
Chris et al., (2014)
Healthcare supply chain represents the conduit in which pharmaceutical products take ingredients from the suppliers of active pharmaceuticals to the manufacturers of pharmaceuticals to the healthcare providers (hospitals and medical clinics) and clinicians to the ultimate end user: the patient.
Healthcare supply chain risk
management
Schneller and Smeltzer (2006)
The healthcare supply chain is defined as ‘the information, supplies, and finances involved in the acquisition and movement of goods and services from supplier to the end user in order to enhance clinical outcomes while controlling costs’.
Table 2.4: Approaches to definitions of HCSCM
Approach to Definition
Articles Count
Developed own
definition
Kitsiou et al., (2007); Vries and Huijsman (2011); Brennan (1998); Chen et al., (2013); Breen (2008); Enyinda et al., (2014); Bourlakis and Patten (2011); Langabeer (2005)
8
Used existing definitions
Elmuti et al., (2013); Mustaffa and Potter (2009); Matopoulos and Michailidou (2013); Priyan and Uthayakumar (2013); Böhme et al., (2013); Kumar et al., (2008, 2009); Pan and Pokharel (2007); Kjos et al., (2016); Rivard-Royer et al., (2002); Meijboom et al., (2011); Samuel et al., (2010); Drupsteen et al., (2013); Rahimnia
18

27
and Moghadasian (2010); Hugo et al., (2002); Narayana et al., (2014); Kim and Kwon (2015); Aronsson et al., (2011).
Incrementally changed existing
definitions
Villa et al., (2014); Parnaby and Towill (2009); Towill (2005) 3
None used Behzad et al., (2011); McKone-Sweet et al., (2005); Kumar and Blair (2013); Chakraborty et al., (2014); Agwunobi and London (2009); Burns and Lee (2008); Jin et al., (2008); Gebicki et al., (2014); Guimaraes et al., (2013); Heibuch (1995); Jurado et al., (2016); Kelle et al., (2012); Böhme et al., (2014, 2016); Kumar et al., (2005, 2008); Bakar et al., (2009); Fernie and Rees (1995); Lega et al., (2013); Bhaoo et al., (2012); Rego et al., (2014); Grose and Richardson (2014); Aptel and Pourjalali (2001); Jarrett (1998); Xie et al., (2016); Elleuch et al., (2014); Aguas et al., (2013); Kanyoma et al., (2013); Cullen and Taylor (2009); Ketikidis and Stalidis (2010); Lin and Ho (2014); Sampson et al., (2015); Lillrank et al., (2011); Ghorani (2015); Breen and Crawford (2005); Bendavid et al., (2010); Chireu (2014); Laureani et al., (2013); Radnor et al., (2013); Al-Balushi et al., (2014); Brandao de Sourza (2009); Chadha et al., (2012); Stanton et al., (2014); Joosten et al., (2009); Curatolo et al., (2014); Poksinska (2010); Souza and Pidd (2011); Guven-Uslu et al., (2014); Guimaraes and Carvalho (2013); Burgess and Radnor (2013); Kollberg et al., (2006); Olsson and Aronsson (2015); Dobrzykowski et al., (2014); Machado et al., (2015); Granlund and Wiktorsson (2013); Lapierre and Ruiz (2007); Vries (2011); Lent et al., (2012).
58
Total 87
2.2.2.2.2 Taxonomy for healthcare SCM literature
Over the last few years, the literature on healthcare SCM has been broadening to include not
only medical and surgical supplies but also a focus on patient flow i.e. the process in which
patients enter the hospital until discharge (Jan et al., 2011; Paul and Johan, 2011; Walley,
2007; Towill and Christopher, 2006; Cherian et al., 2010; Olsson and Aronsson, 2015). The
reviewed literature shows that different researchers studied this area through diverse
perspectives. As it describes above, there is no consensus on the concept of the healthcare
supply chain; most researchers only focus on the supply chain partially or on a specific aspect.
These publications can be placed into three main categories: physical flow, patient flow, and
whole supply chain. Further classification can be divided into seven sub-categories as follows:
physical flow (logistics management, information communication system implementation,

28
performance measurement, process improvement orientation, risk management) and
patient flow (performance measurement and process reengineering). Figure 2.5 illustrates
this proposed taxonomy.
Figure 2-5: Taxonomy of HCSCM literature
2.2.2.3 Profiling published literature
2.2.2.3.1 Whole supply chain perspective
There is evidence of several opportunities where new thinking in commercial and industrial
logistics and SCM are being transformed into healthcare delivery to advantageous effect
(Towill and Christopher, 2003). According to Mentzer et al., (2001), SCM can be defined as
the systemic, strategic coordination of traditional business functions and tactics across these
business functions within a company and across businesses within the supply chain to
improve the long-term performance of individual companies and the supply chain.
Hea
lth
care
Su
pp
ly C
hai
n
Man
agem
ent
(HC
SCM
)
Physical Flow
Risk Management
Information Communication
Technology
E-Commerce
Computer Application and Electrnic Data Interchange
Logistics Management
Procurement Management
Inventory Management
Performance Measurement
Performance improvement
Service/Patient Flow
Process Reengering
Lean/Agility
Process orientation improvement
Performance Measurement
Whole SCM

29
Individual businesses no longer compete as stand-alone entities but as supply chains
(Christopher, 2000). It is noteworthy that the great competitions in the future will not be
between companies but rather between supply chains. Arthur Andersen and Co, (1990)
developed a structure of a healthcare supply chain, as shown in Figure 2.6. They give the
operational definition of the healthcare supply chain process: ‘the vendor delivers products
in ‘eaches’ (single), sorted by user department, to the hospital receiving dock where they are
transported directly to the department, usually on a daily basis’. In addition to hospital,
pharmacies are the final step on the healthcare supply chain before drugs reach the
consumer/patient. Pharmacies purchase drugs from wholesalers, and occasionally directly
from manufacturers, and then take physical possession of the drug products. After purchasing
pharmaceuticals, pharmacies assume responsibility for their safe storage and dispensing to
consumers. Pharmacy operations include maintaining an adequate stock of drug products,
providing information to consumers about the safe and effective use of prescription drugs,
and dacilitating billing and paument for consumers participating in group health benefit plans.
Vendors
Manufacturers
Distributors
HospitalHospital storeroom
External chain
Internal chain
Patient care units
Points of care
Figure 2-6: Healthcare supply chain structure

30
Due to the fact that, SCM is based on a systematic approach, only a few researchers have
evaluated the healthcare supply chain through both physical and patient flows perspectives.
Most studies have devoted the contributions into SCM partially or regarding a specific aspect.
More specifically, Vries and Huijsman (2011) argued that the characteristics of the healthcare
supply chain have some unique features, which make it difficult for the transition of the
managerial knowledge directly from industrial to healthcare settings to take place. However,
they have not denied that the healthcare sector can benefit from the knowledge learned in
the industrial sector. They discussed the healthcare setting towards more process-oriented
and greater integration of the healthcare supply chain through transformation. They
suggested the healthcare processes might refer to physical products, such as pharmaceuticals,
medical devices, and health aids as well as processes associated with the flow of patients. The
authors produced a schematic overview of supply chain integrated development in Figure 2.7.
In addition, de Vries and Huijsman (2011) discussed the following five main research areas
with respect to healthcare supply chain integration development: (1) use of IT, (2) the
influence of power and interest relationships between stakeholders, (3) lean and agile
management practices, (4) performance measurements, and (5) applying SCM concepts to
patient flows. Nevertheless, it lacks the empirical study to test the suggestion by the authors.
Figure 2-7: Stages of supply chain integration
(adopted from de Vries and Huijsman, 2011).

31
2.2.2.3.2 Physical flow perspective
a) Logistics management
Logistics activities involve planning, designing, implementing, and managing material flows in
a supply chain to support functions such as procurement, distribution, inventory
management, packaging, and manufacturing (Pokharel, 2005). In the healthcare sector, the
demand for the items is quite difficult to predict (Jarrett, 1998). Moreover, Van Merode et al.,
(2004) also mentioned that the stochasticity in the patient mix and the average length of in-
patient stays are big problems in scheduling resources. The two main approaches used to plan
the logistics activities in hospitals are inventory oriented and schedule oriented (Lapierre and
Ruiz, 2007). The healthcare logistics aimed to deliver the right drugs and medical supplies in
the right quantities and the right conditions at the right health service delivery points and at
the right time for the right patients/users for the right cost (Chikumba, 2010).
b) Procurement management
Decision procurement professionals always play a vital role in influencing inventory levels and,
ultimately, the service provided to the consumer of the hospital or clinic, as they tend to have
control over many supplier relationships. Inefficient procurement will eventually be passed
along to the patient as additional costs. Thus, any advances in efficiencies must first begin
with procurement (Parker and Anderson, 2002). Based on a survey by the National Health
Service (NHS, 2011), 30% of a hospital’s budget is spent on procurement. The NHS aims to
achieve £1.2 bn in efficiency savings through improved procurement.
According to Messelbeck and Sutherland (2000), the US Environmental Protection Agency
(EPA) investigated medical waste as the fourth largest contributor of mercury in the
environment. Therefore, better packaging could reduce medical waste and simultaneously
lead to logistical efficiencies (Shah, 2004). However, the packaging of supplies is ignored as
part of the purchasing decision-making process within the healthcare industry (Kumar et al.,
2008). Kumar et al., (2008) studied the effect of packaging design on procurement decisions
in hospitals and examined inefficiencies in the US hospital supply chain. The researchers
conducted surveys of 75 hospitals across the US in different regions. The survey results
revealed that packaging and environmental friendly supplier/medical products do not
currently play a role in hospital procurement decisions. Nevertheless, it has effectively been
shown that the opportunities for improvement in the packaging industry, engaged in supply

32
of products to the healthcare industry, require an environmentally conscious approach for
long-term cost effectiveness.
c) Inventory management
An area of hospital SCM that particularly warrants close study is inventory (Zepeda et al.,
2016). However, the inventory and obsolescence in the healthcare sector are several times
higher than in the retail/industrial sector. This is caused by the main driver of hospital
inventory decisions, which is not cost but the need to meet service performance outcomes.
It is a complex problem due to the uncertainty in the drug demands and the variety of
constraints to be considered.
Nevertheless, the budget for healthcare organisations is under increasing strain. It faces a
major challenge to reduce costs. Thus, some researchers assessed the best trade-off between
cost savings and the high quality of service performance. Moreover, the risk associated with
a stock out is also much higher because the demand is hard to predict (Kowalski, 1986). Thus,
most researchers (Mustaffa and Potter, 2009; Matopoulos and Michailidou, 2013; Guimaraes
et al., 2013) suggested that a vendor-managed inventory approach appears to be the best
solution for inventory control. Bhakoo et al., (2012) extended the vendor-managed inventory
implementation in the healthcare domain. Furthermore, they suggested that the hospital can
participate in myriad collaborative arrangements with supply chain partners to manage
inventory. The critical success factor for this arrangement is the compatibility of information
systems technology between the third party and the hospital pharmacy.
In the 1980s, US distributors offered hospitals the inventory managerial method called the
stockless system. According to Arthur Andersen and Co. (1990), the stockless method means
a programme under which the vendor takes over the hospital’s central distribution function
and delivers products in ‘eaches’ (single), sorted by the user department, to the hospital
receiving dock where they are transported directly to the department, usually daily. Further,
by the late 1990s, the method seemed to be losing popularity.
Thus, Rivard-Royer et al., (2002) examined a hybrid version of the stockless system, combining
stockless material management and a conventional approach to patient care unit
replenishment. The hybrid approach promised further benefits beyond the distributor-

33
patient care unit interface, to seek opportunities to reengineer the logistics processes for both
internal and external unit logistics.
d) Performance measurement
According to Neely (1999), performance measurement can be considered the process of
quantifying action, where measurement is the process of quantification and action, which
leads to performance. The application of measurement would help organisations calibrate
their capabilities and move forward via targeted continual improvement initiatives (Bakar,
2009). Fernie and Rees (1995) evaluated the performance of supply services from three
perspectives: the NHS supply managers (service providers), trust hospital chief executives
(purchasers of services), and companies supplying products to the NHS. The authors
suggested that the establishment of a new internal market within the NHS in the wake of the
1990 legislation has had major implications for the members involved in SCM. Owing to the
uncertainty that exists in the market environment, ‘partnershipping’ was introduced in the
research.
Some researchers (Lai et al., 2002; Sharahi and Abedian, 2009) argued that one of the major
problems of SCM is the lack of a relevant methodology for performance measures. Further,
the Supply Chain Council developed the supply chain reference model (SCOR), which be used
in the scientific literature and provides a useful framework for assessing supply chain
performance (Lai et al., 2002; Zanjirani et al., 2009). However, Bolstorff (2006) argued that
the SCOR model does not focus on the important dimensions of performance that
characterise the value chain and thus suggested the use of the balanced scorecard framework
(Kaplan and Norton, 1992). In addition, Kumar et al., (2005) developed a procurement
performance measurement model combining the generic measures (e.g., efficiency,
effectiveness, time, and IT system reliability), healthcare supply chain environment and
structure, and procurement procedures. Further, a balanced scorecard is proposed by
considering these three main components of the measurement model through six
perspectives as follows: customer, supplier, process, IT system, learning, and growth overall.
e) Performance improvement
Brennan and Charles (1998) considered integrated delivery systems (IDSs) to be a key
dimension of the integrated supply chain process, which aims to simplify clinical and business

34
processes within and across entire organisations. In this paper, the authors examined the
need for IDSs to meet and exceed the ‘best practice’ performance in healthcare SCM for
demand management, order management, supplier management, logistics management, and
inventory management. Further, the limitation of IDSs in implementing service changes, such
as user resistance, should be addressed by balancing the customer demand and plan
objectives. In addition, IT systems and expertise, human resources, change management,
organisational structure, and the relationship between the customer and supplier are the key
enablers that can help prepare an organisation to transition to an integrated supply chain.
Healthcare organisations must overcome years of adversarial supplier relationships and
dramatic internal and external inefficiencies to reengineer their supply chain (Toba et al.,
2008). Risk pooling among the hospitals could be a strategic policy to increase the cost
effectiveness of hospitals (Pan and Pokharel, 2007). With the increasing requirement to
rationalise healthcare services, there have been diverse attempts to improve the efficiency
and effectiveness of hospital systems through vertical or horizontal and direct or indirect
supply chain collaboration (Rego et al., 2014).
Moreover, Nyaga et al., (2015) conducted an evaluation of the effects of intra- and inter-
organisational arrangements by examining the effect of incentive mechanisms for internal
stakeholders and negotiating leverage with external partners on supply chain efficiency in the
hospital sector. The result indicated that a higher percentage of physician employment and
recruitment of supply chain professionals from the retail and industrial sectors will bring well-
established best practices to enhance supply chain efficiency. According to Chakraborty et al.,
(2014), supply chain collaboration has been established as an antecedent to value co-creation,
which acts as a mediator role in the relationship between supply chain collaboration and firm
performance. The novel conceptual framework has been proposed using a service dominant
logic lens to conceptualise supply chain collaboration and its components in the context of
the healthcare supply chain.
McKone-Sweet et al., (2005) explored some barriers to the implementation of SCM practices,
which include the lack of executive support, misaligned or conflicting incentives, the need for
data collection and performance measurement, limited education about the supply chain,
and inconsistent relationships with GPOs and other supply chain partners. Therefore, the
authors conducted in-depth interviews with hospital executives and material managers, GPO

35
executives, distributors, and industry experts from November 2002 to June 2003 to obtain
accurate information regarding the above barriers. Further, they divided the healthcare
industry into three levels of the hospital supply chain: the environmental level (GPOs and
distributors), the organisational level (hospital executives), and the operational level (material
and supply chain managers). Then, the authors gave some recommendations for improving
the healthcare supply chain regarding the levels, such as:
Leveraging information systems to standardise, measure, analyse, and report
performance metrics in a necessary step to streamline the healthcare supply chain.
Building a long-term relationship with GPOs for potential advantages in reducing costs
and achieving information sharing.
Creating a structural training programme about supply chain knowledge is necessary
for executives and material managers to develop good decision-making and planning
capabilities.
Supply chain performance (delivery performance, clinician and patient satisfaction,
etc.) measurement plays a vital role for material/supply chain managers to track not
only product costs but also other kind of costs.
f) Information communication systems
I. Computer application and electronic data interchange
Healthcare institutions are now adapting to supply chain information management systems
to help them manage their procurements and increase efficiency (Zhu et al., 2008). Various
customised SCM software for the healthcare sector exists on the market (Gosling and Naim,
2009). Additionally, SCM helps procurement managers make informed decisions when it
comes to matters related to the health supply chain. Various information management
systems can be used in healthcare supply management data warehousing and analysis of
healthcare big data (Carter and Rogers, 2008). However, education on healthcare SCM
remains underdeveloped. For the world to achieve efficient healthcare SCM, more emphasis
must be focused on healthcare SCM (Wisner et al., 2015).
Kitsiou et al., (2007) conducted the evaluation of various integration technology approaches
that can be used as a potential guideline for assessing integration technology alternatives to

36
add value to a healthcare SCM system. In this study, the different information system
technologies have been investigated, such as electronic data interchange (EDI), XML, Health
Level Seven (HL7), common object request broker architecture, distributed healthcare
environment, and web services.
The RFID technology is a wireless automatic identification and data capture technology
(Wamba et al., 2008) used to track and manage products, people, and assets with minimal
human intervention. Clearly, RFID technology can provide many benefits for healthcare and
pharmaceutical applications that allow service providers to design more efficient processes,
reduce costs, and improve service and patient safety. In addition, pharmaceutical companies
are using RFID to protect against counterfeit drugs (Kumar et al., 2009). In fact, RFID spending
in healthcare organisations was expected to increase rapidly from $474 million in 2008 to $3.1
billion in 2013 (Kalorama, 2008).
Bendavid et al., (2011) examined the implementation of an RFID-based two-bin ‘e-Kanban’
replenishment system solution to improve the replenishment processes of medical supplies
in a hospital distributed storage location through case study analysis. The results
demonstrated that automating the nursing unit supply chain with the RFID system in
conjunction with the redesign of the ward floor and of the roles and functions can
substantially improve business and operational performance. However, the current RFID
technology is too expensive for broad implementation within the healthcare sectors; thus, it
must be calculated carefully to ensure proper investment for the organisations (Kumar et al.,
2009).
Pan and Pokharel (2007) investigated the motivators and barriers to the use of ICT in logistics
in Singapore hospital settings. In this study, the authors mentioned that increasing efficiency,
reducing data entry error, decreasing operational cost, and decreasing labour costs are some
of the main reasons for ICT adoption in hospitals. In contrast, the cost of implementation, the
availability of expertise to handle such new ICT, and a long period could be the main barriers.
II. E-commerce
The term e-commerce has been defined as ‘the sharing of business information, maintaining
business relationships, and conducting business transactions by means of telecommunication

37
networks (Dutta, 1997). While e-commerce is in its infancy in the hospital supply chain, it can
be considered an important facet of SCM.
Breen and Crawford (2005) examined the role of e-commerce in a hospital pharmacy in the
procurement of pharmaceuticals through EDI application. The researchers conducted an
evaluation of the barriers and benefits for an applied EDI system in a hospital pharmacy, such
as the lack of funding, security issues, and time saving. In addition, they suggested that
internal customer satisfaction is central to the success of e-procurement deployment. The
limitation of the study is that they only conducted a case study of a specific regional area of
the NHS, which could have been applied to a larger national sample group. Cullen and Taylor
(2009) determined five composite factors that are perceived by users to influence successful
on-going use of e-commerce systems in business-to-business (B2B) buying and selling
transactions in the UK NHS pharmaceutical supply chain. ‘System quality’, ‘information
quality’, ‘management and use’, ‘world wide web – assurance and empathy’, and ‘trust’ were
proposed as potential critical success factors. In a questionnaire based on this in the UK NHS
pharmaceutical supply chain, all respondents ranked information quality, system quality, and
trust as being the most crucial factors. However, they are not devoid of limitations, as they
only focused on a single supply network.
2.2.2.3.3 Patient flow perspective
a) Process reengineering
I. Process orientation improvement
The redesign of supply chain processes for a smoother, faster response has become the main
research topic since the classic contribution by Jay Forrester (1961) over 50 years ago. Most
key ideas by Jay Forrester have been subsumed within business process reengineering. Berry
et al., (1995) further examined this approach in the electronic products supply chain for
improving performance. According to Aronsson and Abrahamsson (2011), the healthcare
supply chain can be considered the patient flow, which means the customer is part of the
production process. Instead of going to the store to buy a finished product, a patient seeks
medical help and is then a part of the entire process until the treatment is finished, as shown
in Figure 2.8 (Bourlakis and Patten, 2011).

38
Figure 2-8: Hospital supply chain process for patient flow
(adopted from Bourlakis and Patten, 2011).
In terms of the viewpoint, the healthcare supply chain fits within the broader research
discussion of the service supply chain, which should be managed differently because it has
the following characteristics that are not found in manufacturing supply chains: intangibility,
heterogeneity, simultaneous production and consumption, and perishability (Zeithaml et al.,
2009). Meijboom et al., (2011) investigated the applicability of SCM in health services. In this
study, they discussed four organisational problems (communication, patient safety, waiting
times, and integration) that occur in situations that are complex because the patient
treatment process requires multiple healthcare providers. Regarding these issues, they
suggested breaking down the boundaries of each department, within healthcare providers
and inter-organisationally, which is a necessary condition for enhanced patient-centred
integration. Although it is necessary to implement the commercial SCM strategies into the
healthcare sector, the research on the healthcare service supply chain is still in its infancy.
In the healthcare sector, improving patient flow is considered of immense importance in
boosting hospital performance (Litvak, 2009; Villa et al., 2009). Towill and Christopher (2005)

39
introduced a new concept of ‘pipeline differentiation’ as different supply chain strategies to
deal with different requirements from patients in multiple situations. They argued that the
perspective of ‘one size does not fit all’ should be adopted by the NHS system because they
always meet different treatment processes. They cannot rely on the same pipeline to handle
multiple demands, such as elective and emergency treatment. In the paper, four types of
pipelines were implemented as follows: 1) HOLPIP, emergency care or multi-task activity
requirements; 2) PARPIP, regular and high-volume elective surgery requirements; 3) SINPIP,
GP services; and 4) SEQPIP, convalescent care.
II. Lean and Agile Practices
The use of technology and the changing medical field has given rise to the need to reduce
waste and operation costs. From this perspective, lean SCM is beneficial. The lean concept
originated from the Japanese manufacturing system, especially Toyota car manufacturing.
The philosophy was developed to fit the Japanese post-war context, where natural resources
were scarce, and the demand was very high (Kumar et al., 2009). Due to its multinational
status, the Toyota lean philosophy was spread to other countries and other fields (Fawcett et
al., 2014).
In fact, lean philosophy focuses on how to eliminate non-value-added activities in the chain
to use less money to do more things. The five principles of lean (identify value, map the value
stream, create flow, establish pull, and seek perfection) are utilised to identify and eliminate
waste, improving the flow of activities to maximise the value for customers. It considers
standardisation and specification of work processes, organisation of work in such a way that
unexpected events are easy to spot, and deployment of activities that find and fix mistakes
that could result in potential risks (Ohno, 1988; Womack and Jones, 2003). Therefore, lean
tools, such as the fishbone diagram and failure mode and effect analysis (FMEA), can also be
used for risk analysis and mitigation (Faisal and Ebrahim, 2014).
Instead of lean philosophy, the key to being agile is to accommodate unpredictable demand,
including low volumes per individual ‘product’ and high levels of ‘product variety’
(Christopher and Towill, 2000). However, the following limitations of applying lean thinking
in the healthcare sector have been argued by many researchers: narrow technical solutions,
a limited system approach, and a focus on internal efficiency with limited consideration of

40
external effectiveness, which is insufficient for handling the increasingly turbulent external
complexity that characterises the hospital setting (Mazzocato et al., 2010; Radnor and
Osborne, 2013). Thus, Dove (1999) described the concept of agile as the ability of an
organisation to thrive in a continuously changing, unpredictable business environment.
The healthcare sector is characterised by high levels of uncertainty, complexity, and
fragmentation. Organisations require agility in their supply chains to provide superior value
and to manage risks and ensure uninterrupted service to patients (Michael and Nallan, 2009).
The agile supply chain manufacturing programme was coined by researchers at the University
of Leigh in 1991 (Kumar et al., 2008). It described the various strategies that are crucial to
enterprise success in environments of rapid and unpredictable changes (Melo et al., 2009).
Today, the healthcare landscape is at an inflection point where the two key issues that persist
in the minds of healthcare providers are the changing reimbursement landscape and all the
changes in the healthcare service delivery model.
In recent times, lean and agile supply management has considered supplements rather than
alternatives. Some companies require implementing both lean and agile supply management
for a successful SCM (Zsidisin and Ritchie, 2008). A hybrid of agile and lean SCM applies to a
company that wishes to become a ‘mass customizer’ (Kumar et al., 2009). A lean supply chain
focuses mainly on adding value for business customers while reducing waste and cost. Being
agile means that the supply chain can handle unpredictability. Whenever organisations
choose to adopt a hybrid of lean and agile SCM, it is easier said than done since it has so many
moving parts (Fawcett et al., 2014). Several methods to combine agile and lean supply
management methodologies exist, and the choice depends on the type and size of the
business. Today’s business environment is ever-changing, volatile, and very competitive,
especially on the global front. As a result, it is important to adapt to an agile and lean supply
chain (Lee and Schniederjans, 2011).
However, the lean principles that have been adopted in the healthcare context first appeared
in a work published by the NHS Modernisation Agency (2001). Figure 2.9 illustrates the
historical development of lean healthcare. Healthcare delivery is still far from achieving the
level of excellence of lean applications in manufacturing (Berwick et al., 2005). The lean
healthcare supply chain is about simplifying the process by understanding what adds value
and eliminating the non-value-added activities. The implementation in the healthcare setup

41
seeks to reduce patient delays in the emergency department (ED) and the number of return
patient visits and to eliminate errors in the medical process (Melo et al., 2009). Adaptation of
lean in the healthcare context has been challenging since the redesign efforts expose patients
and health service providers to unnecessary risks (Parker and DeLay, 2008).
Hospital Management
Service Management
Operations Management
Auto Industry
Lean Healthcare
Lean Thinking
Lean manufacturing
TPS
1940s 1984s 1992s 2002s
Figure 2-9: Historical development of research in lean healthcare
Chadha et al., (2012) explored a lean healthcare transformation model that integrates
queuing theory and lean methodology to improve the dynamic performance of the healthcare
system. A system dynamic model and value stream mapping or other lean technologies were
adapted in an ED at a hospital. The results that can be achieved include improved patient flow
and decreased length of stay.
Laureani et al., (2013) conducted a case study of the implementation of lean six sigma
techniques (e.g., 5S, DMAIC, process mapping, seven wastes, and control charts) through
serious projects (e.g., ward inventory, medical records, laboratory processes, fall prevention,
and psychiatric clinic) in the Irish hospital sector. The results showed that support from top

42
management and regular communication with stakeholders were identified as key factors for
success by three of the five project teams.
Similarly, Stanton et al., (2014) explored a process improvement project based on lean six
sigma techniques in the ED of a large Australian hospital. They found that the engagement of
clinicians with the project and having extra resources provided improved patient flow from
the ED to the hospital wards, leading to some changes having a positive effect on the work of
staff. Burgess and Radnor (2013) evaluated the divergent approaches to lean implementation
in English hospitals. In this study, they learned that implementation tends to be isolated
rather than system-wide. The study reflects the perception of lean implementation in
healthcare, which is fragmented, focusing on visible lean elements, tools and technology, but
failing to address the less-visible strategic elements that relate to leadership and
organisational readiness.
Nevertheless, Souza and Pidd (2011) identified and analysed the barriers to lean healthcare
implementation in the UK NHS. In this study, they provided a list of barriers based on the
experiences and interview results, such as perception, terminology, and organisational
momentum and functional and professional resistance to change/scepticism. More specially,
functional and professional silos can be found as major barriers to lean implementation
because lean focuses on process improvement, which requires the elimination of
impediments to the flow of patients.
Radnor and Osborne (2013) also found that the implementation of lean to data has been
defective. They suggested that lean can only achieve its potential in public services when
based within a public-service dominant business logic, which is context-specific to public
services, embraces the true nature of services rather than products, and provides fertile
rather than sterile directions for the evolution of public services that are both internally
efficient and externally effective.
The redesign of the healthcare system depends on the lean paradigm that tends to focus on
reducing waste processes and increasing efficiency. Lean SCM in the field of healthcare has
experienced some opposition. According to Haszlinna et al., (2009), lean SCM is not
appropriate in a field with very high demand variability and high customisation demands. The
healthcare sector is among these fields; thus, it is inappropriate to use lean supply

43
management. Agility is the fundamental characteristic of a successful supply chain faced with
unprecedented and volatile demand (Martínez-Jurado and Moyano-Fuentes, 2014). The agile
approach is the most promising paradigm for healthcare SCM. In the healthcare context,
service supply chain integration is becoming more prevalent as the team-based care model is
becoming standardised. The question of whether it is possible to combine lean and agile SCM
in the healthcare context remains a major cause of disagreement since the experiments are
expensive and risky for both the patient and service providers (Monczka et al., 2008;
Distelhorst et al., 2014). Rahimnia and Moghadasian (2011) proposed that the decoupling
point (DP) is the main concern in leagility to best suit the need to respond to downstream
volatile demand while providing level scheduling upstream from the market place. The
authors divided the healthcare service processes into three pipelines based on patient needs.
According to the DP, they suggested that, from this point on, the treatment process is
customised and specialised for each patient, as shown in Figure 2.10. However, Aronsson et
al., (2011) argued that leagility was not considered applicable in the studied healthcare
organisations because the investigated processes had a high level of variety in demand and a
high level of uncertainty. They concluded that it was not easy to define a DP among the
processes, and they developed a hybrid strategy so that lean and agile methods could be
efficiently applied throughout the system.
Figure 2-10. Healthcare delivery pipelines and location of the main DP
(adopted from Rahimnia and Moghadasian, 2011)

44
Guven-Uslu et al., (2014) further indicated that a purposefully designed DP as a reference
model can help improve integration between the processes, technology, and people
components of service operations. They have a potential to help document the details of each
sub-process so that people at various parts of the organisation can become aware of the
technological and process-related necessities of the service.
b) Performance measurement
A considerable number of studies have examined patient satisfaction in various healthcare-
related areas. However, few studies are focused on the performance measurement of doctor
satisfaction. Bakar et al., (2009) filled this gap and investigated the efficiency level of the
decision-making units with hospital laboratories through the utilisation of resources to satisfy
doctors’ demands based on a data envelopment analysis. The study achieved its objective of
evaluating the supply chain performance of two hospital laboratory supply chains in
Singapore based on the important dimensions of doctor satisfaction and hospital laboratory
inputs. The researcher observed that some dimensions are considered important that satisfy
doctors and require more attention from hospital laboratory administrators, such as
obtaining the necessary medical results and quality and services given by the laboratory staff.
Analysing hospital-wide patient flow performance, Villa et al., (2014) developed a framework
that adopts a system-wide approach to patient flow management. The conducted framework
is structured into three distinct levels: the hospital, the pipeline (patient flow in hospital), and
the production units (e.g., ED, operating rooms, or outpatient clinics). In this study, patient
flow variability caused by a bad allocation of capacity represents a key problem concerning
hospital patient flow problems. The authors suggested the creation of a standardised flow of
data and information, which is an essential prerequisite for establishing effective patient flow.
2.2.2.4 Theoretical concerns (grouping 3)
Theoretical perspective
Theory development is an essential requirement for proper development of any field (Wacker,
1998). However, the theory building process is controversial. Some researchers suggest that
theories should be built based on existing theories (Pfeffer, 1995), while other researchers
encourage building new innovative theories (Van Maanen, 1995). For the field of healthcare

45
SCM, the exploration of which theories have been developed and where existing theories are
being used is still limited. This study adapts an expanded version of theories suggested by
Ammundan (1998) who offered a suitably comprehensive list to classify the theoretical stance.
The existing theories can be classified into three types: economics (transaction costs and
others that include agency), strategic management (resource-based view of the firm and
competitive advantage), and psychology and sociology (organisational learning and inter-
organisational networks). The results of classifying the articles based on the theoretical stance
are summarised in Table 2.5.
Table 2.5 shows several articles that had no discernible theories for now (34%). All the
remaining articles used existing theories, while none proposed an innovative healthcare SCM
theory. Closer examination of specific theories that were utilised indicated that the
organisational learning and inter-organisational network were most attractive to researchers
(28% and 13%, respectively). In contrast, transaction cost, resource-based view, and
competitive advantages were not as popular (9%, 9%, and 1%, respectively). Only two papers
attempted multi-theory grounding.
Table 2.5: Articles classified by theory
Theory Articles Count
No discernible theories
Cullen and Taylor (2009); Aguas et al., (2013); Enyinda et al., (2014); Elleuch et al., (2014); Breen (2008); Dobrzykowski et al., (2014); Grose and Richardson (2014); Kjos et al., (2016); Aptel and Pourjalali (2001); Heinbuch (1995); Gebicki et al., (2014); Guimaraes et al., (2013); Fernie and Rees (1995);Baker et al., (2009); Samuel et al., (2010); Lent et al., (2012); Aronsson and Olsson (2015); Aronsson et al., (2011); Souza and Pidd (2011); Poksinska (2010); Souza (2009); Balushi et al., (2014); Bendavid et al., (2010); Chircu et al., (2014); Kumar et al., (2009); Ghorani (2015);Narayana et al., (2014); Machado et al., (2015); Kim and Kwon (2015); Elmuti et al., (2013);
30
New Healthcare SCM-specific Theories Economic
transaction cost Mustaffa and Potter (2009); Jarrett (1998); Kumar et al., (2008); Burns and Lee (2008); Rego et al., (2014); Breen and Crawford (2005); Kumar and Blair (2013); Agwunobi and London (2009)
8
Strategic Management
Resource-based view of firm
Jin et al., (2008); Uthayakumar and Priyan (2013); Kelle et al., (2012); Jurado et al., (2016); Drupsteen et al., (2013); Lillrank et al., (2011); Langabeer (2005); Kitsiou et al., (2007)
8

46
2.2.2.5 Research approaches (grouping 4)
Research methods
Researchers have a wide range of options, depending on the nature of knowledge and the
certainty with which it is presented (Burgess et al., 2006). According to Ghadge et al., (2012),
the research methodologies used for decision making in the healthcare SCM field were
broadly classified as qualitative and quantitative methods. Qualitative research methods are
further categorised as empirical study, conceptual theory/model, and literature review.
Accordingly, quantitative research methods include mathematical modelling, probability and
statistics theory, and simulation for detailed thematic analysis. Results of classifying the
articles according to adopted research methods are shown in Table 2.6.
As Table 2.6 shows, most of the articles were classified as using qualitative methods (76 out
of 87 articles or 87%). Within the utilised qualitative methods, empirical study has been
conducted by researchers in 55 articles (63%). Obviously, the quantitative methods have
attracted much less attention than qualitative methods (11 out of 87 or 13%). None of the
articles used either probability or statistics theory. Regarding previous literature reviews in
healthcare SCM, only six researchers conducted a literature review in healthcare SCM, as
Competitive advantage
Lega et al., (2013); Bourlakis and Patten (2011); Guimaraes and Carvalho (2013); Guven-Uslu et al., (2014)
4
Psychological/Sociological
Organisational learning
Bhakoo et al., (2012); Matopoulos and Michailidou (2013); Lin and Ho (2014); Granlund and Wiktorsson (2013); Lapierre and Ruiz (2007); Böhme et al., (2013, 2014, 2016); Kumar et al., (2005, 2008); Villa et al., (2014); Sampson et al., (2015); Behzad et al., (2011); Radnor and Osborne (2013); Burgess and Radnor (2013); Curatolo et al., (2014); Chadha et al., (2012); Joosten et al., (2009); Kollberg et al., (2006); Laureani et al., (2013); Stanton et al., (2014); Rahimnia and Moghadasian (2010); Vries and Huijsman (2011); Xie et al., (2016)
24
Inter-organisational
networks
Vries (2011); Rivard-Royer et al., (2002); Zepeda et al., (2010); Kanyoma et al., (2013); Meijboom et al., (2011); Pan and Pokharel (2007); Charles (1998); Nyaga et al., (2015); McKone-Sweet et al., (2005); Chen et al., (2013); Chakraborty et al., (2014)
11
Multiple theories
Towill and Christopher (2005); Parnaby and Towill (2009) 2
Total 87

47
shown in Table 2.7. A list of all past literature reviews with the adopted research
methodologies and key findings/contributions is presented in Table 2.7.
Table 2.6: Articles classified by research methods
Research Methodologies
Articles Count
Qualitative Methods 76
Empirical study Heinbuch (1995); Elleuch et al., (2014); Kjos et al., (2016); Lent et al., (2012); Vries (2011); Breen (2008); Enyinda et al., (2014); Xie et al., (2016); Laureani et al., (2013); Granlund and Wiktorsson (2013); Böhme et al., (2013, 2014, 2016); Elmuti et al., (2013); Bhakoo et al., (2012); Cullen and Taylor (2009); Aronsson et al., (2011); Chen et al., (2013); Burgess and Radnor (2013); Souza and Pidd (2011); Chircu et al., (2014); Mustaffa and Potter (2009); Matopoulos and Michailidou (2013); Burns and Lee (2008); Rivard-Royer et al., (2002); Standon et al., (2014); Aptel and Pourjalali (2001); Breen and Crawford (2005); Guven-Uslu et al., (2014); Drupsteen et al., (2013); Charles (1998); Pan and Pokharel (2007); Olsson and Aronsson (2015); Kollberg et al., (2006); Baker et al., (2009); Ghorani (2015); Sampson et al., (2015); Lillrank et al., (2011); Kumar et al., (2005, 2008); Bendavid et al., (2010); Agwunobi and London (2009); Lapierre and Ruiz (2007); Jin et al., (2008); Kanyoma et al., (2013); Grose and Richardson (2014); Rahimnia and Moghadasian (2010); Vries and Huijsman (2011); McKone-Sweet et al., (2005); Langabeer, (2004); Lin and Ho (2014); Kumar and Blair (2013); Bourlakis and Patten (2011); Guimaraes et al., (2013)
55
Conceptual theory/model
Villa et al., (2014); Nyaga et al., (2015); Lega et al., (2013); Towill and Christopher (2005); Joosten et al., (2009); Parnaby and Towill (2009); Kitsiou et al., (2007); Chakraborty et al., (2014); Fernie and Rees (1995); Meijboom et al., (2011)
10
Literature review Curatolo et al., (2014); Dobrzykowski et al., (2014); Radnor and Osborne (2013); Jarrett (1998); Machado et al., (2015); Narayana et al., (2014); Al-Balushi et al., (2014); Guimaraes and Carvalho (2013); Poksinska (2010); Kim and Kwon (2015); De Souza (2009)
11
Quantitative Methods 11
Mathematical modelling
Rego et al., (2014); Chadha et al., (2012); Behzad et al., (2013); Priyan and Uthayakumar (2014); Uthayakumar and Priyan (2013); Kelle et al., (2012); Jurado et al., (2015)
7
Probability and statistics theory
None 0
Simulation Gebicki et al., (2014); Kumar et al., (2009); Samuel et al., (2010); Aguas et al., (2013)
4

48
Total 87
Table 2.7: Summary of literature review in HCSCM research methods and findings
Author(s) Research Methodology Key Findings/Contributions
Vries and Huijsman
(2011)
This paper adopted an exploratory, qualitative approach based on an analysis of existing literature in SCM in health services. Twenty-one papers were attracted based on the papers submitted to Supply Chain Management: An International Journal, and four papers were accepted for publication in this special issue.
Starting from a classification of existing research, five main research areas with respect to SCM in a healthcare setting are defined (IT, stakeholders, management philosophies, performance measurement, and patient flows). Additionally, next to studies with a non-disciplinary focus, an interdisciplinary focus on SCM issues in health services seems to be necessary.
Smith et al., (2011)
Thorough review of the related literature focusing on management strategies, cost containment, IT, and collaboration in the healthcare supply chain.
The high cost and immaturity associated with the healthcare supply chain provides opportunities to make great strides towards supply chain excellence. The experience level of healthcare supply chain professionals and the collaborative nature of the industry are strong catalysts for improvement once the improvement opportunities and their associated barriers are revealed.
Shou (2013)
Literature review of broad literature on SCM in the healthcare industry.
Major managerial issues were identified and discussed, including healthcare supply chain performance, cost reduction, inventory management, the bullwhip effect, quality and security, and supply chain innovation. Some research methods were also discussed.
Dobrzykowski et al., (2014)
Through a structured, analytical review and screening of 9,979 papers from 1982 to 2011 in healthcare operation management and SCM to explore the important trends and reporting on the current knowledge.
Use of quantitative methods to identify the current investigatory themes and quantifying methodological trends. A qualitative narrative description of the top research themes is provided and qualitatively described for future research.

49
Narayana et al.,
(2014)
A systematic review of peer-reviewed academic journals in the pharmaceutical supply chain (PSC).
Research efforts depict a traditional focus on efficiency improvement, with an emerging interest in process analysis and technology implementation in the PSC. The review broadly outlines the scope for integrating research efforts from research and development to final healthcare delivery and for more studies in emerging economies.
Kim and Kwon (2015)
Review of the literature on healthcare SCM published in the United States for the most recent ten years (2004-2015), which ranges widely from hospital and pharmaceutical industries (cold chain) to public policy for healthcare.
The review has placed literature broadly under four categories: overviews of healthcare SCM, comparative studies on commercial SCM and healthcare SCM, major tools in SCM, and the barriers to adopting healthcare SCM.
2.2.2.6 Discussion
Description features of healthcare SCM literature (grouping 1)
The research focus was initially profound for UK researchers in 1995, followed by rapid growth
from 2005, demonstrating that the topic is relatively new and with increasing attention from
researchers. Especially from 2013 to mid-2016, the numbers of published articles rapidly rose
to around 40% of publications in the last 20 years. This also reflects the fact that SCM is
becoming a successful approach for improvement in the healthcare sector.
In terms of journal titles, while three journals comprise one-fifth of the articles, there is a
broad range of journals that publish articles in the healthcare SCM area. This indicates that
healthcare SCM is of interest to researchers from a vast array of backgrounds. In relation to
the contributing countries, the field is growing at a fast pace in the USA and UK healthcare
industries. This is believed to be driven by the fact that the healthcare system in the USA and
Europe is more advanced than other countries. Publications from other continents are
considerably fewer. Therefore, this is assumed to drive the interest of researchers from other
countries.
Definitional issues (grouping 2)
Approaches to definitions of healthcare SCM

50
As Mentzer et al., (2001) highlighted, the lack of clear definitions will inhibit SCM theoretical
development. A good indication of the maturity level of a field is determined by researchers
using existing standard definitions (Burgess et al., 2006). However, as Table 2.3 shows, only
21% (18) of articles used existing standard definitions; in contrast, about 66% of researchers
only followed the definition of the traditional SCM. Definitional consensus does not exist in
this field. Furthermore, this suggests that healthcare SCM is still in the developmental mode
and has not yet reached maturity. Thus, in the future, it can be expected that more new or
modified definitions will be proposed.
Taxonomy of healthcare SCM
Among the selected articles, only four articles conducted an evaluation of the healthcare
supply chain from both patient and physical flow perspectives. Many articles (53) focused on
the performance of physical flow in the healthcare supply chain. They provided some
improvement techniques from different perspectives, such as inventory management,
procurement strategy, IT, and performance measurement. More specifically, within the
improvement of physical flow in hospitals, logistics management in healthcare SCM has been
the focus of strong research attention (22). In contrast, the remaining 30 articles focus on the
service process in the supply chain. Moreover, 17 out of 30 reviewed journal articles applied
lean and agile practices to improve the patient flow in the hospital setting. In addition, from
the patient flow perspective, performance measurement has been the subject of few studies
(2).
Theoretical concersn (grouping 3)
Theoretical perspective
Table 2.4 illustrates that the researchers did not propose original theories for the healthcare
SCM body of knowledge. Thus, most researchers believed that healthcare SCM can be
described through an extension of existing ideas. Nevertheless, since there are multiple
theories being used in the field, Burgess et al., (2006) suggested that a single existing theory
could not demonstrate all that is embraced under SCM. Moreover, two theories are more
popular than others: organisational learning and inter-organisational network theories. In
contrast, a limited number of studies have proposed the competitive advantage, and this

51
suggests a specific feature of the healthcare industry. The current theories are insufficient to
explain healthcare SCM completely, and the field requires further theory development.
Research methodological issues (grouping 4)
Research methods
It is evident that the most prevalent empirical research method is the case study. One of the
key reasons is that an increasing number of practitioners seek collaboration opportunities
with academics to find the optimal way to achieve competitive advantage in the healthcare
industry. Thus, it is now much easier for researchers to communicate with practitioners and
gain access to the industry to conduct empirical studies than before. Moreover, the absence
of probability and statistics theory is similar to that found in other studies. For example,
Burgess et al., (2006) examined a similar pattern in traditional SCM literature. Until now, in
terms of using of research methodologies, the focus has only been on a narrow range (Burgess
et al., 2006). Another issue of concern is the relative lack of quantitative research methods
being used. Therefore, this could have an adverse effect on the development of the field.
2.3 SUPPLY CHAIN RISK MANAGEMENT
As an organisation, hospital operations under a certain supply chain are not only meant to
increase productivity of the hospitals but also to manage the risk associated with healthcare.
However, existing research on hospital supply chain management (SCM) indicates that
healthcare and hospital operations are much more complex and fragmented than other
industries. This is because the healthcare and hospital operations are delivering goods and
services from several suppliers to patients with a wide range of health requirements
according to the need for hospitals to provide both planned and emergency care (Fenies et
al., 2006; MacVaugh, 2007). For example, some drugs require special temperature conditions
for storing and delivery. Furthermore, zero-defect conditions are necessary for the healthcare
delivery process to patients.
In general, there is a vast and rapid change in the events in the hospital supply chain. It is vital
to develop solutions that optimise profit by minimising waste while remaining flexible to the
changing trends in the healthcare sector (Mustaffa and Potter, 2009). It is important for

52
researchers and practitioners to fully understand the process involved to benefit from the
choice of methods. Likewise, it is essential to be knowledgeable about the associated issues
inherent in the service delivery processes and the supply chain because, in business planning,
quality, quantity, cost, and risk are all closely interrelated (Chakraborty et al., 2014). From the
hospital or healthcare perspective, Harris (2000) investigated the ultimate objective of
managing risks as the ability to identify, assess, reduce, and control hazards to staff, patients,
and visitors. Essentially, the hazards can be considered broadly as anything that compromises
service delivery (Rafele et al., 2005), such as scarce services caused by inadequate resources
or inefficient material management (Tomlin, 2009).
In fact, the effect of risk accounts for the substantial proportion of hospital budgets, hence,
risk management is a significant strategy to minimise expenditure and increase service quality
(Scannell et al., 2013). Similarly, SCM must cover risk management. In hospitals, there are so
many supplies and customers with close interconnectivity. This often increases the risks in
hospital supply chains because a disruption in one member may affect another. Usually, the
supply chain capacity is decided by demand and supply (Tang, 2006), which are uncertain,
thus increasing the risk, especially in healthcare, where the resources are constrained.
Organisations across supply chains may only focus on a given subset, which is likely uncertain
(Chopra et al., 2005). However, the literature review reveals that the current healthcare
systems’ supply chain risk management (SCRM) model is not capable of meeting these
challenges (McKinsey and Company, 2013).
To understand healthcare SCM, it is important to critically review the available literature
about how conventional SCRM knowledge has been built up in order for the findings to be
applied to healthcare supply chain contexts. In this regard, the purpose of this section is to
explore the literature about SCRM to obtain the definition of some of the terms used, classify
the risks, provide a comprehensive coverage of the risk management methodologies, and
assess the status of risk management in the healthcare supply chain, especially for the
pharmaceutical flow in the hospital setting.
2.3.1 SCRM literature review research methodology
As indicated in the introduction chapter, the purpose of this thesis was to critically analyse
the available literature about conventional SCRM and its application in the healthcare
industry. This implies that the review work is desk-based or is a literature-based study where

53
data from secondary sources, such as peer-reviewed journal articles, textbooks, previously
conducted research studies, and published organisational reports have been used.
Figure 2-11: Flowchart of the SCRM research methodology for the present systematic literature review
(adapted from Ho et al., 2015)
The research followed the SLR methodology suggested by Ho et al., (2015) for developing an
evidence-informed knowledge management process. The adapted SLR methodology for
identifying the scope of literature is addressed in five distinctive phases, as shown in Figure
2.11. This section provides a presentation of the literature search procedures, databases
used, search terms used, and the inclusion criteria and exclusion criteria used.
2.3.1.1 Literature search procedures and databases
A literature search was conducted to review the available literature regarding conventional
SCRM and risk management in the downstream healthcare pharmaceutical supply chain,
especially in the hospital setting. The literature search was restricted to peer-reviewed journal
articles, textbooks, and organisational reports. As Moher et al., (2009) suggested, peer-
reviewed journal articles provide credible information because, for an article to be published
in a journal, it must be reviewed by a team of specialised personnel to ascertain its
authenticity. Journal articles also provide sources of up-to-date information compared to
books (Moher et al., 2009).
Define the search terms
Identify the databases
Determine and apply criteria for inclusion and exclusion
Refer to the reference lists of the shortlisted articles
Ensure that the resulting articles are representative

54
The literature search involved leading databases, such as Emerald Insight, Google Scholar,
Science Direct, Springer, Taylor and Francis, Web of Science, and Wiley. The primary purpose
for targeting these databases was the fact that these databases contain a huge volume of
peer-reviewed papers. Choosing these established databases also minimised any form of
publication bias or reviewer prejudices because, as Cronin et al., (2008) maintained, some
reviewers may refuse to publish certain primary studies, particularly when they report
findings that do not conform to their expectations.
The researcher first conducted a systematic computer-assisted literature search in the above-
mentioned databases, a process that was supplemented using a manual search. Combining
the two literature search strategies facilitated the comprehensive analysis of journal issues,
articles, and case studies that may not be published in the core databases. Footnote chasing
or citation searching was applied to identify relevant studies captured during the database
search. The researcher also used various database packages, such as Mendeley, to handle the
bibliography list in a systematic manner. This made it easier to process, streamline, and
produce a reference list in a straightforward way without duplication.
Search terms
Next, the chosen electronic subject databases were scanned to the defined keywords for
articles published between 2003 and 2017. The search terms used in conducting this research
included ‘risk management’ and ‘supply chain’. In additional, the search terms ‘supply chain
risk(s)’ or ‘supply chain risk management’ were used in the article abstract with the keywords
‘hospital/healthcare/pharmaceutical’ in the abstract, keywords, and title search.
Inclusion and exclusion criteria
The researcher included studies that were published between 2003 and 2017. In addition, the
included studies or peer-reviewed journal articles must be published in English. For a study to
be included, it must be available in full, meaning that studies available in the form of a title
and abstract were not included. Moreover, essays, letters, reports, conference papers, and
comments were also disqualified. The abstracts and conclusions were reviewed to determine
the relevance to hospital SCRM. Thus, after the examination, 32 references were excluded
because they did not seem relevant to the topic. However, among the excluded papers, three
were published as a conference paper but have been attracted by other researchers. Thus,

55
these papers were added to the retrieved reference lists. In the end, to ensure the
comprehensiveness, the cross-checked references of the selected papers were further
conducted and did not find any other relevant papers. Overall, 213 papers were included in
this literature review. Among these 213 articles, 11 papers plus one official report are focused
on the healthcare pharmaceutical supply chain in the hospital sector, which are relevant to
this research.
2.3.2 Data analysis
2.3.2.1 Descriptive analysis
2.3.2.1.1 Year of Publication and journal
There is a continuous growth in the number of research works focusing on SCRM in the last
14 years, as seen in Figure 2.12. We can discern that more focus on this area was mainly
triggered after disasters like the 9/11 terrorist attack in 2001. Until 2003, few researchers
were dedicated to this field or indicated the potential of the future research agenda (Jüttner
et al., 2003; Harland et al., 2003). After that, by 2004, the first peak was reached in this
research field. The number of publications showed that some scholars made substantial
contributions. Their findings laid the foundations for future work to understand the
complexity of the risks in supply chain networks (Finch, 2004; Christopher and Peck, 2004;
Chopra and Sodhi, 2004; Sinha et al., 2004; Christopher and Lee, 2004; Norrman and Jansson,
2004; Hallikas et al., 2004). In fact, most of the reviewed journal articles were published from
2012 onwards (60%, 127 out of 213). In 2012 20 (9%) were published, followed by 14 each in
2013 and 2014 (7% each), 20 in 2015 (9%), and 34 in 2016 (16%), which reached the peak.
There are some special issues that can explain the reason for some peaks on these topics
(Kilubi, 2016).

56
Figure 2-12: Distribution of the publication years
In this review, 213 articles were derived from 66 journals as shown in Table 2.8. In detail, the
top eight journals were as follows: International Journal of Production Economics (39 papers),
International Journal of Production Research (20 papers), International Journal of Physical
Distribution and Logistics Management (15 papers), International Journal of Logistics
Research and Applications (11 papers), Journal of Operations Management (9 papers), Journal
of Purchasing and Supply Management (9 papers), Supply Chain Management: An
International Journal (9 papers), and European Journal of Operational Research (8 papers on
SCRM). That also indicates the prominent level of scientific relevance and significance of these
journals. In addition, among these 66 published journals, the top eight journals had published
about 56% of the articles. Besides the top eight ranking, it was also observed that 42 journals
have published only one article related to SCRM.
Table 2.8: Number of articles in alphabetical order (appearing at least twice)
Academic Journals No. of Articles
%
Computers and Chemical Engineering 3 1.4
Computers in Industry 2 0.9
Computers and Industrial Engineering 4 1.9
Computers and Operations Research 2 0.9
European Journal of Operational Research 8 3.8
Expert Systems with Applications 3 1.4
International Journal of Production Research 20 9.4
International Journal of Production Economics 39 18
4
14
6
11
5
1213
1011
20
14 14
20
34
25
0
5
10
15
20
25
30
35
40
2003 2004 2005 2006 2007 2008 2009 2010 2011 2012 2013 2014 2015 2016 2017

57
International Journal of Logistics Research and Applications 11 5.1
International Journal of Logistics Management 7 3.3
International Journal of Physical Distribution and Logistics Management 15 7
International Journal of Operations and Production Management 2 0.9
Journal of Business Logistics 2 0.9
Journal of Manufacturing Technology Management 4 1.9
Journal of Risk Research 4 1.9
Journal of Operations Management 9 4.2
Journal of the Operational Research Society 2 0.9
Journal of Purchasing and Supply Management 9 4.2
Omega 4 1.9
Production Planning and Control 2 0.9
Production and Operations Management 2 0.9
Safety Science 2 0.9
Supply Chain Management: An International Journal 9 4.2
Transportation Research 4 1.9
2.3.2.1.2 Demographics
With reference to the Figure 2.13, one-third of the contributions were from the USA (71
papers). Other leading countries, such as the UK (33 papers), China (23 papers), Germany (19
papers), and India (13 papers) also demonstrated their increasing attention to this topic. The
finding is in line with that of Prakash et al., (2017) who also found that developing countries,
such as China and India, are working more on SCRM because Asian markets are being
recognised as a source of economic activity for all sectors, especially manufacturing.
Moreover, an increasing trend for co-author collaboration research has been observed all
over the world.
Figure 2-13: Distribution of the contributing countries
0
10
20
30
40
50
60
70
80
71
33231913 8 8 8 6 6 6 5 5 4 4 4 3 3 3 3 2 2 2 2 2 1 1 1 1 1 1 1 1 1 1
Country

58
2.3.2.2 Thematic analysis
2.3.2.2.1 Evolving definitions for SCRM
In recent years, many companies are reporting increased concerns about the risk of supply
chain vulnerability. Per Snyder and Shen (2006), ‘for as long as there have been supply chains,
there have been disruptions, and no supply chain, logistics system, or infrastructure network
is immune to them’. According to a study conducted by the Computer Sciences Corporation,
60% of the surveyed companies recognised that their supply chains are vulnerable to
disruptions (CSC, 2004). For example, a fire at a Phillips plant in 2000 disrupted production,
leading to a $400 million loss (Chopra and Sodhi, 2004). Natural disasters, terrorist attacks,
labour strikes, accidents, and inefficient management can all be the causes for supply chain
disruption and delay (Berger et al., 2004; Christopher and Lee, 2004; LaLonde, 2004; Norrman
and Jansson, 2004; Poirier et al., 2007; Quinn, 2006; Tang, 2006). The above examples show
that any environmental, internal, and external risks with supply chain practices will cause
delay and even disruption.
Few areas of management interest have risen to prominence as rapidly as SCRM, from the
perspective of practitioners as a research area (Colicchia and Strozzi, 2012). Krajic (1983) is
referred to as a pioneer in this research area. According to Haszlinna et al., (2009), ‘risk
management refers to the identification, prioritisation and assessment of risks’. Risk
management also encompasses coordination and economical application of resources with
an aim of minimising, monitoring, and controlling the probability of unfortunate events
(Kumar et al., 2009).
Ghadge et al., (2011) observed that there are considerable number of researchers that started
researching SCRM in early 2000, according to their preliminary search. The 9/11 terrorist
attack (2001) affected the major global supply chain, and this triggered interest in the SCRM
field (Chopra and Sodhi, 2004; Sheffi, 2005), causing the increase in the number of articles on
SCRM during 2003 and 2004 (Ghadge et al., 2011).
The early research tended to be a reactive approach to risk management. They explored the
improvement of the capability to respond to uncertain events. Moreover, the focus was on
the supply chain network design to address a single company. Further, the business
environment is becoming more unpredictable and increasingly unstable due to globalisation,

59
shorter product life time, and the series of crises and economic recessions. The risk
management process has become more proactive and the focus goes beyond the boundaries
of the single company until 2003, as the collaborative sharing of information and best
practices among supply chain partners received increased attention. Accordingly, Jüttner et
al., (2003) built a foundation of effective SCRM as ‘the specification and management of risks
for the supply chain, through a co-ordinated approach amongst supply chain members, to
reduce supply chain vulnerability as a whole’. Tang (2006) extended this definition by
combining with others to define SCRM as ‘the management of supply chain risks through
coordination or collaboration among the supply chain partners so as to ensure profitability
and continuity’. There is a slight difference in the managerial objectives for both definitions.
In comparison with the former, Tang (2006) aimed not just to reduce risks but also to achieve
business continuity. The author reviewed different quantitative models for managing supply
chain risks and proposed four basic approaches: supply management, product management,
demand management, and information management.
Ritchie and Brindley (2007) studied five main components of SCRM: risk drivers, risk
management influencers, decision-maker characteristics, risk management responses, and
performance outcomes. The performance and risk in SCM are interconnected and require the
robust implementation of management tools and controls to maximise performance while
controlling the consequential risks (Lonsdale and Cox, 1998). Thus, Ritchie and Brindley (2007)
studied the supply chain performance in terms of efficiency and effectiveness, which is linked
to risk drivers and risk management responses, and provided insight into managing and
measuring risk in supply chains. However, this topic is still under considerable development
for theory-building.
Furthermore, Vanany et al., (2009) reviewed the current literature and found that SCRM was
a relatively ‘immature’ stage from the academics’ perspective. Until 2011, Wieland and
Wallenburg (2011) found that SCRM helps supply chains proactively reduce vulnerabilities by
supporting robustness reactively by supporting agility. Both approaches are identified to have
an influence on the supply chain’s customer value and on business performance.
Further, Abolghasemi et al., (2015) also mentioned that SCRM has a close relationship with
supply chain performance. They identified some key factors of supply chain performance
based on the supply chain operation reference (SCOR) model through the predictive and

60
diagnostic abilities of Bayesian networks (BN). After a sensitivity analysis, the authors found
that ‘total cost’ and its criteria, which include costs of labour, warranty, transportation, and
inventory, have the widest range and most effect on supply chain performance; thus,
managing them and controlling their related risk play a vital role for supply chain performance.
Heckmann et al., (2015) demonstrated that the contributions in SCRM mainly focus on the
identification of triggering events and the assessment of their likelihood of occurrence,
although this risk perception might be limited for the supply chain. Nevertheless, Kilubi and
Haasis (2015) found that the SCRM definition of Jüttner et al., (2003) is the most frequently
used in journal articles studying SCRM. Their definition is based on a synthesis of traditional
risk management and SCM principles. Without incorporating the concepts of SCM into supply
chain risk mitigation practices, the mitigation efforts are unlikely to be effective (Li et al.,
2015).
In SCM, risk management entails the implementation of various strategies to manage daily
and exceptional risk along the supply chain (Carvalho and Cruz-Machado, 2011). However,
there is no consensus for the researchers to define the meaning for SCRM (Jüttner, 2003;
Sodhi, 2012). After reviewing the literature from 2000 to 2015, Kilubi and Haasis (2015)
indicated that a definitional consensus does not exist and that SCRM is still in the evolving
stage and has not yet reached maturity. Senior managers from Cisco (McMorrow, 2009) and
Deloitte (Zhou, 2009) also realised the definition gap of SCRM among company executives
and emphasised the need to develop a clear definition of SCRM.
Without a mutual understanding and clear definitions, researchers could be confused when
communicating with practitioners. Alternatively, a consistent definition would help
researchers estimate and evaluate the probability and consequences of the full set of supply
chain risks and measure the effectiveness of SCRM methods (Ho et al., 2015). One
comprehensive definition of SCRM was suggested by Ho et al., (2015) who defined SCRM as
an inter-organisational collaborative endeavour using quantitative and qualitative risk
management methodologies to identify, evaluate, mitigate, and monitor unexpected macro
and micro level events or conditions that might adversely affect any part of a supply chain.
Their definition is built on the existing literature (Jüttner et al., 2003; Jutter, 2005; Norrman
and Jansson, 2004; Tang, 2006; Thun, 2011).

61
2.3.2.2.2 Supply chain risk types and classification methods
Several studies demonstrated different definitions and types of risk in the supply chain
(Jüttner et al., 2003; Gaokar and Viswanadham, 2004; Tang, 2006; Manuj and Mentzer, 2008;
Tummala and Schoenherr, 2011). These definitions have applicability to specific decision
contexts and types. According to Tang and Musa (2011), a better definition of supply chain
risk should refer to the events with a small probability that may occur abruptly and that can
bring substantial negative consequences to the system. Ho et al., (2015) defined supply chain
risk as: ‘the likelihood and impact of unexpected macro and/or micro level events or
conditions that adversely influence any part of a supply chain leading to operational, tactical,
or strategic level failures or irregularities’. What most definitions of risk have in common are
the three dimensions: (1) likelihood of occurrence of a particular event or outcome, (2)
consequences of a particular event or outcome occurring, and (3) causal pathways leading to
the event (Ritchie and Brindley, 2007).
Among the 213 reviewed journal articles, 45 articles discussed supply chain risk types as
shown in Table 2.9. Rangel et al., (2015) mentioned the lack of uniformity of the classification
methods. According to some studies, supply chain risks can be divided into different
perspectives. Specifically, some researchers simply classified the risk types into two
categories, such as internal (e.g., human errors, equipment failures, and material quality that
can be controlled by the organisation) or external (e.g., exchange rate changes, legislation,
and natural events like earthquakes that cannot be controlled by the organisation). Some
classified the risk types in terms of the controllable degree of the organisation (Trkman and
McCormack, 2009; Cagliano et al., 2012; Tukamuhabwa et al., 2017), the supply-side risks and
demand-side risks (Nagurney et al., 2005; Manuj et al., 2014), operational and disruption risks
(Tang, 2006; Kὄnig and Spinler, 2016), purchasing and demand risks (Thun and Hoenig, 2011),
or macro and micro risks (Ho et al., 2015). In addition, some scholars have added one or two
more risk factors on the basis of the above studies (Wagner and Bode, 2006; Manuj and
Mentzer, 2008; Jiang et al., 2009; Oke and Gopalakrishnan, 2009; Cruz, 2013; Aguas et al.,
2013; Sreedevi and Saranga, 2017). Moreover, some researchers listed the risk types without
explicit classification (Harland et al., 2003; Chopra and Sodhi, 2004; Blackhurst et al., 2008;
Tummala and Schoenherr, 2011; Ghadge et al., 2013; Aqlan and Lam, 2015; Rangel et al., 2015;
Blos et al., 2016; Rogers et al., 2016; Quang and Hara, 2017).

62
Moreover, some risk types have been extensively proposed and studied, such as supply risks
(35 out of 45 papers), demand risks (27 out of 45 papers), and environmental risks (28 out of
45 papers) because their effects are observed more clearly within organisations that are
configured in a supply chain array than in other organisations (Rangel et al., 2015). In contrast,
some risk types have obtained less attention from scholars (reputation, technology, and
financial risks). Although the origins of risk research initially focused on the banking sector,
most scholars have paid more attention to the physical and information flows rather than
cash flow in SCM.
Table 2.9: Supply chain risk types identified by researchers
Authors Risk Types
Harland et al., (2003)
Strategic risks, operation risks, supply risks, customer risks, asset impairment risks, competitive risks, reputation risks, financial risks, fiscal risks, regulatory risks, and legal risks
Jὓttner et al., (2003)
Environmental risks, network-related risks, and organisational risks
Christopher and Peck (2004)
Internal to the firm: process and control risks, external to the firm but internal to the supply chain network: demand and supply risks, and external to the network: environmental risks
Chopra and Sodhi (2004)
Disruption, delays, systems, forecast, intellectual property, procurement, receivables, inventory, and capacity risks
Nagurney et al., (2005)
Supply-side risks and demand-side risks
Tang (2006) Operational risks and disruption risks
Wagner and Bode (2006)
Demand-side risks, supply-side risks, and catastrophic risks
Bogataj and Bogataj (2007)
Supply risks, process risks, demand risks, control risks, and environmental risks
Deleris and Erhun (2007)
Operational/technological risks, social risks, natural hazard, economy/competition risks, and legal/political risks
Cheng and Kam (2008)
Environmental risks, infrastructure risks, service delivery risks, and organisational and relationship risks
Manuj and Mentzer (2008)
Supply risks, demand risks, operational risks, and security risks
Blackhurst et al., (2008)
Disruptions/disasters, logistics, supplier dependence, quality, information systems, forecast, legal, intellectual property, procurement, receivables (accounting) inventory, capacity, and management security
Tang and Tomlin (2008)
Supply risks, process risks, demand risks, intellectual property risks, behavioural risks, and political/social risks
Jiang et al., (2009)
Cost risks, operational risks, and reputational risks

63
Oke and Gopalakrishnan
(2009)
Supply related risks: imports, climate, man-made disasters, natural disasters, socio-economic, loss of key suppliers, demand related risks: economic, demand variability and unpredictability, and miscellaneous risks
Rao and Goldsby (2009)
Organisational risks, industry risks, and environment risks
Trkman and McCormack
(2009)
Endogenous risks: market and technology turbulence and exogenous risks: discrete events (e.g., terrorist attacks, contagious diseases, workers’ strikes), and continuous risks (e.g., inflation rate, consumer price index changes)
Thun and Hoenig (2011)
Purchasing risks and demand risks
Tummala and Schoenherr
(2011)
Demand risks, delay risks, disruption risks, inventory risks, manufacturing (process) breakdown risks, physical plant (capacity) risks, supply (procurement) risks, system risks, sovereign risks, and transportation risks
Cagliano et al., (2012)
External risks: catastrophic, political, economic, social, legal, culture, industrial, partner and internal risks: strategic, tactical, and operational
Jnandev et al., (2012)
Regulatory risks, counterfeit risks, inventory risks, and financial risks
Lockamy and McCormack
(2012)
Network risks, operational risks, and external risks
Vilko and Hallikas (2012)
Supply risks, operational risks, security risks, macro risks, policy risks, and environment risks
Ghadge et al., (2013)
Product design information risks, distortion risks, demand risks, quality risks, disruption risks, operational risks, financial risks, skill/performance risks, poor management risks, safety/security risks, reputation risks, supply safety risks, geopolitical risks, supply capacity risks, intellectual property risks, regulatory/legal risks, information distortion risks, integration risk, network risks, and technology risks
Cruz (2013) Supply-side risks, demand-side risks, exchange rate risks, and social risks
Aguas et al., (2013)
Supply delays, disruptions in the supply, differences in quantities received, and demand forecast errors
Enyinda et al., (2014)
Supply risks, operational risks, infrastructure risks, and political risks
Manuj et al., (2014)
Supply-side risks and demand-side risks
Aqlan and Lam (2015)
Supplier risks, customer risks, process and control risks, technology risks, product risks, occupational risks, culture risks, transportation risks, and commodity risks
Jaberidoost et al., (2015)
Supply and supplier risks, organisation and strategies risks, financial risks, market risks, political risks, logistics risks, and regulation risks
Rangel et al., (2015)
Strategic risks, inertia risks, informational risks, capacity risks, demand risks, supply risks, financial risks, relational risks, operational risks,

64
disruption risks, customer risks, legal risks, environmental risks, and culture risks
Ceryno et al., (2015)
Organisational risks, network-related risks, industry risks, and environmental risks
Ho et al., (2015) Macro risks: man-made and natural risks, and micro risks: demand risks, manufacturing risks, supply risks, information risks, transportation risks, and financial risks
Aqlan and Lam (2015)
Demand risks, supply risks, process risks, control risks, and environmental risks
Blos et al., (2016) Water risks, raw material risks, ingredient risks, packaging risks, manufacturing process risks, infrastructure and nature hazard risks, energy risks, environmental risks, worker safety and health risks, people, skills and availability risks, information and systems risks, route to market and in market risks, legal, legislative, and regulatory risks, and workplace rights and social responsibility risks
Mokrini et al., (2016)
Operational risks, financial risks, technology risks, information-related risks, relational risks, and internal risks
Torabi et al., (2016)
Supplier risks, internal risks, environmental risks, and market risks
Govindan and Chaudhuri (2016)
Risk in internal operations of logistics service providers, financial risks, and customer-related risks
Rogers et al., (2016)
Operational risks, infrastructure risks, legal risks, cultural risks, economic risks, supplier risks, forecasting risks, warehouse risks, transportation risks, labour risks, and natural disaster risks
Kὄnig and Spinler (2016)
Operational risks: process risks, control risks, supply risks, demand risks, and disruption risks: man-made risks, and natural risks
Nakandala et al., (2017)
Internal risks: process and control risks, operational risk external to the firm: supply and demand risks, and macro-level risks
Prakash et al., (2017)
Environmental risks, supply risks, demand risks, and process risks
Quang and Hara (2017)
External risks, time risks, information risks, financial risks, supply risks, operational risks, and demand risks
Tukamuhabwa et al., (2017)
Endogenous risks: supply-side, firm level, demand side, and exogenous risks: geopolitical and economic risks
Sreedevi and Saranga (2017)
Supply risks, manufacturing process risks, and delivery risks
2.3.2.2.3 Applied research methodologies
Generally, the research methodologies developed and applied for decision making in the
SCRM field were broadly divided into two categories, as qualitative and quantitative methods.
More specially, qualitative research methods were further divided based on research design,
conceptual theory, empirical study (e.g., case study, industrial survey, structured/informal

65
interview, and focus group methodologies), and literature review. Comparatively,
quantitative methods were divided into mathematical modelling, simulation, and statistics
and probabilistic theory for a more detailed thematic analysis (Ghadge et al., 2012).
Figure 2.14 displays the distribution of the number of journal articles applying both
methodologies and mixed methods between 2003 and 2017.The analysis found that empirical
study was the primary methodology adopted to deal with contemporary industrial problems
over the last few years (28%, 60 papers). Moreover, a wide range of studies have used the
case study method to study supply chain risks. These studies focus on the various aspects and
sectors, such as the risks in an uncertain global supply chain environment (Barry, 2004),
strategies for the fragile food supply chain (Dani and Deep, 2010), managing the supply chain
relational risk caused by cultural differences between China and the West (Jia and Rutherford,
2010), and mitigating supply chain risk through improved confidence (Christopher and Lee,
2004).
Additionally, Ghadge et al., (2012) found that 80% of the case studies were focused on
network-related risks. Mixed methods are the second most-used research methodology (25%,
54 papers), which shows that an increasing number of scholars pay more attention to using
combined research to create new evidentiary knowledge. Figure 2.15 gives the growth trend
of using mixed methods since 2012. This finding is also in line with the results by Tang and
Musa (2010) and Ho et al., (2015).
Figure 2-14: Distribution of research methodologies
0
10
20
30
40
50
60
36
60
19
42
124
54
Preferred research methodologies in SCRM

66
Moreover, scholars have also frequently applied mathematical modelling (20%, 42 papers) to
deal with SCRM strategy and policy formulation, followed by conceptual theory (17%, 36
papers). Mathematical modelling can be further divided into hard OR and soft OR techniques,
which comprise multi-objective programming, linear and nonlinear programming, game
theory, queuing theory, scenario planning, system thinking, etc.
The most popular approach is fuzzy-based multi-objective mathematical programming
(Oliveira et al., 2013; Yu and Goh, 2014; Nooraie and Parast, 2015). For example, Oliveira et
al., (2013) used the multi-objective mathematic modelling method to weigh the priority of
risk-reduction investments through the financial perspective to deal with optimised decision
making under demand uncertainty.
Fuzzy TOPSIS and Fuzzy analytical hierarchy/network process also have attracted more
attention in the SCRM literature to easily quantify risk in many cases (Wang et al., 2012;
Samvedi et al., 2013; Jaberidoost et al., 2015; Li et al., 2015). Using conceptual theory,
researchers could represent a research methodology describing fundamental concepts on
SCRM (Vanany et al., 2009).
Figure 2-15: Distribution of quantitative and qualitative methods over the last decades
0
5
10
15
20
25
30
35
40
2003 2004 2005 2006 2007 2008 2009 2010 2011 2012 2013 2014 2015 2016 2017
Mixed methods 0 2 1 1 2 4 2 2 1 6 2 2 6 13 10
Statistics and Probablistic 0 0 0 0 1 1 0 0 0 0 1 0 1 0 1
Simulation 0 0 0 0 1 0 0 1 0 1 1 2 1 4 1
Mathematical modelling 0 2 1 2 1 1 3 1 2 7 2 5 5 6 4
Literature review 0 0 0 0 0 0 1 1 1 2 1 2 4 4 3
Empirical study 2 6 4 2 0 3 4 2 6 5 6 3 3 6 8
Conceptual theory 2 7 0 5 0 2 3 3 2 1 2 1 4 3 1

67
Based on the above findings, most scholars made outstanding contributions to this field,
laying the foundation for future research in the initial stage (Jüttner et al., 2003; Harland et
al., 2003; Finch, 2004; Christopher and Peck, 2004; Chopra and Sodhi, 2004; Sinha et al., 2004;
Christopher and Lee, 2004; Hallikas et al., 2004; Tang, 2006). Thus, several conceptual
theories or framework developments were frequently attempted by these scholars. As Figure
2.15 shows, the first SCRM literature review was published in 2009. At this stage, a large
number of scholars had been dedicated to this topic for many years. It is necessary to provide
the whole picture of associated issues in past works, which serves as a basis and guide to
proposed future research. Although simulation (6%, 12 papers) and statistics/probability (2%,
4 papers) have attracted less attention in the literature, some researchers have argued that
simulation will play a key role in SCRM, as it is able to devise decision options for well-defined
risk-mitigating techniques (Talluri et al., 2013; Kilubi, 2016).
2.3.2.2.4 Supply chain risk management process
In most cases, SCRM involves four processes that include identification, assessment, and
controlling and monitoring of supply chain risks (Sarac et al., 2010). The complexities of some
supply chains make it difficult to apply these processes in preparing for all eventualities
(Ganeshan and Magazine, 2012).
Tummala and Schoenherr (2011) extended the previous studies (Tummala et al., 1994;
Tummala and Mak, 2001) based on the structured risk management process (RMP), consisting
of the following five phases: risk factors identification, risk measurement, risk assessment,
risk evaluation, and risk control and monitoring. They also extracted further studies
conducted by Ellegaard (2008), Finch (2004), Manuj and Mentzer (2008), and Schoenherr et
al., (2008) who proposed an approach consisting of a modified RMP to identify, assess, and
manage supply chain risks. The final modified approach is an SCRM process including three
phases, which are risk identification, risk measurement, and risk assessment in Phase I; risk
evaluation, risk mitigation, and contingency plans in Phase II; and risk control and monitoring
in Phase III. This approach provides a foundation of the SCRM process framework for supply
chain managers for strategic decision making, considering the different supply chain risk
profiles associated with a given situation.

68
More specifically, various processes make up the process of risk management in the supply
chain. The process of risk management usually begins with identifying internal and external
factors in the supply chain environment (Walker et al., 2008). For example, in the
manufacturing industry, some industries are faced with climatic risk, such as severe weather,
while others experience the risk of the high cost of transporting goods.
Organisations can identify their supply chain risks by mapping the supply chain. Supply chain
mapping also helps an organisation to prioritise various risks and address them effectively
(Sarac et al., 2010). In most cases, the starting point in supply chain mapping is the product
or service that can greatly affect a company or organisation’s profitability (Mollenkopf et al.,
2010). After understanding how to identify risk types, factors or both, the next steps involve
risk assessment. The process involves prioritising risks according to the threat they pose to
the well-being of a business. Risk assessment is associated with the occurrence of the trigger
event and the severity of the consequences (Harland et al., 2003). After identification and
assessment of the risk, the next step entails devising risk treatment plans. At this point, it is
important to devise measures that can protect the supply chain from risks, creating plans to
respond to events that may be caused by the identified risks and developing plans to help
continue operations in the case of disruptions (Gosling and Naim, 2009).
Figure 2-16: Number of categories of papers by the associated research areas
0
20
40
60
80
100
120
Hazardidentification
Risk assessment Risk mitigation Risk monitoring Mix riskmanagement
12
45
104
1
51

69
Finally, the process can also entail determining metrics and ways of measuring risk and the
effectiveness of various plans put in place to mitigate risk (Fawcett et al., 2014). By analysing
the data based on the reviewed articles, most of the studies were focused on risk mitigation
activity (49%, 104 papers). This indicated the relative maturity stage of researchers in SCRM.
The RMP is not complete without monitoring and review. Risk monitoring can be defined as
monitoring developments in the supply chain that may increase or decrease risks on an on-
going basis (Zsidisn et al., 2005). The four main principles of SCRM include leadership,
governance, management of change, and the development of a business case (Carter and
Rogers, 2008). Monitoring and review not only entails checking the effectiveness of risk
management practice but also maintaining various plans to meet changes in processes and
suppliers and the regulation of any other elements that influence the supply chain (Walker et
al., 2008). Less focus has been centred on the last stage of the SCRM process, risk monitoring,
which embeds risk management into the daily practices of organisations (1 paper). As shown
in Figure 2.16, many articles studied a specific or individual SCRM process, while a few
researchers considered holistic RMPs (24%, 51 papers).
2.3.2.2.5 Supply chain risk sources identification
As a decision-making support tool, the analytic hierarchy process (AHP) method has been
applied by several researchers. It can support managers in setting up a priority hierarchy of
risk management. Gaudenzi and Borghesi (2006) proposed the AHP method to identify supply
chain risk factors with a view to improving the objective of customer value. However, the
limitation of the research is the focus on the single focal company; thus, the risk indicators
would not be applicable to other industries. Besides this, the following approaches can help
in the identification of potential supply chain risks: supply chain mapping, checklists or check
sheets, event tree analysis, fault tree analysis, Ishikawa cause and effect analysis (Tummala
et al., 1994), and failure mode and effect analysis (FMEA) (Tuncel and Alpan, 2010). According
to Adhitya et al., (2009), the hazard and operability analysis method from chemical process
risk management has been employed for risk factors identification and consequence analysis.
Blos et al., (2009) identified the supply chain risks in the automotive and electronic industries
in Brazil by implementing a supply chain vulnerability map. The drawback of their study comes
from the small sample size. A fishbone diagram has been used as an efficient method to

70
identify and visually depict the potential causes of common problems in the supply chain
(Desai et al., 2015). Four categories of potential effects have been examined in their study,
such as defects, delays, counterfeits, and general errors. However, the lack of a case study is
the main drawback for this research.
2.3.2.2.6 Supply chain risk assessment
An increasing number of risk assessment methods have been developed in the last two
decades, especially for supply risk assessment (Ho et al., 2015). Techniques such as the Delphi
method, expert focus groups, five-point estimation, or Monte Carlo simulation can aid in the
assessment of the probabilities of the risks (Tummala et al., 1994).
There are plenty of research studies focused on the financial risk assessment in the supply
chain. Value at risk and conditional value at risk are common methods that have been used
in portfolio theory as percentile measures of downside-risk associated with undesirable
outcomes (Chen and Yano, 2010; Hahn and Kuhn, 2012; Lockamy and McCormack, 2010;
Poojari et al., 2008; Sawik, 2013; Soleimani and Govindan, 2014). Furthermore, variance or
standard deviation are largely used as a measure of supply chain financial risks as well (Azaron
et al., 2008; Babazadeh and Razmi, 2012; Hahn and Kuhn, 2012).
However, some articles argued that deviation-based measures are problematic measures of
risk in general (Cox, 2008; Pedersen and Satchell, 1998). Cigolini and Rossi (2010) conducted
a fault tree method to assess the operational risk at three stages of the oil supply chain
(drilling, primary transport, and refining). The limitation of the study is ignoring operational
risk assessment at other important stages like design, construction, and outsourcing.
Wagner and Neshat (2010) applied graph theory to convert the ‘fuzzy’ construct of supply
chain vulnerability to an index (the SCVI). They revealed that graphs can be used as visual
maps that facilitate the understanding of supply chain vulnerability and support decision
making in SCRM. However, the proposed approach heavily depends on the expert judgements
and availability of data that quantifies the drivers of SCV.
Ruiz-Torres et al., (2013) proposed the model to utilise the decision tree approach to consider
the possible situation in which one or more suppliers fail and develop contingency plans.
However, the research did not consider the dynamic characteristics of the supply chain

71
network and all the input parameters and supplier characteristics were considered
deterministic.
Kumar et al., (2010) applied the artificial bee colony technique, genetic algorithms, and
particle swarm optimisation to identify operational risk factors, their expected value, the
probability of occurrence, and the associated additional cost. However, they are not devoid
of limitations, as they only focused on a single-product supply chain network.
Tummala and Schoenherr (2011) suggested the hazard totem pole (HTP) analysis for the
systematic evaluation of supply chain risks, integrating the risk assessment aspects of their
severity, probability, and cost. Ramkumar (2016) proposed a risk assessment methodology
for in-house and third-party type of e-procurement implementation based on a modified
analytic network process (ANP) coupled with fuzzy inference systems. They investigated the
technological implementation risks, which are found to be higher for both in-house and third-
party e-procurement systems. However, the above two methods are also mostly depending
on the assumption and subjective nature of the rankings and evaluations.
Moreover, there is a substantial number of quantitative methods that have been broadly
proposed for the risk assessment, such as multicriteria decision-making and AHP approaches
(Gaudenzi and Borghesi, 2006; Kull and Talluri, 2008; Levary, 2008; Kamath et al., 2012; Wang
et al., 2012; Ling, 2014; Li et al., 2015; Jaberidoost et al., 2015; Dong and Cooper, 2016; Mu
and Carroll, 2016), MRP-DRP stochastic modelling (Bogataj and Bogataj, 2007), fuzzy TOPSIS
(Chatterjee and Kar, 2016), BNs (Lockamy and McCormack, 2012; Badurdeen et al., 2014),
modified FMEA method (Chen and Wu, 2013), and hierarchical holographic modelling
(Nakandala et al., 2017). It is obvious that there is a large body of literature on risk assessment
focused on the priority of risk factors.
Nevertheless, it is also necessary to identify cause-effect relations between each risk factor in
terms of their direct and indirect influence in the network. Hence, approaches such as
interpretive structural modelling (ISM) or decision-making trial and evaluation laboratory can
be used to present a hierarchical model showing the interrelationships between the risk
sources (Hachicha and Elmsalmi, 2014; Govindan and Chaudhuri, 2016). The main drawback
of those approaches is the lack of capability to deal with the complex system, while only
considering a limited number of variables in the development of the model.

72
2.3.2.2.7 Supply chain risk mitigation and control strategies
As discussed above, among the 213 reviewed journal articles, 104 articles discussed risk
mitigation strategies. According to Grötsh et al., (2013), the research found that supplier
insolvencies are a major source of interruption of the supply chain. Regarding these issues,
they explored a mechanistic management control system, a rational cognitive style, and
relational buyer-supplier relationships, which have positive effects on proactively managing
supplier insolvency risks.
Yu et al., (2015) proposed a novel conceptual model combining two variables: supply chain
integration and organisational risk propensity for mitigating supply chain risk. The mechanism
of supply chain risk on company performance through supply chain integration and
organisational risk propensity can also help firms solve the problem of strategy choice under
such a risk.
Ghadge et al., (2012) surveyed the articles and found that, at a strategic level, contingency
planning and risk-sharing outsourcing contracts are prominently used as risk mitigation
strategies. Likewise, Li et al., (2015) identified risk information sharing and risk-sharing
mechanisms as two important joint SCRM practices in improving financial performance that
can be strengthened by collaborative relationship characteristics, including relationship
length, supplier trust, and shared SCRM understanding.
Bayesian networks are graphical models that display a set of possible variables and their
conditional dependencies as a decision-making tool that can help managers mitigate risks
within different fields (Abolghasemi et al., 2015). An evaluation technique, the HTP analysis,
has already been applied by Tummala et al., (1994; Tummala and Mak, 2001). However, the
limitations of the method must be noted regarding the assumptions and subjective nature of
the ranking and evaluations.
Some similar strategies were stressed by different studies, which showed that supply chain
risks can be mitigated by implementing flexibility (Chang et al., 2015; Tang, 2006; Miller, 1992;
Wieland and Wallenburg, 2012), redundancy (Chang et al., 2015; Manuj et al., 2014; Miller,
1992; Bucklin, 1965), hedging (Manuj et al., 2014; Achrol et al., 1983; Agrawal and Seshadri,
2000; Cachon, 2004; Miller, 1992; Tang, 2006), robustness (Wieland and Wallenburg, 2012;
Tang, 2006; Downey, 2004), postponement (Manuj et al., 2008; Tang, 2006; Bucklin, 1965;

73
Chiou et al., 2002; Zinn and Bowersox, 1988), co-operation (Miller, 1992; Nooraie and Parast,
2015; Manuj et al., 2008; Tang, 2006; Manuj et al., 2014), and information technology (Tang,
2006).
There are limitations associated with the above articles. Wieland and Wallenburg (2012),
Grötsh et al., (2013), and Li et al., (2015) surveyed samples that are geographically limited to
only one country (i.e., Germany or China) and have a small sample size. Manuj and Mentzer
(2008) only focused on internal stakeholders. The proposed risk mitigation model was based
on stable demand instead of fluctuating demand (Nooraie et al., 2015). Chang et al., (2015)
proposed the conceptual framework mainly considers risk mitigation approaches rather than
more fine-grained strategic options and contexts. Yu et al., (2015) have not applied an
empirical study to test the model.
Risk mitigation and control strategies that have been proposed by several researchers were
mainly classified into two approaches: proactive and reactive. Furthermore, many more
researchers have conducted proactive mitigation strategies than those that have proposed
reactive strategies (Perry, 2007; Hopp et al., 2012; Richey, 2009; Kumar and Havey, 2013).
Grötsh et al., (2013) also learned that scholars have continuously suggested managing SCRM
proactively to mitigate risks. After reviewing 87 peer-reviewed academic articles from 2000
to mid-2015, Kilubi and Haasis (2015) classified the most frequently mentioned enablers on
SCRM based on two risk-mitigating methods: preventive and responsive. For the preventive
approach, the strategy constitutes the enablers of visibility, relationships, collaboration,
multiple sourcing, postponement, and redundancy. For the responsive methods, the strategy
comprises visibility, flexibility, multiple sourcing, redundancy, and coordination. Proactive
SCRM can be defined as planning and operating ahead to mitigate risks before they emerge
(Mitroff and Alpaslan, 2003; Knemeyer et al., 2009) while reactive SCRM are applied after a
disruption has occurred to respond to or aid recovery (Tukamuhabwa et al., 2017).
Moreover, few researchers use other classifications of strategies that focus on whether they
support the robustness and/or agility of the supply chain under uncertainty (Wieland and
Wallenburg, 2013). Some strategies could be proactive or reactive based on when and why
they are applied, such as collaboration, agility, and postponement.

74
Agility, for example, can help to mitigate the emergency incident when the disruption occurs
or afterward. However, agility also helps to manage the hazards before disruption occurs by
investing in people and information (Jüttner et al., 2003; Schmitt and Singh, 2012). Meanwhile,
some strategies should be planned before a disruption, such as building a risk management
culture (Tang, 2006; Dani and Deep, 2010; Diabat et al., 2012; Grötsh et al., 2013; Yu et al.,
2015; Oliva, 2016).
In Table 2.10, the SCRM strategies that have been put forward by researchers are summarised
based on whether they are employed proactively or reactively. Table 2.10 represents visibility
and transparency; collaboration and agility have been frequently adopted to mitigate risks.
The findings are in line with findings by other scholars. For example, Kilubi (2016) found that
the top three identified SCRM strategies were visibility and transparency,
relationship/partnerships, and flexibility. Flexibility can be defined as a primary component
of agility (Saravanapandi and Kumaran, 2015). However, the research deals with these
strategies individually rather than collectively.
Some strategies can facilitate each other. For example, increasing visibility and transparency
can improve collaboration within the organisation or with other supply chain members by
sharing the risk information. In addition, although some strategies appear to complement
each other dramatically, they can also conflict. For instance, horizontal collaboration between
suppliers may increase supply chain risk through collusion (Choi and Krause, 2006). Moreover,
a wide range of studies are adopting a ‘one size fits all’ approach to risk mitigation strategies.
There are few research studies that consider the efficiency of alternative supply chain risk
mitigation strategies under related contexts (Chang et al., 2015). Consequently, the spread of
disruption can be due to the lack of effective mitigation strategies (Ghadge et al., 2012).
Table 2.10: Summary of reviewed risk mitigation strategies
SCRM Strategies References
Proactive strategies

75
Increasing visibility and transparency, for example, information sharing (risk-related information) between supply chain members and intra-organisational departments (information sharing mechanism), communication, use of information technology to enhance connectivity and traceability, etc.
Jüttner et al., (2003); Christopher and Peck (2004); Christopher and Lee (2004); Giunipero and Eltantawy (2004); Hallikas et al., (2004); Blackhurst et al., (2005); Faisal et al., (2006); Tang (2006); Ritchie and Brindley (2007); Enyinda and Szmerekovsky (2008); Chen and Huang (2010); Dani and Deep (2010); Giannakis and Louis (2011); Thun and Hoenig (2011); Diabat et al., (2012); Groznik and Trkman (2012); Lavastre et al., (2012); Lei et al., (2012); Tse and Tan (2012); Zou and Couani (2012); Ilie and Popa (2013); Maryland (2013); Xue et al., (2013); Yu and Goh (2014); Chang et al., (2015); Li et al., (2015); Nooraie and Parast (2015); Rajesh and Ravi (2015); Singh (2015); Choi et al., (2016); Mishra et al., (2016); Oliva (2016); Riley et al., (2016); Yang and Fan (2016); Fan et al., (2017); Kurniswan et al., (2017); Namdar et al., (2017); Nguyen et al., (2017); Tsai (2017); Tukamuhabwa et al., (2017); Urciuoli and Hintsa (2017)
Collaboration: The ability to work effectively with either other supply chain entities or within the organisation for mutual benefit, for example, sharing information and other resources to reduce vulnerability, participative management, cross functional involvement, risk sharing, etc.
Jüttner et al., (2003); Christopher and Peck (2004); Giunipero and Eltantawy (2004); Hallikas et al., (2004); Spekman and Davis (2004); Kleindorfer and Saad (2005); Cucchiella and Gastaldi (2006); Faisal et al., (2006); Blackhurst et al., (2008); Jiang et al., (2008); Khan et al., (2008); Lai et al., (2009); Scheller-Wolf and Tayur (2009); Dani and Deep (2010); Jia and Rutherford (2010); Thun and Hoenig (2011); Lavastre et al., (2012); Zou and Couani (2012); Elzarka (2013); Grötsh et al., (2013); Maryland (2013); Bandaly et al., (2014); Kim and park (2014); Lavastre et al., (2014); Scholten et al., (2014); Ellinger et al., (2015); Gao (2015); Li et al., (2015); Yu et al., (2015); Cheng and Chen (2016); Mishra et al., (2016); Oliva (2016); Riley et al., (2016); Zepeda et al., (2016); Tukamuhabwa et al., (2017); Wiengarten et al., (2016); Fan et al., (2017); Ghadge et al., (2017); Revilla and Saenz (2017); Wang et al., (2017)
Postponement: The manufacturer produces a generic product, which can be modified at the later stages before the final transport to the customer.
Jüttner et al., (2003)

76
Agility: The ability to efficiently change operating states in response to uncertain and changing market conditions, for example, flexibility to adapt to changing requirements with minimum time and effort, visibility, joint planning, customer responsiveness, etc.
Jüttner et al., (2003); Schmitt and Singh (2012)
Knowledge management: The exploitation of computational systems that can store, process, and transmit knowledge from one individual to another, to facilitate daily operations within the supply chain (e.g., staff training, etc.)
Hallikas et al., (2004); Sinha et al., (2004); Faisal et al., (2006); Maryland (2013); Scholten et al., (2014); Riley et al., (2016)
Multiple sourcing and flexible contractual agreements
Zsidisin and Ellram (2003); Christopher and Peck (2004); Tang (2006); Trkman and McCormack (2009); Diabat et al., (2012); Wieland and Wallenburg (2012); Xanthopoulos et al., (2012); Fang et al., (2013); Kanyoma et al., (2013); Gaudenzi et al., (2017); Lücker and Seifert (2017); Tukamuhabwa et al., (2017); Wang et al., (2017)
Redundancy or buffering strategy, for example, buffer (emergency) stock, excess productive capability, back sourcing, etc.
Jüttner et al., (2003); Zsidisin and Ellram (2003); Chopra and Sodhi (2004); Colicchia et al., (2011); Chang et al., (2015); Aven (2016); Mishra et al., (2016); Park et al., (2016); Mohammaddust et al., (2017)
Building risk management culture, for example, managers’ attitude towards risks, top management support, firm integration/team work, risk governance, etc.
Eltantawy (2004); Faisal et al., (2006); Tang (2006); Dani and Deep (2010); Diabat et al., (2012); Grötsh et al., (2013); Yu et al., (2015); Oliva (2016); Park et al., (2016); Fattahi et al., (2017); Urciuoli and Hintsa (2017)
Increasing logistics capabilities, for example, increasing transportation equipment capability, inventory management, investment in new facilities, etc.
Chopra and Sodhi (2004); Sinha et al., (2004); Kleindorfer and Saad (2005); Schmitt (2011); Wieland and Wallenburg (2012); Maryland (2013); Micheli et al., (2014); Gao (2015); Choi et al., (2016); Li et al., (2016); Tsai (2017); Tukamuhabwa et al., (2017); Urciuoli and Hintsa (2017)
Supplier development, for example, supplier assessment; supplier certification; quality management programmes; financial, training, and technical knowledge to improve efficiency, commitment, reliability, etc.
Zsidisin and Ellram (2003); Christopher and Peck (2004); Blackhurst et al., (2005); Blackhurst et al., (2008); Thun and Hoenig (2011); Diabat et al., (2012); Micheli et al., (2014); Kurniswan et al., (2017); Tukamuhabwa et al., (2017)

77
Increasing innovativeness: The motivation and capability to seek and invest in new business ideas, for example, research and development, technologies, processes, and strategies that can reduce vulnerability, etc.
Norrman and Jansson (2004); Scholten et al., (2014); Bandaly et al., (2016); Prakash et al., (2017)
Outsourcing: Outsourcing non-core product offshore and insourcing core products and developing offshore insourcing capabilities.
Huq et al., (2016); Tukamuhabwa et al., (2017)
Financial management, for example, financial hedging, borrowing from customers, effective credit management, insurance, etc.
Elleuch et al., (2014); Tukamuhabwa et al., (2017)
Reactive Strategies
Collaboration: The ability to work effectively with either other supply chain entities or within the organisation for mutual benefit, for example, sharing information and other resources to reduce vulnerability, participative management, cross functional involvement, risk sharing, etc.
Ojala and Hallikas (2006); Oke and Gopalakrishnan (2009); Simchi-Levi et al., (2013); Rajesh and Ravi (2015)
Agility: The ability to efficiently change operating states in response to uncertain and changing market conditions, for example, flexibility to adapt to changing requirements with minimum time and effort, visibility, joint planning, customer responsiveness, etc.
Christopher and Peck (2004); Chopra et al., (2004); Sodhi (2004); Blackhurst et al., (2005); Kleindorfer and Saad (2005); Cucchiella and Gastaldi (2006); Faisal et al., (2006); Tang (2006); Tomlin (2006); Enyinda et al., (2008); Khan et al., (2008); Tang and Tomlin (2008); Braunscheidel and Suresh (2009); Narasimhan and Talluri (2009); Oke and Gopalakrishnan (2009); Chen and Huang (2010); Dani and Deep (2010); Christopher and Holweg (2011); Thun and Hoenig (2011); Wallace and Choi (2011); Diabat et al., (2012); Wieland and Wallenburg (2012); Zou and Couani (2012); Simchi-Levi et al., (2013); Scholten et al., (2014); Varzandeh et al., (2014); Abolghasemi et al., (2015); Chang et al., (2015); Rajesh and Ravi (2015); Singh (2015); Sahay and Ierapetritou (2015); Kurniswan et al., (2017); Lücker and Seifert (2017); Sreedevi and Saranga (2017); Wang et al., (2017)

78
2.3.2.2.8 Supply Chain Risk Monitoring and Review
Compared with risk assessment and mitigation strategies, there is only one article that
assessed risk monitoring and review so far. However, in the growing research based on supply
chain risk, some studies have developed an SCRM framework and stress the need for risk
monitoring (Hallikas et al., 2004; Norrman and Jansson, 2004; Zsidisin and Ellram, 1999). The
current business environment is becoming more uncertain. To identify new types of risk
requires monitoring changes in the network, customer needs, technology, partner strategies,
and competitors and updating the risk assessment correspondingly (Hallikas et al., 2004).
Redundancy or buffering strategy, for example, buffer (emergency) stock, excess productive capability, back sourcing, investments in a back-up IT system, etc.
Schmitt (2011); Thun and Hoenig (2011); Schmitt and Singh (2012); Simchi-Levi et al., (2013)
Increasing logistics capabilities, for example, increasing transportation equipment capability; inventory management; investment in new facilities, etc.
Nooraie and Parast (2016)
Business contingency planning Norrman and Jansson (2004); Finch (2004); Kleindorfer and Saad (2005); Oke and Gopalakrishnan (2009); Colicchia et al., (2011); Diabat et al., (2012); Wieland and Wallenburg (2012)
Demand management, for example, silent product rollover; dynamic assortment planning, creating customer flexibility, customer incentives, demand forecasting, etc.
Chopra and Sodhi (2004); Diabat et al., (2012); Elleuch et al., (2014); Rajesh and Ravi (2015); Tukamuhabwa et al., (2017); Urciuoli and Hintsa (2017)
Financial management, for example, financial hedging, borrowing from customers, effective credit management, insurance, etc.
Gaudenzi et al., (2017); Tukamuhabwa et al., (2017)
Multiple sourcing and flexible contractual agreements
Jüttner et al., (2003); Oke and Gopalakrishnan (2009); Thun and Hoenig (2011); Mohammaddust et al., (2017); Namdar et al., (2017)
Postponement: The manufacturer produces a generic product, which can be modified at the later stages before the final transport to the customer.
Jüttner et al., (2003); Tang (2006); Manuj and Mentzer (2008); Yang and Yang (2010); Wieland and Wallenburg (2012); Manuj et al., (2014); Rajesh and Ravi (2015); Wang et al., (2017)

79
Blome et al., (2011) found that most of their surveyed sample firms incorporated risk
monitoring into their regular supplier monitoring activities, shortened the assessment cycle,
and increased the monitoring depth during the financial crises. Moreover, the existing
disruption is not only determined by the nature of the disruption but is also influenced by the
organisational maturity level to handle such disruption issues (Qzai et al., 2015).
Tummala and Schoenherr (2011) determined that data management systems can be utilised
in the risk control and monitoring process for storing and updating the related risk
information. This would help the organisation implement risk response action plans and
provide guidelines for future improvement. In addition, there are plenty of sophisticated
SCRM software applications that offer commercial solutions for risk management.
Zhang et al., (2011) developed an integrated mathematical abnormality diagnosis model by
combining radial base function neural network, fuzzy control, and statistical analysis methods
to propose a pre-warning system of production quality issues in the food supply chain. The
pre-warning system can effectively identify abnormal data types and accurately determine
whether a warning should be issued. The drawback of the study is the narrow focus on quality
risk in the food supply chain.
2.3.2.2.9 Integrated SCRM processes
A wide variety of studies focused on more than one stage of the SCRM process (24%, 51
papers). Ritchie and Brindley (2007) proposed a conceptual framework for SCRM consisting
of five major components: risk sources and profile, risk and performance drivers, risk and
performance consequences, risk management responses, and risk and performance
outcomes. Tummala and Schoenherr (2011) modified the previous RMP to identify, assess,
and manage supply chain risks. The complete SCRM process constitutes three phases: Phase
I (risk factors identification, risk measurement, risk assessment), Phase II (risk evaluation, risk
mitigation, and contingency plans), and Phase III (risk control and monitoring).
Bandaly et al., (2014) developed an integrated approach to SCRM using operational methods
and financial instruments. They suggested that the SCRM process requires the collaboration
of supply chain members (e.g., suppliers, manufacturers, and distributors) and the
collaboration of functional units (operations and finance) of these members. In addition,

80
some research only covered two SCRM processes, such as risk identification and assessment
(4%, 9 papers) or risk assessment and mitigation (8%, 18 papers). For instance, Jennifer et al.
(2008) explored a proposed supplier risk assessment and monitoring framework related to a
project with a US-based automotive manufacturer. A multi-criterion scoring procedure is
proposed to evaluate part and supplier risk indices.
Tuncel and Alpan (2010) presented a failure mode, effects, and criticality analysis (FMECA)
technique to examine the disruption factors in the supply chain network and proposed a
timed Petri nets framework to analyse the effectiveness and efficiency of various risk
mitigation actions. Abolghasemi et al., (2015) proposed a novel approach for SCRM, which
combined SCOR metrics and BNs to measure the supply chain performance for selecting the
best alternative to mitigate risks.
There are limitations associated with the above studies. Abolghasemi et al., (2015) only
focused on a single industry with limited real data for the performance metrics. Tuncel and
Alpan (2010) focused only on the perspective of the manufacturer. Tummala and Schoenherr
(2011) demonstrated only the phases of the SCRM approaches but did not explain how the
approach could be applied in practice. Ritchie and Brindley (2007) and Bandaly et al., (2014)
only conducted a single-case study. The development of alternative risk assessment
approaches would increase the sensitivity of the risk analysis (Jennifer et al., 2008), and there
was a lack of empirical study to test the proposed risk management concept (Hofmann et al.,
2014).
2.3.3 Status of risk management in the healthcare supply chain
All activities in the health supply chain have risks to a certain extent. In the health supply chain,
members of staff work in the procurement department, storage, distribution, and inventory
with the aim of ensuring that all clients and customers in the health sector obtain all the
services they need. A potential problem that can erupt from this process is called supply chain
risks (Kumar et al., 2009). Like other industries, the healthcare industry is not immune from
both predictable and unpredictable supply chain disruptions, which have significant effects
on costs and patient care (e.g., losses due to downtime, shortage of essential drugs, and loss
of life; Enyinda et al., 2014).

81
However, the biggest difference compared to other industries is that risk has a direct serious
effect on the patient’s life. Research has indicated that, in Europe, medicine can travel
through as many as 20 to 30 pairs of hands before it finally reaches the patient (Haigh, 2004).
Consequently, operational failures in hospitals can result from the inability of a hospital’s
work system to reliably provide supplies when, where, and to whom they are needed (Tucker,
2004). Therefore, successful SCM is a significant element of an organisation’s ability to
increase efficiency and ensure the safety of the patients’ lives.
To manage the healthcare supply chain, most organisations identify the types and sources of
risk and then derive effective strategies to mitigate the effects of the risk in their operations
(Wisner et al., 2015). Risk management from a healthcare perspective refers to a formal
approach that is employed to identify and mitigate all sources of disruption and dysfunction
within the healthcare supply chain (Gosling and Naim, 2009).
There are various benefits of risk management in the healthcare supply chain. First, effective
risk management helps a firm or organisation achieve its supply chain objective. Risk
management enables organisations to reduce the cost of enhancing efficiency in the
healthcare supply chain operations. Risk management in the healthcare supply chain helps to
improve the governance and leadership of the supply chain (Haszlinna et al., 2009). In
addition, risk management in the healthcare supply chain can help to improve the confidence
and trust in the supply chain of various stakeholders and customers (Tummala and
Schoenherr, 2011). Finally, effective risk management in the healthcare supply chain helps
supply chain managers focus more on proactive risk management rather than reacting to
unforeseen events (Kumar et al., 2009).
Risk management in the healthcare supply chain has continued to improve (Simpson et al.,
2015). Various enablers of risk management in the healthcare supply chain have been
identified; they include information sharing, building trust among supply chain partners,
building a responsive supply chain, collaborative relationships among healthcare supply chain
partners, strategic risk planning, aligning initiatives, and risk sharing in the healthcare supply
chain. Other enablers of healthcare SCRM include knowledge about risks in the healthcare
supply chain and continual risk assessment and benchmarking of various healthcare SCM
practices (Tummala and Schoenherr, 2011).

82
Healthcare institutions are now adapting to supply chain information management systems
to help them manage their procurement and increase efficiency (Zhu et al., 2008). Various
customised SCM software packages for the healthcare sector exist in the market (Gosling and
Naim, 2009). The SCM helps procurement managers make informed decisions in matters
related to the health supply chain. Various information management systems can also be used
in healthcare supply management data warehousing and analysis of healthcare big data
(Carter and Rogers, 2008). However, education on healthcare SCRM remains underdeveloped.
According to Burn (2008), the healthcare supply chain consists of four main components:
producer, purchaser, provider, and patient. In this study, particular focus is placed on the
downstream chain (e.g., hospital), from the sourcing of the pharmaceutical products and
materials from distributors/suppliers to the dispensation of medication in the care
department. There is scarce research data on risk management within the healthcare supply
chain pertaining to hospitals. Thus, in this study, after reviewing 213 quality papers in the
SCRM field, only 11 papers and one official report were selected that were related to the
hospital pharmaceutical SCRM. Similarly, there is no consensus on the concepts of healthcare
SCRM as there are in SCRM in traditional industries. Among the reviewed articles, only one
researcher defined healthcare SCRM as: ‘Risk management in the healthcare supply chain
represents a systematic approach of identifying, analysing, treating and monitoring the risks
that affect patient care process’ (Enyinda et al., 2014). To provide a meaningful analysis, Table
2.11 summarises the selected papers in terms of the title, authors, publication year, research
objectives, research methodology, and key findings.
Table 2.11: Summary of 12 selected research papers
Paper Citation Focus Method Type
Key Finding
‘A Preliminary Examination of Risk in The Pharmaceutical Supply Chain (PSC) In the National Health Service (NHS)(UK)’ (Breen, 2008)
Gain a more realistic understanding of the nature and prevalence of risk in the PSC in the UK NHS.
Qualitative Thirty-five prevalent risks have been identified, similar to those prevalent in industrial supply chains, regardless of the idiosyncrasies of the PSC, via a workshop forum held in November 2005. Suggesting that caution must be applied in how such risks are addressed, there are aspects

83
of the product that highlight its uniqueness (e.g., criticality).
‘Evaluation of Different types of Risks in Pharmaceutical Supply Chain’ (Kamath et al., 2012)
Analysing and mitigating four major risks affecting the PSC.
Hybrid Outsourcing, incorporating the latest anti-counterfeiting technologies, inventory management logistics planning, and good warehousing practices, insurance of products, and facilities and proper risk management strategies are suggested by the authors to mitigate risks.
‘Summary of the executive session on critical threats to the pharmacy supply chain and the effects on patient care’ (Maryland, 2012)
Focusing on the viable solutions to various critical threats to the PSC.
Qualitative A discussion group taken by various stakeholders in the PSC on August 2012 in Bethesda, Maryland. Viable solutions to critical threats to the PSC were suggested during the discussion. Collaboration among all stakeholders involved in the PSC is needed to ensure a reliable PSC and to protect public safety.
‘Supply risk analysis: applying system dynamics to the Colombian healthcare sector’ (Aguas et al., 2013)
This paper addresses supply risk in the oncological medicine supply chain in Colombia. A system dynamics model was developed for assessing supply risk effect on supply chain operation and performance.
Quantitative The results show the market response level, implying a deficit in the medication system. Logistics service supply present delays in delivery times. It was found that the waiting time for receiving treatment was longer than three months in most cases. On average, it is known that only few patients requiring drugs will receive them in normal conditions.
‘Efficient Healthcare Consumer Supply Chain Optimization’ (Ilie and Popa, 2013)
The article aims to present the supply chain of the Romanian public healthcare system to determine if the end results of this work are positive and meet current requirements and
Qualitative Romanians will require more money to buy a vaccine because imported drugs have a higher price than domestic production. Another conclusion is that policies developed by local healthcare institutions remain faithful to the MS to protect the interests

84
challenges faced by society.
of patients and consumers and to build a safer future.
‘Sourcing Strategy and Supply Chain Risk Management in the Healthcare Sector: A Case Study of Malawi’s Public Healthcare Delivery Supply Chain’ (Kanyoma et al., 2013)
The study primarily investigated the role of a single sourcing strategy in either exacerbating or mitigating persistent supply failure in Malawi’s public healthcare delivery supply chain.
Qualitative The study findings confirmed that single sourcing exacerbates the risk of supply failure, evidenced by persistent stock outs of drugs in hospitals that consequently risk the lives of many patients who rely on the public healthcare system.
‘An Analytical Model for Healthcare Supply Chain Risk Management’ (Enyinda et al., 2014)
This research is concerned with the quantification of risk in the healthcare supply chain using AHP.
Hybrid The results indicated that infrastructure is the most important risk in the healthcare supply chain, followed by operational, supply, and political risk. Moreover, risk reduction is the overall best risk management option rather than risk avoidance, risk acceptance, and risk transfer.
‘A combined approach for supply chain risk management: description and application to a real hospital pharmaceutical case study’ (Elleuch et al., 2014)
The paper describes a supply network risk approach to assist supply chain decision makers to risk identification, assessment, and management.
Hybrid The proposed approach is based on combining many techniques and methods include the following: 1) FMECA to identify risk and its current location and assess risks, 2) design of experiment to design risks mitigation and action scenarios, 3) discrete event simulation to assess risks mitigation action scenario, 4) AHP method to evaluate risk management scenarios, and 5) desirability optimisation to perform the best risk scenario.
‘Supply chain risk management and hospital
In this study, the authors examine the effects of horizontal
Quantitative Results suggest that, while affiliation with local, regional, and national systems has

85
inventory: Effects of system affiliation’ (Zepeda et al., 2016)
inter-organisational arrangements on inventory costs for hospitals facing two key environmental conditions: the logistics services infrastructure at the hospital and the demand uncertainty for clinical requirements that a hospital experiences.
mitigating effects under weak logistics services infrastructure, the mitigating effect is greatest for affiliation with local systems.
‘i-RM: An intelligent risk management framework for context-aware ubiquitous cold chain logistics’ (Kim et al., 2016)
The research focus is on a special type of logistics in the healthcare setting, called ubiquitous cold chain logistics (UCCL).
Quantitative An intelligent risk management framework for UCCL, namely, i-RM was suggested to automatically handle risks.
‘How internal integration, information sharing and training affect supply chain risk management capabilities’ (Riley et al., 2016)
The research determined if internal integration, information sharing, and training constitute direct antecedents to organisations’ warning and recovery capabilities.
Hybrid The findings suggested that building SCRM capabilities and their antecedents can better address an array of supply chain risks. They examined internal integration and training competencies as abilities to strengthen organisations’ warning and recovery capabilities.
‘Operational productivity and performance in English NHS acute hospitals: Unwarranted variations’ (Lord Carter’s report, 2016)
Lord Carter of Coles’ final report sets out how non-specialist acute trusts can reduce unwarranted variation in productivity and efficiency across every area in the hospital to save the NHS £5 billion each year by 2020/2021.
Qualitative The 15 core recommendations on hospital productivity were designed to tackle unwarranted variation and help NHS trusts improve their performance.

86
2.3.3.1 Supply chain risk management methodologies in healthcare setting
Risk management in the healthcare supply chain represents a systematic approach of
identifying, analysing, treating, and monitoring the risks that affect the patient care process
(Enyinda et al., 2014). To do so, risk factors identification, assessment, mitigation, and
monitoring processes were reviewed along with the selected papers. As shown in Table 2.12,
the divergent strategies explored by researchers are summarised.
Table 2.12: Classification of the SCRM process in the healthcare setting
Articles Risk Factors Identification
Risk Assessment
Risk Mitigation
Risk Monitoring
Breen (2008) X
Kamath, et al., (2012)
X X X
Maryland (2012) X
Ilie and Popa (2013)
X
Kanyoma et al., (2013)
X X X
Aguas et al., (2013)
X X
Elleuch et al., (2014)
X X X
Enyinda et al., (2014)
X X
Kim et al., (2016) X X X
Zepeda et al., (2016)
X
Riley et al., (2016)
Lord Carter’s report (2016)
X X
2.3.3.1.1 Healthcare supply chain risk factors identification
Risk factors identification defines the cause of accidents in the healthcare supply chain. It is a
first and essential step in SCRM. Brainstorming is employed to define the risk factors
according to the perception of decision makers (Elleuch et al., 2014).
As a pioneer of studying risk management in the UK NHS pharmaceutical supply chain (PSC),
Breen (2008) conducted a workshop forum that focused on risk factors identification within

87
the PSC. The outputs of the workshop showed that there were 35 prevalent risks with varying
levels of criticality. The participants were split into two groups to rate the criticality of the
selected risk factors and to produce a general structure of the PSC. Furthermore, those
identified risk factors have been divided into three distinct sections: supply chain structure,
controllability, and strategy. The fragmentation of the supply chain has the highest rating due
to a lack of uniformity in decision making within the PSC. This was followed by the lack of
visibility of stock, unexpected increases in demand, demand versus capacity, and lack of
information, which also have high ratings.
Maryland (2012) discussed the fragmentation of the drug distribution processes and the use
of restricted drug distribution systems, grey-market activity, counterfeiting, and drug
shortage, which are critical threats to the PSC in the healthcare setting. Fake medicines range
from useless to highly dangerous, and they often contain the wrong level of active ingredient
or an active ingredient intended for a different purpose. The individuals taking counterfeit
medicine put their health and even their lives at high risk. These risk factors are also
mentioned by other researchers (Breen, 2008; Kamath et al., 2012; Enyinda et al., 2014).
Moreover, several researchers also found that the shortage of drugs is another high-risk
factor in the healthcare supply chain (Breen, 2008; Ilie and Popa, 2013; Aguas et al., 2013;
Elleuch et al., 2014). With nearly 40% of hospital budgets dedicated to inventory (McKone-
Sweet et al., 2005), managers must explore available SCRM techniques to reduce inventory-
related risks. In a review of over 500,000 medication incidents reported to the National
Reporting and Learning System between 2005 and 2010, omitted and delayed medicine was
the category with the greatest number (16%) of reported medicine incidents (David, 2012).
Colombian pharmaceutical policy shows that some of the main problems in the Colombian
health systems are related to the availability of essential medicines (Aguas et al., 2013).
Kanyoma and Khomba (2013) also revealed that stock outs have paralysed healthcare delivery
systems and caused the deaths of patients, delays in medical surgery, and worsened medical
conditions of patients, among other effects. Furthermore, Kanyoma et al., (2013) also learned
of the major causes of medicine shortage in complementary empirical studies of Malawi’s
public hospitals. The risk factors have been identified as follows: single sourcing strategy,
insufficient inventory at the Central Medical Store (CMS), delays by procurement staff, and
withholding of funds by donors. Moreover, other risk factors mentioned in their study that

88
are potential causes of recurrent stock outs include wrong demand forecasting, unexpected
disease outbreaks, lack of funds at the hospital level, poor inventory management, and
unavailability of drugs on the market. In this study, they found that the government instituted
only a single supplier, namely, the ‘Central Medical Stores’, which is the main cause of
medicine shortages. Moreover, variation in demand is another major factor influencing
inventory management. Because of the higher demand uncertainty for alternative clinical
services, the risk of stock out of needed items has higher uncertainty, which makes it difficult
to reliably forecast (Davis, 1993; Lee et al., 1997; Sodhi and Lee, 2007).
Supplier failure is another important risk factor that would lead to high cost or other serious
consequences. It could be caused by either the location of the manufacture/supplier (not
domestic based) or contract problems with hospitals, and so on (Breen, 2008; Kanyoma et al.,
2013; Ilie and Popa, 2013; Elleuch et al., 2014; Enyinda et al., 2014). Some researchers also
identified the risk factors associated with regulation and political issues because the
healthcare supply chain is regulated and monitored by various parties, such as the
Department of Health, National Institute for Health and Clinical Effectiveness (NICE),
Medicine and Healthcare Products Regulatory Agency, and the NHS Purchasing and Supply
Agency (NHS PASA), to name but a few (Breen, 2008; Kamath et al., 2012; Kanyoma et al.,
2013; Ilie and Popa, 2013).
Inventory risks could incur significant costs to healthcare providers. Kamath et al., (2012) and
Enyinda et al., (2014) investigated the effects of inventory risk in the Indian and Nigerian
healthcare industries, respectively. In general, inventory accumulation and obsolescence in
the hospital sector are several times higher than in the retail/industrial sector (Ebel et al.,
2013). This is due to the unique characteristics of the healthcare industry, which does not
regard the supply chain costs as the main driver of inventory decisions. Instead, inventory
level is dictated by the need to meet service performance outcomes (Zepeda et al., 2016).
Several researchers have determined that organisations encounter issues in managing
inventory due to the different types of supply chain risks; demand exceeds supply, resulting
in stock outs, or supply exceeds demand, resulting in surplus inventory (Craighead et al., 2007;
Kremer and Wassenhove, 2014; Sodhi et al., 2012; Talluri et al., 2013).
Some researchers stated that information-related risks have been a threat to the healthcare
industry for many years (Breen 2008; Ilie and Popa, 2013; Aguas et al., 2013). They identified

89
several information-related issues including ‘Slow information transmission and single
channel’, ‘asymmetries of the information’, ‘information flow or lack of demand information’,
‘too much information’, ‘fragmentation of SC-no single source, multiple channels, no
communication, unilateral decisions’, ‘lack of data standardisation (common codes)’. It was
reported that the lack of data standardisation (common codes) is the top pharmaceutical
information-related risk factor in terms of risk severity.
As described above, supply chain risk refers to the ‘variation in the distribution of possible
supply chain outcomes, their likelihoods, and their subjective values’ (Jüttner et al., 2003).
Labour Peer Lord Carter (2016) produced a report for the government that reviewed what
could be done to eliminate the unwarranted variations, to improve efficiency in hospitals in
England. In this report, the various unwarranted variations can be considered as the risk
factors. Since 2015, Lord Carter has engaged with 136 acute hospitals in England and further
conducted empirical studies in 40 of those hospitals about the challenges in delivering
improved productivity and improving efficiency. Nevertheless, this report disclosed some
major issues related to the NHS SCM. In this report, Lord Carter found an astonishing variety
in the numbers of products and suppliers used across and within NHS trusts. A sample of 22
trusts used 30,000 suppliers, 20,000 different product brands, over 400,000 manufacturer
products codes, and more than 7,000 people can place orders. There is a dramatic increase in
the average price paid for procurements each year. Lord Carter also mentioned the significant
variation in inadequate medicine stockholding between 11 and 36 days, holding £200 m of
stock at any one time. Additionally, Lord Carter found that about 50% of medicine deliveries
come from a small number of wholesalers, while the other 50% come directly from the
manufacturers. That can mean that an NHS trust will receive up to 30 medicine deliveries
every day, which would lead to dispensing or picking errors of medication and is time-
consuming for staff.
Table 2.13 summaries the risk factors in healthcare supply chain operations from previous
studies. A common limitation of the above articles is the applied qualitative methods for risk
factors identification (Breen, 2008; Maryland, 2012; Enyinda et al., 2014; Kanyoma et al.,
2013), and they did not quantify the negative effects and severity of the risk factors. Some
researchers conducted studies based on a sample of hospitals from a single state (Enyinda et
al., 2014; Kanyoma et al., 2013; Zepeda et al., 2016).

90
Table 2.13: Summary of HSC risk factors from previous studies
Risk Factors Authors
Drive competitors out of the market, manufacturer defence tactic diversions of manufacturing capacity, cash-flow threat associated with small pharmaceutical companies and hospitals, demand versus capacity, lack of forecasting-customer side, demand/economics not able to respond to demand, increase in demand due to NICE approval, short-term supply chain planning, prioritisation conflict between patients/profits, regulatory issues such as manufacturing licensing, change of standards, drug recalls, risk of litigation, and influence on market.
Breen (2008)
Counterfeit risk and grey-market activity. Breen (2008), Kamath et al., (2012), Maryland (2012), Enyinda et al., (2014)
Unexpected increase in demand, fluctuation in customer demands, and demand uncertainty for clinical requirements.
Breen (2008), Elleuch et al., (2014), Zepeda et al., (2016)
Unavailability of raw material, true and commercially induced, and domestic drug shortages.
Breen (2008), Ilie and Popa (2013), Maryland (2012), Aguas et al., (2013), Elleuch et al., (2014)
Unavailability of supplier, location of manufacture/supplier (not domestic based), inferior quality of purchased drugs from supplier, supplier failure, contract problems with suppliers, and contracting treated as a commodity, where big contracts equal big risk.
Breen (2008), Kanyoma et al., (2013), Ilie and Popa (2013), Elleuch et al., (2014), Enyinda et al., (2014)
Time limit of drugs. Enyinda et al., (2014)
Inventory risk, insufficient inventory at Central Medical Store (CMS), lack of visibility of stock, inadequate buffer stock (JIT/lean), and poor inventory management by pharmacies.
Breen (2008), Kamath et al., (2012), Kanyoma et al., (2013), Lord Carter’s report, (2016)
Delay by procurement staff, procurement hubs – introduce more complexity.
Breen (2008), Kanyoma et al., (2013)
Clinician’s preference. Ilie and Popa (2013)
Slow information transmission and single channel, asymmetries of the information, information flow or lack of demand information, too much information, fragmentation of supply chain (no single source, multiple channels, no communication, unilateral decisions), and lack of data standardisation (common codes).
Breen (2008), Ilie and Popa (2013), Aguas et al., (2013)
Fragmentation of drug distribution processes and use of restricted drug distribution systems, transportation (unavailability of fuel, congestion, weather, illness),
Breen (2008), Maryland (2012), Aguas et al.,

91
dispensing/picking error-medication/packaging, storage/cold chain, and capacities of logistics systems.
(2013), Lord Carter’s report, (2016)
Lack of incentive mechanism. Maryland (2012)
Financial risk and lack of funds at the hospital. Kamath et al., (2012), Kanyoma et al., (2013)
Reimbursement policies not consistent, regulatory risk, rigorous government intervention, and regulation risks (EU).
Breen (2008), Kamath et al., (2012), Kanyoma et al., (2013), Ilie and Popa (2013)
Unexpected disease outbreaks and external influences-disaster recovery.
Breen (2008), Kanyoma et al., (2013)
High purchase price and high product and supplier/brand variety.
Lord Carter’s report, (2016)
2.3.3.1.2 Healthcare supply chain risk assessment
Breen (2008) recommended that further examinations could apply the AHP method to rate
identified risk factors to assist in more structured decision making. Furthermore, this method
has been used by several researchers (Kamath et al., 2012; Enyinda et al., 2014) in healthcare
SCRM. Regulation risk has been ranked as the priority risk factor by Kamath et al., (2012).
Moreover, Enyinda et al., (2014) investigated infrastructure risks (transportation logistics,
electricity, and technology risks), which are important risks. Meanwhile, for sub-risk
categories, the most important risk is counterfeits.
The system dynamics model has been applied in various types of organisations, leading to
capturing complex dynamics for representing causal relationships and inter-dependence
between variables (Sterman, 2002). Wang and Zhang (2010) set the risk rate as the rate of
emergency process in completion by utilising the system dynamics model. They revealed that
there is a higher risk rate when the patient quantity is random, and the hospital staff is stable,
while there is an obvious drop in the risk rate when medical affairs are adjusted in time on
the condition of actual demand. Aguas et al., (2013) also developed a system dynamics model
for assessing oncological medicine supply risk effect on supply chain operation and
performance. They pointed out that the risk mitigation and management strategies focused
on policy definition and negotiation rules with market provider and agent coordination,
where logistics service operators and suitable information systems for management would

92
cause the reduction of overall supply chain costs and improve service and quality
performance.
Elleuch and Chabchoub (2011) evaluated the FMECA technique to identify and assess the risks
in the PSC and proposed a simulation method to analyse the proposed scenarios according to
the risk exposure levels. The methodology was illustrated by a real case study in a drugstore.
Limitations exist in the above articles. Kamath et al., (2012) and Enyinda et al., (2014)
surveyed samples that are geographically limited to only one country (i.e., India or Nigeria)
with a small sample size. Moreover, AHP has a subjective modelling process nature, which is
a constraint. That means that the methodology cannot guarantee the decisions as definitely
true. The historical data was used to determine the severity index, and the probability of the
identified risk factors would not be reliable (Elleuch et al., 2014). The major limitation of the
study is that it was conducted at a time when stock outs of drugs were at crisis levels in
Malawi’s public hospitals (Kanyoma et al., 2013). The data were collected based on subjective
opinions, which will cause bias for the results (Breen, 2008). Elleuch et al., (2014) surveyed
one hospital for the case study, which is limited to examining the structure of the hospital
PSC.
2.3.3.1.3 Healthcare supply chain risk mitigation
Many risk mitigation strategies in the healthcare supply chain have been mentioned in the
previous studies. Kamath et al., (2012) examined the four reactive risk mitigation strategies
based on the different types of risk by applying the AHP method. In this study, transfer of risk,
such as outsourcing insurance, was determined as the best management strategy with
respect to regulatory risk and financial risk.
Lord Carter (2016) presented five strategies for managing the unwarranted variations in the
NHS supply chain as follows: collaboration, supply chain integration, outsourcing the non-core
supply chain activities to a third party, NHS e-procurement strategy, and implementing
information system technology. Moreover, some other researchers also indicated that
building vertical inter-organisational relationships between an organisation and its suppliers
is a key element to manage supply chain risk (e.g., Wiengarten et al., 2014; Zsidisin and Ellram,
2003).

93
Table 2.14 summaries the risk mitigation strategies in healthcare supply chain operations
from previous studies. However, there are limited studies focused on the establishment of
horizontal inter-organisational arrangements among organisations with regards to the
management of supply chain risks (Chen et al., 2013). To fill this gap, Zepeda et al., (2016)
examined the moderating effects of horizontal inter-organisational arrangements on hospital
inventory accumulation in the presence of supply chain risks arising from its environmental
conditions, namely, the logistics services infrastructure where the hospital is located and the
demand uncertainty for clinical requirements that the hospital experiences. The authors
suggested that affiliation with a local system safeguards hospitals from supply chain risk under
the conditions of a weak logistics service infrastructure. Furthermore, Riley et al., (2016)
suggested that interaction and exchange of information between intra-organisational entities
would positively affect organisations’ warning and recovery capabilities.
Employee training can reduce risks in the healthcare industry. Most studies have paid much
attention to it. This is because most supply chain activities are handled by pharmacists who
lack skills to provide proper training of personnel and ensure adherence to quality-control
policies and procedures for compounding sterile products and repackaging bulk medication
supplies in all settings in the healthcare industry (Maryland, 2012). Ellench et al., (2014)
examined personnel training and reward systems, which are important mechanisms to reduce
human error in handling and storing drugs. Training also can identify risk factors and handle
anomalies (Riley et al., 2016).
2.3.3.1.4 Healthcare supply chain risk monitoring
Until now, no studies in the academic literature have focused on risk monitoring in the
healthcare SCRM process.
Table 2.14: Summary of HSC risk mitigation strategies
Risk Mitigation Strategies Authors
Collaboration with the manager of the care units, forecasting, ERP, involvement of doctors and nurses of the care units, communication and information sharing with suppliers, collaboration with FDA to develop guidelines for importing drugs in short supply, and affiliation with local healthcare systems for hospital inventory management.
Breen (2008), Maryland (2012), Lord Carter’s report, (2016), Riley et al., (2016), Zepeda et al., (2016)
Employee training, ameliorating working ergonomics, reward system revision, investment in handling materials, motivation,
Maryland (2012), Ellench et al., (2014),

94
relation with labour union, career management, providing proper training of personnel and ensuring adherence to quality-control policies and procedures for compounding sterile products and repackaging bulk medication supplies in all settings, and educate personnel about how to comply with FDA and USP requirements for sterile compounding and repackaging of bulk supplies.
Riley et al., (2016)
Outsourcing the non-core supply chain activities to a third party. Kamath et al., (2012), Lord Carter’s report, (2016)
NHS e-procurement strategy. Lord Carter’s report, (2016)
Implement information system technology (RFID), traceability and information systems, and EDI.
Lord Carter’s report (2016), Kim et al., (2016), Ellench et al., (2014)
Inventory management and improving just-in-time and other inventory management practices.
Maryland (2012), Jurado et al., (2016), Zepeda et al., (2016)
Multiple sourcing strategies and development of contractual arrangements between health systems and multiple suppliers of selected essential products to avoid relying on a sole source.
Maryland (2012), Kanyoma et al., (2013)
Statistical quality control, inspection, and quality control. Ellench et al., (2014)
Periodic maintenance and statistical process control. Ellench et al., (2014)
Design PSC systems to support a patient-centred model of healthcare delivery (integrate all drug distribution channels, implement electronic medical record technologies that support data exchange with multiple provider functional profiles, such as pharmacist–pharmacy provider electronic health records), standardise communication (eligibility for receipt of drugs with restricted distribution and file format for reports), develop a national standard for tracking and tracing medications that includes pricing information to deter price gouging, encourage greater manufacturer transparency and communication about the anticipated duration of shortages to allow practitioners to address the shortage, and encourage the FDA to compile and maintain a list of approved foreign sources of drugs in short supply in the United States.
Maryland (2012)
2.3.3.1.5 Integrated HCSCRM process
Most researchers applied SCRM strategies in more than one stage. Most of these studies
focused on two SCRM processes, such as risk factors identification and assessment (Aguas et
al., 2013) or risk factors identification and mitigation (Maryland, 2012; Kanyoma, et al., 2013;

95
Kim et al., 2016; Lord Carter, 2016). Additionally, four out of 12 papers dealt with the entire
process of SCRM in the healthcare setting. Kamath et al., (2012) conducted a literature review
to identify four major risks affecting the PSC, and then the AHP model was proposed for
ranking the identified risks. In addition, those solutions, based on risks, were provided in the
results of the survey questionnaires and literature study.
Similarly, Enyinda et al., (2014) explored SCRM using a questionnaire survey and AHP based
on the qualitative judgements or opinions of the experts. Elleuch et al., (2014) developed a
combined approach including FMECA, design of experiment, discrete event simulation, AHP,
and the desirability function approach to deal with the SCRM process. Moreover, i-RM was
suggested by Kim et al., (2016) as a divide-and-combine approach comprising context
identification, risk detection, and response action judgement in semantic ontologies.
2.4 LITERATURE GAPS IDENTIFIED
From the research aspect, the importance of understanding the current research status and
finding the research gaps based on the existing knowledge should be mentioned (Boote and
Beile, 2005). Although the studies reviewed in this chapter have provided some valuable
insight on risks and risk management in the healthcare supply chain, it shows that the research
in this area is still in the early stage and is rather fragmented. For example, there has been
limited academic research on the effects of external risks on healthcare supply chain
disruption. Therefore, identifying the effects of risks on supply chain processes and functions
should be considered in this research. During the last ten years, a considerable number of
studies have emphasised the importance of process redesign and performance measurement
to rationalise supply chain processes to improve the performance of patient risk flows. The
existing studies indicated that most of the research focus has been on some specific risk
management steps (e.g., risk factors identification or risk mitigation).
However, there is a lack of research that has explicitly developed a thorough and sound risk
management framework for evaluating integrated SCRM (e.g., risk factors identification, risk
assessment, and risk mitigation) performance in the public healthcare sector, especially
concerning physical flows. Moreover, to employ a single method is not appropriate as a risk
management technique, as a multiple model would help reduce each models’ drawbacks.

96
Thus, it is imperative to develop a combined risk management model that contains several
fuzzy-based MCDA models to deal with the complex supply chain risk-related decisions in an
efficient manner. Besides, the majority of extant SCRM research regarding risk assessment
only explored risks and provided typologies or taxonomies of those identified risks without
concerning interrelationships between each risk. Mason-Jones and Towill (1999) have
emphasized the significance of discovering risk interactions because it would support decision
makers by understanding and tackling the root causes inherent in each of the risk area, and,
equally importantly, how they interact with each other.
Risk factors identification is the first step of SCRM to recognise the cause of risks across the
healthcare supply chain. Although some studies can be found that deal with healthcare supply
chain risk factors, the attention that is given to systematic identification is limited. A further
analysis of risk factors identification is required to capture a more exhaustive variety of risk
factors under a broader context. More importantly, no studies have examined the efficiency
of the current implemented supply chain risk mitigation strategies in public healthcare
organisations, although many risk mitigation strategies could be used to manage the effect of
risk factors.
However, due to the limited budget and resources of each public healthcare organisation, they
must first pay more attention to the most imminent and significant risk factors. It is therefore
necessary to evaluate the relative importance of different implemented risk mitigation
strategies under given performance criteria.
2.5 CONCLUSION
The literature on HCSCM, SCRM and HCSCRM have been thoroughly reviewed in this chapter.
Definitions of most of the terms used in healthcare supply chains, the developments of
conventional SCRM, the status of risk management in the healthcare supply chain, and risk
management methodologies implemented have been presented. Based on the analysis
conducted in this paper, the healthcare supply chain can be expounded to include the supply
of medical and surgical supplies, technology, partnerships, and consolidation within the
supply chain community. Afterwards, the term risk management, which has previously been
used to mean identification, prioritisation, and assessment of risks, can be used to include

97
coordination and economical application of resources with the aims of minimising,
monitoring, and controlling the probability of unfortunate events. Thirdly, SCRM in the
healthcare sector is subjected to a wide range of challenges, hence, procurement department
leaders among other personnel who are in charge of whole supply chain activities in the
hospital setting should be aware of the vulnerability of HCSC and adopt appropriate risk
management methodologies. In general, it is fair to conclude that the analysis carried out in
this paper has made a crucial contribution to the field of SCRM in a hospital setting. Finally,
literature gaps on healthcare supply chain risk management were identified and summarised
as follows:
There is no research that has explicitly developed a thorough and sound risk
management framework for evaluating integrated SCRM (e.g., risk factors
identification, risk assessment, and risk mitigation) performance in the public
healthcare sector, especially concerning physical flows.
There is a deficiency in the research relating to external risks stemming from
healthcare supply chains.
Although a number of studies have been found dealing with HCSCRM problems, the
systematic way of risk factors identification and classification have not been provided
by the existing literature.
There is a lack of consideration on the interdependencies between different risk
factors.
No studies have examined the efficiency of the currently implemented supply chain
risk mitigation strategies in public healthcare organisations.
In order to address the research gaps aforementioned and to bridge the existing literature
with healthcare supply chain risk management, this thesis proposes research questions
outlined below. More specifically, RQ1 is associated with the first research gaps (risk
management conceptual framework) while RQ2 relate to the second and third research gaps
(risk factors identification and classification), thereafter, RQ3 and RQ4 dealing with the fourth
research gaps (risk assessment) and lastly, RQ 5 and RQ6 are associated with the fifth research
gap which highlight risk management strategies identification and evaluation.

98
RQ1. What is the most effective HCSCRM framework that can be implemented to deal
with the HCSC risks?
RQ2. What are the main sources of risk factors causing public sector healthcare supply
chains to be vulnerable and how to identify and classify those risks?
RQ3. Which risk factors are relatively more significant to a hospital’s supply chain
management performance?
RQ4. How are these risk factors interacting with each other?
RQ5. How can the hospitals from both UK and China effectively manage their supply
chain related risks?
RQ6. What are the main risk mitigation strategies to be considered?

99
3.CHAPTER THREE - RESEARCH METHODOLOGY
3.1 INTRODUCTION
This chapter aims to explain research methods that can adequately address the research
questions in the previous chapter based on the research gaps found in the literature review.
As the interests of this research encompass all three phases of the risk management process,
namely risk factors identification, risk assessment and risk mitigation, one research method
is not able to sufficiently cover the entire topic of risk management. Rather, selection of
appropriate research methods for each phase will be more desirable, which eventually leads
to serves Chapters five, six and seven which are at the core of this thesis. Meanwhile, this
chapter also helps for the selection of the appropriate methodology to validate and further
develop the proposed model of this research.
This chapter starts by presenting an overall structure of the research methodology to
illustrate the philosophical stance of this research. The next section focuses more on the data
collection methods and analysis techniques that will be applied in Chapter five, six and seven
respectively. It needs to be mentioned that this research conducts the empirical studies from
both the UK and China healthcare industries as well as other healthcare SCM research centers
such as LogHealth Center in Thailand. Questionnaire survey and Semi-structured interviews
are employed for the empirical study design. In addition, direct observation and official
documentation were implemented as data input. Figure 3.1 demonstrates an overview of a
methodological framework for the purpose of this thesis upon which the research
methodology will be developed.

100
A Methodological Framework For Healthcare Supply Chain Risk Management
Risk FactorsIdentification
Risk Assessment
Risk Mitigation
Chapter 5 Chapter 6 Chapter 7
Literature Review
Risk Classification
Empirical Studies
Initial Hierarchical Structure Diagram
Validation of Developed
Diagram
Final Hierarchical Structure Diagram
Risk Priority Assessment
Fuzzy AHP Method
Empirical Studies
Ranked Risk factors
Risk Analysis (Contextual
Relationships)
ISM Method
Empirical Studies
ISM-Based Model & Driving Power and Dependence
Diagram
MICMAC Analysis
Risk Mitigation Strategy Identification
Empirical Studies
Risk Mitigation Strategy Evaluation
Fuzzy TOPSIS Method
Empirical Studies
Ranked Strategies
Conceptual Framework
Chapter 4
Conceptual Framework
Integrated Risk Management
Model
Figure 3-1: Proposed methodology of Healthcare Supply Chain Risk Management

101
3.2 RESEARCH DESIGN
Research onion can be regarded to as an overview framework, which has been developed by
Saunders et al., (2009) as indicated in Figure 3.2, to facilitate the research process of the
researchers. The research onion is a multiple layer model, and in this model, each inside layer
is more detailed as compared to the outside layer of the model. The research onion essentially
starts with the layer which deals with the research philosophies. After this, it considers
research approaches, research strategies, choices, time horizons and lastly the research
techniques and procedures.
As far as the outermost layer of the research onion is concerned, it deals with the research
philosophies, which includes four types of research philosophies, namely positivism, realism,
pragmatism and interpretivism. The second layer of the research onion deals with the
research approaches, which includes two types of research approaches, namely deductive
and inductive. The third layer of the research onion deals with the research strategies.
Depending on the nature of the research work, there are various strategies that can be
adopted by a researcher, such as an experiment, survey method, ethnography, grounded
theory and many more. The fourth layer of the research onion deals with the research
choices. Here, the researchers need to decide whether they wish to apply a mono-method,
multi-method or a mixed method to the research. The fifth layer of the research onion deals
with the time horizons, which classifies the research work into either cross-sectional research
or a longitudinal research. The last layer, the innermost layer, deals with techniques and the
procedures, which include the data collection and data analysis methods which can be
adopted by the researcher to carry out the research work.

102
Figure 3-2: Research onion
[Source from Saunders et al., 2009]
3.3 RESEARCH PHILOSOPHY
The first task for any researcher is to examine the research philosophy, which essentially deals
with the knowledge development and assessment of the nature of that knowledge as
highlighted by Taylor et al.,(2015). The choice made by any researcher regarding the research
philosophy is largely dependent upon the way of the researcher of viewing the world. It is
because each researcher views the similar situation in a different manner as expressed by
Wilson (2010). For instance, one researcher might be factual and wish to assess the resources
required in a manufacturing process. On the other hand, the other researchers might be
concerned with the feelings and attitudes of the employees in an organization in the same
research set up. Primarily, there are two types of research philosophies, namely the positivist
research philosophy, which is also known as scientific as well as the interpretivist research
philosophy, which is also regarded as the antipositivism as highlighted by Panneerselvam
(2014).

103
As far as the positivist research philosophy is concerned, the reality is essentially assumed to
be stable and the positivist believes that the reality can be observed as well as described from
an objective viewpoint and the researcher to have minimal contact with the research
participants thus the researcher should be independent and detached. The researcher, in this
case, prefers ‘working with observable social reality and that the end product of such research
can be law-like generalisations similar to those produced by the physical and natural
scientists' (Easterby-Smith et al., 2002). The analysis of observations and results are usually
quantitative as it follows rigid guidelines when conducting empirical reseach (Creswell, 2003).
In an interpretivist research philosophy, the researcher is essentially critical of the positivist
philosophy and is of the view that the social world is a complex system and it is not possible
to theorise this social world by certain definite scientific laws (Gray, 2013). According to this
philosophy, there is a difference between researching human beings and some objects.
Human beings are considered as social actors in this philosophy as indicated by Babbie (2015).
The author further elaborated that the interpretivist philosophy is based on two intellectual
traditions, namely phenomenology and symbolic interactionism. Here, phenomenology
refers to the way of assigning meaning to the external world by humans and social
interactionism refers to the process in which humans continuously interpret the surrounding
social world. In other words, humans interpret the actions of other human beings during their
interaction. Table 3.1 illustrates the difference between these two research philosophies.
Table 3.1: Methodologies used in the Positivist and Interpretivism Philosophies
Positivism Interpretivism
Ontology It considers reality to be real as well as apprehensible.
It assumes that reality can be multiple as well as constructed.
Epistemology It assumes the findings to be true, i.e., objectivist
It assumes the findings to be created, i.e., subjectivist
Research Methodologies Experiments and surveys Hermeneutical or dialectical
3.4 RESEARCH APPROACH
To carry out a research work, the researcher has to make a choice between the two
approaches, namely the deductive approach and the inductive approach as mentioned by
Brannen (2017). . . . . . . . . . . . . . . . . . . . . . . . . . . . . . . . . . . . . . . . . . . . . . . . . . . . . . . . . . . . . . . . . . . . . . . . . . . . . . . . . . . . . . . . . . . . . . . . . . . . . . . . . . . . . . . . . . . . . . . . . . . . . . . . . . . . . . . . . . . . . . . . . . . . . . . . . . . . . . . . . . . . . . . . . . . . . . . . . . . . . . . . . . . . . . . . . . . . . . . . . . . . . . . . . . . . . . . . . . . . . . . . . . . . . . . . . . . . . . . . . . . . . . . . . . . . . . . . . . . . . . . . . . . . . . . . . . . . . . . . . . . . . . . . . . . . . . . . . . . . . . . . . .
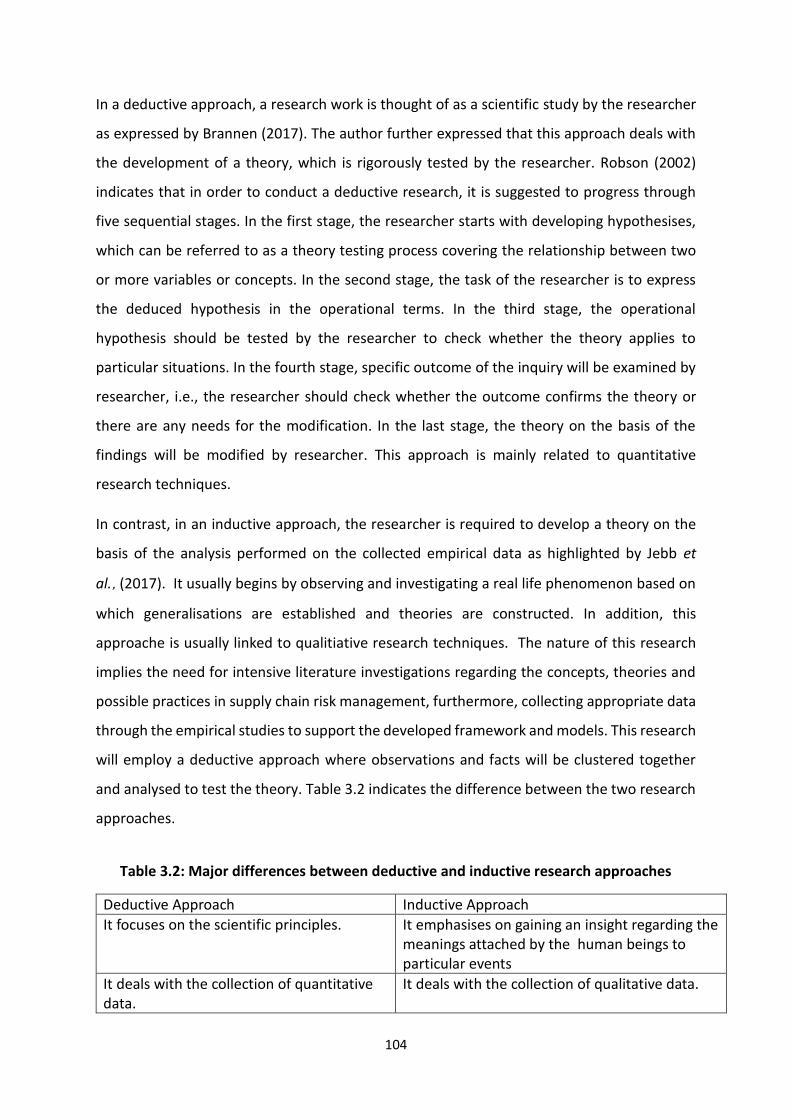
104
In a deductive approach, a research work is thought of as a scientific study by the researcher
as expressed by Brannen (2017). The author further expressed that this approach deals with
the development of a theory, which is rigorously tested by the researcher. Robson (2002)
indicates that in order to conduct a deductive research, it is suggested to progress through
five sequential stages. In the first stage, the researcher starts with developing hypothesises,
which can be referred to as a theory testing process covering the relationship between two
or more variables or concepts. In the second stage, the task of the researcher is to express
the deduced hypothesis in the operational terms. In the third stage, the operational
hypothesis should be tested by the researcher to check whether the theory applies to
particular situations. In the fourth stage, specific outcome of the inquiry will be examined by
researcher, i.e., the researcher should check whether the outcome confirms the theory or
there are any needs for the modification. In the last stage, the theory on the basis of the
findings will be modified by researcher. This approach is mainly related to quantitative
research techniques.
In contrast, in an inductive approach, the researcher is required to develop a theory on the
basis of the analysis performed on the collected empirical data as highlighted by Jebb et
al.,(2017). It usually begins by observing and investigating a real life phenomenon based on
which generalisations are established and theories are constructed. In addition, this
approache is usually linked to qualitiative research techniques. The nature of this research
implies the need for intensive literature investigations regarding the concepts, theories and
possible practices in supply chain risk management, furthermore, collecting appropriate data
through the empirical studies to support the developed framework and models. This research
will employ a deductive approach where observations and facts will be clustered together
and analysed to test the theory. Table 3.2 indicates the difference between the two research
approaches.
.. . . . . . . . . . . . . . . . . . . . . . . . . . . . . . . . . . . . . . . . . . . . . . . . . . . . . . . . . . . . . . . . . . . . . . . . . . . . . . . . . . . . . . . . . . . . . . . . . . . . . . . . . . . . . . . . . . . . . . . . . . . . . . . . . . . . . . . . . . . . . . . . . . . . . . . . . . . . . . . . . . . . . . . . . . . . . . . . . . . . . . . . . . . . . . . . . . . . . . . . . . . . . . . . . . . . . . . . . . . . . . . . . . . . . . . . . . . . . . . . . . . . . . . . . . . . . . . . . . . . . . . . . . . . . . . . . . . . . . . . .. . . . . . .
Table 3.2: Major differences between deductive and inductive research approaches
Deductive Approach Inductive Approach
It focuses on the scientific principles. It emphasises on gaining an insight regarding the meanings attached by the human beings to particular events
It deals with the collection of quantitative data.
It deals with the collection of qualitative data.

105
It moves from theory to data. It moves from data to theory.
It is highly structured research approach. It is comparatively more flexible research approach.
Here, it is necessary to come with generalized conclusion.
Here, there is no need to come up with generalized conclusion.
3.5 RESEARCH STRATEGIES AND CHOICES
3.5.1 Exploratory and explanatory study
An exploratory study is generally conducted when there is a little knowledge about the
subject matter in the existing literature (Robson and McCartan, 2016). Or if the research
subject is something which is highly uncertain, then an exploratory method is required. In
addition, this particular type of research strategy can be characterised as the one which
possesses a high degree of flexibility. However, Kotzab (2000) indicated that this type of
strategy essentially lacks a formal structure. The main aim behind conducting an exploratory
research, as expressed by Ghauri et al., (1995) is to identify the boundaries of the
environment in which the events, situations, opportunities or any problem which is of utmost
interest to the researcher are likely to reside. An exploratory research is also aiming to identify
the significant factors or variables which might be found in that environment and are of
utmost relevance to the research as mentioned by Naeslund (2002).
On the other hand, an explanatory research, which is sometimes called as analytical study, is
conducted by the researcher with the major aim of identifying any causal links, which might
be present between the variables or factors that are of relevance to the research problem.
Unlike exploratory research, an explanatory research is very structured in nature (Robson and
McCartan, 2016). In this thesis, the above two types of research strategies are applied to carry
out this research. In this thesis, Chapter five provides a preliminary exploratory analysis to fill
the gap in risk factors identification. In order to investigate the risk generation mechanism,
the explanatory strategy is implemented to explain what is going on and conceptualise the
risk propagation mechanism (Saunders et al., 2007).
3.5.2 Mixed methods approach
Mixed methods approach can be described “as a method which focuses on collecting,
analysing, and mixing both quantitative and qualitative data in a single study or series of

106
studies. Its central premise is that the use of quantitative and qualitative approaches, in
combination, provides a better understanding of research problems than either approach
alone” (Creswell and Clark, 2011).
There are multifarious characteristics associated with mixed methods research as expressed
by Creswell and Clark (2011). Firstly, in this type of research, the researcher collects and
analyses both quantitative and qualitative data. Secondly, it gives an opportunity to the
researcher to mix the two types of data in different ways. Thirdly, it essentially gives priority
to either one of the types of data, or both the types of data. Lastly, it can be used by the
researcher in a single study or multiple phases of a study. This phenomenon is also known as
triangulation technique, as no research methodology is being considered universally superior
to the other as each has its drawbacks and advantages. “By combining multiple observers,
theories, methods, and empirical materials, researchers can hope to overcome the weakness
or intrinsic biases and the problems that come from single-method, single-observer and
single-theory studies.
Often the purpose of triangulation in specific contexts is to obtain confirmation of findings
through the convergence of different perspectives. The point at which the perspectives
converge is seen to represent reality.” (Liouka, 2007). The researchers expressed their
concern by stating that in the contemporary era, scholars and researchers are often
interested in utilizing both the qualitative and quantitative methods in order to analyse the
same phenomenon. Due to this, there is an observable growth in the practice of utilizing some
sort of 'triangulation'. Further, Mangan et al., (2004) described Triangulation' as a process
which involves the verification, which certainly increases the validity of any research work via
the incorporation of multiple viewpoints as well as research methods. Based on the research
paper produced by Yeasmin and Rahman (2012), indicated that the triangulation method
could be used by the researchers for two main reasons, i.e. for confirmatory and for
completeness purposes. With confirmation, Young (2007) refers to the validation of results
of the qualitative study by quantitative studies, and with completeness, Yeasmin and Rahman
(2012) refer to the increase in the in-depth knowledge as well as understanding of the
researcher regarding the phenomenon under investigation because the researcher has
essentially utilized the combination of multiple methods and theories to come up with the
outcome. Amaratunga et al., (2002) concluded their research by stating that the triangulation

107
technique is essentially a good technique because it allows the researcher to reap the benefits
of both qualitative and quantitative methods.
The choice of data collection method should be in line with the research questions and its aim
and the objectives (Saunders et al., 2009). Two types of data collection methods will be used
in this thesis. Primary data collective involves collecting new data, whereas secondary data
collection concerns the collection of existing data. Therefore, both qualitative and
quantitative methods are applied to identify, assess and mitigate SC related risks in the
healthcare setting. To determine the risk factors in healthcare SC, literature review and
questionnaire surveys are adapted to investigate and categorise unstructured risks. The
questionnaire is proposed to verify the comprehensiveness and validation of identified risk
factors as well as to examine the appropriateness of the risk classification method. Another
questionnaire surveys and semi-structured interview are used for the data collection in risk
assessment and mitigation stages. The data collection method applied in this thesis is mainly
based on expert judgements. The obtained risk data are used as inputs of the proposed
integrated risk management models to understand the priority of risks and evaluation of
currently implemented risk mitigation strategies. Full details about research methods and
research techniques will be discussed in the following sections.
3.6 METHODOLOGY FOR DATA COLLECTION AND ANALYSIS
This section presents a detailed explanation of the data collection and analysis methods used
in the research. For the purpose of systematically identifying and understanding the relevant
risk factors, it is necessary to employ an approach involving the use of both qualitative and
quantitative methods to obtain and investigate the risks along with justification. The first sub-
section describes the data collection method in each risk management phase. More
specifically, the first phase of questionnaire survey covering the key concepts of the identified
risk factors will be conducted to verify the comprehensiveness of risk factors identification
and the initial assessment of addressed risks as well as the validation of the proposed
classification method. The second and third phase of the questionnaire survey will be
conducted to quantifying the level of identified risks along with their contextual
interrelationships. The empirical studies are conducted to extract identified supply chain risk
mitigation strategies for further evaluation. Moreover, the last questionnaire survey is

108
designed to acquire the priority ratings of identified strategies for mitigating supply chain
risks. The second sub-section introduces the data analysis methods in each risk management
phase. Table 3.3 describes the methodologies for data collection and data analysis, which
involves the three main risk management steps, and the related approaches and purposes of
these approaches.
Table 3.3: Summaries of the research methods for data collection and analysis
Steps Approaches Purposes
Risk factors identification
Literature review To identify the existing risk factors in healthcare supply chain from the selected articles.
Questionnaire survey To investigate the reliability and validation of identified risk factors and risk classification method, and explore if there are more risk factors that are not mentioned in previous studies.
Email and face to face interviews
To further explore the appropriateness of the developed hierarchy model.
Risk assessment Fuzzy Analytic Hierarchy Process survey (web-based
questionnaire (eSurvey Creator)
To evaluate the risk factors for determining of their priority (weight) of concern.
Interpretive Structural Modelling survey
(telephone, email and face-to-face interview)
To develop contextual relationships to analyze the inter-relationships among healthcare supply chain risk factors.
Risk mitigation strategies
identification
Empirical studies (semi-structured interview, direct
observation, official documentation)
According to the finding from previous chapter, to explore the current complemented risk mitigation strategies from both UK and China hospital cases. Meanwhile, to validate the identified risk mitigation strategies through documentation review and direct observation during the semi-structured interview,
Risk mitigation strategies evaluation
Fuzzy TOPSIS (Technique for Order Preference by
Similarity to Ideal Solution) survey (email
questionnaire)
To rank the importance of the identified risk mitigation strategies under difference risk context.

109
3.6.1 Data collection methods
The data collection will be presented in relation to each step of the risk management process.
In order to capture and understand the risk factors, it is necessary to conduct an approach
involving the use of both qualitative and quantitative methods to gather and examine the risk
source along with justification due to the scarcity of the existing research in this field. In
general, the purpose of empirical study is to verify the existing or newly proposed collected
evidence about a piece of research on the basis of empirical data. A well-structured
methodology, based on experienced should enable organizations to take full advantage of the
findings. In this thesis, the purpose of conducting the empirical studies are to refine the
understanding of risk factors that lead to major disruption and identify the currently
implemented risk mitigation strategies in the hospital sector. Empirical studies were
conducted separately for Chapters five, six, and seven respectively. The first sub-section
introduces the data collection methods in risk factors identification phase. Questionnaire
survey A covering the key definitions of the identified healthcare SC risk factors will be
conducted to verify the comprehensiveness of risk factors identification and the importance
of addressed risk factors as well as the appropriateness of the risk classification model. The
second sub-section discusses the data collection methods in risk assessment phase. Another
two questionnaire surveys B and C will be proposed to evaluate the weighted priority and
contextual relationships between each risk factor. The third sub-section describes the data
collection methods in risk mitigation strategies identification, validation and analysis. Some
source of evidence in empirical studies, i.e., semi-structured interview, site observation,
official documentation are utilized in order to identify the current implemented risk
mitigation strategies from both the UK and China hospitals. Then the questionnaire survey D
will be conducted to analyse those identified strategies by ranking their priority.
3.6.1.1 Data collection methods in risk factors identification and validation
To conduct the systematic risk factors identification and decomposition, the research
continues with the empirical studies including the key definitions of the identified risk
sources. Chapter five provides a detailed description of data analysis and taxonomic diagram
validation in risk factors identification phase.

110
Several methods can be used for identifying risk factors such as, historical data collection,
interviews, relevant document review and group meetings (Water, 2007). Researchers also
used a literature review to identify the risks in the supply chain sector (Barry 2004; Wagner
and Bode 2006; Kayis and Karningsih 2012; Ranger et al., 2015; Blos et al., 2016; Rogers et al.,
2016). This research first reviewed the relevant literature in order to identify all the risk
factors that have been directly addressed in the healthcare supply chain, especially in the
hospital drugs/pharmaceutical supply chain. The advantage of literature review is that it saves
time since it has already been collected, and it is also less expensive than other methods
(Saunders et al., 2009). After this, some experts from both academic and practitioner fields
will be invited to take part in the expert panel so as to validate the identified risk factors and
explore other potential risks. The experts are selected based on their professional working
experience, job position as well as the qualification to the research topic.
Following the rigorous approaches, the questionnaire is developed in line with research
questions and the relevant studies to collect the opinions from the experts who are most
familiar with conditions to clarify the ambiguity (McCormack and Hill, 1997). Besides, behind
doing this, the researcher also aims to investigate the reliability of the proposed risk
classification model in the healthcare supply chain. In general, the number of parameters in
the construct, the selection of a Likert scale and avoiding negative words are the critical
issues, which must be given more attention (Hinkin, 1995). This research adapts a five-point
Likert scale so as to investigate the level of agreement with each question from the experts.
Initially, the questionnaire is developed in English language by the researcher, however, it is
later translated from English language to the Chinese language by the researcher because the
targeted experts are both from China as well as the UK. It is deliberately done by the
researcher to make it easy for the experts from China to understand the questionnaire in the
Chinese language. In order to verify the appropriateness as well as accuracy of the
questionnaire after it is translated to the Chinese language, the researcher has made use of
both forward and backward translation methods in order to examine the developed
questionnaire. Two forward translators, native speakers of the Chinese and fluent in English.
Both translators are come from Wuhan University of Technology in China and conduct
translations independently. Any disagreements are resolved via a reconciliation process,
resulting in a single provisional forward translation. Using this translation, backward

111
translation is carried out by a translator (fluent in Chinese and English, and different from the
forward-translators) from Liverpool John Moores University to subsequently translate back
the Chinese questionnaire into the English language.
The draft of questionnaire A is then pilot tested on the target participant before being field-
tested on a larger sample. Face-to-face and telephonic interviews are carried out to assist the
questionnaire builder to obtain a clear picture of the meaningful advice. After the
questionnaire feedbacks are received, a validity test was required to be conducted so as to
test whether the study measured the necessary items and whether the study received the
reliable responses. Based on the comments, the questionnaire is properly modified to fit in
with the requirements (See Appendix One). By the end, the identified risk factors will be
summarized into a hierarchy structure. Before conducting the further larger-scale risk
assessment survey (to measure their weight priority and inter-relationships), the developed
hierarchy structure will be send to the “validation team” by email and the face-to-face
interviews are distributed and conducted with them so as to further explore the
appropriateness of the developed hierarchy. Based on the obtained results, the identified risk
factors are summarized into a final hierarchy structure, which provides a comprehensive risk
database to healthcare SCRM research.
3.6.1.2 Data collection methods in risk assessment stage
Following the questionnaire development procedures described in section 3.6.1.1, the
questionnaire surveys B and C are constructed to elicit expert opinion on the healthcare SC
risk factors regarding their weight priority and inter-relationships. The Chinese/English
translation processes are applied on both of these questionnaires, the same as applied in
questionnaire survey A. The draft of both the questionnaires will be send to experts with very
good knowledge and experience firstly as pilot study and then questionnaire Survey B will
send to the experts from both UK and China hospitals, pharmaceutical manufacturer,
pharmaceutical companies and supply chain service consultant organizations. According to
Saaty (1980), an AHP-based questionnaire survey is acceptable when the consistency ratio
(C.R.) is smaller than 0.1. Therefore, if the consistency ratio (C.R.) is over the standard
acceptable value (0.1), the received survey will be returned to the experts to modify the
answer. After the results obtained from questionnaire B, following the same procedure, the

112
questionnaire Survey C is developed and conducted via the email, telephonic and face-to-face
interview to the experts both from academic and practitioner fields. Full explanations and
discussion in respect of those two questionnaire survey procedures are explained in Chapter
six. The finalised English and Chinese questionnaires B and C are attached in Appendix Two
and Three.
3.6.1.3 Data collection methods in risk mitigation strategies identification and analysis
An empirical approach with surveys, followed by reviewing the official documentation, direct
observation and semi-structured interview from both China and the UK hospitals,
pharmaceutical companies. The current implemented risk mitigation strategies will firstly be
identified, validated, and finally evaluated.
Based on the obtained results from risk assessment phase, this thesis firstly reviews the most
relevant official documentations to identify the risk mitigation strategies in the healthcare
industry. The following step is conducting the direct observation in the relevant departments
hospitals and pharmaceutical company (e.g. procurement department; material department,
pharmacy department etc.). According to Yin (2009), the leading strength of conducting direct
observation in the case based organization is to ensure the reality in real time and cover the
event context. The semi-structured interview will be constructed to identify more risk
mitigation strategies. During these formal interviews, the above results will be presented to
the experts, and they are supposed to decide whether the identified strategies are relevant
or not. In addition, these experts will be asked if they would be willing to accept the invitation
of the interview in advance.
In the last phase, depending on the results obtained from above, another questionnaire
survey D will be conducted aiming to evaluate the efficiency of the identified risk mitigation
strategies with related to each risk factor. Following the same procedure of developing the
questionnaire survey above, the Chinese/English translation process will applied on
questionnaire D and the forward format is the pilot tested by four academic researchers
before being field-tested on a larger sample. The finalised English and Chinese questionnaire
D is attached in Appendix Four.

113
3.6.2 Data analysis methods
The data collected in the previous sections are explained and analysed prior to being used in
other stages of the research. According to Yin (2009), some specific methodologies and
techniques are required to analyse collected data in order to produce high quality results. In
this thesis, Fuzzy AHP and ISM models have been used to analyse the survey results from
questionnaire B and C respectively and further fuzzy TOPSIS has been utilized to analyse the
survey results from questionnaire D. For the purpose of ensuring the reliability and
consistency of the gathered data, a series of tests (e.g. statistical test, consistency check and
sensitivity analysis) should be conducted prior to carrying out the evaluation of risk factors
and mitigation strategic research. The procedure of applying each model and producing a
high-quality data analysis will be presented in Chapter six and Chapter seven.
3.7 CONCLUSION
In this chapter, various research methodologies were reviewed based on the “research onion”
categorization which serves as an approach constituted by different layers of the research in
a strategic manner. Based on the literature study, the appropriate methodologies for this
research were identified and outlined. The techniques for the data collection and analysis by
conducting the empirical studies have been described in this chapter. There are three main
parts for the data collection methods, which are: (1) data collection methods in risk factors
identification, validation, (2) data collection methods in risk assessment phase, and (3) data
collection methods in risk mitigation strategies identification, validation and evaluation. In
the first part, the risk factors are identified through literature review, and then the validation
and exploration of the identified risks are done through questionnaire survey with both
industrial and academic experts. Next, another two questionnaire surveys and telephone
interview are conducted for the assessment of risk factors. In the last part, the implemented
risk mitigation strategies are identified and validated by conducting the empirical studies (e.g.
interview, direct observation and official documentation). In order to evaluate the identified
risk mitigation strategies, a mitigation-strategy questionnaire survey is conducted. This
enables the researcher to select the most efficient risk mitigation strategies. The techniques
for the analysis of data are based on the employment of combined Fuzzy AHP, ISM and Fuzzy
TOPSIS for the risk assessment and mitigation strategy evaluation.

114
4.CHAPTER FOUR - CONCEPTUAL FRAMEWORK AND INTEGRATED RISK MANAGEMENT MODEL
4.1 INTRODUCTION
The previous literature review indicated that there is lack of knowledge about how to control
supply chain related risks in the healthcare industry. The majority of existing studies on
healthcare SCRM merely imitated the traditional risk management approaches from
manufacturing industry directly without considering the unique characteristicd of the
healthcare setting. Specifically, there is a lack of risk management framework in healthcare
organizations as a guidance or foundation which would support decision makers in the
achievement of efficient risk management. The objective of this chapter is to develop a novel
supply chain risk management conceptual framework. Hence, the chapter is structured as
follows: firstly, the development of a risk management framework in the context of
healthcare setting will be presented. Based on the proposed conceptual framework, the
three steps risk management process (i.e. risk factors identification, assessment and
mitigation) as the main guideline to structure the research process are discussed. Finally, the
chapter concludes by developing an integrated risk management model incorporating the
reviewed MCDM and qualitative models.
4.2 CONCEPTUAL FRAMEWORK
Risk management has an integral role in the establishment of an effective supply chain that
operates in the existence of different turbulences. In any supply chain, a risk management
framework depicts an integrated process that takes place across a number of business
settings before a turbulent event happens. The importance of a contemporary healthcare
supply chain is evident in the improvement of patient care quality through practices of
removing unnecessary costs and in the achievement of more robustness as well as resilience.
Most healthcare providers and suppliers are committed to automating and streamlining
supply chain processes with the aim of improving its efficiency. In fact, the current healthcare

115
supply chain is extensive and intricate and hence increases the level of potential risks for all
the organizations involved.
The proposed risk management conceptual framework is based on the idea of determining
different factors that creates a risk-supporting environment as shown in Figure 4.1. It has five
unique components that elaborate on the sequence that is supposed to be followed in
assessing and managing uncertainties in a healthcare supply chain. They are the component
of risk drivers and sources, decision makers, SC strategies, SCRM process and performance
outcomes. The feature of the framework is more than simply to aggregate all the elements
together but far more interactive and repetitive. The framework has a sequential process that
is repetitive in nature and is centered around the risk management process, which is
connected in circulation process, indicating that one component is dependent on another
component. The literature on SCRM show that a common risk management process is
generally organized into three steps: risk identification, risk assessment and risk mitigation
(Kleindorfer and Saad, 2005; Hendricks and Singhal, 2005; Bode and Wagner, 2009; Kern et
al., 2012). These three key steps are adapted in the framework for managing supply chain
risks. Besides, many researchers also emphasiszed the importance of an ongoing risk
monitoring and iterative risk management process that is constantly adapted to the requirem
ents of a changing environment (Kleindorfer and Saad, 2005; Hendricks and Singhal, 2005;
Bode and Wagner, 2009; Kern et al., 2012). Without continuous improvement, even
successful risk management processes will become weak and unable to identify and address
risks with the risk measures when environmental conditions change and new risks arise.
Therefore, risk management activities need to go hand-in-hand with a continuous
improvement process in the long run.
For risk management to be successful, there is a need to identify the risk driving factors that
have a direct impact on SC performance. Several SC disruptions reported were clearly caused
by these driving factors, or at least exacerbated by them. The term driver has been introduced
to differentiate those factors likely to have a significant impact on the exposure to undesirable
performance and risk outcomes, or possibly providing the opportunity to improve
performance, albeit with increased risk (Ritchie and Brindley, 2007).

116
External environment
Industry specific Supply chain
configuration Partner specific Note specific
Risk drivers
Financial performance improved (Cost reduction)
Patients/employee satisfactions
Ext
ern
al t
o
the
ho
spit
al
bu
t in
tern
al
wit
hin
th
e SC
Inte
rna
l to
th
e h
osp
ital
Ext
ern
al t
o
the
SC
Ris
k so
urc
e
Performance outcomes
SC strategies
Visibility and transparency
Multiple sourcing
Outsourcing Vendor
Managed Inventory (VMI)
Lean philosophy
Potential decrease in SC Vulnerability
Risk Management Plan
(Contingency theory)
Potential increase in SC Vulnerability
Risk attitudes
Risk mitigation
Risk factors identification
Risk assessment
Decision makers
Individual and/or groups(Risk transfer, share, elimination using internal solutions, reduction with other partners, avoidance)
Continuous improvement process
Strategies identification
Strategies implementation
Figure 4-1: Healthcare supply chain risk management conceptual framework by author

117
To assess supply chain risk, triggering events are modeled as a function of their severity in
terms of impact on the supply chain goals and their frequency of occurrence. Different
researchers have identified and configured risk drivers from different perspectives, such as
the globalisation of supply chains or the trend towards outsourcing, have exacerbated the risk
exposure as well as the impact of any supply chain disruption (Christopher and Lee, 2001).
Since competitive pressures are often the drivers of risk, Svensson (2002) uses the term
“calculated risks” that a company takes in order to improve competitiveness, reduce costs
and increase or maintain profitability. The risk drivers in the developed framework are
comprised more generically under five categories, linking to the level at which they are likely
to have most impact (e.g. external environment risks likely to impact every organization,
whereas node specific will impact only the organization itself). The idea also based on the
suggestion of Jὓttner et al., (2003), who discovered the potential disruptions faced by
organizations in supply chains into three categories: environmental-related (i.e. external
environment and industry specific), network-related (i.e. supply chain configuration and
partner specific) and organizational-related (i.e. note specific). This is then followed with the
phase of determining the available risk sources that are expected to facilitate and support risk
management initiatives. Based on different types of decision-making unit, the perception and
attitude towards risks might be different. The subjective perception of the significance or risks
in divided into five groups: risk transfer (i.e. transfer the risk to another actor in the supply
logistics (e.g. supplier, subcontractor, service, distributor, customer. etc) so they bear the risk),
risk share (i.e. share or divide the risk with another actor in the supply chain networks),
elimination using internal solutions (i.e. singlehandedly try to reduce or eliminate this risk
using internal solutions), reduction with other partners (e.g. supplier, service, customer, etc),
risk avoidance (i.e. do nothing at all and ignore the risk). These attitudes may drive managers’
decision-making processes and lead to different solutions. Supply chain risk, as risk in general,
may be regarded as a subjective concept that relies on the individual’s assessment of
potential outcomes, rather than an objective concepts (Heckmann et al., 2015). The decision
maker’s degree of acceptance with respect to the deterioration of target-values defines their
attitude towards supply chain risks. For example, risk taker supply chain managers would
behave in a way that can potentially cause harm and financial loss, but also have opportunities
to get reward. On the other hand, risk avoidance decision makers would avoid the activities
that may lead to exposure to a risk, such as not select suppliers that use unsustaintable

118
technique and process. In addition to this, the framework also highlights the essence of
implementing appropriate SC strategies that should be tied to both risk context and type of
decision-making units.
Moreover, the contingency theory is used to describe the importance of situational influences
on the risk management initiatives due to different SC networks being unique in certain
respects and requiring the tailored strategies. Otherwise, risk management helps to reduce
the adverse impact while absorbing many resources and increasing the supply chain
vulnerability. This feedback loop acknowledges that attempts to manage risks can sometione
have an impact on that risk itself either positively or negatively, or another risk source. For
example, Enterprise Resource Planning (ERP) system can be used to improve production
planning and reduce control risks. However, highly dependency on such computer-based
system may initiate another risks in terms of delayed processes caused by
computer/hardware problem. Regarding to the performance outcomes, due to the different
perspectives, the focus in the healthcare provider is towards both cost reduction and service
quality improvement as well as employee satisfaction. The detailed discussions of each
component are given below.
4.2.1 Risk drivers and sources
The component of risk sources and drivers are based on the assumptions that the supply chain
is conceptually and practically holistic and supply chain risk resources are triggered by various
factors. This framework can be acting as a platform to group them into five sectors: external
environmental, industry specific, supply chain configuration, partner specific, and node
specific.
External environmental factors are associated with the changes in the natural disasters,
unexpected disease, and economic, social as well as political environments, basically on a
local, national and global scale and how they affect the performance of healthcare
organizations. In China, since the initiation of economic reforms in 1978, the country has
undergone profound transformations in its social and economic structures associated with
healthcare reform. As a matter of fact, the reform has brought tremendous opportunities and
also the huge challenges to the healthcare industry. These challenges are associated with
growing inequality in access to healthcare services, ineffective supervision and increased
financial burden on hospitals. At the same time, the regulated pharmaceutical supply chain

119
system in China has always lacked the competitive mechanisms and leads to bureaucratic
behaviour, inefficiencies and an imbalanced supply. It is widely acknowledged that the UK
National Health System (NHS) is hugely reliant on EU-trained health professional staff who
come to work in the UK from 27 other EU countries. Since the UK voted to leave the EU, there
are about 10,000 NHS staff who have opted to go back to the EU or other countries. The staff
losses will intensify the shortfall problems of the NHS, which is struggling to retain qualified
staff.
Some specific risks are also generated within the particular industry (i.e. Industry specific) or
sector exposing those operating primarily within the sector. Based on the findings of some
reports, human life expectancy increased from 67.3 years in 1950 to 77.6 years in 2011 (OECO
2013), it can be expected that the life expectancy will reach 88.5 years by 2050 (Miken
Institute, 2013). As people live longer, there is more needs for frequent treatment and quality
of healthcare service. Medical tourism is generally referred to as the act of patients travelling
away their home country for the purpose of receiving better medical treatment and
alternative care. The growth trend has been driven by a great affordability of medical care in
other countries, high quality of speciality care, avoidance of long waiting times for certain
medical procedures etc. According to Transparency Market Research (2013), the global
medical tourism market was estimated to be £10. 6 billion in 2013 and is expected to reach a
market worth £33.6 billion by 2020. Moreover, the healthcare reform in the UK includes
‘Patient Choice’ which aims to provide patients more choices of hospitals for their elective
care (Department of Health, 2006a). As a consequence of intensified competition, the
healthcare providers have to improve their quality, efficiency and responsiveness. As a result
of globalization of the economy, the healthcare supply chain has increased reliance on foreign
sources of pharmaceuticals and raw materials with questionable quality. There is evidence
that nearly half of the injectable drug shortages were caused by manufacturing quality
problems in 2015. More significantly, the increased drug shortages could lead to the
emergence of a grey market in which drugs are obtained and aggressively marketed to
healthcare providers, usually at inflated prices, or even worse, counterfeiting drugs.
Supply chain configuration, on the other hand, refers to the number of nodes or members
within the chain and their relative influence are examples of variables that may influence the
risk perceived at any node in the chain. Hospital operations should handle the multifaceted

120
distribution system consisting of multiple storerooms and warehouses where different
pharmaceutical products are stored according to various instructions and regulations. Breen
(2008) asserts that the convoluted nature of the pharmaceutical SC is suffering from issues
like counterfeit medications, product shortages etc. Similarly, other research has described
that in Europe drugs can pass through as many as 20-30 pairs of hands before they can
eventually be delivered to patients (Haigh, 2004).
Thus, the total 25 effective pharmaceutical markets in Europe have made the SC network
more fragmented, which has resulted in a decline in the transparency of the whole SC
(European Federation of Pharmaceutical Industries and Associations (EFPIA), 2005).
According to the EFPIA, more than 2,500 medicines have some stage of manufacturer in the
UK and 46m patient packs are supplied from the UK to EU countries every month, while
another 38m flow in the opposite direction. Therefore, under the no-deal Brexit scenario, it
should be considered that medicine supply chain would face ‘chaotic disruption’ and a rise in
prices for UK and some EU hospitals.
Partner specific refers to the key considerations in sustaining an efficiency of relationship
between healthcare organization and pharmaceutical supplier and distributor. This can be
realized through the introduction of consignment stockholding, retention of skilled labour,
service quality and support, financial performance of the pharmaceutical company and
training and development especially technical expertise. Moreover, neighbouring hospitals
are encouraged to collaborate horizontally to achieve the goal of controlling procurement
costs and sharing SCM knowledge (Rego et al., 2014).
Node specific represents relevant considerations for the capabilities of healthcare
organizations to respond to the demands of the end user in the supply chain, i.e. patients.
The reasons for the above are such things as ill-equipped or poorly trained staff, inadequate
management control and ineffective communications (Ritchie and Brindley 2007). For
example, the Chapel Allerton Orthopaedic Centre (CHOC) in the UK faced the overstock
problem due to inefficient inventory management. The centre spent over £3 million per year
to improve the inventory management performance (Medwell, 2009). Similarly, in UK NHS,
nursing staff have to spend on average 15 per cent of working hours to operate inventory
management instead of clinical functions due to the lack of professionals.

121
It is indicated by Chopra and Sodhi (2004) that the main sources of supply chain risk are
delays, capacity, disruptions, receivables, intellectual property, systems, inventory, forecasts,
and procurement. Trkman and McCormack (2009) suggested a new theoretical framework in
identifying and predicting different supply chain risks as shown in Figure 4.2.
Supplier attributes
SC strategy and structure
Financial performanceHuman resource factors
Operational factorsCulture
Relationship factors
SC typelean, agile, hybridSuppliers types
Business structureGeographic location
Market turbulenceNew products
Price sensitivityLevel of competition
Demand swingsNew customers v. repeat
Technology turbulenceRapid changes
High tech influence
Risk of supplierNon performance or
Disruption in a SC
ContinuousInterest ratesCPIGDPCommodity pricesDiscreteTerrorismDisastersStrikes
Endogenous uncertainty
Exogenous uncertainty
Figure 4-2: Conceptual model
[Source: Trkman and McCormack (2009)]
It is noted that the factors in the specific environment of the supplier, which are endogenous
and exogenous uncertainty, transform the nature and functionality of a supply chain.
Endogenous uncertainty refers to turbulent situations that are exemplified by recurrent and
volatile technological and/or market changes in a given industry that heighten risk and makes
it difficult for accurate forecasting. Exogenous uncertainty, on the other hand, refers to
environmental disruptions experienced in either human-centred problems (fraud, terrorism,
labor strike, delays in logistics) or in the appearance of natural disasters (earthquakes, floods,
hurricanes). The proposition of the model is that the relationships between supply chain

122
attributes, supplier risk of disruption or non-performance in a chain, supplier characteristics,
and chain structure and strategy are transformed by environmental, market and technology
turbulence. Giannakis and Papadopoulos (2016) also offer a significant contribution in
defining a strategic risk management framework that focuses only on sustainability-related
risks (Figure 4.3). A supply chain is impacted by environmental risks, financial risks and social
risks, which are categorized under two key drivers: endogenous and exogenous.
Fin
anci
al
risk
sSo
cial
ri
sks
Envi
ron
men
tal
risk
s
Drivers
Endogenous
Cultural/human nature
Business plan
Operational
Errors
Natural phenomena
Regulatory
Economic envment
Endogenous
Risk identification
Risk assessment
Risk analysis
Risk treatment
Risk Monitoring and control
Share Avoid
Retain Control
Potential cause
Potential cause
Consequences
Financial
Operational
Social
Environmental
Regulational
Strategic
Figure 4-3: A risk management framework for sustainability-related risks
[Source: Giannakis and Papadopoulos (2016)]
Same as discussed by Trkman and McCormack (2009), endogenous and exogenous risks are
characterized by disruptive situations that seek to heighten the uncertainty in forecasting and
flow of supplies as demanded. It is believed that endogenous environmental risks have a
relatively higher interconnectedness between different sustainability-related risks and,
hence, are perceived as the most important element of consideration. As a result, there is a
need to have integrated sustainability risk management models that assist in the
determination and implementation of realistic sustainable initiatives. It is through such
proactive projection that the adoption of a sustainability risk-related framework is found to

123
be useful. The significance of this sustainability risk management framework is that it can be
used on various levels of the supply chain. One of the levels can be for the organization that
is concerned with integrating sustainability-related risks to its decisions for strategic
operations. Another level could be the dyadic connections with some suppliers as a way of
improving the selection and assessment process for suppliers. Finally, the framework can be
used for the general supply chain strategy, particularly where sustainability-related risks are
associated with the decisions on investment and relationship with other networks such as
shareholders, customers, and governments. The framework elaborates on an opportunity for
creating distinction between typical supply chain risks and sustainability-related supply chain
risks. This provides constructive insights concerning the causes and impacts of such risks and
the appropriate measures to be taken as risk responses. In this thesis, the proposed risk
management framework suggests the categorization of these sources into different areas of
focus, including internal to the hospital, external to the hospital but relevant to the supply
chain network, and external to the network. Any form of turbulence that is likely to happen
in a defined supply chain will definitely have a source, which when determined proper
measures can be put in place to ensure that the supply chain is efficient. Chapter five provides
a detailed explanation about the risk factors identification and classification.
4.2.2 Decision makers
Individual and/or groups
In terms of the decision-making types, it depends on the whether the external SC partners
are participating in the decision making process. In general, the healthcare providers
exhibited the combination of individual and group decision-making. Informing policy and
operational decisions by identifying supply chain related risks and their likelihood as well as
consequences usually involved at least one hospital manager interacting with their
corresponding colleagues in the Procurement Department, such as, in order to avoid the
shortage of vital drugs would typically involve the Procurement Department and the Material
Management Department. In this case, the likelihood and the serious consequence of the
shortage in terms of performance measurement (e.g. patient’s health, service quality, and
cost of emergency delivery) are reasonably predictable. If the problem becomes increasingly
prominent and escalates into considerations about replacement of the major suppliers and
increased stockholding, this might expand the scope of participation based on department

124
functions and working experience. Hence, as the main unit of pharmaceutical administration,
the Hospital Pharmacy Management Committee (HPMC) would be involved in the decision
process. The evidence also suggested that in the context of RM strategies and policies in
hospital, the decision-making process is rarely the outcomes of a single individual or within a
single time period. The process also engaged clinical involvement and the participants
including suppliers and the other stakeholders (e.g. Finance and Staff training). In terms of
risks and performance outcomes, the more strategically the decision is made, the more
extensively this engagement took place (Ritchie and Brindley, 2007).
Attitude towards risks
According to Lavastre et al., (2012), attitude towards risk determines the level of success in
its management. There are ways that a healthcare organization can adopt in addressing the
identified risks in a supply chain. The nature of a given business and individual behaviour and
style influences the attitude toward risk. The managerial perception of risks is critical for
SCRM has been studied by few researchers (Zsidisinm, 2003b; Sodhi et al., 2012). Some of the
generic attitudes that are adopted at this phase include risk transfer, risk share, risk
elimination by using internal solutions, risk reduction by other partners, and risk avoidance.
The element of attitude towards supply chain risks is associated with organizations’ trade-offs
or what is considered as a tolerable level of risk. It is also deemed as the attitude of an
organization and size of potential benefit with reference to risk taking, and it is such a
perspective that determines whether an organization is a risk-taker or a risk-averse, which
will have a direct impact on the risk mitigation.
4.2.3 Risk management process
The main tasks of risk management (RM) include the identification of risk sources, assessment
of risks and mitigation of risks. Good practice of risk management depends on the
preparedness of the whole risk management process, which provides a clear pathway for
finding appropriate solutions for the potential turbulences in a supply chain. It should also be
understood that the process of risk management is a circular and repetitive process.
Therefore, some risk mitigation strategies can turn out to be new risk triggers. As indicated
in the framework, the iterative risk management process should adopt the continuous
monitoring and improvement process because of the continually changing environment.

125
When environment conditions change and new risks occur, even efficient risk management
processes would become weak and lack capability to identify and reduce risks with the right
assessment without continuous improvement. It means the application of the current RM
activities needs regular review, measurement and the continuous improvement being made
with new inputs at each stages. Learning from previous mistakes will facilitates risk factors
identification activities to investigate the root cause of the accidents across the SC.
Transparency about an organization’s ongoing improvement in the effectiveness of RM can
also promote the enormous motivations for staff to raise awareness of crisis and justify
financial investment into staff training and other additional resources (Kleindorfer and Saad,
2005).Therefore, the continuous evaluation of an organization’s RM processes helps to clarify
potential areas for improvement and recognize the contribution of effective measurement
and lessons learned from past accidents.
4.2.4 Supply chain risk management strategies
A key assumption established by this conceptual framework is that a number of risks will be
reduced while others will be increased when various risk mitigation strategies are used. For
example, in a conventional perspective, healthcare providers will increase the level of their
stock as a way of mitigating the demand risks. At the same time, an increase in stock level
would cause the risk of experiencing costs in terms of losses as the shelf life of some specific
drugs is relatively short. The assumption draws upon contingency theory, which emphasized
that there is no one-size-fits-all strategy to govern the organization, manage the leadership
and decision-making due to different environments providing different antecedents (Fiedler,
1964). The theory argues that implementing the optimal decisions within the organization is
contingent on both internal and external factors and the optimal solutions to adopt depend
on the characteristic of industry and nature of the organization’s environment. That is to say,
decision makers should consider that some tailored strategies are more fit than others for
given circumstances. The organization’s performance is affected by the degree of matching
of its organizational resources with the corresponding industry environment (Kim and Pae,
2007). Otherwise, risk management helps to control the impact of turbulence on
organizational performance, this brings many benefits, on the other hand, due to some
strategies (e.g. Lean philosophy) focus on cost reduction could remove all slack from the SC
network, increasing vulnerability with unexpected implications for profit. Based on the

126
contingency theory, it seeks to provide decision makers with guidance to evaluate and
implement appropriate mitigation strategies by considering various risk drivers, risk
categories, type of decision maker, priority or risk factors as well as the performance
outcomes.
4.2.5 Performance outcomes
There are different studies define the meaning of the term performances from the various
perspectives. Child (1975) expresses performance on the basis of profitability and efficiency,
while Hage and Dewar (1973) define performance in relation to employee satisfaction. Such
differences reflect the different purpose and strategic objectives of the organization and the
stakeholder composition. It is widely acknowledged that cost reduction and service quality
improvement are two main performance objectives for building an efficient healthcare supply
chain operation. However, in the meanwhile, most researchers often ignore the serious
consequences incurred by the employee dissatisfaction in hospital operations. It can be
acknowledge that workforce quality and talent management are not only related to the
organizational performance but also cover the entire SC activities (Hohenstein et al., 2014).
Thus, existing studies have identified workforce as the key success factor in SCM, even beyond
pursuit of quality and profitability (Scott et al., 2015). For example, the UK NHS junior doctors’
strikes had significant negative impacts on patient care. There were over 100,000 operations
and exceeding 1 million outpatient appointments which were cancelled in 2016. In fact,
decision makers should understand what factors both influence the retention of SC
professionals and support the effective working environments within the organization, which
is crucial for the long-term sustainability and performance of the field.
4.3 DEVELOPMENT OF INTEGRATED RM MODEL IN HCSC
The above novel risk management conceptual framework offers a comprehensive overview
of the steps that needs to be followed in addressing various turbulences in a healthcare supply
chain. However, due to the time and workload limitations, all the components cannot be
covered in this research. Besides, Kleindorfer and Saad (2005) underlined the effective SCRM
on the basis of three key tasks: specification of risk sources, risk assessment and risk
mitigation. Therefore, based on the guideline of the framework, this research extracts a piece

127
of structure to develop an integrated risk management model comprising of three main SCRM
steps (i.e. risk factors identification, assessment and mitigation) as presented in Figure 4.4.
The concept of risks has all the time been associated with the supply chain, and this is based
on the fact that it represents a clear picture of what an organization is all about. Both in the
upstream of an organization and downstream supply chain, streamlining of operations is an
important affair as it minimizes legal, financial, operational, confidentiality and reputational
risk. The management of risk sources is a constructive decision-making process that sets a
platform of understanding the engineering, social, political and economic factors as they are
related to a scenario. In the case of supply chain management, risk management analyses
these factors with regard to how they are related to a potential turbulence. This requires a
methodology that allows the assessment of such a scenario from all perspectives with the
objective of analysing organizational, SC network as well as environmental risks and
accordingly, evaluation of the relevant risk management strategies.
Hence, the adoption of an integrated risk management model has also been used in various
frameworks and decision models (Samvedi et al., 2013; Elleuch et al., 2014; Nazam et al.,
2015). Among these studies. Samvedi et al., (2013) integrated Fuzzy AHP and Fuzzy TOPSIS
for quantifying supply chain risks in relation to the probability and severity. Meanwhile, they
have the benefit of combining approaches like fuzzy set theory, which by its nature is built to
handle subjective assessments. However, there is no systematic approach to identify supply
chain risks in this study. By using the combined approach including: (1) Failure model, effects,
and criticality analysis (FMEA), (2) Design of experiment (DOE), (3) Discrete event simulation
(DSE), (4) Analytic hierarchy process (AHP) and (5) Desirability function approach (DFA) to
managing risks in hospital sector. The main focus on this study is centred on determining the
most signification supply chain risks mitigation strategy for a supply chain but not to evaluate
the contextual relations as hidden influences between the risks which are focused on in this
thesis. Using the same set of MCDA methods with Samvedi et al., (2013), Nazam et al., (2015)
proposed a decision making model to support ranking and assessing the risks associated with
implementation of green supply chain management practices under the fuzzy environment.
Nevertheless, this research does not primarily concentrate on estimation of the efficiency of
specific risk mitigation strategies but instead on the evaluation of when the GSCM initiatives
should be implemented. Moreover, there is also lack of a systematic approach for identifying

128
the current implemented risk management strategies. Although there is increased attention
on SCRM in the literature, only a few studies have focused on the effective risk management
methods which support healthcare organizations to make appropriate decisions for a more
resilient supply chain.
The integrated risk management model, illustrated in Figure 4.4, focuses on the identification
and assessment of supply chain risk factors as well as prioritising implemented risk mitigation
strategies through the fuzzy set theory, qualitative and interpretive as well as MCDM
methods. Firstly, both literature review and questionnaire survey are employed to
systematically identify and classify relevant risks and conduct an initial assessment. It is
followed by quantifying the priority weight of identified risks through the use of Analytic
Hierarchy Process (AHP) incorporating with fuzzy set theory. Interpretive Structural Modelling
(ISM) is then applied to investigate the interrelation among the risks. Lastly, empirical studies
are conducted to extract identified current implemented risk mitigation strategies for further
evaluation. Thereafter, Fuzzy TOPSIS is employed to capture the priority ratings of identified
strategies for managing SC related risks.
4.3.1 Phase 1 - Risk factors identification
Risk factors identification is the first step in the process of risk management and it is an
essential stage in the risk management process as the organizations can understand the
unfavourable factors in the projects (Norrman and Jansson, 2004). Besides, risk factors
identification provide the list of risks that not only impact on the one piece of process but also
the whole supply chain network.

129
Recognize and select the risk factors
Finalized the criteria to be used in risk assessment
Establishing hierarchical structure
Literature review
Obtaining expert s opinion
Phase 1
Approval of hierarchy
Phase 2 FAHPYesNo
Structure problem hierarchy
Construct the fuzzy comparison matrix
Transform linguistic judgements into fuzzy numbers
Consistency check
Calculate the fuzzy weight of criteria and sub-criteria s
Ranking of the risk factors
Yes
Triangular fuzzy number (TFN)
No
Phase 3 ISMConstruction of structural self-interaction matrix
(SSIM) by pairwise comparison
Developing a reachability matrix from the SSIM and checking for transitivity
Ensuring the reachability matrix is appropriately partitioned into several levels
Conversion of diagraph with removed transitivity links
MICMAC analysis
Drawing of diagraph with removed transitivity links
Remove the risk factors with weak drivers and dependents
Phase 4 FTOPSISConduct the empirical studies for identified the
implemented risk mitigation strategies
Choose the appropriate linguistic values for alternatives with respect to criteria
Compute aggregate fuzzy ratings for the alternatives
Construct the weighted normalized fuzzy decision matrix
Construct the fuzzy decision matrix and the normalized fuzzy decision matrix
Determine and calculate the distance of each alternative from FPIS and FNIS
Calculate the closeness coefficient (CCI) of each alternative
Rank the alternative
Triangular fuzzy number (TFN)
Figure 4-4: Proposed integrated risk management model in healthcare supply chain

130
Hazard and operability (HAZOP) analysis is a systematic and structured method of examining
an intricate operation or process for the purpose of identifying issues that are potential risks.
As argued by Venkatasubramanian, Zhao and Viswanathan (2000), HAZOP is based on the
idea of breaking the complicated process design into straightforward sections known as
‘nodes’ for reviewing. As a qualitative method, HAZOP focuses on stimulating the idea of
identifying operability issues and potential turbulences in a supply chain. Conducting a semi-
structured interview or organizing the focus group through brainstorming session are other
appropriate risk factors identification methods that consider the experience of managers in
dealing with challenges in supply chains. There are qualitative methods that can be used in
inquiring about the nature of risks and the root causes in the supply chain. This is realized by
combining a pre-determined set of open-ended questions.
Moreover, literature review and qualitative questionnaire survey are other risk factors
identification methods which serves as a base and guide to build upon throughout the risk
factors identification research process. In this thesis, it starts with the literature review and
then an initial healthcare supply chain risk taxonomic diagram is developed. More specifically,
the focus of the risk review needs to be defined in advance and an organized HCSC risk
classification schema is mapped for creating a more complete picture of each stakeholder,
responsibilities and three different kind of flows (i.e. material, information and cash flow) in
the network. It provides an overview by enumerating all possible threats that could produce
the adverse consequences for the SC performance. However, it is clear that not all risks are
easy to find out. Feedback loops and dependent events chains often pose additional
challenges for risk factors identification (Hallikas et al., 2004). Therefore, by conducting the
qualitative survey, the obtained risks are analysed to verify the comprehensiveness and
validation as well as to confirm the appropriateness of risk classification method. Besides this,
an initial assessment is conducted to quantify the important level of identified risks as this
thesis only focuses on those risks requiring most attention by experts.
4.3.2 Phase 2 - Risk assessment
Risk assessment is the second step in the risk management process. It provides a quantitative
view of the priority of the risks and would help decision makers to understand which risks
should be payed more attention as well as which risks are less critical. Risk assessment in a
supply chain is an imperative fraction of the SCRM process, and this is based on the idea that

131
it is an extensive criterion for decision making while under unclear environments. It is always
concerned with the probabilities for identifying risk-taking events in the SC system and
determining the consequences of these risk events defined in the previous stage. Norrman
and Jansson (2004) provide an in-depth analysis of the supply chain risk management model
by Ericsson, which proposes the assessment of the impact of risk on profitability. The
approach elaborates on the economic damage caused by disruption in a supply chain. It also
focuses of the probability of occurrence of a risk. Deleris and Erhun (2011) offer a quantitative
model of risk assessment that is a derivative of probabilistic risk analysis (PRA). It is an
important method that can be used for various scenarios as it becomes realistic to simulate
the impact of risk scenarios on supply chain performance. However, uncertainty issues cannot
be presented simply by using the concept of probabilistic or crisp values. The fact that there
are a lot of subjective judgements involved in the multiple factor analysis hinders the
applicability of many risk assessment methods. Nevertheless, the application of Multiple-
Criteria Decision Making (MCDM) methods combined with the fuzzy set theory (FST) in the
risk assessment allows the qualitative risk assessment descriptions to be mathematically
modelled (Wang et al., 2017). Meanwhile, by applying another interpretive method for
developing understanding of the complex relationships among system element aims to
analyze the impact of each individual risk on another.
As described above, risk assessment involves multiple factor analysis. Many researchers have
conducted studies to assess and measure the supply chain related risks by using multi-criteria
decision-making (MCDM) methods from different perspectives. It is a powerful tool widely
used for evaluating and ranking problems containing multiple criteria. Moeinzadeh and
Hajfathaliha (2009) developed a SC risk assessment approach based on the analytic network
process (ANP) and the VIKOR methods to evaluate the risks through ranking the relative
importance of the risk categories. Analytic network process (ANP) is a MCDM method, which
is capable of handling interdependence and feedback among the evaluation criteria.
Feedback can better capture the complex effects of interplay in human society. Each criteria,
sub-criteria and alternative are treated equally as nodes in a network. Each node might be
compared to another node as long as there is a relation. For example, the ranking of
alternatives might not only depend on the weighting of criteria, but also given alternatives
can influence the ranking of criteria. However, the method require a specific software to

132
calculate results and the explanation of concept and process to management extremely
challenging. Furthermore, the inconsistency may occur, leading to doubtful or wrong results.
Therefore, Wang et al., (2012) applied fuzzy Analytic Hierarchy Process (FAHP) to assess risk
of implementing various green initiatives in the fashion industry. Samvedi et al., (2013)
applied fuzzy AHP and fuzzy TOPSIS (Technique for Order Preference by Similarity to an Ideal
Solution) to quantify the risks in a supply chain, and aggregated the values into a
comprehensive risk index. Similarly, Nazam et al., (2015) proposed a hybrid model to rank and
assess the risks associated with implementation of green supply chain management (GSCM)
practices under the fuzzy environment using fuzzy AHP and fuzzy TOPSIS approaches.
Founded by Thomas Saaty in 1971, the Analytic Hierarchy Process (AHP) is an MCDM method
to deal with intricate decision making by creating a series of pair-wise comparisons from
complex decisions and synthesize the outcome. It is also effective in capturing both objective
and subjective elements of decision and, hence, providing a comprehensive analysis of a
situation and helps decision makers evaluate whether the problems in each level are of the
same order of magnitude. In other words, it provides the decomposition of a complex
problem into a systematic hierarchical level. In the conventional AHP model, the pairwise
comparison is made using a nine-point scale which converts the human preferences between
available criteria and alternatives as equally, moderately, strong, very strong or extremely
preferred as shown in Table 4.1.
Table 4.1: Nine-point pairwise comparison scale (Saaty, 2008)
Measure scale Definition Description
1 Equal importance Two factors contribute equally to the objective
3 Weak importance of one over another
Experience and judgement slightly favour one over another.
5 Essential or strong importance Experience and judgement strongly favour one over another.
7 Very strong or demonstrated importance
A decision element is favoured very strongly over another. Its dominance demonstrated in practice.
9 Absolutely importance The evidence favouring one decision element over another is of the highest possible order of affirmation.
2, 4, 6, 8 Intermediate values When compromise is needed.

133
Reciprocals of above nonzero
If decision element i has one of the above nonzero numbers assigned to it when compared with decision element j, then j has the reciprocal value when compared with i
A reasonable assumption
Rational Ratios arising from the scale If consistency were to be forced by obtaining n numerical values to span the matrix
By incorporating essential techniques of checking evaluation consistency, AHP assists in
addressing any form of bias in a decision-making process. Compared with other decision-
making approaches, there are three mainly advantageous features of the differentiated AHP:
its ability to handle both tangible and intangible attributes; its ability to structure the
problems in a hierarchical manner to gain insights into the decision-making process; and its
ability to monitor the consistency with which a decision maker makes a judgement (Vargas,
1990; Wedley, 1990). Moreover, Golden et al., (1989) determined the characteristics of AHP
as including simplicity, ease of use, flexibility and the ability to deal with ill-structured
problems; its principles have been successfully applied on many complex real-life decision-
making scenarios. On the other hand, despite the popularity and simplicity of applying AHP,
this model is often criticized because it does not adequately address the inherent
uncertainties and inaccuracies associated with mapping decision-maker’s perception to exact
numbers (Chan et al., 2008; Gopalan et al., 2015). In addition, the subjective evaluation is
evident with following the capacity of the decision maker, which can be misleading at times.
It also over relies on the decision maker and any form on conflict in the decision affects the
whole process.
As discussed above, the traditional AHP cannot be directly applied to solving uncertain
decision-making problems as it is not able to reflect human cognitive processes. Thus, Bellman
and Zadeh (1970) investigated the decision-making method in fuzzy environments, and the
fuzzy set theory has been applied by an increasing number of researchers to handle uncertain
fuzzy problems. It has proven advantages within vague, imprecise and uncertain contexts and
it resembles human reasoning in its use of approximate information and uncertainty to
generate decisions (Chan and Kumar, 2007). There are more than 7,000 journal articles,
reports, monographs and books on fuzzy set theory and applications that have been

134
published since 1965 (Kaufmann and Gupta, 1988). The procedure of fuzzy theory is shown
at Figure 4.5.
Fuzzy Inference Rules
Process Under Control
DefuzzificationFuzzification
Output Fuzzy Linguistic Variables
Input Fuzzy Linguistic Variables
Input Crisp Variables
Output Crisp Variables
Figure 4-5: A typical Fuzzy Logic control – Fuzzy control system schema
[Source: Kὂse and Deperlioglu 2015]
The crisp variable is entered into the fuzzy controller and then another crisp variable is output
for further evaluation. There are four main components in the fuzzy control system (Kὂse and
Deperlioglu 2015): “(1) the rule-base learns how to best control the system in the form of a
series of rules, (2) the reasoning mechanism determines which control rules are currently
more relevant at the current time and then decides what the input variables to the plant
should be; (3) the fuzzy interface simply modifies the inputs so that it can be interpreted and
compared with the rules in the rule-base; and (4) the defuzzification interface converts the
conclusions reached by the inference mechanism into the inputs to the plant”. Zimmermann
(2010) defined fuzzy set theory is an expansion of classical set theory with the capacity of
allowing varying assessment of a set element’s membership. This is effectively illustrated by
the help of membership function, which normally has real unit interval of [0, 1]. A title “~” is
placed above a symbol if the symbol represents a fuzzy set. Therefore, fuzzy logic goes beyond

135
the use of ‘True’ and ‘False’ when expounding on human reasoning by using ‘0’ to indicate
‘False’ and 1 to indicate ‘True’ when describing the reasoning of humans. Conversion scales
are used in fuzzy set theory for the purpose of transforming the linguistic concepts into the
fuzzy numbers.
The Fuzzy Analytic Hierarchy process (FAHP) method extends the classic AHP method by
combining the concepts of fuzzy set theory as the conventional AHP fails to reflect human
thinking style. It provides a solution to the drawback of pairwise comparison, which is unable
to deal with uncertainty and imprecision related to the mapping of the decision makers’
preference to a crisp number (Deng, 1999). According to Wang and Chin (2011), fuzzy AHP is
a practical method that can be used for several criteria decision-making, particularly in fuzzy
environments. Van Laarhoven and Pedrycz (1983) initially applied Fuzzy AHP to compare fuzzy
ratios described by triangular membership functions. Buckley (1985) conducted a Fuzzy
Hierarchy Analysis in which “experts are allowed to replace exact ratio by using fuzzy ratio”.
The majority of fuzzy AHP applications focus on the crisp point estimate method, therefore,
the basis of this thesis is on Chang’s extent analysis method as it is a widely accepted FAHP
method by many researchers (Kahraman et al., 2003; Chan and Kumar, 2007; Chan et al., 2008;
Kumar and Singh, 2012; Ganguly and Guin, 2013; Samvedi et al., 2013; Radivojević and gajović
2014; Gopalan et al., 2015; Prakash and Barua, 2016 etc.). Chang (1992, 1996) introduced a
new extent analysis approach for the synthetic extent values of the pairwise comparison for
handling fuzzy AHP. The proposed method with extent analysis is simply and easy to
implement to prioritise decision variables as compared with the conventional AHP (Chan and
Kumar, 2007). However, the disadvantage of this method is that it lacks the capacity of
handling any form of vagueness possible in numbers as only triangular fuzzy numbers are
allowed in the application. The computational procedure for calculating the priority weights
of the different criteria and sub-criteria using Chang’s extent analysis method can be
summarized as follows:
Construct the fuzzy comparison matrix of criteria and sub-criteria with respect to the
goal.
Determine the fuzzy synthetic extent value with respect to the each criterion with the
help of the equations.

136
Determine the degree of possibility of the superiority of each fuzzy synthetic extent
value with respect to each other.
Decide the minimum degree of possibility of the superiority of each criterion over
another.
Determine the weight vectors of the criteria with the help of minimum degree of
possibility of superiority of each criterion.
Normalize this weight vectors and determine the final weight of the criteria with
respect to the goal.
Repeat this process to decision weight of all the sub-criteria with respect with their
specific criteria.
In this research, the proposed risk management model aims to interpret the fuzzy logic for
dominance of one risk factor over the other by determining and confirming of their relative
importance. By choosing one method out of all the existing ones should based on its
multicriteria task and appropriateness of the data, the structure of the problem, method
applicability, acceptance of the decision, etc. Moreover, the method should be easy to
understand and apply and match the human thinking. Also, as compared to the ANP, AHP is
a linear assessment type of method. It provides an easily understandable and defensible
approach to practitioners. It allows practitioners to be involved in the analysis and actually to
guide the decision more effectively. This managerial transparency and lack of complexity
allow for greater acceptance by both researchers and pracitioners. Therefore, fuzzy AHP is
considered to be the most appropriate method for assessing the priority weights of supply
chain risks in this research.
The technique, ISM, proposed by Warfield (1974) is qualitative in its approach used in
identifying key relations among explicit items that define an issue. The model is described as
interpretive since a group discussion is deciding, whether and how the elements are related
(Srivastava et al., 2015). It involves a set of elements that are directly and indirectly related,
which are structured into an all-inclusive systematic model. Thus, such a model represents
the structure of an intricate problem depicted in words as well as graphics.
Figure 4.6 presents the basic logic of the ISM model. The complex problem or the
dependencies between each element to be examined are interpreted as a complex system
(object system). The modelling converts the object system into a well-defined and

137
representative system consisting of directed graphs (digraph). Then the object system
mapped as digraphs becomes the “basic structural model”. The expansion with content finally
leads to an “interpretive structural model” (Szyperski and Eul-Bischoff, 1983). Thus, its basic
idea is to use expert’s practical experience and knowledge to decompose a complicated
system into several elements and construct a multilevel structural model (Warfield, 1974).
The model is developed since the complex variables are structured comprehensively by
considering all possible pairwise interaction between each other.
Figure 4-6: ISM-logic
Interpretive Structural Modelling (ISM) has been widely used by multiple authors for supply
chain risk management (Faisal et al., 2007; Alawamleh and Popplewell, 2011; Hachicha and
Elmsalmi, 2013; Chaudhuri et al., 2016; Prakash et al., 2017), modelling of supply chain risks
(Pfohl et al., 2011, Srivastava et al., 2015), risk mitigation (Diabat et al., 2012), the
measurement of supply chain resilience by using ISM for evaluating enablers for supply chain
resilience and their relationships (Soni et al., 2014) as well as a framework built for designing
robust food supply chain (Vlajic et al., 2014). Under the supply chain context, it is not sufficient
for merely understanding the significance of each individual risk for the organization as there
are various types of risks which may affect each other. The direct and indirect relationships
among risk driver reflect the situation more accurately than the individual risk taken into
isolation (Chaudhuri et al., 2016). Therefore, the model provides an insightful understanding

138
by which the decision maker can impose and structure risks and highlight interrelationships
between each risk in the SC sector (Mandal and Deshmukh, 1994).
The modelling process of ISM is systematic, efficient, easily applicable, and produces a
graphical representation or structured model for the problem. It transforms unclear, poorly
articulated models of systems into clear, well-defined-models (Sage, 1977). On the other
hand, the disadvantage of this method is that the possibility of having many variables to an
issue increases the difficulty of the ISM method. This makes it difficult to be used in situations
where there are many variables to a problem (Lim et al., 2017). Another disadvantage is that
the model constructed may be strongly influenced by the bias of the subjective judgement by
the experts since the relationships between each variable always based on the expert’s
experience and familiarity with the organization and industry. In addition, in the ISM model,
no weights are associated with the variables to take into account their relative importance.
As illustrated in Figure 4.4, ISM is being employed with the following steps:
Construction of structural self-interaction matrix (SSIM) by pairwise comparison.
Developing a reachability matrix from the SSIM and checking for transitivity.
Ensuring that the reachability matrix is appropriately partitioned into several levels
Drawing of diagraph with removed transitivity links.
Conversion of digraph into an ISM and checking of conceptual inconsistency.
Matriced’Impacts Croisés Multiplication Appliquéea’un Classement (MICMAC)
analysis
Decision-Mking Trial and Evaluation Laboratory (DEMATEL) can be another approach used to
develop relationships between the various elements but requires selection of a threshold
value to generate impact diagraph map. DEMATEL and ISM are similar as both use diagraphs.
DEMATEL can divide the factors into cause group and effect group. Fazli et al., (2015) applied
the approach to determine the interdependency between risks in crude oil supply chain, while
Rajesh and Ravi (2015) uses it to find out cause/effect relationships among the enablers of
supply chain risk mitigation. In this thesis, the author are not particularly focused on dividing
the risk factors into cause and effect groups, but pay more attention on how interaction
between each risk factor, ISM is considered to be the most appropriate methodoloy for this
thesis.

139
Lastly, it needs to be mentioned that using quantitative or qualitative risk assessment
methods solely is inadequate for prioritising risks (Wang et al., 2017), as the main drawback
of employing Fuzzy AHP is that it cannot examine the contextual relations between each
variable. By contrast, in the ISM model, no weights are associated with the variables to take
into account their relative importance. The model should combine both numerical and
graphical results. Thus, in this thesis, both Fuzzy AHP and ISM models are incorporated to
complement each other, in order to effectively evaluate and analyze supply chain risks.
4.3.3 Phase 3 - Risk mitigation
There is a need for decision makers to adopt some risk mitigation strategies in order to reduce
any adverse impacts. The risk mitigation procedure represents the method of dealing with
unexpected hazardous events. The literature in SCRM has provided extensive researches in
assisting decision making for analysing and mitigating various types of supply chain risks like
Multiple Criteria/attribute Decision Making, Bayesian Theory, System Dynamics (SD), Data
Envelopment Analysis and Structural Equation Modelling (SEM), etc. However, there are
some drawbacks in each of these method. For example, by employing Bayesian theory, a large
amount of data is required in order to generate stable results; Data Envelopment Analysis
focuses on measuring organizational performance in respect of the inputs; in order to apply
Artificial Neural Networks, Genetic Algorithms, and Simulation-based Methods, high
computer language design skills and extensive quantitative data are usually required.
Among the mentioned MCDM methods, TOPSIS is a practical and advantageous technique for
ranking and choosing the best alternatives. TOPSIS (Technique for Order Preference by
Similarity to an Ideal Solution) is based on the suggestion that the selected option should be
closer to the positive ideal exposition and far from the negative ideal exposition when
addressing complex issues. The most preferred alternatives should have the shortest distance
from the positive ideal solution and the longest distance from the negative ideal solution
(Hwang and Yoon 1981). As indicated by Abidin et al., (2016), the method sensibly represent
the cogent option with consideration of both the best and the worst-case scenario of the
alternatives in a simultaneous way, which is highlighted by a scalar value. The capability for
TOPSIS to be effective in dealing with various weight estimation systems makes it to be a
scalable method for risk mitigation strategies evaluation. However, the limitation of TOPSIS
is in its inability to handle the vagueness and imprecision inherent in the cognitive process of

140
mapping the perceptions of decision makers which also leads to its combination with fuzzy
set theory (Krohling and Campanharo, 2011). Thus, it is affirmed by Sodhi and TV (2012) that
Fuzzy TOPSIS is effective in systematic and objective evaluation of multiple criteria’s
alternatives. The technique can be used in evaluating different alternatives at the same time
and against the identified criteria. Just as the TOPSIS method is conducted, an optimal value
is arrived at in Fuzzy TOPSIS by identifying and selecting an alternative that is closer to the
Fuzzy Positive Ideal Solution (FPIS) and far from the Fuzzy Negative Ideal Solution (FNIS). The
FPIS and FNIS are best and worst performance values respectively. Fuzzy TOPSIS has
successfully been applied to solve different types of MCDA issues, such as supply chain risk
management strategies evaluation and mitigation (Nazam et al., 2015; Chatterjee and Kar
2016; Wang et al., 2017), supply chain risk modelling (Samvedi et al., 2013; Wang and Hao
2016), supplier selection and evaluation (Chen et al., 2006; Sevkli et al., 2008; Zouggari and
Benyoucef, 2012), evaluation of the banks’ performance (Seçme et al., 2009), location
selection for the ITU Faculty of Management (Suder and Kahraman, 2015), logistics provider
selection and evaluation (Kannan et al., 2009, Selçuk 2009) and rank the solutions of
knowledge management adoption in SC (Patil and kant, 2014).
As presented in Figure 4.4, the following steps of Fuzzy TOPSIS are given:
Conduct the empirical studies for identified the implemented risk management
strategies.
Choose the appropriate linguistic ratings values for alternatives with respect to criteria.
Aggregate the weight of criteria to get the aggregated fuzzy weight of criterion.
Construct the fuzzy decision matrix and the normalized fuzzy decision matrix.
Construct the weighted normalized fuzzy decision matrix.
Determine the fuzzy positive ideal solution (FPIS) and fuzzy negative ideal solution
(FNIS) and calculate the distance of each alternative from FPIS and FNSI, respectively.
Calculate the closeness coefficient of each alternative.
According to the closeness coefficient, the ranking order of all alternatives can be
determined.

141
4.4 CONCLUSION
This chapter develops a conceptual framework in the healthcare supply chain sector as a
research platform. It takes considerations of risk drivers, risk sources, decision makers, risk
management process, SC strategies as well as performance outcomes. The proposed
framework can be built as a guidance to address the industrial needs for practical decision
support methodology. Based on the framework, an integrated healthcare supply chain risk
management model is proposed to support effective risk factors identification, assessment as
well as sensible decision-making on the adoption of supply chain risk mitigation strategies.
With the increasing emphasis on risk management across different industries, many
approaches including both quantitative and quanlitative methods have been suggested in the
literature. However, neglecting the call to integrate modern risk management models has a
negative impact on the whole procedure as most of the risks behind the failures experienced
in the supply chain of healthcare organizations are complex in nature. There are a lot of
complex systems and procedures involved in facilitating the supply chain and the application
of the suggested risk management framework offers a dynamic approach to dealing with the
causes of such turbulences. It enables us to take explicit account of multiple types of risk in
the analysis systematically and to compare and prioritise current alternative mitigation
strategies based on the experts’ professional experience and knowledge both from academic
and industrial fields. The proposed model has the capacity of reflecting the internal
hierarchical nature of a healthcare organization’s extensive systems, and this allows a deeper
analysis of complicated systems as they are linked to a supply chain. Integrating these risk
management methods allows the facilitation of trade-off analysis, particularly among
different subsystems and the general system. Finally, the method adds realism to the overall
risk management process by identifying any form of disruptions in a supply chain and
determining useful measures that can be numerable for the efficiency of a healthcare
organization. The application of the proposed integrated risk management model is followed
in the next chapters to identify risk factors, assessment and reduce the associated risks in the
healthcare supply chain.

142
5.CHAPTER FIVE - HEALTHCARE SUPPLY CHAIN RISK FACTORS IDENTIFICATION
5.1 INTRODUCTION
Identification of the relevant supply chain related risk factors is the vital step for employing
efficient risk management in the healthcare industry. Furthermore, there is a substantial
number of supply chain risk classification methods that can be found in the current literature.
Most researchers identify sources of risks related to the unpredictable environment,
organizational operations, and supply chain related networks with the potential to directly
affect the outcome of supply chain activities. This chapter describes risk factors identification
undertaken to capture and verify risk issues through a questionnaire survey. It also presents
a modified comprehensive taxonomy and classification approach to decompose the
unstructured risks to strengthen the knowledge base in healthcare SCRM. In further risk
assessment research, the classified risks can be evaluated through analysing various risk
assessment methods to find out the unacceptable ones. Figure 5.1 illustrates the proposed
methodology for risk factors identification.
5.2 HEALTHCARE SUPPLY CHAIN RISK FACTORS IDENTIFICATION AND CLASSIFICATION
The objective of this chapter is to develop a comprehensive supply chain risk factors
identification and classification model within the context of the healthcare industry. The
procedure for risk factors identification and classification is one of the most significant steps
in SCRM process. Risk classification helps firms to identify the causes of possible disruptions
of supply activities (Heckmann et al., 2015) and helps risk managers to understand the events
and the circumstances from which they arise (Harland et al., 2003; Chopra and Sodhi, 2004).
However, many researchers note the lack of a standard classification for SC resulting in a
research gap due to the conception of risks (Harland et al., 2003; Jὓttner et al., 2003; Chopra
and Sodhi, 2004; Christopher and Peck, 2004; Tang 2006; Wu et al., 2006; Manuj and Mentzer,
2008; Tang and Tomlin, 2008).

143
A Methodological Framework For Healthcare Supply Chain Risk Factors Identification
Risk FactorsIdentification
Risk Assessment
Risk Mitigation
Chapter 5 Chapter 6 Chapter 7
Literature Review
Risk Classification
Empirical Studies
Initial Hierarchical Structure Diagram
Validation of Developed Diagram
Final Hierarchical Structure Diagram
Conceptual Framework
Chapter 4
Figure 5-1: Proposed methodology for healthcare SC risk factors identification

144
The extensive review of the literature in the previous chapter provides an outline for critical
insight into the supply chain risks characterised with contemporary firms. The literature
review showed that many researchers have identified several different supply chain risk
classification methods, sources, or types. However, the literature review also showed the lack
of a common methodology or consensus among researchers that can outline a universally
accepted supply chain risk classification. The present methods and approaches of
classification demonstrate the ever-growing complexity and difficulty of the process. It is
evident that researchers have yet to arrive at a universally acceptable supply chain risks
classification method. Thus, it is necessary to establish a standard vocabulary that can be
used to assess and to identify risk fators between organizations operating within the
healthcare supply chain for strategy with the most potential to mitigate risks.
In this thesis, the researcher adopted the risk classification model suggested by Christopher
and Peck (2004) to build a new organized classification model in the context of healthcare SC
as presented in Figure 5.2.
Figure 5-2: Sources of risks in the healthcare supply chain
Based on the uncertainty framework originally proposed by Mason-jones and Towill (1998),
Christopher and Peck (2004) suggested a classification model to divide SC risks into three
broad categories which can be sub-divided into five main types:

145
Internal to the firm (i.e. arise from the boundaries of the cross-functional
departments and range from labour (e.g. strikes) or production uncertainties to IT-
system uncertainties).
o Process risks and control risks
External to the organization yet internal within the supply chain (i.e. arise from
interactions between organizations within the supply chain).
o Demand risks and supply risks
External to the supply chain network (i.e. any uncertainties arising from the
supply chain-environment interaction).
o Environmental
More specifically, integrating the distinct risk perspectives in the healthcare SC strengthens
the knowledge base in risk factors identification that comprises the risk portfolio for the
material, information and cash flows from original pharmaceutical manufacturer through the
healthcare provider to end-user, i.e. patients. It enhances the understanding of different
sources of risks and the interrelation of risk factors that can disrupt the processes, control,
demand, distribution, or supply of healthcare services and products. Using the model, this
thesis adopts and presents a new healthcare supply chain risk factors identification and
classification method. The new approach divides the five sub-categories of Christopher and
Peck’s (2004) model into eleven sub-category levels: process risks are divided into
information risks, logistics risks, and procurement risks. Control risks are divided into strategic
risks and labour risks; demand risks are divided into capability risks and focus risks; supply
risks are divided into quality risks and supplier risks; and lastly, environmental risks are
divided into natural risks and man-made risks. Based on the initial literature review in Chapter
two, the risk factors have been identified and classified into the Table 5.1 and summarized in
Table 5.2. Thereafter, the eleven sub-levels of healthcare supply chain risks are discussed in
detail in the section below.

146
Table 5.1: Classification of healthcare supply chain risk factors identified by researchers
External to the hospital but internal to the supply chain network
Internal to the hospital External to the supply chain
network
Authors Supply risks Demand risks Process risks Control risks Environmental risks
Breen (2008)
Counterfeiting; Drive competitors out of market; Manufacturer defence tactics diversion of manufacturing capacity; Unavailability of raw material – true and commercially induced; Cash flow threat associated with small pharmaceutical companies and hospitals;
Unexpected increase in demand; Demand versus capacity; Lack of forecasting-customer side; Demand/economics-not able to respond to demand; Increase in demand due to NICE approval; Demand trigged by the nurse, not the patient
Lack of visibility of stock; Inadequate buffer stock-JIT/Lean; Transportation-unavailability of fuel, congestion, weather, illness; Dispensing/picking error-medication/packaging; storage/cold chain; Procurement Hubs- introduce more complexity. Information flow or lack of demand information; Too much information; Fragmentation of SC-no single source, multiple channels, no communication, unilateral decisions;
Short term SC planning; Prioritisation-conflict between patients/profits.
The requirement of environment protection Regulatory issues-manufacturing licensing/change of standards/drug recalls; External influences-disaster recovery; Risk of litigation- influence on market.

147
Lack of data standardization (common codes); Contract problems with suppliers; contracting treated as a commodity-big contracts equals big risk;
Kamath et al., (2012)
Counterfeit risk Inventory risk Financial risk; Regulatory risk
Kanyoma et al., (2013)
Unavailability of supplier Wrong demand forecasting Insufficient inventory at central medical store (CMS); delay by procurement staff,
poor inventory management by pharmacies;
Withholding of funds by donor partners; lack of funds at the hospital; rigorous government intervention; unexpected disease outbreaks.
Ilie, C., and Popa, V., (2013)
Domestic drug shortages, location of manufacture/supplier(not domestic based)
Clinician’s preference; Slowly information transmission and single channel;
Regulation risks (EU);

148
Maryland (2012)
Grey-market activity, counterfeiting, and diversion of drugs; drugs shortage;
Fragmentation of the drug distribution processes and use of restricted drug distribution systems;
Lack of incentive mechanism;
Aguas et al., (2013)
Medicine availability in the market;
Capacities of logistics systems; Asymmetries of the information;
Elleuch et al., (2014)
Poor quality in the purchased drugs from supplier; shortage of drugs (without substitute); Time limit of drugs;
Fluctuation in customer demands;
Lack of personnel; human error.
Enyinda et al., (2014)
Supplier failure; counterfeiting.
Transportation logistics, electricity; technology
Strikes and lack of key talents.
Geopolitical; public opinion; regulations and laws.
Kim et al., (2016)
Unexpected changes in environmental conditions.
Zepeda et al., (2016)
Demand uncertainty for clinical requirements.
Weak logistics services infrastructure (obsolete equipment in the warehouse, improper distribution facility, route)

149
Lord Carter’s report (2016)
High purchase price; High product and supplier/brand variety;

150
Table 5.2: Summary of the identified healthcare supply chain risk factors
External to the hospital but internal to the supply chain network
Internal to the hospital External to the supply chain network
Supply risks Demand risks Process risks Control risks Environmental risks
- Counterfeiting, Grey- market activity; (S1)
- Poor quality in the purchased drugs from suppliers; (S2)
- Time limit of drugs, drugs perishability; (S3)
- Shortage of drugs, unavailability of drugs on the market; (S4)
- Location of manufacture/supplier (not domestic based) (S5)
- Unavailability of raw material – true and commercially induced. (S6)
- Cash flow threat associated with small
- Capability versus demand; inability of capacity to meet demand; (S8)
- Demand trigged by the nurse, not the patient (S9)
- Demand uncertainty; (S10)
- Wrong demand forecasting;
(S11)
- Poor IT system, lack of data standardization; (S12)
- Asymmetries of the information, unilateral decision; collaboration issues, restriction, not share information between each department;
(S13) - Dispensing/ picking
error-medication/ packaging; (S14)
- Weak logistics service infrastructure (S15)
- Fragmentation of the drug distribution process; (S16)
- Inadequate buffer stock-JIT/Lean (S17)
- Focus on short term SC planning than long term; (S24)
- Prioritization-conflict between patients/profits; (S25)
- Strikes and lack of key talents; (S26)
- Lack of incentive mechanism; (S27)
- External influences- disaster recovery; (S28)
- Unexpected disease outbreaks; (S29)
- Unexpected changes in environmental conditions; (S30)
- Regulatory issues- manufacturing licensing/change of standards/ drug recalls; (S31)
- Rigorous government interventions; (S32)
- Lack of funds from government to the hospital; (S33)
- The requirement of environment

151
pharmaceutical companies and hospitals; (S7)
- Lack of visibility concerning placement and availability of stock; (S18)
- Procurement Hub-introduce more complexity, long lead time; (S19)
- Contract problems with suppliers; contracting treated as a commodity-big contracts equals big risk; (S20)
- Clinician’s preference; (S21)
- High purchase price; (S22)
- High product and supplier/brand variety; (S23)
protection; (S34)

152
5.2.1 Process risks
The processes refer to the managerial and value-adding activities the firm undertakes
(Christopher and Peck, 2004). The success of these activities depends on internally owned or
managed assets, such as the infrastructure, that can support the firm’s transport and
communication, and process risks that arise when they are disrupted (Breen, 2008). The sub-
levels of process risks include information risks, logistics risks, and procurement risks.
Information risks arise from poor information technology (IT), asymmetries of information,
and high product or supplier/brand variety. Logistics risks occur from dispensing or picking
error, lack of stock visibility, distribution fragmentation, contract problems with suppliers, and
weak logistics service infrastructure. Lastly, procurement risks arise from long lead time, high
purchase prices, lack of visibility, and inadequate buffer stock as shown in Figure 5.3.
Figure 5-3: A schematic classification of sources of the process risks
Process risks
Information risks
poor IT system, too much information, lack of data standardization
Asymmetries of information
Logistics risks
Dispensing/picking error-medication/packaging
Weak logistics service infrastructure
Fragmentation of the drug distribution process
Inadequate buffer stock-JIT/Lean
lack of visibility concerning placement and availability of stock
Procurement risks
Procurement hub-introduce more complexity, long lead time
Contract problems with suppliers
Clinician's preferences
High purchase price
High product and supplier/brand variety

153
Information risks are associated with the potential disruption in the flow of information or
failure in communication within the healthcare supply chain network. They may also arise
from the probability and impact of cooperation from shared information with suppliers, or an
internal cross-functional department. A poor IT system is likely to lead to information
dissemination causing disruptions in communication or information flow such as poor access
to information on demand. Decision based on poor quality information provides ineffective
healthcare services which negatively affects the outcome of treatment for patients and
provides to the healthcare provider with significant and avoidable cost (Gibbons, 2009). In
the United Stated, most health industries have been greatly affected by the inconsistent as
well as inaccurate information about drugs hence ending up giving poor service to the
patients. In addition, results from a study by Pleasant, (2009) showed that more than $ 11
billion has been wasted because of inadequate processes, use of outdated information and
technology, and invoice and order errors. Moreover, Simangunsong et al., (2012) also found
other threats that affect information and technology used in the health industry at the
organizational level, application or among organizations: technical breakdowns, misuse of
information, computer viruses and information accessed by unauthorised individuals, among
others.
Further, lack of data standardisation likely to contribute to many data silos. The difficulty
faced by UK National Health Service (NHS) trusts is that the available data in a large volume
whereas quality information is in short supply. In fact, in the NHS database, there are 130
different information descriptions for a single product. Therefore, to promote operational
improvement and healthcare supply chain integration, standardisation is of concern.
Implementation of supply chain standard data contributes to information synchronisation so
that all stakeholders in the industry can speak the same electronic language (Kreysa and
Denecker, 2009).
Asymmetries of information associated with unilateral decision-making and poor
collaboration between the hospital and suppliers, or between the patient care units and the
hospitals, which is a serious risk factors found in SC links. This leads to power relationships,
lack of coordination and communication among the supply chain agents, rivalry conditions
among the providers in the market, and limited use of communication and information
technologies. Even worse, the healthcare industry exists as highly fragmented systems in

154
which manufacturers, distributors, wholesalers, and providers operate independently from
one another. Burns et al., (2002) found that all members in the healthcare SC still lacked
coordinated effort, strategic alliance formation, and information to share among the agents
of the supply chain. A study by Gibbons (2009) underlined that healthcare is an information
intensive environment and the availability of quality information is essential for the delivery
of safe and effective healthcare services. Thus, due to lack of inter- or intra-organizational
information sharing, the supply chain acts more to push products down the chain instead of
pulling them from the customer (Burns et al., 2002).
Lack of visibility concerning placement and availability of stock, for instance, may cause a drug
shortage in the warehouses, which can lead to hospitals’ inadequate buffer stock. For
example, the UK’s Chapel Allerton Orthopaedic Centre’s (CHOC) inefficient inventory
management contributed to an overstock problem. Yet, the centre spend in excess of £3
million on inefficient inventory management (Medwell, 2009). Research shows that in the
retail or industrial sector there is less inventory accumulation compared with the health
sector because of product-based supply chain cost, which is generally not the main driver of
inventory decision-makings among healthcare organizations. In fact, the purpose of inventory
is to meet the outcome of the service performance instead of cost saving.
Dispensing or picking error-medication/packaging may arise from packaging through
manually operating, sound-alike or look-alike drug names, same appearance from outside
covers, similar packages and labelling, unclear or incomplete labelling information,
handwritten prescriptions, or high delivering frequency per day. For example, handwritten
recommendations for medicine can be dangerous because it can cause different medication
errors, such as prescribing, transcribing, pre-dispensing, and dispensing. Moreover,
fragmentation of the drug distribution process is also likely to cause disruption in hospital
services. For example, about 50 per cent of medicine supplies come from a small number of
wholesalers, however, the remaining is obtained directly from manufacturers. This means
each hospital will receive up to 30 medicine deliveries every day, which is time-consuming for
staff (Lord Carter’s report, 2016) and more opportunity for errors. Furthermore, Breen (2008)
showed that there was no uniform information sharing and decision making among the
Pharmaceutical SC, which also led to such problems and affected the efficacy of the complete
supply chain.

155
Weak logistics service infrastructure can be caused from poor service infrastructure, such as
poor supplier routes, obsolete equipment in the warehouse, improper drug store
environment and transportation facility/route, inefficient cold chain management during
transportation that affects the quality and stability of temperature-sensitive products. In the
hospital sector, certain categories of goods have a short shelf-life and need to be stored at
specific temperatures. Sooksriwong (2009) also carried out a similar study and realised that if
there is inefficient cold chain management during the transportation of goods, the quality
and stability of products is highly affected. It is vitally important to maintain the freshness of
pharmaceutical logistics because the reduced freshness of products, especially medicine,
leads directly to serious impacts on human health. In particular, logistics services
infrastructure affects the level of integration between an organization and its supply chain
partners partly because with access to a well-developed infrastructure can support a range of
logistics services and transportation modes enabling suppliers to meets distribution
requirements for goods and services (Bookbinder and Tan, 2003). Moreover, several
researchers also supported this viewpoint and emphasized that well developed infrastructure
can promote organizations’ operating efficiency by facilitating shorter and more reliable
replenishment lead times as well as accurate delivery of desired supplies (Zsidisin and Ellram,
2003; Shirley and Winston, 2004; Narasimgan and Talluri, 2009). Therefore, Zepeda et al.,
(2016) further suggested that the better developed a hospital’s local logistics services
infrastructure, the lower the hospital’s inventory costs.
In the UK, a number of NHS trusts have implemented Just-In-Time (JIT) logistics systems given
its advantages of reducing inventory costs and involving the supplier the hospital SC
operation. According to Wilson et al., (1992), the JIT approach can reduce inventory holding
costs in the organization, while maintaining service levels. Nevertheless, the major issues with
implementing JIT are demand fluctuation, which is hard to predict in the healthcare industry
(Kowalski, 1986), and inadequate buffer stock level in hospital centre stores as JIT is more
likely to reduce the inventory level as low as possible.
An uncoordinated procurement hub is also likely to introduce more complexities and long
lead times for drug orders until they arrive at the hospital’s central store. Procurement lead
time is defined as the average duration of time between placing of the order and receipt of
material. It may be divided into internal lead time (time required for organizational formalities

156
to be completed for placing the order) and external lead time (time interval in placement of
order and receipt of drugs). Anand et al., (2016) found that average lead time between the
preparation of indent and receipt of drugs in the hospital pharmacy is 161 days, while the
average internal lead time is 114 days and the average external lead time is 47 days. Only 59%
of the drugs were received in time. Kamath et al., (2012) and Kanyoma et al., (2013) identified
procurement related process risks that delays by the untrained procurement staff, lack of
handling material, and the high product and supplier/brand variety, which can cripple the
supply chain network. According to Lord Carter’s report (2016), a sample of 22 hospitals
covering approximately 16 per cent of NHS spending revealed that in one year they used
30,000 suppliers, 20,000 different product brands, and more than 400,000 manufacturers’
product codes with more than 7,000 people being able to place orders. This high product and
supplier/brand variety disaggregates and undermines NHS buying power with the inevitable
result of variation and higher prices. Furthermore, product variety is the root cause of hospital
supply chain wastes, such as high inventories, expiration and obsolescence, and low value
orders and delivery changes.
Managing contracts effectively can save hospital substantial money each and every year. One
problem that becomes a consistent issue is that hospitals may not remember that their
contracts or leases automatically renew if they do not renegotiate or follow the end of lease
terms detailed in the written contract. Hospital employee does not always know that they
have existing contact in place, and may duplicate services such as a service and maintenance
contract on a piece of medical equipment. Furthermore, there is another risk that the vendor
could inadvertently fail to comply with all the terms of that contact.
In any case, clinical professionals do not always prioritise efficient resource utilisation and
cost-effectiveness due devoting their attention to the treatment effect rather than to
corporate performance (Lega et al., 2013). Nevertheless, these demand-side problems often
limit the cost-effective procurement of clinical solutions as those clinical professionals lack
the awareness of cost containment. Because clinician education is founded on science and
clinicians, it responds favourably to scientific, fact-based justification for proposed changes
(Freidson, 1988). Moreover, Mckone-Sweet et al., (2005) also found that the primary
challenge is to balance costs with physician and other clinician preferences because allowing
the clinicians to be involved in product selection would add complexity since most lack any

157
formal training in supply chain practices. The findings are also in line with Böhme’s (2016)
research, which was conducted among health organizations through a survey, which
indicated that the executives give consultant clinicians a higher status as opposed to the
supply professionals, leading to the high level of uncertainty in the hospital sector.
5.2.2 Control risks
The concept of controls as the assumptions, rules, procedures and systems that a firm
employs to manage its processes (Christopher and Peck, 2004). Sub-levels of control risks are
strategic risks, including a focus on short term SC planning than long term, prioritization
conflict between patient/profits, and labour risks, including employee strikes, inadequate
talents, and poor incentive mechanisms, as presented in Figure 5.4.
Figure 5-4: A schematic classification of sources of the control risks
Strategic risks are associated with the direction of fundamental decisions concerning an
organization’s objectives. For example, a possible source of loss that might arise from the
pursuit of an unsuccessful business plan, inadequate resource allocation or from a failure to
respond well to changes in the business environment. Breen (2008) observed that good
planning should focus on product quantities, nature, batch sizes, priorities, and safety stock
policies and other control procedures that outline transport and asset management to
address both short-term and long-term supply chain risks. Prioritization conflict between
Control risks
Strategic risks
Focus on short term SC planning than long term
Priopritization-conflic between patients/profits
Labour risks
Strikes and lack of talents
Lack of incentive mechanism

158
patients/profits are likely to arise from poor planning and poor focus on service delivery at
the expense of profit making. It is likely to find hospitals making prescriptions and charges on
drugs for profit rather than gains at the expense of quality and service delivery. Moreover,
healthcare organizations face a variety of stakeholders who place demands and constraints
on their managers. Thus, the presence of different stakeholders (e.g. taxpayers and recipients
of services or industrial groups) requires healthcare organizations to pursue different and
sometimes conflicting objectives (Lega et al., 2013). It has frequently been argued that public
agents often meet distinctive goals, such as ethics, equity, or accountability, which are non-
existent in the private sector (Flynn, 2007).
The range of actions available to healthcare organizations is restricted by political constraints.
Political dynamics lead to frequent policy changes and the imposition of short time horizons
on healthcare organizations (Lega et al., 2013). Therefore, developing comprehensive long-
term SC strategies and innovative projects is more difficult in this context (Zanjirani et al.,
2009). Focus on short term SC planning than long term may mean hospitals lack the basic
infrastructure, such as IT and network designs. Supply chain orientation based on the
functional not long term strategic objectives. It goes with short term profit rather than making
long-term but necessary investment. Hospitals can thus experience inadequate information
sharing and partner relationship management challenges and experience the improper
selection of health facilities and poor sourcing of healthcare products. For instance, proper
planning may consider single, dual, and multiple sourcing strategies to address issues of
supplier reliability and minimise potential supplier-based disruptions in the supply chain
network.
Furthermore, strikes are associated with poor management or lack of incentive mechanisms
that can motivate employees to work under challenging conditions or during extra hours. For
example, in 2015 and 2016, England’s junior doctors took part several times in a general
strike, such that up to 100,000 operations were affected and up to one million appointments
were cancelled. Inadequate talent can cause lack of adequate process capacity, poor
inventory management by pharmacies, and labour problems that can create core control
breakdowns in operational processes within the hospital and the patient care unit.
Inadequately skilled workers, strikes, carelessness, and poor motivation are likely to damage
the reputation of the supply chain. Though the risks are regarded as short-term, they can

159
cause serious disruption to the control of the entire supply chain and should, therefore, be
solved with a long-term perspective (Elleuch, 2014). McKone-Sweet’s (2005) research
suggested that most health organizations with executives who possess high levels of supply
chain information or experience always stand a higher chance of high levels of supply chain
performance.
5.2.3 Demand risks
Demand risks specify the possibility of unexpected changes arising from market or
downstream members (Christopher and Peck, 2004). Existing literature revealed that more
attention is given to demand side risks than other sources of supply chain risks (Elleuch, 2014).
Two sub-levels of demand risks adopted in this thesis are capability risks, which include the
hospital’s inability to meet demand, poor flow of demand information; and forecast risks,
which include wrong demand forecasting and demand uncertainty. A schematic presentation
of the demand risk sources discussed is presented in Figure 5.5.
Figure 5-5: A schematic classification of sources of the demand risks
Capacity risks are caused by lack of flexibility towards environmental changes, inefficient
production with over- or under-utilization capacity, poor planning, failed schedule, control
production, and inventory organization. In the hospital sector, capacity risks may arise from
Demand risks
Capacity risks
Capability versus demand, inability of capacity to meet demand
Demand trigged by the nurse, not the patient
Forecast risks
Demand uncertainty
Wrong demand forecasting

160
the lack of capacity or flexibility to meet the needs of the patients or patient care units. Supply
chain system capacity is associated with response times and quality regarding drug
management and delivery. In other words, these risks are associated with either financial
constraints or time/staff constraints. Elmuti et al., (2013) found that the US healthcare
industry’s major challenge is lack of training for the supply chain professionals. They surveyed
700 healthcare organizations to measure their familiarity with, and utilization of, healthcare
SCM initiatives. The results indicated that approximately 62 per cent of respondents reported
no existing healthcare SCM programmes. The remaining organizations reported the duration
of their SCM programme to be less than one year. The lack of attention to SCM was due to
senior managers failing to recognise the importance of efficient SCM therefore the employees
also paid less attention to SCM services (McKone-Sweet et al., 2005). Furthermore, regarding
demand and flow complexity compared with industry, the disparate care processes and
clinicians increasingly difficult to manage and align, resulting in greater risk to patients and
inefficient use of system resource. Hence, understanding and quickly adapting to the ever-
changing needs of patients as they move through networks of healthcare providers is crucial
to the success of the healthcare delivery system (Rust et al., 2013). For example, unlike other
consumer products where the customer can either defer their purchase or acquire an
alternative can be critical in providing patient care, as there may be no alternative option for
treatment. Therefore, urgent orders need to be delivered immediately. Meanwhile, as the
nurse-to-patient ratio decreases, nurses are under increasing pressure to spend more time
with patients, and errors tend to occur. Friedrich (2017) found that a critical decrease in the
number of nurses at a facility can have detrimental effects on patients. Studies show that
there are different reasons that led to nursing shortages in the United States, such as the
nation continues to age, foreshadowing an ever-growing need for care and nursing schools
struggle to expand capacity to meet the need for care, and so forth. Moreover, another risk
factor is triggered when clinicians and nurses bypass the official replenishment channels and
directly order supplies from manufacturer or distributors. In fact, a ‘vicious cycle’ is created
because the real-time demand is not triggered directly by patients. As one SC manager
reported, “We have the knee replacement parts found in their theatre which are worth a
hundred thousand pounds, and the new surgeon won’t even touch them and require an
alternative one” (Böhme et al., 2016).

161
Another theme raised by several researchers is demand uncertainty (Lee et al., 1997;
Mustaffa and Potter, 2009; Zepeda et al., 2016; Böhme et al., 2016). In the case of the hospital
sector, demand uncertainty is observed in the clinical requirements to treat patients at any
given time (Gittell, 2002). In other words, demand uncertainty is a construct of demand
invisibility, which is not known in advance, i.e., it is stochastic. There may also be uncertainty
in the transport delays (Jurado et al., 2016). Moreover, since the provision of hospital services
requires both intangible services supported by supplies and supplies supported by intangible
services (Berry and Bendapudi, 2007). The hospital’s tast environment will impact the ability
to accurately predict the supplies necessary to carry out required tasks. For this reason, it is
usual a push to get hospitals to prepare for healthcare supplies or intangible services to satisfy
uncertain demand within time constraints. Therefore, the higher level of a hospital’s demand
uncertainty for alternative clinical services, the higher the risk of stock out of needed items
because the hospital’s task environment makes it increasingly difficulty to reliably forecast
the supplies needed to meet patient’s demand (Lee et al., 1997; Sodhi and Lee, 2007). As a
result, operational failures in hospitals can results from the inability of the related work
system to reliably provide supplies when, where, and to whom they are needed (Tucker,
2004).
Therefore, the dynamic changes, fluctuation in demand, and other related risks call for close
monitoring of the control process to identify novel hazards to enhance the risk assessment,
control, and reduction in hospitals. Kanyoma (2013) found that low visibility of the sourcing
and supply chain network is likely to hinder effective supervision and control. Jüttner (2005)
also suggested that players within the healthcare supply chain should work as a team to
improve transparency of all control activities that relate to medicine flows.
5.2.4. Supply risks
Supply risks may arise from the actual interruption or disruptions within the supply
procedures and related operations that a firm adopts to let products or information flow
within the supply chain network, commonly upstream from the firm (Christopher and Peck,
2004). In this classification the risk factors are often related to the hospital’s external
environment but arise from the internal network of the supply chain where services and

162
products flow. Conducting a critical interpretive synthesis of the literature, two sub-levels of
supply risks adopted in this research are quality risks which may arise from counterfeiting,
time limit of drugs/perishability, availability of raw materials and supplier risks related risks
which may arise from the location of suppliers in relation to their availability, flexibility,
shortage of drugs, availability of raw material-true, and the expected flow of cash/ cash
management treated associated with small companies and hospitals. Figure 5.6 presents a
schematic view of the supply risks.
Figure 5-6: A schematic classification of sources of the supply risks
Many healthcare organizations continue increasing rapidly with most of them getting
involved in counterfeiting (Thun et al., 2011). Counterfeit drugs are defined as drugs sold
under a product name without proper authorization, where the identify or the source of the
drug is knowingly and intentionally mislabelled to suggests that it is an authentic Food Drug
Administration (FDA) approved product (Maryland, 2012). According to Kamath et al., (2012),
issues regarding counterfeiting can be managed by incorporating the current anti-
counterfeiting technologies such as the hologram, mass encoding systems, bar-codes, and
Radio Frequenct iDentification (RFID) systems. The shortage of drugs can adversely affect
patients’ health results and lead to extra spending on healthcare services. Shortages may be
the result of limited supply or the poor quality of raw materials needed for manufacturing
and regulatory or legislative issues, business or market factors, unanticipated increases in
demand, natural disasters, or inventory control practices (Maryland, 2012). Previous studies
Supply risks
Quality risks
Counterfeiting
Poor quality in the purchased drugs from suppliers
Time limit of drugs, product perishability
Supplier risks
Shortage of drugs, unavailability of drugs on the market
Location of manufacturer/supplier (not domestic based)
Unavailability of raw material-true and commercially induced
Cash flow/cash management threat associated with small companies and
hospitals

163
show that since 2011, in Malawi public hospitals have faced a serious shortage in drugs, which
affected health delivery services leading to the increased patient deaths. In addition, delays
in medical surgery, and worsened medical conditions of the patients among other effects
(Kanyoma and Khomba, 2013). Moreover, a shortage of medicines forces the search for
substitutes thereby causing over costs due to the difference in prices for available medicine
on the market (United Nations, 2013). Aguas et al., (2013) found that the main problems in
the health systems are related to poor supply and unavailability of essential medicines. In
their case from Colombia, about 15.8 per cent of patients had been prescribed medicine and
received the wrong medication, while 21.2 per cent did not receive any medicine. Most
pharmaceutical manufacturers source raw materials from remote and unstable areas where
unanticipated events may occur, for instance civil wars or terrorist activities. The shortage
may force manufacturers to use materials of low quality in the production of healthcare
products. Thus, unavailable raw materials and poor quality of medicines are frequently
experienced which lead to supply process disruption or even breakdown. For hospital, some
raw material obtained from manufacturer, but manufacturer mergers often result in
decisions to narrow the focus of product lines, resulting in the discontinuation of a key raw
material. Meanwhile, the unique characteristics of the product perishability of some specific
pharmaceutical items must always be stored under the strict temperature-monitoring
environment. Therefore, it is necessary to manage risks caused by the unexpected changes in
environmental conditions for delivery items during the distribution process, as such risks can
directly or indirectly negatively affect the quality in purchased drugs from the supplier (Kim et
al., 2016).
Considering issues of remote location of pharmaceutical manufacturer or supplier, Colicchia
and Strozzi (2012) observed that the current supply chain physical extension includes global
sourcing which creates a massive volume of healthcare items bought and supplied worldwide.
However, transport costs for hospitals and pharmaceutical distributors are likely to increase
because of the high distance to travel to either deliver or collect supplies. In addition, different
from the typical consumer products, where the customer can either postpone their purchase
or obtain an alternative one, this can be critical in providing patient care as there may be no
alternative treatment for the patient. Thus, the immediate response of urgent delivery may
be required. For this reason, the stock levels of normal and urgent medicines need to be

164
monitoring as the daily work, due to the remote location of some pharmaceutical suppliers.
Greater domestic manufacturing was considered to reduce the risk of medicine shortages
especially in global crisis situations.
The success of supply and control activities depends on the reliability and flexibility of
suppliers within the healthcare supply chain. Low supplier flexibility and reliability are likely
to force hospitals to incur high sourcing costs, storage problems, acute drug shortages, and
poor monitoring of the supply activities (Brown et al., 2014). Thus, a reliable supplier is
expected to give quantities and qualities ordered within a given time frame. Moreover, the
flexible suppliers makes the supply chain quick able to respond to the changing consumer
demands and other complex requirements. Otherwise, hospitals will frequently experience
the supply process disruption or even breakdown in the supply market (Colicchia and Strozzi,
2012). Meanwhile, in terms of cash flow, the risks arise from the delayed payment from
hospitals to the small pharmaceutical companies. More than a quarter of UK hospital trusts
are now routinely delaying payments to their supplier because of cash flow problems.
Obviously, the consequences of such activities could be significant challenges faced by several
pharmaceutical suppliers as their cash flow would be interrupted, especially for those small-
scale companies. In fact, several NHS hospitals confirmed that some suppliers had put their
account “on stop” and refused to deliver further supplies due to the late payments. Although
both hospitals and suppliers are confronting such issues, though, it appears that this problem
will last for a long time due to an increasing number of hospitals struggling to maintain
adequate cash levels given recurring income and expenditure deficits.
5.2.5. Environmental risks
Environment risks refer to the unexpected events that may directly influence the focal firm,
or impact directly the downstream or upstream flow of goods or services in the supply chain
network (Christopher and Peck, 2004). Environmental risks are likely to arise when the events
negatively affect the value stream such as the contamination of the healthcare products or
damages. Sources of environmental risks are divided into two sub-levels which include natural
risks and man-made risks. Sources of natural risks include natural disaster, unexpected
disease outbreaks, and unforeseen changes in environmental conditions such as adverse
weather or natural catastrophe (Breen, 2008). Man-made risks, on the other hand, may arise
from regulatory issues, rigorous government interventions, and inadequate funds from the

165
government to support hospitals and the requirement of environment protection (Kamath et
al., 2012), as shown in Figure 5.7.
Figure 5-7: A schematic classification of sources of environmental risks
A United Nations report indicates that frequent natural disasters and catastrophes, such as
earthquakes or hostile weather conditions, are becoming more active and common in various
parts of the world. In fact, earthquakes and heat waves, for instance, increase the chances of
damaging drugs in transit. Meanwhile, flooding can cause delay in supplies or transportation
of healthcare products. More importantly, the delay is highly likely to cause healthcare drugs
perish, which can make hospitals experience drug shortages and cause tremendous losses.
Unexpected disease outbreaks have caused significant losses in the healthcare supply chain
as well. The World Health Organization (WHO) reported that a severe outbreak of acute
respiratory syndrome that caused over approximately 800 deaths in Southern China between
November 2002 and July 2003. The outbreak spread to over 36 countries within weeks (Breen,
2008). The lack of essential drugs and medical staff as well as the government travel ban in
the affected area resulted in the shutdown of 75 per cent of the plants and subsequently,
significant economic losses (Colicchia and Strozzi, 2012). Therefore, the nature of disasters
and disease outbreaks can reveal the cascade of problems that may have been unforeseen
Environmental risks
Natural risks
External influences-disaster recovery
Unexpected disease outbreaks
Unexpected changes in environment conditions
Man-made risks
Regulatory issues-manufacturing using licensing/change of standards/drug recalls
Rigorous government interventions
Lack of funds from government to the hospital
The requirement of environment protection

166
and unplanned but overcome had officials been prepared and trained to deal with the
complexities related to emergency management (VanVactor, 2012). Unexpected changes in
environment conditions, such as the impact of extreme weather events and climate change
(i.e. heatwaves and coldwaves). The extreme weather may impair functionality of hospitals
including medical equipment and shortage of medicines. More concerns is needed on the
extent of such problems, especially since mortality risks during heatwaves are particularly
high for vulnerable patients. Other issues, particularly transport systems, are likely to be
disrupted by snow and ice, creating diffculities of access for patients needing to use health
facilities and for domiciliary care staff in reaching their clients in their homes. Ambulance
response times also fall during very cold weather.
Government always plays an essential role in healthcare SCRM, not only allocating funds to
the healthcare organizations, but also providing industry with informal regulatory guidance
and recommendations. In the UK NHS, since 2015, the budget’s gaping hole was on social
care, which is close to collapse and putting ever-increasing pressure on hospitals through bed-
blocking. Furthermore, the Local Government Association estimates a £1.3bn funding gap
between what care providers need and what councils pay. Under this circumstance, the UK
NHS front-line services simply lack the funding to manage. Besides, the increased demand has
led to more people waiting longer to be seen in Accident and Emergency (A&E) over the
festival period. Rigorous government interventions may adversely affect the total output
(quantity and quality) of physicians and other healthcare providers. For example, if
government uses its monopsony power to reduce prices of medical services and wages of
healthcare employees, shortages of medical services might result. Those shortages would
lead to higher mortality rates. Government regulation gives a distinct competitive advantage
to companies large enough to maintain secure funding. For example, some drugs benefit from
additional government incentives. Orphan drugs receive special consideration from the UK
Medicine & Healthcare Products Regulatory Agency in order to encourage pharmaceutical
companies to develop treatments for rare diseases. Incentives for the development of orphan
drugs include quicker approval time and potential financial assistance for development.
Companies are often permitted to charge substantial prices for orphan drugs, making them
more profitable than they would be without government intervention. Regulatory issues may
arise from unpredictable regulations and legislations such as new licensing policies, changes

167
in the standards of requirements, drug recalls from the manufacturers, inconsistent
government interventions, and quota restrictions. Any change in the manufacturing process
necessitates a licence variation which often entails a delay (Breen 2008).
In the healthcare supply chain, the increasing attention on policy risk is emphasised on the
safe use and disposal of hazardous drugs presents potential challenges to the surrounding
environment and general supply chain operations. Improper drug disposals threatens human
health as well as the ecological balance leading governments and other environmental
conservation agencies to implement formal and informal regulatory policies (Scruggs et al.,
2014). The provided investigation estimated that some of these policies expose hospitals to
hefty fines and potential financial losses. Therefore, it is advisable for hospitals to avoid loses
by ensuring the safe disposal of used or expired drugs.
5.3 RISK FACTORS IDENTIFICATION DATA ANALYSIS AND TAXONOMIC DIAGRAM
VALIDATION
The visibility of the supply chain related risks is one of the most challenging aspects of
healthcare SCRM, it is therefore essential to comprehensively identify and validate risk factors
existing in the healthcare SC. The foundation of effective SCRM requires three critical tasks:
specification of sources, risk assessment and risk mitigation (Kleindorfer and Saad, 2005). This
research started with identifying the risk factors that have been addressed in the relevant
literatures (shown in Chapter two), and then a decomposition method was applied to classify
unstructured risk factors into different risk domains. The preliminary structured hierarchical
diagram of healthcare supply chain risks is developed as shown in Figures 5.8 to 5.11.
5.3.1 Procedure for questionnaire design and pilot study
The questionnaire was built to explore the feasibility of the developed risk classification
taxonomic diagram and to explore if any other remaining risks were yet to be explored.
Therefore, the performance of risk factors identification and classification is based on the
expertise of the constructed group. The data was obtained and content validity was
performed to improve the clarity of the developed questionnaire. Firstly, a draft version of
the questionnaire and cover letter was developed. The questionnaire was examined by two
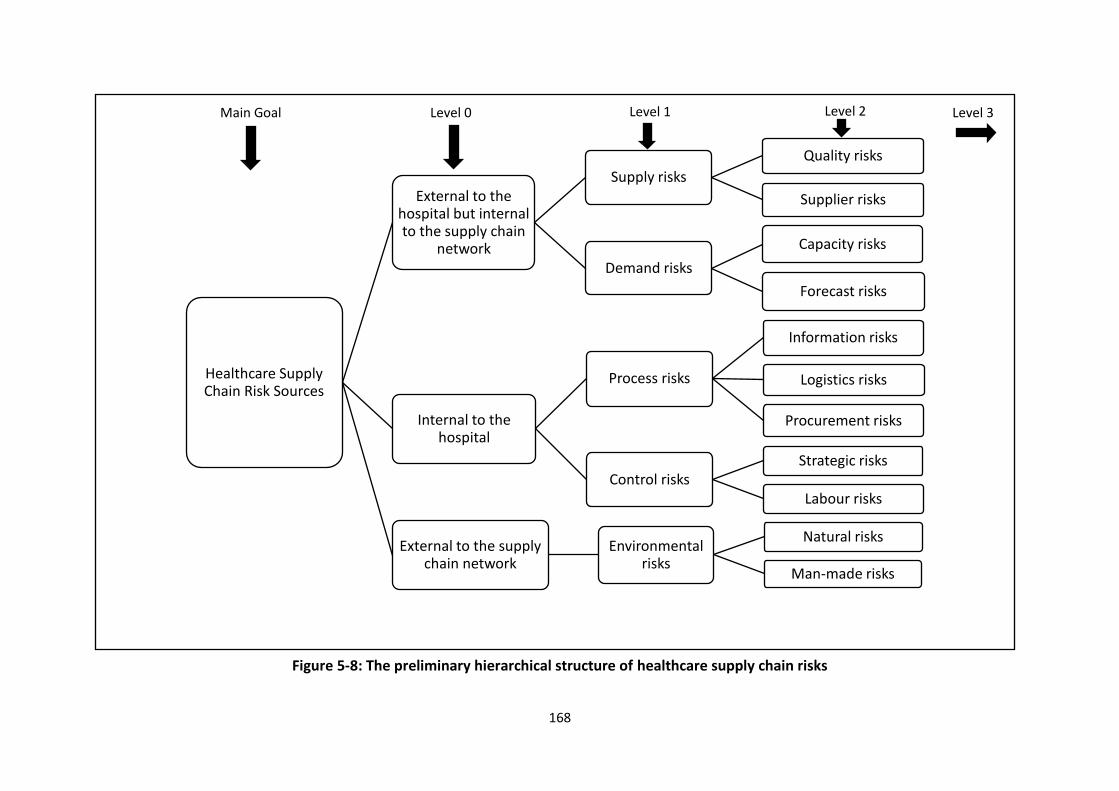
168
Figure 5-8: The preliminary hierarchical structure of healthcare supply chain risks
Healthcare Supply Chain Risk Sources
External to the hospital but internal to the supply chain
network
Supply risks
Quality risks
Supplier risks
Demand risks
Capacity risks
Forecast risks
Internal to the hospital
Process risks
Information risks
Logistics risks
Procurement risks
Control risksStrategic risks
Labour risks
External to the supply chain network
Environmental risks
Natural risks
Man-made risks
Main Goal Level 0 Level 1 Level 2 Level 3

169
Figure 5-9: The preliminary External to the hospital but internal to the supply chain network risks hierarchical structure for healthcare SC
External to the hospital but internal
to the supply chain
network
Supply risks
Quality risks
Counterfeiting (S1)
Poor quality in the purchased drugs from suppliers (S2)
Time limit of drug, Product perishability (S3)
Supplier risks
Shortage of drug, unavailability of drugs on the market (S4)
Location of manufacturer/supplier (not domestic based) (S5)
Unavailability of raw material-true and commercially induced (S6)
Cash flow/cash management threat associated with small companies and hospitals (S7)
Demand risks
Capacityrisks
Capability versus demand; inability of capacity to meet demand (S8)
Demand trigged by the nurse, not the patient (S9)
Forecast risks
Demand uncertainty (S10)
Wrong demand forecasting (S11)

170
Figure 5-10: The preliminary Internal to the hospital risks hierarchical structure for healthcare SC
Internal to the hospital
Process risks
Information risks
Poor IT system, lack of data standardization (S12)
Asymmetries of the information, collaboration issues, restriction, not share information each department (S13)
Logistics risks
Dispensing/picking errors-medication/packaging (S14)
Weak logistics service infrastructure (S15)
Fragmentation of the drug distribution process (S16)
Inadequate buffer stock-JIT/Lean (S17)
Lack of visibility concerning placement and availability of stork (S18)
Procurement risks
Procurement Hub-introduce more complexity, long lead time (S19)
Contract problems with suppliers (S20)
Clinician's preference (S21)
High purchase price (S22)
High product and supplier/brand variety (S23)
Control risks
Strategic risks
Focus on short term SC planning than long term (S24)
Prioritization-conflic between patients/profits (S25)
Labour risks
Strikes and lack talents (S26)
Lack of incentive mechanism (S27)

171
Figure 5-11: The preliminary External to the supply chain network risks hierarchical structure for healthcare SC
External to the supply
chain network
Environmental risks
Natural risks
External influences-disaster recovery (S28)
Unexpected disease outbreaks (S29)
Unexpected changes in environment conditions (S30)
Man-made risks
Regulatory issues-manufacturing using licensing/change of standards/drug recalls (S31)
Rigorous government interventions (S32)
Lack of funds from government to the hospital (S33)
The requirement of environment protection (S34)

172
academic researchers and two specialists to comment on the appropriateness and clarify of
the questions. Based on their feedbacks, the questionnaire was revisited for the pilot study.
The pilot study was conducted by exploring different judges to pre-asses the questionnaire’s
effectiveness, accuracy, and unambiguous communication. All items on the questionnaire
were measured on a five-point Likert-type scale with response options ranging from 1 (very
unimportant) to 5 (very important). Ethical approval was also obtained to further validate the
questionnaire content and participant consent. The questionnaire (see Appendix One) as
represented at the end of the pilot study was used for data collection.
5.3.2 Selection of experts for validation
As an exploratory study, a cross-section of experts or decision makers was considered for
participation in the survey. The questionnaire survey was conducted with six experts from
both the UK and China in academic fields as well as the healthcare industry to address the
concerned risk-related events. The sample size was considered acceptable for this study. Satty
(2001) stated that just a small sampling size (<10 responses) was necessary if the data
collected were gathered from the experts. This is due to that fact that professionals should
share consistent belief and thus diminish the need for a huge sample size. Experts working
experience and academic qualifications were used as the selection threshold (John et al.,
2016). Meanwhile, the group included experts from a wide variety of professionals with
expertise from different functional groups, such as supply chain and logistics management,
pharmacy science, and risk management, which are grouped for risk factors identification and
assessment groups. Hammitt and Zhang (2013) emphasized that a sample size of 𝑁 experts
(𝑖)(where 𝑖 =1,2,3,…, 𝑁) was necessary if the well-calibrated experts are of equal or unequal
quality and their judgements are independent, positively or negatively dependent. In order
to obtain a balanced view from different professional areas, the invited experts consisted of
two heads of procurement (i.e. pharmacy department leader in Chinese hospital is the same
as the head of procurement in UK NHS) in charge of all the supply chain and logistics activities
in the hospital; two academic professors within a background in both pharmacy and supply
chain and logistics management; and one senior lecturer and one senior manager who have
rich experience and knowledge in risk management. The risk validation and exploration
procedure in this thesis includes two major parts: (1) the results of the questionnaire survey
and (2) the results of email and face to face interview. Within the results obtained from the

173
questionnaire survey, this thesis firstly presents the confirmation of the identified risk factors
and the developed classification model and the risk factors exploration. In the results of email
and face to face interviews, the modified hierarchy model was confirmed.
Different experts have different impacts on the final decisions and results, thus, the
evaluation weighting criteria have been developed and allocated to each expert on the basis
of their job position, qualification and work experience. According to Cooke et al., (2008),
expert weighting criteria refer to the measure of the relevance of data that is considered as a
function of professional duty (position in the organization) and work experience in terms of
time in years. Table 5.3 presents the details of weighting and relevant description of each
expert evaluation criteria used in identifying respondents.
Table 5.3: Experts’ Weighting Criteria(expert evaluation)
Weight value
Keyword Description (either-or)
20%-30% Highly relevant
The respondents have many years of rich experience in pharmaceutical supply chain management; and they always hold the top position in pharmaceutical logistics activities; In academia, the respondents have a rich knowledge and in-depth studies that make a demonstrate contribution to pharmacy or supply chain risk management.
10%-19% Fairly relevant
The respondents have at least 10 years work experience in pharmaceutical supply chain management or doing the similar work in other industry. In academia, the respondents have a good knowledge in pharmacy or supply chain risk management. They clearly understand the severity and consequence of supply chain disruption.
1%-9% Relevant The respondents have basic work experience in pharmaceutical supply chain management or doing the similar work in other industry. In academia, they have the general understanding of the status of the healthcare industry and the pharmacy supply chain risk aspects.
0 Irrelevant No experience or knowledge in relation to the research topic.
Based on the experts weighting criteria proposed above, six experts were assigned the
weighting on the basis of their individual background and experience as shown in Table 5.4.
Expert A has the highest weighting (30 per cent) as he holds a position of head of procurement
with a very long professional work experiences in the UK NHS hospitals. While, both experts

174
B and C have the same weighting (20 per cent) as they are either a specialist in pharmacy
sciences or hold a managerial positions in the pharmacy department. The remaining three
experts have the lowest weighting (10 per cent) among the experts group because their
background is not relevant to the healthcare industry, but they have rich knowledge in supply
chain and risk management.
Table 5.4: Research expert weighting respondents’ profile
Expert Weight Organization type
Job title Years of experience
Functional SCM/RM/Pharmacy
experience
Expert A
30% hospital Head of Procurement
>20 Procurement , warehousing and logistics
Expert B
20% Academic Professor >20 Pharmacy and Biomolecular Sciences
Expert C
20% Hospital Pharmacy department
leader
10 Procurement , warehousing and logistics
Expert D
10% Academic Professor 13 Transportation and Logistics management
Expert E
10% Academic Senior Lecturer
12 Risk and Operation management; supply chain
management
Expert F
10% Logistics Company
Senior Manager - Operations
9 Supply Chain Risk management
5.3.3 Data analysis and description
The survey equally aimed at establishing the extent to which the identified risk factors are
comprehensive. Accordingly, a reliability and validity test was carried out to test whether the
study measures the required items and the reliability of the received responses. It should be
mentioned that the reliability of the questionnaire survey is closely associated to its validity.
A questionnaire survey cannot be valid unless it is reliable. Cronbach’s Alpha has become the
widely accepted method in different types of research when multiple-item measures of a
concept or construct are employed. This is because the method is much easier to use in
comparison with other estimates as it only requires one test administration. The reliability of
the obtained results was examined through employing Cronbach's Alpha method (Sijtsma,
2009; Cohen and Swerdlik, 2010) by using the following functions and equations:

175
𝑎 =𝐾
𝐾 − 1(1 −
∑ 𝜎𝑌𝑖2𝐾
𝑖=1
𝜎𝑥2 (5.1)
𝑎𝑠𝑡𝑎𝑛𝑑𝑎𝑟𝑑𝑖𝑠𝑒𝑑 =KY
1+(K−1)Y (5.2)
where K is defined as number of the questions in the investigation, 𝜎𝑥2 is the variance of the
total sample, 𝜎𝑌𝑖2 is the variance of the current question, and 𝑖 is the question number. Eq. 5.1
is for the calculation of Cronbach's Alpha, whereas Eq. 5.2 examines the Alpha based on
standardised items, where K is defined as the number of the questions in the survey and ��
refers the meaning of the non-redundant correlation coefficients.
The study tested 204 questions in total. The calculated Cronbach's Alpha value was 0.944. The
Cronbach's Alpha based on standardised items was found to be 0.952. Alpha coefficient
ranges in value between 0 and 1 and can be used to describe the reliability of factors extracted
from the questionnaire. The higher the score, the more reliable the generated scale. In
practice, a value of 0.8 indicates that the collected data is reliable. The data is also satisfactory
if the value falls between 0.7 and 0.8. However, in principal, a value less than 0.7 shows poor
internal consistency of the data (Chomeya, 2010). It can be deduced that the survey attains a
high level of reliability. Table 5.5 presents the reliability test results of Cronbach’s Alpha.
Table 5.5: The reliability test for the questionnaire survey
Reliability Statistics
Cronbach's Alpha
Cronbach's Alpha Based on Standardized Items
Number of
questions
Whole survey
0.944
0.952
204
Tables 5.6 and 5.7 illustrate the Sum, Mean, the Weighted Average and Standard Deviation
(S.D.), and the ranking of the identified risk factors on the basis of expert judgements.
Standard deviation is the measure of dispersion of a given data. The result analysis shows the
standard deviation to range from 0 to 2.74. When the value of a standard deviation is high, it
implies that the experts attribute a particular factor of measurement value to spread to a

176
Table 5.6: Results of the significance of healthcare supply chain risks (Questionnaire Survey)
Identified risk factors How important is this risk factor to healthcare SC operations?
Sum Mean Weighted Average
S.D.
Quality risks Counterfeiting (S1) 30 5 5 0
Poor quality in the purchased drugs from suppliers (S2) 28 4.67 4.8 1.15
Time limit of drug, Product perishability (S3) 25 4.17 4.2 0.91
Supplier risks
Shortage of drug, unavailability of drugs on the market (S4) 27 4.5 4.6 1.22
Location of manufacturer/supplier (not domestic based) (S5) 22 3.67 3.6 2.31
Unavailability of raw material-true and commercially induced (S6) 22 3.67 3.7 1.15
Cash flow/cash management threat associated with small companies and hospitals (S7)
21 3.5 3.6 2.74
Capacity risks
Capability versus demand; inability of capacity to meet demand (S8) 26 4.33 4.3 1.15
Demand trigged by the nurse, not the patient (S9) 25 4.17 4.1 2.2
Forecast risks
Demand uncertainty (S10) 22 3.67 3.7 1.7
Wrong demand forecasting (S11) 24 4 4 1.41
Information risks
Poor IT system, lack of data standardization (S12) 27 4.5 4.4 1.22
Asymmetries of the information, collaboration issues, restriction, not share information each department (S13)
21 3.5 3.5 1.83
Logistics risks
Dispensing/picking errors-medication/packaging (S14) 27 4.5 4.5 1.87
Weak logistics service infrastructure (S15) 27 4.5 4.4 1.22
Fragmentation of the drug distribution process (S16) 23 3.83 3.7 2.2
Inadequate buffer stock-JIT/Lean (S17) 22 3.67 3.5 2.61
Lack of visibility concerning placement and availability of stock (S18)
24 4 4 2
Procurement risks
Procurement Hub-introduce more complexity, long lead time (S19) 25 4.17 4.1 0.91
Contract problems with suppliers (S20) 22 3.67 3.6 2.31
Clinician's preference (S21) 25 4.17 4.2 2.61

177
High purchase price (S22) 27 4.5 4.6 1.22
High product and supplier/brand variety (S23) 25 4.17 4.2 1.68
Strategic risks
Focus on short term SC planning than long term (S24) 22 3.67 3.5 1.68
Prioritization-conflict between patients/profits (S25) 21 3.5 3.6 1.87
Labour risks Strikes and lack talents (S26) 23 3.83 3.6 2.61
Lack of incentive mechanism (S27) 22 3.67 3.4 1.83
Natural risks External influences-disaster recovery (S28) 26 4.33 4.2 1.83
Unexpected disease outbreaks (S29) 28 4.67 4.5 1.15
Unexpected changes in environment conditions (S30) 25 4.17 4 1.68
Man-made risks
Regulatory issues-manufacturing using licensing/change of standards/drug recalls (S31)
22 3.67 3.4 2.45
Rigorous government interventions (S32) 22 3.67 3.4 2
Lack of funds from government to the hospital (S33) 21 3.5 3.3 2.2
The requirement of environment protection (S34) 22 3.67 3.6 1.83
* S.D.= Standard Deviation

178
Table 5.7: Ranking of the significance of healthcare supply chain risks (Questionnaire Survey)
Risk Factors Sum Rank (Sum) Mean Rank (Mean) Weighted Average Rank (W.A) S.D. Rank (S.D.)
S1 30 30 5 5 5 5 0 0
S2 28 28 4.67 4.67 4.8 4.8 1.15 0.91
S3 25 28 4.17 4.67 4.2 4.6 0.91 0.91
S4 27 27 4.5 4.5 4.6 4.6 1.22 1.15
S5 22 27 3.67* 4.5 3.6* 4.5 2.31 1.15
S6 22 27 3.67* 4.5 3.7* 4.5 1.15 1.15
S7 21 27 3.5* 4.5 3.6* 4.4 2.74 1.15
S8 26 27 4.33 4.5 4.3 4.4 1.15 1.22
S9 25 26 4.17 4.33 4.1 4.3 2.2 1.22
S10 22 26 3.67* 4.33 3.7* 4.2 1.7 1.22
S11 24 25 4 4.17 4 4.2 1.41 1.22
S12 27 25 4.5 4.17 4.4 4.2 1.22 1.41
S13 21 25 3.5* 4.17 3.5* 4.2 1.83 1.68
S14 27 25 4.5 4.17 4.5 4.1 1.87 1.68
S15 27 25 4.5 4.17 4.4 4.1 1.22 1.68
S16 23 25 3.83* 4.17 3.7* 4 2.2 1.7
S17 22 24 3.67* 4 3.5* 4 2.61 1.83
S18 24 24 4 4 4 4 2 1.83
S19 25 23 4.17 3.83* 4.1 3.7* 0.91 1.83
S20 22 23 3.67* 3.83* 3.6* 3.7* 2.31 1.83
S21 25 22 4.17 3.67* 4.2 3.7* 2.61 1.87
S22 27 22 4.5 3.67* 4.6 3.6* 1.22 1.87
S23 25 22 4.17 3.67* 4.2 3.6* 1.68 2
S24 22 22 3.67* 3.67* 3.5* 3.6* 1.68 2
S25 21 22 3.5* 3.67* 3.6* 3.6* 1.87 2.2
S26 23 22 3.83* 3.67* 3.6* 3.6* 2.61 2.2

179
S27 22 22 3.67* 3.67* 3.4* 3.6* 1.83 2.2
S28 26 22 4.33 3.67* 4.2 3.5* 1.83 2.31
S29 28 22 4.67 3.67* 4.5 3.5* 1.15 2.31
S30 25 22 4.17 3.67* 4 3.5* 1.68 2.45
S31 22 21 3.67* 3.5* 3.4* 3.4* 2.45 2.61
S32 22 21 3.67* 3.5* 3.4* 3.4* 2 2.61
S33 21 21 3.5* 3.5* 3.3* 3.4* 2.2 2.61
S34 22 21 3.67* 3.5* 3.6* 3.3* 1.83 2.74
* denotes the identified risk factors with both Mean and Weighted Average below 4.

180
Figure 5-12: Comparison the results based on Mean and Weighted Average
range of many other values. Furthermore, a set of data was chosen based on the expert
weighted average as the weighting of each expert has been considered.
Figure 5.12 illustrates the comparison between the data based on Mean and Weight Average
for each risk factor. It showed that the results are almost the same as the two lines are close
to each other. Therefore, an indication is that the proposed expert weighting criteria is
reliable. In the questionnaire survey, the experts were asked to respond to the items by
indicating their level of agreement using a five-point Likert scale (i.e. 1=very unimportant,
2=minor unimportant, 3=moderate, 4=minor important and 5=very important). Finally, some
risk factors with Weighted Averages below 4 were omitted by the end of the score analysis as
they are less important or moderate. Those eliminated risk factors are highlighted in grey as
shown in Figures 5.13 to 5.16.
As well, low Weighted Average values indicated that most of the experts expressed similar
concerns about a particular factor. In this case, the remaining risk factors were observed to
address other factors with low Means. The summary from the table shows the surveyed
experts’ in relation to the identified categories of supply chain risks to suggest the concerned
hazardous events. Moreover, it also justifies the reliability and validity of the research findings
on the methods of supply chain risk classification methods in the healthcare industry.
0
1
2
3
4
5S1
S2S3
S4S5
S6
S7
S8
S9
S10
S11
S12
S13
S14S15
S16S17
S18S19
S20S21
S22
S23
S24
S25
S26
S27
S28
S29
S30
S31S32
S33S34
Mean Weighted Average
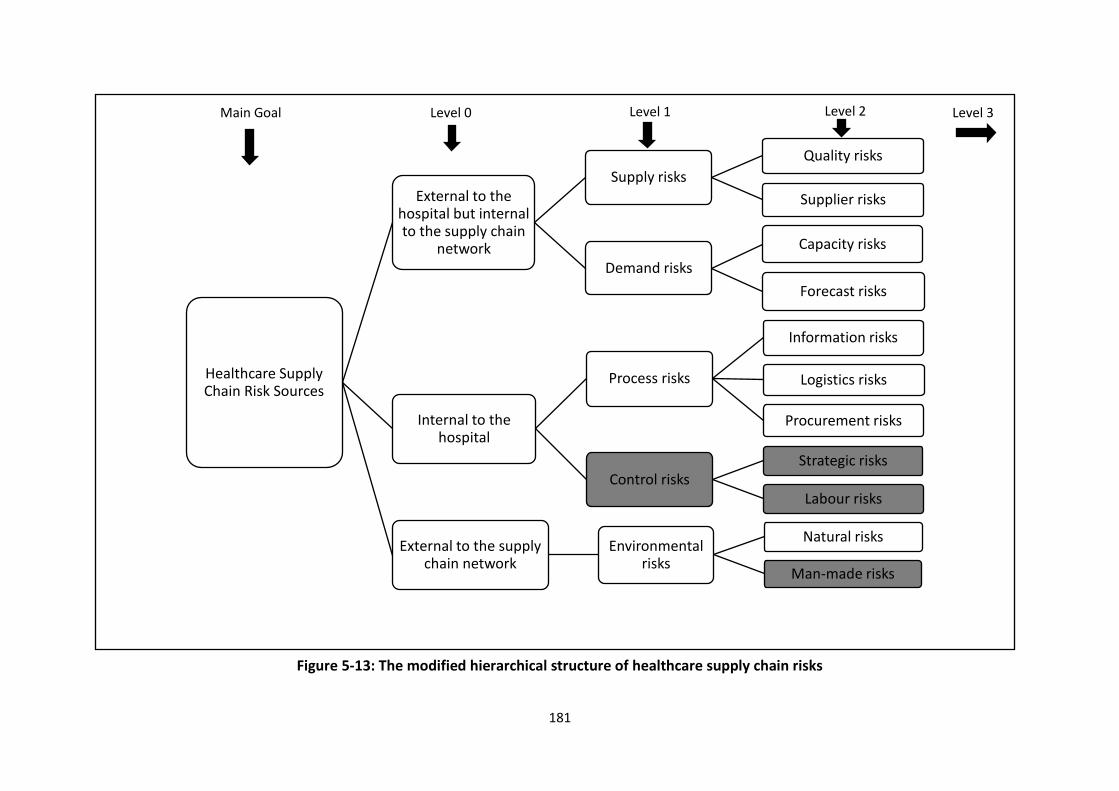
181
Figure 5-13: The modified hierarchical structure of healthcare supply chain risks
Healthcare Supply Chain Risk Sources
External to the hospital but internal to the supply chain
network
Supply risks
Quality risks
Supplier risks
Demand risks
Capacity risks
Forecast risks
Internal to the hospital
Process risks
Information risks
Logistics risks
Procurement risks
Control risksStrategic risks
Labour risks
External to the supply chain network
Environmental risks
Natural risks
Man-made risks
Main Goal Level 0 Level 1 Level 2 Level 3

182
Figure 5-14: The modified External to the hospital but internal to the supply chain network risks hierarchical structure for healthcare SC
External to the hospital but internal
to the supply chain
network
Supply risks
Quality risks
Counterfeiting (S1)
Poor quality in the purchased drugs from suppliers (S2)
Time limit of drug, Product perishability (S3)
Supplier risks
Shortage of drug, unavailability of drugs on the market (S4)
Location of manufacturer/supplier (not domestic based) (S5)
Unavailability of raw material-true and commercially induced (S6)
Cash flow/cash management threat associated with small companies and hospitals (S7)
Demand risks
Capacity risks
Capability versus demand; inability of capacity to meet demand (S8)
Demand trigged by the nurse, not the patient (S9)
Forecast risks
Demand uncertainty (S10)
Wrong demand forecasting (S11)

183
Figure 5-15: The modified Internal to the hospital risks hierarchical structure for healthcare SC
Internal to the
hospital
Process risks
Information risks
Poor IT system, lack of data standardization (S12) Asymmetries of the information, collaboration issues, restriction, not share information each department (S13)
Logistics risks
Dispensing/picking errors-medication/packaging (S14)
Weak logistics service infrastructure (S15)
Fragmentation of the drug distribution process (S16)
Inadequate buffer stock-JIT/Lean (S17)
Lack of visibility concerning placement and availability of stork (S18)
Procurement risks
Procurement Hub-introduce more complexity, long lead time (S19)
Contract problems with suppliers (S20)
Clinician's preference (S21)
High purchase price (S22)
High product and supplier/brand variety (S23)
Control risks
Strategic risksFocus on short term SC planning than long term (S24)
Prioritization-conflic between patients/profits (S25) Labour risks
Strikes and lack talents (S26)
Lack of incentive mechanism (S27)

184
Figure 5-16: The modified External to the supply chain network risks hierarchical structure for healthcare SC
External to the supply
chain network
Environmental risks
Natural risks
External influences-disaster recovery (S28)
Unexpected disease outbreaks (S29)
Unexpected changes in environment conditions (S30)
Man-made risks
Regulatory issues-manufacturing using licensing/change of standards/drug recalls (S31)
Rigorous government interventions (S32)
Lack of funds from government to the hospital (S33)
The requirement of environment protection (S34)

185
Among the total 34 risk factors, the results analysis according to the statistical means
demonstrated that the quality related risks, including counterfeiting (grey market activity) (5)
and poor drug quality from suppliers (4.8), supplier related risks including shortage of drugs
in the market (4.6), logistics related risks including dispensing/ picking error-medication/
packaging (4.5), procurement related risks including high purchase price (4.6), and natural
disaster related risks, including unexpected disease outbreaks (4.5), are of high concern to the
experts, which could frequently be experienced within the healthcare supply chain networks.
The significance for each identified risk factor is ranked to suggest the significant and
influential factors to healthcare SC operations. Nevertheless, although the invited experts
consisting of the people from different fields and countries, the results also reflect the
consensus of their opinion under a different contexts. Thus, a typological model of healthcare
SC risk factors was developed through the preceding discussion of risk factors in the
healthcare SCs and integrating summarised questionnaire results. The identified healthcare
SC risk factors are ranked in each categorisation and outlined in a hierarchical structure,
shown in Figure 5.17.
Thereafter, to assure the validity and reliability of the developed hierarchy diagram, emails
and face-to-face interviews were subsequently distributed and conducted with the
“validation team” (six earlier experts as well as two academics with experience in supply chain
and risk management who were not part of the expert panel). Finally, experts agreed and the
developed hierarchy diagram was accepted without modification. Additionally, the experts
offered informal advice and opinions, such as this research attend more to the 15 key
recommendations provided in Lord Carter’s report. Moreover, the risks can also be
categorised as controllable and uncontrollable risk factors (Behnezhad et al., 2013). In this
thesis, more attention is paied to the several controllable risks instead of uncontrollable risks
(e.g. natural risks). Collaboration and employing information communication technology
(ICT) are also highly recommendations given by the experts as the key elements for efficiency
risk mitigation strategies.

186
Figure 5-17: Final hierarchical structure of healthcare supply chain risks
Hospital Pharmaceutical
Supply Chain Risk Sources
External to the hospital but
internal to the supply chain
network
Supply risks
Quality risks
Counterfeiting (S1) 5
Poor quality in the purchased drugs from suppliers (S2) 4.8
Time limit of drug, Product perishability (S3) 4.2
Supplier risks Shortage of drug; unavailability of drugs on the market (S4) 4.6
Demand risks
Capacity risks
Capability versus demand; inability of capacity to meet demand (S5) 4.3
Demand trigged by the nurse, not the patient (S6) 4.1
Forecast risks Wrong demand forecasting (S7) 4
Internal to the hospital
Process risks
Information risks
Poor IT system, lack of data standardization (S8) 4.4
Logistics risks
Dispensing/picking errors-medication/packaging (S9) 4.5
Weak logistics service infrastructure (S10) 4.4
Lack of visibility concerning placement and availability of stock (S11) 4
Procurement risks
Procurement Hub-introduce more complexity, long lead time (S12) 4.1
Clinician's preference (S13) 4.2
High purchase price (S14) 4.6
High product and supplier/brand variety (S15) 4.2
External to the supply chain
network
Environmental risks
Natural risks
External influences-disaster recovery (S16) 4.2
Unexpected disease outbreaks (S17) 4.5
Unexpected changes in environment conditions (S18) 4

187
5.4 CONCLUSION
This chapter recognises supply chain risk factors identification and classification as the
significant process for conducting the efficient risk management. The literature review and
the questionnaire survey serves as a base and guide to strengthen the knowledge base for
supply chain risk factors identification. In order to identify the risk factors as completely as
possible, the literature review investigated the broad risk classification methods addressed in
the previous studies and the questionnaire survey and a series of emails as well as face-to-
face interviews were established to develop a structural hierarchy risk taxonomic diagram.
In the thesis, a hierarchical risk classification is presented, which consists of five different
supply chain risk categories (i.e. supply, demand, control, process and environment) based on
organizational-related, network-related, and environmental-related. Thereafter, those five
categories of risk factors were further divided into eleven different sub-categories risks:
quality, supplier, capacity, forecast, information, logistics, procurement, strategic, labour,
natural, and man-made risks.
The empirical studies in this chapter were carried out to make an inference about the
experts’attitudes and opinions in order to capture the risk factors in a more comprehensive
and reliable way. Meanwhile, the importance of the performance of the identified risk factors
and developed classification model for the healthcare SC system was addressed. There is a
consensus between the inputs from academic and industry experts. It provided a portfolio of
risks and suggested the most concerning hazardous events from both academic and industrial
perspectives. In the next chapter, the captured risk factors can be assessed by applying both
Fuzzy AHP and ISM models to discover the priorities and context relations among them.

188
6.CHAPTER SIX – HEALTHCARE SUPPLY CHAIN RISK ASSESSMENT
6.1 INTRODUCTION
This chapter focuses on risk assessment using Fuzzy AHP to prioritise and detect the critical
risk factors that can lead to serious consequences for healthcare SC operations. Furthermore,
it will analyse those important risk factors using an ISM model to provide a comprehensive
outline by considering their interconnectedness. Empirical studies were conducted to collect
the primary data on the risk factor weighting and risk factors inter-relationship. It also
illustrates the applications of the proposed methods. This will facilitate the decision-making
process for choosing appropriate strategies and take preventive/corrective actions in later
stages for mitigating risks towards a successful healthcare supply chain management.
6.2 METHODOLOGY FOR RISK ASSESSMENT IN HEALTHCARE SUPPLY CHAIN
Based on the developed integrated risk management model, a generic Fuzzy AHP and ISM
based risk assessment model is proposed for determining and assessing the critical levels and
interrelationship of identified risk factors. The proposed model is a key part in the RM model
and the schematic diagram of the proposed Fuzzy AHP and ISM based risk assessment model
is illustrated in Figure 6.1. The proposed Fuzzy AHP and ISM based risk assessment model will
be implemented on the healthcare SC sector during risk assessment phases via carrying out
the following steps:
Step 1: Developing a generic hierarchical structure based on the identified risk factors (this
step has been done in the last chapter).
Step 2: Conducting the Fuzzy AHP based questionnaire survey to obtain the experts’
judgement and opinions, the significance of the structured risk factors will be explored. These

189
judgements will be carried out in the form of the pre-defined linguistics variables which have
been explained in Chapter four.
Step 3: The linguistic variables then will be transformed into the Triangular fuzzy numbers
(TFNs) for the pair-wise comparisons.
Step 4: The consistency check test will be conducted on the comparison matrix in order to
ensure that experts’ judgements and pair-wise comparisons were reasonable.
Step 5: By use of the expert’s judgements and pair-wise comparisons matrices the local and
global weights of the risk factors will be calculated. Moreover, the risk factors will be ranked
directly per their numerical priorities in order to show their significance.
Step 6: Those risk factors with high priorities will be selected to develop a structural self-
interaction matrix (SSIM) on the basis of pairwise comparison of the risk factors.
Step 7: A questionnaire containing selected risk factors will be administered to the experts
with an instruction to compare each and every pair of criteria depicted in SSIM.
Step 8: Construction of reachability matrix from the SSIM and checking for transitivity
property.
Step 9: The obtained reachability matrix is partitioned into different levels.
Step 10: Drawing a directed graph by removing the transitivity links and also on the basis of
reachability matrix.
Step 11: Conversion of diagraph into ISM model by replacing element nodes with statements.
Moreover, the conceptual inconsistency of developed ISM model will be checked.
Step 12: MICMAC analysis will be carried out by investigating the driving and dependence
power among each risk factor. Those risk factors with weak driving power and weak
dependence will be removed and the remaining risks will be used for the risk mitigation
strategies identification and evaluation.

190
Risk Factors Identification
Risk Assessment Risk Mitigation
Chapter 5 Chapter 6 Chapter 7
Developing a hierarchy structure for risk factors
Construct the fuzzy comparison matrix
Transform linguistic judgements into fuzzy numbers
Consistency check
Calculate the fuzzy weight of criteria and sub-criteria s
Ranking of the risk factors
AHP method under fuzzy environment
Construction of structural self-interaction matrix (SSIM) by pairwise comparison
Developing a reachability matrix from the SSIM and checking for transitivity
Ensuring the reachability matrix by appropriately partitioned into several levels
Drawing of diagraph with removed transitivity links
Conversion of diagraph into an ISM and checking of conceptual inconsistency
MICMAC analysis
Remove the risk factors with weak drivers and dependents
Figure 6-1: Proposed Fuzzy AHP and ISM based risk assessment model for healthcare SC

191
6.3 RISK ASSESSMENT WITH FUZZY ANALYTIC HIERARCHY PROCESS (FUZZY AHP)
For the purpose of solving various uncertain decision-making problems in the real world, it is
necessary to handle the vagueness and uncertainty in the environment. Uncertainties in
decision making process include, for example, ill-posed questions, imprecision in
computation, ambiguity in data/knowledge representation, and some terms of expressing
opinions, such as “neither agree nor disagree” and “nearly equal importance” can often be
heard in daily life. It is acknowledged that some methods are widely used for dealing with
these uncertainties, including heuristic approaches, possibility theory, probability theory, and
fuzzy set theory (FST).
FST was originally proposed by Zadeh (1965) to deal with vagueness in human judgement,
which oriented with the rationality of uncertainty due to ambiguity or vagueness. It is defined
by a membership function that maps elements to degree of membership within a certain
interval between o and 1 (Patil and Kant 2014). The main advantage of FST is to provide a
range to express the vague data and to tackle the ambiguities involved in the process of
linguistic estimation. In practice, these linguistic terms can be represented by fuzzy numbers.
According to Chang’s (1996) definition, the fuzzy number is established when various factors
have been considered in formation of a closed interval. This is represented as follows:
1) exists 𝑥0 ∈ 𝑅 such that 𝜇𝑀(𝑥0)=1.
2) For any 𝑎 ∈ [0, 1].
𝐴𝑎= [𝑥, 𝜇𝐴(𝑥)≥𝑎]
Then the fuzzy number will be represented by:
𝑀 ∈ 𝐹(𝑅)
It is possible to use different fuzzy numbers according to the situation and in practice
triangular and trapezoidal fuzzy numbers are the most commonly used (Klir and Yuan, 1995).
Trapezoidal fuzzy numbers are specific case of triangular fuzzy numbers. A trapezoidal fuzzy
number A is a fuzzy number denoted as A= (a, b, c, d) which membership function is defined
as:

192
𝜇𝐴(𝑥) =
{
0, 𝑥 < 𝑎
𝜇𝑙𝐴(𝑥) =𝑥−𝑎
𝑏−𝑎, 𝑎 ≤ 𝑥 ≤ 𝑏
1, 𝑏 ≤ 𝑥 ≤ 𝑐
𝜇𝑟𝐴(𝑥) =𝑥−𝑑
𝑐−𝑑, 𝑐 ≤ 𝑥 ≤ 𝑑
0, 𝑜𝑡ℎ𝑒𝑟𝑤𝑖𝑠𝑒
(6.1)
where a, b, c, d are real numbers and a<b<c<d. If b=c, it is defined a triangular fuzzy number.In
applications it is often suitable to work with Triangular Fuzzy Numbers (TFNs) due to their
computation ease, they are useful in supporting illustration and information processing under
a fuzzy environment (Ertugrul and Karakasoglu, 2007). Moreover, this research applied
Chang’s (1996) extent analysis method. In this method an extent is quantified using triangular
fuzzy number. This method is preferred over other fuzzy AHP method’s because the method
is easy, simple and its application similar to conventional AHP.
In this case, F(R) refers to all fuzzy sets established while R represents the set of real numbers.
A fuzzy number M on R is defined as a triangular fuzzy number when its membership function,
which is µM(X): R → [0, 1], is equivalent to the following function:
𝜇𝑀(𝑥) =
{
𝑥
𝑚−𝑙−
𝑙
𝑚−𝑙 , 𝑥 ∈ {𝑙,𝑚}.
𝑥
𝑚−𝑢−
𝑢
𝑚−𝑢 , 𝑥 ∈ {𝑚, 𝑢}.
0, 𝑜𝑡ℎ𝑒𝑟𝑤𝑖𝑠𝑒
(6.2)
The membership function of TFN is illustrated in Figure 6.2.
Figure 6-2: Membership function of TFN
𝜇𝑀(𝑥)
1
0 𝑙 𝑚 𝑢 𝑥

193
In this case, u and l represent the respective upper and lower measures of the support of M,
where m refers to the modal measure, and l ≤ m ≤ u. Therefore, (l, m, u) can be used to
represent the triangular fuzzy number. In a situation where l = m = u, a non-fuzzy number is
realized by convention. At the same time, the support of M is a collection of the following
elements.
{𝑥 ∈ 𝑅|𝑙 < 𝑥 < 𝑢}
Consider two triangular fuzzy numbers 𝑀1and𝑀2,𝑀1=(𝑙1, 𝑚1, 𝑢1) and 𝑀2=(𝑙2, 𝑚2, 𝑢2). The
distance measurement d(𝑀1, 𝑀2) is identical to the Euclidean distance. Then under fuzzy
environments their basic operations laws such as addition i.e. +, multiplication i.e. ⊗ and
their inverse can be depicted as follows:
(𝑙1, 𝑚1, 𝑢1) + (𝑙2, 𝑚2, 𝑢2) = (𝑙1 + 𝑙2, 𝑚1 +𝑚2, 𝑢1+ 𝑢2) (6.3)
(𝑙1, 𝑚1, 𝑢1) ⊗ (𝑙2, 𝑚2, 𝑢2) = (𝑙1𝑙2, 𝑚1𝑚2, 𝑢1𝑢2) (6.4)
(λ,λ,λ) ⊗ (𝑙1, 𝑚1, 𝑢1) = (λ𝑙1,λ𝑚1, λ𝑢1) λ›0, λ⊂R.
(6.5)
(𝑙1, 𝑚1, 𝑢1)−1 ≈(1/𝑢1, 1/𝑚1, 1/𝑙1) (6.6)
The Analytic Hierarchy Process (AHP) was initially devised by Saaty (1977, 1980) as a powerful
and flexible decision making method for the complex criteria structure in different levels. In
principle, it aims to facilitate the decision maker to decompose the complex problems into a
series of smaller sub-problems and enable making several pair-wise comparisons, assign
priority weights to each element in different levels. It helps to provide a preference list of the
best criteria that have the significant influence. However, despite the advantages of applying
the AHP method mentioned above, it is believed to have some drawbacks since it is often
used in nearly crisp-decision applications. The experts usually feel more confidence to make
interval judgements rather than expressing their opinion in the form of single numeric values.
Therefore, Fuzzy AHP extends the conventional AHP method by combing it with fuzzy set
theory (FST) to solve such problems. Although Fuzzy AHP requires tedious computations, it is

194
capable of capturing the experts’ judgement of ambiguity when complex multi-criteria
decision making problems are considered.
It can be observed that many researchers have proposed Fuzzy AHP method in different areas.
Van Laarhoven and Pedrycz (1983) initially use it to compare fuzzy ratios described by
triangular membership functions. Buckley (1983) further determined fuzzy priorities of
comparison ratios whose membership functions are trapezoidal. Both studies extended
Saaty’s conventional AHP method to deal with the imprecision and subjectivity of the pairwise
comparison process using fuzzy numbers. Their fuzzy utilities need to be ranked to prioritise
the concerned alternatives. This ranking method can be quite complex and may produce
unreliable results. Mikhailov (2004) proposed a fuzzy preference programming method to
derive optimal crisp priorities, which are obtained from fuzzy pairwise comparison
judgements based on α-cuts decomposition of the fuzzy judgements into a series of interval
comparisons. The most widely accepted Fuzzy AHP method is proposed by Chang (1992, 1996)
to introduce a new extent analysis approach for the synthetic extent values of the pairwise
comparison. The proposed method with extent analysis is simple and easy for
implementation to prioritise decision variables as compared with the conventional AHP
method.
As suggested by Chang (1996), the fuzzy AHP’s pair-wise comparison scale uses triangular
fuzzy numbers, which by integrating the extent analysis method, the introduction of the pair-
wise comparison’s synthetic extent value Si is achieved. The principle used is the comparison
of fuzzy numbers to estimate the weight vectors. The value of fuzzy synthetic extent can be
defined by taking each object and carrying out an extent analysis for each goal. Considering
that X = {x1, x2 ....,. xn} is a goal set and G= {g1, g2 ...., gn} as an object set, the m extent analysis
values can be achieved for each object as follows:
��𝑔𝑖1 , ��𝑔𝑖
2 , …, ��𝑔𝑖𝑚, 𝑖 = 1,2, … 𝑛.
Where the triangular fuzzy numbers are represented by the following:
��𝑔𝑖𝑗
. (𝑗 = 1,2, …𝑚)

195
The sequences of Chang’s analysis can be given in the following sections (Chang, 1996):
Firstly: The value of fuzzy synthetic extent with respect to the 𝑖 th object is defined as:
𝑆𝑖 =∑��𝑔𝑖𝑗 ⊗ [∑∑��
𝑔𝑖𝑗
𝑚
𝑗=1
𝑛
𝑖=1
]
−1
𝑚
𝑗=1
(6.7)
To obtain∑ 𝑀𝑔𝑖𝑗
𝑚
𝑗=1, perform the fuzzy addition operation of m extent analysis value for a
particular matrix such that:
∑��𝑔𝑖𝑗= (∑𝑙𝑗,∑𝑚𝑗 ,∑𝑢𝑗
𝑚
𝑗=1
𝑚
𝑗=1
𝑚
𝑗=1
)
𝑚
𝑗=1
(6.8)
and to obtain[∑ ∑ ��𝑔𝑖𝑗 𝑚
𝑖=1𝑛𝑗=1 ]
−1
, perform the fuzzy addition operation of
��𝑔𝑖𝑗
(j= 1, 2, …, m) values such that:
∑∑��𝑔𝑖𝑗
𝑚
𝑗=1
= (∑𝑙𝑖,∑𝑚𝑖
𝑛
𝑖=1
,∑𝑢𝑖
𝑛
𝑖=1
𝑛
𝑖=1
) (6.9)
𝑛
𝑖=1
and then compute the inverse of the vector above, such that:
[∑∑��𝑔𝑖𝑗
𝑚
𝑗=1
𝑛
𝑖=1
]
−1
= (1
∑ 𝑢𝑖𝑛𝑖=1
,1
∑ 𝑚𝑖𝑛𝑖=1
,1
∑ 𝑙𝑛𝑖=1 𝑖
) (6.10)
Calculating the priority vectors of the fuzzy AHP requires the consideration of comparison for
fuzzy numbers principle, which involves determining the fuzzy value of the greatest or least

196
number. This is achieved by evaluating the degree of possibility of ��2 = (𝑙2,𝑚2, 𝑢2) ≥ ��1 =
(𝑙1,𝑚1, 𝑢1) , and it is defined as follows:
𝑉(��2 ≥ ��1) = sup𝑦≥𝑥
[min ( 𝜇��1(𝑥), 𝜇��2(𝑦))] (6.11)
and can be equivalently expressed as follows:
𝑉(��2 ≥ ��1) = ℎ𝑔𝑡( ��1 ∩ ��2) = 𝜇��2(𝑑) (6.12)
=
{
1, 𝑖𝑓 𝑚2 ≥ 𝑚1
0, 𝑖𝑓 𝑙1 ≥ 𝑢2𝑙1 − 𝑢2
(𝑚2 − 𝑢2) − (𝑚1 − 𝑙1), 𝑜𝑡ℎ𝑒𝑟𝑤𝑖𝑠𝑒 .
(6.13)
Figure 6.3 illustrates Eq. 6.12 where d is the ordinate of the highest intersection point D
between 𝜇��1 and 𝜇��2. To compare ��1 and ��2, it requires both the values of “𝑉(��1 ≥
��2)” and “(��2 ≥ ��1)”
Figure 6-3: The intersection between 𝑴𝟏and 𝑴𝟐
The degree of possibility for a convex fuzzy number to be greater than k convex fuzzy
��1(𝑖 = 1,2, 𝑘) numbers can be defined by:
𝑉(�� ≥ ��1, ��2, … 𝑀𝑘) = 𝑉[(�� ≥ ��1𝑎𝑛𝑑 (�� ≥ ��2)𝑎𝑛𝑑 … . 𝑎𝑛𝑑 (�� ≥ ��𝑘)]
D
𝑀1 𝑀2
𝑀
V(MI ≥ M2)
𝑙2 𝑚2 𝑙1 𝑑 𝑢2 𝑚1 𝑢1

197
= 𝑚𝑖𝑛 𝑉(�� ≥ ��𝑖), 𝑖 = 1,2,3, … , 𝑘 (6.14)
Assume that 𝑑(𝐴𝑖) = 𝑚𝑖𝑛𝑉(𝑆𝑖 ≥ 𝑆𝑘) for K= 1,2, …, n; k ≠i. then the weight vector is given
by
𝑊′ = (𝑑′(𝐴1),𝑑′(𝐴2), … . , 𝑑
′(𝐴𝑛))𝑇 (6.15)
Where 𝐴𝑖 is 𝑖th element and 𝑑′(𝐴1),… . , 𝑑′(𝐴𝑛) are priority weights calculated by Eq.6.13
before their normalization.
In the end, via normalization, the normalized weight vectors are:
𝑊 = (𝑑(𝐴1),𝑑(𝐴2), … . , 𝑑(𝐴𝑛))𝑇 (6.16)
where 𝑊 is a non-fuzzy number.
In this chapter, Chang’s extent analysis method is used since this approach is widely
acceptable and easier than other Fuzzy AHP approaches. The triangular fuzzy numbers (TFNs)
are applied as a pairwise comparison scale for deriving the weights of the criteria (i.e. risks)
and sub-criteria (i.e. sub-risks). In practice, experts usually express the opinion using the
linguistic variables to appraise the importance of one criterion over another or even to rank
the alternatives with respect to various criteria. Table 6.1 illustrates the idea of the Fuzzy
Multi-Attribute Criteria Decision-making (FMACD) has intentionally transformed the existing
linguistic values to TFNs i.e. equal, weak, strong, very strong and absolute strong importance
along with their values, and the illustration of membership function of triangular fuzzy
numbers used in Fuzzy AHP is presented in Figure 6.4. The purpose of the transformation
process is to illustrate the application of the proposed method and benchmark the empirical
results using other precise value methods in the later analysis. Moreover Ma et al., (2007)
and Karahalios (2009) highlighted the following issues when using linguistic variables:

198
Experts need to select linguistic terms for presenting their opinions by their
preference. It is not demanded that all experts must use the same linguistic terms.
It is not required for all linguistic terms to be placed symmetrically and to have total
order. Therefore experts and decision makers have more independent right to present
their opinions.
Each linguistic term should be treated as a whole and the only concern is on its
determinacy and consistency.
Among the commonly used fuzzy numbers, triangular and trapezoidal fuzzy numbers are
likely to be the adoptive ones due to their ease in modelling easy interpretations. Anoop et
al., (2006) explain it is known that for engineering applications, to reduce the computational
complexity, fuzzy sets with triangular or trapezoidal form are most commonly used. Both
triangular and trapezoidal fuzzy numbers are applicable to the present study; however, this
study use TFN for Fuzzy AHP application due to its easiness in use. In practical applications,
the triangular form of the membership function is used most often for representing fuzzy
numbers (Ding and Liang, 2005; Karsak and Tolga, 2001). TFN can adequately represent the
mentioned fuzzy linguistic variables, thus it is used for the analysis thereafter. During the
calculations whenever it is supposed to carry out a pair-wise comparison between the same
criterion e.g. to compare criterion 𝐶1 with 𝐶2, 𝐶2 with 𝐶3 etc obviously the result is equal is 1
in which its converted TFN will be (1,1,1).
Table 6.1: Linguistic scales for difficulty and importance
Linguistic judgement
Triangular fuzzy number (l,m,u)
Inverse linguistic judgements
Inverse triangular fuzzy scale
Equal importance (Eq)
(1, 1, 1) Equal importance (Eq)
(1, 1, 1)
Weak importance (Wk)
(2/3, 1, 3/2) Weak importance (Wk)
(2/3, 1, 3/2)
Strong importance (St)
(3/2, 2, 5/2) Strong importance (St)
(2/5, 1/2, 2/3)
Very strong importance (Vs)
(5/2, 3, 7/2) Very strong importance (Vs)
(2/7, 1/3, 2/5)
Absolute strong importance (As)
(7/2, 4, 9/2) Absolute strong importance (As)
(2/9, 1/4, 2/7)

199
0 2/3 1 3/2 2 5/2 3 7/2 4 9/2
1
0.5
Wk St Vs As
Figure 6-4: The membership functions of the triangular fuzzy numbers
6.4 AN EMPIRICAL STUDY ON THE APPLICABILITY OF THE FUZZY AHP METHOD
To investigate the significance of the identified healthcare supply chain related risks, a Fuzzy
AHP method has been developed. This study was executed in four phases: (1) conducting a
questionnaire survey, including questionnaire formulation, pilot study, and the selection of
experts, (2) data collection, description, and analysis, (3) testing the robustness of the
proposed method and (4) the finding discussion.
6.4.1 Conducting the Fuzzy AHP-based questionnaire survey
Prior to actual data collection, content validity was performed to improve the clarification of
the questionnaire. A cover letter and questionnaire were drafted and the same forward as
well as backward translation process was applied on the questionnaires as was applied earlier.
Two drafted versions of the questionnaires with different languages were further examined
by two academic researchers and two specialists from Universities in the UK and China for
comments. Their feedbacks were useful for the final drafted questionnaire, which was used
for a pilot study. The pilot study was conducted by asking different judges to pre-assess the

200
questionnaires effectiveness, accuracy and unambiguous communication with the experts.
Ethical approval was also obtained to further validate the questionnaire contents and
participant consent. The final questionnaire is shown in Appendix Two.
In Section A, the personal details of the experts were included in order to verify their
organization, position, and length of working year, which can be used for the evaluation of
each expert’s proficiency. Section B firstly provides the predefined linguistic terms for experts
to make decisions in the rest of the questionnaire. The experts are asked to choose a set of
pairwise comparisons for demonstrating the extent to which a risk factor is more important
than another in each pair. The last part of Section B has ten matrices which need to be duly
marked as per experts’ judgements.
The target sample is selected from the National Health Service (NHS) Choices which provides
the comprehensive health information service including all NHS hospitals in England, to
support patients making the best choices. In China, the target sample was selected from a list
from the Chinese National Hospital Association. The main factor in selecting experts was their
expertise and their contribution to the fields related to the identified risk factors. Experts who
specialize in supply chain and logistics related work in hospitals were selected as the
respondents. The research also used publicly available directories and LinkedIn to obtain
contact details. For the pharmaceutical manufacturer and distributor, the relevant
information was provided from some hospitals involved into our empirical studies. Moreover,
the NHS Supply Chain has been providing supply chain services to the UK NHS since 2006. As
well, the LogHealth Center in Thailand is one of three research institutes that specialize in the
healthcare supply chain management. Thus, those consulting organizations are also selected
as the respondents in this research. In total 231 UK NHS hospitals, eleven Chinese hospitals,
seven pharmaceutical distributors/companies, NHS Supply Chain, and LogHealth Center were
selected and each organization was sent several questionnaire surveys to relevant
departments, e.g. director, pharmacy department, operation department, material
department, and procurement department. The target respondents were first asked by email
or phone call whether they were willing to take participate in our survey. Then, the link to the
online questionnaire via eSurveyCreator or email questionnaire were distributed. In total 431

201
questionnaires were distributed in 14th Feb 2017 with 72 replies in three months, including
56 valid and 16 invalid questionnaires as the respondents did not answer all the questions of
this survey, within a month. The valid return rate is 13 per cent, see Table 6.2.
Table 6.2: Questionnaires return detail
Questionnaire distributed
Questionnaire returned
Invalid replies Valid replies Valid reply rate
431 72 16 56 13%
Table 6.3 presents the 56 respondents’ profile. Approximately 55 per cent of respondents
have already worked within the healthcare industry for more than 16 years. This indicates
that most respondents have long professional working experiences in the relevant supply
chain and logistics operations and therefore the results of this survey have a high reliability.
From the types of organization, most respondents are working in the hospital (76 per cent in
total, 30 per cent from Chinese hospitals and 70 per cent from UK NHS), followed by the
supply chain consulting agency (11 per cent in total, 5 experts from LogHealth Center and one
from the NHS supply chain), and pharmaceutical distributor/companies (13 per cent, all
respondents from China). Although in this survey the author has tried to distribute the
questionnaire to the pharmaceutical distributor/companies in the UK since the response rates
from different departments appeared to be quite different. The unbalanced samples might
cause bias in the risk assessment. Nevertheless, the similar structure of the healthcare supply
chain in both countries and each respondent from the Chinese pharmaceutical companies
holding the position at a manager level may reduce such bias. In addition, the validity test of
the survey results is conducted by some respondents from UK NHS could also ensure the
reliability of this survey.
In terms of the professional role, the largest type of respondent’ role is head of
procurement/pharmacy department leader (38 per cent) in charge of all the hospital’s supply
chain and logistics activities, and the second group is head of supply chain, logistics and
warehouse manager (16 per cent). Most respondents hold a position at or above the manager

202
level and have the power to make decisions within healthcare organizations. From the
classification degree China’s hospitals, most are 3A grade with at least 500 beds and 25 care
departments, and so forth.
Table 6.3: respondents’ profile
Number %
What is the type of your organization?
Pharmaceutical Manufacturer 0 0
Pharmaceutical distributor (pharmaceutical company)
7 13%
Hospital 43 76%
Other 6 11%
What is your job title?
Head of Procurement/Pharmacy department leader
21 38%
Purchase/procurement Manager (Non-clinical, clinical)
8 14%
Head of Supply chain, Logistics, Materials, Warehouse
9 16%
Head of Contracts, category, IT manager, E-commerce
3 5%
General manager (pharmaceutical company)
7 12%
Supply chain consulting institute 6 11%
Hospital Director 2 4%
For how many years have you worked in the healthcare industry or healthcare supply chain?
1 – 5 years 0 0
6 – 10 years 9 16%
11 – 15 years 16 29%
16 – 19 years 13 23%
≥20 years 18 32%
Location based UK 31 55%
China 20 36%
Thailand 5 9%
6.4.2 Numerical illustration
The fuzzy AHP phase obtained respondents’ judgements about the relative importance of
identified risk factors and calculated total weights. The details of the data analysis are
described in the following steps.
Step 1, Structure problem hierarchy

203
The first step is to construct the problem into a hierarchy including a goal, set of criteria and
sub-criteria. As Fuzzy AHP method is employed only for the risk assessment in this research,
thus the decision alternatives are not carried out in the hierarchy. The hierarchical structure
was built from the previous chapter as shown in Figure 6.5.
Step 2. Construct fuzzy pairwise comparison matrices
Table 6.4: Linguistic judgements for Fuzzy AHP
Linguistic judgements Explanations
Equal importance (Eq) Two activities contribute equally to the
objective
Weak importance (Wk) Experience and judgement slightly favour one
over another
Strong importance (St) Experience and judgement strongly favour one
over another
Very strong importance (Vs) An activity is favoured very strongly over
another
Absolute strong importance (As) The evidence favouring one activity over
another is of the highest possible order of
affirmation
In this step, the respondents were asked to compare each risk factor at a given level of the
hierarchy on a pair-wise basis. This is to measure their relative importance. It is noteworthy
that the input to the risks has to be well-defined to give the experts an exact understanding
of all risks that have to be assessed. This research uses the basic linguistic preference as equal
importance (Eq), weak importance (Wk), Strong importance (St), Very strong importance (Vs)
and Absolute strong importance (As). Instead of using nine-point scales for the judgments as
the traditional AHP, the fuzzy AHP uses linguistic preference to take into account the
uncertain preference of the decision maker. Moreover, it is easier to use these terms to
express the respondents’ feelings of judgements like good, bad etc (Kunal et al., 2013). The

204
Figure 6-5: Hierarchical structure of healthcare supply chain risks
Hospital Pharmaceutical
Supply Chain Risk Assessment
External to the hospital
but internal to the supply
chain network
Supply risks
Quality risks
Counterfeiting (S1)
Poor quality in the purchased drugs from suppliers (S2)
Time limit of drug, Product perishability (S3)
Supplier risks Shortage of drug; unavailability of drugs on the market (S4)
Demand risks
Capability risks
Capability versus demand; inability of capacity to meet demand (S5)
Information flow/lack of demand information (S6)
Forecast risks
Wrong demand forecasting (S7)
Internal to the hospital
Process risks
Information risks
Poor IT system, too much information, lack of data standardization (S8)
Logistics risks
Dispensing/picking errors-medication/packaging (S9)
Weak logistics service infrastructure (S10)
Lack of visibility concerning placement and availability of stork (S11)
Procurement risks
Procurement Hub-introduce more complexity, long lead time (S12)
Clinician's preference (S13)
High purchase price (S14)
High product and supplier/brand variety (S15)
External to the supply chain
network
Environmental risks Natural risks
External influences-disaster recovery (S16)
Unexpected disease outbreaks (S17)
Unexpected changes in environment conditions (S18)

205
linguistic judgements and their explanations used for measuring the importance of the risk
factors in pair-wise comparisons are shown in Table 6.4.
Step 3. Transform linguistic judgements into fuzzy numbers
In this step, after received the 56 valid questionnaires, the linguistic terms need to transform
into triangular fuzzy numbers as shown in Table 6.5. In order to save space, the author only
presents the results of the fuzzy AHP for one selected respondent’s opinion. The result of the
fuzzy pair-wise comparison matrix at criteria layer is shown in Table 6.6. The consistency ratio
of the criteria level is 0.033.
Table 6.5: Linguistic scales for difficulty and importance
Linguistic judgement
Triangular fuzzy number (l,m,u)
Inverse linguistic judgements
Inverse triangular fuzzy scale
Equal importance (Eq)
(1, 1, 1) Equal importance (Eq)
(1, 1, 1)
Weak importance (Wk)
(2/3, 1, 3/2) Weak less importance (Wk)
(2/3, 1, 3/2)
Strong importance (St)
(3/2, 2, 5/2) Strong less importance (St)
(2/5, 1/2, 2/3)
Very strong importance (Vs)
(5/2, 3, 7/2) Very strong less importance (Vs)
(2/7, 1/3, 2/5)
Absolute strong importance (As)
(7/2, 4, 9/2) Absolute strong less importance (As)
(2/9, 1/4, 2/7)
Table 6.6: The fuzzy pair-wise comparison matrix of three criteria
Linguistic judgement External to the hospital but internal to the supply chain
network
Internal to the hospital
External to the supply chain
network
External to the hospital but internal to the supply chain
network
(1, 1, 1) (2/3, 1, 3/2) (3/2, 2, 5/2)
Internal to the hospital
(2/3, 1, 3/2) (1, 1, 1) (2/3, 1, 3/2)
External to the supply chain network
(2/5, 1/2, 2/3) (2/3, 1, 3/2)
(1, 1, 1)
C.R. = 0.033

206
The AHP method provides a measure of the consistency of pairwise comparisons by
introducing the Consistency Index (CI) and Consistency Ratio (CR), which can be calculated by
using Eq. 6.17 and Eq. 6.18. The 𝜆𝑚𝑎𝑥 is the maximum average of the values or the maximum
eigenvalue of an n*n comparison matrix and is calculated by Eq. 6.19. RI is the random index
for the matrix size, n and depends on the number of items being compared and is shown in
Table 6.7 (Saaty, 1994). If CR is valued less than or equal to 0.1 then a consistency is indicated
and the pairwise comparisons are reasonable.
It needs to be mentioned that the survey will be sent back to the respondents to revise the
choice if the C.R. is larger than 0.1.
𝐶𝐼 = 𝜆𝑚𝑎𝑥−𝑛
𝑛−1 (6.17)
𝐶𝑅 = 𝐶𝐼
𝑅𝐼 (6.18)
∑ 𝑥𝑖𝑗𝑛𝑖=1 𝑤𝑖 = 𝜆𝑚𝑎𝑥𝑊𝑗; where i=1,2, …, n (6.19 )
Table 6.7: Average random index value
n 1 2 3 4 5 6 7 8 9 10
RI 0 0 0.58 0.90 1.12 1.24 1.32 1.41 1.45 1.49
Source: based on Saaty (1994)
Before the fuzzy weights for each risk factor was calculated, every preferences made by the
individual respondent were aggregated into a group preference for each risk factor. The
aggregation of the triangular fuzzy numbers (TFNs) were performed by applying two
mathematical models, namely an Arithmetic Mean method and a Geometric Average
method. According to the literature, most researchers have highly recommended that the
Geometric Average method as more reliable (Kahraman et al., 2003; Ramkumar, 2016),
However, in order to obtain more reliable and accurate results in this thesis, both
mathematical models have been applied. The result of the fuzzy matrix at the criteria layer

207
using Arithmetic Mean method is shown in Table 6.8; and the results of the fuzzy matrix at
the criteria layer using Geometric Average method is shown in Table 6.9.
Table 6.8: The fuzzy pair-wise comparison matrix of three criteria (Arithmetic Mean
method)
External to the hospital but internal to the supply chain
network
Internal to the hospital
External to the supply chain
network
External to the hospital but internal to the supply chain
network
(1, 1, 1) (1.23, 1.4, 1.64) (1.5, 1.85, 2.3)
Internal to the hospital
(0.97, 1.1, 1.26) (1, 1, 1) (1.6, 1.9, 2.3)
External to the supply chain
network
(0.63, 0.78, 0.99) (0.65, 0.8, 0.99)
(1, 1, 1)
C.R. = 0.013
Table 6.9: The fuzzy pair-wise comparison matrix of three criteria (Geometric Average
method)
External to the hospital but internal to the supply chain
network
Internal to the hospital
External to the supply chain
network
External to the hospital but internal to the supply chain
network
(1, 1, 1) (1, 1.15, 1.3) (1.25, 1.65, 1.96)
Internal to the hospital
(0.77, 0.87, 0.99) (1, 1, 1) (1.26, 1.56, 1.9)
External to the supply chain
network
(0.51, 0.63, 0.8) (0.55, 0.64, 0.79)
(1, 1, 1)
C.R. = 0.001
Step 4. Calculate fuzzy weights
In this step, the fuzzy weights of the criteria and sub-criteria are calculated, based on the
extent analysis method suggested by Chang (1996). It is a widely accepted methodology which
has been used by several researchers owing to its simplicity. The extent analysis method was

208
applied to consider the extent of an object or criteria to be satisfied for the goal. (Kunal et al.,
2013)
The numerical analysis of deciding the weight vectors of the criteria with respect to goal is
discussed as follows:
The fuzzy comparison matrix of the criteria by Arithmetic Mean method as an example which
is shown in Table 6.9. The fuzzy synthetic extent value with respect to each criterion was
calculated by using Eq. 6.7.
The different values of fuzzy synthetic extent with respect to the three different criteria were
denoted by𝑆1,𝑆2, 𝑆3, respectively.
𝑆1 = (3.73, 4.25, 4.94) ⊗ (1/12.48, 1/10.83, 1/9.58) = (0.3, 0.39, 0.52)
𝑆2= (3.57, 4, 4.56) ⊗ (1/12.48, 1/10.83, 1/9.58) = (0.29, 0.37, 0.48)
𝑆3 = (2.28, 2.58, 2.98) ⊗ (1/12.48, 1/10.83, 1/9.58) = (0.18, 0.24, 0.31)
These fuzzy synthesis values were compared with each other by using Eq. 6.13 of the extent
analysis as follows:
V(𝑆1 ≥ 𝑆2)= 1
V(𝑆1 ≥ 𝑆3)= 1
V(𝑆2 ≥ 𝑆1)= 0.3−0.48
(0.37−0.48)−(0.39−0.3)= 0.9
V(𝑆2 ≥ 𝑆3)= 1
Similarity, V(𝑆3 ≥ 𝑆1)= 0.3−0.31
(0.24−0.31)−(0.39−0.3) = 0.06
V(𝑆3 ≥ 𝑆2)= 0.29−0.31
(0.24−0.31)−(0.37−0.29) = 0.13

209
Then priority weights were calculated by using Eq. 6.14 of the extent analysis as follows:
d’(𝐶1)= min V(𝑆1 ≥ 𝑆2, 𝑆3) = min (1, 1) = 1,
Similarity, d’(𝐶2)= min V(𝑆2 ≥ 𝑆1, 𝑆3) = min (0.9, 1) = 0.9
d’(𝐶3)= min V(𝑆3 ≥ 𝑆1, 𝑆2) = min (0.06, 0.13) = 0.06
Therefore the weight vector was given as
W’= (1, 0.9, 0.06)𝑇
Finally after normalisation of these value as per Eq. 6.16 of the extent analysis, the weight
vector with respect to criteria𝐶1, 𝐶2, 𝐶3 is obtained as follows. The complete result is also
given in Table 6.10.
W= (0.51, 0.46, 0.03)𝑇
Table 6.10: The fuzzy pair-wise comparison matrix of three criteria (Arithmetic Mean
method)
External to the hospital but
internal to the supply chain
network
Internal to the hospital
External to the supply chain
network
Weight
External to the hospital but
internal to the supply chain
network
(1, 1, 1) (1, 1.15, 1.3) (1.25, 1.65, 1.96) 0.51
Internal to the hospital
(0.77, 0.87, 0.99) (1, 1, 1) (1.26, 1.56, 1.9) 0.46
External to the supply chain
network
(0.51, 0.63, 0.8) (0.55, 0.64, 0.79)
(1, 1, 1) 0.03
C.R. = 0.001

210
Hospital Pharmaceutical
Supply Chain Risk Sources
External to the hospital but
internal to the supply chain network (A1)
0.51
Supply risks (B1) 0.79/0.4
Quality risks (C1)
0.61/0.25
Counterfeiting (S1) 0.61/0.15
Poor quality in the purchased drugs from suppliers (S2) 0.3/0.075
Time limit of drug, Product perishability (S3) 0.09/0.0225
Supplier risks (C2)
0.39/0.16Shortage of drug, unavailability of drugs on the market (S4)0.16/0.16
Demand risks (B2)
0.21/0.11
Capability risks (C3)
0.95/0.105
Capability versus demand, inability of capacity to meet demand (S5) 0.81/0.085
Demand trigged by the nurse, not the patients (S6) 0.19/0.02
Forecast risks (C4)
0.05/0.005Wrong demand forecasting (S7) 0.005/0.005
Internal to the hospital (A2)
0.46
Process risks (B3)0.46/0.46
Information risks (C5)
0.29/0.133Poor IT system, lack of data standardization (S8) 0.133/0.133
Logistics risks (C6)
0.46/0.212
Dispensing/picking errors-medication/packaging (S9) 0.49/0.104
Weak logistics service infrastructure (S10) 0.33/0.07
Lack of visibility concerning placement and availability of stork (S11) 0.18/0.038
Procurement risks (C7)
0.25/0.115
Procurement Hub-introduce more complexity, long lead time (S12) 0.13/0.015
Clinician's preference (S13) 0.29/0.033
High purchase price (S14) 0.33/0.038
High product and supplier/brand variety (S15) 0.25/0.029
External to the supply chain network (A3)
0.03
Environmental risks
(B4)0.03/0.03
Natural risks (C8)
0.03/0.03
External influences-disaster recovery (S16) 0.32/0.0096
Unexpected disease outbreaks (S17) 0.63/0.0189
Unexpected changes in environment conditions (S18) 0.05/0.0015
Figure 6-6: Results in relation to Arithmetic Mean Method

211
Hospital Pharmaceutical
Supply Chain Risk Sources
External to the hospital but
internal to the supply chain network (A1)
0.53
Supply risks (B1) 0.75/0.4
Quality risks (C1) 0.61/0.24
Counterfeiting (S1) 0.66/0.159
Poor quality in the purchased drugs from suppliers (S2) 0.33/0.079
Time limit of drug, Product perishability (S3) 0.01/0.002
Supplier risks (C2) 0.39/0.16
Shortage of drug, unavailability of drugs on the market (S4) 0.16/0.16
Demand risks (B2)
0.25/0.133
Capability risks (C3)
0.95/0.126
Capability versus demand,inability of capacity to meet demand (S5) 0.86/0.108
Demand trigged by the nurse, not the patients (S6) 0.14/0.018
Forecast risks (C4)
0.05/0.007Wrong demand forecasting (S7) 0.007/0.007
Internal to the hospital (A2)
0.43
Process risks (B3) 0.43/0.43
Information risks (C5)
0.26/0.112Poor IT system, lack of data standardization (S8) 0.112/0.112
Logistics risks (C6)
0.48/0.206
Dispensing/picking errors-medication/packaging (S9) 0.47/0.097
Weak logistics service infrastructure (S10) 0.36/0.074
Lack of visibility concerning placement and availability of stork (S11) 0.17/0.035
Procurement risks (C7)
0.26/0.112
Procurement Hub-introduce more complexity, long lead time (S12) 0.12/0.014
Clinician's preference (S13) 0.29/0.032
High purchase price (S14) 0.31/0.035
High product and supplier/brand variety (S15) 0.28/0.031
External to the supply chain network (A3)
0.04
Environmental risks (B4) 0.04/0.04
Natural risks (C8) 0.04/0.04
External influences-disaster recovery (S16) 0.33/0.013
Unexpected disease outbreaks (S17) 0.61/0.024
Unexpected changes in environment conditions (S18) 0.06/0.003
Figure 6-7: Results in relation to Geometric Average Method

212
Now the different sub-criteria are compared under each criteria separately by following the
same procedure as discussed above. It needs to be mentioned that the value of the elements
of the matrix must be normalized whenever the value is larger than zero and then the same
process will be repeated again to calculate the weight vector of each attribute.
Step 5. Calculate global weights
Once the local weights of criteria and sub-criteria of different levels of the hierarchy were
calculated, the final results were aggregated to obtain the final or global weights. The values
are shown in both Figures 6.6 and 6.7.
6.4.3 Testing the robustness of the proposed Fuzzy AHP approach
6.4.3.1 Comparing the results of both methods (Geometric and Arithmetic mean)
As described above, both mathematical methods were employed for the aggregation of the
survey results in order to ensure the reliability and accuracy of the findings. Figure 6.8
presents the comparison of the results obtained by using both methods. The summary of the
results, as shown in Table 6.11, reveals that the higher risk weighting is obtained for “shortage
of drug, unavailability of drugs on the market (S4)”, followed by “counterfeiting (S1)” and
“poor IT system and lack of data standardization (S8)”. As a summary of the results, one can
argue that for both methods, a minor deviation is observed in the outcomes, but it does not
affect the final ranking. Thus, it can be concluded that the consequences are reliable. By the
end, 11 risk factors with the highest priorities were chosen for further evaluation based on
the results obtained by using the Geometric Average method.

213
Table 6.11: Summary of results from Arithmetic Mean and Geometric Average methods
Geometric Average Rank Global weights
Arithmetic Mean Rank Global weights
Shortage of drug, unavailability of drugs on the market (S4)
1 0.16* Shortage of drug,, unavailability of drugs on the market (S4)
1 0.16
Counterfeiting (S1) 2 0.159* Counterfeiting (S1) 2 0.15
Poor IT system, lack of data standardization (S8) 3 0.112* Poor IT system, lack of data standardization (S8)
3 0.133
Capability versus demand; inability of capacity to meet demand (S5)
4 0.108* Dispensing/picking errors-medication/packaging (S9)
4 0.104
Dispensing/picking errors-medication/packaging (S9) 5 0.097* Capability versus demand, inability of capacity to meet demand (S5)
5 0.085
Poor quality in the purchased drugs from suppliers (S2) 6 0.079* Poor quality in the purchased drugs from suppliers (S2)
6 0.075
Weak logistics service infrastructure (S10) 7 0.074* Weak logistics service infrastructure (S10) 7 0.07
Lack of visibility concerning placement and availability of stork (S11)
8 0.035* Lack of visibility concerning placement and availability of stork (S11)
8 0.038
High purchase price (S14) 9 0.035* High purchase price (S14) 9 0.038
Clinician's preference (S13) 10 0.032* Clinician's preference (S13) 10 0.033
High product and supplier/brand variety (S15) 11 0.031* High product and supplier/brand variety (S15) 11 0.029
Unexpected disease outbreaks (S17) 12 0.024 Time limit of drug, product perishability (S3) 12 0.0225
Demand trigged by the nurse, not the patients (S6) 13 0.018 Demand trigged by the nurse, not the patients (S6)
13 0.02
Procurement Hub-introduce more complexity, long lead time (S12)
14 0.014 Unexpected disease outbreaks (S17) 14 0.0189
External influences-disaster recovery (S16) 15 0.013 Procurement Hub-introduce more complexity, long lead time (S12)
15 0.015
Wrong demand forecasting (S7) 16 0.007 External influences-disaster recovery (S16) 16 0.0096
Unexpected changes in environment conditions (S18) 17 0.003 Wrong demand forecasting (S7) 17 0.005

214
Time limit of drug, product perishability (S3) 18 0.002 Unexpected changes in environment conditions (S18)
18 0.0015
“*” denotes those risk factors are significant and selected for further analyses

215
Figure 6-8: Comparison of the results from Arithmetic Mean and Geometric Average
methods
6.4.3.2 Reliability test for weights obtained by the pairwise comparison
To implement the Fuzzy AHP method, the pairwise comparison was carried out by covering
each variable in the hierarchical structure. The less important risk factors have been omitted
from the initial developed structure based on their importance levels in the phase of risk
identification. During the phase of risk assessment, only the remaining risks with experts’
comments are measured. As depicted in Figures 6.6 and 6.7, there are few risks to stay in
isolation not involved in the comparison among the same level, i.e. “S4 shortage of drugs”,
“S7 wrong demand forecasting”, “S8 poor IT system”. Therefore, this will give rise to concerns
about the larger weight of these individual risks when compared those risks involved in either
two or three-time comparison in each level. Therefore, in order to ensure the reliability of our
results, a sensitivity analysis was done by gradually changing the weights for some sub-criteria
while keeping other weights at the same value, and the impact on the concluding results was
examined. Among those risk factors, 18 sub-criteria were selected for the evaluation. Until
now, there is no study in the literature that determine the feasibility of individual weighting.
0
0.02
0.04
0.06
0.08
0.1
0.12
0.14
0.16
0.18
S1 S2 S3 S4 S5 S6 S7 S8 S9 S10 S11 S12 S13 S14 S15 S16 S17 S18
Arithmetic Mean Method Geometric Average Method

216
Figure 6-9: Results of the sensitive analysis (multiplication)
0 0.1 0.2 0.3 0.4 0.5 0.6
S1 Counterfeiting
S2 Poor quality in the purchased drugs from suppliers
S3 Time limit of drugs, product perishability
S4 Shortage of drugs, unavailability of drugs on the market
S5 Capability versus demand, inability of capacity to meet demand
S6 Demand trigged by the nurse, not the patients
S7 Wrong demand forecasting
S8 Poor IT system, lack of data standardization
S9 Dispensing/picking errors-medication/ packaging
S10 Weak logistics service infrastructure
S11 Lack of visibility concerning placement and availability
S12 Procurement Hub-introduce more complexity, long lead time
S13 Clinician's preference
S14 High purchase price
S15 High product and supplier/brand variety
S16 External influences- disaster recovery
S17 Unexpected disease outbreaks
S18 Unexpected changes in environment conditions
After Multiplying Before Multiplying

217
Figure 6-10: Results of the sensitive analysis (division)
0 0.02 0.04 0.06 0.08 0.1 0.12 0.14 0.16 0.18
S1 Counterfeiting
S2 Poor quality in the purchased drugs from suppliers
S3 Time limit of drugs, product perishability
S4 Shortage of drugs, unavailability of drugs on the market
S5 Capability versus demand, inability of capacity to meet demand
S6 Demand trigged by the nurse, not the patients
S7 Wrong demand forecasting
S8 Poor IT system, lack of data standardization
S9 Dispensing/picking errors-medication/ packaging
S10 Weak logistics service infrastructure
S11 Lack of visibility concerning placement and availability
S12 Procurement Hub-introduce more complexity, long lead time
S13 Clinician's preference
S14 High purchase price
S15 High product and supplier/brand variety
S16 External influences- disaster recovery
S17 Unexpected disease outbreaks
S18 Unexpected changes in environment conditions
After Dividing Before Dividing

218
Table 6.12: Summary of the sensitivity analysis for weight obtained by pairwise comparison
Risk factors Before Multiplying (rank)
After Multiplying (rank)
Before Dividing (rank)
After Dividing (rank)
S1 Counterfeiting* 0.159 S4* 0.477 S1* 0.159 S4* 0.159 S1*
S2 Poor quality in the purchased drugs from suppliers* 0.079 S1* 0.237 S9* 0.079 S1* 0.079 S5*
S3 Time limit of drugs, product perishability 0.002 S8* 0.006 S2* 0.002 S8* 0.002 S9*
S4 Shortage of drugs, unavailability of drugs on the market* 0.16 S5* 0.16 S10* 0.16 S5* 0.053 S2*
S5 Capability versus demand, inability of capacity to meet demand*
0.108 S9* 0.216 S5* 0.108 S9* 0.108 S10*
S6 Demand trigged by the nurse, not the patients 0.018 S2* 0.036 S4* 0.018 S2* 0.018 S4*
S7 Wrong demand forecasting 0.007 S10* 0.007 S14* 0.007 S10* 0.0023 S8*
S8 poor IT system, lack of data standardization* 0.112 S11* 0.112 S13* 0.112 S11* 0.0373 S11*
S9 Dispensing/picking errors-medication/packaging* 0.097 S14* 0.291 S15* 0.097 S14* 0.097 S14*
S10 Weak logistics service infrastructure* 0.074 S13* 0.222 S8* 0.074 S13* 0.074 S13*
S11 Lack of visibility concerning placement and availability stock*
0.035 S15* 0.105 S11* 0.035 S15* 0.035 S15*
S12 Procurement Hub-introduce more complexity, long lead time
0.014 S17 0.056 S17 0.014 S17 0.014 S17
S13 Clinician’s preference* 0.032 S6 0.128 S12 0.032 S6 0.032 S6
S14 High purchase price* 0.035 S12 0.14 S16 0.035 S12 0.035 S12
S15 High product and supplier/brand variety* 0.031 S16 0.124 S6 0.031 S16 0.031 S16
S16 External influences-disaster recovery 0.013 S7 0.039 S18 0.013 S7 0.013 S18
S17 Unexpected disease outbreaks 0.024 S18 0.072 S7 0.024 S18 0.024 S7
S18 Unexpected changes in environment conditions 0.003 S3 0.009 S3 0.003 S3 0.003 S3
“*” denotes those risk factors are significant and selected for further analyses

219
Thus, this research could be a preliminary study to deal with the pairwise comparison under
such a context.
The first step is to multiply each set of data which covers at least two risk factors by the same
number of risk factors in the pairwise comparison group. For example, the quality risks consist
of three various types of risk factors, which are “S1 counterfeiting”, “S2 poor quality in the
purchase drugs”, and “S3 time limit of drugs”. Therefore, each risk factor will be multiplied by
three to get a new weighted number (See Figure 6.9). Along the same line, those individual
risk factors will be divided by three, which is the amount of most sets of data (See Figure
6.10). The summary of the results are in a list in Table 6.12, where the top 11 risk factors are
retained as the same results before either multiplying or dividing calculation. Based on their
high priority among all the risk factors, the results of pairwise comparison are not affected.
As a result, it can be concluded that the proposed model is robust since the best result is
impervious to the changes in weighting either by multiplying or dividing.
6.4.4 Findings from Fuzzy AHP method
It was found that healthcare supply chain related risk sources can be categorized into three
risks “external to the hospital but internal to the supply chain network (A1)”, weighted 0.53;
“internal to the hospital (A2)”, weighted 0.43; and “external to the supply chain network
(A3)”, weighted 0.04. The results showed that factors “external to hospital but within supply
chain” have the greatest effects in the healthcare supply chain. It is easy to understand that
almost every organization faces challenges in the dynamic environment either from the
unexpected demand or unstable supplier relationships and performance. These results
corroborate the findings of Ho et al., (2015), who reviewed categorization of sources of supply
chain risks and concluded that external factors to firms contribute to risks in the supply chain.
The results also showed that “risks external to the hospital but internal to the supply chain
network, A1”, are “supply risks (B1)” weighted as 0.75 and “demand risks (B2)” weighted as
0.25. The weights result in an overall global weight of 0.75 × 0.53 = 0.3975, approximated
as 0.4 for supply risk and 0.25 × 0.53 = 0.1325, approximated as 0.133 for demand risks. It

220
indicated that supply risks are about triple the weight of demand risks. This is because supplier
performance and relationship management is very sensitive to the healthcare industry.
6.4.4.1 Supply risks
The results further show that those two components of supply risks are weighted as: “quality
risks (C1)” weighted as 0.61 of 0.4 giving overall global weight of 0.24; and “supplier risks
(C2)” weighted as 0.39 of 0.4 giving overall global weight of 0.16. Therefore, it is noted that
quality risks have a higher weight than supplier risks. These results corroborate the findings
by Tse and Tan (2011) who found that quality risks is an inherent part of the supply chain
risks. In other words, it tends to encompass some or all of the risk elements in a multi-tier
supply chains, such as disruption risks and operational risks. Therefore, it must be considered
for successful management of multi-tier supply chains, especially in the healthcare setting as
they are a major cause of health problems or even deaths.
Furthermore, supplier risk is associated with “shortage of drug, unavailability of drugs on the
market (S4)” weighted as 0.16, which is most important risk factors among 18 sub-criteria. As
discussed in the previous chapter, such shortages/stock outs can have serious consequences
on patients’ health since they can result in total failure of healthcare delivery systems (White
and Modhzain, 2009). This finding is also in line with research by Aguas et al., (2013) and
Kanyoma et al., (2013), who investigated the shortage of drugs caused by inadequate drugs
in the healthcare industry, the health service delivery has perfomed poorly, resulted in delays
in medical surgery, and led to more worsed medical conditions of patients. It was also found
that the major causes of shortage, such as unexpected diease outbreaks, wrong demand
forecasting, and lack of funds at the hospital. For example, supply of drugs should be linked
to some specific environment, such as seasonality where during a certain season, more
individuals are diagnosed with a certain disease, which means the demand for some particular
drugs are substantially increased. Thus, special circumstances require that healthcare
organizations be both efficient (in the care of products with predictable demand) and
responsive (in the case of transplants, pharmaceutical and surgical supplies with an
unpredictable demand) (Matopoulos and Michailidou 2013).

221
Thereafter, results show that of the three quality risk factors studied, “counterfeiting (S1)”
accounted for 66 per cent of 0.24 giving overall weight for the risk factor as 0.159, “poor
quality in the purchased drugs from suppliers (S2)” accounted for 33 per cent of 0.24 giving
weight of 0.079 while “time limit of drug and product perishability (S3)” accounted for 1 per
cent of 0.24 giving weight of 0.002. It is therefore noted that of the three studied quality risk
factors, counterfeiting has the highest risk index followed by poor drug quality and time limit
of drugs. The results also support some existing findings, e.g., findings from Kamath et al.,
(2012), Enyinda et al., (2014), Jaberidoost et al., (2015), and Lawrence and Kopcha (2017),
that determined that counterfeiting also has serious risk consequences among other risk
factors, especially when hospitals depend on third parties for medical commodities that can
cause a breakdown in the healthcare SC, which can disrupt core health services. The research
suggested managing the risks by incorporating the lastest anti-counterfeiting technologies
such as hologram, mass encoding systems, bar-codes, and RFID system (Kamath et al., 2012).
Since the supply of counterfeit drugs is a major threat as revealed by our data, which is
consistent with Mackey et al.’s, (2015) findings show that over 51.3 per cent of drugs in supply
chains are counterfeit. Thus, hospital management must set up a strict quality control and
quality assurance department for curbing the supply of counterfieit drugs. However, in terms
of the time limit for drugs and product perishability, it plays a less important role in healthcare
SC with the smallest weight among 18 risk factors. This result reveals that although the
concern should be given to the risks associated with the inefficient cold chain management
during transportation and storage, healthcare providers still need to pay more attention to
managing the other higher priority risks.
6.4.4.2 Demand risks
The results show that “demand risks (B2)” accounted for 25 per cent of the weight of risks
“external to the hospital but internal to the supply chain network”, which is 25 per cent ×
0.53 = 0.133. “Demand risks” are categorized into two types: “capability risks (C3)”, which
were weighted at 0.95 of 0.133 giving global weight of 0.126; and “forecast risks (C4)”
weighted at 0.05 of 0.133, which gave global weight of 0.007. Under “forecast risks (C4)”,
“wrong demand forecasting (S7)” was given weight of 0.007. “Capability risks” were

222
categorized into “capability versus demand, inability of capacity to meet demand (S5)”
which was weighted at 0.86 of 0.126 giving a global weight of 0.108 and “demand trigged by
the nurse, not the patients (S6)” weighted at 0.14 of 0.126 giving a global weight of 0.018.
Compared with the sub-criteria “capability versus demand (S5)”, the weights of (S6) and (S7)
are less notable. This may be explained by the fact that it is imperative to improve clinician
and pharmacist education in relation to the relevant knowledge of supply chain management
(Maryland 2012; Elleuch et al., 2014). Moreover, more effort has been made in developing a
closer cooperative relationship between the hospital and its major suppliers or among
hospitals in the same region. Such a movement increases operational capacity with less
capital investment to deal with the uncertain demands.
6.4.4.3 Process risks
“Process risks (B3)” are classified under risks “internal to the hospital (A2)” and weighted as
0.43. Results of Fuzzy AHP shows that the three risk factors under “process risks” were
weighted as: “information risks (C5)” given weight of 0.26 of 0.43 giving 0.112 with “poor IT
system, lack of data standardization (S8)” under it given similar weight of 0.112; “logistics
risks (C6)” given weight of 0.48 of 0.43 giving 0.206; and “procurement risks (C7)” given
weight of 0.26 of 0.43 giving 0.112. Categories of risks under “logistics risks” were weighted
with “dispensing/picking errors-medication/packaging (S9)” at 0.47 of 0.206 which resulted
in weight of 0.097, “weak logistics service infrastructure (S10)” at 0.36 of 0.206 which
resulted in weight of 0.074 and “lack of visibility concerning placement and availability of
stock (S11)” at 0.17 which resulted in weight of 0.035. “Procurement risks” sub-categories
were “procurement hub-introduce more complexity, long lead time (S12)” weighted as 0.12
of 0.26 giving 0.014, “clinician's preference (S13)” weighted as 0.29 of 0.26 giving 0.032, “high
purchase price (S14)” weighted as 0.31 of 0.26 giving 0.035 and “high product and
supplier/brand variety (S15)” weighted as 0.28 giving 0.031.
Among those risk factors under the criterion “process risks”, “Poor IT system, lack of data
standardization (S8) is the most important risks, followed by S9, S10, S11, S14, S13 and S15.
These results confirm findings by several studies (Jaberidoost, et al., 2013; Bὃhme et al., 2016;
Graudins, et al., 2016) that have suggested the necesssity of investing in the development of

223
a modern information system because of independent and loosely-coupled information
systems that contain incomplete information and cannot be trusted. Moreover, the results
also corroborate Kritchanchai’s (2012) results that implementation of standard data in the SC
network would facilitate information synchronisation so that all stakeholders in the industry
can speak the same electronic language. Meanwhile, it needs to be mentioned that “high
purchase price (S14)” and “high product and supplier/brand variety (S15)” are matters of
important concern in Lord Carter’s report (2016). It suggested the implementation of a new
purchasing price index and eProcurement strategy as well as developing procurement
partnerships between UK NHS trusts to manage those risks.
6.4.4.4 Environmental risks
“Environmental risks (B4)”, weighted as 0.04, are part of the “risks external to the hospital
supply chain network (A3)”. Under “environmental risks” there were “natural risks (C8)”
weighted 0.04. Natural risks were further categorized as: “external influences-disaster
recovery (S16)” weighted as 0.33 of 0.04 giving 0.013; “unexpected disease outbreaks (S17)”
weighted as 0.61 of 0.04 giving 0.024; and “unexpected changes in environment conditions
(S18)” weighted as 0.06 of 0.04 giving 0.003. Among the 18 risk factors, the weight of these
three risks are significantly lower than the others. These three risks are often beyond the
control of hospitals, which means that it is difficult to reduce their impact through likelihood
reduction. To reduce these risks, these supply chains should be designed to accommodate
readiness of unplanned events, to be ready to offer efficient and quick response in case of an
emergency. They should also be able to recover to the original state of the health facility after
the disruption event and make the state even better than it was before (Ponomarov and
Holcomb 2009).
6.4.4.5 Summary of Fuzzy AHP results
Results of fuzzy AHP process were summarized in Table 6.11. The 18 risk factors were ranked
according to their weights from highest to lowest. “Shortage of drug, unavailability of drugs
on the market (S4)” with global weight of 0.160 has the highest risk compared with other risk
items, followed by “counterfeiting (S1)” with global weight of 0.159; “poor IT system, lack of

224
data standardization (S8)” with global weight of 0.112; “capability versus demand; inability
of capacity to meet demand (S5)” with global weight of 0.108; and “dispensing/picking
errors-medication/packaging (S9)” with global weight of 0.097, “poor quality in the
purchased drugs from suppliers (S2)” with global weight of 0.079; “weak logistics service
infrastructure (S10)” with global weight of 0.074; “lack of visibility concerning placement
and availability of stock (S11)” with global weight of 0.035; “high purchase price with global
weight of 0.035; clinician’s preference (S13)” with global weight of 0.032 and “high product
and supplier/brand variety (S15)” with global weight 0.031. Each of these factor has a
significant impact on supply chain operational performance, the uncertainty associated with
these factors will make the supply chain more complex to manage and therefore more
attention must be paid to them and acknowledgment of their work. It is not surprising to see
“shortage of drug, unavailability of drugs on the market (S4)” at the top of the risk ranking
because unlike other consumer products where the customer can either defer their purchase
or acquire an alternative, shortage of drugs can adversely affect patient outcomes and
increase health care costs. Therefore, this risk factors need to be analysed and eliminated
precisely during the future works.
By using the developed risk-based model, risk managers can obtain a broad view of the risk
factors in healthcare supply chain. The proposed risk-based model is suitable for
comprehensive risk assessments. It can be developed by different users in the healthcare
industry. The developed risk-based model can be simply established at various hierarchical
levels according to the needs of users and existing data. Additional, it can aggregate various
groups of risk factors along with a consistent order to generate useful risk-based information
for decision makers. It can be simply applied on the other risk factors not mentioned in this
study (such as patient pathway related risks, etc). In next step, the ISM model is applied to
supports risk managers in identifying and understanding interdependencies among those
selected 11 supply chain risks.
6.5 RISK ASSESSMENT WITH INTERPRETIVE STRUCTURAL MODELLING (ISM)
Interpretive Structural Modelling (hereinafter, “ISM”) is a qualitative and interpretive method
that supports the decision-making process to identify the structure of complex relations of

225
elements by analysing two elements pair-wisely (Pfohl et al., 2011). The structural mapping
of the ISM model provides decision makers with the solutions to complex issues by
highlighting the interconnections of elements in a graphical manner. It is seen as an
interactive learning process by considering different direct and indirect relations among each
risk factor so that complex interconnections of risks can be portrayed within a model. In fact,
knowledge of individual risks alone may not be enough for an organization planning to
understand the relationship between the various risks. In this respect, ISM can provide
insightful understanding of those relations to describe the situation more accurately than the
individual risks taken in isolation (Chaudhuri et al., 2016). In SCRM studies, ISM has been
applied by several researchers focusing on various problems (Pfohl et al., 2011; Srivastara et
al., 2015; Chaudhuri et al., 2016; Prakash et al., 2017).
ISM generates an understanding of a complex system by considering the hierarchy and
relationships among the system’s elements (Sage, 1977). ISM is being considered interpretive
because of the decision from the experts’ judgement on how and whether the elements are
related is the basic idea in the ISM process. It is also described as structured because it
eventually decomposes a complicated system into several elements and constructs a
multilevel structural model (Srivastara et al., 2015). Thus, the model is appropriate for use in
capturing experts’ practical experience and knowledge for modelling and to portray a
structure in a carefully designed pattern. In this research, the ISM model is applied to
determine the interdependencies among the selected risk factors from the last phase and
obtain a hierarchy to synthesize the knowledge about these risks. It will facilitate the decision
makers in easily understanding the dependence and driving power of those significant risks
in their SC network while formulating the appropriate risk mitigation strategies.
There are several steps that are involved in ISM modelling, which include the following:
Step 1. Recognizing elements that are relevant to the problem through group or survey
problem solving approach. Starting point is the identification of the relevant elements to the
problem. This can be done by primary research techniques including: questionnaire survey,
interview, focus group etc, or secondary research including: desk research etc.

226
Step 2. Creating an appropriate relationship between the identified elements. In this stage,
the contextual relation must be explicitly illustrated among the elements. Relations may be
of various types such as comparative, influence, neutral or temporal relations (Austin and
Burns, 1985; Warfield, 1994).
Step 3. Creating a structural self-interaction matrix (SSIM) for all the elements. It is through
such a matrix that the pair-wise relationship accorded for the system’s elements is
established. In this stage, the experts are required to make the decision upon which one
element leads to another one. Keeping in mind the contextual relationship for each element,
the existence of a relation between any two sub-elements ( 𝑖 𝑎𝑛𝑑 𝑗 ) and the associated
direction of the relation is questioned. Four symbols are used to denote the direction of the
relationship between the elements 𝑖 𝑎𝑛𝑑 𝑗:
V – for the relation from 𝑖 𝑡𝑜 𝑗 but not in both directions;
A – for the relation from 𝑗 𝑡𝑜 𝑖 but not in both directions;
X – for both direction relations from 𝑖 𝑡𝑜 𝑗 and 𝑗 𝑡𝑜 𝑖; and
O – if the relation between the elements does not appear to be valid.
Step 4. Creating a reachability matrix in accordance with the created SSIM and checking for
transitivity. The SSIM is transformed into a binary matrix, called the initial reachability matrix
by substituting 1 or 0 for the original symbols, V, A, X and O. The rules for the substitution are
the following:
(1) If the (𝑖 , 𝑗) entry in the SSIM is V, then the (𝑖 , 𝑗) entry in the reachability matrix
becomes 1 and the (𝑗 , 𝑖) entry becomes O.
(2) If the (𝑖 , 𝑗) entry in the SSIM is A, then the (𝑖 , 𝑗) entry in the reachability matrix
becomes O and the (𝑗 , 𝑖) entry becomes 1.
(3) If the (𝑖 , 𝑗) entry in the SSIM is X, then both the (𝑖 , 𝑗) and (𝑗 , 𝑖 ) entries of the
reachability matrix become 1.
(4) If the (𝑖 , 𝑗) entry in the SSIM is O, then both the (𝑖 , 𝑗) and (𝑗 , 𝑖 ) entries of the
reachability matrix become O.

227
Following these rules, the initial reachability matrix for the elements is built. Then the final
reachability matrix is developed by incorporating the transitivity which is a basic assumption
in ISM. It stated that if element A is related to B and B is related to C, it may be inferred that
A is related to C. If element (𝑖 , 𝑗) of the initial reachability matrix is zero, which means there
is neither any direct nor indirect relationship from element 𝑖 to element 𝑗 . The initial
reachability matrix may not have this characteristic because when there is no direct but an
indirect relationship from element 𝑖 to 𝑗, entry (𝑖 , 𝑗) is also zero. Indirect relationships can
be found by raising the initial reachability matrix (with diagonal entries set to 1) to successive
powers until no new entries are obtained (Malone, 1975).
Step 5. Ensuring that the reachability matrix is appropriately partitioned into several levels. In
this stage, two different sets (reachability and antecedent sets) can be obtained from the final
reachability matrix by level partitioning. The purpose of this step is to facilitate the
construction of the diagraph from the reachability matrix (Prohl et al., 2011). The reachability
set R (𝑆𝑖) consists of the element itself and other elements which are reachable from 𝑆𝑖 ,
whereas the antecedent set A (𝑆𝑖) consists of the element itself and other elements that may
impact it. Thereafter, an intersection of the reachability set and antecedent set (R(𝑆𝑖) ∩ A(𝑆𝑖)).
The element for which the reachability and the intersection sets are the same occupies the
top-level position in the ISM hierarchy. The top-level element in the hierarchy has no relation
to any other elements above its own level. Once top-level elements are identified, they are
discarded from the other elements. The same process is then repeated until the levels of all
elements are achieved.
Step 6. Drawing of diagraph with removed transitivity links. An initial diagraph including
transitivity links is found from the conical form of the reachability matrix. Then, by partitioning
the reachability matrix by rearranging the elements according to their level, the appropriate
conical matrix is achieved. That means all the elements having the same level are pooled. For
the sake of simplicity, sketching the final digraph in relation to the affiliations identified in the
reachability matrix and ensuring that transitive links are removed. If there is a relationship
between risk 𝑖 and 𝑗, this is shown by an arrow which points from 𝑖 to 𝑗.

228
Step 7. Conversion of diagraph into an ISM and checking of conceptual inconsistency.
Translating the resultant digraph into an ISM-based model. This can be done by putting
statements in places of element nodes. Finally, the ISM model is reviewed to check
conceptual inconsistency.
MICMAC analysis. MICMAC stands for Matriced’Impacts Croisἑs-Multiplication Appliquἑe
a’un Classement, which means “cross-impact matrix multiplication applied to classification”.
The object of the MICMAC analysis is to assess the driving power and dependence of each
element (Mandal and Deshmukh, 1994; Saxena and Sushil, 1990). All elements have been
classified into four categories based on their dependence and driving power:
(1) Autonomous elements, which have weak driver power and weak dependence.
(2) Dependent elements, which have weak driver power and strong dependence.
(3) Linkage elements, which have both strong driving and dependence power.
(4) Independent elements, which have strong driving power but poor dependence power.
6.6 AN EMPIRICAL STUDY ON THE APPLICABILITY OF THE ISM MODEL
A survey was conducted to facilitate a general understanding and knowledge of the
contextual interrelations among the selected risk factors. This study was conducted in three
phases: (1) Conducting the questionnaire survey, (2) application of the proposed ISM model
and (3) discussion of the results. Each of the phases will be discussed below.
6.6.1 Conducting the ISM-based questionnaire survey
Similarly, prior to actual data collection and, to eliminate content ambiguity in the questions,
a pilot study was conducted to validate the developed questionnaire. Frist, a draft version of
the questionnaire was developed and the same forward as well as backward translation
process were applied on these questionnaire as was applied earlier. The questionnaire was
examined by the same people who participated in a previous pilot study of an AHP-based
questionnaire for experts to comment on the appropriateness of the question and whether
any were unclear. Based on their feedback, the questionnaire was revised for the pilot study.

229
Ethical approval was also obtained to further validate questionnaire contents and participant
consent. The final questionnaire is shown in Appendix Three.
The participating experts who would decide pairwise relationships of risks were selected from
the previous AHP survey because they are experts in the healthcare supply chain and risk
management and familiar with the research topic. Hence, these experts were contacted again
through either email or telephone to briefly explain the purpose of the survey and their
involvement and the reasons for their interest. Additionally, in the context of this research,
this would have amounted to filling up another 55 times pairwise comparison which was
considered a highly labour-intensive task through a survey. Eleven participants who
responded to the survey confirmed their willingness to participate in the study as they were
interested in the topic of research, since most of them faced similar problems with the supply
chain in their organizations. Thereafter, one of these contracts suggested involvement of
another manager from his own hospital leading the inventory management department and
he was allowed to join also the expert panel. Thus, a panel of twelve experts was secured to
participate in this survey. The experts, represented multiple roles within the healthcare
industry like procurement, warehousing and logistics, and demand planning, SC consulting,
and they possessed the requisite experience to participate in the research. The experts’
profiles are presented in Table 6.13. The presence of each expert with a different background,
reduced the individual researcher bias (Oppermann, 2000). In addition, unlike the Fuzzy AHP
survey conducted, considering the highly labour-intensive task in the ISM survey, thus the
interview proved to be more reliable than an assessment based on paper-based
questionnaires only. Hence, the questionnaire were sent to them first and their inputs were
solicited through in different ways (i.e. telephonic interview, email and face-to-face interview)
between 10th June and 3th Aug 2017.
Table 6.13: respondents’ profile
No Participant Position Method Location Operating
Base

230
It is recommended that the researcher share the study objectives and classify the meaning of
each risk factor with the experts. This step provides an exact understanding of all risks to
ensure that their responses concentrated on the direct relationships between each pairwise
comparison. In the subsequent stage, the replies were combined, analysed and a convergence
in various relationships identified by the research. Finally, the results were discussed with the
experts and a final matrix was arrived at reflecting the experts’ consensus (Srivastava et al.,
2015).
6.6.2 Interpretive structural modelling (ISM) and MICMAC analysis
Each step of employing the ISM model has been discussed above. The details of the practical
application are as follows:
Step 1. Construction of structural self-interaction matrix (SSIM) by pairwise comparison.
During this stage, the twelve experts decided upon the pairwise relationship between the
selected 11 risk factors from the previous section. Thus. four symbols were used to denote
the direction of the relationship between the element I and j (i.e. V, measure I will influence
measure j; A measure j will be influence by measure I; X, measure I and j will help influence
each other; O, measure I and j are unrelated). For the sake of the simplicity, in the survey,
1 Chinese Hospital 1 Stock Manager Telephone China
2 Chinese Hospital 1 Pharmacy department leader Telephone China
3 Chinese Hospital 2 Pharmacy department leader Telephone China
4 Chinese Hospital 3 Pharmacy department leader Telephone China
5 Chinese Hospital 4 Pharmacy department leader Telephone China
6 Chinese Hospital 5 Pharmacy department leader Telephone China
7 Chinese Hospital 5 Stock Manager Telephone China
8 Pharmaceutical Company
General Manager Telephone China
9 LogHealth Center Researcher/Consulting Telephone Thailand
10 University Researcher/Consulting Face-to-Face interview
UK
11 NHS Trust 1 Head of Procurement Face-to-Face interview
UK
12 NHS Trust 2 Purchase and Supply Manager Face-to-Face interview
UK

231
four symbols were replaced by four Arabic numerals as 1=V, 2=A, 0=O, 3=X. Thereafter, based
on these contextual relationships, the SSIM developed for all the 11 relevant risk factors are
shown in Table 6.14.
Step 2. Developing a reachability matrix from the SSIM and checking for transitivity.
During this stage, following the rules for the substitution (i.e. the entry V, A, X and O of the
SSIM are converted into 1 and 0), the initial reachability matrix for the variables was
developed as shown in Table 6.15. Next, the final reachability matrix was then obtained by
incorporating the transitivities rules as if element A is related B and B is related to C, it may
be inferred that A is related to C. This is shown in Table 6.16. Moreover, in this table, the
driving power and dependence of each risk are also presented. The driving power of a
particular risk factor is the total number of risk factors (including the risk factor itself) that it
impacts. For example, “counterfeiting (S1)” impacts eight other risks and so has a driving
power of 8. On the other hand, the dependence is the total number of risk factors that may
impact a particular risk factor, such as “weak logistics service infrastructure (S3)” is impacted
by 10 other risk factors and so has a dependence power of 10. Based on these driving power
and dependence, those risk factors have later been classified in MICMAC analysis.
Step 3. Ensuring that the reachability matrix is appropriately partitioned into several levels
In this stage, a hierarchical ordering will be extracted from the reachability matrix by level
partitioning. It aims to facilitate the construction of the digraph from the reachability matrix.
Thus, the reachability and antecedent set for each variable are obtained from the final
reachability matrix (Warfield, 1974). As indicated above, the “reachability set” for a particular
variable consists of the variable itself and the other variables which it may help achieve. The
“antecedent set” consists of the variable itself and other variable which may help in achieving
it. (Srivastava et al., 2015).

232
Table 6.14: Structural self-interaction matrix (SSIM) of risk factors in healthcare supply chain
Notes: V, measure I will influence measure j; A measure j will be influence by measure I; X, measure I and j will help influence each other; O,
measure I and j are unrelated (1=V, 2=A, 0=O, 3=X)
Risk factors S11 S10 S9 S8 S7 S6 S5 S4 S3 S2 S1
S1 Counterfeiting 3 0 2 0 2 0 1 1 0 0
S2 Capability versus demand, inability of capability to meet demand
0 0 0 0 3 1 0 3 0
S3 Weak logistics service infrastructure 2 0 0 0 3 3 0 0
S4 Shortage of drug, unavailability of drugs on the market
0 0 3 2 2 0 0
S5 Poor quality in the purchased drugs from suppliers
2 0 0 0 0 2
S6 Dispensing/picking errors medication/packaging
2 0 0 0 0
S7 Poor IT system; lack of data standardization
0 0 0 3
S8 Lack of visibility concerning placement and availability of stock
3 0 0
S9 High purchase price 3 2
S10 Clinician's preference 1
S11 High product and supplier/brand variety

233
Table 6.15: Initial Reachability Matrix
Risk factors S1 S2 S3 S4 S5 S6 S7 S8 S9 S10 S11
S1 0 0 0 1 1 0 0 0 0 0 1
S2 0 0 0 1 0 1 1 0 0 0 0
S3 0 0 0 0 0 1 1 0 0 0 0
S4 0 1 0 0 0 0 0 0 1 0 0
S5 0 0 0 0 0 0 0 0 0 0 0
S6 0 0 1 0 1 0 0 0 0 0 0
S7 1 1 1 1 0 0 0 1 0 0 0
S8 0 0 0 1 0 0 1 0 0 0 1
S9 1 0 0 1 0 0 0 0 0 0 1
S10 0 0 0 0 0 0 0 0 1 0 1
S11 1 0 1 0 1 1 0 1 1 0 0

234
Table 6.16: Final Reachability Matrix
Risk factors S1 S2 S3 S4 S5 S6 S7 S8 S9 S10 S11 Driving power
S1 1 1* 0 1 1 1* 0 1* 1* 0 1 8
S2 1* 1 1* 1 1* 1 1 1* 1* 0 0 9
S3 1* 1* 1 1* 1* 1 1 1* 0 0 0 8
S4 1* 1 0 1 0 1* 1* 0 1 0 1* 7
S5 0 0 0 0 1 0 0 0 0 0 0 1
S6 0 0 1 0 1 1 1* 0 0 0 0 4
S7 1 1 1 1 1* 1* 1 1 1* 0 1* 10
S8 1* 1* 1* 1 1* 1* 1 1 1* 0 1 10
S9 1 1* 0 1 1* 1* 0 1* 1 0 1 8
S10 1* 1* 0 1* 1* 1* 0 1* 1 1 1 9
S11 1 0 1 1* 1 1 1* 1 1 0 1 9
Dependence 9 8 6 9 10 10 7 8 8 1 7
Note: 1* entries are indicated as transitivity

235
More precisely, reachability set of the risk is the set of elements of a final reachability matrix
which contain 1 in row of that particular risk. Coversely, antecedent set of the risk is the set
of elements which contain 1 in column of that particular risk (Pfohl et al., 2011). Based on the
reachability set and antecedent set, the intersection sets have been derived for all elements.
Intersection sets are the common elements of both reachability set and the antecedent set.
The case where the elements of both reachability and intersection sets are the same, which
is the indicator of top-level element in the ISM hierarchy. For example, “poor quality in the
purchased drugs from suppliers (S5)” have been identified as top-level elements as shown in
Table 6.17 (Iteration 1). The top-level variables have no relation to any other variable above
their own level. Once the top-level element is identified, it is discarded from the other
remaining variables. Then, the same process is repeated till the levels of all elements are
achieved. The subsequent iterations identified other levels aiding in building the diagraph and
ultimately the final ISM model. The stepwise level partitions of all 11 risk factors have been
completed in six iterations are presented from Tables 6.17 to 6.22. The summary of all
partition levels has been represented in Table 6.23.
Table 6.17: Iterations of the partition of reachability matrix to arrive at ISM diagram
Elements Iteration
1
Reachability set Antecedent set Intersection Level
S1 1,2,4,5,6,8,9,11 1,2,3,4,7,8,9,10,11 1,2,4,8,9,11
S2 1,2,3,4,5,6,7,8,9 1,2,3,4,7,8,9,10 1,2,3,4,7,8,9
S3 1,2,3,4,5,6,7,8 2,3,6,7,8,11 2,3,6,7,8
S4 1,2,4,6,7,9,11 1,2,3,4,7,8,9,10,11 1,2,4,7,9,11
S5 5 1,2,3,5,6,7,8,9,10,11 5 I
S6 3,5,6,7 1,2,3,4,6,7,8,9,10,11 3,6,7
S7 1,2,3,4,5,6,7,8,9,11 2,3,4,6,7,8,11 2,3,4,6,7,8,11
S8 1,2,3,4,5,6,7,8,9,11 1,2,3,7,8,9,10,11 1,2,3,7,8,9,11

236
S9 1,2,4,5,6,8,9,11 1,2,4,7,8,9,10,11 1,2,4,8,9,11
S10 1,2,4,5,6,8,9,10,11 10 10
S11 1,3,4,5,6,7,8,9,11 1,4,7,8,9,10,11 1,4,7,8,9,11
Table 6.18: Iterations of the partition of reachability matrix to arrive at ISM diagram
Elements Iteration
2
Reachability set Antecedent set Intersection Level
S1 1,2,4,6,8,9,11 1,2,3,4,7,8,9,10,11 1,2,4,8,9,11
S2 1,2,3,4,6,7,8,9 1,2,3,4,7,8,9,10 1,2,3,4,7,8,9
S3 1,2,3,4,6,7,8 2,3,6,7,8,11 2,3,6,7,8
S4 1,2,4,6,7,9,11 1,2,3,4,7,8,9,10,11 1,2,4,7,9,11
S6 3,6,7 1,2,3,4,6,7,8,9,10,11 3,6,7 II
S7 1,2,3,4,6,7,8,9,11 2,3,4,6,7,8,11 2,3,4,6,7,8,11
S8 1,2,3,4,6,7,8,9,11 1,2,3,7,8,9,10,11 1,2,3,7,8,9,11
S9 1,2,4,6,8,9,11 1,2,4,7,8,9,10,11 1,2,4,8,9,11
S10 1,2,4,6,8,9,10,11 10 10
S11 1,3,4,6,7,8,9,11 1,4,7,8,9,10,11 1,4,7,8,9,11
Table 6.19: Iterations of the partition of reachability matrix to arrive at ISM diagram
Elements Iteration
3
Reachability set
Antecedent set Intersection Level
S1 1,2,4,8,9,11 1,2,3,4,7,8,9,10,11 1,2,4,8,9,11 III

237
S2 1,2,3,4,7,8,9 1,2,3,4,7,8,9,10 1,2,3,4,7,8,9 III
S3 1,2,3,4,7,8 2,3,7,8,11 2,3,7,8
S4 1,2,4,7,9,11 1,2,3,4,7,8,9,10,11 1,2,4,7,9,11 III
S7 1,2,3,4,7,8,9,11 2,3,4,7,8,11 2,3,4,7,8,11
S8 1,2,3,4,7,8,9,11 1,2,3,7,8,9,10,11 1,2,3,7,8,9,11
S9 1,2,4,8,9,11 1,2,4,7,8,9,10,11 1,2,4,8,9,11 III
S10 1,2,4,8,9,10,11 10 10
S11 1,3,4,7,8,9,11 1,4,7,8,9,10,11 1,4,7,8,9,11
Table 6.20: Iterations of the partition of reachability matrix to arrive at ISM diagram
Elements Iteration
4
Reachability set Antecedent set Intersection Level
S3 3,7,8 3,7,8,11 3,7,8 IV
S7 3,7,8,11 3,7,8,11 3,7,8,11 IV
S8 3,7,8,11 3,7,810,11 3,7,8,11 IV
S10 8,10,11 10 10
S11 3,7,8,11 7,8,10,11 7,8,11
Table 6.21: Iterations of the partition of reachability matrix to arrive at ISM diagram
Elements Iteration
5
Reachability set Antecedent set Intersection Level
S10 10,11 10 10

238
S11 11 10,11 11 V
Table 6.22: Iterations of the partition of reachability matrix to arrive at ISM diagram
Elements Iteration
6
Reachability set Antecedent set Intersection Level
S10 10 10 10 VI
Table 6.23: Iterations of the partition of reachability matrix to arrive at ISM diagram
Elements
Reachability set Antecedent set Intersection Level
S1 1,2,4,5,6,8,9,11 1,2,3,4,7,8,9,10,11 1,2,4,8,9,11 III
S2 1,2,3,4,5,6,7,8,9 1,2,3,4,7,8,9,10 1,2,3,4,7,8,9 III
S3 1,2,3,4,5,6,7,8 2,3,6,7,8,11 2,3,6,7,8 IV
S4 1,2,4,6,7,9,11 1,2,3,4,7,8,9,10,11 1,2,4,7,9,11 III
S5 5 1,2,3,5,6,7,8,9,10,11 5 I
S6 3,5,6,7 1,2,3,4,6,7,8,9,10,11 3,6,7 II
S7 1,2,3,4,5,6,7,8,9,11 2,3,4,6,7,8,11 2,3,4,6,7,8,11 IV
S8 1,2,3,4,5,6,7,8,9,11 1,2,3,7,8,9,10,11 1,2,3,7,8,9,11 IV
S9 1,2,4,5,6,8,9,11 1,2,4,7,8,9,10,11 1,2,4,8,9,11 III
S10 1,2,4,5,6,8,9,10,11 10 10 VI
S11 1,3,4,5,6,7,8,9,11 1,4,7,8,9,10,11 1,4,7,8,9,11 V

239
Step 4. Drawing of diagraph with removed transitivity links.
An initial digraph including transitivity links was obtained from the conical form of the
reachability matrix. The conical matrix is achieved from the partitioned reachability matrix by
rearranging the elements according to their level, which means all the elements having the
same level are pooled. For the sake of simplicity, transitivity links are removed to obtain the
final digraph. If there is a relationship between risk 𝑖 and j , this is shown by an arrow which
points from 𝑖 to 𝑗.
Step 5. Conversion of digraph into an ISM and checking of conceptual inconsistency.
The resultant digraph is converted into an ISM-based model by replacing element nodes with
statements. Finally, the ISM model is reviewed by research in order to check for
incompatibilities, if any, the result will be sent back to the experts for revision. The final ISM
diagram indicated the contextual relations between each risk factor is shown in Figure 6.10.
Step 6. Matriced’Impacts Croisés Multiplication Appliquéea’un Classement (MICMAC) analysis
MICMAC is an indirect classification method to critically analyse the scope of each variables
(Pfohl et al., 2011). MICMAC analysis is part of a structural analysis that aims to identify the
most important variables of a system from a matrix that establishes the relations among them
(Villacorta et al., 2012). It is carried out to classify each risk factor in accordance with their
driving power and dependence power, as shown in Figure 6.11. Thus, in MICMAC analysis,
the dependence power and driving power of each risk factor was analysed. Cluster I consists
of autonomous risk factors with weak driving power and weak dependence and do not have
much influence on the system. Therefore, it does not need much managerial focus from risk
mitigation perspective. A close look at Figure 6.11 reveals that there is no risk in this cluster.
Cluster II includes independent risk factors, which have strong driving power but weak
dependence and are at the lower level of the model. Only one risk factor is identified in this
cluster, “clinician’s preference (S10)”, which requires attention from the management in the
event of change since it is beyond control. Cluster III comprises linkage risk factors which have
both strong driving and dependence power. Figure 6.11 shows that most of the risk factors
come under the linkage cluster namely, “shortage of drugs, unavailability of drugs on the
market (S4)”, “counterfeiting (S1)”, “poor IT system, lack of data standardization (S7)”,
“capability versus demand; inability of capacity to meet demand (S2)”, “weak logistics service

240
infrastructure (S3)”, “lack of visibility concerning placement and availability of stock (S8)”,
“high purchase price (S9)” and “high product and supplier/brand variety (S11)”. These factors
form the middle level of the ISM hierarchy model. Though the lower level risk factor induces
or affect these risks, these also have significant driving power to influence some other risks,
which are at the top of the model (Prohl et al., 2011). More importantly, these risk factors are
unstable because if any change occurs to these risks that will have an effect on other risks
(Samantra et al., 2016). Thus, these risks need continuous managerial focus and attention.
Cluster IV includes the dependent risk factors with weak driving power and strong
dependence. As expected, “poor quality in the purchased drugs from suppliers (S5)” and
“dispensing/picking errors-medication/ packaging (S6)” are grouped into this cluster. In fact,
these are consequences and are at the top of the ISM hierarchy. The lower level risks also
have a significant resulting power for other risks at the top level of the model. It is good to
note that the risk factors are always unstable because if there are any changes, one risk factor
will lead to more consequences for other risks. Therefore, more attention should be given to
these risks so that management identifies and understands the dependence of these risks on
the lower levels and these will help to achieve the SCRM goals as well as the objectives.

241
S5 Poor quality in the purchased drugs from supppliers
S6 Dispensing/picking errors medication/packaging, prescription management
S1 CounterfeitingS4 Shortage of
drugsS9 High purchase
priceS2 Capability
versus demand
S3 Weak logistics service infrastructure
S8 Lack of visibility concerning placement
and availability of stock
S7 poor IT system; lack of data standardization
S11 High product and supplier/brand variety
S10 Clinician s preference
Figure 6-11: ISM-based hierarchy model

242
Figure 6-12: Driving power and dependence diagram
6.6.3 Finding from ISM model
Risks are all about choice and how decisions are made (Khan and Burnes, 2007), thus, in this
chapter, an attempt has been made to apply the ISM model in the healthcare industry in order
to uncover interdependencies of supply chain related risks. Experts stated that management
always lacks awareness regarding how the risks relate to each other and how they can affect
one another. Thus, improvement initiatives to address the risk factors are not implemented
due to either lack of strategic focus or do not obtain the management buy-in. (Srivastava et
al., 2015). Therefore, the contextual relationships between pairs of elements were examined
for the selected 11 risk factors based on the results of Fuzzy AHP method. The structural self-
interaction matrix (SSIM) was developed to indicate pair-wise relationships between each risk
10
9
8
7
6
5
4
3
2
1
1 2 3 4 5 6 7 8 9 10
I
VI III
II
Low High
Driver Power
L
ow
H
igh
D
epen
den
ce P
ow
er
◆S1
◆S2
◆S3
◆S4
◆S5 ◆S6
◆S7
◆S8 ◆S9
◆S11
◆S10

243
factor as shown in Table 6.13. This matrix was converted to initial reachability matrix (RM)
and its transitivity was checked in conformity with recommendations in literature (Upadhye,
et al., 2014). Thereafter, the final reachability matrix represented in Table 6.23 was used to
create the ISM based model, as shown in Figures 6.10. Moreover, MICMAC analysis has been
carried out for the 11 risk factors and classified into four clusters (autonomous, dependent,
linkage, independent) based on their driving power and dependence power, as shown in
Figure 6.11. The results provide an understanding of the identified risk factors in different
levels of the ISM model. In order to facilitate prioritization of the risks for the decision-making
process, the developed hierarchical ISM model contains all types of risks starting from the
highest to the lowest in different levels. Accordingly, this mapping of inter-relationships is a
useful method for supply chain risk managers to evaluate supply chain risks and learn about
the impact chains of these risks (Pfohl et al., 2011). Thus, understanding the impact of risks
at each level is indeed important as it will help managers to construct and implement
successful risk management strategies towards achieving the efficacy of the healthcare supply
chain management (Samantra et al., 2016).
It can be observed that “poor quality in the purchased drugs from suppliers (S5)” has the
lowest driving power (1) and highest dependence (10), thus it is placed in the top level as
shown in the ISM based model. In such a case, it could be riskier than the others that can
produce major impacts in the healthcare SC because all other risks which are being placed
just below the top level, strongly influence to it. Therefore, hospital managers should pay
special attention to control them to reduce risks to patient’s health.
One of the experts who is in a leadership role in procurement commented
“When the drugs are received at the drugstore site, all the supplies have to pass strict
inspection before they are delivered to the internal drugstore as part of the resupply. If a drug
has a quality problem, it is returned to the supplier. It should be noted that both suppliers and
hospital pharmacists have to ensure appropriate temperature conditions in their storage
areas, and make necessary investments in real-time serial communication of the temperature
monitoring system. In addition, it is required that the pharmacy department are working
under supervision of the pharmacy administration committee which comprises some clinician,
pharmacist and other department leaders. The pharmacy department through collaboration
with the pharmacy administration committee will then put in place policies aimed at ensuring

244
that drug selection, their distribution as well as subsequent clinical usage to meet the
minimum set of standards. It sets up where the pharmacy department directly manages all
the pharmaceutical supplies, then the pharmacy administration committee should be put in
place to ensure that the roles of drugs procurement are not solely left in the hands of a single
individual.”
Furthermore, quality associated risks should be emphasized in different approaches, such as
getting a suitable logistic provider and designing an appropriate alliance with them to help in
managing unplanned risks. Another participating manager in a pharmaceutical company,
concurred with this result. He commented “To ensure appropriate flow and good quality of
drugs in the pharmaceutical company should consistent adherence to the guidelines of the
supply chain management professionals. What this implies is that all activities pertaining to
the sourcing, procurement, logistics as well as conversions are properly planned and managed.
In general, we had selected the lowest cost third party logistics service provider. Subsequently,
we ran into problems due to pilferage and contamination issues, improper temperature
control, and so forth. In essence, the management team should aim at optimizing supply
through elimination of the established bottlenecks, ensuring there is a close connection with
the logistics service providers as well as to be willing to pay them appropriately through well-
designed contracts that will maintain the interests for both parties. More importantly, the
supplier should ensure that the quality of drugs meets the safety standards set by the
European Medicines Agency (EMA) and Medicines and Healthcare products Regulatory
Agency (MHRA), Good Manufacturing Practice (GMP).” In contrast, lower level risks (e.g.
“clinician’s preference (S10)”) have the high driving power (9) with lowest dependence
power (1) and strongly influence the middle-level factors such as “high purchase price (9)”
and “high product and supplier/brand variety (11)” (see Figure 6.8). This had indeed been a
source of concern for many procurement leaders as the clinician’s preference is characterized
by a lack of awareness of cost containment. More importantly, doctors were taking money
from pharmaceutical companies, which influences their judgement about a medicine.
According to a new database published by Association of the British Pharmaceutical Industry
(ABPI) in 2016, the practices of NHS staff who take up to £100,000 in advisory fees per year
from pharmaceutical companies have been exposed by various Telegraph investigations. In

245
this case, it raises concerns regarding the possibility of conflicts of interest between the
individual commercial and hospital work.
Those middle-level risks seem to influence the risks at the same level or above in the ISM
diagraph such as: “counterfeiting (S1)” influence “shortage of drug, unavailability of drugs on
the market (S4)” and “poor quality in the purchased drugs from suppliers (S5)”. Literature
confirms that counterfeiting leads to risks of shortage or unavailability of quality drugs as
evidenced by the findings of Koczwara and Dressman (2017) and Patel (2017). In addition,
“high purchase price (S9)” in turn directly results in “counterfeiting (S1)”. It means that high
pharmaceutical prices have a high likelihood of pushing suppliers to counterfeiting to keep
business despite the perceived risks and other implications (Patel, 2017).
One of the pharmacy department leaders in a hospital commented: “Though the
management of counterfet drugs is not easy, most hospitals have tried to set up the Drug and
Therapeutics Committee (DTC) in the facility which aims to ensure effective management of a
list of approved medicines, reviewing the drugs in place as well as reporting any adverse
effects of the supplied drugs. In this committee, each member should have diverse
backgrounds from pharmacy, nursing, hospital adminstrations as well as quality assurance
department. In the selection of the suppliers, the pharmaceutical manufactures or companies
should to be considered are those with Good Manufacturing Practices (GMP), Good
Distribution Practice (GDP) as well as Good Supplying Practice (GSP) certificates administered
by the MHRA and EMA or China Food and Drug Administration (CFDA).”
In addition, the DTC should also design a mechanism to ensure that there is effective
monitoring of medicine use in the hospital. The committee should also advise on the selection
of formulary drugs appropriate for treatment of diseases diagnosed at the facility for lowering
the risk of stocking generic duplicate drugs that have lower demand. Although the primary
consideration should be cost effectiveness, there is also a need for management to consider
some very crucial aspects of the selected drug, such as its toxicity, pharmacokinetics,
bioequivalence, therapeutic equivalence, and most importantly its efficacy. Moreover,
“counterfeiting risks (S1)” was also found to be influenced by “Poor IT system; lack of data
standardization (S7)” where it could not be easy to verify genuine from counterfeits (Jiang et
al., 2016). Experts and practitioners believe that a poor IT system and lack of standardization
of data can lead to poor anti-counterfeiting performance and these are likely to gain more

246
importance in the future. Moreover, it can also be observed that “shortage of drug,
unavailability of drugs on the market (S4)” was found to be influenced by a “poor IT system,
lack of data standardization (S7)” and “lack of visibility concerning placement as well as
availability of stock (S8)”. This finding corroborates the findings in literature that precise
demand forecasting, timeliness and adequacy of order, reorder patterns and inventory
management are affected by a reliable IT system (Bam et al., 2017; Iqbal et al., 2017; Qrunfleh
and Tarafdar, 2014). It may be worth mentioning that “poor IT system, lack of data
standardization (S7)” and “lack of visibility concerning placement and availability of stock
(S8)” have been identified as risks with both high driving and dependence power.
One of the pharmacy department leaders during the telephone interview stated: “For the
reason of the importance of information system management and integration as a vital
element to drive towards added value in healthcare supply chain management. Most
managers must concentrate on various types of information related risks, such as: inadequate
or absence of information management platforms, manual processes, inadequate or lack of
standardized product identification, lack of product traceability and integrated system with
suppliers, limited information systems which cover logistics activities.” The comments are
consistent with the findings from the literature review. Kitsiou et al., (2007) presents different
kinds of technological approaches that can be implemented in the healthcare SC, including
Electronic data interchange (EDI), XML, Health level seven (HL7), Common object request
broker architecture (CORBA), Distributed healthcare environment (DHE), Web services and
RFID. Thus, it clearly shows that the facilitation of an efficient information technology system
would increase the visibility of product information and demand predictability, establish
integrated process methods to support decision making and balance costs and demands. In
terms of lack of visibility concerning placement and availability of stock, one of the purchase
and supply managers in the NHS hospital also stated.
“There are various challenges that are faced by our organization, such as lack of space for
storage, the procedures needed the involvement of clinicians, wastage of products and lack of
traceability as well as product visibility. We are highly concerned with inventory management
because the fluctuated level of stock, product identification was difficult, and storage was
spread across the hospital. Thus, these problems prompted us to adopt an innovative
inventory management system, which beyond our early expectations, both financially and

247
from a service viewpoint. The cost-savings in the theatre was £1.78 million and the
consignment stock savings was £350,000. We also realised that the wastages had been
reduced and there was a £885,000 stock reduction, and the hospitals have realised a space
savings of £31,000. In addition, discovering 13 types of barcode made us to adopt the GSI
standards and that helped us to come up with a database that was accurate and up-to-date
information, and that was fed in the management systems of our inventory This type of
technology has enabled our hospital to really move forward with our aim to achieve supply
chain excellence.”
“Capability versus demand, inability of capability to meet demand (S2)” and “weak logistic
service infrastructure (S3)” have been identified as the risks with high driver and dependence
power as well. These two risk factors have a direct influence on “dispensing/picking errors
medication/packaging (S6)”. The findings agree with that of Liu et al.’s (2017) findings that
the lack of skilled staff and handling material could lead to the human error in handing or
storing of drugs. One re-occurring issue was the larger number of patient transports made by
nursing staff, despite it being the transportation departments’ responsibility (Granlund and
Wiktorsson, 2013). The transportation department was perceived as lacking the capacity to
handle all transports and often late with deliveries, thus the nurses were forced to carry out
transportation which is time wastage and the products are likely to be spoilt hence increasing
chances of errors. Meanwhile, automatic transport systems are introduced as a founding
principle for current hospital logistics, such as automated guided vehicles (AGVs) that handle
the major part of all deliveries of food, linen, waste, and goods, while pneumatic dispatch
systems are used for samples, blood, and medicine shipments. According to Granlund and
Wiktorsson (2013), healthcare internal logistics strives for a high degree of automation, e.g.
IT systems for ordering supplies, tracing equipment and staff. Equipment for picking and
packing medicine for patients are supposed to be integrated with the pneumatic dispatch
system. As a result, the ISM model provides the conceptualization of healthcare SC risks and
to understand mutual influence between 11 risk factors that have been identified. Therefore,
lower level factors are mainly responsible for increasing the degree of risk extent as they have
a strong influence on the higher or equal level factors. In this regard, it is recommended that
interdependency among various risk factors plays an important role in assessing the risk
effects on healthcare SCM (Samantra et al., 2016).

248
6.7 CONCLUSION
This chapter presents the implementation of the combined Fuzzy AHP and ISM model to
analyse and evaluate the risks in the healthcare SC. The application of the combined models
indicated its feasibility as a tool of analysis as well as a decision-support tool that facilitates
understanding of the problem. The problem of the study was to determine the exposure level
and the relationship of the risks of the supply chain to healthcare products delivery. The fuzzy
approach adopted in the chapter is significant especially under circumstances where the
uncertainties exist when making decisions. The pairwise analysis of each risk is based on the
experts’ knowledge from both academic and practitioner fields, that is, contributions from
those who understand the issues. Therefore, the developed models from this study will
increase awareness among stakeholders and the decision makers to better understand the
priority weighting, the relationship and the effects of different supply chain risks and
consequences. Therefore, this implies decisions about risk mitigation strategies.
In terms of the findings, the Fuzzy AHP method was used to determine the weights of the
criteria and sub-criteria, which are more accurate than the direct weights received from the
decision makers. It can be noted that eleven sub-criteria risk factors with high priority
weighting were selected. Subsequently, they were used as inputs for the ISM model for
evaluating their inter-relationships and providing a concept of identification and classification
of those risk factors in four different clusters based on their driving power and dependence
power. In this regard, it is recommended that interdependency among various risk factors
play an important role in assessing the risk effects on healthcare SCM (Samantra et al., 2016).
Lower level factors are mainly responsible for increasing the degree of risk extent as they are
influencing strongly to the higher or equal level factors. The ISM model provides the
conceptualization of healthcare SC risks and the insightful understanding of mutual influence
between 11 risk factors. As a result, the key finding is that no risks are categorized as the
autonomous risk, which are weak drivers and weak dependents and with little influence on
the system. All the 11 risk factors should be considered when determining the relevant risk
mitigation strategies in the next chapter.

249
7.CHAPTER SEVEN – IDENTIFICATION AND EVALUATION OF RISK MITIGATION STRATEGIES
7.1 INTRODUCTION
This chapter focuses on the last stage of the risk management process, i.e. identification,
validation and evaluation of current implemented risk mitigation strategies. The current
implemented risk mitigation strategies are identified through conducting empirical studies
from both China and UK healthcare industries (i.e. official documentation review, direct-
observation and semi-structured interview). The validation of the identified risk mitigation
strategies and the exploration of new risk mitigation strategies are conducted via the semi-
structured interviews. The overview of each identified risk mitigation strategy is presented.
The identified strategies are prioritized over the previously identified risk factors using a Fuzzy
TOPSIS method.
7.2 METHODOLOGY FOR RISK MITIGATION STRATEGY IDENTIFICATION AND EVALUATION
Based on the developed integrated RM model, a generic risk mitigation model is proposed for
determining and evaluating the implemented risk mitigation strategies. It is a key part in the
proposed RM model for healthcare organizations. The schematic diagram of the generic risk
mitigation model is illustrated in Figure 7.1.
The proposed risk mitigation model will be implemented for healthcare organizations through
the following steps:
Step 1: Exploiting the current implemented risk mitigation strategies on the basis of the
identified significant risk factors though empirical studies.
Step 2: Develop a questionnaire to evaluate the identified risk mitigation strategies to the
case organizations and distributed to the participating experts to contribute their
judgements. Next, the Fuzzy TOPSIS method is applied to rank the significance of these
strategies.

250
Risk FactorsIdentification
Risk Assessment Risk Mitigation
Chapter 5 Chapter 6 Chapter 7
Conduct the empirical studies for identifying the implemented risk mitigation strategies
Choose the appropriate linguistic values for alternatives with respect to criteria
Compute aggregate fuzzy ratings for the alternatives
Conduct the weighted normalized fuzzy decision matrix
Construct the fuzzy decision matrix and the normalized fuzzy decision matrix
Determine and calculate the distance of each alternative from FPIS and FNIS
Calculate the closeness coefficient (CCi) of each alternatives
Rank the alternatives (Rank risk management strategies in HCSC)
TOPSIS method under fuzzy environment
Figure 7-1: A generic risk mitigation model for healthcare supply chain

251
7.3 IDENTIFICATION OF RISK MITIGATION STRATEGIES FROM EMPIRICAL STUDIES
Various risk mitigation strategies exist in both the general and healthcare supply chain setting.
However, the existing literature is rather limited and fragmented. This thesis therefore
focuses on the current risk mitigation strategies in both UK and China healthcare
organizations. It provides the latest information that can reflect the current situation in both
countries’ healthcare industry. Especially, instead of identifying the risk mitigation strategies
through a literature review, this research explored the currently implemented strategies which
turned out to be more reasonable in actual situations. Although it is good to have choices of
strategies for supply chain risk mitigation, how to tailor them with their various features and
benefits is still a big challenge for many healthcare organizations. In this thesis, the healthcare
provider (i.e. hospitals) is taken as a focal organization in the context of the supply chain.
Based on the identified risk factors in previous chapters, a number of risk mitigation strategies
are identified and their efficiency will be evaluated through the developed method.
An empirical studies approach is employed to explore the healthcare supply chain operations
in the hospital context. It provides description of what is transpiring by using in-depth
interviews, direct observations, and documentation review, which are referenced as both
qualitative and quantitative studies (Christensen et al. 2011; Creswell and Creswell 2017;
Taylor et al., 2015; Yanow and Schwartz-Shea 2015). The purpose of empirical studies is to
verify current existing or newly proposed collected evidence about research on the basis of
empirical data. Long (2014) reported that an empirical study is based on ‘field’ experiences or
direct observation, enabling researchers to conduct investigations on modern phenomenon
in depth and in its natural context where there is no clear evidence between phenomenon
and context. According to Yin (2013), the research design is used to judge the quality of
empirical studies that consist of reliability and construct validity, internal validity, and external
validity. In this chapter, construct validity is achieved when multiple sources of evidence were
employed for data collection. More specifically, semi-structured interviews were used as the
primary data collection approach, while site observation and official documentation review
were also gathered for triangulation purposes.
Empirical studies were conducted in both UK and China healthcare industries to extract the
appropriate number of mitigation strategies for further evaluation. The studies were
conducted in three phases: (1) review of official documentation and other published

252
materials, (2) direction observation, and (3) conducting semi-structured interviews. Each of
the phase is discussed below.
7.3.1 Description of the procedure of conducting the empirical studies
The research followed the particular steps to ensure that all sources were used in the study.
To begin with, some relevant documentation was reviewed critically, such as NHS England
Risk Management Policy and Process Guide; Lord Carter’s report; NHS Supply Chain Case
studies; NHS eProcurement Strategy; Eight UPS Pain in the Chain Survey; and McKinsey and
Company reports and other Department of Health and Social Care official documents.
Especially, some official documentation was provided by the participating organizations in the
survey. Documentary research has the advantage of ensuring that the researcher gaints
access to information which would otherwise be challenging to acquire using other means
like people who may be difficult to track down or may be unwilling to engage in an official
study. In most cases, documentation review is an effective mechanism to track change over
a long period of time. It is also less expensive, especially when documents may be accessed
easily. After documentations review, some mitigation strategies are identified. For example,
Lord Carter’s report has given the discussion on the savings which could be supplied from
good e-procurement practices. The strong emphasis is placed on the employee issues as well
as informatization of hospital supply chain network. Among these recommendations, some
key lessons have been retrieved in relation to our research:
Collaboration (i.e. local, regional, national)
“By collaborating with suppliers and leveraging the NHS’s purchasing power on a national
scale (aggregating national demand and releasing funds) the Future Operating Model …”
Outsourcing the supply chain activities to the third party. (capitalise on economies of
scale in the provision of non-core services to reduce back-office costs).
NHS eProcurement strategy (electronic invoicing by suppliers direct into the Oracle
system; GS1 Product bar coding technology; modernizing the complete purchase-to-pay
process.
Information technology and system (RFID etc.)
“Integrated IT platforms that allow each function within the operating model to work
seamlessly..(NHS Procurement Transformation Programme Future Operating Model

253
(FOM)). (Lord Carter’s report, 2016)
The in-depth observation presented here was conducted in the UK and China. The author
visited three hospitals as well as one pharmaceutical company: 𝐻𝐴 (children’s hospital), 𝐻𝐵
(public hospital) and 𝐻𝐶 (university hospital), which differ in terms of patient group, size of
hospital, and location. 𝐻𝐴 is one of the largest childrens’ hospitals (309 beds) in the United
Kingdom and Europe. It currently employs about 2,400 staff and treats over 270,000 children
from across the UK each year. The other two hospitals 𝐻𝐵 and 𝐻𝐶 are state-owned hospitals
in China and third-grade class-A hospital (2,100 beds and 11,000 beds, respectively). 𝐻𝐶 is
located in one provincial capital city while 𝐻𝐵 is located in a third-tier city, and 𝐻𝐵 currently
employs about 2,447 staff and treats over 1,060,000 outpatients and 60,000 inpatients per
year, while, 𝐻𝐶 currently employs about 11,859 staff and treats over 5,700,000 outpatients
and 410,000 inpatients every year. During the site visits, the author received a tour of the
different sites for observation, which was especially helpful in gathering data pertaining to
operational aspects. Importantly, carrying out direct observations has a major benefit of
ensuring that the author can actually observe what is done or said by the intended
participants with interviews (Yin, 2015). Human beings, by their very nature, would not
normally be willing to tell strangers their thoughts during interviews or to write their honest
opinions on questionnaires. Therefore, observations enable the researcher to access the
meaning and context of what people say and do. Nonetheless, a direct observation also has
its weaknesses that can be overcome by other data collection methods.
In the last stage, the semi-structured interviews were conducted in the healthcare industry of
the two countries by inviting nine experts from seven Chinese hospitals and three experts
from one UK hospital and another two general managers from different pharmaceutical
companies to take part in the survey as shown in Table 7.1. Most respondents were involved
our previous surveys and a regular contact was maintained from the point of contacting until
the research project’s completion. Interviews were held face-to-face or telephonically with
participants from different hierarchical levels of each healthcare organization. It was
important to examine if information from participants were consistent throughout the
different organizational levels of the cases. Therefore, involving various hierarchical levels as
well as different types of organization interviews aided in determining the integrity and

254
validity of data within cases. In addition to this, as discussed in the previous chapter,
organizations were selected on the basis of their experience with supply chain disruptions
and represent a leading organization in the healthcare industry (e.g. the selected Chinese
hospitals are all the third-grade class-A hospitals). Positions held by the interviewees included
pharmacy department leader, stock manager, former director of hospital, material
department manager, and general manager in a pharmaceutical company. Most interviewees
were helpful in gaining access to additional documentation.
Table 7.1: Respondents’ profile
Participant Position Method
Chinese Hospital A Pharmacy department leader Telephone interview (40 min)
Chinese Hospital A Stock Manager Face-to-Face interview (30 min)
Chinese Hospital B Pharmacy department leader Face-to-Face interview (30 min)
Chinese Hospital B Pharmacy department senior manager
Face-to-Face interview (30 min)
Chinese Hospital C Pharmacy department leader Face-to-Face interview (30 min)
Chinese Hospital D Pharmacy department leader Face-to-Face interview (30 min )
Chinese Hospital E Pharmacy department leader Face-to-Face interview (50 min)
Chinese Hospital F Former director Telephone interview (30 min)
Chinese Hospital G Pharmacy department leader Face-to-Face interview (40 min)
UK Hospital A Head of Procurement Face-to-Face interview (30 min)
UK Hospital A Material department Manager Face-to-Face interview (30 min)
UK Hospital A Pharmacy department Manager Face-to-Face interview (40 min)
Chinese Pharmaceutical
Company A
General Manager Face-to-Face interview (40 min)
Chinese Pharmaceutical
Company B
Vice-general Manager Telephone interview (40 min)

255
The interviewees were asked to validate the identified strategies from the previous steps to
determine if they thought the strategies were inappropriate. More so, by providing their
opinions about whether some strategies had been addressed. A semi-structured interview in
research as a technique has a number of advantages (Creswell and Creswell 2017). It is reliable
and efficient to generate a huge amount of details. Therefore, based on the selected 11 sub-
criteria risk factors for the cases and interviewees, questions were designed for one hour
interviews time. This ensured enough time to get sufficient data to answer research
questions, whilst the amount of time was deemed acceptable for any research participant to
invest in the research. During the interview, as some confidential topic would be of concern
to the interviewees (e.g. especially in China), the interviewees might be uncomfortable with
being recorded. Hence, the author had honed a pen-and-paper note taking method to record
the information due to the interviewees’ refusal to allow audio-recorders. Furthermore, the
notes would be given to the interviewee to make sure the essence of their comments were
transcribed.
The interviews were spread over three months and included four site visits by the author.
Each time, the author visited a placement based on the interviewees’ locations. Sites visited
by the author included hospital’s pharmacy department, material management department,
centre store, and dispensary and a distribution centre as well as a warehouse in the
pharmaceutical company. Three of four visited sites were located in China, whilst the fourth
site was located in the United Kingdom. Consequently, integrating the three sources,
documentation, direct observation, and interviews ensured research with reduced bias. In the
end, nine risk mitigation strategies were identified and discussed below.
7.3.2 Overview of identified implemented mitigation strategies in hospital setting
As presented in Figure 7.2, the identified risk mitigation strategies are summarized and more
details will be discussed below.
7.3.2.1 Strategy 1: Building efficient distribution management
- Poor quality in the purchased drugs from suppliers (S2)
- Weak logistics service infrastructure (S7)

256
The main goal of distribution management is to ensure that pharmaceutical supplies are
smooth and maintained to the hospitals where they are required and ensuring that resources
are effectively utilized (Jaberidoost et al., 2013). Costs of distribution, such as transportation,
are an important issue for running a supply system of a public health supply system. In
countries covering large geographical areas like China, the cost of transportation might
surpass the distributed medicines’ value (Syahrir and Vanany 2015). Therefore, minimizing
these costs may imply that more money would be present for clinical care and for the
purchase of medicine. A distribution system is considered good only when it is cost-effective
and provides quality service.
Figure 7-2: Summary of the identified risk mitigation strategies
The distribution cycle starts with the dispatch of pharmaceuticals by suppliers or
manufacturers and ends with the reporting of information regarding medicine consumption
Strategy 1: Building efficient
distribution management
Strategy 2: Developing advantaged information
technology and systems
Stretagy 3: developing inter
and intra organizational collaboration
Strategy 4:Building efficient
inventory management
Strategy 5: Implementing eProcurement
strategy
Strategy 6: Implementing outsourcing
strategy
Strategy 7: Implementing agility strategy
Strategy 8: Developing
internal capability
management
Strategt 9: Implementing single sourcing
strategy

257
to the facility’s procurement department (Jaberidoost et al., 2013). The main activities
involved in pharmaceutical logistics management are varied. Cold chain management, for
example, is one of the most important HCSCM tasks and generally defined as a temperature-
controlled supply chain that warrants and extends the shelf life of goods like pharmaceutical
drugs, seafood, fresh agricultural products, and frozen food. According to Purssell (2015) and
Ogboghodo et al., (2017), understanding cold chain management is important to supply chain
management since it manages temperature to minimizes the challenges of risks affecting
efficacy and safety of medicines, especially high cost vaccines, stored in large quantities and
temperature labile (i.e. safety and efficacy may be compromised by excessive heat or
freezing). In particular, it is a sequence of activities involved in distribution to steadily
maintain this temperature to safeguard drugs from manufacturing to consumption points.
The unique characteristics of the product perishability of some specific pharmaceutical items
must always be stored under the strict temperature-monitoring environment. Therefore, it is
necessary to manage risks caused by the unexpected changes in environmental conditions for
delivery items during the distribution process, as such risks can directly or indirectly
negatively affect the quality in purchased drugs from the supplier. Meanwhile, when logistics
services infrastructure is poor, it also lead to the poor supplier routes, obsolete equipment in
the warehouse, improper drug store environment and transportation facility/route,
inefficient cold chain management during transportation. According to a report produced by
the UPS Company (2015),
“There are many organizations which have succeeded in addressing the issue of product
damage as well as spoilage last year. The main reasons for success cited are partnering with
higher-quality carriers, using faster shipping service levels, and using temperature-monitoring
devices.”
One general manager in a pharmaceutical company stated that:
“Transparency has to be critical. Applying real time monitoring and recording devices would
help us identify where to find the product and evaluate the condition in which the product is
found. It can also tell where it can be stored. For example, for the various types of sensors,
there are sensors and tags which have been installed on the transportation facilities such as a
delivery item, worker, or container. These tags are used when distributing items from one
place to another. They are used in the identification of the entities according to the unique

258
identifiers given to the tags. A sensor is defined as a device that measures environmental
conditions according to the environmental features like Thermocouples, Resistance
Temperature Detectors (RTD) and Vaccine Vial monitoring (VVM). We use VVM whereby the
RTD is found on the Vial label which when exposed to the high temperature it becomes dark.
” (Pharmaceutical Company A)
On the other hand, in the hospital setting, refrigerated medicines must be stored at 2-8⁰C.
Most non-refrigerated medicines must be stored at less than 25⁰C. However, some medicines
can be stored at up to 30⁰C. Sensitivity to changes in temperature varies depending on the
medicine. One stock manager mentioned:
“We have to ensure that all medicines are stored within the manufacturers recommended
temperature range. Otherwise, it could invalidate the expiry date and cause manufacturers to
disclaim responsibility for any apparent failure of the medicine as the safety and efficacy of
such medicines can be significantly compromised or unknown.” (Chinese Hospital A)
Another pharmacy department leader used vaccine management for example and said:
“In our hospital, all the employees who carry out any activity involving medicine such as
transportation, storage as well as administration should be given proper training. This training
will help them to ensure that all the medicine or vaccines are in their right status. The
pharmacist is the one supposed to be dealing with cold chain management of all the vaccines
which are stored in the hospital stores. The nurse manager is responsible for the medicines
that are removed from the store and they store them in the clinic refrigerators as they wait
for administration to the patient. Once the medicine is transferred from the stores to the
ward, they should also be monitored and kept under cool conditions using the battery-
operated thermometer. The persons who transfers the medicines should ensure that they are
packed well and the temperatures are monitored from the time they are being transferred to
the time they reach the ward. The person who receives the vaccine should record their receipt
and that the cold chain was maintained during transfer on the Health Vaccine Refrigerator
Temperature Chart. The vaccines must be unpacked and stored immediately in the ward/clinic
refrigerator. After that the nurse administering the vaccine is responsible for maintaining the
cold chain from the time it has been removed from the refrigerator to administration.
Especially, during these process, when the refrigerator temperature readings fall outside the

259
range 2⁰C to 8⁰C this must be reported to the service/ward manager for risk assessment and
appropriate action.” (Chinese Hospital E)
The other activities are receipt and inspection. Kanyoma et al., (2013) noted that central
stores staff must accurately inspect all shipments as soon as they are received from local
suppliers or the port. The shipments must be kept separate from other stock until the
inspection is completed, which should focus on missing and damaged items. The inspection
should also pay attention to compliance with agreement conditions relating to labeling,
packaging, presentation, quantity, drug type, and other special requirements. It is essential
to inspect every shipment promptly and accurately in order to ensure that suppliers fulfill the
contracts, where receipts and distribution (R&D) are responsible for matching receipts to
orders and arranging the internal delivery schedule. A pharmacy department leader
mentioned:
“When expecting a delivery of a refrigerated medicine, the designated accountable person
must ensure that whoever accepts the delivery is aware of the need to maintain the cold chain
and check the order for leakage, damage and discrepancies. All deliveries of refrigerated
medicines must be unpacked immediately on arrival and placed in a pharmacy refrigerator.
Items must remain in the manufacturer’s original packaging to protect them from light. If
there is any concern that the cold chain has been broken prior to delivery, the staff cannot
accept the delivery and report the reason for non-acceptance to the distributor.” (Chinese
Hospital C)
7.3.2.2 Strategy 2: Developing advanced information technology and system
- Counterfeiting (S1)
- Poor IT system, lack of data standardization (S5)
- Dispensing/picking errors-medication/packaging (S6)
- Lack of visibility concerning placement and availability of stock (S8)
The issues regarding counterfeiting can be managed by incorporating the current anti-
counterfeiting technologies such as the hologram, mass encoding systems, bar-codes etc.
With regard to mitigating risks in the supply chain, the empirical studies revealed a number
of IT-related techniques currently used. These include data standardization, information

260
sharing, drugs traceability, integrated IT platform, RFID, and EDI (Coustasse et al., 2013).
According to Lord Carter’s report,
“All hospital trusts should have the key digital information systems in place where it is fully
integrated and utilized e-catalogue and inventory systems for procurement, RFID systems. For
example, there is one hospital which has adopted the same technology like that of the well-
known United Kingdom’s largest retailers-real time Amazon-style which deals with purchase-
to-pay platform. It has an in built catalogue and product information solution which it uses to
monitor the processes of the supply chain management. The procurement platform enables
the trust to ensure safe delivery and leads to a reduction cost of a £3 millions annual costs. It
enables the company to develop transparency, visibility as well as step-change in the
interoperability in the health organizations.” (Lord Carter’s report, 2016)
In the UK, the Department of Health (DH) has announced a guideline called “Coding for
success”, which is related to the implementation of an automatic identify and data capture
programme (DH, 2010). To address patient safety issues, the National Health System
Connecting for Health (NHS CFH) entered into the agreement with GS1 UK to issue the
adoption of the GS1 coding standard. In addition to coding, it also encourages manufacturers
to implement GTINs while driving the NHS to implement effective supply chain technologies
(GS1, 2010). According to Wu et al., (2013), GS1 is the world’s leading supply chain
organization. The GS1 system is composed of four key standards: barcodes (used to
automatically identify things), eCom, global data synchronization standards (GDSS), which
allow business partners to have consistent item data in their systems at the same time) and
EPC global (which uses RFID technology to immediately track an item). GS1 coding standards
are, therefore, integral in the supply chain as they standardize data and require all players to
implement the same data standard and system so that they can speak the same electronic
language to achieve end to end traceability. Furthermore, GS1 also allows for product
traceability through Automatic Identification and Data Capture (AIDC) systems, including
barcodes and RFID. The RFID also continuously monitors and provides reports concerning
temperature, humidity, and voltage (Coustasse et al., 2013). Through this technology, after
the medicines are unpacked from the box or pallet, they also can be tracked or traced. As
such, increasing the visibility of stock as well as decreasing the dispensing or picking error-

261
medication can be interpreted as a reduction in the degree of exposure to supply chain risk.
One head of procurement mentioned:
“We have discovered that most medicine products on the shelf did not have a unique identifier.
We found thirteen various types of barcode. In addition, there were many codes from the
manufacturers, distributors, suppliers’ manufacturers leading to a lack of clarity and poor
data. Hence, it requires us to adopt GS1 standards and ensure the managers are focused.”
(UK hospital A)
The key challenges for the efficient inventory management process include a lack of stock
control and visibility along with a shortage of management information. A material
department manager stated:
“We have worked with Ingenica Solutions to implement a GS1 standards-based inventory
management system (GS1 Global Trade Item Numbers (GTINS)) in the hospital’s operating
theatres. It enables us to manage the processes, secure efficiency savings as well as release
valuable clinical time back to patients. Scanning the barcode once the items are received,
moved and used in the hospital which help us to capture data electronically as well as
exchanged without manual intervention.” (UK Hospital A)
Another pharmacy department manager also mentioned:
“Since the GS1 was implemented, everything from patient ID bracelets and bandages, to A4
paper and medical implants, is now trackable.” (UK Hospital A)
Moreover, counting items in the pharmacy inventory and using auto-ID technology, e.g. RFID
(cycle-count policy) to provide inventory visibility and items traceability is now possible.
During the empirical study, the author found that several hospitals are applying RFID-enabled
real-time inventory management systems. A head of procurement mentioned:
“We had already equipped each cabinet with RFID tags which have records of all the
transactions and the information like what was removed, who removed it and for which
patient the product is intended. When the hospital has been implemented with the Hospital
Information System (HIS), real-time data captured by RFID reader is able to feed the medical
document for the patient in the documentation system, modify expiration data as well as
eliminating the need to maintain excess inventory.” (UK Hospital A)

262
Last, RFID has been gaining increasing attention for reducing counterfeiting and enabling
monitoring of drug quality in supply chains from improved traceability. During the visit
observation in the case hospitals, the application of the RFID-enabled traceability system
could be learned:
“Once receiving a product in the centre store, after undergoing careful inspection, the staff
scan the manufacturer’s barcode on the package to obtain the relevant information (e.g.
product, serial number and expiry data). The obtained information is then moved to the
middleware in real time to save specific information such as requesting department/specialty,
the internal product number and product description, the specific storage location where the
product needs to be put away. Thereafter, the RFID printer prints a transferrable self-adhesive
label which consists of the RFID transponder that is unique as well as any other related
information such as the storage location. The RFID label is thereafter affixed to the packaging
of the product. Once the product is delivered to the user department, clinical staff use the
RFID board to swipe the product, the information will update to the application database,
which confirms the delivery time and location as well as the status of product as ready for use.
Then the product is stored in a specific storage location. Once the product is selected and
dispensed to the doctor, and the product has been used for a certain procedure the automatic
transfer of the captured information will trigger the replenishment process to the inventory
management system that the hospital HIS has.” (UK Hospital A)
Whenever the product is used for a specific procedure, the replenishment process will be
automatically triggered to transfer the captured information to the inventory management
application hosted on the hospital’s HIS system. Therefore, the end-to-end traceability of
medical products in the healthcare SC becomes an important strategy to avoid or reduce the
impact from supply and IT related risk factors.
7.3.2.3 Strategy 3: Developing inter and intra organizational collaborations
- Shortage of drug, unavailability of drugs on the market (S3)
- Capability versus demand, inability of capacity to meet demand (S4)
- High purchase price (S10)
Supply chain collaboration is often defined as two or more chain members working together
to create a competitive advantage through sharing information, making joint decisions, and

263
sharing benefits which result from greater profitability of satisfying end customer needs than
acting alone (Simatupang and Sridharan, 2005). Studies on service-dominant logic (SDL), for
example by Schmenner et al., (2009), significantly show how customer and supplier are no
longer external to the system. Instead, they play the important roles in the process of value
creation in the central company in the supply chain via the application and sharing of one
another’s competencies. Similarly, exchanges involve numerous suppliers because of the
reliance on a wide range but specialised sources and forms of information and material
supplies in the hospital supply chain. And, these exchanges may suggest collaboration
because in the healthcare supply chain where independent partners are connected in co-
creating values.
The findings, likewise, revealed that collaboration is a great way to mitigate supply chain risks.
According to Lord Carter’s report:
“Most evidence was done by close working relationships among Trusts at national, regional,
and local levels and collaboration with pharmacy wholesalers and manufacturers. This
collaboration resulted to the consolidation of medicines supply chain, which led to full
utilization of e-ordering, invoicing, aggregating and rationalizing deliveries to be used in the
wards. Combining drugs stock-holding and modernizing the supply chain to combine and
rationalize distributions to decrease stock-holding days from 20 to 15, deliveries to less than
5 per day. It also makes certain that about 90 per cent of invoices and orders are electronically
processed and delivered” (Lord Carter’s report, 2016)
In order to realize these supply chain benefits through collaboration, substantial
consolidation has been occurring through the formation of hospital systems that entail
common ownership of two or more hospitals. In the UK, a Multi Trust Aggregation (MTA) was
adopted by most hospital trusts to integrate the requirements across many affiliated
hospitals. The procurement activities are aligned to enable each member to take advantage
of volume economies and gain better negotiating leverage with suppliers. As such, group
buying helps mitigate supply chain-related risks because it confers product variety, price
stability, and produces availability for members irrespective of their size and location, which
they may otherwise not achieve if they purchased individually (Zepeda et al., 2016). For this
reason, the Group Purchasing Organization (GPO) has received increasing attention from both
academic and industrial fields (Burns and Lee 2008; Rego et al., 2014; Zepeda et al., 2016;

264
Yang et al., 2017). According to the Healthcare Supply Chain Association (HSCA), a GPO is “an
entity which assist the clinicians at hospitals, nursing homes, and home health agencies to
obtain savings and efficiencies by combining purchasing volume as well as using that power
to negotiate discounts with their vendors, distributor or manufacturers.” GPOs do not
purchase products for their own facility but instead support their members in their contract
development and management and negotiate contracts with respective vendors. In addition
to discounts, many GPOs also offer supply chain optimization consulting services and provide
healthcare facilities valuable insights. One former hospital director stated:
“In China, hospitals are increasing relying on their GPO partners for a broad range of services
beyond cost-saving, although cost-saving and delivering the quality products are the main
elements to the GPOs’ core mission. Moreover, many GPOs are expanding their services to
meet evolving hospital and provider needs, such as market research, innovative technology
integration, electronic product tracking and supply chain experts to share best practices.”
(Chinese Hospital F)
Meanwhile, “risk sharing” and “reduced inventory costs” are additional benefits from
collaboration between hospitals, especially at the local system. It allows the affiliated
hospitals to avoid a drug shortage by filling orders from other affiliated hospitals’ central stock
with inventory on hand. More importantly, this means the inventory is not always physically
consolidated at a single location. Instead, the hospitals can physically or virtually access the
inventory used by affiliated hospitals allowing the inventories to be shared among demand
locations reducing the use of the inventory rate and related costs while achieving required
service levels. One pharmacy department leader mentioned:
“Since 2007, we signed the contract with other three hospitals in the same regional area to
provide the supply chain consolidation and reduced stock holding. It allows us to obtain
needed stock from another hospital, especially when the urgent need for supplies arises. With
this back-up arrangement, it enables us to reduce our safety stock and thus avoid the massive
waste.” (Chinese Hospital B)
It is noteworthy that most healthcare organizations are under pressure to make savings each
year. One important reason is a lack of cross-functional department involvement in the
procurement process. A pharmacy department leader mentioned:

265
“We have a large number of stakeholders working on product specifications, it meant difficulty
reaching consensus and often led to purchasing several different versions of the same product.
Hence, we set up the Pharmacy Administration Committee, which is composed of one vice
president of hospital, pharmacy department leader, material department manager, several
clinicians and a head nurse. Those members were given responsibility for making decisions on
the how and where products could be purchased more efficiently.” (Chinese Hospital C)
Working closely with other departments aids in the collaboration across internal boundaries
and provides of a structure which enables swift communication. This is also in line with
findings from Lord Carter’s report (2016):
“…improving employee management capacity, building greater engagement and creates an
engaged and inclusive environment for all colleagues by significantly improving leadership
capability from “Ward to board.”” (Lord Carter’s report, 2016)
7.3.2.4 Strategy 4: Building efficient inventory management
- Capability versus demand, inability of capacity to meet demand (S4)
- Poor IT system, lack of data standardization (S5)
- Lack of visibility concerning placement and availability of stock (S8)
Excess inventories may add costs, drugs expiration and result in huge hits to the hospital’s
bottom line. Since the early 1990s, healthcare organizations began to adopt the idea of Just
in Time (JIT) supply chains to decrease the rate of inventory holding costs and reduce
employing more labour for managing the inventory management. The implementation of JIT
management has a positive impact on the healthcare supply chain processes. In this case, the
main objective is to ensure that they remove all stock in the central store. It means that
suppliers deliver products to each point-of-use location in the hospitals without intermediate
buffer inventories. The different collaborative arrangements between hospitals and
pharmaceutical suppliers, such as “ward box”, where hospitals place orders of the products
required in a specific ward directly and the suppliers deliver to each ward without taking the
detour to the central store. However, it is difficult to accurately forecast the demand due to
considerable variability and unpredictability. The healthcare providers must transform their
relationships with their key suppliers from an adversary to a long-term business partner to
improve the supply efficiency and lower the inventory costs. Meanwhile, the healthcare

266
providers should be working with their suppliers to determine the capability of current
logistics systems in order to identify and categorise all types of products and their predicted
utilization. Moreover, material managers have to be actively involved since they have an
integral role in assisting health facilities to implement more and better standards. Among the
key activities that were revealed from the empirical study, a head of procurement said:
“Our new hospital was built in June 2015, since that, our Central Stores have now been
replaced by the Receipts and Distribution facility, that does not have to have so many stock.
The amount of stocks held by the General Stores Department is now decreased due to the Just-
in-Time approach, as well as ensuring that most of the purchases are done through the NHS
Supply Chain (NHS SC) route. The NHS SC supplies to the hospital three times per week now so
there is no need have so much stocks on site because the stock is readily available in the nearby
warehouse which can be delivered in the shortest time possible. In addition to the above, the
ward/department level took the responsibility to create the shopping lists on Oracle e-ordering
system for their own requirements. Therefore, each ward/department can manage and
control their own budgets and stock levels more closely as they are more accurately predict
activity. Because of this, our stockholding costs reduced by 58 per cent to £86,000. There are
two people who have been allocated in the General Stores who are supposed to leave under
the Mutually Agreed Severance Scheme (MASS) and they save about £40,000. This has realised
a reduction in the workload in General Stores because of the few items that are handled
locally. In addition to those, ongoing savings of £80,000 in the health care organization
hospital based on more exact estimation of activity affecting the purchases. ” (UK Hospital A)
Another inventory management strategy, apart from the aforementioned, is adopting
inventory management systems. In some cases, a lack of visibility of stock level had let to
inefficient processes. For this reason, hospitals only know what is spent and not what is held,
consumed, and wasted and use IT as an enabler to initiate a change in the stock management
and replenishment process. 𝐴𝑡𝑡𝑖𝑐𝑢𝑠𝑇𝑀 is the first GS1 compliant inventory management
solution, which helped UK NHS hospitals reduce wastage and historical inefficiencies by
facilitating greater transparency, better stock and data management. A pharmacy
department manager stated:

267
“Using the system enabled us to significantly improve the control functions of our corporate
stores service and has achieved significant savings and visibility. Today consumption of stock
is recorded at point of use at the same time ordering is based on exact consumption, allowing
a reduction in stock holding. As a result, it has created more space due to being cleared of
stock, and more has been reassigned for clinical usage. This has reduced the labour force of
the people who deal with stock management saving more than 7,000 hours clinical time which
has been initially reallocated to frontline care.” (UK Hospital A)
7.3.2.5 Strategy 5: Implementing eProcurement strategy
- Counterfeiting (S1)
- Poor IT system, lack of data standardization (S5)
- Dispensing/picking errors-medication/packaging (S6)
- Lack of visibility concerning placement and availability of stock (S8)
- High purchase price (S10)
- High product and supplier/brand variety (S11)
To increase supply chain efficiency and ensure patient safety, Kritchanchai et al., (2016)
suggested that standardized healthcare infrastructures are the important means of managing
healthcare supply chain and logistics to increase visibility and security. In their study, the
infrastructure was composed of five main areas including: Standardized Product and Location
Identification; Electronic product catalogues; eProcurement enabled by Electronic Data
Interchange (EDI); Automatic Identification and Data Capture (AIDC) systems, e.g. barcodes
and RFID; and traceability systems. The findings are also in line with the elements of
eProcurement Strategy, such as E-catalogue management, location identification, and GS1
Global Data Synchronisation Network. To address the problem of supply chain capability,
Lord Carter’s interim report (2016) also suggested that all NHS trusts should work in
collaboration both with national procurement strategies and to explore common systems
adoption, such as enhancing current purchase to pay systems and adopting GS1 and PEPPOL
standards which are all included in the eProcurement strategy.
eProcurement Strategy can be defined as “the act of using technology application in
automating procurement information exchange in the whole supply chain system.” The UK
Department of Health (DH) announced its aim to implement global standards throughout the

268
healthcare sector and support machine-machine processing of transactions with little or no
human intervention. More specially, the commonly used standards reported by various
hospitals and their suppliers are GS1 coding and Pan European Public Procurement On-Line
(PEPPOL). GS1 is meant for data synchronisation, location coding, and product coding (Bartsch
et al., 2012; Lichtner et al., 2016). It can be seen that using master data across the whole
healthcare supply chain network is essential to achieving effective management of long,
complex SCs, e.g. procurement activities. In brief, master data is the definitive and accurate
version of the information held about an item. However, the main issue for using master data
is the same item coded and described differently by healthcare providers and suppliers. To
address this issue, adopting GS1 standards provides an opportunity for the healthcare
providers to benchmark and analyse medicine expenditure from their systems with other
providers, sharing the purchasing requirements when tendering. Moreover, the adoption of
these standards will enable interoperability between healthcare provider and supplier
systems. Figure 7.3 displays how GS1 master data are maintained between the suppliers and
healthcare provider catalogue solution.
SUPPLIER SOURCE DATAPOOL NHS DATAPOOLHOSPITAL
CATALOGUE
Product Information
Management System
Master data Publish data Request data Manage data Master data
Figure 7-3: GS1 Global Data Synchronization Network in NHS system
(source from NHS E-procurement Strategy)
At the beginning, suppliers need to place the information in the GS1 specialised data pool
Then, DH develops a GS1 certified NHS data pool, which takes the supplier master product
data from any GS1 certified source datapool and makes it the data repository for master data
according to products purchased by the healthcare provider. Next, the national Product
Information Management (PIM) system was established by DH to integrate the NHS datapool
with local healthcare provider catalogue solutions. Each provider uses the PIM to request and

269
manage master product data from the datapool, then request master product data from the
source datapool selected by a supplier. Also, the GS1 Global Data Synchronisation Network
was applied to ensure the master data to be synchronized in near real time, thereby ensuring
that healthcare provider catalogues always contain accurate master data.
Master item data synchronized from a GS1 accredited datapool to the healthcare provider
catalogue system which is then retrieved in the management of logistics activities in the SC
by employing Automatic Identification Data Capture (AIDC) devices to scan barcodes. As
discussed above, those capture devices and systems can track and trace items through a lot
numbers and serial numbers, manage expiry dates, provide the interface with patient records
to support traceability. Pharmaceutical manufacturers should record the unique random
serial numbers according to every products in a database by matching it with the barcode
printed on the product packaging. So that the product can be scanned at the point of
dispensing and checked against the database. A system of pharmaceutical verification to
prevent counterfeiting is determined by user.
Furthermore, in the UK NHS, the purchase order transactions are processed using the GHX
Pharmacy Messaging Service platform, which integrates both the buying order system and
the selling order processing system. To achieve automated machine-to-machine purchase
order and invoice transactions performed among providers and suppliers, both are supposed
to operate in a common messaging standard. Thus, PEPPOL (Pan European Public
Procurement On Line) is recommended as a messaging standard to be adopted by both
provider and suppliers. PEPPOL provides a set of messaging standards to exchange key
documents (i.e. invoice messaging, advice note, and purchase order) between selling and
buying organizations electronically with no manual intervention via PEPPOL ‘access points’.
Figure 7.4 presents the architecture for the provision of a messaging platform for the NHS
provider and its suppliers using PEPPOL messaging standards.

270
NHS provider systems SUPPLIER systems
NHS provider ACCESSPOINT
SUPPLIER ACCESSPOINT
Purchase order Invoice
Figure 7-4: the architecture of PEPPOL messaging platform
(source from NHS E-procurement Strategy)
The NHS provider access point is integrated to the NHS provider purchase order processing
system. The access point receives the purchase orders from the NHS provider and converts
them to the PEPPOL messaging standard. The PEPPOL-compliant purchase order message is
exchanged with the supplier access point, which in turn is incorporated into the supplier sales
order processing system. As a result, a purchase order from an NHS provider is transmitted
and loaded directly into the supplier’s sales order processing system without manual
intervention. Lastly, this process works in reverse to accommodate the exchange of invoice
data between supplier accounts receivable systems and NHS provider accounts payable
systems.
7.3.2.6 Strategy 6: Implementing outsourcing strategy
- Weak logistics service infrastructure (S7)
Outsourcing the non-core supply chain activities is one risk mitigation strategy. Several
studies showed that outsourcing the supply chain related activities to the third party logistics
service providers (3rd LSPs) would helps in creating the significant efficiency advantages for
both parties because of economies of scale and scope, focus on core competencies, and fixed
cost reduction (Azzi et al., 2013; Lannone et al., 2014; Volland et al., 2017). Supply chain
activities can be contracted to the 3rd LSPs with specialisation and more experience in logistics
than the internal organisation’s logistics department. According to Guimarães and de
Carvalho (2012), the most important aspect of outsourcing to the 3rd LSPs is building

271
relationships and integration of IT information are all accomplished, as logistics companies
would endeavour to ensure that their clients’ (in this case healthcare facilities) requirements
are quickly and accurately delivered. Waters and Rinsler (2014) argued that the trend of
outsourcing has increased over the last few years in healthcare sector, and extended from
meals preparation and washing to division management in the supply chain.
Today, patients are increasingly demanding and informed and they request healthcare more
frequently and earlier (Christopher, 2016). Subsequently, healthcare departments require
additional focus on their core business more than in previous years. Outsourcing some key
elements within the hospital supply chain like pharmaceuticals may result in more efficient
inventory management leading to cost savings directly. Hospitals can put more investments
into clinical trials and researches linked to their main business in order to meet patients’
different and numerous demands with the saved capital. The number of 3rd LSPs offering
healthcare inventory management services together with their expertise levels has
significantly increased over the last few years. Through their professional experiences, the
providers have successfully reduced inventory costs in the healthcare sector. Thus, in the
literature on healthcare outsourcing reviewed, the most cited outsourcing drivers include:
cost reduction, risk mitigation, and rapid change without compromising internal resources
(Roberts, 2001; Volland et al., 2017).
According to the empirical studies, some hospitals outsourced their two-echelon distribution
network, from central store to each “point-of-use” department for non-critical medical items
(i.e. latex gloves, plastic/disposable sheets) does not compromise on the quality of care. In
addition, Lord Carter’s report (2016) also recommended that:
“…buying and supply services do not need to be handled by hospital staff. It is recommended
that those hospitals which have not outsourced their outpatient dispensing services (i.e.
community pharmacy providers) should look for a way through outsourcing to improve their
productivity and efficiency. This can be done through adopting alternative supply route and
make sure that that more than 80 per cent of hospitals’ pharmacist resource is utilized for
direct medicines optimization activities, medications governance and safety concerns while at
the same time revising the provision of all local organizational services, which could be
delivered collaboratively with another trust or through a 3rd party provider.” (Lord Carter’s
report, 2016)

272
In the meantime, during the interview, a pharmacy department manager stated that:
“We wanted to free up time for clinicians so that they are able to focus on their main
responsibilities. Achieving this would let us to invest in additional services. We outsourced
stock replenishment and maintenance to a logistics provider since last year. It means our
resources are more appropriately focused on collaborative arrangements; the clinical element
of the service are now out of direct stock procurement and stock control. ” (Chinese Hospital
D)
7.3.2.7 Strategy 7: Implementing agility strategy
- Shortage of drug, unavailability of drugs on the market (S3)
- Capability versus demand, inability of capacity to meet demand (S4)
The healthcare industry systems are often characterized as particularly complex systems
operating in a changing environment, interacting with a wide variety of heterogeneous actors,
interests and factors, often with disparate demands (Tolf et al., 2015). Thus, agility requires
both reactive and proactive strategies to enable healthcare organizations to thrive in high-
frequency changing, turbulent, and unpredictable environments. According to Ebel et al.,
(2013), agility not only implies quick responses to emergency circumstances, but also implies
the ability to remove change as an ad hoc disturbance and make it an essential condition of
organizational behaviour. Although most studies argued that the agility strategy is effective
in reengineering the patient pathway (Aronsson et al., 2011; Vries and Huijsman 2011; Guven-
Uslu et al., 2014), some maintained that it ensures productivity objectives and SC integration.
The enabler for an agile organization was explored by Tolf et al., (2015), who focused on the
interaction between each party in the SC network and its surrounding context. Breen et al.,
(2008) emphasized that it is impractical for one organization to have everything it takes to
fully meet customer demands. Thus, an agile organization should use the competencies and
strengths of network partners.
The different stakeholders within the supply chain, regulators and government must be
dedicated to working together to ensure that patients can continue to receive medicines on
time and conveniently (e.g. under normal circumstances, the medicines should be received
from pharmacies within 24 hours). Therefore, the pharmacies’ and doctors’ dispensaries must
have contingency arrangements are in place to source items where understocked from the

273
supplier. In this case, reasonable steps should be taken to have reciprocal arrangements with
neighbouring pharmacies to meet urgent demands and the use of manufacturers’
contingency order arrangements.
The cases hospitals highlight the importance of out of hours, urgent and emergency deliveries
for major incidents or medical emergencies. NHS Supply Chain, an organization run by the
DHL supply chain on behalf of the NHS Business Services Authority, provided a dedicated
supply chain service and products to each NHS trust in England. In the event of unexpected
emergencies by providing 24 hours emergency service to deliver the order within five hours.
For some products not stocked within their distribution centre network, such as Blue
Diamond (e.g. non-stock items but can be consolidated and sent out with NHS Supply Chain
delivery) or eDirect product (e.g. delivered separately, direct from manufacturer), they will
endeavour to obtain stock for delivery within the shortest time (i.e. less than 24 hours). During
the interview, a head of procurement stated:
“Most of the time, when we have an urgent requirement for our intensive care unit. We make
a call to NHS Supply Chain and to our delight, the delivery arrives one hour later. This is
absolutely an exceptionally quick service by anyone’s standards. Because of this, we can avoid
many serious consequences.” (UK Hospital A)
7.3.2.8 Strategy 8: Developing internal capability management
- Clinician’s preference (S9)
Capability management is a set of activities to facilitate learning and knowledge sharing within
the organization (Dow et al., 2013). It identifies the organization’s capabilities needed to meet
its strategic objectives while ensuring continual alignment of staff talent management, career
progression, and employee development to the dynamic business needs. More specifically,
Ferlie et al., (2015) argued that capability management includes succession management for
all employees and leaders at lower levels, talent pool management, talent reviews,
competency maintenance, and modelling, career development and planning, and skills
transferability. In the supply chain context, managers use training to learn about different
supply chain risk sources and how to employ appropriate SCRM tactics (Riley et al., 2016).

274
In any case, clinician education is founded on science and clinicians therefore tend to respond
favourably to scientific, fact-based justifications for proposed changes. Thus clinical
professionals often pay more attention to patient management rather than to organizational
performance. The issue should be solved by providing clinicians with empirical evidence that
supply chain redesign will streamline processes, improve outcomes, and reduce expenses
without lowering levels of clinical effectiveness. Even though the healthcare SCM has
attracted increasing attention by several researchers in recent years, the overall tendency in
the healthcare sector is to slowly embrace new SCM practice (McKone-Sweet et al., 2005). It
reveals that lack of supply chain education and awareness are a common phenomenon to
most healthcare providers. According to the empirical studies, most healthcare providers paid
attention to staff training as they continually put investment into activities related to training
and development. One pharmacy department manager mentioned that:
“We hold regular staff training sessions to train the relevant staff to avoid or at least reduce
the failures caused by human errors. Our aims to ensure that about 75 percent of staffs who
responsible for material/purchasing management roles could get membership of the
Chartered Institute of Purchasing and Supply Qualifications.” (UK Hospital A)
Moreover, NHS Procurement and Commercial Standards were launched by Department of
Health (DH) in 2012; they provide a clear vision of continual improvement and advisory panel
of NHS Procurement professionals. In particular, people and skills are the key elements to be
mentioned in the report. For example:
“All new staff undertaking procurement supply chain operations should, however, have a
training plan in place; this should be tailored to the amount of time expected to be spent on
them. The procurement team should have a relevant mix of skills to enable strategic and
transactional working as needed. Procurement staff can demonstrate a commitment to
continuous professional development (CPD), such as having relevant professional qualification
(e.g. CIPS & IACCM) and evidence of CPD. Good mix of “on the job” training and classroom
training provided to the Procurement teams.” (NHS Procurement and Commercial Standards,
2016)
7.3.2.9 Strategy 9: Implementing single sourcing strategy

275
- High purchase price (S10)
- High product and supplier/brand variety (S11)
Sourcing decisions have become among the most commonly used strategies not only in the
healthcare sector, but also in other industries. According to Yu et al., (2009), three sourcing
approaches were identified as follows:
Single sourcing, in which a buyer chooses a single main supplier even though other
comparable suppliers do exist.
Dual sourcing, in which a buyer employs two suppliers, one of which may dominate
the other in terms of business share, price and reliability.
Multiple sourcing, in which a buyer is involved in a business with various suppliers and
plays one supplier against the other via the bidding process to enjoy the best purchase
conditions.
Yu et al., (2009) suggested that a single sourcing strategy represents the narrowest form of
supply base and strives for a strategic collaboration between a buyer and a supplier and also
improve shared profits, can be used to proactively manage supply risks. Moreover, single
sourcing can significantly minimize the supervisory and administrative roles of contracting
many firms to perform the same work. In agreement, Tomlin (2006) observed that by
adopting Just-in-Time (JIT) management, healthcare providers will constantly source from a
single supplier for the given products to establish close relationships with mutual
interdependence and a close strategic relationship, cooperative action, short lead times.
Therefore, it is sometimes seen as the best option to reduce logistics costs, as placing all
purchasing orders with one single supplier. However, Hou et al., (2010) opposed such a
strategy, arguing that buyers should have more than one supplier to avoid putting all the eggs
in one basket there by increasing the supply risk. Kanyoma et al., (2013) further argued that
mutual dependency is the one major limitation related to single sourcing. The relevance of
single sourcing is further emphasized by Burke et al., (2007), whereby single sourcing is an
ideal solution only when supplier capacities are enough to handle product demand and when
the buying organization does not obtain variation in benefits.
This high product and supplier/brand variety disaggregates and undermines hospital’s buying

276
power with the inevitable result of variation and higher prices. Furthermore, product variety
is the root cause of hospital supply chain wastes, such as high inventories, expiration and
obsolescence, and low value orders and delivery changes. According to the empirical studies,
two observed hospital cases using a single sourcing system, rely on a government instituted
supplier namely the “Sinopharm Group”, which is the biggest Chinese pharmaceutical
company. The company manages factories, Research and Developmeng (R&D) laboratories,
traditional Chinese medicine plantations, and marketing and distribution networks that cover
all 31 provinces in China. One pharmacy department leader stated:
“We have emphasized the importance of collaboration with Sinopharm Group since 2005. As
for the single sourcing strategy, which improved our bargaining power and reduced costs as
well as decreased effort to track supplier performance. In particular, they can deliver the
urgent order very quickly from their nearby distribution center or from other hospitals which
are under the same contract with them. (Chinese Hospital A)”
A general manager from a pharmaceutical company stated:
“To be honest, as a pharmaceutical supplier, it is far better for us to be approved as a sole
partner of hospitals. If they do, we can upgrade our quality of logistics services as well as price
discount, and these efforts eventually lead to win-win scenario. As the rich experience in
operating logistics activities, we are in discussion with our partner hospitals about whether
they could outsource their second tier pharmacy to us. That would free up time for pharmacists
so they could focus on their main responsibilities.” (Pharmaceutical Company B)
7.4 EVALUATION OF RISK MITIGATION STRATEGIES
Technique for order Preference by Similarly to Ideal Solution (TOPSIS) is one of the most
practical and useful methods for solving multi-criteria decision-making (MCDM) problem
(Hwang and Yoon, 1981). The basic idea of the method is to rank and select possible
alternatives, which have the longest distance from the negative-ideal solution (i.e. the
solution that maximizes the cost criteria and minimizes the benefits criteria) and the shortest
distance from the positive-ideal solution (i.e. the solution that maximizes the benefit criteria
and minimizes the cost criteria). Despite the benefits of the TOPSIS method, namely that it
supports managers for selecting the most suitable alternatives, it has certain drawbacks. One

277
major drawback is its inability to handle vagueness and imprecision inherent in the process
of mapping the perceptions of decision-makers. Fuzzy TOPSIS has been successfully used to
solve such problems. In this research, the focus is on the fuzzy TOPSIS by combined TOPSIS
with fuzzy set theory. The fuzzy TOPSIS method is suitable for solving the group decision-
making problem under the fuzzy environment (Vinodh et al., 2014). More features of fuzzy
TOPSIS are detailed in the following sections. There are several fuzzy TOPSIS methods
proposed by various researchers. Chen (2000) has used the extensions of the TOPSIS for group
decision-making under a fuzzy environment. As per the theory of the TOPSIS, the author has
defined a closeness coefficient to conclude the ranking order of all alternatives by calculating
the distances to both the fuzzy positive-ideal solution and fuzzy negative-ideal solution at the
same time. Nazam et al., (2015) fomulated the fuzzy AHP-TOPSIS framework to calculate the
weight of each risk criterion and rank the risks associated with implementation of green
supply chain management practices under the fuzzy environment. The proposed models
helps the researchers and practitioners to understand the importance of conducting
appropriate risk assessment when implementing green supply chain initiatives. The
incorporation of fuzzy risk assessment, fuzzy Delphi and fuzzy TOPSIS as an integrated
methodology has been proved by Wang et al., (2017) to be a systematic and practical
decision-making tool supporting a very effective supply chain risk communication and risk
mitigation strategy evaluation.
In this research, a Fuzzy AHP method has been used for determining the priority weights of
the risk factors (i.e. criteria and sub-criteria). Fuzzy TOPSIS can be utilized for selecting the
most appropriate risk mitigation strategies (i.e. alternatives). Using the Fuzzy AHP in Chapter
six, the relative weights of the risk factors in the healthcare supply chain systems were
calculated.
Using the mentioned fuzzy approach, the chosen fuzzy TOPSIS process is then addressed as
follows (Chen, 2000).
Step 1: Choose the appropriate linguistic variables for the importance weight of the criteria
and the linguistic rating values for alternatives with respect to criteria. It can be assumed that
there are m possible alternatives called A= {𝐴1, 𝐴2, 𝐴3…𝐴𝑚} which are to be analysed in
relation to the criteria, C= {𝐶1, 𝐶2, 𝐶3…𝐶𝑛} The criteria weights are denoted by 𝑤𝑗 (𝑗 =

278
1, 2, …𝑛). The performance ratings of each expert 𝐷𝑘 (𝐾 = 1, 2, …𝐾) for each alternative
𝐴𝑖 (𝑖 = 1, 2, …𝑚) with respect to criteria 𝐶𝑗 (𝑗 = 1,2, … 𝑛) are denoted by ��𝑘 = ��𝑖𝑗𝑘(𝑖 =
1,2, …𝑚; 𝑗 = 1,2, … 𝑛; 𝑘 = 1,2…𝐾 ) membership function 𝜇��𝑘(𝑥) . In this thesis, it is
suggested that the experts use the linguistic variables (Shown as Tables 7.2 and 7.3) to
evaluate the importance of the criteria and the ratings of alternatives with respect to various
criteria, and the illustration of membership function for linguistic expressions is presented in
Figure 7.5.
Table 7.2: Linguistic variables for the importance weight of each criterion and sub-criteria
Linguistic judgement Triangular fuzzy number (l, m, u)
Equal importance (Eq) (1, 1, 1)
Weak importance (Wk) (2/3, 1, 3/2)
Strong importance (St) (3/2, 2, 5/2)
Very strong importance (Vs) (5/2, 3, 7/2)
Absolute strong importance (As) (7/2, 4, 9/2)
Table 7.3: Linguistic variables for the alternatives rating
Very poor (VP) (1, 1, 3)
Poor (P) (1, 3, 5)
Medium (M) (3, 5, 7)
Good (G) (5, 7, 9)
Very good (VG) (7, 9, 11)

279
0 1 2 3 4 5 6 7 8 9 10 11
1
0.5
VP P M G VG
Figure 7-5: Fuzzy membership function for linguistic expressions
Step 2: Aggregate the weight of criteria to get the aggregated fuzzy weight ��𝑗 of criterion 𝐶𝑗
and pool the experts’ opinions to get the aggregated fuzzy rating ��𝑖𝑗 of alternative 𝐴𝑖 under
criterion𝐶𝑗. If the fuzzy ratings of all experts are described as TFN ��𝑘 = (𝑎𝑘, 𝑏𝑘, 𝑐𝑘), 𝑘 =
1,2, …𝐾 then the aggregated fuzzy rating is given by �� = (𝑎, 𝑏, 𝑐) 𝑘 = 1,2, . . 𝐾 where
𝑎 =𝑚𝑖𝑛𝑘{𝑎𝑘}, 𝑏 =
1
𝑘∑𝑏𝑘𝑖
𝐾
𝑘=1
, 𝑐 =𝑚𝑎𝑥𝑘{𝑐𝑘} (7.1)
Assume that the fuzzy rating of the kth expert is ��𝑖𝑗𝑘 = (𝑎𝑖𝑗𝑘, 𝑏𝑖𝑗𝑘 , 𝑐𝑖𝑗𝑘), 𝑖 = 1,2, …m, 𝑗 =
1,2, … n then the aggregated fuzzy ratings ��𝑖𝑗 of alternatives with respect to each criterion
are given by ��𝑖𝑗(𝑎𝑖𝑗, 𝑏𝑖𝑗, 𝑐𝑖𝑗), where
𝑎𝑖𝑗 =𝑚𝑖𝑛𝑘{𝑎𝑖𝑗𝑘}, 𝑏 =
1
𝑘∑𝑏𝑖𝑗𝑘
𝐾
𝑘=1
, 𝑐 =𝑚𝑎𝑥𝑘{𝑐𝑖𝑗𝑘} (7.2)
Step 3: Construct the fuzzy decision matrix and the normalized fuzzy decision matrix. The
fuzzy decision matrix for the alternatives (��) is constructed as follows:

280
𝐴1𝐴𝑖⋮𝐴𝑚
𝐶1 𝐶2 … 𝐶𝑗 … 𝐶𝑛
[ ��11 ��12 … … … ��1𝑛��21 ��22 … … … ��2𝑛………��𝑚1
………��𝑚2
…………
…………
…………
………��𝑚𝑛]
= �� (7.3)
�� = [��1, ��2, … , ��𝑗 , … , ��𝑛] (7.4)
where ��𝑖𝑗 , 𝑖 = 1,2, … . ,𝑚; 𝑗 = 1,2, … . , 𝑛 and ��𝑗 , 𝑗 = 1,2, … , 𝑛 are linguistic TFNs, ��𝑖𝑗 =
(𝑎𝑖𝑗, 𝑏𝑖𝑗, 𝑐𝑖𝑗) and ��𝑗 = (𝑎𝑗1, 𝑏𝑗2, 𝑐𝑗3) . Note that ��𝑖𝑗 is the performance rating of the 𝑖 th
alternative, 𝐴𝑖, with respect to the 𝑗th criterion, ��𝑗represents the weight of the 𝑗th criterion,
𝐶𝑗. The normalised fuzzy decision matrix denoted by �� is shown in Eq. 7.5:
�� = [��𝑖𝑗]𝑚 × 𝑛 (7.5)
where B and C are the set of benefit criteria and cost criteria, respectively, and
��𝑖𝑗 = (𝑎𝑖𝑗
𝑐𝑗∗ ,𝑏𝑖𝑗
𝑐𝑗∗ ,𝑐𝑖𝑗
𝑐𝑗∗) , 𝑗 ∈ 𝐵;
��𝑖𝑗 = (𝑎𝑗−
𝑐𝑖𝑗,𝑎𝑗−
𝑏𝑖𝑗,𝑎𝑗−
𝑎𝑖𝑗) , 𝑗 ∈ 𝑐;
𝑐𝑗∗ =
𝑚𝑎𝑥𝑖𝑐𝑖𝑗 𝑖𝑓 𝑗 ∈ 𝐵;
𝑎𝑗− =
𝑚𝑖𝑛𝑖𝑎𝑖𝑗 𝑖𝑓 𝑗 ∈ 𝐶. (7.6)
Step 4; Construct the weighted normalized fuzzy decision matrix. The weighted normalized
matrix v for criteria is computed by multiplying the weights (𝑤𝑗) of evaluation criteria with
the normalized fuzzy decision matrix ��𝑖𝑗.

281
�� = [
��11 ��12��21 ��22
……
��1𝑛��2𝑛
⋮ ⋮ ⋱ ⋮��𝑚1 ��𝑛2 ⋯ ��𝑚𝑛
] = [
��1��11 ��2��12��1��21 ��2��22
……
��𝑛��1𝑛��𝑛��2𝑛
⋮ ⋮ ⋱ ⋮��1��𝑚1 ��2��𝑚2 ⋯ ��𝑛��𝑚𝑛
] (7.7)
Step 5: Determine the fuzzy ideal solution (FPIS) and fuzzy negative ideal solution (FNIS)
The FPIS and FNIS of the alternatives is computed as follows:
𝐴∗ = (��1∗, ��2
∗, … , ��𝑛∗) = {(𝑚𝑎𝑥𝑖��𝑖𝑗|𝑖 = 1,… ,𝑚)𝑗 = 1,2, … , 𝑛} (7.8)
𝐴− = (��1−, ��2
−, … , ��𝑛−), {(𝑚𝑖𝑛𝑖��𝑖𝑗|𝑖 = 1,… ,𝑚)𝑗 = 1,2, … , 𝑛} (7.9)
Maximun and minimum operations do not give TFN but it is likely to state the approximated
values of minimum and maximum as TFNs (Kwang, 2005). It is known that the elements ��𝑖𝑗∀𝑖𝑗
are normalised positive TFNs and their ranges belong to the closed interval [0, 1]. Thus, it can
define the fuzzy positive ideal solution and the negative ideal solution as ��𝑗∗ = (1,1,1) and
��𝑗− = (0,0,0) 𝑗 = 1,2, … 𝑛 (Patil and Kant, 2014).
Step 6: Calculate the distance of each alternative from FPIS and FNIS, respectively. The
distance of each alternative from 𝐴∗ and 𝐴− can be currently calculated as
𝑑𝑖∗ =∑𝑑(��𝑖𝑗 , ��𝑗
∗)
𝑛
𝑗=1
, 𝑖 = 1,2, … ,𝑚. (7.10)
𝑑𝑖− =∑𝑑(��𝑖𝑗, ��𝑗
−),
𝑛
𝑗=1
𝑖 = 1,2, … . ,𝑚. (7.11)
where d (. , .) is the distance measurement between two fuzzy numbers.

282
Step 7: Calculate the closeness coefficient of each alternative.
The closeness coefficient 𝐶𝐶𝑖 represents the distances to the fuzzy positive ideal solution
(𝐴∗) and the fuzzy negative ideal solution (𝐴−) simultaneously. The closeness coefficient of
each alternative is calculated as:
𝐶𝐶𝑖 =𝑑𝑖−
𝑑𝑖−+𝑑𝑖
∗ , 𝑗 = 1,2, … . ,𝑚. (7.12)
Step 8: According to the closeness coefficient, the ranking order of all alternatives can be
determined.
7.5 AN EMPIRICAL STUDY ON THE APPLICABILITY OF THE FUZZY TOPSIS METHOD
In order to complete the predefined integrated risk management (RM) model, the identified
risk factors must be mitigated to complete the RM model. To investigate the priorities of the
identified mitigation strategies over the previous risk factors, the Fuzzy TOPSIS method was
developed. A survey was conducted to facilitate an insightful understanding and knowledge
of the significance of the implemented risk mitigation strategies and formulate appropriate
risk management solutions. This study was conducted in three phases: (1) conducting the
survey, (2) application of the proposed Fuzzy TOPSIS method, and (3) sensitivity analysis. Each
of the phases will be discussed in this section.
7.5.1 Conducting the Fuzzy TOPSIS-based questionnaire survey
The questionnaire survey was conducted over five weeks from 17th Oct to 21th Nov 2017,
with the respondents selected based on their involvement within the healthcare supply chain
management, disruption experience, and understanding of risk management related to this
research’s objectives. However, in order to increase the valid response rate, the respondents
were contacted in advance to determine if they would agree to participate into our survey.
As explained in Chapter three, the selected respondents consisted of experts from both
academic and practitioner fields in order to balance their professional areas.

283
At the beginning, a pilot study was conducted to address the content ambiguity and other
bias in the questions. The draft version of the questionnaire was examined by four academic
researchers from both UK and China Universities to comment on the appropriateness and
clarify of the questions. Moreover, the ethical approval was also obtained to further validate
questionnaire contents and participant consent. The revised questionnaire as represented at
the end of the pilot study was sent out to those twenty experts for data collection. The
questionnaire was web-based using eSurvey Creator, and thus a link was emailed to the
experts. In addition, the cover letter was offered to respondents prior to the main question
page (see Appendix Five).
Table 7.4 demonstrates the profile of the respondents who participated the questionnaire
survey. The respondents were expected to have expertise in risk mitigation design, strategy,
and operations, thus this survey limited participants to department leader, logistics or supply
chain executives and risk management professionals. All experts from healthcare
organizations are at the manager level or higher. The survey yielded a 90 per cent valid
response rate as two experts did not answer all the questions of this survey, within five weeks.
Figure 7.6 shows that most of the participant experts come from hospital sectors by 60 per
cent, 10 per cent were general manager in pharmaceutical companies and the remaining 30
per cent experts from university or consultative institutes.
Table 7.4: The profile of survey respondents
No Participant Position Method Location Operating
Base
1 Hospital Stock Manager Email China
2 Hospital Pharmacy department leader Email China
3 Hospital Pharmacy department leader Email China
4 Hospital Pharmacy department leader Email China
5 Hospital Pharmacy department leader Email China
6 Hospital Pharmacy department leader Email China
7 Hospital Former Director Email China
8 Hospital Director Email China
9 Hospital Stock Manager Email China
10 Pharmaceutical Company
General Manager Email China
11 LogHealth Center Researcher/Consulting Email UK
12 LogHealth Center Professor Email UK
13 University Researcher/Consulting Email UK

284
14 University Professor Email China
15 University Senior Lecturer Email UK
16 University Researcher/Consulting Email UK
17 NHS Trust Head of Procurement Email UK
18 NHS Trust Pharmacy Purchasing Manager Email UK
19 NHS Trust E-Procurement and Inventory Systems Team Manager
Email UK
20 Pharmaceutical Company
General Manager Email China
Figure 7-6: Distribution of respondents
7.5.2 Evaluation of identified risk mitigation strategies
In Chapter six all of the relative weights for risk factors (i.e. criteria and sub-criteria) in the
healthcare supply chain were calculated. In this chapter, nine mitigation strategies (i.e.
alternatives) which were identified previously in Section 7.3 will be applied on healthcare
supply chain operations using the Fuzzy TOPSIS method. The hierarchical structure of this
decision problem is shown in Figure 7.7. This process is carried out to rank the alternatives as
per their priorities for risk mitigation purpose as per the following steps.
Step 1: Choose the appropriate linguistic ratings values for alternatives with respect to criteria.
The participant experts were consulted to construct a fuzzy evaluation matrix using a linguistic
scale for subjective judgments presented in Table 7.5. This research uses the basic linguistic
preference as very poor (VP), poor (P), medium (M), good (G) and very good (VG). As discussed
above, the concept of linguistic variables is suitable for dealing with real-world decision-
0%
10%
20%
30%
40%
50%
60%
70%
Hospital Pharmaceutical company University and consultative institude

285
making problems, which are usually complex, partially defined and related to uncertainty
(Chatterjee and Kar, 2016). Hence, the linguistic judgements are used to measure the
performance of the identified risk mitigation strategies when managing each risk factor. Due
to space limitations, the linguistic evaluation matrix and fuzzy evaluation matrix of three
experts under sub-criteria counterfeiting risks (S1) are given here only in Tables 7.6 and 7.7.
Then, the linguistic terms were converted into assigned TFNs to construct the fuzzy evaluation
matrix as shown in Table 7.7.

286
Figure 7-7: Decision hierarchy for the performance of implemented risk mitigation strategies
Man
agin
g SC
-rel
ated
ris
ks in
h
ealt
hca
re s
ecto
r
External to the hospital but internal to the supply chain
network (C1)
Counterfeiting (S1) 0.159
Poor quality in the purchased drugs from suppliers (S2) 0.079
Shortage of drug, unavailability of drugs on the market (S3) 0.16
Capability versus demand,inability of capacity to meet demand (S4) 0.108
Internal to the hospital (C2)
Poor IT system, lack of data standardization (S5) 0.112
Dispensing/picking errors-medication/packaging (S6) 0.097
Weak logistics service infrastructure (S7) 0.074
Lack of visibility concerning placement and availability of stock (S8) 0.035
Clinician's preference (S9) 0.032
High purchase price (S10) 0.035
High product and supplier/brand variety (S11) 0.031
Building efficient distribution management (A1)
Developing advanced information technology and
system (A2)
Developing inter and intra organizational
collaboration (A3)
Building efficient inventory management (A4)
Implementing eProcurement strategy (A5)
Implementing outsourcing strategy (A6)
Implementing agility strategy (A7)
Developing internal capability management (A8)
Implementing single sourcing strategy (A9)

287
Table 7.5: Linguistic variables for the ratings
Table 7.6: The ratings of alternatives by three experts under sub-criteria counterfeiting risks (S1)
Sub-criteria Alternative Participant Experts
E1 E2 E3
counterfeiting risks (S1) Logistic management (A1) G VP P
Information Technology System (A2)
G VG G
Collaboration (A3) VG VG G
Inventory management (A4) VG P P
e-Procurement strategy (A5) G G G
Outsourcing (A6) VP M G
Agility (A7) P VG P
Capability management (A8) M VP M
Single sourcing (A9) P G G
Table 7.7: Fuzzy evaluation matrix for the implementation of risk mitigation strategies
Sub-criteria Alternative Participant Experts
E1 E2 E3
counterfeiting
risks (S1)
Logistic management (A1) (1, 3, 5) (1, 1, 3) (1, 3, 5)
Information Technology System (A2)
(5, 7, 9) (7, 9, 11) (5, 7, 9)
Collaboration (A3) (7, 9, 11) (7, 9, 11) (5, 7, 9)
Inventory management (A4) (7, 9, 11) (1, 3, 5) (1, 3, 5)
e-Procurement strategy (A5) (5, 7, 9) (5, 7, 9) (5, 7, 9)
Very poor (VP) (1, 1, 3)
Poor (P) (1, 3, 5)
Medium (M) (3, 5, 7)
Good (G) (5, 7, 9)
Very good (VG) (7, 9, 11)

288
Outsourcing (A6) (1, 1, 3) (3, 5, 7) (5, 7, 9)
Agility (A7) (1, 3, 5) (7, 9, 11) (1, 3, 5)
Capability management (A8) (3, 5, 7) (1, 1, 3) (3, 5, 7)
Single sourcing (A9) (1, 3, 5) (5, 7, 9) (5, 7, 9)
Step 2: Aggregate the weight of criteria to get the aggregated fuzzy weight ��𝑗 of criterion 𝐶𝑗
and pool the experts’ opinions to get the aggregated fuzzy rating ��𝑖𝑗 of alternative 𝐴𝑖 under
criterion𝐶𝑗. In this step, aggregating fuzzy weights of the alternatives are computed using Eq.
(7.1) discussed in section 7.4 and presented in Table 7.8.
Step 3: Construct the fuzzy decision matrix and the normalized fuzzy decision matrix. In this
research, all the criteria are the risks in the healthcare supply chain, as per the goal mitigation
of these risks is required. Hence, all the risks are termed as cost criteria and normalization
performed by Eq. (7.6) and for further detail (see Table 7.9).
Step 4; Construct the weighted normalized fuzzy decision matrix. This step is to obtain a fuzzy
weighted evaluation matrix. Using the sub-criteria weight calculated by Fuzzy AHP (see
Chapter six), the weighted evaluation matrix is established using the Eq. (7.7) which is shown
in Table 7.10.
Step 5: Determine the fuzzy ideal solution (FPIS) and fuzzy negative ideal solution (FNIS).
Step 6: Calculate the distance of each alternative from FPIS and FNIS, respectively. In this
study, all the sub-criteria risks are the cost criteria. Hence, fuzzy positive-ideal solution
(FPIS,𝐴∗) and fuzzy negative-ideal solution (FNIS, 𝐴−) as ��∗= (0,0,0) and ��−=(1,1,1) for all
these sub-criteria. Then compute the distance 𝑑𝑣 of each alternative form FPIS (𝐴∗ ) and
FNIS ( 𝐴− ) using the Eq. (7.10) and Eq. (7.1). For example, the distance 𝑑𝑣(𝐴1, 𝐴∗) and
𝑑𝑣(𝐴1, 𝐴−) for alternative 𝐴1 and sub-criteria 𝐶1 from (FPIS, 𝐴∗ ) and (FNIS, 𝐴− ), are
calculated as follows.

289
Table 7.8: Aggregate fuzzy decision matrix for the implementation of risk mitigation strategies
C1 C2 C3 C4 C5 C6 C7 C8 C9 C10 C11
A1 (1, 5, 11) (1, 6.7, 11) (1, 7.1, 11) (1, 7.2, 11) (1, 5.9, 11) (3, 8.1, 11) (1, 4.6, 9) (1, 7.1, 11) (1, 4.7, 9) (1, 4.8, 9) (1, 5.1, 11)
A2 (3, 7.4, 11) (3, 7.5, 11) (1, 7.5, 11) (3, 7.9, 11) (1, 7.5, 11) (1, 6.8, 11) (5, 8.8, 11) (1, 8.2, 11) (1, 6.1, 11) (1, 6.6, 11) (1, 7, 11)
A3 (1, 7.5, 11) (1, 8, 11) (1, 5.3, 11) (3, 6.3, 11) (1, 5.5, 11) (1, 6.4, 11) (1, 4.8, 11) (1, 3.9, 9) (1, 8.2, 11) (1, 7.7, 11) (1, 7.7, 11)
A4 (1, 5.9, 11) (1, 7.1, 11) (1, 7.1, 11) (1, 7.3, 11) (1, 5.4, 11) (1, 7.7, 11) (1, 4.4, 9) (5, 8.7, 11) (1, 5.6, 9) (1, 5.4, 11) (1, 5, 11)
A5 (1, 7.3, 11) (3, 6.6, 11) (1, 5.6, 11) (3, 6.4, 11) (1, 5.9, 11) (1, 5.1, 9) (1, 6.7, 11) (1, 5.6, 11) (1, 5.7, 11) (1, 6.5, 11) (3, 6.8, 11)
A6 (1, 2.1, 9) (1, 2.5, 9) (1, 2.1, 9) (1, 2.4, 9) (1, 2.8, 11) (1, 2.5, 9) (1, 2.1, 9) (1, 2.4, 11) (1, 2.8, 9) (1, 2.4, 9) (1, 2.3, 9)
A7 (1, 3.7, 7) (1, 5.7, 11) (1, 4.3, 11) (1, 5.5, 11) (1, 4.5, 11) (1, 4.3, 7) (1, 2.3, 11) (1, 2.5, 9) (1, 2.8, 11) (1, 3.4, 11) (1, 3.1, 7)
A8 (1, 4.2, 9) (1, 5.8, 11) (1, 5.1, 11) (1, 4.5, 9) (1, 3.6, 9) (1, 4.4, 11) (1, 3.6, 7) (1, 4.2, 9) (1, 4.1, 11) (1, 5.6, 11) (1, 4.3, 9)
A9 (1, 4.2, 11) (1, 3.6, 11) (1, 1.9, 9) (1, 2.6, 11) (1, 2.3, 11) (1, 2.1, 9) (1, 1.9, 9) (1, 2.1, 9) (1, 2.7, 11) (1, 2.3, 9) (1, 2.7, 11)
Table 7.9: Normalized fuzzy decision matrix for the implementation of risk mitigation strategies
C1 C2 C3 C4 C5 C6
A1 (0.09, 0.2, 1) (0.09, 0.15, 1) (0.09, 0.14, 1) (0.09, 0.14, 1) (0.09, 0.17, 1) (0.09, 0.12, 0.33)
A2 (0.09, 0.14, 0.33) (0.09, 0.13, 1) (0.09, 0.13, 1) (0.09, 0.13, 0.33) (0.09, 0.13, 1) (0.09, 0.15, 1)
A3 (0.09, 0.13, 1) (0.09, 0.13, 1) (0.09, 0.19, 1) (0.09, 0.16, 0.33) (0.09, 0.18, 1) (0.09, 0.16, 1)
A4 (0.09, 0.17, 1) (0.09, 0.14, 1) (0.09, 0.14, 1) (0.09, 0.14, 1) (0.09, 0.19, 1) (0.09, 0.13, 1)
A5 ((0.09, 0.14, 1) (0.09, 0.15, 0.33) (0.09, 0.18, 1) (0.09, 0.16, 0.33) (0.09, 0.17, 1) (0.11, 0.2, 1)
A6 (0.11, 0.48, 1) (0.11, 0.4, 1) (0.11, 0.48, 1) (0.11, 0.42, 1) (0.09, 0.36, 1) (0.11, 0.4, 1)
A7 (0.14, 0.27, 1) (0.09, 0.18, 1) (0.09, 0.23, 1) (0.09, 0.18, 1) (0.09, 0.22, 1) (0.14, 0.23, 1)
A8 (0.11, 0.24, 1) (0.09, 0.17, 1) (0.09, 0.2, 1) (0.11, 0.22, 1) (0.11, 0.28, 1) (0.09, 0.23, 1)
A9 (0.09, 0.24, 1) (0.09, 0.28, 1) (0.11, 0.53, 1) (0.09, 0.38, 1) (0.09, 0.43, 1) (0.11, 0.48, 1) C7 C8 C9 C10 C11
A1 (0.11, 0.22, 1) (0.09, 0.14, 1) (0.11, 0.21, 1) (0.11, 0.21, 1) (0.09, 0.2, 1)
A2 (0.09, 0.11, 0.2) (0.09, 0.12, 1) (0.09, 0.16, 1) (0.09, 0.15, 1) (0.09, 0.14, 1)
A3 (0.09, 0.21, 1) (0.11, 0.26, 1) (0.09, 0.12, 1) (0.09, 0.13, 1) (0.09, 0.13, 1)
A4 (0.11, 0.23, 1) (0.09, 0.11, 0.2) (0.11, 0.18, 1) (0.09, 0.19, 1) (0.09, 0.2, 1)
A5 (0.09, 0.15, 1) (0.09, 0.18, 1) (0.09, 0.18, 1) (0.09, 0.15, 1) (0.09, 0.15, 0.33)
A6 (0.11, 0.48, 1) (0.09, 0.42, 1) (0.11, 0.36, 1) (0.11, 0.42, 1) (0.11, 0.43, 1)

290
A7 (0.09, 0.43, 1) (0.11, 0.4, 1) (0.09, 0.36, 1) (0.09, 0.29, 1) (0.14, 0.32, 1)
A8 (0.14, 0.28, 1) (0.11, 0.24, 1) (0.09, 0.24, 1) (0.09, 0.18, 1) (0.11, 0.23, 1)
A9 (0.11, 0.53, 1) (0.11, 0.48, 1) (0.09, 0.37, 1) (0.11, 0.43, 1) (0.09, 0.37, 1)
Table 7.10: Weighted normalized fuzzy decision matrix for the implementation of risk mitigation strategies
C1 C2 C3 C4 C5 C6
A1 (0.014, 0.032, 0.159) (0.01, 0.016, 0.108) (0.009, 0.014, 0.097) (0.014, 0.022, 0.16) (0.007, 0.013, 0.079) (0.007, 0.009, 0.024)
A2 (0.014, 0.022, 0.052) (0.01, 0.014, 0.108) (0.009, 0.013, 0.097) (0.014, 0.021, 0.053) (0.007, 0.01, 0.079) (0.007, 0.011, 0.074)
A3 (0.014, 0.021, 0.159) (0.01, 0.14, 0.108) (0.009, 0.018, 0.097) (0.014, 0.026, 0.053) (0.007, 0.014, 0.079) (0.007, 0.012, 0.074)
A4 (0.014, 0.027, 0.159) (0.01, 0.015, 0.108) (0.009, 0.014, 0.097) (0.014, 0.022, 0.16) (0.007, 0.015, 0.079) (0.007, 0.01, 0.074)
A5 (0.014, 0.022, 0.159) (0.01, 0.016, 0.036) (0.009, 0.017, 0.097) (0.014, 0.026, 0.053) (0.007, 0.013, 0.079) (0.008, 0.015, 0.074)
A6 (0.017, 0.076, 0.159) (0.012, 0.043, 0.108) (0.011, 0.047, 0.097) (0.018, 0.067, 0.16) ((0.007, 0.028, 0.079) (0.008, 0.03, 0.074)
A7 (0.022, 0.043, 0.159) (0.01, 0.019, 0.108) (0.009, 0.022, 0.097) (0.014, 0.029, 0.16) (0.007, 0.017, 0.079) (0.01, 0.017, 0.074)
A8 (0.017, 0.038, 0.159) (0.01, 0.018, 0.108) (0.009, 0.019, 0.097) (0.018, 0.035, 0.16) (0.009. 0.022, 0.079) (0.007, 0.017, 0.074)
A9 (0.014, 0.038, 0.159) (0.01, 0.03, 0.108) (0.011, 0.051, 0.097) (0.014, 0.061, 0.16) (0.007, 0.034, 0.079) (0.008, 0.036, 0.074)
Weight 0.159 0.108 0.097 0.16 0.079 0.074
C7 C8 C9 C10 C11
A1 (0.012, 0.025, 0.112) (0.003, 0.005, 0.035) (0.004, 0.007, 0.035) (0.004, 0.007, 0.032) (0.003, 0.006, 0.031)
A2 (0.01, 0.012, 0.022) (0.003, 0.004, 0.035) (0.003, 0.006, 0.035) (0.003, 0.005, 0.032) (0.003, 0.004, 0.031)
A3 (0.01, 0.024, 0.112) (0.004, 0.009, 0.035) (0.003, 0.004, 0.035) (0.003, 0.004, 0.032) (0.003, 0.004, 0.031)
A4 (0.012, 0.026, 0.112) (0.003, 0.004, 0.007) (0.004, 0.006, 0.035) (0.003, 0.006, 0.032) (0.003, 0.006, 0.031)
A5 (0.01, 0.017, 0.112) (0.003, 0.006, 0.035) (0.003, 0.006, 0.035) (0.003, 0.005, 0.032) (0.003, 0.005, 0.01)
A6 (0.012, 0.054, 0.112) (0.003, 0.015, 0.035) (0.004, 0.013, 0.035) (0.004, 0.013, 0.032) (0.003, 0.01, 0.031)
A7 (0.01, 0.048, 0.112) (0.004, 0.014, 0.035) (0.003, 0.013, 0.035) (0.003, 0.009, 0.032) (0.004, 0.01, 0.031)
A8 (0.016, 0.031, 0.112) (0.004, 0.008, 0.035) (0.003, 0.008, 0.035) (0.003, 0.006, 0.032) (0.003, 0.007, 0.031)
A9 (0.012, 0.059, 0.112) (0.004, 0.017, 0.035) (0.003, 0.013, 0.035) (0.004, 0.014, 0.032 (0.003, 0.011, 0.031)
Weight 0.112 0.035 0.035 0.032 0.031

291
𝑑(𝐴1, 𝐴∗) = √
(0−0.014)2+(0−0.032)2+(0−0.159)2
3
𝑑(𝐴1, 𝐴∗)= 0.0939876
𝑑(𝐴1, 𝐴−) = √
(1−0.014)2+(1−0.032)2+(1−0.159)2
3
𝑑(𝐴1, 𝐴−) = 0.933899
Similarly, calculations are done for other sub-criteria for solutions of alternative 𝐴1 and the
cumulative distances of 𝑑𝑖+ and 𝑑𝑖
− as 𝑑𝑖+= 0.514646 and 𝑑𝑖
−= 10.63685 are computed.
Step 7: Calculate the closeness coefficient of each alternative.
Step 8: According to the closeness coefficient, the ranking order of all alternatives can be
determined.
By using Eq. (7.12), the closeness coefficient (𝐶𝐶𝑖) of alternative 𝐴1 is computed as follows:
𝐶𝐶𝑖 =𝑑𝑖−
𝑑𝑖−+𝑑𝑖
∗ = 10.63685
10.63685+0.514646 = 0.95385
The same procedure can be adopted to compute the distances and (𝐶𝐶𝑖 ) values of the
remaining alternatives. The final results are summarized in Table 7.11. Based on the (𝐶𝐶𝑖)
values, alternatives were ranked in descending order. The strategy A2 “developing advanced
information technology and system” is regarded as the best strategy for managing supply
chain related risks. The strategt A5 “implementing eProcurement strategy” within alternative

292
ranked second and the strategy A1 “building efficient distribution management” ranked third.
Therefore, those strategies are determined as the priority strategies for the case
organizations to further implement in order to mitigate their supply chain risks.
Table 7.11: Fuzzy TOPSIS results and final ranking for the implementation of risk mitigation strategies
Alternatives 𝑑𝑖+ 𝑑𝑖
− (𝐶𝐶𝑖) Rank
A1 Distribution management 0.514646 10.63685 0.95385 3
A2 Information technology and system
0.370368 10.72934 0.966633 ○1
A3 Collaboration 0.522004 10.61581 0.953132 4
A4 Inventory management 0.526529 10.63193 0.952814 5
A5 eProcurement strategy 0.431122 10.68783 0.961226 ○2
A6 Outsourcing 0.582634 10.53498 0.947594 9
A7 Agility 0.554765 10.58862 0.950216 7
A8 Capability management 0.549148 10.59833 0.950738 6
A9 Single sourcing 0.577029 10.54913 0.948138 8
7.5.3 Sensitivity analysis
A sensitivity analysis is proposed to investigate the influence of different sub-criteria weights
on selection of risk mitigation strategies. It generates different scenarios that may change the
ranking of alternatives and be needed to reach a consensus. If the ranking order be changed
by increasing or decreasing the importance of the sub-criteria, the results are expressed to
be sensible otherwise it is robust. In this research, sensitivity analysis is implemented to see
how sensitive the alternatives change with the importance of the sub-criteria. More
specifically, the author has exchanged each sub-criterion’s weights with another sub-
criterion’s weights, and hence ten combinations of the eleven sub-criterion’s weights were
analysed, with each combination stated as a condition. For each condition, the relative
closeness to the ideal solution 𝐶𝑗∗ was computed. This type of sensitivity analysis has been

293
applied by several researchers (Ӧnὒt and Soner 2007; Gumus 2009; Perçin 2009 and Bianchini
2018). The results of sensitivity analysis are summarized in Table 7.12 and the graphical
representation of these results is shown in Figure 7.7.
The first condition in Table 7.12 shows the original ranking (A2, A5, A1, A3, A4, A8, A7, A9 and
A6, respectively), where the strategy A2 obtained 0.967. From Table 7.12 and Figure 7.8, it is
possible to observe that the strategies A2 and A5 take turns leading the top in every
conditions since they have the higher priorities of relative closeness 𝐶𝑗∗ in each combination.
In other words, strategy A2 will be selected if conditions 1,3,5,8 and 9 are met. Otherwise,
strategy A5 will be selected in conditions 2,4,6,7 and 10. The result gives great effort to
facilitate the implementation of both strategies for managing the risks under different
contexts. Meanwhile, no significant sensitivity for the remaining alternatives in changing
between different conditions can be observed, especially for strategies A6, A7, A8 and A9,
which always have the lower 𝐶𝑗∗ value in each combination. Therefore, since the weights of
sub-criterion are based on experts’ assessments, managers could adjust the strategic
deployment according to their own conditions.
Figure 7-8: Sensitivity analysis: computation of the relative closeness to the ideal solution for each evaluated combination
0.935
0.94
0.945
0.95
0.955
0.96
0.965
0.97
1 2 3 4 5 6 7 8 9 10
A1 A2 A3 A4 A5 A6 A7 A8 A9

294
Table 7.12: Results of the sensitivity analysis
Weights of criteria 𝐶𝑗∗
Conditions 𝑊1 𝑊2 𝑊3 𝑊4 𝑊5 𝑊6 𝑊7 𝑊8 𝑊9 𝑊10 𝑊11 A1 A2 A3 A4 A5 A6 A7 A8 A9
1 0.159 0.108 0.097 0.16 0.079 0.074 0.112 0.035 0.035 0.032 0.031 𝐶𝑗∗ 0.954 0.967 0.9531 0.9528 0.961 0.9476 0.95 0.951 0.9481
Ranking 3 1 4 5 2 9 7 6 8
2 0.031 0.032 0.035 0.035 0.112 0.074 0.079 0.16 0.097 0.108 0.159 𝐶𝑗∗ 0.954 0.957 0.953 0.958 0.959 0.9479 0.95 0.951 0.9477
Ranking 4 3 5 2 1 8 7 6 9
3 0.112 0.035 0.035 0.032 0.031 0.159 0.108 0.097 0.16 0.079 0.074 𝐶𝑗∗ 0.957 0.961 0.953 0.955 0.956 0.9477 0.95 0.951 0.9478
Ranking 2 1 5 4 3 9 7 6 8
4 0.079 0.16 0.097 0.108 0.159 0.031 0.032 0.035 0.035 0.112 0.074 𝐶𝑗∗ 0.952 0.959 0.955 0.953 0.963 0.9478 0.95 0.951 0.9482
Ranking 5 2 3 4 1 9 7 6 8
5 0.16 0.159 0.112 0.108 0.097 0.079 0.074 0.035 0.035 0.032 0.031 𝐶𝑗∗ 0.954 0.964 0.955 0.953 0.961 0.9476 0.95 0.951 0.9483
Ranking 4 1 3 5 2 9 7 6 8
6 0.031 0.032 0.035 0.035 0.074 0.079 0.097 0.108 0.112 0.159 0.16 𝐶𝑗∗ 0.954 0.958 0.953 0.956 0.959 0.9478 0.95 0.951 0.9477
Ranking 4 2 5 3 1 8 7 6 9
7 0.108 0.159 0.16 0.097 0.074 0.079 0.035 0.112 0.032 0.031 0.035 𝐶𝑗∗ 0.954 0.96 0.955 0.956 0.961 0.9476 0.95 0.951 0.948
Ranking 5 2 4 3 1 9 7 6 8
8 0.032 0.031 0.035 0.035 0.074 0.112 0.16 0.079 0.159 0.108 0.097 𝐶𝑗∗ 0.955 0.96 0.953 0.954 0.957 0.9478 0.949 0.951 0.9475
Ranking 3 1 5 4 2 8 7 6 9
9 0.112 0.108 0.16 0.159 0.035 0.074 0.079 0.097 0.031 0.032 0.035 𝐶𝑗∗ 0.954 0.964 0.957 0.955 0.961 0.9475 0.95 0.951 0.9478
Ranking 5 1 3 4 2 9 7 6 8
10 0.032 0.035 0.074 0.031 0.079 0.097 0.035 0.108 0.112 0.159 0.16 𝐶𝑗∗ 0.9545 0.955 0.952 0.956 0.959 0.9479 0.95 0.951 0.9477
Ranking 4 3 5 2 1 8 7 6 9

295
7.6 DISCUSSION AND MANAGERIAL IMPLICATIONS
Choosing the appropriate risk mitigation strategies is deemed to be an important step in
mitigating supply chain related risks. Although the hospital managers did not realized that
they had similar approaches to ensure the supply chain operates more efficiency. Instead of
identifying the relevant mitigation strategies based on the literature review, in this research,
the current implemented management strategies were identified as the risk management
solutions through empirical studies. Thereafter, the Fuzzy TOPSIS method was employed to
rank the importance levels of those mitigation strategies in relation to 11 risk factors. The
mechanism of the Fuzzy TOPSIS model was to analyse twenty experts’ subjective judgements.
It is an appropriate tool to help MADM under a fuzzy environment where the available data
is subjective and vague. Moreover, these strategies also consider all potential risks and the
effectiveness of individual strategies in mitigating these risks. It provides a practical decision
support tool for taking explicit account of multiple types of risk in aiding decision-making, and
compares and ranks alternative strategies in indicator basis individually. To change any
management practices or implement any new strategies would require significant additional
resources and time before they can commit to investing in the new practices. Theoretically
speaking, the costs for implementing these strategies can be viewed as “insurance premiums”
that will safeguard the supply chains from major disruptions. However, it is difficult to
quantify the return on these insurance premiums, especially in the absence of reliable data
(probability that a disruption would occur, potential loss due to a disruption, etc.). More
importantly, the healthcare industry is currently under increasing pressure to reduce costs
while maintaining the quality of care. The decision of adopting appropriate mitigation
strategies requires a trade-off between cost saving and the benefits of implementing such
strategies. Therefore, the alternatives with the highest ranking should be given the priority in
formulating the strategic plan, i.e. strategy A2, “developing advanced information technology
and system” and strategy A5, “implementing eProcurement strategy.” More importantly, the
findings are also in line with the recommendations provided by Lord Carter in their interim
report to England NHS trusts.

296
Furthermore, through our interview with the hospital managers, the major challenge of
implementing those strategies is to have supply chain risk management become a part of the
job responsibility across different departments with all functions involved collaborating and
communicating effectively. The use of the tool as a cross-functional risk mitigating and
monitoring process should be considered as a long-term objective. And as such, the
involvement of top managers from different areas is essential in establishing a thorough
consideration of critical issues and interdepencies in determining a complete supply chain risk
management process. In addition to this, Van Vuuren (2000) stated that the success of a
strategy is related to the congruency between organizations’ strategies and culture. Risk
management culture is embedding formally risk management within the decision-making
processes at every level of the compant operating within the culture of the organization. It is
emphasized that risk management culture can impact on manager’s ability to process risk and
disruption information, rationalize and exercise discretion in their vulnerability mitigation
decision-making processes. The risk management culture within an organization is important
to transform vulnerability awareness into mitigation actions. Therefore, hospital managers
should give importance to risk management culture, which can become a tool to provide the
legal path for risk decisions in a supply chain operation.
More especially, the strategy A2, “developing advanced information technology and systems”
provides enabler for managing the healthcare supply chain to increase visibility, traceability
and security. As mentioned earlier, advances in interoperability standards and other
technology tools, the advanced information technology and system helps in facilitating the
aggregation as well as ensuring a timely exchange of useful data among the stakeholders in
the supply chain. This, in turn, could provide a rich pool of data to support regulation and
oversight of the medicine delivery system from the initial to the end. Instead, paper-based
systems are still be common at most hospitals, which are all but “drowning” in paperwork.
Therefore, it requires an effort to develop an infrastructure capable of connecting, integrating
and supporting various information systems as well as applications at health facilities
nationwide. In spite of the demonstrated benefits, financial constraints in many hospitals
means creasting different systems for different settings is not feasible. The challenge will be

297
generating a flexible system, duplicable for various circumstances without investing extra
resources. Further, the benefits of developing new information technology and systems are
not immediately visible, but the costs are. For instance, the cost of an RFID tag can range from
£950 to £1,150 per reader. As the fully functioning RFID system requires tags, readers,
infrastructure, middleware, and printers and can cost a hospital millions of pounds. However,
a significant resistance to adoptation of technology and changes in work processes and
reluctance in the division of labour among health care specialists is actually existing. There is
a significant impact in implementing technologies and tools that can only be realized if
management can persuade the supporting staff to change their work practices and
organization.
Furthermore, strategy A5, “implementing eProcurement strategy” is one of the most effective
ways to facilitate the order and demand information among each member in the chain. As
such, it is critical for hospital managers to ensure that they share the integrated system with
supplier under the same standard (i.e. global GS1 coding and PEPPOL messaging), which as a
consequence, will be more collaborative than conducting the traditional approach for the
procurement procedure. Employing e-procurement process means that the healthcare
provider must simplify the existing procurement procedure and shorten the administration
lead time. Beyond the benefit that comes from the efficient operation process and enhanced
collaboration among trading partners, the strategy also drives patient safety benefits.
Automatic Identification and Data Capture like barcodes based on the GS1 standards, can now
be accessed and read at any point in the supply chain process. This enables them to quickly
locate the safety alert regarding the product. Besides the benefits, there is a significant up-
front cost and the continuing costs of implementing this practice are particularly burdensome
for small-size hospitals or individual healthcare providers. The relevant costs include the cost
of hardware, software and technical support and also the costs of intensive staff training.
Hence, this is a considerable limitation to currently implementing the strategy at the national
level.
The least important is strategy A6, “outsourcing the non-core supply chain activities to the 3rd
party logistics service provider.” The healthcare organizations benefit more through

298
outsourcing expanding activities beyond core and clinical activities and build an environment
which is more cooperative with their suppliers. However, some healthcare organizations do
not achieve the expected benefits from the outsourcing strategy because outsourcing
activities are incredibly complicated and lack a formal outsourcing decision making process,
such as medium and long-term cost-benefit analyses, reluctance to embrace any changes.
Moreover, it also requires a decision on which activities should remain within the hospital or
be outsourced, whether all or part of the supply chain activities should be outsourced, and
also how to manage relationships with suppliers rather than internal functions and processes.
Another major issue that concerned by hospitals managers is losing good long-term
employees if they outsource some functions. Hence, mistakes in identifying core and noncore
activities can lead hospitals to outsource their competitive advantages, which are difficult to
rebuild. Therefore, this may explain why this strategy became the least important one among
the nine identified strategies.
7.7 CONCLUSION
This chapter presented the last step in the supply chain risk management process, i.e. risk
mitigation strategies identification and evaluation. In this research, all strategies were
retrieved from real-life by employing empirical studies from both China and UK healthcare
industries. This research empirically identified nine risk mitigation strategies, including:
strategy A1, “building efficient distribution management”; strategy A2, “Developing advanced
information technology and system”; strategy A3, “developing inter and intra organizational
collaboration”; strategy A4, “building efficient inventory management”; strategy A5,
“implementing eProcurement strategy”; strategy A6, “implementing outsourcing strategy”;
strategy A7, “implementing agility strategy”; strategy A8, “developing internal capability
management” and strategy A9, “implementing single sourcing strategy”. After the
identification, a risk mitigation-strategy questionnaire survey was used to rank the
importance of these strategies. To address risk management issues, both quantitative and
qualitative methods have been adopted by both researchers and practitioners. However, risk
management is a complex subject involving vagueness and uncertainty in the decision-making

299
process. Therefore, a Fuzzy TOPSIS model was implemented to provide a practical decision
support tool for evaluating risk mitigation strategies. The application of the fuzzy
methodology is also useful in situations where uncertainties exist in the decision-making
process. The nine strategies are ranked according to their overall priorities i.e. A2, A5, A1, A3,
A4, A8, A7, A9, and A6. This is generally consistant with the recommendation provided by
Lord Carter’s interim report. Strategy A2, “developing advanced information technology and
system” and strategy A5, “implementing eProcurement Strategy” have the highest relative
closeness indices and should therefore be recommended as the top strategies for the
healthcare organizations to implement.

300
8.CHAPTER EIGHT - CONCLUSION
8.1 INTRODUCTION
This concluding chapter presents a brief overview of the research and introduces future
directions for developing the work. Initially, the chapter returns to the defined research
objectives and research questions to delineate the research’s important findings. This is
followed by description of the contribution to established knowledge and its practical
implications. The chapter then explores limitations and future research direction arising from
this research.
8.2 RESEARCH FINDINGS
Based on the literature review in Chapter two, several research gaps were identified. The
primary research gap was the lack of the comprehensive framework proposed to evaluate
SCRM (e.g., risk factors identification, risk assessment, and risk mitigation) performance in the
public healthcare sector. The second research gap was the limited attention given to
systematic risk factors identification in healthcare SC. The third research gap was related to
the need for systematic and holistic risk assessment as existing studies have tended to provide
independent risk concepts without concerning interconnection and interconnectedness of
risk factors. The fourth research gap identified was the lack of studies examining the
performance of the currently implemented supply chain risk mitigation strategies under
different risk contexts in public healthcare organisations.
To address these gaps, research questions for this study were developed. To answer the
questions, a multi-methodology approach involving the questionnaire survey, documentation
review, direct observation and semi-structured interviews were adopted. RQ1 was concerned
with the proposed novel conceptual framework which presents a platform to support
managers in making significant strategic decisions on SCRM. Moreover, when the SCRM

301
process comprise of risk factors identification, risk assessment and risk mitigation are
considered, RQ2, RQ3, and RQ4 were concerned with identification and assessment of
healthcare SC risks, whereas RQ5 and RQ6 focused on risk mitigation. A summary of the
research outputs specific to each question is given as follows:
RQ1. What is the most effective HCSCRM framework that can be implemented to deal with
the HCSC risks?
A novel conceptual framework was developed to support managers in proactively controlling
the risks by considering risk drivers and sources, decision-making, SC strategies, performance
outcomes, and the risk management process. The focus is towards the proposed framework,
recognizing that the key components provide a more robust portrayal of the factors that
affect the nature of risk management responses under different situations. It has a sequential
process that is repetitive in nature and articulated in a circular process, indicating that one
component is dependent on another component. For risk management to be successful, the
risk drivers to establish the potential nature of the risks must be identified. This is then
followed by the phase of determining the available risk resources expected to facilitate and
support risk management initiatives. Based on different attitudes of risk appropriate for the
case, a healthcare organization can implement various risk management initiatives for the
desired change to be realized. In terms of the performance outcomes, due to the difference
perspectives, the focus in the healthcare provider is towards both cost reduction and service
quality improvement as well as the employee satisfaction. The proposed conceptual
framework can be acting as a risk management platform to address the industrial needs for
practical decision support methodology, and to facilitate the integration of innovative
approaches such as Fuzzy AHP, ISM and Fuzzy TOPSIS into the healthcare supply chain risk
management process.
RQ2. What are the main sources of risk factors causing public sector healthcare supply
chains to be vulnerable and how to identify and classify those risks?
It is important for healthcare organizations to be aware of the specification of sources of risks
due to the invisibility of risks existing in the supply chain network. Identification of risk factors

302
is the first step of the supply chain risk management process. In this thesis, the author
identifies a comprehensive list of risk factors in the healthcare supply chain system initially
through a literature review. It is particularly noteworthy that healthcare supply chain systems
have risk factors in common with conventional supply chain risks, but also unique risk factors
that can be differentiated from the traditional supply chain risks. In particular, the
“counterfeiting risks”; “time limit of drugs, product perishability”; “demand trigged by the
nurse, not the patient”; “fragmentation of drug distribution process”; “clinician’s preference”;
“lack of funds from government to the hospital” and “regulatory issues-manufacturing using
licensing/change of standards/drugs recalls” appeared to generate unique threats to
healthcare supply chain systems. In addition, various entities involved in the healthcare
supply chain network can generate fresh risk areas in inter-organizational and intra-
organizational relationships. Thereafter, a total of 34 risk factors were found to reside in the
healthcare supply chain operations and classified into three main categories including:
“external to the hospital but internal to the supply chain network” (i.e. supply, demand risks),
“internal to the hospital” (i.e. process and control risks) and “external to the supply chain
network” (i.e. environmental risks). Furthermore, a new classification model applied in this
thesis divided the risks into eleven sub-categories: quality, supplier, capacity, forecast,
information, logistics, procurement, strategic, labour, natural and man-made risks. Based on
the addressed risk factors, a questionnaire survey was conducted to ensure the feasibility of
the developed risk classification method and to determine the important levels of identified
risk factors. An interesting insight is that “counterfeiting risks”, “poor quality in the purchased
drugs from suppliers”, “shortage of drugs” and “high purchase price” attract more attention
than other risk factors from the participant experts’ viewpoint. In order to broadly outline the
sources of healthcare supply chain risks, a hierarchical structure model was developed. To
assure the validity and reliability of the developed hierarchy diagram, a series of emails and
face-to-face interviews were subsequently sent out and conducted with the “validation team”
(six earlier experts as well as two academic researchers with experience in supply chain and
risk management who were not part of the expert panel). Finally, agreement among the
experts was received, and the hierarchy diagram was accepted.

303
RQ3. Which risk factors are relatively more significant to a hospital’s supply chain
management performance?
In risk assessment research, Fuzzy AHP was used to determine the priority weight among the
identified risk factors. It needs to be mentioned that risk assessment is inherently uncertain
and imprecision, therefore, any analysis that ignores this uncertainty and imprecision may
cause information to be seriously misleading and thus cause major mistakes. In this thesis,
Fuzzy AHP was developed along the lines of fuzzy set theory to manage the uncertainty
associated with the mapping of experts’ judgements. 56 valid replies were received from
selected respondents from China, the UK, and Thailand. The respondents are working in both
academic and industrial fields. The results indicate that risks associated in “external to the
hospital but internal to the supply chain network” (0.53) and “internal to the hospital” (0.43)
are much greater than that of “external to the supply chain network” (0.04). Under the criteria
“external to the hospital but internal to the supply chain network”, “supply risks” (0.75) is the
top risk in the same level. It is particularly noteworthy that “shortage of drugs” (0.16),
“counterfeiting” (0.159), “poor IT system” (0.112), “capability versus demand” (0.108),
“dispensing/picking errors” (0.097), “poor quality in the purchased drugs from suppliers”
(0.079), “weak logistics service infrastructure” (0.074), “lack of visibility concerning placement
and availability of stock” (0.035), “high purchase price” (0.035), “clinicians’ preference”
(0.032) and “high product and supplier/brand variety” (0.031) are the key risk factors for
hospital’s supply chain performance.
RQ4. How are these risk factors interacting with each other?
This thesis sought interactions between each risk by employing an ISM model. A total of 12
industrial and academic experts were invited to identify the relationships between risk
elements, analysed with the ISM technique. The results provide an understanding of
identified risk factors in different levels of ISM hierarchy model and the cluster in MICMAC
diagram. The developed hierarchical ISM model comprises 11 risk factors. Among the 11 risk
factors, “poor quality in the purchased drugs from suppliers” and “dispensing/picking errors”
were placed on the top level. These are the risks that can produce a major impact on

304
healthcare SC systems. Furthermore, lower level risks like “clinician’s preference” and “high
produce and supplier/brand variety” have strong influence to the middle-level risks like
“counterfeiting”, “shortage of drugs”, “capability versus demand”, “high purchase price”,
“weak logistics service infrastructure”, “poor IT system”, and “lack of visibility concerning
placement and availability of stock”. Also, the aforementioned middle-level risks again seen
to influence the top-level in the ISM model. Top-level factors are more risky than the others
and can cause serious consequences for supply chain systems. Nevertheless, lower level
factors are mainly responsible for increasing the degree of risk exposure as they have strong
influence to the top-level factors. In this regard, it is worth noting that interdependency
among various risk factors plays an important role in the assessment of risk impact on the
healthcare supply chain performance.
MICMAC analysis was carried out by classifying the 11 risk factors into four clusters
comprising autonomous, dependent, linkage, and independent, based on their driving power
and dependence power. The risk factors are namely, “poor quality in the purchased drugs
from suppliers” and “dispensing/picking errors” are dependent factors. The impact of these
risks depends on the remaining risks of the healthcare supply chain and seriously affects the
supply chain system. Similarly, the risk factor “clinician’s preference” has been found
independent with strong driving power: it plays a key role in influencing others and finally
intensifies to the strength of its impact on the healthcare supply chain system. The remaining
risk factors are clustered as linkage risks with both strong driving and dependence power.
Those should be assigned as high priority and the manager should understand the
dependence of these risks on lower level risks, in achieving the risk management objectives.
Autonomous risks are weak driving power and dependence power and lack influence on the
supply chain system. In this research, no risk factor in this cluster. As a result, this cluster
analysis provides valuable insight into the extant body knowledge to the researchers to
understand and assess the intensity of risk factors as well as to manage these risks by
implementing an effective risk management strategy.
RQ5. How can the hospitals from both UK and China effectively manage their supply chain
related risks?

305
This research employed empirical studies from the UK and China healthcare organizations to
identify their currently implemented supply chain risk management strategies. The empirical
study is based on ‘field’ experiences or direct observations, and it allows the researcher to
investigate a contemporary phenomenon in depth and within its real-life context when the
boundaries between phenomenon and context may not be clearly evident. In this thesis, a
large amount of official documents and other published materials were reviewed critically.
Thereafter, multiple departments in three hospitals and one pharmaceutical company were
visited to ensure the collected data was accurate and reliable in nature. By combining direct
observation with various other methods, the research results can give a complete picture of
the performance situation. The author conducted semi-structured interviews with 14 experts
from seven Chinese hospitals, one UK hospital, and two different pharmaceutical companies.
The interviews were spread over three months and included four site visits by the author. As
a result, healthcare organizations involved in healthcare supply chain operations have
implemented nine basic strategies: (1) “strategy A1: building efficient distribution
management”, (2) “strategy A2: developing advanced information technology and system”,
(3) “strategy A3: developing inter and intra organizational collaboration”, (4) “strategy
A4:building efficient inventory management”, (5) “strategy A5: implementing eProcurement
Strategy”, (6) “strategy A6: implementing outsourcing strategy”, (7) “strategy A7:
implementing agility Strategy”, (8) “strategy A8: developing internal capability management”
and (9) “strategy A9: implementing single sourcing strategy”.
RQ6. What are the main risk mitigation strategies to be considered?
In this thesis, Fuzzy TOPSIS was used to rank risk mitigation strategies. The model incorporates
the fuzzy set theory and conventional TOPSIS methods to capture the vagueness of
uncertainty in the evaluation of alternative risk mitigation strategies. Twenty experts from
both academia and industry were invited to participate the survey. The analysis results
indicate that the “strategy A2, developing advanced information technology and system” had
the highest ranking among the alternative mitigation strategies, closely followed by “strategy
A5, implementing eProcurement strategy”. On the contrary, “strategy A6, implementing
outsourcing strategy” fell behind other strategies due to the outsourcing activities being

306
incredibly complicated and lacked formal outsourcing decision-making processes, such as
medium and long-term cost-benefit analyses, and reluctance to embrace any changes.
8.3 RESEARCH CONTRIBUTION TO KNOWLEDGE
The significance of this thesis is to complement the existing literature by proposing a
comprehensive framework that provided abundant insights into how risks in the healthcare
supply chain systems can be understood and how organizations involved in the healthcare
industry can effectively manage these risks. Specifically, this research is the first study to
provide an integrated SCRM model by using both qualitative and quantitative techniques for
risk factors identification, assessment, and mitigation in the healthcare supply chain setting.
Although there are studies on this topic, their research scope was limited to a specific mode
or a certain phase of supply chain risk management, thus their studies lacked a holistic view
of risk management (Breen, 2008; Enyinda et al., 2014). The novelty of the proposed model
lies in the fact that it incorporates the Fuzzy AHP, ISM model and Fuzzy TOPSIS as an integrated
methodology, which has been proposed enabling the specific decision maker’s preferences to
be considered in making the strategic decision on a healthcare SCRM. Moreover, the model
also considers the uncertainties caused by unknown data. Therefore, the application of fuzzy
logic theory can help organizations to solve the problem of handling uncertainty in decision-
making in a timely manner. Additionally, compared with most of the SCRM literature using
secondary data for simulation, this research makes practical contributions by conducting
empirical studies in both the UK and China healthcare industries to support a resource
effective and time-efficient decision-making tool for managers. It provides the latest
information that can reflect the current situation in both countries’ healthcare industry.
Especially, instead of identifying the risk mitigation strategies through a literature review, this
research explored the currently implemented mitigation strategies which turned out to be
more reasonable in actual situations. Therefore, healthcare organizations can evaluate the
current status of their risk management efforts with the risk mitigation strategies and
practices suggested in this research. Nine strategies were introduced with practical examples
from case hospitals, which provide practical ideas as to how the organizations can manage

307
risks. Furthermore, the profile of healthcare supply chain risks will enable managers to
anticipate and proactively deal with potential risks. Although the risks discussed in this thesis
are not completely exhaustive, the work is still meaningful because those are explored by
literature, Lord Carter’s report and experts from different fields involved in a healthcare supply
chain and risk management. To the end, although the case discussed in this research is
healthcare provider, i.e. hospital, the results could be generalised to similar industry or other
service-based environments.
8.4 RESEARCH LIMITATION
The limitations of this research are discussed below.
• Firstly, in this study, the risk factors have been retrieved mainly from eleven research
literatures and one official interim reports due to the limited research focused on
healthcare supply chain risk management to date. Meanwhile, data collection was
limited between the years 2003 and 2017 by systematic identification, screening, and
synthesis of quality data sources. It provides a way to focus the development of
research in the past 14 years but also limited the study’s time frame. It would be more
comprehensive if the omitted literature could be reviewed.
• Secondly, the confidential nature of the healthcare industry when conducting the
empirical studies highlights the difficulty of gathering primary and secondary data. In
addition, the sample selection is limited to specific professional roles. Most
participants involved in this research either have abundant knowledge in academia or
rich practical experience in the field and hold a position at or above the manager level
in practitioner fields. Therefore, a further limitation of the research is reflected in the
size of the sample.
• Thirdly, the proposed integrated model is highly dependent on the respondents’
knowledge, experience, and attitude that might lead to the subjective bias. For
instance, respondents and their attitudes or perceptions might be affected by the
surrounding environment in which they participated in the survey. The unexpected

308
factors, such as personal issues, or other external factors might have impacts on their
attitudes. Furthermore, another factor that needs to be considered is the length of
the interview. In this study, the interview questions were designed to limit interviews
to one hour (interviewing time), but some participants might have thought that there
were too many questions and these feelings would have negatively affected their
attitudes toward the questions.
• Fourthly, this study does not address all the identified 34 risk factors in detail due to
the time constraints and the size of the questionnaire survey, which mostly required
pair-wise comparison between each factor.
8.5 RECOMMENDATION AND FUTURE RESEARCH
A number of research areas need to be investigated for further study. It is advocated that the
following areas should be addressed going forward:
• Further research is expected for the generalisability of the developed conceptual
framework and integrated risk management model into other industry sectors and
being applied into different tiers of the supply chain network. The application of the
same research process to other areas will broaden knowledge into supply chain risk
management.
• The cross-validation of the proposed risk management model can be possible by
widening the geographical scope of the research. This thesis investigated risk
management for hospitals in the UK and China. Both countries are selected for
sampling because of their advanced healthcare systems, the larger and costly market
and the enormous healthcare demands. Therefore, it is noteworthy that a
comparative analysis between countries with different social and economic systems
and different healthcare and hospital systems will provide fresh insights into the
development of risk management initiatives.

309
• Supply chain risk management has been defined as “the management of supply chain
related risks including both internal and external risks through a coordinated approach
among each SC member to managing supply chain vulnerability as a whole”
(Christopher et al., 2002). In the healthcare supply chain setting, hospitals are closely
linked to other channel stakeholders, such as pharmaceutical manufacturer, supplier,
distributor, GPO, insurance company, government, and third-party logistics provider.
It requires a coordinated effort from all key members involved in order to mitigate
risks and build a resilient healthcare supply chain. Another further research direction
is to incorporate the views of other SC members into the decision-making process.
• As mentioned in Chapter five, many types of risk factors exist in the healthcare supply
chain, such as strategic risks, labour risks and man-made risks are omitted as they are
less significant; nonetheless, they should be of concern. Therefore, it would be more
comprehensive to consider all kinds of risks in the structural model so that more
complete results could be obtained.
• As any strategic implementation requires substantial investments, the decision to
adopt appropriate risk management mitigation strategies requires a trade-off
between the benefits and costs involved. Further research can cover cost and benefit
analysis to support significant strategic decisions on SCRM.

310
REFERENCES
Abidin, M.Z., Rusli, R. and Shariff, A.M. (2016). Technique for Order Performance by Similarity
to Ideal Solution (TOPSIS)-entropy Methodology for Inherent Safety Design
Decision Making Tool. Procedia Engineering, Vol.148, pp.1043-1050
AbuKhousa, E., Al-Jaroodi, J., Lazarova-Molnar,S., and Mohamed, N. (2014). Simulation and
modelling efforts to support decision making in healthcare supply chain
management. The Scientific World Journal. pp. 1-16
Agrell, P.J., Lindroth, R., and Norrman, A. (2004). Risk, Information and incentives in telecom
supply chains. International Journal of Production Economics, Vol. 90(1), pp. 1-16
Agwunobi, J., and London, P.A. (2009). Removing costs from the health care supply chain:
lessons from mass retail, Health Affairs, Vol. 28(5), pp.1336-1342
Aguas, J.P.Z., Adarme, W.A., and Arango Serna, M.D. (2013). Supply risk analysis: applying
system dynamics to the Colombian healthcare sector, INGENIERIA E
INVESTIGACION. Vol. 33(32), pp. 76-81
Alawamleh, M. and Popplewell, K. (2011). Interpretive structural modelling of risk sources in
a virtual organization, International Journal of Production Research, Vol. 49(2), pp.
6041-6063
Al-Balushi, S., Sohal, A.S., Singh,P.J., Al Hajri, A., Al Farsi, Y.M., and Al Abri, R. (2014), Readiness
factors for lean implementation in healthcare settings- a literature review ,
Journal of Health Organization and Management, Vol. 28(2), pp. 135-153
Al-Qatawneh, L.K, et al. (2005), Health care supply chain dynamics: systems design of an
American health care provider. ISDC NY2003
Al-Karaghouli, W., Ghoneim, A., Sharif, A., and Dwivedi, Y.K. (2013). The effect of knowledge
management in enhancing the procurement process in the UK healthcare supply
chain. Information Systems Management. Vol. 30(1). pp. 35-49.
Al-Saa’da, R.J., Taleb, Y.K.A., Al Abdallat, M.E., Al-Mahasneh, R.A.A., Nimer, N.A., and Al-
Weshah, G.A. (2013). Supply chain management and its effect on health care
service quality: quantitative evidence from Jordanian private hospitals. Journal of
Management and Strategy, Vol. 4(2), pp. 42
Amaratunga, D. et al. (2002) Quantitative and qualitative research in the built environment:
application of mixed research approach. Work Study, Vol. 51(1) pp. 17-31
Anderson, J.C., and Narus, J.A. (1990). A model of distributor firm and manufacturer firm
working partnerships. The Journal of Marketing. pp. 42-58.
Andraski, J.C. (1998). Leadership and the realization of supply chain collaboration, Journal of
Business Logistics, Vol. 19(2), pp.9

311
Anoop, M.B., Balaji, R.K., and Gopalakrishnan,S. (2006). Conversion of probabilistic
information into fuzzy sets for engineering decision analysis. Computers and
Structures, Vo. 84, pp.141-155
Aptel, O., and Pourjalali, H. (2001). Improving activities and decreasing costs of logistics in
hospitals: a comparison of U.S. and French hospitals. The International Journal of
Accounting, Vol. 36(1), pp.65-90
Aqlan, F., and Lam, S.S. (2015). A fuzzy-based integrated framework for supply chain risk
assessment. International Journal of Production Economics, Vol. 161, pp. 54-63
Aqlan, F., and Lam,S.S. (2015). Supply chain risk modelling and mitigation, International
Journal of Production Research, Vol. 53(18), pp. 5640-5656
Aronsson, H., Abrahamsson, M., and Spens, K. (2011). Developing lean and agile health care
supply chains. Supply Chain Management: An International Journal, Vol. 16(3),
pp.176-183
Ary, D., Jacobs, L.C., Irvine, C.K.S. and Walker, D. (2013). Introduction to research in
education. 9th ed. UK: Cengage Learning.
Attri, R., Dev, N. and Sharma, V. (2013). Interpretive structural modelling (ISM) approach: an
overview. Research Journal of Management Sciences, 2319, pp.1171-1179
Austin, K.M. and Burn, J.R. (1985). Management Science: An Aid for Managerial Decision
Making. Macmillan, New York, NY.
Babbie, E. (2015). The practice of social research. Canada: Nelson Education.
Badurdeen,F., Shuaib,M., Wijekoon,K., Brown,A., Faulkner,W., Amundson,J., Jawahir,I.S.,
Goldsby,T.J., Iyengar,D., and Boden,B. (2014). Quantitative modelling and analysis
of supply chain risks using Bayesian theory. Journal of Manufacturing Technology
Management, Vol, 25(5), pp. 631-654.
Bailey, G., Cherrett, T., Waterson, B., and Breen, L. (2015). Boxed up and locked up, safe and
tight! Making the care for unattended electronic locker bank logistics for an
innovative solution to NHS Hospital supplies (UK). International Journal of
Procurement Management, Vol. 8(1-2), pp. 104-125
Bakar, A.H.A., Hakim, I.L., Chong, S.C., and Lin, B. (2009). Measuring supply chain performance
among public hospital laboratories, International Journal of Productivity and
Performance Management, Vol. 59 (1), pp.75-97
Balasubramanian, S. and Jones, E.C. (2016). Hospital closures and the current healthcare
climate: the future of rural hospitals in the USA. Rural and remote
health, 16(3935)

312
Bam, L., McLaren, Z. M., Coetzee, E. and von Leipzig, K. H. (2017). Reducing stock-outs of
essential tuberculosis medicines: a system dynamics modelling approach to
supply chain management. Health Policy and Planning, Vol. 32 (8), pp.1127-1134
Barngetuny, D.C., and Kimutai, G. (2015). Effects of e-procurement on supply chain
management performance in Eglgeyo-Marakwet County. International Academic
Journal of Procurement and Supply Chain Management, Vol. 1(5), pp. 99-120
Barry, J. (2004). Supply chain risk in an uncertain global supply chain environment,
International of Physical Distribution and Logistics Management, Vol. 34 (9),
pp.695-697
Bartsch, P., Lux, T., Wagner, A. and Gabriel. R. (2012). E-Procurement in hospitals- an
integrated supply chain management of pharmaceutical and medical products by
the usage of mobile devices. In International Conference on Wireless Mobile
Communication and Healthcare (pp. 406-412). Springerm Berlin, Heidelberg.
Behzad, B., Moraga, R.J., and Chen, S.J. (2011). Modelling healthcare internal service supply
chains for the analysis of medication delivery errors and amplification effects.
Journal of Industrial Engineering and Management, Vol. 4 (4), pp. 554-576
Barker, T., Davidson, O., Davidson, W., Huq, S., Karoly, D., Kattsov, V., Liu, J., Lohmann, U.,
Manningm M., Matsuno, T., and Menn, B. (2007). Climate change 2007: synthesis
report. Valencia; IPPC.
Beikkhakhian, Y., Javanmardi,M., Karbasian, M., and Khayambashi, B. (2015). The application
of ISM model in evaluating agile supplier selection criteria and ranking suppliers
using fuzzy TOPSIS-AHP methods. Experts Systems with Applications, Vol. 42(15-
16), pp. 6224-6236
Bellman, R.E. and Zadeh, L.A. (1970). Decision making in a fuzzy environment. Management
Science, Vol. 17 (4), pp.141-164
Bendavid, Y., Boeck, H., and Philippe, R. (2010). Redesigning the replenishment process of
medical supplies in hospitals with RFID. Business Process Management Journal,
Vol. 16 (6). pp. 991-1013
Berry, D., Naim, M.M., Towill, D.R. (1995). Business process re-engineering an electronic
products supply chain. IEE Proceedings-Science, Measurement and Technology,
Vol.142 (5), pp. 395-403.
Berger, P.D., Gerstenfeld, A., and Zeng, A.Z. (2004). How many suppliers are best? A decision-
analysis approach. Omega. Vol. 32 (1), pp. 9-15
Beier, F.J., (1995). The management of the supply chain for the hospital pharmacies: a focus
on inventory management practices. Journal of Business Logistics. Vol. 16, pp. 153-
173.

313
Bhakoo, V., Singh, P., and Sohal, A. (2012). Collaborative management of inventory in
Australian hospital supply chains: practices and issues. Supply Chain
Management: An International Journal, Vol.17 (2). pp. 217-230
Bhakoo, V., and Choi, T. (2013). The iron cage exposed: Institutional pressures and
heterogeneity across the healthcare supply chain. Journal of Operations
management, Vol. 31(6), pp. 432-449
Bianchini, A. (2018) 3PL provider selection by AHP and TOPSIS methodology, Benchmarking:
An International journal. Vol. 25(1), pp. 235-252
Blackhurst, J.V., Scheibe, K.P., and Johnson, D.J. (2008). Supplier risk assessment and
monitoring for the automotive industry, International Journal of Physical
Distribution and Logistics Management. Vol. 38(2), pp. 143-165
Blackhurst, J., Dunn, K.S., and Craighead, C.W. (2011). An empirically derived framework of
global supply resiliency. Journal of Business Logistics. Vol. 32(4), pp. 374-391
Blome, C., and Schoenherr, T. (2011). Supply chain risk management in financial crises – A
multiple case-study approach. International Journal of Production Economics, Vol.
134(1), pp. 43-57
Blos, M.F., Quaddus, M., Wee, H.M., and Watanabe, k. (2009). Supply chain risk management
(SCRM): a case study on the automotive and electronic industries in Brazil. Supply
Chain Management: An International Journal, Vol. 14(4), pp. 247-252
Blos, M.F., Hoeflich, S.L., Dias, E.M., and Wee, H.M. (2016). A note on supply chain risk
classification: discussion and proposal, International Journal of Production
Research, Vol. 54 (5), pp.1568-1569
Bogataj, D., and Bogataj,M. (2007). Measuring the supply chain risk and vulnerability in
frequency space. International Journal of Production Economics, Vol. 108, pp. 291-
301
Böhme, T., Williams, S.J., Childerhouse, P., Deakins, E., and Towill, D. (2013). Methodology
challenges associated with benchmarking healthcare supply chains. Production
Planning and Control: The Management of Operations, Vol. 24 (10), pp.1002-1014
Böhme, T., Williams, S.J., Childerhouse, P., Deakins, E., and Towill, D. (2013). Squaring the
circle of healthcare supplies. Journal of Health Organization and Management,
Vol. 28 (2) pp.247-265
Böhme, T., Williams, S.J., Childerhous, P., Deakins, E., and Towill, D. (2016). Cause, effects and
mitigation of unreliable healthcare supplies. Production Planning and Control.
Vol. 27 (4), pp.249-262

314
Bookbinder, J.H., and Tan, C.S. (2003). Comparison of Asian and European logistics systems.
International Journal of Physical Distribution and Logistics Management, Vol.
33(1), pp. 33-58
Bolstorff, P. (2006). Balancing your value chain metrics. Using the Balanced Scorecard to
manage value chain performance. Report, SCE Limited. [Online] available from
<https://www.scribd.com/document/72267947/Balancing-Your-Value-Chain-
Metrics> [Sept 2006]
Bolumole, Y.A. (2001). The supply chain role of Third-party logistics providers. International
Journal of Logistics Management, Vol. 12 (2), pp.87-102
Boote, D.N. and Beile, P. (2005). Scholars before researchers: On the centrality of the
dissertation literature review research preparation. Educational Research, Vol.
34(6), pp.3-15
Bourlakis, M., Clear, F., and Patten, L. (2011). Understanding the UK hospital supply chain in
an Era of patient choice. Journal of Marketing Management, Vol. 27 (3-4). pp. 401-
423
Bozarth, C. C., and Handfield, R. B. (2015). Introduction to operations and supply chain
management. Prentice Hall.
Brandao de Souza, L. (2009). Trends and approaches in Lean healthcare. Leadership in Health
Services, Vol. 22 (2), pp. 121-139
Brannen, J. ed. (2017). Mixing methods: Qualitative and quantitative research. 2nd Ed. New
York: Routledge.
Breen, L., and Crawford, H. (2005). Improving the pharmaceutical supply chain. International
Journal of Quality and Reliability Management, Vol. 22 (6). pp. 572-590
Breen, L. (2008). A preliminary examination of risk in the pharmaceutical supply chain (PSC)
in the National Health Service (NHS) (UK). Journal of Service Science and
Management, Vol. 1(02), pp.193-199
Breen, L. (2008). What risks can affect the supply of pharmaceuticals to the NHS?
Pharmaceutical Journal, 280(7503), pp. 631-635
Brennan, C.D. (1998). Integrating the healthcare supply chain. Healthcare Financial
Management, Vol. 52(1) pp. 31-34
Burns, L.R., DeGraaff, R.A., Danzon, P.M., Kimberly, J.R., Kissick, W.L., and Pauly, M.V. (2002).
The Wharton School study on the health care value chain. The health care value
chain: producers, purchasers and providers. San Francisco: Jossey-Bass, pp. 3-26
Burns, L.R., and Lee, J.A. (2008). Hospital purchasing alliances: utilization, services, and
performance. Health Care Management Review. Vol. 33(3), pp.203-215

315
Burgess, K., Singh, P.J., and Koroglu, R. (2006). Supply chain management: a structured
literature review and implications for future research. International Journal of
Operations and Production Management, Vol. 26 (7). pp. 703-729
Burgess, N., and Radnor, Z. (2013). Evaluating Lean in healthcare. International Journal of
Health Care Quality Assurance, Vol.26 (3). pp. 220-235
Buckley, J.J. (1985). Fuzzy hierarchy analysis. Fuzzy Sets and Systems, Vol.17 (3), pp.233-47
Cabała, P. (2010). Using the analytic hierarchy process in evaluating decision
alternatives. Operations research and decisions, Vol. 20 (1), pp.5-23
Cabral, I., Grilo, A., and Cruz-Machado, V. (2012). A decision-making model for lean, agile,
resilient and green supply chain management. International Journal of Production
Research, Vol. 50 (17), pp. 4830-4845.
Cagliano, A., Carlin, A. and Grimaldi, S. (2007). The logistics of drug in healthcare sector. XXXIV
Convegno Nazionale ANIMP OICE UAMI, Isola d’Elba.
Cagliano, A.C., De Marco, A., Grimaldi, S. and Rafele, C. (2012). An integrated approach to
supply chain risk analysis. Journal of risk research, Vol. 15 (7), pp.817-840
Cagliano, M., McCormick, M.I., and Meekan, M.G. (2007). Temperature-induced shifts in
selective pressure at a critical developmental transition. Oecologia. Vol. 152 (2),
pp.219-225
Cagnin, F., de Oliveira, M.C., Simon, A.T., Helleno, A.L., and Vendramini, M.P. (2016). Proposal
of a method for selecting suppliers considering risk management: An application
at the automotive industry. International Journal of Quality and Reliability
Management, Vol. 33(4), pp. 488-498
Carruthers, J., Ashill, N.J., and Rod, M. (2006). Mapping and assessing the key management
issues influencing UK public healthcare purchaser-provider cooperation.
Qualitative Market Research: An International Journal, Vol. 9(1). pp. 86-102
Carter, C. R., and Rogers, D. S. (2008). A framework of sustainable supply chain management:
moving toward new theory. International journal of physical distribution and
logistics management, Vol. 38 (5), pp.360-387
Carvalho, H., and Cruz-Machado, V. (2011). Integrating Lean, Agile, Resilience and Green
Paradigms in Supply Chain Management (LARG_SCM). In Supply Chain
Management. In Tech.
Centers for Medicare and Medicaid Services, Office of the Actuary (2010). National Health
Expenditure Projections 2009-2019.
Ceryno, P.S., Scavarda, L.F., and klingebiel, K. (2015). Supply chain risk: empirical research in
the automotive industry, Journal of Risk Research. Vol. 18(9), pp. 1145-1164

316
Chadha, R., Singh, A., and Kalra, J. (2012). Lean and queuing integration for the
transformation of health care processes. Clinical Governance: An International
Journal, Vol. 17 (3). pp. 191-199
Chakraborty, S., Bhattacharya, S., and Dobrzykowski, D.D. (2014). Impact of supply chain
collaboration on value co-creation and film performance: a healthcare service
sector perspective. Procedia Economics and Finance. Vol. 11, pp.676-694
Chan, F.T. and Kumar, N. (2008). Global supplier development considering risk factors using
fuzzy extended AHP-based approach. Omega, Vol. 35 (4), pp.417-431
Chang, D.Y. (1996). Applications of the extent analysis method on fuzzy AHP. European journal
of operational research, Vol. 95 (3), pp.649-655
Chang, W., Ellinger, A.E., and Blackhurst, J. (2015). A contextual approach to supply chain risk
mitigation. The International Journal of Logistics Management, Vol. 26(3), pp.
642-656
Chanpuypetch, W., and Kritchanchai, D. (2017). A design thinking framework and design
patterns for hospital pharmacy management. International Journal of Healthcare
Management. pp. 1-9
Chatterjee,K., and Kar,S. (2016). Multi-criteria analysis of supply chain risk management using
interval valued fuzzy TOPSIS, OPSEARCH, Vol. 53(3). pp. 474-499.
Chaudhuri, A., Srivastava, S.K., Srivastava, R.K., and Parveen, Z. (2016). Risk propagation and
its impact on performance in food processing supply chain: A fuzzy interpretive
structural modelling based approach. Journal of Modelling in Management, Vol.
11(2), pp. 660-693
Chaudra, C., Kumar, S., and Ghildayal, N.S. (2009). Hospital cost structure in the USA: what’s
behind the costs? A business case. International Journal of Health Care Quality
Assurance, Vol. 24(4), pp. 314-328
Chauhan, A., and Singh, A. (2016). A hybrid multi-criteria decision making approach for
selecting a sustainable location for healthcare waste disposal. Journal of Cleaner
Production 139, pp.1001-1010
Chen, C.T. (2000). Extensions of the TOPSIS for group decision-making under fuzzy
environment. Fuzzy Sets and Systems. Vol. 114, pp. 167-174
Chen, C.T., Lin, C.T., and Huang, S.F. (2006). A fuzzy approach for supplier evaluation and
selection in supply chain management. International Journal of production
Economics. Vol. 102, pp.289-301
Chen, D.Q., Preston, D.S., ad Xia W. (2013). Enhancing hospital supply chain performance: A
relational view and empirical test. Journal of Operations Management, Vol. 31(6),
pp. 391-408

317
Cheng, S.K., and Kam, B.H. (2008). A conceptual framework for analysing risk in supply
networks. Journal of Enterprise Information Management, Vol. 22(4), pp.345-360
Cherian, B.M., Leão, A.L, et al. (2010).Isolation of Nan cellulose from pineapple leaf fibres by
steam explosion. Carbohydrate Polymers. Vol. 81(3), pp.720-725
Christopher, M. (2000). The Agile supply chain, competing in volatile markets. Industrial
Marketing Management, Vol 29, pp. 37-44
Christopher, M. and Peck, H. (2004). Building the resilient supply chain. The international
journal of logistics management, Vol. 15(2), pp.1-14
Christopher, M., and Lee, H. (2004). Mitigating supply chain risk through improved confidence.
International Journal of Physical Distribution and Logistics. Management. Vol. 34
(5), pp. 388-396
Christopher, M., and Holweg, M. (2011). “Supply Chain 2.0”, managing supply chains in the
era of turbulence. International Journal of Physical Distribution and Logistics
management, Vol. 41(1), pp. 63-82
Christopher, M. (2016). Logistics and supply chain management. Pearson, UK.
Chiarini, A. (2012). Risk management and cost reduction of cancer drugs using Lean Six Sigma
tools. Leadership in Health Services, Vol. 25(4). pp. 318-330
Chikumba, P.A. (2010). Utilization of ICTs in multipurpose community telecentres in rural
Malawi. International Conference on e-Infrastructure and e-Services for
Developing Countries. Springer Berlin Heidelberg. pp. 93-101
Chireu, A., Sultanow, E., and Saraswat, S.P. (2014). Healthcare RFID in Germany: an
integrated pharmaceutical supply chain perspective. The Journal of Applied
Business Research, Vol, 30 (3). pp. 737-752
Chikumba, P.A. (2010). Application of geographic information system (GIS) in drug logistics
management information system (LMIS) at district level in Malawi: opportunities
and challenges, in Villafiorita, A., Saint-Paul, R. and Zorer, R. (Eds). E-
Infrastructures and E-Services on Developing Countries, Springer, Berlin
Heidelberg, pp. 105-115
Chopra, S., and M.S.Sodhi. (2004). Managing Risk to Avoid Supply-Chain Breakdown. MIT
Sloan Management Review Vol. 46, pp. 53-62
Chomeya, R. (2010). Quality of psychology test between Likert scale 5 and 6 points. Journal of
Social Sciences, Vol. 6(3), pp.399-403
Colicchia, C., and Strozzi, F. (2012). Supply chain risk management: a new methodology for a
systematic literature review. Supply Chain Management: An International Journal.
Vol. 17(4). pp. 403-418

318
Cooke, R.M., ElSaadany, S. and Huang, X. (2008). On the performance of social network and
likelihood-based expert weighting schemes. Reliability Engineering and System
Safety, Vol. 93(5), pp.745-756
Cohen, M., and Kunreuther, H. (2007). Operations risk management: overview of Paul
kleindorfer’s contributions. Production and Operations management, Vol.16 (5),
pp. 525-541
Colletti, J.J. (1994). Health care reform and the hospital supply chain. Hospital Materiel
Management Quarterly, Vol. 15(3), pp. 28-35
Cousins, D., Evans, M and Wind, K. (2012). Managing risks arising from medicine shortages in
NHS hospitals. The Pharmaceutical Journal, 289(7723), 306
Coustasse, A., Tomblin, S., and Slack, C. (2013). Impact of radio-frequency identification (RFID)
technologies on the hospital supply chain: a literature review. Perspectives in
Health Information Management, 10 (Fall).
Craighead, C.W., Blackhurst, J., Rungtusanatham, J.M., Handfield, R.B. (2007). The severity of
supply chain disruptions: design characteristics and mitigation capabilities. Decis.
Sci. Vol. 38(1). pp. 131-156
Creswell, J.W. and Clark, V.L.P. (2011). Designing and conducting mixed methods research. 2nd
ed. Thousand Oaks, CA: Sage Publications
Creswell, J.W., and Creswell, J.D. (2017). Research design: Qualitative, quantitative, and mixed
methods approaches, Sage publications.
Cronin, P., Ryan, F., and Coughlan, M. (2008). Undertaking a literature review: a step-by-step
approach. British Journal of Nursing. Vol. 17(1). 38
Cruz, J.M. (2013). Mitigating global supply chain risks through corporate social responsibility.
International Journal of Production Research, Vol. 51(13), pp. 3995-4010
Cullen, A.J. and Taylor, M. (2009). Critical success factors for B2B e-commerce use within the
UK NHS pharmaceutical supply chain. International Journal of Operations and
Production Management, Vol. 29 (11). pp. 1156-1185
Curatolo, N., Lamouri, S., Huet, J.C., and Rieutord, A. (2014). A critical analysis of Lean
approach structuring in hospitals. Business Process Management Journal, Vol. 20
(3). pp. 433-454
Davis, T. (1993). Effective supply chain management. Sloan Management Review. Vol. 34,
pp.35-46
Deleris, L.A. and Erhun, F. (2011). Quantitative risk assessment in supply chains: a case study
based on engineering risk analysis concepts. In Planning Production and
Inventories in the Extended Enterprise, pp. 105-131, Springer New York.

319
Deng, H. (1999). Multi criteria analysis with fuzzy pair wise comparison, International Journal
of Approximate Reasoning, Vol.21, pp.215-31
De Marco, A., Cagliano, A.C., Nervo, M.L. and Rafele, C. (2012). Using System Dynamics to
assess the impact of RFID technology on retail operations. International journal of
production economics, Vol. 135(1), pp.333-344
Department of Health (2010). Coding for success: simple technology for safer patient care.
[Online] Available at: https://www.bipsolutions.com/docstore/pdf/15955.pdf
[Accessed: 15 May 2017]
Department of Health (2014). NHS eProcurement strategy. [Online] Available at:
https://assets.publishing.service.gov.uk/government/uploads/system/uploads/a
ttachment_data/file/344574/NHS_eProcurement_Strategy.pdf [Accessed: 12
May 2017]
Department of Health (2016). NHS procurement and commercial standards. [Online] Available
at:
https://assets.publishing.service.gov.uk/government/uploads/system/uploads/a
ttachment_data/file/539626/Standards_of_Procurement.pdf [Accessed: 12 May
2017]
De Souza, L.B. (2009). Trends and approaches in lean healthcare, Leadership in Health
Services, Vol. 22 (2). pp. 121-139
De Souza, L.B., and Pidd, M. (2011). Exploring the barriers to lean health care implementation,
Public Money and Management, Vol. 31(1), pp.59-66
De Somer, E. (2011). Securing the supply chain. Aust Prescr, Vol. 34, pp. 105-107.
De Vries, J., and Huijsman, R. (2011). Supply chain management in health services: an
overview, Supply Chain Management: An International Journal, Vol. 16 (3),
pp.159-165
Diabat, A., Govindan, K., and Panicker, V.V. (2012). Supply chain risk management and its
mitigation in a food industry, International Journal of Production Research, Vol. 50
(11), pp.3039-3050
Diehi, D., and Spinler, S. (2013). Defining a common ground for supply chain risk management
– a case study in the fast-moving consumer goods industry. International Journal
of Logistics Research and Applications, Vol. 16 (4), pp. 311-327
Ding, W., Liu, K., and Ke, G. (2003). The study on supply chain risk. China Safety Science
Journal, Vol. 13(4), pp.64-66
Ding, J.F., and Liang,G.S. (2005). Using fuzzy MCDM to select partners of strategic alliances for
liner shipping. Information Sciences. Division, The World Bank, Washington, DC.
173, pp. 197-225

320
Distelhorst, G., Hainmueller, J., and Locke, R. M. (2014). Does Lean Improve Labour
Standards? Management and Social Performance in the Nike Supply Chain.
Watson Institute for International Studies Research Paper.
Dobrzykowski, D., Deilami, V.S., Hong, P., and Kim, S.C. (2014). A structured analysis of
operations and supply chain management research in healthcare (1982-2011).
International Journal of Production Economics, 147(2014) pp. 514-530
Dow, A.W., DiazGranados, D., Mazmanian, P.E., and Retchin, S.M. (2013). Applying
organizational science to health care: a framework for collaborative practice.
Academic Medicine: Journal of the Association of American Medical Colleges, Vol.
88(7), pp. 952-957
Drupsteen, J., Van der Vaart, T., and Van Donk, P. (2013). Integrative practices in hospitals and
their impact on patient flow. International Journal of Operations and Production
Management, Vol. 33 (7). pp. 912-933
Dutta, P.S, et al. (1997). The physics and technology of gallium antimonite: an emerging
optoelectronic material. Journal of Applied Physics. Vol. 91(9). pp. 5821-5870
Easterby-Smith, M. Thorpe, R., and Jackson, P.R. (2002). Management Research. 2nd ed.
California: Sage publications
Ebel, T., George, K., Larsen, E., Shah, K., and Ungerman, D. (2013). Building new strengths in
the healthcare supply chain. McKinsey & Company.
Enyinda, C.I., Ogbuehi, A., and Briggs, C. (2008). Global supply chain risks management: A new
battleground for gaining competitive advantage. Proceedings of ASBBS, Vol.15 (1),
pp. 278-292
Enyinda,C.I., and Tolliver, D. (2009). Taking counterfeits out of the pharmaceutical supply chain
in Nigeria: leveraging multilayer mitigation approach. Journal of African Business.
Vol. 10(2), pp. 218-234.
Enyinda, C.I., Gebremikael, F., and Ogbuehi, A.O. (2014). An analytical model for healthcare
supply chain risk management. African Journal of Business and Economic
Research, Vol. 9 (1), pp. 13-27.
EI mokrini,A., Dafaoui, E., Berrado,A., and EI Mhamedi,A. (2016). An approach to risk
assessment for outsourcing logistics: Case of pharmaceutical industry. IFAC-
PapersOnLine, Vol.49 (12), pp. 1239-1244
Elleuch, H., Hachicha, W. and Chabchoub, H. (2014). A combined approach for supply chain
risk management: description and application to a real hospital pharmaceutical
case study. Journal of Risk Research, Vol. 17(5), pp 641-663.

321
Elmuti, D., Khoury, G., Omran, O., and Aou-Zaid, A.S. (2013). Challenges and opportunities of
health care supply chain management in the United State. Health Marketing
Quarterly, Vol. 30 (2), pp.128-143
Elzarka, S.M. (2013). Supply chain risk management: the lessons learned from the Egyptian
revolution 2011. International Journal of Logistics Research and Applications, Vol.
16(6), pp. 482-492
Fan, H., Li, G., Sun, H. and Cheng, T.C.E. (2017). An information processing perspective on
supply chain risk management: Antecedents, mechanism, and
consequences. International Journal of Production Economics, Vol.185, pp.63-75
Faisal, M.N., Banwet, D.K., and Shankar, R. (2007). Supply chain risk mitigation: modelling the
enabler. Business Process Management Journal, Vol. 12 (4), pp.535-552
Fawcett, S. E., Ellram, L. M., and Ogden, J. A. (2014). Supply chain management: from vision
to implementation. London: Pearson.
Fazli, S., Mavi, R.K., and Vosooghidizaji, M. (2015). Crude oil supply chain risk management
with DEMATEL-ANP. Operational Research, Vol. 15(3), pp. 453-480
Fernie, J., and Rees, C. (1995). Supply chain management in the National Health Service. The
International Journal of Logistics Management, Vol. 6 (2). pp. 83-92
Feibert, D.C., Andersen,B., and Jacobsen, P. (2017). Benchmarking healthcare logistics
processes – a comparative case study of Danish and US hospitals. Total Quality
Management and Business Excellence. pp. 1-27
Fenies, P., Gourgand, M., Rodier, S. (2006). Interoperable and multi-flow software
environment: application to health care supply chain. Business Process
Management Workshops. Springer Berlin/Heidelberg. pp. 311-322
Ferlie, E., Crilly, T., Jashapara, A., Trenholm, S., Peckham, A., and Currie, G. (2015). Knowledge
mobilization in healthcare organizations: a view from the resource-based view of
the firm. International Journal of Health Policy and Management, Vol. 4(3), pp.
127-130
Flick, U. (2015). Introducing research methodology: A beginner's guide to doing a research
project. 2nd ed. London: Sage Publications Limited.
Flynn. N. (2007). Public sector management. 5thed. London: Sage.
Forrester, J.W. (1961). Industrial dynamics. MIT Press, Cambridge, Ma, USA.
Foerstl, K., Reuter, C., Hartmann, E., and Blome, C. (2010). Managing supplier sustainability
risk in a dynamically changing environment – Sustainable supplier management in
the chemical industry. Journal of Purchasing and Supply Management, Vol. 16(2),
pp.118-130

322
Freidson,E. (1988). Profession of medicine: a study of the sociology of applied knowledge.
Chicago: University of Chicago Press.
Fu, Y. (2005). Case-Based reasoning for supply chain risk assessment. Forecasting, 1, pp.56-58
Ganguly,K.K., and Guin,K.K. (2013). A fuzzy AHP approach for inbound supply risk assessment.
Benchmarking: An International Journal, Vol. 20(1), pp. 129-146
Gaudenzi,B., and Borghesi,A. (2006). Managing risks in the supply chain using the AHP
method. The International Journal of Logistics Management, Vol.17(1), pp. 114-
136
Gebicki, M., Mooney, E., and Chen, S.J. (2014). Evaluation of hospital medication inventory
policies. Health Care Management Science. Vol. 17(3) pp.215-229
Ghadge, A., Dani, S., and Kalawsky, R. (2012). Supply chain risk management: present and
future scope. The International Journal of Logistics Management, Vol. 23(3), pp.
313-339
Ghade,A., Dani,S., Chester,M., and Kalawsky,R. (2013). A systems approach for modelling
supply chain risks. Supply Chain Management: An International Journal, Vol. 18(5),
pp. 523-538
Ghauri, P., Grønhaug, K., and Kristianslund, I. (1995). Research Methods in Business Studies -
a practical guide. Harlow, Essex: Prentice Hall.
Ghorani, S.F. (2015). Model of healthcare supply chain agility based on information
technology. Research Journal of Recent Science. Vol. 4(4), pp. 54-60
Gopalan, R., Sreekumar. Satpathy, B. (2015). Evaluation of retail service quality – a fuzzy AHP
approach. Benchmarking: An International Journal, Vol. 22(6), pp.1058-1080
Gosling, J., and Naim, M. M. (2009). Engineer-to-order supply chain management: A literature
review and research agenda. International Journal of Production Economics, Vol.
122(2), 741-754
Govindan,K., and Chaudhuri,A. (2016). Interrelationships of risks faced by third party logistics
service providers: A DEMATEL based approache. Transportation Research Part E,
pp. 177-195
Granlund, A., and Wiktorsson, M. (2013). Automation in healthcare internal logistics: a case
study of practice and potential. International Journal of Innovation and
Technology Management. Vol. 10(3). pp. 1-20
Graudins, L., Treseder, R., Hui, C., Samuel, T.L., and Dooley, M.J. (2016). A proactive quality
strategy to decrease the risk of error associated with medication procurement.
Journal of Pharmacy Practice and Research, Vol. 46(2), pp. 145-151
Gray, D.E. (2013). Doing research in the real world. 3rd ed. London: Sage.

323
Grose, J., and Richardson, J. (2014). Strategies to identify future shortages due to
interruptions in the health care procurement supply chain and their impact on
health services: a method from the English National Health Service. Journal of
Health Services Research and Policy. Vol. 19 (1). pp. 19-26
Grὂtsh,V.M., Blome,C., and Schleper, M.C. (2013). Antecedents of proactive supply chain risk
management- a contingency theory perspective. International Journal of
Production Research. Vol. 51(10), pp. 2842-2867
Giannakis, M and Louis, M. (2011). A multi-agent based framework for supply chain risk
management. Journal of Purchasing and Supply Management, Vol. 17, pp.23-31
Giannakis, M. and Papadopoulos, T. (2016). Supply chain sustainability: A risk management
approach. International Journal of Production Economics, Vol. 171, pp.455-470
Gibbons, R.H. (2009). The NHS procurement eEnablement program using information to
deliver better healthcare, in GS1 (Eds.). GS1 Healthcare Reference Book
2009/2010, GS1 Global Office, pp.22-25
Giunipero, L.C. and Aly Eltantawy, R. (2004). Securing the upstream supply chain: a risk
management approach. International Journal of Physical Distribution and
Logistics Management, Vol. 34 (9), pp.698-713
Gualandris,j., and Kalchschmidt, M. (2015). Supply risk management and competitive
advantage: a misfit model. The International Journal of Logistics Management,
Vol. 26(3), pp. 459-478
Gunasekaran, A., Lai, K. H., and Cheng, T. E. (2008). Responsive supply chain: a competitive
strategy in a networked economy. Omega, Vol. 36(4), pp. 549-564
Guen-Uslu, P., Chan, H.K., Ljaz, S., Bak, O., Whitlow, B., and Kumar, Vikas. (2014). In-depth
study of ‘decoupling point’ as a reference model: an application for health service
supply chain. Production Planning and Control: The Management of Operations,
Vol. 25 (13), pp. 1107-1117
Guimarães, C.M., and de Carvalho, J.C. (2013). Strategic outsourcing: a lean tool of healthcare
supply chain management. Strategic Outsourcing: An International Journal, Vol.6
(2) pp.138-166
Guimarães, C.M., de Carvalho, J.C., and Maia, A. (2013). Vendor managed inventory (VMI):
evidences from lean deployment in healthcare. Strategic Outsourcing: An
International Journal, Vol. 6 (1). pp. 8-24
Gulati, PM. (2009). Research Management: Fundamental and Applied Research. Global India
Publications, Busca Inc.

324
Gupta, U., and Ramesh, A. (2015). Analyzing the barriers of healthcare supply chain in India:
the contribution and interaction of factors. Procedia-Social and Behavioural
Sciences. 189. pp.217-228
Hachicha, W. and Elmsalmi, M. (2013). An integrated approach based-structural modelling for
risk prioritization in supply network management. Journal of Risk Research, Vol.
17 (10), pp.1301-1324
Hallikas, J., Karvonen, I., Pulkkinen, U., virolainen, V.M., and Tuominen, M. (2004). Risk
management processes in supplier networks. International Journal of Production
Economics, Vol. 90, pp. 47-58
Haigh, J., IMS Global Consulting, quoted in ‘Parallel Trade in Medicines’. Social Market
Foundation, June 2004.
Harland, C.M. (1997). Supply chain operational performance roles. Integrated Management
Systems, Vol.8 (2), pp.6-14
Harland, C., Brenchley, R. and Walker, H. (2003). Risk in supply networks. Journal of
Purchasing and Supply management, Vol. 9(2), pp.51-62
Harris,J., Ozgen,H., and Ozcan,Y. (2000). Do mergers enhance the performance of hospital
efficiency? Journal of the Operational Research Society, Vol. 51(7), pp. 801-811
Haszlinna Mustaffa, N., and Potter, A. (2009). Healthcare supply chain management in
Malaysia: a case study. Supply Chain Management: An International
Journal, Vol.14 (3), pp. 234-243
Heckmann, I., Comes, T., and Nickel, S. (2015). A critical review on supply chain risk–
Definition, measure and modelling. Omega, 52, pp. 119-132
Heinbuch, S.E. (1995). A case of successful technology transfer to health care. Journal of
Management in Medicine, Vol, 9 (2). pp. 48-56
Hinkin, T.R. (1995). A review of scale development practices in the study of organizations.
Journal of Management, Vol. 21 (5), pp. 967-988
Hohenstein, N.-O., Feisel, E. and Hartmann, E. (2014). Human resource management issues in
supply chain management research, International Journal of Physical Distribution
and Logistics Management, Vol. 44 No. 6, pp. 434-463
Hovav, S., and Tsadikovich, D. (2015). A network flow model for inventory management and
distribution of influenza vaccines through a healthcare supply chain. Operations
Research for Health Care. Vol. 5. pp. 49-62
Ho,W ., Zheng, T., Yildiz, H., and Talluri, S. (2015). Supply chain risk management: a literature
review. International Journal of Production Research, Vol. 53 (16), PP. 5031-5069

325
Hutchins, M. J., and Sutherland, J. W. (2008). An exploration of measures of social
sustainability and their application to supply chain decisions. Journal of Cleaner
Production, Vol. 16 (15), pp. 1688-1698
Hwang, C.L., and Yoon, K. (1981). Multiple Attributes Decision Making Methods and
Applications. Berlin: Springer.
Iqbal, M., Geer, M. and Dar, P. (2017). Medicines Management in Hospitals: A Supply Chain
Perspective. Systematic Reviews in Pharmacy, Vol. 8(1), pp. 80
Ilie,C., Popa p. (2013). Efficient healthcare consumer supply chain optimization. Valahian
journal of Economic Studies. Vol. 4(18).pp. 41-48
Jarreet, P.G. (1998). Logistics in the healthcare industry. International Journal of Physical
Distribution and Logistics Management, Vol.28 (9/10), pp. 741-772
Jaberidoost, M., Nikfar, S., Abdollahiasl, A. and Dinarvand, R. (2013). Pharmaceutical supply
chain risks: a systematic review. DARU Journal of Pharmaceutical Sciences, Vol.
21(1), pp. 69
Jaberidoost, M., Olfat,L., Hosseini, A., Kebriaeezadeh, A., Abdollahi, M., Alaeddini, M., and
Dinarvand, R. (2015). Pharmaceutical supply chain risk assessment in Iran using
analytic hierarchy process (AHP) and simple additive weighting (SAW) methods.
Journal of pharmaceutical policy and practice, Vol. 8(1), pp. 9.
Jebb, A.T., Parrigon, S. and Woo, S.E. (2017). Exploratory data analysis as a foundation of
inductive research. Human Resource Management Review, Vol. 27(2), pp.265-
276
Jnandev, K.K., Krishnananda, k.K., Mohamad, A., Shabharaya,A.R. (2012). Evaluation of
different types of risks in pharmaceutical supply chain. American Journal of
Pharmtech Research. Vol. 2(4). pp. 280-287
Jin, M., Switzer, M., and Agirbas, G. (2008). Six sigma and lean in healthcare logistics centre
design and operation: a case at North Mississippi Health Services. International
Journal of Six Sigma and Competitive Advantage. Vol. 4(3). pp. 270-288
Jia,F., and Rutherford, C. (2010). Mitigation of supply chain relational risk caused by cultural
differences between China and the West. The International journal of Logistics
Management, Vol. 21(2), pp. 251-270
Jiang, X., Chen, F., and Wang, F. (2007). Risk analysis and assessment in supply chain network.
Journal of Southeast University (Natural Science Edition), Vol. 37 (s2), pp.354- 360
Jiang,B., Baker,R.C., and Frazier,G.V. (2009). An analysis of job dissatisfaction and turnover to
reduce global supply chain risks: Evidence from China. Journal of Operations
Management, Vol. 27, pp. 169-184
326
Jiang, K. et al. (2016). Triple-Mode Emission of Carbon Dots: Applications for Advanced Anti-
Counterfeiting. Angewandte Chemie International Edition, Vol. 55(25), pp. 7231-
7235
Joosten, T., Bongers, I., and Janssen, R. (2009). Application of lean thinking to health care:
issues and observations. International Journal for Quality in Health Care. Vol 21
(5), pp. 341-347
Jurado, I., Maestre, J.M., Velarde, P., Ocampo-Martinez, C., Fernández, I., Tejera, B.I., and del
Prado, J.R. (2016). Stock management in hospital pharmacy using chance-
constrained model predictive control. Computers in Biology and Medicine. 72. pp.
248-255
Jüttner, U., Peck, H. and Christopher, M. (2003). Supply chain risk management: outlining an
agenda for future research. International Journal of Logistics: Research and
Applications, Vol. 6(4), pp.197-210
Jüttner, U. (2005). Supply chain risk management. The International Journal of Logistics
Management, Vol. 16(1), pp.120-141
Kannan, G., Pokharel, S. and Kumar, P.S. (2009). A hybrid approach using ISM and fuzzy TOPSIS
for the selection of reverse logistics provider. Resources, conservation and
recycling, Vol. 54(1), pp.28-36
Kanyoma, K.E., Khomba, J.K., Sankhulani, E.J., and Hanif, R. (2013). Sourcing strategy a supply
chain risk management in the healthcare sector: a case study of Malawi’s public
healthcare delivery supply chain. Journal of Management and Strategy. Vol. 4 (3).
pp. 16-26
Kahraman,C., Cebeci,U., and Ulukan, Z. (2003). Multi-criteria supplier selection using fuzzy
AHP. Logistics Information Management, Vol.16(6), pp. 382-394
Kaplan, R.S. and Norton, V. (1992). The balanced scorecard – measures that drive
performance. Harvard Business Review, Vol. 70 (1), pp. 71-79
Karaghouli, AL., Kazmersku, L. (2013). Energy consumption and water production cost of
conventional and renewable-energy-powered desalination processes. Renewable
and Sustainable Energy Reviews. 24, pp. 343-356
Karahalios, H. (2009). A risk based appraisal of maritime regulations in the shipping industry.
PhD Thesis. Liverpool John Moores University
Karsak, E.E., and Tolga, E. (2001). Fuzzy multi-criteria decision-making procedure for
evaluating advanced manufacturing system investments. International journal of
Production Economics. Vol. 69, pp. 49-64

327
Karwa, R. et al. (2017). Addressing the 3A’s (Availability, Accountability, Adherence) of
Supply Chain Systems in Western Kenya. s.l., American Chemical Society, pp.
129-157
Kaufmann, A. and Gupta, M.M. (1988). Fuzzy mathematical Models in Engineering and
Management Science, Elsevier Science Inc., New York, NY.
Kayis, B., karningsih, P.D. (2012). SCRIS: A knowledge-based system tool for assisting
manufacturing organizations in identifying supply chain risks. Journal of
Manufacturing Technology Management, Vol. 23 (7), pp.834-852
Kelle, P., Woosley, J., and Schneider, H. (2012). Pharmaceutical supply chain specifics and
Inventory solutions for a hospital case. Operations Research for Health Care. Vol.
1(2), pp.54-63
Kern,D., moser,R., Hartmann,E., and Moder, M. (2012). Supply risk management: model
development and empirical analysis. International Journal of Physical Distribution
and Logistics Management, Vol. 42(1), pp.60-82
Ketikidis, P., and Stalidis, G. (2010). Applying e-procurement system in the healthcare: the
EPOS paradigm. International Journal of Systems Science. Vol. 41(3), pp. 281-299
Khan, O., and Burnes, B. (2007). Risk and supply chain management: creasting a research
agenda. The International Journal of Logistics Management, Vol. 18(2), pp. 197-
216
Khan, O., Christopher, M., and Burnes, B. (2008). The impact of product design on supply chain
risk: a case study. International Journal of Physical Distribution and Logistics
Management, Vol. 38(5), pp. 412-432
Kleindorfer, P.R. and Saad, G.H. (2005). Managing disruption risks in supply chains. Production
and operations management, Vol. 14(1), pp.53-68
Kwong, C.K., and Bai, H. (2003). Determining the importance weights for the customer
requirements in QFD using a fuzzy AHP with an extent analysis approach. IIE
Transactions, Vol. 35(7), pp. 619-626
Kitsiou, S., Matopoulos, A., Manthou, V., and Vlachopoulou, M. (2007). Evaluation of
integration technology approaches in the healthcare supply chain. International
Journal of Value Chain Management, Vol.1 (4). pp. 325-343
Kim,N., and Pae, J. (2007). Utilization of new technologies: organizational adaptation to
business environments. Journal of the Academy of Marketing Science. Vol. 35(2),
pp. 259-269
Kim, S.H., and Kwon, I.W.G. (2016). The study of healthcare supply chain management in
United States: Literature Review. Management Review: An International Journal.
Vol. 10 (2). pp. 34-56

328
Kjos, A.L., Binh, N.T., Robertson, C. and Rovers,J. (2016). A drug procurement, storage and
distribution model in public hospitals in a developing country. Research in Social
and Administrative Pharmacy. Vol. 12(3), pp. 371-383
Knight, A.K., Blessner, P., Olson, B.A. and Blackburn, T.D. (2017). Strategic sourcing and
corporate social responsibility: Aligning a healthcare organization's strategic
objectives. Journal of Purchasing and Supply Management, Vol. 23(2), pp.94- 104
Koczwara, A. and Dressman, J. (2017). Poor Quality and Counterfeit Drugs: a
systematicassessment of prevalence and risks based on data published from
2007-2016.Journal of Pharmaceutical Sciences.
Kogan, K., Leu,J., and Chernonog, T. (2014). Healthcare supply chain operations: why are
doctors reluctant to consolidate? Operations Research for Health Care. Vol. 3(3).
pp. 101-115
Kollberg, B., Dahlgaard, J.J., and Brehmer, P.O. (2006). Measuring lean initiatives in healthcare
services: issues and findings. International Journal of Productivity and
Performance Management, Vol. 56 (1). pp. 7-24
König, A. and Spinler, S. (2016). The effect of logistics outsourcing on the supply chain
vulnerability of shippers: Development of a conceptual risk management
framework. The International Journal of Logistics Management, Vol. 27(1),
pp.122-141
Kὂse, U and Deperlioglu, O. (2015). FL-LAB v2: Design and Development of an Easy-to-Use,
Interactive Fuzzy Logic Control Software System. Applied Mathematics and
Information Sciences: An International Journal. Vol. 9 (2), pp.883-897
Kotzab, H., Seuring, S., Miller, M. And Reiner, G. (2000). Research Methodologies in Supply
Chain Management. New York: Physica-Verlag Heidelberg.
Kowalski, R., and Sergot, M. (1986). A logic-based calculus of events. New Generation
Computing. Vol. 4(1). pp. 97-95
Kowalski, J.C. (1986). Just-in-time for hospitals – so what’s new? Hospitals Materials
Management, Vol. 11 (11), pp. 6-9
Kremer, M., Van Wassenhove, L.N. (2014). Willingness to pay for shifting inventory risk: the
role of contractual form. Production Operation Management. Vol. 23 (2), pp. 239-
252
Kreysa, U., and Denecker, J. (2009). GS1 Standards in healthcare: raising the bar on patient
safety and supply chain efficiency. GS1 Healthcare Reference Book, 2010, pp. 1-5
Kritchanchai, D. (2012). A framework for healthcare supply chain improvement in Thailand.
Operations and Supply Chain Management: An International Journal, Vol.5 (2), pp.
103-113

329
Krohling, R.A., and Campanharo, V.C. (2011). Fuzzy TOPSIS for Group Decision Making: A Case
Study for Accidents with Oil Spill in the Sea. Expert Systems with Applications. Vol.
38 (4). pp. 4190-4197
Kumar, A., Ozdamar, L., and Ng, C.P. (2005). Procurement performance measurement system
in the health care industry. International Journal of Health Care Quality Assurance,
Vol.18 (2). pp. 152-166
Kumar, A., Ozdamar, L., and Ning Zhang, C. (2008). Supply chain redesign in the healthcare
industry of Singapore. Supply Chain Management: An International Journal, Vol.
13 (2), pp. 95-103
Kumar, S., Degroot, R.A., and Choe, D. (2008). Rx for smart hospital purchasing decisions.
International Journal of Physical Distribution and Logistics Management. Vol. 38
(8). pp. 601-615
Kumar, S., Swanson, E., and Tran, T. (2009). RFID in the healthcare supply chain: usage and
application. International Journal of Health Care Quality Assurance, Vol. 22(1), pp.
67-112
Kumar, P., Singh,R.K. (2012). A fuzzy AHP and TOPSIS methodology to evaluate 3PL in a supply
chain. Journal of Modelling in Management, Vol. 7(3), pp. 287-303
Kumar, S., and Blair, J.T. (2013). U.S. healthcare fix: Leveraging the lessons from the food
supply chain. Technology and Health Care. Vol. 21(2), pp.125-141
Kumar, S., Gorane,S., and Kant,R. (2015). Modelling the supplier selection process enablers
using ISM and fuzzy MICMAC approach. Journal of Business and Industrial
Marketing, Vol. 30(5), pp. 536-551
Kwang, H.L. (2005). First course on fuzzy theory and applications, Springer-verlag, Berlin
Heidelberg/New York, 2005. pp. 137-144
Kwon,I.W.G., kim,S.H., and Martin,D.G. (2016). Healthcare supply chain management:
strategic areas for quality and financial improvement, Technological Forecasting
and Social Change, Vol. 113, pp. 422-428
Lam, J. (2003). Enterprise risk management: From incentives to controls. New Jersey: Wiley
Lai, K.H, Ngai, E.W.T., and Cheng, T.C.E. (2002). Measures for evaluating supply chain
performance in transport logistics. Logistics and Transportation Review, Vol. 38
(6), pp. 439- 456
Langabeer, J. (2005). The evolving role of supply chain management technology in healthcare,
Journal of Healthcare Information Management. Vol. 19(2) pp.27-33
Laosirihongthong, T., Samaranayake, P., and Adebanjo, D. (2014). Prioritizing lean supply
chain management initiatives in healthcare service operations: A fuzzy-AHP
approach. Production Planning and Control. Vol. 27(12). pp 953-966

330
Lapierre, S.D., and Ruiz, A.B. (2007). Scheduling logistic activities to improve hospital supply
systems. Computers and Operations Research, Vol. 34(3), pp.624-641
Laureani, A., and Antony, J. (2012). Critical success factors for the effective implementation
of Lean Sigma: results from an empirical study and agenda for future research.
International Journal of Lean Six Sigma. Vol. 3(4). pp. 274-283
Laureani, A., Brady, M. and Antony, J. (2013). Application of Lean six sigma in an Irish hospital,
Leadership in Health Services. Vol. 26(3). pp. 322-337
Lavastre, O., Gunasekaran, A. and Spalanzani, A. (2012). Supply chain risk management in
French companies. Decision Support Systems, Vol. 52(4), pp.828-838
Lwa,K.M.Y. (2016). How schedule issues affect drug logistics operations: an empirical study in
hospitals in China. Industrial Management and Data Systems, Vol. 116(3). pp. 369-
387
Lawrence, X. and Kopcha, M. (2017). The future of pharmaceutical quality and the path to
get there. International Journal of Pharmaceutics. Vol. 528 (1-2). pp. 354-359
Lee, H.J., Padmanabhan, V., Whang, S. (1997). Information distortion in a supply chain: the
bullwhip effect. Management Science. Vol. 43(4), pp. 546-558.
Lee, S. M., Lee, D., and Schniederjans, M. J. (2011). Supply chain innovation and organizational
performance in the healthcare industry. International Journal of Operations and
Production Management, Vol. 31(11), pp. 1193-1214
Lega, F., Marsilio, M., and Villa, S. (2013). An evaluation framework for measuring supply
chain performance in the public healthcare sector: evidence from the Italian NHS.
Production Planning and Control: The Management of Operations, Vol. 24(10),
pp.931-947
Li, J., Wang, S., and Cheng, T.C.E. (2010). Competition and Cooperation in a Single-retailer
Two-supplier Supply Chain with Supply Disruption. International Journal of
Production Economics, Vol. 124(1), pp. 137-150
Li, G., Kong, J. and Yin, Z. (2014). Analysis of Factors Influencing the Development of Medical
E- Commerce Based on ISM. In Applied Mechaincs and Materials. Trans Tech
Publications, Vol 444. pp. 1612-1619
Lichtner, V., Hibberd, R., and Cornford, T. (2016). Networking hospital ePrescribing: a
systemic view of digitalization of medicines’ use in England. Studies in health
technology and informatics, Vol. 225, pp. 73-77
Lillrank, P., Groop, J., and Venesmaa, J. (2011). Processes, episodes and events in health
service supply chains. Supply Chain Management: An International Journal, Vol 16
(3) pp. 194-201

331
Lim, M.K., Tseng, M.L., Tan, K.H. and Bui, T.D. (2017). Knowledge management in sustainable
supply chain management: improving performance through an interpretive
structural modelling approach. Journal of Cleaner Production. Vol. 162. pp. 806-
816
Lin, C., Lin, H.C.K., Huang, Y.A., and Jalleh, G. (2011). The fit between organizational B2B e-
commerce policy, IT maturity and evaluation practices on B2B e-commerce
performance in Australian healthcare organizations. African Journal of Business
Management, Vol. 5(5), pp. 1983
Lin, R.H., and Ho, P.Y. (2014). The study of CPFR implementation model in medical SCM of
Taiwan. Production Planning and Control, Vol. 25(3), pp.260-271
Liouka, I. (2007). Opportunity identification in MNC subsidiaries: context and performance.
PhD Thesis, University of Glasgow, Glasgow: UK
Liu, W., Zhao, X., Tang, O. and Xu, H. (2017). Impacts of demand and supply factors on the
capacity scheduling performance of logistics service supply chain with mass
customisation service modes: an empirical study from China. Production
Planning and Control , Vol. 28 (9). pp. 1-17
Lockamy III, A., and McCormack,K. (2012). Modelling supplier risks using Bayesian networks.
Induatrial Management and Data Systems, Vol. 112(2), pp. 313-333
Long, H. (2014). An empirical review of research methodologies and methods in creativity
studies (2003-2012). Creativity Research Journal, Vol. 26(4), pp. 427-438
Lord Carter (2016). Operational productivity and performance in English NHS acute hospitals;
Unwarranted variables. [Online] Available at:
https://assets.publishing.service.gov.uk/government/uploads/system/uploads/a
ttachment_data/file/499229/Operational_productivity_A.pdf [Accessed: 11 Sep
2016]
Lὒcker,F., and Seifert, R.W. (2017). Building up resilience in a pharmaceutical supply chain
through inventory, dual sourcing and agility capacity. Omega. Vol. 73, pp. 114-124
Lusch, R.F. (2011). Reframing supply chain management: a service-dominant logic
prespective. Journal of Supply Chain Management, Vol. 47(1), pp. 14-18
Ma, K., Ruan,D., Xu, Y., and Zhang, G. (2007). A fuzzy-set approach to treat determinacy and
consistency of linguistics terms in multi-criteria decision making. International
Journal of Approximate Reasoning, Vol. 44, pp. 165-181
Mackey, T., Liang, B., York, P. and Kubic, T. (2015). Counterfeit drug penetration into global
legitimate medicine supply chains: a global assessment. The American journal of
tropical medicine and hygiene, Vol. 92(6), pp. 59-67

332
MacVaugh, T.W. (2007). Complex organizational issues require complex solutions. Hospital
Material Management. Vol. 32(4) pp. 12-12
Machado, C.M.L., Scavarda, A., Vaccaro, G., Korzenowsk, A.L., and Kipper, L.M. (2015).
Making decisions in the hospital’s supply chain: the new look for its model of
management. Academy of Taiwan Business Management Review. Vol. 4(5). pp.
55- 63
Malone, D.W. (1975). An introduction to the application of interpretive structural modelling.
Proceeding of the IEEE, Vol. 63 (3), pp.397-404
Mandal, A. and Deshmukh, S.G. (1994). Vendor selection using interpretive structural
modelling (ISM). International Journal of Operations and Production
Management, Vol. 14 (6), pp.52-59
Mandal, S. (2017). The influence of dynamic capabilities on hospital-supplier collaboration
and hospital supply chain performance. International Journal of Operations and
Production Management. Vol. 37(5). pp. 664-684
Mangan, J., Lalwani, B.J. and Gardner, B. (2004). Combining quantitative and qualitative
methodologies in logistics research. International Journal of Physical Distribution
and Logistics Management, Vol. 34(7), pp. 565-578
Manuj, I. and Mentzer, J.T. (2008). Global supply chain risk management. Journal of business
logistics, Vol. 29(1), pp.133-155
Manuj, I., Esper,T.L., and Stank,T.P. (2014). Supply chain risk management approaches under
different conditions of risk. Journal of Business Logistics, Vol. 35(3), pp. 241-258
Martínez-Jurado, P. J., and Moyano-Fuentes, J. (2014). Lean management, supply chain
management and sustainability: a literature review. Journal of Cleaner
Production, 85, 134-150.
Maryland, B. (2012). Summary of the executive session on critical threats to the pharmacy
supply chain and the effects on patient care. American Journal of Health-System
Pharmacy, Vol. 70(19), pp. 1689-1698
Mason-Jones, R. and Towill, D.R. (1999). Shrinking the supply chain uncertainty circle. IOM
Control, Vol 24(7), pp. 17-22.
Mason-Jones, R., Naylor, B. and Towill, D.R. (2000). Engineering the league supply chain.
International Journal of Agile Management Systems, Vol. 2(1), pp.54-61
Maslaric, M., Backalic, T., Nikolicic, S., and Mircetic, D. (2013). Assessing the trade-off
between lean and resilience through supply chain risk management. International
Journal of Industrial Engineering and Management, Vol. 4(4), pp.229-236

333
Matopoulos, A., and Michailidou, L. (2013). Healthcare supply chains: a case study of hospital-
vendor collaborative practices. International Journal of Logistics Systems and
Management. Vol. 15(2), pp.288-303
McCormack, B. and Hill, E. (1997). Conducting a survey: The SPSS workbook. London:
Thompson.
McKinsey & Company (2013). Building new strengths in the healthcare supply chain. [Online]
Available at:
https://www.mckinsey.com/~/media/mckinsey/industries/healthcare%20syste
ms%20and%20services/our%20insights/strengthening%20health%20cares%20s
upply%20chain%20a%20five%20step%20plan/building%20new%20strengths%2
0in%20the%20health%20care%20supply%20chain.ashx [Accessed on 17 March
2017]
McKone-Sweet, K.E., Hamilton, P., and Willis, S.B. (2005). the ailing healthcare supply chain:
a prescription for change. Journal of Supply Chain Management. Vol. 41 (1) pp.4-
17
Medwell, G. (2009). Integrating information flows in orthopaedics at Leeds Teaching Hospital
NHS Trust, in GS1 (Eds.), GS1 Healthcare Reference Book 2009/2010, GS1 Global
Office, pp. 26-31
Mentzer, T.J. and Kahn, K.B. (1995). a framework of logistics research. Journal of Operations
Management, Vol.16 (1), pp.231-250
Mentzer, J.T., Dewitt, W., Keebler, J.S., (2001), Defining supply chain management. Journal of
Business Logistics. Vol. 22(2). pp. 1-25
Melo, M. T., Nickel, S., and Saldanha-da-Gama, F. (2009). Facility location and supply chain
Management –A review. European journal of operational research, Vol. 196(2),
pp. 401-412
Meijboom, B., Schmidt-Bakx, S., and Westert, G. (2011). Supply chain management practices
for improving patient-oriented care. Supply Chain Management: An International
Journal, Vol. 16 (3). pp. 166-175
Messelbeck, J., and Sutherland, L. (2000). Applying environmental product design to
biomedical products research. Environmental Health Perspectives. Vol. 108 (6).
997
Moeinzadeh, P., and Hajfathaliha, A. (2009). A combined fuzzy decision making approach to
supply chain risk assessment. World Academy of Science, Engineering and
Technology, Vol. 60(2), pp. 519-528
Mollenkopf, D., Stolze, H., Tate, W. L., and Ueltschy, M. (2010). Green, lean, and global supply
chains. International Journal of Physical Distribution and Logistics
Management, Vol. 40 (1/2), pp. 14-41

334
Monczka, R., Handfield, R., Giunipero, L., and Patterson, J. (2008). Purchasing and supply chain
management. Cengage Learning.
Moher, D., Liberati, A., Tetzlaff, J., and Altman, D.G. (2009). Preferred reporting items for
systematic reviews and Meta-analyses: the PRISMA statement. PLoS Medicine.
Vol 6. (7). pp. 1-6
Mustaffa, N.H., and Potter, A. (2009). Healthcare supply chain management in Malaysia: a
case study. Supply Chain Management: An International Journal, Vol. 14 (3). pp.
234-243
Musyoki, K. and Ngugi, E. (2017). Effects of supplier development practices on performance
of pharmaceutical suppliers for hospitals in Nairobi City County. International
Journal of Supply Chain Management, Vol. 2 (1), pp. 32-56
Nachtmann,H., and Pohl,E.A. (2009). The state of healthcare logistics: cost and quality
improvement opportunities, Center for Innovation in Healthcare Logistics,
University of Arkansas
Naeslund, D. (2002). Logistics needs qualitative research: especially action research.
International Journal of Physical Distribution and Logistics Management, Vol.
32(5), pp. 321-338
Nagurney, A. and Wakolbinger, T. (2005). Super networks: An introduction to the concept and
its applications with a specific focus on knowledge super networks. International
Journal of Knowledge, Culture and Change Management, 4.
Nagurney,A., Cruz,J., Dong,J., and Zhang,D. (2005). Supply chain networks, electronic
commerce, and supply side and demand side risk. European Journal of
Operational Research, Vol. 164, pp. 120-142
Nakandala,D., Lau,H., and Zhao,L. (2017). Development of a hybrid fresh food supply chain
risk assessment model. International Journal of Production Research, Vol. 55(14),
pp. 4180-4195
Narasimhan, R., and Talluri, S. (2009). Perspectives on risk management in supply chains.
Journal of Operation Management, Vol. 27(2), pp. 114-118
Narayana, S.A., Pati, R.K., and Vrat, P. (2014). Managerial research on the pharmaceutical
supply chain – an critical review and some insights for future directions. Journal
of Purchasing and Supply Management, Vol. 20 (1), pp.18-40
Nazam, M., Xu, J.P., Tao, Z.M., Ahmand, J., and Hashim, M. (2015). A fuzzy AHP-TOPSIS
framework for the risk assessment of green supply chain implementation in the
textile industry. International Journal of Supply and Operations Management. Vol.
2(1). pp. 548-568

335
Neely, A. (1999). The performance measurement revolution: why now and what next?
International Journal of Operations and Production Management. Vol. 19(2). pp.
205-228
Norrman, A., and Jansson, U. (2004). Ericsson’s proactive supply chain risk management
approach after a serious sub-supplier accident. International Journal of Physical
Distribution and Logistics Management. Vol. 34 (5), pp. 434-456
Nouei, M.T., Kamyad, A.V., Ghazalbash, S. and Sarzaeem, M.R. (2013). Application of fuzzy-
AHP extent analysis to determine the relative importance of risk factors in
operative mortality after Coronary Artery Bypass surgery. International Journal on
Computer Science and Engineering, Vol. 5(5), pp.393
Nyaga,G.N., Young, G.J., and Zepeda, E.D. (2015). An analysis of the effects of intra- and inter-
organizational arrangements on hospital supply chain efficiency. Journal of
Business Logistics, Vol. 36(4), pp.340-354
Ogboghodo, E.O., Omuemu, V.O., Odijie, O., and Odaman, O.J. (2017). Cold chain
management practices of health care workers in primary health care facilities in
Southern Nigeria. Pan African Medical Journal, Vol. 27(1)
Oke, A. and Gopalakrishnan, M. (2009). Managing disruptions in supply chains: A case study
of a retail supply chain. International journal of production economics, Vol. 118
(1), pp. 168-174
Oliveira, F. and Hamacher, S. (2012). Optimization of the petroleum product supply chain
under uncertainty: A case study in Northern Brazil. Industrial and Engineering
Chemistry Research. Vol. 51(11). pp. 4279-4287
Olson, D. L., and Wu, D. (2015). Enterprise risk management. Vol. 3. World Scientific
Publishing Company.
Olsson, O., and Aronsson, H. (2015). Managing a variable acute patient flow – categorising
the strategies. Supply Chain Management: An International Journal, Vol. 20 (2).
pp. 113-127
Oluka, P.N., Ssennoga, F., and Kambaza, S. (2013). Tackling supply chain bottlenecks of
essential drugs: A case of Uganda local government health units. In 4th
International Procurement Conference (pp. 26-28).
Oppermann, M. (2000). Triangulation -a methodological discussion. The International Journal
of Tourism Research, Vol. 2(2), pp. 141-146
Pan, Z.X., and Pokharel, S. (2007). Logistics in hospitals: a case study of some Singapore
hospitals. Leadership in Health Services, Vol.20 (3). pp. 195-207
Panneerselvam, R. (2014). Research methodology. 2nd ed. Delhi: PHI Learning Pvt. Ltd.

336
Parnaby, J., and Towill, D.R. (2009). Engineering cellular organization and operation for
effective healthcare delivery supply chains. The International Journal of Logistics
Management, Vol. 20 (1). pp. 5-29
Parker, J., and DeLay, D. (2008). The future of the healthcare supply chain. Healthcare
financial management: journal of the Healthcare Financial Management
Association, Vol. 62 (4), pp. 66-69
Parker, G.G., and Anderson, E.G. (2002). From buyer to integrator: the transformation of the
supply chain manager in the vertically disintegrating firm. Production and
Operations Management. Vol. 11 (1). pp. 75-91
Patel, S. (2017). The availability of counterfeit medicines and products continues to be a
concern. Journal of Aesthetic Nursing, Vol. 6 (10), pp. 544-546
Patil, S.K. and Kant, R. (2014). A fuzzy AHP-TOPSIS framework for ranking the solutions of
Knowledge Management adoption in Supply Chain to overcome its
barriers. Expert Systems with Applications, Vol. 41(2), pp.679-693
Paul, W. (2007). Managing variation through system redesign. International Journal of
Healthcare Technology and Management. Vol. 8(6). pp. 589-602
Peck, H. (2006). Reconciling supply chain vulnerability, risk and supply chain management.
International Journal of Logistics Research and Applications, Vol. 9(2), pp. 127-142
Perҫin,S. (2009). Evaluation of third-party logistics (3PL) providers by using a two-phase AHP
and TOPSIS methodology, Benchmarking: An International Journal, Vol. 16(5), pp.
588-604
Pettit, T. J., Fiksel, J., and Croxton, K. L. (2010). Ensuring supply chain resilience: development
of a conceptual framework. Journal of Business Logistics, Vol. 31(1), pp. 1-21
Pfohl, H.C., Gallus, P. and Thomas, D. (2011). Interpretive structural modelling of supply chain
risks. International Journal of physical distribution and logistics management, Vol.
41(9), pp.839-859
Pleasant, J. (2009). Changes has finally come: U.S. Healthcare industry to implement common
data standards to improve safety, reduce cost, in GS1 (Eds.). GS1 Healthcare
Reference Book 2009/2010, GS1 Global Office, pp.6-9
Pokharel, S. (2005). Perception on information and communication technology perspectives
in logistics, Enterprise Information Management, Vol.18 (2), pp. 136-149
Poksinska, B. (2010). The current state of Lean implementation in health care: literature
review, Quality Management in Healthcare. Vol. 19 (4), pp.319-329
Poirier, C.C., Swink, M.L., and Quinn, F.J. (2007). 5th annual global survey of supply chain
progress. Supply Chain Management Review. Vol. 11(7)

337
Prakash, S., Soni, G., Rathore, A.P.S., and Singh, S. (2017). Risk analysis and mitigation for
perishable food supply chain: a case of dairy industry. Benchmarking: An
International Journal, Vol. 24 (1). pp. 2-23
Priyan, S., and Uthayakumar, R., (2013), Optimal inventory management strategies for
pharmaceutical company and hospital supply chain in a fuzzy-stochastic
environment, operations Research for Health Care, Vol. 3(4), pp.177-190
Pinna, R., Carrus, P.P., and Marras, F. (2015). Emerging trends in healthcare supply chain
management- An Italian experience. Applications of Contemporary Management
Approaches in Supply Chain. INTECH
Postacchini,L., Ciarapica, F.E., Bevilacqua, M., Mazzuto,G., and Paciarotti, C. (2016). A way for
reducing drug supply chain cost for a hospital district: a case study. Journal of
Industrial Engineering and Management. Vol. 9(1), pp. 207-230
Potter, M. (1980). Competitive strategy: techniques for analysing industries and competitors.
New York: Free Press.
Purssell, E. (2015). Reviewing the importance of the cold chain in the distribution of vaccines.
British Journal of Community Nursing, Vol. 20(10)
Prakash, C., and Barua, M.K. (2016). An analysis of integrated robust hybrid model for third-
party reverse logistics partner selection under fuzzy environment. Resources,
Conservation and Recycling, Vol. 108, pp. 63-81
Qazi, A., Quigley, J., Dickson, A., and Ekici, S,Ö. (2017). Exploring dependency based
probabilistic supply chain risk measures for prioritising interdependent risks and
strategies. European Journal of Operational Research, Vol. 259(1), pp. 189-204
Qrunfleh, S. and Tarafdar, M. (2014). Supply chain information systems strategy: Impacts on
supply chain performance and firm performance. International Journal of
Production Economics, Vol. 147, pp. 340-350
Quang,H.T., and Hara,Y. (2017). Risks and performance in supply chain: the push effect.
International Journal of Production Research, pp. 1-20
Quinn, F. (2006). Risky business. Supply Chain Management Review. May/Jun 2006, Vol. 10
(4), pp.5
Radivojević, G., and Gajović, V. (2014). Supply chain risk modelling by AHP and Fuzzy AHP
methods. Journal of Risk Research, Vol. 17(3), pp. 337-352
Radzor, Z., and Osborne, S.P. (2013). A failed theory for public services? Public Management
Review, Vol. 15 (2), pp.267-287
Rafele,C., Hillson,D., and Grimaldi,S. (2005). Understanding project risk exposure using the
two-dimensional risk breakdown matrix. Project Management Institute.

338
Rahimnia, F., and Moghadasian, M. (2010). Supply chain leagility in professional services:
how to apply decoupling point concept in healthcare delivery system. Supply
Chain Management: An International Journal, Vol. 15 (1). pp. 80-91
Rajesh, R., and Ravi, V. (2015). Modelling enablers of supply chain risk mitigation in electronic
supply chains: A Grey-DEMATEL approach. Computers & Industrial Engineering,
Vol 87, pp. 126-139
Rangerl, D.A., de Oliveira, T.K., and Leite, M.S.A., (2015), Supply chain risk classification:
discussion and proposal, International Journal of Production Research, Vol. 53
(22). pp. 6868-6887.
Rao, S. and Goldsby, T.J. (2009). Supply chain risks: a review and typology. The International
Journal of Logistics Management, Vol. 20 (1), pp.97-123
Rathore, R., Thakkar,J.J., and Jha, J.K. (2017). A quantitative risk assessment methodology and
evaluation of food supply chain. The International Journal of Logistics
Management, Vol.28(1), pp. 1272-1293
Rego, N., Claro, J. and Sousa, J.P. (2014). A hybrid approach for integrated healthcare
cooperative purchasing and supply chain configuration. Health care
management science. Vol. 17 (4), pp.303-320.
Remenyi, D. and Williams, B. (1998). Doing research in business and management: an
introduction to process and method. London: Sage Publications Limited.
Rivard-Royer, H., Landry, S., and Beaulieu, M. (2002). Hybrid stockless: a case study.
International Journal of Operatios and Production Management, Vol. 22 (4),
pp.412- 424
Ritchie, B., and Brindley, C. (2007). Supply chain risk management and performance.
International Journal of Operations and Production management, Vol. 27(3), pp.
303-322
Ritchie, B., and Brindley, C. (2007). An emergent framework for supply chain risk management
and performance measurement. Journal of the Operational Research Society, Vol.
58 (11), pp.1398-1411
Robson, C. and McCartan, K. (2016). Real world research. New Jersey: John Wiley and Sons.
Roger, H., Srivastava, M., Pawar, K.S., and Shah, J. (2016). Supply chain risk management in
India – practical insights. International Journal of Logistics Research and
Applications, Vol. 19 (4), pp. 278-299
Roma, P., Reed, D., Reed, F. and Hursh, S. (2017). Progress of and Prospects for Hypothetical
Purchase Task Questionnaires in Consumer Behavior Analysis and Public Policy.
The Behavior Analyst, Vol. 40 (2). pp. 329-342

339
Rossetti, C.L., Handfield, R., and Dooley, K.J. (2011). Forces, trends, and decisions in
pharmaceutical supply chain management, International Journal of Physical
Distribution and Logistics Management. Vol. 41(6), pp. 601-622
Saaty, T.L. (2008). Decision making with the analytic hierarchy process. International journal
of services sciences, Vol. 1(1), pp.83-98
Saedi,S., Kundakcioglu, O.E., and Henry, A.C. (2016). Mitigating the impact of drug shortages
for a healthcare facility: An inventory management approach. European Journal
of Operational Research. Vol. 251(1). pp. 107-123
Sage, A.P. (1977). Interpretive Structural Modelling: Methodology for Large-Scale Systems,
McGraw-Hill, New York, NY, pp.91-164.
Sampson, S.E., Schmidt, G., Gardner, J.W., and Orden, J.V. (2015). Process coordination within
a health care service supply network. Journal of Business Logistics. Vol. 36 (4),
pp. 355-373
Samuel, C., Gonapa, K., Chaudhary, P.K., and Mishra, A. (2010). Supply chain dynamics in
healthcare services. International Journal of Health Care Quality Assurance.
Vol.23 (7). pp. 631-642
Samantra, C., Datta, S., Mahapatra, S.S. and Debata, B.R. (2016). Interpretive structural
modelling of critical risk factors in software engineering project. Benchmarking:
An International Journal, Vol. 23(1), pp.2-24
Samvedi, A., Jain, V., and Chan,T.S. (2013). Quantifying risks in a supply chain through
integration of fuzzy AHP and fuzzy TOPSIS. International Journal of Production
Research, Vol. 51(8). pp. 2433-2442
Sarac, A., Absi, N., and Dauzère-Pérès, S. (2010). A literature review on the impact of RFID
technologies on supply chain management. International Journal of Production
Economics, Vol. 128 (1), pp. 77-95
Saunders, M., Lewis, P., Thornhill, A. and Wang, C.L. (2009). Analysing quantitative
data. Research Methods for Business Students, Prentice Hall, UK.
Savino.M.M., Mazza,A., and Marchetti, B. (2015). Lean manufacturing within critical
healthcare supply chain: an exploratory study through value chain simulation.
International Journal of Procurement Management. Vol. 8(1/2), pp. 3-24
Saxena, J.P. and Sushil, V.P. (1990). Impact of indirect relationships in classification of
variables – a MICMAC analysis for energy conservation. Systems Research, Vol. 7
(4), pp.245-53
Seçme, N.Y., Bayrakdaroğlu, A., and Kahraman,C. (2009). Fuzzy performance evaluation in
Turkish banking Sector using Analytic Hierarchy Process and TOPSIS. Expert
Systems with Applications. Vol. 36 (9). pp. 11699-11709

340
Selçuk, P. (2009). Evaluation of third-party logistics (3PL) providers by using a two-phase AHP
and TOPSIS methodology. Benchmarking: An International Journal, Vol.16(5) pp.
588-604
Sekaran, U. and Bougie, R. (2016). Research methods for business: A skill building approach.
7th Ed. New Jersey: John Wiley and Sons.
Serhiy Y. Ponomarov, Mary C. Holcomb. (2009). Understanding the concept of supply chain
resilience. The International Journal of Logistics Management, Vol. 20(1), pp.124-
143
Seuring, S., and Müller, M. (2008). From a literature review to a conceptual framework for
sustainable supply chain management. Journal of cleaner production, Vol. 16(15),
pp. 1699-1710
Sevkli, M., Koh, S.L., Zaim, S., Demirbag, M., and Tatoglu, E. (2008). Hybrid Analytical hierarchy
Process Model for Supplier Selection. Industrial management and Data Systems,
Vol. 108(1), pp.122-142
Schmenner, R.W., Van Wassenhove, L., Ketokivi, M., Heyl, J., and Lusch, R.F. (2009). Too much
theory, not enough understanding. Journal of Operations Management, Vol.
27(5), pp. 339-343
Schmitt, A.J., and Singh, M. (2012). A quantitative analysis of disruption risk in a multi echelon
supply chain. International Journal of Production Economics, Vol. 139(1), pp. 22-
32
Schneller, E.S., and Smeltzer, L.R. (2006). Strategic management of the health care supply
chain. Jossey-Bass.
Scholten, K. and Fynes, B., (2017). Risk and uncertainty management for sustainable supply
chains. s.l., Springer International Publishing, pp. 413-436.
Scott, S., Burnette, M., Dittman, P., Stank, T. and Autry, C. (2015). Supply chain talent: Our
most important resource, [Online] Available at:
www.blog.ryder.com/2015/05/supply-chain-talentmanagement/ [Accessed
August 12, 2015].
Scioli, A. (2017). Leadership Strategies for Addressing US Pharmaceutical Drug Shortages and
Supply Chain Disruptions. s.l.:(Doctoral dissertation, Walden University).
Shamah, R.A. (2013). Measuring and building lean thinking for value creation in supply
chains. International Journal of Lean Six Sigma, Vol. 4(1), pp. 17-35
Sharahi, S. and Abedian, M. (2009). Performance Measurement. In Supply chain and logistics
in national, international and Government environment. Heidelberg: Physica-
Verlag Springer, pp 21-41

341
Shah, N.P., Tran, C., and Lee F.Y., et al. (2004). Overriding imatinib resistance with a novel ABL
kinase inhibitor, Science, Vol. 305(5682), pp.399-401
Shirley,C., and Winston, C. (2004). Firm inventory behaviour and the returns from high way
infrastructure investment. Journal of Urban Economic, Vol. 55(2), pp. 398-415
Simangunsong, E., Hendry, L.C., and Stevenson, M. (2012). Supply-chain uncertainty: a review
and theoretical foundation for future research. International Journal of
Production Research, Vol. 50(16), pp. 4493-4523
Simatupang, T.M., and Sridharan, R. (2005). The collaboration index: a measure for supply
chain collaboration. International Journal of Physical Distribution and Logistics
Management, Vol. 35(1), pp. 44-62
Simpson, D., Meredith, J., Boyer, K., Dilts, D., Ellram, L. M., and Leong, G. K. (2015).
Professional, Research, and Publishing Trends in Operations and Supply Chain
Management. Journal of Supply Chain Management. Vol. 51 (3), pp.87-100
Singhal, P., Agarwal, G. and Mittal, M.L. (2011). Supply chain risk management: review,
classification and future research directions. International Journal of Business
Science and Applied Management, Vol. 6 (3).
Singh, C.D., Singh, R., and Singh, S. (2013). Application of lean and JIT principles in supply chain
management. International Journal of Management Research and Business
Strategy, Vol. 2(1), pp. 85-98
Singh, R.K., Kumar, R., and Kumar, P. (2016). Strategic issues in pharmaceutical supply chains:
a review. International Journal of Pharmaceutical and Healthcare Marketing, Vol.
10(3). pp. 234-257
Sinha, K.K., and Kohnke, E.J. (2009). Health care supply chain design: toward linking the
development and delivery of care globally. Decision Sciences. Vol. 40 (2). pp. 197-
212
Skipper, N. and Vejlin, R. (2015). Determinants of generic vs. brand drug choice: Evidence
from population-wide Danish data. Social Science and Medicine, Vol 130, pp.
204-215
Smith, B.K, et al. (2011). An investigation of the healthcare supply chain: literature review. IIE
Annual Conference Proceedings. Institute of Industrial and Systems Engineers.
Snyder, L., and Shen, Z.J.M. (2006). Managing Disruptions to Supply Chains, In Frontiers of
Engineering Reports on Leading-Edge Engineering from the 2006 Symposium (p.
139). National Academies Press.
Sodhi, M.S., Lee, S. (2007). An analysis of sources of risk in the consumer electronics industry.
Journal of the Operational Research Society. Vol. 58(11), pp. 1430-1439.

342
Sodhi, B. and T V, P. (2012). A simplified description of Fuzzy TOPSIS. arXiv preprint arXiv , pp.
1205.5098.
Sodhi, M.S., Son, B.G. and Tang, C.S. (2012). Researchers' perspectives on supply chain risk
management. Production and operations management, Vol. 21(1), pp.1-13
Soni, U., Jain, V. and Kumar, S. (2014). Measuring supply chain resilience using a deterministic
modelling approach. Computers and Industrial Engineering, Vol. 74(1), pp.11-25
Sooksriwong,C., and Bussaparock, W. (2009). Quality of cold storage drugs transportation and
delivery to Thai hospital. Journal of the Medical Association of Thailand, Vol.
92(12), pp.1681-1685
Sreedevi,R., and Saranga, H. (2017). Uncertainty and supply chain risk: the moderating role of
supply chain flexibility in risk mitigation. International Journal of Production
Economics, Vol. 193, pp.332-342
Stank,T.P., Keller,S.B., and Closs,D.J. (2001). Performance benefits of supply chain logistical
integration. Transportation Journal, pp.32-46
Stanton, P., Gough, R., Ballardie, R., Bartram, T., Bamber, G.J., and Sohal, A. (2014).
Implementing lean management/six sigma in hospitals: beyond empowerment or
work intensification? The International Journal of Human Resource
Management, Vol. 25 (21), pp.2926-2940
Su, S.L.I., Gammelgaard, B., and Yang, S.L. (2011). Logistics innovation process revisited:
insights from a hospital case study. International Journal of Physical Distribution
and Logistics Management. Vol. 41(6), pp. 577-600
Sun, C.C. (2010). A performance evaluation model by integrating fuzzy AHP and fuzzy TOPSIS
methods. Expert systems with applications, Vol. 37 (12), pp.7745- 7754
Suder, A., and Kahraman, C. (2015). Minimizing environmental risks using fuzzy TOPSIS:
location selection for the ITU Faculty of Management. Human and Ecological Risk
Assessment: An International Journal. Vol. 21 (5), pp. 1326-1340
Syahrir, I., and Vanany, I. (2015). Healthcare and disaster supply chain: literature review and
future research. Procedia Manufacturing, Vol. 4, pp. 2-9
Szyperski, N. and Eul-Bischoff, M. (1983). Interpretative Strukturmodellierung (ISM): Stand der
Forschung und Entwicklungsmöglichkeiten, Springer-Verlag.
Talluri, S., Kull, T.J., Yildiz, H., and Yoon, J. (2013). Assessing the efficiency of risk mitigation
strategies in supply chains. Journal of Business Logistics Vol. 34(4), pp. 253-269
Tate, W. L., Ellram, L. M., and Kirchoff, J. F. (2010). Corporate social responsibility reports: a
thematic analysis related to supply chain management. Journal of Supply Chain
Management, Vol. 46 (1), pp. 19-44
343
Tan, O. and Musa, S. (2010). Identifying risk issues and research advancements in supply chain
risk management. International Journal of Production Economics, Vol. 133 (1),
pp.25-34
Tang, C.S. (2006a). Perspectives in supply chain risk management. International Journal of
Production Economics. Vol. 103, pp. 451-488
Tang, C. and Tomlin, B., (2008). The power of flexibility for mitigating supply chain risks.
International Journal of Production Economics, Vol. 116 (1), pp.12-27
Tarafdar, M., and Qrunfleh, S. (2017). Agile supply chain strategy and supply chain
performance: complementary roles of supply chain practices and information
systems capability for agility. International Journal of Production Research, Vol.
55(4), pp. 925-938
Tayur, S., Ganeshan, R., and Magazine, M. (Eds.). (2012). Quantitative models for supply chain
management (Vol. 17). Springer Science and Business Media.
Taylor, S.J., Bogdan, R. and DeVault, M. (2015). Introduction to qualitative research methods:
A guidebook and resource. New Jersey: John Wiley and Sons.
Thun, J.H. and Hoenig, D. (2011). An empirical analysis of supply chain risk management in
the German automotive industry. International Journal of Production Economics,
Vol. 131(1), pp.242-249
Thun, J.H., Drȗke, M., and Hoenig, D. (2011). Managing uncertainty – an empirical analysis of
supply chain risk management in small and medium-sized enterprises.
International Journal of Production Research, Vol. 49(18), pp. 5511-5525
Tranfield, D., Denyer, D., and Smart, P. (2003). Towards a methodology for developing
evidence-informed management knowledge by means of systematic review.
British Journal of Management. Vol. 14 (3). pp. 207-222
Trautmann, G., Bals, L., Hartmann, E. (2009). Global sourcing in integrated network structures:
the case of hybrid purchasing organizations. Journal of International
Management. Vol. 15 (2). pp. 194-208
Trkman, P., and McCormack, K. (2009). Supply chain risk in turbulent environments—A
conceptual model for managing supply chain network risk. International Journal
of Production Economics, Vol. 119 (2), pp.247-258
Toba, S, et al. (2008). Supply chain management in hospital: A case study. California Journal
of Operations Management. Vol. 6 (1). pp. 49-55
Tolf, S., Nystrὂm, M.E., Tishelman, C., Brommels, M., and Hansson, J. (2015). Agile, a guiding
principle for health care improvement? International journal of Health Care
Quality Assurance. Vol. 28(5). pp. 468-493

344
Tomlin, B. (2006). On the value of mitigation and contingency strategies for managing supply
chain disruption risks. Management Science, Vol. 52(5), pp. 639-657
Tomlin,S., Cokerill,H., Cpsyello,I., Griffith,R., Hicks,R., Sutcliffe,A., and Tuleu,C. (2009). Making
medicines safer for children-guidance for the use of unlicensed medicines in
paediatric patients. Guidelines handbook. Nursingtimesnet.
Torabi,S.A., Giahi,R., and Sahebjamnia,N. (2016). An enhanced risk assessment framework for
business continulty management systems. Safety Science, Vol. 89, pp. 201-218
Towill, D.R., and Christopher, M. (2003). The supply chain strategy conundrum: to be lean or
agile or to be lean and agile. Supply Chain Practice. Vol. 5 (2). pp. 30-45
Towill, D.R., and Christoper, M. (2005). An evolutionary approach to the architecture of
effective healthcare delivery systems. Journal of Health Organization and
Management, Vol. 19 (2). pp. 130-147
Tse, Y. and Tan, K. (2011). Managing product quality risk in a multi-tier global supply chain.
International Journal of Production Research, Vol. 49 (1), pp. 139-158
Tucker, A.L. (2004). The impact of operational failures on hospital nurses and their patients.
Journal of Operations Management. Vol. 22(2), pp. 151-169
Tummala, R., and Schoenherr, T. (2011). Assessing and managing risks using the supply chain
risk management process (SCRMP). Supply Chain Management: An International
Journal, Vol. 16 (6), pp. 474-483.
Tukamuhabwa,B., and Stevenson,M., and Busby,J. (2017). Supply chain resilience in a
developing country context: a case study of the interconnectedness of threats,
strategies and outcomes. Supply Chain Management: An International Journal,
Vol. 22(6), pp. 486-505
Upadhye, N., Awana, D. and Mathur, S. (2014). Interpretive structural modeling of
implementation enablers for just in time in ICPI. International Journal of Lean
Thinking, Vol. 5 (1), pp. 36-51.
UPS (2015). Eight UPS Pain in the chain. [Online] Available at:
https://www.pressroom.ups.com/pressroom/ContentDetailsViewer.page?Conce
ptType=FactSheets&id=1447447621905-301 [Accessed: 12 May 2017]
Uthayakumar,R., and Priyan, S. (2013). Pharmaceutical supply chain and inventory
management strategies: optimization for a pharmaceutical company and a
hospital. Operations Research for Health Care. Vol. 2 (3), pp. 52-64
Vanany, I., Zailani, S. and Pujawan, N. (2009). Supply chain risk management: literature review
and future research. International Journal of Information Systems and Supply
Chain Management, Vol.2 (1), pp.16-33

345
Van Laarhoven, P.J.M. and Pedrycz, W. (1983). A fuzzy extension of Saaty’s priority theory.
Fuzzy Sets and Systems, Vol. 11, pp.229-41
Van Merode, G.G., Groothuis, S. and Hsaman, A. (2004). Enterprise resource planning for
hospitals. International Journal of Medical Informatics, Vol.73, pp.493-501
Van Weele, A. J. (2009). Purchasing and supply chain management: Analysis, strategy,
planning and practice. Cengage Learning EMEA.
Van Wyk, B. (2012). Research design and methods Part I. University of Western Cape.
Van Vuuren, W. (2000). Cultural influences on risks and risk management: six case studies.
Safety Science, Vol. 34 (1), pp. 31-45
Vargas, L.G. (1990). An overview of the analytic hierarchy process and its application.
European Journal of Operational Research, Vol. 48 (1), pp.2-8
Venkatasubramanian, V., Zhao, J. and Viswanathan, S. (2000). Intelligent systems for HAZOP
analysis of complex process plants. Computers and Chemical Engineering, Vol. 24
(9), pp.2291-2302
Venkatesh,V.G., Rathi,S., and Patwa,S. (2015). Analysis on supply chain risks in Indian apparel
retail chains and proposal of risk prioritization model using Interpretive Structural
Modelling. Journal of Retailing and Consumer Services, Vol, 26, pp. 153-167
Vlajic, J.V., Van der Vorst, J.G., and Haijema, R. (2012). A framework for designing robust food
supply chains. International Journal of Production Economics, Vol. 137 (1), pp.176-
189
Vries, J.D. (2011). The shaping of inventory systems in health services: A stakeholder analysis.
International Journal of Production Economics, Vol. 133(1). pp. 60-69
Vilko, J.P. and Hallikas, J.M. (2012). Risk assessment in multimodal supply chains.
International Journal of Production Economics, Vol. 140 (2), pp.586-595
Vitalari, N.P. (2016). Prospects for the future of the healthcare industry: a speculative
analysis. American Journal Medical Research, Vol. 3 (2), pp.7-52
Villa, S., Prenestini, A. and Giusepi, I. (2014). A framework to analyse hospital-wide patient
flow logistics: evidence from an Italian comparative study. Health Policy, Vol. 115
(2), pp. 196-205
Villacorta, P.J., Masegosa, A.D., Castellanos, D., and Lamata, M.T. (2012). A linguistic approach
to structural analysis in prospective studies, in Greco, S., Bouchon-Meunier, B.,
Coletti, G., Fedrizzi, M., Matarazzo, B., and Yager, R.R., (Eds), Advances on
Computational Intelligence, Part One, Springer, Berlin, Heidelberg, pp. 150-159,
297
Vincent,C. (2006). Patient Safety, Elservier Science Limited, London, UK.

346
Vinodh,S., Prasanna,M., and Prakash,N.H. (2014). Integrated fuzzy AHP-TOPSIS for selecting
the best plastic recycling method: a case study. Applied Mathematical Modelling,
Vol. 38(19-20), pp. 4662-4672
Volland, J., Fὒgener, A., Schoenfelder, J., and Brunner,J.O. (2017). Material logistics in
hospitals: A literature review. Omega. Vol. 69. pp. 82-101.
Wagner, S.M., and Bode, C. (2006). An empirical investigation into supply chain vulnerability.
Journal of Purchasing and Supply management, Vol. 12 (6), pp. 301- 312
Walker, H., Di Sisto, L., and McBain, D. (2008). Drivers and barriers to environmental supply
chain management practices: Lessons from the public and private sectors. Journal
of purchasing and supply management, Vol. 14 (1), pp. 69-85
Wamba, S.F., et al. (2008). Exploring the impact of RFID technology and the EPC network on
mobile B2B eCommerce: a case study in the retail industry. International Journal
of Production Economics. Vol. 112 (2). pp. 614-629
Wang,C.B., Mao,Z.F., Johansen, J., Luxhoj,J.T., O’Kane, J., Wang,J., Wang,L.G., and Chen, X.Z.
(2016). Critical success criteria for B2B E-commerce systems in Chinese medical
supply chain. International Journal of Logistics: Research and Application, Vol.
19(2), pp. 105-124
Wang, S.P., and Lee, W. (2013). A joint economic lot-sizing model for the hospital’s supplier
with capacitated warehouse constraint. Journal of Industrial and Production
Engineering. Vol. 30(3). pp. 202-210
Wang, X., Chan, H.K., Yee, R.W.Y., and Diaz-Rainey, I. (2012). A two-stage Fuzzy-AHP model
for risk assessment of implementing green initiatives in the fashion supply chain.
International Journal of Production Economics, Vol. 135, pp. 595-606
Wang, Y.M. and Chin, K.S. (2011). Fuzzy analytic hierarchy process: A logarithmic fuzzy
preference programming methodology. International Journal of Approximate
Reasoning, Vol. 52 (4), pp.541-553
Wang, X., and Durugbo, C. (2013). Analysis network uncertainty for industrial product- service
delivery: a hybrid fuzzy approach. Expert Systems with Applications, Vol. 40(11),
pp. 4621-4636.
Wang,X. (2015). A comprehensive decision-making model for the evaluation of green
operations initiatives. Technological Forecasting and Social Change, Vol. 95, pp.
191-207
Wang, X., Tiwari, P. and Chen, X. (2017). Communicating supply chain risks and mitigation
strategies: a comprehensive framework. Production Planning and Control, Vol. 28
(13), pp.1-14

347
Wang,X.J., Li,D., and Shi,X.L. (2012). A fuzzy model for aggregative food safety risk assessment
in food supply chains. Production Planning and Control, Vol. 23(5), pp. 377-395
Wang,Y., and Hao,H.X. (2016). Research on the supply chain risk assessment of the Fresh
Agricultural products based on the improved TOPSIS Algorithm. Chemical
Engineering Transactions, Vol. 51, 445-450
Warfield, J.N. (1994). A Science of Generic Design: Managing Complexity through Systems
Design. 2nd ed., Iowa State University Press, Ames, IA.
Waters, C. D. J. (2007). Supply Chain Risk Management: Vulnerability and Resilience in
Logistics. Norfolk: Biddles Ltd, King’s Lynn.
Waters, D., and Rinsler, S. (2014). Global logistics: New directions in supply chain
management. Kogan Page Publishers.
Wedley, W.C. (1990). Combining qualitative and quantitative factors – an analytic hierarchy
process, Socio-Economic Planning Sciences, Vol, 24 (1), pp.57-64
Wilding, R., and Wagner, B. (2014). Building theory in supply chain management through
‘systematic reviews’ of the literature. Supply Chain Management: An International
Journal.
Wilson, J.W., Cunningham, W.A. and Westbrook, K.W. (1992). Stockless inventory systems for
the health care provider: three successful applications. Journal of Health Care
Marketing, Vol. 12 (2), pp. 39-45
Wilson, J. (2010). Essentials of Business Research: A Guide to Doing Your Research Project.
New Delhi: Sage Publications
Wisner, J., Tan, K. C., and Leong, G. (2015). Principles of supply chain management: a balanced
approach. Cengage Learning.
Wu, T., Blackhurst, J and Chidambaram, V. (2006). A model for inbound supply risk analysis.
Computers in Industry, Vol. 57 (4), pp. 350-365
Wu, D.F., Rossetti, M.D., and Tepper, J.E. (2015). Possibility of inventory pooling in China’s
public hospital and appraisal about its performance. Applied Mathematical
Modelling. Vol. 39(23-24). pp. 7277-7290
Wu, Y., Cegielski, C.G., Hazen, B.T., and Hall, D.J. (2013). Cloud computing in support of supply
chain information system infrastructure: understanding when to go to the cloud.
Journal of Supply Chain Management, Vol. 49(3), pp. 25-41
Xanthopoulos, A., Vlachos, D., Iakovou, E. (2010). Optimal Newsvendor Policies for Dual-
sourcing Supply Chains: A Disruption Risk Management Framework. Computers
and Operations Research, Vol. 39(2), pp.350-357

348
Xie, Y., Breen, L., Cherrett, T., Zheng, D.C., and Allen, C.J. (2016). An exploratory study of
reverse exchange systems used for medical devices in the UK National Health
Service (NHS). Supply Chain Management: An International Journal. Vol. 21 (2).
pp. 194-215
Xu, E., Wermus, M., and Bauman, D.B. (2011). Development of an integrated medical supply
information system. Enterprise Information Systems, Vol. 5(3), pp. 385-399
Yang, L., Huang, C. and Liu, C. (2017). Distribution of essential medicines to primary care
institutions in Hubei of China: effects of centralized procurement arrangements.
BMC health services research, Vol. 17(1), p. 727
Yang, Y.C., Cheng, H.K., Ding, C., and Li, S.L. (2017). To join or not to join group purchasing
organization; A vendor’s decision. European Journal of Operational Research. Vol.
258 (2). pp. 581-589
Yanow, D., and Schwartz-Shea, P. (2015). Interpretation and method: Empirical research
methods and the interpretive turn. Routledge.
Yaroson, E., Breen, L. and Matthias, O. (2017). Disruptions, recovery strategies and the
pharmaceutical supply chain; empirical evidence from first tier customers in the
United Kingdom..
Yeasmin, S. and Rahman, K.F. (2012). Triangulation' research method as the tool of social
science research. Bup Journal, Vol. 1 (1), pp.154-163
Yin, R.K. (2015). Qualitative research from start to finish. Guilford Publications.
Young, S. (2007). Comparing Best Practice Cases in Creating an Environment Conducive to
Development Benefits, Growth and Investment - Developing a Case Study
Methodology. In Proceedings: of the United Nations Conference on Trade and
Development, Geneva, Switzerland
Yu, H., Zeng, A.Z., and Zhao, L. (2009). Single or Dual Sourcing: Decision-making in the
Presence of Supply Chain Disruption Risks. Omega, Vol. 37(4), pp.788-800
Yu, X., Li, C., Shi,Y.H., and Yu,M. (2010). Pharmaceutical supply chain in China: current issues
and implications for health system reform, Health Policy, Vol.97 (1), pp.8-15
Yu,Y.B., Xiong,W., and Cao,Y.h. (2015). A conceptual model of supply chain risk mitigation: the
role of supply chain integration and organizational risk propensity. Journal of
Coastal Research, Vol.73 (sp 1), pp. 95-98
Zanjirani, R., Farahani, N., and Davarzani, H. (2009). Supply chain and logistics in national,
international and government environment. Heidelberg: Physica-Verlag Springer.
Zepeda, E.D., et al. (2016). Supply chain risk management and hospital inventory: Effects of
system affiliation. Journal of Operations Management. 44. pp.30-47

349
Zhu, Q., Sarkis, J., and Lai, K. H. (2008). Confirmation of a measurement model for green
supply chain management practices implementation. International journal of
production economics, Vol. 111 (2), pp. 261-273
Zimmermann, H.J. (2010). Fuzzy set theory. Wiley Interdisciplinary Reviews: Computational
Statistics, Vol. 2 (3), pp.317-332
Zsidisin, G. A., and Ritchie, B. (2008). Supply chain risk: a handbook of assessment,
management, and performance (Vol. 124). Springer Science and Business Media
Zsidisin, G.A., and Ellram, L.M. (2003). An agency theory investigation on supply risk
management. Journal of Supply Chain Management, Vol. 39(2), pp. 15-27
Zou, P.X.W., and Couani, P. (2012). Managing risks in green building supply chain.
Architectural Engineering and Design management, Vol. 8(2), pp. 143-158
Zouggari, A., and Benyoucef, L. (2012). Simulation based fuzzy TOPSIS approach for group for
group multi-criteria supplier selection problem. Engineering. Applications of
Artificial intelligence. Vol. 25 (3), pp. 507-519

350
APPENDIX ONE
Questionnaire used in Survey A for the purpose of Chapter five

351
Research on Risk Management for Healthcare Supply Chain in Hospital
Dear Sir/Madam,
My name is Lei Wang, who is currently the PhD candidate at the Liverpool Logistics Offshore
and Marine Research Institute (LOOM) in Liverpool John Moores University. My research topic
is “Research on risk management for healthcare supply chain in hospital”. The research aims
to propose a novel risk management methodology to identify, evaluate and mitigate the risk
factors in hospital supply chain.
I should be very pleased if you can take part in this study in view of your professional
knowledge in risk management, supply chain management or in hospital. It is necessary to
pre-test the reliability and validity of the identified risk factors in the research and your
assistance would be greatly appreciated in making this a meaningful questionnaire. The
information gathered is this survey will be treated in the strictest confidence. The researcher
will make every effort to prevent anyone who is not on the research team from knowing that
you provided this information, or what the information is. If you have any questions about
this study, please feel free to contract me either email [email protected] or by phone.
You also can contact my supervisor, Dr Jun Ren, at (44)1512312236, or by email
Yours faithfully,
Lei Wang,
PhD Candidate,
Liverpool Logistics Offshore and Marine Research Institute (LOOM)
Tel: +(44)7510535904 or (86)13223898880
Email: [email protected]
Room 121, James Parsons Building
Liverpool John Moores University, Byrom Street, Liverpool, L3 3AF, UK

352
Section A: Respondent Profile
1. What is the type of your organization?
Pharmaceutical
Manufacturer
Pharmaceutical
distributor
(pharmaceutical
company )
Hospital
(Procurement department;
Material management
department etc.)
Other
☐ ☐ ☐ ☐
2. What is your job title?
3. For how many years have you worked in the healthcare industry or healthcare supply
chain?
☐1-5 years ☐6-10 years ☐11-15 years ☐16-19 years ☐≥20 years
4. Would you like to provide additional information and participate in the next survey if
necessary?
☐Yes ☐No
Section B:
Based on the research, the purpose categorizing the risks in hospital supply chain into three
main categories: 1) external to the hospital but internal to the supply chain network; 2)
internal to the hospital; 3)external to the supply chain network. (See the figure below for a
schematic of where these risks are focused) The following questions are related to the rank
and modify the identified risk factors in the hospital supply chain.

353
For the identified risk factors in the hospital supply chain, the important levels can be
marked based on the corresponding numbers:
1=Very Unimportant;
2=Minor Unimportant;
3=Moderate;
4= Minor Important;
5=Very Important
External to the hospital but internal to the supply chain network (i.e. arise from interactions
between organizations within the supply chain)
Supply risks (i.e. adversely affects inward flow of any type of resource to enable
operations to take place or the transpiration of significant and/or disappointing
failures with inbound goods and service)
Quality risks
Supplier risks

354
Identified Risk Factors (Quality risks)
Important level
Quality risks S1 Counterfeiting ☐1 ☐ 2☐ 3 ☐4☐ 5
S2 Poor quality in the purchased drugs from suppliers
☐1 ☐ 2☐ 3 ☐4☐ 5
S3 Time limit of drug, product perishability ☐1 ☐ 2☐ 3 ☐4☐ 5
Identified Risk Factors (Supplier risks)
Important level
Supplier risks S4 Shortage of drugs, unavailability of drugs on the market
☐1 ☐ 2☐ 3 ☐4☐ 5
S5 Location of manufacturer/supplier (not the domestic based); (e.g. sourcing from the global, long lead time, high costs)
☐1 ☐ 2☐ 3 ☐4☐ 5
S6 Unavailability of raw material – true and commercially induced.
☐1 ☐ 2☐ 3 ☐4☐ 5
S7 Cash flow/cash management threat associated with small pharmaceutical companies and hospitals;
☐1 ☐ 2☐ 3 ☐4☐ 5
Considering the above structure, elements contributing to risks associated with supply risks
are categorized into “quality risks” and “supplier risks”. Do you think this categorization is
appropriate?
Risk element categories Yes No Any comments
Quality risks
Supplier risks
Any other elements should be considered?
Demand risks (i.e. the possibility of unexpected changes arising from market or
Ver
y U
nim
po
rtan
t
Min
or
Un
imp
ort
ant
Mo
der
ate
Min
or
imp
ort
ant
Ver
y im
po
rtan
t
Ver
y U
nim
po
rtan
t
Ver
y U
nim
po
rtan
t
Ver
y U
nim
po
rtan
t
Ver
y U
nim
po
rtan
t
Ver
y U
nim
po
rtan
t
Ver
y U
nim
po
rtan
t
Ver
y U
nim
po
rtan
t
Ver
y U
nim
po
rtan
t
Min
or
Un
imp
ort
ant
Min
or
Un
imp
ort
ant
Min
or
Un
imp
ort
ant
Min
or
Un
imp
ort
ant
Min
or
Un
imp
ort
ant
Min
or
Un
imp
ort
ant
Min
or
Un
imp
ort
ant
Min
or
Un
imp
ort
ant
Mo
der
ate
Mo
der
ate
Mo
der
ate
Mo
der
ate
Mo
der
ate
Mo
der
ate
Mo
der
ate
Mo
der
ate
Min
or
imp
ort
ant
Min
or
imp
ort
ant
Min
or
imp
ort
ant
Min
or
imp
ort
ant
Min
or
imp
ort
ant
Min
or
imp
ort
ant
Min
or
imp
ort
ant
Min
or
imp
ort
ant
Ver
y im
po
rtan
t
Ver
y im
po
rtan
t
Ver
y im
po
rtan
t
Ver
y im
po
rtan
t
Ver
y im
po
rtan
t
Ver
y im
po
rtan
t
Ver
y im
po
rtan
t
Ver
y im
po
rtan
t

355
downstream customers)
Capability risks
Forecast risks
Identified Risk Factors (Capability risks)
Important level
Capability risks (the capabilities such as technical skills, knowledge and leadership competencies of individuals and the collective group responsible for managing the demand, plus the relationships within and outside organizations and individuals)
S8 Capacity versus demand, inability of capacity to meet demand;
☐1 ☐ 2☐ 3 ☐4☐ 5
S9 Demand triggered by the nurse, not the patient
☐1 ☐ 2☐ 3 ☐4☐ 5
Identified Risk Factors (Forecast risks)
Important level
Forecast risks S10 Demand uncertainty ☐1 ☐ 2☐ 3 ☐4☐ 5
S11 Wrong demand forecasting ☐1 ☐ 2☐ 3 ☐4☐ 5
Ver
y U
nim
po
rtan
t
Ver
y U
nim
po
rtan
t
Ver
y U
nim
po
rtan
t
Ver
y U
nim
po
rtan
t
Ver
y U
nim
po
rtan
t
Ver
y U
nim
po
rtan
t
Ver
y U
nim
po
rtan
t
Ver
y U
nim
po
rtan
t
Min
or
Un
imp
ort
ant
Min
or
Un
imp
ort
ant
Min
or
Un
imp
ort
ant
Min
or
Un
imp
ort
ant
Min
or
Un
imp
ort
ant
Min
or
Un
imp
ort
ant
Min
or
Un
imp
ort
ant
Min
or
Un
imp
ort
ant
Mo
der
ate
Mo
der
ate
Mo
der
ate
Mo
der
ate
Mo
der
ate
Mo
der
ate
Mo
der
ate
Mo
der
ate
Min
or
imp
ort
ant
Min
or
imp
ort
ant
Min
or
imp
ort
ant
Min
or
imp
ort
ant
Min
or
imp
ort
ant
Min
or
imp
ort
ant
Min
or
imp
ort
ant
Min
or
imp
ort
ant
Ver
y im
po
rtan
t
Ver
y im
po
rtan
t
Ver
y im
po
rtan
t
Ver
y im
po
rtan
t
Ver
y im
po
rtan
t
Ver
y im
po
rtan
t
Ver
y im
po
rtan
t
Ver
y im
po
rtan
t
Ver
y U
nim
po
rtan
t
Ver
y U
nim
po
rtan
t
Ver
y U
nim
po
rtan
t
Ver
y U
nim
po
rtan
t
Ver
y U
nim
po
rtan
t
Ver
y U
nim
po
rtan
t
Ver
y U
nim
po
rtan
t
Ver
y U
nim
po
rtan
t
Min
or
Un
imp
ort
ant
Min
or
Un
imp
ort
ant
Min
or
Un
imp
ort
ant
Min
or
Un
imp
ort
ant
Min
or
Un
imp
ort
ant
Min
or
Un
imp
ort
ant
Min
or
Un
imp
ort
ant
Min
or
Un
imp
ort
ant
Mo
der
ate
Mo
der
ate
Mo
der
ate
Mo
der
ate
Mo
der
ate
Mo
der
ate
Mo
der
ate
Mo
der
ate
Min
or
imp
ort
ant
Min
or
imp
ort
ant
Min
or
imp
ort
ant
Min
or
imp
ort
ant
Min
or
imp
ort
ant
Min
or
imp
ort
ant
Min
or
imp
ort
ant
Min
or
imp
ort
ant
Ver
y im
po
rtan
t
Ver
y im
po
rtan
t
Ver
y im
po
rtan
t
Ver
y im
po
rtan
t
Ver
y im
po
rtan
t
Ver
y im
po
rtan
t
Ver
y im
po
rtan
t
Ver
y im
po
rtan
t

356
Considering the above structure, elements contributing to risks associated with demand risks
are categorized into “capability risks” and “forecast risks”. Do you think this categorization is
appropriate?
Risk element categories Yes No Any comments
Capability risks
Forecast risks
Any other elements should be considered?
Internal to the hospital (i.e. the risk sources lie within the boundaries of the supply chain
parties and range from labour to IT-system uncertainties).
Process risks (i.e. the risks lie in the sequences of value-adding and managerial
activities undertaken by the firm).
Information risks
Logistics risks
Procurement risks
Identified Risk Factors (Information risks)
Important level
Information risks
S12 Poor IT system, lack of data standardization; (e.g. lack of information management platform)
☐1 ☐ 2☐ 3 ☐4☐ 5
S13 Asymmetries of the information, collaboration issues, restriction, not share information each department
☐1 ☐ 2☐ 3 ☐4☐ 5
Ver
y U
nim
po
rtan
t
Ver
y U
nim
po
rtan
t
Ver
y U
nim
po
rtan
t
Ver
y U
nim
po
rtan
t
Ver
y U
nim
po
rtan
t
Ver
y U
nim
po
rtan
t
Ver
y U
nim
po
rtan
t
Ver
y U
nim
po
rtan
t
Min
or
Un
imp
ort
ant
Min
or
Un
imp
ort
ant
Min
or
Un
imp
ort
ant
Min
or
Un
imp
ort
ant
Min
or
Un
imp
ort
ant
Min
or
Un
imp
ort
ant
Min
or
Un
imp
ort
ant
Min
or
Un
imp
ort
ant
Mo
der
ate
Mo
der
ate
Mo
der
ate
Mo
der
ate
Mo
der
ate
Mo
der
ate
Mo
der
ate
Mo
der
ate
Min
or
imp
ort
ant
Min
or
imp
ort
ant
Min
or
imp
ort
ant
Min
or
imp
ort
ant
Min
or
imp
ort
ant
Min
or
imp
ort
ant
Min
or
imp
ort
ant
Min
or
imp
ort
ant
Ver
y im
po
rtan
t
Ver
y im
po
rtan
t
Ver
y im
po
rtan
t
Ver
y im
po
rtan
t
Ver
y im
po
rtan
t
Ver
y im
po
rtan
t
Ver
y im
po
rtan
t
Ver
y im
po
rtan
t

357
Identified Risk Factors (Logistics risks)
Important level
Logistics risks (the risks are associated to all the logistic activities in/or between each organizations)
S14 Dispensing/picking error medication/packaging
☐1 ☐ 2☐ 3 ☐4☐ 5
S15 Weak logistics service infrastructure (e.g.
Obsoleted equipment in the warehouse; Improper drug store environment and transportation facility, route etc. )
☐1 ☐ 2☐ 3 ☐4☐ 5
S16 Fragmentation of drug distribution processes ☐1 ☐ 2☐ 3 ☐4☐ 5
S17 Inadequate buffer stock-JIT/Lean ☐1 ☐ 2☐ 3 ☐4☐ 5
S18 Lack of visibility concerning placement and availability of stock
☐1 ☐ 2☐ 3 ☐4☐ 5
Identified Risk Factors (Procurement risks)
Important level
Procurement risks
S19 Procurement Hubs-introduce more complexity, Long lead time; (e.g. from placing the order until receiving)
☐1 ☐ 2☐ 3 ☐4☐ 5
S20 Contract problems with suppliers (e.g. contracting treated as a commodity-big contracts equals big risk)
☐1 ☐ 2☐ 3 ☐4☐ 5
S21 Clinician’s preference; (e.g. lack the awareness of cost containment)
☐1 ☐ 2☐ 3 ☐4☐ 5
S22 High purchase price ☐1 ☐ 2☐ 3 ☐4☐ 5
S23 High product and supplier/brand variety ☐1 ☐ 2☐ 3 ☐4☐ 5
Considering the above structure, elements contributing to risks associated with process risks
are categorized into “information risks”, “logistics risks” and “procurement risks”. Do you
think this categorization is appropriate?
Ver
y U
nim
po
rtan
t
Ver
y U
nim
po
rtan
t
Ver
y U
nim
po
rtan
t
Ver
y U
nim
po
rtan
t
Ver
y U
nim
po
rtan
t
Ver
y U
nim
po
rtan
t
Ver
y U
nim
po
rtan
t
Ver
y U
nim
po
rtan
t
Min
or
Un
imp
ort
ant
Min
or
Un
imp
ort
ant
Min
or
Un
imp
ort
ant
Min
or
Un
imp
ort
ant
Min
or
Un
imp
ort
ant
Min
or
Un
imp
ort
ant
Min
or
Un
imp
ort
ant
Min
or
Un
imp
ort
ant
Mo
der
ate
Mo
der
ate
Mo
der
ate
Mo
der
ate
Mo
der
ate
Mo
der
ate
Mo
der
ate
Mo
der
ate
Min
or
imp
ort
ant
Min
or
imp
ort
ant
Min
or
imp
ort
ant
Min
or
imp
ort
ant
Min
or
imp
ort
ant
Min
or
imp
ort
ant
Min
or
imp
ort
ant
Min
or
imp
ort
ant
Ver
y im
po
rtan
t
Ver
y im
po
rtan
t
Ver
y im
po
rtan
t
Ver
y im
po
rtan
t
Ver
y im
po
rtan
t
Ver
y im
po
rtan
t
Ver
y im
po
rtan
t
Ver
y im
po
rtan
t
Ver
y U
nim
po
rtan
t
Ver
y U
nim
po
rtan
t
Ver
y U
nim
po
rtan
t
Ver
y U
nim
po
rtan
t
Ver
y U
nim
po
rtan
t
Ver
y U
nim
po
rtan
t
Ver
y U
nim
po
rtan
t
Ver
y U
nim
po
rtan
t
Min
or
Un
imp
ort
ant
Min
or
Un
imp
ort
ant
Min
or
Un
imp
ort
ant
Min
or
Un
imp
ort
ant
Min
or
Un
imp
ort
ant
Min
or
Un
imp
ort
ant
Min
or
Un
imp
ort
ant
Min
or
Un
imp
ort
ant
Mo
der
ate
Mo
der
ate
Mo
der
ate
Mo
der
ate
Mo
der
ate
Mo
der
ate
Mo
der
ate
Mo
der
ate
Min
or
imp
ort
ant
Min
or
imp
ort
ant
Min
or
imp
ort
ant
Min
or
imp
ort
ant
Min
or
imp
ort
ant
Min
or
imp
ort
ant
Min
or
imp
ort
ant
Min
or
imp
ort
ant
Ver
y im
po
rtan
t
Ver
y im
po
rtan
t
Ver
y im
po
rtan
t
Ver
y im
po
rtan
t
Ver
y im
po
rtan
t
Ver
y im
po
rtan
t
Ver
y im
po
rtan
t
Ver
y im
po
rtan
t

358
Risk element categories Yes No Any comments
Information risks
Logistics risks
Procurement risks
Any other elements should be considered?
Control risks (i.e. the assumptions, rules, systems and procedures that govern how an
organization exerts control over the processes. In terms of the supply chain they may
be order quantities, batch sizes, safety stock policies etc. Control risk is therefore the
risk arising from the application or misapplication of these rules)
Strategic risks
Labour risks
Identified Risk Factors (Strategic risks)
Important level
Strategic risks (a possible source of loss that might arise from the pursuit of an unsuccessful business plan.)
S24 Focus on short term SC planning than long term
☐1 ☐ 2☐ 3 ☐4☐ 5
S25 Prioritization-conflict between patients/profits; (e.g. doctors would advise patients to take a lot of unnecessary medical measures and drugs in order to increase the profits of hospital)
☐1 ☐ 2☐ 3 ☐4☐ 5
Identified Risk Factors (Labour risks)
Important level
Labour risks
S26 Strikes and lack talents ☐1 ☐ 2☐ 3 ☐4☐ 5
S27 Lack of incentive mechanism
☐1 ☐ 2☐ 3 ☐4☐ 5
Ver
y U
nim
po
rtan
t
Ver
y U
nim
po
rtan
t
Ver
y U
nim
po
rtan
t
Ver
y U
nim
po
rtan
t
Ver
y U
nim
po
rtan
t
Ver
y U
nim
po
rtan
t
Ver
y U
nim
po
rtan
t
Ver
y U
nim
po
rtan
t
Min
or
Un
imp
ort
ant
Min
or
Un
imp
ort
ant
Min
or
Un
imp
ort
ant
Min
or
Un
imp
ort
ant
Min
or
Un
imp
ort
ant
Min
or
Un
imp
ort
ant
Min
or
Un
imp
ort
ant
Min
or
Un
imp
ort
ant
Mo
der
ate
Mo
der
ate
Mo
der
ate
Mo
der
ate
Mo
der
ate
Mo
der
ate
Mo
der
ate
Mo
der
ate
Min
or
imp
ort
ant
Min
or
imp
ort
ant
Min
or
imp
ort
ant
Min
or
imp
ort
ant
Min
or
imp
ort
ant
Min
or
imp
ort
ant
Min
or
imp
ort
ant
Min
or
imp
ort
ant
Ver
y im
po
rtan
t
Ver
y im
po
rtan
t
Ver
y im
po
rtan
t
Ver
y im
po
rtan
t
Ver
y im
po
rtan
t
Ver
y im
po
rtan
t
Ver
y im
po
rtan
t
Ver
y im
po
rtan
t
Ver
y U
nim
po
rtan
t
Ver
y U
nim
po
rtan
t
Ver
y U
nim
po
rtan
t
Ver
y U
nim
po
rtan
t
Ver
y U
nim
po
rtan
t
Ver
y U
nim
po
rtan
t
Ver
y U
nim
po
rtan
t
Ver
y U
nim
po
rtan
t
Min
or
Un
imp
ort
ant
Min
or
Un
imp
ort
ant
Min
or
Un
imp
ort
ant
Min
or
Un
imp
ort
ant
Min
or
Un
imp
ort
ant
Min
or
Un
imp
ort
ant
Min
or
Un
imp
ort
ant
Min
or
Un
imp
ort
ant
Mo
der
ate
Mo
der
ate
Mo
der
ate
Mo
der
ate
Mo
der
ate
Mo
der
ate
Mo
der
ate
Mo
der
ate
Min
or
imp
ort
ant
Min
or
imp
ort
ant
Min
or
imp
ort
ant
Min
or
imp
ort
ant
Min
or
imp
ort
ant
Min
or
imp
ort
ant
Min
or
imp
ort
ant
Min
or
imp
ort
ant
Ver
y im
po
rtan
t
Ver
y im
po
rtan
t
Ver
y im
po
rtan
t
Ver
y im
po
rtan
t
Ver
y im
po
rtan
t
Ver
y im
po
rtan
t
Ver
y im
po
rtan
t
Ver
y im
po
rtan
t

359
Considering the above structure, elements contributing to risks associated with control risks
are categorized into “Strategic risks” and “labour risks”. Do you think this categorization is
appropriate?
Risk element categories Yes No Any comments
Strategic risks
Labour risks
Any other elements should be considered?
External to the supply chain network (i.e.can be defined as events driven by external forcers
such as weather, earthquakes, political, regulatory and market forces).
Environmental risks
Natural risks
Man-made risks
Identified Risk Factors (Natural risks)
Important level
Natural risks S28 External influences- disaster recovery; (e.g. natural disaster)
☐1 ☐ 2☐ 3 ☐4☐ 5
S29 Unexpected disease outbreaks; (e.g. emerging virus diseases)
☐1 ☐ 2☐ 3 ☐4☐ 5
S30 Unexpected changes in environment conditions
☐1 ☐ 2☐ 3 ☐4☐ 5
Identified Risk Factors (Man-made risks)
Important level
Man-made risks (intentional or unintentional
S31 Regulatory issues-manufacturing using licensing/change of standards/drug recalls
☐1 ☐ 2☐ 3 ☐4☐ 5
S32 Rigorous government interventions; (e.g. policy)
☐1 ☐ 2☐ 3 ☐4☐ 5
Ver
y U
nim
po
rtan
t
Ver
y U
nim
po
rtan
t
Ver
y U
nim
po
rtan
t
Ver
y U
nim
po
rtan
t
Ver
y U
nim
po
rtan
t
Ver
y U
nim
po
rtan
t
Ver
y U
nim
po
rtan
t
Ver
y U
nim
po
rtan
t
Min
or
Un
imp
ort
ant
Min
or
Un
imp
ort
ant
Min
or
Un
imp
ort
ant
Min
or
Un
imp
ort
ant
Min
or
Un
imp
ort
ant
Min
or
Un
imp
ort
ant
Min
or
Un
imp
ort
ant
Min
or
Un
imp
ort
ant
Mo
der
ate
Mo
der
ate
Mo
der
ate
Mo
der
ate
Mo
der
ate
Mo
der
ate
Mo
der
ate
Mo
der
ate
Min
or
imp
ort
ant
Min
or
imp
ort
ant
Min
or
imp
ort
ant
Min
or
imp
ort
ant
Min
or
imp
ort
ant
Min
or
imp
ort
ant
Min
or
imp
ort
ant
Min
or
imp
ort
ant
Ver
y im
po
rtan
t
Ver
y im
po
rtan
t
Ver
y im
po
rtan
t
Ver
y im
po
rtan
t
Ver
y im
po
rtan
t
Ver
y im
po
rtan
t
Ver
y im
po
rtan
t
Ver
y im
po
rtan
t
Ver
y U
nim
po
rtan
t
Ver
y U
nim
po
rtan
t
Ver
y U
nim
po
rtan
t
Ver
y U
nim
po
rtan
t
Ver
y U
nim
po
rtan
t
Ver
y U
nim
po
rtan
t
Ver
y U
nim
po
rtan
t
Ver
y U
nim
po
rtan
t
Min
or
Un
imp
ort
ant
Min
or
Un
imp
ort
ant
Min
or
Un
imp
ort
ant
Min
or
Un
imp
ort
ant
Min
or
Un
imp
ort
ant
Min
or
Un
imp
ort
ant
Min
or
Un
imp
ort
ant
Min
or
Un
imp
ort
ant
Mo
der
ate
Mo
der
ate
Mo
der
ate
Mo
der
ate
Mo
der
ate
Mo
der
ate
Mo
der
ate
Mo
der
ate
Min
or
imp
ort
ant
Min
or
imp
ort
ant
Min
or
imp
ort
ant
Min
or
imp
ort
ant
Min
or
imp
ort
ant
Min
or
imp
ort
ant
Min
or
imp
ort
ant
Min
or
imp
ort
ant
Ver
y im
po
rtan
t
Ver
y im
po
rtan
t
Ver
y im
po
rtan
t
Ver
y im
po
rtan
t
Ver
y im
po
rtan
t
Ver
y im
po
rtan
t
Ver
y im
po
rtan
t
Ver
y im
po
rtan
t

360
acts that cause products or supply chains to react differently than originally intended. e.g. political instability, elections, labor strikes can completely shut down business and government operations)
S33 Lack of funds from government to the hospital
☐1 ☐ 2☐ 3 ☐4☐ 5
S34 The requirement of environment protection
☐1 ☐ 2☐ 3 ☐4☐ 5
Considering the above structure, elements contributing to risks associated with
environmental risks are categorized into “natural risks” and “man-made risks”. Do you think
this categorization is appropriate?
Risk element categories Yes No Any comments
Natural risks
Man-made risks
Any other elements should be considered?
THANK YOU ONCE AGAIN FOR YOUR KIND PARTICIPATION IN THIS SURVEY.YOUR
ANSWERS WILL BE KEPT CONFIDENTIAL

361
医疗供应链风险管理
问卷调查
尊敬的专家:
您好!我叫王磊。来自利物浦约翰莫尔斯大学(LJMU)物流和海洋研究所的
博士研究生。我的研究课题是提出一种全新的、系统化和结构化的方法针
对医院药品供应链过程中产生的风险因素进行识别、分析和控制。
对于占用您宝贵的时间我深感歉意。也同时非常的荣幸能够邀请您参加到
我的研究课题当中。您对于医疗供应链管理和风险管理的宝贵经验将对此
次问卷调查的起到非常重要的作用。同时需要强调的是,根据研究课题组
的要求,本次调查的信息将会被严格的保密;其中所涉及到的相关单位及
个人信息会采取匿名的方式。
本次调查需要 10 分钟左右的时间。如果您有任何问题,请通过电子邮件
[email protected] 联系我。您也可以通过电子邮件 [email protected]
联系我的导师任军教授。
王磊
博士研究生
Liverpool Logistics Offshore and Marine Research Institute (LOOM)
Tel: +(44)7510535904
Email: [email protected]
Room 121, James Parsons Building
Liverpool John Moores University, Byrom Street, Liverpool, L3 3AF, UK

362
基于前期的文献研究,我们将医疗药品供应链中存在的风险因为分为三个主要种类:
1)供应链网络内部风险;2)医院内部风险;3)供应链网络外部环境风险。以下问题
是针对所识别出的风险因素的重要性进行评分,并修改和添加遗漏的其他风险因素。
供应链网络内部风险 (此类风险产生于供应链网络内部,由组织成员之间相互作用引
起)
供应风险 (围绕供应链运营中的药品供应过程的潜在的和实际的风险)
质量风险:
- (S1) 假药;
- (S2) 购买药品的质量不合格;
- (S3) 药品的易腐性,保质期周期短;
针对已识别出的质量风险因素,您认为在医疗供应链当中,这些风险各自的重要性得
分是多少?另外还有哪些风险未被考虑在内?
(1=完全不重要; 2=不重要; 3=不是很重要; 4=一般重要; 5= 比较重要; 6=很重要; 7=非常重
要)
识别出的风险因素 影响程度
质量风险 S1 假药 ☐1 ☐ 2☐ 3 ☐4☐ 5 ☐ 6☐ 7
S2 购买药品的质量不合格 ☐1 ☐ 2☐ 3 ☐4☐ 5 ☐ 6☐ 7
S3 药品的易腐性,保质期周期
短
☐1 ☐ 2☐ 3 ☐4☐ 5 ☐ 6☐ 7
您是否认为还有
其它因素?
☐1 ☐ 2☐ 3 ☐4☐ 5 ☐ 6☐ 7
☐1 ☐ 2☐ 3 ☐4☐ 5 ☐ 6☐ 7
☐1 ☐ 2☐ 3 ☐4☐ 5 ☐ 6☐ 7
供应商风险:
- (S4) 药品短缺;
- (S5) 药品供应商的地址偏远,非本地或者本国供应(例如:进口药品会产生高额费
用,由下单到收获的过程耗时长 )
- (S6) 原材料在市场上供应短缺,其中原因包括因商业诱导而导致采购困难
- (S7) 规模较小的药品供应商的现金流中断,缺乏可靠性;
针对已识别出的供应商风险因素,您认为在医疗供应链当中,这些风险各自的重要性
得分是多少?另外还有哪些风险未被考虑在内?
(1=完全不重要; 2=不重要; 3=不是很重要; 4=一般重要; 5= 比较重要; 6=很重要; 7=非常重
要)

363
识别出的风险因素 影响程度
供应商风险 S4 药品短缺 ☐1 ☐ 2☐ 3 ☐4☐ 5 ☐ 6☐ 7
S5 药品供应商的地址偏远,非
本地或者本国供应
☐1 ☐ 2☐ 3 ☐4☐ 5 ☐ 6☐ 7
S6 医院与供应商之间的合作以
短期为主,缺乏长期合作机制
☐1 ☐ 2☐ 3 ☐4☐ 5 ☐ 6☐ 7
S7 规模较小的药品供应商的现
金流中断,缺乏可靠性
☐1 ☐ 2☐ 3 ☐4☐ 5 ☐ 6☐ 7
您是否认为还有
其它因素?
☐1 ☐ 2☐ 3 ☐4☐ 5 ☐ 6☐ 7
☐1 ☐ 2☐ 3 ☐4☐ 5 ☐ 6☐ 7
☐1 ☐ 2☐ 3 ☐4☐ 5 ☐ 6☐ 7
需求风险 (指供应链下游中不可预知的变化所导致的风险)
能力风险:
- (S8) 医院整体实力与各科室需求不匹配,出现供不应求的情况;
- (S9) 需求由护理人员驱动而非患者,导致真实需求信息不正确而产生过量采购等问
题;
针对已识别出的能力风险因素,您认为在医疗供应链当中,这些风险各自的重要性得
分是多少?另外还有哪些风险未被考虑在内?
(1=完全不重要; 2=不重要; 3=不是很重要; 4=一般重要; 5= 比较重要; 6=很重要; 7=非常重
要)
识别出的风险因素 影响程度
能力风险 S8 医院整体实力与各科室需求
不匹配,出现供不应求的情况
☐1 ☐ 2☐ 3 ☐4☐ 5 ☐ 6☐ 7
S9 需求由护理人员驱动而非患
者,导致真实需求信息不正确
而产生过量采购等问题
☐1 ☐ 2☐ 3 ☐4☐ 5 ☐ 6☐ 7
您是否认为还有
其它因素?
☐1 ☐ 2☐ 3 ☐4☐ 5 ☐ 6☐ 7
☐1 ☐ 2☐ 3 ☐4☐ 5 ☐ 6☐ 7
☐1 ☐ 2☐ 3 ☐4☐ 5 ☐ 6☐ 7
预测风险:
- (S10) 需求不确定;
- (S11) 错误的需求预测;
针对已识别出的预测风险因素,您认为在医疗供应链当中,这些风险各自的重要性得
分是多少?另外还有哪些风险未被考虑在内?

364
(1=完全不重要; 2=不重要; 3=不是很重要; 4=一般重要; 5= 比较重要; 6=很重要; 7=非常重
要)
识别出的风险因素 影响程度
预测风险 S10 需求不确定 ☐1 ☐ 2☐ 3 ☐4☐ 5 ☐ 6☐ 7
S11 错误的需求预测 ☐1 ☐ 2☐ 3 ☐4☐ 5 ☐ 6☐ 7
您是否认为还有
其它因素?
☐1 ☐ 2☐ 3 ☐4☐ 5 ☐ 6☐ 7
☐1 ☐ 2☐ 3 ☐4☐ 5 ☐ 6☐ 7
☐1 ☐ 2☐ 3 ☐4☐ 5 ☐ 6☐ 7
医院内部风险 (此风险来源在医院内部的供应链运营流程,如采购、物流、仓储等)
流程风险 (风险源产生于组织的增值和管理活动的流程中.)
信息风险: (一定概率由于信息的不正确、不完整或者非法访问而导致组织损失)
- (S12) 落后的信息系统;单一的信息传送渠道;信息传输缓慢; (例如:缺乏信息管理
系统)
- (S13) 各科室之间存在合作壁垒,科室之间信息不共享;
针对已识别出的信息风险因素,您认为在医疗供应链当中,这些风险各自的重要性得
分是多少?另外还有哪些风险未被考虑在内?
(1=完全不重要; 2=不重要; 3=不是很重要; 4=一般重要; 5= 比较重要; 6=很重要; 7=非常重
要)
识别出的风险因素 影响程度
信息风险 S12 落后的信息系统;单一的信
息传送渠道;信息传输缓慢
☐1 ☐ 2☐ 3 ☐4☐ 5 ☐ 6☐ 7
S13 各科室之间存在合作壁垒,
科室之间信息不共享
☐1 ☐ 2☐ 3 ☐4☐ 5 ☐ 6☐ 7
您是否认为还有
其它因素?
☐1 ☐ 2☐ 3 ☐4☐ 5 ☐ 6☐ 7
☐1 ☐ 2☐ 3 ☐4☐ 5 ☐ 6☐ 7
☐1 ☐ 2☐ 3 ☐4☐ 5 ☐ 6☐ 7
物流风险: (指组织内部以及供应链成员之间的物流活动中产生的风险)
- (S14) 医院内部药品的拣选、包装和运输出现错误;
- (S15) 物流服务基础设施薄弱(例如:药品库房中陈旧的设备, 不适当的药品储存环境
和运输设备、路径)
- (S16) 分散的药品配送流程;
- (S17) 缓冲库存不足(运用 Lean/Just in Time 保持较低的库存水平);
- (S18) 库存管理的可视化程度低;

365
针对已识别出的物流风险因素,您认为在医疗供应链当中,这些风险各自的重要性得
分是多少?另外还有哪些风险未被考虑在内?
(1=完全不重要; 2=不重要; 3=不是很重要; 4=一般重要; 5= 比较重要; 6=很重要; 7=非常重
要)
识别出的风险因素 影响程度
物流风险 S14 医院内部药品的拣选、包装
和运输出现错误
☐1 ☐ 2☐ 3 ☐4☐ 5 ☐ 6☐ 7
S15 物流服务基础设施薄弱 ☐1 ☐ 2☐ 3 ☐4☐ 5 ☐ 6☐ 7
S16 分散的药品配送流程 ☐1 ☐ 2☐ 3 ☐4☐ 5 ☐ 6☐ 7
S17 缓冲库存不足(运用
Lean/Just in Time 保持较低的库
存水平)
☐1 ☐ 2☐ 3 ☐4☐ 5 ☐ 6☐ 7
S18 库存管理的可视化程度低 ☐1 ☐ 2☐ 3 ☐4☐ 5 ☐ 6☐ 7
您是否认为还有
其它因素?
☐1 ☐ 2☐ 3 ☐4☐ 5 ☐ 6☐ 7
☐1 ☐ 2☐ 3 ☐4☐ 5 ☐ 6☐ 7
☐1 ☐ 2☐ 3 ☐4☐ 5 ☐ 6☐ 7
采购风险:
- (S19) 采购中心工作复杂性程度高,从采购到交货的流程过长;
- (S20) 与供应商的合同问题;
- (S21) 医生的个人偏好加重采购的成本;
- (S22) 过高的采购价格;
- (S23) 采购药品种类和供应商的数量过多;
针对已识别出的采购风险因素,您认为在医疗供应链当中,这些风险各自的重要性得
分是多少?另外还有哪些风险未被考虑在内?
(1=完全不重要; 2=不重要; 3=不是很重要; 4=一般重要; 5= 比较重要; 6=很重要; 7=非常重
要)
识别出的风险因素 影响程度
采购风险 S19 采购中心工作复杂性程度
高,从采购到交货的流程过长
☐1 ☐ 2☐ 3 ☐4☐ 5 ☐ 6☐ 7
S20 与供应商的合同问题 ☐1 ☐ 2☐ 3 ☐4☐ 5 ☐ 6☐ 7
S21 医生的个人偏好加重采购的
成本
☐1 ☐ 2☐ 3 ☐4☐ 5 ☐ 6☐ 7
S22 过高的采购价格 ☐1 ☐ 2☐ 3 ☐4☐ 5 ☐ 6☐ 7
S23 采购药品种类和供应商的数
量过多
☐1 ☐ 2☐ 3 ☐4☐ 5 ☐ 6☐ 7
☐1 ☐ 2☐ 3 ☐4☐ 5 ☐ 6☐ 7

366
您是否认为还有
其它因素?
☐1 ☐ 2☐ 3 ☐4☐ 5 ☐ 6☐ 7
☐1 ☐ 2☐ 3 ☐4☐ 5 ☐ 6☐ 7
控制风险
战略风险: (战略行为影响整个供应链体系,战略风险可根据其战略特征得到。)
- (S24) 医院将供应链管理视为短期效应,不重视供应链与物流管理的战略意义;
- (S25) 优先级-患者/利润冲突;
针对已识别出的战略风险因素,您认为在医疗供应链当中,这些风险各自的重要性得
分是多少?另外还有哪些风险未被考虑在内?
(1=完全不重要; 2=不重要; 3=不是很重要; 4=一般重要; 5= 比较重要; 6=很重要; 7=非常重
要)
识别出的风险因素 影响程度
战略风险 S24 医院将供应链管理视为短期
效应,不重视供应链与物流管
理的战略意义
☐1 ☐ 2☐ 3 ☐4☐ 5 ☐ 6☐ 7
S25 优先级-患者/利润冲突 ☐1 ☐ 2☐ 3 ☐4☐ 5 ☐ 6☐ 7
您是否认为还有
其它因素?
☐1 ☐ 2☐ 3 ☐4☐ 5 ☐ 6☐ 7
☐1 ☐ 2☐ 3 ☐4☐ 5 ☐ 6☐ 7
☐1 ☐ 2☐ 3 ☐4☐ 5 ☐ 6☐ 7
人力风险:
- (S26) 医护或后勤人员罢工;
- (S27) 缺乏激励机制;
针对已识别出的战略风险因素,您认为在医疗供应链当中,这些风险各自的重要性得
分是多少?另外还有哪些风险未被考虑在内?
(1=完全不重要; 2=不重要; 3=不是很重要; 4=一般重要; 5= 比较重要; 6=很重要; 7=非常重
要)
识别出的风险因素 影响程度
人力风险 S26 医护或后勤人员罢工 ☐1 ☐ 2☐ 3 ☐4☐ 5 ☐ 6☐ 7
S27 缺乏激励机制 ☐1 ☐ 2☐ 3 ☐4☐ 5 ☐ 6☐ 7
您是否认为还有
其它因素?
☐1 ☐ 2☐ 3 ☐4☐ 5 ☐ 6☐ 7
☐1 ☐ 2☐ 3 ☐4☐ 5 ☐ 6☐ 7
☐1 ☐ 2☐ 3 ☐4☐ 5 ☐ 6☐ 7

367
供应链网络外部环境风险 (可以定义为由供应链外部环境因素如自然灾害、宏观经济、
政府政策等产生的风险)
自然灾害风险:
- (S28) 外部影响-灾难恢复缓慢;
- (S29) 突发性重大疫情爆发;
- (S30) 环境状况出现意外变化;
针对已识别出的自然灾害风险因素,您认为在医疗供应链当中,这些风险各自的重要
性得分是多少?另外还有哪些风险未被考虑在内?
(1=完全不重要; 2=不重要; 3=不是很重要; 4=一般重要; 5= 比较重要; 6=很重要; 7=非常重
要)
识别出的风险因素 影响程度
自然灾害风险 S28 外部影响-灾难恢复缓慢 ☐1 ☐ 2☐ 3 ☐4☐ 5 ☐ 6☐ 7
S29 突发性重大疫情爆发 ☐1 ☐ 2☐ 3 ☐4☐ 5 ☐ 6☐ 7
S30 环境状况出现意外变化 ☐1 ☐ 2☐ 3 ☐4☐ 5 ☐ 6☐ 7
您是否认为还有
其它因素?
☐1 ☐ 2☐ 3 ☐4☐ 5 ☐ 6☐ 7
☐1 ☐ 2☐ 3 ☐4☐ 5 ☐ 6☐ 7
☐1 ☐ 2☐ 3 ☐4☐ 5 ☐ 6☐ 7
人为制造风险:
- (S31) 监管问题-制造许可使用/更改标准/药品召回;
- (S32) 严格的政府干预;
- (S33) 医院缺乏政府的资金拨给;
- (S34) 环境保护的需求得不到改善;
针对已识别出的人为制造风险因素,您认为在医疗供应链当中,这些风险各自的重要
性得分是多少?另外还有哪些风险未被考虑在内?
(1=完全不重要; 2=不重要; 3=不是很重要; 4=一般重要; 5= 比较重要; 6=很重要; 7=非常重
要)
识别出的风险因素 影响程度
人为制造风险 S31 监管问题-制造许可使用/更
改标准/药品召回
☐1 ☐ 2☐ 3 ☐4☐ 5 ☐ 6☐ 7
S32 严格的政府干预 ☐1 ☐ 2☐ 3 ☐4☐ 5 ☐ 6☐ 7
S33 医院缺乏政府的资金拨给 ☐1 ☐ 2☐ 3 ☐4☐ 5 ☐ 6☐ 7
S34 环境保护的需求得不到改善 ☐1 ☐ 2☐ 3 ☐4☐ 5 ☐ 6☐ 7
您是否认为还有
其它因素?
☐1 ☐ 2☐ 3 ☐4☐ 5 ☐ 6☐ 7
☐1 ☐ 2☐ 3 ☐4☐ 5 ☐ 6☐ 7
☐1 ☐ 2☐ 3 ☐4☐ 5 ☐ 6☐ 7

368
再次感谢您在此次调查中提供的帮助
您的回答将会被保密

369
APPENDIX TWO
Questionnaire used in Survey B for the purpose of Fuzzy AHP in Chapter six

370
Research on Risk Management for Healthcare Supply Chain in Hospital
Questionnaire
Dear Sir/Madam,
My name is Lei Wang, who is currently the PhD candidate at the Liverpool Logistics Offshore
and Marine Research Institute (LOOM) in Liverpool John Moores University. My research topic
is “Research on risk management for healthcare supply chain in hospital”. The research aims
to propose a novel risk management methodology to identify, evaluate and mitigate the risk
factors in hospital supply chain. The purpose of the questionnaire is to evaluate the risk
factors for determining of their priority (weight) of concern.
I would be very pleased if you can take part in this study in view of your professional
knowledge in risk management, supply chain management or in hospital. The information
gathered in this survey will be treated in the strictest confidence, as this has always been the
policy of the Liverpool John Moores University. The questionnaire is anonymous, thus your
response can not be attributed to you or your organization.
If you have any questions about this study, please feel free to contract me either email
[email protected] or by phone. You also can contact my supervisor, Dr Jun Ren, at
(44)1512312236, or by email [email protected]
Yours faithfully,
Lei Wang,
PhD Candidate,
Liverpool Logistics Offshore and Marine Research Institute (LOOM)
Tel: +(44)7510535904 or (86)13223898880
Email: [email protected]
Room 121, James Parsons Building
Liverpool John Moores University, Byrom Street, Liverpool, L3 3AF, UK

371
Section A: Respondent Profile
1. What is the type of your organization?
Pharmaceutical
Manufacturer
Pharmaceutical
distributor
(pharmaceutical
company )
Hospital
(Procurement department;
Material management
department etc.)
Other
☐ ☐ ☐ ☐
2. What is your job title? (optional)
3.
3. For how many years have you worked in the healthcare industry or healthcare supply
chain?
☐1-5 years ☐6-10 years ☐11-15 years ☐16-19 years ☐≥20 years
Section B: Analytical Hierarchical Process (AHP)
Part A: Introduction and Explanation

372
For your opinion as an expert, the pair-wise comparison scale can be used to assess or express
the importance of one element over another. The linguistic judgements and their
explanations used for evaluating the importance of the elements in pair-wise comparison
shown in Table 1.
Table 1. Linguistic judgements for fuzzy AHP
Linguistic judgements Explanations
Equal importance (Eq) Two activities contribute equally to the objective
Weak importance (Wk) Experience and judgement slightly favour one over another
Strong importance (St) Experience and judgement strongly favour one over another
Very strong importance (Vs) An activity is favoured very strongly over another
Absolute strong importance (As) The evidence favouring one activity over another is of the highest possible order of affirmation
Part B: Questionnaire
1) Regarding the three main criteria, in your opinion what is the relative importance of the
risk factor in healthcare supply chain (HCSC)?
Key definitions:
External to the hospital but internal to the supply chain network (i.e. arise from
interactions between organizations within the supply chain)
Internal to the hospital (i.e. the risk sources lie within the boundaries of the supply chain
parties and range from labour to IT-system uncertainties.)
External to the supply chain network (i.e. can be defined as events driven by external
forcers such as weather, earthquakes, political, regulatory and market forces)

373
Ab
solu
te S
tro
ng
Imp
ort
ance
Ver
y st
ron
g im
po
rtan
ce
Stro
ng
imp
ort
ance
Wea
k im
po
rtan
ce
Equ
al im
po
rtan
ce
Wea
k im
po
rtan
ce
Stro
ng
imp
ort
ance
Ver
y st
ron
g im
po
rtan
ce
Ab
solu
te S
tro
ng
Imp
ort
ance
External to the hospital but internal
to the supply chain
network
☐ ☐ ☐ ☐ ☐ ☐ ☐ ☐ ☐ Internal to the hospital
External to the hospital but internal
to the supply chain
network
☐ ☐ ☐ ☐ ☐ ☐ ☐ ☐ ☐ External to the supply chain
network
Internal to the hospital
☐ ☐ ☐ ☐ ☐ ☐ ☐ ☐ ☐ External to the supply chain
network
2) Regarding the sub-criteria, in your opinion what is the relative importance of the risk
factor under “external to the hospital but internal to the supply chain network”?
Supply risks (i.e. adversely affects inward flow of any type of resource to enable
operations to take place or the transpiration of significant and/or disappointing
failures with inbound goods and service)
Demand risks (i.e. the possibility of unexpected changes arising from market or
downstream customers)
Ab
solu
te S
tro
ng
Imp
ort
ance
Ver
y st
ron
g im
po
rtan
ce
Stro
ng
imp
ort
ance
Wea
k im
po
rtan
ce
Equ
al im
po
rtan
ce
Wea
k im
po
rtan
ce
Stro
ng
imp
ort
ance
Ver
y st
ron
g im
po
rtan
ce
Ab
solu
te S
tro
ng
Imp
ort
ance
Supply risks ☐ ☐ ☐ ☐ ☐ ☐ ☐ ☐ ☐ Demand risks

374
3) Regarding the quality and supplier risks, in your opinion what is the relative importance
of these two risks under supply risks in HCSC?
Ab
solu
te S
tro
ng
Imp
ort
ance
V
ery
stro
ng
imp
ort
ance
Stro
ng
imp
ort
ance
Wea
k im
po
rtan
ce
Equ
al im
po
rtan
ce
Wea
k im
po
rtan
ce
Stro
ng
imp
ort
ance
Ver
y st
ron
g im
po
rtan
ce
Ab
solu
te S
tro
ng
Imp
ort
ance
Quality risks ☐ ☐ ☐ ☐ ☐ ☐ ☐ ☐ ☐ Supplier risks
4) Regarding the capability and forecast risks, in your opinion what is the relative importance
of these two risks under demand risks in HCSC?
Capabilities risk (i.e. the capabilities such as technical skills, knowledge and leadership
competencies of individuals and the collective group responsible for managing the
demand, plus the relationships within and outside organizations and individuals)
Ab
solu
te S
tro
ng
Imp
ort
ance
V
ery
stro
ng
imp
ort
ance
Stro
ng
imp
ort
ance
Wea
k im
po
rtan
ce
Equ
al im
po
rtan
ce
Wea
k im
po
rtan
ce
Stro
ng
imp
ort
ance
Ver
y st
ron
g im
po
rtan
ce
Ab
solu
te S
tro
ng
Imp
ort
ance
Capability risks ☐ ☐ ☐ ☐ ☐ ☐ ☐ ☐ ☐ Forecast risks
5) Regarding the information, logistics and procurement risks, in your opinion what is the
relative importance of these two risks under process risks in HCSC?
Logistics risks (i.e. the risks are associated to all the logistic activities in/or between
each organizations)

375
Ab
solu
te S
tro
ng
Imp
ort
ance
V
ery
stro
ng
imp
ort
ance
Stro
ng
imp
ort
ance
Wea
k im
po
rtan
ce
Equ
al im
po
rtan
ce
Wea
k im
po
rtan
ce
Stro
ng
imp
ort
ance
Ver
y st
ron
g im
po
rtan
ce
Ab
solu
te S
tro
ng
Imp
ort
ance
Information risks
☐ ☐ ☐ ☐ ☐ ☐ ☐ ☐ ☐ Logistics risks
Information risks
☐ ☐ ☐ ☐ ☐ ☐ ☐ ☐ ☐ Procurement risks
Logistics risks ☐ ☐ ☐ ☐ ☐ ☐ ☐ ☐ ☐ Procurement risks
6) Regarding the sub-criteria, in your opinion what is the relative importance of these risks
under quality risks in HCSC?
Ab
solu
te S
tro
ng
Imp
ort
ance
V
ery
stro
ng
imp
ort
ance
Stro
ng
imp
ort
ance
Wea
k im
po
rtan
ce
Equ
al im
po
rtan
ce
Wea
k im
po
rtan
ce
Stro
ng
imp
ort
ance
Ver
y st
ron
g im
po
rtan
ce
Ab
solu
te S
tro
ng
Imp
ort
ance
Counterfeiting
☐ ☐ ☐ ☐ ☐ ☐ ☐ ☐ ☐ Poor quality in the purchased
drugs from suppliers
Counterfeiting
☐ ☐ ☐ ☐ ☐ ☐ ☐ ☐ ☐ Time limit of drug, product perishability,
Poor quality in the purchased
drugs from suppliers
☐ ☐ ☐ ☐ ☐ ☐ ☐ ☐ ☐ Time limit of drug, product perishability,

376
7) Regarding the sub-criteria, in your opinion what is the relative importance of these risks
under capability risks in HCSC?
Ab
solu
te S
tro
ng
Imp
ort
ance
V
ery
stro
ng
imp
ort
ance
Stro
ng
imp
ort
ance
Wea
k im
po
rtan
ce
Equ
al im
po
rtan
ce
Wea
k im
po
rtan
ce
Stro
ng
imp
ort
ance
Ver
y st
ron
g im
po
rtan
ce
Ab
solu
te S
tro
ng
Imp
ort
ance
Capability versus
demand; inability of capacity to
meet demand
☐ ☐ ☐ ☐ ☐ ☐ ☐ ☐ ☐ Demand trigged by the nurse, not the
patient
8) Regarding the sub-criteria, in your opinion what is the relative importance of these risks
under logistics risks in HCSC?
Weak logistics service infrastructure (i.e. obsolete equipment in the warehouse;
Improper drug store environment and transportation facility, route)
Ab
solu
te S
tro
ng
Imp
ort
ance
Ver
y st
ron
g im
po
rtan
ce
Stro
ng
imp
ort
ance
Wea
k im
po
rtan
ce
Equ
al im
po
rtan
ce
Wea
k im
po
rtan
ce
Stro
ng
imp
ort
ance
Ver
y st
ron
g im
po
rtan
ce
Ab
solu
te S
tro
ng
Imp
ort
ance
Dispensing/picking errors
medication/packaging,
☐ ☐ ☐ ☐ ☐ ☐ ☐ ☐ ☐ Weak logistics service
infrastructure
Dispensing/picking errors
medication/packaging
☐ ☐ ☐ ☐ ☐ ☐ ☐ ☐ ☐ Lack of visibility
concerning placement and availability of
stock
Weak logistics service
☐ ☐ ☐ ☐ ☐ ☐ ☐ ☐ ☐ Lack of visibility
concerning

377
infrastructure
placement and availability of
stock
9) Regarding the sub-criteria, in your opinion what is the relative importance of these risks
under procurement risks in HCSC?
Procurement Hubs-introduce more complexity, Long lead time (i.e. from placing the
order until receiving)
Clinician’s preference (i.e. lack the awareness of cost containment)
Ab
solu
te S
tro
ng
Imp
ort
ance
Ver
y st
ron
g im
po
rtan
ce
Stro
ng
imp
ort
ance
Wea
k im
po
rtan
ce
Equ
al im
po
rtan
ce
Wea
k im
po
rtan
ce
Stro
ng
imp
ort
ance
Ver
y st
ron
g im
po
rtan
ce
Ab
solu
te S
tro
ng
Imp
ort
ance
Procurement Hub-
introduce more
complexity, long lead
time
☐ ☐ ☐ ☐ ☐ ☐ ☐ ☐ ☐ Clinician's preference
Procurement Hub-
introduce more
complexity, long lead
time
☐ ☐ ☐ ☐ ☐ ☐ ☐ ☐ ☐ High purchase price
Procurement Hub-
introduce more
complexity, long lead
time
☐ ☐ ☐ ☐ ☐ ☐ ☐ ☐ ☐ High product and
supplier/brand variety
Clinician's preference
☐ ☐ ☐ ☐ ☐ ☐ ☐ ☐ ☐ High purchase price
Clinician's preference
☐ ☐ ☐ ☐ ☐ ☐ ☐ ☐ ☐ High product and
supplier/brand variety

378
High purchase
price
☐ ☐ ☐ ☐ ☐ ☐ ☐ ☐ ☐ High product and
supplier/brand variety
10) Regarding the sub-criteria, in your opinion what is the relative importance of these risks
under natural risks in HCSC?
Ab
solu
te S
tro
ng
Imp
ort
ance
Ver
y st
ron
g im
po
rtan
ce
Stro
ng
imp
ort
ance
Wea
k im
po
rtan
ce
Equ
al im
po
rtan
ce
Wea
k im
po
rtan
ce
Stro
ng
imp
ort
ance
Ver
y st
ron
g im
po
rtan
ce
Ab
solu
te S
tro
ng
Imp
ort
ance
External influences-
disaster recovery
☐ ☐ ☐ ☐ ☐ ☐ ☐ ☐ ☐ Unexpected disease
outbreaks
External influences-
disaster recovery
☐ ☐ ☐ ☐ ☐ ☐ ☐ ☐ ☐ Unexpected changes in
environment conditions
Unexpected disease
outbreaks
☐ ☐ ☐ ☐ ☐ ☐ ☐ ☐ ☐ Unexpected changes in
environment conditions
THANK YOU ONCE AGAIN FOR YOUR KIND PARTICIPATION IN THIS SURVEY.
YOUR ANSWER WILL BE KEEP CONFIDENTIAL.

379
医疗药品供应链风险管理问卷调查
尊敬的专家:
您好!我叫王磊。来自利物浦约翰莫尔斯大学(LJMU)物流和海洋研究所的博士研
究生。我的研究课题是提出一种全新的、系统化和结构化的方法针对医院药品供应链
过程中产生的风险因素进行识别、分析和控制。
本次问卷的目的是:
针对已经识别出存在于医疗供应链中的风险因素,根据专家的经验与意见对其风
险因素之间的重要性大下进行比较,并最终得到各个风险因素的优先级权重。
对于占用您宝贵的时间我深感歉意。也同时非常的荣幸能够邀请您参加到我的研
究课题当中。您对于医疗供应链管理和风险管理的宝贵经验将对此次问卷调查的起到
非常重要的作用。同时需要强调的是,根据研究课题组的要求,本次调查的信息将会
被严格的保密;其中所涉及到的相关单位及个人信息会采取匿名的方式。本次调查需
要 5-10 分钟左右的时间。如果您有任何问题,请通过电子邮 [email protected]
联系我。您也可以通过电子邮件 [email protected] 联系我的导师任军教授。最终的研
究成果将无偿分享给您和您所在的单位。
王磊
博士研究生
Liverpool Logistics Offshore and Marine Research Institute (LOOM)
Tel: 13223898880
Email: [email protected] or [email protected]
Room 121, James Parsons Building
Liverpool John Moores University, Byrom Street, Liverpool, L3 3AF, UK

380
第一部分:受访者基本情况
1. 请问您所在的单位是以下哪一个?
医药制造企业
医药批发企业
医药零售企业
医院
其它
☐ ☐ ☐ ☐ ☐
4. 请问您的职位是什么?(可选)
3. 请问您从事医药物流和供应链的工龄多久?
☐1-5 年 ☐6-10 年 ☐11-15 年 ☐16-19 年 ☐≥20 年
第二部分:风险因素之间权重大小对比
1)简介与解释

381
根据您的观点对各个风险因素之间的重要性进行两两比较打分。评分标准列在表格 1
中。
表格 1. 风险因素两两比较评分标准
评分标准 解释
同等重要 两个风险的重要性同等重要
稍微重要 其中一个风险比另一个风险稍微重要
稍强重要 其中一个风险比另一个风险稍强重要
非常重要 其中一个风险比另一个风险非常重要
极端重要 其中一个风险比另一个风险极端重要
2) 问卷内容
I. 针对整个医疗供应链,根据您的意见对以下三个部分的风险因素的重要性进行
对比。
含义解释:
供应链网络内部风险
(此风险产生于医疗供应链成员之间,例如医药批发商与医院之间, 医药制造商与医
药批发商之间产生的风险)
医院内部风险
(此风险产生于医院内部,例如采购风险,物流配送风险等)
供应链网络外部风险
(此风险产生于供应链网络外部,例如自然灾害,国家法律法规,政策等)

382
极端重要
非常重要
稍
强重要
稍微重要
同等重要
稍微重要
稍强重要
非常重要
极端重要
供应链网络内部风险 ☐ ☐ ☐ ☐ ☐ ☐ ☐ ☐ ☐ 医院内部风险
供应链网络内部风险 ☐ ☐ ☐ ☐ ☐ ☐ ☐ ☐ ☐ 供应链网络外部风险
医院内部风险 ☐ ☐ ☐ ☐ ☐ ☐ ☐ ☐ ☐ 供应链网络外部风险
II. 针对供应链网络内部风险,根据您的意见对以下两个风险的重要性进行对比。
供应风险 (围绕供应链运营中的药品供应过程的潜在的和实际的风险)
需求风险 (指供应链下游中不可预知的变化所导致的风险)
极端重要
非常重要
稍
强重要
稍微重要
同等重要
稍微重要
稍强重要
非常重要
极端重要
供应风险 ☐ ☐ ☐ ☐ ☐ ☐ ☐ ☐ ☐ 需求风险
III. 针对供应风险,根据您的意见对以下两个风险的重要性进行对比。
极端重要
非常重要
稍
强重要
稍微重要
同等重要
稍微重要
稍强重要
非常重要
极端重要
质量风险 ☐ ☐ ☐ ☐ ☐ ☐ ☐ ☐ ☐ 供应商风险

383
IV. 针对需求风险,根据您的意见对以下两个风险的重要性进行对比。
能力风险 (医院整体实力与各科室需求不匹配,出现供不应求的情况;缺乏需求信息,有关客户需求和市场等的信息不完整等)
极端重要
非常重要
稍
强重要
稍微重要
同等重要
稍微重要
稍强重要
非常重要
极端重要
能力风险 ☐ ☐ ☐ ☐ ☐ ☐ ☐ ☐ ☐ 预测风险
V. 针对医院内部流程风险,根据您的意见对以下三个风险的重要性进行对比。
流程风险 (风险源产生于组织的增值和管理活动的流程中.)
信息风险 (一定概率由于信息的不正确、不完整或者非法访问而导致组织损失)
物流风险 (指组织内部以及供应链成员之间的物流活动中产生的风险)
极端重要
非常重要
稍
强重要
稍微重要
同等重要
稍微重要
稍强重要
非常重要
极端重要
信息风险 ☐ ☐ ☐ ☐ ☐ ☐ ☐ ☐ ☐ 物流风险
信息风险 ☐ ☐ ☐ ☐ ☐ ☐ ☐ ☐ ☐ 采购风险
物流风险 ☐ ☐ ☐ ☐ ☐ ☐ ☐ ☐ ☐ 采购风险
VI. 针对质量风险,根据您的意见对以下三个风险的重要性进行对比。
极端重要
非常重要
稍
强重要
稍微重要
同等重要
稍微重要
稍强重要
非常重要
极端重要
假药 ☐ ☐ ☐ ☐ ☐ ☐ ☐ ☐ ☐ 购买药品的质量不合
格
假药 ☐ ☐ ☐ ☐ ☐ ☐ ☐ ☐ ☐ 药品的易腐性,保质
期周期短
购买药品的质量不合
格
☐ ☐ ☐ ☐ ☐ ☐ ☐ ☐ ☐ 药品的易腐性,保质
期周期短

384
VII. 针对能力风险,根据您的意见对以下两个风险的重要性进行对比。
极端重要
非常重要
稍
强重要
稍微重要
同等重要
稍微重要
稍强重要
非常重要
极端重要
医院整体实力与各科
室需求不匹配
☐ ☐ ☐ ☐ ☐ ☐ ☐ ☐ ☐ 需求由护理人员驱动
而非患者, 导致真
实需求信息不正确从
而产生过量的采购等
问题
VIII. 针对医院内部物流风险,根据您的意见对以下三个风险的重要性进行对比。
极端重要
非常重要
稍
强重要
稍微重要
同等重要
稍微重要
稍强重要
非常重要
极端重要
医院内部药品的拣
选,包装和运输出错
☐ ☐ ☐ ☐ ☐ ☐ ☐ ☐ ☐ 物流服务基础设施薄
弱
医院内部药品的拣
选,包装和运输出错
☐ ☐ ☐ ☐ ☐ ☐ ☐ ☐ ☐ 库存管理的可视化程
度低
物流服务基础设施薄
弱
☐ ☐ ☐ ☐ ☐ ☐ ☐ ☐ ☐ 库存管理的可视化程
度低
IX. 针对医院内部的采购风险,根据您的意见对以下四个风险的重要性进行对比。
采购中心工作复杂性程度高,从采购到交货的流程过长
医生的个人偏好加重采购的成本 (医生有各自对于药品使用的偏好,医生更多
关注药效而忽视药品价格)

385
极端重要
非常重要
稍
强重要
稍微重要
同等重要
稍微重要
稍强重要
非常重要
极端重要
采购中心工作复杂性
程度高
☐ ☐ ☐ ☐ ☐ ☐ ☐ ☐ ☐ 医生的个人偏好
采购中心工作复杂性
程度高
☐ ☐ ☐ ☐ ☐ ☐ ☐ ☐ ☐ 过高的采购价格
采购中心工作复杂性
程度高
☐ ☐ ☐ ☐ ☐ ☐ ☐ ☐ ☐ 采购药品的种类和供
应商的数量过多
医生的个人偏好 ☐ ☐ ☐ ☐ ☐ ☐ ☐ ☐ ☐ 过高的采购价格
医生的个人偏好 ☐ ☐ ☐ ☐ ☐ ☐ ☐ ☐ ☐ 采购药品的种类和供
应商的数量过多
过高的采购价格 ☐ ☐ ☐ ☐ ☐ ☐ ☐ ☐ ☐ 采购药品的种类和供
应商的数量过多
X. 针对供应链网络外部自然风险,根据您的意见对以下三个风险的重要性进行对
比。
极端重要
非常重要
稍
强重要
稍微重要
同等重要
稍微重要
稍强重要
非常重要
极端重要
外部影响-灾难恢复缓
慢
☐ ☐ ☐ ☐ ☐ ☐ ☐ ☐ ☐ 突发性重大疫情爆发
外部影响-灾难恢复缓
慢
☐ ☐ ☐ ☐ ☐ ☐ ☐ ☐ ☐ 环境状况出现意外变
化
突发性重大疫情爆发 ☐ ☐ ☐ ☐ ☐ ☐ ☐ ☐ ☐ 环境状况出现意外变
化
再次感谢您在此次调查中提供的帮助
您的回答将会被严格保密

386
APPENDIX THREE
Questionnaire used in Survey C for the purpose of ISM model in Chapter six

387
Research on Risk Management for Healthcare Supply Chain in hospital
Questionnaire
Dear Sir/Madam,
My name is Lei Wang, who is currently the PhD candidate at the Liverpool Logistics Offshore
and Marine Research Institute (LOOM) in Liverpool John Moores University. My research topic
is “Research on risk management for healthcare supply chain in hospital”. The research aims
to propose a novel risk management methodology to identify, evaluate and mitigate the risk
factors in hospital supply chain. The purposes of the questionnaire is to develop contextual
relationships to analyze the inter-relationships among healthcare supply chain risk factors.
I would be very pleased if you can take part in this study in view of your professional
knowledge in risk management, supply chain management or in hospital. The information
gathered in this survey will be treated in the strictest confidence, as this has always been the
policy of the Liverpool John Moores University. The questionnaire is anonymous, thus your
response can not be attributed to you or your organization.If you have any questions about
this study, please feel free to contract me either email [email protected] or by phone.
You also can contact my supervisor, Dr Jun Ren, at (44)1512312236, or by email
Yours faithfully,
Lei Wang,
PhD Candidate,
Liverpool Logistics Offshore and Marine Research Institute (LOOM)
Tel: +(44)7510535904 or (86)13223898880
Email: [email protected]
Room 121, James Parsons Building
Liverpool John Moores University, Byrom Street, Liverpool, L3 3AF, UK

388
Section A: Respondent Profile
1. What is the type of your organization?
Pharmaceutical
Manufacturer
Pharmaceutical
distributor
(pharmaceutical
company )
Hospital
(Procurement department;
Material management
department etc.)
Other
☐ ☐ ☐ ☐
5. What is your job title? (optional)
3. For how many years have you worked in the healthcare industry or healthcare supply
chain?
☐1-5 years ☐6-10 years ☐11-15 years ☐16-19 years ☐≥20 years
Section B: Interpretive Structural Modelling (ISM)
The occurrence of one risk gives rise to multiple risks resulting into a domino effect which
makes it very importance for the managers to control these risks before they occur. The
following questions are related to analyze the inter-relationships among the identified risk
factors.
Contextual relationship = leads to What to enter in the cells:
1) Enter 1 when the column influences the row and the row not influences the column
2) Enter 2 when the column influences the row and the row not influences the row
3) Enter 0 when there is no relation between the row and the column
4) Enter 3 when row and column influences each other

389
Risk factors S11 S10 S9 S8 S7 S6 S5 S4 S3 S2 S1
S1 Counterfeiting
S2 Capability versus demand, inability of capacity to meet demand
S3 Dispensing/picking errors medication/packaging
S4 Shortage of drug, unavailability of drugs on the market
S5 Poor quality in the purchased drugs from suppliers
S6 Weak logistics service infrastructure
S7 Poor IT system, lack of data standardization
S8 Lack of visibility concerning placement and availability of stock
S9 High purchase price
S10 Clinician's preference
S11 High product and supplier/brand variety

390
THANK YOU ONCE AGAIN FOR YOUR KIND PARTICIPATION IN THIS SURVEY.
YOUR ANSWER WILL BE KEEP CONFIDENTIAL.

391
医疗药品供应链风险管理问卷调查
尊敬的专家:
您好!我叫王磊。来自利物浦约翰莫尔斯大学(LJMU)物流和海洋研究所的博士研
究生。我的研究课题是提出一种全新的、系统化和结构化的方法针对医院药品供应链
过程中产生的风险因素进行识别、分析和控制。
本次问卷的目的是:
针对已经识别出存在于医疗供应链中的风险因素,根据专家的经验与意见对其风
险因素之间的相互影响关系进行评估。
对于占用您宝贵的时间我深感歉意。也同时非常的荣幸能够邀请您参加到我的研
究课题当中。您对于医疗供应链管理和风险管理的宝贵经验将对此次问卷调查的起到
非常重要的作用。同时需要强调的是,根据研究课题组的要求,本次调查的信息将会
被严格的保密;其中所涉及到的相关单位及个人信息会采取匿名的方式。
本次调查需要 5-10 分钟左右的时间。如果您有任何问题,请通过电子邮件
[email protected] 联系我。您也可以通过电子邮件 [email protected]
联系我的导师任军教授。最终的研究成果将无偿分享给您和您所在的单位。
王磊
博士研究生
Liverpool Logistics Offshore and Marine Research Institute (LOOM)
Tel: 13223898880
Email: [email protected] or [email protected]
Room 121, James Parsons Building
Liverpool John Moores University, Byrom Street, Liverpool, L3 3AF, UK

392
第一部分:受访者基本情况
1. 请问您所在的单位是以下哪一个?
医药制造企业
医药批发企业
医药零售企业
医院
其它
☐ ☐ ☐ ☐ ☐
6. 请问您的职位是什么?(可选)
3. 请问您从事医药物流和供应链的工龄多久?
☐1-5 年 ☐6-10 年 ☐11-15 年 ☐16-19 年 ☐≥20 年
第二部分:解释结构模型法
一个风险的发生会引起其他多个风险,继而在组织中产生多米诺效应。下列问题是针
对于风险之间的相互影响关系进行评估。
相互之间的关系= 导致
填入方块中的数字各自代表的意思:
5) 填入 1 表示纵列中的风险因素会影响或导致横行中的风险因素, 但横行中的风
险因素不会影响或导致纵列中的风险因素。
6) 填入 1 表示横行中的风险因素会影响或导致纵列中的风险因素, 但纵列中的风
险不会影响或导致横行中的风险因素。
7) 填入 0 表示纵列和横行中的风险因素互不影响。
8) 填入 3 表示纵列和横行中的风险因素互相影响。
注:由于篇幅原因,横行中的风险因素仅以数字代替,例如 S11 表示采购药品的种类
和供应商的数量过多。

393
风险因素 S11 S10 S9 S8 S7 S6 S5 S4 S3 S2 S1
S1 假药
S2 医院整体实力与各科室需求不匹配
S3 医院内部药品的拣选,包装和运输出错
S4 药品短缺
S5 购买药品的质量不合格
S6 物流服务基础设施薄弱
S7 落后的信息系统;单一的信息传送渠道;信息传
输缓慢
S8 库存管理的可视化程度低
S9 过高的采购价格
S10 医生的个人偏好 (医生有各自对于药品使用的偏
好,医生更多关注药效而忽视药品价格)
S11 采购药品的种类和供应商的数量过多

394
再次感谢您在此次调查中提供的帮助。
您的回答将会被严格保密。

395
APPENDIX FOUR
List of Semi-structured Interview Questions for the purpose of Chapter seven

396
1. What is your job titles?
____________________________________________
2. The number of years in your organization:
_______________years and ______________months
3. The number of employee or beds in your organization: __________________
4. Is your organization concerned about supply chain risks?
_______________________________________
5. Have you had any issues or incidents in the past 12 months resulting in supply chain
disruption to your organization or to any other customer?
________________________________________
6. In your opinion, list the main risks in hospital supply chain regarding to five risk factors
(demand, supply, process, control and environmental risks):
________________________________________
7. Does your organization have the formal mechanisms for identifying and documenting
risks facing your area? If you answered “yes”,
How long it has been implemented?
_________________________________________
What elements does your risk management program cover?
_________________________________________
As circumstances change, risks may also change. How often is your risk factors
identification reviewed and undated?
_________________________________________
Do you think what is the key factor in execution the mechanisms?
__________________________________________
8. If you do not have formal risk factors identification mechanisms, how do you ensure
coverage of key risks?
__________________________________________
9. Does your organization operate risk management strategy so far? If you answered “yes”,
How long it has been implemented?
__________________________________________

397
Which department or procedure are using the strategy?
__________________________________________
For your opinion, what are the advantages and disadvantages for using the
strategy in your organization?
___________________________________________
10. The hospital supply chain is constituted by three main components which are
procurement, warehouse and transportation activities. So for your opinion, which
component is more high risk than other two?
____________________________________________
11. Does the decision maker play the key role for managing risks in your organization?
_____________________________________________

398
APPENDIX FIVE
Questionnaire used in Survey D for the purpose of TOPSIS method in Chapter
seven

399
Research on Risk Management for Healthcare Supply Chain in
Hospital Questionnaire
Dear Sir/Madam,
My name is Lei Wang, who is currently the PhD candidate at the Liverpool Logistics Offshore
and Marine Research Institute (LOOM) in Liverpool John Moores University. My research topic
is “Research on risk management for healthcare supply chain in hospital”. The research aims
to propose a novel risk assessment methodology to identify, evaluate and mitigate the risk
factors in hospital supply chain. The purpose of the questionnaire is to examine the best
solutions for the risk mitigation of the healthcare supply chain in hospital sector.
I would be very pleased if you can take part in this study in view of your professional
knowledge in risk management, supply chain management or in hospital. The information
gathered in this survey will be treated in the strictest confidence, as this has always been the
policy of the Liverpool John Moores University. The questionnaire is anonymous, thus your
response can not be attributed to you or your organization.If you have any questions about
this study, please feel free to contract me either email [email protected] or by phone.
You also can contact my supervisor, Dr. Jun Ren, at (44)1512312236, or by email
Yours faithfully,
Lei Wang,
PhD Candidate,
Liverpool Logistics Offshore and Marine Research Institute (LOOM)
Tel: +(44)7510535904 or (86)13223898880
Email: [email protected]

400
Section A: Introduction and Explanation
Based on the findings from the previous survey, the following factors have been weighted
by the experts as the most importance risks:
S1 Counterfeiting
S2 Capability versus demand; inability of capacity to meet demand (e.g. not able to
response the demand, procurement is not sufficient to copy with demand. Lack of
human resource(inherent efficiencies and recruitment and retention problems with the
pharmacy profession), lack of information accuracy; the number of lifts is limited, and
it is not capable to support the delivering process during the rush hour)
S3 Dispensing/picking errors medication/packaging (e.g. Manually operate; delay
delivery, urgent delivery; sound-alike or look-alike drug names, similarities in the outer
appearance of medicines’ packages and labeling as well as unclear or incomplete
labeling information; high delivering frequency per day; handwritten prescription leads
to various types of medication error such as prescribing error, transcribing error, pre-
dispensing and dispensing error.)
S4 Shortage of drugs
S5 Poor quality in the purchased drugs from suppliers
S6 Weak Logistics service infrastructure (e.g. Obsolete equipment in the warehouse;
Improper drug store environment and transportation facility, route, inefficient cold
chain management during transportation affects the quality and stability of
temperature-sensitive products)
S7 Poor IT System, too much information, lack of data standardization (e.g. slowly
information transmission and single transmission channel; lack of information
management platform, manual process, lack of standardized product identification
(RFID, QR code), Lack of product traceability and integrated system with suppliers,
limited information system which covering logistics activities.)
S8 Lack of visibility concerning placement and availability of stock
S9 High purchase price
S10 Clinician’s preference (e.g. lack the awareness of cost containment)
S11 High product and supplier/brand variety (e.g. high stock levels)
We further need to determine which relevant risk mitigation solutions has become the key
strategic consideration. The following 9 appropriate risk management strategies have been
identified through the empirical studies from both UK and China hospitals. For your opinion
as an expert, please kindly give your comments about the performance of following
mitigation solutions with respect to manage each risk factor.

401
Section B: Questionnaire
Q1. With respect to manage S1 Counterfeiting, please determine the importance of each risk
mitigation strategy.
Important level
Risk Mitigation Strategies Very Poor Poor Medium Good Very good
Logistics Management e.g. appropriate distribution route and used temperature-
monitoring devices
☐ ☐ ☐ ☐ ☐
Information Technology System e.g. Data standardization, information sharing, drugs traceability, integrated IT
platform, RFID, EDI
☐ ☐ ☐ ☐ ☐
Collaboration Vertical and Horizontal (e.g.
clinical staff engagement, supplier relationship
management; GPO, etc)
☐ ☐ ☐ ☐ ☐
Inventory Management e.g. Consignment stock,
visibility, Drugs expiry date management, Just-in -time
☐ ☐ ☐ ☐ ☐
eProcurement Strategy (the application of technology to automate the exchange of
procurement information through the SC)
☐ ☐ ☐ ☐ ☐
Outsourcing e.g. Stock replenishment, maintenance and repairs;
outsourcing non-core services
☐ ☐ ☐ ☐ ☐
Agility e.g. out of hours, urgent
deliveries; responsiveness; flexibility
☐ ☐ ☐ ☐ ☐
Capability Management e.g. Staff training, set up a central control of logistics
activities to manage people
☐ ☐ ☐ ☐ ☐
Single Sourcing e.g. long-term contract with
only one supplier
☐ ☐ ☐ ☐ ☐
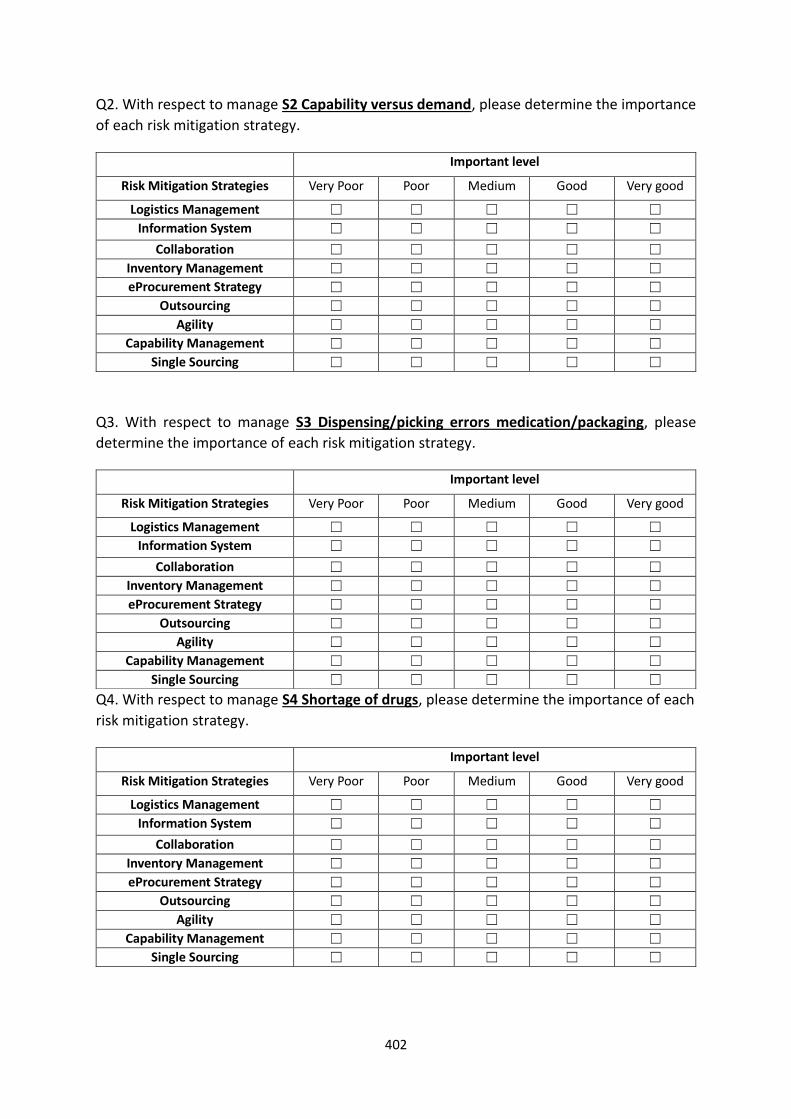
402
Q2. With respect to manage S2 Capability versus demand, please determine the importance
of each risk mitigation strategy.
Q3. With respect to manage S3 Dispensing/picking errors medication/packaging, please
determine the importance of each risk mitigation strategy.
Q4. With respect to manage S4 Shortage of drugs, please determine the importance of each
risk mitigation strategy.
Important level
Risk Mitigation Strategies Very Poor Poor Medium Good Very good
Logistics Management ☐ ☐ ☐ ☐ ☐
Information System ☐ ☐ ☐ ☐ ☐
Collaboration ☐ ☐ ☐ ☐ ☐
Inventory Management ☐ ☐ ☐ ☐ ☐
eProcurement Strategy ☐ ☐ ☐ ☐ ☐
Outsourcing ☐ ☐ ☐ ☐ ☐
Agility ☐ ☐ ☐ ☐ ☐
Capability Management ☐ ☐ ☐ ☐ ☐
Single Sourcing ☐ ☐ ☐ ☐ ☐

403
Q5. With respect to manage S5 Poor quality in the purchased drugs from suppliers, please
determine the importance of each risk mitigation strategy.
Q6. With respect to manage S6 Weak logistics service infrastructure, please determine the importance of each risk mitigation strategy.
Q7. With respect to manage S7 Poor IT system, too much information, lack of data standardization, please determine the importance of each risk mitigation strategy.
Important level
Risk Mitigation Strategies Very Poor Poor Medium Good Very good
Logistics Management ☐ ☐ ☐ ☐ ☐
Information System ☐ ☐ ☐ ☐ ☐
Collaboration ☐ ☐ ☐ ☐ ☐
Inventory Management ☐ ☐ ☐ ☐ ☐
eProcurement Strategy ☐ ☐ ☐ ☐ ☐
Outsourcing ☐ ☐ ☐ ☐ ☐
Agility ☐ ☐ ☐ ☐ ☐
Capability Management ☐ ☐ ☐ ☐ ☐
Single Sourcing ☐ ☐ ☐ ☐ ☐

404
Q8. With respect to manage S8 Lack of visibility concerning placement and availability of stock, please determine the importance of each risk mitigation strategy.
Q9. With respect to manage S9 High purchase price, please determine the importance of each risk mitigation strategy.
Q10. With respect to manage S10 Clinician’s preference, please determine the importance of each risk mitigation strategy.
Important level
Risk Mitigation Strategies Very Poor Poor Medium Good Very good
Logistics Management ☐ ☐ ☐ ☐ ☐
Information System ☐ ☐ ☐ ☐ ☐
Collaboration ☐ ☐ ☐ ☐ ☐
Inventory Management ☐ ☐ ☐ ☐ ☐
eProcurement Strategy ☐ ☐ ☐ ☐ ☐
Outsourcing ☐ ☐ ☐ ☐ ☐
Agility ☐ ☐ ☐ ☐ ☐
Capability Management ☐ ☐ ☐ ☐ ☐
Single Sourcing ☐ ☐ ☐ ☐ ☐

405
Q11. With respect to manage S11 High product and supplier/brand variety, please determine the importance of each risk mitigation strategy.
THANK YOU ONCE AGAIN FOR YOUR KIND PARTICIPATION IN THIS SURVEY.
YOUR ANSWER WILL BE KEEP CONFIDENTIAL.
Important level
Risk Mitigation Strategies Very Poor Poor Medium Good Very good
Logistics Management ☐ ☐ ☐ ☐ ☐
Information System ☐ ☐ ☐ ☐ ☐
Collaboration ☐ ☐ ☐ ☐ ☐
Inventory Management ☐ ☐ ☐ ☐ ☐
eProcurement Strategy ☐ ☐ ☐ ☐ ☐
Outsourcing ☐ ☐ ☐ ☐ ☐
Agility ☐ ☐ ☐ ☐ ☐
Capability Management ☐ ☐ ☐ ☐ ☐
Single Sourcing ☐ ☐ ☐ ☐ ☐

406
医疗药品供应链风险管理
问卷调查
尊敬的专家:
您好!我叫王磊。来自利物浦约翰莫尔斯大学(LJMU)物流和海洋研究所的博士研究生。
我的研究课题是提出一种全新的、系统化和结构化的方法针对医院药品供应链过程中
产生的风险因素进行识别、分析和控制。本次问卷的目的是评价不同风险控制策略在
面对不同的风险因素时的重要程度。
对于占用您宝贵的时间我深感歉意。也同时非常的荣幸能够邀请您参加到我的研究课
题当中。您对于医疗供应链管理和风险管理的宝贵经验将对此次问卷调查的起到非常
重要的作用。同时需要强调的是,根据研究课题组的要求,本次调查的信息将会被严
格的保密;其中所涉及到的相关单位及个人信息会采取匿名的方式。
本次调查需要 10 分钟左右的时间。如果您有任何问题,请通过电子邮件
[email protected] 联系我。您也可以通过电子邮件 [email protected]
联系我的导师任军教授。
王磊
博士研究生
Liverpool Logistics Offshore and Marine Research Institute (LOOM)
Tel: +(44)7510535904
Email: [email protected]
Room 121, James Parsons Building
Liverpool John Moores University, Byrom Street, Liverpool, L3 3AF, UK

407
第一部分:简介
根据此前的调查研究,我们识别出以下存在于医院供应链之中最重要的 11个风险因素:
S1 假药
S2 医院整体实力与各科室需求不匹配 (例如:不能够有效及时地对满足需求,出现供不应求
的情况; 相应的工作人员缺乏;缺少准确信息;在需求高峰期时,电梯的数量不足,不能够
及时将药物配送的各个科室等)
S3 医院内部药品的拣选,包装和运输出错 (例如:手动操作容易引起操作失误;相似包装的
药品或者不清晰的条形码信息容易造成药品拣选,配送出错;每个工作日中高批量的配送等)
S4 药品短缺
S5 购买药品的质量不合格
S6 落后的物流服务设施 (例如:药品库房设备陈旧;不适当的药品储存环境和运输设备,路
径; 冷链控制不当等)
S7 落后的信息系统,过量的信息,缺乏药品数据标准化 (例如:信息传送缓慢,单一的信息
传送渠道;缺乏同意的信息服务平台;自动化操作程度低; 缺乏统一的药品代码; 缺乏药品
的可追踪性以及与供应商的信息系统不整合等)
S8 库存管理的可视化程度低
S9 过高的采购价格
S10 医生的个人偏好加重采购的成本 (医生有各自对于药品使用的偏好,医生更多关注药效
而忽视药品价格)
S11 采购药品的种类和供应商的数量过多 (例如:过高的库存量造成浪费等)
针对于以上 11个高风险因素,我们通过在英国和中国的医院内部进行实证研究,识别出 10个
相应的风险管理策略。请您以专家的观点对其在管理不同的风险时的重要程度进行打分,并提
出不同的改进意见。

408
第二部分:问卷部分
问题一:针对降低 S1假药的风险,请问以下各风险策略的重要程度。
重要程度
风险管理策略 非常差 差 一般 好 非常好
物流管理
例如:合理的运输路径,采取先进的温度控制设备提高冷链
效率等
☐ ☐ ☐ ☐ ☐
信息技术系统
例如:数据标准化,信息共享,药品的可追溯性,先进的
信息系统等
☐ ☐ ☐ ☐ ☐
注重合作
例如:医院内部各个科室之间以及医院与上游供应商之间建立长期有效的合作机制,临床医生参与采购等物流活动等
☐ ☐ ☐ ☐ ☐
库存管理
例如: 库存可视化管理;药品期效管理;JIT库存管理等
☐ ☐ ☐ ☐ ☐
电子采购战略
例如:采购流程电子化,信息化等
☐ ☐ ☐ ☐ ☐
外包
例如:将医院内部非核心的物流活动外包给第三方管理;二
级库房外包等
☐ ☐ ☐ ☐ ☐
敏捷管理
例如:针对突发事件进行快速反应等
☐ ☐ ☐ ☐ ☐
能力管理
例如:注重员工技能培训(采购,配送,拣选等)
☐ ☐ ☐ ☐ ☐
单一化采购
例如:只与一家大的药品供应商建立长期合作,其供应商提供医院内部药品用量的 90%以上,降低多向采购带来的质量
等问题
☐ ☐ ☐ ☐ ☐

409
问题二:针对降低 S2 医院整体实力与各科室需求不匹配的风险,请问以下各风险策略的重要程
度。
问题三:针对降低 S3 医院内部药品的拣选,包装和运输出错的风险,请问以下各风险策略的重
要程度。
重要程度
风险管理策略 非常差 差 一般 好 非常好
物流管理
☐ ☐ ☐ ☐ ☐
信息技术系统
☐ ☐ ☐ ☐ ☐
注重合作
☐ ☐ ☐ ☐ ☐
库存管理
☐ ☐ ☐ ☐ ☐
电子采购战略
☐ ☐ ☐ ☐ ☐
外包
☐ ☐ ☐ ☐ ☐
敏捷管理
☐ ☐ ☐ ☐ ☐
能力管理
☐ ☐ ☐ ☐ ☐
单一化采购
☐ ☐ ☐ ☐ ☐
重要程度
风险管理策略 非常差 差 一般 好 非常好
物流管理
☐ ☐ ☐ ☐ ☐
信息技术系统
☐ ☐ ☐ ☐ ☐
注重合作
☐ ☐ ☐ ☐ ☐
库存管理
☐ ☐ ☐ ☐ ☐
电子采购战略
☐ ☐ ☐ ☐ ☐
外包
☐ ☐ ☐ ☐ ☐
敏捷管理
☐ ☐ ☐ ☐ ☐
能力管理
☐ ☐ ☐ ☐ ☐
单一化采购
☐ ☐ ☐ ☐ ☐
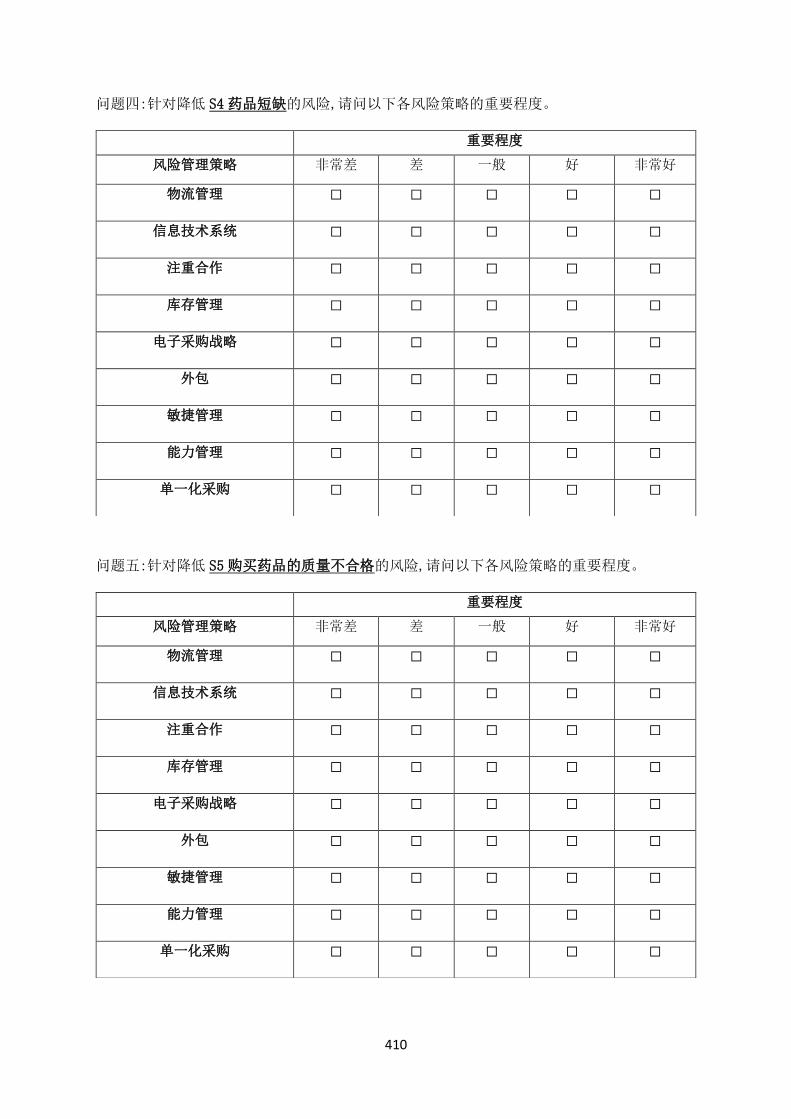
410
问题四:针对降低 S4 药品短缺的风险,请问以下各风险策略的重要程度。
问题五:针对降低 S5购买药品的质量不合格的风险,请问以下各风险策略的重要程度。
重要程度
风险管理策略 非常差 差 一般 好 非常好
物流管理
☐ ☐ ☐ ☐ ☐
信息技术系统
☐ ☐ ☐ ☐ ☐
注重合作
☐ ☐ ☐ ☐ ☐
库存管理
☐ ☐ ☐ ☐ ☐
电子采购战略
☐ ☐ ☐ ☐ ☐
外包
☐ ☐ ☐ ☐ ☐
敏捷管理
☐ ☐ ☐ ☐ ☐
能力管理
☐ ☐ ☐ ☐ ☐
单一化采购
☐ ☐ ☐ ☐ ☐
重要程度
风险管理策略 非常差 差 一般 好 非常好
物流管理
☐ ☐ ☐ ☐ ☐
信息技术系统
☐ ☐ ☐ ☐ ☐
注重合作
☐ ☐ ☐ ☐ ☐
库存管理
☐ ☐ ☐ ☐ ☐
电子采购战略
☐ ☐ ☐ ☐ ☐
外包
☐ ☐ ☐ ☐ ☐
敏捷管理
☐ ☐ ☐ ☐ ☐
能力管理
☐ ☐ ☐ ☐ ☐
单一化采购
☐ ☐ ☐ ☐ ☐

411
问题六:针对降低 S6 落后的物流服务设施的风险,请问以下各风险策略的重要程度。
问题七:针对降低 S7 落后的信息系统,过量的信息,缺乏数据标准化的风险,请问以下各风险策
略的重要程度。
重要程度
风险管理策略 非常差 差 一般 好 非常好
物流管理
☐ ☐ ☐ ☐ ☐
信息技术系统
☐ ☐ ☐ ☐ ☐
注重合作
☐ ☐ ☐ ☐ ☐
库存管理
☐ ☐ ☐ ☐ ☐
电子采购战略
☐ ☐ ☐ ☐ ☐
外包
☐ ☐ ☐ ☐ ☐
敏捷管理
☐ ☐ ☐ ☐ ☐
能力管理
☐ ☐ ☐ ☐ ☐
单一化采购
☐ ☐ ☐ ☐ ☐
重要程度
风险管理策略 非常差 差 一般 好 非常好
物流管理
☐ ☐ ☐ ☐ ☐
信息技术系统
☐ ☐ ☐ ☐ ☐
注重合作
☐ ☐ ☐ ☐ ☐
库存管理
☐ ☐ ☐ ☐ ☐
电子采购战略
☐ ☐ ☐ ☐ ☐
外包
☐ ☐ ☐ ☐ ☐
敏捷管理
☐ ☐ ☐ ☐ ☐
能力管理
☐ ☐ ☐ ☐ ☐
单一化采购
☐ ☐ ☐ ☐ ☐

412
问题八:针对降低 S8 库存管理的可视化程度低的风险,请问以下各风险策略的重要程度。
问题九:针对降低 S9 过高的采购价格的风险,请问以下各风险策略的重要程度。
重要程度
风险管理策略 非常差 差 一般 好 非常好
物流管理
☐ ☐ ☐ ☐ ☐
信息技术系统
☐ ☐ ☐ ☐ ☐
注重合作
☐ ☐ ☐ ☐ ☐
库存管理
☐ ☐ ☐ ☐ ☐
电子采购战略
☐ ☐ ☐ ☐ ☐
外包
☐ ☐ ☐ ☐ ☐
敏捷管理
☐ ☐ ☐ ☐ ☐
能力管理
☐ ☐ ☐ ☐ ☐
单一化采购
☐ ☐ ☐ ☐ ☐
重要程度
风险管理策略 非常差 差 一般 好 非常好
物流管理
☐ ☐ ☐ ☐ ☐
信息技术系统
☐ ☐ ☐ ☐ ☐
注重合作
☐ ☐ ☐ ☐ ☐
库存管理
☐ ☐ ☐ ☐ ☐
电子采购战略
☐ ☐ ☐ ☐ ☐
外包
☐ ☐ ☐ ☐ ☐
敏捷管理
☐ ☐ ☐ ☐ ☐
能力管理
☐ ☐ ☐ ☐ ☐
单一化采购
☐ ☐ ☐ ☐ ☐

413
问题十:针对降低 S10 医生的个人偏好加重采购的成本的风险,请问以下各风险策略的重要程
度。
问题十一:针对降低 S11 采购药品的种类和供应商的数量过多的风险,请问以下各风险策略的
重要程度。
重要程度
风险管理策略 非常差 差 一般 好 非常好
物流管理
☐ ☐ ☐ ☐ ☐
信息技术系统
☐ ☐ ☐ ☐ ☐
注重合作
☐ ☐ ☐ ☐ ☐
库存管理
☐ ☐ ☐ ☐ ☐
电子采购战略
☐ ☐ ☐ ☐ ☐
外包
☐ ☐ ☐ ☐ ☐
敏捷管理
☐ ☐ ☐ ☐ ☐
能力管理
☐ ☐ ☐ ☐ ☐
单一化采购
☐ ☐ ☐ ☐ ☐
重要程度
风险管理策略 非常差 差 一般 好 非常好
物流管理
☐ ☐ ☐ ☐ ☐
信息技术系统
☐ ☐ ☐ ☐ ☐
注重合作
☐ ☐ ☐ ☐ ☐
库存管理
☐ ☐ ☐ ☐ ☐
电子采购战略
☐ ☐ ☐ ☐ ☐
外包
☐ ☐ ☐ ☐ ☐
敏捷管理
☐ ☐ ☐ ☐ ☐
能力管理
☐ ☐ ☐ ☐ ☐
单一化采购
☐ ☐ ☐ ☐ ☐

414
再次感谢您在此次调查中提供的帮助
您的回答将会被严格保密