Reporting indicators: What do they indicate
26
The indicators selected for performance reporting reflect the attitudes of state policymakers on the goals, values, and models for excellence for public colleges and universities. NEW DIRECTIONS FOR INSTITUTIONAL RESEARCH, no. 116, Winter 2002 © Wiley Periodicals, Inc. 33 3 Reporting Indicators: What Do They Indicate? Performance reporting for higher education adds to the adage that what gets measured is what gets valued. Measuring results may increase what is val- ued, but publicizing the findings is more likely to improve performance. Banta and Borden claim that performance indicators “can be defined as the generation of judgments about performance”(1994, p. 18). The indicators picked for reporting provide clues about what state policymakers want from higher education and offer insights into their attitudes toward public col- leges and universities. All programs of reporting, including those not man- dated in legislation, respond mostly to issues raised in external demands from governors, legislators, and business leaders. Although coordinating or system officials in consultation with campus leaders may have picked or proposed the indicators, they knew that governors and legislators were looking over their shoulders. The underlying question is, what do the reporting indicators really indicate? The goal in this chapter is not just to describe and define the indi- cators but also to probe for their implication and intent. The answers can assist state and campus policymakers in devising reporting systems that can better attain the major purposes of demonstrating accountability, improv- ing performance, and responding to state needs. They might even add to the credibility of public higher education in ways that could contribute to increased state funding. In this chapter, we seek answers to a series of questions. What types of indicators are preferred in performance reporting—inputs, processes, out- puts, or outcomes? Do they reflect more the external concerns of state offi- cials or the internal concerns of the academic community? To what extent
-
Upload
independent -
Category
Documents
-
view
3 -
download
0
Transcript of Reporting indicators: What do they indicate

The indicators selected for performance reporting reflectthe attitudes of state policymakers on the goals, values,and models for excellence for public colleges anduniversities.
NEW DIRECTIONS FOR INSTITUTIONAL RESEARCH, no. 116, Winter 2002 © Wiley Periodicals, Inc. 33
3
Reporting Indicators: What Do They Indicate?
Performance reporting for higher education adds to the adage that what getsmeasured is what gets valued. Measuring results may increase what is val-ued, but publicizing the findings is more likely to improve performance.Banta and Borden claim that performance indicators “can be defined as thegeneration of judgments about performance”(1994, p. 18). The indicatorspicked for reporting provide clues about what state policymakers want fromhigher education and offer insights into their attitudes toward public col-leges and universities. All programs of reporting, including those not man-dated in legislation, respond mostly to issues raised in external demandsfrom governors, legislators, and business leaders. Although coordinating or system officials in consultation with campus leaders may have picked orproposed the indicators, they knew that governors and legislators werelooking over their shoulders.
The underlying question is, what do the reporting indicators reallyindicate? The goal in this chapter is not just to describe and define the indi-cators but also to probe for their implication and intent. The answers canassist state and campus policymakers in devising reporting systems that canbetter attain the major purposes of demonstrating accountability, improv-ing performance, and responding to state needs. They might even add to thecredibility of public higher education in ways that could contribute toincreased state funding.
In this chapter, we seek answers to a series of questions. What types ofindicators are preferred in performance reporting—inputs, processes, out-puts, or outcomes? Do they reflect more the external concerns of state offi-cials or the internal concerns of the academic community? To what extent

34 REPORTING HIGHER EDUCATION RESULTS
do the indicators express the classic policy values of efficiency, quality,equity, and choice? What do the reporting indicators imply about the mod-els of excellence for public colleges and universities desired by state poli-cymakers? How do the answers to these questions about performancereporting compare with those reached for performance funding? Finally, towhat extent do the indicator types, concerns, values, and models of excel-lence differ between two- and four-year colleges and universities, and whatdoes this answer tell us about the attitudes of state policymakers towardthese two types of institutions?
Methods
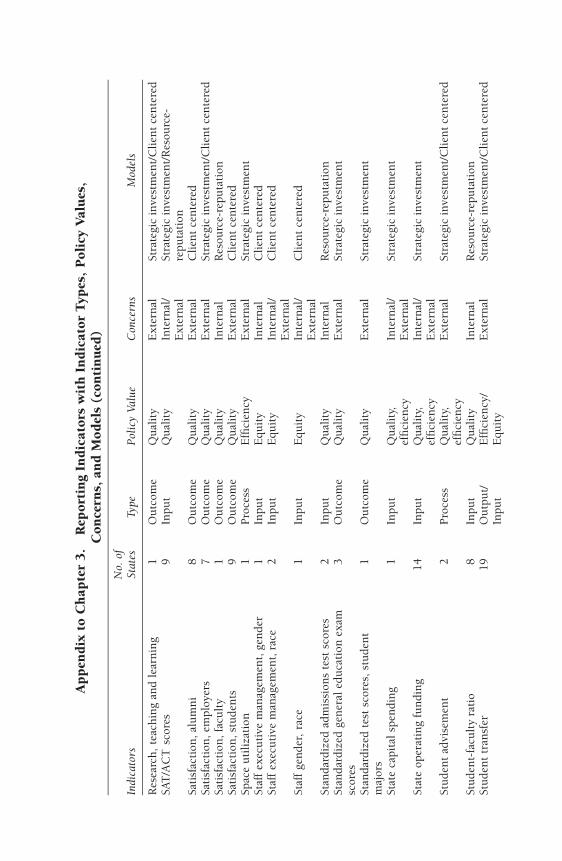
Comparing the indicators in the twenty-nine study reports proved chal-lenging because the measures varied widely in number, content, and word-ing. Some programs link different objectives in a single indicator whereasothers list them separately. We constructed a common core of 158 genericindicators by combining measures with similar intent but different namesand by separating those with different purposes into distinct measures. Staffthen categorized each indicator by type, concern, policy value, and modelof excellence (see Appendix at end of chapter).
The analysis examines the implication and intent of the performanceindicators in two ways. The first uses the total number of generic indicatorsfor both performance reporting (158) and for performance funding (66) toidentify the percentages each program allocates to indicator types, concerns,values, and models of excellence (Burke and Serban, 1998; also see thischapter’s Appendix). The second makes the same calculations for the eightmost used indicators in performance reporting and performance funding,as shown in Table 3.1.
Common Indicators
Both programs exhibit a limited number of widely used indicators, but theperformance reports share more common measures than those for perfor-mance funding. In Table 3.1, the top eight indicators for both programs are
Table 3.1. Rank of Top Eight Indicators by Use
Performance Reports, Total Number � 29 Performance Funding, Total Number � 11
Graduation or retention 24 Graduation or retention 10Enrollment or race 21 Job placement 8Research, sponsored 20 Student transfers 6Student transfers 19 Faculty workload 5Tuition and fees 18 Institutional choice 5Financial aid 17 Licensure test scores 4Degrees awarded 16 Time to degree 4Licensure test scores 16 Workforce and economic development 4

REPORTING INDICATORS: WHAT DO THEY INDICATE? 35
ranked according to their usage. The items in bold type are the measuresshared by performance reporting and funding, which includes only threeindicators. The top eight indicators for performance reporting are used inat least sixteen of the twenty-nine study reports. Conversely, the top eightmeasures in the eleven cases of performance funding include indicatorsused by four or more programs. In other words, more than half of the per-formance reports use their top eight measures, but less than 40 percent ofthe funding programs apply their top eight indicators. Although analyzingall of the generic indicators gives some sense of their overall usage, focus-ing on the most popular indicators gives a better reading of the intent ofpolicymakers on the indicator types, concerns, values, and models of excel-lence where it matters most—on the most used measures.
Comparison with Performance Funding Indicators
Although Table 3.1 shows that both programs adopted few common indi-cators, more performance reports than funding programs used their mostpopular indicators. Performance reporting and performance funding stresssome of the same indicators, such as graduation, transfer, job placementrates, and licensure test scores (Burke and others, 2002; Burke and Serban,1998). Despite these similarities, performance reporting reveals increasedemphasis on total enrollments, student diversity, tuition and fees, and finan-cial aid. Apparently the issues of access, diversity, and affordability seemmore crucial to policymakers in performance reporting than in performancefunding. Conversely, funding programs paid more attention to efficiencymeasures such as faculty workload and time to degree. Clearly, performancereporting stressed more the inputs of enrollments, student diversity, tuitionand fees, and financial aid, whereas performance funding emphasized morethe outputs of graduation, transfer, and job placement. Performance fund-ing would naturally not reward increased access because state budgets forpublic colleges and universities already funded enrollments in campus bud-gets. In addition, this funding program would not add allocations forincreased financial aid because states fund the lion’s share of these programsfor public colleges and universities. The most common measures in perfor-mance funding favor the output category of efficiency and productivity, andthose from performance reporting emphasize the input category of accessand equity.
Two-and Four-Year Reporting Indicators
Although studies criticize performance funding for not including more mea-sures that encourage the special missions of community colleges, fundingprograms seem more sensitive than performance reporting to the differencesbetween the two types of institutions (Burke, 1997; Burke and others, 2002;Burke and Serban, 1998). Reporting programs use nearly identical indicators

36 REPORTING HIGHER EDUCATION RESULTS
for two- and four-year campuses. In contrast, performance funding inFlorida, Missouri, Ohio, and Tennessee have both shared and different indi-cators for their baccalaureate and associate institutions. Recent changes inSouth Carolina also apply the same approach. The use of identical indicatorsin performance funding in Arkansas for community colleges and baccalau-reate campuses has had dire effects, having contributed to the demise of thefirst effort at performance funding in that state (Burke and others, 2002;Burke and Serban, 1998).
Two- and four-year colleges should share some of the same measuresthat stress their common goals in providing general and specialized educa-tion. However, they should also have different indicators that reflect theirdiverse missions. Many four-year campuses have special missions inresearch and graduate studies whereas two-year colleges have distinct man-dates in workforce training and adult education. Failure to include moreindicators that differentiate the distinct missions of two- and four-year col-leges lends some credence to complaints that performance reporting repre-sents a one-size-fits-all indicator system, at least as applies to two- andfour-year colleges and universities.
Indicator Types. Whether used for reporting or funding, perfor-mance indicators fall into four types (Carter, Klein, and Day, 1992; Cave,Hanney, and Kogan, 1991; Richardson, 1994). Inputs involve the human,financial, and physical resources received to support programs, activitiesand services, such as funding, enrollments, and staffing indicators.Processes include the means used to deliver programs, activities, and ser-vices. Assessment of student learning, use of technology, and teacher train-ing constitute process measures. Outputs reflect the quantity of productsactually produced—degrees awarded, retention or graduation rates, andsponsored research funding. Outcomes cover the quality of programs, activ-ities, and services or their benefits to students, states, and society. Testscores, job placements, and satisfaction surveys results of students, alumni,and employers represent common outcomes measures. Some writers stopwith outputs and include the concept of outcomes within that designation(Cave, Hanney, and Kogan, 1991). We see outputs and outcomes as dif-ferent enough that they require separate designations because outputs con-note quantity and outcomes quality.
The four indicator types have different characteristics and objectives, butoperationally they are related. Successful indicator systems—whether at the state, system, or campus levels—should link all four types in an input-process-output-outcome model (Borden and Bottrill, 1994) or Astin’s input-environment-outcome concept (1991). For example, at the campuslevel, the input of the academic preparation of students requires different pro-cesses of teaching and learning to produce the output of graduation and thedesired outcomes in life and careers. In other words, the processes shouldmatch the inputs to produce desired outputs and outcomes. Unfortunately,none of the programs studied in performance reporting or funding follow this

NEW ACCOUNTABILITY: FROM REGULATION TO RESULTS 37
prescription, although the state university system in Florida initially proposedsuch an approach in a performance budgeting proposal. All too often, stateand campus policymakers consider performance indicators as isolated ratherthan related items that should reinforce each other. The advocates ofperformance-based management and programs forget this connection whenthey belittle inputs and processes and laud outputs and outcomes. Both per-formance reporting and funding may include too many input and processindicators and too few output and outcome indicators, but all performanceprograms should recognize the interaction of all four types of perfor-mance measures.
Designing the four types of indicators involves different levels of dif-ficulty and controversy. Inputs and outputs with their emphasis on quan-tity are easy to count and, at least on the surface, to assess. Consequently,they are less controversial than the other types, although outputs such asretention and graduation rates stir opposition, especially from communitycolleges, because of their part-time and nontraditional students. Outcomespresent by far the greatest difficulty and arouse the most controversy. Theyattempt to capture the elusive characteristics of quality in undergraduateeducation and its benefits to external society. Judgments on these charac-teristics are always subjective and never self-evident. Quality and benefitvary with the eye of the beholder. The multiple stakeholders of students,parents, governors, legislators, business leaders, and the general publicdefine quality differently depending on their interests. Processes are alsodifficult to measure but are far less controversial on campus than outcomesor even outputs. Colleges and universities divided by their disciplines anddepartment focus more on processes than products, whether outputs oroutcomes. Conversely, governors and legislators often see input indicatorsas pleas for additional resources and view processes as vague measures ofquality that lack the comparability required to assess statewide or institu-tional performance.
Figure 3.1 shows the percentages by indicator types for the total num-ber of indicators for performance reporting and performance funding.Performance reporting has more than twice the percentage of input indica-tors than performance funding. In contrast, funding programs rely on morethan double the percentage of process measures than reporting initiatives.The increased emphasis on inputs in the performance reports stems fromtheir stress on access, affordability, and diversity. Reporting also showssomewhat higher percentages of outputs and outcomes indicators than per-formance funding. The heavy use of process measures in performance fund-ing is surprising because the rationale for most of these programs extolledshifting funding from process and inputs to outcomes and outputs.
The reliance of performance funding on process indicators may arisein part from the lack of acceptance in the academic community of stan-dardized testing. Only three of the eleven programs in one study includedstandardized tests in general education and academic majors. Instead, they

38 REPORTING HIGHER EDUCATION RESULTS
relied on process measures such as course availability, class size, student-faculty ratios, and program review. In addition, process indicators provedless controversial to administrators and faculty than outcome indicators(Burke and others, 2002; Burke and Serban, 1998).
Indicator Types and the Most Popular Measures. Comparing theeight most popular indicators rather than their total number reveals somedifferences in emphasis between the two programs of reporting and fund-ing. The reporting indicators have 37 percent inputs, 37 percent outputs,and 13 percent outcome measures. The student transfer (13 percent) is amixed type—an input for baccalaureate campuses but an output for two-year colleges. The absence of process measures and the increased stress onoutputs represents the most significant change for the top eight indicatorsof performance reporting. Those for performance funding show 25 percentinput, 37 percent process, 25 percent outcomes, the mixed input-outputmeasure of student transfers (13 percent), and no output measures. Themajor change in the most popular indicators for performance fundingcomes in the elimination of output, a diminished emphasis on process, andincreased interest in outcomes measures.
Indicator Types and Two- and Four-Year Institutions. Both two-and four-year institutions use indicator types for performance reporting thatshow only small differences (Figure 3.2). Baccalaureate colleges and uni-versities have slightly more input and outcome indicators whereas com-munity and technical colleges have more process and output measures.Much of the difference of inputs and outputs for these two types arises fromtransfers, an output from two-year colleges and an input for four-year insti-tutions. Given the differences of missions between two- and four-year col-leges and universities, more differences in the types of indicators would beanticipated. With the community colleges’ focus on the dual goals of pro-ducing graduates for the workforce and baccalaureate transfer, more empha-sis on output measures would be expected. A partial explanation for thisless-than-expected emphasis is that several reports do not apply graduationrates—by far the most important output measure—to two-year collegesbecause of their large enrollments of part-time and nontraditional studentswho may not wish to complete a degree.
3%
18%23%
20%
36%
6%12%
19%
48%
15%
Inputs Process Outputs Outcomes Mixed
Performance Reporting IndicatorsPerformance Funding Indicators
Figure 3.1. Performance Reporting and Funding Indicators by Type

NEW ACCOUNTABILITY: FROM REGULATION TO RESULTS 39
External or Internal Concerns
An important policy question is whether the selected indicators express theexternal concerns of states and society or the internal concerns of the aca-demic community. External concerns clearly dominate performance report-ing. Over two-thirds of the total reporting indicators reflect externalconcerns, only a fifth internal concerns, and the rest a mixture of both con-cerns (Figure 3.3). In performance funding, external concerns also over-whelm internal interests. When the top eight indicators used forperformance reporting are analyzed, the predominance of external concernsincreases. No less than six of eight indicators for reporting suggest externalconcerns, and two a combination of external and internal. Using the topeight indicators for performance funding shows that external concerns gen-erate seven measures, with only one coming from internal concerns.
External Focus and Program Initiation. The heavy external empha-sis on performance reporting is especially surprising. A natural assumptionis that the method of initiation would affect indicator selection, especiallytheir reflection of external and internal concerns. External concerns wouldbe expected to dominate in mandated-prescribed programs, where legisla-tion dictated the indicators. Yet, this method initiated only 28 percent of the
4%
15%
23%25%
33%
3%
20%20%20%
37%
Input Process Ouptut Outcome Mixed
Two-year InstitutionsFour-year Institutions
Figure 3.2. Type of Indicators by Two- and Four-Year Institutions
13%20%
67%
15%21%
64%
External Internal Mixed
Performance Reporting Indicators Performance Funding Indicators
Figure 3.3. Performance Reporting and Funding Indicators by Concerns

40 REPORTING HIGHER EDUCATION RESULTS
twenty-nine study reports. In contrast, coordinating or system boards, inconsultation with campus representatives, launched the reports without leg-islation in 38 percent of the reports. They also proposed the indicators inmandated-not-prescribed programs, which constitute 34 percent of the pro-grams. The last two methods allow ample opportunity for expressing inter-nal concerns because coordinating officials in consultation adopted or atleast proposed the performance indicators. As a result, 72 percent of the per-formance reporting programs allowed educators to propose the indicators.Clearly, even in not-mandated programs of performance reporting, coordi-nating or system boards with their campus collaborators choose indicatorsdesired by governors and legislators to avoid a mandate.
The method of initiation affected substantially the indicators selectedin performance funding (Burke and Serban, 1998). In contrast to perfor-mance reporting, 64 percent of the funding programs in an initial eleven-state study came from mandate and prescription, but just 9 percentoriginated as mandated-not-prescribed and only 27 percent as not-mandatedprograms. Clearly, the initiation method explains the dominance of exter-nal concerns in the earlier performance funding programs, which over-whelmingly originated as mandated-prescribed programs. Recent trends inperformance funding have shifted the method of initiation to not-mandatedand mandated-not-prescribed initiatives (Burke and Minassians, 2001).
Previous studies show that the initiation method affected the choice of indicators in performance funding and had considerable effect on notonly indicator concerns but also the policy values and models of excellencefor public campuses reflected in the measures selected (Burke and others,2002; Burke and Serban, 1998). Our analysis suggests that this effect didnot occur in performance reporting on indicator concerns, values, or mod-els. The reasons for this result are unclear and require further study. Wecould speculate that coordinating officials and campus representativesseemed willing in mandated-not-prescribed and not-mandated programs toaccept the concerns, values, and models of governors and legislators forreporting, but not for funding. They appeared to accept reporting indica-tors desired by outsiders as the price of credibility in state capitols but optedfor funding measures more favored by academics. For performance report-ing, the price was right; for performance funding, the stake was too high toadopt indicators favored by governors, legislators, and business leaders.
Two- and Four-Year Institutions. As noted before, the performancereports failed to provide a sufficient number of distinctive indicators thatreflected the different mission of two-year colleges, especially for workforcetraining, older part-time students, and contract courses and services forbusiness and industry. This failure explains the small differences betweentwo- and four-year campuses on indicators reflecting internal and externalconcerns (Figure 3.4). Two-year colleges show slightly more external con-cerns—but not nearly as much as expected because community colleges bytheir charter and character are closely connected to community needs.

NEW ACCOUNTABILITY: FROM REGULATION TO RESULTS 41
Conversely, four-year colleges and universities are usually thought torespond more to the internal concerns of their faculty. Obviously, the indi-cators used by both types of institutions in performance reporting respondoverwhelmingly to external concerns.
Policy Values
Public policies, including those on higher education, reflect the core socialvalues of quality, efficiency, equity, and choice (Richardson, 1994). Qualityconsists of achieving or exceeding high standards of performance. Ofcourse, quality is the most elusive of all the values, especially in higher edu-cation. It can be real or perceived. It can be an input (SAT or ACT scores),a process (assessment of student learning), or an outcome (licensure testscores). It is traditionally not an output, which suggests quantity. Efficiencycovers the calculation of the resources received in relation to the resultsachieved—or a cost-benefit analysis. It includes indicators such as gradua-tion or retention rates and time to degree. Choice constitutes the ability toselect from a range of options. An obvious example is campus-specific indi-cators left to institutional choice. Equity represents the response to the dis-parities in needs and the diversity among different groups. In the case ofhigher education, equity often relates to students admitted and staffemployed, as expressed in indicators on enrollment race and gender ordiversity of faculty and staff (Burke and others, 2002; Burke and Serban,1998). Of course, ascribing a value to a particular indicator is challengingand represents judgment calls.
Efficiency and quality indicators have nearly equal percentages in per-formance reporting (Figure 3.5). Reporting shows a lower percentage of effi-ciency indicators than performance funding, a significantly higherpercentage of quality measures, and much less interest in the combined effi-ciency and quality as a policy value. The surprise is the stress on equityitems in reporting as opposed to funding. Choice has few indicators ineither program. The striking trait in performance funding is the consider-able support for indicators that combine the characteristics of both quality
17%13%
70%
17%17%
67%
External Internal Mixed
Two-year Institutions
Four-year Institutions
Figure 3.4. Concerns by Two- and Four-Year Institutions

42 REPORTING HIGHER EDUCATION RESULTS
and efficiency. Funding programs devote much less attention to equity mea-sures than those for reporting.
The reasons for these differences require more study at the state level.One possible explanation of the differing emphasis on indicators that com-bined quality and efficiency is that for performance funding, more of its mea-sures have dual roles because the link to funding forces the inclusion offewer measures than performance reporting. Perhaps the different timing of the studies of performance indicators for funding and then reportingexplain the differences. The analysis of performance funding measureslooked at the ones in place in 1996–97 (Burke and Serban, 1998). The oneon performance reporting examined the indicators in place in 2000–01. Thefirst analysis occurred in the heat of the assaults on affirmative action. The second appeared in a period of growing concern that legal prohibitionswould devastate minority enrollment, especially in states where AfricanAmericans and Hispanics were becoming an increasing proportion of thetraditional college-aged students.
The balanced support for efficiency and quality indicators in both pro-grams and the combination of the two values in performance funding sug-gest a new concept of quality and efficiency in state capitols but not oncollege campuses. State policymakers view quality and efficiency differentlythan campus leaders. Governors, legislators, and business leaders increas-ingly see efficiency and quality as complementary values, whereas adminis-trators and professors traditionally view them as conflicting. Externalgroups think of quality in the external context of effectiveness, whichincludes both efficiency and quality. This combination reflects the newmanagement maxim that business, government, and educational organiza-tions not only can but also must improve both quality and efficiency.
Policy Values and the Most Popular Measures. Although using thetotal number of indicators for performance reporting and funding reveals abalance between quality and efficiency, looking at the values implied in theeight most used indicators for each tells a different tale. Three of the report-ing indicators represent efficiency, and not one implies quality, although
32 31
22
4 3
8
37
25
13
2
20
3
0
5
10
15
20
25
30
35
40
Efficiency Quality Equity Choice Quality-Efficiency Mixed
Performance Reporting Indicators
Performance Funding Indicators
Figure 3.5. Performance Reporting and Funding Indicators by Value

NEW ACCOUNTABILITY: FROM REGULATION TO RESULTS 43
two of them suggest the combination of quality and efficiency. One indica-tor reflects equity and another its combination with choice. The top eightmeasures for performance funding present a radically different array of pol-icy values. Fully six of the measures suggest efficiency, and none implyquality. One measure suggests quality and efficiency, and another choice.When it came to the most used indicators, quality clearly lost out to effi-ciency in both programs, more so in performance funding than in perfor-mance reporting.
One possible conclusion is that quality does fairly well when all of thereporting indicators are included because it has many possible measures: 31percent of the total. On the other hand, it lacks two or three generallyaccepted indicators that can compete with graduation, transfer, and jobplacement rates and can win admission into the top measures of perfor-mance reporting or funding. Clearly, more measures are no defense of qual-ity in indicator systems for higher education. The lack of emphasis on a fewquality measures may well reflect the reluctance of the academy to definemore clearly the critical elements of quality in undergraduate education.The solution is not to press for even more measures of quality, as campusrepresentatives are wont to do. These results suggest that the academic com-munity has failed to develop a few good indicators of educational qualitycapable of attracting internal and external support.
The difficulty of devising acceptable indicators of undergraduate learn-ing plagues both reporting and funding. Both programs show the reluc-tance of the higher education community to accept standardized tests as ameasure of educational quality, except in professional licensure examina-tions. Only two performance reports use standardized tests to evaluatequality in general education and the same number in academic majors.Three programs in performance funding adopt standardized tests in bothareas. On the other hand, 55 percent of the performance reports and 36percent of the funding programs include licensure test scores. Apparently,academics accept licensure examinations required by external organiza-tions for professional practice, but not standardized tests that evaluate thegeneral and specialized knowledge and skills acquired by their graduatesin the arts and sciences.
Given this resistance to standardized testing, more use would beexpected in performance reporting of satisfaction surveys of students(nine reports) and alumni (eight reports) as evidence of the quality ofundergraduate education. Results from student satisfaction surveys mayincrease as more colleges and universities adopt new designs, such as theNational Survey of Student Engagement, which is largely a process assess-ment (Indiana University Center for Postsecondary Research andPlanning, 2001). A limitation of that survey is that the publication of insti-tutional results is voluntary among participating campuses. To date, manyparticipants have not authorized publication. Surveys of employers (sevenreports) are becoming more common but require considerable effort and

44 REPORTING HIGHER EDUCATION RESULTS
costs. Reporting also relied on indirect measures, such as assessment ofstudent learning (seven reports), where five of the reports merely notedthat campuses had plans in place for assessing student learning. The othertwo were Missouri and Tennessee, which assessed student learningthrough testing.
Performance reporting reveals some continuing allegiance to the tra-ditional input-and-process measures of quality found in U.S. News & World Report. They use input indicators of SAT and ACT scores (ninereports), high school average (three reports), and faculty credentials (fourreports). The reports also assess quality through the old and inadequateprocess measures of student-faculty ratios (eight reports), class size (fourreports), and faculty teaching in lower division courses (nine reports).Frankly, even these inadequate indicators of quality, with the possibleexception of SAT and ACT scores, appear in only a small proportion of thetwenty-nine reports in this study. The decision of Measuring Up 2000,the state-by-state report card, to give an incomplete grade on the quality ofstudent learning (National Center for Public Policy and Higher Education,2000), should spur efforts to develop better measures of educational qual-ity. It will not be easy, but it is clearly necessary.
The reason performance reporting stresses equity indicators more thanperformance funding is unclear. Perhaps the different time periods of thestudies for funding and reporting, noted earlier, explain the differences.
Policy Values and Two- and Four-Year Institutions. Reporting indi-cators for two- and four-year institutions show only slight variations in thepolicy values of efficiency, quality, equity, and choice (Figure 3.6).Community and technical colleges have a higher percentage of efficiencyand a lower percentage of quality indicators than baccalaureate colleges anduniversities. However, neither of these differences is as large as would beexpected from their diversity of missions and goals. Again, the reason is thatmost reports used nearly all of the same indicators for two- and four-yearinstitutions. The percentages for the other values of equity, choice, and themixed values are almost identical.
33%29%
24%
4%7%
3%
30%33%
23%
5%7%
2%
Efficiency Quality Equity Choice Quality-Efficiency Mixed
Two-year InstitutionsFour-year Institutions
Figure 3.6. Policy Value by Two- and Four-Year Institutions

Models of Excellence
The indicators selected for reporting and funding suggest—consciously orunconsciously—models of excellence for public colleges and universitiesbecause they signify the characteristics that policymakers desire in suc-cessful higher education systems and public colleges and universities. Thediverse stakeholders of higher education mean multiple models of excel-lence. Astin (1991), Ewell (1994), and Richardson (1994) have developedmodels for public colleges and universities that reflect the interests and con-cerns of the stakeholders. Drawing on some of their concepts, this study andprevious ones on performance funding use three models of excellence forhigher education: resource and reputation, strategic investment, and clientcentered (Burke, 1997; Burke and others, 2002; Burke and Serban, 1998).
The resource-and-reputation model is the traditional faculty-orientedmodel. It combines Astin’s two models of resource and reputation into onebecause, as he concedes (1985), both produce similar results or ratings. Thismodel is provider driven because it reflects internal concerns of the aca-demic community rather than external needs of states and society. Theresource-and-reputation model relies heavily on input and process indica-tors to represent the resources and reputations of colleges and universities.It uses performance indicators such as SAT and ACT scores of new students,faculty credentials, faculty compensation, graduate education, and programreview. Professors tend to favor these measures as marks of quality collegesand universities.
The strategic investment model reflects a state-oriented model. It usesEwell’s concept of strategic investment that stresses the state’s interest inseeing its funding of public higher education from a cost-benefit point ofview (Ewell and Jones, 1994). Richardson (1994) also presents a cost-benefit model. This concept rests on the interests of state governments inderiving the most benefit from public colleges and universities for the leastcost. It stresses efficiency and productivity measures, such as graduationrates, time to degree, degrees awarded, and expenditures per student.
The client-centered model is primarily student oriented. It follows thecustomer- or client-centered focus of the quality movement and, to a lesserextent, the “good educational practices” model advocated by the NationalCenter for Higher Education Management System (1994). Supporting indi-cators include enrollment by race, gender, and age; tuition and fees; facultyavailability to students; and satisfaction survey results of students, alumni,and employers. The last measure suggests the expansion of this model toinclude other clients, such as businesses.
Analyzing all of the 158 generic measures shows that performance report-ing spreads its indicators fairly evenly across the strategic investment, client-centered, and a combination of these two models into a strategicinvestment–client-centered category (Figure 3.7). The resource-and-reputation
NEW ACCOUNTABILITY: FROM REGULATION TO RESULTSS 45

model generates much less interest. The percentage of indicators in perfor-mance reporting reflecting the client-centered model is two-and-a-half timesthat in performance funding but just half of the latter’s combination of thestrategic investment and client-centered type. Performance reporting seems tofavor the pure models of client-centered or strategic investment rather than themodel that combines the two. Both policies show considerable attention tomeasures implying strategic investment and slight support for resource andreputation. The combination of strategic investment and client-centered modelinvolves indicators that join cost benefit with customer service, like gradua-tion and job placement rates, workforce and economic development, andteacher training and K–16 collaboration.
Models and the Most Popular Measures. Looking at the eight mostpopular indicators, the emphasis in performance reporting tilts heavilytoward the combination of strategic investment and client centered and tothe pure client-centered models. Indeed, the other models do not attracteven a single indicator. The combination of strategic investment and client-centered model covers five indicators and the client centered three. Thecombination of strategic investment and client-centered model is even moredominant in performance funding. It garners six of the eight indicators,leaving strategic investment and resource-and-reputation models each withone measure. This dominance suggests the linkage between efficiency andproductivity in strategic investment combined with the responsiveness toclients that now includes students, states, and society. The client-centeredportion of this combination expands the notion of customers far beyondstudents to nearly every group in the state or society. Clients now coveredcommunities, businesses, schools, and nonprofit organizations. State gov-ernments—typically seen as the primary financiers of public higher educa-tion—became increasingly a critical customer, balancing the cost of theenterprise against the benefits to society.
These shifts in top indicators for both programs suggest a new defini-tion of effectiveness for public higher education and its colleges and
46 REPORTING HIGHER EDUCATION RESULTS
29
23
13
27
8
24
9
16
46
5
05
101520253035404550
StrategicInvestment
ClientCentered
Resource-Reputation
Strategic Investment–Client Centered
Mixed
Performance ReportingIndicators
Performance FundingIndicators
Figure 3.7. Performance Reporting and Funding Indicated by Model

universities. The traditional resource-and-reputation model focused in-ternally on the inputs of students, budgets, and faculty. In contrast, thestrategic investment–client-centered model focuses externally; combinesefficiency, productivity, and quality; and suggests an input-process-output–outcome model. The best institutions are the ones that make themost of the inputs of students, faculty, and resources through productivityand responsiveness in outputs and outcomes to the needs of students, states,and society.
Models and Two- and Four-Year Institutions The use of mostly thesame indicators for two- and four-year colleges and universities againdiminished the differences in preferred models by institutional type.Baccalaureate campuses exhibit more interest in indicators that reflect theresource-and-reputation model, but not nearly as much as anticipated.Conversely, community and technical colleges give more attention to thecombination of strategic investment and client-centered model. The twotypes of campuses show similar ratings of the models in performance fund-ing (Burke and Serban, 1998). The major difference is that both recordhigher percentages for the combined strategic investment–client-centeredmodel. Two-year colleges devote 56 percent and four-year campuses 52 per-cent of their indicators to this combined model.
If the baccalaureate campus—especially the research university—rep-resents the ideal of the resource-and-reputation model of excellence, thecommunity college embodies the exemplar of the combined strategic invest-ment and client-centered type. Traditional excellence for the baccalaureatecampus derives from the quality of the students admitted, the size of itsresources, and the reputation of its faculty for research. The community col-lege follows the new model. It is certainly client centered and offers big ben-efits for low costs. It focuses externally on community customers, admitsnearly all applicants, responds productively to their many needs, and con-strains costs. These are the characteristics of the strategic investment–client-centered model of excellence. Despite these decided differences, Figure 3.8shows only minor variations between the two types of institutions in themodels of excellence suggested by their reporting indicators. The only realdifferences show that the indicators for four-year campuses favor theresource-and-reputation model slightly more than those for two-year col-leges and that the reverse is true for the combination of the strategic invest-ment and client-centered models.
Findings
This study of reporting indicators suggests the following findings:
Two- and four-year campuses largely share the same reporting indicators.Performance reporting stresses the inputs of access and equity whereas per-
formance funding relies surprisingly on processes.
NEW ACCOUNTABILITY: FROM REGULATION TO RESULTS 47

The indicators used in both programs stem from the external concerns ofstates and society rather than the internal concerns of the academic com-munity.
The most common reporting indicators show a strong shift to inputs, exter-nal concerns, efficiency, and the joint strategic investment–client-centeredmodel of excellence.
Unlike performance funding, the method of initiating performancereporting—mandated-prescribed, mandated-not prescribed, and not man-dated—seems to have little or no influence on indicator types, concerns,values, and models.
Coordinating and system boards and campus representatives accept report-ing indicators desired by outsiders as the price of credibility in state capi-tols but opt for funding measures more favored by academics.
Quality has a large number of indicators in the total generic measures butlacks a few accepted and robust measures that can compete with effi-ciency measures like graduation and job placement rates.
Governors, legislators, and business leaders view quality and efficiency ascomplementary goals whereas campus leaders see them as conflicting val-ues.
We have the following recommendations:
Two- and four-year colleges and universities should have some commonindicators to reflect their shared goals but different measures to encour-age their different missions.
Reporting programs should allow each public college or university tochoose a few indicators that reflect their special goals or missions.
State policymakers should carefully consider the desired indicator types,concerns, values, and models in designing the details of those programs.
They should link indicators in an input-process-output-outcome modelrather than add them as desirable separate items.
48 REPORTING HIGHER EDUCATION RESULTS
2623
10
32
9
2622
14
28
10
0
5
10
15
20
25
30
35
StrategicInvestment
ClientCentered
Resource-Reputation
StrategicInvestment–
Client Centered
Mixed
Two-year Institutions
Four-year Institutions
Figure 3.8. Model of Excellence by Two- and Four-year Institutions

The academic community should quit quarreling about inadequate indica-tors of student learning and devise collectively a few valid and reliable mea-sures that can win acceptance on college campuses and in state capitols.
Conclusion
Surveys show that both state and campus policymakers believe that select-ing indicators is the most difficult task in designing performance plans(Burke and others, 2002; Burke and Serban, 1998). On the other hand, alltoo often they adopt or accept performance measures without carefully con-sidering critical issues such as their types, concerns, policy values, or mod-els of excellence. The choice of indicator type causes conflict between stateand campus policymakers. The former opt for outputs and outcomes, andthe latter push for inputs and processes. Accepting the inputs-processes-outputs-outcomes approach aligns inputs with processes in ways that canproduce the best possible outputs and outcomes. This throughput modelensures that campuses tailor their internal process to suit their studentinputs, which encourages a diversity of missions of public colleges and uni-versities. The indicators used in performance reporting and funding stressexternal rather than internal concerns. Public colleges and universitiesneeded the external push to make them more responsive to the needs ofstates and society. On the other hand, successful reporting indicators shouldbalance the legitimate needs of external society and internal concerns of theacademic community. Colleges and universities should respond to the long-term educational needs but not the momentary wants of states and society.
Performance indicators should reflect all of the policy values of qual-ity, efficiency, equity, and choice. Like the indicator types, they are com-plementary, not conflicting. The changing attitudes toward equity anddiversity in admissions demonstrate the difference between the long-termfocus of higher education and the short-term interest of states and society.Whatever the attitudes of states and society, colleges and universities shouldinsist that equity and diversity are enduring values that are always worthyof their support. Finally, the models of excellence desired for public highereducation should direct the choice of indicators. The combined strategicinvestment–client-centered model reflects a new notion of effectiveness thatcombines quality, efficiency, and productivity in service to states, students,and society. This new model surely suits the mandated mission of publiccolleges and universities.
NEW ACCOUNTABILITY: FROM REGULATION TO RESULTS 49


Ap
pen
dix
toC
hap
ter
3.
Rep
orti
ng
Ind
icat
ors
wit
hIn
dic
ator
Typ
es,
Pol
icy
Val
ues
,C
once
rns,
and
Mod
els
Indi
cato
rsN
o.of
Stat
esTy
pePo
licy
Valu
eC
once
rns
Mod
els
Aca
dem
icpr
ogra
mcu
ts1
Pro
cess
Qu
alit
y,ef
fici
ency
Ext
ern
alSt
rate
gic
inve
stm
ent
Acc
epta
nce
rate
4In
put
Qu
alit
y,ch
oice
,equ
ity
Inte
rnal
/Ext
ern
alSt
rate
gic
inve
stm
ent/
Cli
ent
cen
tere
d/R
esou
rce-
repu
tati
onA
ccre
dite
dpr
ogra
ms
3O
utc
ome
Qu
alit
yIn
tern
alR
esou
rce-
repu
tati
onA
dmin
istr
ativ
e,ac
adem
icco
sts,
staf
f10
Pro
cess
Effi
cien
cyIn
tern
al/E
xter
nal
Stra
tegi
cin
vest
men
t/R
esou
rce-
repu
tati
onA
dult
basi
ced
uca
tion
1P
roce
ssE
quit
yE
xter
nal
Stra
tegi
cin
vest
men
t/C
lien
tce
nte
red
Ass
essm
ent
stu
den
tle
arn
ing
7P
roce
ssQ
ual
ity
Ext
ern
alSt
rate
gic
inve
stm
ent
Bes
tm
anag
emen
tpr
acti
ces
1P
roce
ssE
ffici
ency
Ext
ern
alSt
rate
gic
inve
stm
ent
Bu
sin
ess
serv
ices
1O
utp
ut
Effi
cien
cyE
xter
nal
Stra
tegi
cin
vest
men
tC
ampu
sch
oice
ofm
issi
on-s
peci
fic
indi
cato
rs4
Pro
cess
Ch
oice
Inte
rnal
Res
ourc
e-re
puta
tion
Cla
sssi
ze4
Pro
cess
Qu
alit
yE
xter
nal
Stra
tegi
cin
vest
men
t/C
lien
tce
nte
red
Col
labo
rati
onam
ong
cam
puse
s4
Pro
cess
Effi
cien
cyE
xter
nal
Stra
tegi
cin
vest
men
tC
olla
bora
tive
purc
has
ing
1P
roce
ssE
ffici
ency
Ext
ern
alSt
rate
gic
inve
stm
ent
Col
lege
goin
gra
te2
Inpu
tE
quit
yE
xter
nal
Stra
tegi
cin
vest
men
t/C
lien
tce
nte
red
Col
lege
goin
gra
te,r
ace
2In
put
Equ
ity
Ext
ern
alSt
rate
gic
inve
stm
ent/
Cli
ent
cen
tere
dC
olle
gepa
rtic
ipat
ion
rate
14In
put
Equ
ity
Ext
ern
alSt
rate
gic
inve
stm
ent/
Cli
ent
cen
tere
dC
olle
gepa
rtic
ipat
ion
rate
,low
-in
com
efa
mil
ies
1In
put
Equ
ity
Ext
ern
alSt
rate
gic
inve
stm
ent/
Cli
ent
cen
tere
d
Coo
pera
tive
edu
cati
on,i
nte
rnsh
ips
3P
roce
ssC
hoi
ceE
xter
nal
Stra
tegi
cin
vest
men
t/C
lien
tce
nte
red
Cos
tof
degr
eepe
rst
ude
nt
1In
put
Effi
cien
cyE
xter
nal
Stra
tegi
cin
vest
men
tC
oun
type
rcen
tage
popu
lati
onse
rved
1O
utp
ut
Effi
cien
cyE
xter
nal
Stra
tegi
cin
vest
men
t/C
lien
tce
nte
red
Cou
rse
avai
labi
lity
2P
roce
ssQ
ual
ity,
effi
cien
cyE
xter
nal
Stra
tegi
cin
vest
men
t/C
lien
tce
nte
red
Cou
rse
com
plet
ion
s3
Ou
tpu
tE
ffici
ency
Ext
ern
alSt
rate
gic
inve
stm
ent
Deg
ree
atta
inm
ent
6O
utc
omes
Effi
cien
cyE
xter
nal
Stra
tegi
cin
vest
men
t/C
lien
tce
nte
red

Ap
pen
dix
toC
hap
ter
3.
Rep
orti
ng
Ind
icat
ors
wit
hIn
dic
ator
Typ
es,
Pol
icy
Val
ues
,C
once
rns,
and
Mod
els
(con
tin
ued
)
Indi
cato
rsN
o.of
Stat
esTy
pePo
licy
Valu
eC
once
rns
Mod
els
Deg
ree
atta
inm
ent,
ann
ual
earn
ing
2O
utc
ome
Effi
cien
cyE
xter
nal
Stra
tegi
cin
vest
men
tD
egre
eat
tain
men
t,em
ploy
men
tra
tes
1O
utc
ome
Effi
cien
cyE
xter
nal
Stra
tegi
cin
vest
men
tD
egre
esaw
arde
d,ag
e3
Ou
tpu
tE
quit
yE
xter
nal
Cli
ent
cen
tere
dD
egre
esaw
arde
d,fi
elds
10O
utp
ut
Effi
cien
cyE
xter
nal
Stra
tegi
cin
vest
men
tD
egre
esaw
arde
d,ge
nde
r4
Ou
tpu
tE
quit
yE
xter
nal
Cli
ent
cen
tere
dD
egre
esaw
arde
d,le
vel
nu
mbe
r16
Ou
tpu
tE
ffici
ency
Ext
ern
alSt
rate
gic
inve
stm
ent/
Cli
ent
cen
tere
dD
egre
esaw
arde
d,ra
ce5
Ou
tpu
tE
quit
yE
xter
nal
Cli
ent
cen
tere
dD
egre
escr
itic
alfi
elds
7O
utp
ut
Effi
cien
cyE
xter
nal
Stra
tegi
cin
vest
men
tD
egre
escr
itic
alfi
elds
,tea
cher
edu
cati
on1
Ou
tpu
tE
ffici
ency
Ext
ern
alSt
rate
gic
inve
stm
ent
Div
ersi
tyfa
cult
yst
aff
10In
put
Equ
ity
Inte
rnal
Cli
ent
cen
tere
dE
con
omic
impa
ct1
Ou
tcom
eE
ffici
ency
Ext
ern
alSt
rate
gic
inve
stm
ent
En
roll
men
tag
e11
Inpu
tE
quit
yE
xter
nal
Cli
ent
cen
tere
dE
nro
llm
ent
bycr
itic
alfi
elds
2In
put
Effi
cien
cyE
xter
nal
Stra
tegi
cin
vest
men
tE
nro
llm
ent
byfi
elds
5In
put
Effi
cien
cyE
xter
nal
Stra
tegi
cin
vest
men
tE
nro
llm
ent
degr
eele
vel
14In
put
Effi
cien
cyE
xter
nal
Stra
tegi
cin
vest
men
t/R
esou
rce-
repu
tati
onE
nro
llm
ent
fres
hm
en1
Inpu
tQ
ual
ity,
effi
cien
cyIn
tern
al/E
xter
nal
Stra
tegi
cin
vest
men
t/R
esou
rce-
repu
tati
onE
nro
llm
ent
fres
hm
enm
inor
ity
1In
put
Equ
ity
Ext
ern
alSt
rate
gic
inve
stm
ent/
Cli
ent
cen
tere
dE
nro
llm
ent
gen
der
10In
put
Equ
ity
Inte
rnal
/Ext
ern
alC
lien
tce
nte
red
En
roll
men
tn
oncr
edit
5In
put
Effi
cien
cyE
xter
nal
Stra
tegi
cin
vest
men
t/C
lien
tce
nte
red
En
roll
men
tn
ontr
adit
ion
al1
Inpu
tE
quit
yE
xter
nal
Cli
ent
cen
tere
dE
nro
llm
ent
off
cam
pus
1In
put
Ch
oice
Ext
ern
alC
lien
tce
nte
red
En
roll
men
tra
ce21
Inpu
tE
quit
yE
xter
nal
Cli
ent
cen
tere
dE
nro
llm
ent
resi
den
ce12
Inpu
tE
quit
yE
xter
nal
Stra
tegi
cin
vest
men
t/C
lien
tce
nte
red
En
roll
men
tst
atu
s8
Inpu
tC
hoi
ceE
xter
nal
Stra
tegi
cin
vest
men
t/C
lien
tce
nte
red
En
roll
men
tto
pst
ude
nts
6In
put
Qu
alit
yIn
tern
alR
esou
rce-
repu
tati
on

En
roll
men
ttr
ends
13In
put
Effi
cien
cyE
xter
nal
Stra
tegi
cin
vest
men
tE
xpen
ditu
repe
rst
ude
nt
5In
put
Effi
cien
cyE
xter
nal
Stra
tegi
cin
vest
men
tF
acil
itie
s,gr
oun
ds9
Pro
cess
Effi
cien
cyE
xter
nal
Stra
tegi
cin
vest
men
tF
acu
lty
age
1In
put
Equ
ity
Inte
rnal
Res
ourc
e-re
puta
tion
Fac
ult
yav
aila
bili
ty1
Pro
cess
Qu
alit
yE
xter
nal
Cli
ent
cen
tere
dF
acu
lty
com
pen
sati
on11
Inpu
tQ
ual
ity
Inte
rnal
/Ext
ern
alSt
rate
gic
inve
stm
ent/
Res
ourc
e-re
puta
tion
Fac
ult
yco
mpe
nsa
tion
,gen
der
3In
put
Equ
ity
Ext
ern
alC
lien
tce
nte
red
Fac
ult
ycr
eden
tial
s4
Inpu
tQ
ual
ity
Inte
rnal
Res
ourc
e-re
puta
tion
Fac
ult
yev
alu
atio
n,t
enu
red
facu
lty
1P
roce
ssQ
ual
ity
Ext
ern
alSt
rate
gic
inve
stm
ent/
Cli
ent
cen
tere
dF
acu
lty
eval
uat
ion
s1
Pro
cess
Qu
alit
yE
xter
nal
Stra
tegi
cin
vest
men
t/C
lien
tce
nte
red
Fac
ult
yge
nde
r,ra
ce6
Inpu
tE
quit
yIn
tern
al/E
xter
nal
Cli
ent
cen
tere
dF
acu
lty
mor
ale
1O
utc
ome
Qu
alit
yIn
tern
alR
esou
rce-
repu
tati
onF
acu
lty
nat
ion
alaw
ards
1O
utc
ome
Qu
alit
yIn
tern
alR
esou
rce-
repu
tati
onF
acu
lty
publ
icat
ion
s4
Ou
tpu
tQ
ual
ity
Inte
rnal
Res
ourc
e-re
puta
tion
Fac
ult
yra
nk
3In
put
Qu
alit
yIn
tern
alR
esou
rce-
repu
tati
onF
acu
lty
resi
gnat
ion
s1
Ou
tcom
eQ
ual
ity
Inte
rnal
/Ext
ern
alSt
rate
gic
inve
stm
ent/
Res
ourc
e-re
puta
tion
Fac
ult
y,st
ude
nt
eval
uat
ion
s2
Pro
cess
Qu
alit
yE
xter
nal
Cli
ent
cen
tere
dF
acu
lty
teac
hin
g,lo
wer
divi
sion
cou
rses
9P
roce
ssQ
ual
ity
Ext
ern
alSt
rate
gic
inve
stm
ent/
Cli
ent
cen
tere
d
Fac
ult
yte
nu
re3
Pro
cess
Qu
alit
yIn
tern
alR
esou
rce-
repu
tati
onF
acu
lty
ten
ure
,ge
nde
ran
dra
nk
3In
put
Equ
ity
Inte
rnal
/Ext
ern
alC
lien
tce
nte
red
Fac
ult
yte
nu
retr
ack,
race
3In
put
Equ
ity
Inte
rnal
/Ext
ern
alC
lien
tce
nte
red
Fac
ult
yw
orkl
oad
9P
roce
ssE
ffici
ency
Ext
ern
alSt
rate
gic
inve
stm
ent/
Cli
ent
cen
tere
dF
inan
cial
aid
17In
put
Ch
oice
,equ
ity
Inte
rnal
/Equ
ity
Cli
ent
cen
tere
dF
inan
cial
aid,
loan
s1
Inpu
tC
hoi
ce,e
quit
yE
xter
nal
Stra
tegi
cin
vest
men
t/C
lien
tce
nte
red
Fin
anci
alai
d,m
erit
4In
put
Qu
alit
yIn
tern
al/E
xter
nal
Stra
tegi
cin
vest
men
t/R
esou
rce-
repu
tati
onF
orei
gnin
vest
men
t1
Inpu
tE
ffici
ency
Ext
ern
alSt
rate
gic
inve
stm
ent
Fu
nd
bala
nce
s1
Ou
tpu
tE
ffici
ency
Ext
ern
alSt
rate
gic
inve
stm
ent
GE
Dpa
ssra
te1
Ou
tpu
tE
ffici
ency
Ext
ern
alSt
rate
gic
inve
stm
ent

Ap
pen
dix
toC
hap
ter
3.
Rep
orti
ng
Ind
icat
ors
wit
hIn
dic
ator
Typ
es,
Pol
icy
Val
ues
,C
once
rns,
and
Mod
els
(con
tin
ued
)
Indi
cato
rsN
o.of
Stat
esTy
pePo
licy
Valu
eC
once
rns
Mod
els
Gen
eral
edu
cati
ongr
adu
ate
sati
sfac
tion
1O
utc
ome
Qu
alit
yE
xter
nal
Cli
ent
cen
tere
dG
rade
aver
age
ofco
mm
un
ity
coll
ege
AA
tran
sfer
stu
den
ts2
Ou
tcom
eQ
ual
ity
Ext
ern
alSt
rate
gic
inve
stm
ent
Gra
duat
est
ude
nt
qual
ity
1In
put
Qu
alit
yIn
tern
alR
esou
rce-
repu
tati
onG
radu
ate
stu
den
tsu
ppor
t1
Inpu
tQ
ual
ity
Inte
rnal
Res
ourc
e-re
puta
tion
Gra
duat
est
ude
nts
wit
hu
nde
rgra
duat
ede
gree
s1
Inpu
tE
quit
yE
xter
nal
Stra
tegi
cin
vest
men
t/C
lien
tce
nte
red
Gra
duat
esba
ccal
aure
ate,
firs
tge
ner
atio
nco
lleg
e1
Ou
tpu
tE
quit
yE
xter
nal
Stra
tegi
cin
vest
men
t/C
lien
tce
nte
red
Gra
duat
esqu
anti
tati
vean
dw
riti
ng
skil
ls1
Ou
tcom
eQ
ual
ity
Ext
ern
alSt
rate
gic
inve
stm
ent
Gra
duat
esto
adva
nce
dde
gree
s5
Ou
tcom
eQ
ual
ity
Inte
rnal
Res
ourc
e-re
puta
tion
Gra
duat
esw
ho
part
icip
ated
inco
mm
un
ity
serv
ice
1O
utc
ome
Ch
oice
Ext
ern
alC
lien
tce
nte
red
Gra
duat
ion
rate
,3ye
ars
5O
utp
ut
Effi
cien
cyE
xter
nal
Stra
tegi
cin
vest
men
tG
radu
atio
nra
te,4
year
s5
Ou
tpu
tE
ffici
ency
Ext
ern
alSt
rate
gic
inve
stm
ent
Gra
duat
ion
rate
,5ye
ars
6O
utp
ut
Effi
cien
cyE
xter
nal
Stra
tegi
cin
vest
men
tG
radu
atio
nra
te,6
year
s17
Ou
tpu
tE
ffici
ency
Ext
ern
alSt
rate
gic
inve
stm
ent
Gra
duat
ion
rate
,7to
10ye
ars
3O
utp
ut
Equ
ity
Inte
rnal
Cli
ent
cen
tere
dG
radu
atio
nra
te,g
radu
ate
prog
ram
s1
Ou
tpu
tE
ffici
ency
Ext
ern
alSt
rate
gic
inve
stm
ent
Gra
duat
ion
rate
,tra
nsf
erst
ude
nts
7O
utp
ut
Effi
cien
cyE
xter
nal
Stra
tegi
cin
vest
men
t/C
lien
tce
nte
red
Gra
duat
ion
/ret
enti
onra
tes
24O
utp
ut
Effi
cien
cyE
xter
nal
Stra
tegi
cin
vest
men
t/C
lien
tce
nte
red
Gra
duat
ion
rete
nti
onge
nde
r1
Ou
tpu
tE
quit
yE
xter
nal
Cli
ent
cen
tere
dG
radu
atio
nre
ten
tion
,m
inor
itie
s9
Ou
tpu
tE
quit
yE
quit
yC
lien
tce
nte
red
Hig
hsc
hoo
l-co
lleg
ear
ticu
lati
on1
Pro
cess
Qu
alit
y,ef
fici
ency
Ext
ern
alSt
rate
gic
inve
stm
ent/
Cli
ent
cen
tere
d
Hig
hsc
hoo
lco
urs
e,du
alcr
edit
1In
put
Qu
alit
yE
xter
nal
Stra
tegi
cin
vest
men
t/C
lien
tce
nte
red

Hig
hsc
hoo
lco
urs
eta
kin
g2
Inpu
tQ
ual
ity,
effi
cien
cyE
xter
nal
Stra
tegi
cin
vest
men
t/R
esou
rce-
repu
tati
onH
igh
sch
ool
cou
rses
,adv
ance
dpl
acem
ent
2In
put
Qu
alit
yIn
tern
alC
lien
tce
nte
red/
Res
ourc
e-re
puta
tion
Hig
hsc
hoo
lex
ams,
adva
nce
dpl
acem
ent
3In
put
Qu
alit
yIn
tern
alR
esou
rce-
repu
tati
on
Hig
hsc
hoo
lgr
ade
poin
tav
erag
e3
Inpu
tQ
ual
ity
Inte
rnal
Res
ourc
e-re
puta
tion
Inst
itu
tion
alin
crea
se1
Inpu
tQ
ual
ity
Ext
ern
alSt
rate
gic
inve
stm
ent
Job
plac
emen
t13
Ou
tcom
eE
ffici
ency
Ext
ern
alSt
rate
gic
inve
stm
ent/
Cli
ent
cen
tere
dJo
bpl
acem
ents
,sal
arie
san
dw
ages
3O
utc
ome
Effi
cien
cyE
xter
nal
Stra
tegi
cin
vest
men
t/C
lien
tce
nte
red
Job
plac
emen
ts,s
alar
ies
byfi
eld
1O
utc
ome
Effi
cien
cyE
xter
nal
Stra
tegi
cin
vest
men
t/C
lien
tce
nte
red
Job
trai
nin
gco
ntr
acts
1O
utp
ut
Effi
cien
cyE
xter
nal
Stra
tegi
cin
vest
men
t/C
lien
tce
nte
red
K–
16co
llab
orat
ion
7P
roce
ssQ
ual
ity,
effi
cien
cyE
xter
nal
Stra
tegi
cin
vest
men
t/C
lien
tce
nte
red
Lib
rary
expe
ndi
ture
3In
put
Qu
alit
yIn
tern
alR
esou
rce-
repu
tati
onL
icen
seex
ams,
pass
rate
s16
Ou
tcom
eQ
ual
ity,
effi
cien
cyE
xter
nal
Stra
tegi
cin
vest
men
t/C
lien
tce
nte
red
Mis
sion
focu
s1
Pro
cess
Effi
cien
cyE
xter
nal
Stra
tegi
cin
vest
men
t/C
lien
tce
nte
red
Non
-gen
eral
fun
dop
erat
ing
supp
ort
1In
put
Qu
alit
y,ef
fici
ency
Inte
rnal
/Ext
ern
alSt
rate
gic
inve
stm
ent
Par
tici
pati
onpr
e-co
lleg
epr
ogra
mof
disa
dvan
tage
dst
ude
nts
1In
put
Equ
ity
Ext
ern
alC
lien
tce
nte
red
Pat
ents
,lic
ense
sdi
sclo
sure
s3
Ou
tpu
tQ
ual
ity
Inte
rnal
/Ext
ern
alSt
rate
gic
inve
stm
ent/
Res
ourc
e-re
puta
tion
Pre
para
tion
ofn
ewst
ude
nts
1In
put
Qu
alit
yIn
tern
al/E
xter
nal
Stra
tegi
cin
vest
men
t/R
esou
rce-
repu
tati
onP
riva
tefu
nd
rais
ing
5O
utp
ut
Qu
alit
yIn
tern
al/E
xter
nal
Stra
tegi
cin
vest
men
t/R
esou
rce-
repu
tati
onP
riva
tiza
tion
offu
nct
ion
s1
Pro
cess
Effi
cien
cyE
xter
nal
Stra
tegi
cin
vest
men
tP
rogr
amap
prov
al1
Pro
cess
Qu
alit
yE
xter
nal
Stra
tegi
cin
vest
men
tP
rogr
amre
view
1P
roce
ssQ
ual
ity
Inpu
tR
esou
rce-
repu
tati
onP
ubl
icse
rvic
e6
Ou
tpu
tE
ffici
ency
Ext
ern
alSt
rate
gic
inve
stm
ent/
Cli
ent
cen
tere
dR
emed
ial
acti
vity
effe
ctiv
enes
s14
Ou
tpu
t/P
roce
ssE
ffici
ency
Ext
ern
alSt
rate
gic
inve
stm
ent/
Cli
ent
cen
tere
dR
esea
rch
,ec
onom
icde
velo
pmen
t2
Ou
tcom
eE
ffici
ency
Ext
ern
alSt
rate
gic
inve
stm
ent/
Cli
ent
cen
tere
dR
esea
rch
spon
sore
d20
Ou
tpu
tQ
ual
ity
Inpu
t/E
xter
nal
Stra
tegi
cin
vest
men
t/R
esou
rce-
repu
tati
on
Ap
pen
dix
toC
hap
ter
3.
Rep
orti
ng
Ind
icat
ors
wit
hIn
dic
ator
Typ
es,
Pol
icy
Val
ues
,C
once
rns,
and
Mod
els
(con
tin
ued
)
Indi
cato
rsN
o.of
Stat
esTy
pePo
licy
Valu
eC
once
rns
Mod
els
Res
earc
h,
teac
hin
gan
dle
arn
ing
1O
utc
ome
Qu
alit
yE
xter
nal
Stra
tegi
cin
vest
men
t/C
lien
tce
nte
red
SAT
/AC
Tsc
ores
9In
put
Qu
alit
yIn
tern
al/
Ext
ern
alSt
rate
gic
inve
stm
ent/
Res
ourc
e-re
puta
tion
Sati
sfac
tion
,alu
mn
i8
Ou
tcom
eQ
ual
ity
Ext
ern
alC
lien
tce
nte
red
Sati
sfac
tion
,em
ploy
ers
7O
utc
ome
Qu
alit
yE
xter
nal
Stra
tegi
cin
vest
men
t/C
lien
tce
nte
red
Sati
sfac
tion
,fac
ult
y1
Ou
tcom
eQ
ual
ity
Inte
rnal
Res
ourc
e-re
puta
tion
Sati
sfac
tion
,stu
den
ts9
Ou
tcom
eQ
ual
ity
Ext
ern
alC
lien
tce
nte
red
Spac
eu
tili
zati
on1
Pro
cess
Effi
cien
cyE
xter
nal
Stra
tegi
cin
vest
men
tSt
aff
exec
uti
vem
anag
emen
t,ge
nde
r1
Inpu
tE
quit
yIn
tern
alC
lien
tce
nte
red
Staf
fex
ecu
tive
man
agem
ent,
race
2In
put
Equ
ity
Inte
rnal
/E
xter
nal
Cli
ent
cen
tere
d
Staf
fge
nde
r,ra
ce1
Inpu
tE
quit
yIn
tern
al/
Ext
ern
alC
lien
tce
nte
red
Stan
dard
ized
adm
issi
ons
test
scor
es2
Inpu
tQ
ual
ity
Inte
rnal
Res
ourc
e-re
puta
tion
Stan
dard
ized
gen
eral
edu
cati
onex
amsc
ores
3O
utc
ome
Qu
alit
yE
xter
nal
Stra
tegi
cin
vest
men
t
Stan
dard
ized
test
scor
es,
stu
den
tm
ajor
s1
Ou
tcom
eQ
ual
ity
Ext
ern
alSt
rate
gic
inve
stm
ent
Stat
eca
pita
lsp
endi
ng
1In
put
Qu
alit
y,ef
fici
ency
Inte
rnal
/E
xter
nal
Stra
tegi
cin
vest
men
t
Stat
eop
erat
ing
fun
din
g14
Inpu
tQ
ual
ity,
effi
cien
cyIn
tern
al/
Ext
ern
alSt
rate
gic
inve
stm
ent
Stu
den
tad
vise
men
t2
Pro
cess
Qu
alit
y,ef
fici
ency
Ext
ern
alSt
rate
gic
inve
stm
ent/
Cli
ent
cen
tere
d
Stu
den
t-fa
cult
yra
tio
8In
put
Qu
alit
yIn
tern
alR
esou
rce-
repu
tati
onSt
ude
nt
tran
sfer
19O
utp
ut/
Inpu
tE
ffici
ency
/E
quit
yE
xter
nal
Stra
tegi
cin
vest
men
t/C
lien
tce
nte
red

Stu
den
ttr
ansf
er,
gen
der
1O
utp
ut/
Inpu
tE
quit
yIn
tern
al/E
xter
nal
Stra
tegi
cin
vest
men
t/C
lien
tce
nte
red
Stu
den
ttr
ansf
er,
race
3O
utp
ut/
Inpu
tE
quit
yIn
tern
al/E
xter
nal
Cli
ent
cen
tere
dSt
ude
nt
tran
sfer
,u
pper
divi
sion
grad
eav
erag
e5
Ou
tcom
eQ
ual
ity
Ext
ern
alSt
rate
gic
inve
stm
ent
Stu
den
ttr
ansf
er,
cred
itac
cept
ance
1P
roce
ssE
ffici
ency
Ext
ern
alSt
rate
gic
inve
stm
ent/
Cli
ent
cen
tere
dSt
ude
nts
part
icip
atin
gin
rese
arch
3O
utc
ome
Qu
alit
yIn
tern
alR
esou
rce-
repu
tati
onSt
udy
abro
ad1
Pro
cess
Ch
oice
Ext
ern
alC
lien
tce
nte
red
Teac
her
aver
age
sala
ry2
Ou
tcom
eE
ffici
ency
Ext
ern
alSt
rate
gic
inve
stm
ent
Teac
her
empl
oym
ent
1O
utc
ome
Effi
cien
cyE
xter
nal
Stra
tegi
cin
vest
men
t/C
lien
tce
nte
red
Teac
her
exam
pass
rate
,rac
e2
Ou
tcom
eE
quit
yE
xter
nal
Stra
tegi
cin
vest
men
t/C
lien
tce
nte
red
Teac
her
trai
nin
g9
Pro
cess
Qu
alit
yE
xter
nal
Stra
tegi
cin
vest
men
tTe
ach
ertr
ain
ing,
race
2P
roce
ssE
quit
yE
xter
nal
Stra
tegi
cin
vest
men
t/C
lien
tce
nte
red
Tech
nol
ogy
dist
ance
lear
nin
g13
Pro
cess
Effi
cien
cyE
xter
nal
Stra
tegi
cin
vest
men
t/C
lien
tce
nte
red
Tim
eto
degr
ee,
cred
its
ongr
adu
atio
n10
Ou
tpu
tE
ffici
ency
Ext
ern
alSt
rate
gic
inve
stm
ent
Tim
eto
degr
ee,
cred
its
ongr
adu
atio
n,t
ran
sfer
s3
Ou
tpu
tE
ffici
ency
Ext
ern
alSt
rate
gic
inve
stm
ent
Trai
nin
g,em
ploy
edsu
peri
nte
nde
nts
and
prin
cipa
ls2
Ou
tpu
tE
ffici
ency
Ext
ern
alSt
rate
gic
inve
stm
ent/
Cli
ent
cen
tere
d
Tuit
ion
and
fees
18In
put
Equ
ity
Ext
ern
alC
lien
tce
nte
red
Tuit
ion
and
fees
,per
cen
tof
fam
ily
inco
me
2O
utc
ome
Equ
ity
Ext
ern
alC
lien
tce
nte
red
Un
derg
radu
ate
acce
ss2
Inpu
tE
quit
yE
xter
nal
Stra
tegi
cin
vest
men
t/C
lien
tce
nte
red
Wor
kfor
cetr
ain
ing
8O
utp
ut
Effi
cien
cyE
xter
nal
Stra
tegi
cin
vest
men
t/C
lien
tce
nte
red