Report on Children's Profile at School Entry 2008-2009: Evaluation of the 'Preparing For Life' Early...
98
Report on Children’s Profile at School Entry 2008-2009 EVALUATION OF THE ‘PREPARING FOR LIFE’ EARLY CHILDHOOD INTERVENTION PROGRAMME By UCD GEARY INSTITUTE PFL EVALUATION TEAM (Orla Doyle, Carly Cheevers, Sarah Finnegan, Louise McEntee & Kelly McNamara) June 2009 UCD Geary Institute, University College Dublin, Belfield, Dublin 4, Ireland T +353 1 716 4637 F +353 1 716 1108 E-mail: [email protected] Preparing for Life Bell Building Darndale/Belcamp Village Centre, Dublin 17 T +353 1 877 1509 F +353 1 877 1586 E-mail: [email protected]
Transcript of Report on Children's Profile at School Entry 2008-2009: Evaluation of the 'Preparing For Life' Early...
Report on Children’s Profileat School Entry
2008-2009
EVALUATION OF THE
‘PREPARING FOR LIFE’EARLY CHILDHOOD
INTERVENTION PROGRAMMEBy
UCD GEARY INSTITUTE PFL EVALUATION TEAM(Orla Doyle, Carly Cheevers, Sarah Finnegan, Louise McEntee &
Kelly McNamara)June 2009
UCD Geary Institute,University College Dublin,Belfield, Dublin 4, Ireland
T +353 1 716 4637F +353 1 716 1108E-mail: [email protected]
Preparing for LifeBell BuildingDarndale/Belcamp Village Centre,Dublin 17
T +353 1 877 1509F +353 1 877 1586E-mail: [email protected]

ii
Table of Contents
List of Tables ................................................................................................................................. ivList of Figures ................................................................................................................................. vAcknowledgements........................................................................................................................ viExecutive Summary...................................................................................................................... viiI. Introduction......................................................................................................................... 1
A. Background & Aims ................................................................................................... 1B. Overview of Report..................................................................................................... 2
II. Definition of School Readiness .......................................................................................... 2A. Physical Well-Being and Motor Development ........................................................... 3B. Social and Emotional Development............................................................................ 3C. Approaches to Learning.............................................................................................. 4D. Language Development and Emerging Literacy ........................................................ 4E. Cognition and General Knowledge............................................................................. 4
III. Determinants of School Readiness ..................................................................................... 5A. Child Health ................................................................................................................ 5B. Family Factors ............................................................................................................ 6C. Emergent Literacy Practices ....................................................................................... 7D. Early Childhood Care and Education ......................................................................... 7E. School Transitional Practices...................................................................................... 8F. Community and Neighbourhood Effects .................................................................... 9G. Media Effects ............................................................................................................ 10
IV. Importance of School Readiness....................................................................................... 11A. Academic Achievement ............................................................................................ 11B. Peer Relationships..................................................................................................... 12C. Psychological Well-being ......................................................................................... 13D. Teenage Pregnancy ................................................................................................... 14E. Employment & Earnings........................................................................................... 14F. Criminal Activity ...................................................................................................... 15
V. Differential Parent and Teacher Definitions of School Readiness ................................... 16VI. Parenting ........................................................................................................................... 17
A. Description of Parenting Styles Identified by Baumrind (1966) .............................. 191. Authoritative Parenting Style.................................................................................... 192. Authoritarian Parenting Style ................................................................................... 193. Permissive Parenting Style ....................................................................................... 19
B. Relationship between Parenting and Child Outcomes.............................................. 20VII. Methodology..................................................................................................................... 21
A. Support from Local Primary Schools and Ethics Committee ................................... 21B. Survey Design and Piloting ...................................................................................... 21C. Participants................................................................................................................ 22
1. Eligibility .................................................................................................................. 222. Response Rates ......................................................................................................... 22
D. Instruments:............................................................................................................... 231. Teacher Questionnaire .............................................................................................. 232. Parent Questionnaire ................................................................................................. 26

iii
E. Testing Procedures.................................................................................................... 291. Non-Normality Tests ................................................................................................ 292. Use of Monte Carlo Permutation Tests..................................................................... 29
VIII. Results, .............................................................................................................................. 30A. CPSE Cohort Descriptives ........................................................................................ 30B. School Readiness Assessment .................................................................................. 31C. Use of Teacher Reported School Readiness ............................................................. 41D. Child Age .................................................................................................................. 42E. Gender....................................................................................................................... 43F. Siblings ..................................................................................................................... 45G. Relationship Status.................................................................................................... 47H. Parent Age................................................................................................................. 49I. Parental Education .................................................................................................... 52J. Employment Status ................................................................................................... 55K. Social Welfare Dependency...................................................................................... 57L. Centre-Based Childcare ............................................................................................ 59M. Parenting Behaviours ................................................................................................ 61
IX. Summary & Conclusion.................................................................................................... 63X. References......................................................................................................................... 71XI. Appendix........................................................................................................................... 88

iv
List of TablesTable 1 Standardised Cronbach alpha coefficients and interrcorrelations between teacher
rated S-EDI domains....................................................................................................... 24Table 2 Standardised Cronbach alpha coefficients and interrcorrelations between teacher
rated additional behavioural domains ............................................................................ 26Table 3 Standardised Cronbach alpha coefficients, and interrcorrelations between parent
rated S-EDI domains....................................................................................................... 27Table 4 Standardised Cronbach alpha coefficients, and interrcorrelations between parent
rated additional behavioural domains ............................................................................ 27Table 5 Standardised Cronbach alpha coefficients, and interrcorrelations between parent
rated parenting constructs .............................................................................................. 28Table 6 Wilcoxon signed-rank and t-test results for comparisons of CPSE teacher ratings,
parent ratings and Canadian norm on S-EDI................................................................. 34Table 7 Percent of teacher rated CPSE cohort below and above Canadian norm on S-EDI
domains ........................................................................................................................... 34Table 8 Number of S-EDI scales on which CPSE cohort scored low as rated by teachers ......... 35Table 9 Wilcoxon signed-rank results for differences between CPSE parent and teacher
ratings on additional behavioural domains .................................................................... 36Table 10 Wilcoxon signed-rank test results for differences in Lifeways parent school and
CPSE teacher ratings on additional behavioural domains ............................................ 37Table 11 Wilcoxon signed-rank test results for differences in Lifeways parent home and
CPSE parent ratings on additional behavioural domains .............................................. 38Table 12 Wilcoxon signed rank test results for differences in Lifeways parent home
ratings for a subsample with less than secondary education and CPSE parentratings on additional behavioural domains .................................................................... 39
Table 13 T-test results for comparisons of CPSE teacher ratings, parent ratings andQLSCD Quebec sample on additional behavioural items.............................................. 41
Table 14 Spearman's rho non-parametric correlations representing the relationshipbetween child age and School Readiness........................................................................ 42
Table 15 Monte Carlo Permutation test results for differences in School Readiness basedon child gender................................................................................................................ 44
Table 16 Monte Carlo Permutation test results for differences in School Readiness basedon sibling presence in household .................................................................................... 46
Table 17 Monte Carlo Permutation test results for differences in School Readiness basedon parent relationship status........................................................................................... 49
Table 18 Spearman's rho non-parametric correlations representing the relationshipbetween parent’s age and School Readiness .................................................................. 50
Table 19 Monte Carlo Permutation test results for differences in School Readiness basedon young mother’s categorisation................................................................................... 52
Table 20 Monte Carlo Permutation test results for differences in School Readiness basedon education level of respondent .................................................................................... 54
Table 21 Monte Carlo Permutation test results for differences in School Readiness basedon maternal employment status....................................................................................... 56
Table 22 Monte Carlo Permutation test results for differences in School Readiness basedon receipt of social welfare payments ............................................................................. 58
Table 23 Monte Carlo Permutation test results for differences in School Readiness basedon child’s participation in centre-based childcare ......................................................... 60
Table 24 Spearman's rho non parametric correlations representing the relationshipbetween parenting behaviours and school readiness ..................................................... 63

v
List of FiguresFigure 1. CPSE teacher, parent and youngest subset of Canadian norm means for each S-EDI
domain..........................................................................................................................viiiFigure 2.Parenting styles identified by Baumrind based on parent use of responsive and
controlling behaviours to parent their child. ................................................................. 18Figure 3. Weekly total household income. ................................................................................... 31Figure 4. CPSE teacher, parent and youngest subset of Canadian norm means for each S-EDI
domain........................................................................................................................... 32Figure 5. Comparisons of teacher and parent reports of the additional behavioural items for
children in the 2008-2009 CPSE cohort. ...................................................................... 36Figure 6.Comparison of CPSE teacher reported behaviours and Lifeways school reported
behaviours. .................................................................................................................... 37Figure 7. Comparisons of CPSE parent reported behaviours vs Lifeways home reported
behaviours ..................................................................................................................... 38Figure 8. CPSE parent rated behavioural domains and Lifeways parent rated behavioural
domains for a subsample with a less than secondary school education........................ 39Figure 9. CPSE teacher, parent and QLSCD Quebec sample for each additional behavioural
domain........................................................................................................................... 40Figure 10. Gender differences in teacher reported S-EDI domains. ............................................ 43Figure 11. Gender differences in teacher reported behavioural domains..................................... 44Figure 12. Differences in teacher reported S-EDI domains based on presence of siblings in the
home.............................................................................................................................. 45Figure 13. Differences in teacher reported behavioural domains based on presence of siblings in
the home. ....................................................................................................................... 46Figure 14. Relationship status of respondents. ............................................................................. 47Figure 15. Differences in teacher reported S-EDI domains based on relationship status. ........... 48Figure 16. Differences in teacher reported additional behavioural domains based on relationship
status.............................................................................................................................. 48Figure 17. Differences in teacher reported S-EDI domains based on age of respondent when
child was born. .............................................................................................................. 51Figure 18. Differences in teacher reported additional behavioural domains based on young
mothers categorisation. ................................................................................................. 51Figure 19. Highest level of education completed by survey respondent...................................... 52Figure 20. Relationship between teacher rated S-EDI and respondent education level............... 53Figure 21. Relationship between teacher rated additional behavioural items and respondent
education level. ............................................................................................................. 54Figure 22. Relationship between teacher rated S-EDI and maternal employment status............. 55Figure 23. Relationship between teacher rated additional behavioural items and maternal
employment status......................................................................................................... 56Figure 24. Relationship between teacher rated S-EDI and respondent receipt of socialwelfare payments. ......................................................................................................... 57
Figure 25. Relationship between teacher additional behavioural items and respondent receipt ofsocial welfare payments. ............................................................................................... 58
Figure 26. Relationship between teacher rated S-EDI and child’s participation in centre-basedchildcare prior to school entry. ..................................................................................... 59
Figure 27. Relationship between teacher additional behavioural items and child’s participationin centre-based childcare prior to school entry. ............................................................ 60
Figure 28. Mean scores of parenting style behaviours. ................................................................ 61Figure 29. Mean scores on subdomains of parenting style behaviours ........................................ 62

vi
Acknowledgements
The Preparing for Life Team and the UCD Geary Institute would like to thank all those whoparticipated and supported this research.
We would like to thank all participating schools, teachers, and parents. We would like to thankschool principals and Boards of Management for supporting the project and teachers and parentsfor their time and honesty in completing surveys. We would like to thank all parents andteachers who helped the research team pilot the surveys for their time and feedback indeveloping the final survey used.
Preparing for Life would particularly like to thank the UCD Geary Institute Team, under thedirection of Dr. Orla Doyle, for their work in bringing this report to life. Dr. Orla Doyle wouldalso like to thank the Lifeways team at the UCD School of Public Health and Population Sciencefor providing access to the Lifeways Cross-Generation Cohort Study. Thanks also to AmeliePetitclerc and Professor Richard Tremblay for providing information on the QuebecLongitudinal Study of Child Development (QLSCD) and to the Offord Centre for Child Studies,McMaster University for providing the Early Development Instrument and their assistance incoding the data obtained from this instrument.
We would also like to thank our funders The Atlantic Philanthropies and the Office of theMinister for Children and Youth Affairs and acknowledge the advice and guidance given bystaff of both organisations. We also thank our Expert Panel for their support and guidance.
Finally we thank the St. Stephen’s Green Trust for their support with this research and thefunding to publish this report.
Noel Kelly,Manager, Preparing for Life.

vii
Executive Summary
The Children’s Profile at School Entry (CPSE) was conducted by the UCD Geary Institute whohave been commissioned by the Northside Partnership to assess the levels of school readiness ina designated disadvantaged community of Ireland, as part of an overall evaluation of thePreparing for Life (PFL) early childhood intervention programme.
Purpose and Description of the CPSEThe CPSE is an annual representative survey of the levels of school readiness of junior infantchildren attending the local primary schools in the PFL catchment area. Specifically, the surveyfocuses on the children’s levels of school readiness in the year they started school, and over timewill 1) indicate the general level of school readiness for the older cohorts of children in the PFLarea, 2) indicate whether the PFL programme is generating positive externalities, and 3) willserve as a baseline for the PFL cohort.
This report provides a thorough description of the definition, determinants and importance ofschool readiness for outcomes later in life. The holistic nature of school readiness is discussed,following by an in-depth review of the familial, societal and environmental factors influencing achild’s readiness for school.
CPSE MethodThe CPSE survey was conducted between October and December of the 2008-2009 academicyear. Data were collected via online questionnaires completed by teachers and paper and penquestionnaires completed by parents. The teachers’ and parents’ response rate was 99% and76%, respectively. This resulted in a CPSE sample of 101 children across five schools.
Pupil school readiness was assessed using teacher and parent reports on the Short EarlyDevelopment Instrument (S-EDI; Janus Duku, & Stat, 2005). The S-EDI is composed of 48 coreitems and provides scores across five domains of school readiness (physical health and well-being, social competence, emotional maturity, language and cognitive development, andcommunication and general knowledge). The S-EDI has normative data that correspond to eachdomain, allowing comparisons with a representative Canadian sample. Parents and teachers alsocompleted an additional set of questions on child behaviour to facilitate comparisons with anational Irish sample.
School Readiness in the 2008-2009 CPSE CohortS-EDI results indicate that teachers rated children in the 2008-2009 CPSE cohort as displayingsignificantly lower levels of school readiness than a Canadian norm, while parents rated childrenin this cohort as displaying significantly higher levels of school readiness than a Canadian norm.Specifically, tests show that parents rated children as displaying higher levels of physical healthand well-being, social competence, emotional maturity, and communication and generalknowledge, while teachers’ ratings were significantly lower. According to both parent andteacher reports, children score highest on physical health and well-being and social competence,while they received the lowest scores on the communication and general knowledge scale byteachers and were rated lowest on the language and cognitive development scale by parents.Please see Figure 1 below.

viii
0
1
2
3
4
5
6
7
8
9
10
Physical Health& Well-being
SocialCompetence
EmotionalMaturity
Language &Cognitive
Development
Communication& GeneralKnowledge
School Readiness Domain
Mea
nS
core
CPSE - Teacher
Canadian Norm
CPSE - Parent
Figure 1. CPSE teacher, parent and youngest subset of Canadian norm means for each S-EDIdomain.
While on average the teacher reported level of school readiness was significantly below theCanadian norm, approximately 50% of children in the CPSE cohort are performing above thenorm in terms of physical health and well-being and social competence. However,approximately 70% of children were rated below the Canadian norm on the emotional maturity,language and cognitive development, and communication and general knowledge domains,demonstrating specific areas of weakness for a large portion of the CPSE cohort. In addition,about one-fifth of the children received a low score on one of the five domains and a further11% scored low on two domains, with only 5% scoring low on more than three domains. Thisreinforces the need to focus on multiple domains of school readiness.
The differences in parental and teacher reports were replicated for the additional behaviouraldomains. In sum, teachers rate the CPSE children as displaying more behavioural difficulties interms of hyperactivity/inattention and anxiety. In a comparison with a representative sample ofIrish children from the Lifeways Cross Generational Cohort Study, teacher reports of behaviourdemonstrate that children in the CPSE sample are more aggressive, oppositional, hyperactive,anxious, and less prosocial. However, comparing a low education sub-samples of the Lifewaysand CPSE data reveal that the CPSE cohort are significantly less aggressive and anxious, yetmore hyperactive/inattentive.
Group Differences in School ReadinessIn addition to providing information on the children’s readiness for school, the report alsoinvestigates differences in scores across a range of socio-demographic, parental, andenvironmental factors. Specifically, Monte Carlo permutation tests show that girls were reportedto be more emotionally mature, more prosocial, and less aggressive than boys. Children with nosiblings were rated as being more socially competent and less oppositional compared to theirclassmates with at least one sibling. Parental demographics played less of a role in children’sschool readiness. For example, no significant differences emerged by parental relationship statusor age.
Yet indicators of parental socioeconomic status were associated with a child’s readiness forschool. Children of parents with very low levels of education were rated as being less sociallycompetent and emotionally mature, and more aggressive, oppositional, and
ix
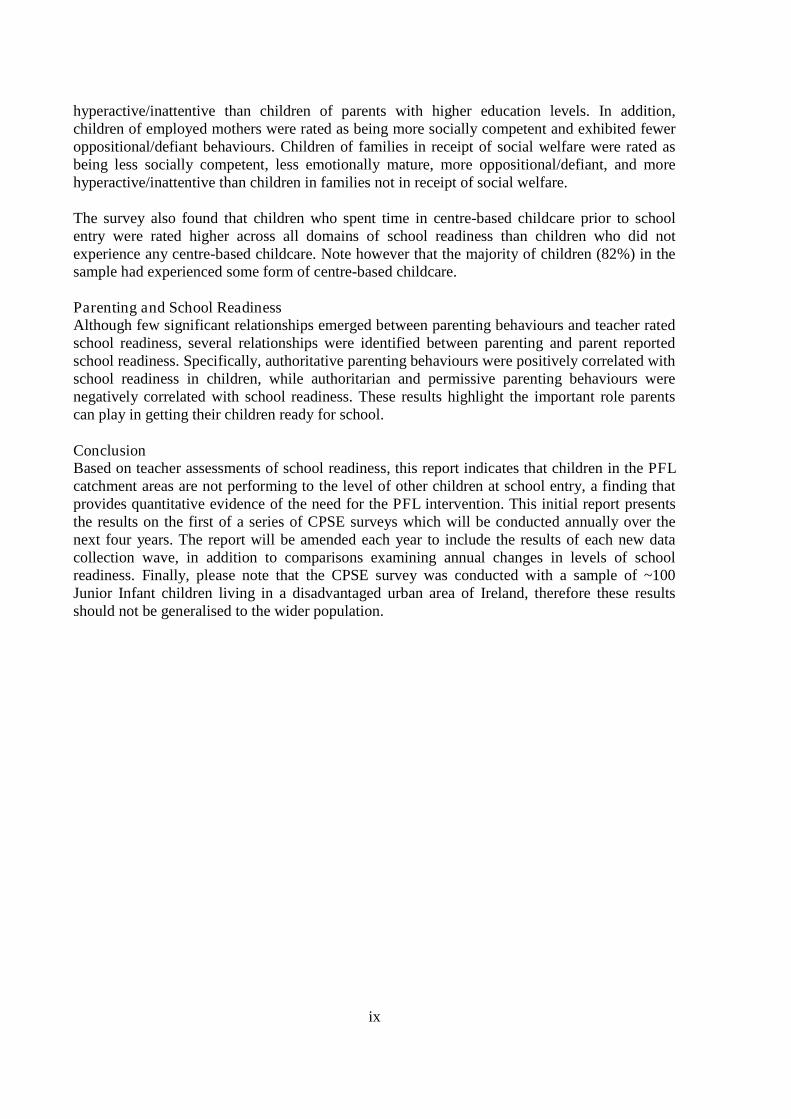
hyperactive/inattentive than children of parents with higher education levels. In addition,children of employed mothers were rated as being more socially competent and exhibited feweroppositional/defiant behaviours. Children of families in receipt of social welfare were rated asbeing less socially competent, less emotionally mature, more oppositional/defiant, and morehyperactive/inattentive than children in families not in receipt of social welfare.
The survey also found that children who spent time in centre-based childcare prior to schoolentry were rated higher across all domains of school readiness than children who did notexperience any centre-based childcare. Note however that the majority of children (82%) in thesample had experienced some form of centre-based childcare.
Parenting and School ReadinessAlthough few significant relationships emerged between parenting behaviours and teacher ratedschool readiness, several relationships were identified between parenting and parent reportedschool readiness. Specifically, authoritative parenting behaviours were positively correlated withschool readiness in children, while authoritarian and permissive parenting behaviours werenegatively correlated with school readiness. These results highlight the important role parentscan play in getting their children ready for school.
ConclusionBased on teacher assessments of school readiness, this report indicates that children in the PFLcatchment areas are not performing to the level of other children at school entry, a finding thatprovides quantitative evidence of the need for the PFL intervention. This initial report presentsthe results on the first of a series of CPSE surveys which will be conducted annually over thenext four years. The report will be amended each year to include the results of each new datacollection wave, in addition to comparisons examining annual changes in levels of schoolreadiness. Finally, please note that the CPSE survey was conducted with a sample of ~100Junior Infant children living in a disadvantaged urban area of Ireland, therefore these resultsshould not be generalised to the wider population.

1
I. Introduction
A. Background & AimsThe Children’s Profile at School Entry (CPSE) study was conducted by the UCD Geary Institutewho have been commissioned by the Northside Partnership to assess the levels of schoolreadiness in a designated disadvantaged community of Ireland as part of an overall evaluation ofthe Preparing for Life (PFL) early childhood intervention programme.
In 2004, a school readiness survey was conducted by the Children’s Research Centre in TrinityCollege Dublin (Kiernan et al., 2008) in the PFL catchment area in which teachers reported that52% of children were not ready for school. As a result, the PFL programme was set up with theaim of increasing the levels of school readiness in these disadvantaged areas.
PFL is a 5-year school readiness intervention starting in pregnancy and lasting until the childrenstart school. The programme is jointly funded by Atlantic Philanthropies and the Office of theMinster for Children and Youth Affairs. The aim of the programme is to work with families frompregnancy onwards to help and support the healthy development of the child. All programmefamilies receive facilitated access to enhanced pre-school and public health information, inaddition to the services of a support worker. Half of these families are randomly allocated toreceive enhanced supports including participation in a home-visiting mentoring programme anda group parent training programme. This experimental programme is one of the first of its kind inIreland and aims to provide real time evidence on best practice in early intervention.
PFL operates under a holistic definition of school readiness composed of five dimensions: 1)physical health and well being; 2) socio-emotional development; 3) approaches to learning; 4)language development and emergent literacy; 5) cognitive and general knowledge.
The CPSE is an annual representative survey of the levels of school readiness of junior infantschildren attending the local primary schools in the PFL catchment area. Specifically, the surveyfocuses on the children’s levels of school readiness in the year they started school, and will 1)indicate the general level of school readiness in the area for the older cohorts of children in thePFL area, 2) indicate whether the PFL programme is generating positive externalities, i.e.whether the public health style messages and improved service integration by the local providerstranslate into improving levels of school readiness, and 3) will serve as a baseline measure ofschool readiness for the PFL cohort.
This initial report presents the results on the first of a series of CPSE surveys which will beconducted over the next four years. This report will be amended each year to include the resultsof each new data collection wave, in addition to comparisons examining annual changes in levelsof school readiness.

2
B. Overview of ReportThis report describes the first annual CPSE survey conducted in 2008. The report will beamended throughout the next 4 years to include subsequent data collection waves. The report isorganised as follows: Section II provides a robust definition of school readiness incorporatingfive dimensions. Section III examines the determinants of school readiness and the factors thatcan positively or negatively impact on a child’s readiness for school. Section IV discusses theimportance of school readiness for both short-term and long-term success. Section V discussesthe differential parent and teacher definitions of school readiness. Section VI examines the roleof parenting style in influencing school readiness. Section VII provides the methodologyemployed including survey design, instruments, response rates, and a description of the sample.Section VIII presents the results of the analysis. Finally, Section IX summaries and concludes thereport.
II. Definition of School Readiness
School readiness is a multi-dimensional concept which reflects the holistic nature of children’sdevelopment and takes account of a host of factors in their wider environment. Poor schoolreadiness has been linked to later academic failure (Raver, 2003), poor socio-emotionaladjustment (Arnold et al., 1999; Hinshaw, 1992), and poor life outcomes such as unemployment(Ross & Shillington, 1990) and teenage pregnancy (Brooks-Gunn, 2003). It has been describedas a foundation on which all later learning is built and it has been argued that children whodevelop well at earlier stages and are ready to start school are in a position to elicit interactionsand experiences that accelerate their subsequent development and facilitate their achievement(Heckman, 2000).
School readiness is often conceptualised in terms of the joint responsibilities that the home,school, and community have in providing caring environments that promote children’s learning(Piotrkowski, Botsko, & Matthews, 2000). The many facets of the child’s environment,including their family and societal systems and values, neighbourhood security, quality andequality of access to the public health system, governmental policies and practices, andeconomical considerations largely determine early childhood well-being.
While the traditional definition of school readiness focused on academic ability alone, morerecent research on child development and early education has noted that school readiness is amulti-faceted concept which also includes physical health and well-being and motordevelopment, social and emotional development, approaches to learning, language development,and emergent literacy (Child Trends, 2001; Kagan, Moore, & Bradenkamp, 1995). Together,these developmental domains have the capacity to influence the child’s readiness for school andfuture academic achievement, as children who begin school with the appropriate cognitive andsocial skills maintain this advantage throughout the school years.

3
A. Physical Well-Being and Motor DevelopmentPhysical health and well-being incorporates both developmental progress and the child’s contextof development. It can be characterised as physical development and growth, but alsoincorporates physical abilities including motor skills and development during both the pre andpostnatal environment (Kagan et al., 1995).
A number of studies have found that poor health in childhood, including inferior health status,growth deficiencies, disabilities, poor gross and fine motor skills, is associated with a lack ofschool readiness (Dockett, Perry, & Tracey, 2000). Children who are born prematurely or at alow birth weight are more likely to experience lower levels of school readiness upon schoolentry. Specifically, children born prematurely may experience difficulties in the social andemotional domain whereas low birth weight children may experience more problems withlanguage development (Janus & Offord, 2001).
B. Social and Emotional DevelopmentWhile social development is characterised by a child’s interactions with others, emotionaldevelopment refers to the child’s awareness and knowledge of emotions for both the self andothers, as well as the expression of feelings (Kagan et al., 1995). Social and emotionaldevelopment are important contributors to a child’s school readiness as they affect how a childinteracts with teachers and peers in the classroom. A child who is mature in these domains maypossess the skills necessary to engage in learning and interact with teachers and peers in apositive and effective manner, thus promoting school readiness.
Social development is an indicator of school readiness as social skills such as the ability toeffectively interact with others, take turns, and display empathy can influence the child’stransition into school. Therefore, children need a certain level of social competence when theystart school (Ladd, 1999; McLellan & Katz, 2001; Parker & Asher, 1987) as having friendsprovides opportunities for social, emotional, and cognitive development (Hartup, 1989).Additionally, having the social skills necessary to form and maintain interpersonal relationshipsis important as it eases the transition to school (Ladd, 1990). Specifically, children perceive theirfriends as providing greater support than nonfriends (Berndt & Perry, 1986) during transitionsand children who enter school with friends view school more favourably, enjoy school more, anddisplay greater academic achievements (Ladd, 1990).
Having the skills to effectively interact with peers in the social domain is an importantcomponent of school readiness as this may enhance the child’s desire and ability to learn.Specifically, children who are not well accepted by their peers display lower cognitive abilities(Newcomb, Bukowski, & Pattee, 1993) and experience various school difficulties such asdecreased participation in the classroom, greater school avoidance, and lower schoolachievement (Buhs & Ladd, 2001; Buhs, Ladd, & Herald, 2006; French, Jansen, Riansari, &Setiono, 2003; Ladd, 1990). Consequently, children who do not maintain positive peerrelationships are reported by teachers and peers as being more aggressive and withdrawn as wellas lower in academic achievement and social preference within the classroom (French et al.,2003).

4
Socially negative behaviour, characterised by inattention and opposition in the classroom, hasbeen found to be associated with emotional instability, disruptive peer interactions, and poorlearning behaviours. Furthermore, children who experience socially withdrawn behaviour in theclassroom show lower adaptability in terms of emotional interactions and these children lack anawareness of self and others (Fantuzzo, Bulotsky-Shearer, Fusco, & McWayne, 2005).
C. Approaches to LearningApproaches to learning are characterised as clear, observable behaviours that illustrate wayschildren become engaged in classroom interactions and learning activities. Additionally, childrendisplay these behavioural patterns as they approach and undertake classroom learning tasks.Specific behaviours include initiative, curiosity, cooperativeness, engagement, and persistence(Fantuzzo et al., 2007). They directly affect school readiness as they refer to the child’sinclination to use skills, knowledge and capacities. The key components of approaches tolearning include enthusiasm, curiosity, and persistence on tasks, as well as gender, temperament,and cultural patterns and values (Conn-Powers, 2006).
Children who are aggressive or inattentive in the classroom setting typically display poorerapproaches to learning. Specifically, aggressive behaviour is related to lower competencemotivation and attitude toward learning, while inattention is related to lower competencemotivation and lower task persistence (Fantuzzo et al., 2005).
D. Language Development and Emerging LiteracyLanguage development includes both verbal language and emerging literacy and provideschildren with the necessary tools for effective communication and learning (Whitehead, 2002;Whitehurst & Lonigan, 1998). Language development, including the child’s ability to listen,speak and understand vocabulary, can affect school readiness as it enables effectivecommunication. In addition, emerging literacy skills such as print awareness, story sense andwriting process can also affect school readiness.
By the time they start school, children should be able to understand adults’ and other children’sverbal communication and also verbally communicate experiences, ideas, wishes, and feelings ina way that can be understood by others. These abilities help the child to adjust successfully to theschool setting (Doherty, 1997). However, research suggests that the ability to communicateeffectively with teachers (Dockett et al., 2000) and peers (Janus & Offord, 2000), rather than theactual developmental level of language, is more important for school readiness. Katz (1991)points out that even if children have the same ‘mother tongue’, they need to speak the same‘language’, such as using the same words to refer to particular concepts and ideas.
E. Cognition and General KnowledgeAlthough the definition of school readiness has evolved into a multidimensional concept,cognition and general knowledge is still a significant component of a child’s readiness forschool. It incorporates physical knowledge (i.e., knowledge about the properties of objects),logical-mathematical knowledge (i.e., knowledge derived from looking across objects, events orpeople for similarities, differences and associations) and social-conventional knowledge (i.e., theassignment of particular letters to sounds, knowledge about shapes and spatial relations andnumber concepts). This knowledge is often derived from looking across objects, events, or

5
people for similarities, differences, or associations. These components of school readinessrepresent assimilation and accommodation of new information presented in a stimulatingenvironment which assists in future problem solving capabilities (Kagan et al., 1995) andreadiness for school.
III. Determinants of School Readiness
School readiness is a multidimensional concept which can be influenced by several factorsaffecting a child’s development. International research has identified several factors thatinfluence a child’s readiness for school including child health, family factors, emergent literacypractices, early childhood care and education, school transitional practices, community andneighbourhood effects and media effects (Halle, Zaff, Calkins, & Geyelin-Margie, 2000).
A. Child HealthSuboptimal health early in life strongly contributes to vulnerability at school entry (Janus &Duku, 2007) as health in the early years, including birth weight, pre-birth, and post-birth healthcan affect multiple dimensions of children’s readiness for school. Adequate nutrition; a quiet,toxin free environment; and appropriate treatment of childhood medical conditions all play animportant role in ensuring that young children arrive at school each morning ready to learn(Pascoe, Shaikh, Forbis, & Etzel, 2007).
Nutrition is an important determinant of school readiness as it can affect a child’s physical,intellectual, and behavioural development which subsequently affects his/her success in school(Korenman, Miller, & Sjaastad, 1995). Several studies have identified a causal relationshipbetween nutritional deficits and lower cognitive test scores, even when the home environmentand maternal characteristics are taken into account (Korenman et al., 1995; Grantham-McGregor,1995). Low birth weight can affect the child’s cognitive abilities (Hack et al., 1994; Klebanov,Brooks-Gunn, & McCormick, 1994; McCormick, Workman-Daniels, & Brooks-Gunn, 1996)and can lead to behavioural problems (Liaw & Brooks-Gunn, 1993; Pharoah, Stephenson,Cooke, & Stevenson, 1994), while immunisations protect children from communicable diseaseswhich can cause school absences and affect learning capabilities.
Research suggests that childhood emotional and behavioural problems affect school readiness.For example, children who are depressed are more likely to display maladaptive socialbehaviours, such as poor problem-solving and poor conflict negotiation skills as well as affectregulation deficits (Rudloph, Hammen, & Burge, 1994).
Unintentional injury, which refers to events such as car crashes, fires, and accidents in the home,can affect a child’s school readiness as it can result in long term deficits in cognitive,behavioural, and motor functioning. Accidents can also cause pain and can have emotional andeconomic costs to the family, as well as a reduction in the quality of life of the child (Deal,Gomby, Zippirolo, & Behrman, 2000). Other health factors that affect a child’s school readinessinclude lead exposure which can lead to problems such as lowered IQ, short attention span,hyperactivity, learning disabilities (Canfield et al., 2003), and dental health such as tooth decay

6
which can lead to problems with eating and also to increased absences from school (Platt &Cabezas, 2000).
B. Family FactorsResearch consistently highlights the importance of the environment in a child’s earlydevelopment and subsequently his/her success in school. Family factors which affect a child’sschool readiness include family poverty, maternal employment, maternal well-being, the homeenvironment, and family structure.
Family poverty has a number of adverse effects on a child’s school readiness. Children fromlower socio-economic status (SES) backgrounds are more likely to have poor nutrition and poorphysical health. They are also are likely to score lower on tests of verbal ability (Brooks-Gunn,Britto, & Brady, 1999) and tests of cognitive skills including reading readiness, number skills,problem solving, creativity and memory (Stipek & Ryan, 1997). Additionally, children from lowincome families demonstrate greater vulnerability at school entry as they are likely to arrive atkindergarten/preschool with lower cognitive and reading skills. They are also likely to have lessdeveloped social skills and approaches to learning than children with fewer risk factors (Janus &Duku, 2007) and they are more likely to have emotional and behavioural problems (McLoyd,1998).
Several maternal factors have the capacity to influence a child’s readiness for school. Forexample, maternal employment is associated with lower levels of school readiness. Specifically,research has demonstrated that maternal employment when the child is nine months old ispredictive of lower school readiness scores at 36 months, with the effects more pronounced whenmothers were working 30 hours per week or more, a relationship that remained even when childcare quality, the home environment, and maternal sensitivity were controlled for (Brooks-Gunn,Han, & Waldfogel, 2002). Additionally, maternal well-being has the capacity to influence achild’s readiness for school as children of depressed mothers are at increased risk of sufferingfrom behavioural and emotional problems (Hammen, Adrian, Gordon, Burge, & Jaenicke, 1987;Radke-Yarrow, Nottelman, Martinez, Fox, & Belmont, 1992).
Furthermore, the home environment, which includes aspects such as family relations, howparents and children interact and the physical environment within the home, can influence achild’s school readiness. This particularly holds with regard to the social, emotional, andcognitive developmental aspects of school readiness (Caughy, 1996; Hammen et al., 1987;Radke-Yarrow et al., 1992). Family structure is important as research shows that children whoare born out of a planned pregnancy, who grow up in a family with low conflict and where bothbiological parents are present, are likely to have better outcomes in the early years of school(Barber, Axinn, & Thornton, 1999; Moore et al., 1997; Morrison & Coiro, 1999; Thompson,Entwisle, Alexander, & Sundius, 1992). Paternal involvement in a child’s life has significanteffects on the child’s school readiness and early development. Specifically, father involvementpromotes physical play and parent-child play, which stimulates the child’s emotional andcognitive development (Biller & Kimpton, 1997) and is usually matched with maternalinvolvement, resulting in children having two highly involved parents which in turn leads todiversity of stimulation (Amato, 1994). Father involvement also indicates good parental relationswhich creates a positive family environment leading to better child outcomes (Coiro & Emery,

7
1998). Paternal involvement typically leads to more educational activities, such as visitingmuseums, and to more resources in the home as it is usually accompanied by financial support,which has positive effects on child outcomes as it improves the economic well-being of thehousehold (Flouri & Buchanan, 2004).
C. Emergent Literacy PracticesEmergent literacy refers to the earliest signs of interest in and abilities relating to reading andwriting. It includes such skills as vocabulary, the ability to rhyme, and identification of letters(Whitehurst et al., 1994). These skills result from of the child’s family environment and theirearly childhood care and education settings. A child’s level of literacy when he/she enters schoolhas been shown to be a good predictor of reading ability throughout the course of his/hereducation (Whitehurst & Lonigan, 1998).
Children who live in families where reading and writing are common practice are more likely toenter school with greater reading levels (Halsall & Green, 1995). Additionally, shared bookreading with children is related to language development, emergent literacy, and readingachievement (Bus, van Ijzendoorn & Pelligrini, 1995). Furthermore, it appears that it is quality ofreading rather than quantity that counts, as parents whose children learn to read more easily donot simply read to their children but engage in dialogic reading, a strategy of reading thatinvolves asking questions to make children active participants rather than passive listeners(Whitehurst & Lonigan, 1998). Book reading, when combined with phonological training, ismost effective in improving literacy skills. These findings are greater for children from lowincome families (Gillon & Dodd, 1995).
Although living in a supportive home environment can enhance emergent literacy practices inyoung children, there are several family risk factors that can have a negative impact on children’sdevelopment of emergent literacy practices. Specifically, family poverty, living in a low incomeneighbourhood, limited proficiency in English, hearing impairments, low parental education, andparental illiteracy have all been found to have negative associations with a child’s emergentliteracy development (National Research Council, 1998). This negative relationship may beexplained by lack of resources. If a family does not have the necessary resources, either financialor personal, to provide reading opportunities for their child, that child may not have as manyopportunities to engage in reading in the home environment, thus influencing his/her emergentliteracy practices at school entry.
D. Early Childhood Care and EducationRecent studies show that high quality childcare, early in life, may compensate for a low resourcehome environment among low SES children (Cote et al., 2007; Cote, Borge, Geoffroy, Rutter, &Tremblay, 2008; Geoffroy et al., 2006). One factor which directly influences the child’s earlyenvironment is the form and quality of childcare. Research focusing on the effects of these onchild outcomes offer contrasting results (Baydar & Brooks-Gunn, 1991; Belsky, 1990; Blau,1999; Burchinal, Ramey, Reid, & Jaccard, 1995; Hickman, 2006; NICHD, 2000; Peisner-Feinberg et al., 2001), with results varying depending on the type, duration and age of entry.Evidence indicates that childcare quality is an important determinant of child outcomes, and thatchildcare has a differential impact across specific domains of child development (Burchinal,

8
Roberts, Nabors, Bryant, 1996; Burchinal et al., 2000; NICHD & Duncan, 2003; Love et al.,2003).
Although most studies examine the quality of centre-based care, evidence suggests that formalchildcare is of higher quality than informal care, in terms of cognitive development andpromotion of academic success (Bernal & Keane, 2006). In particular, studies have found thatchildcare characteristics which are commonly found to be positively associated with childoutcomes include child to adult ratios, qualifications, experience, and stability of the childcarestaff, the structure and content of daily activities, and the centre’s space and facilities (Phillips,McCartney, & Scarr, 1987). High quality formal childcare has been found to have a positiveimpact on child cognitive abilities and school readiness, in particular math and reading skills, aswell as expressive vocabulary and language development (NICHD, 2000; 2002; 2008; NICHD &Duncan, 2003). The literacy environment and activities within a childcare setting also can makeimportant contributions to emergent literacy. Preschool settings where books are available andwhere children are read to either one-on-one or in small groups can promote higher readingabilities (National Research Council, 1998).
The quality of early childhood care and education affects a child’s cognitive, emotional, andsocial development, expressive language, and receptive language (Kagan & Neuman, 1997;Vandell & Pierce, 2003). Furthermore, high quality care and education lead to higher cognitivetest scores, better school achievement, less special education placements, and higher schoolcompletion rates (Barnett, 1995). Participation in high quality programmes, such as High/ScopePerry Preschool and the Carolina Abecedarian Project, has been shown to have a high impact onchildren from low income families (Barnett, 1995). Additionally, parental involvement inchildcare setting has proven very beneficial to a child’s school readiness (Mallory & Goldsmith,1991). Well designed early education programmes serving disadvantaged children in the yearprior to the first year of school have been shown to generate benefits for government, society,and for the participants themselves, across a wide range of measures. These associated benefitshave been shown to outweigh the costs of the programmes (Karoly & Bigelow, 2005).
Previous research also has found that extensive non-maternal care can have detrimental effectson a child’s development. It has been suggested that non-maternal care may have long termnegative implications for social interactions. Recent evidence by Hickman (2006) shows thatchildren in centre-based care actually have poorer peer-related social skills and their social skillsmay deteriorate over time. There may, however, be a potential trade off of non-parental care suchthat there are improvements in child’s cognitive and language abilities (NICHD, 2000) at theexpense of socioemotional development (Bates et al., 1994).
E. School Transitional PracticesSchools play a key a role in preparing children for school. Not only is it important for children tobe ready for school, but the schools also must be ready for children as they enter school withdifferent skills, knowledge, and previous experiences (NGA Task Force on School Readiness,2005).
Starting formal education can be a stressful time for children. They face many new challengessuch as being expected to be independent and act responsibly, they must interact with teachers,

9
meet certain academic achievements, and face large class sizes (Rimm-Kaufman & Pianta,2000). Children who do not make effective transitions to formal education may be lesssuccessful in school, have difficulties making friends, and may be vulnerable to mental healthand adjustment problems (Goal One Ready Schools Resource Group, 1995).
To ease transitions to school, schools must be ready for the diverse experiences of the children.However, many schools do not have specific guidelines on how to facilitate this transition, nor isthere extensive research on best practices in the area. The limited literature that does exist,however, suggests four steps that schools can take. Schools often do not build on what childrenhave learned in preschools (Love, Logue, Trudeau, & Thayer, 1992), therefore, schools shouldmaintain contact with the preschools so that they can plan for individual children which will easethe transition to school by helping the child to know what to expect as he/she enters school(Kagan & Neuman, 1998; Smolkin, 1999). The second step which schools can take is to maintaincontact between the school and the child’s home both before and after the child starts school sothat the parents can be actively involved in their child’s education (Melton, Limber, & Teague,1999; Swick et al., 1997) as parental involvement can lead to higher grades, test scores andgraduation rates, increased motivation and self-esteem, lower rates of suspension, and fewerinstances of violent behaviour (Rose, Gallup, & Elam, 1997). Third, it has been suggested thatschools should maintain contact with community resources so that a child can receive theservices he/she needs as soon as possible (Halle, Zaff, Calkins, & Geyelin-Margie, 2000). Lastly,it has also been suggested that children should not be held out of school for an extra year asresearch suggests that this can have detrimental effects, especially for poor and minority children(Gullo & Burton, 1992; May & Kundert, 1997).
F. Community and Neighbourhood EffectsThe community or neighbourhood that a child lives in can also affect school readiness asevidence has found that children who live in neighbourhoods with less than 10% poverty tend toscore higher in cognitive tests (Brooks-Gunn, Guo, & Furstenburg, 1993). In contrast, poverty inthe community is associated with lower school readiness and poorer long-term academicachievement (Brooks-Gunn, Duncan, & Aber, 1997; Ensminger, Lamkin, & Jacobson, 1996;Garner & Raudenbush, 1991; Klebanov, Brooks-Gunn, McCarton & McCormick, 1998).Additionally, children in high poverty neighbourhoods are at a higher risk of low birth weight,infant mortality, child abuse, and behaviour problems (Gephart, 1997), all of which havenegative effects on school readiness.
Resources associated with increased levels of school readiness include a high qualityneighbourhood environment (e.g., safe streets and playgrounds) which may not be available inneighbourhoods with high poverty rates. Areas that are characterised by crime, violence andvacant buildings, where parents may not allow children to play outside or walk to school alone,may adversely affect children through increased stress, negative peer influences, and a lack ofpositive role models (Jencks & Mayer, 1990). In particular, male unemployment levels inneighbourhoods have been shown to be associated with young children’s behavioural andphysical outcomes (Chase-Lansdale, Gordon, Brooks-Gunn, & Klebanov, 1997). Living amongrelatively affluent neighbours, on the other hand, has been shown to be particularly important forchildren aged three and older as families may model their neighbours’ behaviours, such asregular school attendance and parental employment. However, research suggests that much of

10
the effect of poor neighbourhoods on negative child outcomes is mediated through the homeenvironment. Therefore, parents who provide a warm, supportive home environment, who useappropriate parenting behaviours, and who provide a stimulating learning environment can offsetthe negative effects of living in a poor neighbourhood (Klebanov et al., 1998).
G. Media EffectsExposure to television can have both positive and negative effects on a child’s school readiness.Watching educational programmes such as Sesame Street has been found to increase children’svocabulary, letter and number knowledge, and positive attitudes towards school. These effectsare most robust for children aged between two and four years of age. Specifically, experimentalstudies have shown that television viewing can improve vocabulary while longitudinal studieshave found that the positive effect of educational television on cognitive and languagedevelopment is greater for younger than older preschoolers (Rice & Woodsmall, 1988). Prosocialand moral shows have been found to increase a child’s prosocial behaviour (Huston & Wright,1998). On the other hand, watching adult programmes and cartoons does not show this effect andchildren who watch these programmes frequently have been shown to perform poorly onmeasures of pre-reading skills and school readiness (Wright & Heuston, 1995).
Although there are positive effects associated with developmentally appropriate televisionviewing, research finds that watching violent programmes is associated with a decrease infantasy play and an increase in aggressive behaviour (Hughes & Hasbrouck, 1996; Huston-Stein,Fox, Greer, Watkins, & Whitaker, 1981; Noble, 1970). Time spent watching television can alsotake away from time spent doing physical and social activities and these children tend to be lesscreative and imaginative in school (Valkenburg & van der Voort, 1994). Additionally, frequentviewers of educational programmes spend more time reading or being read to than frequentviewers of cartoons and adult programmes (Huston & Wright, 1996), which can have an effecton the development of literacy skills.
The impact of other forms of media, such as video games and computers is less explored. Onerecent review of the literature found that the evidence of an association between video gameplaying and aggression in children is insufficient, contradictory, and methodologically flawed(Mitrofan, Paul, & Spencer, 2009). With regard to computer use among preschoolers, researchindicates that children under the age of three should not use computers, although for three to fouryear olds computer programmes, when combined with teaching activities, can help develop longterm memory, manual dexterity and verbal skills (Haugland, 2000).

11
IV. Importance of School Readiness
School readiness is a complex, multifaceted concept and is important across a wide range ofareas. Each dimension of school readiness can have consequences for a child’s social, physicaland educational outcomes. Additionally, developmental problems in childhood are associatedwith negative life outcomes in adulthood. Poor school readiness is associated with difficulties informing healthy relationships with peers, low academic achievement, lower likelihood of beingin employment, higher rates of teenage pregnancy, and poor psychological well-being. Themechanisms by which these relationships operate are complex, and often result from cumulativenegative consequences associated with low readiness at school entry.
A. Academic AchievementStrong associations have been demonstrated between several dimensions of school readiness andlater academic achievement. According to the North Central Regional Academic Laboratory,readiness for school “involves a specific set of cognitive, linguistic, social and motor skills thatenables the child to assimilate the school’s curriculum” (in Le, Kirby, Barney, Setodji, &Gershwin, 2006). School readiness affects a child’s learning and school adjustment as well asfuture academic achievement (Forget-Dubois et al., 2007). Meta-analytic techniques haveindicated that early math concepts are powerful predictors of later learning, and that earlylanguage, reading and attention skills are less powerful but consistent predictors of later learningacross studies (Duncan et al., 2007). Additionally, longitudinal research indicates that children’semotional and social development is strongly linked to academic achievement as therelationships children form with peers and teachers stem from their ability to regulate emotionsin prosocial versus antisocial ways and these relationships either help or hinder children’schances of academic success (Raver, 2003). Furthermore, research has demonstrated thatchildren who act antisocially are less likely to be accepted by peers and teachers (Kupersmidt &Coie, 1990) and tend to participate less in class activities and receive poorer academic resultsthan their prosocial counterparts, an association which remains when pre-existing cognitive skillsand family backgrounds are controlled for (Ladd, Birch, & Buhs, 1999).
Different approaches to learning, children’s tendencies, dispositions and learning styles in usingtheir knowledge and skills to interact with their learning environment (Conn-Powers, 2006) areother dimensions of school readiness that have been shown to relate to academic achievement.Evidence suggests strong links between positive approaches to learning and children’s success inschool. Conn-Powers (2006) identified six key dispositions or skills that reflect importantapproaches to learning: curiosity/initiative, persistence, attention, self-direction, problem solvingand creativity. Furthermore, Heckman has spearheaded much research stressing the importanceof non-cognitive skills such as motivation, tenacity and perseverance in promoting higherachievement test scores and later social success (Heckman; 2006; Heckman & Masterov, 2007).
Several studies have shown that poor health status in childhood is associated with future deficitsin academic performance, illustrating the importance of the physical well-being and motordevelopment dimensions of school readiness in affecting future academic success. Caughy(1996) found that hospitalisation within a year of birth predicted lower reading recognitionscores at ages 5 and 6 years. Additionally, longitudinal studies have shown that general andmental health status in kindergarten predicted third grade achievement when family

12
socioeconomic status variables were controlled for (Spernak, Schottenbauer, Ramey, & Ramey,2006). Research has also found relationships between gross and fine motor skills and academicachievement as early kindergarten motor skills have been found to influence achievement inreading and mathematics at the end of first grade, after controlling for initial skills anddemographics (Son & Meisels, 2006).
In sum, there is wide evidence that both academic and non-academic school readiness skills andcompetencies are related to later academic achievement and thus later social and career success.
B. Peer RelationshipsIt is well established that children’s development in many areas of functioning is influenced byan ability to maintain positive, primary and consistent relationships with peers (Sroufe, Cooper,& DeHart, 1992). The social and emotional aspects of school readiness, such as the ability tointerpret and express feelings, interact socially and display empathy, have been shown toincrease the likelihood that a child will form friendships with peers (Ladd, 1999). In addition,studies have indicated important associations between positive peer play interactions and thedevelopment of other school readiness competencies, such as emerging literacy skills and selfregulation (Fisher, 1992). Furthermore, children who form positive relationships in preschool aremore likely to experience positive social and academic outcomes in the elementary and highschool grades (Ladd & Price, 1987).
Although positive peer acceptance is an important aspect of development, the importance ofreciprocated friendships cannot be overlooked as it constitutes a different domain to peeracceptance. Friendships are voluntary, intimate, dynamic relationships built on cooperation andtrust (Gifford-Smith & Brownell, 2003). Whereas group acceptance reflects the perspective ofthe child’s peer group, friendship serves as a means for mutual enjoyment, play and positiveaffect in the early years, achieving group identity and acceptance in middle childhood, andachieving individual identity and greater understanding of self in adolescence (Gifford-Smith &Brownell, 2003).
Whether or not a child has reciprocated friends can be a critical determinant of his or her socialadaptation and adjustment. Children with mutual friends tend to be more prosocial, have higherlevels of self-esteem and manage difficult transitions more smoothly (Ladd, 1990). Recentresearch stresses the importance of friendship quality in fostering self-esteem, promoting socialadjustment, and enabling children to cope more efficiently with stressors (Hartup & Stevens,1999). Friendship quality refers to the amount of positive characteristics a friendship features,such as intimacy, loyalty, or prosocial behaviour. Research shows that children who report theirfriendship to be high on one of these dimensions typically report that it is also high in all theother dimensions. This suggests that all positive features are linked to a single dimension offriendship quality (Berndt, 2002).
Children experiencing peer relationship difficulties are at risk for a variety of future adjustmentproblems, such as school drop-out, delinquency, and emotional problems. In addition,experiencing problems in the peer domain during childhood can predict mental health problems

13
such as depression and anxiety, as well as physical health and school problems (Parker & Asher,1987).
C. Psychological Well-beingA relationship between school readiness and later mental health and socio-emotional well-beinghas been identified. As discussed above, high levels of school readiness increases the likelihoodthat a child will form friendships with peers. Children who have more friends in school tend tohave higher levels of self-esteem and can cope with difficult life transitions more effectively(Ladd, 1990). Low self-esteem is strongly associated with the presence of psychiatric disordersin adolescence and adulthood, such as depression, anxiety and anorexia nervosa (Guillon, Croq,& Bailey, 2002).
Additionally, children’s cognitive styles are linked to psychological well-being (Alloy,Abramson, & Francis, 1999) such that negative cognitive styles, such as catastrophising theconsequences of a negative life event or the attribution of negative events to stable negativecharacteristics within the child (e.g., worthlessness), are associated with a vulnerability todepression (Alloy et al., 1999).
Psychological well-being also is linked to academic achievement, which is, in turn, influenced bya child’s level of readiness at school entry. A 10-year longitudinal study of mental health inadolescence finds that negative self perceptions of academic competence, negative feelings ofself-worth, and a sense of school as unimportant or uninteresting were important mediators in therelationship between poor academic grades and mental health problems (Roeser, Eccles, &Freedman-Doan, 1999). This again highlights the importance of incorporating non-cognitivetraits such as motivation into the definition of school readiness.
Several of the long-term possible outcomes associated with poor school readiness, such asteenage pregnancy and unemployment, are also associated with poor psychological well-being.Teenage pregnancy has been shown to be strongly associated with maternal depression (Deal &Holt, 1998). Childrearing during the teenage years interrupts normal cognitive anddevelopmental processes and is associated with a higher likelihood of socioeconomicdisadvantage, single motherhood, and low social support. Teenage pregnancy also is associatedwith fewer years in education and thus diminished career opportunities, which in turn leads tofinancial instability and added life stress (Deal & Holt, 1998).
Research has long documented a link between poor mental health and unemployment; which isanother long term outcome of low school readiness. Unemployment is associated with anincrease in depressive symptoms, admissions to psychiatric hospitals, and death by suicide(Rodriguez, Frongillo, & Chandra, 2001). Research suggests that it is not simply the individual’sfinancial situation which moderates these effects, but that social stigma and an individuals’ self-perception may also have an effect (Rodriguez et al., 2001).
Thus, entering school with a low level of readiness puts children at greater risk of experiencingmental health difficulties as they mature. This stems from a greater likelihood of experiencingnegative outcomes over the life course, such as fewer friendships in school, lower grades,

14
teenage pregnancy and unemployment in adulthood, which are all associated with poorerpsychological well-being.
D. Teenage PregnancyAlthough poor school readiness is associated with a greater likelihood of teenage pregnancy, themechanisms underlying this relationship are not yet clear (Brooks-Gunn, 2003). Similar to theissue of unemployment, it is most likely due to a negative set of events stemming from variousdimensions of school readiness. Entering school with a low level of readiness is associated withpoor peer relationships and academic achievement, both of which foster a negative attitudetoward school. Dislike of school has been found to be associated with a young person’s belief inbecoming a parent before the age of twenty (Haldre, Rahu, Rahu, & Karro, 2009). Additionally,research has shown that 13 and 14 year olds who disliked school were more likely to have sexualintercourse, expect to have sexual intercourse by age 16, and expect to be parents by the age of20, despite reporting similar levels of sexual knowledge and education (Bonell et al., 2003).Furthermore, research indicates a relationship between poor academic performance andlikelihood of becoming a teenage mother, whereas educational attainment has been shown tohave a strong delaying effect on motherhood (e.g. Kiernan, 1980; 1995; Marini, 1984).
Low self-esteem and poor peer relationships are factors associated with low school readinessand, in turn, teenage pregnancy. Low self-esteem may increase the likelihood of teenagepregnancy by up to 50%, which may be attributed to an increased likelihood of unprotectedintercourse (Emler, 2001). Poor school readiness in socio-emotional domains is associated withpeer rejection, which can lead to antisocial behaviour and the formation of deviant peer groups inlater childhood and adolescence (Parker & Asher, 1987). Antisocial tendencies have also beenlinked to earlier childbearing (Woodward, Fergusson, & Horwood, 2001). Furthermore, researchhas shown that having conduct problems at age eight is linked to later pregnancy risk(Woodward & Fergusson, 1999).
Studies indicate clear and persistent relationships between early childbearing and a range ofnegative consequences such as poor mental health and psychological functioning, reducedearnings potential, lower levels of educational achievement, and greater health risks (Langille,2007). Teenage mothers typically have lower incomes than older mothers, and therefore aresubject to the risks associated with living in poverty such as less adequate housing, less access tomedical care, and poorer nutritional intake (Coley & Chase-Lansdale, 1998). Their children arealso at greater risk for low birth weight, infant mortality, cognitive delay, behavioural problemsand child abuse (Paranjothy, Broughton, Adappa, & Fone, 2009), all of which have an effect onthe school readiness of their children, representing a intergenerational cycle of disadvantage.
E. Employment & EarningsChildren who enter school not ready to learn tend to have lower educational levels and aresubsequently more likely to have poor employment records in adulthood (Rouse, Brooks-Gunn,& McLanahan, 2005). Several lines of research have demonstrated that school readiness at agesix predicts a child’s academic success in the early grades of elementary school (Conn-Powers,2006; Duncan et al., 2007; Raver, 2003). Due to the cumulative nature of curriculum subjectssuch as mathematics, early failure to grasp the basic concepts can impede children’s ability to

15
grasp more advanced concepts over time (Barrington & Hendricks, 1989) and children may fallfurther behind and become increasingly less likely to complete school and proceed to third-leveleducation. In addition, significantly more school drop-outs report difficulty understanding andcompleting an employment application (Doherty, 1997).
Research also shows that the level of formal education significantly predicts employability, withlower unemployment rates among males and females who proceeded to further education ortraining after high school (Doherty, 1997). For example, males who do not graduate from highschool have on average 5.8 years of unemployment during a 40 year work life in contrast to 3.6years among males who complete high school, while males with a third-level degree onlyexperience 1.3 years of unemployment on average (Ross & Shillington, 1990). Furthermore,higher levels of unemployment lead to higher costs to society, as both males and females whohave not completed high school are more likely to seek social assistance (Ross & Shillington,1990). Unemployed individuals also pay little to no income tax, do not contribute employmentinsurance premiums, and have a tendency to pay lower consumption taxes as they purchase lessthan those who are employed (Doherty, 1997). Involuntary unemployment also hasconsequences for an individual’s mental health. It can lead to feelings of incompetence andfrustration, low self-esteem, and alienation from the norms and goals of society (Murphy &Athanasou, 1999).
Education and literacy also play an important role in future wage determination. Higher levels ofeducation are typically associated with higher earnings (see Harmon, Oosterbeek, & Walker,2000 for a review). Using the Living in Ireland survey one study finds that an additional year ofeducation in Ireland is associated with an increase in earnings of between 5.6-8.4% for men and7.5%-11.2% for women (McGuinness, McGinnity, & O’Connell, 2008). A study by Denny,Harmon and O'Sullivan (2003) also shows that the returns to literacy, as measured by theInternational Adult Literacy Survey, are among the highest in the OECD countries. They findthat improving literacy scores by one standard deviation of the scores (52 points) is associatedwith an increase in earnings of 17%.
Therefore, the dynamic set of events stemming from a child’s level of readiness at school entrycan have consequences for their future skill level and labour market outcomes and thus society ingeneral.
F. Criminal ActivityPoor school readiness may be linked to higher levels of delinquency and crime. For example,cognitive, social, linguistic and motor dimensions of school readiness have been linked to pooreducational attainment later in life (Le et al., 2006) and a strong negative relationship betweencrime and educational attainment has been established after controlling for age, state of birth,state of residence, cohort of birth, and state-specific year effects (Lochner & Moretti, 2004).
Aggressive behaviour in early childhood is associated with delinquent and criminal behaviour inlater years. Research finds that physical aggression in kindergarten is the single best predictor oflater involvement in property crimes (Haapasalo & Tremblay, 1994). Individual risk factorsassociated with aggressive behaviour include restlessness, poor mental ability and poor linguisticskills, all of which form important facets of school readiness (DeMatteo & Marcyzk, 2005).

16
Conversely, prosocial behaviours such as helping, sharing and cooperation with others, appear tobe robust protective factors for those with risk factors for committing violent and property crimesbefore the age of 13 (Haapasalo & Tremblay, 1994).
Further evidence suggests that peer rejection in childhood is a risk factor for antisocialbehaviours later in life. Specifically, peer rejection in third grade is predictive of increasinglygreater antisocial behaviours from sixth grade upwards, even when earlier aggressiveness isaccounted for (Coie, Terry, Lenox, Lochman, & Hyman, 1995). In the first few years of school,peer rejection can strengthen the relationship between early attention/hyperactivity problems andconduct problems in fourth grade. It is well documented that early onset offending is related tolater serious and chronic offending (McCluskey, McCluskey, & Bynum, 2006).
Criminal behaviour imposes a substantial cost on society, including government costs to operatethe criminal justice system, medical costs for injuries, and the loss of productive citizens in theform of offenders who are not rehabilitated. Poor school readiness puts children at risk ofincreasing behaviour problems across their school years and increased likelihood of criminalactivity.
V. Differential Parent and Teacher Definitions of School Readiness
Parents and teachers can have different definitions of school readiness, with parent definitionsfocusing more often on academic skills, and teachers on nonacademic skills (Knudsen-Lindauer& Harris, 1989; West, Hausken, & Collins, 1993). For example, parents rate knowledge of thealphabet and ability to count as essential components to school readiness, however both items arerated as very low in importance by teachers (Lewit & Schuurman Baker, 1995). Teachers aremore likely to rate physical health, including nourishment and well-restedness, as being essentialor more important than any other characteristic. Teachers also place more of an emphasis thanparents on the child’s ability not to disrupt a class (Harradine & Clifford, 1996). However,parents and teachers seem to be in general agreement about the order of importance of thevarious dimensions of school readiness. A majority of parents and teachers rate the nonacademiccharacteristics of communication skills, enthusiasm and turn-taking as either essential or veryimportant for school readiness (Lewit & Schuurmann-Baker, 1995).
Research has also focused on the different social skills parents and teachers view as critical forsuccess in school. Though it seems parents and teachers do not differ in the value placed oncooperation skills, parents rate assertion and self-control skills as more important than doteachers (Lane, Stanton-Chapman, Jamison, & Philips, 2007). In contrast, preschool teachersrated assertion skills almost exclusively as not being critical for classroom success. Studies havealso examined the differences between preschool and kindergarten teachers’ perceptions ofschool readiness, finding that preschool teachers place more importance on general knowledge atschool entry (Piotrowski, Botsko, & Matthews, 2000).
Researchers have offered a number of possible explanations for these differing parent andteacher beliefs. One explanation is that parents may not comprehend all of the issues surrounding

17
school readiness, and that teachers gain a more holistic impression of readiness throughclassroom experience. This is supported in part by research findings that experienced teachersand student teachers place different values on aspects of readiness. Although both studentteachers and experienced teachers tend to view academic skills as relatively unimportant,experienced teachers rate social skills, language competence and self-regulation as moreimportant than student teachers. Both experienced teachers and student teachers rate theirexperiences with children as most important in informing their understanding of schoolreadiness, with a lack of emphasis placed on textbooks and academic material in both groups(Cuskelly & Detering, 2003). Furthermore, qualified teachers are more likely than studentteachers to see themselves recommending that a child be retained, supporting the idea thatteachers place more of an emphasis on child characteristics, while less experienced professionalsmay believe that the responsibility for children’s success lies in the school and the opportunitiesit can provide (Cuskelly & Detering, 2003). Similarly, it is suggested that parents’ schoolreadiness beliefs may be a function of concerns that their child will not succeed in a resource-poor school, particularly in disadvantaged communities. Parents may emphasise concreteacademic skills to help children adjust successfully to classroom demands (Piotrkowski et al.,2001).
Some researchers have expressed concerns about the differing beliefs held by parents andteachers regarding readiness for school entry. It is important that parents and teachers share acommon understanding of the attributes and attitudes essential for a smooth transition to school.Shared beliefs facilitate congruence between the skills that parents encourage in children beforeschool entry, and the skills teachers look for in the child’s first year of school. This, in turn, canincrease a teacher’s positive evaluation of the child early in school life and may contribute to achild’s early school success (West et al., 1993). When a child is labeled “unready” by a teacher,it can influence how the child is treated in class and may have negative consequences for his orher academic and social development (Lewit & Schuurman Baker, 1995).
In sum, the main difference between teacher and parent definitions of school readiness lies in thetendency for parents to place more importance on academic skills. Though reasons for thisdifference are not fully understood, it is likely due in part to teachers’ classroom experience anda more holistic impression of school readiness resulting from this experience. A gap betweenteacher and parent understandings of readiness potentially carries problems in the form ofincongruence between skills encouraged at home and those encouraged in the classroom.Children whose parents have not encouraged the skills teachers focus on can be labeled“unready” by teachers, and thus may not reach their true potential in the first years of school dueto differential classroom treatment.
VI. Parenting
With few exceptions, (e.g., Harris, 1998; Rowe, 1994; Scarr, 1992) a consensus has been reachedthat parents play a central role in the development of their children. While parenting practices,parent involvement in education, and parental expectations have been found to support orimprove school performance among older children and adolescents (e.g., Dornbusch, Ritter,

18
Leiderman, Roberts, & Fraleigh, 1987; Griffith, 1996; Grolnick, Benjet, Kurowski, &Apostoleris, 1997), the relationships between parenting and schooling are less clear amongyounger children.
Differences in parenting can affect school readiness in a number of dimensions. For example,parenting practices such as reading to children and enrolling them in preschool promotes bothschool readiness and subsequent academic achievement (Zigler, Pfannenstiel, & Seitz, 2008) andsupportive parenting during toddlerhood and early childhood is strongly related to schoolreadiness and academic competence (Horvath, 2004). Harsh and inconsistent parenting, on theother hand, predicts social and cognitive deficits, which are associated with conduct problembehaviour, which in turn predicts elementary school social and academic failure (Dodge,Greenberg, & Malone, 2008).
Key dimensions of parenting in the literature include constructs reflecting parental acceptance orresponsiveness, demandingness or control (Cummings, Davies, & Campbell, 2000; Maccoby &Martin, 1983), and emotional warmth (Maccoby & Martin, 1983). One of the best known isBaumrind’s person-centered analytical approach (1966; 1971), which identifies three types ofparenting patterns based on the relative use of responsiveness and control. Using these twodimensions, Baumrind identified three parenting styles based on parents’ relative use of eachdimension to parent their children (Baumrind, 1966; 1967). These parenting types are presentedin Figure 2.
Acceptance/Responsiveness
Dem
andi
ngne
ss/C
ontr
ol
HIG
HL
OW
HIGH LOW
AUTHORITATIVE AUTHORITARIAN
PERMISSIVE
Note. This figure is adapted from Maccoby & Martin (1983).
Figure 2.Parenting styles identified by Baumrind based on parent use of responsive andcontrolling behaviours to parent their child.

19
A. Description of Parenting Styles Identified by Baumrind (1966)
1. Authoritative Parenting StyleThe authoritative parenting style is characterised by high responsiveness and high control and ismost consistently associated with instrumental competence and other positive outcomes inAmerican samples. Children of authoritative parents are expected to respect parental decisionsand demands, but parents, in turn, are responsive to their child’s opinions and needs (Maccoby &Martin, 1983). Authoritative parents are consistent, loving, conscientious, and secure in theirinteractions with their child and these parents encourage independence by respecting the child’sopinions and equipping the child with the skills to make independent decisions by providingreasons for rules and explanations for consequences of behaviour while engaging in opencommunication with the child, respecting his/her autonomy, and recognising the child’sperspective and interests (Baumrind, 1966; 1967; Maccoby & Martin, 1983). These parents aredemanding as they expect mature behaviour from their child, exhibit firm control andenforcement of rules, and set clear standards while simultaneously being supportive of andcommunicating clearly with the child (Baumrind, 1967; Maccoby & Martin, 1983). In sum, theseparents are nurturing and warm. However, they are also controlling, demanding, and clear aboutexpectations of the child (Baumrind, 1967).
2. Authoritarian Parenting StyleBaumrind’s authoritarian parenting style is characterised by low responsiveness and high levelsof control and is more commonly associated with negative outcomes in young children(Dornbusch et al., 1987; Lamborn, Mounts, Steinberg, & Dornbusch, 1991; Querido, Warner, &Eyberg, 2002). Authoritarian parents are less nurturing and less involved in their child’sdevelopment and demonstrate high levels of control and lack support and affection (Baumrind,1967). The authoritarian parent is not open to a child’s differing viewpoints, does not encouragethe child to express himself/herself and exhibits high levels of directive control and imposesmany rules while offering very little reason or explanation for rules and/or decisions (Baumrind,1966; 1967; Shaffer & Kipp, 2007). Authoritarian parents value authority as absolute andcorrect, contain any attempts by their child to challenge their authority, and do not value give andtake in the parent-child relationship (Baumrind, 1966; 1967; Maccoby & Martin, 1983).
3. Permissive Parenting StyleThe permissive parenting style is characterised by a lenient pattern of parenting in which fewdemands, responsibilities, or expectations are placed on the child (Baumrind, 1966; 1967;Shaffer & Kipp, 2007). Permissive parents are disorganised and use little punishment (Maccoby& Martin, 1983). Rather, this parent attempts to have the child comply through the use of reasonand manipulation (Baumrind, 1966; 1967). Permissive parents do not assert their parentalauthority, set boundaries or rules for their child, nor insist that the child exhibit mature behaviour(Maccoby & Martin, 1983).

20
B. Relationship between Parenting and Child OutcomesOriginal research conducted by Baumrind (1967) demonstrated that children of authoritativeparents are well socialised and independent. In terms of specific child outcomes, authoritativeparenting is associated with better academic and social outcomes for children and adolescents(Baumrind, 1991; Hetherington, Henderson, & Reiss, 1999; Hill, 1999; Taylor, Clayton, &Rowley, 2004). Furthermore, authoritative parenting, characterised by high levels of warmth andresponsiveness, has been shown to be associated with positive peer play interaction, and co-occurred with higher levels of parent education and lower stress levels (Coolahan, 1997).
Authoritarian parenting, on the other hand, is associated with children who are less content, lesswell liked by peers, more insecure, and more reactive in stressful situations than the children ofauthoritative parents (Baumrind, 1967). Additionally, authoritarian parenting, characterised bylack of warmth and responsiveness is negatively related to kindergarten/preschool readiness(Kessler, 2002) and is associated with problematic peer play interaction, withdrawn behaviour,higher stress levels, and lower educational levels (Coolahan, 1997).
Permissive parenting is characterised by parents who are non-controlling, non-demanding, andrelatively warm. Parents are tolerant and accepting towards the child’s impulses, use as littlepunishment as possible, make few demands for mature behaviour, and allow considerable selfregulation by the child (Dornbusch et al., 1987). Children of permissive parents display lowerlevels of self-control and self reliance (Baumrind, 1967). These children were shown to beimmature, lacking in impulse control, social responsibility and independence. Permissiveparenting is negatively associated with grades (Dornbusch et al., 1987), and with social andcognitive competence (Baumrind, 1971, 1973).
In addition to Baumrind’s parenting styles characterised by warmth and control, otherdimensions or behaviours of parenting have become the focus of investigation in recent years.For example, autonomy support and coercion and psychological control are identified asimportant aspects of child rearing and have shown both direct and indirect links to earlychildhood behaviour and development (e.g., Brook, Zheng, Whiteman, & Brook, 2001; Grolnick,Price, Beiswenger, & Sauck, 2007). Support for a child’s autonomy has been associated withhigher levels of self regulation, greater academic achievement, higher levels of adjustment, fewerbehavioural problems, greater peer acceptance, and more positive personality traits (Grolnick,Kurowski, Dunlap, & Hevey, 2000; Grolnick & Ryan, 1989; McNamara, Selig, & Hawley, inpress; NICHD, 2008), and is related to increased friendship quality and peer acceptance (Clark &Ladd, 2000).
While autonomy support for young children is commonly associated with positive outcomes,controlling parenting behaviours are associated with more negative outcomes such asexternalizing behaviour (Bates, Pettit, Dodge, & Ridge, 1998). Specifically, children of motherswho report little support for their child’s autonomy and high restrictive control of their child’sbehaviours in their parenting style are more aggressive, less agreeable, conscientious,extraverted, and less well accepted by their peers than children of parents who report using lessrestrictive behaviours to parent their children (McNamara et al., in press). Theoretically,autonomy support encourages independence and allows young children to take an active role intheir own problem solving. This may help them navigate the social world more effectively,

21
resulting in positive social outcomes. Controlling behaviours, on the other hand, may have theopposite effect. Specifically, children who experience high levels of parental control may nothave the opportunity to learn to navigate the social world on their own resulting in a lesseffective interaction style (i.e., more aggressive) and lower peer acceptance.
VII. Methodology
A. Support from Local Primary Schools and Ethics CommitteePrior to conducting the CPSE study, members of the PFL programme team and the UCDevaluation team met with school principals, the Boards of Management and teachers from eachschool to describe the project and obtain their support for conducting the survey. These meetingswere held sequentially. School principals agreed for the study to take place and wrote a letter insupport of the project that was submitted to the UCD Ethics Board, along with the projectproposal on 24th June, 2008. Ethics approval was guaranteed from the UCD Ethics Board on 24th
July, 2008. Support was subsequently obtained from the Boards of Management and the juniorinfant teachers in all participating schools.
B. Survey Design and PilotingIn order to assess the level of school readiness in the PFL catchment area, a cross-sectionaldesign was developed which collects information via surveys completed by the teachers andparents of junior infant children. Data for the CPSE were collected duringOctober/November/December of the 2008-2009 academic year. All survey instruments werepiloted prior to administering the surveys to the study population. The teacher questionnaire waspiloted with four teachers from the local primary schools who do not teach junior infants. Thepilot teachers were given a paper version of the questionnaire and asked to write any commentsdirectly on the questionnaire. Pilot teachers provided feedback on items that were unclear andappropriate adjustments were made to the online teacher survey which was the teacher datacollection tool.
The parent questionnaire was piloted with four parents of young children (not junior infants) inthe PFL catchment area. Two UCD researchers and the PFL Programme Manager conducted afocus group with the pilot parents. The parents were given copies of the questionnaire and wereasked to read through the questionnaire prior to this meeting. During the meeting the researcherswent through the questionnaire question by question and asked the parents for their feedback onthe material. Specifically, the parents identified sensitive questions which the parentsparticipating in the project may not be comfortable answering and identified any questions thatwere unclear or that they did not understand. For questions or words that the pilot mothers didnot understand, the researchers, together with the pilot parents, decided on alternativeexplanations to ensure 1) understandability of questions and 2) that standardised explanationswould be given to all parents participating in the study.

22
C. Participants
1. EligibilityAll teachers and parents of junior infant children either residing in or attending schools in thePFL catchment areas were eligible for participation in the study. Parents were presented with aninformation and consent form which described the project in detail. Parents had to give consentto complete the questionnaire themselves and also for their child’s teacher to complete thequestionnaire. While the study is interested in gaining an index of school readiness for childrenwho reside in the PFL catchment area, parents of classmates of children who do not reside in thearea themselves, were also asked to participate to ensure no one child was excluded or singledout in the classroom.
It was anticipated that the majority of children living in the PFL catchment areas attend one ofthe two schools located in the area. However it was realised that an additional 20 pupils could besurveyed by approaching schools outside the area in which children living in the PFL catchmentarea were attending. Therefore, select children, identified by the school principals, from threeadditional schools were invited to participate. Once collected, data from all schools and parentswere aggregated.
2. Response RatesBased on local birth rates in the PFL catchment area, calculated using Census SAPS (Small AreaPopulation Statistics) data from 2006, it was estimated that the potential sample for the surveywould be the teachers and parents of between approximately 96 and 113 children.
Based on communications with the local school principals, it was determined that there were 102eligible children in the two schools located in the PFL catchment areas. Of these 102 pupils, 80(78%) of the parent questionnaires were completed and 87 (85%) of the parents gave permissionfor the teacher to complete the survey regarding their child. Additionally, 67 (76%) of the 88children reside in the original PFL catchment area, 6 (7%) in the new PFL expansion area, 13(15%) do not reside in either PFL catchment area, and two (2%) did not provide an address.
Based on these response rates it was decided to approach an additional three schools. Althoughthese schools are not in the PFL catchment area, there were approximately 20 pupils residing inthe area and attending these schools. By conducting the CPSE with these additional participantsa more complete picture of school readiness of children residing in the PFL catchment areascould be achieved.
In total, there were 21 pupils who reside in the PFL catchment area, but attend schools outsidethe area. Of these 21 pupils, 14 (67%) of the parent questionnaires were completed and 14 (70%)of the parents gave permission for the teacher to complete the survey regarding their child.Additionally, 13 (93%) of the 14 pupils reside in the original PFL catchment area and theremaining 1 (7%) is from the new PFL expansion area.
Based on these figures, there were a total of 123 eligible pupils across the 5 schools. In total, 94parent questionnaires were received resulting in a response rate of 76%. In total, 101 teacher

23
questionnaires were completed, capturing data for 82% of eligible participants. Teacherquestionnaires were completed for all pupils with parental consent, bar one, resulting in a teacherresponse rate of 99%.
D. Instruments:
1. Teacher QuestionnaireThe teacher questionnaire was administered using an online survey with the teachers accessing asecure website using a unique user ID and password. The teacher completed the questionnaire athis/her convenience. The survey could be completed in one session, or in multiple sessions, asthe teacher was able to return to the secure website at a suitable time. By completing an onlinequestionnaire, the data were automatically entered onto a secure server housed in the UCD GearyInstitute. The questionnaire took approximately 10 minutes to complete for each child.
The teacher questionnaire contained the following instruments:
Teacher DemographicsTeachers were asked a number of demographic questions including their age, qualifications, howlong they have been teaching in general, how long they have been teaching at this particularschool, and how long they have taught junior infant classes.
Short Early Development Instrument (S-EDI; Janus, Duku, & Stat, 2005)The core measure of school readiness in the teacher questionnaire was a short form of the EarlyDevelopment Instrument (S-EDI). This instrument is a short version of the Early DevelopmentInstrument (EDI; Janus & Offord, 2000) which was developed at the Offord Centre of ChildStudies, McMaster University (Hamilton, Ontario, Canada), with the specific purpose of meetingthe needs implied by the paradigm shift in school readiness research in which a more holisticdefinition of school readiness was adpoted. It was developed in consultation with the Early Yearsaction group and Parenting and Literacy Centres, as well as with educators, in particular,kindergarten teachers. The EDI was refined through extensive preliminary testing in the 1998-1999 school year for validation purposes and cultural validity before being introduced in allkindergarten classes in the Metro Toronto and New York sections of the Toronto District SchoolBoard, as well as several other communities across Canada. The EDI is used regularly acrossCanada and has been used in many countries including America, Chile, Kosovo, Holland, NewZealand, and Jamaica.
The EDI was developed at the Offord Centre of Child Studies (OCCS) with the specific aim ofdesigning an instrument to measure school readiness from a comprehensive perspective (Guhn,Janus, & Hertzman, 2007). The OCCS has established normative data for the EDI in order to seta representative benchmark for comparison of data from all projects using the instrument. Since1999, EDI data have been collected for over 300,000 four to five year old children in Canada andseveral other countries. A subset of this database, including data from the year 2000 and later,were analysed to provide normative data on the EDI domains. The normative sample includes116,860 children and represents 93.3% of the full sample of children. Using this normativesample allows users of the EDI to compare the results of their sample to a larger, normativesample of similar aged children. Research comparing the predictive capability of the EDI with

24
direct school readiness assessments has shown that the EDI predicts school achievement in earlychildhood as accurately as direct assessments of school readiness (Fantuzzo et al., 2005).
The short form EDI was developed by conducting a factor analysis of the 104 items on the longversion of the EDI. The 16 subscales of the EDI were retained in this analysis and the three itemswith the highest factor loadings on each subscale comprised the S-EDI (Janus et al., 2005).Therefore, the S-EDI is composed of 48 core items and provides scores in five domains of schoolreadiness. A description of all S-EDI scales and subscales is reported below. Standardisedcoefficient reliability estimates (Cronbach, 1951) are reported for each scale and are presented inTable 1. The number of observations used to calculate the standardised Cronbach alphacoefficients and the intercorrelations among factors also are reported. Teacher-rated S-EDIdomains that reached reliability of .65 or above are included in further analyses.
Table 1Standardised Cronbach alpha coefficients and interrcorrelations between teacher rated S-EDIdomains
Variable N 1 2 3 4 5
1. Physical Health and Well-Being 79 (.71)Gross and Fine Motor Skills 85 (.68)Physical Readiness for the School Day (.44)Physical Independence (.41)
2. Overall Social Competence 100 .61*** (.89)Responsibility and Respect 100 (.82)Approaches to Learning 101 (.86)Social Competence with Peers 101 (.84)Readiness to Explore New Things 101 (.72)
3. Overall Emotional Maturity 51 .52*** .80*** (.85)Prosocial and Helping Behaviour+ 65 (.87)Hyperactivity and Inattention 101 (.87)Anxious and Fearful Behaviour 100 (.81)Aggressive Behaviour 82 (.87)
4. Overall Language and Cognitive Development 65 .57*** .69*** .48*** (.87)Interest in Literacy/Numeracy and Memory 86 (.80)Basic Numeracy Skills 77 (.80)Basic Literacy Skills 91 (.73)Advanced Literacy Skills 86 (.57)
5. Communication and General Knowledge 101 .61*** .50*** .43*** .53*** (.90)Note: Standardised reliability coefficients appear in parentheses. These coefficients were calculated usingobservations with no missing data. *** p < .001+This subscale was reverse coded to derive the Overall Emotional Maturity construct.
The physical health and well-being construct is composed of three three-item subscales includingphysical readiness for the school day (e.g., over/underdressed for school related activities; tootired/sick to do schoolwork), physical independence (e.g., independent in washroom habits mostof the time; well coordinated), and gross and fine motor skills (e.g., ability to manipulate objects;

25
overall physical development). The social competence construct comprises four three-itemsubscales including respect and responsibility (e.g., respects the property of others; acceptsresponsibility for actions), approaches to learning (e.g., works independently; able to follow classroutines without reminders), readiness to explore new things (e.g., eager to play with a new toy;eager to play with/read a new book), and overall social competence with peers (e.g., ability to getalong with peers; plays and works cooperatively with peers at age appropriate level). Theemotional maturity construct consists of four three-item constructs including prosocial andhelping behaviour (e.g., will try to help someone who has been hurt; comforts a child who iscrying or upset), aggressive behaviour (e.g., gets into physical fights; bullies or is mean toothers), anxious and fearful behaviour (e.g., appears fearful or anxious; appears worried), andhyperactive and inattentive behaviour (e.g., can’t sit still is restless; fidgets). The language andcognitive development construct contains four three-item subscales related to basic literacy skills(e.g., is able to attach sounds to letters; is able to identify at least 10 letters of the alphabet),advanced literacy skills (e.g., is able to read simple words; is able to read simple sentences),basic numeracy skills (e.g., is able to count to 20; is able to say which is the bigger of the two),and interest in literacy/numeracy and memory (e.g., is interested in reading; is interested ingames involving numbers). The final construct, communication and general knowledgecomprises three items and contains items such as ability to tell a story and ability tocommunicate in an understandable way.
Additional Behavioural QuestionsIn addition to the core measure of school readiness (i.e., S-EDI), 18 additional items wereincluded in the teacher questionnaire to assess several further components of school readiness.These additional items measures school readiness as characterised by the following fivedomains: aggressive behaviour (e.g., physically attacks people; kicks, hits or bites otherchildren), oppositional/defiant behaviour (e.g., refuses to comply with rules or requests;punishment doesn’t seem to change his/her behaviour), hyperactivity/inattention (e.g., hasdifficulty waiting his/her turn in games; is inattentive; unable to concentrate or pay attention forlong), anxiety (too fearful or anxious; worries), and prosocial behaviour (e.g., tries to helpsomeone who has been hurt; helps other children who are feeling sick).
It should be noted that there are a total of 18 items included in this measure. However, 10 of the18 items overlap with items included on the S-EDI, leaving an additional 5 unique items thatwere included in this survey. These items were included in both the teacher and parentquestionnaires as they are present in the 5-year old follow-up of the Irish Lifeways Cross-Generation Cohort Study which was conducted in 2007.1 As there are no comparable data on theS-EDI available in Ireland, including these additional items enables a comparison between theCPSE sample and a sample of representative Irish children on several dimensions of schoolreadiness.
1 The Lifeways Cross Generational Cohort Study is a cross-generation cohort study comprising three generations of the same family. Its goal is to identifyopportunities for development, change and improvement in the healthcare and well-being of the Irish population. The aim of this cohort study is a) torecord physical and psychological health status and socio-economic circumstances in individuals at birth, during childhood, early childhood and earlymiddle age in Ireland, b) to follow such individuals prospectively in order to measure their changing health status, c) and assess the extent to which thatrelates to their social circumstances. Between October 2001 and Jan 2003, 1124 pregnant women were recruited in the ante-natal clinics of the CoombeHospital Dublin and University College Hospital, Galway. 1088 babies were born to 1076 mothers. Fathers (n=331), maternal grandparents and paternalgrandparents (n=1231) were subsequently recruited. The study is now comprised of 520 three-generation families. Data includes; baseline lifestyleinformation on mothers, fathers and grandparents; electronic mother and child ante-natal/birth hospital records; grandparent examination and biologicaldata; patient-held records for a sub-sample of children; general practice follow-up data and immunisation records of all infants/children. This cohort hasbeen followed for five years to date.

26
Standardised coefficient reliability estimates (Cronbach, 1951) of the five scales derived fromthese additional items are presented in Table 2. The number of observations used to calculate thestandardised Cronbach alpha coefficients and the intercorrelations among factors also arereported. All teacher-rated domains that reached reliability of .70 are included in furtheranalyses.
Table 2Standardised Cronbach alpha coefficients, and intercorrelations between teacher rated UCDMeasure of School Readiness Constructs
Variable N 1 2 3 4 5
1. Aggressive Behaviour 84 (.90)2. Oppositional/Defiant Behaviour 76 .77*** (.90)3. Hyperactive/Inattentive Behaviour 100 .56*** .66*** (.92)4. Anxious Behaviour 100 .20† .12 .05 (.72)5. Prosocial Behaviour 64 -.29** -.33** -.32** -.07 (.86)
***p < .001; **p<.01; *p<.05; † p<.10
2. Parent QuestionnaireParents were recruited via their child’s teacher. Participating teachers gave a packet containingan information sheet, consent form, and parent questionnaire to the parents of every child in theirclass when the parents dropped off or collected their child from school. The consent formdescribed the study in detail and provided contact information for the UCD researchers on theproject. If the parent agreed to join the study they signed the consent form and returned it to theteacher along with the completed parent questionnaire. The questionnaire took approximately 30minutes for the parent to complete.
Participating parents completed a paper and pen questionnaire consisting of the followingmeasures:
Parent/Family DemographicsSocio-demographic information related to family composition, parent age, ethnicity, parentemployment and education, family income, social welfare status, and childcare were included.
Short Early Development Instrument (S-EDI; Janus, Duku, & Stat, 2005)The core measure of school readiness in the parent questionnaire was the short form of the EarlyDevelopment Instrument (S-EDI) described above. Items were adapted to be answered byparents and assessed the parents’ ratings of their child’s physical health and well-being, socialcompetence, emotional maturity, language and cognitive development, and communication andgeneral knowledge.
Standardised coefficient reliability estimates (Cronbach, 1951) for parent rated S-EDI scales arepresented in Table 3. The number of observations used to calculate the standardised Cronbachalpha coefficients and the intercorrelations among factors also are reported.

27
Table 3Standardised Cronbach alpha coefficients, and intercorrelations between parent rated S-EDIdomains
Variable N 1 2 3 4 5
1. Physical Health and Well-BeingGross and Fine Motor Skills 86 (.38)Physical Readiness for the School Day 88 (.10)Physical Independence
2. Overall Social Competence 86 .32** (.85)Responsibility and Respect 90 (.67)Approaches to Learning 89 (.63)Social Competence with Peers 92 (.58)Readiness to Explore New Things 93 (.85)
3. Overall Emotional Maturity 66 .25* .53*** (.71)Prosocial and Helping Behaviour+ 78 (.79)Hyperactivity and Inattention 87 (.80)Anxious and Fearful Behaviour 86 (.65)Aggressive Behaviour 85 (.68)
4. Overall Language and Cognitive Development 47 .20† .48*** .33** (.80)Interest in Literacy/Numeracy and Memory 61 (.25)Basic Numeracy Skills 80 (.56)Basic Literacy Skills 86 (.57)Advanced Literacy Skills 78 (.60)
5. Communication and General Knowledge 92 .14 .29** .16 .37*** (.77)Note: Standardised reliability coefficients appear in parentheses. These coefficients were calculated usingobservations with no missing data.***p < .001; **p<.01; *p<.05; † p<.10+This subscale was reverse coded to derive the Overall Emotional Maturity construct.
Additional Behavioural QuestionsAs in the teacher questionnaire, 18 items comprising several additional behavioural domainsrelated to school readiness were also included in the parent questionnaire. Standardisedcoefficient reliability estimates (Cronbach, 1951) are reported for the five scales derived fromthese additional items in Table 4. The number of observations used to calculate the standardisedCronbach alpha coefficients and the intercorrelations among factors also are reported.
Table 4Standardised Cronbach alpha coefficients, and intercorrelations between parent rated UCDMeasure of School Readiness Constructs
Variable N 1 2 3 4 5
1. Aggressive Behaviour 89 (.63)2. Oppositional/Defiant Behaviour 88 .39*** (.54)3. Hyperactive/Inattentive Behaviour 82 .42*** .49*** (.76)4. Anxious Behaviour 86 .34*** .22* .23* (.65)5. Prosocial Behaviour 81 -.04 -.13 -.08 .16 (.80)
***p < .001; **p<.01; *p<.05; † p<.10

28
Parenting Styles and Dimensions Questionnaire (PSDQ; Robinson, Mandleco, Olsen & Hart,2001).This 32 item self report measure of parenting examines how often a parent displays certainbehaviours toward his/her child yielding scores related to the traditional Baumrind (1971)parenting styles. The parent is asked to indicate how often he/she performs certain behaviours ona five point scale ranging from ‘Never’ to ‘Always.’ This measure yields three constructsregarding parent’s average use of authoritative parenting, authoritarian parenting, and permissiveparenting behaviours.
The authoritative construct is composed of three subdomains, each comprised of five questions.Specifically related to the authoritative dimension, five items assessed connection (e.g.,encourages child to talk about the child’s troubles; gives praise when child is good), five itemsassessed regulation (e.g., explains the consequences of the child’s behaviour; emphasizes thereasons for rules), and five items measured autonomy (e.g., shows respect for child’s opinions byencouraging child to express them; allows child to give input to family rules). The authoritarianconstruct comprises three four-item subdomains. Specifically, the authoritarian construct iscomposed of four items relating to physical coercion (e.g., spanks child when disobedient; usesphysical punishment as a way of disciplining child), four items related to verbal hostility (e.g.,explodes in anger toward child; scolds and criticises to make child improve), and four itemsrelated to non-reasoning/punitive behaviors (e.g., punishes by taking privileges away from childwith little if any explanations; uses threats as punishment with little or no justification). Last, thepermissive construct contains five items such as states punishments to child and does not actuallydo them, and spoils child.
Standardised coefficient reliability estimates (Cronbach, 1951) are reported for the scales andsubscales derived from the PSDQ in Table 5. The number of observations used to calculate thestandardised Cronbach alpha coefficients and the intercorrelations among factors also arereported. Parent-rated domains that reached reliability of .63 or above were included in furtheranalyses. Therefore, the non-reasoning/punitive subdomain was dropped from further analysesdue to the low reliability of this subscale.
Table 5Standardised Cronbach alpha coefficients, and intercorrelations between parent rated parentingconstructs
Variable N 1 2 3
1. Authoritative Parenting Style 72 (.84)Connection Dimension (Warmth and Support) 86 (.69)Regulation Dimension (Reasoning/Induction) 81 (.65)Autonomy Dimension (Democratic Participation) 81 (.72)
2. Authoritarian Parenting Style 83 -.12 (.74)Physical Coercion Dimension 86 (.63)Verbal Hostility Dimension 88 (.70)Non-Reasoning/Punitive Dimension 88 (.44)
3. Permissive Parenting Style 87 -.26* .41*** (.79)***p < .001; **p<.01; *p<.05; † p<.10

29
E. Testing Procedures
1. Non-Normality TestsAs the CPSE data violate assumptions of normality based on the Skewness/Kurtosis tests and theShapiro-Wilk test for normality, all statistical procedures used for analysing the results are basedon non-parametric assumptions.2 In testing for differences, the Wilcoxon Signed-Rank test isused as an alternative to the paired samples t-test. In testing for relationships between twocontinuous variables, the non-parametric Spearman’s rho correlation is used instead of Pearson’scorrelation/OLS. With one exception, where the CPSE data are compared with the Canadiannorm on S-EDI scores, a parametric test is used as only the mean and standard deviation of thenorm sample was available, thus it was not possible to carry out the non-parametric equivalent.
2. Use of Monte Carlo Permutation TestsClassical hypothesis tests such as the t-test, f-test and chi-square tests can be unreliable when thesample size is small. Therefore, as the CPSE study is working with a relatively small sample(<100 observations), we use Monte Carlo permutation tests throughout to test whether theobserved differences in S-EDI scores within the variables of interest (e.g., gender (male/female),education (high/low) etc.) are statistically significant. A permutation test is a statistical procedurefor hypothesis testing whereby one calculates the values that the test statistic assumes on theobserved data and on all permutations of the data to decide whether to accept or reject the nullhypothesis. The p-value of a permutation test is computed as the proportion of permutations thathave a test statistic greater than or equal to the observed test statistic (Marozzi, 2002). Aspermutation tests give accurate p-values even when the sampling distribution is skewed, they canbe used when sample sizes are small and simple statistics are unlikely to be normal (Heckman,Moon, Pinto, Savelyev, & Yavitz, 2009). Monte Carlo permutation based inference tests, basedon 20,000 replications, are therefore used throughout the remainder of the report to test for groupdifferences in school readiness scores.
2 Statistical methods are based on a number of underlying assumptions. If any of these assumptions are violated thenthe interpretation of the results may not be reliable or valid. One common assumption is that variables are normallydistributed. This means that the majority of observations are clustered around the mean and when plotted graphicallythe distribution of the variable is bell-shaped. On plotting the CPSE data and conducting normality tests, it is clearthat the data is not normally distributed i.e. it is skewed such that one tail of the distribution is considerable longerthan the other. Therefore, using standard tests based on the assumption of normality is not feasible. Non-parametrictests such as the Wilcoxon Signed-Rank test is used instead, which do not rely on the assumption that the data isdrawn for a normal distribution.

30
VIII. Results3,4
A. CPSE Cohort Descriptives
Teacher characteristicsAll teachers who were invited to participate completed the online CPSE questionnaire forstudents in their class who had parental consent. In total, 12 teachers from five different schoolscompleted the online questionnaire assessing basic demographics of the teachers and eachpupil’s school readiness. On average, the teachers are 37.25 years old and have been teaching for10.83 years. The average duration spent specifically teaching Junior Infants is 4.25 years. Theamount of time spent teaching in the current schools ranges from one year to 31 years, with anaverage of 9.41 years. In terms of education, just over 58% of the teachers have a Postgraduatequalification and one-third have a Primary degree. All participating teachers are female. There isinformation on class size for 58% (n=7) of the teachers, with class sizes ranging from 13 to 16students, and on average there are 14.7 (SD = 1.30) students in these classes.
Parent characteristicsIn total, 94 respondents completed the CPSE pen and paper questionnaire assessing family socio-demographics, work life and finances of the respondent, parenting styles and behaviours, and theschool readiness of their junior infant child. The majority (94%, n=87) of respondents are thechild’s biological mother. The average age of respondents is 30.48 years old and the majority ofrespondents are Irish (88%, n=81), with 9.78% (n=9) being Irish Travellers. This corresponds tothe 2006 Census data for the PFL catchment area which report that approximately 10% of thepopulation in this area are Travellers.
Child characteristicsThe average age of the 2008-2009 CPSE cohort is 4.77 (SD = 0.39) years old and 59% (n=55)are male.
Household characteristicsOn average, 4.69 people are living in each household and parents have 2.88 biological children.
Total Household Weekly IncomeSixty percent (n=56) of respondents provided information on their household weekly income,which includes income from all sources, social benefits, wages, salaries, dividends and interest,unemployment insurance, the dole, worker’s compensation, government pension, child benefit,and child support for every member of the household. Fifty-five percent of the sample earn
3 The p-values represent the probability that the result obtained is due to chance rather than a true relationshipbetween variables. Consistent with the literature, p-values below 0.05 (5%) are considered to be statisticallysignificant in the present report. A p-value of less than 0.5 (5%), 0.01 (1%), 0.001 (0.01%) conveys that theprobability that the difference between the two groups is due to chance is less than 5%, 1% and 0.01% respectively.Trend level results were reported if the p value was equal to or less than .10.4 Tables 1 and 2 reporting the full descriptive statistics (mean, standard deviation, minimum and maximum values,and frequencies of categorical variables) for the variables reported in this section can be found in the Appendix.

31
between €200-500 per week, with the largest category being those that take home between €300-400 per week (20%, n=11) (Figure 3).
0
5
10
15
20
25
Lessthan€50
€100-€150
€150-€200
€200-€250
€250-€300
€300-€400
€400-€500
€500-€600
€600-€750
€750-€900
€900-€1000
€1000-€1500
Household's weekly income
%
Figure 3. Weekly total household income.
Medical card, GP visit card, health insuranceThree quarters (75%, n=66) of respondents are in possession of a medical card, 12% (n=9) are inpossession of a GP Visit Card, and 5% (n=4) of respondents have private health insurance.
B. School Readiness AssessmentThe main measure of interest in this report is the Short Early Development Instrument (S-EDI;Janus et al., 2005) which measures children’s readiness for school across five domains includingphysical health and well-being, social competence, emotional maturity, language and cognitivedevelopment, communication and general knowledge. For each domain of the S-EDI, teacherand/or parent ratings are converted to a scaled score ranging from zero to ten. Higher scoresindicate higher levels of that specific domain. Higher scores across the five S-EDI domainsrepresent higher levels of school readiness. The teacher and parent report of S-EDI domains forthe CPSE sample are presented in Figure 4 along with a comparison to Canadian norms.
Note that the error bars on each bar in the figure below represent the amount of error in thatmeasurement. Error bars can be used to visually evaluate differences between two values.Specifically, if the error bars for two values do not overlap, it is a good indication that these twovalues are statistically significant. For more exact measures of significance, however, pleaserefer to the reported test statistics and p values in Table 6.

32
0
1
2
3
4
5
6
7
8
9
10
Physical Health& Well-being
SocialCompetence
EmotionalMaturity
Language &Cognitive
Development
Communication& GeneralKnowledge
School Readiness Domain
Mea
nS
core
CPSE - Teacher
Canadian Norm
CPSE - Parent
Figure 4. CPSE teacher, parent and youngest subset of Canadian norm means for each S-EDIdomain.
Teacher Reported S-EDITeachers rated children in the 2008-2009 CPSE cohort highest on the physical health and well-being and social competence domains, with mean scores of 7.56 (SD5 = 2.18) and 7.33 (SD =2.05), respectively (see Figure 4). They rated the children lowest on the communication andgeneral knowledge domain with a mean score of 5.12 (SD = 3.47). Children’s scores on eachteacher reported S-EDI domain were generally all statistically significantly different from eachother with two exceptions. First, differences between the teacher rated physical health and well-being domain and the teacher rated social competence domain did not reach significance andsecond, differences between the teacher rated language and cognition and communication andgeneral knowledge domains did not reach significance.
Parent Reported S-EDIParents rated children highest in the domains of physical health and well-being andcommunication and general knowledge, with mean scores of 9.14 (SD = 0.94) and 9.09 (SD =1.66), respectively (see Figure 4). Parent reports of school readiness were lowest on the languageand cognitive development domain, with a mean score of 6.45 (SD = 2.20). Children’s scores oneach parent rated S-EDI domain were significantly different from each other, with the exceptionthat the differences between parent rated physical health and well-being domain andcommunication and general knowledge domain did not reach significance.
Comparisons of Teacher and Parent Reported S-EDIAs seen in Figure 4 above, parent ratings of child school readiness were significantly higher thanteacher ratings across most domains, indicating that parents attributed their children with higherlevels of school readiness compared to teachers. A Wilcoxon Signed Rank test was used tocompare parent and teacher ratings of school readiness for each of the S-EDI domains. Parentratings were significantly higher than teacher ratings on the S-EDI domains of physical health
5 SD represents the standard deviation.

33
and well-being, social competence, emotional maturity, and communication and generalknowledge. Although not significant at the 0.05 level, trends in the data also reveal potentialdifferences between parent and teacher reports of language and cognitive development. Resultsof these significance tests are presented in Table 6. Note that the parent and teacher reports ofcertain domains of school readiness follow similar patterns. For example, both teachers andparents rated children highest on the physical health and well-being domain. In contrast, parentsrated children high on the communication and general knowledge domain, a domain that wasrated low by teachers.
Comparisons of CPSE S-EDI Scores and Canadian Normed ScoresIn addition to comparing teacher and parent ratings of the S-EDI domains within the CPSEsample, the developers of this instrument provide teacher rated norms representing a nationalCanadian sample. Teacher and parent ratings on each domain of the CPSE S-EDI were comparedwith the ratings of the youngest subset from the Canadian norm sample which includes childrenranging in age from 4 years, 11 months to 5 years and 1 month. Note that the Canadian normeddata is based on teacher reports.
Several similarities in the patterns of mean scores were present across parent and teacherreporters. Specifically, all reporters showed the same pattern in ratings for the physical healthand well-being, social competence and emotional maturity domains, with scores decreasingacross each one, with the mean scores across all three samples being highest in the physicalhealth and well-being domain. Additionally, the communication and general knowledge domainreceived the lowest rating by the CPSE teacher report and the norm report, yet was rated ashighest by parents.
An independent samples t-test (for unequal sample sizes) was used to compare the meandifferences between parent reported S-EDI scores and Canadian norms as well as teacherreported S-EDI scores and Canadian norms. As illustrated in Figure 4, teacher rated schoolreadiness of children in the 2008-2009 CPSE cohort was consistently below Canadian norms andparent ratings on each S-EDI domain. The test reveals that parent rated school readiness wassignificantly higher than the Canadian norms on the S-EDI domains of physical health and well-being, social competence, and communication and general knowledge. Conversely, parent ratedlanguage and cognitive development were significantly lower than the Canadian norm.Differences between parent rated emotional maturity and the Canadian norms did not reachsignificance. Tests also showed that teacher rated S-EDI domains were significantly lower thanthe Canadian norm on every S-EDI domain (see Table 6).
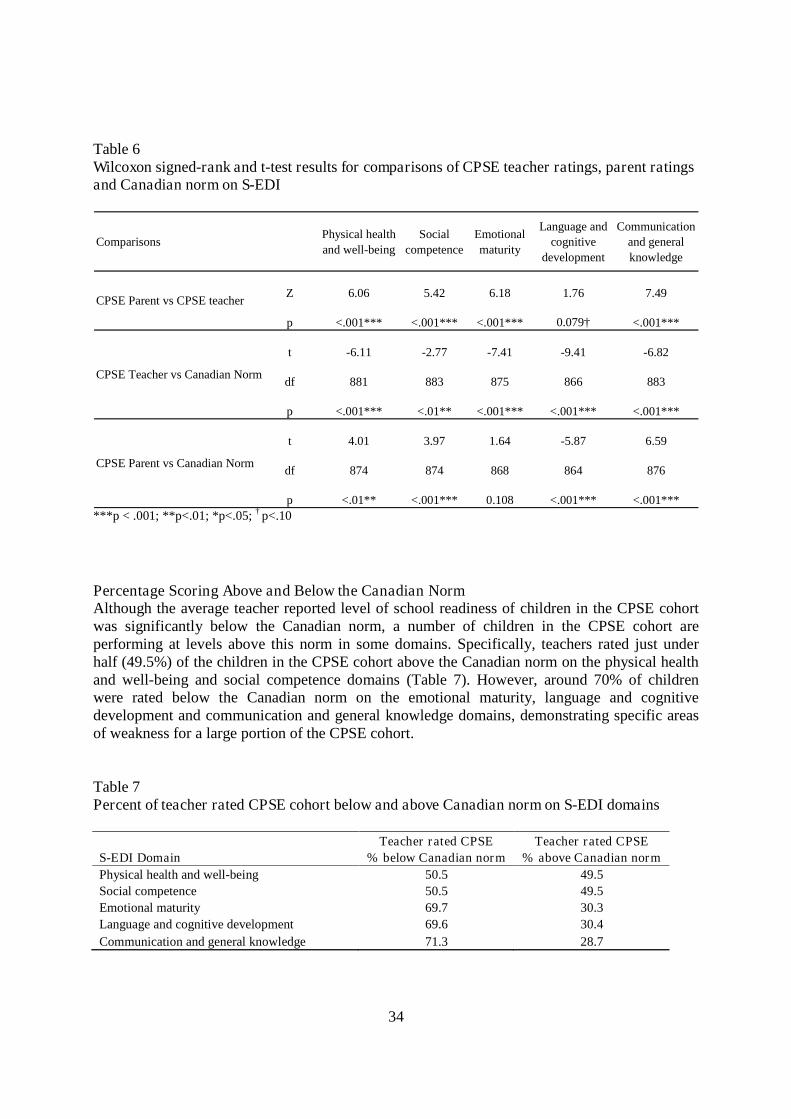
34
Table 6Wilcoxon signed-rank and t-test results for comparisons of CPSE teacher ratings, parent ratingsand Canadian norm on S-EDI
ComparisonsPhysical healthand well-being
Socialcompetence
Emotionalmaturity
Language andcognitive
development
Communicationand generalknowledge
Z 6.06 5.42 6.18 1.76 7.49
p <.001*** <.001*** <.001*** 0.079† <.001***
t -6.11 -2.77 -7.41 -9.41 -6.82
df 881 883 875 866 883
p <.001*** <.01** <.001*** <.001*** <.001***
t 4.01 3.97 1.64 -5.87 6.59
df 874 874 868 864 876
p <.01** <.001*** 0.108 <.001*** <.001***
CPSE Parent vs CPSE teacher
CPSE Teacher vs Canadian Norm
CPSE Parent vs Canadian Norm
***p < .001; **p<.01; *p<.05; † p<.10
Percentage Scoring Above and Below the Canadian NormAlthough the average teacher reported level of school readiness of children in the CPSE cohortwas significantly below the Canadian norm, a number of children in the CPSE cohort areperforming at levels above this norm in some domains. Specifically, teachers rated just underhalf (49.5%) of the children in the CPSE cohort above the Canadian norm on the physical healthand well-being and social competence domains (Table 7). However, around 70% of childrenwere rated below the Canadian norm on the emotional maturity, language and cognitivedevelopment and communication and general knowledge domains, demonstrating specific areasof weakness for a large portion of the CPSE cohort.
Table 7Percent of teacher rated CPSE cohort below and above Canadian norm on S-EDI domains
Teacher rated CPSE Teacher rated CPSES-EDI Domain % below Canadian norm % above Canadian normPhysical health and well-being 50.5 49.5Social competence 50.5 49.5Emotional maturity 69.7 30.3Language and cognitive development 69.6 30.4Communication and general knowledge 71.3 28.7

35
Percentage of ‘low’ scoresJust over 65% (n=66) of children in the CPSE cohort did not score in the lowest 10% of thecohort on any of the five S-EDI domains, according to teacher ratings (Table 8). However, closeto one-fifth (19%, n=19) of the children scored low on one of the five domains, with a further11% (n=11) scoring low on two domains. Four percent (n=4) of the CPSE cohort scored low onthree out of five domains, while 1% scored low on four of the five S-EDI domains. None of theCPSE cohort scored low on all five of the domains.
Table 8Number of S-EDI scales on which CPSE cohort scored low as rated by teachers
Number of S-EDI scales on which childrenscore in the lowest 10% n %
None 66 65.3
One 19 18.8
Two 11 10.9
Three 4 4.0
Four 1 1.0
Additional Behavioural Item ComparisonsTo facilitate comparisons with a sample of Irish children of similar age to the CPSE cohort,additional behavioural items were included in the surveys administered to the teachers andparents. These additional behavioural items are identical to a subset of questions included in theLifeways Cross Generational Cohort Study, a national Irish cohort study comprising threegenerations of the same family. By including these additional behavioural questions,comparisons on school readiness domains can be made to a representative Irish sample, which isbeneficial given potential social, economic, and cultural differences between not only Ireland andCanada, but also disadvantaged and non disadvantaged populations. These additional items arerelated to behaviours associated with aggression, oppositional/defiance, hyperactivity/inattention,anxiety, and prosociality.
CPSE Teacher Reported Additional Behavioural ItemsTable 9 below shows that the highest CPSE teacher rated domain is prosocial behaviour (M=5.22, SD = 2.74), with hyperactive/inattentive behaviour receiving the second highest rating (M= 4.82, SD = 3.34). Teacher reports of anxious and oppositional/defiant behaviours, were ratedslightly lower with means scores of 2.64 (SD = 2.76) and 2.24 (SD = 3.16), respectively. Finally,teacher ratings were lowest in terms of aggression, with a mean score of 1.46 (SD = 2.41).
CPSE Parent Reported Additional Behavioural ItemsSimilar to teacher reports, prosocial behaviour received the highest score in terms of parentreports (please see Table 9 below), with a mean score of 8.05 (SD = 2.20). Parent ratedoppositional/defiant and hyperactive/inattentive domains were rated similarly with mean scores

36
of 3.16 (SD = 2.38) and 3.29 (SD = 2.32), respectively. Finally, parent ratings show that childrendisplay few anxious and aggressive behaviours with mean scores of 1.10 (SD = 1.78) and 1.26(SD = 1.80).
Comparison of Teacher and Parent Reported Additional Behavioural ItemsAs demonstrated in Figure 5 and Table 9 significant differences emerged between teacher andparent ratings of oppositional/defiant behaviour, hyperactive/inattentive behaviour, anxiousbehaviour, and prosocial behaviour, such that parents rated children in the 2008-2009 CPSEcohort as displaying more oppositional and defiant behaviours as well as more prosocialitycompared to teachers. Teachers, on the other hand, rated children as displaying morehyperactivity/inattention and anxiety. No significant differences were observed between theparent and teacher ratings of aggression.
0
1
2
3
4
5
6
7
8
9
10
Aggression Oppositional/Defiant
Hyperactivity/Inattention
Anxiety Prosocial
Behavioural Domain
Mea
nS
core
Teacher
Parent
p<.001 p<.001 p<.001 p<.001
Figure 5. Comparisons of teacher and parent reports of the additional behavioural items forchildren in the 2008-2009 CPSE cohort.
Table 9Wilcoxon signed-rank results for differences between CPSE parent and teacher ratings onadditional behavioural domains
Domain Parent Teacher z pn Mean SD n Mean SD
Aggressive Behaviour 93 1.26 1.80 89 1.46 2.41 -0.27 0.791Oppositional/Defiant Behaviour 94 3.16 2.38 101 2.24 3.16 3.27 0.0011**Hyperactive/Inattentive Behaviour 92 3.29 2.32 101 4.82 3.34 -3.56 0.0004***Anxious Behaviour 92 1.10 1.78 101 2.64 2.76 -5.07 <0.0001***Prosocial Behaviour 91 8.05 2.20 78 5.22 2.74 5.39 <0.0001******p < .001; **p<.01; *p<.05; † p<.10

37
Comparison of CPSE Teacher Reported Behaviours and Lifeways School ReportedBehavioursAs part of the Lifeways Cross Generational Cohort Study parents were asked to rate thefrequency of their child’s behaviours as they occur separately in the home setting and the schoolsetting. This section compares parent reports of children’s behaviours in school using theLifeways data and teacher ratings of the CPSE cohort. Similar to the teachers in the CPSEcohort, parents from the Lifeways study rated their children highest on the prosocial domain andlowest on displaying aggressive behaviours (Figure 6 and Table 10). On the remaining domains,the Lifeways parents rated their children relatively low compared to the teacher ratings of thechildren in the CPSE cohort. Group differences between children in the Lifeways study andchildren in the 2008-2009 CPSE cohort were significant across all additional behaviouraldomains. Specifically, children in the Lifeways study were rated as being less aggressive, lessoppositional/defiant, less hyperactive/inattentive, less anxious, and more prosocial in a schoolsetting than teacher ratings of children in the CPSE cohort.
0
1
2
3
4
5
6
7
8
9
10
Aggression Oppositional/Defiant
Hyperactivity/Inattention
Anxiety Prosocial
Behavioural Domain
Mea
nS
core
Lifeways
CPSE
p<.001 p<.001 p<.001 p<.001 p<.001
Figure 6.Comparison of CPSE teacher reported behaviours and Lifeways school reportedbehaviours.
Table 10Wilcoxon signed-rank test results for differences in Lifeways parent school and CPSE teacherratings on additional behavioural domains
Domain Lifeways CPSE teacher z pn Mean SD n Mean SD
Aggressive Behaviour 544 0.56 1.26 89 1.46 2.41 3.54 0.0004***Oppositional/Defiant Behaviour 534 0.87 1.72 101 2.24 3.16 3.65 0.0003***Hyperactive/Inattentive Behaviour 533 1.54 2.02 101 4.82 3.34 6.47 <0.0001***Anxious Behaviour 537 1.68 2.14 101 2.64 2.76 2.78 0.0055**Prosocial Behaviour 530 6.62 2.85 78 5.22 2.74 -3.53 0.0004******p < .001; **p<.01; *p<.05; † p<.10

38
Comparison of CPSE Parent Reported Behaviours and Lifeways Home Reported BehavioursThis section compares parent reports of their children’s behaviours at home in the Lifewayssample with parent ratings in the CPSE cohort. As illustrated in Figure 7, parent ratings from theLifeways study and CPSE parent ratings are more similar than the CPSE teacher ratings.However, comparisons of parent reported behaviour show that children in the CPSE sample arerated less aggressive, more hyperactive and inattentive, less anxious, and more prosocial byparents than the children in the Lifeways cohort. Group differences for oppositional/defiantbehaviour did not reach statistical significance (see Table 11).
0
1
2
3
4
5
6
7
8
9
10
Aggression Oppositional/Defiant
Hyperactivity/Inattention
Anxiety Prosocial
SR Domain
Par
ent
Rat
edM
ean
Sco
re
Lifeways
CPSE
p<.001 p<.05 p<.001 p<.01
Figure 7. Comparisons of CPSE parent reported behaviours vs Lifeways home reportedbehaviours
Table 11Wilcoxon signed-rank test results for differences in Lifeways parent home and CPSE parentratings on additional behavioural domains
Domain Lifeways CPSE parent z pn n Mean SD Mean SD
Aggressive Behaviour 536 93 1.26 1.80 2.91 2.24 -4.91 0.0001***Oppositional/Defiant Behaviour 542 94 3.16 2.38 2.99 2.22 -0.05 0.963Hyperactive/Inattentive Behaviour 541 92 3.29 2.32 2.39 2.09 2.52 0.012*Anxious Behaviour 541 92 1.10 1.78 2.22 2.19 -3.90 0.0001***Prosocial Behaviour 522 91 8.05 2.20 7.16 2.77 2.58 0.010*****p < .001; **p<.01; *p<.05; † p<.10
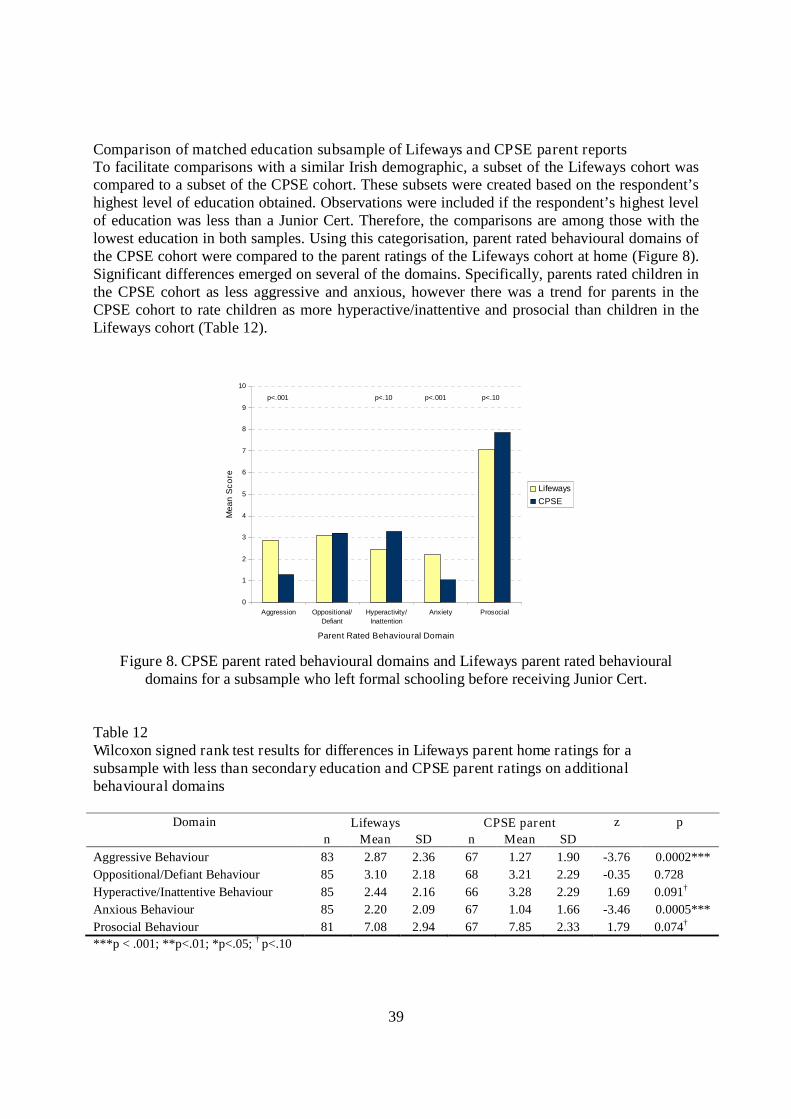
39
Comparison of matched education subsample of Lifeways and CPSE parent reportsTo facilitate comparisons with a similar Irish demographic, a subset of the Lifeways cohort wascompared to a subset of the CPSE cohort. These subsets were created based on the respondent’shighest level of education obtained. Observations were included if the respondent’s highest levelof education was less than a Junior Cert. Therefore, the comparisons are among those with thelowest education in both samples. Using this categorisation, parent rated behavioural domains ofthe CPSE cohort were compared to the parent ratings of the Lifeways cohort at home (Figure 8).Significant differences emerged on several of the domains. Specifically, parents rated children inthe CPSE cohort as less aggressive and anxious, however there was a trend for parents in theCPSE cohort to rate children as more hyperactive/inattentive and prosocial than children in theLifeways cohort (Table 12).
0
1
2
3
4
5
6
7
8
9
10
Aggression Oppositional/Defiant
Hyperactivity/Inattention
Anxiety Prosocial
Parent Rated Behavioural Domain
Mea
nS
core
Lifeways
CPSE
p<.001 p<.10 p<.001 p<.10
Figure 8. CPSE parent rated behavioural domains and Lifeways parent rated behaviouraldomains for a subsample who left formal schooling before receiving Junior Cert.
Table 12Wilcoxon signed rank test results for differences in Lifeways parent home ratings for asubsample with less than secondary education and CPSE parent ratings on additionalbehavioural domains
Domain Lifeways CPSE parent z pn Mean SD n Mean SD
Aggressive Behaviour 83 2.87 2.36 67 1.27 1.90 -3.76 0.0002***Oppositional/Defiant Behaviour 85 3.10 2.18 68 3.21 2.29 -0.35 0.728Hyperactive/Inattentive Behaviour 85 2.44 2.16 66 3.28 2.29 1.69 0.091†
Anxious Behaviour 85 2.20 2.09 67 1.04 1.66 -3.46 0.0005***Prosocial Behaviour 81 7.08 2.94 67 7.85 2.33 1.79 0.074†
***p < .001; **p<.01; *p<.05; † p<.10
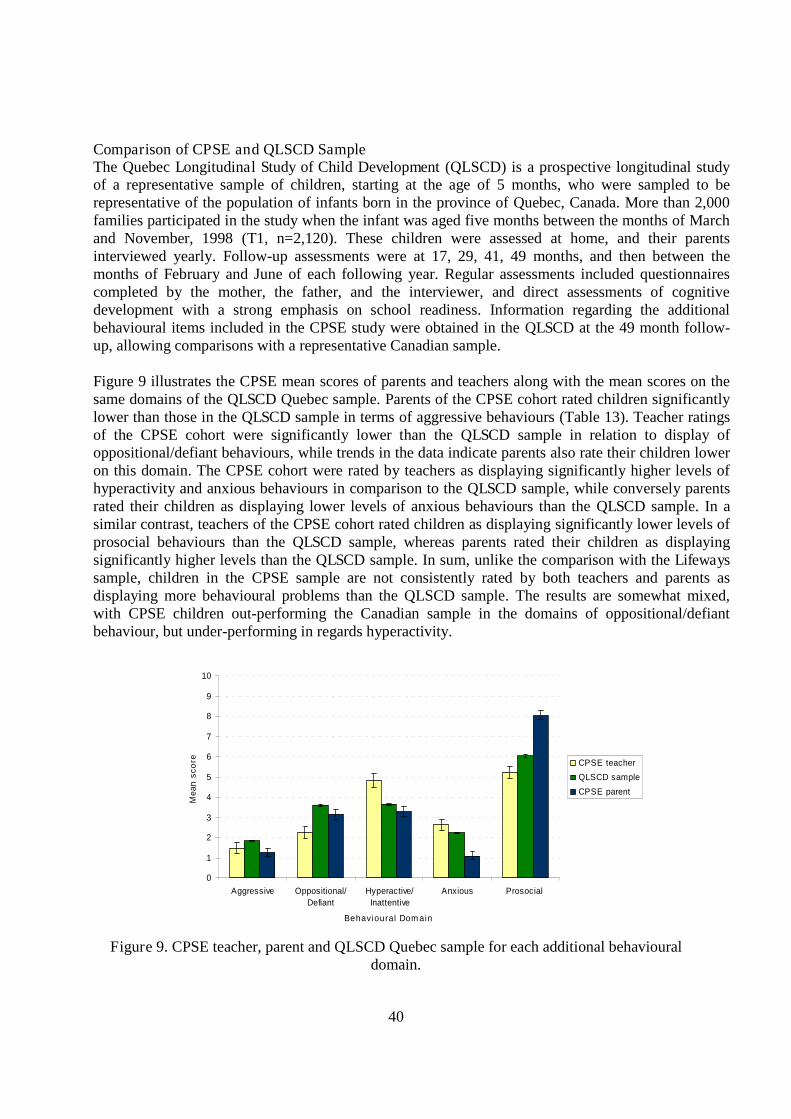
40
Comparison of CPSE and QLSCD SampleThe Quebec Longitudinal Study of Child Development (QLSCD) is a prospective longitudinal studyof a representative sample of children, starting at the age of 5 months, who were sampled to berepresentative of the population of infants born in the province of Quebec, Canada. More than 2,000families participated in the study when the infant was aged five months between the months of Marchand November, 1998 (T1, n=2,120). These children were assessed at home, and their parentsinterviewed yearly. Follow-up assessments were at 17, 29, 41, 49 months, and then between themonths of February and June of each following year. Regular assessments included questionnairescompleted by the mother, the father, and the interviewer, and direct assessments of cognitivedevelopment with a strong emphasis on school readiness. Information regarding the additionalbehavioural items included in the CPSE study were obtained in the QLSCD at the 49 month follow-up, allowing comparisons with a representative Canadian sample.
Figure 9 illustrates the CPSE mean scores of parents and teachers along with the mean scores on thesame domains of the QLSCD Quebec sample. Parents of the CPSE cohort rated children significantlylower than those in the QLSCD sample in terms of aggressive behaviours (Table 13). Teacher ratingsof the CPSE cohort were significantly lower than the QLSCD sample in relation to display ofoppositional/defiant behaviours, while trends in the data indicate parents also rate their children loweron this domain. The CPSE cohort were rated by teachers as displaying significantly higher levels ofhyperactivity and anxious behaviours in comparison to the QLSCD sample, while conversely parentsrated their children as displaying lower levels of anxious behaviours than the QLSCD sample. In asimilar contrast, teachers of the CPSE cohort rated children as displaying significantly lower levels ofprosocial behaviours than the QLSCD sample, whereas parents rated their children as displayingsignificantly higher levels than the QLSCD sample. In sum, unlike the comparison with the Lifewayssample, children in the CPSE sample are not consistently rated by both teachers and parents asdisplaying more behavioural problems than the QLSCD sample. The results are somewhat mixed,with CPSE children out-performing the Canadian sample in the domains of oppositional/defiantbehaviour, but under-performing in regards hyperactivity.
0
1
2
3
4
5
6
7
8
9
10
Aggressive Oppositional/Defiant
Hyperactive/Inattentive
Anxious Prosocial
Behavioural Domain
Mea
nsc
ore CPSE teacher
QLSCD sample
CPSE parent
Figure 9. CPSE teacher, parent and QLSCD Quebec sample for each additional behaviouraldomain.
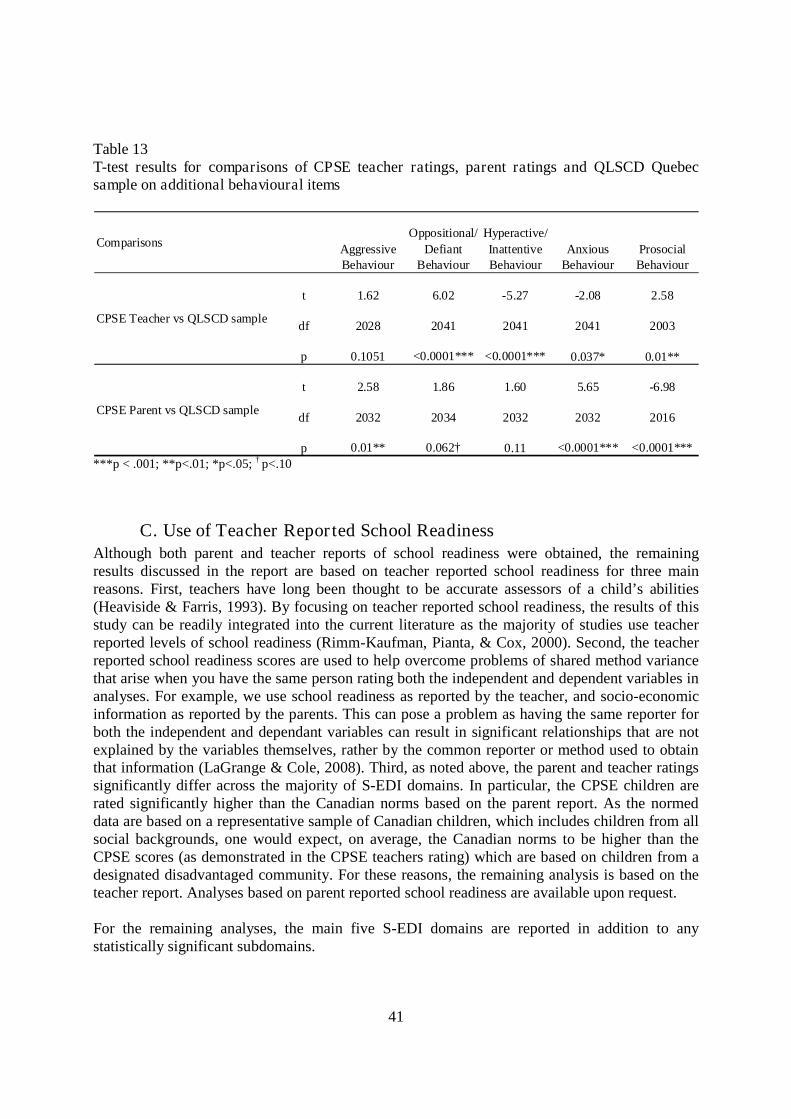
41
Table 13T-test results for comparisons of CPSE teacher ratings, parent ratings and QLSCD Quebecsample on additional behavioural items
Comparisons AggressiveBehaviour
Oppositional/Defiant
Behaviour
Hyperactive/InattentiveBehaviour
AnxiousBehaviour
ProsocialBehaviour
t 1.62 6.02 -5.27 -2.08 2.58
df 2028 2041 2041 2041 2003
p 0.1051 <0.0001*** <0.0001*** 0.037* 0.01**
t 2.58 1.86 1.60 5.65 -6.98
df 2032 2034 2032 2032 2016
p 0.01** 0.062† 0.11 <0.0001*** <0.0001***
CPSE Parent vs QLSCD sample
CPSE Teacher vs QLSCD sample
***p < .001; **p<.01; *p<.05; † p<.10
C. Use of Teacher Reported School ReadinessAlthough both parent and teacher reports of school readiness were obtained, the remainingresults discussed in the report are based on teacher reported school readiness for three mainreasons. First, teachers have long been thought to be accurate assessors of a child’s abilities(Heaviside & Farris, 1993). By focusing on teacher reported school readiness, the results of thisstudy can be readily integrated into the current literature as the majority of studies use teacherreported levels of school readiness (Rimm-Kaufman, Pianta, & Cox, 2000). Second, the teacherreported school readiness scores are used to help overcome problems of shared method variancethat arise when you have the same person rating both the independent and dependent variables inanalyses. For example, we use school readiness as reported by the teacher, and socio-economicinformation as reported by the parents. This can pose a problem as having the same reporter forboth the independent and dependant variables can result in significant relationships that are notexplained by the variables themselves, rather by the common reporter or method used to obtainthat information (LaGrange & Cole, 2008). Third, as noted above, the parent and teacher ratingssignificantly differ across the majority of S-EDI domains. In particular, the CPSE children arerated significantly higher than the Canadian norms based on the parent report. As the normeddata are based on a representative sample of Canadian children, which includes children from allsocial backgrounds, one would expect, on average, the Canadian norms to be higher than theCPSE scores (as demonstrated in the CPSE teachers rating) which are based on children from adesignated disadvantaged community. For these reasons, the remaining analysis is based on theteacher report. Analyses based on parent reported school readiness are available upon request.
For the remaining analyses, the main five S-EDI domains are reported in addition to anystatistically significant subdomains.

42
D. Child AgeThe average age of children in the 2008-2009 CPSE cohort is 4.77 (SD = 0.39) years old. ASpearman’s rho correlation was used to determine if there is a relationships between the age ofthe child and levels of school readiness identified on the S-EDI and the additional behaviouralitems. Table 14 below indicates a positive correlation between child age and scores on thephysical health and well-being domain, suggesting that older children perform to higher levels onthis domain, particularly in terms of physical independence and gross and fine motor skills.Older children are rated by teachers as displaying higher levels of social competence, and inparticular, approaches to learning. The results also suggests that older children perform better onthe language and cognitive development domain, with a trend suggesting this relationship isinfluenced by higher levels of basic literacy. Interestingly, in terms of the additional behaviouralitems, child age was negatively associated with the prosocial behaviour domain, suggesting thatthe younger children exhibit higher levels of prosociality than do the older children.
Table 14Spearman's rho non-parametric correlations representing the relationship between child ageand School Readiness
Domain Child Age
S-EDIPhysical Health & Well-being 0.227*
Physical Independence 0.219*Gross and Fine Motor Skills 0.270*
Social Competence 0.223*Approaches to Learning 0.280**
Emotional Maturity 0.156Language and Cognitive Development 0.244*
Basic Literacy 0.186†Communication & General Knowledge 0.112
Additional Behavioural ItemsAggressive Behaviour 0.142Oppositional/Defiant Behaviour -0.008Hyperactive/Inattentive Behaviour 0.138Anxious Behaviour 0.118Prosocial Behaviour -0.322**
***p < .001; **p<.01; *p<.05; † p<.10

43
E. GenderFifty-nine percent (n=55) of the children in the CPSE sample were male. Figure 10 below showsthat significant gender differences emerged for the S-EDI construct of emotional maturity, suchthat males are rated as displaying lower levels of emotional maturity than females. Specifically,the subdomains of emotional maturity reveal a trend indicating that males display lower levels ofprosocial and helping behaviour than their female classmates (see Table 15). There were nosignificant gender differences on any of the other S-EDI domains.
0
1
2
3
4
5
6
7
8
9
10
Physical Health& Well-being
SocialCompetence
EmotionalMaturity
Language &Cognitive
Development
Communication& GeneralKnowledge
Teacher Rated S-EDI Domain
Mea
nS
core
Male
Female
p<.05
Figure 10. Gender differences in teacher reported S-EDI domains.
In terms of the additional behavioural items, teachers rated males as displaying significantlymore aggression and less prosocial behaviour compared to their female counterparts (Figure 11and Table 15). Gender differences in all other school readiness domains did not reachsignificance.

44
0
1
2
3
4
5
6
7
8
9
10
Aggression Oppositional/Defiant
Hyperactivity/Inattention
Anxiety Prosocial
Teacher Rated Behavioural Domains
Mea
nS
core
Male
Female
p<.05 p<.05
Figure 11. Gender differences in teacher reported behavioural domains.
Table 15Monte Carlo Permutation test results for differences in School Readiness based on child gender
Domain Male Female p valuen Mean SD n Mean SD
S-EDIPhysical Health & Well-being 59 7.39 2.34 42 7.79 1.92 0.357Social Competence 59 7.22 2.21 42 7.50 1.79 0.511Emotional Maturity 57 6.14 2.10 42 7.01 1.84 0.034*
Prosocial and Helping Behaviour 43 5.17 3.00 35 6.31 2.79 0.088†
Language and Cognitive Development 56 5.68 3.23 36 5.27 2.60 0.526Communication & General Knowledge 59 5.19 3.72 42 5.00 3.12 0.810
Additional Behavioural ItemsAggressive Behaviour 52 1.91 2.74 37 0.83 1.71 0.034*Oppositional/Defiant Behaviour 59 2.44 3.16 42 1.94 3.19 0.453Hyperactive/Inattentive Behaviour 59 5.12 3.32 42 4.40 3.35 0.286Anxious Behaviour 59 2.97 2.80 42 2.18 2.67 0.144Prosocial Behaviour 42 4.54 2.82 36 6.02 2.46 0.015*
***p < .001; **p<.01; *p<.05; † p<.10

45
F. SiblingsInformation on whether the CPSE child lived in the same household as any siblings wasavailable for 89% (n=90) of the children. Of these, 18% (n=17) were the only child living in thehousehold, while the remaining 82% were living with one or more siblings.
Children with no siblings in the household were rated by teachers as displaying significantlyhigher levels of social competence compared to children with siblings (Figure 12 and Table 16).Specifically, pupils who do not have any siblings in the household display significantly morerespect and responsibility behaviours than pupils who have at least one sibling. Additionally,trends in the data show that pupils with no siblings display higher levels of social competencewith peers, higher levels of emotional maturity and significantly lower levels of aggression thando their classmates who do have siblings.
0
1
2
3
4
5
6
7
8
9
10
Physical Health& Well-being
SocialCompetence
EmotionalMaturity
Language &Cognitive
Development
Communication& GeneralKnowledge
Teacher Rated S-EDI Domain
Mea
nS
core
No Siblings
Siblings
p<.05 p<.10
Figure 12. Differences in teacher reported S-EDI domains based on presence of siblings in thehome.
In terms of the additional behavioural items, children who do not have any siblings are rated asdisplaying significantly less oppositional/defiant behaviour and trends reveal that these childrenalso display fewer hyperactive/inattentive behaviours (Figure 13 and Table 16).

46
0
1
2
3
4
5
6
7
8
9
10
Aggression Oppositional/Defiant
Hyperactivity/Inattention
Anxiety Prosocial
Teacher Rated Behavioural Domain
Mea
nS
core
No Siblings
Siblings
p<.05 p<.10
Figure 13. Differences in teacher reported behavioural domains based on presence of siblings inthe home.
Table 16Monte Carlo Permutation test results for differences in School Readiness based on siblingpresence in household
DomainNo Siblings Siblings
p valuen Mean SD n Mean SD
S-EDIPhysical Health & Well-being 16 8.27 2.10 74 7.36 2.20 0.135Social Competence 16 8.33 1.94 74 7.20 2.03 0.047*
Social Competence with Peers 16 7.08 2.24 74 5.56 3.11 0.071†
Respect and Responsibility 16 8.96 2.01 74 7.25 2.65 0.017*Emotional Maturity 14 7.42 1.42 74 6.32 2.17 0.071†
Aggressive Behaviour 14 0.54 1.11 67 2.08 2.86 0.047*Language and Cognitive Development 15 5.70 3.11 67 5.83 2.84 0.878Communication & General Knowledge 16 5.52 4.20 74 5.25 3.39 0.799
Additional Behavioural ItemsAggressive Behaviour 14 0.54 1.11 65 1.71 2.66 0.114Oppositional/Defiant Behaviour 16 0.52 2.08 74 2.08 3.16 0.012*Hyperactive/Inattentive Behaviour 16 3.37 3.67 74 4.94 3.24 0.091†
Anxious Behaviour 16 3.23 2.15 74 2.82 2.91 0.609Prosocial Behaviour 12 6.18 2.42 56 5.24 2.82 0.279
***p < .001; **p<.01; *p<.05; † p<.10

47
G. Relationship StatusIn regards relationship status, one-third (n=29) of respondents reported they are single, 30%(n=27) are married, and 22% (n=20) are living with their partner. One in ten (10%; n =9) have apartner they are not living with and just over 4% are separated or widowed (Figure 14).
0
5
10
15
20
25
30
35
Single Married Cohabitating Partner not livingtogether
Legallyseparated/Widowed
Relationship Status
%
Figure 14. Relationship status of respondents.
Two categories were derived to examine differences in school readiness based on therelationship status of the respondent. ‘Single’ comprises respondents who indicate they aresingle, legally separated, or widowed. Respondents classified as ‘being in a relationship’ arethose who are married, cohabitating, or have a partner with whom they are not living.
Although the association between the S-EDI domains and relationship status of the respondentdid not reach statistical significance, trends in the data show that children of single parents areperforming lower on measures of physical health and well-being, gross and fine motor skills,language and cognitive development, and basic literacy (Figure 15 and Table 17).

48
0
1
2
3
4
5
6
7
8
9
10
Physical Health& Well-being
SocialCompetence
EmotionalMaturity
Language &Cognitive
Development
Communication& GeneralKnowledge
Teacher Rated S-EDI Domain
Mea
nS
core
Single
In Relationship
p<.10 p<.10
Figure 15. Differences in teacher reported S-EDI domains based on relationship status.
Results from the additional behavioural items did not reach significance (Figure 16 and Table17).
0
1
2
3
4
5
6
7
8
9
10
Aggression Oppositional/Defiant
Hyperactivity/Inattention
Anxiety Prosocial
Teacher Rated Behavioural Domain
Mea
nS
core
Single
In Relationship
Figure 16. Differences in teacher reported additional behavioural domains based on relationshipstatus.

49
Table 17Monte Carlo Permutation test results for differences in School Readiness based on parentrelationship status
DomainSingle In Relationship
p valuen Mean SD n Mean SD
S-EDIPhysical Health & Well-being 32 6.85 2.39 55 7.76 2.16 0.074†
Gross and Fine Motor Skills 30 5.47 3.546 44 6.818 3.236 0.093†
Social Competence 32 7.05 2.32 55 7.57 1.86 0.267Emotional Maturity 31 6.51 2.02 54 6.49 2.07 0.961Language and Cognitive Development 28 4.93 2.88 51 6.12 2.91 0.090†
Basic Literacy 31 5.97 3.38 54 7.38 3.66 0.092†
Communication & General Knowledge 32 4.38 3.27 55 5.48 3.61 0.167
Additional Behavioural ItemsAggressive Behaviour 29 1.26 2.29 49 1.50 2.45 0.684Oppositional/Defiant Behaviour 32 2.19 3.32 55 2.00 2.79 0.783Hyperactive/Inattentive Behaviour 32 4.84 3.55 55 4.64 3.25 0.799Anxious Behaviour 32 3.28 3.04 55 2.82 2.62 0.465Prosocial Behaviour 20 4.83 3.10 46 5.45 2.71 0.427
***p < .001; **p<.01; *p<.05; † p<.10
H. Parent AgeThe mean age of parents in the 2008-2009 CPSE cohort is approximately 30 years old (SD =5.53), with ages ranging from 22 to 45 years. A Spearman’s rho correlation is used to determineif there was any discernable relationship between parent’s age and teacher rated S-EDI andadditional behavioural domains (Table 18). Results indicate there is no significant relationshipbetween parent’s age and teacher rated S-EDI domains. However, trends in the data indicate apositive correlation between parent’s age and the oppositional/defiant domain, suggestingchildren of older parents exhibit more oppositional/defiant behaviours.

50
Table 18Spearman's rho non-parametric correlations representing the relationship between parent’s ageand School Readiness
Domain ParentAge
S-EDIPhysical Health & Well-being 0.015Social Competence -0.061Emotional Maturity -0.093Language and Cognitive Development 0.075Communication & General Knowledge 0.112
Additional Behavioural ItemsAggressive Behaviour 0.031Oppositional/Defiant Behaviour 0.190†Hyperactive/Inattentive Behaviour 0.133Anxious Behaviour -0.104Prosocial Behaviour 0.007
***p < .001; **p<.01; *p<.05; † p<.10
In addition to treating age as a continuous variable, further analyses were conducted to examinewhether the children of young mothers differ in terms of school readiness compared to childrenof older mothers. To achieve this, respondents were divided into two groups based on the agethey were when the child was born. The first group consisted of those who were 20 years old oryounger when the child was born and the second group consisted of those who were older than20 years when the child was born. In the sample, 18% (n=15) are classified as being a youngmother. Although no significant differences emerged based on this categorisation, trends in thedata show the possibility of differences in the communication and general knowledge categorysuch that children of parents who were 20 years or older when they were born perform higher inthis domain (Figure 17 and Table 19).

51
0
1
2
3
4
5
6
7
8
9
10
Physical Health& Well-being
SocialCompetence
EmotionalMaturity
Language &Cognitive
Development
Communication& GeneralKnowledge
Teacher Rated S-EDI Domain
Mea
nS
core
20 years old oryoungerOlder than 20years
p<.10
Figure 17. Differences in teacher reported S-EDI domains based on age of respondent whenchild was born.
Differences in the additional behavioural domains based on the young mothers categorisation didnot reach significance (Figure 18 and Table 19).
0
1
2
3
4
5
6
7
8
9
10
Aggression Oppositional/Defiant
Hyperactivity/Inattention
Anxiety Prosocial
Teacher Rated Behavioural Domain
Mea
nS
core
20 years old oryounger
Older than 20years
Figure 18. Differences in teacher reported additional behavioural domains based on youngmothers categorisation.

52
Table 19Monte Carlo Permutation test results for differences in School Readiness based on youngmother’s categorization
Domain 20 years old or younger Older than 20 years p valuen Mean SD n Mean SD
S-EDIPhysical Health & Well-being 15 7.33 2.30 69 7.53 2.28 0.768Social Competence 15 7.52 1.79 69 7.42 2.09 0.862Emotional Maturity 13 6.56 1.78 69 6.54 2.16 0.974Language and Cognitive Development 13 5.02 3.01 63 6.07 2.78 0.228Communication & General Knowledge 15 3.78 3.42 69 5.70 3.53 0.062†
Additional Behavioural ItemsAggressive Behaviour 12 0.83 1.28 62 1.60 2.64 0.330Oppositional/Defiant Behaviour 15 1.56 3.30 69 2.40 3.16 0.356Hyperactive/Inattentive Behaviour 15 4.93 3.62 69 4.52 3.24 0.663Anxious Behaviour 15 3.33 2.60 69 2.73 2.77 0.472Prosocial Behaviour 13 5.32 2.58 50 5.40 2.94 0.945
I. Parental EducationThe highest level of education attained by the majority (28%, n=25) of the CPSE respondents isthe Junior/Group/Inter Certificate (see Figure 19) and the average school leaving age is 16 yearsold. Just over 11% (n=10) of respondents’ highest level of education attained is PrimaryEducation, while 16% (n=14) have completed Lower Secondary. Almost 15% (n=13) haveUpper Secondary education, 14% (n=12) have the Leaving Certificate, 14% (n=12) have someform of non-degree qualification and finally, the highest level of education for 2% (n=2) ofrespondents is a Primary degree.
0
5
10
15
20
25
30
Did not attend school Primary Low er Secondary Junior/Group/Intercert Upper Secondary Applied LeavingCertif icate
Leaving Certif icate/ Alevels
Non degreequalif ication
Primary Degree
Level of education
%R
esp
ond
ents
Figure 19. Highest level of education completed by survey respondent.

53
The educational categories reported above were collapsed in order to enable a comparisonbetween those with the lowest level of education and those with higher levels of education. Thelow education group contains respondents who did not attend school, had primary education, orlower secondary education. It is important to note that the respondents represented in the loweducation group did not have a Junior Certification. The low education categorisation comprisesapproximately 28% (n=25) of the sample. For purposes of these results, the ‘high’ educationcategorisation was derived to include all respondents who have reached their Junior Certificationor higher. The ‘high’ education category in this sample represents approximately 72% (n=64) ofthe total cohort.
Figure 20 and Table 20 below reveal that children of parents in the low education group wererated by teachers as displaying significantly less social competence as measured by the S-EDI.Specifically, children of low educated parents were significantly less socially competent in theirinteractions with peers. Additionally, teacher reports demonstrated that children of parents withlow education display significantly less emotional maturity, particularly in terms of high levelsof aggression and anxious and fearful behaviour, compared to children of parents who havereached the Junior Certification level of education.
0
1
2
3
4
5
6
7
8
9
10
Physical Health& Well-being
SocialCompetence
EmotionalMaturity
Language &Cognitive
Development
Communication& GeneralKnowledge
Teacher Rated S-EDI Domain
Mea
nS
core
Low Education
High Education
p<.05 p<.01 p<.10
Figure 20. Relationship between teacher rated S-EDI and respondent education level.
In terms of the additional behavioural items, children of parents in the low education group aresignificantly more aggressive, oppositional/defiant, and hyperactive/inattentive than children ofparents in the higher education group (Figure 21 and Table 20).

54
0
1
2
3
4
5
6
7
8
9
10
Aggression Oppositional/Defiant
Hyperactivity/Inattention
Anxiety Prosocial
Teacher Rated Behavioural Domain
Mea
nS
core
Low Education
High Education
p<.01 p<.05 p<.01
Figure 21. Relationship between teacher rated additional behavioural items and respondenteducation level.
Table 20Monte Carlo Permutation test results for differences in School Readiness based on educationlevel of respondent
Domain Low Education High Education p valuen Mean SD n Mean SD
S-EDIPhysical Health & Well-being 25 7.14 1.97 62 7.61 2.36 0.370Social Competence 25 6.60 1.73 62 7.60 2.12 0.039*
Social Competence with Peers 25 4.20 2.68 62 6.26 3.00 0.003**Respect and Responsibility 25 6.67 2.85 62 7.80 2.48 0.069†
Emotional Maturity 25 5.42 2.23 61 6.83 1.87 0.004**Aggressive Behaviour 21 6.51 3.44 57 8.76 2.17 0.001**Anxious and Fearful Behaviour 25 3.20 3.00 62 5.70 3.45 0.003**
Language and Cognitive Development 21 4.76 2.48 58 6.14 3.03 0.066†
Basic Literacy 23 5.94 3.72 62 7.42 3.44 0.094†
Communication & General Knowledge 25 4.40 3.00 62 5.59 3.60 0.154
Additional Behavioural ItemsAggressive Behaviour 19 3.07 3.43 57 1.01 1.92 0.002**Oppositional/Defiant Behaviour 25 3.43 3.47 62 1.84 2.88 0.036*Hyperactive/Inattentive Behaviour 25 6.37 2.79 62 4.06 3.28 0.004**Anxious Behaviour 25 2.60 2.73 62 3.06 2.82 0.51Prosocial Behaviour 22 4.92 2.65 46 5.53 2.94 0.42
***p < .001; **p<.01; *p<.05; † p<.10
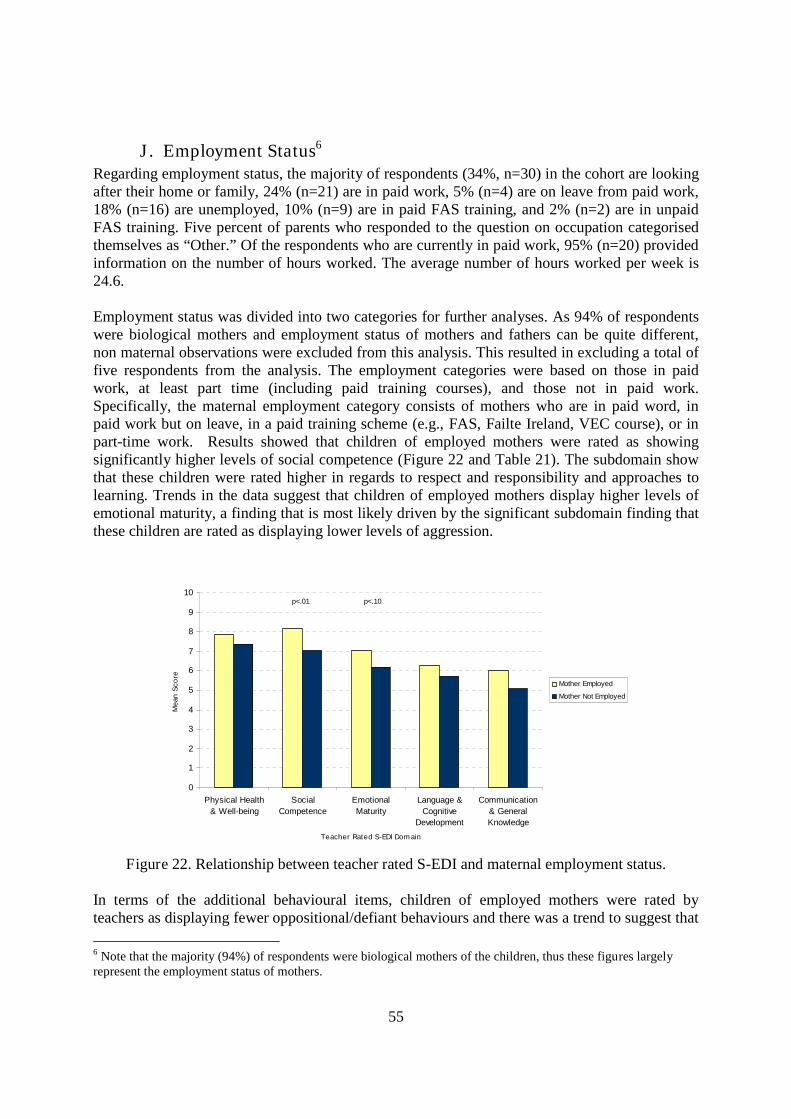
55
J. Employment Status6
Regarding employment status, the majority of respondents (34%, n=30) in the cohort are lookingafter their home or family, 24% (n=21) are in paid work, 5% (n=4) are on leave from paid work,18% (n=16) are unemployed, 10% (n=9) are in paid FAS training, and 2% (n=2) are in unpaidFAS training. Five percent of parents who responded to the question on occupation categorisedthemselves as “Other.” Of the respondents who are currently in paid work, 95% (n=20) providedinformation on the number of hours worked. The average number of hours worked per week is24.6.
Employment status was divided into two categories for further analyses. As 94% of respondentswere biological mothers and employment status of mothers and fathers can be quite different,non maternal observations were excluded from this analysis. This resulted in excluding a total offive respondents from the analysis. The employment categories were based on those in paidwork, at least part time (including paid training courses), and those not in paid work.Specifically, the maternal employment category consists of mothers who are in paid word, inpaid work but on leave, in a paid training scheme (e.g., FAS, Failte Ireland, VEC course), or inpart-time work. Results showed that children of employed mothers were rated as showingsignificantly higher levels of social competence (Figure 22 and Table 21). The subdomain showthat these children were rated higher in regards to respect and responsibility and approaches tolearning. Trends in the data suggest that children of employed mothers display higher levels ofemotional maturity, a finding that is most likely driven by the significant subdomain finding thatthese children are rated as displaying lower levels of aggression.
0
1
2
3
4
5
6
7
8
9
10
Physical Health& Well-being
SocialCompetence
EmotionalMaturity
Language &Cognitive
Development
Communication& GeneralKnowledge
Teacher Rated S-EDI Domain
Mea
nS
core
Mother Employed
Mother Not Employed
p<.01 p<.10
Figure 22. Relationship between teacher rated S-EDI and maternal employment status.
In terms of the additional behavioural items, children of employed mothers were rated byteachers as displaying fewer oppositional/defiant behaviours and there was a trend to suggest that
6 Note that the majority (94%) of respondents were biological mothers of the children, thus these figures largelyrepresent the employment status of mothers.

56
these children display lower levels of hyperactivity/inattention than children of non employedmothers (Figure 23 and Table 21).
0
1
2
3
4
5
6
7
8
9
10
Aggression Oppositional/Defiant
Hyperactivity/Inattention
Anxiety Prosocial
Teacher Rated Behavioural Domain
Mea
nS
core
Mother Employed
Mother Not Employed
p<.10p<.05
Figure 23. Relationship between teacher rated additional behavioural items and maternalemployment status.
Table 21Monte Carlo Permutation test results for differences in School Readiness based on maternalemployment status
DomainEmployed mother Not employed mother
p valuen Mean SD n Mean SD
S-EDIPhysical Health & Well-being 35 7.87 2.15 49 7.37 2.25 0.315Social Competence 35 8.13 1.78 49 7.02 1.99 0.010*
Respect and Responsibility 35 8.43 2.17 49 7.04 2.81 0.020*Approaches to Learning 35 8.43 2.25 49 7.18 2.48 0.022*
Emotional Maturity 34 7.02 1.74 49 6.19 2.33 0.083†
Aggressive Behaviour 31 8.98 1.81 45 7.65 3.17 0.041*Language and Cognitive Development 32 6.27 2.93 44 5.71 2.77 0.398Communication & General Knowledge 35 6.00 3.57 49 5.07 3.50 0.235
Additional Behavioural ItemsAggressive Behaviour 31 1.02 1.96 43 1.80 2.87 0.198Oppositional/Defiant Behaviour 35 1.36 2.48 49 2.77 3.37 0.037*Hyperactive/Inattentive Behaviour 35 3.71 3.19 49 5.10 3.35 0.061†
Anxious Behaviour 35 3.19 2.84 49 2.72 2.82 0.463Prosocial Behaviour 26 5.77 2.79 39 5.19 2.86 0.425
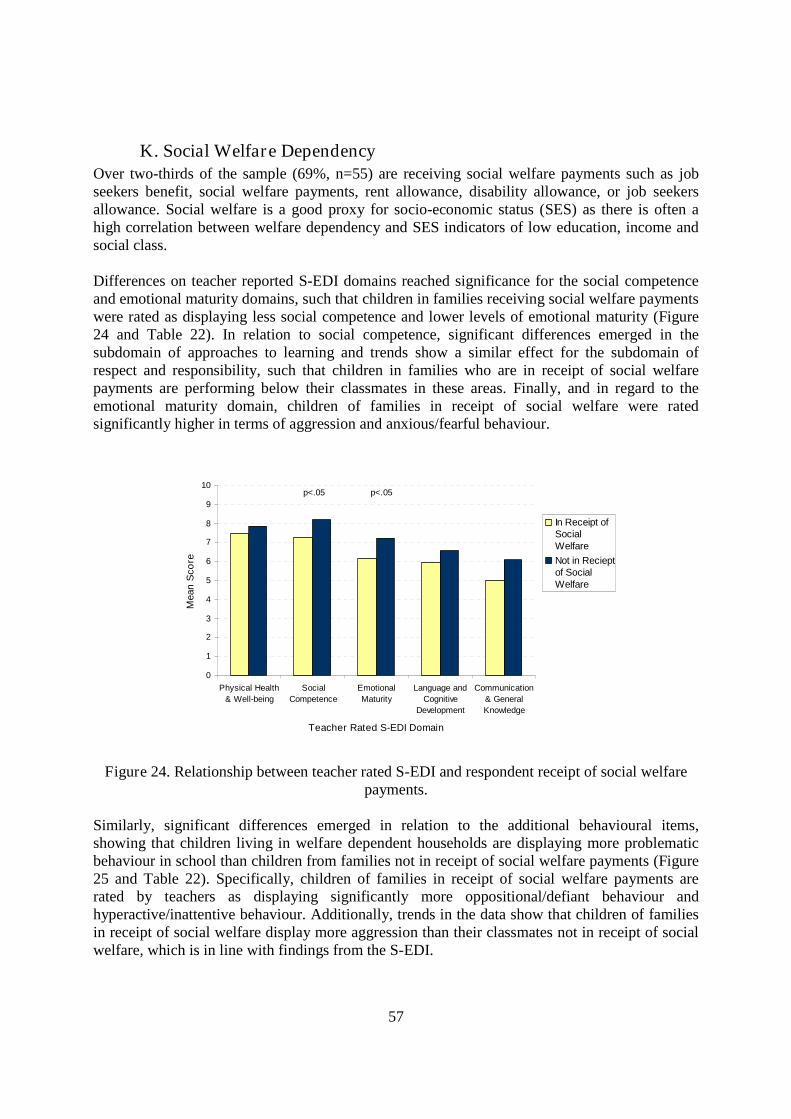
57
K. Social Welfare DependencyOver two-thirds of the sample (69%, n=55) are receiving social welfare payments such as jobseekers benefit, social welfare payments, rent allowance, disability allowance, or job seekersallowance. Social welfare is a good proxy for socio-economic status (SES) as there is often ahigh correlation between welfare dependency and SES indicators of low education, income andsocial class.
Differences on teacher reported S-EDI domains reached significance for the social competenceand emotional maturity domains, such that children in families receiving social welfare paymentswere rated as displaying less social competence and lower levels of emotional maturity (Figure24 and Table 22). In relation to social competence, significant differences emerged in thesubdomain of approaches to learning and trends show a similar effect for the subdomain ofrespect and responsibility, such that children in families who are in receipt of social welfarepayments are performing below their classmates in these areas. Finally, and in regard to theemotional maturity domain, children of families in receipt of social welfare were ratedsignificantly higher in terms of aggression and anxious/fearful behaviour.
0
1
2
3
4
5
6
7
8
9
10
Physical Health& Well-being
SocialCompetence
EmotionalMaturity
Language andCognitive
Development
Communication& GeneralKnowledge
Teacher Rated S-EDI Domain
Mea
nS
core
In Receipt ofSocialWelfareNot in Recieptof SocialWelfare
p<.05 p<.05
Figure 24. Relationship between teacher rated S-EDI and respondent receipt of social welfarepayments.
Similarly, significant differences emerged in relation to the additional behavioural items,showing that children living in welfare dependent households are displaying more problematicbehaviour in school than children from families not in receipt of social welfare payments (Figure25 and Table 22). Specifically, children of families in receipt of social welfare payments arerated by teachers as displaying significantly more oppositional/defiant behaviour andhyperactive/inattentive behaviour. Additionally, trends in the data show that children of familiesin receipt of social welfare display more aggression than their classmates not in receipt of socialwelfare, which is in line with findings from the S-EDI.

58
0
1
2
3
4
5
6
7
8
9
10
Aggression Oppositional/Defiant
Hyperactivity/Inattention
Anxiety Prosocial
Teacher Rated Behavioural Domain
Mea
nS
core In Receipt of Social
Welfare
Not in Receipt ofSocial Welfare
p<.10 p<.05 p<.05
Figure 25. Relationship between teacher additional behavioural items and respondent receipt ofsocial welfare payments.
Table 22Monte Carlo Permutation test results for differences in School Readiness based on receipt ofsocial welfare payments
DomainIn Receipt of
Social WelfareNot in Receipt ofSocial Welfare p value
n Mean SD n Mean SDS-EDI
Physical Health & Well-being 54 7.48 2.11 25 7.86 2.29 0.474Social Competence 54 7.28 2.00 25 8.20 1.59 0.046*
Respect and Responsibility 54 7.35 2.83 25 8.53 2.11 0.063†
Approaches to Learning 54 7.41 2.46 25 8.53 2.00 0.049*Emotional Maturity 53 6.16 1.67 25 7.23 1.71 0.042*
Aggressive Behaviour 47 2.36 3.14 24 0.97 1.83 0.049*Anxious and Fearful Behaviour 54 5.53 3.48 25 3.40 3.35 0.013*
Language and Cognitive Development 49 5.93 2.62 22 6.55 2.75 0.371Communication & General Knowledge 54 5.00 3.36 25 6.07 4.08 0.246
Additional Behavioural ItemsAggressive Behaviour 45 1.94 2.95 24 0.76 1.63 0.069†
Oppositional/Defiant Behaviour 54 2.64 3.31 25 1.00 2.04 0.022*Hyperactive/Inattentive Behaviour 54 5.09 3.32 25 3.30 3.05 0.023*Anxious Behaviour 54 2.96 2.72 25 2.93 2.82 1.000Prosocial Behaviour 42 5.34 2.82 22 5.61 2.64 0.709
***p < .001; **p<.01; *p<.05; † p<.10

59
L. Centre-Based ChildcareRespondents provided information on whether their children had received any form of childcareprior to entering school, including being looked after by grandparents, relatives, other friends, ananny, or attending crèche, nursery, preschool or Montessori. The survey shows that 85% ofchildren (n=80) experienced some form of childcare prior to starting school, with 82% attendingcentre-based care. Those children who received childcare in a home setting (either being lookedafter by grandparents, other relatives or nannies) were in this type of care for, on average, 27.5months (SD = 14.44). Children who received centre-based childcare either in a nursery orMontessori school spent 18 months (SD = 10.52) on average in this type of childcare.
Several differences in school readiness emerged based on whether or not a child participated incentre-based childcare prior to school entry. The differences between these two groups emergedon all five domains of the S-EDI, in addition to multiple subdomains. Children who attended anyform of centre-based care, for any period prior to entering primary school, were rated by teachersas displaying significantly higher levels of physical health and well-being, gross and fine motorskills, social competence, respect and responsibility, approaches to learning, readiness to explorenew things, emotional maturity, and less anxious and fearful behaviour (Figure 26 and Table 23).They also are rated significantly higher than children who did not attend centre-based care interms of levels of language and cognitive development, basic literacy, interest in literacy,numeracy, and memory, as well as higher levels of communication and general knowledge.
0
1
2
3
4
5
6
7
8
9
10
Physical Health& Well-being
SocialCompetence
EmotionalMaturity
Language &Cognitive
Development
Communication& GeneralKnowledge
Teacher Rated S-EDI Domain
Mea
nS
core
No CentreBased Care
CentreBased Care
p<.001 p<.001 p<.05 p<.001 p<.001
Figure 26. Relationship between teacher rated S-EDI and child’s participation in centre-basedchildcare prior to school entry.
Although fewer differences emerged in terms of the additional behavioural items, children whoattended centre-based care prior to school entry were rated by teachers as displaying feweropposition/defiant and hyperactive/inattentive behaviours (Figure 27 and Table 23).

60
0
1
2
3
4
5
6
7
8
9
10
Aggression Oppositional/Definat
Hyperactivity/Inattention
Anxiety Prosocial
Teacher Rated Behavioural Domains
Mea
nS
core
No Centre BasedCareCentre BasedCare
p<.05 p<.05
Figure 27. Relationship between teacher additional behavioural items and child’s participation incentre-based childcare prior to school entry.
Table 23Monte Carlo Permutation test results for differences in School Readiness based on child’sparticipation in centre-based childcare
DomainCentre-Based Care No Centre-Based Care
p valuen Mean SD n Mean SD
S-EDIPhysical Health & Well-being 76 7.80 2.10 16 5.87 2.32 0.001**
Gross and Fine Motor Skills 63 6.88 3.24 14 4.17 3.28 0.005**Social Competence 76 7.72 1.76 16 5.86 2.69 0.001***
Respect and Responsibility 76 7.86 2.51 16 6.35 0.04 0.039*Approaches to Learning 76 8.00 2.18 16 5.31 3.29 < 0.0001***Readiness to Explore New Things 76 9.01 1.37 16 6.98 3.40 < 0.0001***
Emotional Maturity 74 6.71 2.03 16 5.58 2.13 0.048*Anxious and Fearful Behaviour 76 4.61 3.51 16 6.56 3.36 0.040*
Language and Cognitive Development 68 6.28 2.58 16 3.50 3.13 0.0003***Basic Literacy 74 7.52 3.21 16 4.17 3.75 < 0.0001***Interest in literacy/numeracy & memory 74 8.92 2.53 15 5.33 4.14 < 0.0001***
Communication & General Knowledge 76 5.61 3.56 16 3.13 2.91 0.0107**
Additional Behavioural ItemsAggressive Behaviour 67 1.41 2.49 14 1.73 2.46 0.664Oppositional/Defiant Behaviour 67 1.89 2.86 16 3.65 3.73 0.035*Hyperactive/Inattentive Behaviour 76 4.31 3.27 16 6.20 3.29 0.036*Anxious Behaviour 76 2.85 2.77 16 3.13 2.78 0.753Prosocial Behaviour 59 5.55 2.71 11 4.09 3.11 0.111
***p < .001; **p<.01; *p<.05; † p<.10

61
M.Parenting Behaviours3
Reports from the ‘Parenting Styles and Dimensions Questionnaire’ show that respondentsindicated a high number of authoritative parenting behaviours when parenting their children (M= 4.30; SD = 0.50). It was indicated that the mean level of authoritarian behaviours used toparent children is 1.76 (SD = 0.43) and 2.28 (SD = 0.91) for permissive parenting behaviours(see Figure 28). Parents report using a significantly higher level of authoritative parentingbehaviours than authoritarian and permissive behaviours (Z = -8.37, p<0.0001 and Z= - 8.13,p<0.0001, respectively), while they use a significantly higher level of permissive behaviours thanauthoritarian behaviours (Z = -5.25 p<0.0001).
0
1
2
3
4
5
Authoritative Authoritarian Permissive
Parenting Behaviour
Mea
nS
core
Figure 28. Mean scores of parenting style behaviours.
Figure 29 below shows the mean scores on the subscales that comprise the authoritative andauthoritarian parenting styles. The non-reasoning/punitive subdomain of the authoritarianparenting behaviours has not been reported due to the low reliability of this scale ( = .44). Eachremaining subscale is significantly different within and across each parenting style. Of theparenting behaviours measured, parents endorsed the highest levels of connection, which relatesto warmth and support, while displaying the lowest level of physical coercion, a subdomaincharacterised by the use of physical punishment (e.g., spanking, slapping). As expected based onthe mean differences in the larger parenting constructs, parents reported that they engage inauthoritative parenting significantly more often than they use parenting behaviours related to theauthoritarian parenting style.
3 The authoritative parenting style is characterised by warmth and support, while the authoritarian style ischaracterised by low responsiveness and high control. Permissive parenting style, although characterised by warmth,is one in which parents exert little control over children.

62
0
1
2
3
4
5
Connection Regulation Autonomy Verbal hostility Physical coercion
Authoritative Authoritarian
Parenting Behaviour
Mea
nS
core
Figure 29. Mean scores on subdomains of parenting style behaviours
Authoritative parenting behaviour is positively correlated (using Spearman’s rho correlation)with parent rated emotional maturity, communication and general knowledge, and prosocialbehaviour, suggesting that higher self-reported use of authoritative parenting behaviours arerelated to higher parent reported levels of school readiness of children on each of these domains(see Table 24). Additionally, trends in the data show a positive relationship between use ofauthoritative parenting behaviours and parent reported language and cognitive development.Conversely, authoritative parenting was negatively associated with aggressive behaviour. Therewas a trend for authoritative behaviours to be negatively associated withhyperactivity/inattention, suggesting that greater authoritative parenting is associated with lessaggression and hyperactivity/inattention as reported by parents. Authoritarian and permissiveparenting behaviours, on the other hand, are both negatively correlated with parent ratedemotional maturity, indicating that children of parents who report using a larger number of harshor inconsistent parenting behaviours are reported as having lower levels of school readiness inthis domain. On the other hand, authoritative and permissive parenting behaviours are positivelycorrelated with oppositional/defiant behaviour and hyperactivity/inattentive behaviour,suggesting that higher use of these parenting behaviours is associated with greater levels of thesebehaviours in children.
Authoritarian parenting is negatively correlated with language and cognitive development andthere is a trend illustrating a negative relationship between authoritarian parenting and socialcompetence, suggesting that a high use of authoritarian parenting behaviours is significantlyassociated with lower parent reported language and cognitive development and socialcompetence in children. Furthermore, there is a significant positive correlation betweenauthoritarian parenting behaviours and aggression, suggesting that higher use of authoritarianparenting behaviours are associated with higher levels of aggression in children. Finally,permissive parenting also is negatively associated with physical health and well-being, socialcompetence, and prosocial behaviour suggesting that greater use of lax parenting behaviours is

63
associated with lower parent reported levels of physical health and well-being, socialcompetence, and prosocial behaviour in children.
Despite the reported correlations between parenting behaviours and parent reports of children’sschool readiness, few significant relationships emerged between parenting behaviours andteacher reports of school readiness. Specifically, three discernable relationships emerged amongthese variables. First, authoritarian parenting behaviours are positively associated with teacherreports of oppositional/defiant behaviours. Second, teacher reported physical health and well-being is negatively correlated with parent rated use of permissive parenting behaviours. Last,there is a trend suggesting that permissive parenting is positively associated with teacherreported hyperactive/inattentive behaviour.
Table 24Spearman's rho non parametric correlations representing the relationship between parentingbehaviours and school readiness
Parenting BehaviourAuthoritative Authoritarian Permissive
Domain Teacher Parent Teacher Parent Teacher ParentS-EDI Domain
Physical Health and Well-Being 0.02 0.01 -0.09 -0.15 -0.23* -0.19*Social Competence 0.05 0.09 -0.09 -0.19† -0.02 -0.21*Emotional Maturity 0.04 0.26** -0.06 -0.28** -0.12 -0.20*Language and Cognitive Development 0.10 0.17† -0.14 -0.22* -0.07 -0.11Communication & General Knowledge 0.07 0.24* -0.06 -0.02 -0.03 -0.07
Additional Behavioural ItemsAggressive Behaviour 0.11 -0.22* 0.08 0.32** 0.15 0.16Oppositional/Defiant Behaviour -0.01 -0.10 0.21* 0.34** 0.15 0.34**Hyperactive/Inattentive Behaviour -0.03 -0.18† 0.08 0.26** 0.19† 0.22*Anxious Behaviour -0.10 -0.04 0.01 0.10 0.11 0.06Prosocial Behaviour -0.01 0.29** -0.08 -0.05 -0.03 -0.20*
***p < .001; **p<.01; *p<.05; † p<.10
IX. Summary & Conclusion
School readiness is a multifaceted concept, encompassing several domains of development. Dueto its complexity, school readiness can not be adequately compiled into one concept or figurethat is truly reflective of children’s abilities, nor can one skill define school readiness. Rather,different areas of school readiness may have different relationships with child and familycharacteristics. It is therefore important to measure each domain of school readiness separately.By doing this, one can gain a more complete reflection of school readiness and the factors thatinfluence a child’s abilities at school entry.
The 2008-2009 CPSE report examines this holistic view of school readiness of a small sample ofchildren living in a disadvantaged urban community of Ireland. Therefore for the purpose of this

64
study, assessments of school readiness were obtained via teacher and parent report using theshort form of the Early Development Instrument. Several additional questions related tobehaviours associated with school readiness were also measured to facilitate comparisons with arepresentative sample of Irish children. In addition to assessing school readiness, parents wereasked questions regarding their socioeconomic situation as well as parenting behaviours that theyuse to parent their children.
School Readiness in the CPSE 2008-2009 CohortUsing the Short Early Development Instrument (S-EDI) (Janus et al., 2005), allowed for parentand teacher ratings of school readiness to be compared to a normative sample of Canadianchildren. Although arguments regarding cultural, social and economic differences betweenCanada and Ireland can be made, it is important to note that there are no available representativeor comprehensive data on the school readiness of Irish children. The S-EDI has been used inCanada, America, Australia and several other countries illustrating its cross cultural utility andvalidity (e.g., Brinkman et al., 2007). Additionally, research has highlighted the stability of EDIratings across different groups of children (Guhn, Gaderman, & Zumbo, 2007). By using the S-EDI, the levels of school readiness in the 2008-2009 CPSE cohort can be compared to arepresentative sample, albeit a Canadian one, facilitating conclusions regarding the schoolreadiness of children in this cohort.
Several differences emerged between parent and teacher rated school readiness and the Canadiannorms. The general pattern shows that teachers rated children in the 2008-2009 CPSE cohort asdisplaying significantly lower levels of school readiness than the Canadian norm, while parentsrated children in the cohort as displaying significantly higher levels of school readiness than theCanadian norm. While on average children in the CPSE sample scored below the norms acrossall domains based on the teacher reports, approximately half the sample are performing abovethe norm in regards physical health and well-being and social competence and one-third of thesample are scoring above the norm in the other three domains. Therefore, there is larger degreeof heterogeneity within the CPSE sample.
As stated previously, several differences emerged between parent and teacher reports of schoolreadiness for children in the 2008-2009 CPSE cohort. Both parent and teacher school readinessreports were compared across five domains of school readiness: physical health and well-being,social competence, emotional maturity, language and cognitive development, andcommunication and general knowledge. Results show that parents rated children as displayinghigher levels of physical health and well-being, social competence, emotional maturity, andcommunication and general knowledge than the teachers. Although the difference betweenparent and teacher rated language and cognitive development was not significant, there is a trendto suggest that parents also rate their children higher in this domain.
To compliment the S-EDI, additional behavioural items were included in the questionnaire tofacilitate comparisons with a national Irish sample, obtained from the Irish Lifeways Cross-Generation Cohort Study which was conducted in 2007. As there are no comparable data on theS-EDI available in Ireland, including these additional items enables a comparison between theCPSE sample and a sample of Irish children on several dimensions of behaviour related to schoolreadiness. Significant differences emerged on the majority of these domains, with patterns

65
mirroring those elucidated in the S-EDI. Specifically, teachers rated children in the 2008-2009CPSE cohort as displaying significantly more behaviours that are negatively associated withreadiness for school such as aggression, oppositional/defiant behaviours,hyperactivity/inattention, and anxiety. Additionally, teachers rated children as displaying fewerprosocial behaviours compared to the behaviours ratings in the Lifeways cohort. Results for theparent rated items, on the other hand, were mixed. Specifically, parents rated children in theCPSE cohort as being more prosocial, less anxious, less aggressive, and morehyperactive/inattentive than the children in the national Irish sample. Although this measure doesnot include every domain of school readiness, it is the first step to comparing the 2008-2009CPSE cohort to a representative sample of children growing up in Ireland and illustrates thatchildren in these disadvantaged areas are performing below a representative sample of Irishchildren on these specific domains.
Results of the present report support the concept that school readiness is multidimensional innature, encompassing several domains of development. Given that the traditional view of schoolreadiness focused on cognitive development and general knowledge, it is important to note thatseveral differences emerged for the social competence and emotional maturity domains of schoolreadiness in this report. This further provides support for parents, schools, practitioners, andresearchers to take a more holistic approach to the definition of school readiness. If this reporttook a more unidimensional view of school readiness, some of these important relationships mayhave been masked. Additionally, these findings demonstrate the importance of social andemotional development in preparing a child for success in school and such non-cognitivedomains should also be targeted when designing programmes to promote school readiness ofyoung children.
Group Differences in School ReadinessIn addition to measuring the level of school readiness in the PFL catchment area, the report alsoinvestigates how school readiness differs by demographic and socioeconomic factors. The reportreplicates several of the findings from the 2004 school readiness survey conducted in thecatchment area (Kiernan et al., 2008). For example, older children were reported as being moreready for school. In addition, girls were more emotionally mature, more prosocial, and lessaggressive than boys. Several group differences in school readiness were also identified betweenhigh and low resource families, with children from high resource families typically performingabove those from low resource families. Specifically, children of parents with less than a JuniorCertificate qualification, families in receipt of social welfare payments, and those of singleparents were not as ready for school as their classmates; findings supported in the literature(Janus & Duku, 2007). It is important to note that a lack of resources may play a direct role inschool readiness. For example, parents of children who are less ready for school may not possessthe necessary financial, material, and social resources to help prepare their children for school.
An interesting finding also emerged in the relationship between the presence of siblings in thehousehold and child school readiness. Children with no siblings were rated as displaying higherlevels of social competence, emotional maturity, less oppositional and defiant behaviours, andless hyperactivity and inattentive behaviours than those with siblings. There are several plausibleexplanations for this unexpected finding. First, children may be modelling their behaviour aftertheir parents, rather than siblings, and parents may be exhibiting more socially competent and

66
emotionally mature behaviours than children. Second, parents of lone children may have moretime to spend with them and this time may be more interactive, thus further providing theopportunity for children to learn socially competent and emotionally mature behaviours throughthese vertical relationships with parents.
Childcare & School ReadinessAs formal childcare has been identified as one of key promoters of early school readiness (pleasesee section III.D above), the CPSE survey collected detailed information about the children’schildcare experiences prior to school entry in terms of childcare type, duration and starting age.A significant finding of this report is that the majority of children in the sample had experiencedsome form of centre-based childcare prior to starting school. The results also indicate thatchildren experienced informal childcare (e.g. care by grandparents, other relatives or nannies) foran average of 28 months and formal childcare (care in nursery or Montessori school) for 18months. Studies typically find that children from disadvantaged areas are more likely to avail ofinformal, rather than formal, childcare (Côté, Doyle, & Petitclerc, 2009) however this result isnot borne out in the CPSE sample.
Several significant relationships were identified between participation in centre-based childcareprior to school entry and school readiness. The general finding was that children whoparticipated in centre-based care were rated higher than children who did not attend centre-basedchildcare on all domains of school readiness. These findings are consistent with current literaturewhich suggests that centre-based childcare is beneficial for children’s development. A number ofstudies have shown that formal childcare, which tends to be of a higher quality than informalcare, can have a positive impact on children’s cognitive abilities and school readiness, inparticular math and reading skills, as well as expressive vocabulary and language development(Clarke–Stewart, 1991; NICHD, 2002; NICHD & Duncan, 2003). Evidence also shows thatintensive centre-based care which begins in toddlerhood may have positive effects on cognitiveskills and language development (Gregg, Washbrook, Propper, & Burgess, 2005), with one studyindicating that the greatest academic benefits are for those children that begin centre-based careat ages 2-3 (Loeb, Bridges, Bassok, Fuller, & Rumberger, 2007).
There is also evidence that the benefits of childcare may be greatest for those fromdisadvantaged backgrounds as childcare can play a protective role for children from low resourcefamilies. As demonstrated in this report, these effects can impact on all areas of developmentincluding cognitive ability (Geoffroy et al., 2006; Caughy, DiPetro, & Strobino, 1994), physicalaggression (Borge, Rutter, Cote, & Tremblay, 2004; Côté et al. 2007) and emotional maturity(Côté et al., 2008). Childcare may have a direct effect on the school readiness of disadvantagedchildren as the quality of the childcare setting may be greater than the home environment, forexample, low-income families may not have the available resources to provide an enriched homeenvironment. In addition, formal childcare typically provides access to better facilities andresources and access to more educational stimulation. Childcare may also indirectly affect schoolreadiness resulting from changes in parenting due to the child’s childcare attendance(McCartney, Dearing, Taylor, & Bub, 2007).
Studies consistently show that the quality of childcare matters (Burchinal et al., 2000),particularly in terms of the qualification of childcare staff, the stability of staff, and the structure
67
and content of daily activities. However, it is important to note that this study does not controlfor the quality of the childcare settings which the CPSE cohort attended. Síolta, the NationalQuality Framework for Early Childhood Education, which provides the first nationally agreed setof standards for early childhood care and education in Ireland, is currently being implemented bythe local pre-schools, schools and childcare settings in the CPSE catchment area as part of thePreparing for Life programme. This framework is set to raise the standards of the childcaresettings within the CPSE community, therefore future CPSE surveys may be able to incorporatethese measures to analyse the effects on school readiness over time.
Differences in Parent & Teacher Reported School ReadinessAn important observation of this report is that several differences emerged between teacher andparent reports on both the S-EDI and the additional behavioural domains. Such discrepanciesacross informants have been documented elsewhere and are a common finding in the literature(e.g., Gangon, Vitaro, & Tremblay, 1992; Shaw, Hammer, & Leland, 1991; Tasse & Lecavalier,2000). The discrepancy between parent and teacher reported school readiness has severalimplications and possible explanations. First, parents may perceive the same child behavioursdifferently than teachers. The teachers observe multiple children on a daily basis and over manyyears, whereas parents may only regularly observe their own children, other children in thecommunity, neighbours, and friends’ children. Additionally, while teachers may interact withchildren from several areas, communities, and even cultures, parents may only be familiar withthe children living in their area. Therefore, the frame of reference upon which these assessmentsof child skill and behaviour are made may be quite different for parents and teachers, resulting inmean differences between the school readiness and behavioural ratings in the CPSE sample.
Furthermore, this study was conducted in a designated disadvantaged area, with above nationallevels of unemployment and social welfare dependency (see Census Small Area PopulationStatistics from 2006). This is important to note as research has identified lower levels of schoolreadiness in disadvantaged areas and has identified familial factors such as low socioeconomicstatus that put children at risk for poor school readiness (Janus & Duku, 2007; Lapointe, Ford, &Zumbo, 2007). Given these documented differences, the frame of reference upon which parentsare rating their children may be skewed to this effect resulting in higher ratings of children’sbehaviour and school readiness. In other words, parents may see their children as performingabove average for that community, a level which may be rated lower by individuals who have amore broad frame of reference upon which to compare children. Specifically, parents maywitness low levels of school readiness and high incidence of problematic behaviours in thecommunity. If the parent does not perceive his/her child to exhibit these negative behaviours tothe same extent as he/she sees in the community, the parent and teacher ratings of behaviour maydiverge. A plausible explanation for this divergence may result from teachers rating the child’sbehaviours based on a larger sample of children from several areas including those living incommunities that do not experience the same high levels of delinquency and poor schoolreadiness as often seen in disadvantaged areas.
A second possible explanation for differences between parent and teacher ratings of schoolreadiness and behaviour is that children may behave differently in a school context than in afamily context. Children are often expected to follow different rules in the home and schoolenvironment and the consequences for one’s actions may not be consistent across contexts.

68
Therefore, the child may learn that some behaviours which are acceptable at school are notacceptable at home and vice versa. It may not be that parents and teachers are rating the samebehaviours differently, rather it may be a function of children exhibiting different behaviours indifferent contexts. This argument is supported by the differences in parent reports of childbehaviour in school and in the home. Specifically, data from the Lifeways Cross-GenerationCohort Study show significant differences between parent ratings of children’s behaviour basedon how the child behaves at home and at school, suggesting that according to parents, childrenbehave differently in the school context than they do at home.
Although the lack of concordance between parent and teacher ratings of children’s schoolreadiness may be viewed simply as a methodological problem, it may represent a moreinteresting finding. One potential explanation is that parents in disadvantaged areas may viewtheir children as thriving in the environment and therefore they may not recognise anyweaknesses in their children’s school readiness, and subsequently they may not recognise theneed for early intervention to prevent or remedy these weaknesses. Therefore, the possibility ofparental attitudes affecting parental behaviour, which clearly affect child behaviour andultimately a child’s readiness for school, cannot be ruled out and highlights the need for multiplesources to report on school readiness and the need for longitudinal studies to track children’sprogress over time. Given the present data, we are unable to determine whether parents andteachers are rating similar behaviours in a different way, whether children exhibit differentbehaviour in school versus the home environment, whether parent or teacher perceptions areskewed, or which report of school readiness is a more accurate reflection of children’s trueability. Furthermore, it is important to note that the results cannot definitively show whetherthese discrepancies in parent and teacher reports of child’s school readiness are simply due to aresponse bias in terms of the parents or teachers, or whether the difference between parent andteacher ratings is due to context specific behaviour on the part of the children.
Although clear differences emerged between parent and teacher ratings of children’s schoolreadiness, this report mainly focuses on the teacher reports. This method was employed formultiple reasons. First, teacher ratings are typically reported in the literature. Second, teachershave long been relied upon to make accurate assessments of children’s readiness for school(Heaviside & Farris, 1993). Lastly, in an attempt to escape problems of shared method varianceassociated with one rater rating both the independent and dependant variables, the analysis usedthe school readiness scores as reported by the teacher and the socioeconomic data as reported bythe parent.
Strengths and Limitations of the StudyThe present study has several strengths. First, the reliability of the scales used in the analyseswas acceptable, with the reliability of several scales falling above the .80 level. Additionally, the99% response rate of teachers and 76% of parents is high for a study of this type. Another clearstrength of the study is that non-standard statistical methods were employed specifically tailoredto accommodate the small sample size used in the analyses. This allows for robust conclusionsabout the results to be obtained. Another benefit of the study is the holistic approach to schoolreadiness through which this survey was designed. Specifically, the study assessed all fivedomains of school readiness commonly reported in the literature. It also is important to note thatthe PFL programme, which aims to improve levels of school readiness in the area, operatesunder this holistic definition of school readiness. Therefore, it is important to assess all areas of

69
school readiness in the area on a yearly basis to determine any year-on-year improvements, aswell as any significant improvements of school readiness of children in the PFL cohort uponschool entry. Lastly, although the results reported here focused on teacher reported schoolreadiness, data were also obtained for parent reports of school readiness. By obtaining bothteacher and parent reports of school readiness, important differences in these ratings wereelucidated. Specifically, by using both reports it became clear that parents are consistently ratingtheir children’s levels of school readiness above the teacher’s report which has severalimplications for future work in this area.
In addition, there are several limitations to the study that should be noted. First, all the analysesconducted to test for differences in school readiness across the range of socio-demographicfactors (e.g., gender, maternal education and employment, social welfare dependency, parentingand childcare) represent correlations or associations in the data. They are indicative ofunderlying relationships that may exist between two factors, however they are not necessarilycausal relationships, nor should they be interpreted as such. For example, the analyses show thatattendance at centre-based childcare is associated with higher S-EDI scores. While childcare maydirectly lead to an increase in school readiness through providing a cognitively stimulatingenvironment for the child (i.e., a causal effect), this relationship may also be driven by selectionbias, whereby the types of families to place their children in childcare are also the types offamilies who readily invest in their children’s development. Hence, ‘childcare’ may be a proxyfor a range of other factors influencing the child’s development, such as the quality of the homeenvironment or parental income. Due to the relatively small sample size, controlling for suchpotentially confounding factors through multiple regression modelling is not possible, as suchmodels are dependant on the number of observations in the analysis and the amount of factorsincluded in the model. However, as the CPSE survey will be conducted annually for the nextfour years, the sample size is set to grow, which will allow us to estimate multiple regressionmodels which will help uncover and disentangle some of these relationships. Therefore, cautionshould be taken when interpreting the results of this first study.
The Need for the PFL InterventionThe 2008-2009 CPSE was conducted as part of an overall evaluation of the PFL early childhoodintervention programme. Thus, the results presented in this report are inherently intertwined withthe PFL intervention itself. It is clear, based on teacher assessments of school readiness, thatchildren in the PFL catchment areas are not performing to the level of other children at schoolentry, a finding that provides quantitative evidence for the need of the PFL intervention.Additionally, the vast differences between parent and teacher assessments of school readinessprovide solid evidence that any intervention aiming to improve levels of school readiness in thisarea must integrate several contexts of development rather than simply focusing on one context.Development is based on the interaction of contexts and people within each of these contextssuch as the family, the school, and the community, all of which have direct and indirect effectson child development and school readiness (Bronfenbrenner, 1986). Therefore, an interventionshould focus on the multiple contexts in which a child is developing in order to effectivelyintervene and promote adaptive functioning and development, such as the PFL intervention.Intervening at the family level and operating through an ecological approach by providingopportunities for schools and the larger community to work together may allow for greateropportunities to improve school readiness of children in the area.

70
Future CPSE SurveysThe current report provides a comprehensive analysis of the levels of school readiness of juniorinfants children in a disadvantaged urban community in Ireland. The survey will be replicatedand conducted annually until 2012. One of the aims of this study is to measure the general levelof school readiness in the area for the cohort of children who are not receiving the PFLprogramme. By comparing the year-on-year changes in school readiness, this study will indicateif the PFL programme is generating positive externalities. It will determine whether providing anintensive school readiness intervention to the community’s younger cohort will have knock-oneffects for the older children in the community starting school between 2008-2012. The currentreport elucidates several interesting relationships in the data in terms of factors influencingschool readiness. However, determining the causal nature of these relationships is constrained bythe small sample size. Combining the samples of future CPSE surveys over time will providemuch larger data which will deepen the richness of the analysis and allow us to fully investigatethe determinants and antecedents to school readiness.

71
X. References
Alloy, L.B., Abramson, L.Y. & Francis, E.L. (1999). Do negative cognitive styles confervulnerability to depression? Current Directions in Psychological Science, 8(4), 128-132.
Amato P.R. (1994). Father-child relations, mother-child relations, and offspring psychologicalwellbeing in early adulthood. Journal of Marriage and the Family, 56, 1031–1042.
Arnold, D.H., Ortiz, C., Curry, J.C., Stowe, R.M., Goldstein, N.E., Fisher, P.H., Zelja, A., &Yershova, K. (1999). Promoting academic success and preventing disruptive behaviourdisorders through community partnership. Journal of Community Psychology, 27(5), 589-598.
Barber, J. S., Axinn, W. G., & Thornton, A. (1999). Unwanted childbearing, health, and mother-child relationships. Journal of Health and Social Behavior, 40, 231-257.
Barnett, W. S. (1995). Long-term effects of early childhood programmes on cognitive and schooloutcomes. Future of Children, 5(3), 25-50.
Barrington, B.L., & Hendricks, B. (1989). Differentiating characteristics of high-schoolgraduates, dropouts and non-graduates. Journal of Educational Research, 82(6), 309-319.
Bates, J., Marvinney, D., Kelly, T., Dodge, K., Bennett, D., & Pettit, G. (1994). Child carehistory and kindergarten adjustment. Developmental Psychology, 30, 690–700.
Bates, M.E., Pettit, G.S., Dodge, K.A., & Ridge, B. (1998). Interaction of temperamentalresistance to control and restrictive parenting in the development of externalizingbehaviour. Developmental Psychology, 34, 982-995.
Baumrind, D. (1966). Effects of authoritative control on child behaviour. Child Development, 37,887-907.
Baumrind, D. (1967). Child care practices anteceding three patterns of preschool behaviour.Genetic Psychology Monographs, 75, 43-88.
Baumrind, D. (1971). Current patterns of parental authority. Developmental PsychologyMonograph, 4, 1-103.
Baumrind, D. (1991). The influence of parenting style on adolescent competence and substanceuse. Journal of Early Adolescence, 11, 56-95.
Baydar, N., & Brooks-Gunn, J. (1991). Effects of maternal employment and child-carearrangements in infancy on preschoolers’ cognitive and behavioral outcomes: Evidencefrom the Children of the NLSY. Developmental Psychology, 27, 932-945.

72
Belsky, J. (1990). Developmental risks associated with infant day care: Attachment insecurity,noncompliance and aggression? In S. Chehrazi (Ed.), Psychosocial Issues in Day Care(pp. 37–68). New York: American Psychiatric Press, Inc.
Bernal, R., & Keane, M.P. (2006). Child care choices and children’s cognitive achievement: Thecase of single mothers. Working Paper Series, Institute for Policy Research,Northwestern University.
Berndt, T.J. (2002). Friendship quality and social development. Current Directions inPsychological Science, 11(1), 7-10.
Berndt, T. J., & Perry, B. T. (1986). Children's perceptions of friendships as supportiverelationships. Developmental Psychology, 22(5), 640-648.
Biller, H.B., & Kimpton, J.L. (1997). The father and the school-aged child. In M. E. Lamb (Ed.),The role of the father in child development (pp. 143–161). New York: Wiley.
Blau, D.M. (1999). The effects of childcare characteristics on child development. The Journal ofHuman Resources, 34(1), 786-822.
Bonell, C.P., Strange, V.J., Stephenson, J.M., Oakley, A.R., Copas, A.J., Forrest, S.P., Johnson,A.M., & Black, S. (2003). Effect of social exclusion on the risk of teenage pregnancy:Development of hypotheses using baseline data from a randomised trial of sex education.Journal of Epidemiology and Community Health, 57, 871-876.
Borge, A., Rutter, M., Côté, S., & Tremblay, R.E. (2004). Early childcare and physicalaggression: Differentiating social selection and social causation. Journal of ChildPsychology and Psychiatry, 45(2), 367-376.
Brinkman, S.A., Silburn, S., Lawrence, D., Goldfeld, S., Sayers, M., & Oberklaid, F. (2007).Investigating the validity of the Australian Early Development Index. Early Educationand Development, 18(3), 427-451.
Bronfenbrenner, U. (1986). Ecology of the family as a context for human development researchperspectives. Developmental Psychology, 22, 723-742.
Brook, J.S., Zheng, L., Whiteman, M., & Brook, D.W. (2001). Aggression in toddlers:Associations with parenting and marital relations. The Journal of Genetic Psychology,162, 228-241.
Brooks-Gunn, J. (2003). Do you believe in magic? Social Policy Report, 17(1), 3-16.
Brooks-Gunn, J., Britto, P. R., & Brady, C. (1999). Struggling to make ends meet: Poverty andchild development. In Lamb. M.E. (Ed.) Parenting and Child Development in“Nontraditional” Families (pp. 279-304). Mahwah, NJ: Lawrence Erlbaum Associates,Publishers.

73
Brooks-Gunn, J., Duncan, G.J., & Aber, J.L. (1997). Neighborhood Poverty, New York, NY:Russell Sage Foundation.
Brooks-Gunn, J., Guo, G., & Furstenberg, F.F. (1993). Who drops out of and who continuesbeyond high school? A twenty-year follow-up of black urban youth. Journal of Researchon Adolescence, 3(3), 271-194.
Brooks-Gunn, J. Han, W.J., & Waldfogel, J. (2002). Maternal employment and child cognitiveoutcomes in the first three years of life: The NICHD study of early child care. ChildDevelopment, 73(4), 1052-1072.
Buhs, E. S., & Ladd, G. W. (2001). Peer rejection as antecedent of young children's schooladjustment: An examination of mediating processes. Developmental Psychology, 37(4),550-560.
Buhs, E. S., Ladd, G. W., & Herald, S. L. (2006). Peer exclusion and victimization: Processesthat mediate the relation between peer group rejection and children's classroomengagement and achievement? Journal of Educational Psychology, 98(1), 1-13.
Burchinal, M.R., Ramey, S.L., Reid, M.K., & Jaccard, J. (1995). Early child care experiencesand their association with family and child characteristics during middle childhood. EarlyChildhood Research Quarterly, 10, 33-61.
Burchinal, M.R., Roberts, J.E., Nabors, L.A., & Bryant, D. (1996). Quality of centre child careand infant cognitive and language development. Child Development, 67, 606-20.
Burchinal, M.R., Roberts, J.E., Riggins, R., Zeisel, S.A., Neebe, E., & Bryant, D. (2000).Relating quality of center-based child care to early cognitive and language developmentlongitudinally. Child Development, 71(2), 339-357.
Bus, A.G., van Ijzendoorn, M.H., & Pelligrini, A.D. (1995). Joint book reading makes forsuccess in learning to read: A meta-analysis on intergenerational transmission of literacy.Review of Educational Research, 65(1), 1-21.
Canfield, R.L., Henderson, C.R., Cory-Slechta, D.A., Cox, C., Jusko, T.A., & Lanphear, B.P.(2003). Intellectual impairments in children with blood lead concentrations below 10 µgper decilitre. The New England Journal of Medicine, 348 (16), 1517-1526.
Caughy, M.O. (1996). Health and environmental effects on the academic readiness of school-agechildren. Developmental Psychology, 32, 515-522.
Caughy, M.O., DiPietro, J.A., & Strobino, D.M. (1994). Day-care participation as a protectivefactor in the cognitive development of low-income children. Child Development, 65(2),457-471.
Chase-Lansdale, P.L., Gordon, R.A., Brooks-Gunn, J., & Klebanov, P.K. (1997). Neighborhood

74
and family influences on the intellectual and behavioral competence of preschool andearly school-age children. In Brooks-Gunn, J., Duncan, G.J. and Aber J.L. (Eds.)Neighborhood Poverty (pp. 79-118). New York, NY: Russell Sage Foundation.
Child Trends. (2001). School readiness: Helping communities get children ready for school andschools ready for children. Washington, DC: Author.
Clark, K.E., & Ladd, G.W. (2000). Connectedness and autonomy support in parent-childrelationships: Links to children’s socioemotional orientation and peer relationships.Developmental Psychology, 36, 485-498.
Clarke–Stewart, K.A. (1991). A home is not a school: The effects of child care on children’sdevelopment. Journal of Social Issues, 47, 105–124.
Coie, J.D., Terry, R.A., Lenox, K., Lochman, J.E., & Hyman, C. (1995). Childhood peerrejection and aggression as predictors of stable patterns of adolescent disorder.Development and Psychopathology, 8, 597-600.
Coiro, M. J., & Emery, R. E. (1998). Do marriage problems affect fathering more thanmothering? A quantitative and qualitative review. Clinical Child and Family PsychologyReview, 1, 23–40.
Coley, R.L., & Chase-Lansdale, P.L. (1998). Adolescent pregnancy and parenthood: Recentevidence and future directions. American Psychologist, 53, 152-166.
Conn-Powers, M. (2006). All children ready for school: Approaches to learning. EarlyChildhood Briefing Series. Indiana: Indiana Institute on Disability and Community.
Coolahan, K.C. (1997). Empirical relationships among parenting styles, determinants ofparenting, and children’s school readiness in urban Head Start families. University ofPennsylvania, Philadelphia, PA. Unpublished doctoral dissertation.
Cote, S., Boivin, M., Nagin, D., Japel, C., Xu, Q., Zoccolillo, M., Junger, M., & Tremblay, R.E.(2007). The role of maternal education and nonmaternal care services in the prevention ofchildren’s physical aggression problems. Archives of General Psychiatry, 64(11), 1305-1312.
Cote, S.M., Borge, A.I., Geoffroy, M.C., Rutter, M., & Tremblay R.E. (2008). Nonmaternal carein infancy and emotional/behavioral difficulties at 4 years old: Moderation by family riskcharacteristics. Developmental Psychology, 44(1), 155-168.
Cote, S., Doyle, O., & Petitclerc A. (2009). Social selection in child care services: ComparingBritain, Canada and the United States. UCD Geary Institute, Unpublished Manuscript.
Cronbach, L.J. (1951). Coefficient alpha and the internal structure of tests. Psychometrika, 16,297-334.

75
Cummings, E.M., Davies, P.T., & Campbell, S.B. (2000). Developmental psychopathology andfamily process: Theory, research, and clinical implications. New York: Guilford Press.
Cuskelly, M.M., & Detering, N. (2003). Teacher and student perspectives of school readiness.Australian Journal of Early Education, 28(2), 39-46.
Deal, L.W., Gomby, D.S., Zippiroli, L., & Behrman, R.E. (2000). Unintentional injuries inchildhood: Analysis and recommendations. The Future of Children 10, 4-22.
Deal, L.W., & Holt, V.L. (1998). Young maternal age and depressive symptoms: Results fromthe 1988 national maternal and infant health survey. American Journal of Public Health,88, 266 – 270.
DeMatteo, D., & Marczyk, G. (2005). Risk factors, protective factors, and the prevention ofantisocial behaviour among juveniles. In Heilbrum, K., Sevin-Goldstein, N.E. &Redding, R.E. (Eds.). Juvenile Delinquency. Oxford: OUP.
Denny, K., Harmon, C. & O’Sullivan, V. (2003). Education, earnings and skills: A multi-countrycomparison. Institute for Fiscal Studies (IFS) Working Paper 04/08.
Dockett, S., Perry, B. & Tracey, D. (2000). Getting ready for school. Paper presented at theAnnual Conference of the Australian Association for Research in Education, Brisbane,December, 2000.
Dodge, K.A., Greenberg, M.T., & Malone, P.S. (2008). Testing an idealized dynamic cascademodel of the development of serious violence in adolescence. Child Development, 79(6),1907-1927.
Doherty, G. (1997). Zero to six: The basis for school readiness. Quebec: HRDC PublicationsCentre.
Dornbusch, S. M., Ritter, P. L., Leiderman, P. H., Roberts, D. F., & Fraleigh, M. J. (1987). Therelation of parenting style to adolescent school performance. Child Development, 58,1244-1257.
Duncan, G.J., Dowsett, C.J., Claessens, A., Magnuson, K., Huston, A.C., Klebanov, P., et al.(2007). School Readiness and Later Achievement. Developmental psychology, 43(6),1428-1446.
Emler, N. (2001). Self-esteem: The costs and causes of low self-worth. York: Joseph RowntreeFoundation. Retrieved June 4, 2009 fromhttp://flyvapnet.com/LargeFiles/SelfEsteemTheCostsAndCausesOfLowSelfWorth.pdf
Ensminger, M. E., Lamkin, R. P., & Jacobson, N. (1996). School leaving: A longitudinalperspective including neighborhood effects. Child Development, 67, 2400-2416.

76
Fantuzzo, J.W., Bulotsky-Shearer, R., Fusco, R.A., & McWayne C. (2005). An investigation ofpreschool classroom behavioural adjustment problem and social-emotional schoolreadiness competencies. Early Childhood Research Quarterly, 20, 259-275.
Fantuzzo, J.W., Bulotsky-Shearer, R., McDermott, P.A., McWayne, C., Frye, D., & Perlman, S.(2007). Investigation of dimensions of social-emotional classroom behaviour and schoolreadiness for low-income urban preschool children. School Psychology Review, 36, 44-62.
Fisher, (1992).The impact of play on development: A metaanalysis. Play and Culture, 5,159–181.
Flouri, E., & Buchanan, A. (2004). Early father’s and mother’s involvement and child’s latereducational outcomes. British Journal of Educational Psychology, 74, 141-153.
Forget-Dubois, N., Lemelin, J.P., Boivin, M., Dionne, G., Seguin, J.R., Vitaro, F., & Tremblay,R.E. (2007). Predicting early school achievement with the EDI: A longitudinalpopulation-based study. Early Education and Development, 18, 405-426.
French, D.C., Jansen, E.A., Riansari, M., & Setiono, K. (2003). Friendships of Indonesianchildren: Adjustment of children who differ in friendship presence and similarity betweenmutual friends. Social Development, 12(4), 605-621.
Gagnon, C., Vitaro, F., & Tremblay, R.E. (1992). Parent-teacher agreement on kindergartner’sbehaviour problems. Journal of Child Psychology and Psychiatry, 33(7), 1255-1261.
Garner, C. L., & Raudenbush, S. W. (1991). Neighborhood effects on educational attainment: Amultilevel analysis. Sociology of Education, 64, 251-261.
Geoffroy, M.C., Cote, S.M., Borge, A., Larouche, F., Seguin, J.R., & Rutter, M. (2006).Association between nonmaternal care in the first year of life and children’s receptivelanguage skills prior to school entry: the moderating role of socioeconomic status.Journal of Child Psychology and Psychiatry, 48(5), 490-497.
Gephart, M.A. (1997). Neighborhood and communities as contexts for development. In Brooks-Gunn, J., Duncan, G.J. and Aber, J. L. (Eds.) Neighborhood Poverty (pp. 1-43). NewYork, NY: Russell Sage Foundation.
Gifford-Smith, M.E., & Brownell, C.A. (2003). Childhood peer relationships: Social acceptance,friendships, and peer networks. Journal of School Psychology, 41, 235-284.
Gillon, G., & Dodd, B. (1995). The effects of training phonological, semantic, and syntacticprocessing skills in spoken language on reading ability. Language, Speech, and HearingServices in Schools, 26, 58-68.

77
Goal One Ready Schools Resource Group. (1995). Ready schools for young children.Washington, DC: National Education Goals Panel.
Grantham-McGregor, S. (1995). A review of studies of the effect of severe malnutrition onmental development. Journal of Nutrition, 125, 2233-2238.
Gregg, P., Washbrook, E., Propper, C., & Burgess, S.M. (2005).The effects of a mother's returnto work decision on child development in the UK. Economic Journal, 115(501), 48-80.
Griffith, J. (1996). Relation of parental involvement, empowerment, and school traits toacademic performance. Journal of Educational Research, 90(1), 33-41.
Grolnick, W. S., Benjet, C., Kurowski, C. O., & Apostoleris, N. H. (1997). Predictors of parentinvolvement in children’s schooling. Journal of Educational Psychology, 89(3), 538–48.
Grolnick, W.S., Kurowski, C.O., Dunlap, K., & Hevey, C. (2000). Parental resources and thetransition to junior high. Journal of Research on Adolescence, 10, 465-480.
Grolnick, W.S., Price, C.E., Beiswenger, K.L., & Sauck, C.C. (2007). Evaluative pressure inmothers: Effects of situation, maternal, and child characteristics on autonomy supportiveversus controlling behaviour. Developmental Psychology, 43, 991-1002.
Grolnick, W.S., & Ryan, R.M. (1989). Parent styles associated with children's self-regulationand competence in school. Journal of Educational Psychology, 81, 143-154.
Guhn, M., Gaderman, A., & Zumbo, B.D. (2007). Does the EDI measure school readiness in thesame way across different groups of children? Early Education and Development, 18(3),453-472.
Guhn, M., Janus, M., & Hertzman, C. (2007). The Early Development Instrument: Translatingschool readiness assessment into community actions and policy planning. EarlyEducation and Development. 18(3), 369-374.
Guillon, M.S., Crocq, M., & Bailey, P.E. (2002). The relationship between self-esteem andpsychiatric disorders in adolescents. European Psychiatry, 18, 59-62.
Gullo, D.F., & Burton, C.B. (1992). Age of entry, preschool experience, and sex as antecedentsof academic readiness in kindergarten. Early Childhood Research Quarterly, 7, 175-186.
Haapasalo, J., & Tremblay, R.E. (1994). Physically aggressive boys from ages 6 to 12: Familybackground, parenting behaviour, and prediction of delinquency. Journal of Consultingand Clinical Psychology, 62, 1044-1052.
Hack, M., Taylor, H.G., Klein, N., Eiben, R., Schatschneider, C., & Mercuri-Minich, N. (1994).School-age outcomes in children with birthweights under 750g. New England Journal ofMedicine, 331, 753-759.

78
Haldre, K., Rahu, K., Rahu, M., & Karro, H. (2009). Individual and familial factors associatedwith teenage pregnancy: An interview study. European Journal of Public Health, 1-5.
Halle, T., Zaff J., Calkins, J., & Geyelin-Margie, N. (2000). Part II: Reviewing the literature oncontributing factors to school-readiness. In Background for Community-Level Work onSchool readiness: A review of Assessments and Investment Strategies. Child Trends,Final Report to the Knight Foundation.
Halsall, S., & Green. C. (1995). Reading aloud: A way for parents to support their children’sgrowth in literacy. Early Childhood Education Journal, 23(1), 27-31.
Hammen, C., Adrian, C., Gordon, D., Burge, D., & Jaenicke, C. (1987). Children of depressedmothers: Maternal strain and symptom predictors of dysfunction. Journal of AbnormalPsychology, 96, 190-198.
Harmon, C., Oosterbeek, H., & Walker, I. (2000). The returns to education: Microeconomics.Journal of Economic Surveys, 17(2), 115-156.
Harradine, C.C., & Clifford, R.M. (1996). When are children ready for kindergarten? Views offamilies, kindergarten teachers, and child care providers. Paper presented at the meetingof the American Educational Research Association, New York, NY (ERIC DocumentReproduction Service No. ED 399044).
Harris, J.R. (1998). The nurture assumption: Why children turn out the way they do. New York:Free Press.
Hartup, W.W. (1989). Social relationships and their developmental significance. AmericanPsychologist, 44(2), 120-126.
Hartup, W.W., & Stevens, N. (1999). Friendships and adaptation across the life span, CurrentDirections in Psychological Science 8, 76–79.
Haugland, S.W. (2000). What role should technology play in young children’s learning? YoungChildren 54(6), 26-31.
Heaviside, S., & Farris, E., (1993). Public school kindergarten teachers’ views on children’sreadiness for school, U.S. Department of Education, NCES 93–410, Washington, DC.
Heckman, J. (2000). Invest in the very young. Chicago, IL: Ounce of Prevention Fund.
Heckman, J.J. (2006). Skill formation and the economics of investing in disadvantaged children.Science, 312 (5782), 1900-1902.
Heckman, J.J., & Masterov, D.V. (2007). The productivity argument for investing in youngchildren. Review of Agricultural Economics, 29(3), 446-493.
79
Heckman, J.J., Moon, S. Pinto, R., Savelyev, P., & Yavitz, A. (2009). A reanalysis of theHigh/Scope Perry Preschool Program. Unpublished working paper.
Hetherington, E.M., Henderson, S.H., & Reiss, D. (1999). Adolescent siblings in stepfamilies:family functioning and adolescent adjustment. In Hetherington, E.M., Henderson, S.H.,Reiss, D. (Eds), Adolescent siblings in stepfamilies: Family functioning and adolescentadjustment, monographs of the society for research in child development (pp.1-25).Monographs of the Society for Research in Child Development, Serial No. 259, Vol. 64,No. 4.
Hickman, L.N. (2006). Who should care for our children? The effects of home versus center careon child cognition and social adjustment. Journal of Family Issues, 27(5), 652-684.
Hill, R. (1999). The strengths of Black families. New York: Emerson-Hall.
Hinshaw, S.P. (1992). Externalizing behaviour problems and academic underachievement inchildhood and adolescence: Causal relationships and underlying mechanisms.Psychological Bulletin. 111(1), 127-155.
Horvath, D.L. (2004). Parenting over time: A developmental perspective. Dissertation AbstractsInternational: Section B: The Sciences and Engineering. 64(11-B).
Hughes, J.N., & Hasbrouck, J.E. (1996). Television violence: Implications for violenceprevention. School Psychology Review, 25(2), 134-151.
Huston, A.C., & Wright, J.C. (1996). Television and socialization of young children. InMacBeth, T. (Ed.) Tuning in to young viewers (pp. 37-60), Thousand Oaks, CA: Sage.
Huston, A.C., & Wright, J.C. (1998). Mass media and children’s development. In I.E. Sigel andK.A. Renninger (Eds.), Handbook of Child Psychology, Vol. 4. (pp. 999-1058) NewYork: John Wiley & Sons, Inc.
Huston-Stein, A., Fox, S., Greer, D., Watkins, B.A., & Whitaker, J. (1981). The effects of actionand violence on children’s social behavior. Journal of Genetic Psychology, 138, 183-191.
Janus, M., & Duku, E. (2007). The school entry gap: Socioeconomic, family, and health factorsassociated with children's school readiness to learn. Early Education & Development,18(3), 375-403.
Janus, M., Duku, E.K., & Stat, P. (2005). Development of the Short Early DevelopmentInstrument (S-EDI). Report for the World Bank.
Janus, M., & Offord, D. (2000). Readiness to learn at school. Canadian Journal of PolicyResearch, 1(2), 71-75.
Janus, M., & Offord, D. (2001). Birth weight, early birth, and readiness to learn at school at 5

80
years. Paper presented at the Society for Reproductive and Infant Psychology meeting,Oxford, UK, September 2001.
Jencks, C., & Mayer, S. (1990). The social consequences of growing up in a poorneighbourhood. In Lynn L.E. Jr. and McCeary M. G. (Eds.) Inner-city poverty in theUnited States, Washington, D.C: National Academy Press.
Kagan, S.L., Moore, E., & Bradenkamp, S. (1995). Reconsidering children's early developmentand learning: Toward common views and vocabulary. Washington, DC: NationalEducation Goals Panel, Goal 1 Technical Planning Group.
Kagan, S.L., & Neuman, M.J. (1997). Defining and implementing school readiness: Challengesfor families, early care and education, and schools. In Weissberg, R.P. Gullotta, T.P.,Hampton, R.L., Ryan, B.A., and Adams, G.R. (Eds.) Healthy children 2010: Establishingpreventive services (pp. 61-96). Thousand Oaks, CA: Sage Publications.
Kagan, S. L., & Neuman, M. J. (1998). Lessons from three decades of transition research. TheElementary School Journal, 98(4), 365–379.
Karoly, L.A., & Bigelow, J.H. (2005). The Economics of Investing in Universal PreschoolEducation in California. Santa Monica, CA: RAND Corporation.
Katz, L. (1991). Readiness, Children and Schools. ERIC Digest, Urbana, Ill, ERICClearinghouse on Elementary and Early Childhood Education.
Kessler, C. (2002).Parenting styles, parental school involvement beliefs, and parental activities:Influential factors in the development of kindergarten readiness. ETD collection forUniversity of Nebraska - Lincoln Retrieved 14 April 2009 fromhttp://digitalcommons.unl.edu/dissertations/AAI3045522
Kiernan, K.E. (1980). Teenage motherhood-associated factors and consequences- Theexperiences of a British birth cohort. Journal of Biosocial Science, 12, 393-405.
Kiernan, K. E. (1995). Transition to Parenthood: Young Mothers, Young Fathers and AssociatedFactors and Later Life Experiences. Welfare State Programme Discussion paperWSP113. London School of Economics: London.
Kiernan, G., Axford, N., Little, M., Murphy, C., Greene, S. & Gormley, M. (2008). The schoolreadiness of children living in a disadvantaged area in Ireland. Journal of EarlyChildhood Research, 6, 119.
Klebanov, P.K., Brooks-Gunn, J., McCarton, C., & McCormick, M.C. (1998). The contributionof neighbourhood and family income to developmental test scores over the first threeyears of life. Child Development, 69, 1420-1436.
Klebanov, P.K., Brooks-Gunn, J., & McCormick, M.C. (1994). Classroom behavior of very low
81
birthweight elementary school children. Pediatrics, 94, 700-708.
Knudsen-Lindauer, S.L., & Harris, K. (1989). Priorities for kindergarten curricula: Views ofparents and teachers. Journal of Research and Childhood Education, 4(1), 51-61.
Korenman, S., Miller, J.E., & Sjaastad, J.E. (1995). Long-term poverty and child development inthe United States: Results from the NLSY. Children and Youth Services Review, 17, 127-155.
Kupersmidt, J.B., & Coie, J.D. (1990). Preadolescent peer status, aggression, and schooladjustment as predictors of externalizing problems in adolescence. Child Development,61, 1350–1362.
Ladd, G. W. (1990). Having friends, keeping friends, making friends, and being liked by peers inthe classroom: Predictors of children's early school adjustment? Child Development,61(4), 1081-1100.
Ladd, G.W. (1999). Peer relationships and social competence during early and middle childhood.Annual Review of Psychology, 50, 333-359.
Ladd, G.W., Birch, S.H., & Buhs, E.S. (1999). Children's social and scholastic lives inkindergarten: Related spheres of influence? Child Development, 70(6), 1373-1400.
Ladd, G. W. & Price, J. M. (1987). Predicting children's social and school adjustment followingthe transition from preschool to kindergarten. Child Development, 58(5), 1168-1189.
LaGrange, B., & Cole, D.A. (2008). An expansion of the Trait-State-Occasion Model:Accounting for shared method variance. Structural Equation Modeling, 15, 241–271.
Lamborn, S.D., Mounts, N.S., Steinberg, L., & Dornbusch, S.M. (1991). Patterns of competenceand adjustment among adolescents from authoritative, authoritarian, indulgent, andneglectful families. Child Development, 62, 1049-1065.
Lane, K.L., Stanton-Chapman, T., Jamison, K.R., & Phillips, A. (2007). Teacher and parentexpectations of preschoolers’ behaviour: Social skills necessary for success. Topics inEarly Childhood Special Education, 27, 86–97.
Langille, D.B. (2007). Teenage pregnancy: Trends, contributing factors and the physician’s role.Journal of the Canadian Medical Association, 176(11), 1601-1602.
Lapointe, V.R., Ford, L., & Zumbo, B.D. (2007). Examing the relationship betweenneighborhood environment and school readiness for kindergarten children. EarlyEducation and Development, 18, 473-495.
Le, V., Kirby, S.N., Barney, H., Setodji, C.M., & Gershwin, D. (2006). School readiness, full-

82
day kindergarten and student achievement: An empirical investigation. Santa Monica,California: RAND Corporation. Retrieved March 25, 2009 from: http://www.rand.org.
Lewit, E.M., & Schuurman Baker, L. (1995). School readiness. Critical Issues for Children andYouths, 5, 128-139.
Liaw, F.R., & Brooks-Gunn, J. (1993). Patterns of low birth weight, children’s cognitivedevelopment and their determinants. Developmental Psychology, 19(6), 1024-1035.
Lochner, L., & Moretti, E. (2004). The effect of education on crime: Evidence from prisoninmates, arrests and self-reports. American Economic Review, 94(1), 155-189.
Loeb, S., Bridges, M., Bassok D., Fuller, B., & Rumberger, R. (2007). How much is too much?The influence of preschool centers on children’s development nationwide. Economics ofEducation Review, 26, 52-66.
Love, J.M., Harrison, L., Sagi-Schwartz, A., van Ijzendoorn, M.H., Ross, C., Ungerer, J.A., et al.(2003). Child care quality matters: How conclusions may vary with context. ChildDevelopment, 74(4), 1021-1033.
Love, J.M., Logue, M.E., Trudeau, J.V., & Thayer, K. (1992). Transition to kindergarten inAmerican schools. Final Report of the National Transition Study. Washington DC: Officeof Policy and Planning.
Maccoby, E.E., & Martin, J.A. (1983). Socialization in the context of the family: Parent-childinteraction. In P.H. Mussen (Series Ed.) & E.M. Hetherington (Vol. Ed.), Handbook ofchild psychology: Vol. 4. Socialization, personality, and social development (4th ed., pp.1-101). New York: Wiley.
Mallory, N.J., & Goldsmith, N.A. (1991). The Head Start Experience. ERIC Digest. Urbana, IL:ERIC Clearinghouse on Elementary and Early Childhood Education. (ERIC DocumentReproduction Service No. ED 327 313).
Marini, M.M. (1984). Women’s educational attainment and the timing of entry into parenthood.American Sociological Review, 49, 491-511.
Marozzi, M. (2002). Some notes on nonparametric inferences and permutation tests. MetronInternational Journal of Statistics, 0(3-4), 139-151.
May, D.C., & Kundert, D.K. (1997). School readiness practices and children at risk: Examiningthe issues. Psychology in the Schools, 34(2), 73-84.
McCartney, K., Dearing, E., Taylor, B.A., & Bub, K.L. (2007). Quality child care supports theachievement of low-income children: Direct and indirect pathways through caregivingand the home environment. Journal of Applied Developmental Psychology, 28(5-6), 411-426.

83
McCluskey, C.P., McCluskey, J.D., & Bynum, T.S. (2006). Early onset offending and laterviolent and gun outcomes in a contemporary youth cohort. Journal of Criminal Justice,34(5), 531-541.
McCormick, M.C., Workman-Daniels, K., & Brooks-Gunn, J. (1996). The behavioural andemotional well-being of school-age children with different birthweights. Pediatrics, 97,18-25.
McGuinness, S., McGinnity, F., & O’Connell, P. (2008). Changing returns to education during aboom? The case of Ireland. ESRI Working paper No. 227.
McLellan, D.E., & Katz, L.G. (2001). Assessing young children’s competence, URL:http://ceep.crc.uiuc.edu/eecearchive/digests/2001/mcclel01.html
McLoyd, V. (1998). Socioeconomic disadvantage and child development. AmericanPsychologist, 53(2), 185-204.
McNamara, K.A., Selig, J.P., & Hawley, P.H. (in press). A typological approach to the study ofparenting: Associations between maternal parenting patterns and child behaviour andsocial reception. Early Child Development and Care.
Melton, G. B., Limber, S. P., & Teague, T. L. (1999). Changing schools for changing families. InR. C. Pianta and M. J. Cox (Eds.), The Transition to Kindergarten (pp. 179-213).Baltimore, MD: Paul H. Brookes Publishing Co., Inc.
Mitrofan, O., Paul, M., & Spencer, N. (2009). Is aggression in children with behavioural andemotional difficulties associated with television viewing and video game playing? Asystematic review. Child: Care, Health, and Development, 31(1), 5-15.
Moore, K., Manlove, J., Richter, K., Halle, T., LeMenestrel, S., Zaslow, M., Greene, A. D.,Mariner, C., Romano, A., & Bridges, L. (1997). A birth cohort study: Conceptual anddesign considerations. Working paper for the National Center for Education Statistics.Washington, DC.
Morrison, D. R., & Coiro, M. J. (1999). Parental conflict and marital disruption: Do childrenbenefit when high-conflict marriages are dissolved? Journal of Marriage and the Family,61, 626-637.
Murphy, G.C., & Athansou, J.A. (1999). The effect of unemployment on mental health. Journalof Occupational and Organisational Psychology, 72, 83-99.
National Institute of Child Health and Human Development Early Child Care Research Network.(2000). The relation of child care to cognitive and language development. ChildDevelopment, 71(4), 960-980.

84
National Institute of Child Health and Human Development Early Child Care Research Network.(2002). Early child care and children’s development prior to school entry: Results fromthe NICHD Study of Early Child Care. American Educational Research Journal, 39,133-164.
National Institute of Child Health and Human Development Early Child Care Research Network.(2008). Mothers’ and fathers’ support for child autonomy and early school achievement.Developmental Psychology, 44, 895-907.
National Institute of Child Health and Human Development Early Child Care Research Network,& Duncan, G. J. (2003). Modeling the impacts of child care quality on children’spreschool cognitive development. Child Development, 74, 1454-1475.
National Research Council. (1998). Preventing Reading Difficulties in Young Children,Washington, DC: National Academy Press.
Newcomb, A. F., Bukowski, W. M., & Pattee, L. (1993). Children's peer relations: A meta-analytic review of popular, rejected, neglected, controversial, and average sociometricstatus. Psychological Bulletin, 113(1), 99-128.
NGA Taskforce on School Readiness. (2005). Final report. The National GovernorsAssociation.
Noble, G. (1970). Film-mediated aggressive and creative play. British Journal of Social andClinical Psychology, 9, 1-7.
Paranjothy, S., Broughton, H., Adappa, R., & Fone, D. (2009). Teenage pregnancy: Whosuffers? Archives of Disease in Childhood, 94, 239-245.
Parker, J.G., & Asher, S.R. (1987). Peer relations and later personality adjustment: Are lowaccepted children at risk? Psychological Bulletin, 102(3), 357-389.
Pascoe, J.M., Shaikh, U., Forbis, S.G., & Etzel, R.A. (2007). Health and nutrition as a foundationfor success in schools. In R. C. Pianta, M. J. Cox & K. L. Snow (Eds.), School readinessand the transition to kindergarten in the era of accountability (pp. 99-120). Baltimore:Paul Brookes.
Peisner-Feinberg, E., Burchinal, M., Clifford, R., Culkin, M., Howes, C., Kagan, S., & Yazejian,N. (2001). The relation of preschool child-care quality to children’s cognitive and socialdevelopmental trajectories through second grade. Child Development, 72, 1534–1553.
Pharoah, P.O.D., Stevenson, C.J., Cooke, R.W.I., & Stevenson, R.C. (1994). Prevalence ofbehaviour disorders in low birthweight infants. Archives of Disease in Children, 70, 271-274.
Phillips, D., McCartney, K., & Scarr, S. (1987) Child-care quality and children’s social

85
development. Developmental Psychology, 23(4), 537-543.
Piortowski, C.S., Botsko, M., & Matthews, E. (2000). Parent’s and teachers beliefs aboutchildren’s school readiness in a high need community. Early Childhood ResearchQuarterly, 15(4), 537-558.
Platt, L.J., & Cabezas, M.C. (2000). Early childhood dental caries. Los Angeles, CA: UCLACenter for Healthier Children, Families and Communities.
Querido, J.G., Warner, T.D., & Eyberg, S.M. (2002). Parenting styles and child behaviourin African American families of preschool children. Journal of Clinical ChildPsychology, 31, 272-277.
Radke-Yarrow, M., Nottelmann, E., Martinez, P., Fox, M.B., & Belmont, B. (1992). Youngchildren of affectively ill parents: A longitudinal study of psychosocial development.Journal of the American Academy of Child Adolescent Psychiatry, 31, 68-76.
Raver, C. (2003). Young children’s emotional development and school readiness. ERIC Digest.URL: http://www.childcareresearch.org/SendPdf?resourceId=2833
Rice, M. L., & Woodsmall, L. (1988). Lessons from television: Children’s word learning whenviewing. Child Development, 59, 420-429.
Rimm-Kaufman, S.E., & Pianta, R.C. (2000). An ecological perspective on the transition tokindergarten: A theoretical framework to guide empirical research. Journal of AppliedDevelopmental Psychology, 21, 491-511.
Rimm-Kaufman, S.E., Pianta, R.C., & Cox, M.J. (2000). Teachers’ judgements of problems inthe transition to kindergarten. Early Childhood Research Quarterly, 15(2), 147-166.
Robinson, C.C., Mandleco, B., Olsen, S.F., & Hart, C.H. (2001). The Parenting Styles andDimensions Questionnaire (PSQD). In: B.F. Perlmutter, J. Touliatos and G.W. Holden,(Eds.), Handbook of family measurement techniques: Vol. 3. Instruments & index, (pp.319-321), Sage, Thousand Oaks.
Rodriguez, E., Frongillo, E.A., & Chandra, P. (2001). Do social programmes contribute tomental well-being? The long-term impact of unemployment on depression in the UnitedStates. International Journal of Epidemiology, 30, 163-170.
Roeser, R.W., Eccles, J.S., & Freedman-Doan, C. (1999). Academic functioning and mentalhealth in adolescence: Patterns, progressions and routes from childhood. Journal ofAdolescent Research, 14, 135-174.
Rose, L.C., Gallup, A.M., & Elam, S.M. (1997). The 29th annual Phi Delta Kappan/Gallup Pollof the public's attitude toward the public schools. Phi Delta Kappan, 79(1), 41-56.

86
Rouse, C., Brooks-Gunn, J., & McLanahan, S. (2005). School readiness: Closing racial andethnic gaps. The Future of Children, 15(1), 5-15.
Ross, D., & Shillington, R. (1990). Child poverty and poor educational attainment: Theeconomic costs and implications for society. In Children in Poverty: Toward a BetterFuture. Report of the Standing Committee on Social Affairs, Science and Technology.Ottawa: Minister of Supply and Services, Appendix I.
Rowe, D. C. (1994). The limits of family influence: Genes, experience, and behaviour. NewYork: Guilford Press.
Rudolph, K.D., Hammen, C., & Burge, D. (1994). Interpersonal functioning and depressivesymptoms in childhood: Addressing the issues of specificity and comorbidity. Journal ofAbnormal Child Psychology, 22, 355-371.
Scarr, S. (1992). Developmental theories for the 1990s: Development and individual differences.Child Development, 63, 1-19.
Shaffer, D.R., & Kipp, K. (2007). Developmental Psychology: Childhood and adolescence (7th
ed.). Canada: Thomson Wadsworth.
Shaw, J.G., Hammer, D., & Leland, H. (1991). Adaptive behaviour of preschool children withdevelopmental delays: Parent versus teacher ratings. Mental Retardation, 29(1), 49-53.
Son, S., & Meisels, S.J. (2006). The relationship of young children’s motor skills to later readingand math achievement. Merrill-Palmer Quarterly, 52(4), 755-778.
Smolkin, L. B. (1999). The practice of effective transitions: Players who make a winning team.In R. C. Pianta & M. J. Cox (Eds.). The transition to kindergarten (pp. 325-349).Baltimore, MD: Paul H. Brookes Publishing Co., Inc.
Spernak, S.M., Schottenbauer, M.A, Ramey, S.L., & Ramey, C.T. (2006). Child health andacademic achievement among former Head Start children. Children and Youth ServicesReview, 28, 1251-1261.
Sroufe, L.A., Cooper, R.G., & DeHart, G.B. (1992). Child development: Its nature and course.New York: McGraw-Hill.
Stipek, D.J., & Ryan, R.H. (1997). Economically disadvantaged preschoolers: Ready to learn butfurther to go. Developmental Psychology, 33(4), 711-723.
Swick, K.J., Grafwallner, R., Cockey, M., Roach, J., Davidson, S., Mayor, M., & Gardner, N.(1997). On board early: Building strong family-school relations. Early ChildhoodEducation Journal, 24(4), 269-273.
Tasse, M.J., & Lecavalier, L. (2000). Comparing parent and teacher ratings of social competence
87
and problem behaviours. American Journal of Mental Retardation, 105(4), 252-259.
Taylor, L., Clayton, J., & Rowley, S. (2004). Academic socialization: Understanding parentalinfluences on children’s school-related development in the early years. Review of GeneralPsychology, 8(3), 163-178.
Thompson, M. S., Entwisle, D. R., Alexander, K. L., & Sundius, M. J. (1992). The influence offamily composition on children’s conformity to the student role. American EducationResearch Journal, 29, 405-424.
Valkenburg, P.M., & van der Voort, T.H.A. (1994). Influence of TV on daydreaming andcreative imagination: A review of research. Psychological Bulletin, 116(2), 316-339.
Vandell, D.L., & Pierce, K.M. (2003). Child care quality and children's success at school. In A.Reynolds and M. Wang (Eds.) Early Childhood Learning: Programs for a New Century(pp. 115-139). New York: Child Welfare League.
West, J., Hausken, E.G., & Collins, M. (1993). Readiness for kindergarten: Parent and teacherbeliefs. Washington, DC: US Department of Education, Office of Educational Researchand Improvement, NCES, 93-257.
Whitehead, M.R. (2002). Developing Language and Literacy with Young Children. CA: SAGE
Whitehurst, G. J., Epstein, J.N., Angell, A.L., Payne, A.C., Crone, D.A., & Fischel, J.E. (1994).Outcomes of an emergent literacy intervention in Head Start. Journal of EducationalPsychology, 86(4), 542-555.
Whitehurst, G. J., & Lonigan, C. J. (1998). Child development and emergent literacy. ChildDevelopment, 69(3), 848-872.
Woodward, L.J., & Fergusson, D.M. (1999). Early conduct problems and later risk of teenagepregnancy in girls. Development and Psychopathology, 11, 127-141.
Woodward, L., Fergusson, D.M. & Horwood, J. (2001). Risk factors and life processesassociated with teenage pregnancy: Results of a prospective study from birth to 20 years.Journal of Marriage and Family, 63, 1170-1184.
Wright, J.C., & Huston, A.C. (1995). Effects of educational TV viewing of lower-incomepreschoolers on academic skills, school readiness, and school adjustment one to threeyears later. Report to Children’s Television Workshop, Lawrence, KS: University ofKansas, Center for Research on the Influences of Television on Children.
Zigler, E., Pfannenstiel, J.C., & Seitz, V. (2008). The parents as teachers program and schoolsuccess: A replication and extension. Journal of Primary Prevention, 29, 103-120.

88
XI. Appendix
Table 1Descriptive Statistics for Continuous Variables
N Mean St. Dev. Min Max
Child InformationAge 92 4.35 0.64 2 7
Teacher InformationAge 12 37.25 10.46 24 55Years teaching 12 10.83 8.88 2 31Years teaching Junior Infants 12 4.25 3.65 1 15Years teaching at school 12 9.42 7.83 1 31Number of students in class 7 14.70 1.30 13 16
Household InformationNumber of household members 91 4.69 1.44 2 9No. of biological children 92 2.88 1.61 1 10Number of siblings in household 94 1.84 1.52 0 7
Respondent Information*Age 92 30.48 5.53 22 45
Childcare informationLength of time in home based care(months) 14 27.50 14.44 12 52
Length of time in centre based care(months) 80 18.44 10.52 6 45
* 94% of respondents are the child’s mother.

89
Table 2Descriptive Statistics for Categorical Variables
n %Teacher Information
Highest level of education completedNon-degree qualification 1 8.33Primary degree 4 33.33Postgraduate qualification 7 58.33
Respondent Information
Relationship to child
Biological Mother 87 93.55Foster Mother 1 1.08Biological Father 1 1.08Adoptive Father 4 4.30
Ethnic group
Irish 81 88.04Irish Traveller 9 9.78British 1 1.09Other White 1 1.09
Household Information
Household weekly income
Less than €50 2 3.57€100-€150 1 1.79€150-€200 2 3.57€200-€250 5 8.93€250-€300 6 10.71€300-€400 11 19.64€400-€500 9 16.07€500-€600 6 10.71€600-€750 6 10.71€750-€900 5 8.93€900-€1000 1 1.79€1000-€1500 2 3.57
Childcare Information
Type of Childcare
Grandparent 12 12.77Other relative 1 1.06Nanny 1 1.06Nursery 41 43.62Montessori 39 41.50