REPORT of the 1993 National Survey of Science and ...
219
REPORT of the 1993 National Survey of Science and Mathematics Education 1994 Iris R. Weiss Michael C. Matti P. Sean Smith Horizon Research, Inc. 111 Cloister Court, Suite 220 Chapel Hill, NC 27514-2296
-
Upload
khangminh22 -
Category
Documents
-
view
0 -
download
0
Transcript of REPORT of the 1993 National Survey of Science and ...
REPORT of the 1993 National Survey of Science and Mathematics Education
1994 Iris R. Weiss
Michael C. Matti P. Sean Smith
Horizon Research, Inc. 111 Cloister Court, Suite 220
Chapel Hill, NC 27514-2296

1.· The Rf:port-bfthei993NationalSurveyo~fScience and Matheniatics .·.Education was prepareciwifl·isupp()rt .. fromthe National Science
Foundation under gnuit number RED"9150005~ These writings do not
1 necessarily reflect the vieW:s of the National Science Foundation.
'·. ·. ·:: ... ·. . .

Table of Contents Page
List of Tables ....................................... , ............................ v
Acknowledgements . . . . . . . . . . . . . . . . . . . . . . . . . . . . . . . . . . . . . . . . . . . . . . . . . . . . . . . . . . . . . . . ix
Chapter One: Introduction A. Background and Purpose of the Study . . . . . . . . . . . . . . . . . . . . . . . . . . . . . . . . . . . . . . . . . . . 1 B. Sample Design and Sampling Error Considerations ......... : ........................ 2 C. Instrument Development ....................................... · ............. 3 D. Data Collection .......................................................... 4 E. File Preparation and Analysis ................................................. 5 F. Outline of This Report ..................................................... 5
Chapter Two: Teacher Background and Beliefs A. Overview . . . . . . . . . . . . . . . . . . . . . . . . . . . . . . . . . . . . . . . . . . . . . . . . . . . . . . . . . . . .... 7 B. Teacher Characteristics ..................................................... 7 C. Teacher Preparation . . . . . . . . . . . . . . . . . . . . . . . . . . . . . . . . . . . . . . . . . . . . . . . . . . . . . . 1 0 D. Teacher Pedagogical Beliefs ................................................. 21 E. Teacher Perceptions of Their Preparation ....... · ................................. 29 F. Teacher Familiarity with NSF-Supported Curricula ................................. 37
Chapter Three: Teachers as Professionals A. Overview .............................................................. 41 B. The School as a Collegial Work Place ......................................... 41 C. Teacher Perceptions of Their Decisionmaking Autonomy ............................ 43 D. Professional Development .................................................. 46
Chapter Four: Science and Mathematics Courses A. Overview . . . . . . . . . . . . . . . . . . . . . . . . . . . . . . . . . . . . . . . . . . . . . . . . . . . . . . . . . . . . . . 51 B. Time Spent in Elementary Science and Mathematics Instruction ........................ 51 C. Science and Mathematics Course Offerings ...................................... 53 D. Other Characteristics of Science and Mathematics Classes ............................ 59
Chapter Five: Instructional Objectives and Activities A. Overview . . . . . . . . . . . . . . . . . . . . . . . . . . . . . . . . . . . . . . . . . . . . . . . . . . . . . . . . . . . . . . 69 B. Objectives of Science and Mathematics Instruction ................................. 69 C. Determining What is Taught ................................................ 72 D. Class Activities ......................................................... 75 E. Homework and Grading Practices ............................................. 85
Chapter Six: Instructional Resources A. Overview .............................................................. 89 B. Textbook Usage ......................................................... 89 C. Facilities and Equipment ................................................... 97
Chapter Seven: Factors Affecting Instruction A. Overview . . . . . . . . . . . . . . . . . . . . . . . . . . . . . . . . . . . . . . . . . . . . . . . . . . . . . . . . . . . . . 107 B. School Programs and Practices .............................................. 107 C. Extent of Influence of the NCTM Standards . . . . . . . . . . . . . . . . . . . . . . . . . . . . . . . . . . . . 112 D. Problems Affecting Instruction .............................................. 113
iii

Appendix A: Sample Design Sample Design
Appendix B: Survey Questionnaires Science Program Questionnaire Mathematics Program Questionnaire Science Questionnaire Mathematics Questionnaire List of Course Titles
Appendix C: Pre-Survey Mailout National Science Foundation Letter Principal Letter Fact Sheet Information Needed Before the Survey
Appendix D: Description of Data Collection Description of Data Collection
Appendix E: Description of Reporting Variables Description of Reporting Variables
Bibliography
iv

Chapter One: Introduction (None)
List of Tables
Chapter Two: Teacher Background and Beliefs
Page
2.1 Characteristics of the Science and Mathematics Teaching Force ........................... 8 2.2 Females in the Science and Mathematics Teaching Force: 1977, 1985-86, and 1993 ............ 9 2.3 Average Age of the Science and Mathematics Teaching Force: 198~86 and 1993 .............. 9 2.4 Science and Mathematics Teachers with Degrees Beyond the Bachelor's, by Years Teaching ..... 10 2.5 Teacher Undergraduate Majors in Science and Mathematics . . . . . . . . . . . . . . . . . . . . . . . . . . . . 11
2.6 Teacher Majors and Minors in Science/Mathematics and Science/Mathematics Education ........ 11 2.7 Number of Semesters of College Coursework in Science .............................. 12 2.8 Number of Semesters Completed in Various Course Categories .......................... 13 2.9 Middle and High School Science Teachers Completing Various College Courses .............. 14 2.10 Elementary Science Teachers Meeting NSTA Course-Background Standards ................. 15
2.11 Middle and Junior High School Science Teachers Meeting NSTA Course-Background Standards ... 15 2.12 Science Classes Taught by Teachers with Six or More College Courses in Field,
in Another Science Field, and Lacking In-Depth Preparation in Any Science . . . . . . . . . . . . . . 16 2.13 Science Teachers Teaching Courses in One, Two, or Three or More Science Subjects,
by Community Type . . . . . . . . . . . . . . . . . . . . . . . . . . . . . . . . . . . . . . . . . . . . . . . . . . . . . 17 2.14 Number of Semesters of College Coursework in Mathematics . . . . . . . . . . . . . . . . . . . . . . . . . . . 17 2.15 Grade 1-4 Mathematics Teachers Completing Various College Courses .................... 18
2.16 Middle and High School Mathematics Teachers Completing Various College Courses .......... 19 2.17 Mathematics Teachers Completing NCTM-Recommended College Mathematics Courses ........ 20 2.18 Grade 9-12 Mathematics Teachers Who Have Completed Various College Courses,
by Teaching Assignment .................................................. 21 2.19 Mathematics Teachers' Familiarity with the NCTM Standards ........................... 22 2.20 Mathematics Teachers Reported Understanding of the NCTM Standards ................... 22
2.21 Science Teachers' Opinions on Curriculum and Instruction Issues ........................ 24 2.22 Mathematics Teachers' Opinions on Curriculum and Instruction Issues ..................... 24 2.23 Mathematics Teachers Indicating that Various Strategies Definitely Should be a
Part of Mathematics Instruction ............................................. 25 2.24 Mathematics Teachers Indicating that Various Strategies Are an Important
Part of Mathematics Instruction . . . . . . . . . . . . . . . . . . . . . . . . . . . . . . . . . . . . . . . . . . . . . 26 2.25 Science Teachers Indicating that Various Strategies Definitely Should be a
Part of Science Instruction ................................................. 27
2.26 Science Teachers Indicating that Various Strategies Are an Important Part of Science Instruction . . . . . . . . . . . . . . . . . . . . . . . . . . . . . . . . . . . . . . . . . . . . . . . . . . . . . . 28
2.27 Self-Contained Grade 1-6 Teachers Feeling Very Well Qualified to Teach Each Subject: 1977, 1985-86, and 1993 ........................................... 29
2.28 Grade 1-4 Science Teachers' Ratings of Their Qualifications to Teach Each of a Number of Subjects .................................................. 30
2.29 Grade 5-8 Science Teachers' Ratings of Their Qualifications to Teach Each of a Number of Subjects .................................................. 30
2.30 Grade 9-12 Science Teachers' Ratings of Their Qualifications to Teach Each of a Number of Subjects .................................................. 30
v

2.31 Grade 1-4 Mathematics Teachers' Ratings of Their Qualifications to Teach Each of a Number of Topics ....................................................... 31
2.32 Grade 5-8 Mathematics Teachers' Ratings of Their Qualifications to Teach Each of a Number of Topics ....................................................... 32
2.33 Grade 9-12 Mathematics Teachers' Ratings of Their Qualifications to Teach Each of a Number of Topics ....................................................... 33
2.34 Grade 9-12 Mathematics Teachers Considering Themselves Well Qualified to Teach Each Mathematics Topic, by Teaching Assignment .................................... 34
2.35 Teachers' Opinions About Their Science and Mathematics Teaching: 1985-86 and 1993 ........ 35
2.36 Mathematics Teachers Considering Themselves Well Prepared for ~ach of a Number of Tasks .... 36 2.37 Science Teachers Considering Themselves Well Prepared for Each of a Number of Tasks ....... 37 2.38 Science Teachers Having Heard of Selected NSF-Supported Curricula ..................... 38 2.39 Mathematics Teachers Having Heard of Selected NSF-Supported Curricula .................. 39
Chapter Three: Teachers as Professionals 3.1 Science Teachers Agreeing with Each of a Number of Statements Related to
Teacher Collegiality ..................................................... 42 3.2 Mathematics Teachers Agreeing with Each of a Number of Statements Related to
Teacher Collegiality ..................................................... 42 3.3 Science Classes Where Teachers Report Having Strong Control Over
Various Curriculum and Instructional Decisions .................................. 43 3.4 Mathematics Classes Where Teachers Report Having Strong Control Over
Various Curriculum and Instructional Decisions .................................. 44 3.5 Science Classes Where Grade 1-12 Teachers Report Having Strong Control Over
Various Curriculum and Instructional Decisions, by Region .......................... 45
3.6 Mathematics Classes Where Grade 1-12 Teachers Report Having Strong Control Over ·Various Curriclllum and Instructional Decisions, by Region .......................... 45
3.7 Time Spent on In-Service Education in Science and Mathematics in Last Three Years .......... 46 3.8 Time Spent on In-Service Education in Science and Mathematics in Last 12 Months:
1985-86 and 1993 ...................................................... 47 3.9 Time Spent by Mathematics Teachers on In-Service Education in Mathematics
in Last 12 Months and Last Three Years, by Teaching Assignment .................... 47 3.10 Science Teachers' Most Recent College Coursework in Field ........................... 48
3.11 Mathematics Teachers' Most Recent College Coursework in Field ........................ 49 3.12 Science Teachers Participating in Various Science-Related, Professional Activities
in Last 12 Months ...................................................... 50 3.13 Mathematics Teachers Participating in Various Mathematics-Related, Professional
Activities in Last 12 Months ............................................... 50
Chapter Four: Science and Mathematics Courses 4.1 Science and Mathematics Lessons Taught on Most Recent Day of School ................... 51 4.2 Average Number of Minutes Per Day Spent in Elementary Science and Mathematics:
1977, 1985-86, and 1993 ................................................. 52 4.3 Average Number of Minutes Per Day Spent Teaching Each Subject in Self-Contained
Classes: 1977 and 1985-86 ................................................ 53 4.4 Schools Offering Various Science Courses, Grades 7 or 8 .............................. 54 4.5 Schools Offering Various Science Courses, Grade 9 and Grades 10, 11, or 12 ................ 55
vi

4.6 Schools Offering Various Mathematics Courses, Grades 7 or 8 .......................... 56 4.7 Schools Offering Various Mathematics Courses, Grade 9 and Grades 10, 11, or 12 ............ 57 4.8 Most Commonly Offered Grade 7-12 Science and Mathematics Classes .................... 58 4.9 Average Science and Mathematics Classroom Size ................................... 59 4.10 Trends in Average Science and Mathematics Class Sizes: 1977, 1985-86, and 1993 ............ 60
4.11 Students Assigned to Science and Mathematics Classes, by Ability Level ................... 60 4.12 Ability Grouping in Science and Mathematics Classes, by Grade Range .................... 61 4.13 Ability Grouping in Selected High School Science and Mathematics Classes ................. 62 4.14 Ability Grouping in Grade 1-12 Science Classes with Low, Medium, and High Percentages
of Minority Students ...................................................... 63 4.15 Ability Grouping in Grade 1-12 Mathematics Classes with Low, Medium, and High Percentages
of Minority Students . . . . . . . . . . . . . . . . . . . . . . . . . . . . . . . . . . . . . . . . . . . . . . . . . . . . . 63
4.16 Science and Mathematics Classes with One or More Disabled Students .................... 64 4.17 Science and Mathematics Classes with One or More Learning Disabled Students .............. 64 4.18 Science and Mathematics Classes with One or More Limited English Proficiency
Students, by Region and Community Type ..................................... 65 4.19 Female and Non-Asian Minority Students in Science and Mathematics Classes ............... 66 4.20 Race/Ethnic Composition of Science and Mathematics Classes .......................... 67
Chapter Five: Instructional Objectives and Activities 5.1 Science Classes with Heavy Emphasis on Various Instructional Objectives .................. 70 5.2 Mathematics Classes with Heavy Emphasis on Various Instructional Objectives .............. 71 5.3 Science Classes Where Teachers Report that Various Factors Have a Major
Influence on What They Teach .............................................. 72 5.4 Mathematics Classes Where Teachers Report That Various Factors Have a Major
Influence on What They Teach ............................................. 73 5.5 Grade 1-12 Science and Mathematics Classes Where Selected Factors Have a Major
Influence on What is Taught, by Region ....................................... 74
5.6 Science Classes Participating in Various Instructional Activities at Least Once a Week ......... 75 5.7 Science Classes Engaged in Various Instructional Activities on a Daily Basis ................ 76 5.8 Science Classes Never Taking Part in Various Instructional Activities ..................... 77 5.9 Science Classes Participating in Various Activities in Most Recent Lesson .................. 78 5.10 Mathematics Classes Participating in Various Instructional Activities at Least Once a Week ...... 79
5.11 Mathematics Classes Engaged in Various Instructional Activities on a Daily Basis ............. 80 5.12 Mathematics Classes Never Taking Part in Various Instructional Activities .................. 8 I 5.13 Mathematics Classes Participating in Various Activities in Most Recent Lesson ............... 82 5.14 Science and Mathematics Classes Using Lecture and Hands-On Activities in Most
Recent Lesson: 1977, 1985-86, and 1993 ...................................... 83 5.15 Science and Mathematics Class Time Spent on Different Types of Activities ................ 84
5.16 Amount of Homework Assigned in Science Classes Per Week .......................... 85 5.17 Amount of Homework Assigned in Mathematics Classes Per Week ....................... 85 5.18 Science Classes Where Teachers Report Various Types of Activities Are Important
in Determining Student Grades . . . . . . . . . . . . . . . . . . . . . . . . . . . . . . . . . . . . . . . . . . . . . . 86 5.19 Mathematics Classes Where Teachers Report Various Types of Activities Are Important
in Determining Student Grades .............................................. 87
Vll

Chapter Six: Instructional Resources 6.I Science and Mathematics Classes Using Commercially Published Textbooks/Programs .......... 89 6.2 Science and Mathematics Classes Using Commercially Published Textbooks/Programs:
1977, I985-86, and I993 ................................................. 90 6.3 Market Share of the Commercial Science and Mathematics Textbook Publishers . . . . . . . . . . . . . . 91 6.4 Most Commonly Used Science Textbooks ..............•.......................... 92 6.5 Most Commonly Used Mathematics Textbooks ..................................... 93
6.6 Publication Year of Science and Mathematics Textbooks/Programs . . . . . . . . . . . . . . . . . . . . . . . 94 6.7 Percent of Science and Mathematics Textbooks/Programs Covered During the Course .......... 95 6.8 Teacher Perception of the Quality of Textbooks/Programs Used in Science
and Mathematics Classes .......................... : . . . . . . . . . . . . . . . . . . . . . . . 96 6.9 Equipment Use in Grade I-4 Science Classes ...................................... 97 6. I 0 Equipment Use in Grade 5-8 Science Classes ...................................... 98
6.1 I Equipment Use in Grade 9-12 Science Classes ..................................... 99 6.12 Equipment Use in Grade I-4 Mathematics Classes .................................. 100 6.13 Equipment Use in Grade 5-8 Mathematics Classes . . . . . . . . . . . . . . . . . . . . . . . . . . . . . . . . . . 100 6.14 Equipment Use in Grade 9-12 Mathematics Classes ................................. 101 6.15 Median Amount Schools Spend Per Year on Science and Mathematics Equipment,
Consumable Supplies, and Software . . . . . . . . . . . . . . . . . . . . . . . . . . . . . . . . . . . . . . . . . I 02
6.16 Median Amount Schools Spend Per Pupil Per Year on Science and Mathematics Equipment, Consumable Supplies, and Software . . . . . . . . . . . . . . . . . . . . . . . . . . . . . . . . . 103
6.17 Schools Purchasing Science and Mathematics Equipment, Consumable Supplies, and Software in Previous Year . . . . . . . . . . . . . . . . . . . . . . . . . . . . . . . . . . . . . . . . . . . . . 103
6.1 8 Extent of Teacher Input in Science and Mathematics Decisions About Equipment/Materials Purchases . . . . . . . . . . . . . . . . . . . . . . . . . . . . . . . . . . . . . . . . . . . . . 1 04
6.19 Amount of Own Money Science and Mathematics Teachers Spend on Supplies Per Class ....... 105
Chapter Seven: Factors Affecting Instruction 7.1 Science Programs Indicating Considerable Use of Various Programs/Practices,
by School Type . . . . . . . . . . . . . . . . . . . . . . . . . . . . . . . . . . . . . . . . . . . . . . . . . . . . . . . 108 7.2 Mathematics Programs Indicating Considerable Use of Various Programs/Practices,
by School Type . . . . . . . . . . . . . . . . . . . . . . . . . . . . . . . . . . . . . . . . . . . . . . . . . . . . . . . 1 09 7.3 Use of Science and Mathematics Instructional Arrangements in Elementary Schools .......... 110 7.4 Opportunities for High School Students to Take Science and Mathematics Courses
Not Offered in School . . . . . . . . . . . . . . . . . . . . . . . . . . . . . . . . . . . . . . . . . . . . . . . . . . . 111 7.5 Respondents Agreeing with Various Statements Regarding NCTM Standards, by School Type 112
7.6 Science Teachers Viewing Each of a Number of Factors as a Serious Problem for Science Instruction in Their School .......................................... I 14
7. 7 Mathematics Teachers Viewing Each of a Number of Factors as a Serious Problem for Mathematics Instruction in Their School ...................................... 115
7.8 Grade 7-9 Science and Mathematics Teachers Viewing Each Factor as a Serious Problem: 1977, 1985-86, and 1993 .................................... 116
Vlll

Acknowledgements
The 1993 National Survey of Science and Mathematics Education was coordinated by Horizon Research, Inc. (HRI) of Chapel Hill, North Carolina with support from the National Science Foundation (NSF). Iris R. Weiss,· President of HRI, served as Principal Investigator, assisted by Michael C. Matti and P. Sean Smith. CODA, Inc. of Silver Springs, Maryland served as data collection subcontractor, under the direction of James TerMaat, assisted by Jacqueline Smith. The sample design was developed by Benjamin Tepping and Josefina Lago.
A number of science and mathematics educators contributed to the design of the survey, including Bill Aldridge, Rolf Blank, Joan Ferrini-Mundy, Susan Friel, Frances Lawrenz, Andrew Porter, Senta Raizen, Bill Schmidt, Joan Talbert, and Wayne Welch. Larry Suter of NSF's Division of Research, Evaluation, and Dissemination provided valuable advice during the instrument development and analysis phases of the study. Special thanks are due to the thousands of teachers throughout the United States who took time from their busy schedules to provide information about their science and mathematics teaching.
ix

©[fu~[rQ)~[f @[fi)@
Introduction
A. Background and Purpose of the Study
In 1993, the National Science Foundation supported the third in a series of surveys through a grant to Horizon Research, Inc. (HRI). The first survey was conducted in 1977 as part of a major assessment of science and mathematics education consisting of a comprehensive review of the literature; case studies of 11 districts throughout the United States; and a national survey of teachers, principals, district, and state personnel. A second survey of teachers and principals was conducted in 1985-86 to identify trends since 1977.
The 1993 National Survey of Science and Mathematics Education was designed to provide up-to-date information and to identify trends in the areas of teacher background and experience, curriculum and instruction, and the availability and use of instructional resources. A total of 6,120 science and mathematics teachers from I ,252 schools across the United States were selected for this survey. Among the questions addressed by the survey:
... How well prepared are science and mathematics teachers in terms of both content and pedagogy?
... To what extent do teachers support reform notions embodied in the National Council of Teachers of Mathematics' Standards and the National Science Education Standards?
... What are teachers trying to accomplish in their science and mathematics instruction, and what activities do they use to meet these objectives?
... What are the barriers to effective and equitable science and mathematics education?
The design and implementation of the 1993 National Survey of Science and Mathematics Education involved developing a sampling strategy and selecting samples of schools and teachers; developing and field testing survey instruments; collecting data from sample members; and preparing data files and analyzing the data. These activities are described in the following sections. The final section of this chapter outlines the contents of the remainder of the report.

B. Sample Design and Sampling Error Considerations
The 1993 National Survey of Science and Mathematics Education is based on a national probability sample of science and mathematics program heads and teachers in grades 1-12 in the 50 states and the District of Columbia. The sample was designed to allow national estimates of science and mathematics course offerings and enrollment; teacher background preparation; textbook usage~ instructional techniques; and availability and use of science and mathematics facilities and equipment. Every eligible school and teacher in the target population had a known, positive probability of being drawn int9 the sample.
The sample design involved clustering and stratification prior to sample selection. The first stage units consisted of elementary and secondary schools. Science and mathematics teachers constituted the second stage units. The target sample sizes were 1 ,250 schools and 6,000 teachers, large enough to allow sub-domain estimates such as for particular regions or types of community.
The sampling frame for the school sample was constructed from the Quality Education Data, Inc. database, which includes school name and address and information about the school needed for stratification and sample selection. The sampling frame for the teacher sample was constructed from lists provided by sample schools, identifying current teachers and the specific science and mathematics subjects they were teaching in the spring of 1993.
Since biology is by far the most common science course at the high school level, selecting a random sample of science teachers would result in a much larger number of biology teachers than chemistry or physics teachers. Similarly, random selection of mathematics teachers might result in a smaller than desired sample of teachers of advanced mathematics courses. In order to ensure that the sample would include a sufficient number of advanced science and mathematics teachers for separate analyses, information on teaching assignments was used to create separate domains, e.g., for teachers of chemistry and physics, and sampling rates were adjusted by domain.
The study design included obtaining in-depth information from each teacher about curriculum and instruction in a single, randomly selected class. Most elementary teachers were reported by their principals to teach in self-contained classrooms, i.e. they are responsible for teaching all academic subjects to a single group of students. Each such sample teacher was randomly assigned to one of two groups-science or mathematics-and received a questionnaire specific to that subject. Most secondary teachers in the sample taught several classes of a single subject; some taught both science and mathematics. For each such teacher, one class
. was randomly selected. For example, a teacher who taught two classes of science and three classes of mathematics each day might have been asked to answer questions about his first or second science class or his first, second, or third mathematics class of the day.
Whenever a sample is anything other than a simple random sample of a population, the results must be weighted to take the sample design into account. In the 1993 Survey, the weight for each respondent was calculated as the inverse of the probability of selecting the
2

individual into the sample multiplied by a non-response adjustment factor. 1 In the case of data about a randomly selected class, the teacher weight was adjusted to reflect the number of classes taught, and therefore, the probability of a particular class being selected. Detailed information about the sample design, weighting procedures, and non-response adjustments used in the 1993 National Survey of Science and Mathematics Education is included in Appendix A.
The results of any survey based on a sample of a population (rather than on the entire population) are subject to sampling variability. The sampling error (or standard error) provides a measure of the range within which a sample estimate· can be expected to fall a certain proportion of the time. For example, it may be estimated that 9 percent of all grade 1-4 mathematics lessons involve the use of computers. If it is determined that the sampling error for this estimate was 1 percent, then according to the Central Limit Theorem, 95 percent of all possible samples of that same size selected in the same way would yield calculator usage estimates between 7 percent and 11 percent (that is, 9 percent ±2 standard error units).
The decision to obtain information from a sample rather than from the entire population is made in the interest of reducing costs, both in terms of money and the burden on the population to be surveyed. The particular sample design chosen is the one which is expected to yield the most accurate information for the least cost. It is important to realize that, other things being equal, estimates based on small sample sizes are subject to larger standard errors than those based on large samples. Also, for the same sample design and sample size, the closer a percentage is to zero or 100, the smaller the standard error. The standard errors for the estimates presented in this report are included in parentheses in the tables. The narrative sections of the report generally point out only those differences which are substantial as well as statistically significant as the .05 level or beyond.
C. Instrument Development
Since a primary purpose of the 1993 National Survey of Science and Mathematics Education was to identify trends in science and mathematics education, the process of developing survey instruments began with the questionnaires that had been used in the earlier national surveys, in 1 977 and 1985-86. The project Advisory Panel, comprised of experienced researchers in science and mathematics education, reviewed these questionnaires and made recommendations about retaining or deleting particular items. Additional items needed to provide important information about the current status of science and mathematics education were also considered.
Preliminary drafts of the questionnaires were sent to a number of professional organizations for review; these included the American Association for the Advancement of Science, the National Science Teachers Association, the National Council of Teachers of Mathematics, the
1 The aim of non-response adjustments is to reduce possible bias by distributing the non-respondent weights among the respondents expected to be most similar to these non-respondents. In this study, adjustment was made by region and by urbanicity of the school.
3

National Education Association, the American Federation of Teachers, and the National Catholic Education Association.
The Education Information Advisory Committee (EIAC) also played an important role in the instrument development process. This committee was established by the Council of Chief State School Officers to reduce the burden of data collection efforts on local education agencies; most state commissioners of education will not approve a survey unless it is first endorsed by EIAC. Horizon Research, Inc. worked with members of the EIAC committee throughout the planning stages of this project to make sure that the disruption to school activities and the burden on schools and teachers would be kept ·to a minimum. EIAC officially endorsed the survey in May of 1992.
The survey instruments were revised based on feedback from the various reviewers, field tested, and revised again. The instrument development process was a lengthy one, constantly compromising between information needs and data collection constraints. There were several iterations of field testing and revision to help ensure that individual items were clear and unambiguous and that the survey as a whole would provide the necessary information with the least possible burden on participants. Copies of the survey questionnaires are included in Appendix B.
D. Data Collection
Once the Education Information Advisory Committee had approved the study design, instruments, and procedures, the data subcontractor (CODA) proceeded with the data collection. First, notification letters were mailed to the Chief State School Officers, identifying the schools in the state that had been selected for the survey. Similar letters were subsequently mailed to superintendents of districts including sampled public schools and diocesan offices of sampled Catholic schools. (Information about this pre-survey mailout is included in Appendix C.) Copies of the survey instruments and additional information about the study were provided when requested. Eleven schools were deleted from the study at this point, because the districts refused to allow the schools to participate.
Principals in the remaining schools were asked to provide demographic information about the students in the school; the names of the science and mathematics department heads or other individuals who would be able to provide information about the science and mathematics program in the school; and a list of all teachers responsible for teaching science and/or mat?ematics to one or more classes. The response rate at the school level was 89 percent.
An incentive system was developed to encourage school and teacher participation in the survey. Each school was given a credit of $25 towards the purchase of science and mathematics education materials; the amount was augmented by $10 for each responding teacher. At the completion of the data collection phase, schools were sent vouchers that they could use for purchasing NCTM publications, calculators, science activity books, kits, etc. from a catalogue developed for this study. Postcard reminders, phone calls, and additional mailings of survey materials were also used to encourage non-respondents to complete the
4

questionnaires; the final questionnaire response rates were 88 percent for school program representatives and 84 percent for science and mathematics teachers. A more detailed description of the data collection procedures is included in Appendix D.
E. File Preparation and Analysis
Completed questionnaires were recorded in the data receipt system and routed to editing and coding. Manual edits were used to identify missing information. and obvious out-of-range answers; to identify and, if possible resolve, multiple responses; and to make a number of consistency checks. When necessary, respondents were re-contacted and asked to clarify and/or complete responses to key items. After data entry, machine-edits were performed to check for out-of-range answers, adherence to skip patterns, and logical inconsistencies, and weights were added to the data files. All population estimates presented in this report were computed using weighted data.
F. Outline of This Report
This report of the 1993 National Survey of Science and Mathematics Education is organized into major topical areas. In most cases, results are presented for groups of teachers categorized by grade ranges-grades 1-4, 5-8, and 9-12. Trend results are typically reported for grades 1-3, 4-6, 7-9, and 10-12, the grade ranges used in the 1977 and 1985-86 surveys. The definitions of these categories and other reporting variables used in this report are included in Appendix E.
Chapter Two focuses on science and mathematics teacher backgrounds and beliefs. Basic demographic data are presented along with information about course background, perceptions of preparedness, and pedagogical beliefs. Chapter Three examines data on the professional status of teachers, including their perceptions of their autonomy in making curriculum and instructional decisions, and their opportunities for continued professional development.
Chapter Four presents information about the time spent on science and mathematics instruction in the elementary grades, and about science and mathematics course offerings at the secondary level. Chapter Five examines the instructional objectives of science and mathematics classes, and the instructional activities used to achieve these objectives, followed by a discussion of the availability and use of various types of instructional resources in Chapter Six. Finally, Chapter Seven presents data about a number of factors which are likely to affect science and mathematics instruction, including school-wide programs, practices, and problems.
5

©[futiD[pJ~[f N©
Teacher Background and Beliefs
A. Overview
While various reform efforts focus initially on different parts of the science and mathematics education system, e.g., curriculum, assessment, in-service teacher education, there is a consensus that having a well-prepared teaching force is essential for effective science and mathematics education. The 1993 National Survey of Science and Mathematics Education collected a variety of information about science and mathematics teachers, including their age, sex, race/ethnicity, number of years teaching, course background, and pedagogical beliefs. These data are presented in the following sections.
B. Teacher Characteristics
As can be seen in Table 2.1, the vast majority of science and mathematics teachers in grades 1-4 are female. In grades 5-8, approximately 70 percent of science and mathematics teachers are female, compared to about 40 percent in grades 9-12, including 34 percent of science teachers and 48 percent of mathematics teachers. It is interesting to note that the percentage of female middle and high school science and mathematics teachers has increased considerably in recent years. For example, in 1977, 46 percent of grade 7-9 mathematics
' teachers were female, increasing to 54 percent in 1985-86, and 63 percent in 1993. (See Table 2.2.)
Blacks, Hispanics, and other minority groups continue to be underrepresented in the science and mathematics teaching force; at a time when minorities constitute roughly 30 percent of the student enrollment, only from 6 to 11 percent of science and mathematics teachers, depending on subject and grade range, are members of minority groups.
7

Sex Male
Female
Race White
Black
Hispanic
American Indian
Asian
Age < 31 Years
31-40 Years
41-50 Years
>50 Years
Experience 0-2 Years
3-5 Years
6--IO Years
11-20 Years
> 20 Years
Masters Degree Yes
No
Table 2.1 Characteristics of the Science
and Mathematics Teaching Force
Science
Grades 1-4 Grades 5-8 Grades 9-12 Grades 1-4
9 (1.3) 3I (3.3) 66 (3.2) 3 (1.2)
9I (1.4) 69 (3.4) 34 (3.2) 97 (1.3)
88 (2.2) 89 (2.6) 95 (0.8) 90 (1.1)
6 (1.8) 6 (1.4) 3 (0.4) 4 (0.7)
5 (1.2) 1 (0.7) I (0.3) 5 (1.8)
0 (0.3) 0 (0.3) 1 (0.4) 0 (0.3)
0 (0.3) 3 (1.7) I (0.1) I (0.1)
I6 (2.3) II (1.4) 13 (1.1) 17 (2.2)
26 (2.6) 28 (3.0) 23 (3.2) 27 (2.6)
40 (2.9) 36 (3.4) 41 (3.4) 32 (2.3)
18 (2.4) 25 (3.9) 23 (2.7) 23 (2.4)
13 (2.1) 12 (1.9) 11 (1.2) 12 (1.8)
I 0 (1.5) II (1.6) 10 {1.1) 14 (1.3)
I5 (1.7) I9 (2.7) 14 (3.1) 17 (2.3)
43 (2.7) 34 (3.1) 30 (1.9) 36 (2.3)
19 (2.7) 25 (3.1) 35 (2.6) 22 (2.7)
34 (2.8) 42 (3.4) 57 (2.1) 35 (2.4)
66 (2.8) 58 (3.4) 43 (2.1) 65 (2.4)
8
Mathematics
Grades 5-8 Grades 9-12
27 (2.7) 52 (2.8)
73 (2.5) 48 (2.8)
90 (1.7) 92 (1.1)
5 (0.7) 4 (0.8)
4 (1.2) I (0.5)
0 (0.2) 0 (0.2)
I (0.7) 2 (0.7)
15 (3.4) 13 ( 1.8)
21 (1.9) 23 (2.7)
46 (2.9) 42 (2:3)
18 (3.1) 22 (1.9)
12 (2.2) IO (1.2)
9 (I.4) 9 (1.2)
22 (3.5) 20 (3.3)
34 (2.8) 28 (1.6)
22 (2.9) 33 (1.9)
41 (3.2) 53 (2.8)
59 (3.2) 47 (2.8)

Science Grades 1-3
Grades 4--6
Grades 7-9
Grades 10-12
Mathematics Grades J-3
Grades 4--6
Grades 7-9
Grades I 0-12
Table 2.2 Females in the Science and Mathematics
Teaching Force: 1977, 1985-86, 1993
Percent of Teachers
1977* 1985-86
98 (1.0) 96 (1.0)
67 (3.3) 77 (2.8)
38 (2.5) 42 '(3.0)
25 (2.1) 31 (2.5)
94 (1.6) 96 (1.0)
78 (2.9) 80 (2.5)
46 (2.5) 54 (3.0)
32 (2.4) 46 (2.0)
1993
96 (0.8)
79 (3.4)
43 (3.1)
34 (2.3)
98 (1.3)
84 (2.1)
63 (4.0)
46 (2.6)
* The 1977 survey included Kindergarten teachers; figures are for teachers of grades K-3 rather than 1-3.
As can be seen in Table 2.3, the science and mathematics teaching force is growing older; the average age of teachers has increased by approximately two years since 1985-86. While it is extremely difficult to monitor teacher supply-many people who prepare to become teachers do not actually do so and many others who leave the profession return at a later date-the fact that 1 in 5 science and mathematics teachers in each grade range is over age 50 (and sma11er percentages are age 30 or younger) raises concerns about having an adequate supply of qualified teachers as these teachers reach retirement age.
Table 2.3 Average Age of the Science and Mathematics
Teaching Force: 1985-86 and 1993
Percent of Teachers
Science Mathematics
198~6 1993 198~6 1993
Grades 1-6 40.1 (0.4) 42.1 (0.6) 39.8 (0.4) 42.1 (0.6) Grades 7-9 39.2 (0.8) 41.8 (0.6) 39.2 (0.6) 41.6 (0.9) Grades I 0-12 40.3 (0.4) 43.3 (0.5) 40.3 (0.5) 43.4 (0.5)
9

About 1 in 3 teachers in grades 1-4 has earned a degree beyond the bachelor's, increasing to roughly 40 percent in grades 5-8 and more than 50 percent in grades 9-12. It is interesting to note that the percentage of teachers with master's degrees rises steadily with years of teaching experience; for example, as can be seen in Table 2.4, only 8 percent of grade 1-12 science teachers with two or fewer years prior teaching experience have master's degrees, compared to 55 percent of those with more than 20 years prior teaching experience.
Table 2.4 Science and Mathematics Teachers with Degrees
Beyond the Bachelor's, by Years Teaching
Percent of Teachers
Science Mathematics
Prior Teaching Experience
0-2 Years 8 (1.8) 12
3-5 Years 19 (3.5) 18
6--10 Years 36 (3.9) 41
11-20 Years 45 (4.0) 43
> 20 Years 55 (3.1) 53
C. Teacher Preparation
(2.5)
(4.0)
(4.9)
(3.8)
(3.5)
National standards call for the introduction of challenging science and mathematics content to all students beginning in the early grades. If teachers are to guide students in their exploration of science and mathematics concepts, they must themselves have a firm grasp of powerful science and mathematics concepts.
Because it would be extremely difficult to gauge the extent to which a large national sample of teachers understands science and mathematics concepts (and knows how to help their students learn these concepts), proxy measures such as major or number of courses taken in the field are typically used. Table 2.5 shows that very few grade 1-4 teachers had undergraduate majors in these fields. (Roughly 80 percent majored in elementary education.) While science and mathematics teachers in grades 5-8 were more likely than their grade 1-4 colleagues to have undergraduate majors in science, a majority still had majors in education.
10

Table 2.5 Teacher Undergraduate Majors in Science and Mathematics
Percent of Teachers
Grades 1-4 Grades 5-8 Grades 9-12
Science Teachers Science 2 (0.5) 17 (2.0) 63 (2.1)
Science Education 0 (0.2) 2 (0.4) 6 (1.2)
Other Education 86 (2.9) 63 (3.2) 22 (3.7)
Other Fields 12 (2.1) 18 (3.3) 10 (2.1)
Mathematics Teachers Mathematics I (0.4) 7 (0.8) 41 (2.5)
Mathematics Education 0 (0.0) 3 (0.5) I8 ( 1.8)
Other Education 89 (2.2) 7I (2.3) 20 (2.1)
Other Fields 1I (1.9) 20 (2.I) 22 (34)
Grade 9-12 science teachers were much more likely to have majored in a science discipline (63 percent) than in science education (6 percent). The comparable figures for mathematics teachers were 41 percent mathematics majors and 18 percent mathematics education majors. \\'bile the percentages of teachers with major in field are greater for grades 9-12 than for the lower grades, still roughly 3 out of 10 high school science teachers and 4 out of 10 high school mathematics teachers did not major in their fields at either the undergraduate or graduate level. Moreover, while the vast majority of grade 9-12 science teachers had at least a minor in science or science education, nearly I in 5 grade 9-12 mathematics teachers did not have even a minor in the field. (See Table 2.6.)
Table 2.6 Teacher Majors and Minors in Science/Mathematics
and Science/l\1athematics Education
Percent of Teachers
Science Mathematics
Grades Grades Grades Grades Grades 1-4 5-8 9-12 1-4 5-8
Undergraduate major in science/mathematics 2 (0.5) I7 (2.0) 63 (2.1) 1 (0.4) 7 (0.8)
Undergraduate or graduate major in science/ science education (mathematics/ mathematics education) 3 (0.7) 2I (2.3) 72 (2.2) 1 (1.0) II (1.5)
Undergraduate or graduate major or minor in science/science education (mathematics/ mathematics education) 7 (1.6) 32 (2.9) 94 (1.2) 7 (1.9) I8 (2.I)
11
Grades 9-12
41 (2.5)
63 (1.5)
81 (2.1)

Tables 2.7, 2.8, and 2.9 tell a similar story, in this case using the number of semesters of college science coursework completed by science teachers in each grade range: elementary teachers have less extensive backgrounds in science than do their middle grade counterparts, who in turn have had less science coursework than their high school counterparts. For example, Table 2.7 shows the percentages of grade 1-4, 5-8, and 9-12 science teachers who have completed various numbers of semesters of col1ege science coursework; the average number of courses completed ranges from 6.8 for grades 1-4 to 17.6 for grades 9-12.
Table 2.7 Number of Semesters* of College Coursework in Science
Percent of Science Teachers
Grades 1-4 Grades 5-8 Grades 9-12
< 6 Semesters 50 (3.3) 28 (4.1) I (0.5)
6-1 0 Semesters 31 (2.6) 31 (3.4) 12 (1.6)
11-14 Semesters 11 (1.6) 16 (2.6) 20 (20)
15-20 Semesters 6 (1.4) 17 (3.0) 39 (2.1)
> 20 Semesters 1 (0.6) 8 (1.2) 28 (1.7)
Average number of semesters 6.8 (0.3) 10.3 (0.6) 17.6 (0.3)
* Since the highest number of semesters a teacher could indicate for each of the four categories-life science, chemistry, physics/physical science, and earth/space science-was "8," these figures underestimate the total for any teacher who completed more than eight courses in a particular category.
As can be seen in Table 2.8, 92 percent of grade 1-4 science teachers have had at least one college course in the life sciences. Most (85 percent) have had coursework in earth science, science education (82 percent), and physics/physical science (66 percent), while nearly onehalf have had one or more college courses in chemistry. Similarly, most grade 5-8 science teachers have had coursework in the life sciences (94 percent), earth sciences (86 percent), science education (78 percent), physics/physical science (72 percent), and chemistry (61 percent).
12

Grades 1-4
Life Sciences
Chemistry
Physics/Physical SCience
Earth/Space Science
Science Education
Grades S-8 Life Sciences
Chemistry
Physics/Physical Science
Earth/Space Science
Science Education
Grades 9-12
Life Sciences
Chemistry
Physics/Physical Science
Earth/Space Science
Science Education
Table 2.8 Number of Semesters Completed in
Various Course Categories
Percent of Science Teachers
No 1-2 3-S Semesters Semesters Semesters
8 (1.2) 52 (3.0) 29
53 (2.3) 37 (2.6) 8
34 (2.3) 53 (2.9) 11
15 ( 1.6) 51 (2.9) 30
18 (1.7) 58 (2.3) 17
6 ( 1.6) 32 (3.3) 34
39 (3.4) 36 (3.0) 17
28 (3.6) 45 (4.3) 19
14 (2.2) 36 (3.9) 36
22 (2.8) 50 (3.9) 18
6 (1.1) 13 (2.3) 16
4 (0.8) 22 (2.2) 34
8 (0.9) 35 (2.9) 28
20 (2.3) 32 (2.4) 29
20 (2.3) 31 (2.3) 24
6 or More Semesters
(2.7) 11 (2.5)
(1.6) 2 (0.2)
(1.8) I (0.7)
(2.0) 4 (1.3)
(2.8) 7 ( 1.1)
(2.9) 28 (3.0)
(2.1) 8 ( 1.5)
(2.5) 8 (1.6)
(3.8) 14 (2.4)
(2.8) 10 (1.4)
(2.5) 65 (2.3)
(1.5) 40 (2.8)
(2.6) 29 (1.9)
(1.3) 19 (1.4)
(2.0) 26 (2.3)
Almost all high school science teachers have had at least one course in chemistry (96 percent), biology/life science (94 percent), and physics or physical science (92 pe.rcent). Somewhat fewer (80 percent in each case) have had coursework in earth/space science or science education. In terms of specific courses, the majority of high school science teachers have completed college coursework in general chemistry, introductory biology, general physics, botany, zoology, organic chemistry, anatomy /physiology, genetics, life science, and microbiology. (See Table 2.9.)
13

Table 2.9 Middle and High School Science Teachers
Completing Various College Courses
Percent of Teachers
Grades 5-8 Grades 9-12
Life Science 59 (3.2) 56 (2.6)
Introductory Biology 79 (2.6) 83 (1.7)
Botany, Plant Physiology 42 (3.6) 66 (3.6)
Cell Biology 22 . (2.9) 49 (2.7)
Ecology 25 (3.2) 48 (2.5)
Genetics, Evolution 20 (2.2) 57 (3.2)
Microbiology 15 (2.3) 50 (2.8)
Anatomy/Physiology 31 (3.9) 62 (3.5)
Zoology, Animal Behavior 32 (2.9) 63 (3.7)
General Chemistry 56 (3.2) 96 (0.8)
Analytical Chemistry 7 (l. I) 45 (2.9)
Organic Chemistry 15 (2.0) 63 (4.8)
Physical Chemistry 10 (2.0) 29 (2.0)
Quantum Chemistry 1 (0.3) II (l.J)
Biochemistry 9 (1.8) 37 (3.2)
Physical Science 55 (3.5) 48 (2.8)
General Physics 34 (3.1) 80 (3.9)
Electricity and Magnetism 15 (2.6) 32 (2.4)
Heat and Thermodynamics 7 (2.0) 23 (1.6)
Mechanics 5 (1.5) 24 (1.4)
Modem or Quantum Physics 2 (0.9) 15 (1.6)
Nuclear Physics 2 (0.6) 12 (14)
Solid State Physics 3 (I.Q) 5 (0.9)
Optics 4 (1.6) 14 (1.1)
Eanh Science 66 (3.3) 47 (2.9)
Astronomy 26 (2.1) 36 (2.0)
Geology 42 (3.8) 48 (24)
Meteorology 13 (2.0) 22 (1.6)
Oceanography 12 (3.0) 20 ( 1.8)
Physical Geography 44 (3.7) 25 (2.9)
Environmental Science 36 (2.8) 42 (2.5)
History of Science 9 (1.5) 25 (1.9)
Science and Society 7 (1.2) 18 (1.8)
Electronics 4 (1.2) 12 (14)
Engineering 3 (1.5) 13 (2.2)
Integrated Science 8 () .6) 5 (0.8)
Supervised Student Teaching in Science 56 (3.8) 75 (2.0)
Instructional Use of Computers/Other Technologies 41 (2.6) 44 (3.0)
14

The National Science Teachers Association (NSTA) has recommended that elementary teachers have at least one college course in each of three science areas-biological sciences, physical sciences, and earth sciences-as wel1 as coursework in science education. As can be seen in Table 2.1 0, roughly half of the science teachers in .the elementary and middle grades meet those standards, while another 12 to 14 percent meetthe science coursework standard but lack a course in science education.
Table 2.10 Elementary Science Teachers Meeting NST A Course-Background Standards
Percent of Teachers
Grades 1-4 Grades 5-8
Coursework in each science discipline plus science education 51 (3.4) 54
Lack coursework in science education only 12 (1.6) 14
Lack coursework in one science discipline 28 (2.2) 25
Lack coursework in two science disciplines 9 (1.4) 7
Lack coursework in three science disciplines I (0.5) 0
(3.6)
(3.0)
(3.2)
(1.9)
(0.2)
NST A course background standards for middle/junior high school science teachers include at least two courses in each of the three science areas, as wel1 as coursework in science education. Table 2.11 shows that the majority of grade 7-9 science teachers (57 percent) meet the NST A standards, compared to 42 percent of those in grades 5-8. The differences between "middle grade" and "junior high school" teachers are most evident at the lower end of the scale, where 28 percent of grade 5-8 teachers, but only 8 percent of grade 7-9 science teachers lack the recommended coursework in two or three of the science areas.
Table 2.11 Middle and Junior High School Science Teachers Meeting
NSTA Course-Background Standards
Percent of Teachers
Grades 5-8 Grades 7-9
Two or more semesters in each science discipline plus science education 42 (3.5) 57
Lack science education only 7 (2.1) 9
Inadequate coursework in one science discipline 24 (2.7) 26
Inadequate coursework in two science disciplines 20 (3.5) 7
Inadequate coursework in all three science disciplines 8 (1.4) I
15
(3.1)
(1.3)
(2.7)
(2.0)
(0.4)

At the high school level, NSTA's recommendations are very detailed and extensive, including lists of specific courses that teachers of each discipline should have completed. Because very few teachers, even those with considerable coursework in the field, meet the specific NST A requirements, analyses of data from the 1993 National Survey of Science and Mathematics Education used a more general measure in defining "well-prepared"-six or more courses in field.
As can be seen in Table 2.12, there is considerable variation in extent of teacher preparation for the various science subjects taught at the secondary level. For example, 94 percent of high school biology classes are taught by teachers who have taken six or more biology courses, but only 45 percent of grade 7-12 earth science classes are taught by teachers who have had six or more earth science courses. Note also that while almost all high school biology, chemistry, and physics classes are taught by teachers with in-depth preparation either in that discipline or in another science discipline, substantial percentages of secondary life science, earth science, and physical science classes are taught by teachers who have not had in-depth preparation in any science discipline.
Table 2.12 Science Classes Taught by Teachers with Six or More College Courses in Field,
in Another Science Field, and Lacking In-Depth Preparation in Any Science
Percent of Classes
Six or More Not In-Depth in Field, Not In-Depth Courses But Six or More in in Any In Field Another Science Science
Grades 7-12
Life Science/Biology 82 (5.6) 3 (1.2) 14
Earth Science 45 (5.3) 34 (8.2) 21
Physical Science 75 (4.2) II (2.5) 14
Grades 9-12
Biology 94 (1.9) 3 (1.6) 3
Chemistry 82 (3.4) 18 (3.6) I
Physics 74 (6.0) 22 {5.7) 4
(5.7)
(8.2)
(3.9)
(1.1)
(0.4)
(2.9)
Most prospective secondary school science teachers are prepared to teach one discipline, typically either biology, chemistry, or physics. The reality, however, is that many science teachers will be assigned to teach courses in more than one discipline, resulting in extensive out-of-field teaching. As can be seen in Table 2.13, this situation is particularly prevalent in rural schools, where more than 1 in 3 teachers teach courses in two science disciplines and 1 in 8 teaches courses in three or more science disciplines.
16

Table 2.13 Science Teachers Teaching Courses in One, Two, or
Three or More Science Subjects, by Community Type
Percent of Teachers
Total Urban Suburban
Number of Subjects Taught One Subject 71 (3.7) 79 (3.1) 76 (3.8)
Two Subjects 26 (3.3) 20 (2.9) 23 (3.9)
Three or More Subjects 4 (1.0) 2 (0.8) I (0.4)
Rural
51 (II. 7)
37 (10.4)
12 (3.5)
Turning to mathematics, the 1993 National Survey of Science and Mathematics Education found that, as is the case in science, mathematics teachers in the higher grades tend to have much stronger course background in mathematics than do their colleagues in the lower grades. For example, as can be seen in Table 2.14, 83 percent of grade 9-12 mathematics teachers have had at least eight semesters of coursework in mathematics, compared to 8 percent of those teaching in grades 1-4. It is interesting to note that while only 20 percent of grade 5-8 mathematics teachers have had eight or more semesters of college mathematics, 32 percent of grade 5-8 mathematics classes are taught by these teachers, a reflection of the fact that teachers in grades 7 and 8 are generally both better prepared than teachers in grades 5 and 6 and are more likely to teach multiple mathematics classes each day.
< 4 Semesters
4-7 Semesters
8-11 Semesters
> II Semesters
Table 2.14 Number of Semesters* of College
Coursework in Mathematics
Percent of Mathematics Teachers Percent of Mathematics Classes
Grades Grades Grades Grades Grades Grades 1-4 5-8 9-12 1-4 5-8 9-12
80 (1.9) 62 (3.5) 4 (0.9) 80 (1.7) 48 (3.3) 3 (0.9)
13 (1.4) 19 (2.3) 12 (1.6) 13 (1.3) 20 (1.9) 10 (1.2)
6 (1.5) 13 (1.9) 45 (3.2) 6 (1.4) 20 (2.4) 46 (3.1)
2 (0.6) 7 (0.8) 38 (2.4) I (0.6) 12 (1.6) 41 (2.8)
* Since the highest number of semesters a teacher could indicate for "calculus" and for "all other mathematics courses" was "8," these figures underestimate the total for any teacher who completed more than eight courses in a particular category.
17

As can be seen in Table 2.15, the vast majority of grade 1-4 teachers have had college coursework in mathematics education and mathematics for elementary school teachers. Far fewer have had college coursework in geometry or probability and statistics, areas that the National Council of Teacher of Mathematics (NCTM) Curriculum and Evaluation Standards suggest should be addressed beginning in the primary· grades.
Table 2.15 Grade 1-4 Mathematics Teachers
Completing Various College Courses
Percent of Teachers
Mathematics education 99 (0.4)
Mathematics for elementary school teachers 98 (1.2)
College algebra/trigonometry/elementary functions 42 (2.3)
Geometry for elementary/middle school teachers 30 (2.2)
Probability and statistics 27 (3.0)
Applications of mathematics/problem solving 24 ( 1.8)
Calculus 12 (1.8)
Table 2.16 shows the percentages of grade 5-8 and 9-12 mathematics teachers who have completed each of a number of college courses in mathematics and related fields. At the middle/junior high school level, the National Council of Teachers of Mathematics has recommended that mathematics teachers have college coursework in abstract algebra; geometry; calculus; probability and statistics; and applications of mathematics/problem solving. Percentages of grade 5-8 teachers having completed these courses range from 22 percent for abstract algebra to 44 percent for probability and statistics.
In contrast, the 1993 Survey found that high school mathematics teachers have relatively strong content backgrounds. The majority have had college coursework in calculus (95 percent); college algebra (89 percent); geometry (84 percent); probability and statistics (81 percent); linear algebra (78 percent); abstract algebra (75 percent); advanced calculus (72 percent); differential equations (62 percent); and other upper division mathematics (57 percent). The only two NCTM-recornmended areas where fewer than half of the high school mathematics teachers had coursework were applications of mathematics/problem-solving (45 percent) and history of mathematics (42 percent).
18

Table 2.16 Middle and High School Mathematics Teachers
Completing Various College Courses
Percent of Teachers
Grades 5-8 Grades 9-12
Mathematics for middle school teachers 41 (3.6) 30 ( 1.9)
Geometry for elementary/middle school teachers 35 (3.2) 24 (1.7)
Any computer programming/computer science 43 (2.3) 69 (2.4)
Methods of teaching mathematics 91 .(2.1) 84 (2.7)
College algebra/trigonometry/elementary functions 57 (3.7) 89 (1.0)
Calculus 32 (2.2) 95 (1.3)
Advanced calculus 17 (2.1) 72 (2.9)
Differential equations 12 (1.3) 62 (3.3)
Geometry 39 (3.0) 84 (2.6)
Probability and statistics 44 (3.1) 81 (2.7)
Abstract algebra/number theory 22 (2.2) 75 (2.9)
Linear algebra 20 (2.0) 78 (2.6)
Applications of mathematics/problem solving 28 (2.5) 45 (2.7)
History of mathematics 13 (1.6) 42 (2.6)
Discrete mathematics 6 (1.2) 26 (2.0)
Other upper division mathematics 18 (1.9) 57 (3.3)
Biological sciences 72 (2.9) 55 (2.9)
Chemistry 37 (2.4) 51 (2.8)
Physics 27 (1.9) 59 (3.0)
Physical science 48 (3.6) 31 (2.6)
Earth/space science 45 (2.4) 28 (2.8)
Engineering 3 (0.9) 10 (0.8)
Computer programming 30 (2.4) 65 (2.5)
Other computer science 24 (2.6) 33 (2.6)
Supervised student teaching in mathematic~ 41 (3.3) 65 (2.9)
Instructional use of computers/other technologies 32 (2.7) 43 (2.3)
19

As can be seen in Table 2.17, 34 percent of grade 5-8 mathematics teachers have not had any of the five recommended mathematics courses; only 7 percent have had all five. Nearly onethird of all high school mathematics teachers had completed at least 9 of the 10 recommended courses; another 43 percent had completed 6, 7, or 8 of these courses.
Table 2.17 Mathematics Teachers Completing
NCTM-Recommended College Mathematics Courses
Percent of Teachers
Grades 5-8 Grades 9-12
Recommended for Middle/Junior High School Teachers
No Courses 34 (2.8) 1
1-2 Courses 37 (2.6) 14
~Courses 21 (2.4) 53
5 Courses 7 (1.3) 33
Recommended for High School Teachers
0-1 Courses 50 (3.7) 2
2-5 Courses 33 (3.8) 25
6-8 Courses 12 (1.4) 43
9-1 0 Courses 4 (0.7) 31
(0.3)
(2.7)
(2.6)
(2.3)
(0.4)
(3.8)
(2.9)
(2.1)
There is evidence, however, that students who take lower level mathematics classes are not as likely to get the benefits of having well-prepared teachers. For example, Table 2. I 8 shows the percentage of high school mathematics teachers who do and do not teach advanced mathematics classes (Algebra II or higher) who have completed each of a number of college mathematics classes. Note that much larger percentages of teachers who are assigned to advanced classes have taken coursework in a number of these areas. For example, 62 percent of high school teachers assigned to lower-level mathematics courses only have had coursework in abstract algebra, compared to 85 percent of those who teach one or more advanced mathematics courses.
20

Table 2.18 Grade 9-12 Mathematics Teachers Who Have
Completed Various College Courses, by Teaching Assignment
Percent of Teachers
Teaching No Teaching One or More Advanced Courses Advanced Courses
Calculus 91 (1.8) 97 (1.4)
Advanced Calculus 66 (3.6) 77 (4.7)
Differential Equations 54 (4.7) 69 (4.3)
Geometry 84 (2.0) 83 (4.6)
Probability and Statistics 73 (4.9) 87 (2.1)
Abstract Algebra/Number Theory 62 (4.4) 85 (2.0)
Linear Algebra 70 (4.8) 85 (2.7)
Applications of Mathematics/Problem Solving 46 (4.7) 45 (3.1)
History of Mathematics 34 (4.1) 48 (3.0)
Discrete Mathematics 21 (2.4) 31 (2.9)
Other upper division mathematics 45 (3.9) 68 (4.6)
Computer Programming 57 (4.5) 71 (2.2)
Instructional use of computers/other technologies 39 (3.4) 46 (3.5)
D. Teacher Pedagogical Beliefs
The National Council of Teachers of Mathematics published Curriculum and Evaluation Standards in 1989 and Professional Standards for Teaching Mathematics in 1991. As one measure of the influence of the NCTM Standards, mathematics teachers in the 1993 National Survey of Science and Mathematics Education were asked the extent of their familiarity with each of these documents. As can be seen in Table 2.19, mathematics teachers in the higher grades are much more likely than their counterparts in the lower grades to report that they are familiar with the two standards documents. Roughly 1 in 5 elementary mathematics teachers, 1 in 4 middle grade mathematics teachers, and 1 in 2 high school mathematics teachers indicated they were "well aware" of the Curriculum and Evaluation Standards. Not surprisingly, teachers in each grade range are less likely to be familiar with the more recently released Professional Standards for Teaching Mathematics.
21

Table 2.19 Mathematics Teachers' Familiarity with the NCTM Standards
Percent of Teachers
Grades 1-4 Grades 5-8 Grades 9-12
Curriculum and Evaluation Standards
Well aware of the NCTM Standards 18 (1.6) 28 (2.2) 56 (2.6)
Heard of the NCTM Standards, but don't know much about them 39 (1.8) 41 (3.0) 33 (2.7)
Not aware of the NCTM Standards 30 (2.9) 22 (2.6) 8 (1.4)
Not sure 13 (1.2) 9 (2.1) 3 (0.3)
Professional Standards for Teaching
Well aware of the NCTM Teaching Standards 12 (1.3) 19 (1.7) 40 (2.0)
Heard of the NCTM Teaching Standards, but don't know much about them 38 (2.0) 48 (3.0) 44 (2.7)
Not aware of the NCTM Teaching Standards 38 (2.8) 25 (2.9) 13 ( 1.8)
Not Sure 13 (1.3) 8 (1.4) 3 (0.4)
Those teachers who indicated they were "well aware" of each set of standards were asked to indicate the depth of their knowledge. As can be seen in Table 2.20, roughly 90 percent of the teachers in each grade range who said they were well aware of a particular set of standards indicated they were well informed about them for the grades they teach, and onehalf or more said they were prepared to explain the Standards to their colleagues.
Table 2.20 Mathematics Teachers Reported Understanding of the NCTM Standards
Pei"cent of Teachers Agreeing*
Grades 1-4 Grades 5-8 Grades 9-12
Curriculum and Evaluation Standards
I am well informed about the NCTM Standards for the grades I teach 87 (1.6) 88 (2.4) 91 (2.6)
I am prepared to explain the NCTM Standards to my colleagues 50 (1.3) 53 (1.7) 58 (2.9)
Professional Standards for Teaching
I am well informed about the NCTM Teaching Standards for the grades l teach 90 (1.2) 91 (1.8) 89 (1.9)
I am prepared to explain the NCTM Teaching Standards to my colleagues 57 (1.1) 49 (1.3) 55 (1.7)
* Only teachers who indicated they were "well aware" of each set of standards were asked to respond to these items. These percentages include teachers who responded "strongly agree" or "agree."
22

Of course, whether or not they are knowledgeable about the documents, mathematics teachers may or may not agree with the principles underlying the Standards or the recommendations that flow from them. The NCTM Standards and the National Science Education Standards stress the need to involve all students in learning important and powerful science and mathematics concepts from the earliest grades; deemphasizing, for example, arithmetic computation in favor of having students develop reasoning and problem-solving abilities. Tracking and other school and district policies that prevent some students from having the opportunity to learn challenging science and mathematics content are to be discontinued.
Moreover, reform advocates stress that all students need to be actively engaged in learning science and mathematics-studying science phenomena through hands-on, inquiry-based explorations; using manipulatives to investigate mathematics concepts; using calculators, computers, and other technologies to explore science and mathematics concepts; and working with their peers in cooperative learning groups. The teacher should be a guide rather than simply a dispenser of information, and should use a variety of strategies to assess student learning, rather than relying primarily on paper and pencil, multiple-choice tests.
To get an idea of teachers' beliefs as they relate to reforms suggested by the NCTM Standards and the National Science Education Standards, teachers were asked if they agreed with a number of statements about science and mathematics education. The results show that while most science and mathematics teachers believe that "virtually all students can Jearn to think scientifically (mathematically)," sizable proportions believe that such learning is best accomplished by placing students in classes with students of similar abilities. Support for homogeneous grouping is stronger in mathematics than in science; for example, 41 percent of grade 1-4 teachers indicated that students Jearn mathematics best in classes with students of similar abilities compared to 23 percent for science. And in both subjects high school teachers are more likely than middle grade teachers, who in turn are more likely than elementary grade teachers, to endorse such grouping. (See Tables 2.21 and 2.22.)
While most middle and high school science teachers believe that science is learned best in the context of a personal or social application, and that laboratory-based science classes are more effective than non-laboratory classes, there is resistance to the reform notion of teaching science concepts first and only then having students learn the terminology associated with those concepts. Almost one-third of the teachers in grades 1-4, increasing to more than half of all high school science teachers, indicated that "it is important for students to learn basic scientific terms and formulas before learning underlying concepts and principles."
Mathematics teachers are supportive of the importance of teaching in the context of personal and social applications, but they voiced considerable resistance to another of the tenets of current reform ideas. While the NCTM Curriculum and Evaluation Standards argue for the earlier introduction of algebraic concepts, the majority of elementary, middle, and high school mathematics teachers indicated their belief that "students must master arithmetic computations before going on to algebra.'' Support for the frequent use of calculators, another emphasis of the NCTM Standards, was quite high among high school mathematics teachers, with 73 percent indicating that "students should be able to use calculators most of the time"; mathematics teachers in the lower grades were Jess likely to support such extensive use of calculators.
23

In another attempt to gauge teacher support for reform recommendations, science and mathematics teachers were provided with a list of instructional "strategies" and asked how important they believed each was for effective science/mathematics instruction. Again, it is clear that science and mathematics teachers support some of the current reform notions, but are less convinced about others. ·
Table 2.21 Science Teachers' Opinions on
Curriculum and Instruction Issues
Percent of Teachers Agreeing*
Grades 1-4
Students Jearn best when they study science in the context of a personal or social application 94 (I .4)
Virtually all students can Jearn to think scientifically 80 (2.4)
Laboratory-based science classes are more effective than non-laboratory classes 78 (2.1)
The testing program in my state/district dictates what science I teach 38 (2.5)
It is important for students to learn basic scientific terms and formulas before learning underlying concepts and principles 31 (2.2)
Students Jearn science best in classes with students of similar abilities 23 (2.3)
Activity-based experiences aren't worth the time and expense for what students learn 4 (0.7)
* Includes teachers indicating "strongly agree" and "agree" to each statement.
Table 2.22 Mathematics Teachers' Opinions on Curriculum and Instruction Issues
Grades 5-8 Grades 9-12
92 (2.2) 86 (4.5)
84 (3.3) 76 (2.6)
87 (1.5) 90 (1.2)
40 (3.4) 30 (3.8)
44 (3.7) 55 (26)
33 (3.3) 68 (2.0)
5 (1.4) 6 (1.3)
Percent of Teachers Agreeing*
Grades 1-4 Grades 5-8 Grades 9-12
Students learn best when they study mathematics in the context of a personal or social application 94 (1.3) 91 (1.7) 84 (1.7)
Virtually all students can Jearn to think mathematically 76 (2.0) 76 (2.6) 72 (2.3)
Students Jearn mathematics best in classes with students of similar abilities 41 (1.9) 62 (3.8) 76 (2.9)
Students need to master arithmetic computation before going on to algebra 70 (2.2) 77 (3.1) 81 (1.7)
The testing program in my state/district dictates what mathematics l teach 60 (3.0) 52 (3.3) 40 (2.6)
Students should be able to use calculators most of the time 24 (1.9) 39 (3.1) 73 (I 7)
Activity-based experiences aren't worth the time and expense for what students Jearn 5 (1.3) 8 (2.2) 9 (1.0)
* Includes teachers indicating "strongly agree" and "agree" to each statement.
24

Table 2.23 shows the percent of mathematics teachers rating each strategy a five on a fivepoint scale ("definitely should be a part of mathematics instruction") at the grade level they teach. Table 2.24 shows the analogous data combining ratings of four and five. Note that pedagogical beliefs among mathematics teachers vary considerably by grade taught. For example, as can be seen in Table 2.23, more than 80 percent of grade I-4 mathematics teachers, but only I in 2 in grades 5-8 and I in 4 in grades 9-I2 consider the use of handson/manipulative activities to be essential for effective mathematics instruction. Teachers in the higher grades are similarly less likely to consider essential such strategies as concrete experiences before abstract treatments; applications of mathematics in daily life; having students work in cooperative learning groups; use of computers;.and taking students' prior conceptions about a topic into account when planning curriculum and instruction. In contrast, high school teachers are more likely than their co11eagues in the elementary grades to consider the use of calculators essential for effective mathematics instruction.
Table 2.23 Mathematics Teachers Indicating that Various Strategies Definitely Should be a Part of Mathematics Instruction
Percent of Teachers
Grades 1-4 Grades 5-8
Hands-on/manipulative activities 82 (2.2) 49 (3.2)
Concrete experience before abstract treatments 81 (2.0) 55 (2.7)
Applications of mathematics in daily life 81 (1.6) 75 (3.1)
Emphasis on solving real problems 80 (1.9) 78 (2.6)
Every student studying mathematics each year 76 (2.7) 69 (3.5)
Emphasis on mathematical reasoning 69 (2.0) 64 (2.6)
Emphasis on connections among concepts 68 (1.7) 62 (2.4)
Students working in cooperative learning groups 58 (1.8) 41 (2.8)
Use of computers 52 (2.9) 39 (3.3)
Emphasis on arithmetic computation 49 (2.4) 36 (2.4)
Coordination of mathematics with science 34 (2.1) 27 (3.4)
Taking student preconceptions about a topic into account when planning curriculum/instruction 34 (2.9) 26 (2.8)
Use of calculators 33 (3.2) 37 (3.7)
Inclusion of performance-based assessment 33 (1.9) 29 (2.9)
Deeper coverage of fewer mathematics ideas 33 (3.6) 31 (3.4)
Emphasis on writing about mathematics 32 (2.0) 23 (2.6)
Integration of mathematics subjects (e.g., algebra, probability, geometry, etc.) all taught together each year 26 (1.7) 25 (3.2)
Coordination of mathematics with vocational/technology education 25 (2.5) 23 (2.8)
25
Grades 9-12
26 (2.2)
33 (2.5)
50 (2.8)
57 (2.9)
38 (2.5)
58 (3.0)
52 (2.2)
27 (2.2)
34 (2.3)
22 (1.8)
22 (2.6)
18 (2.5)
50 (2.5)
18 (1.6)
16 (2.6)
20 (2.8)
20 (2.8)
19 (1.7)

Table 2.24 Mathematics Teachers Indicating that Various Strategies Are
an Important Part of Mathematics Instruction*
Percent of Teachers
Grades 1-4 Grades 5-8 Grades 9-12
Emphasis on solving real problems 99 (0.7) 99 (0.9) 98 (0.4)
Applications of mathematics in daily life 99 (0.4) 99 (1.0) 95 (1.0)
Emphasis on mathematical reasoning 98 (0.5) 98 (_1.0) 98 (0.3)
Emphasis on connections among concepts 98 (0.8) 98 (1.0) 97 (0.5)
Hands-on/manipulative activities 98 (1.0) 89 (2.2) 78 (2.1)
Every student studying mathematics each year 97 (1.1) 96 ( 1.2) 81 (2.7)
Concrete experience before abstract treatments 97 (1.3) 92 (1.6) 85 (1.6)
Students working in cooperative learning groups 92 (1.5) 82 (3.0) 78 (1.6)
Emphasis on arithmetic computation 90 (1.7) 89 (1.6) 64 (2.5)
Use of computers 87 (1.7) 87 (2.3) 81 (2.7)
Inclusion of performance-based assessment 82 (2.2) 78 (2.3) 71 (2.3)
Coordination of mathematics with science 81 (2.2) 75 (2.4) 80 ( 1.6)
Taking student preconceptions about a topic into account when planning curriculum/instruction 79 (2.1) 80 (2.2) 67 (2.3)
Deeper coverage of fewer mathematics ideas 72 (2.4) 75 (3.1) 55 (2.9)
Use of calculators 71 (2.1) 80 (3.8) 89 (1.0)
Emphasis on writing about mathematics 71 (2.0) 64 (4.0) 60 (2.0)
Integration of mathematics subjects (e.g., algebra, probability, geometry, etc.) all taught together each year 64 (1.7) 65 (2.9) 56 (2.8)
Coordination of mathematics with vocational/technology education 62 (2.7) 73 (2.5) 75 (2.1)
* Teachers were given a five-point scale for each strategy, with 1 labeled "definitely should !!.Q! be a part of science instruction"; 3, "makes no difference"; and 5, "definitely should be a part of science instruction." These numbers represent the total circling 4 or 5.
26

Science teacher ratings of the importance of each of a number of strategies for effective science teaching are shown in Tables 2.25 ("definitely should be included") and 2.26 ("definitely should" or "should be included"). Roughly 3 out of 4 science teachers in grades 1-4, 5-8, and 9-12 indicated that hands-on activities should definitely be a part of science instruction; nearly that many consider teaching of applications of science in daily life to be essential. Support for concrete experience before abstract treatments is much lower, especially in grades 9-12, as is having students work in cooperative learning groups. Even fewer high school science teachers (about 1 in 5) consider it essential to take student conceptions about natural phenomena into account when planning curriculum and instruction; to have deeper coverage of fewer science concepts; or to revisit -science topics, each time in greater depth.
Table 2.25 Science Teachers Indicating that Various Strategies Definitely Should be a Part of Science Instruction
Percent of Teachers
Grades 1-4 Grades 5-8 Grades 9-12
Hands-on/laboratory activities 78 (2.3) 78 (2.8) 76 (2.1)
Applications of science in daily life 73 (2.5) 69 (4.3) 60 (3.6)
Concrete experience before abstract treatments 70 (2.6) 51 (4.4) 35 (3.1)
Every student studying science every year 63 (2.0) 61 (2.9) 37 (2.6)
Students working in cooperative learning groups 57 (2.5) 50 (3.0) 30 (2.0)
Emphasis on connections among concepts 52 (2.7) 54 (4.4) 53 (2.5)
Coordination of sciences with mathematics 47 (2.8) 43 (3.5) 47 (3.8)
Coordination of sciences with language arts 46 (2.7) 35 (3.7) 20 (3.0)
Coordination of sciences with social science 43 (2.9) 34 (3.6) 19 (3.8)
Taking student conceptions about a natural phenomenon into account when planning curriculum/instruction 39 (2.2) 34 (4.0) 22 (1.4)
Coordination of sciences with vocational/technology education 37 (2.5) 33 (4.2) 29 (I. 7)
Use of computers 30 (3.6) 37 (4.3) 36 (2.3)
Coordination of science disciplines 30 (3.4) 37 (3.3) 35 (2.7)
Revisiting science topics, each time in greater depth 29 (2.6) 21 (2.4) 19 (1.6)
Deeper coverage of fewer science concepts 28 (2.8) 30 (3.1) 20 (1.6)
Applications of scientific methods in addressing societal issues 28 (2.3) 33 (3.3) 35 (3.1)
Inclusion of performance-based assessment 22 (2.4) 26 (3.5) 18 ( 1.8)
27
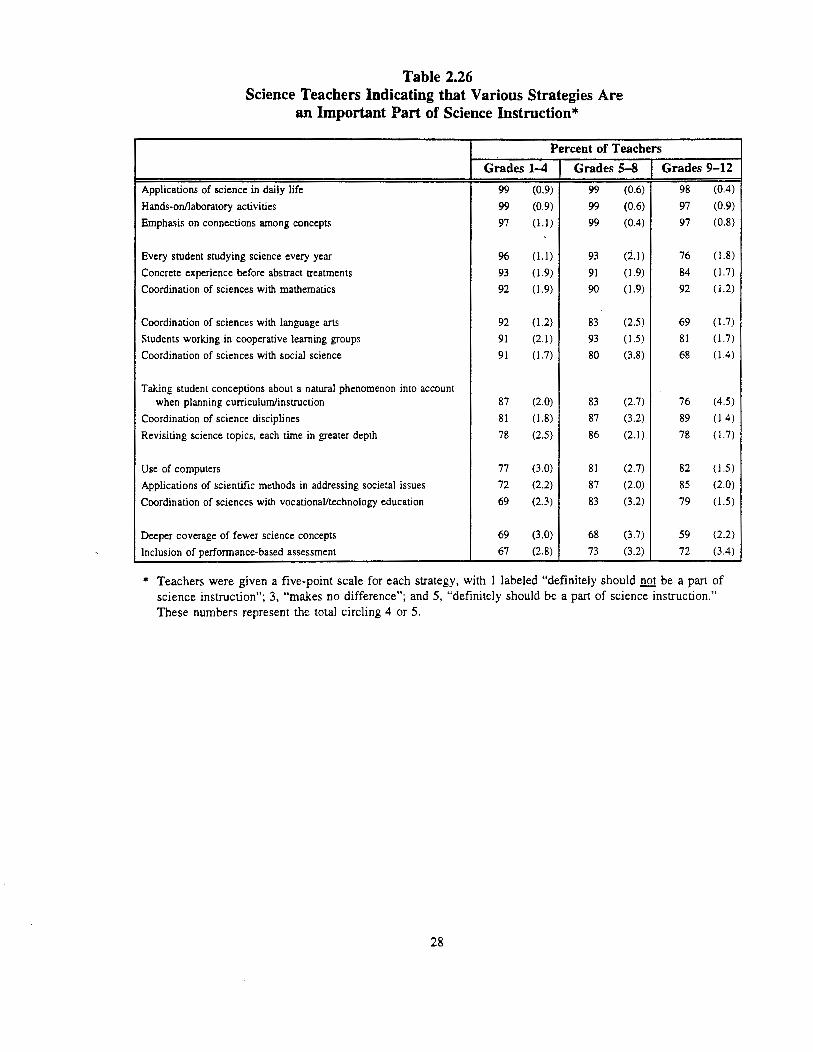
Table 2.26 Science Teachers Indicating that Various Strategies Are
an Important Part of Science Instruction*
Percent of Teachers
Grades 1-4 Grades 5-8
Applications of science in daily life 99 (0.9) 99 (0.6)
Hands-onllaboratory activities 99 (0.9) 99 (0.6)
Emphasis on connections among concepts 97 (l.l) 99 (0.4)
Every student studying science every year % (l.l) 93 (i.l)
Concrete experience before abstract treatments 93 (1.9) 91 (1.9)
Coordination of sciences with mathematics 92 (1.9) 90 (1.9)
Coordination of sciences with language arts 92 (1.2) 83 (2.5)
Students working in cooperative learning groups 91 (2.1) 93 (1.5)
Coordination of sciences with social science 91 (1.7) 80 (3.8)
Taking student conceptions about a natural phenomenon into account when planning curriculum/instruction 87 (2.0) 83 (2.7)
Coordination of science disciplines 81 (1.8) 87 (3.2)
Revisiting science topics, each time in greater depth 78 (2.5) 86 (2.1)
Use of computers 77 (3.0) 81 (2.7)
Applications of scientific methods in addressing societal issues 72 (2.2) 87 (2.0)
Coordination of sciences with vocational/technology education 69 (2.3) 83 (3.2)
Deeper coverage of fewer science concepts 69 (3.0) 68 (3.7)
Inclusion of performance-based assessment 67 (2.8) 73 (3.2)
Grades 9-12
98 (0.4)
97 (0.9)
97 (0.8)
76 ( 1.8)
84 (1.7)
92 ( 1.2)
69 (1.7)
81 (1.7)
68 (I .4)
76 (4.5)
89 (I .4)
78 (1.7)
82 (1.5)
85 (2.0)
79 (1.5)
59 (2.2)
72 (3.4)
* Teachers were given a five-point scale for each strategy, with 1 labeled "definitely should not be a part of science instruction"; 3, "makes no difference"; and 5, "definitely should be a part of science instruction." These numbers represent the total circling 4 or 5.
28

E. Teacher Perceptions of Their Preparation
Knowing the extent of teachers' course backgrounds provides useful information about the preparation of the nation's science and mathematics teaching force. Of equal importance are teachers' perceptions of their preparation-how well prepared teachers feel they are to teach the various content areas and to use the various instructional strategies recommended for science and mathematics education.
Elementary teachers are typically assigned to teach science, mathematics, and other academic subjects to one group of students, but it is clear that they do not. feel equally qualified to teach these subjects. Table 2.27 shows the percent of self-contained elementary teachers perceiving themselves to be "very well qualified" to teach reading/language arts, social studies, mathematics, and science at three different points in time-1977, 1985-86, and 1993. In 1993, 76 percent of elementary teachers assigned to teach all four subjects indicated they felt very well qualified to teach reading/language arts, compared to roughly 60 percent for both mathematics and social studies, but only 26 percent for li.fe science.
Table 2.27 Self-Contained Grade 1-6 Teachers Feeling
Very Well Qualified to Teach Each Subject: 1977, 1985-86, and 1993
Percent of Teachers
1977* 1985-86
Reading/Language Arts 63 (1.7) 86 (1.0)
Mathematics 49 (1.8) 69 (1.3)
Social Studies 39 (1.7) 51 (1.4)
Life Sciences -- -- 27 (1.2)
Science 22 (1.5) -- --
* 1977 figures include Kindergarten teachers.
1993
76 (1.9)
60 (2.4)
61 (1.7)
26 (2.0)
-- --
Tables 2.28, 2.29, and 2.30 provide more detailed data on grade 1-4, 5-8, and 9-12 teachers' perceptions of their qualifications to teach each of a number of subjects in their particular grade levels; response options were "not well qualified," "adequately qualified," and "very well qualified." Note that relatively few elementary and middle grade teachers indicated they feel well prepared to teach chemistry and physics, perhaps because they were thinking about the traditional high school treatment of these subjects rather than how one might approach them with younger students; many more elementary and middle grade science teachers perceive themselves as well prepared to teach the life and earth sciences.
29

Life Sciences
Chemistry
Physics
Earth Sciences
Technology
Table 2.28 Grade 1-4 Science Teachers' Ratings of Their Qualifications
to Teach Each of a Number of Subjects
Percent of Teachers
Not Well Adequately Qualified Qualified
8 (1.5) 65 (2.7)
64 (2.5) 30 (2.4)
69 (1.9) 25 (2.0)
8 (1.6) 61 (2.9)
52 (3.5) 41 (3.5)
Integrated Science, drawing from various science disciplines 30 (3.3) 56 (2.9)
Mathematics
Life Sciences
Chemistry
Physics
Earth Sciences
Technology
I (0.4) 36 (3.1)
Table 2.29 Grade 5-8 Science Teachers' Ratings of Their Qualifications
to Teach Each of a Number of Subjects
Percent of Teachers
Not Well Adequately Qualified Qualified
7 (1.5) 52 (2.5)
47 (4.1) 39 (3.6)
52 (4.2) 36 (3.7)
9 (2.7) 56 (3.3)
46 (3.8) 44 (H)
Integrated Science, drawing from various science disciplines 24 (4.2) 53 (3.8)
Mathematics
Life Sciences
Chemistry
Physics
Earth Sciences
Technology
7 (0.9) 44 (3.1)
Table 2.30 Grade 9-12 Science Teachers' Ratings of Their Qualifications
to Teach Each of a Number of Subjects
Percent of Teachers
Not Well Adequately Qualified Qualified
18 (1.5) 22 (2.9)
24 (1.6) 40 (3.2)
48 (2.2) 30 (1.8)
26 (1.9) 43 (2.7)
42 (2.5) 46 (2.7)
Integrated Science, drawing from various science disciplines 15 (1.0) 59 (3.3)
Mathematics 29 (2.1) 44 (2.9)
30
Very Well Qualified
27 (2.5)
6 (1.1)
5 (1.1)
31 (2.9)
7 (1.3)
14 ( 1.8)
63 (2.7)
Very Well Qualified
42 (2.8)
14 (1.8)
12 (2.3)
35 (2.9)
10 (2.2)
23 (2.9)
49 (3.0)
Very Well Qualified
60 (3.4)
36 (2.4)
22 (1.6)
31 (3.6)
12 (1.4)
27 (2.8)
27 (3.3)

While current notions of science education reform recommend teaching about technology as part of science instruction, only about half of the teachers in each grade range feel at least adequately qualified to do so. Larger percentages of teachers feel at least adequately qualified to teach integrated science, ranging from 70 percent in grades 1-4 to 85 percent in grades 9-12.
Mathematics teachers were also given a list of 14 mathematics topics recommended by the NCTM Curriculum and Evaluation Standards for one or more of the grade ranges 1-4, 5-8, and 9-12 and asked to indicate how well qualified they felt to teach each one at the grade level they teach. As can be seen in Table 2.31, the only topics which a majority of grade 1-4 mathematics teachers feel very well qualified to teach are number sense and numeration (66 percent); patterns and relationships (58 percent); measurement (54 percent); and estimation (50 percent). Only 1 in 10 grade 1-4 teachers feels very well qualified to teach probability and statistics, topics that are recommended by the NCTM Standards for grades 1-4.
Table 2.31 Grade 1-4 Mathematics Teachers' Ratings of Their Qualifications
to Teach Each of a Number of Topics
Percent of Teachers
Not Well Adequately Very Well Qualified Qualified Qualified
Estimation 3 (0.8) 47 (2.6) 50 (2.7)
Number sense and numeration I (0.4) 33 (2.3) 66 (2.6)
Number systems and number theory 9 (1.5) 47 (2.4) 44 (2.3)
Measurement 3 (0.7) 44 (2.7) 54 (2.6)
Fractions and decimals 6 (1.0) 47 (1.7) 47 (2.1)
Geometry and spatial sense 9 (1.6) 49 (2.4) 42 (2.3)
Functions 14 (1.5) 50 (2.0) 36 (2.1)
Patterns and relationships 3 (0.8) 39 (3.1) 58 (3.1)
Algebra 42 (1.4) 41 (2.5) 17 (2.0)
Trigonometry 70 (1.9) 24 (2.1) 5 (1.3)
Probability and statistics 50 (1.7) 39 (2.2) 11 (1.6)
Discrete mathematics 64 (1.8) 31 (1.8) 5 (0.8)
Conceptual underpinnings of calculus 80 (2.1) 17 (1.9) 2 (0.5)
Mathematical structure 55 (2.1) 38 (2.2) 7 (1.8)
31

In grades 5-8 (see Table 2.32), a majority of mathematics teachers feels very well qualified to teach each of seven topics: fractions and decimals (81 percent); number sense and numeration (71 percent); estimation (64 percent); measurement (60 percent); number systems and number theory (58 percent); patterns and relationships (52 percent); and geometry and spatial sense (50 percent). Nearly that many feel very well qualified to teach functions (49 percent) and algebra (44 percent), but only 28 percent feel well qualified to teach probability and statistics.
Table 2.32 Grade 5-8 Mathematics Teachers' Ratings of Their Qualifications to
Teach Each of a Number of Topics
Percent of Teachers
Not Well Adequately Very Well Qualified Qualified Qualified
Estimation 3 (1.1) 33 (3.4) 64 (3.3)
Number sense and numeration 2 (0.7) 27 (3.0) 71 (3.0)
Number systems and number theory 5 (1.4) 37 (3.0) 58 (2.8)
Measurement 2 (0.8) 38 (3.3) 60 (3.2)
Fractions and decimals 0 (0.1) 19 (2.8) 81 (3.0)
Geometry and spatial sense 7 (2.0) 43 (3.5) 50 (3.0)
Functions II (2.0) 40 (2.8) 49 (2.5)
Patterns and relationships 2 (0.7) 46 (3.4) 52 (3.3)
Algebra 18 (2.5) 38 (2.4) 44 (3.1)
Trigonometry 59 (2.6) 28 (2.5) 13 (1.6)
Probability and statistics 27 (4.0) 46 (3.2) 28 (3.0)
Discrete mathematics 57 (4.0) 33 (3.2) 10 (2.0)
Conceptual underpinnings of calculus 73 (2.1) 24 (1.7) 4 (0.8)
Mathematical structure 46 (2.5) 41 (3.0) 14 (2 I)
32

As can be seen in Table 2.33, a majority of mathematics teachers in grades 9-12 feels very well qualified to teach each of 10 out of the 14 topics listed, ranging from 95 percent for algebra to 60 percent for trigonometry. In contrast, only about 3 out of 10 high school mathematics teachers feel well qualified to teach probability and statistics; mathematical structure; and the conceptual underpinnings of calculus; and only 2 out of 10 feel well qualified to teach discrete mathematics at the high school level.
Table 2.33 Grade 9-12 Mathematics Teachers' Ratings of Their Qualifications to
Teach Each of a Number of Topics
Percent of Teachers
Not Well Adequately Very Well Qualified Qualified Qualified
Estimation 2 (0.6) 27 (2.0) 72 (2.2)
Number sense and numeration I (0.2) 21 (2.2) 78 (2.3)
Number systems and number theory 2 (0.5) 30 (2.8) 67 (2.9)
Measurement I (0.5) 20 (2.1) 79 (2.2)
Fractions and decimals 0 (0.0) 7 (1.6) 93 (1.6)
Geometry and spatial sense 3 (0.7) 27 (3.3) 69 (3.3)
Functions 2 (0.5) 23 (2.1) 75 (2.2)
Patterns and relationships I (0.4) 28 (2.8) 71 (2.8)
Algebra 0 (0.2) 5 (0.8) 95 (0.8)
Trigonometry 10 (2.6) 30 (2.4) 60 (2.7)
Probability and statistics 14 (1.7) 54 (2.3) 33 (2.3)
Discrete mathematics 26 (1.8) 55 (2.3) 20 (1.7)
Conceptual underpinnings of calculus 33 (2.8) 38 (2.4) 29 (1.8)
Mathematical structure 19 (2.7) 51 (2.4) 30 (2.0)
Earlier, it was noted that teachers of advanced high school mathematics classes had stronger mathematics backgrounds than did teachers who were not assigned to advanced classes. It is not surprising, therefore, that teachers of advanced classes are more likely to perceive themselves as well qualified to teach various mathematics topics. As can be seen in Table 2.34, the difference is particularly large for mathematical structure; 41 percent of teachers assigned to one or more advanced high school mathematics classes, but only 18 percent of those who don't teach advanced classes, feel well qualified to teach this topic.
33

Table 2.34 Grade 9-12 Mathematics Teachers Considering Themselves
Well Qualified to Teach.Each Mathematics Topic, by Teaching Assignment
Percent of Teachers
Teaching No Teaching One or More Advanced Courses Advanced Courses
Algebra 90 (1.7) 99 (0.7)
Fractions and decimals 90 (2.7) 95 (1.4)
Measurement 80 (2.9) 78 (3.1)
Number sense and numeration 72 (3.7) 82 (2.4)
Estimation 70 (3.5) 74 (3.0)
Functions 64 (3.7) 86 (2.5)
Patterns and relationships 63 (4.3) 77 (2.5)
Geometry and spatial sense 62 (4.4) 77 (4.1)
Number systems and number theory 59 (4.5) 74 (3.3)
Trigonometry 40 (3.4) 78 (2.4)
Probability and statistics 33 (3.0) 31 (2.9)
Mathematical structure 18 (2.1) 41 (2.8)
Discrete mathematics 17 (2.4) 22 (2.1)
Conceptual underpinning of calculus 14 (2.1) 43 (3.1)
Teachers in both the 1985-86 and 1993 national surveys were asked about their enjoyment of science/mathematics teaching and whether or not they consider themselves to be "master" teachers of these subjects. As can be seen in Table 2.35, in 1993, 86 percent of grade 1-6 science teachers and more than 95 percent of grade 1-6 mathematics, and grade 7-9 and 10--12 science and mathematics teachers reported that they enjoy teaching these subjects. Smaller numbers, but still sizeable percentages at the secondary level consider themselves to be "master" science and mathematics teachers, including nearly 70 percent of grade 7-9 science and mathematics teachers and roughly 75 percent of those in grades 10--12. While elementary science teachers continue to be far less likely than other science and mathematics teachers to perceive of themselves as "master" teachers of their subject, the percentage of grade 1-6 science teachers considering themselves to be "master" science teachers has increased from 14 to 25 percent since 1985-86.
34
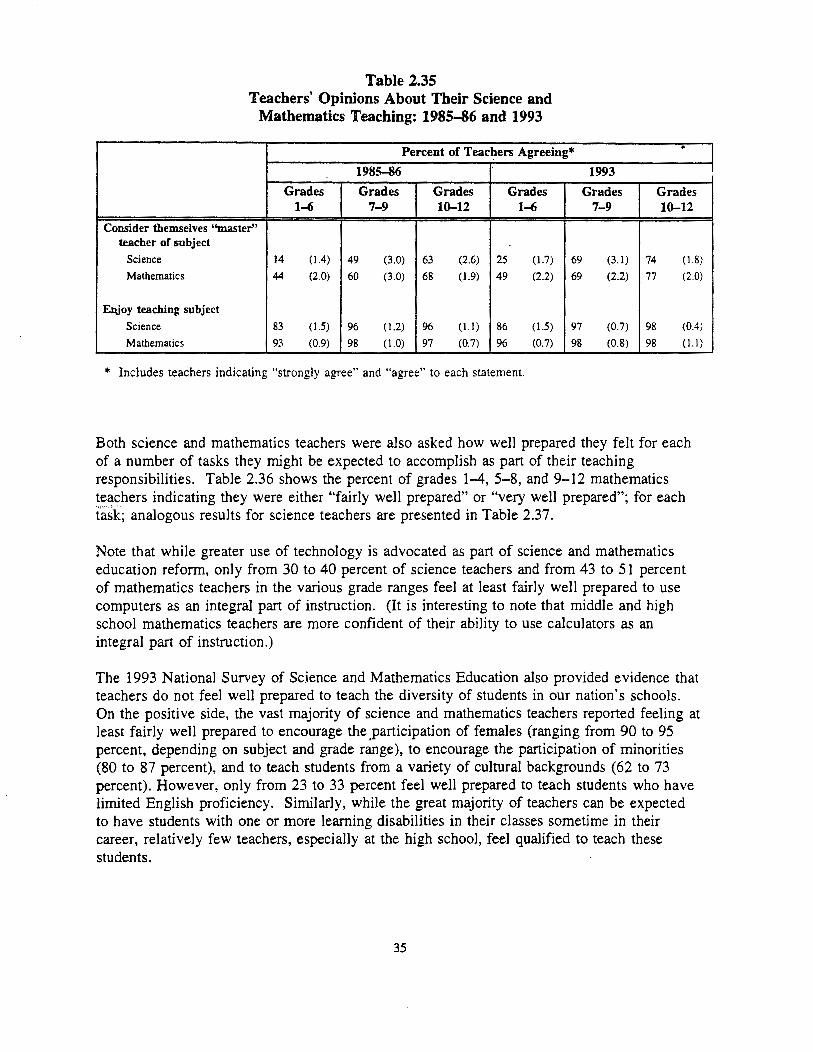
Table 2.35 Teachers' Opinions About Their Science and
Mathematics Teaching: 1985-86 and 1993
Percent of Teachers Agreeing*
1985-86 Grades Grades Grades Grades
1-6 7-9 10-12 1-6
Consider themselves "master" teacher of subject
Science 14 (1.4) 49 (3.0) 63 (2.6) 25 (1 .7) 69
Mathematics 44 (2.0) 60 (3.0) 68 (1.9) 49 (2.2) 69
Enjoy teaching subject Science 83 (1.5) 96 (1.2) % (l.l) 86 (1.5) 97
Mathematics 93 (0.9) 98 (1.0) 97 (0.7) % (0.7) 98
* Includes teachers indicating "strongly agree" and "agree" to each statement.
. 1993
Grades Grades 7-9 10-12
(3.1) 74 (1.8)
(2.2) 77 (2.0)
(0.7) 98 {0.4)
(0.8) 98 (1.1)
Both science and mathematics teachers were also asked how well prepared they felt for each of a number of tasks they might be expected to accomplish as part of their teaching responsibilities. Table 2.36 shows the percent of grades 1-4, 5-8, and 9-12 mathematics teachers indicating they were either "fairly well prepared" or "very well prepared"; for each task; analogous results for science teachers are presented in Table 2.37.
Note that while greater use of technology is advocated as part of science and mathematics education reform, only from 30 to 40 percent of science teachers and from 43 to 51 percent of mathematics teachers in the various grade ranges feel at least fairly well prepared to use computers as an integral part of instruction. (It is interesting to note that middle and high school mathematics teachers are more confident of their ability to use calculators as an integral part of instruction.)
The 1993 National Survey of Science and Mathematics Education also provided evidence that teachers do not feel well prepared to teach the diversity of students in our nation's schools. On the positive side, the vast majority of science and mathematics teachers reported feeling at least fairly well prepared to encourage the .Participation of females (ranging from 90 to 95 percent, depending on subject and grade range), to encourage the participation of minorities (80 to 87 percent), and to teach students from a variety of cultural backgrounds (62 to 73 percent). However, only from 23 to 33 percent feel well prepared to teach students who have limited English proficiency. Similarly, while the great majority of teachers can be expected to have students with one or more learning disabilities in their classes sometime in their career, relatively few teachers, especially at the high school, feel qualified to teach these students.
35
I
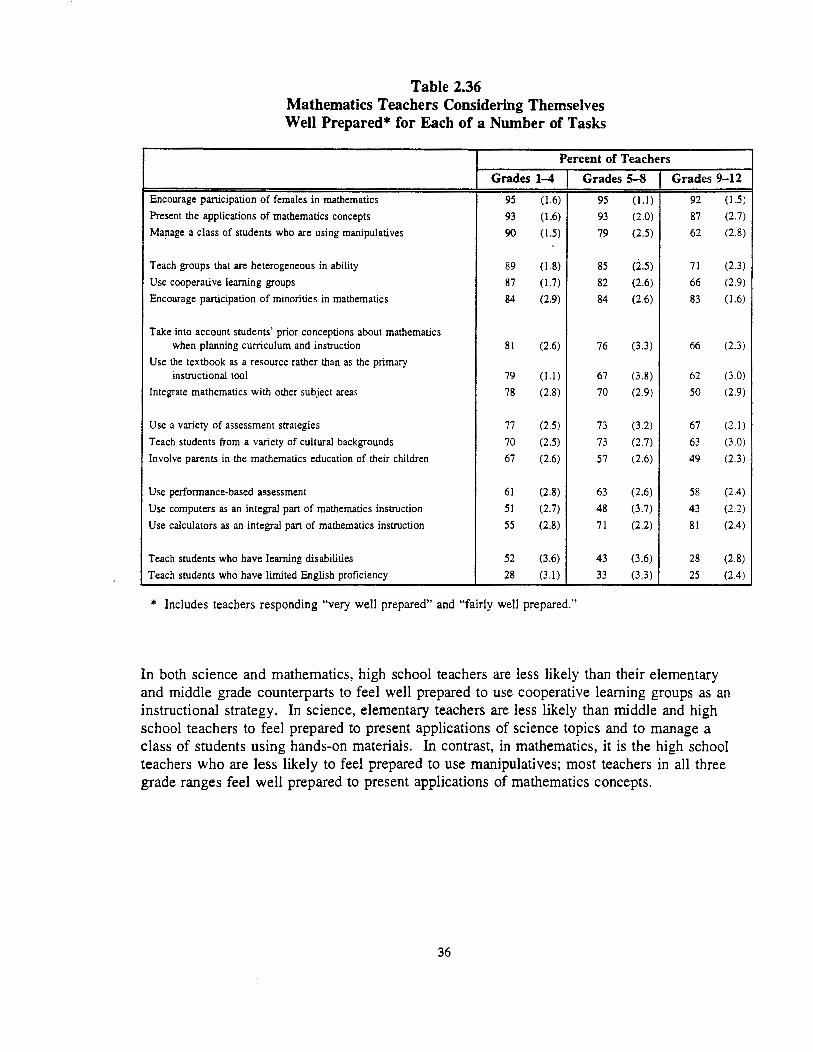
Table 2.36 Mathematics Teachers Considering Themselves Well Prepared* for Each of a Number of Tasks
Percent of Teachers
Grades 1-4 Grades 5-8
Encourage panicipation of females in mathematics 95 (1.6) 95 ( 1.l)
Present the applications of mathematics concepts 93 (1.6) 93 (2.0)
Ma~age a class of students who are using manipulatives 90 (1.5) 79 (2.5)
Teach groups that are heterogeneous in ability 89 ( 1.8) 85 (2.5)
Use cooperative learning groups 87 (1.7) 82 (2.6)
Encourage panicipation of minorities in mathematics 84 (2.9) 84 (2.6)
Take into account students' prior conceptions about mathematics when planning curriculum and instruction 81 (2.6) 76 (3.3)
Use the textbook as a resource rather than as the primary instructional tool 79 (1.1) 67 (3.8)
Integrate mathematics with other subject areas 78 (2.8) 70 (2.9)
Use a variety of assessment strategies 77 (2.5) 73 (3.2)
Teach students from a variety of cultural backgrounds 70 (2.5) 73 (2.7)
Involve parents in the mathematics education of their children 67 (2.6) 57 (2.6)
Use performance-based assessment 61 (2.8) 63 (2.6)
Use computers as an integral part of mathematics instruction 51 (2.7) 48 (3.7)
Use calculators as an integral part of mathematics instruction 55 (2.8) 71 (2.2)
Teach students who have learning disabilities 52 (3.6) 43 (3.6)
Teach students who have limited English proficiency 28 (3.1) 33 (3.3)
* Includes teachers responding "very well prepared" and "fairly well prepared."
Grades 9-12
92 (1.5)
87 (2.7)
62 (2.8)
71 (2.3)
66 (2.9)
83 (1.6)
66 (2.3)
62 (3.0)
50 (2.9)
67 (2.1)
63 (3.0)
49 (2.3)
58 (2.4)
43 (2.2)
81 (2.4)
28 (2.8)
25 (2.4)
In both science and mathematics, high school teachers are less likely than their elementary and middle grade counterparts to feel well prepared to use cooperative learning groups as an instructional strategy. In science, elementary teachers are less likely than middle and high school teachers to feel prepared to present applications of science topics and to manage a class of students using hands-on materials. In contrast, in mathematics, it is the high school teachers who are less likely to feel prepared to use manipulatives; most teachers in all three grade ranges feel well prepared to present applications of mathematics concepts.
36

Table 2.37 Science Teachers Considering Themselves
Well Prepared* for Each of a Number of Tasks
Percent of Teachers
Grades 1-4 Grades 5-8
Encourage participation of females in science 92 (2.0) 94 (1.7)
Teach groups that are heterogeneous in ability 89 (2.3) 90 (1.9)
Encourage participation of minorities in science 87 (2.3) 86 (2.4)
Use cooperative learning groups 83 (2.2) 83 (2.5)
Manage a class of students who are using bands-on! laboratory activities 78 (2.6) 83 (2.1)
Use the textbook as a resource rather than as the primary instructional tool 77 (3.1) 70 (3.0)
Integrate science with other subject areas 76 (2.3) 67 (3.0)
Present the applications of science concepts 74 (2.3) 80 (3.5)
Teach students from a variety of cultural backgrounds 73 (2.7) 69 (3.7)
Use a variety of assessment strategies 70 (3.0) 78 (3.2)
Take into account students' prior conceptions about natural phenomena when planning curriculum and instruction 70 (2.2) 63 (3.8)
Use performance-based assessment 60 (2.9) 65 (3.3)
Involve parents in the science education of their children 57 (3.6) 56 (3.1)
Teach students who have learning disabilities 50 (3.5) 46 (3.1)
Teach students who have limited English proficiency 32 (2.7) 25 (3.4)
Use computers as an integral part of science instruction 30 (3.4) 31 (2.7)
* Includes teachers responding "very well prepared" and "fairly well prepared."
F. Teacher Familiarity with NSF-Supported Curricula
Grades 9-12
90 (3.0)
71 (2.9)
80 (3.3)
64 (3.4)
91 (3.1)
80 (3.0)
62 (2.5)
92 (3.1)
62 (2.3)
85 (1.5)
62 (3.0)
64 (2.7)
43 (3.0)
27 (1.8)
23 (2.1)
40 (2.4)
The National Science Foundation (NSF) has provided support for the development of curriculum and instructional materials since the late 1950s. In an attempt to gauge the extent to which these efforts have impacted on science and mathematics education, the 1993 National Survey asked teachers about each of a number of projects in a list supplied by NSF program staff. Response options were: "Have never heard of," "have heard of but not seen," "have seen but not used," and "have used in teaching." Table 2.38 shows the percent of science teachers who had heard of each of the projects, whether or not they had actually seen or used them; analogous results for mathematics are shown in Table 2.39.
In grade 1-4 science, by far the most widely known project in the list was the National Geographic Kids Network (68 percent), followed by several projects in the 35 to 45 percent awareness range, including Biological Science: An Ecological Approach (a high school
37

program, but one that has been around for several decades); SuperScience Magazine, Quantum Magazine for Students (again aimed at a high school audience), and Grow Lab.
Grade 5-8 science teachers were also most likely to have heard of the National Geographic Kids Network (68 percent), followed by Biological Science: An Ecological Approach (57 percent); Second Voyage of the Mimi (49 percent); and Quantum Magazine for Students (43 percent).
At the high school level, science teachers were most likely to lalow about Biological Science: An Ecological Approach (77 percent); Science For Life and Living (61 percent); ChemCom: Chemistry in the Community (58 percent); National Geographic Kids Network (45 percent); and Second Voyage of the Mimi (40 percent).
Table 2.38 Science Teachers Having Heard of Selected
NSF -Supported Curricula
Percent of Teachers
Grades 1-4 Grades 5-8
National Geographic Kids Network 68 (3.0) 68 (2.8)
Biological Science: An Ecological Approach 45 (2.4) 57 (2.7)
Quantum Magazine for Students 38 (2.5) 43 (3.2)
SuperScience Magazine 38 (2.2) 42 (4.1)
Grow Lab, National Gardening Association 35 (2.4) 35 (4.3)
Second Voyage of the Mimi (Mayan Expedition) 29 (3.1) 49 (3.7)
Science Vision 26 (3.0) 28 (3.2)
Middle School Life Science 24 (2.5) 34 (3.9)
Science for Life and Living: Integrating Science, Technology, and Health (BSCS) 24 (2.5) 33 (2.9)
Full Option Science System (FOSS Science Kits) 23 (2.2) 31 (3.6)
Bottle Biology 22 (2.1) 23 (2.9)
Chemical Education for Public Understanding Program
(CEPUP) 10 (1.6) 22 (3.9)
ChemCom: Chemistry in the Community 10 (1.4) 19 (2.7)
Texas Learning Technology Group (TLTG) Physical Science/Math for Science 10 (1.5) 12 (2.2)
Wisconsin Fast Plants 7 (1.2) 13 (2.5)
Mechanical Universe, High School Adaptation 6 (1.2) 6 (1.5)
38
Grades 9-12
45 (2.5)
77 (1.7)
37 (1.9)
19 (1.5)
22 (1.3)
40 (2.5)
28 (1.5)
34 (1.9)
61 (4.3)
17 (1.5)
25 (1.8)
26 ( 1.7)
58 (2.9)
13 (1.3)
25 ( 1.7)
27 (1.8)

Awareness of the NSF-supported mathematics materials was generally lower than in science. In grades 1-4, the most widely known materials were Elementary Mathematician (38 percent); Logo Geometry (33 percent); Geometry and Measurement, K-6 (29 percent); and Futures with Jaime Escalante (24 percent).
The same four projects were the most widely known among grade 5-8 mathematics teachers, with percentages having heard of the various materials ranging from 31 to 43 percent. A fifth project, the Middle Grades Mathematics Project, was known by 29 percent of mathematics teachers in these grades.
At the high school level, slightly more than half of mathematics teachers had heard of each of three projects: Geometer's Sketchpad (54 percent); Futures with Jaime Escalante (51 percent); and Logo Geometry (51 percent). Three other projects were known by roughly onethird of high school mathematics teachers, including Computer-Intensive Algebra (35 percent); the High School Mathematics and Its Applications Project (29 percent); and Getting Ready for Algebra (28 percent).
Table 2.39 Mathematics Teachers Having Heard of Selected
NSF -Supported Curricula
Percent of Teachers
Grades 1-4 Grades 5-8
Elementary Mathematician 38 (3.3) 32 (3.6)
Logo Geometry 33 (2.2) 43 (2.5)
Geometry and Measurement, K-6 29 (2.5) 31 (2.8)
Futures with Jaime Escalante 24 (2.7) 36 (3.4)
Math and the Mind's Eye 18 (3.2) 24 (2.5)
Journeys in Mathematics 16 (1.7) 23 (3.1)
Calculus and Mathematics Project-Los Angeles (CAMP-LA) 16 (1.7) 20 (3.5)
Getting Ready for Algebra 14 (1.9) 26 (2.2)
Project Mathematics! 14 (2.0) 22 (2.6)
Computer-Intensive Algebra 14 (2.4) 18 (2.4)
Used Numbers: Collecting and Analyzing Real Data 12 (1.9) 16 (2.2)
Middle Grades Mathematics Project 10 (1.3) 29 (2.8)
Quantitative Literacy Series 8 (I.!) 10 (2.0)
Geometer's Sketchpad 7 (1.3) 20 (2.0)
Jasper Series 6 (0.8) 8 (1.7)
High School Math and Its Applications Project (HIMAP) 4 (0.7) 10 (1.6)
39
Grades 9-12
16 (1.2)
51 (2.7)
21 ( 1.8)
51 (2.8)
23 (1.7)
19 (1.6)
25 ( 1.5)
28 (1.9)
20 (1.9)
35 (2.7)
15 ( 1.4)
20 (1.4)
14 (1.3)
54 (2.8)
7 (0.9)
29 (2.4)

40

A. Overview
©Gu@[,Q)~[f Wufi®®
Teachers as Professionals
The National Council of Teachers of Mathematics' Professional Standards for Teaching and the National Science Education Standards describe a vision for teaching in which teachers are treated as professionals-respected for their expertise, allowed to exercise their professional judgement, and provided ample opportunities to work collaboratively with their peers and to continue to Jearn throughout their careers. The 1993 National Survey of Science and Mathematics Education collected data related to teacher professionalism, including teacher perceptions of their autonomy in making curriculum and instructional decisions, their opportunities for collaborative work, and their participation in in-service education and other professional activities. These data are discussed in the following sections.
B. The School as a Collegial Work Place
Teacher perceptions on issues related to collegiality are shown in Tables 3.1 and 3.2 for science and mathematics, respectively. On the positive side, most science and mathematics teachers in each grade range feel supported by their colleagues to try out new ideas in teaching (from 74 to 87 percent); indicate that teachers in their school share ideas and materials on a regular basis (52 to 72 percent); and feel that they have many opportunities to learn new things in their job (57 to 76 percent). Similarly, most science and mathematics teachers feel supported by their administrators. However, fewer than 1 in 5 have time during the regular school week to work with their peers on science/mathematics curriculum and instruction and only about 1 in 8 indicated that science/mathematics teachers in their school regularly observe each other teaching classes as part of sharing and improving instructional strategies. The picture that emerges is one where teachers feel supported by their colleagues, but have to .. steal" moments to work with them.
41

Table 3.1 Science Teachers Agreeing* with Each of a Number of
Statements Related to Teacher Collegiality
Percent of Teachers
Grades 1-4 Grades 5-8
I feel supported by colleagues to try out new ideas in teaching science 74 (2.3) 76 (3.1)
I feel that I have many opportunities to Jearn new things in my present job 74 (2.2) 68 (3.9)
Science teachers in this school regularly share ideas and materials 55 (2.5) 56 (3.1)
Most science teachers in this school contribute actively to making decisions about the science curriculum 44 (2.8) 47 (3.8)
I receive little support from the school administration for teaching science 21 (2.3) 23 (3.5)
I have time during the regular school week to work with my peers on science curriculum and instruction 14 (1.6) 14 (2.4)
Science teachers in this school regularly observe each other teaching classes as part of sharing and improving instructional strategies 11 (1.8) 11 (1.8)
I am required to follow rules at this school that conflict with my best professional judgment 10 (1.4) 13 (1.7)
* Includes teachers indicating "strongly agree" and "agree" to each statement.
Table 3.2 Mathematics Teachers Agreeing* with Each of a Number of
Statements Related to Teacher Collegiality
Grades 9-12
87 (1.6)
66 (2.0)
72 (2.1)
66 (2.3)
23 (2.6)
16 (3.6)
14 (3.1)
18 (1.6)
Percent of Teachers
Grades 1-4 Grades 5-8 Grades 9-12
1 feel supported by colleagues to try out new ideas in teaching mathematics 84 (2.0) 83 (3.3) 80 (2.3)
I feel that I have many opportunities to Jearn new things in my present job 76 (2.3) 72 (2.5) 57 (3.0)
Mathematics teachers in this school regularly share ideas and materials 65 (2.3) 52 (3.2) 67 (2.8)
Most mathematics teachers in this school contribute actively to making decisions about the mathematics curriculum 47 (1.8) 46 (2.8) 69 (2.6)
I have time during the regular school week to work with my peers on mathematics curriculum and instruction 21 (1.9) 17 (1.8) 16 (1.6)
I receive little support from the school administration for teaching mathematics 14 (1.5) 19 (3.1) 20 (2.6)
Mathematics teachers in this school regularly observe each other teaching classes as part of sharing and improving instructional strategies 12 (1.8) 10 (2.1) 11 ( 1.8)
I am required to follow rules at this school that conflict with my best professional judgment 10 (1.8) 14 (2.0) 16 (1.7)
* Includes teachers indicating "strongly agree" and "agree" to each statement.
42

C. Teacher Perceptions of Their Decisionmak.ing Autonomy
Underlying many school reform efforts is the notion that classroom teachers are in the best position to know their students' needs and interests, and therefore should be the ones to make decisions for tailoring instruction to a particular group of students. The 1993 National Survey of Science and Mathematics Education asked teachers the extent to which they had control over a number of curriculum and instructional decisions for their classes. Results for grades 1-4, 5-8, and 9-12 science and mathematics teachers are presented in Tables 3.3 and 3.4, respectively. Note that in both science and mathematics, in all grade ranges, teachers are most likely to perceive themselves as having autonomy in selecting teaching techniques (from 66 to 79 percent); determining the amount of homework to be assigned (68 to 81 percent); choosing criteria for grading students (53 to 69 percent); and selecting both the sequence (52 to 68 percent) and the pace (55 to 71 percent) for covering topics. Fewer science and mathematics teachers, especially in the elementary and middle grades, perceive themselves as having strong control in determining the goals and objectives of their courses; selecting the content, topics, and skills to be taught; or selecting textbooks. For example, while teachers in 72 percent of grade 5-8 classes report having strong control over the selection of teaching techniques, only 36 percent of these teachers report strong control in selecting the content, topics, and skills to be taught.
Table 3.3 Science Classes Where Teachers Report Having Strong Control*
Over Various Curriculum and Instructional Decisions
Percent of Classes
Grades 1-4 Grades 5-8 Grades 9-12
Determining the amount of homework to be assigned 72 (2.1) 75 (3.1) 81
Selecting teaching techniques 66 (2.1) 72 (3.0) 79
Choosing criteria for grading students 60 (3.4) 66 (3.1) 69
Selecting the sequence in which topics are covered 56 (2.0) 62 (3.0) 68
Setting the pace for covering topics 56 (2.5) 63 (2.8) 71
Determining goals and objectives 32 (1.9) 40 (3.0) 53
Selecting other instructional materials 30 (2.0) 42 (2.8) 55
Selecting content, topics, and skills to be taught 27 (2.5) 36 (2.6) 50
Selecting textbooks 11 (1.5) 25 (2.3) 45
* Teachers were given a five-point scale for each decision, with 1 labeled as "no control" and 5 labeled "strong control."
43
(2.5)
(3.0)
(2.5)
(2.7)
(2.6)
(3.7)
(3.8)
(3.3)
(4.2)

Table 3.4 Mathematics Classes Where Teachers Report Having Strong Control*
Over Various Curriculum and Instructional Decisions
Percent of Classes
Grades 1-4 Grades 5-8 Grades 9-12
Selecting teaching techniques 69 (2.7) 71 (2.7) 76 (1.4)
Detennining the amount of homework to be assigned 68 (3.1) 72 (2.9) 79 (1.8)
Setting the pace for covering topics 60 (3.3) 55 (3.1) 56 (2.4)
Choosing criteria for grading students 53 (2.7) 63 (2.7) 66 (2.3)
Selecting the sequence in which topics are covered 52 (2.1) 52 (2.9) 54 (2.4)
Selecting other instructional materials 36 (2.3) 40 (2.1) 52 (2.2)
Determining goals and objectives 29 (3.1) 33 (1.8) 41 (2.4)
Selecting content, topics, and skills to be taught 22 (2.0) 27 (2.2) 39 (2.4)
Selecting textbooks 12 (1.4) 20 (2.0) 35 (2.6)
* Teachers were given a five-point scale for each decision, with I labeled as "no· control" and 5 labeled "strong control."
As can be seen in Table 3.5, there are some large regional differences among science teachers in perceived control over decisionmaking. Given that state-wide textbook adoption is primarily a Southern and Western practice, it is not surprising that science and mathematics teachers in these regions are less likely to consider themselves as having strong control over textbook selection. However, science teachers in the South are substantially less likely than teachers in the other regions to perceive themselves as having strong control over decisions in many other areas as well. For example, only about half of the science teachers in the South feel empowered to select the sequence or pace in which topics are covered, compared to roughly two-thirds of the teachers in the Midwest, Northeast, and West. Regional differences among mathematics teachers are much less pronounced. (See Table 3.6)
44

Table 3.5 Science Classes Where Grade 1-12 Teachers Report Having
Strong Control* Over Various Curriculum and Instructional Decisions, by Region
Percent of Classes
Midwest Northeast South
Determining the amount of homework to be assigned 80 (2.2) 76 (1.8) 69 (3.7)
Selecting teaching techniques 75 (2.1) 73 (2.0) 65 (3.3)
Choosing criteria for grading students 70 (2.7) 68 (2.3) 54 (3.0)
Selecting the sequence in which topics are covered 68 (1.9) 64 (2.3) 53 (3.4)
Setting the pace for covering topics 66 (2.0) 67 (1.8) 51 (3.0)
Selecting content, topics, and skills to be taught 43 (2.5) 40 (3.9) 27 (2.8)
Selecting other instructional materials 43 (2.5) 43 (4.8) 34 (3.3)
Detennining goals and objectives 43 (2.3) 42 (3.2) 30 (3.0)
Selecting textbooks 35 (2.2) 31 (3.6) 13 (2.8)
West
76 (2.3)
72 (2.5)
66 (3.9)
61 (2.4)
66 (2.4)
35 (2.3)
42 (2.5)
46 ( 1.9)
23 (2.8)
* Teachers were given a five-point scale for each decision, with I labeled as "no control" and 5 labeled "strong control."
Table 3.6 Mathematics Classes Where Grade 1-12 Teachers Report Having
Strong Control* Over Various Curriculum and Instructional Decisions, by Region
Percent of Classes
Midwest Northeast South
Selecting teaching techniques 73 (1.6) 70 (3.2) 71 (2.6)
Determining the amount of homework to be assigned 71 (1.9) 68 (3.4) 76 (3.7)
Choosing criteria for grading students 60 (3.4) 62 (2.2) 56 (2.5)
Setting the pace for covering topics 58 (4.0) 54 (3.7) 54 (3.4)
Selecting the sequence in which topics are covered 57 (2.1) 48 (3.0) 51 (3.8)
Selecting other instructional materials 47 (3.4) 39 (2.8) 38 (3.0)
Detennining goals and objectives 35 (2.4) 31 (2.3) 32 (4.7)
Selecting content, topics, and skills to be taught 33 (2.9) 28 (2.9) 23 (2.4)
Selecting textbooks 29 (2.0) 23 (2.2) 14 (1.9)
'West
72 (2.7)
74 (3.2)
62 (2.3)
61 (2.6)
54 (2.5)
42 (3.1)
36 (2.1)
30 (2.3)
20 (2.8)
* Teachers were given a five-point scale for each decision, with I labeled as "no control" and 5 labeled "strong control."
45

D. Professional Development
Having discretion in making curriculum and instructional decisions is one of the hallmarks of teachers as professionals. Another is keeping up with advances in their field. Table 3.7 shows the percentages of science and mathematics teachers in grades 1-4, 5-8, and 9-12 spending various amounts of time on in-service education in their field in the last three years. While most science and mathematics teachers have had at least some in-service education in their field during that time, relatively few have devoted a substantial amount of time to these activities; percentages of teachers spending 35 or more hours on in-service education in science/mathematics in the prior three years ranged from 9 percent of grade 1-4 science teachers to 38 percent of high school science teachers.
Table 3.7 Time Spent on In-Service Education in Science
and Mathematics in Last Three Years
Percent of Teachers
Grades 1-4 Grades 5-8 Grades 9-12 Science
None 26 (2.8) 17 (1.9) 12 (1.5) < 6 Hours 30 (1.8) 22 (2.6) 14 (1.8) 6-15 Hours 22 (2.1) 27 (4.2) 18 (3.0) 16-35 Hours 14 (1.9) 14 (2.8) 19 (1.4)
> 35 Hours 9 (1.8) 20 (2.4) 38 (3.1)
Mathematics None 17 (1.5) 15 (1.5) 10 (1.8)
< 6 Hours 22 (2.0) 22 (3.5) 14 (2.8)
6-15 Hours 29 (2.4) 23 (2.5) 21 (1.8)
16-35 Hours 18 (2.4) 24 (2.5) 24 (2.6)
> 35 Hours 15 (2.0) 17 (2.0) 31 (2.2)
Trend data available for science and mathematics teachers in grades 1-6, 7-9, and 10-12 indicate an increase in the percent of teachers participating in in-service education. For example, in 1993 only 19 percent of grade 10-12 mathematics teachers indicated they had not participated in any in-service activities in mathematics in the last 12 months, down from 35 percent in 1985-86. (See Table 3.8.)
Earlier it was noted that high school mathematics teachers who do not teach advanced classes have weaker content backgrounds than do teachers of advanced mathematics classes. Unfortunately, while these teachers appear to be more in need of in-service .education to strengthen their content knowledge, they are less likely to receive it. As can be seen in Table 3.9, only 44 percent of high school mathematics teachers who teach lower level classes had 16 or more hours of in-service education in the last three years, compared to 63 percent of those who teach at least one advanced mathematics class.
46

Science
None
< 6 Hours
6-15 Hours
16-35 Hours
> 35 Hours
Mathematics
None
< 6 Hours
6-15 Hours
16-35 Hours
> 35 Hours
Table 3.8 Time Spent on In-Service Education in Science and Mathematics in Last 12 Months: 1985-86 and 1993
Percent of Teachers
1985-86 1993 Grades 1-6 Grades 7-9 Grades 1~12 Grades 1-6 Grades 7-9
53 (2.0) 31 (2.8) 28 (1.8) 43 (3.1) 23 (4.3)
24 (1.7) 23 (2.5) 22 (1.7) 31 (2.0) 23 (3.0)
14 (1.4) 23 (2.5) 25 (1.7) 20 (1.6) 30 (3.0)
5 (0.9) 13 (2.0) 12 (1.3) 4 (0.5) 16 ( 1.8)
3 (0.7) II (1.9) 12 (1.3) 3 (0.5) 9 (2.1)
43 (2.0) 31 (2.8) 35 (2.6) 33 (3.2) 20 (2.4)
33 (1.9) 27 (2.7) 19 (2.2) 32 (2.4) 32 (3.6)
16 (1.5) 23 (2.5) 22 (2.3) 21 (1.8) 26 (2.5)
5 (0.9) 12 (1.9) 14 (1.9) 8 (0.9) II (1.6)
3 (0.7) 8 (1.6) 9 (1.6) 6 (1.2) 10 ( 1.2)
Table 3.9
Grades 1~12
21 (2.5)
23 (2.3)
32 (3.0)
13 (1.3)
II (1.2)
19 (3.1)
25 (1.9)
31 (2.9)
14 (1.7)
II (1.2)
Time Spent by Mathematics Teachers on In-Service Education in Mathematics in Last 12 Months and Last Three Years, by Teaching Assignment
Percent of Teachers
Teach No Advanced Teach At Least One Advanced
Mathematics Courses Mathematics Course
Last 12 Months
None 23 (3.9) 15 (2.6)
Less Than 16 Hours 56 (4.7) 57 (3.0)
16 or More Hours 21 (2.8) 28 (2.3)
Last Three Years
None 13 (2.5) 7 (2.0)
Less Than 16 Hours 42 (4.3) 30 (2.8)
16 or More Hours 44 (3.8) 63 (3.2)
47

Tables 3.10 and 3.11 show that science and mathematics teachers in the higher grades are more likely than those in the lower grades to have taken college coursework in their discipline in recent years. The pattern is much more pronounced in science than in mathematics. For example, in 1993 50 percent of grade 9-12 science teachers compared to 36 percent in grades 5-8 and 18 percent in grades 1-4 had taken a science course for college credit since 1989. Analogous figures for mathematics teachers are 33 percent in grades 9-12, 29 percent in grades 5-8, and 23 percent in grades 1-4.
Science 1989-1993
1983-1988
Prior to 1983
Science Education 1989-1993
1983-1988
Prior to 1983
Science or Science Education 1989-1993
1983-1988
Prior to 1983
Table 3.10 Science Teachers' Most Recent
College Coursework in Field
Percent of Teachers
Grades 1-4 Grades 5-8
18 (2.0) 36 (3.0)
23 (1.8) 18 (1.8)
60 (2.3) 46 (2.8)
23 (2.6) 33 (2.0)
20 (2.1) 16 (1.5)
57 (2.7) 52 (3.3)
26 (3.0) 41 (2.8)
20 (2.1) 18 (1.6)
53 (2.5) 41 (3.0)
48
Grades 9-12
50 (2.9)
22 (1.3)
28 (3.3)
40 (2.5)
20 ( 1.3)
40 (3.7)
55 (3.2)
21 ( 1.5)
24 (3.8)

Mathematics 1989-1993
1983-1988
Prior to 1983
Mathematics Education 1989-1993
1983-1988
Prior to 1983
Table 3.11 Mathematics Teachers' Most Recent
College Coursework in Field
Percent of Teachers
Grades 1-4 Grades 5-8
23 (1.9) 29 (2.6)
24 (2.2) 24 (3.2)
53 (2.6) 47 (3.6)
34 (2.1) 36 (3.7)
24 (1.8) 18 (2.1)
42 (2.3) 46 (3.7)
Mathematics or Mathematics Education 1989-1993 38 (2.6) 44 (3.3)
1983-1988 22 (1.9) 20 (3.1)
Prior to 1983 40 (2.3) 36 (3.8)
Grades 9-12
33 (2.2)
29 (3.2)
39 ( 1.8)
36 (2.0)
24 (2.3)
40 (2.1)
45 (2.2)
24 (2.7)
31 (1.8)
Teachers were also asked whether or not they had participated in each of a number of professional activities in the 12-month period preceding the survey; these data are presented in Tables 3.12 and 3.13. In both science and mathematics, grade 9-12 teachers were generally more likely than grade 5-8 teachers, who in turn were more likely than grade 1-4 teachers, to have participated in each activity. For example, 51 percent of high school mathematics teachers indicated serving on a school or district mathematics curriculum committee in the past 12 months, compared to 25 percent of grade 5-8 mathematics teachers and 18 percent of those in grades 1-4.
Similarly, 37 percent of high school science teachers, compared to 20 percent in grades 5-8 and 7 percent in grades 1-4, had attended a state or national science teachers association meeting in the previous year. And roughly 1 in 6 high school science teachers, but only about 1 in 20 at the elementary level had been involved in teaching science in-service workshops for other teachers. Finally, high school science teachers were considerably more likely than science teachers in the lower grades or mathematics teachers in any grade to have received a local, state, or national grant or award related to their teaching in these fields.
49

Table 3.12 Science Teachers Participating in Various Science-Related
Professional Activities in Last 12 Months
Percent of Teachers
Grades 1-4 Grades 5-8 Grades 9-12
Served on a school or district curriculum committee 17 (3.4) 26 (2.3) 40 (2.7) Served on a school or district textbook selection committee 14 (2.0) 19 (2.1) 37 (2.9) Attended any national or state teacher association meeting 7 (1.0) . 20 (3.0) 37 (3.3)
Taught any in-service workshop or course in science or science teaching 5 (1.1) 9 (1.2) 16 (2.0)
Received a local, state, or national grant or award 3 (0.7) 8 (1.3) 17 (0.7)
Table 3.13 Mathematics Teachers Participating in Various Mathematics-Related
Professional Activities in Last 12 Months
Percent of Teachers
Grades 1-4 Grades 5-8 Grades 9-12
Served on a school or district curriculum committee 18 (1.9) 25 (2.6) 51 (2.5) Served on a school or district textbook selection committee 16 (2.0) 31 (2.7) 47 (2.9) Attended any national or state teacher association meeting 9 (1.4) 19 (2.1) 39 (2.6)
Taught any in-service workshop or course in mathematics or mathematics teaching 6 (1.4) 6 (0.8) 13 (1.2)
Received a local, state, or national grant or award 3 (0.7) 3 (0,8) 8 (0.6)
50

©[{ufiD~l@[f (F@QJJ[f,
Science and Mathematics Courses
A. Overview
The 1993 National Survey of Science and Mathematics Education collected data on science and mathematics course offerings in the nation's schools. Teachers provided information about time spent in elementary science and mathematics instruction; titles and duration of secondary science and mathematics courses; class sizes; ability levels; gender and race/ethnic composition; and number of students with various types of special needs. These data are presented in the following sections.
B. Time Spent in Elementary Science and Mathematics Instruction
Each teacher was asked to indicate the number of minutes spent in the most recent lesson in the selected subject and class. It was recognized that some subjects are not taught every day in some classes; for example, some elementary classes have instruction in reading and mathematics every day and in science and social studies only on alternate· days. Consequently, teachers were asked to indicate if the selected Jesson had taken place on the most recent school day. As can be seen in Table 4.1, mathematics is taught more frequently than science in the early grades. On a typical day, 95 percent of grade 1-4 classes spend time on mathematics instruction, but only 62 percent spend time on science instruction.
Grades 1-4
Grades 5-8
Grades 9-12
Table 4.1 Science and Mathematics Lessons
Taught on Most Recent Day of School
Percent of Classes
Science Mathematics
62 (2.8) 95
85 (2.2) 93
94 (1.0) 93
51
(1.1)
(1.8)
(l.l)

To avoid overestimating the number of minutes typically spent on science and mathematics, if the most recent lesson did not take place on the last day school was in session, the number of minutes was treated as zero when the average was computed. Table 4.2 shows the average number of minutes per day spent in grade 1-3 and 4-6.science and mathematics instruction in 1977, 1985-86, and 1993.2 Note that the time spent on science and mathematics instruction in grades 1-3 has increased in the last decade, but that at each grade level, considerably more time is spent on mathematics instruction than on science instruction.
Science
Grades 1-3**
Grades 4--6
Mathematics
Grades 1-3**
Grades 4--6
Table 4.2 Average Number of Minutes Per Day Spent in Elementary
Science and Mathematics: 1977, 1985-86 and 1993*
Number of Minutes
1977 1985-86
19 (4.1) 19 (1.0)
35 (1.7) 38 (5.3)
38 (2.5) 38 ( 1.2)
44 (2.1) 49 ( 1.5)
1993
24
34
45
48
* Classes in which the most recent lesson was not on the last day school was in session were assigned zeros for the number of minutes spent in the lesson.
** 1977 and 1985-86 figures include Kindergarten.
( 1.6)
( 1.3)
(1.3)
( 1.1)
In addition to asking teachers about the number of minutes spent in their most recent lesson in a particular subject, each elementary teacher was asked to write in the approximate number of minutes typically spent teaching mathematics, science, social studies, and reading. The average number of minutes per day typically spent on instruction in each subject in grades 1-3 and 4-6 is shown in Table 4.3; to facilitate comparisons among the subject areas, only teachers who teach all four of these subjects to one class of students were included in these analyses. In 1993, grade 1-3 self-contained classes spent an average of 84 minutes on reading instruction, and 51 minutes on mathematics instruction, compared to only 24 minutes on science and 23 minutes on social studies instruction. Differences in instructional time on the various subjects are less pronounced in grades 4-6, ranging from 62 minutes spent on reading and 54 minutes on mathematics to from 33 to 36 minutes on science and social studies instruction. Note that the time spent on reading in the primary grades declined between 1977 and 1985-86, but then leveled off. In contrast, the time spent on both mathematics and science has increased steadily since 1977, especially in grades 1-3.
2 The reader should exercise caution in interpreting these results since they are based on teacher estimates of time spent, rather than on actual measurements.
52

1977
Table 4.3 Average Number of Minutes Per Day Spent Teaching Each Subject in Self-Contained Classes: 1977, 1985-86, and 1993*
Number of Minutes
Reading Mathematics Science Social Studies
K-3** 96 (1.6) 41 (0.6) 17 (0.2) 21 (0.6)
4-6
1985-86 1-3
4-6
1993 1-3
4-6
*
**
66 (1.3) 51 (0.4) 28 (0.6) 34 (0.7)
84 (1.6) 46 (0.6) 20 (0.4) 20 (0.4)
63 (1.3) 52 (0.6) 29 (0.6) 33 (0.5)
84 (1.4) 51 (0.7) 24 (0.6) 23 (0.6)
62 (1.3) 54 (0.6) 33 (1.0) 36 (0 7)
Only teachers who indicated they teach reading, mathematics, science, and social studies to one class of students were included in these analyses. Note that figures for 1977 include Kindergarten teachers.
C. Science and Mathematics Course Offerings
Each sample school that included grades seven or higher was given a list of science and mathematics courses and asked to specify the number of sections of each course offered in the school. Respondents were also asked to write in course names for those science and mathematics courses offered in the school which were not already on the list.
Table 4.4 shows the percent of schools with grades 7 or 8 offering each science course; data for grade 9-12 science courses are provided in Table 4.5. The most commonly offered science course in grades 7-8 is life science, with 68 percent of schools with one or both of these grades offering life science courses. Slightly more than half of schools with grades 7 or 8 offer earth science courses; 36 percent offer physical science in grades 7 or 8; and 42 percent offer some form of general, coordinated, or integrated science in these grades.
At the high school level, a total of 98 percent of schools with one or more of grades 10, 11, or 12 offer courses in biology, with 96 percent offering such first year courses as Biology I, Introductory Biology, General Biology, Regents Biology, and College-Prep Biology; and 22 percent offering applied courses such as Basic Biology; 22 percent offering Advanced Placement Biology; and 49 percent offering another second year advanced biology course.
53

Table 4.4 Schools Offering Various Science Courses,
Grades 7 or 8
Percent of Schools
Life Science 68 (5.5) Earth Science 53 (4.9) Physical Science 36 (4.8)
General Science 18 (3.6) Coordinated Science 17 (5.9) Integrated Science 10 (3.7)
General, Coordinated, or Integrated Science 42 (5.8)
The vast majority of high schools (94 percent) offer such courses as Chemistry I, or General, Introductory, or Regents Chemistry; 14 percent offer applied chemistry courses such as Consumer, Technical, or Practical Chemistry; 18 percent offer Advanced Placement Chemistry; and 16 percent offer another second year advanced chemistry course.
Overall, 88 percent of high schools offer a course in first year physics, such as Physics I, or General, Introductory, or Regents Physics; only 9 percent offer a first-year course in applied physics such as Practical Physics, Electronics, or Radiation Physics. Relatively few high schools (14 percent) offer one or more advanced physics courses, with 10 percent offering advanced placement physics and only 5 percent offering other advanced physics courses.
Far fewer high schools offer coursework in earth science (38 percent) than in the other science disciplines, with first-year courses in earth science, or earth/space science, considerably more common than courses in specific earth science disciplines such as oceanography, astronomy, geology, or meteorology. Only 3 percent of high schools offer any second-year earth science courses.
While a sizeable number of high schools offer courses in general science (29 percent), only 6 percent indicated they offer courses in either "coordinated" or "integrated" science, defined for this survey as courses than "include content from more than one science discipline, e.g., life and physical science," either coordinated (keeping the disciplines separate) or integrated by blurring the distinctions among disciplines.
54

Table 4.5 Schools Offering Various Science Courses,
Grade 9 and Grades 10, 11, or 12
·Percent of Schools
Schools with Schools with Grade 9 Grades 10, 11 or 12
1st Year Biology 90 (3.8) 96 (1.8)
1st Year Applied Biology 19 (2.1) 22 (2.1)
Any 1st Year Biology 91 (3.6) 98 (1.0)
2nd Year AP Biology 19 (2.7) 22 (2.8)
2nd Year Advanced Biology 44 (3.2) 49 (3.0)
2nd Year Other Biology 18 (2.5) 20 (2.4)
Any 2nd Year Biology 66 (3.1) 74 (1.9)
Any Advanced 2nd Year Biology 57 (3.2) 64 (2.6)
1st Year Chemistry 86 (3.7) 94 (2.2)
1st Year Applied Chemistry 13 (1.9) 14 (2.0)
Any 1st Year Chemistry 86 (3.7) 94 (2.2)
2nd Year AP Chemistry 15 (1.6) 18 ( 1.6)
2nd Year Advanced Chemistry 14 (1.5) 16 (1.5)
Any 2nd Year Chemistry 15 (1.6) 18 (1.6)
1st Year Physics 80 (4.8) 88 (3.9)
1st Year Applied Physics 8 (1.2) 9 (1.5)
Any 1st Year Physics 80 (4.7) 88 (3.8)
2nd Year AP Physics 8 (1.0) 10 (1.1)
2nd Year Advanced Physics 5 (1.0) 5 (1.1)
Any 2nd Year Physics 13 (1.2) 14 (1.3)
Physical Science 42 (3.3) 44 (3.0)
Astronomy/Space Science 6 (1.0) 6 (1.1)
Geology 4 (1.4) 5 (1.5)
Meteorology 1 (0.4) 1 (0.5)
Oceanography/Marine Science 6 (0.9) 7 (1.0)
I st Year Earth Science 31 (3.7) 30 (3.0)
I st Year Applied Earth Science 2 (0.3) 2 (0.3)
Any 1st Year Earth Science Course 39 (3.8) 38 (3.3)
2nd Year Advanced Earth Science 1 (0.6) 2 (0.6)
Any 2nd Year Earth Science 3 (1.4) 3 (1.5)
Other Earth Science 2 (1.3) 2 (1.4)
General Science 27 (3.5) 29 (3.4)
Environmental Science 22 (2.2) 24 (2.3)
Science, Technology, and Society 5 ( 1.2) 5 (1.3)
Coordinated Science 2 (0.6) 2 (0.6)
Integrated Science 4 (1.3) 4 (1.3)
Coordinated and Integrated Science 6 (1 .4) 6 (1.4)
General, Coordinated, or Integrated Science 32 (3.4) 34 (3.2)
55

In mathematics, most schools with grades 7 or 8 offer courses in regular mathematics at those grades, 91 percent offering Regular Math 7 and 79 percent offering Regular Math 8. (See Table 4.6.) Overall, 58 percent of schools at this level offer Algebra I to their eighth graders.
Table 4.6 Schools Offering Various Mathematics Courses,
Grades 7 or 8
Percent of Schools
Remedial Math, Grade 7 33 (5.4) Regular Math, Grade 7 91 (2.4) Accelerated Math, Grade 7 51 (6.0)
Remedial Math, Grade 8 32 (4.8) Regular Math, Grade 8 79 (5.1) Enriched Math, Grade 8 34 (4.4)
Algebra I, Grade 8 58 (5.5) Enriched or Algebra I, Grade 8 69 (5.0)
At the high school level, the traditional three year formal mathematics sequence is offered in virtually all schools with grades 10, 11, or 12, with 98 percent offering Introductory Algebra or the first year in a unified/integrated mathematics sequence; 97 percent offering Geometry or a second formal unified course; and 97 percent offering Intermediate Algebra or a third year of unified/integrated mathematics. While 90 percent of high schools offer a fourth year in the formal mathematics sequence, including such courses as Trigonometry, Advanced Algebra, and Pre-Calculus, only 41 percent of high schools offer level five courses such as Calculus and only 34 percent offer a course in Advanced Placement Calculus. (See Table 4.7.)
56

Table 4.7 Schools Offering Various Mathematics Courses,
Grade 9 and Grades 10, 11, or 12
Percent of Schools
Grade 9 Grades 10, 11, or 12
Review Math Level I (e.g., Remedial Math) 40 (2.9) 41 (2.7)
Review Math Level 2 (e.g., Consumer Math) 51 (3.9) 56 (3.7)
Review Math Level 3 (e.g., General Math 3) 25 (3.4) 28 (3.5)
Review Math Level 4 (e.g., General Math 4) 10 (3.0) II (3.2)
Informal Math Level 1 (e.g., Pre-Algebra) 59 (3.6) 57 (3.5)
Informal Math Level 2 (e.g., Basic Geometry) 28 (3.3) 31 (3.3)
Informal Math Level 3 (e.g., after Pre-Algebra, but 15 (2.4) 17 (2.6)
not Algebra I)
Formal Math Level 1 (e.g., Algebra I) 97 (1.2) 98 (1.2)
Formal Math Level 2 (e.g., Geometry) 95 (1.4) 97 (1.4)
Formal Math Level 3 (e.g., Algebra II) 89 (3.4) 97 (1.5)
Formal Math Level 4 (e.g., Advanced 81 (4.0) 90 (2.7) Algebra)
Formal Math Level 5 (Calculus) 37 (2.9) 41 (2.8)
Advanced Placement Calculus 29 (2.6) 34 (2.7)
Probability/Statistics 12 (1.8) 13 (2.0)
Math integrated with other subjects 3 (0.8) 3 (0.8)
In addition to obtaining information on school course offerings, the survey instruments requested that each science and mathematics teacher provide the title of a randomly selected class. As can be seen in Table 4.8, the most common science courses in grades 7 and 8 are Life Science (44 percent of classes) and Earth Science (21 percent). Physical Science, General Science, and Coordinated/Integrated Science each account for slightly more than 10 percent of grade 7 and 8 science classes. One out of every three science classes in grades 9-12 is first-year Biology, first-year Chemistry, Physical Science, and Earth Science each account for 10 to 16 percent of classes at that level.
Slightly more than half of seventh and eighth grade mathematics classes are "regular mathematics"; 42 percent are some kind of enriched or accelerated mathematics; and 5 percent are remedial mathematics. In grades 9-12, the most commonly offered courses are Algebra I, Geometry, and Algebra II, each accounting for approximately 20 percent of mathematics classes. More advanced mathematics, including Algebra ill, Pre-Calculus, and
57

Calculus, comprise 15 percent of grade 9-12 classes. "Informal" mathematics classes such as Basic Algebra and Basic Geometry account for 13 percent of grade 9-12 mathematics classes, while I 0 percent of classes at this level focus on review mathematics.
Table 4.8 Most Commonly Offered Grade 7-12
Science and Mathematics Classes
Percent of Classes
Grades 7-8 Science
Life Science 44
Earth Science 21
Physical Science 12
General Science II
Coordinated Science 9
Integrated Science _3
100
Grades 9-12 Science
1st Year Biology 33
Advanced Biology 7
I st Year Chemistry 16
Advanced Chemistry 2
I st Year Physics 7
Advanced Physics 2
Physical Science 15
Earth Science 10
General Science 4
Integrated/Coordinated/Other Science _4
100
Grades 7-8 Mathematics
Regular Mathematics, 7 32
Accelerated Mathematics, 7 18
Remedial Mathematics, 7 2
Regular Mathematics, 8 22
Emiched Mathematics, 8 14
Algebra I, Grade 8 10
Remedial Mathematics, 8 _3
100
Grades 9-12 Mathematics
Algebra l/Mathematics I 22
Geometry/Mathematics 2 21
Algebra Il/Mathematics 3 19
Advanced Mathematics/Calculus 15
Informal/Basic Mathematics 13
Review/General Mathematics __J.Q
100
58
(5.0)
(3.6)
(2.1)
(2.4)
(2.0)
(0.7)
(2.1)
(1.3)
(1.1)
(2.1)
(0.6)
(0.5)
(1.5)
(2.2)
(1.2)
(0.7)
(3.3)
(2.8)
(0.7)
(3.1)
(2.4)
(2.1)
(0.9)
(1.5)
(1.7)
( 1.8)
(1.2)
(1.3)
(1.3)

D. Other Characteristics of Science and Mathematics Classes
As can be seen in Table 4.9, the average size of science and mathematics classes varies slightly by subject and grade range, but is generally around 22 to 25 students. Table 4. 10 shows trends in average class size since 1977 for the grade range categories used in the earlier reports. Note that average sCience and mathematics class sizes decreased between 1977 and 1985-86 in most grade ranges and leveled off between 1985-86 and 1993.
Table 4.9 Average Science and Mathematics Classroom Size
Average Size
Science Mathematics
Grades 1-4 22.7 (0.4) 22.2 (0.3)
Grades 5-8 24.9 (0.4) 23.6 (0.6)
Grades 9-12 23.0 (0.4) 21.9 (0.4)
Grade 9-12 Science Courses
1st Year Biology 24.8 (0.4) -- --1st Year Chemistry 22.4 (0.6) -- --1st Year Physics 19.9 (0.7) -- --Advanced Science Courses 18.7 (1.0) -- --
Grade 9-12 Mathematics Courses
Review Mathematics -- -- 18.9 (0.8)
Informal Mathematics -- -- 23.3 (0.7)
Algebra I -- -- 23.4 (0.8)
Geometry -- -- 23.0 (0.6)
Algebra II and Higher Mathematics -- -- 20.1 (0.6)
59

Science Grades 1-3*
Grades 4-6
Grades 7-9
Grades I 0--12
Mathematics Grades 1-3*
Grades 4-6
Grades 7-9
Grades I 0--12
Table 4.10 Trends in Average Science and Mathematics
Class Sizes: 1977, 1985-86, and 1993
Average Size
1977 1985-86
23.5 (0.4) 23.8 (0.4)
26.6 (0.7) 24.6 (0.5)
30.6 (0.7) 23.7 (0.4)
22.8 (0.4) 22.1 (0.3)
24.2 (0.2) 22.9 (0.3)
27.7 (0.5) 23.5 (0.6)
26.7 (0.3) 23.5 (0.4)
23.6 (0.5) 21.8 (0.4)
* 1977 figures include Kindergarten.
1993
22.6 (0.4)
24.3 (0.5)
24.1 (0.4)
22.8 (0.4)
22.0 (0.3)
24.0 (0.6)
22.7 (0.4)
21.6 (0.5)
Teachers were asked whether students in the randomly selected science or mathematics class were assigned to that class by level of ability. Table 4.11 shows that the practice of assigning students to classes by ability level is more prevalent in mathematics than in science, and in each case is much more common in the higher grades, with half of grade 9-12 science classes and two-thirds of grade 9-12 mathematics classes having students assigned by ability level.
Grades 1-4 Grades 5-8 Grades 9-12
Table 4.11 Students Assigned to Science and
Mathematics Classes, by Ability Level
Percent of Classes
Science Mathematics
6 (2.6) 14 (2.3) 15 (1.7) 46 (2.5) 50 (2.5) 66 (1.8)
60

Teachers were also asked to indicate the ability make-up of the selected class, specifying the ability level of the students if the class was fairly homogeneous in ability or indicating that it was a mixture of ability levels. As can be seen in Table 4.12, roughly two-thirds of classes in grades 1-4 are heterogeneous in ability; most of the rem~ining classes are composed primarily of average ability students. The percent of classes that are heterogeneous in ability declines with increasing grade level; only about one-third of high school science and mathematics classes are comprised of students of varying ability levels. And, as can be seen in Table 4.13, the high school science and mathematics courses that are typically taken in the ninth or tenth grade (Biology, Geometry) are more likely to be heterogeneously grouped than are the more advanced courses in the traditional college-preparatory sequence.
Table 4.12 Ability Grouping in Science and
Mathematics Classes, by Grade Range
Percent of Classes
Grades 1-4 Grades 5-8
Science Classes Fairly homogeneous and low in ability 6 ( 1.8) 4 (0.5)
Fairly homogeneous and average in ability 24 (2.2) 26 (2.2)
Fairly homogeneous and high in ability 4 (1.1) 12 (1.9)
Heterogeneous, with a mixture of two or more ability levels 66 (2.6) 58 (2.4)
Mathematics Classes Fairly homogeneous and low in ability 6 (0.9) 8 ( 1.1)
Fairly homogeneous and average in ability 24 (2.1) 25 (2.7)
Fairly homogeneous and high in ability 7 (1.7) 22 (2.5)
Heterogeneous, with a mixture of two or more ability levels 63 (2.6) 46 (2.3)
61
Grades 9-12
10 (1.7)
26 (1.9)
27 (3.0)
37 (1.5)
lJ (1.3)
34 ( 1.5)
24 (2.4)
32 (2.0)

Table 4.13 Ability Grouping in Selected High School
Science and Mathematics Classes
Percent of Classes
Low Average High Heterogeneous
Science Classes 1st Year Biology 12 (3.7) 33 (3.8) 16 (2.7) 39
1st Year Chemistry 3 (1.2) 35 (3.7) 36 (5.0) 26
1st Year Physics 1 (0.9) 23 (4.1) 50 (6.8) 26
Mathematics Classes Geometry/Integrated Math 2 5 (2.0) 37 (4.6) 20 (2.7) 39
Algebra Il!Integrated Math 3 4 (1.2) 33 (3.8) 35 (7.5) 28
Algebra Ill/Integrated Math 4/Calculus I (0.5) 15 (2.6) 62 (3.3) 23
Table 4.14 presents data on ability grouping for science classes categorized by the percent of minority students in the class; comparable data for mathematics classes are shown in Table 4.15. Note that in both science and mathematics, classes with a high proportion of minority students are more likely to be labeled "low ability." For example, while overall 26 percent of mathematics classes in grades 5-8 have at least 40 percent minority students, 57 percent of the "low ability" classes are high minority.
62
(5.8)
(3.3)
(5.0)
(4.2)
(5.6)
(3.7)

Table 4.14 Ability Grouping in Grade 1-12 Science Classes with Low,
Medium, and High Percentages of Minority Students
Percent of Classes
Total Low Average High Heterogeneous
Grades 1-4 < 10% Minority 39 (3.5) 23 (13.8) 43 (5.1) 43 (15.6)
10-39% Minority 34 (2.8) 19 (6.5) 29 (4.6) 48 (18.8)
,;::. 40% Minority 27 (3.1) 58 (11.4) 28 (5.0) 9 (8.1)
Grades 5-8 < 10% Minority 46 (3.5) 24 (8.2) 51 (5.0) 55 (8.3)
10-39% Minority 29 (2.6) 26 (7.7) 26 (4.8) 36 (7.9)
,;::. 40% Minority 26 (2.7) 50 (7.2) 24 (4.2) 10 (2.8)
Grades 9-12 < 10% Minority 52 (2.6) 44 (9.2) 52 (2.7) 60 (5.2)
I 0-39% Minority 29 (2.6) 28 (6.2) 32 (2.7) 30 (4.0)
,;::. 40% Minority 19 (1.7) 28 (5.9) 16 (2.4) 9 (1.5)
Table 4.15 Ability Grouping in Grade 1-12 Mathematics Classes with Low,
Medium, and High Percentages of Minority Students
Percent of Classes
Total Low Average High
Grades 1-4 < I 0% Minority 43 (2.4) 13 (5.9) 43 (3.5) 52 (12.6)
10-39% Minority 33 (2.6) 12 (3.3) 38 (4.4) 26 (9.4)
,;::. 40% Minority 25 (2.5) 75 (6.3) 19 (3.6) 22 (9.7)
Grades 5-8 < 10% Minority 40 (2.7) 23 (4.9) 44 (5.8) 53 (7.7)
10-39% Minority 34 (1.8) 20 (5.9) 36 (5.6) 26 (5.2)
,;::. 40% Minority 26 (2.8) 57 (6.2) 21 (4.0) 21 (2.0)
Grades 9-12 < 10% Minority 51 (1.9) 29 (5.7) 55 (2.0) 61 (5.1)
10-39% Minority 29 (1.5) 29 (5.8) 30 (2.0) 30 (4.6)
,;::. 40% Minority 20 (1.4) 42 (6.6) 15 ( 1.6) 9 (2.2)
63
38 (3.4)
37 (3.5)
25 (3.1)
43 (5.0)
29 (3.5)
28 (4.3)
49 (5.0)
26 (3.8)
25 (3.5)
Heterogeneous
44 (3.5)
33 (3.3)
22 (2.9)
36 (4.5)
38 (2.8)
26 (3.6)
47 (3.7)
28 (4 7)
25 (3.8)

Teachers were also asked to indicate if the randomly selected science/mathematics class included students who were formally classified as limited English proficiency, learning disabled, mentally handicapped, or physically handicapped. As can be seen in Table 4.16, slightly more than half of the science and mathematics classes in grades 1-4 include students with learning disabilities, decreasing to fewer than 1 in. 3 overall in grades 9-12 at the high school level and only 6 percent of science classes and 13 percent of mathematics classes in grade 12 (see Table 4.17) suggesting that students with learning disabilities tend to stop taking elective science and mathematics courses.
Table 4.16 Science and Mathematics Classes With
One or More Disabled Students
Percent of Classes
Grades 1-4 Grades 5-8
Science
Learning Disabled 53 (3.2) 54 (3.3)
Limited English Proficiency 22 (2.3) 18 (2.0)
Mentally Handicapped 9 (1.4) 7 (1.2)
Physically Handicapped 4 (0.8) 6 (1.3)
Mathematics
Learning Disabled 52 (2.6) 40 (2.6)
Limited English Proficiency 20 (2.1) 16 (2.1)
Mentally Handicapped 5 (0.6) 2 (0.6)
Physically Handicapped 6 (1.1) 4 (1.4)
Table 4.17 Science and Mathematics Classes with
One or More Learning Disabled Students
Percent of Classes
Grades 9-12
31 (2.7)
14 (1.3)
2 (0.3)
5 (1.0)
24 (1 .4)
15 (1.4)
1 (0.2)
2 (0.4)
Science Mathematics
Grade 9 44 (5.0) 36 (3.1)
Grade 10 34 (5.1) 20 (2.6)
Grade 11 16 (3.6) 19 (5.0)
Grade 12 6 (1.5) 13 (4.2)
64

From 14 to 22 percent of science ahd mathematics classes in grades 1--4, 5-8, and 9-12 include one or more students with limited English proficiency (LEP), depending on subject and grade range. However, as can be seen in Table 4.18, the percentages of science and mathematics classes including students with limited English proficiency varies considerably more by region and type of community. For example, only 11 percent of science classes in the Midwest, but 33 percent of those in the West, include LEP students. Similarly, more than 1 in 5 urban and suburban science and mathematics classes, but fewer than 1 in 10 in rural areas, include LEP students.
Table 4.18 Science and Mathematics Classes with One or More Limited English Proficiency Students,
by Region and Community Type
Percent of Classes
Science Mathematics
Region
Midwest II ( 1.8) 8
Northeast 17 (2.5) 14
South 13 (1.9) 12
West 33 (3.3) 34
Type of Community
Urban 28 (2.9) 21
Suburban 22 (2.1) 21
Rural 6 (1.4 9
(1.7)
(2.5)
(0.8)
(2.5)
(2.9)
(1.6)
(1.6)
Students with mental handicaps are more likely to be included in regular science instruction than in mathematics instruction. For example, 9 percent of grade 1--4 science classes, but only 5 percent of grade 1-4 mathematics classes include one or more students with mental handicaps. However, very few such students continue in regular science and mathematics classes past the middle grades. Students with physical handicaps are more evenly distributed across science and mathematics classes and across the grades; typically from 4 to 6 percent of classes include students with physical handicaps.
While females in each grade range are as likely as males to be enrolled in science and mathematics classes overall, females are underrepresented in physics classes. (See Table 4.19.) Non-Asian minority students make up roughly 25 percent of the enrollment in grade 1-4 and 5-8 science and mathematics classes, but only 18 to 19 percent of the enrollment in grades 9-12 science and mathematics classes. In general, the higher the level class, the lower the non-Asian minority representation. For example, non-Asian minority students comprise 34 percent of the enrollment in informal/review mathematics courses, but only 13 percent of
65

the enrollment in Geometry, 13 percent in Algebra II, and 8 percent of more advanced mathematics courses. Similarly, non-Asian minority students constitute 22 percent of the enrollment in first-year biology, but only 12 percent of the enrollment in introductory chemistry and 11 percent in first-year physics.
Table 4.19 Female and Non-Asian Minority Students in
Science and Mathematics Classes
Percent of Students
Science Mathematics
Non-Asian Non-Asian Female Minority Female Minority
Grades 1-4 48 (0.6) 26 (2.4) 50 (0.4) 24 (2.0)
Grades 5-8 50 (0.7) 24 (2.1) 49 (0.7) 25 (2.7)
Grades 9-12 50 (1.1) 18 (1.2) 50 (0.7) 19 ( 1.0)
Science Courses Jst Year Biology 52 (1.7) 22 (2.9) -- -- -- --1st Year Chemistry 53 (1.8) 12 (1.7) -- -- -- --
1st Year Physics 42 (2.9) II (2.1) -- -- -- --
Mathematics Courses Review/Informal Mathematics -- -- -- -- 45 (1.6) 34 (2.9)
Algebra I -- -- -- -- 50 (1.3) 20 (2.4)
Geometry/Mathematics 2 -- -- -- -- 53 ( 1.5) 13 (1.3)
Algebra ll/Mathernatics 3 -- -- -- -- 53 (2.1) 13 (1.9)
Advanced Mathematics -- -- -- -- 49 ( 1.6) 8 (1.3)
66

Course enrollment data for particular race/ethnic groups are shown in Table 4.20. It is interesting to note that in both science and mathematics much of the decrease in non-Asian minority enrollment is due to a smaller representation of Hispanic students at the high school level.
Table 4.20 Race/Ethnic Composition of
Science and Mathematics Classes
Percent of Students
Grades 1-4 Grades 5-8 Grades 9-12
Science
White 72 (2.5) 74 (2.2) 79 (1.2)
Black II (1.0) 13 (1.5) 11 (0.8)
Hispanic 13 (2.2) 10 ( 1.4) 7 (0.6)
Asian-American 2 (0.6) 1 (0.3) 3 (0.3)
American Indian I (0.4) I (0.4) 0 (0.0)
Mathematics
White 74 (2.0) 72 (2.6) 78 (1.0)
Black 12 (1.6) 13 (1.5) II (0.8)
Hispanic II (1.9) 12 (2.5) 7 (0.5)
Asian-American 2 (0.4) 2 (0.4) 3 (0.3)
American Indian I (0.2) 1 (0.3) 0 (0.1)
67

68

©[fu®[pJi!®[f rP~w®
Instructional Objectives and Activities
A. Overview
Teachers were asked to provide detailed information about instruction in a particular, randomly selected science or mathematics class. Questions focused on their objectives for instruction, the class activities they use in accomplishing these objectives, and how student performance is assessed. These results are presented in the following sections.
B. Objectives of Science and Mathematics Instruction
Teachers were given a list of possible objectives of science and mathematics instruction and asked how much emphasis each would receive in the entire course. Table 5.1 shows the percent of science classes whose teachers indicated heavy emphasis for each objective; analogous data for mathematics classes are shown in Table 5.2.
Three instructional objectives stand out as key in science classes at all grade levels, with twothirds or more of grade 1-4, 5-8, and 9-12 science classes giving heavy emphasis to learning basic science concepts; increasing awareness of the importance of science in daily life; and developing problem solving/inquiry skills.
While increasing student interest in science is more likely to be emphasized in the lower grades, many of the other objectives in the list are much more likely to be emphasized by middle and high school than by elementary science classes. For example, learning important terms and facts of science, and preparing for further study in science are emphasized heavily in about 2 out of 3 middle and high school science classes, but only about 1 in 2 grade 1-4 science classes. Similarly, about half of middle and high school science classes, but fewer than 1 in 3 in grades 1-4, focus on having students Jearn about the relationship between science, technology, and society or learn to evaluate arguments based on scientific evidence. The objectives least likely to be emphasized heavily in science classes are preparing students for standardized tests and having students learn about the history of science.
69
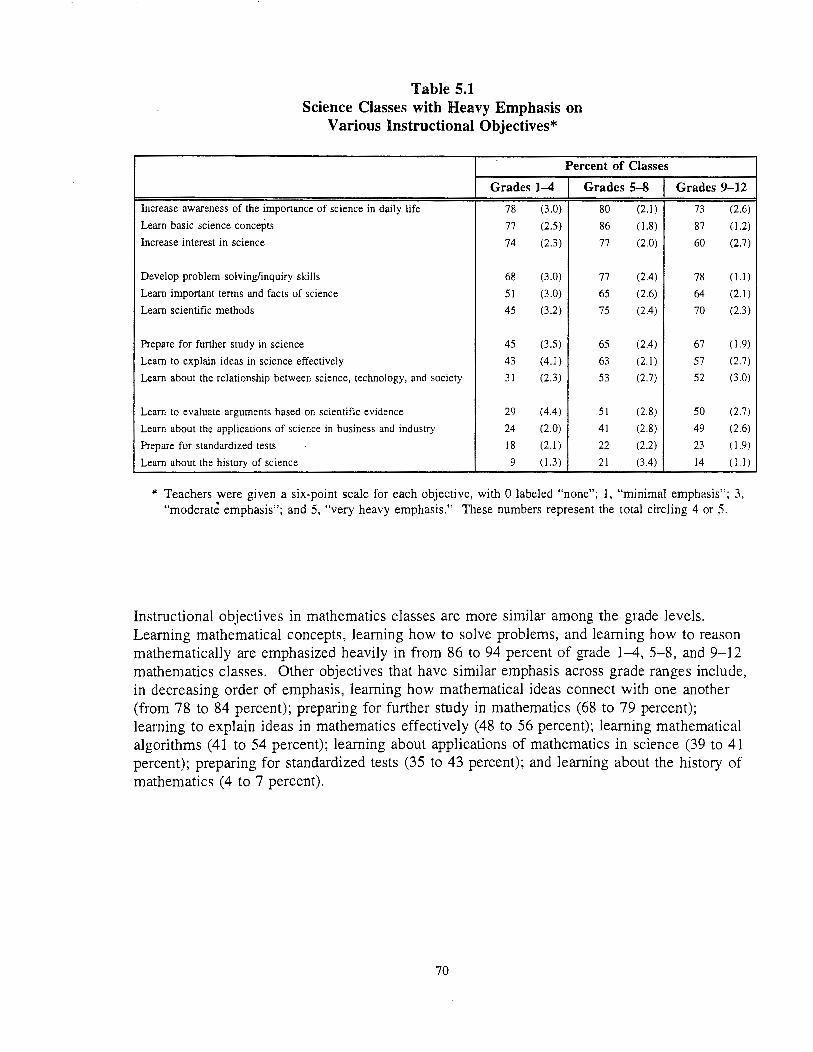
Table 5.1 Science Classes with Heavy Emphasis on
Various Instructional Objectives*
Percent of Classes
Grades 1-4 Grades 5-8
Increase awareness of the importance of science in daily life 78 (3.0) 80 (2.1)
Learn basic science concepts 77 (2.5) 86 ( 1.8)
Increase interest in science 74 (2.3) 77 (2.0)
Develop problem solving/inquiry skills 68 (3.0) 77 (2.4)
Learn important terms and facts of science 51 (3.0) 65 (2.6)
Learn scientific methods 45 (3.2) 75 (2.4)
Prepare for further study in science 45 (3.5) 65 (2.4)
Learn to explain ideas in science effectively 43 (4.1) 63 (2.1)
Learn about the relationship between science, technology, and society 31 (2.3) 53 (2.7)
Learn to evaluate arguments based on scientific evidence 29 (4.4) 51 (2.8)
Learn about the applications of science in business and industry 24 (2.0) 41 (2.8)
Prepare for standardized tests 18 (2.1) 22 (2.2)
Learn about the history of science 9 (1.3) 21 (3.4)
Grades 9-12
73 (2.6)
87 (1.2)
60 (2.7)
78 (1.1)
64 (2.1)
70 (2.3)
67 (1.9)
57 (2.7)
52 (3 0)
50 (2.7)
49 (2.6)
23 ( 1.9)
14 (ll)
* Teachers were given a six-point scale for each objective, with 0 labeled "none"; 1, "minimal emphasis"; 3, "moderate emphasis"; and 5, "very heavy emphasis." These numbers represent the total circling 4 or 5.
Instructional objectives in mathematics classes are more similar among the grade levels. Learning mathematical concepts, learning how to solve problems, and learning how to reason mathematically are emphasized heavily in from 86 to 94 percent of grade 1-4, 5-8, and 9-12 mathematics classes. Other objectives that have similar emphasis across grade ranges include, in decreasing order of emphasis, learning how mathematical ideas connect with one another (from 78 to 84 percent); preparing for further study in mathematics (68 to 79 percent); learning to explain ideas in mathematics effectively (48 to 56 percent); learning mathematical algorithms ( 41 to 54 percent); learning about applications of mathematics in science (39 to 41 percent); preparing for standardized tests (35 to 43 percent); and learning about the history of mathematics (4 to 7 percent).
70

Table 5.2 Mathematics Classes with Heavy Emphasis on
Various Instructional Objectives*
Percent of Mathematics Classes
Grades 1-4 Grades 5-8 Grades 9-12
Learn mathematical concepts 93 (1.9) 94 (0.9) 88 (2.3)
Learn how to solve problems 93 (1.0) 91 (1.6) 89 (1.8)
Learn to reason mathematically 86 (1.6) 88 (1.5) 87 (2.0)
Increase awareness of importance of mathematics in daily life 83 (2.0) 84 (2.0) 60 (2.4)
Learn how mathematical ideas connect with one another 79 (2.8) 84 (1.7) 78 (2.0)
Increase interest in mathematics 77 (2.8) 72 (2.3) 57 (1.6)
Prepare for further study in mathematics 68 (2.1) 76 (3.1) 79 (1.9)
Learn to perform computations with speed and accuracy 67 (2.7) 59 (2.6) 39 ( 1.5)
Understand logical structure of mathematics 55 (2.2) 72 (2.5) 67 (2.2)
Learn to explain ideas in mathematics effectively 50 (2.0) 56 (2.9) 48 (2.3)
Prepare for standardized tests 43 (3.5) 42 (3.3) 35 (2.3)
Learn mathematical algorithms 41 (1.9) 49 (3.5) 54 (2.5)
Learn about applications of mathematics in science 41 (2.5) 40 (2.7) 39 (2.8)
Learn about applications of mathematics in business and industry 24 (2.3) 49 (2.6) 37 (1.8)
Learn about the history of mathematics 4 (0.7) 7 (1.5) 6 (0.9)
* Teachers were given a six-point scale for each objective, with 0 labeled "none"; 1, "minimal emphasis"; 3, "moderate emphasis"; and 5, "very heavy emphasis." These numbers represent the total circling 4 or 5.
In contrast, several objectives are treated differently depending on grade range. Elementary and middle grade mathematics classes are much more likely than high school mathematics classes to emphasize awareness of the importance of mathematics in daily life, increasing interest in mathematics, and learning to perform computations with speed and accuracy. Middle and high school classes, on the other hand, are much more likely than those in grades 1-4 to emphasize understanding the logical structure of mathematics and learning about the applications of mathematics in business and industry.
71

C. Determining What is Taught
Science and mathematics teachers were given a list of factors that might affect what they teach in a randomly selected class and asked to indicate the extent of influence of each. Tables 5.3 and 5.4 show the percent of grade 1-4, 5-8, and 9-12 science and mathematics teachers, respectively, indicating that each factor is a major influence on what they teach.
Table 5.3 Science Classes Where Teachers Report that Various Factors
Have a Major Influence on What They Teach*
Percent of Classes
Grades 1-4 Grades 5-8 Grades 9-12
Your own understanding of what motivates your students 92 (1.3) 94 (0.9) 89
Your own science content background 82 (2.7) 83 (2.3) 91
Your district's curriculum framework/course of study 79 (4.7) 74 (3.7) 62
Available laboratory facilities, equipment, and supplies 75 (2.9) 84 (1 .8) 91
Your state's curriculum framework/course of study 64 (3.6) 61 (41) 51
Textbook 53 (3.1) 66 (2.9) 69
Parents/community 41 (3.5) 37 (3.1) 33
State test 27 (2.5) 33 (3. 1) 25
District test 22 (1.9) 24 (2.2) 15
Scope, Sequence, and Coordination philosophy or Coment Core (NSTA's SS&C project) 12 (1.4) 18 (2.1) 10
Science for All Americans (AAAS' Project 2061) 4 ( 1.3) 8 (1.3) 7
* Teachers were given a four-point scale for each factor, with I labeled as "no influence" and 4 labeled "extensive influence." These percentages include the total circling either 3 or 4.
(2.8)
(1.0)
(2.5)
( 1.0)
(3.2)
(1.6)
(2.4)
(2.1)
(1.5)
( 1.5)
(1.5)
In both science and mathematics, teachers were most likely to report that their understanding of what motivates their students (from 89 to 97 percent) and their own content background (from 82 to 91 percent) was a major influence on what they taught. Large numbers of science and mathematics teachers (from 75 to 91 percent) also reported that available facilities, equipment, and supplies had a major influence on what they taught.
The districts' curriculum framework/course of study tended to be more of a factor in mathematics (75 to 87 percent) than in science (62 to 79 percent), and in each subject more of an influence in the elementary and middle grades than at the high school level. The state's curriculum framework followed the same pattern of greater influence on mathematics and in the early grades although fewer teachers in each subject reported state frameworks as a major influence. In contrast, textbooks appear more influential on choice of content in the high
72

school grades (major influence in 69 percent of science classes and 84 percent of mathematics classes) than at the elementary level (53 percent in science and 77 percent in mathematics).
Table 5.4 Mathematics Classes Where Teachers Report that Various Factors
Have a Major Influence on What They Teach*
Percent of Classes
Grades 1-4 Grades 5-8 Grades 9-12
Your own understanding of what motivates your students 96 (1.0) 97 (0.6) 90
Your own mathematics content background 89 (1.6) 88 (1.9) 89
Available facilities, equipment, and supplies 88 (1.4) 83 (2.4) 79
Your district's curriculum framework/course of study 87 (2.3) 83 (2.9) 75
Your state's curriculum framework/course of study 78 (1.9) 74 (2.3) 60
Textbook 77 (1.9) 76 (2.5) 84
State test 57 (2.7) 55 (2.8) 37
Parents/community 57 (2.8) 54 (2.9) 40
District test 51 (2.1) 39 (2.9) 23
NCTM's Curriculum and Evaluation Standards 24 (1.5) 43 (2.9) 54
NCTM's Professional Standards for Teaching Mathematics 21 (1.6) 39 (3.0) 46
Science for All Americans (AAAS' Project 2061) 4 (0.5) 6 (0.9) 3
* Teachers were given a four-point scale for each factor, with I labeled as "no influence" and 4 labeled "extensive influence." These percentages include the total circling either 3 or 4.
(1.6)
(0.8)
(1.4)
(2.2)
(2.4)
(1.4)
(1.5)
(2.7)
(2.3)
(2.2)
(2.3)
( 1.0)
As would be expected, given that states and districts are more likely to test mathematics than science, these tests were more likely to be a major influence on what is taught in mathematics than in science, especially in the elementary and middle grades.3 Apparently, parent and community expectations are also quite influential in determining what is taught in elementary and middle grade mathematics classes, with teachers in more than half of these classes reporting that parents/community were a major influence.
Finally, science and mathematics teachers were asked about the extent of influence of a number of national reform efforts. In mathematics, high school teachers are more likely than
3 Similarly, in a related question, results of which were presented in Tables 2.21 and 2.22 in Chapter Two, more than half of all grade 1-4 and 5-8 mathematics teachers, compared to 30 to 40 percent of science teachers and high school mathematics teachers, agreed that "the testing program in my state/district dictates what I teach."
73

middle grade teachers, who are in turn more likely than teachers in grades 1-4, to indicate that the NCTM Curriculum and Evaluation Standards and the Professional Standards for Teaching were a major influence on what they taught; percentages ranged from 21 to 24 percent in grades 1-4 to 46 to 54 percent at the high school level. In science, middle grade teachers ( 18 percent) were more likely than their elementary or high school counterparts (12 and 10 percent, respectively) to indicate that the National Science Teachers Association's Scope, Sequence and Coordination Project, aimed at grades 6-9, was a major influence on what they taught. Fewer than 10 percent of science or mathematics teachers in any grade range indicated that the American Association for the Advancement of Science's Science for All Americans (Project 2061) was a major influence on what they taught, not surprising given that project's focus on curriculum developers rather than on teachers.
As can be seen in Table 5.5, there are fairly large regional differences in curriculum influences. While district curriculum frameworks are influential in more than 3 out of 4 science and mathematics classes in each region, state curriculum frameworks appear to exert a much greater influence in the South and West regions. (States in the South and West typically have statewide textbook adoption processes, with the state purchasing textbooks for the districts as long as they are on the state approved lists.) Similarly, state and district tests appear more influential in determining curriculum content in the South and West regions.
Table 5.5 Grade 1-12 Science and Mathematics Classes Where
Selected Factors Have a Major Influence on What is Taught, by Region
Percent of Classes
South West Midwest
Science
State's curriculum framework/course of study 77 (5.9) 70 (4.6) 58 (2.9)
District's curriculum framework/course of study 77 (6.2) 80 (4.3) 80 (3.4)
State tests 49 (4.0) 37 (3.8) 32 (2.3)
District tests 40 (2.8) 31 (2.8) 24 (1.4)
Mathematics
State's curriculum framework/course of study 83 (2.0) 78 (2.6) 63 (2.2)
District's curriculum framework/course of study 79 ( 1.8) 86 (2.8) 82 (3.6)
State tests 61 (1.7) 53 (2.4) 43 (3.1)
District tests 45 (2.0) 45 (1.9) 29 (3.2)
74
Northeast
47 (3.4)
82 (2.9)
23 (2.9)
22 (2.8)
60 (2.9)
82 (2.9)
44 (4.5)
34 (2.2)

D. Class Activities
Teachers were given a list of activities and asked to indicate how often students in the randomly selected science or mathematics class took part in each; response options were: never, once or twice per semester, once or twice a month, and almost daily. Table 5.6 shows the percent of grade 1-4, 5-8, and 9-12 science classes participating in various instructional activities at least once a week; the percent of classes participating in selected activities on a daily basis is shown in Table 5.7.
A frequent instructional activity in science classes is having the students engage in dialogue with the teacher to develop an idea, with about 3 out of 4 classes in each grade range participating in this type of activity at least once a week. As would be expected, having students listen and take notes during a teacher presentation increases in frequency with increasing grade range; 25 percent of grade 1-4 science classes compared to 67 percent in grades 5-8 and 93 percent in grades 9-12 do so at least once a week. At the same time, classes in the higher grades are more likely to work on science in small groups at least once a week (ranging from 60 percent of grade 1-4 science classes to 74 percent of grade 5-8 and 9-12 science classes); do laboratory activities at least weekly (ranging from 41 percent in grades 1-4 to 67 percent in grades 9-12); and watch the teacher demonstrate a scientific principle at least once a week (30 percent in grades 1-4 compared to 53 percent in grades 9-12).
Table 5.6 Science Classes Participating in Various
Instructional Activities at Least Once a Week
Percent of Classes
Grades 1-4 Grades 5-8
Participate in dialogue with the teacher to develop an idea 76 (2.8) 82 (2.3)
Work in small groups 60 (3.5) 74 (2.5)
Read a science textbook in class 51 (3.6) 55 (3.2)
Do hands-onllaboratory science activities 41 (2.6) 59 (2.3)
Use a computer 38 (2.5) 18 (2.0)
Watch the teacher demonstrate a scientific principle 30 (2.5) 48 (3.1)
Listen and take notes during presentation by teacher 25 (2.3) 67 (2.3)
Watch films, filmstrips, or videotapes 17 (1.6) 19 (2.8)
Watch television programs 9 (1.4) 8 (1.8)
Prepare written science reports 8 (2.0) 15 (2.1)
75
Grades 9-12
76 (2.3)
74 (3.1)
39 (2.2)
67 (2.6)
4 (0.7)
53 (2.1)
93 (1.0)
18 (1.5)
4 (0.9)
25 (2.1)

In contrast, grade 1-4 science classes are more likely than others to use computers at least weekly (38 percent, compared to only 4 percent in grades 9-12), and grades 1-4 and 5-8 science classes are more likely to read from the textbook during class at least once a week than are high school science classes (51 percent, 55 percent, and 39 percent, respectively). Nearly 1 in 5 science classes in each grade range watches films, filmstrips, or videotapes at least weekly; far fewer watch science television programs (from 4 to 9 percent).
Table 5.7 Science Classes Engaged in Various
Instructional Activities on a Daily Basis
Percent of Classes
Grades 1-4 Grades 5-8
Participate in dialogue with the teacher to develop an idea 36 (3.6) 48 (3.5)
Work in small groups 18 (1.6) 27 (3.1)
Read a science textbook in class 13 (1.9) 16 (1.7)
Listen and take notes during presentation by teacher 8 (1.2) 17 (1.9)
Do hands-on!laboratory science activities 7 (1.6) 10 (1.8)
Use a computer 7 (1.3) 4 (0.9)
Watch the teacher demonstrate a scientific principle 3 (1.2) 6 (1.0)
76
Grades 9-12
41 (3.1)
18 (2.0)
10 (1.9)
44 (2.0)
7 (1.0)
I (0.1)
8 (1.1)

Table 5.8 shows the percent of science classes which never participate in particular instructional activities. Note that more than 1 in 5 elementary and middle grade science classes and 2 in 5 at the high school level never have class projects of a week's duration. Similarly, large percentages of science classes never use computers (from 38 percent in grades 1-4 to 54 percent in grades 9-12); and 23 percent of grade 1-4 classes, 35 percent of grade 5-8 classes, and 62 percent of grade 9-12 science classes never take field trips.
Table 5.8 Science Classes Never Taking Part in
Various Instructional Activities
Percent of Classes
Grade 1-4 Grade 5-8
Listen and take notes during presentation by teacher 52 (1.8) 6 (1.0)
Work at home on science projects that take a week or more 51 (1.9) 27 (2.3)
Watch television programs 43 (3.6) 40 (2.3)
Use a computer 38 (3.0) 44 (3.0)
Prepare written science reports 36 (2. 1) 10 (J.l)
Work in class on science projects that take a week or more 28 (2.5) 22 (2.1)
Take field trips 23 (2.7) 35 (2.9)
Read a science textbook in class 23 (2.4) 9 (1.4)
Watch films, filmstrips, or videotapes 6 (1.9) 2 (0.5)
Watch the teacher demonstrate a scientific principle 3 (0.8) 4 (1.6)
Participate in dialogue with the teacher to develop an idea 3 (1.0) 1 (0.5)
Do hands-on/laboratory science activities 2 (0.7) 2 (0.6)
Work in small groups 2 (1.0) 1 (0.2)
77
Grade 9-12
0 (0.2)
49 (2.3)
60 (2.7)
54 (3.2)
12 (2.3)
43 (3.4)
62 (2.3)
21 (1.2)
8 ( 1.5)
1 (0.4)
1 (0.4)
1 (0.3)
1 (0.1)

In addition to asking about class activities in the course as a whole, the 1993 National Survey of Science and Mathematics Education gave teachers a list of possible class activities and asked teachers to indicate those that took place during their most recent lesson in the randomly selected class. As can be seen in Table 5.9, approximately 8 out of 10 science lessons in each grade range included lecture, and roughly 60 percent involved students completing textbook or worksheet problems.
Approximately 6 out of 10 science lessons in grades 1-4 involved students in reading about science, compared to 5 out of 10 in grades 5-8 and 4 out of 10 in grades 9-12. Similarly, classes in the lower grades were more likely than those in the higher grades to have students working in cooperative learning groups "where the entire group receives a single grade," ranging from 51 percent of science lessons in grades 1-4 to 31 percent in grades 9-12. Use of calculators was much more common in high school science classes (28 percent of lessons) than in elementary and middle grade science classes (2 percent and 6 percent, respectively), and only 3 to 4 percent of science lessons in any grade range involved computer use.
Table 5.9 Science Classes Participating in Various
Activities in Most Recent Lesson
Percent of Classes
Grades 1-4 Grades 5-8
Lecture 78 (2.9) 79 (2.6)
Students reading about science 62 (2.6) 51 (3.4)
Students completing textbook/workbook problems 58 (3.1) 59 (2.8)
Students working in cooperative learning groups where the entire group receives a single grade 51 (3.0) 47 (2.9)
Student use of other technologies 15 (2.2) 19 (2.1)
Test or quiz 12 (1.7) 13 (1 .8)
Student use of computers 3 (0.6) 4 (0.9)
Student use of calculators 2 (0.8) 6 ( 1.5)
78
Grades 9-12
86 (2.1)
39 (2.3)
62 (2.3)
31 (2.1)
19 (2.2)
20 (1 9)
4 ( 1.1)
28 (17)

Tables 5.10 and 5.11 present results on frequency of class activities in mathematics classes. Note that students doing problems from textbooks is a very frequent activity in mathematics classes, especially in the higher grades. Ninety-eight percent of grade 9-12 classes participate in this activity at least weekly, with 86 percent doing so on. a daily basis; comparable figures for grades 5-8 are 93 percent weekly, and 72 percent daily; and for grades 1-4, 82 percent weekly and 55 percent daily. Many mathematics classes also do problems from worksheets at least once a week, ranging from 58 percent of grade 9-12 classes to 81 percent of those in grades 1-4.
In addition to working on textbook and worksheet problems, many mathematics classes participate in dialogue with the teacher to develop ideas; approximately 70 percent of mathematics classes in each grade range do this at least weekly. Other frequent activities in grade 1-4 mathematics classes include small group work (84 percent of classes work in small groups at least once a week) and the use of manipulatives and models (83 percent). Use of these techniques is less common at the middle and high school levels, with 70 percent and 64 percent of classes, respectively, working in small groups once a week or more, and only 39 percent of grade 5-8 classes and 18 percent of those in grades 9-12 using manipulatives that often.
Table 5.10 Mathematics Classes Participating in Various Instructional Activities at Least Once a Week
Percent of Classes
Grades 1-4 Grades 5-8
Work in small groups 84 (2.5) 70 (2.8)
Use manipulative materials or models 83 (1.8) 39 (2.6)
Do mathematics problems from textbooks 82 (2.4) 93 (1.4)
Do mathematics problems from worksheets 81 (1.8) 69 (2.6)
Participate in dialogue with the teacher to develop an idea 71 (2.5) 72 (2.7)
Learn about mathematics through real-life applications 62 (2.6) 61 (3.1)
Use computers/calculators to do computations 45 (2.5) 57 (3.3)
Use computers/calculators to explore problems 44 (2.3) 53 (3.5)
Make conjectures and explore possible methods to solve a mathematical problem 44 (2.8) 51 (2.7)
Use computers/calculators to develop an understanding of mathematics concepts 37 (2.1) 39 (2.9)
Write their reasoning about how to solve a problem 28 (2.3) 31 (2.6)
Listen and take notes during presentation by teacher 18 (1.5) 66 (2.5)
Watch films, filmstrips, or videotapes 4 (0.8) 2 (0.6)
Watch television programs 2 (0.7) 2 (0.5)
79
Grades 9-12
64 (2.3)
18 (1.5)
98 (0.5)
58 (2.2)
72 (2.7)
40 (1.3)
76 (2.4)
54 (2.9)
41 (2.1)
40 (3.0)
31 (1.4)
94 (1.4)
2 (0.6)
1 (0.4)
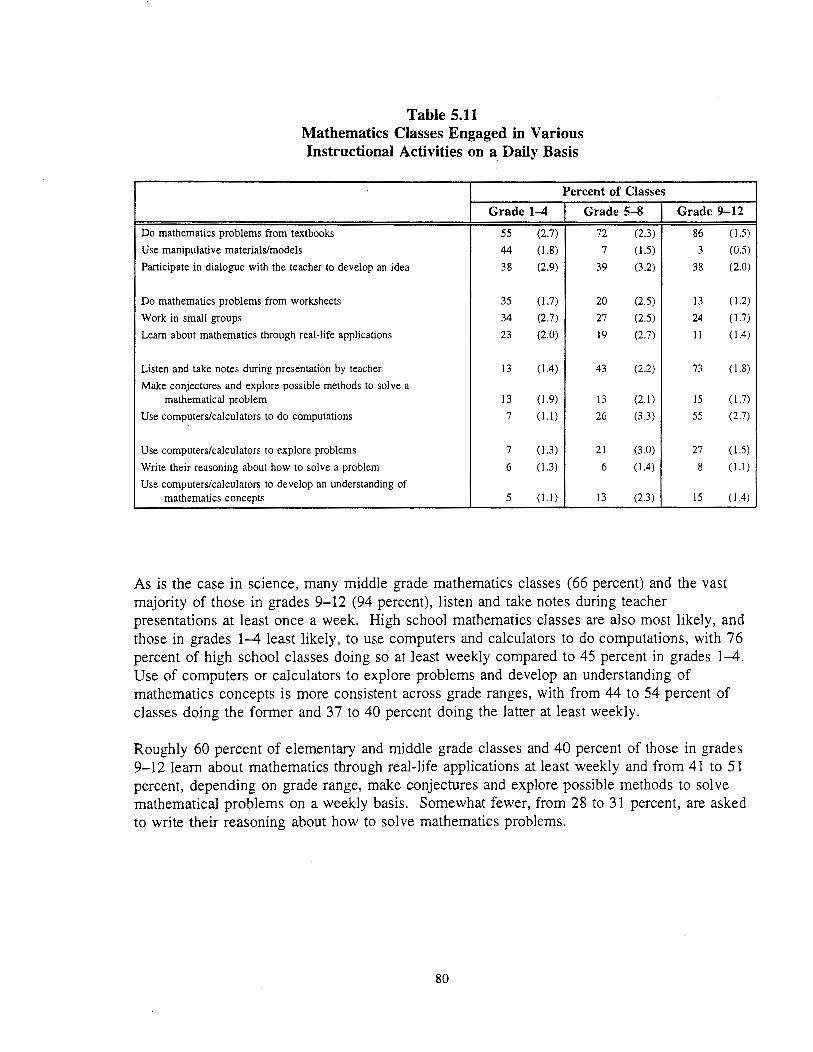
Table 5.11 Mathematics Classes Engaged in Various Instructional Activities on a Daily Basis
Percent of Classes
Grade 1-4 Grade 5-8
Do mathematics problems from textbooks 55 (2.7) 72 (2.3)
Use manipulative materials/models 44 (1.8) 7 (1.5)
Participate in dialogue with the teacher to develop an idea 38 (2.9) 39 (3.2)
Do mathematics problems from worksheets 35 (1.7) 20 (2.5)
Work in small groups 34 (2.7) 27 (2.5)
Learn about mathematics through real-life applications 23 (2.0) 19 (2.7)
Listen and take notes during presentation by teacher 13 (1.4) 43 (2.2)
Make conjectures and explore possible methods to solve a mathematical problem 13 (1.9) 13 (2.1)
Use computers/calculators to do computations 7 (1.1) 26 (3.3)
Use computers/calculators to explore problems 7 (1.3) 21 (3.0)
Write their reasoning about how to solve a problem 6 (1.3) 6 (1.4)
Use computers/calculators to develop an understanding of mathematics concepts 5 (1.1) 13 (2.3)
Grade 9-12
86 (1.5)
3 (0.5)
38 (2.0)
13 ( 1.2)
24 (1.7)
II ( 1.4)
73 (1.8)
15 (1.7)
55 (2.7)
27 ( 1.5)
8 ( 1.1)
15 (1.4)
As is the case in science, many middle grade mathematics classes (66 percent) and the vast majority of those in grades 9-12 (94 percent), listen and take notes during teacher presentations at least once a week. High school mathematics classes are also most likely, and those in grades 1-4 least likely, to use computers and calculators to do computations, with 76 percent of high school classes doing so at least weekly compared to 45 percent in grades 1-4. Use of computers or calculators to explore problems and develop an understanding of mathematics concepts is more consistent across grade ranges, with from 44 to 54 percent of classes doing the former and 37 to 40 percent doing the latter at least weekly.
Roughly 60 percent of elementary and middle grade classes and 40 percent of those in grades 9-12 learn about mathematics through real-life applications at least weekly and from 41 to 51 percent, depending on grade range, make conjectures and explore possible methods to solve mathematical problems on a weekly basis. Somewhat fewer, from 28 to 31 percent, are asked to write their reasoning about how to solve mathematics problems.
80
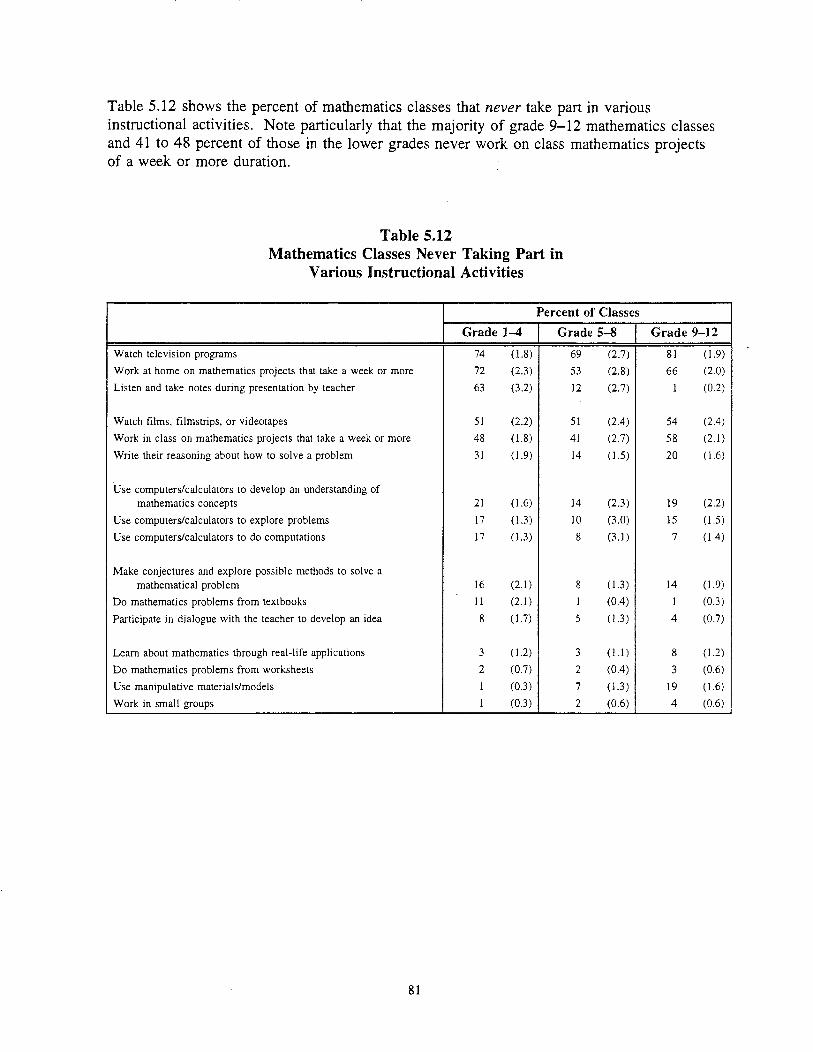
Table 5.12 shows the percent of mathematics classes that never take part in various instructional activities. Note particularly that the majority of grade 9-12 mathematics classes and 41 to 48 percent of those in the lower grades never work on class mathematics projects of a week or more duration.
Table 5.12 Mathematics Classes Never Taking Part in
Various Instructional Activities
Percent of Classes
Grade 1-4 Grade 5-8
Watch television programs 74 ( 1.8) 69 (2.7)
Work at home on mathematics projects that take a week or more 72 (2.3) 53 (2.8)
Listen and take notes during presentation by teacher 63 (3.2) 12 (2.7)
Watch films, filmstrips, or videotapes 51 (2.2) 51 (2.4)
Work in class on mathematics projects that take a week or more 48 ( 1.8) 41 (2.7)
Write their reasoning about how to solve a problem 31 ( 1.9) 14 (1.5)
Use computers/calculators to develop an understanding of mathematics concepts 21 (1.6) 14 (2.3)
Use computers/calculators to explore problems 17 (1.3) 10 (3.0)
Use computers/calculators to do computations 17 (1.3) 8 (3.1)
Make conjectures and explore possible methods to solve a mathematical problem 16 (2.1) 8 (1.3)
Do mathematics problems from textbooks II (2.1) I (0.4)
Participate in dialogue with the teacher to develop an idea 8 (1.7) 5 (1.3)
Learn about mathematics through real-life applications 3 (1.2) 3 ( 1.1)
Do mathematics problems from worksheets 2 (0.7) 2 (0.4)
Use manipulative materials/models I (0.3) 7 (1.3)
Work in small groups I (0.3) 2 (0.6)
81
Grade 9-12
81 (1.9)
66 (2.0)
1 (0.2)
54 (2.4)
58 (2.1)
20 (1.6)
19 (2.2)
15 (1.5)
7 (1.4)
14 (1.9)
1 (0.3)
4 (0.7)
8 (1.2)
3 (0.6)
19 (1.6)
4 (0.6)

Table 5.13 shows the percent of "most recent lessons" in grades 1-4, 5-8, and 9-12 mathematics classes that included various instructional activities. Again we see the preponderance of having students work textbook/worksheet problems, with roughly 85 percent of mathematics lessons in each grade range involving these activities. Most mathematics lessons also include lecture, ranging from 82 percent in grades 1-4 to 94 percent in grades 9-12. As is the case in science, use of cooperative learning groups is highest in grades 1-4, with 43 percent of mathematics lessons including this technique compared to 34 percent in grades 5-8 and 24 percent in grades 9-12. While computer use is generally low (ranging from 2 percent of lessons in grades 9-12 to 9 percent in grades 1-4), calculator use is fairly common, especially in the high school grades, where 67 percent of lessons involve the use of ca:Iculators.
Table 5.13 Mathematics Classes Participating in Various
Activities in Most Recent Lesson
Percent of Classes
Grades 1-4 Grades 5-8
Students completing textbook/workbook problems 86 (1.9) 87 (2.1)
Lecture 82 (2.0) 90 (1.8)
Students working in cooperative learning groups where the entire group receives a single grade 43 (2.4) 34 (2.8)
Students reading about mathematics 28 (2.9) 47 (3.6)
Student use of other technologies 16 (2.3) 13 (1.5)
Test or quiz 12 (1.5) 14 (1.8)
Student use of calculators 11 (1.5) 37 (3.4)
Student use of computers 9 (1.1) 6 (1.5)
82
Grades 9-12
84 ( 1.5)
94 (1.4)
24 (2.0)
32 (2.3)
7 (1.3)
17 (1.3)
67 (1.6)
2 (0.4)

Similar surveys conducted in 1977 and 1985-86 reported results for four grade ranges-1-3, 4-6, 7-9, and 10-12. Table 5.14 compares the percent of science and mathematics lessons in 1977, 1985-86, and 1993 in those grades using lecture and hands-on activities in their most recent lesson. Note that in science, use of lecture increased between 1977 and 1985-86 and then tended to level off. Note also that frequency of hands-orr use in science decreased markedly between 1977 and 1985-86. While there was a substantial rebound in use of handson science between 1985-86 and 1993, the frequency of hands-on activities is still lower than it was in 1977 at the junior high and high school levels. In mathematics, frequency of lecture increased between 1977 and 1985-86 and continued to increase between 1985-86 and 1993. Use of hands-on activities in mathematics, which had declined in some grade ranges between 1977 and 1985-86, increased dramatically between 1985-86 and 1993.
Table 5.14 Science and Mathematics Classes Using
Lecture and Hands-On Activities in Most Recent Lesson: 1977, 1985-86, and 1993
Percent of Classes
Science Mathematics
Lecture Hands-On Lecture Hands-On
1977 K-3* 60 (3.4) 67 (3.3) 58 (3 .4) 58 (3.4)
4-6 69 (3.3) 54 (3.6) 68 (3.3) 38 (3.5)
7-9 72 (2.3) 59 (2.5) 83 (1.9) 23 (2.1)
10-12 76 (2.1) 53 (2.4) 89 (1.6) 24 (2.2)
1985-86 1-3 73 (2.3) 54 (2.5) 70 (2.3) 61 (2.5)
4-6 78 (2.8) 45 (3.3) 82 (2.4) 31 (2.9)
7-9 83 (2.2) 43 (3.0) 90 (1.8) 19 (2.3)
10-12 84 (2.0) 39 (2.7) 92 ( 1.5) 11 (1.7)
1993 1-3 75 (4.1) 62 (3.7) 79 (2.6) 79 (1.9)
4-6 82 (2.5) 50 (3.3) 90 (2.0) 51 (4.1)
7-9 80 (2.9) 50 (3.9) 93 (1.4) 26 (2.7)
10-12 88 (1.5) 43 (2.3) 94 (2.1) 26 (3.1)
* Note that 1977 figures include Kindergarten teachers
83

In 1993, science and mathematics teachers were also asked to estimate the time spent on each of a number of kinds of activities in their most recent lesson in the randomly selected class. These results are shown in Table 5.15. Note that on the average, science lessons appear to be relatively similar in instructional arrangements in the various grade ranges, with roughly 35 to 40 percent of class time spent on whole class lecture/discussion, a little less than 20 percent of time with students working individually reading textbooks and completing worksheets; and a little more than 20 percent of time on hands-on activities. Mathematics classes vary considerably more by grade range, with more time spent in whole class lecture/discussion in the higher grades and more time working with manipulative materials in the lower grades.
Table 5.15 Science and Mathematics Class Time Spent on Different Types of Activities
Average Percent of Lesson
Grades 1-4 Grades 5-8 Grades 9-12
Science Classes Daily routines, interruptions, and other non-instructional activities 8 (0.5) 11 (0.5) 11 (0.3)
Whole class lecture/discussion 36 (1.2) 36 (1.1) 42 ( 1.3)
Individual students reading textbooks, completing worksheets, etc. 21 (0.8) 18 (1.2) 17 (0.7)
Working with hands-on, manipulative, or laboratory materials 26 (1.5) 23 (1.2) 21 (1.2)
Non-laboratory small group work 9 (0.7) 12 (1.0) 10 (1.2)
Mathematics Classes Daily routines, interruptions, and other non-instructional activities 9 (0.6) 11 (0.5) 11 (0.3)
Whole class lecture/discussion 26 (0.9) 37 (1.1) 48 ( 1.0)
Individual students reading textbooks, completing worksheets, etc. 26 (0.6) 26 (I. 1) 19 (0.8)
Working with hands-on, manipulative, or laboratory materials 29 (1. 1) 12 (0.9) 7 (0.9)
Non-laboratory small group work 9 (0 7) 15 (1.3) 14 (0.6)
84

E. Homework and Grading Practices
Science and mathematics teachers were asked about the amount of homework assigned per week in a randomly selected class. As can be seen in Tables 5.16 and 5.17, teachers in only about 1 in 5 grade 1-4 science classes and about 1 in 2 grade 1-4 mathematics classes expect their students to do more than 30 minutes of homework in these subjects per week. Students in the higher grades are typically expected to spend more time on homework, with a median amount of 31 to 60 minutes in science and 61 to 90 minutes in mathematics in grades 5-8. In grades 9-12, the median amount of homework assigned is 61 to 90 minutes in science and 91 to 120 minutes in mathematics.
Table 5.16 Amount of Homework Assigned in Science Classes Per Week
Percent of Classes
Grades 1-4 Grades 5-8 Grades 9-12
0-30 Minutes 82 (2.1) 33 (2.9) 12 (1.4)
31-60 Minutes 12 (2.4) 40 (2.9) 23 (2.0)
61-90 Minutes 6 (2.2) 19 (2.1) 32 (2.3)
91-120 Minutes 0 (0.2) 5 (l.l) 17 (1.3)
2-3 Hours 0 (0.0) 2 (0.7) II (0.9)
More tharl 3 Hours 0 (0.4) 0 (0.3) 5 (0.7)
Table 5.17 Amount of Homework Assigned in Mathematics Classes Per Week
Percent of Classes
Grades 1-4 Grades 5-8 Grades 9-12
0-30 Minutes 52 (3.5) II (2.7) 5 (0.7)
31-60 Minutes 26 (2.3) 17 (2.1) 12 (1.7)
61-90 Minutes 12 (1.6) 34 (2.9) 16 (1.4)
91-120 Minutes 7 (1.8) 21 (2.1) 23 (1.9)
2-3 Hours 3 (0.9) 13 (1.7) 31 (1.9)
More than 3 Hours 1 (0.6) 5 (1.1) 14 (1.5)
85

Teachers were also given a list of factors that might be considered in determining student grades in their science and mathematics classes and asked to indicate the importance they gave to each in setting grades; these results are shown in Tables 5.18 and 5.19. More than 70 percent of teachers in grades 1-4 consider each of several factors important in setting grades in both science and mathematics: individual improvement over past performance; effort; participation in whole class discussion; and contribution to small group work. Teachers in these grades report being much more likely to use systematic observations of students, handson performance tasks, and interviewing students about what they understand than written products such as objective or essay tests.
While many of the same factors that are considered important for setting grades in elementary science and mathematics continue to be used by middle and high school teachers, the percentages considering them important decrease with increasing grade range. In contrast, larger numbers of teachers in the higher grades consider objective tests in setting grades, especially in science, and homework assignments, especially in mathematics.
Table 5.18 Science Classes Where Teachers Report Various Types of Activities Are Important in Determining Student Grades*
Percent of Classes
Grades 1-4 Grades 5-8 Grades 9-12
Participation in whole class discussion 92 (1.6) 72 (3.0) 48
Effort 91 (1.6) 83 (1.8) 60
Individual improvement or progress over past performance 88 ( 1.1) 77 (2.0) 54
Contribution to small group work 87 (2.0) 77 (2.6) 50
Systematic observations of students 85 (2.3) 72 (2.4) 50
Hands-on/performance tasks 83 (2.9) 77 (2.3) 65
Interviewing students about what they understand 75 (3.0) 56 (3.2) 37
Class attendance 62 (3.0) 58 (2.8) 43
Behavior 60 (3.2) 48 (3.0) 32
Objective tests (e.g., multiple choice, true/false) 47 (3.0) 79 (2.7) 85
Science projects 52 (3.0) 67 (2.9) 35
Homework assignments 29 (2.2) 62 (2.6) 64
Laboratory reports 26 (2.8) 61 (2.5) 68
Essay tests 24 (2.7) 56 (2.8) 52
* Teachers were given a four-point scale for each activity, with 1 labeled "not important" and 4 labeled "very important." These percentages include the total circling either 3 or 4.
86
(1.8)
(2.1)
(2.5)
(2.4)
(2.6)
(3.1)
(2.4)
(2.6)
(!.7)
( 1.9)
(1.7)
(2.0)
(2.8)
(2.2)

Table 5.19 Mathematics Classes Where Teachers Report Various Types of
Activities Are Important in Determining Student Grades*
Percent of Classes
Grades 1-4 Grades 5-8
Individual improvement or progress over past performance 91 (1.6) 77 (2.1)
Systematic observations of students 86 (2.0) 73 (2.3)
Participation in whole class discussion 82 (2.4) 69 (2.3)
Effort 81 (2.4) 78 (2.2)
Hands-on/performance tasks 81 (1.4) 62 (2.6)
Contribution to small group work 79 (2.0) 64 (3.0)
Interviewing students about what they understand 72 (2.1) 55 (2.4)
Objective tests (e.g., multiple choice, true/false) 53 (2.9) 64 (3.3)
Class attendance 53 (2.5) 49 (2.4)
Behavior 44 (4.0) 39 (2.8)
Homework assignments 39 (3.5) 77 (2.4)
Mathematics projects 36 (1.8) 41 (3. 1)
Essay tests 12 (1.3) 22 (2.4)
Grades 9-12
60 (2.0)
54 (1.8)
54 (2.4)
60 (1.6)
48 (2.1)
45 (1.5)
32 (1.5)
62 ( 1.6)
42 (2.7)
28 (1.8)
75 (2.6)
23 (2.0)
19 (1.5)
* Teachers were given a four-point scale for each activity, with 1 labeled "not important" and 4 labeled "very important." These percentages include those circling either 3 or 4.
87

88

A. Overview
©Gu~[p)ll@[f ®~~
Instructional Resources
The nature of science and mathematics teaching is affected by the quality and availability of instructional resources. The 1993 National Survey of Science and Mathematics Education included a series of items on science and mathematics textbooks-which ones were being used, how much of the textbook was covered, and teachers' perceptions of textbook quality. Teachers were also asked about the availability and use of a number of other instructional resources, including computers and various types of calculators. These results are presented in the following sections, along with comparisons to 1977 and 1985-86 results when data are available.
B. Textbook Usage
Each teacher was asked if a particular, randomly selected class was using one or more commercially published textbooks or programs. As can be seen in Table 6.1, 95 percent or more of grade 1--4, 5-8, and 9-12 mathematics classes and grade 9-12 science classes use published textbooks/programs. Textbook usage is somewhat lower in grade 5-8 science classes (91 percent of classes) and markedly lower in grade 1--4 science classes (72 percent). Moreover, as can be seen in Table 6.2, textbook usage in grade 1-3 science classes has declined since 1985-86.
Grades 1-4
Grades 5-8
Grades 9-12
Table 6.1 Science and Mathematics Classes Using
Commercially Published Textbooks/Programs
Percent of Classes
Science Mathematics
72 (3.1) 95
91 (2.2) 95
97 (1.0) 96
89
( 1.5)
(1.3)
(1.0)

Table 6.2 Science and Mathematics Classes Using Commercially
Published Textbooks/Programs: 1977, 1985-86, and 1993
Percent of Classes
1977 1985-86 1993
Science
Grades 1-3* 63 (3.4) 78 (2.1) 66
Grades 4-6 90 (2.2) 89 (2.0) 87
Grades 7-9 94 (1.2) 93 (1.5) 96
Grades I 0-12 92 (1.3) 93 (1.0) 97
Mathematics
Grades 1-3* 92 (1.9) 93 (1.3) 94
Grades 4-6 96 (1.4) 94 (1.6) 96
Grades 7-9 95 (1.1) 96 (1.3) 96
Grades 10-12 95 (1.1) 94 (1.4) 95
* 1977 figures include Kindergarten teachers.
(3.5)
(3.3)
(1.3) (1.0)
(1.7)
(1.4)
(I. I)
(1.3)
Teachers who indicated that the randomly selected class used a published textbook/program were given a list of science and mathematics textbook publishers and asked to indicate the publisher of the one textbook/program used most often by students in that class. Table 6.3 shows the share of the market held by each of the major science and mathematics textbook publishers. It is interesting to note that two publishers (Scott, Foresman and Silver, Burdett, & Ginn) account for 60 percent of the textbook usage in grade 1-4 science classes. Similarly, three publishers (Merrill/Glencoe; Prentice Hall; and Silver, Burdett, & Ginn) account for 54 percent of the grade 5-8 science textbook usage, and three publishers (Holt, Rinehart, Winston; Merrill/Glencoe; and Prentice Hall) account for 56 percent of the grade 9-12 science textbook usage.
The publishers with the largest grade 1-4 mathematics textbook market share are AddisonWesley; Harcourt, Brace, & Jovanovich; Scott, Foresman; and Silver, Burdett, & Ginn; together they account for 61 percent of textbook usage. Similarly, four publishers-AddisonWesley; Scott, Foresman; Houghton Mifflin; and Harcourt, Brace, & Jovanovich-account for 57 percent of the textbook usage in grade 5-8 mathematics classes, and three (Houghton Mifflin, Addison-Wesley, and Merrill/Glencoe) for 52 percent of mathematics textbook usage in grades 9-12.
90

Science Scott, Foresman
Silver, Burdett, & Ginn
Merri1J!Glencoe
Addison-Wesley
Holt, Rinehart, Winston
D.C. Heath
Harcourt, Brace, & Jovanovich
MacMillan
Prentice Hall
Houghton Mifflin
Mathematics Addison-Wesley
Harcourt, Brace, & Jovanovich
Scott. Foresman
Silver, Burdett. & Ginn
D.C. Heath
Houghton Mifflin
Holt, Rinehart, Winston
MacMillan
Merri111Giencoe
Prentice Hall
Table 6.3 Market Share of Commercial Science and Mathematics Textbook Publishers
Percent of Classes
Grades 1-4 Grades 5-8
31 (2.9) 13 (1.2)
29 (2.4) 17 (2.2)
11 (2.2) 20 (2.3)
6 (1.1) 4 (0.8)
4 (1.2) 10 (2.0)
3 (1.2) 4 (0.9)
3 (0.4) 4 (0.7)
3 (1.5) 3 (0.7)
0 (0.0) 17 (3.4)
0 (0.1) 0 (0.0)
23 (3.1) 16 (1.8)
15 (2.9) 12 (2.1)
12 (2.5) 15 (2.5)
II (2.2) 6 (I.!)
8 (1.0) 6 (0.9)
7 (1.8) 14 (2.6)
6 (1.8) 6 (1.3)
5 (1.1) 4 (1.1)
2 (1.0) 7 (1.6)
0 (0.0) 0 (0.2)
Grades 9-12
2 (0.6)
2 (0.7)
18 (2.5)
7 (0.7)
20 (2.0)
8 (1.5)
6 (0.8)
1 (0.4)
18 ( 1.5)
1 (0.4)
II (1.0)
5 (0.9)
8 (0.8)
0 (0.0)
4 (0.5)
30 (2.9)
4 (0.8)
0 (0.0)
II (1.4)
6 (0.7)
Teachers were also asked to provide the title, author, and publication year of this textbook/ program. Tables 6.4 and 6.5 list the most commonly used science and mathematics textbooks in each grade range; secondary textbooks are shown by discipline, as well.
91
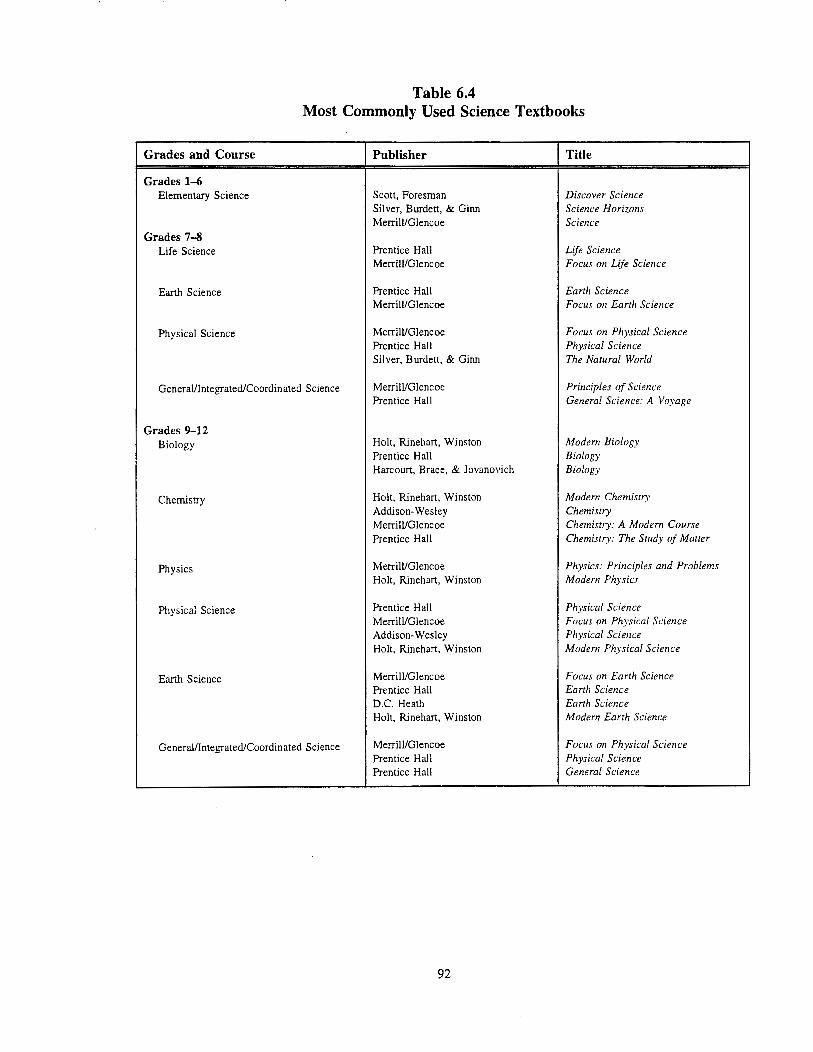
Table 6.4 Most Commonly Used Science Textbooks
Grades and Course Publisher Title
Grades 1-6 Elementary Science Scott, Foresman Discover Science
Silver, Burdett, & Ginn Science Horizons MerrilVGlencoe Science
Grades 7-8 Life Science Prentice Hall Life Science
Merri!VGlencoe Focus on Life Science
Earth Science Prentice Hall Earth Science Merri!VGlencoe Focus on Earth Science
Physical Science MerrilVGlencoe Focus on Physical Science Prentice Hall Physical Science Silver, Burdett, & Ginn The Natural World
GeneraVlntegrated/Coordinated Science MerrilVGlencoe Principles of Science Prentice Hall General Science: A Voyage
Grades 9-12 Biology Holt, Rinehart, Winston Modern Biology
Prentice Hall Biology Harcourt, Brace, & Jovanovich Biology
Chemistry Holt, Rinehart, Winston Modern Chemistry Addison-Wesley Chemistry Merri!VGiencoe Chemistry: A Modern Course Prentice Hall Chemistry: The Study of Matter
Physics MerrilVGiencoe Physics: Principles and Problems Holt, Rinehart, Winston Modern Physics
Physical Science Prentice Hall Physical Science Merri!VGlencoe Focus on Physical Science Addison-Wesley Physical Science Holt, Rinehart, Winston Modern Physical Science
Earth Science MerriJVGiencoe Focus on Earth Science Prentice Hall Earth Science D.C. Heath Earth Science Holt, Rinehart, Winston Modern Earth Science
Generalllntegrated/Coordinated Science MerrilVGlencoe Focus on Physical Science Prentice Hall Physical Science Prentice Hall General Science
92

Table 6.5 Most Commonly Used Mathematics Textbooks
Grades and Course Publisher Title
Grades 1-6 Elementary Mathematics Addison-Wesley Mathenwtics
Silver, Burdett, & Ginn Mathenwtics Scott, Foresman Exploring Mathenwtics Harcourt, Brace, & Jovanovich Mathenwtics Today
Grades 7-8 Middle School Mathematics Addison-Wesley Mathenwtics
Scott, Foresman Mathenwtics Scott, Foresman Transition Mathenwtics
Grades 9-12 Algebra I Houghton Mifflin Algebra I
Addison-Wesley Algebra: Structure and Method Scott, Foresman UCSMP Algebra I
Geometry Houghton Mifflin Geometry Merrill/Glencoe Geometry
Algebra II Houghton Mifflin Algebra and Trigonometry Merrill/Glencoe Algebra II with Trigonometry Addison-Wesley Algebra and Trigonometry
Algebra III Houghton Mifflin Algebra Ill Merrill/Glencoe Advanced Mathenwtics Harcourt, Brace, & Jovanovich Advanced Mathenwtics
93

Table 6.6 shows the distribution of publication years of science and mathematics textbooks. In 1993, roughly 1 in 4 science classes and nearly 1 in 2 mathematics classes were using textbooks published since 1990. Only 3 percent of grade 1-4 mathematics classes and 5 percent of those in grades 5-8 were using textbooks published prior to 1985; in contrast, 23 percent of grade 9-12 mathematics classes and from 12 to 18 percent of science classes in the various grade ranges were using textbooks published prior to 1985.
Science 1979 or Earlier
1980-1984
1985-1989
1990 or Later
Mathematics 1979 or Earlier
1980-1984
1985-1989
1990 or Later
Table 6.6 Publication Year of Science and
Mathematics Textbooks/Programs
Percent of Classes
Grades 1-4 Grades 5-8
2 (0.7) 2 (I. 1)
16 (2.7) 10 (I .5)
59 (4.3) 62 (3.4)
23 (4.8) 25 (2.2)
I (0.5) 0 (0.1)
2 (0.9) 5 (1.1)
47 (3.3) 48 (3.6)
50 (2.7) 47 (4.0)
94
Grades 9-12
3 (0.4)
11 (0.8)
57 (2.9)
29 ( 1.8)
5 ( 1.0)
18 ( 1.9)
34 (1 .8)
44 (1.8)

Table 6.7 shows the percentages of science and mathematics classes in grades 1-4, 5-8, and 9-12 which use published textbooks/programs "covering" various proportions of their textbooks. Note that in each grade range mathematics classes are more likely than science classes to go through a substantial portion of their textboo~, with from 69 to 74 percent of mathematics classes, compared to 43 percent to 52 percent of science classes, covering 75 percent or more of their textbooks.
Science Classes < 25%
25-49%
50--74%
75-90%
> 90%
Mathematics < 25%
25-49%
50--74%
75-90%
> 90%
Table 6.7 Percent of Science and Mathematics
Textbooks/Programs Covered During the Course*
Percent of Classes
Grades 1-4 Grades 5-8
10 (2.6) 9 (1.7)
17 (3.7) 19 (2.0)
20 (2.8) 30 (3.3)
30 (2.4) 33 (3.7)
22 (3.3) 10 (1.5)
I (0.5) I (0.2)
4 (0.8) 4 (0.9)
21 (1.9) 23 (2.6)
44 (2.2) 50 (2.7)
30 (2.1) 22 (2.1)
Grades 9-12
3
16
36
37
8
0
7
23
48
21
* Only classes using commercially published textbooks/programs were included in these analyses.
95
(0.8)
(2.3)
(1.8)
(2.7)
(1.1)
(0.2)
(0.7)
(2.1)
(2.3)
(1.3)

It is interesting to note that while many science and mathematics education reformers are critical of textbooks, most teachers consider their textbooks to be of relatively high quality. As can be seen in Table 6.8, the majority of science and mathematics teachers in each grade range consider their textbooks/programs to be good or better, with percentages ranging from 63 to 80 percent in science and from 72 to 84 percent in mathematics.
Science
Very Poor
Poor
Fair
Good
Very Good
Excellent
Mathematics
Very Poor
Poor
Fair
Good
Very Good
Excellent
Table 6.8 Teacher Perception of the Quality of Textbooks/Programs
Used in Science and Mathematics Classes*
Percent of Classes
Grades 1-4 Grades 5-8 Grades 9-12
3 (0.8) 3 (0.5) 2
8 (1.4) 5 (1.1) 4
27 (2.5) 23 (2.3) 14
38 (3.4) 30 (1.8) 36
18 (1.8) 29 (2.6) 33
7 (1.4) 10 (3.5) 11
3 (1.4) 0 (0.7) I
4 (0.6) 5 (0.7) 3
21 (1.9) 20 (3.2) 11
32 (2.4) 32 (2.7) 30
30 (3.5) 31 (2.7) 38
10 (1.5) 14 ( 1.8) 16
* Only classes using commercially published textbooks/programs were included in these analyses.
96
(0.5)
(04)
(2.0)
(2.0)
(2.5)
(1.1)
(0.3)
(0.7)
(1.1)
(2.7)
(1.8)
( 1.7)

C. Facilities and Equipment
Science and mathematics teachers were given a list of equipment and asked to indicate the approximate number of times per semester each is used in the randomly selected class. Tables 6.9 through 6.14 show the percent of grade 1-4, 5-8, and 9-12 science and mathematics classes reporting at least some use of each type of equipment, as well as the percentages of classes where each is "not needed" or "needed, but not available."
Note that overhead projectors are commonly used, with from 74 to 88 percent of science and mathematics classes in the various grade ranges making use of them. Videotape players are more likely to be used in science instruction, with from 88 to 94 percent of classes reporting usage, compared to from 38 to 44 percent of mathematics classes. Similarly, science classes are more likely than mathematics classes to use both videodisc and CD-ROM players.
Table 6.9 Equipment Usage in Grade 1-4 Science Classes
Percent of Classes
Not Needed, But Needed Not Available
Used
Videotape player 88 (2.0) 9 (1.3) 2 (0.7)
Overhead projector 74 (2.8) 21 (2.9) 6 (1.3)
Videodisc player 18 (1.6) 59 (1.9) 23 (2.5)
CD-ROM player 10 (1.5) 65 (2.4) 25 (2.7)
Four function calculators 31 (2.8) 57 (1.7) 12 (2.0)
Fraction calculators 2 (0.6) 88 ( 1.5) 10 (1.5)
Graphing calculators 0 (0.2) 89 (1.9) 11 (1.6)
Scientific calculators 0 (2.6) 88 (2.4) 12 (1.6)
Electrical outlets in laboratories 51 (2.6) 32 (2.2) 17 (2.3)
Running water in laboratories 49 (2.7) 28 (2.2) 24 (1.9)
Gas for burners in laboratories 7 (2.1) 73 (3.0) 20 (2.1)
Hoods or air hoses in laboratories 3 (1.6) 79 (2.5) 18 (1.6)
Computers 52 (2.4) 30 (1.8) 18 (2.2)
Computer/lab interfacing devices 13 (1.8) 64 (1.9) 23 (1.9)
97
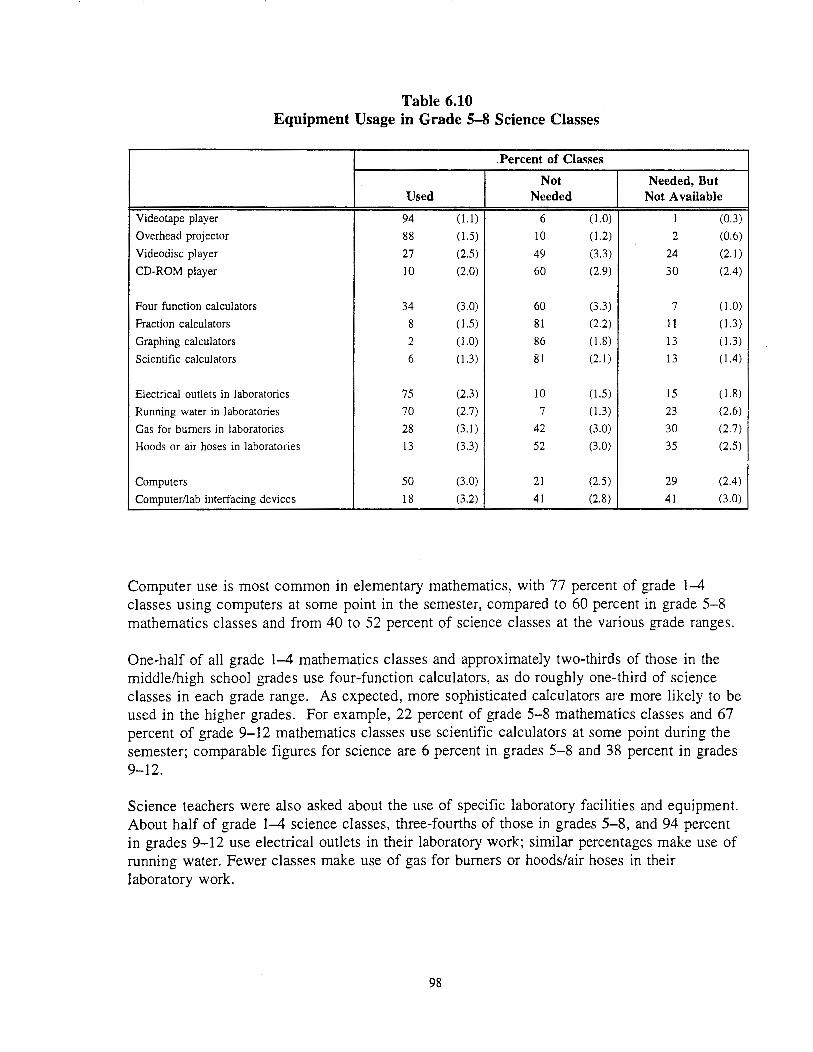
Table 6.10 Equipment Usage in Grade 5-8 Science Classes
.Percent of Classes
Not Needed, But Used Needed Not Available
Videotape player 94 (I. I) 6 (1.0) 1 (0.3)
Overhead projector 88 (1.5) 10 (1.2) 2 (0.6)
Videodisc player 27 (2.5) 49 (3.3) 24 (2.1)
CD-ROM player 10 (2.0) 60 (2.9) 30 (2.4)
Four function calculators 34 (3.0) 60 (3.3) 7 ( 1.0)
Fraction calculators 8 ( 1.5) 81 (2.2) 11 (1.3)
Graphing calculators 2 (1.0) 86 (1.8) 13 (1.3)
Scientific calculators 6 (1.3) 81 (2.1) 13 (1.4)
Electrical outlets in laboratories 75 (2.3) 10 (1.5) 15 ( 1.8)
Running water in laboratories 70 (2.7) 7 (1.3) 23 (2.6)
Gas for burners in laboratories 28 (3.1) 42 (3.0) 30 (2 7)
Hoods or air hoses in laboratories 13 (3.3) 52 (3.0) 35 (2.5)
Computers 50 (3.0) 21 (2.5) 29 (2.4)
Computer/lab interfacing devices 18 (3.2) 41 (2.8) 41 (3.0)
Computer use is most common in elementary mathematics, with 77 percent of grade 1-4 classes using computers at some point in the semester, compared to 60 percent in grade 5-8 mathematics classes and from 40 to 52 percent of science classes at the various grade ranges.
One-half of all grade 1-4 mathematics classes and approximately two-thirds of those in the middle/high school grades use four-function calculators, as do roughly one-third of science classes in each grade range. As expected, more sophisticated calculators are more likely to be used in the higher grades. For example, 22 percent of grade 5-8 mathematics classes and 67 percent of grade 9-12 mathematics classes use scientific calculators at some point during the semester; comparable figures for science are 6 percent in grades 5-8 and 38 percent in grades 9-12.
Science teachers were also asked about the use of specific laboratory facilities and equipment. About half of grade 1-4 science classes, three-fourths of those in grades 5-8, and 94 percent in grades 9-12 use electrical outlets in their laboratory work; similar percentages make use of running water. Fewer classes make use of gas for burners or hoods/air hoses in their laboratory work.
98

Table 6.11 Equipment Usage in Grade 9-12 Science Classes
Percent of Classes
Not Needed, But Used Needed Not Available
Videotape player 90 (1.8) 8 (1.4) 2 (0.3)
Overhead projector 83 (2.6) 14 (2.8) 3 (0.9)
Videodisc player 29 (2.1) 47 (3.1) 24 (2.0)
CD-ROM player 7 (1.4) 60 (3.2) 33 (3.3)
Four function calculators 38 (2.2) 54 (2.6) 8 (2.1)
Fraction calculators 11 (1.1) 83 ( 1.9) 6 (1.3)
Graphing calculators 7 (1.4) 82 (1.6) 11 (2.1)
Scientific calculators 38 (2.1) 53 (2.9) 9 ( 1.8)
Electrical outlets in laboratories 94 (0.9) 4 (0.9) 2 (0.8)
Running water in laboratories 90 (2.7) 3 (0.8) 7 (2.5)
Gas for burners in laboratories 67 (2.7) 24 (3.1) 9 (l.Q)
Hoods or air hoses in laboratories 36 (2.1) 38 (2.3) 26 (2.3)
Computers 40 (2.5) 24 (2.2) 36 (2.1)
Computer/lab interfacing devices 18 (1.2) 37 (1.6) 46 ( 1.9)
Many science teachers reported needing particular types of equipment and not having them available. Lack of computers and computer/lab interfacing devices were most frequently noted as needed but not available, especially in the higher grades. Running water and gas for burners in laboratories were noted as needed, but not available for 20 to 30 percent of grade 1-4 and 5-8 science classes (but fewer than 10 percent of those in grades 9-12). In addition, roughly 1 out of 4 science classes in each grade range reportedly need videodisc and CDROM players, but do not have them available.
It is also interesting to note that sizeable percentages of teachers reported "not needing" items that seem quite central to effective science and mathematics teaching. For example, 32 percent of grade 1-4 teachers indicated they did not need electrical outlets and 28 percent said they did not need running water in laboratories. Similarly, 30 percent of grade 1-4 teachers, 21 percent of grade 5-8 teachers, and 24 percent of grade 9-12 science teachers indicated they didn't need computers.
99

Table 6.12 Equipment Usage in Grade 1-4 Mathematics Classes
Percent of Classes
Not Needed, But Used Needed Not Available
Videotape player 42 (2.8) 54 (2.7) 4 (1.0)
Overhead projector 78 (3.2) 15 (2.1) 8 (1.7)
Videodisc player 8 (1.0) 80 (2.2) 12 ( 1.8)
CD-ROM player 3 (0.8) 81 (1.9) 16 (2.])
Four function calculators 50 (2.5) 34 (2.2) 16 (1.1)
Fraction calculators 3 (0.7) 85 (1.6) 13 (1.6)
Graphing calculators 1 (0.3) 88 (1.4) 12 (1.8)
Scientific calculators I (0.4) 90 (1.2) 9 ( 1.7)
Computers 77 (2.1) )) (1.4) 12 (1.8)
Computer/lab interfacing devices 33 (2.4) 46 (3.0) 21 (2.3)
Table 6.13 Equipment Usage in Grade 5-8 Mathematics Classes
Percent of Classes
Not Needed, But Used Needed Not Available
Videotape player 44 (2.8) 51 (2.7) 5 (2.4)
Overhead projector 79 (3.7) 16 (2.3) 5 (2.5)
Videodisc player 5 (1.0) 80 (2.9) 15 (2.4)
CD-ROM player 3 (0.9) 84 (1.8) 13 ( 1.8)
Four function calculators 72 (3.0) 17 (2.2) II (2.9)
Fraction calculators 26 (2.3) 35 (2.2) 39 (2.9)
Graphing calculators 5 (1.0) 66 (3.0) 30 (2.7)
Scientific calculators 22 (3.0) 61 (3.4) 17 (2.0)
Computers 60 (3.1) 12 (1.3) 29 (3.1)
Computer/lab interfacing devices 26 (2.0) 35 (2.4) 39 (3.1)
100

Table 6.14 Equipment Usage in Grade 9-12 Mathematics Classes
Percent of Classes
Not Needed, but Used Needed Not Available
Videotape player 38 (2. I) 57 (1.7) 5 ( 1.2)
Overhead projector 76 (2.9) 20 (2.3) 5 (1.2)
Videodisc player 2 (0.7) 88 (1.6) 10 (1.4)
CD-ROM player I (0.3) 88 (1.4) 12 ( 1.3)
Four function calculators 65 (2.3) 30 (2.2) 5 ( 1.3)
Fraction calculators 28 (2.3) 53 (1.7) 19 (2.2)
Graphing calculators 40 (2.3) 40 (1.6) 20 (1.9)
Scientific calculators 67 (2.0) 27 (2.1) 6 ( 1.2)
Computers 44 (2.4) 29 (1.8) 28 (2.4)
Computer/lab interfacing devices 2I (2.1) 43 (2.0) 36 (2.7)
In mathematics, teachers in 34 percent of grade 1-4 classes reported not needing fourfunction calculators and 16 percent reported needing them, but not having them available. Mathematics teachers in the middle grades were particularly likely to report needing more sophisticated calculators but not having them available, with 30 percent of grade 5-8 mathematics classes needing graphing calculators and 39 percent needing fraction calculators. While smaller percentages of high school classes need fraction and graphing calculators and do not have them available (19 and 20 percent, respectively), teachers in surprisingly large percentages of classes reported not needing to use these calculators in their mathematics instruction.
Eleven percent of grade 1-4 mathematics classes, 12 percent of those in grades 5-8, and a sizeable 29 percent of grade 9-12 mathematics classes reportedly do not need computers. Many other mathematics classes need computers, but do not have them available, including 12 percent of those in grades 1-4 and nearly 30 percent of those in grades 5-8 and 9-12.
101

The school and teacher surveys also included a number of questions about the amount of money spent on science and mathematics equipment and supplies and who had input into decisions about how that money would be spent. As can be seen in Table 6.15, the typical elementary school spent $300 on science equipment and $150 on consumable science supplies in their most recently completed budget year. Middle schools spent somewhat more (a median of $500 on science equipment and $300 on science supplies) and high schools considerably more (a median of $1,100 on science equipment and $1,000 on science supplies). In contrast, in mathematics there was relatively little difference by grade range in the median amount spent on equipment (from $300 to $400 per year) and the typical elementary school spent considerably more on consumable mathematics supplies ($350 per year) than did schools with higher grades ($110 for middle schools and $150 for high schools).
Table 6.15 Median Amount Schools Spend Per Year on Science and
Mathematics Equipment, Consumable Supplies, and Software
Median Amount Spent
Equipment Consumable Supplies Software
Science Elementary Schools $ 300 $ 150 $ 40
Middle Schools $ 500 $ 300 $ 50
High Schools $ 1,100 $ 1,000 $ 125
Mathematics Elementary Schools $ 300 $ 350 $ 100 Middle Schools $ 300 $ 110 $ 100 High Schools $ 400 $ !50 $ 100
Table 6.16 shows the amount elementary, middle, and high schools reported spending on science and mathematics equipment, consumable supplies, and software in their most recently completed budget year, expressed as a per pupil amount. The typical elementary school spent only $.51 per student on consumable science supplies such as chemicals, glassware, batteries, etc. and $1.00 per student on mathematics manipulative materials/supplies in the same time period. These amounts are clearly insufficient when a single meter stick costs $3.00 and a set of mathematics pattern blocks costs $24.00. Note that the amount spent on mathematics supplies per student enrolled in the school is lower at the middle and high school levels, while the amount spent on science supplies increases with increasing grade levels. As can be seen in Table 6.17, while schools were likely to make at least some purchases to replenish consumable supplies, this was by no means universal. For example, 15 percent of elementary schools reported spending no money on consumable science supplies in the previous year.
102

Table 6.16 Median Amount Schools Spend Per Pupil Per Year on Science
and Mathematics Equipment, Consumable Supplies, and Software
Median Amount
Equipment Consumable Supplies
Science Elementary Schools $ 1.06 $ .51
Middle Schools $ 1.78 $ .88
High Schools $ 2.11 $2.22
Mathematics Elementary Schools $ 1.40 $1.00
Middle Schools $1.00 $ .40
High Schools $ .87 $ .38
Table 6.17 Schools Purchasing Science and Mathematics Equipment,
Consumable Supplies, and Software in Previous Year
Percent of Schools
Consumable Equipment Supplies Software
Science Elementary Schools 83 (4.9) 85 (5.9) 53 (5.0)
Middle Schools 84 (5.7) 88 (6.0) 56 (5.1)
High Schools 94 (2.2) 98 (1.8) 64 (2.9)
Mathematics Elementary Schools 85 (4.7) 85 (3.7) 74 (3.5)
Middle Schools 85 (5.1) 79 (5.9) 69 (4.3)
High Schools 87 (3.2) 79 (3.4) 63 (3.0)
103
Software
$ .09
$ .16
$ .25
$ .46
$ .49
$ .22
Any Purchase
92
89
100
94
91
93
(4.5)
(5.8)
(1.5)
(3.3)
(3.7)
(2.8)

School representatives were also asked about the amount of input the state, central office, principal, science and mathematics departments, and individual teachers have in decisions about equipment and materials purchases. As can be seen in Table 6.18, teachers and departments tend to have considerably more say in these decisions than do school, district, or state level personnel. For example, 75 percent of high schools report that individual teachers have a major say in purchases of science equipment and supplies; only 7 percent indicate that teachers have little input.
Table 6.18 Extent of Teacher Input in Science and Mathematics
Decisions About Equipment/Materials Purchases
Percent of Schools
Science Mathematics
Little Moderate Major Little Moderate Input Input Input Input Input
Elementary Schools
State 80 (3.0) 10 (2.4) 10 (2.5) 65 (4.5) 18 (2.7)
Deparonent, as a whole 59 (4.0) 14 (2.8) 27 (4.1) 56 (3.4) II (2.1)
Central Office 54 (4.5) 17 (2.8) 28 (3.3) 42 (4.6) 23 (2.4)
Department Chair 54 (5.3) 10 (2.2) 36 (5.6) 59 (5.2) 13 (2.7)
Principal 41 (3.3) 41 (3.5) 38 (5.1) 15 (2.6) 33 (3.5)
Individual Teachers 19 (2.8) 19 (3.7) 61 (3.7) 15 (2.6) 23 (3.1)
Middle Schools
State 89 (2.2) 7 (1.4) 4 (1.2) 78 (4.3) 12 (2.8)
Department. as a whole 38 (5.1) 15 (3.2) 48 (5.3) 28 (5.1) 21 (3.0)
Central Office 64 (4.4) 17 (3.1) 19 (3.5) 53 (5.2) 19 (3.1)
Department Chair 39 (3.8) 12 (2.3) 48 (5.0) 38 (5.0) 18 (2.5)
Principal 27 (3.7) 38 (5.9) 34 (6.3) 16 (2.6) 32 (5.1)
Individual Teachers 10 (2.7) 16 (2.9) 75 (3.4) 11 (2.2) 29 (4.1)
High Schools
State 87 (2.3) 9 (1.7) 4 (1.4) 79 (3.0) 12 (2.3)
Department, as a whole 21 (3.9) 22 (2.2) 58 (4.0) 15 (2.7) 25 (2.7)
Central Office 61 (2.3) 18 (2.4) 21 (2.5) 49 (3.3) 24 (2.7)
Department Chair 27 (3.1) 23 (2.0) 50 (3.4) 20 (2.1) 25 (3.3)
Principal 44 (2.3) 29 (3.0) 27 (2.5) 28 (2.2) 34 (2.4)
Individual Teachers 7 (1.7) 19 (3.0) 75 (3.1) 9 (1.4) 31 (3.0)
104
Major
Input
18 (2.3)
33 (3.1)
25 (3.2)
27 (3.8)
52 (4.0)
62 (4.2)
10 (2.1)
51 (4.8)
28 (3.1)
44 (5.3)
52 (5.1)
60 (4.7)
10 (1.7)
60 (3.6)
27 (2.5)
56 (3.4)
38 (2.5)
60 (34)
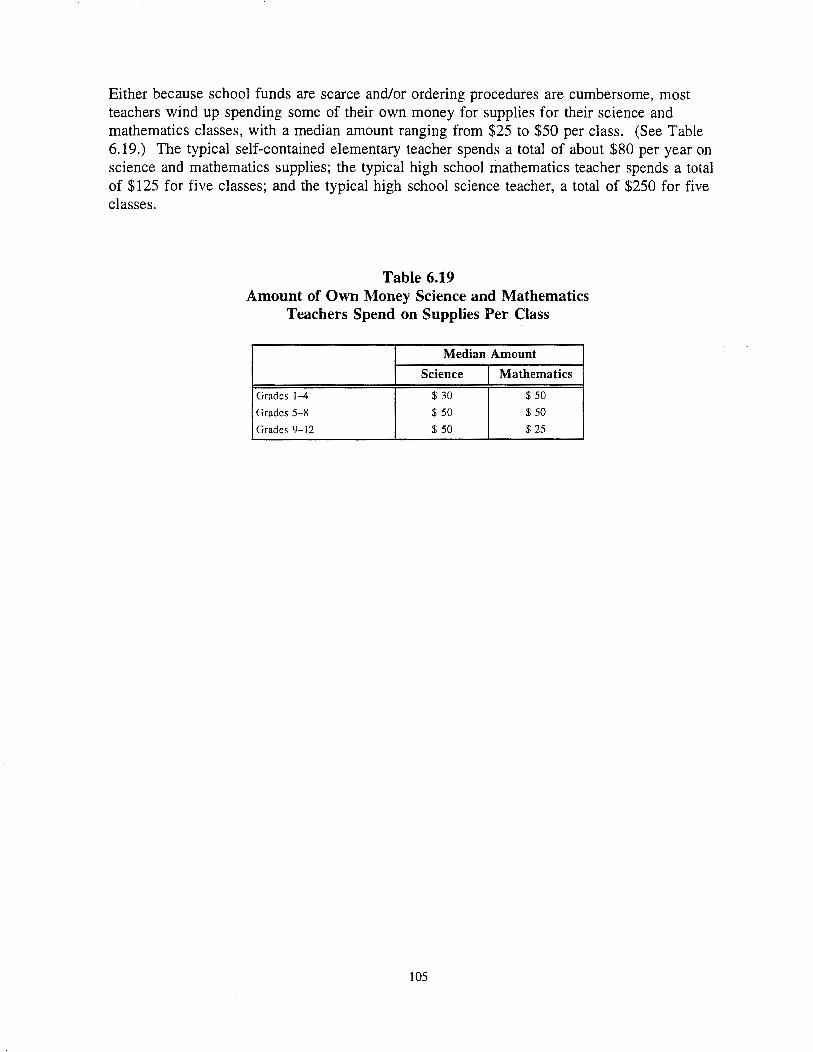
Either because school funds are scarce and/or ordering procedures are cumbersome, most teachers wind up spending some of their own money for supplies for their science and mathematics classes, with a median amount ranging from $25 to $50 per class. (See Table 6.19.) The typical self-contained elementary teacher spends a total of about $80 per year on science and mathematics supplies; the typical high school mathematics teacher spends a total of $125 for five classes; and the typical high school science teacher, a total of $250 for five classes.
Table 6.19 Amount of Own Money Science and Mathematics
Teachers Spend on Supplies Per Class
Median Amount
Science Mathematics
Grades 1-4 $ 30 $50
Grades 5-8 $50 $50
Grades 9-12 $50 $ 25
105

106

A. Overview
©f.fu®~i!@[f ~W@[fi)
Factors Affecting Instruction
The 1993 National Survey of Science and Mathematics Education asked the principal of each school in the sample to designate persons to answer questions about the school's science and mathematics programs; typically these were the science and mathematics chairs or other knowledgeable teachers. Among the data collected about each school were the extent of use of various programs and practices in the school and the extent of influence of the NCTM Standards. Teachers were also asked about problems that affect science and mathematics instruction in the school. These data are presented in the following sections.
B. School Programs and Practices
The designated school representatives were given a list of programs and practices and asked to indicate the extent to which each was being implemented in the school, Tables 7.1 and 7.2 show the percentages of elementary, middle, and high schools indicating considerable use (3 or 4 on a scale from 1, "not used" to 4, "used extensively") of each program or practice.
Of those listed, the most extensively used practice in both science and mathematics is an emphasis on problem-solving and reasoning skills. Percentages of schools reporting considerable use of this practice in science and mathematics ranged from 83 to 88 percent, depending on grade range. There was a sharp drop-off between this and the next most common practice, with roughly two-thirds of schools reporting considerable use of handson/performance-assessment in science and from 33 to 60 percent in mathematics.4
Elementary, middle, and high school science programs were equally likely to emphasize integration of science and mathematics instruction, ranging from 43 percent at the high school level to 50 percent at the elementary level. In contrast, only 23 percent of high school mathematics programs and 32 percent of those in middle schools, compared to 47 percent at the elementary level, emphasize integrating science and mathematics instruction.
4 These percentages seem much higher than observation of science and mathematics classes would suggest, raising concern that some respondents may have interpreted the question as hands-on instruction in general rather than using hands-on activities specifically as a part of student assessment.
107

Emphasis on integrating science/mathematics instruction with language arts instruction is greatest in the lower grades. For example, only 9 percent of high schools report an emphasis on integrating mathematics and language arts, compared to 35 percent of elementary schools.
Table 7.1 Science Programs Indicating Considerable Use* of
Various Programs/Practices, by School Type
Percent of Programs
Elementary Middle High Schools Schools Schools
School-based management 49 (4.2) 45 (5.3) 45
Common daily planning period for members of the science department 13 (2.8) 16 (3.4) 29
Common work space for members of the science department 13 (2.3) 20 (3.2) 27
Interdisciplinary teams of teachers who share the same students (e.g., school within a school) 31 (3.4) 33 (3.8) 8
Students assigned to science classes by ability 6 (2.1) 19 (3.4) 40
Independent study projects for credit in science 27 (2.9) 27 (3.5) 18
Emphasis on problem solving, reasoning skills in science 83 (3. l) 86 (3.3) 87
Use of computers to solve science problems 12 (2.4) 22 (2.7) 40
Hands-on/performance assessment in science classes 66 (4.0) 69 (4.0) 66
Integration of science and mathematics instruction 50 (5.0) 46 (5.1) 43
Integration of science and language arts instruction 46 (4.8) 32 (5.6) 21
Use of vocationalltechnical applications in science instruction 18 (6.0) 24 (5.7) 17
Science content changes recommended by AAAS' Project 2061 (Science for All Americans) 11 (2.3) 10 (2.7) 10
Science content changes recommended by NSTA's Scope, Sequence, and Coordination Project (SS&C Content Core) 10 (2.2) 10 (2.4) 11
* Respondents were given a four-point scale for each program/practice, with 1 labeled "not used" and 4 labeled "used extensively." These numbers represent the total circling either 3 or 4.
(2.8)
(4.9)
(4.3)
( 1.8)
(2.8)
(3.2)
(2.6)
(2.5)
(2.8)
(3.0)
(2.7)
(2.2)
(2.0)
(2.5)
Nearly one-third of elementary and middle schools, compared to only about 10 percent of high schools, report considerable use of interdisciplinary teams of teachers who share the same students. In contrast, high schools are more likely than elementary or middle schools to provide a common daily planning period and common work space for members of the science and mathematics departments (due in large measure to the fact that high schools are more likely to have science and mathematics departments.)
Ability grouping is more common in mathematics than in science, and becomes more widespread in the higher grades. For example, 6 percent of elementary schools, compared to 40 percent of high schools, frequently assign students to science classes by ability level;
108

comparable figures for mathematics are 25 percent at the elementary level and 69 percent at the high school level.
Table 7.2 Mathematics Programs Indicating Considerable Use*
of Various Programs/Practices, by School Type
Percent of Programs
Elementary Middle High Schools Schools Schools
School-based management 52 (4.0) 49 (5.8) 41
Common daily planning period for members of the mathematics department 15 (3.3) 18 (3.6) 24
Common work space for members of the mathematics department 13 (3.1) 18 (3.8) 32
Interdisciplinary teams of teachers who share the same students (e.g., school within a school) 26 (3.6) 33 (4.7) 12
Students assigned to mathematics classes by ability 25 (5.5) 54 (5.8) 69
Independent study projects for credit in mathematics 16 (4.7) 17 (6.1) 14
Emphasis on problem solving, reasoning skills in mathematics 87 (1.8) 84 (3.1) 88
Use of computers to solve mathematics problems 47 (4.0) 27 (5.0) 24
Hands-on/performance assessment in mathematics 60 (3.5) 41 (5.0) 33
Integration of mathematics and science instruction 47 (5.0) 32 (6.3) 23
Integration of mathematics and language arts instruction 35 (3.8) 20 (6.5) 9
Use of vocational/technical applications in mathematics instruction 20 (3.4) 26 (4.9) 25
Content changes recommended by AAAS' Project 2061 (Science for All Americans) 7 (2.3) 7 (2.8) 6
Content changes recommended by NCTM's Curriculum and Evaluation Standards 39 (3.2) 50 (5.1) 56
Pedagogical shifts recommended by NCTM's Professional Standards for Teaching Mathematics 36 (3.0) 44 (5.0) 44
Integration of mathematics subjects (e.g., algebra, probability, geometry, etc. all taught together each year) 33 (3.7) 39 (6.3) 19
* Respondents were given a four-point scale for each program/practice, with I labeled "not used" and 4 labeled "used extensively." These numbers represent the total circling either 3 or 4.
(5.7)
(3.4)
(3.9)
(19)
(4.5)
(4.0)
(2.2)
(2.9)
(3 7)
(3.4)
(2.8)
(2.3)
(1.1)
(3.9)
(4.2)
(3.8)
School representatives were also asked if their schools were changing their curricula based on various reform recommendations. Roughly 1 in 1 0 schools at each level indicated that NSTA's Scope Sequence, and Coordination Project and AAAS' Project 2061 had led to changes in science content: Much larger percentages indicated that NCTM' s Curriculum and Evaluation Standards had influenced the mathematics content taught, ranging from 39 percent of elementary schools to 56 percent of high schools. Somewhat fewer schools (from 36 to 44 percent) indicated that they had made considerable effort to implement the pedagogical shifts recommended by NCTM's Professional Standards for Teaching Mathematics.
109

School representatives were asked about several instructional arrangements for elementary students-whether they were pulled out from self-contained classes for remediation or enrichment in science and mathematics and whether they received science and mathematics instruction from specialists instead of, or in addition to, their regular teacher. These results are shown in Tables 7.3. Note that pulling students out of self-contained classes for remedial instruction is much more common in mathematics than in science, with 6I percent of elementary schools doing so in mathematics, but only I 0 percent in science. Elementary schools are also more likely to pull students out for enrichment in mathematics (44 percent of schools) than in science (27 percent). In contrast, use of specialists for instruction is equally common in science and mathematics, with roughly I in 4 schools having students receive instruction in mathematics and science in addition to their regular teacher and I in 8 instead of from their regular teacher.
Table 7.3 Use of Science and Mathematics Instructional
Arrangements in Elementary Schools
Percent of Schools
Not Used Used Extensively
I 2 3 4
Science
Students pulled out from self-contained classes for remedial instruction in science 83 (3.9) 6 (2.2) 2 (0.5) 2 (1.0)
Students pulled out from self-contained classes for enrichment in science 66 (5.3) 16 (3.5) 7 ( 1.8) 4 (1.4)
Students receiving instruction from science specialists in addition to their regular teacher 72 (3.1) 16 (3.1) 5 ( l.l) 3 (1.1)
Students receiving instruction from science specialists instead of their regular teacher 82 (2.8) 5 (0.8) 3 (1.0) 4 (1.0)
Mathematics
Students pulled out from self-contained classes for remedial instruction in mathematics 32 (3.7) 23 (3.4) 25 (3.3) 13 (2.2)
Students pulled out from self-contained classes for enrichment in mathematics 53 (4.0) 19 (3.6) 18 (3.9) 7 (1.9)
Students receiving instruction from mathematics specialists in addition to their regular teacher 69 (4.5) 12 (2.7) 10 (3.2) 4 (1.0)
Students receiving instruction from mathematics specialists instead of their regular teacher 79 (4.3) 9 (2.1) 3 (0.9) 2 (1.1)
110
Don't Know or Not
Applicable
7 (1.9)
7 (3.3)
4 (1.4)
5 ( 1.4)
8 (3.3)
3 (1.0)
5 (1.6)
7 (1.8)
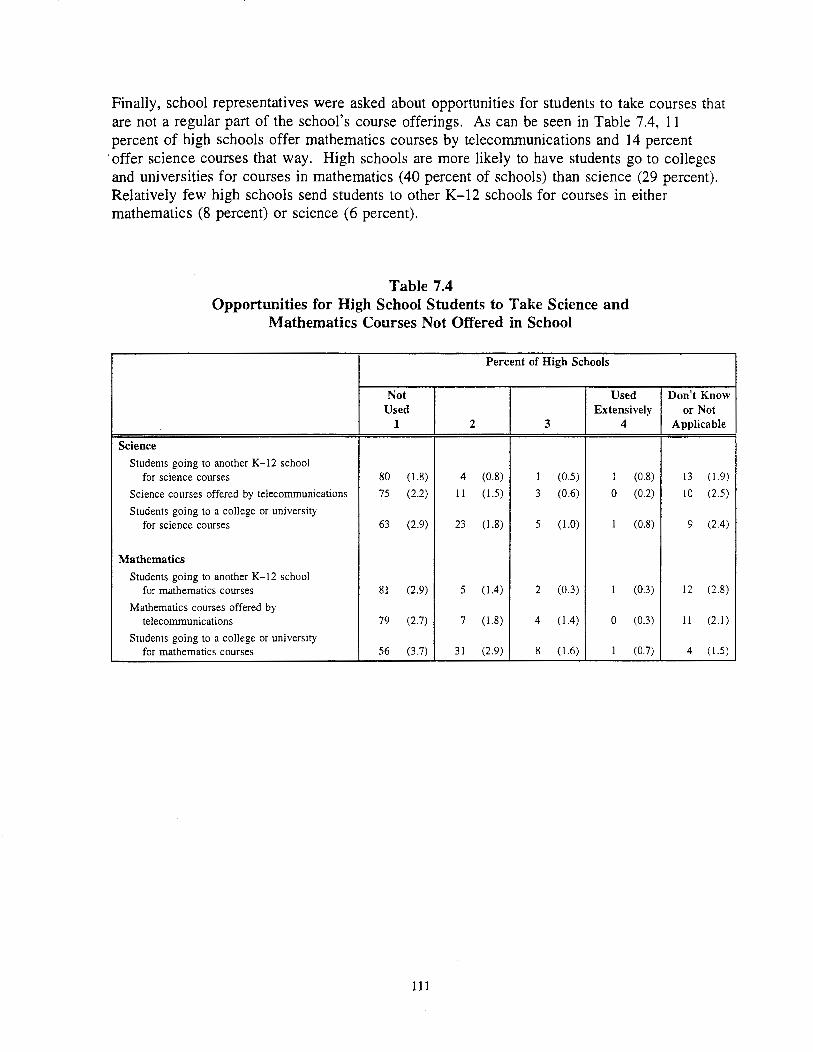
Finally, school representatives were asked about opportunities for students to take courses that are not a regular part of the school's course offerings. As can be seen in Table 7.4, 11 percent of high schools offer mathematics courses by telecommunications and 14 percent
·offer science courses that way. High schools are more likely to have students go to colleges and universities for courses in mathematics (40 percent of schools) than science (29 percent). Relatively few high schools send students to other K-12 schools for courses in either mathematics (8 percent) or science (6 percent).
Table 7.4 Opportunities for High School Students to Take Science and
Mathematics Courses Not Offered in School
Percent of High Schools
Not Used Used Extensively
1 2 3 4
Science
Students going to another K-12 school for science courses 80 (1.8) 4 (0.8) I (0.5) I (0.8)
Science courses offered by telecommunications 75 (2.2) II (1.5) 3 (0.6) 0 (0.2)
Students going to a college or university for science courses 63 (2.9) 23 (1.8) 5 (1.0) I (0.8)
Mathematics
Students going to another K-12 school for mathematics courses 81 (2.9) 5 (1.4) 2 (0.3) I (0.3)
Mathematics courses offered by telecommunications 79 (2.7) 7 (1.8) 4 (1.4) 0 (0.3)
Students going to a college or university for mathematics courses 56 (3.7) 31 (2.9) 8 (I 6) I (0.7)
Ill
Don't Know or Not
Applicable
13 (1.9)
10 (2.5)
9 (2.4)
12 (2.8)
II (2.1)
4 (1.5)

C. Extent of Influence of the NCTM Standards
School mathematics representatives were given a series of statements about the influence of the NCTM Standards in their school and district and asked the extent to which they agreed with each. As can be seen in Table 7 .5, in 1993, sizeable proportions (from 45 to 53 percent) of elementary, middle, and high schools were reportedly engaged in school-wide efforts to make changes inspired by the Standards. Similarly, 34 percent of high schools, 41 percent of middle schools, and 50 percent of the elementary schools reported that their districts are organizing staff development based on the standards.
Table 7.5 Respondents Agreeing* with Various Statements Regarding
NCTM Standards, by School Type
Percent of Programs
Elementary Middle High Schools Schools Schools
The principal of this school is well-informed about the Standards 59 (2.8) 55 (3.9) 35
The superintendent of this district is well-informed about the Standards 55 (3.4) 49 (4.1) 33
Our district is organizing staff development based on the Standards 50 (4.3) 41 (3.9) 34
There is a school-wide effort to make changes inspired by the Standards 48 (2.8) 53 (4.1) 45
The school board is well-informed about the Standards 28 (2.7) 23 (3.4) 14
The Standards have been thoroughly discussed by teachers in this school 21 (2.6) 30 (4.0) 39
Our district has changed how it evaluates teachers based on the Standards 19 (2.8) 17 (3.8) 6
Parents of students in this school are well-informed about the Standards 8 (2.2) 10 (3.0) 6
* Includes responses of "strongly agree" and "agree" to each statement. "Don't know" responses were excluded from the analyses.
More than 40 percent of elementary and middle school representatives, compared to 28 percent of the high school representatives, reported that their principals were well-informed about the Standards. Superintendents were generally less likely to be considered knowledgeable of the Standards (from 24 to 31 percent). And relatively few school representatives indicated that their school boards (from 10 to 15 percent) or parents of students in the schools (5 to 8 percent) were well-informed about the Standards.
112
(3.3)
(2.6)
(2.4)
(2.4)
(1.7)
(3.5)
(1.4)
(1.3)

D. Problems Affecting Instruction
Teachers were given a list of "factors" that might affect science and mathematics instruction in their school and asked to indicate which, if any, cause serious problems. (The other response options were "not a significant problem" and "somewhat of a problem.") Results for science are presented in Table 7.6 and those for mathematics in Table 7.7.
Resource-related issues were typically the ones most often cited as serious problems. In science, inadequate funds for purchasing equipment and supplies and lack of materials for individualizing instruction were labeled serious problems by more than 30 percent of teachers in grades 1--4, 5-8, and 9-12, and inadequate facilities by from 18 to 28 percent. Inadequate access to computers and lack of appropriate computer software for teaching science appear to be more problematic in the higher grades. For example, 19 percent of grade 1--4 science teacher compared to 29 percent of those in grades 5-8 and 40 percent of those in grades 9-12 cited access to computers as a serious problem.
Other issues that appear to become increasingly problematic for science education in the higher grades include large classes; student absences; student reading ability; student interest in science; interruptions for announcements, assemblies, and other school activities; and parental support for education. In contrast, time to teach science is more problematic in the lower grades, with 17 percent of grade 1--4 teachers and 16 percent of those in grades 5-8 compared to 9 percent in grades 9-12 citing lack of time to teach science as a serious problem.
Two other areas were considered serious problems for science instruction by sizeable proportions of teachers in each grade range; from 20 to 27 percent of teachers cited lack of opportunities for teachers to share ideas as a serious problem and from 14 to 19 percent indicated that lack of in-service education opportunities was a serious problem. Teacher interest in science; teacher preparation to teach science; state/district testing policies; and maintaining discipline were less often cited as serious problems for science instruction.
As was the case in science, resource-related issues were the ones most likely to be cited as problematic in mathematics. Approximately 1 in 5 mathematics teachers in grades 1-4 and 1 in 3 in grades 5-8 and 9-12 indicated that access to computers and lack of appropriate computer software caused serious problems for mathematics education in their schools. Lack of funds for purchasing equipment and supplies and lack of materials for individualizing instruction were also rated as serious problems by many mathematics teachers in each grade range, ranging from 21 to 25 percent. Other problems considered serious by sizeable percentages of mathematics teachers in each grade range included large classes and lack of opportunities for teachers to share ideas.
Several areas appear to be more problematic in the higher grades, essentially the same areas cited in science, including student reading abilities; lack of student interest in mathematics; student absences; lack of parental support; and interruptions for announcements, assemblies, and other school activities. Similarly, most of the areas that rarely cause serious problems in science instruction were not likely to be considered serious for mathematics instruction,
113

including teacher preparation and interest in mathematics and maintaining discipline. It is interesting to note that so few mathematics teachers (ranging from 7 to 11 percent, depending on grade range) consider state/district testing problems as problematic for mathematics instruction, essentially the same percentages as in science even though mathematics tests are much more prevalent.
Table 7.6 Science Teachers Viewing Each of a Number of
Factors as a Serious Problem for Science Instruction in Their School
Percent of Teachers
Grades 1-4 Grades 5-8
Funds for purchasing equipment and supplies 39 (3.1) 40 (3.2)
Materials for individualizing instruction 32 (2.5) 45 (2.8)
Appropriate computer software 27 (3.1) 42 (3.0)
Opportunities for teachers to share ideas 24 (2.7) 27 (3.0)
Facilities 21 (2.1) 28 (2.1)
Access to computers 19 (1.7) 29 (2.5)
Large classes 17 (2.4) 27 (3.0)
Time to teach science 17 (2.4) 16 (2.8)
In-service education opportunities 14 (1.6) 16 (2.8)
State/district testing policies 10 (1.6) 12 (2.7)
Teacher preparation to teach science lO (1.8) 6 (1.7)
Parental support for education 9 (1.4) 12 (1.7)
Student reading abilities 8 ( 1.0) 12 (2.2)
Maintaining discipline 8 (1.2) 12 (2.1)
Interruptions for announcements, assemblies, other school activities 4 (0.9) 9 (1.5)
Teacher interest in science 3 (0.8) 2 (0.8)
Student interest in science 2 (0.9) 7 (l.l)
Student absences 2 (0.4) 4 (0.8)
114
Grades 9-12
36 (2.3)
38 (2.4)
45 (2.8)
20 (2.1)
IS (1.9)
40 (2.2)
26 (2.5)
9 (0.8)
19 (2.8)
9 (2.2)
I (0.3)
22 (2.6)
26 (3.8)
9 (1.0)
18 ( 1.7)
0 (0.2)
14 ( 1.5)
21 (1.4)

Table 7.7 Mathematics Teachers Viewing Each of a Number of
Factors as a Serious Problem for Mathematics Instruction in Their School
Percent of Teachers
Grades 1-4 Grades 5-8
Appropriate computer software 23 (1.9) 35 (3.6)
Funds for purchasing equipment and supplies 23 (2.6) 24 (4.4)
Access to computers 21 (2.0) 33 (3.3)
Materials for individualizing instruction 21 (3.0) 23 (3.6)
Large classes 19 ( 1.8) 23 (3.0)
Opportunities for teachers to share ideas 18 (1.3) 17 (2.6)
Student reading abilities 13 ( 1.9) 16 (2.6)
In-service education opportunities 12 (1.8) 11 (1.6)
Parental support II (1.2) 16 (2.3)
State/district testing policies 11 (1.4) II (1.7)
Maintaining discipline 8 (1.5) 13 (2.3)
Interruptions for announcements, assemblies, other school activities 5 (0.9) 7 (1.0)
Student absences 4 (0.8) 8 (1.3)
Time to teach mathematics 4 (0.8) 4 (1.3)
Teacher preparation to teach mathematics 4 (0.9) 2 (0.8)
Student interest in mathematics 3 (0.7) 12 (2.3)
Facilities 3 (0.8) 3 (1.0)
Teacher interest in mathematics I (0.3) 1 (0.5)
115
Grades 9-12
32 (2.3)
25 (2.1)
31 (2.5)
24 ( 1.9)
19 (1.6)
16 (2.6)
20 (I .4)
12 (1.6)
17 (1.3)
7 (1.2)
9 (1.7)
14 ( 1.8)
20 (1.4)
3 (0.5)
1 (0.2)
24 - (2.6)
6 (0.9)
1 (0.2)

A similar question was administered to teachers in both the 1977 and 1985-86 national surveys. Trend results for science and mathematics teachers are shown in Table 7.8, using grades 7-9 for illustrative purposes. Note that resource-related issues were generally more likely to be considered serious problems in 1993 than in previous years. For example, the percent of grade 7-9 science teachers citing access to computers as a serious problem increased from 23 percent in 1985-86 to 37 percent in 1993; in mathematics the increase was even larger, from 18 percent to 39 percent. Similarly, while funds for purchasing equipment and supplies was rarely cited as a serious problem for mathematics instruction in 1977 and 1985-86, 31 percent of teachers in 1993 cited lack of funds as a serious problem, which may be a reflection of the increased use of manipulatives in mathematics instruction.
Table 7.8 Grade 7-9 Science and Mathematics Teachers
Viewing Each Factor as a Serious Problem: 1977, 1985-86, and 1993
Percent of Teachers
1977 1985-86
Science Student reading abilities 40 (2.5) 19 (2.3)
Materials for individualizing instruction 27 (2.3) 27 (2.7)
Facilities 26 (2.2) 25 (2.6)
Funds for purchasing equipment/supplies 24 (2.2) 26 (2.6)
Large classes 19 (2.0) 19 (2.3)
Student interest in science 19 (2.0) 14 (2.1)
Maintaining discipline 6 (1.2) 9 (1.7)
Teacher preparation to teach science 3 (0.9) 5 (1.3)
Teacher interest in science 2 (0.7) 2 (0.8)
Access to computers -- -- 23 (2.5)
Student absences -- -- II (1.9)
Mathematics Student reading abilities 42 (2.5) 18 (2.3)
Student interest in mathematics 31 (2.3) 22 (2.5)
Large classes 23 (2.1) 15 (2.2)
Materials for individualizing instruction 21 (2.1) 15 (2.2)
Funds for purchasing equipment/supplies 13 (1.7) 11 (1.9)
Maintaining discipline 12 (1.6) 6 (1.4)
Facilities 10 (1.5) 3 (1.0)
Teacher preparation to teach mathematics 5 (1.1) 3 (1.0)
Teacher interest in mathematics 2 (0.7) I (0.6)
Access to computers -- -- 18 (2.3)
Student absences -- -- 13 (2.2)
116
1993
24 (3.5)
38 (2.9)
23 (3.7)
33 (3.2)
25 (2.4)
13 (1.5)
10 (1.5)
2 (1.0)
0 (0.2)
37 (2.9)
14 (1.2)
18 (2.1)
18 (1.7)
18 (1.9)
24 (2.3)
31 (5.8)
12 (1.6)
7 (1.7)
1 (0.5)
0 (0.1)
39 (3.2)
16 (2.2)

ffi\~[pmcru(Q]n~ £
Sample Design

Sample Design
A. Design Overview
The sample design for the 1993 National Survey of Science and Mathematics Education (NSSME) is a national probability sample of science and mathematics program heads and teachers in grades 1-12 in the 50 states and the District of Columbia. The sample was designed to allow national estimates (totals and ratios of totals) of science and mathematics course offerings and enrollment; teacher background preparation; textbook usage; instructional techniques; and availability and use of science and mathematics facilities and equipment. Every eligible school and teacher in the target population had a known, positive probability of being drawn into the sample.
The sample design involved clustering and stratification. The first stage units consisted of elementary and secondary schools. Science and mathematics teachers constituted the second stage units. From the mathematics and science classes taught by sample teachers, a sample of one class was selected for each teacher. The target sample sizes were 1,250 schools and 6,000 teachers selected within sample schools. These sample sizes are large enough to allow subdomain estimates such as for particular regions or types of community.
The sampling frame for the school sample was constructed from the Quality Education Data, Inc. (QED) database, which includes school name and address and information about other characteristics needed for stratification and sample selection. The sampling frame for the teacher sample was constructed from lists provided by sample schools identifying active teachers and the specific mathematics and science subjects they were teaching in the Spring of 1993.
B. School Sample
This section describes the sample design features of the NSSME school sample. It is organized as follows:
.. Target Population
.. Sampling Frame
.. Stratification
.. Sample Allocation
.. Sample Selection
.. School Weight

Target Population
The target population for the school sample includes all regular public and private schools in the 50 states and the District of Columbia. Excluded frorri the target universe are vocational/ technical schools, schools offering alternative, special or adult education only, and preschool/ kindergarten only schools.
Sampling Frame
The sampling frame for the school sample was constructed from the Quality Education Data (QED) school-level database. Educational institutions classified by QED as public, private and Catholic elementary and secondary schools were included. Excluded were Bureau of Indian Affairs (BIA) schools and Department of Defense (DOD) schools. A file was extracted from the original QED file including records for all eligible schools.
For all schools in the database, QED includes information on grade span by indicating the lowest and highest grade offered in the school. Schools eligible for the survey were classified on the basis of the grade span variables into one of three sampling frames corresponding to the three primary sampling strata. In schools with nonconsecutive grade spans, school eligibility and assignment to strata were based on the four grade-level fields on the QED file that provide the low and high grades for the nonconsecutive grade levels.
Stratification
Three primary sampling strata were defined for the school sample. The strata definition is based on grade span as follows:
• Stratum 1: Schools with any grade 10, 11 or 12 • Stratum 2: Schools not in stratum 1, but with no grades lower than 5 • Stratum 3: All other schools
Secondary strata were defined by Census geographic region-Northeast, Midwest, South and West; metropolitan status-urban, suburban and rural; and private (including parochial schools) versus public auspices. Implicit stratification was achieved by sorting the file by Orshansky percentile (i.e. proportion of the students in the school district who live in families with incomes under the poverty line) within secondary stratum.
Sample Allocation
The allocation of the total school sample (1 ,250 schools) among the three primary strata was based on the minimum sample size desired for each stratum and the desired sample sizes for
A-2

teachers of advanced mathematics and physics/chemistry. The sample allocation was the following:
• Stratum 1: 650 schools • Stratum 2: 300 schools • Stratum 3: 300 schools
Sample Selection
The school sample was selected with probability proportional to size (PPS). The measure of size was defined for each of the primary strata as follows:
• Stratum 1:
• Stratum 2: • Stratum 3:
Estimated number of teachers in grades 10-12 [computed as: (number of grades in 10-12 range) x (Total teachers from QED/number of grades)]
Total number of teachers, from QED Total number of teachers, from QED
For school records with missing teacher counts, the measure of size was estimated by imputing a total number of teachers in the relevant grades based on grade specific student to teacher ratios, estimated separately for private and public schools.
Within primary stratum, the file was sorted by secondary strata and two independent halfsamples of the specified sizes were selected using the standard PPS selection procedure. Independent random starts were generated to achieve independent half-samples within secondary strata. In the process of sample selection, a half-sample identifier was assigned to each sample record. The table below shows the distribution of the sample by primary and secondary stratum.
A-3

SECONDARY STRATUM PRIMARY STRATUM
1 2 3 # REGION STATUS PUBLIC/ Including No Grade
PRIVATE Grades 10+ Less Than 5 Other
1 Midwest Metropolitan Public 33 14 11
2 Private 11 2
3 Urban Public 81 46 33
4 Private 7 8
5 Suburban Public 36 17 16
6 Private 4 4
7 Northeast Metropolitan Public 29 15 12
8 Private 7 6
9 Urban Public 77 40 30
10 Private 14 1 6
11 Suburban Public 14 3 7
12 Private 3
13 South Metropolitan Public 55 34 25
14 Private 11 5
15 Urban Public 105 59 46
16 Private 7 4
17 Suburban Public 44 20 26
18 Private 5
19 West Metropolitan Public 28 18 14
20 Private 5 3
21 Urban Public 56 35 24
22 Private 7 6 1-
23 Suburban Public 13 4 4
24 Private 1 1
TOTAL 653 306 293
A-4

School Weight
A base weight, Whs-the reciprocal of the school's probability of selection-was assigned to every school in the sample as follows:
MOSh(total) w hs = -----"--
nhMOShs
where: MOSh (total) MOSsh
= Total measure of size in primary stratum h = Measure of size for school s
This is also the base weight associated with program heads since mathematics and science program questionnaires were distributed in every sample school.
C. Teacher Sample
The following section describes the sample design features of the NSSME teacher sample. It is organized as follows:
~ Target Popula6on ~ Sampling Frame ~ Stratification ~ Sample Allocation ~ Sample Selection ~ Selection of Classes
Target Population
The target population for the teacher sample consists of teachers in eligible schools (see School Sample, Target Population) who teach mathematics and/or science. Science includes biology, chemistry, physics, earth science and other science.
Sampling Frame
The sampling frame for the teacher sample was constructed by requesting that principals in all sample schools provide a list of eligible teachers and identify the courses taught by each teacher. To assist the school in providing the information necessary to build the frame, a listing sheet was provided with appropriate column headings depending on the school's
A-5

primary stratum. For schools in stratum I the following mathematics and science categories were listed:
• Physics or chemistry • Other science • Mathematics: Advanced (Algebra III and above) • Mathematics: Not advanced
For strata 2 and 3 the categories listed were:
• Science • Mathematics
Stratification
Based on the course information provided for teachers on the school list, each teacher was assigned to one of the following five teacher strata:
• Stratum 1: Physics or chemistry with or without other science (no mathematics) • Stratum 2: Advanced mathematics (no science) • Stratum 3: Other science only (no mathematics or physics/chemistry) • Stratum 4: Other mathematics only (no advanced mathematics) • Stratum 5: Any combination of mathematics and science
Sample Allocation
The target allocation of the sample of 6,000 teachers to the three primary school strata was the following:
• Stratum I: 2,900 teachers • Stratum 2: 1,550 teachers • Stratum 3: 1 ,550 teachers
To meet the objectives of the survey, teachers in the higher grades and teachers teaching advanced mathematics and/or physics and/or chemistry were oversampled.
A-6

Sample Selection
The sampling rate for teachers in teacher stratum l (l = 1-5) was computed as follows:
fz = nJNz
where:
!J nl
Nl
= = =
the overall stratum sampling fraction in teacher stratum l Target sample size in stratum l Number of listed teachers in stratum I
Within each primary school stratum and teacher stratum, an independent sample was selected at the specified rate. For each of the three school groups, the table below shows the number of teachers selected in the cooperating schools and the sampling rate in each teacher stratum.
Sample Sampling Size Rate
Teacher Stratum (nl) (fl)
School Stratum 1 (including grades 1 0+ ): 3007 1: Physics/chemistry with or without other science 747 .470 2: Advanced mathematics only (no science or other mathematics) 753 .461 3: Other science only (no mathematics or physics/chemistry) 702 .248 4: Other mathematics only (no advanced mathematics) 707 .218 5: Any combination of mathematics and science 98 .200
School Stratum 2 (No grades less than 5): 1596 1: Physics/chemistry with or without other science 6 .470 2: Advanced mathematics only (no science or other mathematics) 4 .461 3: Other science only (no mathematics or physics/chemistry) 633 .461 4: Other mathematics only (no advanced mathematics) 628 .395 5: Any combination of mathematics and science 325 .608
School Stratum 3 (Other): 1517 1: Physics/chemistry with or without other science I .470 2: Advanced mathematics only (no science or other mathematics) 2 .461 3: Other science only (no mathematics or physics/chemistry) 48 .463 4: Other mathematics only (no advanced mathematics) 54 .281 5: Any combination of mathematics and science 1412 .389
Selection of Subject and Class
Sample teachers were sent a self-administered questionnaire. As part of the sampling process. teachers in sub-stratum five in each stratum were assigned to receive either a mathematics or a science questionnaire. This represented an additional stage of sampling since only half of the sample teachers in this stratum were assigned to report on mathematics and the other half on science. This one-in-two subsampling must be reflected in producing mathematics or science-specific estimates.
A-7

Some of the items on the questionnaire apply to individual classes. Teachers with multiple mathematics or science classes each day were asked to report on only one of these classes. Teachers were asked to list all of their mathematics and science classes in order by class period. The questionnaire instructed the teachers to refer to a pre-printed sampling table to make a random selection from among their classes listed. The sampling table was randomly generated so that a random selection of classes would be achieved overall.
D. Weighting and Variances
In surveys involving complex, multistage designs such as NSSME, weighting is necessary to reflect the differential probabilities of selection among sample units at each stage of selection. Weights were developed to produce unbiased estimates of the population of schools and teachers in the NSSME survey. Weighting is also used to adjust for different rates of participation in the survey by different types of schools and teachers.
Variance computation for the NSSME survey must also take into account the survey design. Sampling errors generated by available procedures in SAS, SPSS and other standard statistical software packages are not appropriate because they assume simple random sampling. With the sample design used in NSSME, direct estimators of the variance of an estimated total or ratio are available based on the two independent half-samples and can be programmed in SAS or a higher level language.
Weighting
Weights were developed to permit unbiased estimates for school and teacher characteristics. The base weight associated with a school or teacher is the reciprocal of the respective probabilities of selection. To adjust for different rates of participation in the survey by different types of schools and teachers, both school and teacher non-response adjustments were developed and applied to the base weight.
In addition, because in some cooperating schools the person designated to answer questions about the school mathematics or science program may have failed to participate, it was necessary to adjust the weights for school science and mathematics program level estimates. Accordingly three distinct school non-response adjustments were developed:
• NRAl: To be applied to the school weight to produce teacher-level estimates • NRA2: To produce mathematics program level estimates • NRA3: To produce science program level estimates
A-8

For non-response adjustment cell c, the general form of the NRA is given by:
L W;
NRA = <elig)in c
c L wi (resp)in c
where wi is the base weight of the ith school in cell c. The numerator of the three adjustment factors is the same-all eligible schools. The denominator (respondents) for NRI includes all schools that provided lists of teachers for sampling; respondents for NR2 and NR3 include only schools that completed a program questionnaire in mathematics and science, respectively.
Since non-response adjustment through weighting assumes that response patterns of nonrespondents are similar to that of respondents, c corresponds to a secondary sampling stratum, except in cases where two or more secondary strata were collapsed because of small cell sizes (all private schools and suburban schools in a region were collapsed into a single stratum).
The three school weights adjusted for non-response are given by:
where:
wsh NRlhEC NR2hEc NR3hEC
WI* sh = W sh · NR J hE c
w2*sh = wsh . NR2hEC w3*sh = wsh . NR2hEC
= base weight associated with school s in stratum h = school non-response adjustment for estimates of teacher characteristics in cell c = school non-response adjustment for estimates of mathematics programs in cell c = school non-response adjustment for estimates of science programs in cell c
The final weight associated with a teacher includes additional components related to teacher selection and participation. That is:
where:
wtJ
w*sh W3*u w*shl NRTI
= reciprocal of the probability of selection for teacher stratum l = final weight associated with the teacher's school = final weight associated with teachers in stratum l, school s = final weight associated with teachers in stratum l, school s = non-response adjustment for teacher stratum l,
L n, rE(elig)l
L n, rE (resp)l
A-9

Variance Computation
With the NSSME design, direct estimators of the variance of an estimated total are available. Estimating the variance of a ratio, requires estimates of the variances of the numerator and denominator as well as estimates of their covariance. Direct estimates of the covariance are also available. The variance of a total for a given secondary stratum is estimated by:
24
var X L (X"'- Xh2)2 h~l
where Xh1 and Xh2 are the sums of the weighed values of the two half-samples in secondary stratum h.
The estimated covariance is:
cov X,Y 24
L ex" 1 - xh2) CY, 1 - Y~z2) h=l
with similar definition of the y values. The estimated variance of the ratio Y IX is then simply:
var Y/X = l/X 2 [var Y + (Y/X)2 var X- 2 (Y/X) cov X,:Y)
For the entire universe, the variance of a total is estimated by the sum of the estimated variances of that total over all relevant primary and secondary strata. The same holds for the covariance. The variance of a ratio for the entire universe is estimated by the same formula given above for a single primary stratum.
A-10

~~[FU@]~~ [ID
Survey Questionnaires
Science Program Questionnaire
Mathematics Program Questionnaire
Science Questionnaire
Mathematics Questionnaire
List of Course Titles

NATIONAL SCIENCE FOUNDATION
Form Approval OMB No: 3145-0142 Expires: Dec. 31, 19113
1993 National Survey of Science and ~athematics Education
Science Program Questionnaire
How to Complete the Questionnaire You have been selected to answer questions about science Instruction in your school. Most of the questions instruct you to "circle one" answer or "circle all that apply". For a few questions, you are asked to write in your answer on the line provided. If you have questions about the study or any Items in the questionnaire, call us toll-free at 1-800-598-2888.
About the Survey The 1993 National Survey of Science and Mathematics Education is supported by the National Science Foundation and is the third in a series. It Is being conducted by Horizon Research, Inc., under the direction of Dr. Iris R. Weiss. Data collection is the responsibility of CODA, a survey research firm in Silver Spring, Md. The study has been endorsed by the American Federation of Teachers, the National Catholic Education Association, the National Council of Teachers of Mathematics, the National Education Association, and the National Science Teachers Association.
Approximately 6,000 teachers from 1 ,200 schools throughout the country have been selected for the survey, which is designed to collect information about science and mathematics education in grades 1-12. Its purpose is to provide the education community with current information about science and mathematics education and to identify trends in the areas of teacher education and experience, course offerings, curriculum and Instruction, and the availability and use of equipment.
The 1 ,200 schools were randomly selected for the survey from the Quality Education Data (QED) database. Last June, Chief State School Officers and district superintendents were notified about the survey. In September, school principals were sent a pre-survey information booklet, requesting the names of all science and mathematics teachers. From these lists, a national sample of teachers was selected to receive science or mathematics questionnaires. Questionnaires are also being sent to the science and mathematics department representatives at each school. Teacher questionnaires are also being sent to all winners (1983 - 1992) of the National Science Foundation's Presidential Awards for Excellence in Science and Mathematics Teaching.
All survey data received will be kept strictly confidential and will be reported only in aggregate form, such as by grade or region of the country. No information identifying individual states, districts, schools or teachers will be released. Each participating school will receive a copy of the study's results in the spring of 1994.
Information About Your Participation Public reporting burden for this collection of information Is estimated to average 15 minutes per response. Send comments regarding this burden estimate or any other aspect of this collection of information, Including suggestions for reducing this burden, to Herman Fleming, National Science Foundation, 1800 G Street- NW, Washington, DC 20550 and to the Office of Management and Budget, Paperwork Reduction Project, OMS #3145-D142, Washington, DC20503.
Thank you very much. Your participation is greatly appreciated. Please return the questionnaire to us in the postage-paid envelope:
1993 National Survey of Science and Mathematics Education cjoCODA 1400 Spring Street- Suite 150 Silver Spring, MD 20910

Science Program Questionnaire
1. Indicate the extent to which each of the following programs/practices is currently being implemented in your school.
(CIRCLE ONE ON EACH UNE.)
Used Don't know/ Not used extensively Not applicable
a School-based management ............................................ 2 3 4 8 b. Common daily planning period for members
of the science department ............................................... 2 3 4 8 c. Common work space for members
of the science department ............................................... 1 2 3 4 8
d. Interdisciplinary teams of teachers who share the same students (e.g., school within a school) 2 3 4 8
e. Students assigned to science classes by ability ............. 2 3 4 8 f. Independent study projects for credit in science ............ 2 3 4 8
g. Emphasis on problem solving, reasoning skills in science ......................................................................... 2 3 4 8
h. Use of computers to solve science problems ................ 2 3 4 8 i. Hands-on/performance assessment in science
classes ............................................................................. 2 3 4 8
j. Integration of science and mathematics instruction ....... 1 2 3 4 8
k. Integration of science and language arts instruction ...... 2 3 4 8
I. Use of vocational/technical applications
in science instruction ....................................................... 2 3 4 8
m. Science content changes recommended by AAAS' Project 2061 (Science for All Americans) ............ 2 3 4 8
n. Science content changes recommended by NST A's Scope, Sequence, and Coordination Project (SS&C Content Core) ....................................................... 2 3 4 8
0. Elementary students pulled out from self-contained classes for remedial instruction in science ......................................................................... 2 3 4 8
p. Elementary students pulled out from self-contained classes for enrichment in science .................. 2 3 4 8
q. Elementary students receiving instruction from science specialists in addition to their regular teacher ......................................................... 2 3 4 8
r. Elementary students receiving instruction from science specialists Instead of their regular teacher ................................................................. 2 3 4 8
s. Science courses offe,red by telecommunications ........... 2 3 4 8
t. Students going to another K- 12 school for science courses .......................................................... 1 2 3 4 8
u. Students going to a college or university for science courses .......................................................... 2 3 4 8
2

2. Does your school include secondary students (grades 7 or higher)?
Yes.................................................................... (CONTINUE WrTH QUESTION 3.)
No...................................................................... 2 (SKIP TO QUESTION 8.)
3. Please give the number of sections of each of the following science courses currently offered in your school. (Additional course titles for these categories are shown on the enclosed blue "Ust of Course Titles.")
Current number
GRADES 7-8
of sections .Q.QQ& COURSE CATEGORY
108 Ufe Science, 7- 8 109 Earth Science, 7 - 8 110 Physical Science, 7 - 8 111 General Science, 7 - 8 112 Coordinated Science, 7- 8 113 Integrated Science, 7- 8
GRADES 7- 8, Other Science Courses
3
GRADES 9-12
Current number
of sections CODE COURSE CATEGORY
114 Biology, 1st year 115 Biology, 1st year, Applied 116 Biology, 2nd year, AP 117 Biology, 2nd year, Advanced 118 Biology, 2nd year, Other
119 Chemistry, 1st year 120 Chemistry, 1st year, Applied 121 Chemistry, 2nd year, AP 122 Chemistry, 2nd year, Advanced
123 Physics, 1st year 124 Physics, 1st year, Applied 125 Physics, 2nd year, AP 126 Physics, 2nd year, Advanced 127 Physical Science
128 Astronomy /Space Science • 129 Geology* • 130 Meteorology 131 Oceanogr~hy /Marine
Science*
132 Earth Science, 1st year 133 Earth Science, 1st year, Applied 134 Earth Science, 2nd year,
Advanced 135 Earth Science, Other
136 General Science 137 Environmental Science 138 Science, Technology, Society 139 Coordinated Science 140 Integrated Science
!:,lRADES 9 - 12, Q!ber §cience Qourses
*NOTE: A course that includes substantial content from two or more of the earth sciences should be listed under code 132, 133, 134 or 135.

4. Please give the code number of any science courses offered this year that will not be offered next year.
CHECK BOX, IF ALL WILL BE OFFERED D OR
Ust code number of courses that will not be offered:
5. a Are 7th grade students {or those in the lowest secondary grade in this school) assigned to science courses, or sections within courses, by ability levels?
Yes.................................................................... 1 (CONTINUE WITH QUESTION 5.b.}
No...................................................................... 2 (SKJP TO QUESTION 6.}
b. Please list the titles of the science course(s) that low ability, average ability, and high ability students would be likely to take in their first year in this school.
Low ability students: 1) --------2) ______ _ 3) ______ _
Average ability students: 1) --------- 2) ______ _ 3) ______ _
High ability students: 1) -------- 2) ______ _ 3) ______ _
6. How many minutes long is a typical class period?
___ MINUTES
7. In many schools science classes meet for five class periods per week. Are any of the science courses in this school organized in some other way? {e.g., meet only three class periods per week or have a double class period once a week for laboratories)
YES ......................................•....•...•................... 1 (PLEASE DESCRIBE BELOW)
NO .........................................•••..••.......•............. 2 (GO TO QUESTION 8.}
Course Title Number of davs/week Length of class oeriod
4

B. How much money was spent on science equipment and consumable supplies in this school during the most recently completed budget year? (If you don't know the exact amounts, please provide your best estimates.)
a Science equipment (noO-consumable, non-perishable items such as microscopes, scales, etc.)
$ ___ _ CHECK BOX, IF ESTIMATE D b. Consumable science supplies (materials that must continually be replenished such as chemicals,
glassware, batteries, etc.)
$ ___ _ CHECK BOX, IF ESTIMATE D c. Science software
$ ___ _ CHECK BOX, IF ESTIMATE D
9. How much input does each of the following have in decisions about science equipment/materials purchases?
(CIRCLE ON£ ON EACH UN£.)
No Uttle Moderate Heavy Complete Not input input input input control applicable
a State .................................................. 2 3 4 5 8
b. Central office ..................................... 2 3 4 5 8
c. Principal ············································ 2 3 4 5 8
d. Science department chair ................. 2 3 4 5 8
e. Science department as a whole .............................................. 2 3 4 5 8
f. Individual science teachers ............... 2 3 4 5 8
5

NOTE: Questions 10 ·14 are being asked of all science teachers in the sample. If you received a Science Teacher Questionnaire in addition to this School Science Program Questionnaire, please check here 0 and skip to Question 15.
10. In your opinion, how great a problem is each of the following for science instruction in your school as a whole?
(CIRCLE ONE ON EACH UN E.)
Nota Somewhat significant of a Serious problem problem problem
a Facilities ........................................................................................... . 1 2 3
b. Funds for purchasing equipment and supplies .............................. . 1 2 3 c. Materials for individualizing instruction ........................................... . 2 3 d. Access to computers ....................................................................... . 2 3
e. Appropriate computer software ...................................................... .. 2 3 f. Student interest in science ............................................................. . 2 3 g. Student reading abilities .................................................................. . 2 3 h. Student absences ............................................................................ . 2 3
i. Teacher interest in science .............................................................. . 2 3 j. Teacher preparation to teach science ............................................. . 2 3 k. Time to teach science ..................................................................... .. 2 3 I. Opportunities for teachers to share ideas ...................................... .. 2 3
m. In-service education opportunities .................................................. . 2 3 n. Interruptions for announcements, assemblies,
other school activities ...................................................................... . 2 3 o. Large classes ................................................................................... . 2 3 p. Maintaining discipline ...................................................................... . 2 3
q. Parental support for education ........................................................ . 2 3 r. State/district testing policies ........................................................... . 2 3
11. Indicate your sex: (CIRCLE ONE.)
Male ................................................................... 1
Female .............................................................. 2
6

12. Are you: (CIRCLE ONE.)
13. In what year were you born?
White (not of Hispanic origin)........................... 1 Black (not of Hispanic origin)........................... 2 Hispanic............................................................ 3
(Mexican, Puerto Rican, Cuban, Central or South American, or other Hispanic cunure or origin)
American Indian or Alaskan Native.................. 4 Asian or Pacific Islander................................... 5
19
14. How many years have you taught in grades K-12 prior to this school year?
YEARS
15. When did you complete this questionnaire?
MONTH DAY YEAR
16. What is your title? (CIRCLE ONE.)
Science department chair ................................ . Science lead teacher........................................ 2 Teacher............................................................. 3 Principal ............................................................ 4 Assistant principal............................................. 5 Other (SPECIFY) .............................................. 6
Thank you for your help!
0 Check here if you are the person originally chosen to complete this questionnaire.
If not, please fill in your name here:--------------------
Please retum the questionnaire to us in the postage-paid envelope:
1993 National Survey of Science and Mathematics Education · cjoCODA
1400 Spring Street- Suite 150 Silver Spring, MD 20910
7

NATIONAL SCIENCE FOUNDATION
Form Approval OMB No: 3145-0142 Expll'llll: DIIC. 31, 19513
1993 National Survey of Science and Mathematics Education
Mathematics Program Questionnaire
How to Complete the Questionnaire You have been selected to answer questions about mathematics Instruction In your school. Most of the questions Instruct you to "circle one" answer or "circle all that apply". For a few questions, you are asked to write in your answer on the line provided. If you have questions about the study or any Items In the questionnaire, call us toll-free at 1-800-598-2888.
About the Survey The 1993 National Survey of Science and Mathematics Education Is supported by the National Science Foundation and Is the third In a series. It Is being conducted by Horizon Research, Inc., under the direction of Dr. Iris R. Weiss. Data collection is the responsibility of CODA, a survey research firm in Silver Spring, Md. The study has been endorsed by the American Federation of Teachers, the National Catholic Education Association, the National Council of Teachers of Mathematics, the National Education Association, and the National Science Teachers Association.
Approximately 6,000 teachers from 1 ,200 schools throughout the country have been selected for the survey, which is designed to collect information about science and mathematics education in grades 1-12. Its purpose is to provide the education community with current Information about science and mathematics education and to Identify trends in the areas of teacher education and experience, course offerings, curriculum and instmctlon, and the availability and use of equipment.
The 1 ,200 schools were randomly selected for the survey from the Quality Education Data (QED) database. Last June, Chief State SchoQI Officers and district superintendents were notified about the survey. In September, school principals were sent a pre-survey Information booklet, requesting the names of all science and mathematics teachers. From these lists, a national sample of teachers was selected to receive science or mathematics questionnaires. Questionnaires are also being sent to the science and mathematics department representatives at each school. Teacher questionnaires are also being sent to all winners {1983 - 1992) of the National Science Foundation's Presidential Awards for Excellence in Science and Mathematics Teaching.
All survey data received will be kept strictly confidential and will be reported only In aggregate form, such as by grade or region of the country. No information identifying individual states, districts, schools or teachers will be released. Each participating school will receive a copy of the study's results in the spring of 1994.
Information About Your Participation Public reporting burden for this collection of information is estimated to average 15 minutes per response. Send comments regarding this burden estimate or any other aspect of this collection of information, including suggestions for reducing this burden, to Herman Fleming, National Science Foundation, 1800 G Street - NW, Washington, DC 20550 and to the Office of Management and Budget, Paperwork Reduction Project, OMS #3145-0142, Washington, DC20503.
Thank you very much. Your participation is greatly appreciated. Please return the questionnaire to us in the postage-paid envelope:
1993 National SuNey of Science and Mathematics Education cjoCODA 1400 Spring Street- Suite 150 Silver Spring, MD 20910

Mathematics Program Questionnaire
, . Indicate the extent to which each of the following programs/practices is currently being implemented in your school.
(CIRCLE ONE ON EACH UN£.)
Used Don't know/ Not used extensively Not applicable
a School-based management ••••.....•••...•••....•.••••••..•••..••••••• 2 3 4 8 b. Common daily planning period for members
of the mathematics department •..••.•....•........••••••••••••..••.• 2 3 4 8 c. Common work space for members of
the mathematics department .••...••....•....•.......•••.•.•.•.•....... 2 3 4 8 d. Interdisciplinary teams of teachers who share the
same students (e.g., school within a school) ...•••.••......... 2 3 4 8
e. Students assigned to mathematics classes by ability .••. 2 3 4 8 f. Independent study projects for credit in mathematics ... 2 3 4 8 g. Emphasis on problem solving, reasoning
skills in mathematics ........................................................ 2 3 4 8 h. Use of computers to solve mathematics problems ........ 2 3 4 8
i. Hands-on/performance assessment in mathematics classes ...........•.•...............•...................•........................•.. 2 3 4 8
j. Integration of mathematics and science instruction ....... 2 3 4 8 k. Integration of mathematics and language arts
instruction .••...••.•...•..........•................•...........••.•••...•.......... 2 3 4 8 I. Use of vocational/technical applications
in mathematics instruction ....•......•......•.•....•.........••...••••... 2 3 4 8
m. Content changes recommended by AAAS' Project 2061 (Science for All Americans) ........................ 2 3 4 8
n. Content changes recommended by NCTM's Curriculum and Evaluation Standards .................•.......... 2 3 4 8
0. Pedagogical shifts recommended by NCTM's Professional Standards for Teaching Mathematics ...•... 2 3 4 8
p. Elementary students pulled out from self-contained classes for remedial instruction in mathematics .••.......... 2 3 4 8
q. Elementary students pulled out from self-contained classes for enrichment in mathematics ........................... 2 3 4 8
r. Elementary students receiving instruction from mathematics specialists in addition to their regular teacher .••......•••..•................................••..•.••...•....•• 2 3 4 8
s. Elementary students receiving instruction from mathematics specialists Instead of their regular teacher .•••..•....••••••.•..............•............••••............•.• 2 3 4 8
t. Mathematics courses offered by telecommunications ... 2 3 4 8
u. Students going to another K- 12 school for mathematics courses ................................................. 2 3 4 8
v. Students going to a college or university for mathematics courses ................................................. 2 3 4 8
w. Integration of mathematics subjects (e.g. algebra, probability, geometry, etc. all taught together each year) .............................................. 2 3 4 8
2

2. Please give us your opinion about each of the following statements in regard to the National Council of Teachers of Mathematics' work in setting standards for mathematics curriculum, instruction and evaluation.
(CIRCLE ONE ON EACH UNE.)
Strongly No Strongly Disagree Disagree Opinion Agree ~ Don't know
a I am well informed about the NCTM Standards for the grades I teach .............................. 2 3 4 5 8
b. I am prepared to explain the NCTM Standards to my colleagues •....•.............................. 2 3 4 5 8
c. The Standards have been thoroughly discussed by teachers in this school ................. 2 3 4 5 8
d. There is a school-wide effort to make changes inspired by the Standards ........... 2 3 4 5 8
e. The principal of this school is well-informed about the Standards .................... 2 3 4 5 8
f. Parents of students in this school are well-informed about the Standards ...........•........ 2 3 4 5 8
g. The superintendent of this district is well-informed about the Standards ........•........... 2 3 4 5 8
h. The School Board is well-informed about the Standards .... 2 3 4 5 8
i. Our district is organizing staff development based on the Standards ...•........••••....•.......... 2 3 4 5 8
j. Our district has changed how it evaluates teachers based on the Standards .............. 2 3 4 5 8
3. Does your school include secondary students (grade 7 or higher)?
Yes .................................................................... (CONTINUE WITH QUESTION 4.)
No ...................................................................... 2 (SKIP TO OUEST/ON 9.)
3

4. Please give the number of sections of each of the following mathematics courses currently offered in your school. (Additional course titles for these categories are shown on the enclosed "Ust of Course Titles.")
Current number
GRADES 7-8
of sections ~ COURSE CATEGORY
208 Mathematics 7, Remedial 209 Mathematics 7, Regular 210 Mathematics 7, Accelerated/
Pre-Algebra 211 Mathematics 8, Remedial 212 Mathematics 8, Regular 213 Mathematics 8, Enriched 214 Mathematics 8, Algebra I
GRADES 7-8. OTHER MATHEMATICS
Current number
Qf sections
GRADES 9-12
.QQ.Qg QQ!.!B~E QATE!aQRY
~BADES 9-12, REVIEW MATHEMATICS
215 Level1 (e.g., Remedial Mathematics)
216 Level2 (e.g., Consumer Mathematics)
217 Level3 (e.g., General Mathematics 3)
218 Level4 (e.g., General Mathematics 4)
~RADES 9-12, INFQRMAL MATHEMATICS
219 Level1 (e.g., Pre-Algebra) 220 Level2 (e.g., Basic Geometry) 221 Leve13 (e.g., after Pre-Algebra,
but not Algebra I)
~RADES 9- 12, FORMAL MATHEMATICS
222 Level1 (e.g., Algebra I or Integrated Math 1)
223 Level2 (e.g., Geometry or Integrated Math 2)
224 Level3 (e.g., Algebra II or Integrated Math 3)
225 Level4 (e.g., Advanced Algebra or Integrated Math 4)
226 Level5 (e.g., Calculus) 227 Advanced Placement Calculus
~RADES 9- 12, OTHER MATHEMATICS
228 Probability and Statistics 229 Mathematics integrated with
other subjects
5. Please give the code number of any mathematics courses offered this year that will not be offered next year.
CHECK BOX, IF ALL WILL BE OFFERED D OR
Ust code numbers of courses that will not be offered:
4

6. a Are 7th grade students (or those in the lowest secondary grade in this school) assigned to mathematics courses, or sections within courses, by ability levels?
Yes ................................................................... . (CONTINUE WITH QUESTION 6.b.)
No...................................................................... 2 (SKIP TO QUESTION 7.}
b. Please list the titles of the mathematics course(s) that low ability, average ability, and high ability students would be likely to take in their first year in this school.
Low ability students: 1) --------- 2) ______ _ 3) ______ _
Average ability students: 1) --------- 2) ______ _ 3) ______ _
High ability students: 1) --------- 2) ______ _ 3) ______ _
7. How many minutes long is a typical class period?
___ MINUTES
8. In many schools mathematics classes meet for five class periods per week. Are any of the mathematics courses in this school organized in some other way? (e.g., meet only three class periods per week or have a double class period once a week)
Course Title
Yes.................................................................... 1 (PLEASE DESCRIBE BELOW)
No ...................................................................... 2 (GO TO QUESTION 9.}
Number of davs/week Length of class period
5

9. How much money was spent on mathematics equipment and consumable supplies in this school during the most recently completed budget year? (If you don't know the exact amounts, please provide your best estimates.)
a Mathematics equipment (non-consumable items such as calculators)
$ ___ _ CHECK BOX, iF ESTIMATE D b. Consumable mathematics supplies (manipulative materials)
$ ___ _ CHECK BOX, IF ESTIMATE D c. Mathematics software
$ ___ _ CHECK BOX, IF ESTIMATE D
10. How much input does each of the following have in decisions about mathematics equipmentjmaterials purchases?
(CIRCLE ONE ON EACH UNE.)
No Uttle Moderate Heavy Complete Not input input input input control applicable
a State ..........................•.•............•........ 2 3 4 5 8
b. Central office ..................................... 1 2 3 4 5 8
c. Principal ············································ 2 3 4 5 8
d. Mathematics department chair ....•.... 2 3 4 5 8
e. Mathematics department as a whole ........•.•......•.....•...................... 2 3 4 5 8
f. Individual mathematics teachers .....• 2 3 4 5 8
6

NOTE: Questions 11 • 15 are being asked of all mathematics teachers in the sample. If you received a Mathematics Teacher Questionnaire in addition to this School Mathematics Program Questionnaire, please check D here and skip to question 16.
11. In your opinion, how great a problem is each of the following for mathematics instruction in your school as a whole?
(CIRCLE ONE ON EACH UNE.)
a Facilities ........................................................................................... .
b. Funds for purchasing equipment and supplies .............................. .
c. d.
Materials for individualizing instruction ........................................... .
Access to computers ....................................................................... .
e. Appropriate computer software ....................................................... .
f. Student interest in mathematics ..................................................... .
g. Student reading abilities ................................................................. ..
h. Student absences ........................................................................... ..
i.
j.
k.
I.
m. n.
0.
Teacher interest in mathematics ..................................................... .
Teacher preparation to teach mathematics .................................... .
Time to teach mathematics ............................................................. .
Opportunities for teachers to share ideas ...................................... ..
In-service education opportunities .................................................. .
Interruptions for announcements, assemblies, other school activities ...................................................................... .
Large classes .................................................................................. ..
p. Maintaining discipline ...................................................................... .
q. Parental support for education ........................................................ .
r. State/district testing policies ........................................................... .
12. Indicate your sex: (CIRCLE ONE.)
Nota significant problem
1 1
1
1
1
1
1
1
Somewhat of a
problem
2 2 2
2
2
2 2 2
2 2 2
2
2
2
2
2
2
2
Male .................................................................. .
Female.............................................................. 2
(OVER)
7
Serious problem
3
3 3 3
3 3 3 3
3 3 3 3
3
3
3 3
3 3

13. Are you: (CIRCLE ONE.)
14. In what year were you born?
White (not of Hispanic origin)........................... 1 Black (not of Hispanic origin)........................... 2 Hispanic............................................................ 3
(Mexican. Puerto Rican. CUban, Central or South Amertcan, or other Hispanic cuHure or· origin)
American Indian or Alaskan Native.................. 4 Asian or Pacific Islander................................... 5
19
15. How many years have you taught in grades K-12 prior to this school year?
16. When did you complete this questionnaire?
17. What is your title? (CIRCLE ONE.)
YEARS
MONTH DAY YEAR
Mathematics department chair......................... 1 Mathematics lead teacher................................ 2 Teacher............................................................. 3 Principal ............................................................ 4 Assistant principal............................................. 5 Other (SPECIFY) .............................................. 6
Thank you for your help!
0 Check here lf you are the person originally chosen to complete this questionnaire.
If not, please fill in your name here:--------------------
Please return the questionnaire to us in the postage-paid envelope:
1993 National Survey of Science and Mathemadcs Education · cjo CODA
1400 Spring Street- Suite 150 Silver Spring, MD 20910
8

NATIONAL SCIENCE FOUNDATION
Fonn Approval OMB No: 3145-0142 Expires: Dec. 31, 1993
1993 National Survey of Science and Mathematics Education
Science Questionnaire
You have been selected to answer questions about your science instruction. If you do not currently teach science, please call us toll-free at 1-800-598-2888.
How to Complete the Questionnaire
Most of the questions instruct you to "circle one" answer or "circle all that apply". For a few questions, you are asked to write in your answer on the line provided.
Class Selection
Part of the questionnaire (sections C and D) asks you to provide information about instruction in a particular class. If you teach science to more than one class, use the label at right to determine the science class that has been randomly selected for you to answer about. (If your teaching schedule varies by day, use today's schedule, or if today is not a school day, use the most recent school day.)
If You Have Questions
Please see the inside cover of this questionnaire for more information about this study. If you have questions about the study or any items In the questionnaire, call us toll-free at 1-B00-59B-2888.
Thank you very much. Your participation is greatly appreciated. Please return the questionnaire to us In the postage-paid envelope:
1993 National Survey of Science and Mathematics Education cjoCODA 1400 Spring Street- Suite 150 Silver Spring, MD 20910
1993 National Survey of Science and Mathematics Education
The 1993 National Survey of Science and Mathematics Education is supported by the National Science Foundation and is the third in a series. It is being conducted by Horizon Research, Inc., under the direction of Dr. Iris R. Weiss. Data collection is the responsibility of CODA, a survey research organization in Silver Spring, Maryland. The study has received endorsements from the following organizations:
American Federation of Teachers (AFT) National Catholic Education Association (NCEA) National Council of Teachers of Mathematics (NCTM) National Education Association (NEA) National Science Teachers Association (NSTA)
INFORMATION ABOUT YOUR PARTICIPATION
Public reporting burden for this collection of information is estimated to average 30 minutes per response. Send comments regarding this burden estimate or any other aspect of this collection of information, including suggestions for reducing this burden, to Herman Aeming, National Science Foundation, 1800 G Street - NW, Washington, DC 20550 and to the Office of Management and Budget, Paperwork Reduction Project, OMS #3145-0142, Washington, DC 20503.
ABOUT THE SURVEY
Approximately 6,000 teachers from 1 ,200 schools throughout the country have been selected for the 1993 National Survey of Science and Mathematics Education. The survey is designed to collect information about science and mathematics education in grades 1 -12. Its purpose is to provide the education community with current information about science and mathematics education and to identify trends in the areas of teacher education and experience, course offerings, curriculum and instruction, and the availability and use of equipment.
The 1 ,200 schools were randomly selected for the survey from the Quality Education Data (QED) database. In June of last year, Chief State School Officers and district superintendents were notified about the survey. In September, school principals were sent a pre-survey information booklet, requesting the names of all science and mathematics teachers. From these lists, a national sample of teachers was selected to receive science or mathematics questionnaires. In addition, program questionnaires are being sent to science and mathematics department representatives at each school. Teacher questionnaires are also being sent to all winners (1983 - 1992) of the National Science Foundation's Presidential Awards for Excellence in Science and Mathematics Teaching.
All survey data received will be kept strictly confidential and will be reported only in aggregate form, such as by grade level or region of the country. No information identifying Individual states, districts, schools or teachers will be released. No identifying information whatsoever will be included in the dataset.
Each participating school will receive a copy of the study's results in the spring of 1994.

II SECTION A: TEACHER OPINIONS II
1. Please provide your opinion about each of the following statements.
(CIRCLE ONE ON EACH UNE.)
Strongly No Strongly Disagree Disagree Opinion Agree Agree
a Students learn best when they study science in the context of a personal or social application ............................................... 2 3 4 5
b. Students learn science best in classes with students of similar abilities ..................................... 2 3 4 5
c. It is important for students to learn basic scientific terms and formulas before learning underlying concepts and principles ........ 2 3 4 5
d. Laboratory-based science classes are more effective than non-laboratory classes .......... 2 3 4 5
e. Virtually all students can learn to think scientifically .............. : ............................................. 2 3 4 5
f. The testing program in my state/district dictates what science I teach ................................. 2 3 4 5
g. I enjoy teaching science ........................................ 2 3 4 5
h. I consider myself a "master" science teacher ....... 2 3 4 5
i. I feel supported by colleagues to try out new ideas in teaching science ............................... 2 3 4 5
j. I receive little support from the school administration for teaching science ...................... 2 3 4 5
k. Science teachers in this school regularly share ideas and materials ...................................... 2 3 4 5
I. Science teachers in this school regularly observe each other teaching classes as part of sharing and improving instructional strategies ........................................... 2 3 4 5
m. Activity-based science experiences aren't worth the time and expense for what students learn ................................................ 2 3 4 5
n. I feel that I have many opportunities to learn new things in my present job ....................... 2 3 4 5
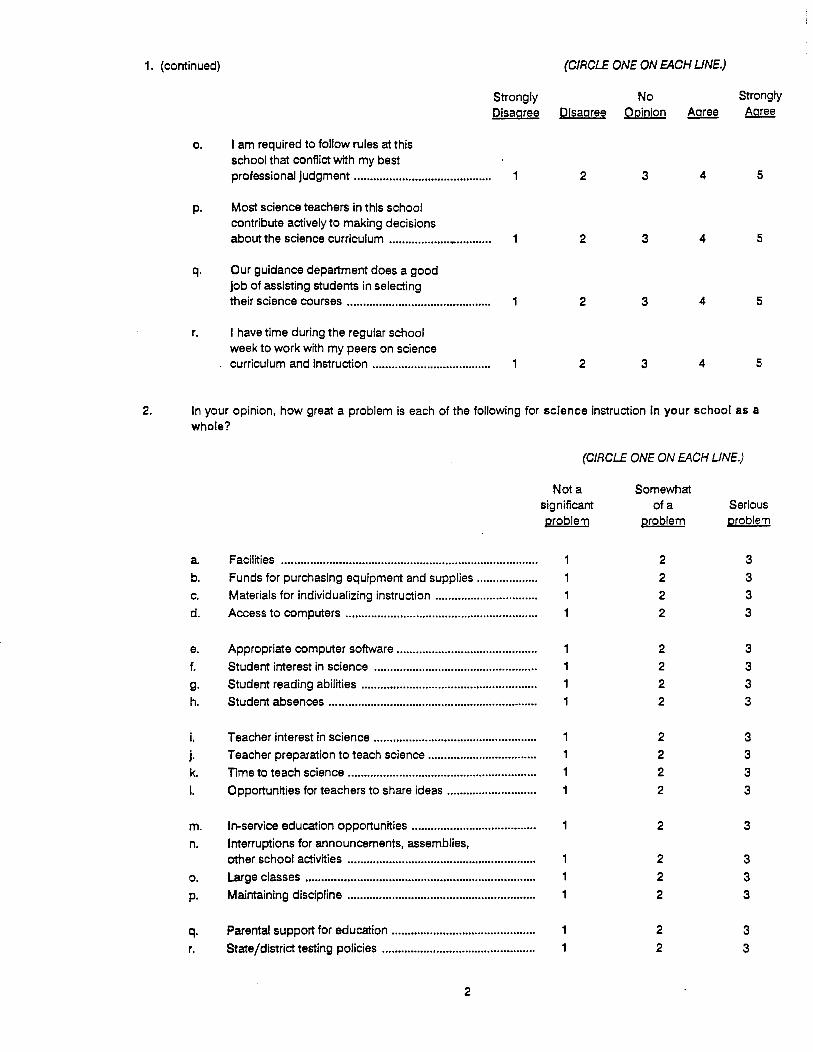
1. (continued) (CIRCLE ONE ON EACH UNE.)
Strongly No Strongly
Disagree Disagree Opinion Acree Agree
0. I am required to follow rules at this school that conflict with my best professional judgment ........................................... 1 2 3 4 5
p. Most science teachers in this school contribute actively to making decisions about the science curriculum ................... _ ........... 2 3 4 5
q. Our guidance department does a good job of assisting students in selecting their science courses ............................................. 2 3 4 5
r. I have time during the regular school week to work with my peers on science curriculum and instruction ..................................... 1 2 3 4 5
2. In your opinion, how great a problem is each of the following for science instruction in your school as a whole?
a b.
Facilities .............................................................................. ..
Funds for purchasing equipment and supplies ................. ..
c. Materials for individualizing instruction .............................. ..
d. Access to computers .......................................................... ..
e. Appropriate computer software ........................................... .
f. Student interest in science ................................................. ..
g. Student reading abilities ..................................................... ..
h. Student absences ............................................................... ..
i. j.
k. I.
m. n.
0.
Teacher interest in science .................................................. .
Teacher preparation to teach science ................................. .
Time to teach science .......................................................... .
Opportunities for teachers to share ideas .......................... ..
In-service education opportunities ...................................... .
Interruptions for announcements, assemblies, other school activities ......................................................... ..
Large classes ...................................................................... ..
p. Maintaining discipline .......................................................... .
q. r.
Parental support for education ........................................... ..
State/district testing policies .............................................. ..
2
(CIRCLE ONE ON EACH UNE.)
Nota significant problem
1
1
1
1
1
1
1
1
Somewhat of a
problem
2
2
2 2
2
2
2
2
2
2 2
2
2
2
2
2
2
2
Serious problem
3
3 3 3
3 3
3 3
3 3
3
3
3
3
3 3
3
3

3. Please rate each of the following in terms of its importance for effective science teaching at the grade levels you teach.
(CIRCLE ONE ON EACH UNE.)
Definitely Definitely should not should be be a part a part of
of science Makes no science ·instruction difference instruction
a Concrete experience before abstract treatments .....•....... 2 3 4 5
b. Students working in cooperative learning groups ............ 2 3 4 5
c. Emphasis on connections among concepts .................... 2 3 4 5
d. Deeper coverage of fewer science concepts .................... 2 3 4 5
e. Hands-on/laboratory activities .......................................... 2 3 4 5
f. Applications of science in daily life .................................... 2 3 4 5
g. Applications of scientific methods in addressing societal issues .................................................................... 2 3 4 5
h. Coordination of science disciplines .................................. 2 3 4 5
i. Coordination of sciences with mathematical .................. 2 3 4 5
j. Coordination of sciences with language arts .................. 2 3 4 5
k. Coordination of sciences with social science ................. 2 3 4 5
I. Coordination of sciences with vocational/ technology education ...................................................... 2 3 4 5
m. Revisiting science topics, each time in greater depth ...... 2 3 4 5
n. Every student studying science every year ....................... 2 3 4 5
o. Taking student conceptions about a natural phenomenon into account when planning curriculum and instruction ................................................. 2 3 4 5
p. Inclusion of performance-based assessment ................... 2 3 4 5
q. Use of computers ............................................................... 2 3 4 5
3

II SECTION B: TEACHER BACKGROUND
4. Many teachers feel better qualified to teach some subject areas than others. How well qualified do you feel to teach each of the following subjects at the grade levels you teach, whether or not they are currently included in your curriculum?
(CIRCLE ONE ON EACH UNE.)
Not well Adequately Very well qualified qualified qualified
a Ute Sciences .................................................................................... . 1 2 3
b. Chemistry ......................................................................................... . 1 2 3 c. Physics •.•.•....•............••..•..................•..•....•.••.••...•.•••.••••••.......•.....••.•.. 2 3
d. Earth Sciences ................................................................................. . 1 2 3 e. Technology ...................................................................................... . 1 2 3 f. Integrated Science, drawing from various science disciplines ...... . 2 3
g. Mathematics ..................................................................................... . 2 3 h. Reading/Language Arts .................................................................. . 2 3 i. Social Studies .................................................................................. . 2 3
5. How well prepared are you to do each of the following?
(CIRCLE ONE ON EACH UNE.)
a b. c.
d.
e. f.
g. h.
i. j.
k.
I.
Present the applications of science concepts ........... ..
Use cooperative learning groups ............................... ..
Take into account students' prior conceptions about natural phenomena when planning curriculum and instruction ........................................... .
Use computers as an integral part of science instruction ..................................................................... .
Integrate science with other subject areas ................. ..
Manage a class of students who are using hands-on/laboratory activities ..................................... .
Use a variety of assessment strategies ......••..............•.
Use the textbook as a resource rather than as the primary instructional tool .................................. .
Use performance-based assessment ............•......••.....
Teach groups that are heterogeneous in ability ......... .
Teach students from a variety of cultural backgrounds ................................................................ .
Teach students who have limited English proficiency .................................................................... .
4
Not well prepared
1
1
Somewhat prepared
2 2
2
2
2
2
2
2
2
2
2
2
Fairly well prepared
3 3
3
3
3
3
3
3
3 3
3
3
Very well prepared
4
4
4
4
4
4
4
4
4
4
4
4
II

5. (continued)
Not well prepared
(CIRCLE ONE ON EACH UN E.)
Somewhat prepared
Fairly well prepared
Very well prepared
m. Teach students who have learning disabilities ............ 2 3 4
n. Encourage participation of females in science ............ 1 2 3 4
0. Encourage participation of minorities in science ......... 1 2 3 4
p. Involve parents in the science education of their children ................................................................. 2 3 4
6. Which of the following college courses have you completed? Include both semester hour and quarter hour courses, whether graduate or undergraduate level. (CIRCLE ALL THAT APPLY.)
EDUCATION Supervised student teaching in science .............. . Instructional uses of computers/
other technologies.............................................. 2
MATHEMATICS College algebra/trigonometry I
elementary functions ......................................... 3 Calculus ................................................................. 4 Advanced calculus ................................................. 5 Differential equations ............................................. 6 Discrete mathematical ........................................... 7 Probability and statistics ......................... ................ 8
CHEMISTRY General chemistry................................................... 9 Analytical chemistry................................................ 10 Organic chemistry................................................... 11 Physical chemistry .................................................. 12 Quantum chemistry ................................................ 13 Biochemistry ........................................................... 14
EARTH /SPACE SCIENCES Earth science .......................................................... 15 Astronomy ............................................................... 16 Geology ................................................................... 17 Meteorology ............................................................ 18 Oceanography ........................................................ 19 Physical geography................................................ 20 Environmental science ........................................... 21
5
LIFE SCIENCES Ufe science ............................................................. 22 Introductory biology ............................................... 23 Botany, plant physiology........................................ 24 Cell biology............................................................. 25 Ecology ................................................................... 26 Genetics, evolution ................................................. 27 Microbiology ........................................................... 28 Anatomy /Physiology.............................................. 29 Zoology, animal behavior ....................................... 30
PHYSICS Physical science ...................................................... 31 General physics ...................................................... 32 Electricity and magnetism ...................................... 33 Heat and thermodynamics..................................... 34 Mechanics ............................................................... 35 Modern or quantum physics .................................. 36 Nuclear physics ...................................................... 37 Solid state physics .................................................. 38 Optics ...................................................................... 39
OTHER History of science ................................................... 40 Science and society ................................................ 41 Electronics .............................................................. 42 Engineering (Any)................................................... 43 Integrated science .................................................. 44 Computer programming......................................... 45 Other computer science......................................... 46

7. For each of the following subject areas, indicate the number of college semester and quarter courses you have completed. Count each course you have taken, regardless of whether it was a graduate or undergraduate course. If your transcripts are not available, provide your best estimates.
NUMBER OF COURSES COMPLETED
(CIRCLE ONE NUMBER ON ~CH UNE.) (CIRCLE ONE NUMBER ON EACH UN E.)
Semester Courses Quarter Courses
a Ufe sciences ........................... 0 2 3 4 5 6 7 ~8 0 1 2 3 4 5 6 7 ~8 b. Chemistry ............................... 0 2 3 4 5 6 7 ~8 0 2 3 4 5 6 7 ~8 c. Physics/physical science ....... 0 1 2 3 4 5 6 7 ~8 0 2 3 4 5 6 7 ~8 d. Earth/space science .............. 0 2 3 4 5 6 7 ~8 0 2 3 4 5 6 7 ~8 e. Science education .................. 0 2 3 4 5 6 7 ~8 0 2 3 4 5 6 7 ~8
8. Please check the box(es) next to the degree(s) you hold. Use the list of code numbers on the right to indicate your major and minor fields of study for each degree. (If you do not have a second major or minor field, please enter "00. ")
9.
Bachelor's Degree
Master's Degree
Doctorate Degree
0 0 0
Major field code
Second major or minor
field code
Other Degree(s) 0 Specify below:
1) ________________ __
2) ______________ ___
a In what year did you last take a course for college credit in science?
19 ______ _
MAJOR & MINOR FIELD CODES
Education 11 Elementary Education 12 Middle School Education 13 Secondary Education 14 Mathematics Education 15 Science Education 16 Other Education
Mathematics/Computer Science 21 Mathematics 22 Computer Science
Science 31 Biology, Ufe Science 32 Chemistry 33 Physics 34 Physical Science 35 Earth/Space Sciences 36 Other Science
Other Disciplines 41 History, English
Foreign Language, etc.
b. In what year did you last take a course for college credit in the teaching of science?
19 _____ _
6

10. What is the total amount of time you have spent on in-service education in science or the teaching of science in the last 12 months? in the last 3 years? (Include attendance at professional meetings, workshops, and conferences, but do not include formal courses for which you received college credit.)
(CIRCLE ONE NUMBER IN EACH COLUMN.)
Hours of In-service Education Last 12 months Last 3 years
None ................................................................. : ................. .
Less than 6 hours ............................................................. ..
6-15 hours ....................................................................... ..
16-35 hours ..................................................................... .. More than 35 hours ........................................................... .
11. In the past twelve months, have you: (CIRCLE ONE ON EACH UN E.)
1
2 3 4
5
a Attended any national or state science teacher association meetings? ......................... ..
b. Taught any in-service workshops or courses in science or science teaching? ............... . c. Received any local, state, or national grants or awards for science teaching? ............... .
d. Served on a school or district science curriculum committee? ....................................... .
e. Served on a school or district science textbook selection committee? .......................... ..
2
3 4
5
2
2
2
2
2
12. For each of the materials listed below, please mark one of the following categories: (1) have never heard of, (2) have heard of but not seen, (3) have seen but not used, or (4) have used in teaching.
(CIRCLE ONE ON EACH UNE.)
Have Have heard Have Have never of but seen but used in
heard of not seen not used teaching
a Biological Science: An Ecological Approach ............ .. 2 3 4
b. Bottle Biology .............................................................. .. 2 3 4
c. ChemCom: Chemistry in the Community .................. .. 2 3 4
d. Chemical Education for Public Understanding Program (CEPUP) ....................................................... .. 2 3 4
e. Full Option Science System (Foss Science Kits) ....... .. 2 3 4
f. Grow Lab, National Gardening Association ............... .. 2 3 4
g. Mechanical Universe, High School Adaptation ......... .. 2 3 4
h. Middle School Ufe Science ......................................... . 2 3 4
i. National Geographic Kids Network ............................. . 2 3 4
j. Quantum Magazine for Students ............................... .. 2 3 4
k. Science for Ute and Uving: Integrating Science, Technology, and Heatth (BSCS) ................. .. 2 3 4
I. ScienceVision ., ........................................................... .. 2 3 4
m. Second Voyage of the Mimi (Mayan Expedition) ...... .. 2 3 4
n. SuperScience Magazine ............................................. . 2 3 4
o. Texas Learning Technology Group (TLTG) Physical Science/Math for Science ............................ . 2 3 4
p. Wisconsin Fast Plants .................................................. . 2 3 4
7

13. Do you teach in a self-contained classroom, i.e., are you responsible tor teaching all or most academic subjects to one class?
YES .................................................................. 1 (COMPLETE 14.a., THEN GO TO 15.)
NO..................................................................... 2 (COMPLETE 14.b., THEN GO TO 15.}
14. a For Teachers of Self-Contained Classes: We are interested in knowing how much time your students spend studying various subjects. In a typical week, how many days do you have lessons on each of the following subjects, and how many minutes long is an average lesson? (Please write ·o· if you do not teach a particular subject to this class.)
Mathematics
Science
Social Studies
Reading
NOW GO TO 015.
Number of days per week
Approximate number of minutes per day
b. For Teachers of Non Self-Contained Classes: For each class period you are currently teaching, regardless of subject, give course title, the code number from the enclosed blue 'Ust of Course Titles' that best describes the content of each course, number of students, and the grade level of most of the students in that class.
1
2
3
4
5
6
7
8
Course Title
8
Code No. No. of
Students Predominant Grade Level

SECTION C: YOUR SCIENCE TEACHING IN A PARTICULAR CLASS
The questions in this section are about a particular science class you teach. If you teach science to more than one class, please think about the science classes you are teaching today (or the most recent school day). Then consult the label on the front of this questionnaire to determine which science class to consider when answering these questions.
15. a. Please provide the complete title of the course you will be describing:
COURSE TITLE
b. Using the blue "Ust of Course Titles, • indicate the code number that best describes this course:
COURSE CODE
(If "Other Science• [Code 199], briefly describe content of course: ---------------
16. What is the duration of this course? (CIRCLE ONE.)
a Year ................................................•......... b. Semester.................................................. 2 c. Quarter..................................................... 3 d. Other (PLEASE SPECIFY) ........................ 4
17. How many of the students in this science class are in each of the following grades?
I 1213141516171819110 I" 1'21 TOTAL I 18. Please indicate the number of students in this science class in each race jsex category.
a White (not of Hispanic origin) .....•...............••••.....
b. Black (not of Hispanic origin) .....•..............•.........
c. Hispanic ......•....•................•...•.•...•••.....................• (MexJcan, Puerto RJcan, Cuban, Central or South American, or other Hispanic culture or origin)
d. American Indian or Alaskan Native .................... .
e. Asian or Pacific Islander ..................................... .
TOTAL .............................. ..
9
(NOTE: The total number of males and females should be the same as the total number of students In question 17.)

19. How many of the students in this science class are formally classified as:
a Umited English Proficiency students
b. Learning Disabled students
c. Mentally Handicapped students
d. Physically Handicapped, please specify handicaps:
1) students
2) students
20. Are students assigned to this science class by level of ability? (CIRCLE ONE.)
Yes .................................................................... 1 No .......................................•••..........•..•••....•....... 2
21. Which of the following best describes the ability of the students in this science class? (CIRCLE ONE.)
Fairly homogeneous and low in ability......................................................... 1
Fairly homogeneous and average in ability.................................................. 2
Fairly homogeneous and high in ability........................................................ 3
Heterogeneous, with a mixture of two or more ability levels........................ 4
22. Think about your plans for this science class for the entire course. How much emphasis will each of the following student objectives receive?
a. b. c. d.
e.
f.
g.
h.
i.
j.
k.
I. m.
Increase interest in science ....................................... ..
Learn basic science concepts .................................... .
Learn important terms and facts of science ............... .
Learn scientific methods ............................................. .
Prepare for further study in science . ............................. Develop problem solving/inquiry skills .......................
Learn to evaluate arguments based on scientific evidence ...................•.......•........................•...
Learn to explain ideas in science effectively •..............
Increase awareness of the importance of science in daily life .......................................................
Learn about the applications of science in business and industry ..............................................
Learn about the relationship between science, technology, and society ................................
Learn about the history of science ...............................
Prepare for standardized tests .....................................
10
0 0
0 0
0
0
0
0
0
0
0
0
0
(CIRCLE ONE ON EACH UNE.)
Minimal emphasis
1 1
1
1
1
1
1
1
2
2
2 2
2
2
2 2
2
2
2 2 2
Moderate emphasis
3 3
3 3
3
3
3 3
3
3
3 3
3
4
4
4 4
4
4
4
4
4
4
4
4
4
Very heavy emphasis
5 5
5 5
5
5
5 5
5
5
5
5
5

23. How much does each of the following influence what you teach in this science class?
(CIRCLE ONE ON EACH UN E.)
No Extensive Not influence influence applicable
a. Your state's curriculum framework/course of study ...... 2 3 4 8 b. Your district's curriculum framework/course of study .•. 2 3 4 8 c. State test ...•........••..............•••..•.••..............•.•.••••.....••••..••.. 1 2 3 4 8 d. District test .................•...............•..............•...•.•.•..........•.... 2 3 4 8
e. Textbook ...•.........•..••........•..........................•..•.......•......... 1 2 3 4 8 f. Science for All Americans {AAAS' Project 2061) ...•...•.... 2 3 4 8 g. Scope, Sequence, and Coordination philosophy
or Content Core {NSTA's SS&C project) ........................ 2 3 4 8
h. Your own science content background .......................... 2 3 4 8 i. Your understanding of what motivates your students .... 1 2 3 4 8 j. Available laboratory facilities, equipment, and supplies . 2 3 4 8 k. Parentsjcommunfty ......................................................... 2 3 4 8
24. About how often do students in this science class take part in the following types of activities?
(CIRCLE ONE ON EACH UNE.)
Once Once Once or twice or twice or twice Almost
Never semester a month a week daily
a Usten and take notes during presentation by teacher ............................................................... 2 3 4 5
b. Watch the teacher demonstrate a scientific principle .................................................................. 2 3 4 5
c. Work in small groups ............................................. 2 3 4 5 d. Read a science textbook in class .......................... 2 3 4 5
e. Participate in dialogue with the teacher to develop an idea ................................................. 2 3 4 5
f. Do hands-on/laboratory science activities ........... 2 3 4 5 g. Prepare written science reports ............................. 2 3 4 5 h. Work in class on science projects that
take a week or more .............................................. 2 3 4 5
i. Work at home on science projects that take a week or more .......•..........•.........•.......•.•.•..... 1 2 3 4 5
j. Use a computer ..................................................... 1 2 3 4 5 k. Take field trips ........................................................ 2 3 4 5 I. Watch films, filmstrips, or videotapes .................... 2 3 4 5 m. Watch television programs .................................... 2 3 4 5
11

25. For the following equipment, please indicate the approximate number of times per semester each is used in this science class. For those not used, circle either 1, Not needed, or 2, Needed but not available.
(CIRCLE ONE ON EACH UN E.)
Not Needed but Number of times used ger semester needed not available .:!.:£ ~ §:1Q lli
a Overhead projector .............................. 2 3 4 5 6 b. Videotape player .................................. 2 3 4 5 6 c. Videodisc player .................................. 1 2 3 4 5 6 d. CD-ROM player .................................... 2 3 4 5 6
e. Four function calculators ..................... 1 2 3 4 5 6 f. Fraction calculators ............................. 2 3 4 5 6 g. Graphing calculators ........................... 1 2 3 4 5 6 h. Scientific calculators ............................ 1 2 3 4 5 6
i. Computers ........................................... 2 3 4 5 6 j. Computer flab interfacing devices ....... 2 3 4 5 6
k. Running water in laboratories .............. 2 3 4 5 6 I. Electric outlets in laboratories ............. 2 3 4 5 6 m. Gas for burners in laboratories ............ 2 3 4 5 6 n. Hoods or air hoses in laboratories ...... 2 3 4 5 6
26. How much of your own money do you estimate you will spend for supplies for this science class this year?
$ _____ _
27. How much control do you have over each of the following for this science class?
(CIRCLE ONE ON EACH UN E.)
a Determining goals and objectives .................................................. ..
b. Selecting textbooks ......................................................................... .
c. Selecting other instructional materials ............................................ .
d. Selecting content, topics, and skills to be taught .......................... ..
e. f.
Selecting the sequence in which topics are covered .................... ..
Setting the pace for covering topics ............................................... .
g. Selecting teaching techniques ........................................................ .
h. Determining the amount of homework to be assigned ................. ..
i. Choosing criteria for grading students ............................................ .
12
No control
1
1
2
2 2
2
2 2
2
2
2
Strong control
3 4 5
3 4 5 3 4 5
3 4 5
3 4 5
3 4 5
3 4 5
3 4 5 3 4 5

28. a Are you using one or more commercially published textbooks or programs for teaching science to this class?
YES ................................................................. .. (CONTINUE WITH 28.b.)
NO..................................................................... 2 (SKJP TO QUESTION 32.)
b. Indicate the publisher of the~ textbook/program used most often by students in this science class. (CIRCLE ONE.)
Addison-Wesley ............................................... . Kendall Hunt ..................................................... 13 Allyn & Bacon ................................................... 2 Laidlaw Brothers ............................................... 14 Amsco ............................................................... 3 Little, Brown ...................................................... 15 Delta Education ................................................ 4 Macmillan .......................................................... 16 Ginn ................................................................... 5 McGraw Hill....................................................... 17 Glencoe ............................................................. 6 Merrill. ................................................................ 18 Globe ................................................................. 7 Prentice Hall...................................................... 19 Harcourt, Brace, & Jovanovich ........................ 8 Scott, Foresman ............................................... 20 Harper & Row................................................... 9 Silver, Burdett, & Ginn ...................................... 21 D.C. Heath ......................................................... 10 Wiley .................................................................. 22 Holt, Rinehart, Winston..................................... 11 Houghton Mifflin ............................................... 12 Other (PLEASE SPECIFY) ............................... 23
29. What is the title, author, publication year, and edition of this textbook/program?
Title ----------------------------------------------------------------First Author -------------- Publication Year ------ Edition------
30. Approximately what percentage of this textbook/program will you "cover" in this course? (CIRCLE ONE.)
Less than 25 percent .. ................................. ..... 1
25 - 49 percent.................................................. 2
50-74 percent.................................................. 3
75 - 90 percent.................................................. 4
More than 90 percent....................................... 5
31. How would you rate the overall quality of this textbook/program? (CIRCLE ONE.)
Very Poor.......................................................... 1
Poor................................................................... 2
Fair ................................................................... 3
Good ................................................................. 4
Very Good......................................................... 5
Excellent ............................................................ 6
13

32. How much homework do you assign in this science class in a typical week? (CIRCLE ONE.)
0 - 30 minutes .................................................. .
31 - 60 minutes ................................................. 2
61 - 90 minutes ................................................. 3
91 - 120 minutes............................................... 4
2-3 hours......................................................... 5
More than 3 hours ............................................ 6
33. Indicate the importance you give to each of the following in setting grades for students in this science class.
a Objective tests (e.g., multiple choice, true/false) .................................. .
b. Essay tests ............................................................................................. ..
c. Hands-on/performance tasks ................................................................ .
d. Systematic observations of students ..................................................... .
e. f.
g. h.
i. j.
k. I.
m. n.
Interviewing students about what they understand ............................... .
Homework assignments ........................................................................ ..
Behavior .................................................................................................. .
Effort ....................................................................................................... ..
Laboratory reports .................................................................................. .
Science projects .................................................................................... ..
Class attendance ................................................................................... ..
Contribution to small group work .......................................................... ..
Participation in whole class discussion ................................................. ..
Individual improvement or progress over past performance ............... ..
14
(CIRCLE ONE ON EACH UN E.)
Not important
1 1
1
1
1
1
1
1
1
2
2
2
2
2-
2
2 2
2 2 2 2
2
2
3 3 3 3
3
3
3
3
3
3 3 3
3
3
Very imoortant
4
4
4
4
4
4
4
4
4
4
4
4
4
4

SECTION D: YOUR MOST RECENT SCIENCE LESSON
Use your most recent science lesson in this class to answer the following questions. Do not be concerned if this lesson was not typical of instruction in this class.
34. a How many minutes were allocated to the most recent science lesson?
---- minutes
b. Of these, how many minutes were spent on the following:
(1) Daily routines, interruptions, and other non-instructional activities
(2) Whole class lecture/discussions
(3) Individual students reading textbooks, completing worksheets, etc.
(4) Working with hands-on, manipulative, or laboratory materials
(5) Non-laboratory small group work
TOTAL MINUTES
(SHOULD BE THE SAME AS 34.a.)
35. Which ofthe following activities took place during that science lesson? (CIRCLE ALL THAT APPLY.)
a Lecture ................................................................................................. .
b. Students completing textbook/worksheet problems.......................... 2
c. Students reading about science .......................................................... 3
d. Students working in cooperative learning groups where the entire group receives a single grade................................... 4
e. Student use of calculators.................................................................... 5
f. Student use of computers.................................................................... 6
g. Student use of other technologies....................................................... 7
h. Test or quiz........................................................................................... 8
36. Did that lesson take place on the most recent day your school was in session? (CIRCLE ONE.)
Yes ................................................................... .
No ...................................................................... 2
15

II SECTION E: DEMOGRAPHIC INFORMATION
37. Indicate your sex: (CIRCLE ONE.)
38. Are you: (CIRCLE ONE.)
39. In what year were you born?
Male .........••••••••.....••...••...•••.....••..•••••.••.•.•.••.••.•...
Female .....•...•..••....•.........................•..•...•....••..•. 2
White (not of Hispanic origin)........................... 1
Black (not of Hispanic origin)........................... 2
I
Hispanic .....•................•......•••..........•••....•.......... 3 (Mexican, Puerto Rican, Cuban, Central or South American, or other Hispanic cuHure or origin)
American Indian or Alaskan Native.................. 4
Asian or Pacific Islander................................... 5
19
40. How many years have you taught prior to this school year?
YEARS
41. How many years have you taught science prior to this school year?
____ YEARS
42. When did you complete this questionnaire?
MONTH DAY YEAR
Thank you for your assistance!
Please retum the questionnaire to us in the postage-paid envelope:
1993 National Survey of Science and Mathematics education cjoCODA 1400 Spring Street- Suite 150 Silver Spring, MD 20910
16
II

NATIONAL SCIENCE FOUNDATION
Form Approval OMB No: 3145-0142 Expires: Dec. 31, 111513
1993 National Survey of Science and Mathematics Education
Mathematics Questionnaire
You have been selected to answer questions about your mathematics instruction. If you do not currently teach mathematics, please call us toll-free at 1-soo-598-2888.
How to Complete the Questionnaire
Most of the questions instruct you to "circle one" answer or "circle all that apply". For a few questions, you are asked to write In your answer on the line provided.
Class Selection
Part of the questionnaire (sections C and D) asks you to provide information about instruction in a particular class. If you teach mathematics to more than one class, use the label at right to determine the mathematics class that has been randomly selected for you to answer about. (If your teaching schedule varies by day, use today's schedule, or if today is not a school day, use the most recent school day.)
If You Have Questions
Please see the inside cover of this questionnaire for more information about this study. If you have questions about the study or any items in the questionnaire, call us toll-free at 1-800-598-2888.
Thank you very much. Your participation is greatly appreciated. Please return the questionnaire to us In the postage-paid envelope:
1993 National Survey of Science and Mathematics Education cjo CODA 1400 Spring Street- Suite 150 Silver Spring, MD 20910

1993 National Survey of Science and Mathematics Education
The 1993 National Survey of Science and Mathematics Education is supported by the National Science Foundation and is the third in a series. It is being conducted by Horizon Research, Inc., under the direction of Dr. Iris R. Weiss. Data collection is the responsibility of CODA, a survey research organization in Silver Spring, Maryland. The study has received endorsements from the following organizations:
American Federation of Teachers (AFT) National Catholic Education Association (NCEA) National Council of Teachers of Mathematics (NCTM) National Education Association (NEA) National Science Teachers Association (NSTA)
INFORMATION ABOUT YOUR PARTICIPATION
Public reporting burden for this collection of information is estimated to average 30 minutes per response. Send comments regarding this burden estimate or any other aspect of this collection of information, including suggestions for reducing this burden, to Herman Fleming, National Science Foundation, 1800 G Street - NW, Washington, DC 20550 and to the Office of Management and Budget, Paperwork Reduction Project, OMS #3145-0142, Washington, DC 20503.
ABOUT THE SURVEY
Approximately 6,000 teachers from 1 ,200 schools throughout the country have been selected for the 1993 National Survey of Science and Mathematics Education. The survey is designed to collect information about science and mathematics education in grades 1 - 12. Its purpose is to provide the education community with current information about science and mathematics education and to identify trends in the areas of teacher education and experience, course offerings, curriculum and instruction, and the availability and use of equipment.
The 1,200 schools were randomly selected for the survey from the Quality Education Data (QED) database. In June of last year, Chief State School Officers and district superintendents were notified about the survey. In September, school principals were sent a pre-survey information booklet, requesting the names of all science and mathematics teachers. From these lists, a national sample of teachers was selected to receive science or mathematics questionnaires. In addition, program questionnaires are being sent to science and mathematics department representatives at each school. Teacher questionnaires are also being sent to all winners (1983 - 1992) of the National Science Foundation's Presidential Awards for Excellence in Science and Mathematics Teaching.
All survey data received will be kept strictly confidential and will be reported only In aggregate form, such as by grade level or region of the country. No information identifying individual states, districts, schools or teachers will be released. No identifying information whatsoever will be included in the dataset.
Each participating school will receive a copy of the study's results in the spring of 1994.

II SECTION A: TEACHER OPINIONS II
1. Please provide your opinion about each of the following statements.
(CIRCLE ONE ON EACH LINE.)
Strongly No Strongly Qisagree Disagree Opinion Agree Agree
a Students learn best when they study mathematics in the context of a personal or social application ............................... 2 3 4 5
b. Students learn mathematics best in classes with students of similar abilities .................................... 2 3 4 5
c. Students need to master arithmetic computation before going on to algebra .............. 2 3 4 5
d. Students should be able to use calculators most of the time .................................. 2 3 4 5
e. Virtually all students can learn to think mathematically ············································· 2 3 4 5
f. The testing program in my state/district dictates what mathematics I teach ........................ 2 3 4 5
g. I enjoy teaching mathematics ............................... 2 3 4 5
h. I consider myself a •master" mathematics teacher ·································································· 2 3 4 5
i. I feel supported by colleagues to try out new ideas in teaching mathematics ............•...• 2 3 4 5
j. I receive little support from the school administration for teaching mathematics ............. 2 3 4 5
k. Mathematics teachers in this school regularly share ideas and materials ····················· 2 3 4 5
I. Mathematics teachers in this school regularly observe each other teaching classes as part of sharing and improving instructional strategies ........................................... 1 2 3 4 5
m. Activity-based mathematics experiences aren't worth the time and expense for what students learn •.••••••.•.•..••..••......•.•.•........••...... 2 3 4 5
n. I feel that I have many opportunities to learn new things in my present job .................. 2 3 4 5

1. (continued) (CIRCLE ONE ON EACH UNE.)
Strongly No Strongly Disagree Disagree Opinion Agree Agree
0. I am required to follow rules at this school that conflict with my best professional judgment .......................................... 2 3 4 5
p. Most mathematics teachers in this school contribute actively to making decisions about the mathematics curriculum ....................... 2 3 4 5
q. Our guidance department does a good job of assisting students in selecting their mathematics courses .................................... 2 3 4 5
r. I have time during the regular school week to work with my peers on mathematics curriculum and instruction ···································· 2 3 4 5
2. In your opinion, how great a problem is each of the following for mathematics instruction in your school as a whole?
a Facilities ............................................................................... .
b. Funds for purchasing equipment and supplies .................. .
c. Materials for individualizing instruction ............................... .
d. Access to computers .......................................................... ..
e. Appropriate computer software .......................................... ..
f. Student interest in mathematics ......................................... ..
g. Student reading abilities ..................................................... ..
h. Student absences ............................................................... ..
i. Teacher interest in mathematics ........................................ ..
j. Teacher preparation to teach mathematics ....................... ..
k. Time to teach mathematics ................................................ ..
I. Opportunities for teachers to share ideas .......................... ..
m. In-service education opportunities ..................................... ..
n. Interruptions for announcements, assemblies, other school activities ......................................................... .
0. Large classes ....................................................................... .
p. Maintaining discipline .......................................................... .
q. Parental support .................................................................. .
r. State/district testing policies .............................................. .
2
(CIRCLE ONE ON EACH UN E.)
Not a significant problem
1
1
Somewhat of a
problem
2
2
2 2
2
2
2 2
2
2
2 2 2
2 2
2
2 2
Serious problem
3
3
3
3
3
3
3
3
3
3
3 3
3
3
3
3 3
3
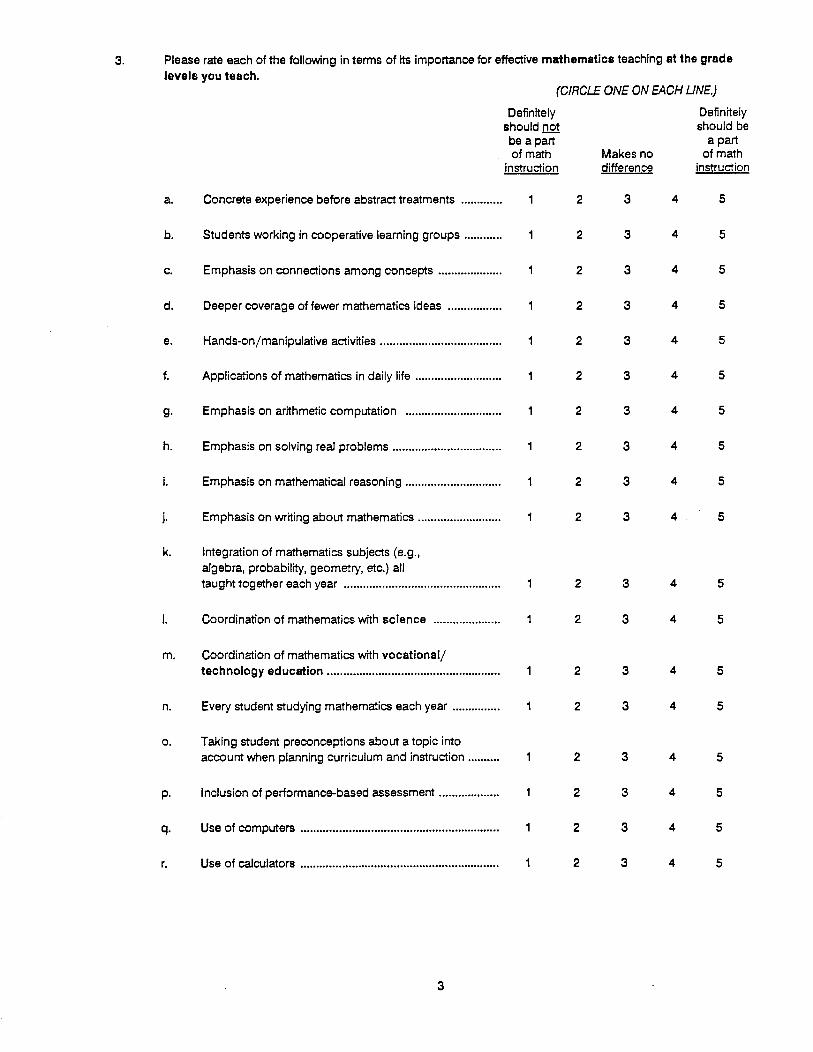
3. Please rate each of the following in terms of its importance for effective mathematics teaching at the grade levels you teach.
(CIRCLE ONE ON EACH UNE.)
Definitely Definitely should not should be be a part a part of math Makes no of math
instruction difference instruction
a Concrete experience before abstract treatments ............. 2 3 4 5
b. Students working in cooperative learning groups ............ 2 3 4 5
c. Emphasis on connections among concepts .................... 2 3 4 5
d. Deeper coverage of fewer mathematics ideas ................. 2 3 4 5
e. Hands-on/manipulative activities ...................................... 2 3 4 5
f. Applications of mathematics in daily life ........................... 2 3 4 5
g. Emphasis on arithmetic computation . ............................. 2 3 4 5
h. Emphasis on solving real problems .................................. 2 3 4 5
i. Emphasis on mathematical reasoning .............................. 2 3 4 5
j. Emphasis on writing about mathematics .......................... 2 3 4 5
k. Integration of mathematics subjects (e.g., algebra, probability, geometry, etc.) all taught together each year ................................................. 2 3 4 5
I. Coordination of mathematics with science ····················· 2 3 4 5
m. Coordination of mathematics with vocational/ technology education ...................................................... 2 3 4 5
n. Every student studying mathematics each year ............... 2 3 4 5
0. Taking student preconceptions about a topic into account when planning curriculum and instruction .......... 2 3 4 5
p. Inclusion of performance-based assessment ................... 2 3 4 5
q. Use of computers .............................................................. 2 3 4 5
r. Use of calculators .............................................................. 2 3 4 5
3
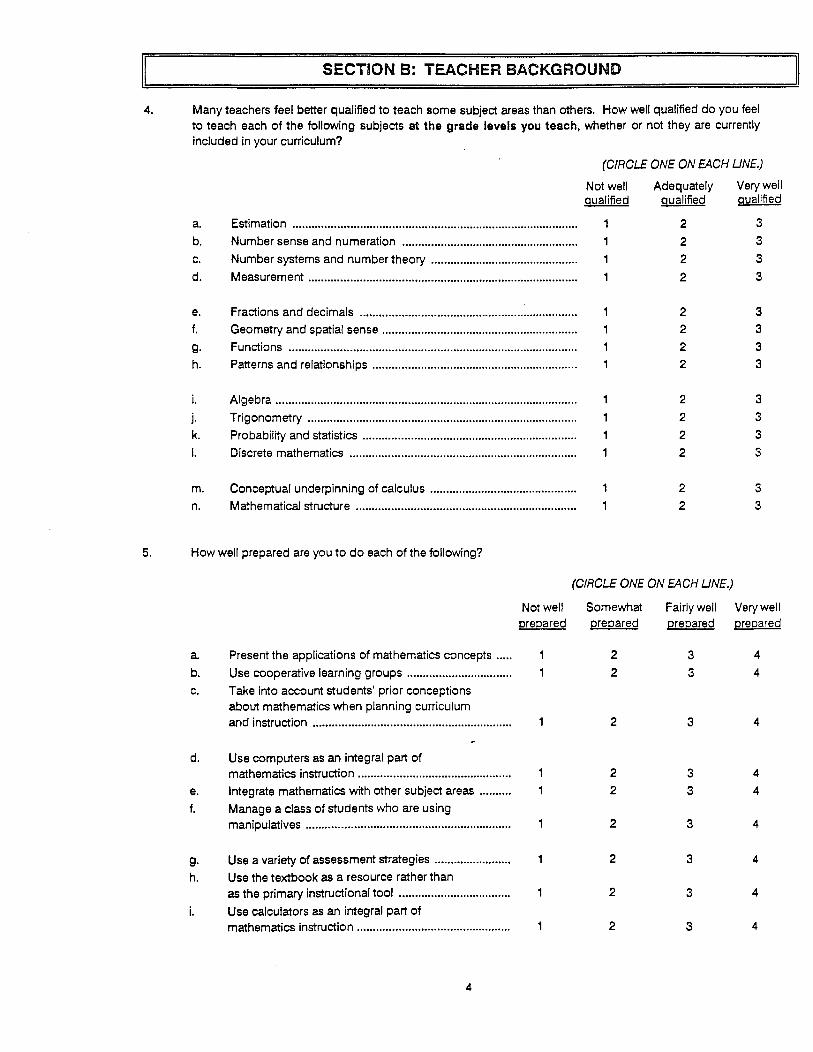
II SECTION 8: TEACHER BACKGROUND
4. Many teachers feel better qualified to teach some subject areas than others. How well qualified do you feel to teach each of the following subjects at the grade levels you teach, whether or not they are currently included in your curriculum?
(CIRCLE ONE ON EACH UNE.)
Not well Adequately Very well gualified gualified gualified
a. Estimation ........................................................................................ . 2 3
b. Number sense and numeration ..................................................... .. 2 3
c. Number systems and number theory ............................................ .. 2 3
d. Measurement ................................................................................... . 2 3
e. Fractions and decimals .................................................................. .. 2 3 f. Geometry and spatial sense ............................................................ . 2 3
g. Functions ......................................................................................... . 2 3
h. Patterns and relationships .............................................................. .. 2 3
i. Algebra ............................................................................................. . 2 3
j. Trigonometry ................................................................................... . 1 2 3
k. Probability and statistics ................................................................. .. 1 2 3
I. Discrete mathematics ...................................................................... . 2 3
m. Conceptual underpinning of calculus ............................................. . 2 3 n. Mathematical structure .................................................................... . 2 3
5. How well prepared are you to do each of the following?
(CIRCLE ONE ON EACH UNE.)
a Present the applications of mathematics concepts .... .
b. Use cooperative learning groups ................................ .
c. Take into account students' prior conceptions about mathematics when planning curriculum
d.
e. f.
g. h.
i.
and instruction ............................................................ ..
Use computers as an integral part of mathematics instruction ............................................... . Integrate mathematics with other subject areas ........ ..
Manage a class of students who are using manipulatives .............................................................. ..
Use a variety of assessment strategies ...................... ..
Use the textbook as a resource rather than as the primary instructional tool .................................. .
Use calculators as an integral part of mathematics instruction ............................................... .
4
Not well preoared
Somewhat prepared
2
2
2
2 2
2
2
2
2
Fairly well prepared
3
3
3
3 3
3
3
3
3
Very well preoared
4
4
4
4
4
4
4
4
4
II

5. {continued) (CIRCLE ONE ON EACH UN E.)
Not well Somewhat Fairly well Very well prepared prepared prepared prepared
j. Use performance-based assessment .......................... 2 3 4
k. Teach groups that are heterogeneous in ability .......... 2 3 4
I. Teach students from a variety of cultural backgrounds ................................................................. 2 3 4
m. Teach students who have limited English proficiency. 1 2 3 4
n. Teach students who have learning disabilities ............ 2 3 4
0. Encourage participation of females in mathematics ... , 2 3 4
p. Encourage participation of minorities in mathematics 2 3 4
q. Involve parents in the mathematics education of their children ................................................................. 2 3 4
6. Which of the following college courses have you completed? Include both semester hour and quarter hour courses, whether graduate or undergraduate level. (CIRCLE ALL THAT APPLY.)
MATHEMATICS Mathematics for elementary school teachers ....... .
Mathematics for middle school teachers............... 2 Geometry for elementary jmiddle school
teachers................................................................ 3
College algebra/trigonometry I elementary
functions ............................................................. 4
Calculus.................................................................. 5 Advanced Calculus................................................. 6 Differential Equations.............................................. 7
Geometry................................................................ 8 Probability and statistics......................................... 9 Abstract algebra/number theory ............................ 10 Unear algebra......................................................... 1 1
Applications of mathematics/problem solving ...... 12
History of mathematics ........................................... 13 Discrete Mathematics ............................................. 14 Other upper division mathematics ......................... 15
5
SCIENCES/COMPUTER SCIENCES Biological sciences ................................................. 16
Chemistry................................................................ 17 Physics .................................................................... 18 Physical science...................................................... 19
Earth/space science ............................................... 20
Engineering (any) ................................................... 21 Computer programming......................................... 22
Other computer science......................................... 23
EDUCATION Supervised student teaching in
mathematics......................................................... 24 Instructional use of computers/
other technologies............................................... 25

7. For each of the following subject areas, indicate the number of college semester and quarter courses you have completed. Count each course you have taken, regardless of whether it was a graduate or undergraduate course. If your transcripts are not available, provide your best estimates.
NUMBER OF COURSES COMPLETED
(CIRCLE ON£ NUMBER ON EACH UN£.) (CIRCLE ON£ NUMBER ON EACH Ul\
Semester Courses Quarter Courses
a. Mathematics education .................. 0 2 3 4 5 6 7 ~8 0 2 3 4 5 6 7 .?..,8
b. Calculus .......................................... 0 2 3 4 5 6 7 ~8 0 2 3 4 5 6 7 .?..,8
c. All ~ mathematics courses ....... 0 2 3 4 5 6 7 .?..,8 0 2 3 4 5 6 7 ~8
d. Computer science ........................... 0 2 3 4 5 6 7 ~8 0 2 3 4 5 6 7 ~8
e. Science ........................................... 0 2 3 4 5 6 7 .?..,8 0 2 3 4 5 6 7 ~8
8. Please check the box(es) next to the degree(s) you hold. Use the list of code numbers on the right to indicate your major and minor fields of study for each degree. (If you do not have a second major or minor field, please enter ·oo. ")
9.
Bachelor's Degree
Master's Degree
Doctorate Degree
0 0 0
Major field code
Other Degree(s) 0 Specify below:
1) ------------------2) ______________ __
Second major or minor
field code
MAJOR & MINOR FIELD CODES
Education 11 Elementary Education 12 Middle School Education 13 Secondary Education 14 Mathematics Education 15 Science Education 16 Other Education
Mathematics/Computer Science 21 Mathematics 22 Computer Science ~
31 Biology, Ufe Science 32 Chemistry 33 Physics 34 Physical Science 35 Earth/Space Sciences 36 Other Science
Other Disciplines 41 History, English
Foreign Language, etc.
a. In what year did you last take a course for college credit in mathematics?
19 ___ _
b. In what year did you last take a course for college credit in the teaching of mathematics?
19 ___ _
6

10. What is the total amount of time you have spent on in-service education in mathematics or the teaching of mathematics in the last 12 months? in the last 3 years? (Include attendance at professional meetings, workshops, and conferences, but do not include formal courses for which you received college credit.)
(CIRCLE ONE NUMBER IN EACH COLUMN.)
Hours of In-service Education Last 12 months
None ................................................................................... .
Less than 6 hours .............................................................. .
6 ·15 hours ........................................................................ .
16 • 35 hours ..................................................................... ..
More than 35 hours ........................................................... .
11. In the past twelve months, have you: (CIRCLE ONE ON EACH UN£.)
2
3 4
5
a Attended any national or state mathematics teacher association meetings? .................. .
b. Taught any in-service workshops or courses in mathematics or mathematics
teaching? ........................................................................................................................ . c. Received any local, state, or national grants or awards for mathematics teaching? ....... .
d. Served on a school or district mathematics curriculum committee? .............................. ..
e. Served on a school or district mathematics textbook selection committee? .................. .
Last 3 years
1
2 3 4
5
2
2 2 2
2
12. For each of the materials listed below, please mark one of the following categories: (1) have never heard of, (2) have heard of but not seen, (3) have seen but not used, or (4) have used in teaching.
a Calculators and Mathematics Project -Los Angeles (CAMP-LA) .............................................. .
b. Computer • Intensive Algebra ...................................... . c. Elementary Mathematician .......................................... .
d. Futures with Jaime Escalante ...................................... .
e. Geometer's Sketchpad ............................................... ..
f. Geometry and Measurement, K-6 ............................... .
g. Getting Ready for Algebra .......................................... ..
h. High School Mathematics and Its Applications Project (HIMAP) ...................................... .
i. Jasper Series ............................................................... .
j.
k. I.
m.
Journeys in Mathematics ............................................ ..
Logo Geometry ............................................................ .
Math and the Mind's Eye ............................................ ..
Middle Grades Mathematics Project ........................... .
n. Project Mathematics! .................................................. ..
0. Quantitative Literacy Series ........................................ ..
p. Used Numbers: Collecting and Analyzing Real Data ...................................................................... .
7
(CIRCLE ONE ON EACH UN£.)
Have Have heard never of but
heard of not seen
1
1
1
1
1
1
1
2
2
2
2
2
2 2
2
2
2 2 2
2
2 2
2
Have Have seen but used in not used teaching
3 4
3 4
3 4
3 4
3 4
3 4
3 4
3 4
3 4
3 4
3 4 3 4
3 4
3 4 3 4
3 4

13. a The National Council of Teachers of Mathematics has prepared Curriculum and Evaluation Standards, generally called the NCTM Standards, for mathematics instruction. Which of the statements below best describes your familiarity with the NCTM Standards? (CIRCLE ONE.)
Well aware of the NCTM Standards ..•.....•.......
Heard of the NCTM Standards but don't know much about them ........................ .
Not aware of the NCTM Standards ................ .
Not sure ........................................................... .
b. Please indicate the extent to which you agree with each of the following statements.
(CONTINUE WITH QUESTION 13.b.)
:J ~KIP TO 14)
(CIRCLE ONE ON EACH UN£.)
Strongly Disagree
I am well informed about the NCTM Standards for the grades I teach ................................................ ..
I am prepared to explain the NCTM Standards to my colleagues ................................................... .
Disagree
2
2
No Strongly Opinion Agree Agree
3 4 5
3 4 5
14. a. The National Council of Teachers of Mathematics has prepared Professional Standards for Teaching Mathematics, generally called the NCTM Teaching Standards, for mathematics instruction. Which best describes your familiarity with the NCTM Teaching Standards? (CIRCLE ONE.)
Well aware of the NCTM Teaching Standards.
Heard of the NCTM Teaching Standards but don't know much about them ......................... .
Not aware of the NCTM Teaching Standards ..
Not sure ............................................................ .
b. Please indicate the extent to which you agree with each of the following statements.
(CONTINUE WITH QUESTION 14.b.)
}ShlPT015)
(CIRCLE ONE ON EACH UN£.)
Strongly No Strongly Disagree Disagree Opinion Agree Agree
I am well informed about the NCTM Teaching Standards for the grades I teach .......................... . 2 3 4 5
I am prepared to explain the NCTM Teaching Standards to my colleagues ................................. . 2 3 4 5
8

15. Do you teach in a self-contained classroom, i.e., are you responsible for teaching all or most academic subjects to one class?
Yes ..•••••...•••...••..••••••....•.••.....•••.•..••.••..••••••••.•••.. 1 (COMPLETE 16.a., THEN GO TO 17.)
No...................................................................... 2 (COMPLETE 16.b., THEN GO TO 17.)
16. a For Teachers of Self-Contained Classes: We are interested in knowing how much time your students spend studying various subjects. In a typical week, how many days do you have lessons on each of the following subjects, and how many minutes long is an average lesson? (Please write ·o· if you do not teach a particular subject to this class.)
Mathematics
Science
Social Studies
Reading
NOW GO TO 017.
Number of days per week
Approximate number of minutes per day
b. For Teachers of Non Self-Contained Classes: For each class period you are currently teaching, regardless of subject, give the course title, the code number from the enclosed blue •ust of Course Titles• that best describes the content of each course, number of students, and the grade level of most of the students in that class.
2
3
4
5
6
7
8
Course Title
9
Code No. No. of
Students Predominant Grade Level

SECTION C: YOUR MATHEMATICS TEACHING IN A PARTICULAR CLASS
The questions in this section are about a particular mathematics class you teach. If you teach more than one class per day, please think about the mathematics classes you are teaching today (or the most recent school day). Then consutt the label on the front of this questionnaire to determine which mathematics class to consider when answering these questions.
17. a. Please provide the complete title of the course you will be describing:
COURSE TITLE
b. Using the blue "Ust of Course Titles, • indicate the code number that best describes this course:
COURSE CODE
(If "Other Mathematics" [Code 299], briefly describe content of course: -------------
18. What is the duration of this course? (CIRCLE ONE.)
a Year.......................................................... 1 b. Semester.................................................. 2 c. Quarter..................................................... 3 d. Other (PLEASE SPECIFY) ........................ 4
19. How many of the students in this mathematics class are in each of the following grades?
20. Please indicate the number of students in this mathematics class in each racejsex category.
a White (not of Hispanic origin) ............................ ..
b. Black (not of Hispanic origin) ............................. .
c. Hispanic .............................................................. . (Mexican, Puerto Rican, Cuban, Central or South American, or other Hispanic cunure or or1gln)
d. American Indian or Alaskan Native ................... ..
e. Asian or Pacific Islander .................................... ..
TOTAL ............................... .
10
(NOTE: The total number of males and females should be the same as the total number of students In question 1 9.)

21. How many of the students in this mathematics class are formally classified as:
a Umited English Proficiency students
b. Learning Disabled students
c. Mentally Handicapped students
d. Physically Handicapped, please specify handicaps:
1) students
2) students
22. Are students assigned to this mathematics class by level of ability? (CIRCLE ONE.)
Yes ................................................................... . No ...................................................................... 2
23. Which of the following best describes the ability of the students in this mathematics class? (CIRCLE ONE.)
Fairly homogeneous and low in ability......................................................... 1
Fairly homogeneous and average in ability.................................................. 2
Fairly homogeneous and high in ability........................................................ 3
Heterogeneous, with a mixture of two or more ability levels........................ 4
24. Think about your plans for this mathematics class for the entire course. How much emphasis will each of the following student objectives receive?
a b. c. d.
e. f.
g. h.
i. j.
k.
I.
Increase interest in mathematics ................................ .
Learn mathematical concepts .................................... .
Learn mathematical algorithms .................................. .
Learn how to solve problems .................................... ..
Learn to reason mathematically ................................. .
Learn how mathematical ideas connect with one another ........................................................ ..
Prepare for further study in mathematics ................... .
Understand the logical structure of mathematics ...... .
Learn about the history of mathematics .................... ..
Learn to explain ideas in mathematics effectively .... ..
Increase awareness of the importance of
mathematics in daily life ............................................. .
Learn about the applications of
mathematics in science .............................................. .
m. Learn about the applications of
mathematics in business and industry ...................... ..
n. Learn to perform computations with
speed and accuracy ................................................. ..
0. Prepare for standardized tests ................................... .
11
0
0
0 0
0
0
0
0
0
0
0
0
0
0
0
(CIRCLE ONE ON EACH UN E.)
Minimal emghasis
1
1 1
1
1
2
2
2 2
2
2
2 2
2 2
2
2
2
2
2
Moderate emghasis
3
3
3 3
3
3
3 3
3 3
3
3
3
3
3
4
4
4
4
4
4
4
4
4
4
4
4
4
4
4
Very heavy emghasis
5
5
5 5
5
5
5
5
5 5
5
5
5
5
5

25. How much does each of the following influence what you teach in this mathematics class?
(CIRCLE ONE ON EACH UN E.)
No Extensive Not influence influence applicable
a Your state's curriculum framework/course of study ...... 2 3 4 8
b. Your district's curriculum framework/course of study ... 2 3 4 8
c. State test .......................................................................... 2 3 4 8
d. District test ........................................................................ 2 3 4 8
e. Textbook .......................................................................... 2 3 4 8 f. NCTM's Curriculum and Evaluation Standards .............. 2 3 4 8 g. NCTM's Professional Standards for Teaching
Mathematics ···································································· 2 3 4 8 h. Science for All Americans (MAS' Project 2061) ............ 2 3 4 8
i. Your own mathematics content background ················· 2 3 4 8 j. Your understanding of what motivates your students .... 2 3 4 8 k. Available facilities, equipment, and supplies ·················· 2 3 4 8 I. Parentsjcommunity ......................................................... 2 3 4 8
26. About how often do students in this mathematics class take part in the following types of activities?
(CIRCLE ONE ON EACH UNE.)
Once Once Once or twice or twice or twice Almost
Never semester a month a week daily
a. Usten and take notes during presentation byteacher .............................................................. 2 3 4 5
b. Do mathematics problems from textbooks .......... 2 3 4 5 c. Do mathematics problems from worksheets ........ 2 3 4 5 d. Work in small groups ............................................. 2 3 4 5
e. Work in class on mathematics projects
that take a week or more ....................................... 2 3 4 5 f. Work at home on mathematics projects
that take a week or more ....................................... 2 3 4 5 g. Make conjectures and explore possible
methods to solve a mathematical problem ·········· 2 3 4 5 h. leam about mathematics through real-life
applications ............................................................ 2 3 4 5
i. Write their reasoning about how to solve a problem ..................................................... 2 3 4 5
j. Use manipulative materials or models .................. 2 3 4 5 k. Use computersjcalculators to explore
problems ................................................................ 2 3 4 5
I. Use computersjcalculators to do computations ......................................................... 2 3 4 5
12

26. {continued) (CIRCLE ONE ON EACH UNE)
Once Once Once or twice or twice or twice Almost
Never semester a month a week daily
m. Use computers/calculators to develop an
understanding of mathematics concepts ............. 2 3 4 5
n. Participate in dialogue with the teacher to develop an idea ..................................................... 2 3 4 5
o. Watch films, filmstrips, or videotapes .................... 2 3 4 5
p. Watch television programs .................................... 2 3 4 5
27. For the following equipment, please indicate the approximate number of times per semester each is used in this mathematics class. For those not used, circle either 1, Not needed or 2, Needed but not available.
(CIRCLE ONE ON EACH UNE)
Not Needed but Number of times used 12er semester needed not available 1-2 ~ §:1Q 11 +
a Overhead projector .............................. 2 3 4 5 6 b. Videotape player .................................. 2 3 4 5 6
c. Videodisc player .................................. 2 3 4 5 6
d. CD-ROM player .................................... 2 3 4 5 6
e. Four function calculators ..................... 2 3 4 5 6
f. Fraction calculators ····························· 2 3 4 5 6
g. Graphing calculators . .......................... 2 3 4 5 6
h. Scientific calculators ............................ 2 3 4 5 6
i. Computers ··········································· 2 3 4 5 6
j. Computer flab interfacing devices ....... 2 3 4 5 6
28. How much of your own money do you estimate you will spend for supplies for this mathematics class this year?
$ _____ _
13

29. How much control do you have over each of the following for this mathematics class?
30.
a b.
c.
d.
e. f.
g. h. i.
a
(CIRCLE ONE ON EACH UNE.)
No Strong control control
Determining goals and objectives ................................................... . 2 3 4 5
Selecting textbooks ..••...........•.••...•......•......•...........•..•...................... 2 3 4 5 Selecting other instructional materials ............................................ . 2 3 4 5
Selecting content, topics, and skills to be taught ....................•....... 2 3 4 5
Selecting the sequence in which topics are covered ................... ... 2 3 4 5
Setting the pace for covering topics ....................•........................... 2 3 4 5
Selecting teaching techniques ......................•.......••...............•......... 2 3 4 5
Determining the amount of homework to be assigned .................. . 2 3 4 5 Choosing criteria for grading students ............................................ . 2 3 4 5
Are you using one or more commercially published textbooks or programs for teaching mathematics to this class?
Yes.................................................................... (CONTINUE WITH 30.b.)
No...................................................................... 2 (SKiP TO 32.)
b. Indicate the publisher of the ~ textbook/program used most often by students in this mathematics class. (CIRCLE ONE.)
Addison-Wesley ............................................... . Allyn & Bacon ................................................... 2 Amsco ............................................................... 3 Delta Education ................................................ 4 Ginn................................................................... 5 Glencoe .... :........................................................ 6 Globe................................................................. 7 Harcourt, Brace, & Jovanovich ........................ 8 Harper & Row ................................................... 9 D.C. Heath ......................................................... 10 Holt, Rinehart, Winston ..................................... 11 Houghton Mifflin ............................................... 12
Kendall Hunt ..................................................... 13 Laidlaw Brothers ............................................... 14 Little, Brown ...................................................... 15 Macmillan .......................................................... 16 McGraw Hill ....................................................... 17 Merrill ................................................................. 18 Prentice Hall ...................................................... 19 Scott, Foresman ............................................... 20 Silver, Burdett, & Ginn ...................................... 21 Wiley .................................................................. 22
Other (PLEASE SPECIFY) ............................... 23
31. What is the title, author, publication year, and edition of this textbook/program?
Title ----------------------------------------------------------------First Author --------------- Publication Year ---- Edition -----
14

32. Approximately what percentage of this textbook/program will you cover in this course? {CIRCLE ONE.)
Less than 25 percent ........................................ 1 25 - 49 percent.................................................. 2 50- 74 percent.................................................. 3 75 - 90 percent.................................................. 4 More than 90 percent....................................... 5
33. How would you rate the overall quality of this textbook/program? (CIRCLE ONE.)
Very Poor ......................................................... . Poor................................................................... 2 Fair ................................................................... 3
Good................................................................. 4 VeryGood......................................................... 5 Excellent............................................................ 6
34. How much homework do you assign in this mathematical class in a typical week? (CIRCLE ONE.)
0 - 30 minutes ................................................... 1 31 - 60 minutes ................................................. 2 61 - 90 minutes ................................................. 3 91 - 120 minutes............................................... 4 2-3 hours......................................................... 5 More than 3 hours............................................ 6
35. Indicate the importance you give to each of the following in setting grades for students in this mathematical class.
(CIRCLE ONE ON EACH UNE.)
Not Very important important
a Objective tests (e.g., multiple choice, true/false) ................................. .. 2 3 4
b. Essay tests ............................................................................................. .. 2 3 4
c. Hands-on/performance tasks ................................................................ . 2 3 4 d. Systematic observations of students .................................................... .. 2 3 4
e. Interviewing students about what they understand ............................... . 2 3 4 f. Homework assignments ........................................................................ .. 2 3 4
g. Behavior .................................................................................................. . 2 3 4 h. Effort ....................................................................................................... .. 2 3 4
i. Mathematics projects ............................................................................ .. 2 3 4
j. Class attendance .................................................................................... . 2 3 4 k. Contribution to small group work ........................................................... . 2 3 4
I. Participation in whole class discussion .................................................. . 2 3 4
m. Individual improvement or progress over past performance ................ . 2 3 4
15

SECTION D: YOUR MOST RECENT MATHEMATICS LESSON
Use your most recent mathematical lesson in this dass to answer the following questions. Do not be concerned if this lesson was not typical of instruction in this class.
36. a How many minutes were allocated to the most recent mathematical lesson?
37.
minutes ----b. Of these, how many minutes were spent on the following:
(1) Daily routines, interruptions, and other non-instructional activities
(2) Whole class lecture/discussions
(3) Individual students reading textbooks, completing worksheets, etc.
(4) Working with hands-onjmanipulative materials
(5) Non-manipulative small group work
TOTAL MINUTES
(SHOUW BE THE SAME AS 36.a.)
Which of the following activities took place during that mathematical lesson? APPLY.)
(CIRCLE ALL THAT
a Lecture ................................................................................................. .
b. Students completing textbook/worksheet problems.......................... 2
c. Students reading about mathematical................................................. 3
d. Students working in cooperative learning groups where the entire group receives a single grade................................... 4
e. Student use of calculators.................................................................... 5
f. Student use of computers.................................................................... 6
g. Student use of other technologies....................................................... 7
h. Test or quiz........................................................................................... 8
38. Did that lesson take place on the most recent day your school was in session? (CIRCLE ONE.)
Yes .................................................................. ..
No ...................................................................... 2
16

II SECTION E: BACKGROUND INFORMATION
39. Indicate your sex: (CIRCLE ONE.)
40. Are you: (CIRCLE ONE.)
41. In what year were you born?
Male ................................................................. ..
Female.............................................................. 2
White (not of Hispanic origin) .......................... .
Black (not of Hispanic origin)........................... 2
Hispanic............................................................ 3 (Mexican, Puerto Rican, Cuban, Central or South American, or other Hispanic cuHure or origin)
American Indian or Alaska Native.................... 4
Asian or Pacific Islander................................... 5
19
42. How many years have you taught prior to this school year?
___ YEARS
43. How many years have you taught mathematical prior to this school year?
___ YEARS
44. When did you complete this questionnaire?
MONTH DAY YEAR
Thank you for your assistance!
Please return the questionnaire to us in the postage-paid envelope:
1993 National Survey of Science and Mathematics Education cjo CODA 1400 Spring Street- Suite 150 Silver Spring, MD 20910
17
II

A. SCIENCE COURSES
CODE Course Category Grades 1 ·6
101 Science, Grade 1
102 Science, Grade 2
103 Science, Grade 3
104 Science, Grade 4
105 Science, Grade 5
106 Science, Grade 6 107 Other Elementary Science
CODE Course Category
114
115
116
117
118
119
120
121
122
123
124
125
126
127
128
129 130
Grades 9 ·12 Biology
1st Year
1st Year, Applied
2nd Year, AP
2nd Year, Advanced
2nd Year, Other
Chemistrv
1st Year
1st Year, Applied
2nd Year, AP
2nd Year, Advanced
Physics
1st Year
1st Year, Applied
2nd Year, AP 2nd Year, Advanced
Physical Science
Earth Science
Astronomy /Space Science *
Geology*
Meteorology *
LIST OF COURSE TITLES
CODE Course Category Grades 7 ~ 8
108
109
110
111
112
113
Ufe Science
Earth Science
Physical Science·
General Science
Coordinated Science: Includes content from more than one science discipline,
e.g., life and physical science, but keeps the disciplines separate.
Integrated Science: Includes science from various science disciplines, but blurs
the distinctions among them.
Sample Course Tttles
Biology I; General Biology; College Prep Biology; Regents Biology; Introductory Biology; BSCS I
Basic Biology; Applied Biology; ute Science; Biomedical Education; Animal Science; Horticulture; Biology
Science; Health Science; Nutrition; Man and Disease; Agriculture Science; Fundamentals of Biology
Advanced Placement Biology
Biology II; Advanced Biology; College Biology; Psychobiology; Physiology; Anatomy; Microbiology; Genetics;
Cell Biology; Embryology; Molecular Biology; Invertebrate/Vertebrate Biology; BSCS II
Zoology; Botany; Bio-Medical Careers; Field Biology; Marine Biology; Other Biological Sciences
Chemistry I; General Chemistry; Introductory Chemistry; Regents Chemistry
Applied Chemistry; Consumer Chemistry; Technical Chemistry; Practical Chemistry
Advanced Placement Chemistry
Chemistry II; Advanced Chemistry; College Chemistry; Organic Chemistry; Inorganic Chemistry;
Physical Chemistry; Biochemistry; Analytical Chemistry
Physics I; General Physics; Regents Physics; Introductory Physics
Applied Physics; Electronics; Radiation Physics; Practical Physics
Advanced Placement Physics
Physics II; Advanced Physics; College Physics; Nuclear Physics; Atomic Physics
Physical Science; Interaction of Matter and Energy; Applied Physical Science
* NOTE: A course that includes substantial content from
two or more of the earth sciences should be
listed under code 132, 133, 134, or 135.
131 Oceanography/Marine Science*
132 133
134
135
136 137
138
139
140
199
1st Year
1st Year, Applied
2nd Year, Advanced
Other Earth Science
Other Science
General Science
Environmental Science
Science, Technology,
Society
Coordinated Science
Integrated Science
Other Science
Earth Science; Earth/Space Science; Regents Earth Science
Applied Earth Science; Fundamentals of Earth Science; Soil Science
Advanced Earth Science; Earth Science II
General Science; Basic Science; Consumer Science; Introductory Science; Investigations In Science
Ecology, Environmental Science
Science, Technology, Society; Science and Society
Includes content from more than one science discipline, e.g., life and physical science, but keeps the
disciplines separate
Includes content from the various science disciplines, but blurs the distinctions among them.
Research Topics; science integrated with other disciplines, e.g., technology, engineering, mathematics.

B. MATHEMATICS COURSES
Course Category Sample Course T"rtles :
Grades 1 ·6 201 Mathematics, Grade 1
202 Mathematics, Grade 2
203 Mathematics, Grade 3
204 Mathematics, Grade 4
205 Mathematics, Grade 5
206 Mathematics, Grade 6 207 Other Elementary Mathematics
Grades 7-8 208 Remedial Math, 7
209 Math 7, Regular
210 Math 7, Accelerated
211 Remedial Math, 8 212 Math a. Regular
213 Math a. Enriched
214 Math, a, Algebra I
Grades 9 • 12 Review Mathematics
215 Level 1
216
217
21a
Level 2
Level 3
Level4
Informal Mathematics
219 Level 1
220 Level2
221 Level 3
Formal Mathematics
222 Level1
223 Level2
224 Level3
225 Level 4
226 Level 5
227 LevelS, AP
Other Mathematics
228 Probability and Statistics
Remedial Math 7
Math 7
Accelerated Math 7; Pre-Algebra; Introductory Algebra; Enriched Math 7; Transitional Math 7
Remedial Math 8 Math a Pre-Algebra: Accelerated Math a: Honors Math a: Transitional Math 8 Algebra I; Beginning Algebra: Elementary Algebra
General Math 1; Basic Math; Math 9; Developmental Math; High School Arithmetic; Comprehensive Math
Transitional Math
General Math 2; Vocational Math; Applied Math: Consumer Math; Technical Math: Business Math; Math 10
Career Math; Practical Math; Essential Math: Cultural Math
General Math 3; Math 11, Intermediate Math; Applied Math II General Math 4, Math 12
Pre-Algebra: Introductory Algebra; Basic Algebra; Applications: Algebra 1A; Non-College Algebra: Math A
Basic Geometry; Informal Geometry; Practical Geometry: Core Geometry
Basic Algebra 2; Mathematics of Consumer Economics
Algebra I; Elementary Algebra; Beginning Algebra: Unified Math 1: Integrated Math 1: Algebra 1 B: Math 8 Geometry; Plane Geometry; Solid Geometry; Integrated Math 2; Unified Math II; Math C
Algebra II, Intermediate Algebra; Algebra and Trigonometry: Algebra and Analytic Geometry; Integrated Math 3 Unified Math Ill
Algebra Ill; Trigonometry; Advanced Algebra; College Algebra: Pre-Calculus: Analytic/Advanced Geometry
Trigonometry and Analytic/Solid Geometry; Math Topics; Introduction to College Math; Number Theory Math IV; College Prep Senior Math; Elementary Functions; Finite Math; Numerical Analysis; DiscretE
Math
Calculus and Analytic Geometry; Calculus: Abstract Algebra; Differential Equations; Multivariate Calculus; Unea
Algebra; Theory of Equations; Vectors/Matrix Algebra; Math Analysis
Advanced Placement Calculus AS; Advanced Placement Calculus BC.
229 Mathematics integrated with other subjects
299 Other Mathematics

C. OTHER COURSES
CODE Course Category
301 Computer Science
302 Social StudiesjHistory
303 English/Language Arts/Reading
304 Business Education
305 Vocational Education
306 Technology Education
307 Foreign Language
308 Health/Physical Education
309 Art/Music/Drama
399 Other subject

ffi\GQ_)~[[UcQ]~~ ©
Pre-Survey Mailout
National Science Foundation Letter
Principal Letter
Fact Sheet
Information Needed Before the Survey

NATIONAL SCIENCE FOUNDATION 1800 G STREET, N.W.
WASHINGTON, D.C. 20550
Division of Research, Evaluation and Dissemination
January 1993
Dear Colleague:
The National Science Foundation (NSF) requests your participation in the 1993 National Survey of Science and Mathematics Education. NSF supports the development of curriculum materials, workshops for teachers, and a variety of other activities aimed at improving science and mathematics education. The 1993 Survey, third in a series begun in 1977, will provide information about current practices and teachers' perceptions of their needs. Your response will allow NSF to learn about important changes in teaching practices.
This study has been endorsed by the American Federation of Teachers, the National Catholic Education Association, the National Council of Teachers of Mathematics, the National Education Association, and the National Science Teachers Association.
Horizon Research, Inc. and CODA are conducting the survey for the National Science Foundation by the authority of the NSF Act of 1950 as amended. Participation in the survey is voluntary. Your response is very valuable because it represents the responses of many others. The information you provide will be kept strictly confidential and will be reported only in statistical summary form such as by grade level. No information identifying teachers, schools, districts or states will be released.
More details about your participation in the survey are contained in the accompanying letter. Thank you for your cooperation in this very important effort.
Sincerely,
-f(tf-~ Kenneth J. Travers Director Division of Research, Evaluation and Dissemination

1993 NATIONAL SURVEY OF SCIENCE AND MATHEMATICS EDUCATION
FACT SHEET
Overview
Approximately 1,250 schools in more than 950 school districts throughout the United States have been selected to participate in the 1993 National Survey of Science and Mathematics Education. The survey has been designed to collect information about science and mathematics education in grades K-12. It is being conducted by Horizon Research, Inc., under the direction of Dr. Iris R. Weiss. Data collection is the responsibility of CODA, Inc., in Silver Spring, Md. The study is supported by the National Science Foundation. The survey previously was conducted in 1977 and 1985.
Background and Purpose
The purpose of the survey is to provide the education community with accurate and current information about science and mathematics education and trends in the following areas.
Experience of Teachers:
• How many years of experience do today's science and mathematics teachers have? • What proportion of the science and mathematics teachers are minority? How has this changed since
1985? • What is the extent of out-of-field teaching in the nation's science and mathematics classes? • In what areas do science and mathematics teachers feel a need for additional assistance?
Course Offerings:
• What are the current course offerings? • How have offerings changed over the last 15 years? • How do course offerings relate to other factors, such as school size or community type?
Curriculum and Instruction:
• How much time is spent by teachers on science and mathematics in the elementary grades? • What are the teachers' objectives for science and mathematics instruction? • What textbooks are most commonly used?
Availability and Use of Eguipment:
• What types of equipment (e.g., calculators) are available and to what extent? • How are computers used for instruction?
The study has been coordinated with the data collection efforts of the Department of Education (including the National Assessment of Educational Progress, the National Educational Longitudinal Study, and the Schools and Staffing Surveys) to avoid unnecessary duplication.
How Schools Were Selected
A total of 1,250 schools were randomly selected, using the Quality Education Data (QED) database as a sampling frame. To ensure adequate representation for national and regional estimates, all schools in the country were stratified as follows before the sample was drawn:
• Grade span • Region of the country
(SEE OTIIER SIDE)

• Metropolitan status • Public versus private • Orshansky percentile
District superintendents were notified of the schools in their district selected for the survey. Approximately 6000 teachers will be selected for the survey from lists of mathematics and science teachers provided by school principals. On average, five teachers will be selected from each school.
Survey Schedule
The survey is being conducted according to the following schedule:
CSSO's notified District offices with sampled schools notified Mail to schools for list of teachers Mail questionnaires to sampled teachers Study results available
Survey Questionnaires
June 1992 June 1992 Sept. 1992 Jan.1993 Spring 1994
In January 1993, we will mail questionnaires for all sampled teachers and department beads to the individual the principal has designated as the survey coordinator for the school. The coordinator will be asked to distribute the questionnaires within the school.
Each sampled teacher will receive one of the following types of questionnaires:
• Elementary Science Teacher Questionnaire; • Elementary Mathematics Teacher Questionnaire; • Secondary Science Teacher Questionnaire; or • Secondary Mathematics Teacher Questionnaire.
Questionnaires will take about 25 minutes to complete. If the teacher has been categorized as a "mathematics and science" teacher, the assignment of questionnaire type will be randomized.
Also included in the packet will be a short questionnaire (10 minutes) for each department bead: the School Science Program Questionnaire and the School Mathematics Program Questionnaire.
Respondents who have any questions about items in the questionnaire can call us toll-free at 1-800-598-2888 for assistance. A postage-paid return envelope will be included with each questionnaire. Once the questionnaire is completed, the teacher may simply seal it and drop it in the mail.
Confidentiality
All survey data received by CODA will be kept strictly confidential and will be reported only in aggregate form, such as by grade level or region of the country. No information identifying individual districts, schools, or teachers will be released. No identifying information whatsoever will be included in the dataset.
In Appreciation for Participation
While every school and teacher's cooperation is important to obtain accurate results, participation is voluntary. To compensate participants for their time, the study has arranged to give each school a voucher to be used in purchasing science and mathematics education materials. The amount of the voucher will depend on the degree each school participates. Each school completing the teacher listing phase and program head questions will receive a $25 voucher. Additionally, $10 will be given for each responding teacher. At the conclusion of the study, each school will receive a copy of the results of the survey.

1993 NATIONAL SURVEY OF SCIENCE AND MATHEMATICS EDUCATION CODA, Inc. 1400 Spring Street, Suite 150 Silver Spring MD 20910 (800) 598-2888 (301) 588-0177
September 1, 1992
Dear Principal,
FAX: (301) 588-0417
The purpose of this letter is to inform you that your school has been selected for the 1993 National Survey of Science and Mathematics Education. A total of 1,250 public and private schools and 6,000 K-12 teachers throughout the United States will be involved in the 1993 survey. The survey is supported by the National Science Foundation and is the third in a series of national surveys of science and mathematics education (the others were in 1977 and 1985-86). The enclosed Fact Sheet provides more information.
The 1993 survey will help determine how well-prepared schools and teachers are for effective science and mathematics education, what would help them do a better job, and how the National Science Foundation can best use its resources and prestige to improve science and mathematics education. The survey is being conducted by Horizon Research, Inc., under the direction of Dr. Iris R. Weiss. Data collection is the responsibility of CODA, Inc., in Silver Spring, Maryland.
As explained in the enclosed Fact Sheet, the topics to be covered in this study include science and mathematics course offerings and enrollments, availability of facilities and equipment, instructional techniques, textbook usage, teacher background, and needs for inservice education. Information will be collected from selected teachers by printed questionnaire only -- no classroom visits will be involved. Data will be kept strictly confidential and will be reported only in aggregate form, such as by grade level. No individually identifying information will be released.
The survey has two stages.
1. At this time, we ask that you complete the enclosed booklet and return it to us in the enclosed postage-paid envelope. The booklet requests that you:
Part 1: Designate individuals, such as department heads, to receive the science and mathematics program questionnaires. We also request that you designate someone to serve as our contact point for the survey.
Part 2: List all teachers of science or mathematics at your school. Instructions for creating the list have been included in the booklet.
Part 3: Provide some basic background information about your school.
When all booklets have been received, CODA will draw a sample of teachers at each school. On average, we will sample five teachers for each school.

2. In January 1993, we will mail teacher questionnaires and the two program questionnaires to the attention of the individual you designated as our contact point. Teacher questionnaires will take an average of 20-30 minutes to complete. The science and mathematics program questionnaires will take about 10 minutes. Respondents will be asked to return questionnaires directly to us, using the postagepaid envelopes provided.
To compensate participants for their time, the study has arranged to give each school a voucher to be used in purchasing science and mathematics education materials, such as the NCTM's Curriculum and Education Standards, Project 2061's Science for All Americans, and NSTA's Scope, Sequence, and Coordination Content Core. (The amount of the voucher will depend on response rates, with each participating school receiving $25, plus $10 for each responding teacher.) In addition, each school will receive a copy of the results of the survey.
Your cooperation is greatly appreciated. Please return the completed booklet for your school within the next 10 days so that we can begin the teacher selection process. If you have any questions about any of the items in the booklet or the study in general, please call us tollfree at 1-800-598-2888. Ask for the Science and Mathematics Survey specialist.
Thank you for your cooperation.
Sincerely,
~~ . '·
.iaJsmith Data Collection Coordinator
JS:pr Enclosures

1993 NATIONAL SURVEY OF SCIENCE AND MATHEMATICS EDUCATION
INFORMATION NEEDED BEFORE THE SURVEY
LABEL
Please complete the following items in this booklet and return it to us in the enclosed envelope. There are three parts:
Part 1: Designation of department heads and school contact
Part 2: Names of science and mathematics teachers for sampling purposes
Part 3: School background information
Part 1: Designations
1. To whom should we address the School Science Program Questionnaire? This should be completed by the science department head or other staff member who is most knowledgeable about the science curriculum for all grades at your school. (The questionnaire takes about 10 minutes.)
Name of individual to receive Science Program Questionnaire
Title
2. To whom should we address the School Mathematics Program Questionnaire? This should be completed by the mathematics department head or other staff member most knowledgeable about the mathematics curriculum for all grades at your school. (The questionnaire takes about 10 minutes.)
Name of individual to receive Mathematics Program Questionnaire
Title
3. We would like you to designate someone to serve as our contact point at the school. (We will send all questionnaires to this person for distribution to teachers/department heads.)
Name of contact
Telephone number
1

Part 2: Listing of Science and Mathematics Teachers
Instructions
On the following sheets, please list every teacher in this school who is responsible for science and/or mathematics instruction. (While most schools will need only one sheet, three have been provided to accommodate extremely large schools.) We will use this list to randomly select a sample of approximately five teachers to receive questionnaires.
1. List all teachers who will be teaching science/mathematics at this school in the 1992 - 1993 school year. (If a teacher has been designated to receive the science or mathematics program questionnaire, the teacher should still be listed.)
2. Do not include teacher aides or teachers responsible only for special education, e.g., self-contained classes for the educable mentally handicapped or "pull-out" classes for remediation or enrichment of students who also receive science/mathematics instruction from the regular classroom teacher.
3. For each teacher you list, circle the grades or subjects taught.
• If the teacher has a self-contained class, such as in the elementary grades, circle the grade(s).
• If the teacher has classes that are not self-contained, circle .§.[! of the categories that apply for that teacher. (See the examples below.)
4. If you have a listing of teachers for this school, you may send that back instead. Please make sure the list includes all teachers of science and mathematics and provides the other information we will need (i.e., "grades taught" for teachers of selfcontained classes, subject categories for block and departmentalized teachers.)
5. If you have any questions, please call us toll-free at (800) 598-2888.
How to Categorize Science and Mathematics Classes
Here are some examples of science and mathematics courses in middle and high school grades, classified according to the four categories on the listing form:
High School Physics or Chemistry: Chemistry (1st year), Advanced Chemistry, Advanced Placement Chemistry, Physics I, Advanced Physics.
Other Science: Biology, Earth Science, Physical Science, Integrated Science, General Science.
High School Calculus or Advanced Math: Calculus, Pre-calculus, Algebra 3, Analytic Geometry, Trigonometry, Math IV, College Prep/Senior Math.
Other Math: General Math, Basic Math, Algebra I, Algebra 2, Geometry, Integrated Math I - Ill, Unified Math I - Ill.
For the purposes of this survey, the following are not considered science or mathematics courses: Computer Science, Health, Hygiene, Technology Education, Business.
2

Example of a Completed Teacher Listing Form
At the bottom of this page is an example of how the listing form would be completed for a K - 12 school with the teachers listed below. At this school, there are self-contained classes in grades K - 5, block teaching in grades 6- 8, and departmentalized teaching in grades 9- 12.
Teacher
Carol Linstrom Mary Wilson Lorraine Thomas Lucy Mathieu Allison Scott Sarah Anderson
Bill Madigan Karen Renwick
John Kilgore Louise Gaines Barney Kessel Lillian Foster Angela White Tom Lancer
Grade/Subject
Kindergarten, self-contained 1st grade, self-contained 2nd grade, self-contained 3rd grade, self-contained 3rd/4th grades combined, self-contained 5th grade, self-contained
6th grade block: science, social studies 6th grade block: math, english
basic algebra, geometry, general science trigonometry biology, physical science geometry, pre-calculus high school chemistry high school physics, earth science
PAGE1 SCIENCE AND MATHEMATICS TEACHERS AT THIS SCHOOL
Please Jist all teachers who teach science and/or mathematics at this school. For teachers who teach:
- Self-contained classes, circle each grade taught. - Classes that are not self-contained, circle each subject taught. (See examples.)
" OR " IF YOU NEED ASSISTANCE, CAU...; SELF-CONTAINED NOT SELF-CONTAINED
1-800-598-2888 (CIRCLE AU. SUBJECTS TAUGHT) MA1H
tngn tiCnOOI Htgnocnoo~
(CIRCLE ALL PhY*a caleulucor TEACHER NAME GRADES TAUGH1) ar Other Advanced Olbar
I First Last Chern! .try ~ Math Math
101 LQ..ro \ \.:,'11. .l I(K)_1 2 3 4 5 ' 7 I 1 2 3 4
02 ~V'\1 \.J\\~ov-. K (1) 2 3 4 5 ' 7 • 1 2 3 4
C3 L~rrrrd .... ~ '1\ ... - .. c. K 1 {D3 4 5 ' 7 I 1 2 3 4
~ Luc.." ""''~\~\~... K 1 2®4 5 e 7 I 1 2 3 4
ii AU·,~o"" S.urt-T- K 1 2G)(!)5 ' 7 I 1 2 3 4
Oi So.m. ~- K 1 2 3 4 (!)e 7 I 1 2 3 4
Ct! ~\\ \-.\rut. 1'1.. tl. V'\ K 1 2 3 4 5 ' 7 I 1 u) 3 4
Oi ~(C!..Y'\ fo • ..;.} 'r_ K 1 2 3 4 5 ' 7 I 1 2 3 (7)
~ :Soh~ t:. ·, \ ao'i"P K 1 2 3 4 5 ' 7 I 1 (2) 3 (4)
~0 .t!)u\!. e.. (..0.\~~ K 1 2 3 4 5 e 7 I 1 2 (3) ···-h ~ .......... c. t.P~~~ K 1 2 3 4 5 e 7 I 1 (2) 3 4 -:·:-.·:·
\\\·.t~....\. t2 fil~it.'("' K 1 2 3 4 5 ' 7 I 1 2 (3) (4) ··=·=···· ~ ... tt\o.. ~.~ K 1 2 3 4 5 ' 7 I _Gj_ 2 3 4 ,s ij To~ I o._.,. rP_v- K 1 2 3 4 5 e 7 I ( 1) (2) 3 4
t5 K 1 2 3 4 5 ' 7 I 1 2 3 4
3

PAGE1 SCIENCE AND MATHEMATICS TEACHERS AT THIS SCHOOL
Please list all teachers who teach science and/or mathematics at this school. For teachers who teach:
- Self-contained classes, circle each grade taught.
- Classes that are not self-contained, circle each subject taught. (See examples.)
.. OR .. IF YOU NEED ASSISTANCE, CALL: SELF-CONTAINED NOT SELF-CONTAINED 1-800-598-2888 (CIRCLE ALL SUBJECTS TAUGHl)
SCIENCE MATH High School High School
(CIRCLE ALL Physics Calculus or TEACHER NAME GRADES TAUGHl) or Other Advanced Other ,
* First Last Chemistry Science Math Math i ;
01 K 1 2 3 4 5 6 7 8 1 2 3 4 1 .. · 02 K 1 2 3 4 5 6 7 8 1 2 3 4
03 K 1 2 3 4 5 6 7 8 1 2 3 4
04 K , 2 3 4 5 6 7 8 , 2 3 4
05 K 1 2 3 4 5 6 7 8 , 2 3 4
06 K 1 2 3 4 5 6 7 8 1 2 3 4
07 K 1 2 3 4 5 6 7 8 1 2 3 4
68 K 1 2 3 4 5 6 7 8 1 2 3 4
09 K 1 2 3 4 5 6 7 8 1 2 3 4
10 K 1 2 3 4 5 6 7 8 1 2 3 4
11 K 1 2 3 4 5 6 7 8 1 2 3 4
12 K , 2 3 4 5 6 7 8 1 2 3 4
13 K 1 2 3 4 5 6 7 8 , 2 3 4
;l K 1 2 3 4 5 6 7 8 1 2 3 4
·~~· K 1 2 3 4 5 6 7 8 1 2 3 4
i~ K 1 2 3 4 5 6 7 8 , 2 3 4
17 K 1 2 3 4 5'6 7 8 1 2 3 4
18 K , 2 3 4 5 6 7 8 , 2 3 4
19 K 1 2 3 4 5 6 7 8 1 2 3 4
20 K 1 2 3 4 5 6 7 8 1 2 3 4
21 K 1 2 3 4 5 6 7 8 1 2 3 4 ·.·:···.·.
22 K 1 2 3 4 5 6 7 8 1 2 3 4
i§ K 1 2 3 4 5 6 7 8 1 2 3 4
·~~ K , 2 3 4 5 6 7 8 , 2 3 4 :-·:·
25 K 1 2 3 4 5 6 7 8 , 2 3 4
4

PAGE2 SCIENCE AND MATHEMATICS TEACHERS AT THIS SCHOOL (CONTINUED)
'f{ OR " IF YOU NEED ASSISTANCE, CALL: SELF-CONTAINED NOT SELF-CONTAINED
1-800-598-2888 (CIRCLE ALL SUBJECTS TAUGHT)
SCIENCE MATH
High School High School
(CIRCLE ALL Physics Calculus or
TEACHER NAME GRADES TAUGHT) or Other Advanced Other
II First Last Chemistry Science Math Math
126 K , 2 3 4 5 6 7 8 , 2 3 4
27 K , 2 3 4 5 6 7 8 , 2 3 4
28 K , 2 3 4 5 6 7 8 , 2 3 4
29 K , 2 3 4 5 6 7 8 , 2 3 4
30 K , 2 3 4 5 6 7 8 , 2 3 4
31 K 1 2 3 4 5 6 7 8 1 2 3 4 . '
32 K 1 2 3 4 5 6 7 8 1 2 3 4
33 K 1 2 3 4 5 6 7 8 1 2 3 4
34 K , 2 3 4 5 6 7 8 , 2 3 4
35 K , 2 3 4 5 6 7 8 , 2 3 4
36 K , 2 3 4 5 6 7 8 , 2 3 4
37 K 1 2 3 4 5 6 7 8 1 2 3 4
38 K 1 2 3 4 5 6 7 8 , 2 3 4
39 K 1 2 3 4 5 6 7 8 1 2 3 4
46 K 1 2 3 4 5 6 7 8 1 2 3 4
ur K 1 2 3 4 5 6 7 8 1 2 3 4
42 K 1 2 3 4 5 6 7 8 1 2 3 4
43 K 1 2 3 4 5 6 7 8 1 2 3 4
44 K 1 2 3 4 5 6 7 8 1 2 3 4
45 K 1 2 3 4 5 6 7 8 , 2 3 4
46 K , 2 3 4 5 6 7 8 , 2 3 4
47 K , 2 3 4 5 6 7 8 1 2 3 4
48 K , 2 3 4 5 6 7 8 1 2 3 4
4s K , 2 3 4 5 6 7 8 , 2 3 4
so K 1 2 3 4 5 6 7 8 , 2 3 4 ' sf K 1 2 3 4 5 6 7 8 , 2 3 4
52 K 1 2 3 4 5 6 7 8 1 2 3 4
53 K 1 2 3 4 5 6 7 8 1 2 3 4 :::::::::·· 54 K 1 2 3 4 5 6 7 8 , 2 3 4
·-·-
55 K 1 2 3 4 5 6 7 8 1 2 3 4
5

PAGE3 SCIENCE AND MATHEMATICS TEACHERS AT THIS SCHOOL (CONTINUED)
~ OR • IF YOU NEED ASSISTANCE, CALL: SELF-CONTAINED NOT SELF-CONTAINED
1-800-598-2888 (CIRCLE ALL SUBJECTS TAUGHT)
SCIENCE MATH High School High School
(CIRCLE ALL Physics calculus or
TEACHER NAME GRADES TAUGHT) or Other Advanced Other
II First Last Chemistry Science Math Math
58 K 1 2 3 4 5 6 7 8 1 2 3 4 <··.·.
57 K 1 2 3 4 5 6 7 8 1 2 3 4
58 K 1 2 3 4 5 6 7 8 1 2 3 4
59 K 1 2 3 4 5 6 7 8 1 2 3 4
60 K 1 2 3 4 5 6 7 8 1 2 3 4 •• 0·
61 K 1 2 3 4 5 6 7 8 1 2 3 4 1- 00·.
62 K 1 2 3 4 5 6 7 8 1 2 3 4
63 K 1 2 3 4 5 6 7 8 1 2 3 4 ·::::.:=:
64 K 1 2 3 4 5 6 7 8 1 2 3 4 . ;.·.:: ! . 65 K 1 2 3 4 5 6 7 8 1 2 3 4
66 K 1 2 3 4 5 6 7 8 1 2 3 4
67 K 1 2 3 4 5 6 7 8 1 2 3 4 I
68 K 1 2 3 4 5 6 7 8 1 2 3 4
69 K 1 2 3 4 5 6 7 8 1 2 3 4 r ....
70 K 1 2 3 4 5 6 7 8 1 2 3 4
71 K 1 2 3 4 5 6 7 8 1 2 3 4
72 K 1 2 3 4 5 6 7 8 1 2 3 4
73 K 1 2 3 4 5 6 7 8 1 2 3 4
74 K 1 2 3 4 5 6 7 8 1 2 3 4
75 K 1 2 3 4 5 6 7 8 1 2 3 4
76 K 1 2 3 4 5 6 7 8 1 2 3 4
77 K 1 2 3 4 5 6 7 8 1 2 3 4
7~ K 1 2 3 4 5 6 7 8 1 2 3 4
1§ K 1 2 3 4 5 6 7 8 1 2 3 4
80 K 1 2 3 4 5 6 7 8 1 2 3 4 =::::::.:·.
81 K 1 2 3 4 5 6 7 8 1 2 3 4 .~,
K 1 2 3 4 5 6 7 8 1 2 3 4
B3 K 1 2 3 4 5 6 7 8 1 2 3 4
84 K 1 2 3 4 5 6 7 8 1 2 3 4
85 K 1 2 3 4 5 6 7 8 1 2 3 4
6

Part 3: Background Information About this School
1 . How many K - 12 students are there in this school at the present time?
# K - 12 students
2. Indicate the grades included in this school. (Circle all that apply.)
K 1 2 3 4 5 6 7 8 9 10 11 12
3. Which of the following best describes the community in which this school is located? (Circle the best answer.)
a. A rural or farming community...................................................... 01
b. A small city or town of fewer than 50,000 that is not a suburb of a larger city .............................................. 02
c. A medium-sized city (50,000 to 100,000 people) .......................... 03
d. A suburb of a medium-sized city.................................................. 04
e. A large city (1 00,000 to 500,000 people).................................... 05
f. A suburb of a large city.............................................................. 06
g. A very large city (over 500,000 people) ....................................... 07
h. A suburb of a very large city .... .... .. ............. ............... ...... .. .... .. .. . 08
i. A military base or station............................................................ 09
j. An Indian reservation.................................................................. 10
4. Does this school provide Chapter 1 services under the Elementary and Secondary Education Act as amended {i.e., federal funds for the special educational needs of disadvantaged children)?
YES NO
1 ---- > 2
IF YES: How many K -12 students are served? ------
5. Are any of the students in this school eligible for free or reduced price lunches that are paid for with public funds (e.g., Federal government or other government)?
YES NO
.............. 1---> 2
IF YES: How many K - 12 students receive free or reduced price lunches? _____ _
7

6. Approximately what percentage of the students attending this school are children of: (Round to nearest percent.)
a. Professional or managerial personnel %
b. Sales, clerical, technical, or skilled workers %
c. Factory or other blue collar workers %
d. Farm workers %
e. Persons not regularly employed %
f. Persons on welfare %
TOTAL 100 %
7. Approximately what percentage of the students attending this school are: (Round to nearest one-tenth percent.)
a. White (not of Hispanic origin)
b. Black (not of Hispanic origin)
c. Hispanic, regardless of race
(Mexican, Puerto Rican, Cuban, Central or South American, or other Hispanic culture or origin)
d. American Indian or Alaskan Native
e. Asian or Pacific Islander
TOTAL
8. Who completed this booklet:
a. Name:
b. Title:
c. Phone:
100 %
PLEASE RETURN THIS BOOKLET TO CODA IN THE ENVELOPE PROVIDED.
QUESTIONNAIRES WILL BE MAILED TO YOUR SCHOOL IN JANUARY, 1993.
THANK YOU FOR YOUR ASSISTANCE
CODA, Inc. 1400 Spring St. - Suite 1 50 Silver Spring, MD 2091 0
8
%
%
%
%
%

£[?J~cru(Q]~lZ [Q)
Description of Data Collection

Description of Data Collection
A. Advance Notification
On May 12, 1992, the Principal Investigator and staff members from CODA, and the data collection subcontractor, met with the Council of Chief State School Officer's Subcommittee on Statistics, the Education Information Advisory Committee (EIAC). The proposed study and survey instruments received a favorable review. Notification letters were mailed to the Chief State School Officers on June 1, 1992. The letters advised the CSSOs of the format and schedule of the study and identified the schools in their states that had been sampled for the survey.
Two weeks later similar information letters were mailed to superintendents of districts in which sampled public schools were located. Letters also were sent to diocesan education offices for the Catholic schools sampled. District officials were asked to contact CODA if they had any questions or concerns, if any sampled schools had closed, or if school address information was incorrect. In response to this mailing, CODA learned about several closed schools and address changes. A total of seven districts refused, accounting for 11 sampled schools. Eight districts required us to submit to an approval process, which usually involved sending an abstract describing the study and submitting samples of the survey instruments.
New York City (NYC), in particular, had a very long approval process. Materials were submitted to the Office of Evaluation, Research and Assessment (OERA). After OERA had granted approval to conduct research, approval forms had to be signed by principals of participating schools and district superintendents. These trickled .in over the several months of the data collection period. In several cases sub-districts within the NYC school system also had their own approval process which required the submission of survey materials.
B. Pre-Survey
During the first week in September 1992, pre-survey packets were sent to the principals of each sampled school which had not refused at the district level. Based on information obtained during the initial district contact, packets for a few schools were directed to school district officials, who then forwarded them to the schools.
The pre-survey packet consisted of a cover letter from CODA, a fact sheet about the survey, and an eight-page pre-survey booklet. The booklet was designed to obtain the following information from the school principal, or someone designated by the principal:
" The names of the heads of the science and mathematics departments or, if there were no official departments, individuals who were knowledgeable enough about
the science and mathematics programs at their school to fill out Program questionnaires;
... The name of a person to act as our contact point for the survey;
... Names of those who taught science and mathematics at the school; and
... Key characteristics about the school and the population it served which would be useful during the analysis. These were: number of students, grades included in· school, community size description, Chapter 1 status, number of students receiving free or reduced price lunches, percentage breakdown of parents' occupational categories, and racial/ethnic breakdown of school population.
As an incentive for schools to participate, schools were offered a voucher redeemable at the end of the year for instructional materials. Schools which completed the pre-survey form were credited $25. (Later, during the questionnaire phase of the study, the value of the voucher increased by $10 for each completed teacher questionnaire and $5 for each completed Program questionnaire.)
Principals from non-responding schools were sent prompting postcards three weeks after the initial mailing. A week later telephone prompts followed to those still not responding. It generally required a series of telephone calls to determine whether anyone had received the pre-survey, to whom the task had been delegated, and whether or not that person was planning to complete it. In many cases, schools requested a remail of the survey materials. For some of the smaller schools, prompters were able to complete the survey form over the telephone. All schools were offered the option to send in teacher "codes" rather than actual teacher names, thereby preserving the anonymity of the respondents. Only two principals exercised this option.
A few school officials directly refused to participate at this stage, citing that the current state of school funding or low teacher salaries would not permit this additional burden. When this occurred, telephone prompters did not attempt to change the respondent's mind. Instead, after a five-day "cool down" period, CODA sent personalized letters which addressed the particular concerns given by the school. If a completed pre-survey was not received soon thereafter, a follow-up telephone call was made. While this method was effective in some cases, most direct refusers were fairly unyielding in their original decision.
Table 1 summarizes the results of the pre-survey by stratum. A total of 18 schools were identified as ineligible. Completed pre-survey forms were received from 1 ,098 of the remaining 1,234 schools for an overall response rate of 89.1 percent.
D-2

Table 1 Results of Pre-Surveys by Stratum
I I Stratum 1 I Stratum 2 . I Stratum 3 I TOTAL
TOTAL SURVEYS 660 299 293 1,252
Completed 581 276 241 1,098
Response Rate 89% 93'71: 85% 899c:
Ineligible 8 1 9 18 Closed 4 1 1 6 Pre-K, K Only 0 0 7 7 Sampled Twice 1 0 1 2 Home School 1 0 0 I Job Corps Center 1 0 0 1 School Does Not Exist I 0 0 I
Non-Response 71 22 43 136 District Level 4 2 5 II School Level 67 20 38 125
Upon receipt, CODA staff reviewed the pre-survey booklets carefully to ensure that school staff had provided the information needed for sampling teachers. In particular, the following checks were made:
~ The address was the same as that found on the original sampling frame (QED);
... The school's enrollment (by grade) was consistent with that reported by QED; and
~ The number of teachers listed was consistent with the reported enrollment.
Discrepancies in this information were resolved by a call to the local contact.
Of all the problems detected by this review, a discrepancy between QED's grade range and that reported by the school was the most common. This problem can be illustrated by two examples:
1. Wilson Middle School (grades 7-8) and Wilson High School (grades 9-12) are listed separately in the QED sampling frame. Only the middle school, however, is sampled for the survey. The pre-survey form contains information for grades 7-12. To resolve this problem, CODA re-contacted the school and clarified which information pertained only to the middle school.
2. The converse of this situation occurred as well. For example, if the sampled entity from QED was Wilson School, grades 7-12, but the school provided information
D-3
I

only for the middle school, CODA re-contacted the school and requested additional information (i.e. enrollment, teacher names, and background data) for the high school.
In general, schools were asked to report information in a manner consistent with the way QED reported the grade range. If this was not possible because the QED file was in error or there had been a reorganization at the school, the school's revised grade range was used. In a few cases, the new grade range created a change in school stratum. A list of schools changing stratum as a result of corrected grade ranges was maintained and the appropriate adjustments were made to the base sample weights.
The pre-survey resulted in a file of 16,776 teachers. From this frame, a sample of 6,120 science and mathematics teachers was drawn. The number of teachers sampled per school ranged from 1 to 65.1
Teachers were actually sampled in two separate sample draws in order that late responders to
the pre-survey would not hold up the main data collection effort. The first sample, consisting of 16,733 teachers, was drawn in January 1993 and included teachers from 1,055 schools. The second selection was made in March 1993. This draw resulted in a sample 186 teachers from 43 schools.
C. Teacher Survey
During the week of February 8, 1993, CODA staff mailed packets of teacher and program head questionnaires by priority mail to local contacts. (Packets were mailed to the second group of schools during the week of March 22, 1993.) When requested, the packets were sent to district officials. The packets contained:
.. Cover letters from CODA and from Kenneth Travers, Director, Division of Research, Evaluation and Dissemination, National Science Foundation.
.. A catalog of school supplies available through the redemption of the incentive voucher.
.. A School Summary Sheet. This sheet listed the school name, address, ID number, grade range, local contact, program heads, sampled teachers and their subjects, and the potential value of the school's incentive voucher. It provided an area for the local contact to keep track of which individuals had responded to the survey.
.. Individual sealed envelopes for each sampled teacher, the science program representative, and the mathematics program representative. Each packet contained:
• Cover letters from CODA and Kenneth Travers of the National Science Foundation.
D-4

• The appropriate version of the questionnaire. The cover of each questionnaire also contained a label identifying the particular class the teacher should consider when answering Sections C and D of the questionnaire.
• List of course codes.
• A postage-paid return envelope.
Many of the individuals designated to respond for the program questionnaires were teachers and, consequently, had been randomly sampled as teachers as well. While these individuals received copies of both questionnaires, they were given a special cover letter which explained why both questionnaires had been included in the packet. The letter alerted these respondents that a number of questions in the program questionnaire could be skipped because they were identical to questions in the teacher questionnaire.
The 1993 National Survey of Science and Mathematics Education was endorsed by the following groups:
.,. American Federation of Teachers,
.,. National Catholic Education Association,
.,. National Council of Teachers of Mathematics,
.,. National Education Association, and
.,. National Science Teachers Association.
The endorsements were noted on the covers of the questionnaires. Copies of the letters of endorsement were sent to districts, schools and teachers when a reluctance to participate was encountered.
D. Presidential A ward Winners
In conjunction with the I993 National Survey of Science and Mathematics Education, I ,390 winners of the Presidential Awards for Excellence in the Teaching of Science and Mathematics (from the years 1983 to I992) were mailed copies of the same versions of the science and mathematics questionnaires. Awardees were not offered any incentive for taking part in the survey. A small number of awardees had also been sampled as part of the main study. These individuals were sent only one copy of the questionnaire, but the resulting data were included in both datasets. A total of I, I27 out of 1,377 eligible Presidential Awardees completed questionnaires, yielding an overall response rate of 81.8 percent.
D-5

E. Prompting Respondents
A series of steps was taken to increase the response rate. Four weeks after the first mail-out, teachers and program heads who had not responded were sent a postcard reminder. If no responses had been received from the school, the local contact was called to ensure that the packet had arrived and its contents had been distributed. As a result of this call, remails were made to a number of schools.
In April, new packets of survey materials were remailed directly to all remaining nonrespondents. The cover letter emphasized that the end of the data collection period was approaching and that participation would increase the total voucher amount for the school. This mailout was followed by another series of telephone prompts to the individual teachers and program heads. When contact could not be made, prompters left a toll-free number for the teacher to call.
Telephone prompting resulted in a significant number of remails to sampled teachers. While in a few cases the local contact either misplaced the materials or never distributed them, in most other cases it was a matter of the teacher discarding the survey materials or losing them among other paperwork.
Periodically, local school contacts were sent updated school summary sheets, indicating which teachers had returned completed questionnaires. The summary sheet also showed the current value of the school supply voucher vs. the expected value if all sampled teachers and department heads returned questionnaires.
Cases classified as temporary refusals were sent new copies of questionnaires and support material with personalized cover letters and copies of letters from educational organizations that had endorsed the survey. If a questionnaire was not received within 10 days, office staff called the school and tried to speak directly to the teacher to find out if s/he had received the packet and would be participating. If it was not possible to reach the teacher, the caller would leave a message, asking the teacher to call CODA's toll-free "800" number. A log was kept of all incoming calls on the toll-free line.
D-6

F. Response Rates
A total of 5,026 out of 5,990 eligible teachers took part in the survey; the response rate was 84 (83.91) percent. Completed program questionnaires were received from 1,940 out of the 2,196 possible, for a response rate of 88 (88.34) percent. Tables 2 and 3 provide response rate breakdowns for program heads and teachers, respectively.
Table 2 Results of Program Questionnaires, by Stratum and Subject
Sampled Non-Response Ineligible Completed Response Rate
Stratum 1 1,162 146 0 1,016 87% Science 581 0 0 508 87'k Mathematics 58! 0 0 508 87"ll:
Stratum 2 552 58 0 494 90% Science 276 32 0 244 889( Mathematics 276 26 0 250 91 o/r
Stratum 3 482 52 0 430 89% Science 241 31 0 210 87% Mathematics 241 21 0 220 91%
TOTAL 2,196 256 0 1,940 88o/c
Table 3 Results of Teacher Questionnaires, by Stratum and Subject
Sampled Non-Response Ineligible Completed Response Rate
Stratum 1 3,034 502 49 2,483 84% Science 1,509 254 23 1,232 83o/c: Mathematics 1,525 248 26 1,251 84%
Stratum 2 1,555 260 40 1,255 83% Science 775 128 20 627 84o/c: Mathematics 780 132 20 628 83%
Stratum 3 1,531 202 41 1,288 87% Science 756 96 23 637 87o/c Mathematics 775 106 18 651 86%
TOTAL 6,120 964 130 5,026 84%
D-7

G. Data Retrieval
Survey respondents did not always complete all items in the questionnaire data. A set of guidelines was developed to determine the course of action for varying degrees of missing data. For the pre-survey, two levels of data retrieval were established, Level 1 and Level 2. Level 1 items were those considered crucial for verifying the correctness of the school sampling and the completeness of the teacher and program head sampling frame. Specifically, these items included:
.... School grade range;
.... Number of students;
.... Names of teachers with either their subject area or the grade number of the self-contained class they taught;
.... Names of science and mathematics program representatives; and
.... Name of local contact.
Level 1 items were retrieved immediately.
Level 2 items were defined as those which did not impact the second phase of data collection. Included were:
.... Type of community;
.... Number of children receiving Chapter I services;
.... Number of children receiving free or reduced-price lunches;
.... Percentage of students whose parents fell into various occupational categories: and
.... Percentage of students of various racial/ethnic groups.
These items were usually retrieved easily from the local contact during the second phase of the data collection. Information about a school's ethnic breakdown and the percentage of parents in certain occupational categories was less readily available. Near the end of the teacher data collection period, a mailout was made to schools not responding to these questions, asking them to give us their best estimates of the percentages in each category.
D-8

Data retrieval was also conducted when information was missing from the program or teacher questionnaires. The following items were data-retrieved for the program questionnaires:
... Missed pages;
... Unclear or missing information for school course offerings;
... Reported grade ranges discrepant with school grade ranges; and
"' Designation of mathematics or science courses that students of low, average and high ability would be likely to take in their first year at the school.
For the teacher questionnaire, the following items were data-retrieved:
... Missing pages or sections
... Incomplete textbook titles
... Teacher's class load (or breakdown of time spent on various subjects for teachers in self-contained classrooms). Discrepancies between the infonnation in this item and the information about a particular class were resolved by data retrieval after the pre-survey information was consulted for possible useful information.
... The size of the class randomly sampled for Sections C and D of the questionnaire.
Because individual teachers were difficult to reach by telephone, those whose questionnaires required data retrieval were first sent forms on which they could check off the conect information or clarify their answers. In some cases it was possible to obtain information about the number of classes taught, course names, and class sizes from school office staff.
H. File Preparation
Completed questionnaires were recorded in CODA's receipt system and given a temporary batch number. Next they were routed to editing and coding. Manual edits were used to identify missing information and obvious out-of-range answers, to identify and, if possible, resolve multiple answers, and to make several consistency checks. For example, if a teacher indicated that s/he was responding for a specific class in seventh grade pre-algebra, the editor would check that the course was in the teacher's list of courses and that the teacher indicated seventh graders among the classes of students that s/he taught.
As questionnaires were processed, codes were created for open-ended questions. Many of the answers needing special codes on both the teacher and program questionnaires involved length of class period, the number of times a class met, and the duration of a course. For
D-9

instance, many schools are experimenting with varying blocks of instruction time and with rotating schedules. These schools did not fit easily into pre-coded answers about the length of a class period and the number of times a week a class was offered.
Questionnaires requiring data retrieval were turned over to appropriate staff for follow-up. Those that were completely coded were given a final batch number and sent to a data entry firm to be keyed. When the keyed data were returned, they were run by batch through a machine-edit program, which checked for missing data, out-of-range answers, adherence to skip patterns, and logical inconsistencies. Corrections were made in the keyed data and on the hardcopy questionnaires.
After the individual batches of questionnaires had been machine-edited, corrected, and, if necessary, flagged for unresolvable problems, frequencies and cross-tabulations were run on each dataset to detect any inconsistencies not captured by the edit program. At the conclusion of this process, the following datasets were delivered to Horizon Research, Inc.:
... A file containing pre-survey data, receipt system information, and QED background information;
... Science program data;
... Mathematics program data;
... Science teacher data;
... Mathematics teacher data;
... Teacher file with receipt system information and background data from QED;
... Presidential Awardee science teacher data;
... Presidential Awardee mathematics teacher data; and
... Presidential Awardee receipt system.
The teacher sampling algorithm resulted in no teachers sampled in 13 small schools. For these schools, one teacher per school was randomly selected with certainty.
D-10

LA\[rQJ~cru(Q]nJZ §
Description of Reporting Variables

Description of Reporting Variables
A. Region
Each sample school and teacher was classified as belonging to one of four census regions.
.. Midwest: IA, IL, IN, KS, MI, MN, MO, ND, NE, OH, SD, WI
.. Northeast: CT, MA, ME, NH, NJ, NY, PA, RI, VT
.. South: AL, AR, DC, DE, FL, GA, KY, LA, MD, MS, NC, SC, TN, VA, WV
.. West: AK, AZ, CA, CO, HI, ID, MT, NM, NV, OK, OR, TX, UT, WA, WY
B. Type of Community
Each sample school and teacher was classified as belonging to one of three types of communities.
.. Urban: Central city
.. Suburban: Area surrounding central city, but still located within the counties constituting a Metropolitan Statistical Area (MSA)
.. Rural: Area outside any MSA
C. Grade Range
Teachers were classified by grade range according to the information they provided about their teaching schedule. Most of the analyses in this report used the grade ranges 1-4, 5-8, and 9-12; a teacher who taught classes in more than one grade range was included in both. In contrast, each class was categorized as either grades 1-4, 5-8, or 9-12 based on the grade range information provided by the teacher.
D. Teach Advanced High School Mathematics
High school mathematics teachers who are assigned to teach Algebra II, Algebra III, PreCalculus, and/or CaJculus were categorized as teaching "advanced" high school mathematics.

Bibliography
American Association for the Advancement of Science. Benchmarks for Science Literacy: Project 2061. New York, NY: Oxford University Press, 1993.
American Association for the Advancement of Science. Science for All Americans: A Project 2061 Report on Literacy Goals in Science, Mathematics, and Technology. Washington, DC: American Association for the Advancement of Science, 1989.
Madaus, G.F., West, M.M., Harmon, M.C., Lomax, R.G., and Viator, K.A. The Impact of Mandated Standardized Testing on Minority Students. Chestnut Hill, MA: Center for the Study of Testing, Evaluation, and Educational Policy, Boston College, 1992.
National Council of Teachers of Mathematics. Curriculum and Evaluation Standards for School Mathematics. Reston, VA: National Council of Teachers of Mathematics, 1989.
National Council of Teachers of Mathematics. Professional Standards for Teaching Mathematics. Reston, VA: National Council of Teachers of Mathematics, 1991.
National Research Council. "National Science Education Standards: Progress Report." Washington, DC: National Research Council, 1993.
National Research Council. "National Science Education Standards: Discussion Summary." Washington, DC: National Research Council, 1994.
National Research Council. National Science Education Standards. Washington, DC: National Research Council, Draft, November 1994.
National Science Teachers Association. Scope, Sequence and Coordination of Secondmy School Science: The Content Core, A Guide for Curriculum Designers, Volume I. Washington, DC: National Science Teachers Association, 1992.
Oakes, J., Orrnseth, T., Bell, R., and Camp, P. Multiplying Inequalities: The Effects of Race, Social Class, and Tracking on Opportunities to Learn Mathematics and Science. Santa Monica, CA: RAND Corporation, 1990.
Weiss, I.R. Report of the 1985-86 National Survey of Science and Mathematics Education. Research Triangle Park, NC: Research Triangle Institute, 1987.
Weiss, I. R. Report of the 1977 National Survey of Science, Mathematics, and Social Studies Education. Research Triangle Park, NC: Research Triangle Institute, 1978.