Religion and Childhood Death in India
45
THE CENTRE FOR MARKET AND PUBLIC ORGANISATION The Centre for Market and Public Organisation (CMPO) is a leading research centre, combining expertise in economics, geography and law. Our objective is to study the intersection between the public and private sectors of the economy, and in particular to understand the right way to organise and deliver public services. The Centre aims to develop research, contribute to the public debate and inform policy-making. CMPO, now an ESRC Research Centre was established in 1998 with two large grants from The Leverhulme Trust. In 2004 we were awarded ESRC Research Centre status, and CMPO now combines core funding from both the ESRC and the Trust. Centre for Market and Public Organisation Bristol Institute of Public Affairs University of Bristol 2 Priory Road Bristol BS8 1TX http://www.bris.ac.uk/Depts/CMPO/ Tel: (0117) 33 10799 Fax: (0117) 33 10705 E-mail: [email protected] Religion and Childhood Death in India Sonia Bhalotra, Christine Valente and Arthur van Soest January 2008 Working Paper No. 08/185 ISSN 1473-625X
Transcript of Religion and Childhood Death in India
THE CENTRE FOR MARKET AND PUBLIC ORGANISATION
The Centre for Market and Public Organisation (CMPO) is a leading research centre, combining expertise in economics, geography and law. Our objective is to study the intersection between the public and private sectors of the economy, and in particular to understand the right way to organise and deliver public services. The Centre aims to develop research, contribute to the public debate and inform policy-making. CMPO, now an ESRC Research Centre was established in 1998 with two large grants from The Leverhulme Trust. In 2004 we were awarded ESRC Research Centre status, and CMPO now combines core funding from both the ESRC and the Trust.
Centre for Market and Public Organisation Bristol Institute of Public Affairs
University of Bristol 2 Priory Road
Bristol BS8 1TX http://www.bris.ac.uk/Depts/CMPO/ Tel: (0117) 33 10799
Fax: (0117) 33 10705 E-mail: [email protected]
Religion and Childhood Death in India
Sonia Bhalotra, Christine Valente and Arthur van Soest
January 2008
Working Paper No. 08/185
ISSN 1473-625X
CMPO Working Paper Series No. 08/185
CMPO is jointly funded by the Leverhulme Trust and the ESRC
Religion and Childhood Death in India
Sonia Bhalotra1, Christine Valente1
and Arthur van Soest2
1 CMPO, University of Bristol, UK 2 University of Tilsburg
January 2008 Forthcoming in A.Sharif and R.Basant (eds.), Handbook of Muslims in India, Oxford University Press
Abstract Muslim children in India face substantially lower mortality risks than Hindu children. This is surprising because one would have expected just the opposite: Muslims have, on average, lower socio-economic status, higher fertility, shorter birth-spacing, and are a minority group in India that may be expected to live in areas that have relatively poor public provision. Although higher fertility amongst Muslims as compared with Hindus has excited considerable political and academic attention in India, higher mortality amongst Hindus has gone largely unnoticed. This paper considers this seeming puzzle in depth. Keywords: religion, child mortality, Muslim, Hindu, India JEL Classification: I12, O12, J13
Electronic version: http://www.bris.ac.uk/Depts/CMPO/workingpapers/wp185.pdf
Acknowledgements We acknowledge the support of a research award from ESRC-DFID, Grant Number RES-167-25-0236. Address for Correspondence CMPO, Bristol Institute of Public Affairs University of Bristol 2 Priory Road Bristol BS8 1TX [email protected] www.bris.ac.uk/Depts/CMPO/
2
Religion and Childhood Death in India
Sonia Bhalotra, Christine Valente and Arthur van Soest
1. Introduction
Motivation
In his keynote address at the annual conference of the European Society of Population
Economics in 2005, Timothy Guinnane argued that religion explains much of the variation
across Europe in the timing of the fertility transition; in particular, religion effects seem to
dominate the effects of women’s education. He speaks of the extent to which culture effects
are compositional as a “remaining puzzle”. He states that “this may be an uncomfortable fact
for economists”, but “religion really matters”. Although there is a recent surge of interest
amongst economists in ethnicity effects, especially in education (e.g. Fryer and Levitt 2004,
Wilson et al 2005), there remains limited research on religion effects in economics, and
especially so in the area of health.
The analysis in this paper is motivated by the observation that Muslim children in
India face lower mortality risk than Hindu children. This is puzzling because knowledge of
religion-differences in the predictors of mortality risk suggests that the opposite should be the
case. In particular, Muslims have, on average, lower socio-economic status, higher fertility
and shorter birth intervals, and they are thought to accord a lower status to women within the
household. 1 Moreover, as they are a minority group in India, we may expect that the areas in
which they are concentrated receive relatively poor public services. Although higher fertility
amongst Muslims as compared with Hindus has excited considerable political and academic
attention in India, higher mortality amongst Hindus has gone largely unnoticed and there
appears to be no previous research that has set out to explain it. Indeed, the only multivariate
analysis that we are aware of appears in our earlier work (Bhalotra and van Soest 2007).
Using data from the state of Uttar Pradesh, where about 17% of the population is Muslim, we
find that Muslim-status is associated with a 1.6%-point reduction in neonatal mortality. This
is a remarkably large fixed religion effect, obtained after controlling for a rich set of
covariates (birth-spacing, the survival status of the previous sibling, maternal age at birth,
education of the mother and father, caste, the gender and birth-order of the child, and the
child’s cohort) and mother and village level unobserved heterogeneity.
.
1 There is considerable evidence that, when mothers have greater power in the household or the community, children benefit in terms of their health and education (e.g. Thomas 1990).
3
Framework
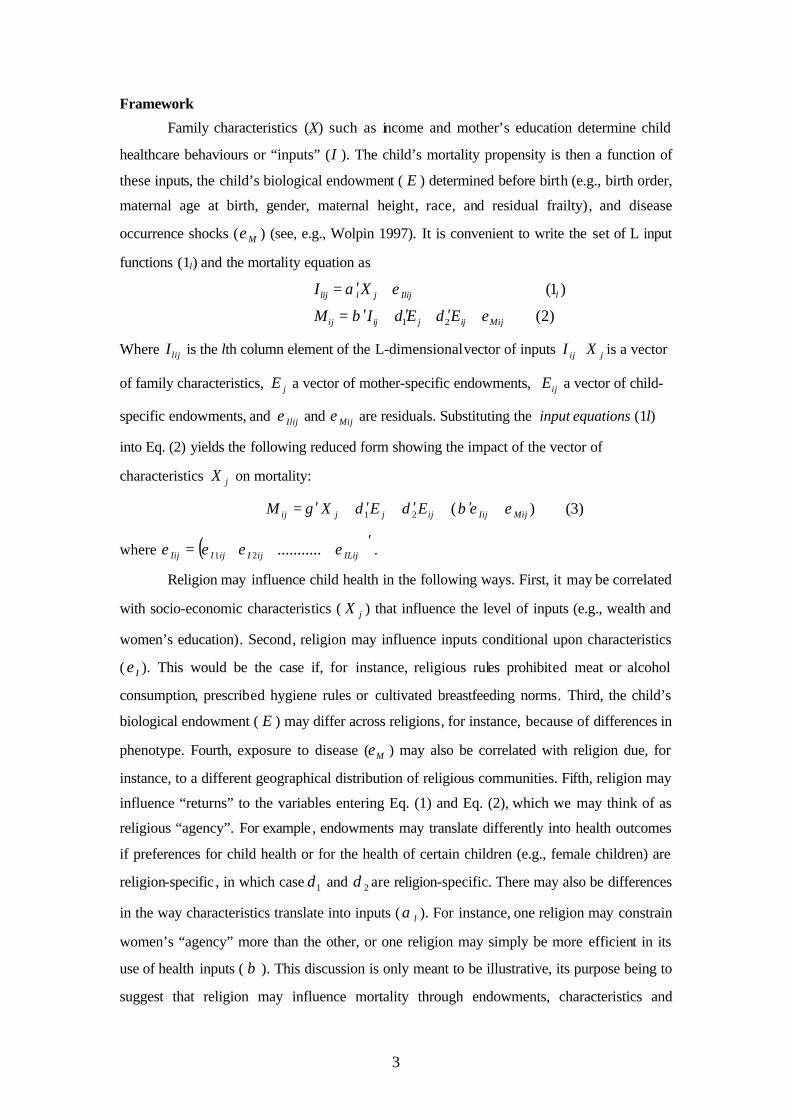
Family characteristics (X) such as income and mother’s education determine child
healthcare behaviours or “inputs” (I ). The child’s mortality propensity is then a function of
these inputs, the child’s biological endowment ( E ) determined before birth (e.g., birth order,
maternal age at birth, gender, maternal height, race, and residual frailty), and disease
occurrence shocks ( Mε ) (see, e.g., Wolpin 1997). It is convenient to write the set of L input
functions (1l) and the mortality equation as
1 2
(1 )
(2)lij l j Ilij l
ij ij j ij Mij
I X
M I E E
α ε
β δ δ ε
′= +
′ ′ ′= + + +
Where lijI is the lth column element of the L-dimensional vector of inputs ijI jX is a vector
of family characteristics, jE a vector of mother-specific endowments, ijE a vector of child-
specific endowments, and Ilijε and Mijε are residuals. Substituting the input equations (1l)
into Eq. (2) yields the following reduced form showing the impact of the vector of
characteristics jX on mortality:
)3()(21 MijIijijjjij EEXM εεβδδγ +′+′+′+′=
where ( )′= ILijijIijIIij εεεε ...........21 .
Religion may influence child health in the following ways. First, it may be correlated
with socio-economic characteristics ( jX ) that influence the level of inputs (e.g., wealth and
women’s education). Second, religion may influence inputs conditional upon characteristics
( Iε ). This would be the case if, for instance, religious rules prohibited meat or alcohol
consumption, prescribed hygiene rules or cultivated breastfeeding norms. Third, the child’s
biological endowment ( E ) may differ across religions, for instance, because of differences in
phenotype. Fourth, exposure to disease ( Mε ) may also be correlated with religion due, for
instance, to a different geographical distribution of religious communities. Fifth, religion may
influence “returns” to the variables entering Eq. (1) and Eq. (2), which we may think of as
religious “agency”. For example , endowments may translate differently into health outcomes
if preferences for child health or for the health of certain children (e.g., female children) are
religion-specific , in which case 1δ and 2δ are religion-specific. There may also be differences
in the way characteristics translate into inputs ( lα ). For instance, one religion may constrain
women’s “agency” more than the other, or one religion may simply be more efficient in its
use of health inputs ( β ). This discussion is only meant to be illustrative, its purpose being to
suggest that religion may influence mortality through endowments, characteristics and
4
potentially endogenous behaviours. It is useful to distinguish fixed or time-invariant factors
from factors that are more policy amenable, that is, factors that we might imagine Hindus
could emulate from Muslims to bring their mortality risks down to similar levels.
This paper profiles differences in characteristics and behaviours of the two
communities with a view to understanding the extent to which these resolve or deepen the
paradox, as the case may be. In Section 2, we outline the apparent paradox. In Section 3, we
consider the role of characteristics and agency in determining the level of health inputs (Eq.
1). In Section 4, we turn to differences in inputs and endowments and returns to these (Eq.
(2)). In Section 5, we consider the potential role played by compositional factors. Section 6
presents results of descriptive regressions aimed at synthesising the discussion. Section 7
concludes.
2. The Apparent Paradox
Data
The data are drawn from the first and second rounds of the National Family Health
Survey of India (NFHS-1 and NFHS-2) conducted in 1992/93 and 1998/99 (see IIPS 1995
and IIPS and ORC Macro 2000). These surveys interviewed ever-married women aged 13-49
and 15-49 at the time of the survey and obtained from them complete fertility histories,
including number of live births, birth intervals, and the time and incidence of child deaths.
The survey contains information on relevant individual, household and community
characteristics.
Births in the pooled sample occur during 1954-1999. Since the number of births in
1954-1959 is small, we drop children born in these years (0.09% of the sample). We drop the
10.53% of births that occur in households of religions other than Muslim or Hindu. 2 So, from
now, we refer to the Hindu-Muslim differential as the mortality differential. We also drop
mothers who have had a multiple birth, and this removes 2% of mothers and 3.24% of
children. The proportion of multiple births amongst Muslims is 1.47% and amongst Hindus is
1.27%.3 We right-censor the data to allow for full exposure to under-5 mortality, thus
dropping 20.92% of observations. The sample used to analyse under-5 mortality has 356,236
live births of 105,891 mothers, and contains 85.94% Hindu and 14.06% Muslim children.
Antenatal and postnatal care are analysed for a restricted sample of recent births for
which this information is available : the last three births if they occurred in the four years
preceding the interview date for NFHS-1, and the last two births if they occurred in the three
years preceding the interview date for NFHS-2. Unless specified otherwise, we pool data
2 Hindu mortality exceeds that of Sikhs and Christians. This is not investigated further. 3 It is standard practice in the demographic literature to restrict the analysis to singletons as death risks are many times higher for multiple births and, although relatively rare, they can skew the statistics.
5
from the two rounds of the NFHS. All summary statistics presented in tables and graphs are
weighted, using the sampling weights provided in the surveys, to correct for sampling design
and for non-response .
The mortality differential by child age
In developing countries, most child deaths occur in the first four weeks of life (the
neonatal period), after which the risk of death declines continuously and falls sharply after
age 5. Neonatal risk factors tend to be “biological”, the role of environment and care rising as
the child ages (e.g. Wolpin 1997).
Averaged over 1960-95, the overall mortality rates for the neonatal, infant and under-
5 categories are 6.65%, 10.70%, and 14.14% respectively. The religion differential in under-5
mortality is 2.6%-points, the rate being 14.52% amongst Hindus and 11.92% amongst
Muslims. The religion differential in infant and neonatal mortality is 2.09%-points and
1.18%-points respectively. The fact that Muslim children exhibit a survival advantage in the
first month of life suggests a possible role for phenotype or for maternal health. And the fact
that the religion differential grows (in absolute terms) with child age suggests a possible role
for nutrition and health care. The religion differences in mortality are large. To put their size
in perspective, note that the Hindu disadvantage is 17.91% of baseline mortality risk amongst
Hindus in the under-5 category. The average annual rate of decrease in under-5 mortality risk
between 1960 and 1995 was 0.65%-points p.a., which is only a fourth of the religion
differential. And the more widely discussed gender differential in under-5 mortality is only
0.43%-points (in contrast to the religion differential of 2.6%-points)
Evolution of the mortality differential across time
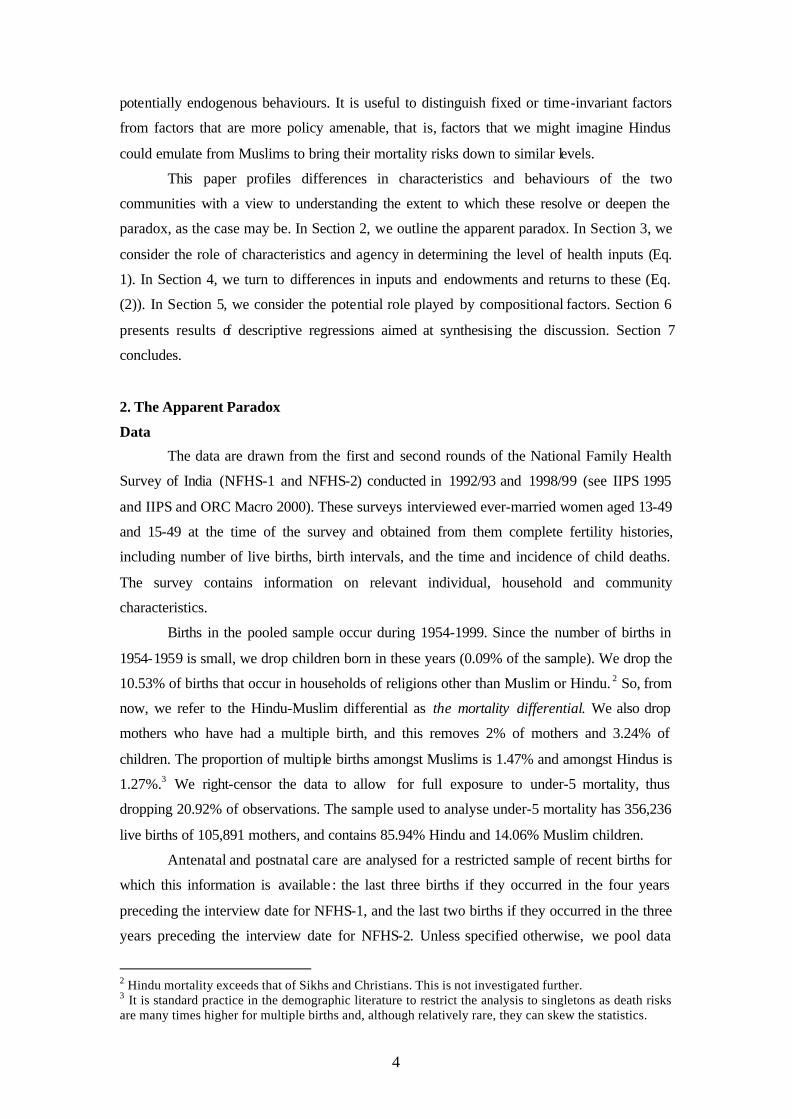
Lower mortality amongst Muslim as compared with Hindu children is not a recent
phenomenon, being apparent in our data since about 1966 (see Figure 1);4 also see Bhat and
Zavier (2005).5 For children born in 1965-70, the under-5 mortality rate was, on average,
21.31% for Hindus and 19.44% for Muslims. In 1990-1995, these rates had fallen to 9.50%
and 7.58% respectively. Over the 36-year period spanned by the data, under-5 mortality
declined at an average rate of 0.64%-points p.a. amongst Hindus and 0.66%-points p.a.
amongst Muslims. For births occurring during 1965-70, Muslim children show a survival
advantage of 0.50, 1.40 and 2.53 %-points in the neonatal, infant and under-5 age-groups
4 It is noteworthy than there was no Hindu disadvantage in 1960-1965. 5 See their Table 6, p.389, which reports the relevant means from the National Sample Surveys of 1963/4 and 1965/6, the Sample Registration Survey of 1979, Census 1981 and 1991, and the National Family Health Surveys (NFHS) of 1992/3 and 1998/9. While data on mortality from surveys such as the NFHS can be subject to large sampling errors, SRS and Census data are not likely to suffer this problem. The religion difference investigated here therefore seems real.
6
respectively. The corresponding figures for 1990-95 are 1.61, 2.33 and 2.99%-points.
Comparing these points, the differential appears to have increased. However it is clear from
Figure 1 that it fluctuates over time. Comparison of particular years is also likely to be
affected by sampling variation.
Figure 1
Sample of children fully exposed to under-5 mortality risk
3. Differences in Characteristics and Agency
In this section, we consider differences in fixed socio-economic characteristics
between the two religious communities, and how these might influence the mortality
differential (refer equation 1). The characteristics discussed here are summarised, by religion,
in Table 1, and under-5 mortality rates, by characteristic and religion, are reported in
Appendix Table 1.
Socio-economic characteristics
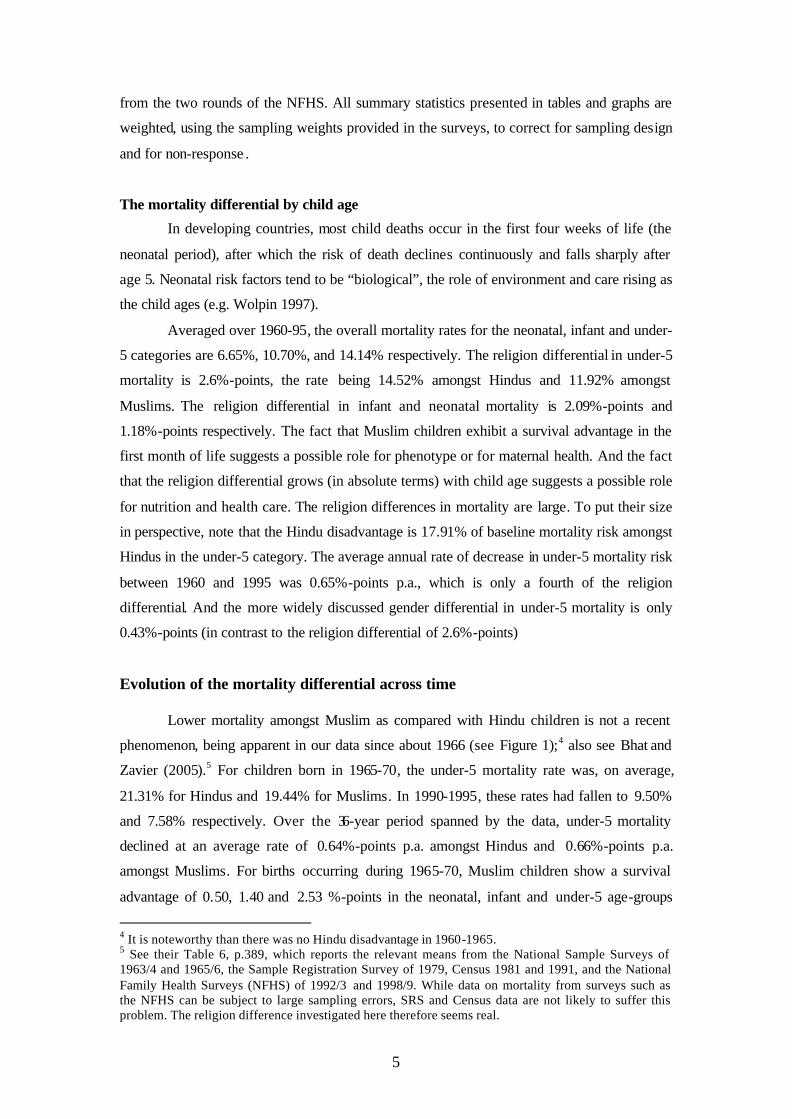
Hindu mothers are, on average, more educated than Muslim mothers, and the Hindu
educational advantage is even more pronounced amongst fathers (see Figure 2 and Table 1).
Several studies have established a direct effect of education on mortality conditional on
income. If income is not held constant, education will also proxy permanent income. For both
reasons the education differential between the communities leads us to expect lower mortality
amongst Hindus, contrary to what we observe .
Figure 2
7
See Table 1.
The mortality differential between Hindus and Muslims decreases as mother’s education
increases to the secondary level. It then appears to increase amongst mothers with higher
education (see Appendix Figure 11 and Appendix Table 1).
Hindus are more likely than Muslims to be employed, this differential being
especially marked amongst women (see Table 1). One would expect father’s employment to
increase household resources and thus favour lower mortality. The correlation of maternal
employment with child mortality is less obvious. If mothers work only when an income
supplement to the father’s earnings is needed, then women from low-income households are
over-represented amongst employed women (a composition effect). This, on its own, would
tend to lead to a positive correlation between mother’s employment and child mortality. A
positive correlation may also arise if the child minder in place when the mother is at work is
less qualified than her. These effects may or may not overwhelm the beneficial effect of
maternal employment that works through an increase in household income (an income effect).
Our data suggest that they do. Children of working mothers exhibit higher mortality rates (see
Appendix Table 1 and Appendix Figure 12). A similar result is reported in Bhalotra (2007). It
is recognised that maternal employment is endogenous, although endogeneity would only
drive this result if mothers of less healthy children were more likely to work. This seems
unlikely in models that condition upon the education of both parents to the extent that
education proxies the permanent income of the household.
8
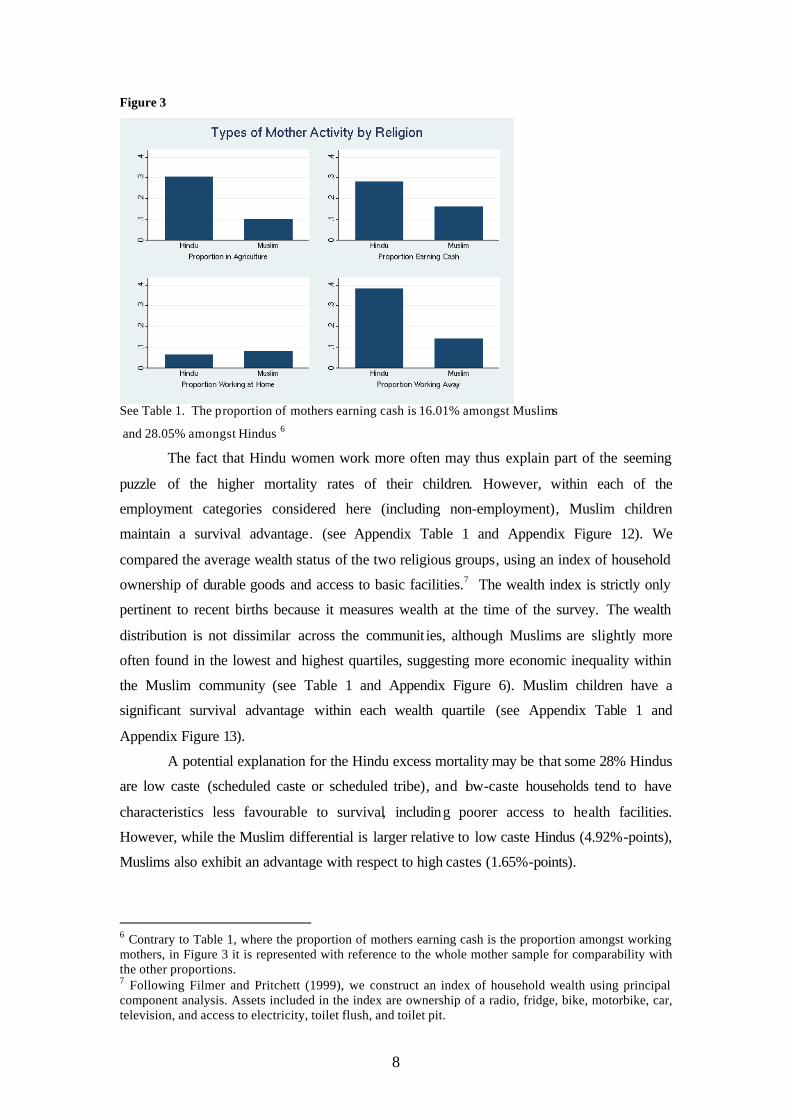
Figure 3
See Table 1. The proportion of mothers earning cash is 16.01% amongst Muslims
and 28.05% amongst Hindus 6
The fact that Hindu women work more often may thus explain part of the seeming
puzzle of the higher mortality rates of their children. However, within each of the
employment categories considered here (including non-employment), Muslim children
maintain a survival advantage. (see Appendix Table 1 and Appendix Figure 12). We
compared the average wealth status of the two religious groups, using an index of household
ownership of durable goods and access to basic facilities.7 The wealth index is strictly only
pertinent to recent births because it measures wealth at the time of the survey. The wealth
distribution is not dissimilar across the communit ies, although Muslims are slightly more
often found in the lowest and highest quartiles, suggesting more economic inequality within
the Muslim community (see Table 1 and Appendix Figure 6). Muslim children have a
significant survival advantage within each wealth quartile (see Appendix Table 1 and
Appendix Figure 13).
A potential explanation for the Hindu excess mortality may be that some 28% Hindus
are low caste (scheduled caste or scheduled tribe), and low-caste households tend to have
characteristics less favourable to survival, including poorer access to health facilities.
However, while the Muslim differential is larger relative to low caste Hindus (4.92%-points),
Muslims also exhibit an advantage with respect to high castes (1.65%-points).
6 Contrary to Table 1, where the proportion of mothers earning cash is the proportion amongst working mothers, in Figure 3 it is represented with reference to the whole mother sample for comparability with the other proportions. 7 Following Filmer and Pritchett (1999), we construct an index of household wealth using principal component analysis. Assets included in the index are ownership of a radio, fridge, bike, motorbike, car, television, and access to electricity, toilet flush, and toilet pit.
9
Women’s status
Women’s status may be relevant given evidence that the bargaining power of women
within the household matters for child health, for example, because they have different
preferences from men, with their preferences being more favourable to child health. One
study finds, for instance, that women are more likely to spend household resources on food
rather than tobacco (e.g. Alderman et al. 2001). So, if religion is correlated with women’s
status, then religion may be correlated with child health.
Muslim women are commonly regarded as being less “empowered” than Hindu
women although, as we shall see, this view is not defended by the data. NFHS-2 asked
women a number of questions designed to elicit their level of empowerment or autonomy.
The questions we consider here relate to (1) the extent of control the woman has over the way
that the money she earns is spent and whether she is allowed to have money set aside, (2) her
attitudes regarding domestic violence and the frequency with which she was beaten in the
year preceding the survey, and, more importantly for our discussion, (3) who in the household
decides whether she can seek healthcare. Given evidence that female autonomy is good for
child health (an agency effect), we would expect lower mortality amongst children of more
empowered mothers, other things equal.
The relevant data are summarised in Table 1 and Appendix Table 1. Consider first
control over cash earned. Since only 28.05% of Hindu and 16.01% of Muslim women work
for cash, this information is only available for this sub-sample. Muslim mothers are less often
allowed to have money set aside but they have more control over the way cash earned is spent
compared to Hindu mothers. Although the mother’s autonomy in setting money aside is
associated with lower under-5 mortality, Muslim children’s survival chances do not improve
when the mother decides how to spend the money alone (see Figure 4). Fewer Muslim women
think that it is justified for a husband to hit his wife in various circumstances going from “if
he suspects her of being unfaithful” to “if she doesn’t cook food properly”. There is no
significant difference in the proportion of women never beaten in the year preceding the
survey.8.Muslim mothers report more often making the decision of seeking healthcare on their
own. But there is little difference in the under-5 mortality rate between mothers who say they
make this decision on their own and other mothers (see Figure 4 below), which is partly due
to women making this decision on their own being also more often household heads and thus
at a socio-economic disadvantage. Indeed, women making this decision alone are household
heads in 16.52% of cases compared to 1.43% for mothers who do not make this decision
alone.
8 The response rate is low for this sensitive question: 22.91% amongst Muslim women and 21.66% amongst Hindus. But given the negligible difference in response rates between communities, this is not likely to bias the comparison.
10
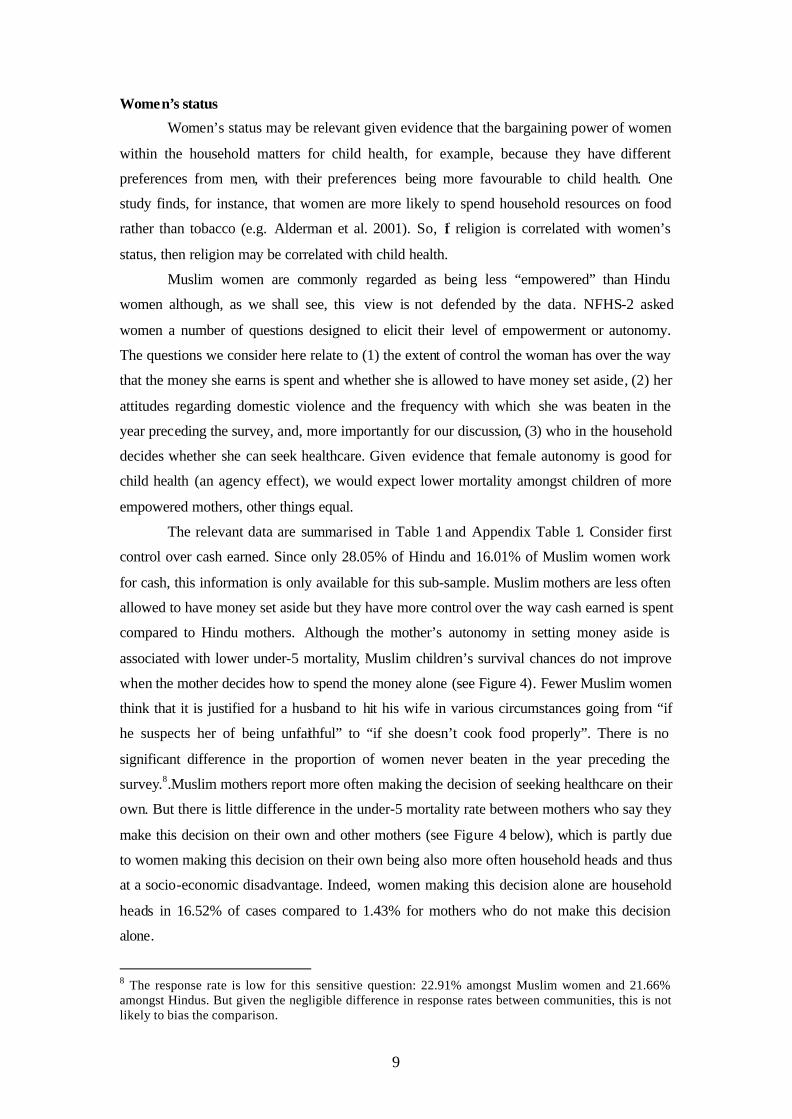
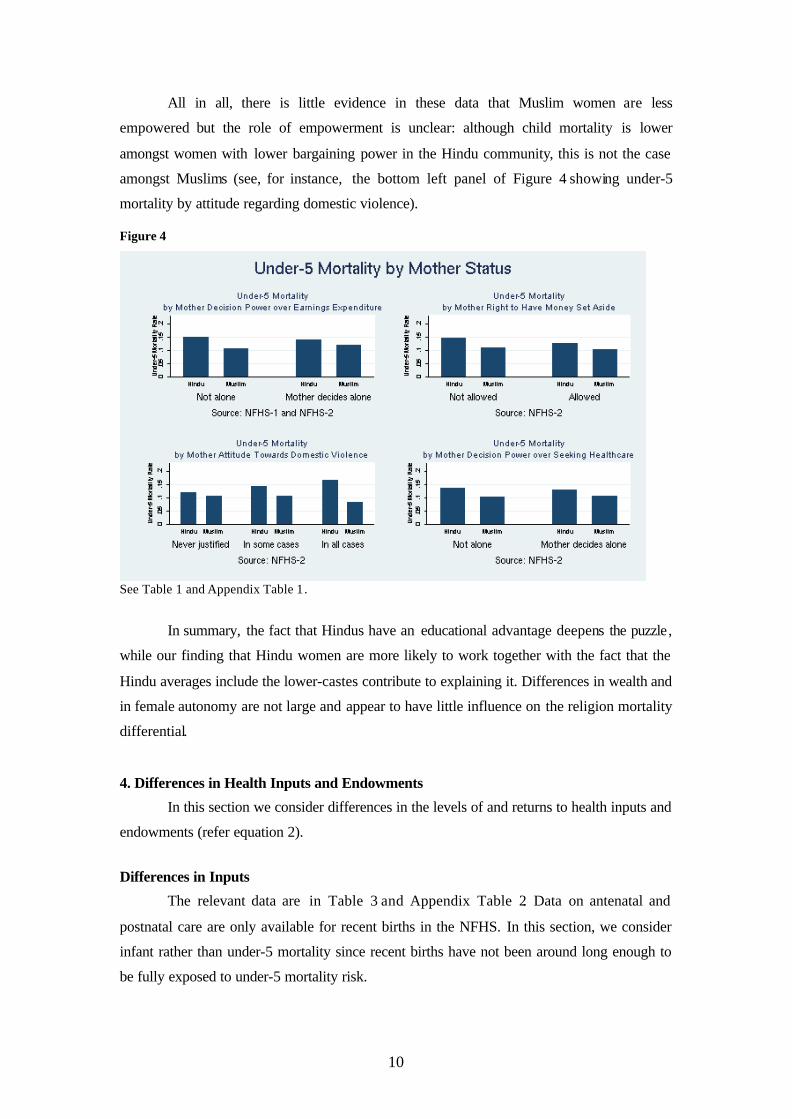
All in all, there is little evidence in these data that Muslim women are less
empowered but the role of empowerment is unclear: although child mortality is lower
amongst women with lower bargaining power in the Hindu community, this is not the case
amongst Muslims (see, for instance, the bottom left panel of Figure 4 showing under-5
mortality by attitude regarding domestic violence).
Figure 4
See Table 1 and Appendix Table 1.
In summary, the fact that Hindus have an educational advantage deepens the puzzle,
while our finding that Hindu women are more likely to work together with the fact that the
Hindu averages include the lower-castes contribute to explaining it. Differences in wealth and
in female autonomy are not large and appear to have little influence on the religion mortality
differential.
4. Differences in Health Inputs and Endowments
In this section we consider differences in the levels of and returns to health inputs and
endowments (refer equation 2).
Differences in Inputs
The relevant data are in Table 3 and Appendix Table 2. Data on antenatal and
postnatal care are only available for recent births in the NFHS. In this section, we consider
infant rather than under-5 mortality since recent births have not been around long enough to
be fully exposed to under-5 mortality risk.
11
For this reduced sample, the infant mortality differential between the religions is
smaller than for the larger sample that we have been looking at so far (0.94%-points
compared to 2.09%-points), although it is significant at the 2% level. 9 The mortality
differential often loses significance when splitting the sample by input indicator despite small
changes in its value (e.g., when comparing mortality between the two religions according to
whether or not the mother received iron folic tables). For this reason, we do not discuss the
mortality differentials conditional on each input, although these are presented, for reference,
in Appendix Table 2.
Antenatal care and place of delivery
The data suggest that antenatal care practices are less favourable to child survival
amongst Muslims. Muslim mothers receive fewer tetanus injections and iron folic tablets
before birth and make fewer antenatal visits and these differences are statistically significant
(see Table 3). As a consequence, fewer Muslim mothers have complete antenatal care which,
in India, involves having had at least three antenatal care visits, at least one tetanus shot and
iron and folic tablets.10 Muslim mothers also deliver at home (theirs or that of a relative or
friend) significantly more often than Hindu mothers. These findings reinforce the puzzle since
antenatal care and delivery outside the home both significantly lower the risk of childhood
mortality (see Appendix Figures 1 to 4 and Appendix Table 2).
Postnatal care
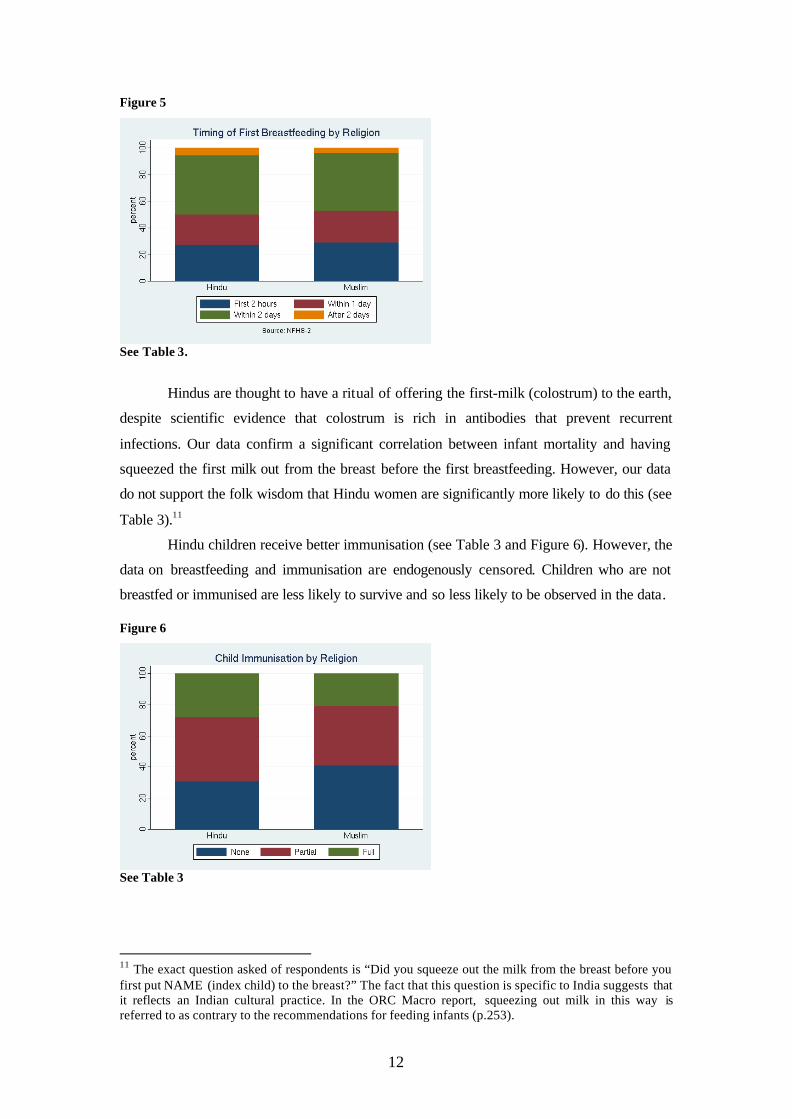
Consider breastfeeding practices. As shown in Table 3, Hindu mothers tend to wean
later, although the difference in duration of breastfeeding is only noticeable for the top half of
the distribution: the median being 13 months for both communities. However, Muslim
mothers tend to put the baby to the breast sooner after birth (see also Figure 5). Whilst a
quarter of Muslim mothers put the baby to the breast within an hour of birth, the
corresponding figure is two hours for Hindu mothers. Early initiation of breastfeeding is
especially important as the first milk contains antibodies and this has a positive impact on
survival chances (see Appendix Table 2). This may therefore contribute to explaining the
puzzle.
9 In section 2, we stated that the religion differential in under-5 mortality has increased between the end-points of the entire period, 1960-65 and 1990-95, where we cut the data at 1995 to allow full exposure to the risk of under-5 mortality. This may appear to contradict our observation here that the infant mortality rate for recent births (1988-98) is smaller than the average infant mortality differential over the entire period (1960-98). In fact it is not, the size of this differential being sensitive to the period being considered (see Figure 1). 10 Hindu-Muslim differences in the timing of antenatal care (ie which month of pregnancy) are insignificant.
12
Figure 5
See Table 3.
Hindus are thought to have a ritual of offering the first-milk (colostrum) to the earth,
despite scientific evidence that colostrum is rich in antibodies that prevent recurrent
infections. Our data confirm a significant correlation between infant mortality and having
squeezed the first milk out from the breast before the first breastfeeding. However, our data
do not support the folk wisdom that Hindu women are significantly more likely to do this (see
Table 3).11
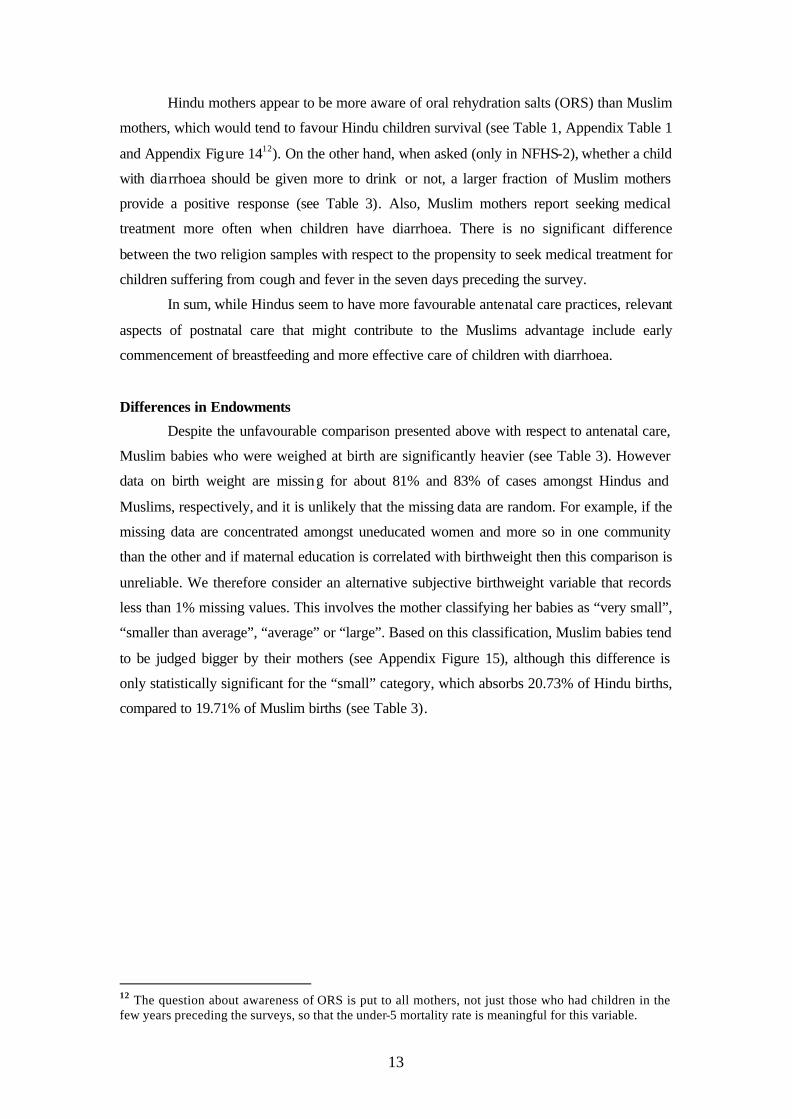
Hindu children receive better immunisation (see Table 3 and Figure 6). However, the
data on breastfeeding and immunisation are endogenously censored. Children who are not
breastfed or immunised are less likely to survive and so less likely to be observed in the data.
Figure 6
See Table 3
11 The exact question asked of respondents is “Did you squeeze out the milk from the breast before you first put NAME (index child) to the breast?” The fact that this question is specific to India suggests that it reflects an Indian cultural practice. In the ORC Macro report, squeezing out milk in this way is referred to as contrary to the recommendations for feeding infants (p.253).
13
Hindu mothers appear to be more aware of oral rehydration salts (ORS) than Muslim
mothers, which would tend to favour Hindu children survival (see Table 1, Appendix Table 1
and Appendix Figure 1412). On the other hand, when asked (only in NFHS-2), whether a child
with diarrhoea should be given more to drink or not, a larger fraction of Muslim mothers
provide a positive response (see Table 3). Also, Muslim mothers report seeking medical
treatment more often when children have diarrhoea. There is no significant difference
between the two religion samples with respect to the propensity to seek medical treatment for
children suffering from cough and fever in the seven days preceding the survey.
In sum, while Hindus seem to have more favourable antenatal care practices, relevant
aspects of postnatal care that might contribute to the Muslims advantage include early
commencement of breastfeeding and more effective care of children with diarrhoea.
Differences in Endowments
Despite the unfavourable comparison presented above with respect to antenatal care,
Muslim babies who were weighed at birth are significantly heavier (see Table 3). However
data on birth weight are missing for about 81% and 83% of cases amongst Hindus and
Muslims, respectively, and it is unlikely that the missing data are random. For example, if the
missing data are concentrated amongst uneducated women and more so in one community
than the other and if maternal education is correlated with birthweight then this comparison is
unreliable. We therefore consider an alternative subjective birthweight variable that records
less than 1% missing values. This involves the mother classifying her babies as “very small”,
“smaller than average”, “average” or “large”. Based on this classification, Muslim babies tend
to be judged bigger by their mothers (see Appendix Figure 15), although this difference is
only statistically significant for the “small” category, which absorbs 20.73% of Hindu births,
compared to 19.71% of Muslim births (see Table 3).
12 The question about awareness of ORS is put to all mothers, not just those who had children in the few years preceding the surveys, so that the under-5 mortality rate is meaningful for this variable.
14
Figure 7
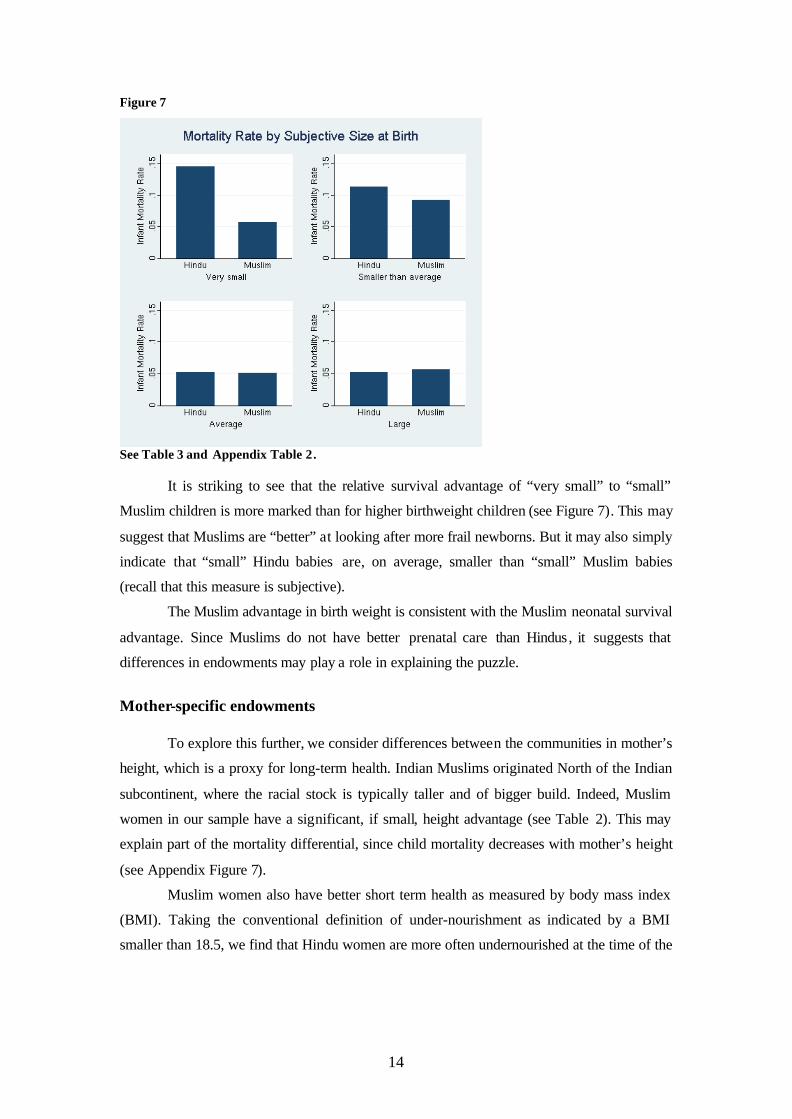
See Table 3 and Appendix Table 2.
It is striking to see that the relative survival advantage of “very small” to “small”
Muslim children is more marked than for higher birthweight children (see Figure 7). This may
suggest that Muslims are “better” at looking after more frail newborns. But it may also simply
indicate that “small” Hindu babies are, on average, smaller than “small” Muslim babies
(recall that this measure is subjective).
The Muslim advantage in birth weight is consistent with the Muslim neonatal survival
advantage. Since Muslims do not have better prenatal care than Hindus, it suggests that
differences in endowments may play a role in explaining the puzzle.
Mother-specific endowments
To explore this further, we consider differences between the communities in mother’s
height, which is a proxy for long-term health. Indian Muslims originated North of the Indian
subcontinent, where the racial stock is typically taller and of bigger build. Indeed, Muslim
women in our sample have a significant, if small, height advantage (see Table 2). This may
explain part of the mortality differential, since child mortality decreases with mother’s height
(see Appendix Figure 7).
Muslim women also have better short term health as measured by body mass index
(BMI). Taking the conventional definition of under-nourishment as indicated by a BMI
smaller than 18.5, we find that Hindu women are more often undernourished at the time of the
15
survey than Muslim women (36.76% compared to 32.58%).13 A simple regression of under-5
mortality on maternal BMI shows a significant inverse relationship (also see Appendix Figure
16).
The difference in BMI may be due to religious rules affecting maternal and foetal
health. A mortality advantage has been observed for Muslim adults as well as children (see
Bhat and Zavier, 2005), suggesting that these differences in diet and other religious rules may
be relevant over the lifecourse. First, the complete avoidance of meat consumption by some
Hindu sects may matter. In NFHS-2, women were asked about the frequency with which they
consume different types of food. We used these data to compare the prevalence of
vegetarianism amongst Hindus and Muslims, and we find that Muslim mothers eat meat and
eggs much more often than Hindu mothers (see Table 1). We also find that children born of
vegetarian mothers have higher mortality rates, and the religion mortality differential is
smaller amongst vegetarian mothers (see Appendix Table 1 and Appendix Figure 6). 14 This is
an important observation. Vegetarianism at higher living standards probably does not affect
health as much as amongst relatively poor people.
Other religious rules that may matter are the avoidance of alcohol in the Muslim
community, the hygiene imposed by daily prayers amongst Muslims, and attitudes towards
tobacco use by women. In NFHS-2, respondents are asked whether they consume alcohol and
tobacco. The data indicate that a significantly larger share of Hindu respondents drink alcohol
compared to their Muslim counterparts, although the proportions are very small in both
communities (Table 1). The opposite holds true for tobacco consumption (Table 1). Tobacco
consumption is correlated with higher child mortality in both religious groups (Appendix
Table 1 and Appendix Figure 6), so tobacco differentials reinforce the puzzle. However,
alcohol consumption is correlated with higher child mortality amongst Hindus and lower child
mortality amongst Muslims , this probably being due to a positive correlation between alcohol
consumption by Muslim mothers and socio-economic status.
Child-specific endowments
In addition to mother-specific endowments, there are child-specific variables that may
vary with religion (e.g., age of mother at birth and birth order) and “returns” to these
characteristics may vary between religions due, for instance, to variations in the degree of son
preference.
13 These statistics exclude mothers who were pregnant at the time of the survey. Since we are, here, analysing only births in the three or four years preceding the survey, BMI at the time of the survey is a relevant indicator of maternal health around if not at birth. 14 Defined as mothers who report never eating meat or eggs.
16
Fertility behaviour implies that Hindu babies are less often born to very young or
older mothers, for both of whom mortality rates are larger (e.g. Bhalotra and van Soest 2007)
On average, age at birth is not very different, being 22.62 years for Muslim women and 22.26
for Hindu women. Muslim children appear to have a survival advantage across the
distribution of maternal age at birth, the differential being larger until about age 25, which is
above the median (and mean) age at birth in the sample (see Appendix Figure 10)
There are numerous accounts of son-preference amongst Indians (e.g. Miller 1981).
Although girls are, by nature, born with a survival advantage, this is seen to be eroded with
age and, for India as a whole, the data suggest that the risk of death for girls begins to exceed
that for boys shortly after the age of five months. For India as a whole, the infant mortality
rate is larger for boys (10.30% versus 9.92%) but the under-5 mortality rate is larger for girls
(14.36% versus 13.93%). The girl disadvantage has been observed to increase with birth-
order (e.g. DasGupta 1987). In other words, it is the arrival of more and more girls that
appears, in India, to reduce the value of the marginal girl to her parents.
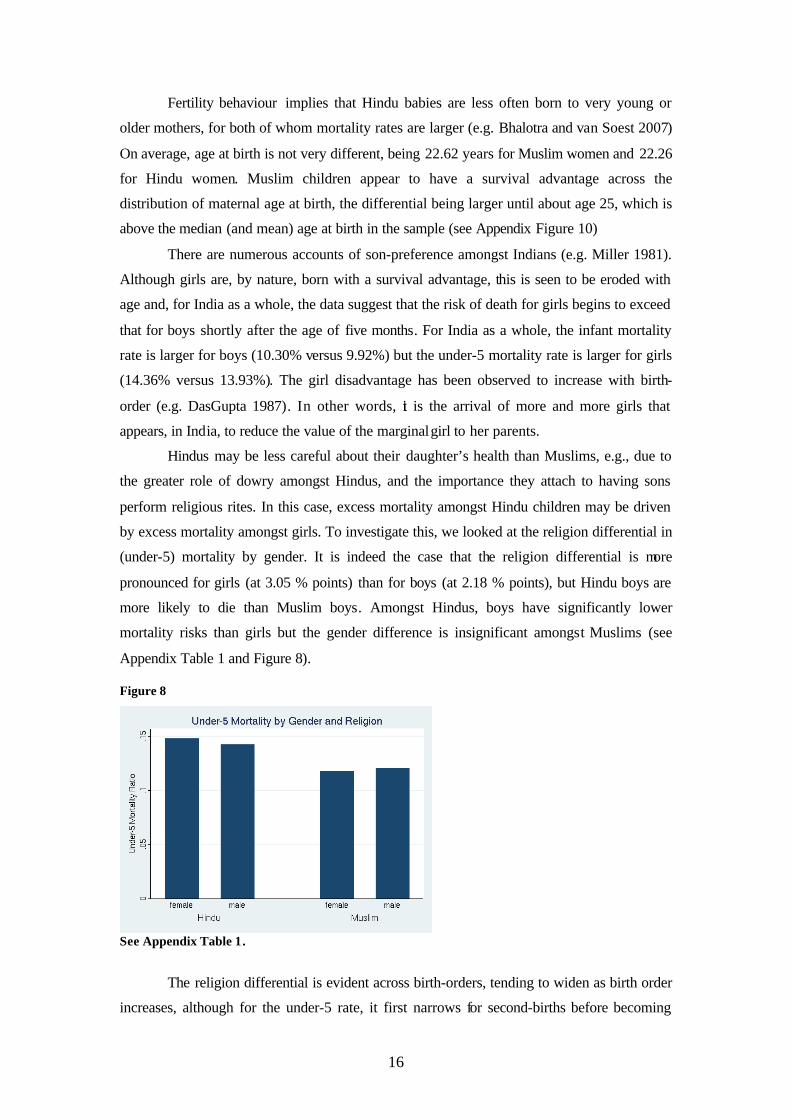
Hindus may be less careful about their daughter’s health than Muslims, e.g., due to
the greater role of dowry amongst Hindus, and the importance they attach to having sons
perform religious rites. In this case, excess mortality amongst Hindu children may be driven
by excess mortality amongst girls. To investigate this, we looked at the religion differential in
(under-5) mortality by gender. It is indeed the case that the religion differential is more
pronounced for girls (at 3.05 % points) than for boys (at 2.18 % points), but Hindu boys are
more likely to die than Muslim boys. Amongst Hindus, boys have significantly lower
mortality risks than girls but the gender difference is insignificant amongst Muslims (see
Appendix Table 1 and Figure 8).
Figure 8
See Appendix Table 1.
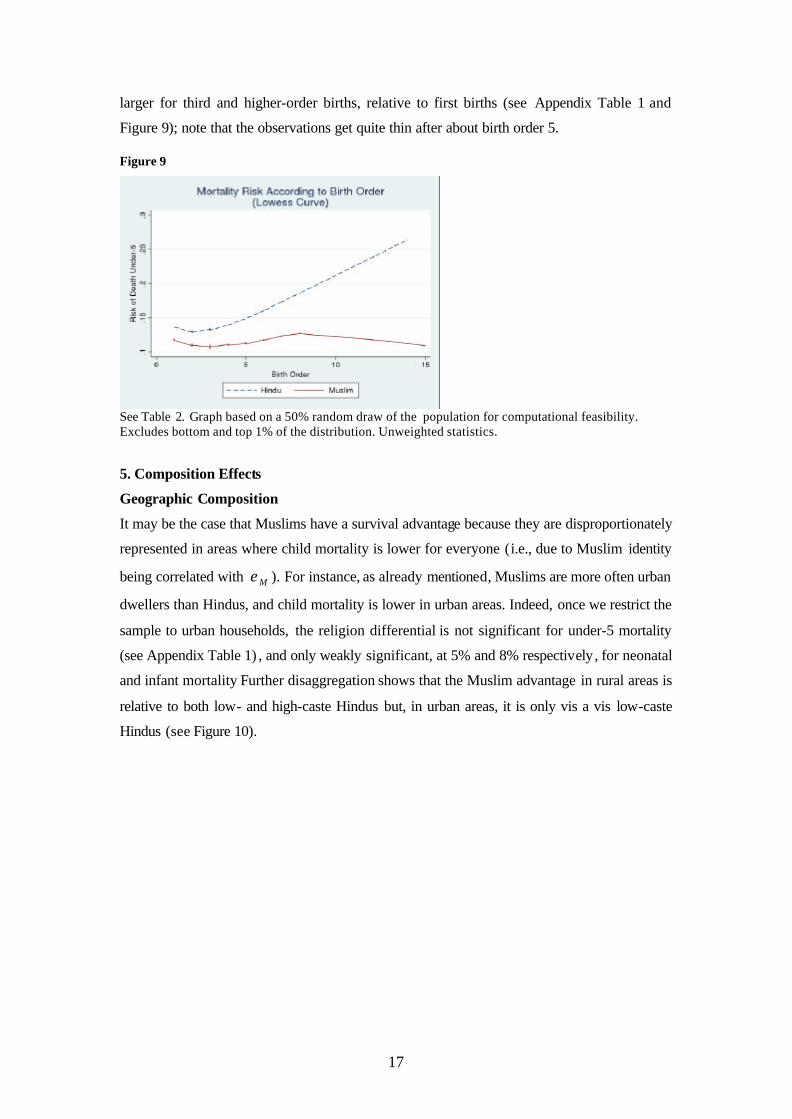
The religion differential is evident across birth-orders, tending to widen as birth order
increases, although for the under-5 rate, it first narrows for second-births before becoming
17
larger for third and higher-order births, relative to first births (see Appendix Table 1 and
Figure 9); note that the observations get quite thin after about birth order 5.
Figure 9
See Table 2. Graph based on a 50% random draw of the population for computational feasibility. Excludes bottom and top 1% of the distribution. Unweighted statistics.
5. Composition Effects
Geographic Composition
It may be the case that Muslims have a survival advantage because they are disproportionately
represented in areas where child mortality is lower for everyone (i.e., due to Muslim identity
being correlated with Mε ). For instance, as already mentioned, Muslims are more often urban
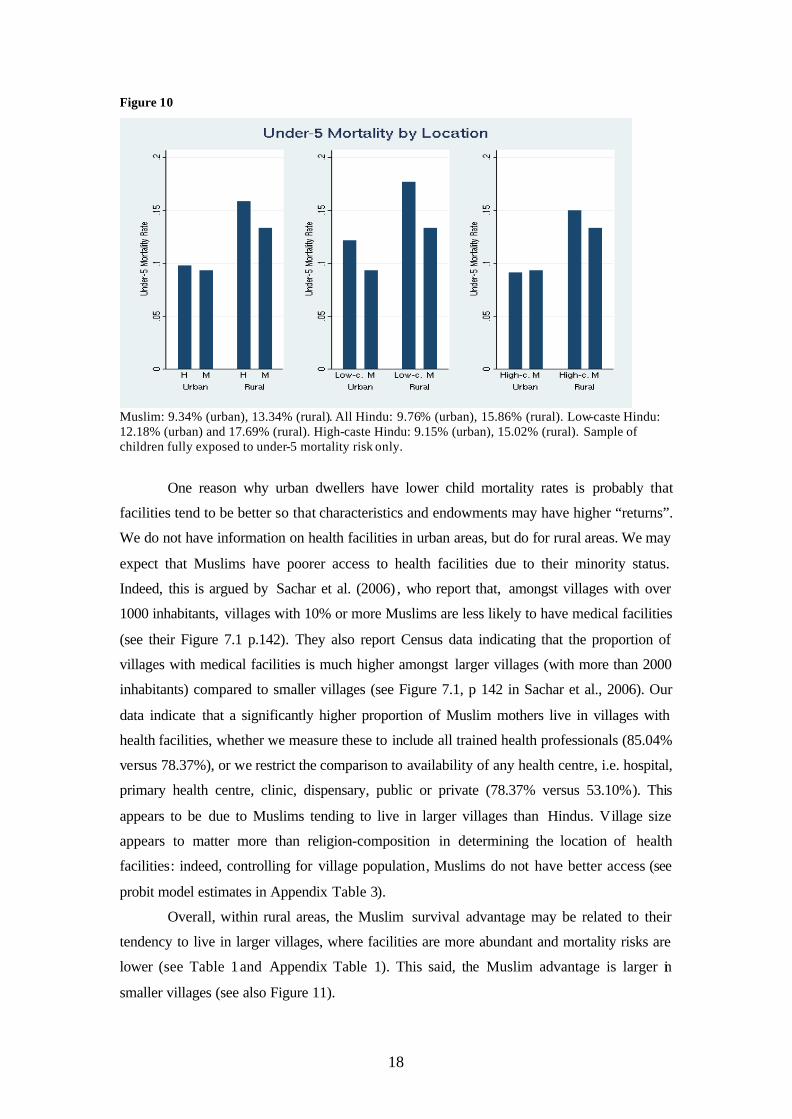
dwellers than Hindus, and child mortality is lower in urban areas. Indeed, once we restrict the
sample to urban households, the religion differential is not significant for under-5 mortality
(see Appendix Table 1) , and only weakly significant, at 5% and 8% respectively , for neonatal
and infant mortality Further disaggregation shows that the Muslim advantage in rural areas is
relative to both low- and high-caste Hindus but, in urban areas, it is only vis a vis low-caste
Hindus (see Figure 10).
18
Figure 10
Muslim: 9.34% (urban), 13.34% (rural). All Hindu: 9.76% (urban), 15.86% (rural). Low-caste Hindu: 12.18% (urban) and 17.69% (rural). High-caste Hindu: 9.15% (urban), 15.02% (rural). Sample of children fully exposed to under-5 mortality risk only.
One reason why urban dwellers have lower child mortality rates is probably that
facilities tend to be better so that characteristics and endowments may have higher “returns”.
We do not have information on health facilities in urban areas, but do for rural areas. We may
expect that Muslims have poorer access to health facilities due to their minority status.
Indeed, this is argued by Sachar et al. (2006) , who report that, amongst villages with over
1000 inhabitants, villages with 10% or more Muslims are less likely to have medical facilities
(see their Figure 7.1 p.142). They also report Census data indicating that the proportion of
villages with medical facilities is much higher amongst larger villages (with more than 2000
inhabitants) compared to smaller villages (see Figure 7.1, p 142 in Sachar et al., 2006). Our
data indicate that a significantly higher proportion of Muslim mothers live in villages with
health facilities, whether we measure these to include all trained health professionals (85.04%
versus 78.37%), or we restrict the comparison to availability of any health centre, i.e. hospital,
primary health centre, clinic, dispensary, public or private (78.37% versus 53.10%). This
appears to be due to Muslims tending to live in larger villages than Hindus. Village size
appears to matter more than religion-composition in determining the location of health
facilities: indeed, controlling for village population, Muslims do not have better access (see
probit model estimates in Appendix Table 3).
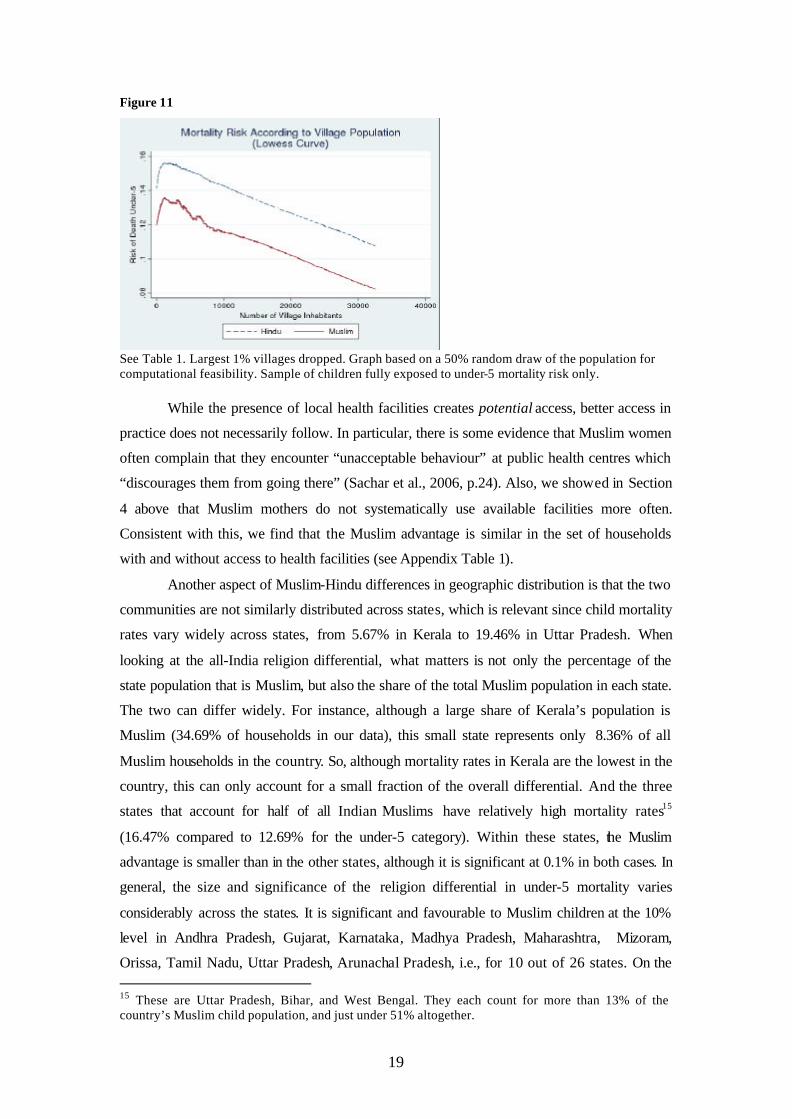
Overall, within rural areas, the Muslim survival advantage may be related to their
tendency to live in larger villages, where facilities are more abundant and mortality risks are
lower (see Table 1 and Appendix Table 1). This said, the Muslim advantage is larger in
smaller villages (see also Figure 11).
19
Figure 11
See Table 1. Largest 1% villages dropped. Graph based on a 50% random draw of the population for computational feasibility. Sample of children fully exposed to under-5 mortality risk only.
While the presence of local health facilities creates potential access, better access in
practice does not necessarily follow. In particular, there is some evidence that Muslim women
often complain that they encounter “unacceptable behaviour” at public health centres which
“discourages them from going there” (Sachar et al., 2006, p.24). Also, we showed in Section
4 above that Muslim mothers do not systematically use available facilities more often.
Consistent with this, we find that the Muslim advantage is similar in the set of households
with and without access to health facilities (see Appendix Table 1).
Another aspect of Muslim-Hindu differences in geographic distribution is that the two
communities are not similarly distributed across states, which is relevant since child mortality
rates vary widely across states, from 5.67% in Kerala to 19.46% in Uttar Pradesh. When
looking at the all-India religion differential, what matters is not only the percentage of the
state population that is Muslim, but also the share of the total Muslim population in each state.
The two can differ widely. For instance, although a large share of Kerala’s population is
Muslim (34.69% of households in our data), this small state represents only 8.36% of all
Muslim households in the country. So, although mortality rates in Kerala are the lowest in the
country, this can only account for a small fraction of the overall differential. And the three
states that account for half of all Indian Muslims have relatively high mortality rates15
(16.47% compared to 12.69% for the under-5 category). Within these states, the Muslim
advantage is smaller than in the other states, although it is significant at 0.1% in both cases. In
general, the size and significance of the religion differential in under-5 mortality varies
considerably across the states. It is significant and favourable to Muslim children at the 10%
level in Andhra Pradesh, Gujarat, Karnataka, Madhya Pradesh, Maharashtra, Mizoram,
Orissa, Tamil Nadu, Uttar Pradesh, Arunachal Pradesh, i.e., for 10 out of 26 states. On the 15 These are Uttar Pradesh, Bihar, and West Bengal. They each count for more than 13% of the country’s Muslim child population, and just under 51% altogether.
20
other hand, in the states of Assam, Kerala, Manipur, Nagaland and in New Delhi, Hindus
enjoy a survival advantage significant at 10% or below (see Appendix Table 1).
Demographic Composition
In our sample, Muslim women have an average of 4.63 children in contrast to 3.85
amongst Hindus. They also have shorter birth intervals. To the extent that short birth intervals
increase mortality risk (as shown in Bhalotra and van Soest 2007) and there is sibling
resource competition, higher fertility may be expected to have a causal effect of raising
childhood mortality risk. In this way, it deepens the puzzle.
However, higher rates of fertility amongst Muslims may exert compositional effects
that work in the opposite direction. For instance, a mechanical consequence of higher Muslim
fertility is that a smaller share of Muslim children are first-borns, and the demographic
literature suggests that first-born children in high-mortality settings experience higher
mortality rates (Chibdambaram et al. 1985). This said, mortality risk is also high at very high
parity (Chibdambaram et al. 1985) and this should confer some disadvantage upon Muslim
families. However, we have seen in Section 4 that Muslims have an advantage at every birth-
order. The fact that this advantage is increasing in birth order is consistent with the hypothesis
that, relative to Muslims, Hindus prefer lower fertility or, equivalently, prefer lower-order
births. Another way in which the religion fertility differential may impact the mortality
differential is as follows. Based simply on higher fertility amongst this group, Muslim
children are born a bit later in time (see Table 2). Given trend improvements in health
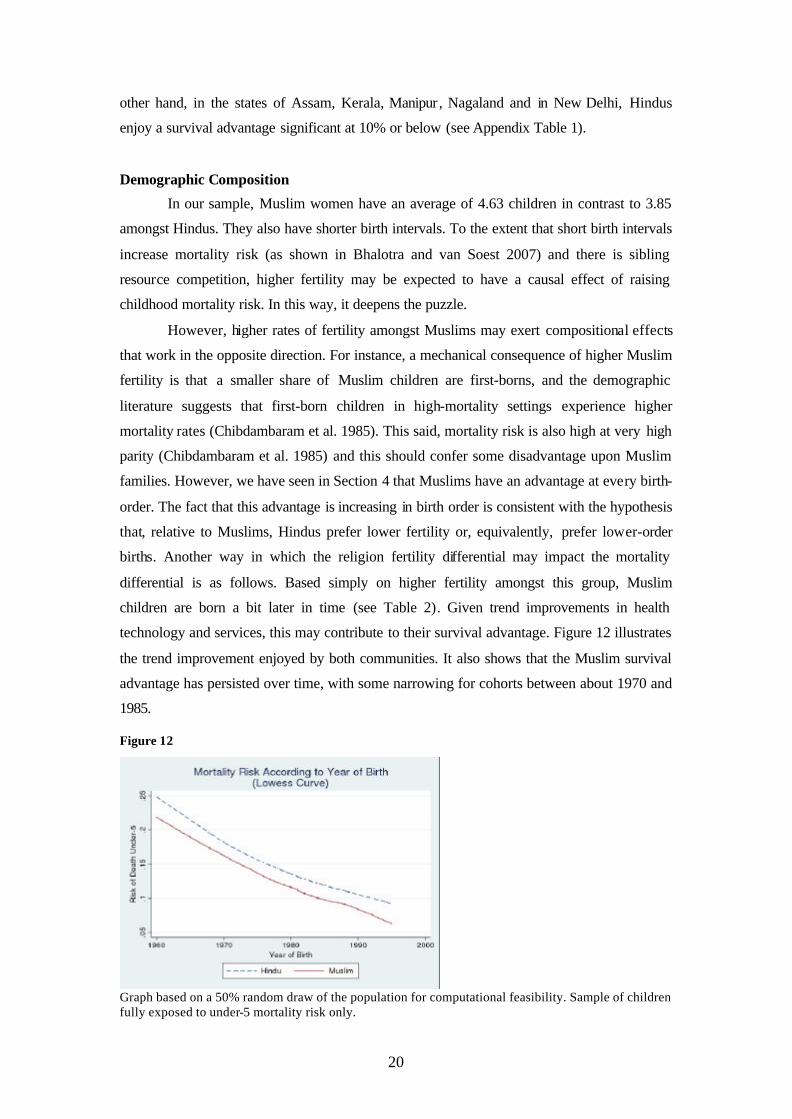
technology and services, this may contribute to their survival advantage. Figure 12 illustrates
the trend improvement enjoyed by both communities. It also shows that the Muslim survival
advantage has persisted over time, with some narrowing for cohorts between about 1970 and
1985.
Figure 12
Graph based on a 50% random draw of the population for computational feasibility. Sample of children fully exposed to under-5 mortality risk only.
21
Our analysis suggests several partial explanations for the observed Muslim survival
advantage: earlier initialisation of breastfeeding, awareness of the importance of fluids in
treating a child with diarrhoea and a greater likelihood of taking a child with diarrhoea to a
facility for treatment, mothers who are taller and less likely to be undernourished, less of a
differential in preferences for children by gender and birth-order, urban location and cohort
composition effects. A full treatment of the question is beyond the scope of this chapter.
Nevertheless, in the following section, we present results of descriptive regressions that allow
us to obtain the effects of some of the variables we have considered conditional upon the
others.
6. Multivariate Regressions
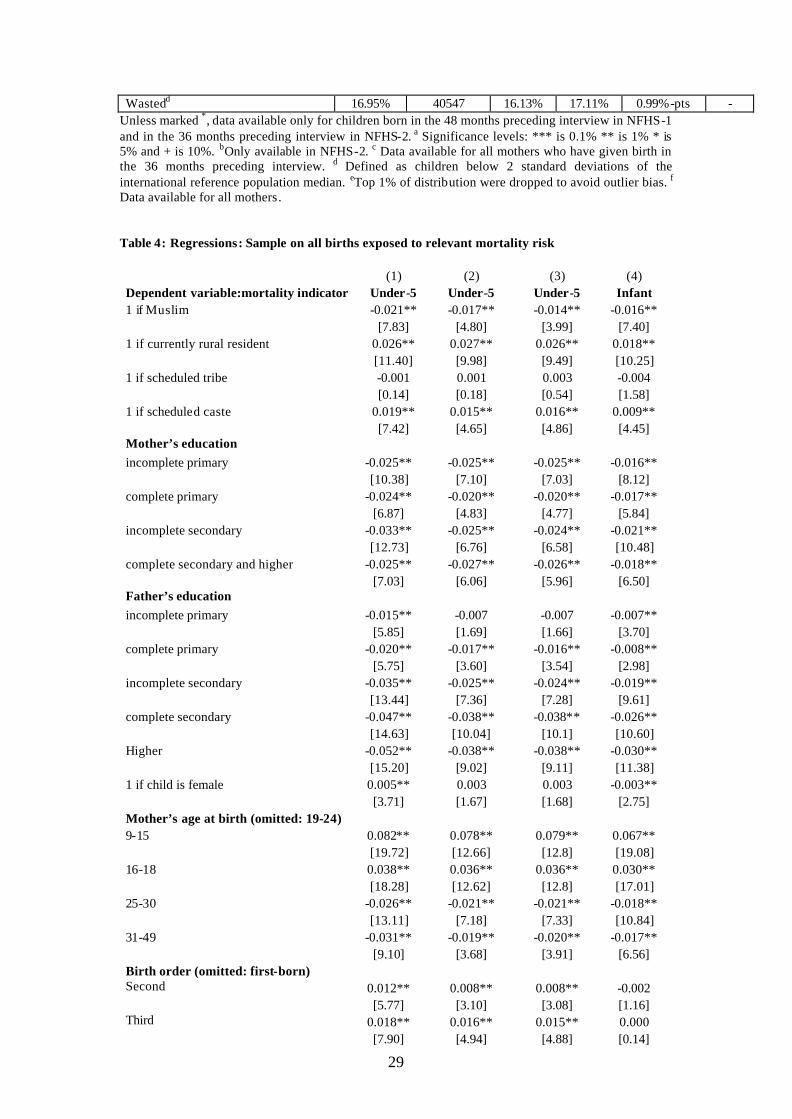
Multivariate regressions are reported in Tables 4 and 5. We do not attempt to estimate
structural parameters, only to report conditional effects and, in particular, to see if a
sufficiently rich specification eliminates the fixed effect associated with being Muslim. 16 This
is -0.022 and -0.017 in simple regressions of an indicator for under-5 and infant mortality
(respectively) on an indicator for the mother being Muslim. We use the linear probability
model, and have confirmed that a probit gives very similar results. The standard errors are
robust to arbitrary forms of heteroskedasticity and to allowing for clustering within villages.
Allowing non-independence of the standard errors within clusters raises them, the standard
error on the Muslim dummy rising by about a third.
Table 4 uses the full birth history of each mother in each of the two rounds of the
NFHS. Births span 1960-1999 and there are more than 352000 observations after we drop
children who have not had full exposure to the risk of under-5 mortality. In columns 1-3, the
dependent variable is under-5 mortality. The specification in column 1 is re-estimated for
infant mortality and these results are in column 4.
Here we summarise the main results. Controlling for mother’s and father’s
educational level, caste (if Hindu), rural v urban location, state of residence, cohort (or time)
effects, the age of the mother at birth and the gender and birth-order of the child hardly
diminishes the Muslim effect. It is -0.021 for under-5 (col.1) and -0.016 for infant mortality.
Columns 2 and 3 show how the under-5 estimate is altered by adding to the model first
maternal height and then indicators for a vegetarian diet and for alcohol and tobacco
consumption. These four variables were only collected for the second round (NFHS2), so that
columns 2 and 3 are estimated on a different (and smalle r) sample than that used in column 1.
The coefficient drops to -0.017 with height alone. Height has a significant mortality-reducing
16 A more careful decomposition exercise that estimates the extent to which observables can explain the religion differential in mortality is presented in Bhalotra and van Soest (2005).
22
effect and, as Muslim women are taller, this may explain the fall in the religion effect.
However, we cannot be certain of this since the estimation sample has changed. Tobacco and
vegetarianism have the expected risk-raising effect but the effect of alcohol consumption is
insignificant.
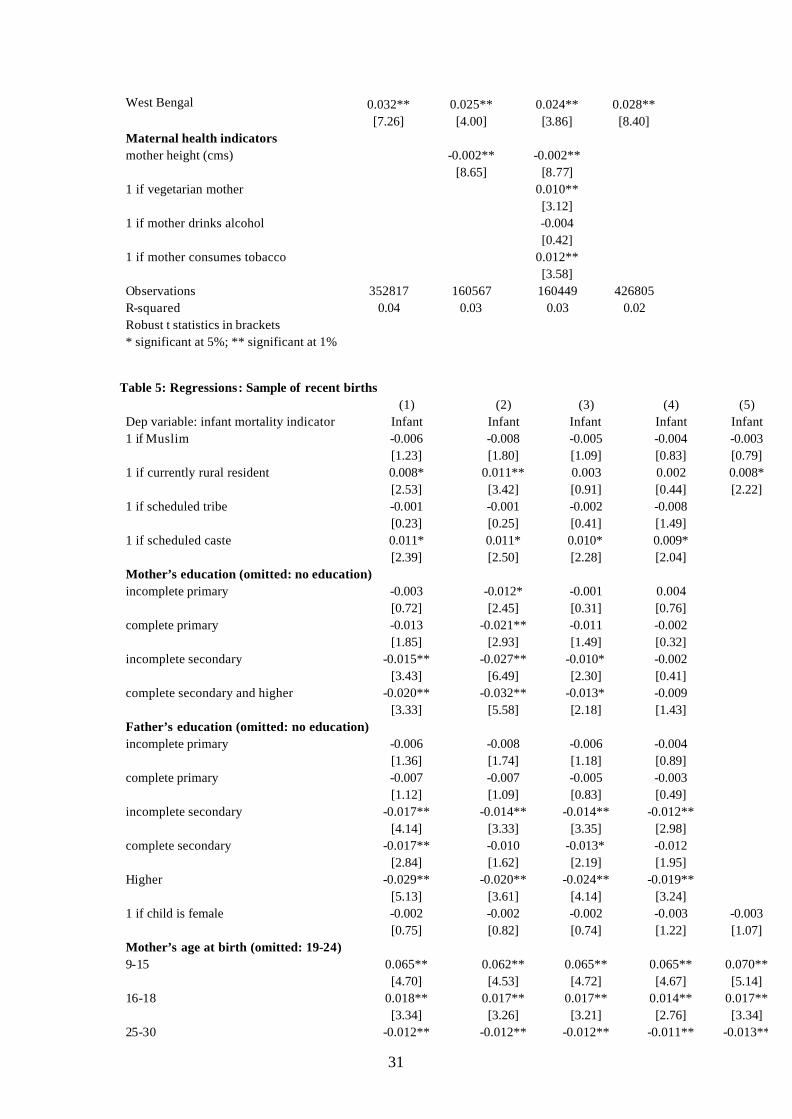
Table 5 reports estimates on the sample of recent births for which we have additional
information on household wealth, whether parents are currently working, and antenatal care.
Since this information is for births in the three (NFHS2) or four (NFHS1) years preceding the
survey, we cannot model under-5 mortality conditional upon full exposure. So these equations
are for infant mortality and children born less than 12 months before the date of the survey are
dropped. Pooling the two rounds of the NFHS, there are just less than 45000 births in the
years 1988-1998.
The main result apparent across the columns of Table 5 is that the Muslim advantage
in survival is now insignificant. It is possible that with the sample size restricted to about an
eighth of that in Table 4, we do not have enough variation to estimate the religion effect.
Alternatively, the conditional survival advantage has been eroded with time so that, in the last
decade, it is genuinely insignificantly small. It is hard to make a definitive distinction between
these explanations. Compare column 4 of Table 4 with column 1 of Table 5. These are
identical model specifications, the first using data that go back as far as 1960, and the second
starting in 1988. The standard error on the Muslim dummy is much larger in the second case
(0.0043 v 0.0027) but the coefficient is also much smaller (-0.006 v -0.016). Column 2 shows
that, if we drop state fixed effects, the conditional religion differential becomes significant at
the 10% significance level, although it remains, at -0.008, only half as big as the differential
estimated on the longer-range data. Columns 3-5 demonstrate that conditioning on further
explanatory variables does not make a significant difference to the (already poorly
determined) religion differential. The direct effects of the new regressors are of some interest.
Whether the parents are working or not has no significant impact conditioning on other socio-
economic characteristics. Above-median wealth and use of antenatal care result in
significantly lower infant mortality risk. Place of delivery does not have the expected effect
when conditioning on socio-economic characteristics (Column 4), and is insignificant when
included along with the other antenatal care variables (Column 5). As these variables are
potentially endogenous, we lay no interpretation on the coefficient estimates, our purpose
being only to consider how the partial correlation of religion and mortality is affected by
controlling for them. Other relevant endogenous variables that we have discussed above
include breastfeeding, immunization and treatment-seeking conditional upon child disease.
These are not included in the regressions either because they are only defined for alive
children (treatment-seeking) so that it is impossible to estimate their impact on the probability
23
of death, or because they are jointly determined with survival duration (duration of
breastfeeding, immunization).
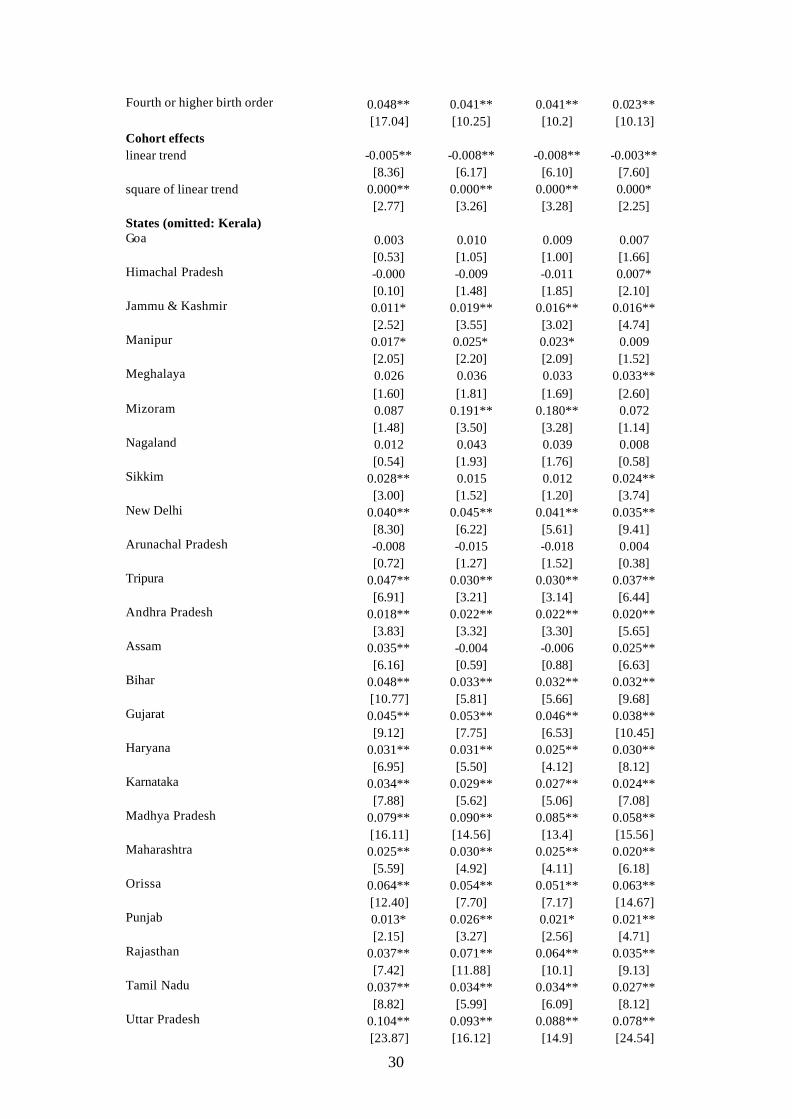
The (conditional) effects of the more standard covariates are summarised here and
displayed in the Tables. Refer to columns 1 and 4 in Table 4. There are large state
differentials in mortality, conditional upon family and individual characteristics. Controlling
for these reduces the religion differential. Rural residence is associated with higher mortality
risk and, as discussed before, Muslims are less likely to live in a rural location than Hindus.
Amongst Hindus, scheduled caste families face higher risk than the upper castes but,
conditional on the other variables in the model, scheduled tribes do not. Mortality risk is
consistently decreasing in the education of the mother and father, the effects of father’s
education being larger than of mother’s education at higher levels of education. Mortality has
been decreasing during 1960-98, and the decline has slowed in recent years. Girls face lower
infant mortality risk but higher under-5 mortality risk, consistent with the view that the role of
liquidity constraints and/or parental preferences relative to the role of nature grows with child
age. Mortality risk appears to be consistently decreasing in maternal age at birth, in contrast to
the U-shape noted in some other studies. Conditional upon maternal age at birth, mortality
risk is increasing in birth-order, this effect being stronger for under-5 than for infant mortality.
7. Conclusion
The analysis confirms the existence of differences in education, and fertility
characteristics (a greater number of children and shorter birth spacing) that are unfavourable
to the survival of Muslim compared to Hindu children. Hindu women also appear to achieve
better antenatal care and child immunization rates. Although the fraction of women
consuming tobacco in both communities is very small, it is larger amongst Muslim women
and we show that tobacco consumption by the mother has a significant positive impact on
childhood mortality risk. These are some of the factors that deepen the paradox in the sense
that they lead us to expect better survival chances amongst Hindu children, contrary to what is
observed.
We nevertheless find some clues to the puzzle of Muslim children exhibiting a
survival advantage. Muslim mothers are taller, which indicates long-term health, and are less
likely to be undernourished around the time of birth. There is some evidence that a non-
vegetarian diet of the mother (more prevalent amongst Muslims) lowers mortality risk, at least
in India, where the median person is quite poor. Muslim mothers are less likely to work than
Hindu mothers and this appears to confer an advantage on their children. Although there is no
systematic evidence of one group having better access to public health services, the data
indicate that Muslim mothers are more likely to seek treatment for diarrhoea, which is an
important cause of child death. Seemingly greater son preference amongst Hindus may also
24
contribute to explaining the Muslim advantage. The religion differential is larger amongst
girls, even if it is also evident amongst boys.
Some of the Muslim advantage can be explained in terms of composition effects. The
average Hindu mortality rate reflects, to some degree, the higher mortality rates of lower-
caste groups in the Hindu community. Muslims are more likely to live in urban areas and,
within rural areas, in larger villages- and these areas tend to be better supplied with health
facilities and, possibly, to be less prone to disease shocks (because of better sanitation, for
example). A consequence of higher fertility is that the average Muslim child is born more
recently and benefits from the improvements in health infrastructure and technology that drive
the secular decline in mortality rates. Another advantage conferred by their higher fertility is
that fewer Muslim children are first-borns or, related, fewer are born to very young mothers.
Reduced-form regressions of childhood mortality rates on these covariates indicate
that they do not explain away the Muslim survival advantage: there is a significant fixed
effect associated with being Muslim, holding constant these predictors. This would suggest
either that Muslim parents tend to provide better care for given characteristics or that we are
missing an important determinant of inputs contributing to child health that is strongly
correlated with being Muslim. However, the data indicate that Muslim children receive poorer
antenatal care and differences in postnatal care go in both directions. Furthermore, there does
not seem to be a robust Muslim advantage in terms of returns to inputs. More specifically, in a
regression of infant mortality on inputs and endowments alone, a Muslim dummy is only
significant if we do not control for the state in which the child lives. We may gain more
insight into the overall differential by looking more carefully at the religion differentials
within states which, we have shown, varies considerably across states.
References
Alderman , H., Pierre-André Chiappori , Lawrence Haddad , John Hoddinott , and
Ravi Kanbur (2001). Unitary versus collective models of the household: Is it time to shift the
burden of the proof? World Bank Research Observer 10(1).
Bhalotra, S. (2007), Fatal fluctuations: Cyclicality in infant mortality in India,
Discussion Paper, Bonn: IZA
Bhalotra, S. and A. van Soest (2005), A decomposition of the Hindu-Muslim
difference in childhood mortality risk. Paper presented at the Workshop on the
Microfoundations of Human Development, IIC: Delhi.
Bhalotra, S. and A. van Soest (2007), Neonatal mortality and birth-spacing in India:
Dynamics, frailty and fecundity, Journal of Econometrics, forthcoming.
Bhat, Mari P.N. and A.J. Francis Zavier (2005). Role of Religion in Fertility Decline:
The case of Indian Muslims. Economic and Political Weekly, 29 January: 385-402.
25
Chidambaram, V. C.; John W. McDonald; Michael D. Bracher (1985). Infant and
Child Mortality in the Developing World: Information from the World Fertility Survey.
International Family Planning Perspectives, Vol. 11, no.1: 17-25.
Das Gupta, Monica. (1987). Selective Discrimination against Female Children in
Rural Punjab. Population and Development Review 13, no. 1:77-100.
Filmer, D. and L Pritchett (1999). The Effect of Household Wealth on Educational
Attainment: Evidence from 35 Countries. Population and Development Review 25(1).
Fryer, RG. and SD Levitt (2004). Understanding the Black-White Test Score Gap in
the First Two Years of School. Review of Economics and Statistics (86): 447-464.
IIPS (1995). National Family Health Survey (MCH and Family Planning), India
1992-93. International Institute for Population Sciences (IIPS). Bombay, India.
IIPS and ORC Macro (2000). National Family Health Survey (NFHS-2) 1998-99
India. International Institute for Population Sciences (IIPS). Bombay, India.
Miller, Barbara. 1981. The Endangered Sex: Neglect of Female Children in Rural
North India. Ithaca, NY: Cornell University Press.
Sachar, R.. S. Hamid, T.K. Oommen, M.A. Basith, R. Basant, A. Majeed, and A.
Shariff (2006). Social, Economic and Educational Status of the Muslim Community of India:
A report. Prime Minister’s High Level Committee. Government of India. New Delhi, India.
Wilson, D., S. Burgess and A. Briggs (2005), The dynamics of school attainment of
England’s ethnic minorities, Working Paper 05/130, CMPO, University of Bristol.
Wolpin, K. (1997), Determinants and consequences of the mortality and health of
infants and children, Chapter 10 in Mark Rosenzweig and Oded Stark (eds.), Handbook of
Population and Family Economics, Volume 1A, Amsterdam: North Holland.
26
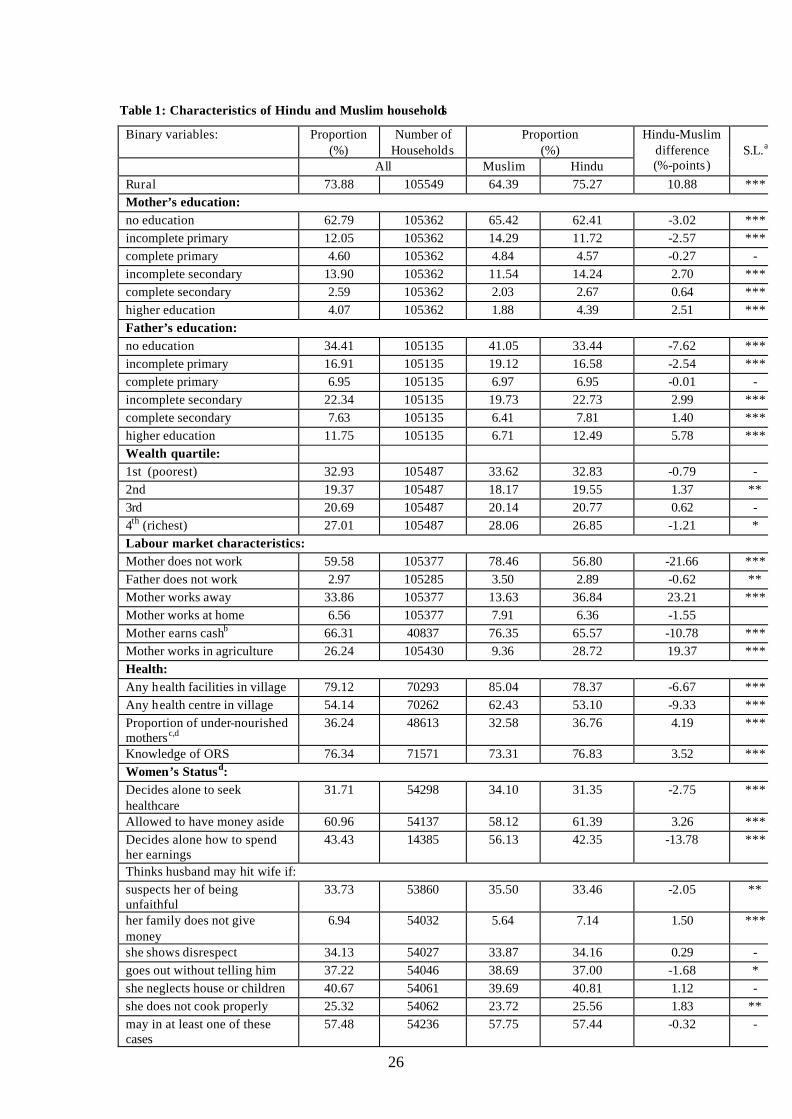
Table 1: Characteristics of Hindu and Muslim households
Binary variables: Proportion (%)
Number of Households
Proportion (%)
All Muslim Hindu
Hindu-Muslim difference (%-points)
S.L.a
Rural 73.88 105549 64.39 75.27 10.88 *** Mother’s education: no education 62.79 105362 65.42 62.41 -3.02 *** incomplete primary 12.05 105362 14.29 11.72 -2.57 *** complete primary 4.60 105362 4.84 4.57 -0.27 - incomplete secondary 13.90 105362 11.54 14.24 2.70 *** complete secondary 2.59 105362 2.03 2.67 0.64 *** higher education 4.07 105362 1.88 4.39 2.51 *** Father’s education: no education 34.41 105135 41.05 33.44 -7.62 *** incomplete primary 16.91 105135 19.12 16.58 -2.54 *** complete primary 6.95 105135 6.97 6.95 -0.01 - incomplete secondary 22.34 105135 19.73 22.73 2.99 *** complete secondary 7.63 105135 6.41 7.81 1.40 *** higher education 11.75 105135 6.71 12.49 5.78 *** Wealth quartile: 1st (poorest) 32.93 105487 33.62 32.83 -0.79 - 2nd 19.37 105487 18.17 19.55 1.37 ** 3rd 20.69 105487 20.14 20.77 0.62 - 4th (richest) 27.01 105487 28.06 26.85 -1.21 * Labour market characteristics: Mother does not work 59.58 105377 78.46 56.80 -21.66 *** Father does not work 2.97 105285 3.50 2.89 -0.62 ** Mother works away 33.86 105377 13.63 36.84 23.21 *** Mother works at home 6.56 105377 7.91 6.36 -1.55 Mother earns cashb 66.31 40837 76.35 65.57 -10.78 *** Mother works in agriculture 26.24 105430 9.36 28.72 19.37 *** Health: Any health facilities in village 79.12 70293 85.04 78.37 -6.67 *** Any health centre in village 54.14 70262 62.43 53.10 -9.33 *** Proportion of under-nourished mothersc,d
36.24 48613 32.58 36.76 4.19 ***
Knowledge of ORS 76.34 71571 73.31 76.83 3.52 *** Women’s Statusd: Decides alone to seek healthcare
31.71 54298 34.10 31.35 -2.75 ***
Allowed to have money aside 60.96 54137 58.12 61.39 3.26 *** Decides alone how to spend her earnings
43.43 14385 56.13 42.35 -13.78 ***
Thinks husband may hit wife if: suspects her of being unfaithful
33.73 53860 35.50 33.46 -2.05 **
her family does not give money
6.94 54032 5.64 7.14 1.50 ***
she shows disrespect 34.13 54027 33.87 34.16 0.29 - goes out without telling him 37.22 54046 38.69 37.00 -1.68 * she neglects house or children 40.67 54061 39.69 40.81 1.12 - she does not cook properly 25.32 54062 23.72 25.56 1.83 ** may in at least one of these cases
57.48 54236 57.75 57.44 -0.32 -
27
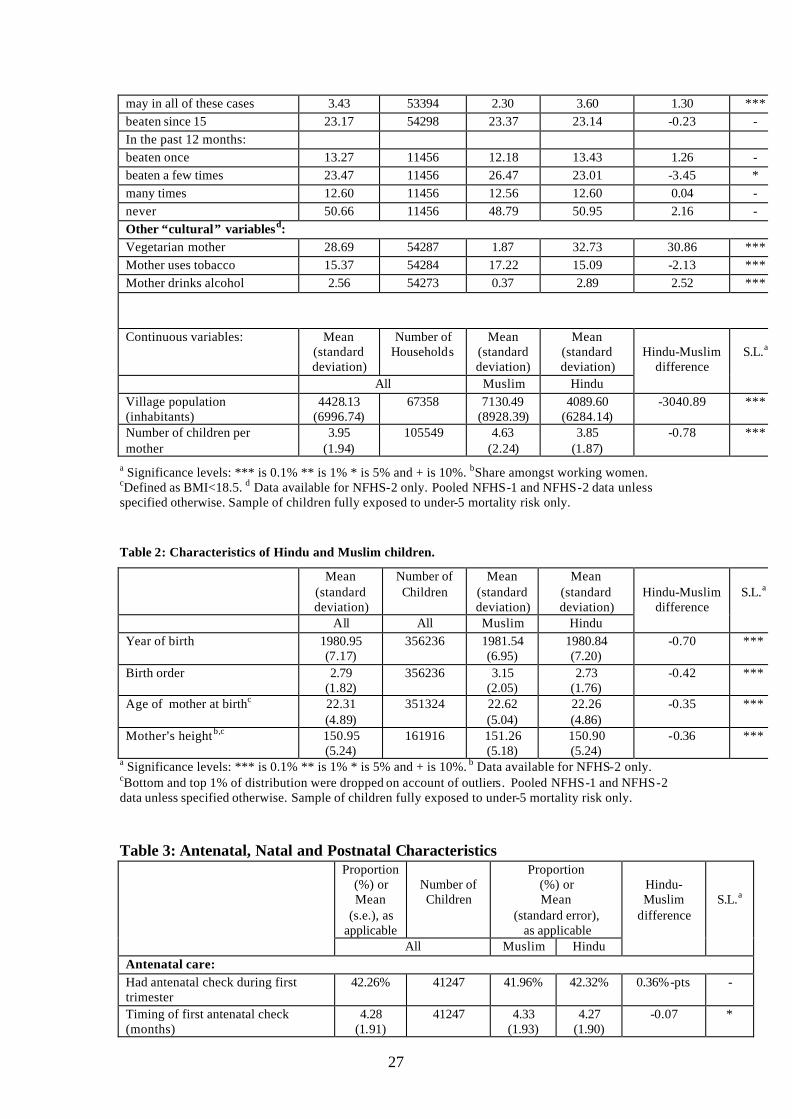
may in all of these cases 3.43 53394 2.30 3.60 1.30 *** beaten since 15 23.17 54298 23.37 23.14 -0.23 - In the past 12 months: beaten once 13.27 11456 12.18 13.43 1.26 - beaten a few times 23.47 11456 26.47 23.01 -3.45 * many times 12.60 11456 12.56 12.60 0.04 - never 50.66 11456 48.79 50.95 2.16 - Other “cultural” variablesd: Vegetarian mother 28.69 54287 1.87 32.73 30.86 *** Mother uses tobacco 15.37 54284 17.22 15.09 -2.13 *** Mother drinks alcohol 2.56 54273 0.37 2.89 2.52 ***
Continuous variables: Mean (standard deviation)
Number of Households
Mean (standard deviation)
Mean (standard deviation)
All Muslim Hindu
Hindu-Muslim
difference
S.L.a
Village population (inhabitants)
4428.13 (6996.74)
67358
7130.49 (8928.39)
4089.60 (6284.14)
-3040.89
***
Number of children per mother
3.95 (1.94)
105549
4.63 (2.24)
3.85 (1.87)
-0.78
***
a Significance levels: *** is 0.1% ** is 1% * is 5% and + is 10%. bShare amongst working women. cDefined as BMI<18.5. d Data available for NFHS-2 only. Pooled NFHS-1 and NFHS-2 data unless specified otherwise. Sample of children fully exposed to under-5 mortality risk only.
Table 2: Characteristics of Hindu and Muslim children.
Mean (standard deviation)
Number of Children
Mean (standard deviation)
Mean (standard deviation)
All All Muslim Hindu
Hindu-Muslim
difference
S.L.a
Year of birth 1980.95 (7.17)
356236 1981.54 (6.95)
1980.84 (7.20)
-0.70
***
Birth order 2.79 (1.82)
356236 3.15 (2.05)
2.73 (1.76)
-0.42
***
Age of mother at birthc 22.31 (4.89)
351324 22.62 (5.04)
22.26 (4.86)
-0.35
***
Mother’s height b,c 150.95 (5.24)
161916 151.26 (5.18)
150.90 (5.24)
-0.36
***
a Significance levels: *** is 0.1% ** is 1% * is 5% and + is 10%. b Data available for NFHS-2 only. cBottom and top 1% of distribution were dropped on account of outliers. Pooled NFHS-1 and NFHS-2 data unless specified otherwise. Sample of children fully exposed to under-5 mortality risk only. Table 3: Antenatal, Natal and Postnatal Characteristics
Proportion (%) or Mean
(s.e.), as applicable
Number of Children
Proportion (%) or Mean
(standard error), as applicable
All Muslim Hindu
Hindu-Muslim
difference
S.L.a
Antenatal care: Had antenatal check during first trimester
42.26% 41247 41.96% 42.32% 0.36%-pts -
Timing of first antenatal check (months)
4.28 (1.91)
41247 4.33 (1.93)
4.27 (1.90)
-0.07 *
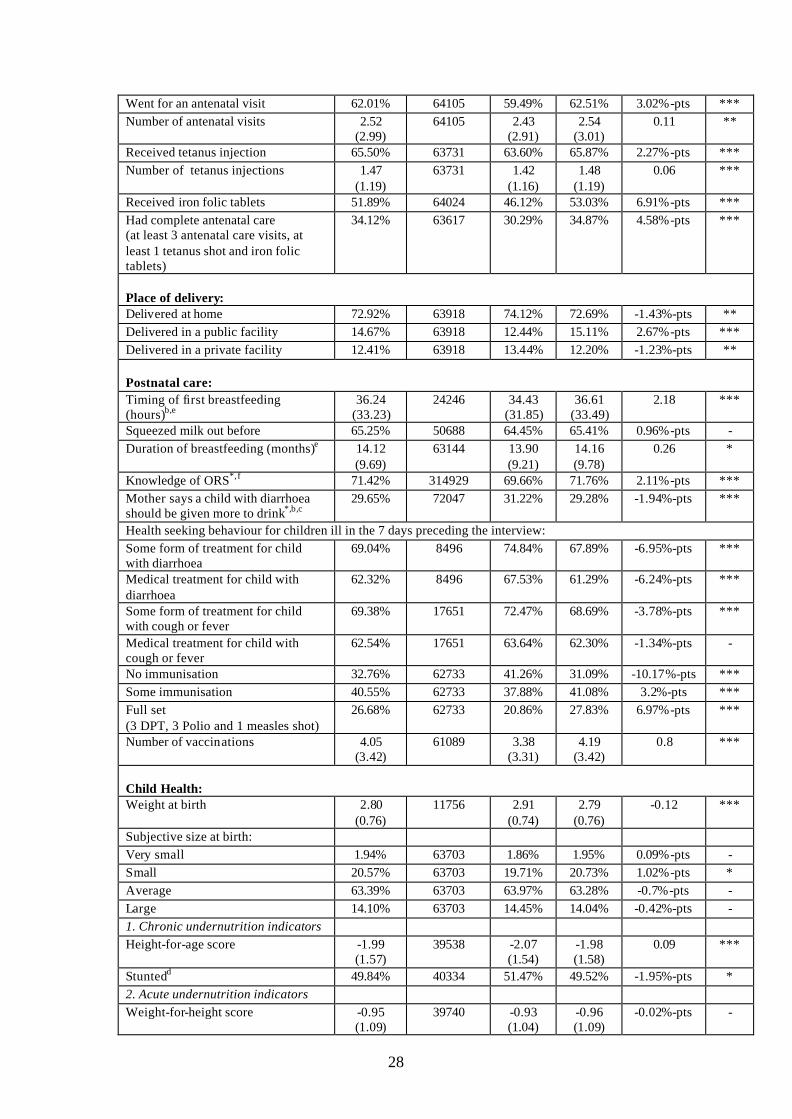
28
Went for an antenatal visit 62.01% 64105 59.49% 62.51% 3.02%-pts *** Number of antenatal visits 2.52
(2.99) 64105 2.43
(2.91) 2.54
(3.01) 0.11 **
Received tetanus injection 65.50% 63731 63.60% 65.87% 2.27%-pts *** Number of tetanus injections 1.47
(1.19) 63731 1.42
(1.16) 1.48
(1.19) 0.06 ***
Received iron folic tablets 51.89% 64024 46.12% 53.03% 6.91%-pts *** Had complete antenatal care (at least 3 antenatal care visits, at least 1 tetanus shot and iron folic tablets)
34.12% 63617 30.29% 34.87% 4.58%-pts ***
Place of delivery: Delivered at home 72.92% 63918 74.12% 72.69% -1.43%-pts ** Delivered in a public facility 14.67% 63918 12.44% 15.11% 2.67%-pts *** Delivered in a private facility 12.41% 63918 13.44% 12.20% -1.23%-pts ** Postnatal care: Timing of first breastfeeding (hours)b,e
36.24 (33.23)
24246 34.43 (31.85)
36.61 (33.49)
2.18 ***
Squeezed milk out before 65.25% 50688 64.45% 65.41% 0.96%-pts - Duration of breastfeeding (months)e 14.12
(9.69) 63144 13.90
(9.21) 14.16 (9.78)
0.26 *
Knowledge of ORS*,f 71.42% 314929 69.66% 71.76% 2.11%-pts *** Mother says a child with diarrhoea should be given more to drink*,b,c
29.65% 72047 31.22% 29.28% -1.94%-pts ***
Health seeking behaviour for children ill in the 7 days preceding the interview: Some form of treatment for child with diarrhoea
69.04% 8496 74.84% 67.89% -6.95%-pts ***
Medical treatment for child with diarrhoea
62.32% 8496 67.53% 61.29% -6.24%-pts ***
Some form of treatment for child with cough or fever
69.38% 17651 72.47% 68.69% -3.78%-pts ***
Medical treatment for child with cough or fever
62.54% 17651 63.64% 62.30% -1.34%-pts -
No immunisation 32.76% 62733 41.26% 31.09% -10.17%-pts *** Some immunisation 40.55% 62733 37.88% 41.08% 3.2%-pts *** Full set (3 DPT, 3 Polio and 1 measles shot)
26.68% 62733 20.86% 27.83% 6.97%-pts ***
Number of vaccinations 4.05 (3.42)
61089 3.38 (3.31)
4.19 (3.42)
0.8 ***
Child Health: Weight at birth 2.80
(0.76) 11756 2.91
(0.74) 2.79
(0.76) -0.12 ***
Subjective size at birth: Very small 1.94% 63703 1.86% 1.95% 0.09%-pts - Small 20.57% 63703 19.71% 20.73% 1.02%-pts * Average 63.39% 63703 63.97% 63.28% -0.7%-pts - Large 14.10% 63703 14.45% 14.04% -0.42%-pts - 1. Chronic undernutrition indicators Height-for-age score -1.99
(1.57) 39538 -2.07
(1.54) -1.98 (1.58)
0.09 ***
Stuntedd 49.84% 40334 51.47% 49.52% -1.95%-pts * 2. Acute undernutrition indicators Weight-for-height score -0.95
(1.09) 39740 -0.93
(1.04) -0.96 (1.09)
-0.02%-pts -
29
Wastedd 16.95% 40547 16.13% 17.11% 0.99%-pts - Unless marked *, data available only for children born in the 48 months preceding interview in NFHS-1 and in the 36 months preceding interview in NFHS-2. a Significance levels: *** is 0.1% ** is 1% * is 5% and + is 10%. bOnly available in NFHS-2. c Data available for all mothers who have given birth in the 36 months preceding interview. d Defined as children below 2 standard deviations of the international reference population median. eTop 1% of distribution were dropped to avoid outlier bias. f Data available for all mothers.
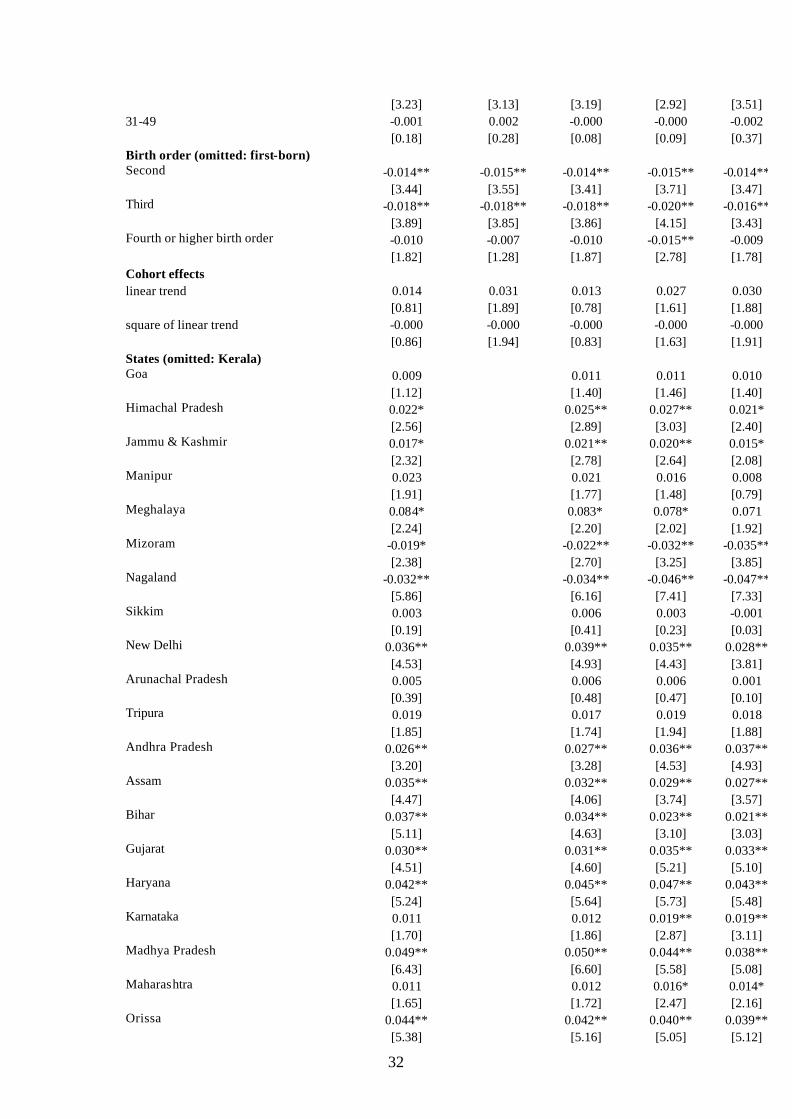
Table 4: Regressions: Sample on all births exposed to relevant mortality risk
(1) (2) (3) (4) Dependent variable:mortality indicator Under-5 Under-5 Under-5 Infant 1 if Muslim -0.021** -0.017** -0.014** -0.016** [7.83] [4.80] [3.99] [7.40] 1 if currently rural resident 0.026** 0.027** 0.026** 0.018** [11.40] [9.98] [9.49] [10.25] 1 if scheduled tribe -0.001 0.001 0.003 -0.004 [0.14] [0.18] [0.54] [1.58] 1 if scheduled caste 0.019** 0.015** 0.016** 0.009** [7.42] [4.65] [4.86] [4.45] Mother’s education incomplete primary -0.025** -0.025** -0.025** -0.016** [10.38] [7.10] [7.03] [8.12] complete primary -0.024** -0.020** -0.020** -0.017** [6.87] [4.83] [4.77] [5.84] incomplete secondary -0.033** -0.025** -0.024** -0.021** [12.73] [6.76] [6.58] [10.48] complete secondary and higher -0.025** -0.027** -0.026** -0.018** [7.03] [6.06] [5.96] [6.50] Father’s education incomplete primary -0.015** -0.007 -0.007 -0.007** [5.85] [1.69] [1.66] [3.70] complete primary -0.020** -0.017** -0.016** -0.008** [5.75] [3.60] [3.54] [2.98] incomplete secondary -0.035** -0.025** -0.024** -0.019** [13.44] [7.36] [7.28] [9.61] complete secondary -0.047** -0.038** -0.038** -0.026** [14.63] [10.04] [10.1] [10.60] Higher -0.052** -0.038** -0.038** -0.030** [15.20] [9.02] [9.11] [11.38] 1 if child is female 0.005** 0.003 0.003 -0.003** [3.71] [1.67] [1.68] [2.75] Mother’s age at birth (omitted: 19-24) 9-15 0.082** 0.078** 0.079** 0.067** [19.72] [12.66] [12.8] [19.08] 16-18 0.038** 0.036** 0.036** 0.030** [18.28] [12.62] [12.8] [17.01] 25-30 -0.026** -0.021** -0.021** -0.018** [13.11] [7.18] [7.33] [10.84] 31-49 -0.031** -0.019** -0.020** -0.017** [9.10] [3.68] [3.91] [6.56] Birth order (omitted: first-born) Second 0.012** 0.008** 0.008** -0.002 [5.77] [3.10] [3.08] [1.16] Third 0.018** 0.016** 0.015** 0.000 [7.90] [4.94] [4.88] [0.14]
30
Fourth or higher birth order 0.048** 0.041** 0.041** 0.023** [17.04] [10.25] [10.2] [10.13] Cohort effects linear trend -0.005** -0.008** -0.008** -0.003** [8.36] [6.17] [6.10] [7.60] square of linear trend 0.000** 0.000** 0.000** 0.000* [2.77] [3.26] [3.28] [2.25] States (omitted: Kerala) Goa 0.003 0.010 0.009 0.007 [0.53] [1.05] [1.00] [1.66] Himachal Pradesh -0.000 -0.009 -0.011 0.007* [0.10] [1.48] [1.85] [2.10] Jammu & Kashmir 0.011* 0.019** 0.016** 0.016** [2.52] [3.55] [3.02] [4.74] Manipur 0.017* 0.025* 0.023* 0.009 [2.05] [2.20] [2.09] [1.52] Meghalaya 0.026 0.036 0.033 0.033** [1.60] [1.81] [1.69] [2.60] Mizoram 0.087 0.191** 0.180** 0.072 [1.48] [3.50] [3.28] [1.14] Nagaland 0.012 0.043 0.039 0.008 [0.54] [1.93] [1.76] [0.58] Sikkim 0.028** 0.015 0.012 0.024** [3.00] [1.52] [1.20] [3.74] New Delhi 0.040** 0.045** 0.041** 0.035** [8.30] [6.22] [5.61] [9.41] Arunachal Pradesh -0.008 -0.015 -0.018 0.004 [0.72] [1.27] [1.52] [0.38] Tripura 0.047** 0.030** 0.030** 0.037** [6.91] [3.21] [3.14] [6.44] Andhra Pradesh 0.018** 0.022** 0.022** 0.020** [3.83] [3.32] [3.30] [5.65] Assam 0.035** -0.004 -0.006 0.025** [6.16] [0.59] [0.88] [6.63] Bihar 0.048** 0.033** 0.032** 0.032** [10.77] [5.81] [5.66] [9.68] Gujarat 0.045** 0.053** 0.046** 0.038** [9.12] [7.75] [6.53] [10.45] Haryana 0.031** 0.031** 0.025** 0.030** [6.95] [5.50] [4.12] [8.12] Karnataka 0.034** 0.029** 0.027** 0.024** [7.88] [5.62] [5.06] [7.08] Madhya Pradesh 0.079** 0.090** 0.085** 0.058** [16.11] [14.56] [13.4] [15.56] Maharashtra 0.025** 0.030** 0.025** 0.020** [5.59] [4.92] [4.11] [6.18] Orissa 0.064** 0.054** 0.051** 0.063** [12.40] [7.70] [7.17] [14.67] Punjab 0.013* 0.026** 0.021* 0.021** [2.15] [3.27] [2.56] [4.71] Rajasthan 0.037** 0.071** 0.064** 0.035** [7.42] [11.88] [10.1] [9.13] Tamil Nadu 0.037** 0.034** 0.034** 0.027** [8.82] [5.99] [6.09] [8.12] Uttar Pradesh 0.104** 0.093** 0.088** 0.078** [23.87] [16.12] [14.9] [24.54]
31
West Bengal 0.032** 0.025** 0.024** 0.028** [7.26] [4.00] [3.86] [8.40] Maternal health indicators mother height (cms) -0.002** -0.002** [8.65] [8.77] 1 if vegetarian mother 0.010** [3.12] 1 if mother drinks alcohol -0.004 [0.42] 1 if mother consumes tobacco 0.012** [3.58] Observations 352817 160567 160449 426805 R-squared 0.04 0.03 0.03 0.02 Robust t statistics in brackets * significant at 5%; ** significant at 1%
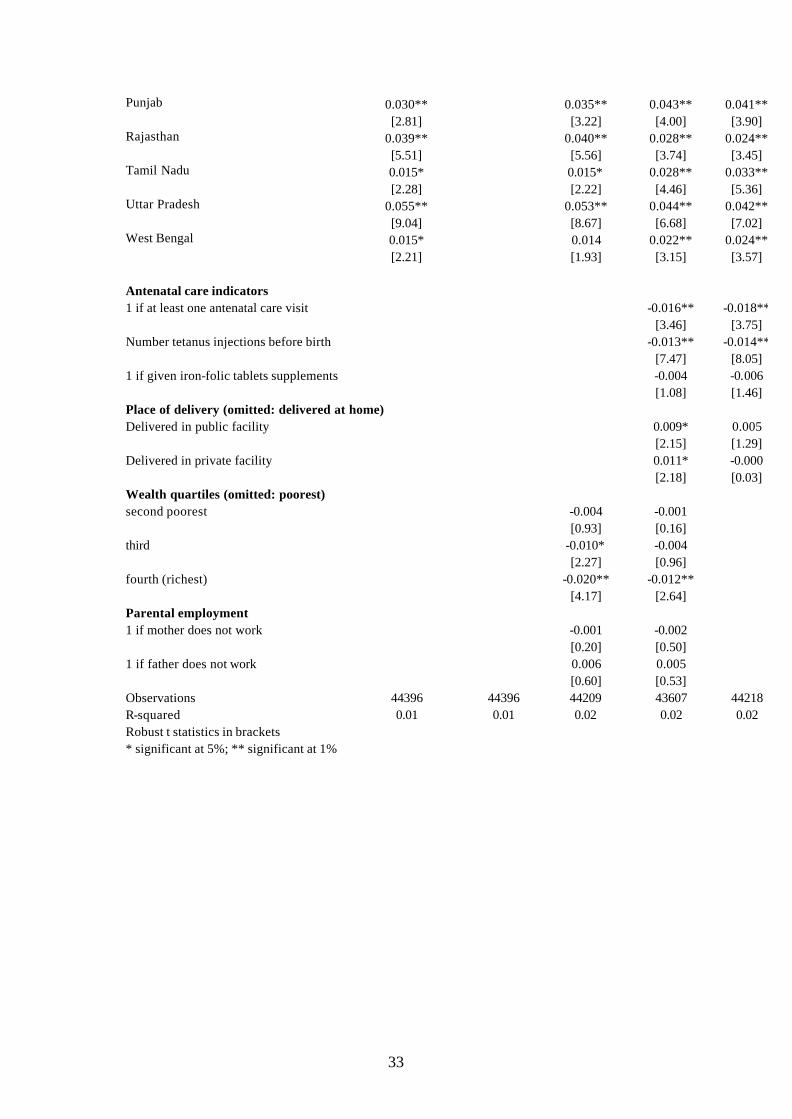
Table 5: Regressions: Sample of recent births (1) (2) (3) (4) (5) Dep variable: infant mortality indicator Infant Infant Infant Infant Infant 1 if Muslim -0.006 -0.008 -0.005 -0.004 -0.003 [1.23] [1.80] [1.09] [0.83] [0.79] 1 if currently rural resident 0.008* 0.011** 0.003 0.002 0.008* [2.53] [3.42] [0.91] [0.44] [2.22] 1 if scheduled tribe -0.001 -0.001 -0.002 -0.008 [0.23] [0.25] [0.41] [1.49] 1 if scheduled caste 0.011* 0.011* 0.010* 0.009* [2.39] [2.50] [2.28] [2.04] Mother’s education (omitted: no education) incomplete primary -0.003 -0.012* -0.001 0.004 [0.72] [2.45] [0.31] [0.76] complete primary -0.013 -0.021** -0.011 -0.002 [1.85] [2.93] [1.49] [0.32] incomplete secondary -0.015** -0.027** -0.010* -0.002 [3.43] [6.49] [2.30] [0.41] complete secondary and higher -0.020** -0.032** -0.013* -0.009 [3.33] [5.58] [2.18] [1.43] Father’s education (omitted: no education) incomplete primary -0.006 -0.008 -0.006 -0.004 [1.36] [1.74] [1.18] [0.89] complete primary -0.007 -0.007 -0.005 -0.003 [1.12] [1.09] [0.83] [0.49] incomplete secondary -0.017** -0.014** -0.014** -0.012** [4.14] [3.33] [3.35] [2.98] complete secondary -0.017** -0.010 -0.013* -0.012 [2.84] [1.62] [2.19] [1.95] Higher -0.029** -0.020** -0.024** -0.019** [5.13] [3.61] [4.14] [3.24] 1 if child is female -0.002 -0.002 -0.002 -0.003 -0.003 [0.75] [0.82] [0.74] [1.22] [1.07] Mother’s age at birth (omitted: 19-24) 9-15 0.065** 0.062** 0.065** 0.065** 0.070** [4.70] [4.53] [4.72] [4.67] [5.14] 16-18 0.018** 0.017** 0.017** 0.014** 0.017** [3.34] [3.26] [3.21] [2.76] [3.34] 25-30 -0.012** -0.012** -0.012** -0.011** -0.013**
32
[3.23] [3.13] [3.19] [2.92] [3.51] 31-49 -0.001 0.002 -0.000 -0.000 -0.002 [0.18] [0.28] [0.08] [0.09] [0.37] Birth order (omitted: first-born) Second -0.014** -0.015** -0.014** -0.015** -0.014** [3.44] [3.55] [3.41] [3.71] [3.47] Third -0.018** -0.018** -0.018** -0.020** -0.016** [3.89] [3.85] [3.86] [4.15] [3.43] Fourth or higher birth order -0.010 -0.007 -0.010 -0.015** -0.009 [1.82] [1.28] [1.87] [2.78] [1.78] Cohort effects linear trend 0.014 0.031 0.013 0.027 0.030 [0.81] [1.89] [0.78] [1.61] [1.88] square of linear trend -0.000 -0.000 -0.000 -0.000 -0.000 [0.86] [1.94] [0.83] [1.63] [1.91] States (omitted: Kerala) Goa 0.009 0.011 0.011 0.010 [1.12] [1.40] [1.46] [1.40] Himachal Pradesh 0.022* 0.025** 0.027** 0.021* [2.56] [2.89] [3.03] [2.40] Jammu & Kashmir 0.017* 0.021** 0.020** 0.015* [2.32] [2.78] [2.64] [2.08] Manipur 0.023 0.021 0.016 0.008 [1.91] [1.77] [1.48] [0.79] Meghalaya 0.084* 0.083* 0.078* 0.071 [2.24] [2.20] [2.02] [1.92] Mizoram -0.019* -0.022** -0.032** -0.035** [2.38] [2.70] [3.25] [3.85] Nagaland -0.032** -0.034** -0.046** -0.047** [5.86] [6.16] [7.41] [7.33] Sikkim 0.003 0.006 0.003 -0.001 [0.19] [0.41] [0.23] [0.03] New Delhi 0.036** 0.039** 0.035** 0.028** [4.53] [4.93] [4.43] [3.81] Arunachal Pradesh 0.005 0.006 0.006 0.001 [0.39] [0.48] [0.47] [0.10] Tripura 0.019 0.017 0.019 0.018 [1.85] [1.74] [1.94] [1.88] Andhra Pradesh 0.026** 0.027** 0.036** 0.037** [3.20] [3.28] [4.53] [4.93] Assam 0.035** 0.032** 0.029** 0.027** [4.47] [4.06] [3.74] [3.57] Bihar 0.037** 0.034** 0.023** 0.021** [5.11] [4.63] [3.10] [3.03] Gujarat 0.030** 0.031** 0.035** 0.033** [4.51] [4.60] [5.21] [5.10] Haryana 0.042** 0.045** 0.047** 0.043** [5.24] [5.64] [5.73] [5.48] Karnataka 0.011 0.012 0.019** 0.019** [1.70] [1.86] [2.87] [3.11] Madhya Pradesh 0.049** 0.050** 0.044** 0.038** [6.43] [6.60] [5.58] [5.08] Maharashtra 0.011 0.012 0.016* 0.014* [1.65] [1.72] [2.47] [2.16] Orissa 0.044** 0.042** 0.040** 0.039** [5.38] [5.16] [5.05] [5.12]
33
Punjab 0.030** 0.035** 0.043** 0.041** [2.81] [3.22] [4.00] [3.90] Rajasthan 0.039** 0.040** 0.028** 0.024** [5.51] [5.56] [3.74] [3.45] Tamil Nadu 0.015* 0.015* 0.028** 0.033** [2.28] [2.22] [4.46] [5.36] Uttar Pradesh 0.055** 0.053** 0.044** 0.042** [9.04] [8.67] [6.68] [7.02] West Bengal 0.015* 0.014 0.022** 0.024** [2.21] [1.93] [3.15] [3.57] Antenatal care indicators 1 if at least one antenatal care visit -0.016** -0.018** [3.46] [3.75] Number tetanus injections before birth -0.013** -0.014** [7.47] [8.05] 1 if given iron-folic tablets supplements -0.004 -0.006 [1.08] [1.46] Place of delivery (omitted: delivered at home) Delivered in public facility 0.009* 0.005 [2.15] [1.29] Delivered in private facility 0.011* -0.000 [2.18] [0.03] Wealth quartiles (omitted: poorest) second poorest -0.004 -0.001 [0.93] [0.16] third -0.010* -0.004 [2.27] [0.96] fourth (richest) -0.020** -0.012** [4.17] [2.64] Parental employment 1 if mother does not work -0.001 -0.002 [0.20] [0.50] 1 if father does not work 0.006 0.005 [0.60] [0.53] Observations 44396 44396 44209 43607 44218 R-squared 0.01 0.01 0.02 0.02 0.02 Robust t statistics in brackets * significant at 5%; ** significant at 1%
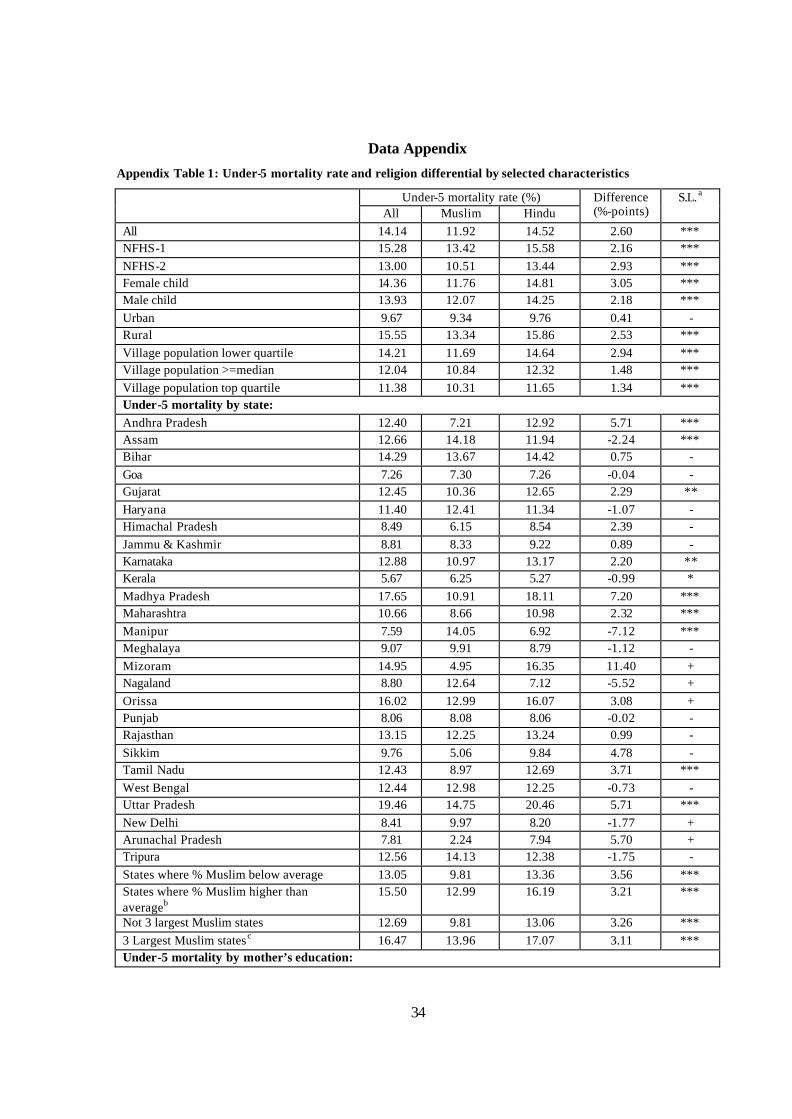
34
Data Appendix
Appendix Table 1: Under-5 mortality rate and religion differential by selected characteristics
Under-5 mortality rate (%) All Muslim Hindu
Difference (%-points)
S.L. a
All 14.14 11.92 14.52 2.60 *** NFHS-1 15.28 13.42 15.58 2.16 *** NFHS-2 13.00 10.51 13.44 2.93 *** Female child 14.36 11.76 14.81 3.05 *** Male child 13.93 12.07 14.25 2.18 *** Urban 9.67 9.34 9.76 0.41 - Rural 15.55 13.34 15.86 2.53 *** Village population lower quartile 14.21 11.69 14.64 2.94 *** Village population >=median 12.04 10.84 12.32 1.48 *** Village population top quartile 11.38 10.31 11.65 1.34 *** Under-5 mortality by state: Andhra Pradesh 12.40 7.21 12.92 5.71 *** Assam 12.66 14.18 11.94 -2.24 *** Bihar 14.29 13.67 14.42 0.75 - Goa 7.26 7.30 7.26 -0.04 - Gujarat 12.45 10.36 12.65 2.29 ** Haryana 11.40 12.41 11.34 -1.07 - Himachal Pradesh 8.49 6.15 8.54 2.39 - Jammu & Kashmir 8.81 8.33 9.22 0.89 - Karnataka 12.88 10.97 13.17 2.20 ** Kerala 5.67 6.25 5.27 -0.99 * Madhya Pradesh 17.65 10.91 18.11 7.20 *** Maharashtra 10.66 8.66 10.98 2.32 *** Manipur 7.59 14.05 6.92 -7.12 *** Meghalaya 9.07 9.91 8.79 -1.12 - Mizoram 14.95 4.95 16.35 11.40 + Nagaland 8.80 12.64 7.12 -5.52 + Orissa 16.02 12.99 16.07 3.08 + Punjab 8.06 8.08 8.06 -0.02 - Rajasthan 13.15 12.25 13.24 0.99 - Sikkim 9.76 5.06 9.84 4.78 - Tamil Nadu 12.43 8.97 12.69 3.71 *** West Bengal 12.44 12.98 12.25 -0.73 - Uttar Pradesh 19.46 14.75 20.46 5.71 *** New Delhi 8.41 9.97 8.20 -1.77 + Arunachal Pradesh 7.81 2.24 7.94 5.70 + Tripura 12.56 14.13 12.38 -1.75 - States where % Muslim below average 13.05 9.81 13.36 3.56 *** States where % Muslim higher than averageb
15.50 12.99 16.19 3.21 ***
Not 3 largest Muslim states 12.69 9.81 13.06 3.26 *** 3 Largest Muslim statesc 16.47 13.96 17.07 3.11 *** Under-5 mortality by mother’s education:
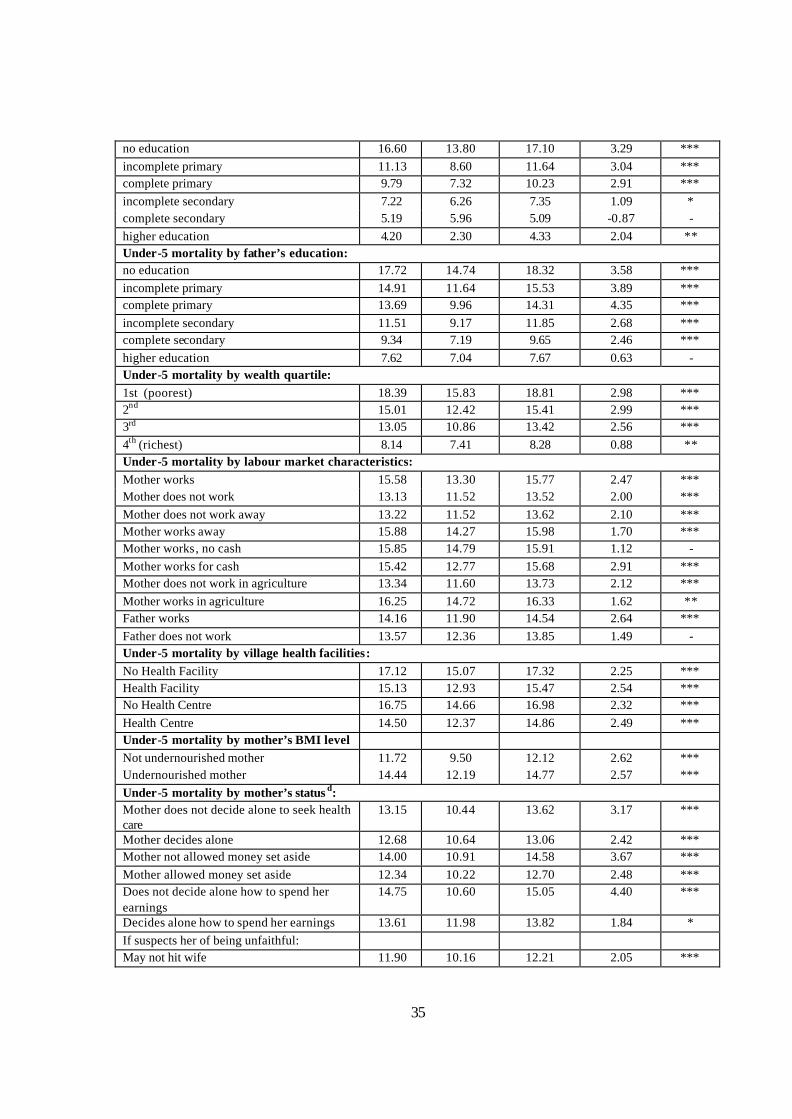
35
no education 16.60 13.80 17.10 3.29 *** incomplete primary 11.13 8.60 11.64 3.04 *** complete primary 9.79 7.32 10.23 2.91 *** incomplete secondary 7.22 6.26 7.35 1.09 * complete secondary 5.19 5.96 5.09 -0.87 - higher education 4.20 2.30 4.33 2.04 ** Under-5 mortality by father’s education: no education 17.72 14.74 18.32 3.58 *** incomplete primary 14.91 11.64 15.53 3.89 *** complete primary 13.69 9.96 14.31 4.35 *** incomplete secondary 11.51 9.17 11.85 2.68 *** complete secondary 9.34 7.19 9.65 2.46 *** higher education 7.62 7.04 7.67 0.63 - Under-5 mortality by wealth quartile: 1st (poorest) 18.39 15.83 18.81 2.98 *** 2nd 15.01 12.42 15.41 2.99 *** 3rd 13.05 10.86 13.42 2.56 *** 4th (richest) 8.14 7.41 8.28 0.88 ** Under-5 mortality by labour market characteristics: Mother works 15.58 13.30 15.77 2.47 *** Mother does not work 13.13 11.52 13.52 2.00 *** Mother does not work away 13.22 11.52 13.62 2.10 *** Mother works away 15.88 14.27 15.98 1.70 *** Mother works, no cash 15.85 14.79 15.91 1.12 - Mother works for cash 15.42 12.77 15.68 2.91 *** Mother does not work in agriculture 13.34 11.60 13.73 2.12 *** Mother works in agriculture 16.25 14.72 16.33 1.62 ** Father works 14.16 11.90 14.54 2.64 *** Father does not work 13.57 12.36 13.85 1.49 - Under-5 mortality by village health facilities: No Health Facility 17.12 15.07 17.32 2.25 *** Health Facility 15.13 12.93 15.47 2.54 *** No Health Centre 16.75 14.66 16.98 2.32 *** Health Centre 14.50 12.37 14.86 2.49 *** Under-5 mortality by mother’s BMI level Not undernourished mother 11.72 9.50 12.12 2.62 *** Undernourished mother 14.44 12.19 14.77 2.57 *** Under-5 mortality by mother’s status d: Mother does not decide alone to seek health care
13.15 10.44 13.62 3.17 ***
Mother decides alone 12.68 10.64 13.06 2.42 *** Mother not allowed money set aside 14.00 10.91 14.58 3.67 *** Mother allowed money set aside 12.34 10.22 12.70 2.48 *** Does not decide alone how to spend her earnings
14.75 10.60 15.05 4.40 ***
Decides alone how to spend her earnings 13.61 11.98 13.82 1.84 * If suspects her of being unfaithful: May not hit wife 11.90 10.16 12.21 2.05 ***
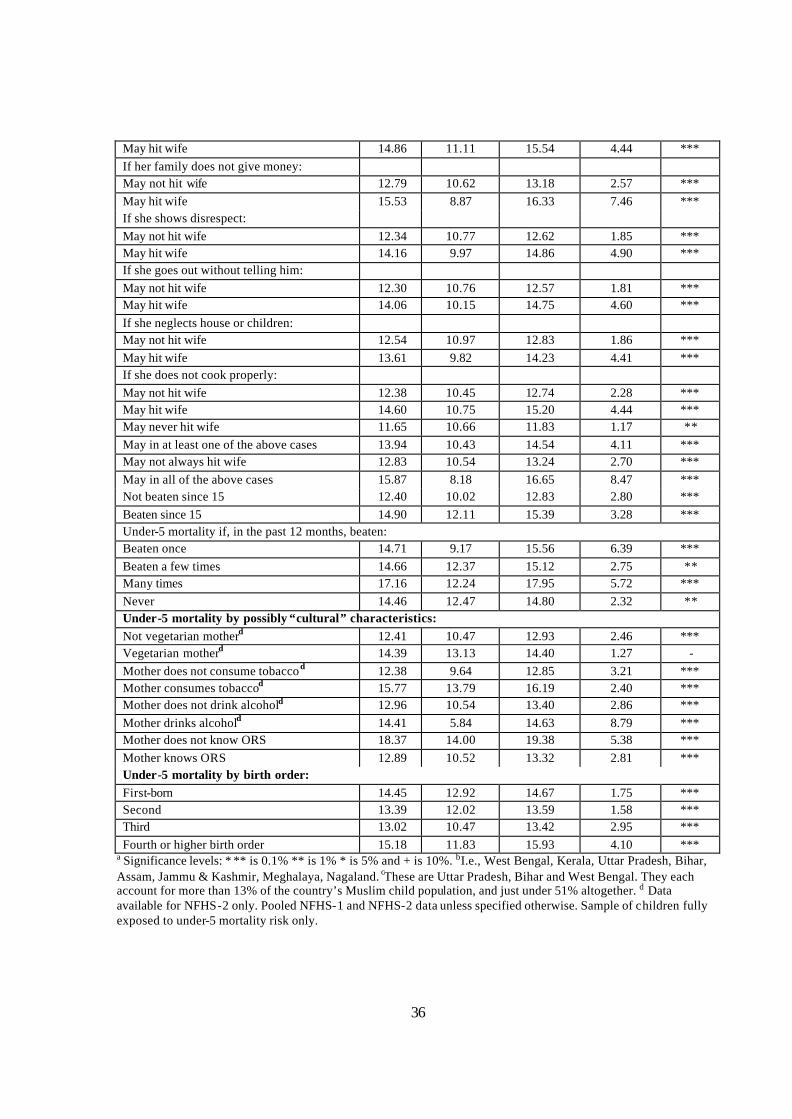
36
May hit wife 14.86 11.11 15.54 4.44 *** If her family does not give money: May not hit wife 12.79 10.62 13.18 2.57 *** May hit wife 15.53 8.87 16.33 7.46 *** If she shows disrespect: May not hit wife 12.34 10.77 12.62 1.85 *** May hit wife 14.16 9.97 14.86 4.90 *** If she goes out without telling him: May not hit wife 12.30 10.76 12.57 1.81 *** May hit wife 14.06 10.15 14.75 4.60 *** If she neglects house or children: May not hit wife 12.54 10.97 12.83 1.86 *** May hit wife 13.61 9.82 14.23 4.41 *** If she does not cook properly: May not hit wife 12.38 10.45 12.74 2.28 *** May hit wife 14.60 10.75 15.20 4.44 *** May never hit wife 11.65 10.66 11.83 1.17 ** May in at least one of the above cases 13.94 10.43 14.54 4.11 *** May not always hit wife 12.83 10.54 13.24 2.70 *** May in all of the above cases 15.87 8.18 16.65 8.47 *** Not beaten since 15 12.40 10.02 12.83 2.80 *** Beaten since 15 14.90 12.11 15.39 3.28 *** Under-5 mortality if, in the past 12 months, beaten: Beaten once 14.71 9.17 15.56 6.39 *** Beaten a few times 14.66 12.37 15.12 2.75 ** Many times 17.16 12.24 17.95 5.72 *** Never 14.46 12.47 14.80 2.32 ** Under-5 mortality by possibly “cultural” characteristics: Not vegetarian motherd 12.41 10.47 12.93 2.46 *** Vegetarian motherd 14.39 13.13 14.40 1.27 - Mother does not consume tobaccod 12.38 9.64 12.85 3.21 *** Mother consumes tobaccod 15.77 13.79 16.19 2.40 *** Mother does not drink alcohold 12.96 10.54 13.40 2.86 *** Mother drinks alcohold 14.41 5.84 14.63 8.79 *** Mother does not know ORS 18.37 14.00 19.38 5.38 *** Mother knows ORS 12.89 10.52 13.32 2.81 *** Under-5 mortality by birth order: First-born 14.45 12.92 14.67 1.75 *** Second 13.39 12.02 13.59 1.58 *** Third 13.02 10.47 13.42 2.95 *** Fourth or higher birth order 15.18 11.83 15.93 4.10 ***
a Significance levels: * ** is 0.1% ** is 1% * is 5% and + is 10%. bI.e., West Bengal, Kerala, Uttar Pradesh, Bihar, Assam, Jammu & Kashmir, Meghalaya, Nagaland. cThese are Uttar Pradesh, Bihar and West Bengal. They each account for more than 13% of the country’s Muslim child population, and just under 51% altogether. d Data available for NFHS-2 only. Pooled NFHS-1 and NFHS-2 data unless specified otherwise. Sample of children fully exposed to under-5 mortality risk only.
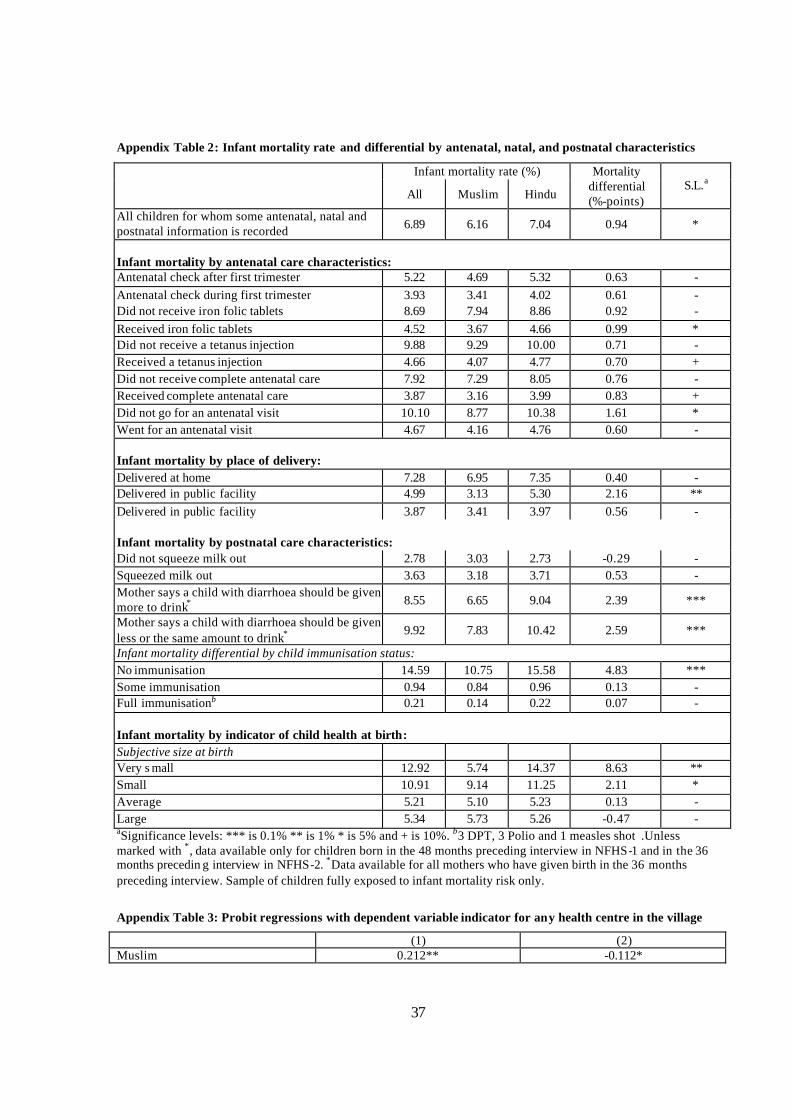
37
Appendix Table 2: Infant mortality rate and differential by antenatal, natal, and postnatal characteristics
Infant mortality rate (%)
All Muslim Hindu
Mortality differential (%-points)
S.L.a
All children for whom some antenatal, natal and postnatal information is recorded 6.89 6.16 7.04 0.94 *
Infant mortality by antenatal care characteristics: Antenatal check after first trimester 5.22 4.69 5.32 0.63 - Antenatal check during first trimester 3.93 3.41 4.02 0.61 - Did not receive iron folic tablets 8.69 7.94 8.86 0.92 - Received iron folic tablets 4.52 3.67 4.66 0.99 * Did not receive a tetanus injection 9.88 9.29 10.00 0.71 - Received a tetanus injection 4.66 4.07 4.77 0.70 + Did not receive complete antenatal care 7.92 7.29 8.05 0.76 - Received complete antenatal care 3.87 3.16 3.99 0.83 + Did not go for an antenatal visit 10.10 8.77 10.38 1.61 * Went for an antenatal visit 4.67 4.16 4.76 0.60 - Infant mortality by place of delivery: Delivered at home 7.28 6.95 7.35 0.40 - Delivered in public facility 4.99 3.13 5.30 2.16 ** Delivered in public facility 3.87 3.41 3.97 0.56 - Infant mortality by postnatal care characteristics: Did not squeeze milk out 2.78 3.03 2.73 -0.29 - Squeezed milk out 3.63 3.18 3.71 0.53 - Mother says a child with diarrhoea should be given more to drink* 8.55 6.65 9.04 2.39 ***
Mother says a child with diarrhoea should be given less or the same amount to drink* 9.92 7.83 10.42 2.59 ***
Infant mortality differential by child immunisation status: No immunisation 14.59 10.75 15.58 4.83 *** Some immunisation 0.94 0.84 0.96 0.13 - Full immunisationb 0.21 0.14 0.22 0.07 - Infant mortality by indicator of child health at birth: Subjective size at birth Very s mall 12.92 5.74 14.37 8.63 ** Small 10.91 9.14 11.25 2.11 * Average 5.21 5.10 5.23 0.13 - Large 5.34 5.73 5.26 -0.47 - aSignificance levels: *** is 0.1% ** is 1% * is 5% and + is 10%. b3 DPT, 3 Polio and 1 measles shot .Unless marked with *, data available only for children born in the 48 months preceding interview in NFHS-1 and in the 36 months precedin g interview in NFHS-2. *Data available for all mothers who have given birth in the 36 months preceding interview. Sample of children fully exposed to infant mortality risk only.
Appendix Table 3: Probit regressions with dependent variable indicator for any health centre in the village
(1) (2) Muslim 0.212** -0.112*
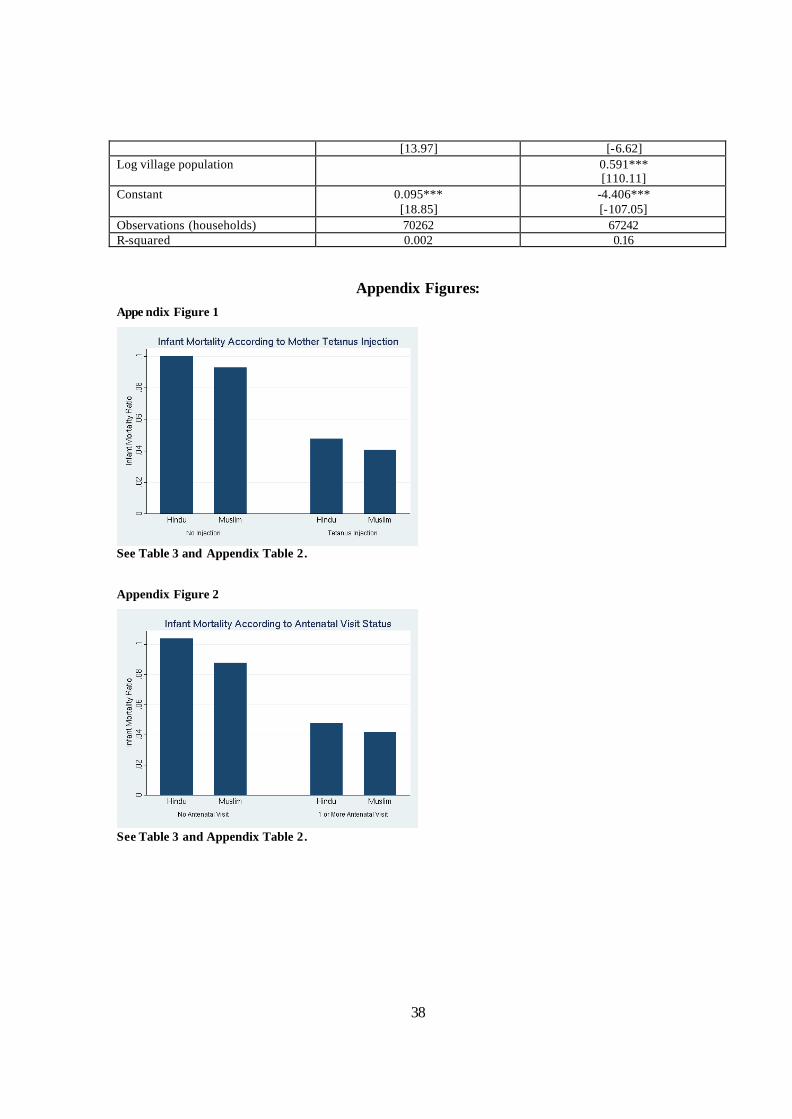
38
[13.97] [-6.62] Log village population 0.591***
[110.11] Constant 0.095***
[18.85] -4.406*** [-107.05]
Observations (households) 70262 67242 R-squared 0.002 0.16
Appendix Figures: Appe ndix Figure 1
See Table 3 and Appendix Table 2. Appendix Figure 2
See Table 3 and Appendix Table 2.
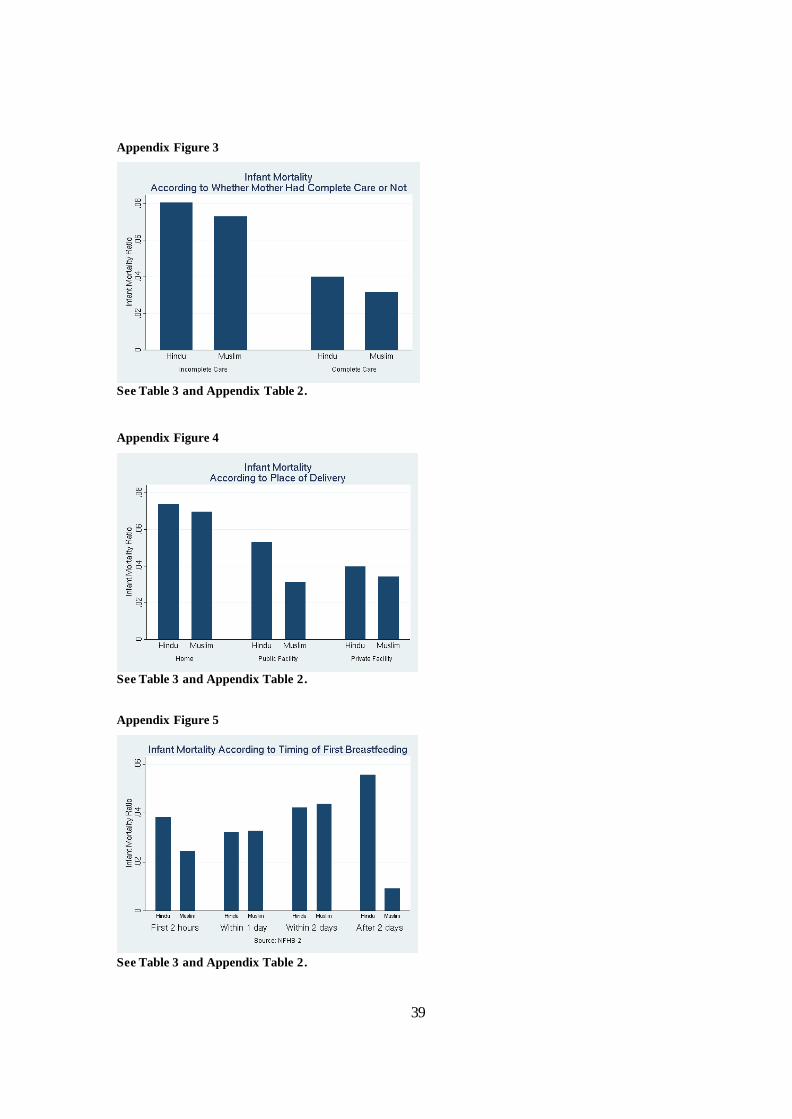
39
Appendix Figure 3
See Table 3 and Appendix Table 2.
Appendix Figure 4
See Table 3 and Appendix Table 2. Appendix Figure 5
See Table 3 and Appendix Table 2.
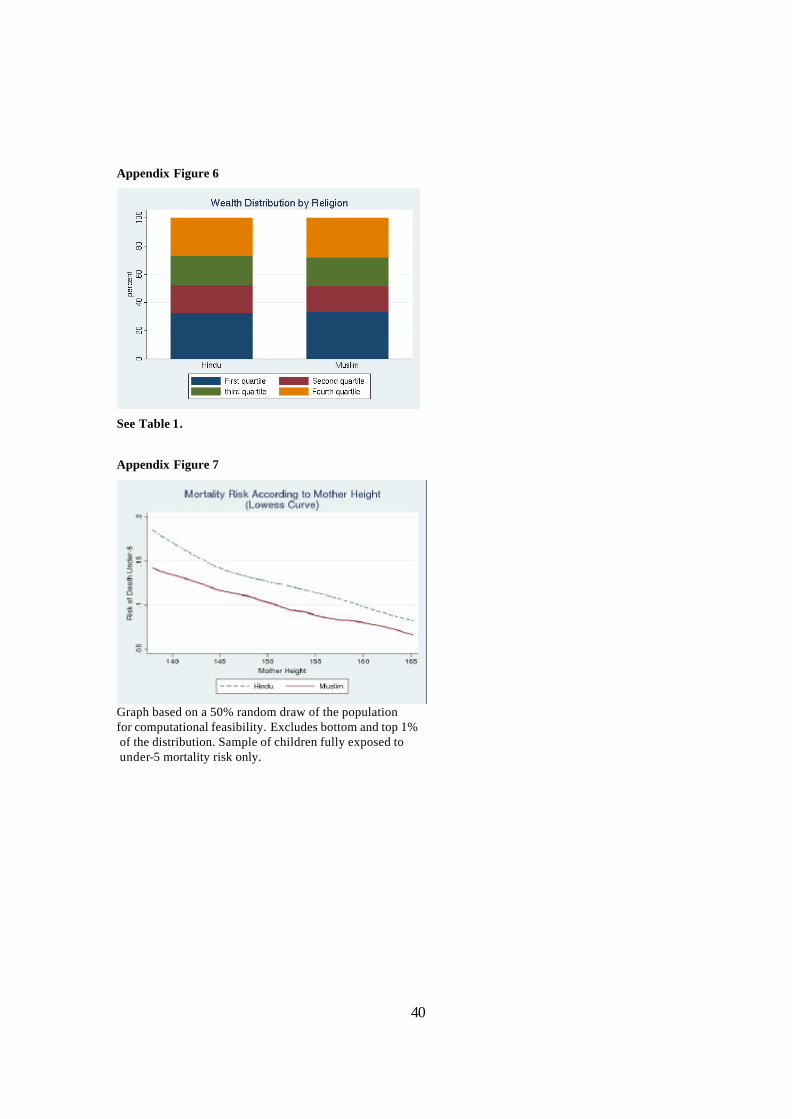
40
Appendix Figure 6
See Table 1.
Appendix Figure 7
Graph based on a 50% random draw of the population for computational feasibility. Excludes bottom and top 1% of the distribution. Sample of children fully exposed to under-5 mortality risk only.
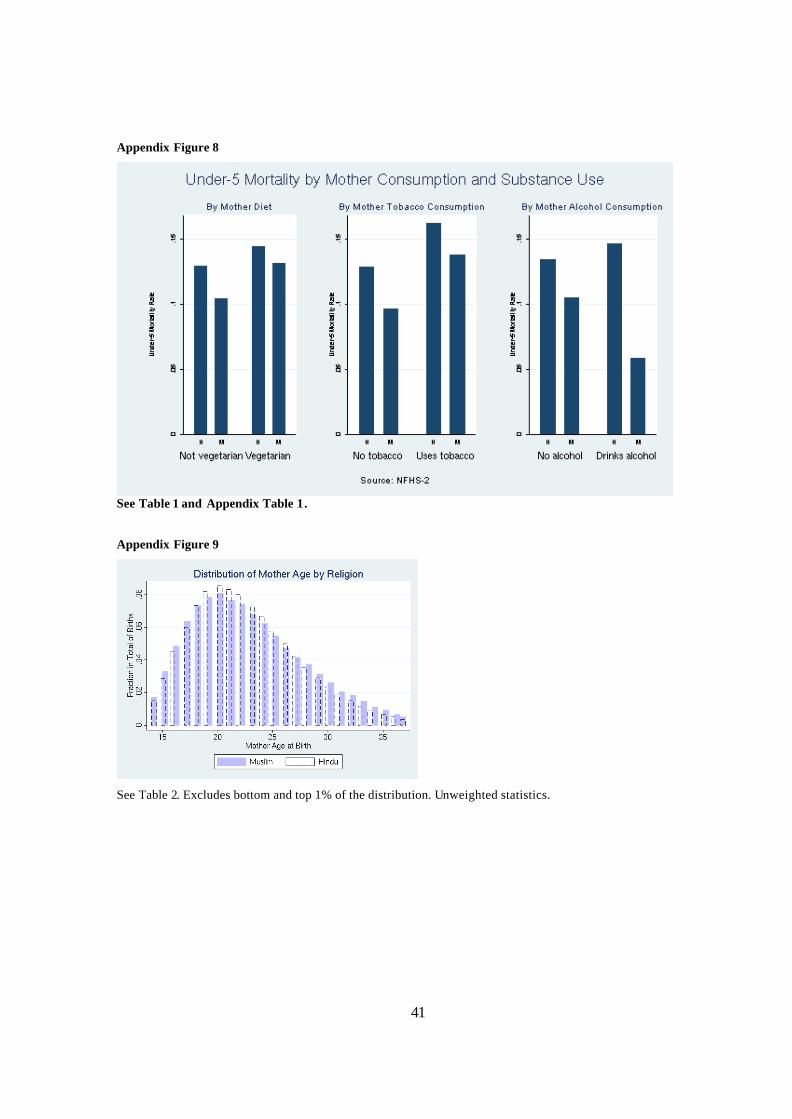
41
Appendix Figure 8
See Table 1 and Appendix Table 1.
Appendix Figure 9
See Table 2. Excludes bottom and top 1% of the distribution. Unweighted statistics.
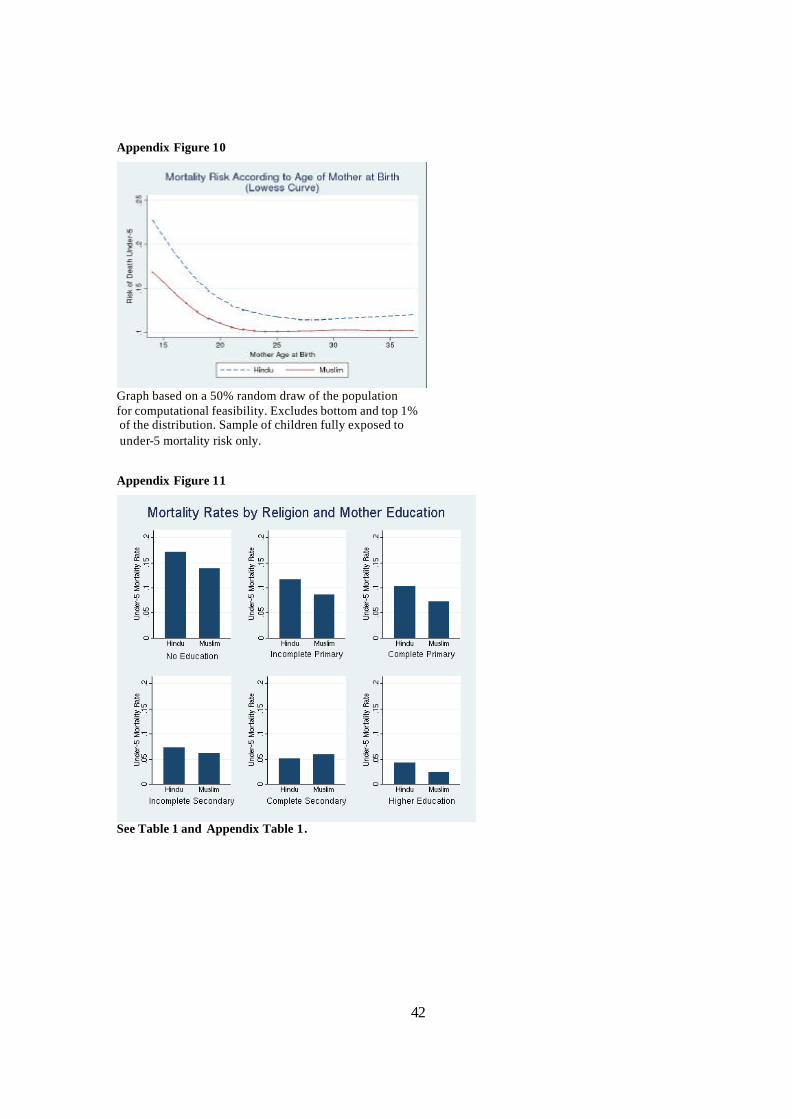
42
Appendix Figure 10
Graph based on a 50% random draw of the population for computational feasibility. Excludes bottom and top 1% of the distribution. Sample of children fully exposed to under-5 mortality risk only.
Appendix Figure 11
See Table 1 and Appendix Table 1.
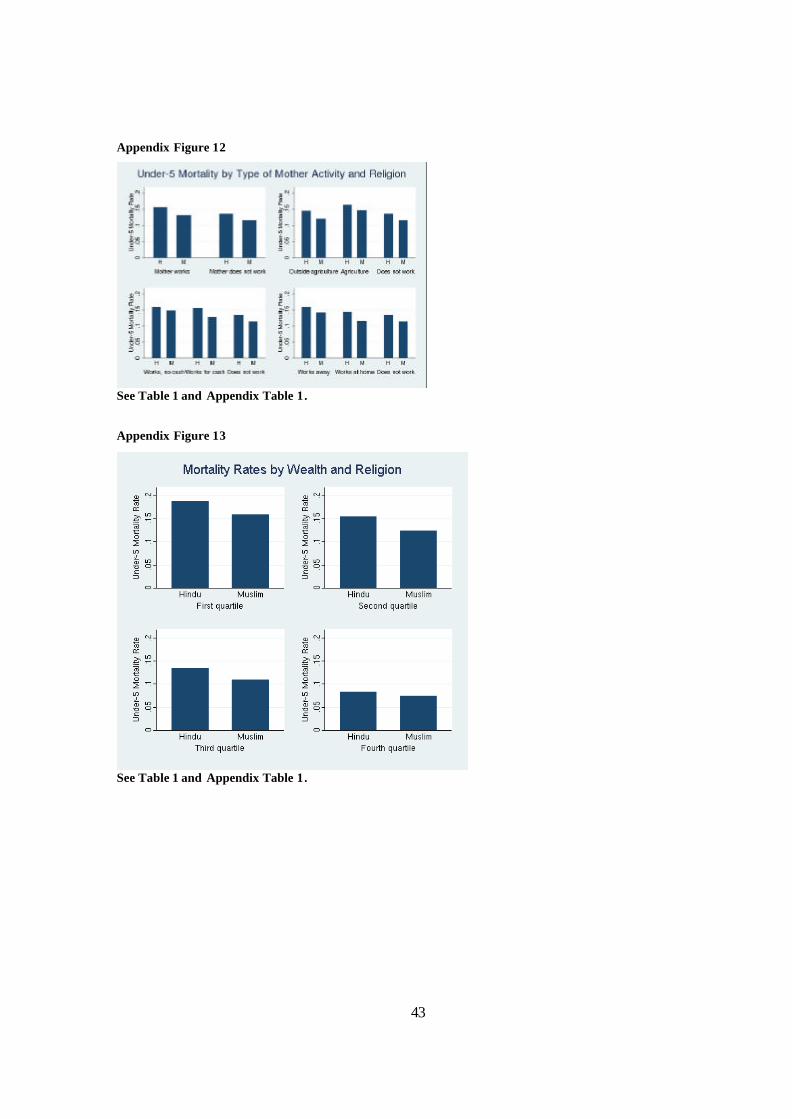
43
Appendix Figure 12
See Table 1 and Appendix Table 1. Appendix Figure 13
See Table 1 and Appendix Table 1.
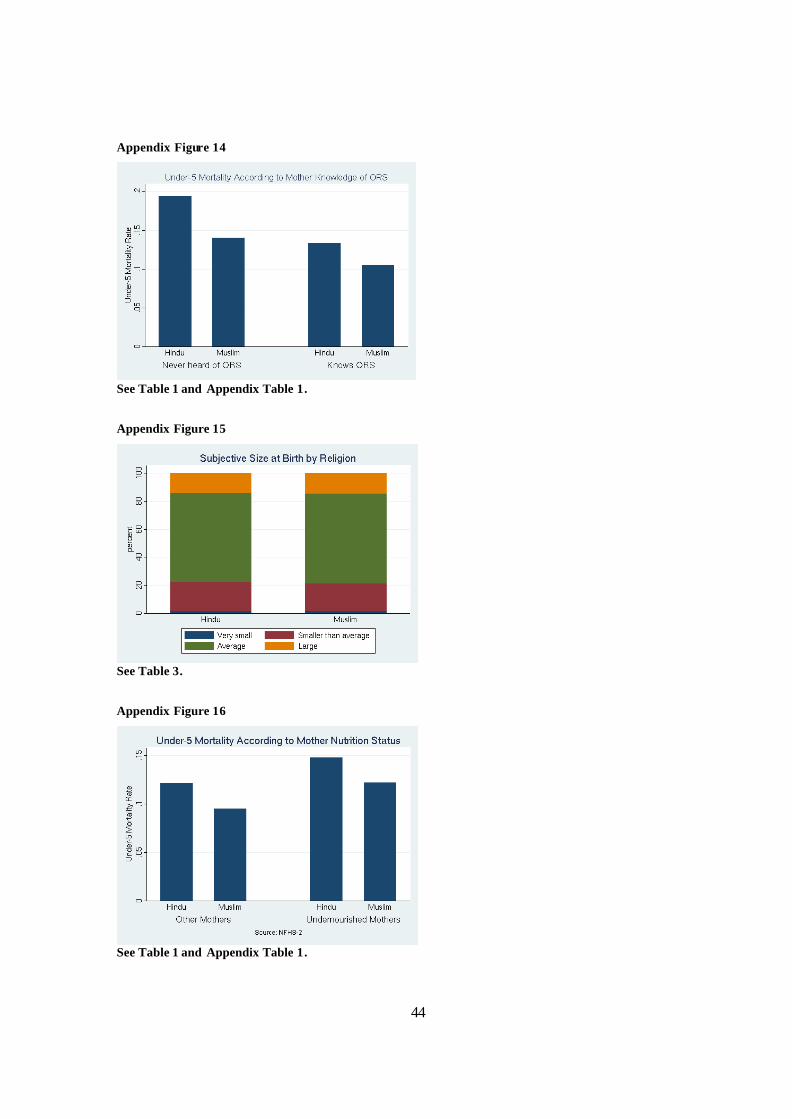
44
Appendix Figure 14
See Table 1 and Appendix Table 1.
Appendix Figure 15
See Table 3.
Appendix Figure 16
See Table 1 and Appendix Table 1.