RELIABLE MIDDLEWARE FRAMEWORK FOR RFID SYSTEM
188
RELIABLE MIDDLEWARE FRAMEWORK FOR RFID SYSTEM A Thesis Presented to The Academic Faculty by Nova Ahmed In Partial Fulfillment of the Requirements for the Degree Doctor of Philosophy in the School of Computer Science Georgia Institute of Technology May 2010
-
Upload
khangminh22 -
Category
Documents
-
view
1 -
download
0
Transcript of RELIABLE MIDDLEWARE FRAMEWORK FOR RFID SYSTEM

RELIABLE MIDDLEWARE FRAMEWORK FOR RFIDSYSTEM
A ThesisPresented to
The Academic Faculty
by
Nova Ahmed
In Partial Fulfillmentof the Requirements for the Degree
Doctor of Philosophy in theSchool of Computer Science
Georgia Institute of TechnologyMay 2010

RELIABLE MIDDLEWARE FRAMEWORK FOR RFIDSYSTEM
Approved by:
Dr. Umakishore Ramachandran,AdvisorSchool of Computer ScienceGeorgia Institute of Technology
Dr. Marilyn WolfSchool of Electrical and ComputerEngineeringGeorgia Institute of Technology
Dr. Mustaque AhamadSchool of Computer ScienceGeorgia Institute of Technology
Dr. David BaderSchool of Electrical and ComputerEngineeringGeorgia Institute of Technology
Dr. Ling LuSchool of Computer ScienceGeorgia Institute of Technology
Date Approved: May 2010

To
My inspiration, my maa,
Gultekin Khan,
My love, my whole world,
Anuva and Arisha,
My strength and hope,
Arshad Chowdhury.
iii

ACKNOWLEDGEMENTS
It my greatest pleasure to share my gratitude to Almighty Allah (swt) for this precious
journey.
My advisor Professor Umakishore Ramachanran has been an extra ordinary men-
tor throught these years. He uses to tell us: sky is the limit and he gave us the
best support within his capabilities for research and discovery. He has been a very
approachable person whom I seeked guidance in many difficult situations.
I would like to thank the honorable committee members Professor Marilyn Wolf,
Professor Mustaque Ahmad, Professor David Bader and Professor Ling Liu for their
valuable advices, suggestions and time.
I want to very specially thank Dr. Maureen S. Biggers from Indiana University
for keeping her doors always open for me. She has been a great source of inspiration
for me.
There have been extra ordinary support from the great members of the COC
family - Susie Mcclaine, Alan Glass and Dani Denton. I thank you all for you sincere
support.
I want to thank all my lab members for their cooperation and support. A special
thanks to Bikash for being a great mentor. I learned a lot from Rajnish Kumar,
Hasnain Mandviwalla, Xiang Song, Junsuk Shin, Dave L Lillethon and David Hilley.
Hyojun Kim, Moonkyung Ryu, Dushmanta Mohapatra , Lateef Yusuf, Kirak Hong-
it has been really fun to have you as lab members. I also learned a lot from the gifted
under graduate and MS students I mentored. I specially thank Vladimir Urazov and
Stewart Batler for the hard work through the project. I would also like to thank
Brent B. Rowswell, Michael Slaughter, Rocky Dunlop, Paolo Mentonelli, Jahmeilah
iv

Richardson, Robert Steven French, and Echezona Ukah for the great value added to
the research work.
I would like to thank my exteded family in USA who are my dear friends for their
great support in our lives. Farzana Apu, Moin Bhai, Tulip, Galib Bhai, Rasha Apa,
Shuvo Bhai, Monir, Farhana,Khalid Bhai, Koli, Banani, Uttam Bhai, Woni, Asif for
consistent support and inspiration. A very special thanks to my sister Neela and
Shujon bhai for always being there for support.
I would like to thank my loving family for the great support and for helping me to
reach where I am now. My mother, the source of inspiration has set high standards
for us not by her words but by setting examples through work. I want to say aloud,
Maa I love you! My two sisters Sheila and Bipasha and very special brother Nuhash
are also amazing in their own ways. I have been inspired by the spirit of my father
and father in law although they are not here anymore in our lives.
Arshad, my husband had to go through the real challenges along this journey!
There have been many gray days when he was the one who lightened it up. He gave
me the support, strength and love to carry on - it would not be the same without his
tremendous support.
I was honored to share the laughter and tears with my two amazing baby daughters
Anuva and Arisha, They gave me the best gift a PhD student needs - the gift of
patience and confidence.
I have spent valuable years in Georgia Tech - it has been one of the greatest time
period of my life. As a student from Bangladesh -the rich resources here amazed me.
The library, the craft center, CRC, Women’s Resource Center, Student Parents Net-
work and Bangladesh Students Association - all have added countless value towards
my achievements. I enjoyed every footstep here - thank you Georiga Tech!
v

TABLE OF CONTENTS
DEDICATION . . . . . . . . . . . . . . . . . . . . . . . . . . . . . . . . . . . iii
ACKNOWLEDGEMENTS . . . . . . . . . . . . . . . . . . . . . . . . . . . . iv
LIST OF TABLES . . . . . . . . . . . . . . . . . . . . . . . . . . . . . . . . . xi
LIST OF FIGURES . . . . . . . . . . . . . . . . . . . . . . . . . . . . . . . . xii
GLOSSARY . . . . . . . . . . . . . . . . . . . . . . . . . . . . . . . . . . . . xv
SUMMARY . . . . . . . . . . . . . . . . . . . . . . . . . . . . . . . . . . . . . xviii
I INTRODUCTION . . . . . . . . . . . . . . . . . . . . . . . . . . . . . . 1
1.1 Thesis Statement . . . . . . . . . . . . . . . . . . . . . . . . . . . . 3
1.2 Solution Approach . . . . . . . . . . . . . . . . . . . . . . . . . . . 3
1.3 Item Tracking . . . . . . . . . . . . . . . . . . . . . . . . . . . . . . 4
1.3.1 Requirements . . . . . . . . . . . . . . . . . . . . . . . . . . 4
1.3.2 Existing Solution Approaches . . . . . . . . . . . . . . . . . 7
1.3.3 RF 2ID for Item Tracking . . . . . . . . . . . . . . . . . . . 8
1.4 Item Guidance-and-Monitoring . . . . . . . . . . . . . . . . . . . . 10
1.4.1 Application Scenario and Requirement Analysis . . . . . . . 11
1.4.2 Existing Solution Approaches . . . . . . . . . . . . . . . . . 12
1.4.3 GuardianAngel for Guidance-Monitoring . . . . . . . . . . . 13
1.5 Item Tracking Applications and Item Guidance-Monitoring Appli-cations . . . . . . . . . . . . . . . . . . . . . . . . . . . . . . . . . . 15
1.6 Major Contributions . . . . . . . . . . . . . . . . . . . . . . . . . . 16
1.6.1 Path Based System . . . . . . . . . . . . . . . . . . . . . . . 16
1.6.2 A system for Unreliable Devices . . . . . . . . . . . . . . . . 16
1.6.3 Human Centric Design . . . . . . . . . . . . . . . . . . . . . 17
1.7 Outline of the Dissertation . . . . . . . . . . . . . . . . . . . . . . . 17
II BACKGROUND . . . . . . . . . . . . . . . . . . . . . . . . . . . . . . . 19
2.1 Applications using RFID Technology . . . . . . . . . . . . . . . . . 19
vi

2.1.1 Item Tracking Applications . . . . . . . . . . . . . . . . . . 20
2.1.2 Item guidance-monitoring Applications . . . . . . . . . . . . 23
2.2 RFID Technology . . . . . . . . . . . . . . . . . . . . . . . . . . . . 24
2.2.1 Tag Types by Operational Methods . . . . . . . . . . . . . . 25
2.2.2 Tag Types by Operational Methods . . . . . . . . . . . . . . 28
2.2.3 Considerations for Choosing Particular Type of Tag . . . . 30
2.2.4 RFID Antennas . . . . . . . . . . . . . . . . . . . . . . . . . 31
2.2.5 Basic RFID Operational Technology . . . . . . . . . . . . . 32
2.3 Summary . . . . . . . . . . . . . . . . . . . . . . . . . . . . . . . . 34
III STUDY ON RFID READERS . . . . . . . . . . . . . . . . . . . . . . . 35
3.1 Basic Properties of Passive RFID Devices . . . . . . . . . . . . . . 35
3.1.1 Effect on Reader to Tag Distance . . . . . . . . . . . . . . . 35
3.1.2 Effect on Reader to Angular Position . . . . . . . . . . . . . 36
3.1.3 Effect of Reader Attenuation . . . . . . . . . . . . . . . . . 36
3.1.4 Effect on Reader to Angular Position . . . . . . . . . . . . . 37
3.1.5 Passive RFID Devices for Item Tracking Applications . . . . 38
3.2 Basic Properties of Active RFID Devices . . . . . . . . . . . . . . . 40
3.2.1 Stable Reader to Tag Positioning . . . . . . . . . . . . . . . 41
3.2.2 Mobile Reader and Stable Tags . . . . . . . . . . . . . . . . 43
3.2.3 Positioning Performance . . . . . . . . . . . . . . . . . . . . 44
3.2.4 Guidance Performance . . . . . . . . . . . . . . . . . . . . . 46
3.3 Summary . . . . . . . . . . . . . . . . . . . . . . . . . . . . . . . . 47
IV RF 2ID:RELIABLE FRAMEWORK FOR RADIO FREQUENCY IDEN-TIFICATION . . . . . . . . . . . . . . . . . . . . . . . . . . . . . . . . . 49
4.1 System Architecture . . . . . . . . . . . . . . . . . . . . . . . . . . 50
4.2 Virtual Reader . . . . . . . . . . . . . . . . . . . . . . . . . . . . . 52
4.2.1 Initialization . . . . . . . . . . . . . . . . . . . . . . . . . . 56
4.2.2 Data Management . . . . . . . . . . . . . . . . . . . . . . . 57
4.2.3 Path Management . . . . . . . . . . . . . . . . . . . . . . . 57
vii

4.2.4 Query Management . . . . . . . . . . . . . . . . . . . . . . 58
4.3 Name Server and Path Server . . . . . . . . . . . . . . . . . . . . . 59
4.4 Implementation . . . . . . . . . . . . . . . . . . . . . . . . . . . . . 60
4.4.1 Virtual Readers . . . . . . . . . . . . . . . . . . . . . . . . 60
4.4.2 Physical Readers . . . . . . . . . . . . . . . . . . . . . . . . 61
4.4.3 Emulated Physical Readers . . . . . . . . . . . . . . . . . . 62
4.4.4 Path Controller and Static Path Map . . . . . . . . . . . . . 62
4.5 Evaluation . . . . . . . . . . . . . . . . . . . . . . . . . . . . . . . 63
4.5.1 Improved System Reliability and Scalability using RF 2ID . 63
4.5.2 Missing and Misplaced Item Location . . . . . . . . . . . . 67
4.5.3 RF 2ID Deployed in a Real Testbed System . . . . . . . . . 67
4.6 Related Work . . . . . . . . . . . . . . . . . . . . . . . . . . . . . . 77
4.6.1 RFID Based Systems . . . . . . . . . . . . . . . . . . . . . . 78
4.6.2 Path Abstraction . . . . . . . . . . . . . . . . . . . . . . . . 79
4.7 Summary . . . . . . . . . . . . . . . . . . . . . . . . . . . . . . . . 79
V LOAD SHEDDING BASED RESOURCE MANAGEMENT . . . . . . . 80
5.1 Motivation . . . . . . . . . . . . . . . . . . . . . . . . . . . . . . . 82
5.2 Notation and Terminologies . . . . . . . . . . . . . . . . . . . . . . 84
5.2.1 Acceptable Values for AV R and APR . . . . . . . . . . . . . 86
5.3 Load Shedding Strategies . . . . . . . . . . . . . . . . . . . . . . . 87
5.3.1 Load Monitoring and Overload Detection Phase . . . . . . . 87
5.3.2 Load Shedding Strategies . . . . . . . . . . . . . . . . . . . 88
5.4 Evaluation . . . . . . . . . . . . . . . . . . . . . . . . . . . . . . . 91
5.4.1 Implementation of the Load Shedding Strategies . . . . . . 91
5.4.2 Experimental Setup for the Study . . . . . . . . . . . . . . 92
5.4.3 Performance of Baseline System . . . . . . . . . . . . . . . . 96
5.4.4 Performance of RF2ID with Load Shedding . . . . . . . . . 99
5.5 Related Work . . . . . . . . . . . . . . . . . . . . . . . . . . . . . . 104
viii

5.5.1 Load Balancing and Resource Migration in Distributed Systems104
5.5.2 Streaming Applications . . . . . . . . . . . . . . . . . . . . 105
5.6 Summary . . . . . . . . . . . . . . . . . . . . . . . . . . . . . . . . 106
VI GUARDIANANGEL: AN RFID-BASED INDOOR GUIDANCE AND MON-ITORING SYSTEM . . . . . . . . . . . . . . . . . . . . . . . . . . . . . 107
6.1 Application Scenario and Requirement Analysis . . . . . . . . . . . 108
6.2 System Architecture . . . . . . . . . . . . . . . . . . . . . . . . . . 109
6.2.1 Pervasive Environment . . . . . . . . . . . . . . . . . . . . . 112
6.2.2 Virtual Server (VS) . . . . . . . . . . . . . . . . . . . . . . 115
6.2.3 Mobile Object (MO) . . . . . . . . . . . . . . . . . . . . . . 118
6.2.4 Other Components . . . . . . . . . . . . . . . . . . . . . . . 119
6.3 System Prototype . . . . . . . . . . . . . . . . . . . . . . . . . . . 120
6.3.1 RFID Testbed . . . . . . . . . . . . . . . . . . . . . . . . . 120
6.3.2 Emulated RFID Based System . . . . . . . . . . . . . . . . 125
6.4 Related Work . . . . . . . . . . . . . . . . . . . . . . . . . . . . . . 133
6.5 Summary . . . . . . . . . . . . . . . . . . . . . . . . . . . . . . . . 135
VII DISCUSSION ON ITEM TRACKING AND ITEM GUIDANCE-MONITORING136
7.1 Common Requirements . . . . . . . . . . . . . . . . . . . . . . . . 136
7.1.1 Scalable Solution . . . . . . . . . . . . . . . . . . . . . . . . 137
7.1.2 Path Based Information . . . . . . . . . . . . . . . . . . . . 139
7.2 Differences in Requirements . . . . . . . . . . . . . . . . . . . . . . 139
7.2.1 Information Transparency . . . . . . . . . . . . . . . . . . . 140
7.3 Information Exchange . . . . . . . . . . . . . . . . . . . . . . . . . 140
7.4 Summary . . . . . . . . . . . . . . . . . . . . . . . . . . . . . . . . 141
VIII CONCLUSIONS . . . . . . . . . . . . . . . . . . . . . . . . . . . . . . . 143
8.1 Conclusions . . . . . . . . . . . . . . . . . . . . . . . . . . . . . . . 143
8.2 Future Work . . . . . . . . . . . . . . . . . . . . . . . . . . . . . . 146
8.2.1 Generalized Architecture for Heterogeneous Sensors . . . . . 146
ix

8.2.2 Applications . . . . . . . . . . . . . . . . . . . . . . . . . . 146
8.2.3 Combining Sensing with High Performance Resources . . . . 147
8.3 Open Problems . . . . . . . . . . . . . . . . . . . . . . . . . . . . . 147
8.3.1 Security . . . . . . . . . . . . . . . . . . . . . . . . . . . . . 147
8.3.2 Energy Conservation . . . . . . . . . . . . . . . . . . . . . . 148
8.3.3 Generality . . . . . . . . . . . . . . . . . . . . . . . . . . . . 148
REFERENCES . . . . . . . . . . . . . . . . . . . . . . . . . . . . . . . . . . . 149
VITA . . . . . . . . . . . . . . . . . . . . . . . . . . . . . . . . . . . . . . . . 167
x

LIST OF TABLES
1 System Parameters . . . . . . . . . . . . . . . . . . . . . . . . . . . . 69
2 Comparison of a Real Supply Chain Deployment with ExperimentalTestbed . . . . . . . . . . . . . . . . . . . . . . . . . . . . . . . . . . 72
3 Comparison of a Real Airport Deployment with Experimental Testbed 74
4 Comparison of a Real Supply Chain Deployment with ExperimentalTestbed . . . . . . . . . . . . . . . . . . . . . . . . . . . . . . . . . . 92
5 System Workload Parameters . . . . . . . . . . . . . . . . . . . . . . 96
6 VS Responsibilities . . . . . . . . . . . . . . . . . . . . . . . . . . . . 116
xi

LIST OF FIGURES
1 A Block Diagram of the Solution Space Provided as a Framework . . 5
2 Basic Concept of Item Tracking . . . . . . . . . . . . . . . . . . . . . 20
3 Item Tracking Application Scenario . . . . . . . . . . . . . . . . . . . 21
4 Example of Item Tracking Applications [10],[4],[5] (a) RFID technologyenabled toll booth (b) The RFID tag used in toll booth (c) RFIDenabled fast tracking in FedEx . . . . . . . . . . . . . . . . . . . . . 22
5 Basic Concept of Item guidance-monitoring . . . . . . . . . . . . . . . 23
6 Examples of Item guidance-monitoring Applications [8], RFID Readeron a patient . . . . . . . . . . . . . . . . . . . . . . . . . . . . . . . . 24
7 Near field RFID . . . . . . . . . . . . . . . . . . . . . . . . . . . . . . 27
8 Far field RFID . . . . . . . . . . . . . . . . . . . . . . . . . . . . . . 28
9 RFID Operation using backscatter method . . . . . . . . . . . . . . . 33
10 Physical properties of Passive RFID Devices VaryingTag distance fromantenna . . . . . . . . . . . . . . . . . . . . . . . . . . . . . . . . . . 36
11 Physical properties of Passive RFID Devices VaryingTag distance fromantenna . . . . . . . . . . . . . . . . . . . . . . . . . . . . . . . . . . 37
12 Physical properties of Passive RFID Devices VaryingTag Reader Atte-nation . . . . . . . . . . . . . . . . . . . . . . . . . . . . . . . . . . . 38
13 Physical properties of Passive RFID Devices VaryingTag ObservationTime . . . . . . . . . . . . . . . . . . . . . . . . . . . . . . . . . . . . 39
14 Physical properties of Passive RFID Devices Varying bulk size . . . . 40
15 Physical properties of Passive RFID Devices Varying Item Speed . . . 41
16 Active RFID Reader properties over time . . . . . . . . . . . . . . . . 42
17 Active RFID Reader Properties based on distance and angular position 43
18 Active RFID Reader Properties based on distance and angular position(standard deviation of readings to define the stability of readings) . . 44
19 Effect of Speed in RFID Read Performance . . . . . . . . . . . . . . . 45
20 Error in Tag Detection for 20 cm Inter Tag Spacing . . . . . . . . . . 46
21 The effect of inter tag distance on reading accuracy . . . . . . . . . . 47
22 System architecture of RF 2ID . . . . . . . . . . . . . . . . . . . . . . 51
xii

23 VR to VR Communication using logical Path . . . . . . . . . . . . . 51
24 Graph representation of the System . . . . . . . . . . . . . . . . . . . 52
25 A Warehouse scenario showing RFID deployment . . . . . . . . . . . 56
26 Accuracy as percentage of found items at virtual reader level varyingnumber of readers . . . . . . . . . . . . . . . . . . . . . . . . . . . . . 64
27 False Negative Reading of the System using single PR (PR1, PR2) andPath among PRs . . . . . . . . . . . . . . . . . . . . . . . . . . . . . 65
28 False negative readings varying number of VRs . . . . . . . . . . . . . 65
29 Missing or misplaced item detection . . . . . . . . . . . . . . . . . . . 66
30 Attetuation and Reading Range . . . . . . . . . . . . . . . . . . . . . 66
31 Laboratory Testbed . . . . . . . . . . . . . . . . . . . . . . . . . . . . 68
32 Impact of detected items with various data speed . . . . . . . . . . . 70
33 Percentage of detected items with varying bulk size . . . . . . . . . . 71
34 Experimental Layout to mimic a Warehouse . . . . . . . . . . . . . . 72
35 Increased System accuracy with increasing number of VRs . . . . . . 73
36 Testbed Setup . . . . . . . . . . . . . . . . . . . . . . . . . . . . . . . 75
37 Effect of Variable Bulk Size on Detected Baggage corresponding toPeople . . . . . . . . . . . . . . . . . . . . . . . . . . . . . . . . . . . 76
38 Detected missing people with various bulk size . . . . . . . . . . . . . 77
39 : Number of VRs vs Tracking of High Priority Objects . . . . . . . . 78
40 CPU usage and data accuracy with respect to variable tag arrival . . 84
41 Space Based Load Shedding . . . . . . . . . . . . . . . . . . . . . . . 89
42 Time Based Load Shedding . . . . . . . . . . . . . . . . . . . . . . . 90
43 Experimental Setup . . . . . . . . . . . . . . . . . . . . . . . . . . . . 93
44 Emulated PR vs Real PR Performance . . . . . . . . . . . . . . . . . 94
45 PR Performance with variable Speed and Bulk Size . . . . . . . . . . 97
46 Improved System Performance with Increased Number of PRs withVariable Bulk Size . . . . . . . . . . . . . . . . . . . . . . . . . . . . 98
47 System Performance for Various Data Rate . . . . . . . . . . . . . . . 99
xiii

48 Baseline System Performance Compared to Space Based and TimeBased Load Shedding . . . . . . . . . . . . . . . . . . . . . . . . . . . 100
49 Space Based Load Shedding -Varying value of ∆ . . . . . . . . . . . 101
50 Space Based Load Shedding using various Queue Size . . . . . . . . . 102
51 Time Based Load Shedding with various read time . . . . . . . . . . 103
52 Time Based Load Shedding with various interval time . . . . . . . . . 104
53 Overivew of the entire system. . . . . . . . . . . . . . . . . . . . . . . 110
54 GuardianAngel Architecture. . . . . . . . . . . . . . . . . . . . . . . . 111
55 Experimental Setup of the (a) Pervasive Environment. (b) The an-tenna setup that mimics the reading performance of a mobile user. . . 120
56 RFID testbed behavior over time steps (a) Definition of actual tags,neighbor tags and outlier tags. (b) Percentage of various tag reads(c)Table quantifying the various tag reads. . . . . . . . . . . . . . . . 121
57 Number of unique tag reads. . . . . . . . . . . . . . . . . . . . . . . . 122
58 Number of tag neighbor and outlier tag reads. . . . . . . . . . . . . . 123
59 Number of actual and neighbor tag reads. . . . . . . . . . . . . . . . 123
60 Reading performance with varying sample size. . . . . . . . . . . . . . 124
61 (a) Reading performance for individual tag read. . . . . . . . . . . . . 125
62 (a) Percent accuracy for RFID testbed. (b) Percent accuracy for em-ulation based study. . . . . . . . . . . . . . . . . . . . . . . . . . . . . 126
63 GUI based interface showing Root Tag information. . . . . . . . . . 127
64 GUI based interface showing Zone information. . . . . . . . . . . . . 127
65 GUI based interface showing Source to destination Path Direction. . . 128
66 Measurements of a large indoor space. (a) Deviation from destination.(b) Percent inaccuracy in direction and region information. . . . . . . 129
67 (a) Scalability study of VS serving multiple MOs (b) Block miss ratein an MO varying block size . . . . . . . . . . . . . . . . . . . . . . . 131
68 The Path based Communication across Computational Elements (Vir-tual Reader or Virtual Stations) . . . . . . . . . . . . . . . . . . . . . 137
xiv

GLOSSARY
α Per message CPU cost (%), p. 54.
A(Path,k) Path level accuracy as a proportion of items correctly detected along apath and total items, p. 85.
A(PR,i) PR level accuracy as a proportion of items correctly detected by PR andtotal items, p. 85.
Asys System performance as a ratio of observed item by the system comparedto actual number of items, p. 85.
A(th) Threshold accuracy is the desired accuracy level of the system, p. 86.
A(V R,j) VR level accuracy as a proportion of items correctly detected in a VR andtotal items, p. 85.
ComputationalCapacity(C) Computational capacity of a VR that corresponds tocommunication and computation involved in a particular VR, p. 88.
connin Maximum number of incoming messages handled per unit time, p. 53.
connout Maximum number of outgoing messages handled per unit time, p. 53.
dB Decibel, p. 61.
delta sensitivity parameter for space based load shedding, p. 89.
Di RFID data with ID i corresponds to timestamp and identification, p. 84.
D(proc) Data items to be processed in a VR under heavy load, p. 86.
D(shed) Data items to shed in a VR under heavy load, p. 86.
Dtotal Total amount of RFID data in system, p. 85.
D(total) Total Data items in the system, p. 86.
expectedTagList(p,i) Information from neighbor V Rp(i−1) along the path, p. 53.
FalseNegative RFID item missed that are within the reading range of the RFIDreader, p. 119.
FalsePositive RFID item read that are beyond the reading range of the RFIDreader, p. 118.
GPS Global Positioning System, p. 109.
xv
GuidanceServer(GS) Server that makes decision to guide mobile objects in theenvironment in a fine grain manner, p. 110.
Instantaneousload(L) Computational Load of a VR that corresponds to communi-cation and computation involved in a particular VR, p. 88.
L(t) Upper limit for instantaneous load, p. 88.
MAX(tags) Maximum number of tags flowing through a path per time, p. 89.
Messagein(source) Incoming messages from source, p. 53.
Messageout(destination) Outgoing messages to destination, p. 53.
MHz MegaHertz, p. 61.
missingTagList(p,i) Tags expected from V Rp(i−1) but not received by PRs, p. 53.
MobileObject(MO) Mobile entity carrying RFID reader and computational device,p. 110.
Monitoringserver(MS) Server that is in charge of coarse grain guidance and mon-itoring of mobile objects, p. 110.
MPI Message Passing Interface, p. 60.
NS Name Server, p. 50.
observedTagList(p,i) tag information detected by corresponding PRs, p. 53.
PE Pervasive Environment, p. 110.
PR(p,i,j) Set of PRs corresponding to V R(p,i) as PR(p,i,1), PR(p,i,2), .., PR(p,i,m),p. 53.
PS Path Server, p. 50.
QoS Quality of Service, p. 49.
receivedTagList(p,i) Filtered tag information comparing PR inputs, p. 53.
RF 2ID Reliable Framework for Radio Frequency Identification, p. 49.
RFID Radio Frequency Identification, p. 50.
spuriousTagList(p,i) Tags received but not expected from V Rp(i−1), p. 53.
tao Sensitivity parameter for time based load shedding, p. 91.
T(cycle) Time a particular item takes to traverse from source to destination, p. 90.
T(interval) Time interval between read times of VRs, p. 90.
xvi
Total Path Total number of paths associated with a given VR, p. 53.
Total PR Total number of PRs Associated with a given VR, p. 53.
T(read) Time a VR accepts data read by PR, p. 90.
T(window) Window of time considered for load shedding mechanism, p. 88.
V Path Virtual Path, p. 49.
V R Virtual Reader, p. 49.
V R gCountPathID Final count of number of VRs in new path, p. 54.
V R localCountPathID Local copy of final count in each VR, p. 54.
V R(num) Number of VRs along a particular path, p. 88.
V R(p,i) Set of VRs corresponding to a Vpath P as V R(p,1), V R(p,2), .., V R(p,n),p. 53.
V R(p,i)num Number of participating VRs in path Pi, p. 53.
V Rtr Minimum number of VRs needed for a new path P, p. 54.
V S Virtual Station, p. 111.
wcpu Average per path CPU load on a VR (%), p. 53.
wcurr Current CPU load on a VR (%), p. 54.
west Estimated load due to a new path P (%), p. 54.
wtr Threshold maximum permissible CPU load on a VR (%), p. 54.
xvii

SUMMARY
The reliability of RFID systems depends on a number of factors including: RF
interference, deployment environment, configuration of the readers, and placement
of readers and tags. While RFID technology is improving rapidly, a reliable deploy-
ment of this technology is still a significant challenge impeding wide-spread adoption.
This research investigates system software solutions for achieving a highly reliable
deployment that mitigates inherent unreliability in RFID technology.
We have considered two different problem domains for large scale RFID deploy-
ment. One is item tracking and the other is guidance-monitoring. Item tracking
considers applications that have statically placed RFID readers to observe the RFID
tagged objects in motion. An airport scenario to observe the tagged baggage or ware-
house scenarios to track the tagged goods are examples of item tracking applications.
A self guided tour, search and rescue scenario or a visually impaired person looking
for direction and guidance in a tagged environment are examples of item location
applications. It is observed that there is a notion of path that follows the direction
and flow of the mobile items in the item tracking applications and a path gets created
along the direction and flow of the mobile object in item location applications. A
system level knowledge of the data flow can benefit the system in different aspects
such as improved reliability, resource management and real time response. We have
designed and implemented an RFID middleware for item tracking: RF 2ID (Reliable
Framework for Radio Frequency Identification) to organize and support queries over
data streams in an efficient manner. We have developed (1) a virtual reader ab-
straction to improve the potentially error-prone nature of reader generated data (2) a
xviii

novel path abstraction to capture the logical flow of information among virtual read-
ers. Prototype implementation using both RFID readers and emulated readers using
an empirical model of RFID readers show that RF 2ID is able to provide high relia-
bility, support path-based object detection and offer efficient resource management.
We propose a middleware solution that takes into account the data flow information
for item location applications that requires real time response.
The guidance-monitoring scenario considers mobile RFID readers that traverse
in a tagged environment. We consider the scenario of an Assisted Living Center
for elderly residents as a motivating guidance-monitoring application. The solution
for guidance-monitoring system is called GuardianAngel. The application scenario
considers a tagged indoor environment with residents having their own RFID readers
to provide them with adequate information about the surroundings. The guidance
and monitoring requirement can be conflicting. The guidance information requires
very fine grain information about the environment to make proper decisions. On
the other hand, the monitoring system must not have a fine grain knowledge of the
residents to protect their privacy concerns. We consider this aspect during the design
and implementation. The system is a two layered infrastructure that has the upper
layer which is the monitoring layer. This layer is in charge of monitoring of the actors
in the environment. The monitoring layer is physically a set of distributed virtual
stations that have the knowledge about the environment. The environment itself is
equipped with RFID tags. The residents of the environment have a mobile object that
has a sensing element and a computing element (e.g., handhold device with a portable
RFID reader) - the guidance server runs on this mobile object. The guidance server
is in charge of making local decisions for the users. It is resource limited and asks
for new information from the virtual stations as needed. The guidance server also
provides the monitoring server with the information regarding the status of the mobile
object. But the status information is not fine grained - the guidance server wraps up
xix

the information over a period of time and over a larger region to obfuscate space and
time at the discretion of the user.The system uses the logical path based abstraction
to guide the users. We have implemented a real testbed using grid structured RFID
devices along with scalability study using emulated RFID readers.
The basic contribution of our work is providing novel middleware solution that is
able to serve the application taking into account the inherent unreliability of RFID
technology. Our path abstraction that uses the physical flow of data as an ally to
generate a logical system level flow enhances the performance in many ways. The
contributions of this dissertation are summarized below:
• Defining novel system architecture for item tracking applications: We have
defined a system architecture referred to as Reliable Framework for RFID
(RF 2ID) that takes into account the unreliability of RFID devices and pro-
vides a scalable, reliable system architecture for item tracking applications. It
uses a distributed system abstraction named Virtual Reader (VR) that han-
dles RFID data in different geographic locations. Virtual Path (VPath) is the
abstraction that creates channels among the VRs and facilitates a data flow
oriented data management in the system.
• Implementation of RF 2ID: We have implemented RF 2ID that is able to incor-
porate physical RFID devices as well as emulated devices for scalability study
taking into account various real world challenges of large scale RFID deploy-
ment.
• Load Shedding Based Resource Management: RF 2ID requires a mechanism to
handle unexpected system load in the presence of asynchronous arrival of data
items. Space based load shedding and time based load shedding techniques are
used in RF 2ID. The basic idea is to exploit the VR and Vpath abstraction to
intelligently share the load among the VRs in the presence of high system load,
xx

and yet provide some guaranteed Quality of Service (QoS).
• Architecture for GuardianAngel: We define an architecture for an indoor perva-
sive environment which provides novel system abstraction and communication
framework. The layered architecture has distributed computational elements
known as the virtual station (VS) that are in charge of serving different regions
of the environment. The Mobile Objects (MO) are the physical and logical en-
tities that use sensing device and traverse the environment. The environment
itself is tagged with RFID. The MO uses its sensing device to make guidance
decisions locally. The VS keeps status information of MOs and keeps coarse
grained information of the MO over time and space providing a virtual location
for each MO.
• Implementation of GuardianAngel: We have implemented the GuardianAngle
system as defined by the architecture. We have used a testbed that uses real
RFID readers and tags in the pervasive environment in a limited laboratory
setup. We have also developed a distributed system setup using emulated tags
for a scalability study of the proposed architecture. We have also implemented
a prototype application, to test its feasibility in the real world.
• Evaluation of the system: We have conducted extensive evaluation using the
real RFID testbed as well as scalability study using emulated readers and tags.
The evaluation using the real RFID tags and readers gives us the credibility of
the system under various environmental considerations. The large scale exper-
imentations provide us with scalability and feasibility study to strengthen our
limited resource study using real RFID testbed.
xxi

CHAPTER I
INTRODUCTION
In recent years, there is widespread adoption of RFID technology in various applica-
tions. For example, RFID technology is rapidly becoming part of today’s life through
a variety of applications in smart homes, airports, and supply chain management.
With the ubiquity of RFID deployments, there exists a growing amount of data being
generated from multiple sources that needs to be processed in order to support user
queries. However, handling large volumes of sensor generated data streams stresses
even high performance computing resources and broadband network bandwidth. It
presents several challenges, especially when these streams are distributed across mul-
tiple geographic locations. First, the amount of data from different sources that needs
to be organized properly is very large [65], [51], [59]. A retail strategy consulting com-
pany estimates Wal-Mart could generate as much as 7.7 million terabytes of data per
day if all its items are tagged [105], [60]. Second, because of the nature of RFID
applications, the streamed data and possibly legacy data must be fused together in a
time-sensitive manner (e.g., using timestamps). Finally, the overall system has to be
able to manage complexities in a scalable manner to answer queries efficiently. These
problems become more severe in RFID systems where data is generated from error
prone devices like RFID readers [38], [47],[57], [72], [61].
RFID readers use radio waves to communicate with electronic tags that vary in
type, capability and size. Passive tags, in particular, are gaining considerable amount
of attention as a low cost solution for automating a wide range of applications. How-
ever, one of the major drawbacks of the readers using passive tags is their unreliable
behavior. Typical readers accurately detect tags 80-90% of the time, whereas readers
1

with improved performance have a detection rate of 95-99%. Unfortunately, this rate
is adversely affected by different environmental factors such as the presence of metal
objects, objects containing liquids, interference from multiple readers, or the presence
of multiple tags within close proximity of one another. For example, the detection
rate drops to 70% when a reader attempts to detect more than five tags [38], [47].
The RFID reader’s inability to read an item within its reading range is referred to as
false negative reads and the reader’s ability to read an item beyond its reading range
is called false positive read. The existing technology suffers from these false negative
and false positive readings.
We take a close look at the possible application scenarios and application spe-
cific requirements and try to provide a middleware framework to handle the existing
challenges. The broad category of large scale RFID deployment is divided into item
tracking applications and item guidance-and-monitoring applications. Item tracking
applications consider a vast application environment where the RFID readers are stat-
ically placed at various points in the environment and the mobile items are tagged
with RFID tags. The objective is to get adequate information about these RFID
tagged items as they flow through the system in real time with high reliability. Ex-
ample of such an application scenario is an airport baggage handling system where
the baggage are tagged with RFID tags and are destined to various routes through
conveyor belts. Other application scenarios include supply chain systems where goods
are equipped with RFID tags and their flow is observed using RFID readers placed
at strategic points. It is observed that there is a notion of path as the tagged items
traverse from a specific source towards a destination.
The item guidance-and-monitoring considers a different scenario in terms of RFID
tags and reader deployment. In this case, we consider an environment that is equipped
with the RFID tags and the residents have their own RFID reader to get guidance
2
as well as monitoring support from the system. The environment under considera-
tion can be an assisted living center where the residents require close guidance and
monitoring through their daily activities. The level of guidance can be different in a
search and rescue scenario where a robot may be equipped with an RFID reader along
with a chemical sensor to guide the search and rescue personnel through a safe way
in the environment dynamically; monitoring is required for the overall organization
among the personnel and information sharing. We observe a path as the mobile users
equipped with RFID readers explore the environment. The goal is to seek a solution
for item tracking applications and item guidance-monitoring applications where large
scale RFID deployment is considered.
1.1 Thesis Statement
We use the concept of path at system level that is based on the data flow and status
of the mobile objects as shown in Figure 1. The thesis statement of this dissertation
is as follows:
We can significantly improve system reliability using a data flow
oriented path based distributed middleware for item tracking and loca-
tion applications that employ inherently error-prone sensing technolo-
gies, such as RFID.
1.2 Solution Approach
The broader scope of the solution space explored in this dissertation is shown in
Figure 1. The RFID infrastructure is at the lowest layer serving both item tracking
applications and item guidance-monitoring applications. There are various types of
RFID readers and tags such as active tags and readers, passive RFID tags and readers,
or environment where a combination of active and passive RFID technology may co-
exist. At the top level are applications that can benefit from the RFID deployment.
There are tracking applications where various RFID tagged goods are tracked as the
3

items are followed as they flow through a designated source to destination route by
statically placed RFID readers. Similarly, there are guidance-monitoring applications
where the environment is tagged with RFID tags and the mobile users use their
RFID readers to get local guidance information while at the same time the users are
monitored at a coarser grain for their safety (in a hospital or an assisted living center).
Our contribution is in the middle layer that connects the application layer with RFID
infrastructure. We take a close look at the application requirements and figure out
the proper system support for such applications. The block diagram illustrates our
middleware solutions for item tracking as we have done in the system named RF 2ID
and and item guidance-and-monitoring system named GuardianAngel that facilitates
various large scale RFID deployment. We discuss each of the scenarios (item tracking
and item guidance-and-monitoring) separately as the application requirements vary
significantly in these two cases.
1.3 Item Tracking
We first concentrate our focus on item tracking applications. We look at application
specific requirements, existing solution approaches and our solution scheme in the
following subsections.
1.3.1 Requirements
A middleware for RFID deployment requires careful design considerations taking
into account the inherent vulnerabilities of these devices. We have designed a novel
system architecture that addresses different aspects of such a middleware design. In
designing this architecture, we have considered various application requirements that
are specific for item tracking applications.
4

Improved
Performance
(Accurate, timely, stable
performance)
Application
Framework (System)
Infrastructure
Guidance TrackingMonitoring
System
RF2ID
(Item Tracking)
GuardianAngel
(Item Guidance and Monitoring)
Passive
RFID Reader
RFID Tags
Active
RFID Reader
RFID Tags
Data Flow Information
for Improved System
Performance
No Intelligence
at RFID readers
Hybrid:
Active & Passive
RFID Reader
RFID Tags
Figure 1: A Block Diagram of the Solution Space Provided as a Framework
1.3.1.1 Reliability
Our primary challenge is to provide system level reliability for inherently unreliable
components. The system should be able to provide a certain Quality of Service
(QoS) as required by application queries. For example, in the item tracking scenario
using passive RFID technology, the RFID data contains many false negative and false
positive reads. The system must be able to deliver a level of data accuracy in terms
of number of actual items flowing through the system.
1.3.1.2 Load Balancing
System load should be balanced across the computational elements when handling a
large amount of data. In real application scenarios in a supply chain environment or in
5

an airport baggage handling system, there are period of times when there is a sudden
increase in the amount of items (tagged goods in a warehouse or tagged baggage in
the airport). The system must be able to dynamically adjust to unexpected amount
of incoming data without hampering the basic operations.
1.3.1.3 High Throughput
The system is expected to provide extremely high update rates from the readers
and therefore requires high throughput to handle the sheer numbers of items. The
throughput is important for most of the tracking applications that require the systems
ability to operate within a bounded time.
1.3.1.4 Scalability:
The system should be capable of handling the addition of new readers or to dynami-
cally ignore malfunctioning readers without significantly impacting performance. Also
the system should not contain a dependency on a single point of failure which occurs
in centralized set ups.
1.3.1.5 Data Organization
The data organization process requires cleaning up of large amount of RFID reader
generated data (e.g., removing duplicate reads), timestamping the data in a consistent
manner (consistent in spatial and temporal relationship of the data items), sorting the
data with respect to its destination and type (e.g., observed items and missing items)
and finally being able to deliver the data according to application requirements. In
summary, for large amounts of data there is a need to properly sort and organize data
for efficient query responses.
1.3.1.6 Real Time Responses
The system must process appropriate feedback to the application within a predefined
window of time. In many of the item tracking applications, there are requirements
6

for real time observational data. For example, real time inventory in supply chain
systems asks for the real time information regarding the tagged goods. The system
must be able to provide tracking information within a predefined window of time that
is acceptable for that particular application.
1.3.2 Existing Solution Approaches
There have been several recent proposals involving middleware systems for RFID de-
ployment. The Savant architecture presented by the MIT Auto ID Lab presents a
framework for management of RFID generated data through data capturing, monitor-
ing and transmission [91]. A Pervasive environment is built on the savant architecture
[41] that tracks mobile RFID tagged objects. A middleware solution for RFID de-
vices is proposed in RFIDStack [46] which uses aggregation and filtering mechanism
on RFID data for efficient data management. The High Fan-in System [47] takes into
account the volume of data produced at different level of a sensor deployment and pro-
poses a specific topology for data management. WinRFID [81] presents a middleware
solution for RFID devices that takes care of the details of network communication
and data management for a distributed environment.
The focus of our work is complementary to these systems. In our work, we focus
on the inherent unreliability of RFID systems, and ask whether the reliability can
be improved using a middleware system. We use the nature of the data flow as our
ally to improve reliability. Further, the data flow can help in data organization as
well, which has been the focus of earlier systems. For example, consider a typical
RFID deployment scenario in a warehouse. RFID readers are placed at appropriate
locations, and they continuously read tags associated with the moving items, e.g.,
palettes. Often, palettes of a particular item type follow the same physical path
from an entry point to the designated destination in the warehouse. Therefore, for
many applications, generated tag data can be categorized based on their physical
7

flow. Recent studies have addressed the resource management problem in large scale
RFID systems as well. The heuristic based solution [44] provides near optimal reader
to tag assignment for statically placed reader and tags rather than considering tags in
motion for item guidance-monitoring applications. Load migration based approach is
used in various research works for RFID data. Examples include a mobile agent [39] to
re-adjust imbalance of load, and the connection pool based method [80] where load is
re-adjusted from heavily loaded nodes to lightly loaded nodes. Load migration based
techniques are not very suitable for streaming data to meet real time constraints [98],
[64].
1.3.3 RF 2ID for Item Tracking
We make the following contributions to address the item tracking problem and provide
an effective solution approach:
1.3.3.1 Study of the unreliable behavior of RFID devices
A middleware for RFID devices needs to take into account the inherent unreliable
nature of these devices. To have a better understanding of the RFID readers and tags,
we have done an extensive study of these devices to identify the variety of parameters
that affect RFID reader performance.
1.3.3.2 Design and Implementation of a path based system architecture
In item tracking applications, items follow a path from source to destination. The key
idea is to allow collaboration among resources along a particular data flow path. A
system that has an understanding of the data flow at system level has been developed
as RF2ID (Reliable Framework for Radio Frequency Identification) to combat the er-
ror prone nature of the RFID technology[16]. By using redundancy and exploiting
the relative flow of RFID tagged objects with respect to the readers, RF2ID increases
the reliability of an RFID deployment. RF2ID provides two system level abstractions
8

for increasing the reliability: Virtual Reader (VR) and Virtual Path (VPath). Each
VR is assigned to a distinct geographical region and by collecting data from physical
readers in its vicinity, it locally increases the reliability of the deployment. Further,
the VRs in the direction of flow of the items form a logical path (VPath). By ex-
changing data with one another along the VPath, the VRs further increase the global
reliability of the deployment. The net result of this middleware is to increase the
reliability of the entire deployment (by reducing the number of false negatives, i.e.,
the number of tags that are missed by the system) in spite of the error prone nature
of the physical readers.
1.3.3.3 Incorporating load shedding based resource management in RF 2ID
We deal with the large volume of data and the time sensitive nature of both tag
and query processing, by incorporating cooperative load shedding into the RF2ID
middleware. The key insight is once again to leverage the notion of path for dynamic
load distribution among the VRs under heavy load for item tracking applications.
We propose intelligent load shedding mechanisms that avoid or minimizes data loss
- when one VR sheds load, another VR along the same path most likely covers for
the data loss by the first one. Two different load shedding approaches are presented
here: space based load shedding mechanism and time based load shedding mechanism.
In the space based approach, each VR dynamically decides to read a subset of the
tags on the path that it is participating, based on their physical ordering in space.
In time based load shedding, each VR dynamically decides to read tags for a chosen
time interval.
1.3.3.4 Evaluation of RF 2ID
We have evaluated the system using a real testbed using passive RFID readers (ALR-
9800 readers) and tags (Gen2 tags) as well as emulated readers in a large distributed
setup for scalability study. We have done detailed evaluation of the system to validate
9

the scalable solution and resource management techniques using the load shedding
mechanisms.
1.4 Item Guidance-and-Monitoring
The focus of the item guidance-monitoring problem is different as it considers mon-
itoring and guidance support in an indoor environment. It is interesting to note the
limited incorporation of pervasive technology in our daily lives. For example, consider
the following hypothetical scenarios in an assisted living center for elderly residents:
Grandma Ayesha is not able to locate her medicine box with her impaired vision.
She requires assistance as she moves along the center. On the other hand, uncle Joe,
a quiet person who spends a large amount of time isolated in his room, falls and is
injured in the bathroom, but due to his solitary nature his caretakers do not notice
his situation.
These hypothetical scenarios are meant to draw attention to situations where non-
intrusive monitoring and guidance can enhance the quality of life as well as ensure
the well-being of residents in such environments. The problem is challenging since
neither Grandma Ayesha nor Uncle Joe would feel comfortable with an intrusive
monitoring system (such as video cameras or wearing an ID badge) that would reveal
the details of their daily lives to all and sundry. We define this problem in the
pervasive environment as a monitoring and guidance requirement, where individuals
seek guidance information in a complex indoor environment at a desired level chosen
by them without compromising privacy.
The monitoring and guidance facility introduces challenges in the requirements. A
robust guidance system requires positioning information, which enhances the monitor-
ing capabilities. However, monitoring individuals at a fine grain level is not desirable
for reasons already mentioned. So we ask the questions: (1) What are the require-
ments of a simple pervasive environment? (2) What are the challenges in existing
10

solutions? (3) What is the system level support required to bridge the gap between
existing technology and the requirements? We present the answers to these questions
in this work.
1.4.1 Application Scenario and Requirement Analysis
The applications we consider are best suited for environments that are statically
tagged with an RFID location grid. This would be especially useful for a visually im-
paired person to be self-reliant within a large office complex, hospital, etc. Equipped
with a gadget that combines an RFID reader and an audio system that gives verbal
instructions, such an individual would be able to chart out a route unassisted through
an unfamiliar large indoor environment. Essentially, the fixed RFID tags enable the
dynamic creation of a path from source to destination. A second use case for such a
static deployment of RFID tags is in search and rescue operations following either a
man-made or a natural disaster. A robot or a swat team may use this infrastructure
to dynamically chart out paths that are reachable within the indoor environment
following the disaster, as well as locate assets (humans and articles of value) within
the affected environment.
While the details of each specific application may be different, they all pose some
common requirements. We investigate such common requirements to design a middle-
ware system solution. The premise in this discussion is that the application comprises
mobile agents that use the RFID-tagged environment for making forward progress.
From an application perspective, the middleware should provide the following
types of information to the mobile agents in the application:
1.4.1.1 Current location
The mobile agent may need this information to make some local decisions (e.g., have
we arrived at the destination yet?). This information is best presented in some familiar
form such as GPS coordinates.
11

1.4.1.2 Routing information
The mobile agent would benefit if the middleware could provide a route given the
current location and the desired destination.
1.4.1.3 Assets in the neighborhood
This would be particularly useful in asset location applications as well as self-guided
tours in museums and the like. Based on the current location information, the mid-
dleware provides a map of assets in the neighborhood.
1.4.1.4 Terrain
The kind of information envisaged here includes obstacles (e.g., doors, stairwell, etc.)
as well as landmarks (e.g., information desk, copier room, etc.). This information
serves the mobile agent to make local routing decisions to destinations when there
are multiple paths available as well as seek help if needed.
1.4.1.5 Message board
This allows a mobile agent to share information with other agents if so desired. Es-
sentially, this allows the mobile agent to leave electronic bread crumbs (either signed
or anonymous) that may be useful for other applications or agents that use the same
infrastructure.
1.4.2 Existing Solution Approaches
The GPS based guidance systems do not cover the indoor scenario. The low cost
of sensor devices such as passive RFID technology opens up many new possibili-
ties. RFID readers use radio waves to communicate with electronic tags. There has
been previous research investigating indoor positioning systems, including the Active
Badge location system [89], Radar [23], Cricket [93], LotTrack [101], and Landmarc
[76]. The goals of these systems are to figure out the precise location information.
12

There are two major differences of our work related to these existing systems. First,
we do not present a positioning system to identify the exact position of a mobile
person; rather, we want to give them a sense about where they are in a more coarse
grain level at low cost. Second, we differ due to the fact that we do not expect the
user to wear a sensor badge or tag. Instead, we assume the user to possess a mobile
sensor device that they can carry around that allows them to be in control of when
they want the environment to know about their whereabouts. The environment itself
is equipped with low cost passive RFID tags. The Sixth Sense [83] system consid-
ers a tagged environment covered by readers and incorporates privacy concerns as
the entire environment is being sensed constantly. Similarly the MAX system [112]
considers a hierarchy of tagged environment that is observable by the base stations
containing reader elements. Fundamentally, our approach is different in that the in-
tent is to enable the user to sense the environment and update the environment at
their will rather than the other way around. This circumvents privacy and security
concerns that would require the user to trust the environment for such information
sharing.
For those cases in which information sharing is desired, security can be improved
by the use of available protocols for two-way authentication [26]. Such techniques
can be plugged into our guidance and monitoring framework, but are outside of the
purview of this research, so they will not be further discussed. There have also been
research efforts in guidance systems for various outdoor scenarios, but these differ
from our own in that we focus on an indoor environment. Context aware frameworks
[14], [28], [15], [62] would serve to enhance the robustness of the solution approach.
1.4.3 GuardianAngel for Guidance-Monitoring
We have developed a two layer middleware solution named GuardianAngel that pro-
vides system support in such a pervasive environment. The lower layer, named as
13

the Guidance Layer, provides the locality information to the user to make guidance
decisions. The upper layer, known as the Monitoring Layer, has the global knowl-
edge of the environment. The environment is equipped with low cost RFID tags. The
guidance layer is supported by a hand held device that has an RFID reader attached
to it. The guidance layer is thus able to provide information regarding the resident’s
current location and immediate objects by sensing the environment. The monitoring
layer has the information about the entire environment. The guidance layer under
user control periodically updates coarse grain information defined as the virtual loca-
tion about the resident to the monitoring layer. The guidance layer with its limited
capability only keeps partial map information that is acquired on demand from the
monitoring layer. If we go back to our previous example: Grandma Ayesha can use
her hand held device through the guidance layer to figure out where she is and where
her medicine is. Uncle Joe is periodically sending information about his coarse grain
location information to the monitoring layer. It detects an unusual amount of time
spent in the restroom and sends out an alert signal to the application layer.
The novelty of our approach lies in its uniqueness along three dimensions: first,
by virtualizing the user position information; second, by providing a more natural
way of gathering environmental information using RFID tags in an unobtrusive man-
ner under user control; and third, by enabling the deployment of large scale indoor
environment using low cost passive RFID tags and mobile readers. Specifically, our
contributions are summarized in the following subsections.
1.4.3.1 Defining an architecture
We define an architecture for an indoor pervasive environment that provides a novel
system abstraction and a communication framework. The layered architecture com-
prises distributed computational elements known as the virtual station (VS) that are
in charge of serving different regions of the environment; the Mobile Objects (MO)
14

are the physical and logical entities that use the sensing device and traverse the envi-
ronment; the environment itself is tagged with RFID tags. The MO uses its sensing
device to make guidance decisions locally. The VS keeps status information of MOs
and keeps coarse grained information of each MO over time and space (providing a
virtual location) that hides the fine grain positioning information of each MO.
1.4.3.2 Implementation of the middleware system
We have implemented the GuardianAngle system as defined by the architecture. We
have used a testbed that uses real RFID readers and tags in the pervasive environment
in a limited laboratory setup. We have also developed a distributed system setup
using emulated tags for a scalability study of the proposed architecture along with
an implementation of a prototype application, to test its feasibility in the real world.
1.4.3.3 Evaluation of the system
We have conducted extensive evaluation using the real RFID testbed as well as scal-
ability study using emulated readers and tags. The evaluation using the real RFID
tags and readers gives us the credibility of the system under various environmental
considerations. The large scale experimentations using emulated readers and tags
strengthens our limited resource study that uses a real RFID testbed.
1.5 Item Tracking Applications and Item Guidance-MonitoringApplications
Our experience on working with RFID technology has given us the opportunity to
deal with the limitations of the current technology and has guided us to come up
with simple but powerful solution approaches to use in various scenarios. There are
common goals to achieve in item tracking applications and item guidance-monitoring
applications which ask for a scalable solution having knowledge of data flow through
the system. The flow of data is different for two different application requirements as
15

the item tracking aims to share the tagged object through a path while the guidance-
monitoring application asks for status information to be shared across a designated
path. The way the information is shared is very unique in each individual application
scenario. For example, the goal of the item tracking application is transparency of
information, being able to determine the object’s placement in a particular window
of time. On the other hand, the item guidance-monitoring applications bring in
challenges as information transparency conflicts with the privacy requirements of the
indoor residents. We present two distinct solution approaches that are very specific
for the individual problems in RF 2ID and GuardianAngel.
1.6 Major Contributions
We describe the major contributions in the following subsections.
1.6.1 Path Based System
We present a data flow oriented approach in designing the middleware using the
system abstraction called path. A path allows interesting ways to improve the system
performance. The generic concept of data flow oriented path is used to increase
the system accuracy for item tracking applications in RF 2ID. The path is further
used to dynamically balance the system load in the presence of unexpected system
load for item tracking applications. For item location applications as presented in
GuardianAngel, the concept of path is used to support guidance and monitoring.
1.6.2 A system for Unreliable Devices
Large scale deployment of sensor devices can be error prone as most of the scenarios
have some level of physical inaccuracy. The RFID devices are error prone and are
very sensitive to the environment they are deployed in. The environmental factors
like presence of metal objects or liquid can increase the level of inaccuracy of the
RFID readers. The incorporation of motion, large number of items also play a role in
16

the reading of the RFID devices. Our system takes into account the basic unreliable
nature of these RFID devices and uses a redundancy and data flow centric design to
improve the system accuracy.
1.6.3 Human Centric Design
The consideration of the users in the item guidance and monitoring system introduces
interesting design considerations. We used an architecture that provides unobtrusive
system solution for the users. The user is able to control the amount of data being
shared among the users and monitoring servers. The consideration of the user’s
preference for an unobtrusive system is a way to bridge the gap between a system
designer and the user centric choices.
1.7 Outline of the Dissertation
We organize the dissertation in the following manner: the detailed background of the
system is presented in Chapter 2 that covers the two major application scenarios and
the basic working principles of different types of RFID technology. We then focus
our study on the properties of RFID technology which asks the following questions:
How unreliable are these RFID readers and tags? What are the factors that affect
the performance of these RFID readers and tags? The answers to these questions
are presented in Chapter 3. The unreliable property of the RFID readers creates the
motivation for a reliable, scalable solution approach. We discuss the solution for item
tracking named RF 2ID in Chapter 4. The resource management requirements and
a suitable solution using the data flow centric concepts are discussed in Chapter 5.
It discusses how the system incorporates load shedding based resource management
techniques using a time based load shedding mechanism and a space based load
shedding mechanism. We leverage the data flow information used in RF 2ID to
intelligently shed load dynamically in the presence of unexpected overflow of data..
The item guidance-monitoring solution GuardianAngel is presented in Chapter 6.
17

The unique challenges and lessons learned developing the two solution approaches are
discussed in Chapter 7. The conclusions and future work are presented in Chapter 8.
18

CHAPTER II
BACKGROUND
This section presents the background information that enables us to understand the
existing applications that use RFID technology along with the very basic information
on how the technology operates. There are a wide range of applications that use
the basic RFID technology. We focus on mainly applications concerning large scale
deployment of the technology. We categorize them into two general classes of large
scale RFID deployment as item tracking applications and item guidance-monitoring
applications. We discuss each type of applications in the first subsection. We then
explore the RFID technology itself based on various kinds of existing RFID tags and
readers and their operating principles. We also discuss various factors that impact the
decision on which particular RFID technology to choose for a particular application
scenario. We use this chapter to set the stage for the research presented in the
subsequent chapters.
2.1 Applications using RFID Technology
RFID technology is rapidly gaining attention in various applications. There are refer-
ence based applications such as collection tolls without stopping the vehicle, gaining
access in the building, automated parking etc.; there are monitoring based applica-
tions in automobile stores and merchandise stores; there are tracking applications in
libraries, airport and retail industries; there are location based applications in search
and rescue scenarios [71]. There are set of medical applications that links patients
with drugs, personnel with patients and links equipment access to the hospital per-
sonnel. The RFID technology has been successfully used in sports event to track the
athletes and their race time in recent days [74],[94], [1]. We address the application
19

scenario that considers large scale deployment of RFID devices. There are a set of
applications called item tracking applications and item guidance-monitoring applica-
tions that we are going to mainly focus on for our research work. We discuss these
two applications in detail.
RFID Reader
Tagged Mobile Object
Logial Path
Figure 2: Basic Concept of Item Tracking
2.1.1 Item Tracking Applications
The item tracking applications consider taking notes on the RFID tagged items using
static RFID readers. In the item tracking applications, statically placed readers are
in charge of tracking tagged items in motion as shown in Figure 2. The warehouse
scenario where objects are tracked as the items arrive and leave and the airport
baggage claim system where tagged baggages are tracked through the conveyor belts
are examples of tracking applications. It is observed that there is a flow of data that
creates a path as the tagged items traverse through the system. The main challenges
faced by large scale deployment of item tracking applications are the unreliable RFID
readers as they provide false negative and false positive readings. False negative
readings refers to the reader’s inability to read an existing item and false positive is
the reader’s reading of an item that is beyond its reading range. Then there is the
20

challenge that a large amount of data is produced as the items traverse through the
system in item tracking applications. The system must be able to provide adequate
support for large scale expected and unexpected (sudden) data arrival.
Item Storage
RFID Read Point
RFID Tagged
Data Items
Conveyor
Belt
Time
Real time
Information
(misplaced
item)
Aggregation
Information
Figure 3: Item Tracking Application Scenario
There are many large scale item tracking applications using current RFID tech-
nology. A warehouse scenario which uses RFID tags to monitor and note real time
information as shown in Figure 3 is a classic example of item tracking using RFID
21

technology. There are many interesting item tracking deployment mentioned in the
literature [74],[94],[10],[4],[5], [88] and shown in Figure 4:
(a) (c)
(b)
Figure 4: Example of Item Tracking Applications [10],[4],[5] (a) RFID technologyenabled toll booth (b) The RFID tag used in toll booth (c) RFID enabled fast trackingin FedEx
• Logistics and Supply Chain: In this case, the RFID tagged containers and items
are tracked as items enter, traverse through the system and leave.
• Baggage Entry: Airport baggage system uses RFID technology for easier track-
ing of baggage and proper management of baggage destinations.
• Livestock or Pet Tracking: RFID tagged items are tracked as they live in the
environment and appropriate actions are taken if they are lost.
• Traffic Tracking: Speed pass and E-pass pay tolls around USA uses wireless
RFID tags to track vehicles to pay tolls, other fees.
22

• Express Parcel Tracking: It is used in fast tracking of package delivery in many
companies (e.g., FedEx) using RFID technology.
• Library Systems: RFID tagged library books are managed using passive RFID
technology to keep track of checked in and checked out books.
Tagged Environment
Logical Path
Object of
Interest
Mobile
RFID Reader
Figure 5: Basic Concept of Item guidance-monitoring
2.1.2 Item guidance-monitoring Applications
The problem of item guidance-monitoring considers a complimentary scenario of
tracking applications as shown in Figure 5. It assumes a tagged environment that is
relatively static and mobile readers are used to locate objects of interest. A search
and rescue scenario where rescue personnel are equipped with RFID readers is an
example of item guidance-monitoring. It is observed that a path gets created as the
rescue personnel traverse the environment. The main challenge in this scenario is
to provide adequate guidance to a user without hampering the individual’s comfort
level.
There are many interesting proposals and approaches towards item guidance-
monitoring applications. The real implementation of RFID technology requires vari-
ous considerations such as interference with the environment and privacy concerns of
23

the users. There are many proposals for such application scenario (such as [74],[94],[8],
[9]). Figure 6 shows an example.
Figure 6: Examples of Item guidance-monitoring Applications [8], RFID Reader ona patient
• Healthcare Industry: RFID technology can be used in the hospitals, nursing
cares where the residents can achieve improved care using the technology in an
RFID enabled care unit.
• Search and Rescue Scenario: Search and rescue becomes very challenging for
complex indoor environment. An RFID enabled building can be searched using
robots and rescue personnel equipped with RFID readers to make real time
decisions.
2.2 RFID Technology
We discuss the various components of the RFID technology in this section. We initiate
our discussion with RFID tags.
24

The RFID tag is a device that is attached to other items for identification. It
consists of a micro chip and an antenna. RFID tags can be categorized in many
different ways. The tags can be divided by their operational methodology or data
acquisition techniques. We discuss different types of tags in the subsequent sections.
2.2.1 Tag Types by Operational Methods
The basic operational methodology divides the tags in certain types. RFID tags can
be categorized as active, passive and semi-passive (semi-active) [11]. EPC global
classification divides them according to four categories: class 1 tags are passive tags,
class 2 are passive tags with additional memory and commands, class 3 are semi
passive tags. As the name suggests, the active tags are always active, semi-passive
tags are sometimes active and passive tags are not active unless activated externally.
We describe each type of tags in the following subsection.
2.2.1.1 Active Tags
Active RFID tags are often known as beacons. The active tags have their own power
source to power the IC and generate an outgoing signal. The active tags consist
of an on board power supply, an active transmitter and an active receiver. The
specification defined by ISO 18000-7, the active tags are not allowed to have tag to
tag communication - the communication takes place through the reader. The active
transmitter of the tags allows longer transmission of signal and active receiver enables
receiving of signal from a longer distance compared to ones in passive tags. Many of
the active tags send out signals in a fixed interval to minimize the power consumption.
There are existing active RFID tags that have ranges as far as tens of meters and
limited battery life that can be as long as 10 years. The lifetime of active tags depend
on the power supply entirely as it is not able to harvest energy from the environment.
25

2.2.1.2 Passive Tags
Passive RFID tags do not have an internal power supply. The incoming electrical
current induces the antenna to power up the CMOS Integrated Circuit (IC) and to
transmit a response. The reader antenna has to be specially designed to collect power
from the incoming signal as well as transmit outgoing response. The absence of on
board power supply reduces the size of such tags. The life time of the passive tag is
unlimited. The reading distance can range from 2 mm to few meters. The passive
tags are the cheapest among all the types of tags. The passive tags are divided into
three categories based on their operational process: near field tags, far field tags and
SAW tags.
Near Field RFID: The near field tags require physical proximity between the
reader and tag. Near field tags use magnetic coupling. It is illustrated in Figure 7.
Here the reader generates the magnetic field which excites the tag coil (antenna).
This works within the reading distance of 1 meter. The boundary of near filed is
inversely proportional to frequency and approximately equal to c/2 ∗ Π ∗ f where c
is the speed of light, f is the frequency. Thus only low carrier frequencies are used
which requires a large antenna coil. Another limitation is its low bandwidth causing
low data rate in near field RFIDs. But the near field RFID uses long wave lengths
for communication which makes them very efficient regardless of what is attached to
them. The signal is able to travel through many non-metallic substances and non-
penetrable substances such as water and metal. The most common operating band
is 13.56 Hz band for commercial use.
Far Field RFID: Far field RFID are different from near filed ones and use traveling
waves to transmit and receive information as shown in Figure 8. An antenna requires
to satisfy the distance d > max(λ,D2/λ) to be in the far field where D is the largest
dimension of reader antenna. Antenna can be small compared to near filed RFID.
Far field tags have many applications such as toll collection, automated assembly line
26

Transmitter
Receiver
RFID Reader
RFID Tag
Magnetic Field in Near Field Region
Power and Data
Data Transmitted via charges
In Field Strength
Figure 7: Near field RFID
etc. where the tag does not need to be physically close to the reader. The far field
antennas are implemented using higher frequency signal as the low frequency signal
would require an extremely large antenna size. Most of the far field tags use UHF
and microwave bands. The commonly used bands are 915MHz, 2.4 G Hz and 5.4 G
Hz. One limitation of far field tags is the vulnerability to the material attached to it
(e.g., metal or water). The advantage of these tags are the small antenna size which
requires low fabrication and assembly cost. The improvement in silicon technology
has allowed tag designs that consume very low power.
SAW Tags: The SAW tags work on a different principle compared to near field
and far field tags. It uses the surface acoustic wave (SAW) technology. The tags were
bulky in size when first introduced but with improved technology of having smaller
sizes these tags are gaining attention in recent days. It has the built in capability of
measuring the temperature of an object and estimate real time location of the object.
It has higher reliability in presence of water and metal. Although the SAW tags have
27

Transmitter
Receiver
RFID Reader
RFID Tag
Power and Data
Data Transmitted via Backscatter
Near
Field
Region
Far
Field
Region
Magnetic Field
Figure 8: Far field RFID
many advantages over silicon based tags, it has not gained the commercial acceptance
for widespread adoption.
2.2.1.3 Semi-Passive Tags
Semi-passive tags have an internal battery attached to it. It works in similar way as
the passive tags do except for the fact that the internal battery allows the tag IC to
be constantly powered. This removes the necessity of the antenna to be collecting
power from incoming signal. These types of tags are faster in response and have a
stronger reading ratio compared to passive tags.
2.2.2 Tag Types by Operational Methods
RFID tags can be again classified based on the data acquisition techniques. The
data in a tag are acquired in various methods where each method has its own ad-
vantages and limitations. The tags are classified by data acquisition techniques into
five major categories: pre-encoded tags, Write-Once-Read-Many (WORM), Erasable
28

tags (EEPROM), Read-Write tags and Database on a tag. The following definition
is used to define the data acquisition process:
Commissioning : The initial data entry technique to the tag is known as commis-
sioning.
We describe the different tag categories here.
2.2.2.1 Pre-Encoded Tags
The pre-encoded tags are commissioned at the manufacturing time. Users request to
encode specific information can be applied to the tag only it is placed before the actual
manufacturing process. The users do not have control to change the tag information.
These tags are used in small scale applications like pilot projects of RFID where the
user wants to explore how the RFID enabled environment performs.
2.2.2.2 Write-Once-Read-Many
This class of tags are commissioned by the user unlike the pre-encoded tags. The
encoded information is permanent once it is written to the tag. These tags are also
known as field programmable tags. These tags are used in many smart labels.
2.2.2.3 Erasable Tags
The Erasable tags, as the name suggests allow information to be erased after it is
commissioned to the tag, adding more flexibility to the previously mentioned cat-
egories. This type of tags can be rewritten multiple times. It uses electronically
erasable programmable read only memory (EEPROM). Typically these tags can pre-
serve information as long as the oxide layer of the EEPROM is available which is
close to ten years for many tags.
2.2.2.4 Read Write Tags
The read-write tags are programmed using a reader at any point of time. Data can
be added to the tag as the tag traverses through the system. This capability enables
29

these set of tags to be used in many different application scenarios. These tags can be
attached to other sensors for rich set of environmental information. The capability of
embedding important information in the tag opens up security concerns. There are
active and passive read write tags available commercially.
2.2.2.5 Database on a Tag
These tags use a compression mechanism to hold a large set of data in the tag. The
large set of data can comprise of an entire database. Automated entry of items in a
system that has numerous individual items is an example application of such tags.
2.2.3 Considerations for Choosing Particular Type of Tag
The large variety of available tags make it very important to make a decision on which
type of tag to consider for a particular application scenario. There are many different
factors that are considered that we present in the subsection.
• Physical Size of Tag: The physical tag size is important when tags are attached
to various items. For example in merchandise scenario, the attached label must
be readable and prominent in some cases (e.g., where tags are used to show the
item’s lifetime for a perishable item), or can be as small as possible for some
cases e.g., clothes to describe the item itself.
• Durability of Tag: The tag selection must consider the environment into ac-
count. For example there are environments that require special considerations
for the tag like extreme cold temperature or environment containing moisture.
The tag durability depends on many of these environmental factors.
• Reusability of Tag: If the application requires multiple write operations, tag
selection should be based on them.
• Sensitivity of Tag: The tag sensitivity in many cases depend on the parameters
like tag to reader orientation or reader to tag distance. The application must
30

take into account various factors to make sure the system is performing in the
desired manner.
The RFID antenna is discussed in the next section.
2.2.4 RFID Antennas
The basic function of an RFID antenna is to convert electronic signals and broadcast
them into radio waves. Antennas are present in RFID tags as well as RFID readers.
The high frequency antennas require very careful design as they cannot tolerate much
error. On the other hand, the low frequency antennas are tolerant of minor deviations
[29].
We discuss some of the basic properties of the RFID antennas that impact the
performance.
2.2.4.1 Impedance
The resistance of an electronic component to alternating current is called impedance,
the unit measurement of impedance is in ohms. The performance of an RFID antenna
depends on the matching impedance of the antenna and device circuit. The power is
able to flow through the reader to antenna if the impedance is matched. Otherwise, if
the impedance of the reader does not match that of the tag, some power is returned
to the reader and this can decrease the reader performance and in many cases even
damage the reader. The antenna impedance is affected by various environmental
factors such as the materials around the environment.
2.2.4.2 Polarization
The polarization of the radio wave is perpendicular to the direction the wave travels.
There are linear polarization antennas where the polarization is constant as the wave
travels. The linear polarization antennas can be horizontal or vertical. There are also
31

circular polarized antennas which rotates in a place that is perpendicular to the di-
rection of the wave. The polarization also affects the reader to antenna performance
heavily - the best performance is achieved when the reader and tag antenna have
aligned polarization. Thus the best performance is achieved when the reader and tag
are placed in parallel for linear polarization antennas. For circular polarization an-
tennas the performance is constant and it is useful when the reader to tag orientation
can be variable.
2.2.4.3 Gain
Gain is the measurement of antenna performance - it is measured as the proportion
of the output in a given direction against a standard. It is measured in decibels (dB).
A higher power antenna radiating in a given direction requires the other antenna to
radiate in a different direction.
2.2.5 Basic RFID Operational Technology
The basic Radio Frequency Identification system has three major parts. It consists of
a scanning antenna, a transceiver with a decoder to interpret data and a transponder
also known as the tag which contains the information.
The scanning antenna is responsible for delivering Radio frequency signals in a rel-
atively short range. The RF frequency enables the communication with the transpon-
der and provides energy for the transponder to respond for the passive RFID tags
[12]
2.2.5.1 Passive RFID Operation using Backscatter communication
The passive tag contains an antenna which serves two purposes. First, the antenna
stores energy from incoming signal. Second, the antenna also communicates back
to the interrogator. The amount of energy a tag can preserve is affected by several
major factors such as antenna to tag distance, the transmission power of interrogator
32

Transmitter
Receiver
RFID Reader
RFID Tag
CW Signal
Modulated Signal from Tag
Figure 9: RFID Operation using backscatter method
and efficiency of tag antenna.
The backscatter modulation works in the following steps as shown in Figure 9.
First, the reader sends out a continuous wave signal to the tag known as a CW signal.
Second, the tag uses the electromagnetic energy to do two things: (a) power up and
(b) operate. Third, the tag modulates into pre programmed code and sends out a
modulated reflection of CW signal.
2.2.5.2 Active Tag Operation
Active RFID tags contain their own power supply, an active transmitter and active
receiver. The active receiver is able to decode even very weak signals. And the active
transmitters have a longer range compared to backscatter communication. The active
tag can transmit a signal at a specific power level regardless of the power it received
from the interrogator. The lifetime of the active tags are limited by the power supply.
33

2.3 Summary
In this section we concentrate on the basics of RFID technology and its various
applications. We focus on item tracking and item guidance-monitoring applications
for large scale RFID deployment. The item tracking applications consider statically
placed RFID readers to track mobile tagged items. The item guidance-monitoring
applications, on the other hand, assume a tagged environment where mobile RFID
readers locate objects of interest. We have discussed the different types of RFID tags
which varies in operating principles and reading strengths.
34

CHAPTER III
STUDY ON RFID READERS
The goal of this chapter is to understand the physical behavior of RFID devices
under various environmental conditions. This exploratory evaluation gives us insight
about the problems large scale RFID deployments would face and thus provide us a
motivation for a reliable solution. The effect of physical conditions like item speed
or presence of multiple tags in the environment are studied as these conditions are
present in large scale item tracking applications. We study the passive RFID reader-
tag behavior and active reader-tag behavior in this section. Our study points out the
limitations and strengths of different types of RFID technology.
3.1 Basic Properties of Passive RFID Devices
An RFID reader from Alien technology ALR-9800 [45] is used with two circular
antennas along with 2x2 Omni directional passive tags for the study. The experiments
show the key factors that affect the number of detected tags by a reader: varying the
reader to tag distance, reader to tag angle and RF attenuation level. Lastly, it is
studied how the tag reading varies over time when the above parameters remain
unchanged.
3.1.1 Effect on Reader to Tag Distance
Figure 21 shows the impact of reader to tag distance when varying quantity and
proximity of tags from the antenna. For example, using six tags, 3 tags are detected
at a distance of 40 inches; whereas for 2 tags all the tags are detected up to 40 inches
away.
35

1
Angular Position: 90 Degree
Number of Reader Antenna : 2
Reader Power: 31.5 dB
0
1
2
3
4
5
6
0 10 20 30 40 50 60 70
Nu
mb
er
of d
ete
cte
d ta
gs
Tag distance from antenna (inches)
Total tags=1
Total tags=2
Total tags=3
Total tags=4
Total tags=5
Control parameter: # of tags in palette varied from 1 to 6
Experiment to Study Unreliability of Physical Readers ALR 9800 with
2 antennas from Alien Technologies
Figure 10: Physical properties of Passive RFID Devices VaryingTag distance fromantenna
3.1.2 Effect on Reader to Angular Position
Similarly, Figure 11 exhibits how the angle of the antenna affects accuracy while
varying the total number of tags. For a fixed reader to tag distance of 15 inches- it
is observed that, when the palette is placed +30 from perpendicular to the antenna,
most of the tags are detected; otherwise, the number of tags detected begins to
degrade.
3.1.3 Effect of Reader Attenuation
Reader attenuation level also has an impact on the number of detected items, which
is shown in Figure 12. Considering a group of 6 tags placed 15 inches from the reader
at an angle of 90 , only 3 items can be detected with a reader attenuation of 9 dB.
36
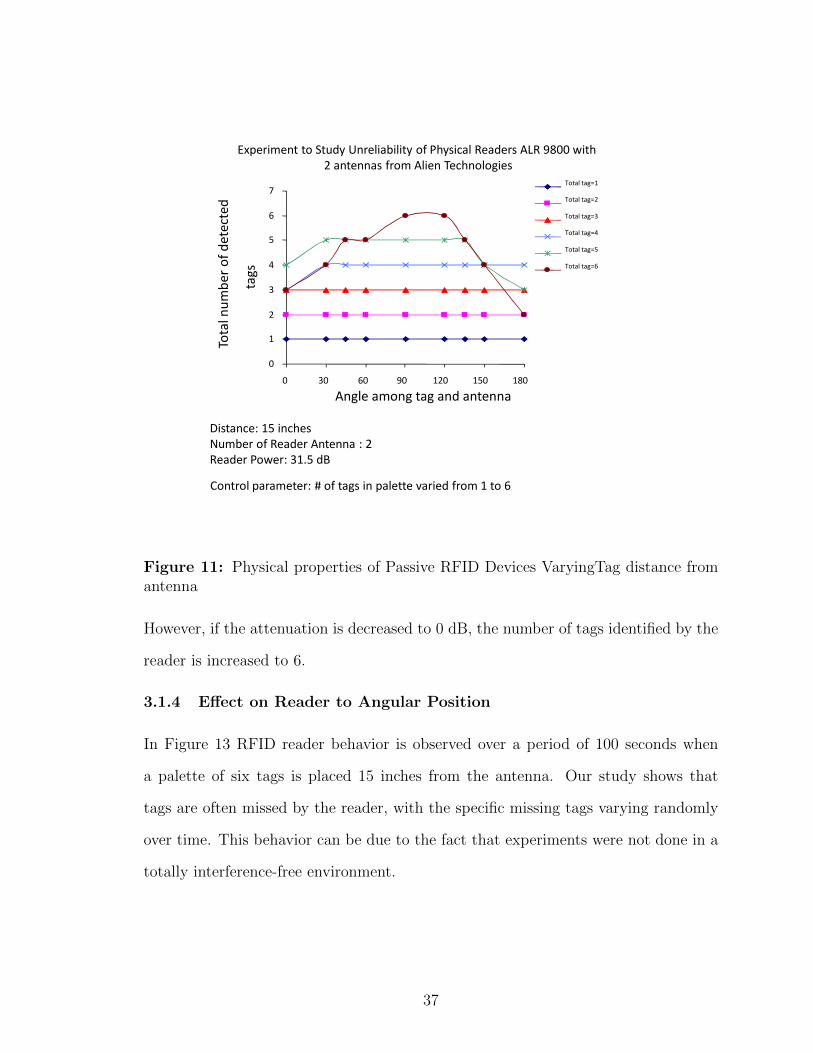
0
1
2
3
4
5
6
7
0 30 60 90 120 150 180
Angle among tag and antenna
Tota
l n
um
be
r o
f d
ete
cte
d
tag
s
Total tag=1
Total tag=2
Total tag=3
Total tag=4
Total tag=5
Total tag=6
Control parameter: # of tags in palette varied from 1 to 6
Experiment to Study Unreliability of Physical Readers ALR 9800 with
2 antennas from Alien Technologies
Distance: 15 inches
Number of Reader Antenna : 2
Reader Power: 31.5 dB
Figure 11: Physical properties of Passive RFID Devices VaryingTag distance fromantenna
However, if the attenuation is decreased to 0 dB, the number of tags identified by the
reader is increased to 6.
3.1.4 Effect on Reader to Angular Position
In Figure 13 RFID reader behavior is observed over a period of 100 seconds when
a palette of six tags is placed 15 inches from the antenna. Our study shows that
tags are often missed by the reader, with the specific missing tags varying randomly
over time. This behavior can be due to the fact that experiments were not done in a
totally interference-free environment.
37

1
0
1
2
3
4
5
6
7
0 2 4 6 8 10 12 14
RF Attenuation (dB)
Nu
mb
er
of
de
tect
ed
ta
gs
Detected Tags
(among 6 tags)
Number of tags are fixed to 6
Experiment to Study Unreliability of Physical Readers ALR 9800 with
2 antennas from Alien Technologies
Angular
Position: 90
Degree
Number of
Reader
Antenna : 2
Figure 12: Physical properties of Passive RFID Devices VaryingTag Reader Atte-nation
3.1.5 Passive RFID Devices for Item Tracking Applications
The RFID devices are studied for item tracking applications where RFID readers
are stationary and the tags are in motion. These experiments consider the bulk size
(number of items traversed through the system in a time window) and the item speed.
3.1.5.1 Effect of Bulk Size
The bulk size has a significant impact on the reader’s ability to detect items. Alien
ALR 9800 reader is studied using the tag speed of 9cm/sec to achieve the best PR
level accuracy varying the bulk size. The number of detected items decreases as the
bulk size increases. Figure 14-(e) indicates 98% detected items for a bulk size of 5
tags which decrease as the bulk size increases; it lowers to 16% when the bulk size
38
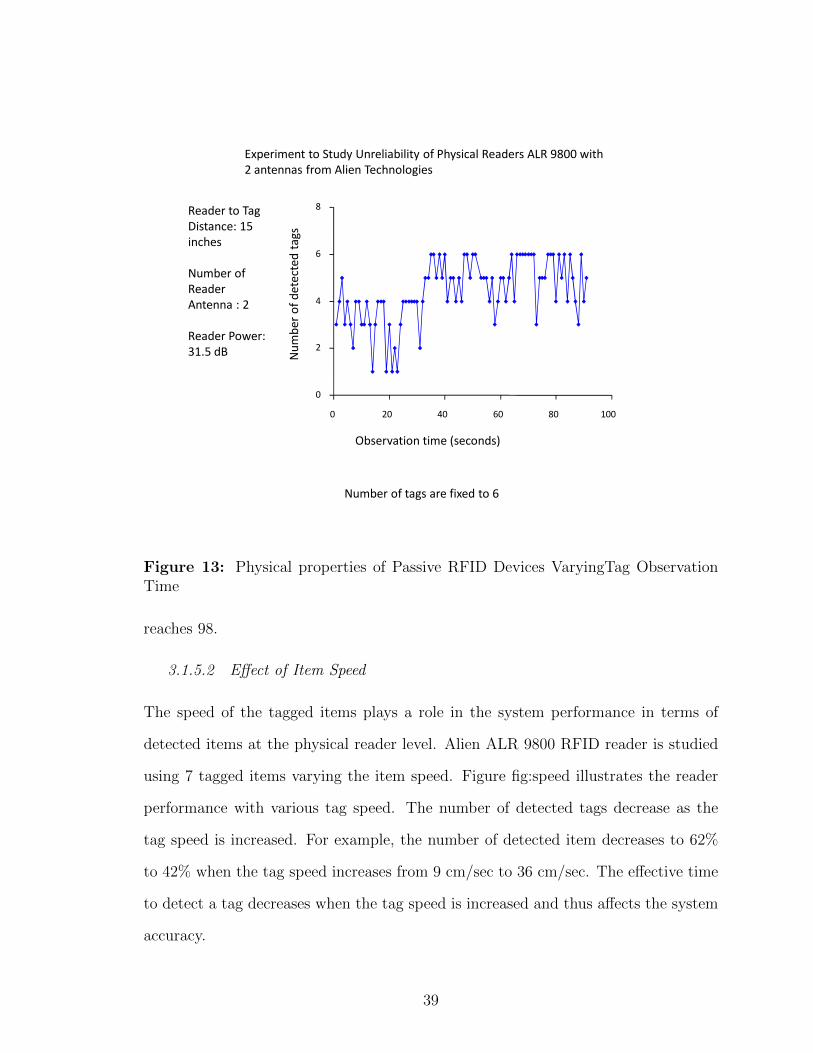
0
2
4
6
8
0 20 40 60 80 100
Observation time (seconds)
Nu
mb
er
of
de
tect
ed
ta
gs
Number of tags are fixed to 6
Experiment to Study Unreliability of Physical Readers ALR 9800 with
2 antennas from Alien Technologies
Reader to Tag
Distance: 15
inches
Number of
Reader
Antenna : 2
Reader Power:
31.5 dB
Figure 13: Physical properties of Passive RFID Devices VaryingTag ObservationTime
reaches 98.
3.1.5.2 Effect of Item Speed
The speed of the tagged items plays a role in the system performance in terms of
detected items at the physical reader level. Alien ALR 9800 RFID reader is studied
using 7 tagged items varying the item speed. Figure fig:speed illustrates the reader
performance with various tag speed. The number of detected tags decrease as the
tag speed is increased. For example, the number of detected item decreases to 62%
to 42% when the tag speed increases from 9 cm/sec to 36 cm/sec. The effective time
to detect a tag decreases when the tag speed is increased and thus affects the system
accuracy.
39

Item Speed: 18 cm/sec
Number of Reader Antenna : 4
Reader Power: 31.5 dB
Experiment to Study Unreliability of Physical Readers ALR 9800 with
2 antennas from Alien Technologies
60
65
70
75
80
85
90
95
100
5 25 45 65 85
Bulk Size
% D
ete
cte
d Ite
m
Figure 14: Physical properties of Passive RFID Devices Varying bulk size
Our experiment with the readers gives insight into their unreliable nature. Envi-
ronmental factors that hamper the reading as well as the inherent unreliability in the
reader behavior are elaborated upon here.
3.2 Basic Properties of Active RFID Devices
In this section we explore RFID technology for the pervasive environment. We have
considered active RFID tags and readers instead of the passive RFID readers and
tags as the passive technology is very vulnerable to its environment.
We have used a setup that uses a single VS that interacts with a mobile RFID
reader (M220 reader from RFCode) using blue tooth connection. The pervasive en-
vironment is the laboratory setup with 25 active RFID tags (M100-i IR Asset Tags).
40

Bulk Size: 7
Number of Reader Antenna : 4
Experiment to Study Unreliability of Physical Readers ALR 9800 with
2 antennas from Alien Technologies
35
40
45
50
55
60
65
70
75
9 14 19 24 29 34
Data Speed (cm/sec)
%D
ete
cte
d Ite
ms
Figure 15: Physical properties of Passive RFID Devices Varying Item Speed
The RFID reader sensitivity ranges from -58 dB to 108 dB and has eight factory
programmable ranges each with a 5 dB increment in power level.
3.2.1 Stable Reader to Tag Positioning
In these studies the reader to tag placement (distance, angular position) are stable
during the experiment. We have used two different reader to tag distance - 50 cm
and 100 cm under power level 2 and the angular positions are considered to be 30
degrees apart starting from 0 degree.
3.2.1.1 Reading stability over time
We have conducted study on the reader performance over time in 16. It is observed
that items are observed within a range of signal strength for a certain reader to tag
41

relative position (distance, angular position). For example, the reader is able to read
the items at power level 56 when an item is placed 50 cm away while the same item
is observed using signal strength 64 when the reader to item distance is 100 cm. We
have observed that the active tags are detected with various signal strengths without
having any false negative reads at power level 2. A higher power level setting (power
level ≥ 3) stabilizes the item reads. We have conducted the experiments to define
the behavior at minimal power level. We have not used any statistical methods to
represent the data here, we have collected the data over a 280 seconds interval.
50
52
54
56
58
60
62
64
0 50 100 150 200 250
An
ten
na
Sin
gn
al P
ow
er
(dB
)
Elapsed Time (seconds)
Reader Angle=90 degree distance = 50 cm Reader Angle=30 degree distance= 50 cm
Reader Angle=90 degree distance=100 cm Reader Angle=60 degree distance =100 cm
Reader Angle=120 degree distance =50 cm Reader Angle=60 degree distance =50 cm
Reader Angle=0 degree distance =50 cm Reader Angle=300 degree distance =50 cm
Reader Angle=0 degree distance =100 cm Reader Angle=330 degree distance =100 cm
Reader Angle=30 degree distance =50 cm Reader Angle=330 degree distance =50 cm
Reader Angle=270 degree distance =50 cm Reader Angle=210 degree distance =50 cm
Reader Angle=270 degree distance =100 cm Reader Angle=240 degree distance =100 cm
Reader Angle=300 degree distance =50 cm Reader Angle=240 degree distance =50 cm
Reader Angle=180 degree distance =50 cm Reader Angle=120 degree distance =50 cm
Reader Angle=180 degree distance =100 cm Reader Angle=150 degree distance =100 cm
Reader Angle=150 degree distance =50 cm Reader Angle=210 degree distance =100 cm
Figure 16: Active RFID Reader properties over time
3.2.1.2 Distance and Angular Position
The reading performance under various reader to tag distance and relative angular
position are observed in this study. Figure 21 indicates how the reader power level
42

various in various reader to tad distances and angular positions. There are angular
positions that have lower reader signal strength compared to other angular positions.
For example, the reader signal strength is higher for 150, 20 degrees angular positions
for both 50 c and 100 cm reader to tag distance.
40
45
50
55
60
65
0 50 100 150 200 250 300
An
ten
na
Sig
na
l S
tre
ng
th (
dB
)
Reader to Tag Angular Position
Reader to Tag Distance =50 cm
Reader to Tag Distance =100 cm
Figure 17: Active RFID Reader Properties based on distance and angular position
The stability of the readings over time varying the distance and angular position is
observed in Figure 18 where the standard deviation is measured over the 280 seconds
time period. It shows that the readings are more stable with closer reader to tag
distances.
3.2.2 Mobile Reader and Stable Tags
The effect of user speed in tag detection is studied using a toy train setup where the
train carries the mobile reader to mimic the effect of a mobile user carrying a reader.
43

0
0.1
0.2
0.3
0.4
0.5
0.6
0.7
0 50 100 150 200 250 300 350
Sta
nd
ard
De
via
tio
n
Angular Position (degrees)
Reader to Tag Distance =50 cm
Reader to Tag Distance =100 cm
Figure 18: Active RFID Reader Properties based on distance and angular position(standard deviation of readings to define the stability of readings)
The reader to tag distance remains less than 10 cm in this study. It is observed that
the signal strength increases as the reader speed increases. For example, the signal
strength is increased from 28 to 30.2 when the train speed increases from 9 cm/sec
to 30 cm/sec as can be seen in Figure 19.
3.2.3 Positioning Performance
We have used the 4 x 4 grid spaced setup presented to determine the mobile objects
approximate location information as a positioning system. The inter tag distance is
varied from 20 cm x 20 cm to 50 cm x 50 cm in a laboratory setup. The intent of
this experiment is to figure out a radius in where the user belongs approximately.
But unfortunately, the results had many false positive readings at low power level
44

27.5
28
28.5
29
29.5
30
30.5
9 18 27 36
Sig
nal S
trength
(dB
)
Reader Speed (cm/sec)
Figure 19: Effect of Speed in RFID Read Performance
and increasing the power level includes the various tags in a larger range making it
difficult to determine a small radius of user’s current position.
The reader is able to detect all the tags irrespective of its power level when the
tags are placed within the range of 10 cm. That is why we started the inter tag
spacing starting at 20 cm. The reader starts with its minimum power level to detect
the surrounding reference tags. Ideally, the reader should detect the tags surrounding
the reader at the minimum power level. But the reader receives many false positive
readings. False positive readings refer to the reader’s ability to detect surrounding
tags that are theoretically out of range of the reader. Figure 20 presents the mean
square error along with the actual deviation of reading using a setup where the tags
are placed 20 cm apart from each other. The average reading incorporates error
45

although some individual samples may contain error free reading. The sampling has
been conducted with the same setup but varied with time.
0
5
10
15
20
25
30
35
40
45
1 2 3 4
Samples for 20 cm spaced tags
Err
or
dis
tance (
%)
Root Mean Square Error (%)
Individual Error Distance (%)
Figure 20: Error in Tag Detection for 20 cm Inter Tag Spacing
3.2.4 Guidance Performance
We have studied RFID tag placement for coarse grain guidance information rather
than accurate positioning information. For this particular experiment, the system had
the pre-installed information of the tag placement and a define source to destination
route to guide the mobile user. The mobile user equipped with the RFID reader,
provides the system its status information that contains the current observed tags.
The system has been able to successfully guide the user when the reader is placed at
power level 2: the reader is able to detect all the tags in its vicinity and get proper
guidance. At the minimum power level (power level =1), the reader is not able to
46

detect tags placed far apart and could not gain adequate guidance information shown
in Figure 21. This experiment is a proof of concept study that shows how the system
is able to guide the mobile user if the reader power level is matched to the inter tag
distance in the environment.
30
40
50
60
70
80
90
100
30 60 90
% D
ete
cte
d T
ag
s
Inter Tag Distance (cm)
% Detected Tags (PowerLevel=1)
% Detected Tags (PowerLevel=2)
Figure 21: The effect of inter tag distance on reading accuracy
3.3 Summary
We have studied the RFID technology under various reader to tag relationship. The
passive RFID technology is getting wide spread adoption in many large scale tracking
systems such as supply chain management and airport baggage claim systems. But
this technology has its limitations as the reader performance is heavily influenced by
various environmental conditions. It is interesting to find out that the passive reader
47

provides unstable readings under constant environmental conditions when multiple
samples are taken. The reader performance further decreases as mobility of tagged
items and presence of multiple tags are considered. Thus a middleware solution to
handle RFID generated data must take into account the inherent unreliable nature of
this data. The active RFID technology has a more stable reading performance under
varying environmental factors. It can be used to complement the unreliable passive
RFID behavior in many different scenarios. A search and rescue scenario or an indoor
assistive living center scenario requires stable place holders for exploratory purpose.
Our study using the active RFID technology confirms such possible applications.
48

CHAPTER IV
RF 2ID:RELIABLE FRAMEWORK FOR RADIO
FREQUENCY IDENTIFICATION
The study on the inherent unreliability of passive RFID readers validate the require-
ment of a solution that is able to improve the system performance in terms of reading
accuracy. The solution approach must be scalable that is able to perform in real time
to deal with large amount of RFID generated data. The system requirements can be
further evaluated from analyzing the basic application requirements in the context
of the item tracking applications. The item tracking application refers to the set of
applications that use RFID tags to track the mobile items while the RFID readers
are placed at static locations around the environment. Airport baggage tracking and
tracking of goods in a warehouse are examples of such applications.
A middleware that has inherent support for this flow of data considered as a
path can be very useful for organizing, filtering and thus responding faster to queries.
Using the intuition of data flow, we have designed a path based distributed system
architecture for RFID middleware called RF 2ID (Reliable Framework for Radio Fre-
quency Identification). Our proposed scheme consists of (1) a virtual reader(V R)
abstraction to capture the static and potentially error-prone nature of the physical
readers and antennas in a scalable manner; and (2) a novel path abstraction, called
V Path (Virtual Path) to capture the logical flow of information among the virtual
readers as RFID-tagged objects move throughout the environment. Using a notion
of path at the system level gives us several advantages. First, the system load can
be distributed among multiple virtual readers that constitute a specific virtual path.
Second, different QoS attributes can be defined for a path, such as accuracy and
49

priority levels that the virtual readers use to operate on data flowing through the
corresponding path. Finally, as there is an internal representation of data based on
path attributes, it becomes trivial to support path-related operations on the data,
e.g., searching for query results, or making a future projection of data behavior based
on history.
We present the system architecture, the implementation of the system and its
evaluation in the light of two motivating application scenarios: a warehouse scenario
and an airport scenario. The evaluation considers a testbed that consists of real
RFID readers to serve as a proof-of-concept system solution. The system is further
evaluated using emulation based RFID readers and tags in a large scale distributed
system setup to study the scalability aspects. The related work and summary of the
chapter is presented followed by the system evaluation.
4.1 System Architecture
The inherent unreliable nature of RFID devices requires a system architecture that
is able to improve the system reliability as well as being scalable. Our proposed
solution, RF 2ID consists of a name server, a path server, virtual reader and the
RFID readers [14]. The name server and path server keep system wide information
to improve system performance. Virtual readers (VR) are distributed computational
elements placed in a particular geographic location that are in charge of physical
RFID readers (PR) in that vicinity. Virtual readers communicate to each other using
a logical communication channel called virtual path (Vpath).
The system architecture is shown in Figure 22. The novelty of the system lies in
the notion of logical communication channels among the VRs called Virtual Paths
(Vpaths), creating a scalable and robust solution for RFID middleware. The name
server (NS) and path server (PS) are components that keep systemwide information
to improve the system efficiency. We discuss the overall system in the following
50

Virtual Reader 1
Application
Name Server
Path Server
RFID Readers
Virtual Reader 2
Virtual Reader N -1
Virtual Reader N
Physical Reader Interface
System Interface
Figure 22: System architecture of RF 2ID
subsections briefly.
Figure 23: VR to VR Communication using logical Path
The VRs and Vpaths can be considered as a graph G=(V,E) where V represents
the VRs as nodes and E is the logical connection among VRs as edges of the graph.
Each VR V is responsible for processing E (Data) along edges incident to it - the
51

node value at V is defined in terms of Dataaccuracy. A Vpath P is a sequence of edges
starting from node s and ending at node t defined as P(s,t) where s, t ∈ V and s 6= t.
Every Vpath in the system should provide a QoS value Q in terms of Dataaccuracy, all
the VRs in a path should provide an overall QoS as a group. This can be defined by a
function f(V,Dataaccuracy) ≤ Q where f is the function that represents the operations
on data sets to provide system accuracy.
VR1 VR2 VR3
VR4
VR5 VR8
VR7
VR6
VR9
Destination VR
Destination VR
Source VR
Source VR
Source VR
Path1
Path2
Path3
Figure 24: Graph representation of the System
4.2 Virtual Reader
To achieve reliability in a scalable and distributed manner, we have designed a novel
abstraction called virtual reader (VR). Virtual Paths (Vpaths) are logical channels
across a set of VRs. A Vpath is created dynamically taking into account various VR
specific parameters described in later subsections. Each VR is responsible for a set
of physical readers (PR) within its vicinity. For applications such as a warehouse
wherein the topology does not change very often, the PR to VR mapping takes
place during initialization (described in next subsection). A VR is responsible for
data management, virtual path management, and query management. VRs use local
variables and data structures to make individual local decisions that impact global
52

system behavior. We use the following notations in describing these functions carried
out by a VR:
• Set of VRs named as V R(p,i) corresponding to a Vpath P as V R(p,1), V R(p,2), ..,
V R(p,n)
• Set of PRs named as PR(p,i,j) corresponding to V R(p,i) as PR(p,i,1), PR(p,i,2), ..,
PR(p,i,m)
• A VR maintains five lists and a variable for each path Pi
– observedTagList(p,i) : tag information detected by corresponding PRs
– receivedTagList(p,i) : filtered tag information comparing PR inputs
– expectedTagList(p,i) : information from neighbor V Rp(i−1) along the path
– missingTagList(p,i) : tags expected from V Rp(i−1) but not received by PRs
– spuriousTagList(p,i): tags received but not expected from V Rp(i−1)
– V R(p,i)num: number of participating VRs in path Pi
• A set of control parameters in a VR to make path creation decisions
– connin: maximum number of incoming messages handled per unit time
– connout: maximum number of outgoing messages handled per unit time
– Total Path: Total number of paths associated with a given VR
– Total PR: Total number of VRs in the system
– Total PR: Total number of PRs Associated with a given VR
– Messagein(source): Incoming messages from source
– Messageout(destination): Outgoing messages to destination
– wcpu: Average per path CPU load on a VR (%)
53

– wcurr: Current CPU load on a VR (%)
– west: Estimated load due to a new path P (%)
– wtr: Threshold maximum permissible CPU load on a VR (%)
– V Rtr: Minimum number of VRs needed for a new path P
– V R gCountPathID: Final count of number of VRs in new path
– V R localCountPathID: Local copy of final count in each VR
– α: Per message CPU cost (%)
54

Input: wcpu, ci,i+x, c− i, p, west, ci,i+xest, ci,p−est
Output: Creates a Vpath among VRs
foreach (V R− i for i=1 to total V R) dowcurr =∑total PR
j=1 ((wcurr + α(Messagein(V Ri−1) +Messageout(V Ri+1))) +∑total PR
k=1 (α ∗Messagein(PRj)))
west =
wCPU+α(estimatedMessagein(V Ri−1) + estimatedMessageout(V Ri+1))
if (wcurr + west ≤ wtr) then
Send participatedPathCreation(PathID, VRID) to V Rdest
end
else
Send notparticipatedPathCreation(PathID, VRID) to V Rdest
end
if (VRID==V Rdest) then
V R gCountPathID= Total number of participate messages received
end
if (V R gCountPathID ≥ V Rtr) then
Register (PathID, V R gCountPathID) in Path Server
V R localCountPathID=V R gCountPathID Send pathCreation(PathID,
V R gCountPathID) to V Ri−1
end
else
Throw pathNotCreated exception to the Application
end
else
Receive pathCreation (PathID, V R gCountPathID) from V Ri+1
V R localCountPathID =V R gCountPathID Send pathCreation(PathID,
V R gCountPathID) to V Ri−1
end
end
Algorithm 1: Distributed Load Estimation and Path Creation Algorithm
55

4.2.1 Initialization
In a physical topology of a warehouse, there are separate sets of PRs associated
with different conveyor belts. A VR creates a complete list of PRs within its own
geographic region; including path associations related to each PR. Figure 25 shows
an RFID deployment in a warehouse. The figure shows a 2-dimensional (plan) view
of the physical space where the system is deployed. The physical space is divided
into regions (dashed rectangles) and a VR is assigned to each geographical region.
The tracks show the belts along which items will flow physically from source to
destination. Each VR is initially assigned to a disjoint set of PRs that are in the
geographical region covered by that VR. A set of 6 PRs are assigned initially to VR1
since they are in the geographical coverage area of VR1. However, the set of PRs used
by a VR during system operation is path specific. In Figure 25, VR1 uses the readings
from the top PR group for the path created between Source A and Destination D;
similarly, it uses the readings from the bottom PR group for the path created from
Source B to Destination E.
Vpath
Vpath1
Vpath2
Figure 25: A Warehouse scenario showing RFID deployment
56

4.2.2 Data Management
The data management consists of two major tasks-filtering the data (from the PRs
associated with this VR, and from neighboring VRs), and timestamping the data in
a consistent manner. We assume that V R(p,i) is able to send the data to neighbor-
ing V R(p,i+1) in path P, before the item physically reaches the neighbor. The data
acquisition and processing phase by V R(p,i) is the process of accumulating scan data
from all PRs PR(p,i,1), PR(p,i,2), ..,PR(p,i,m) contained in path P. A corresponding
observedTagList(p,i) is generated for each PR in order to compare them with each
other. The result of these comparisons is a concrete list of tags in receivedTagList(p,i)
that is timestamped with the current system time. In the data comparison phase,
every V R(p,i) (except the source VR), receives a list of expected items from V R(p,i−1)
along path P and stores it in expectedTagList(p,i). The timestamps in expectedTagList(p,i)
and receivedTagList(p,i) are then compared to guarantee a consistent temporal or-
dering amongst these VR-generated lists. The items of expectedTagList(p,i) and
receivedTagList(p,i) are also compared to create a list of items expected but not ac-
quired inmissingTagList(p,i) and received items that are not expected in spuriousTagList(p,i).
4.2.3 Path Management
Path management includes a load estimation and path creation phase and an over-
loaded path management phase. The load estimation and path creation phase works
as follows shown in Algorithm 1. A VR receiving a path creation request first con-
tacts the path server to check if any existing path satisfies the request; otherwise, it
contacts the name server for possible set of VRs that can potentially belong to that
path. Each V R(p,i) in path P estimates its current load wcurr from the number of
existing paths (n) that it is currently serving. The load estimation takes into ac-
count the current CPU load wcpu; incoming and outgoing messages ci,j from V Ri to
V Rj; and messages from the associated PRs. The numbers of incoming and outgoing
57

messages to V R(p,i) are bound, respectively, to connin and connout to restrict the
total number of messages handled by a VR in a given time period. Messages beyond
this bound is likely to overload the system and would lead to random message drops
above this number. Then V R(p,i) estimates the additional load west for the new path
using history data from previous paths. If the combined workload of wcurr and west
does not exceed a predefined threshold wtr then the VR sends a participateNewPath
message; otherwise it sends a notparticipateNewPath message to V R(p,i+1) along the
path until the message reaches the destination V R(p,n). V R(p,n) sends a pathCreation
message containing the number of participating VRs as V R(p,num) to all the member
VRs in the path if and only if this number is not below a predefined system threshold
V Rtr. Otherwise a pathNotCreated exception is sent out to the application. Each
VRpi then updates its local variable V R(p,i)−num with the number of participating
VRs in the path.
The overloaded path management phase works as follows: although each VR
makes an assumption of its future load, at a particular point of time, one or more
member VRs can become overloaded. An overload is detected through comparing
current system load wcurr with the load estimation threshold value wtr. The over-
loaded V R(p,i) will update VRpinum and send messages to member VRs to reduce
their local value V R(p,i)−num . Any V R(p,i) receiving the overloaded message updates
its local variable V R(p,i)−num and checks if the updated value is below V Rtr. The
application is notified about the path overload whenever the number of participating
VRs falls below the threshold V Rtr.
4.2.4 Query Management
Any VR can respond to queries from an application. Vpaths allow a VR to either
answer the query itself or route the query to the VR best able to answer the query.
The set of queries include aggregation operation such as:
58

• Information on all items
• Information on items along a specific path (source to destination)
• Information on items of a specific type or number of items over a period of time
The real power of the path abstraction lies in its ability to handle item location queries
and troubleshooting queries such as:
• Locate a missing item
• Locate an item last recorded by a specific VR or a specific PR in a VR
• Information about a malfunctioning reader (e.g., a reader that is consistently
missing items)
• Information about a specific conveyor belt (e.g., a Vpath that is missing items
below a threshold)
It is well known that the time to respond to a real time query has to be very
precise [25, 26]. The system is well positioned to handle time specific queries since
the readers timestamp the information they gather as well as disseminate. Thus for
example, if a VR receives a query that is in its immediate past, it will forward it to
the appropriate VR that is ahead of it in the Vpath.
4.3 Name Server and Path Server
The name server is responsible for keeping the mapping between the topology of the
warehouse and the VRs assigned to different regions. It knows the physical location
of the PRs in the warehouse as well as the physical routes via conveyor belts that
exist in the warehouse. In a scenario where the deployment is reasonably stable such
as a warehouse, all the information in the name server are defined at initialization.
59

A lookup request to the nameserver for a physical route between a source, desti-
nation pair (Source(x, y), Destination(x, y)), yields the set of VRs V Rsource, V R1,
V R2,..V Rn, V Rdest that are along that route. The path server carries dynamic in-
formation about the paths that exist in the system at any point of time. A path is
registered with the path server upon creation by the destination VRdest, and contains
the path id, participating VRs in that path and a lifetime associated with the path.
The path entry is deleted when the lifetime expires allowing an automated garbage
collection scheme. A new request to use an existing path or a subpath increments
the path’s lifetime
4.4 Implementation
We have implemented a proof of concept prototype of the system architecture. The
prototype allows us to perform controlled experiments to quantify the reliability prop-
erties of the proposed architecture. It embodies all the same distributed computing
elements as described in Section 4.1, albeit in a stripped down form. The main dif-
ference is in the decision making components. The implementation uses a centralized
path controller which works with a static route map instead of the path server and
name server, described in the previous section. This structural difference does not af-
fect our study on system performance or reliability. On the other hand, our prototype
includes physical readers as well as emulated physical readers. This feature of the
implementation allows us to perform controlled experiments far beyond the limited
scale of the real hardware at our disposal using the same distributed architecture. In
the next few subsections, we describe the features of the prototype system.
4.4.1 Virtual Readers
In a real deployment, a VR may be mapped to any PC class machine (or even one
of the PRs in a given region). Our implementation of the VR is in C, and fully
implements the functionalities outlined in Section 4.2. MPI is used for inter-VR
60

communication. In the VR implementation, the path management and creation
mechanisms are considerably simplified to get a prototype system up and running
for experimentation. Using a static route map, each VR knows its neighbors for any
desired source-destination pair. So, upon receiving a path request, a source VR knows
the neighbor to contact to create a path. The path creation request is transmitted
in a chain-like fashion along the static route by the VRs until it reaches the destina-
tion VR. When the message reaches the destination VR, it broadcasts the successful
path creation message to all the VRs. This is clearly inefficient when there is a large
number of VRs in a Vpath. Further, this can be a source of bottleneck if a specific
destination VR is hot. Since the primary purpose of the prototype implementation
is to study reliability, we decided to use this simple minded path creation and man-
agement. However, a full-fledged deployment will use the detailed algorithms (shown
in Algorithm 1) using parameters such as computational and communication load on
each VR.
4.4.2 Physical Readers
The physical reader used in our implementation is ALR-9800 [2] from Alien Tech-
nology. We have done extensive study of this reader with two antennas supporting
point to multipoint and multi static architectures, operating at frequency range of
902.75 MHz to 927.25 MHz, and including 50 hopping channels with channel spac-
ing of 500 KHz. We studied tag behaviors using 6 passive RFID tags with reader
power set to its maximum level (31.5 dB). Alien reader provides a rich set of APIs
to access a variety of reader and tag parameters. Reader discovery methods such
as setDiscoveryListener() and startService() are used for network component discov-
ery within the same subnet. For a large system consisting of thousands of readers,
this auto discovery is very efficient. Various reader methods are used to get and set
different reader parameters and observed tag information such as getReaderType(),
61

getAcquireMode(), getTagList(), setRFAttenuation(), and setRFLevel(). A PR talks
to its associated VR using Unix sockets. The tags are placed by a PR in a queue
abstraction implemented using sockets. Thus the PR-VR communication follows a
producer-consumer model.
4.4.3 Emulated Physical Readers
We have implemented a emulated physical reader that is designed to have the same
interface and behavior as the Alien readers. Thus a VR treats a emulated PR no
different from a true PR. These emulated physical readers offer a powerful and trans-
parent mechanism to study system scalability. Different parameters that affect the
reader accuracy such as reader to tag distance, reader to tag angular position, reader
power level, etc. are defined as input parameters to the emulated PRs. They can be
set to be different for different emulated PRs to study a heterogeneous deployment,
or all the same for a homogeneous deployment. In the experiments conducted that in-
volved varying accuracy levels of readers, we maintained the optimal positions among
reader and tags. For example, we placed the reader to tag distance to be within 5
inches, angular positions as perpendicular from tag to reader, highest reader power
level and limited the number of items in a palette to six, thereby demonstrating op-
timal tag detection properties. Therefore, it differs from other simulators concerned
with tuning device level components such as the work in [28]; instead, our focus is on
efficient and distributed computations on reader generated data in order to support
scalability studies of the system.
4.4.4 Path Controller and Static Path Map
As we mentioned earlier, the path server and name server are non-existent in our
prototype implementation. Instead, the system maintains a static route map (in lieu
of a name server) that contains for each potential source-destination pairs the list
of VRs. Upon a request to create a new path, this static route map is consulted to
62

determine the set of VRs that could be participants for the new Vpath. The VRs
initiate the path creation as we detailed in section 4.2.3. The VRs that are potential
participants may elect to be part of the Vpath or not depending on their current CPU
load and memory utilization. Once a path is created, the centralized path controller
creates an entry in its table with a unique ID for the new Vpath and the set of
participating VRs for that path.
4.5 Evaluation
The system is studied using emulated and real RFID readers. We have considered
two different item tracking application scenarios: a warehouse scenario that tracks
the tagged items in motion where the RFID readers are statically placed in the envi-
ronment. The main objective of this scenario is to track the items of interest in real
time and be able to query about specific items (e.g., missing or misplaced items). The
airport scenario is also considered where it is assumed that every passenger gets an
RFID tagged boarding pass along with a baggage that is tagged with the RFID tag
that has the exact same ID as the passenger to match the baggage with corresponding
passenger. The goal of this system is to make sure that a passenger is matched with
their corresponding baggage for convenience and security of the environment.
4.5.1 Improved System Reliability and Scalability using RF 2ID
The reliability improvement is investigated here where reliability is defined as the
number of detected items in the presence of false negative readings. False negative
readings indicate a reader not being able to detect an existing item. The impact on
increasing accuracy level in a single VR over the system reliability is studied here.
Multiple emulated PRs are attached to a single VR. Figure 26 illustrates that the
presence of more than one physical reader for each VR improves the system accuracy
significantly. For example, when the VR consists of four PRs, with accuracy varying
form 50% to 100%, the aggregated (VR) accuracy level of the system is obtained as
63

97%.
70
75
80
85
90
95
100
0 2 4 6 8Number of Physical Readers
Acc
urac
y at
Sin
gle
VR
(%)
Accuracy range(90-100)
Accuracy range(80-100)
Accuracy range(70-100)
Accuracy range(60-100)
Accuracy range(50-100)
Figure 26: Accuracy as percentage of found items at virtual reader level varyingnumber of readers
Figure 27 demonstrates improved performance when two actual physical RFID
readers are used with varying number of tags. Individual PRs show false negative
readings from 55% to 60% of the time. But using our notion of Vpath false negatives
are reduced significantly. A reading over 120 tags show 52% and 55% false negative
readings in PR1 and PR2 where a Path reduces this to 39%. Due to the limited
number of physical RFID readers and tags, we have used emulated physical readers
to examine reliability as well as scalability in the presence of larger numbers of VRs.
A one to one mapping of PR to VR effectively simulates the unreliability of PRs. In
Figure 26, it is observed that the increasing number of VRs reduces the number false
negatives. For example, 10 VRs with 50% reader accuracy achieves less than 10%
false negatives.
64

0
10
20
30
40
50
60
70
30 60 90 120 150 180 210 240 270 300
Number of tags
Fals
e N
egat
ive
(%)
PR1PR2Path
Figure 27: False Negative Reading of the System using single PR (PR1, PR2) andPath among PRs
0
20
40
60
80
100
0 10 20 30Number of Virtual Reader
Num
ber o
f fal
se n
egat
ve
tags
(%)
Reader Accuracy40% Reader Accuracy 50% Reader Accuracy 60% Reader Accuracy 70% Reader Accuracy 80% Reader Accuracy 90%
Figure 28: False negative readings varying number of VRs
65
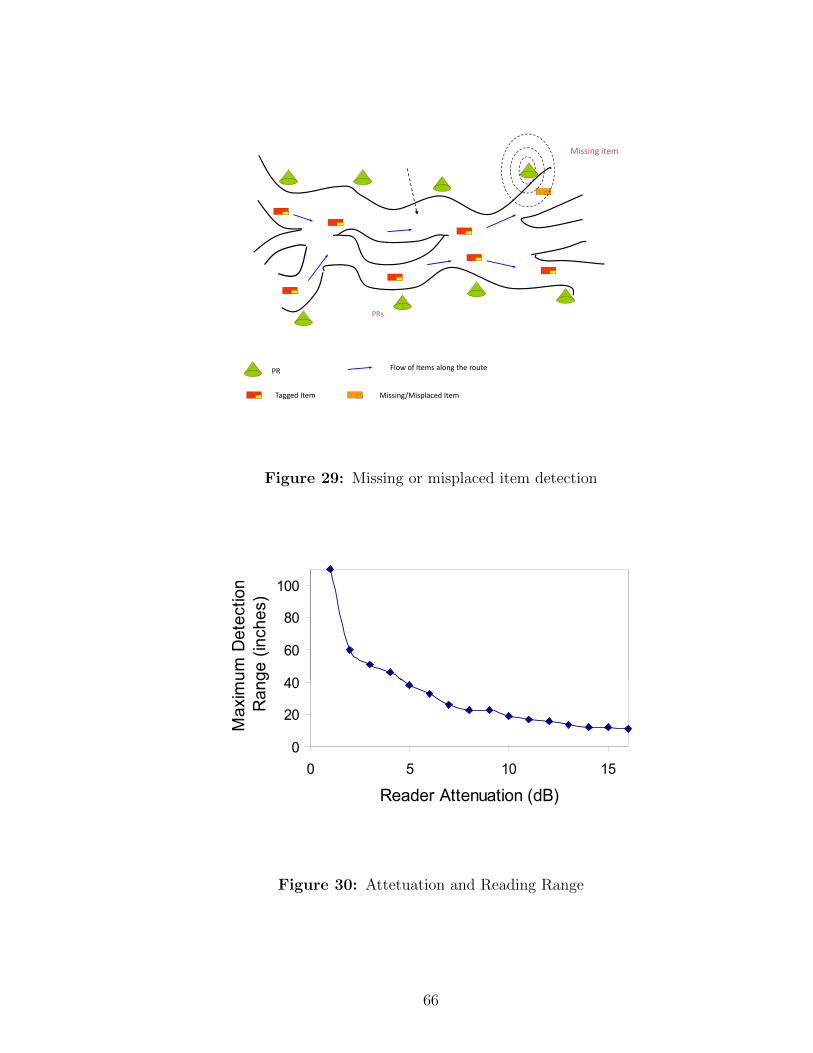
Missing item
PRs
PR
Tagged Item Missing/Misplaced Item
Flow of Items along the route
Figure 29: Missing or misplaced item detection
40
60
80
100
Maximum Detection
Range (inches)
0
20
40
0 5 10 15
Reader Attenuation (dB)
Maximum Detection
Range (inches)
Figure 30: Attetuation and Reading Range
66

4.5.2 Missing and Misplaced Item Location
Our Vpath abstraction plays in important role in item location. We have examined
the maximum tag detection range of readers in perpendicular position gradually de-
creasing antenna attenuation level from 31.5 dB. This study allows us to define a
radius around the reader, of possible tag location as can be seen in Figure 29. Figure
30 shows the relationship between reader attenuation and maximum item detection
range. In an item tracking scenario, a particular item or group of items may be mis-
placed along its physical route (e.g., conveyor belt). After deciding that an item is
lost, the system identifies which PR last observed this item and initiates item location
operations. Antenna attenuation can be used to locate, within a certain radius, the
last physical location of a lost item. To this end, we have placed a tag 28 inches apart
from the reader at an angle of 90 degrees relative to the antenna. Here the item is
detected by the reader at attenuation set to 7dB indicating a 30 inches radius.
The results from the mentioned studies indicate how the system is able to improve
the system reliability in a scalable manner using the built in system redundancy
considered in the system architecture. The key idea is to take into account the data
flow along the Vpaths using redundant VRs and PRs for higher system accuracy in
terms of detected tags (lower false negative readings).
4.5.3 RF 2ID Deployed in a Real Testbed System
The effectiveness of RF 2ID is studied in a real testbed setup for itopretion while the
proposed study uses a testbed of 2 RFID readers and 500 tags. Moreover the motion
of items and various bulk sizes are considered in the current setup. Bulk size refers
to the number of items flowing through the conveyor belt at the same time. Two
different application scenarios are considered for the study - a warehouse setup and
an airport setup.
67

Figure 31: Laboratory Testbed
4.5.3.1 Laboratory Setup
Two EPC Class 1 Gen 2 compliant RFID readers from Alien technology have been
used with eight 915 MHZ linear antenna attached to it. Gen 2 (2 x 2) tags from
Alien technology are used for the experimentations. Toy trains with railroad tracks
are used to take into account tag motion in the experiments. The toy trains carries
the RFID tags while the RFID readers observe the tags from their static locations.
Figure 31 shows four RFID readers in our laboratory setup where the train cars are
carrying RFID tags.
We have adjusted the antennas so that moving train cars carrying the tags are
positioned perpendicular with respect to the antenna. It has been studied how false
negative reading tends to increase with speed of the tagged items. We have set the
train speed to 18 cm/second for the rest of the experiments based on this study as
the tags are read most consistently by all the antennas. Every antenna is considered
as separate PRs in the system that communicates to different VRs. The antenna to
68

tag distance has been chosen such that multiple tags can be detected effectively by
the readers. The antenna orientation also plays a role in tag detection. It has been
observed that tags are best detected within the range of 50 cm and when the tags
are placed perpendicular with respect to the antenna. The term bulk size is used
to indicate the number of items moving through the system at a time. The system
parameters considered for the experiment are presented in Table 1.
Table 1: System ParametersDescription System ParametersNumber of VRs Varies from 1 to 8Number of PRs Varies from 1 to 8PR/VR 1PR Type ALR 9800 model RFID readerPR Attenuation 0 dBTotal Number of Tags 500Bulk size Varies from 1 to 98 dBTag to Antenna Distance Within 50 cmTag to Antenna Orientation 90 degrees perpendicularTag Speed 18 cm/sec
4.5.3.2 Environmental Factors in Real Testbed
The mobility and bulk size are the two factors that affect the readings in a real
RFID system deployment. A careful study has been done that aims to figure out
an optimal setup in which the RFID readers are able to read items consistently and
accurately. The environmental factors ask for a solution that is able to show improved
performance taking into account the physical limitations of PRs.
Object Tracking with Various Tag Speed: The speed of the tagged items plays
a vital role in the PR level accuracy. Figure 32 indicates how the system accuracy
is affected by the speed of tagged items. In this particular study twenty RFID tags
have been attached to the train cars and the train speed is varied among four different
speed levels. It is observed in out study that objects are tracked with higher accuracy
when the objects are moving in a slower speed and the number of detected items
69

decreases with increased speed level. For example, 62% items are detected when the
tags travel at 9cm/sec which decreases to 41% when the speed level is increased to
36cm/sec.
35
40
45
50
55
60
65
70
75
9 14 19 24 29 34
Data Speed (cm/sec)
%P
roc
es
se
d I
tem
s
Setup
Type of PR= ALR 9800 model PR
Total Item =7
Figure 32: Impact of detected items with various data speed
Object Tracking with Various Bulk Size: The bulk size impacts the reader ac-
curacy level as we have studied in section two and it worsens when the items are in
motion. Figure 33 shows how the number of detected items decreases when the bulk
size is increased. The study considers 8 PRs each attached to a single VR and varies
the number of tags in motion. The system is able to detect all the tagged items until
the bulk size remains smaller than 60. When the bulk size is further increased, the
accuracy level starts to drop as we can see it reaches 65% for a bulk size 97.
The decreased system performance in terms of detected items validate the need
for a solution that is able to provide improved performance taking into account the
physical limitations of physical RFID devices (PRs).
70

60
70
80
90
100
5 25 45 65 85
Bulk Size
% D
ete
cte
d I
tem
..
Figure 33: Percentage of detected items with varying bulk size
4.5.3.3 Experiments for a Warehouse Scenario
The warehouse like scenario is considered for tracking multiple items where number
of items passes through the RFID readers on a conveyor belt. This section illustrates
how the redundancy in RF 2ID system helps to achieve higher accuracy level in the
system.
Evaluation Setup: The testbed experiments vary from the previously mentioned
experiments as real RFID readers and tags are used and the tagged items are in
motion as opposed to statically placed items. Studies have been conducted varying
the speed of tagged items and number of items.
A logical view of the warehouse setup is shown in Figure 34. Here the train
cars carry various numbers of tags along a route guarded by eight different RFID
reader antennas (PRs). Every PR is attached to a single VR in this setup. The
train cars attached with RFID tags in motion resemble the warehouse conveyor belts
carrying tagged items. We have conducted some basic experiments to figure out the
71

StartingPoint
EndingPoint
Train car Carrying RFID Tags
(2m x 2m) loop
(2m x 2m)loop
2m distance
RFID Tag
Item Route
RFID Antenna
Figure 34: Experimental Layout to mimic a Warehouse
Table 2: Comparison of a Real Supply Chain Deployment with ExperimentalTestbed
Parameters Real Supply Chain ExperimentalDeployment Testbed
Area 22 meter x12 meter 2 meter x 2 meterRead Points 9 8PR/Read Point order of 10 1Number of tags order of thousands 500Conveyor Speed ≥ 18 meter/min 15meter/min
parameters further affecting the reader accuracy while the objects are in motion and
then conducted evaluation to study the reliability as well as scalability of the system.
Testbed Compared to a Real Warehouse: Table 2 compares the experimental
testbed to an actual warehouse deployment. The magnitude of the experimental
setup is much smaller compared to a real deployment and we have limited resources
for the experiments.
Evaluation Results: Finally we have studied the impact of increasing number
of VRs to improve the system accuracy in a real deployment as shown in Figure 35.
72

We have used 8 VRs each attached to a single PR, used two different bulk sizes of
25 and 50 to conduct this study. The study shows improvement in item detection,
for example 22% items are detected with a single VR where 100% items are detected
when 8 VRs are used. The improvement raises sharp when the 7th and 8th VR are
introduced. The PRs attached to these two VRs outperforms others in terms of item
detection.
0
20
40
60
80
100
1 3 5 7
Number of VRs
% D
ete
cte
d Ite
ms...
% Detected Items (Bulk size =25)
% Detected Items (Bulk size =50)
PR Type =ALR 9800
PR/VR =1
Figure 35: Increased System accuracy with increasing number of VRs
The evaluation result confirms improved system performance in tracking multiple
items under various bulk sizes. There is a requirement to study the system to figure
out its tracking capability for missing, misplaced and high priority items. The study
conducted in the theme of an airport scenario considers such cases.
4.5.3.4 Experiments for an Airport Scenario
In this section we evaluate the item tracking capability of RF2ID in an airport sce-
nario. Tracking of multiple items, high priority items and individual item of interest
73

Table 3: Comparison of a Real Airport Deployment with Experimental TestbedParameters Real Airport TestbedConveyor Length 18 Km 2 meter x 2 meterNumber of Baggage 1500/flight, daily 5 flights 500Tag Type Gen2 RFID Tag Gen2 RFID Tag
(missing, misplaced items) are considered for this study.
Evaluation Setup: Figure 36 shows the logical setup for the testbed to mimic an
airport scenario. In this scenario, two separate routes are used - one for the baggage
and the other for the passenger wishing to board a particular aircraft. Every person
is given a unique RFID tag on his or her boarding pass and one on the baggage the
person is carrying. The system matches the arrival of matching tags before either the
person or the baggage enters the aircraft.
We have established a testbed that consists of criss-crossing toy train tracks to
simulate a mock-up of baggage belts and passenger movement in an airport. One train
track represents the path used for moving baggage and a second train track represents
the path taken by passengers as they wander through the airport. The baggage
themselves are emulated by moving train cars carrying RFID tags corresponding to
the ones that will be on the baggage. Similarly, the passengers are emulated by train
cars carrying tags corresponding to them. We have a total of 8 antennas so we can
devote 4 antennas for each of the tracks (baggage and passengers). In other words,
with our experimental testbed we can have at most 4 matched pairs of VRs.
Testbed Compared to a Real Airport: Our testbed is compared against an RFID
enabled airport to illustrate the scaling factors of the systems. Heathrow airport has
deployed RFID technology in terminal 5 recently [50],[33],[32]. The actual numbers
of RFID reader and read points are not available but from the length of the conveyor
belt, it is evident that the number of items, PRs and VRs will be much larger than
our experimental testbed.
74
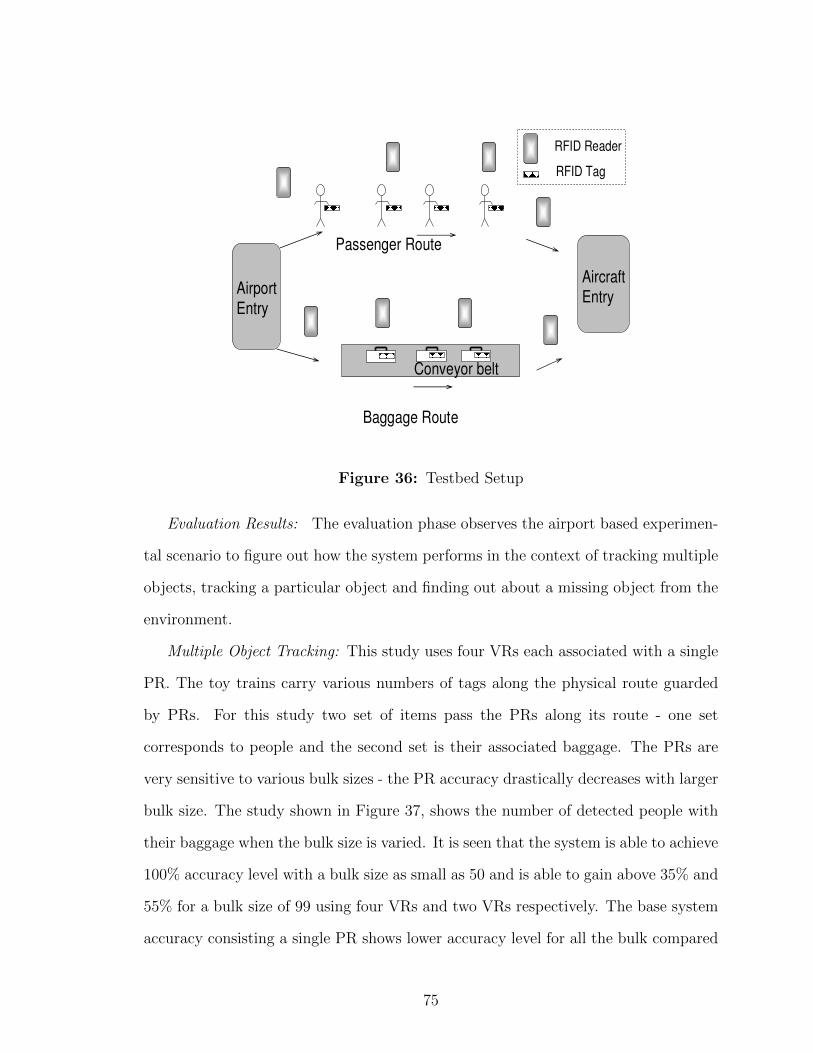
Airport
Entry
Baggage Route
Passenger Route
AircraftEntry
RFID Reader
RFID Tag
Conveyor belt
Figure 36: Testbed Setup
Evaluation Results: The evaluation phase observes the airport based experimen-
tal scenario to figure out how the system performs in the context of tracking multiple
objects, tracking a particular object and finding out about a missing object from the
environment.
Multiple Object Tracking: This study uses four VRs each associated with a single
PR. The toy trains carry various numbers of tags along the physical route guarded
by PRs. For this study two set of items pass the PRs along its route - one set
corresponds to people and the second set is their associated baggage. The PRs are
very sensitive to various bulk sizes - the PR accuracy drastically decreases with larger
bulk size. The study shown in Figure 37, shows the number of detected people with
their baggage when the bulk size is varied. It is seen that the system is able to achieve
100% accuracy level with a bulk size as small as 50 and is able to gain above 35% and
55% for a bulk size of 99 using four VRs and two VRs respectively. The base system
accuracy consisting a single PR shows lower accuracy level for all the bulk compared
75

to RF2ID using multiple VRs.
0
10
20
30
40
50
60
70
80
90
100
5 25 45 65 85
Bulk Size
Pro
ce
ss
ed
Pa
ss
en
ge
r_B
ag
ga
ge
Pa
ir (
%)
Number of VR=4
Number of VR=2
Base Accuracy (1 PR)
Figure 37: Effect of Variable Bulk Size on Detected Baggage corresponding to People
Tracking Missing Item: The system is able to track missing item when it is track-
ing multiple items. The study tries to match the baggage with its owner (people)
here. A baggage which does not have a corresponding person is a possible threat to
the environment. This experiment allows set of baggage to flow through the physical
route without any changes while some of the items are removed from the set of per-
son. This study uses four VRs, each using one PR attached to it shown in Figure 38.
The number of mission person is varied to one and five to figure out how the system
performs while objects are removed from the system. The system is efficiently able
to detect 100% mismatch for a bulk size lower than 55 but decreases in its ability to
detect all missing item with larger bulk size.
Tracking High Priority Items: Application level information concerning the prior-
ity of different objects can be used to detect high priority items using a priority aware
method. In an airport scenario, particular baggage of interest can be assumed to have
76

0
10
20
30
40
50
60
70
80
90
100
5 15 25 35 45 55 65 75 85
Bulk size
De
tecte
d M
issin
g P
eo
ple
(%
)Missing Person=5
Missing Person=1
Figure 38: Detected missing people with various bulk size
higher priority over others. When individual VRs have limited processing capability,
there is a need to select high priority objects over lower priority ones. Figure 39
shows the number of tracked objects using a priority aware and non-priority aware
policy using different bulk sizes using the experimental testbed. The priority aware
methods are able to track 100% high priority items using 4 VRs where the scheme
which is not priority aware tracks 50% and 81% of high priority items using bulk size
of 25 and 50, respectively.
4.6 Related Work
The various aspects of related work are discussed here. We consider different middle-
ware systems aimed at RFID based data for item tracking applications. There are
also other works that have similarities to ours considering the path based flow of data
through the system. The two subcategories are discussed in detail.
77

0
10
20
30
40
50
60
70
80
90
100
1 2 3 4 5 6 7 8
Number of VRs
Tra
ck
ed
hig
h p
rio
rity
ite
ms
(%
) ..
No_priority_scheme, bulk size 50
No_priority_scheme, bulk size 25
priority_aware_scheme, bulk size 50
priority_aware_scheme, bulk size 25
Figure 39: : Number of VRs vs Tracking of High Priority Objects
4.6.1 RFID Based Systems
It is important to compare other middleware that have been proposed for RFID based
systems. The Savant architecture proposed by the MIT Auto-ID Center involves a
hierarchy of software components called Savants [91]. The RFID middleware design
of RFIDStack [46] focuses on reducing data flooding with built-in aggregation and
filter types. The architecture of High Fan-in Systems [47] utilizes a tree structure
with large numbers of sensors at the edges. De et al. [41] propose a system for object
tracking that builds on the Savant architecture. Similarly, MAX [111] uses a tree-like
structure for object location. WinRFID [81] uses a hierarchical tree-like architecture
that uses web services for deployment of information. SCOUT [69] uses two different
approaches depending on the application to ensure scalability of object tracking for
mobile devices. None of these systems exploit the data flow that is inherent in the
movement of items typical of RFID deployments. Jiang [107] defines a Virtual Route
Tracking algorithm to form a virtual route among readers that are in close proximity
78

to one another. The idea of virtual route is similar in spirit to Vpath of RF2ID, with
the exception that Vpath spans geographically distributed elements.
4.6.2 Path Abstraction
The concept of path is used in many different contexts including fault tolerance
[37], compiler optimization [19], profiling distributed systems [24], [53], and resource
allocation [108], [85]. Our proposed architecture is inspired by the use of paths in
these various contexts.
4.7 Summary
We have presented the design and implementation of RF 2ID, a reliable middleware
framework for RFID deployment. We have discussed two novel abstractions that
RF 2ID uses; virtual reader and virtual path, and we have presented experimental
results to validate the usefulness of these abstractions. We have shown that a path-
based architecture improves system accuracy and enables the support of queries over
partially located items, i.e., items whose tags are lost at some intermediate location
along the physical route from source to destination. We consider two specific appli-
cation scenarios for item tracking applications: a warehouse scenario where tagged
items flow through a conveyor belt and an airport scenario where tagged boarding
pass holders are matched with their tagged baggage. We have evaluated the system
using real RFID readers as well as emulation based scalability framework.
79
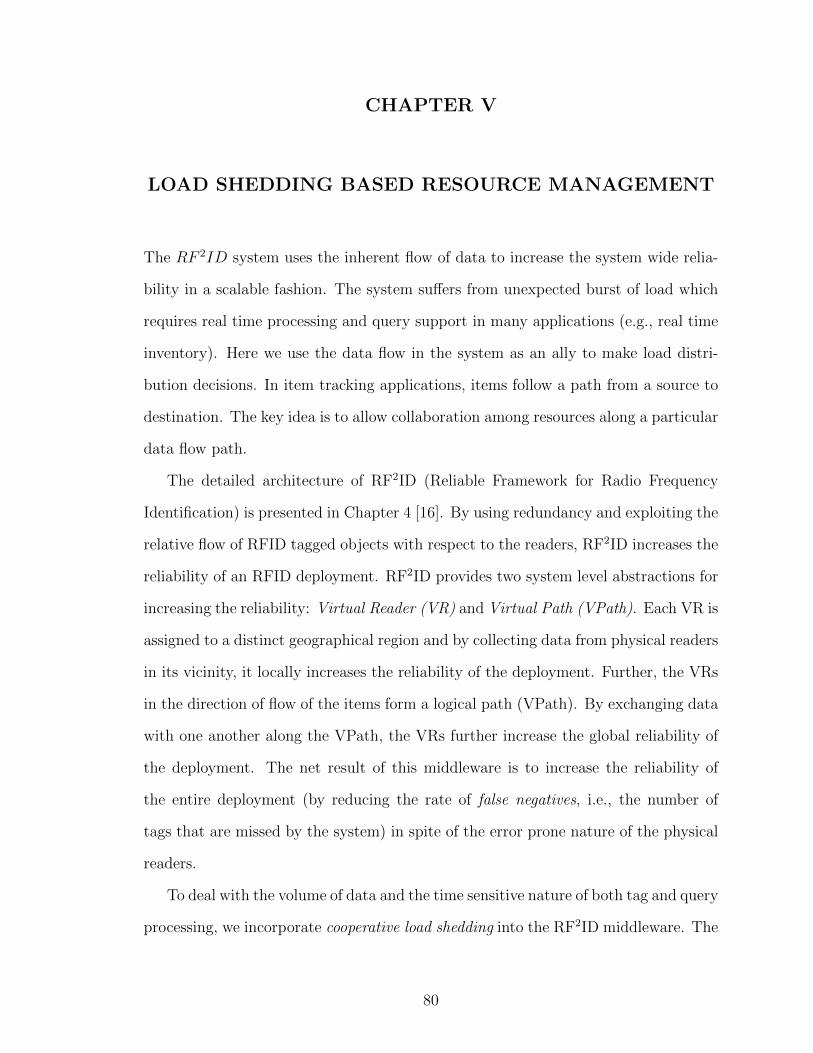
CHAPTER V
LOAD SHEDDING BASED RESOURCE MANAGEMENT
The RF 2ID system uses the inherent flow of data to increase the system wide relia-
bility in a scalable fashion. The system suffers from unexpected burst of load which
requires real time processing and query support in many applications (e.g., real time
inventory). Here we use the data flow in the system as an ally to make load distri-
bution decisions. In item tracking applications, items follow a path from a source to
destination. The key idea is to allow collaboration among resources along a particular
data flow path.
The detailed architecture of RF2ID (Reliable Framework for Radio Frequency
Identification) is presented in Chapter 4 [16]. By using redundancy and exploiting the
relative flow of RFID tagged objects with respect to the readers, RF2ID increases the
reliability of an RFID deployment. RF2ID provides two system level abstractions for
increasing the reliability: Virtual Reader (VR) and Virtual Path (VPath). Each VR is
assigned to a distinct geographical region and by collecting data from physical readers
in its vicinity, it locally increases the reliability of the deployment. Further, the VRs
in the direction of flow of the items form a logical path (VPath). By exchanging data
with one another along the VPath, the VRs further increase the global reliability of
the deployment. The net result of this middleware is to increase the reliability of
the entire deployment (by reducing the rate of false negatives, i.e., the number of
tags that are missed by the system) in spite of the error prone nature of the physical
readers.
To deal with the volume of data and the time sensitive nature of both tag and query
processing, we incorporate cooperative load shedding into the RF2ID middleware. The
80

key insight is once again to leverage the notion of path for dynamic load distribution
among the VRs under heavy load. The inherent redundancy in the system allows
the system to do effective load shedding with desirable performance in the context
of item tracking applications. Two different load shedding approaches are proposed
in this paper: space based load shedding mechanism and time based load shedding
mechanism. In the space based approach, each VR dynamically decides to read a
subset of the tags on the path that it is participating, based on their physical ordering
in space. In time based load shedding, each VR dynamically decides to read tags for
a chosen time interval. We show by experimentation that our load shedding schemes
achieve the desired performance results without significantly sacrificing reliability.
The evaluation testbed considers real world constraints such as tag mobility, pres-
ence of multiple RFID readers and multiple paths using real PRs as well as emulated
PRs for item tracking applications. The workload is different for various application
scenarios. For example, in an airport baggage claim scenario, there is asynchronous
arrival of large batches of tagged items, that is, the arrival of items can be bursty.
On the other hand, in supply chain systems items can arrive any time from different
sources, and the flow of items into the system is more consistent. The application
requirements also play a major role in the selection of a suitable load management
strategy. The time based strategy achieves improved performance for synchronous
data arrival, while minimizing the power consumption, as it allows readers to operate
in dormant mode in different time intervals. The space based method is the simplest
strategy that sheds load and achieves improved performance taking into account the
built in redundancy in our system.
The motivation for resource management is presented first, then we discuss the
notations to clarify the resource management problem, followed by the load shedding
techniques and the evaluation of the resource aware RF 2ID system. The related
work and summary of the resource aware system is presented afterwards.
81

5.1 Motivation
RF2ID[16] focused on the error prone nature of RFID readers and how using middle-
ware techniques we can increase the reliability of an RFID deployment. For example,
using physical readers with 60% read accuracy, and 10 virtual readers (each associ-
ated with a single PR) the system achieved 100% accuracy. The experimental set up
for this result uses emulated PRs that process 100,000 tags using variable tag arrival
rate.
The volume of data produced in typical RFID deployments have been increasing by
leaps and bounds. This is going to have a significant effect on both the tag processing
and query processing times in any RFID deployment. An example presented in [98]
considers 10,000 items in a warehouse using 96-bit RFID tags where the system
takes inventory every 2 minutes. Roughly 1000 items are added and 1000 items are
removed from the warehouse every day. The approximate amount of data generated
every two minutes is 117 kilobytes which is almost 3.5 megabytes of data every hour
and 85 megabytes of data per day. A more ambitious example presented in [64]
considers a larger dataset of 1 billion items generating 720 Gbytes of data per day. A
study mentioned in [55] estimates the current inventory database of Wal-Mart at 460
Terabytes. The database grows roughly at a rate of half a Gigabyte being populated
by reading 1 million items from nine disjoint access points with each item represented
by a 65-byte record daily. Although the amount of data can be reduced by different
filtering mechanisms, the system should be able to capture this amount of data in
the first place for further processing. If the arrival rate of items is fixed and uniform
then it is fairly straightforward to provision the storage and processing resources for
data capture. However, the challenge is in the bursty and often unpredictable nature
of item arrival in many RFID deployments [90]. This could lead to overloading the
infrastructure and potential loss of data and contributing to the unreliability of RFID
deployments.
82

To illustrate this problem, we have conducted some simple experiments using
the RF2ID middleware. Each VR is a dual core Pentium-4 Xeon processor, which
represents one node of a 56-node Linux cluster. The experiment studies the CPU load
experienced by a VR as a function of the tag arrival rate. The CPU load indicates
the load in a single VR. Figure 40 shows the impact on a VRs CPU load as the
tag arrival rate is increased. As can be seen, the CPU load is close to 100% when
the tag arrival rate is 50000 data per minute (y-axis of left hand side). Figure 40
also shows decrease in the accuracy in item detection as a result of increased tag
arrival rate. The study on system accuracy uses 9 VRs, each attached to 5 PRs. It
shows that we are able to achieve 100% accuracy for tag reading with a tag arrival
rate of up to 20000 tags/minute (y-axis of right hand side). However, as we increase
the tag arrival rate the accuracy of the system starts deteriorating. It can be seen
that the system accuracy drops to 50% when the tag arrival rate is around 35000
tags/min. Basically, the VRs are overloaded and cannot cope with the arrival rate
for tag processing. The interesting point to note is that due to the built-in redundancy
of the RF2ID middleware, the VRs may be spending time processing the same set
of tags. We have observed the overlap in the set of tags read by distinct VRs to be
between 40% and 80% in this experimental set up. Clearly, the VR CPU bandwidth
used in processing this overlapping set of tags represents wasted resources. If we
could harness this wasted CPU bandwidth for processing disjoint sets of tags then
obviously we could achieve higher accuracy even at higher tag arrival rates. This is
the intuition behind the cooperative load shedding approach presented in this work.
We present some notations and terminologies to define the problem and our proposed
solution strategy to solve the problem. It should be noted that each of the term is
defined in consideration of operation within a time window twindow.
83

65
75
85
95
3
23
43
63
83
5000 15000 25000 35000 45000
Accu
racy (
%).
CP
U U
sa
ge
(%
).
Data Rate (Items/min)
CPU usage
% Accuracy
Figure 40: CPU usage and data accuracy with respect to variable tag arrival
5.2 Notation and Terminologies
• VRs and PRs: The RF2ID system comprises of multiple VRs denoted as
{V R1,V R2, .... , V Rn}. Each V Ri is associated with number of PRs as
{PR1,PR2, .... , PRm}. Each PR has a physical accuracy level that is an aver-
age detection level of items considering various environmental factors (presence
of metal, liquid, multiple tags, high data speed ect.) that impact the reader
accuracy.
• Data Items: The set of data items D in the system is defined as {D1, D2, ...., Dl}.
Each data item Di ∈ D is represented by a unique id and timestamp Di(ID,
time). We present the data item as Di in the rest of the paper for simplicity.
The data items are directed to various paths in the system and the total data
84

along a path is defined as D(path,ptotal) where path is the pathID and ptotal is
the total number of items intended along that path. For a total of p paths in
the system, the total amount of data in the system Dtotal is defined as:
Dtotal =∑i=0
pD(p,ptotal) (1)
• System Performance: The system performance is measured by the system ac-
curacy level Asys which can be in the range of [0,1] and is defined as a fraction
of correctly processed items Dproc and total items Dtotal:
Asys =Dproc
Dtotal
(2)
The overall system accuracy level depends on the VR accuracy level which is
determined by the accuracy level of PRs.
• PR Level Accuracy: The PR accuracy level A(PR,i) is defined as the proportion of
items correctly detected by PRi (DPR,i) and the total data for path p (D(p,ptotal)):
A(PR,i) =D(PR,i)
D(p,ptotal)
(3)
• VR Level Accuracy: The VR level accuracy A(V R,j) is determined by m PRs
attached to a particular VR and a VR’s ability to process the data. The accu-
racy level is defined as a proportion of processed data of V Rj (D(V R,j)) and the
total data along path p (D(p,ptotal)):
A(V R,j) =D(V R,j)
Dtotal
=(⋃m
j=0DPR,j)
D(p,ptotal)
(4)
• Path Level Accuracy: The path level accuracy A(Path,k) for a pathk is determined
by n VRs that participate in a path. The accuracy (A(p,k)) level is defined as
a proportion of processed data along a path p (D(p,k)) and the total data along
path p (D(p,ptotal)) given as:
A(p,k) =D(p,k)
D(p,ptotal)
=(⋃n
k=0DV R,k)
D(p,ptotal)
(5)
85

• System Level Accuracy: The system level accuracy Asys for p paths is deter-
mined by the following equation:
Asys =D(sys)
Dtotal
=(⋃p
l=0Dpath,l)
Dtotal
(6)
• Problem Definition: The goal is to achieve desirable accuracy level defined as
threshold accuracy (A(th)) even when the system is under heavy load. This can
be defined as:
Asys ≥ Ath (7)
• Solution Strategy: As the items follow a particular route, it is likely that if a
particular VR gets overloaded, the successive VRs along the path will become
overloaded eventually. The basic idea is to let each VR process a subset of total
data (D(proc)⊂ D(total)) along a path. Each V Ri makes decision on shedding a
certain amount of load (D(shed))where
Dproc +Dshed = Dtotal (8)
5.2.1 Acceptable Values for AV R and APR
Given a threshold value for the overall system performance Ath and accuracy of indi-
vidual VRs (AV R) for n VRs in the system, the minimum acceptable value of AV R can
be computed. If we assume that each of the n VRs have the same accuracy level, the
system accuracy level can be generated in the following way which must be greater
than or equal to the threshold value defined by the application.
Ath ≤ 1− (1− AV R)n (9)
Thus the desired level of VR accuracy after shedding load must be within the
given range
AV R ≥ 1− (1− Ath)1/n (10)
86

Similarly, as a single VR value is comprised of the accuracy level of m PRs (APR)
attached to it, the VR level accuracy (AV R) can be determined as:
AV R = 1− (1− APR)m (11)
Thus individual VR accuracy can be improved by using appropriate number of PRs
with operational accuracy level. To preserve the accuracy level after load shedding,
the system must ensure proper distribution of the overall data within a window of
time. The proper methods to choose the amount of load to shed are determined by
the load shedding strategies discussed in the next section.
5.3 Load Shedding Strategies
Operationally, the load shedding strategy can be split into two phases. The first
phase, namely, load monitoring and overload detection is common to all the load
shedding strategies.
5.3.1 Load Monitoring and Overload Detection Phase
The computational load on an individual VR has two components:
• A communication component that comprises receiving messages from the PRs
physically associated with it and for sending/receiving messages to/from the
peer VRs logically associated by the paths with this VR.
• A computation component that comprises a complex mixture of processing time
for reading and classifying tags from PRs into the physical routes and logical
paths associated with this VR; processing time for filtering the tags (elimina-
tion of false positives, etc.) based on the messages received from peer VRs;
executing admission control algorithm in response to path creation requests;
and processing queries for inventory control.
87

Each VR has to ensure that the cumulative load does not exceed its computational
capacity (ComputationalCapacity(C)). We express the above computational load on
a VR in terms of its physical and logical connectivity. Let each VR be connected to
m PRs and p paths. Let PRi be the computational load due to an individual physical
connection i; let Pathj be the computational load due to an individual path j. The
instantaneous load Instantaneousload(L) on a VR is expressed as:
L =m∑i=1
PRi +
p∑j=1
Pathj (12)
The system as a whole is not overloaded so long as the following equation holds for
all VRs:
L ≤ C (13)
Since items flow along paths, if one VR is overloaded then it is likely that other VRs
on the same path are overloaded as well. Fortunately, the path abstraction gives a
common basis for each VR to make a local determination on the load for taking load
shedding decisions. To ensure that there is some performance cushion for dealing
with overloads and for avoiding sudden drop in the quality of service, we preset an
upper limit for the instantenous load on a VR as L(t) (Lt < C). Each VR monitors
its instantenous load (L) and when it exceeds the preset threshold Lt, it enters a load
shedding phase.
5.3.2 Load Shedding Strategies
Two load shedding approaches - space based load shedding and time based load shed-
ding mechanisms are discussed here.
5.3.2.1 Space Based Approach
In this approach, each VR decides to read a subset of the tags flowing through a given
path in a given time quantum T(window). Each VR has a finite per path queue of size Q
for processing incoming tags. Each VR knows a priori the number of VRs (V R(num))
88

Time
VR 11 2 .. .. .. Q 1 2 .. .. .. Q 1 2 .. .. .. Q
VR 2 VR nQueue in VRs
1 2 ..Data flow Assumption: D >> Q
.. .. .. .. .. .. .. D
Figure 41: Space Based Load Shedding
on a particular path. Let MAX(tags) be the expected maximum number of tags per
time quantum flowing through the path. This quantity can be readily computed
knowing the item arrival rate into the system. A particular V Ri reads a number of
items Dread in a time window which is defined by the queue length as follows:
Dread = Q =MAXtag
V Rnum
(14)
In an ideal situation (i.e., assuming PRs with 100% accuracy), it is sufficient if each
VR reads MAXtags / V Rnum disjoint set of tags to ensure 100% accuracy of the
deployment. However, there is the complication that the PRs do not have 100%
accuracy. The term delta is used in the evaluation of space based load shedding where
∆ is a sensitivity parameter for keeping the error rate within acceptable bounds.The
performance impact of ∆ is studied in the evaluation section. The evaluation study
considering the sensitivity parameter is given by:
Dread = Q =MAXtag
V Rnum
+ ∆ (15)
We propose two variations of space based load shedding which differ in the method
of choosing the amount of data to read and process (Dread) based on its queue length
Q.
• The random space based load shedding strategy provides read-autonomy to in-
dividual VRs, each VR reads a random subset of items bounded by queue size
Q.
89

Time
Read time
Tread
Read
time Tread
Interval
time
Tinterval
Interval
time Tinterval
VR i+1VR i
Cycle time Tcycle
Time
Figure 42: Time Based Load Shedding
• The cooperative space based load shedding strategy allows individual VRs in a
path to cooperatively select a disjoint portion of the RFID data stream bounded
by the queue size Q. The disjoint set is determined by choosing a data set in the
same sequence as the sequence of VRs along the path in a particular window of
operation. Ideally, each VR would read separate sets of tags. However, RFID
readers use their internal protocol to reduce collision [86], [104] and reads tags
in the reading range in a random order.
5.3.2.2 Time Based Approach
This approach can be considered as the time analog to the space-based approach.
First, we introduce some terminologies:
• Cycle Time (T(cycle)) is the time a particular item takes to traverse from source
to destination along a particular physical route.
• Read Time (T(read)) is the time a VR accepts data read by PRs, where, Tread �
Tcycle.
• Interval Time (T(interval)) is the time interval between the read times of two
90

consecutive VRs, where, Tinterval � Tcycle.
If we consider the conveyor belt speed as S m/sec, width of W and number of items
in a palette as N items, then we can define the data rate (r) as:
r =(S ×N)
W(items/sec) (16)
Each VR reads (Dread) items within a predefined read time:
Dread = r × Tread (17)
We use tao⊂ Tinterval that serves as the sensitivity parameter to increase the reliability
of the deployment. Thus the read time is defined as:
Dread = r(Tread + τ) (18)
Note that neither of the load shedding strategies require any additional intelligence
in the PRs. The choice of a specific strategy depends on the application requirement.
In the next section, we evaluate these strategies.
5.4 Evaluation
This section discusses the implementation, experimental setup used for the experi-
ments and finally, the performance results using the proposed load shedding strategies.
The performance results subsection evaluates the system in various phases which looks
at performance bottlenecks under heavy load of the basic PRs, the baseline system
which uses RF2ID but no load management scheme and finally presents the system
performance using the load shedding techniques.
5.4.1 Implementation of the Load Shedding Strategies
As we mentioned earlier in section 4.4, RF2ID is currently implemented in Java us-
ing sockets for inter-VR communication. The implementation supports both physical
91

RFID readers (Alien 9800 model) as well as emulated physical readers that are indis-
tinguishable so far as the VRs are concerned. The emulated physical readers are a
faithful reproduction of the Alien 9800 readers, and allow controlled experiments to
be carried out varying different sensitivity parameters of the physical readers. Each
VR executes on a 3 GHz dual core Intel Xeon processor with 1 GB RAM, 512 KB L2
cache and 1 MB L3 cache. The processors are interconnected by Gigabit Ethernet
and form part of a 56-node cluster.
We have extended the implementation of the base RF2ID system to include the
load shedding strategies discussed in the previous section. At system initialization
time any particular load shedding strategy may be chosen providing the system with
the parameters specific to that strategy (for e.g., queue size for space-based approach;
read and interval times for time-based approach).
5.4.2 Experimental Setup for the Study
The purpose of the experimental study is to understand the effectiveness of the load
shedding strategies under heavy load to increase the reliability of an RFID deploy-
ment without data loss. In our lab, we have constructed a mock up of a supply chain
using toy trains (the trains move carrying the tags on stationary tracks instead of
stationary tagged items moving on a conveyor belt) illustrated in Figure 43. The var-
ious parameters considered for the experimental testbed is presented as a comparison
toward an actual testbed in Table 4.
Table 4: Comparison of a Real Supply Chain Deployment with ExperimentalTestbed
Parameters Real Supply Chain ExperimentalDeployment Testbed
Area 22 meter x12 meter 2 meter x 2 meterRead Points 9 8PR/Read Point order of 10 1Number of tags order of thousands 500Conveyor Speed ≥ 18 meter/min 15meter/min
92

The laboratory setup is considered as a scaled down version of a typical distri-
bution center as presented in [56, 55]. We have used this testbed for validating the
emulated physical readers used in the RF2ID middleware.
Figure 43: Experimental Setup
5.4.2.1 Validation of Emulated PRs
The scalability study to be discussed in the next section uses emulated PRs that
have been designed to faithfully reproduce the behavior of the real PRs. We have
designed experiments to validate the emulated PRs using the RF2ID middleware and
the laboratory testbed. In this experiment, we fix the tag arrival speed at 15 meter per
minute (approximately, 35 ft per minute) and use 7 RFID tags in the validation study.
Each VR is associated with a single PR, thus making it a one-to-one comparison of
the performance of real PRs and emulated PRs. We vary the number of VRs from 1
to 4 and observe the accuracy (i.e., the number tags read compared to actual number
of tags). Figure 44 shows the result comparing the false negative rate of the real PRs
and emulated PRs. As can be seen, the observed results validate the accuracy of the
93

emulated PRs in faithfully reproducing the results of the real PRs. For one PR, the
readings are almost identical. However, for higher number of PRs, there is a small
difference between the real and emulated results. This is due to the variance in the
accuracy levels of the individual real PRs, which is not present for the emulated ones.
Still the discrepancy between real and emulated PRs is less than 5%.
Ath
60
65
70
75
80
85
90
95
100
1 2 3 4
Number of VRs
% A
ccu
racy
Experiment (Total tag = 7, Average over 4 readings)
Simulation (total tag = 7, Average over 1000 readings)
(Asys
)
Figure 44: Emulated PR vs Real PR Performance
5.4.2.2 System Parameters
In this study, we consider a distribution center of moderate size (described in [56, 55]).
The distribution center uses 9 disjoint read points which we have considered to be
individual VR operating points. Each VR is attached to 5 PRs. A moderate sized
center expects 1 million data items every day, which amounts to 7000 items per
minute [56]. A uniform distribution of this much amount of data may not cause the
system to get overloaded. However, the arrival of RFID tagged data is bursty in
nature that could cause the system to overload. The various system parameters used
for the experiment are discussed here.
94

• System Performance (Asys): The measured quantity for evaluation is in system
accuracy Asys, indicating the reliability of the deployment.
• Incoming Data Rate: In the experiments requiring variable data rates, we have
considered the data rate defined from the conveyor speed, palette width and
items per palette (defined as bulk size) as defined in equation 16. We have fixed
the belt speed and palette width and vary the bulk size to vary the data rate.
• Data Processing: A time window (twindow) for n tags is considered within which
a VR performs the following tasks: processing of the tags (n × ttag), processing
of incoming VR messages tin, processing of outgoing VR messages (tout) and
processing of queries (tquery). The VR needs to make sure tprocess < twindow
holds before it can send its processed data to the next VR.
tprocess = (n× ttag + tin + tout + tquery) (19)
• Time Window (twindow): A real distribution center needs to update the data
values every 1 to 2 minutes to meet real time application requirements [16].
Based on these requirements, we choose a time window of 1.5 minutes, since
the the computation and communication at every VR has to complete within
the data update rate demanded by the real time requirements.
• System Threshold (Ath): We have considered a threshold system accuracy
(Ath) of 80%. The system evaluation using the minimum PR accuracy as low as
19%, attaching 5 PRs to a single VR and having a total of 9 VRs in the system,
ideally, the system should perform at 99.994% accuracy level. But we must
take into account the real time requirements that limit the system performance
which is exhibitted in the next subsections.
The various workload parameters for the conducted experiments are summarized
in Table 5.
95

Table 5: System Workload ParametersData rate 5000 to 55000 items/minuteTime window 1.5 minutesNumber of VR 1 to 9Number PR assigned to VR 1 to 5Types of PR Emulated PRs and
real PRs (ALR 9800)Speed of Items 9 to 36 cm/secAccuracy (Ath) 80%
5.4.3 Performance of Baseline System
In this section, we evaluate the baseline system. First, we study the inherent physical
limitations of the PRs, and motivate the need for the RF2ID middleware for improv-
ing system reliability. While RF2ID scales well and meets reliability requirements
(Section 5.3.2) under normal data rates, we show its limitation in meeting reliability
requirements at high data rates. Finally, we show the performance of the RF2ID
system enhanced with the load shedding strategies proposed in this paper.
5.4.3.1 PR Level Evaluation
The PR performance depends on various environmental factors such as tag to reader
distance, orientation, and angle has been reported in previous chapter.
In this study, we look at two other limiting factors, namely, belt speed and bulk
size. These factors are of great importance in the context of a warehouse. We use item
speed and belt speed synonymously in this paper, since in our laboratory testbed the
items move on the train instead of a moving belt in a real warehouse. Figure 45 shows
the sensitivity of processed items to the item speed and bulk size. We use Alien ALR
9800 RFID reader and the experiment uses 7 tagged items with our experimental
set up for the speed evaluation (y-axis of left hand side). The number of detected
items decreases as the item speed is increased. For example, the number of detected
item decreases from 62% to 42% when the item speed increases from 9 cm/sec to
96

5
15
25
35
45
55
65
75
85
95
10010010010010084.884.47065.3
% Accuracy
Bulk
Siz
e
9
15
21
27
33
Data
Speed (
cm
/sec)
Bulk size
Speed (cm/sec)
Figure 45: PR Performance with variable Speed and Bulk Size
36 cm/sec. Figure 45 also shows the sensitivity of the processed items to bulk size
(y-axis of right hand side). We fix the item speed at 18 cm/sec. The number of
detected items detoriates as the bulk size increases. As can be seen, 98% of the items
are detected when the bulk size is 5, which drops to 16% when the bulk size reaches
98.
These results clearly show that as the data rate is increased (either due to belt
speed or bulk size or both), a single PR is incapable of meeting the reliability require-
ments of an RFID deployment. We show in the next section how the reliability can
be improved using the RF2ID middleware.
97

5.4.3.2 Improved System Accuracy using RF2ID
The system performance is improved using the redundancy of PRs using RF2ID. The
performance is enhanced at individual VR level using larger number of PRs and at
system level increasing the number of VRs. First, we look at multiple PRs associated
with a single VR.
Figure 46 shows the sensitivity of processed items as bulk size is varied assuming
an item speed of 18 cm/sec and associating 4 PRs with a single VR. As can be seen,
100% processed items is achieved when the bulk size is 40, while it is only 60% with
a single PR. Next, we study the scalability of the system for larger number of PRs
0
20
40
60
80
100
5 25 45 65 85
Bulk Size
% A
ccu
racy
Four PRs
Single PRSetup
Total VR=1
Type of PR= ALR 9800 model PR
Item speed = 18 cm/sec
(Asys
)
Ath
Figure 46: Improved System Performance with Increased Number of PRs withVariable Bulk Size
and larger data rates.
5.4.3.3 RF2ID Performance under Heavy Load
Figure 47 shows the scalability of the RF2D middleware. The set up uses 9 VRs with
each VR associated with 5 PRs. As can be seen, the system scales well up to 25000
98

items/minute. However, at higher data rates the reliability drops off. This is the
reason for the proposed load shedding mechanisms.
In the next section, we evaluate how the load shedding mechanisms are able to
address the scalability problem at high data rates.
50
70
90
1000 2000 3000 4000 5000 6000 7000 8000
Tags/sec
Proc
esse
d ite
m (%
)
50
70
90
CPU
usa
ge (%
)
Processed Item
CPU usage
Figure 47: System Performance for Various Data Rate
5.4.4 Performance of RF2ID with Load Shedding
The load shedding mechanisms are studied elaborately in this section. The space
based load shedding and time based load shedding mechanisms are studied and com-
pared against the baseline system that does not use load shedding. We also conduct
sensitivity analysis on the parameters of each of the load shedding strategies.
5.4.4.1 Comparison of Baseline with the Two Load Shedding Mechanisms
The study uses 9 VRs, each associated with 5 PRs. The baseline performance deto-
riates when the data rate increases beyond 25000. As we discussed earlier, within
the time window of 1.5 min, each VR has to do all the chores associated with pro-
cessing the items and communicate the result to the VR downstream from it. As
99

the data rate increases, the baseline has a hard time keeping up with the demands
of processing all the items (see Figure 48). On the other hand, it can be seen that
the space-based approaches is able to sustain good reliability with higher data rates.
The cooperative space based approach performs the best among all the evaluation
strategies (above Ath). The randomized space based load shedding performs better
than the baseline method for higher data rates. The time-based approach, although
has a lower reliability compared to baseline for low data rates, does better at high
data rates and performs at Ath level.
In the next two sections, we study the sensitivity of space-based and time-based
mechanisms to the parameters that define those strategies.
0
10
20
30
40
50
60
70
80
90
100
1000 3000 5000 7000 9000
Data/min
% A
ccura
cy
BaseLine Method
Ranomized Space Based Load
Shedding
Cooperative Space Based Load
Shedding
Time Based Load Shedding
Experimental Details
Total VR =9PR/ VR =5Type of PR=emulated PRPR Accuracy = Variable (minimum 19%)Averaged over 5 readingsIndividual reading variation ≤ 1%
(Asys
)
Ath
5000 15000 25000 35000 45000
Figure 48: Baseline System Performance Compared to Space Based and Time BasedLoad Shedding
5.4.4.2 Space Based Load Shedding
Figure 49 shows the sensitivity of the space-based approach to the ∆ parameter (the
effective queue length is equal to 5000 + ∆). With increasing ∆ values, the system
reliability increases.
However, arbitrarily increasing the queue length would eventually degrade the
100

performance. This is illustrated in Figure 50. For this experiment, the data rate is
fixed at 75000 items/min, and ∆ is 0 using cooperative space based load shedding.
The number of processed tags detoriates for larger queue lengths as there is more data
to process at each reader. This coupled with the incoming data from neighbor VRs
results in degradation of performance. The accuracy level increases with increasing
queue length up to 15000 and then detoriates for larger queue size. It should be
noted that, the cooperative space based approach performs beyond the Ath level of
performance.
60
65
70
75
80
85
90
95
100
5000 15000 25000 35000 45000 55000
Data /min
%A
cc
ura
cy
Space Based (∆ = 0)
Space Based (∆ = 300)
Space Based (∆ = 600)
Space Based (∆ = 900)
Experiment Details
Total VR=9PR/ VR =5Type of PR= emulated PRPR Accuracy Level =Variable (minimum 19%)Value averaged over 5 readingsIndividual Read Difference ≤ 1%
(Asys
)
Ath
Figure 49: Space Based Load Shedding -Varying value of ∆
The study conducted using variable queue size illustrates how the queue size im-
pacts the system accuracy under heavy load in the cooperative space based load
shedding approach. The queue size is varied while the data rate is constant to 15000
items per minute using 9 VRs and 5 PRs per VR for this experiment shown in Figure
50. The number of processed tags detoriates for larger queue length as there are more
data to process along with the incoming data stream from neighbor VRs and gets
101

closer to the baseline performance as the queue length keeps increasing. The accuracy
level increases with increasing queue length up to 10000 and then detoriates for larger
queue size.
30
32
34
36
38
40
42
44
46
48
50
5000 15000 25000 35000 45000 55000 65000 75000
Queue Size
%A
ccura
cy
Experiment Details
Data Rate =75000 items/minTotal VR=9PR/ VR =5Type of PR= emulated PRPR Accuracy Level =19%Reading Averaged over 5 timesIndividual Reading Difference ≤ 1%
(Asys
)
Figure 50: Space Based Load Shedding using various Queue Size
5.4.4.3 Time Based Load Shedding
The sensitivity of the time-based strategy to its parameters is shown in Figure 51.
This study compares the effect of overlapping read times among the PRs. In the non
overlapping case, the interval time (τ= 0) is considered to be 0. For the overlapping
case, each reader reads for 200 ms more (τ=200) time along with its distinct read
time. It is shown that the larger read time increases the system performance in terms
of processed items.
The impact of variable interval time is shown in Figure 52. The overlapping
reading (Interval time > 0) shows improved performance over non overlapping reads
(Interval time = 0) in the study. However, the number of processed items decrease
102

25
35
45
55
65
75
85
95
5000 15000 25000 35000 45000 55000
Data/min
%A
cc
ura
cy
Time Based Load Shedding(Read time =200, τ =200)
Time Based Load Shedding(Read time =200, τ =0)
Experiment Details
Total VR=9PR/ VR =5Type of PR= emulated PRPR Accuracy Level =19%Reading Averaged over 5 timesIndividual Reading Difference ≤ 1%
(Asys
)Ath
Figure 51: Time Based Load Shedding with various read time
as the interval time increases over 800ms. For example, the percentage of processed
items are 30%, 62% and 44% for interval time of 0, 600 and 1000 milliseconds, re-
spectively. Basically, increasing the overlapping times effectively increases the load
on the associated VRs, and this detrimental effect eventually dominates leading to
deterioration of performance. The load shedding based approach is an effective way to
handle temporary overload in the VRs where the technique itself is not computation
intensive. The performance study on the system shows how the inherent redundancy
is used to alleviate the adverse affect of system overload. The choice of a specific load
shedding strategy depends on the application scenario and the available resources.
Time based load shedding mechanism requires synchronization among PRs as well as
VRs in real time which is desirable in a smaller setup. It allows set of PRs to be in
dormant mode while other PRs are in operation. This feature can be very useful con-
sidering resources which has power constraints. On the other hand, the space based
method operates independently among VRs and is able show improved performance
103
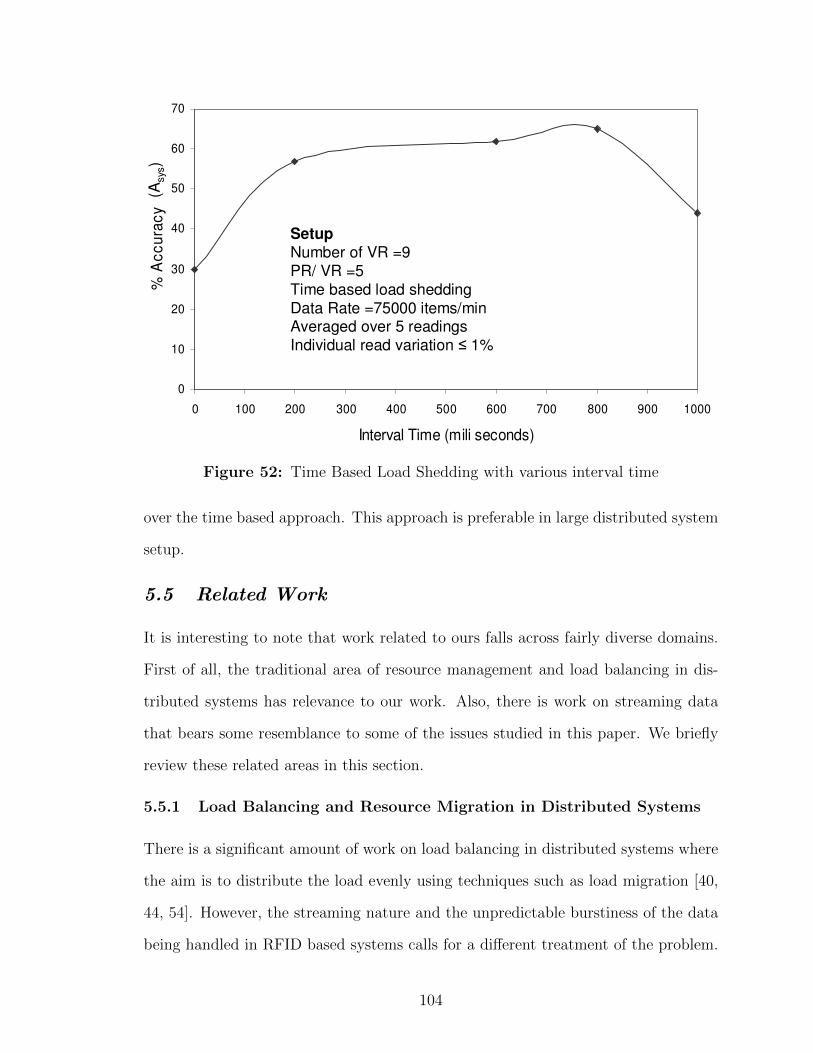
0
10
20
30
40
50
60
70
0 100 200 300 400 500 600 700 800 900 1000
Interval Time (mili seconds)
% A
cc
ura
cy
Setup
Number of VR =9
PR/ VR =5
Time based load shedding
Data Rate =75000 items/minAveraged over 5 readings
Individual read variation ≤ 1%
(Asys
)
Figure 52: Time Based Load Shedding with various interval time
over the time based approach. This approach is preferable in large distributed system
setup.
5.5 Related Work
It is interesting to note that work related to ours falls across fairly diverse domains.
First of all, the traditional area of resource management and load balancing in dis-
tributed systems has relevance to our work. Also, there is work on streaming data
that bears some resemblance to some of the issues studied in this paper. We briefly
review these related areas in this section.
5.5.1 Load Balancing and Resource Migration in Distributed Systems
There is a significant amount of work on load balancing in distributed systems where
the aim is to distribute the load evenly using techniques such as load migration [40,
44, 54]. However, the streaming nature and the unpredictable burstiness of the data
being handled in RFID based systems calls for a different treatment of the problem.
104

Recently, there has been research work focusing on load management aspects of RFID
based systems. The work in [42] provides a heuristic based solution for near optimal
reader to tag assignment to deal with the load in the system. However, the solution
only addresses statically placed readers and tags. Producing a system that accounts
for tags in motion adds another layer of complexity. The mobile agent based load
management system in [39] uses a mobile agent to re-adjust imbalance of load in the
system using load migration. The connection pool based load balancing presented
in [80] also readjusts load among different nodes from heavily loaded one with a
lighter load. Load migration is not very suitable for streaming data that needs to
meet real time constraints [98, 64]. There is a need for load management that deals
with a large amount of error prone data while simultaneously meeting the challenge
of real time query processing requests, which is the focus of our paper. Traditional
resource migration techniques may not be applicable for RFID based systems since
such techniques require additional processing to make such decisions when the system
is already under stress to meet the real time query processing requests and data
overload. Load shedding based load management has been incorporated as an effective
stream handling mechanism systems such as Aurora [38, 22, 96], that are designed
to meet real time application constraints. Our work is similar in that we adopt a
cooperative load shedding strategy among the system components.
5.5.2 Streaming Applications
The Aurora system [38, 22, 96] uses the notion of load. MobiQual [48] uses load
shedding based techniques to make decision based on freshness of data. Our system
is also based on load shedding but it uses the built-in redundancy of the RF2ID
middleware to cope with the load with minimal data loss. TelegraphCQ [34] is aimed
to support streaming data but differs from our work in system structure. It uses
stream partitioning for load balancing compared to load shedding techniques. The
105

pipelined framework [61] processes correlated data locally which has similarity to the
VR abstraction of our work; however, the power of our work is in having the VRs
operate in concert via the Vpath abstraction.
5.6 Summary
RFID based deployments for large-scale supply chain environments are becoming
widespread. These deployments face the fundamental challenge in RFID based sys-
tems that the devices are error prone. The demands placed on the deployments from
the applications in the form of increased data rates and requests for real time query
processing are compounding these challenges even more. We have designed cooper-
ative load shedding mechanisms for dealing with the increased data rates and query
processing requests in large-scale RFID deployments. The mechanisms are piggy-
backed on a middleware called RF2ID that deals with the error-prone nature of the
physical RFID readers. The middleware uses the spatial notion of path along which
the items flow in a supply chain to cumulatively aggregate the tags collected by the
virtual readers to increase the overall reliability. The load shedding algorithms lever-
age the built-in redundancy in this middleware to cooperatively shed the load among
the virtual readers with minimal data loss thus increasing the overall reliability of
the deployment. Our implementation and performance results confirm the utility of
these load shedding mechanisms.
106
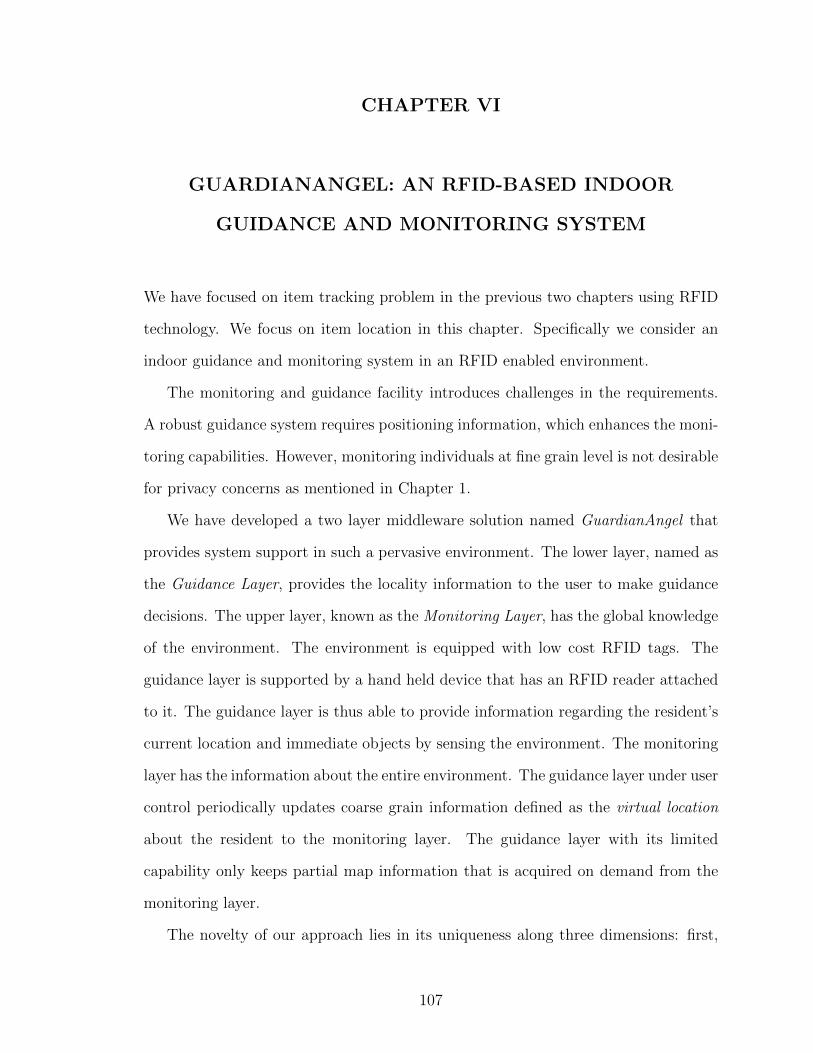
CHAPTER VI
GUARDIANANGEL: AN RFID-BASED INDOOR
GUIDANCE AND MONITORING SYSTEM
We have focused on item tracking problem in the previous two chapters using RFID
technology. We focus on item location in this chapter. Specifically we consider an
indoor guidance and monitoring system in an RFID enabled environment.
The monitoring and guidance facility introduces challenges in the requirements.
A robust guidance system requires positioning information, which enhances the moni-
toring capabilities. However, monitoring individuals at fine grain level is not desirable
for privacy concerns as mentioned in Chapter 1.
We have developed a two layer middleware solution named GuardianAngel that
provides system support in such a pervasive environment. The lower layer, named as
the Guidance Layer, provides the locality information to the user to make guidance
decisions. The upper layer, known as the Monitoring Layer, has the global knowledge
of the environment. The environment is equipped with low cost RFID tags. The
guidance layer is supported by a hand held device that has an RFID reader attached
to it. The guidance layer is thus able to provide information regarding the resident’s
current location and immediate objects by sensing the environment. The monitoring
layer has the information about the entire environment. The guidance layer under user
control periodically updates coarse grain information defined as the virtual location
about the resident to the monitoring layer. The guidance layer with its limited
capability only keeps partial map information that is acquired on demand from the
monitoring layer.
The novelty of our approach lies in its uniqueness along three dimensions: first,
107

by virtualizing the user position information; second, by providing a more natural
way of gathering environmental information using RFID tags in an unobtrusive man-
ner under user control; and third, by enabling the deployment of large scale indoor
environment using low cost passive RFID tags and mobile readers.
We present the application scenario and requirement analysis of the system, then
we discuss the system architecture followed by the evaluation of the system. The
GuardianAngel system is evaluated in an RFID enabled testbed as well as in a large
scale emulation based system. The related work and summary are presented to con-
clude the chapter.
6.1 Application Scenario and Requirement Analysis
The applications we consider are best suited for environments that are statically
tagged with an RFID location grid. This would be especially useful for a visually im-
paired person to be self-reliant within a large office complex, hospital, etc. Equipped
with a gadget that combines an RFID reader and an audio system that gives verbal
instructions, such an individual would be able to chart out a route unassisted through
an unfamiliar large indoor environment. Essentially, the fixed RFID tags enable the
dynamic creation of a path from source to destination. A second use case for such a
static deployment of RFID tags is in search and rescue operations following either a
man-made or natural disaster. A robot or a SWAT team may use this infrastructure
to dynamically chart out paths that are reachable within the indoor environment
following the disaster, as well as locate assets (humans and articles of value) within
the affected environment.
While the details of each specific application may be different, they all pose some
common requirements. We investigate such common requirements to design a middle-
ware system solution. The premise in this discussion is that the application comprises
mobile agents that use the RFID-tagged environment for making forward progress.
108

From an application perspective, the middleware should provide the following
types of information to the mobile agents in the application:
• Current location: The mobile agent may need this information to make some
local decisions (e.g., have we arrived at the destination yet?). This information
is best presented in some familiar form such as GPS coordinates.
• Routing information: The mobile agent would benefit if the middleware could
provide a route given the current location and the desired destination.
• Assets in the neighborhood: This would be particularly useful in asset location
applications as well as self-guided tours in museums and the like. Based on the
current location information, the middleware provides a map of assets in the
neighborhood.
• Terrain: The kind of information envisaged here include obstacles (e.g., doors,
stairwell, etc.) as well as landmarks (e.g., information desk, copier room, etc.).
This information serves the mobile agent to make local routing decisions to
destinations when there are multiple paths available as well as seek help if
needed.
• Message board: This allows a mobile agent to share information with other
agents if so desired. Essentially, this allows the mobile agent to leave elec-
tronic bread crumbs (either signed or anonymous) that may be useful for other
applications or agents that use the same infrastructure.
6.2 System Architecture
The overall system setup is presented in Figure 53. The physical environment is the
indoor space under consideration. The physical environment has RFID tags installed
109

RFID Infrastructure
RFID tagged Environment along with Mobile Users equipped with RFID Readers
Coffee on
table
I am
here
Destination
Path
Bedroom
9:00AM
10:00 AM
Corridor
10:00 AM
10:15 AM
Living room
10:15 AM
Now(10:20)
History Information Current
Information
Physical Environment
Middleware System
Provides Accuracy, Level of Abstraction (Virtual Position to External Users), Guidance and
Monitoring Capability
Fine Grain Information for Residents
Coarse Grain Information for External Users
(Virtual Location)
System Interface
Secured Interaction Interface
Exit
MSG
Board
Dynamic Query Interface
Figure 53: Overivew of the entire system.
and has the residents carrying mobile RFID readers 1. The middleware is a data flow
oriented system which is responsible for processing the environmental information,
monitor the mobile residents and guide the residents as required taking care of all the
low level communication and computational details. The residents of the environment
(e.g., grandma in assisted living center) and the external user (family members of
grandma) get different views of the envornment and can use the user interface to
generate dynamic queries in real time.
The GuardianAngel system has three major components. The first of these is
the Pervasive Environment (PE). This is the indoor environment in which the
system operates. Second is the Mobile Object (MobileObject(MO)), which is the
entire mobile system: user, computational device, and reader. The Guidance Server
(GuidanceServer(GS)), a software entity that computes position and gives directions
to the destination, runs on this MO. The third component is the Monitoring Server
(Monitoringserver(MS)), a logically omnipresent server that contains information
1We assume that it is quite natural for a mobile user to carry a handheld device that incorporatessuch RFID reader capability. Nokia has developed a cellphone equipped with a passive RFID reader,and there are several mobile RFID readers available in the market today [97].
110

Virtual
Station 1
Reference
TagsVirtual
LocationHandheld
Device
Virtual
Station 2VirtualStation 3
Region3
Pervasive Environment (PE)
Region2
Region1
Path from
Source to
destination
Monitoring
Servers
Guidance Server (runs on Handheld Device)
Secured Interface
External Users
Figure 54: GuardianAngel Architecture.
about the PE. It communicates with the GS to obtain information about the status
of mobile users. While a single logical entity, physically the MS is broken into a set
of distributed servers, called Virtual Servers (V S), that load balance and provide
better feedback to the user through geographic and logical proximity. The monitor-
ing information does not reveal the actual location information of the active users, it
presents a virtual location over a period of time. The system architecture is presented
in Figure 54.
111

6.2.1 Pervasive Environment
The pervasive environment (PE) represents the entire indoor environment under con-
sideration. The PE is logically divided among different regions. The logical definition
can be matched with physical entities (e.g., each room of a house or each floor in a
building). The zones can be matched to physical spaces based on application require-
ments (e.g., a family space region can be subdivided into TV zone, sitting zone and
empty zone).
The PE consists of a set of regions R = {r1, r2, ...., rn}. Each region ri is equipped
with set of reference tags T(r) = {t(1,r,T ), t(2,r,T ), ...., t(m,r,T )}. The reference tags are
logically divided among three different layers for different operations. The location
tags T(l) ⊂ T(r) are used to define the current location of an object. The direction tags
T(d) ⊂ T(r) are used to define direction information. The object tags T(o) ⊂ T(r) are the
tags containing objects of interest. We must note that T(r) = T(l) + T(d) + T(o). The
PE requires a setup phase by which the environment is installed with RFID tags. The
setup phase is followed by the location phase that provides the system with actual or
virtual position information.
6.2.1.1 Setup Phase
The setup phase requires two consecutive steps: the installation of tags followed by
zone definition.
The tag installation phase can be carried out manually in a structured format
(e.g., grid format) or a random format. The structured tag installation process re-
quires manually placing the tags in a grid structure in the environment providing a
convenient way to define a mobile user’s current location. The random installation
process is easier to install but requires a tag discovery process. In the tag discov-
ery process, mobile users (e.g., human user, robot) traverse the environment in a
definitive route to discover tag placement information. We have considered the grid
112

structured tag installation in our implementation as the tag discovery process is often
error prone.
The zone definitions are initialized in one of three fashions, static, dynamic, or
semi-dynamic. Static definition requires that the user or application directly pro-
gram each tag into its appropriate zone. This process is best for situations in which
a tailored zone setup is needed, but is very time consuming. Dynamic allocation sets
up the zones automatically, without user input or further input from the application.
This is easiest, but can lead to imbalanced zones or zone layouts that are not appro-
priate for the physical environment due to the error prone reading properties of RFID
readers [38], [47]. Semi-dynamic setup relies on the user to define root nodes, which
act as anchors for each zone. The system then follows a heuristic algorithm a variant
of breadth-first search in the prototype to assign proximate nodes to the same zone.
We used the semi-dynamic approach in the GuardianAngel system.
6.2.1.2 Location Phase
The RFID reader equipped with the guidance server uses the environmental informa-
tion to determine the location information. We use an application defined probability
threshold Pr(location) ≥ Pr(Th) to place the MO within a boundary location, or
the location of the MO within a predefined area of the PE. From this, the GS can
compute the MO’s virtual location, which combines historical and present position
information to calculate with higher accuracy the current location of the MO. Note
that the boundary and virtual locations do not have to perfectly coincide with the
MO’s physical position, just approximate it.
The location information depends on the tag samples read by the RFID reader and
the reading accuracy of an RFID reader while the person carrying it is in motion. The
reading accuracy is determined by a reader’s ability to correctly read items compared
to the total number of actual items: Pr(r) = RT
where R refers to the number of items
113

correctly read and T refers to the total number of items. The observation accuracy
can be increased by increasing the number of samples where the observation accuracy
is defined as: Pr(O) ≡ 1− (1− Pr(r))s, where s is the number of samples and O is
the probability over a number of samples.
The single sample time depends on the physical properties of the RFID readers and
is defined as t(sample,1): time required for a single sample read. The total sample time
(t(sample,s)) is the time required to read s number of samples. We have, t(sample,s) =
s ∗ t(sample,1). We must take the speed of the mobile user into consideration. If the
user speed is d distance per unit time then the user traverses a distance of d∗t(sample,s)
in t(sample,s) time. We must make an optimal choice of choosing a reasonable sample
size to limit the distance traveled during the sample time.
The actual position of a mobile object can be determined using a number of
samples of tags from the environment. For s number of samples of tags, the current
position is defined using a weighted average of tag positions observed over the samples.
We can assume Wti to be the number of times a particular tag ti is seen over the S
samples and Posi to be the (x,y) position of that particular tag along with its history
information as: CurrentPos = f(Sample(s), History(h)) where the sample is ex-
pressed as∑s
i=1 ((Wti−1) ∗ Posi) and History is mentioned as∑h
j=1 ((Wtj−1) ∗ Posj)
where history represents last few samples to make sure the proper area is chosen
discarding outlier tags.
The system has provision for providing a boundary within which the MO stays
with higher probability rather than defining an (x,y) position. As the MO advances
along with time, the system is able to define the relative direction information from the
history boundary information relative to current position boundary. The virtualized
position is similar to defining the boundary of the tags except the boundary region
is defined over a period of time Tperiod. If the boundary position is very definitive as
MO remains temporarily stationary over the last time period, the virtual position is
114

defined by some cushion area around the current position. The mobile user depends
on its handheld computation device for this information. The user sends out its
virtual position to the monitoring server.
6.2.2 Virtual Server (VS)
The VS provides services to the MO present in the designated region for that VS. The
major responsibilities include communication management, information management,
and status management as shown in Table 6.
6.2.2.1 Communication Management
The VS provides three major communication abstractions for effective communica-
tion among the system components. There is a message board interface that allows
information exchange among the MOs in the same region. The message board is a
permanent communication abstraction that remains in a region. The path based com-
munication mechanism uses the route information from the MO to create a logical
communication channel across the PE among the VSs. The path abstraction is a
semi-permanent communication abstraction. It remains active as long as there is a
MO traversing through the designated route. The MO to VS communication is done
on demand, and thus is a transient communication mechanism.
The message board interface, as the name suggests, provides an open interface for
communication among the MOs. There is a single message board in each region. The
message board acts as a provision to put electronic bread crumbs in the environment
by existing MOs that can be followed by incoming MOs in the same region. The
message board is designed to be distributed in each region for improved scalability
of the messaging mechanism. The MOs are able to post general messages for infor-
mation exchange within the same region and read posted messages from the board.
The MOs can post information regarding the MO status and information regarding
environmental updates (e.g., missing reference or addition of new references) to the
115

Table 6: VS ResponsibilitiesTask Name Responsibilities
Information Management (1)Store physical and logicalmapof a zone(2) Provide subzone or zone mapto MO based on compute capability(3) Update zone information basedon inputs(4) Provide guidance information givensource and destination information
Status Management (1) Generate an automaton based statuslist for each participating MO which isorganizedby time sequences(2) Generate a rule set for generalor specific MO status(3) Update MO status information &check MO rule engine whether anyrule is violated(4)Garbage Collect statusinformation based on predefinedapplication requirements(5)Generate appropriate alert messages
Communication Management (1)Manage the logical message boardacross MO in a region(2) Communicate to neighbor MS forpath generation or alert messageexchange(3)Communicate from Mo to MSperiodically for map update, statusupdate and guidancequeries or item queries(4)Communicate from MS to MOif MO has not contacted beyonda predefined threshold
message board. The VS creates a logical path among the VSs if guidance information
is required for a particular source to destination route. The path creation request is
initiated by a request from a particular MO to a VS. A VS contacts its peer VSs and
generates a list of VSs that correspond to the shortest path. The cost associated with
a path may be expressed using traditional metrics (such as time and distance), or may
116

be expressed based on convenience (e. g., a path without any stairs is lower in cost
and more desirable) commensurate with application requirements. The VSs agree on
a path creation after assessing the current and predicted future workload in a similar
way that is done in RF 2ID [16] as mentioned in Chapter 4. As the MO progresses
through the regions, the MO to VS assignment changes based on the current MO
location. The VSs transparently transfer status information regarding the MO along
the logical path for monitoring purposes. The handoff of VS to MO takes place after
the MO changes its region and which is initiated by the VS. The VS to MO messaging
takes place in a sporadic fashion based on needs. The MO asks for PE information as
it makes progress in the environment. The MO also needs to update the MO status
information to the VS. The MO piggybacks its status information with its request
for new blocks of PE information. The VS queries the MO if it does not hear from a
particular MO beyond a predefined threshold time.
6.2.2.2 Information Management
The information management of a VS requires managing the physical map and logical
map based on application requirements, providing region information to the MO,
updating region and zone information and guidance services. It concentrates on
maintaining the PE information and providing such information to the MOs present
in a particular region. The physical map and logical map functionality allows the VS
to act as a distributed repository of information regarding the PE. The information
contains the three layer view of the PE consisting of the RFID tags. The VS is able to
provide physical information about an object of interest as well as logical information
about the environment. Logical information provides an abstraction to the MO in a
more natural way. For example, a query about the medicine with the tag ID 770 can
be responded by its (x,y) coordinate position or by a logical entry such as it is on the
black table near you. The logical setup requirements are application specific. The VS
117

is responsible for providing region and zone information. The MO can ask for map
based information in a block by block manner where the block size is dependent on
the computational capability of MO along with the application requirements. The
VS provides guidance information given the source and destination inputs from the
MO. The VS is in charge of creating a path to guide the MO as discussed in previous
subsection.
6.2.2.3 Status Management
The VS keeps the information of each individual MO in the form of a deterministic
finite automata. The status information of the MO is represented as a sequence of
states and important information concerning each state. The state change parameters
are application dependent and can be adjusted based on requirements. The applica-
tion can also specify logical rules to be checked dynamically on the MO status. The
rules must be set to minimize the number of FalsePositive notices. The application
should also be able to determine a threshold on how much status information should
be stored so that the VS can perform automatic garbage collection on MO status
information.
6.2.3 Mobile Object (MO)
The mobile object (MO) is the mobile entity that contains an RFID reader along with
a portable computation and communication device. The residents of the pervasive
environment carry the MO. The MO provides the guidance service to the user. The
relationship of the guidance server and the monitoring server can be compared to
that of the cache and main memory. The monitoring server keeps the information
regarding the entire PE. The guidance server asks for block of data about the current
surroundings. The MO makes proper decisions based on that information. Thus the
MO is responsible for several specific tasks. It senses the PE using the RFID reader
attached to it. The MO has to make sure of adjusting the power level of the RFID
118

reader to minimize the effect of FalseNegative reads ((missing an item in its range))
and false positive reads (reading items beyond its range). The MO has to acquire
proper map information for the current region it is in from the VS. The MO uses
the map to make proper guidance decisions for the user. The MO is responsible for
answering the queries regarding objects of interest (e.g., where is my medicine?) or
objects within surroundings (e.g., what objects are around me?). It is also responsible
for updating the status as a virtual location of itself to the VS. The MO sends out
a list of encountered tags along with its virtual location information. The VS can
update its environment if required. The MO is able to post and read messages from
message board to communicate to other MOs in the same region.
6.2.4 Other Components
The system consists of the external users who are interested in obtaining the mon-
itoring information about the residents (MO). To address the privacy and security
concerns of the residents, we have created system hooks so that various security mea-
sures can take place while the external users gain access to monitoring information.
In the current implementation, we consider a two way authentication among the MO
and VS before any monitoring information can be transferred. But the system is able
to incorporate other security measures such as cryptography based authentication for
more secured communication - the balance of performance and security is application
dependant and must be considered carefully. The application queries are supported
by a user interface based approach which shows the current surrounding information
in case of the MO residents and a coarse grain state information for the external
residents. We have a basic implementation of the interface to communicate to the
system (e.g., for path creation, finding out the objects of interest).
We have implemented the GuardianAngel system and developed a prototype ap-
plication for testing purposes. We describe it in the next section.
119

(a) (b)
Figure 55: Experimental Setup of the (a) Pervasive Environment. (b) The antennasetup that mimics the reading performance of a mobile user.
6.3 System Prototype
To study the feasibility of a passive RFID-based location system constructed on
the GuardianAngel framework, we have developed a prototype application centered
around evaluating various aspects of the system. The evaluation takes place in two
phases. In the first phase we consider the feasibility of an RFID enabled pervasive
environment. We use an indoor prototype system using real hardware (RFID readers
and tags) for this purpose. The second phase of the evaluation considers a large scale
building scenario using emulated readers. We elaborate on our study in the following
subsections.
6.3.1 RFID Testbed
The objective of the RFID testbed using real RFID readers and tags is to determine
the feasibility of an RFID enabled pervasive environment. We explore the system and
its performance in the following subsections.
120

6.3.1.1 Testbed Setup
The small scale prototype testbed consists of Alien ALR 9800 model passive RFID
reader and Alien Gen 2 passive RFID tags. The prototype is developed using Python,
interfacing with the RFID reader using the Telnet protocol. We have placed passive
RFID tags in the laboratory setup as shown in Figure 55. The area is covered by (14 x
11) tags and each tag is placed 50 cm apart from each other as shown in Figure 55-(a).
There is an obstacle of (7 x 6) tag space where the reference tags are not present. We
have used a grid structured based setup phase to create the PE. It enables a convenient
way to locate objects of interest. The Mobile object of consideration uses two ALR
9800 model omnidirectional passive antennas. The redundancy at the antenna level
increases the number of items read in each iteration.
(a)
(c)
%Tag Read at Neighbor Level 1
%Tag Read at Neighbor Level 2
%Outlier Tags
%Tag Read at actual position
%Tag Read
at Neighbor
Level 1
%Tag Read
at Neighbor
Level 2
% Outlier
Tags
%Tag Read
at actual
position
57.39348 1.027569 0.250627 41.32832
(b)
Figure 56: RFID testbed behavior over time steps (a) Definition of actual tags,neighbor tags and outlier tags. (b) Percentage of various tag reads (c)Table quanti-fying the various tag reads.
121

6.3.1.2 The RFID Behavior in Indoor Setup
We have done extensive study on the RFID reader and tag performance in the indoor
laboratory setup. We first define the relationship of the tags based on proximity
from the tag of interest mentioned as actual tag. The tags within 50 cm radius are
mentioned as neighbor level 1 tags and the tags from 51 cm to 100 cm radius are
neighbor level 2 tags. The tags beyond neighbor level 2 are called outlier tags as
shown in Figure 56-(a). Figure 56-(b) shows the comparative distribution of different
tags over 300 samples where the neighbor level 1 tags are read 57.39% of the the
overall reads, the actual tags are read 41.3% of the times, the neighbor level 2 and
outlier tags are read 1.02% and 0.25% of the times respectively as indicated in 56-(c).
1
2
3
4
5
6
1 21 41 61 81 101 121
Nu
mb
er
of
un
iqu
e t
ag
s re
ad
Time steps (seconds)
Tag Type : Gen 2
Passive
RFID Tag
Grid Area: 14 x11
Inter Grid Space:
50 cm
Figure 57: Number of unique tag reads.
Figure 57 indicates how the sample size varies over time when the mobile object is
in motion which shows a large variation in the sample size over time with the average
read being 3.33 over 300 samples.
Figure 58 shows the neighbor tags with respect to a tag of interest which assures
that the majority of the tags read in the sample are mostly the close neighbors. Figure
122

0
10
20
30
40
50
60
70
80
1 21 41 61 81 101 121
Nu
mb
er
of
tag
s re
ad
Time Steps (seconds)
Outlier Tags
%Tags in Neighbor Level 2
%Tags in Neighbor Level 1
Figure 58: Number of tag neighbor and outlier tag reads.
1 3 5 7 9 11 13 15 17 19 21 23 25 27 29
0
0.5
1
1.5
2
2.5
3
Time Steps (second)
Nu
mb
er
of
Tag
re
ad
Neighbor 2
Neighbor 1
Actual Tag
Tag Type : Gen 2 Passive
RFID Tag
Grid Area: 14 x11
Inter Grid Space: 50 cm
Neighbor1: Individual Tag in
50 cm radius from actual tag
Neighbor 2: Individual tag apart
From Neighbor 1 in 50 cm
Radius from actual tag
Figure 59: Number of actual and neighbor tag reads.
59 illustrates the consistency of different types of tag reads over time - it is observed
that the neighbor tags are not read as consistently as the actual tag reads (which is
good news).
We have used a buffer size of 5 samples to determine location information. The
123

0
10
20
30
40
50
60
70
80
90
100
1 3 5 7 9 11 13
Observation Steps
%R
ead
ing o
f T
ag in P
ositio
n
Self Read for 5 Observations
Self Read for 3 Observations
Self Read for 1 Observations
Observed
Above
80% time
Figure 60: Reading performance with varying sample size.
sample size less than 5 shows larger variations and larger samples require larger
sampling time as can be seen in Figure 60. The sample size of 5 proved to be optimal
in terms of time and performance.
Figure 61 shows the variation of number of readings of individual tags over three
samples where each position is visited manually. The tag placement is shown in
colored circles where the brighter red circles indicate larger number of readings of a
particular tag compared to a darker shade of tag.
6.3.1.3 The RFID Behavior in Indoor Setup
The accuracy of zone information is shown in Figure 62-(a) to be 100% over the
readings of the tag after the data is sampled 5 times for each output. The output
over multiple samples yields a perfect zone information despite the inaccurate readings
of the RFID tags. The study using a larger setup using emulated RFID readers and
tags are discussed in the next subsection.
The evaluation of the indoor pervasive environment depicted in Figure 62-(a)
124

Tag Type : Gen 2 Passive RFID Tag
Grid Area: 14 x11
Inter Grid Space: 50 cm
Average Read: 2
Average Read: 3.33
Average Read: 4.67
Average Read: 4.33
Figure 61: (a) Reading performance for individual tag read.
shows that the system comprising a simple passive RFID based infrastructure is able
to provide accurate zone information that can be the basis for a guidance application.
Our current implementation is feasible for many indoor scenarios where a coarse grain
zone information is sufficient for various activities.
6.3.2 Emulated RFID Based System
The distributed large scale testbed considers a large scale application scenario that
requires significant communication and computational capabilities. This setup is used
for the scalability study of the system. The testbed uses emulated MOs, emulated
RFID tagged environment 2 and a set of distributed VSs for scalability study.
2We faithfully emulate the behavior of the Alien RFID reader for this large-scale set up. Thisallows scaling up the pervasive environment since the behavior of the real and emulated readers areindistinguishable. For more details on the emulated readers please refer to [17].
125

90
92
94
96
98
100
0 5 10 15 20 25 30
% A
ccu
racy
Output Time (every 5 seconds)
99
99.2
99.4
99.6
99.8
100
0 5 10 15 20 25 30
% A
ccu
racy
Output Time (every 5 seconds)
%Accuracy using 5 samples
%Accuracy using History data
(a)
(b)
Figure 62: (a) Percent accuracy for RFID testbed. (b) Percent accuracy for emula-tion based study.
6.3.2.1 Setup
The system is developed in C using MPI for communication among the system compo-
nents. The system runs over a 53-node, 106-core Dell PowerEdge 1850 Linux cluster
with dual Pentium4 Xeon EMT 64 processors using Infiniband interconnects and
Gigabit Ethernet.
6.3.2.2 Guidance in a Region Towards a Zone
The zones are defined in a semi static manner in the PE. We have used a GUI based
interface that shows the PE tag distribution as shown in Figure 63. A set of root tags
in the region are selected by the application user as shown in Figure 63.
The number of root tags defines the number of zones in the region. Once the root
126

Root Tags (the color coded ones)
Figure 63: GUI based interface showing Root Tag information.
Zone
Center of
Gravity of a
zone
Current
Zone
position
Figure 64: GUI based interface showing Zone information.
tags are defined, the VS runs a breadth first search based heuristic where each tag is
assigned to its nearest root node as shown in Figure 64 where each different colored
area corresponds to a unique zone within a region. The breadth first algorithm could
127

be changed where the root nodes choose the closest tags for a faster zone assignment
that would result in an uneven zone distribution. So we have used our current method
as it only runs once during the initialization of the environment.
Path
from
source to
destination
Destination
Figure 65: GUI based interface showing Source to destination Path Direction.
The VS uses the GUI based interface to define the desired destination of the user
from his/her current location. The system then directs the user (using direction and
flow) towards the destination as shown in Figure 65. If the user goes towards a
wrong direction, the system recalculates the destination route and guides the user
accordingly. We have considered a 50 x50 grid size where the grid spacing is 50 cm
within the region. It mimics a large physical space within the indoor environment
which can be a large room or corridor of the building under consideration.The system
is able to detect the zone information with an average of 98.7% accuracy using 5
samples which reaches 100% accuracy considering the history data to determine a
particular zone.
128

(a)
1
2
3
4
5
6
7
15 20 25 30 35
% I
na
ccu
racy
Number of Regions
%Incorrect Direction
Information
% Incorrect Region
Information
0
5
10
15
20
25
301
23
#Number of
root nodes =35
#Number of
root nodes
25
#Number of
root nodes =15
Average
Deviation
(cm)
(b)
Figure 66: Measurements of a large indoor space. (a) Deviation from destination.(b) Percent inaccuracy in direction and region information.
6.3.2.3 Guidance In a Building Towards a Region
We have considered a large scale indoor space for this experiment of 3900 sq foot which
approximately corresponds to a 1100 x 1100 tag placement in a grid setup where the
inter tag distance is 50 cm using emulated tags and readers. The results shown in
Figure 66 confirm the soundness of our design in that the reading performance and
accuracy is maintained in this larger deployment. The average deviation from a source
to destination position is shown in Figure 66-(a). As can be seen, the deviation from
the desired destination is a function of the number of zones or regions defined by the
root nodes. The deviation is 10 cm with 15 regions. It increases to 28 cm with 25
regions, and to 35 cm with 35 regions. The number of incorrect region information
and direction information is shown for the same setup in Figure 66-(b). The level of
inaccuracy increases with smaller zone area as we increase the number of root nodes.
129

The region shows 1.51%, 4.54% and 6.06% incorrect region information and 1.1%,
5.68% and 6.18% incorrect direction information due to wrong zone information for
a setup using 15, 25 and 35 regions, respectively. The level of accuracy is acceptable
for the guidance information towards a room as the deviation from the destination is
below 35cm.
6.3.2.4 Communication
The VS acts like a repository of local information for the particular region it is in
charge of. At the same time it keeps information concerning the MOs attached to it
and all the message board information.
We have implemented three general APIs for message posting. The Post-new
function call allows the MO to post the current update message concerning the current
region and is posted locally in the VS message board. This message can be posted
anonymously if the MO wishes to remain unnoticed. The Post-status message keeps
the status information on an MO locally at the VS and must contain the information
of the MO posting the message. The Post-alert message is sent to the VS which again
sends the message to the name server and the name server broadcasts the message to
all the participating VSs in the system. This message cannot be sent anonymously
so that the system is able to figure out the MO in case there are too many alert
messages generated by a particular MO. We have used the broadcast functionality
provided by the MPI library to implement the broadcast messages for generating the
alert messages.
The message board interface allows the MOs in the same region to share infor-
mation for that specific region or residents residing within that region. Examples of
shared information can be notes like coffee in coffee pot or Mr. X prefers to stay
alone for a while or the opposite like MS Y wants to speak to some one.
Our system level evaluation of the large scale system has confirmed that the
130

messaging schemes are scalable across the system as we have seen insignificant increase
of execution time when there is communication across multiple VSs. The VS acts
like a repository of local information for the particular region it is in charge of. At
the same time it keeps information concerning the MOs attached to it and all the
message board information.
25 100 400 2500 10000 40000 250000 1000000
%Block Miss 16.082 8.0418 4.0209 1.6080 0.8032 0.4016 0.1607 0.0804
0.01
0.1
1
10
%B
lock
Mis
s
Block Size
(a)
(b)
0
0.005
0.01
0.015
0.02
1 3 5 7 9
Exe
cuti
on
Tim
e
(se
con
ds)
Number of VSs
Path Creation Time
Alert Messages
Figure 67: (a) Scalability study of VS serving multiple MOs (b) Block miss rate inan MO varying block size
Scalability for Messaging:
The study presented in 67-(a) illustrates the communication overhead as the number
of VSs increase. We have used 10 VSs in the system and each VS is attached to 5
MOs. It shows that the communication time does not increase more than linearly
with the number of VSs.
The alert message uses a broadcast mechanism to make sure the alert reaches
131

every component of the system. But the generation of alert message is expected to
be limited. It grows linearly with the number of VSs. As can be seen, 4 VSs require
0.005 seconds, which increases to 0.015 seconds using 9 VSs.
The path creation time increases gradually but again this is a one time system
cost that occurs during initialization of the system. For example, 4 VSs require 0.005
seconds to process the path creation requests which is similar to the time for alert
message generation using the same number of VSs. However, the growth is slower
compared to alert message generation. For example, with 9 VSs, the system requires
only 0.009 seconds.
Local Caching Effect on the MO:
We have studied the caching effect at an MO using a single MO, VS pair as shown in
67-(b). We have considered a region covering (10000 x 1000) tags. We have simulated
object motion behavior taking into account the locality of reference considering that
an MO is sequentially moving from source to destination. The MO asks for infor-
mation regarding the environment from the VS, as it progresses to a new region (it
is a lazy policy requesting a block only when it is needed). The MO keeps using its
local block information to help the user until there is a location that is not available
in its local block causing a block miss. It is evident from our study that the larger
size of block information reduces the number of block misses in MOs. For example
a (5x5) block size experiences 16% block misses compared to 4% block misses when
the block size is increased to (20x20). The optimal block size would depend on the
MO capacity as well as application requirements.
Our evaluation results confirm the scalability of GuardianAngel in a large scale
deployment.
132

6.4 Related Work
It is interesting to note that work related to ours falls across fairly diverse domains.
We briefly review each of these related areas in this section.
First, there is research aimed at indoor positioning systems. The active badge
system [89] uses IR sensing for providing location support. IR has line of sight prob-
lem and consequently has a limited sensing range. Radar [23] uses RF signal based
location information and considers the signal strength information gathered at mul-
tiple locations to triangulate user location information. The Cricket [93] system uses
ultrasound signals to find out precise location information. LotTrack [101] uses RFID
and Ultrasound sensors for accurate location information. Landmarc [76] uses ac-
tive RFID readers and reference tags as an inexpensive solution for indoor location
sensing. The positioning systems like Radar, Cricket, Landmarc, LotTrack and Ac-
tiveBadge aim to provide precise location information. Our work is complementary
to these research efforts. Our proposed solution strategy considers the middleware
level requirements to support guidance information to applications.
The Sherlock system [75] uses an environment that has objects of interest using
RFID tags along with two RFID readers mounted on a motor along with a camera
to make localization decisions where the hardware cost is close to 10,000 dollars.
Although the environmental consideration is similar to our work, we focus on a low
cost environment using state of the art devices for use in daily lives. The Sixth Sense
[83] system considers a tagged environment covered by readers which raises privacy
concerns as the entire environment is being sensed constantly. Similarly the MAX
system [112] considers a hierarchy of tagged environment that is observable by the
base stations containing reader elements.
There is also a rich variety of work in the field of context aware computing which
focuses on a generalized solution for a diverse set of devices, interfaces, and operations.
A supportive environment for individuals requiring cognitive assistance is presented
133

in Chang et. al. [35]. This system considers using a tag enabled environment, similar
to our approach, but focuses more on creating a unified interface that improves the
user experience. Our work complements this approach, as we focus on the underlying
system that would support such applications. The system described in Abascal et.
al. [14] presents an environment for people with cognitive disability which provides
context-aware information and intelligent decision making. Our work also expands on
this approach, focusing specifically on RFID technology for monitoring and guidance
purposes.
Also worth noting are the programming abstractions described in Acharya et.al.
[15], which provide for a high level virtualization architecture that enables a layer
to aggregate queries. This is more generalized than our work, which focuses on a
specific sensor technology. Other research has been done with RFID-based middle-
ware systems. The work presented by Thiem et. al. [100] discusses a framework
that combines RFID infrastructure with a wireless communication interface. This
allows for the expansion of existing infrastructure, increasing environment coverage
at a significantly lower cost than other options.
Systems like Savant [91], RFIDStack [46], High Fan-in Systems [47] and Win-
RFID [81] consider item tracking applications as opposed to guidance applications.
RF2ID [16] exploits the data flow for item tracking applications as opposed to guid-
ing techniques. The concept of path is used in many different contexts including fault
tolerance [37], profiling distributed systems [24, 53], and resource allocation [108, 85].
Scout OS [73] defines path abstraction to navigate through the layers of the network
stack and Ninja project [52] utilizes path abstraction as a way to compose multiple
services distributed on the Internet into a single logical unit. Our work is inspired by
the use of paths in these various contexts.
134

6.5 Summary
We have presented a low-cost and effective middleware solution (GuardianAngel)
based on passive RFID technology that can be used as a building block for indoor
guidance and unobtrusive monitoring applications, such as in an assisted living en-
vironment. We proposed the basic system abstractions that would be necessary for
such environments and showed an efficient implementation of these abstractions us-
ing passive RFID technology. By virtualizing the position information into zones,
obfuscating precise timing information, and by giving user control on when and what
to report for monitoring purposes, we make the system more user friendly for such
environments. We showed through experimentation using real RFID devices in the
small, and emulated readers in the large that GuardianAngel delivers close to 100%
accuracy for zone information allowing the construction of very robust guidance and
monitoring applications.
135

CHAPTER VII
DISCUSSION ON ITEM TRACKING AND ITEM
GUIDANCE-MONITORING
In this section we share our experiences with working in two different application do-
mains using RFID technology. The unreliable properties of RFID is common for many
sensor technologies and hence our results have broader applicability. Item tracking
and item guidance-monitoring applications are common and use a wide variety of
sensors. We have mainly focused on instances of these applications using state of the
art RFID readers and tags as a low cost solution that has a wide applicability.
7.1 Common Requirements
There are many requirements from the application perspective that are common for
item tracking and item guidance-monitoring systems. It is observed that the appli-
cations require a scalable solution that is able to perform well with increasing load in
the system, while at the same time increasing the performance with high availabil-
ity of resources. The concept of path is useful for item tracking where tagged items
follow a path; at the same time it is evident that a path is created along the line
of movement of a mobile object through the tagged environment for item guidance-
monitoring applications. The concept of geographic distinction is useful for both
application scenarios as it opens up new possibilities for the application layer that is
not achievable otherwise. The general scalable system concept is presented in Figure
68. We discuss this concept in detail in the following subsections.
136

Computational
Element
Computational
ElementComputational
Element
Computational
Element
Computational
Element
Logical Path for Communication
among Computational elements
RFID Sensors
(stationary or mobile)
Figure 68: The Path based Communication across Computational Elements (VirtualReader or Virtual Stations)
7.1.1 Scalable Solution
The large scale data in the item tracking applications and high mobility data for item
guidance-monitoring systems require a scalable solution approach as opposed to a cen-
tralized control system. We have considered a distributed architecture that is trans-
parent to the application layer and the lower hardware layer. The item tracking and
item guidance-monitoring applications have a common requirements of a scalable in-
frastructure for large scale deployment. The computational elements must be logically
or physically distributed to serve the RFID readers in the environment. The scalabil-
ity requirement is reflected in the basic architecture of RF 2ID and GuardianAngel.
In RF 2ID we have virtual readers (VR) in charge of different geographic regions.
137

The individual VRs are able to serve geographically distributed stationary RFID read-
ers for item tracking applications. In very large scale deployments like supply chain
scenarios, the system needs a coordinator among the VRs - the name server serves
this purpose to make important decisions and expedite the VR to VR coordinations.
The distribution of VRs that is based on the geographic topology is able to relate the
actual physical environment with the application requirements in real time. The VRs
are able to create a path among themselves that takes into account the actual flow
of the data items. The distributed VRs are also able to coordinate with each other
in real time to make dynamic resource management decisions based on application
requirements. We use the load shedding based resource management techniques that
use the spatial information for space based load shedding and the temporal property
of data to perform time based load shedding in the presence of unexpected heavy
load in the system.
For guidance-monitoring applications, we have virtual stations (VS) that are in
charge of various geographic regions of the environment. The VSs are able to serve
the mobile objects (MO) in various geographic locations as the MOs traverse the
environment. The logical separation of physical space to computational elements
provides a scalable way to distribute the computational load in the system. The VS
are in charge of providing the MOs with information regarding the environment while
at the same time keeping status information in the form of sequence of states. The
rule engine is in charge of matching the state information to make sure the MOs do
not require closer surveillance or immediate attention (e.g., special care needed for
an elderly person in an assisted living center). The VSs share the status information
among themselves as the MOs traverse through the environment.
138

7.1.2 Path Based Information
The data flow oriented concept at system level is the underlying theme of the disser-
tation research. We have explored the concept of path in item tracking applications
as well as item guidance-monitoring applications.
The item tracking applications require the computational elements to interact
based on the actual flow of tagged items. The virtual readers create a logical path
that resembles the actual data flow. The VRs use the logical path to dynamically
compare, contrast, refine the data and make valuable decisions in real time. The
path eases the query process that can be regular aggregation queries as well as flow
centric queries such as information regarding a missing item or a misplaced item.
Such queries are very difficult in a large scale deployment. The resource management
also takes place along the logical path to make dynamic adjustments for incoming
heavy load during the course of operation.
The concept of path holds true for the item guidance-monitoring applications. The
virtual stations create a logical path that follows the mobile user’s (MO) intended
route. The path here is used to share the status information of the MO across
the VSs. The path is used also within the MO to provide guidance information
to the user with fine granularity. The concept of path at system level eases the
guidance and monitoring information to flow naturally as the MO traverses through
the environment.
Our discussion on the similar requirements open up new possibilities to explore
unique solution approach that may be applicable for item tracking and item guidance-
monitoring systems.
7.2 Differences in Requirements
There are certain requirements in item tracking applications and item location ap-
plications that are very different and ask for a different set of solution approaches to
139

deal with them. These set of requirements are the reason behind the distinct system
architectures for item tracking applications and item guidance-monitoring applica-
tions. The actors in the environment are the main reason behind the differences in
the application requirements. The inclusion of the human actors in the environment
for item guidance-monitoring raises many important concerns unlike the item track-
ing applications. The level of transparency of information and the type of information
being shared are the key differences in the application requirements.
7.2.1 Information Transparency
The application requirements for item tracking applications ask for the ability to
figure out the previous, current and future possible location of a tagged item There
are also query requirements for missing and misplaced items which are very tedious
in a large system setup where numerous items are processed. The question of privacy
does not arise as the item tracking application scenarios consider tagging of non-living
objects mainly.
The item guidance-monitoring applications require a level of abstraction to pre-
serve the privacy as in these scenarios, we are considering human actors. The infor-
mation about the actors are aggregated over the dimensions of time and space and
presented as virtual position of an actor. The nature of the application scenarios
ask for a two layer architecture that separates the detailed information and virtual
information (over space and time).
7.3 Information Exchange
The level of information exchange through the path is different in the two applications.
The virtual readers transfer information regarding the tagged items along the path
where the tagged items traverse through the route. The VRs first locally refine the
data gathered from the physical RFID readers attached to them. The VRs must
generate a set of timestamped data that includes the observed items (intersection of
140

items received and items expected from previous VR) and spurious items (items not
expected but received at the current VR) and missing items (items expected from
previous VRs but not received in current VR). Then a VR shares the timestamped
list of items with its neighbor along the path. The main goal of the information
exchange is to improve the global reliability in terms of items observation, detection
and tracking in the system.
In the case of item guidance-monitoring, the virtual stations create a logical path
that follows the flow of the movement of the mobile objects (MO). The VSs are in
charge of the status information of the MOs in that particular region. As the MO
provides the VS with its intended source to destination traversal plan, the VSs are
able to share the MO status information among participating VSs as the MO pro-
gresses through the environment. In the case when the MO is not able to provide the
source to destination route, the VS dynamically determines the MO’s current loca-
tion and updates the corresponding VS accordingly. The VSs do not share dynamic
information of the environment along the path which is done for the item tracking
applications. The status information is shared among the VSs instead.
It is interesting to note the differences in the requirements for item tracking appli-
cations and item location applications and how the internal operations vary although
the high level architecture looks similar.
7.4 Summary
Our experience on working with RFID technology has given us the opportunity to
deal with the limitations of the current technology and has guided us to come up
with simple but powerful solution approach to use it in various environmental setup.
There are common goals to achieve in item tracking applications and item guidance-
and-monitoring applications which ask for a scalable solution having knowledge of
141

data flow through the system. The flow of data is different for two different appli-
cation requirements as the item tracking aims to share the tagged object through
a path while the guidance-monitoring application asks for status information to be
shared across a designated path. The way the information is shared is very unique in
the two application scenarios. For example, the goal of the item tracking application
is transparency of information, being able to determine the object’s placement in a
particular window of time. On the other hand, the item guidance-monitoring ap-
plications bring in challenges as information transparency conflicts with the privacy
requirements of the indoor residents. We present two distinct solution approaches
that are very specific for the individual problems in RF 2ID and GuardianAngel.
142
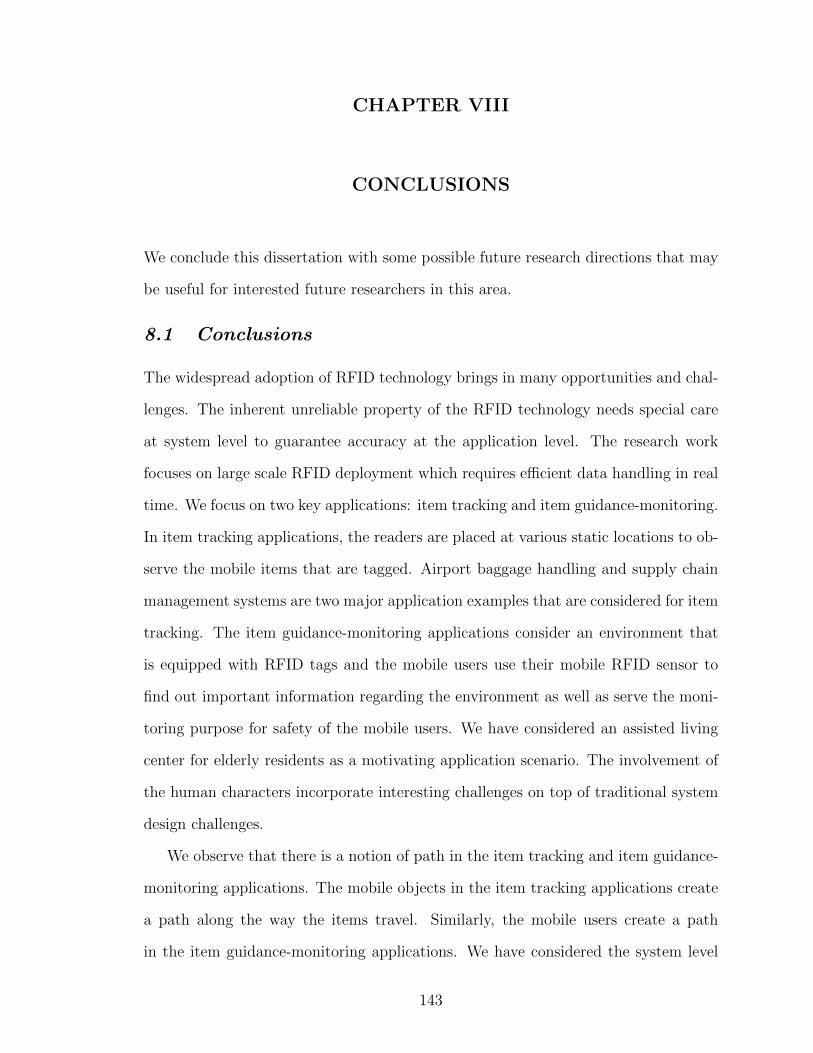
CHAPTER VIII
CONCLUSIONS
We conclude this dissertation with some possible future research directions that may
be useful for interested future researchers in this area.
8.1 Conclusions
The widespread adoption of RFID technology brings in many opportunities and chal-
lenges. The inherent unreliable property of the RFID technology needs special care
at system level to guarantee accuracy at the application level. The research work
focuses on large scale RFID deployment which requires efficient data handling in real
time. We focus on two key applications: item tracking and item guidance-monitoring.
In item tracking applications, the readers are placed at various static locations to ob-
serve the mobile items that are tagged. Airport baggage handling and supply chain
management systems are two major application examples that are considered for item
tracking. The item guidance-monitoring applications consider an environment that
is equipped with RFID tags and the mobile users use their mobile RFID sensor to
find out important information regarding the environment as well as serve the moni-
toring purpose for safety of the mobile users. We have considered an assisted living
center for elderly residents as a motivating application scenario. The involvement of
the human characters incorporate interesting challenges on top of traditional system
design challenges.
We observe that there is a notion of path in the item tracking and item guidance-
monitoring applications. The mobile objects in the item tracking applications create
a path along the way the items travel. Similarly, the mobile users create a path
in the item guidance-monitoring applications. We have considered the system level
143

incorporation of the concept of path to increase the performance of the system. The
path uses the data flow nature of the applications at system level. The main theme
of the middleware solution is a data flow centric computation at system level which
is incorporated for item tracking applications as well as item guidance-monitoring
applications.
The item tracking and item guidance-monitoring applications have many simi-
larities in requirements. The applications require a scalable solution for large scale
deployment. The system must be able to handle large amount of data efficiently in
real time for both of the application scenarios. On the other hand, the sharing of
data is done at two different levels for two kinds of applications. The item tracking
applications require transparency in handling of the data as the system is interested
in finding out where the items are and how the items are at real time. However, the
item guidance-monitoring applications face challenges in data sharing as the human
characters are involved in the system. The data must be available to the system in
some abstract form so that the human users are not worried about compromising
their privacy. The differences lead to two different solution approaches that has the
same underlying theme of data flow centric computing.
RF 2ID is the middleware system that stands for Reliable Framework for Radio
Frequency IDentification. It is the middleware level solution for item tracking appli-
cations. It uses two major system abstractions named virtual reader (VR) and virtual
path (Vpath). The VRs are the distributed computing elements that are placed at
various geographic locations. Each VR is in charge of collecting and managing data
acquired from Physical RFID readers placed in that particular geographic location.
The VRs coordinate to transfer data using a logical Vpath that resembles the actual
flow of data in the environment. The VRs are able to coordinate and intelligently
dynamically manage load in the presence of unexpected system load. We propose two
144

resource management mechanism that uses load shedding among the VRs to dynam-
ically manage the system load. One mechanism is called space based load shedding
and the other one is time based load shedding that manages system load on the ba-
sis of space and time, respectively. We have designed and implemented the RF 2ID
system and evaluated the entire system using real RFID devices as well as emulated
RFID devices for scalability purposes. Our evaluation has shown improved system
reliability in terms of number of tracked items in the system which provides a scalable
infrastructure.
The middleware solution for item guidance-monitoring application is called GuardianAn-
gel. The application considers a tagged indoor scenario with residents having their
own RFID readers to provide them with adequate information about the environ-
ment. The guidance and monitoring requirement can be conflicting with each other.
The guidance information requires very fine grain information about the environment
to make proper decisions. On the other hand, the monitoring system must not have a
fine grain knowledge which can introduce privacy concerns. We consider this aspect
during the design and implementation. The system is a two layered infrastructure
that has the upper layer which is the monitoring layer. This layer is in charge of
monitoring of the actors in the environment. The monitoring layer is physically a set
of distributed virtual stations that have knowledge about the environment. The en-
vironment itself is equipped with RFID tags. The residents of the environment carry
a mobile object that has a sensing element and a computing element (e.g., handhold
device with a portable RFID reader) - the guidance server runs on this mobile object.
The guidance server is in charge of making local decisions to the users. It is resource
limited and asks for new information from the virtual stations as needed. The guid-
ance server also provides the monitoring server with the information regarding the
status of the mobile object. But the status information is not fine grain information -
the guidance server wraps up the information over a period of time and over a larger
145

region to hide the detailed information of the users. We have implemented a real
testbed using grid structured RFID devices along with scalability study using emu-
lated RFID readers. The current implementation of GuardianAngel shows promising
performances
8.2 Future Work
We discuss different avenues for future research.
8.2.1 Generalized Architecture for Heterogeneous Sensors
There are numerous real world application that require handling with variety of sensor
data in real time. Example application can be a surveillance system that uses several
forms of sensor input for decision making. The data flow based architecture can be
very useful for data prioritization and data fusion for multimodal sensor system. Our
path based architecture that is geared towards RFID based data can be generalized
to use the data flow centric information for a scalable, reliable and resource aware
framework. A general framework introduces many interesting research challenges and
can be an active area to explore for today’s emerging technology.
8.2.2 Applications
There are avenues for interdisciplinary work that involves application of sensor data in
a real world setup. One example application is a healthcare facility which introduces
a new set of challenges for real time data fusion, data processing, data dissemination
and delivery of the data for improved system performance. A hospital using low
cost sensor devices like RFID technology to reduce medication error is a specific
application scenario geared towards this direction.
Outdoor sensing applications are also very important. These sensing techniques
are useful for rural areas to improve the quality of life (e.g., reduce the impact of an
upcoming natural disaster). The real time processing of sensor data and interpreting
146

the data involves challenges that we have already mentioned. Moreover, the outdoor
sensors have the added challenges of being severely influenced by the dynamic nature
of the environment.
8.2.3 Combining Sensing with High Performance Resources
The current research can be extended along the line of today’s high performance
resources to mitigate the computational challenges introduced by dynamic incoming
sensor data. There are multicore machines which allow tremendous amount of parallel
processing. There are also new trends like cloud computing that would help deal with
the computation load of sensor generated data.
8.3 Open Problems
RFID based applications are growing and middleware systems are emerging in re-
cent years to meet various application requirements. However, there are remaining
challenges to be addressed in near future that are of great importance. We consider
security, energy awareness and generality to be of greater interest.
8.3.1 Security
Security is a major concern in RFID systems as it is for any other system. The mid-
dleware system must be cautious to deal with large amount of data as some of it may
be malicious. The large amount of information available in RFID middleware sys-
tems makes it very attractive for malicious users to access sensitive information. The
current middleware systems discussed from research perspective do not incorporate
security as a feature in the system. The commercial solutions do not mention secu-
rity as a major service to offer. Security can be incorporated on top of a middleware
solution. However, the middleware layer is very suitable for incorporating security
such that malicious devices, data or queries can be eliminated at the lowest level.
147

8.3.2 Energy Conservation
Energy conservation is becoming a major concern in large scale systems of recent
years. Large scale RFID based systems are being designed and deployed - these sys-
tems must consider a way to minimize the energy footprint. A middleware solution
is best suited for such measures as it couples closely with hardware devices. It is
believed that there will be new design considerations for energy aware RFID middle-
ware or existing middleware systems enhanced for energy conservation features in the
near future.
8.3.3 Generality
A system that may serve a diverse set of applications is hard to generalize. There
are many existing solutions offered for RFID based systems. However, there is still a
requirement for a generic middleware system that offers solutions for a wide range of
applications such as tracking, monitoring, guidance etc. In the future we expect to
see more generic solutions that can be tuned to specific needs. The open problems
indicate the growth of interest in improvement in the area of middleware for RFID
technology.
148

REFERENCES
[1] “Acitvewave, RFID solution provider.” http://www.activewaveinc.com/
applications_overview.php.
[2] “Alien technology.” http://www.alientechnology.com/.
[3] “The basics of RFID technology.” http://www.rfidjournal.com/article/
articleview/1337/1/129/.
[4] “E-Zpass.” http:\\www.answers.com.
[5] “E-Zpass.” http:\\www.weblogs.baltimoresun.com.
[6] “IRobot corporation.” http://store.irobot.com/corp/index.jsp.
[7] “RFCode.” http://www.rfcode.com/.
[8] “RFID Guidance.” http:\\www.yenra.com.
[9] “RFID Guidance.” http:\\www.ae.gatech.edu.
[10] “RFID Tracking.” http:\\www.electrocom.com.au.
[11] “The SMART Solutions.” http:\\www.tcm-s.com.
[12] “The Technovelgy Com Where Science Meets Fiction.” http://www.
technovelgy.com/.
[13] “Tor project: Anonymity online.” http://www.torproject.org/index.html.
en.
[14] Abascal, J., Bonail, B., Casas, R., Marco, A., Sevillano, J. L.,and Cascado, D., “Towards an intelligent and supportive environment forpeople with physical or cognitive restrictions,” in PETRA ’09: Proceedings ofthe 2nd International Conference on PErvsive Technologies Related to AssistiveEnvironments, pp. 1–8, 2009.
[15] Acharya, A., Misra, A., Wang, X., Wright, C., Banerjee, N.,Chakraborty, D., Dasgupta, K., and Sharma, S., “Presence virtual-ization middleware for next-generation converged applications,” in Companion’08: Proceedings of the ACM/IFIP/USENIX Middleware ’08 Conference Com-panion, pp. 124–126, 2008.
149

[16] Ahmed, N., Kumar, R., French, R. S., and Ramachandran, U.,“RF2ID: A reliable middleware framework for RFID deployment,” in Inter-national Parallel and Distributed Processing Symposium (IPDPS), IEEE Com-puter Society, 2007.
[17] Ahmed, N. and Ramachandran, U., “Load shedding based resource man-agement techniques for rfid data,” in IEEE International Conference on RFID,IEEE Computer Society, 2009.
[18] Ahmed, N. and Ramachandran, U., “Load shedding based resource man-agement techniques for RFID data,” in IEEE International Conference onRFID, IEEE Computer Society, 2009.
[19] Ammons, G. and Larus, J. R., “Improving data-flow analysis with pathprofiles,” ACM SIGPLAN Notices, vol. 39, no. 4, pp. 568–582, 2004.
[20] Archer, Jr., J. E., Conway, R., and Schneider, F. B., “User recoveryand reversal in interactive systems,” ACM Trans. Program. Lang. Syst., vol. 6,pp. 1–19, Jan. 1984.
[21] Armstrong, R., “Seven steps to optimizing data warehouse performance,”Computer, vol. 34, no. 12, pp. 76–79, 2001.
[22] Babcock, B., Datar, M., and Motwani, R., “Load shedding techniquesfor data stream systems,” in Proc. of the 2003 Workshop on Management andProcessing of Data Streams (MPDS, 2003.
[23] Bahl, P. and Padmanabhan, V. N., “Radar: an in-building rf-based userlocation and tracking system,” in IEEE INFOCOM, pp. 775–784, 2000.
[24] Barham, P., Donnelly, A., Isaacs, R., and Mortier, R., “Using magpiefor request extraction and workload modelling,” in OSDI’04: Proceedings of the6th conference on Symposium on Opearting Systems Design & Implementation,pp. 18–18, USENIX Association, 2004.
[25] Barton, J. and Kindberg, T., “The Cooltown User Experience,” Tech. Rep.HPL-2001-22, HP Labs, 2001.
[26] Beller, M. and Yacobi, Y., “Fully-fledged two-way public key authentica-tion and key agreement for low-cost terminals,” Electronics Letters, vol. 29,no. 11, pp. 999–1001, 1993.
[27] Blazic, A., Dolinar, K., and Porekar, J., “Enabling privacy in perva-sive computing using fusion of privacy negotiation, identity management andtrust management techniques,” in First International Conference on the DigitalSociety (ICDS), Digital Society, January 2007.
[28] Brodt, A. and Sathish, S., “Together we are strong,” Pervasive Computingand Communications, IEEE International Conference on, vol. 0, pp. 1–4, 2009.
150

[29] Brown, D., RFID Implementation. New York, NY, USA: McGraw-Hill, Inc.,2007.
[30] Brown, D. E., RFID Implementation. McGraw-Hill Communications, 2007.
[31] Buettner, M. and Wetherall, D., “An empirical study of uhf rfid perfor-mance,” in MobiCom ’08: Proceedings of the 14th ACM international conferenceon Mobile computing and networking, pp. 223–234, ACM, 2008.
[32] Burnell, J., “Heathrow airport terminal 5.” http://www.
heathrow-airport-guide.co.uk/terminal-5.html.
[33] Burnell, J., “Intercontinental rfid baggage tagging trial.” http://www.
rfidupdate.com/articles/index.php?id=1544.
[34] Chandrasekaran, S., Cooper, O., Deshpande, A., Franklin, M. J.,Hellerstein, J. M., Hong, W., Krishnamurthy, S., Madden, S., Ra-man, V., Reiss, F., and Shah, M. A., “TelegraphCQ: Continuous dataflowprocessing for an uncertain world,” in CIDR, 2003.
[35] Chang, Y.-J., Tsai, S.-K., and Wang, T.-Y., “A context aware handheldwayfinding system for individuals with cognitive impairments,” in Assets ’08:Proceedings of the 10th international ACM SIGACCESS conference on Com-puters and accessibility, pp. 27–34, 2008.
[36] Chawathe, S. S., Krishnamurthy, V., Ramachandran, S., and Sarma,S., “Managing rfid data,” in VLDB ’04: Proceedings of the Thirtieth interna-tional conference on Very large data bases, pp. 1189–1195, VLDB Endowment,2004.
[37] Chen, M. Y., Accardi, A., Kiciman, E., Lloyd, J., Patterson, D.,Fox, A., and Brewer, E., “Path-based faliure and evolution management,”in NSDI’04: Proceedings of the 1st conference on Symposium on NetworkedSystems Design and Implementation, pp. 23–23, USENIX Association, 2004.
[38] Cherniack, M., Balakrishnan, H., Balazinska, M., Carney, D.,Cetintemel, U., Xing, Y., and Zdonik, S., “Scalable Distributed StreamProcessing,” in CIDR 2003 - First Biennial Conference on Innovative DataSystems Research, (Asilomar, CA), January 2003.
[39] Cui, J. F. and Chae, H. S., “Load balancing for RFID middlewares based onagent technology,” in SE’07: Proceedings of the 25th conference on IASTED In-ternational Multi-Conference, (Anaheim, CA, USA), pp. 136–141, ACTA Press,2007.
[40] Cybenko, G., “Dynamic load balancing for distributed memory multiproces-sors,” J. Parallel Distrib. Comput., vol. 7, no. 2, pp. 279–301, 1989.
151

[41] De, P., Basu, K., and Das, S. K., “An ubiquitous architectural frameworkand protocol for object tracking using RFID tags,” in International Conferenceon Mobile and Ubiquitous Systems, pp. 174–182, IEEE Computer Society, 2004.
[42] Dong, Q., Shukla, A., Shrivastava, V., Agrawal, D., Banerjee, S.,and Kar, K., “Load balancing in large-scale RFID systems,” Comput. Netw.,vol. 52, no. 9, pp. 1782–1796, 2008.
[43] Dunlop, D. D. and Basili, V. R., “Generalizing specifications for uniformlyimplemented loops,” ACM Trans. Program. Lang. Syst., vol. 7, pp. 137–158,Jan. 1985.
[44] Eager, D. L., Lazowska, E. D., and Zahorjan, J., “Adaptive load sharingin homogeneous distributed systems,” IEEE Trans. Softw. Eng., vol. 12, no. 5,pp. 662–675, 1986.
[45] Enge, P. and Misra, P., “Special issue on global positioning system,” Pro-ceedings of the IEEE, vol. 87, no. 1, pp. 3–15, 1999.
[46] Floerkemeier, C. and Lampe, M., “RFID middleware design: addressingapplication requirements and RFID constraints,” in sOc-EUSAI ’05: Proceed-ings of the 2005 joint conference on Smart objects and ambient intelligence,pp. 219–224, ACM, 2005.
[47] Franklin, M. J., Jeffery, S. R., Krishnamurthy, S., and Reiss, F.,“Design considerations for high fan-in systems: The HiFi approach,” in CIDR,pp. 290–304, 2005.
[48] Gedik, B., Wu, K.-L., Yu, P. S., and Liu, L., “Mobiqual: Qos-aware loadshedding in mobile cq systems,” in ICDE ’08: Proceedings of the 2008 IEEE24th International Conference on Data Engineering, (Washington, DC, USA),pp. 1121–1130, IEEE Computer Society, 2008.
[49] Gerndt, M., Automatic Parallelization for Distributed-Memory Multiprocess-ing Systems. PhD thesis, University of Bonn, Bonn, Germany, Dec. 1989.
[50] Ghias, S., “Radio-tagging luggage at heathrow.” http://current.newsweek.
com/budgettravel/2008/02/radiotagging_luggage_at_heathr.html.
[51] Gonzalez, H., Han, J., Li, X., and Klabjan, D., “Warehousing and ana-lyzing massive rfid data sets,” in ICDE ’06: Proceedings of the 22nd Interna-tional Conference on Data Engineering, p. 83, IEEE Computer Society, 2006.
[52] Gribble, S. D., Welsh, M., Behren, R. V., Brewer, E. A., Culler,D., Borisov, N., Czerwinski, S., Gummadi, R., Hill, J., Joseph, A.,Katz, R. H., Mao, Z. M., Ross, S., and Zhao, B., “The ninja architecturefor robust internet-scale systems and services,” Computer Networks, vol. 35,pp. 473–497, 2001.
152

[53] Gschwind, T., Eshghi, K., Garg, P. K., and Wurster, K., “Webmon:A performance profiler for web transactions,” in WECWIS ’02: Proceedings ofthe Fourth IEEE International Workshop on Advanced Issues of E-Commerceand Web-Based Information Systems (WECWIS’02), p. 171, IEEE ComputerSociety, 2002.
[54] Hac, A. and Johnson, T., “A study of dynamic load balancing in a dis-tributed system,” SIGCOMM Comput. Commun. Rev., vol. 16, no. 3, pp. 348–356, 1986.
[55] Hardgrave, B. C. and Miller, R., “The myths and realities of RFID,”Tech. Rep. ITRI-WP067-0306, SAM. M. Walton College of Business, Universityof Arkansas, 2006.
[56] Hardgrave, B. C., Miller, R., and Waller, M., “Does RFID reduce outof stocks? a preliminary analysis,” Tech. Rep. ITRI-WP058-1105, SAM. M.Walton College of Business, University of Arkansas, 2005.
[57] Hassan, T. and Chatterjee, S., “A taxonomy for RFID,” in HICSS ’06:Proceedings of the 39th Annual Hawaii International Conference on SystemSciences, p. 184.2, IEEE Computer Society, 2006.
[58] Heering, J. and Klint, P., “Towards monolingual programming environ-ments,” ACM Trans. Program. Lang. Syst., vol. 7, pp. 183–213, Apr. 1985.
[59] Hu, Y., Sundara, S., Chorma, T., and Srinivasan, J., “Supporting rfid-based item tracking applications in oracle dbms using a bitmap datatype,” inVLDB ’05: Proceedings of the 31st international conference on Very large databases, pp. 1140–1151, VLDB Endowment, 2005.
[60] Intel, “Tomorrow’s high performance network.” http://developer.intel.
com/technology/comms/perfnet/index.htm.
[61] Jeffery, S. R., Alonso, G., Franklin, M. J., Hong, W., and Widom,J., “A pipelined framework for online cleaning of sensor data streams,” in ICDE’06: Proceedings of the 22nd International Conference on Data Engineering,IEEE Computer Society, 2006.
[62] Jeffery, S. R., Franklin, M. J., and Garofalakis, M., “An adaptiverfid middleware for supporting metaphysical data independence,” The VLDBJournal, vol. 17, no. 2, pp. 265–289, 2008.
[63] Juang, P., Oki, H., Wang, Y., Martonosi, M., Peh, L., and Ruben-stein, D., “Energy-efficient computing for wildlife tracking: Design tradeoffsand early experiences with ZebraNet,” in Proceedings of ASPLOS-X, October2002.
[64] Kanters, R., “Data Management Risks of Radio Frequency Identification(RFID),” Master’s thesis, Tilburg University, 2007.
153

[65] Kimball, R., “Rfid tags and smart dust.” http://www.
intelligententerprise.com/030718/612warehouse1\_1.jhtml.
[66] Knuth, D. E., The TEXbook. Reading, Mass.: Addison-Wesley, 1984.
[67] Korach, E., Rotem, D., and Santoro, N., “Distributed algorithms forfinding centers and medians in networks,” ACM Trans. Program. Lang. Syst.,vol. 6, pp. 380–401, July 1984.
[68] Kornerup, J., “Mapping powerlists onto hypercubes,” Master’s thesis, TheUniversity of Texas at Austin, 1994. (In preparation).
[69] Kumar, S., Alaettinoglu, C., and Estrin, D., “Scalable object-trackingthrough unattended techniques (SCOUT),” in Proceedings of the 8th Interna-tional Conference on Network Protocols (ICNP), pp. 253–262, 2000.
[70] Lamport, L., LATEX: A Document Preparation System. Reading, Mass.:Addison-Wesley, 1986.
[71] Landt, J., “Shrouds of Time: The History of RFID,” 2001. http://www.
rfidconsultation.eu/docs/ficheiros/shrouds_of_time.pdf.
[72] Martins, C., “RFID data management: It’s not the mass, it’s the momen-tums.” AIM Global, 2005.
[73] Mosberger, D. and Peterson, L. L., “Making paths explicit in the scoutoperating system,” in Proceedings of the second USENIX symposium on Operat-ing systems design and implementation (OSDI), (Seattle, Washington, UnitedStates), 1996.
[74] Nath, B., Reynolds, F., and Want, R., “Rfid technology and applications,”IEEE Pervasive Computing, vol. 5, no. 1, pp. 22–24, 2006.
[75] Nemmaluri, A., Corner, M. D., and Shenoy, P., “Sherlock: automaticallylocating objects for humans,” in MobiSys ’08: Proceeding of the 6th interna-tional conference on Mobile systems, applications, and services, pp. 187–198,2008.
[76] Ni, L. M., Liu, Y., Lau, Y. C., and Patil, A. P., “Landmarc: indoorlocation sensing using active RFID,” Wirel. Netw., vol. 10, no. 6, pp. 701–710,2004.
[77] Nielson, F., “Program transformations in a denotational setting,” ACMTrans. Program. Lang. Syst., vol. 7, pp. 359–379, July 1985.
[78] Nielson, F., “Program transformations in a denotational setting,” ACMTrans. Program. Lang. Syst., vol. 7, pp. 359–379, July 1986.
154

[79] Papadopoulou, E., McBurney, S., Taylor, N., Williams, M.,Dolinar, K., and Neubauer, M., “Using user preferences to enhance privacyin pervasive systems,” in ICONS 08, pp. 271 – 276, April 2008.
[80] Park, S.-M., Song, J.-H., Kim, C.-S., and Kim, J.-J., “Load balancingmethod using connection pool in RFID middleware,” in SERA ’07: Proceedingsof the 5th ACIS International Conference on Software Engineering Research,Management & Applications, pp. 132–137, IEEE Computer Society, 2007.
[81] Prabhu, B. S., Su, X., Qiu, C., Ramamurthy, H., Chu, P., and Gadh,R., “WinRFID middleware for distributed RFID infrastructure,” in Interna-tional Workshop on Radio Frequency Identification (RFID) and Wireless Sen-sors, (Indian Institute of Technology, Kanpur, India), 2005.
[82] Prothro, J. T., “Improved Performance of a Radio Frequency IdentificationTag Antenna on a metal ground plane,” Master’s thesis, Georgia Institute ofTechnology, 2007.
[83] Ravindranath, L., Padmanabhan, V. N., and Agrawal, P., “Sixthsense:Rfid-based enterprise intelligence,” in MobiSys ’08: Proceeding of the 6th inter-national conference on Mobile systems, applications, and services, pp. 253–266,2008.
[84] Reid, B. K., “A high-level approach to computer document formatting,” inProceedings of the Seventh Annual Symposium on Principles of ProgrammingLanguages, (New York), pp. 24–31, ACM, Jan. 1980.
[85] Reumann, J., Mehra, A., Shin, K. G., and Kandlur, D., “Virtual ser-vices: a new abstraction for server consolidation,” in ATEC ’00: Proceedings ofthe USENIX Annual Technical Conference, USENIX Association, 2000.
[86] Romer, K., “Distributed algorithms for finding centers and medians in net-works,” Smart Playing Cards: A Ubiquitous Computing Game, vol. 6, pp. 371–377, 2002.
[87] Roussos, G., Networked RFID. Springer, 2008.
[88] Roussos, G., Networked RFID: Systems, Software and Services. SpringerPublishing Company, Incorporated, 2008.
[89] Roy, W., Andy, H., Veronica, F., and Gibbons, J., “The active badgelocation system,” ACM Trans. Inf. Syst., vol. 10, no. 1, pp. 91–102, 1992.
[90] Sarma, S., “Integrating RFID,” Queue, vol. 2, no. 7, pp. 50–57, 2004.
[91] “Savant technical manual,” Tech. Rep. Version 0.1 (Alpha), OAT SYSTEMS &MIT AUTO-ID CENTER, 2002.
155

[92] “State of Georgia Logistics Innovation Center, (Page Siplon, Execu-tive Director).” ttp://www.georgia.org/Business/Maritime+Logistics+
Innovation+Center.tm.
[93] Smith, A., Balakrishnan, H., Goraczko, M., and Priyantha, N. B.,“Tracking Moving Devices with the Cricket Location System,” in 2nd Inter-national Conference on Mobile Systems, Applications and Services (Mobisys2004), 2004.
[94] Stanford, V., “Pervasive computing goes the last hundred feet with rfidsystems,” IEEE Pervasive Computing, vol. 2, no. 2, pp. 9–14, 2003.
[95] Sullivan, L., “Wal-Mart tests RFID with eight suppliers.” Information Week,2004.
[96] Tatbul, N., Cetintemel, U., Zdonik, S., Cherniack, M., and Stone-braker, M., “Load shedding in a data stream manager,” in VLDB ’2003: Pro-ceedings of the 29th international conference on Very large data bases, pp. 309–320, VLDB Endowment, 2003.
[97] Teskey, M., “Official Homepage for IDtronic.” http://www.idtronic.de/.
[98] Teskey, M., “Turning RFID Data into Information.” http://www.devx.com/
enterprise/Article/32251/0/page/1.
[99] “ThermAssureRF: The RFID Temperature Solution.” http://www.
evidencia.biz/products/acti-tag.htm.
[100] Thiem, L., Riemer, B., Witzke, M., and Luckenbach, T., “Rfid-basedlocalization in heterogeneous mesh networks,” in SenSys ’08: Proceedings of the6th ACM conference on Embedded network sensor systems, pp. 415–416, 2008.
[101] Thiesse, F., Dierkes, M., and Fleisch, E., “Lottrack: RFID-based processcontrol in the semiconductor industry,” IEEE Pervasive Computing, vol. 5,no. 1, 2006.
[102] Tjoa, A., “Modeling temporal consistency in data warehouses,” in DEXA’01: Proceedings of the 12th International Workshop on Database and ExpertSystems Applications, IEEE Computer Society, 2001.
[103] Tucci, L., “RFID: Where Sam’s Club goes Wal-Mart to follow.” EnterpriseInnovation, 2008.
[104] Vaidya, N. and Das, S. R., “Rfid-based networks: exploiting diversity andredundancy,” SIGMOBILE Mob. Comput. Commun. Rev., vol. 12, no. 1, pp. 2–14, 2008.
[105] Violino, B., “Rfid opportunities and challenges.” http://www.rfidjournal.
com/article/articleview/537.
156

[106] Violino, B., “RFID opportunities and challenges.” http://www.
rfidjournal.com/article/articleview/537.
[107] Wei, J., Dan, Y., and Yan, M., “A tracking algorithm in RFID reader net-work,” in FCST ’06: Proceedings of the Japan-China Joint Workshop on Fron-tier of Computer Science and Technology, (Washington, DC, USA), pp. 164–171, IEEE Computer Society, 2006.
[108] Welsh, M., Culler, D. E., and Brewer, E. A., “SEDA: An Architecturefor Well-Conditioned, Scalable Internet Services,” in Proceedings of the ACMSymposium on Operating Systems Principles (SOSP), Oct. 2001.
[109] Wickramasuriya, J., Datt, M., Mehrotra, S., and Venkatasubrama-nian, N., “Privacy protecting data collection in media spaces,” in MULTI-MEDIA ’04: Proceedings of the 12th annual ACM international conference onMultimedia, pp. 48–55, 2004.
[110] Wu, H., Fujimoto, R., Riley, G., and Hunter, M., “Spatial propaga-tion of information in vehicular networks,” IEEE Transactions on VehicularTechnology, vol. 58, pp. 420 – 431, January 2009.
[111] Yap, K.-K., Srinivasan, V., and Motani, M., “Max: human-centric searchof the physical world,” in SenSys ’05: Proceedings of the 3rd internationalconference on Embedded networked sensor systems, pp. 166–179, ACM, 2005.
[112] Yap, K.-K., Srinivasan, V., and Motani, M., “Max: Wide area human-centric search of the physical world,” ACM Trans. Sen. Netw., vol. 4, no. 4,pp. 1–34, 2008.
[113] Zhao, W., Ammar, M., and Zegura, E., “A message ferrying approachfor data delivery in sparse mobile ad hoc networks,” in Proceedings of ACMMobihoc, (Tokyo Japan), May 2004.
157

REFERENCES
[1] “Acitvewave, RFID solution provider.” http://www.activewaveinc.com/
applications_overview.php.
[2] “Alien technology.” http://www.alientechnology.com/.
[3] “The basics of RFID technology.” http://www.rfidjournal.com/article/
articleview/1337/1/129/.
[4] “E-Zpass.” http:\\www.answers.com.
[5] “E-Zpass.” http:\\www.weblogs.baltimoresun.com.
[6] “IRobot corporation.” http://store.irobot.com/corp/index.jsp.
[7] “RFCode.” http://www.rfcode.com/.
[8] “RFID Guidance.” http:\\www.yenra.com.
[9] “RFID Guidance.” http:\\www.ae.gatech.edu.
[10] “RFID Tracking.” http:\\www.electrocom.com.au.
[11] “The SMART Solutions.” http:\\www.tcm-s.com.
[12] “The Technovelgy Com Where Science Meets Fiction.” http://www.
technovelgy.com/.
[13] “Tor project: Anonymity online.” http://www.torproject.org/index.html.
en.
[14] Abascal, J., Bonail, B., Casas, R., Marco, A., Sevillano, J. L.,and Cascado, D., “Towards an intelligent and supportive environment forpeople with physical or cognitive restrictions,” in PETRA ’09: Proceedings ofthe 2nd International Conference on PErvsive Technologies Related to AssistiveEnvironments, pp. 1–8, 2009.
[15] Acharya, A., Misra, A., Wang, X., Wright, C., Banerjee, N.,Chakraborty, D., Dasgupta, K., and Sharma, S., “Presence virtual-ization middleware for next-generation converged applications,” in Companion’08: Proceedings of the ACM/IFIP/USENIX Middleware ’08 Conference Com-panion, pp. 124–126, 2008.
158

[16] Ahmed, N., Kumar, R., French, R. S., and Ramachandran, U.,“RF2ID: A reliable middleware framework for RFID deployment,” in Inter-national Parallel and Distributed Processing Symposium (IPDPS), IEEE Com-puter Society, 2007.
[17] Ahmed, N. and Ramachandran, U., “Load shedding based resource man-agement techniques for rfid data,” in IEEE International Conference on RFID,IEEE Computer Society, 2009.
[18] Ahmed, N. and Ramachandran, U., “Load shedding based resource man-agement techniques for RFID data,” in IEEE International Conference onRFID, IEEE Computer Society, 2009.
[19] Ammons, G. and Larus, J. R., “Improving data-flow analysis with pathprofiles,” ACM SIGPLAN Notices, vol. 39, no. 4, pp. 568–582, 2004.
[20] Archer, Jr., J. E., Conway, R., and Schneider, F. B., “User recoveryand reversal in interactive systems,” ACM Trans. Program. Lang. Syst., vol. 6,pp. 1–19, Jan. 1984.
[21] Armstrong, R., “Seven steps to optimizing data warehouse performance,”Computer, vol. 34, no. 12, pp. 76–79, 2001.
[22] Babcock, B., Datar, M., and Motwani, R., “Load shedding techniquesfor data stream systems,” in Proc. of the 2003 Workshop on Management andProcessing of Data Streams (MPDS, 2003.
[23] Bahl, P. and Padmanabhan, V. N., “Radar: an in-building rf-based userlocation and tracking system,” in IEEE INFOCOM, pp. 775–784, 2000.
[24] Barham, P., Donnelly, A., Isaacs, R., and Mortier, R., “Using magpiefor request extraction and workload modelling,” in OSDI’04: Proceedings of the6th conference on Symposium on Opearting Systems Design & Implementation,pp. 18–18, USENIX Association, 2004.
[25] Barton, J. and Kindberg, T., “The Cooltown User Experience,” Tech. Rep.HPL-2001-22, HP Labs, 2001.
[26] Beller, M. and Yacobi, Y., “Fully-fledged two-way public key authentica-tion and key agreement for low-cost terminals,” Electronics Letters, vol. 29,no. 11, pp. 999–1001, 1993.
[27] Blazic, A., Dolinar, K., and Porekar, J., “Enabling privacy in perva-sive computing using fusion of privacy negotiation, identity management andtrust management techniques,” in First International Conference on the DigitalSociety (ICDS), Digital Society, January 2007.
[28] Brodt, A. and Sathish, S., “Together we are strong,” Pervasive Computingand Communications, IEEE International Conference on, vol. 0, pp. 1–4, 2009.
159

[29] Brown, D., RFID Implementation. New York, NY, USA: McGraw-Hill, Inc.,2007.
[30] Brown, D. E., RFID Implementation. McGraw-Hill Communications, 2007.
[31] Buettner, M. and Wetherall, D., “An empirical study of uhf rfid perfor-mance,” in MobiCom ’08: Proceedings of the 14th ACM international conferenceon Mobile computing and networking, pp. 223–234, ACM, 2008.
[32] Burnell, J., “Heathrow airport terminal 5.” http://www.
heathrow-airport-guide.co.uk/terminal-5.html.
[33] Burnell, J., “Intercontinental rfid baggage tagging trial.” http://www.
rfidupdate.com/articles/index.php?id=1544.
[34] Chandrasekaran, S., Cooper, O., Deshpande, A., Franklin, M. J.,Hellerstein, J. M., Hong, W., Krishnamurthy, S., Madden, S., Ra-man, V., Reiss, F., and Shah, M. A., “TelegraphCQ: Continuous dataflowprocessing for an uncertain world,” in CIDR, 2003.
[35] Chang, Y.-J., Tsai, S.-K., and Wang, T.-Y., “A context aware handheldwayfinding system for individuals with cognitive impairments,” in Assets ’08:Proceedings of the 10th international ACM SIGACCESS conference on Com-puters and accessibility, pp. 27–34, 2008.
[36] Chawathe, S. S., Krishnamurthy, V., Ramachandran, S., and Sarma,S., “Managing rfid data,” in VLDB ’04: Proceedings of the Thirtieth interna-tional conference on Very large data bases, pp. 1189–1195, VLDB Endowment,2004.
[37] Chen, M. Y., Accardi, A., Kiciman, E., Lloyd, J., Patterson, D.,Fox, A., and Brewer, E., “Path-based faliure and evolution management,”in NSDI’04: Proceedings of the 1st conference on Symposium on NetworkedSystems Design and Implementation, pp. 23–23, USENIX Association, 2004.
[38] Cherniack, M., Balakrishnan, H., Balazinska, M., Carney, D.,Cetintemel, U., Xing, Y., and Zdonik, S., “Scalable Distributed StreamProcessing,” in CIDR 2003 - First Biennial Conference on Innovative DataSystems Research, (Asilomar, CA), January 2003.
[39] Cui, J. F. and Chae, H. S., “Load balancing for RFID middlewares based onagent technology,” in SE’07: Proceedings of the 25th conference on IASTED In-ternational Multi-Conference, (Anaheim, CA, USA), pp. 136–141, ACTA Press,2007.
[40] Cybenko, G., “Dynamic load balancing for distributed memory multiproces-sors,” J. Parallel Distrib. Comput., vol. 7, no. 2, pp. 279–301, 1989.
160

[41] De, P., Basu, K., and Das, S. K., “An ubiquitous architectural frameworkand protocol for object tracking using RFID tags,” in International Conferenceon Mobile and Ubiquitous Systems, pp. 174–182, IEEE Computer Society, 2004.
[42] Dong, Q., Shukla, A., Shrivastava, V., Agrawal, D., Banerjee, S.,and Kar, K., “Load balancing in large-scale RFID systems,” Comput. Netw.,vol. 52, no. 9, pp. 1782–1796, 2008.
[43] Dunlop, D. D. and Basili, V. R., “Generalizing specifications for uniformlyimplemented loops,” ACM Trans. Program. Lang. Syst., vol. 7, pp. 137–158,Jan. 1985.
[44] Eager, D. L., Lazowska, E. D., and Zahorjan, J., “Adaptive load sharingin homogeneous distributed systems,” IEEE Trans. Softw. Eng., vol. 12, no. 5,pp. 662–675, 1986.
[45] Enge, P. and Misra, P., “Special issue on global positioning system,” Pro-ceedings of the IEEE, vol. 87, no. 1, pp. 3–15, 1999.
[46] Floerkemeier, C. and Lampe, M., “RFID middleware design: addressingapplication requirements and RFID constraints,” in sOc-EUSAI ’05: Proceed-ings of the 2005 joint conference on Smart objects and ambient intelligence,pp. 219–224, ACM, 2005.
[47] Franklin, M. J., Jeffery, S. R., Krishnamurthy, S., and Reiss, F.,“Design considerations for high fan-in systems: The HiFi approach,” in CIDR,pp. 290–304, 2005.
[48] Gedik, B., Wu, K.-L., Yu, P. S., and Liu, L., “Mobiqual: Qos-aware loadshedding in mobile cq systems,” in ICDE ’08: Proceedings of the 2008 IEEE24th International Conference on Data Engineering, (Washington, DC, USA),pp. 1121–1130, IEEE Computer Society, 2008.
[49] Gerndt, M., Automatic Parallelization for Distributed-Memory Multiprocess-ing Systems. PhD thesis, University of Bonn, Bonn, Germany, Dec. 1989.
[50] Ghias, S., “Radio-tagging luggage at heathrow.” http://current.newsweek.
com/budgettravel/2008/02/radiotagging_luggage_at_heathr.html.
[51] Gonzalez, H., Han, J., Li, X., and Klabjan, D., “Warehousing and ana-lyzing massive rfid data sets,” in ICDE ’06: Proceedings of the 22nd Interna-tional Conference on Data Engineering, p. 83, IEEE Computer Society, 2006.
[52] Gribble, S. D., Welsh, M., Behren, R. V., Brewer, E. A., Culler,D., Borisov, N., Czerwinski, S., Gummadi, R., Hill, J., Joseph, A.,Katz, R. H., Mao, Z. M., Ross, S., and Zhao, B., “The ninja architecturefor robust internet-scale systems and services,” Computer Networks, vol. 35,pp. 473–497, 2001.
161

[53] Gschwind, T., Eshghi, K., Garg, P. K., and Wurster, K., “Webmon:A performance profiler for web transactions,” in WECWIS ’02: Proceedings ofthe Fourth IEEE International Workshop on Advanced Issues of E-Commerceand Web-Based Information Systems (WECWIS’02), p. 171, IEEE ComputerSociety, 2002.
[54] Hac, A. and Johnson, T., “A study of dynamic load balancing in a dis-tributed system,” SIGCOMM Comput. Commun. Rev., vol. 16, no. 3, pp. 348–356, 1986.
[55] Hardgrave, B. C. and Miller, R., “The myths and realities of RFID,”Tech. Rep. ITRI-WP067-0306, SAM. M. Walton College of Business, Universityof Arkansas, 2006.
[56] Hardgrave, B. C., Miller, R., and Waller, M., “Does RFID reduce outof stocks? a preliminary analysis,” Tech. Rep. ITRI-WP058-1105, SAM. M.Walton College of Business, University of Arkansas, 2005.
[57] Hassan, T. and Chatterjee, S., “A taxonomy for RFID,” in HICSS ’06:Proceedings of the 39th Annual Hawaii International Conference on SystemSciences, p. 184.2, IEEE Computer Society, 2006.
[58] Heering, J. and Klint, P., “Towards monolingual programming environ-ments,” ACM Trans. Program. Lang. Syst., vol. 7, pp. 183–213, Apr. 1985.
[59] Hu, Y., Sundara, S., Chorma, T., and Srinivasan, J., “Supporting rfid-based item tracking applications in oracle dbms using a bitmap datatype,” inVLDB ’05: Proceedings of the 31st international conference on Very large databases, pp. 1140–1151, VLDB Endowment, 2005.
[60] Intel, “Tomorrow’s high performance network.” http://developer.intel.
com/technology/comms/perfnet/index.htm.
[61] Jeffery, S. R., Alonso, G., Franklin, M. J., Hong, W., and Widom,J., “A pipelined framework for online cleaning of sensor data streams,” in ICDE’06: Proceedings of the 22nd International Conference on Data Engineering,IEEE Computer Society, 2006.
[62] Jeffery, S. R., Franklin, M. J., and Garofalakis, M., “An adaptiverfid middleware for supporting metaphysical data independence,” The VLDBJournal, vol. 17, no. 2, pp. 265–289, 2008.
[63] Juang, P., Oki, H., Wang, Y., Martonosi, M., Peh, L., and Ruben-stein, D., “Energy-efficient computing for wildlife tracking: Design tradeoffsand early experiences with ZebraNet,” in Proceedings of ASPLOS-X, October2002.
[64] Kanters, R., “Data Management Risks of Radio Frequency Identification(RFID),” Master’s thesis, Tilburg University, 2007.
162

[65] Kimball, R., “Rfid tags and smart dust.” http://www.
intelligententerprise.com/030718/612warehouse1\_1.jhtml.
[66] Knuth, D. E., The TEXbook. Reading, Mass.: Addison-Wesley, 1984.
[67] Korach, E., Rotem, D., and Santoro, N., “Distributed algorithms forfinding centers and medians in networks,” ACM Trans. Program. Lang. Syst.,vol. 6, pp. 380–401, July 1984.
[68] Kornerup, J., “Mapping powerlists onto hypercubes,” Master’s thesis, TheUniversity of Texas at Austin, 1994. (In preparation).
[69] Kumar, S., Alaettinoglu, C., and Estrin, D., “Scalable object-trackingthrough unattended techniques (SCOUT),” in Proceedings of the 8th Interna-tional Conference on Network Protocols (ICNP), pp. 253–262, 2000.
[70] Lamport, L., LATEX: A Document Preparation System. Reading, Mass.:Addison-Wesley, 1986.
[71] Landt, J., “Shrouds of Time: The History of RFID,” 2001. http://www.
rfidconsultation.eu/docs/ficheiros/shrouds_of_time.pdf.
[72] Martins, C., “RFID data management: It’s not the mass, it’s the momen-tums.” AIM Global, 2005.
[73] Mosberger, D. and Peterson, L. L., “Making paths explicit in the scoutoperating system,” in Proceedings of the second USENIX symposium on Operat-ing systems design and implementation (OSDI), (Seattle, Washington, UnitedStates), 1996.
[74] Nath, B., Reynolds, F., and Want, R., “Rfid technology and applications,”IEEE Pervasive Computing, vol. 5, no. 1, pp. 22–24, 2006.
[75] Nemmaluri, A., Corner, M. D., and Shenoy, P., “Sherlock: automaticallylocating objects for humans,” in MobiSys ’08: Proceeding of the 6th interna-tional conference on Mobile systems, applications, and services, pp. 187–198,2008.
[76] Ni, L. M., Liu, Y., Lau, Y. C., and Patil, A. P., “Landmarc: indoorlocation sensing using active RFID,” Wirel. Netw., vol. 10, no. 6, pp. 701–710,2004.
[77] Nielson, F., “Program transformations in a denotational setting,” ACMTrans. Program. Lang. Syst., vol. 7, pp. 359–379, July 1985.
[78] Nielson, F., “Program transformations in a denotational setting,” ACMTrans. Program. Lang. Syst., vol. 7, pp. 359–379, July 1986.
163

[79] Papadopoulou, E., McBurney, S., Taylor, N., Williams, M.,Dolinar, K., and Neubauer, M., “Using user preferences to enhance privacyin pervasive systems,” in ICONS 08, pp. 271 – 276, April 2008.
[80] Park, S.-M., Song, J.-H., Kim, C.-S., and Kim, J.-J., “Load balancingmethod using connection pool in RFID middleware,” in SERA ’07: Proceedingsof the 5th ACIS International Conference on Software Engineering Research,Management & Applications, pp. 132–137, IEEE Computer Society, 2007.
[81] Prabhu, B. S., Su, X., Qiu, C., Ramamurthy, H., Chu, P., and Gadh,R., “WinRFID middleware for distributed RFID infrastructure,” in Interna-tional Workshop on Radio Frequency Identification (RFID) and Wireless Sen-sors, (Indian Institute of Technology, Kanpur, India), 2005.
[82] Prothro, J. T., “Improved Performance of a Radio Frequency IdentificationTag Antenna on a metal ground plane,” Master’s thesis, Georgia Institute ofTechnology, 2007.
[83] Ravindranath, L., Padmanabhan, V. N., and Agrawal, P., “Sixthsense:Rfid-based enterprise intelligence,” in MobiSys ’08: Proceeding of the 6th inter-national conference on Mobile systems, applications, and services, pp. 253–266,2008.
[84] Reid, B. K., “A high-level approach to computer document formatting,” inProceedings of the Seventh Annual Symposium on Principles of ProgrammingLanguages, (New York), pp. 24–31, ACM, Jan. 1980.
[85] Reumann, J., Mehra, A., Shin, K. G., and Kandlur, D., “Virtual ser-vices: a new abstraction for server consolidation,” in ATEC ’00: Proceedings ofthe USENIX Annual Technical Conference, USENIX Association, 2000.
[86] Romer, K., “Distributed algorithms for finding centers and medians in net-works,” Smart Playing Cards: A Ubiquitous Computing Game, vol. 6, pp. 371–377, 2002.
[87] Roussos, G., Networked RFID. Springer, 2008.
[88] Roussos, G., Networked RFID: Systems, Software and Services. SpringerPublishing Company, Incorporated, 2008.
[89] Roy, W., Andy, H., Veronica, F., and Gibbons, J., “The active badgelocation system,” ACM Trans. Inf. Syst., vol. 10, no. 1, pp. 91–102, 1992.
[90] Sarma, S., “Integrating RFID,” Queue, vol. 2, no. 7, pp. 50–57, 2004.
[91] “Savant technical manual,” Tech. Rep. Version 0.1 (Alpha), OAT SYSTEMS &MIT AUTO-ID CENTER, 2002.
164

[92] “State of Georgia Logistics Innovation Center, (Page Siplon, Execu-tive Director).” ttp://www.georgia.org/Business/Maritime+Logistics+
Innovation+Center.tm.
[93] Smith, A., Balakrishnan, H., Goraczko, M., and Priyantha, N. B.,“Tracking Moving Devices with the Cricket Location System,” in 2nd Inter-national Conference on Mobile Systems, Applications and Services (Mobisys2004), 2004.
[94] Stanford, V., “Pervasive computing goes the last hundred feet with rfidsystems,” IEEE Pervasive Computing, vol. 2, no. 2, pp. 9–14, 2003.
[95] Sullivan, L., “Wal-Mart tests RFID with eight suppliers.” Information Week,2004.
[96] Tatbul, N., Cetintemel, U., Zdonik, S., Cherniack, M., and Stone-braker, M., “Load shedding in a data stream manager,” in VLDB ’2003: Pro-ceedings of the 29th international conference on Very large data bases, pp. 309–320, VLDB Endowment, 2003.
[97] Teskey, M., “Official Homepage for IDtronic.” http://www.idtronic.de/.
[98] Teskey, M., “Turning RFID Data into Information.” http://www.devx.com/
enterprise/Article/32251/0/page/1.
[99] “ThermAssureRF: The RFID Temperature Solution.” http://www.
evidencia.biz/products/acti-tag.htm.
[100] Thiem, L., Riemer, B., Witzke, M., and Luckenbach, T., “Rfid-basedlocalization in heterogeneous mesh networks,” in SenSys ’08: Proceedings of the6th ACM conference on Embedded network sensor systems, pp. 415–416, 2008.
[101] Thiesse, F., Dierkes, M., and Fleisch, E., “Lottrack: RFID-based processcontrol in the semiconductor industry,” IEEE Pervasive Computing, vol. 5,no. 1, 2006.
[102] Tjoa, A., “Modeling temporal consistency in data warehouses,” in DEXA’01: Proceedings of the 12th International Workshop on Database and ExpertSystems Applications, IEEE Computer Society, 2001.
[103] Tucci, L., “RFID: Where Sam’s Club goes Wal-Mart to follow.” EnterpriseInnovation, 2008.
[104] Vaidya, N. and Das, S. R., “Rfid-based networks: exploiting diversity andredundancy,” SIGMOBILE Mob. Comput. Commun. Rev., vol. 12, no. 1, pp. 2–14, 2008.
[105] Violino, B., “Rfid opportunities and challenges.” http://www.rfidjournal.
com/article/articleview/537.
165
[106] Violino, B., “RFID opportunities and challenges.” http://www.
rfidjournal.com/article/articleview/537.
[107] Wei, J., Dan, Y., and Yan, M., “A tracking algorithm in RFID reader net-work,” in FCST ’06: Proceedings of the Japan-China Joint Workshop on Fron-tier of Computer Science and Technology, (Washington, DC, USA), pp. 164–171, IEEE Computer Society, 2006.
[108] Welsh, M., Culler, D. E., and Brewer, E. A., “SEDA: An Architecturefor Well-Conditioned, Scalable Internet Services,” in Proceedings of the ACMSymposium on Operating Systems Principles (SOSP), Oct. 2001.
[109] Wickramasuriya, J., Datt, M., Mehrotra, S., and Venkatasubrama-nian, N., “Privacy protecting data collection in media spaces,” in MULTI-MEDIA ’04: Proceedings of the 12th annual ACM international conference onMultimedia, pp. 48–55, 2004.
[110] Wu, H., Fujimoto, R., Riley, G., and Hunter, M., “Spatial propaga-tion of information in vehicular networks,” IEEE Transactions on VehicularTechnology, vol. 58, pp. 420 – 431, January 2009.
[111] Yap, K.-K., Srinivasan, V., and Motani, M., “Max: human-centric searchof the physical world,” in SenSys ’05: Proceedings of the 3rd internationalconference on Embedded networked sensor systems, pp. 166–179, ACM, 2005.
[112] Yap, K.-K., Srinivasan, V., and Motani, M., “Max: Wide area human-centric search of the physical world,” ACM Trans. Sen. Netw., vol. 4, no. 4,pp. 1–34, 2008.
[113] Zhao, W., Ammar, M., and Zegura, E., “A message ferrying approachfor data delivery in sparse mobile ad hoc networks,” in Proceedings of ACMMobihoc, (Tokyo Japan), May 2004.
166

VITA
Nova Ahmed is from Bangladesh. She has her research interested in the field of
distributed systems, embedded systems, pervasive environments, bioinformatics al-
gorithms and computational platforms like grid computing and cloud computing.
She enjoyes research that involves hands on development using various embdedded
devices. She has received her B.Sc. and M.Sc. from the Departmet of Computer
Science, University of Dhaka. She has served as a lecturer in the Department of
Computer Science, University of Dhaka right after her graduation. She has received
M.S. from Georgia State University. She is currently working towards her completion
of her Ph.D. at Georgia Institute of Technology under the supervision of Dr. Umak-
ishore Ramachandran. She enjoys her leisure time with her family including her two
daughters Anuva, Arisha and her husband Arshad Chowdhury.
167