Reliability in Flood Incident Management Planning - GOV.UK
74
Reliability in Flood Incident Management Planning Final Report – Part A: Guidance Science project SC060063/SR1
-
Upload
khangminh22 -
Category
Documents
-
view
1 -
download
0
Transcript of Reliability in Flood Incident Management Planning - GOV.UK

Reliability in Flood Incident Management Planning
Final Report – Part A: Guidance Science project SC060063/SR1

ii Science Report – Reliability in Flood Incident Management Planning
The Environment Agency is the leading public body protecting and improving the environment in England and Wales. It’s our job to make sure that air, land and water are looked after by everyone in today’s society, so that tomorrow’s generations inherit a cleaner, healthier world. Our work includes tackling flooding and pollution incidents, reducing industry’s impacts on the environment, cleaning up rivers, coastal waters, contaminated land and improving wildlife habitats. This report is the result of research commissioned by the Environment Agency’s Science Department and funded by the joint Environment Agency/Defra Flood and Coastal Erosion Risk Management Research and Development Programme. Published by: Environment Agency, Rio House, Waterside Drive, Aztec West, Almondsbury, Bristol, BS32 4UD Tel: 01454 624400 Fax: 01454 624409 www.environment-agency.gov.uk ISBN: 978-1-84911-129-4 © Environment Agency – October 2009 All rights reserved. This document may be reproduced with prior permission of the Environment Agency. The views and statements expressed in this report are those of the author alone. The views or statements expressed in this publication do not necessarily represent the views of the Environment Agency and the Environment Agency cannot accept any responsibility for such views or statements. This report is printed on Cyclus Print, a 100% recycled stock, which is 100% post consumer waste and is totally chlorine free. Water used is treated and in most cases returned to source in better condition than removed. Email:[email protected] Further copies of this summary are available from our publications catalogue: http://publications.environment-agency.gov.uk or our National Customer Contact Centre: T: 08708 506506 E: [email protected].
Key Author(s): Peter von Lany, Halcrow Andy Barnes, Halcrow Richard Dawson, University of Newcastle Dennis Parker, Middlesex University Dissemination Status: Released to all regions Publicly available Keywords: Flood Incident Management Planning Research Contractor: Halcrow Group Ltd, Burderop Park, Swindon, SN4 0QD, 01793 812479 Environment Agency’s Project Manager: Adam Baylis, Science Department Theme manager: Dr Suresh Surendran, Modelling and Risk Theme Collaborator(s): University of Newcastle, Middlesex University FHRC, JBA Consulting, University of Bristol Science Project Number: SC060063 Product Code: SCHO1009BRDI-E-P

Science Report – Reliability in Flood Incident Management Planning iii
Science at the Environment Agency Science underpins the work of the Environment Agency. It provides an up-to-date understanding of the world about us and helps us to develop monitoring tools and techniques to manage our environment as efficiently and effectively as possible.
The work of the Environment Agency’s Science Department is a key ingredient in the partnership between research, policy and operations that enables the Environment Agency to protect and restore our environment.
The science programme focuses on five main areas of activity:
• Setting the agenda, by identifying where strategic science can inform our evidence-based policies, advisory and regulatory roles;
• Funding science, by supporting programmes, projects and people in response to long-term strategic needs, medium-term policy priorities and shorter-term operational requirements;
• Managing science, by ensuring that our programmes and projects are fit for purpose and executed according to international scientific standards;
• Carrying out science, by undertaking research – either by contracting it out to research organisations and consultancies or by doing it ourselves;
• Delivering information, advice, tools and techniques, by making appropriate products available to our policy and operations staff.
Steve Killeen
Head of Science

iv Science Report – Reliability in Flood Incident Management Planning
Executive summary Flood incident management (FIM) plays an important part in reducing the adverse consequences of flooding, but it only does so when it is well planned and effective. Following the summer floods of 2007, the Pitt Review called for:
• improved planning and preparation for floods;
• a step change in the quality of flood warnings;
• a more resilient approach to managing floods.
This research focuses upon ways of improving the planning of FIM. New tools have been created that improve the way FIM planners can evaluate the likely reliability and performance of a FIM process in any given situation. These evaluations can be used to identify the components of FIM which should be addressed in the planning phase to improve the reliability and effectiveness of FIM actions.
Part A of the final report provides guidance on how to apply the various tools developed during this study. Part B describes the technical process undertaken to develop and test these tools. The test results provide the evidence for the guidance presented in this report.
Floods can be managed through structural and non-structural approaches. Structural approaches involve the use of physical structures to prevent, divert or mitigate the impacts of flooding. FIM aims to reduce the impacts of flooding upon society and the economy through non-structural interventions. The reliability of any approach, including FIM, has a direct influence on its effectiveness; this is why this project focuses on reliability. FIM involves complex core processes covering:
• the detection and forecasting of potential flood conditions;
• the issuing and dissemination of warnings;
• the planning and implementation of responses to flood emergencies.
However, the scope of FIM goes beyond these core processes and, for example, often involves:
• the operation of structural flood defences;
• complex information management;
• media management;
• close collaboration with a range of professional FIM partners.
Importantly, FIM also involves safeguarding the reputation of the Environment Agency. Research has indicated that the public must have high regard for and trust in the Environment Agency for flood warning response systems to work effectively.
The reliability of FIM depends on both technical and human components. These technical and human components both introduce uncertainties which influence the reliability and performance of FIM systems. The overall performance of FIM systems depends on the reliability of a large set of individually linked and interactive components which can act to either propagate or reduce uncertainty.
Planners and managers need to be assured that decisions they take are based on a good understanding of the consequences of failure and the effects of uncertainty on the performance of a FIM system. In the case of flood defence systems, this insight is

Science Report – Reliability in Flood Incident Management Planning v
provided by fragility curves which indicate the reliability of defence elements. Equipped with similar metrics for the FIM system, planners will be able to identify, evaluate, and implement measures to improve the performance of FIM processes.
Part A of the final report provides guidance on the hierarchy of tools, at three levels, which can now be used to help plan and evaluate improvements to FIM processes:
i. Overview level The tools can be used across a range of possible flood incidents to provide an overview of FIM performance. This will help to identify the root causes of, and contributory factors to, good, adequate and inadequate performance. Two tools have been developed: performance matrices using a balanced scorecard approach, and root cause analysis using fish-bone diagrams.
ii. High level The tools can analyse quantitative and qualitative information on reliability and uncertainty in order to determine how these factors contribute to overall FIM performance and identify how FIM is vulnerable to uncertainty, risk of failure or underperformance. The tool developed is a Windows-based hierarchical process modelling tool called Perimeta.
iii. Detailed level The tools focus on modelling the dynamics of FIM processes or systems and show how the evolution of a flood event, technical systems and human behavioural processes may interact and combine to influence FIM performance. The tool developed uses agent-based modelling.
These tools facilitate a systematic risk-based approach to performance management; they are able to address, in various ways, the reliability issues and uncertainties inherent in emergency management. They complement FIM assessment tools within the Environment Agency (such as the FIM Benefits Roadmaps, the Flood Warning Validation Database, the National Flood Forecasting System Benefits Realisation project and the Floodline Warnings Direct Benefits Assessments) to support effective investment in FIM.
Although the tools described in this report were tested in fluvial and coastal flooding contexts, they are generic, and have the potential to be applied to other forms of flooding. The outcomes of this research will provide those responsible for planning FIM with a set of tools which can be coupled with FIM benefit assessment models in order to demonstrate the value of planned interventions to improve FIM.

vi Science Report – Reliability in Flood Incident Management Planning
Acknowledgements The authors would like to thank the Project Board (Adam Baylis, Kate Marks, Mike Steel and Suresh Surendran) for their valuable input and guidance throughout this project. We are grateful for the significant time and effort spent by Helen James and Kate Vincent (Environment Agency, Thames Region) in helping to develop and carry out case studies. Their enthusiasm and knowledge were invaluable for this particular aspect of the project. We would also like to thank the Environment Agency staff who put aside time to review earlier drafts of this report and whose constructive comments helped shape this final report.

Science Report – Reliability in Flood Incident Management Planning vii
Contents 1 Introduction 1 1.1 Background 1 1.2 Study objectives 1 1.3 Purpose of Part A 2 1.4 Structure of Part A 2
2 The reliability and performance of FIM 3 2.1 Introduction 3 2.2 The objectives and scope of FIM 3 2.3 Influences on the reliability and performance of FIM 6 2.4 Current measures of FIM performance 7 2.5 A process for planning improvements to FIM performance 13
3 Tools for assessing and improving the reliability of FIM 16 3.1 Introduction 16 3.2 Overview level tools 16 3.3 A ‘high-level’ approach using Perimeta 19 3.4 A ‘detailed’ approach using agent-based modelling 22
4 Guidance on applying the tools 24 4.1 Introduction 24 4.2 Potential areas of application 24 4.3 Sources of evidence on FIM performance 27 4.4 Improving FIM 29 4.5 Current limitations to the use of the tools 29 4.6 Applying the tools to provide decision support 30 4.7 Assessing the benefits of good FIM performance 34 4.8 Longer term use of the tools to improve FRM 36
5 Recommendations 38 5.1 Introduction 38 5.2 General recommendations 38 5.3 Specific recommendations 39
References 41
Appendix 1 FIM performance indicators 44
Appendix 2 – Estimating the benefits and performance of FIM 54 A2.1 The Flood Warning and Response Benefits Pathways model (FWRBP model) 55 A2.2 FWRBP model equations 59

viii Science Report – Reliability in Flood Incident Management Planning
A2.3 Applications of the FWRBP model 61 A2.4 Using the FWRBP model to enhance FIM 61 A2.5 The revised and recalibrated FHRC or ‘FDA’ model 61 A2.6 References 64

Science Report – Reliability in Flood Incident Management Planning 1
1 Introduction
1.1 Background The Environment Agency commissioned Halcrow, in collaboration with the University of Newcastle, the Flood Hazard Research Centre (FHRC) at Middlesex University, the University of Bristol and JBA Consulting to carry out research into improving flood incident management (FIM) planning, taking into account its vulnerability to risk and uncertainty.
The project commenced in June 2007. It forms Science Project SC060063 under the joint Defra / Environment Agency Flood and Coastal Erosion Risk Management R&D Programme. It builds on the outputs from an earlier science study Risk Assessment in Flood Incident Management – Phase 1 (SR11206), published by Defra and the Environment Agency in 2006.
This latest research project has potentially far-reaching implications for the management and planning of non-structural flood measures. It seeks to develop methods which evaluate the reliability of FIM, integrating a number of non-structural approaches so that reliability may be enhanced.
This project has developed tools to evaluate and enhance reliability; the tools are now at a point where they can be applied. They will benefit from refinement over time, in the light of application, experience and learning, for which there is no substitute.
1.2 Study objectives The overall objective of this study was to develop a set of tools to improve pre-event planning of FIM. The output from this research is intended to:
• enhance understanding and provide evidence of what influences the reliability of the different human and technical components of the FIM system, and how these components interact to influence the performance of FIM as a whole;
• identify techniques for evaluating the performance of a FIM system (at a high level and at a more detailed level) in order to improve planning where improvements may be required;
• demonstrate how these techniques can be applied to provide decision support to those planning and justifying improvements to FIM reliability and overall performance.
The approach adopted for this study was developed in response to the project brief. The Project Board set up by the Environment Agency provided guidance through periodic meetings.

2 Science Report – Reliability in Flood Incident Management Planning
1.3 Purpose of Part A The final report is in two parts, Part A and Part B. Part A is a guidance report and provides:
• background information on assessing the reliability of FIM planning;
• guidance on the tools which have been developed to evaluate and improve FIM planning;
• suggestions for ways in which these tools could be applied.
Part A also considers the current state of development of these tools, and recommends what additional science and R&D is required to enhance their potential capability and application.
Part B is a technical report; it should be read (in conjunction with this report) by those looking for more detail on the theoretical basis and the case study test results for the tools.
This report is aimed at those with an interest in what influences the performance of FIM. It will be of specific interest to those who wish to gain insight into:
• evaluating the reliability and performance of FIM in particular;
• non-structural flood risk management (FRM) measures in general.
The report is intended to provide guidance to those with responsibilities for evaluating FIM performance on how to manage the performance, how to determine where improvements to FIM may be necessary, identify improvements and develop a business case to support planned improvements.
1.4 Structure of Part A Chapter 2 provides guidance on performance management of FIM.
Chapter 3 outlines how the tools that were developed and tested (via case studies) during the course of this study can help assess the reliability and performance of FIM.
Chapter 4 provides guidance on situations in which users could apply the tools.
Chapter 5 discusses the work required to develop further the capability and application of the tools developed in this study.

Science Report – Reliability in Flood Incident Management Planning 3
2 The reliability and performance of FIM
2.1 Introduction This chapter discusses:
• the objectives and scope of FIM;
• the factors that can influence the reliability and performance of FIM;
• measures of FIM performance;
• a process for FIM performance management.
2.2 The objectives and scope of FIM The objective of FIM is to minimise the severity of flooding and its adverse consequences on society, the economy and the environment. This may be achieved through sound preparation for flooding by organisations and individuals. It requires timely, reliable and effective warnings. These must be communicated to anyone likely to be affected by a flood or with responsibilities for carrying out flood emergency responses. Finally impact of flooding is minimised by an effective response to warnings by organisations, especially emergency responder organisations, but also infrastructure providers and individuals.
There are many partners involved in planning for, and dealing with, flooding events at the national, regional and local levels. Their responsibilities are set out in Defra’s Lead Department Plan (Defra, 2009). Regionally, the lead planning role falls to the government offices for the regions working with local authorities, the Environment Agency and emergency services (police, fire, ambulance and coastguard). The police will lead the response during an actual emergency.
The Environment Agency’s main operational role is to forecast flooding, issue flood warnings and operate its own flood defence infrastructure (for example barriers and sluices) to mitigate the consequences of flooding. The Environment Agency also briefs local professional partners on the likelihood and implications of flooding; it conducts public awareness campaigns and prepares for flooding emergencies.
This portfolio approach to reducing flood risk and managing its potential impacts is a major element of the Defra Making Space for Water programme. This programme recognises that it is not sustainable –economically, technically or environmentally – to rely solely on structural flood defence systems.
FIM is an integral part of the non-structural approach to FRM (Figure 2.1). FIM is particularly broad in scope because:
• it involves all phases of the emergency cycle from planning and preparation through to recovery and rehabilitation;
• it takes place in a complex multi-agency setting;

4 Science Report – Reliability in Flood Incident Management Planning
• it requires particular behavioural outcomes to be displayed by those affected.
Added to this, the level and influence of management for non-structural measures varies; management control over some aspects of FIM is much more limited than others (see Figure 2.2).
Categorisation of non-structural measures employed in Thames Estuary 2100 study
Managing flood incidents Managing flood losses Flood recovery
Pre-event measures e.g.• public awareness raising• flood response planning• business continuity planning
Flood forecasting & warning • detection, prediction• warning communication
Flood fighting e.g.• demountables, repairing failing defences• pumping, diversions
Collective-scale damage avoidance actions e.g.• formal evacuation, traffic diversions• turning off power to areas
Individual-scale damage avoidance actions e.g.• moving valuables
Land use management e.g.• voluntary relocation• public purchase of property• compulsory purchase of property
Flood proofing e.g.• permanent flood proofing• temporary flood proofing
Land use planning e.g.• planning guidance for FR areas• design and specification to restrict new development in FR areas
Building codes e.g.• general building codes• individual property design• development control roles
Insurance, shared risk and compensation e.g.• government or private flood insurance
Health and social measures e.g.• measures to reduce health and socialimpacts of flooding
Figure 2.1 Categorisation of non-structural measures employed in Thames Estuary 2100 study.
Given the potential breadth of scope of FIM and the management influence issue, the research project was discussed at some length at the project workshop in October 2007. This workshop brought together members of the research project team and representatives of both internal and external (i.e. professional partner) stakeholders.
There was agreement at the workshop that the Environment Agency possessed different levels of control over components of the FIM system; the study should therefore focus on those components of the FIM system over which the Environment Agency currently has the greatest control, responsibility and influence.
However, there was no clear agreement on which these functions were, and on what distinguished them from other possible functions of FIM. The Environment Agency may, for example, have complete or almost complete control over its internal communication system or, say, the resources that it can deploy in a flood event. However, in its approach to FIM the Environment Agency particularly seeks to influence responses to flood warnings by informing and educating the public at risk so that they take appropriate actions during a flood event. The Environment Agency has a role in shaping the public response to flood warnings, even though the behavioural response is partly beyond its control, responsibility and influence.

Science Report – Reliability in Flood Incident Management Planning 5
Degree of managementcontrol over performance
Management poweris low or limited
Managementpower is high
Collectivemeasures
Individual measures
Political culture
Managedcollective measures
Communitybased measures
Behaviouralmeasures
Leveredbehaviouralmeasures
Land use regulationsand planning controls
Demountableflood defences,
Community-basedflood warning schemes
Property flood proofing,Response to warnings,Private flood insurance,
Business Continuity Plans
Flood insurance soldon condition that property is
flood proofed or land useregulations are adopted
A ‘management influence’ typology of non-structural measures
Figure 2.2 A ‘management influence’ typology of non-structural measures.
As part of its legal duties under the Civil Contingencies Act 2004, the Environment Agency is expected to work ‘seamlessly’ with its professional partners; its FIM performance depends partly upon these working arrangements. It can therefore be argued that from this perspective, the Environment Agency’s specific contribution to FIM performance is difficult to identify and measure separately.
This research has focused in particular on the following activities within FIM:
• delivering a flood warning service which elicits an appropriate level of response from flood warning recipients;
• vital organisational and contingency planning, including assembling and deploying materials, equipment and manpower, and maintaining satisfactory internal communications according to embedded procedures;
• information management in relation to FIM activities, including the provision of flood risk information during the course of a flood event.
In addition, effective FIM is underpinned by:
• establishing and maintaining effective (i.e. seamless) working relationships between the Environment Agency and professional partners, as well as other stakeholders (including the Government and members of the public);
• running training and joint training events and exercises;

6 Science Report – Reliability in Flood Incident Management Planning
• managing stakeholder expectations (including reputation management and media management);
• collecting and recording information relevant to FRM and maintaining national databases.
Flood forecasting and warning are also essential to ensure that flood defences and related assets can be effectively operated and maintained before and during an event.
2.3 Influences on the reliability and performance of FIM
Our research has shown that the performance of FIM varies and can be affected by factors such as:
• the reliability of technical processes involved in the detection and forecasting of flood events, and in the dissemination of flood warnings;
• human behavioural factors – such as perception and response to risk and uncertainty; socio-psychological processes affecting response to warnings; human error; and complexities of intra and inter-organisational cooperation;
• the scale of the flood event – larger, longer events present greater challenges than smaller, shorter ones;
• risks and uncertainty associated with all the above.
There are fundamental differences between technical and human processes. Human behaviour is always likely to be prone to significant levels of uncertainty and unpredictability, including cases of human error. This means that it is inappropriate to consider human processes as pseudo-mechanical ones in which a response to a stimulus is highly predictable. This unpredictability has fundamental implications for the way in which the performance of human processes within a system may be modelled. It also sets limits on expectations about the degree to which human behaviour can be influenced or controlled.
The flood events in the summer of 2007 highlight the complexities of performance analysis and management, especially during large scale events. The conclusions of the Pitt Review (Sir Michael Pitt, 2008) indicated that the country was not as well prepared as it could have been to the floods in the summer of 2007. Responders were surprised by the scale and duration of the emergencies. They often found themselves reacting to unexpected events.
For example, in July 2007 demountable flood defences could not be transported on time to Upton on Severn from their safe off-site storage location: the defences had become stuck on the motorway because of traffic congestion caused by flooding.
During the June 2007 floods in Hull, what might be imagined as critical FIM process failures (e.g. the inability to start up computer systems and the loss of rainfall radar information) did not significantly affect FIM performance. In the same event, however, a severe flood warning was issued late. This failure in FIM was put down to a combination of an under-resourced FIM team, weak communications, and a confusing manual of procedures.
An initial assessment by the Environment Agency on more than 500 flood warnings issued during June and July 2007, showed that although most were issued to target (more than two hours before the flood threshold was reached); around 20 per cent
Science Report – Reliability in Flood Incident Management Planning 7
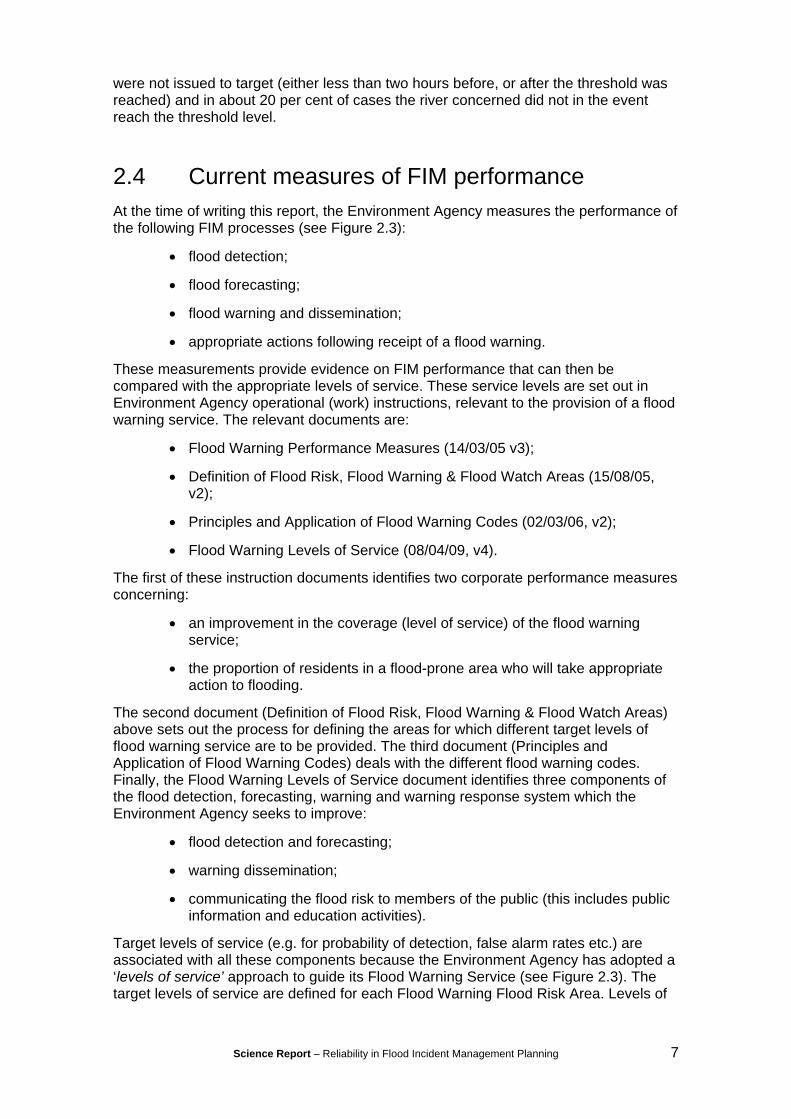
were not issued to target (either less than two hours before, or after the threshold was reached) and in about 20 per cent of cases the river concerned did not in the event reach the threshold level.
2.4 Current measures of FIM performance At the time of writing this report, the Environment Agency measures the performance of the following FIM processes (see Figure 2.3):
• flood detection;
• flood forecasting;
• flood warning and dissemination;
• appropriate actions following receipt of a flood warning.
These measurements provide evidence on FIM performance that can then be compared with the appropriate levels of service. These service levels are set out in Environment Agency operational (work) instructions, relevant to the provision of a flood warning service. The relevant documents are:
• Flood Warning Performance Measures (14/03/05 v3);
• Definition of Flood Risk, Flood Warning & Flood Watch Areas (15/08/05, v2);
• Principles and Application of Flood Warning Codes (02/03/06, v2);
• Flood Warning Levels of Service (08/04/09, v4).
The first of these instruction documents identifies two corporate performance measures concerning:
• an improvement in the coverage (level of service) of the flood warning service;
• the proportion of residents in a flood-prone area who will take appropriate action to flooding.
The second document (Definition of Flood Risk, Flood Warning & Flood Watch Areas) above sets out the process for defining the areas for which different target levels of flood warning service are to be provided. The third document (Principles and Application of Flood Warning Codes) deals with the different flood warning codes. Finally, the Flood Warning Levels of Service document identifies three components of the flood detection, forecasting, warning and warning response system which the Environment Agency seeks to improve:
• flood detection and forecasting;
• warning dissemination;
• communicating the flood risk to members of the public (this includes public information and education activities).
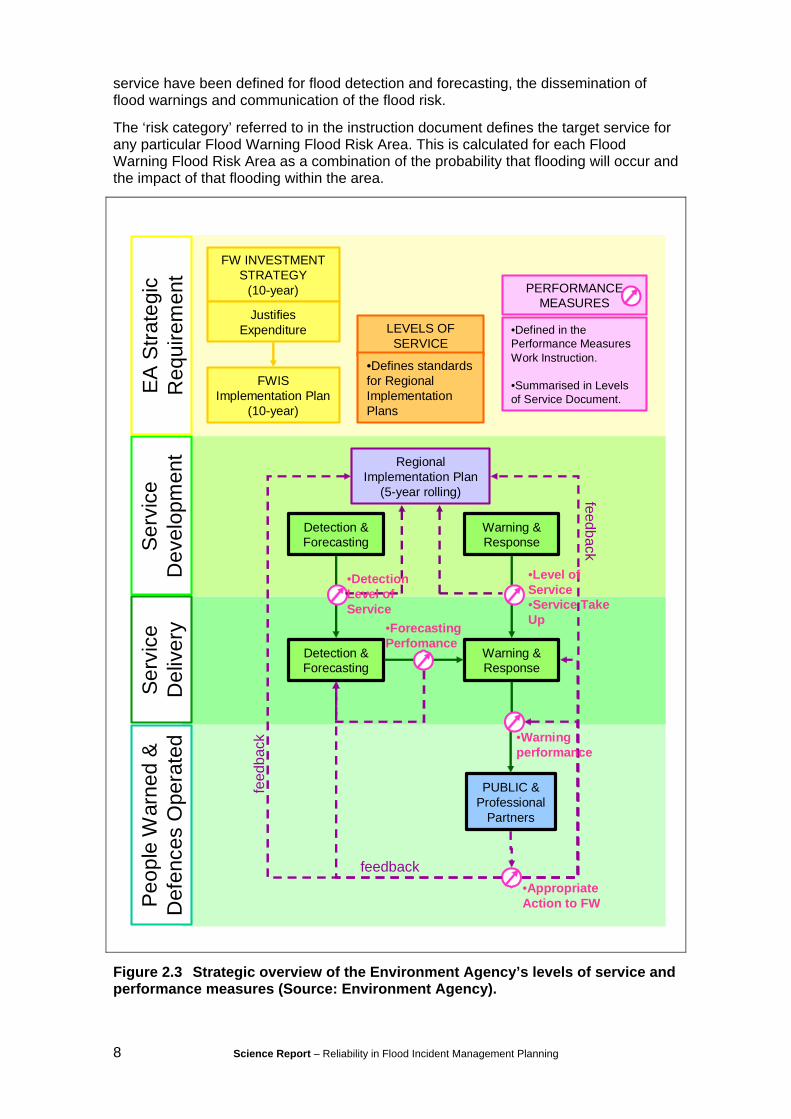
Target levels of service (e.g. for probability of detection, false alarm rates etc.) are associated with all these components because the Environment Agency has adopted a ‘levels of service’ approach to guide its Flood Warning Service (see Figure 2.3). The target levels of service are defined for each Flood Warning Flood Risk Area. Levels of
8 Science Report – Reliability in Flood Incident Management Planning
service have been defined for flood detection and forecasting, the dissemination of flood warnings and communication of the flood risk.
The ‘risk category’ referred to in the instruction document defines the target service for any particular Flood Warning Flood Risk Area. This is calculated for each Flood Warning Flood Risk Area as a combination of the probability that flooding will occur and the impact of that flooding within the area.
•Defined in the Performance Measures Work Instruction.
•Summarised in Levels of Service Document.
FWIS Implementation Plan
(10-year)
Warning & Response
Detection & Forecasting
Warning & Response
Detection & Forecasting
PUBLIC & Professional
Partners
Regional Implementation Plan
(5-year rolling)
FW INVESTMENT STRATEGY
(10-year)
LEVELS OF SERVICE
PERFORMANCE MEASURES
•Defines standards for Regional Implementation Plans
feedback
feedback
feed
back
Justifies Expenditure
Serv
ice
Dev
elop
men
tSe
rvic
e D
eliv
ery
Peop
le W
arne
d &
D
efen
ces
Ope
rate
dEA
Stra
tegi
c R
equi
rem
ent
•Warning performance
•Level of Service•Service Take Up
•Appropriate Action to FW
•DetectionLevel of Service
•Forecasting Perfomance
Figure 2.3 Strategic overview of the Environment Agency’s levels of service and performance measures (Source: Environment Agency).

Science Report – Reliability in Flood Incident Management Planning 9
2.4.1 Performance Measures used for FIM
We have reviewed a range of performance measures currently used by the Environment Agency in relation to FRM. Within this set we have identified the performance measures and indicators that are currently used to inform FIM decision-making within the Environment Agency.
The information on performance measures came from a number of sources within the Environment Agency and for this reason there is some duplication in our identified indicators. The full set of performance indicators is detailed within Tables A.1 to A.10 in Appendix 1. Table 2.1 summarises the performance indicators within these tables that applied to FIM at the time this study was carried out. As new performance indicators relevant to FIM are developed, these will provide additional evidence on performance for use in the tools developed by this study. This extra evidence could potentially improve the quality of the tools’ output.
We have indicated which performance indicators are relevant to the Flood Damage Avoided (FDA) equation. This equation can be used to value the benefits of improvements to FIM (see Part B: Technical Report, Section 3.6). In addition to the performance indicators identified within Table 2.1, we identify 13 separate measures to assess the key outcomes of the National Flood Forecasting Service (NFFS) and a total of 22 measures to assess the key outcomes of Floodline Warning Direct (FWD), as indicated in Table A.10 in Appendix 1.
Where possible, these measures can be used to provide direct evidence on the reliability and performance for their use in the tools developed by this study. For example, one of the measures associated with FWD is “O-49M4: An increase in total number of properties/customers (offered)”. This indicator has been used to provide evidence for the ‘coverage’ component of the FDA equation, which looks specifically at the proportion of properties (homes and businesses) within the Flood Warning Service Limit that have been offered an appropriate Flood Warning Service.
The issue of performance indicators was discussed at length at the project workshop in October 2007. The participants concluded that the Environment Agency did not require the project to develop new performance indicators for FIM unless necessary. For example, the pilot testing of the tools (described in the Part B: Technical Report) has indicated that model validation would be improved if there were some additional performance measures at an intermediate level within some FIM processes.
10 Science Report – Reliability in Flood Incident Management Planning
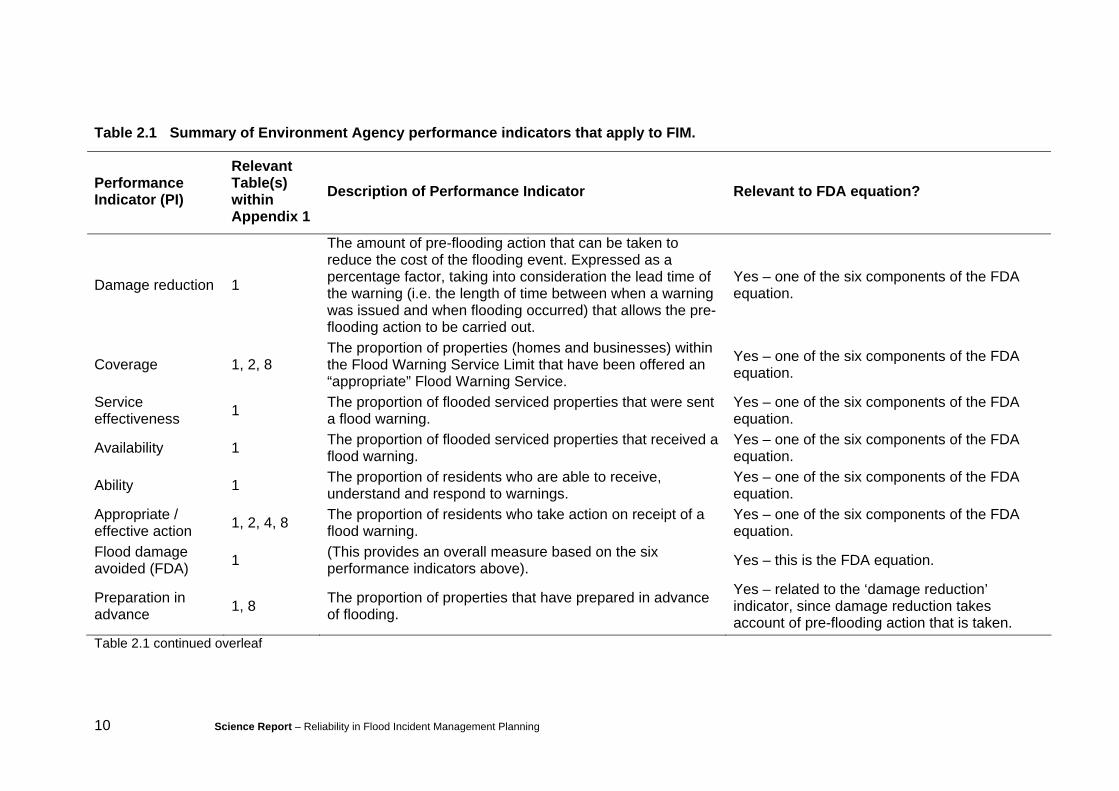
Table 2.1 Summary of Environment Agency performance indicators that apply to FIM.
Performance Indicator (PI)
Relevant Table(s) within Appendix 1
Description of Performance Indicator Relevant to FDA equation?
Damage reduction 1
The amount of pre-flooding action that can be taken to reduce the cost of the flooding event. Expressed as a percentage factor, taking into consideration the lead time of the warning (i.e. the length of time between when a warning was issued and when flooding occurred) that allows the pre-flooding action to be carried out.
Yes – one of the six components of the FDA equation.
Coverage 1, 2, 8 The proportion of properties (homes and businesses) within the Flood Warning Service Limit that have been offered an “appropriate” Flood Warning Service.
Yes – one of the six components of the FDA equation.
Service effectiveness 1 The proportion of flooded serviced properties that were sent
a flood warning. Yes – one of the six components of the FDA equation.
Availability 1 The proportion of flooded serviced properties that received a flood warning.
Yes – one of the six components of the FDA equation.
Ability 1 The proportion of residents who are able to receive, understand and respond to warnings.
Yes – one of the six components of the FDA equation.
Appropriate / effective action 1, 2, 4, 8 The proportion of residents who take action on receipt of a
flood warning. Yes – one of the six components of the FDA equation.
Flood damage avoided (FDA) 1 (This provides an overall measure based on the six
performance indicators above). Yes – this is the FDA equation.
Preparation in advance 1, 8 The proportion of properties that have prepared in advance
of flooding.
Yes – related to the ‘damage reduction’ indicator, since damage reduction takes account of pre-flooding action that is taken.
Table 2.1 continued overleaf

Science Report – Reliability in Flood Incident Management Planning 11
Table 2.1 continued
Performance Indicator (PI)
Relevant Table(s) within Appendix 1
Description of Performance Indicator Relevant to FDA equation?
Service take-up 1, 4, 8 The proportion of serviced properties that have accepted the Flood Warning Service offered to them.
Yes – implicitly related to ‘service effectiveness’ and ‘availability’ performance indicators. To be sent a warning and to receive it the offered Flood Warning Service must first be accepted.
High-risk area FWD take-up 3, 8
The proportion of properties in high-risk areas that have registered to receive warnings, having been offered Floodline Warnings Direct.
Yes – similar to ‘service take-up’, but focuses on high risk areas.
Fora flood plans 3, 8 The proportion of Local Resilience Fora Flood Plans that are considered adequate by the Environment Agency. No.
Detection level of service 4, 8
The proportion of warning areas that have sufficient radar coverage, rain gauge coverage and river monitoring station coverage to meet the detection requirements for the Flood Warning level of service
Yes – related to ‘coverage’ indicator; for the Flood Warning Service to be considered appropriate, it must satisfy the detection requirements set out in the level of service.
Forecasting performance 4, 8
The proportion of warning areas that have flood forecasts available that meet the forecasting criteria for the Flood Warning level of service.
Yes – related to ‘coverage’ indicator; for the Flood Warning Service to be considered appropriate, it must satisfy the forecasting performance requirements set out in the level of service.
Warning performance 4, 8 The proportion of warnings meeting the required standards.
Yes – related to ‘coverage’; for the Flood Warning Service to be considered appropriate it must satisfy the warning performance requirements in the level of service.
Warning lead-time 5 Percentage of flood warnings issued at least two hours before flooding occurs.
Yes – related to the ‘coverage’ and ‘service effectiveness’ indicators, since these consider the appropriateness and issuing of warnings.
Table 2.1 continued overleaf

12 Science Report – Reliability in Flood Incident Management Planning
Table 2.1 continued
Performance Indicator (PI)
Relevant Table(s) within Appendix 1
Description of Performance Indicator Relevant to FDA equation?
Floodline calls 5 Percentage of calls to Floodline answered within 15 seconds. No.
Floodline information packs 5 Percentage of Floodline information packs sent by the next
working day. No.
False alarm rate (FAR) 6 The number of ‘false-alarms’ that would have been issued.
Yes – related to ‘coverage’ performance indicator, since the levels of service specify targets for the FAR that must be met for the service to be considered appropriate.
Probability of detection (POD) 6 The probability of detection of the forecasting model.
Yes – related to ‘coverage’ indicator, since the levels of service specify targets for the POD that must be met for the service to be considered appropriate.
NFFS benefits measure 7 Measures whether the benefits of the NFFS are being
delivered on an annual basis.
Indirectly – the NFFS has a key role in the Environment Agency’s ability to provide appropriate levels of service (specifically forecasting) and is therefore related to the ‘coverage’ performance indicator.
FWD benefits measure 7 Measures whether the benefits of FWD are being delivered
on an annual basis.
Indirectly – the FWD has a key role in the Environment Agency’s ability to provide appropriate levels of service (specifically dissemination) and is therefore indirectly related to the ‘coverage’ indicator.

Science Report – Reliability in Flood Incident Management Planning 13
2.5 A process for planning improvements to FIM performance
The process of FIM performance measurement and management is in essence a four stage cyclical process (Santos, Belton and Howick, 2007) involving:
i. The design of a performance measurement system. This system includes an integrated set of performance measures and indicators, agreed performance targets, and procedures for periodic performance review.
ii. The measurement of performance against the set targets.
iii. A growing understanding of what is influencing good and poor performance. With this insight it is then possible to devise actions to reinforce good performance and improve inadequate performance.
iv. The value of corrective actions. Evaluation is necessary to assess the value or benefit that can be derived from good performance and the cost of achieving and maintaining good performance, implementing the most appropriate set of actions, and monitoring outcomes in terms of improved performance.
Since “what gets measured gets done”, inappropriate or inadequate performance measures can have adverse consequences for an organisation (Wisniewski and Dickson, 2001). Performance measures, indicators and targets therefore need to be clearly linked with the mission, aims and strategic objectives the organisation. They should also reflect stakeholder needs. The aims and strategic objectives of the Environment Agency and the needs of its partners in dealing with flood incidents will change over time. Performance improvement is thus an adaptive process. The United Kingdom Climate Impacts Programme (2003) recently developed a decision-making framework to help guide the development of adaptive responses to climate change. This tool provides useful insight into how to structure an adaptive decision support process. Certain stages within this process are tiered, allowing the decision-maker to identify, screen, prioritise and evaluate risks and response options, before embarking on more detailed assessments of risks and responses (ESPACE, 2008). Performance measurement is neither precise (because intrinsic and other uncertainties influence the performance of systems), nor objective (because different systems of value, some subjective, influence the definition of ‘good’ performance). The emphasis of performance management should be on measuring relative rather than absolute levels and changes in FIM performance. Performance is also situation specific – a FIM system may, for example, perform very well if the scale of the flood incident is small, but less well if faced with a much larger incident where limited resources may force a choice between, say, focusing effort on issuing flood warnings and focusing on dealing quickly with telephone calls requesting information as the flood incident evolves. These two activities could involve the same set of people and force them to prioritise their activities. With this in mind, performance improvement needs to consider the advantages of a robust, well-performing system over one that performs extremely well, but only under a limited set of conditions.

14 Science Report – Reliability in Flood Incident Management Planning
2.5.1 Performance improvement
Performance improvement results from an iterative process of performance management, using evidence and feed-back, as illustrated in Figure 2.4.
Figure 2.4 Performance management for FIM.
This above process is made up of several key elements, specifically:
• defining the objectives of FIM and agreeing on how the benefits of good FIM performance can be valued;
• devising and periodically reviewing an integrated set of performance indicators;
• setting performance targets;
Set targets for FIM performance
Collect data and evidence on FIM performance
Identify and evaluate opportunities to improve FIM performance
Implement improvements to FIM
Analyse FIM performance against targets set
Identify & periodically review key FIM performance indicators
Define the scope and objectives of FIM, and agree on how to evaluate the benefits of good (reliable) FIM performance
Review targets, if necessary

Science Report – Reliability in Flood Incident Management Planning 15
• collecting data and evidence on FIM performance;
• analysing FIM performance against the set targets;
• identifying and evaluating opportunities for improving FIM and selecting improvement measures;
• implementing measures to improve FIM;
• reviewing (if necessary) the performance targets.
2.5.2 Performance evaluation
Measures of performance can be combined with value functions to evaluate the benefits of good performance as illustrated in Figure 2.5.
Figure 2.5 Assessing the quality and value of performance (after Hall J W et al., 2004).
The Environment Agency does not appear to have a single value function that makes it possible to evaluate the benefits and value of overall FIM performance in the context of FRM and broader Environment Agency management objectives. In place of such a function, we have used the Flood Damage Avoided equation (see Part B: Technical Report, Section 3.6) in this study, and the guidance we provide in this report assumes the application of this equation for performance evaluation.
Problem context
Aims and objectives
Value functions
Assessment of the quality and value of good performance
Performance indicators
System behaviour
System state variables
Collecting data and evidence on performance
Measured indicators of performance
Values

16 Science Report – Reliability in Flood Incident Management Planning
3 Tools for assessing and improving the reliability of FIM
3.1 Introduction This study has identified and developed tools for assessing the reliability of FIM processes and thereby help to improve their performance. The tools can be applied in three different ways:
i. Overview level The tools can be used across a range of possible flood incidents to provide an overview of FIM performance. This will help to identify the root causes of, and contributory factors to, good, adequate and inadequate performance.
ii. High level The tools can analyse quantitative and qualitative information on reliability and uncertainty in order to determine how these factors contribute to overall FIM performance.
iii. Detail The tools can focus on modelling the dynamics of FIM processes or systems and show how they can influence FIM performance.
The tools provide different forms of analysis, each of which can be applied to evaluate different aspects of reliability and performance in FIM. Examples of potential applications are illustrated in Section 3.2 below.
3.2 Overview level tools The purpose of the overview level tools is to provide a broad assessment of FIM performance. They can be applied across a range of different flood incidents to help identify areas of good and poor performance, giving some indication of the reasons for such performance.
The following sections outline the overview level tools developed during this study. A more detailed description of these tools is given in Part B: Technical Report.

Science Report – Reliability in Flood Incident Management Planning 17
Example 1: Overview assessment of FIM performance following a recent flood event
The Regional Flood and Coastal Risk Manager has been asked by the Regional Flood Defence Committee (RFDC) at short notice to provide an overview of the performance of the FIM system during a flood event that occurred over the previous weekend. The RFDC is particularly interested in whether there have been any improvements since the last significant flood. There has not yet been time to undertake a full event debrief with the duty officers involved. Since the RFDC only requires a relatively broad indication of performance (primarily what went well and what did not), performance matrices are appropriate for use in this situation.
The Regional Flood and Coastal Risk Manager arranges a short meeting with the Regional Flood Forecasting team leader and the FIM team leader for the affected area. Performance matrices covering the operational performance are reviewed and the results provide the Regional Flood and Coastal Risk Manager with an overview of FIM performance.
Example 2: Investigation of why flooded properties did not receive flood warnings until four hours after they were flooded
Several complaints have been received from residents on a new housing estate who only received a flood warning four hours after being flooded. Those signed-up to the flood warning service were only recruited three months ago and some residents are now very sceptical about the value of the service. The reason for the late flood warning is not immediately clear, but pressure from those affected means that a prompt explanation is required.
Root Cause Analysis can be used to assess the key processes within FIM that could have failed or under-performed. These include:
• the accuracy and timeliness of the flood forecasts provided by the Monitoring and Forecasting Duty Officer (MFDO);
• how the flood defence structure upstream of the affected properties was operated by the Operations Delivery Flood Incident Duty Officer (FIDO);
• the appropriateness of actions taken by the Flood Warning Duty Officer (FWDO) upon receipt of the flood forecasts;
• performance of dissemination methods (e.g. Floodline Warnings Direct).
Flood incident ma na gement (FIM ) de scr iptors a nd/or numbers
Proc
ess
–op
erat
iona
l per
form
ance
Ele m en t “P a rtic ula rlyPo or FIM”
“ Typic a l” or“a ve ra ge ” FIM
“E s pe c ia llyG ood ” F IM
E la bo ra tion an dca te gorisa tio n
Im me dia tepre p are dness
Fo recastin g
W arn ing a n dpro mo tin gre spo n se
Othe r co mm u nic at io n
Co -ord ina tio n
Med iaman a ge m e nt
E qu ip mentp rovisio n
E qu ip mentreliab ilit y
P oo r s ta te o fp re pa re dn e ss
Flo o d fo rec as t v eryp o or in te rmsof a ccu rac y
<5 0 % of wa rnin g sre ce ived in tim e fo r se n sib le resp o ns e
M a jo r co mm un ica tion
pro bl em s
Distin ct lac k o f co -ord ina tio n
M edia po orly ma n a ge d
Cle ar e q u ip m e nt sh o rtco ming s
G o od le ve ls of pre p are d ne ss
E xce llen t s ta te of p rep a red n es s
Categ ories: awareness raising; tr aining; pi lot exercises ;
appropr iate documentation; contingency plans
So me fo re ca stin g a ccu ra cy proble ms
Flo od s fo rec as t a cc ura te ly in term s
of time an d e xte n t
Categories: Detection; forecas ting; dissemination;
response; r ev iew
7 5% o f wa rnin g s re ceive d in t ime fo rse nsib le re sp on se
9 5% o f warn in gstim e ly f o r
se n sib le re sp o ns e
Categ ories: Internal warning messages ; dis semination;
response; r ev iew
S o me co mm u nic at ion
p rob le ms
No m a jo r co mmu n ica tio n
pro ble ms
Categ ories: I ns ide Agency ; outs ide Agency; Met Office; between responders; to/from publ ic ; f rom gauges ; to s ir ens
G ood c o-o rdin a tio n
E xce llen tc o-ordin a tio n;
no pro ble ms a t a ll
Categ ories: B r onze, Si lver, Gold Comm and; DEFRA/COBRA; profess ional
partners ; voluntar y bodies
G o o d me d ia man a g em e nt
No m a jor med ia ma na g e me n t
pro ble ms
Catego ries: National TV ; local TV ; national r adio, local r adio;
printed pr ess locally/national ly ; internet; others
S om e e qu ip men t l ac kin g
A ll rele va n t e q u ip m e nt ava ilab le
a n d in pla ce
C at ego ries: Detection; data processing; communication
power ; flood fighting ( dem ountables ); other equip.
Ev e nt 1 Ev e nt 2Key:
S ign ifica n t re liab ilitypro bl em s
Som e re li ab ilityp rob lem s
E qu ip me n trea so n ab ly re lia ble
Catego ries: Detection; data processing; communication
power; flood fighting ( demountables); other equip.
Flood incident ma na gement (FIM ) de scr iptors a nd/or numbers
Out
com
e –
oper
atio
nal p
erfo
rman
ce
E n viron me nt ald a ma g e
Eco n omi c d ama g e
(e xterna l)
Dama g e to A ge n cy’s
a sse ts
In jurie s
L o ss o f life
V ict im tra u ma
Re p u tat ion o f A ge ncy
a n d ot hers
Ele m en t “P a rtic ula rlyPo or FIM”
“ Typic a l” or“a ve ra ge ” FIM
“ Espe c ia llyG ood ” F IM
El ab ora tion andca te gorisatio n
Sig nif ica nte n viro nme n ta l
d ama g e
G re ater th anMult i-Co lo ure d
M an u a l d ama g e
Sig nif ica ntd am a g e to
Ag e n cy a sse ts
Grea te r th a n 5in 1 0 00
E q u al to o r g re a te r t ha n 1
in 1 0 00
G rea ter t han 25 in 10 00 p e o ple
a ff ec te d
R ep u ta tio n da m a ge d
Min or environ m en ta l
d a mag e
Ne g ligib le e n viron me n ta l
d ama g e
C atego ries : flora; f auna; landsc ape; ar chaeological
remains; others
L ess t h an Mu lti-Colo u red
M a nu al da m ag e
M uch le ss th a n M ulti-Co loure d M a nu a l d ama g e
Categ ories: R es idential; non-resident ial; publ ic buildings;
inf rastructure damage ( util ities) ; beyond floodplain affects; others
No m o re th an to be e xp e cte d
M uch le ss th a n e xp ec te d
Categ ories: Agency ins tallations ( gauges ; depots ; stores ; offices );
c ommunication equipment; flood defenc es; other
E qu a l to o r g rea ter th an 1
in 1 00 0Non e
Categ ories: Immediate and di rec tly flood related; medium
term effects (dir ect and indi rec t)
Non e Non eCateg ories: Age; gender ; Soc ial class; local/v is itor;
pr ior health status
E qu a l to o r gre a te r th a n
5 in 10 0 0 pe o ple
No p eo p le a ff ec te d
Categ ories: Age; gender ; Soc ial class; local/v is itor;
pr ior health status
No ef fe ct o n rep uta tio n
Rep u ta tio n en h an ce d
Categ ories: Public nationally; public locally; poli tically (MPs; DEF RA etc ) with
P rofess ional par tners
Key: Ev e nt 1 Ev e nt 2
Effective staff and resources available when needed?
Reliable technical systems?
Effective communications and good information management
Effective embedded procedures?
Good leadership promoting effective team work?
Working environment enables efficient teamwork?
Adequate skills?
Effective training?
Availability via rosters?
Successful FIM process
Techniques to ensure accuracy?
Polling equipment?
Data telemetry?
Good information management?
Effective means of communications?
Reliable data?
Contingency plans?
Leadership?
Enough working space?
Good support facilities?
Established procedures?
Team coordination?
Awareness of responsibilities?
Good team interactions?
Effective procedures?

18 Science Report – Reliability in Flood Incident Management Planning
3.2.1 Performance matrices
The development and application of performance matrices as an approach to improve FIM reliability was discussed in an earlier Science Report (11206/SR). Two performance matrices were developed and presented in this earlier science report: The matrices were designed to assess two aspects of FIM performance, namely ‘FIM processes’ and ‘FIM outcomes’. A third matrix was added during the course of this study to assess the performance of ‘FIM planning and readiness’. This addition broadens the capability of the performance matrices to provide a better overview of FIM performance.
Each element within a performance matrix is assessed as either ‘good’ (i.e. exemplary and worth sharing as an example of best practice); ‘adequate’ (i.e. average) or ‘inadequate’ (i.e. poor). Applying these matrices in a systematic way, for different flood events, indicates how FIM has performed from different aspects or points of view.
The idea of assessing performance from different perspectives is based on a ‘balanced scorecard’ approach. Balanced scorecards are used extensively in business and industry, government and non-profit organisations for strategic planning and management:
• to align business activities with the vision and strategy of the organisation;
• improve internal and external communications;
• monitor organisation performance against strategic goals.
The balanced scorecard approach originated in the 1990s with the work of Robert Kaplan (Harvard Business School) and David Norton. As a performance measurement framework, it adds strategic non-financial performance measures to traditional financial metrics, thus giving managers and executives a more 'balanced' view of organisational performance (Kaplan and Norton, 1992;1993;1996).
While the phrase ‘balanced scorecard’ was coined in the early 1990s, the roots of the this type of approach are deep, and include the pioneering work of General Electric on performance measurement reporting in the 1950s and the work of French process engineers (who created the tableau de bord – literally, a "dashboard" of performance measures) in the early part of the 20th century.
3.2.2 Root cause analysis
Root cause analysis is driven by the belief that failures and associated risks are best managed by dealing with their fundamental causes of failure rather than by responding, as a matter of expediency, to their symptoms. But in systems that are complex, dynamic and/or inherently uncertain it may be difficult to identify, with confidence, single root causes; failures and their associated risks may arise from a combination of causes (some deeper than others) that interact with one another.
Root cause analysis is used, for example, by the National Patient Safety Agency of the National Health Service (NHS) to determine the root causes of incidents that affect patient safety. A toolkit to guide the application of root cause analysis following incidents that have affected patient safety can be found on the NHS website of the National Patient Safety Agency (2009).
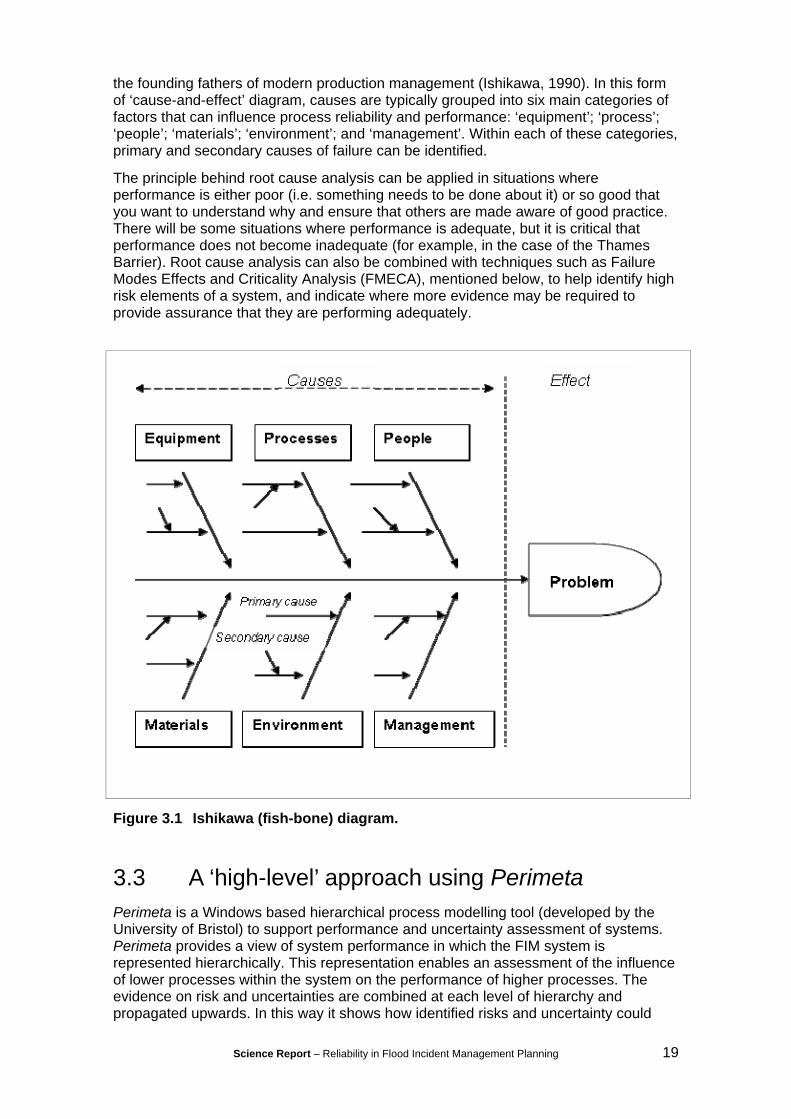
The process of carrying out a root cause analysis can be helped by using ‘cause-and-effect’ diagrams such as the ‘fish-bone diagram’. This form of diagram is also known as the Ishikawa diagram (see Figure 3.1), after Kaoru Ishikawa, who pioneered quality management processes in the Kawasaki shipyards in the 1960s and became one of
Science Report – Reliability in Flood Incident Management Planning 19
the founding fathers of modern production management (Ishikawa, 1990). In this form of ‘cause-and-effect’ diagram, causes are typically grouped into six main categories of factors that can influence process reliability and performance: ‘equipment’; ‘process’; ‘people’; ‘materials’; ‘environment’; and ‘management’. Within each of these categories, primary and secondary causes of failure can be identified.
The principle behind root cause analysis can be applied in situations where performance is either poor (i.e. something needs to be done about it) or so good that you want to understand why and ensure that others are made aware of good practice. There will be some situations where performance is adequate, but it is critical that performance does not become inadequate (for example, in the case of the Thames Barrier). Root cause analysis can also be combined with techniques such as Failure Modes Effects and Criticality Analysis (FMECA), mentioned below, to help identify high risk elements of a system, and indicate where more evidence may be required to provide assurance that they are performing adequately.
Figure 3.1 Ishikawa (fish-bone) diagram.
3.3 A ‘high-level’ approach using Perimeta Perimeta is a Windows based hierarchical process modelling tool (developed by the University of Bristol) to support performance and uncertainty assessment of systems. Perimeta provides a view of system performance in which the FIM system is represented hierarchically. This representation enables an assessment of the influence of lower processes within the system on the performance of higher processes. The evidence on risk and uncertainties are combined at each level of hierarchy and propagated upwards. In this way it shows how identified risks and uncertainty could
20 Science Report – Reliability in Flood Incident Management Planning
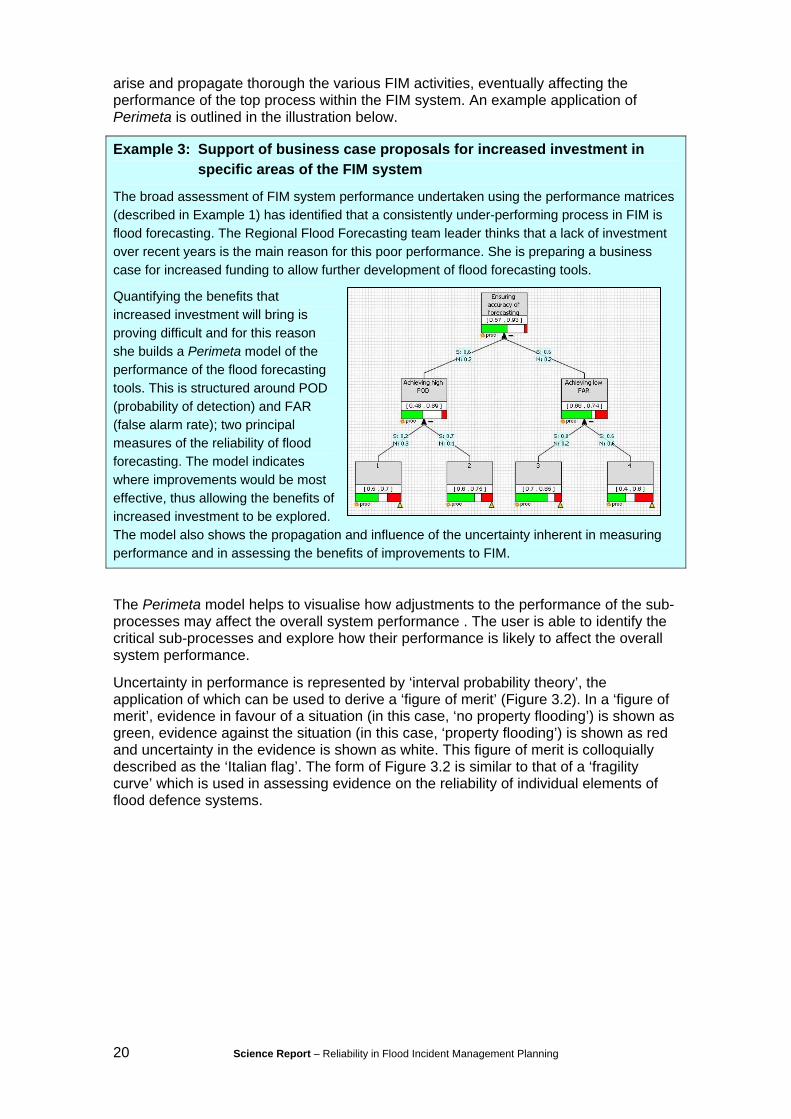
arise and propagate thorough the various FIM activities, eventually affecting the performance of the top process within the FIM system. An example application of Perimeta is outlined in the illustration below.
Example 3: Support of business case proposals for increased investment in specific areas of the FIM system
The broad assessment of FIM system performance undertaken using the performance matrices (described in Example 1) has identified that a consistently under-performing process in FIM is flood forecasting. The Regional Flood Forecasting team leader thinks that a lack of investment over recent years is the main reason for this poor performance. She is preparing a business case for increased funding to allow further development of flood forecasting tools.
Quantifying the benefits that increased investment will bring is proving difficult and for this reason she builds a Perimeta model of the performance of the flood forecasting tools. This is structured around POD (probability of detection) and FAR (false alarm rate); two principal measures of the reliability of flood forecasting. The model indicates where improvements would be most effective, thus allowing the benefits of increased investment to be explored. The model also shows the propagation and influence of the uncertainty inherent in measuring performance and in assessing the benefits of improvements to FIM.
The Perimeta model helps to visualise how adjustments to the performance of the sub-processes may affect the overall system performance . The user is able to identify the critical sub-processes and explore how their performance is likely to affect the overall system performance.
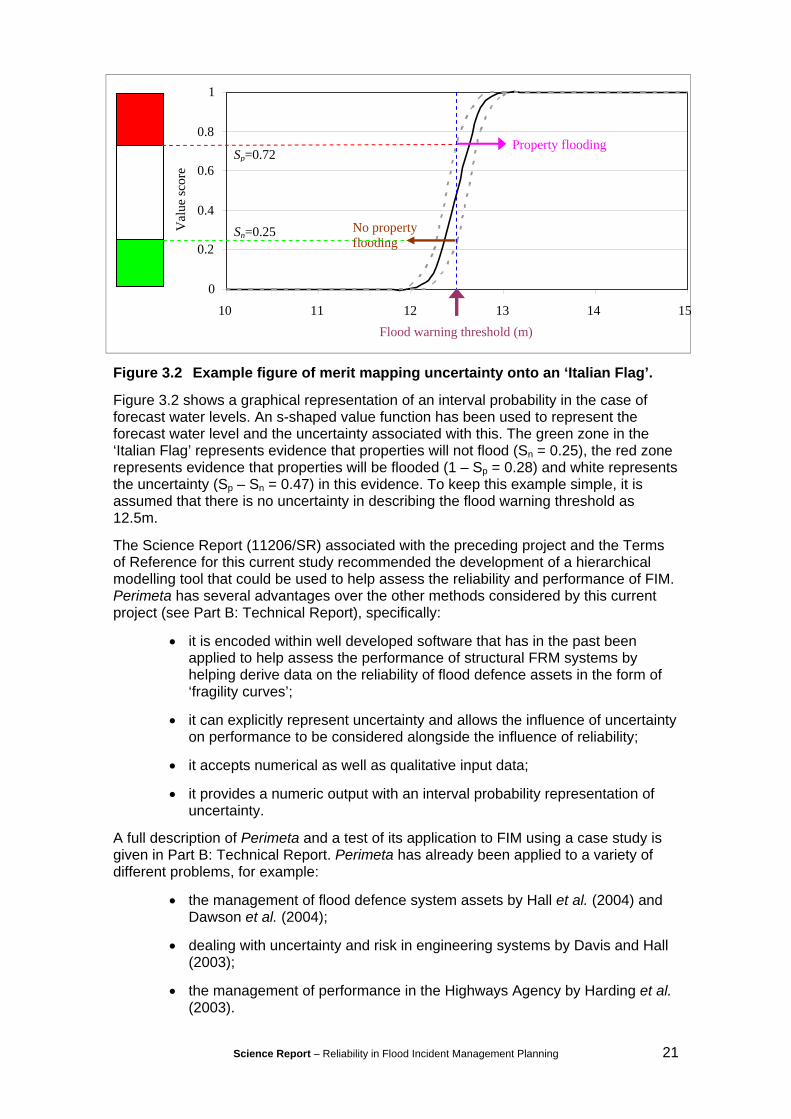
Uncertainty in performance is represented by ‘interval probability theory’, the application of which can be used to derive a ‘figure of merit’ (Figure 3.2). In a ‘figure of merit’, evidence in favour of a situation (in this case, ‘no property flooding’) is shown as green, evidence against the situation (in this case, ‘property flooding’) is shown as red and uncertainty in the evidence is shown as white. This figure of merit is colloquially described as the ‘Italian flag’. The form of Figure 3.2 is similar to that of a ‘fragility curve’ which is used in assessing evidence on the reliability of individual elements of flood defence systems.
Science Report – Reliability in Flood Incident Management Planning 21
Figure 3.2 Example figure of merit mapping uncertainty onto an ‘Italian Flag’.
Figure 3.2 shows a graphical representation of an interval probability in the case of forecast water levels. An s-shaped value function has been used to represent the forecast water level and the uncertainty associated with this. The green zone in the ‘Italian Flag’ represents evidence that properties will not flood (Sn = 0.25), the red zone represents evidence that properties will be flooded (1 – Sp = 0.28) and white represents the uncertainty (Sp – Sn = 0.47) in this evidence. To keep this example simple, it is assumed that there is no uncertainty in describing the flood warning threshold as 12.5m.
The Science Report (11206/SR) associated with the preceding project and the Terms of Reference for this current study recommended the development of a hierarchical modelling tool that could be used to help assess the reliability and performance of FIM. Perimeta has several advantages over the other methods considered by this current project (see Part B: Technical Report), specifically:
• it is encoded within well developed software that has in the past been applied to help assess the performance of structural FRM systems by helping derive data on the reliability of flood defence assets in the form of ‘fragility curves’;
• it can explicitly represent uncertainty and allows the influence of uncertainty on performance to be considered alongside the influence of reliability;
• it accepts numerical as well as qualitative input data;
• it provides a numeric output with an interval probability representation of uncertainty.
A full description of Perimeta and a test of its application to FIM using a case study is given in Part B: Technical Report. Perimeta has already been applied to a variety of different problems, for example:
• the management of flood defence system assets by Hall et al. (2004) and Dawson et al. (2004);
• dealing with uncertainty and risk in engineering systems by Davis and Hall (2003);
• the management of performance in the Highways Agency by Harding et al. (2003).
1
Flood warning threshold (m)
0
0.2
0.4
0.6
0.8
10 11 12 13 14 15
Val
ue sc
ore
Property flooding
No propertyflooding
Sp=0.72
Sn=0.25

22 Science Report – Reliability in Flood Incident Management Planning
3.4 A ‘detailed’ approach using agent-based modelling An agent-based model is a computational method for simulating the actions and interactions of autonomous decision-making entities in a network or system. The modelling attempts to assess the effects of these actions on the system as a whole. Each agent individually assesses its situation and makes decisions on the basis of a set of rules. Agents may execute various behaviours appropriate for the system component they represent, for example, producing or consuming.
At its simplest level, an agent-based model consists of a system of agents and the relationships between them. Even a simple agent-based model can exhibit complex behaviour patterns because a series of simple interactions between individuals may result in more complex system scale outcomes that could not have been predicted just by aggregating individual agent behaviours. This modelling approach therefore provides valuable information about the dynamics of the real-world system that it emulates. In addition, agents may be capable of evolving, allowing unanticipated behaviours to emerge.
Example 4: Design and effectiveness of flood incident management strategies
Studies have identified poor performance in the existing FIM system. It is proving difficult to quantify the benefits of different interventions because several of the options under scrutiny rely on actions being undertaken during a flood event following the delivery of flood warnings to the public and others involved in FIM. The interventions under investigation include temporary flood barriers; automatic warning systems; a door-knocking warning service for the elderly; and evacuation shelters and traffic control measures to manage evacuation. Moreover, many of the benefits of these measures derive from improved health and safety of residents, which cannot be measured in economics terms alone.
Evacuation pointCongestion
Trapped agents
Flooded agents
Built up areas
Flooded area
An agent-based model has been constructed to understand better the dynamics of the flood incident. In particular, human and organisational responses are represented in the model. This enables the effect of different interventions to be compared using a consistent, transparent and auditable approach. The model can help identify how significant various factors (such as the storage location of temporary barriers, the amount of warning time, and the evacuation route taken) are to the overall level and spatial distribution of flood risk. The agent-based model is particularly useful in situations where the dynamic interactions between sequences of events in time and space are important.

Science Report – Reliability in Flood Incident Management Planning 23
Agent-based modelling is an effective means of analysis for systems that are composed of interacting, heterogeneous agents which exhibit emergent (e.g. reproductive, dynamic, learning, adaptive) properties. Agents can be individual people, groups of people or agencies.
Agent-based modelling was developed as a relatively simple concept in the late 1940s. Since it requires computation-intensive procedures, it was not until the 1980s that it attracted the interest of operations researchers and management scientists. The modelling approach has since been applied to political science by Axelrod (1997); to management and organisational effectiveness by Samuelson (2000); and to the behaviour of social networks by Gilbert and Troitzsch (1999) and by Sallach and Macal (2001).
Other approaches (that are briefly reviewed in Part B: Technical Report) are limited in their ability to capture dynamic responses; agent-based modelling is one of the few practical methods to provide this simulation capacity. Research shows that the response by humans and organisations to flood risk and flood warnings is strongly related to their prior experience of flooding and flood warnings, and also to a learning process. The agent-based approach is well suited to modelling these kinds of system dynamics. Agent-based models also have a good pedigree in testing the effectiveness of warning dissemination mechanisms and the susceptibility of evacuation routes to overcrowding in fire and terrorist incident simulations (Still, 1993; Galea et al.,1996; Wong and Luo, 2005) and situations of ‘panic’ (Helbing et al., 2000; Zarboutis and Marmaras, 2005), making them natural tools for a FIM application.
Agents can be both reactive (they are influenced by other agents) or proactive (they actively seek to perform a task). For example, during a flood event members of the public agents may be reactive; the first reaction may be to ‘move their valuables upstairs’. Emergency service agents, however, may be proactive and seek to ‘travel around disseminating warnings using a loud haler and house calls’. When the public and emergency service agents meet, the public agent may be influenced by the emergency service agent and change their behaviour to ‘evacuate the floodplain’.
An agent may also interact with the environment. For example, a public agent may observe flood water coming towards them and run in the opposite direction. By coupling hydrodynamic simulations with the agent-based modelling, the impact of the flood event and responses to the event as it unfolds can be explored. Results of interest might include:
• routes likely to be blocked by flood water and optimal access routes for emergency services;
• roads liable to congestion during an evacuation;
• expected casualties from different breach and storm surge events;
• optimal locations to place temporary evacuation shelters.
Agent-based models let users explore the dynamics of individuals and organisations during a flood event. They also explicitly enable users to identify uncertainties and vulnerable processes, components and systems. More importantly, this approach can be used to identify and test the impact of sequential (knock-on) failure of different components and processes in the FIM system.

24 Science Report – Reliability in Flood Incident Management Planning
4 Guidance on applying the tools
4.1 Introduction The tools outlined in the Chapter 3 are able to help assess the performance of FIM systems and their vulnerability to risk and uncertainty. The tools thus provide decision support on planning improvements to FIM.
These tools can be applied:
• retrospectively – using data from post-flood reviews and/or simulated flood
exercises to determine how well the FIM systems performed in a given flood event;
• prospectively – using validated models of process performance to test the effects of measures for improving FIM reliability on FIM performance.
4.2 Potential areas of application Table 4.1 provides examples of FIM processes and areas of activity to which the tools can be used to help assess FIM reliability and performance, and evaluate planned improvements to FIM. The table suggests the types of tool(s) that could be applied for a variety of applications. Comments have been added on the outputs from applying the tools, and the potential use of these outputs.

Science Report – Reliability in Flood Incident Management Planning 25
Table 4.1 Application of tools for assisting with principal FIM activities.
Tool
Activity Tasks Performance matrices
Root cause analysis
PerimetaAgent-based modelling
Comments
Assessing /recent or simulated (via an emergency exercise) FIM performance
Performance matrices and root cause analysis will facilitate a qualitative assessment of performance at an overview level. Perimeta will allow a more detailed assessment to be made, incorporating both qualitative and quantitative evidence
Analyse FIM performance against set targets
Understanding why FIM performance is inadequate
Performance analysis and root cause analysis will help provide insight into reasons for under-performance, which can then be investigated in more detail using Perimeta and agent-based modelling
Testing ideas to improve FIM processes
Perimeta can be used in forward-planning mode to assess the impact of changes in the performance of sub-processes within the FIM system. Agent-based modelling simulations can be used to assess the effect of changing specific FIM processes
Identifying and evaluating opportunities for improving FIM and selecting improvement measures
Testing ideas to improve emergency response (including evacuation)
Agent-based modelling can be run for a range of scenarios to test different emergency response plans
Table 4.1 continued overleaf

26 Science Report – Reliability in Flood Incident Management Planning
Table 4.1 continued
Tool
Activity Tasks Performance matrices
Root cause analysis
PerimetaAgent-based modelling
Comments
Evaluating ideas to improve FIM processes and emergency response (at an Area, Region and National scale)
By using Perimeta in a forward-planning mode at a range of spatial scales, ideas to improve FIM processes can be tested. Agent-based modelling can be used in a similar vein to evaluate different methods of improving emergency responses Evaluate
opportunities for improving FIM
Business case development relating to the above (at varying spatial scales)
The use of Perimeta as a forward-planning tool will provide evidence to support the development of business cases for the improvement of FIM processes. Agent-based modelling can also be used to provide evidence in support of business cases
Implement improvements to FIM (via training)
Using tools and techniques as a training aid during duty officer training sessions
Knowledge and use of the tools and techniques available will help duty officers appreciate the impact and importance of various sub-processes within the FIM system
Assess level of flood risk
Quantitative analysis of flood risk
Outputs from event simulations using agent-based modelling are able to quantify the risk associated with flooding (e.g. flood extent, depth, damages etc)

Science Report – Reliability in Flood Incident Management Planning 27
4.3 Sources of evidence on FIM performance Current knowledge regarding the behaviour and performance of different components of the FIM system is incomplete. Flood incidents vary dramatically in their geographical impact and the time course of the event. Descriptions of FIM performance are often based on sparse and/or incomplete data, which may not have been systematically collected or interpreted.
Potential sources of data or evidence on FIM performance include:
• post flood reviews at a national level;
• post flood reviews at a regional or an area level;
• post-flood surveys of recipients of flood warnings and those affected by flooding;
• outputs from simulated flood emergencies;
• internal Environment Agency audits of FIM performance;
• expert opinion.
Table 4.2summarises the typical data sources that may be needed to satisfy that information and data requirements for each of the tools.

28 Science Report – Reliability in Flood Incident Management Planning
Table 4.2 Data requirements for each of the tools.
Data source / type required for each tool
Data source / type Performance matrices
Root cause analysis
Perimeta Agent-based modelling
Adequacy of duty officer facilities & equipment (office and home)
Available contingency techniques Available dissemination techniques Available forecasting techniques Duty officer information (availability, competence, experience, level of training received etc.)
Duty officer procedures (availability, comprehensiveness etc.)
Flood forecasting performance measures
Flooded property information Flood warning level of service compliance
Hydrodynamic model simulations Hydrometric network (location, reliability, performance etc.) Information from simulated emergencies
Information on agent behaviour Informed judgement National Receptors Database and AddressPoint data Defence information from the National Flood and Coastal Defence Database (NFCDD)
OS MasterMap transport network Pitt Review Post-event debrief reports Post-event flood reports Public opinion surveys RASP model (Risk Assessment for System Planning)
Topographic data

Science Report – Reliability in Flood Incident Management Planning 29
4.4 Improving FIM The tools developed in this study can be used by staff in the Environment Agency involved in the management of national flood systems and services, to strengthen the evidence-base for planning work to improve the reliability of FIM processes by:
• assessing the current reliability of the FIM (human and technical) processes;
• understanding the vulnerability of FIM processes to risks and uncertainty and how these factors influence FIM reliability and performance;
• providing insight into how FIM performance could be improved (where this is shown to be necessary);
• indicating the benefits of improved FIM in areas where they are needed most.
Examples of potential applications of the FIM tools are illustrated in Chapter 3 of this report.
Case study applications and outputs of the tools, in the context of FIM, are described in Part B: Technical Report. Section 5 of the Technical Report provides information on how to:
• interpret outputs from the different types of model;
• interpreting the uncertainty included in the results;
• compare modelled performance against target levels of performance.
4.5 Current limitations to the use of the tools Current limitations in the application of the tools fall into three main groups, namely:
• conceptual limitations in the techniques on which the tools are based;
• the extent of validation possible;
• the availability of adequate input data.
Information on the conceptual strengths and weaknesses of each of the tools and techniques is given in Section 6 of Part B: Technical Report.
In the case study tests, the Perimeta and agent-based models were parameterised as rigorously as possible using readily available information at the time. The case studies considered the robustness of the models and how accurately they represent the nature and behaviour of FIM processes and systems.
Well validated models provide assurance in the quality of the model outputs. The quality of validation depends on the quality and availability of information on performance as well as knowledge about uncertainty against which model output can be checked. Some of this information, especially that relating to uncertainty will, by its nature, be subjective. Model re-validation may be required following significant changes to the structure of processes or changes to the processes themselves within FIM.

30 Science Report – Reliability in Flood Incident Management Planning
Our insight into model validation which emerged from the case studies is provided in Section 5, Part B: Technical Report. In particular the process of validation needs to consider several important questions:
i. Do the outputs from the model(s) look plausible? Is there evidence – from existing performance indicators or from information collected by the Environment Agency – with which the model results can be compared?
ii. Do the results of key intermediate processes modelled look sensible? Can these results be compared with evidence from performance indicators or measured data?
iii. Does the model output plausibly represent sources and effects of potential process failures and uncertainty?
iv. Are the models robust to changes in parameterisation? In other words, to they respond plausibly to alternative weightings of data and different levels and sources of uncertainty?
The case studies have shown that:
• some of the evidence of reliability and uncertainty inputted into the models is typically obtained at snapshots in time (i.e. following a significant flood event or an emergency simulation) – this evidence will change as post-flood event improvements to the FIM system are implemented so it is likely that performance now will be different to that experienced during the flood event;
• some of the evidence will inevitably be based on best estimates rather than observed or recorded information – this introduces an unavoidably subjective element into the model validation process;
• the structure of the model, and the weights attached to links between processes, may need to change to reflect revisions to processes as they are modified and evolve.
In the case of agent-based modelling, we recommend that future work should in part help to develop an approach to calibration based on fusing best available data from multiple sources to obtain the most representative simulation of flood events.
4.6 Applying the tools to provide decision support Although the overview, high-level and detailed tools are designed for different purposes, they can be applied in a complementary manner. They provide different forms of analysis, each of which can help evaluate different perspectives on reliability and performance in FIM at different scale and levels of detail.
The tools were tested on different types of flood incident – the overview method and Perimeta used data for fluvial flood events; agent-based modelling was tested in the context of a coastal flood incident. The case studies described in Part B: Technical Report provide insight into how these tools can support and complement one another. Insight from the case study tests is outlined in brief in Section 4.6.1 and 4.6.2.

Science Report – Reliability in Flood Incident Management Planning 31
4.6.1 Spatial scale
The three types of tool can in principle be applied following a tiered approach: that is, they can be applied at spatial scales from an operational area used in FRM (a region or river catchment) down to an individual flood warning zone within an operational area.
The most appropriate scale of application for each of the tools is influenced by:
• the scale at which the particular FIM planning decisions are taken;
• factors relating to how the failure of FIM processes affects FIM performance (e.g. the failure to deliver flood warnings in time to a flood warning area will affect performance at a local rather than at a catchment level);
• the level of detail at which we can represent specific risks and uncertainties that can influence FIM performance – the selection of too coarse a model resolution may mask the influence of specific factors;
• the level of detail at which indicators and data on FIM performance are typically measured;
• the amount of input data required – applications that require data at a high resolution will be limited in terms of the spatial area over which they can be applied effectively.
The performance matrices were tested for an operational area, but could be applied to larger scale analyses. Although root cause analysis considers specific performance related issues, the scale of the root causes could range from local to regional processes within FIM.
Perimeta was tested for an operational area, but given its hierarchical structure, it can be applied at whatever scale is deemed most appropriate for representing the specific factors thought to influence performance; these could range from a group of FIM processes within an operational area or a region to an entire operational area or region itself. A large area could be represented by a set of Perimeta models.
The agent-based models were tested at a community scale such as a Flood Warning Risk Area (FWRA). However, the agent-based modelling demonstrated here is not in principle constrained by scale. However, it would be less practical to apply this particular simulation model over very wide areas due to the increasing computational demand of simulating so many agents. Work at Los Alamos National Laboratory has shown that large scale simulations are still viable (Rilett, 2002). An appropriate method to extend the agent-based model to a larger scale may be to group agents, or simplify the flood modelling and/or agent behaviour rules.
4.6.2 The conceptual integration of the tools
The tools developed in this study can be integrated conceptually as illustrated in Figure 4.1. More detailed discussion of how the use of the tools could be integrated is provided in Part B: Technical Report, Section 3.6.
Our Perimeta case study demonstrated that the use of performance matrices prior to the construction of the Perimeta model helped to identify the FIM processes that had caused concern during recent flood events. The builders of the Perimeta models were then able to represent these processes at an appropriate level of detail in their models. The structure of the fish-bone diagram proved to be useful in helping develop an appropriate structure for the Perimeta models.

32 Science Report – Reliability in Flood Incident Management Planning
The case studies generated the following insight:
i. Performance matrices can provide an overview of which FIM processes are performing adequately and which are not. The matrices therefore highlight which FIM processes (or sub-systems) need to be assessed in more detail.
ii. Root cause analysis identifies specific causes of inadequate performance. This approach highlights more clearly the processes (or sub-systems) that are contributing to poor (or good) performance.
iii. Application of these tools can help to structure Perimeta and agent-based models.
iv. Outputs from Perimeta and agent-based models can then be used in a complementary way. A suitable value function can evaluate the benefits of improved FIM performance.
A value function takes information on FIM performance and evaluates the benefits that would arise from improvements in FIM performance. The value function used by the Environment Agency at the time of writing this report is outlined in the following section, along with a commentary on how it could be refined further.

Science Report – Reliability in Flood Incident Management Planning 33
Figure 4.1 Conceptual integration of overview, high level and detailed methods within a decision-support framework.
Benefit function: FDA = (annual average damage) x (damage reduction)
x (coverage) x (service effectiveness) x (availability) x (ability)
x (effective action)
Evidence Base: flood risk assessments; post flood surveys; simulated flood incidents; performance audits, etc
Performance Matrices – provide a strategic overview of performance of FIM processes
Aspects of FIM requiring more specific assessment
Root Cause Analysis – helps identify causes of FIM system or process failure
Specific processes within flood warning service systems
Dynamic systems within emergency responses
Perimeta model – assesses the influence of failure and uncertainty on FIM
Identify, test and evaluate improvements to FIM
Agent-based model – models dynamic aspects of FIM system behaviour
Assessment of potential benefits from measures to improve FIM (identified from the above) and development of a business case for implementing improvements to
FIM

34 Science Report – Reliability in Flood Incident Management Planning
4.7 Assessing the benefits of good FIM performance FIM is recognised as one component in a range of activities carried out by the Environment Agency to manage flood risk. Flood risk planners and managers recognise that they are dealing with dynamic ‘risk producing-risk response’ systems; natural and man-made components interact to generate floods and respond to flood risks. FIM aims to avoid loss of life and injury and reduce the level of trauma, as well as the physical, economic and environmental damage caused by flooding. These aims are achieved by issuing flood warnings and assisting flood emergency responses.
The benefits of structural responses to avoiding flood damage can be assessed by a range of methods and tools already developed and used by the Environment Agency. For example, the RASP methodology expresses the performance of flood defence systems in the form of ‘fragility curves’. The Perimeta software is already used to generate fragility curves for flood defence systems (Dawson et al., 2004).
In this study we tested the high level method (see Part B: Technical Report) using the ‘flood damage avoided’ (FDA) equation outlined in two documents: Flood Warning Performance Measures (Version 3, Issued 14/03/05) and Flood Warning Levels of Service (Version 2, Issued 05/05/06). The equation (shown below) provides a means of converting the level of performance (in various FIM processes) into the actual benefits of FIM, in terms of flood damage avoided:
FDA (flood damage avoided) = AAD (annual average damage) x DR (damage reduction) x C (coverage) x r (service effectiveness) x RA (availability) x PR (ability) x PE (effective action)
The FDA equation is based on a flood warning damage reduction model developed by the Flood Hazard Research Centre (FHRC) at Middlesex University described by Parker (1991). The original FHRC model formed the basis for the FDA model which was employed in the Environment Agency’s Flood Warning Investment Strategy 2003/4–2012/13 (Environment Agency, 2003). It also formed the basis for understanding flood warning responses in Defra’s Making Space for Water strategy (2004).
A new and more comprehensive approach for estimating the monetary benefits of flood warnings, the Flood Warning and Response Benefits Pathways (FWRBP) model, has been devised by the European Commission funded FLOODsite research project. The model is described by Parker et al. (2008) and is outlined in the following section (Section 4.7.1).
4.7.1 Flood Warning and Response Benefits Pathways (FWRBP) model
The Flood Warning and Response Benefits Pathways (FWRBP) model aims to estimate the monetary benefits that arise when property damage, flooding and losses are avoided. We focus on this model below. It is also possible to place monetary values on human life; if this is desirable and acceptable such values may be added to the monetary benefits estimated by the FWRBP model.
The new FWRBP approach arises from a critique of the FHRC flood warning damage reduction model published by Parker (1991). The new model takes account of how responses commonly made to flood warnings have evolved since the early 1990s.

Science Report – Reliability in Flood Incident Management Planning 35
Conditions have changed since the early 1990s, making the 1991 model somewhat out-of-date when used on its own. However, the FLOODsite research project suggests that the 1991 FHRC model remains valid, albeit in a revised and recalibrated form (see below), and should continue to be used to estimate the benefits of moving property contents out of the reach of floodwaters.
A critique of the 1991 model was undertaken through research jointly funded by Defra and the Environment Agency; the critique was published by FHRC in 2005 (Tunstall et al., 2005). It foresaw the need for a broader approach to capturing the benefits of flood warnings, and observed that some of the most important benefits of flood warnings were no longer being captured in the original 1991 model. The critique was subsequently mirrored in scoping research undertaken by the Scotland and Northern Ireland Forum for Environmental Research (SNIFFER) in 2006.
The critiques, which recommend a holistic perspective, help to identify eight principal response pathways to flood warnings during the management of flood incidents. These eight pathways represent the theoretical choice of responses to flood warnings that can be taken to reduce damage and loss. Each possible choice is potentially capable of reducing flood damage and producing flood warning or FIM benefits, although this potential is still often far from being fully exploited for various reasons.
Examples of these potential responses are given in Table 4.3. A more detailed description of the FWRBP model is given in Appendix 2.
From Table 4.3 we can see that “the movement of contents of properties” (i.e. either their movement upstairs or their evacuation from the property) is only one of eight possible flood warning response and benefit ‘pathways’. Thus the 1991 FHRC model (i.e. the ‘FDA’ model currently used by the Environment Agency) is only likely to estimate a small proportion of the total potential flood warning benefits if the other pathways are engaged, as hopefully they will be in any effective and efficient case of FIM.
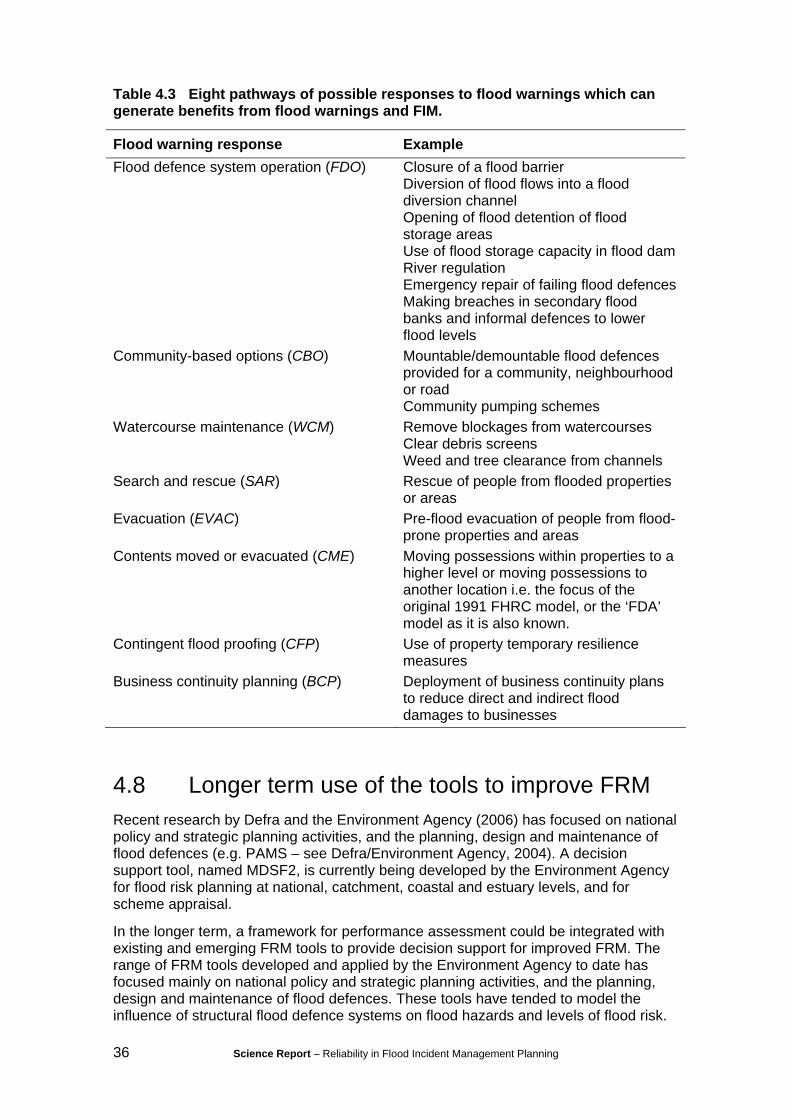
36 Science Report – Reliability in Flood Incident Management Planning
Table 4.3 Eight pathways of possible responses to flood warnings which can generate benefits from flood warnings and FIM.
Flood warning response Example Flood defence system operation (FDO) Closure of a flood barrier
Diversion of flood flows into a flood diversion channel Opening of flood detention of flood storage areas Use of flood storage capacity in flood dam River regulation Emergency repair of failing flood defences Making breaches in secondary flood banks and informal defences to lower flood levels
Community-based options (CBO) Mountable/demountable flood defences provided for a community, neighbourhood or road Community pumping schemes
Watercourse maintenance (WCM) Remove blockages from watercourses Clear debris screens Weed and tree clearance from channels
Search and rescue (SAR) Rescue of people from flooded properties or areas
Evacuation (EVAC) Pre-flood evacuation of people from flood-prone properties and areas
Contents moved or evacuated (CME) Moving possessions within properties to a higher level or moving possessions to another location i.e. the focus of the original 1991 FHRC model, or the ‘FDA’ model as it is also known.
Contingent flood proofing (CFP) Use of property temporary resilience measures
Business continuity planning (BCP) Deployment of business continuity plans to reduce direct and indirect flood damages to businesses
4.8 Longer term use of the tools to improve FRM Recent research by Defra and the Environment Agency (2006) has focused on national policy and strategic planning activities, and the planning, design and maintenance of flood defences (e.g. PAMS – see Defra/Environment Agency, 2004). A decision support tool, named MDSF2, is currently being developed by the Environment Agency for flood risk planning at national, catchment, coastal and estuary levels, and for scheme appraisal.
In the longer term, a framework for performance assessment could be integrated with existing and emerging FRM tools to provide decision support for improved FRM. The range of FRM tools developed and applied by the Environment Agency to date has focused mainly on national policy and strategic planning activities, and the planning, design and maintenance of flood defences. These tools have tended to model the influence of structural flood defence systems on flood hazards and levels of flood risk.

Science Report – Reliability in Flood Incident Management Planning 37
By extending this set of tools to include non-structural FRM responses, in particular those that depend on reliable FIM processes, we will help FRM planners to analyse portfolios of structural and non-structural FRM actions.
A future version of MDSF2 should include representations of non-structural FRM responses alongside structural FRM responses. It will thus be able to analyse integrated portfolios of structural and non-structural FRM actions
At each stage of the FIM process planners and managers need to be assured that the decisions they take are based on a good understanding of the effects of failure and uncertainty on system reliability. With a clearer understanding of how risks and uncertainty may affect FIM reliability, planners will be better able to evaluate interventions to improve the performance of the FIM system.

38 Science Report – Reliability in Flood Incident Management Planning
5 Recommendations
5.1 Introduction The decision-support tools (performance matrices, root cause analysis, Perimeta based hierarchical modelling and agent-based modelling) investigated in this study have all been tested to a ‘proof-of-concept’ level. In their current forms, they are emerging prototypes that can be applied, in an exploratory way, to help assess the reliability of FIM and evaluate FIM performance in a more structured and systematic way than has been possible to date.
This study has provided an opportunity to test the application of these tools to FIM. In most cases this has been their first documented application to FIM. The study has therefore made a significant contribution to our knowledge and understanding of FIM, in particular, and of how the performance and reliability of FRM measures can be assessed in general.
Further testing and progressive refinement of each of the tools is still needed before they can be issued as standard tools for general use by staff across the Environment Agency. Nevertheless, they are at a stage where their application could be undertaken by staff with some training.
5.2 General recommendations The following general recommendations arise from the technical and science work carried out in this study. They are listed as short-term and medium-term recommendation and given in order of priority.
5.2.1 Suggested developments in the short term
i. Wider trialling of these models The models need to be tested on additional case study areas and flood types to involve potential users in applying these tools and to assess more extensively:
• their effectiveness in assessing, evaluating and improving different aspects of FIM performance;
• their application to FIM planning and business case development within the Environment Agency;
• the input data requirements for each tool, including the means of capturing these data efficiently during the course of a flood incident and making them accessible to users of the tools after the event;
• the development of generic prototype forms (or templates) of the tools to facilitate their use within the Environment Agency;
• the practicalities of applying the tools in a complementary way.

Science Report – Reliability in Flood Incident Management Planning 39
ii. Testing the benefits of a broader application of the methods The tools should also be trialled to support strategic assessments (such as the Long Term Investment Strategy (LTIS)) and developments in flood forecasting processes and reliability.
5.2.2 Suggested developments in the medium term
i. Refinements to model validation More refined forms of model validation are needed to check the ability of the models to represent human (behaviour) factors and systems, as well as the physical, technical, and information systems involved in FIM.
ii. Additional performance measures Additional performance measures within parts of the FIM system should be devised – for example, at an intermediate level within the Perimeta model to provide clearer evidence on the effectiveness of key processes.
iii. Integrating the tools within a decision-support framework The use of the tools should be incorporated into decision-support frameworks, especially to improve benefit assessments, and to evaluate the efficacy of improvements to FIM performance and their influence on FRM (via future developments in the MDSF and RASP modelling systems).
5.3 Specific recommendations Recommendations for further science R&D to refine each of the methods developed and tested during the course of this study are outlined in Part B: Technical Report, Section 7.2. The key recommendations for further science R&D are listed below:
i. Refinements to performance matrices and fish-bone diagrams The structure, descriptors, and performance categories of the performance matrices and fish-bone diagrams should be refined through wider testing. This will help to ensure the adequacy and robustness of their representation of key aspects of the FIM system.
ii. Perimeta refinements The structure, parameterisation and robustness of the Perimeta models require further refinement through wider testing to ensure their adequacy to represent key aspects of the FIM system.
iii. The influence of data quality Before the application of the models for forward-looking planning can be explored further, it is necessary to assess how the quality of input and validation data influence the quality of the models over a range of flood areas and flood events.
iv. Strengthening the validation process for agent-based models
v. Extension of the agent-based model The agent-based model may be extended to better represent organisational and other agents.

40 Science Report – Reliability in Flood Incident Management Planning
vi. Training The application of these new tools will require some new skills in performance assessment and modelling. In addition to the development of user-guides on how to apply these tools, we recommend training, especially in the use of Perimeta and agent-based modelling, to provide Environment Agency staff with the skills to build, validate and apply their own models with confidence.

Science Report – Reliability in Flood Incident Management Planning 41
References AXELROD, R., 1997. The Complexity of Cooperation: Agent-Based Models of Competition and Collaboration, Princeton: Princeton University Press.
DAVIS, J. P., and HALL, J. W., 2003. A software supported process for assembling evidence and handling uncertainty in decision making. Decision Support Systems, vol 35, pp. 415–433.
DAWSON, R., HALL, J. W. and DAVIS, J. P., 2004. Performance based management of flood defence systems, Proc Institution of Civil Engineers: Water Management, vol 157, pp. 35–44.
Defra, 2004. Flood Warning and Forecasting. Making Space for Water, July 2004, London: Defra Flood Management Division.
Defra, 2006. Consultation on policy options for promoting property-level flood protection and resilience, July 2006, London.
Defra and Environment Agency, 2006. Flood risks to people – Phase 2, Defra, London.
Defra, 2009. Guidance on FRM responsibilities available from: http://www.defra.gov.uk [Accessed 6 April 2009].
Defra/Environment Agency, 2004. Performance-based Asset Management System (PAMS) – Phase 1 Scoping Study, HR Wallingford Report SR 660.
Defra/Environment Agency, 2006. MDSF2 Main Development Phase – Initial Report.
Defra/Environment Agency, 2006. Risk Assessment in FIM – Phase1. Science Report SR11206.
Environment Agency, 2007a. Public Response to Flood Warnings, Science Report, SC020116, EA, Bristol.
Environment Agency, 2007b. Response to Flooding 2007. Response to Flood Events of January 2007 in Midlands Region and North East Region, EA, Bristol.
Environment Agency National Flood Warning Centre, 2003. Flood Warning Investment Strategy Appraisal Report 2003/04 to 2012/13, Frimley: Environment Agency National Flood Warning Centre.
ESPACE, 2008. Climate Change Impacts and Spatial Planning Decision Support Guidance. Report by Halcrow and the Environment Agency. June 2008.
GALEA, E., OWEN, E. and LAWRENCE, P., 1996. The EXODUS model, Fire Engineers Journal, July 1996: 26-30..
GILBERT, N. and TROITZSCH, K., 2005. Simulation for the Social Scientist, 2nd Edition, Milton Keynes: Open University Press..
HALL, J. W., LE MASURIER, J. W., BAKER-LANGMAN, E. A., DAVIS, J.P., TAYLOR, C. A., 2004. A decision-support methodology for performance based asset management, Civil Engineering and Environmental Systems, 21(1):51–75.
HALL, J. W., DAWSON, R. J., SAYERS, P. B., ROSU, C., CHATTERTON, J. B. and DEAKIN, R., 2003. A methodology for national-scale flood risk assessment. Water and Maritime Engineering, ICE, 156(3) 235–247.

42 Science Report – Reliability in Flood Incident Management Planning
HARDING, N., GODFREY, P. and BENJAMIN, D., 2003. Delivering Best Value Highway Performance, presented at Transportation Research Board 83 Annual Conference, Washington DC.
HELBING, D., FARKAS, I. and VICSEK, T., 2000. Simulating dynamical features of escape panic, Nature 407, 487–490(28th September 2000)..
ISHIKAWA, K., 1990. Introduction to Quality Control (translated by Loftus J H), 448p, ISBN 4-906224-61-X.
KAPLAN, R. S. and NORTON, D. P., 1992. "The balanced scorecard: measures that drive performance", Harvard Business Review Jan – Feb pp. 71–80. .
KAPLAN, R. S. and NORTON, D. P., 1993. "Putting the Balanced Scorecard to Work", Harvard Business Review Sep – Oct pp2–16. .
KAPLAN, R. S. and NORTON, D. P., 1996. "Using the balanced scorecard as a strategic management system", Harvard Business Review Jan – Feb pp. 75–85. .
National Health Service, 2009. Guidance on Root Cause Analysis available from: http://www. msnpsa.nhs.uk/rcatoolkit [Accessed 6 April 2009].
PARKER, D. J., 1991. The Damage Reducing Effects of Flood Warnings. Report Prepared for Halcrow National and for the National Rivers Authority (Anglian Region) Regional Telemetry Scheme Appraisal, FHRC, Enfield, UK..
PARKER, D. J., PRIEST, S., SCHILDT, A., HANDMER, J., 2008. Modelling the damage reducing effects of flood warnings, FLOODsite, Final Report No. T10-07-13, Wallingford: HR Wallingford.
RILETT, L. R., 2002. Transportation Planning and TRANSIMS Microsimulation Model, Transportation Research Record 1777, Transportation Research Board, Washington, DC, pp. 84–92..
SALLACH, D. and MACAL, C., 2001. The simulation of social agents: an introduction. Special Issue of Social Science Computer Review, 19, (3), 245–248.
SAMUELSON, D. A., 2000. Designing Organisations, OR/MS Today, December..
SANTOS, S. P., BELTON, V. and HOWICK, S., 2007. Enhanced performance measurement using OR: a case study. Journal of the Operational Research Society, pp 1–14.
SNIFFER, 2006. Assessing the benefits of flood warning: a scoping study, Project Code UKCC10, Edinburgh: SNIFFER.
SNIFFER, 2008. Assessing the benefits of flood warning: Phase 2 (Report UKCC10A), SNIFFER, Feb 2008 (www.sniffer.org.uk) .
STILL, K. G., 1993. New Computer system can predict human behaviour response to building fires, Fire, 84(January 1993):40–41..
Pitt Review, 2008. Learning lessons from the 2007 floods, June 2008 accessed from http://archive.cabinetoffice.gov.uk/pittreview.
TUNSTALL, S. M., TAPSELL, S. M., FERNANDEZ-BILBAO, A., 2005. The damage reducing effects of flood warnings: Results from new data collection. Enfield: Flood Hazard Research Centre, Middlesex University.
UKCIP, 2003. Climate adaptation: Risk uncertainty and decision making. WILLOWS, R. I. and CONNELL, R. K., (Eds). UKCIP Technical Report, UKCIP, Oxford.

Science Report – Reliability in Flood Incident Management Planning 43
WISNIEWSKI, M. and DICKSON, A., 2001. Measuring performance in Dumfries and Galloway Constabulary with the Balanced Scorecard. Journal of the Operational Research Society (2001) 52, pp1057–1066 .
WONG, K. H. L. and LUO, M., 2005. Computational tool in infrastructure emergency total evacuation analysis, in P. Kantor et al. (Eds.) Intelligence and Security Informatics, Springer, Berlin..
ZARBOUTIS, N. and MARMARAS, N., 2005. Investigating Crowd behaviour during Emergency Evacuations using Agent-Based Modelling, in Proc. EAM 2005, Oct. 17th-19th, Athens, Greece.
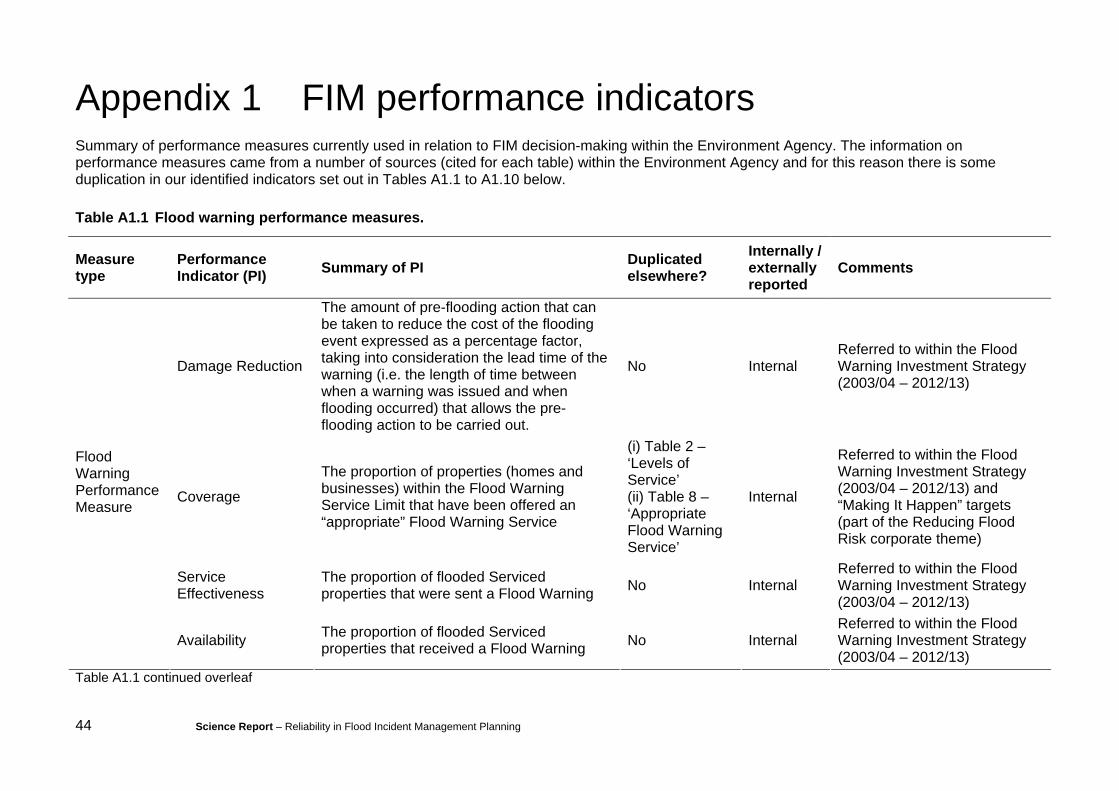
44 Science Report – Reliability in Flood Incident Management Planning
Appendix 1 FIM performance indicators Summary of performance measures currently used in relation to FIM decision-making within the Environment Agency. The information on performance measures came from a number of sources (cited for each table) within the Environment Agency and for this reason there is some duplication in our identified indicators set out in Tables A1.1 to A1.10 below.
Table A1.1 Flood warning performance measures.
Measure type
Performance Indicator (PI) Summary of PI Duplicated
elsewhere? Internally / externally reported
Comments
Damage Reduction
The amount of pre-flooding action that can be taken to reduce the cost of the flooding event expressed as a percentage factor, taking into consideration the lead time of the warning (i.e. the length of time between when a warning was issued and when flooding occurred) that allows the pre-flooding action to be carried out.
No Internal Referred to within the Flood Warning Investment Strategy (2003/04 – 2012/13)
Coverage
The proportion of properties (homes and businesses) within the Flood Warning Service Limit that have been offered an “appropriate” Flood Warning Service
(i) Table 2 – ‘Levels of Service’ (ii) Table 8 – ‘Appropriate Flood Warning Service’
Internal
Referred to within the Flood Warning Investment Strategy (2003/04 – 2012/13) and “Making It Happen” targets (part of the Reducing Flood Risk corporate theme)
Service Effectiveness
The proportion of flooded Serviced properties that were sent a Flood Warning No Internal
Referred to within the Flood Warning Investment Strategy (2003/04 – 2012/13)
Flood Warning Performance Measure
Availability The proportion of flooded Serviced properties that received a Flood Warning No Internal
Referred to within the Flood Warning Investment Strategy (2003/04 – 2012/13)
Table A1.1 continued overleaf

Science Report – Reliability in Flood Incident Management Planning 45
Table A1.1 continued Measure type
Performance Indicator (PI) Summary of PI Duplicated
elsewhere?
Ability The proportion of residents who are able to receive, understand and respond to warnings
No Internal Referred to within the Flood Warning Investment Strategy (2003/04 – 2012/13)
Effective Action The proportion of residents who take action on receipt of a flood warning
Tables 2, 4 & 8 – ‘Appropriate Action’
Internal
Referred to within the Flood Warning Investment Strategy (2003/04 – 2012/13) and “Making It Happen” targets (part of the Reducing Flood Risk corporate theme)
Flood Damage Avoided (FDA)
(This provides an overall measure based on the six PI’s above) No Internal
Referred to within the Flood Warning Investment Strategy (2003/04 – 2012/13)
Preparation in Advance
The proportion of properties that have prepared in advance of flooding
Table 8 – ‘Preparation in advance’
Internal Water Management Marketing & Communications Team
Flood Warning Performance Measure
Service Take-up The proportion of Serviced properties that have accepted the Flood Warning Service Offered to them.
Tables 4 & 8 – ‘Service take-up’
?
Notes: Source – Work instruction: Flood Warning Performance Measures (Version 3, Issue date 14/03/05)

46 Science Report – Reliability in Flood Incident Management Planning
Table A1.2 Corporate measures.
Measure type
Performance Indicator (PI) Summary of PI Duplicated
elsewhere? Internally / externally reported
Comments
Corporate Measure Levels of Service
The proportion of those properties at risk within the extreme flood outline that can receive a flood warning
Table 1 – ‘Coverage’
Defra (Corporate measure)
‘Reducing Flood Risk’ theme within the corporate plan ‘Creating A Better Place’
Corporate Measure Appropriate Action
Measures the public’s general awareness of appropriate action that can be taken to mitigate flooding
Tables 1, 4 & 8 – ‘Appropriate Action’
Defra (Corporate measure) and Internal
Measures in other tables are subtly different to this
Notes: Source – Email from Stephen Merrett 05/12/07
Table A1.3 New outcome measures.
Measure type
Performance Indicator (PI) Summary of PI Duplicated
elsewhere? Internally / externally reported
Comments
High-risk area FWD take-up
The proportion of properties in high risk areas that have registered to receive warnings having been offered Floodline Warnings Direct
Table 8 – Defra Service Measure 6
Defra (new Outcome Measure)
New Outcome Measure
Fora flood plans The proportion of Local Resilience Fora Flood Plans that are considered adequate by the Environment Agency
Table 8 – Defra Service Measure 7
Defra (new Outcome Measure)
Notes: Source – Email from Stephen Merrett 05/12/07

Science Report – Reliability in Flood Incident Management Planning 47
Table A1.4 Service level sub-measures.
Measure type
Performance Indicator (PI) Summary of PI Duplicated
elsewhere? Internally / externally reported
Comments
Appropriate action Measures the public’s general awareness of appropriate action that can be taken to mitigate flooding
(i) Table 1 – ‘Effective Action (ii) Tables 2 & 8 – ‘Appropriate Action’
Defra (Corporate measure) and Internal
‘Reducing Flood Risk’ theme within the corporate plan ‘Creating A Better Place’
Service Take Up The proportion of Serviced properties that have accepted the Flood Warning Service Offered to them
Tables 1 & 8 – ‘Service take-up’
Internal
Detection Level of Service
The proportion of warning areas that have sufficient radar coverage, rain gauge coverage and river monitoring station coverage to meet the detection requirements for the Flood Warning LoS
Table 8 – ‘Detection LoS’ Internal
Forecasting performance
The proportion of warning areas that have flood forecasts available that meet the forecasting criteria for the Flood Warning LoS
Table 8 – ‘Forecasting Performance’
Internal
Service Level Sub-Measure
Warning performance
The proportion of warnings meeting the required standards
Table 8 – ‘Warning Performance’
Internal
Notes: Source – Email from Stephen Merrett 05/12/07
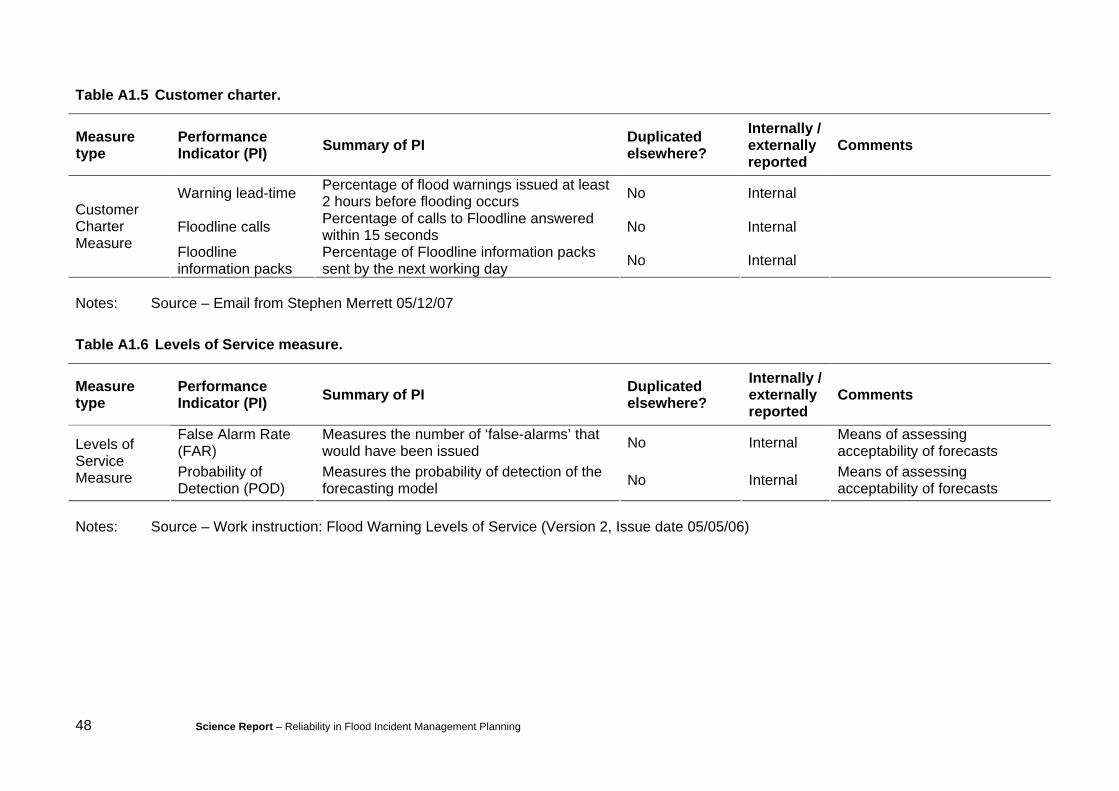
48 Science Report – Reliability in Flood Incident Management Planning
Table A1.5 Customer charter.
Measure type
Performance Indicator (PI) Summary of PI Duplicated
elsewhere? Internally / externally reported
Comments
Warning lead-time Percentage of flood warnings issued at least 2 hours before flooding occurs No Internal
Floodline calls Percentage of calls to Floodline answered within 15 seconds No Internal Customer
Charter Measure Floodline
information packs Percentage of Floodline information packs sent by the next working day No Internal
Notes: Source – Email from Stephen Merrett 05/12/07
Table A1.6 Levels of Service measure.
Measure type
Performance Indicator (PI) Summary of PI Duplicated
elsewhere? Internally / externally reported
Comments
False Alarm Rate (FAR)
Measures the number of ‘false-alarms’ that would have been issued No Internal Means of assessing
acceptability of forecasts Levels of Service Measure Probability of
Detection (POD) Measures the probability of detection of the forecasting model No Internal Means of assessing
acceptability of forecasts Notes: Source – Work instruction: Flood Warning Levels of Service (Version 2, Issue date 05/05/06)

Science Report – Reliability in Flood Incident Management Planning 49
Table A1.7 Benefits measure.
Measure type
Performance Indicator (PI) Summary of PI Duplicated
elsewhere? Internally / externally reported
Comments
NFFS benefits measure
Measures whether the benefits of the NFFS are being delivered on an annual basis No Internal Benefits measure – refer to
Table 9 Benefits Measure FWD benefits
measure Measures whether the benefits of FWD are being delivered on an annual basis No Internal Benefits measure – refer to
Table 10 Notes: Source – Email from Stephen Merrett 05/12/07
Table A.8 Measures referred to within the FIM Benefits Roadmap.
Measure type Performance Indicator (PI) Summary of PI Duplicated elsewhere?
Service Level measure
SL2: Appropriate action Percentage of residents in flood risk areas taking appropriate action in response to flooding increases
(i) Table 1 – ‘Effective Action (ii) Tables 2 & 4 – ‘Appropriate Action’
Sub-measure SL2a: Appropriate action
Percentage of residents receiving a flood warning message who respond with appropriate action increases
(i) Table 1 – ‘Effective Action (ii) Tables 2 & 4 – ‘Appropriate Action’
Sub-measure SL2b: Preparation in advance
Number of properties where preparation has taken place in advance of flooding increases
Table 1 – ‘Preparation in advance’
Service Level measure
SL3: Appropriate flood warning service Properties offered an appropriate flood warning service increases
(i) Table 1 – ‘Coverage’ (ii) Table 2 – ‘Levels of Service’
Sub-measure SL3a: Warning performance
Warning performance – report on whether a warning was justified at all locations issued
Table 4 – ‘Warning Performance’
Table A.8 continued overleaf

50 Science Report – Reliability in Flood Incident Management Planning
Table A.8 continued Measure type Performance Indicator (PI) Summary of PI Duplicated elsewhere?
Sub-measure SL3b: Forecasting performance
Forecasting performance – % of flood warning areas where forecasts meet the level of accuracy defined in Flood Warning Levels of Service work instruction
Table 4 – ‘Forecasting Performance’
Sub-measure SL3c: Service take up
Service take up – % of properties directly offered Floodline Warnings Direct who are registered
Tables 4 & 8 – ‘Service take-up’
Sub-measure SL3d: Detection LoS
Detection Level of Service – % of flood warning areas where detection meets that defined in Flood Warning Levels of Service work instruction
Table 4 – ‘Detection LoS’
Defra Service measure
6
6. Proportion of homes & businesses in high-risk areas that are offered the FWD service & have registered to receive warnings
Table 3 – ‘High-risk area FWD take-up’
Defra Service measure
7
7. Proportion of Local Resilience Fora emergency response plans that are considered to satisfactorily address flood risk
Table 3 – ‘Fora flood plans’
Notes: Source – FIM Benefits Roadmap (Draft Version, December 2007)

Science Report – Reliability in Flood Incident Management Planning 51
Table A.9 Measures referred to within the NFFS Benefits Realisation Report.
Key Outcome Measure Relevant to FDA equation? O-87M1: Proportion of regional time spent on system management. No O-87: Increased use of primary staff
expertise in all disciplines O-87M2: Proportion of regional time spent developing forecast models. No
O-59M1: System performance same as (or improves on) current systems No
O-59M2: Regional Business Process performance. No O-59M3: Perception (level of confidence) of NFFS Operational Users. No
O-59: Maintained current levels of service
O-59M4: Perception (level of confidence) of NFFS internal customers (Warnings staff). No
O-27M1: System False Alarm Rate (FAR). Yes – see Table 2.1
O-27M2: System Probability of Detection (POD). Yes – see Table 2.1
O-27M3: Forecaster Value Added. No
O-27M4: Forecasted Value Added. No
O-27: Increased quality of forecast
O-27M5: Satisfaction score Yes – could be used as a measure of forecast performance within the ‘Coverage’ PI
O-205: Ability to measure performance and accuracy of models and demonstrate value
O-205M1: Increase in proportion of locations where system forecast quality is routinely monitored. No – it is the actual performance that we are
interested in
O-25: Increased efficiency of forecasting service
O-25M1: Reduction in man hours spent forecasting per warning issued. No
Notes: Source – National Flood Forecasting System, Benefits Realisation: Year 1 Summary Report

52 Science Report – Reliability in Flood Incident Management Planning
Table A.10 Measures referred to within the FWD Benefits Delivery Report.
Key Outcome Measure Relevant to FDA equation? O-87M1: An increase in the proportion of Area time spent engaging with local communities Not directly O-87: Increased use of primary
staff expertise O-87M2: An increase in the proportion of Area time spent on bringing more flood warning areas into operation Not directly
O-59M1: System performance same as (or improves on) AVM-based arrangements (e.g. availability, reliability, etc) Yes O-59: Maintained current levels
of service O-59M2: The perception (level of confidence) of FWD operational users increases No
O-73M1: Number of expressions of interest in Warnings system No O-73: Capability to exploit existing investments created O-73M2: Number of conference presentations or publications No O-74: Ability to raise revenue created
O-74M1: Ability to raise revenue created No
O-38: Increased potential to respond to customer expectations
O-38M1: Percentage of customers receiving warning messages via new channels, e.g. email and SMS, increases No
O-88M1: Number of Professional Partners viewing Summary views No
O-88M2: Proportion of Professional Partners receiving messages via new channels (e.g. emails, SMS, XML) No
O-88M3: Overall satisfaction with FWD system and service Yes
O-88: Improved warning and information service to Professional Partners
O-88M4: % of professional partners maintaining details on-line No Table A.10 continued overleaf

Science Report – Reliability in Flood Incident Management Planning 53
Table A.10 continued
Key Outcome Measure Relevant to FDA equation? O-49M1: % of customer registrations conducted on-line No O-49M2: % of registrations conducted through Floodline No O-49M3: % of registrations conducted through Area Offices No O-49M4: An increase in total number of properties/customers (offered) Yes
O-49: Increased take up of service
O-49M5: An increase in total number of properties/customers (registered) Yes
O-99M1: Reduction in the unit cost per customer No O-99M2: Size of the customer database/number of Agency staff ratio increases No
O-99M3: Reduction in unit cost of disseminating warning messages per customer No
O-99: Unit cost of registration decreased
O-99M4: Proportion of Public registrations that includes one or more new channels as a contact No
O-105: Increased quality of warning messages – timeliness and clarity
O-105M1: Time taken to issue a warning (automated by FWD) reduced Yes
Notes: Source – Floodline Warnings Direct (FWD), Year 1 Annual Benefits Delivery Report, 2006 / 2007

54 Science Report – Reliability in Flood Incident Management Planning
Appendix 2 – Estimating the benefits and performance of FIM A new and more comprehensive approach for estimating the monetary benefits of flood warnings has been devised by the FLOODsite research project (Parker et al., 2008) funded by the European Commission. The benefits of flood warnings are a core component of any evaluation of the performance of FIM, and should in part underpin any flood warning and FIM investment strategy.
Overall, the two main categories of benefits of flood warnings are:
• the monetary benefits gained by avoiding damage to property and flood losses;
• benefits to human security and safety by preventing loss of life and injury during floods, reducing potential anxiety and stress, and related ill health effects.
The FLOODsite research project develops an approach to estimate these monetary benefits. However, as the Environment Agency’s Thames Estuary 2100 project appraisal demonstrates, it is perfectly possible to place a monetary value on human life; if this is desirable and acceptable such values may be added to the monetary benefits calculated using the FLOODsite methodology.
A new approach to estimate the benefits that arise from flood warning was explored due to a critique of the FHRC flood warning damage reduction model published in 1991 (Parker, 1991). Furthermore, it is now better understood how responses commonly made to flood warnings have evolved since the 1990sm when the FDA model was first introduced.
Basically, conditions have changed since the early 1990s making the 1991 model out-of-date when used on its own. However, the FLOODsite research project suggests that the 1991 FHRC model remains valid (in a revised and recalibrated form) and should continue to be used to estimate the benefits of moving property contents out of the reach of floodwaters.
The critique of the 1991 model was developed through research jointly funded by Defra and the Environment Agency and published by FHRC in 2005 (Tunstall et al., 2005). It foresaw the need for a broader approach to capturing the benefits of flood warnings. The critique also observed that some of the most important benefits of flood warnings were no longer being captured in the original 1991 model. The critique was subsequently mirrored in scoping research undertaken by the SNIFFER in the following year (SNIFFER, 2006).
The FHRC’s original 1991 model formed the basis for the FDA model which was employed in the Environment Agency’s Flood Warning Investment Strategy 2003/4–2012/13 (Environment Agency, 2003). The older model has also formed the basis for understanding flood warning responses in Defra’s Making Space for Water strategy (Defra, 2004).

Science Report – Reliability in Flood Incident Management Planning 55
A2.1 The Flood Warning and Response Benefits Pathways model (FWRBP model)
Taking the kind of holistic perspective recommended in the critiques referred to above, eight principal response pathways to flood warnings can be identified during the management of flood incidents (Figure A2.1). These eight pathways represent the theoretical range of responses to flood warning that can be selected to reduce damage and loss. Each response is potentially capable of reducing flood damages and producing flood warning or FIM benefits, although this potential is often currently far from being fully exploited for various reasons. Examples of these potential responses are given in Table A2.1.
From Figure A2.1 and Table A2.1 we can see that the movement of property content (either their movement upstairs or their evacuation from the property – CME in Figure A2.1) is only one of eight possible flood warning response and benefit ‘pathways’. This means that the 1991 FHRC model (and therefore also the ‘FDA’ model) is only likely to estimate a small proportion of total potential flood warning benefits if the other pathways are also followed, as hopefully they would be in any effective and efficient case of FIM.
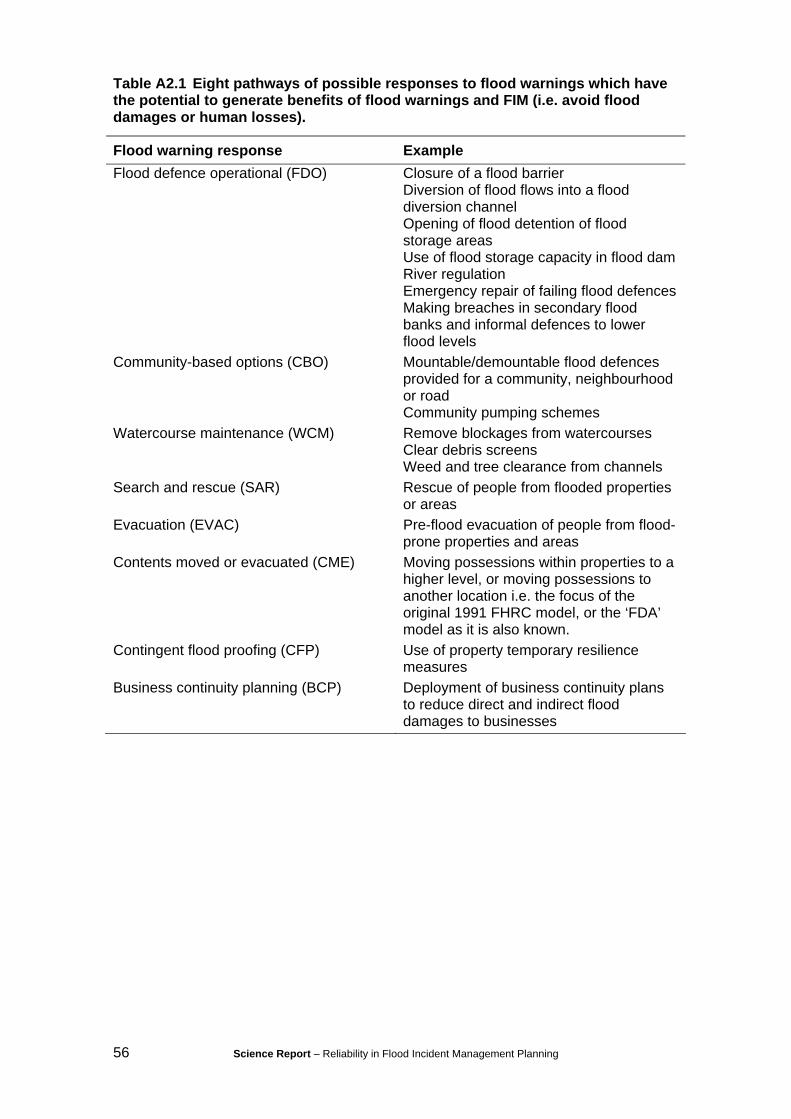
56 Science Report – Reliability in Flood Incident Management Planning
Table A2.1 Eight pathways of possible responses to flood warnings which have the potential to generate benefits of flood warnings and FIM (i.e. avoid flood damages or human losses).
Flood warning response Example Flood defence operational (FDO) Closure of a flood barrier
Diversion of flood flows into a flood diversion channel Opening of flood detention of flood storage areas Use of flood storage capacity in flood dam River regulation Emergency repair of failing flood defences Making breaches in secondary flood banks and informal defences to lower flood levels
Community-based options (CBO) Mountable/demountable flood defences provided for a community, neighbourhood or road Community pumping schemes
Watercourse maintenance (WCM) Remove blockages from watercourses Clear debris screens Weed and tree clearance from channels
Search and rescue (SAR) Rescue of people from flooded properties or areas
Evacuation (EVAC) Pre-flood evacuation of people from flood-prone properties and areas
Contents moved or evacuated (CME) Moving possessions within properties to a higher level, or moving possessions to another location i.e. the focus of the original 1991 FHRC model, or the ‘FDA’ model as it is also known.
Contingent flood proofing (CFP) Use of property temporary resilience measures
Business continuity planning (BCP) Deployment of business continuity plans to reduce direct and indirect flood damages to businesses

Science Report – Reliability in Flood Incident Management Planning 57
Flood defences are operated
e.g. flood barriers are closed, flood storage
areas operated
Integrity of flood defences is monitored
And maintained
Official emergency response (e.g. fire service, police, local authorities, military, mayors etc.)
Watercourse
capacity maintenance
Floodplain occupants and
users
Householders
Monitoring, Flood detection,
and forecasting
Flood warning
Flood warning
Flood defence agency mobilises its resources
Public dissemination devices (e.g. internet, media)
Operation of community-
based measures
Move house contents and/or
evacuate belongings
Activate formal or ad hoc business continuity plans e.g. reschedule business
to minimise loss
Activate contingent flood proofing
measures to buildings and other assets
Search and rescue
Evacuation of areas at risk, before and
during flooding
Hospitals/ health care
facilities
Public Building owners
Public Utility
managers
Retail Outlet
managers
Transport network
managers
Transport Network
users
Finance institutions and offices
Manufacturing companies
Logistics Sector
managers
Farm enterprises
BUSINESS AND UTILITY USERS
Human losses
avoided
Human losses
avoidedHuman losses
avoided
1FDO
2 CBO
3WCM
5EVAC
4SAR
6CME
7CFP
8BCP
Flood damages avoided
Flood damages avoided
Flood damages avoided
Flood damages avoided
Flood damages avoided
Flood damages avoided
If damages are avoided human losses through reduction in
stress/anxiety may be observed
Measures will reduce water levels and therefore also lower the
threat to people
If damages are avoided human losses through reduction in
stress/anxiety may be observed
If businesses losses are avoided, and job security guaranteed avoided human losses through reduction in stress/anxiety may be
observed
Human losses
avoided
Human losses
avoided
Figure A2.1 FWRBP model.

58 Science Report – Reliability in Flood Incident Management Planning
Structural flood defences are sometimes used in conjunction with flood forecasting and warning systems. Perhaps the most prominent, large-scale example is the Thames Barrier which protects London from tidal flooding. Its closure is dependent on flood forecasts. In fact, the river Thames tidal flood defence system as a whole relies upon the Thames Barrier and several smaller barriers, all of which must be closed once a tidal flood is forecast. In addition, the flood walls and embankments downstream of the Thames Barrier contain numerous openings (used for access to the river) which also have to be closed to make the defences ‘watertight’; the integrity of these defences also depends upon a flood forecast and receipt of a flood warning by the floodgate operators.
Similar structural flood defence systems exist in other parts of the UK and elsewhere in Europe, such as in The Netherlands. The flood damages saved by these systems are attributable to the combined effect of the structures and flood forecasting and warning systems. Indeed, these kinds of structural defences depend entirely upon a fully functioning flood forecasting system which delivers a timely warning.
In practice, there are many other ways in which the operation of structural flood defences is dependent or partly dependent upon flood forecasting and warning systems. Some of Britain’s major rivers are heavily regulated; the procedures and structures in place to regulate the rivers and deliver different degrees of flood protection have to make use of flood forecasting and warning data.
Community-based options are taken here to mean temporary mountable/demountable flood defences. These temporary defences are erected or positioned in the days and hours prior to a flood, and depend entirely upon a reliable flood forecast and warning for their deployment. They were first used in Germany, and have now become widely used in the River Severn valley in England and in other locations in Europe.
Watercourse maintenance aims to maintain the efficiency of channels that carry river and flood waters. In many parts of Europe watercourse maintenance is routinely undertaken, but specific maintenance activity may also be initiated by a flood forecast and warning in the period just before a flood is anticipated or on the rising limb of a flood curve. The efficiency of these channels helps to keep flood levels to a minimum, and thus potentially reduce the extent of the area flooded and the depths of flooding.
Search and rescue and evacuation measures are common and vitally important responses to flood warnings. These activities aim primarily to save lives and mitigate other adverse effects of flooding on human beings. They do not usually help to avoid damages and so do not contribute much to financial or economic savings, unless the value of life is represented monetarily. Indeed, rescue and evacuation may actually reduce monetary savings in particular circumstances (e.g. where flood warning lead times are short), especially where the priority is getting people out of floodplains rather than moving and saving their possessions. These activities are included in the FWRBP model because of their impact on other interventions i.e. they may limiting or lower financial and economic damage saving.
The movement of possessions to higher levels or to locations beyond the floodplain is a time-honoured response to flood warnings. It is a well-developed response pathway in the UK particularly in locations where there is a reasonable lead time from the flood warning and the expected flooding conditions do not present a major threat to people in terms of loss of life (i.e. the floods are shallow and/or of low velocity).
Contingent flood proofing is a particular type of flood proofing originally identified by Shaeffer in the 1960s in the United States. It has taken about 40 years to fully recognise the significance of these flood proofing measures in the UK. Property-level flood protection and resilience measures have only recently been evaluated and promoted, within Defra’s Making Space for Water strategy (Defra, 2006).

Science Report – Reliability in Flood Incident Management Planning 59
Sheaffer distinguished three types of flood proofing: permanent, contingent and flood-fighting. Today in the UK and the rest of Europe, these measures are usually referred to as flood resistance and resilience measures. Contingent flood proofing measures are flood resilience measures which are ‘contingent upon’ (i.e. they depend upon) a flood warning being received, after which they are deployed. They are planned measures put into operation in advance of a flood to avoid or to reduce flood damage. Examples include use of demountable door guards and airbrick covers, sump pump systems and remedial works to seal water entry points. They are distinguished from flood fighting measures which are last-minute, unplanned measures which are often used by those about to be flooded (these measures typically include the emergency use of sandbags).
Each of the eight flood warning response pathways in Figure A2.1 is capable of generating flood damage savings. However, these benefits must be set against the costs associated with each response to gain a measure of the net benefit of flood warnings.
A2.2 FWRBP model equations The analysis represented by Figure A2.1 leads to the following equations which may be applied at a range of scales or levels of resolution. The equations may, for example, be applied at the national level to assess the benefits of flood warning for national investment decision-making purposes, or at a community level. Finer-grained quantitative data are generally required within the equations as the level of resolution is increased.
Firstly, we need to distinguish between those damages saved by flood warning systems working in combination with structural flood defences, from those which arise in other ways.
TEDS = EDS1 + EDS2
Equation 1
where:
TED = total economic damage saving generated by flood warnings
EDS1 = economic damage saving generated by flood warning systems working in combination with large scale structural flood defence systems
EDS2 = economic damage saving generated by flood warning systems working without the support of large scale structural flood defence systems
The calculation or estimation of expected average annual flood damages (EAD) is now a commonly employed step in benefit-cost analyses of flood mitigation projects, and is derived by establishing a loss-probability relationship for any floodplain or area under investigation (see for example Penning-Rowsell et al., 2005a). To estimate EDS1 we need to take into account the proportion of unprotected floodplain properties (UFP), and estimate the proportion of EAD1 which will be saved in the unprotected properties by flood warning systems (FDO). Estimates are likely to be fairly crude, at least initially, and this model assumes that flood defences will not be breached or overtopped. The UFP value can be increased judgementally to take these effects into account if necessary.

60 Science Report – Reliability in Flood Incident Management Planning
EDS1 = EAD1 x PFP x FDO
Equation 2
where:
EAD = expected annual average flood damage without any flood defences
PFP = the protected floodplain: the proportion of properties at risk from flooding which are unprotected by structural flood defence systems
FDO = the proportion of EAD1 which is likely to be saved by the operation of flood defence measures which are dependent upon a flood being forecast and a warning being available to the operators of flood defences
Estimates of EDS2 require values to be assigned to each of the warning response variables in Figure 1.
EDS2 = (EAD1 x UFP x CBO) + (EAD1 x UFP x WCM) + (EAD1 x UFP x SAR) + (EAD1 x UFP x EVAC) + (EAD1 x UFP x BCP) + (EAD1 x UFP x CFP) + (EAD1 x UFP x CME)
Equation 3
where :
UFP = unprotected floodplain: the proportion of properties at risk from flooding which are unprotected by structural flood defence systems and relies upon a flood forecasting and warning system for protection of life and property
CBO = proportion of properties protected by small-scale demountable/moveable flood defence systems installed at the community or neighbourhood level following a flood forecast and warning
WCM = proportion of potential flood damage saved by watercourse maintenance activities before and during a flood (e.g. removal of blockages, maintenance of efficient flood flows, protection against overtopping and breaching where feasible, deployment of contingency flood storage areas)
SAR = proportion of flood damage to property saved by search and rescue operations. This will normally be zero or close to zero as SAR is usually mainly aimed at saving life and limb
EVAC = proportion of flood damage to property saved by human evacuation operations. This will normally be zero or close to zero as EVAC is aimed at saving life and limb
BCP = proportion of flood damage to property and business activities avoided by the use of business continuity plans
CFP = proportion of flood damage to property avoided through contingent flood proofing measures, operated once a flood warning is received
CME = proportion of flood damage to property avoided by occupants moving contents either upstairs out of the reach of the flood, or by evacuating property from path of flooding

Science Report – Reliability in Flood Incident Management Planning 61
A2.3 Applications of the FWRBP model The FWRBP model has been applied in simplified terms to a national-scale calculation of monetary flood warning benefits in England and Wales (Parker et al., 2008). The simplifications introduced in this application mean the results should be treated as indicative only. This application demonstrates the contribution that each of the eight benefit pathways makes to total flood warning benefits. In total the application indicates that 26% of the estimated total expected average annual flood damages are saved by flood warnings when used in combination with a range of measures.
The FWRBP model is also demonstrated in a simulation of flood warning savings in three European settlements, and also in a detailed application to the German town of Grimma located on the River Mulde in the Elbe catchment (Parker et al., 2008).
A2.4 Using the FWRBP model to enhance FIM The FRWBP model suggests a range of ways in which flood warnings may be responded to in order to reduce flood damage potential. If this model is considered in each situation in which flood warning systems are installed it may lead to additional – and particularly valuable and earlier – damage-reducing measures being taken in future. For example, at the moment it would be rare to find that all of the damage reducing means indicated in Figure A2.1 have been systematically considered and evaluated in any particular flood and FIM case. We have discovered during the course of this study several cases where applicable measures are not currently being considered and employed.
Clearly in some flood locations and under certain conditions not all of the measures to reduce flood damages indicated in Figure A2.1 will be applicable. In such cases damage reduction will depend more heavily on one, two or a small number of measures. Nevertheless, the consideration of combinations of measures can lead to increased damage reduction. For example, in particular cases, it may be that the full potential of watercourse maintenance activity following a flood warning has not yet been exploited.
Rapid response catchments and flash flood locations pose a particular challenge where there are no structural flood defences. In these cases, focus upon WCM, SAR, EVAC, CFM and CME becomes critical; BCP can also make a contribution to damage savings by ensuring the most rapid return to normal business conditions possible. CBO (e.g. erection of demountable defences) appears to be largely infeasible in flash flood circumstances, although pumping systems might be feasible.
A2.5 The revised and recalibrated FHRC or ‘FDA’ model The original FHRC flood warning damage reduction model (Parker, 1991), which is the basis of the Environment Agency’s ‘FDA’ model, should still be used to estimate the CME component in the FWRBP model. However, the model should now be used in a revised and recalibrated form to yield reliable results.
62 Science Report – Reliability in Flood Incident Management Planning
Fresh research into the original 1991 FHRC model (Tunstall et al., 2005; Parker et al., 2007) has produced a revised ‘FDA’ model (Equation 4):
FDA = (TPD x PID x MID) x RAS x PHE
Equation 4
where:
FDA = Estimated actual flood damage avoided owing to the flood warning
TPD = Total potential damages (i.e. the total potential monetary value of damages to structure and contents inventory)
PID = Potential inventory damage (i.e. the potential monetary value of damages to contents inventory items)
MID = Moveable inventory damage (i.e. the potential monetary value of damages to moveable contents inventory items)
RAS = Reliability of the flood warning service combined with proportion of householders available to respond to a warning (i.e. the proportion (percentage) of householders who receive a flood warning message, based upon a) success in disseminating a warning and b) the availability of householders to receive it)
PHE = Effective response (i.e. the proportion (percentage) of properties for which an appropriate flood warning service is provided, where the occupants are either willing to take effective action or which have actually taken effective action following a flood warning to reduce flood damages)
IT is important to note that the PHR parameter (the proportion (percentage) of householders able to respond to a warning) is now excluded on the grounds of the latest research findings from England and Wales (Parker et al., 2007). However, this parameter might warrant inclusion elsewhere if local social survey results indicate that ability (or disability) affects warning response.
Various figures (i.e. proportions or percentages) have been applied to the terms in the original 1991 FHRC model, within the FDA model used by the Environment Agency and in other research by the Met Office and Posford Duvivier. These are summarised in Table A2.2 which provides, in the final column, the figures which Parker et al. (2007) recommend on the basis of extensive social survey research in England and Wales. The figures in the final column should be used to calibrate the revised model described above (i.e. Equation 4).
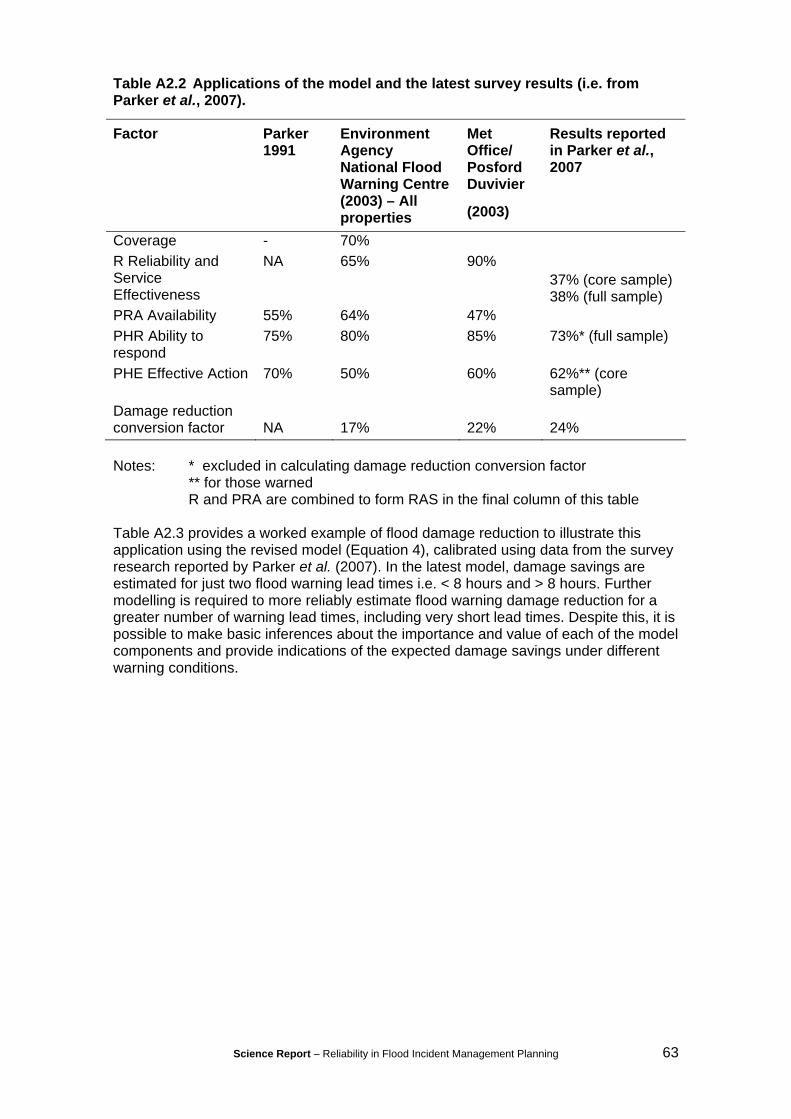
Science Report – Reliability in Flood Incident Management Planning 63
Table A2.2 Applications of the model and the latest survey results (i.e. from Parker et al., 2007).
Factor Parker 1991
Environment Agency National Flood Warning Centre (2003) – All properties
Met Office/ Posford Duvivier
(2003)
Results reported in Parker et al., 2007
Coverage - 70% R Reliability and Service Effectiveness
NA 65% 90%
PRA Availability 55% 64% 47%
37% (core sample) 38% (full sample)
PHR Ability to respond
75% 80% 85% 73%* (full sample)
PHE Effective Action 70% 50% 60% 62%** (core sample)
Damage reduction conversion factor
NA
17%
22%
24%
Notes: * excluded in calculating damage reduction conversion factor
** for those warned R and PRA are combined to form RAS in the final column of this table
Table A2.3 provides a worked example of flood damage reduction to illustrate this application using the revised model (Equation 4), calibrated using data from the survey research reported by Parker et al. (2007). In the latest model, damage savings are estimated for just two flood warning lead times i.e. < 8 hours and > 8 hours. Further modelling is required to more reliably estimate flood warning damage reduction for a greater number of warning lead times, including very short lead times. Despite this, it is possible to make basic inferences about the importance and value of each of the model components and provide indications of the expected damage savings under different warning conditions.

64 Science Report – Reliability in Flood Incident Management Planning
Table A2.3 Flood warning damage reduction example.
Item/ calculation factor
Description % (Y) Example Calculation
TPD (A) Total Potential damages
100 £30,000
PID (B) Potential Inventory damage ( as a % of TPD)
52 £15,600 BY*AX
MID (C) Moveable Inventory damage (as a % of Potential Inventory damage)
41 £6,396 CY*BX
RAS (D) Households in receipt of a warning
38
PHE Effectiveness of : (E) < 8 hour warning 55 (F) > 8 hour warning 71 Total Potential damage saved by: < 8 hour warning 4.46 £1,337 AY*BY*CY*DY*EY > 8 hour warning 5.75 £1,726 AY*BY*CY*DY*FY Potential Inventory damage saved by: < 8 hour warning 8.57 £1,337 CX*DY*EY > 8 hour warning 11.06 £1,726 CX*DY*FY Note: < 8 and >8 warning lead time data derived from sample of 110 interviews
where residents could report their warning lead time.
A2.6 References Environment Agency National Flood Warning Centre, 2003. Flood Warning Investment Strategy Appraisal Report 2003/04 to 2012/13, Frimley: Environment Agency National Flood Warning Centre
Defra, 2004. Flood Warning and Forecasting. Making Space for Water, July 2004, London: Defra Flood Management Division
Defra, 2006. Consultation on policy options for promoting property-level flood protection and resilience, July, 2006.
Meteorological Office/Posford Duvivier, 2003. Pluvial flooding impact strategy study, Met. Office, Bracknell.
PARKER, D. J., 1991. The Damage Reducing Effects of Flood Warnings. Report Prepared for Halcrow National and for the National Rivers Authority (Anglian Region) Regional Telemetry Scheme Appraisal, FHRC, Enfield, UK.
PARKER, D. J., TUNSTALL, S. M., McCARTHY, S. M., 2007. New insights into the benefits of flood warnings: results from a household survey in England and Wales, Environmental Hazards, 7, 193–210
PARKER, D. J., PRIEST, S., SCHILDT, A., HANDMER, J., 2008. Modelling the damage reducing effects of flood warnings, FLOODsite, Final Report No. T10-07-12

Science Report – Reliability in Flood Incident Management Planning 65
PENNING-ROWSELL, E. C., JOHNSON, C., TUNSTALL, S., TAPSELL, S., MORRIS, J., CHATTERTON, J., GREEN, C. H., 2005. The benefits of flood and coastal risk management: a manual of assessment techniques. Enfield: Flood Hazard Research Centre
SNIFFER, 2006. Assessing the benefits of flood warning: a scoping study, Project Code UKCC10, Edinburgh
TUNSTALL, S. M., TAPSELL, S. M., FERNANDEZ-BILBAO, A., 2005. The damage reducing effects of flood warnings: Results from new data collection. Enfield: Flood Hazard Research Centre, Middlesex University