Relationships of Acylated and Des-Acyl Ghrelin Levels to Bone Mineralization In Obese Children and...
6
Relationships of acylated and des-acyl ghrelin levels to bone mineralization in obese children and adolescents Lucia Pacifico a,d, ⁎, Caterina Anania a , Eleonora Poggiogalle a , John F. Osborn b , Giancarlo Prossomariti c , Francesco Martino a , Claudio Chiesa d a Department of Pediatrics, Sapienza University of Rome, Rome, Italy b Department of Public Health Sciences, Sapienza University of Rome, Rome, Italy c Department of Radiological Sciences, Sapienza University of Rome, Rome, Italy d National Research Council, Rome, Italy abstract article info Article history: Received 16 January 2009 Revised 18 March 2009 Accepted 14 April 2009 Available online 21 April 2009 Edited by: T. Matsumoto Keywords: Acylated ghrelin Des-acyl ghrelin Bone mineralization DXA Children Aims: Bodyweight is a significant predictor of bone mass. Hormonal factors are thought to play a role in the mechanisms controlling the association of body weight and fat mass with bone mass. Very recently, the orexigenic hormone ghrelin has also been implicated in bone metabolism. In this study we examined the associations of circulating acylated and des-acyl ghrelin concentrations with measures of bone in a group of obese children and adolescents as well as in a group of healthy control children. We also determined whether the associations were independent of body composition, chronological age, gender, Tanner stage, and leptin, glucose, insulin and insulin-like growth factor (IGF)-1 levels. Methods: We performed a prospective cross-sectional study of 100 obese children [age, 8.9 (8.3 to 9.4); BMI- Standard Deviation Score (SDS), 2.2 (2.0 to 2.3)], and 100 age-matched lean healthy subjects. Fasting insulin, leptin, IGF-1, acylated and total ghrelin were measured by radioimmunoassay. Des-acyl ghrelin values were calculated as total ghrelin minus acylated ghrelin. Whole body (WB) and lumbar spine (LS) BMD, and BMC as well as body composition were assessed by DXA (Hologic QDR-4500W). LS volumetric BMD (BMAD) was estimated using the formula of Katzman (BMC/area 1.5 ), while WB BMC data were expressed as BMC/height. Results: Backward linear regression analysis was performed for individual groups, with age, gender, Tanner stage, weight, height, body composition (lean and fat mass), acylated ghrelin, des-acyl ghrelin, leptin, glucose, insulin, and IGF-1, entered into the model. In healthy children, acylated ghrelin was a significant and independent negative predictor of WB BMD, and WB BMC/height, while lean mass was positively associated significantly with these bone measures. In contrast, in obese children, a positive significant association was observed between des-acyl ghrelin and WB BMD as well as WB BMC/height, along with lean mass, and to a lesser degree, with fat mass. Acylated as well as des-acyl ghrelin were not significant predictors of LS BMD and LS BMAD in obese as well as control children. Conclusions: The results of this investigation indicate that the influence of the two distinct isoforms of ghrelin on BMD is mediated by specific body composition parameters in obese and control healthy children. © 2009 Elsevier Inc. All rights reserved. Introduction Bodyweight is a significant predictor of bone mass in both sexes, and is associated with increased bone mineral density and decreased risk of fractures [1–3]. However, the mechanisms, explaining these relations, are still not completely understood. Body mass depends on fat mass and lean mass, and a number of cross-sectional studies have established a strong relationship between fat mass and bone mineral density [4]. Excessive fat mass, consistent with obesity, induces a greater mechanical loading on the skeleton, which contributes to the total body mass and bone mineral density relationship [5]. A number of hormones may contribute to the fat–bone relationship [4]. Those associated with nutrition are prime candidates [6]. There are many hormones regulated in response to feeding that could account for the effects of fasting on bone formation, such as glucose-dependent insulinotropic peptide, a gut-derived hormone anabolic to bone [7], and glucagon-like peptide-2, which increases bone density in patients with bowel resections [8]. Likewise, there are increasing numbers of hormones that are related to fat mass. These include insulin-like growth factor (IGF)-1 and -2 [9], the products of the adipocyte itself, and also hormones secreted by the beta cell of the pancreatic islets [4]. The discovery of ghrelin provides another possible link between these two tissues. Ghrelin is a recently described 28-amino acid Bone 45 (2009) 274–279 ⁎ Corresponding author. Department of Pediatrics, Sapienza University of Rome, Viale Regina Elena, 324, 00161 Rome, Italy. Fax: +39 06 4997 9216. E-mail address: lucia.pacifi[email protected] (L. Pacifico). 8756-3282/$ – see front matter © 2009 Elsevier Inc. All rights reserved. doi:10.1016/j.bone.2009.04.204 Contents lists available at ScienceDirect Bone journal homepage: www.elsevier.com/locate/bone
-
Upload
independent -
Category
Documents
-
view
1 -
download
0
Transcript of Relationships of Acylated and Des-Acyl Ghrelin Levels to Bone Mineralization In Obese Children and...
Bone 45 (2009) 274–279
Contents lists available at ScienceDirect
Bone
j ourna l homepage: www.e lsev ie r.com/ locate /bone
Relationships of acylated and des-acyl ghrelin levels to bone mineralization in obesechildren and adolescents
Lucia Pacifico a,d,⁎, Caterina Anania a, Eleonora Poggiogalle a, John F. Osborn b, Giancarlo Prossomariti c,Francesco Martino a, Claudio Chiesa d
a Department of Pediatrics, Sapienza University of Rome, Rome, Italyb Department of Public Health Sciences, Sapienza University of Rome, Rome, Italyc Department of Radiological Sciences, Sapienza University of Rome, Rome, Italyd National Research Council, Rome, Italy
⁎ Corresponding author. Department of Pediatrics, SapRegina Elena, 324, 00161 Rome, Italy. Fax: +39 06 4997
E-mail address: [email protected] (L. Pacific
8756-3282/$ – see front matter © 2009 Elsevier Inc. Adoi:10.1016/j.bone.2009.04.204
a b s t r a c t
a r t i c l e i n f oArticle history:
Received 16 January 2009Revised 18 March 2009Accepted 14 April 2009Available online 21 April 2009Edited by: T. Matsumoto
Keywords:Acylated ghrelinDes-acyl ghrelinBone mineralizationDXAChildren
Aims: Bodyweight is a significant predictor of bone mass. Hormonal factors are thought to play a role in themechanisms controlling the association of body weight and fat mass with bone mass. Very recently, theorexigenic hormone ghrelin has also been implicated in bone metabolism. In this study we examined theassociations of circulating acylated and des-acyl ghrelin concentrations with measures of bone in a group ofobese children and adolescents as well as in a group of healthy control children. We also determined whetherthe associations were independent of body composition, chronological age, gender, Tanner stage, and leptin,glucose, insulin and insulin-like growth factor (IGF)-1 levels.Methods: We performed a prospective cross-sectional study of 100 obese children [age, 8.9 (8.3 to 9.4); BMI-Standard Deviation Score (SDS), 2.2 (2.0 to 2.3)], and 100 age-matched lean healthy subjects. Fasting insulin,leptin, IGF-1, acylated and total ghrelin were measured by radioimmunoassay. Des-acyl ghrelin values werecalculated as total ghrelin minus acylated ghrelin. Whole body (WB) and lumbar spine (LS) BMD, and BMC aswell as body composition were assessed by DXA (Hologic QDR-4500W). LS volumetric BMD (BMAD) wasestimated using the formula of Katzman (BMC/area1.5), while WB BMC data were expressed as BMC/height.
Results: Backward linear regression analysis was performed for individual groups, with age, gender, Tannerstage, weight, height, body composition (lean and fat mass), acylated ghrelin, des-acyl ghrelin, leptin,glucose, insulin, and IGF-1, entered into the model. In healthy children, acylated ghrelin was a significant andindependent negative predictor of WB BMD, and WB BMC/height, while lean mass was positively associatedsignificantly with these bone measures. In contrast, in obese children, a positive significant association wasobserved between des-acyl ghrelin and WB BMD as well as WB BMC/height, along with lean mass, and to alesser degree, with fat mass. Acylated as well as des-acyl ghrelin were not significant predictors of LS BMDand LS BMAD in obese as well as control children.Conclusions: The results of this investigation indicate that the influence of the two distinct isoforms of ghrelinon BMD is mediated by specific body composition parameters in obese and control healthy children.© 2009 Elsevier Inc. All rights reserved.
Introduction
Bodyweight is a significant predictor of bone mass in both sexes,and is associated with increased bone mineral density and decreasedrisk of fractures [1–3]. However, the mechanisms, explaining theserelations, are still not completely understood. Body mass depends onfat mass and lean mass, and a number of cross-sectional studies haveestablished a strong relationship between fat mass and bone mineraldensity [4]. Excessive fat mass, consistent with obesity, induces a
ienza University of Rome, Viale9216.o).
ll rights reserved.
greater mechanical loading on the skeleton, which contributes to thetotal body mass and bone mineral density relationship [5]. A numberof hormones may contribute to the fat–bone relationship [4]. Thoseassociated with nutrition are prime candidates [6]. There are manyhormones regulated in response to feeding that could account for theeffects of fasting on bone formation, such as glucose-dependentinsulinotropic peptide, a gut-derived hormone anabolic to bone [7],and glucagon-like peptide-2, which increases bone density in patientswith bowel resections [8]. Likewise, there are increasing numbers ofhormones that are related to fat mass. These include insulin-likegrowth factor (IGF)-1 and -2 [9], the products of the adipocyte itself,and also hormones secreted by the beta cell of the pancreatic islets [4].
The discovery of ghrelin provides another possible link betweenthese two tissues. Ghrelin is a recently described 28-amino acid
275L. Pacifico et al. / Bone 45 (2009) 274–279
polypeptide mainly secreted by neuroendocrine cells in the stomach,which participates in the release of growth hormone, in energybalance, in food intake, in adipogenesis, in the long-term regulationof body weight, and in cortisol release [10–16], all of whichpotentially affect bone metabolism indirectly. Circulating ghrelinlevels reflect changes in body weight and fat mass, and ghrelinlevels are decreased with obesity and increased after diet-inducedweight loss [17,18]. The ghrelin receptor, known as the growthhormone secretagogue receptor (GHS-R), is found in many organs,including the stomach, heart, lung, pancreas, intestine, kidney,testes, and ovary, as well as in the hypothalamus and in the adiposetissues [10,19–25]. The wide distribution of this receptor indicatesthat ghrelin may have a variety of regulatory functions both in thebrain and peripheral tissues [11]. Recent studies indicate that ghrelinis involved in the regulation of bone growth and metabolism[25–35]. Currently, however, no clear evidence is present in theliterature about the relationship of circulating total ghrelin withbone mineral density in humans. Furthermore, ghrelin circulates inacylated and desacylated forms, and data regarding their potentialdifferential roles in the modulation of bone metabolism are verylimited [36,37].
Therefore, we examined the associations of circulating acylatedand des-acyl ghrelin concentrations with measures of bone in a groupof obese children and adolescents as well as in a group of lean healthysubjects. We also determined whether the associations wereindependent of body composition (lean and fat mass), chronologicalage, gender, Tanner stage, and leptin, glucose, insulin and insulingrowth factor-1 (IGF-1) levels.
Materials and methods
Subjects
Between June 2007 and November 2008, 100 children andadolescents with primary obesity were consecutively enrolled at theDepartment of Pediatrics, Sapienza University of Rome, Italy. Subjectswere eligible if they were between 4 and 16 years of age, and had abody mass index (BMI) equal to or higher than the age- and sex-specific 97th percentile, which defines obesity according to the ItalianBMI charts [38]. Exclusion criteria included: acute or chronic disease;any condition known to influence body composition, insulin action, orinsulin secretion (e.g. glucocorticoid therapy, hypothyroidism, Cush-ing's disease); use of medications that could affect growth anddevelopment; and history of alcohol consumption and smoking(where appropriate). All patients underwent physical examinationincluding measurements of weight, standing height, BMI, anddetermination of the stage of puberty according to the criteria ofTanner [39,40], laboratory tests, and dual energy X-ray absorptiometry(DXA) scans. The degree of obesity was quantified using Cole's leastmean-square method, which normalizes the skewed distribution ofBMI and expresses BMI as a Standard Deviation Score (SDS). Thismeasure gives age- and gender-specific estimates of the distributionmedian, the variation coefficient, and the degree of skew by amaximum likelihood fitting technique [41].
Over the same study period, a control group consisting of 100healthy childrenwith BMI appropriate for age and gender, matched foragewith the obese group, was recruited from thewell-child care clinicof our department if parents consented to participate in the study,which included anthropometric measurements, laboratory investiga-tions, and DXA scans. Subjects with acute or chronic disease, use ofmedications potentially affecting growth and development, nutri-tional status, or dietary intake, and history of alcohol consumptionand smoking (where appropriate) were excluded.
The research protocol was approved by the Hospital EthicsCommittee, and informed consent was obtained from subjects'parents prior to assessment.
Lumbar spine and whole body DXA scans
Anteroposterior lumbar spine (L1–L4), and whole body scans wereobtained using a Hologic QDR-4500W (Waltham, MA, USA) in the fanbeam mode with a multidetector system. All subjects were measuredon the same machine. The measurements were performed by usingstandard positioning techniques. Quality control was performed dailyusing the Hologic anthropomorphic spine, and weekly with the wholebody phantom. In our department, the precision error for bonemineral density (BMD) and bone mineral content (BMC) measure-ments is less than 1% for the spine phantom, and less than 2.5% for thewhole body phantom. The data were analyzed using the softwareversion 11.2. Spine scans were analyzed with low-density software[42]. Previous studies reported that skull size confounds whole bodybone data in young children [43]; therefore, all whole body DXAresults shown in this study represent values excluding the skull.
The DXA scans were analyzed to generate measures of vertebralprojected bone area (BA) (in cm2), BMC (in g), and areal BMD(in g/cm2). Lumbar spine bone mineral apparent density (BMAD, ing/cm3) was calculated using established formulae [44] as a surrogatemeasure for volumetric BMD. Whole body scans were analyzed togenerate whole body projected BA (in cm2), BMC (in g), and arealBMD (in g/cm2). Whole body BMC data were presented as BMC/height, because of uncertainty of the accuracy of the total bodyreference volume prediction equation of Katzman et al. [44]. Estimatesof fat mass (kg) and lean mass (kg) were obtained from the wholebody DXA scan excluding the skull.
Hormone assay
After an overnight fast, blood samples were collected from eachsubject for the measurement of circulating concentrations of glucose,insulin, leptin, IGF-1, total and acylated ghrelin. Blood samples werecentrifuged and kept at −80 °C until further analyses were achieved.In order to prevent degradation and loss of the octanoyl group on theserine 3 position of ghrelin, after centrifugation acylated ghrelinsamples were processed with 50 μl of 1 N HCL and addition of 10 μl ofphenylmethylsulfonyl fluoride per 1 ml of plasma. Plasma immunor-eactive total and acylated ghrelin levels were measured in duplicatewith a commercial RIA using 125I-labeled bioactive human acylatedghrelin as tracers and rabbit polyclonal antibody raised against full-length total ghrelin and against the serine 3 position of theoctanoylated portion of acylated ghrelin, respectively (Linco Research,Inc., St Charles, MO, USA). According to the supplier's specifications,inter- and intra-assay coefficients of variations were 14.7–17.8 and3.3–10.0%, respectively, for total ghrelin, and 9.6–16.2 and 6.5–9.5%,respectively, for acylated ghrelin. Des-acyl ghrelin values werecalculated as total ghrelin minus acylated ghrelin [45,46]. A RIA wasalso used to measure human leptin (DRG Diagnostica, Marburg,Germany; detection limit, 0.5 μg/L; inter- and intra-assay CVs, 3.0–6.2% and 3.4–8.3%, respectively), and insulin (CIS Bio International,Schering S.A., Gif-Sur-Yvette Cedex, France; detection limit, 2.0 mU/L;inter- and intra-assay CVs, 6.4–8.8% and 4.2–8.2%, respectively). Animmunoradiometric assay (Immunotech, Beckman Coulter, Inc.,Marseilles, France) was used to measure IGF-1 (detection limit,2.0 μg/L; inter-assay CV,≤6.8%; intra-assay CV,≤6.3%). We measuredglucose concentrations by the glucose oxidase method using aSynchron LX 20 (Beckman Coulter Inc.).
Statistics
Statistical analyses were performed using the SPSS package. Thedata are expressed either as frequencies or as means with 95%confidence intervals (CIs). Insulin, leptin, IGF-1, acylated and des-acylghrelin levels were distributed with a long tail to the right (positiveskew), but their logarithms were approximately normally distributed.
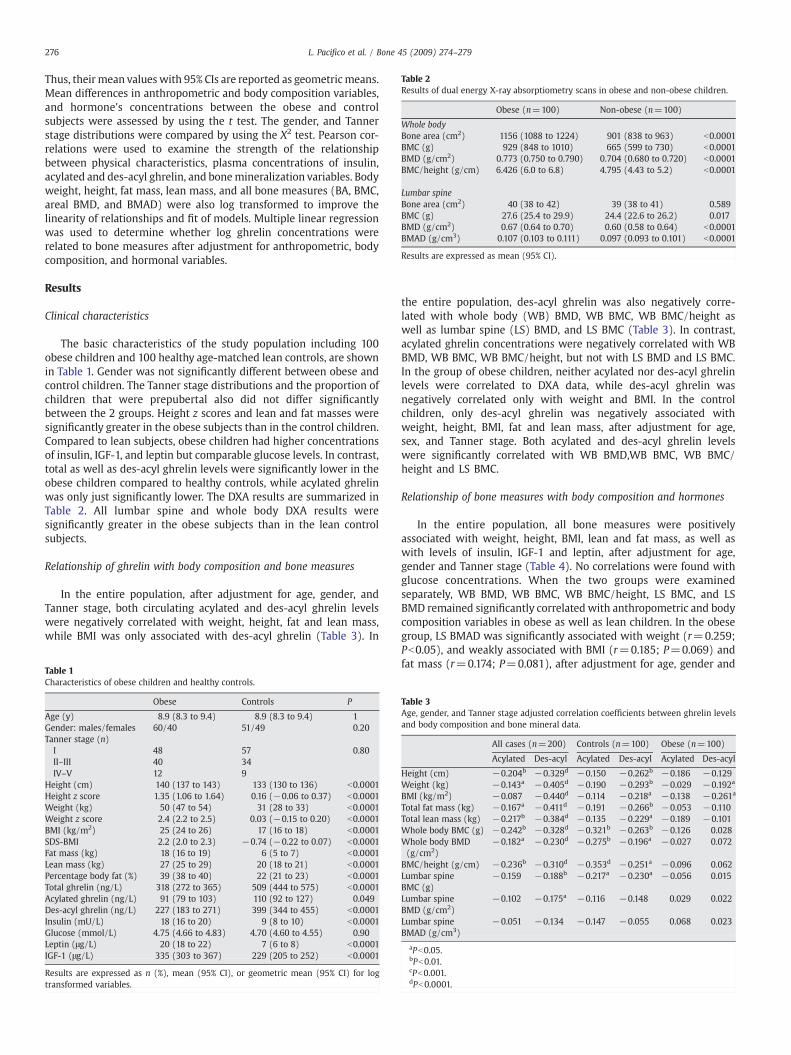
Table 2Results of dual energy X-ray absorptiometry scans in obese and non-obese children.
Obese (n=100) Non-obese (n=100)
Whole bodyBone area (cm2) 1156 (1088 to 1224) 901 (838 to 963) b0.0001BMC (g) 929 (848 to 1010) 665 (599 to 730) b0.0001BMD (g/cm2) 0.773 (0.750 to 0.790) 0.704 (0.680 to 0.720) b0.0001BMC/height (g/cm) 6.426 (6.0 to 6.8) 4.795 (4.43 to 5.2) b0.0001
Lumbar spineBone area (cm2) 40 (38 to 42) 39 (38 to 41) 0.589BMC (g) 27.6 (25.4 to 29.9) 24.4 (22.6 to 26.2) 0.017BMD (g/cm2) 0.67 (0.64 to 0.70) 0.60 (0.58 to 0.64) b0.0001BMAD (g/cm3) 0.107 (0.103 to 0.111) 0.097 (0.093 to 0.101) b0.0001
Results are expressed as mean (95% CI).
276 L. Pacifico et al. / Bone 45 (2009) 274–279
Thus, their mean values with 95% CIs are reported as geometricmeans.Mean differences in anthropometric and body composition variables,and hormone's concentrations between the obese and controlsubjects were assessed by using the t test. The gender, and Tannerstage distributions were compared by using the X2 test. Pearson cor-relations were used to examine the strength of the relationshipbetween physical characteristics, plasma concentrations of insulin,acylated and des-acyl ghrelin, and bonemineralization variables. Bodyweight, height, fat mass, lean mass, and all bone measures (BA, BMC,areal BMD, and BMAD) were also log transformed to improve thelinearity of relationships and fit of models. Multiple linear regressionwas used to determine whether log ghrelin concentrations wererelated to bone measures after adjustment for anthropometric, bodycomposition, and hormonal variables.
Results
Clinical characteristics
The basic characteristics of the study population including 100obese children and 100 healthy age-matched lean controls, are shownin Table 1. Gender was not significantly different between obese andcontrol children. The Tanner stage distributions and the proportion ofchildren that were prepubertal also did not differ significantlybetween the 2 groups. Height z scores and lean and fat masses weresignificantly greater in the obese subjects than in the control children.Compared to lean subjects, obese children had higher concentrationsof insulin, IGF-1, and leptin but comparable glucose levels. In contrast,total as well as des-acyl ghrelin levels were significantly lower in theobese children compared to healthy controls, while acylated ghrelinwas only just significantly lower. The DXA results are summarized inTable 2. All lumbar spine and whole body DXA results weresignificantly greater in the obese subjects than in the lean controlsubjects.
Relationship of ghrelin with body composition and bone measures
In the entire population, after adjustment for age, gender, andTanner stage, both circulating acylated and des-acyl ghrelin levelswere negatively correlated with weight, height, fat and lean mass,while BMI was only associated with des-acyl ghrelin (Table 3). In
Table 1Characteristics of obese children and healthy controls.
Obese Controls P
Age (y) 8.9 (8.3 to 9.4) 8.9 (8.3 to 9.4) 1Gender: males/females 60/40 51/49 0.20Tanner stage (n)I 48 57 0.80II–III 40 34IV–V 12 9
Height (cm) 140 (137 to 143) 133 (130 to 136) b0.0001Height z score 1.35 (1.06 to 1.64) 0.16 (−0.06 to 0.37) b0.0001Weight (kg) 50 (47 to 54) 31 (28 to 33) b0.0001Weight z score 2.4 (2.2 to 2.5) 0.03 (−0.15 to 0.20) b0.0001BMI (kg/m2) 25 (24 to 26) 17 (16 to 18) b0.0001SDS-BMI 2.2 (2.0 to 2.3) −0.74 (−0.22 to 0.07) b0.0001Fat mass (kg) 18 (16 to 19) 6 (5 to 7) b0.0001Lean mass (kg) 27 (25 to 29) 20 (18 to 21) b0.0001Percentage body fat (%) 39 (38 to 40) 22 (21 to 23) b0.0001Total ghrelin (ng/L) 318 (272 to 365) 509 (444 to 575) b0.0001Acylated ghrelin (ng/L) 91 (79 to 103) 110 (92 to 127) 0.049Des-acyl ghrelin (ng/L) 227 (183 to 271) 399 (344 to 455) b0.0001Insulin (mU/L) 18 (16 to 20) 9 (8 to 10) b0.0001Glucose (mmol/L) 4.75 (4.66 to 4.83) 4.70 (4.60 to 4.55) 0.90Leptin (μg/L) 20 (18 to 22) 7 (6 to 8) b0.0001IGF-1 (μg/L) 335 (303 to 367) 229 (205 to 252) b0.0001
Results are expressed as n (%), mean (95% CI), or geometric mean (95% CI) for logtransformed variables.
the entire population, des-acyl ghrelin was also negatively corre-lated with whole body (WB) BMD, WB BMC, WB BMC/height aswell as lumbar spine (LS) BMD, and LS BMC (Table 3). In contrast,acylated ghrelin concentrations were negatively correlated with WBBMD, WB BMC, WB BMC/height, but not with LS BMD and LS BMC.In the group of obese children, neither acylated nor des-acyl ghrelinlevels were correlated to DXA data, while des-acyl ghrelin wasnegatively correlated only with weight and BMI. In the controlchildren, only des-acyl ghrelin was negatively associated withweight, height, BMI, fat and lean mass, after adjustment for age,sex, and Tanner stage. Both acylated and des-acyl ghrelin levelswere significantly correlated with WB BMD,WB BMC, WB BMC/height and LS BMC.
Relationship of bone measures with body composition and hormones
In the entire population, all bone measures were positivelyassociated with weight, height, BMI, lean and fat mass, as well aswith levels of insulin, IGF-1 and leptin, after adjustment for age,gender and Tanner stage (Table 4). No correlations were found withglucose concentrations. When the two groups were examinedseparately, WB BMD, WB BMC, WB BMC/height, LS BMC, and LSBMD remained significantly correlated with anthropometric and bodycomposition variables in obese as well as lean children. In the obesegroup, LS BMAD was significantly associated with weight (r=0.259;Pb0.05), and weakly associated with BMI (r=0.185; P=0.069) andfat mass (r=0.174; P=0.081), after adjustment for age, gender and
Table 3Age, gender, and Tanner stage adjusted correlation coefficients between ghrelin levelsand body composition and bone mineral data.
All cases (n=200) Controls (n=100) Obese (n=100)
Acylated Des-acyl Acylated Des-acyl Acylated Des-acyl
Height (cm) −0.204b −0.329d −0.150 −0.262b −0.186 −0.129Weight (kg) −0.143a −0.405d −0.190 −0.293b −0.029 −0.192a
BMI (kg/m2) −0.087 −0.440d −0.114 −0.218a −0.138 −0.261a
Total fat mass (kg) −0.167a −0.411d −0.191 −0.266b −0.053 −0.110Total lean mass (kg) −0.217b −0.384d −0.135 −0.229a −0.189 −0.101Whole body BMC (g) −0.242b −0.328d −0.321b −0.263b −0.126 0.028Whole body BMD(g/cm2)
−0.182a −0.230d −0.275b −0.196a −0.027 0.072
BMC/height (g/cm) −0.236b −0.310d −0.353d −0.251a −0.096 0.062Lumbar spineBMC (g)
−0.159 −0.188b −0.217a −0.230a −0.056 0.015
Lumbar spineBMD (g/cm2)
−0.102 −0.175a −0.116 −0.148 0.029 0.022
Lumbar spineBMAD (g/cm3)
−0.051 −0.134 −0.147 −0.055 0.068 0.023
aPb0.05.bPb0.01.cPb0.001.dPb0.0001.
Table 4Age, sex, and Tanner stage adjusted correlation coefficients between total and lumbar spine bone mineral data and body composition in all children together.
Weight (kg) Height (cm) BMI (kg/m2) Lean mass (kg) Fat mass (kg) Insulin (mU/L) Glucose (mmol/L) IGF-1 (μg/L) Leptin (μg/L)
Total bodyBMC (g) 0.711d 0.792d 0.631d 0.868d 0.705d 0.471d −0.061 0.238c 0.403d
BMD (g/cm2) 0.571d 0.639d 0.482d 0.711d 0.506d 0.378d −0.081 0.185b 0.266d
BMC height (g/cm) 0.689d 0.709d 0.644d 0.826d 0.708d 0.459d −0.054 0.249d 0.414d
Lumbar spineBMC (g) 0.514d 0.685d 0.339d 0.667d 0.355d 0.272b −0.049 0.159a 0.142a
BMD (g/cm2) 0.419d 0.407d 0.371d 0.453d 0.370d 0.228b −0.054 0.145a 0.217b
BMAD (g/cm3) 0.288c 0.170a 0.321d 0.245b 0.310d 0.161a −0.048 0.113 0.240b
a Pb0.05.b Pb0.01.c Pb0.001.d Pb0.0001.
Table 5AResults of backward multiple linear regression analysis with bone density measures asdependent variables and age, gender, Tanner stage, weight, height, body composition(lean and fat mass), and acylated ghrelin, des-acyl ghrelin, leptin, IGF-1, glucose andinsulin levels as independent variables in healthy children.
Variablea Unstandardizedcoefficient, b
95% CI P
WB BMC/height (g/cm)Age (y) 0.030 0.011 to 0.048 b0.001Gender 0.047 0.006 to 0.088 b0.05Fat mass (kg) 0.073 0.016 to 0.130 b0.05Lean mass (kg) 0.418 0.134 to 0.702 b0.001Acylated ghrelin (ng/L) −0.068 −0.104 to −0.033 b0.0001WB BMD (g/cm2)Age (y) 0.012 0.002 to 0.021 b0.05Lean mass (kg) 0.298 0.221 to 0.375 b0.0001Acylated ghrelin (ng/L) −0.024 −0.046 to −0.003 b0.05LS BMAD (g/cm3)Gender 0.058 0.004 to 0.112 b0.05Tanner stage 0.066 0.046 to 0.085 b0.0001LS BMD (g/cm2)Gender 0.072 0.028 to 0.116 b0.001Age 0.027 0.011 to 0.044 b0.001Weight (kg) 0.009 0.004 to 0.013 b0.0001
a WB BMC/height, WB BMD, LS BMAD, LS BMD, lean mass, fat mass, and acylatedghrelin, des-acyl ghrelin, leptin, IGF-1 and insulin were log transformed for best fit.
277L. Pacifico et al. / Bone 45 (2009) 274–279
Tanner stage. In the control group, no correlation coefficient wasstatistically significant between LS BMAD and anthropometric andbody composition variables, after adjustment for age, gender andTanner stage. Insulin was significantly associated with all bonemeasures in obese children. In the healthy subjects, insulin tendedto correlate with WB BMD (P=0.095), WB BMC (P=0.089), and WBBMC/height (P=0.061). Leptin and IGF-1 were not significantlycorrelated with any of the bone data in either group.
Regression analysis to determine contribution of ghrelin to bone densitymeasures
Backward linear regression analysis was performed for individualgroups, with age, gender, Tanner stage, weight, height, bodycomposition (lean and fat mass), acylated ghrelin, des-acyl ghrelin,glucose, leptin, IGF-1 and insulin entered into the model. We reportthese results in Tables 5A and B. In healthy children, acylated ghrelinwas a significant and independent negative predictor of WB BMD, andWB BMC/height, while lean mass was positively significantlyassociated with these bone measures. In contrast, in obese children,a positive significant association was observed between des-acylghrelin andWB BMD aswell asWB BMC/height, alongwith leanmass,and to a lesser degree, with fat mass. Acylated as well as des-acylghrelinwere not predictors of LS BMD and LS BMAD in obese aswell ascontrol children.
Discussion
Research studying the association between ghrelin and bone islimited mostly to laboratory studies. Results in animals are suggestivebut inconclusive: in one study in rats, ghrelinwas positively associatedwith BMD [25], but another study in mice found no association [47]. Inrats, ghrelin administration increased osteoblast activity, boneformation, and calcium accretion in osteoblasts, and inhibitedosteoblast apoptosis [25,28,31]. GHS-Rs have been identified in bonecells in rats and humans, and a recent study found that osteoblastssecrete ghrelin [28,31,36].
In humans, there are few studies on the association of totalghrelin with BMD, with conflicting results obtained in different studypopulations, primarily adults. In the study by Oh et al. including 80Korean middle-aged men, serum ghrelin levels were not correlatedwith the lumbar spine or femoral neck BMD, even after adjustmentswere made for age and BMI [34]. In the study by Weiss et al.involving 525 men (mean age, 68.6 years) and 452 non-estrogenusing postmenopausal women (mean age, 71.9 years), no significantghrelin–BMD or ghrelin–bone loss associations were observed ineither sex of older adults, after adjusting for age and BMI [33]. In thestudy by Makovey et al. reporting on 79 opposite-sex twin pairs ofadults (38 pairs under 51.2 years, and 41 pairs over 51.2 years),plasma ghrelin levels were not associated with BMD in men of any
age [35]. In women in the younger age group, plasma ghrelin levelsshowed an inverse relationship with BMD, which was statisticallysignificant only for total hip, even after adjustment for fat mass, bodysize and lifestyle factors [35]. In older women, no such relationshipswere significant. In the very recent study by Jürimäe et al. reportingon 88 postmenopausal women (between the ages of 58 to 80 years),negative associations of plasma ghrelin concentrations with totalBMC, total BMD, lumbar spine BMD, and femoral neck BMD wereobserved [32]. These associations remained significant after control-ling for adiponectin, leptin, IGF-1, insulin, glucose, homeostasismodel assessment of insulin resistance, fat mass, and fat-free mass,but not when adjusting for waist-to-hip ratio and waist-to-thighcircumference ratio. Therefore, from the findings of the investigationby Jürimäe et al. [32] in healthy postmenopausal women, it appearsthat fasting ghrelin concentrations have no independent effect onBMC and BMD values, and that the relationship of plasma ghrelinwith bone mineral values is mediated or confounded by specificbody composition parameters.
Studies in children have also yielded contradictory results. In thestudy by Misra et al. involving 23 adolescent girls with anorexianervosa and 21 healthy adolescent girls, total ghrelin secretionpredicted bone density at the lumbar spine and the hip independentof body composition, the GH–IGF-1 axis, cortisol or estradiol inhealthy girls but not in those with anorexia nervosa [26]. On the otherhand, in the study by Pomerants et al. reporting on 60 healthy

Table 5BResults of backward multiple linear regression analysis with bone density measures asdependent variables and age, gender, Tanner stage, weight, height, body composition(lean and fat mass), and acylated ghrelin, des-acyl ghrelin, leptin, IGF-1, glucose andinsulin levels as independent variables in obese children.
Variablea Unstandardizedcoefficient, b
95% CI P
WB BMC/height (g/cm)Gender 0.074 0.010 to 0.138 b0.05Lean mass (kg) 0.751 0.414 to 1.088 b0.0001Fat mass (kg) 0.262 0.096 to 0.429 b0.01Des-acyl ghrelin (ng/L) 0.038 0.001 to 0.075 b0.05WB BMD (g/cm2)Gender 0.032 0.004 to 0.061 b0.001Lean mass (kg) 0.388 0.347 to 0.429 b0.0001Des-acyl ghrelin (ng/L) 0.017 0.001 to 0.035 b0.05LS BMAD (g/cm3)Gender 0.108 0.039 to 0.177 b0.001Weight (kg) 0.006 0.001 to 0.010 b0.001LS BMD (g/cm2)Gender 0.093 0.032 to 0.154 b0.01Weight (kg) 0.008 0.006 to 0.010 b0.0001
a WB BMC/height, WB BMD, LS BMAD, LS BMD, lean mass, fat mass, and acylatedghrelin, des-acyl ghrelin, leptin, IGF-1 and insulin were log transformed for best fit.
278 L. Pacifico et al. / Bone 45 (2009) 274–279
non-obese male schoolchildren (aged 10–18 years), serum totalghrelin concentration was inversely related to total BMD, lumbarBMD, and BMAD, but those correlations were not as strong as seenbetween BMD and testosterone or IGF markers [30].
In our study, an inverse correlation was found in healthy normal-weight children and adolescents between acyl ghrelin levels andwhole body BMD, andmultiple regression analysis confirmed that acylghrelin was a significant determinant of whole body BMD, indepen-dent of gender, age, Tanner stage, and body composition as well asleptin, IGF-1, and insulin. Conversely, in obese children and adoles-cents multiple regression analysis showed a significant positiveassociation between des-acyl ghrelin and whole body BMD. To ourknowledge, this is the first report of the associations of acyl and des-acyl ghrelin in obese and healthy lean (age-matched) children. Thecurrent results are supported by reports of potential differential rolesof acyl and des-acyl ghrelin in mediating peripheral biologic actions[15,48]. Very little is known about effects of the two distinct isoformson bone. A recent experimental study demonstrated that total as wellas des-acyl ghrelin are potent stimulators of proliferation in humanosteoblasts [36].
Differential acute impacts of acyl and des-acyl ghrelin on oralglucose disposal and metabolism in post-absorptive humans havebeen reported [45,49,50]. Differential effects also appear to extend tohepatic insulin sensitivity [46]. The very recent study by Kos et al. onthe expression of ghrelin in human adipose tissue indicates that bothisoforms of ghrelin induce lipid deposition [51]. However, from thefindings of Kos et al., it appears that des-acyl ghrelin, the predominantperipheral form of ghrelin, constituting 80 to 90% of circulatingghrelin, inhibits hormone sensitive lipase production and significantlyreduces glycerol release, consistent with the pro-adipogenic effect ofghrelin. In contrast, acyl ghrelin failed to show an antilipolytic effect,hence ghrelin's action on peripheral humanmetabolism appears to beisoform dependent [51]. Therefore, it is plausible that different ghrelinforms are differentially associated with bone mineral values in obeseand non-obese subjects.
The role of leptin on bone mineral in humans remains unclear. Theresults of the present study imply that leptin does not increase bonemineral in youths. Previous investigations in children and adults havealso reported no independent effect of leptin on bone mineral [52,53].However, others have reported that the relationship between bonemineralization and serum leptin concentrations is significant but lowin magnitude, including studies of children, but these studies did not
statistically adjust for confounding correlated variables including fatmass, insulin and IGF-1 concentrations [54–56].
In summary, the results of this investigation indicate that theinfluence of the two distinct isoforms of ghrelin on BMD is mediatedby specific body composition parameters in obese and control healthychildren. However, the cross-sectional nature of our study limitsdeterminations of causality. Additional studies are necessary to betterunderstand the complex interplay of body composition and ghrelinisoforms in determining the state of bone metabolism. Furthermore,this needs to be examined across a spectrum of nutritional conditionsto develop a clearer understanding of the effect of nutritional status onbone.
References
[1] Felson DT, Zhang Y, HannanMT, Anderson JJ. Effects of weight and bodymass indexon bone mineral density in men and women: the Framingham study. J Bone MinerRes 1993;8:567–73.
[2] De Laet C, Kanis JA, Odén A, Johanson H, Johnell O, Delmas P, et al. Bodymass indexas a predictor of fracture risk: a meta-analysis. Osteoporos Int 2005;16:1330–8.
[3] Leonard MB, Shults J, Wilson BA, Tershakovec AM, Zemel BS. Obesity duringchildhood and adolescence augments bone mass and bone dimensions. Am J ClinNutr 2004;80:514–23.
[4] Reid IR. Relationship among body mass, its components, and bone. Bone 2002;31:547–55.
[5] Rubin CT, Lanyon LE. Regulation of bone mass by mechanical strain magnitude.Calcif Tissue Int 1985;37:411–7.
[6] Reid IR, Cornish J, Baldock PA. Nutrition-related peptides and bone homeostasis.J Bone Miner Res 2006;21:495–500.
[7] Bollag RJ, Zhong Q, Ding KH, Phillips P, Zhong L, Qin F, et al. Glucose-dependentinsulinotropic peptide is an integrative hormone with osteotropic effects. Mol CellEndocrinol 2001;177:35–41.
[8] Haderslev KV, Jeppesen PB, Hartmann B, Thulesen J, Sorensen HA, Graff J, et al.Short-term administration of glucagons-like peptide-2. Effects on bone mineraldensity and markers of bone turnover in short-bowel patients with no colon.Scand J Gastroenterol 2002;37:392–8.
[9] Ong K, Kratzsch J, Kiess W, Dunger D, ALSPAC Study Team. Circulating IGF-1 levelsin childhood are related to both current body composition and early postnatalgrowth rate. J Clin Endocrinol Metab 2002;87:1041–4.
[10] Kojima M, Hosoda H, Date Y, Nakazato M, Matsuo H, Kangawa K. Ghrelin is agrowth-hormone-releasing acylated peptide from stomach. Nature 1999;402:656–60.
[11] Kojima M, Kangawa K. Ghrelin: structure and function. Physiol Rev 2005;85:495–522.
[12] Nakazato M, Murakami N, Date Y, Kojima M, Matsuo H, Kangawa K, et al. A role forghrelin in the central regulation of feeding. Nature 2001;409:194–8.
[13] Date Y, Murakami N, Kojima M, Kuroiwa T, Matsukura S, Kangawa K, et al. Centraleffects of a novel acylated peptide, ghrelin, on growth hormone release in rats.Biochem Biophys Res Comm 2000;275:477–80.
[14] Takaya K, Ariyasu H, Kanamoto N, Iwakura H, Yoshimoto A, HaradaM, et al. Ghrelinstrongly stimulates growth hormone release in humans. J Clin Endocrinol Metab2000;85:4908–11.
[15] van der Lely AJ, Tschöp M, Heiman ML, Ghigo E. Biological, physiological,pathophysiological, and pharmacological aspects of ghrelin. Endocr Rev2004;25:426–57.
[16] Tschöp M, Weyer C, Tataranni PA, Devanarayan V, Ravussin E, Heiman ML.Circulating ghrelin levels are decreased in human obesity. Diabetes 2001;50:707–9.
[17] Cummings DE, Weigle DS, Frayo RS, Breen PA, Ma MK, Dellinger EP, et al. Plasmaghrelin levels after diet-inducedweight loss or gastric bypass surgery. N Engl J Med2002;346:1623–30.
[18] Hansen TK, Dall R, Hosoda H, Kojima M, Kangawa K, Christiansen JS, et al. Weightloss increases circulating levels of ghrelin in human obesity. Clin Endocrinol2002;56:203–6.
[19] Tschöp M, Smiley DL, Heiman ML. Ghrelin induces adiposity in rodents. Nature2000;407:908–13.
[20] Kojima M, Hosoda H, Matsuo H, Kangawa K. Ghrelin: discovery of the naturalendogenous ligand for the growth hormone secretagogue receptor. TrendsEndocrinol Metab 2001;12:118–22.
[21] Choi K, Roh SG, Hong YH, Shrestha YB, Hishikawa D, Chen C, et al. The role ofghrelin and growth hormone secretagogues receptor on rat adipogenesis.Endocrinology 2003;144:754–9.
[22] Gualillo O, Caminos JE, Kojima M, Kangawa K, Arvat E, Ghigo E, et al. Gender andgonadal influences on ghrelin mRNA levels in rat stomach. Eur J Endocrinol2001;144:687–90.
[23] Gaytan F, Barreiro ML, Chopin LK, Herington AC, Morales C, Pinilla L, et al.Immunolocalization of ghrelin and its functional receptor, the type 1a growthhormone secretagogue receptor, in the cyclic human ovary. J Clin EndocrinolMetab 2003;88:879–87.
[24] Gaytan F, Barreiro ML, Caminos JE, Chopin LK, Herington AC, Morales C, et al.Expression of ghrelin and its functional receptor, the type 1a growth hormonesecretagogue receptor, in normal human testis and testicular tumors. J ClinEndocrinol Metab 2004;89:400–9.
279L. Pacifico et al. / Bone 45 (2009) 274–279
[25] Fukushima N, Hanada R, Teranishi H, Fukue Y, Tachibana T, Ishikawa H, et al.Ghrelin directly regulates bone formation. J Bone Miner Res 2005;20:790–8.
[26] Misra M, Miller KK, Stewart V, Hunter E, Kuo K, Herzog DB, et al. Ghrelin and bonemetabolism in adolescent girls with anorexia nervosa and healthy adolescents.J Clin Endocrinol Metab 2005;90:5082–7.
[27] Caminos JE, Gualillo O, Lago F, OteroM, Blanco M, Gallego R, et al. The endogenousgrowth hormone secretagogue (ghrelin) is synthesized and secreted bychondrocytes. Endocrinology 2005;146:1285–92.
[28] Maccarinelli G, Sibilia V, Torsello A, Raimondo F, Pitto M, Giustina A, et al. Ghrelinregulates proliferation and differentiation of osteoblastic cells. J Endocrinol2005;184:249–56.
[29] Coates PS, Fernstrom JD, Fernstrom MH, Schauer PR, Greenspan SL. Gastric bypasssurgery for morbid obesity leads to an increase in bone turnover and a decrease inbone mass. J Clin Endocrinol Metab 2004;89:1061–5.
[30] Pomerants T, Tillmann V, Jürimäe J, Jürimäe T. The influence of serum ghrelin, IGFaxis and testosterone on bone mineral density in boys at different stages of sexualmaturity. J Bone Miner Metab 2007;25:193–7.
[31] Kim SW, Her SJ, Park SJ, Kim D, Park KS, Lee HK, et al. Ghrelin stimulatesproliferation and differentiation and inhibits apoptosis in osteoblastic MC3T3-E1cells. Bone 2005;37:359–69.
[32] Jürimäe J, Jürimäe T, Leppik A, Kums T. The influence of ghrelin, adiponectin, andleptin on bone mineral density in healthy postmenopausal women. J Bone MinerMetab 2008;26:618–23.
[33] Weiss LA, Langenberg C, Barrett-Connor E. Ghrelin and bone: is there anassociation in older adults? The Rancho Bernardo study. J Bone Miner Res2006;21:752–7.
[34] Oh KW, Lee WY, Rhee EJ, Baek KH, Yoon KH, Kang MI, et al. The relationshipbetween serum resistin, leptin, adiponectin, ghrelin levels and bone mineraldensity in middle-aged men. Clin Endocrinol 2005;63:131–8.
[35] Makovey I, Naganathan V, Seibel M, Sambrook P. Gender differences in plasmaghrelin and its relations to body composition and bone—an opposite-sex twinstudy. Clin Endocrinol 2007;66:530–7.
[36] Delhanty PJD, van der Eerden BCJ, van der Velde M, Gauna C, Pols HAP, Jahr H, et al.Ghrelin and unacylated ghrelin stimulate human osteoblast growth via mitogen-activated protein kinase (MAPK)/phosphoinositide 3-kinase (PI3K) pathways inthe absence of GHS-R1a. J Endocrinol 2006;188:37–47.
[37] Misra M, Katzman D, Cord J, Manning SJ, Mendes N, Herzog DB, et al. Bonemetabolism in adolescent boys with anorexia nervosa. J Clin Endocrinol Metab2008;93:3029–36.
[38] Cacciari E, Milani S, Balsamo A, Dammacco F, De Luca F, Chiarelli F, et al. Italiancross-sectional growth charts for eight, weight and BMI (6–20 y). Eur J Clin Nut2002;56:171–80.
[39] MarshallWA, Tanner JM. Variations in pattern of pubertal changes in girls. Arch DisChild 1969;44:291–303.
[40] Marshall WA, Tanner JM. Variations in pattern of pubertal changes in boys. ArchDis Child 1970;45:13–23.
[41] Cole TJ, Bellizzi MC, Flegal KM, Dietz WH. Establishing a standard definition forchild overweight and obesity worldwide: international survey. Brit Med J2000;320:1240–3.
[42] Leonard MB, Feldman HI, Zemel RS, Berlin JA, Barden EM, Stallings VA. Evaluationof low density spine software for the assessment of bone mineral density inchildren. J Bone Miner Res 1998;13:1687–90.
[43] Taylor A, Konrad PT, Norman ME, Harcke HT. Total body bone mineral density inyoung children: influence of head bonemineral density. J BoneMiner Res 1997;12:652–5.
[44] Katzman DK, Bachrach LK, Carter DR, Marcus R. Clinical and anthropometriccorrelates of bone mineral acquisition in healthy adolescent girls. J Clin EndocrinolMetab 1991;73:1332–9.
[45] St-Pierre DH, Karelis AD, Coderre L, Malita F, Fontaine J, Mignault D, et al.Association of acylated and nonacylated ghrelin with insulin sensitivity inoverweight and obese postmenopausal women. J Clin Endocrinol Metab2007;92:264–9.
[46] Barazzoni R, Zanetti M, Ferreira C, Vinci P, Pirulli A, Mucci M, et al. Relationshipsbetween desacylated and acylated ghrelin and insulin sensitivity in the metabolicsyndrome. J Clin Endocrinol Metab 2007;92:3935–40.
[47] Sun Y, Ahmed S, Smith RG. Deletion of ghrelin impairs neither growth nor appetite.Mol Cell Biol 2003;23:7973–81.
[48] Thompson NM, Gill DA, Davies R, Loveridge N, Houston PA, Robinson IC, et al.Ghrelin and des-octanoyl ghrelin promote adipogenesis directly in vivo by amechanism independent of the type 1a growth hormone secretagogue receptor.Endocrinology 2004;145:234–42.
[49] Gauna C, Meyler FM, Janssen JA, Delhanty PJ, Abribat T, van Koetsveld P, et al.Administration of acylated ghrelin reduces insulin sensitivity, whereas thecombination of acylated plus unacylated ghrelin strongly improves insulinsensitivity. J Clin Endocrinol Metab 2004;89:5035–42.
[50] Broglio F, Gottero C, Prodam F, Gauna C, Muccioli G, Papotti M, et al. Non-acylatedghrelin counteracts the metabolic but not the neuroendocrine response toacylated ghrelin in humans. J Clin Endocrinol Metab 2004;89:3062–5.
[51] Kos K, Harte AL, O'Hare PJ, Kumar S, McTernan PG. Ghrelin and thedifferential regulation of des-acyl and oct-anoyl ghrelin in human adiposetissue. Clin Endocrinol. Epub. ahead of print. June 23, 2008, doi:10.1111/j.1365-2265.2008.03321.x.
[52] Martini G, Valenti R, Giovani S, Franci B, Campagna S, Nuti R. Influence of insulin-like growth factor-1 and leptin on bone mass in healthy postmenopausal women.Bone 2001;28:113–7.
[53] Roemmich JN, Clark PA, Mantzoros CS, Gurgol CM, Weltman A, Rogol AD.Relationship of leptin to bone mineralization in children and adolescents. J ClinEndocrinol Metab 2003;88:599–604.
[54] Sato M, Takeda N, Sarui H, Takami R, Takami K, Hayashi M, et al. Associationbetween serum leptin concentrations and bone mineral density, and biochemicalmarkers of bone turnover in adult men. J Clin Endocrinol Metab 2001;86:5273–6.
[55] Blain H, Vuillemin A, Guillemin F, Durant R, Hanesse B, de Talance N, et al. Serumleptin level is a predictor of bonemineral density in postmenopausal women. J ClinEndocrinol Metab 2003;87:1030–5.
[56] Ibanez L, Potau N, Ong K, Dunger DB, De Zegher F. Increased bone mineral densityand serum leptin in non-obese girls with precocious pubarche: relation to lowbirth weight and hyperinsulinism. Horm Res 2000;54:192–7.