A Classification of Tasmanian Estuaries and Assessment of ...
Southern Cross UniversityePublications@SCUSchool of Environment, Science and EngineeringPapers School of Environment, Science and Engineering
2003
Relationship between physical characteristics ofestuaries and the size and diversity of waderpopulations in the North Island of New ZealandMichael B. WhelanSouthern Cross University
T M. HumeNational Institute of Water and Atmospheric Research,
P M. Sager
Ude ShankarNational Institute of Water and Atmospheric Research,
R LiftingNational Institute of Water and Atmospheric Research,
ePublications@SCU is an electronic repository administered by Southern Cross University Library. Its goal is to capture and preserve the intellectualoutput of Southern Cross University authors and researchers, and to increase visibility and impact through open access to researchers around theworld. For further information please contact [email protected].
Publication detailsWhelan, MB, Hume, TM, Sagar, PM, Shankar, U, Liefting, R 2003, 'Relationship between physical characteristics of estuaries and thesize and diversity of wader populations in the North Island of New Zealand', Norornis, vol. 50, pp. 11-22.
Notornis, 2003, Vol. 50: 11-22 0029-4470 O The Ornithological Society of New Zealand, Inc. 2003
Relationship between physical characteristics of estuaries and the size and diversity of wader populations in the North Island of New Zealand
M.B. WHELAN School of Environmental Science and Management, Southern Cross University, P.O. Box 157, Lismore, NSW 2480, Australia [email protected]
T.M. HUME National Institute of Water and Atmospheric Research, P.O. Box 11-115, Hamilton, New Zealand
P.M. SAGAR UDE SHANKAR National Institute of Water & Atmospheric Research, P.O. Box 8602, Christchurch, New Zealand
R. LIEFTING National Institute of Water and Atmospheric Research, P.0. Box 11-115, Hamilton, New Zealand
Abstract The aim of this study was to associate the distribution of waders (Charadriiformes) with physical attributes of estuaries and map the distribution of estuaries that have the potential to support large diverse wader populations. Maximum wader abundance and the maximum number of species recorded (1983-1994) at 94 estuaries on the North Island, New Zealand were related to physical attributes of the estuaries using General Linear Modelling techniques. Parameters describing the estuary type, area, tidal influence, catchment area, catchment rainfall, intertidal area and temperature were used as independent variables. Anaiysis revealed strong positive relationships between the size and diversity of a wader population and estuary area. A negative relationship between catchment runoff and wader abun- dance and diversity existed in some estuaries. The model predicted that relatively small estuaries (100 to 999 ha) could support large, diverse wader populations if catchment runoff was low. A map of estuaries predicted by the model to support large diverse populations of wading birds is presented. This study highlights the value of large estuaries in New Zealand in maintaining large populations and high species diversity of migratory and nonmigratory waders.
Whelan, M.B.; Hume, T.M.; Sagar, P.M.; Shankar, U.; Liefting, R. 2003. Relationship between physical characteristics of estuaries and the size and diversity of wader populations in the North Island of New Zealand. Notornis 50(1): 11-22.
Keywords wading birds; estuaries; populations; distributions; physical characteristics
INTRODUCTION Wading birds (Order Charadriiformes) are an important and highly visible component of estuaries. Waders worldwide are being put under pressure from recreational use of estuaries (Davidson & Rothwell 1993), hunting, habitat loss, drainage for agriculture, pollution and fishing (Parish et al. 1987; Scott & Poole 1989). Morrison et a/. (2001) found that the number of shorebirds in Canada had declined from 1974 to 1999 but could not identify any single cause for the decline.
Received 14 November 2001; accepted 8 October 2002
Changes in the hydrology of estuaries have led to changes in wader populations (Maisonneuve 1993; Collazo et a/. 1995). Burton (2001) attributed a decline of 87% of birds in Cardiff Bay to hydrological changes in the estuary caused when a barrage was built across the mouth of the bay.
New Zealand estuaries support over 160,000 waders of local breeding species and a similar number of migrants from the northern hemisphere (Sagar et a/. 1999). Most of the populations of waders that breed in New Zealand d o so away from estuaries and a recent review of their status (Dowding & Murphy 2001) concluded that most are under increased predation pressure from introduced mammals. After breeding, most of
12 Whelan et al.
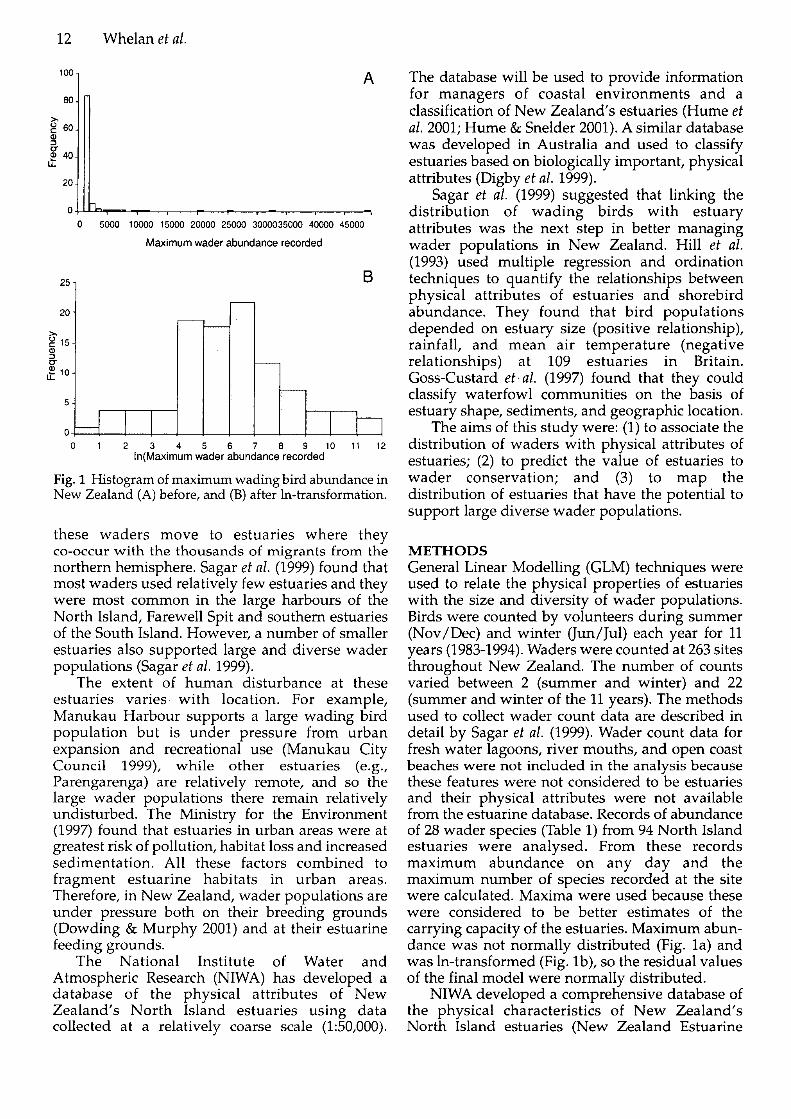
0 5000 10000 15000 20000 25000 3000035000 40000 45000
Maximum wader abundance recorded
0 1 2 3 4 5 6 7 8 9 1 0 1 1 1 2 In(Maximurn wader abundance recorded
Fig. 1 Histogram of maximum wading bird abundance in New Zealand (A) before, and (B) after In-transformation.
these waders move to estuaries where they co-occur with the thousands of migrants from the northern hemisphere. Sagar et al. (1999) found that most waders used relatively few estuaries and they were most common in the large harbours of the North Island, Farewell Spit and southern estuaries of the South Island. However, a number of smaller estuaries also supported large and diverse wader populations (Sagar et al. 1999).
The extent of human disturbance at these estuaries varies. with location. For example, Manukau Harbour supports a large wading bird population but is under pressure from urban expansion and recreational use (Manukau City Council 1999), while other estuaries (e.g., Parengarenga) are relatively remote, and so the large wader populations there remain relatively undisturbed. The Ministry for the Environment (1997) found that estuaries in urban areas were at greatest risk of pollution, habitat loss and increased sedimentation. All these factors combined to fragment estuarine habitats in urban areas. Therefore, in New Zealand, wader populations are under pressure both on their breeding grounds (Dowding & Murphy 2001) and at their estuarine feeding grounds.
The National Institute of Water and Atmospheric Research (NIWA) has developed a database of the physical attributes of New Zealand's North Island estuaries using data collected at a relatively coarse scale (1:50,000).
The database will be used to provide information for managers of coastal environments and a classification of New Zealand's estuaries (Hume et al. 2001; Hume & Snelder 2001). A similar database was developed in Australia and used to classify estuaries based on biologically important, physical attributes (Digby et al. 1999).
Sagar et al. (1999) suggested that linking the distribution of wading birds with estuary attributes was the next step in better managing wader populations in New Zealand. Hill et al. (1993) used multiple regression and ordination techniques to quantify the relationships between physical attributes of estuaries and shorebird abundance. They found that bird populations depended on estuary size (positive relationship), rainfall, and mean air temperature (negative relationships) at 109 estuaries in Britain. Goss-Custard et al. (1997) found that they could classify waterfowl communities on the basis of estuary shape, sediments, and geographic location.
The aims of this study were: (1) to associate the distribution of waders with physical attributes of estuaries; (2) to predict the value of estuaries to wader conservation; and (3) to map the distribution of estuaries that have the potential to support large diverse wader populations.
METHODS General Linear Modelling (GLM) techniques were used to relate the physical properties of estuaries with the size and diversity of wader populations. Birds were counted by volunteers during summer (Nov/Dec) and winter (Jun/Jul) each year for 11 years (1983-1994). Waders were counted at 263 sites throughout New Zealand. The number of counts varied between 2 (summer and winter) and 22 (summer and winter of the 11 years). The methods used to collect wader count data are described in detail by Sagar et al. (1999). Wader count data for fresh water lagoons, river mouths, and open coast beaches were not included in the analysis because these features were not considered to be estuaries and their physical attributes were not available from the estuarine database. Records of abundance of 28 wader species (Table 1) from 94 North Island estuaries were analysed. From these records maximum abundance on any day and the maximum number of species recorded at the site were calculated. Maxima were used because these were considered to be better estimates of the carrying capacity of the estuaries. Maximum abun- dance was not normally distributed (Fig. la) and was In-transformed (Fig. lb), so the residual values of the final model were normally distributed.
NIWA developed a comprehensive database of the physical characteristics of New Zealand's North Island estuaries (New Zealand Estuarine
Estuary attributes and wader populations 13
Table 1 Common and scientific names (after Turbott 1990) of species used in the analysis.
Common name Scientific name
Pied oystercatcher Variable oystercatcher Pied stilt Black stilt Hybrid stilt New Zealand dotterel Banded dotterel Black-fronted dotterel Large sand dotterel Mongolian dotterel Wrybill Pacific golden plover Spur-winged plover Turnstone Lesser knot Curlew sandpiper Sharp-tailed sandpiper Pectoral sandpiper Red-necked stint Eastern curlew Asiatic whimbrel Little whimbrel Eastern bar-tailed godwit Black-tailed godwit Hudsonian godwit Greenshank Marsh sandpiper Terek sandpiper
Haematopus ostralegus Haematopus unicolor Himantopus himantopus Himantopus novaezelandiae Himantopus sp. Charadrius obscurus Charadrius bicinctus Charadrius melanops Charadrius leschenaultii Charadrius mongolus Anarhynchus frontalis Pluvialis fulva Vanellus miles Arenaria interpres Calidris canutus Calidrisferruginea Calidris acuminata Calidris melanotos Calidris ruficollis Numenius madagascariensis Numenius phaeopus variegatus Numenius minutus Limosa lapponica Limosa limosa Limosa haemastica Tringa nebularia Tringa flavipes Trinxa terek
Database, NZED). The database contains information on the location, type, area, intertidal area, geology, tidal influences, climatic, and catchment characteristics of 234 estuaries (Table 2). A subset of NZED fields was used in the analysis.
The variables Area, Intertidal area, Catchment area, Fluvial Flow, and Rain Power, Fresh Volume, and Tidal Prism were not normally distributed and were In-transformed.
Preliminary analysis Preliminary analysis was necessary to reduce the number of independent variables in the model. It was not possible to perform GLM on 94 estuaries with 25 independent variables because there were too few degrees of freedom to estimate the contribution all interactions could make to the model. The following categories were considered to be important driving factors in estuaries that could affect wading bird populations, and were the broad parameters that Hill et al. (1993) found to be correlated with the abundance and diversity of waders in estuaries in Britain: Size of the estuary Large estuaries are likely to contain a variety of habitats that would lead to greater diversity, to accommodate a larger population of birds (Sagar e t al. 1999); Intertidal area The intertidal area is used by many species of waders for foraging, and Burton
(2001) found 1-hat loss of intertidal area leads to a decline in wader numbers and diversity; Tidal influence The tidal influence affects the size of the intertidal area of an estuary, and also influences the amount of marine water entering the estuary and hence the diversity of prey for waders; Catchment rainfall and fluvial flow Selected because they are measures of the amount of fresh water flowing into the estuary, bringing nutrients and sediment into the estuary and influencing the estuarine habitats and prey species; Tempera ture Temperature influences the type and abundance of prey.
Correlations between abundance and species diversity and all continuous independent variables presented in Table 2 were calculated. One variable from each of the categories was selected based on the strength of the relationship between it and the size and diversity of wader populations. Six continuous variables with the highest correlation coefficients were selected to use in multivariate analysis as independent variables: ln(Area); Intertidal Percent; ln(Tida1 Prism); Catchment Runoff; In (Fluvial Flow); and Daily Maximum Temperature.
Because estuary type is a categorical variable it was not possible to correlate estuary type with abundance or species diversity. A 1-way analysis of variance (ANOVA) was used to estimate the contribution estuary type made to the variation of wader abundance and diversity.
General Linear Modelling All GLM analysis was performed using SASB (Version 8 for Windows@). Model I Sums of Squares and probability of Type I error of 0.05 were used to identify statistically significant terms. The aim was to produce a model equation with the least number of terms, but which explained a large pro- portion of the variation in abundance and diversi- ty of waders. The following sequence was used in all analysis: 1, a General Linear Model incorporat- ing all main effects, 2-way interactions and 3-way interactions was generated; 2, non-significant 3-way interactions were removed and the model re-calculated, the step being repeated until there were no non-significant 3-way interactions in the model; 3, non-significant 2-way interactions were removed from the model and the model re-calcu- lated, but a 2-way interaction was not removed if a significant higher order interaction was present in the model, the step being repeated until there were no non-significant 2-way interactions in the model (similarly, if a 3-way interaction became non-signif- icant during this step it was removed from the model, and on completion of this stage no 3-way interactions remained in the model); 4, terms were removed from the model one at a time (the model consisted of all main effects and significant 2-way
14 Whelan et al.
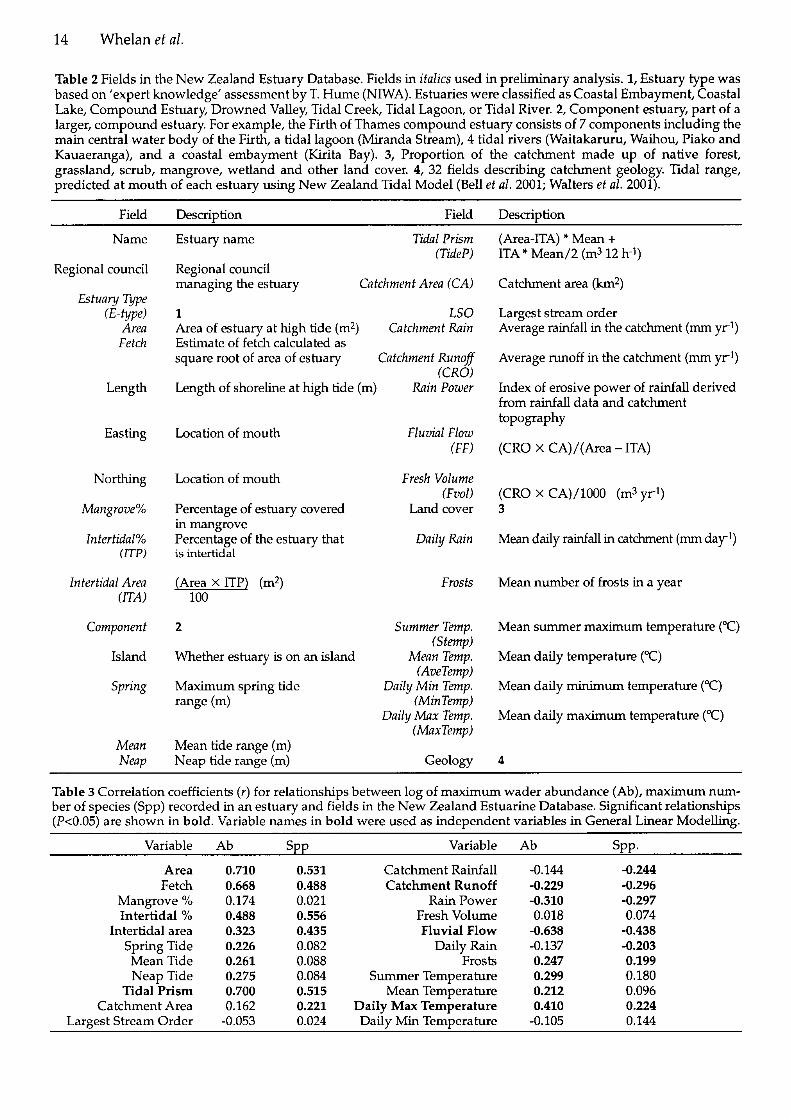
Table 2 Fields in the New Zealand Estuary Database. Fields in italics used in preliminary analysis. 1, Estuary type was based on 'expert knowledge' assessment by T. Hume (NIWA). Estuaries were classified as Coastal Embayment, Coastal Lake, Compound Estuary, Drowned Valley, Tidal Creek, Tidal Lagoon, or Tidal River. 2, Component estuary, part of a larger, compound estuary. For example, the Firth of Thames compound estuary consists of 7 components including the main central water body of the Firth, a tidal lagoon (Miranda Stream), 4 tidal rivers (Waitakaruru, Waihou, Piako and Kauaeranga), and a coastal embayment (Kirita Bay). 3, Proportion of the catchment made up of native forest, grassland, scrub, mangrove, wetland and other land cover. 4, 32 fields describing catchment geology. Tidal range, predicted at mouth of each estuary using New Zealand Tidal Model (Bell et al. 2001; Walters et al. 2001).
Field Description Field Description
Name
Regional council
Estua y Type (E-type)
Area Fetch
Length
Eas ting
Northing
Mangrove%
Intertidal% (ITP)
Intertidal Area UTA)
Component
Island
Spring
Mean Neap
Estuary name Tidal Prism (TideP)
Regional council managing the estuary Catchment Area (CA)
1 LSO Area of estuary at high tide (m2) Catchment Rain Estimate of fetch calculated as square root of area of estuary Catchment Runoff
(CRO) Length of shoreline at high tide (m) Rain Power
Location of mouth Fluvial Flow (FF)
Location of mouth Fresh Volume (Fvol)
Percentage of estuary covered Land cover in mangrove Percentage of the estuary that Daily Rain is intertidal
(Area X ITP) (m2) 100
Frosts
2 Summer Temp. (Stemp)
Whether estuary is on an island Mean Temp. (AveTemp)
Maximum spring tide Daily Min Temp. range ( 4 (MinTemp)
Daily Max Temp. (MaxTemp)
Mean tide range (m) .., . Neap tide range (m) Geology
(Area-ITA) * Mean + ITA * Mean/2 (m3 12 h-')
Catchment area (kd)
Largest stream order Average rainfall in the catchment (mm yrl)
Average runoff in the catchment (mm yrl)
Index of erosive power of rainfall derived from rainfall data and catchment topography
(CRO X CA)/(Area - ITA)
(CRO x CA)/1000 (m3 yrl) 3
Mean daily ramfall in catchment (mm day')
Mean number of frosts in a year
Mean summer maximum temperature ("C)
Mean daily temperature ( T )
Mean daily minimum temperature ("C)
Mean daily maximum temperature ( T )
Table 3 Correlation coefficients (r) for relationships between log of maximum wader abundance (Ab), maximum num- ber of species (Spp) recorded in an estuary and fields in the New Zealand Estuarine Database. Significant relationships (P<0.05) are shown in bold. Variable names in bold were used as independent variables in General Linear Modelling.
Variable
Area Fetch
Mangrove % Intertidal %
Intertidal area Spring Tide Mean Tide Neap Tide
Tidal Prism Catchment Area
Laraest Stream Order
Variable
Catchment Rainfall Catchment Runoff
Rain Power Fresh Volume Fluvial Flow
Daily Rain Frosts
Summer Temperature Mean Temperature
Daily Max Temperature Dailv Min Temperature
Estuary attributes a n d wader populations 15
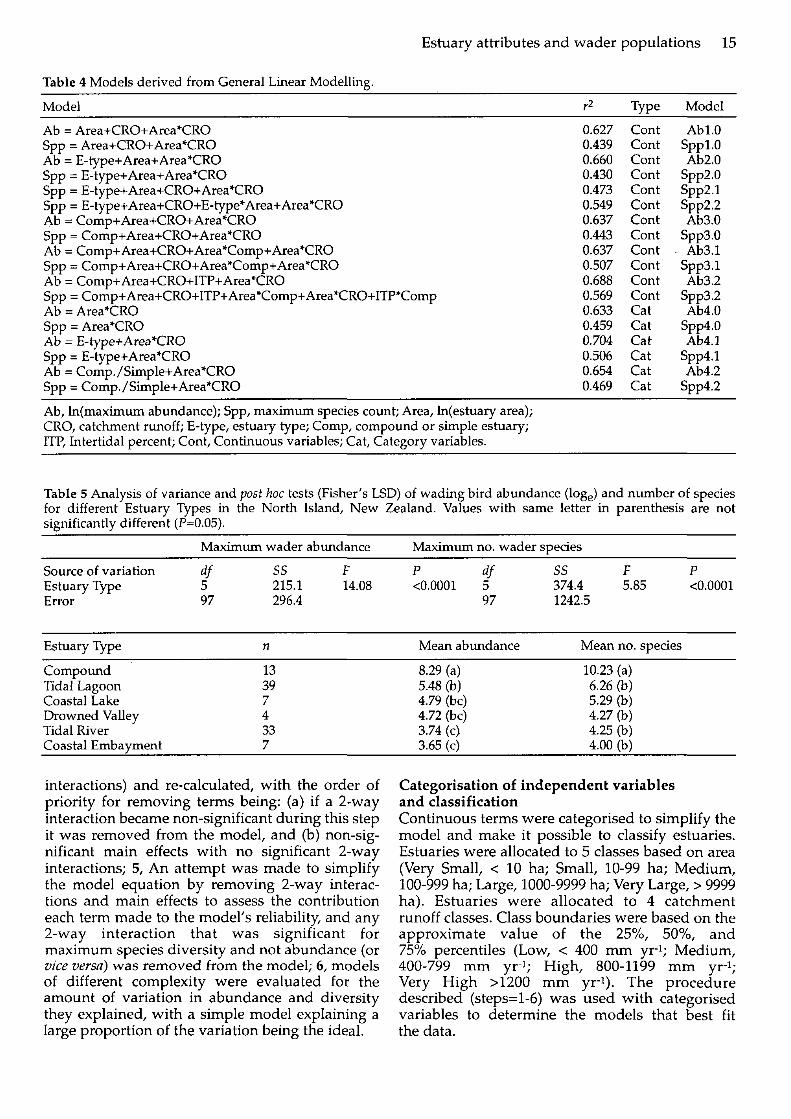
Table 4 Models derived from General Linear Modelling.
Model r2 Type Model
Ab = Area+CRO+Area*CRO 0.627 Cont Abl.0 Spp = Area+CRO+Area*CRO 0.439 Cont Sppl.0 Ab = E-type+Area+Area*CRO 0.660 Cont Ab2.0 Spp = E-type+Area+AreaSCRO 0.430 Cont Spp2.O Spp = E-type+Area+CRO+Area*CRO 0.473 Cont Spp2.1 Spp = E-type+Area+CRO+E-typerArea+Area*CRO 0.549 Cont Spp2.2 Ab = Comp+Area+CRO+Area*CRO 0.637 Cont Ab3.0 Spp = Comp+Area+CRO+Area*CRO 0.443 Cont Spp3.0 Ab = Comp+Area+CRO+Area*Comp+Area'CRO 0.637 Cont . Ab3.1 Spp = Comp+Area+CRO+Area*Comp+Area*CRO 0.507 Cont Spp3.1 Ab = Comp+Area+CRO+ITP+Area*CRO 0.688 Cont Ab3.2 Spp = Comp+Area+CRO+ITP+Area'Comp+Area*CRO+ITP*Comp 0.569 Cont Spp3.2 Ab = Area*CRO 0.633 Cat Ab4.0 Spp = Area8CR0 0.459 Cat Spp4.0 Ab = E-type+Area*CRO 0.704 Cat Ab4.1 Spp = E-type+Area*CRO 0.506 Cat Spp4.1 Ab = Comp./Simple+Area*CRO 0.654 Cat Ab4.2 Spp = Comp./Simple+Area*CRO 0.469 Cat Spp4.2
Ab, ln(maximum abundance); Spp, maximum species count; Area, ln(estuary area); CRO, catchment runoff; E-type, estuary type; Comp, compound or simple estuary; ITP, Intertidal percent; Cont, Continuous variables; Cat, Category variables.
Table 5 Analysis of variance and post hoc tests (Fisher's LSD) of wading bud abundance (log,) and number of species for different Estuary Types in the North Island, New Zealand. Values with same letter in parenthesis are not significantly different (P=0.05).
Maximum wader abundance Maximum no. wader species
Source of variation df SS F P df SS F P Estuary Type 5 215.1 14.08 <0.0001 5 374.4 5.85 <0.0001 Error 97 296.4 97 1242.5
Estuary Type n Mean abundance Mean no. species
Compound 13 8.29 (a) 10.23 (a) Tidal Lagoon 39 5.48 (b) 6.26 (b) Coastal Lake 7 4.79 (bc) 5.29 (b) Drowned Valley 4 4.72 (bc) 4.27 (b) Tidal River 33 3.74 (c) 4.25 (b) Coastal Embayment 7 3.65 (c) 4.00 (b)
interactions) a n d re-calculated, with the order of priority for removing terms being: (a) if a 2-way interaction became non-significant during this s tep it w a s removed from the model, and @) non-sig- nificant main effects with n o significant 2-way interactions; 5, A n attempt w a s made to simplify the model equation b y removing 2-way interac- tions a n d main effects to assess the contribution each term made to the model's reliability, and a n y 2-way interaction that w a s significant for maximum species diversity a n d not abundance (or vice versa) w a s removed from the model; 6, models of different complexity were evaluated for the amount of variation i n abundance a n d diversity they explained, with a simple model explaining a large proportion of the variation being the ideal.
Categorisation of independent variables and classification Continuous terms were categorised to simplify the model a n d make it possible to classify estuaries. Estuaries were allocated to 5 classes based o n area (Very Small, < 10 ha; Small, 10-99 ha; Medium, 100-999 ha; Large, 1000-9999 ha; Very Large, > 9999 ha). Estuaries w e r e allocated to 4 catchment runoff classes. Class boundaries were based o n the approximate va lue of t h e 25%, 50%, a n d 75% percentiles (Low, < 400 m m yr-1; Medium, 400-799 m m yr-1; High, 800-1199 m m yr-1; Very High >I200 m m yr-1). T h e procedure described (steps=l-6) w a s used wi th categorised variables to determine the models that best fit the data.
16 Whelan et al.
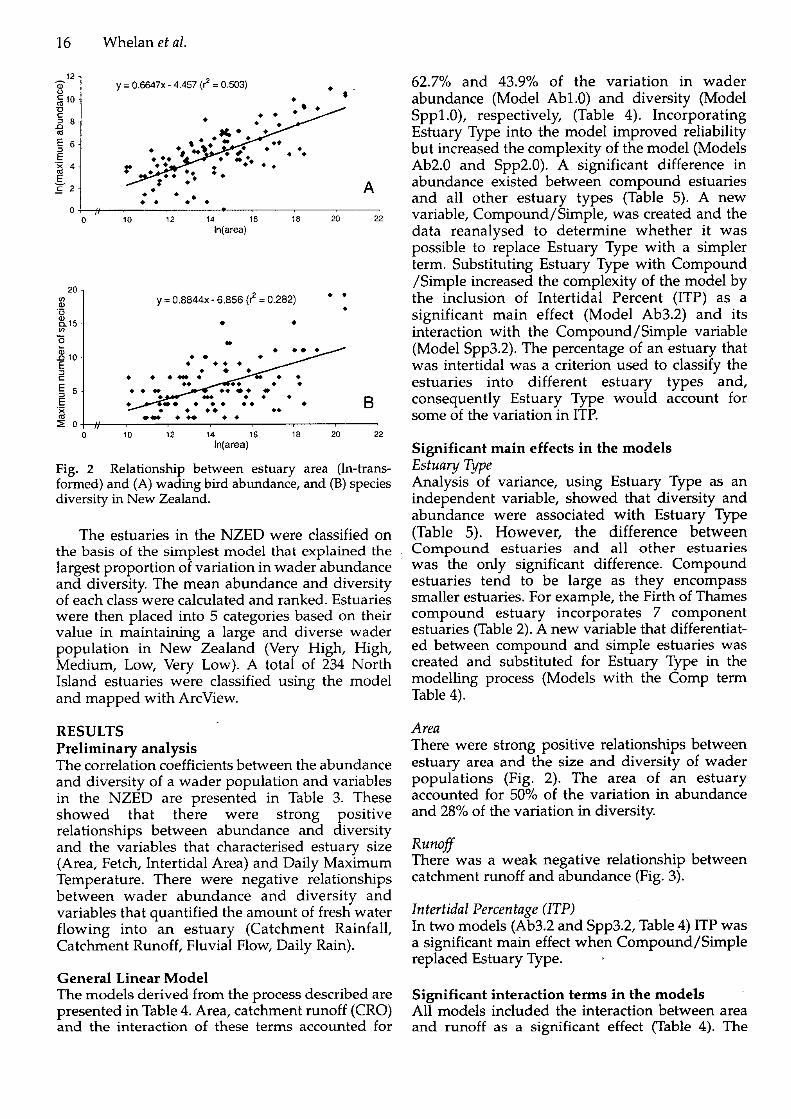
Fig. 2 Relationship between estuary area (ln-trans- formed) and (A) wading bird abundance, and (B) species diversity in New Zealand.
The estuaries in the NZED were classified on the basis of the simplest model that explained the largest proportion of variation in wader abundance and diversity. The mean abundance and diversity of each class were calculated and ranked. Estuaries were then placed into 5 categories based on their value in maintaining a large and diverse wader population in New Zealand (Very High, High, Medium, Low, Very Low). A total of 234 North Island estuaries were classified using the model and mapped with ArcView.
RESULTS Preliminary analysis The correlation coefficients between the abundance and diversity of a wader population and variables in the NZED are presented in Table 3. These showed that there were strong positive relationships between abundance and diversity and the variables that characterised estuary size (Area, Fetch, Intertidal Area) and Daily Maximum Temperature. There were negative relationships between wader abundance and diversity and variables that quantified the amount of fresh water flowing into an estuary (Catchment Rainfall, Catchment Runoff, Fluvial Flow, Daily Rain).
General Linear Model The models derived from the process described are presented in Table 4. Area, catchment runoff (CRO) and the interaction of these terms accounted for
62.7% and 43.9% of the variation in wader abundance (Model Abl.0) and diversity (Model Sppl.O), respectively, (Table 4). Incorporating Estuary Type into the model improved reliability but increased the complexity of the model (Models Ab2.0 and Spp2.0). A significant difference in abundance existed between compound estuaries and all other estuary types (Table 5). A new variable, Compound/Simple, was created and the data reanalysed to determine whether it was possible to replace Estuary Type with a simpler term. Substituting Estuary Type with Compound /Simple increased the complexity of the model by the inclusion of Intertidal Percent (ITP) as a significant main effect (Model Ab3.2) and its interaction with the Compound/Simple variable (Model Spp3.2). The percentage of an estuary that was intertidal was a criterion used to classify the estuaries into different estuary types and, consequently Estuary Type would account for some of the variation in ITP.
Significant main effects in the models Estuary Type Analysis of variance, using Estuary Type as an independent variable, showed that diversity and abundance were associated with Estuary Type (Table 5). However, the difference between Compound estuaries and all other estuaries was the only significant difference. Compound estuaries tend to be large as they encompass smaller estuaries. For example, the Firth of Thames compound estuary incorporates 7 component estuaries (Table 2). A new variable that differentiat- ed between compound and simple estuaries was created and substituted for Estuary Type in the modelling process (Models with the Comp term Table 4).
Area There were strong positive relationships between estuary area and the size and diversity of wader populations (Fig. 2). The area of an estuary accounted for 50% of the variation in abundance and 28% of the variation in diversity.
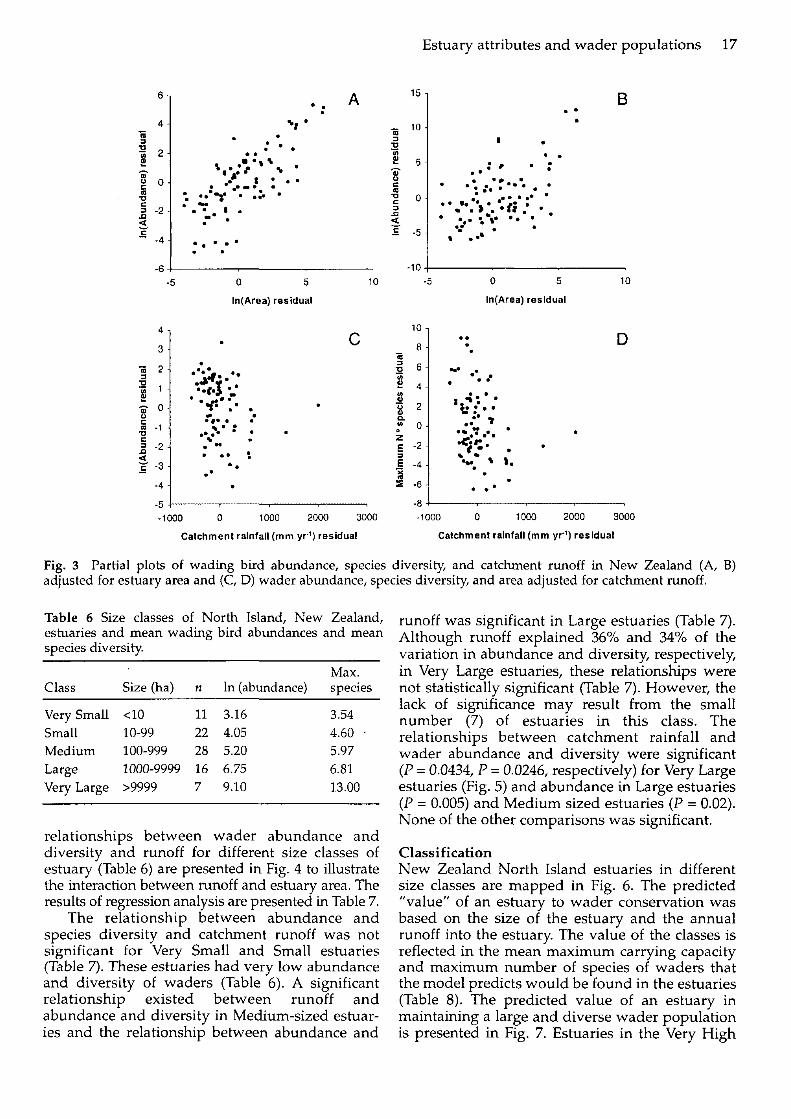
Runof There was a weak negative relationship between catchment runoff and abundance (Fig. 3).
Intertidal Percentage (ITP) In two models (Ab3.2 and Spp3.2, Table 4) ITP was a significant main effect when Compound/Simple replaced Estuary Type. .
Significant interaction terms in the models All models included the interaction between area and runoff as a significant effect (Table 4). The
Estuary attributes and wader populations 17
-5 0 5 10
In(Area) residual
-5 1 -1000 0 1000 2000 3000
Catchment rainfall (mm yr') residual Catchment rainfall (mm yr-') residual
Fig. 3 Partial plots of wading bird abundance, species diversity, and catchment runoff in New Zealand (A, B) adjusted for estuary area and (C, D) wader abundance, species diversity, and area adjusted for catchment runoff.
Table 6 Size classes of North Island, New Zealand, estuaries and mean wading bud abundances and mean species diversity.
Class Size (ha)
Very Small <I0 Small 10-99 Medium 100-999 Large 1000-9999 Very Large >9999
Max. n In (abundance) species
11 3.16 3.54 22 4.05 4.60 .
28 5.20 5.97 16 6.75 6.81 7 9.10 13.00
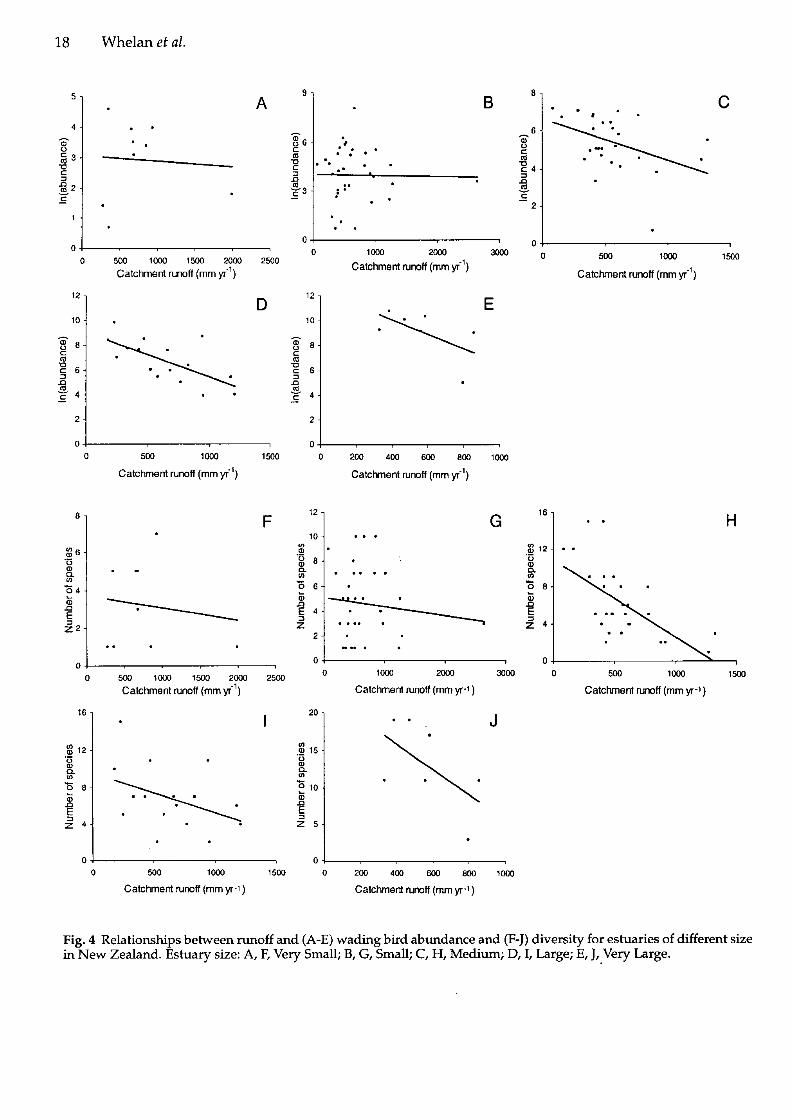
relationshivs between wader abundance and diversity and runoff for different size classes of estuary (Table 6) are presented in Fig. 4 to illustrate the interaction between runoff and estuary area. The results of regression analysis are presented in Table 7.
The relationship between abundance and species diversity and catchment runoff was not significant for Very Small and Small estuaries (Table 7). These estuaries had very low abundance and diversity of waders (Table 6). A significant relationship existed between runoff and abundance and diversity in Medium-sized estuar- ies and the relationship between abundance and
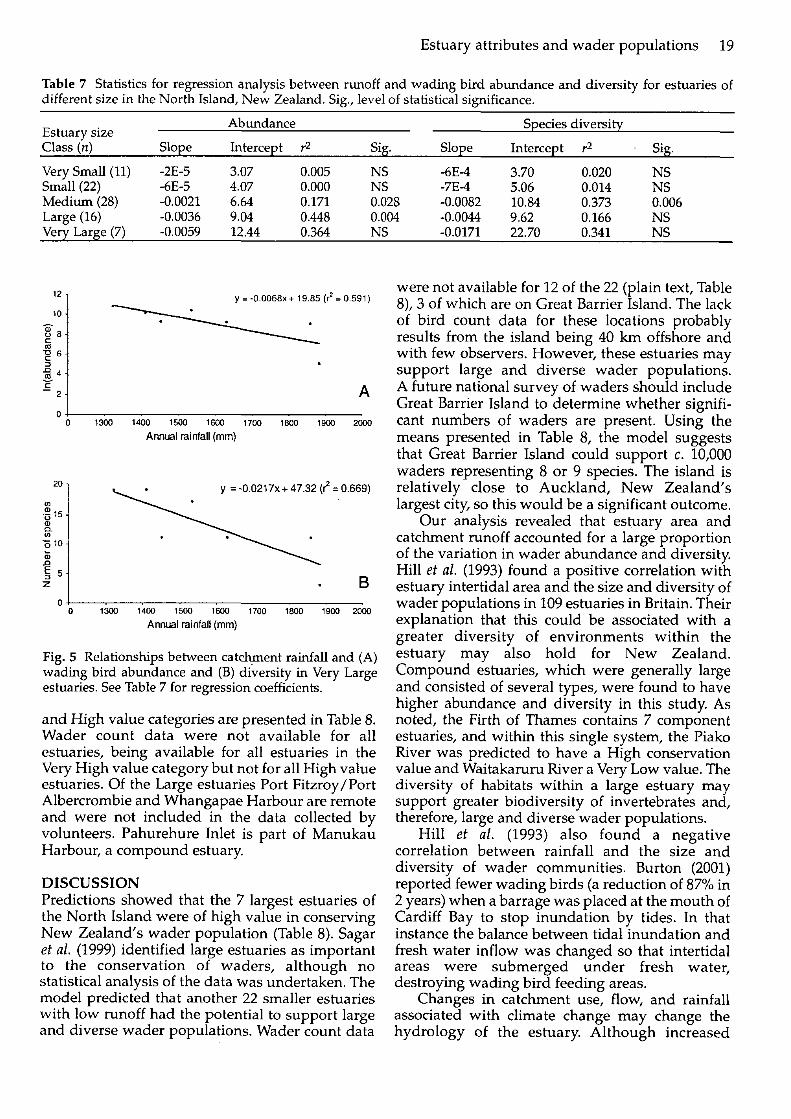
runoff was significant in Large estuaries (Table 7). Although runoff explained 36% and 34% of the variation in abundance and diversity, respectively, in Very Large estuaries, these relationships were not statistically significant (Table 7). However, the lack of significance may result from the small number (7) of estuaries in this class. The relationships between catchment rainfall and wader abundance and diversity were significant (P = 0.0434, P = 0.0246, respectively) for Very Large estuaries (Fig. 5) and abundance in Large estuaries (P = 0.005) and Medium sized estuaries (P = 0.02). None of the other comparisons was significant.
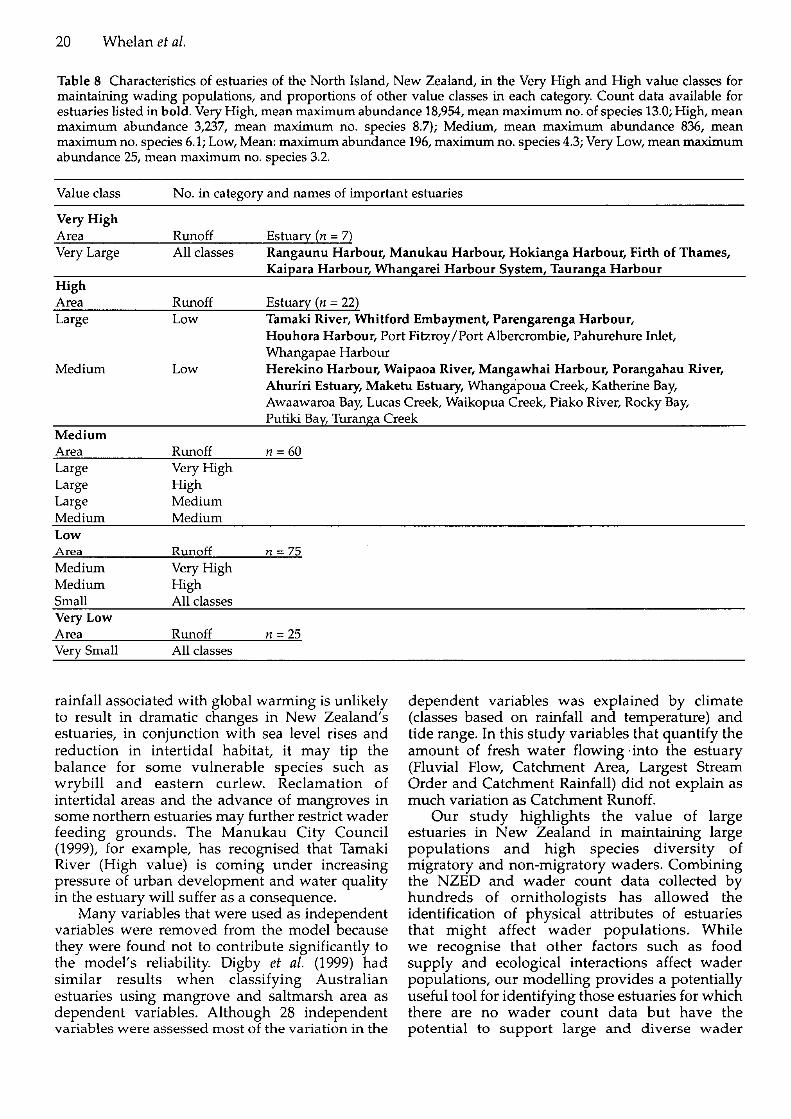
Classification New Zealand North Island estuaries in different size classes are mapped in Fig. 6. The predicted "value" of an estuary to wader conservation was based on the size of the estuary and the annual runoff into the estuary. The value of the classes is reflected in the mean maximum carrying capacity and maximum number of species of waders that the model predicts would be found in the estuaries (Table 8). The predicted value of an estuary in maintaining a large and diverse wader population is presented in Fig. 7. Estuaries in the Very High
Whelan et al.
- 0 1000 2WO mo 0 500 1000 15W 20W 2500
Catchment runoff (mrn yfl) Catchment runoff (mm yil)
Catchment runoff (mrn yi') Catchment runoff (mm yil)
0 5M) 1000 1500 2000 2500 " 1000 2000 3 W
Catchment runoff (mm yil) Catchment runoff (mm y-1)
0 0
0 500 1000 15W 0 2 W 4M) 600 BW 1000
Catchment runoff (mm y-1) Catchment runoff (mm yvl)
Catchment runoff (mm yfl)
Catchment runoff (mm yr-1)
Fig. 4 Relationships between runoff and (A-E) wading bird abundance and (F-J) diversity for estuaries of different size in New Zealand. Estuary size: A, F, Very Small; 8, G, Small; C, H, Medium; D, I, Large; E, J, Very Large.
Estuary attributes and wader populations 19
Table 7 Statistics for regression analysis between runoff and wading bird abundance and diversity for estuaries of different size in the North Island, New Zealand. Sig., level of statistical significance.
Abundance Species diversity Estuary size Class in) Slope Intercept r2 Sig. Slope Intercept r2 Sig.
Very Small (11) -2E-5 3.07 0.005 NS -6E-4 3.70 0.020 NS Small (22) -6E-5 4.07 0.000 NS -7E-4 5.06 0.014 NS Medium (28) -0.0021 6.64 0.171 0.028 -0.0082 10.84 0.373 0.006 Large (16) -0.0036 9.04 0.448 0.004 -0.0044 9.62 0.166 NS Verv Laree (7) -0.0059 12.44 0.364 NS -0.0171 22.70 0.341 NS
0 1300 1400 1500 1600 1700 1800 1900 2000
Annual rainfall (mm)
0 4 0 1300 14W 1500 1600 1700 1800 1900 2WO
Annual rainfall (mm)
Fig. 5 Relationships between catchment rainfall and (A) wading bird abundance and (B) diversity in Very Large estuaries. See Table 7 for regression coefficients.
and High value categories are presented in Table 8. Wader count data were not available for all estuaries, being available for all estuaries in the Very High value category but not for all High value estuaries. Of the Large estuaries Port Fitzroy/Port Albercrombie and Whangapae Harbour are remote and were not included in the data collected by volunteers. Pahurehure Inlet is part of Manukau Harbour, a compound estuary.
DISCUSSION Predictions showed that the 7 largest estuaries of the North Island were of high value in conserving New Zealand's wader population (Table 8). Sagar et al. (1999) identified large estuaries as important to the conservation of waders, although no statistical analysis of the data was undertaken. The model predicted that another 22 smaller estuaries with low runoff had the potential to support large and diverse wader populations. Wader count data
were not available for 12 of the 22 (plain text, Table 8), 3 of which are on Great Barrier Island. The lack of bird count data for these locations probably results from the island being 40 km offshore and with few observers. However, these estuaries may support large and diverse wader populations. A future national survey of waders should include Great Barrier Island to determine whether signifi- cant numbers of waders are present. Using the means presented in Table 8, the model suggests that Great Barrier Island could support c. 10,000 waders representing 8 or 9 species. The island is relatively close to Auckland, New Zealand's largest city, so this would be a significant outcome.
Our analvsis revealed that estuarv area and J
- .~
catchment runoff accounted for a large proportion of the variation in wader abundance and diversity. Hill et al. (1993) found a positive correlation with estuary intertidal area and the size and diversity of wader populations in 109 estuaries in Britain. Their explanation that this could be associated with a greater diversity of environments within the estuary may also hold for New Zealand. Compound estuaries, which were generally large and consisted of several types, were found to have higher abundance and diversity in this study. As noted, the Firth of Thames contains 7 component estuaries, and within this single system, the Piako River was predicted to have a High conservation value and Waitakaruru River a Very Low value. The diversity of habitats within a large estuary may support greater biodiversity of invertebrates and, therefore, large and diverse wader populations.
Hill et al. (1993) also found a negative correlation between rainfall and the size and diversity of wader communities. Burton (2001) reported fewer wading birds (a reduction of 87% in 2 years) when a barrage was placed at the mouth of Cardiff Bay to stop inundation by tides. In that instance the balance between tidal inundation and fresh water inflow was changed so that intertidal areas were submerged under fresh water, destroying wading bird feeding areas.
Changes in catchment use, flow, and rainfall associated with climate change may change the hydrology of the estuary. Although increased
20 Whelan et a/.
Table 8 Characteristics of estuaries of the North Island, New Zealand, in the Very High and High value classes for maintaining wading populations, and proportions of other value classes in each category. Count data available for estuaries listed in bold. Very High, mean maximum abundance 18,954, mean maximum no. of species 13.0; High, mean maximum abundance 3,237, mean maximum no. species 8.7); Medium, mean maximum abundance 836, mean maximum no. species 6.1; Low, Mean: maximum abundance 196, maximum no. species 4.3; Very Low, mean maximum abundance 25, mean maximum no. species 3.2.
Value class No. in category and names of important estuaries
Very High . - Area Runoff Estuary (n = 7) Very Large All classes Rangaunu Harbour, Manukau Harbour, Hokianga Harbour, Firth of Thames,
Kaipara Harbour, Whangarei Harbour System, Tauranga Harbour High Area Runoff Estuary (n = 22) Large Low Tamaki River, Whitford Embayment, Parengarenga Harbour,
Houhora Harbour, Port Fitzroy/Port Albercrombie, Pahurehure Inlet, Whangapae Harbour
Medium Low Herekino Harbour, Waipaoa River, Mangawhai Harbour, Porangahau River, Ahuriri Estuary, Maketu Estuary, Whangapoua Creek, Katherine Bay, Awaawaroa Bay, Lucas Creek, Waikopua Creek, Piako River, Rocky Bay, Putiki Bay, Turanga Creek
Medium Area Runoff n = 60 Large Very High Large High
Meiium Medium Low Area Runoff n = 75 Medium Very High Medium High Small All classes Very Low Area Runoff n = 25 Verv Small All classes
rainfall associated with global warming is unlikely to result in dramatic changes in New Zealand's estuaries, in conjunction with sea level rises and reduction in intertidal habitat, it may tip the balance for some vulnerable species such as wrybill and eastern curlew. Reclamation of intertidal areas and the advance of mangroves in some northern estuaries may further restrict wader feeding grounds. The Manukau City Council (1999), for example, has recognised that Tamaki River (High value) is coming under increasing pressure of urban development and water quality in the estuary will suffer as a consequence.
Many variables that were used as independent variables were removed from the model because they were found not to contribute significantly to the model's reliability. Digby et al. (1999) had similar results when classifying Australian estuaries using mangrove and saltmarsh area as dependent variables. Although 28 independent variables were assessed most of the variation in the
dependent variables was explained by climate (classes based on rainfall and temperature) and tide range. In this study variables that quantify the amount of fresh water flowing ,into the estuary (Fluvial Flow, Catchment Area, Largest Stream Order and Catchment Rainfall) did not explain as much variation as Catchment Runoff.
Our study highlights the value of large estuaries in New Zealand in maintaining large populations and high species diversity of migratory and non-migratory waders. Combining the NZED and wader count data collected by hundreds of ornithologists has allowed the identification of physical attributes of estuaries that might affect wader populations. While we recognise that other factors such as food supply and ecological interactions affect wader populations, our modelling provides a potentially useful tool for identifying those estuaries for which there are no wader count data but have the potential to support large and diverse wader
Estuary attributes a n d wader populations 21
Estuary size classes . Very SrnaU. <loha . Small 10-99ha o Medium: 1W-999ha 0 Lame: 1000-9999ha - "
0 Very Large: ,9999ha
Fig. 6 Distribution of estuaries in New Zealand in 5 size classes.
populations. The value of the NZED for this purpose could b e improved b y increasing the scale of the database so that habitats 'and environments within estuaries are also mapped. More detailed information should improve o u r ability to conserve wader populations a n d manage estuarine environments.
ACKNOWLEDGEMENTS This study was undertaken while Michael Whelan was on sabbatical at NIWA and supported by Southern Cross University. The study was part of NIWA's programme 'Effects of suspended sediment on coastal and estuarine ecosystems' funded by the Foundation for Research Science and Technology (contract COlX0024). Our special thanks go to the several hundred people who, over the years 1983-1994, assisted with the Ornithological Society of New Zealand National Wader Count scheme.
Importance to wader conservatlon . very Low 0 LOW o Medlum 0 Huh 0 Very Hlgh
Fig. 7 Distribution of estuaries in New Zealand and their predicted value in maintaining large and diverse wading bird populations.
Burton, N. 2001. Displaced redshark finding refuge. British Trust for Ornithology news 234: 10-11.
Collazo, J.A.; Harrington, B.A.; Grear, J.S.; Colon, J.A. 1995. Abundance and distribution of shorebirds at the Cabo Rojo Salt Flats, Puerto Rico. Journal of field ornithology 66: 424-438.
Davidson, N.C.; Rothwell, P. 1993. Disturbance of waterfowl on estuaries. International Wader Study Group bulletin 68 Special issue: 1-2.
Digby, M.J.; Saenger, P.; Whelan, M.B.; McConchie, D.; Eyre, B.; Holrnes, N.; Bucher, D. 1999. A physical classi- fication of Australian estuaries. Report prepared for the Urban Water Research Association of Australia. 48 p.
Dowding, J.E.; Murphy, E.C. 2001. The impact of predation by introduced mammals on endemic shorebirds in New Zealand: a conservation perspective. Biological conservation 99: 47-64.
Goss-Custard, J.; Yates, M.; Austin, G.; Holloway, S.; Rehfich, M. 1997. Estuary shape, sediments and geographic position - do these determine waterfowl - " A A
communities. British Trust for Ornithology news 208: 5. LITERATURE CITED Hill, D.; Rushton, S.P.; Clark, N.; Green, P.; Prys-Jones, R. Bell, R.G.; Goring, D.G.; Walters, R.A. 2001. Advances in 1993. Shorebird communities on British estuaries:
understanding sea-level variability around New factors affecting community composition. Journal of Zealand. pp. 1490-1500 In: Edge, B.L. (ed.) Proceedings applied ecology 30: 220-234. of 27th International conference on coastal engineering, Hume, T.; Liefting, R.; Snelder, T.; Hicks, M. 2001. Sydney. New York, American Society of Civil Classdying New Zealand's estuaries and EEZ. New Engineers. Zealand Coastal Society newsletter 17: 3-5.

22 Whelan et al.
Hume, T.; Snelder, T. 2001. Marine typology down-under. LOICZ Newsletter 19. LOICZ International Project Office, IGBP, The Netherlands.
Maisonneuve, C. 1993. Is population decline in short-billed dowitchers, Limnodromus-griseus, related to hydroelectric projects? Canadian field-naturalist 107(2): 253-255.
Manukau City Council 1999. State of the environment report for Manukau 1999. Manukau City Council, New Zealand.
Ministry for the Environment 1997. The state of New Zealand's environment 1997. Wellington, Ministry for the Environment.
Morrison, R.I.G.; Aubry, Y.; Butler, R.W.; Beyersbergen, G.W.; Donaldson, G.M.; Gratto-Trevor, C.L.; Hicklin, P.W.; Johnston, V.H.; Ross, R.K. 2001. Declines in North American shorebird populations. lnternational wader study group bulletin 94: 34-38.
Parish, D; Lane, B.; Sagar, P.M.; Tomkovich, I? 1987. Wader migration systems in East Asia and Australasia. In: Davidson N.C.; Pienkowski, M.W. (eds.) The conservation of international flyaway populations of waders. International Wader Study Group bulletin 49 / lnternational waterfowl research bureau special publication 7: 4-14.
Sagar, P.M.; Shankar, U.; Brown, S. 1999. Distribution and numbers of waders in New Zealand, 1983-1994. Notornis 46: 1-43.
Scott, D.A.; Poole, C. 1989. A status overview of Asian wetlands. Kuala Lumpur, Asian Wetland Bureau.
Turbott, E.G. (Convener) 1990. Checklist of the birds of New Zealand. 3rd ed. Auckland, Random Century and the Ornithological Society of New Zealand.
Walters, R.A.; Goring; D.G.; Bell, R.G. 2001. Ocean tides around New Zealand. New Zealand journal of marine and freshwater research 35: 567-579.
Checklist for authors
Please use this checklist to ensure that your manuscript has a smooth passage through the editorial system
O Include three identical double-spaced copies of the MS, single-sided, o n numbered pages; MSS presented otherwise will b e delayed until three copies double-spaced copies have been provided
O Three copies of all figures a n d tables, with captions double-spaced o n separate sheets
O Full title a n d suggested running header o n title page
0 Provide names a n d addresses of all authors o n the title page
O N o original figures o r electronic copies included o n first submission
O All figures a n d tables cited in text
R Format a n d conventions a s far a s possible in journal format a s laid out in Instructions t o Authors published i n first issue of each year from March 2000
O References in journal style, with n o abbreviated journal o r book titles
O For a paper, a n Abstract of not more than 150 words
O For all submissions, u p to seven keywords
O Ensure that the figures a n d tables follow the journal format s o far a s possible
O A covering letter signed b y the senior o r communicating author, wi th explicit statements that the work has not been published before, is not being considered for publication elsewhere, a n d that the MS h a s the agreement of all authors
Copyright © 2022 FDOKUMEN