Reinvasion by ship rats ( Rattus rattus ) of forest fragments after eradication
18
ORIGINAL PAPER Reinvasion by ship rats (Rattus rattus) of forest fragments after eradication Carolyn M. King • John G. Innes • Dianne Gleeson • Neil Fitzgerald • Tom Winstanley • Barry O’Brien • Lucy Bridgman • Neil Cox Received: 16 December 2010 / Accepted: 25 June 2011 / Published online: 9 August 2011 Ó Springer Science+Business Media B.V. 2011 Abstract Reinvasions provide prime examples of source-sink population dynamics, and are a major reason for failure of eradications of invasive rats from protected areas. Yet little is known about the origins and population structure of the replacement population compared with the original one. We eradicated eight populations of ship rats from separate podo- carp-broadleaved forest fragments surrounded by open grassland (averaging 5.3 ha, scattered across 20,000 ha) in rural landscapes of Waikato, New Zealand, and monitored the- re-establishment of new populations. Rats were kill-trapped to extinction during January to April 2008, and then again after reinvasion in April–May (total n = 517). Rats carrying Rhodamine B dye (n = 94), available only in baits placed 1–2 months in advance in adjacent source areas located 170–380 m (average 228 m edge to edge) away, appeared in 7 of the 8 fragments from the first day of the first eradication. The distribution of age groups, genders and proportions of reproductively mature adults (more immature juvenile males and fewer fully mature old females) was different among marked rats compared with all other rats (P = 0.001, n = 509); in all rats caught on days 7? of the first eradication compared with on days 1–6 (P = 0.000); and in the total sample collected in fragments by trapping to and after local extinction compared with in brief, fixed-schedule sampling of populations in continuous forests (P = 0.000). Genotyping of 493 carcases found no significant population-level differ- entiation among the 8 fragments, confirming that the C. M. King (&) Á B. O’Brien Á L. Bridgman Department of Biological Sciences, University of Waikato, Private Bag 3105, Hamilton 3240, New Zealand e-mail: [email protected] B. O’Brien e-mail: [email protected] L. Bridgman e-mail: [email protected] J. G. Innes Á N. Fitzgerald Á L. Bridgman Landcare Research, Private Bag 3127, Hamilton 3240, New Zealand e-mail: [email protected] N. Fitzgerald e-mail: fi[email protected] D. Gleeson Á T. Winstanley Ecological Genetics Laboratory, Landcare Research, Private Bag 92170, Auckland 1142, New Zealand e-mail: [email protected] T. Winstanley e-mail: [email protected] N. Cox Invermay Statistics Group, AgResearch, Invermay Research Centre, Puddle Alley, Private Bag 50034, Mosgiel, New Zealand e-mail: [email protected] 123 Biol Invasions (2011) 13:2391–2408 DOI 10.1007/s10530-011-0051-6
-
Upload
independent -
Category
Documents
-
view
0 -
download
0
Transcript of Reinvasion by ship rats ( Rattus rattus ) of forest fragments after eradication

ORIGINAL PAPER
Reinvasion by ship rats (Rattus rattus) of forest fragmentsafter eradication
Carolyn M. King • John G. Innes • Dianne Gleeson •
Neil Fitzgerald • Tom Winstanley • Barry O’Brien •
Lucy Bridgman • Neil Cox
Received: 16 December 2010 / Accepted: 25 June 2011 / Published online: 9 August 2011
� Springer Science+Business Media B.V. 2011
Abstract Reinvasions provide prime examples of
source-sink population dynamics, and are a major
reason for failure of eradications of invasive rats from
protected areas. Yet little is known about the origins
and population structure of the replacement population
compared with the original one. We eradicated eight
populations of ship rats from separate podo-
carp-broadleaved forest fragments surrounded by
open grassland (averaging 5.3 ha, scattered across
20,000 ha) in rural landscapes of Waikato, New
Zealand, and monitored the- re-establishment of new
populations. Rats were kill-trapped to extinction
during January to April 2008, and then again after
reinvasion in April–May (total n = 517). Rats carrying
Rhodamine B dye (n = 94), available only in baits
placed 1–2 months in advance in adjacent source areas
located 170–380 m (average 228 m edge to edge)
away, appeared in 7 of the 8 fragments from the first
day of the first eradication. The distribution of age
groups, genders and proportions of reproductively
mature adults (more immature juvenile males and
fewer fully mature old females) was different among
marked rats compared with all other rats (P = 0.001,
n = 509); in all rats caught on days 7? of the first
eradication compared with on days 1–6 (P = 0.000);
and in the total sample collected in fragments by
trapping to and after local extinction compared with in
brief, fixed-schedule sampling of populations in
continuous forests (P = 0.000). Genotyping of 493
carcases found no significant population-level differ-
entiation among the 8 fragments, confirming that the
C. M. King (&) � B. O’Brien � L. Bridgman
Department of Biological Sciences,
University of Waikato, Private Bag 3105,
Hamilton 3240, New Zealand
e-mail: [email protected]
B. O’Brien
e-mail: [email protected]
L. Bridgman
e-mail: [email protected]
J. G. Innes � N. Fitzgerald � L. Bridgman
Landcare Research, Private Bag 3127,
Hamilton 3240, New Zealand
e-mail: [email protected]
N. Fitzgerald
e-mail: [email protected]
D. Gleeson � T. Winstanley
Ecological Genetics Laboratory, Landcare Research,
Private Bag 92170, Auckland 1142, New Zealand
e-mail: [email protected]
T. Winstanley
e-mail: [email protected]
N. Cox
Invermay Statistics Group, AgResearch,
Invermay Research Centre, Puddle Alley,
Private Bag 50034, Mosgiel, New Zealand
e-mail: [email protected]
123
Biol Invasions (2011) 13:2391–2408
DOI 10.1007/s10530-011-0051-6

rats in all fragments belonged to a single dynamic
metapopulation. Marked rats of both genders travelled
up to 600 m in a few days. Conservation of forest
fragments is compromised by the problem that ship rats
cannot be prevented from rapidly reinvading any
cleared area after eradication.
Keywords Invasive predators � Reinvasion �Roof rat � Black rat � Forest fragment �Genetic differentiation � Eradication units
Introduction
In a fragmented landscape, the survival of functional
populations of native species in the remaining
patches of preferred habitat, and the rate at which
invasive species colonise those patches, depends on
the species-specific dispersal abilities and inter-patch
movements of individuals (Bowne and Bowers 2004).
Relatively little is known about how dispersal affects
the important early stages of either colonisation or
reinvasion (Puth and Post 2005), when population
structure and behaviour might be different from those
of established populations (Russell et al. 2009a).
Therefore, understanding how the spatial configura-
tion of habitats influences dispersal distances and
population dynamics is essential for wildlife man-
agement, both to protect native species affected by
forest fragmentation and to control introduced species
(With 2002; Hastings et al. 2005).
Eradication programmes on islands are now
clearing more and larger areas of invasive species,
with huge conservation benefits (Brooke et al. 2007;
Towns 2009). Forest fragments share certain charac-
ters of islands (Watling and Donnelly 2006), and
some aspects of conservation management developed
on islands could potentially be applied to managing
mainland fragments. The main limitation for manag-
ers of forest fragments is that the primary condition
required to match the successes of island pest
eradication programmes (isolation from reinvasion)
is hard to meet on the mainland.
Lowland rural landscapes in most settled countries
include many scattered remnants of original mainland
ecosystems, most in private ownership, supporting a
disproportionately large repository of threatened
native ecosystems and species (Walker et al. 2006).
In New Zealand, as elsewhere, it is especially
important to protect such remnants and their biota
from invasive predators, because forest fragments on
private land represent the principal opportunity to
protect biodiversity in lowland environments
(Department of Conservation and Ministry for the
Environment 2000; Green and Clarkson 2006).
Ship rats (Rattus rattus, also called black or roof
rats) are widespread and abundant pests world-wide.
Their depredations on the fauna of native forests on
the New Zealand mainland and offshore islands were
recently reviewed by Innes et al. (2010a). As arboreal,
nocturnal omnivores, ship rats are key predators of
small forest passerines (Innes et al. 1999; Armstrong
et al. 2006a, b; Brown et al. 1998), lizards, inverte-
brates (Gibbs 2009; Towns et al. 2006) and seeds.
They can search the canopy for vulnerable native
fauna with great thoroughness and agility, especially
in forests that offer a complex, three-dimensional
habitat (Foster et al. 2011).
Within continuous mainland forests of the North
Island, ship rats are very common, and vitally neces-
sary control operations are undone within months by
rapid repopulation of cleared areas (Innes et al. 1995).
Small and isolated forest fragments are much more
numerous than large ones, and yet the times required to
achieve a specified conservation outcome in them, and
conditions favouring or preventing it, have seldom
been analysed. The commonest and simplest form of
protection is stock fencing, but, unexpectedly, we have
found that invasive rats may be significantly more
abundant in fenced compared with unfenced fragments
(Innes et al. 2010b). The demographic characters of
invaders are almost unknown, largely because they
cannot be determined from the results of control
programmes (the majority) using toxic baits, and
reinvasion is rarely monitored by carcase analysis.
In short stature habitats of various kinds, such as
alpine tussock, very young pine forests and grassland,
ship rats are much less common than in forest (Innes
2005). One implication of this is that they might be
expected to avoid the open, short-grassed pasture that
mostly surrounds these fragments, where they would
be more vulnerable to attack from predators. Hence,
one might expect that ship rats could be slow to
disperse to forest fragments surrounded by grazed
pasture, much as populations of the Australian native
rat R. fuscipes eradicated from forest patches could be
2392 C. M. King et al.
123

slow to recolonise across surrounding cleared regions
(Peakall and Lindenmayer 2006). Confirmation of
any factor inhibiting reinvasion would greatly
encourage the implementation of pest control oper-
ations in privately-owned forest fragments, with
potentially valuable consequences for biodiversity
conservation in rural areas.
Reinvasion is a serious threat to all pest control
programs, because it is the most likely cause of
failure to achieve protection of core values (Pascal
et al. 2004; Abdelkrim et al. 2007; Russell et al.
2010). The sink effect, induced by eradication of
local populations connected by gene flow to a wider
meta-population (Russell et al. 2009b), makes rein-
vasion inevitable. Eradication operations are bound to
fail unless confined to ‘‘eradication units’’ isolated
from reinvasion, which may be much larger than their
obvious geographical components. For example, off
the coast of France, some eradication units for
Norway rats comprise whole archipelagos, not indi-
vidual islands (Abdelkrim et al. 2005).
The limited data available for ship rats suggests
that effective eradication units are likely to comprise
archipelagos of forest fragments. For example, Rus-
sell et al. (2009b) found no genetic distinction
between samples of ship rats from two mainland
fragments separated by 400 m of grazed pasture.
Likewise, Abdelkrim et al. (2010) found no signif-
icant genetic isolation between ship rats living in
Puketi Forest, Northland, and those in two adjacent
fragments each 3.5 km away.
Therefore, documenting the extent of potential
gene flow between local pest populations is vital
information for pest managers, for two reasons. (1)
Local populations that are not complete eradication
units must be eradicated simultaneously (Abdelkrim
et al. 2010) and (2) Genetic mixing across broad
geographical areas reduces the chances that post-
eradication samples could distinguish between invad-
ers and survivors at the population level (Russell
et al. 2009b, 2010).
In this study we aimed to integrate demographic
and genetic data, gathered during the course of a
closely monitored eradication programme, that could
document the processes of recovery of eight ship rat
populations eradicated from separate forest fragments
scattered over a large area (20,000 km2), and to
produce results of general significance for the man-
agement of rodent pests on mainland New Zealand.
Objectives
This paper describes part of a wider study of the
interactive effects of routine management (stock
fencing and pest control) on key ecological processes
on pastoral land around rural Waikato, New Zealand.
Elsewhere we have described the vegetation (Burns
et al. 2010) and abundance of invertebrates (Didham
et al. 2009) in 53 forest fragments managed under
different combinations of strategies (Dodd et al.
2011), and the abundance of ship rats in eight (Innes
et al. 2010b).
Our primary hypotheses were as follows.
(1) After an eradication, immigrant rats might be
expected to differ from the previous residents in
their age structure and breeding potential. To
test this hypothesis, we identified rats known to
have visited or arrived from outside as those
marked with vital dye obtainable only in
potential source areas, and searched for detect-
able differences in age, gender and breeding
status between marked and unmarked rats.
(2) The processes of eradication and replacement of
rat populations in all eight fragments could be
influenced by the nature of the fragments
(isolated or connected to source areas, fenced
or grazed by livestock); by precise timing
(fragments 1–4 and 5–8 differed in trapping
dates); and by longer-term seasonal effects. To
test this hypothesis we applied a generalised
linear mixed model with binomial distribution
and logit link to the complete dataset, searching
for possible inter-relationships between the
proportion of marked rats collected at each site
and for correlations suggesting how the above
factors might influence it.
(3) The replacement populations appearing in the
eradicated fragments could represent a slightly
different gene pool from the original population.
To test this hypothesis, we genotyped all rats
collected throughout the study, and checked for
genetic differentiation between fragments and
between original and replacement populations.
Study areas
The eight fragments chosen are scattered along a range
of hills 20–30 km SE of Hamilton City in the central
Eradication and reinvasion by Rattus rattus in forest fragments 2393
123
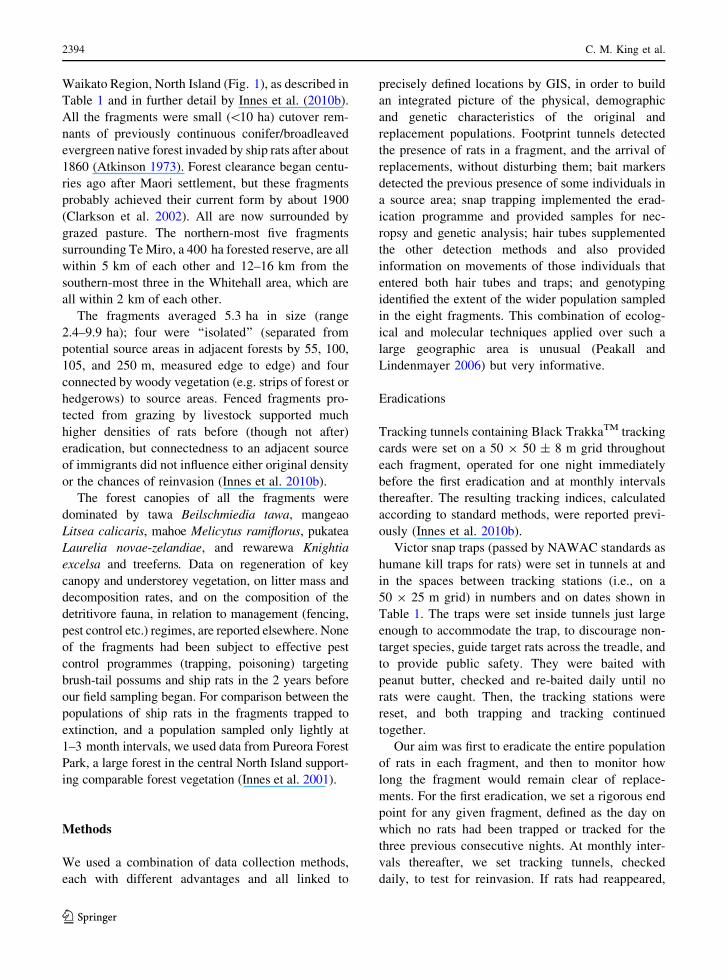
Waikato Region, North Island (Fig. 1), as described in
Table 1 and in further detail by Innes et al. (2010b).
All the fragments were small (\10 ha) cutover rem-
nants of previously continuous conifer/broadleaved
evergreen native forest invaded by ship rats after about
1860 (Atkinson 1973). Forest clearance began centu-
ries ago after Maori settlement, but these fragments
probably achieved their current form by about 1900
(Clarkson et al. 2002). All are now surrounded by
grazed pasture. The northern-most five fragments
surrounding Te Miro, a 400 ha forested reserve, are all
within 5 km of each other and 12–16 km from the
southern-most three in the Whitehall area, which are
all within 2 km of each other.
The fragments averaged 5.3 ha in size (range
2.4–9.9 ha); four were ‘‘isolated’’ (separated from
potential source areas in adjacent forests by 55, 100,
105, and 250 m, measured edge to edge) and four
connected by woody vegetation (e.g. strips of forest or
hedgerows) to source areas. Fenced fragments pro-
tected from grazing by livestock supported much
higher densities of rats before (though not after)
eradication, but connectedness to an adjacent source
of immigrants did not influence either original density
or the chances of reinvasion (Innes et al. 2010b).
The forest canopies of all the fragments were
dominated by tawa Beilschmiedia tawa, mangeao
Litsea calicaris, mahoe Melicytus ramiflorus, pukatea
Laurelia novae-zelandiae, and rewarewa Knightia
excelsa and treeferns. Data on regeneration of key
canopy and understorey vegetation, on litter mass and
decomposition rates, and on the composition of the
detritivore fauna, in relation to management (fencing,
pest control etc.) regimes, are reported elsewhere. None
of the fragments had been subject to effective pest
control programmes (trapping, poisoning) targeting
brush-tail possums and ship rats in the 2 years before
our field sampling began. For comparison between the
populations of ship rats in the fragments trapped to
extinction, and a population sampled only lightly at
1–3 month intervals, we used data from Pureora Forest
Park, a large forest in the central North Island support-
ing comparable forest vegetation (Innes et al. 2001).
Methods
We used a combination of data collection methods,
each with different advantages and all linked to
precisely defined locations by GIS, in order to build
an integrated picture of the physical, demographic
and genetic characteristics of the original and
replacement populations. Footprint tunnels detected
the presence of rats in a fragment, and the arrival of
replacements, without disturbing them; bait markers
detected the previous presence of some individuals in
a source area; snap trapping implemented the erad-
ication programme and provided samples for nec-
ropsy and genetic analysis; hair tubes supplemented
the other detection methods and also provided
information on movements of those individuals that
entered both hair tubes and traps; and genotyping
identified the extent of the wider population sampled
in the eight fragments. This combination of ecolog-
ical and molecular techniques applied over such a
large geographic area is unusual (Peakall and
Lindenmayer 2006) but very informative.
Eradications
Tracking tunnels containing Black TrakkaTM tracking
cards were set on a 50 9 50 ± 8 m grid throughout
each fragment, operated for one night immediately
before the first eradication and at monthly intervals
thereafter. The resulting tracking indices, calculated
according to standard methods, were reported previ-
ously (Innes et al. 2010b).
Victor snap traps (passed by NAWAC standards as
humane kill traps for rats) were set in tunnels at and
in the spaces between tracking stations (i.e., on a
50 9 25 m grid) in numbers and on dates shown in
Table 1. The traps were set inside tunnels just large
enough to accommodate the trap, to discourage non-
target species, guide target rats across the treadle, and
to provide public safety. They were baited with
peanut butter, checked and re-baited daily until no
rats were caught. Then, the tracking stations were
reset, and both trapping and tracking continued
together.
Our aim was first to eradicate the entire population
of rats in each fragment, and then to monitor how
long the fragment would remain clear of replace-
ments. For the first eradication, we set a rigorous end
point for any given fragment, defined as the day on
which no rats had been trapped or tracked for the
three previous consecutive nights. At monthly inter-
vals thereafter, we set tracking tunnels, checked
daily, to test for reinvasion. If rats had reappeared,
2394 C. M. King et al.
123

we immediately began snap-trapping again. For the
second eradication, we defined our end point in all
fragments as 10 days since the start of trapping.
We divided the eight fragments into two groups,
numbers 1–4 and 5–8, arranged to enable the paired
comparisons of fencing and isolation that we
expected to have primary influence on the results.
Because it was logistically impossible to treat all the
fragments simultaneously, both eradications in frag-
ments 1–4 were done earlier than in fragments 5–8
(Table 1). Although the difference between the two
groups of fragments was analysed under the heading
‘‘Location’’, the distinction between them was pri-
marily a matter of timing. We did not expect any
geographical effect, so did not attempt to control for
it: the northern group included Fragments 1, 2, 4, 7
Lake Karapiro
3
8
6
2
5
4 1
7
Lake Karapiro
170°E
40°S
Whitehall
Te Miro
Study fragmentOther forest
mk50
Fig. 1 Map of the study
area in the Waikato
province east of Hamilton,
showing the relative
positions of the eight forest
fragments. Lake Karapiro
occupies part of the course
of the Waikato River
southeast of Cambridge
Eradication and reinvasion by Rattus rattus in forest fragments 2395
123

and 8, and the southern group numbers 3, 5 and 6
(Fig. 1).
Rat population data
All rats caught were returned to the lab for dissection.
We removed all the whiskers and half an ear from
one side, and sent them for further analysis. We
recorded gender, colour morph, whole body weight,
head and body length, tail length and reproductive
condition.
Sexual maturity
Sexual maturity was classified as a simple binary
category, yes or no, regardless of whether the
individuals so classified were in active reproductive
condition at the time of capture. Extensive breeding
data for ship rats analysed by Innes et al. (2001) from
various North Island forest types at Pureora Forest
Park have previously shown that no indicator of
reproductive activity varied significantly with habitat,
including % females pregnant; mean number of live
embryos; % with uterine scars; mean number of
uterine scars; % lactating; % pregnant females with
resorbing embryos; % males with scrotal testes (Innes
et al. 2001: tables 6 and 7). For females, these
characters also did not vary between summer and
autumn, which were the only two seasons sampled
here. The proportion of fertile males did not vary with
habitat, but declined slightly in autumn.
For the present analysis, we therefore defined
sexually mature females as those with active uteri
(‘‘string’’ or ‘‘cord’’ condition, as opposed to the
‘‘thread’’ condition of juveniles) or pregnant or with
uterine scars. Sexually mature and fertile males were
Table 1 Study areas, all located 20–30 km SE of Hamilton, central Waikato, where rats were trapped between December 2007 and
June 2008
Fragment 1 2 3 4 5 6 7 8
Area (ha) 3.5 4.9 9.9 4.3 4.8 5.7 2.4 7.0
Fenced or Grazed G F G F G F G F
Connected to source, or isolated C C I I C I I C
Distance from source (m) 115 210 100 250 40 55 105 10
Number of traps 25 44 75 42 48 48 23 54
RhB baits placed or renewed 11 Dec,
10 Jan,
21 Feb,
28 Mar,
10 Ap
17 Dec,
10 Jan,
27 Feb,
27 Mar,
10 Ap
10 Dec,
10 Jan,
27 Feb,
28 Mar,
28 Ap
11 Dec,
10 Jan,
26 Feb,
31 Mar,
28 Ap
10 Dec,
17 Jan,
26 Feb,
26 Mar,
23 Ap
17 Dec,
17 Jan,
27 Feb,
27 Mar,
28 Ap
12 Dec,
17 Jan,
26 Feb,
28 Mar,
23 Ap
13 Dec,
17 Jan,
26 Feb,
27 Mar,
24 Ap
Distance bait station to
nearest fragment edge (m)
215 250 170 380 245 200 195 170
Traps set for 1st eradication 10 Jan 10 Jan 10 Jan 10 Jan 14 Feb 14 Feb 14 Feb 14 Feb
Traps set for 2nd eradication 11 Ap 11 Ap 29 Ap 29 Ap 21 May 8 May 21 May 21 May
Number of hair tubesa 10/6 21/10 33/10 19/9 22/6 20/10 10/10 24/10
Dates hair tubes set 9 Jan
21 Feb
17 Mar
10 Ap
9 Jan
11 Mar
10 Ap
9 Jan
11 Mar
28 Ap
9 Jan
17 Mar
28 Ap
13 Feb
20 Mar
23 Ap
20 May
13 Feb
7 May
13 Feb
23 Ap
20 May
13 Feb
20 May
Genotypes/matchesb 0 12/4 0 0 0 0 5/1 12/3
During the first eradication, trapping ended when no rats had been trapped or tracked for 3 consecutive nights, and during the second,
after 10 days. For density indices derived from footprint tracking, taken immediately before each eradication started, see the
matching Table 1 in Innes et al. (2010b)a Number of hair tubes set in eradication and reinvasion source areas respectivelyb Number of hair samples genotyped, and the number of genotypes matching other hair or ear samples
2396 C. M. King et al.
123

defined as those with scrotal, active testes containing
visible tubules in the epididymes. The lack of any
correlation between these classifications and habitat
in the Pureora sample (n = 547, summer and autumn
captures only) showed that the same classifications
could be applied with confidence to the entire sample
of rats collected from our forest fragments that were
in good enough condition to be classified by age,
gender and reproductive condition (n = 509).
Age groups
Innes et al. (2001) also showed that body weight
controlled for season, year and gender increases
predictably with age estimated from tooth wear,
regardless of habitat. For this study we divided the
samples into three age-related groups by weight. The
lower boundary of the middle group, the young
adults, was defined as the upper limit of body weights
of all individuals still not sexually mature, which was
found by inspection of the ranked data from the
current (forest fragments) samples (109 g in males
and 79 g in females). The upper boundary of this
group was based on the average whole body weight
of rats from Pureora (males 141 g, females 121 g).
We confirmed that these groups represented real
categories distinctly different from each other in age
by applying the same weight-class definitions retro-
spectively to the Pureora data set (summer-autumn
samples only) (Table 2).
Identifying the sources of re-established
populations
Rhodamine B marking
In forest adjacent to each fragment, located
170–380 m (average 228 m edge to edge) from each
fragment, we set out up to ten possum-proof bait
stations at 40 m spacing a month before trapping was
due to begin. Each initially contained 200 g of bait
pellets (RS5 cereal prefeed pellets, made by Animal
Control Products, Wanganui) surface-coated with
Rhodamine B (RhB) biomarker at 0.1% concentra-
tion. RhB dye can be detected in external keratinous
tissue such as hair and claws (Fisher 1999). Baits
were replaced with 100 g of fresh stock at monthly
intervals, on the dates shown in Table 1.
During necropsy, all rats were checked visually for
RhB staining on the fur of the paws, face and belly.
We then selected 6–7 medium to long whiskers from
each carcase, preferably those with an intact follicle
and a fine tip, for examination under flourescence
microscopy. Whiskers were washed and dry-
mounted, at least 6 to a glass microscope slide, under
a 60 mm #2 coverslip, and examined at 1009 under a
compound microscope fitted with a 50 W mercury
vapour arc lamp and a Leitz Ploemopak epifluores-
cence unit. Green excitation was produced by an M2
filter set (excitation BP 530–560 nm, dichroic mirror
580 nm, barrier filter LP 580 nm) which passes all
wavelengths in the yellow, orange and red range of
the spectrum.
Autofluorescence, a natural property of some
biological materials, can be distinguished from a true
RhB signal by adding an I2 block. The resultant blue
excitation gives a stronger signal from the autofluo-
rescent sources and a substantially reduced rhoda-
mine excitation. We scored whiskers showing this
relative change of intensity as negative for RhB.
We examined how the proportions of RhB-marked
rats collected at each site and in each trapping session
might vary with isolation (connected to a source or not),
habitat disturbance (grazed or not), trapping history
(first eradication or second), timing of the first eradi-
cation (earlier in fragment locations 1–4 than in 5–8)
and day of operation (days 1–6 or day 7?). Connect-
edness was included because, although we have already
shown it did not affect the chances that some rats would
reappear after the first eradication (Innes et al. 2010b), it
Table 2 Definitions of weight groups used as a proxy for age
classifications of 509 Fragments rats, compared with the actual
toothwear classes of 547 Pureora rats allocated to the same
weight groups
Age
group
Fragments Pureora
Body weight
range (g)
n Mean
toothwear class
SD
Males
1 \109 52 2.6 0.64
2 110–140 76 3.4 0.87
3 [141 186 4.3 0.70
Females
1 \79 18 2.5 0.92
2 80–120 80 3.4 0.84
3 [121 135 4.3 0.78
Totals 547 3.9 1.00
Eradication and reinvasion by Rattus rattus in forest fragments 2397
123

might affect the age, gender, reproductive or genetic
distributions of which rats arrived.
We checked for possible inter-relationships
between all these factors by applying a generalised
linear mixed model with binomial distribution and
logit link to the complete dataset. The model included
random terms (hence extra-binomial variation) for the
individual fragments and repeats within these. It
adjusted the estimated percentage frequencies for each
variable by controlling for imbalances in the others.
To check for a possible seasonal variation in the
supply of immigrants, we divided the total sample
into four periods of time (roughly a month each)
defined from the dates on which the Rhodamine B
baits were renewed in each area (dates given in
Table 1). Period 2 started on the date of the first
renewal of marked baits in mid January and ran until
the second renewal at the end of February, and so on
to period 5 running from the last bait renewal in late
April until the end of the study in late May.
We assumed that any rats we caught within a
fragment that were clearly marked with RhB (but not
only these) could be classified as definite replace-
ments. We do not call them ‘‘reinvaders’’ because
some could have been wandering residents.
Hair tubes
Before and during the eradications, the rat popula-
tions in the fragments, and in adjacent reinvasion
source areas, were monitored with hair tubes (Glee-
son et al. 2010) baited with peanut butter and set at
trap sites (on a 50 9 50 m grid) 2–4 times through
the study as shown in Table 1. GPS positions of all
hair tubes were recorded to ±8 m. Hair samples were
collected after 1 day, and stored dry pending DNA
extraction. We searched for exact matches between
genotypes derived from hair samples collected from
more than one hair tube, and between hair samples
and ear tissue from carcases, assuming that an exact
match represents the same animal sampled on
separate occasions. Distances between matching
sample sites indicate minimum movements by indi-
viduals between or within fragments.
DNA extraction and genotyping
We extracted genomic DNA from ear samples stored
in 95% ethanol, and from dry hair samples including
at least five clearly visible follicles, using the Corbett
X-tractor Gene automated DNA solid tissue extraction
system following the manufacturer’s recommendation
with external digest (Corbett Robotics, Brisbane,
Australia). We used a total of nine microsatellite
markers, previously developed from R. norvegicus
genome mapping (Jacob et al. 1995), to genotype each
sample: D2Rat234, D5Rat83, D7Rat13, D10Rat20,
D11Mgh5, D15Rat77, D16Rat81, D18Rat96,
D19Mit2. We performed PCR amplification in 10ul
volumes, following Abdelkrim et al. (2010), and ran
the PCR products as two multiplex runs on an ABI
prism 3130 capillary electrophoresis system (Applied
Biosystems). We derived genotypes using GeneMap-
per software (Applied Biosystems). From the tissue
genotypes, we calculated an overall Psib score using
GenAlEx v 6.2 (Peakall and Smouse 2006) in order to
determine the probability that a sibling would possess
an identical genotype. From the hair samples, we
made three replicates per sample, and did not accept a
genotype as complete unless there was consensus
from at least two of the three replicates.
We assessed evidence for allelic drop-out, scoring
error due to stutter, and the presence and frequency of
any null alleles with MICRO-CHECKER (Oosterhout
et al. 2004) using a Bonferroni adjusted 95% confi-
dence interval and 10,000 repetitions. We calculated
genetic diversity indices and pairwise genetic differ-
ences, and conducted Principal Components Analysis
(PCA) using GENALEX v 6.2 (Peakall and Smouse
2006), and conducted tests for Hardy–Weinberg
Equilibrium (HWE) and linkage disequilibrium using
GENEPOP v 4.0 (Raymond and Rousset 1995).
The fixation index (FST) is calculated from the
correlation of randomly chosen alleles within one
sub-population relative to that found in the entire
population. Population differentiation can then be
estimated from a series of pairwise comparisons.
Values for FST between 0.0–0.05 are consistent with
little genetic differentiation (near panmixis);
0.05–0.15 indicates moderate, and 0.15–0.25 high
differentiation between populations. We calculated
pair-wise FST estimates using FSTAT (version
2.9.3.2) (Goudet 1995), and determined their signif-
icance by Fisher’s method (Manly 1985: 432–433;
Raymond and Rousset 1995).
We used the Bayesian clustering method imple-
mented in STRUCTURE 2.3.2 (Hubisz et al. 2009) to
estimate the best-supported number, K, of genetic
2398 C. M. King et al.
123

clusters. We chose the admixture model with corre-
lated allele frequencies, and conducted 10 replicates
for each value of K varying from 1–8 for each run,
consisting of a burn-in period of 100,000 MCMC
(Markov Chain Monte Carlo) steps followed by 106
iterations.
Results
Altogether, 517 ship rats were collected from the 8
fragments over two eradication attempts (mean 46,
range 0–110 each; Table 3), of which 509 were
classified by age and reproductive condition, and 465
by RhB status. Sample and sub-sample sizes are
given in context as appropriate in Tables 2, 3, 4, 5, 6,
7, 8, 9, 10. We also caught 11 Norway rats (in two
fragments), one weasel and two mice.
Summer eradication
In January-April 2008, the mean time needed to meet
our definition of eradication in each of the eight
fragments was 33 nights (range 3–67). Summer rat
density estimated from the first six nights of trapping
was significantly higher in fenced (6.5 rats ha–1, SE
1.4) than in stock-grazed fragments (mean 0.5 rats
ha–1, SE 0.4; P = 0.02, and the time to complete the
first eradication averaged 47 nights in fenced and 19
nights in grazed fragments (Table 3). Ship rats
replaced the eradicated populations in all fragments
within a month, regardless of fencing or isolation
(Innes et al. 2010b).
Replacement (autumn) rat populations
The mean time between initial eradication and the
second tracking index (Table 1) was 63 nights, range
30–92 nights. The relative abundances of the re-
established rat populations were often different from
those measured in the same fragments 4 months
previously (Table 3). Rats were no longer signifi-
cantly more abundant in the fenced fragments, at least
over the 10 days we observed them (Innes et al.
2010b). The autumn populations were not pursued to
local extinction.
Distribution of rats marked with RhB
Rhodamine B dye had been available since December
only in adjacent areas outside the fragments
(Table 1). From January onwards, only one of the
eight fragments did not produce at least one marked
rat from among the previously untrapped populations.
Of the 517 rats examined, the RhB status was
ambiguous or unknown in 52, and definite in 465, of
which 94 were marked (Table 3) The overall mean
minimum distance they had moved, from the centre
Table 3 Proportions of marked rats caught in eight forest fragments (total 94 of 465 rats with definite RhB status)
Fragment 1 2 3 4 5 6 7 8
First eradication (summer)
Days to complete 6 27 29 41 3 54 39 67
Rats/ha (days 1–6) 0.3 6.3 1.3 4.2 0 11.1 1.3 4.5
Rats with clear RhB status 1 45 28 52 0 98 27 72
Rats marked n (total 79) 0 4 3 8 0 26 17 21
Rats marked % of 323 0 8.9 10.7 15.4 – 26.0 63.0 29.2
Total rats trapped 1 49 33 60 0 110 30 83
Second eradication (autumn)
Rats/ha (days 1–6) 4.6 3.1 2.3 4.0 2.3 3.7 0.8 0.9
Rats with clear RhB status 23 13 34 26 13 21 2 10
Rats marked n (total 15) 0 3 2 2 3 1 0 4
Rats marked % of 142 0 23.1 5.9 7.7 23.1 4.3 0 40.0
Total rats trapped 23 17 35 26 15 23 2 10
Pre-eradication tracking indices are given by Innes et al. (2010b). Density estimates are given only for the first 6 days of trapping
(Watkins et al. 2010), after which immigration is expected to increase the total catch to many more rats than could live in each
fragment at one time. The second eradication attempt was stopped after 10 days
Eradication and reinvasion by Rattus rattus in forest fragments 2399
123

of a minimum convex polygon enclosing the loca-
tions of the set of bait stations nearest the fragment to
the point of capture within it, was 387 m (range
190–640 m, n = 88); means for marked rats col-
lected from individual fragments varied from 282 to
547 m.
The distribution of marked rats through the
samples was uneven, but they continued to appear
in all fragments throughout the eradication process.
Of the 94 marked rats collected, 79 were caught
during the first eradication (Table 3), and 10 of these
were caught on the first day of trapping (12 January),
whereas only 15 marked rats were caught during the
second eradication. After accounting for other factors
influencing the samples, our GLM model estimated
these proportions as 19.9 and 13.9% respectively
(P = 0.413, Table 4).
The proportion of marked rats was significantly
higher (P = 0.004) in fragment numbers 5–8
(Table 4), where the first eradication was done a
month later than in fragments 1–4 (Table 1). The
proportion of marked rats was also higher after the
first 6 days of trapping (P = 0.003), as would be
expected if they represent the immigrant group, but it
was not higher in connected versus isolated frag-
ments, or in fenced versus grazed fragments, or
during the first versus the second eradications. Visual
inspection of the plotted capture positions of the
marked rats collected within each fragment showed
no perceptible clustering along the edge habitats
closest to the sources of RhB-marked bait.
We compared the proportion of marked rats
caught during four successive monthly periods,
defined in Table 4, to check for seasonal effects
whilst controlling for isolation, location and other
factors as before. This comparison confirmed a
significant variation in proportion of marked rats
through the trial, but almost all of that effect was due
to the large influx of marked rats (40%) observed
from mid January to the end of February. The total
number of rats caught increased slightly in May, but
only 12% of these were marked, implying no
increase in the supply of immigrants after the end
of the breeding season in autumn.
Table 4 Distribution of 465 rats with determined Rhodamine B status
Factor SD Significance
Isolation Connected Isolated
% marked 13.7% 18.1% 6.9% P = 0.522
n 177 288
Eradication 1st 2nd
% marked 17.9% 13.9% 4.9% P = 0.413
n 323 142
Location 1–4 5–8
% marked 8.4% 27.8% 6.8% P = 0.004
n 222 243
Disturbance Fenced Grazed
% marked 15.1% 16.5% 7.1% P = 0.842
n 337 128
Day of trapping 1–6 7?
% marked 10.9% 22.3% 3.8% P = 0.003
n 261 204
Period since renewal of RhB Jan–Feb Feb–Mar Mar–Ap Ap–May
% marked 16.3% 39.9% 5.8% 12.0% 9.2% P = 0.043
n 228 70 25 142
For each factor listed, the model calculates the percentage of rats marked in each of two conditions plus the standard error and
significance of the differences attributable to that factor, after allowing for all the other factors. The two groups comprising Fragments
1–4 and 5–8 (in sub-heading ‘‘Locations’’) are distinguished by the slightly different timings of the operations in each (Table 1), not
their geographic locations (Fig. 1). The exact significance values are given for all comparisons, in bold type if P \ 0.005
2400 C. M. King et al.
123

Population structure (age and gender)
In the 509 rats collected in good enough condition to
be classified, the six groups defined from gender and
weight were distinctly different in age by, on average,
one toothwear class (Table 2). This difference in age
is consistent with the significant increase in the
proportions of rats in the top compared with the
middle weight classes of each gender that were
sexually mature (Table 5). There was no overall
difference in the proportions of males and females
that were mature (P = 0.144).
The age and gender ratios among the 94 marked
rats differed significantly (P = 0.001) from those of
unmarked rats (Table 6). The largest single group of
marked rats comprised juvenile males (28%), and the
smallest, old breeding females (8%).
Impact of removal trapping on age
and gender ratios
The reference samples from Pureora were collected
according to a fixed, intermittent schedule in contin-
uous forest, in which traps were never set for more
than 12 days at a time (Innes et al. 2001), whereas the
first trapping programme continued until a robust
predetermined criterion of eradication had been met
in each fragment, which took up to 67 consecutive
Table 5 Distribution of
weight groups and sexual
maturity, total fragments
sample
Body weight
range (g)
n % sexually
mature
Difference between
weight groups in %
mature by gender
Males
1 Juveniles \109 99 0
2 Young 110–140 47 22.7 P \ 0.001
3 Old [141 96 77.1
Females
1 Juveniles \79 59 0
2 Young 80–120 84 32.5 P \ 0.001
3 Old [121 124 84.7
Totals 509 43.1
Table 6 Distribution of age/gender classes among rats with and without RhB marker dye, which they could have acquired only
outside the study fragments
Total classified by
age/gender
Marked rats (% marked
of total age group)
Unmarked, Eradication
1 only
Unmarked, Eradication
2 only
Males
1 Juveniles 99 28 (28.3) 49 18
2 Young 47 4 (8.5) 16 23
3 Old 96 20 (20.8) 44 20
Females
1 Juveniles 59 12 (20.3) 32 9
2 Young 84 20 (23.8) 23 36
3. Old 124 10 (8.1) 85 21
Totals 509 94 249* 129*
The age structure of marked rats was significantly different from that of all unmarked rats (P = 0.001), and also from that of the
replacement population caught during Eradication 2 (P = 0.0034)
* Excluding rats of uncertain RhB status
Eradication and reinvasion by Rattus rattus in forest fragments 2401
123

days (Table 3). These different sampling regimes
were associated with a highly significant difference
(P = 0.000) in the age structure of the rats collected
(Table 7). Many more juvenile males were collected
by trapping to extinction in the fragments than by the
repeated, brief, low-level sampling at Pureora. The
disproportionate representation of juvenile males in
the prolonged Fragments samples was associated
with a significant decline by 20.90 g, se = 3.52 g
(P \ 0.001) in the average male body weight of rats
collected from the Fragments compared with the
Pureora males (Table 7). The same difference did not
reappear in the female body weights.
Not all immigrant rats were marked, which raises
the question of whether the marked rats were typical
of the immigrant group as a whole. Our data suggest
that they were. During the first eradication in the
Fragments, the shift towards juvenile males in
distribution of age/gender classes was already evident
among the 206 rats caught after day 7 compared with
the 160 rats caught on days 1–6 (P = 0.000,
Table 8). If these marked rats do indeed represent
the unmarked immigrants during that period, there
should be no difference in age distribution between
the marked rats and the 127 unmarked rats caught on
days 7?; that was so (P = 0.168, Table 9).
By the second eradication, the proportion of
juvenile males caught was not different in the later
versus early days of trapping (P = 0.191, Table 8).
The marked rats no longer represented the immi-
grants, because total sample of rats collected during
the second eradication, conducted late in the season,
included fewer juveniles and more young adults than
in the marked group (P = 0.005).
Genetic diversity and population differentiation
A total of 493 ear samples from all fragments and 29
hair samples from three fragments (Table 1) were
successfully genotyped at nine microsatellite loci
identifying nine pairs of hair-hair or hair-ear matches.
Eight loci had between zero and \10% null alleles.
One locus, D10Rat20, had [10% null alleles at all
sites, so we removed it from subsequent population
analyses, as did Abdelkrim et al. (2010) for the same
reason.
Allele frequencies and Hardy–Weinberg Equilib-
rium (HWE) summary statistics for each fragment are
given in Table 10. The mean number of alleles per
locus varied by fragment from 5.9 to 12.1. Fragments
with private alleles had, on average, higher numbers
of alleles per locus, and these private alleles were all
low frequency (\0.05). All fragments had similar
observed heterozygosities ranging from 0.74–0.78.
Only Fragment 5, the area from which fewest rats
Table 7 Distribution of age/gender groups in samples of rats
collected by sampling to and after local extinction (Fragments
programme) and by fixed-period short-term sampling (Pure-
ora), summer/autumn data only
Group Fragments Pureora
n % n %
Males
1 Juveniles 99 41 52 17
2 Young 47 19 76 24
3 Old 96 40 186 59
Mean male 244 323
Body weight (g) 121.7 142.6
sd 46.88 33.19
Females
1 Juveniles 59 22 18 8
2 Young 84 31 80 34
3 Old 124 46 135 58
Mean female 267 343
Body weight (g) 117.5 121.8
sd 41.72 27.47
Totals 509 547
P 0.000
Table 8 Distribution of age/gender groups in samples of rats
collected on the first 6 days of trapping compared with sub-
sequent days, Fragments programme
Group Eradication 1 Eradication 2
Days 1–6 7? 1–6 7?
Males
1 Juveniles 23 51 13 12
2 Young 7 14 19 7
3 Old 35 38 19 4
Females
1 Juveniles 20 30 7 2
2 Young 6 35 33 10
3 Old 65 36 18 5
Totals 160 206 111 40
P 0.000 0.191
2402 C. M. King et al.
123

were collected (Table 3) showed a significant depar-
ture from HWE.
For our entire collection (n = 493 genotyped rats),
FST values ranged between 0.024 and 0.096, indicat-
ing low to moderate genetic differentiation between
fragments. Plotting pair-wise FST values against the
corresponding linear separations of the eight frag-
ments showed no significant correlation between
genetic and geographic distance (Fig. 2). Principal
Components Analysis based on pairwise genetic
differences showed no correlation between rats caught
during the first versus the second eradication attempts
(Fig. 3). The cumulative percentage of variation
explained by the first three PCA axes was very low
(24.13, 42.78 and 59.09%) and subsequent compo-
nents added progressively less, suggesting a ball-like
data cloud. Analysis using STRUCTURE 3.2 also
showed little genetic structure between fragments.
Models that subdivided the total dataset into K [ 1
were not supported when compared with the null
hypothesis of no substructure.
Hair/hair and hair/ear matches
We collected 78 hair samples from 230 hair tube-
nights, of which 29 (Table 1) from three fragments
returned genotypes of good enough quality for
subsequent analysis. Hair samples from the other
five fragments were not analysed.
The overall Psib score was 0.004, which is below
the 0.01 reported as the upper limit required for
individual genetic assignment and population esti-
mation (Mills et al. 2000). We therefore considered it
unlikely that matching hair and tissue genotypes were
from siblings, as opposed to two samples from the
same individual.
We obtained pairs of matching hair samples
(identical at all nine loci) from three individual rats
that visited two hair tubes within a source area, 45
and 87 m apart in Fragment 8, and 32 m apart in
Fragment 7 (mean 54.5 m). The hair tubes were
Table 9 Distribution of rats classed by both RhB status and
age/gender group collected during the first eradication com-
pared with the unmarked rats collected after day 7
Group Marked Unmarked
Days All days 7?
Males
1 Juveniles 17 31
2 Young 3 12
3 Old 18 17
Females
1 Juveniles 12 20
2 Young 15 20
3 Old 9 27
Totals 74 127
P 0.168
Table 10 Summary statistics of genetic diversity for rats trapped within eight Waikato remnant forest fragments
Fragment 1 2 3 4 5 6 7 8
n 23 65 67 79 15 121 31 92
Na 6.6 8.1 10.1 9 5.9 9 8.8 12.1
Priv. – – 0.86 0.75 – 1 1 2
He 0.73 0.74 0.75 0.72 0.66 0.71 0.74 0.78
Ho 0.78 0.78 0.77 0.73 0.74* 0.74 0.76 0.77
n number of samples, Na mean number of alleles per locus, Priv. mean number of private alleles per locus, Ho mean observed
heterozygosity, He mean expected heterozygosity
* denotes a significant departure from HWE
0
0.02
0.04
0.06
0.08
0.1
0.12
0 5 10 15 20
F S
T v
alu
e
Distance between pairs, km
FST
Fig. 2 Pair-wise comparisons of all FST values plotted against
the cross-country distances between each pair of fragments
Eradication and reinvasion by Rattus rattus in forest fragments 2403
123

always set 1 day and cleared the next day, so all these
distances refer to net movements over 24 h. The
identities, ages and genders of these rats were
unknown because none of the genotypes identified
from hair tubes in source areas matched any of the rat
ears genotyped from the adjacent (or any) fragment.
Four hair samples returned identical matches with
an ear sample from four rats trapped; three were
caught 27, 28, and 55 m from the tube where the hair
was collected within Fragment 2 and one (matching
at 8 loci) at 40 m from the hair tube within Fragment
8. In every case, the hair sample was collected on the
day before the traps were set, and the rat was
collected 2 days later, on the first day of the first
eradication. All four pairs of hair-ear matches came
from old females that we sampled inside a fragment,
both before and after death, presumably within their
home ranges.
A fifth hair sample matched an ear sample from
another old female caught 99 m from the hair tube on
the first day of the second eradication in Fragment 2.
We cannot distinguish whether this rat was (1) a
survivor of the 27 days of the first eradication
attempt, or (2) a post-eradication colonist arriving
from or via the broad shelterbelt that connected this
fragment to the adjacent Te Miro forest reserve. This
rat was not detected by the hair tubes and RhB bait
stations along the Te Miro forest edge, and was not
genetically distinct from the rats caught during the
first eradication. The minimum overnight local
movements of these five old females averaged 50 m.
Only a single old male recorded a hair-ear match,
again within Fragment 2. This rat was caught on the
second day of the first eradication, in a trap 203 m
from the hair tube it had visited 3 days previously.
None of the marked rats trapped had left matching
samples in hair tubes in source areas. Hence none of
the nine hair-ear matches (n = 9) or the 94 carcases
marked with RhB identified individual animals
moving into a fragment from a source area.
Discussion
Ship rats are key pests throughout New Zealand.
Conservation managers working to protect endemic
species on the mainland have long known how
rapidly reinvasion can reverse the beneficial effects
of local ship rat eradication programmes (Innes et al.
1999), but the demographic characters of replacement
populations have remained obscure. Here we present
new data decisively demonstrating three key obser-
vations on the re-invasions we observed: (1) the
replacement rats were derived from a meta-popula-
tion so large that our samples, spread over
20,000 km2, could not define its boundaries; (2) gene
flow between forest fragments within the meta-
population was not inhibited by large areas of
intervening non-preferred habitat, so a few hundred
metres of pasture clearly could not protect our study
areas from reinvasion after eradication; and (3)
movements of individual rats towards the cleared
fragments from outside were not stimulated by
human interference–on the contrary, we detected
substantial numbers of marked rats on the very first
day of trapping, suggesting an ongoing dynamic
interaction between the rats living in the fragments
and in neighbouring areas that was already in
progress before our first eradications began to take
effect.
Demography of the replacement population
Marked rats could have picked up the RhB marker
dye if they were either (1) resident in a fragment with
home ranges extending into a source area, which had
wandered outside the fragment, picked up the bait
marker and then returned, or (2) immigrants which
had newly arrived from a different area outside the
fragment. We acknowledge that our methods could
not objectively distinguish between these two cate-
gories, so the rats collected from the original
population comprised, at least at first, an unknown
mixture of original residents and immigrants.
Component 1
E1E 2
Co
mp
on
ent
2
Fig. 3 Principal components analysis (PCA) performed with
GENALEX software using the nine microsatellite loci from rats
caught during the first eradication (E1) versus rats caught
during the second eradication (E2)
2404 C. M. King et al.
123

However, our criteria for achieving an eradication
were severe, and allowed for trap evasion (we
specified that no rats be detected in either traps or
footprint tunnels for three consecutive nights), so we
think it likely that few or no rats remained by the end
of the first eradication.
Dispersal is male-biased in most rodents, including
Rattus sp. (Calhoun 1963; Krebs et al. 2007) and is
most frequently undertaken by younger, non-breeding
individuals (Peakall and Lindenmayer 2006). For
example, Stokes et al. (2009) found higher propor-
tions of subadults, and no breeding females at all, in
replacement populations of R. rattus collected from
eradication sites. If our marked rats fairly represented
the immigrants, they would be expected to differ
significantly in age, gender ratio and reproductive
(but not genetic) characters from unmarked rats. This
was true (P = 0.001, Table 6); the marked rats
included more immature juvenile males than any
other age/gender group, and fewer old adult females
(Tables 5, 6), and the difference was established
relatively early (after day 7 of the first eradication:
Tables 7, 8, 9).
The implication is that, although rat populations
re-establish rapidly after an eradication operation, the
new group can be expected to start with a different
demography and a lower reproductive potential
compared with that of the original population. These
observations have some important implications for
management of invasive rats on the mainland,
because age distribution and sexual maturity are
two of the parameters most affecting population rate
of increase. This information gives some interesting
clues about the population dynamics of invaders,
although it does not help conservation in the short
term since rats of all ages and both genders are
equally unwelcome conservation pests.
In our study, the movements of individual rats
revealed by both genetic and RhB techniques were
consistent with previous knowledge of male and
female ship rat range lengths in New Zealand podo-
carp-broadleaved forest (summarised by Innes 2005).
Five of the six matched hair and ear samples came from
old females caught on the first day of a trapping session,
and the sixth from an old male caught on the second
day. These data suggest that old rats freely ran through
both hair tubes and trap tunnels, and so were likely to be
caught as soon as the traps were set. Larger, older and
socially dominant rats are often the first to explore new
devices containing food, because fear of conspecific
aggression prevents smaller, younger rats exploring or
feeding in a confined space inside a tunnel or bait
station (Quy 2003). If the old females had often moved
outside the fragments, they might have been more often
marked with RhB, but, on the contrary, Table 6 shows
that they were the least likely group to be marked.
Since RhB dye was available only outside the
fragments, this confirms that the old females were the
most sedentary group (with smallest home ranges and
shortest local movements) resident within the frag-
ments (Innes 2005). Older adult males are much more
mobile and hold larger home ranges than old females
(Hooker and Innes 1995), perhaps because older males
are at greater risk of mating with their own offspring.
We did not document any larger movements that
could clearly be seen as natal dispersal. In other
species of Rattus, dispersal studies have revealed
typically small local movements, with occasionally
some much longer, e.g., \100 m and up to 1,750 m
in R. fuscipes (Bentley 2008) or c.62 m and 11 km in
R. norvegicus (Gardner-Santana et al. 2009). Such
comparisons depend on assuming no difference in
trappability between marked and unmarked rats, but
we have no way to test for this.
Our data illustrate incidentally the potential bias
inherent in using the results of continuous snap-
trapping for population analyses. Density estimates
calculated from samples of rats taken as by-catch in
permanently-set trap lines for carnivores (Dilks et al.
2003), assume that the probability of capture remains
constant over the long term, but it does not (Watkins
et al. 2010). Likewise, the proportions of age/gender
classes (and hence, the reproductive potential) will be
estimated differently from small rat populations
trapped to extinction than from samples of rats taken
from a large population sampled periodically.
Genetic differentiation among fragments
Table 10 may be compared directly with Abdelkrim
et al. (2010: table 1), who document the same
statistics for 274 rats from 5 km2 Puketi forest
(Northland) and 39 from two outlying fragments each
separated by 3.5 km from Puketi in opposite direc-
tions. The values for observed and expected mean
heterozygosity were comparable across all samples.
The lack of any significant correlation between
genetic and geographic distance among our 8
Eradication and reinvasion by Rattus rattus in forest fragments 2405
123

fragments separated by up to 16 km (Fig. 2) sup-
ported our RhB results in suggesting that all the rats
we sampled belonged to a single widely distributed
meta-population. Our data support the inference of a
continuous, dynamic interaction between rats living
in fragments and in the adjacent source areas
supplying immigrants, thereby ruling out the use of
genetic techniques to distinguish survivors from
reinvaders (Russell et al. 2010). Abdelkrim et al.
(2010) reached the same conclusion for Puketi and its
two adjacent fragments. No model dividing the
Puketi sample and its outliers into K [ 1 was
supported, and likewise, we found no clear genetic
distinction between rats collected during the first and
second eradications. Our estimates of FST are a little
higher for some pair-wise comparisons, as expected
considering the greater separation distances we
sampled. Private alleles appeared in five of our
fragments, but in neither of the two Puketi outliers.
All the fragments we sampled were situated along
a line of low hills east of the flood plain of the
Waikato River, which was until about 1900 com-
pletely covered with conifer/broadleaved forest
(Clarkson et al. 2002). Fragmentation of the original
forest has also fragmented the rat population, so in
theory our results could reflect either the former
contiguity and common ancestry of the present
isolates, or later gene flow between them. However,
if there had been a complete lack of gene exchange
across the cleared areas for more than a 100 years, we
would have expected to see some evidence of genetic
distinction between our sample areas. Our data
support the conclusion that gene flow among frag-
mented populations of non-commensal ship rats can
extend across substantial distances of non-forest
habitat.
Conclusions
Our analyses were done on the largest geographic
scale reported so far (up to 16 km between sample
areas), but we still could not find the boundaries of
the metapopulation of ship rats surrounding our eight
study areas. Pair-wise comparisons of FST between all
8 fragments returned low values, indicating that all
the individuals sampled belonged to interbreeding
sub-populations. Hence, we cannot define a suitable
‘eradication unit’ that might protect native biota in
our forest fragments in the sense proposed by
Abdelkrim et al. (2010). Eradication operations in
small fragments like those we studied are therefore
bound to fail, because they cannot be confined to an
isolated landscape unit not connected to extensive
source areas. On the contrary, we showed that
replacement populations arrived very quickly, and
were genetically indistinguishable from the previ-
ously resident populations, although including a large
proportion of young rats at the beginning of their
reproductive lives. Marked individual rats travelled
from at least 0.5 km away, reaching all but one of our
fragments in a few days, including those that we had
classed as isolated from potential reinvaders. Pest-
proof fencing (Connolly et al. 2009) is the only
effective way to prevent reinvasions.
MacQueen et al. (2008) also found no genetic
differentiation between populations of Rattus fuscipes
in fragmented Queensland landscapes. They sug-
gested that R. fuscipes was able to move between the
larger forest reserves using habitat corridors. It would
be valuable to know more about movement behaviour
of R. rattus in New Zealand farmed landscapes,
especially about how they typically move between
fragments. Certainly, a fragmented landscape is no
barrier to their movements, so is no help in control-
ling their spread (With 2002). Indeed, ship rats can
cross far more daunting barriers, such as the sea water
channels separating the 13 islets off the main island
of Lavezzu, between Corsica and Sardinia (Abdelk-
rim et al. 2009).
We could not exclude less obvious connections
between our fragments such as wire fences or
waterways, and if these features routinely provide
possible reinvasion routes, they could be targeted
with traps or poison in the future. We need more
detailed documentation of the use made by ship rats
of habitat corridors, and of their patterns of natal
dispersal. We suggest that these should be important
priorities for future research, not only in New
Zealand but in any of the large number of countries
where Rattus rattus is a pervasive conservation pest.
Acknowledgments We gratefully acknowledge the
landowners and managers who generously gave us free access
to their forest fragments: Lyndon Bergerson, Shane Blair, Paul
and Jo Bodle, Mr R.A. Boyte, Bill Boyte, Des McAllister, Allen
Marr, Greg and Jackie Nicholls, Brett and Narelle Pollock,
Deborah and John Stretton. Chris Floyd helped locate study sites,
and Penny Fisher gave valuable advice about Rhodamine B
2406 C. M. King et al.
123

marking. Scott Bartlam, Sam Cave, Toni Cornes, and
particularly Stacey Foster and Jordan Edgar helped with the
substantial fieldwork required for this project, including daily
trap-clearing that lasted several months. The manuscript was
greatly improved by the perceptive comments of two anonymous
referees. The research was funded by the Foundation for
Research, Science and Technology under UOW X0609 and the
2010 Strategic Investment Fund of Waikato University.
Approval for the Rhodamine B bait-marking work was granted
under Waikato University Animal Ethics Protocol No. 707.
References
Abdelkrim J, Pascal M, Calmet C, Samadi S (2005) Importance
of assessing population genetic structure before eradica-
tion of invasive species: examples from insular Norway
rat populations. Conserv Biol 19(5):1509–1518. doi:
10.1111/j.1523-1739.2005.00206.x ISSN0888-8892
Abdelkrim J, Pascal M, Samadi S (2007) Establishing causes of
eradication failure based on genetics: case study of ship
rat eradication in Ste. Anne archipelago. Conserv Biol 21:
719–730
Abdelkrim J, Pascal M, Samadi S (2009) Genetic structure and
functioning of alien ship rat populations from a Corsican
micro-insular complex. Biol Invasions 11(3):473–482
Abdelkrim J, Byrom AE, Gemmell NJ (2010) Fine-scale genetic
structure of mainland invasive Rattus rattus populations:
implications for restoration of forested conservation areas
in New Zealand. Conserv Genet 11:1953–1964
Armstrong D, Raeburn E, Lewis R, Ravine D (2006a) Esti-
mating the viability of a reintroduced New Zealand robin
population as a function of predator control. J Wildl
Manage 70:1020–1027
Armstrong D, Raeburn E, Lewis R, Ravine D (2006b) Mod-
eling vital rates of a reintroduced New Zealand robin
population as a function of predator control. J Wildl
Manage 70:1028–1036
Atkinson IAE (1973) Spread of the ship rat (Rattus r. rattus L.)
in New Zealand. J Roy Soc NZ 3(3):457–472
Bentley JM (2008) Role of movement, interremnant dispersal
and edge effects in determining sensitivity to habitat
fragmentation in two forest-dependant rodents. Austral
Ecol 33:184–196
Bowne DR, Bowers MA (2004) Interpatch movements in
spatially structured populations: a literature review.
Landscape Ecol 19:1–20
Brooke MD, Hilton GM, Martins TLF (2007) Prioritizing the
world’s islands for vertebrate-eradication programmes.
Anim Conserv 10(3):380–390. doi:10.1111/j.1469-1795.
2007.00123.x
Brown KP, Moller H, Innes J, Jansen P (1998) Identifying
predators at nests of small birds in a New Zealand forest.
Ibis 140(2):274–279
Burns BR, Floyd CG, Smale MC, Arnold GC (2010) Effects of
forest fragment management on vegetation condition and
maintenance of canopy composition in a New Zealand
pastoral landscape. Austral Ecol. doi:10.1111/j.1442-
9993.2010.02130.x
Calhoun JB (1963) The ecology and sociobiology of the Nor-
way rat. United States Department of Health, Education
and Welfare, Public Health Service Publication 1008,
Bethesda, Maryland
Clarkson BD, Merrett M, Downs T (2002) Botany of the
Waikato. Waikato Botanical Society, Hamilton
Connolly TA, Day TD, King CM (2009) Estimating the
potential for re-invasion by mammalian pests through
pest-exclusion fencing. Wildl Res 36:410–421
Department of Conservation and Ministry for the Environment
(2000) The New Zealand Biodiversity Strategy. Depart-
ment of Conservation and Ministry for the Environment,
Wellington
Didham RK, Barker GM, Costall JA, Denmead L, Floyd C,
Watts CH (2009) The interactive effects of livestock
exclusion and mammalian pest control on the restoration
of invertebrate communities in small forest fragments.
N Z J Zool 36:135–163
Dilks P, Willans M, Pryde M, Fraser I (2003) Large scale stoat
control to protect mohua (Mohoua ochrocephala) and
kaka (Nestor meridionalis) in the Eglinton Valley, Fi-
ordland, New Zealand. N Z J Ecol 27(1):1–9
Dodd M, Barker G, Burns B, Didham R, Innes J, King C,
Smale M, Watts C (2011) The resilience of New Zealand
indigenous forest fragments to impacts of livestock and
pest mammals. N Z J Ecol 35:83–95
Fisher P (1999) Review of using Rhodamine B as a marker for
wildlife studies. Wildlife Soc B 27:318–329
Foster SP, King CM, Patty B, Miller SD (2011) Tree-climbing
capabilities of Norway and ship rats. N Z J Zool 38. doi:
10.1080/03014223.2011.599400
Gardner-Santana LC, Norris DE, Fornadel CM, Hinson ER,
Klein SL, Glass GE (2009) Commensal ecology, urban
landscapes, and their influence on the genetic character-
istics of city-dwelling Norway rats (Rattus norvegicus).
Mol Ecol 18:2766–2778
Gibbs G (2009) The end of an 80-million year experiment: a
review of evidence describing the impact of introduced
rodents on New Zealand’s ‘mammal-free’ invertebrate
fauna. Biol Invasions 11(7):1587–1593. doi:10.1007/
s10530-008-9408-x
Gleeson D, Byrom AE, Howitt RLJ (2010) Non-invasive
methods for genotyping of stoats (Mustela erminea) in
New Zealand: potential for field applications. N Z J Ecol
34:356–359
Goudet J (1995) Fstat version 12: a computer program to
calculate Fstatistics. J Hered 86(6):485–486
Green W, Clarkson BD (2006) Turning the tide? A review of
the first five years of the New Zealand Biodiversity
Strategy: the synthesis report. Department of Conserva-
tion Wellington
Hastings A, Cuddington K, Davies KF, Dugaw CJ, Elmendorf
S, Freestone A, Harrison S, Holland M, Lambrinos J,Malvadkar U, Melbourne BA, Moore K, Taylor C,
Thomson D (2005) The spatial spread of invasions:
new developments in theory and evidence. Ecol Lett
8:91–101
Hooker S, Innes J (1995) Ranging behaviour of forest-dwelling
ship rats, Rattus rattus, and effects of poisoning with
brodifacoum. N Z J Zool 22:291–304
Eradication and reinvasion by Rattus rattus in forest fragments 2407
123

Hubisz MJ, Falush D, Stephens M, Pritchard JK (2009)
Inferring weak population structure with the assistance of
sample group information. Mol Ecol Resour 9:1322–1332
Innes JG (2005) Ship rat. In: King CM (ed) The handbook of
New Zealand mammals, 2nd edn. Oxford University
Press, Melbourne, pp 187–203
Innes J, Warburton B, Williams D, Speed H, Bradfield P (1995)
Large-scale poisoning of ship rats (Rattus rattus) in
indigenous forests of the North Island, New Zealand. N Z
J Ecol 19(1):5–17
Innes JG, Hay R, Flux I, Bradfield P, Speed H, Jansen P (1999)
Successful recovery of North Island kokako Callaeascinerea wilsoni populations, by adaptive management.
Biol Conserv 87(2):201–214
Innes JG, King CM, Flux M, Kimberley MO (2001) Population
biology of the ship rat and Norway rat in Pureora Forest
Park 1982–1987. N Z J Zool 28(1):57–78
Innes J, Kelly D, Overton J, Gillies C (2010a) Predation and
other factors currently limiting New Zealand forest birds.
N Z J Ecol 34(1):86–114
Innes J, King CM, Bridgman L, Fitzgerald N, Arnold GC, Cox
N (2010b) Effect of grazing on ship rat density in forest
fragments of lowland Waikato, New Zealand. N Z J Ecol
34(2):227–232
Jacob HJ, Brown DM, Bunker RK, Daly MJ, Dzau VJ,
Goodman A, Koike G, Kren V, Kurtz T, Lernmark A et al
(1995) A genetic linkage map of the laboratory rat, Rattusnorvegicus. Nature Genet 9:63–69
Krebs CJ, Lambin X, Wolff JO (2007) Social behaviour and
self-regulation in murid rodents. In: Wolff JO, Sherman
PW (eds) Rodent species: an ecological and evolutionary
perspective. University of Chicago Press, London,
pp 173–181
MacQueen PE, Nicholls JA, Hazlitt SL, Goldizen AW (2008)
Gene flow among native bush rat, Rattus fuscipes(Rodentia: Muridae), populations in the fragmented sub-
tropical forests of south-east Queensland. Austral Ecol
33:585–593
Manly BF (1985) The statistics of natural selection on animal
populations. Chapman and Hall, New York
Mills LS, Citta JJ, Lair KP, Schwartz MK, Tallmon DA (2000)
Estimating animal abundance using noninvasive DNA
sampling: promise and pitfalls. Ecol Appl 10:283–294
Oosterhout C, Hutchinson W, Willds D, Shipley P (2004)
MICROCHECKER: software for identifying and cor-
recting genotyping errors in microsatellite data. Mol Ecol
Notes 4:535–538
Pascal M, Brithmer R, Lorvelec O, Venumiere N (2004)
Consequences of the Ship Rat (Rattus rattus) recent
invasion on the breeding avifauna of Sainte-Anne Islets
Natural Reserve (Martinique, French West Indies),
established after an eradication attempt. Revue D Ecolo-
gie-La Terre Et La Vie 59(1–2):309–318
Peakall R, Lindenmayer D (2006) Genetic insights into popu-
lation recovery following experimental perturbation in a
fragmented landscape. Biol Conserv 132:520–532
Peakall R, Smouse PE (2006) GENALEX 6: genetic analysis in
Excel. Population genetic software teaching and research.
Mol Ecol Notes 6:288–295
Puth LM, Post DM (2005) Studying invasion: have we missed
the boat? Ecol Lett 8:715–721
Quy RJ (2003) Adapting baiting tactics to match the foraging
behaviour of Norway rats: a balance between efficacy and
safety. In: Singleton GR, Hinds LA, Krebs CJ, Spratt DM
(eds) Rats, mice and people: rodent biology and man-
agement, vol Monographs 96. ACIAR, Canberra,
pp 451–456
Raymond M, Rousset F (1995) GENEPOP (version 1.2):
population genetics software for exact tests and ecumen-
icism. J Hered 86:248–249
Russell JC, Abdelkrim J, Fewster RM (2009a) Early coloni-
sation population structure of a Norway rat island inva-
sion. Biol Invasions 11(7):1557–1567
Russell JC, Mackay JWB, Abdelkrim J (2009b) Insular pest
control within a metapopulation context. Biol Conserv
142(7):1404–1410. doi:10.1016/j.biocon.2009.01.032
Russell JC, Miller SD, Harper GA, MacInnes HE, Wylie MJ,
Fewster RM (2010) Survivors or reinvaders? Using
genetic assignment to identify invasive pests following
eradication. Biol Invasions 12(6):1747–1757
Stokes VL, Banks PB, Pech RP, Spratt DM (2009) Competition
in an invaded rodent community reveals black rats as a
threat to native bush rats in littoral rainforest of south-
eastern Australia. J Appl Ecol 46:1239–1247
Towns DR (2009) Eradications as reverse invasions: lessons
from Pacific rat (Rattus exulans) removals on New Zea-
land islands. Biol Invasions 11:1719–1733
Towns DR, Atkinson IAE, Daugherty CH (2006) Have the
harmful effects of introduced rats on islands been exag-
gerated? Biol Invasions 8(4):863–891
Walker S, Price R, Rutledge D, Stephens RTT, Lee WG (2006)
Recent loss of indigenous cover in New Zealand. N Z J
Ecol 30(2):169–177
Watkins AF, McWhirter JL, King CM (2010) Variable
detectability in long-term population surveys of small
mammals. Eur J Wildl Manage 56(3):261–274
Watling JI, Donnelly MA (2006) Fragments as Islands: a
synthesis of faunal responses to habitat patchiness. Con-
serv Biol 20(4):1016–1025
With KA (2002) The landscape ecology of invasive spread.
Conserv Biol 16(5):1192–1203
2408 C. M. King et al.
123