Regional Policies, Firm Characteristics, and Exporting in the Indian State of Karnataka
30
Munich Personal RePEc Archive Regional Policies, Firm Characteristics, and Exporting in the Indian State of Karnataka Jaya Prakash Pradhan and Mohammad Zohair and Mallikarjun V. Alagawadi School of Business Studies, Central University of Karnataka 17. August 2012 Online at http://mpra.ub.uni-muenchen.de/40717/ MPRA Paper No. 40717, posted 30. August 2012 09:13 UTC
-
Upload
independent -
Category
Documents
-
view
1 -
download
0
Transcript of Regional Policies, Firm Characteristics, and Exporting in the Indian State of Karnataka
MPRAMunich Personal RePEc Archive
Regional Policies, Firm Characteristics,and Exporting in the Indian State ofKarnataka
Jaya Prakash Pradhan and Mohammad Zohair and
Mallikarjun V. Alagawadi
School of Business Studies, Central University of Karnataka
17. August 2012
Online at http://mpra.ub.uni-muenchen.de/40717/MPRA Paper No. 40717, posted 30. August 2012 09:13 UTC

REGIONAL POLICIES, FIRM CHARACTERISTICS,
AND EXPORTING IN THE INDIAN STATE OF KARNATAKA
Jaya Prakash Pradhan Associate Professor of Economics,
School of Business Studies, Central University of Karnataka
E‐mail: [email protected]
Mohammad Zohair Assistant Professor of Management,
School of Business Studies, Central University of Karnataka E‐mail: [email protected]
Mallikarjun V. Alagawadi Professor of Management, School of Business Studies,
Central University of Karnataka E‐mail: [email protected]
SCHOOL OF BUSINESS STUDIES CENTRAL UNIVERSITY OF KARNATAKA
GULBARGA

i
CONTENTS
Contents i
1. Introduction 1
2. Government Policy and Export Performance of Karnataka 2
2.1. Department of Industries and Commerce, Government of Karnataka 2
2.2. Visvesvaraya Industrial Trade Centre (VITC) 3
2.3. Other Agencies 4
2.4. Exports from Karnataka 4
2.4.1. Export performance at the firm‐level 8
3. Firm Level Export Determinants for Karnataka 13
3.1. Export Determinants: A Review of Literature 13
3.1.1. Firm size 13
3.1.2. Firm age 13
3.1.3. In‐house technological activities 14
3.1.4. Foreign technology imports 14
3.1.5. Product differentiation 14
3.1.6. Domestic business group affiliation 15
3.1.7. Foreign affiliations 15
3.1.8. Fiscal incentives 15
3.1.9. Sector‐specific factors 15
3.2. Empirical Framework 16
3.3. Data Source and Method of Estimation 17
3.4. Results and Inferences 18
4. Conclusion and Implications 21
References 23
Appendix 26

ii
List of Figures
Figure‐1 Commodity and Software Exports from Karnataka 5
Figure‐2 Export Intensity of Karnataka Manufacturing Firms, 1991–2008 9
Figure‐3 Export Intensity of Karnataka Manufacturing Firms by Sectors, 1991–2008 11
Figure‐4 Export Intensity of Karnataka Manufacturing SMEs and Large Firms, 1991–2008 12
Figure‐5 Total Effect of Firm Size 20
List of Tables
Table‐1 Exports from Karnataka, US$ million 6
Table‐2 Growth and Composition of Karnataka Exports, (In per cent) 7
Table‐3 Exports by Firm Categories, US$ million & Percentage 9
Table‐4 Exports by Sectors, US$ million & Percentage 10
Table‐5 Exports by Firm Size, US$ million & Percentage 12
Table‐6 Description and Measurement of Variables 16
Table‐7 Firms’ Export Determinants of Karnataka Manufacturing Firms 19
Table‐A2 Descriptive Statistics for Full Sample 26
1
REGIONAL POLICIES, FIRM CHARACTERISTICS, AND EXPORTING IN THE INDIAN STATE OF KARNATAKA
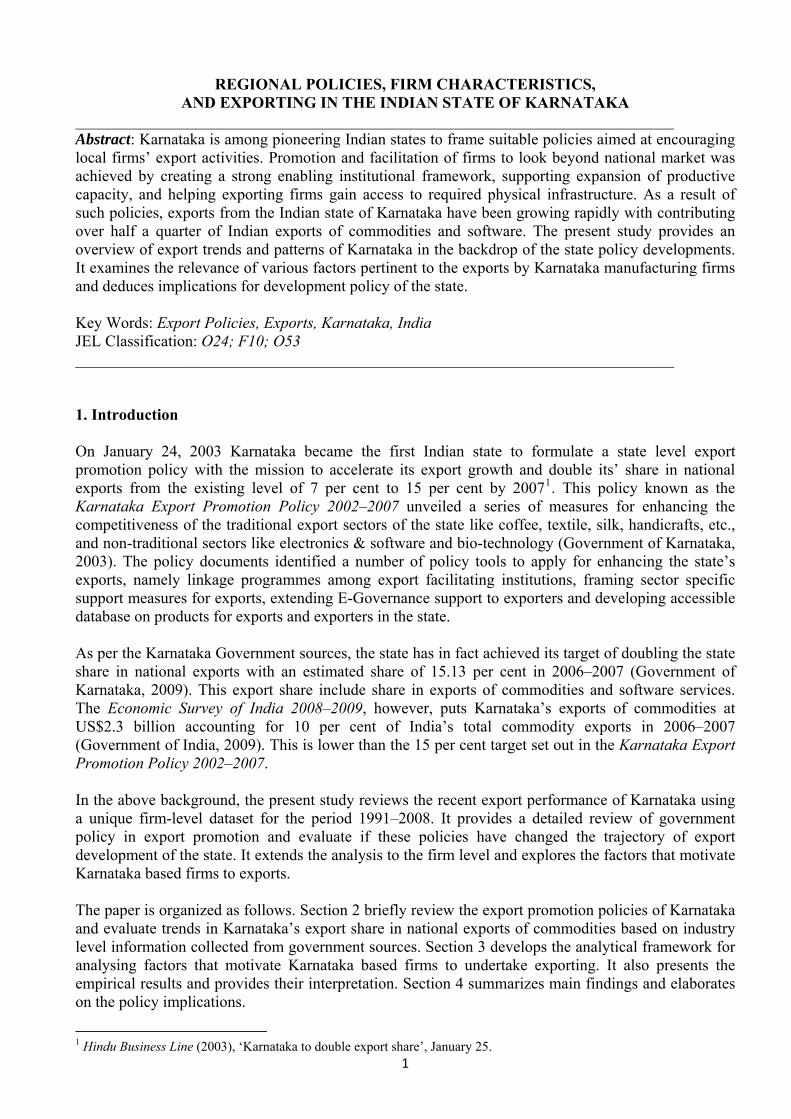
___________________________________________________________________________ Abstract: Karnataka is among pioneering Indian states to frame suitable policies aimed at encouraging local firms’ export activities. Promotion and facilitation of firms to look beyond national market was achieved by creating a strong enabling institutional framework, supporting expansion of productive capacity, and helping exporting firms gain access to required physical infrastructure. As a result of such policies, exports from the Indian state of Karnataka have been growing rapidly with contributing over half a quarter of Indian exports of commodities and software. The present study provides an overview of export trends and patterns of Karnataka in the backdrop of the state policy developments. It examines the relevance of various factors pertinent to the exports by Karnataka manufacturing firms and deduces implications for development policy of the state. Key Words: Export Policies, Exports, Karnataka, India JEL Classification: O24; F10; O53 ___________________________________________________________________________ 1. Introduction On January 24, 2003 Karnataka became the first Indian state to formulate a state level export promotion policy with the mission to accelerate its export growth and double its’ share in national exports from the existing level of 7 per cent to 15 per cent by 20071. This policy known as the Karnataka Export Promotion Policy 2002–2007 unveiled a series of measures for enhancing the competitiveness of the traditional export sectors of the state like coffee, textile, silk, handicrafts, etc., and non-traditional sectors like electronics & software and bio-technology (Government of Karnataka, 2003). The policy documents identified a number of policy tools to apply for enhancing the state’s exports, namely linkage programmes among export facilitating institutions, framing sector specific support measures for exports, extending E-Governance support to exporters and developing accessible database on products for exports and exporters in the state. As per the Karnataka Government sources, the state has in fact achieved its target of doubling the state share in national exports with an estimated share of 15.13 per cent in 2006–2007 (Government of Karnataka, 2009). This export share include share in exports of commodities and software services. The Economic Survey of India 2008–2009, however, puts Karnataka’s exports of commodities at US$2.3 billion accounting for 10 per cent of India’s total commodity exports in 2006–2007 (Government of India, 2009). This is lower than the 15 per cent target set out in the Karnataka Export Promotion Policy 2002–2007. In the above background, the present study reviews the recent export performance of Karnataka using a unique firm-level dataset for the period 1991–2008. It provides a detailed review of government policy in export promotion and evaluate if these policies have changed the trajectory of export development of the state. It extends the analysis to the firm level and explores the factors that motivate Karnataka based firms to exports. The paper is organized as follows. Section 2 briefly review the export promotion policies of Karnataka and evaluate trends in Karnataka’s export share in national exports of commodities based on industry level information collected from government sources. Section 3 develops the analytical framework for analysing factors that motivate Karnataka based firms to undertake exporting. It also presents the empirical results and provides their interpretation. Section 4 summarizes main findings and elaborates on the policy implications.
1 Hindu Business Line (2003), ‘Karnataka to double export share’, January 25.

2
2. Government Policy and Pxport Performance of Karnataka Karnataka is among pioneering Indian states to embed international trade as an important objective in the overall development policy of the state. Different agencies and organizations were created and entrusted in the task of export promotion and industrial development in the state. Following agencies in Karnataka are actively propagating exports as a goal for firms’ growth and competitiveness: 2.1. Department of Industries and Commerce, Government of Karnataka This department is responsible for the overall development of the state industrial sector and is increasingly adding to the state supply capacity for exports by facilitating establishments of Export Promotion Industrial Parks (EPIPs), Agro Export Zones (AEZs) and Special Economic Zones (SEZs). Since 1992 it is running the first ever state level export award scheme through Visvesvaraya Industrial Trade Centre (VITC) for promoting exporters excelling in different product categories of exports from the state. The agency has been regularly providing various incentives and concessions for export promotion under the state industrial policies. In November 1989, setting up of fully export oriented units (EOUs) in the Export Oriented Industrial Zone (EOIZ) at Bengaluru and other two zones comprising designated 152 talukas were offered capital investment subsidy of 10 per cent of the value of fixed assets (subject to maximum limit of Rs. 10 lakh) and those in the EOIZ are further exempted from entry tax on all raw materials, components, etc. EOUs located in the state were exempted from the power cuts imposed by Karnataka Electricity Board and also from payment of sales tax payable on raw materials, components, capital goods, packaging materials, etc. procured from industrial units within the state. These policies, except investment subsidy, remained in place during 1989−19952. In the New Industrial Policy 1993, the Government of Karnataka unveiled a number of policy measures to promote exports in targeted sectors like electronics, software, readymade garments, gem & jewellery and agricultural products including processed foods3. These includes setting up of an Export Promotion Industrial Park near Bengaluru, constitution of an Export Promotion Board that includes leading exporters and Government of India agencies concerned and strengthening the function of VITC. The Government of Karnataka has announced a New Industrial Policy in 1996 where export promotion continued to be an important policy objective. For promoting exports, a number of measures were proposed including the acceleration of projects on Export Promotion Industrial Park at Bangaluru and Mangalore, establishment of a permanent Exhibition Complex at Bangaluru, provision of market intelligence and other assistance to EOUs, formulation of a scheme of Market Development Assistance to those EOUs in the small scale sector, creation of an exclusive ‘Export Wing’ in KSIMC (Karnataka Small Industries Marketing Corporation Ltd.) and a network of container feed stations for rapid transportation of export cargo. It was also proposed to develop a strong database on export related information for SMEs and the state government owned marketing organizations were pressed into exporting of products from the small scale sector. The Industrial Policy of 1996 remained valid upto 31st March 2001. With effect from 1st April 2001, Karnataka formulated the New Industrial Policy – 2001 that remained valid upto 31st March 2006. Among several objectives of this policy, one was to enable Karnataka industry to access new markets (domestic and export) based on new products of global standards of quality and competitiveness. The focus was on catalysing Karnataka’s exports in strategic sectors like IT, bio-technology, food processing, electronics and communication, garments, machine tools and
2 http://www.karnatakaindustry.gov.in/Industrial_Policy1990.htm 3 http://www.karnatakaindustry.gov.in/Industrial_Policy1993.htm

3
precision engineering goods. In order to achieve this, Karnataka Industrial Areas Development Board (KIAD) was required to develop sector specific/location specific industry parks including five agro food processing parks, two apparel export parks, three auto parks, an export promotion industrial park, a special economic zone and a knowledge park at specified locations. KSIMC as before was expected to play its role in enhancing exports from Karnataka SME sector. EOUs were continued to be accorded with investment subsidy, exemption from power cut, freedom from entry tax and sales tax payable on purchase of raw materials and inputs if sources within India and the state respectively. A World Trade Organization (WTO) Relay Centre was established at the Karnataka Council for Technological Upgradation (KCTU) for lending legal, technical and administrative support to Karnataka user industries affected by WTO and enabling them to seize emerging market opportunities abroad. In August 2006, the state government articulated its New Industrial Policy 2006−11 that seek to double the state’s export from the current level of Rs.130000 crores. Recognizing the potential of SEZs in driving state exports, an exclusive SEZ Policy was announced with single point clearance to the SEZ proposals. Policy emphasis was also on improving skills of local labour force that contributes in the rapid transformation of industries and exports. The policy also invoked the need for supporting Karnataka based firms in the areas of market intelligence, export documentation, finance, technology upgradation, and capabilities to compliance with specifications of international buyers. For enhancing exports, special supports were visualized for EOUs in obtaining compulsory certifications such as China Compulsory Certificate, Conformité Européenne, etc. The policy was also geared towards encouraging industries in the state to participate in international exhibitions and trade fairs. 2.2. Visvesvaraya Industrial Trade Centre (VITC) Karnataka is probably the first Indian state to constitute an autonomous and nodal body named as the VITC way back in 1965 for the promotion of international trade from Karnataka. Over the years, VITC has formulated and implemented a number of measures for actualizing the export potential of various industries of the state4. Short duration programmes on export awareness are being conducted for firms near to their place of location and with the support of the local District Industries Centres, Chambers of Commerce and Industry/Trade Associations. The basic purpose is to make firms aware about export potential of their products and increasingly simplified procedures and formalities related to actual exports. Recently, VITC is undertaking intensive export training programmes at the district level for encouraging firms’ export participation. These programmes involve imparting of training on different aspect of exporting such as procedures and formalities, documentation, packaging, shipment, export marketing, export quality, export finance, export insurance and incentives from exporting from various government agencies. It also covers the rules, procedures and requirements of importing countries. In addition to organizing exhibitions at the state and national levels, VITC arranges the participation of Karnataka based firms, specifically small industrial units, in exhibitions and trade fairs organised by India Trade Promotion Organsiation (ITPO), various export promotion councils and other organisations. The idea is to showcase the products and services originating from Karnataka at these exhibitions. For providing updated databases and information on export markets, procedures and formalities, VITC is regularly subscribing to relevant databases including publications and making them accessible to
4 Discussion is based on the information available from the website of the Visvesvaraya Industrial Trade Centre accessible at: http://www.vitcblr.org/

4
prospective and existing exporters in the state. It is providing the export market information, country particulars, and profiles of importers and exporter on cost basis to interested exporters/ importers. Moreover, it is frequently organizing seminars and workshops on international trade and World Trade Organization (WTO) matters so as to create awareness among Karnataka based exporters to take immediate steps for meeting new regulatory challenges and benefitting from them. 2.3. Other Agencies Karnataka Industrial Areas Development Board (KIADB) is a wholly owned infrastructure agency of the Government of Karnataka. It is entrusted with the task of establishing infrastructure projects in different parts of the state. Apart from establishing 132 industrial areas across 28 districts, KIADB is in charge of establishing EPIPs (each one at Bengaluru and Mangalore), sector specific SEZs (textile, pharmaceutical, and agro tech & food processing at Hassan; IT/ITES at Mangalore; aerospace at Bengaluru), apparel parks (each one at Bengaluru, Bellary and Davanagere), and agro tech and food parks (each one at Bagalkot, Kolar, Gulburga, and Chitradurga). Karnataka Council for Technology Upgradation (KCTU) a joint venture between Government of India, Government of Karnataka and industries bodies is in operation since 1996. The council is motivated to enhance competitive status of SMEs in Karnataka by catalysing their technology upgradation through acquisition, adoption and modernization and make their products internationally competitive through reduced cost, increased productivity and improved quality. It helps SMEs to obtain nationally and internationally recognized quality certifications and undertakes programmes for creating awareness and provides supports in obtaining patents, modernization and expansion of plant, etc. These policies are likely to play a vital role in the development of local capabilities for export activities. A number of other state level agencies are constantly engaged in promoting and facilitating the establishment of new industrial projects, thus, catalyzing Karnataka’s supply capacity for export. Karnataka Udyog Mitra (KUM), for instance, act as the single point contact for investors to secure necessary government approvals and as the monitoring agency for implementation of the approved projects. Karnataka State Small Industries Development Corporation (KSSIDC) plays its role in the provision of ready-built industrial sheds for investors’ use 5 . Technical Consultancy Services Organisation of Karnataka (TECSOK) is another state-level agency that provides technical, industrial and management consultancy to investors. The Centre for Entrepreneurship Development of Karnataka (CEDOK) is involved in development of entrepreneurship in the state. Financial assistance for industrial and business ventures is extended by the Karnataka State Financial Corporation (KSFC6) and Karnataka State Industrial Investment and Development Corporation (KSIIDC7). 2.4. Exports from Karnataka As a result of various policy measures adopted by the state government and as presented above, exports from Karnataka grew rapidly during the first-decade of the twenty-first century. The total 5 It has so far developed about 3976 plots and constructed about 5750 sheds of different dimensions in 159 industrial estates throughout the state. 6 KSFC provides term loans to new and existing units up to Rs.200 lakh in case of non-corporate bodies and up to Rs.500 lakh for corporate bodies and registered cooperative societies. KSFC has a number of schemes, suitable for different kinds of entrepreneurs and projects. KSFC has fully decentralized its operations and the corporation has 7 zonal offices, 3 Super 'A' grade branch offices, 12 'A' grade branch offices and 14 'B' grade branch offices. 7 KSIIDC extends finance to the bigger projects solely or jointly with KSFC, commercial banks or any other financial institutions. KSIIDC is also acting as the Nodal Agency of the State Government to plan and promote industrial infrastructural development project and monitor specified mega projects during its implementation. KSIIDC also participates in joint stock companies by way of equity contribution. The Corporation has 4 zonal offices in the state.

5
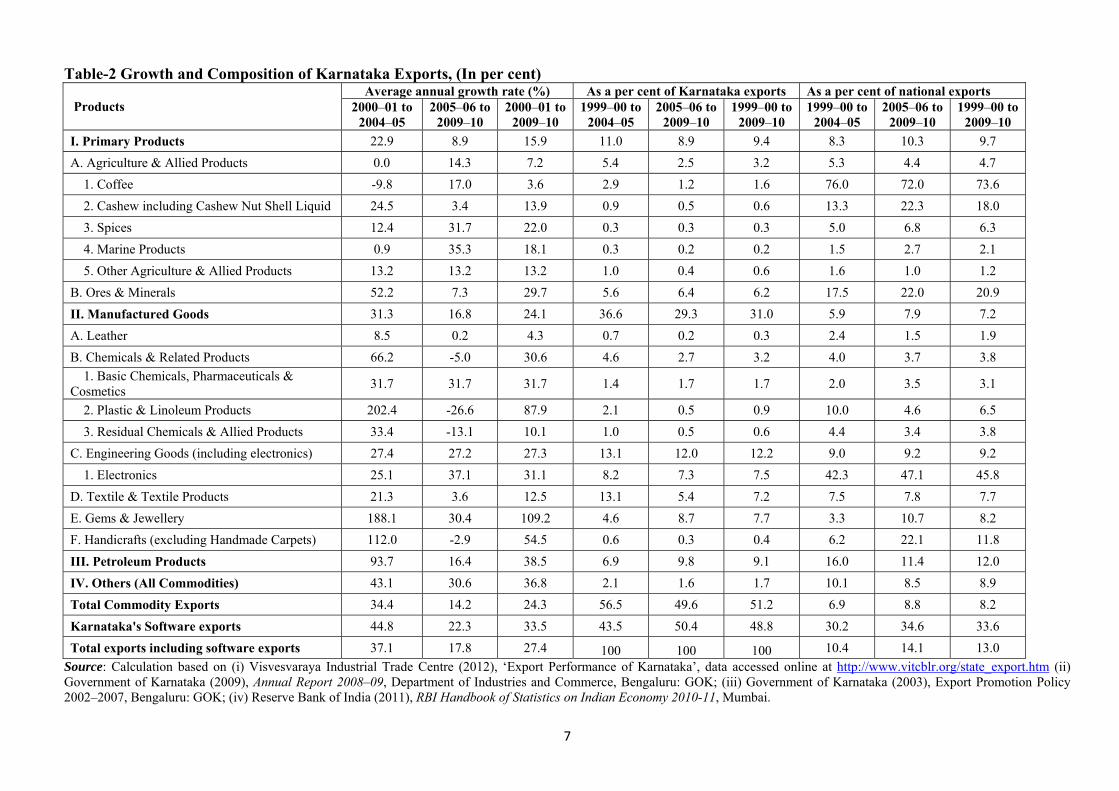
exports from Karnataka continuously improved from $3 billion in 1999–00 to nearly $14 billion in 2004–05 and then to a record highest of $30 billion in 2007–08, thereafter it fell in 2008–09 (Figure-1, Table-1). This fall for the first time in a decade was probably the result of slowdown in the global economy and contraction of overseas demand. Meanwhile, the long-run expansion of Karnataka exports differ much from its evolution in the sub-period 2001–05 to the other sub-period 2006–10. It could be argued that the real export boom from Karnataka took place in the sub-period 2001–05. During this sub-period, Karnataka experienced steepest and impressive average annual growth rate of 37 per cent for her exports (Table-2). Nearly all sectors of Karnataka economy, except a few products like coffee and marine products, shared in the export boom from Karnataka in this sub-period. By far the highest growth took place in software exports (45 per cent), followed by manufacturing (31 per cent) and primary products (23 per cent). Karnataka export growth slowed down markedly in the sub-period 2006–10 to just about an average annual growth rate of 17.8 per cent, nearly half of the growth it achieved in the previous sub-period (Table-2). While export growth becomes half between 2001–05 and 2006–10 for manufacturing and software exports, it fell by more than half for the primary exports. The negative impact of poor global growth, financial instability, and falling consumer spending appears to have contracted Karnataka export performance during this sub-period. Relatively Karnataka’s commodity exports suffered significant slowdown in terms of growth rate as compared to its software exports. Figure-1: Commodity and Software Exports from Karnataka
Source: Based on Table-1. Karnataka’s export performance can also be evaluated in terms of its contribution to the national exports of commodities and software services. During the sub-period 2000–05 Karnataka accounted for about 10.4 per cent of national exports of commodities and software exports from India. This share increased by 3.7 percentage points to become 14.1 per cent in 2006–10. Comparing Karnataka’s share in national commodity and software exports between 2000–05 and 2006–10, its share increased by a moderate 1.9 percentage points to become 8.8 per cent for commodity, compared to 4.4 percentage points rise in software exports to attain 34.6 per cent. This shows that Karnataka emerged as a leading exporting state in software but its role is moderate as far as Indian commodity exports are concerned. Specifically in the case of manufacturing and primary products, Karnataka contributed just 7.2 per cent and 9.7 per cent respectively during the sub-period 2000–10. For the same period and at a disaggregated level, Karnataka’s major export contribution can be seen in the case of a few selected items like Coffee (74 per cent) followed by electronics (46 per cent), software (34 per cent), and ores & minerals (21 per cent).
0
5000
10000
15000
20000
25000
30000
35000
Commodity exports Software exports Total exports including software

6
Table-1 Exports from Karnataka, US$ million Products 1999–00 2000–01 2001–02 2002–03 2003–04 2004–05 2005–06 2006–07 2007–08 2008–09 2009–10
I. Primary Products 590 488 470 639 796 1395 1852 2740 3191 2374 1733
A. Agriculture & Allied Products 411 340 325 324 341 398 515 659 658 793 743
1. Coffee 273 210 185 151 165 157 249 350 325 343 300 2. Cashew including Cashew Nut Shell Liquid
58 41 34 58 58 115 118 131 131 139 136
3. Spices 14 16 14 19 22 24 38 52 61 104 81
4. Marine Products 20 21 18 20 18 20 22 32 38 51 87
5. Other Agriculture & Allied Products 45 52 73 76 79 81 87 94 103 155 140
B. Ores & Minerals 180 149 145 315 456 997 1337 2081 2533 1582 990
II. Manufactured Goods 1332 1335 1549 2382 3131 4854 5351 7803 8759 7532 9775
A. Leather 34 52 50 46 60 42 48 52 50 47 41
B. Chemicals & Related Products 114 120 127 150 378 942 813 742 667 707 717 1. Basic Chemicals, Pharmaceuticals & Cosmetics
45 64 67 85 141 166 230 435 514 550 582
2. Plastic & Linoleum Products 17 15 17 20 163 619 418 131 53 58 69
3. Residual Chemicals & Allied Products 52 40 42 45 74 157 165 176 99 99 66 C. Engineering Goods (including electronics)
652 443 562 1074 940 1538 1724 3134 4227 2916 4033
1. Electronics 497 296 342 733 527 865 1035 1841 2165 1571 3107
D. Textile & Textile Products 478 665 742 997 1109 1226 1390 1938 1288 1401 1259
E. Gems & Jewellery 50 48 59 61 573 1034 1293 1846 2421 2368 3672 F. Handicrafts (excluding Handmade Carpets)
5 7 10 54 71 73 81 92 106 93 54
III. Petroleum Products 396 973 1377 2691 2746 2790 2531 2329
IV. Others (All Commodities) 47 49 129 210 229 173 199 599 636 461 266
Total Commodity Exports 1969 1872 2148 3626 5129 7798 10092 13888 15376 12899 14103
Karnataka's Software exports 997 1636 2076 2552 3939 6143 8493 11527 15101 16291 16028
Total exports including software exports 2966 3508 4224 6178 9068 13941 18585 25414 30477 29190 30131 Note: Financial year average annual exchange rate has been used to convert rupees export figure of Karnataka into dollar export figure. Source: (i) Visvesvaraya Industrial Trade Centre (2012), ‘Export Performance of Karnataka’, data accessed online at http://www.vitcblr.org/state_export.htm (ii) Government of Karnataka (2009), Annual Report 2008–09, Department of Industries and Commerce, Bengaluru: GOK; (iii) Government of Karnataka (2003), Export Promotion Policy 2002–2007, Bengaluru: GOK.
7
Table-2 Growth and Composition of Karnataka Exports, (In per cent)
Products Average annual growth rate (%) As a per cent of Karnataka exports As a per cent of national exports
2000–01 to 2004–05
2005–06 to 2009–10
2000–01 to 2009–10
1999–00 to 2004–05
2005–06 to 2009–10
1999–00 to 2009–10
1999–00 to 2004–05
2005–06 to 2009–10
1999–00 to 2009–10
I. Primary Products 22.9 8.9 15.9 11.0 8.9 9.4 8.3 10.3 9.7
A. Agriculture & Allied Products 0.0 14.3 7.2 5.4 2.5 3.2 5.3 4.4 4.7
1. Coffee -9.8 17.0 3.6 2.9 1.2 1.6 76.0 72.0 73.6
2. Cashew including Cashew Nut Shell Liquid 24.5 3.4 13.9 0.9 0.5 0.6 13.3 22.3 18.0
3. Spices 12.4 31.7 22.0 0.3 0.3 0.3 5.0 6.8 6.3
4. Marine Products 0.9 35.3 18.1 0.3 0.2 0.2 1.5 2.7 2.1
5. Other Agriculture & Allied Products 13.2 13.2 13.2 1.0 0.4 0.6 1.6 1.0 1.2
B. Ores & Minerals 52.2 7.3 29.7 5.6 6.4 6.2 17.5 22.0 20.9
II. Manufactured Goods 31.3 16.8 24.1 36.6 29.3 31.0 5.9 7.9 7.2
A. Leather 8.5 0.2 4.3 0.7 0.2 0.3 2.4 1.5 1.9
B. Chemicals & Related Products 66.2 -5.0 30.6 4.6 2.7 3.2 4.0 3.7 3.8
1. Basic Chemicals, Pharmaceuticals & Cosmetics
31.7 31.7 31.7 1.4 1.7 1.7 2.0 3.5 3.1
2. Plastic & Linoleum Products 202.4 -26.6 87.9 2.1 0.5 0.9 10.0 4.6 6.5
3. Residual Chemicals & Allied Products 33.4 -13.1 10.1 1.0 0.5 0.6 4.4 3.4 3.8
C. Engineering Goods (including electronics) 27.4 27.2 27.3 13.1 12.0 12.2 9.0 9.2 9.2
1. Electronics 25.1 37.1 31.1 8.2 7.3 7.5 42.3 47.1 45.8
D. Textile & Textile Products 21.3 3.6 12.5 13.1 5.4 7.2 7.5 7.8 7.7
E. Gems & Jewellery 188.1 30.4 109.2 4.6 8.7 7.7 3.3 10.7 8.2
F. Handicrafts (excluding Handmade Carpets) 112.0 -2.9 54.5 0.6 0.3 0.4 6.2 22.1 11.8
III. Petroleum Products 93.7 16.4 38.5 6.9 9.8 9.1 16.0 11.4 12.0
IV. Others (All Commodities) 43.1 30.6 36.8 2.1 1.6 1.7 10.1 8.5 8.9
Total Commodity Exports 34.4 14.2 24.3 56.5 49.6 51.2 6.9 8.8 8.2
Karnataka's Software exports 44.8 22.3 33.5 43.5 50.4 48.8 30.2 34.6 33.6
Total exports including software exports 37.1 17.8 27.4 100 100 100 10.4 14.1 13.0
Source: Calculation based on (i) Visvesvaraya Industrial Trade Centre (2012), ‘Export Performance of Karnataka’, data accessed online at http://www.vitcblr.org/state_export.htm (ii) Government of Karnataka (2009), Annual Report 2008–09, Department of Industries and Commerce, Bengaluru: GOK; (iii) Government of Karnataka (2003), Export Promotion Policy 2002–2007, Bengaluru: GOK; (iv) Reserve Bank of India (2011), RBI Handbook of Statistics on Indian Economy 2010-11, Mumbai.

8
With regard to the evolving sectoral profile of Karnataka exports, one may find that its export bundle is heavily dominated by software exports. Software alone accounted for 43.5 per cent of total exports from Karnataka during 2000–05, which increased to 50 per cent in 2006–10. The falling share of manufacturing and primary products in Karnataka exports during these periods indicate that the state export is not diversifying as desired by the state policy makers. As a per cent of the state’s total exports, a number of sectors like textile products, chemicals, coffee, plastic, and electronics witnessed significant decrease in their export share. 2.4.1. Export performance at the firm-level The aggregate or sectoral level export performance of any economy alone is inadequate to understand the overall export development. Measuring the intensity and scope of firm-level export performance can be crucial as export operations are initiated and sustain at the firm level. Given the interconnections of exports and firm-specific characteristics, this sub-section draws upon a dataset of 376 manufacturing firms that are exclusively based in Karnataka (i.e. all of their plants are located in Karnataka alone) and examined their export behaviour. Please see data appendix for detail on data source. Exports by ownership categories The sample firms are grouped into four categories, namely domestic standalone firms, domestic business groups, foreign firms and public sector firms. During 1991–2008 Karnataka witnessed that all categories of its firms have remarkably expanded their exports volume (Table-3). The public sector firms in particular have shown the most impressive performance by increasing their exports from $22.5 million in the sub-period 1991–94 to $9341.7 million in the sub-period 2005–08, which translated to an increased by above 400 times. Public sector firms increased their contribution in Karnataka manufacturing exports from 5.6 per cent to about 47 per cent between these two sub-periods. This export performance of public sector in Karnataka, however, is observed to be largely determined by the exports by BEML Limited in the 1990s and that by Mangalore Refinery & Petrochemicals Limited in the 2000s. While there are 29 public sector companies in the sample, BEML Limited alone accounted for nearly 65 per cent of public sector exports from Karnataka during 1991–99 and Mangalore Refinery & Petrochemicals Limited solely contributed as high as 99 per cent during 2000–2008. Domestic standalone firms emerged as the second important set of firms propelling exports from Karnataka. They achieved a rapid export growth over the years by increasing the quantum of their exports from $86.6 million in 1991–94 to $7660 million in 2005–08. Their export share grew from 21 per cent of Karnataka manufacturing exports in the early 1990s to 38.5 per cent in 2005–08. When Karnataka manufacturing exports by the sample firms increased by about 48 times between 1991–94 and 2005–08, domestic business groups shown just a nine fold increase in their export volume (Table-3). Clearly manufacturing firms affiliated to big domestic business groups have contributed modestly to the exports of Karnataka as compared to domestic standalone firms and public owned companies. Had the domestic business groups also expanded their exports in the same rate as the growth in the total exports of Karnataka based sample firms, Karnataka would have achieved an additional exports volume of over US$10 billion8. 8 If the domestic business groups’ exports increased by 47 times between 1991–94 and 2005–08 as is the case for overall exports by all Karnataka manufacturing sample firms, then exports by business groups would have been US$ 12.7 billion in place of actual exports of US$2.4 billion in 2005–08.

9
It is also a notable trend that foreign firms have contributed marginally to Karnataka manufacturing exports throughout the study period. This would suggest that the state that has successfully benefitted from export-oriented foreign firms in the service sector, particularly IT, is not been able to leverage FDI for export promotion in the case of manufacturing. Table-3 Exports by Firm Categories, US$ million & Percentage
Year Exports ($ million)
Domestic standalone
Domestic business groups
Foreign firms
Public sector
Grand Total
1991–1994 86.6 (20.9) 269.8 (65.1) 35.6 (8.6) 22.5 (5.4) 414.5 (100)
1995–1999 514.7 (47.9) 362.8 (33.8) 157.9 (14.7) 38.7 (3.6) 1074.0 (100)
2000–2004 1285.1 (30.5) 1105.7 (26.3) 255.3 (6.1) 1564.7 (37.2) 4210.8 (100)
2005–2008 7660.0 (38.5) 2447.3 (12.3) 453.8 (2.3) 9341.7 (46.9) 19902.7 (100) Note: Parentage share in parenthesis. Source: SPIESR-GIDR locational dataset of Indian manufacturing firms (2009) In terms of export intensity—exports as a per cent of sales—Karnataka firms were found to have a consistently increasing figure from 6.5 per cent in 1991–94 to 37.2 per cent in 2005–08 (Figure-2). While all the categories of firms have generally improved their export intensities, domestic standalone firms once again outperformed others. Export intensity increased from 12 per cent in 1991–94 to 68.6 per cent in 2005–08 for domestic standalone firms, 10.4 per cent in 1991–94 to 31 per cent in 2005–08 for domestic business groups, 1 per cent in 1991–94 to 30 per cent in 2005–08 for public sector firms, and 4 per cent in 1991–94 to 13.3 per cent in 2005–08 for foreign affiliates. Domestic standalone firms maintained highest export intensity among all groups of firms and throughout the study period. This once again confirm our earlier observation that expansion in Karnataka manufacturing exports is dominantly led by higher export-orientation of domestic standalone firms, distantly followed by domestic business groups and public sector firms. Figure-2 Export Intensity of Karnataka Manufacturing Firms, 1991–2008
Note: Export-intensity is the weighted average of export intensity of individual firms weighted by their sales relative to the total sales of the relevant group. Source: SPIESR-GIDR locational dataset of Indian manufacturing firms (2009)
6.512.1 10.4
4.41.0
8.9
24.4
9.0 8.70.9
21.3
36.7
23.1
11.716.8
37.2
68.6
31.1
13.3
30.1
0
10
20
30
40
50
60
70
80
All Firms Domesticstandalone
Domestic businessgroups
Foreign firms Public sector
1991–1994 1995–1999 2000–2004 2005–2008

10
Exports by technological categories It will be useful to analyse export behaviour of Karnataka manufacturing firms from technological intensity of manufacturing activities. As technology-intensive industries are assumed to be a source of new technology, productivity and high value-addition, it is imperative that Karnataka should strengthen its competitiveness in these vital sectors. Thus, Karnataka manufacturing firms are further grouped on the basis of the technology intensity as per the relevant OECD classification. Accordingly, high-technology sectors are assumed to include chemicals, pharmaceuticals, electrical & optical equipment, machinery & equipment and transport equipment, whereas sectors like pulp and paper products, publishing and printing, textiles and textile products, food including beverages and tobacco, wood and wood products, leather and leather products, other manufacturing, and diversified are defined as low technology firms. Medium-technology sectors consist of coke and refined petroleum products, rubber and plastic products, other non-metallic mineral products, and basic metal and metal products. Karnataka manufacturing firms from all the three technological categories of industries have apparently succeeded in improving volumes of their exports. However, the most impressive export contribution came from the medium-technology firms that exported $9356 million in 2005–08, about 203 times of their exports of $46 million in 1991–94 (Table-4). Between 1991–94 and 2005–08, exports of low- and medium-technology firms respectively increased by 34 and 16 folds. The analysis of relative export shares reveal that Karnataka manufacturing exports is progressively getting concentrated to low- and medium-technology industry segments. The share of high technology sectors in Karnataka manufacturing exports has gradually fallen below 10 per cent in 2005–08 from about 28 per cent in 1991–94 (Table-4). On the contrary the share of medium technology firms rose from 11 per cent to 47 per cent between these sub-periods. During 2005–08 low- and medium-technology products accounted for as high as 90 per cent of Karnataka’s manufacturing export baskets. This is clearly a worrying fact for Karnataka policy makers as the state’s export specialization is becoming low- and medium- technology products rather high technology manufactures. A better performance by high-technology firms would be of importance for building a globally competitive and sustainable Karnataka economy. Table-4 Exports by Sectors, US$ million & Percentage
Period Exports ($ million)
High-technology
Medium-technology
Low-technology
Grand Total
1991–1994 116(27.9) 46(11.1) 253(61.0) 414(100)
1995–1999 238(22.1) 152(14.2) 684(63.7) 1074(100)
2000–2004 665(15.8) 1656(39.3) 1890(44.9) 4211(100)
2005–2008 1899(9.5) 9356(47.0) 8647(43.4) 19903(100)
Note: Parentage share in parenthesis. Source: SPIESR-GIDR locational dataset of Indian manufacturing firms (2009) The finding that Karnataka manufacturing exports is more driven by low- and medium- technology firms can be further corroborated by examining their export intensities. Among the

11
three technological groups, low-technology firms possessed highest export intensity, followed by medium- and high-technology enterprises (Figure-3). Low technology firms achieved an export intensity of 68 per cent in 2005–08, which is doubled and quadrupled the export intensity of medium- and high-technology firms accordingly. Thus, most aggressive exporters from Karnataka come from low and medium-technology segment of manufacturing. High-technology firms are rather modest players in international trade. Figure-3 Export Intensity of Karnataka Manufacturing Firms by Sectors, 1991–2008
Note: Export-intensity is the weighted average of export intensity of individual firms weighted by their sales relative to the total sales of the relevant group. Source: SPIESR-GIDR locational dataset of Indian manufacturing firms (2009) Exports by size of firms Firm export performance can also be explored based on different size categories of sample firms. Following the Micro, Small and Medium Enterprise Development Act, 2006, Karnataka manufacturing firms are divided into three groups, namely small, medium and large enterprises based on specified investment ceilings and available firm-specific latest year data on cumulative investment in plant and machinery. Manufacturing firms with an accumulated value of plant & machinery up to Rs. 5 crore is taken as small firms, those with investment above Rs. 5 crore but up to Rs. 10 crore are termed as medium firms and that with investment of above Rs. 10 crore is designated as large firms. Karnataka manufacturing firms of all sizes appear to have enhanced their respective export volume over times, however, with an asymmetric rate. Medium enterprises displayed a rapid growth with their exports jumping by 554 folds to become $5537 million in 2005–08 from just $10 million in 1991–94. Large sized firms achieved 51 folds surge in their exports between 1991–94 and 2005–08 while small firms come next with 12 fold enlargement in export. It is important to note that Karnataka’s manufacturing exports is excessively dependent on large firms that contribute more than 60 per cent of the state total exports. Small firms that once were
3.1 3.4
19.8
4.0 4.6
24.5
9.9
19.3
41.6
16.6
32.0
67.8
0.0
10.0
20.0
30.0
40.0
50.0
60.0
70.0
80.0
High‐technology Medium‐technology Low‐technology
1991–1994 1995–1999 2000–2004 2005–2008
12
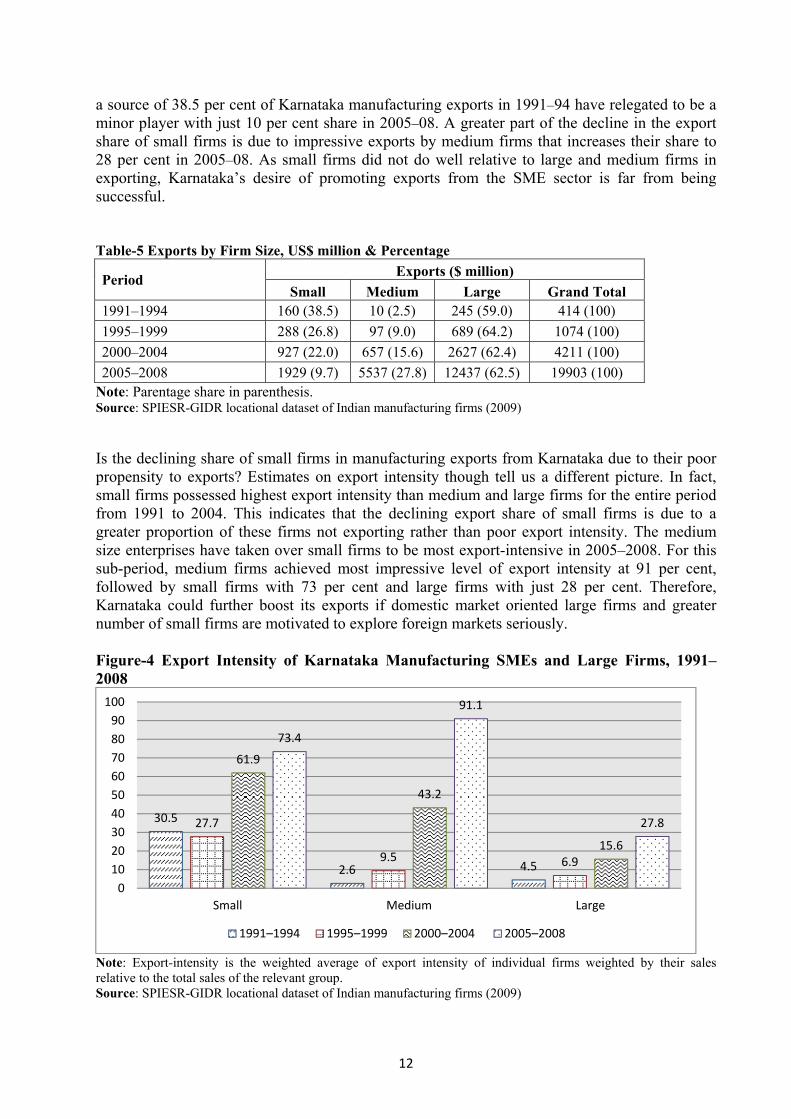
a source of 38.5 per cent of Karnataka manufacturing exports in 1991–94 have relegated to be a minor player with just 10 per cent share in 2005–08. A greater part of the decline in the export share of small firms is due to impressive exports by medium firms that increases their share to 28 per cent in 2005–08. As small firms did not do well relative to large and medium firms in exporting, Karnataka’s desire of promoting exports from the SME sector is far from being successful. Table-5 Exports by Firm Size, US$ million & Percentage
Period Exports ($ million)
Small Medium Large Grand Total 1991–1994 160 (38.5) 10 (2.5) 245 (59.0) 414 (100)
1995–1999 288 (26.8) 97 (9.0) 689 (64.2) 1074 (100)
2000–2004 927 (22.0) 657 (15.6) 2627 (62.4) 4211 (100)
2005–2008 1929 (9.7) 5537 (27.8) 12437 (62.5) 19903 (100) Note: Parentage share in parenthesis. Source: SPIESR-GIDR locational dataset of Indian manufacturing firms (2009) Is the declining share of small firms in manufacturing exports from Karnataka due to their poor propensity to exports? Estimates on export intensity though tell us a different picture. In fact, small firms possessed highest export intensity than medium and large firms for the entire period from 1991 to 2004. This indicates that the declining export share of small firms is due to a greater proportion of these firms not exporting rather than poor export intensity. The medium size enterprises have taken over small firms to be most export-intensive in 2005–2008. For this sub-period, medium firms achieved most impressive level of export intensity at 91 per cent, followed by small firms with 73 per cent and large firms with just 28 per cent. Therefore, Karnataka could further boost its exports if domestic market oriented large firms and greater number of small firms are motivated to explore foreign markets seriously. Figure-4 Export Intensity of Karnataka Manufacturing SMEs and Large Firms, 1991–2008
Note: Export-intensity is the weighted average of export intensity of individual firms weighted by their sales relative to the total sales of the relevant group. Source: SPIESR-GIDR locational dataset of Indian manufacturing firms (2009)
30.5
2.6 4.5
27.7
9.5 6.9
61.9
43.2
15.6
73.4
91.1
27.8
0
10
20
30
40
50
60
70
80
90
100
Small Medium Large
1991–1994 1995–1999 2000–2004 2005–2008

13
3. Firm Level Export Determinants for Karnataka For promoting exports, it is imperative to understand various factors that motivate a firm to start exporting and undertake higher commitment for exports. The policy makers from Karnataka should know why some firms do better exports than others and why some turns out to be more export-intensive than other exporting firms. The present section seeks answer to the above questions by undertaking quantitative analysis of the sample firms. 3.1. Export Determinants: A Review of Literature The extant literature suggests that firm level export performance is crucially shaped by firms’ own characteristics, sectoral specificities and policy related incentives. The role of firm-specific technological and non-technological (i.e. physical, human, and social) resources in export activities has been strongly emphasised in various theoretical frameworks like neo-technology theories of international trade (Posner, 1961; Vernon, 1966), stage theory of internationalization (Johanson and Wiedersheim-Paul, 1975; Newbould, Buckley and Thurwell, 1978; Buckley, 1989; Johanson and Vahlne, 1977, 1990, 2006), and resource-based theory of the firm (Penrose, 1959; Barney, 1991; Connor, 1991). 3.1.1. Firm size Size of the firm (SIZE) has been found to be a crucial firm level determinant of export performance (Kumar and Pradhan, 2007; Bernard and Wagner, 2001, Bernard and Jensen, 1999; Roberts and Tybout, 1997; Kumar and Siddharthan, 1994; Calof, 1994; Bonaccorsi, 1992). Large size generally allows firms a preferential access to capital, skills, raw materials etc., so as to enjoy distinct advantages in internationalization activities including exports. Large and resourceful firms possess competitive advantages in the product and inputs market and greater ability to bear risk and uncertainty of venturing into overseas operations. Small firms, on the contrary, characterised by limited resource, low ability to take risk and lower economy of scale, face greater constraints in doing exports. The resource-based view of the firm (Barney, 1991; Connor, 1991; Penrose, 1959) and monopolistic advantage theory of transnationalization (Caves, 1971; Kindleberger, 1969; Hymer, 1960) suggested that the process of firms’ internationalisation is dependent on firm-specific accumulated resources and monopolistic advantages respectively. Since small firms relatively have lower level of such resources as compared to large firms, firm size does explain inter-firm differences in internationalization process. It is also argued that when firm size grows beyond certain level the firm’s core capabilities become core rigidities because of loosening of its pro-activeness and flexibilities, which were their competitive strength when they were of moderate size (Pradhan, 2008; Sterlacchini, 2001). Hence, SIZE is likely to have a positive influence on exports, while its squared term SIZE2 is postulated to have a negative coefficient. 3.1.2. Firm age As per the learning models of industrial and firm dynamics (Ericson and Pakes, 1995; Jovanovic, 1982), the age of firm (AGE) represents firm’s accumulated learning and information over the past. Therefore, relatively older firms given their long-term business experience, networks and linkages can be expected to do better in international market than newly established firms.

14
A contradictory possibility, though, may occur if the secured position enjoyed by the old and established firms in the domestic market provides them less incentive for exploring overseas opportunities. On the other hand, newly started entities might turn out to be proactive exporters as they have fringe status in the domestic market. Exports become a lucrative business strategy for young firms to escape from stiffer domestic competition and to achieve optimum plant utilisation. The impact of firm age in exporting activities, therefore, is a priori not clear. 3.1.3. In-house technological activities Technology is one of the most crucial intangible assets that affect firm’s export behaviour. In the trade theory of ‘technology gap’ innovating firms/countries emerge as leaders in international markets because of the time lag in technology transfer/diffusion from innovating firms/countries to non-innovating firms/countries (Dosi and Soete, 1988; Soete, 1981; Posner, 1961). Firms’ regular technological efforts targeted at developing new products, production technique and improvement in product features are, thus, expected to enhance their exporting capabilities (Anh et. al., 2007; Singh, 2006; Fernandez and Nieto, 2005; Yang, Chen and Chuang, 2004; Lefebvre and Lefebvre, 2002; Bleaney and Wakelin, 1999; Wakelin, 1998; Braunerhjelm, 1996). In the present study, the in-house R&D expenses of the firm as a percentage of sales (RDIN) is taken as a measure of firm’s indigenous technological efforts. Ceteris paribus, RDIN is expected to contribute to firm’s export activities. 3.1.4. Foreign technology imports Developing country firms in their initial period of establishment tend to depend heavily on innovation driven developed countries for accessing necessary production technologies (Lall, 1995; Nelson, 1987; Teitel, 1987; Kim, 1980). Foreign technology acquisition by these firms generally assumes two notable forms like imports of new capital goods and equipment and disembodied imports like technological licensing. While imported new machineries and capital goods may support firms’ exporting by enlarging their supply capacity, the role played by technology contracts is not straight forward. This is because technology contracts to developing countries come with restrictive clauses that prohibit the sale of products manufactured through imported technology outside the technology importing country (UNCTC, 1984). Thus, technological payments made abroad by the firm as a percentage of its sales (ETP1) is postulated to have a vague effect on exports but a positive role can be hypothesized for imports of capital goods as a percentage of sales (ETP2). 3.1.5. Product differentiation As export markets for a number of commodities are characterised by marketing entry barriers, national firms undertaking conscious advertising and marketing efforts to build brand recognition are expected to do better in exporting than those firms focusing marginally on sales promotion activities. This is because advertising enable firms to differentiate their products from others by creating brand image in the minds of the buyers (Pradhan, 2008). Further marketing skills are often supposed to be relatively scarce resources for the firms in developing countries that hinder their manufacturing exports (de la Torre, 1971). Hence, marketing and advertising expenses (ADV) of the firm, which is taken as a measure of product differentiation activities, is predicted to influence exports favourably.

15
3.1.6. Domestic business group affiliation Firms in developing economies generally operate under the conditions of extensive market failures and asymmetric information (Guillén, 2000; Khanna and Palepu, 2000). In this context, an affiliating firm to a domestic business group that share and enjoy access to group infrastructure, information, inputs, skills, technologies, etc., is likely to be protected from negative impact of market failures. On the other hand the standalone firms are likely to face high degree of uncertainties on account of lack of access to infrastructure, information and other key resources. This would suggest that group affiliating firms shall be more comfortable in exporting from developing country situations than standalone firms. Hence, BGA that takes unit value for group affiliation and zero otherwise is hypothesised to have a positive effect on firms’ export activities. 3.1.7. Foreign affiliations The affiliation of a firm to multinational enterprises (MNE) may encourage one to undertake more exports as affiliating firms get access to a variety of intangible resources such as capital, technology, marketing skill, information and distribution networks in the global market (de La Torre, 1971). The role of FDI in promoting the export performance of a number of developing economies has been identified (UNCTAD, 2002). It is suggested that MNE affiliation may be more relevant to the local firms engaged in the production of technology-intensive and dynamic export oriented products. In the Indian context, a number of studies have brought out a positive association of foreign ownership and firms’ export performance for recent periods (Kumar and Pradhan, 2007; Siddharthan and Nollen, 2004; Aggarwal, 2002). Hence, affiliation to foreign companies (AFF) is taken as a relevant variable to study the firms’ export behaviour. 3.1.8. Fiscal incentives Home country policy regime tends to sanction a number of fiscal benefits to promote exports by the national firms. These measures such as duty-drawback, export credit, export insurance, tax holiday on export income are likely to play a positive role in export activities (Pradhan and Sahu, 2008; Roy, 1993; Fitzgerald and Monson, 1989). In India, the union government has been providing incentives to the exporting firms through a variety of schemes such as duty free import of inputs required for export production under the Duty Exemption Scheme, concessional duty on the import of capital goods under Export Promotion Capital Goods (EPCG) Scheme, reimbursement of central excise and custom duties paid on the inputs used in the manufacture of goods meant for export under Duty Drawback Scheme, and various benefits to Export Oriented Units (EOU) and firms located in Special Economic Zone (SEZs). These fiscal incentives (FSB) may release additional resources to firms for improving their supply and competitive capabilities to meet the global quality challenges and to reduce the operative cost of internationalisation, thus, promoting exports. 3.1.9. Sector-specific factors Sectors vary greatly in terms of technological opportunities, degree of competition from foreign firms and competitive structure. Such inter-industry differences may also influence firms’ export performance across sectors. Firms operating in industries with high level of R&D intensities (RDS) are likely to benefit from a greater scope to do technological improvements for improved product quality and efficiency, which may translate into greater export activities (Barros, Gorg and Strobl, 2003).

16
At the same time, the entry of foreign firms possessing more product varieties that increase competition in the domestic market may cause pro-export behaviour on the part of domestic firms. Surviving local firms shall be forced to increase their R&D efforts to reduce costs and improve product quality when faced with competition from foreign firms (FIS). Local firms may experience a boost in their exports due to the forward and backward linkages, demonstration of new technologies and management practices, and knowledge spillovers that foreign firms create in the local economy (UNCTAD, 1999, 2001). Thus, sectors under heavy pressures from foreign firms may throw up more export-intensive domestic firms than other sectors. Firms’ export performance is also linked to the level of industry concentration. On the one hand, highly concentrated industries that give strong market power to their firms might discourage exporting. On the other hand, the dominant firms that possess strong intangible and tangible assets might be more inclined for exploring export markets as well (Wu, Fu and Tang, 2010). Therefore, exporting is ambiguously related to the level of industry concentration (HI). 3.2. Empirical Framework In the backdrop of above discussion, the present study specified the following analytical model for explaining inter-firm patterns of export intensity:
)...(..........
21
131211109
876542
3210
AFSBFISRDSHIBGA
AFFADVETPETPRDINSIZESIZEAGEFEX
ititjtjtjti
iitititititititit
Where explanatory variables are as measured in Table-6 and εit is the random error term.
Table-6 Description and Measurement of Variables Variables Symbols Measurements
Dependent Variable
Firm Export Intensity FEXit Goods and services exports of ith manufacturing firm as a per cent of sales in the year t.
Independent variables
Firm-specific variables
Firm Age AGEit Natural log of the age of ith firm in number of years from the year of its incorporation.
Firm Size SIZEit Natural log of total sales (Rs. Million) of ith firm in tth year.
Firm Size Squared SIZE2it Squared of the natural log of total sales (Rs. Million) of ith firm in tth year.
External Technology Purchase ETP1it
Expenses in royalties, technical and other professional fees paid abroad by ith firm as a per cent of sales in the year t.
ETP2it Expenses on imports of capital goods and equipment by ith firm as a per cent of sales in tth year.
R&D Intensity RDINit R&D expenditure (capital+current) as a per cent of total sales of ith firm in tth year.
Product Differentiation ADVit Advertising and marketing expenses of ith firm as a per cent of sales in the year t.
Affiliation to Foreign Firm AFFi Assume 1 if ith firm has affiliation to a foreign firm, 0 otherwise.
Business Group Affiliation BGAi Assume 1 if ith firm has affiliation to a domestic business group, 0 otherwise.
Industry-specific variables
Sectoral R&D intensity RDSjt R&D expenses (capital+current) of jth Indian industry as a per cent of industry sales in tth year.
Sectoral concentration HIjt Natural log of Herfindahl Index of jth Indian industry in tth year based on domestic sales.
Competition from foreign investment
FISjt Foreign firms’ share in domestic sales of jth Indian industry in tth year.
Policy variable
Fiscal benefits FSBit Total fiscal benefits related to exports activities received by ith firm as a per cent of sales in the year t.
17
3.3. Data Source and Method of Estimation The empirical Model A has been tested for a sample of Karnataka manufacturing firms during 1991‒2008 drawn from a multi-dimensional dataset SPIESR-GIDR locational Dataset on Indian Firms (SG-LoDIF) built for an ICSSR project (see Appendix A1 for detail). In this database all the firm-level financial and non-financial variables are derived mainly from the Prowess Database of the Centre for Monitoring Indian Economy (CMIE). While firm- and policy-specific variables are measured at the individual Karnataka manufacturing firm level, sector-specific variables, namely industry level R&D intensity (RDS), Herfindahl index (HI) and foreign firms’ share in domestic sales (FIS) are calculated based on the full sample of Indian manufacturing firms. Three-step Censored Quantitle Regression (CQR) The dependent variable in the model A is basically censored in character as it assumes zero values for firms not exporting in a given year. For instance, 51 per cent of observations in our sample of Karnataka manufacturing firms possess zero export during the study period 1991‒2008. The traditional Tobit estimator though useful for censored dependent variable, requires strong parametric assumptions and is incapable of managing extreme censoring. Moreover, Tobit produces unreliable estimates when there is heteroscedastic, non-normal and asymmetric errors. For extremely censored dependent variable the error term is likely to violate the classical assumption and it is recommended to apply Powell’s (1986) censored quantile regression (CQR) for obtaining more robust and consistent estimates (Powell, 1986; Chay and Powell 2001; Wilhelm, 2008). Powell’s CQR method manages censoring semi-parametrically based on the quantile function. For estimating the CQR for samples with heavy censoring and high dimensionality a three-step algorithm was introduced by Chernozhukov and Hong (2002). In its first step, the Chernozhukov and Hong algorithm starts with estimating the conditional probabilities of censoring through a logit binary choice model and then selecting a subsample for which the conditional quantile function lies above the censoring point. That is, after estimating the probability model, ∗ for the full sample a subset of observations
∗ 1 was selected. Here, is an indicator of not censoring, ∗ is a suitable transformation of the matrix of explanatory variables, is the preferred conditional quantile to keep the set of observations that are above the censoring point, and c is the trimming constant chosen such that ratio of the size of the selected subsample to the size of the quantile-uncensored subsample is 0.9. As in our sample, 50th percentile value of the distribution of export intensity is zero, this distribution is centered at 75th per cent quantile that depart from the censoring point upward (i.e. 0.75 . So our specification relates changes in the 0.75 quantile of the export intensity to the changes in the predictor variables. In the second step, the Chernozhukov and Hong algorithm fits an ordinary quantile regression to the subsample to arrive at an initial estimator . This initial estimator is not efficient even though it is consistent. Now, the final subsample of quantile-uncensored observations
∗ 0 was selected using the predicted values of the estimated quantitle regression. In the final step, the Chernozhukov and Hong algorithm runs quantile regression for with bootstrap standard errors based on selected number of replications. For robust standard errors we have used 1000 replications.

18
As a number of firm-level explanatory variables are not strictly exogenous with the possibility of reverse feedbacks from the dependent variable the estimation may suffers from the problem of endogeneity. For example, firms’ R&D performance may be influenced by its export activities (e.g. Pradhan, 2011). Likewise, other factors like firm survival (age), size, purchase of foreign technologies and advertising expenses may possibly be influenced by export intensity of the firm. For minimising any such bias all the firm-specific variables, except AFF and BGA dummies, were introduced in one year lagged form. Another common problem is multicollinearity and in fact we found that firm size (SIZE) and its squared term (SIZE2) are strongly correlated. To address this problem of multicollinearity we used mean centred series in place of SIZE and SIZE2. 3.4. Results and Inferences An unbalanced sample of 267 Karnataka manufacturing firms for the period 1991‒2008 has been used to obtain the final estimates for the empirical model A9. The CQR estimation is done at the full sample of Karnataka manufacturing firms as well as three technology-based subsamples classified following the OECD technological classification of manufacturing industries10. The idea is to examine if export determinants of Karnataka firms vary across technological intensities of manufacturing activities. Table-7 summarizes findings from the three-step CQR and descriptive statistics for the full sample is presented in the annexure Table-A2. All the fitted models are overall highly significant as indicated by the respective estimated F statistics but relatively the F statistic for the model related to the medium-technology subsample is lowest. This indicates that the specified export function in fact takes into account relevant variables to explain inter-firm variation in export intensity. The performance of individual variables is presented below. AGEit-1 has a negative and significant effect on the export intensity of Karnataka manufacturing firms at the level of full sample as well as subsamples of firms from high- and low-technology sectors. However, its coefficient is statistically not different from zero for the sub-sample of medium-technology firms. This would suggest that newer firms from Karnataka are generally more export intensive then their older counterparts. It emphasizes that the emerging entrepreneurial and industrial leaders in Karnataka have a distinct tendency to move early into international activities deeply as against the established business groups.
9 Originally we had a sample of 376 manufacturing firms from Karnataka. As a result of the trimming process involved in the Chernozhukov and Hong algorithm to arrive at the final sample, the number of firms got reduced to 267. 10 The industries falling under ‘High’ and ‘Medium-high’ technology in the OECD classification are define as the high-tech category in present study while industries belonging to ‘Medium-low’ and ‘Low technology ‘in OECD are respectively termed as medium-tech and low-tech categories. The OECD technological classification is accessible at: http://www.oecd.org/dataoecd/43/41/48350231.pdf

19
Table-7 Firms’ Export Determinants of Karnataka Manufacturing Firms
Dependent Variable: Export Intensity
Independent variables
Coefficients (Absolute bootstrap t-statistic)
Full sample High-tech subsample
Medium-tech subsample
Low-tech subsample
AGEit-1 -5.397883*** (4.17) -2.246325** (2.40) -7.842879 (1.47) -13.050387*** (3.53) SIZEit-1 2.651290*** (4.36) 0.835951** (2.15) -2.430941 (1.02) 4.744413** (2.54) SIZE2
it-1 0.199072 (0.60) -0.392093** (2.41) 1.416228* (1.77) 3.671750*** (3.55) ETP1it-1 0.674605 (1.41) 0.690149 (1.26) -0.652525 (0.04) -1.441382 (0.69) ETP2it-1 0.346891 (1.23) 0.012700 (0.19) -0.196298 (0.21) 0.848193* (1.66)
RDINit-1 0.257692 (0.40) 0.759907 (1.11) -4.551897 (0.22) 27.653517 (1.40)
ADVit-1 -0.173609** (2.26) -0.431088*** (3.73) -3.203619*** (2.70) 0.026560 (0.12)
AFFi -1.720843 (0.97) 1.018481 (0.76) 11.433900 (0.56) -7.189757 (1.36) BGAi -0.399050 (0.48) -0.355952 (0.32) 1.097743 (0.34) -16.785448*** (4.24) HIjt 42.606463** (2.01) -17.040335 (0.61) -61.535692 (0.85) 46.089655* (1.79)
RDSjt 6.348210*** (3.93) 9.365707*** (5.31) 87.688673*** (4.76) 10.158861 (0.88)
FISjt 0.008631 (0.19) 0.241413** (2.29) 0.358092 (0.99) 0.051490 (0.32)
FSBit-1 9.037804*** (10.73) 9.636073*** (5.92) 7.056609*** (4.33) 7.633928*** (5.69)
Constant 18.583987*** (4.01) 2.874572 (0.76) 16.222086 (0.92) 48.838439*** (3.07) F-value! 33.68 12.57 4.69 31.15 Prob > F 0.0000 0.0000 0.0000 0.0000 Observations 1698 803 207 622 No. of exporting firms@ 179 90 21 71
No. of total firms@ 267 119 31 113 Proportion of exporting firms@ 67.0 75.6 67.7 62.8
Note: Absolute value of bootstrap t-statistics in parentheses; * significant at 10%; ** significant at 5%; *** significant at 1%; !-test values are obtained from the independent tests conducted to check if the coefficient of all explanatory variables are simultaneously zero using the testparm command in the STATA; @- Number of firms from the final sample obtained in the second step of the Chernozhukov and Hong’s CQR algorithm as described in the text. SIZEit-1 is found to have a positive and significant coefficient for the full sample while it’s squared term, SIZE2
it-1, turns up with an insignificant effect. Therefore, large sized Karnataka firms enjoyed a special edge in manufacturing exporting and this advantage goes up linearly with increases in firm size. The subsample estimations, however, show that firm size-exporting relation varies depending upon the technological intensities of manufacturing activities. For high-technology subsample, the linear and quadratic terms, both are significant with a positive and negative sign respectively. This implies that increases in firm size promote high-technology exports of Karnataka firms but up to some critical level of sales. In the case of medium-technology subsample, the linear coefficient of firm size is insignificant but its quadratic term is positive and significant. In contrast to the findings for high-technology subsample, both the linear and quadratic terms are positive and significant for low-technology manufacturing. Thus, firm size-export relationship follows an inverted U-shaped curve for Karnataka manufacturing firms in high-technology sectors but a U-shaped one for low-technology industries. These results underline the fact that the size can promote exports of Karnataka firms operating in low-technology sectors if they first exceed some critical level of sales.

20
Figure-5: Total Effect of Firm Size A: High-tech subsample
B: Low-tech subsample
ETP1it-1 and ETP2it-1 both come up with coefficients that are statistically not different from zero, except modestly significant and positive effect of ETP2it-1 for low-technology subsample. Thus, foreign technology imports in embodied and disembodied channels seem to add little advantage for exporting by Karnataka manufacturing firms. However, firms upgrading their physical capital stocks by importing new equipment and machineries are likely to reap some gain for undertaking exports in low-technology sectors. RDINit-1 has a predicted positive sign in the full sample of Karnataka manufacturing firms but failed to achieve acceptable significance level. It continues with non-significant effects for subsample estimations. In-house R&D, therefore, seen as playing a marginal role in firms’ export performance from Karnataka. It may be a reflection of the fact that R&D by Karnataka manufacturing firms is either negligible or inadequate for creating export competitiveness. ADVit-1 shows up with a significantly negative coefficient for the full sample and subsamples of high-technology and medium-technology. It has an insignificant role in the exporting for Karnataka firms from low-technology sectors. This implies that advertising-intensive Karnataka firms tend to focus more on national market than overseas markets. Probably the large size of the domestic market acts as a disincentive for firms to do more exports, especially if they are able to discriminate their product and create brand image based on strategic advertising and selling activities. AFFi has consistently insignificant impact on firms’ export performance across estimations. This corroborate our previous observation that Karnataka while benefitted from attracting export-oriented FDI in IT sector is yet to replicate it in the case of manufacturing activities. Probably, actual FDI inflows into Karnataka manufacturing sector is far below its potential or such inflows are mostly on account of domestic market-oriented projects11. BGAi is found with coefficients that are not different from zero for majority of the estimations. In the case of low-technology subsample alone it has a significant and negative effect on firms’
11 From January 2000 to December 2009, more than 52 per cent of FDI equity inflows received by Karnataka have gone into services sector including computer software, real estate, construction and telecommunication (Department of Industrial Policy and Promotion, 2009).
Total effect of lagsizecent
F(la
gsiz
ecen
t la
gsiz
ecen
tsqr
d)
l agsizecent-4.24669 4.25865
-10.6212
.445566
Total effect of lagsizecent
F(la
gsiz
ecen
t la
gsiz
ecen
tsqr
d)
lagsizecent-5.50738 5.49456
-1.5326
136.919

21
export behaviours. This indicates that there may not be much difference between standalone firms and domestic business group affiliated firms as far as manufactures exporting from Karnataka is concerned. Among sector-specific variables, HIjt has a positive sign and is different from zero for the full sample. Therefore, Karnataka manufacturing firms emerging from concentrated domestic industries may achieve higher export performance. Subsample estimations, however, verify that this positive role of industrial concentration is largely confined to the low-technology sectors. In the case of high- and medium-technology sectors, firms export performance is not systematically related to domestic market structure. RDSjt achieves a positive effect throughout and is significant for the case of full sample and high- and medium-technology subsamples. This may indicate that Karnataka firms if belong to R&D-intensive industries are likely to be more export-oriented. FISjt measuring the competition from foreign firms operating in Indian markets, has a positive sign consistently but is non-zero statistically only for high-technology subsample. While exporting by Karnataka manufacturing firms are generally not affected by the intensity of foreign competition, those from high-technology sectors do feel that impact strongly. Growing domestic market share of foreign firms in India would push more exports by Karnataka firms producing high-technology products. FSBit-1, the sole policy variable, has a significantly positive effect consistently. That would suggest that Karnataka firms export is crucially and positively influenced by different fiscal incentives that are provided for export promotion. 4. Conclusions and Implications This study has explored the export promotion policies adopted by the Karnataka state in India and evaluated the state performance in exporting. As Karnataka is among pioneering Indian states to adopt export promotion as one of its sine-qua-none component of industrialization, its study is important for understanding the linkages between regional policies and global competitiveness of regions in a given country. For encouraging industrialization and exports by Karnataka firms, the state government created a set of institutions like the Department of Industries and Commerce, Visvesvaraya Industrial Trade Centre, Karnataka Industrial Areas Development Board, Karnataka Council for Technology Upgradation and host of other agencies. These institutions played crucial role in expanding industrial capabilities and infrastructure aim at enabling successful integration of local enterprises into specific segments of global market. The long-term export promotion strategy of the state included policies geared towards encouraging acquisition and development of technologies, disseminating information on international trade, supporting to earn quality standards, establishing industrial areas/growth centres, sector specific parks, SEZs, etc. These strategic policies by the state have had a positive effect on the capacity and intensity of local firms in doing exporting. Total exports from Karnataka continued to rise substantially to contribute half a quarter of national exports of commodities and software during the second half of the last decade. In the case of coffee, electronics, software and ores & minerals, Karnataka emerged as the most dominating exporting state in India.

22
However, there are a number of concerns over Karnataka export performance evident in the present analysis. First, the export basket of the state has not undergone sectoral diversification, which is important for sustaining the export performance in the long run. The falling shares of primary sector and manufacturing products in the state export underline the need for calibrating policy measures to bring about a more diversified export structure. Second, state exports are more driven by low- and medium-technology products, thus, exposing the limitation of the state in encouraging her technology-intensive exports. Third, the state appears to be unable to inspire local established business groups and foreign subsidiaries in doing more exports as evident by falling shares of both these category of firms in the state manufacturing exports. Fourth, small firms from Karnataka manufacturing sector, on the contrary to the policy objective of the state, are found with shrinking export share as against medium and large enterprises. In spite of their high export intensity, small firms’ share in state manufacturing export declined as the state policy is not able to increase the proportion of exporters among small firms. The empirical analysis on determinants of exporting for Karnataka manufacturing sector identified a number of relevant factors. Karnataka firms export performances is found to be positively and linearly influenced by firm size at the overall manufacturing level. This would suggest that export can be facilitated by developing industrial clusters with common facility centres and agglomeration that mitigate size disadvantage of local SMEs in a given region. A non-linear relationship between firm size and exporting, though, can be observed for Karnataka high- and low-technology sectors. Another important factor that positively influences Karnataka firms’ export performance is the provision of fiscal incentives. Therefore, Karnataka can use fiscal incentives as a key component of her policy strategy for stimulating firm-level exports. The firm age is seen to have played a discouraging role in firms’ exporting behaviour. This signifies proactive export strategies of newer firms in Karnataka as compared to their old and established counterparts. Therefore, Karnataka may benefit by targeting and encouraging older firms for export promotion. Further, results imply that there is no substantial difference between exporting done by domestic enterprises and foreign affiliates; similarly between domestic firms and business group affiliated companies. Imports of foreign technologies in either disembodied or embodied channels seem to be not so crucial factors for exporting by Karnataka firms. In-house R&D turns out to be another less relevant factor for shaping firms’ exporting in Karnataka. Thus, R&D done by Karnataka firms might be inadequate in scale and quality for achieving export competitiveness. Industrial concentration and sectoral R&D are other two variables that shape firms’ exporting in Karnataka. Firms from concentrated and relatively R&D intensive sectors are likely to show higher exporting than firms from other sectors. Therefore, Karnataka should promote knowledge-based or R&D-intensive industries for developing a dynamic export profile in the long term.
23
Reference Aggarwal, A. (2002) ‘Liberalisation, Multinational Enterprises and Export Performance:
Evidence from Indian Manufacturing’, Journal of Development Studies, 38 (3), pp. 119–137.
Anh, N.N., P. Q. Ngoc, N.D. Chu, and N.D. Nhat (2007) ‘Innovation and Export of Vietnam’s SME Sector’, Paper for UNU-MERIT Conference on Micro-Evidence on Innovation in Developing Economies.
Barney, J. (1991) ‘Firm Resources and Sustained Competitive Advantage’, Journal of Management, 17, pp. 99–120.
Barrios, S., H. Gorg, and E. Strobl (2003), ‘Explaining Firms’ Export Behaviour: R&D, Spillovers and the Destination Market’, Oxford Bulletin of Economics and Statistics, 65(4), pp. 475–496.
Bernard, A.B. and J. Wagner (2001), ‘Export Entry and Exit by German Firms’ Weltwirtschaftliches Archiv, 137(1), pp.105–123.
Bernard, A.B. and J.B. Jensen (1999), ‘Exceptional Exporter Performance: Cause, Effect, or Both?’, Journal of International Economics, 47(1), pp.1–25.
Bleaney, M. and K. Wakelin (1999), ‘Sectoral and Firm-Specific Determinants of Export Performance: Evidence from the United Kingdom’, GLM Research Paper, No. 99/12, University of Nottingham.
Bonaccorsi, A. (1992) ‘On the Relationship Between Firm Size and Export Intensity’ Journal of International Business Studies, 23(4), pp. 605-635.
Braunerhjelm, P. (1996), ‘The relationship between firm-specific intangibles and exports’ Economic Letters, 53(2), pp. 213–219.
Buckley, P. J. (1989) ‘Foreign Direct Investment by Small- and Medium-sized Enterprises: The theoretical background’, Small Business Economics, 1(2), pp. 89–100.
Calof, J.L. (1994), ‘The Relationship between Firm Size and Export Behaviour Revisited’, Journal of International Business Studies, 25 (2), pp. 367–387.
Caves, R.E. (1971) ‘International Corporations: The Industrial Economics of Foreign Investment’, Economica, 38(149), pp. 1–27.
Chay, K.Y. and J.L. Powell (2001), ‘Semiparametric Censored Regression Models’, Journal of Economic Perspectives, 15 (4), pp. 29–42.
Chernozhukov, V. and H. Hong (2002), ‘Three-Step Censored Quantile Regression and Extramarital Affairs’, Journal of American Statistical Association, 97 (459), pp. 872–882.
Conner, K.R. (1991) ‘A Historical Comparison of Resource-Based Theory and Five Schools of Thought within Industrial Organization Economics: Do We Have a New Theory of the Firm?’, Journal of Management, 17(1), pp. 121–154.
de la Torre, J.R.(1971), ‘Exports of Manufactured Goods from Developing Countries: Marketing Factors and the Role of Foreign Enterprise’, Journal of International Business Studies, 2(1), pp. 26–39.
Department of Industrial Policy and Promotion (2009), SIA Newsletter - Annual Issue 2009, New Delhi: GOI.
Dosi, G. and L. Soete, (1988), ‘Technical change and international trade’, in G. Dosi, C. Freeman, R. Nelson, G. Silverberg and L. Soete (eds), Technical Change and Economic Theory, pp. 401–431, London: Printer Publisher.
Ericson, R. and A. Pakes (1995), ‘Markov-perfect industry dynamics: A framework for empirical work’, Review of Economic Studies, 62(1), pp. 53–82.
Fernandez, Z and M. J. Nieto (2005) ‘Internationalization Strategy of Small and Medium-sized Family Business: Some Influential Factors’, Family Business Review, 18(1), pp. 77–89.

24
Fitzgerald, B. and T. Monson (1989), ‘Preferential Credit and Insurance as Means to Promote Exports’, The World Bank Research Observer, 4(1), pp. 89–114.
Government of India (2009), Economic Survey 2008–09, Ministry of Finance, New Delhi: GOI. Government of Karnataka (1990), Industrial Policy 1990, Department of Industries and
Commerce, Bengaluru: GOK. Government of Karnataka (1993), Industrial Policy 1993, Department of Industries and
Commerce, Bengaluru: GOK. Government of Karnataka (2003), Export Promotion Policy 2002–2007, Bengaluru: GOK. Government of Karnataka (2009), Annual Report 2008–09, Department of Industries and
Commerce, Bengaluru: GOK. Guillén, M.F. (2000) ‘Business Groups in Emerging Economies: A Resource-Based View’, The
Academy of Management Journal, 43(3), pp. 362–380. Hindu Business Line (2003), ‘Karnataka to Double Export Share’, January 25. Hymer, S. H. (1960) The International Operations of National Firms: A Study of Direct Foreign
Investment, Ph.D. Dissertation, Massachusetts Institute of Technology. Published in 1976 Cambridge, Massachusetts: MIT Press.
Johanson, J. and J-E. Vahlne (2006) ‘Commitment and Opportunity Development in the Internationalization Process: A Note on the Uppsala Internationalization Process Model’, Management International Review, 46 (2), pp. 165‒178.
Johansson, J. and F. Wiedersheim-Paul (1975) ‘The Internationalization of the Firm-four Swedish case’, Journal of Management Studies, 12 (3), pp. 305–322.
Johansson, J. and J-E. Vahlne (1977) ‘The Internationalization Process of the Firm: A Model of Knowledge Development and Increasing Foreign Market Commitments’, Journal of International Business Studies, 8(1), pp. 23–32.
Johansson, J. and J-E. Vahlne (1990) ‘The Mechanism of Internationalization’, International Marketing Review, 7(4), pp. 11–24.
Jovanovic, B. (1982), ‘Selection and the Evolution of Industry’, Econometrica, 50(3), pp. 649–670.
Khanna, T. and K. Palepu (2000), ‘The Future of Business Groups in Emerging Markets: Long Run Evidence from Chile’, Academy of Management Journal, 43(3), pp. 268–285.
Kim, L. (1980), ‘Stages of Development of Industrial Technology in a Developing Country: A Model’, Research Policy, 9(3), pp. 254−277.
Kindleberger, C. P. (1969) American Business Abroad, New Haven: Yale University Press. Kumar, N. and J.P. Pradhan (2007) ‘Knowledge-based Exports from India: A Firm-level
Analysis of Determinants’, in N. Kumar and K.J. Joseph (2007) (eds.) International Competitiveness & Knowledge-based Industries in India, pp.53–96, New Delhi: Oxford University Press.
Kumar, N. and N.S. Siddharthan (1994) ‘Technology, Firm Size and Export Behaviour in Developing Countries: The Case of Indian Enterprises’, The Journal of Development Studies, 31(2), pp. 289-309.
Lall, S. (1995), ‘The Creation of Comparative Advantage: The Role of Industrial Policy’, In I.U. Haque, M. Bell, C. Dahlman, S. Lall and K. Pavitt (Eds.), Trade, Technology, and International Competitiveness, EDI Development Studies, pp. 103−134, Washington, D.C.: The World Bank.
Lefebvre, E., and L.A. Lefebvre (2002), ‘Innovative Capabilities as Determinants of Export Performance and Behaviour: A longitudinal study of manufacturing SMEs’, in A. Kleinknecht and P. Mohnen (eds.), Innovation and Firm Performance: Econometric Explorations of Survey Data, pp. 281–309, London: Palgrave.

25
Nelson, R. R. (1987), ‘Innovation and Economic Development Theoretical Retrospect and Prospect’, In J. M. Katz (Ed.), Technology Generation in Latin American Manufacturing Industries, pp. 78–93, Hong Kong: The Macmillan Press.
Newbould, G., P.J. Buckley and J.C. Thurwell (1978) Going International: The Experience of Smaller Companies Overseas, London: Associated Business Press.
Penrose, E. T. (1959), The Theory of the Growth of the Firm, New York: Wiley. Posner, M.V. (1961), ‘International Trade and Technical Change’, Oxford Economic Papers,
13(3), pp. 323–341. Powell, J.L. (1986), ‘Censored Regression Quantiles’, Journal of Econometrics, 32(1), pp. 143–155. Pradhan, J.P. (2008), Indian Multinationals in the World Economy: Implications for
Development, New Delhi: Bookwell Publisher. Pradhan, J.P. (2011), ‘Regional Heterogeneity and Firms’ R&D in India’, Innovation and
Development, 1(2), pp. 259–282. Pradhan, J.P. and P.P. Sahu (2008), Transnationalization of Indian Pharmaceutical SMEs, New
Delhi: Bookwell Publisher. Roberts, M. and J. Tybout (1997), ‘The Decision to Export in Columbia: An Empirical Model of
Entry with Sunk Costs’, American Economic Review, 87(4), pp. 545–564. Roy, D. K. (1993), ‘Impact of Incentives on Export Performance of Bangladesh: A Preliminary
Assessment’, Bangladesh Development Studies, 21(2), pp. 25–44. Siddharthan, N.S. and S. Nollen (2004) ‘MNE Affiliation, Firm Size and Exports Revisited: A
Study of Information Technology Firms in India’, Journal of Development Studies, 40 (6), pp. 146–168.
Singh, N. (2006) ‘R&D, Imports of Technology and Trade Intensities: A Simultaneous Equation Micro-level Examination’, in S. Tendulkar, A. Mitra, K. Narayanan and D. Das (eds.) India: Industrialization in a Reforming Economy–Essays for K L Krishna, pp. 471–491, New Delhi: Academic Foundation.
Soete, L.L.G. (1981) ‘A general Test of the Technological Gap Trade Theory’, Weltwirtschaftliches Archiv, 117(4), pp. 638–660.
Sterlacchini, A. (2001), ‘The Determinants of Export Performance: A Firm-Level Study of Italian Manufacturing’ Weltwirtschaftliches Archiv, 137(3), pp .450–472.
Teitel, S. (1987), ‘Towards an Understanding of Technical Change in Semi-Industrialized Countries’, In Katz, J. M. (Ed.), Technology Generation in Latin American Manufacturing Industries, pp. 94–115, Hong Kong: The Macmillan Press.
UNCTAD (1999), World Investment Report 1999: Foreign Direct Investment and the Challenge of Development, New York and Geneva: United Nations.
UNCTAD (2001), World Investment Report 2001: Promoting Linkages, New York and Geneva: United Nations.
UNCTAD (2002), World Investment Report 2002: Transnational Corporations and Export Competitiveness, New York and Geneva: United Nations.
UNCTC (1984), Costs and Conditions of Technology Transfer through Transnational Corporations, ESCAP/UNCTC Publication Series B, No. 3, Bangkok: United Nations.
Vernon, R. (1966), ‘International Investment and International Trade in the Product Cycle’, Quarterly Journal of Economics, 88(2), pp.190–207.
Wakelin, K. (1998), ‘Innovation and Export Behaviour at the Firm Level’, Research Policy, 26 (7–8), pp. 829–841.
Wilhelm, M. O. (2008), ‘Practical Considerations for Choosing Between Tobit and SCLS or CLAD Estimators for Censored Regression Models with an Application to Charitable Giving’, Oxford Bulletin of Economics and Statistics, 70 (4), pp. 559–582.
Wu, Y., D. Fu, and Y. Tang (2010), ‘The effects of ownership structure and industry characteristics on export performance: Evidence from Chinese manufacturing firms’,

26
Economics Discussion Paper, No. 10-09, Department of Economics, Crawley: The University of Western Australia.
Yang, C.H., J.R Chen and W.B. Chuang (2004) ‘Technology and Export Decision’, Small Business Economics, 22(5), pp. 349–64.
Appendix Data Appendix A1 The dataset: The SPIESR-GIDR locational dataset of Indian manufacturing firms has been compiled for the ICSSR (Indian Council of Social Science Research) sponsored research project entitled Exploring Regional Patterns of Internationalization of Indian Firms: Learnings for Policy. This dataset is a unique database that classifies a total of 8486 Indian manufacturing firms obtained from the Prowess database of the Centre for Monitoring Indian Economy (2009) into different Indian states and union territories based on their plant location, product profile (producer of single or multi-products), and size of production (capacity/actual). As the location information obtained from the Prowess is not comprehensive and there is no information available on the plant location of 1000 odd companies, these data gaps have been filled with information collected through intensive internet searches of company websites, annual reports, consultancy reports, etc. The Prowess database provides company specific financial variables like sales, exports, R&D, etc. Table- A2: Descriptive Statistics for Full Sample Variable Mean Std. Dev. Min Max Independent variable FEXit 14.25 26.58 0 100 Dependent variable AGEit-1 2.86 0.74 0 4.58 SIZEit-1 0.00 1.48 -4.80 6.82 SIZE2
it-1 2.19 3.68 4.75E-06 46.48 ETP1it-1 0.39 2.78 0 52.69 ETP2it-1 2.57 18.01 0 337.74 RDINit-1 0.32 1.74 0 48.28 ADVit-1 2.71 4.37 0 30.78 AFFi 0.17 0.37 0 1 BGAi 0.29 0.46 0 1 HIjt 0.05 0.06 0.01 0.56 RDSjt 0.53 0.88 0 5.39 FISjt 20.13 12.34 0 59.03 FSBit-1 0.66 2.13 0 38.61 Note: No. of observations =1698 for the final sample obtained in the second step of the Chernozhukov and Hong’s CQR algorithm as described in the text; ; SIZEit-1 is the mean centred series of the original variable.