Reduced interferon (IFN)-α conditioned by IFNA2 (−173) and IFNA8 (−884) haplotypes is...
28
Reduced interferon (IFN)-α conditioned by IFNA2 (−173) and IFNA8 (−884) haplotypes is associated with enhanced susceptibility to severe malarial anemia and longitudinal all- cause mortality Prakasha Kempaiah 1 , Samuel B. Anyona 2 , Evans Raballah 2 , Gregory C. Davenport 1 , Tom Were 2,3 , James B. Hittner 4 , John M. Ong’echa 1,2 , and Douaglas J. Perkins 1,2,* 1 Center for Global Health, Department of Internal Medicine, University of New Mexico Health Sciences Center, Albuquerque, NM, USA 2 University of New Mexico/KEMRI Laboratories of Parasitic and Viral Diseases, Kisumu, Kenya 3 Department of Pathology, Kenyatta University, Nairobi, Kenya 4 Department of Psychology, College of Charleston, Charleston, SC, USA Abstract Severe malarial anemia (SMA) is a leading cause of pediatric morbidity and mortality in holoendemic Plasmodium falciparum transmission areas. Although dysregulation in cytokine production is an important etiology of SMA, the role of IFN-α in SMA has not been reported. As such, we investigated the relationship between IFN-α promoter polymorphisms [i.e., IFNA2 (A-173T) and IFNA8 (T-884A)], SMA, and functional changes in IFN-α production in children (n=663; <36 mos.) residing in a holoendemic P. falciparum transmission region of Kenya. Children with SMA had lower circulating IFN-α than malaria-infected children without severe anemia (P=0.025). Multivariate logistic regression analyses revealed that heterozygosity at −884 (TA) was associated with an increased risk of SMA [OR, 2.80 (95% CI, 1.22–6.43); P=0.015] and reduced IFN-α relative to wild-type (TT; P=0.038). Additional analyses demonstrated that carriage of the −173T/−884A (TA) haplotype was associated with increased susceptibility to SMA [OR, 3.98 (95% CI, 1.17–13.52); P=0.026] and lower IFN-α (P=0.031). Follow-up of these children for 36 mos. revealed that carriers of TA haplotype had greater all-cause mortality than non-carriers (P<0.001). Generation of reporter constructs showed that the IFNA8 wild-type −884TT exhibited higher levels of luciferase expression than the variant alleles (P<0.001). Analyses of malaria-associated inflammatory mediators demonstrated that carriers of TA haplotype had altered production of IL-1β, MIG, and IL-13 compared to non-carriers (P<0.050). Thus, variation at IFNA2 −173 and IFNA8 −884 conditions reduced IFN-α production, and increased susceptibility to SMA and mortality. * Address correspondence to: Douglas J. Perkins, Ph.D, 1 Center for Global Health, Department of Internal Medicine, University of New Mexico Health Sciences Center, MSC10-5550, Albuquerque, NM 87131-0001, USA. Phone: 505-272-6867; fax: 505-272-8441, [email protected]. COMPETING INTEREST STATEMENT The authors have declared that no competing interests exist. The study was approved by the ethical and scientific review committees at the University of Pittsburgh and University of New Mexico, and the Kenya Medical Research Institute. A portion of this work was presented previously at the 58 th ASTMH annual meeting held at Washington, D.C., abstract # 742. NIH Public Access Author Manuscript Hum Genet. Author manuscript; available in PMC 2013 May 28. Published in final edited form as: Hum Genet. 2012 August ; 131(8): 1375–1391. doi:10.1007/s00439-012-1175-1. NIH-PA Author Manuscript NIH-PA Author Manuscript NIH-PA Author Manuscript
Transcript of Reduced interferon (IFN)-α conditioned by IFNA2 (−173) and IFNA8 (−884) haplotypes is...
Reduced interferon (IFN)-α conditioned by IFNA2 (−173) andIFNA8 (−884) haplotypes is associated with enhancedsusceptibility to severe malarial anemia and longitudinal all-cause mortality
Prakasha Kempaiah1, Samuel B. Anyona2, Evans Raballah2, Gregory C. Davenport1, TomWere2,3, James B. Hittner4, John M. Ong’echa1,2, and Douaglas J. Perkins1,2,*
1Center for Global Health, Department of Internal Medicine, University of New Mexico HealthSciences Center, Albuquerque, NM, USA2University of New Mexico/KEMRI Laboratories of Parasitic and Viral Diseases, Kisumu, Kenya3Department of Pathology, Kenyatta University, Nairobi, Kenya4Department of Psychology, College of Charleston, Charleston, SC, USA
AbstractSevere malarial anemia (SMA) is a leading cause of pediatric morbidity and mortality inholoendemic Plasmodium falciparum transmission areas. Although dysregulation in cytokineproduction is an important etiology of SMA, the role of IFN-α in SMA has not been reported. Assuch, we investigated the relationship between IFN-α promoter polymorphisms [i.e., IFNA2(A-173T) and IFNA8 (T-884A)], SMA, and functional changes in IFN-α production in children(n=663; <36 mos.) residing in a holoendemic P. falciparum transmission region of Kenya.Children with SMA had lower circulating IFN-α than malaria-infected children without severeanemia (P=0.025). Multivariate logistic regression analyses revealed that heterozygosity at −884(TA) was associated with an increased risk of SMA [OR, 2.80 (95% CI, 1.22–6.43); P=0.015] andreduced IFN-α relative to wild-type (TT; P=0.038). Additional analyses demonstrated thatcarriage of the −173T/−884A (TA) haplotype was associated with increased susceptibility to SMA[OR, 3.98 (95% CI, 1.17–13.52); P=0.026] and lower IFN-α (P=0.031). Follow-up of thesechildren for 36 mos. revealed that carriers of TA haplotype had greater all-cause mortality thannon-carriers (P<0.001). Generation of reporter constructs showed that the IFNA8 wild-type−884TT exhibited higher levels of luciferase expression than the variant alleles (P<0.001).Analyses of malaria-associated inflammatory mediators demonstrated that carriers of TAhaplotype had altered production of IL-1β, MIG, and IL-13 compared to non-carriers (P<0.050).Thus, variation at IFNA2 −173 and IFNA8 −884 conditions reduced IFN-α production, andincreased susceptibility to SMA and mortality.
*Address correspondence to: Douglas J. Perkins, Ph.D, 1Center for Global Health, Department of Internal Medicine, University ofNew Mexico Health Sciences Center, MSC10-5550, Albuquerque, NM 87131-0001, USA. Phone: 505-272-6867; fax: 505-272-8441,[email protected].
COMPETING INTEREST STATEMENTThe authors have declared that no competing interests exist.
The study was approved by the ethical and scientific review committees at the University of Pittsburgh and University of NewMexico, and the Kenya Medical Research Institute. A portion of this work was presented previously at the 58th ASTMH annualmeeting held at Washington, D.C., abstract # 742.
NIH Public AccessAuthor ManuscriptHum Genet. Author manuscript; available in PMC 2013 May 28.
Published in final edited form as:Hum Genet. 2012 August ; 131(8): 1375–1391. doi:10.1007/s00439-012-1175-1.
NIH
-PA Author Manuscript
NIH
-PA Author Manuscript
NIH
-PA Author Manuscript

KeywordsInterferon; promoter polymorphism; SMA; inflammatory mediators
INTRODUCTIONMalaria is an infectious disease caused by parasites of the genus Plasmodium. Of the fiveprimary human forms of malaria causing over 1.24 million deaths per year, Plasmodiumfalciparum, accounts for greater than 1 million deaths, with more than 3.3 billion people atrisk of infection (Murray et al. 2012). Among the various clinical sequelae in P. falciparuminfections, the most prevalent severe disease manifestation is severe malarial anemia (SMA)that occurs primarily in children <5 years of age, resulting in ~22% of the malaria-associatedchildhood deaths in Africa (Obonyo et al. 1998). SMA results from a combination ofhematological factors including, direct and indirect destruction of parasitized red blood cells(pRBC), increased clearance of uninfected erythrocytes, and suppression of theerythropoietic response (Keller et al. 2009; Kurtzhals et al. 1997; Were et al. 2006;Wickramasinghe and Abdalla 2000). In holoendemic P. falciparum transmission regions,such as our study site in western Kenya, we have found that inefficient erythropoiesis is aprimary etiology of SMA; a process that is largely influenced by an imbalance ininflammatory mediators (Ong'echa et al. 2011; Othoro et al. 1999; Ouma et al. 2010; Oumaet al. 2006; Perkins et al. 2011; Were et al. 2006).
Along these lines, the current study focused on the role of interferon (IFN)-α in conditioningSMA. Although the role of IFN-α, particularly in human malaria, is largely unexplored, wepreviously showed that reduced circulating IFN-α levels were associated with severefalciparum malaria in Gabonese and Kenyan children (Luty et al. 2000; Ong'echa et al.2011). In addition, studies in murine models of malaria demonstrated that treatment withrecombinant huIFN-α resulted in reduced blood parasite levels and mortality from cerebralmalaria, but had no effect on anemia outcomes (Vigario et al. 2001; Vigario et al. 2007).IFN-α is a pleiotropic cytokine in the type 1 interferon family that has been extensively usedfor decades as an immunotherapeutic agent in malignant, angiogenic, allergic, inflammatory,viral, parasitic, and autoimmune diseases (Beilharz et al. 1997; Bogdan 2000; Ferbas et al.1994; Muller et al. 1994; Vigario et al. 2001; Vilcek 2006). IFN-α is also an importantregulator of cellular growth and differentiation that bridges innate and adaptive immuneresponses (Biron 1999). IFN-α is primarily produced and secreted by fibroblasts,macrophages, plasmacytoid monocytes, T cells, dendritic cells (DCs), and natural killer(NK) cells (Francis et al. 1996; Havell et al. 1978).
There are (at least) 14 different IFN-α intronless genes encoding for 13 identical matureproteins clustered on human chromosome 9p22 (Samuel 2001). However, due to post-translational modifications, there are more than 22 IFN-α subtypes differing by one or twoamino acids (Bekisz et al. 2004; Song et al. 2006). Several in vitro studies showed that thesesubtypes vary considerably in their ability to produce IFN-α in response to viruses and otherstimuli (Izaguirre et al. 2003; Seto et al. 1995).
Previous investigations demonstrated that polymorphic variability in the promoter region ofIFNA2 was associated with reduced transcription and susceptibility to hepatitis B and Cviruses, but had no association with malaria disease severity (Song et al. 2006; Tena-Tomaset al. 2008). Among the IFN-α subtypes, IFNA8 is one of the highest producers of IFN-αand possesses potent antiviral activity (Foster et al. 1996; Garcia et al. 2007; Izaguirre et al.2003; Seto et al. 1995). However, IFNA8 has not been investigated in the context of malaria.
Kempaiah et al. Page 2
Hum Genet. Author manuscript; available in PMC 2013 May 28.
NIH
-PA Author Manuscript
NIH
-PA Author Manuscript
NIH
-PA Author Manuscript
Based on the allelic distribution reported for IFN-α polymorphic variability in referenceAfrican ethnic populations (NCBI_refSNP), we focused our investigations on IFNA2(A-173T) and IFNA8 (T-884A) since these particular variants have minor allelic frequency(MAF) distributions that can generate comprehensive coverage in the population. Thecurrent study determined the association between individual promoter variants, theirhaplotypic constructs, and susceptibility to both SMA and mortality during acute malariaand throughout the development of naturally acquired malarial immunity in children(n=663) residing in a holoendemic P. falciparum transmission region of western Kenya.Functionality of the genetic variation was determined by examining the relationship betweengenotypes/haplotypes and circulating IFN-α, and through the generation of luciferasereporter constructs. In addition, we investigated the association between IFN-α genotypes/haplotypes and inflammatory mediators known to be dysregulated in malarial anemia usinga 25-plex inflammatory array (Perkins et al. 2011).
MATERIALS AND METHODSStudy subjects
The study was conducted at Siaya District Hospital (SDH) in Siaya District, western Kenya,a holoendemic P. falciparum transmission area (Beier et al. 1994). In this region, SMA is theprimary clinical manifestation of severe malaria in children under the age of five years, withcerebral malaria occurring only in rare cases (Bloland et al. 1999; McElroy et al. 2000;Ong'echa et al. 2006). A complete description of the clinical, demographic, and hematologiccharacteristics of the cohort is presented in our previous publication (Ong'echa et al. 2006).Children (n=663, age 3–36 mos.) were recruited during their first hospital visit for thetreatment of malaria between 2003 and 2008. Although the global distribution of malaria hasundergone a decrease, the rates of malaria-related morbidity and mortality have actuallyincreased in Siaya during the time frame of the current study (Hamel et al. 2011). Childrenwith non-falciparum malaria, cerebral malaria, prior transfusions, or previous hospitalization(for any reason) were excluded from the study. Since our previous studies demonstrated thatHIV-1 and bacteremia are common in this area, (Otieno et al. 2006; Were et al. 2011), allchildren were tested for these pathogens (see procedures listed below). Once disease statuswas determined, the children were given appropriate treatment and supportive therapyaccording to Ministry of Health, Kenya guidelines. Pre- and post-test HIV counseling wasprovided for the parents/guardians of all study participants. Written informed consent in thelanguage of choice (i.e., English, Kiswahili, or Dholuo) was obtained from the parents/guardians of participating children. The study was approved by the ethical and scientificreview committees at the Kenya Medical Research Institute and the Institutional ReviewBoard at the University of New Mexico.
Children with falciparum malaria were classified according to World Health Organization(WHO) definitions of malarial anemia: non-SMA (Hb ≥5.0 g/dL, with any densityparasitemia) and SMA (Hb <5.0 g/dL, with any density parasitemia) (WHO 2000). Inaddition, based on a previous study examining >14,000 longitudinal Hb measurementsaccording to age, gender, and geographical context in children less than 48 months of age inwestern Kenya (McElroy et al. 1999), parasitemic children were stratified into two primaryclinical groups: non-SMA (Hb ≥6.0 g/dL, with any density parasitemia) and SMA (Hb <6.0g/dL, with any density parasitemia).
Sample collection laboratory measuresVenous blood samples (<3.0 mL) were collected into EDTA-containing Vacutainer® tubesprior to administration of anti-malarials and/or any other treatment interventions. Asexualmalaria parasites (trophozoites) were counted against 300 leukocytes in peripheral blood
Kempaiah et al. Page 3
Hum Genet. Author manuscript; available in PMC 2013 May 28.
NIH
-PA Author Manuscript
NIH
-PA Author Manuscript
NIH
-PA Author Manuscript

smears stained with Giemsa reagent and parasite density was estimated as follows: parasitedensity/µL=white blood cell (WBC) count/µL × trophozoites/300. Complete hematologicalparameters were determined with a Beckman Coulter® AC.T diff2™ (Beckman-CoulterCorporation, Fullerton, CA). Sickle-cell trait (HbAS), glucose-6-phosphate dehydrogenase(G6PD) deficiency, HIV-1 status, and bacteremia were determined according to ourpublished methods (Ong'echa et al. 2006; Otieno et al. 2006; Ouma et al. 2010).
DNA extraction and genotypingGenomic DNA was extracted from buccal swabs using the Buccal Amp™ DNA extractionkit (Epicentre Biotechnologies, Madison, WI) and then amplified using GenomiPhi™ (GEHealthcare Life Sciences, Amersham, UK). IFNA2 A-173T and IFNA8 T-884A SNPs weregenotyped using the Taqman® 5'-allelic discrimination Assay-By-Design method accordingto the manufacturer’s instructions (Assay ID’s: C_33349900_10 and C_31289660_10,respectively) on the StepOnePlus™ PCR system (Applied Biosystems, Foster City, CA).
Cell lines and cultureThe human monocyte-macrophage cell line (U937) and human fibrosarcoma cell line(HT-1080) were obtained from American Type Culture Collection (ATCC, Manassas, VA).The monocyte-macrophage (U937) and fibroblast (HT-1080)-based cell lines were used toexamine promoter variants, since IFN-α is primarily produced and secreted by monocyte/macrophages, fibroblasts, and other cells (Havell et al. 1978). U937 cells were maintained inRPMI-1640 medium (ATCC, Manassas, VA), supplemented with 10% fetal bovine serum(FBS, Gibco-Invitrogen, Carlsbad, CA), penicillin (100 U/mL), and streptomycin (0.1 mg/mL) (Sigma-Aldrich,St Louis, MO), while the HT-1080 cell line was maintained inDulbecco’s modified Eagle medium (DMEM) (Mediatech, Manassas, VA), supplementedwith 10% heat-inactivated FBS, and penicillin-streptomycin. Cells were cultured at 37°C ina humidified atmosphere containing 5% CO2.
Construction of reporter plasmidsFor all reporter constructs, the fragment of the IFNA8 promoter region (as determined by thegenome analyzer and search engine at http://www.genomatix.de) from −961 to +39 (1kb)was synthesized by PCR using the genomic DNA template from individuals carrying thedifferent variants at position −884 (T/A). The fragment was amplified using the forwardprimer - containing a Sac I (underlined) site (5′-TTTGAGCTCCAGAGTCATACCATGTGATG-3′) and reverse primer- containing a NheI (underlined) site (5′-TTTGCTAGCATAGGGAACATATTTGTTTC-3′), and Phusion®
high-fidelity DNA polymerase kit (Finnzymes, Woburn, MA). PCR conditions were: onecycle for 1 min at 98°C, for an initial denaturation step; followed by 32 cycles at 98°C for10 s; annealing for 30 s at 58°C; and extension for 30 s at 72°C; followed by a finalextension step for 10 min at 72°C. PCR products were then purified over Microcon®
centrifugal filter devices (Millipore, Bedford, MA) and digested with restriction enzymes.The gel-extracted product was cloned directly into Sac I and Nhe I sites of a promoter-lessluciferase reporter gene vector, pGL3-Basic (Promega, Madison, WI). Positive clones(carrying the promoter region) were cut with the same enzymes to confirm presence of theinsert. To verify the −884 promoter variants and ensure no additional variation was present,sequencing was performed using the BigDye® Terminator Cycle Sequencing Kit in a Model377 Sequencing System (Applied Biosystems, Foster City, CA).
Transient transfection and luciferase assayPromoter constructs were prepared using an endotoxin-free plasmid DNA isolation kit(Qiagen, Valencia, CA). For transient transfection of reporter vectors, U937 cells (2 × 10⁵
Kempaiah et al. Page 4
Hum Genet. Author manuscript; available in PMC 2013 May 28.
NIH
-PA Author Manuscript
NIH
-PA Author Manuscript
NIH
-PA Author Manuscript

cells) were freshly added to 12-well plates, while HT-1080 cells (1.5 × 10⁵ cells) weregrown 24 h prior to transfection in 12-well plates. The pGL3-control vector, pGL3-basic andtest reporter constructs (1 µg each), were separately mixed with Opti-MEM® I reducedserum medium and Lipofectamine™ 2000 reagent (Invitrogen, Carlsbad, CA), andtransfection was performed according to manufacturer’s instructions. Cells were incubatedat 37°C for 5 h in a 5% CO2 atmosphere. After transfection, cells were further incubatedwith (stimulated) or without (basal) 50 ng/mL phorbol 12-myristate 13-acetate (PMA) and1.5 µM ionomycin (Sigma-Aldrich, St. Louis, MO) in 1 mL of fresh medium for differenttime periods. At selected intervals, cells were harvested, washed once with phosphate-buffered saline (PBS, Invitrogen, Carlsbad, CA), and lysed using the passive lysis buffer(Promega, San Luis Obispo, CA) following the supplier’s protocol. Twenty microliters ofthe lysates were used to measure luciferase activity in a Lumat LB9501 luminometer (EG &G Berthold, Oak Ridge, TN) using the dual luciferase® reporter assay system kit (Promega,San Luis Obispo, CA). Relative luciferase activity was calculated by dividing the raw dataof the test reporter’s gene expression to pGL3-basic data, and the transfection efficiency wasverified using the pGL3-control plasmid. All assays were conducted in duplicate in threeindependent experiments and the mean value from each experiment was selected for dataanalyses.
Nitrate and nitrite quantitationSystemic nitric oxide (NO) production [nitrite plus nitrate levels (NOx)] was quantified inurine samples according to our previous methods using Aspergillus nitrate reductase coupledwith the Griess reaction(Perkins et al. 1999). Creatinine (Cr) levels were measured using acommercially available colorimetric assay (Creatinine Assay Kit, Cayman Chem., AnnArbor, MI). Urinary NOx concentrations were expressed as a ratio of NOx/Cr (µM/µM) toaccount for potential differences in renal function.
Multiplex assayPlasma samples obtained from venous blood were stored at −80°C until use. Samples werethen thawed and clarified by centrifugation (14,000 rpm for 10 min) before assaying.Inflammatory mediators levels were determined by the Cytokine 25-plex Antibody BeadKit, Human (BioSource™ International, Camarillo, CA) according to the manufacturer’sinstructions. Plates were read on a Luminex® 100™ system (Luminex® Corporation, Austin,TX) and analyzed using the Bio-plex manager software (version IS.2.3; Bio-RadLaboratories, Hercules, CA). Analyte detection limits were: 3pg/mL (IL-5, IL-6, IL-8/CXCL8); 4pg/mL [monokine induced by IFN-γ (MIG/CXCL9)]; 5pg/mL (IL-1α, IL-3,IL-4, IL-10, eotaxin-1/CCL11, IFN-γ, IP-10/CXCL10); 6pg/mL (IL-2); 10pg/mL (IL-7,IL-13, IL-15, IL-17, MIP-1α/CCL3, MIP-1β/CCL4, monocyte chemotactic protein [MCP-1/CCL2], TNF-α); and 15pg/mL (IL-1β, IL-12p40/p70, granulocyte-macrophage colony-stimulating factor [GM-CSF], IFN-α, RANTES/CCL5).
Longitudinal follow-upUpon enrollment of the children into the study (n=663, Day 0), parents/guardians wereasked to return with their child every 3 mos. throughout a 36 mos. follow-up period. If theparent/guardian had not returned to hospital by 1:00 pm on the day of the quarterly follow-up visit, our study staff visited the child's residence to check on their health status, includingmortality. Since we determined the exact location of each child's residence with our GIS/GPS surveillance system, we could readily locate each child. In addition, since childrenexperience multiple episodes of malaria, and other pediatric infectious diseases, in thisregion, parents/guardians were asked to return to hospital during their child's febrileepisode(s). All laboratory tests required for proper clinical management of the patients wereperformed at each acute and quarterly visit, including complete hematological indices,
Kempaiah et al. Page 5
Hum Genet. Author manuscript; available in PMC 2013 May 28.
NIH
-PA Author Manuscript
NIH
-PA Author Manuscript
NIH
-PA Author Manuscript

malaria parasitemia measures, and evaluation of bacteremia (if clinically indicated). Inaddition, all-cause mortality data were collected throughout the three year follow-up.Mortality data, clinical and laboratory measures for multiple episodes of malaria were usedto evaluate the association between IFN-α haplotypes and longitudinal outcomes of SMAand mortality. Although most children within this region die at home, visits by our studyteam confirmed the date of mortality.
Statistical analysesStatistical analyses were performed using SPSS (version 15.0 for Windows, SPSS Inc.).Kruskal-Wallis test was used to compare medians across the groups, while pairwisecomparisons of medians were performed using Mann-Whitney U test. Chi-square (χ2)analyses and Fisher’s exact test were used to examine differences in gender, parasite density,and genotype and haplotype proportions between non-SMA and SMA groups. IFN-αpromoter haplotypes were constructed using HPlus software (version 4.0 for windows 7) andthe distribution frequencies of SNPs and haplotypes were determined using the Haploview(version 4.2). Multivariate logistic regression analyses, controlling for co-variates, includingage, gender, G6PD deficiency, HIV-1 status, bacteremia, and sickle-cell trait (Aidoo et al.2002), was used to examine the association between IFN-α variation and SMA outcomes.Deviation from Hardy-Weinberg Equilibrium (HWE) was determined using web-basedsoftware (Court 2008). Co-efficient (D′) of pairwise linkage disequilibrium (LD) betweenSNPs was calculated using MIDAS software (version 1.0) (Gaunt TR 2006). Analyses ofluciferase reporter assay data were performed using the GraphPad Prism 5® (GraphPadSoftware Inc. La Jolla, CA) software. Hierarchical logistic regression was used toinvestigate the association between IFN-α haplotypes on longitudinal outcomes of SMAepisodes and mortality. For the analyses using this model, the covariates (i.e., age, gender,G6PD deficiency, sickle cell trait, HIV-1, and bacteremia status) were entered asindependent confounding effects with haplotype contrast (carrier vs. non-carrier) inpredicting outcomes (SMA and mortality). All values of P<0.100 were further analyzedusing Cox regression/survival analysis and the mean hazard rates for haplotype groupsbetween carriers and non-carriers were examined using non-parametric Mann-Whitney Uand Kolmogorov-Smirnov Z tests. The hierarchical logistic regression analyses wereconducted by entering two sequential blocks of predictor variables: Block 1 consisted ofAge, Gender, G6PD, Sickle cell status, bacteremia, and HIV status (and the intercept termfor the model, b0). Block 2 consisted of haplotype status (carrier vs. non-carriers). For bothof our longitudinal outcome variables (i.e., mortality status and SMA episodes), the equationfor the logit function is the same. That is, the probability of the event occurring, P(Y), is afunction of the intercept and the seven predictors listed. The specific logistic regressionequation (logit function) is presented below:
Statistical significance for all analyses was set at P≤0.050.
RESULTSDemographic and clinical characteristics of the study participants
Children (n=508) from day 0 with P. falciparum infections were stratified into two groupsbased on Hb concentrations: non-SMA (Hb ≥5.0 g/dL, n=384) and SMA (Hb <5.0 g/dL,n=124) in the cross-sectional analyses. The demographic and clinical characteristics of thestudy participants are shown in Table 1. SMA was characterized by younger age (P=0.047),
Kempaiah et al. Page 6
Hum Genet. Author manuscript; available in PMC 2013 May 28.
NIH
-PA Author Manuscript
NIH
-PA Author Manuscript
NIH
-PA Author Manuscript

increased axillary temperature (°C, P=0.024), and a higher WBC count (103/µL) (P<0.001).As expected based on the a priori grouping, Hb (g/dL), hematocrit (%), and RBC counts(1012/L) were lower in the SMA group (P<0.001, P<0.001 and P<0.001, respectively). Themean corpuscular volume (MCV), mean corpuscular hemoglobin (MCH), and meancorpuscular hemoglobin concentration (MCHC) were significantly different in SMA group(P<0.001, P=0.018, and P=0.033, respectively). Reticulocyte indices such as absolutereticulocyte number (ARN), reticulocyte production index (RPI) and RPI<2 (an indicator ofinefficient erythroid production) were significantly lower in SMA group (P=0.005, P=0.032and P=0.008, respectively). Additional hematological indices such as lymphocytes,monocytes, granulocytes and platelets counts were also significantly different between thegroups (P<0.001, P<0.001, P=0.003, and P=0.028, respectively). None of the otherparameters differed significantly between the two groups. Although there was not enoughsample available to perform a comprehensive differential diagnosis of anemia, the non-significant difference in the RDW, and the significantly elevated MCV and MCHC in theSMA group, suggest that iron deficiencies may not be a primary cause of severe anemia inthis cohort. Moreover, our previous report in this cohort of children showing comparablelevels of acanthocytes in the non-SMA and SMA groups supports this notion (Novelli et al.2010). Consistent with our previous results illustrating significantly higher numbers ofnucleated RBCs in children with SMA (Novelli et al. 2010), and our finding that inefficienterythropoiesis is a primary cause of SMA in this region (Awandare et al. 2011; Were et al.2006), the SMA group presented here had a significantly lower RPI and greater percentageof children with an RPI<2.0, suggesting that severe anemia is due, at least in part, to bonemarrow abnormalities.
Circulating IFN-α in the non-SMA and SMA groupsPrior to investigating the impact of variation in the IFNA2 and IFNA8 loci on SMA,circulating IFN-α was examined in the non-SMA and SMA groups. Since co-infection(s)could potentially affect the levels of IFN-α, all co-infected children were excluded from theanalyses. As shown in Figure 1, IFN-α levels [median, range (Q1-Q3)] were lower inchildren with SMA [12.50 (5.0–69.75), n=66] compared to those with non-SMA [39.0 (5.0–90.0), n=177, P=0.025]. Based on the significant difference in IFN-α levels, we thenproceeded with genotyping the IFNA2 (A-173T) and IFNA8 (T-884A) loci followed byconstruction of their respective haplotypes.
Distribution of IFN-α genotypes and haplotypesGenotypic distributions of the individual IFNA2 (A-173T) and IFNA8 (T-884A) loci andtheir haplotypic constructs in the non-SMA (n=384) and SMA (n=124) groups, as well asthe overall cohort (n=508) are shown in Table 2. The overall allele [major/minor (p/q)]frequencies for the polymorphisms were: A-173T (0.77/0.23); and T-884A (0.89/0.11),respectively. The frequencies for A-173T were not in HWE for both the non-SMA(χ2=5.09, P=0.023) and SMA (χ2=6.80, P=0.009) groups, and overall cohort (χ2=11.433,P<0.001). However, the distribution of genotypes for IFNA2 between the non-SMA andSMA groups did not differ (P=0.814). The frequencies of the T-884A locus were not inHWE in the non-SMA (χ2=23.70, P<0.001) and SMA (χ2=31.14, P<0.001) groups, and theoverall cohort (χ2=45.51, P<0.001). Although non-significant, there was an enhancedfrequency of the A allele in the non-SMA group relative to children with SMA (P=0.080).
After examining the two SNPs independently, haplotypes were then constructed. Thehaplotypic distributions were: AT (0.69), TT (0.20), AA (0.08), and TA (0.03). Comparisonof the four haplotypes between the non-SMA and SMA groups revealed a higher distributionof individuals with the TA haplotype in the non-SMA group (P=0.072). The AT, TT, and
Kempaiah et al. Page 7
Hum Genet. Author manuscript; available in PMC 2013 May 28.
NIH
-PA Author Manuscript
NIH
-PA Author Manuscript
NIH
-PA Author Manuscript

AA haplotypes did not significantly differ between non-SMA and SMA groups (P=0.385,P=0.311, and P=0.252, respectively).
Examination of linkage disequilibrium (LD)Additional analyses showed that there was no evidence of LD between the SNPs (A-173T/T-884A): (D'=0.099; r2=0.004).
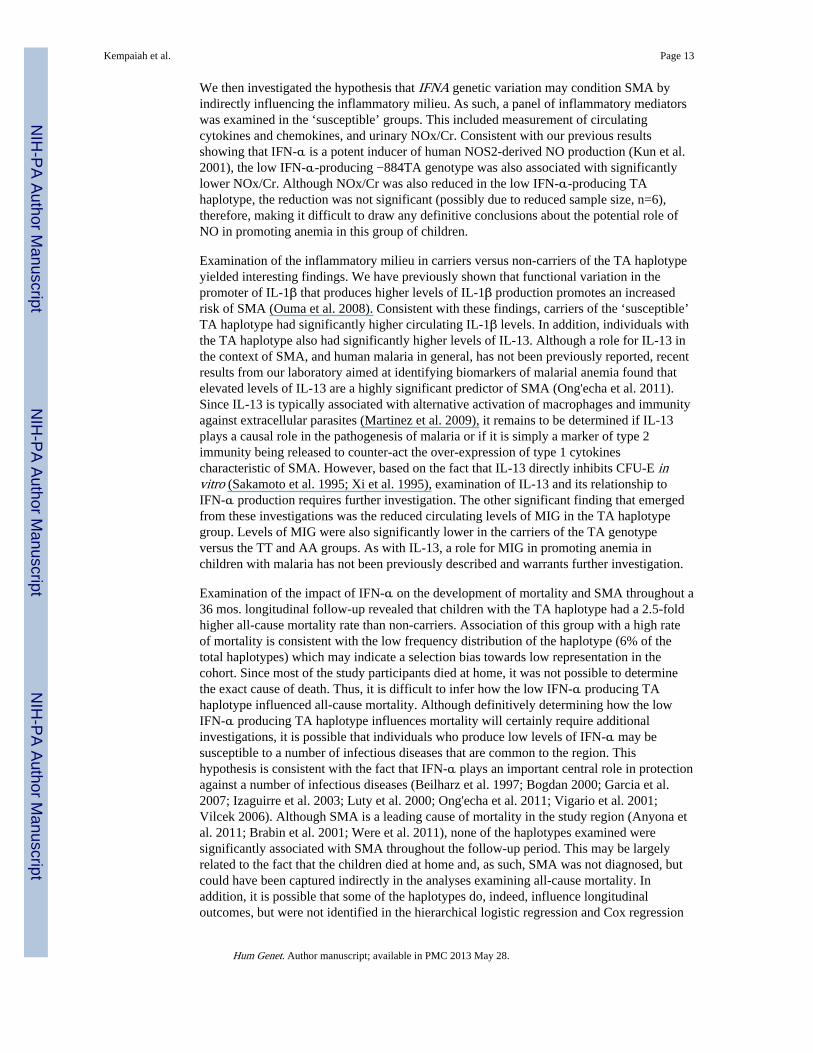
Association between IFN-α genotypes/haplotypes and SMATo determine the effect of individual promoter variants and haplotypes on susceptibility toSMA, multivariate logistic regression was performed controlling for the confounding effectsof age, gender, G6PD deficiency, sickle-cell trait, HIV-1 status, and bacteremia (Aidoo et al.2002; Okwara et al. 2004; Ong'echa et al. 2006; Otieno et al. 2006; Ouma et al. 2006; Wereet al. 2011). Relative to the AA genotype at the IFNA2 −173 locus, the AT (OR; 1.24, 95%CI, 0.74–2.07; P=0.406) and TT (OR; 1.27, 95% CI, 0.53–3.05; P=0.587) genotypes werenot associated with susceptibility to SMA [using either WHO (Hb <5.0 g/dL) or modifieddefinition (Hb <6.0 g/dL)] (Figure 2). Analysis of the IFNA8 −884 locus revealed thatrelative to TT individuals, carriage of the TA genotype was associated with increasedsusceptibility to SMA according to the WHO and modified definitions of disease (Hb <5.0g/dL, OR; 2.80, 95% CI, 1.22–6.43; P=0.015, Figure 2 and Hb<6.0 g/dL, OR; 2.19, 95% CI,1.23–3.90; P=0.008, data not shown). However, homozygosity for the A allele was notassociated with susceptibility to SMA (OR; 0.91, 95% CI, 0.32–2.62; P=0.874, Figure 2).
Multivariate logistic regression modeling of the haplotypes, controlling for identicalcovariates, revealed that carriage of the TA (−173T/−884A) haplotype was associated withsignificantly higher risk of developing SMA (Hb <5.0 g/dL, OR; 3.98, 95% CI, 1.17–13.52;P=0.026, Figure 2, and Hb<6.0 g/dL, OR; 2.68, 95% CI, 1.24–5.82; P=0.012, data notshown). There was no significant association between the AT (Hb <5.0 g/dL, OR; 1.0, 95%CI, 0.5–2.0; P=0.939), AA (Hb <5.0 g/dL, OR; 1.48, 95% CI, 0.66–3.3; P=0.331), and TT(Hb <5.0 g/dL, OR; 0.98, 95% CI, 0.6–1.61; P=0.953) haplotypes and susceptibility to SMAusing either WHO definition (Figure 2) or modified disease definition (data not shown).Thus, there was an increased risk of developing SMA in individuals with the TA genotype atthe IFNA8 −884 locus (OR=2.80) that was further enhanced in individuals carrying ahaplotype that contained the T and A alleles at IFNA2 −173 and IFNA8 −884, respectively(OR=3.98).
Relationship between IFNA genotypes/haploytpes and IFN-αTo examine potential functionality associated with the genotypes/haplotypes, levels of IFN-α were compared across the groups after stratifying according to IFNA2 −173 and IFNA8−884 genotypes, and their haplotypes. These analyses revealed that variation at the IFNA2−173 locus was not associated with circulating IFN-α levels (P=0.198, Figure 3). Analysisof the IFNA8 −884 locus demonstrated that IFN-α was significantly different across thegroups (P=0.045, Figure 3). Individuals with TT genotype had the highest IFN-α levelscompared to TA group [21.0 (5.0–74.50) vs. 7.0 (5.0–45.50), P=0.038]. IFN-α levels werelowest in individuals carrying the AA genotype, but did not differ significantly from thosewith the TT genotype [5.0 (1.0–48.50), P=0.860] (Figure 3).
Further analyses examining the haplotypes showed that individuals with the TA (−173T/−884A) haplotype had significantly lower circulating IFN-α levels than the non-TA group[7.0 (5.0–31.50) vs. 18.0 (5.0–74.50), P=0.031, Figure 3]. None of the other haplotypes wereassociated with significantly different IFN-α levels. Taken together, these results illustratethat the IFNA8 −884 TA genotype and the TA haplotype which conditioned increased riskof developing SMA were associated with significantly lower levels of circulating IFN-α.
Kempaiah et al. Page 8
Hum Genet. Author manuscript; available in PMC 2013 May 28.
NIH
-PA Author Manuscript
NIH
-PA Author Manuscript
NIH
-PA Author Manuscript
Analysis of variant specific constructsFunctional variation within promoter regions can dramatically affect transcriptional activity.In silico transcription factor binding site (TFBS) analysis (http://www.cbil.upenn.edu/cgi-bin/tess/tess) indicated that a T to A transition at the −884 loci of IFNA8 can abrogate thebinding site for HOXA5 (Homeobox protein Hox-A5, IMD matrix 100184) factor, while noknown TFBS were identified at −173 locus. Based on this information and the fact thatvariation at the −884 locus, but not the −173 locus was associated with susceptibility toSMA, only the −884 locus was investigated for transcriptional activity using variant specificconstructs in a luciferase-based expression system. In addition, generating constructs forhaplotypes composed of alleles from both the −173 and −884 loci was not feasible sincethey are located in two (separate) haploblocks (analyzed using SNPbrowser 3.0™ program,NCBI build 36). The pGL3-TT, pGL3-TA, and pGL3-AA constructs for the −884 locuswere created using genomic DNA from the study participants with the respective genotypesas a template for PCR amplification. As shown in Figure 4, there was significantly higherbasal activity for the wild-type (TT) construct versus either the TA or AA constructs in bothcell lines at 24 and 48 hrs (P<0.001 for all comparisons). Although the wild-type promoterconstruct (pGL3-TT) showed increased gene expression following stimulation with PMAand ionomycin in both cell lines at 24 and 48 hrs, particularly in the HT-1080 cell line,induction of gene expression was completely lacking in the presence of the polymorphicalleles (Figure 4). No significant differences between the TA and AA constructs wereobserved at any of the time points under basal or stimulated conditions for both cell lines(P>0.50 for all comparisons, Figure 4). These results demonstrate that the wild type allele isassociated with both higher baseline and stimulated gene expression than the polymorphicalleles, supporting the in vivo observations in children with falciparum malaria.
Potential mechanisms of anemia: inhibition of erythropoiesisThe mechanism(s) by which reduced IFN-α could promote enhanced anemia in humanmalaria are unclear. Our previous results in the cohort examined here demonstrated that oneof the primary mechanisms responsible for SMA was suppression of erythropoiesis(Awandare et al. 2011; Were et al. 2006). In addition, previous studies in a murine model ofmalaria illustrated that administration of recombinant IFN-α reduced blood-stage diseasethrough its ability to decrease the number of reticulocytes induced following infection(Vigario et al. 2001). To determine the association between genotypes/haplotypes and theerythropoietic response, we performed additional multivariate modeling for the specificgenetic variants that were associated with significantly higher risk of developing SMA andlower circulating IFN-α (i.e., the IFNA8 −884 TA genotype and the TA haplotype). Forthese analyses, the dependent variable in the multivariate logistic regression modeling(controlling for identical co-variates) was a reticulocyte production index (RPI)<2.0 basedon the fact that this particular measure is indicative of inefficient erythropoiesis (Were et al.2006). Relative to the TT genotype at the IFNA8 −884 locus, carriage of the ‘susceptible”TA (OR; 1.07, 95% CI, 0.429–2.69; P=0.878) or AA (OR; 1.843, 95% CI, 0.399–8.519;P=0.434) genotypes were not associated with an inefficient erythropoietic response. Inaddition, carriage of the ‘susceptible’ TA haplotype, relative to non-carriers, was notassociated with reduced erythropoiesis (OR; 1.081, 95% CI, 0.307–3.806; P=0.903). Thus,there does not appear to be a direct association between reduced erythropoiesis and carriageof either the TA genotype or TA haplotype, suggesting that other mechanisms areresponsible for the enhanced risk of SMA in these children.
Potential mechanisms of anemia: soluble mediators of inflammationOur previous investigations, focused on mechanisms of anemia in children with malaria,have shown that soluble mediators of inflammation play an important role in conditioninganemia outcomes (Keller et al. 2009; Ong'echa et al. 2011; Ouma et al. 2010; Were et al.
Kempaiah et al. Page 9
Hum Genet. Author manuscript; available in PMC 2013 May 28.
NIH
-PA Author Manuscript
NIH
-PA Author Manuscript
NIH
-PA Author Manuscript

2006). In addition, we recently showed that several inflammatory mediators (i.e., nitricoxide and TNF-α), that are associated with anemia outcomes in children with malaria, alsodirectly inhibit erythropoiesis in a novel in vitro model developed in our laboratory(Awandare et al. 2011). To further investigate potential mechanisms by which variation inIFNA subtypes could promote SMA, we determined the association between the‘susceptible’ genetic variants (i.e., the IFNA8 −884 TA genotype and TA haplotype) and apanel of circulating inflammatory mediators (n=26). Stratification of the IFNA8 −884genotypes revealed that carriage of the ‘susceptible’ TA genotype was associated withsignificantly lower levels of NOx/Cr [median, range (Q1-Q3) 0.014 (0.011–0.025) vs. 0.026(0.017–0.040), P=0.008] and MIG [123.7 (81.58–201.5) vs. 187.0 (98.67–319.9), P=0.006]compared to the TT genotype (Figure 5A). However, although the carriage of the AAgenotype was associated with lower NOx/Cr [0.038 (0.004–0.067)] and MIG [95.19 (66.69–589.4)], these results were not statistically significant vs. the TT genotype (P=0.235 andP=0.632, respectively, Figure 5A). None of the other inflammatory mediators examinedwere significantly different across the genotypic groups (data not presented).
When inflammatory mediators were stratified according to carriage of the TA haplotype, the‘susceptible’ carriers of the TA haplotype had significantly lower circulating MIG levels[136.7 (78.70–161.2), vs. 180.5 (92.14–310.1), P=0.031, Figure 5B] relative to non-carriersof the haplotype. Although NOx/Cr was lower in carriers of the TA halpotype, the resultswere not significant [0.022 (0.012–0.028) vs. 0.026 (0.016–0.040), P=0.580, Figure 5A]relative to non-carriers. Additional analyses revealed that carriers of the TA haplotype hadsignificantly higher levels of IL-1β [334.4 (195.6–692.4) vs. 170.0 (72.32–345.0), P=0.020]and IL-13 [41.80 (26.30–75.12) vs. 23.40 (9.08–45.30), P=0.020], and marginally higherlevels of RANTES [22,912 (4,118–14,0554) vs. 11,313 (4,437–42,358), P=0.066] (Figure5C) relative to non-carriers of the TA haplotype. None of the other inflammatory mediatorsdiffered significantly between the TA and non-TA haplotypes (data not presented). Resultspresented here show that the carriage of the ‘susceptible’ IFNA8 −884TA genotype and TA(−173T/−884A) haplotype are associated with altered levels of inflammatory mediators thatwe have previously shown are associated with susceptibility to malarial anemia (Keller et al.2004; Ong'echa et al. 2011; Were et al. 2006).
Association between IFN-α haplotypes and longitudinal outcomes (mortality and SMA)After examining the cross-sectional relationship between haplotypes and susceptibility toSMA, hierarchical logistic regression was used to investigate the relationship betweencarriage of the different haplotypes and longitudinal outcomes (i.e., mortality and SMA).Haplotypic distributions for the overall cohort (n=663) were: 0.64 (AT), 0.08 (AA), 0.22(TT), and 0.06 (TA), consistent with those documented cross-sectionally. In addition, aswith the cross-sectional data analyses, the two loci were not in LD (|D'|=0.096, r2=0.004) forthe cohort. Longitudinal modeling via hierarchical logistic regression revealed that there wasa 14.5% mortality rate (8/55) in carriers of the TA haplotype and 8.1% (49/608) in non-carriers (β=−0.921, P=0.060). Consistent with these results, Cox regression modeling,controlling for the same confounding variables as those in the cross-sectional modeling,revealed mean hazard rates (the probability of dying over time) of 0.1467 and 0.0587 forcarriers and non-carriers of the TA haplotype, respectively (P<0.001) (Figure 6). Thus, therewas a 2.5-fold higher risk of all-cause mortality in carriers of the TA haplotypes. However,the longitudinal mortality did not differ between carriers and non-carriers of the AT (β=−0.004, P=0.995), AA (β=−513, P=0.339) and TT (β=0.283, P=0.488) haplotypes.
Examination of the association between haplotypes and repeated episodes of SMA over 36mos. with hierarchical logistic regression modeling failed to find any significant relationshipbetween SMA outcomes and carriage of AT (β=0.131, P=0.642), AA (β=−0.095, P=0.732),TT (β=0.100, P=0.605), and TA (β=−0.399, P=0.195) haplotypes.
Kempaiah et al. Page 10
Hum Genet. Author manuscript; available in PMC 2013 May 28.
NIH
-PA Author Manuscript
NIH
-PA Author Manuscript
NIH
-PA Author Manuscript

DISCUSSIONIFN-α has long been described as a cytokine with a wide variety of biological functionsincluding antiviral and immunoregulatory functions (Beilharz et al. 1997; Bogdan 2000;Ferbas et al. 1994; Muller et al. 1994). Studies using in vitro and in vivo models have alsoshown that IFN-α both directly, and indirectly, regulates the activity of a number of othercytokines and chemokines (Biron 2001; Brinkmann et al. 1993; Mori et al. 1998; Taylor andGrossberg 1998). A role for IFN-α in regulating the immune response during humanmalarial infections was first described in our previous study showing that suppression ofIFN-α in Gabonese children was associated with enhanced severity of malaria, with severedisease characterized by a mixed clinical sequelae of anemia and/or hyperparasitemia (Lutyet al. 2000). Subsequent investigations in murine models of malaria demonstrated thatadministration of recombinant IFN-α treatment resulted in lower peripheral parasite loadsand reduced mortality from cerebral malaria (Vigario et al. 2001; Vigario et al. 2007).Results presented here support and extend previous human and animal studies by showingthat reduced circulating IFN-α levels are associated with SMA and conditioned by specificgenetic variants in the promoter region of IFN A2 and IFNA8.
Several in vitro and in vivo studies have shown that promoter polymorphisms in IFN-α areassociated with susceptibility to viral and parasitic infections, and altered transcriptionalrates (Song et al. 2006; Tena-Tomas et al. 2008). To explore the impact of naturallyoccurring variation in the IFN-α promoter on malaria disease outcomes, we investigated twoIFN-α subtypes, IFNA2 (A-173T) and IFNA8 (T-884A). Selection of these variants wasbased on the abundant MAF distribution in African populations that was available frominformation at (CHIP_bioinformatics; NCBI_refSNP). The high MAF distribution in theKenyan cohort examined here (i.e., Luo ethnic group) are similar to the other Kenyan ethnicgroups such as Luhya in Webuye (LWK), Maasai in Kinyawa (MKK) and Yorubanpopulation [i.e., YRI, Yoruba people of Ibadan (0.22 for −173 locus and 0.11 for −884locus)]. Interestingly, we identified no variation for these particular IFN subtypes in otherancestral groups (e.g., Asian, European, etc.) (Kwiatkowski 2005; NCBI_refSNP). Althoughthe reason for this phenomenon is difficult to define, it is consistent with the notion thatselective pressure exerted on the human genome by malaria, and other infectious diseases, inAfrican populations has created extensive variation in immune response genes that is notwitnessed in other ancestral groups (Kwiatkowski 2005; NCBI_refSNP). Therefore, theseresults further reinforce the notion that the genetic diversity has been enhanced in immuneresponse genes in ethnic groups from sub-Saharan African. Analyses of the allelicdistribution of the IFNA2 −173 and IFNA8 −884 promoter variants revealed a significantdeparture from HWE for both loci in the overall cohort, and in the non-SMA and SMAgroups. However, these two loci were not in linkage disequilibrium.
To determine the effects of individual genotypic variants on susceptibility to SMA, weperformed multivariate logistic regression analyses, controlling for the confounding effectsof age, gender, G6PD deficiency, sickle-cell trait, HIV-1 status, and bacteremia (Aidoo et al.2002; Okwara et al. 2004; Ong'echa et al. 2006; Otieno et al. 2006; Ouma et al. 2008; Oumaet al. 2006; Were et al. 2011). In addition, hepatitis B and C could (potentially) influence ourresults. However, based on implementation of the HBV vaccine in November of 2001 inKenya (Ndiritu et al. 2006), and the fact that all of the children in the cohort received thisvaccination as part of their routine childhood immunizations, HBV is not a likelyconfounding variable. Although studies from this geographic region show that the HCVinfection rate in adults is 0.2–0.9% (Muasya et al. 2008), no data are available regardingHCV for pediatric populations in the region. To control for the possibility of HCV infection,we used clinical and laboratory data to exclude all children from the analyses who presentedwith jaundice, hepatomegaly (particularly, inflammation at the right lower rib margin), and
Kempaiah et al. Page 11
Hum Genet. Author manuscript; available in PMC 2013 May 28.
NIH
-PA Author Manuscript
NIH
-PA Author Manuscript
NIH
-PA Author Manuscript
“coffee-colored” urine. As such, the phenotypically well-defined cohort studied here offers aunique advantage for investigating the genetic basis of susceptibility to severe malaria as asingle disease entity without the confounding effects of co-infection. Results from themultivariate modeling revealed that heterozygous individuals (TA) at IFNA8 −884 locus hada significantly higher risk of developing SMA. Construction of haplotypes and additionalmodeling, controlling for identical co-variates, demonstrated that carriage of the −173T/−884A (TA) haplotype increased susceptibility to SMA to an even greater extent than thatobserved for the IFNA8 −884 TA genotype. These findings support our previousinvestigations showing that polymorphic variation in the promoter regions of innate immuneresponse genes are important for conditioning susceptibility to SMA (Anyona et al. 2011;Keller CC 2009; Ouma et al. 2008; Ouma et al. 2010; Ouma et al. 2006).
To further determine the potential functional consequences of variation in the IFNA2 −173and IFNA8 −884 loci, data were stratified according to genotypes/haplotypes and circulatinglevels of IFN-α were examined. These analyses showed that the TA genotype at the IFNA8−884 locus and the TA (−173T/−884A) haplotype, both of which conditioned significantlyhigher risk of developing SMA, were also associated with significantly lower IFN-α levels.Thus, our previous findings in Gabonese children showing progressive reduction incirculating IFN-α with increasing malaria severity (Luty et al. 2000), along with resultspresented here, suggest that reduced IFN-α production, at least in part, influences thedevelopment of severe malaria.
Based on the genotypic results for the IFNA8 −884 locus, in conjunction with lower levelsof circulating IFN-α, and in silico analysis suggesting potential abrogation of the HOXA5binding site, variant specific constructs were created for this locus. This series ofexperiments demonstrated that the wild-type promoter construct (pGL3-TT) had high levelsof basal expression that was further up-regulated in response to stimulation. In contrast, boththe heterozygous (pGL3-TA) and homozygous (pGL3-AA) constructs had low levels ofbasal activity that was largely unresponsive to stimulation with PMA and ionomycin. Theseresults, along with the relatively similar risks associated with susceptibility to SMA for theIFNA8 TA genotype (OR=2.80) and the −173T/−884A (TA) haplotype (OR=3.98), and theircomparable reductions in circulating IFN-α, suggests that it is actually variation at IFNA8−884 that is driving the genetic-based relationship and consequent changes in IFN-α. Theseresults are consistent with previous studies showing that the IFNA8 subtype is one of themost important type 1 interferon subtypes for regulating potent IFN-α production (Foster etal. 1996; Garcia et al. 2007; Izaguirre et al. 2003; Seto et al. 1995).
The exact mechanism by which IFN-α regulates anemia outcomes is largely unknown.Potential mechanisms may include IFN-α acting directly on the erythropoietic process oralternatively, through indirect effects in which IFN-α acts on other inflammatory mediatorswithin the bone marrow milieu. A previous study in a murine model of malaria, using aparasitic strain that preferentially invade reticulocytes, showed that IFN-α treatment reducesblood-stage disease through its ability to reduce the overall number of reticulocytes (Vigarioet al. 2001). This, along with our previous investigation demonstrating that pediatric SMA inwestern Kenya is characterized by suppression of erythropoiesis (Awandare et al. 2011;Keller CC 2009; Ong'echa JM 2011; Ouma et al. 2010; Were et al. 2006) prompted us todetermine the impact of the ‘susceptible’ genotype (IFNA8 TA genotype) and haplotype(−173T/−884A) on the erythropoietic response (i.e., a ‘direct’ mechanism). To our surprise,neither the ‘susceptible’ genotype nor haplotype were associated with reducederythropoiesis (i.e., an RPI<2.0), suggesting an alternative explanation for the associationbetween IFNA genetic variation and susceptibility to SMA.
Kempaiah et al. Page 12
Hum Genet. Author manuscript; available in PMC 2013 May 28.
NIH
-PA Author Manuscript
NIH
-PA Author Manuscript
NIH
-PA Author Manuscript
We then investigated the hypothesis that IFNA genetic variation may condition SMA byindirectly influencing the inflammatory milieu. As such, a panel of inflammatory mediatorswas examined in the ‘susceptible’ groups. This included measurement of circulatingcytokines and chemokines, and urinary NOx/Cr. Consistent with our previous resultsshowing that IFN-α is a potent inducer of human NOS2-derived NO production (Kun et al.2001), the low IFN-α-producing −884TA genotype was also associated with significantlylower NOx/Cr. Although NOx/Cr was also reduced in the low IFN-α-producing TAhaplotype, the reduction was not significant (possibly due to reduced sample size, n=6),therefore, making it difficult to draw any definitive conclusions about the potential role ofNO in promoting anemia in this group of children.
Examination of the inflammatory milieu in carriers versus non-carriers of the TA haplotypeyielded interesting findings. We have previously shown that functional variation in thepromoter of IL-1β that produces higher levels of IL-1β production promotes an increasedrisk of SMA (Ouma et al. 2008). Consistent with these findings, carriers of the ‘susceptible’TA haplotype had significantly higher circulating IL-1β levels. In addition, individuals withthe TA haplotype also had significantly higher levels of IL-13. Although a role for IL-13 inthe context of SMA, and human malaria in general, has not been previously reported, recentresults from our laboratory aimed at identifying biomarkers of malarial anemia found thatelevated levels of IL-13 are a highly significant predictor of SMA (Ong'echa et al. 2011).Since IL-13 is typically associated with alternative activation of macrophages and immunityagainst extracellular parasites (Martinez et al. 2009), it remains to be determined if IL-13plays a causal role in the pathogenesis of malaria or if it is simply a marker of type 2immunity being released to counter-act the over-expression of type 1 cytokinescharacteristic of SMA. However, based on the fact that IL-13 directly inhibits CFU-E invitro (Sakamoto et al. 1995; Xi et al. 1995), examination of IL-13 and its relationship toIFN-α production requires further investigation. The other significant finding that emergedfrom these investigations was the reduced circulating levels of MIG in the TA haplotypegroup. Levels of MIG were also significantly lower in the carriers of the TA genotypeversus the TT and AA groups. As with IL-13, a role for MIG in promoting anemia inchildren with malaria has not been previously described and warrants further investigation.
Examination of the impact of IFN-α on the development of mortality and SMA throughout a36 mos. longitudinal follow-up revealed that children with the TA haplotype had a 2.5-foldhigher all-cause mortality rate than non-carriers. Association of this group with a high rateof mortality is consistent with the low frequency distribution of the haplotype (6% of thetotal haplotypes) which may indicate a selection bias towards low representation in thecohort. Since most of the study participants died at home, it was not possible to determinethe exact cause of death. Thus, it is difficult to infer how the low IFN-α producing TAhaplotype influenced all-cause mortality. Although definitively determining how the lowIFN-α producing TA haplotype influences mortality will certainly require additionalinvestigations, it is possible that individuals who produce low levels of IFN-α may besusceptible to a number of infectious diseases that are common to the region. Thishypothesis is consistent with the fact that IFN-α plays an important central role in protectionagainst a number of infectious diseases (Beilharz et al. 1997; Bogdan 2000; Garcia et al.2007; Izaguirre et al. 2003; Luty et al. 2000; Ong'echa et al. 2011; Vigario et al. 2001;Vilcek 2006). Although SMA is a leading cause of mortality in the study region (Anyona etal. 2011; Brabin et al. 2001; Were et al. 2011), none of the haplotypes examined weresignificantly associated with SMA throughout the follow-up period. This may be largelyrelated to the fact that the children died at home and, as such, SMA was not diagnosed, butcould have been captured indirectly in the analyses examining all-cause mortality. Inaddition, it is possible that some of the haplotypes do, indeed, influence longitudinaloutcomes, but were not identified in the hierarchical logistic regression and Cox regression
Kempaiah et al. Page 13
Hum Genet. Author manuscript; available in PMC 2013 May 28.
NIH
-PA Author Manuscript
NIH
-PA Author Manuscript
NIH
-PA Author Manuscript

analyses since the block 2 haplotypic effects had decreased statistical power based on smalland/or unbalanced haplotypic group sample sizes.
While the exact mechanism(s) through which IFN-α influenced anemia outcomes in thecurrent cohort remains unclear, the association between the ‘susceptible’ genetic groups andaltered levels of inflammatory mediators known to impact on anemia suggests that thebiologic actions of IFN-α may occur through altering the inflammatory environment (anindirect mechanism). Future studies should aim to delineate the precise role of IFN-α andidentify the downstream inflammatory mediators affected by altered IFN-α production inchildren with malaria.
In summary, results in the present study demonstrate that reduced IFN-α, conditioned bygenetic variation, particularly at the IFNA8 locus, promote enhanced anemia in Kenyanchildren with falciparum malaria. These data, along with our previous investigation inGabonese children with malaria (Luty et al. 2000), and studies in animal models of malaria(Vigario et al. 2001; Vigario et al. 2007), all point to IFN-α playing a protective role inmalarial disease. Based on these collective studies, and the abundant and long-standingclinical use of IFN-α to treat a number of inflammatory and infectious diseases, it raises thequestion as to whether IFN-α therapy may also have a role in treating malaria.
AcknowledgmentsThis work was supported by National Institutes of Health Research Grants-R01AI51305 and D43TW05884 (DJP).The authors gratefully acknowledge the assistance of the Siaya District Hospital team and the University of NewMexico/KEMRI staff for all the clinical support. We are very grateful to all the parents, guardians and, children thatparticipated in the study. The authors sincerely thank the Director of Kenya Medical Research Institute forapproving the data to be published in the manuscript.
REFERENCESAidoo M, Terlouw DJ, Kolczak MS, McElroy PD, ter Kuile FO, Kariuki S, Nahlen BL, Lal AA,
Udhayakumar V. Protective effects of the sickle cell gene against malaria morbidity and mortality.Lancet. 2002; 359:1311–1312. [PubMed: 11965279]
Anstey NM, Boutlis CS, Saunders JR. Systemic nitric oxide production in human malaria. I. Analysisof NO metabolites in biological fluids. Methods Mol Med. 2002; 72:461–467. [PubMed: 12125142]
Anyona SB, Kempaiah P, Raballah E, Ouma C, Were T, Davenport GC, Konah SN, Vulule JM,Hittner JB, Gichuki CW, Ong'echa JM, Perkins DJ. Functional promoter haplotypes ofinterleukin-18 condition susceptibility to severe malarial anemia and childhood mortality. InfectImmun. 2011; 79:4923–4932. [PubMed: 21969001]
Awandare GA, Kempaiah P, Ochiel DO, Piazza P, Keller CC, Perkins DJ. Mechanisms oferythropoiesis inhibition by malarial pigment and malaria-induced proinflammatory mediators in anin vitro model. Am J Hematol. 2011; 86:155–162. [PubMed: 21264897]
Beier JC, Oster CN, Onyango FK, Bales JD, Sherwood JA, Perkins PV, Chumo DK, Koech DV,Whitmire RE, Roberts CR, et al. Plasmodium falciparum incidence relative to entomologicinoculation rates at a site proposed for testing malaria vaccines in western Kenya. Am J Trop MedHyg. 1994; 50:529–536. [PubMed: 7911282]
Beilharz MW, McDonald W, Watson MW, Heng J, McGeachie J, Lawson CM. Low-dose oral type Iinterferons reduce early virus replication of murine cytomegalovirus in vivo. J Interferon CytokineRes. 1997; 17:625–630. [PubMed: 9355964]
Bekisz J, Schmeisser H, Hernandez J, Goldman ND, Zoon KC. Human interferons alpha, beta andomega. Growth Factors. 2004; 22:243–251. [PubMed: 15621727]
Biron CA. Initial and innate responses to viral infections--pattern setting in immunity or disease. CurrOpin Microbiol. 1999; 2:374–381. [PubMed: 10458991]
Biron CA. Interferons alpha and beta as immune regulators-a new look. Immunity. 2001; 14:661–664.[PubMed: 11420036]
Kempaiah et al. Page 14
Hum Genet. Author manuscript; available in PMC 2013 May 28.
NIH
-PA Author Manuscript
NIH
-PA Author Manuscript
NIH
-PA Author Manuscript

Bloland PB, Ruebush TK, McCormick JB, Ayisi J, Boriga DA, Oloo AJ, Beach R, Hawley W, Lal A,Nahlen B, Udhayakumar V, Campbell CC. Longitudinal cohort study of the epidemiology ofmalaria infections in an area of intense malaria transmission I. Description of study site, generalmethodology, and study population. Am J Trop Med Hyg. 1999; 60:635–640. [PubMed:10348240]
Bogdan C. The function of type I interferons in antimicrobial immunity. Curr Opin Immunol. 2000;12:419–424. [PubMed: 10899033]
Brabin BJ, Hakimi M, Pelletier D. An analysis of anemia and pregnancy-related maternal mortality. JNutr. 2001; 131:604S–614S. discussion 614S–615S. [PubMed: 11160593]
Brinkmann V, Geiger T, Alkan S, Heusser CH. Interferon alpha increases the frequency of interferongamma-producing human CD4+ T cells. J Exp Med. 1993; 178:1655–1663. [PubMed: 8228812]
CHIP_bioinformatics. http://snpper.chip.org/bio/snpper-enter
Court, M. 2008. www.tufts.edu/~mcourt01/Documents/Court%20lab%20-%20HW%20calculator.xls
Ferbas JJ, Toso JF, Logar AJ, Navratil JS, Rinaldo CR Jr. CD4+ blood dendritic cells are potentproducers of IFN-alpha in response to in vitro HIV-1 infection. J Immunol. 1994; 152:4649–4662.[PubMed: 7908920]
Foster GR, Rodrigues O, Ghouze F, Schulte-Frohlinde E, Testa D, Liao MJ, Stark GR, Leadbeater L,Thomas HC. Different relative activities of human cell-derived interferon-alpha subtypes: IFN-alpha 8 has very high antiviral potency. J Interferon Cytokine Res. 1996; 16:1027–1033. [PubMed:8974005]
Francis ML, Fan XS, Meltzer MS. Loss ability to produce IFN-alpha in response to HIV-1 asmonocytes differentiate into macrophages. Induction through a mechanism independent of double-stranded RNA. J Immunol. 1996; 156:2481–2487. [PubMed: 8786308]
Garcia JC, Ariza AM, Lasa AM, Gonzalez LJ, Perez VB. Increased antiviral activity of microscale-purified HuIFN alpha 8 (human interferon alpha 8) over HuIFN alpha 2b in Hep-2 cells challengedwith Mengo virus. Biotechnol Appl Biochem. 2007; 48:159–165. [PubMed: 17523917]
Gaunt TRRS, Zapata C, Day IN. MIDAS: software for analysis and visualisation of interallelicdisequilibrium between multiallelic markers. BMC Bioinformatics. 2006; 7:227. [PubMed:16643648]
Hamel MJ, Adazu K, Obor D, Sewe M, Vulule J, Williamson JM, Slutsker L, Feikin DR, LasersonKF. A reversal in reductions of child mortality in western Kenya, 2003–2009. Am J Trop MedHyg. 2011; 85:597–605. [PubMed: 21976557]
Havell EA, Hayes TG, Vilcek J. Synthesis of two distinct interferons by human fibroblasts. Virology.1978; 89:330–334. [PubMed: 210576]
Izaguirre A, Barnes BJ, Amrute S, Yeow WS, Megjugorac N, Dai J, Feng D, Chung E, Pitha PM,Fitzgerald-Bocarsly P. Comparative analysis of IRF and IFN-alpha expression in humanplasmacytoid and monocyte-derived dendritic cells. J Leukoc Biol. 2003; 74:1125–1138.[PubMed: 12960254]
Keller CC, Kremsner PG, Hittner JB, Misukonis MA, Weinberg JB, Perkins DJ. Elevated nitric oxideproduction in children with malarial anemia: hemozoin-induced nitric oxide synthase type 2transcripts and nitric oxide in blood mononuclear cells. Infect Immun. 2004; 72:4868–4873.[PubMed: 15271950]
Keller CCOC, Ouma Y, Awandare GA, Davenport GC, Were T, Hittner JB, Vulule JM, Ong'echa JM,Perkins DJ. Suppression of a novel hematopoietic mediator in children with severe malarialanemia. Infect Immun. 2009; 77(9):3864–3871. [PubMed: 19528216]
Keller CC, Ouma C, Y O, Awandare GA, Davenport GC, Were T, Hittner JB, Vulule JM, Ong'echaJM, Perkins DJ. Suppression of a novel hematopoietic mediator in children with severe malarialanemia. Infect Immun. 2009; 77(9):3864–3871. [PubMed: 19528216]
Kun JF, Mordmuller B, Perkins DJ, May J, Mercereau-Puijalon O, Alpers M, Weinberg JB, KremsnerPG. Nitric oxide synthase 2(Lambarene) (G-954C), increased nitric oxide production, andprotection against malaria. J Infect Dis. 2001; 184:330–336. [PubMed: 11443559]
Kurtzhals JA, Rodrigues O, Addae M, Commey JO, Nkrumah FK, Hviid L. Reversible suppression ofbone marrow response to erythropoietin in Plasmodium falciparum malaria. Br J Haematol. 1997;97:169–174. [PubMed: 9136961]
Kempaiah et al. Page 15
Hum Genet. Author manuscript; available in PMC 2013 May 28.
NIH
-PA Author Manuscript
NIH
-PA Author Manuscript
NIH
-PA Author Manuscript

Kwiatkowski DP. How malaria has affected the human genome and what human genetics can teach usabout malaria. Am J Hum Genet. 2005; 77:171–192. [PubMed: 16001361]
Luty AJ, Perkins DJ, Lell B, Schmidt-Ott R, Lehman LG, Luckner D, Greve B, Matousek P, HerbichK, Schmid D, Weinberg JB, Kremsner PG. Low interleukin-12 activity in severe Plasmodiumfalciparum malaria. Infect Immun. 2000; 68:3909–3915. [PubMed: 10858202]
Martinez FO, Helming L, Gordon S. Alternative activation of macrophages: an immunologicfunctional perspective. Annu Rev Immunol. 2009; 27:451–483. [PubMed: 19105661]
McElroy PD, Lal AA, Hawley WA, Bloland PB, Kuile FO, Oloo AJ, Harlow SD, Lin X, Nahlen BL.Analysis of repeated hemoglobin measures in full-term, normal birth weight Kenyan childrenbetween birth and four years of age. III. The Asemobo Bay Cohort Project. Am J Trop Med Hyg.1999; 61:932–940. [PubMed: 10674673]
McElroy PD, ter Kuile FO, Lal AA, Bloland PB, Hawley WA, Oloo AJ, Monto AS, Meshnick SR,Nahlen BL. Effect of Plasmodium falciparum parasitemia density on hemoglobin concentrationsamong full-term, normal birth weight children in western Kenya, IV. The Asembo Bay CohortProject. Am J Trop Med Hyg. 2000; 62:504–512. [PubMed: 11220768]
Mori S, Jewett A, Cavalcanti M, Murakami-Mori K, Nakamura S, Bonavida B. Differential regulationof human NK cell-associated gene expression following activation by IL-2, IFN-alpha and PMA/ionomycin. Int J Oncol. 1998; 12:1165–1170. [PubMed: 9538144]
Muasya T, Lore W, Yano K, Yatsuhashi H, Owiti FR, Fukuda M, Tamada MY, Kulundu J, Tukei J,Okoth FA. Prevalence of hepatitis C virus and its genotypes among a cohort of drug users inKenya. East Afr Med J. 2008; 85:318–325. [PubMed: 19133420]
Muller U, Steinhoff U, Reis LF, Hemmi S, Pavlovic J, Zinkernagel RM, Aguet M. Functional role oftype I and type II interferons in antiviral defense. Science. 1994; 264:1918–1921. [PubMed:8009221]
Murray CJ, Rosenfeld LC, Lim SS, Andrews KG, Foreman KJ, Haring D, Fullman N, Naghavi M,Lozano R, Lopez AD. Global malaria mortality between 1980 and 2010: a systematic analysis.The Lancet. 2012; 379:413–431.
NCBI_refSNP. http://www.ncbi.nlm.nih.gov/projects/SNP/snp_ref.cgi?rs=16938369 and 1096498.
Ndiritu M, Cowgill KD, Ismail A, Chiphatsi S, Kamau T, Fegan G, Feikin DR, Newton CR, Scott JA.Immunization coverage and risk factors for failure to immunize within the Expanded Programmeon Immunization in Kenya after introduction of new Haemophilus influenzae type b and hepatitisb virus antigens. BMC Public Health. 2006; 6:132. [PubMed: 16707013]
Novelli EM, Hittner JB, Davenport GC, Ouma C, Were T, Obaro S, Kaplan S, Ong'echa JM, PerkinsDJ. Clinical predictors of severe malarial anaemia in a holoendemic Plasmodium falciparumtransmission area. Br J Haematol. 2010; 149:711–721. [PubMed: 20408849]
Obonyo CO, Steyerberg EW, Oloo AJ, Habbema JD. Blood transfusions for severe malaria-relatedanemia in Africa: a decision analysis. Am J Trop Med Hyg. 1998; 59:808–812. [PubMed:9840603]
Okwara FN, Obimbo EM, Wafula EM, Murila FV. Bacteraemia, urinary tract infection and malaria inhospitalised febrile children in Nairobi: is there an association? East Afr Med J. 2004; 81:47–51.[PubMed: 15080516]
Ong'echa JM, Davenport GC, Vulule JM, Hittner JB, Perkins DJ. Identification of InflammatoryBiomarkers for Pediatric Malarial Anemia Severity using Novel Statistical Methods. InfectImmun. 2011 [Epub ahead of print].
Ong'echa JMDG, Vulule JM, Hittner JB, Perkins DJ. Identification of Inflammatory Biomarkers forPediatric Malarial Anemia Severity using Novel Statistical Methods. Infect Immun. 2011 [Epubahead of print].
Ong'echa JM, Keller CC, Were T, Ouma C, Otieno RO, Landis-Lewis Z, Ochiel D, Slingluff JL,Mogere S, Ogonji GA, Orago AS, Vulule JM, Kaplan SS, Day RD, Perkins DJ. Parasitemia,anemia, and malarial anemia in infants and young children in a rural holoendemic Plasmodiumfalciparum transmission area. Am J Trop Med Hyg. 2006; 74:376–385. [PubMed: 16525094]
Othoro C, Lal AA, Nahlen B, Koech D, Orago AS, Udhayakumar V. A low interleukin-10 tumornecrosis factor-alpha ratio is associated with malaria anemia in children residing in a holoendemicmalaria region in western Kenya. J Infect Dis. 1999; 179:279–282. [PubMed: 9841855]
Kempaiah et al. Page 16
Hum Genet. Author manuscript; available in PMC 2013 May 28.
NIH
-PA Author Manuscript
NIH
-PA Author Manuscript
NIH
-PA Author Manuscript

Otieno RO, Ouma C, Ong'echa JM, Keller CC, Were T, Waindi EN, Michaels MG, Day RD, VululeJM, Perkins DJ. Increased severe anemia in HIV-1-exposed and HIV-1-positive infants andchildren during acute malaria. AIDS. 2006; 20:275–280. [PubMed: 16511422]
Ouma C, Davenport GC, Awandare GA, Keller CC, Were T, Otieno MF, Vulule JM, Martinson J,Ong'echa JM, Ferrell RE, Perkins DJ. Polymorphic variability in the interleukin (IL)-1betapromoter conditions susceptibility to severe malarial anemia and functional changes in IL-1betaproduction. J Infect Dis. 2008; 198:1219–1226. [PubMed: 18781863]
Ouma C, Keller CC, Davenport GC, Were T, Konah S, Otieno MF, Hittner JB, Vulule JM, MartinsonJ, Ong'echa JM, Ferrell RE, Perkins DJ. A novel functional variant in the stem cell growth factorpromoter protects against severe malarial anemia. Infect Immun. 2010; 78:453–460. [PubMed:19884328]
Ouma C, Keller CC, Opondo DA, Were T, Otieno RO, Otieno MF, Orago AS, Ong'Echa JM, VululeJM, Ferrell RE, Perkins DJ. Association of FCgamma receptor IIA (CD32) polymorphism withmalarial anemia and high-density parasitemia in infants and young children. Am J Trop Med Hyg.2006; 74:573–577. [PubMed: 16606986]
Perkins DJ, Kremsner PG, Schmid D, Misukonis MA, Kelly MA, Weinberg JB. Blood mononuclearcell nitric oxide production and plasma cytokine levels in healthy gabonese children with priormild or severe malaria. Infect Immun. 1999; 67:4977–4981. [PubMed: 10456963]
Perkins DJ, Were T, Davenport GC, Kempaiah P, Hittner JB, Ong'echa JM. Severe malarial anemia:innate immunity and pathogenesis. Int J Biol Sci. 2011; 7:1427–1442. [PubMed: 22110393]
Sakamoto O, Hashiyama M, Minty A, Ando M, Suda T. Interleukin-13 selectively suppresses thegrowth of human macrophage progenitors at the late stage. Blood. 1995; 85:3487–3493. [PubMed:7780135]
Samuel CE. Antiviral actions of interferons. Clin Microbiol Rev. 2001; 14:778–809. [PubMed:11585785]
Seto MH, Harkins RN, Adler M, Whitlow M, Church WB, Croze E. Homology model of humaninterferon-alpha 8 and its receptor complex. Protein Sci. 1995; 4:655–670. [PubMed: 7613464]
Song, lH; Toan, NL.; Xuan, NT.; Uhlemann, AC.; Boldt, AB.; Duy, DN.; Binh, VQ.; Kremsner, PG.;Kun, JF. A promoter polymorphism in the interferon alpha-2 gene is associated with the clinicalpresentation of hepatitis B. Mutat Res. 2006; 601:137–143. [PubMed: 16920161]
Taylor JL, Grossberg SE. The effects of interferon-alpha on the production and action of othercytokines. Semin Oncol. 1998; 25:23–29. [PubMed: 9482537]
Tena-Tomas C, de Messias-Reason I, Song le H, Tomiuk J, Kemsner PG, Kun JF. A globallyoccurring indel polymorphism in the promoter of the IFNA2 gene is not associated with severityof malaria but with the positivity rate of HCV. BMC Genet. 2008; 9:80. [PubMed: 19055755]
Vigario AM, Belnoue E, Cumano A, Marussig M, Miltgen F, Landau I, Mazier D, Gresser I, Renia L.Inhibition of Plasmodium yoelii blood-stage malaria by interferon alpha through the inhibition ofthe production of its target cell, the reticulocyte. Blood. 2001; 97:3966–3971. [PubMed:11389041]
Vigario AM, Belnoue E, Gruner AC, Mauduit M, Kayibanda M, Deschemin JC, Marussig M, SnounouG, Mazier D, Gresser I, Renia L. Recombinant human IFN-alpha inhibits cerebral malaria andreduces parasite burden in mice. J Immunol. 2007; 178:6416–6425. [PubMed: 17475871]
Vilcek J. Fifty years of interferon research: aiming at a moving target. Immunity. 2006; 25:343–348.[PubMed: 16979566]
Were T, Davenport GC, Hittner JB, Ouma C, Vulule JM, Ong'echa JM, Perkins DJ. Bacteremia inKenyan children presenting with malaria. J Clin Microbiol. 2011; 49:671–676. [PubMed:21106789]
Were T, Davenport GC, Yamo EO, Hittner JB, Awandare GA, Otieno MF, Ouma C, Orago AS,Vulule JM, Ong'echa JM, Perkins DJ. Naturally acquired hemozoin by monocytes promotessuppression of RANTES in children with malarial anemia through an IL-10-dependentmechanism. Microbes Infect. 2009; 11:811–819. [PubMed: 19427395]
Were T, Hittner JB, Ouma C, Otieno RO, Orago AS, Ong'echa JM, Vulule JM, Keller CC, Perkins DJ.Suppression of RANTES in children with Plasmodium falciparum malaria. Haematologica. 2006;91:1396–1399. [PubMed: 17018392]
Kempaiah et al. Page 17
Hum Genet. Author manuscript; available in PMC 2013 May 28.
NIH
-PA Author Manuscript
NIH
-PA Author Manuscript
NIH
-PA Author Manuscript

WHO. Centers for Disease Control and Prevention. Severe falciparum malaria. Trans R Soc Trop MedHyg. 2000; 94:S1–S90. [PubMed: 11103309]
Wickramasinghe SN, Abdalla SH. Blood and bone marrow changes in malaria. Baillieres Best PractRes Clin Haematol. 2000; 13:277–299. [PubMed: 10942626]
Xi X, Schlegel N, Caen JP, Minty A, Fournier S, Caput D, Ferrara P, Han ZC. Differential effects ofrecombinant human interleukin-13 on the in vitro growth of human haemopoietic progenitor cells.Br J Haematol. 1995; 90:921–927. [PubMed: 7669673]
Kempaiah et al. Page 18
Hum Genet. Author manuscript; available in PMC 2013 May 28.
NIH
-PA Author Manuscript
NIH
-PA Author Manuscript
NIH
-PA Author Manuscript

Figure 1. Determination of circulating IFN-α levels in parasitemic childrenConcentrations of circulating IFN-α (pg/mL) in children aged <3.0 years with P. falciparummalaria was measured using the ‘Human Cytokine Twenty-Five-Plex Antibody Bead Kit’ asdescribed in the Methods. Children (n=243) were categorized according to the WHOdefinition of SMA based on Hb concentrations (i.e., Hb<5.0 g/dL, with any densityparasitemia). Results are presented for children with non-SMA (i.e., Hb≥5.0 g/dL, n=177)and SMA (i.e., Hb<5.0 g/dL, n=66). Box-plots depict the data where the box represents theinterquartile range, the line through the box is the median, and whiskers illustrate the 10th
and 90th percentiles. Significantly reduced circulating IFN-α levels were found in the SMAgroup compared to the non-SMA group (P=0.025, aMann-Whitney U test).
Kempaiah et al. Page 19
Hum Genet. Author manuscript; available in PMC 2013 May 28.
NIH
-PA Author Manuscript
NIH
-PA Author Manuscript
NIH
-PA Author Manuscript
Figure 2. Effect of IFN-α genotypes and haplotypes on SMAParasitemic children (n=508) were categorized based on clinical categories of SMA (i.e.,Hb<5.0 g/dL) and non-SMA (i.e., Hb≥5.0 g/dL). Data presented as Odds Ratios (OR) and95% CI were determined using multivariate logistic regression analyses controlling forconfounding factors [age, gender, HIV-1 status, G6PD deficiency, bacteremia, and HbAS].In the multivariate analysis of genotypic data, the wild-type was used as reference categoryfor individual SNPs. To determine the impact of each haplotype on disease phenotype,individuals without the haplotype were used as the reference group in the multivariateanalyses. As shown in the figure, the presence of TA genotype at IFNA8 −884 locusincreases susceptibility to SMA and presence of the TA (−173T/−884A) haplotype wasassociated with an increased risk of developing SMA.
Kempaiah et al. Page 20
Hum Genet. Author manuscript; available in PMC 2013 May 28.
NIH
-PA Author Manuscript
NIH
-PA Author Manuscript
NIH
-PA Author Manuscript

Figure 3. Association of circulating IFN-α levels with genotypic and haplotypic variantsCirculating IFN-α concentration (pg/mL) in parasitized children (n=243) aged <3.0 yearswas measured using the ‘Human Cytokine Twenty-Five-Plex Antibody Bead Kit’. Resultsare presented for each IFN-α genotypic category; IFNA2, A-173T (AA, n=140; AT, n=84;TT, n=19) and IFNA8, T-884A (TT, n=194; TA, n=41; AA, n=8). In addition, results arealso presented for carriers vs. non-carriers of the IFNA2 and IFNA8 haplotypiccombinations; [−173A/−884T (AT), n=216; −173A/−884A (AA), n=27; −173T/−884T (TT),n=83; −173T/−884A (TA), n=24]. Box-plots depict the data where the box represents theinterquartile range, the line through the box is the median, and whiskers illustrate the 10th
and 90th percentiles. None of the genotypes at the −173 locus were significantly associatedwith altered levels of circulating IFN-α (P=0.198, aKruskal-Wallis test), while the presenceof heterozygous (TA) genotype at −884, relative to homozygous wild-type (TT), wasassociated with significantly reduced levels of circulating IFN-α (P=0.038, bMann-WhitneyU test). Presence of the −173T/−884A (TA) haplotypes was associated with reduced IFN-αlevels compared to non-carriers (P=0.031, bMann-Whitney U test).
Kempaiah et al. Page 21
Hum Genet. Author manuscript; available in PMC 2013 May 28.
NIH
-PA Author Manuscript
NIH
-PA Author Manuscript
NIH
-PA Author Manuscript

Figure 4. Analyses of IFNA8 promoter variants with luciferase reporter assaysThe luciferase activity from test constructs, pGL3-basic, was measured and corrected fortransfection efficiency with luciferase activity from the pGL3-control. Data are presented asthe relative luciferase reporter activity, and each bar represents the mean ± SEM of tworeplicate samples from three independent experiments with similar results. (A) U937 cells,P-values are calculated by Kruskal-Wallis test for across group corrected by Dunn’s posttests (*P=0.009) and between two groups (TT vs. TA and TT vs. AA) by analysis ofvariance (Two-Way ANOVA) corrected by Bonferroni post tests (P<0.001). (B) HT-1080cells, P-values are calculated by Kruskal-Wallis test for across group corrected by Dunn’spost tests (*P=0.021) and between two groups (TT vs. TA and TT vs. AA) by two-wayANOVA corrected by Bonferroni post tests (P<0.001).
Kempaiah et al. Page 22
Hum Genet. Author manuscript; available in PMC 2013 May 28.
NIH
-PA Author Manuscript
NIH
-PA Author Manuscript
NIH
-PA Author Manuscript

Figure 5. Production of systemic NO and inflammatory mediators(A) Systemic urinary NO levels (NOx/creatinine in µM/µM) in children (n=171) aged <3.0years with P. falciparum malaria were measured using the ‘Human Griess reaction’ (Ansteyet al. 2002; Keller et al. 2004). Results are presented for each group as non-SMA (i.e.,Hb≥5.0 g/dL, n=105), SMA (i.e., Hb<5.0 g/dL, n=66), individual IFNA2 and IFNA8promoter variants [A-173T (AA, n=109; AT, n=48; TT, n=14) and T-884A (TT, n=142; TA,n=23; AA, n=6)], and haplotypes [−173T/−884A (TA, n=10)]. Box-plots depict the datawhere the box represents the interquartile range, the line through the box is the median, andwhiskers illustrate the 10th and 90th percentiles. As shown, significantly reduced NOx/
Kempaiah et al. Page 23
Hum Genet. Author manuscript; available in PMC 2013 May 28.
NIH
-PA Author Manuscript
NIH
-PA Author Manuscript
NIH
-PA Author Manuscript
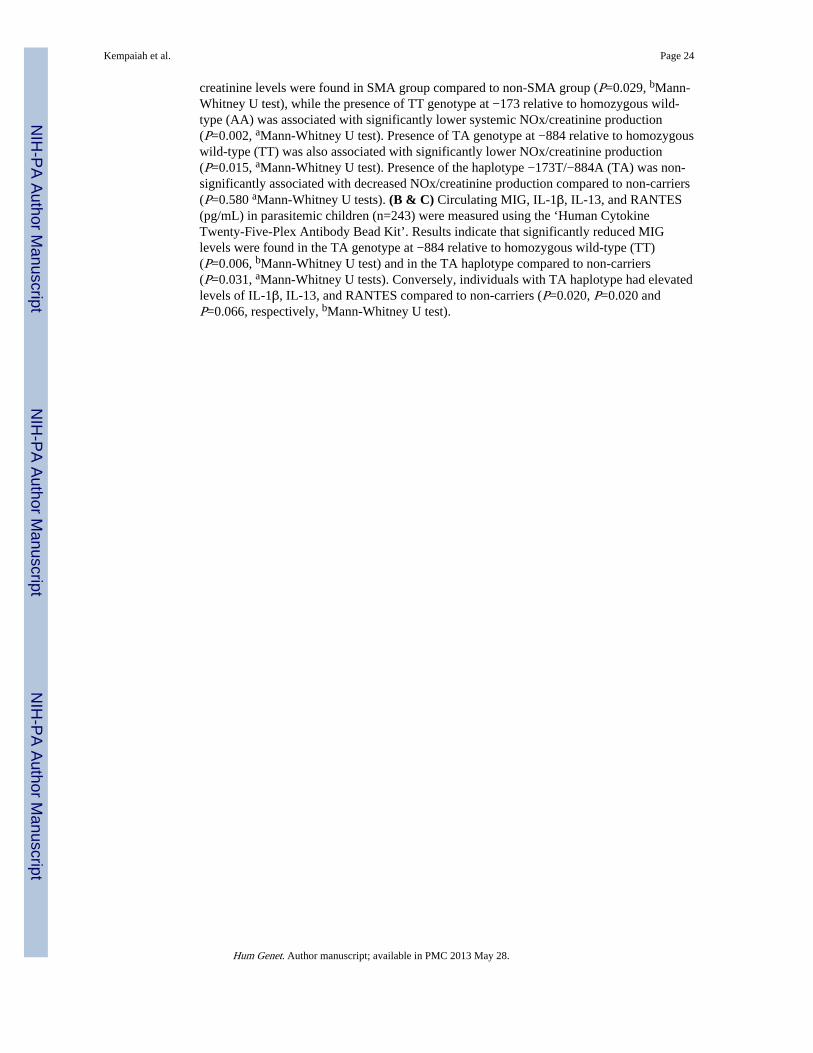
creatinine levels were found in SMA group compared to non-SMA group (P=0.029, bMann-Whitney U test), while the presence of TT genotype at −173 relative to homozygous wild-type (AA) was associated with significantly lower systemic NOx/creatinine production(P=0.002, aMann-Whitney U test). Presence of TA genotype at −884 relative to homozygouswild-type (TT) was also associated with significantly lower NOx/creatinine production(P=0.015, aMann-Whitney U test). Presence of the haplotype −173T/−884A (TA) was non-significantly associated with decreased NOx/creatinine production compared to non-carriers(P=0.580 aMann-Whitney U tests). (B & C) Circulating MIG, IL-1β, IL-13, and RANTES(pg/mL) in parasitemic children (n=243) were measured using the ‘Human CytokineTwenty-Five-Plex Antibody Bead Kit’. Results indicate that significantly reduced MIGlevels were found in the TA genotype at −884 relative to homozygous wild-type (TT)(P=0.006, bMann-Whitney U test) and in the TA haplotype compared to non-carriers(P=0.031, aMann-Whitney U tests). Conversely, individuals with TA haplotype had elevatedlevels of IL-1β, IL-13, and RANTES compared to non-carriers (P=0.020, P=0.020 andP=0.066, respectively, bMann-Whitney U test).
Kempaiah et al. Page 24
Hum Genet. Author manuscript; available in PMC 2013 May 28.
NIH
-PA Author Manuscript
NIH
-PA Author Manuscript
NIH
-PA Author Manuscript
Figure 6. Probability of mortality in children stratified by haplotype carriage during thelongitudinal study periodThe probability of mortality rate was determined for the follow up period as a function ofTA haplotype carriers (1; n=55) and non-carriers (−1; n=608). Green curve indicate TAcarriers (1), and blue curve show non-carriers of TA haplotype (−1). Cox regressionmodeling revealed that mean hazard rates (the probability of dying over time) wassignificantly higher for carriers than non-carriers of the TA haplotype (P<0.001).
Kempaiah et al. Page 25
Hum Genet. Author manuscript; available in PMC 2013 May 28.
NIH
-PA Author Manuscript
NIH
-PA Author Manuscript
NIH
-PA Author Manuscript

NIH
-PA Author Manuscript
NIH
-PA Author Manuscript
NIH
-PA Author Manuscript
Kempaiah et al. Page 26
Table 1
Demographic and laboratory characteristics of the study participants.
Characteristic Non-SMA SMA P
No. of participants 384 124 N/A
Age, mos. 10.00 (9.00) 8.00 (9.75) 0.047a
Gender, n (%)
Male 196 (51.0) 58 (46.8)0.235b
Female 188 (49.0) 66 (53.2)
Admission temp. (°C) 37.30 (1.60) 37.55 (1.68) 0.024a
Hematological Indices
Hemoglobin (g/dL) 7.00 (2.90) 4.20 (1.10) <0.001a
Hematocrit, % 21.90 (8.00) 13.00 (3.00) <0.001a
RBC count (1012/L) 3.37 (1.38) 1.81 (0.60) <0.001a
RDW 20.75 (5.40) 21.50 (4.70) 0.179a
MCV, fL 68.75 (12.45) 73.40 (11.00) <0.001a
MCH, fL/cell 22.15 (4.00) 22.70 (5.00) 0.018a
MCHC, g/dL 32.10 (2.00) 31.90 (4.00) 0.033a
WBC count (103/ µL) 11.30 (5.73) 15.00 (9.55) <0.001a
Lymphocytes, ×103/µL 5.50 (3.00) 6.90 (5.00) <0.001a
Monocytes, ×103/µL 1.00 (1.00) 1.60 (2.00) <0.001a
Granulocytes, ×103/µL 4.50 (4.00) 5.30 (5.00) 0.003a
Platelets, ×103/µL 172 (162) 167 (138) 0.028a
Reticulocyte Indices
Absolute reticulocyte number (ARN) 66.00 (88.00) 46.00 (75.00) 0.005a
Reticulocyte production index (RPI) 1.46 (2.00) 1.15 (1.70) 0.032a
RPI<2, n (%) 259 (67) 100 (81) 0.008b
Parasitological Indices
Parasite denisty (µL) 19,718 (39,650) 16,728 (48,386) 0.468a
HDP (n [%]) 253 (66) 73 (59) 0.157b
Genetic Variants
Sickle cell trait, n (%) 50 (13) 8 (7) 0.127b
G6PD deficiency, n (%) 14 (4) 6 (6) 0.541b
Parasitemic children (n=508) were stratified into SMA (Hb<5.0 g/dL, with any density parasitemia); and non-SMA (Hb≥5.0 g/dL, with any densityparasitemia) (WHO 2000). Data presented are the median (interquartile range, IQR), unless otherwise stated. ARN and RPI were calculated, basedon previous method (Were et al. 2009), as follows: reticulocyte index (RI) = (reticulocyte count × hematoctrit) ÷ 30.7 (average hematocrit ofchildren < 5 years of age in Siaya district); maturation factor (MF) = 1 + 0.05 (30.7 - hematocrit); RPI = RI/MF; ARN = (RI × RBC count /L) ÷
Hum Genet. Author manuscript; available in PMC 2013 May 28.

NIH
-PA Author Manuscript
NIH
-PA Author Manuscript
NIH
-PA Author Manuscript
Kempaiah et al. Page 27
100. All subjects positive for HIV-1 or bacterial infections were excluded from the analyses. Abbreviations: N/A, not applicable; Hb - Hemoglobin;non-SMA - non-severe malarial anemia (Hb≥5.0g/dL, with any density parasitemia); SMA - severe malarial anemia (Hb<5.0g/dL, with any densityparasitemia); RDW - Red cell distribution width; MCV - Mean corpuscular volume; MCH - Mean corpuscular hemoglobin; MCHC - Meancorpuscular hemoglobin concentration; MPS - malaria parasites; HDP - high density parasitemia (MPS≥10,000/µL). RBC, red blood cell; WBC,white blood cell; HDP, high-density parasitemia ≥10,000 parasites/µL.
aStatistical significance determined by Mann-Whitney U test.
bStatistical significance determined by the Chi-square (χ2) analysis.
Hum Genet. Author manuscript; available in PMC 2013 May 28.
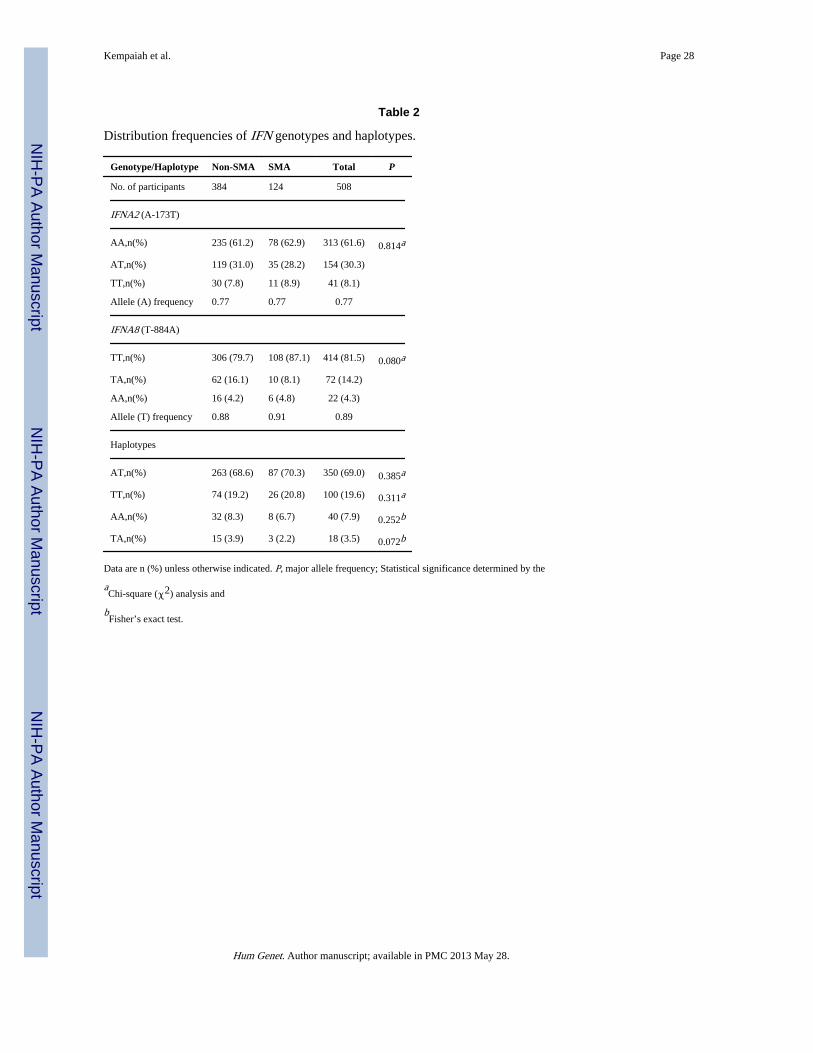
NIH
-PA Author Manuscript
NIH
-PA Author Manuscript
NIH
-PA Author Manuscript
Kempaiah et al. Page 28
Table 2
Distribution frequencies of IFN genotypes and haplotypes.
Genotype/Haplotype Non-SMA SMA Total P
No. of participants 384 124 508
IFNA2 (A-173T)
AA,n(%) 235 (61.2) 78 (62.9) 313 (61.6) 0.814a
AT,n(%) 119 (31.0) 35 (28.2) 154 (30.3)
TT,n(%) 30 (7.8) 11 (8.9) 41 (8.1)
Allele (A) frequency 0.77 0.77 0.77
IFNA8 (T-884A)
TT,n(%) 306 (79.7) 108 (87.1) 414 (81.5) 0.080a
TA,n(%) 62 (16.1) 10 (8.1) 72 (14.2)
AA,n(%) 16 (4.2) 6 (4.8) 22 (4.3)
Allele (T) frequency 0.88 0.91 0.89
Haplotypes
AT,n(%) 263 (68.6) 87 (70.3) 350 (69.0) 0.385a
TT,n(%) 74 (19.2) 26 (20.8) 100 (19.6) 0.311a
AA,n(%) 32 (8.3) 8 (6.7) 40 (7.9) 0.252b
TA,n(%) 15 (3.9) 3 (2.2) 18 (3.5) 0.072b
Data are n (%) unless otherwise indicated. P, major allele frequency; Statistical significance determined by the
aChi-square (χ2) analysis and
bFisher’s exact test.
Hum Genet. Author manuscript; available in PMC 2013 May 28.


![[with H. Stilke] Spätmittelalterliche "Komforen" aus Emden und ihre niederländischen Parallelen. Nachrichten aus Niedersachsens Urgeschichte 61 (1992), 173-188.](https://static.fdokumen.com/doc/165x107/631baae73e8acd9977058960/with-h-stilke-spaetmittelalterliche-komforen-aus-emden-und-ihre-niederlaendischen.jpg)