Seeing the Whole Elephant: A Comprehensive Framework for ...
Upload
independentCategory
view
3download
0
Recruitment of Occipital Cortex during SensorySubstitution Training Linked to Subjective Experience ofSeeing in People with BlindnessTomas Ortiz1*, Joaquın Poch2, Juan M. Santos1,3, Carmen Requena4, Ana M. Martınez1, Laura Ortiz-
Teran1,5, Agustın Turrero6, Juan Barcia7, Ramon Nogales8, Agustın Calvo8, Jose M. Martınez8, Jose L.
Cordoba8, Alvaro Pascual-Leone9,10
1 Department of Psychiatry, Facultad de Medicina, Universidad Complutense, Madrid, Spain, 2 Department of Ear, Nose and Throat (ENT), Hospital Clınico Universitario San
Carlos, Madrid, Spain, 3 CIBERSAM (Centro de Investigacion Biomedica en Red de Salud Mental, Spanish Research Network in Mental Health), Madrid, Spain, 4 Department
of Psychology, Universidad de Leon, Leon, Spain, 5 Department of Radiology, Massachusetts General Hospital, Harvard University, Boston, Massachusetts, United States of
America, 6 Department of Statistics, Facultad de Medicina, Universidad Complutense, Madrid, Spain, 7 Department of Neurosurgery, Hospital Clınico Universitario San
Carlos, Madrid, Spain, 8 Vision-Tactile Project, Facultad de Medicina, Universidad Complutense, Madrid, Spain, 9 Berenson-Allen Center for Noninvasive Brain Stimulation,
Department of Neurology, Beth Israel Deaconess Medical Center, Harvard Medical School, Boston, Massachusetts, United States of America, 10 Instituto Guttman de
Neurorehabilitacio, Universitat Autonoma de Barcelona, Barcelona, Spain
Abstract
Over three months of intensive training with a tactile stimulation device, 18 blind and 10 blindfolded seeing subjectsimproved in their ability to identify geometric figures by touch. Seven blind subjects spontaneously reported ‘visual qualia’,the subjective sensation of seeing flashes of light congruent with tactile stimuli. In the latter subjects tactile stimulationevoked activation of occipital cortex on electroencephalography (EEG). None of the blind subjects who failed to experiencevisual qualia, despite identical tactile stimulation training, showed EEG recruitment of occipital cortex. None of theblindfolded seeing humans reported visual-like sensations during tactile stimulation. These findings support the notion thatthe conscious experience of seeing is linked to the activation of occipital brain regions in people with blindness. Moreover,the findings indicate that provision of visual information can be achieved through non-visual sensory modalities which mayhelp to minimize the disability of blind individuals, affording them some degree of object recognition and navigation aid.
Citation: Ortiz T, Poch J, Santos JM, Requena C, Martınez AM, et al. (2011) Recruitment of Occipital Cortex during Sensory Substitution Training Linked toSubjective Experience of Seeing in People with Blindness. PLoS ONE 6(8): e23264. doi:10.1371/journal.pone.0023264
Editor: Chris I. Baker, National Institute of Mental Health, United States of America
Received December 11, 2010; Accepted July 14, 2011; Published August 10, 2011
Copyright: � 2011 Ortiz et al. This is an open-access article distributed under the terms of the Creative Commons Attribution License, which permitsunrestricted use, distribution, and reproduction in any medium, provided the original author and source are credited.
Funding: This research has been made possible through grants from the Fundacion Esther Koplowitz (grant #EK-4131306) and Instituto Madrileno de Desarrollo(IMADE)/Madrid Regional Government (Spain) (grant #IMADE-4131307). The funders had no role in study design, data collection and analysis, decision to publish,or preparation of the manuscript.
Competing Interests: The authors have declared that no competing interests exist.
* E-mail: [email protected]
Introduction
Cross-modality sensory stimulation may offer a good opportu-
nity to improve recognition, localization and navigation in blind
people. A coherent and unified perceptual experience is created by
the brain with multisensorial input [1–3], although the neural
substrate of this multimodality integration is not yet fully under-
stood yet. Some areas of the brain, mainly the lateral occipital
cortex, are specialized for visual object recognition and can be
activated by tactile stimuli [4–6]. This activation of the visual
cortex might lead to visual-like perception, regardless of the
sensory input modality [3].
In the blind the high demand required by object recognition
appears to also recruit ventral and dorsal occipital areas [7].
Blindness modifies neocortical processing of non-visual tasks,
including frontoparietal and visual regions during tactile stimula-
tion [8]. Some authors have reported sources of connections in
bilateral primary somatosensory cortex as well as in inferior
temporal areas during tactile stimulation in blind subjects, and
have also found that the age of onset of blindness could affect the
set of areas involved [8]. It is also known that people with
blindness proficient in the use of a visuo-tactile sensory substitution
device that presents visual images as patterns of electric stimuli to
the subject’s tongue [9–10] show occipital cortex activation in an
orientation-discrimination task [10].
Evoked potentials are useful to study brain activity triggered by
external stimuli using surface recordings. Around 50 msec after
stimulation, and even earlier, primary somatosensory cortical
activation is normally found. In the case of tactile stimuli, this
happens in parietal areas contralateral to the stimulated hand.
Circa 100 msec shape and object automatic recognition takes
place as well in somatosensory areas. After 300 msec some activity
related to objects with poor-defined identity happens, as well as
some matching between perception and stored representations in
cognitive processing in prefrontal areas [11–17]. As in the case of
imaging studies, ERP-based results suggest that tactile inputs could
produce occipital cortex activation in the blind [18].
However, there are no published studies aimed at understand-
ing the relationship between activation of lateral occipital cortex
and the ability to recognize objects presented to the hand along
PLoS ONE | www.plosone.org 1 August 2011 | Volume 6 | Issue 8 | e23264

time. Thus, we tested if repetitive passive tactile stimulation leads
to activation of visual areas and recognition of spatial patterns in
people with blindness.
We used passive repetitive tactile stimulation over a period of 3
months, one hour a day for five days a week, with vertical,
horizontal and oblique lines generated randomly by a tactile
stimulator. Our aims were (a) to study if repetitive tactile stimulation
can create cross-modality and improve recognition and localization
of patterns in blind people, and (b) to evaluate the impact of this
training on brain activity. We performed EEG recording during the
initial stimulation session and in the last session.
Materials and Methods
SubjectsAfter a call for volunteers was made, we studied 18 blind subjects
(13 men, 5 women) that were recruited consecutively from the
National Organization of Spanish Blind to participate in the study,
plus10 controls (blindfolded seeing normal individuals, 4 men and 6
women) of similar ages to the blind group, who had no visual deficit
at all and had no previous history of synesthesias. All participants
were informed of the nature and purpose of the experiment and all
gave their written informed consent. Whenever minors were
consented, both the minor and his/her legal representative were
informed, minors’ assented and their legal representatives consented
in written form acknowledging the minors assent as well. The study
was approved by the Hospital Clınico San Carlos Clinical Research
Bioethical Committee (Universidad Complutense, Madrid, Spain)
committee/institutional review board and consent adhered to the
Declaration of Helsinki. Participants had no history of neurological,
psychiatric, cognitive or sensorimotor deficits, other than blindness.
They all had normal EEGs at baseline.
Nine subjects had early onset blindness (loss of vision before 5
years of age) while the rest, but one, were late blind, having lost their
sight after age 15. Four subjects had absolute congenital blindness
(from birth), ten had no residual vision at all at the time of our study,
while eight had minimal residual vision. Causes of blindness were
diverse: congenital nystagmus, glaucoma, retinopathy, congenital
cataracts, lenticular fibroplasia, macular degeneration, optic
atrophy, Peter’s anomaly with microphtalmia, retinal detachment,
retina necrosis, retinitis pigmentosa and uveitis (Table 1).
All of the blind subjects were initially considered as a single
category, but they were later classified into two groups according to
the subjective report, or its absence, of visual-like perception. Group
1 (G1, seven blind participants who reported visual sensations, mean
age = 32.83, SD = 15.78); Group 2 (G2, eleven blind who did not
and even denied visual sensations when explicitly asked, mean
age = 46.99, SD = 13.03); and Group 3 (G3, ten blindfolded subjects
with no visual deficit, mean age = 39.12, SD = 11.17).
All but three subjects were right-handed and were stimulated on
the palm of their right hand. The left-handed individuals under-
went the procedure on their left hands (video S1, supplementary
material).
StimuliAll subjects underwent intensive training in the use of a tactile
sensory device. The stimulation program was completed over a
period of three months and involved daily sessions five days a week
(Monday to Friday). The control group (G3) underwent exactly the
same protocol but they were blindfolded just before each training
session until the session ended.
Training consisted of repetitive tactile stimulation with lines
oriented vertically, horizontally or obliquely in a random fashion,
using a tactile piezoelectric device. Each line was presented for
300 msec at 40 Hz, and followed by a blank pause of 700 msec;
hence each direction repeated during one second. The frequency
of 40 Hz was chosen based upon the findings that thalamo-cortical
connections fire at 40 Hz [19–20].
Each stimulation session lasted 60 minutes and included the
presentation of approximately 3600 stimuli per session. The
generation of repetitive passive tactile stimuli was achieved using a
single tactile piezoelectric device with 1536 stimulation points (i.e.,
a tactile matrix with 32648 pixels). Each nylon point had a
1.3 mm diameter and they were spaced every 2.4 mm, equally in
both dimensions. The device generated a 5 cms double line made
up 30 dots each (60 dots in total). The dots of each line were
stimulated simultaneously, not directionally. Each point was
individually controlled both in height (.0 or 0.7 mm) and fre-
quency (40 Hz) by a custom developed software program.
TechniqueEEG was recorded with a 32 channel Neuronic Medicid
Equipment using a standard 10–20 electrocap. We used 32 chan-
nels (Fz, pFz, Cz, pCZ, Pz, Oz, Fp1, Fp2, F3, F4, F7, F8, PF3,
PF4, pC3, C4, PC4, T1, T2, T3, T4, T3A, T4A, T5, T6, P3, P4,
O1 and O2) from the standard 10–20 electrocap. Impedance of all
electrodes was kept below 5 kV. The electrooculogram (EOG) was
recorded with two pairs of leads in order to register horizontal and
vertical eye movement. Data were recorded using a mastoid
electrode as reference. Sampling rate was 1000 Hz. Amplifier
frequency bands were set between 0.05–30.0 Hz.
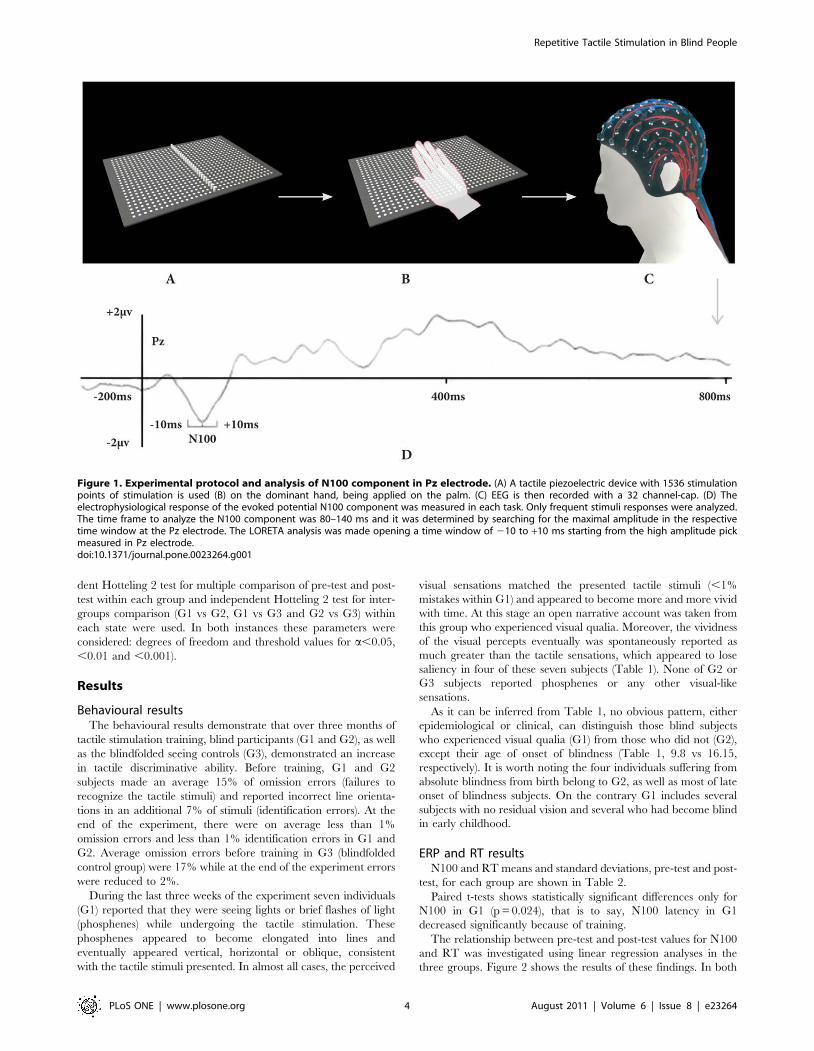
Source localizationLow-resolution electromagnetic tomography (LORETA) was
applied to each individual event-related potential (ERP) recording
to identify underlying brain electric sources of the scalp potentials.
LORETA is a reverse solution method that computes the three-
dimensional distribution of neural generators in the brain as a
current density value (A/m2), for a total of 2394 voxels, with the
constraint that neighbouring voxels show maximal similarity. This
analysis was realized for a time window of 20 msc (between 210
and +10 msc starting from the high amplitude peak measured
from the Pz electrode) (Figure 1). Brain volume anatomical
restrictions were applied for cerebral electrical tomography (CET)
calculations and an average brain template was used. CET data
were analyzed in the time domain and tomography was calculated
for each instance separately.
Source analysis under model (anatomic construction) was
obtained using the traditional LORETA method [21]. Different
models were defined by constraining the source to one anatomic
compartment, chosen using the probabilistic brain atlas (PBA)
[22–23] and Brodmann atlas.
Behavioral and EEG measurementsSubjects were instructed to simply experience the stimulation
and try to identify the line orientation. Subjects were not allowed
to move their hand during the stimulation (video S1, supplemen-
tary material).
Both at baseline and the end of the tactile training program, all
subjects were tested using a two-alternative forced-choice response
task and underwent an ERP study.
For the behavioural assessment, subjects were asked to dis-
criminate pairs of tactile stimuli: horizontal (80% of the stimuli,
frequent) or oblique lines (20%, infrequent). The latter task re-
quired blind subjects to first detect each stimulus; they were then
asked to exclusively respond to the oblique lines by pressing a
button. Subjects’ responses, errors and response times were
collected for further analysis.
Repetitive Tactile Stimulation in Blind People
PLoS ONE | www.plosone.org 2 August 2011 | Volume 6 | Issue 8 | e23264

For the ERP study, EEG recording was performed in a
soundproof room with dim lighting. Subjects were comfortably
seated and were instructed to stay awake, keep their eyes open and
avoid abrupt movements. Only non-target trials (horizontal lines)
were considered for ERP N100 latency (N100) analysis in order to
avoid contamination with motor neural activation during response
production. Epochs were 1000 msec in duration with a 200 msec
pre-stimulus interval and a post-stimulus length of 800 msec.
Baseline was defined as the average voltage over the period from
200 msec prior to stimulus onset.
Data analysisIn order to establish if there were significant differences in
reaction time (RT) and N100, before and after training (pre-test
and post-test) in each group, paired t-tests were used. Linear
regression analyses and Pearson correlation coefficients were
carried out to examine the relationships between pre-test and post-
test values of the variables RT and N100 in each group.
Evaluation of differences between groups due to the training was
done using a repeated-measures mixed-effects model. The
between-subjects factor was the group (G1, G2 and G3) and the
within-subjects factor was the time while the repeated measures
were the RT and N100. Statistical analyses were conducted using
SPSS and Statgraphics Plus software.
Source analysis for each participant was carried out (Figures S1,
S2 and S3, supplementary material). G1, G2 and G3 means
(LORETA) were calculated for baseline (pre-test) and final
evaluation (post-test), respectively. In each group, voxel-by-voxel
Statistical Mapping (SM) was computed to find the activated
sources mean differences between pre-test and post-test. Depen-
Table 1. Sample detailed description.
Subject Age Sex Handedness Cause of blindnessOnset ofblindness (years) Residual Vision
Subjectiveperceptions of vision
1 16 F R Congenital nystagmus 1 Yes; lightperception ,5%
Yes: ‘‘I can see a white line … Honestly, I cansee it but I do not feel it’’
2 14 M L Retinitis pigmentosa 4 Yes; lightperception ,7%
Yes: ‘‘I can see white lines … I can see lightsoriented either vertically, horizontally orobliquely … I see it but I do no longer feel itin my hand’’
3 15 F R Bilateral uveitis 4 Yes; lightperception ,7%
Yes: ‘‘There are lines in grey tones, steel-like’’
4 32 M R Retinal detachment 12 No Yes: ‘‘I see phosphenes always oriented inthe direction of the line … I see phosphenes,but can hardly feel it on the hand’’
5 51 M L Microphtalmia andPeter’s syndrome
3 Yes; lightperception ,3%
Yes: ‘‘I can see a luminous line on the darkscreen … A major change happened when Isuddenly completely forgot the tactilesensations and started seeing in my mind thelights transmitted by the stimuli’’
6 69 M R Bilateral uveitis 35 No Yes: ‘‘I can see light with greater and greaterclarity and intensity’’
7 72 F R Optic pathwaybilateral atrophy
9 No Yes: ‘‘It is like if I see aligned lights’’
8 22 M R Retrolental fibroplasia from birth No No
9 40 M L Retinal necrosis 30 No No
10 43 M R Glaucoma and retinopathy 32 No No
11 50 M R Optic pathway bilaterallesion
22 No No
12 56 F R Macular degeneration andretinosis
29 No No
13 57 M R Macular degenerationand spot degeneration
45 No No
14 59 M R Congenital cataracts From birth Yes; lightperception ,7%
No
15 42 M R Congenital glaucoma From birth No No
16 31 M R Retinitis pigmentosa 16 Yes; lightperception ,3%
No
17 64 M R Congenital cataracts From birth Yes; left eye: lightperception ,2%(right eye: no)
No
18 54 F R Optic pathway bilateralatrophy
1,5 Yes; light perceptionleft eye ,2%, lightperception right eye,7%
No
M = male, F = female. R = right, L = left. L/P = light perception.doi:10.1371/journal.pone.0023264.t001
Repetitive Tactile Stimulation in Blind People
PLoS ONE | www.plosone.org 3 August 2011 | Volume 6 | Issue 8 | e23264
dent Hotteling 2 test for multiple comparison of pre-test and post-
test within each group and independent Hotteling 2 test for inter-
groups comparison (G1 vs G2, G1 vs G3 and G2 vs G3) within
each state were used. In both instances these parameters were
considered: degrees of freedom and threshold values for a,0.05,
,0.01 and ,0.001).
Results
Behavioural resultsThe behavioural results demonstrate that over three months of
tactile stimulation training, blind participants (G1 and G2), as well
as the blindfolded seeing controls (G3), demonstrated an increase
in tactile discriminative ability. Before training, G1 and G2
subjects made an average 15% of omission errors (failures to
recognize the tactile stimuli) and reported incorrect line orienta-
tions in an additional 7% of stimuli (identification errors). At the
end of the experiment, there were on average less than 1%
omission errors and less than 1% identification errors in G1 and
G2. Average omission errors before training in G3 (blindfolded
control group) were 17% while at the end of the experiment errors
were reduced to 2%.
During the last three weeks of the experiment seven individuals
(G1) reported that they were seeing lights or brief flashes of light
(phosphenes) while undergoing the tactile stimulation. These
phosphenes appeared to become elongated into lines and
eventually appeared vertical, horizontal or oblique, consistent
with the tactile stimuli presented. In almost all cases, the perceived
visual sensations matched the presented tactile stimuli (,1%
mistakes within G1) and appeared to become more and more vivid
with time. At this stage an open narrative account was taken from
this group who experienced visual qualia. Moreover, the vividness
of the visual percepts eventually was spontaneously reported as
much greater than the tactile sensations, which appeared to lose
saliency in four of these seven subjects (Table 1). None of G2 or
G3 subjects reported phosphenes or any other visual-like
sensations.
As it can be inferred from Table 1, no obvious pattern, either
epidemiological or clinical, can distinguish those blind subjects
who experienced visual qualia (G1) from those who did not (G2),
except their age of onset of blindness (Table 1, 9.8 vs 16.15,
respectively). It is worth noting the four individuals suffering from
absolute blindness from birth belong to G2, as well as most of late
onset of blindness subjects. On the contrary G1 includes several
subjects with no residual vision and several who had become blind
in early childhood.
ERP and RT resultsN100 and RT means and standard deviations, pre-test and post-
test, for each group are shown in Table 2.
Paired t-tests shows statistically significant differences only for
N100 in G1 (p = 0.024), that is to say, N100 latency in G1
decreased significantly because of training.
The relationship between pre-test and post-test values for N100
and RT was investigated using linear regression analyses in the
three groups. Figure 2 shows the results of these findings. In both
Figure 1. Experimental protocol and analysis of N100 component in Pz electrode. (A) A tactile piezoelectric device with 1536 stimulationpoints of stimulation is used (B) on the dominant hand, being applied on the palm. (C) EEG is then recorded with a 32 channel-cap. (D) Theelectrophysiological response of the evoked potential N100 component was measured in each task. Only frequent stimuli responses were analyzed.The time frame to analyze the N100 component was 80–140 ms and it was determined by searching for the maximal amplitude in the respectivetime window at the Pz electrode. The LORETA analysis was made opening a time window of 210 to +10 ms starting from the high amplitude pickmeasured in Pz electrode.doi:10.1371/journal.pone.0023264.g001
Repetitive Tactile Stimulation in Blind People
PLoS ONE | www.plosone.org 4 August 2011 | Volume 6 | Issue 8 | e23264

G1 and G2, a negative trend is observed for N100. There is an
inverse correlation between pre-test and post-test N100 values
indicating a tendency for decreased N100 post-test when N100
pre-test increases, and viceversa. G3, on the contrary, shows an
opposite pattern since the pre-test and post-test N100 values are
positively correlated. However, this effect is not statistically
significant, according to a t-test of the slope of the regression line,
in all groups (all p.0.14), with correlation coefficients r = 20.47 in
G1 and G2 and r = 0.42 in G3.
The results for the variable RT are more homogeneous in all
groups as the correlation is positive in all of them, but not
statistically significant in G1 and G2 (both p.0.16) with
correlation coefficients r = 0.47 and r = 0.45 respectively. However
this effect is statistically significant in G3 where a strong linear
relationship is observed between the pre-test and post-test RT
values (p,0.0001) with a correlation coefficient r = 0.98.
To evaluate the effects of training, a repeated-measures mixed-
effects model was used. Figure 3 shows the means plot for N100.
The three groups exhibit a divergent behaviour along time, which
suggests a possible interaction N100*group effect.
Statistical analysis shows differences close to statistical signifi-
cance amongst N100 means along time (F = 4.12, p = 0.053). The
interaction N100*group is also close to being statistically
significant (F = 2.70, p = 0.087). Finally, the group effect is not
significant (F = 0.45, p = 0.641).
Training effect upon N100 was previously studied in every
group separately (Table 2). Group effect analysis is rather futile as
G1 and G2 did not have similar N100 start-offs. The interaction
N100*group is very important for our study and it is close to
statistical significance. It seems the possibility of repeating this
analysis with a larger sample size could be very useful.
Figure 4 shows the means plot for RT. The three groups exhibit
a similar behaviour along time so there was no apparent
RT*group interaction. There are significant differences between
RT means along time (F = 6.82, p = 0.015) and the interaction
RT*group is not statistically significant (F = 0.36, p = 0.702).
Again, the group effect is not significant (F = 1.68, p = 0.207).
The first result shows that, as a whole, the training effect is
significant. The previous analysis using paired t-test for each
group, separately, showed no significant differences (all p.0.05).
Source localizationAs illustrated in Figure 5, between pre-test and post-test, people
with blindness who experienced visual-like percepts have a shift in
maximal intensity projection cortical areas after repetitive tactile
stimulation, from temporal-parietal (auditive, tactile) to occipital
(visual) ones, between pre-test and post-test. In fact, the greatest
Table 2. Pre-test and post-test comparisons of N100 and RTin each group.
Pre-testmean (SD)
Post-testmean (SD) t-statistic p value
N100
G1 120.3 (6.8) 91.9 (7.3) 3.012 0.024*
G2 105.1 (5.4) 98.3 (5.9) 0.686 0.508
G3 98.8 (5.7) 101.7 (6.1) 20.413 0.689
RT
G1 645.5 (29.5) 616.5 (27.7) 1.492 0.186
G2 606.3 (23.5) 559.9 (22.1) 1.716 0.117
G3 643.5 (24.7) 620.5 (23.2) 2.167 0.058
Paired t-tests results and p-values are shown. (*) statistically significant.doi:10.1371/journal.pone.0023264.t002
Figure 2. Regression lines of RT (top) and N100 (down) post-test values vs. their respective pre-test values.doi:10.1371/journal.pone.0023264.g002
Figure 3. Standarized means plot of N100 scores. Error barsindicate SE.doi:10.1371/journal.pone.0023264.g003
Repetitive Tactile Stimulation in Blind People
PLoS ONE | www.plosone.org 5 August 2011 | Volume 6 | Issue 8 | e23264

activation in G1 pre-test is found exclusively in temporal areas
(right inferior temporal, right mid-temporal lobes and left superior
temporal). G1 post-test maximal activation is identified in bilateral
calcarine and lingual areas. On the other hand, G2 pre-test
maximal activation is seen in frontal middle orbital, medial
superior frontal and anterior cingular areas, all of them bilaterally,
as well as right superior and middle temporal areas. G2 post-test is
found to be in middle orbital and medial superior frontal areas,
both bilaterally, as well as in bilateral anterior cingulate cortex. G2
does not show any occipital pole activation whatsoever. G3 pre-
test maximal activation is localized in the left middle and superior
temporal areas and does not show any occipital pole activation.
G3 post-test maximal activation is found in the cunneus,
precunneus and calcarine areas, all of them bilaterally.
Using SM significant differences between pre-test and post-test
for each group are found in G1 in BA 17, 18, 19, 9 and 46, in G2
in BA 4, 9 and 39, and in G3 in BA 21, 22, 7, 17, 18 and 48
(Figure 5). Clusters of significant voxels, as well as a brief
description of the anatomic localization, are summarized in
Table 3.
Figure 6 illustrates significant differences inter-groups. There
are significant differences in pre-test between G2 and G3, but not
between G1 and G2 or G1 and G3. There are also significant
differences in post-test between all the groups (G1 and G2, G1 and
G3, G2 and G3). During the pre-test, those significant differences
happen in BA 5, 7, 19 and 37. With regards to the post-test,
significant differences between G1 and G2 are in BA 17. Between
post-test G1 and G3, differences happen in BA 39, 32, 11 and 10.
Finally, significant post-test differences between G2 and G3 are in
BA 40, 39, 36, 35, 19 and 18. Significant differences between
groups either in pre-test or post-test are summarized in Table 4.
Discussion
After tactile passive repetitive training during an extended (3
months) intensive period people with blindness who spontaneously
report visual sensations (G1) exhibited a much shorter RT,
considerably decrease in N100 latency and, in parallel with their
visual sensations, an activation of the occipital lobe. However no
activation of the occipital cortex was found in those blind subjects
who did not report any visual qualia (G2), the subjective
experience of seeing. We postulate that activation of the occipital
cortex, by tactile stimuli results in visual qualia in some blind
subjects. Functional activation of the visual cortex by non-visual
tactile stimulation has been reported in people with blindness
[18,24–33], or with normal vision [17]. Our finding is in tune with
other researchers who have stated that massive plasticity in visual
cortex for the blind for tactile object recognition does happen
[7,34,35]. Thus novel evidence linking activity in early visual
cortex with visual qualia is provided [33]. Specifically, we show
Figure 4. Standarized means plot of RT scores. Error bars indicateSE.doi:10.1371/journal.pone.0023264.g004
Figure 5. Two upper rows show cortical intensity projection (LORETA) mean maps obtained in pre-test and post-test in each group.Maximal intensity projection areas are displayed in red. Lower row show Statistical Mapping (SM) dependent Hotelling T2 significantdifferences maps between pre-test and post-test in each group.doi:10.1371/journal.pone.0023264.g005
Repetitive Tactile Stimulation in Blind People
PLoS ONE | www.plosone.org 6 August 2011 | Volume 6 | Issue 8 | e23264

that extended tactile training for several months leads to cross-
modal stimulation of occipital cortex and visual-like perception.
It seems as if subjects in G1 ‘learned’ a synesthetic perception
with repeated stimulation. It is rather interesting that in G1
subjects tactile sensation decreased when the visual qualia became
prominent (Table 1), consistent with maximal activation of visual
areas and lack of activation of parietal tactile areas. G2 and G3
subjects experienced exclusively tactile sensations throughout the
experiment, again consistent with parietal lobe activation. Thus
persistent tactile sensation (at subjective level) seems to preclude
the experience of phosphenes. Our study supports the idea that
sensory input in one modality can give rise to a percept in another
sensory domain, and that the latter can attenuate the subjective
percept of the former through training.
There was a frontal activity in G2, both in pre-test and post-test,
which did not happen in the other two groups. An increased
attentional process may have played a role and, in fact, the four
blinds from birth within G2 had a very marked frontal activity
(Figure S2, supplementary material). Previous literature [36] has
suggested congenitally blind humans exhibit middle temporal
Table 3. Summary of maximal intensity projection areas significant differences, with each specific localization, for each Group inpre-test and post-test (dependent T2 ).
Mean
AAL BA x y z T2 Hotelling Pretest Postest
G1
Left Calcarine 18 108 76 152 166,6682** 1,9642 5,3346
Left Calcarine 17 109 76 151 150,82 87 * 1,7493 4,6792
Left Lingual 19 110 75 152 134,9632 * 1,7117 4,5672
Left Lingual 18 107 72 150 130,4462 * 1,7647 4,7350
Left Occipital Superior 19 115 99 176 72,6548 * 1,7124 5,0543
Right Middle Frontal 9 48 125 80 61,7910 * 0,7742 0,7643
Left Frontal Middle 9 128 120 70 59,0519 * 1,4497 0,4701
Right Lingual 17 85 65 176 50,7121 * 2,4206 11,8244
G2
Right Frontal Middle 9 44 128 80 29,0635** 0,5201 1,6203
Right Angular 39 44 97 144 21,8607 * 1,2949 2,5158
Left Superior Occipital 17 100 90 192 20,4368 * 0,9870 0,6192
Left Calcarine 16 96 69 196 18,9137 * 0,8518 0,8928
Right Post-central 3 46 108 107 17,1995* 0,8363 1,1732
G3
Left Middle temporal 37 114 72 160 124,7300*** 7,7973 1,7731
Left Middle occipital 19 136 79 161 112,1210*** 90,6255 2,3392
Left Inferior Occipital 37 140 61 154 100,2741*** 211,7078 2,4962
Left Inferior Temporal 37 144 63 155 105,7695*** 201,8498 2,7039
Left Fusiform 37 131 57 145 67,1131** 103,5997 1,6238
Right Opercular Rolandic 48 31 87 107 59,3316** 118,1168 2,2864
Right Postcentral 43 24 95 105 57.8739** 72,0106 1,1750
Right Superior Temporal 48 35 79 107 56,8068* 143,7001 2,5432
Right Middle Cingulum 23 73 115 127 50,2679** 3,3344 1,2536
Left Angular 39 131 102 150 46,4443** 5,4738 0,8514
Right Middle Cingulum 23 70 116 128 45,7150* 1,4218 0,5232
Right Supramarginal 40 26 110 110 43,6336** 26,9931 1,2630
Left Superior occipital 18 108 104 159 36,3355** 6,1381 4,9371
Left Cuneus 18 108 106 164 33,9557** 7,7053 5,3461
Right Middle Temporal 20 35 59 102 22,7929* 127,5687 1,7227
Right Sup Parietal 5 72 143 142 22,8391* 17,9683 2,0495
Right Inferior Parietal 40 35 116 140 21,8265* 9,9151 1,7221
Right Post-central 3 46 108 107 17,1995* 0,8363 1,1732
Right Inferior Temporal 20 36 32 92 17,5265* 15,0795 0,3774
G1 T2 (3–5) = 147.284 for a= .01, = 46.383 for a= .05. G2 T2 (3–10) = 28.466 for a= .01, = 15.248 for a= .05. G3 T2 (3–9) = 72.40764 for a= .001, = 32.59783 for a= .01,= 16.76635 for a= .05. AAL = Anatomical label corresponding to Probabilistic Brain Atlas. BA = Brodmann areas. x, y, z = co-ordinates from PBA in three spatial axes.L = Left; R = Right. * p,.05; ** p,.01 ** and p,.001***.doi:10.1371/journal.pone.0023264.t003
Repetitive Tactile Stimulation in Blind People
PLoS ONE | www.plosone.org 7 August 2011 | Volume 6 | Issue 8 | e23264

cortex (hMT+) and occipital recruitment. Our study replicates the
hMT+ finding, yet all blinds from birth in our study belonged to
G2 and failed to show occipital activation or experience visual
qualia.
In two groups (G2 and G3) the training program did not elicit
changes in the pattern of EEG activation or the subjective
experience of the stimulation. One possible explanation for this
finding that would account for the disparity between the group
memberships (i.e., blind subjects vs. normal seeing controls), takes
into account the stability of brain networks including the primary
visual cortex. Indeed, whenever there has likely been a well
established neuronal network, such as in subjects with late
blindness, or complete lack of visual input because of congenital
blindness, cross-modal connectivity failed to occur. The issue of
congenitally blind still remains controversial, as our findings (blind
subjects from birth did not experience visual qualia and their
occipital areas were not activated) are not fully concordant with
previous research [37].
In normal subjects (G3) at baseline many areas were greatly
activated and they were widely distributed, but the pattern of
activation (and the number of significantly activated brain regions)
was reduced after the training protocol. Though habituation may
have played a role in this shift in controls, the initial novelty of line
orientation information provided in a non-visual fashion to
otherwise normally sighted people may be another explanation
for the initial high activation. G3 post-test results may indicate a
more efficient way of dealing with tactile stimulation through
learning. In sighted subjects, early recruitment of primary visual
cortex for tactile processing has been found over a few days of
blindfolding and intensive tactile training, or auditory training
[7,38–44].
In all groups we found that the pre-test activation of the
temporal middle complex was significantly reduced after extended
training (post-test). Temporal areas are linked to auditive
perception, highly enhanced in people with blindness. Moreover,
blind subjects display a higher activation of multiple sensory
cortical areas than sighted people [45]. A possible explanation for
this phenomenon is that tactile training may refine the way the
tactile signal is processed through a more efficient brain organi-
zation. Therefore, it may functionally deactivate the temporal
areas as these may not serve spatial processing. In our study this
happens within a wide distribution of ages, which points towards
the idea that brain re-organization in blind people has no expiry
date, contrary to what has recently been stated by other
researchers [46].
In contrast to previous literature [37], we found that people with
congenital blindness may be less capable of cross-modality. On the
other hand, our results are consistent with previous studies in
reporting visual cortex activation after tactile information in early
sight deprivation [10,24,25–27,37,47]. Our results also replicate
that occipital activity patterns elicited by tactile inputs are clearly
more prominent in subjects with early blindness than in late onset
of blindness [25,48].
Our findings in blind subjects who experienced cross-modal
induction of visual percepts (G1) also replicate the ‘‘visual’’
matching of the shape of the stimulus [10]. These G1 subjects had
an increased activity in striate areas after the training program was
completed. Given the fact these areas were not activated at the
beginning, it is reasonable to speculate that some form of
neuroplasticity may have taken place. Other authors [49], using
a two-session auditory-visual and visuotactile training, have
hypothesized that promoting efficient functional development of
the ventral pathway in the absence of vision can create vision in
the brain. Recruitment of visual areas for non-visual tasks is most
likely mediated through increased cortico-cortical connectivity
[10,29,50]. In G1 all subjects but one had early onset of blindness
while G2, with one exception, was made of subjects with either late
onset of blindness or congenital one. This might mean that, in
most cases, tactile training induced cross-modal neuroplasticity in
visual areas and that this neuroplasticity would require some,
although not excessive, previous stimulation of the visual pathway.
Other authors [28] have stated that haptic and visual neuronal
networks may be shared, at least in those familiar issues, as in the
case of lines in different orientations after thousands of stimuli. We
have also found that other extrastriate areas participate in the
recognition of spatial orientation (Table 3, Fig. 5) [51]. Previous
literature [52,53] suggested that, despite occipital cortex volume
reduction, blind subjects have visual cortex activation following
somatosensory input guided tasks, consistent with re-organization
of the visual cortex afferent and efferent neural pathways [54]. We
found this to be the case in blind subjects who experienced cross-
modal visual qualia (G1), but not in those fail to do so (G2). On the
other hand, normal blindfolded seeing controls (G3) have occipital
cortex activation during tactile stimulation. This poses the
question whether there is a multimodal brain network for spatial
information, independent of the sensory modality input. Some
authors have suggested primary visual cortex may be part of this
multimodal brain network in congenitally blind subjects [38].
Taking into account evidence from human electrophysiology,
neuropsychology and animal studies, some authors have suggested
Figure 6. Cortical projections of inter-group comparisons in each state: significant differences maps between groups. LORETA meanmaps obtained with independent Hotelling T2.doi:10.1371/journal.pone.0023264.g006
Repetitive Tactile Stimulation in Blind People
PLoS ONE | www.plosone.org 8 August 2011 | Volume 6 | Issue 8 | e23264

that the brain integrates congruent different sensory modalities
and that this integration starts as early as 100 ms after stimulus
presentation [55]. The N100 component of tactile evoked
potentials is an early peak, thought to arise from activation of
primary somatosensory cortex [55,56]. The shortening of the
N100 latency we found in G1 presumably reflects increased co-
ordinated firing of thalamo-cortical ensembles of neurons in
response to the tactile stimuli [57]. On the other hand, a reduction
in N100 latency as a consequence of repeated stimulation has
been described with increased familiarization with the physical
characteristics of a stimulus [58]. Moreover, the greatest improve-
ment starting with greater N100 latency values happen in G1
(Fig. 2). This also points in the direction previously mentioned that
the functional network of G1 subjects may be less efficient at pre-
training level, perhaps due to lesser stimulation in earlier life, but it
is far more plastic. Perhaps this reduction in N100 latency might
help to improve the performing in recognition percept, something
that could be particularly useful for blind people in high-speed
motion targets. In our view, the simplest explanation is that, at the
beginning of tactile stimulation, blind subjects activate a broader
range of available neuronal circuits to compensate for their visual
loss. As passive repetitive tactile training continues, the brain in the
person with blindness re-organizes itself by tuning the input
towards areas more efficient in spatial processing, prominently
occipital cortex.
A few caveats are in order. First, we used a limited set of EEG
channels because this was the only one available for us at the time.
Second, it remains to be established whether the nature of tactile
stimuli or the intensity and repetitive training fashion are critical
for obtaining the observed effect. Third, other neuroimaging
techniques, such as resting fMRI, default state or coherence
analysis, for example, could throw more conclusive data on the
newer neuroplasticity. Another limitation is the restriction to a 3-
month training period. We do not know if further changes may
Table 4. Summary of maximal intensity projection areas significant differences, with each specific localization, inter-groups in eachstate (independent T2 ).
AAL BA x y z T2 Hotelling Mean
Pre-test G2 G3
Left Precuneus 7 104 120 148 14,1740* 1,4213 5,6151
Left occipital middle 19 136 79 171 12,4028* 1,4846 50,0659
Left Precuneus 5 105 130 156 12,2543* 1,9200 7,1426
Left Occipital Inferior 19 131 60 160 11,1081* 1,7229 22,5433
Left Fusiform 37 124 63 153 11,0257* 1,0918 39,8153
Post-test G1 G2
Left Occipital Middle 17 120 76 188 11,5080* 2,8626 1,779
Post-test G1 G3
Left Angular 39 131 108 139 19,3610* 1.0899 1,0510
Left Frontal Superior 10 104 95 22 18,1697* 0,6452 0,4443
Left Inferior parietal 39 132 112 144 17,0643* 2,9607 2,7202
Right Middle Superior 10 87 101 33 16,8351* 1,8370 2,0047
Left Middle Superior Frontal 10 104 81 36 15,4223* 0,7925 0,6370
Left Anterior Cingulum 32 88 87 48 14,0570* 3,5205 3,2940
Left Frontal Sup Orbital 11 104 63 29 13,8279* 2,1197 1,3116
Right Orbital Middle Frontal 11 87 63 32 13,1320* 3,8556 3,2801
Right Anterior Cingulum 32 87 77 48 13,0165* 3,3313 2,9261
Post-test G2 G3
Right Suparmarginal 40 24 112 132 15.8530* 0,4546 0,8095
Left Middle Frontal 8 116 131 72 12,5649* 6,3213 0,9366
Left Fusiform 36 114 35 97 12,2738* 0,3167 1,6700
Right Parahippocampo 35 72 45 90 12,1686* 0,7467 1,0636
Left Middle Occipital 18 120 76 174 12,1421* 1,3117 0,7835
Right Angular 39 29 101 141 12,0550* 3,8171 2,4069
Rigt Fusiform 18 64 60 167 11,9019* 1,8244 1,6919
Right Middle Tempo Pole 36 64 37 86 11,8748* 0,6551 0,8717
Rigt Lingual 18 68 62 167 11,2649* 1,9821 1,9651
Left Hippocampo 35 112 53 99 11,1020* 0,3501 1,5751
Rigt Fusiform 36 66 29 91 11,0176* 0,5722 0,7780
Righ Inferior Occipital 19 56 59 168 11,0393* 2,2506 1,5684
Pre-test G2 vs G3 T2 (3–19) = 10.7186 for a= .05 . Post-test G1 vs G2 T2 (3–15) = 11.4105 for a= .05. Post-test G1 vs G3 T2 (3–14) = 12.21604 for a= .05. Post-test G2 vs G3T2 (3–19) = 10.7186 for a= .05. AAL = Anatomical label corresponding to Probabilistic Brain Atlas. BA = Brodmann areas. x, y, z = co-ordinates from PBA in three spatialaxes. L = Left; R = Right. * p,.05; ** p,.01 ** and p,.001***.doi:10.1371/journal.pone.0023264.t004
Repetitive Tactile Stimulation in Blind People
PLoS ONE | www.plosone.org 9 August 2011 | Volume 6 | Issue 8 | e23264

occur should the passive tactile training continue for a longer
duration. Importantly, the most relevant findings are derived from
post-hoc analysis. Therefore, no predictive analysis of regression or
otherwise could be run. Finally, we studied a limited sample. This
is particularly critical in the case of the four subjects included in
our study who suffer from congenital blindness as the previous
organization of visual cortical columns may be a limiting factor in
this domain. Future studies should address, with a larger sample,
which blind individuals are more likely to experience visual qualia
and to what extent these qualia may affect spatial-processing.
Supporting Information
Figure S1 Maximal cortical intensity projection in eachGroup 1 (G1) subject. Cortical intensity projection (LORETA)
mean maps obtained in pre-test and post-test in each subject.
(TIF)
Figure S2 Maximal cortical intensity projection in eachGroup 2 (G2) subject. Cortical intensity projection (LORETA)
mean maps obtained in pre-test and post-test in each subject.
(TIF)
Figure S3 Maximal cortical intensity projection in eachGroup 3 (G3) subject. Cortical intensity projection (LORETA)
mean maps obtained in pre-test and post-test in each subject.
(TIF)
Video S1 Blind volunteer subject undergoing EEGtesting during the passive tactile training during week12. At the end of the interview the principal investigator (Prof
Ortiz) asks him, in Spanish, about his experience while his hand
was stimulated. Sub-titres translate into English the conversation
between both.
(M4V)
Acknowledgments
The authors want to thank Professor Gabriel A. de Erausquin (University
of Southern Florida, USA) and Ms. Donna van Meer (Washington
University, St Louis, USA) for their invaluable help in the preparation and
correction of this manuscript.
Author Contributions
Conceived and designed the experiments: TO JP JMS. Performed the
experiments: TO CR AMM LO-T. Analyzed the data: TO JP JMS AT JB
AP-L. Contributed reagents/materials/analysis tools: JP RN. Wrote the
paper: TO JMS AMM AT AP-L. Provided engineering support and ad-
hoc software development for the experiment: RN AC JMM JLC.
References
1. Amedi A, Malach R, Pascual-Leone A (2005) Negative BOLD differentiates
visual imagery and perception. Neuron 48: 859–872.
2. Beauchamp MS (2005) See me, hear me, touch me: multisensory integration inlateral occipital-temporal cortex. Curr Opin Neurobiol 15: 145–153.
3. Amedi A, Stern WM, Camprodon JA, Bermpohl F, Merabet L, et al. (2007)Shape conveyed by visual-to-auditory sensory substitution activates the lateral
occipital complex. Nat Neurosci 10: 687–689.
4. Malach R, Reppas JB, Benson RR, Kwong KK, Jiang H, et al. (1995) Object-related activity revealed by functional magnetic resonance imaging in human
occipital cortex. Proc Natl Acad Sci USA 92: 8135–8139.
5. Amedi A, Malach R, Hendler T, Peled S, Zohary E (2001) Visuo-haptic object-related activation in the ventral visual pathway. Nat Neurosci 4: 324–330.
6. Amedi A, Jacobson G, Hendler T, Malach R, Zohary E (2002) Convergence of
visual and tactile shape processing in the human lateral occipital complex. CerebCortex 12: 1202–1212.
7. Amedi A, Raz N, Azulay H, Malach R, Zohary E (2010) Cortical activity duringtactile exploration of objects in blind and sighted humans. Restor Neurol
Neurosci 28: 143–156.
8. Stilla R, Hanna R, Hu X, Mariola E, Deshpande G, et al. (2008) Neuralprocessing underlying tactile microspatial discrimination in the blind: a
functional magnetic resonance imaging study. J Vis 8: 1–19.
9. Bach-y-Rita P, Kercel S (2003) Sensory substitution and the human-machineinterface. Trends Cogn Sci 7: 541–546.
10. Ptito M, Moesgaard SM, Gjedde A, Kupers R (2005) Cross-modal plasticity
revealed by electrotactile stimulation of the tongue in the congenitally blind.Brain 128: 606–614.
11. Bar M, Kassam KS, Ghuman AS, Boshyan J, Schmid AM, et al. (2006)
Top-down facilitation of visual recognition. Proc Natl Acad Sci USA 103:449–454.
12. Peltier S, Stilla R, Mariola E, LaConte S, Hu X, et al. (2007) Activity andeffective connectivity of parietal and occipital cortical regions during haptic
shape perception. Neuropsychologia 45: 476–483.
13. Deshpande G, Hu X, Stilla R, Sathian K (2008) Effective connectivity duringhaptic perception: A study using Granger causality analysis of functional
magnetic resonance imaging data. Neuroimage 40: 1807–1814.
14. Deshpande G, Hu X, Lacey S, Stilla R, Sathian K (2010) Object familiaritymodulates effective connectivity during haptic shape perception. Neuroimage
49: 1991–2000.
15. Sehatpour P, Molholm S, Schwartz TH, Mahoney JR, Mehta AD, et al. (2008)A human intracranial study of long-range oscillatory coherence across a frontal-
occipital-hippocampal brain network during visual object processing. Proc NatlAcad Sci USA 105: 4399–4404.
16. Lacey S, Tal N, Amedi A, Sathian K (2009) A putative model of multisensory
object representation. Brain 21: 269–274.
17. Lucan JN, Foxem JJ, Gomez-Ramirez M, Sathian K, Molholm S (2010) Tactile
shape discrimination recruits human lateral occipital complex during early
perceptual processing. Human Brain Mapping 31: 1813–1821.
18. Uhl F, Franzen P, Lindinger G, Lang W, Deecke L (1991) On the functionality
of the visually deprived occipital cortex in early blind persons. Neurosci Lett 124:256–259.
19. Llinas RR, Ribary U (1998) Temporal conjunction in thalamocortical
transactions. Adv Neurol 77: 95–102.
20. Ribary U (2005) Dynamics of thalamo-cortical network oscillations and human
perception. Prog Brain Res 150: 127–42.
21. Pascual-Marqui RD, Michel CM, Lehmann D (1994) Low resolutionelectromagnetic tomography: a new method for localizing electrical activity in
the brain. Int J Psychophysiol 18: 49–65.
22. Collins DL, Neelin P, Peters TM, Evans AC (1994) Automatic 3D intersubjectregistration of MR volumetric data in standardized Talairach space. J Comput
Assist Tomogr 18: 192–205.
23. Mazziotta JC, Toga AW, Evans A, Fox P, Lancaster J (1995) A probabilisticatlas of the human brain: theory and rationale for its development. The
International Consortium for Brain Mapping (ICBM). Neuroimage 2: 89–101.
24. Kupers R, Fumal A, de Noordhout AM, Gjedde A, Schoenen J, et al. (2006)
Transcranial magnetic stimulation of the visual cortex induces somatotopically
organized qualia in blind subjects. Proc Natl Acad Sci USA 103: 13256–13260.
25. Sadato N, Pascual-Leone A, Grafman J, Ibanez V, Deiber MP, et al. (1996)
Activation of the primary visual cortex by Braille reading in blind subjects.
Nature 380: 526–528.
26. Buchel C, Price C, Frackowiak RS, Friston K (1998) Different activation patterns
in the visual cortex of late and congenitally blind subjects. Brain 121: 409–419.
27. Burton H, Snyder AZ, Diamond J, Raichle ME (2002) Adaptive changes in earlyand late blind: a fMRI study of verb generation to heard nouns. J Neurophysiol
88: 3359–3371.
28. Gizewski ER, Gasser T, de Greiff A, Boehm A, Forsting M (2003) Cross-modalplasticity for sensory and motor activation patterns in blind subjects. Neuro-
image 19: 968–975.
29. Burton H, Sinclair RJ, McLaren DG (2004) Cortical activity to vibrotactile
stimulation: an fMRI study in blind and sighted individuals. Hum Brain Mapp
23: 210–228.
30. Cohen LG, Weeks RA, Sadato N, Celnik P, Ishii K, et al. (1999) Period of
susceptibility for cross-modal plasticity in the blind. Ann Neurol 45: 451–460.
31. De Volder AG, Toyama H, Kimura Y, Kiyosawa M, Nakano H, et al. (2001)Auditory triggered mental imagery of shape involves visual association areas in
early blind humans. Neuroimage 14: 129–139.
32. Lacey S, Flueckiger P, Stilla R, Lava M, Sathian K (2010) Object familiaritymodulates the relationship between visual object imagery and haptic shape
perception. Neuroimage 49: 1977–1990.
33. Matteau I, Kupers R, Ricciardi E, Pietrini P, Ptito M (2010) Beyond visual, aural
and haptic movement perception: hMT+ is activated by electrotactile motion
stimulation of the tongue in sighted and in congenitally blind individuals. BrainRes Bull 82: 264–270.
34. Lewis LB, Saenz M, Fine I (2010) Mechanisms of cross-modal plasticity in early
blind subjects. J Neurophysiol 104: 2995–3008.
Repetitive Tactile Stimulation in Blind People
PLoS ONE | www.plosone.org 10 August 2011 | Volume 6 | Issue 8 | e23264

35. Kitada R, Kito T, Saito DN, Kochiyama T, Matsumura M, et al. (2006)
Multisensory activation of the intraparietal area when classifying grating
orientation: a functional magnetic resonance imaging study. J Neurosci 26:
7491–7501.
36. Noppeney U (2007) The effects of visual deprivation on functional and structural
organization of the human brain. Neurosci Biobehav Rev 31: 1169–1180.
37. Ptito M, Kupers R (2005) Cross-modal plasticity in early blindness. J Integr
Neurosci 4: 479–88.
38. Ptito M, Schneider FC, Paulson OB, Kupers R (2008) Alterations of the visual
pathways in congenital blindness. Exp Brain Res 187: 41–49.
39. Kupers R, Chebat DR, Madsen KH, Paulson OB, Ptito M (2010) Neural
correlates of virtual route recognition in congenital blindness. Proc Natl Acad Sci
USA 107: 12716–12721.
40. Wittenberg GF, Werhahn KJ, Wassermann EM, Herscovitch P, Cohen LG
(2004) Functional connectivity between somatosensory and visual cortex in early
blind humans. Eur J Neurosci 20: 1923–1927.
41. Shimony JS, Burton H, Epstein AA, McLaren DG, Sun SW, Snyder AZ (2006)
Diffusion tensor imaging reveals white matter reorganization in early blind
humans. Cereb Cortex 16: 1653–1661.
42. Sadato N, Okada T, Honda M, Yonekura Y (2002) Critical period for cross-
modal plasticity in blind humans: a functional MRI study. Neuroimage 16:
389–400.
43. Amedi A, Raz N, Pianka P, Malach R, Zohary E (2003) Early ‘visual’ cortex
activation correlates with superior verbal memory performance in the blind. Nat
Neurosci 6: 758–766.
44. De Volder AG, Catalan-Ahumada M, Robert A, Bol A, Labar D, et al. (1999)
Changes in occipital cortex activity in early blind humans using a sensory
substitution device. Brain Res 826: 128–134.
45. Merabet LB, Maguire D, Warde A, Alterescu K, Stickgold R, et al. (2004) Visual
hallucinations during prolonged blindfolding in sighted subjects.
J Neuroophthalmol 24: 109–113.
46. De Santis L, Spierer L, Clarke S, Murray MM (2007) Getting in touch:
Segregated somatosensory what and where pathways in humans revealed byelectrical neuroimaging. Neuroimage 37: 890–903.
47. De Santis L, Clarke S, Murray MM (2007) Automatic and Intrinsic Auditory
‘‘What’’ and ‘‘Where’’ Processing in Humans Revealed by ElectricalNeuroimaging. Cerebral Cortex 17: 9–17.
48. Murray MM, De Santis L, Thut G, Wylie GR (2009) The costs of crossing pathsand switching tasks between audition and vision. Brain and cognition 69: 47–55.
49. Sathian K, Stilla R (2010) Cross-modal plasticity of tactile perception in
blindness. Restor Neurol Neurosci 28: 271–281.50. Ward J, Meijer P (2010) Visual experiences in the blind induced by an auditory
sensory substitution device. Conscious Cogn 19: 492–500.51. Hotting K, Rosler F, Roder B (2003) Crossmodal and intermodal attention
modulate event-related brain potentials to tactile and auditory stimuli. Exp BrainRes 148: 26–37.
52. Rosburg T, Boutros NN, Ford JM (2008) Reduced auditory evoked potential
component N100 in schizophrenia—a critical review. Psychiatry Res 161:259–274.
53. Pedroarena C, Llinas R (1997) Dendritic calcium conductances generate high-frequency oscillation in thalamocortical neurons. Proc Natl Acad Sci USA 94:
724–728.
54. Budd TW, Barry RJ, Gordon E, Rennie C, Michie PT (1998) Decrement of theN1 auditory event-related potential with stimulus repetition: habituation vs.
refractoriness. Int J Psychophysiol 31: 51–68.55. Ortiz T, Poch-Broto J, Requena C, Santos JM, Martınez A, et al. (2010) Brain
neuroplasticity in occipital areas in blind teenagers. Rev Neurol 50: S19–S23.56. Poirier C, De Volder AG, Scheiber C (2007) What neuroimaging tells us about
sensory substitution. Neurosci Biobehav Rev 31: 1064–1070.
57. Pascual-Leone A, Hamilton R (2001) The metamodal organization of the brain.Prog Brain Res 134: 427–445.
58. Bedny M, Konkle T, Pelphrey K, Saxe R, Pascual-Leone A (2010) Sensitiveperiod for a multimodal response in human visual motion area MT/MST. Curr
Biol 20: 1900–1906.
Repetitive Tactile Stimulation in Blind People
PLoS ONE | www.plosone.org 11 August 2011 | Volume 6 | Issue 8 | e23264
Copyright © 2022 FDOKUMEN