Recognition and Classification of Urban Shapes
11
Francesca Medda, Peter Nijkamp and Piet Rietveld Recognition and Classification of Urban Shapes This paper is concerned with a methodology that is able to recognize and clas- sify geometric shapes, in particular urban shapes. The main objective of this study is to develop a shape index that will address Whyte’s category of “‘spatial form” (1 968), that is, the external appearance or outward form, in contrast with the “‘internal form,” which is the structural form. W ejirst review methodologies of shape recognition and classijication. Next, we propose a viable formulation for such an endeavor by drawing from the aforementioned methodologies, and we aim to overcome some of their limitations by formulating a new index. W e will apply the resulting shape index to an illustrative case in order to recognize urban shapes. If we imagine the city to be like a continuously changing container having inside complex mechanisms that affect the container as well, is it then possible to know something about its contents by examining the shape of the container? In his study On Growth and Form, D’Arcy Thompson observes that “the form of an object is a ‘diagram of forces’” (1917), and from this perspective we shall examine our “city-container.” The urban outlines depict the effects of eco- nomic, political, and social factors that interact and develop in this particular space. Our attempt here is to focus on Whyte’s category of spatial form (1968), that is, external appearance or outward form of the city in order to gather information about the internal form of the city, where by internal form we mean the structure of forces which build the spatial form. Given the above research aim, our first step is to define a way of measuring urban spatial forms. The standard approach to this problem is usually to exam- ine the size of the city (Berry 1971; Vining 1977; Sheppard 1982; Nader 1984; Marshall 1997), but is the measure of the size of a city a feasible parameter to recognize and classify its shape? By knowing the size of a three-dimensional object, we may argue that the object is large or small relative to a specific refer- ence unit, but we cannot derive whether this object is a sphere or a cube. The size of the object does not provide us with such information. We have to reex- amine the urban shape as a diagram, as a representation of points, and for this reason we need a feasible parameter. This issue is the subject matter of our paper. fessors in the Department of Spatial Economics, Free University, Amsterdam. Geographical Analysis, Vol. 30, No. 3 (July 1998) Ohio State University Press Submitted: 5/28/97. Revised version accepted: 11/14/97. Francesca Medda is a research assistant and Peter Nijkamp and Piet Rietveld are pro-
Transcript of Recognition and Classification of Urban Shapes

Francesca Medda, Peter Nijkamp and Piet Rietveld
Recognition and Classification of Urban Shapes
This paper is concerned with a methodology that is able to recognize and clas- sify geometric shapes, in particular urban shapes. The main objective of this study is to develop a shape index that will address Whyte’s category of “‘spatial form” (1 968), that is, the external appearance or outward form, in contrast with the “‘internal form,” which is the structural form. W e jirst review methodologies of shape recognition and classijication. Next, we propose a viable formulation f o r such an endeavor by drawing f r o m the aforementioned methodologies, and we aim to overcome some of their limitations by formulating a new index. W e will apply the resulting shape index to an illustrative case in order to recognize urban shapes.
If we imagine the city to be like a continuously changing container having inside complex mechanisms that affect the container as well, is it then possible to know something about its contents by examining the shape of the container? In his study O n Growth and Form, D’Arcy Thompson observes that “the form of an object is a ‘diagram of forces’” (1917), and from this perspective we shall examine our “city-container.” The urban outlines depict the effects of eco- nomic, political, and social factors that interact and develop in this particular space. Our attempt here is to focus on Whyte’s category of spatial form (1968), that is, external appearance or outward form of the city in order to gather information about the internal form of the city, where by internal f o r m we mean the structure of forces which build the spatial form.
Given the above research aim, our first step is to define a way of measuring urban spatial forms. The standard approach to this problem is usually to exam- ine the size of the city (Berry 1971; Vining 1977; Sheppard 1982; Nader 1984; Marshall 1997), but is the measure of the size of a city a feasible parameter to recognize and classify its shape? By knowing the size of a three-dimensional object, we may argue that the object is large or small relative to a specific refer- ence unit, but we cannot derive whether this object is a sphere or a cube. The size of the object does not provide us with such information. We have to reex- amine the urban shape as a diagram, as a representation of points, and for this reason we need a feasible parameter. This issue is the subject matter of our paper.
fessors in the Department of Spatial Economics, Free University, Amsterdam.
Geographical Analysis, Vol. 30, No. 3 (July 1998) Ohio State University Press Submitted: 5/28/97. Revised version accepted: 11/14/97.
Francesca Medda is a research assistant and Peter Nijkamp and Piet Rietveld are pro-

Francesca Medda, Peter Nijkarnp, and Piet Rietveld / 305
1. APPROACHES TO SPATIAL SHAPE RECOGNITION
There is a dearth of studies that address the problem of an analytical recogni- tion of urban forms. In general, we can distinguish two broad approaches which examine this topic: (i) the urban-planning and social approach, and (ii) the eco- nomic and geographical approach. In the first case, urban shapes are examined through descriptive devices such as semiotic analyses (see Eco 1991). The latter case is characterized by the use of quantitative variables such as population size and number of facilities; however, this approach often describes the size rather than the form of the urban environment.
In order to create a background for the method that we shall propose we will analyze four methods of shape recognition. We will begin with a concise descrip- tion of two standard contributions, viz. Bunge (1966) and Boyce and Clark (1964). Bunge’s approach and Boyce and Clark’s application accomplish the same objective, namely, “to measure shape in such a way that shapes can be ranked or compared with specific geometric forms” (Boyce and Clark 1964). The most interesting aspect of the vertex-lag method of Bunge and the radial shape index of Boyce and Clark was to try to determine a univocal correspondence between the value of the index and the shape. Such an attempt, in particular for Boyce and Clark’s index, has produced a valid and suitable procedure applied in geo- graphical studies (Griffith et al. 1986; Lo 1980). According to these authors, the following steps are needed for measuring shape: “For any given shape, deter- mine the center of gravity. Measure the distance from this center to the out- side edges of the shape along equally spaced radials. Compute the percentage of each radial distance with respect to the sum of all radials, and subtract each percentage from the percentage each radial would be expected to have as based on a circle.” Their method employs the general scheme of the centroidal pro- file. The reference shape of this index is the circle. The index shape of the circle is zero; all other shapes have an index shape larger than zero. The results of this index can be summarized in the table below, which expresses the index for geometric figures (Boyce and Clark 1964).
0 Circle 12 Square 18 Cross 25 Star 28 Rectangle
175 Line
However, both methods encounter serious problems in their application. In particular, since the basis of the formulation of our shape index will be the method of Boyce and Clark, we need to observe that the most cumbersome limitation of this technique is the size and rotation problem. The index is vari- ant in relation to the size of the shape and in relation to its orientation. For instance, if we consider two rectangular shapes with different areas we will obtain different indices. A similar discontinuity of results is obtained by considering the same shape, but with a different orientation.
In order to overcome the problem of discontinuity of results caused by the size variations of a specific shape, Batty and Longley (1994) have developed a model structured upon the application of the allometry principle and fractal geometry theory. The allometry principle is developed in accordance with the constant ratio and size-correlated shape change concepts, whereas the fractal geometry approach is applied according to the model of diffusion-limited aggre- gation (DLA) processes.

306 Geographical Analysis
The central arguments asserted in the model can be summarized by means of
1. The growth of the settlements is derived from an underlying dendritic or tree-like form.
2. The cities grow “through replication of some basic unit,. . . by the accretion of new neighborhoods, around which urban development is clustered’ (Longley, Batty, and Shepherd 1991).
3. “The form of urban settlements is self-similar not only within the settlement in question but between settlements of different size.. . . [Tlhe largest settle- ments in the system are simply larger versions of the smaller ones” (Longley, Batty, and Shepherd 1991).
The application of a fractal evolution of urban growth and of the concept of allometry has as its implicit consequence that small settlements have the same form and are considered as the initial growth phase’ of bigger settlements, thus solving the problem of size variation. All cities are therefore considered as members of the same cluster; for instance, neighborhoods might be considered as the basic elements of urban growth. But the question becomes whether a metropolis with a rectangular shape has developed strictly from a hamlet with a rectangular shape. Such a postulate seems less plausible in real life. From the viewpoint of our analysis, that is, the search for a methodology for the rec- ognition and classification of urban shapes, the primary limitation of the afore- mentioned approach is its impossibility to distinguish shapes which are, for example, rectangular but are extremely long and narrow, as well as shapes that are asymmetrical such as the majority of present city forms.
One of the most critical points of our investigation into urban shapes is that the categories of shapes are numerous and have indistinct or vague boundaries. A very active and promising area of application for the mathematics of uncer- tainty is the field of pattern rec0gnition.l Pattern recognition encompasses a large variety of approaches and techniques aimed at discovering structures within data in order to recognize patterns and classify objects. Among the large number of different applications, an interesting one appears to be the method developed by Lee (1976), who examined the shapes of chromosomes in order to classify them into three categories. Lee develops a technique of fuzzy pattern recognition that compares the angles and arms-lengths of the chromosome with those labeled in the idealized chromosome shape. Each chromosome can be classified as approximately median, approximately submedian, or approxi- mately acrocentric by calculating the three membership functions. The cate- gory in which the chromosome attains the maximum value is chosen if that value is sufficiently large. If the maximum value falls below some predefined threshold, then the image is rejected from all three defined classes. An advan- tage of this type of shape-oriented classification is that the method is insensitive to rotation, translation, expansion, or contraction of the shape. A limitation of this approach is that the recognition of the shape is based upon the idealized pattern of shape. Although this methodology is suitable for the recognition of chromosomes where we can define an idealized pattern, it is not necessarily applicable in the case of cities where there is not a limited number of idealized shape patterns. Therefore, we continue our investigation into finding alternative or complementary approaches.
the following:
1 Interesting reviews of various approaches of shape recognition and classification can be found in Attneave and Arnoult (1966) and in recent studies in the journal of Pattern Recognition (Pergamon Press).
Francesca Medda, Peter Nijkamp, and Piet Rietveld / 307
2. RECOGNITION AND CLASSIFICATION OF GEOMETRIC FIGURES
2.1. The Shape Index In order to recognize and classify urban shapes we extend the approach
developed by Boyce and Clark, while trymg to remove some limitations inher- ent in their approach. On this matter, the above-mentioned approach of Lee for chromosome recognition offers some interesting new perspectives. For instance, the advantage of Lee's formulation is, on one hand, its ability to consider fuzzy categories of shapes, that is, categories with overlapping boundaries that do not belong precisely to one of the defined patterns and, on the other hand, its prop- erty of being a shape-oriented classification.
If we want to define an index able to classify polygonal figures-and thus city forms-in accordance with a shape-oriented classification, we have to establish the desired properties of this index. These are
1. Two polygons with the same shape but with different sizes should have the
2. The range of the values of the index has to fall between zero and one. 3. The value of the index for a determined shape is invariant with respect to
rotation, translation, or expansion or contraction in size. 4. The chosen radii, n, are able to correctly discriminate a figure if, by considering
n + m radii, where m = 1 . . . co, the value of the shape index is invariant.
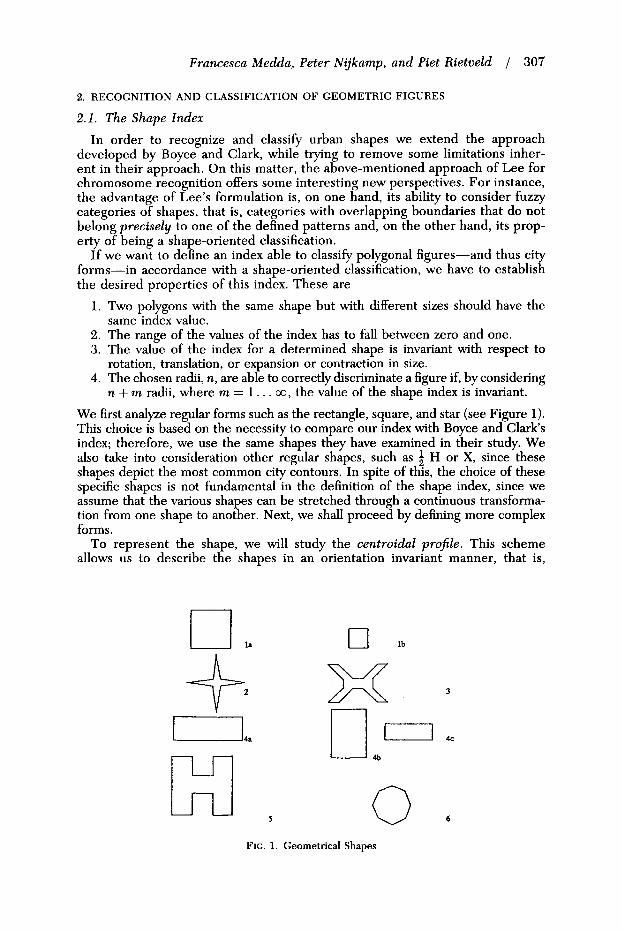
We first analyze regular forms such as the rectangle, square, and star (see Figure 1). This choice is based on the necessity to compare our index with Boyce and Clark's index; therefore, we use the same shapes they have examined in their study. We also take into consideration other regular shapes, such as 4 H or X, since these shapes depict the most common city contours. In spite of this, the choice of these specific shapes is not fundamental in the definition of the shape index, since we assume that the various shapes can be stretched through a continuous transforma- tion from one shape to another. Next, we shall proceed by defining more complex forms.
To represent the shape, we will study the centroidal profile. This scheme allows us to describe the shapes in an orientation invariant manner, that is,
same index value.
5
FIG. 1. Geometrical Shapes

308 / Geographical Analysis
shapes 4a and 4b in Figure 1 have the same shape index. Such a property is relevant in our case, in which the focus is upon the shapes of the blobs rather than on their orientation.
The centroidal profile is simply a normalized plot of the distance from the boundary to the centroid of the blob. The centroid is computed by an algo- rithm, the ratio of the first-order moments to the enclosed area (Freeman 1974); it is therefore a stable point of reference of the blob and has a relatively small noise effect. After having determined the location of the centroid, we determine the distances from the centroid to the line structure. We do this by taking one point on the boundary, computing its distance to the centroid, going to its neighbor point, again computing its distance to the centroid, etc., until we arrive again at the starting point. The determination of the chosen points in the curve will follow the classical geometric procedure that encompasses the choices of vertices, points of inflections, sharp discontinuities, and the medium points of the main sides. With respect to the number of radii to choose and their position, there have been examples of misconceptions in the literature (Griffith et al. 1986). Following the comment of Clark on the “one-to-one cor- respondence between the value of the index and the shape figure” (1987), we observe that the fourth property previously mentioned has been defined in order to avoid possible misinterpretation of the shape index. The number of radii that we have to consider in order to clearly discriminate the shape is that number for which the index value does not change if we consider a greater number of radii. For example, if we examine a rectangle, the minimum number of radii that we must consider in order to discriminate a quadrilateral figure is eight (the four vertices and the four medium points for each side). If we consider more than eight radii, the shape index will have the same value of the index shape calculated with eight radii, and therefore we are able to define the one-to-one correspondence between the index and the shape.
We also want to avoid a shape index that has a dependence on the shape scale.2 In order to accomplish this, we have to normalize the ordinate and the abscissa of our system of measurement. The ordinates are represented by the radius value. We normalize these values by dividing all radius values by the maximum radius value. Such a value is called the vertical normalization factor. Conse- quently, the maximum value of the ordinates is one. In order to normalize the abscissa values that measure the distance between the intersections in the shape contour of two successive radii, we divide all the distances by the maximum distance. This factor yielding the uniform abscissa scale is called the horizontal normalization factor. Each normalized distance has a value between zero and one. In the abscissa we indicate the complete contour of the shape that is given by the sum of these normalized distances. By following this procedure, we determine the same shape index for the shapes l a and Ib and for the shapes 4a and 4c (see Figures 1 and 2).
The mathematical formulation which we have defined in order to elicit the various profiles may constitute a basis for delineating a formula which recog- nizes and classifies shapes. For instance, we can express the formula as follows:
where n = number of radii; rmx = maximum radius value; and ri = radius value.
2For the proofs of the scale and rotation invariant properties of the centroidnl profile procedure, see Freeman (1974).

I-----t- N U ! - -

310 / Geographical Analysis
Radius 2
1.8 1.6 1.4 1.2
1 0.8 0.6 0.4 0.2 0
Rectangle
t Pmax
1 2 2.5 3 4 5 5.5 6 Con tour
FIG. 3. Definition of Pmr and Pmin
This formula satisfies the four properties which we have defined. The sum of the radii is standardized by means of the maximal radius; thus, it is size and rota- tion invariant (first and third properties). By dividing this sum by the number of the radii, the second and fourth properties are also met. However, this formula as such is not sufficiently discriminative to recognize and then to classify shapes. In fact, for different shapes we may obtain the same result of the formula. This can be interpreted as a consequence of the fact that the information provided in the formula is not sufficiently characteristic for all the shapes. I t is therefore necessary to introduce more specific parameters in order to differentiate the various shapes more succinctly.
We can introduce a relevant parameter of the shape. Each shape profile is characterized by increasing and decreasing parts. For each part we can deter- mine a maximum and minimum point that we connect by a segment. Each seg- ment forms an angle with the axis x (see Figure 3).
We determine the maximum and the minimum angles among the defined sets of angles and then we calculate the cosine of their difference. This value is the parameter that we introduce into the shape formula. After the introduction of these parameters, our formula still satisfies the four properties and is now suffi- ciently discriminative.
The formula recognizes each shape through a specific value. We call this function shape membership function, and it is expressed as follows:
where Ptnin = minimum angle of the profile; Pmx = maximum angle of the profile; n = number of radii; ri = radius value; rmx = maximum radius value.
In the specific case of the circle we have

Francesca Medda, Peter Nijkamp, and Piet Rietveld J 311
Shape F o r m u l a
0.6
0.5
0.4
0.3
0.2
0.1
O t
- -- - - - - -- -- --
By applying the above formula we are able to define a value for each shape considered; it is then possible to classify the geometric figures. We then obtain the following list of values for the shapes given in Figure 1; see Figure 4 and the following table.
1. Circle = 1 6. $H = .67 2. Octagon =.95 7. Star =.64
4. Rectangle = .77 9. Line = O 5. H = .69
3. Square =.85 8. x =.57
The formula defines a shape-oriented classification, thus solving the size and rotation problem within Boyce and Clark's formulation.
Suppose that the shape we are studying has a value of the shape membership function that falls between two shape-values. In order to classify the shape, we have to set a threshold, 6, between the known shapes. Only after we have given this information can we classify our shape as, for example, an approximate star or an almost circle.
2.2 Illustrations with Irregular Shapes We can now apply the shape membership function ( 2 ) to irregular shapes.
This application of the function to irregular shapes assumes its relevance in light of our main objective: the recognition and the classification of urban forms.
Let us consider a generic irregular shape (see Figure 5 ) . After having identi- fied the centroid of the shape, we depict the irregularity of the figure through its radii. In this case, because of the complexity of the shape, we examine thirty radii in order to describe the various morphological aspects of the figure. The profile we obtain from our application of the methodology described in the pre- vious section shows a diagram with an undulating, but not periodic trend (see Figure 6).
By calculating the value of the shape membership function we obtain the value ps = .65. This value indicates that our figure is between $H shape and Star shape. The figure we are examining is characterized by two arms; the for- mula recognizes this shape asymmetry as a peculiar element and it classifies the shape according to this element.

312 Geographical Analysis
FIG. 5. Generic Irregular Shape. Source: Freeman (1978)
Irregular Shape
1.5 ‘I 0 a
a 0.5
0 cr-t: : : : : : : : : : : : : : : : : : : : I : : : : : I
Contour
FIG. 6. Profile of Irregular Shape
FIG. 7. The Urban Shape of Milwaukee, USA. Source: Boyce and Clark (1964)
We will now apply the shape membership function (2) in order to recognize and classify an urban shape. Let us examine the shape of the city of Milwaukee (see Figure 7 ). The profile of the urban shape on the right side is similar to the profile of the rectangle (see Figure 8 ) . We may therefore expect a shape index to be near that of the rectangular shape index. The value we obtain for the city of Milwaukee is ps = .73. The formula still recognizes the asymmetry of the shape and therefore we can classify this shape of city as an approximate rectangle.

Francesca Medda, Peter Nijkamp, and Piet Rietveld 313
Mi Iw a u ke e
1.5 ‘T
0-1 : ! : : : : : : : : : : : I
Contour
FIG. 8. Profile of Milwaukee’s Shape
3. CONCLUSION
The foregoing morphological analysis has shown an interesting application to recognize and then classify simple geometric figures. The methodology we have developed is based upon previous studies in the field of shape recognition and classification, particularly the study of Boyce and Clark (1964) and that of Lee (1976). However, in our investigation we have tried to revisit some of the prob- lems encountered in these previous analyses which formed serious limitations for the Boyce, Clark, and Lee approaches. In so doing, we were able to pro- duce a viable formulation for the recognition and classification of urban shapes.
After having recognized the shape of our city-container, are we able to say something about its contents? The Whytian categories of spatial form and inter- nalform are strongly connected, since one is the outward effect of the other. In this relationship between intrinsic and extrinsic form it is important to dwell on how and through which processes urban shapes are determined. The “formative process,” as it was stated by Goethe in 1827, will be the objective for our future investigations.
LITERATURE CITED
Albrecht, D. G., ed. (1982). Recognition of Pattern Fonn. Lecture Notes in Biomathematics 44. Berlin: Springer-Verlag.
Attneave, F., and M. D. Arnoult (1966). “The Quantitative Study of Shape and Pattern Perception.” In Pattern Recognition: Theory, Experiment, Computer Simulations, and Dynamic Modeki of Form Per- ception and Discouery, edited by L. Uhr. New York: John Wiley & Sons.
Batty, M., and P. A. Longley (1994). Fractal Cities: A Geometry of Fonn and Function. London: Academic Press.
Batty, M., and Y. Xie (1996a). “Preliminary Evidence for a Theory of the Fractal City.” Environment and Planning A 28, 1745-62. - (1996b). “Possible Urban Automata.” Environment and Planning B 23, 42-59. Berry, B. J. L. (1971). “City Size and Economic Development: Conceptual Synthesis and Policy Problems
with Special Reference to South and Southeast Asia.” In Urbanization and National Development, edited by L. Jakobson and V. Prakash. Beverly Hills: Sage Publications.
Bezdek, J. C. (1981). Pattern Recognition with Fuzzy Objectiue Function Algorithms. New York: Plenum Press.
Boyce, R. R., and W. A. Clark (1964). “The Concept of Shape in Geography.” The Geographical Review 54, 561-72.
Bunge, W. (1966). Theoretical Geography. Lund Studies in Geography. Ser. C. General and Mathe-
Clark, W. A. V. (1987). “Shape Indices: A Comment on Interpretation.” Professional Geographer 39,201- matical Geography 1. Lund.
202.

314 1 Geographical Analysis
Danta, D. R. (1987). “A Comment on Shape Indices’.” Professional Geographer 39, 199-200. Eco, U. (1991). La Forma Assente. Milano: Bompiani. Freeman, H. (1961). “On the Encoding of Arbitrary Geometric Configurations.” I R E ‘l‘rans. Elect.
- (1974). “Computer Processing of Line-Drawing Images.” Computing Suruey 6, 57-97. - (1978). “Shape Description via the Use of Critical Points.” Pattern Recognition 10, 159-66. Griffith, D. A,, M. P. ONeil, W. A. ONeil, L. A. Leifer, and R. G. Mooney (1986). “Shape Indices:
Height, J. S. (1964). Gold of Goethe: Selected Lyric Poems. Evanston: The Schori Press. a i r , G. J., and T. A. Folger (1988). Fuzzy Sets, Uncertainty, and Information. Englewood Cliffs, N.J.:
Lee, E. T. (1976). “An Application of Fuzzy Sets to the Classification of Geometric Figures and Chro-
C m p . 10, 260-68.
Useful Measures or Red Herrings?” Professional Geographer 38, 263-70.
Prentice Hall.
mosome Images.” Information Science 10, 95-114. Lo, C. P. (1980). “Changes in the Shapes of Chinese Cities, 1934-1974.” Professional Geographer 32,
173-83. Longley, P. A,, M. Batty, and J. Shepherd (1991). “The Size, Shape, and Dimension of Urban Settle-
Mardesic, S., and J. Segal, J., eds. (1986). Geometric Topology and Shape Theory. Lecture Notes in
Marshall, J. U. (1997). “Beyond the Rank-Size Rule: A New Descriptive Model of City Sizes.” Urban
Nader, G. A. (1984). “The Rank-Size Model: A Nonlogarithmic Calibration.” The Professional Geogra-
Pavel, M . (1983). “Shape Theory and Pattern Recognition.” Pattern Recognition 16, 349-56. Sheppard, E. (1982). “City Size Distributions and Spatial Economic Change.” International Regional
Thompson, DA. W. (1917). On Growth and Fonn. Cambridge: Cambridge University Press. Vanderheydt, L., F. Dom, A. Oosterlinck, and H. Van Den Berghe (1981). “Two-Dimensional Shape
Decomposition Using Fuzzy Subset Theory Applied to Automated Chromosome Analysis.” Pattern Recognition 13, 147-57.
Vining, D. R., Jr. (1977). “The Rank-Size Rule in the Absence of Growth.”]ournal of Urban Economics 4, 15-29.
Whyte, L. L., ed. (1968). Aspects of Forms. London: Lund Humphries.
ments.” Institute of British Geographers Transactions N e w Series 16, 75-94.
Mathematics 1283. Berlin: Springer-Verlag.
Geography 18, 36-35.
pher 36, 221-27.
Science Review 7, 127-51.