Rebalancing Risk Management –Part 2: The Active Risk Control (ARC) Toolkit
39
Page 1 of 39 Rebalancing Risk Management –Part 2: The Active Risk Control (ARC) Toolkit Authors: Alan J. Card, PhD, MPH, CPH, CPHQ James R. Ward, BEng, CEng, PhD P. John Clarkson, PhD, HonD, CEng, FIET, FIED, FREng This is the pre-print version of the paper “Rebalancing Risk Management –Part 2: The Active Risk Contron (ARC) Toolkit.” The final and definitive version will be published in the Journal of Healthcare Risk Management. Please cite this work as: Card AJ, Ward JR, & Clarkson PJ. Rebalancing Risk Management –Part 2: The Active Risk Control (ARC) Toolkit. Journal of Healthcare Risk Management. 2015;34(3):4-17. ABSTRACT The adoption of systems-focused risk assessment techniques has not led to measurable improvement in the rate of patient harm. Why? In part, because these tools focus solely on understanding problems, and provide no direct support for designing and managing solutions (i.e., risk control). This second installment of a 2-part series on rebalancing risk management describes a structured approach to bridging this gap: The Active Risk Control (ARC) Toolkit. A pilot study is presented to show how ARC Toolkit can improve the quality of risk management practice.
Transcript of Rebalancing Risk Management –Part 2: The Active Risk Control (ARC) Toolkit

Page 1 of 39
Rebalancing Risk Management –Part 2: The Active Risk Control (ARC) Toolkit
Authors: Alan J. Card, PhD, MPH, CPH, CPHQ
James R. Ward, BEng, CEng, PhD
P. John Clarkson, PhD, HonD, CEng, FIET, FIED, FREng
This is the pre-print version of the paper “Rebalancing Risk Management –Part 2: The Active Risk Contron (ARC) Toolkit.” The final and definitive version will be published in the Journal of Healthcare Risk Management. Please cite this work as: Card AJ, Ward JR, & Clarkson PJ. Rebalancing Risk Management –Part 2: The Active Risk Control (ARC) Toolkit. Journal of Healthcare Risk Management. 2015;34(3):4-17.
ABSTRACT
The adoption of systems-focused risk assessment techniques has not led to measurable
improvement in the rate of patient harm. Why? In part, because these tools focus solely
on understanding problems, and provide no direct support for designing and managing
solutions (i.e., risk control). This second installment of a 2-part series on rebalancing risk
management describes a structured approach to bridging this gap: The Active Risk
Control (ARC) Toolkit. A pilot study is presented to show how ARC Toolkit can
improve the quality of risk management practice.

Page 2 of 39
INTRODUCTION
Risk assessment is the process through which organizations develop an understanding of
the risks they face.1 In current practice, this process is supported by a large number of
tools and techniques.2 Incident investigation and root cause analysis (RCA) are risk
assessment techniques,3,4 as are component tools, such as fishbone diagrams,5 lovebug
diagrams,6 and the 5-whys technique.7 An alphabet soup of prospective risk assessment
techniques are also available, including failure mode and effects analysis (FMEA),8 the
structured what-if technique (SWIFT),9,10 and fault tree analysis (FTA).11–13 When used
correctly, tools like these may significantly improve an organization’s knowledge about
its risk profile.14
But that is where risk assessment tools leave off. They provide no direct support for risk
control,3,9,14 the process of designing and managing solutions to the problems they
explore. This lack of support represents a critical gap in risk management practice, both
in healthcare and beyond.3,15,16
But the impact may be most acute in healthcare risk management. In most industries the
primary users of these tools are professionals like engineers or ergonomists, who are
specifically trained to convert requirements (e.g., assessed risks) into effective and
sustainable solutions.17–19 In the healthcare industry, the primary users of risk assessment
tools tend to have deep clinical expertise, but very limited training in solutions design.
The predictable results are that healthcare personnel face significant difficulty in
designing effective systems-level responses to identified risks,3 and that the adoption of
Page 3 of 39
structured risk assessment techniques has not led to a measurable decrease in the rate of
patient harm.20
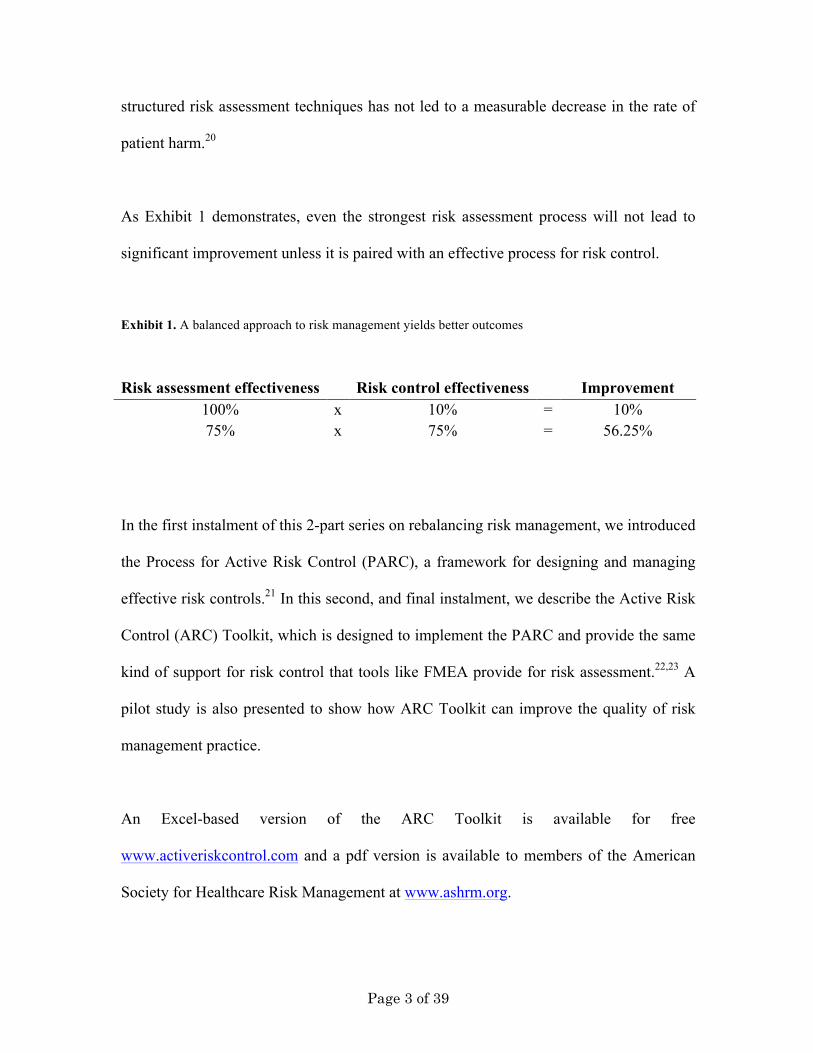
As Exhibit 1 demonstrates, even the strongest risk assessment process will not lead to
significant improvement unless it is paired with an effective process for risk control.
Exhibit 1. A balanced approach to risk management yields better outcomes
Risk assessment effectiveness Risk control effectiveness Improvement 100% x 10% = 10% 75% x 75% = 56.25%
In the first instalment of this 2-part series on rebalancing risk management, we introduced
the Process for Active Risk Control (PARC), a framework for designing and managing
effective risk controls.21 In this second, and final instalment, we describe the Active Risk
Control (ARC) Toolkit, which is designed to implement the PARC and provide the same
kind of support for risk control that tools like FMEA provide for risk assessment.22,23 A
pilot study is also presented to show how ARC Toolkit can improve the quality of risk
management practice.
An Excel-based version of the ARC Toolkit is available for free
www.activeriskcontrol.com and a pdf version is available to members of the American
Society for Healthcare Risk Management at www.ashrm.org.

Page 4 of 39
IMPROVING PRACTICE WITH THE ACTIVE RISK CONTROL
TOOLKIT: A PILOT STUDY
Introducing the ARC Toolkit
While the PARC bridges the conceptual gap between risk assessment and improved
outcomes, the creation of a framework, by itself, is likely to achieve only a small and
slow impact on risk control practice. To make immediate use of the PARC, healthcare
risk managers or patient safety professionals will require practical tools for translating the
PARC framework into improved risk control practice. The Active Risk Control (ARC)
Toolkit22,23 has been developed to address this need.
Exhibit 2 depicts the PARC. The ARC Toolkit provides direct support for Establishing
the Context (defining the goals and conditions for success) and the Options Assessment
process (generating risk control options, analysing individual options, and evaluating how
a suite of risk control options would work together to improve outcomes). It also calls
for users to plan for Implementation, Sustainment, and Outcomes Evaluation and
provides inputs to help enable both Monitoring and Review, and Communication and
Consultation.

Page 5 of 39
Exhibit 2: The Process for Active Risk Control 22 (used by permission under a Creative Commons Attribution 3.0 Unported License)
The Toolkit has four components: The Background section [Establish the Context], the
Generating Options for Active Risk Control (GO-ARC) Technique24,25 [Generate Risk
Control Options], the Options Analysis worksheets [Analyse Risk Control Options], and
the Options Evaluation Matrix [Evaluate Risk Control Options].
!Comm
unication!and!consu
ltation!
Options(assessment(
Establish!the!context!
Generate!risk!control!options!
Analyze!risk!control!options!
Evaluate!risk!control!options!
Select!risk!controls!
Implement!risk!controls!
Sustain!risk!controls!
Evaluate!outcomes!
Monitoring!and!review!

Page 6 of 39
Background Section
The Background section of the Toolkit consists of prompts calling for users to describe
the risk to be controlled, translate the potential causes & contributing factors into
solution-neutral problem statements, and to define the criteria for successful control of
the risk.
The Generating Options for Active Risk Control (GO-ARC) Technique
Drawing on the example of the Structured What-If Technique (SWIFT)9,10 and Hazard
and Operability (HAZOP) Studies26 from the analogous process of Risk Identification,
the GO-ARC Technique uses a structured brainstorming approach to improve the quality
of risk control options generated for consideration. The GO-ARC Technique presents
five risk control tactics as prompts for users to brainstorm against. Each is presented
along with a brief description and several examples. The prompts are:
• Elimination of the hazard or the target
• Design controls (aka engineering controls)
• Administrative controls
• Detection / situational awareness
• Preparedness
The first three represent a hierarchy of risk controls.3 The remaining two are intended to
ensure that users consider resilience27–29 (impact reduction), not just prevention
(likelihood reduction). Evidence from a pilot study24 and an experimental evaluation25 of
the GO-ARC Technique suggests that use this tool leads to the generation of a higher
proportion of non-administrative risk controls, and that this result comes without the
Page 7 of 39
potential negative side effect of generating a reduced number of administrative risk
control options.
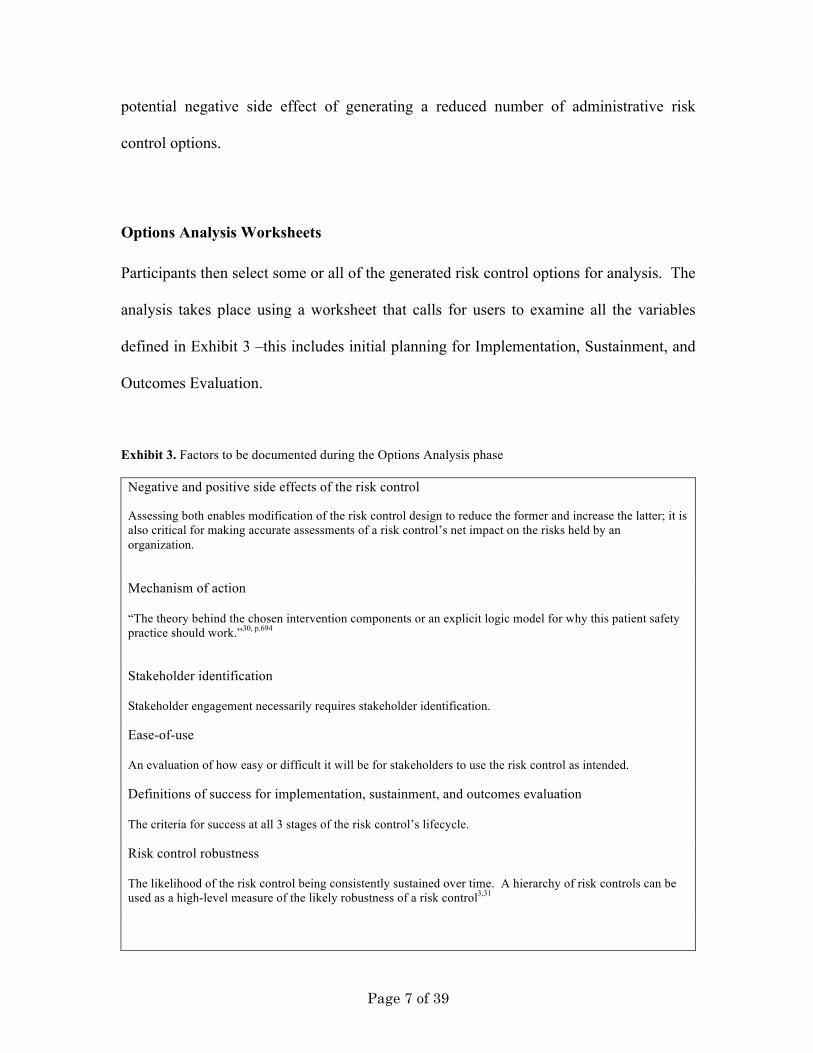
Options Analysis Worksheets
Participants then select some or all of the generated risk control options for analysis. The
analysis takes place using a worksheet that calls for users to examine all the variables
defined in Exhibit 3 –this includes initial planning for Implementation, Sustainment, and
Outcomes Evaluation.
Exhibit 3. Factors to be documented during the Options Analysis phase
Negative and positive side effects of the risk control Assessing both enables modification of the risk control design to reduce the former and increase the latter; it is also critical for making accurate assessments of a risk control’s net impact on the risks held by an organization.
Mechanism of action “The theory behind the chosen intervention components or an explicit logic model for why this patient safety practice should work.”30, p.694
Stakeholder identification Stakeholder engagement necessarily requires stakeholder identification.
Ease-of-use An evaluation of how easy or difficult it will be for stakeholders to use the risk control as intended.
Definitions of success for implementation, sustainment, and outcomes evaluation The criteria for success at all 3 stages of the risk control’s lifecycle.
Risk control robustness The likelihood of the risk control being consistently sustained over time. A hierarchy of risk controls can be used as a high-level measure of the likely robustness of a risk control3,31

Page 8 of 39
Forces in favor of, and against, the risk control’s success These are depicted using a technique known as force-field analysis.32
Requirements for successful implementation, sustainment, and monitoring / evaluation The resources that will be required to implement and sustain the risk control, to monitor implementation and sustainment, and to evaluate the success of the risk control.
Anticipated costs Monetary costs associated with implementing, sustaining, and evaluating the risk control. This may be quantitative or qualitative.
Cost-effectiveness for sustained success An assessment of the risk control’s cost-effectiveness across all 3 stages of its lifecycle. This may be quantitative or qualitative.
The worksheets also include the calculation of a Risk Control Score (RCS). The RCS is
a weighted (qualitative) measure of cost-effectiveness based on the formula:
𝑅𝐶𝑆 = 𝐴 − 𝐵 + 𝐶 𝐷 𝐸
2𝐹
Where:
• A = Effectiveness in reducing the risk of interest
• B = Additional risks that would be added to the system through the
implementation of the risk control (i.e., negative side-effects)
• C = Other risks that would be reduced through the implementation of the risk
control (positive side-effects)
• (A-B+C) = Net risk reduction
• D = Robustness, as measured using the three-tiered hierarchy of risk controls
• E = Ease of use
• F = Cost

Page 9 of 39
Robustness is measured on a scale of 1-3 (administrative controls = 1, design controls =
2, elimination = 3); all others are measured on a scale of 1-6. The RCS provides a
straightforward basis for conducting an initial comparison of risk control options, and
satisfies the additional requirement imposed by the PARC’s definition of risk control for
a focus on achieving a net improvement in the organization’s risk profile. It is also worth
noting that any risk control that is expected to do more harm than good will result in a
negative RCS, while any risk control that is expected to do more good than harm will
result in a positive score.
The primary contribution of the RCS is to ensure that all the component variables receive
due consideration and that the cost-effectiveness of a given risk control option is assessed
at an early stage. It is intended to provide a starting point for options evaluation, and
should not be used mechanistically. For instance, if the three highest-scoring risk control
options all had the same mechanism of action, there might be no marginal benefit in
implementing more than one. Also, it is not clear that the variable weights in the RCS
formula are “correct.” Is an elimination control 1.5 times as robust as a design control,
and 3 times as robust as an administrative control? Ease of use is important in terms of
avoiding work-arounds, but is it 50% as important as risk reduction? Since the
effectiveness of a risk control in terms of the risk of interest is restricted to one risk, and
the side-effects may be spread across innumerable risks, should those side-effects have a
greater range of values available? Until all these issues can be addressed it will not be
possible to formally validate the RCS formula. As a result, it should be seen, as
advertised, solely as a starting point for more robust evaluation.

Page 10 of 39
Options Evaluation Matrix
The final component of the Toolkit is a matrix comparing the risk control options on the
vertical axis (in priority order) vs. the hazards contributing to the risk on the horizontal
axis. It is not necessarily required that every hazard be addressed by one or more risk
controls; some may be only weakly related to the risk in question, or may be very
expensive to mitigate. But by mapping out the relationships between risk controls and
hazards, this tool can help users evaluate how the risk controls will work together as a
system to control the risk. It also results in a rank-ordered list of risk control
recommendations, as called for by ISO 31000.1
The Pilot Study: Introduction and Methods
The ARC Toolkit was used to design risk controls after a prospective risk assessment on
the topic of hospital-acquired pressure ulcers. The study took place in a ~250 bed acute
care hospital in the Midwest United States.
The primary outcome measures for this study were: 1) The proportion of non-
administrative risk controls recommended, as compared to the proportion for previous
prospective risk assessments conducted at the same hospital; 2) Appropriateness of risk
controls.
Page 11 of 39
To assess the first outcome measure, the risk control recommendations from the pilot
study were compared to those that resulted from three previous prospective risk
assessments. The risk controls were first coded using the three-tiered hierarchy of risk
controls,3 then a run chart was constructed that depicted the proportion of non-
administrative risk control options recommended, as well as the 95% confidence interval
(CI) of the cumulative proportion. The CIs were calculated using the Bayesian exact
shortest 95% CI approach.33
Appropriateness of risk controls was measured through a 6-month follow-up of both
progress toward implementation and the assessment of the hospital’s risk manager.
Secondary outcome measures included time investment (measured in terms of meeting
hours); users’ perceptions of the Toolkit’s usefulness, ease of use, cost, and value, as well
as their intent to use the Toolkit in the future; users’ training and experience; qualitative
assessments elicited using open-ended questions. User perceptions were measured
through a user survey based on a hybrid of the Technology Acceptance Model34,35 and the
Value-Based Adoption Model.36–38
The Pilot Study: Results
Time Investment
The study took place over the course of 7 meetings, scheduled for 2 hours each, in
spring/summer 2012. Due to technical difficulties, the first meeting started 20 minutes

Page 12 of 39
late, and the final meeting ended one hour early, so the total meeting time was 12.5 hours.
The number of participants (excluding the facilitator) varied from one (for one meeting)
to ~10. More typically, 5-6 participants were in attendance.
The single meeting with one participant involved conducting an initial Options Analysis
on one complex risk control option. The option’s champion worked with the facilitator to
refine and analyse the option, and the results were vetted in detail by all attendees at the
next meeting. This was felt to be far more efficient than attempting to work through the
option with the entire team in attendance, and the response from all participants was
positive. This approach of conducting an initial Options Analysis with one expert
participant and then reviewing the results with the full team may be a good choice for
handling options that are vague and complex (assuming an expert champion exists for the
option in question).
Establishing the Context
Problem Framing
The problem framing process was successful in producing solution-neutral problem
statements for the hazards underlying the risk of interest. The risk of interest, itself, was
felt to have been well-framed from the start, though the hazards benefitted from some
reframing to make them more solution-neutral. Exhibit 4 shows how the risks and
hazards changed as a result of the problem-framing process.
Exhibit 4. Risks and hazards identified through the risk assessment vs. problem-framing

Page 13 of 39
Risks and hazards identified from the risk assessment
Risks and hazards from the problem-framing process
Risk: Hospital-acquired pressure ulcers
Risk: Hospital-acquired pressure ulcers
Hazards: • Moisture, absorbency, layering • Turning process • Assessment
o Patients with dry / sensitive skin, and wrong products to address this
o Patient acuity & other characteristics
o Lack of assessment / documentation at admission
• Pressure redistribution devices • Nutrition • Friction, shearing • Communication • Lack of protocols / procedures for
intervention for high-risk patients • Education (for patient, family, staff,
physician)
Hazards: • Moisture • Unrelieved pressure • Documentation (non-existent or
inconsistent) • Patient characteristics • Friction, shearing • Communication
Defining Success
The process of defining the criteria for success appeared to be useful in terms of making
the objectives of the process more concrete. The criteria developed using the Toolkit
were: “Zero avoidable pressure ulcers for 6 months as measured 12 months after
complete implementation [of the recommendations].”
Generating Risk Controls
As part of the process of working through the Toolkit, a number of risk control options
were combined. For instance, new policies, training and quick reference guides related to

Page 14 of 39
the policies, and the use of signs on doors (as a part of the new policy) were all rolled into
one risk control option. Similarly, eliminating diapers / briefs was combined with
substituting more effective underpads to absorb waste, as the latter step was a prerequisite
for the former. These combinations were made in order to ensure that the risk controls in
question would be managed in an integrated way. After allowing for these combinations
and the generation of further risk control options during the Options Analysis stage,
participants generated 11 risk controls.
Elimination Controls
Seven Elimination Controls were generated:
• Substitution of more gentle skin cleansers
• Substitute gentler (disposable) washcloths
• Substitute better mattresses than Brand Y
• Substitute Brand X mattress covers for current mattress covers
• Substitute different underpads and eliminating diapers / briefs for patients in bed
with Braden scores above a certain cutoff
• Substituting better waffle cushions or gel pads for chairs
• Substituting a less cumbersome replacement for current boots (for appropriate
patients)
The first of these (substitution of more gentle skin cleansers) was identified as already
being in progress, and was not subjected to Options Analysis. The final Elimination
Control (less cumbersome boots to protect against pressure ulcers on patients’ heels) was
identified later, as part of the Options Analysis step for a different risk control option.

Page 15 of 39
Design Controls
One Design Control was generated:
• Easy physical access to needed products on the unit: Possibly including overlays,
Product A (wound dressings), pre-prepared kits for different levels of ulcer
prevention / treatment, boots, etc.
Administrative Controls
Three Administrative Controls were generated:
• Develop a comprehensive set of policies and procedures for pressure ulcer
prevention and documentation of community-acquired pressure ulcers
• Electronic medical record (EMR) triggers
• Develop a nurse-initiated nutritional supplement program (not at mealtime)
Four relatively discrete policy/procedure options were combined to create the first option,
and the final option (nurse-initiated nutritional supplements) was identified later, as part
of the Options Analysis step for a different risk control option. The EMR triggers option
was determined to have a low priority for analysis, and this option was not further
assessed.
Options Analysis
The Options Analysis worksheets prompted users to consider and document key issues
for each risk control option. It appeared to add significant value by influencing the design
of the risk controls themselves, by providing a more realistic sense of the costs and
benefits each risk control might provide across its lifecycle, and by ensuring that plans
Page 16 of 39
for implementation, sustainment, and evaluation were considered before an
implementation decision was made.
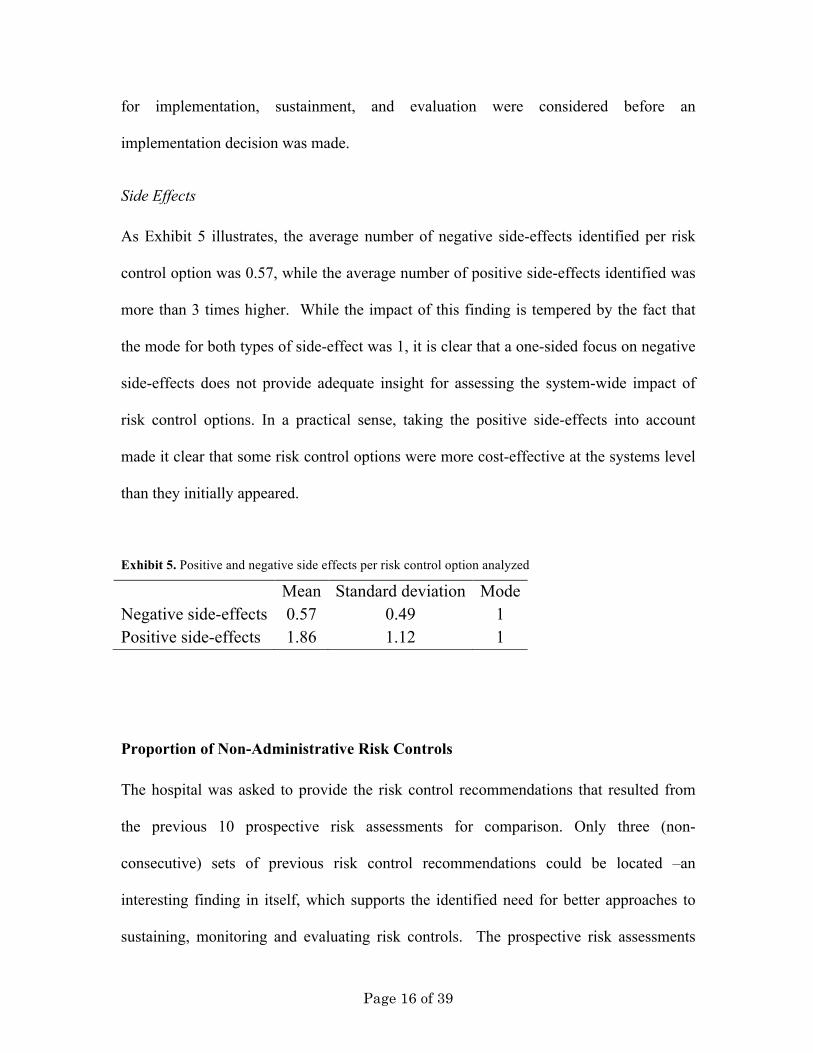
Side Effects
As Exhibit 5 illustrates, the average number of negative side-effects identified per risk
control option was 0.57, while the average number of positive side-effects identified was
more than 3 times higher. While the impact of this finding is tempered by the fact that
the mode for both types of side-effect was 1, it is clear that a one-sided focus on negative
side-effects does not provide adequate insight for assessing the system-wide impact of
risk control options. In a practical sense, taking the positive side-effects into account
made it clear that some risk control options were more cost-effective at the systems level
than they initially appeared.
Exhibit 5. Positive and negative side effects per risk control option analyzed
Mean Standard deviation Mode Negative side-effects 0.57 0.49 1 Positive side-effects 1.86 1.12 1
Proportion of Non-Administrative Risk Controls
The hospital was asked to provide the risk control recommendations that resulted from
the previous 10 prospective risk assessments for comparison. Only three (non-
consecutive) sets of previous risk control recommendations could be located –an
interesting finding in itself, which supports the identified need for better approaches to
sustaining, monitoring and evaluating risk controls. The prospective risk assessments

Page 17 of 39
(PRAs) assessed the following risks: Current Practice 1 (CP1) focused on surgical site
identification; CP2 focused on critical laboratory values; CP3 focused on patient suicide;
the ARC Toolkit case study assessed pressure ulcers.
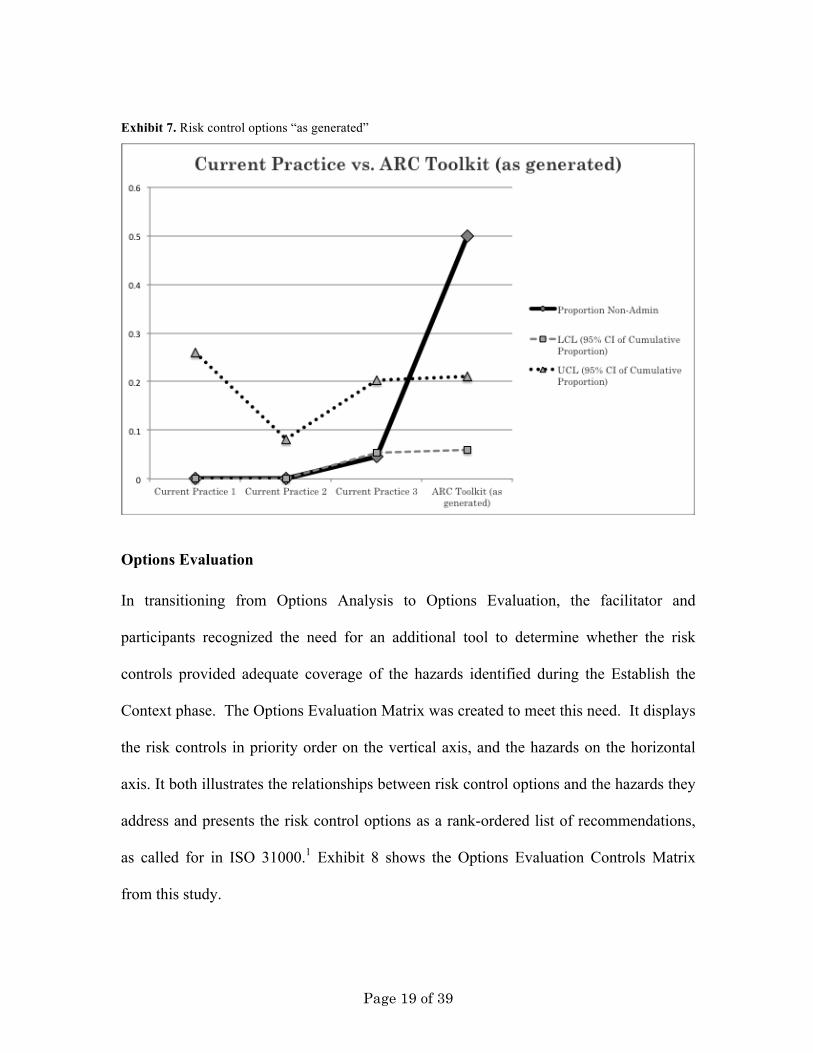
As described earlier, some risk controls were combined before analysis. Because this is
not how risk controls were managed in previous years, the results are presented both “as
recommended” (i.e., in their final form after using the Toolkit), and “as generated” (i.e.,
before discrete risk control options were combined). From the run charts presented in
Exhibits 6 and 7, below, it is immediately apparent in both cases that the risk control
recommendations produced using the Toolkit represent an extremely positive outlier
compared to previous prospective risk assessments. The proportion of non-
administrative controls recommended using the Toolkit was much higher than that which
resulted from previous practice.

Page 18 of 39
Exhibit 6. Risk control options “as recommended”
Page 19 of 39
Exhibit 7. Risk control options “as generated”
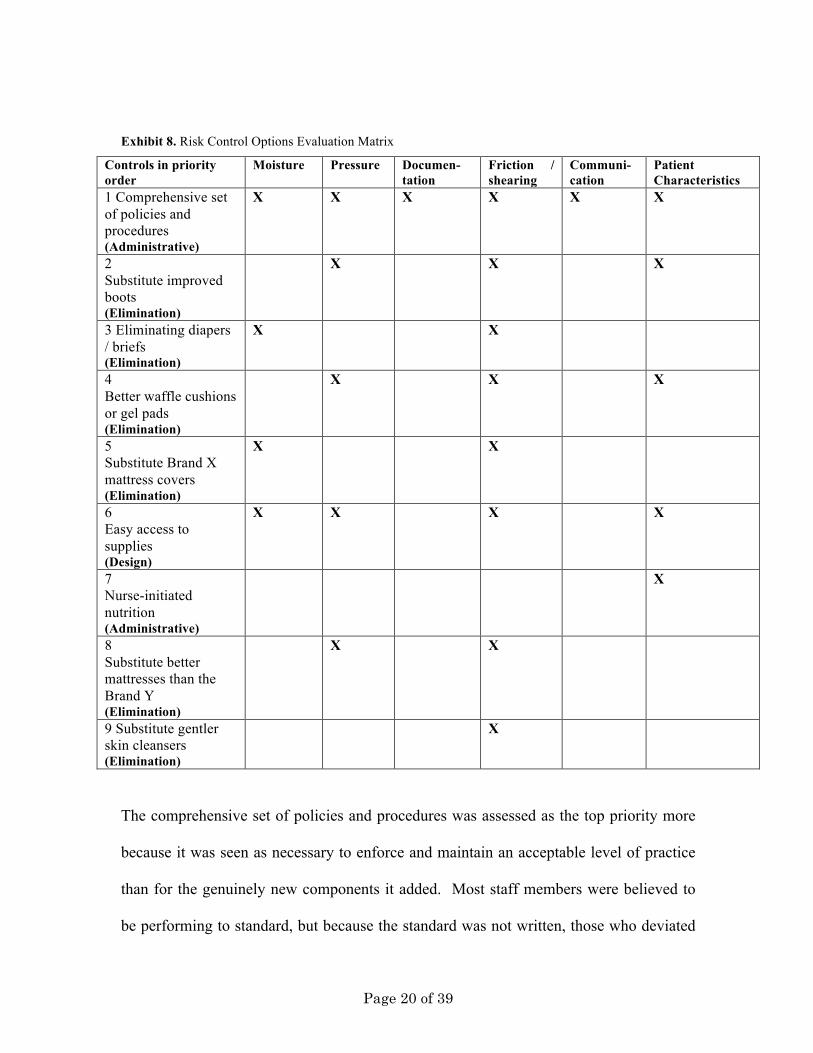
Options Evaluation
In transitioning from Options Analysis to Options Evaluation, the facilitator and
participants recognized the need for an additional tool to determine whether the risk
controls provided adequate coverage of the hazards identified during the Establish the
Context phase. The Options Evaluation Matrix was created to meet this need. It displays
the risk controls in priority order on the vertical axis, and the hazards on the horizontal
axis. It both illustrates the relationships between risk control options and the hazards they
address and presents the risk control options as a rank-ordered list of recommendations,
as called for in ISO 31000.1 Exhibit 8 shows the Options Evaluation Controls Matrix
from this study.
Page 20 of 39
Exhibit 8. Risk Control Options Evaluation Matrix
Controls in priority order
Moisture
Pressure Documen-tation
Friction / shearing
Communi-cation
Patient Characteristics
1 Comprehensive set of policies and procedures (Administrative)
X X X X X X
2 Substitute improved boots (Elimination)
X X X
3 Eliminating diapers / briefs (Elimination)
X X
4 Better waffle cushions or gel pads (Elimination)
X X X
5 Substitute Brand X mattress covers (Elimination)
X X
6 Easy access to supplies (Design)
X X X X
7 Nurse-initiated nutrition (Administrative)
X
8 Substitute better mattresses than the Brand Y (Elimination)
X X
9 Substitute gentler skin cleansers (Elimination)
X
The comprehensive set of policies and procedures was assessed as the top priority more
because it was seen as necessary to enforce and maintain an acceptable level of practice
than for the genuinely new components it added. Most staff members were believed to
be performing to standard, but because the standard was not written, those who deviated
Page 21 of 39
from best practice could not easily be held accountable, nor could continued high-quality
practice be ensured during periods of turnover.
The nurse-initiated nutrition program was given a lower priority because it was seen as
potentially difficult to implement. A doctor’s order is normally required for nutritional
supplements; dieticians (not nurses) are the clinical specialists for nutrition; and
additional stocks of the nutritional supplements would have to be acquired. In short, the
number of internal polities who would have to be convinced to sign off on the project was
high, and, although the nutritional supplement program was seen as potentially very
beneficial (with significant positive side effects), the benefit would be difficult to
measure. Participants made a tactical decision not to risk having their broader list of
priorities held up while the fate of the nutritional program could be decided.
Substituting better mattresses than Brand Y was given the lowest priority because of the
very small number of beds with such mattresses at the hospital.
Substituting Brand X mattress covers was recommended despite the fact that options
analysis was deferred pending additional information; it appeared that this option was
likely to be implemented as part of a related purchasing decision, regardless of the
recommendations made. And, as earlier described, the substitution of gentler skin
cleansers was already underway, so this (while recommended) was not a high priority for
additional action.

Page 22 of 39
Initial User Survey
User Perceptions
Of the 5 participants present at the final meeting, three completed the survey. Exhibit 9
below shows the average scores for each construct (Perceived Usefulness, Ease of Use,
Direct Cost, and Value, as well as Intention to Adopt). Overall, the responses were
positive for each construct. The lowest-scoring construct was Perceived Ease of Use,
with an average score of 4.58 on a scale of 1-6. Other than Perceived Cost, which scored
a 6 (the ARC Toolkit is available at no cost), the highest scoring construct was Perceived
Value, at 5.26.
Exhibit 9. Participant-level and average scores by construct
Construct Average
Perceived usefulness
5.00
Perceived ease of use
4.58
Perceived direct cost
6.00
Perceived value
5.26
Intention to adopt
5.17
Overall, these results indicate that participants felt that the Toolkit was useful, easy to
use, and valuable. They also appear prepared to make future use of the Toolkit, and
found its direct cost (free) very acceptable. Reliability was measured using Cronbach’s

Page 23 of 39
Alpha.39 The results, shown in Exhibit 10, demonstrate very high reliability (i.e., internal
consistency) for the instrument.39
Exhibit 10. Construct reliability
Perceived Usefulness
Perceived Ease of Use
Perceived Direct Cost**
Perceived Value
Intention to Adopt
Cronbach’s Alpha*
0.9652 0.9231 -- 0.9509 0.9231
Participants’ Training and Experience
One respondent had no previous experience conducting retrospective or prospective risk
assessments, nor had that respondent received any training in either approach. The other
two respondents were very experienced in root cause analysis (RCA), and both had
received at least 8 hours of training in the technique. Only one respondent had received
at least 8 hours of training in prospective risk assessment (PRA), and both of those with
previous risk assessment experience were less experienced in PRA than in RCA.
Qualitative Responses
In addition to the quantitatively-oriented questions above, participants were also asked to
provide qualitative feedback based on their experience of using the ARC Toolkit. Two
key themes emerged from the responses: 1) The implementation of the Toolkit as a Word
document was too cumbersome (This has been addressed by converting the Toolkit to an

Page 24 of 39
Excel spreadsheet). 2) The process of using the Toolkit creates insight that supports
effective action.
The implementation of the Toolkit as a Word document was too cumbersome. As
one participant wrote: “My only real negative is the bulkiness of the multiple pages and
scrolling back and forth.” This was echoed by a second participant, who said “The tool was
lengthy, and scrolling back and forth between pages sometimes made the process difficult to
follow.”
Asked how to improve the Toolkit, these participants suggested transferring it to an Excel-
based format, with the Toolkit components in separate tabs to improve the ease and speed of
use. These changes have been made in the latest version of the Toolkit, and user perception
studies of the revised Toolkit suggest that this has solved the problem.23
The process creates insight and supports effective action. The structured process
provided by the ARC Toolkit was seen as helpful, both in providing a high-level roadmap
for risk control practice, and in helping users in the practical task of developing high-
quality risk control recommendations. As one participant wrote: “What using the process
did for me was make a clear path of what needs to be completed to complete a prevention
program,” and “It identifies what really needs to be addressed, after talking through the
process we discovered that many of the issues were caused by the same source and they then
became easier to manage.”

Page 25 of 39
Another issues highlighted by users was the fact that the ARC Toolkit “shows the thought
process behind the recommendations,” which is a key way the Toolkit can support the
Communication and Consultation function of the PARC.21
Follow-up at 6 Months
Risk Control Implementation Status
The hospital’s risk manager was contacted at 6 months post-workshop to determine
whether the Toolkit’s outputs had proven useful in practice. Exhibit 11 provides an
overview of the implementation status for the recommended risk controls at 6 months.
As anticipated, given the purchasing policies of the hospital in question, many of the risk
controls that required purchasing decisions were in the product testing phase at this time.
Given that entry to this process represents a notable investment in itself, this status can be
seen as implying that these risk control recommendations were seen by management as
prima facie reasonable actions to take.

Page 26 of 39
Exhibit 11. Risk control implementation status at 6 months
Risk Control Complete Approved; not yet complete
Approval decision pending
Disapproved
Comprehensive set of policies and procedures
(Administrative)
X
Many components complete; some in progress
Substitute improved boots
(Elimination)
X
Product testing in progress
Eliminating diapers / briefs
(Elimination)
X
Modified: Investigating alternative: pull-up briefs (Elimination)
Better waffle cushions or gel pads
(Elimination)
X
Expected to move forward at a later date, pending completion of higher priority risk controls
Substitute Brand X mattress covers
(Elimination)
X
Easy access to supplies
(Design)
X
Moving forward, but slowly due to the need to negotiate with clinical

Page 27 of 39
managers at each location re: appropriate quantities, space for products
Nurse-initiated nutrition program
(Administrative)
X
Expected to move forward at a later date, pending completion of higher priority risk controls
Substitute better mattresses than the Brand Y
(Elimination)
X
Modified: Alternative design control implemented instead: New overlays being ordered for unit beds. Seen as cheaper and better for patients (Design)
Substitute gentler skin cleansers
(Elimination)
X
Well-received; increased usage; higher unit cost
New: Automated page or other cue to remind nurses that it’s time to turn patients
(Administrative)
X
Evaluating possibility
New: Purchase turning wedges
(Design)
X
Product testing in progress

Page 28 of 39
Two of the risk controls were modified; both were elimination controls. The first,
elimination of diapers / briefs, was changed to substitution of pull-up briefs (which
remains an elimination control by substitution of a different product). The second,
substituting better mattresses than the Brand Y, was changed to a design control: The
introduction of new overlays for these mattresses. This was seen as being both cheaper
and better for patients.
Action on the recommendations was largely consonant with the prioritization scheme set
up in the Options Evaluation step. The one exception was the substitution of better waffle
cushions or gel pads, which came to be seen as a lower priority because they pertain to
reducing pressure while patients are sitting in chairs, whereas most of the hospital’s
recent pressure ulcer cases were among bed-bound patients. Two additional risk control
recommendations were added in the intervening months, one administrative control (an
automated reminder that it is time to turn patients) and one design control (the purchase
of turning wedges, which may make it easier to turn patients and reduce shear during
turning).
In preparing the overview above, it became apparent that the hospital does not use a
centralized tracking system for managing risk control implementation and sustainment,
which made the task somewhat challenging.

Page 29 of 39
Risk Manager’s Assessments
Asked to assess the appropriateness of the risk controls recommended, the hospital’s risk
manager indicated that they were all appropriate, that they were “all things we need to
do.” In the risk manager’s assessment, although some of the risk controls would take
time to accomplish, the recommended risk controls would both make patients safer and
save money.
Because of a change in senior management personnel, very limited use was made of the
Options Analysis data in communicating with decision-makers and gaining approval for
the risk control recommendations. While the senior manager who had approved the study
(and through whom the hospital was recruited) expressed an interest in gaining insight
into the rationales underlying risk control recommendations, the new senior manager was
apparently less interested in the details, preferring a faster-paced approach based on
communication of a very brief summary and the recommendations.
The risk manager felt that the ARC Toolkit process went well and added value.
Transferring the Toolkit to an Excel spreadsheet-based format was likely, in the risk
manager’s estimation, to both improve usability and increase the likelihood that the
hospital would use the Toolkit again. As a practical issue, it was considered helpful to
have someone familiar with the Toolkit to guide users through the process for the first
time.

Page 30 of 39
The Pilot Study: Discussion
This pilot study represented the first full test of the ARC Toolkit, and the initial results
appear positive. Participants found the process useful and valuable, and the risk control
recommendations that resulted were far more robust than those produced through prior
prospective risk assessments. Just as importantly, they were seen as not only appropriate,
but also necessary, even six months after implementation efforts had begun. This is a
critical finding because an important risk was that, if the Options Analysis and Options
Evaluation processes were not effective, the Toolkit might result in theoretically robust
risk controls that were inappropriate to the risk at hand and/or un-implementable.
Quantitative survey results indicated a relatively positive view of the Toolkit’s ease of
use, but in qualitative feedback users highlighted the need for improved usability, in
terms of less scrolling back and forth between pages. This has been addressed by
converting the next iteration of the Toolkit from a Word-based approach to one based on
Excel spreadsheets.23 (This updated version of the ARC Toolkit is available for free at
www.activeriskcontrol.com) User-perception studies of the Excel-based Toolkit did not
elicit any negative feedback related to the new format.21
Overall, it appears that the Toolkit functioned well, and that its outputs were useful,
despite the change in senior management. A fast-paced, action-oriented management
style is common in healthcare, in line with a broader culture of ‘getting on with things.’40
In view of the endemic nature of this cultural issue, it is useful to see that the

Page 31 of 39
recommendations were well-received even in a managerial climate that did not fully
support the level of communication and collaboration called for by the PARC.21
Pilot Study: Limitations
Although the study results were very positive, it is worth noting that the study design
introduced several limitations.
Assessing the Proportion of Non-Administrative Controls
The most important limitation is the lack of an apples-to-apples comparison group for
assessing the impact of the Toolkit on the robustness of risk control recommendations.
Because each PRA assessed a different risk, included different participants, and occurred
at a different time, it is possible that the apparent improvement in the proportion of non-
administrative controls recommended is the result of something other than using the ARC
Toolkit. Further, even if the fact of the increase is due in large part to the use of the
Toolkit, the magnitude of improvement may vary based on the comparison group.
Additional research to validate this finding is ongoing.
That said, the proportion of non-administrative risk controls recommended in this study
was also much higher than the ~20% found in a systematic review of risk control after
root cause analysis in healthcare3 and echoed by a similar study in the field of
occupational health and safety.41 Additionally, anecdotal evidence suggests that run of
the mill RCAs and prospective risk assessments may result in far lower percentages of
non-administrative controls than an assessment of published RCAs might suggest.

Page 32 of 39
Finally, though it appears based on the 6 month follow-up that most of the recommended
risk controls will at least be implemented, it remains unclear whether all of them will be
sustained or what effect they will have on the outcome of interest (i.e., the incidence of
preventable hospital-acquired pressure ulcers).
Survey Results
While the survey responses were useful, particularly in suggesting the need for an Excel-
based version of the Toolkit, the low number of survey respondents limits the
generalizability of these results. However, setting aside the issue of file format, 4 user-
perception studies of the updated Excel-based version of the Toolkit resulted in broadly
similar findings.21 Finally, although the survey was anonymous, the fact that the
developer of the Toolkit served as the facilitator may also have influenced participants’
response.
Conclusion
This study provides the first evidence with which to evaluate the ARC Toolkit as a
whole, and thereby the operational impact of the PARC. Although the study design
imposed significant limitations on the generalizability of the data, the results of this pilot
study are strongly positive, and indicate that further research is clearly warranted. Use of
the Toolkit was associated with a very large increase in the proportion of non-
administrative risk controls recommended; all the recommended risk controls were seen
as appropriate and necessary, both at the time that they were recommended and 6 months
later; the 6 month follow-up also indicated good progress toward risk control
implementation; and overall user assessment of the Toolkit was positive.

Page 33 of 39
Additional research will be required to confirm the findings of this study, and to track the
outcomes in terms of risk control implementation, sustainment, and success. Work done
in the US Veterans Health Administration suggests that a non-monetary incentive
program may also help to improve the proportion of risk assessments that result in the
selection of at least one strong risk control option.42 It may be that combining this pull-
based approach with the push-based approach of the ARC Toolkit could improve the
value of both. In response to user feedback, the ARC Toolkit is now formatted as an
Excel spreadsheet, rather than a Word document.21
ACKNOWLEGDEMENT
The research was partly funded by the UK National Institute for Health Research (NIHR)
Collaboration for Leadership in Applied Health Research and Care East of England
(CLAHRC EoE) at Cambridge and Peterborough NHS Foundation Trust. The views
expressed are those of the author(s) and not necessarily those of the NHS, the NIHR, or
the Department of Health.
REFERENCES
1. ISO. ISO 31000: Risk management — Principles and guidelines on
implementation. Geneva; 2009.
2. ISO. ISO 31010: Risk management — Risk assessment techniques. Geneva; 2009.

Page 34 of 39
3. Card AJ, Ward J, Clarkson PJ. Successful risk assessment may not always lead to
successful risk control: A systematic literature review of risk control after root
cause analysis. J Healthc Risk Manag. 2012;31(3):6–12. doi:10.1002/jhrm.20090.
4. Woloshynowych M, Rogers S, Taylor-Adams S, Vincent C. The investigation and
analysis of critical incidents and adverse events in healthcare. Heal Technol
Assess. 2005;9(19):1–143, iii.
5. Taylor-Adams S, Vincent C. Systems analysis of clinical incidents: the London
protocol. Clin Risk. 2004;10(6):211–220.
6. Card AJ. A new tool for hazard analysis and force field analysis: The Lovebug
Diagram. Clin Risk. 2013;19(4-5):87–92. doi:10.1177/1356262213510855.
7. Serrat O. The five whys technique. Washington, DC; 2010:1–3. Available at:
http://digitalcommons.ilr.cornell.edu/intl/198/.
8. Burgmeier J. Failure mode and effect analysis: an application in reducing risk in
blood transfusion. Jt Comm J Qual Improv. 2002;28(6):331–9.
9. Card AJ, Ward JR, Clarkson PJ. Beyond FMEA: The structured what-if technique
(SWIFT). J Healthc Risk Manag. 2012;31(4):23–29.
10. Potts HW, Anderson JE, Colligan L, Leach P, Davis S, Berman J. Assessing the
validity of prospective hazard analysis methods: a comparison of two techniques.
BMC Health Serv Res. 2014;14(1):41. doi:10.1186/1472-6963-14-41.
11. Hyman WA, Johnson E. Fault tree analysis of clinical alarms. J Clin Eng.
2008;33(2):85–94.
12. Ekaette E, Lee RC, Cooke DL, Iftody S, Craighead P. Probabilistic Fault Tree
Analysis of a Radiation Treatment System. Risk Anal. 2007;27(6):1395–1410.

Page 35 of 39
13. Wreathall J, Nemeth C. Assessing risk: The role of probabilistic risk assessment
(PRA) in patient safety improvement. Qual Saf Health Care. 2004;13(3):206–212.
14. Bagian JP, Gosbee J, Lee CZ, Williams L, McKnight SD, Mannos DM. The
Veterans Affairs root cause analysis system in action. Jt Comm J Qual Improv.
2002;28(10):531–545.
15. Saari H. Risk management in drug development projects. Helsinki: Helsinki
University of Technology Laboratory of Industrial Management; 2004:41.
16. Card AJ, Ward JR, Clarkson PJ. Trust-Level Risk Evaluation and Risk Control
Guidance in the NHS East of England. Risk Anal. 2014;34(8):1471–1481 [epub
ahead of print 2013]. Available at: http://doi.wiley.com/10.1111/risa.12159.
Accessed December 17, 2013.
17. Dul J, Bruder R, Buckle P, et al. A strategy for human factors/ergonomics:
developing the discipline and profession. Ergonomics. 2012;55(4):377–95.
18. Engineering Accreditation Commission. Criteria for accrediting engineering
programs. Baltimore, MD; 2011.
19. Engineering Professors Council. The EPC Engineering Graduate Output
Standard: Interim Report of the EPC Output Standards Project. Godalming, UK;
2000.
20. Landrigan CP, Parry GJ, Bones CB, Hackbarth AD, Goldmann DA, Sharek PJ.
Temporal Trends in Rates of Patient Harm Resulting from Medical Care. N Engl J
Med. 2010;363(22):2124–2134. doi:10.1056/NEJMsa1004404.
21. Card AJ, Ward JR, Clarkson PJ. Rebalancing Risk Management -Part 1: The
Process for Active Risk Control (PARC). J Healthc Risk Manag. 2014;34(2):21–
30.

Page 36 of 39
22. Card AJ. The Active Risk Control (ARC) Toolkit. 1st ed. Davenport, FL: Evidence-
Based Health Solutions, LLC; 2011:1–83.
23. Card AJ. The Active Risk Control (ARC) Toolkit: A New Approach to Designing
Risk Control Interventions. J Healthc Risk Manag. 2014;33(4):5–14.
24. Card AJ, Ward JR, Clarkson PJ. Generating Options for Active Risk Control (GO-
ARC): Introducing a Novel Technique. J Healthc Qual. 2013;00(00):[Epub ahead
of print]. doi:10.1111/jhq.12017.
25. Card AJ, Simsekler MCE, Clark M, Ward JR, Clarkson PJ. Use of the Generating
Options for Active Risk Control (GO-ARC) Technique Can Lead to More Robust
Risk Control Options. Int J Risk Saf Med. 2014;26(4):199–211. doi:10.3233/JRS-
140636.
26. Kletz T. HAZOP and HAZAN. 4th ed. Rugby, UK: Institution of Chemical
Engineers; 2006.
27. Hollnagel E, Braithwaite J, Wears RL, eds. Resilient Health Care. Ashgate
Publishing; 2013.
28. Habraken M, van der Schaaf T. If only....: failed, missed and absent error recovery
opportunities in medication errors. Qual Saf Health Care. 2010;19(1):37–41.
doi:10.1136/qshc.2007.026187.
29. Lyndon A. Skillful Anticipation: Maternity Nurses’ Perspectives on Maintaining
Safety. Qual Saf Healthc. 2010;19(5):e8. doi:10.1136/qshc.2007.024547.
30. Shekelle P, Pronovost P, et al. Advancing the Science of Patient Safety. Ann Intern
Med. 2011;154(10):693–6.
31. Manuele FA. c. Prof Saf. 2005;50(5):33–39.
Page 37 of 39
32. Baulcomb J. Management of change through force field analysis. J Nurs Manag.
2003;11(4):275–280.
33. causaScientia. A Bayesian caluclator. Available at:
http://www.causascientia.org/math_stat/ProportionCI.html#Technical Details.
34. Davis FD. Perceived Usefulness, Perceived Ease of Use, and User Acceptance of
Information Technology. Manag Inf Syst. 1989;13(3):319–340.
35. Davis F, Bagozzi R. User acceptance of computer technology: a comparison of
two theoretical models. Manage Sci. 1989;35(8):982–1003.
36. Lin T, Lee C. Determinants of Enterprise 2.0 Adoption: A Value-based Adoption
Model Approach. In: Information Society (i-Society), 2010. London: IEEE;
2010:12–18.
37. Kim H-W, Chan HC, Gupta S. Value-based Adoption of Mobile Internet: An
empirical investigation. Decis Support Syst. 2007;43(1):111–126.
doi:10.1016/j.dss.2005.05.009.
38. Chang T, Hsiao W. Consumers’ automotive purchase decisions: The significance
of vehicle-based infotainment systems. African J Bus. 2011;5(11):4152–4163.
39. Tavakol M, Dennick R. Making sense of Cronbach’s alpha. Int J Med Educ.
2011;2:53–55. doi:10.5116/ijme.4dfb.8dfd.
40. Dixon-Woods M. Why is patient safety so hard? A selective review of
ethnographic studies. J Health Serv Res Policy. 2010;15 Suppl 1(January):11–6.
doi:10.1258/jhsrp.2009.009041.
41. Amyotte P. An analysis of CSB investigation reports concerning the hierarchy of
controls. Process Saf Prog. 2011;30(3):261–265. doi:10.1002/prs.

Page 38 of 39
42. Bagian JP, King BJ, Mills PD, Mcknight SD. Improving RCA performance: the
Cornerstone Award and the power of positive reinforcement. BMJ Qual Saf.
2011;20(11):974–82. doi:10.1136/bmjqs.2010.049585.
You might also be interested in these papers on related topics
The Active Risk Control (ARC) Toolkit and its Components
Card AJ, Ward JR, & Clarkson PJ. Rebalancing Risk Management –Part 1: The Process for Active Risk
Control (PARC). Journal of Healthcare Risk Management. 2014;34(2):21–30. Available from:
https://www.academia.edu/7992857/Rebalancing_Risk_Management_-
Part_1_The_Process_for_Active_Risk_Control_PARC_
Card AJ. The Active Risk Control (ARC) Toolkit: A New Approach to Designing Risk Control
Interventions. Journal of Healthcare Risk Management. 2014;33(4):5–14. Available from:
http://www.academia.edu/7094246/The_Active_Risk_Control_ARC_Toolkit_A_New_Approach_t
o_Designing_Risk_Control_Interventions
Card AJ. The Active Risk Control (ARC) Toolkit. Evidence-Based Health Solutions, LLC. Available from:
www.activeriskcontrol.com/tools-and-templates
Card AJ, Ward JR, Clarkson PJ. Generating Options for Active Risk Control (GO-ARC): Introducing a
Novel Technique. J Healthc Qual 2013;00:[Epub ahead of print]. Available from:
http://www.academia.edu/3377753/Generating_Options_for_Active_Risk_Control_GO-
ARC_Introducing_a_Novel_Technique
Card AJ, Simsekler MCE, Clark M, Ward JR, Clarkson PJ. Use of the Generating Options for Active Risk
Control (GO-ARC) Technique Can Lead to More Robust Risk Control Options. Int J Risk Saf Med
2014;26(4):199–211. Available from:
http://academia.edu/8744500/Use_of_the_Generating_Options_for_Active_Risk_Control_GO-
ARC_Technique_Can_Lead_to_More_Robust_Risk_Control_Options

Page 39 of 39
Shortfalls in current risk control practice
Card AJ, Ward J, Clarkson PJ. Successful risk assessment may not always lead to successful risk control: A
systematic literature review of risk control after root cause analysis. J Healthc Risk Manag
2012;31(3):6–12. Available from:
https://www.academia.edu/1081937/Successful_Risk_Assessment_May_Not_Always_Lead_To_S
uccessful_Risk_Control_A_Systematic_Literature_Review_of_Risk_Control_after_Root_Cause_A
nalysis
Card AJ, Ward JR, Clarkson PJ. Trust-Level Risk Evaluation and Risk Control Guidance in the NHS East
of England. Risk Anal 2014;34(8):1471–81. [Epub ahead of print: Dec 2013]. Available from:
http://www.academia.edu/5165441/Trust-
Level_Risk_Evaluation_and_Risk_Control_Guidance_in_the_NHS_East_of_England
Advancing the Field of Healthcare Risk Management
Card AJ, Ward JR, Clarkson PJ. Getting to Zero: Evidence-based healthcare risk management is key. J
Healthc Risk Manag 2012;32(2):20–7. Available from:
http://www.academia.edu/1952946/Getting_to_Zero_Evidence-
based_healthcare_risk_management_is_key
Card AJ. Patient Safety: This is Public Health. J Healthc Risk Manag 2014;34(1):6–12. Available from: http://www.academia.edu/6920019/Patient_Safety_This_is_Public_Health