READING SUFFICIENCY ACT STUDY
88
READING SUFFICIENCY ACT STUDY PREPARED BY OKLAHOMA STATE DEPARTMENT OF EDUCATION 2019 2020 SCHOOL YEAR In fulfillment of Section 1210.508C of Title 70 of the Oklahoma Statutes. This study provides data on third grade reading achievement by socio-economic status, learning disability status, English learner status and race. It also provides evidence on reading instructional practices and remediation efforts currently being used by districts in Oklahoma and explores the potential efficacy of these practices.
-
Upload
khangminh22 -
Category
Documents
-
view
3 -
download
0
Transcript of READING SUFFICIENCY ACT STUDY

READING SUFFICIENCY ACT STUDYPREPARED BY OKLAHOMA STATE DEPARTMENT OF EDUCATION2019 ! 2020 SCHOOL YEAR
In fulfillment of Section 1210.508C of Title 70 of the Oklahoma Statutes. This study provides data on third grade reading achievement by socio-economic status, learning disability status, English learner status and race. It also provides evidence on reading instructional practices and remediation efforts currently being used by districts in Oklahoma and explores the potential efficacy of these practices.

2020 READING SUFFICIENCY ACT STUDY | Oklahoma State Department of Education 1
TABLE OF CONTENTS EXECUTIVE SUMMARY .................................................................................................................... 3
PURPOSE OF ANNUAL REPORT ....................................................................................................... 4
HISTORY .......................................................................................................................................... 4
RESEARCH QUESTIONS ................................................................................................................... 7
METHODOLOGY .............................................................................................................................. 8
DATA SOURCES ............................................................................................................................... 9
SURVEY RESULTS .......................................................................................................................................... 9
RESULTS ........................................................................................................................................ 10
DISTRICT DATA RESULTS .............................................................................................................................. 10 Students At Risk for Reading Difficulties at the Beginning of the Year ............................................... 10 Students At Risk for Reading Difficulties at the End of the Year ......................................................... 14 Reading Plan Completion ................................................................................................................... 18 Conclusions from District Data ........................................................................................................... 23
PERFORMANCE ON STATE READING EXAMINATION ........................................................................................... 24 Oklahoma State Testing Program (OSTP) Data .................................................................................. 24 Conclusions from OSTP Data .............................................................................................................. 29
PROMOTION AND RETENTION ....................................................................................................................... 30 LONG TERM EFFECTS OF THE READING SUFFICIENCY ACT ................................................................................... 33
FUNDING FOR READING REMEDIATION ....................................................................................... 39
ASSESSMENTS USED TO IDENTIFY READING DEFICIENCIES AND MONITOR READING PROGRESS ...................................................................................................................................................... 61
INSTRUCTIONAL PRACTICES AND REMEDIATION EFFORTS USED BY DISTRICTS .......................... 63
RESOURCES AVAILABLE OUTSIDE OF SCHOOL ............................................................................. 69
WHAT THE RESEARCH LITERATURE IDENTIFIES AS BEST PRACTICES FOR STUDENTS NOT READING ON GRADE LEVEL .......................................................................................................... 70
MULTI-TIERED SYSTEM OF SUPPORT (MTSS) .................................................................................................. 75
LIMITATIONS ................................................................................................................................ 76
CONCLUSION ................................................................................................................................ 77
WORKS REFERENCED .................................................................................................................... 79

2020 READING SUFFICIENCY ACT STUDY | Oklahoma State Department of Education 2
FIGURE 1. STUDENTS AT-RISK BEGINNING OF YEAR COMPARED TO TOTAL ENROLLMENT ................................. 11
FIGURE 2. BEGINNING-OF-YEAR COHORT TRENDS .................................................................................... 13
FIGURE 3. STUDENTS REMAINING AT-RISK AT END OF YEAR ....................................................................... 16
FIGURE 4. END-OF-YEAR COHORT TRENDS ............................................................................................. 17
FIGURE 5. READING PLAN COMPLETION ................................................................................................. 19
FIGURE 6. READING PLAN COMPLETION COHORT TRENDS .......................................................................... 21
FIGURE 7. STUDENTS AT-RISK BEGINNING VERSUS END OF YEAR ................................................................ 22
FIGURE 8. FUNDING FOR READING SUFFICIENCY ....................................................................................... 41
FIGURE 9. SCREENING ASSESSMENTS USED IN 2019-20 ........................................................................... 62
FIGURE 10. INSTRUCTIONAL PRACTICES USED FOR CORE INSTRUCTION ......................................................... 64
FIGURE 11. INTERVENTION PRACTICES FOR GRADES K-3 ........................................................................... 66
FIGURE 12. INTERVENTION PRACTICES AFTER THIRD GRADE ....................................................................... 68
FIGURE 13. STUDENT ACCESS TO RESOURCES OUTSIDE OF SCHOOL ............................................................. 69
FIGURE 14. MULTI-TIERED SYSTEM OF SUPPORT (MTSS) MODEL .............................................................. 75
2020 READING SUFFICIENCY ACT STUDY | Oklahoma State Department of Education 2
TABLE 1. HISTORICAL CHANGES TO THE READING SUFFICIENCY ACT ............................................................... 5
TABLE 2. STUDENTS AT-RISK BEGINNING OF YEAR ................................................................................... 11
TABLE 3. STUDENTS REMAINING AT-RISK AT END OF YEAR ........................................................................ 15
TABLE 4. READING PLAN COMPLETION .................................................................................................. 19
TABLE 5. STUDENTS AT-RISK BEGINNING VERSUS END OF YEAR .................................................................. 22
TABLE 6. 2017 OSTP RESULTS ............................................................................................................ 25
TABLE 7. 2018 OSTP RESULTS ............................................................................................................ 26
TABLE 8. 2019 OSTP RESULTS ............................................................................................................ 28
TABLE 9. PROMOTION PATHWAYS AND RETENTION DECISIONS ................................................................... 31
TABLE 10. GOOD-CAUSE EXEMPTION PROMOTIONS ................................................................................. 33
TABLE 11. PROMOTION DECISIONS FOR STUDENTS WITH AN INDIVIDUALIZED EDUCATIONAL PROGRAM (IEP) ...... 34
TABLE 12. PROMOTION DECISIONS FOR STUDENTS WHO ARE ENGLISH LEARNERS ........................................... 35
TABLE 13. PROMOTION DECISIONS FOR ECONOMICALLY DISADVANTAGED STUDENTS ..................................... 36
TABLE 14. PROMOTION DECISIONS BY RACE/ETHNICITY ............................................................................ 38
TABLE 15. RSA FUNDING APPROPRIATED TO EACH DISTRICT ..................................................................... 42
TABLE 16. SCREENING ASSESSMENTS APPROVED FOR 2019-20 ................................................................. 61

2020 READING SUFFICIENCY ACT STUDY | Oklahoma State Department of Education 3
EXECUTIVE SUMMARY With school closures in March 2020 and the suspension of the Oklahoma State Testing Program (OSTP) due to the global pandemic, schools have faced many challenges enacting the Reading Sufficiency Act in the 2019-20 school year. Additionally, schools were faced with the challenge of distance learning in the spring along with the suspension of many summer reading programs.
Distance learning was addressed in various ways in schools across the state. Some districts had access to technology for all students along with broadband Internet access, while other districts relied on paper packets picked up by families at schools.
In addition, students who required various levels of supplemental instruction or intervention prior to the pandemic either did not receive those interventions due to lack of resources or received modified interventions based on what schools were able to provide. Often, these modified interventions were not as robust as the in-person instruction students received prior to shifting to distance learning.
While some data traditionally depicted in the annual report are missing from the report this year, the data available provides a picture of the progress and areas for growth still needed to support all students in becoming proficient readers by the end of grade three. Trends in data collected at the school-level over the last four years remains somewhat flat. However, Oklahoma continues to see improvement from the beginning-of-year to the end-of-year data at a consistent rate that demonstrates effectiveness of interventions and supplemental instruction in many schools.
Achievement gaps between students who are on an individualized education program (IEP) or students who are identified for English Learner (EL) services and their peers not receiving those specialized services continue to exist. There are also continuing achievement gaps for students who identified as Black or Hispanic when compared to their peers.
As schools consider how to best move forward from the challenges of the pandemic, the need for teachers well-trained in effective early literacy instruction, along with high-quality instructional materials in every classroom becomes critical. Evidence-based literacy practices grounded in the cognitive science of how students learn to read are gaining increasing traction, and with their spread there is an opportunity for positive change in Oklahoma’s early literacy achievement.

2020 READING SUFFICIENCY ACT STUDY | Oklahoma State Department of Education 4
PURPOSE OF ANNUAL REPORT Section 1210.508C of Title 70 of the Oklahoma Statutes requires that the State Department of Education (SDE) conduct a study on reading instruction and the retention of students in the third grade based on reading assessments.
The purpose of the study is to identify trends in assessment data for students in kindergarten through third grade, as well as trends in promotion and retention decisions for third-grade students. Through this report, data is also collected on the instructional practices utilized by schools and the research literature regarding the effectiveness of those practices is discussed.
HISTORY The Reading Sufficiency Act (RSA) was originally passed in 1997 to improve Oklahoma children’s reading skills before the end of third grade. The law required that all kindergarten through third-grade students be assessed1 at the beginning and end of each school year for the acquisition of reading skills. In 2012,2 the law was amended to require that beginning in the 2013-2014 school year, third-grade students show proficiency on grade-level reading skills or meet one of the good-cause exemptions3 to be promoted to fourth grade. In 2014, HB 2625 was passed with emergency status, going into effect for the 2013-2014 academic year. This allowed a “probationary promotion” for third-graders through the recommendation of a Student Reading Proficiency Team (SRPT), a partnership of the student’s parents and educators. The SRPT was made permanent in 2017 with the passage of HB 1760.4 In 2019, SB 601 was passed and adjusted some of the good-cause exemption requirements, added a mid-year screening assessment for kindergarten through third-grade students, and clarified language around the expectations for kindergarten students.5 These changes are reflected in Table 1.
1 See K-3 Screening and Assessments (70 O.S.§1210.508C (A-B)) 2 See Retention - No Social Promotion (70 O.S.§1210.508C (I.3)(K) 3 See Good Cause Exemptions (70 O.S. § 1210.508C (L)) 4 See Probationary Promotion (70 O.S. § 1210.508C (I)(5)) 5 See K-3 Screening and Assessments (70 O.S.§1210.508C (A)(3))

2020 READING SUFFICIENCY ACT STUDY | Oklahoma State Department of Education 5
TABLE 1. HISTORICAL CHANGES TO THE READING SUFFICIENCY ACT
Academic Year Changes
2013-2014 HB 2625
• Introduced Student Reading Proficiency Team (SRPT) to allow for probationary promotion
• SRPT established to consist of third-grade teacher, fourth-grade teacher, parent/guardian of student, principal, and certified reading specialist
• Allowed students in first, second and third grades to show proficiency through one of the state-approved screening assessments
2013-2014 HB 2497
• Added prekindergarten retention as a qualifier for good-cause exemptions 5 and 6
2015-2016 SB 630
• SRPT amended to consist of third-grade teacher, fourth-grade teacher, parent/guardian of student, and certified reading specialist
• Established RSA criteria based on Standards 2 and 4 of third-grade assessment to determine eligibility for automatic promotion
• Added good-cause exemption 7 for emergency situations
2016-2017 HB 1760
• SRPT made permanent
• SRPT amended to include reading specialist only if one is available
• Oklahoma State Testing Program (OSTP) revised to align to new Oklahoma Academic Standards for English Language Arts
2018-2019 SB 601
• Kindergarten students not meeting grade-level targets by the middle of the year would have a reading plan for support
• Required mid-year screening assessment for all kindergarten through third-grade students
• Eliminated the requirement that students on an Individualized Education Program (IEP) be retained once before qualifying for good-cause exemption 5.
• Adjusted good-cause exemption 6 to apply to students who had been previously retained one year (instead of two years)
• Clarified process for students transitioning to middle school who were promoted with probation

2020 READING SUFFICIENCY ACT STUDY | Oklahoma State Department of Education 6
The ultimate goal of reading is for students to make meaning of text. Foundational skills, such as oral language, phonemic awareness, and phonics, are taught primarily in kindergarten through second grade then reinforced in third grade. While students must have a solid foundation in these skills, reading does not stop there. Students must also learn and apply vocabulary and comprehension skills at the same time. Reading is an extremely complex act that requires students to work on multiple skills in tandem. If any of those skills are not developed, the student cannot become a successful reader. The purpose of the RSA is to identify where students may have reading difficulties and intervene to ensure they become proficient readers. As such, the Reading Sufficiency Act (RSA) follows the Multi-Tiered Systems of Support (MTSS) model.
Third grade is the transition year in which students apply the foundational skills they have been learning in the early grades to focus on more critical analysis and understanding of text. Current legislation mandates that the initial determinant in assessing a third-grader’s reading proficiency is the student’s score on the reading portion of the Oklahoma School Testing Program (OSTP), although it is not the only one. There are multiple pathways for a student to be promoted to fourth grade.
• Pathway 1: Meet RSA criteria on the reading and vocabulary portions of the OSTP;6
• Pathway 2: Demonstrate reading proficiency through one of the approved screening assessments;7
• Pathway 3: Meet the requirements for one of the seven good-cause exemptions;8 and
• Pathway 4: Obtain a unanimous decision by the Student Reading Proficiency Team (SRPT) to be promoted with probation.9
If a student does not demonstrate sufficient ability with foundational reading skills to meet the qualifications for any of the four pathways, the student must be retained.
The 2019-20 school year presented unique challenges. Due to a worldwide pandemic, schools across the state moved to distance learning in mid-March for the remainder of the school year. Due to health concerns with in-person assessment, both the Oklahoma State Testing Program (OSTP) and the end-of-year screening assessment for the Reading Sufficiency Act were suspended. Without the OSTP, schools were requested to make promotion or retention decisions for all third-grade students based on screening assessment data or school work completed prior to March. There were over 204,400 kindergarten through third-grade students in the 2019-20 school year, all of which were supported by provisions of the Reading Sufficiency Act. This report provides an analysis
6 See Third Grade Reading Proficiency (70 O.S.§1210.508C (I)(4)) 7 See Third Grade Reading Proficiency (70 O.S.§1210.508C (I)(1)) 8 See Good Cause Exemptions (70 O.S. § 1210.508C (L)) 9 See Probationary Promotion (70 O.S. § 1210.508C (I)(5))

2020 READING SUFFICIENCY ACT STUDY | Oklahoma State Department of Education 7
of assessment data collected by schools in 2019-20 school year and showcases trends in assessment data over the past four years.
RESEARCH QUESTIONS This annual study is tasked with researching the questions listed below. However, due to the circumstances created by the global pandemic in the spring of 2020, some data were not able to be collected. In those instances, information from previous years that address that question and an explanation for the missing data has been included.
1. How many students (number and percent) in kindergarten through third grade have been determined as at-risk for reading difficulties as compared to the total number of students enrolled in each grade?
2. How many students (number and percent) in kindergarten through third grade continue to be at risk for reading difficulties by the end of the academic year, as determined by the year-end measurement of reading progress?
3. How many students (number and percent) in kindergarten through third grade have successfully completed their program of reading instruction and are reading on grade level as determined by the results of approved reading assessments?
4. How many third-grade students (number and percent) met the performance criteria for the RSA as determined by the Commission for Educational Quality and Accountability on the reading portion of the statewide third-grade assessment?
5. How many third-grade students participated in the Oklahoma State Testing Program (OSTP) and, of that number, how many met proficiency on a screening instrument, how many were promoted through each of the good-cause exemptions, how many were retained, and how many were promoted through probationary promotion?
6. How does reading proficiency vary by socio-economic status, learning disability status, English learner (EL) status and race?
7. What funding was appropriated to each district for reading remediation? 8. What screening instruments are being used to identify reading deficiencies and
monitor reading progress? 9. What types of reading instructional practices, instructional methods and
remediation efforts are currently being used by districts? 10. What types of reading resources do students have access to outside of school? 11. Of the identified instructional practices, instructional methods and remediation
efforts, which ones have been identified as best practices in the research literature for students not reading on grade level?

2020 READING SUFFICIENCY ACT STUDY | Oklahoma State Department of Education 8
METHODOLOGY To answer question 1, data from the beginning of year (BOY) district reports were used. Data from the end of year (EOY) district reports are traditionally used to answer questions 2 and 3. Due to school districts across the state moving to distance learning in the spring of 2020, however, this data was not collected. These reports are completed by districts to provide information on the number of students at risk for reading deficiencies and the number of students completing reading intervention plans.
Because of the pandemic, the Oklahoma State Testing Program (OSTP) was waived for the spring of 2020. The data from the OSTP are traditionally used to address questions 4 and 6. Without this data, these questions cannot be addressed for the 2019-20 report.
To answer questions 5 and 6, data from the Third-Grade Promotion Retention report was used. This report is completed by districts and contains data on the number of students who did not meet criteria and which promotion or retention decision was made for those students. Districts also identify which good-cause exemption was met for those students promoted through exemption. In addition, descriptive statistics on reading proficiency and retention by socio-economic status, learning disability status, English learner (EL) status, and race were calculated using promotion and retention decisions along with demographic data. The purpose of this is to better understand the demographic composition of students who are not reading at grade-level and who are retained.
To answer research question 7, RSA funding by district was reported.
To address question 8, data from the Annual District Reading Plan and RSA Beginning of Year report were used.
To answer research questions 9 and 10, school and district leaders were surveyed on instructional practices, instructional methods, remediation, and reading resource access. The survey data were aggregated to the district level to identify instructional practices, instructional methods, remediation efforts, and reading resource access available at each district.
To answer research question 11, Oklahoma reading experts reviewed and summarized peer-reviewed evidence on the instructional practices, instructional methods, remediation efforts, and reading resources teachers in Oklahoma reported using.

2020 READING SUFFICIENCY ACT STUDY | Oklahoma State Department of Education 9
DATA SOURCES This study used data from the following sources:
• Beginning of Year Reading Report • Third-Grade Promotion and Retention Report • RSA district funding data • State-developed survey on instructional practices, instructional methods,
remediation efforts and reading resource access • Student information data • Literature on instructional practices, instructional methods, remediation efforts,
and reading resources.
Any student data contained in the report was reported only in the aggregate so that individual students could not be identified, with the exception of promotion and retention decisions for third grade students who did not meet RSA criteria on the state test. In this case, districts were asked to report the final retention decision, as well as the method that was used for a student who was promoted.
SURVEY RESULTS To gather information on reading instruction, a survey was sent to district personnel, administrators, and teachers who work with kindergarten through third-grade students. The link to the survey was sent via electronic newsletters in early December, and was available for two weeks. Reminders were sent out through newsletters twice within that window. In total, 2,305 educators and administrators completed the survey. The respondents represented 96% of the counties in Oklahoma and 359 (68%) of 530 school districts. A variety of roles and positions were represented, including 1,381 (58%) classroom teachers, 337 (14%) academic support (e.g., special education, English learner, speech language pathologists) teachers, 26 (1%) superintendents, 256 (11%) building administrators, 228 (10%) reading specialists or instructional coaches, and 52 (2%) district personnel.

2020 READING SUFFICIENCY ACT STUDY | Oklahoma State Department of Education 10
RESULTS
DISTRICT DATA RESULTS Districts must use one of the screening instruments10 approved by the Oklahoma State Board of Education to assess all kindergarten through third-grade students. In the 2019-20 school year, there were seven screening instruments approved for use. This was a reduction from the previous list of fifteen approved assessments. Screening instruments are used to determine potential reading difficulties at the beginning of the year and again at the end of the year to determine growth. As districts identify students who need additional support, those students are placed on an Academic Progress Plan (APP)11 outlining the additional reading intervention that will be provided for that student. Districts report the number of students who need intervention to the Oklahoma State Department of Education. Numbers are reported in aggregate and identify the number of kindergarten through third-grade students who were assessed, the number of students placed on an APP at the beginning of the year, the number of students still on an APP at the end of the year, and the number of students who successfully completed their APPs.
STUDENTS AT RISK FOR READING DIFFICULTIES AT THE BEGINNING OF THE YEAR This section addresses the question, How many students (number and percent) in
kindergarten through third grade have been determined as at-risk for reading difficulties
as compared to the total number of students enrolled in each grade?
The following table showcases the percent of students who are identified as at-risk of not achieving reading proficiency as determined by a beginning-of-year screening assessment administered within the first few weeks of the school year. The data provided does not indicate the progress made in that grade level throughout the year.
10 See K-3 Screening and Assessments (70 O.S.§1210.508C (D)) 11 See Program of Reading Instruction (70 O.S.§1210.508C (E-F))
2020 READING SUFFICIENCY ACT STUDY | Oklahoma State Department of Education 11
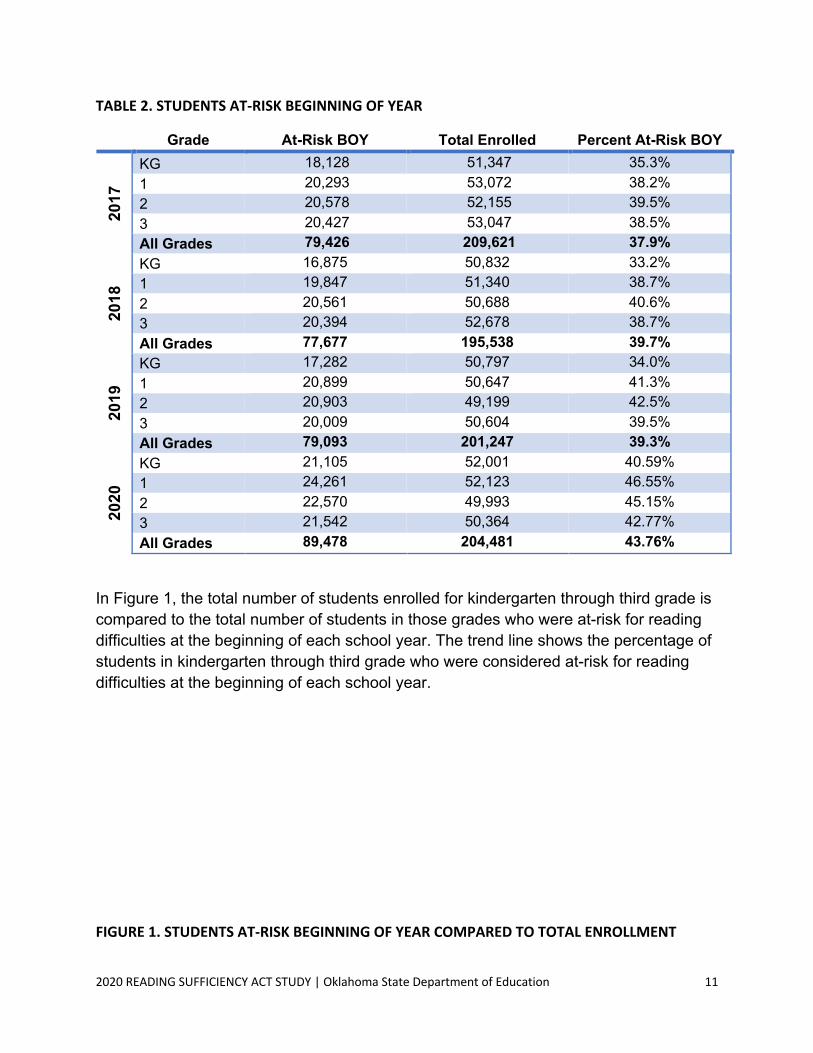
TABLE 2. STUDENTS AT-RISK BEGINNING OF YEAR
Grade At-Risk BOY Total Enrolled Percent At-Risk BOY
2017
KG 18,128 51,347 35.3% 1 20,293 53,072 38.2% 2 20,578 52,155 39.5% 3 20,427 53,047 38.5% All Grades 79,426 209,621 37.9%
2018
KG 16,875 50,832 33.2% 1 19,847 51,340 38.7% 2 20,561 50,688 40.6% 3 20,394 52,678 38.7% All Grades 77,677 195,538 39.7%
2019
KG 17,282 50,797 34.0% 1 20,899 50,647 41.3% 2 20,903 49,199 42.5% 3 20,009 50,604 39.5% All Grades 79,093 201,247 39.3%
2020
KG 21,105 52,001 40.59% 1 24,261 52,123 46.55% 2 22,570 49,993 45.15% 3 21,542 50,364 42.77% All Grades 89,478 204,481 43.76%
In Figure 1, the total number of students enrolled for kindergarten through third grade is compared to the total number of students in those grades who were at-risk for reading difficulties at the beginning of each school year. The trend line shows the percentage of students in kindergarten through third grade who were considered at-risk for reading difficulties at the beginning of each school year.
FIGURE 1. STUDENTS AT-RISK BEGINNING OF YEAR COMPARED TO TOTAL ENROLLMENT

2020 READING SUFFICIENCY ACT STUDY | Oklahoma State Department of Education 12
When looking at the beginning-of-year data over the last four years in Table 2 and Figure 1, the average percentage of kindergarten through third-grade students who have been identified as having reading difficulties at the beginning of the school year has increased from 37.9% in 2017 to 43.8% in 2020, with the largest percent of increase occurring in the 2019-20 school year. Grade one reflects the largest increase in students identified as not meeting proficiency benchmarks at the beginning of the school year and grade three shows the smallest increase over the four-year period. Students tend to have the most growth in reading proficiency skills in grade one, as they learn to apply sounds to print so they can decode words with increasingly difficult spelling patterns.
There were several factors that likely impacted the RSA assessment data in the 2019-20 school year. The 2019-20 school year represented the first-year districts selected screeners from the revised list of approved screening assessments determined by the Oklahoma State Board of Education in 2019. As a result, 527 (57%) elementary sites utilized new screening assessment tools, ensuring all districts were utilizing evidence-based screening assessments strongly aligned to the Oklahoma Academic Standards. With the revised list of approved screening instruments, districts were provided more direct guidance to define grade-level targets for reading proficiency. While this guidance provided greater consistency with grade-level proficiency expectations across the state, it did cause some districts to see an increase or decrease in the number of students reported as at-risk for reading difficulties from previous screener usage. Finally, as a result of changes in SB 601, it became a standard expectation that kindergarten students would be assessed at the three times a year and placed on a reading plan if
2020 READING SUFFICIENCY ACT STUDY | Oklahoma State Department of Education 13
the student had not met grade-level targets by the middle of the year. In several cases, districts had not previously identified kindergarten students as at-risk for reading difficulties and now added these students to their data reports.
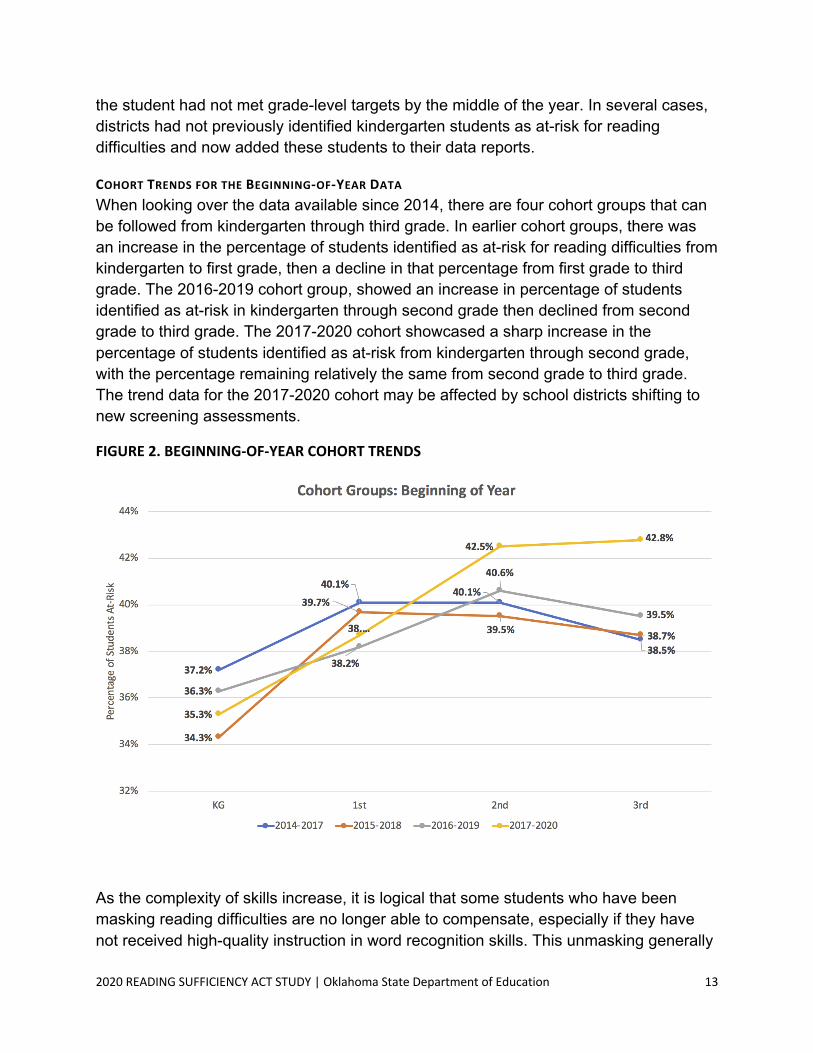
COHORT TRENDS FOR THE BEGINNING-OF-YEAR DATA When looking over the data available since 2014, there are four cohort groups that can be followed from kindergarten through third grade. In earlier cohort groups, there was an increase in the percentage of students identified as at-risk for reading difficulties from kindergarten to first grade, then a decline in that percentage from first grade to third grade. The 2016-2019 cohort group, showed an increase in percentage of students identified as at-risk in kindergarten through second grade then declined from second grade to third grade. The 2017-2020 cohort showcased a sharp increase in the percentage of students identified as at-risk from kindergarten through second grade, with the percentage remaining relatively the same from second grade to third grade. The trend data for the 2017-2020 cohort may be affected by school districts shifting to new screening assessments.
FIGURE 2. BEGINNING-OF-YEAR COHORT TRENDS
As the complexity of skills increase, it is logical that some students who have been masking reading difficulties are no longer able to compensate, especially if they have not received high-quality instruction in word recognition skills. This unmasking generally

2020 READING SUFFICIENCY ACT STUDY | Oklahoma State Department of Education 14
occurs around second grade, as curriculum moves from single-syllable words to longer words with more complex patterns. Students who have been getting by with basic skills in kindergarten and first grade have more difficulty with reading skills as both the curriculum and the text become more difficult. It has also been noted that many second- and third-grade teachers are shifting a majority of instructional focus to comprehension skills, often greatly reducing instruction for word recognition skills when students still need frequent instruction and practice with these skills. Making certain that all elementary teachers, beginning with the youngest grades, are well-prepared to teach foundational reading skills, using evidence-based instructional practices, is critical to ensuring that fewer students are identified with reading difficulties.
The Reading Sufficiency Act follows a Multi-Tiered Systems of Support model (MTSS). Such models,12 indicate that a healthy and effective system for early literacy exists when 20% or fewer of the students in the system are identified as at-risk for reading difficulties. Oklahoma RSA data indicates that double that percentage of students are identified as at-risk consistently since the 2016-2017 school year. Remediation or intervention services are costly and often have undesirable opportunity costs, such as missing instruction in other content areas. While these services are sometimes necessary, schools are struggling to find the personnel and resources to support intervention efforts for such a high percentage of students. The most efficient and effective way to address the high percentage of students identifying as at-risk of reading difficulties is through strong core instruction. Ensuring that schools have well-trained teachers with access to high-quality curriculum materials aligned to evidence-based instruction in every elementary classroom will be critical in the years moving forward from the pandemic.
STUDENTS AT RISK FOR READING DIFFICULTIES AT THE END OF THE YEAR This section addresses the question, How many students (number and percent) in
kindergarten through third grade continue to be at-risk for reading difficulties by the end
of the academic year, as determined by the year-end measurement of reading
progress?
To determine the number and percentage of students considered at-risk for reading difficulties at the end of the year, a calculation was made using the number of students not meeting grade-level reading targets on an Academic Progress Plan (APP) at the end of the year as compared to the number of students not meeting grade-level reading targets on an APP at the beginning of the year. These data were directly reported to the OSDE by districts.
12 More information about MTSS is provided in the Research Literature at the end of this report.

2020 READING SUFFICIENCY ACT STUDY | Oklahoma State Department of Education 15
End-of-year data reflect the effectiveness of instruction for students over the course of that school year. It does not reflect the influence (if any) of a summer break.
It is important to note that these data were not collected for the 2020 school year, so only historical data are included in this section. Due to the pandemic, school districts across the state moved to distance learning in the spring of 2020. At the time, schools were not equipped to administer screening assessments virtually and it was not deemed safe for teachers to meet with students in-person.
Students who end the school year on a reading plan have not met goals set forth in the reading plan and are still considered at-risk. The data do not differentiate between students who have made progress but have not quite reached the goal, students who have maintained growth at the same rate as their peers but have not closed the learning gap, or students who continue to struggle and have fallen further behind their peers.
TABLE 3. STUDENTS REMAINING AT-RISK AT END OF YEAR Grade At-Risk EOY Total Enrolled Percent At-Risk EOY
2017
KG 10,985 51,347 21.4% 1 13,571 53,072 25.6% 2 13,263 52,155 25.4% 3 12,497 53,047 23.6% All Students 50,316 209,621 24.0%
2018
KG 11,015 50,832 21.7% 1 13,179 41,340 31.9% 2 13,822 50,688 27.3% 3 12,812 52,678 24.3% All Students 50,828 195,538 26.0%
2019
KG 10,817 50,797 21.3% 1 13,694 50,647 27.0% 2 13,972 49,199 28.4% 3 12,766 50,604 25.2% All Students 51,249 201,247 25.5%
2020
KG No data available due to pandemic 1 No data available due to pandemic 2 No data available due to pandemic 3 No data available due to pandemic All Students No data available due to pandemic
In Figure 3, the total number of students enrolled for kindergarten through third grade is compared to the total number of students in those grades who continued to be at-risk for reading difficulties at the end of each school year. The trend line shows the

2020 READING SUFFICIENCY ACT STUDY | Oklahoma State Department of Education 16
percentage of students in kindergarten through third grade considered at-risk for reading difficulties at the end of each school year.
FIGURE 3. STUDENTS REMAINING AT-RISK AT END OF YEAR
The overall trend of the percentage of students ending the year still on a reading plan displays little change. From 2017 to 2019, the range of students ending the year on a reading plan has ranged from 24% to 26%.
Kindergarten identified 21.4% students on a reading plan at the end of the year in 2017, while 21.3% were on a reading plan at the end of the year in 2019. The percentage of students remaining on a plan in kindergarten remained consistent across all three years.
From 2017 to 2019, first grade and third grade showed a slight increase of about 1.5% of students ending the year on a reading plan. Second grade showed an increase of 3% of students ending the year on a reading plan from 2017 to 2019. During this time, all three grades reported percentages that were fairly similar, with an average of 26.5%.
When considering the guidelines of the Multi-Tiered Systems of Support (MTSS) model, a percentage of about 20% of students identified as at-risk would indicate a healthy and effective system for early literacy. It is also important to note that these data were taken after instruction had been provided. With more than 20% of Oklahoma students still

2020 READING SUFFICIENCY ACT STUDY | Oklahoma State Department of Education 17
demonstrating difficulty in reading after instruction, districts should closely examine instructional materials and practices for areas where improvements could be made. The most efficient and effective way to address early literacy instruction would be through core instruction that all students receive. Remediation or intervention programs should be closely aligned to core instruction, and there should be clear communication between the classroom teacher and any specialized teachers providing intervention instruction. Ensuring that schools have well-trained teachers with access to high-quality curriculum materials aligned to evidence-based instruction in every elementary classroom will be critical in the years moving forward from the pandemic.
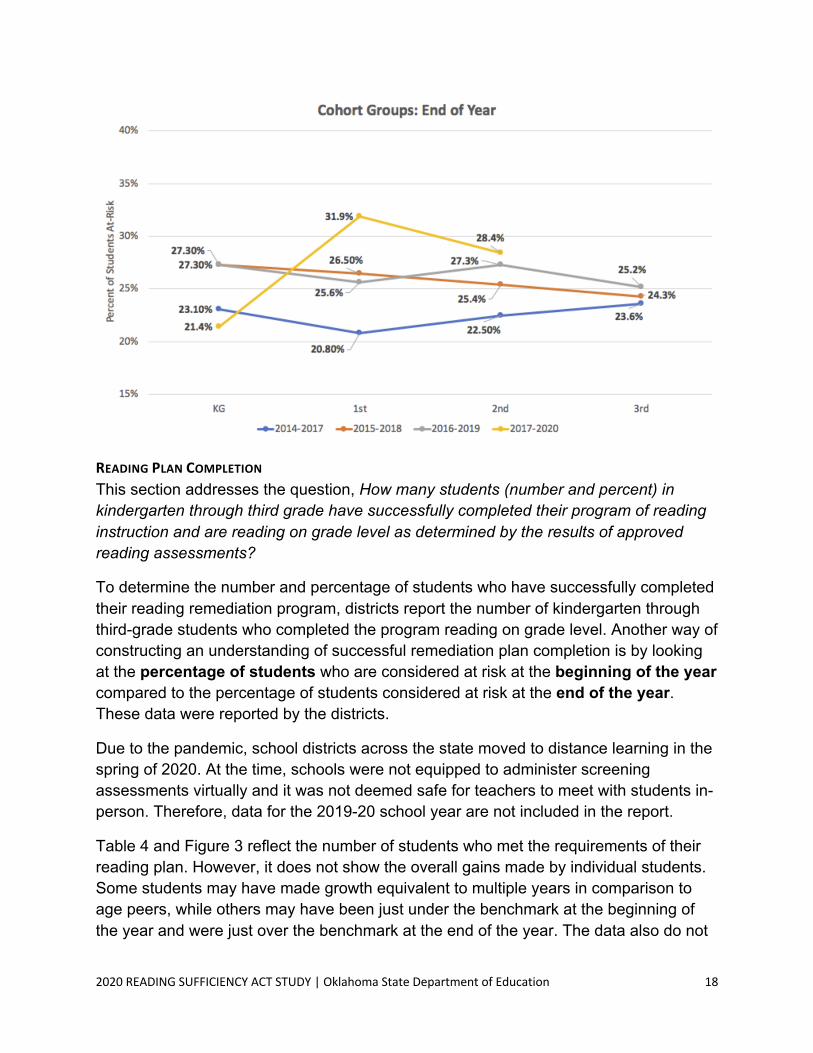
COHORT TRENDS FOR THE END-OF-YEAR DATA When looking at end-of-year data available since 2014, trend data for three cohorts of students can be tracked from kindergarten through grade three. Complete data for the latest cohort (2017-2020) are not available due to the pandemic. The first three cohorts demonstrated consistency in the percentage of students ending the year on a reading plan with little variance between grade levels. The latest cohort had the lowest percentage of kindergarten students end the year on reading plan, but also had a sharp increase in the percentage of first grade students, as compared to kindergarten students, who ended the year on a reading plan. Cohort groups are slowly increasing in the percentage of students remaining on a plan. One recommendation to address this increase is for districts to carefully consider the instructional materials and practices being used, as well as ensure a strong alignment between grade levels and between core instruction in the classroom and supporting instruction that some students receive.
FIGURE 4. END-OF-YEAR COHORT TRENDS
2020 READING SUFFICIENCY ACT STUDY | Oklahoma State Department of Education 18
READING PLAN COMPLETION This section addresses the question, How many students (number and percent) in
kindergarten through third grade have successfully completed their program of reading
instruction and are reading on grade level as determined by the results of approved
reading assessments?
To determine the number and percentage of students who have successfully completed their reading remediation program, districts report the number of kindergarten through third-grade students who completed the program reading on grade level. Another way of constructing an understanding of successful remediation plan completion is by looking at the percentage of students who are considered at risk at the beginning of the year compared to the percentage of students considered at risk at the end of the year. These data were reported by the districts.
Due to the pandemic, school districts across the state moved to distance learning in the spring of 2020. At the time, schools were not equipped to administer screening assessments virtually and it was not deemed safe for teachers to meet with students in-person. Therefore, data for the 2019-20 school year are not included in the report.
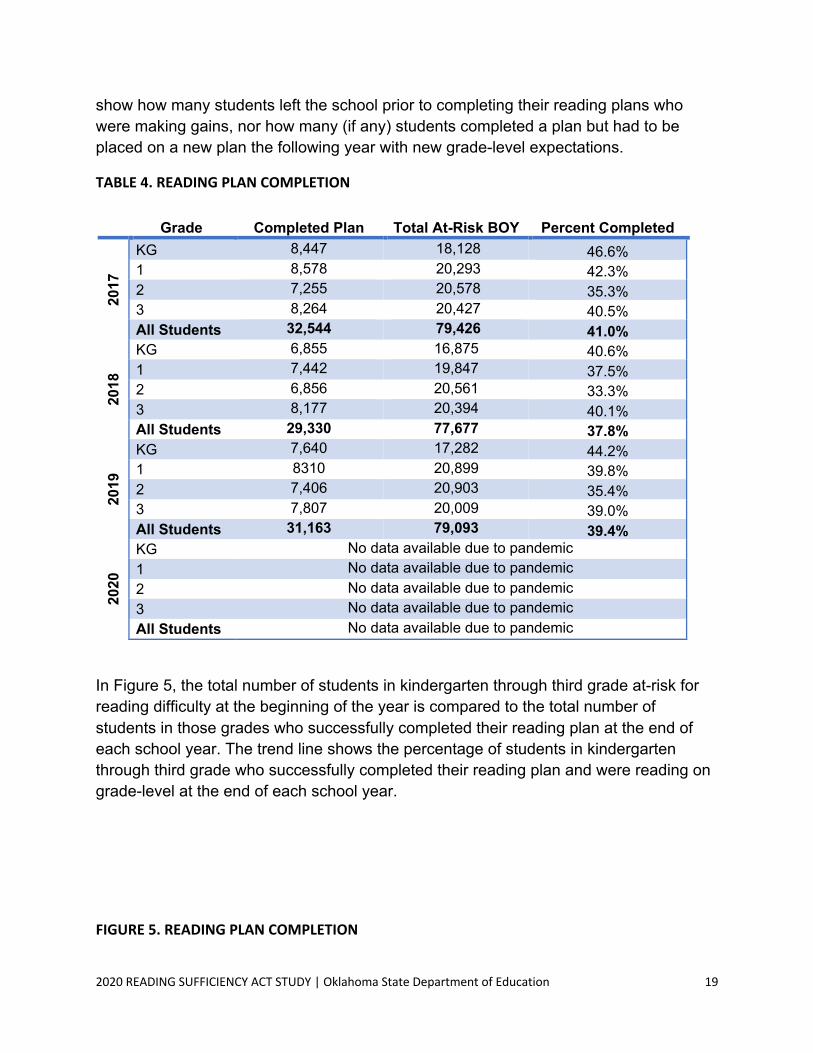
Table 4 and Figure 3 reflect the number of students who met the requirements of their reading plan. However, it does not show the overall gains made by individual students. Some students may have made growth equivalent to multiple years in comparison to age peers, while others may have been just under the benchmark at the beginning of the year and were just over the benchmark at the end of the year. The data also do not
2020 READING SUFFICIENCY ACT STUDY | Oklahoma State Department of Education 19
show how many students left the school prior to completing their reading plans who were making gains, nor how many (if any) students completed a plan but had to be placed on a new plan the following year with new grade-level expectations.
TABLE 4. READING PLAN COMPLETION
Grade Completed Plan Total At-Risk BOY Percent Completed
2017
KG 8,447 18,128 46.6% 1 8,578 20,293 42.3% 2 7,255 20,578 35.3% 3 8,264 20,427 40.5% All Students 32,544 79,426 41.0%
2018
KG 6,855 16,875 40.6% 1 7,442 19,847 37.5% 2 6,856 20,561 33.3% 3 8,177 20,394 40.1% All Students 29,330 77,677 37.8%
2019
KG 7,640 17,282 44.2% 1 8310 20,899 39.8% 2 7,406 20,903 35.4% 3 7,807 20,009 39.0% All Students 31,163 79,093 39.4%
2020
KG No data available due to pandemic 1 No data available due to pandemic 2 No data available due to pandemic 3 No data available due to pandemic All Students No data available due to pandemic
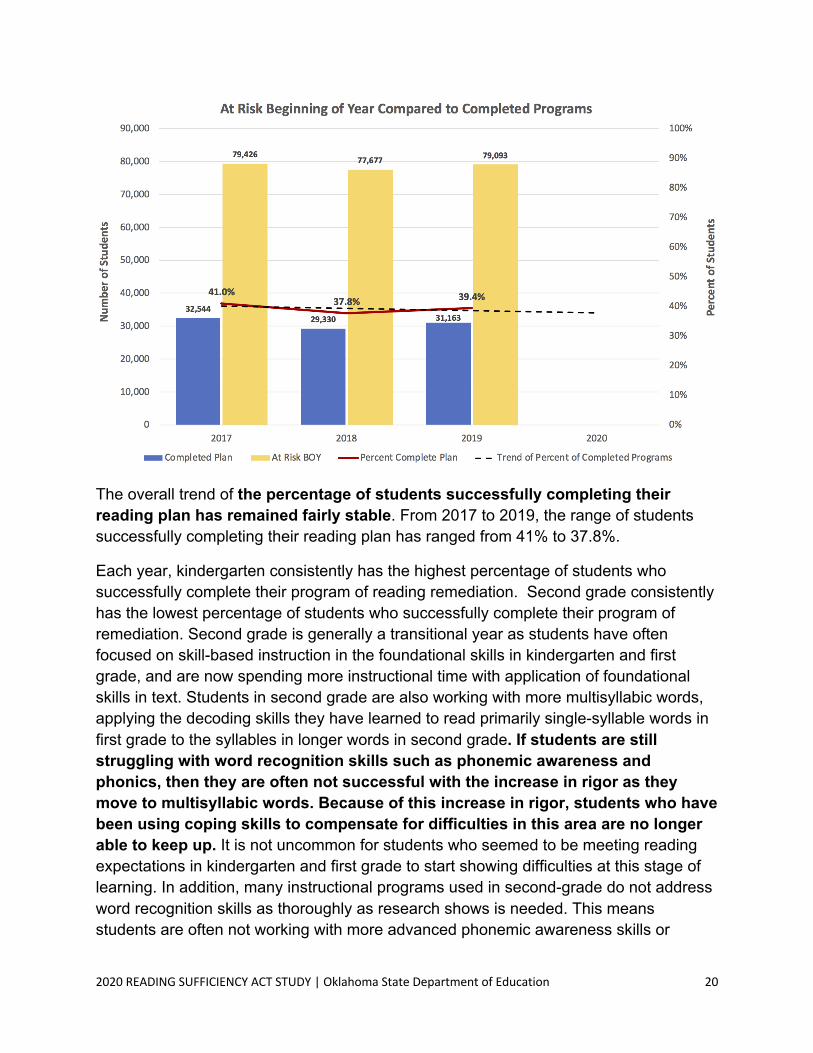
In Figure 5, the total number of students in kindergarten through third grade at-risk for reading difficulty at the beginning of the year is compared to the total number of students in those grades who successfully completed their reading plan at the end of each school year. The trend line shows the percentage of students in kindergarten through third grade who successfully completed their reading plan and were reading on grade-level at the end of each school year.
FIGURE 5. READING PLAN COMPLETION
2020 READING SUFFICIENCY ACT STUDY | Oklahoma State Department of Education 20
The overall trend of the percentage of students successfully completing their reading plan has remained fairly stable. From 2017 to 2019, the range of students successfully completing their reading plan has ranged from 41% to 37.8%.
Each year, kindergarten consistently has the highest percentage of students who successfully complete their program of reading remediation. Second grade consistently has the lowest percentage of students who successfully complete their program of remediation. Second grade is generally a transitional year as students have often focused on skill-based instruction in the foundational skills in kindergarten and first grade, and are now spending more instructional time with application of foundational skills in text. Students in second grade are also working with more multisyllabic words, applying the decoding skills they have learned to read primarily single-syllable words in first grade to the syllables in longer words in second grade. If students are still struggling with word recognition skills such as phonemic awareness and phonics, then they are often not successful with the increase in rigor as they move to multisyllabic words. Because of this increase in rigor, students who have been using coping skills to compensate for difficulties in this area are no longer able to keep up. It is not uncommon for students who seemed to be meeting reading expectations in kindergarten and first grade to start showing difficulties at this stage of learning. In addition, many instructional programs used in second-grade do not address word recognition skills as thoroughly as research shows is needed. This means students are often not working with more advanced phonemic awareness skills or

2020 READING SUFFICIENCY ACT STUDY | Oklahoma State Department of Education 21
complex phonics patterns. A recommendation to increase students’ opportunities for reading proficiency is to ensure second- and third-grade teachers are aware of the importance of continuing instruction in word recognition skills for all students.
COHORT TRENDS FOR READING COMPLETION DATA When looking at data available since 2014, there are three cohort groups that tracked from kindergarten through third grade. Complete data for the latest cohort (2017-2020) are not available due to the pandemic. There is an interesting trend to note when examining the data from cohort groups. As previously mentioned, kindergarten consistently has the highest percentage of students successfully completing a reading plan. That percentage drops in each grade level as the skills to be learned become harder, creating a larger gap between students who are on grade-level and those who are having reading difficulties. However, each cohort group reveals a rise in the percentage of students completing their reading plans in third grade. This rise may be attributed to districts investing more time and resources in third grade in preparation for the third-grade OSTP and potential promotion or retention decisions. Students in Oklahoma may benefit from investing more resources into earlier grades when the learning gaps are less pronounced.
FIGURE 6. READING PLAN COMPLETION COHORT TRENDS
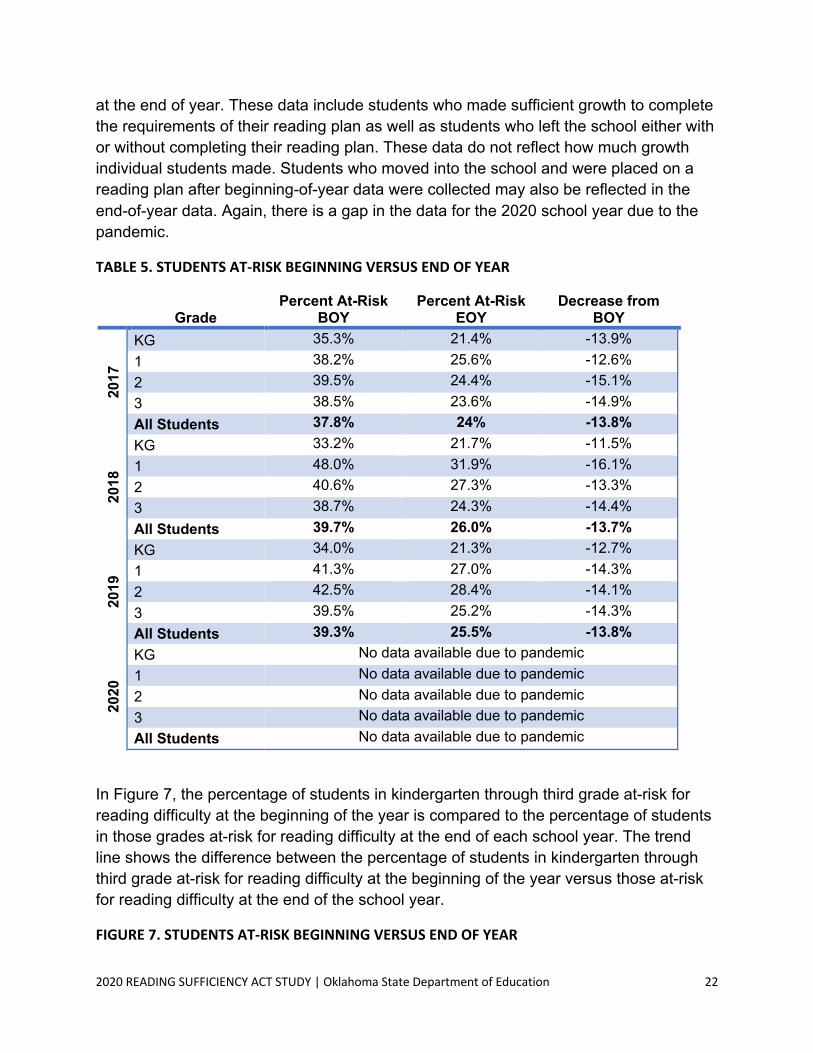
Table 5 and Figure 7 reflect the difference between the number of students identified as having reading difficulties at beginning of year and those still having reading difficulties
2020 READING SUFFICIENCY ACT STUDY | Oklahoma State Department of Education 22
at the end of year. These data include students who made sufficient growth to complete the requirements of their reading plan as well as students who left the school either with or without completing their reading plan. These data do not reflect how much growth individual students made. Students who moved into the school and were placed on a reading plan after beginning-of-year data were collected may also be reflected in the end-of-year data. Again, there is a gap in the data for the 2020 school year due to the pandemic.
TABLE 5. STUDENTS AT-RISK BEGINNING VERSUS END OF YEAR
Grade Percent At-Risk
BOY Percent At-Risk
EOY Decrease from
BOY
2017
KG 35.3% 21.4% -13.9% 1 38.2% 25.6% -12.6% 2 39.5% 24.4% -15.1% 3 38.5% 23.6% -14.9% All Students 37.8% 24% -13.8%
2018
KG 33.2% 21.7% -11.5% 1 48.0% 31.9% -16.1% 2 40.6% 27.3% -13.3% 3 38.7% 24.3% -14.4% All Students 39.7% 26.0% -13.7%
2019
KG 34.0% 21.3% -12.7% 1 41.3% 27.0% -14.3% 2 42.5% 28.4% -14.1% 3 39.5% 25.2% -14.3% All Students 39.3% 25.5% -13.8%
2020
KG No data available due to pandemic
1 No data available due to pandemic
2 No data available due to pandemic
3 No data available due to pandemic
All Students No data available due to pandemic
In Figure 7, the percentage of students in kindergarten through third grade at-risk for reading difficulty at the beginning of the year is compared to the percentage of students in those grades at-risk for reading difficulty at the end of each school year. The trend line shows the difference between the percentage of students in kindergarten through third grade at-risk for reading difficulty at the beginning of the year versus those at-risk for reading difficulty at the end of the school year.
FIGURE 7. STUDENTS AT-RISK BEGINNING VERSUS END OF YEAR

2020 READING SUFFICIENCY ACT STUDY | Oklahoma State Department of Education 23
These data show a very consistent trend between beginning-of-year data and end-of-year data over the last three years.
CONCLUSIONS FROM DISTRICT DATA Overall, district level data over the last four years has been somewhat flat, with little variation and slight increases in students identified as at-risk for reading difficulties likely due more to changes in assessment than student ability or instruction. In order to improve reading instruction across the state, districts should rely more heavily on systemic improvements in core instruction and alignment rather than increased intervention opportunities. The use of high-quality, evidence-based instructional materials by well-qualified teachers will have a more far-reaching effect and represents a more economical solution than increased investment in intervention materials and support.
Ensuring that students in the earliest grades receive effective instructional support, rather than waiting until third grade, is also critical. Reading difficulties in the early grades accumulate exponentially over time, producing immense consequences. Failure to acquire early word reading skills often leads to a phenomenon known as the “Matthew effect,” or that the rich get richer and the poor get poorer. Keith Stanovich13 identified this trend, showing consequences such as negative attitudes toward reading, reduced vocabulary growth, missed opportunities for development of
13 Stanovich, 1986

2020 READING SUFFICIENCY ACT STUDY | Oklahoma State Department of Education 24
reading comprehension strategies, and less actual practice in reading than what other children receive.
As districts consider ways to address learning challenges resulting from the pandemic, these two conclusions—addressing core instruction and investing in the earliest grades—should be taken into consideration.
PERFORMANCE ON STATE READING EXAMINATION This section addresses the question, How many third-grade students (number and
percent) met the performance criteria for the RSA as determined by the Commission for
Educational Quality and Accountability on the reading portion of the statewide third-
grade assessment? It also begins to address the question How does reading
proficiency vary by socio-economic status, learning disability status, English learner
(EL) status, and race? This question continues to be addressed in a later section.
The 2013-2014 school year was the first year that promotion and retention decisions were tied to the state third-grade reading assessment. This portion of the Reading Sufficiency Act legislation has evolved over the last several years, making comparisons from year to year difficult. It is important to keep those changes in mind when looking at long-term data from the state reading examination. Those changes were outlined in Table 1 on page 6. In addition, the state assessment changed in the 2016-2017 academic year. Prior to that time, the Oklahoma Core Curriculum Tests (OCCT) was used. With the adoption of the new Oklahoma Academic Standards in 2016, a new state test called the Oklahoma State Testing Program (OSTP) was created. Because of the differences between the OCCT and the OSTP, it is impossible to draw comparisons across the years these assessments were administered. In addition, the OSTP was suspended for the 2020 school year due to the global pandemic. As a result, the data from this year is not provided in the report. For purposes of this report, a three-year history using only data from the 2017, 2018, and 2019 OSTP is provided.
OKLAHOMA STATE TESTING PROGRAM (OSTP) DATA With the adoption of new standards in 2016, the state assessment for Oklahoma was changed to the Oklahoma State Testing Program (OSTP). Because this is a different test from the OCCT, it is impossible to make meaningful comparisons between assessment results prior to 2017.
To determine the number and percentage of students meeting the performance criteria for the RSA on the reading portion of the statewide third-grade assessment, OSTP reading scores were analyzed. The performance levels for the reading portion of the third-grade test identified by the Commission for Educational Quality and Accountability are “Meets RSA Criteria” and “Does Not Meet RSA Criteria.” These scores are determined by using only questions that address Standard 2: Reading and Writing

2020 READING SUFFICIENCY ACT STUDY | Oklahoma State Department of Education 25
Process and Standard 4: Vocabulary.14 Additionally, demographic data were analyzed to provide descriptive statistics on reading proficiency and retention by free- and reduced-lunch (FRL), individualized education program (IEP), English learner (EL) status and race/ethnicity.
TABLE 6. 2017 OSTP RESULTS
Sub-group Met RSA Criteria Did Not Meet RSA Criteria Total
FRL Not FRL 16,239
(89.1%) 1,979
(10.9%) 18,218 (35.9%)
FRL 24,084 (74.2%)
8,376 (25.8%)
32,460 (64.1%)
IEP
Not on IEP 35,942 (86.2%)
5,734 (13.8%)
41,676 (82.2%)
IEP 4,381 (48.7%)
4,621 (51.3%)
9,002 (17.8%)
EL
Not EL 36,975 (82.4%)
7,911 (17.6%)
44,886 (88.6%)
EL 3,348 (57.8%)
2,444 (42.2%)
5,792 (11.4%)
Rac
e/E
thni
city
Black 2,748 (63.7%)
1,569 (36.3%)
4,317 (8.5%)
American Indian
5,292 (79.9%)
1,330 (20.1%)
6,622 (13.1%)
Asian/Pacific Islander
896 (83.9%)
172 (16.1%)
1,068 (2.1%)
White 20,754 (85.8%)
3,430 (14.2%)
24,184 (47.7%)
Hispanic 6,390 (68.8%)
2,894 (31.2%)
9,284 (18.3%)
Two or More 4,243 (81.5%)
960 (18.5%)
5,203 (10.3%)
All All Students 40,323
(79.6%) 10,355 (20.4%) 50,678
Of all third-grade students assessed with the Oklahoma State Testing Program (OSTP) in 2017, 20.4% did not meet RSA criteria. Two groups, Black and Hispanic, had a higher percentage of students who did not meet RSA criteria as compared to their peers. There were 36.3% of Black students who did not meet RSA criteria, a difference of 15.9 percentage points as compared to all students, and 31.2% of Hispanic students who did not meet RSA criteria, a difference of 10.8 percentage points as compared to all students.
14 Pursuant to 70-2011 §1210.508C.H.8 (SB630)

2020 READING SUFFICIENCY ACT STUDY | Oklahoma State Department of Education 26
There is an achievement gap that exists for students participating in free- and reduced- lunch, students with being served through an Individualized Education Program (IEP), and students receiving English learner (EL) support services when considering RSA criteria. There were 25.8% of students qualifying for free- and reduced-lunch who did not meet RSA criteria, while only 10.9% of students not qualifying for this service did not meet criteria, demonstrating a 14.9-point achievement gap for students in this sub-group. Students receiving EL support services had 42.2% of students who did not meet RSA criteria, while 17.6% of students who were not receiving EL support services did not meet criteria. This was a gap of 24.6 percentage points for students in this sub-group. The largest achievement gap continues to be for students on an IEP. While only 13.8% of students who were not on an IEP did not meet RSA criteria, 51.3% of students on an IEP did not meet RSA criteria, creating an achievement gap of 37.5 percentage points as compared to all students.
TABLE 7. 2018 OSTP RESULTS
Sub-group Met RSA Criteria Did Not Meet RSA Criteria Total
FRL Not FRL 14,431
(90.8%) 1,456 (9.2%)
15,887 (31.6%)
FRL 24,998 (72.6%)
9,443 (27.4%)
34,441 (68.4%)
IEP
Not on IEP 35,410 (85.3%)
6,088 (14.7%)
41,498 (82.5%)
IEP 4,019 (45.5%)
4,811 (54.5%)
8,830 (17.5%)
EL
Not EL 35,308 (80.9%)
8,360 (19.1%)
43,668 (86.8%)
EL 4,121 (61.9%)
2,539 (38.1%)
6,660 (13.1%)
Rac
e/E
thni
city
Black 2,760 (62.9%)
1,631 (37.1%)
4,391 (8.7%)
American Indian
5,160 (78.4%)
1,418 (21.6%)
6,578 (13.1%)
Asian/Pacific Islander
899 (83.9%)
173 (16.1%)
1,072 (2.1%)
White 20,042 (84.6%)
3,652 (15.4%)
23,694 (47.1%)
Hispanic 6,331 (68.1%)
2,971 (31.9%)
9,302 (18.5%)
Two or More 4,237 (80.1%)
1,054 (19.9%)
5,291 (10.5%)
All All Students 39,429
(78.3%) 10,899 (21.7%) 50,328
2020 READING SUFFICIENCY ACT STUDY | Oklahoma State Department of Education 27
Of all third-grade students assessed with the Oklahoma State Testing Program (OSTP) in 2018, 21.7% did not meet RSA criteria. Two groups, Black and Hispanic, had a higher percentage of students who did not meet RSA criteria. There were 37.1% of Black students who did not meet RSA criteria, a difference of 15.4 percentage points, and 31.9% of Hispanic students who did not meet RSA criteria, a difference of 10.2 percentage points. From 2017 to 2018, the achievement gap for both Black and Hispanic students have each been reduced by approximately one percentage point. Again, the achievement gap that exists for students participating in free- and reduced-lunch, students with being served through an Individualized Education Program (IEP), and students receiving English learner (EL) support services in overall performance exists for RSA criteria. There were 27.4% of students qualifying for free- and reduced-lunch who did not meet RSA criteria, while only 9.2% of students not qualifying for this service did not meet criteria, demonstrating an 18.2-point achievement gap for students in this sub-group. There were 38.1% of students who received EL support services that did not meet RSA criteria, while 19.1% of students who were not receiving EL support services that did not meet criteria. This was a gap of 19 percentage points for students in this sub-group. The largest achievement gap continues to be for students on an Individualized Education Program (IEP). While only 14.7% of students who were not on an IEP did not meet RSA criteria, 54.5% of students on an IEP did not meet RSA criteria, creating an achievement gap of 39.8 percentage points.

2020 READING SUFFICIENCY ACT STUDY | Oklahoma State Department of Education 28
TABLE 8. 2019 OSTP RESULTS
Sub-group Met RSA Criteria Did Not Meet RSA Criteria Total
FRL
Not FRL 15,151 (90.9%)
1,512 (9.1%)
16,663 (32.8%)
FRL 24,851 (72.7%)
9,339 (27.3%)
34,190 (67.2%)
IEP
Not on IEP 35,647 (85.0%)
6,281 (15.0%)
41,928 (82.4%)
IEP 4,355 (48.8%)
4,570 (51.2%)
8,925 (17.6%)
EL
Not EL 35,676 (81.2%)
8,252 (18.8%)
43,928 (86.4%)
EL 4,326 (62.5%)
2,599 (37.5%)
6,925 (13.6%)
Rac
e/E
thni
city
Black 2,781 (63.5%)
1,599 (36.5%)
4,380 (8.6%)
American Indian
5,061 (79.5%)
1,304 (20.5%)
6,365 (12.5%)
Asian/Pacific Islander
993 (82.0%)
218 (18.0%)
1,211 (2.4%)
White 20,284 (84.7%)
3,667 (15.3%)
23,951 (47.1%)
Hispanic 6,364 (67.8%)
3,027 (32.2%)
9,391 (18.5%)
Two or More 4,519 (81.4%)
1,036 (18.6%)
5,555 (10.9%)
All All Students
40,002 (78.7%)
10,851 (21.3%) 50,853
In 2019, 21.3% of third-grade students did not meet RSA criteria on the Oklahoma State Testing Program (OSTP). Black and Hispanic students continue to have a higher percentage of students who did not meet RSA criteria. There were 36.5% of Black students who did not meet RSA criteria, a difference of 15.2 percentage points, and 32.2% of Hispanic students who did not meet RSA criteria, a difference of 10.9 percentage points. From 2018 to 2019, the achievement gap for both of these groups has remained about the same. Again, there is an achievement gap that exists for students participating in free- and reduced- lunch, students with being served through an Individualized Education Program (IEP), and students receiving English learner (EL) support services in overall

2020 READING SUFFICIENCY ACT STUDY | Oklahoma State Department of Education 29
reading performance. Of students qualifying for free- and reduced-lunch, 27.3% did not meet RSA criteria, while only 9.1% of students not qualifying for this service did not meet criteria, demonstrating an 18.2-percentage point achievement gap for students in this sub-group. Students receiving EL support services had 37.5% of students who did not meet RSA criteria, while 18.8% of students who were not receiving EL support services did not meet criteria. This was a gap of 18.7 percentage points for students in this sub-group. The largest achievement gap continues to exist for students on an IEP. While only 15% of students who were not on an IEP did not meet RSA criteria, 51.2% of students on an IEP did not meet RSA criteria, creating an achievement gap of 36.2 percentage points. From 2017 to 2019, there has been no real change in overall performance. CONCLUSIONS FROM OSTP DATA From 2017 to 2018, the achievement gap for students receiving EL support services reduced by 5 percentage points. The gap remained the same from 2018 to 2019. The achievement gap for students identified as qualifying for free- and reduced-lunch increased by 3 percentage points from 2017 to 2018, but remained consistent from 2018 to 2019. The achievement gap for students on an IEP had a 2-percentage point increase from 2017 to 2018, but a 3-percentage point decrease from 2018 to 2019, causing a net decrease of 1 percentage point over the three-year history.
Given these findings, in order for the RSA to achieve its goal of all students reading on grade level, regardless of their socio-economic status or race, consideration needs to be given to the needs of these disproportionately underachieving sub-groups. The Oklahoma Educator Equity plan is one way Oklahoma is exploring root causes of inequities and developing potential solutions in the distribution of qualified and effective teachers in high-poverty and high-minority schools. Further research on additional barriers to third-grade reading proficiency for sub-group populations of students should be conducted to more thoroughly understand and address the inequities in third-grade reading proficiency and how resources could be more effectively allocated to close achievement gaps.
Comparing data received from districts about students who are at-risk for reading difficulties at the end of the year and state testing data provides an opportunity to ensure that data is reliable. In 2017, 24% of students were reported by districts to still be on a reading plan. In that year, 20.4% of students did not met RSA criteria. In 2018, 26% of students were reported by districts to still be on a reading plan. In that year, 21.7% of students did not meet RSA criteria. In 2019, 25.5% of students were reported by districts to still be on a reading plan. In that year, 21.3% of students did not meet RSA criteria. The district-reported data supports that defined RSA criteria is in line

2020 READING SUFFICIENCY ACT STUDY | Oklahoma State Department of Education 30
with the expectations of mastery of necessary foundational skills for students to be successful in later grades.
PROMOTION AND RETENTION This section addresses the question, How many third-grade students participated in the
Oklahoma State Testing Program (OSTP) and, of that number, how many met
proficiency on a screening instrument, how many were promoted through each of the
good-cause exemptions, how many were retained, and how many were promoted
through probationary promotion?
Through the Reading Sufficiency Act, students have four pathways to promotion to fourth grade:
• Pathway 1: Meet RSA criteria on the reading and vocabulary portions of the OSTP;15
• Pathway 2: Demonstrate reading proficiency through one of the approved screening assessments;16
• Pathway 3: Meet the requirements for one of the seven good-cause exemptions;17 and
• Pathway 4: Obtain a unanimous decision by the Student Reading Proficiency Team (SRPT) to be promoted with probation.18
Prior to 2017, students participated in the Oklahoma Core Curriculum Test (OCCT). The results of this test are not comparable to the Oklahoma State Testing Program (OSTP). In order to make valid comparisons, information is used beginning in 2017, which was the first-year students participated in the OSTP. To determine the number of students promoted by each of the pathways or retained, districts reported the data to OSDE. Any discrepancies between the data in this section and that in the previous section may be due to the variations in reporting structures. When reporting promotion decisions, districts often indicate all promotion options that a student may be eligible for. In this case, those data are reported here as a hierarchy. Students with multiple promotion pathways are tallied in the order of the pathways. For example, if a student qualified for promotion through both a screening assessment (Pathway 2) and good-cause exemption 5 (Pathway 3), the student was included in the data for Pathway 2 only.
Due to the global pandemic, the OSTP was waived for the spring of 2020. As a result, third-grade students could not demonstrate reading proficiency by meeting RSA criteria
15 See Third Grade Reading Proficiency (70 O.S.§1210.508C (I)(4)) 16 See Third Grade Reading Proficiency (70 O.S.§1210.508C (I)(1)) 17 See Good Cause Exemptions (70 O.S. § 1210.508C (L)) 18 See Probationary Promotion (70 O.S. § 1210.508C (I)(5))

2020 READING SUFFICIENCY ACT STUDY | Oklahoma State Department of Education 31
on the state test. Districts had to determine if one of the other pathways to promotion would apply to each third-grade student. TABLE 9. PROMOTION PATHWAYS AND RETENTION DECISIONS
2017 2018 2019 2020
Pathway 1: Met Criteria on OSTP
41,474 79.7%
39,429 76.3%
40,002 77.6% n/a
Pathway 2: Promoted through Screener
3,008 5.8%
3,574 6.9%
2,669 5.2%
29,093 62.4%
Pathway 3: Met Good-Cause Exemption
3,118 6.0%
3,793 7.3%
3,645 7.1%
9,199 19.7%
Pathway 4: Probationary Promotion through SRPT
2,986 5.7%
3,316 6.4%
3,660 7.1%
7,184 15.4%
Retained 1,460 2.8%
1,591 3.1%
1,543 3.0%
1,171 2.5%
Table 9 reflects the number and percentage of students who were promoted through each of the four pathways or retained over the last four years. From 2017 to 2019, the majority of students were promoted to fourth grade by meeting RSA criteria on the state reading test, or OSTP. However, this was not an option for third graders in 2020.
From 2017 to 2019, there was a fairly even division among each of the last three pathways. Each of the promotion pathways—proficiency through a screening assessment, meeting a good-cause exemption, or probationary promotion through the SRPT—was used for approximately 6% to 7% of students during this three-year span. Also, during this time, approximately 3% of students were retained each year.
The 2020 school year presented unique challenges for the implementation of the RSA. Without OSTP data to determine if students were eligible for automatic promotion to fourth grade, districts had to rely on other pathways to promotion or determine if retention was the best option for every third-grade student, rather than just those who did not qualify for automatic promotion through meeting RSA criteria on the OSTP.
Adding to this challenge was the fact that schools were unable to administer the end-of-year screening assessment, so they had to rely on assessment data taken prior to March 2020. Students who may have been on track to be successful on the state test might not have yet met the end-of-year grade-level target on the screening assessment, making them ineligible for Pathway 2. Also due to the pandemic, many schools may not have been able to complete all of the requirements for some of the good-cause exemptions, specifically exemption 3 (taking an alternate assessment) and exemption 4 (completing a portfolio).

2020 READING SUFFICIENCY ACT STUDY | Oklahoma State Department of Education 32
The data from the 2019-20 school year shows that schools opted to use Pathway 4 to promote students with probation through the Student Reading Proficiency Team (SRPT) more often this year. This is nearly double the percentage of students promoted through this Pathway 4 at the end of the 2020 school year when compared to previous years.
The challenges faced by districts when making decisions for promotion and retention without state-level assessment data and district-level end-of-year assessments may account for slightly fewer students being retained in 2020 compared to previous years. Approximately 3% of students were retained each year from 2017-2019. In 2020, 2.5% of students were retained.
Through the Reading Sufficiency Act, there are seven good-cause exemptions that students might meet to be promoted to fourth grade. These exemptions are:
1. English learners who have had less than two years of instruction in English and are identified as Limited English Proficient/English learner on an approved screening tool may advance to fourth grade.
2. Students with an Individualized Education Program (IEP) assessed with the Oklahoma Alternate Assessment Program may advance to fourth grade.
3. Students who demonstrate an acceptable level of performance on an approved alternative standardized reading test may advance to fourth grade.
4. Students who demonstrate through a teacher-developed portfolio that they can read on grade level may advance to fourth grade.
5. Students with disabilities who take the OSTP and have an IEP that states they have received intensive remediation in reading for more than two years and have made adequate progress in reading according to the student’s IEP may advance to fourth grade. This change went into effect for the 2020 school year.
6. Students who have received intensive remediation in reading for two or more years and who were previously retained for one year may advance to fourth grade. The previous retention may be in prekindergarten for academic reasons, kindergarten, first grade, second grade or third grade. If the student attends a transitional grade for a year, it may also be considered a previous retention. This change went into effect for the 2020 school year.
7. Students facing exceptional emergency circumstances that prevented the student from being assessed during the testing window may advance to fourth grade. This exemption must be approved by OSDE. Since the OSTP was waived, this exemption was not applicable for the 2020 school year.
Good-cause exemptions 1, 2, 5 and 6 are based on student demographics, such as being identified for English learner supports or having an Individualized Education Program (IEP) through the Individuals with Disabilities Education Act (IDEA). Good-

2020 READING SUFFICIENCY ACT STUDY | Oklahoma State Department of Education 33
cause exemptions 3 and 4 require the student to complete an alternate assessment or portfolio through opportunities the school provides.
TABLE 10. GOOD-CAUSE EXEMPTION PROMOTIONS
Exemption 2017 2018 2019 2020
Exemption 1 145 4.6%
219 5.8%
264 7.3%
434 4.7%
Exemption 2 401 12.7%
707 18.6%
791 21.7%
1,138 12.4%
Exemption 3 177 5.6%
302 8.0%
225 6.2%
458 5.0%
Exemption 4 285 9.1%
349 9.2%
243 6.7%
758 8.2%
Exemption 5 1,978 62.8%
2,026 53.4%
1,917 52.6%
4,087 44.4%
Exemption 6 156 5.0%
181 4.8%
193 5.3%
2,324 25.3%
Exemption 7 6 0.2%
9 0.2%
12 0.3% n/a
Two changes to exemptions went into effect this year as noted above. These changes had an effect on the data for 2020. There was a large increase in the percentage of students promoted through exemption 6, along with a decrease in the percentage of students promoted through exemption 5. As schools moved to distance learning in March 2020, students may not have been able to finish the process for obtaining an IEP. However, these same students have often already been retained in a previous grade. While these students may have been promoted under exemption 5 in previous years, they met the requirements for exemption 6 in 2020. There are also more students who have already been retained one year rather than retained two years, as was previously required.
LONG TERM EFFECTS OF THE READING SUFFICIENCY ACT This section continues to address the question How does reading proficiency vary by
socio-economic status, learning disability status, English learner (EL) status, and race? This question was also addressed earlier in the section Performance on State Reading Examination.
In 2017, the RSA statute was revised requiring that data collection include tracking of students promoted through each of the good-cause exemptions, students promoted through probationary promotion, and students who were retained in third grade.19 This data collection was built in the Oklahoma Statewide Student Information System, the
19 Pursuant to 70-2011 §1210.508C.S.6 (HB1760)

2020 READING SUFFICIENCY ACT STUDY | Oklahoma State Department of Education 34
Wave, and collected data beginning in 2019. This report shifted from an aggregate report on which districts reported the number of students in each category to a student level report. As a result of this new report, it is possible to identify how promotion and retention decisions vary by socio-economic status, learning disability status, EL status, and race.
The data collection was set up to include the names of each student who did not meet RSA criteria on the Oklahoma State Testing Program (OSTP). It automatically indicates if the student is eligible for good-cause exemption 2 by participating in the Oklahoma Alternate Assessment Program (OAAP). For each third-grade student who takes the OSTP and does not meet RSA criteria, the district will indicate how that student was promoted or retained. Because the OSTP was waived for 2020, the report was adjusted to include the names of every student enrolled in third grade.
Once the promotion and retention data has been entered, reports can be run to provide information regarding demographics of students who are promoted or retained, as well as how they progress through their public-school academic career, if they graduate with their peer group, or if and for what reason they might exit the public-school system in Oklahoma. The demographics of students who were promoted through Pathway 1 are discussed in the previous section about OSTP results.
When examining the following data, information has been provided for sub-groups of students, promotion or retention decisions related to those students, and retention decisions for peers not in the sub-group.
TABLE 11. PROMOTION DECISIONS FOR STUDENTS WITH AN INDIVIDUALIZED EDUCATIONAL PROGRAM (IEP)
Pathway 1: OSTP
Pathway 2: Screener
Pathway 3: Exemption
Pathway 4: SRPT Retained Total
2019
IEP 4,355 45.4%
506 5.3%
2,745 28.6%
1,534 16.0%
450 4.7%
9,590 18.6%
No IEP
35,647 85.0%
2,163 5.2%
900 2.1%
2,126 5.1%
1,093 2.6%
41,929 81.4%
2020
IEP n/a 2,716 30.9%
5,255 59.8%
643 7.3%
177 2.0%
8,791 18.8%
No IEP n/a 26,467
69.7% 3,944 10.4%
6,541 17.2%
994 2.6%
37,946 81.2%
Table 11 examines the number and percentage of students who receive services through the Individuals with Disabilities Education Act (IDEA) and the promotion or retention decision made as compared to students who are not served under IDEA.

2020 READING SUFFICIENCY ACT STUDY | Oklahoma State Department of Education 35
Students who receive services through IDEA have an Individualized Education Program (IEP). In both years, there were about 19% of students on an IEP and about 81% of students who were not on an IEP. In 2019, nearly half of the students on an IEP (45.4%) were promoted to fourth grade through Pathway 1. When compared to the 85% of students not on an IEP who were promoted the same way, there is a gap of 40 percentage points. Since Pathway 1 was not available as an option in 2020, comparing the percentages between the two years is difficult. However, the same type of gap for Pathway 1 in 2019 can be seen in 2020 with Pathway 2. The discrepancy between students on an IEP and students not on an IEP promoted through Pathway 3 increased greatly from 2019 to 2020. There are two reasons that would contribute to this increase. First, without the OSTP, the other pathways were used for promotion for all students. Because two of the exemptions for Pathway 3 directly address students on an IEP, it would be logical that an increased number and percentage of students on an IEP were promoted in this way. Secondly, there was a statutory change for exemption 5 that went into effect for 2020. Exemption 5 directly addresses students on an IEP and the requirements to meet the exemption were expanded. Formerly, students on an IEP had to have also been retained to qualify for this exemption. Beginning in 2020, students on an IEP making adequate progress in reading met the requirements of the exemption without a previous retention. This change also explains why there was a lower percentage of students on an IEP promoted through Pathway 4, as well as a lower percentage of students on an IEP retained. TABLE 12. PROMOTION DECISIONS FOR STUDENTS WHO ARE ENGLISH LEARNERS
Pathway 1: OSTP
Pathway 2: Screener
Pathway 3: Exemption
Pathway 4: SRPT Retained Total
2019
EL 4,326 63.8%
569 8.4%
660 9.7%
956 14.1%
266 3.9%
6,777 13.2%
Not EL 35,676 79.7%
2,100 4.7%
2,985 6.7%
2,704 6.0%
1,277 2.9%
44,742 86.8%
2020
EL n/a 2,828 42.8%
1,719 26.0%
1,903 28.8%
163 2.5%
6,613 14.1%
Not EL n/a 26,355 65.7%
7,480 18.6%
5,281 13.2%
1,008 2.5%
40,124 85.9%
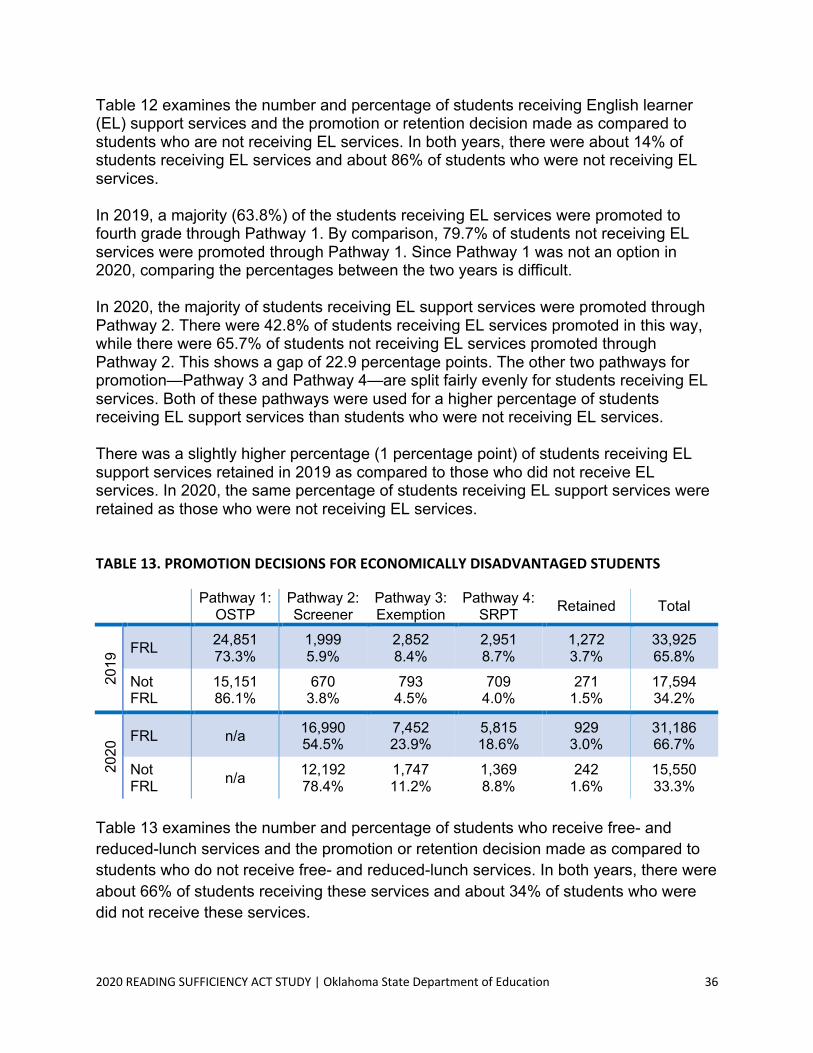
2020 READING SUFFICIENCY ACT STUDY | Oklahoma State Department of Education 36
Table 12 examines the number and percentage of students receiving English learner (EL) support services and the promotion or retention decision made as compared to students who are not receiving EL services. In both years, there were about 14% of students receiving EL services and about 86% of students who were not receiving EL services. In 2019, a majority (63.8%) of the students receiving EL services were promoted to fourth grade through Pathway 1. By comparison, 79.7% of students not receiving EL services were promoted through Pathway 1. Since Pathway 1 was not an option in 2020, comparing the percentages between the two years is difficult. In 2020, the majority of students receiving EL support services were promoted through Pathway 2. There were 42.8% of students receiving EL services promoted in this way, while there were 65.7% of students not receiving EL services promoted through Pathway 2. This shows a gap of 22.9 percentage points. The other two pathways for promotion—Pathway 3 and Pathway 4—are split fairly evenly for students receiving EL services. Both of these pathways were used for a higher percentage of students receiving EL support services than students who were not receiving EL services. There was a slightly higher percentage (1 percentage point) of students receiving EL support services retained in 2019 as compared to those who did not receive EL services. In 2020, the same percentage of students receiving EL support services were retained as those who were not receiving EL services.
TABLE 13. PROMOTION DECISIONS FOR ECONOMICALLY DISADVANTAGED STUDENTS
Pathway 1: OSTP
Pathway 2: Screener
Pathway 3: Exemption
Pathway 4: SRPT Retained Total
2019
FRL 24,851 73.3%
1,999 5.9%
2,852 8.4%
2,951 8.7%
1,272 3.7%
33,925 65.8%
Not FRL
15,151 86.1%
670 3.8%
793 4.5%
709 4.0%
271 1.5%
17,594 34.2%
2020
FRL n/a 16,990 54.5%
7,452 23.9%
5,815 18.6%
929 3.0%
31,186 66.7%
Not FRL n/a 12,192
78.4% 1,747 11.2%
1,369 8.8%
242 1.6%
15,550 33.3%
Table 13 examines the number and percentage of students who receive free- and reduced-lunch services and the promotion or retention decision made as compared to students who do not receive free- and reduced-lunch services. In both years, there were about 66% of students receiving these services and about 34% of students who were did not receive these services.
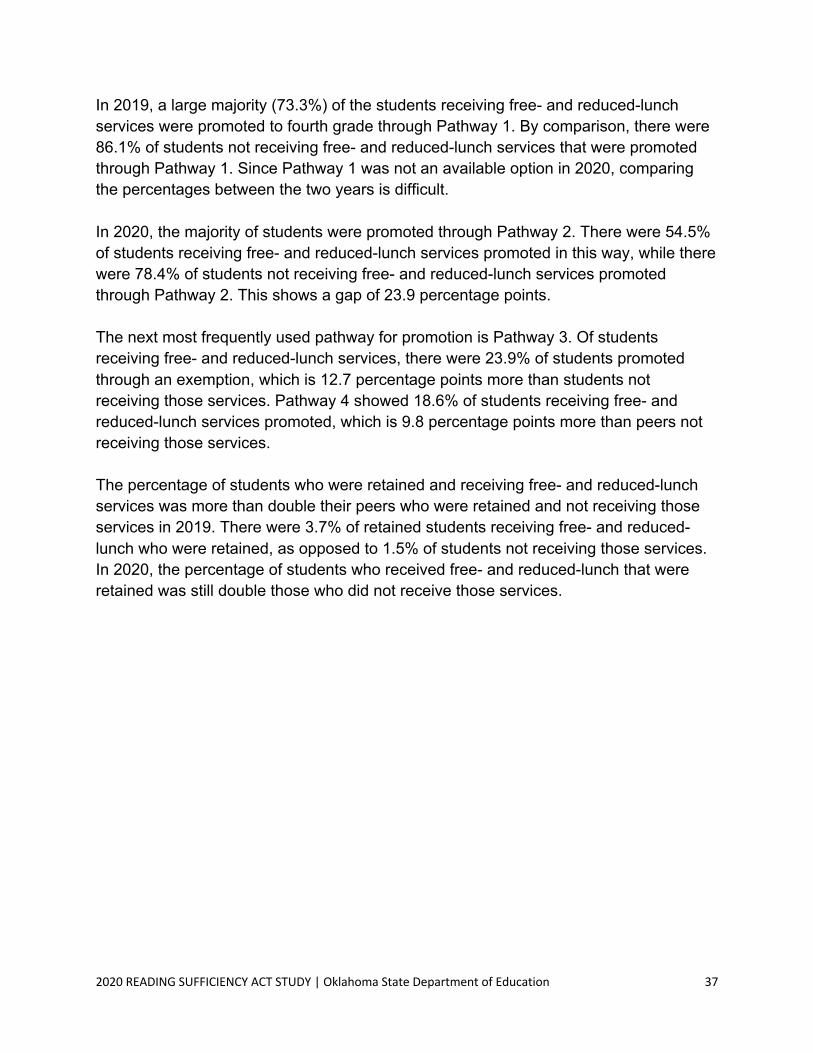
2020 READING SUFFICIENCY ACT STUDY | Oklahoma State Department of Education 37
In 2019, a large majority (73.3%) of the students receiving free- and reduced-lunch services were promoted to fourth grade through Pathway 1. By comparison, there were 86.1% of students not receiving free- and reduced-lunch services that were promoted through Pathway 1. Since Pathway 1 was not an available option in 2020, comparing the percentages between the two years is difficult. In 2020, the majority of students were promoted through Pathway 2. There were 54.5% of students receiving free- and reduced-lunch services promoted in this way, while there were 78.4% of students not receiving free- and reduced-lunch services promoted through Pathway 2. This shows a gap of 23.9 percentage points. The next most frequently used pathway for promotion is Pathway 3. Of students receiving free- and reduced-lunch services, there were 23.9% of students promoted through an exemption, which is 12.7 percentage points more than students not receiving those services. Pathway 4 showed 18.6% of students receiving free- and reduced-lunch services promoted, which is 9.8 percentage points more than peers not receiving those services. The percentage of students who were retained and receiving free- and reduced-lunch services was more than double their peers who were retained and not receiving those services in 2019. There were 3.7% of retained students receiving free- and reduced-lunch who were retained, as opposed to 1.5% of students not receiving those services. In 2020, the percentage of students who received free- and reduced-lunch that were retained was still double those who did not receive those services.

2020 READING SUFFICIENCY ACT STUDY | Oklahoma State Department of Education 38
TABLE 14. PROMOTION DECISIONS BY RACE/ETHNICITY
Pathway 1: OSTP
Pathway 2: Screener
Pathway 3: Exemption
Pathway 4: SRPT Retained Total
2019
Black 2,781 58.0%
469 9.8%
439 9.2%
784 16.3%
321 6.7%
4,794 9.3%
American Indian 5,061 73.7%
395 5.8%
745 10.8%
414 6.0%
253 3.7%
6,868 13.3%
Asian/Pacific Islander 993 78.1%
72 5.7%
83 6.5%
101 7.9%
23 1.8%
1,272 2.5%
White 20,284 83.6%
956 3.9%
1,513 6.2%
988 4.1%
529 2.2%
24,270 47.1%
Hispanic 6,364 70%
603 6.6%
681 7.5%
1,129 12.4%
316 3.5%
9,093 17.6%
Two or More 4,519 86.5%
174 3.3%
184 3.5%
244 4.7%
101 1.9%
5,222 10.1%
Total 40,002 77.6%
2,669 5.2%
3,645 7.1%
3,660 7.1%
1,543 3.0% 51,519
2020
2.
5%
Black n/a 1,713 40.5%
1,107 26.2%
1,266 29.9%
145 3.4%
4,231 9.1%
American Indian n/a 3,471 64%
1,201 22.1%
588 10.8%
167 3.1%
5,427 11.6%
Asian/Pacific Islander n/a 819 67.7%
161 13.3%
213 17.6%
16 1.3%
1,209 2.6%
White n/a 15,217 70.2%
3,786 17.5%
2,189 10.1%
474 2.2%
21,666 46.4%
Hispanic n/a 4,477 50.7%
1,996 22.6%
2,132 24.1%
225 2.5%
8,830 18.9%
Two or More n/a 3,486 64.9%
948 17.6%
796 14.8%
144 2.7%
5,374 11.5%
Total n/a 29,183
62.4% 9,199 19.7%
7,184 15.4%
1,171 2.5% 46,737

2020 READING SUFFICIENCY ACT STUDY | Oklahoma State Department of Education 39
Table 14 examines the number and percentage of students by race and ethnicity and the promotion or retention decisions made for each sub-group. The percentage for each sub-group is similar from 2019 to 2020. As previously noted, the majority of students in all sub-groups were promoted through Pathway 1 in 2019. In 2020, the majority of students were promoted through Pathway 2. Since Pathway 1 was not an available option in 2020, comparing the percentages between the two years is difficult. These was a smaller percentage of students retained in 2020 as compared to 2019. Black students had the biggest difference from 2019 to 2020, with a difference of 3.3 percentage points. There were 6.7% of Black students retained in 2019 and 3.4% Black students retained in 2020. Hispanic students also saw a slight decline (1%) in the percentage of students retained from 2019 to 2020. At the same time, there was a slight increase (0.8%) in the decision to retain with the percentage of students who identified with two or more sub-groups from 2019 to 2020.
FUNDING FOR READING REMEDIATION This section addresses the question, What funding was appropriated to each district for reading remediation?
The State Department of Education Office of State Aid maintains records of funding allocated to each district. Those amounts are reported here.
In Fiscal Year 2013, no state funding was appropriated for RSA. Since Fiscal Year 2014, RSA funds have been allocated and paid without districts submitting claims for reimbursement. Instead, the total allocation has been disbursed to districts for their use throughout the year. Funds are disbursed after every school site serving kindergarten through third-grade students has certified their Beginning of Year data report and has submitted an Annual District Reading Plan that has been approved by the Oklahoma State Department of Education. Funds are generally received by districts in December of each year.
RSA funds may be used for the following:
• Salaries for teachers and teaching assistants for before-school and after-school programs
• Summer school teachers and during-school reading interventionists • Data processing services, software services and internet services • Printing and binding, copy supplies and office supplies • Instructional materials for students identified and placed on a program of reading
instruction

2020 READING SUFFICIENCY ACT STUDY | Oklahoma State Department of Education 40
• Approved screening assessments, academic student assessment supplies and materials
• Books, state-adopted textbooks, supplemental non-state-adopted textbooks, workbooks, magazines, approved technology-related equipment and reading software
• Contracted services (non-payroll personnel) for offsite, onsite or online professional development training
• Travel and registration fees for teachers, paraprofessionals and interventionists to attend approved RSA professional development training
• Salaries for bus drivers providing student transportation for before- and after-school programs or the Summer Academy Reading Program for RSA
Figure 8 depicts the history of overall funding for the RSA, as well as the per-pupil allocation determined each year based on data received from districts. In Fiscal Year 2014, $6,500,000 was allocated across the state. With 82,777 students identified as at-risk, districts received $76.78 per student identified. In Fiscal Year 2015, the total allocation was $6,492,075 and 82,758 students were identified as at-risk, making the per pupil allocation $74.52. In Fiscal Year 2016, the total allocation was $6,492,074. The per-pupil allocation in that year was $76.87 per student identified as at-risk with a total of 79,076 students. In Fiscal Year 2017, the allocation was $56.13 per student identified as at-risk. The total allocation for the state was $4,507,426 to be spread among 79,426 students. In Fiscal Year 2018, the total allocation was $6,500,000 and 77,677 students were identified as at-risk, with a per-pupil allocation of $82.95 per student identified. The total allocation in Fiscal Year 2019 was $6,500,000. The per-pupil allocation was $81.51 for the 79,738 students identified as at-risk. In Fiscal Year 2020, the total allocation was $12,000,000 and 89,459 students were identified as at-risk. The per-pupil allocation was $134.14 per students identified as at-risk.
Table 15 showcases the RSA funding appropriated to each Oklahoma district over the last four years from 2017 through 2020.
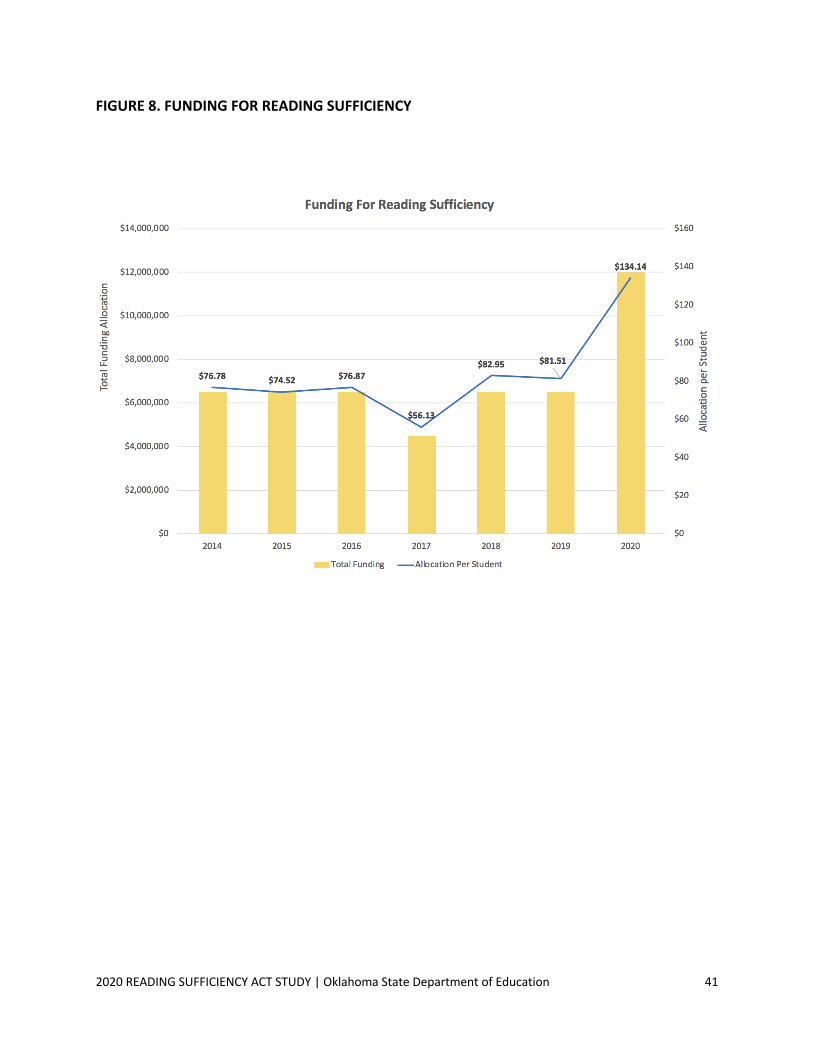
2020 READING SUFFICIENCY ACT STUDY | Oklahoma State Department of Education 41
FIGURE 8. FUNDING FOR READING SUFFICIENCY
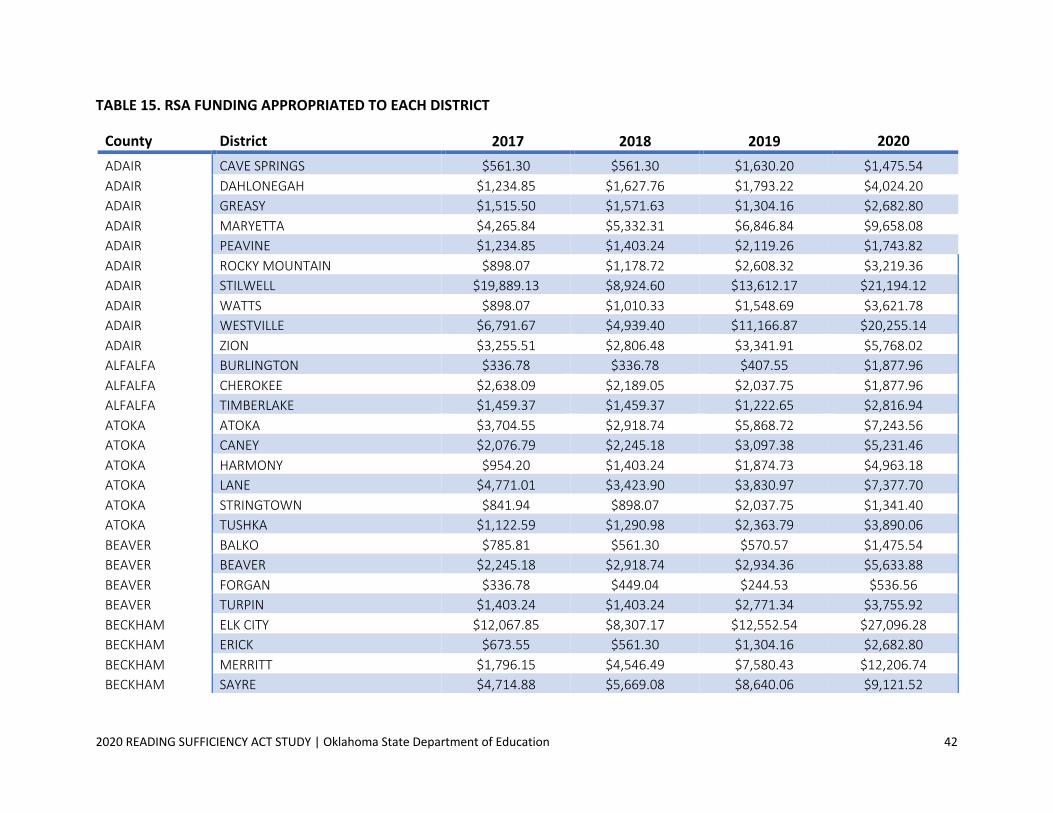
2020 READING SUFFICIENCY ACT STUDY | Oklahoma State Department of Education 42
TABLE 15. RSA FUNDING APPROPRIATED TO EACH DISTRICT
County District 2017 2018 2019 2020 ADAIR CAVE SPRINGS $561.30 $561.30 $1,630.20 $1,475.54 ADAIR DAHLONEGAH $1,234.85 $1,627.76 $1,793.22 $4,024.20 ADAIR GREASY $1,515.50 $1,571.63 $1,304.16 $2,682.80 ADAIR MARYETTA $4,265.84 $5,332.31 $6,846.84 $9,658.08 ADAIR PEAVINE $1,234.85 $1,403.24 $2,119.26 $1,743.82 ADAIR ROCKY MOUNTAIN $898.07 $1,178.72 $2,608.32 $3,219.36 ADAIR STILWELL $19,889.13 $8,924.60 $13,612.17 $21,194.12 ADAIR WATTS $898.07 $1,010.33 $1,548.69 $3,621.78 ADAIR WESTVILLE $6,791.67 $4,939.40 $11,166.87 $20,255.14 ADAIR ZION $3,255.51 $2,806.48 $3,341.91 $5,768.02 ALFALFA BURLINGTON $336.78 $336.78 $407.55 $1,877.96 ALFALFA CHEROKEE $2,638.09 $2,189.05 $2,037.75 $1,877.96 ALFALFA TIMBERLAKE $1,459.37 $1,459.37 $1,222.65 $2,816.94 ATOKA ATOKA $3,704.55 $2,918.74 $5,868.72 $7,243.56 ATOKA CANEY $2,076.79 $2,245.18 $3,097.38 $5,231.46 ATOKA HARMONY $954.20 $1,403.24 $1,874.73 $4,963.18 ATOKA LANE $4,771.01 $3,423.90 $3,830.97 $7,377.70 ATOKA STRINGTOWN $841.94 $898.07 $2,037.75 $1,341.40 ATOKA TUSHKA $1,122.59 $1,290.98 $2,363.79 $3,890.06 BEAVER BALKO $785.81 $561.30 $570.57 $1,475.54 BEAVER BEAVER $2,245.18 $2,918.74 $2,934.36 $5,633.88 BEAVER FORGAN $336.78 $449.04 $244.53 $536.56 BEAVER TURPIN $1,403.24 $1,403.24 $2,771.34 $3,755.92 BECKHAM ELK CITY $12,067.85 $8,307.17 $12,552.54 $27,096.28 BECKHAM ERICK $673.55 $561.30 $1,304.16 $2,682.80 BECKHAM MERRITT $1,796.15 $4,546.49 $7,580.43 $12,206.74 BECKHAM SAYRE $4,714.88 $5,669.08 $8,640.06 $9,121.52

2020 READING SUFFICIENCY ACT STUDY | Oklahoma State Department of Education 43
County District 2017 2018 2019 2020
BLAINE CANTON $3,872.94 $3,087.12 $2,934.36 $3,621.78 BLAINE GEARY $1,627.76 $2,638.09 $5,298.15 $3,890.06 BLAINE OKEENE $1,852.27 $505.17 $1,548.69 $1,877.96 BLAINE WATONGA $4,265.84 $3,423.90 $5,053.62 $10,731.20 BRYAN ACHILLE $2,918.74 $3,872.94 $3,504.93 $8,853.24 BRYAN BENNINGTON $2,413.57 $2,357.44 $4,890.60 $5,365.60 BRYAN CADDO $3,030.99 $2,862.61 $3,830.97 $6,438.72 BRYAN CALERA $2,469.70 $3,648.42 $4,890.60 $8,584.96 BRYAN COLBERT $4,771.01 $4,658.75 $4,727.58 $10,462.92 BRYAN DURANT $24,304.09 $30,197.69 $40,999.53 $63,984.78 BRYAN ROCK CREEK $2,020.66 $3,143.25 $4,564.56 $8,182.54 BRYAN SILO $5,612.95 $5,051.66 $8,721.57 $15,694.38 CADDO ANADARKO $12,123.98 $11,618.81 $14,916.33 $25,620.74 CADDO BINGER-ONEY $2,245.18 $2,245.18 $2,200.77 $4,694.90 CADDO BOONE-APACHE $3,255.51 $2,525.83 $3,260.40 $5,902.16 CADDO CARNEGIE $2,581.96 $3,087.12 $5,461.17 $7,511.84 CADDO CEMENT $673.55 $898.07 $2,200.77 $3,219.36 CADDO CYRIL $1,796.15 $1,178.72 $3,097.38 $8,987.38 CADDO FORT COBB-BROXTON $2,469.70 $1,964.53 $2,200.77 $7,243.56 CADDO GRACEMONT $1,403.24 $1,796.15 $1,793.22 $2,280.38 CADDO HINTON $3,030.99 $2,189.05 $2,363.79 $4,963.18 CADDO HYDRO-EAKLY $3,255.51 $1,740.02 $3,097.38 $6,438.72 CADDO LOOKEBA SICKLES $1,964.53 $1,234.85 $1,630.20 $2,280.38 CANADIAN BANNER $1,290.98 $841.94 $1,630.20 $3,621.78 CANADIAN CALUMET $1,010.33 $1,010.33 $1,385.67 $2,146.24 CANADIAN DARLINGTON $1,627.76 $2,469.70 $2,200.77 $5,499.74 CANADIAN EL RENO $20,936.32 $21,441.48 $37,820.64 $58,350.90 CANADIAN MAPLE $1,122.59 $1,066.46 $2,037.75 $2,816.94 CANADIAN MUSTANG $59,665.69 $60,619.90 $110,201.52 $231,659.78
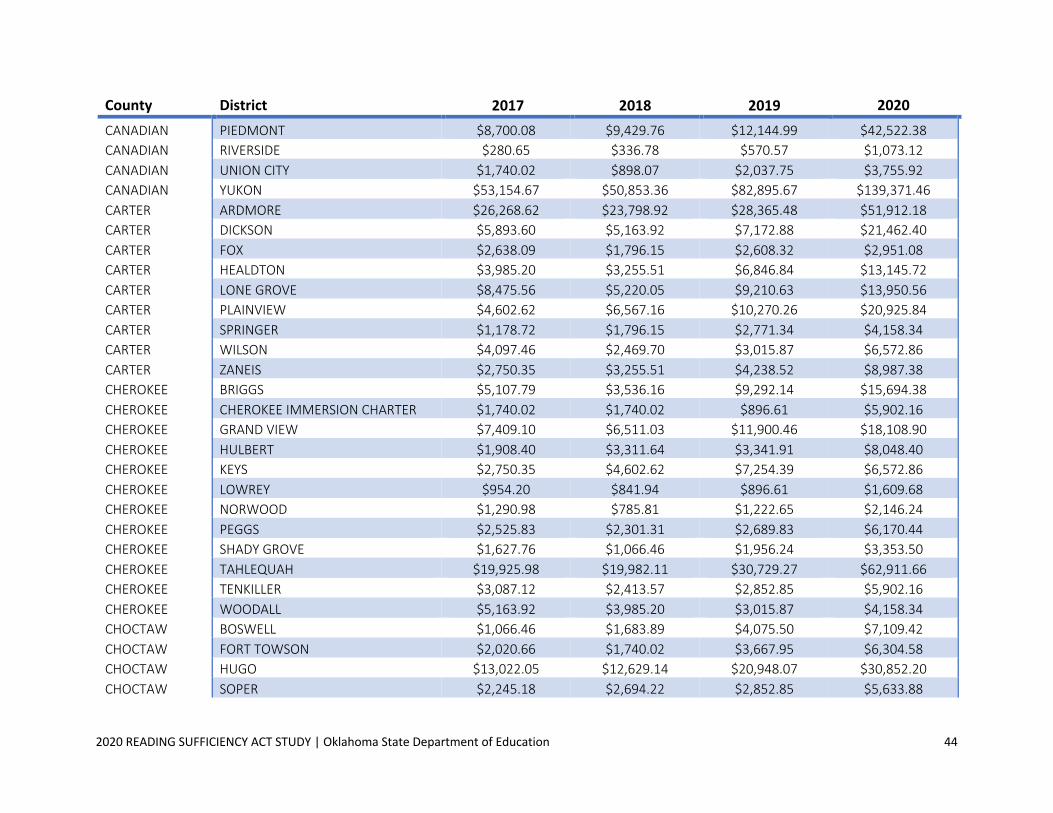
2020 READING SUFFICIENCY ACT STUDY | Oklahoma State Department of Education 44
County District 2017 2018 2019 2020
CANADIAN PIEDMONT $8,700.08 $9,429.76 $12,144.99 $42,522.38 CANADIAN RIVERSIDE $280.65 $336.78 $570.57 $1,073.12 CANADIAN UNION CITY $1,740.02 $898.07 $2,037.75 $3,755.92 CANADIAN YUKON $53,154.67 $50,853.36 $82,895.67 $139,371.46 CARTER ARDMORE $26,268.62 $23,798.92 $28,365.48 $51,912.18 CARTER DICKSON $5,893.60 $5,163.92 $7,172.88 $21,462.40 CARTER FOX $2,638.09 $1,796.15 $2,608.32 $2,951.08 CARTER HEALDTON $3,985.20 $3,255.51 $6,846.84 $13,145.72 CARTER LONE GROVE $8,475.56 $5,220.05 $9,210.63 $13,950.56 CARTER PLAINVIEW $4,602.62 $6,567.16 $10,270.26 $20,925.84 CARTER SPRINGER $1,178.72 $1,796.15 $2,771.34 $4,158.34 CARTER WILSON $4,097.46 $2,469.70 $3,015.87 $6,572.86 CARTER ZANEIS $2,750.35 $3,255.51 $4,238.52 $8,987.38 CHEROKEE BRIGGS $5,107.79 $3,536.16 $9,292.14 $15,694.38 CHEROKEE CHEROKEE IMMERSION CHARTER $1,740.02 $1,740.02 $896.61 $5,902.16 CHEROKEE GRAND VIEW $7,409.10 $6,511.03 $11,900.46 $18,108.90 CHEROKEE HULBERT $1,908.40 $3,311.64 $3,341.91 $8,048.40 CHEROKEE KEYS $2,750.35 $4,602.62 $7,254.39 $6,572.86 CHEROKEE LOWREY $954.20 $841.94 $896.61 $1,609.68 CHEROKEE NORWOOD $1,290.98 $785.81 $1,222.65 $2,146.24 CHEROKEE PEGGS $2,525.83 $2,301.31 $2,689.83 $6,170.44 CHEROKEE SHADY GROVE $1,627.76 $1,066.46 $1,956.24 $3,353.50 CHEROKEE TAHLEQUAH $19,925.98 $19,982.11 $30,729.27 $62,911.66 CHEROKEE TENKILLER $3,087.12 $2,413.57 $2,852.85 $5,902.16 CHEROKEE WOODALL $5,163.92 $3,985.20 $3,015.87 $4,158.34 CHOCTAW BOSWELL $1,066.46 $1,683.89 $4,075.50 $7,109.42 CHOCTAW FORT TOWSON $2,020.66 $1,740.02 $3,667.95 $6,304.58 CHOCTAW HUGO $13,022.05 $12,629.14 $20,948.07 $30,852.20 CHOCTAW SOPER $2,245.18 $2,694.22 $2,852.85 $5,633.88

2020 READING SUFFICIENCY ACT STUDY | Oklahoma State Department of Education 45
County District 2017 2018 2019 2020
CHOCTAW SWINK $1,178.72 $1,571.63 $2,608.32 -- CIMARRON BOISE CITY $1,515.50 $1,852.27 $2,852.85 $2,951.08 CIMARRON FELT $673.55 $785.81 $489.06 $1,475.54 CIMARRON KEYES $336.78 $224.52 $570.57 $804.84 CLEVELAND LEXINGTON $6,960.06 $5,500.69 $9,292.14 $17,438.20 CLEVELAND LITTLE AXE $7,633.62 $12,404.63 $6,928.35 $23,742.78 CLEVELAND MOORE $124,607.56 $106,197.08 $169,051.74 $316,570.40 CLEVELAND NOBLE $21,666.00 $20,262.76 $28,528.50 $44,668.62 CLEVELAND NORMAN $56,746.96 $62,247.65 $90,965.16 $266,267.90 CLEVELAND ROBIN HILL $1,459.37 $449.04 $570.57 $1,207.26 COAL COALGATE $3,199.38 $3,255.51 $4,890.60 $8,584.96 COAL COTTONWOOD $1,010.33 $1,515.50 $1,222.65 $2,414.52 COAL TUPELO $1,852.27 $1,796.15 $3,178.89 $3,487.64 COMANCHE BISHOP $3,255.51 $5,051.66 $7,906.47 $14,352.98 COMANCHE CACHE $9,205.24 $12,011.72 $19,888.44 $28,169.40 COMANCHE CHATTANOOGA $1,234.85 $1,908.40 $2,282.28 $4,426.62 COMANCHE ELGIN $7,240.71 $8,026.52 $13,041.60 $21,730.68 COMANCHE FLETCHER $2,132.92 $1,964.53 $4,157.01 $6,170.44 COMANCHE FLOWER MOUND $9,092.98 $3,423.90 $5,379.66 $6,170.44 COMANCHE GERONIMO $1,347.11 $1,571.63 $1,793.22 $2,280.38 COMANCHE INDIAHOMA $449.04 $505.17 $1,385.67 $2,951.08 COMANCHE LAWTON $123,821.75 $125,898.54 $188,206.59 $324,618.80 COMANCHE STERLING $1,347.11 $1,571.63 $2,363.79 $4,158.34 COTTON BIG PASTURE $898.07 $1,908.40 $3,097.38 $4,426.62 COTTON TEMPLE $2,132.92 $1,403.24 $2,852.85 $2,146.24 COTTON WALTERS $2,806.48 $3,199.38 $4,320.03 $7,377.70 CRAIG BLUEJACKET $1,627.76 $1,683.89 $2,852.85 $4,426.62 CRAIG KETCHUM $1,066.46 $1,347.11 $3,993.99 $6,841.14 CRAIG VINITA $9,822.67 $8,531.69 $9,944.22 $18,645.46

2020 READING SUFFICIENCY ACT STUDY | Oklahoma State Department of Education 46
County District 2017 2018 2019 2020
CRAIG WELCH $392.91 $449.04 $733.59 $1,743.82 CRAIG WHITE OAK $0.00 $56.13 $81.51 $134.14 CREEK ALLEN-BOWDEN $2,862.61 $2,806.48 $4,890.60 $8,719.10 CREEK BRISTOW $9,205.24 $9,766.54 $13,367.64 $27,230.42 CREEK DEPEW $1,964.53 $2,245.18 $1,874.73 $2,548.66 CREEK DRUMRIGHT $2,806.48 $3,872.94 $4,483.05 $6,036.30 CREEK GYPSY $392.91 $729.68 $489.06 $804.84 CREEK KELLYVILLE $7,128.45 $7,072.32 $8,803.08 $16,901.64 CREEK KIEFER $3,648.42 $4,209.71 $4,320.03 $16,365.08 CREEK LONE STAR $6,960.06 $5,781.34 $7,498.92 $9,121.52 CREEK MANNFORD $7,240.71 $7,689.75 $8,966.10 $16,096.80 CREEK MOUNDS $1,010.33 $1,234.85 $1,956.24 $4,158.34 CREEK OILTON $1,403.24 $1,515.50 $1,793.22 $3,487.64 CREEK OLIVE $2,750.35 $2,469.70 $1,711.71 $3,085.22 CREEK PRETTY WATER $1,627.76 $1,459.37 $2,282.28 $2,682.80 CREEK SAPULPA $32,218.35 $28,177.03 $40,591.98 $63,448.22 CUSTER ARAPAHO-BUTLER $841.94 $1,403.24 $1,956.24 $3,353.50 CUSTER CLINTON $20,094.37 $15,435.62 $21,437.13 $32,864.30 CUSTER THOMAS-FAY-CUSTER UNIFIED DIST $1,347.11 $1,347.11 $1,141.14 $4,560.76 CUSTER WEATHERFORD $9,822.67 $9,991.06 $21,192.60 $22,267.24 DELAWARE CLEORA $449.04 $617.42 $489.06 $1,073.12 DELAWARE COLCORD $5,332.31 $5,444.56 $8,558.55 $11,938.46 DELAWARE GROVE $27,559.60 $26,380.88 $44,015.40 $59,289.88 DELAWARE JAY $11,674.94 $12,853.66 $16,138.98 $21,998.96 DELAWARE KANSAS $2,357.44 $1,964.53 $2,852.85 $4,426.62 DELAWARE KENWOOD $785.81 $785.81 $1,222.65 $2,548.66 DELAWARE LEACH $1,290.98 $1,290.98 $3,097.38 $6,438.72 DELAWARE MOSELEY $1,290.98 $2,413.57 $3,586.44 $4,292.48 DELAWARE OAKS-MISSION $954.20 $1,459.37 $2,119.26 $2,280.38

2020 READING SUFFICIENCY ACT STUDY | Oklahoma State Department of Education 47
County District 2017 2018 2019 2020
DEWEY SEILING $3,480.03 $3,255.51 $4,727.58 $7,243.56 DEWEY TALOGA $1,010.33 $392.91 $326.04 $1,743.82 DEWEY VICI $954.20 $673.55 $1,141.14 $3,487.64 ELLIS ARNETT $841.94 $617.42 $733.59 $1,743.82 ELLIS FARGO $1,459.37 $617.42 $1,141.14 $1,207.26 ELLIS SHATTUCK $729.68 $673.55 $1,385.67 $4,158.34 GARFIELD CHISHOLM $6,005.86 $7,240.71 $10,840.83 $19,047.88 GARFIELD COVINGTON-DOUGLAS $617.42 $954.20 $1,304.16 $1,743.82 GARFIELD DRUMMOND $1,964.53 $729.68 $2,119.26 $4,292.48 GARFIELD ENID $85,429.15 $71,340.64 $107,593.20 $172,772.32 GARFIELD GARBER $2,132.92 $1,627.76 $4,075.50 $5,902.16 GARFIELD KREMLIN-HILLSDALE $1,347.11 $1,290.98 $1,304.16 $2,414.52 GARFIELD PIONEER-PLEASANT VALE $3,929.07 $8,756.21 $5,542.68 $8,853.24 GARFIELD WAUKOMIS $2,245.18 $2,357.44 $1,630.20 $5,902.16 GARVIN ELMORE CITY-PERNELL $2,638.09 $1,908.40 $3,586.44 $3,890.06 GARVIN LINDSAY $9,654.28 $10,776.87 $11,655.93 $21,462.40 GARVIN MAYSVILLE $1,178.72 $841.94 $3,260.40 $3,890.06 GARVIN PAOLI $505.17 $729.68 $1,222.65 $938.98 GARVIN PAULS VALLEY $3,929.07 $4,265.84 $13,856.70 $21,194.12 GARVIN STRATFORD $2,357.44 $2,694.22 $4,972.11 $9,389.80 GARVIN WHITEBEAD $3,143.25 $4,939.40 $5,624.19 $8,316.68 GARVIN WYNNEWOOD $3,311.64 $3,030.99 $5,542.68 $9,523.94 GRADY ALEX $1,908.40 $2,189.05 $2,689.83 $6,841.14 GRADY AMBER-POCASSET $3,648.42 $3,648.42 $5,624.19 $7,377.70 GRADY BRIDGE CREEK $3,985.20 $7,409.10 $10,922.34 $31,657.04 GRADY CHICKASHA $7,184.58 $8,980.73 $15,568.41 $28,840.10 GRADY FRIEND $954.20 $1,122.59 $1,059.63 $2,012.10 GRADY MIDDLEBERG $1,683.89 $1,740.02 $1,630.20 $3,353.50 GRADY MINCO $2,581.96 $2,918.74 $2,852.85 $3,755.92

2020 READING SUFFICIENCY ACT STUDY | Oklahoma State Department of Education 48
County District 2017 2018 2019 2020
GRADY NINNEKAH $1,066.46 $505.17 $978.12 $4,158.34 GRADY PIONEER $1,347.11 $841.94 $1,874.73 $2,951.08 GRADY RUSH SPRINGS $5,388.44 $3,367.77 $2,363.79 $6,841.14 GRADY TUTTLE $6,903.93 $7,128.45 $12,144.99 $16,230.94 GRADY VERDEN $2,076.79 $2,357.44 $3,749.46 $4,426.62 GRANT DEER CREEK-LAMONT $280.65 $505.17 $407.55 $804.84 GRANT MEDFORD $2,076.79 $1,683.89 $1,467.18 $2,816.94 GRANT POND CREEK-HUNTER $1,178.72 $1,515.50 $896.61 $2,012.10 GREER GRANITE $1,234.85 $1,403.24 $1,956.24 $2,816.94 GREER MANGUM $3,985.20 $6,511.03 $8,640.06 $9,792.22 HARMON HOLLIS $3,311.64 $3,648.42 $6,683.82 $10,462.92 HARPER BUFFALO $1,178.72 $785.81 $1,141.14 $1,877.96 HARPER LAVERNE $2,413.57 $1,683.89 $3,341.91 $7,243.56 HASKELL KEOTA $2,413.57 $2,413.57 $3,178.89 $6,841.14 HASKELL KINTA $785.81 $1,066.46 $815.10 $3,890.06 HASKELL MCCURTAIN $954.20 $1,234.85 $1,874.73 $4,426.62 HASKELL STIGLER $6,735.54 $6,567.16 $9,699.69 $18,511.32 HASKELL WHITEFIELD $1,347.11 $1,964.53 $2,363.79 $5,097.32 HUGHES CALVIN $1,178.72 $1,515.50 $3,178.89 $2,548.66 HUGHES HOLDENVILLE $5,051.66 $5,220.05 $8,721.57 $17,974.76 HUGHES MOSS $505.17 $1,515.50 $2,363.79 $5,231.46 HUGHES STUART $561.30 $673.55 $652.08 $938.98 HUGHES WETUMKA $2,189.05 $1,908.40 $2,689.83 $8,048.40 JACKSON ALTUS $29,411.88 $30,702.85 $38,554.23 $56,204.66 JACKSON BLAIR $1,964.53 $2,189.05 $3,178.89 $4,963.18 JACKSON DUKE $1,066.46 $1,459.37 $2,363.79 $3,487.64 JACKSON ELDORADO $673.55 -- -- -- JACKSON ELDORADO-OLUSTEE -- $1,908.40 $3,341.91 $938.98 JACKSON NAVAJO $2,357.44 $3,311.64 $4,157.01 $5,499.74

2020 READING SUFFICIENCY ACT STUDY | Oklahoma State Department of Education 49
County District 2017 2018 2019 2020
JEFFERSON OLUSTEE $1,459.37 -- -- -- JEFFERSON RINGLING $2,020.66 $2,301.31 $2,934.36 $5,768.02 JEFFERSON RYAN $449.04 $392.91 $1,793.22 $4,694.90 JEFFERSON TERRAL $1,010.33 $392.91 $652.08 $670.70 JOHNSTON WAURIKA $3,030.99 $3,480.03 $4,727.58 $10,865.34 JOHNSTON COLEMAN $1,347.11 $505.17 $1,630.20 $3,353.50 JOHNSTON MANNSVILLE $1,234.85 $841.94 $2,771.34 $2,682.80 JOHNSTON MILBURN $617.42 $1,010.33 $978.12 $1,475.54 JOHNSTON MILL CREEK $1,627.76 $1,796.15 $1,711.71 $4,829.04 JOHNSTON RAVIA $729.68 $617.42 $652.08 $1,877.96 JOHNSTON TISHOMINGO $5,107.79 $3,311.64 $7,335.90 $7,243.56 KAY WAPANUCKA $1,627.76 $2,806.48 $3,830.97 $5,365.60 KAY BLACKWELL $12,460.76 $10,833.00 $16,546.53 $24,681.76 KAY KILDARE $392.91 $785.81 $489.06 $1,609.68 KAY NEWKIRK $4,602.62 $5,669.08 $8,314.02 $12,609.16 KAY PECKHAM $1,234.85 $1,740.02 $1,385.67 $1,877.96 KAY PONCA CITY $46,587.51 $41,199.08 $49,558.08 $76,459.80 KINGFISHER TONKAWA $2,974.87 $6,398.77 $5,542.68 $9,792.22 KINGFISHER CASHION $3,929.07 $2,862.61 $4,483.05 $9,255.66 KINGFISHER DOVER $2,020.66 $1,852.27 $1,793.22 $2,012.10 KINGFISHER HENNESSEY $8,587.82 $6,061.99 $10,270.26 $17,304.06 KINGFISHER KINGFISHER $3,929.07 $3,872.94 $7,661.94 $15,291.96 KINGFISHER LOMEGA $1,290.98 $841.94 $652.08 $1,341.40 KIOWA OKARCHE $2,020.66 $3,929.07 $3,749.46 $5,097.32 KIOWA HOBART $5,500.69 $4,995.53 $7,498.92 $8,987.38 KIOWA LONE WOLF $841.94 $505.17 $815.10 $2,146.24 KIOWA MOUNTAIN VIEW-GOTEBO $1,908.40 $1,796.15 $2,689.83 $4,829.04 LATIMER SNYDER $3,087.12 $2,694.22 $3,260.40 $8,316.68 LATIMER BUFFALO VALLEY $954.20 $954.20 $1,059.63 $2,146.24

2020 READING SUFFICIENCY ACT STUDY | Oklahoma State Department of Education 50
County District 2017 2018 2019 2020
LATIMER PANOLA $1,683.89 $673.55 $1,304.16 $938.98 LATIMER RED OAK $898.07 $1,122.59 $1,304.16 $2,682.80 LE FLORE WILBURTON $3,872.94 $7,296.84 $8,966.10 $13,279.86 LE FLORE ARKOMA $1,066.46 $1,403.24 $2,608.32 $4,963.18 LE FLORE BOKOSHE $1,403.24 $1,683.89 $3,178.89 $4,292.48 LE FLORE CAMERON $2,638.09 $2,189.05 $2,852.85 $5,097.32 LE FLORE FANSHAWE $841.94 $1,010.33 $1,385.67 $2,682.80 LE FLORE HEAVENER $729.68 $505.17 $1,141.14 $3,487.64 LE FLORE HODGEN $2,918.74 $2,750.35 $4,238.52 $6,170.44 LE FLORE HOWE $2,974.87 $2,750.35 $5,868.72 $8,719.10 LE FLORE LE FLORE $449.04 $1,290.98 $3,912.48 $4,158.34 LE FLORE MONROE $673.55 $392.91 $570.57 $2,012.10 LE FLORE PANAMA $4,771.01 $4,827.14 $8,477.04 $15,962.66 LE FLORE POCOLA $7,409.10 $4,546.49 $7,580.43 $21,596.54 LE FLORE POTEAU $10,215.58 $10,608.48 $13,286.13 $19,718.58 LE FLORE SHADY POINT $3,255.51 $2,357.44 $4,157.01 $5,231.46 LE FLORE SPIRO $10,047.19 $10,776.87 $18,176.73 $18,511.32 LE FLORE TALIHINA $2,301.31 $2,974.87 $6,846.84 $9,389.80 LE FLORE WHITESBORO $1,010.33 $841.94 $896.61 $2,414.52 LINCOLN WISTER $1,796.15 $2,806.48 $978.12 $12,340.88 LINCOLN AGRA $2,694.22 $2,357.44 $2,689.83 $5,902.16 LINCOLN CARNEY $3,030.99 $2,469.70 $2,771.34 $4,292.48 LINCOLN CHANDLER $6,735.54 $7,296.84 $9,699.69 $17,572.34 LINCOLN DAVENPORT $898.07 $954.20 $1,711.71 $3,353.50 LINCOLN MEEKER $7,689.75 $5,444.56 $7,091.37 $11,938.46 LINCOLN PRAGUE $2,862.61 $2,862.61 $6,765.33 $15,694.38 LINCOLN STROUD $1,852.27 $1,515.50 $2,608.32 $6,707.00 LINCOLN WELLSTON $4,939.40 $5,725.21 $6,113.25 $8,316.68 LOGAN WHITE ROCK $2,357.44 $1,347.11 $2,363.79 $2,951.08

2020 READING SUFFICIENCY ACT STUDY | Oklahoma State Department of Education 51
County District 2017 2018 2019 2020
LOGAN COYLE $2,525.83 $1,515.50 $4,075.50 $3,487.64 LOGAN CRESCENT $3,648.42 $2,750.35 $4,075.50 $7,511.84 LOGAN GUTHRIE $21,216.96 $25,538.94 $34,234.20 $61,704.40 LOVE MULHALL-ORLANDO $1,234.85 $1,290.98 $2,119.26 $3,219.36 LOVE GREENVILLE $1,122.59 $1,459.37 $2,282.28 $3,621.78 LOVE MARIETTA $5,893.60 $7,240.71 $7,987.98 $13,279.86 LOVE THACKERVILLE $3,872.94 $2,918.74 $4,972.11 $6,841.14 MAJOR TURNER $2,750.35 $1,683.89 $2,037.75 $5,633.88 MAJOR ALINE-CLEO $449.04 $449.04 $407.55 $536.56 MAJOR CIMARRON $2,357.44 $1,796.15 $4,238.52 $4,829.04 MAJOR FAIRVIEW $3,143.25 $2,750.35 $7,987.98 $12,206.74 MARSHALL RINGWOOD $954.20 $2,020.66 $3,097.38 $3,085.22 MARSHALL KINGSTON $5,332.31 $5,220.05 $9,699.69 $14,352.98 MAYES MADILL $5,837.47 $8,363.30 $10,596.30 $24,145.20 MAYES ADAIR $6,903.93 $6,118.12 $6,683.82 $11,938.46 MAYES CHOUTEAU-MAZIE $5,725.21 $4,209.71 $6,846.84 $11,401.90 MAYES LOCUST GROVE $8,812.34 $8,924.60 $19,480.89 $18,511.32 MAYES OSAGE $1,290.98 $954.20 $1,630.20 $5,365.60 MAYES PRYOR $14,313.03 $17,680.80 $31,788.90 $53,521.86 MAYES SALINA $8,026.52 $7,240.71 $9,862.71 $14,621.26 MCCLAIN WICKLIFFE $729.68 $729.68 $733.59 $1,609.68 MCCLAIN BLANCHARD $8,419.43 $9,205.24 $11,248.38 $24,011.06 MCCLAIN DIBBLE $5,781.34 $4,939.40 $8,966.10 $12,877.44 MCCLAIN NEWCASTLE $4,939.40 $8,419.43 $12,144.99 $27,096.28 MCCLAIN PURCELL $7,465.23 $7,352.97 $11,574.42 $20,255.14 MCCLAIN WASHINGTON $2,862.61 $3,255.51 $5,624.19 $7,914.26 MCCURTAIN WAYNE $2,750.35 $2,357.44 $4,809.09 $9,121.52 MCCURTAIN BATTIEST $1,515.50 $785.81 $1,630.20 $2,548.66 MCCURTAIN BROKEN BOW $9,878.80 $7,633.62 $10,025.73 $17,035.78

2020 READING SUFFICIENCY ACT STUDY | Oklahoma State Department of Education 52
County District 2017 2018 2019 2020
MCCURTAIN DENISON $1,178.72 $1,627.76 $1,874.73 $4,560.76 MCCURTAIN EAGLETOWN $1,010.33 $898.07 $1,304.16 $2,682.80 MCCURTAIN FOREST GROVE $2,245.18 $1,908.40 $2,608.32 $3,890.06 MCCURTAIN GLOVER $617.42 $785.81 $978.12 $1,207.26 MCCURTAIN HAWORTH $2,469.70 $3,423.90 $2,934.36 $8,316.68 MCCURTAIN HOLLY CREEK $1,234.85 $1,290.98 $2,526.81 $3,219.36 MCCURTAIN IDABEL $8,812.34 $6,454.90 $10,188.75 $13,548.14 MCCURTAIN LUKFATA $1,740.02 $1,740.02 $2,037.75 $8,182.54 MCCURTAIN SMITHVILLE $1,122.59 $1,066.46 $896.61 $1,073.12 MCCURTAIN VALLIANT $3,760.68 $2,862.61 $5,298.15 $6,707.00 MCINTOSH WRIGHT CITY $1,796.15 $2,132.92 $5,216.64 $6,707.00 MCINTOSH CHECOTAH $9,261.37 $9,878.80 $10,596.30 $21,998.96 MCINTOSH EUFAULA $5,949.73 $7,970.39 $9,536.67 $5,902.16 MCINTOSH HANNA $561.30 $449.04 $815.10 $268.28 MCINTOSH MIDWAY $1,290.98 $1,066.46 $1,385.67 $2,682.80 MCINTOSH RYAL $954.20 $1,347.11 $2,037.75 $3,621.78 MURRAY STIDHAM $673.55 $1,178.72 $1,630.20 $3,219.36 MURRAY DAVIS $6,511.03 $5,669.08 $10,188.75 $12,072.60 MUSKOGEE SULPHUR $13,134.31 $11,787.20 $12,960.09 $13,414.00 MUSKOGEE BRAGGS $1,347.11 $505.17 $1,304.16 $2,816.94 MUSKOGEE FORT GIBSON $4,883.27 $4,602.62 $7,172.88 $11,804.32 MUSKOGEE HASKELL $7,072.32 $5,107.79 $8,640.06 $14,352.98 MUSKOGEE HILLDALE $17,231.77 $11,843.33 $13,775.19 $35,681.24 MUSKOGEE MUSKOGEE $54,894.68 $47,261.07 $68,060.85 $104,763.34 MUSKOGEE OKTAHA $7,016.19 $7,521.36 $8,477.04 $10,194.64 MUSKOGEE PORUM $4,827.14 $2,974.87 $5,787.21 $8,584.96 MUSKOGEE WAINWRIGHT $841.94 $561.30 $1,548.69 $1,073.12 MUSKOGEE WARNER $4,378.10 $4,097.46 $6,683.82 $9,926.36 NOBLE WEBBERS FALLS $1,796.15 $2,189.05 $3,097.38 $7,645.98

2020 READING SUFFICIENCY ACT STUDY | Oklahoma State Department of Education 53
County District 2017 2018 2019 2020
NOBLE BILLINGS $449.04 $505.17 $407.55 $0.00 NOBLE FRONTIER $2,020.66 $1,908.40 $4,564.56 $6,438.72 NOBLE MORRISON $5,669.08 $4,434.23 $4,483.05 $8,719.10 NOWATA PERRY $8,307.17 $6,118.12 $12,797.07 $26,962.14 NOWATA NOWATA $6,791.67 $7,072.32 $12,797.07 $13,548.14 NOWATA OKLAHOMA UNION $4,546.49 $4,714.88 $5,950.23 $7,377.70 OKFUSKEE SOUTH COFFEYVILLE $1,234.85 $1,347.11 $2,037.75 $4,292.48 OKFUSKEE BEARDEN $617.42 $729.68 $815.10 $1,207.26 OKFUSKEE GRAHAM-DUSTIN $954.20 $1,347.11 $1,467.18 $2,548.66 OKFUSKEE MASON $1,122.59 $1,290.98 $2,934.36 $4,426.62 OKFUSKEE OKEMAH $9,766.54 $7,689.75 $5,298.15 $8,987.38 OKFUSKEE PADEN $3,423.90 $1,066.46 $1,467.18 $2,012.10 OKLAHOMA WELEETKA $2,806.48 $2,469.70 $6,276.27 $8,182.54 OKLAHOMA ABLE CHARTER ABLE LEARNING $0.00 -- -- -- OKLAHOMA ACADEMY OF SEMINOLE -- -- $0.00 $3,890.06 OKLAHOMA ASTEC CHARTERS $0.00 $0.00 $0.00 $0.00 OKLAHOMA BETHANY $5,556.82 $5,893.60 $8,069.49 $16,767.50 OKLAHOMA CHOCTAW-NICOMA PARK $28,962.84 $32,442.87 $35,130.81 $69,350.38 OKLAHOMA CROOKED OAK $12,123.98 $12,180.11 $13,123.11 $26,157.30 OKLAHOMA CRUTCHO $6,061.99 $6,174.25 $10,759.32 $11,133.62 OKLAHOMA DEER CREEK $20,655.67 $26,886.05 $48,335.43 $96,446.66 OKLAHOMA EDMOND $83,183.97 $91,042.10 $144,924.78 $331,728.22 OKLAHOMA EPIC BLENDED LEARNING CHARTER -- $12,404.63 $34,723.26 $90,276.22
OKLAHOMA EPIC ONE ON ONE CHARTER SCHOOL $21,946.65 $17,063.38 $44,748.99 $112,945.88
OKLAHOMA ESCHOOL VIRTUAL -- -- -- $268.28 OKLAHOMA HARRAH $17,231.77 $13,751.74 $22,333.74 $27,632.84 OKLAHOMA INSIGHT SCHOOL OF OKLAHOMA $0.00 $0.00 $0.00 $0.00
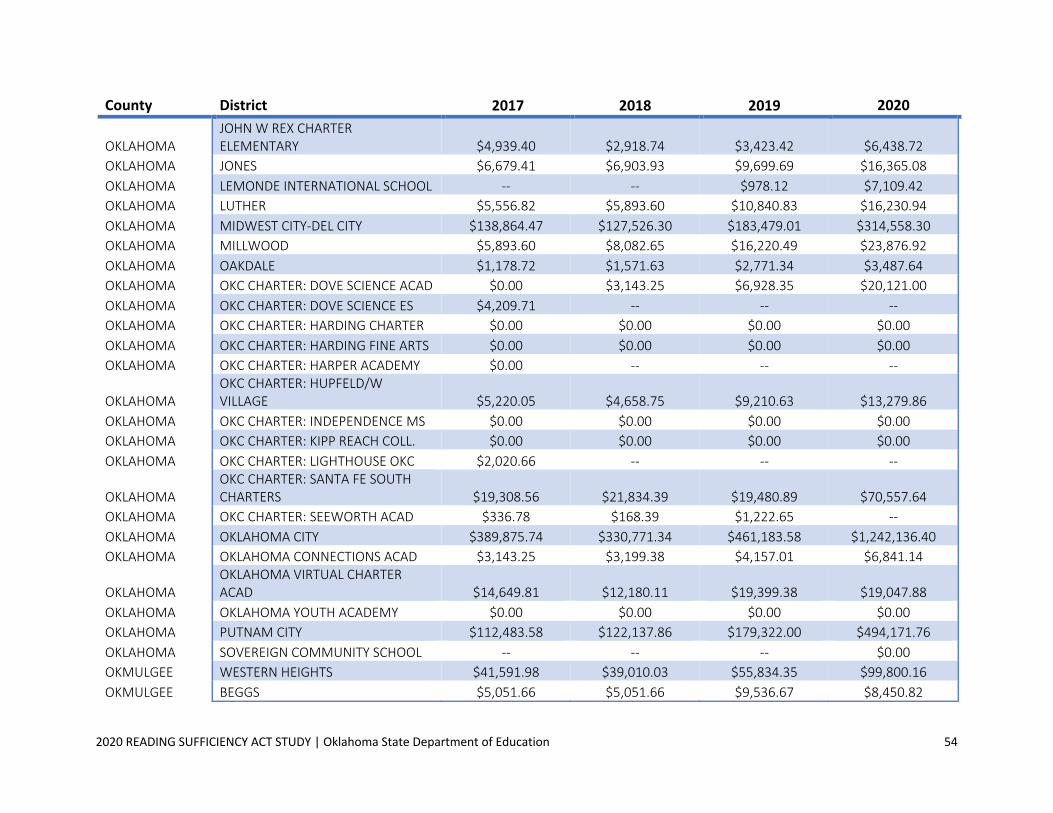
2020 READING SUFFICIENCY ACT STUDY | Oklahoma State Department of Education 54
County District 2017 2018 2019 2020
OKLAHOMA JOHN W REX CHARTER ELEMENTARY $4,939.40 $2,918.74 $3,423.42 $6,438.72
OKLAHOMA JONES $6,679.41 $6,903.93 $9,699.69 $16,365.08 OKLAHOMA LEMONDE INTERNATIONAL SCHOOL -- -- $978.12 $7,109.42 OKLAHOMA LUTHER $5,556.82 $5,893.60 $10,840.83 $16,230.94 OKLAHOMA MIDWEST CITY-DEL CITY $138,864.47 $127,526.30 $183,479.01 $314,558.30 OKLAHOMA MILLWOOD $5,893.60 $8,082.65 $16,220.49 $23,876.92 OKLAHOMA OAKDALE $1,178.72 $1,571.63 $2,771.34 $3,487.64 OKLAHOMA OKC CHARTER: DOVE SCIENCE ACAD $0.00 $3,143.25 $6,928.35 $20,121.00 OKLAHOMA OKC CHARTER: DOVE SCIENCE ES $4,209.71 -- -- -- OKLAHOMA OKC CHARTER: HARDING CHARTER $0.00 $0.00 $0.00 $0.00 OKLAHOMA OKC CHARTER: HARDING FINE ARTS $0.00 $0.00 $0.00 $0.00 OKLAHOMA OKC CHARTER: HARPER ACADEMY $0.00 -- -- --
OKLAHOMA OKC CHARTER: HUPFELD/W VILLAGE $5,220.05 $4,658.75 $9,210.63 $13,279.86
OKLAHOMA OKC CHARTER: INDEPENDENCE MS $0.00 $0.00 $0.00 $0.00 OKLAHOMA OKC CHARTER: KIPP REACH COLL. $0.00 $0.00 $0.00 $0.00 OKLAHOMA OKC CHARTER: LIGHTHOUSE OKC $2,020.66 -- -- --
OKLAHOMA OKC CHARTER: SANTA FE SOUTH CHARTERS $19,308.56 $21,834.39 $19,480.89 $70,557.64
OKLAHOMA OKC CHARTER: SEEWORTH ACAD $336.78 $168.39 $1,222.65 -- OKLAHOMA OKLAHOMA CITY $389,875.74 $330,771.34 $461,183.58 $1,242,136.40 OKLAHOMA OKLAHOMA CONNECTIONS ACAD $3,143.25 $3,199.38 $4,157.01 $6,841.14
OKLAHOMA OKLAHOMA VIRTUAL CHARTER ACAD $14,649.81 $12,180.11 $19,399.38 $19,047.88
OKLAHOMA OKLAHOMA YOUTH ACADEMY $0.00 $0.00 $0.00 $0.00 OKLAHOMA PUTNAM CITY $112,483.58 $122,137.86 $179,322.00 $494,171.76 OKLAHOMA SOVEREIGN COMMUNITY SCHOOL -- -- -- $0.00 OKMULGEE WESTERN HEIGHTS $41,591.98 $39,010.03 $55,834.35 $99,800.16 OKMULGEE BEGGS $5,051.66 $5,051.66 $9,536.67 $8,450.82

2020 READING SUFFICIENCY ACT STUDY | Oklahoma State Department of Education 55
County District 2017 2018 2019 2020
OKMULGEE DEWAR $2,189.05 $1,852.27 $3,912.48 $4,426.62 OKMULGEE HENRYETTA $10,327.83 $7,577.49 $11,900.46 $13,011.58 OKMULGEE MORRIS $7,858.13 $7,802.01 $9,210.63 $14,218.84 OKMULGEE OKMULGEE $8,138.78 $9,485.89 $14,101.23 $20,255.14 OKMULGEE PRESTON $2,525.83 $1,403.24 $4,564.56 $7,780.12 OKMULGEE SCHULTER $673.55 $673.55 $1,711.71 $2,548.66 OKMULGEE TWIN HILLS $785.81 $785.81 $1,711.71 $4,024.20 OSAGE WILSON $1,122.59 $729.68 $1,141.14 $3,487.64 OSAGE ANDERSON $3,816.81 $4,546.49 $4,727.58 $10,194.64 OSAGE AVANT $1,515.50 $1,178.72 $1,630.20 $2,012.10 OSAGE BARNSDALL $3,030.99 $3,255.51 $4,401.54 $7,780.12 OSAGE BOWRING $449.04 $449.04 $652.08 $1,207.26 OSAGE HOMINY $7,858.13 $4,602.62 $7,172.88 $12,206.74 OSAGE MCCORD $2,132.92 $2,750.35 $4,075.50 $6,572.86 OSAGE OSAGE HILLS $1,010.33 $954.20 $1,874.73 $4,694.90 OSAGE PAWHUSKA $6,342.64 $7,072.32 $8,884.59 $14,621.26 OSAGE PRUE $1,796.15 $2,918.74 $3,912.48 $7,511.84 OSAGE SHIDLER $2,076.79 $1,964.53 $1,467.18 $4,158.34 OSAGE WOODLAND $2,020.66 $2,694.22 $2,608.32 $4,829.04 OTTAWA WYNONA $617.42 $1,010.33 $1,630.20 $2,012.10 OTTAWA AFTON $3,199.38 $3,985.20 $3,912.48 $11,267.76 OTTAWA COMMERCE $4,209.71 $4,041.33 $6,031.74 $15,560.24 OTTAWA FAIRLAND $3,367.77 $4,546.49 $6,683.82 $9,255.66 OTTAWA MIAMI $11,787.20 $15,604.01 $25,838.67 $46,010.02 OTTAWA QUAPAW $4,321.97 $3,648.42 $5,950.23 $10,194.64 OTTAWA TURKEY FORD $841.94 $954.20 $1,467.18 $3,621.78 PAWNEE WYANDOTTE $5,332.31 $4,434.23 $6,439.29 $9,389.80 PAWNEE CLEVELAND $22,451.81 $15,267.23 $22,496.76 $28,303.54 PAWNEE JENNINGS $1,740.02 $2,750.35 $4,238.52 $6,304.58
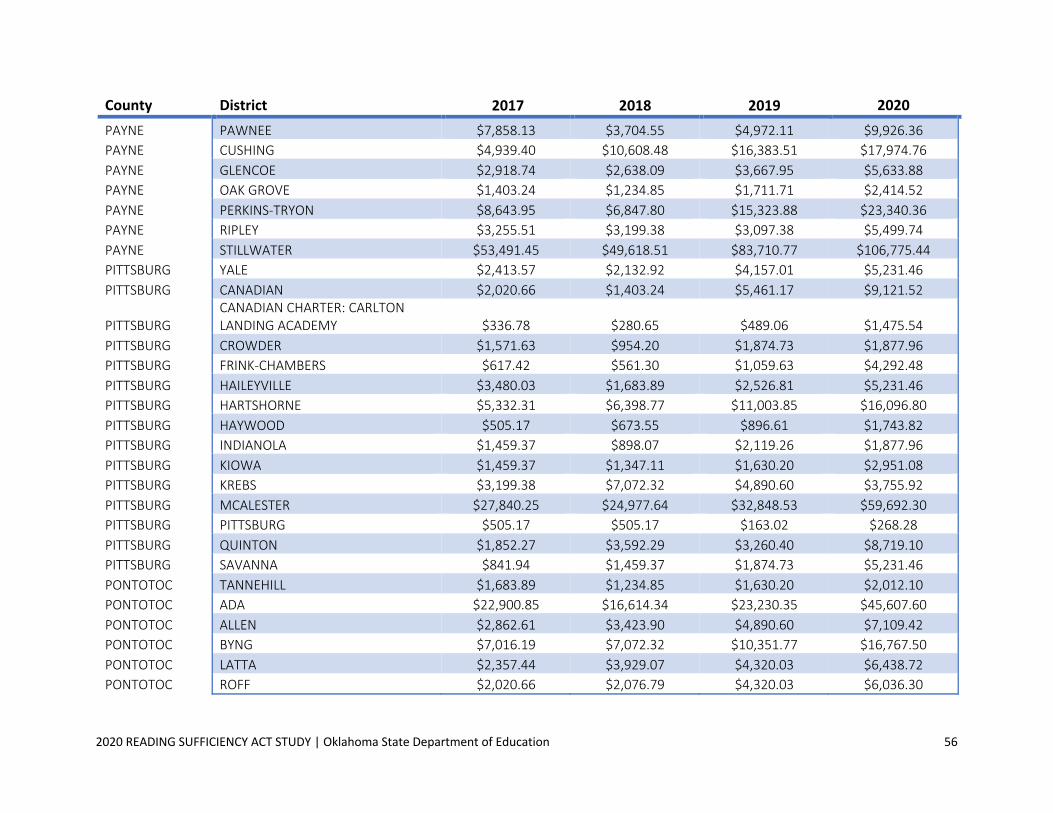
2020 READING SUFFICIENCY ACT STUDY | Oklahoma State Department of Education 56
County District 2017 2018 2019 2020
PAYNE PAWNEE $7,858.13 $3,704.55 $4,972.11 $9,926.36 PAYNE CUSHING $4,939.40 $10,608.48 $16,383.51 $17,974.76 PAYNE GLENCOE $2,918.74 $2,638.09 $3,667.95 $5,633.88 PAYNE OAK GROVE $1,403.24 $1,234.85 $1,711.71 $2,414.52 PAYNE PERKINS-TRYON $8,643.95 $6,847.80 $15,323.88 $23,340.36 PAYNE RIPLEY $3,255.51 $3,199.38 $3,097.38 $5,499.74 PAYNE STILLWATER $53,491.45 $49,618.51 $83,710.77 $106,775.44 PITTSBURG YALE $2,413.57 $2,132.92 $4,157.01 $5,231.46 PITTSBURG CANADIAN $2,020.66 $1,403.24 $5,461.17 $9,121.52
PITTSBURG CANADIAN CHARTER: CARLTON LANDING ACADEMY $336.78 $280.65 $489.06 $1,475.54
PITTSBURG CROWDER $1,571.63 $954.20 $1,874.73 $1,877.96 PITTSBURG FRINK-CHAMBERS $617.42 $561.30 $1,059.63 $4,292.48 PITTSBURG HAILEYVILLE $3,480.03 $1,683.89 $2,526.81 $5,231.46 PITTSBURG HARTSHORNE $5,332.31 $6,398.77 $11,003.85 $16,096.80 PITTSBURG HAYWOOD $505.17 $673.55 $896.61 $1,743.82 PITTSBURG INDIANOLA $1,459.37 $898.07 $2,119.26 $1,877.96 PITTSBURG KIOWA $1,459.37 $1,347.11 $1,630.20 $2,951.08 PITTSBURG KREBS $3,199.38 $7,072.32 $4,890.60 $3,755.92 PITTSBURG MCALESTER $27,840.25 $24,977.64 $32,848.53 $59,692.30 PITTSBURG PITTSBURG $505.17 $505.17 $163.02 $268.28 PITTSBURG QUINTON $1,852.27 $3,592.29 $3,260.40 $8,719.10 PITTSBURG SAVANNA $841.94 $1,459.37 $1,874.73 $5,231.46 PONTOTOC TANNEHILL $1,683.89 $1,234.85 $1,630.20 $2,012.10 PONTOTOC ADA $22,900.85 $16,614.34 $23,230.35 $45,607.60 PONTOTOC ALLEN $2,862.61 $3,423.90 $4,890.60 $7,109.42 PONTOTOC BYNG $7,016.19 $7,072.32 $10,351.77 $16,767.50 PONTOTOC LATTA $2,357.44 $3,929.07 $4,320.03 $6,438.72 PONTOTOC ROFF $2,020.66 $2,076.79 $4,320.03 $6,036.30
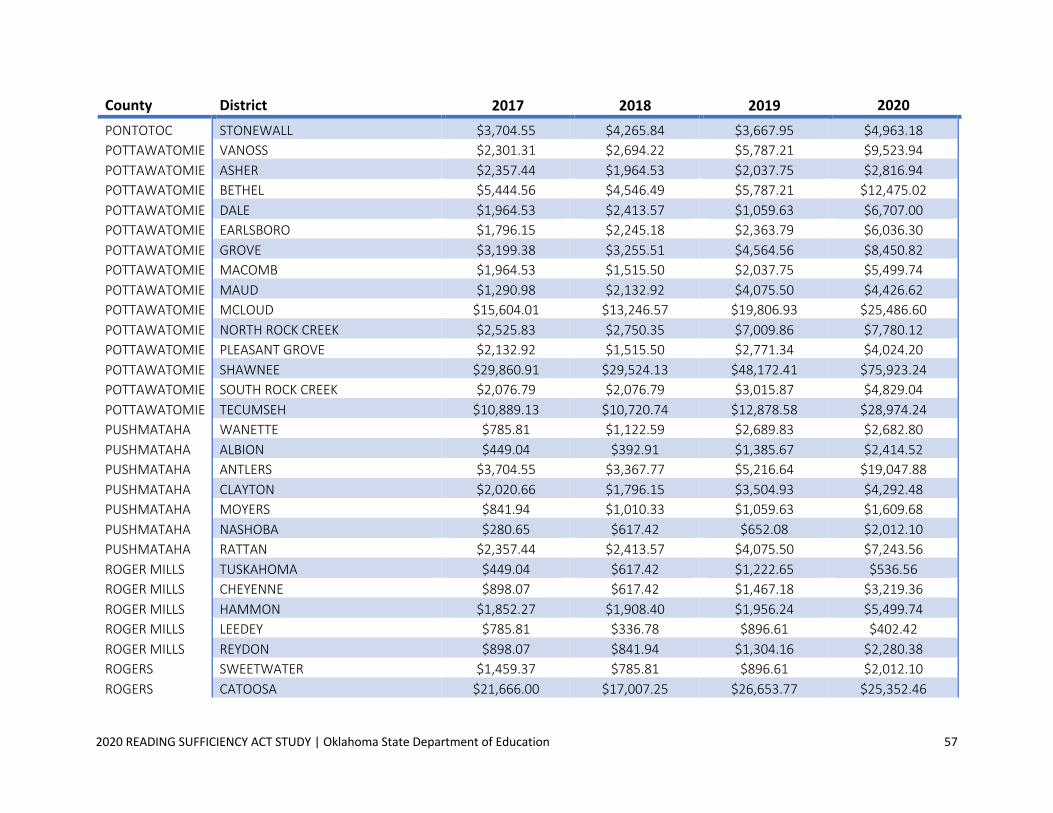
2020 READING SUFFICIENCY ACT STUDY | Oklahoma State Department of Education 57
County District 2017 2018 2019 2020
PONTOTOC STONEWALL $3,704.55 $4,265.84 $3,667.95 $4,963.18 POTTAWATOMIE VANOSS $2,301.31 $2,694.22 $5,787.21 $9,523.94 POTTAWATOMIE ASHER $2,357.44 $1,964.53 $2,037.75 $2,816.94 POTTAWATOMIE BETHEL $5,444.56 $4,546.49 $5,787.21 $12,475.02 POTTAWATOMIE DALE $1,964.53 $2,413.57 $1,059.63 $6,707.00 POTTAWATOMIE EARLSBORO $1,796.15 $2,245.18 $2,363.79 $6,036.30 POTTAWATOMIE GROVE $3,199.38 $3,255.51 $4,564.56 $8,450.82 POTTAWATOMIE MACOMB $1,964.53 $1,515.50 $2,037.75 $5,499.74 POTTAWATOMIE MAUD $1,290.98 $2,132.92 $4,075.50 $4,426.62 POTTAWATOMIE MCLOUD $15,604.01 $13,246.57 $19,806.93 $25,486.60 POTTAWATOMIE NORTH ROCK CREEK $2,525.83 $2,750.35 $7,009.86 $7,780.12 POTTAWATOMIE PLEASANT GROVE $2,132.92 $1,515.50 $2,771.34 $4,024.20 POTTAWATOMIE SHAWNEE $29,860.91 $29,524.13 $48,172.41 $75,923.24 POTTAWATOMIE SOUTH ROCK CREEK $2,076.79 $2,076.79 $3,015.87 $4,829.04 POTTAWATOMIE TECUMSEH $10,889.13 $10,720.74 $12,878.58 $28,974.24 PUSHMATAHA WANETTE $785.81 $1,122.59 $2,689.83 $2,682.80 PUSHMATAHA ALBION $449.04 $392.91 $1,385.67 $2,414.52 PUSHMATAHA ANTLERS $3,704.55 $3,367.77 $5,216.64 $19,047.88 PUSHMATAHA CLAYTON $2,020.66 $1,796.15 $3,504.93 $4,292.48 PUSHMATAHA MOYERS $841.94 $1,010.33 $1,059.63 $1,609.68 PUSHMATAHA NASHOBA $280.65 $617.42 $652.08 $2,012.10 PUSHMATAHA RATTAN $2,357.44 $2,413.57 $4,075.50 $7,243.56 ROGER MILLS TUSKAHOMA $449.04 $617.42 $1,222.65 $536.56 ROGER MILLS CHEYENNE $898.07 $617.42 $1,467.18 $3,219.36 ROGER MILLS HAMMON $1,852.27 $1,908.40 $1,956.24 $5,499.74 ROGER MILLS LEEDEY $785.81 $336.78 $896.61 $402.42 ROGER MILLS REYDON $898.07 $841.94 $1,304.16 $2,280.38 ROGERS SWEETWATER $1,459.37 $785.81 $896.61 $2,012.10 ROGERS CATOOSA $21,666.00 $17,007.25 $26,653.77 $25,352.46

2020 READING SUFFICIENCY ACT STUDY | Oklahoma State Department of Education 58
County District 2017 2018 2019 2020
ROGERS CHELSEA $6,511.03 $7,072.32 $8,721.57 $13,816.42 ROGERS CLAREMORE $27,054.44 $27,784.12 $41,896.14 $63,179.94 ROGERS FOYIL $3,423.90 $2,525.83 $4,075.50 $6,707.00 ROGERS INOLA $7,465.23 $5,051.66 $7,498.92 $15,694.38 ROGERS JUSTUS-TIAWAH $2,245.18 $3,087.12 $4,401.54 $7,511.84 ROGERS OOLOGAH-TALALA $8,475.56 $9,036.85 $10,188.75 $12,743.30 ROGERS SEQUOYAH $7,465.23 $6,960.06 $10,270.26 $19,047.88 SEMINOLE VERDIGRIS $5,444.56 $6,623.28 $8,395.53 $13,145.72 SEMINOLE BOWLEGS $2,132.92 $3,030.99 $2,852.85 $2,682.80 SEMINOLE BUTNER $1,290.98 $1,403.24 $1,956.24 $1,743.82 SEMINOLE JUSTICE $3,255.51 $3,648.42 $3,015.87 $4,426.62 SEMINOLE KONAWA $2,301.31 $2,918.74 $4,564.56 $13,279.86 SEMINOLE NEW LIMA $785.81 $2,020.66 $2,119.26 $4,024.20 SEMINOLE SASAKWA $561.30 $1,571.63 $1,304.16 $4,829.04 SEMINOLE SEMINOLE $13,695.61 $10,552.35 $19,073.34 $26,157.30 SEMINOLE STROTHER $2,581.96 $3,423.90 $4,972.11 $8,316.68 SEMINOLE VARNUM $1,234.85 $1,347.11 $2,771.34 $2,951.08 SEQUOYAH WEWOKA $4,658.75 $3,704.55 $5,379.66 $10,194.64 SEQUOYAH BELFONTE $2,806.48 $2,806.48 $4,646.07 $6,036.30 SEQUOYAH BRUSHY $5,051.66 $5,556.82 $8,640.06 $9,792.22 SEQUOYAH CENTRAL $1,683.89 $1,908.40 $2,445.30 $9,926.36 SEQUOYAH GANS $0.00 $2,301.31 $3,260.40 $5,097.32 SEQUOYAH GORE $7,858.13 $7,745.88 $6,194.76 $18,108.90 SEQUOYAH LIBERTY $2,581.96 $3,872.94 $3,423.42 $5,902.16 SEQUOYAH MARBLE CITY $1,010.33 $1,290.98 $1,141.14 $2,414.52 SEQUOYAH MOFFETT $1,683.89 $1,683.89 $2,037.75 $804.84 SEQUOYAH MULDROW $10,047.19 $8,363.30 $12,389.52 $21,596.54 SEQUOYAH ROLAND $2,862.61 $2,862.61 $3,423.42 $7,377.70 SEQUOYAH SALLISAW $13,583.35 $7,970.39 $15,486.90 $24,011.06

2020 READING SUFFICIENCY ACT STUDY | Oklahoma State Department of Education 59
County District 2017 2018 2019 2020
STEPHENS VIAN $8,475.56 $4,939.40 $6,357.78 $15,023.68 STEPHENS BRAY-DOYLE $1,740.02 $1,740.02 $3,341.91 $5,902.16 STEPHENS CENTRAL HIGH $841.94 $561.30 $1,141.14 $2,012.10 STEPHENS COMANCHE $4,378.10 $6,061.99 $9,047.61 $13,414.00 STEPHENS DUNCAN $20,262.76 $27,054.44 $39,287.82 $85,313.04 STEPHENS EMPIRE $2,413.57 $2,806.48 $4,727.58 $8,316.68 STEPHENS GRANDVIEW $954.20 $785.81 $815.10 $1,743.82 STEPHENS MARLOW $6,679.41 $4,490.36 $8,477.04 $13,950.56 TEXAS VELMA-ALMA $1,290.98 $1,347.11 $2,445.30 $6,707.00 TEXAS GOODWELL $2,918.74 $449.04 $896.61 $536.56 TEXAS GUYMON $27,952.51 $33,733.85 $49,476.57 $79,813.30 TEXAS HARDESTY $729.68 $617.42 $978.12 $1,609.68 TEXAS HOOKER $1,010.33 $7,689.75 $11,818.95 $6,304.58 TEXAS OPTIMA $1,571.63 $841.94 $2,526.81 $2,951.08 TEXAS STRAIGHT $0.00 $56.13 $81.51 $2,816.94 TEXAS TEXHOMA $0.00 $0.00 $0.00 $0.00 TEXAS TYRONE $785.81 $1,290.98 $896.61 $2,280.38 TILLMAN YARBROUGH $505.17 $1,178.72 $1,059.63 $1,207.26 TILLMAN DAVIDSON $336.78 $224.52 $733.59 $804.84 TILLMAN FREDERICK $6,567.16 $4,883.27 $9,047.61 $11,670.18 TILLMAN GRANDFIELD $1,571.63 $1,403.24 $1,467.18 $2,414.52 TULSA TIPTON $2,525.83 $2,638.09 $3,830.97 $6,707.00 TULSA BERRYHILL $6,623.28 $6,679.41 $8,151.00 $15,426.10 TULSA BIXBY $17,568.54 $22,956.98 $36,190.44 $96,044.24 TULSA BROKEN ARROW $117,422.98 $126,066.93 $204,345.57 $342,057.00 TULSA COLLINSVILLE $14,649.81 $14,256.90 $18,421.26 $52,582.88 TULSA DEBORAH BROWN (CHARTER) $1,403.24 $449.04 $4,564.56 $8,853.24 TULSA DISCOVERY SCHOOLS OF TULSA $4,321.97 $4,714.88 $5,298.15 $13,682.28 TULSA GLENPOOL $20,767.93 $22,395.68 $32,440.98 $39,839.58

2020 READING SUFFICIENCY ACT STUDY | Oklahoma State Department of Education 60
County District 2017 2018 2019 2020
TULSA JENKS $42,490.06 $40,750.04 $64,392.90 $139,773.88 TULSA KEYSTONE $5,051.66 $4,041.33 $4,564.56 $9,658.08
TULSA LANGSTON HUGHES ACAD ARTS-TECH $0.00 $0.00 $0.00 $0.00
TULSA LIBERTY $4,209.71 $4,153.59 $4,972.11 $8,182.54 TULSA OWASSO $61,517.97 $66,232.85 $92,758.38 $167,540.86 TULSA SAND SPRINGS $36,203.55 $36,820.97 $51,514.32 $103,690.22 TULSA SANKOFA MIDDLE SCHL (CHARTER) $617.42 $449.04 $489.06 $1,341.40 TULSA SKIATOOK $14,593.68 $14,032.38 $19,317.87 $19,047.88 TULSA SPERRY $13,863.99 $13,022.05 $17,280.12 $20,389.28 TULSA TULSA $371,016.22 $361,193.55 $517,425.48 $855,410.78 TULSA TULSA CHARTER: COLLEGE BOUND $0.00 $0.00 $15,649.92 $24,279.34 TULSA TULSA CHARTER: COLLEGIATE HALL $0.00 $0.00 $0.00 $0.00 TULSA TULSA CHARTER: HONOR ACADEMY $0.00 $0.00 $0.00 $0.00 TULSA TULSA CHARTER: KIPP TULSA $0.00 $0.00 $0.00 $0.00 TULSA TULSA CHARTER: SCHL ARTS/SCI. $0.00 $0.00 $0.00 $0.00 TULSA TULSA LEGACY CHARTER SCHL INC $4,097.46 $8,587.82 $9,618.18 $23,474.50 WAGONER UNION $139,762.54 $142,176.11 $200,596.11 $333,203.76 WAGONER COWETA $24,809.25 $20,206.63 $33,337.59 $58,753.32 WAGONER OKAY $4,209.71 $2,132.92 $3,749.46 $4,158.34 WAGONER PORTER CONSOLIDATED $2,525.83 $2,581.96 $5,216.64 $12,609.16 WASHINGTON WAGONER $25,258.29 $25,707.33 $28,283.97 $38,766.46 WASHINGTON BARTLESVILLE $32,948.04 $30,422.21 $45,401.07 $86,252.02 WASHINGTON CANEY VALLEY $7,521.36 $5,949.73 $12,063.48 $19,852.72 STATE ALL DISTRICTS $4,507,426 $6,500,000 $6,500,000 $12,000,000
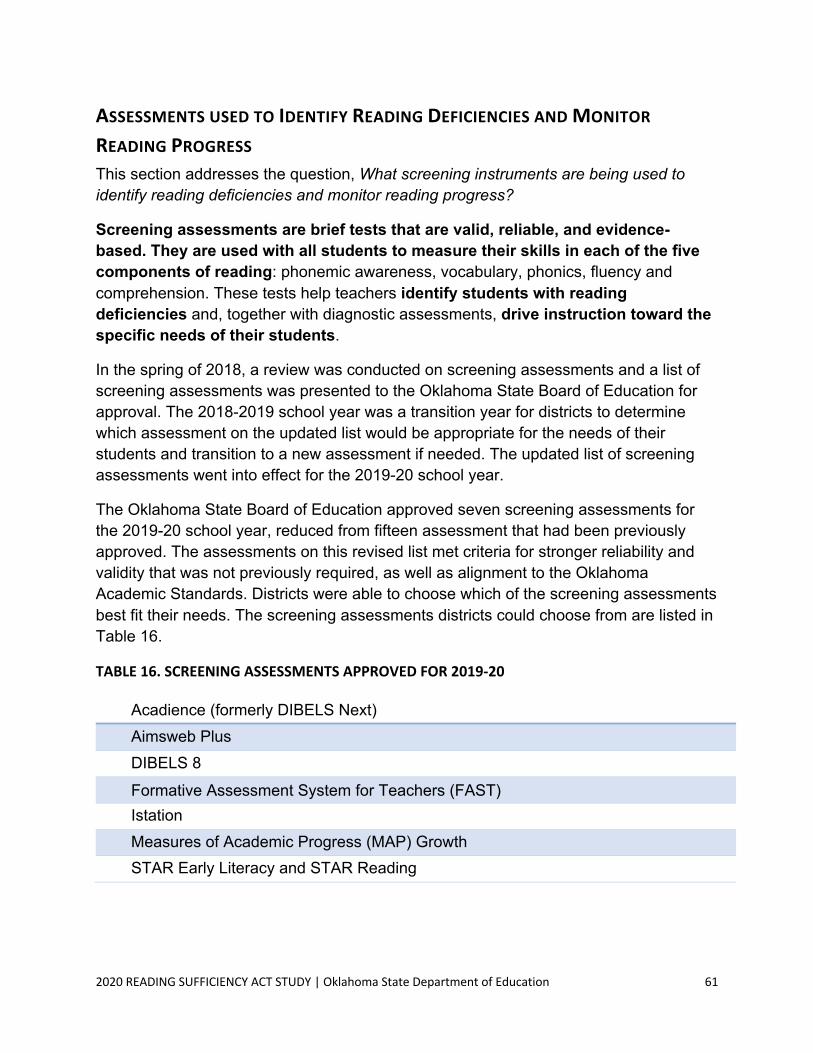
2020 READING SUFFICIENCY ACT STUDY | Oklahoma State Department of Education 61
ASSESSMENTS USED TO IDENTIFY READING DEFICIENCIES AND MONITOR READING PROGRESS This section addresses the question, What screening instruments are being used to identify reading deficiencies and monitor reading progress?
Screening assessments are brief tests that are valid, reliable, and evidence-based. They are used with all students to measure their skills in each of the five components of reading: phonemic awareness, vocabulary, phonics, fluency and comprehension. These tests help teachers identify students with reading deficiencies and, together with diagnostic assessments, drive instruction toward the specific needs of their students.
In the spring of 2018, a review was conducted on screening assessments and a list of screening assessments was presented to the Oklahoma State Board of Education for approval. The 2018-2019 school year was a transition year for districts to determine which assessment on the updated list would be appropriate for the needs of their students and transition to a new assessment if needed. The updated list of screening assessments went into effect for the 2019-20 school year.
The Oklahoma State Board of Education approved seven screening assessments for the 2019-20 school year, reduced from fifteen assessment that had been previously approved. The assessments on this revised list met criteria for stronger reliability and validity that was not previously required, as well as alignment to the Oklahoma Academic Standards. Districts were able to choose which of the screening assessments best fit their needs. The screening assessments districts could choose from are listed in Table 16.
TABLE 16. SCREENING ASSESSMENTS APPROVED FOR 2019-20
Acadience (formerly DIBELS Next) Aimsweb Plus DIBELS 8
Formative Assessment System for Teachers (FAST) Istation Measures of Academic Progress (MAP) Growth STAR Early Literacy and STAR Reading
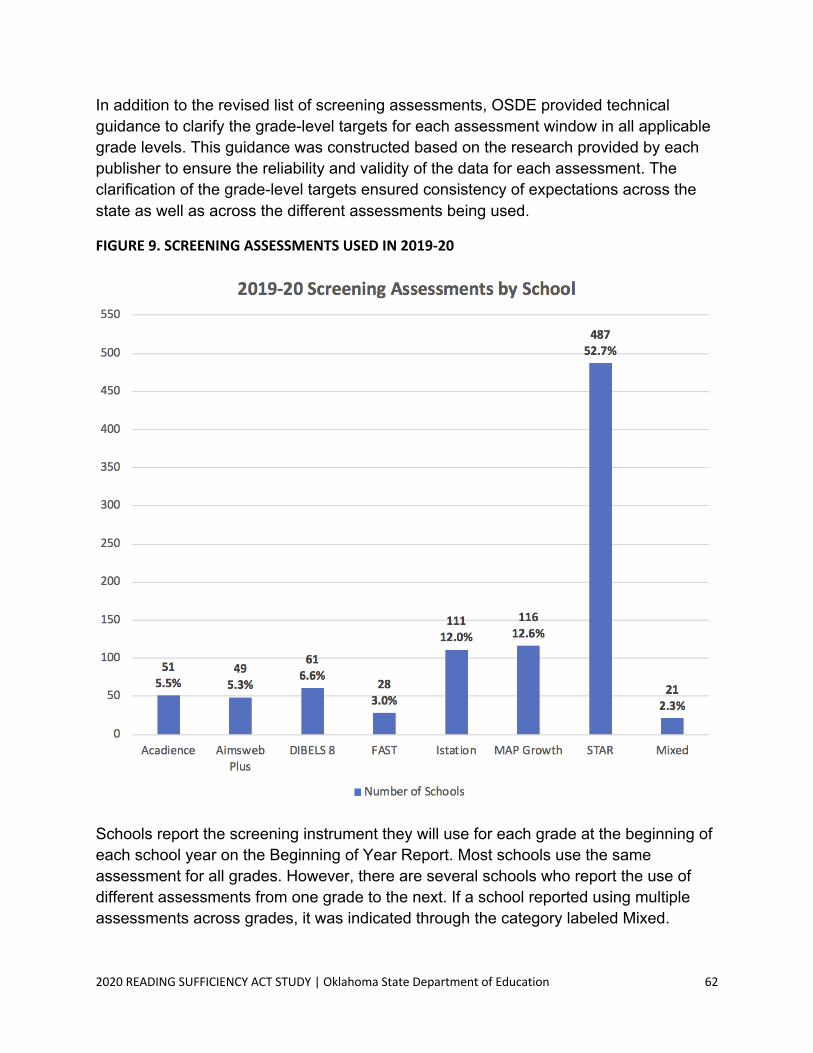
2020 READING SUFFICIENCY ACT STUDY | Oklahoma State Department of Education 62
In addition to the revised list of screening assessments, OSDE provided technical guidance to clarify the grade-level targets for each assessment window in all applicable grade levels. This guidance was constructed based on the research provided by each publisher to ensure the reliability and validity of the data for each assessment. The clarification of the grade-level targets ensured consistency of expectations across the state as well as across the different assessments being used.
FIGURE 9. SCREENING ASSESSMENTS USED IN 2019-20
Schools report the screening instrument they will use for each grade at the beginning of each school year on the Beginning of Year Report. Most schools use the same assessment for all grades. However, there are several schools who report the use of different assessments from one grade to the next. If a school reported using multiple assessments across grades, it was indicated through the category labeled Mixed.

2020 READING SUFFICIENCY ACT STUDY | Oklahoma State Department of Education 63
All schools reported screening assessments to identify reading deficiencies in kindergarten through third-grade classrooms, as per state law. As shown in Figure 9, districts reported using one of seven different state-approved exams. Star Early Literacy and Reading was the most frequently used assessments by schools, being used by more than half (52.7%) of the schools in the state, including six districts with ten or more elementary schools. MAP Growth was the second most used assessment, being used by 12.6% of schools, including one of the two largest urban districts in the state. Istation was the third most frequently used assessment, being utilized by 12.0% of schools, including the other largest urban district in Oklahoma.
When comparing the screening assessments being used in 2020 with those being used in 2019, it appears that 527 schools out of the 924 elementary sites across the state, or 57%, made a change in the screening assessment used. There were 168 schools that reported using an assessment in 2019 that was no longer approved for use in 2020. The remaining schools made a change from one assessment that was approved to a different screening assessment that had been approved in 2020.
INSTRUCTIONAL PRACTICES AND REMEDIATION EFFORTS USED BY DISTRICTS This section addresses the question, What types of reading instructional practices, instructional methods and remediation efforts are currently being used by districts?
A survey was sent to Oklahoma teachers and administrators to gain feedback on the types of instructional practices and methods being used for both core and supplemental instruction in kindergarten through third grade, as well as supplemental practices to aid students after third grade who were promoted through a good-cause exemption or the Student Reading Proficiency Team.
For this question, respondents were asked to identify the instructional practices or methods regularly used as part of on-grade-level core instruction for all kindergarten through third-grade students.
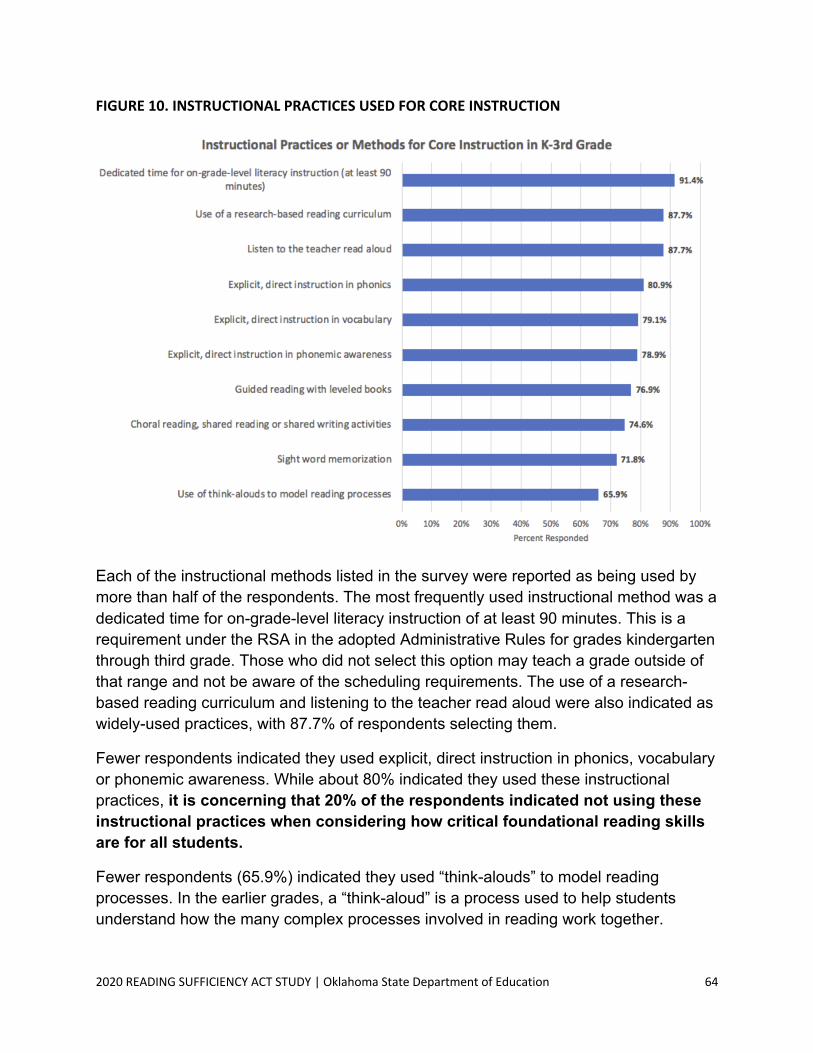
2020 READING SUFFICIENCY ACT STUDY | Oklahoma State Department of Education 64
FIGURE 10. INSTRUCTIONAL PRACTICES USED FOR CORE INSTRUCTION
Each of the instructional methods listed in the survey were reported as being used by more than half of the respondents. The most frequently used instructional method was a dedicated time for on-grade-level literacy instruction of at least 90 minutes. This is a requirement under the RSA in the adopted Administrative Rules for grades kindergarten through third grade. Those who did not select this option may teach a grade outside of that range and not be aware of the scheduling requirements. The use of a research-based reading curriculum and listening to the teacher read aloud were also indicated as widely-used practices, with 87.7% of respondents selecting them.
Fewer respondents indicated they used explicit, direct instruction in phonics, vocabulary or phonemic awareness. While about 80% indicated they used these instructional practices, it is concerning that 20% of the respondents indicated not using these instructional practices when considering how critical foundational reading skills are for all students.
Fewer respondents (65.9%) indicated they used “think-alouds” to model reading processes. In the earlier grades, a “think-aloud” is a process used to help students understand how the many complex processes involved in reading work together.

2020 READING SUFFICIENCY ACT STUDY | Oklahoma State Department of Education 65
Helping teachers understand how to use this instructional practice more effectively may be helpful to students in these grades.
There were 71.8% of respondents who indicated they used memorization of sight words in their classrooms on a regular basis. While this has been a common practice, research has shown that it is a very ineffective way for learning to read. Helping teachers understand and apply more effective methods for beginning reading instruction to help students develop a robust sight word vocabulary would be beneficial for overall reading success.
For the next question, respondents were asked to identify the instructional practices or methods regularly used with kindergarten through third-grade students who were not meeting grade-level targets. This would include students who may need just a bit of supplemental instruction and practice as well as those who need intensive intervention with skills their peers had mastered in earlier grades.

2020 READING SUFFICIENCY ACT STUDY | Oklahoma State Department of Education 66
FIGURE 11. INTERVENTION PRACTICES FOR GRADES K-3
The two most common instructional practices selected for kindergarten through third grade students showing reading difficulties was to administer diagnostic assessments in order to identify the student’s area(s) of need and to regularly monitor student progress. There were 82.6% of respondents who stated using diagnostic assessments was a regular practice, which can be a powerful instructional tool as long as there is a structure in place to analyze the data and use it to make instructional decisions. By the same token, progress monitoring, selected by 82.5% of respondents, is also a potent method for driving student success provided there is a routine for reviewing the data and adjusting instruction accordingly. Without the knowledge of how to interpret the data or a consistent structure to review and

2020 READING SUFFICIENCY ACT STUDY | Oklahoma State Department of Education 67
use the data, teachers will feel as if they are being asked to spend too much time giving meaningless assessments.
The majority of reported instructional methods for students who are having reading difficulties involves having the student work with a tutor or specialized teacher outside of the classroom. It is important when students leave the classroom for specialized instruction that the school consider what grade-level instruction the student might be missing. While students receiving more intensive intervention will give up something for that time, it is important to balance the need for intervention with ensuring students receive a well-rounded education. In some cases, depending on the resources available to the school, having a school-wide structure for supplemental instruction may reduce the amount of instruction students miss in other content areas.
The use of a Summer Academy Reading Program has declined recently. In 2018, 64% of survey respondents reported they used a summer program. However, this dropped to 37% of respondents in 2019. In the current survey for 2020, 34% of respondents reported that a summer reading academy was regularly used. However, this does not mean that all of them held a summer reading program in the summer of 2020, as most schools cancelled their summer programs due to the pandemic. As schools return to in-person learning, this is an area they may wish to explore to provide additional learning opportunities for students who need those programs to be successful.
As schools are looking for additional time for instruction for students who are well below grade-level targets, it may be helpful to consider tutorial instruction before or after school or on Saturdays. These instructional practices are used infrequently. There are many challenges to address in these situations, such as student attendance and transportation, staffing availability and availability of finances. However, it would have the benefit of ensuring students receive the specialized instruction needed while minimizing the need for those students to miss instruction in other content areas that are also important.
The following question asked respondents to identify the instructional practices or methods regularly used for students who were not meeting grade-level targets after third grade. This would include students who were promoted with a good-cause exemption or promoted with probation through the Student Reading Proficiency Team, as these students must continue to receive instructional support until they demonstrate on-grade-level reading proficiency.

2020 READING SUFFICIENCY ACT STUDY | Oklahoma State Department of Education 68
FIGURE 12. INTERVENTION PRACTICES AFTER THIRD GRADE
As with the younger grades, these respondents also indicated that administering diagnostic assessments and regularly monitoring students’ progress were among the most frequently used routines, although monitoring student progress was not quite as frequent at 76.1%. Use of a research-based reading curriculum was selected a bit more frequently in the upper grades as opposed to the early grades.
Many responses for each of these questions indicated the participant didn’t know how student needs were addressed since they did not work in that grade. While understandable, one potential area for improvement is to ensure a fully aligned vertical plan from the earliest to the oldest grade in a building. Utilizing the expertise of teachers in younger grades for students who are having difficulty, as well as teachers in older grades for students who need enrichment, can provide more efficient resources. Having similar or school-wide structures for supplemental instruction and intervention, as well as enrichment, can help to build an academic culture that would better support both students and staff.
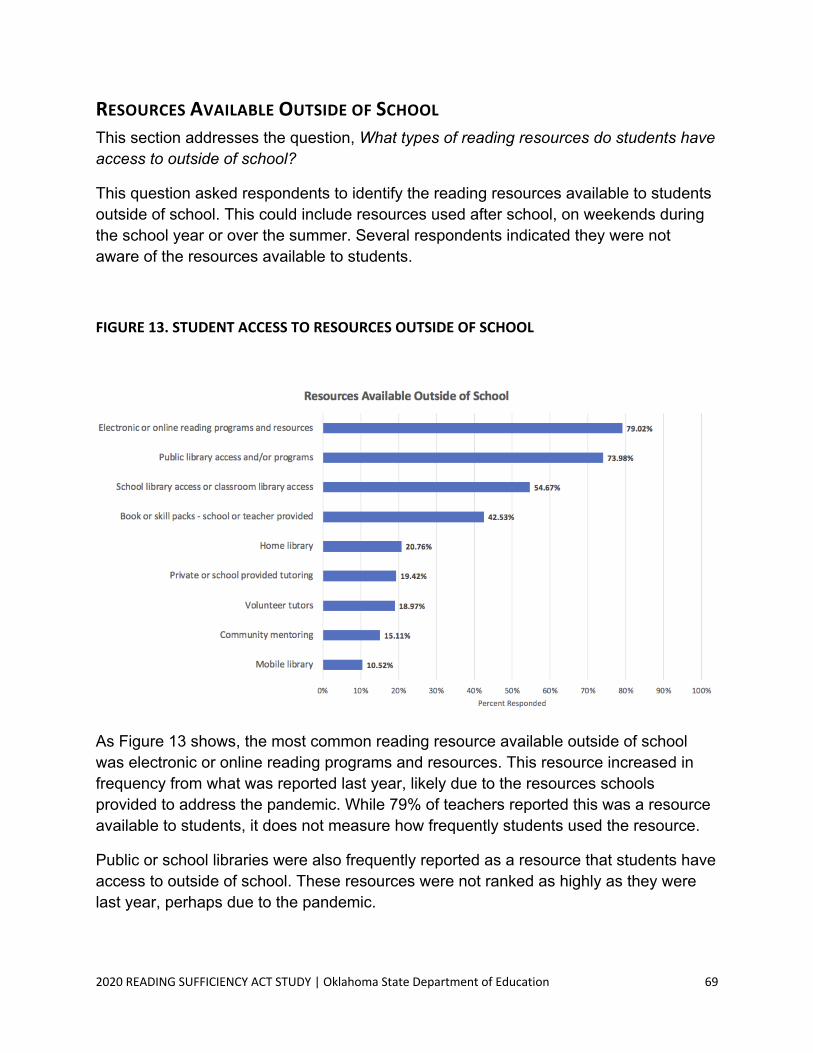
2020 READING SUFFICIENCY ACT STUDY | Oklahoma State Department of Education 69
RESOURCES AVAILABLE OUTSIDE OF SCHOOL This section addresses the question, What types of reading resources do students have access to outside of school?
This question asked respondents to identify the reading resources available to students outside of school. This could include resources used after school, on weekends during the school year or over the summer. Several respondents indicated they were not aware of the resources available to students.
FIGURE 13. STUDENT ACCESS TO RESOURCES OUTSIDE OF SCHOOL
As Figure 13 shows, the most common reading resource available outside of school was electronic or online reading programs and resources. This resource increased in frequency from what was reported last year, likely due to the resources schools provided to address the pandemic. While 79% of teachers reported this was a resource available to students, it does not measure how frequently students used the resource.
Public or school libraries were also frequently reported as a resource that students have access to outside of school. These resources were not ranked as highly as they were last year, perhaps due to the pandemic.

2020 READING SUFFICIENCY ACT STUDY | Oklahoma State Department of Education 70
There was also a large increase in the number of respondents who reported that school- or teacher-provided book and/or skill packs were available to students outside of school. As with the online resources, it is likely this resource was utilized more often in an effort to address disruptions to learning caused by the pandemic.
A mobile library was the resource reported least frequently, with only 10.52% of respondents stating this was a resource available to their students. This is an area that could be considered by schools should they be able to fund it. If paired with a teacher or tutor who could provide additional instruction, a mobile library could provide materials and instruction for students outside of the school day in both rural and urban communities.
While educators in a district may report that some of their students have access to certain resources outside of school, that does not mean that all students have access to these resources. Additional research at the student level is necessary to understand what resources individual students actually have access to outside of school. Such research would also help to better understand what outside reading resources are associated with improved learning outcomes.
These findings suggest opportunities to improve the accessibility of reading resources to students when they are not at school. In particular, there is a lot of room for improvement in the offerings of volunteer tutors, community mentors and mobile libraries since those were some of the least commonly available resources. Developing relationships with community partners across the state, particularly in rural areas where resources are not as abundant, may also be helpful for schools seeking resources to support their students. Potential community partners include local libraries, faith-based communities and service organizations.
WHAT THE RESEARCH LITERATURE IDENTIFIES AS BEST PRACTICES FOR STUDENTS NOT READING ON GRADE LEVEL This section addresses the question, Of the identified instructional practices, instructional methods and remediation efforts, which ones have been identified as best practices in the research literature for students not reading on grade level?
The research surrounding evidence-based reading instruction is often referred to as the science of reading. This term has sometimes been misconstrued to only mean instruction in phonics. A common definition developed by experts in the field is helpful to keep in mind:
The science of reading is a vast, interdisciplinary body of scientifically-based research about reading and issues related to reading and writing. This research

2020 READING SUFFICIENCY ACT STUDY | Oklahoma State Department of Education 71
has been conducted over the last five decades across the world, and it is derived from thousands of studies conducted in multiple languages. The science of reading has culminated in a preponderance of evidence to inform how proficient reading and writing develop; why some have difficulty; and how we can most effectively assess and, therefore, improve student outcomes through prevention of and intervention for reading difficulties. The science of reading is derived from researches from multiple fields, including cognitive psychology, communication sciences, developmental psychology, education, implementation science, linguistics, neuroscience, and school psychology.20
Learning to read is a complex process that does not come naturally. While the human brain is wired for speech and oral language, written language is a relatively new man-made invention. Reading comprehension is the goal of reading instruction, and is the result of both word recognition and language comprehension skills. Word recognition involves foundational reading skills, such as phonological and phonemic awareness, phonics, and sight word recognition. These are the skills that are emphasized in the youngest grades. Language comprehension includes skills such as vocabulary, interpreting meaning of text, grammar, syntax, etc. These are the academic skills that are emphasized in grades three and above.
Word recognition skills become automatic. These are skills that students should master and perform with automaticity. Language comprehension skills are strategic. Even proficient readers continue to work with and improve these skills. If a student does not master the word recognition skills, then working memory must be used for these skills when trying to read a text. Because working memory is limited, there is not enough for students to be able to understand what they read if they are able to decode the text accurately. Fluency is when students are able to apply those foundational skills with enough automaticity that their brains have sufficient working memory to do the more strategic work of making meaning of text.
Students cannot learn just word recognition skills and then move to language comprehension skills. They must learn both in tandem, although different skills are emphasized at different times. If a student does not develop the skills in both areas, then they will not be able to comprehend what they read.
The Reading Sufficiency Act focuses primarily on reading skills in kindergarten through third grade. For the majority of this time, there is a stronger emphasis on word recognition skills, while language comprehension skills are often addressed through speaking, listening to text read aloud, and having discussions. Through research, it has
20 The Reading League, 2021 https://www.whatisthescienceofreading.org/

2020 READING SUFFICIENCY ACT STUDY | Oklahoma State Department of Education 72
been shown that most students require and all students benefit from explicit, systematic, and cumulative instruction in foundational skills.21
When using explicit, or direct, instruction, concepts are taught deliberately with continuous student-teacher interaction. Lessons are highly structured with specific goals, modeling of expected learning, and multiple opportunities for students to apply new learning with teacher support. It is not assumed that students will naturally deduce these concepts on their own. Explicit, or direct, instruction has been shown to have large effect, or a greater than average influence, on student achievement.22
Systematic instruction occurs when skills are taught in a clearly defined sequence which follows the logical order of the language. These skills build upon one another so that learning is cumulative. The sequence must begin with the easiest and most basic concepts and elements and progress methodically to more difficult concepts and elements. Cumulative means each step must be based on concepts previously learned.
The question of what reading practices are best practices for students not reading on grade level is complex and does not have a simple, straightforward answer. There is support in the literature for the use of all the practices, methods and strategies discussed in this report, but whether or not it is a best practice depends on the context of the learning. Instructional practices, methods and remediation efforts are best applied in certain contexts, to certain groups of students and to address specific reading deficiencies. A teacher using best practices thus does not uniformly apply a specific set of strategies but rather applies strategies based on the unique needs and learning styles of his or her students. For this reason, rather than merely labeling strategies as being best practices or not, this section defines each strategy and identifies when and for which students they are most effective.
Choral reading, shared reading or shared writing activities is an instructional framework for all students based on the gradual release of responsibility model (Fisher & Frey, 2013). These activities are the second of the four phases of the gradual release model: I DO, WE DO, YOU DO TOGETHER and YOU DO ALONE. Teachers work collaboratively with students in the WE DO phase to practice and reinforce skills that have been previously demonstrated in the I DO phase. This is used in whole group instruction with all students.
Oral reading connects spoken and written language through the Language Experience Approach. Through this approach, students can see the connection between their oral speech and written words. After students share an experience, the experience is
21 Hempenstall, 2016 22 Hattie, 2012
2020 READING SUFFICIENCY ACT STUDY | Oklahoma State Department of Education 73
discussed in class and then transferred into print by the teacher acting as a scribe. Students then practice reading what has been written.
Explicit phonological and phonemic awareness instruction is critical for early learners and students who are struggling with word recognition skills, including students with dyslexia. According to Kilpatrick, “phoneme awareness is a critical cognitive/linguistic skill needed to store words for immediate, effortless retrieval.” (p. 27)23 Ensuring that students have a solid foundation in these skills requires explicit instruction rather than leaving it to students to discover these skills on their own. It has been shown that “the development of phonological representations for words and their parts is a major step in learning language. The properties of these representations also play a critical role in reading, and impairments in phonological representations are usually observed in developmental reading as speech disorders. Phonological development is not the only factor involved in learning to read, but it is always an important part.” (p. 107)24
Explicit phonics instruction is also a critical foundational skill. Since reading is not natural, explicit instruction in this area is critical for most students. Phonics instruction addresses the relationship between letters and their sounds. While the goal of reading is to make meaning from print, a reader has to first know what the printed symbols represent before meaning can be assigned to them. Since this is not a natural process for the human brain, it must be explicitly taught so that students can develop the neural connections in the brain in order to decode print effectively and efficiently. This process is called orthographic mapping, and “is the mental process we use to permanently store words for immediate, effortless retrieval.” (p. 31)25
Explicit vocabulary instruction means ensuring students know the meaning of the words they encounter. Children in the early grades encounter relatively few of the words they know in the books they read. The vocabulary in written text is often more advanced than what is used in everyday conversation. Charles Perfetti refers to the “lexical quality” of words. He describes words as a hub linking many types of information. When considering a word such as cup, readers must consider the following as part of its lexical quality: its sound, pronunciation, and spelling; its multiple definitions or meanings (e.g., drinking utensil, unit of measurement, trophy); the entities to which it refers (e.g., types of cups) and their various descriptions; facts and associations (e.g., where they are made, where they are kept, Mother’s favorite); their grammatical functions (e.g.,
23 Kilpatrick, D.A. Equipped for Reading Success. Syracuse, NY: Casey & Kirsh Publishers. 2016. 24 Seidenberg, M. Language at the Speed of Sight: How We Read, Why so Many Can’t, and What Can Be Done about It. Basic Books, 2018. 25 Kilpatrick, D.A. Equipped for Reading Success. Syracuse, NY: Casey & Kirsh Publishers. 2016.

2020 READING SUFFICIENCY ACT STUDY | Oklahoma State Department of Education 74
“cup” as a noun or a verb) and how the word combines with others to form expressions (e.g., “sippy cup”). (p. 110)26
Working with the teacher in guided reading practice is a strategy used in the second phase of the gradual release of responsibility model and is referred to as the WE DO phase. This phase allows for active student participation, student engagement, and collaboration, which can result in high levels of student achievement. This second phase is grounded in explicit guided instruction, which is a research-proven best practice and is appropriate for all grade levels and across content areas.
Through guided reading, providing students the opportunity to read texts appropriate for the skills being practiced is an important step in having students apply the skills they are learning. Some texts are better for reinforcing phonics skills, while others are better aligned to support general comprehension skills. Two types of text—leveled and decodable—are often used in this structure. Leveled texts are written with predictable sentence structures and include pictures that emphasize meaning. The words in the stories usually aren’t constrained to specific letter-sound correspondences, and may or may not line up with the phonics patterns student have already learned. For beginning readers, these texts are best used as a read-aloud or for echo reading. A benefit of this practice is to help students develop concepts of print and the elements of a book. Leveled texts can be used to apply and reinforce comprehension skills that have been taught. Decodable texts contain words that mostly consist of letter-sound correspondences that students have already learned. Decodable texts are effectively used to give beginning readers practice reading words spelled with phonics patterns and high frequency words that have been taught. The primary benefit of using decodable texts is to develop a habit of accurate reading in the early stages.
Using think-alouds to model reading processes is an instructional reading framework for all students based on the gradual release of responsibility model (Fisher & Frey, 2013). The teacher demonstration model is the first in four phases of the gradual release model: I DO, WE DO, YOU DO TOGETHER and YOU DO ALONE. Teacher demonstration is in the I DO phase of the lesson. This focused instruction is used to demonstrate thinking aloud strategies, model what fluent reading sounds like, model summarizing and note taking, and identifying similarities and differences. This is used in whole-group instruction with all students.
26 Seidenberg, M. Language at the Speed of Sight: How We Read, Why so Many Can’t, and What Can Be Done about It. Basic Books, 2018.
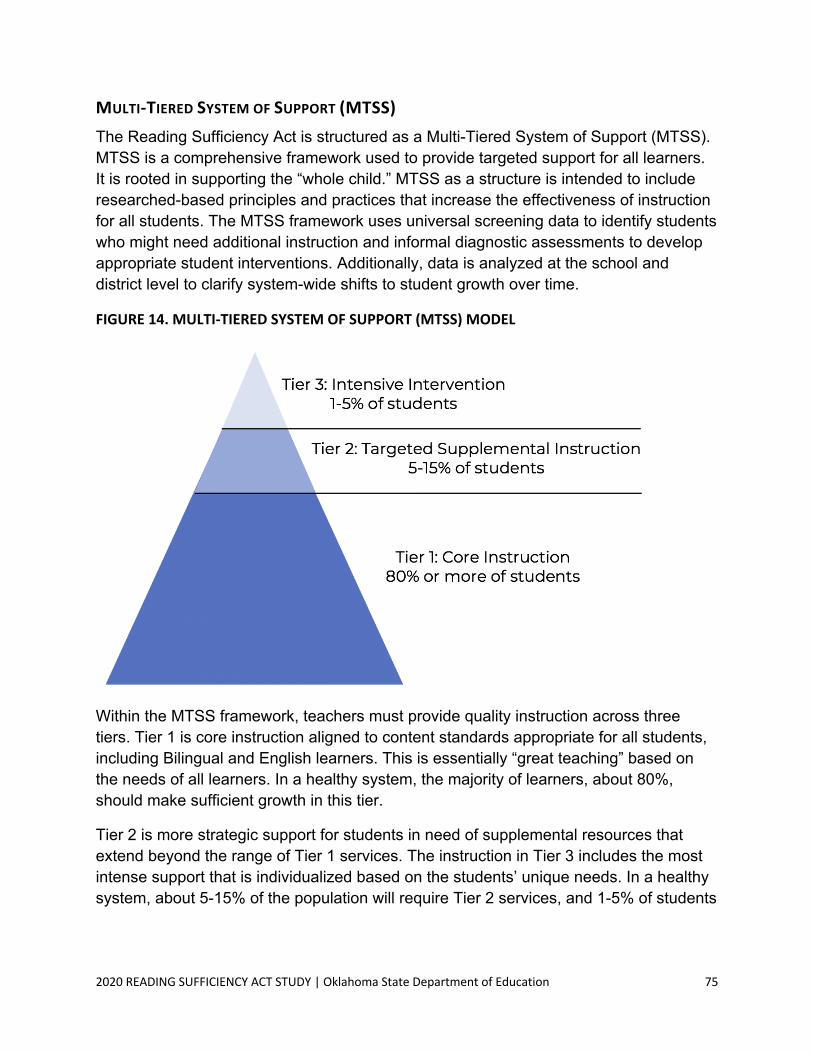
2020 READING SUFFICIENCY ACT STUDY | Oklahoma State Department of Education 75
MULTI-TIERED SYSTEM OF SUPPORT (MTSS) The Reading Sufficiency Act is structured as a Multi-Tiered System of Support (MTSS). MTSS is a comprehensive framework used to provide targeted support for all learners. It is rooted in supporting the “whole child.” MTSS as a structure is intended to include researched-based principles and practices that increase the effectiveness of instruction for all students. The MTSS framework uses universal screening data to identify students who might need additional instruction and informal diagnostic assessments to develop appropriate student interventions. Additionally, data is analyzed at the school and district level to clarify system-wide shifts to student growth over time.
FIGURE 14. MULTI-TIERED SYSTEM OF SUPPORT (MTSS) MODEL
Within the MTSS framework, teachers must provide quality instruction across three tiers. Tier 1 is core instruction aligned to content standards appropriate for all students, including Bilingual and English learners. This is essentially “great teaching” based on the needs of all learners. In a healthy system, the majority of learners, about 80%, should make sufficient growth in this tier.
Tier 2 is more strategic support for students in need of supplemental resources that extend beyond the range of Tier 1 services. The instruction in Tier 3 includes the most intense support that is individualized based on the students’ unique needs. In a healthy system, about 5-15% of the population will require Tier 2 services, and 1-5% of students
2020 READING SUFFICIENCY ACT STUDY | Oklahoma State Department of Education 76
will need intensive support at Tier 3.27 Students receiving special education services through the Individuals with Disabilities Education Act (IDEA) may be in any Tier, depending on the needs of the individual student.
The Institute for Education Sciences noted there are benefits of using a Multi-Tier System of Support (MTSS).28 As a result of universal screening, students who are struggling with reading are able to receive assistance early, rather than waiting to receive help through special education after a diagnosis of a specific learning disability. This usually would not happen until second grade or much later. Longitudinal research consistently shows that students who are weak readers at the early elementary grades tend to stay weak readers in the higher grades without that intervention. Another benefit from MTSS is the recommendation to use evidence-based practices and high-quality instructional materials in all tiers. Finally, “the panel also believes that [MTSS] holds the most potential for serious ongoing collaboration between the special education community and that of general education— largely because the collaboration is based on objective data and shared understandings of the evidence.” This collaboration is critical for providing a cohesive, systematic instructional program for all students.
LIMITATIONS Data on the instructional practices, instructional methods, remediation efforts and reading resource access were available only at the district level, not the student level, so linking specific interventions to specific students was not possible. Also, it was not possible to accurately identify the time students spent with the intervention. Data on reading resource access outside of school were reported by educators, not parents, so it is likely that not all reading resources outside of school were identified.
It is also important to note the limitations due to the disruptions caused by COVID-19. All Oklahoma schools moved to distance learning in March 2019. As a result, schools were unable to administer end-of-year screening assessments or the third-grade OSTP reading assessment. It was also difficult to have students complete portfolios or participate in alternate assessments to meet some of the good-cause exemptions. In addition, most schools were unable to provide ongoing interventions in the fourth quarter of school or extended learning opportunities such as summer school.
27 Oklahoma Response to Intervention Guidance Document, July 2010 28 Assisting Students Struggling with Reading: Response to Intervention and Multi-Tier Intervention in the
Primary Grades, 2009

2020 READING SUFFICIENCY ACT STUDY | Oklahoma State Department of Education 77
CONCLUSION This report provides information concerning several major questions. First, how have reading proficiency rates changed over time in Oklahoma? Second, how does reading proficiency and retention vary by socio-economic status, learning disability status, English Learner status and race? Third, what interventions do districts use to improve reading outcomes? Fourth, what are some of the best instructional practices available that help students become successful readers? Students meeting reading proficiency benchmarks for the last four years has remained somewhat flat, with approximately 40% of students consistently needing intervention supports. To have a healthy MTSS framework, core instruction should meet the instructional needs of about 80% of students. Only about 20% of students should need supplemental supports to be successful. In Oklahoma, the percentage of students needing support to be successful readers are more than double that expectation. It is important for schools to ensure all students are receiving quality core instruction with instructional materials and assessments that are well-aligned to Oklahoma Academic Standards and principles of the science of reading. The study finds that on average, Black and Hispanic students, as well as students receiving services through an Individualized Education Program (IEP), English Learner instruction, or free- and reduced-lunch, continue to score lower on third-grade reading tests relative to their peers. Since the RSA targets students who are not reading at proficiency, the policy therefore disproportionately impacts these groups. It is important to better understand the root causes of inequity among these groups and develop interventions that best address their needs. Additional research is needed at district and school levels to determine root causes. This report also highlighted the use of a wide variety of reading instructional strategies. The most frequently used instructional method was a dedicated time for on-grade-level literacy instruction of at least 90 minutes. The use of a research-based reading curriculum and listening to the teacher read aloud were also indicated as widely-used practices, with 87.7% of respondents selecting them. While approximately 80% of respondents indicated they used explicit, direct instruction in phonics, vocabulary, or phonemic awareness, all students should be afforded this opportunity. Teachers also identified using several intervention practices to support students who do not meet reading proficiency benchmarks at grade-level. The two most common instructional practices utilized to support intervention were administering diagnostic assessments in order to identify the student’s area(s) of need and to regularly monitor student progress.

2020 READING SUFFICIENCY ACT STUDY | Oklahoma State Department of Education 78
Finally, the study found that the most common reading resource available outside of school was electronic or online reading programs and resources. This resource increased in frequency from what was reported last year, likely due to the resources schools provided to address the pandemic. Additional research at the student level is necessary to understand what resources individual students actually have access to outside of school.

2020 READING SUFFICIENCY ACT STUDY | Oklahoma State Department of Education 79
WORKS REFERENCED Allington, R. L. “Content Coverage and Contextual Reading in Reading Groups.” Journal of Reading Behavior, 16(1), 1984: 85-96.
Allington, R., McGill-Franzen, A., Camilli, G., Williams, L., Graff, J., Zeig, J., Zmach, C., and Nowak, R. “Addressing Summer Reading Setback Among Economically Disadvantaged Elementary Students.” Reading Psychology 31 (5), 2010: 411–27.
Alna, O. “The Importance of Oral Storytelling in Literacy Development.” The Ohio Reading Teacher, 31(1), 1999: 15-18.
Amendum, S.J., Li, Y., & Creamer, K.H. “Reading Lesson Instruction Characteristics.” Reading Psychology, 30(1), 2009: 119-143.
Armbruster, Bonnie B. Put Reading First: The Research Building Blocks for Teaching Children to Read: Kindergarten Through Grade 3. Diane Publishing, 2010.
Armbruster, Bonnie B., Lehr, F., & Osborn, J. “Put Reading First: The Research Building Blocks for Teaching Children to Read.” Center for the Improvement of Early Reading Achievement (CIERA) 2001 <http://www.ni.gov/partnershipforreading/publications/reading_rst1uency.html>
Barrentine, S. “Engaging with Reading Through Interactive Read-alouds.” The Reading Teacher, 50(1), 1996: 36-43.
Beck, I.L., McKeown, M.G., & Kucan, L. Bringing Words to Life: Robust Vocabulary Instruction (2nd edition). New York: Guilford Press. 2013
Bennett, R. “Formative Assessment: A Critical Review.” Assessment in Education, 18(1), 2011: 5-25.
Biggs, J. & Moore, P. The Process of Learning. Prentice Hall, New York. 1993
Black, P., Harrison, C., Lee, C., Marshall, B., & William, D. Assessment for Learning: Putting it Into Practice. Maidenhead, U.K.: Open University Press. 2003
Brabham, E.G., & Villaume, S.K. “Questions and Answers: Continuing Conversations about Literature Circles.” The Reading Teacher, 54(3), 2000: 278-280.
Brotherton, S., & Williams, C. “Interactive Writing Instruction in a First Grade Title I Literacy Program.” Journal of Reading Education, 27(3), 2002: 8-19.
2020 READING SUFFICIENCY ACT STUDY | Oklahoma State Department of Education 80
Bruer, J. “The Mind’s Journey from Novice to Expert.” American Educator, 17(2), 1993: 6-45.�
Burkins, J. M. and Croft, M. M. Preventing Misguided Reading: New Strategies for Guided Reading Teachers.
Catts, H.W. “The Simple View of Reading: Advancements and false impressions.” Remedial and Special Education, 39(5), 2018: 317-323.
Chaleff, C., & Toranzo, N.C. “Helping Our Students Meet the Standards through Test Preparation Classes.” American Annals of the Deaf. 145 (1), 2000: 33-40.
Colon-Vila, L. “Storytelling in an ESL Classroom.” Teaching K-8, 27(5), 1997: 58-59.
Cunningham, James W. “The National Reading Panel Report.” Reading Research Quarterly 36.3 2001: 326-335.
Daniels, H., and Bizar, M. Methods That Matter: Six Structures for Best Practice Classrooms. Portland, ME: Stenhouse. 1998
Daniels, H. Literature Circles: Voice and Choice in Book Clubs and Reading Groups. Portland, ME: Stenhouse. 2002
Dehaene, S. Reading in the Brain: The New Science of How We Read. Penguin Books. 2009
Fountas, I. C., & Pinnell, G. S. Guided Reading: Good First Teaching for all Children. Portsmouth, NH: Heinemann. 1996
Fountas, I. C., & Pinnell, G. S. Teaching for Comprehending and Fluency: Thinking, Talking, and Writing About Reading, K–8. Portsmouth, NH: Heinemann. 2006
Fisher, D., Frey, N, & Hattie, J. Visible Learning for Literacy. Thousand Oaks, CA: Corwin. 2016
Fisher, D. & Frey, N. “Implementing a Schoolwide Literacy Framework: Improving Achievement in an Urban Elementary School.” The Reading Teacher, 61(1), 2007: 32-45.
Fisher, D., & Frey, N. “Close Reading in Elementary Schools.” The Reading Teacher, 66(3), 2012: 179-188. Hamilton, M., & Weiss, M. “Children as Storytellers, Teaching the Basic Tools.” School library journal, 50(7), 1993: 4-7.�
2020 READING SUFFICIENCY ACT STUDY | Oklahoma State Department of Education 81
Fuchs, L.S., Fuchs, D., Kazdan, S., & Allen, S. “Effects of peer-assisted learning strategies in reading with and without training in elaborated help giving.” The Elementary School Journal, 99(3), 1999: 201-219.
Gersten, R., Compton, D., Connor, C.M., Dimino, J., Santoro, L., Linan-Thompson, S., and Tilly, W.D. (2008). Assisting students struggling with reading: Response to Intervention and multi-tier intervention for reading in the primary grades. A practice guide. (NCEE 2009-4045). Washington, DC: National Center for Education Evaluation and Regional Assistance, Institute of Education Sciences, U.S. Department of Education. Retrieved from http://ies.ed.gov/ncee/wwc/ publications/practiceguides/ Gough, P.B. & Tunmer, W.E. Decoding, reading, and reading disability. Remedial and Special Education, 7, 1986: 6-10.
Hancock, D.R. “Effects of Test Anxiety and Evaluative Threat On Students’ Achievement and Motivation.” The Journal of Educational Research, 94(5), 2001: 284-290.�
Harvey, S. & Goudvis, A. Strategies That Work: Teaching Comprehension to Enhance Understanding. Portland, ME: Stenhouse. 2000
Hattie, J. & Timperley, H. “The Power of Feedback.” Review of Educational Research, 77 (1), 2007: 81-112.
Hattie, J. A. C. Visible Learning: A Synthesis of Over 800 Meta-Analyses Relating to Achievement. London, UK: Routledge. 2009
Hattie, J. Visible Learning for Teachers: Maximizing Impact on Learning. London, UK: Routledge. 2012
Hattie, J. What Doesn’t Work in Education: The Politics of Distraction. London: Pearson. 2015
Hawe, E., Dixon, H. & Watson, E. “Oral Feedback in the Context of Written Language.” Australian journal of language and literacy, 31 (2), 2008: 43-58.
Hempenstall, K. Read about it: Scientific evidence for effective teaching of reading. CIS Research Report 11. Sydney: The Centre for Indpendent Studies. 2016. Retrieved from https://www.cis.org.au/publications/research-reports/read-aboutit-scientific-evidence-foreffective-teaching-of-reading/
Heritage, M. Formative Assessment and Next-Generation Assessment Systems: Are We Losing an Opportunity? Paper prepared for the Council of Chief State School Of cers. 2010

2020 READING SUFFICIENCY ACT STUDY | Oklahoma State Department of Education 82
Holloway, J.H. “The Use and Misuse of Standardized Tests.” Educational Leadership 59(1), 2001: 77-78.
Keene, E.K., & Zimmerman, S. Mosaic of Thought: Teaching Comprehension in a Reading Workshop. Portsmouth, NH: Heinemann. 1997
Kilpatrick, D.A. Equipped for Reading Success. Syracuse, NY: Casey & Kirsh Publishers. 2016
Klesius, J.P., & Grifth, P. “Interactive Storybook Reading for At-Risk Learners.” The Reading Teacher, 49, 1996: 552-560.
Kosanovich, M., Ladinsky, K., Nelson, L., and Torgesen, J. “Differentiated Reading Instruction: Small Group Alternative Lesson Structures for all Students.” Florida Center for Reading Research, 2007: 1-9.
Koskinen, P. S., Blum, I. H., Bisson, S. A., Phillips, S. M., Creamer, T. S., & Baker, T. K. “Shared Reading, Books, and Audiotapes: Supporting Diverse Students in School and at Home.” The Reading Teacher,�52, 1999: 430-444.
Krashen, S., Lee, S. & McQuillan, J. “An Analysis of the PIRLS (2006) Data: Can the School Library Reduce the Effect of Poverty on Reading Achievement?” California School Library Association 34(1), 2010: 26-8.
Liu, G.-Z. & Chen, A.S.W. “Taxonomy of Internet-Based Technologies Integrated in Language Curricula.” British Journal of Educational Technology, 38(5), 2007: 934–938.
Lloyd, S. L. “Using Comprehension Strategies as a Springboard for Student Talk.” Journal of Adolescent and Adult Literacy, 48(1), 2004: 114-124.
Mallan, K. “Storytelling in the School Curriculum.” Educational practice and theory, 19(1), 1997: 75-82.
Marzano, R.J. & Pickering, D.J. Building Academic Vocabulary. Alexandria, VA: Association for Supervision and Curriculum Development. 2010
McClaskey, J. “Who’s Afraid of the Big, Bad TAAS? Rethinking our Response to Standardized Testing.” English Journal. 91(1), 2001: 88-95.�
McCown, C., & Runnebaum, R. “Rising Stars: High School’s Change Process Produces Higher Test Scores.” Momentum, 32(2), 2001: 48-50.
2020 READING SUFFICIENCY ACT STUDY | Oklahoma State Department of Education 83
Moats, L. Speech to Print: Language essentials for teachers (2nd edition). Baltimore, MD: Paul H Brookes Publishing Co. 2010
Morrison, V., & Wlodarczyk, L. “Revisiting Read-Aloud: Instructional Strategies that Encourage Students’ Engagement with Texts.” The Reading Teacher, 63(2), 2009: 110-118.
Morrow, L. M. Literacy Development in the Early Years: Helping Children Read and Write (3rd edition). Needham Heights, MA: Allyn & Bacon. 1997
Morrow L. M., Asbury E. Current Practices in Early Literacy Development. In Morrow L. M., Gambrell L. B., Pressley M. (Eds.), Best Practices in Literacy Instruction (2nd ed., pp. 43–63). New York: Guilford. 2003
National Reading Panel (U.S.), & National Institute of Child Health and Human Development (U.S.). Report of the National Reading Panel: Teaching children to read: an evidence-based assessment of the scientific research literature on reading and its implications for reading instruction: reports of the subgroups. Washington, D.C.: National Institute of Child Health and Human Development, National Institutes of Health. 2000
Oklahoma State Department of Education. Response to Intervention (RtI) Guidance Document. pp. 10. 2010. https://sde.ok.gov/sites/ok.gov.sde/files/RtIGuidanceDoc.pdf
Palincsar, A. S., & Brown, A. L. “Interactive Teaching to Promote Independent Learning from Text.” The Reading Teacher, 39, 1986: 771-777.
Pearson, P. D. & Gallagher, M. C. “The Instruction of Reading Comprehension.” Contemporary Educational Psychology, 8(1), 1983: 317-344.
Pearson, P.D., & Doyle, J.A. “Explicit Comprehension Instruction: A Review of the Research and a New Conceptualization of Instruction.” Elementary School Journal 18(1), 1987: 151-166.
Pearson, P. D., & Fielding, L. Comprehension Instruction. In R. Barr, M. Kamil, P. Mosenthal & P. D. Pearson (Eds.), Handbook of Reading Research (Vol. II, pp. 815–860). New York: Longman. 1991
Perfetti, C. “Reading Ability: Lexical Quality to Comprehension.” Scientific Studies of Reading (11)4, 2007: 357-383.
Pressley, M., Snyder, B.L. & Cariglia-Bull T. How Can Good Strategy be Taught to Children? Evaluation of Six Alternative Approaches. In S.J. Cormier and J. Hagman

2020 READING SUFFICIENCY ACT STUDY | Oklahoma State Department of Education 84
(Eds.), Transfer of Learning: Contemporary Research and Applications. Orlando, FL.: Academic Press. 1987
Pressley, M. Comprehension Instruction: What Makes Sense Now, What Might Make Sense Soon. In M.L. Kamil, P. Mosenthal, P.D. Pearson, & R. Barr (Eds.) Handbook of Reading Research: Volume III. New York: Longman. 2000
Priestley, M. “10 Tips for Higher Test Scores.” Instructor. 11D (3), 2000: 30-31.
Pullen, P. C., Lane, H. B., Lloyd, J. W., Nowak, R., & Ryals, J. “Effects of Explicit Instruction on Decoding of Struggling First Grade Students: A Data-Based Case Study.” Education And Treatment Of Children, 28, 2005: 63–76.
Rasinkski, T. V. The Fluent Readers: Oral reading strategies for building word recognition, fluency, and comprehension. New York, NY: Scholastic Professional Books. 2003
Reutzel, D. Ray, Parker C. Fawson, and John A. Smith. “Reconsidering Silent Sustained Reading: An Exploratory Study of Scaffolded Silent Reading.” The Journal of Educational Research 102.1 (2008): 37-50.
Rogoff, B. Apprenticeship in Thinking: Cognitive Development in Social Context. NY: Oxford University Press. 1991 Roney, R. C. “Storytelling in the Classroom: Some Theoretical Thoughts.”
Roser, N. L., & Keehn, S. “Fostering Thought, Talk, and Inquiry: Linking Literature and Social Studies.” Reading Teacher, 55(5), 2002: 416-426.
Ross, R., & Kurtz, R. “Making Manipulatives Work: A Strategy for Success.” The Arithmetic Teacher, 40(5), 1993: 254-257.
Routman, R. Conversations: Strategies for Teaching, Learning, and Evaluating. Portsmouth, NH: Heinemann. 2000
Sadler, D.R. “Formative Assessment and the Design of Instructional Systems.” Instructional Science, 18(1) 1989: 119-144.
Scarborough, H.S. Connecting Early Language and Literacy to Later Reading (Dis)abilities: Evidence, theory, and practice. In S. Neuman. D. Dickson (Eds.), Handbook for Research in Early Literacy (pp. 97-110). New York, NY: Guildford Press. 2001
2020 READING SUFFICIENCY ACT STUDY | Oklahoma State Department of Education 85
Schubert, F. & Becker R. “Social Inequality of Reading Literacy: A Longitudinal Analysis with Cross-Sectional Data of PIRLS 2001 and PISA 2000 Utilizing the Pair Wise Matching Procedure.” Research in Social Stratification and Mobility 29(1) 2010: 109–33.
Shavelson, R. J., Yin, Y., Furtak, E. M., Ruiz-Primo, M. A., Ayala, C. C., Young, D. B., Pottenger, F. M., III. On�the Role and Impact of Formative Assessment on Science Inquiry Teaching and Learning. In J. Coffey, R. Douglas, & C. Stearns (Eds.), Assessing Science Learning (pp. 21–36). Arlington, VA: NSTA Press. 2008
Shepard, L. A. Formative Assessment: Caveat Emptor. In C. A. Dwyer (Ed.), The Future of Assessment: Shaping Teaching and Learning (pp. 279-303). Mahwah, NJ: Lawrence Erlbaum Associates. 2008
Simmons, B.J. “The Importance of Being Tested.” Kappa Delta Pi. 34(4), 1998: 129-131.�
Sipe, L. “The Construction of Literary Understanding by First and Second Graders in Oral Response to Picture Storybook Read-Alouds.” Reading Research Quarterly, 35 (2), 2000: 252-275.
Snow, C.E., Burns, M.S., & Griffin, P. (eds.) Preventing reading difficulties in young children. Washington, DC: National Academy Press. 1998
Stanovich, K.E. “Matthew effects in reading: some consequences of individual differences in the acquisition of literacy.” Reading Research Quarterly, 22, 1986: 360-407.
Torgesen, J.K. “Catch Them Before They Fall: Identification and Assessment to Prevent Reading Failure in Young Children.” American Educator. 22(2), 1998: 32-39.
Trelease, J. The Read-Aloud Handbook. NY: Penguin. 2001�
Tyner, B. Small-Group Reading Instruction: A Differentiated Reading Model for Beginning and Struggling Readers. Newark, DE: The International Reading Association. 2003
VanHorn, R. “Improving Standardized Test Scores.” Phi Delta Kappan. 78(7), 1997: 584-585.
Wasik, B. “When Fewer is More: Small Groups in Early Childhood Classrooms.” Early Childhood Education Journal, 35 (6), 2008: 515-521. www.springer-link.com/content/k50743327r8jr251/

2020 READING SUFFICIENCY ACT STUDY | Oklahoma State Department of Education 86
Wilhelm, J., Baker, T. N., Dube-Hackett, J. Strategic Reading. Portsmouth, NH: Heinemann. 2001SUFFICIENCY AUDY
Williams, C., & Lundstrom, R. P. “Strategy Instruction during Word Study and Interactive Writing Activities.” The Reading Teacher, 61(3), 2007: 204-212.
Williams, C., Phillips-Birdsong, C., Hufnagel, K., Hungler, D., & Lundstrom, R.P. “Word Study Instruction in the K-2 Classroom.” The Reading Teacher, 62(7), 2009: 570-578.
Willingham, D.T. “The Usefulness of Brief Instruction in Reading Comprehension Strategies.” American Educator, Winter, 2006. p. 39-45, 50/
Wolf, M. and Stoodley, C.J. Reader, Come Home: The Reading Brain in a Digital World. Harper, 2019.
Worthy, J., and N. Roser. Productive Sustained Reading in a Bilingual Class. In E. Hiebert, and R. Reutzel. (Eds.), Revisiting Silent Reading: New Directions for Teachers and Researchers, Newark, DE: International Reading Association. 2010
Wylie, C., Lyon, C., & Formative Assessment for Students and Teachers (FAST) State Collaborative on Assessment and Student Standards. (SCASS). Using the Formative Assessment Rubrics, Reaction and Observation Tools To Support Professional Reaction on Practice. Washington, DC: Council of Chief State School Officers. 2013
Zahorik, J.A. “Elementary and Secondary Teachers’ Reports of How They Make Learning Interesting.” The Elementary School Journal (May), 1996: 551-564.