RAPID APPRAISAL OF BIO-ENERGY-FOOD SECURITY NEXUS IN PACIFIC ISLAND COUNTRIES Draft Final Report ...
106
1 RAPID APPRAISAL OF BIO-ENERGY-FOOD SECURITY NEXUS IN PACIFIC ISLAND COUNTRIES Draft Final Report For FAO Sub-Regional Office for the Pacific K.R Chapman-FAO Consultant June 2009
-
Upload
independent -
Category
Documents
-
view
1 -
download
0
Transcript of RAPID APPRAISAL OF BIO-ENERGY-FOOD SECURITY NEXUS IN PACIFIC ISLAND COUNTRIES Draft Final Report ...
1
RAPID APPRAISAL OF BIO-ENERGY-FOODSECURITY NEXUS
IN
PACIFIC ISLAND COUNTRIES
Draft Final Report
For
FAO Sub-Regional Office for the Pacific
K.R Chapman-FAO Consultant
June 2009
2
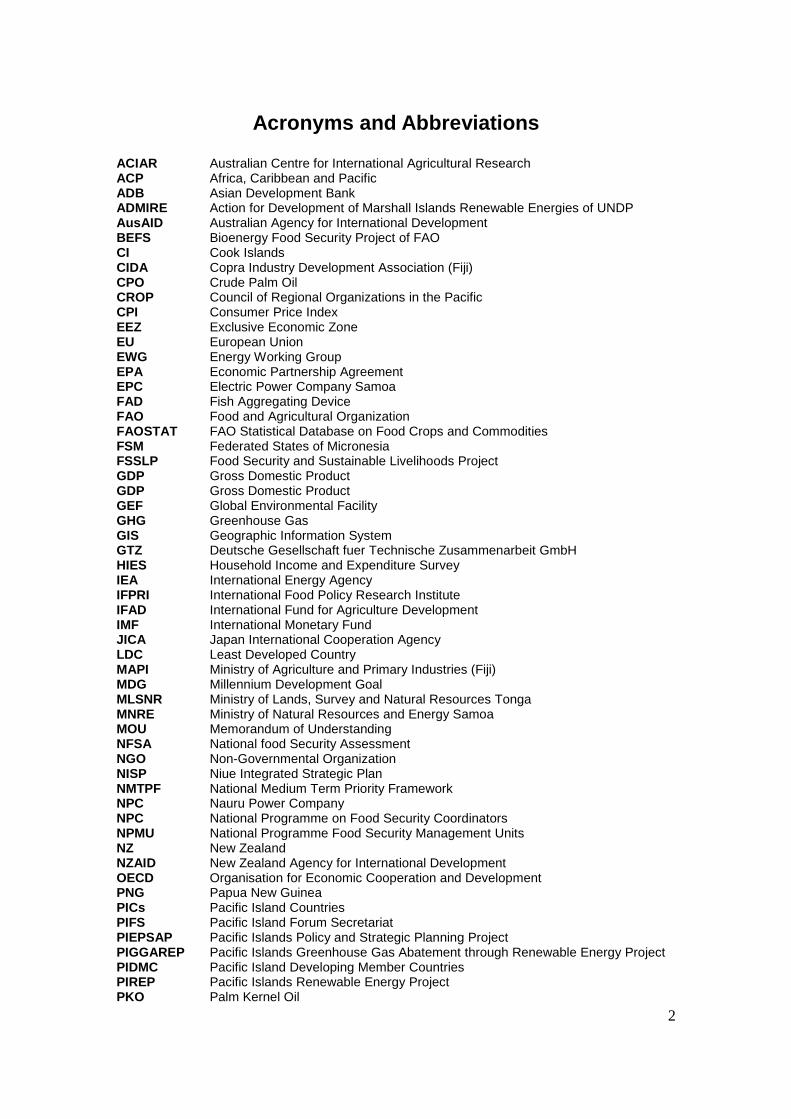
Acronyms and Abbreviations
ACIAR Australian Centre for International Agricultural ResearchACP Africa, Caribbean and PacificADB Asian Development BankADMIRE Action for Development of Marshall Islands Renewable Energies of UNDPAusAID Australian Agency for International DevelopmentBEFS Bioenergy Food Security Project of FAOCI Cook IslandsCIDA Copra Industry Development Association (Fiji)CPO Crude Palm OilCROP Council of Regional Organizations in the PacificCPI Consumer Price IndexEEZ Exclusive Economic ZoneEU European UnionEWG Energy Working GroupEPA Economic Partnership AgreementEPC Electric Power Company SamoaFAD Fish Aggregating DeviceFAO Food and Agricultural OrganizationFAOSTAT FAO Statistical Database on Food Crops and CommoditiesFSM Federated States of MicronesiaFSSLP Food Security and Sustainable Livelihoods ProjectGDP Gross Domestic ProductGDP Gross Domestic ProductGEF Global Environmental FacilityGHG Greenhouse GasGIS Geographic Information SystemGTZ Deutsche Gesellschaft fuer Technische Zusammenarbeit GmbHHIES Household Income and Expenditure SurveyIEA International Energy AgencyIFPRI International Food Policy Research InstituteIFAD International Fund for Agriculture DevelopmentIMF International Monetary FundJICA Japan International Cooperation AgencyLDC Least Developed CountryMAPI Ministry of Agriculture and Primary Industries (Fiji)MDG Millennium Development GoalMLSNR Ministry of Lands, Survey and Natural Resources TongaMNRE Ministry of Natural Resources and Energy SamoaMOU Memorandum of UnderstandingNFSA National food Security AssessmentNGO Non-Governmental OrganizationNISP Niue Integrated Strategic PlanNMTPF National Medium Term Priority FrameworkNPC Nauru Power CompanyNPC National Programme on Food Security CoordinatorsNPMU National Programme Food Security Management UnitsNZ New ZealandNZAID New Zealand Agency for International DevelopmentOECD Organisation for Economic Cooperation and DevelopmentPNG Papua New GuineaPICs Pacific Island CountriesPIFS Pacific Island Forum SecretariatPIEPSAP Pacific Islands Policy and Strategic Planning ProjectPIGGAREP Pacific Islands Greenhouse Gas Abatement through Renewable Energy ProjectPIDMC Pacific Island Developing Member CountriesPIREP Pacific Islands Renewable Energy ProjectPKO Palm Kernel Oil
3
PV Photo VoltaicRAMSI Regional Assistance Mission to Solomon IslandsREMM Regional Energy Ministers MeetingRET Renewable Energy TechnologiesR&D Research and DevelopmentRIF Regional Institutional FrameworkRMI Republic of Marshall IslandsRPFS Regional Programme for Food SecuritySAMRIS Samoa Regional Information SystemSAP FAO Sub-regional Office for PacificSBEC Small Business Enterprise CentreSI Solomon IslandsSIRIS Solomon Islands Regional Information SystemSOPAC South Pacific Applied Geoscience CommissionSPC Secretariat of the Pacific CommunitySPREP Secretariat of the Pacific Regional Environment ProgramTA Technical AssistanceTEC Tuvalu Electric CorporationTFS Training and Facilitation Support SpecialistsUNDAF United Nations Development Assistance FrameworkUNDESA United Nations Department of Economic and Social AffairsUNDP United Nations Development ProgrammeUNEP United Nations Environment ProgrammeUNIDO United Nations Industrial Development OrganisationUSAID United States Agency for International DevelopmentUSP University of the South PacificVANRIS Vanuatu Regional Information SystemWB World BankWFP World Food Programme
4
Table of Contents
Acronyms and Abbreviations ............................................................................................. 2Table of Contents ................................................................................................................ 4Executive Summary............................................................................................................ 5I. Introduction and Background .......................................................................................... 9
Definitions: ................................................................................................................... 10Food Security Policy and Planning involving Bio-energy, Natural Resources andClimate Change -Why?................................................................................................. 11
II. Approach Methodology................................................................................................ 13III. Preliminary Findings................................................................................................... 15
Notes on Data................................................................................................................ 15Energy Policy Data ................................................................................................... 15Food Security Policy Data ........................................................................................ 17Agriculture and Economy Data ................................................................................ 20Natural Resources GIS Remote Sensing Capabilities .............................................. 20
Country Summaries ...................................................................................................... 21Vanuatu ..................................................................................................................... 22Fiji ............................................................................................................................. 25Samoa........................................................................................................................ 28Tonga ........................................................................................................................ 30Papua New Guinea.................................................................................................... 33Solomon Islands........................................................................................................ 37Niue........................................................................................................................... 41Marshall Islands ........................................................................................................ 43Nauru......................................................................................................................... 45Palau.......................................................................................................................... 47Tuvalu ....................................................................................................................... 49Kiribati ...................................................................................................................... 51Cook Islands.............................................................................................................. 54Federated States of Micronesia ................................................................................. 56
IV. Conclusions and Recommendations ........................................................................... 58Acknowledgements........................................................................................................... 62References......................................................................................................................... 63Appendix1. Terms of Reference ....................................................................................... 66Appendix 2. Survey of Pacific Island Countries to Assist with a Rapid Appraisal of TheBioenergy/Food Security Nexus In The Pacific ............................................................... 68Appendix 3. Food Production and Import Data for Pacific Island Countries................... 72Appendix 4. List of Participants ....................................................................................... 87Appendix 4. List of Persons Met ...................................................................................... 97Appendix 5. Programme of Visit .................................................................................... 104
5
Executive Summary
This report presents findings from the conduct a rapid appraisal on the bioenergy-foodsecurity nexus at regional level, including selected Micronesia, Melanesia and PolynesiaPacific island countries. The aim the appraisal was to provide policy-makers a decision-making basis for the prioritization of in-depth country assessments and further analysis tobe conducted in the second half of 2009 under the FAO Bioenergy and Food Security(BEFS) analytical framework.
The approach was to assess the data available in each country on energy/bioenergy,agriculture and the economy and natural resources and assess the ability of each countryto be able to provide or collect the required data with or without additional assistance.Select countries (Samoa, Tonga, Fiji, Vanuatu, PNG and Solomon Islands) of the 14 PICswere visited to interview governmental institutions, donors and key aid projects andprivate sector personnel to verify likely data available and the ability to collect defineddata for assembling a multisector food security, energy/bioenergy and natural resourcespolicy at individual PIC government levels. For all countries an extensive database ofinformation provided by CROP agencies, donors, individuals and searches wasassembled and reviewed for each country and a survey was sent to each PIC forcompletion. From the information, country visits and the survey the outcome of the rapidappraisal is summarised below along with recommendations.
Currently, none of the Pacific Island Countries has in place an integratedenergy/bioenergy/food security and natural resource policy, policy framework orstrategies as a basis for guidelines for energy and food security development in relation tothe existing resource bases. Most PICs have no energy policy or food security policies. SIhas recent National Policy Framework involving Policies and Guidelines while PNG hasin place a Food Security Policy.
All PICs with the exception of PNG and Solomon Islands do not have updated GISimagery, with the last aerial photos from around 1996. PNG has at UPNG and SI atForestry Division has recently updated forest covers and PNG has an updated PNGRISdatabase. SI with AusAID help is preparing to do a Strategic Environmental Assessmentinvolving a broad inventory of forestry types and land use.
Most PICs have virtually no lands of any consequence for large scale plantings of biofuelcrops with exceptions of PNG, Fiji and to a much less extent Solomon Islands.
Most PICs with the possible exception of PNG and Solomon Islands do not have the dataavailable or the ability to collect data needed to develop integrated policy involvingbioenergy, food security and the natural resource base. Alternatively Vanuatu is a goodexample of the application of technologies to make practical use of coconut oil as a vitalenergy source.
With regard to bioenergy crops no PIC country has a clear policy. A policy similar toChina in that no basic food crop, is to be used for biofuel and no food crop land is to beused for biofuel crops is recommended for consideration as a starting point for all PICs.
6
With regard to food security the most urgent and acute would appear to be MarshallIslands and Tuvalu. The economic collapse of the Marshalls and the inundation of Tuvaluand the existing extent of aid support contribute strongly to this urgent position.
While most institutions and agencies consulted have a clear interest in seeing policieslinking food security with energy/bioenergy and natural resources the political will isoften hard to judge because of lack of transparency in decision making particularly interms of land use and concessions to logging, mining, agriculture development and realestate development in many PICs.
Which countries are chosen for further in-depth study depends on the selection criteriathat are chosen, e.g., food security urgency, energy deficiency, bioenergy opportunities,data availability, threats to the natural resource base, vulnerability to natural disasters,complimentary support from FSSLP and other key donor support etc. The data providedin this report will allow choices based on selection criteria chosen.
The response from the PIC countries to the survey was especially disappointing with onlythree countries responding and most except the Marshall Islands in an incomplete way.For better information it was essential to visit the countries and meet with key agencies aswell as donors and CROP agencies.
Apart from the use of wood energy for cooking drying of copra, cocoa and coffee and insome cases gasification, the main opportunity for most PICs, is to use coconut oil as adiesel substitute, as is so successfully practiced in Vanuatu, especially for powergeneration. The exceptions are Nauru, Cook Islands, Niue, Tonga and Palau which havelow coconut production and where most coconut is used for human or animal food.
The use of coconut oil as a diesel substitute is a mature technology as has been so wellproven in Vanuatu and the model for rural electrification where farmers bring copra tothe oil plant and generator site to prepay for metered electricity is very successful. Theprogram is implemented by UNELCO and supported by EU and is operating in 3 sitesand will extend to 9 sites. It make good sense to use the coconut resource to producecoconut oil for diesel substitution since copra and coconut oil prices on the world marketare low and it is uneconomic to export. Use of the coconut for oil will give farmers anincome again and at the same time reduce diesel imports and reduce fuel costs and saveforeign exchange.
There are options for the use of gasifiers but these have failed in most countries in thepast with the possible exception in PNG for crop drying.
Most PICs have little opportunity for biogas production and success has been very mixed.
Fiji and PNG have opportunities to produce ethanol from sugarcane and cassava andprojects are planned with integrated cassava factories for Fiji and PNG. It wasrecommended that both PNG and Fiji look to including Sweet Sorghum as a crop withsugarcane to provide a summer feedstock to keep a sugar factory producing ethanol year-round. Use of breadfruit to make ethanol in Samoa would be very questionable withrespect to economic viability and the desirability since breadfruit is an important foodcrop.
7
Fiji, PNG and Solomons and Vanuatu have been lobbied by Jatropha curcas plantationproposals from investors. To their credit all applications have been refused to date. Thefact is that Jatropha plantations have not proven to be commercially successful anywherein the world, and interplanting of coconut with Jatropha will disrupt food and cash cropproduction and livestock rearing options. The oil and oil cake are toxic, the oil needsreprocessing in 3 months and the plant is a declared perennial noxious weed and invasivespecies in many countries of the world. Chapman and Yishi 2008. Finally, Jatropha hasno place in coconut areas since coconut is infinitely more useful in many different waysas a food, fuel, feed and fibre and is the main basis for very sustainable coconut farmsystems of the Pacific Island countries.
One investor group is proposing to promote Pongamia pinnata as an oil crop forsmallholder farmers in Fiji. Pongamia trees are large, and thick canopies exclude sunlightunlike coconuts and take a number of years to be productive and 10-15 years to attainhigh yields. Once planted the trees will largely occupy all the land and exclude othercropping as trees mature. Single seed pods have to be hand harvested and the economicsof doing so has yet to be demonstrated. If the Pongamia can be effectively mechanicallyharvested it is possible that plantations may be successful, but the crop should not bepromoted to smallholders to replace food crop or livestock areas. The seeds and oil andoil cake are toxic and cannot be used for animal feed.
Ignorance of the pros and cons of biofuel crops generally was found in the PICs visitedand a concerted effort is needed to bring Energy and Agriculture Ministries up to speedon biofuels so they can deal with the extravagant claims of investor proposals made to tryto gain major plantation concessions.
Oil palm is a very successful crop in PNG and the Solomon Islands and is in thesecountries produced in a certified sustainable way and is providing secure incomes forsmallholder diversified farming. CPO is not used for biodiesel in either PNG or SolomonIslands. PNG has 13 plantations and a refinery but The Solomons has only a CPO andPKO plant. All the Solomon Islands exports of CPO and PKO go to Europe and are usedsolely for food products.
Third generation biofuels, as described briefly below, could well become a reality in thePICs, with the support of aid and public/private sector investments and cooperation. Suchsupport for the future is recommended to aid agencies and investors.
Third generation fuel from cellulosic ethanol production from fibre celluloses andlignocelluloses in waste materials such as sugarcane bagasse, crop residues and by-products from crop processing such as cassava stalks oil palm empty bunches or fastgrowing tropical C4 Grasses such as Elephant Grass or from legume fuel wood trees suchas Gliricidia, Leucaena are clear options for the future for energy production. Use of thebagasse of sugarcane can increase the yield of ethanol per hectare from around 3, 500L toaround 30,000L using cellulosic transformation to hexose sugars and their fermentationand distillation. The technology is now going commercial in China and Korea and inEurope and is now a reality.
Third generation oil production from algae is a new and very promising technology thatwhen perfected may prove to be ideal for PICs as the productivity of oil/ha is very high atlevels up to 300,000L/ha, but potentially as high as 1.25mL/ha,
8
http://en.wikipedia.org/wiki/Algae_fuel . Research in the US and in Australia as well asother countries is well advanced on these technologies and their commercialisation.
The German Alpha Kat KDV technologies are used to convert wastes from a whole rangeof sources, like dump sites, animal wastes, plastics, paper, manure, sawdust and wood,sewage etc. to diesel in a high temperature reactor process using catalyticdepolymerisation. SOPAC 2009.
Butanol produced from anaerobic fermentation of starch, sugar, lignin, cellulosic fibre,lignin and other biomass with Clostridium acetobutylicium is another useful thirdgeneration biofuel that has a number of advantages over ethanol as a gasolinereplacement. SOPAC 2009.
Ethanolix continuous fermentation technology developed by St1 Biofuels of Finlandproduces ethanol from organic wastes. Production cost in much smaller plants comparevery favourably with large first generation or second generation bio-ethanol plants.Household and municipal wastes, paper, starch and sugar and may act as feedstocks andby-products/residues of the process depending on feedstocks may be used for animal feedfertilizer or fed to anaerobic fermentation systems. www.st1.eu . The ST1companyfounded in 1997 acquired the Exxon Mobil subsidiary in Finland and operates over 400service stations in Finland and 40 in Sweden.
Synthetic Diesel from the Fischer/Tropsch process using gasification of biomass isanother third generation technology that in the near future may be feasible for a numberof PICs having a biomass resource.
Clearly, when third generation technologies such as cellulosic ethanol and algae oil andthe Alpha Kat KDV 500 waste treatment methods etc as described above are introducedand found to be feasible in PICs then the pressure on food crops or food crop lands andforests would be greatly reduced by these sustainable technologies. PICs would alsodispense with the unacceptable options of Jatropha and other marginal biofuel crops andthe disruption with long time sustainable coconut farm systems, which Pacific islandersknow well and are able to sustainably manage.
One very clear and urgent intervention in all PICs would be the regeneration of thecoconut industries and farm systems (including intercropping with food crops, fruits,vegetables, coffee, cocoa, vanilla, pepper and livestock rearing) and the rehabilitation andreplanting of coconuts to replace the aging coconuts present in all PICs. In addition sucha program should consider all the value adding options of using the whole coconut forfood, fuel, fibre, feed, oil, Virgin Coconut Oil, handicrafts etc. It is recommended thatdonor agencies be alerted to these excellent intervention options to make real impact forPacific Islanders livelihood improvements via income generating opportunities. Urgentdonor support is very much needed for coconut regeneration and rehabilitation along thelines described.
Finally the resolution of energy needs in any individual Pacific Island country will oftenbe a combination of bioenergy, solar, wind and OTEC or other wave energy technologiesdepending on the resource options and capabilities of each country and likely impacts onfood security. Again strong donor support for third generation biofuel technologies isrecommended.
9
I. Introduction and Background
The report prepared is in response to the request, by the FAO Sub-Regional Office of thePacific in Apia, Suva and the Bioenergy group of the FAO Natural ResourcesManagement and Environmental Department in Rome, for a rapid appraisal of thebioenergy-food security nexus at the regional level in selected Micronesia, Melanesia andPolynesia island countries.
The aim is to provide policy-makers a decision-making basis for the prioritization of in-depth country assessments and further analysis to be conducted in the second half of 2009under the Bioenergy and Food Security (BEFS) analytical framework. More specific datarequirements for the BEFS framework, will be noted to the extent possible during theappraisal.
The Terms of Reference (Appendix I), below outline the background and tasks of theRapid Appraisal.
The primary objective of FAO’s three-year Bio-energy and Food Security (BEFS) projectis to mainstream food security concerns into national assessments of bio-energy andestablish an analytical framework for the analysis of the food security and bio-energynexus. Currently, Peru, Tanzania and Thailand have been chosen for BEFS studies withthe activities in Thailand planned to be closely linked to analysis in Cambodia. Some PICcountries will be added.
The strategy of BEFS is based on three central components:
(i) Development of an overall bio-energy and food security analytical frameworkand methodological guidance including data and information support.
(ii) Estimation of bio-energy potential and food security implications withinspecific national and sub-national contexts.
(iii) Development of field activities that are replicable, sustainable and that willstrengthen both institutional capacities, as well as those of key nationalstakeholders.
The BEFS assessment overall includes five analytical steps, namely Module 1: BiomassPotential, Module 2: Biomass Supply Chain Production Costs, Module 3: AgricultureMarkets Outlook, Module 4: Economy-wide Effects and Module 5: Household-level FoodSecurity.
More specific data requirements for the BEFS framework will be, to the extent possible,noted during the completion of the rapid appraisal, as they may additionally influence theselection of countries for more in-depth studies and analysis. In summary the data needsfor in-depth studies will include the following Viz.
Agriculture and Economy Identify what are the main food crops and crops considered for bio-energy in each
country.
10
Collect food insecurity and vulnerability data for national and, if possible, sub-national level. Special emphasis should be placed on specific vulnerability ofremote islands.
Obtain data on each country’s agricultural trade balance to assess self-sufficiencyof country per crop
Assess country’s domestic demand for agricultural commodities and, to the extentpossible, projected future demand.
Gauge the scope and degree of policy commitment and action with regard to bio-energy programmes, regulation and the political sensitivity for food security.
Energy Share of different energy sources in national energy mix. Share of imported energy. Assess current and projected future volumes and costs import of fossil fuels
(crude oil, gas, gasoline, diesel). Collect main fuel prices for consumer (gasoline/liter, diesel/liter, Kw/h). Assess decentralized electrification (e.g. for on-farm use, telecommunication
towers, use in urban/rural transport etc.).
Natural Resources Identify, where possible geo-spatially, current land cover, land use and
(qualitatively) land use change trends in recent years. Where available, collectinformation on crop-specific land use and on existing or planned crop suitabilityassessments.
Assess water availability and constraints and irrigated area. Assess scope of wood energy and most important challenges faced. Highlight major environmental challenges in each country potentially linked to
bio-energy development (deforestation, biodiversity and habitat loss, water stressand pollution).
The purpose of the rapid appraisal is to determine data sources available in the PICs andwhether they need help in collection and synthesis of data so as to assess at least twolikely countries for further in-depth studies under the BEFS project later in 2009.
Definitions:
Bio-energy is defined as energy derived either directly or indirectly from derivatives ofbiological materials or biomass resources including agricultural crops and residues,forestry, livestock, waste, energy crops, algae and natural vegetation. Bio-energy isrenewable energy made available from materials derived from biological sources asopposed to petroleum, coal, nuclear materials etc. In essence bio-energy is derived frombiomass which either directly or indirectly derives from solar energy capture in biologicalmaterials.
Food security exists when all people, at all times, have physical, social and economicaccess to sufficient, safe and nutritious food which meets their dietary needs and foodpreferences for an active and healthy life. Household food security is the application ofthis concept to the family level, with individuals within households as the focus of
11
concern. (FAO. 2002. The State of Food Insecurity in the World 2001. Rome.http://www.fao.org/docrep/005/y4671e/y4671e06.htm )
Food insecurity exists when people do not have adequate physical, social or economicaccess to food as defined above.
In the FAO National Medium Term Priority Framework (NMTPF) for 13 PICs2009-2012 the focus areas for interventions such as food safety, quality and nutrition aswell as production, sustainability and agribusiness and trade, policy and planning,fisheries etc., are all targeted at Improved Food Security and Income EarningOpportunities in the PIC countries which is the central aim of FAO-Governmentpartnerships in the Pacific. (Pacific Multi-Country NMTPF 2009-2012, FAO April 2009).Papua New guinea the 14th PIC is now being addressed to prepare a NMTPF paper.(Stephen Rogers pers.comm.)
Food Security Policy and Planning involving Bio-energy, NaturalResources and Climate Change -Why?
The extract below from the State of Food and Agriculture, by FAO 2008 essentiallysummarises the likely impacts of bio-fuels, a possible major component of bioenergy inmany countries, on food security of especially poor households and reinforces the needfor all countries to have firm well guided policies on bio-energy in relation to foodsecurity.
“The impact of bio-fuels on food prices remains the subject of considerable debate, asdoes their potential to contribute to energy security, climate-change mitigation andagricultural development. Even while this debate continues, countries around the worldconfront important choices about policies and investments regarding bio-fuels. Thesewere among the topics discussed at FAO in June 2008 by delegations from 181 countriesattending the High-Level Conference on World Food Security: the Challenges of ClimateChange and Bioenergy. Given the urgency of these choices and the magnitude of theirpotential consequences, participants at the Conference agreed that careful assessment ofthe prospects, risks and opportunities posed by bio-fuels is essential. This is the focus ofFAO’s 2008 report on the State of Food and Agriculture. The report finds that while bio-fuels will offset only a modest share of fossil energy use over the next decade, they willhave much bigger impacts on agriculture and food security. The emergence of bio-fuelsas a new and significant source of demand for some agricultural commodities– includingmaize, sugar, oilseeds and palm oil – contributes to higher prices for agriculturalcommodities in general, and for the resources used to produce them. For the majority ofpoor households who consume more food than they produce, higher prices can pose aserious threat to food security – especially in the short term.” (FAO 2008. State of Foodand Agriculture-Biofuels: prospects, risks and opportunities.)
The above position on food in relation to bio-fuel development was flagged by variouskey world agencies including the CGIAR Science Council April 2008, and IFPRI policybriefs May 2008, and an OECD policy brief November 2007 among many others as aforerunner to the June 2008 FAO Rome meeting that comprehensively and in detail setforth the position and policy challenges ahead for World Food Security in relation to theChallenges of Climate Change and Bioenergy.
12
The challenges now are to help the PICs develop policies on Food Security in relationto both Bioenergy, especially Bio-fuel crops and Climate Change.
As an example, in China from March 2007, the official government policy directive is notto use food for making bio-fuel and not to use food crop lands for growing bio-fuel crops.By-products of food crops such as stover/crop residues, molasses etc., are consideredsecond generation bio-fuels feedstock and may be used for biofuel manufacture.
Similar positions to those of China may or may not apply or be appropriate for given PICcountries, thus the need for research on food security in relation to both bio-energy andnatural resource base which are both very critical vulnerable issues for these countries.
We should also note that bio-energy from bio-fuels will be unlikely to substitute for asignificant proportion of the energy needs of most countries, because of limited landareas. IEA 2006, estimated that only 4-7% of the road transport fuels would be providedby energy crops by 2030.
The effects on climate change of biofuels are not all positive. The complete life cycle of abio-fuel crop or biomass energy source must be undertaken to reveal the real benefits ofreduction in greenhouse gases and reduced carbon footprints, likely carbon credits, etc. Inmany instances effects of clearing forests and new land areas the benefits of biofuels arenegated for very long periods by the release of carbon dioxide and methane from theinitial land clearings. FAO2008. Lloyd, 2009 reported that the present emergingexperience is that current energy crops contribute little to GHG abatement, but that if andwhen lignin/cellulose digestion and fermentation and biodiesel conversion technologiesare perfected and cost competitive for perennial plants the position may improve and inparticular reduce land competition with food crops and reduce distortion of foodcommodity prices.
The FAO COAG 2007 Environment and Agriculture paper emphasized the urgent needto address the nexus between, bioenergy, biosecurity, climate change in agriculturalpolicy.
Further the FAO/SPREP 2008 report emphasized that climate change will exacerbatethreats to food security already present. The report proposed a list of urgent short andlong term measures term measures for regional action and the need to build resilienceinto food production systems particularly by diversification options for growing andusing crops, among other key issues and proposals.
The SPC/SOPAC Pacific Regional Biofuel Workshop in Fiji 2008, estimated that formany PICs, 20-30% of current fossil fuel demand for power generation and transportcould be replaced with biofuels, using readily available technologies to convert existingbiomass resources. The comprehensive workshop addressed a wide range of strategyissues aimed at striking a balance between increased resilience for food and energy whilereducing poverty and the paper gives “A framework for national biofuel policies toreshape the energy and agricultural sectors of Pacific island countries, recognising thePacific region’s vulnerability to the effects of climate change.” (SPC/SOPAC 2008-Pacific Strategy for Sustainable Biofuels).
13
Pacific Island Developing Member Countries (PIDMCs) remain highly exposed to oilprice shocks which can weaken sound macroeconomic policy management andnegatively impact business and household welfare. ADB continues to advocate use ofEconomic Analyses to strengthen energy policy and planning and overcome PIDMC’sweaknesses to shift towards more diversified energy options and bulk fuel procurementand modify fuel supply arrangements. Woodruff 2009.
The points made above clearly indicate that PICs are well informed about the interactionsand competing issues between food security, biofuels/biomass energy, natural resourcesand climate change and the need for a multi-sectorial approach in each country. Thechallenge is how to achieve sustainable policies and practical implementation. However,recent missions to selected PICs during the rapid appraisal has revealed that manygovernment institutions, power generating utilities and private sector groups areignorant about the pros and cons of biofuel crops trying to be promoted by investors fromwithin and from overseas.
II. Approach Methodology
The Approach Methodology of this rapid appraisal for the 14 PIC countries involvedcollecting data from the PIC countries, Council of Regional Organisations of the Pacific(CROP) agencies, key donor agencies, the Energy Working Group (EWG) and involvedindividual scientists and consultants, along with short missions to a select number ofcountries (Samoa, Tonga, Fiji, PNG, Vanuatu and the Solomon Islands) during the studyto determine what key data are available at country level and the extent of work done onFood Security and Bio-energy and likely future needs to fill the gaps.
In addition to some country missions a survey was assembled to assess what dataindividual PICs have and can access readily or if more help is required to assemble andsynthesise time series data for 5 years or more on Agriculture and Economy, Energy andNatural Resources. The survey also asks if each country has a recent policy on FoodSecurity, and if so, does the policy include Bioenergy crops and whether each country hasa National Agricultural Development Plan. Appendix 2 contains a copy of the survey.
The first input with visits to Samoa, Tonga and Fiji, coincided with the Regional EnergyMinisters Meeting (REMM 2009) and the Regional Officials Meeting in Tonga andprovided an opportunity to meet country ministry officials, and representatives of theCROP energy agencies, the Energy Working Group (EWG), donors, UNIDO, and privatesector and institute participants. Discussions with key persons provided a great deal ofbackground information on energy, including bioenergy for this report.
Detailed collection of time series data on Agriculture and Economy, Energy and NaturalResources by a one person in the narrow window of the consultancy work was consideredimpossible by both the consultant and FAO-SAP and this message was conveyed to theBio-energy group of the FAO Natural Resources Management and EnvironmentalDepartment in Rome, prior to the contract being finalized. It was agreed that the rapidappraisal would try to determine if such data might be available an in which areas andwhich countries and at the same time identify countries that would need significant helpin collecting Agriculture and Economy, Energy and Natural Resources.
14
It was felt that the study would try to:
Assess which countries have in place already policy on Food Security and Energyand in particular Bioenergy and have good Natural Resource base recent data.
Assess interest, willingness, opportunity and commitment by individual countriesto proceed with bioenergy initiatives in the first instance.
Prepare Country Summaries of the positions on energy/bioenergy, food securityand natural resources policy and data and identify also those island countries withlarger tracts of land and natural resources that could be diverted into growing ofadditional bioenergy crops and those where there is a surplus resource of, forexample, coconut or other products such as wood, animal wastes etc., that couldbe utilized in a sustainable and economic way for bioenergy production.
As a short additional task a Briefing Report was prepared for the Eighth Meeting of theFAO South West Pacific Ministers for Agriculture. Alofi, Niue.20 to 22 May, 2009.
Dozens of electronic documents and reports comprising over 2,500 pages of informationwere amassed from individuals in Ministries, institutes and the CROP agencies, donorsand FAO to provide the basis of the appraisal along with the survey and visits to somecountries.
15
III. Preliminary Findings
Notes on Data
Energy Policy Data
Indications are that there is a wealth of accumulated knowledge and studies pertaining toenergy including renewable energy and bio-energy in the PICs. The Pacific IslandsPolicy and Strategic Action Planning Project PIEPSAP) of SOPAC/UNDP /Governmentof Denmark of 2004-2008 had as its overall objective the development of national energypolicies, plans and mechanisms within the PICs, which influence national efforts towardsachieving the PIEEP vision of available, reliable, affordable and environmentally soundenergy for sustainable development for all Pacific islanders.
However, the energy R&D and provision of energy, particularly rural energy, clearlyvaries considerably from country to country and the PIREP Renewable Energy studies ofSPREP /UNDP /GEF of 2003-2004 have been recently flagged for updating to addressthese issues. The information collected in these studies and those of SOPAC/ICCEPT2003, are another repository of individual PIC country biomass and renewable energy,but with far less in-depth detail than the SPREP/PIREP individual country reports. At therecent Regional Energy Ministers Meeting (PEMM 2009) and the Regional OfficialsMeeting (REM 2009) and the resolutions from that meeting it is clear that the time seriesenergy data on energy available over a number of years for each country are verydeficient for many PICs and a priority for the future. Even getting reliable time seriespetroleum data on country use and demand is very difficult because oil companies areoften unwilling to cooperate and even the split between bunkering refueling ofships/boats and domestic use is often not available. SPREP 2004a.
SPREP 2004a summarises the status of National Energy policies and Energy Plans orComponents of National development Plans for PICs. Most countries except Nauru andPalau had made some attempt at development of National Energy Policies that are clearlyvery variable as regards, Cabinet approval and effectiveness. All policies or drafts arelikely to require updating and in addition adjustment to incorporate food security policy,natural resource base and climate change cross cutting issues.
PIEPSAP Recommendations below, to the REM meeting in Cook Is 2007 re-enforces theneed described above for better energy policy planning and development.
It was recommended that Ministers:(i) Consider the need for a permanent planning and policy development facilityin the region and emphasise the need to co-ordinate energy sector developmentamongst all regional and national stakeholders and relevant donors.(ii) Call for more tangible regional collaboration in the energy sector in order toharness joint benefits through:(a) Free exchange of data and information amongst energy sectorstakeholders in the region(b) Harmonization of energy sector regulation with the aim to create a
16
conducive climate for private sector led energy sector investments(c) Regional benchmarking of energy service providers(d) Joint procurement of fuels, goods and services.(iii) Agree to the need for the establishment of a regional energy financing facility thatallows to firmly link energy sector planning with sustainable energy sectorinvestments.
At the 2009 Regional Energy Meeting in Tonga the official 2009 Pacific EnergyMinisters Communiqué emphasised the following key priority areas:
1 “Ministers in noting the progress in the implementation of the RegionalInstitutional Framework (RIF) and the implications on energy recommended andagreed to the following:
a) That regional and donor coordination delivery of energy services to Pacificisland countries be strengthened and delivered through one energy agencyand through one programme contributing to the development of a strongerenergy sector and improved service to member countries; and
b) In this context it was noted that there was a need to ensure that energypolicy and climate change policy remained separate where environmentalaspects are managed by SPREP and energy sector activities by SPC so as toensure that the socio-economic aspects of energy were adequatelyaddressed.
2 Ministers underlined the need to strengthen human capacity developmentinitiatives to support national and regional energy programmes including gendermainstreaming; and further noted on-going need to focus on development ofapprentice schemes for power utilities and alternative energy technologies.
3 Ministers expressed the need to review and as appropriate strengthen nationalcapacity in energy data and information gathering and collation, management,dissemination and, analysis on economics, social and environment to betterinform national and regional energy planning and policy choices where thisshould be incorporated into the one energy agency.
4 Ministers acknowledged progress in the implementation of the regional bulk fuelprocurement initiative and called upon CROP agencies to continue to supportPICs to move the initiative to implementation.
5 Ministers encouraged the necessary actions that would facilitate investment insustainable renewable energy technologies and in energy efficiency and energyconservation initiatives.
Ministers in highlighting these five key priority areas acknowledged that all Pacific islandcountries are individual and unique in their own respect and accepted that the otheroutcome areas as recommended to the Ministers be individually assessed on a case bycase basis as countries deemed necessary and on the availability of human and financialresources.”
17
Clearly there is now a united will by all Energy Ministers to push forward onpolicies and initiatives on all fronts to improve and strengthen energy supply andsecurity in PICs.
Food Security Policy Data
To date investigations indicate, in contrast to energy, a dearth of recent Food Securitypolicy R&D work per se, although there are a number of agricultural policy and nationalagricultural development plan policy related studies completed, on-going or proposedthat can/will support Food Security policy development and strategies and plans.
The FAO Food Security and Sustainable Livelihoods Programme (FSSLP) in PacificIsland Countries has been revised down to US41.8m from US71m. To date the FSSLPhas not been funded for implementation. The information below is an extract from recentcommunications with Fintan Scanlan, FAO Rome. Viz.“Component 3 of the FSSLP will provide support to countries’ food security initiatives,through strategic planning and implementation support, and key initiatives involvingmore than one country or even at the regional level. Its objectives are to bolster nationalinitiatives through enhanced capacities, strategies and policies; address food securityissues of cross-cutting and regional/sub-regional nature (e.g. climate change); and helpfill gaps not readily covered by individual country projects (such as food safety standardsand international trade issues). Taking into consideration the findings of the IndependentEvaluation of the Regional Programme of Food Security (RPFS), multi-countryinitiatives will be designed keeping in mind the diversity in circumstances betweencountries and sub-regions. The Programme will ensure design of such activities iscognisant of, and have clear linkages to, strategies and priorities of individual countries.This component has two sub-components.
Sub-component 3.1. Training, Facilitation and Assessment Support to Countries. Thissub-component will provide training and facilitation support to the countries to helpbuild capacities in food security vulnerability assessment and strategy processes, projectplanning/design, and in monitoring and evaluation. Training and Facilitation Support(TFS) specialists will be deployed on a needs basis, to cover countries by cluster, or sub-regional basis, for at least the first three years of the Programme. A core pool ofexperienced specialists will be used, to ensure consistency and cross-country learning.They will, with guidance of RPMU and in collaboration with other specialist personnel,help organise training for the NPCs/country project teams. They will use a training oftrainers approach, along with hands-on technical assistance and mentoring, to providelearning on the job.
The Programme will support the NPSCs in each country to do a national food securityassessment (NFSA), at the time of programme start-up (or prior to, where possible).Guided by the NPSCs, the NPCs, with RPMU and the TFS support, will initiatedevelopment or refinement of a national strategic framework for food security, based onthe national food security assessment. This will be done iteratively, drawing onexperience gained during programme implementation. The strategy will define priority(sub-) sectors, the programme area and the target groups. It will undertake more detailedparticipatory assessments as necessary, especially in the early years.
18
Sub-component 3.2 Support to Multi-country Food Security Initiatives. This sub-component will support multi-country food security initiatives in the followingProgrammatic Areas: 1) Planning, policy and programme development support;2) Climate change preparedness, adaptation and mitigation; 3) Food quality and safetyimprovement; and 4) Facilitation of trade and marketing. These Programmatic Areaswill make an important contribution to programme objectives through capacitystrengthening and supporting strategic actions to address immediate as well as longerterm food security challenges at country and regional levels. Initiatives in other areas arenot ruled out, however, and there will be sufficient flexibility for inclusion of others, iffound to be justified during programme implementation.” FAO 2008.
Clearly the above programme if/when funded and implemented would give the desiredopportunity to link food security policies development with energy and bioenergypolicies as well as natural resources and climate change policy in all PICs.
McGregor et al 2008 compiled a recent paper on Pacific Island Food Security: Situation,Challenges and Opportunities to highlight the urgencies for food security and the need foraction.
Sharma 2006 reported on Food Security in the South Pacific Island Countries withSpecial Reference to the Fiji Islands.
At the SPC/Committee of Representatives of Governments and Administraions(SPC/CRGA) meeting in Noumea in 2008 a paper was presented by the Secretariat onFood Security in the Pacific emphasising the precarious positions of many PICs withregard to food production and food imports and food prices and that threats to foodsecurity requires a multi-sectorial approach involving the whole of society and whole ofgovernment
A worrying feature of agriculture in PICs is as Reddy 2007 clearly points out is thatagriculture particularly the crop sector, not livestock has leveled off since the 1980’s andexpansion of land under cropping, changes in farming systems and adoption of newtechnologies are urgently needed to improve food security
The World Bank 2008 hosted a very useful meeting in Sydney in July 2008 on the Impactof Global Oil and “Food Price Increases on the Pacific Region and Possible MitigationMeasures.” This meeting among other very useful outcomes produced a “Pacific Foodand Fuel Related Activities Matrix by Agency” document that documented for each PICthe Activity Names and Descriptions for each agency including World Bank, SPC, WFP,UNDP, NZAID, PIFS, FAO, IFAD, AusAID and ADB.
A search of the matrix shows that in matters related to Food Security
WFP has concentrated in recent times on Food Vulnerability and Vulnerabilitymapping in partnership with IFAD.
IFAD in July 2008 had a Pipeline proposal on Regional Food Security andSustainable Livelihoods Programme for PICs.
19
UNDP recently has been concentrating on Poverty Analysis and Energy andPoverty in PICs (UNDP 2007) with Policy and Technical advice support onpoverty reduction, MDG achievement, sustainable livelihoods and energy andsupport to Household Income Expenditure Surveys.
AusAID supports the Department of Food Security in Timor Leste and hasrecently funded a FAO/AusAID Food Security Study.
UNDP is supporting the Integrated Climate Change Adaption Project 2008-2012in Samoa, which will cover climate change, agriculture and food security.
UNDP is also supporting the MDG Achievement and Poverty Reduction 2008-2012 for 11 PICs, with focus on sustainable and affordable energy services for thepoor with inputs on pro-poor interventions, policy and institutional arrangementsfor mainstreaming poverty-energy issues especially with renewable energy.
UNDP is continuing to support Renewable Energy, Energy Efficiency and CarbonFinancing initiatives in selected PIC countries.
FAO has been involved recently in the following Food Security policy relatedareas:
1. Cook Islands: Agricultural Policy Review 2008.2. Nauru: Strategic Plan for Sustainable Development in Nauru 2004-2008.3. Papua New Guinea: Formulation of a National Agriculture Development Plan
2005-2007.4. Solomon Islands: Formulation of a National Agriculture Development Policy
2008-2012. Rejected by Government.5. Vanuatu: Formulation of the Agricultural Policy for Vanuatu 2007-20086. All Forum Is. Countries: Regional Food Security Project in PICs –Component
2. Strengthening Agricultural Trade and Policy.7. Vanuatu Agriculture Sector Study 2007-2012. FAO-SAP Document.8. All PICs: Food Security and Sustainable Livelihood Programme, which has
some policy elements. Pipeline status-as discussed earlier.9. FAO Assessment of the Impact of Climate Change on Agriculture and Food
Security in the Pacific (Case studies Cook Islands, Marshall Islands andVanuatu) 2007-2008.
10. FAO Background Paper: Food Pacific Economic Survey 2009 is anotherpaper in preparation with AusAID support and will be helpful in preparationof food security policies and strategies.
11. Formulation of a FAO National Medium Term Priority Framework (NMTPF)for 13 PICs 2009-2012, which has a clear Food Security target-2008. Aseparate NMTPF study is now being done for PNG. Current 2009. This reportprovides the most recent information on food security policy and constraintsto development.
20
Agriculture and Economy Data
Data on Food Production Mt/year and areas harvested in hectares are available from FAOStat for all 14 PICs, for major food crops of coconut, cassava, sweet potato, taro and rice,for those countries that produce these products. Food imports for 9 countries wheat, rice,flour chicken, processed fish, canned beef and canned tuna Appendix 3. (Source: TimMartyn (SPC) 2009 pers comm). However, for some countries there are many gaps in thedata from year to year and all data depend on local collection capabilities and often noaccount is taken of the subsistence production on home plots of land and very small landholdings. Without HIES and food security surveys the overall picture of individualcountries on food security may be far from clear since pockets of poverty in isolatedareas and islands is often found.
The PIREP/SPREP (2004), national reports for each of the 14 PICs give a snapshot ofeach country, with respect to land areas, economy, population income, MDG etc. Similardata in more detail are available in the NMPTF 2009 and FAO National AgriculturalPolicy and National Agricultural Development Plan Reports for individual countries.
Natural Resources GIS Remote Sensing Capabilities
For most countries, the Lands and Survey Department have a GIS based mapping systemwhich would allow the matching of plants to land as mentioned in the ToR. However, thestatus of the systems and updates are variable (Aru Mathias, FAO-SAP pers comm).
In PNG, the Agriculture Department and the National Forest Authority has anupgraded/advanced version of the AusAID developed PNGRIS similar to SolomonIslands SIRIS and Vanuatu VANRIS. Also, the University of PNG recently has beenreleasing some data and information based on satellite image analysis.
UNDP is supporting Capacity Building for Sustainable Land Management Medium SizeProjects which will involve integrated land use planning with an improved GIS.
In Samoa SAMRIS is housed in the Forestry Division of Ministry of Natural Resourcesand Energy (MNRE).
In Palau, the Ministry of Lands and Survey have a GIS unit while in Niue GIS is withLands Department and Planning Unit.
Kiribati and Tuvalu and Marshall islands, all have GIS units in the Ministry andDepartment of Lands.
For SOPAC member countries, they are provided with technical training and are givenhardware and software, and some data. For most countries a problem is the capacity tokeep updating and upgrading and expanding the GIS systems.
In Tonga, the Lands Department has GIS system, and mapping of the whole country isbeing updated.
21
Most countries have the soil attributes (or soil types) in their systems.
However, for all countries visited except PNG all need upgrading with respect to recentsatellite imagery for upgrading land cover and land use databases.
Country Summaries
In this section for each country a summary of the Energy/Bioenergy, Food Security,Natural Resource Base, data and policies are given based on reports, data available,survey and country missions
As outlined earlier, Bio-energy is defined as energy derived either directly or indirectlyfrom derivatives of biological materials or biomass resources including agricultural cropsand residues, forestry, livestock, waste, energy crops, algae and natural vegetation. Bio-energy is renewable energy made available from materials derived from biologicalsources as opposed to petroleum, coal, nuclear materials etc. In essence bio-energy isderived from biomass which either directly or indirectly derives from solar energycapture in biological materials.
Bioenergy when derived from crops, forestry and natural vegetation and even use ofagricultural wastes have the potential to impact on food crops and thus food security.
The PIREP SPREP assessments of 2003-2004 considered bioenergy as derived from themany biomass resources and these were investigated and presented in detail in each of the14 country reports as such, SPREP2004a. Prior to the PIREP assessments, SOPAC in2003 proposed a Master Plan for Biomass Resources of Fiji, Kiribati, Samoa, TongaTuvalu and Vanuatu and produced the SOPAC 2003a Synthesis Report The BiomassResources of Fiji, Kiribati, Samoa, Tonga Tuvalu and Vanuatu. These reports are muchless detailed than the PIREP/SPREP reports but the TA did provide valuable training forthe countries involved in biomass and biomass assessments by the Imperial CollegeLondon in a consultancy for SOPAC.
The energy and biomass positions for each country have been summarized from existingSPREP country reports, missions to some countries and other SOPAC and CROPagencies reports and Survey results.
11 PIC countries are included in the UNDP/GEF Pacific Islands Greenhouse GasAbatement through Renewable Energy Project (PIGGAREP).The PIGGAREP/SPREP/UNDP/GEF project 2008-2012 seeks to reduce GHG emissions by cost effectiveuse of commercially viable renewable energy technologies. The TA will be particularlybeneficial to those countries with limited experience and capacity in renewable energy.
22
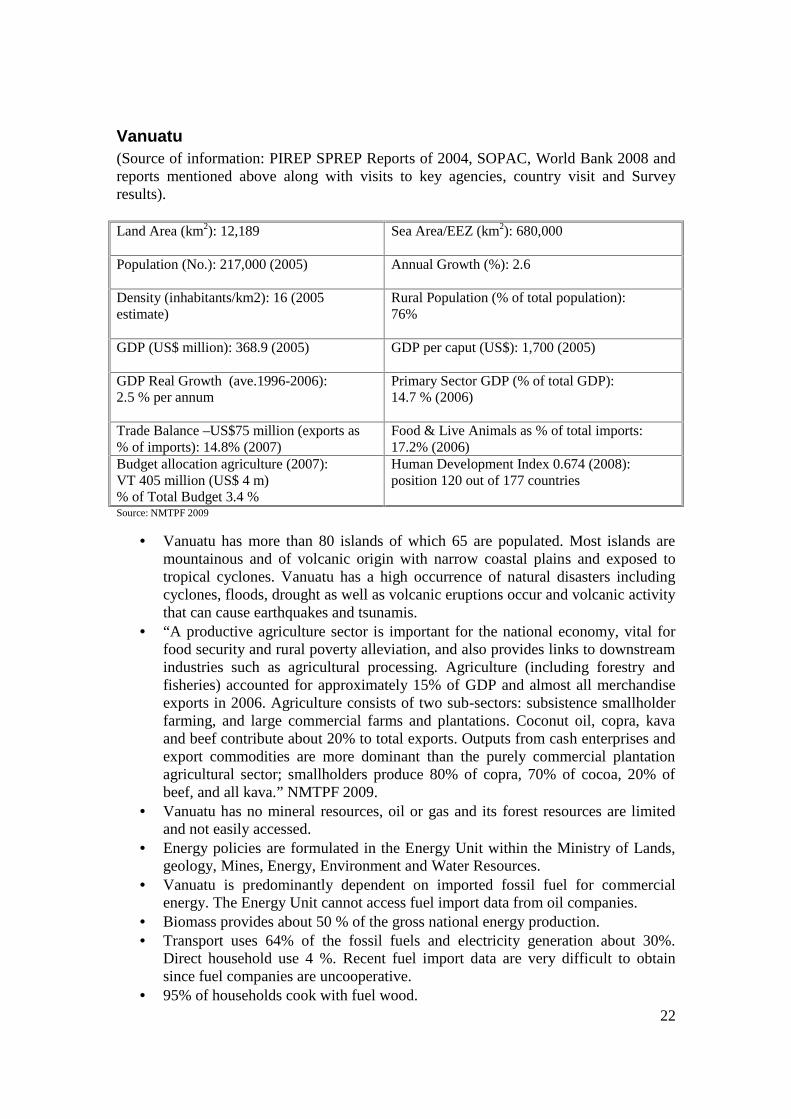
Vanuatu(Source of information: PIREP SPREP Reports of 2004, SOPAC, World Bank 2008 andreports mentioned above along with visits to key agencies, country visit and Surveyresults).
Land Area (km2): 12,189 Sea Area/EEZ (km2): 680,000
Population (No.): 217,000 (2005) Annual Growth (%): 2.6
Density (inhabitants/km2): 16 (2005estimate)
Rural Population (% of total population):76%
GDP (US$ million): 368.9 (2005) GDP per caput (US$): 1,700 (2005)
GDP Real Growth (ave.1996-2006):2.5 % per annum
Primary Sector GDP (% of total GDP):14.7 % (2006)
Trade Balance –US$75 million (exports as% of imports): 14.8% (2007)
Food & Live Animals as % of total imports:17.2% (2006)
Budget allocation agriculture (2007):VT 405 million (US$ 4 m)% of Total Budget 3.4 %
Human Development Index 0.674 (2008):position 120 out of 177 countries
Source: NMTPF 2009
Vanuatu has more than 80 islands of which 65 are populated. Most islands aremountainous and of volcanic origin with narrow coastal plains and exposed totropical cyclones. Vanuatu has a high occurrence of natural disasters includingcyclones, floods, drought as well as volcanic eruptions occur and volcanic activitythat can cause earthquakes and tsunamis.
“A productive agriculture sector is important for the national economy, vital forfood security and rural poverty alleviation, and also provides links to downstreamindustries such as agricultural processing. Agriculture (including forestry andfisheries) accounted for approximately 15% of GDP and almost all merchandiseexports in 2006. Agriculture consists of two sub-sectors: subsistence smallholderfarming, and large commercial farms and plantations. Coconut oil, copra, kavaand beef contribute about 20% to total exports. Outputs from cash enterprises andexport commodities are more dominant than the purely commercial plantationagricultural sector; smallholders produce 80% of copra, 70% of cocoa, 20% ofbeef, and all kava.” NMTPF 2009.
Vanuatu has no mineral resources, oil or gas and its forest resources are limitedand not easily accessed.
Energy policies are formulated in the Energy Unit within the Ministry of Lands,geology, Mines, Energy, Environment and Water Resources.
Vanuatu is predominantly dependent on imported fossil fuel for commercialenergy. The Energy Unit cannot access fuel import data from oil companies.
Biomass provides about 50 % of the gross national energy production. Transport uses 64% of the fossil fuels and electricity generation about 30%.
Direct household use 4 %. Recent fuel import data are very difficult to obtainsince fuel companies are uncooperative.
95% of households cook with fuel wood.
23
Annual petroleum fuel use is expected to grow by 3.5% p.a. GHG emissionscould be reduced by about 15 % over the period 2003-2013 predominantly byusing biofuels.
Vanuatu has good forest cover but in some areas has been dropping rapidly inrecent years. Waste wood is already used as an energy source but is widelydispersed and wood based power generation is not promising. There is good scopefor introducing fuel efficient cooking stoves for fuel wood charcoal and otherwastes for communities to burn biomass more efficiently and hygienically.
There is only limited potential for biogas from animal waste or land fills. A 25 KW gasifier at the Onesua Presbyterian College has not been used in recent
years. Vanuatu like PNG Fiji and Solomons has been receiving proposals for large scale
Jatropha plantations, which it is pleasing to note have been firmly rejected. Largescale planting will affect food crop lands. It should be noted that Jatrophaplantations have not proven to be economic for biofuel production anywhere inthe world to date and the crop is a declared noxious weed invasive specie in manycountries. Replanting of coconut is a far better proposition since the sustainablecoconut based farm systems will be retained.
Vanuatu has good experience and mature technologies for replacing diesel withcoconut oil for transport and power generation. In recent years copra output hasbeen around 40,000 tonnes which could produce 27,000t of coconut oil equivalentin energy content to 28m litres of diesel or enough to replace all diesel fuelimports. However, the economics of the production of coconut oil for dieselreplacement has to be considered carefully in relation to rural demand by widelydispersed communities for electric power. Shipping coconut oil even from Santosto Efate may not be economic depending on diesel and coconut oil pricing.However, in spite of these constraints UNELCO and others such as the TeoumaPrawns group are expanding coconut oil production in Efate, Malekula, and Epiislands to replace diesel. The technologies for making and using 100% coconut oilto substitute for diesel in Vanuatu are impressive and well advanced over otherPacific island countries in the use of coconut oil to substitute for diesel and thetechnologies are well proven. Vanuatu which uses copra as prepayment forelectricity in small local grids in rural areas and runs generators on coconut oilprocessed at the generation facility. The model supported by EU funding andimplemented by UNELCO works very well and is operating very well in 3 rurallocations and at each location serves 100-600 households. The aim is to extendthe model to 9 rural locations.
The PRIREP SPREP Report of 2004 recommended as coconut oil biofuel studyfor replacing power generation and transport and remote communities at a scale of5-30 ML per year and covering government revenue, rural incomes andemployment. The same report recommended that advisers should help Vanuatureview and draft energy policies and prepare practical policy documents forCabinet consideration.
The PIGGAREP/SPREP/UNDP/GEF project which seeks to reduce GHGemissions by cost effective use of commercially viable renewable energytechnologies includes Vanuatu.
Vanuatu has very good scope for use of bio-fuel energy from existing coconut oiland copra. UNELCO 2009. Use of this coconut resource if economic underVanuatu’s existing tax laws and fuel regulation will be unlikely to impact
24
negatively on food security provided generation of power and fuel production isclose to the resource and the community served.
UNELCO has also recently successfully developed a wind farm for electricitygeneration on Efate.
In summary lack of energy legislation, and recent approved national energypolicies, are significant problems for energy development including bioenergy.An Energy Unit Business Plan 2000-2004 provides some guidance at present.Vanuatu would need assistance in collection of the energy data. No final energypolicy has been approved by government.
There is no current recent Food Security policy but FAO recently completed aStudy on the Assessment the Impact of Climate Change on Agriculture and FoodSecurity in the Pacific in 2007-2008 and this will assist with policy formulation aswill the Agricultural Census 2006. The Vanuatu Agriculture Sector Study 2007-2012 document will assist with food security policy and planning. Data arecomprehensive but more household income expenditure surveys are needed.Vanuatu because food is expensive and because it is very prone to naturaldisasters is quite susceptible to food security problems, especially in urban areas,However, further assistance would be needed in formulating and integrating FoodSecurity and Energy Policies taking into account the biomass/biofuelopportunities and the natural resource base, since there is limited financial andhuman resource capacity for sector development in the Ministry of Agricultureespecially in Research, Extension and Information. NMTPF2009. Over-loggingand excessive land clearing and impacts on biodiversity and natural resourcescomplicated by climate change and natural disasters point to a urgent need toupdate natural resources inventory. Vanuatu has the VANRIS data base fornatural resources but the data on satellite imagery and or aerial photography hasnot been updated since 1997 and help will be needed to update the naturalresource base for policy and planning. Vanuatu is not a resource rich country andis mountainous and is very prone to a natural disasters thus food security is a veryhigh priority.
25
Fiji
(Source of information: PIREP SPREP Reports of 2004, SOPAC reports, World Bank2008 and reports mentioned above along with visits to key agencies, country visit andSurvey results)
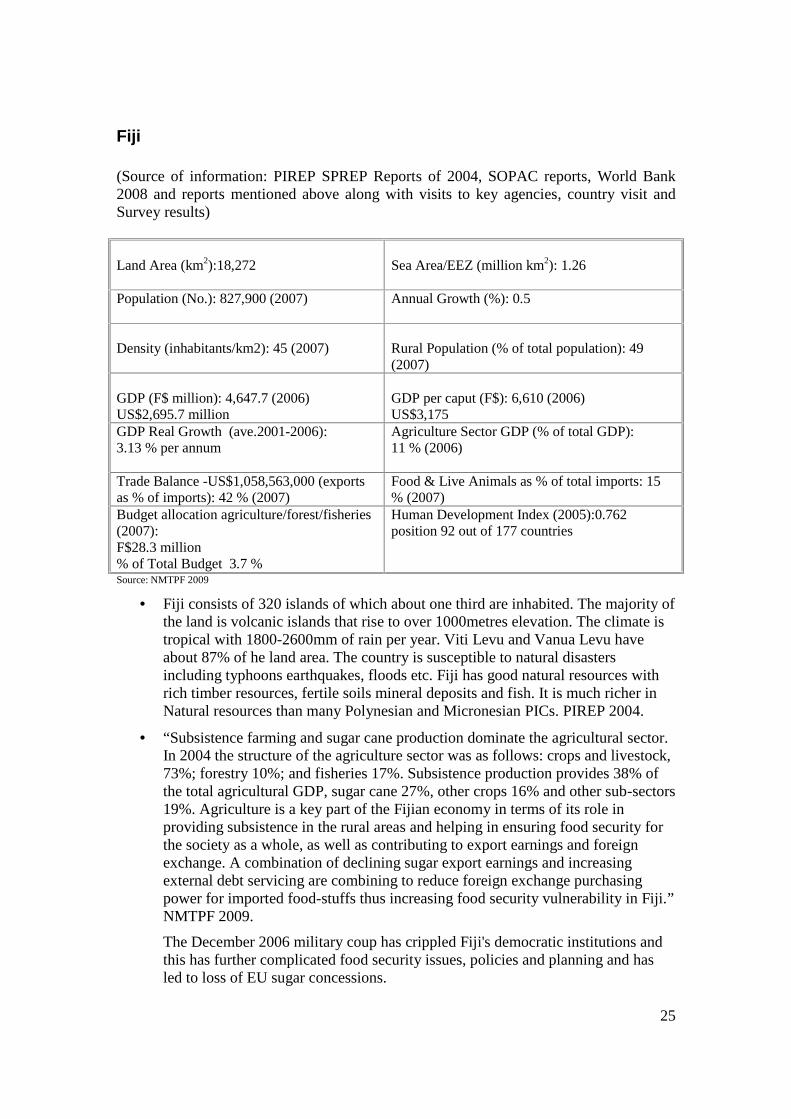
Land Area (km2):18,272 Sea Area/EEZ (million km2): 1.26
Population (No.): 827,900 (2007) Annual Growth (%): 0.5
Density (inhabitants/km2): 45 (2007) Rural Population (% of total population): 49(2007)
GDP (F$ million): 4,647.7 (2006)US$2,695.7 million
GDP per caput (F$): 6,610 (2006)US$3,175
GDP Real Growth (ave.2001-2006):3.13 % per annum
Agriculture Sector GDP (% of total GDP):11 % (2006)
Trade Balance -US$1,058,563,000 (exportsas % of imports): 42 % (2007)
Food & Live Animals as % of total imports: 15% (2007)
Budget allocation agriculture/forest/fisheries(2007):F$28.3 million% of Total Budget 3.7 %
Human Development Index (2005):0.762position 92 out of 177 countries
Source: NMTPF 2009
Fiji consists of 320 islands of which about one third are inhabited. The majority ofthe land is volcanic islands that rise to over 1000metres elevation. The climate istropical with 1800-2600mm of rain per year. Viti Levu and Vanua Levu haveabout 87% of he land area. The country is susceptible to natural disastersincluding typhoons earthquakes, floods etc. Fiji has good natural resources withrich timber resources, fertile soils mineral deposits and fish. It is much richer inNatural resources than many Polynesian and Micronesian PICs. PIREP 2004.
“Subsistence farming and sugar cane production dominate the agricultural sector.In 2004 the structure of the agriculture sector was as follows: crops and livestock,73%; forestry 10%; and fisheries 17%. Subsistence production provides 38% ofthe total agricultural GDP, sugar cane 27%, other crops 16% and other sub-sectors19%. Agriculture is a key part of the Fijian economy in terms of its role inproviding subsistence in the rural areas and helping in ensuring food security forthe society as a whole, as well as contributing to export earnings and foreignexchange. A combination of declining sugar export earnings and increasingexternal debt servicing are combining to reduce foreign exchange purchasingpower for imported food-stuffs thus increasing food security vulnerability in Fiji.”NMTPF 2009.
The December 2006 military coup has crippled Fiji's democratic institutions andthis has further complicated food security issues, policies and planning and hasled to loss of EU sugar concessions.
26
The Department of Energy is responsible for energy policy and off-grid ruralelectrification. The Fiji Electricity Authority is responsible for electricity.
Fiji has three suppliers of petroleum, namely BP, Shell and Mobil. Fiji has good data on energy. Fiji has the highest renewable energy mix of any of
the PICs. Currently about 40% of the total energy cost is transport fuel. Fiji is thelast port for delivery of petroleum fuels in the pacific.
Fiji has specific objectives on formulation of a national energy policy. However,it seems that there is no consistent national policy that provides continuity ofprogrammes through changes of government. Department of Energy has soughtassistance from SOPAC’s PIEPSAP project to develop new national energypolicy. The Fiji Electricity Authority has received support from PIEPSAP onregulation and other aspects of pricing etc.
Fiji could reduce GHG emissions by 90% and in principle use all renewableenergy to produce electricity for the grid system.
Biomass provides about 50 % of the total gross energy use in Fiji. This is made upof biomass bagasse from sugarcane burnt for heat and electricity about 65-70 %,25 % for household cooking and 5-10 % for copra drying. Wood waste and coalare used in the sugarcane off-season to substitute for bagasse for electricitygeneration. PIREP 2004.
About 10,000 tonnes of coconut oil is produced each year which could be used fordiesel replacement. Coconut oil has been used successfully to operate dieselgenerators in two rural locations in the past but the local coconut oil supplysystem broke down and import of coconut oil from other locations proveduneconomic. With current low copra export prices there may more opportunity toexpand use of coconut oil as diesel replacement. Current assumptions are thataround 20 % of coconut oil produced may be used for fuel in due course. Fuelstandards are a key issue for B5 cocodiesel. The World Bank 2008b InitialFeasibility Study for Biodiesel in Fiji conclusions were somewhat negative forcoconut oil production for biodiesel since the prices then for coconut oil werehigh, coconut trees are ageing and volumes of oil are low by industry standards atpresent. It was estimated that about 5 % of a biodiesel blend would use up currentcopra/oil exports.
Discussions held indicated that Fiji is very interested in the Vanuatu technologiesof UNELCO for using coconut oil to replace diesel for power generation and ruralelectrification.
The FAO Coconut Multi-purpose Processing project TA recently assessed thefeasibility of setting up whole-nut processing centres in strategic locations as away to assess rural coconut farmers for production of a range of products.Bawalan 2008.
Fiji produces ethanol from sugar molasses and it is estimated that from sugarcaneand other crops Fiji could produce enough ethanol to replace 10 % of petrol used.To date ethanol production has been marginal cost wise for liquid fuel production.Good opportunities exist for ethanol production from sugar, molasses and sweetsorghum and the government is keen to revisit these options.
Cassava for ethanol production and Pongamia trees for fuel oil are being looked atas possible future biofuels. Sweet sorghum would fit well into the sugarcanegrowing and harvesting cycle and would provide a source of feedstock forsugarcane factories for ethanol production in the off-season. The World Bank2008c Feasibility Study for Ethanol in Fiji concluded that the most attractive
27
feedstock for ethanol production was molasses and that there is potential toproduce ethanol to meet the needs of the domestic market but not for exports.Cassava was not seen as a viable feedstock. Sweet Sorghum which has very goodpotential for supplementing molasses alcohol is an ideal off-season crop to giveyear round production of ethanol. However, Sweet Sorghum was not consideredby the World Bank study. With the loss of Fiji’s EU support for sugar or alcoholimports it may be more profitable in future to turn most of the sugarcane crop intoalcohol to save foreign exchange on imports of gasoline. An overseas investor ispromoting Pongamia pinnata as an oil tree resource. Extravagant claims are madeon its productivity and oil production, but to date the economics of productionremain to be proven given the high cost of harvesting if hand harvesting ispracticed. Pongamia plantings by smallholders could prove a major problem asthe large trees unlike coconut will not be able to be intercropped since treecanopies completely exclude direct sunlight. Pongamia plantations might work ifthe costs of production are competitive and this will largely depend on the abilityto cheaply mechanically harvest the crop.
Fiji like PNG Vanuatu and Solomons has been receiving proposals for large scaleJatropha plantations, which it is pleasing to note have been firmly rejected. Largescale planting will affect food crop lands. It should be noted that Jatrophaplantations have not proven to be economic for biofuel production anywhere inthe world to date and the crop is a declared noxious weed invasive specie in manycountries.
SOPAC 2009 has produced a very useful guideline Miscellaneous Report 677 onPotential of Liquid Biofuels in Fiji.
Suva has an opportunity to produce energy from biomass waste of over 100,000tonnes/year and increasing to 135,000 tonnes by 2013.
Biogas opportunities exist on dairy farms, piggeries and poultry farms, and newdesigns focusing on improved waste disposal control, with biogas used fordomestic cooking and digested materials for fertiliser are proving more successfulthan earlier attempts.
A number of Renewable Energy Technology (RET) initiatives are planned for Fijiand include biomass wood energy and bagasse burning for electricity.
Fiji, has very good scope for developing much further ethanol and coconut oil forfuel for both transportation and power generation. It is unlikely that conflicts withfood production since Fiji has relatively larger tracts of land help by bothgovernment and private sector as well as customary lands. Government and FEAhave an interest in expanding ethanol production from cassava or possibly sweetsorghum. The latter would be preferred since it is more efficient for producingethanol and can be readily mechanized and integrated into the sugarcane factoriesand the crop harvesting cycle of sugarcane and since cassava is an important foodcrop use for biofuel may drive up food prices.
The PIGGAREP/SPREP/UNDP/GEF project which seeks to reduce GHGemissions by cost effective use of commercially viable renewable energytechnologies includes Fiji.
In summary Fiji has good data on energy but would need help with energy policywork. However, lack of an agriculture sector plan weak policy capacity, weakagriculture data and statistics collection and management systems, andiinadequate domestic food production & productivity to meet food security andmarket demands have been identified by the NMTPF 2009. Thus Fiji will need
28
strong support with Food Security issues and policy development, strategies andplans.
Samoa
(Source of information: PIREP SPREP Reports of 2004, SOPAC reports, World Bank2008 and reports mentioned above along with visits to key agencies, country visit andSurvey results)
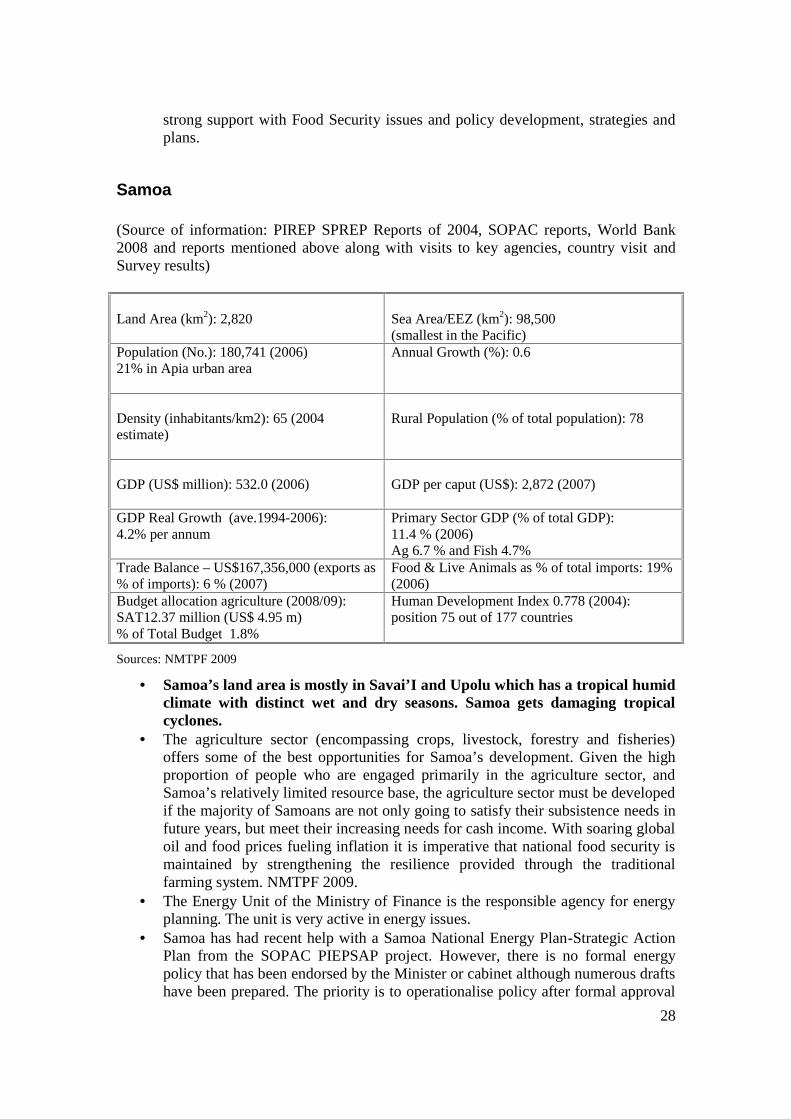
Land Area (km2): 2,820 Sea Area/EEZ (km2): 98,500(smallest in the Pacific)
Population (No.): 180,741 (2006)21% in Apia urban area
Annual Growth (%): 0.6
Density (inhabitants/km2): 65 (2004estimate)
Rural Population (% of total population): 78
GDP (US$ million): 532.0 (2006) GDP per caput (US$): 2,872 (2007)
GDP Real Growth (ave.1994-2006):4.2% per annum
Primary Sector GDP (% of total GDP):11.4 % (2006)Ag 6.7 % and Fish 4.7%
Trade Balance – US$167,356,000 (exports as% of imports): 6 % (2007)
Food & Live Animals as % of total imports: 19%(2006)
Budget allocation agriculture (2008/09):SAT12.37 million (US$ 4.95 m)% of Total Budget 1.8%
Human Development Index 0.778 (2004):position 75 out of 177 countries
Sources: NMTPF 2009
Samoa’s land area is mostly in Savai’I and Upolu which has a tropical humidclimate with distinct wet and dry seasons. Samoa gets damaging tropicalcyclones.
The agriculture sector (encompassing crops, livestock, forestry and fisheries)offers some of the best opportunities for Samoa’s development. Given the highproportion of people who are engaged primarily in the agriculture sector, andSamoa’s relatively limited resource base, the agriculture sector must be developedif the majority of Samoans are not only going to satisfy their subsistence needs infuture years, but meet their increasing needs for cash income. With soaring globaloil and food prices fueling inflation it is imperative that national food security ismaintained by strengthening the resilience provided through the traditionalfarming system. NMTPF 2009.
The Energy Unit of the Ministry of Finance is the responsible agency for energyplanning. The unit is very active in energy issues.
Samoa has had recent help with a Samoa National Energy Plan-Strategic ActionPlan from the SOPAC PIEPSAP project. However, there is no formal energypolicy that has been endorsed by the Minister or cabinet although numerous draftshave been prepared. The priority is to operationalise policy after formal approval
29
so it can be effective. ADB provided support to implementation of the SamoaNational Energy Policy (Component 3) 2007-2008.
Samoa is at present the only country with one petroleum supplier status and isbenefiting from such policy. Petroleum supply is under Ministry of Finance .
The state owned Electric Power Company (EPC) is responsible for powergeneration and distribution. They have been working closely with COCOGENproject of SOPAC on use of coconut oil for power generation in Savai’i island.The outcome of the Feasibility (COCOGEN, 2005 and 2005a) was to precedeimplementation (COCOGEN II 2006) looking at the practical aspect of usingcoconut oil diesel mixes for power generation, and using a 1.5 MW gasifier to usecoconut waste husk and shell and supply chain analysis among other activities,including financial and environmental analyses. EPC has already run successfulcocodiesel blending trials for power generation at Salelonga power station with 10% coconut oil blends. 10% mixes according to EPC would not overstretchavailable supplies of coconut oil. Currently, about 56% of Upoulu and 44% ofSavai’I are under coconut. COCOGEN II in 2009 is proceeding as planned.
FAO recently in 2008b sponsored a Biofuel Feasibility Study to identify selectedagriculture crops for producing biofuel in Samoa and suitable land areas andincluding methodologies for fuel production. 15,000 ha of disaggregated landwould be suited to production of biofuel crops if the production is economicallyfeasible and socially and technically acceptable. Jatropha which wasrecommended should be firmly rejected since large scale planting will affect foodcrop lands and Jatropha plantations have not proven to be economic for biofuelproduction anywhere in the world to date and the crop is a declared noxious weedinvasive specie in many countries. A much better strategy would be to replant andregenerate coconut plantings if the use of coconut oil diesel substitution for powergeneration proves to be viable.
Samoa has exported in the past up to 25,000 tones of copra but more recentlybecause of price drops it has been down to 4,800 tonnes of copra and 3,900 tonnesof coconut oil. This copra and oil if all turned to coconut oil could produce theequivalent of 9 million litres of diesel, provided it is economic to do so. TheCOCOGEN I report gives very good detail on coconut varieties, age and a GISstudy to estimate the extent of the resource. COCOGEN II is now proceeding withimplementation for coconut oil production and testing on Savai’i.
Samoa has lots of repatriation of monies from overseas Samoans and thiscontributes to high food prices and a lack of labour and or interest in harvesting ofcoconut, coffee and cocoa and may be a major issue for sourcing sufficientcoconut for coconut oil for fuel. Many fruits and vegetables are imported whenthey could be easily produced in Samoa.
Since commercial logging of wood will likely cease soon. The use of wastes fromlogging for power generation is limited and is no longer used. Fast growinglegume fuel wood trees like Gliricidia and Leucaena are a possible option forensuring future biomass supply for cooking and possibly for power generationwhen intercropped in older coconut plantings near to the power stations or agasifier.
Cooking with biomass is estimated to account for about half of the gross energydemand, but reliable recent data are not available to confirm this position. Therest of the demand is met from electricity and petroleum fuels. About half ofUpolu’s electricity is from hydro at present.
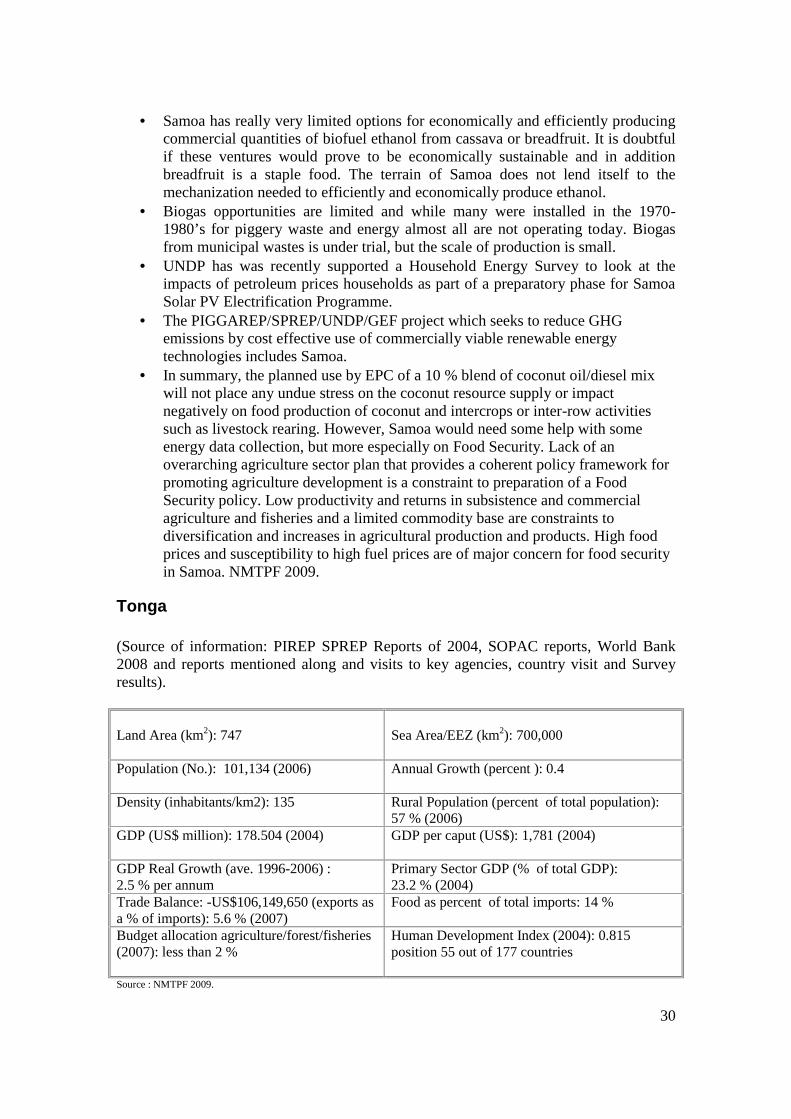
30
Samoa has really very limited options for economically and efficiently producingcommercial quantities of biofuel ethanol from cassava or breadfruit. It is doubtfulif these ventures would prove to be economically sustainable and in additionbreadfruit is a staple food. The terrain of Samoa does not lend itself to themechanization needed to efficiently and economically produce ethanol.
Biogas opportunities are limited and while many were installed in the 1970-1980’s for piggery waste and energy almost all are not operating today. Biogasfrom municipal wastes is under trial, but the scale of production is small.
UNDP has was recently supported a Household Energy Survey to look at theimpacts of petroleum prices households as part of a preparatory phase for SamoaSolar PV Electrification Programme.
The PIGGAREP/SPREP/UNDP/GEF project which seeks to reduce GHGemissions by cost effective use of commercially viable renewable energytechnologies includes Samoa.
In summary, the planned use by EPC of a 10 % blend of coconut oil/diesel mixwill not place any undue stress on the coconut resource supply or impactnegatively on food production of coconut and intercrops or inter-row activitiessuch as livestock rearing. However, Samoa would need some help with someenergy data collection, but more especially on Food Security. Lack of anoverarching agriculture sector plan that provides a coherent policy framework forpromoting agriculture development is a constraint to preparation of a FoodSecurity policy. Low productivity and returns in subsistence and commercialagriculture and fisheries and a limited commodity base are constraints todiversification and increases in agricultural production and products. High foodprices and susceptibility to high fuel prices are of major concern for food securityin Samoa. NMTPF 2009.
Tonga
(Source of information: PIREP SPREP Reports of 2004, SOPAC reports, World Bank2008 and reports mentioned along and visits to key agencies, country visit and Surveyresults).
Land Area (km2): 747 Sea Area/EEZ (km2): 700,000
Population (No.): 101,134 (2006) Annual Growth (percent ): 0.4
Density (inhabitants/km2): 135 Rural Population (percent of total population):57 % (2006)
GDP (US$ million): 178.504 (2004) GDP per caput (US$): 1,781 (2004)
GDP Real Growth (ave. 1996-2006) :2.5 % per annum
Primary Sector GDP (% of total GDP):23.2 % (2004)
Trade Balance: -US$106,149,650 (exports asa % of imports): 5.6 % (2007)
Food as percent of total imports: 14 %
Budget allocation agriculture/forest/fisheries(2007): less than 2 %
Human Development Index (2004): 0.815position 55 out of 177 countries
Source : NMTPF 2009.
31
Tonga consists of 176 islands. There are 36 inhabited islands. Most islands have alimestone base formed from uplifted coral overlying a volcanic base. Volcanicactivity is present. The largest island is the capital island of Tongatapu. Climate istropical with cyclones PIREP 2004.
Agricultural production is still the predominant economic activity, accounting for23 percent of GDP, 70 percent of total merchandise export, and 40 percent ofemployment. Over 64 percent of Tongan households (10,102) are involved inagriculture, out of which 59 percent are subsistence, 38 percent are involved insubsistence agriculture with cash crops and only about 2 percent are fullycommercial crop producers (Agriculture Census 2001). The agriculture sectortherefore is important for employment, as a source of domestic food supply, forcash income, foreign exchange earnings, and for raw materials in processing andhandicrafts. However the sector is under-performing and the output has been indecline for a number of years. Considerable potential exists for improvedperformance. Tonga has a good growing climate and fertile soils, and is wellplaced to serve markets in both southern and northern hemispheres. NMTPF2009.
The Ministry of Lands, Survey and Natural Resources (MLSNR) includes anEnergy Planning Unit in Tonga. Their tasks involve policy development, energyplanning and project coordination. There is a draft Tonga Energy Policy and aPacific Islands energy Plan prepared by the Energy Working Group (EWG) ofCROP. However, it seems that considerable work still has to be done before it canbe of real use to Tonga. Lots of legislation on energy in Tonga has not beenpassed into law. There is no energy policy defining the role of the EPU or theplace for renewable energy in Tonga.
Petroleum products are supplied by and distributed by Shell and BP. Over half theenergy needs are met by imported petroleum products. Tonga is energy supplyvulnerable. There are only limited data available on end-use of petroleum.
For electricity the Tonga Electric Power Board is the regulatory agency. Power isgenerated and distributed by a private company for the urban areas. There areboth community operated diesel grids in rural areas. Small outer islands havesolar power.
About 65% of Tonga is under some sort of tree crop, but in the main coconuts.Biomass use is mostly for cooking and crop drying/copra, and there is littleopportunity for biomass from forests to be a significant resource since mostlogging will be on uninhabited islands. However, many households use wood,LPG and kerosene for cooking. Tonga has been planting wood and fuel woodspecies and is promoting coconut rehabilitation and replanting as well as fastgrowing N fixing trees for fuel wood. However, uptake and follow through havebeen limited. Biomass estimates are not based on recent surveys or measurements,but may supply about 44% of gross national energy production. Mostly thereforested areas are considered as unsuited to other cropping.
For biogas there are limited opportunities only as pigs are mostly free ranging. Tonga has according to SPREP the ability to offset up to 50% of diesel
requirements. However, to do this would require rehabilitation of coconutresources and efficient gathering and processing of coconuts to produce about10ML of coconut oil for biofuel use. However, there has been little biofuel workcarried out in Tonga, but the MLSNR in 2007 expressed interest in using coconut
32
biodiesel to replace diesel after demonstrations by a Chemical Engineering USyouth group. However, just use of coconut oil to replace diesel is much moreeconomic than methyl esterified coconut biodiesel.
Community based diesel systems for generation have proved expensive to operateand biofuel replacement of some diesel may be an attractive alternative as wouldwind or solar power with the latter proving successful in Ha’apai. However, risinglabour costs mean that collection and processing of coconut for coconut oilbiofuels must be efficient and cost effective to compete with diesel.
Large scale development of coconut biofuel would not disturb the agriculturaluse of land since agriculture land use take place between the coconut rows.However, development of this fuel must be economically viable and competitivewith diesel and coconut supplies must be sufficient to offset variability withdroughts and seasonal weather changes. Also, much of the coconut resource atpresent is used for animal feed as well as household consumption and the pricesfor coconut for biofuel would need to be attractive enough to interest farmers inproducing coconut for this purpose.
The PIGGAREP/SPREP/UNDP/GEF project which seeks to reduce GHGemissions by cost effective use of commercially viable renewable energytechnologies includes Tonga.
There is no conflict between biomass trees and biofuel based on coconuts andfood crops in Tonga, and there is thus virtually no threat to food security bybiomass or biofuel crops. Tonga would need help in assessing the benefits andeconomics and social impacts of diesel replacement with coconut oil to helpreduce GHG emissions and offset foreign exchange loss from diesel procurementan helping ensure liquid fuel security into the future.
In summary, Tonga would need assistance with getting legislation passed andaccepted on national energy policy and biomass energy inventory and projections.There is no Food Security policy in place and lack of an agriculture sectorstrategy and plan makes preparation of policy, policy analysis and integrationwith bioenergy and climate change policies very difficult. According to theNMTPF 2009 and from discussions a weak agriculture data and statisticscollection and management system exacerbates the problem of policydevelopment. All of this signals that Tonga would need strong support in policydevelopment in both energy and food security sectors and probably to asignificant extent natural resources assessment.
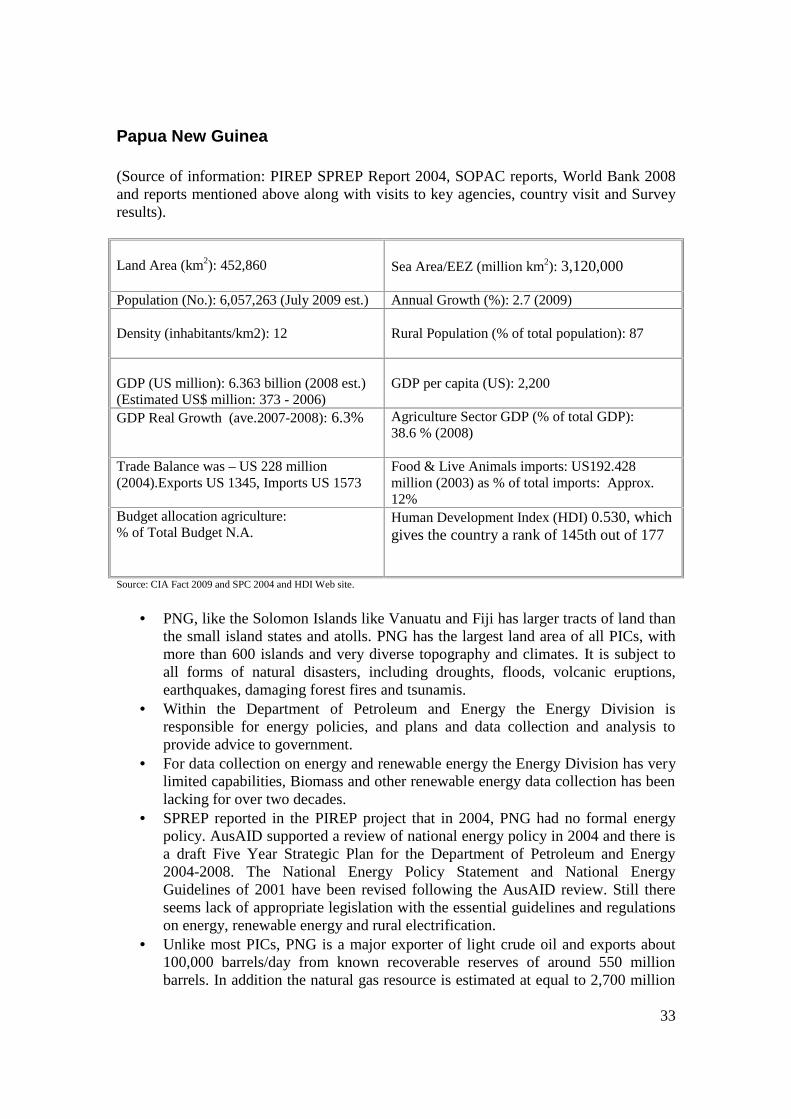
33
Papua New Guinea
(Source of information: PIREP SPREP Report 2004, SOPAC reports, World Bank 2008and reports mentioned above along with visits to key agencies, country visit and Surveyresults).
Land Area (km2): 452,860 Sea Area/EEZ (million km2): 3,120,000
Population (No.): 6,057,263 (July 2009 est.) Annual Growth (%): 2.7 (2009)
Density (inhabitants/km2): 12 Rural Population (% of total population): 87
GDP (US million): 6.363 billion (2008 est.)(Estimated US$ million: 373 - 2006)
GDP per capita (US): 2,200
GDP Real Growth (ave.2007-2008): 6.3% Agriculture Sector GDP (% of total GDP):38.6 % (2008)
Trade Balance was – US 228 million(2004).Exports US 1345, Imports US 1573
Food & Live Animals imports: US192.428million (2003) as % of total imports: Approx.12%
Budget allocation agriculture:% of Total Budget N.A.
Human Development Index (HDI) 0.530, whichgives the country a rank of 145th out of 177
Source: CIA Fact 2009 and SPC 2004 and HDI Web site.
PNG, like the Solomon Islands like Vanuatu and Fiji has larger tracts of land thanthe small island states and atolls. PNG has the largest land area of all PICs, withmore than 600 islands and very diverse topography and climates. It is subject toall forms of natural disasters, including droughts, floods, volcanic eruptions,earthquakes, damaging forest fires and tsunamis.
Within the Department of Petroleum and Energy the Energy Division isresponsible for energy policies, and plans and data collection and analysis toprovide advice to government.
For data collection on energy and renewable energy the Energy Division has verylimited capabilities, Biomass and other renewable energy data collection has beenlacking for over two decades.
SPREP reported in the PIREP project that in 2004, PNG had no formal energypolicy. AusAID supported a review of national energy policy in 2004 and there isa draft Five Year Strategic Plan for the Department of Petroleum and Energy2004-2008. The National Energy Policy Statement and National EnergyGuidelines of 2001 have been revised following the AusAID review. Still thereseems lack of appropriate legislation with the essential guidelines and regulationson energy, renewable energy and rural electrification.
Unlike most PICs, PNG is a major exporter of light crude oil and exports about100,000 barrels/day from known recoverable reserves of around 550 millionbarrels. In addition the natural gas resource is estimated at equal to 2,700 million
34
barrels of oil. PNG has a 36,000 barrel per day refinery, but still imports refinedpetroleum from Shell, BP and Mobil to satisfy about 40 % of the market.
In 2000 APEC prepared an energy balance for PNG which showed net primaryenergy supply at 573 kilo tonnes of oil equivalent (ktoe). Data are available fromNational Bank PNG and IRC on energy imports and exports.
PIREP 2004, report estimated that 1000 ktoe from wood was used for cooking inPNG with 90% of households using wood for cooking in rural areas and muchless in urban areas.
Industry uses around 60%, transport 17%, and agriculture/residential/commercialactivities use 24% of the energy. PIREP 2004.
PNG has a forest cover of around 66% but much is inaccessible and cannot beused to source energy. Also, about 58% of the land is steep and very subject toerosion with about 18 % inundated or flooded. Thus the main biomass energypotential is in areas of logging or those under agricultural production. Log exportsare significant but most are exported whole so there is very little residue forenergy use and for the smaller processors in-country no data are available onwastes. It is estimated that about 200,000 ha of land are cleared annually fortraditional agriculture. Applications for mining, logging and large agriculturaldevelopment projects are numerous and often not well assessed before approval.Procedures for vetting applications are cumbersome and slow.
Traditional biomass was estimated to be about 53% of PNG energy consumptionin 2000, most for cooking and some for industrial and agricultural use like copradrying.
Palm oil biomass wastes are used for fuel in palm oil factories and for somelimited electricity generation.
Heat gasifiers have been used successfully since around 1990 for using biomasswastes in the copra, coffee, cocoa and tea industries mostly for drying.
About 330 ML of palm oil and 33ML of coconut oil are produced annually withmost in the past exported. PNG has around 2% of the world’s oil palm but 28%ofcertified sustainable oil palm with one third of the production by smallholders inintegrated farm systems. Total area under oil palm is 138,000-140,00 ha in 2009with 13 CPO mills and 1 new one coming up. There is one refinery for palm oil.CPO is not used for diesel substitution and no esterified biodeisel is madecommercially from palm oil in PNG.
Palm oil is a good source of oil with high productivity of up to 4,000L/ha of oilfor diesel substitution or methyl esterified biodiesel and the net fossil energy gainis from 4-6:1 or more.
Copra production in 2007 was 677,000 tonnes. However, with low world pricesthere is more interest biofuels to replace diesel in recent times. The University ofTechnology in Lae is undertaking R&D on biofuels. (Gaaraio Gafiye pers comm).Unitech, the Forest Research Institute and agriculture department are expandingR&D for bioenergy looking at biodiesel, and use of agriculture residues. In thepast PNG was a leader in bioenergy technologies among the PICs. World Bank isproviding financing and TA to all New Ireland schools to produce coconut oil tofuel school generators. PNG is very interested in the Vanuatu technologies ofusing coconut oil to replace diesel.
Biogas generation is reported as virtually non-existent at present. Ethanol can be produced from sugarcane, molasses, Sago palm and Nipa palm.
Around 200-1100ML of ethanol/year could be produced by Sago palm in Gulf
35
Province, but the economics and the destructive nature of the process (logging thetrees for starch removal from trunks) make this practice highly questionableeconomically and environmentally. In addition Sago is viewed as a starvationback-up food when other crops like sweet potato etc fail and diversion of Sago toethanol may well affect food security in some locations. Tapping of Nipa palm forsugary sap for making ethanol is a far more sustainable process. The economics ofethanol clearly depend on the costs of sap collection which is laborious.
Ethanol production from sugarcane or molasses is a highly efficient way ofcapturing energy in a biofuel product with a net energy fossil energy gain ratio of10:1 or better. Sugarcane or Sweet Sorghum with ratios of 10:1 to as high as 14:1are much more attractive propositions for ethanol production and the harvestingand processing of both can be mechanized. Ramu Sugar Mills are reported toproduce around 4ML of ethanol/year for fuel use. They have planted fuel woodtrees to supplement bagasse for producing electricity in the non-harvest season.
A Korean company Changae Cassava Project is establishing a 20,000 haplantation for integrated cassava products pellets, powder, starch and ethanol forexport to Korea. The area is 95 km from Port Moresby on flat lands and will havea 6,000ha nucleus plantation with mechanization for planting and harvesting andinvolvement of outgrowers. The area of land is not in conflict with existing foodcrop production and comprises government land ad customary land agreements.
PNG does not have the capability of assessing renewable energy resourcesincluding biomass/bioenergy data and a low capacity in the Energy Division foranalysis and R&D.
If only around 10 % of the vegetable oils (palm and coconut) are diverted tobiofuels then the impact on agriculture and food will be negligible. Coconut oilbased biofuels if economic may be used for power and transport up to especiallyin remote communities and the impact of such diversion of the resource needs tobe assessed if large scale 200ML/year levels are planned.
PNG has good opportunities for biofuel development but if large tracts of forestedlands are cleared for expansion of biofuels from palm oil or sugarcane etc. the fulllife cycle impact of GHG releases from clearing have to be factored in to theassessment of benefits, if any, of conversion to biofuels. Conversion of use ofcopra or existing sugarcane or palm oil for biofuels is much less damaging forGHG production, but there may be other considerations relating to food security ifdiversions are large. PNG like Vanuatu and Solomons and Fiji has been receivingproposals for large scale Jatropha plantations, which it is pleasing to note havebeen firmly rejected. Also, large scale planting will affect food crop lands. Itshould be noted that Jatropha plantations have not proven to be economic forbiofuel production anywhere in the world to date and the crop is a declarednoxious weed/ invasive specie in many countries.
While PNGRIS GIS databases exist in Lands, Environment and Conservation,DAL and Forestry it is only the UPNG Remote Sensing Unit that has the requiredupdated imagery to undertake land cover and land use studies and work with croppotential options for given locations. There is at present no existing NaturalResources and Environment policy, and help would be needed to procure the datarequired and in policy formulation. The PNG Resource Information SystemHandbook 3rd edition prepared for Land Use Section of DAL in 2008, by UPNGwith EU support is a very important document on data collection and data use andanalysis on topography climate and soils and is an excellent basis for future
36
natural resource studies. The State of the Forests of Papua New Guinea has beenmapped and changes assessed over the period 1972-2002 by UPNG RemoteSensing Unit with EU, GTZ and UNDP assistance.
The Office of Climate Change and Environmental Sustainability is a newsomewhat isolated institute that has no legislative basis, no policy framework andno REDD credibility and no ownership over carbon credits for sale. It is unclearwhat basis this office has for its existence and credibility is strongly underquestion at present.
The PIGGAREP/SPREP/UNDP/GEF project which seeks to reduce GHGemissions by cost effective use of commercially viable renewable energytechnologies includes PNG.
PNG has in existence a National Food Security Policy 2000-2010 and is preparingfor a mid term review with FAO assistance of the policy for 2009-2018.However, the policy at present does not take into account bioenergy issues or thenatural resource base policy issues. A National Development Plan 2007-2016 hasbeen prepared and funds set aside, but no implementation has taken place andfunds have been diverted to non-transparent actions. Hanson et al 2001 prepared aPNG Rural Development Handbook which covers in some detail poverty districtsas well as population densities, agricultural intensity and is very useful whenlinked with other food security and HIES studies.
In summary PNG is in need of further help to draft Energy/Bioenergy/RenewableEnergy policy and would benefit from assistance with preparing appropriatelegislation with the essential guidelines and regulations for cabinet approval andlinking Energy policy with Food Security. PNG has the ability if funded toprovide required data on natural resources and food security for policy planning.At the Departmental levels there is a willingness to prepare the essentialintegrated policies, but it is less clear if political will is as strong.
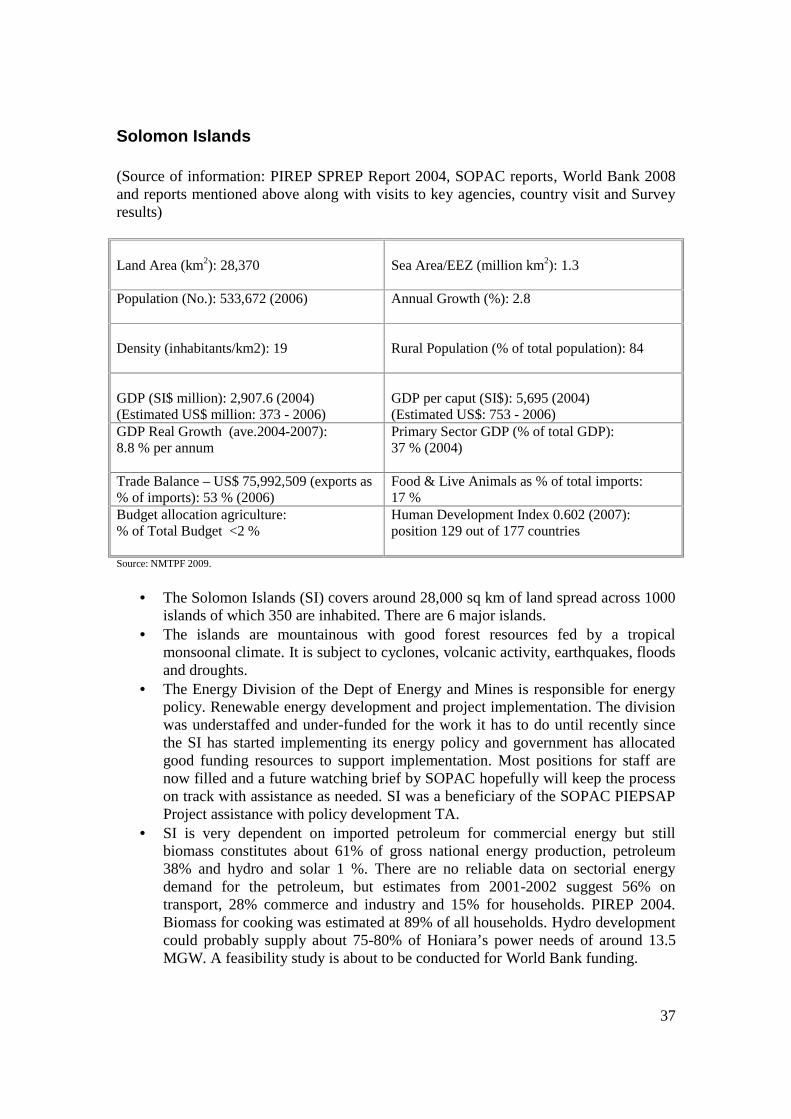
37
Solomon Islands
(Source of information: PIREP SPREP Report 2004, SOPAC reports, World Bank 2008and reports mentioned above along with visits to key agencies, country visit and Surveyresults)
Land Area (km2): 28,370 Sea Area/EEZ (million km2): 1.3
Population (No.): 533,672 (2006) Annual Growth (%): 2.8
Density (inhabitants/km2): 19 Rural Population (% of total population): 84
GDP (SI$ million): 2,907.6 (2004)(Estimated US$ million: 373 - 2006)
GDP per caput (SI$): 5,695 (2004)(Estimated US$: 753 - 2006)
GDP Real Growth (ave.2004-2007):8.8 % per annum
Primary Sector GDP (% of total GDP):37 % (2004)
Trade Balance – US$ 75,992,509 (exports as% of imports): 53 % (2006)
Food & Live Animals as % of total imports:17 %
Budget allocation agriculture:% of Total Budget <2 %
Human Development Index 0.602 (2007):position 129 out of 177 countries
Source: NMTPF 2009.
The Solomon Islands (SI) covers around 28,000 sq km of land spread across 1000islands of which 350 are inhabited. There are 6 major islands.
The islands are mountainous with good forest resources fed by a tropicalmonsoonal climate. It is subject to cyclones, volcanic activity, earthquakes, floodsand droughts.
The Energy Division of the Dept of Energy and Mines is responsible for energypolicy. Renewable energy development and project implementation. The divisionwas understaffed and under-funded for the work it has to do until recently sincethe SI has started implementing its energy policy and government has allocatedgood funding resources to support implementation. Most positions for staff arenow filled and a future watching brief by SOPAC hopefully will keep the processon track with assistance as needed. SI was a beneficiary of the SOPAC PIEPSAPProject assistance with policy development TA.
SI is very dependent on imported petroleum for commercial energy but stillbiomass constitutes about 61% of gross national energy production, petroleum38% and hydro and solar 1 %. There are no reliable data on sectorial energydemand for the petroleum, but estimates from 2001-2002 suggest 56% ontransport, 28% commerce and industry and 15% for households. PIREP 2004.Biomass for cooking was estimated at 89% of all households. Hydro developmentcould probably supply about 75-80% of Honiara’s power needs of around 13.5MGW. A feasibility study is about to be conducted for World Bank funding.
38
While biomass from sawmill and agro-industrial wastes has been used in the pastfor power generation this has not endured. Likewise a gasifier and biogasinitiatives have failed. Logging is running out and the next 2 to 6 years will end.
Good potential exists for reducing energy imports and GHG reductions byswitching to more hydro and biofuels if acceptable socially, financially,economically and environmentally. However, land disputes logging disputes andland alienation by palm oil and replanting of timber are serious complicatingissues in certain parts of the Solomons. The Guandalcanal Plains Palm OilLimited that has around 8,000ha of palms is planning expansion with governmentand land owners cooperation at around 1000 ha per year up to 15,000ha.Smallholders are increasing and now 600 ha of oil palm are grown bysmallholders. 3-4 ha per family is the smallholder allocation which can be readilymanaged by a family without outside labour and generates good incomes whichbegin in year 2 after planting. All technology and inputs are provided by thecompany and paid off with palm bunches. The expansions of palm oil are ongrassland areas or those with light bush cover and are not environmentallydamaging. The whole development will receive full certification as sustainable oilpalm during 2009. All CPO and PKO is exported to Europe and goes solely tofood and is not used for biofuel. The company plans to expand into livestockintegrated with oil palm for the estate and smallholders. Oil palm residue meal isexported for stock feeds at present but could be used locally when the cattleindustry is revived.
Copra exports have been as high as 40,000 tonnes in the 1980’s while recentproduction shows levels of 37,000 tonnes in 2007. Appendix 3. 37,000 tonnes ofcopra would produce around 28ML of coconut oil or about 26ML of dieselequivalent or about half of the diesel imports at 45-55ML/year. With low copraprices options for using coconut oil to replace diesel especially in isolated remoteareas for power generation and transport is now being employed and tested on asmall scale. This initiative may be expanded in the future. Inter-island transport ofdiesel is expensive and in the future more coconut oil may find a regular place inpower generation and transport. More work with coconut oil as a replacement fordiesel is required and palm oil if production resumes to the pre-unrest period.Palm and coconut oil residues can also be used for heating and electricitygeneration. The SI Electricity Authority SIEA is still interested in using coconutoil to replace diesel for power generation and more testing of this technology.
Impacts of large scale use of coconut oil biofuel have to evaluated against a widerange of financial economic, government revenue impacts, import duties etc., aswell as logistics and the extent and size of the resource base. ADB recently hasassisted with coconut oil retro fitting of a diesel generator at a regional provincialcentre to run on coconut oil. Institutional weakness after the unrest periodtranslates to the need for more aid and training TA in undertaking such studiesand R&D. Vanuatu coconut oil diesel replacement technology from UNELCO isthe clear direction for SI to follow.
PIREP estimated that large scale use of coconut oil for biofuel could potentialeliminate 70% of the 2001/2003 national carbon dioxide emissions.
A 10% coconut/diesel oil blend was launched by Solomon Tropical Products inHoniara at the 2006 National Trade Show after testing their product in localvehicles.(Biopact Web site). The small company is now producing esterified
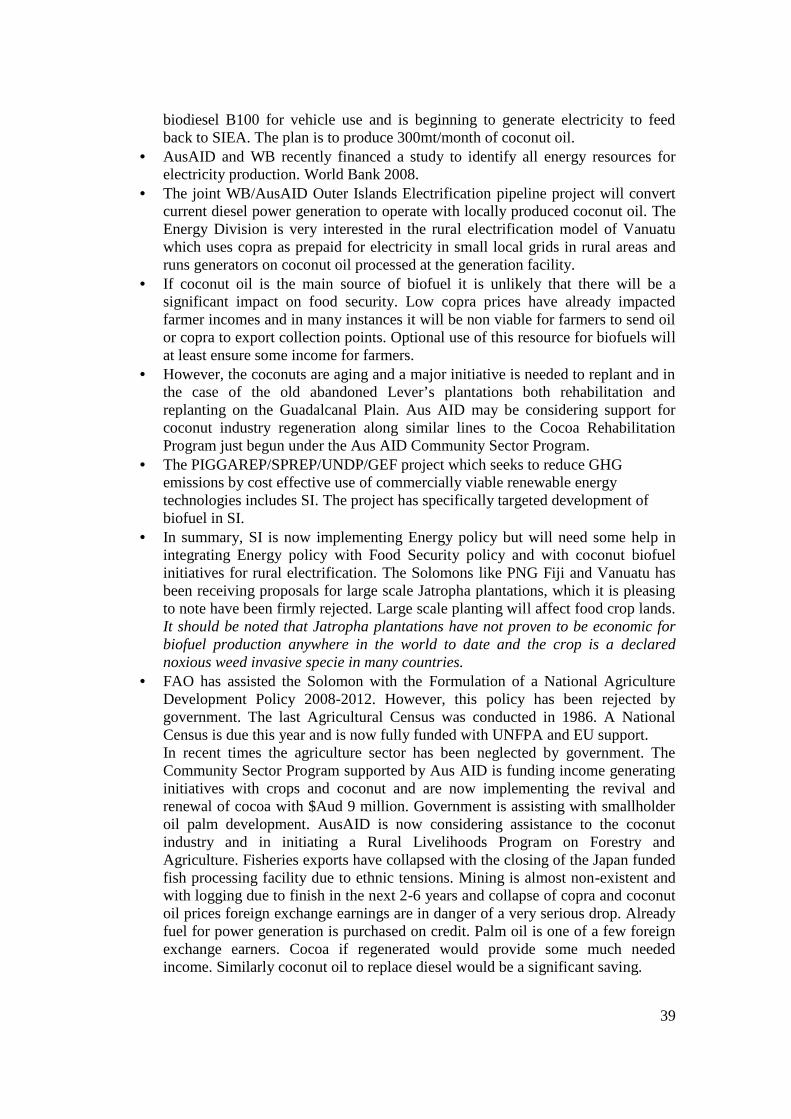
39
biodiesel B100 for vehicle use and is beginning to generate electricity to feedback to SIEA. The plan is to produce 300mt/month of coconut oil.
AusAID and WB recently financed a study to identify all energy resources forelectricity production. World Bank 2008.
The joint WB/AusAID Outer Islands Electrification pipeline project will convertcurrent diesel power generation to operate with locally produced coconut oil. TheEnergy Division is very interested in the rural electrification model of Vanuatuwhich uses copra as prepaid for electricity in small local grids in rural areas andruns generators on coconut oil processed at the generation facility.
If coconut oil is the main source of biofuel it is unlikely that there will be asignificant impact on food security. Low copra prices have already impactedfarmer incomes and in many instances it will be non viable for farmers to send oilor copra to export collection points. Optional use of this resource for biofuels willat least ensure some income for farmers.
However, the coconuts are aging and a major initiative is needed to replant and inthe case of the old abandoned Lever’s plantations both rehabilitation andreplanting on the Guadalcanal Plain. Aus AID may be considering support forcoconut industry regeneration along similar lines to the Cocoa RehabilitationProgram just begun under the Aus AID Community Sector Program.
The PIGGAREP/SPREP/UNDP/GEF project which seeks to reduce GHGemissions by cost effective use of commercially viable renewable energytechnologies includes SI. The project has specifically targeted development ofbiofuel in SI.
In summary, SI is now implementing Energy policy but will need some help inintegrating Energy policy with Food Security policy and with coconut biofuelinitiatives for rural electrification. The Solomons like PNG Fiji and Vanuatu hasbeen receiving proposals for large scale Jatropha plantations, which it is pleasingto note have been firmly rejected. Large scale planting will affect food crop lands.It should be noted that Jatropha plantations have not proven to be economic forbiofuel production anywhere in the world to date and the crop is a declarednoxious weed invasive specie in many countries.
FAO has assisted the Solomon with the Formulation of a National AgricultureDevelopment Policy 2008-2012. However, this policy has been rejected bygovernment. The last Agricultural Census was conducted in 1986. A NationalCensus is due this year and is now fully funded with UNFPA and EU support.In recent times the agriculture sector has been neglected by government. TheCommunity Sector Program supported by Aus AID is funding income generatinginitiatives with crops and coconut and are now implementing the revival andrenewal of cocoa with $Aud 9 million. Government is assisting with smallholderoil palm development. AusAID is now considering assistance to the coconutindustry and in initiating a Rural Livelihoods Program on Forestry andAgriculture. Fisheries exports have collapsed with the closing of the Japan fundedfish processing facility due to ethnic tensions. Mining is almost non-existent andwith logging due to finish in the next 2-6 years and collapse of copra and coconutoil prices foreign exchange earnings are in danger of a very serious drop. Alreadyfuel for power generation is purchased on credit. Palm oil is one of a few foreignexchange earners. Cocoa if regenerated would provide some much neededincome. Similarly coconut oil to replace diesel would be a significant saving.
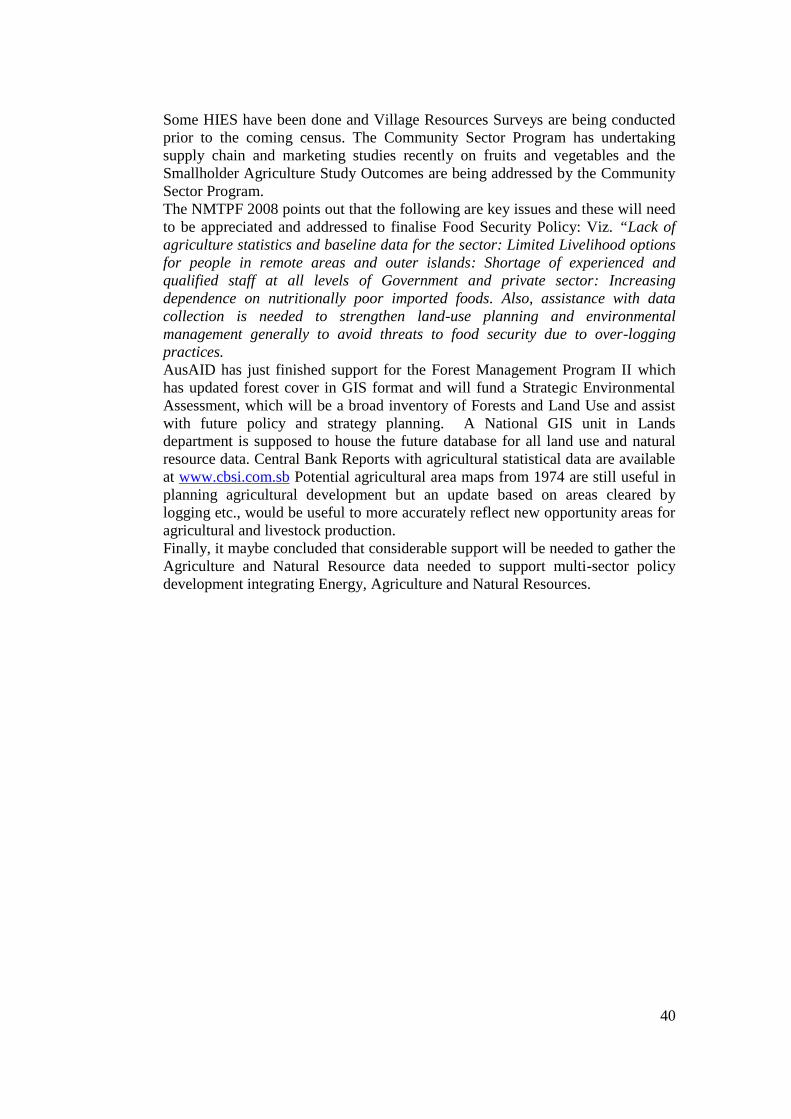
40
Some HIES have been done and Village Resources Surveys are being conductedprior to the coming census. The Community Sector Program has undertakingsupply chain and marketing studies recently on fruits and vegetables and theSmallholder Agriculture Study Outcomes are being addressed by the CommunitySector Program.The NMTPF 2008 points out that the following are key issues and these will needto be appreciated and addressed to finalise Food Security Policy: Viz. “Lack ofagriculture statistics and baseline data for the sector: Limited Livelihood optionsfor people in remote areas and outer islands: Shortage of experienced andqualified staff at all levels of Government and private sector: Increasingdependence on nutritionally poor imported foods. Also, assistance with datacollection is needed to strengthen land-use planning and environmentalmanagement generally to avoid threats to food security due to over-loggingpractices.AusAID has just finished support for the Forest Management Program II whichhas updated forest cover in GIS format and will fund a Strategic EnvironmentalAssessment, which will be a broad inventory of Forests and Land Use and assistwith future policy and strategy planning. A National GIS unit in Landsdepartment is supposed to house the future database for all land use and naturalresource data. Central Bank Reports with agricultural statistical data are availableat www.cbsi.com.sb Potential agricultural area maps from 1974 are still useful inplanning agricultural development but an update based on areas cleared bylogging etc., would be useful to more accurately reflect new opportunity areas foragricultural and livestock production.Finally, it maybe concluded that considerable support will be needed to gather theAgriculture and Natural Resource data needed to support multi-sector policydevelopment integrating Energy, Agriculture and Natural Resources.
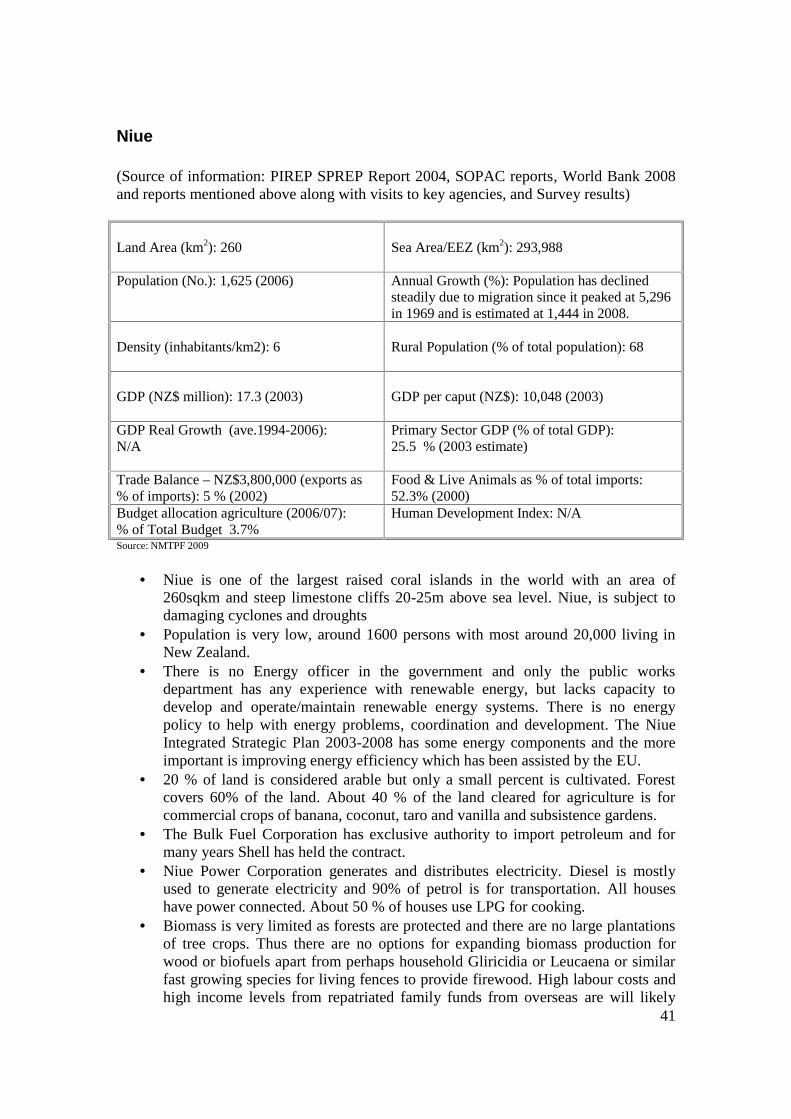
41
Niue
(Source of information: PIREP SPREP Report 2004, SOPAC reports, World Bank 2008and reports mentioned above along with visits to key agencies, and Survey results)
Land Area (km2): 260 Sea Area/EEZ (km2): 293,988
Population (No.): 1,625 (2006) Annual Growth (%): Population has declinedsteadily due to migration since it peaked at 5,296in 1969 and is estimated at 1,444 in 2008.
Density (inhabitants/km2): 6 Rural Population (% of total population): 68
GDP (NZ$ million): 17.3 (2003) GDP per caput (NZ$): 10,048 (2003)
GDP Real Growth (ave.1994-2006):N/A
Primary Sector GDP (% of total GDP):25.5 % (2003 estimate)
Trade Balance – NZ$3,800,000 (exports as% of imports): 5 % (2002)
Food & Live Animals as % of total imports:52.3% (2000)
Budget allocation agriculture (2006/07):% of Total Budget 3.7%
Human Development Index: N/A
Source: NMTPF 2009
Niue is one of the largest raised coral islands in the world with an area of260sqkm and steep limestone cliffs 20-25m above sea level. Niue, is subject todamaging cyclones and droughts
Population is very low, around 1600 persons with most around 20,000 living inNew Zealand.
There is no Energy officer in the government and only the public worksdepartment has any experience with renewable energy, but lacks capacity todevelop and operate/maintain renewable energy systems. There is no energypolicy to help with energy problems, coordination and development. The NiueIntegrated Strategic Plan 2003-2008 has some energy components and the moreimportant is improving energy efficiency which has been assisted by the EU.
20 % of land is considered arable but only a small percent is cultivated. Forestcovers 60% of the land. About 40 % of the land cleared for agriculture is forcommercial crops of banana, coconut, taro and vanilla and subsistence gardens.
The Bulk Fuel Corporation has exclusive authority to import petroleum and formany years Shell has held the contract.
Niue Power Corporation generates and distributes electricity. Diesel is mostlyused to generate electricity and 90% of petrol is for transportation. All houseshave power connected. About 50 % of houses use LPG for cooking.
Biomass is very limited as forests are protected and there are no large plantationsof tree crops. Thus there are no options for expanding biomass production forwood or biofuels apart from perhaps household Gliricidia or Leucaena or similarfast growing species for living fences to provide firewood. High labour costs andhigh income levels from repatriated family funds from overseas are will likely
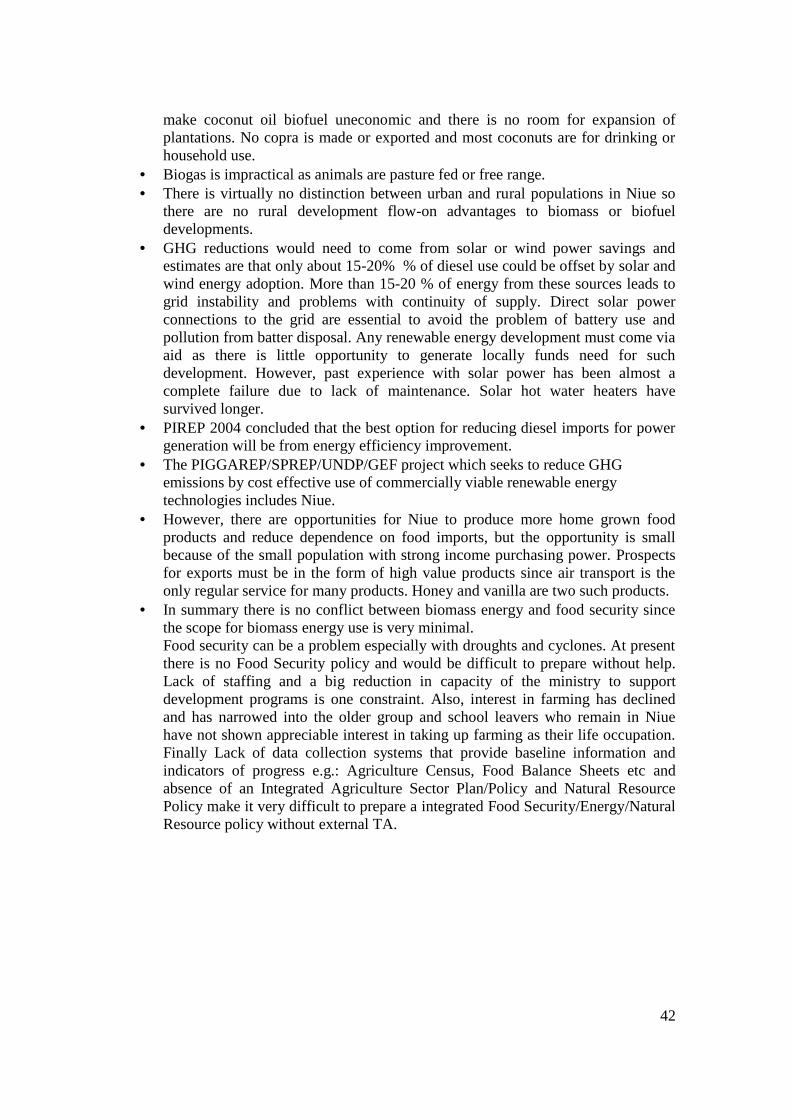
42
make coconut oil biofuel uneconomic and there is no room for expansion ofplantations. No copra is made or exported and most coconuts are for drinking orhousehold use.
Biogas is impractical as animals are pasture fed or free range. There is virtually no distinction between urban and rural populations in Niue so
there are no rural development flow-on advantages to biomass or biofueldevelopments.
GHG reductions would need to come from solar or wind power savings andestimates are that only about 15-20% % of diesel use could be offset by solar andwind energy adoption. More than 15-20 % of energy from these sources leads togrid instability and problems with continuity of supply. Direct solar powerconnections to the grid are essential to avoid the problem of battery use andpollution from batter disposal. Any renewable energy development must come viaaid as there is little opportunity to generate locally funds need for suchdevelopment. However, past experience with solar power has been almost acomplete failure due to lack of maintenance. Solar hot water heaters havesurvived longer.
PIREP 2004 concluded that the best option for reducing diesel imports for powergeneration will be from energy efficiency improvement.
The PIGGAREP/SPREP/UNDP/GEF project which seeks to reduce GHGemissions by cost effective use of commercially viable renewable energytechnologies includes Niue.
However, there are opportunities for Niue to produce more home grown foodproducts and reduce dependence on food imports, but the opportunity is smallbecause of the small population with strong income purchasing power. Prospectsfor exports must be in the form of high value products since air transport is theonly regular service for many products. Honey and vanilla are two such products.
In summary there is no conflict between biomass energy and food security sincethe scope for biomass energy use is very minimal.Food security can be a problem especially with droughts and cyclones. At presentthere is no Food Security policy and would be difficult to prepare without help.Lack of staffing and a big reduction in capacity of the ministry to supportdevelopment programs is one constraint. Also, interest in farming has declinedand has narrowed into the older group and school leavers who remain in Niuehave not shown appreciable interest in taking up farming as their life occupation.Finally Lack of data collection systems that provide baseline information andindicators of progress e.g.: Agriculture Census, Food Balance Sheets etc andabsence of an Integrated Agriculture Sector Plan/Policy and Natural ResourcePolicy make it very difficult to prepare a integrated Food Security/Energy/NaturalResource policy without external TA.
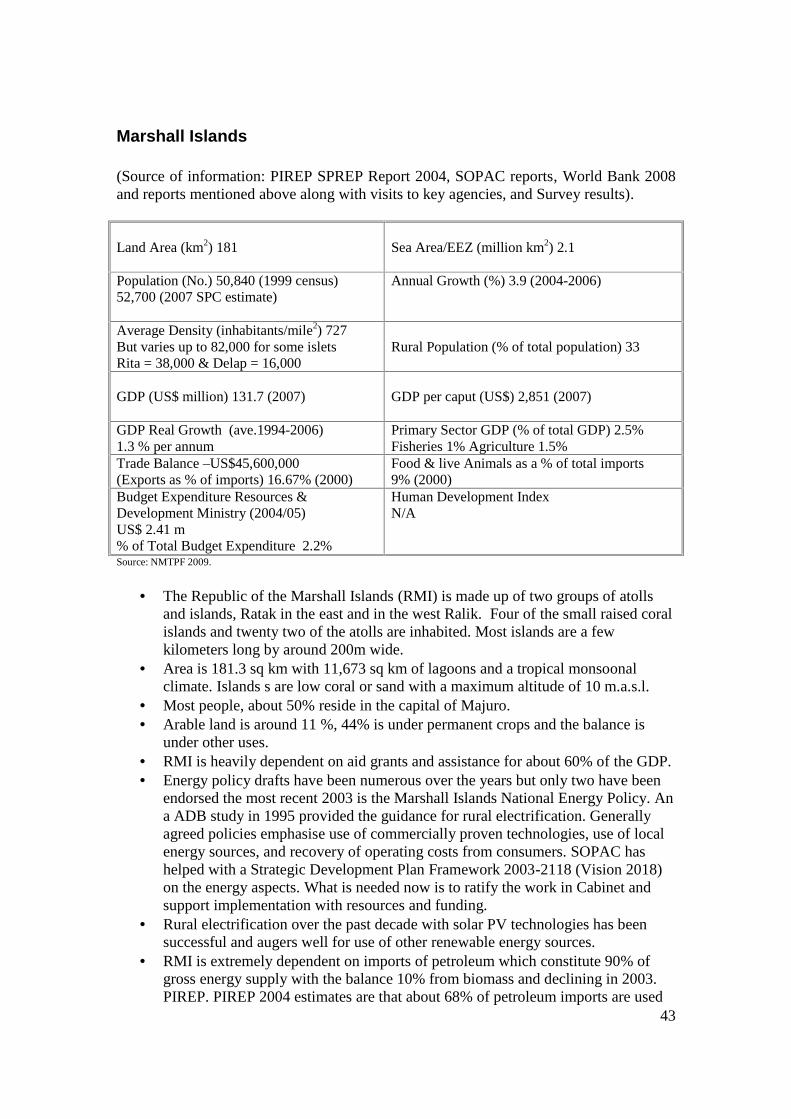
43
Marshall Islands
(Source of information: PIREP SPREP Report 2004, SOPAC reports, World Bank 2008and reports mentioned above along with visits to key agencies, and Survey results).
Land Area (km2) 181 Sea Area/EEZ (million km2) 2.1
Population (No.) 50,840 (1999 census)52,700 (2007 SPC estimate)
Annual Growth (%) 3.9 (2004-2006)
Average Density (inhabitants/mile2) 727But varies up to 82,000 for some isletsRita = 38,000 & Delap = 16,000
Rural Population (% of total population) 33
GDP (US$ million) 131.7 (2007) GDP per caput (US$) 2,851 (2007)
GDP Real Growth (ave.1994-2006)1.3 % per annum
Primary Sector GDP (% of total GDP) 2.5%Fisheries 1% Agriculture 1.5%
Trade Balance –US$45,600,000(Exports as % of imports) 16.67% (2000)
Food & live Animals as a % of total imports9% (2000)
Budget Expenditure Resources &Development Ministry (2004/05)US$ 2.41 m% of Total Budget Expenditure 2.2%
Human Development IndexN/A
Source: NMTPF 2009.
The Republic of the Marshall Islands (RMI) is made up of two groups of atollsand islands, Ratak in the east and in the west Ralik. Four of the small raised coralislands and twenty two of the atolls are inhabited. Most islands are a fewkilometers long by around 200m wide.
Area is 181.3 sq km with 11,673 sq km of lagoons and a tropical monsoonalclimate. Islands s are low coral or sand with a maximum altitude of 10 m.a.s.l.
Most people, about 50% reside in the capital of Majuro. Arable land is around 11 %, 44% is under permanent crops and the balance is
under other uses. RMI is heavily dependent on aid grants and assistance for about 60% of the GDP. Energy policy drafts have been numerous over the years but only two have been
endorsed the most recent 2003 is the Marshall Islands National Energy Policy. Ana ADB study in 1995 provided the guidance for rural electrification. Generallyagreed policies emphasise use of commercially proven technologies, use of localenergy sources, and recovery of operating costs from consumers. SOPAC hashelped with a Strategic Development Plan Framework 2003-2118 (Vision 2018)on the energy aspects. What is needed now is to ratify the work in Cabinet andsupport implementation with resources and funding.
Rural electrification over the past decade with solar PV technologies has beensuccessful and augers well for use of other renewable energy sources.
RMI is extremely dependent on imports of petroleum which constitute 90% ofgross energy supply with the balance 10% from biomass and declining in 2003.PIREP. PIREP 2004 estimates are that about 68% of petroleum imports are used
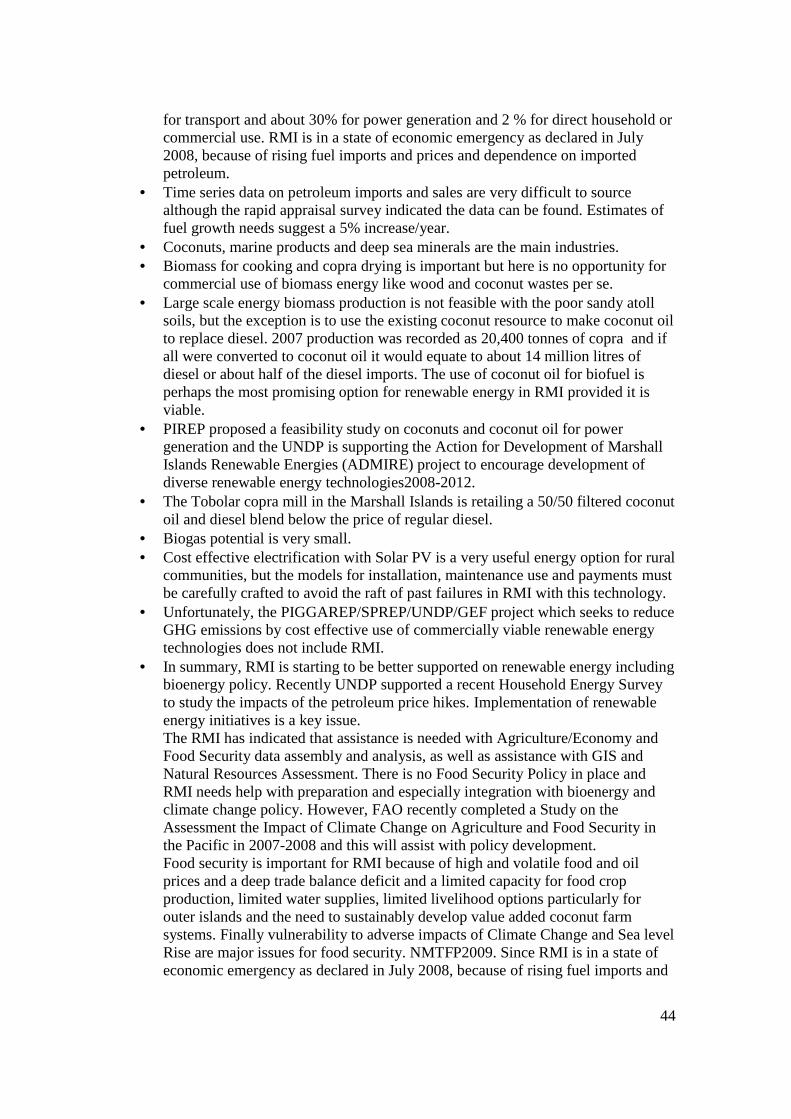
44
for transport and about 30% for power generation and 2 % for direct household orcommercial use. RMI is in a state of economic emergency as declared in July2008, because of rising fuel imports and prices and dependence on importedpetroleum.
Time series data on petroleum imports and sales are very difficult to sourcealthough the rapid appraisal survey indicated the data can be found. Estimates offuel growth needs suggest a 5% increase/year.
Coconuts, marine products and deep sea minerals are the main industries. Biomass for cooking and copra drying is important but here is no opportunity for
commercial use of biomass energy like wood and coconut wastes per se. Large scale energy biomass production is not feasible with the poor sandy atoll
soils, but the exception is to use the existing coconut resource to make coconut oilto replace diesel. 2007 production was recorded as 20,400 tonnes of copra and ifall were converted to coconut oil it would equate to about 14 million litres ofdiesel or about half of the diesel imports. The use of coconut oil for biofuel isperhaps the most promising option for renewable energy in RMI provided it isviable.
PIREP proposed a feasibility study on coconuts and coconut oil for powergeneration and the UNDP is supporting the Action for Development of MarshallIslands Renewable Energies (ADMIRE) project to encourage development ofdiverse renewable energy technologies2008-2012.
The Tobolar copra mill in the Marshall Islands is retailing a 50/50 filtered coconutoil and diesel blend below the price of regular diesel.
Biogas potential is very small. Cost effective electrification with Solar PV is a very useful energy option for rural
communities, but the models for installation, maintenance use and payments mustbe carefully crafted to avoid the raft of past failures in RMI with this technology.
Unfortunately, the PIGGAREP/SPREP/UNDP/GEF project which seeks to reduceGHG emissions by cost effective use of commercially viable renewable energytechnologies does not include RMI.
In summary, RMI is starting to be better supported on renewable energy includingbioenergy policy. Recently UNDP supported a recent Household Energy Surveyto study the impacts of the petroleum price hikes. Implementation of renewableenergy initiatives is a key issue.The RMI has indicated that assistance is needed with Agriculture/Economy andFood Security data assembly and analysis, as well as assistance with GIS andNatural Resources Assessment. There is no Food Security Policy in place andRMI needs help with preparation and especially integration with bioenergy andclimate change policy. However, FAO recently completed a Study on theAssessment the Impact of Climate Change on Agriculture and Food Security inthe Pacific in 2007-2008 and this will assist with policy development.Food security is important for RMI because of high and volatile food and oilprices and a deep trade balance deficit and a limited capacity for food cropproduction, limited water supplies, limited livelihood options particularly forouter islands and the need to sustainably develop value added coconut farmsystems. Finally vulnerability to adverse impacts of Climate Change and Sea levelRise are major issues for food security. NMTFP2009. Since RMI is in a state ofeconomic emergency as declared in July 2008, because of rising fuel imports and
45
prices they desperately need assistance with both food security and renewableenergy including bioenergy.
Nauru
(Source of information: PIREP SPREP Report 2004, SOPAC reports, World Bank 2008and reports mentioned above along with visits to key agencies, and Survey results)
Land Area (km2): 21 Sea Area/EEZ (km2): 320,000
Population (No.): 8,800 (2007 estimate) Annual Growth (%): -10 (2007)(due to increased migration and repatriation)
Density (inhabitants/km2): 495 Rural Population (% of total population): 0
GDP (US$ million): 26.32 (2006) GDP per caput (US$): 2,671 (2006)
GDP Real Growth : N/A Primary Sector : 10.6 % (2006)Trade Balance – A$ 28,720,000 (exports as% of imports): 14.7 % (2005)
Food & Live Animals as % of total imports:13.5% (2005)
Budget allocation agriculture (2008/09):% of Total Budget 0.09 %
Human Development Index : N/A
Source: NMTPF 2009
Nauru is a single raised coral island in the equatorial tropics that is only 21sq kmin area. It is subject to severe droughts.
The island has been a supply of rock phosphate and about 85% of the island hasbeen devastated by mining of the phosphate. Since mining has decreased theisland has become essentially bankrupt and is supported by aid and support fromthe Phosphate Trust funds which are rapidly declining. Australia used Nauru as abase for hosting refugees up until 2008 for screening for entry into Australia, butnow these funds are no longer available and phosphate reserves will be used up by2010.
Rehabilitation of the mined areas is virtually impossible without imports ofreplacement soil. Rehabilitation is supposed to proceed based on an Australianagreement with Nauru, but there is no visible progress to date. Thus there isvirtually no potential for bioenergy other than from existing coconuts and there islittle use of biomass for cooking. Nauru was reputed to produce 1,800 tonnes ofcopra in 2007 (FAOSTAT) which if converted to coconut oil would amount toabout 1.2ML of diesel or about 12.5% of the diesel use in 2004. The use ofcoconut oil as diesel substitute would have to be assessed for impact on foodsupply and if financially and economically feasible in practice.The area of land potentially available for agricultural purposes is small (there isonly about 4 sq km of fertile land, but development is constrained by land rights,plots sizes and fresh water for irrigation. There is currently no formal commercialagriculture in Nauru.
46
Energy comes from diesel generators and in the past with subsidy was so cheapthat often unpaid bills were not enforced and gross wastage of energy wascommon.
There is no government energy office and the Nauru Power company (NPC) hasone generating station that supplies the complete ring main grid. Development ofthe Nauru National Energy Policy with PIEPSAP/SOPAC help in 2008 and goodstakeholder interest produced a final draft and now awaits Cabinet approval. Akey aspect of the policy is establishment of an appropriate fuel supplyarrangement to ensure Nauru can get a reliable affordable fuel supply and on-going SOPAC support and monitoring will be needed because of weakgovernment institutional capacity. The EU continues to assist with promotingenergy saving via improved efficiency of energy use and energy audits.
Recently Nauru signed an MOU with Pacific Island forum secretariat to beinvolved in the Bulk Procurement of Fuel Initiative as a first step to securingsupplies and reducing imported fuel costs.
OTEC and wind renewable energy with a smaller contribution from Solar PV andsolar heating are possibly the other options at present for Nauru. In the past Nauruhad an OTEC generation system that has fallen into disrepair.
A Strategic Plan for Sustainable Development in Nauru 2004-2008 was supportedby FAO and provided a framework to develop agriculture in Nauru.
The PIGGAREP/SPREP/UNDP/GEF project which seeks to reduce GHGemissions by cost effective use of commercially viable renewable energytechnologies includes Niue.
Development of Fisheries is vital to food security in Nauru. Fisheries play animportant role in the economy of the country from license fees for foreign fishingboats fishing in the substantial EEZ.
In summary Nauru at present has no Food Security policy but it does have thebasis for same with the FAO Strategic Plan for Sustainable Development in Nauru2004-2008. Limited livelihood options, high and volatile food prices and a deeptrade balance deficit and total reliance on food imports as agricultural andlivestock production levels are very low have major implications for foodsecurity. Assistance with preparing a Food Security policy and integrating it withenergy policy would need external TA as there is very limited institutionalcapacity to do such work in Nauru.
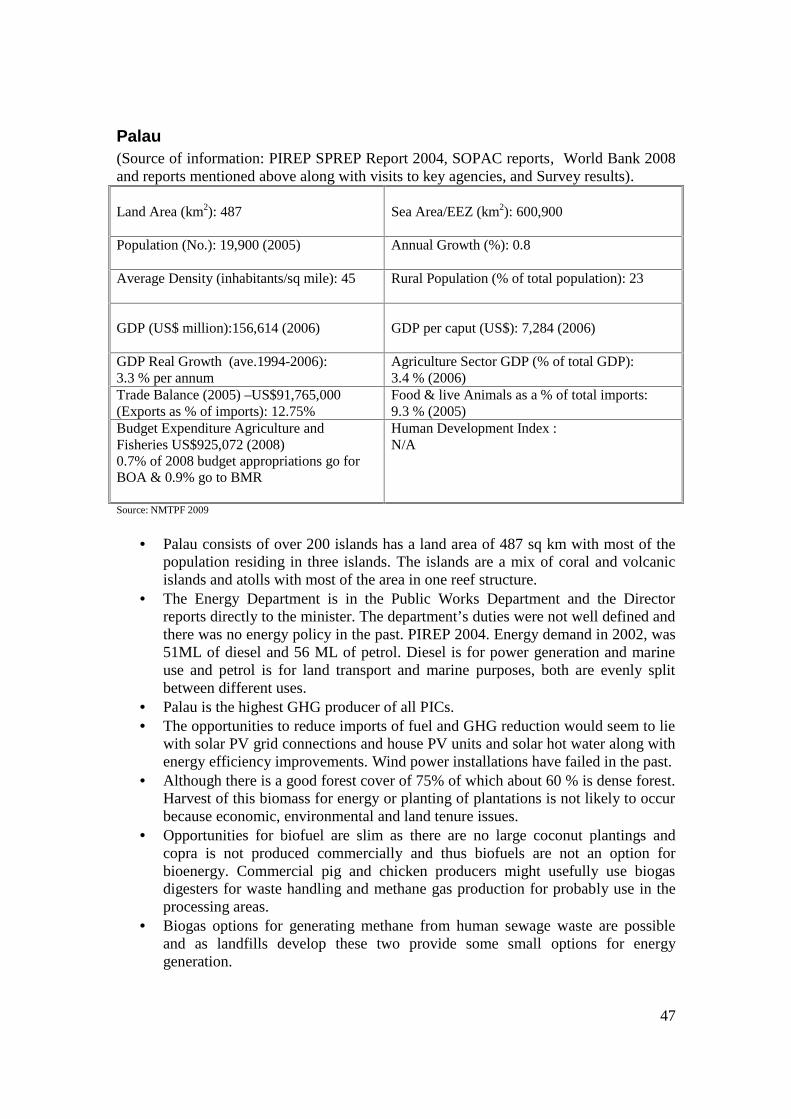
47
Palau(Source of information: PIREP SPREP Report 2004, SOPAC reports, World Bank 2008and reports mentioned above along with visits to key agencies, and Survey results).
Land Area (km2): 487 Sea Area/EEZ (km2): 600,900
Population (No.): 19,900 (2005) Annual Growth (%): 0.8
Average Density (inhabitants/sq mile): 45 Rural Population (% of total population): 23
GDP (US$ million):156,614 (2006) GDP per caput (US$): 7,284 (2006)
GDP Real Growth (ave.1994-2006):3.3 % per annum
Agriculture Sector GDP (% of total GDP):3.4 % (2006)
Trade Balance (2005) –US$91,765,000(Exports as % of imports): 12.75%
Food & live Animals as a % of total imports:9.3 % (2005)
Budget Expenditure Agriculture andFisheries US$925,072 (2008)0.7% of 2008 budget appropriations go forBOA & 0.9% go to BMR
Human Development Index :N/A
Source: NMTPF 2009
Palau consists of over 200 islands has a land area of 487 sq km with most of thepopulation residing in three islands. The islands are a mix of coral and volcanicislands and atolls with most of the area in one reef structure.
The Energy Department is in the Public Works Department and the Directorreports directly to the minister. The department’s duties were not well defined andthere was no energy policy in the past. PIREP 2004. Energy demand in 2002, was51ML of diesel and 56 ML of petrol. Diesel is for power generation and marineuse and petrol is for land transport and marine purposes, both are evenly splitbetween different uses.
Palau is the highest GHG producer of all PICs. The opportunities to reduce imports of fuel and GHG reduction would seem to lie
with solar PV grid connections and house PV units and solar hot water along withenergy efficiency improvements. Wind power installations have failed in the past.
Although there is a good forest cover of 75% of which about 60 % is dense forest.Harvest of this biomass for energy or planting of plantations is not likely to occurbecause economic, environmental and land tenure issues.
Opportunities for biofuel are slim as there are no large coconut plantings andcopra is not produced commercially and thus biofuels are not an option forbioenergy. Commercial pig and chicken producers might usefully use biogasdigesters for waste handling and methane gas production for probably use in theprocessing areas.
Biogas options for generating methane from human sewage waste are possibleand as landfills develop these two provide some small options for energygeneration.
48
OTEC energy generation is possible, based on ocean depths nearby, but not likelyin the next decade or so and hydro potential is very limited.
In every instance because energy use/head is high, changes from conventionaldiesel powered systems to renewable will be costly. Also, Palau has had limitedexperience with renewable energy projects in the past thus giving a range ofconstraints to their design, evaluation and use.
Unfortunately the PIGGAREP/SPREP/UNDP/GEF project which seeks to reduceGHG emissions by cost effective use of commercially viable renewable energytechnologies does not include Palau.
In summary there is likely to be no conflict between bio-energy and food securityissues arising in Palau. Palau was supported on poverty analysis by UNDP andADB and SPC up till the end of 2008. “Currently only a small commercial sub-sector is producing vegetable crops for the local market. Commercial farmsmostly specialize in high value crops such as cucumber, green onion, Chinesecabbage, green peppers, beans, kankum and egg plant. The commercial sub-sector is largely driven by foreigners, either as laborers from the Philippines, orentrepreneurs from China. Traditional farming systems are semi-subsistencesystems producing root crops, cassava, betel nut and pepper leaf, or moreconventional systems that rotate vegetable crops on annual basis, using a mix oforganic and inorganic inputs to ameliorate the relatively infertile acid soils.Traditional subsistence systems predominantly involve production by women.Aspects of the 2020 National Master Development Plan (NMDP), and otherplans, have been implemented, but on a somewhat ad hoc basis. There is a need tostreamline and more effectively coordinate the implementation of the variousdevelopment plans and the assistance provided by Palau’s development partners.High and volatile food and oil prices and a significant trade balance deficit areserious issues. Unexploited potential for increased local agricultural production.,unexploited potential for sustainable timber production in agroforestry systems,lack of appropriate forest policy and legislative framework, lack of local producemarket and weak market chain linkages.” NMTPF 2009. These among manyother issues all point to the need for a Food Security policy for Palau and integrateit with Energy and other policies. External TA will be needed to do the policywork since Palau has weak institutional capacity. Status of Natural Resourcesinventory and databases could not be found.
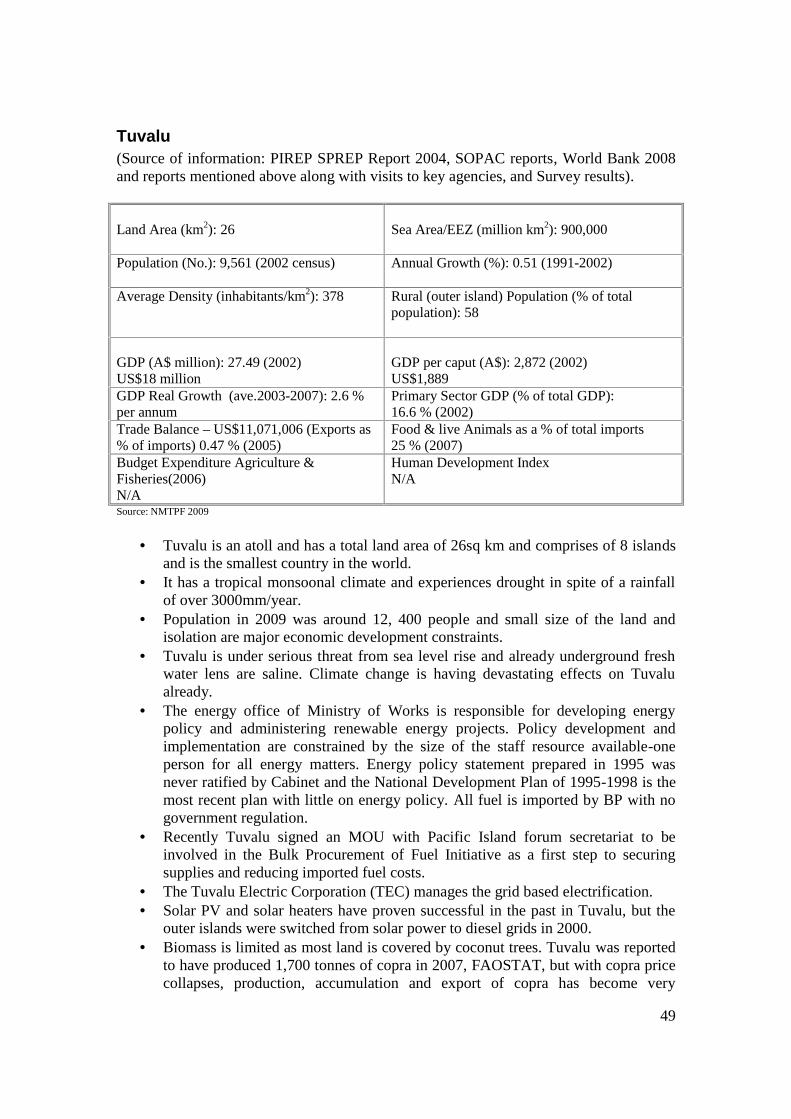
49
Tuvalu(Source of information: PIREP SPREP Report 2004, SOPAC reports, World Bank 2008and reports mentioned above along with visits to key agencies, and Survey results).
Land Area (km2): 26 Sea Area/EEZ (million km2): 900,000
Population (No.): 9,561 (2002 census) Annual Growth (%): 0.51 (1991-2002)
Average Density (inhabitants/km2): 378 Rural (outer island) Population (% of totalpopulation): 58
GDP (A$ million): 27.49 (2002)US$18 million
GDP per caput (A$): 2,872 (2002)US$1,889
GDP Real Growth (ave.2003-2007): 2.6 %per annum
Primary Sector GDP (% of total GDP):16.6 % (2002)
Trade Balance – US$11,071,006 (Exports as% of imports) 0.47 % (2005)
Food & live Animals as a % of total imports25 % (2007)
Budget Expenditure Agriculture &Fisheries(2006)N/A
Human Development IndexN/A
Source: NMTPF 2009
Tuvalu is an atoll and has a total land area of 26sq km and comprises of 8 islandsand is the smallest country in the world.
It has a tropical monsoonal climate and experiences drought in spite of a rainfallof over 3000mm/year.
Population in 2009 was around 12, 400 people and small size of the land andisolation are major economic development constraints.
Tuvalu is under serious threat from sea level rise and already underground freshwater lens are saline. Climate change is having devastating effects on Tuvalualready.
The energy office of Ministry of Works is responsible for developing energypolicy and administering renewable energy projects. Policy development andimplementation are constrained by the size of the staff resource available-oneperson for all energy matters. Energy policy statement prepared in 1995 wasnever ratified by Cabinet and the National Development Plan of 1995-1998 is themost recent plan with little on energy policy. All fuel is imported by BP with nogovernment regulation.
Recently Tuvalu signed an MOU with Pacific Island forum secretariat to beinvolved in the Bulk Procurement of Fuel Initiative as a first step to securingsupplies and reducing imported fuel costs.
The Tuvalu Electric Corporation (TEC) manages the grid based electrification. Solar PV and solar heaters have proven successful in the past in Tuvalu, but the
outer islands were switched from solar power to diesel grids in 2000. Biomass is limited as most land is covered by coconut trees. Tuvalu was reported
to have produced 1,700 tonnes of copra in 2007, FAOSTAT, but with copra pricecollapses, production, accumulation and export of copra has become very
50
marginal. An opportunity if financially and technically feasible and sociallyacceptable would be to replace some about 1.5ML of diesel used to powerelectricity generators with coconut oil. 1,700 tonnes of copra would producearound 1.1ML of diesel equivalent. Coconut oil biofuel seems to be the bestpotential renewable energy resource for Tuvalu along with solar. About half theland area of Tuvalu is covered by coconut. High labour costs may be a majorconstraint for coconut oil production and feasibility studies are essential, for theouter islands along with small scale trials.
UNDP 2008-2011 is assisting with a Capacity Building for Sustainable LandManagement Medium Size Project which strengthens land use capacities andLand Information Management Systems as well as sustainable management ofland systems in traditional and modern agriculture and land rehabilitation.
On April 26th, 2008 the first production of coconut biodiesel was demonstrated inTuvalu.
Poor atoll soils are not conducive to rapid biomass growth. Some wood biomasswould be available from replacement of old coconut trees with new plantings, butthe amount would be limited.
OTEC, Wave, Wind and biogas do not appear to be viable technologies forTuvalu, except possibly for wind in specific locations.
With solar PV and coconut oil biofuel the opportunity is to reduce GHGproduction by about 17% over a 10 year period.
The PIGGAREP/SPREP/UNDP/GEF project which seeks to reduce GHGemissions by cost effective use of commercially viable renewable energytechnologies includes Tuvalu.
In summary, Tuvalu will need help in the assessment of the coconut resourceavailable for biofuel coconut oil and the feasibility studies on coconut oilproduction for diesel substitution. While it is unlikely that use of coconut for oilwould impact greatly on food security, food security studies need to beundertaken in light of the inundation and land loss occurring already from climatechange. It is unlikely that Tuvalu would be able to develop a Food Security policywithout considerable assistance as technical capacity is very limited. Tuvalu hasno energy policy and again would need assistance to develop one and integrate itwith food security policy.
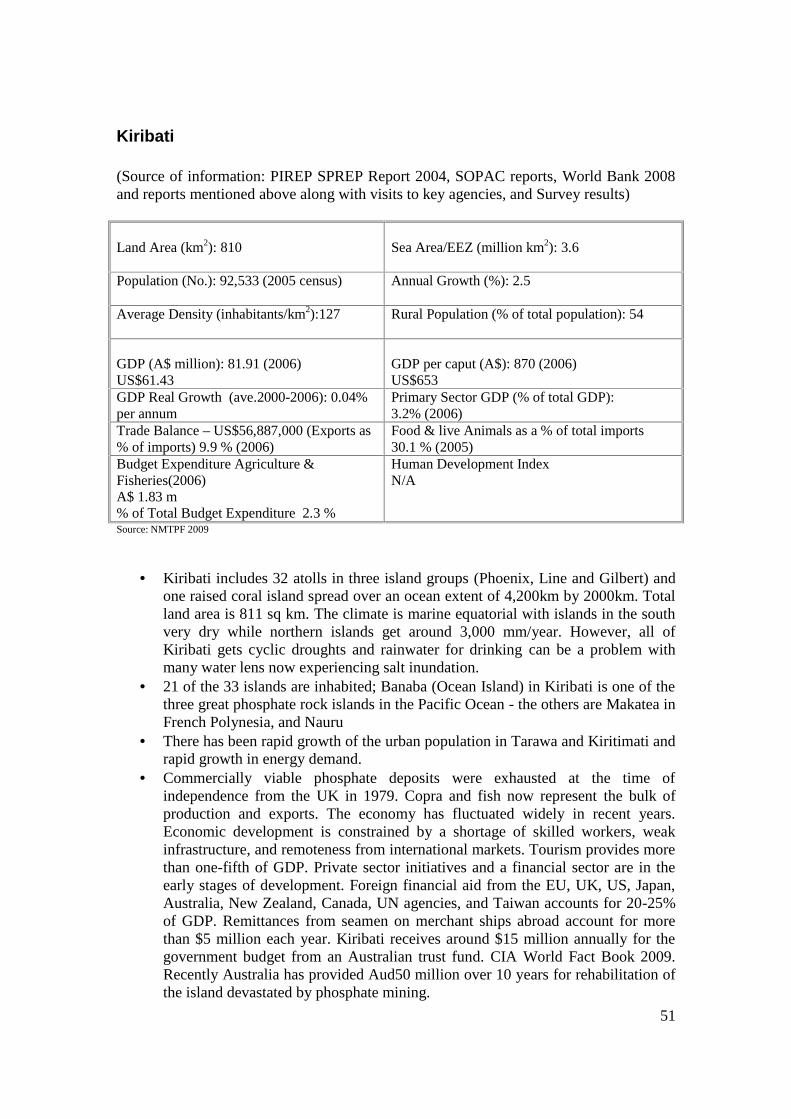
51
Kiribati
(Source of information: PIREP SPREP Report 2004, SOPAC reports, World Bank 2008and reports mentioned above along with visits to key agencies, and Survey results)
Land Area (km2): 810 Sea Area/EEZ (million km2): 3.6
Population (No.): 92,533 (2005 census) Annual Growth (%): 2.5
Average Density (inhabitants/km2):127 Rural Population (% of total population): 54
GDP (A$ million): 81.91 (2006)US$61.43
GDP per caput (A$): 870 (2006)US$653
GDP Real Growth (ave.2000-2006): 0.04%per annum
Primary Sector GDP (% of total GDP):3.2% (2006)
Trade Balance – US$56,887,000 (Exports as% of imports) 9.9 % (2006)
Food & live Animals as a % of total imports30.1 % (2005)
Budget Expenditure Agriculture &Fisheries(2006)A$ 1.83 m% of Total Budget Expenditure 2.3 %
Human Development IndexN/A
Source: NMTPF 2009
Kiribati includes 32 atolls in three island groups (Phoenix, Line and Gilbert) andone raised coral island spread over an ocean extent of 4,200km by 2000km. Totalland area is 811 sq km. The climate is marine equatorial with islands in the southvery dry while northern islands get around 3,000 mm/year. However, all ofKiribati gets cyclic droughts and rainwater for drinking can be a problem withmany water lens now experiencing salt inundation.
21 of the 33 islands are inhabited; Banaba (Ocean Island) in Kiribati is one of thethree great phosphate rock islands in the Pacific Ocean - the others are Makatea inFrench Polynesia, and Nauru
There has been rapid growth of the urban population in Tarawa and Kiritimati andrapid growth in energy demand.
Commercially viable phosphate deposits were exhausted at the time ofindependence from the UK in 1979. Copra and fish now represent the bulk ofproduction and exports. The economy has fluctuated widely in recent years.Economic development is constrained by a shortage of skilled workers, weakinfrastructure, and remoteness from international markets. Tourism provides morethan one-fifth of GDP. Private sector initiatives and a financial sector are in theearly stages of development. Foreign financial aid from the EU, UK, US, Japan,Australia, New Zealand, Canada, UN agencies, and Taiwan accounts for 20-25%of GDP. Remittances from seamen on merchant ships abroad account for morethan $5 million each year. Kiribati receives around $15 million annually for thegovernment budget from an Australian trust fund. CIA World Fact Book 2009.Recently Australia has provided Aud50 million over 10 years for rehabilitation ofthe island devastated by phosphate mining.
52
The Ministry of Works and Utilities is responsible for the energy needs. Itpromotes development of renewable energy and encourages energy efficiency.The Energy Planning Unit (EPU) is responsible for policy development andcoordination and id to provide assistance for all energy activities. There is anurgent need for development of a national energy policy for Kiribati. The SOPACPIEPSP project did assist with the development of a National Energy PolicyFramework. At the REMM 2009 meeting in Tonga Kiribati announced that theyare working on their implementation plan for the policy and other energy relatedactivities.
Kiribati is highly dependent on imported petroleum and energy costs have risensharply in recent years with a serious flow on effect on food prices. Kiribatidepends almost solely on petroleum imports for electricity generation except forabout 1% of electricity that comes from home solar PV on the outer islands,except from government offices and housing where generators are used. Thus,generally the outer islands depend on Solar PV for electricity for lighting andlargely biomass for cooking and copra drying. Solar energy levels for all ofKiribati are very good and Kiribati was one of the first countries in the world topromote solar energy for electrification.
Arable land: 2.74%Permanent crops: 47.95%Other: 49.31% (2005).
Biomass for cooking largely comes from coconut husk, dead leaves and shells orfrom mangrove wood. Biomass is apparently sufficient on outer islands but inshort supply in urban areas of Tarawa and Kiritimati.
Kiribati is a moderate sized producer of copra producing 110,000 tonnes in 2007.FAO STAT. Production is falling, because of low copra prices in recent times andthe costs of producing copra on outer islands have risen. There is now a goodopportunity to use coconut oil for diesel substitution to reduce dependence onimported diesel. The PIREP report of 2004, concluded that potentially up to 85%of diesel could be offset by biofuel based on coconut oil and that a further 15% bysolar and wind. However, before wind is proposed for energy a much betterassessment of the resource must be undertaken. Most GHG emissions are fromurban areas and most emissions will need to be offset by improved energyefficiency.
Biogas is not an alternative for saving fuel. OTEC, wave and tidal energy do notappear feasible for Kiribati.
Use of coconut oil for copra or oil for export or use as biofuel is unlikely toimpact on food security since the resource is simply diverted to an alternate use.Low prices for copra/oil exports do affect food security since incomes fall. FAOsupported a Coconut Study 2004-2008 to review the existing structure of thecopra industry, particularly processing and marketing to recommend operations toassess the long term sustainability of the industry. In spite of repeated requeststhis report was not provided by FAO.
The PIGGAREP/SPREP/UNDP/GEF project which seeks to reduce GHGemissions by cost effective use of commercially viable renewable energytechnologies includes Kiribati.
Kiribati will need considerable help with the feasibility, technologies andrestructuring of the copra industry to produce coconut oil for fuel for dieselreplacement for power generation and land and marine transport. Kiribati was
53
supported on poverty analysis by UNDP and ADB and SPC up till the end of2008. The comments below from the NMTPF 2009 are especially pertinent tofood security policy development:
“High and volatile food and oil prices and a deep trade balance deficit. Highdependency on imported foods and rapidly increasing levels of food and nutritionrelated non communicable diseases, which impact negatively on health system,families and national economy. Limited livelihood options particularly for outerislands. High level of youth unemployment particularly in urban areas. Lack of asector plan that provides a coherent policy and financing framework for promotingagriculture development and food security. Limited human resource capacity forsector development. Limited capacity for staple food crop and livestock production.Limited water supply for competing demands between domestic and agricultural uses.Need to sustainably develop and diversify fisheries and aquaculture commodities fordomestic and international markets. Need to sustainably develop coconut value addedindustries. Vulnerability to adverse impacts of Climate Change and Sea level Rise.”
In summary, Kiribati, would need help in assessing the coconut/bioenergyresource in future. For food security data additional assistance is needed. Kiribatidoes not have at present a Food Security policy or a cabinet ratified energy policyand would need help with preparation and integration. Lack of a sector plan thatprovides a coherent policy and financing framework for promoting agriculturedevelopment and food security and limited human resource capacity for sectordevelopment are major constraints. There is at present no Energy policy but thereis a framework prepared by SOPAC, and there is a clear intent to proceed asflagged at the recent REMM 2009 meeting in Tonga in April. Natural Resourcesdata collection is required
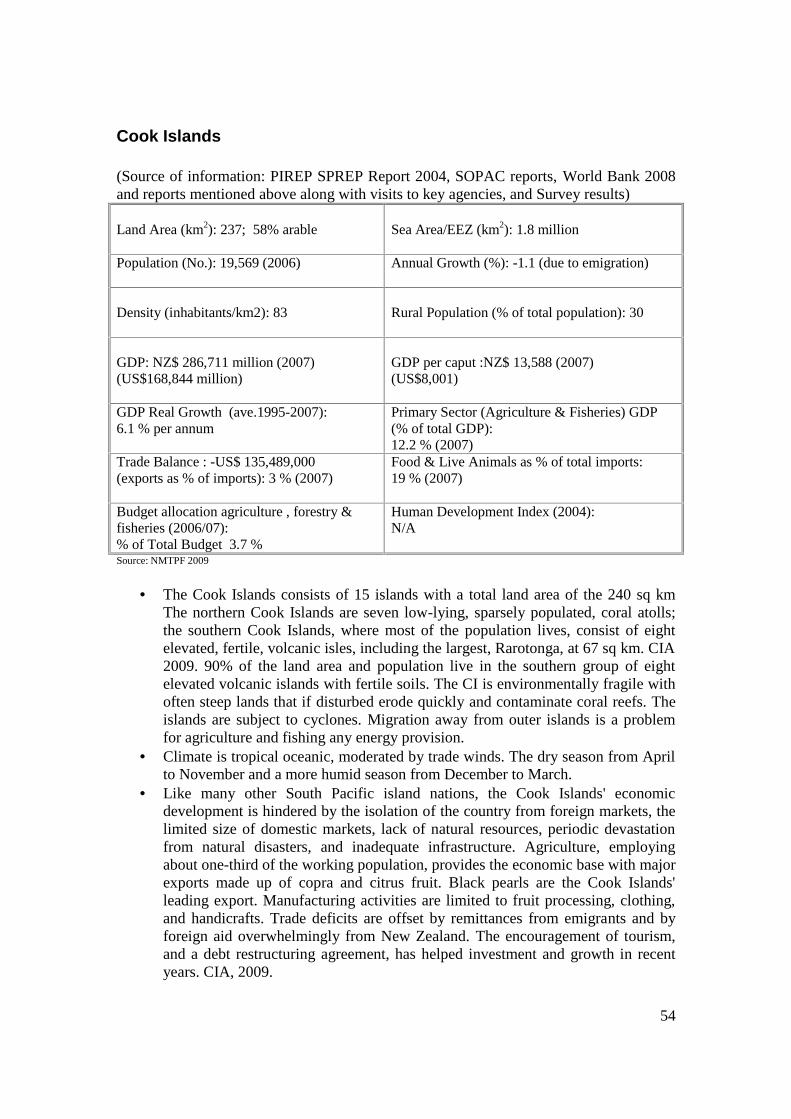
54
Cook Islands
(Source of information: PIREP SPREP Report 2004, SOPAC reports, World Bank 2008and reports mentioned above along with visits to key agencies, and Survey results)
Land Area (km2): 237; 58% arable Sea Area/EEZ (km2): 1.8 million
Population (No.): 19,569 (2006) Annual Growth (%): -1.1 (due to emigration)
Density (inhabitants/km2): 83 Rural Population (% of total population): 30
GDP: NZ$ 286,711 million (2007)(US$168,844 million)
GDP per caput :NZ$ 13,588 (2007)(US$8,001)
GDP Real Growth (ave.1995-2007):6.1 % per annum
Primary Sector (Agriculture & Fisheries) GDP(% of total GDP):12.2 % (2007)
Trade Balance : -US$ 135,489,000(exports as % of imports): 3 % (2007)
Food & Live Animals as % of total imports:19 % (2007)
Budget allocation agriculture , forestry &fisheries (2006/07):% of Total Budget 3.7 %
Human Development Index (2004):N/A
Source: NMTPF 2009
The Cook Islands consists of 15 islands with a total land area of the 240 sq kmThe northern Cook Islands are seven low-lying, sparsely populated, coral atolls;the southern Cook Islands, where most of the population lives, consist of eightelevated, fertile, volcanic isles, including the largest, Rarotonga, at 67 sq km. CIA2009. 90% of the land area and population live in the southern group of eightelevated volcanic islands with fertile soils. The CI is environmentally fragile withoften steep lands that if disturbed erode quickly and contaminate coral reefs. Theislands are subject to cyclones. Migration away from outer islands is a problemfor agriculture and fishing any energy provision.
Climate is tropical oceanic, moderated by trade winds. The dry season from Aprilto November and a more humid season from December to March.
Like many other South Pacific island nations, the Cook Islands' economicdevelopment is hindered by the isolation of the country from foreign markets, thelimited size of domestic markets, lack of natural resources, periodic devastationfrom natural disasters, and inadequate infrastructure. Agriculture, employingabout one-third of the working population, provides the economic base with majorexports made up of copra and citrus fruit. Black pearls are the Cook Islands'leading export. Manufacturing activities are limited to fruit processing, clothing,and handicrafts. Trade deficits are offset by remittances from emigrants and byforeign aid overwhelmingly from New Zealand. The encouragement of tourism,and a debt restructuring agreement, has helped investment and growth in recentyears. CIA, 2009.
55
The Ministry of works has a small Energy Division, but focus is mostly onelectrical works and not on policy. Responsibilities in energy are spread over anumber of ministries. A National Energy Policy was endorsed by Cabinet in 2003.There are several acts of parliament dealing with energy related issues. TheNational Strategic Plan covers some energy issues. There is no development planfor use of renewable energy in the CI to help foster renewable energy investmentand development. The PIREP 2004 report gives details of constraints and needs.
There is limited information to determine energy use by commercial, industrial,household, government and transport sector in Cook Islands. Cook Islands aredependent on 90% of their energy coming from petroleum product imports. Only10% of energy comes from biomass/wood, mostly for cooking. 99% ofhouseholds have electricity, with around 8% having solar connections. Some havediesel generators as well.
Recently CI signed an MOU with Pacific Island forum secretariat to be involvedin the Bulk Procurement of Fuel Initiative ass a first step to securing supplies andreducing imported fuel costs.
There have been no biomass surveys since the 1980’s. While about 65% of theland has light to dense tree cover it is unlikely if this will be used for biomassenergy other than for cooking. Logging and commercial timber production withwaste for biomass is assessed as very unlikely to develop, because of environmentlaws, land tenure and transport costs. CI has only a small amount of coconuts withthe 2000 Agricultural Census showing only 43,000 trees. 97% of coconuts areused for household use including animal feed and copra production for sale isnegligible as generally production costs are too high and thus also likely too highfor fuel production. While 58% of land is considered arable only about 18 % hasbeen cleared for agriculture and about 17% for property development.
Biogas has some but limited potential with only 3 piggeries using digester units. Solar power is used successfully on outer islands and is probably the best
renewable energy option since the resource is good in CI. While there may bepotential for wind, wave and OTEC power none seem likely to be developed atpresent except perhaps wind in a small way. Solar heating of water is used byabout 50% of households. Hydro systems are not being considered as they wouldbe too expensive. Emphasis on energy efficiency is one way to reducedependence on fossil fuels. The spread of population and thus energy demandmake expensive OTEC and wave technologies largely uneconomic.
The PIGGAREP/SPREP/UNDP/GEF project which seeks to reduce GHGemissions by cost effective use of commercially viable renewable energytechnologies includes the Cook Islands. The project has helped with survey forwind farm and other associated wind monitoring activities etc.
Cook Islands in 2007-2008 were supported by a FAO Study on the Assessment ofthe impact of Climate Change on Food Security. Agricultural Policy has beenrecently reviewed in 2008 by FAO and a policy guideline has been drawn up for10 years. Both of these studies will help with Food Security Policy formulation.CI was supported on poverty analysis by UNDP and ADB and SPC up till the endof 2008.
NMTPF 2009 gives a long list of constraints and issues affecting agriculturaldevelopment including: “Limited livelihood options for people on outer islands(particularly Northern atoll group), poor agricultural production potential onatoll soils, isolation of Northern Group and very expensive transport costs, labour
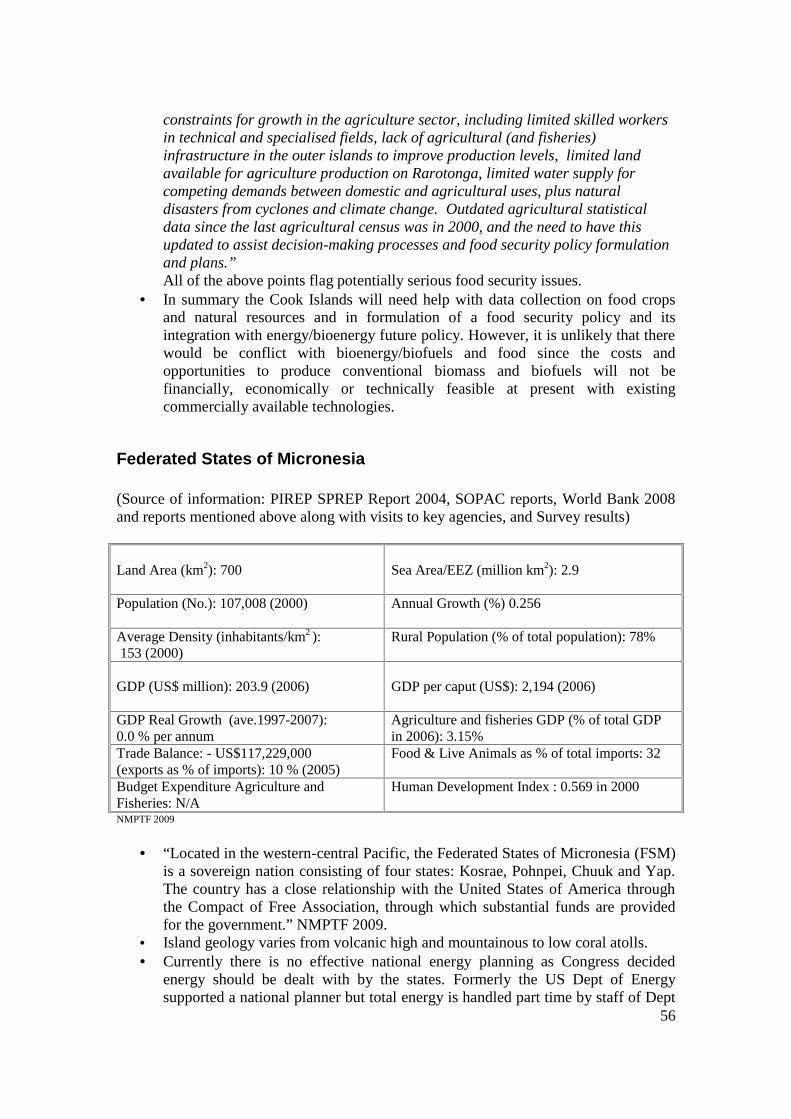
56
constraints for growth in the agriculture sector, including limited skilled workersin technical and specialised fields, lack of agricultural (and fisheries)infrastructure in the outer islands to improve production levels, limited landavailable for agriculture production on Rarotonga, limited water supply forcompeting demands between domestic and agricultural uses, plus naturaldisasters from cyclones and climate change. Outdated agricultural statisticaldata since the last agricultural census was in 2000, and the need to have thisupdated to assist decision-making processes and food security policy formulationand plans.”All of the above points flag potentially serious food security issues.
In summary the Cook Islands will need help with data collection on food cropsand natural resources and in formulation of a food security policy and itsintegration with energy/bioenergy future policy. However, it is unlikely that therewould be conflict with bioenergy/biofuels and food since the costs andopportunities to produce conventional biomass and biofuels will not befinancially, economically or technically feasible at present with existingcommercially available technologies.
Federated States of Micronesia
(Source of information: PIREP SPREP Report 2004, SOPAC reports, World Bank 2008and reports mentioned above along with visits to key agencies, and Survey results)
Land Area (km2): 700 Sea Area/EEZ (million km2): 2.9
Population (No.): 107,008 (2000) Annual Growth (%) 0.256
Average Density (inhabitants/km2 ): 153 (2000)
Rural Population (% of total population): 78%
GDP (US$ million): 203.9 (2006) GDP per caput (US$): 2,194 (2006)
GDP Real Growth (ave.1997-2007):0.0 % per annum
Agriculture and fisheries GDP (% of total GDPin 2006): 3.15%
Trade Balance: - US$117,229,000(exports as % of imports): 10 % (2005)
Food & Live Animals as % of total imports: 32
Budget Expenditure Agriculture andFisheries: N/A
Human Development Index : 0.569 in 2000
NMPTF 2009
“Located in the western-central Pacific, the Federated States of Micronesia (FSM)is a sovereign nation consisting of four states: Kosrae, Pohnpei, Chuuk and Yap.The country has a close relationship with the United States of America throughthe Compact of Free Association, through which substantial funds are providedfor the government.” NMPTF 2009.
Island geology varies from volcanic high and mountainous to low coral atolls. Currently there is no effective national energy planning as Congress decided
energy should be dealt with by the states. Formerly the US Dept of Energysupported a national planner but total energy is handled part time by staff of Dept
57
of Economic Affairs. Of the states only Pohnpei has a Chief of Energy andtechnical staff but with no responsibilities beyond implementation of renewableenergy.
There was a draft National energy Policy in 1999 but no recent progress. SOPAC2004. A Strategic Development Plan was drafted in 2004 but with no significantenergy content. There is no electricity or petroleum legislation.
FSM is heavily dependent on petroleum imports. 85% of gross energy supply isfrom petroleum and 14 % from biomass and an estimated 1% from solar sources.There are no data to give the breakup uses of petroleum for energy, e.g.commercial, household, transport etc.
About 50 % of households used wood for cooking in 2000, census data.Environmental issues make harvesting of forests for energy or clearing of moreland for biofuel crops unlikely. The best biomass resource that could be utilized iscopra, which has declined dramatically from the 1980’s. About 6,500 mt of copramay be potentially available for bio fuel production, but renovation of plantationsand improved efficiency and reduced production costs would be needed for thebiofuel to be economically competitive, as noted in the PIREP 2004 report.
Biogas, no resource assessment available. Hydro did operate in a small way in the past but is now defunct. Good solar resource for development. Limited prospects for wave and OTEC but not able to be developed with current
technologies. The PIGGAREP/SPREP/UNDP/GEF project which seeks to reduce GHG
emissions by cost effective use of commercially viable renewable energytechnologies does not include the FSM. Thus FSM will have to seek biofuel andother renewable technologies from other aid supporters. The UNDP MDGAchievement and Poverty Reduction 2008-2012 for 11 PICs, with focus onsustainable and affordable energy services for the poor with inputs on pro-poorinterventions, policy and institutional arrangements for mainstreaming poverty-energy issues especially with renewable energy may be of some assistance.
ADB 2003 estimated poverty incidence to be as high as 40%. FSM was supportedon poverty analysis by UNDP and ADB and SPC up till the end of 2008.TheNMPTF 2009 report states “Data on the primary economic sectors of FSM areweak; there are no indicators on agricultural production, limited information onagricultural exports, and fisheries information is also generally poor.Agricultural subsistence activities are estimated to make a substantialcontribution to GDP, but production is locally-based and small scale. Food isgrown for local consumption and to support relatively small export sales inregional markets, primarily Guam and the Marshall Islands. Main exportproducts include fish, betel nut, kava, banana and root crops; small amounts ofpepper leaves and citrus are also exported. The small land area generally limitslarge-scale commercial farming for export. Farmstead livestock production isimportant throughout the FSM, particularly for subsistence and cultural use.”
In summary FSM will need assistance with natural resource data collection onbiomass energy, data collection and formulation of energy and Food SecurityPolicies and their integration.
58
IV. Conclusions and Recommendations
Currently, none of the Pacific Island Countries has in place an integratedenergy/bioenergy/food security and natural resource policy, policy framework orstrategies as a basis for guidelines for energy and food security development inrelation to the existing resource bases. Most PICs have no energy policy or foodsecurity policies. SI has recent National Policy Framework involving Policies andGuidelines while PNG has in place a Food Security Policy.
All PICs with the exception of PNG and Solomon Islands do not have updatedGIS imagery, with the last aerial photos from around 1996. PNG has at UPNGand SI at Forestry Division has recently updated forest covers and PNG has anupdated PNGRIS database. SI with AusAID help is preparing to do a StrategicEnvironmental Assessment involving a broad inventory of forestry types and landuse.
Most PICs have virtually no lands of any consequence for large scale plantings ofbiofuel crops with exceptions of PNG, Fiji and to a much less extent SolomonIslands.
Most PICs with the possible exception of PNG and Solomon Islands do not havethe data available or the ability to collect data needed to develop integrated policyinvolving bioenergy, food security and the natural resource base. AlternativelyVanuatu is a good example of the application of technologies to make practicaluse of coconut oil as a vital energy source.
With regard to bioenergy crops no PIC country has a clear policy. A policysimilar to China in that no basic food crop, unless in surplus is to be used forbiofuel and no food crop land is to be used for biofuel crops is recommended forconsideration as a starting point for all PICs.
With regard to food security the most urgent and acute would appear to beMarshall Islands and Tuvalu. The economic collapse of the Marshalls and theinundation of Tuvalu and the existing extent of aid support contribute strongly tothis urgent position.
While most institutions and agencies consulted have a clear interest in seeingpolicies linking food security with energy/bioenergy and natural resources thepolitical will is often hard to judge because of lack of transparency in decisionmaking particularly in terms of land use and concessions to logging, mining,agriculture development and real estate development in many PICs.
Which countries are chosen for further in-depth study depends on the selectioncriteria that are chosen, e.g., food security urgency, energy deficiency, bioenergyopportunities, data availability, threats to the natural resource base, vulnerabilityto natural disasters, complimentary support from FSSLP and other key donorsupport etc. The data provided in this report will allow choices based on selectioncriteria chosen.
59
The response from the PIC countries to the survey was especially disappointingwith only three countries responding and then in an incomplete way. For betterinformation it was essential to visit the countries and meet with key agencies aswell as donors and CROP agencies.
Apart from the use of wood energy for cooking drying of copra, cocoa and coffeeand in some cases gasification, the main opportunity for most PICs, is to usecoconut oil as a diesel substitute, as is so successfully practiced in Vanuatu,especially for power generation. The exceptions are Nauru, Cook Islands, Niue,Tonga and Palau which have low coconut production and where most coconut isused for human or animal food.
The use of coconut oil as a diesel substitute is a mature technology as has been sowell proven in Vanuatu and the model for rural electrification where farmersbring copra to the oil plant and generator site to prepay for metered electricity isvery successful. The program is implemented by UNELCO and supported by EUand is operating in 3 sites and will extend to 9 sites. It make good sense to use thecoconut resource to produce coconut oil for diesel substitution since copra andcoconut oil prices on the world market are low and it is uneconomic to export.Use of the coconut for oil will give farmers an income again and at the same timereduce diesel imports and reduce fuel costs and save foreign exchange.
There are options for the use of gasifiers but these have failed in most countries inthe past with the possible exception in PNG for crop drying.
Most PICs have little opportunity for biogas production and success has been verymixed.
Fiji and PNG have opportunities to produce ethanol from sugarcane and cassavaand projects are planned with integrated cassava factories for Fiji and PNG. It wasrecommended that both PNG and Fiji look to including Sweet Sorghum as a cropwith sugarcane to provide a summer feedstock to keep a sugar factory producingethanol year-round. Use of breadfruit to make ethanol in Samoa would be veryquestionable with respect to economic viability and the desirability sincebreadfruit is an important food crop.
Fiji, PNG and Solomons and Vanuatu have been lobbied by Jatropha curcasplantation proposals from investors. To their credit all applications have beenrefused to date. The fact is that Jatropha plantations have not proven to becommercially successful anywhere in the world, and interplanting of coconut withJatropha will disrupt food and cash crop production and livestock rearing options.The oil and oil cake are toxic, the oil needs reprocessing in 3 months and the plantis a declared perennial noxious weed and invasive species in many countries ofthe world. Chapman and Yishi 2008, andhttp://www.guardian.co.uk/environment/2009/may/05/jatropha-biofuels-food-crops Finally, Jatropha has no place in coconut areas since coconut is infinitelymore useful in many different ways as a food or fuel and is the main basis forvery sustainable coconut farm systems of the Pacific Island countries.
60
One investor group is proposing to promote Pongamia pinnata as an oil crop forsmallholder farmers in Fiji. Pongamia trees are large, and thick canopies excludesunlight unlike coconuts and take a number of years to be productive and 10-15years to attain high yields. Once planted the trees will largely occupy all the landand exclude other cropping as trees mature. Single seed pods have to be handharvested and the economics of doing so has yet to be demonstrated. If thePongamia can be effectively mechanically harvested it is possible that plantationsmay be successful, but the crop should not be promoted to smallholders to replacefood crop or livestock areas. The seeds and oil and oil cake are toxic and cannotbe used for animal feed.
Ignorance of the pros and cons of biofuel crops generally is found in the PICsvisited and a concerted effort is needed to bring Energy and AgricultureMinistries up to speed on biofuels so they can deal with the extravagant claims ofinvestor proposals made to try to gain major plantation concessions.
Oil palm is a very successful crop in PNG and the Solomon Islands and is in thesecountries produced in a certified sustainable way and is providing secure incomesfor smallholder diversified farming. CPO is not used for biodiesel in either PNGor Solomon Islands. PNG has 13 plantations and a refinery but The Solomons hasonly a CPO and PKO plant. All the Solomon Islands exports of CPO and PKO goto Europe and are used solely for food products.
Third generation biofuels, as described briefly below, could well become a realityin the PICs, with the support of aid and public/private sector investments andcooperation. Such support for the future is recommended to aid agencies andinvestors.
Third generation fuel from cellulosic ethanol production from fibre celluloses andlignocelluloses in waste materials such as sugarcane bagasse, crop residues andby-products from crop processing such as cassava stalks oil palm empty bunchesor fast growing tropical C4 Grasses such as Elephant Grass or from legume fuelwood trees such as Gliricidia, Leucaena are clear options for the future for energyproduction. Use of the bagasse of sugarcane can increase the yield of ethanol perhectare from around 3, 500L to around 30,000L using cellulosic transformation tohexose sugars and their fermentation and distillation. The technology is nowgoing commercial in China and Korea and is now a reality.
Third generation oil production from algae is a new and very promisingtechnology that when perfected may prove to be ideal for PICs as the productivityof oil/ha is very high at levels up to 300,000L/ha, but potentially as high as1.25mL/ha, http://en.wikipedia.org/wiki/Algae_fuel . Research in the US and inAustralia as well as other countries is well advanced on these technologies andtheir commercialisation.
The German Alpha Kat KDV technologies are used to convert wastes from awhole range of sources, like dump sites, animal wastes, plastics, paper, manure,
61
sawdust and wood, sewage etc. to diesel in a high temperature reactor processusing catalytic depolymerisation. SOPAC 2009.
Butanol produced from anaerobic fermentation of starch, sugar, lignin, cellulosicfibre, lignin and other biomass with Clostridium acetobutylicium is another usefulthird generation biofuel that has a number of advantages over ethanol as agasoline replacement. SOPAC 2009.
Ethanolix continuous fermentation technology developed by St1 Biofuels ofFinland produces ethanol from organic wastes. Production cost in much smallerplants compare very favourably with large first generation or second generationbio-ethanol plants. Household and municipal wastes, paper, starch and sugar andmay act as feedstocks and by-products/residues of the process depending onfeedstocks may be used for animal feed fertilizer or fed to anaerobic fermentationsystems. www.st1.eu The ST1company founded in 1997 acquired the ExxonMobil subsidiary in Finland and operates over 400 service stations in Finland and40 in Sweden.
Synthetic Diesel from the Fischer/Tropsch process using gasification of biomassis another third generation technology that in the near future may be feasible for anumber of PICs having a biomass resource.
Clearly, when third generation technologies such as cellulosic ethanol and algaeoil and the Alpha Kat KDV 500 waste treatment methods etc as described aboveare introduced and found to be feasible in PICs then the pressure on food crops orfood crop lands and forests would be greatly reduced by these sustainabletechnologies. PICs would also dispense with the unacceptable options of Jatrophaand other marginal biofuel crops and the disruption with long time sustainablecoconut farm systems, which Pacific islanders know well and are able tosustainably manage. Again strong donor support for third generation biofueltechnologies is recommended.
One very clear and urgent Intervention in all PICs would be the regeneration ofthe coconut industries and farm systems (including intercropping with food crops,fruits, vegetables, coffee, cocoa, vanilla, pepper and livestock rearing) and therehabilitation and replanting of coconuts to replace the aging coconuts present inall PICs. In addition such a program should consider all the value adding optionsof using the whole coconut for food, fuel, fibre, feed, oil, Virgin Coconut Oil,handicrafts etc. It is recommended that donor agencies be alerted to theseexcellent intervention options to make real impact for Pacific Islanders livelihoodimprovements via income generating opportunities. Urgent donor support is verymuch needed for coconut regeneration and rehabilitation along the linesdescribed.
Finally the resolution of energy needs in any individual Pacific Island country willoften be a combination of bioenergy, solar, wind and OTEC or other wave energytechnologies depending on the resource options and capabilities of each countryand likely impacts on food security.
62
Acknowledgements
I wish to sincerely acknowledge the assistance of Nadia Scialabba of Bioenergy group ofthe Natural Resources Management and Environment Department FAO Rome and ViliFuavao Sub-Regional FAO Representative for the Pacific Islands Apia, Samoa and hisstaff for their great support in organizing the appraisal mission and visits to Samoa, Fiji,Tonga, Vanuatu, PNG and Solomon Islands and very useful background discussions. Ialso sincerely thank the FAO Focal point officers and their staff in each of the countriesvisited for making all appointments and for very helpful discussions and guidance duringmy visits.
It thank the various governmental agencies, donors and aid projects and private sectorpersonnel in Samoa, Tonga, Fiji, Vanuatu, PNG and Solomon Islands and UPNG fortheir helpful contributions to our discussions on food security, energy/bioenergy andnatural resources and the sharing of information in hard copy and electronic format.
I especially thank the CROP Agencies, particularly SPREP, SOPAC and SPC for theirvery useful contributions and discussions, along with Peter Johnson consultant acontributing author/consultant to the many SPREP/PIREP missions and reports and hisoverview of the renewable energy sector of the PICs. Also, my special thanks to TimMartyn SPC, Solomone Fifita SPREP, Rupeni Mario SOPAC, Anthony Maxwell ADB,and Thomas Jensen UNDP and Stephen Rogers FAO consultant, and Fintan ScanlanFAO Rome for very useful discussions and many electronic reports and data updates.
Finally I thank SOPAC for kindly allowing me attend the Regional Energy MinistersMeeting in Tonga in April 2009 which gave an excellent opportunity to meet with somany PIC participants, donors, CROP agencies and private sector players in renewableenergy technologies.
63
References
Bawalan, Divina 2008. Feasibility Study on the Whole Nut Coconut MultipurposeProcessing Center Concept in Fiji. Report for FAO-SAP. Pp.184.
Chapman, KR and Yishi, Tian 2008. ADB TA PRC-4987 National Strategy forSustainable Energy Crops Development in China Component B. Preparing a NationalStrategy for Sustainable Energy Crops Development. Interim Report. Pp.93.
CIA 2009. The World Fact Book.http://www.google.com/search?sourceid=gmail&rls=gm&q=CIA%20The%20world%20Fact%20book
COCOGEN 2005. SOPAC Feasibility Study into the use of Coconut Oil Fuel in EPCPower Generation-Samoa. SOPAC/UNDP Project Report pp.56.
COCOGEN 2005a. SOPAC COCOGEN Debriefing Report. SOPAC/UNDP ProjectReport. pp.54.
COCOGEN-II 2006. SOPAC Mission Report CCOOGEN II Inception Visit. Pp. 22.
FAO2002. The State of Food Insecurity in the World 2001. Rome.http://www.fao.org/docrep/005/y4671e/y4671e06.htm
FAO COAG 2007 Environment and Agriculture. Item 6 of COAG 2007.
FAO 2008. State of Food and Agriculture-Biofuels: prospects, risks and opportunities.FAO. Rome Publication.
FAO 2008b. FAO Biofuel Feasibility Study Samoa. FAO-SAP Report.
FAO 2008c. National Agriculture Sector Policy 2008-2012. Prepared with Ministry ofAgriculture and Livestock Government of Solomon Islands and FAO. FAO-Sap Report.Pp.33.
FAO 2008a. Food Security and Sustainable Livelihoods Programme in Pacific IslandCountries. Programme Brief for Donor Meeting with ADB in Madrid 5th May 2008.
FAO/SPREP 2008. Report of the Expert Group on Food Security and Climate Change,Rome June 2008. Report prepared by SPREP.
Hanson, L.W., Allen, B.J., Bourke R.M., and McCarthy T.J. 2001. “Papua New GuineaRural Development Handbook.” ANU. ISBN 097938101. Brown Prior and AndersonMelbourne. Australia.
IEA 2006. World Energy Outlook 2006. IEA/OCD ISBN 9789264109896/ pp. 600.
64
Johnston, Peter 2009. Strengthening the Fragile Pacific Islands Energy Sector:Addressing Energy, Economy and Environment in a Period of Rapid Change. Paper andPowerPoint for Regional Energy Ministers 2009, Meeting in Tonga April 2009.
Lloyd, D. 2009. Challenges and Opportunities for Agriculture in a Changing Carboneconomy. Queensland Report on AIAST Symposium 2008. J. Aust. Institute of Agr. Sc.and Technology. 21 (1): 7-9.
McGregor, A., Bourke, R.M, Manley, M., Tubna, S., and Dea, R. 2008 Pacific IslandFood Security: Situation, Challenges and Opportunities. Paper Presented to the ThirdConference of Ministers of Agriculture And Forestry (MOAF) in Apia on the 8th/9th
September 2008. Secretariat of the Pacific Community.
NMTPF 2009. National Medium Term Plan Framework 2009-2012 for Cooperation andPartnership between FAO and 13 Pacific Island Countries. FAO SAP Samoa April 2009.PIEPSAP 2008. Back to Office Project Reports for Nauru (No. 77), Solomon Islands (N.78) and Kiribati (No. 76) of PIEPSAP Missions to assist with energy policy developmentand for Samoa National energy Plan –Strategic Action Plan Project Report No.80.
PIREP 2004. Pacific Regional Energy Assessment- 13 Country Reports of PIREPcompiled by SPREP.
Reddy, M. 2007. Enhancing the agriculture Sector in Pacific Island Economies. PaficicEconomic Bulletin Vol. 22 3: 48-60.Asia Pacific Press.
Sharma, K.L. (2006). Food Security in the South Pacific Island Countries with SpecialReference to the Fiji Islands. UNU-WIDER Research Paper No. 2006/68, United NationsUniversity.
SPC/SOPAC 2008. Pacific Strategy for Sustainable Biofuels. Report for the SPC/SOPACPacific Regional Biofuel Workshop 17-20 November 2008. Nadi. Fiji.
SPC/CRGA 2008. Food Security in the Pacific. Secretariat paper presented atSPC/CRGA 38th Meeting of the Committee of Representatives of Governments andAdministration.
SOPAC 2003. A Master Plan for Biomass Resources of Fiji, Kiribati, Samoa, TongaTuvalu and Vanuatu. ICEPT/EPMG Consultancy report for SOPAC.
SOPAC 2003a Synthesis Report The Biomass Resources of Fiji, Kiribati, Samoa, TongaTuvalu and Vanuatu. ICEPT/EPMG Consultancy report for SOPAC. Pp. 33.
SOPAC 2009. Potential for Liquid Biofuels in Fiji. SOPAC Miscellaneous Report 677pp. 42.
SPREP 2004a Pacific Regional Energy Assessment 2004. Regional Overview Report Vol1 of the Pacific Islands Renewable Energy Project (PIREP).
UNDP 2007. Energy and Poverty in the Pacific Island Countries. Pp. 52. UNDPBangkok. 2007. ISBN 13:978-92-1-126187-5.
65
UNELCO 2009. Energy of the Future. Paper and Power Point for Regional EnergyMinisters 2009, Meeting in Tonga April 2009, by Jan chaniel of UNELCO Vanuatu.
Woodruff, Allison 2009. Taking Control of Oil in the Pacific : Using analysis tostrengthen Energy Policy and Planning. Paper for Regional Energy Ministers 2009,Meeting in Tonga April 2009.
World Bank 2008. The Impact of Global Oil Food Price Increases on the PacificRegional and Possible Mitigation Measures including Pacific food and Fuel RelatedActivities Matrix by Agency. Report from July 2008 Meeting of PICs in Sydney.
World Bank 2008b Initial Feasibility Study for Biodiesel in Fiji. Report Prepared byLMC International for World Bank pp. 32.
World Bank 2008c. Feasibility Study for Ethanol in Fiji. Report Prepared by LMCInternational for World Bank pp.55.
66
Appendix1. Terms of Reference
For Rapid Appraisal of the Bioenergy-Food Security Nexus in the Pacific
Under the overall guidance the Sub-Regional Representative for the Pacific Islands,and technical guidance of the Bioenergy group of the Natural Resources Managementand Environment Department, the consultant is expected to conduct a rapid appraisalon the bioenergy-food security nexus at regional level, including selected Micronesia,Melanesia and Polynesia island countries. The aim is to provide policy-makers adecision-making basis for the prioritization of in-depth country assessments andfurther analysis to be conducted in the second half of 2009 under the Bioenergy andFood Security (BEFS) analytical framework. More specific data requirements for theBEFS framework should, to the extent possible, already be noted during thecompletion of the rapid appraisal, as they may additionally influence the selection ofin-depth countries.
Agriculture and Economy Identify what are the main food crops and crops considered for bioenergy in each
country. Collect food insecurity and vulnerability data for national and, if possible, sub-
national level. Special emphasis should be placed on specific vulnerability ofremote islands.
Obtain data on each country’s agricultural trade balance to assess self-sufficiencyof country per crop
Assess country’s domestic demand for agricultural commodities and, to the extentpossible, projected future demand.
Gauge the scope and degree of policy commitment and action with regard tobioenergy programmes, regulation and the political sensitivity for food security.
Energy Share of different energy sources in national energy mix. Share of imported energy. Assess current and projected future volumes and costs import of fossil fuels
(crude oil, gas, gasoline and diesel). Collect main fuel prices for consumer (gasoline/liter, diesel/liter, Kw/h). Assess decentralized electrification (e.g. for on-farm use, telecommunication
towers, use in urban/rural transport etc.).
Natural Resources Identify, where possible geo-spatially, current land cover, land use and
(qualitatively) land use change trends in recent years. Where available, collectinformation on crop-specific land use and on existing or planned crop suitabilityassessments.
Assess water availability and constraints and irrigated area. Assess scope of wood energy and most important challenges faced.

67
Highlight major environmental challenges in each country potentially linked tobioenergy development (deforestation, biodiversity and habitat loss, water stressand pollution).
Possible references: IEA Country profiles
68
Appendix 2. Survey of Pacific Island Countries to Assistwith a Rapid Appraisal of The Bioenergy/Food Security
Nexus In The PacificBackground Briefing InformationThe FAO-SAP Sub-Regional Office if the Pacific in collaboration with the Bioergy groupof the Natural Resources Management and Environment Department FAO Rome, areconducting a rapid appraisal of the bioenergy-food security nexus at regional level. Theappraisal intends to include selected Micronesia, Melanesia and Polynesia island PICcountries.
In recent years conflicts have arisen between food and bio-energy crops as a consequenceof rising global oil prices and will likely continue in the future. Firm governmentalpolicies on food security and bio-energy and implications for climate change are requiredensure continued sustainable development of island economies, with both access toadequate food and energy at affordable prices for all.
The aim of the work is to provide policy-makers a decision-making basis for theprioritization of in-depth country assessments and further analysis to be conducted in thesecond half of 2009 under the Bio-energy and Food Security (BEFS) analyticalframework.
The primary objective of FAO’s three-year Bio-energy and Food Security (BEFS)Project is to mainstream food security concerns into national assessments of bio-energyand establish an analytical framework for the analysis of the food security and bio-energynexus.
Currently, Peru, Tanzania and Thailand have been chosen for BEFS studies with theactivities in Thailand planned to be closely linked to analysis in Cambodia. Some PICcountries will be added.
The strategy of BEFS is based on three central components:
(iv) Development of an overall bio-energy and food security analytical frameworkand methodological guidance including data and information support.
(v) Estimation of bio-energy potential and food security implications withinspecific national and sub-national contexts.
(vi) Development of field activities that are replicable, sustainable and that willstrengthen both institutional capacities, as well as those of key nationalstakeholders.
The BEFS assessment overall includes five analytical steps, namely Module 1: BiomassPotential, Module 2: Biomass Supply Chain Production Costs, Module 3: AgricultureMarkets Outlook, Module 4: Economy-wide Effects and Module 5: Household-level FoodSecurity.
More specific data requirements for the BEFS framework are needed for completion ofthe rapid appraisal, as they may additionally influence the selection of countries for morein-depth studies and analysis.
69
The purpose of the rapid appraisal is to determine data sources available in the PIC’s andwhether they need help in collection and synthesis of data to assess initially at least twolikely countries for further in-depth studies under the BEFS project later in 2009 and on-going future assistance for Food Security/Energy/Climate Change policy development.
The Survey Form is below on the following page 3 below.
Please kindly complete the Survey Form electronically then save it as described on theform and kindly return the form by 27 May 2009 to:
Keith Chapman-FAO ConsultantEmail: [email protected]
With copy to:
"Fuavao, Vili (FAOSAP)" [email protected] FAO Representative for the Pacific Islands
Please note that all information will remain confidential and will only be referred to ingeneral synthesis statements not attributable to any individuals.
Many thanks for your cooperation.
Vili FuavaoSub-Regional FAO Representative for the Pacific IslandsApia. Samoa.
70
Survey Form-Rapid Appraisal-Bioenergy and Food Security
The data needs for in-depth studies under the FAO BEFS Project include the following in thequestions below. Data should be available for the most recent 5 year period, where possible.
Please place a Y =Yes or N=No or H=Need Help, at the end of each lineand please kindly complete the information on the bottom of the sheet. Many thanks for yourgreatly appreciated participation. After completion please save the completed form under anew file name e.g. Survey Rapid Appraisal Samoa Dept Energy .doc or similar for yourcountry.
Agriculture and Economy
Are you able, within the country, to:
Identify what are the main food crops and crops considered for bio-energy in eachcountry?..................
Collect food insecurity and vulnerability data for national and, if possible, sub-nationallevel? (Special emphasis should be placed on specific vulnerability of remote islands). …
Obtain data on your country’s agricultural trade balance to assess self-sufficiency ofcountry per crop?........
Assess your country’s domestic demand for agricultural commodities and, to the extentpossible, project future demands?......
Gauge the scope and degree of policy commitment and action with regard to bio-energyprograms, regulation and the political sensitivity for food security?......
EnergyCan you determine from your own data or actions the following:
The share of different energy sources (biomass, hydro, oil, gas, solar wind, ocean) innational energy mix?......
The share of imported energy out of the total? …… Current and projected future volumes and costs import of fossil fuels (crude oil, gas,
gasoline, diesel)? …… Collect main fuel prices for consumer (gasoline/liter, diesel/liter, Kw/h)?...... Assess the extent and amount of decentralized electrification? (e.g. for on-farm use,
telecommunication towers, use in urban/rural transport etc.)……Natural Resources
Do you within the country have the ability to:
Identify, where possible geo-spatially, current land cover, land use and (qualitatively)land use change trends in recent years? …….
Collect information on crop-specific land use and on existing or planned crop suitabilityassessments?......
Assess water availability and constraints and irrigated area?....... Assess scope of wood energy and most important challenges faced? ……. Highlight major environmental challenges in each country potentially linked to bio-
energy development? (e.g., deforestation, biodiversity and habitat loss, water stress andpollution)……..
71
Additional Policy Planning Questions
Please answer with Y=Yes or N=No and Dates where known
1. Is there an existing recent Food Security Policy for your country? ……..
If so what was the date of its introduction/last revision, if known? .........
2. Does the existing Food Security policy include considerations on biomass and bio-energy crops and implications of likely conflicts with food crops? .........
3. Does your country have a National Agricultural Development Plan? ........If so what was the date of its introduction/last revision, if known? .........
Please kindly complete the information below.
Name: Email:
Department/Institute:
Country:
Again many thanks for your kind cooperation.
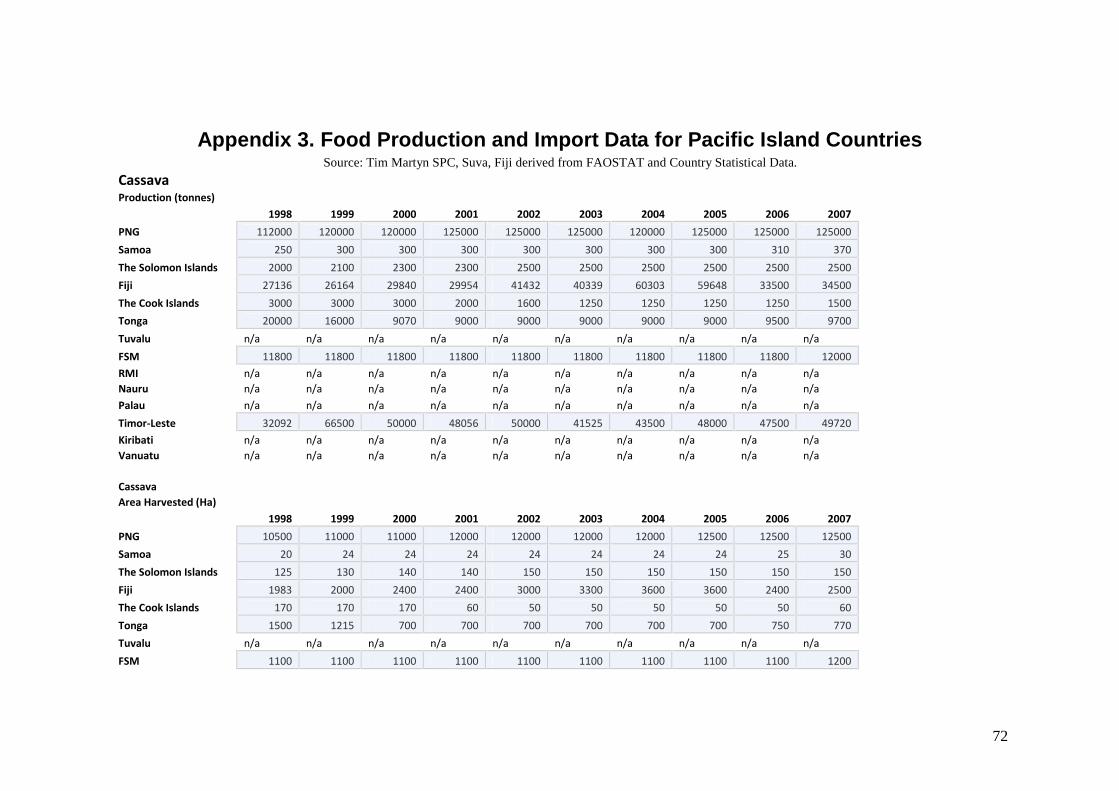
72
Appendix 3. Food Production and Import Data for Pacific Island CountriesSource: Tim Martyn SPC, Suva, Fiji derived from FAOSTAT and Country Statistical Data.
CassavaProduction (tonnes)
1998 1999 2000 2001 2002 2003 2004 2005 2006 2007PNG 112000 120000 120000 125000 125000 125000 120000 125000 125000 125000Samoa 250 300 300 300 300 300 300 300 310 370The Solomon Islands 2000 2100 2300 2300 2500 2500 2500 2500 2500 2500Fiji 27136 26164 29840 29954 41432 40339 60303 59648 33500 34500The Cook Islands 3000 3000 3000 2000 1600 1250 1250 1250 1250 1500Tonga 20000 16000 9070 9000 9000 9000 9000 9000 9500 9700Tuvalu n/a n/a n/a n/a n/a n/a n/a n/a n/a n/aFSM 11800 11800 11800 11800 11800 11800 11800 11800 11800 12000RMI n/a n/a n/a n/a n/a n/a n/a n/a n/a n/aNauru n/a n/a n/a n/a n/a n/a n/a n/a n/a n/aPalau n/a n/a n/a n/a n/a n/a n/a n/a n/a n/aTimor-Leste 32092 66500 50000 48056 50000 41525 43500 48000 47500 49720Kiribati n/a n/a n/a n/a n/a n/a n/a n/a n/a n/aVanuatu n/a n/a n/a n/a n/a n/a n/a n/a n/a n/a
CassavaArea Harvested (Ha)
1998 1999 2000 2001 2002 2003 2004 2005 2006 2007PNG 10500 11000 11000 12000 12000 12000 12000 12500 12500 12500Samoa 20 24 24 24 24 24 24 24 25 30The Solomon Islands 125 130 140 140 150 150 150 150 150 150Fiji 1983 2000 2400 2400 3000 3300 3600 3600 2400 2500The Cook Islands 170 170 170 60 50 50 50 50 50 60Tonga 1500 1215 700 700 700 700 700 700 750 770Tuvalu n/a n/a n/a n/a n/a n/a n/a n/a n/a n/aFSM 1100 1100 1100 1100 1100 1100 1100 1100 1100 1200
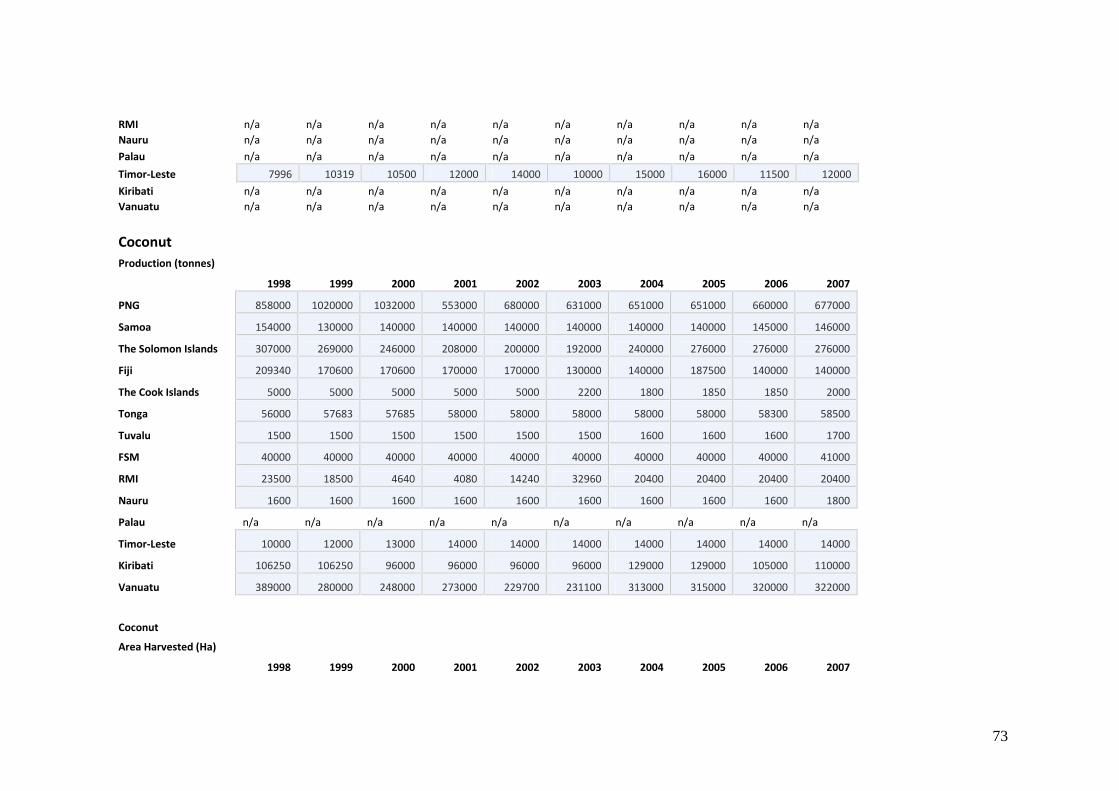
73
RMI n/a n/a n/a n/a n/a n/a n/a n/a n/a n/aNauru n/a n/a n/a n/a n/a n/a n/a n/a n/a n/aPalau n/a n/a n/a n/a n/a n/a n/a n/a n/a n/aTimor-Leste 7996 10319 10500 12000 14000 10000 15000 16000 11500 12000Kiribati n/a n/a n/a n/a n/a n/a n/a n/a n/a n/aVanuatu n/a n/a n/a n/a n/a n/a n/a n/a n/a n/a
CoconutProduction (tonnes)
1998 1999 2000 2001 2002 2003 2004 2005 2006 2007
PNG 858000 1020000 1032000 553000 680000 631000 651000 651000 660000 677000
Samoa 154000 130000 140000 140000 140000 140000 140000 140000 145000 146000
The Solomon Islands 307000 269000 246000 208000 200000 192000 240000 276000 276000 276000
Fiji 209340 170600 170600 170000 170000 130000 140000 187500 140000 140000
The Cook Islands 5000 5000 5000 5000 5000 2200 1800 1850 1850 2000
Tonga 56000 57683 57685 58000 58000 58000 58000 58000 58300 58500
Tuvalu 1500 1500 1500 1500 1500 1500 1600 1600 1600 1700
FSM 40000 40000 40000 40000 40000 40000 40000 40000 40000 41000
RMI 23500 18500 4640 4080 14240 32960 20400 20400 20400 20400
Nauru 1600 1600 1600 1600 1600 1600 1600 1600 1600 1800
Palau n/a n/a n/a n/a n/a n/a n/a n/a n/a n/a
Timor-Leste 10000 12000 13000 14000 14000 14000 14000 14000 14000 14000
Kiribati 106250 106250 96000 96000 96000 96000 129000 129000 105000 110000
Vanuatu 389000 280000 248000 273000 229700 231100 313000 315000 320000 322000
Coconut
Area Harvested (Ha)
1998 1999 2000 2001 2002 2003 2004 2005 2006 2007
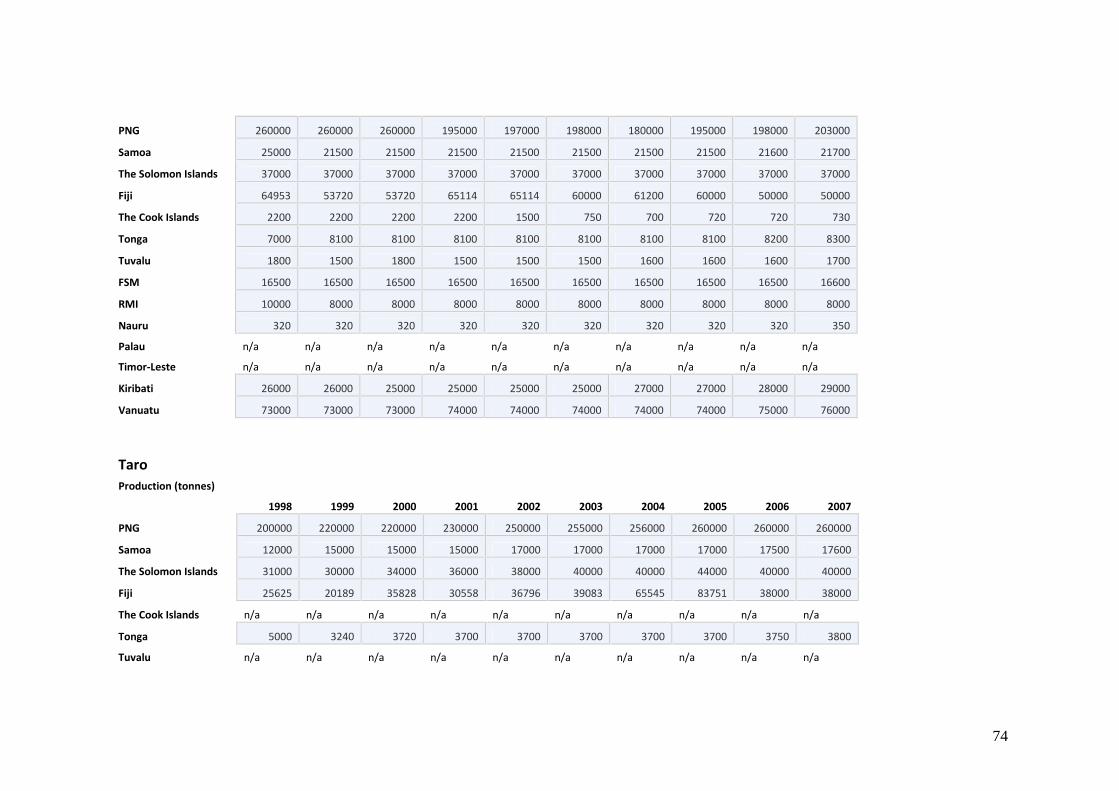
74
PNG 260000 260000 260000 195000 197000 198000 180000 195000 198000 203000
Samoa 25000 21500 21500 21500 21500 21500 21500 21500 21600 21700
The Solomon Islands 37000 37000 37000 37000 37000 37000 37000 37000 37000 37000
Fiji 64953 53720 53720 65114 65114 60000 61200 60000 50000 50000
The Cook Islands 2200 2200 2200 2200 1500 750 700 720 720 730
Tonga 7000 8100 8100 8100 8100 8100 8100 8100 8200 8300
Tuvalu 1800 1500 1800 1500 1500 1500 1600 1600 1600 1700
FSM 16500 16500 16500 16500 16500 16500 16500 16500 16500 16600
RMI 10000 8000 8000 8000 8000 8000 8000 8000 8000 8000
Nauru 320 320 320 320 320 320 320 320 320 350
Palau n/a n/a n/a n/a n/a n/a n/a n/a n/a n/a
Timor-Leste n/a n/a n/a n/a n/a n/a n/a n/a n/a n/a
Kiribati 26000 26000 25000 25000 25000 25000 27000 27000 28000 29000
Vanuatu 73000 73000 73000 74000 74000 74000 74000 74000 75000 76000
TaroProduction (tonnes)
1998 1999 2000 2001 2002 2003 2004 2005 2006 2007
PNG 200000 220000 220000 230000 250000 255000 256000 260000 260000 260000
Samoa 12000 15000 15000 15000 17000 17000 17000 17000 17500 17600
The Solomon Islands 31000 30000 34000 36000 38000 40000 40000 44000 40000 40000
Fiji 25625 20189 35828 30558 36796 39083 65545 83751 38000 38000
The Cook Islands n/a n/a n/a n/a n/a n/a n/a n/a n/a n/a
Tonga 5000 3240 3720 3700 3700 3700 3700 3700 3750 3800
Tuvalu n/a n/a n/a n/a n/a n/a n/a n/a n/a n/a
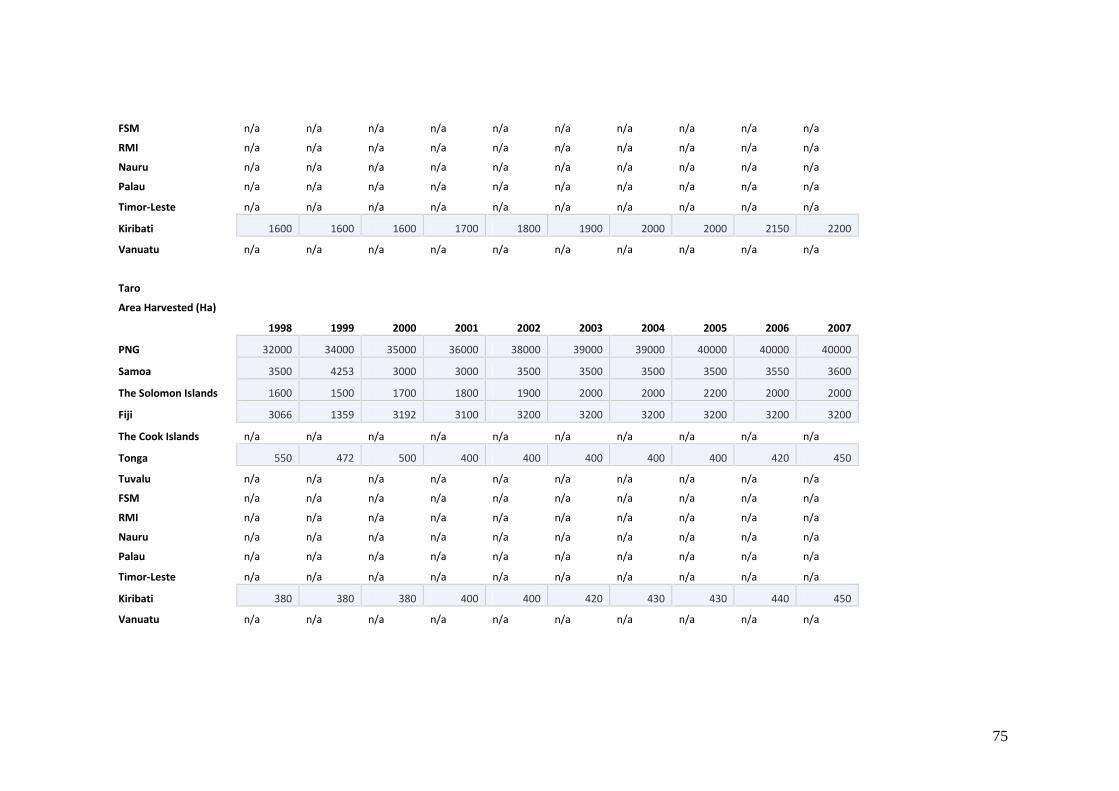
75
FSM n/a n/a n/a n/a n/a n/a n/a n/a n/a n/a
RMI n/a n/a n/a n/a n/a n/a n/a n/a n/a n/a
Nauru n/a n/a n/a n/a n/a n/a n/a n/a n/a n/a
Palau n/a n/a n/a n/a n/a n/a n/a n/a n/a n/a
Timor-Leste n/a n/a n/a n/a n/a n/a n/a n/a n/a n/a
Kiribati 1600 1600 1600 1700 1800 1900 2000 2000 2150 2200
Vanuatu n/a n/a n/a n/a n/a n/a n/a n/a n/a n/a
Taro
Area Harvested (Ha)
1998 1999 2000 2001 2002 2003 2004 2005 2006 2007
PNG 32000 34000 35000 36000 38000 39000 39000 40000 40000 40000
Samoa 3500 4253 3000 3000 3500 3500 3500 3500 3550 3600
The Solomon Islands 1600 1500 1700 1800 1900 2000 2000 2200 2000 2000
Fiji 3066 1359 3192 3100 3200 3200 3200 3200 3200 3200
The Cook Islands n/a n/a n/a n/a n/a n/a n/a n/a n/a n/a
Tonga 550 472 500 400 400 400 400 400 420 450
Tuvalu n/a n/a n/a n/a n/a n/a n/a n/a n/a n/a
FSM n/a n/a n/a n/a n/a n/a n/a n/a n/a n/a
RMI n/a n/a n/a n/a n/a n/a n/a n/a n/a n/a
Nauru n/a n/a n/a n/a n/a n/a n/a n/a n/a n/a
Palau n/a n/a n/a n/a n/a n/a n/a n/a n/a n/a
Timor-Leste n/a n/a n/a n/a n/a n/a n/a n/a n/a n/a
Kiribati 380 380 380 400 400 420 430 430 440 450
Vanuatu n/a n/a n/a n/a n/a n/a n/a n/a n/a n/a
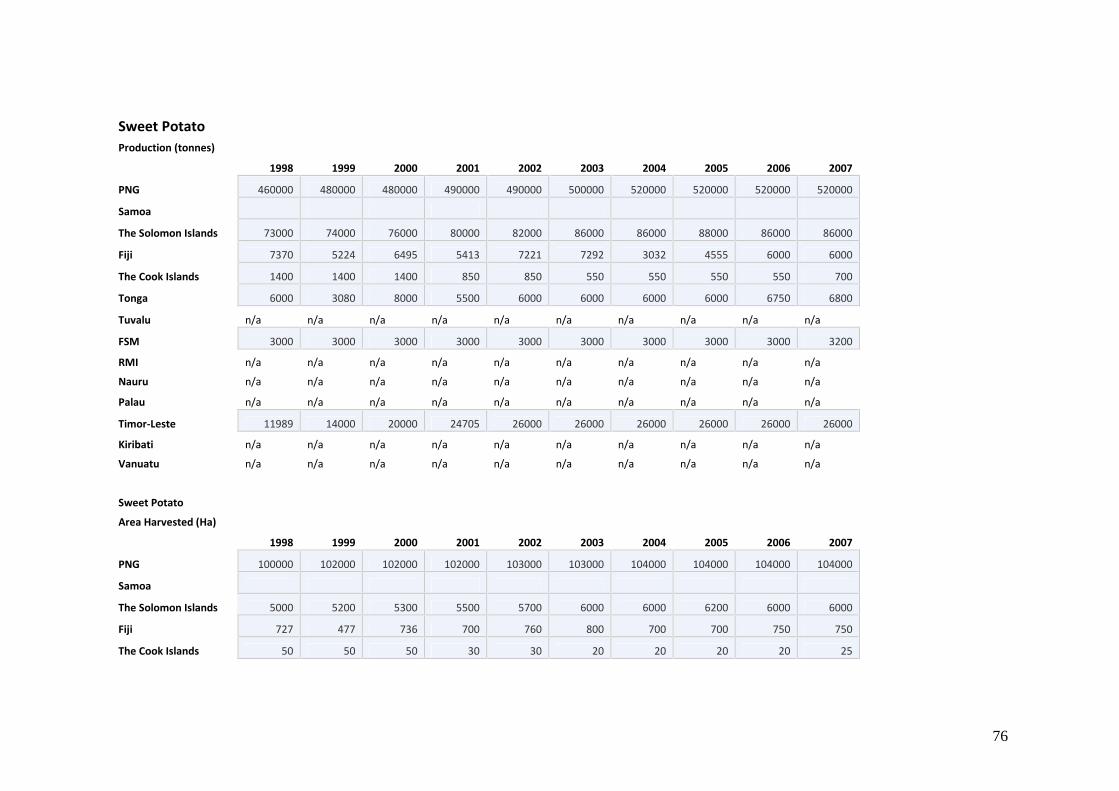
76
Sweet PotatoProduction (tonnes)
1998 1999 2000 2001 2002 2003 2004 2005 2006 2007
PNG 460000 480000 480000 490000 490000 500000 520000 520000 520000 520000
Samoa
The Solomon Islands 73000 74000 76000 80000 82000 86000 86000 88000 86000 86000
Fiji 7370 5224 6495 5413 7221 7292 3032 4555 6000 6000
The Cook Islands 1400 1400 1400 850 850 550 550 550 550 700
Tonga 6000 3080 8000 5500 6000 6000 6000 6000 6750 6800
Tuvalu n/a n/a n/a n/a n/a n/a n/a n/a n/a n/a
FSM 3000 3000 3000 3000 3000 3000 3000 3000 3000 3200
RMI n/a n/a n/a n/a n/a n/a n/a n/a n/a n/a
Nauru n/a n/a n/a n/a n/a n/a n/a n/a n/a n/a
Palau n/a n/a n/a n/a n/a n/a n/a n/a n/a n/a
Timor-Leste 11989 14000 20000 24705 26000 26000 26000 26000 26000 26000
Kiribati n/a n/a n/a n/a n/a n/a n/a n/a n/a n/a
Vanuatu n/a n/a n/a n/a n/a n/a n/a n/a n/a n/a
Sweet Potato
Area Harvested (Ha)
1998 1999 2000 2001 2002 2003 2004 2005 2006 2007
PNG 100000 102000 102000 102000 103000 103000 104000 104000 104000 104000
Samoa
The Solomon Islands 5000 5200 5300 5500 5700 6000 6000 6200 6000 6000
Fiji 727 477 736 700 760 800 700 700 750 750
The Cook Islands 50 50 50 30 30 20 20 20 20 25
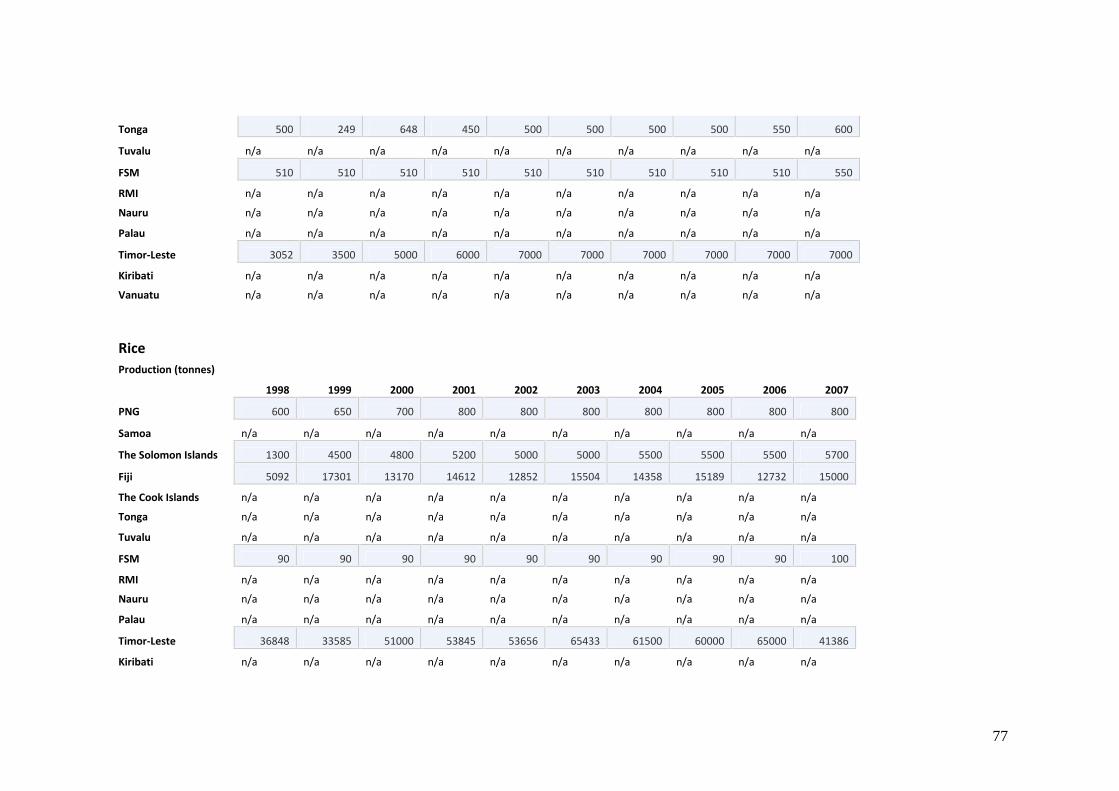
77
Tonga 500 249 648 450 500 500 500 500 550 600
Tuvalu n/a n/a n/a n/a n/a n/a n/a n/a n/a n/a
FSM 510 510 510 510 510 510 510 510 510 550
RMI n/a n/a n/a n/a n/a n/a n/a n/a n/a n/a
Nauru n/a n/a n/a n/a n/a n/a n/a n/a n/a n/a
Palau n/a n/a n/a n/a n/a n/a n/a n/a n/a n/a
Timor-Leste 3052 3500 5000 6000 7000 7000 7000 7000 7000 7000
Kiribati n/a n/a n/a n/a n/a n/a n/a n/a n/a n/a
Vanuatu n/a n/a n/a n/a n/a n/a n/a n/a n/a n/a
RiceProduction (tonnes)
1998 1999 2000 2001 2002 2003 2004 2005 2006 2007
PNG 600 650 700 800 800 800 800 800 800 800
Samoa n/a n/a n/a n/a n/a n/a n/a n/a n/a n/a
The Solomon Islands 1300 4500 4800 5200 5000 5000 5500 5500 5500 5700
Fiji 5092 17301 13170 14612 12852 15504 14358 15189 12732 15000
The Cook Islands n/a n/a n/a n/a n/a n/a n/a n/a n/a n/a
Tonga n/a n/a n/a n/a n/a n/a n/a n/a n/a n/a
Tuvalu n/a n/a n/a n/a n/a n/a n/a n/a n/a n/a
FSM 90 90 90 90 90 90 90 90 90 100
RMI n/a n/a n/a n/a n/a n/a n/a n/a n/a n/a
Nauru n/a n/a n/a n/a n/a n/a n/a n/a n/a n/a
Palau n/a n/a n/a n/a n/a n/a n/a n/a n/a n/a
Timor-Leste 36848 33585 51000 53845 53656 65433 61500 60000 65000 41386
Kiribati n/a n/a n/a n/a n/a n/a n/a n/a n/a n/a
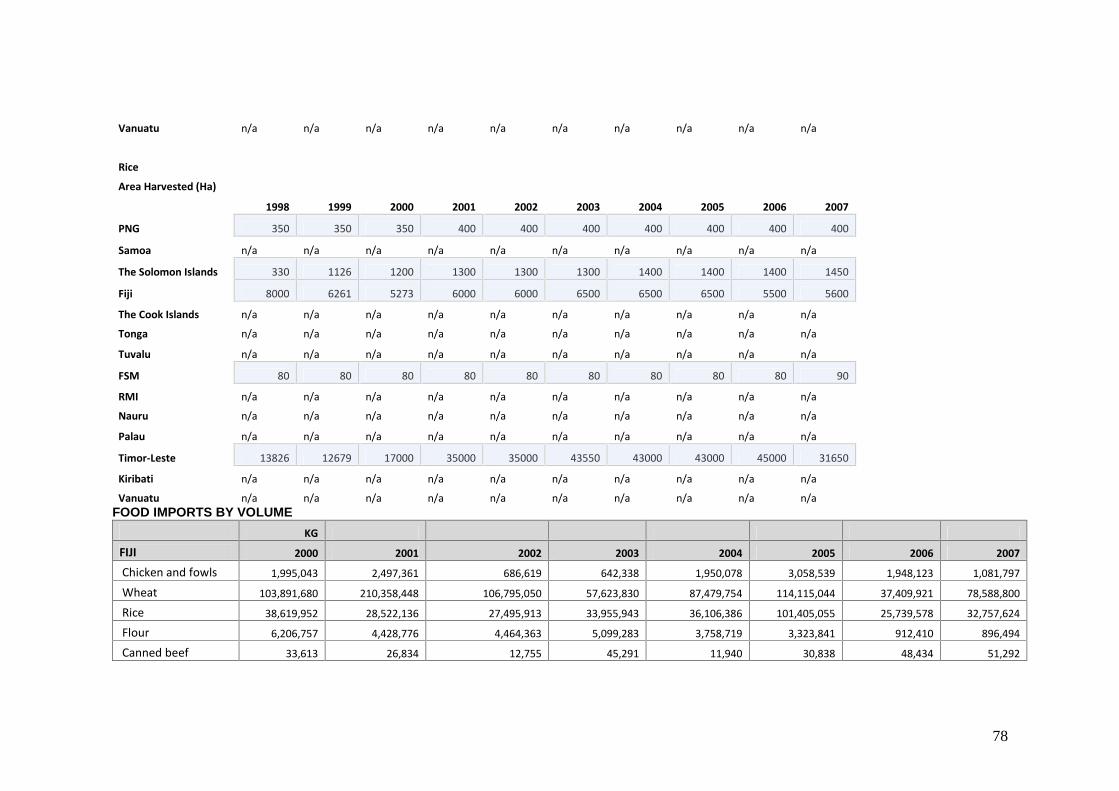
78
Vanuatu n/a n/a n/a n/a n/a n/a n/a n/a n/a n/a
Rice
Area Harvested (Ha)
1998 1999 2000 2001 2002 2003 2004 2005 2006 2007
PNG 350 350 350 400 400 400 400 400 400 400
Samoa n/a n/a n/a n/a n/a n/a n/a n/a n/a n/a
The Solomon Islands 330 1126 1200 1300 1300 1300 1400 1400 1400 1450
Fiji 8000 6261 5273 6000 6000 6500 6500 6500 5500 5600
The Cook Islands n/a n/a n/a n/a n/a n/a n/a n/a n/a n/a
Tonga n/a n/a n/a n/a n/a n/a n/a n/a n/a n/a
Tuvalu n/a n/a n/a n/a n/a n/a n/a n/a n/a n/a
FSM 80 80 80 80 80 80 80 80 80 90
RMI n/a n/a n/a n/a n/a n/a n/a n/a n/a n/a
Nauru n/a n/a n/a n/a n/a n/a n/a n/a n/a n/a
Palau n/a n/a n/a n/a n/a n/a n/a n/a n/a n/a
Timor-Leste 13826 12679 17000 35000 35000 43550 43000 43000 45000 31650
Kiribati n/a n/a n/a n/a n/a n/a n/a n/a n/a n/a
Vanuatu n/a n/a n/a n/a n/a n/a n/a n/a n/a n/aFOOD IMPORTS BY VOLUME
KG
FIJI 2000 2001 2002 2003 2004 2005 2006 2007
Chicken and fowls 1,995,043 2,497,361 686,619 642,338 1,950,078 3,058,539 1,948,123 1,081,797
Wheat 103,891,680 210,358,448 106,795,050 57,623,830 87,479,754 114,115,044 37,409,921 78,588,800
Rice 38,619,952 28,522,136 27,495,913 33,955,943 36,106,386 101,405,055 25,739,578 32,757,624
Flour 6,206,757 4,428,776 4,464,363 5,099,283 3,758,719 3,323,841 912,410 896,494
Canned beef 33,613 26,834 12,755 45,291 11,940 30,838 48,434 51,292
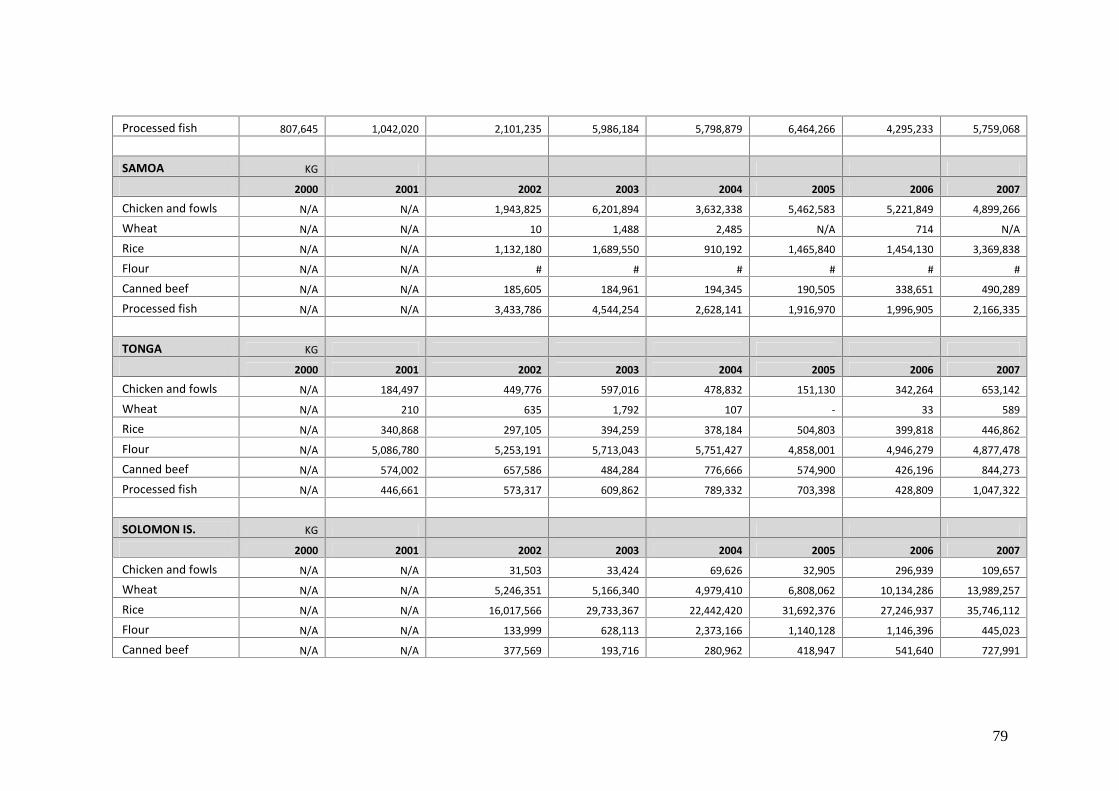
79
Processed fish 807,645 1,042,020 2,101,235 5,986,184 5,798,879 6,464,266 4,295,233 5,759,068
SAMOA KG
2000 2001 2002 2003 2004 2005 2006 2007
Chicken and fowls N/A N/A 1,943,825 6,201,894 3,632,338 5,462,583 5,221,849 4,899,266
Wheat N/A N/A 10 1,488 2,485 N/A 714 N/A
Rice N/A N/A 1,132,180 1,689,550 910,192 1,465,840 1,454,130 3,369,838
Flour N/A N/A # # # # # #
Canned beef N/A N/A 185,605 184,961 194,345 190,505 338,651 490,289
Processed fish N/A N/A 3,433,786 4,544,254 2,628,141 1,916,970 1,996,905 2,166,335
TONGA KG
2000 2001 2002 2003 2004 2005 2006 2007
Chicken and fowls N/A 184,497 449,776 597,016 478,832 151,130 342,264 653,142
Wheat N/A 210 635 1,792 107 - 33 589
Rice N/A 340,868 297,105 394,259 378,184 504,803 399,818 446,862
Flour N/A 5,086,780 5,253,191 5,713,043 5,751,427 4,858,001 4,946,279 4,877,478
Canned beef N/A 574,002 657,586 484,284 776,666 574,900 426,196 844,273
Processed fish N/A 446,661 573,317 609,862 789,332 703,398 428,809 1,047,322
SOLOMON IS. KG
2000 2001 2002 2003 2004 2005 2006 2007
Chicken and fowls N/A N/A 31,503 33,424 69,626 32,905 296,939 109,657
Wheat N/A N/A 5,246,351 5,166,340 4,979,410 6,808,062 10,134,286 13,989,257
Rice N/A N/A 16,017,566 29,733,367 22,442,420 31,692,376 27,246,937 35,746,112
Flour N/A N/A 133,999 628,113 2,373,166 1,140,128 1,146,396 445,023
Canned beef N/A N/A 377,569 193,716 280,962 418,947 541,640 727,991
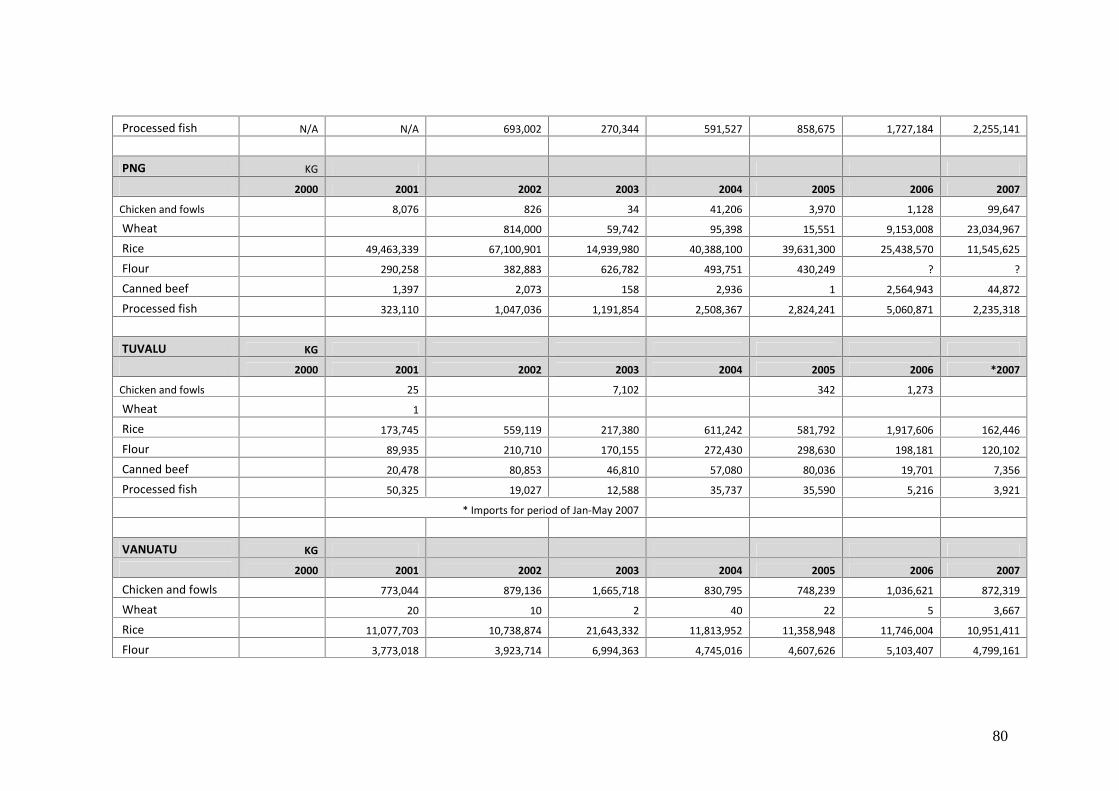
80
Processed fish N/A N/A 693,002 270,344 591,527 858,675 1,727,184 2,255,141
PNG KG
2000 2001 2002 2003 2004 2005 2006 2007
Chicken and fowls 8,076 826 34 41,206 3,970 1,128 99,647
Wheat 814,000 59,742 95,398 15,551 9,153,008 23,034,967
Rice 49,463,339 67,100,901 14,939,980 40,388,100 39,631,300 25,438,570 11,545,625
Flour 290,258 382,883 626,782 493,751 430,249 ? ?
Canned beef 1,397 2,073 158 2,936 1 2,564,943 44,872
Processed fish 323,110 1,047,036 1,191,854 2,508,367 2,824,241 5,060,871 2,235,318
TUVALU KG
2000 2001 2002 2003 2004 2005 2006 *2007
Chicken and fowls 25 7,102 342 1,273
Wheat 1
Rice 173,745 559,119 217,380 611,242 581,792 1,917,606 162,446
Flour 89,935 210,710 170,155 272,430 298,630 198,181 120,102
Canned beef 20,478 80,853 46,810 57,080 80,036 19,701 7,356
Processed fish 50,325 19,027 12,588 35,737 35,590 5,216 3,921
* Imports for period of Jan-May 2007
VANUATU KG
2000 2001 2002 2003 2004 2005 2006 2007
Chicken and fowls 773,044 879,136 1,665,718 830,795 748,239 1,036,621 872,319
Wheat 20 10 2 40 22 5 3,667
Rice 11,077,703 10,738,874 21,643,332 11,813,952 11,358,948 11,746,004 10,951,411
Flour 3,773,018 3,923,714 6,994,363 4,745,016 4,607,626 5,103,407 4,799,161
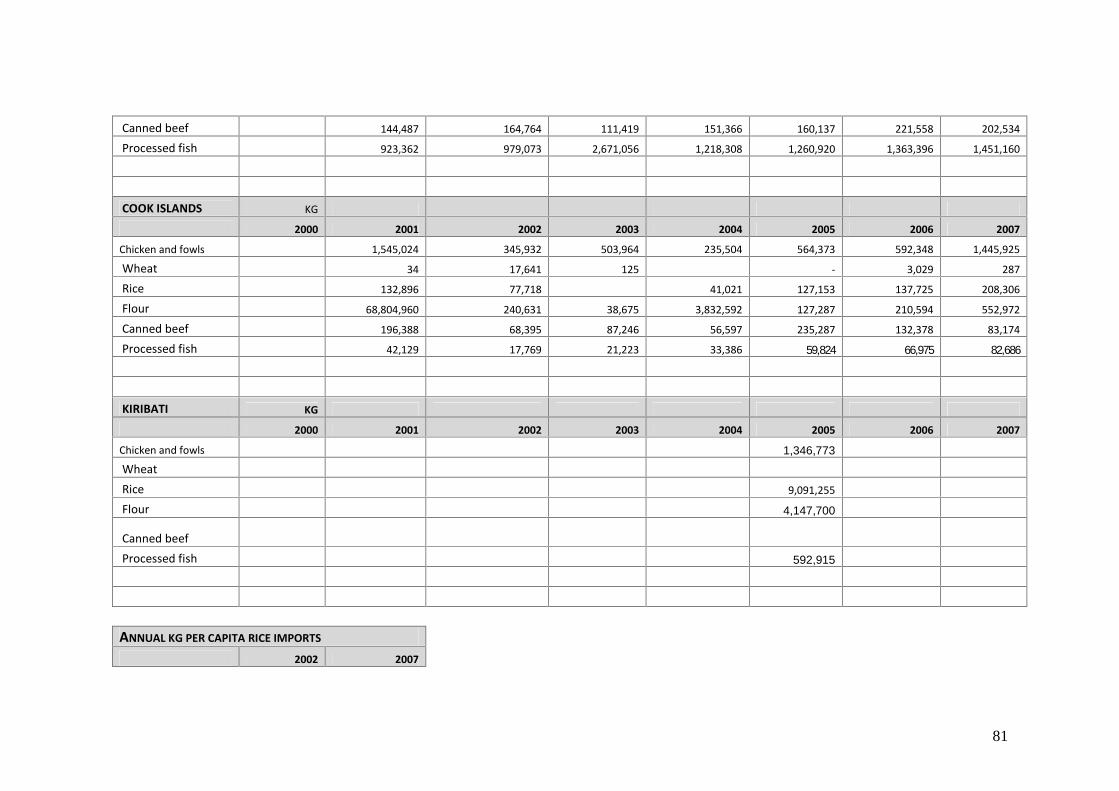
81
Canned beef 144,487 164,764 111,419 151,366 160,137 221,558 202,534
Processed fish 923,362 979,073 2,671,056 1,218,308 1,260,920 1,363,396 1,451,160
COOK ISLANDS KG
2000 2001 2002 2003 2004 2005 2006 2007
Chicken and fowls 1,545,024 345,932 503,964 235,504 564,373 592,348 1,445,925
Wheat 34 17,641 125 - 3,029 287
Rice 132,896 77,718 41,021 127,153 137,725 208,306
Flour 68,804,960 240,631 38,675 3,832,592 127,287 210,594 552,972
Canned beef 196,388 68,395 87,246 56,597 235,287 132,378 83,174
Processed fish 42,129 17,769 21,223 33,386 59,824 66,975 82,686
KIRIBATI KG
2000 2001 2002 2003 2004 2005 2006 2007
Chicken and fowls 1,346,773 Wheat Rice 9,091,255
Flour 4,147,700
Canned beef Processed fish 592,915
ANNUAL KG PER CAPITA RICE IMPORTS
2002 2007
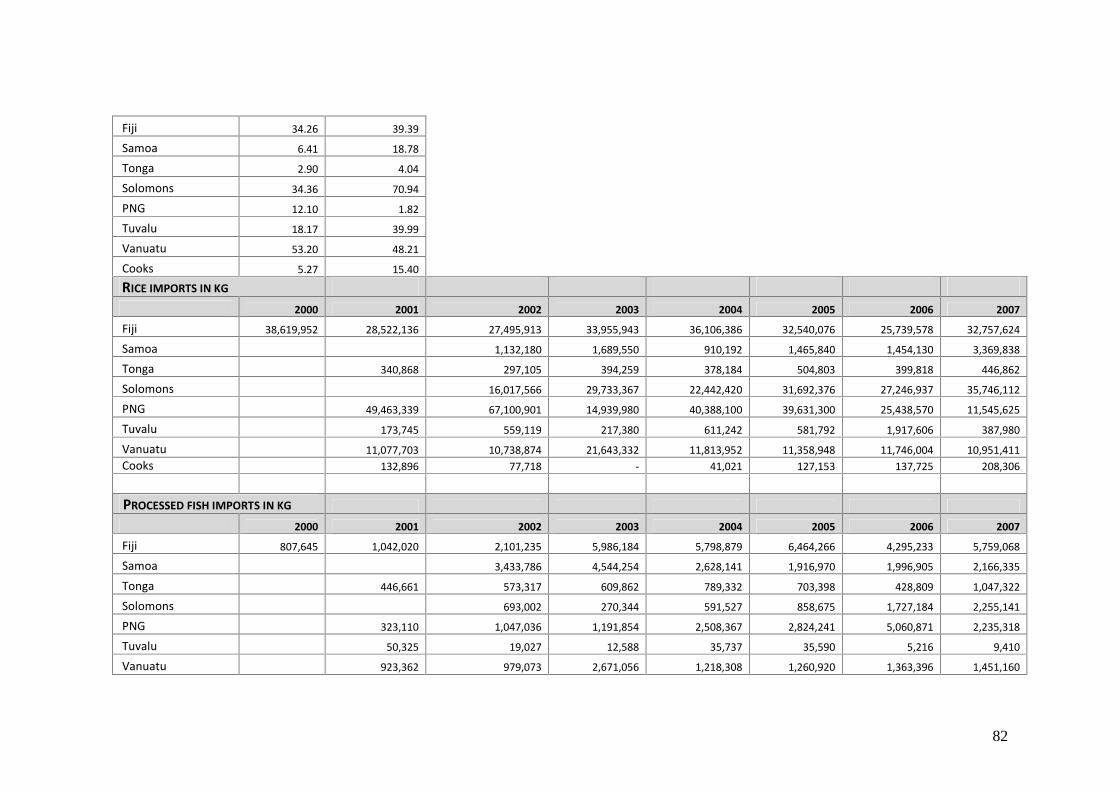
82
Fiji 34.26 39.39
Samoa 6.41 18.78
Tonga 2.90 4.04
Solomons 34.36 70.94
PNG 12.10 1.82
Tuvalu 18.17 39.99
Vanuatu 53.20 48.21
Cooks 5.27 15.40
RICE IMPORTS IN KG
2000 2001 2002 2003 2004 2005 2006 2007
Fiji 38,619,952 28,522,136 27,495,913 33,955,943 36,106,386 32,540,076 25,739,578 32,757,624
Samoa 1,132,180 1,689,550 910,192 1,465,840 1,454,130 3,369,838
Tonga 340,868 297,105 394,259 378,184 504,803 399,818 446,862
Solomons 16,017,566 29,733,367 22,442,420 31,692,376 27,246,937 35,746,112
PNG 49,463,339 67,100,901 14,939,980 40,388,100 39,631,300 25,438,570 11,545,625
Tuvalu 173,745 559,119 217,380 611,242 581,792 1,917,606 387,980
Vanuatu 11,077,703 10,738,874 21,643,332 11,813,952 11,358,948 11,746,004 10,951,411 Cooks 132,896 77,718 - 41,021 127,153 137,725 208,306
PROCESSED FISH IMPORTS IN KG
2000 2001 2002 2003 2004 2005 2006 2007
Fiji 807,645 1,042,020 2,101,235 5,986,184 5,798,879 6,464,266 4,295,233 5,759,068
Samoa 3,433,786 4,544,254 2,628,141 1,916,970 1,996,905 2,166,335
Tonga 446,661 573,317 609,862 789,332 703,398 428,809 1,047,322
Solomons 693,002 270,344 591,527 858,675 1,727,184 2,255,141
PNG 323,110 1,047,036 1,191,854 2,508,367 2,824,241 5,060,871 2,235,318
Tuvalu 50,325 19,027 12,588 35,737 35,590 5,216 9,410
Vanuatu 923,362 979,073 2,671,056 1,218,308 1,260,920 1,363,396 1,451,160
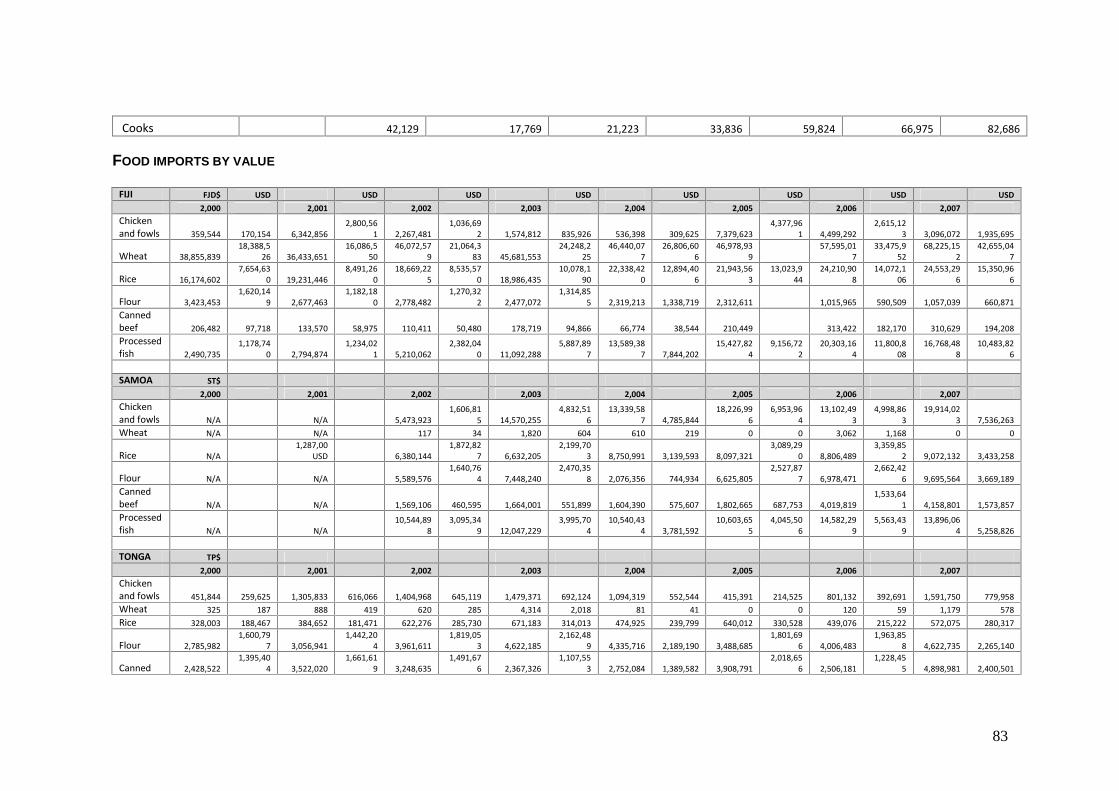
83
Cooks 42,129 17,769 21,223 33,836 59,824 66,975 82,686
FOOD IMPORTS BY VALUE
FIJI FJD$ USD USD USD USD USD USD USD USD2,000 2,001 2,002 2,003 2,004 2,005 2,006 2,007
Chickenand fowls 359,544 170,154 6,342,856
2,800,561 2,267,481
1,036,692 1,574,812 835,926 536,398 309,625 7,379,623
4,377,961 4,499,292
2,615,123 3,096,072 1,935,695
Wheat 38,855,83918,388,5
26 36,433,65116,086,5
5046,072,57
921,064,3
83 45,681,55324,248,2
2546,440,07
726,806,60
646,978,93
957,595,01
733,475,9
5268,225,15
242,655,04
7
Rice 16,174,6027,654,63
0 19,231,4468,491,26
018,669,22
58,535,57
0 18,986,43510,078,1
9022,338,42
012,894,40
621,943,56
313,023,9
4424,210,90
814,072,1
0624,553,29
615,350,96
6
Flour 3,423,4531,620,14
9 2,677,4631,182,18
0 2,778,4821,270,32
2 2,477,0721,314,85
5 2,319,213 1,338,719 2,312,611 1,015,965 590,509 1,057,039 660,871Cannedbeef 206,482 97,718 133,570 58,975 110,411 50,480 178,719 94,866 66,774 38,544 210,449 313,422 182,170 310,629 194,208Processedfish 2,490,735
1,178,740 2,794,874
1,234,021 5,210,062
2,382,040 11,092,288
5,887,897
13,589,387 7,844,202
15,427,824
9,156,722
20,303,164
11,800,808
16,768,488
10,483,826
SAMOA ST$2,000 2,001 2,002 2,003 2,004 2,005 2,006 2,007
Chickenand fowls N/A N/A 5,473,923
1,606,815 14,570,255
4,832,516
13,339,587 4,785,844
18,226,996
6,953,964
13,102,493
4,998,863
19,914,023 7,536,263
Wheat N/A N/A 117 34 1,820 604 610 219 0 0 3,062 1,168 0 0
Rice N/A1,287,00
USD 6,380,1441,872,82
7 6,632,2052,199,70
3 8,750,991 3,139,593 8,097,3213,089,29
0 8,806,4893,359,85
2 9,072,132 3,433,258
Flour N/A N/A 5,589,5761,640,76
4 7,448,2402,470,35
8 2,076,356 744,934 6,625,8052,527,87
7 6,978,4712,662,42
6 9,695,564 3,669,189Cannedbeef N/A N/A 1,569,106 460,595 1,664,001 551,899 1,604,390 575,607 1,802,665 687,753 4,019,819
1,533,641 4,158,801 1,573,857
Processedfish N/A N/A
10,544,898
3,095,349 12,047,229
3,995,704
10,540,434 3,781,592
10,603,655
4,045,506
14,582,299
5,563,439
13,896,064 5,258,826
TONGA TP$2,000 2,001 2,002 2,003 2,004 2,005 2,006 2,007
Chickenand fowls 451,844 259,625 1,305,833 616,066 1,404,968 645,119 1,479,371 692,124 1,094,319 552,544 415,391 214,525 801,132 392,691 1,591,750 779,958Wheat 325 187 888 419 620 285 4,314 2,018 81 41 0 0 120 59 1,179 578Rice 328,003 188,467 384,652 181,471 622,276 285,730 671,183 314,013 474,925 239,799 640,012 330,528 439,076 215,222 572,075 280,317
Flour 2,785,9821,600,79
7 3,056,9411,442,20
4 3,961,6111,819,05
3 4,622,1852,162,48
9 4,335,716 2,189,190 3,488,6851,801,69
6 4,006,4831,963,85
8 4,622,735 2,265,140
Canned 2,428,5221,395,40
4 3,522,0201,661,61
9 3,248,6351,491,67
6 2,367,3261,107,55
3 2,752,084 1,389,582 3,908,7912,018,65
6 2,506,1811,228,45
5 4,898,981 2,400,501
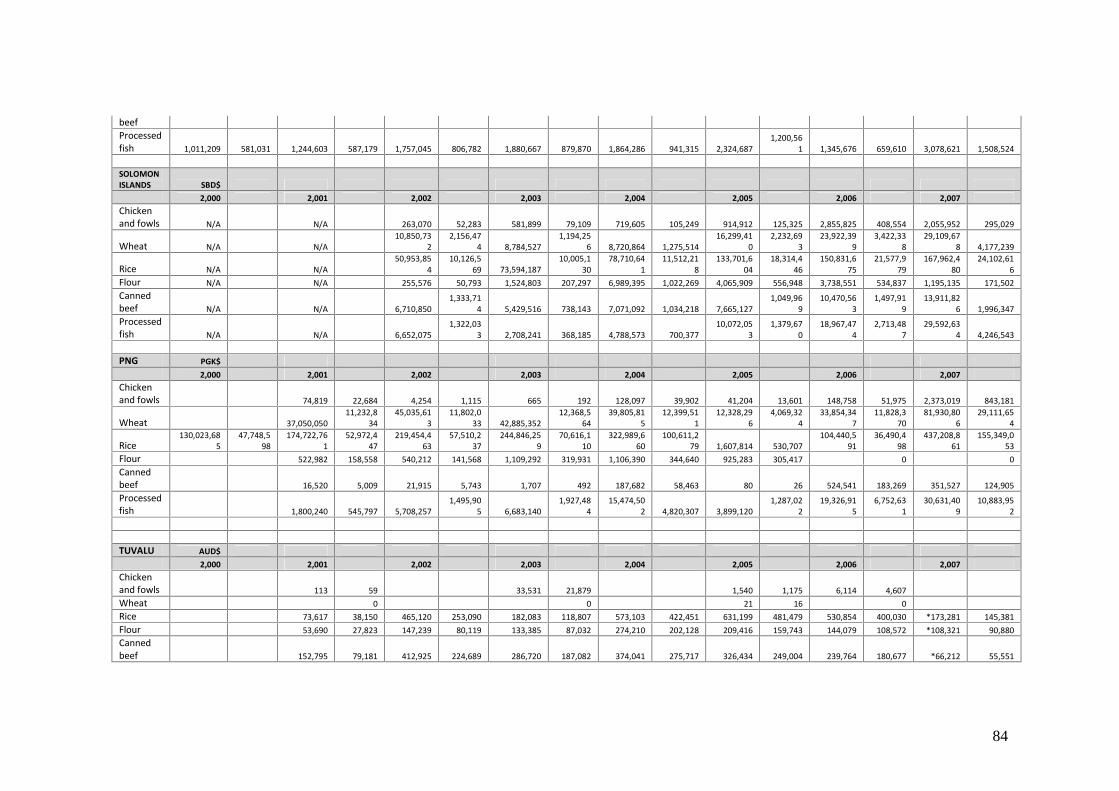
84
beefProcessedfish 1,011,209 581,031 1,244,603 587,179 1,757,045 806,782 1,880,667 879,870 1,864,286 941,315 2,324,687
1,200,561 1,345,676 659,610 3,078,621 1,508,524
SOLOMONISLANDS SBD$
2,000 2,001 2,002 2,003 2,004 2,005 2,006 2,007Chickenand fowls N/A N/A 263,070 52,283 581,899 79,109 719,605 105,249 914,912 125,325 2,855,825 408,554 2,055,952 295,029
Wheat N/A N/A10,850,73
22,156,47
4 8,784,5271,194,25
6 8,720,864 1,275,51416,299,41
02,232,69
323,922,39
93,422,33
829,109,67
8 4,177,239
Rice N/A N/A50,953,85
410,126,5
69 73,594,18710,005,1
3078,710,64
111,512,21
8133,701,6
0418,314,4
46150,831,6
7521,577,9
79167,962,4
8024,102,61
6Flour N/A N/A 255,576 50,793 1,524,803 207,297 6,989,395 1,022,269 4,065,909 556,948 3,738,551 534,837 1,195,135 171,502Cannedbeef N/A N/A 6,710,850
1,333,714 5,429,516 738,143 7,071,092 1,034,218 7,665,127
1,049,969
10,470,563
1,497,919
13,911,826 1,996,347
Processedfish N/A N/A 6,652,075
1,322,033 2,708,241 368,185 4,788,573 700,377
10,072,053
1,379,670
18,967,474
2,713,487
29,592,634 4,246,543
PNG PGK$2,000 2,001 2,002 2,003 2,004 2,005 2,006 2,007
Chickenand fowls 74,819 22,684 4,254 1,115 665 192 128,097 39,902 41,204 13,601 148,758 51,975 2,373,019 843,181
Wheat 37,050,05011,232,8
3445,035,61
311,802,0
33 42,885,35212,368,5
6439,805,81
512,399,51
112,328,29
64,069,32
433,854,34
711,828,3
7081,930,80
629,111,65
4
Rice130,023,68
547,748,5
98174,722,76
152,972,4
47219,454,4
6357,510,2
37244,846,25
970,616,1
10322,989,6
60100,611,2
79 1,607,814 530,707104,440,5
9136,490,4
98437,208,8
61155,349,0
53Flour 522,982 158,558 540,212 141,568 1,109,292 319,931 1,106,390 344,640 925,283 305,417 0 0Cannedbeef 16,520 5,009 21,915 5,743 1,707 492 187,682 58,463 80 26 524,541 183,269 351,527 124,905Processedfish 1,800,240 545,797 5,708,257
1,495,905 6,683,140
1,927,484
15,474,502 4,820,307 3,899,120
1,287,022
19,326,915
6,752,631
30,631,409
10,883,952
TUVALU AUD$2,000 2,001 2,002 2,003 2,004 2,005 2,006 2,007
Chickenand fowls 113 59 33,531 21,879 1,540 1,175 6,114 4,607Wheat 0 0 21 16 0Rice 73,617 38,150 465,120 253,090 182,083 118,807 573,103 422,451 631,199 481,479 530,854 400,030 *173,281 145,381Flour 53,690 27,823 147,239 80,119 133,385 87,032 274,210 202,128 209,416 159,743 144,079 108,572 *108,321 90,880Cannedbeef 152,795 79,181 412,925 224,689 286,720 187,082 374,041 275,717 326,434 249,004 239,764 180,677 *66,212 55,551
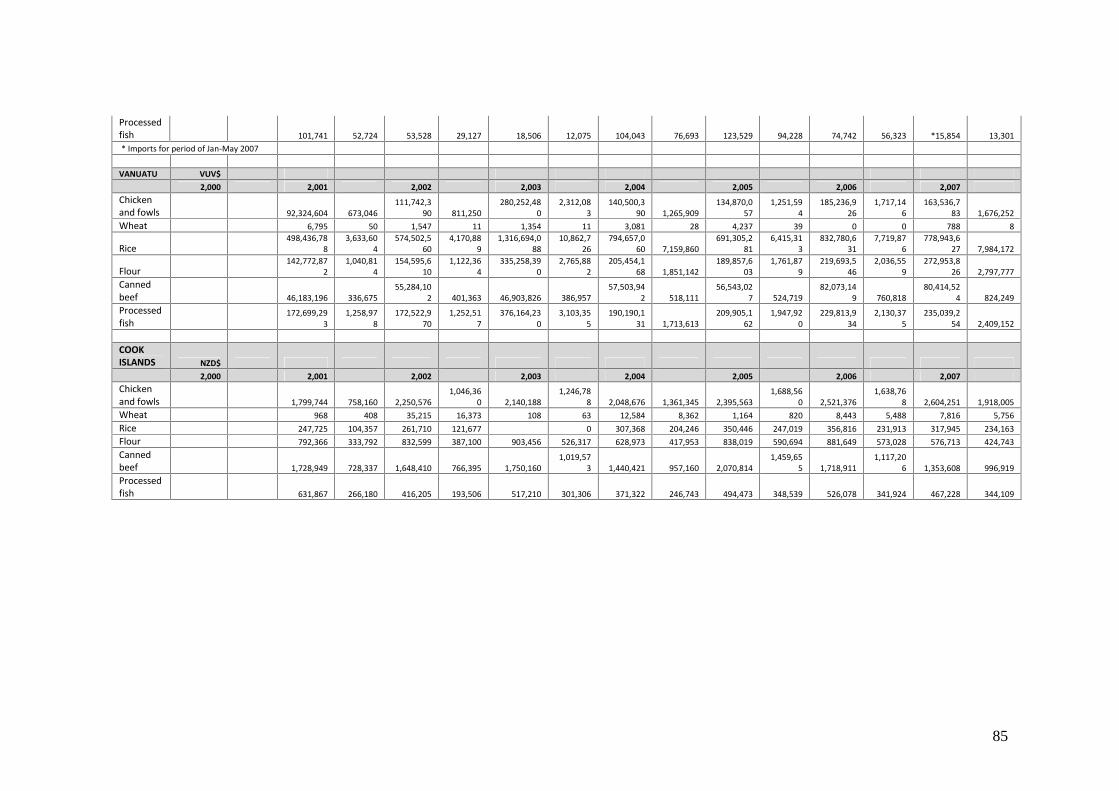
85
Processedfish 101,741 52,724 53,528 29,127 18,506 12,075 104,043 76,693 123,529 94,228 74,742 56,323 *15,854 13,301* Imports for period of Jan-May 2007
VANUATU VUV$2,000 2,001 2,002 2,003 2,004 2,005 2,006 2,007
Chickenand fowls 92,324,604 673,046
111,742,390 811,250
280,252,480
2,312,083
140,500,390 1,265,909
134,870,057
1,251,594
185,236,926
1,717,146
163,536,783 1,676,252
Wheat 6,795 50 1,547 11 1,354 11 3,081 28 4,237 39 0 0 788 8
Rice498,436,78
83,633,60
4574,502,5
604,170,88
91,316,694,0
8810,862,7
26794,657,0
60 7,159,860691,305,2
816,415,31
3832,780,6
317,719,87
6778,943,6
27 7,984,172
Flour142,772,87
21,040,81
4154,595,6
101,122,36
4335,258,39
02,765,88
2205,454,1
68 1,851,142189,857,6
031,761,87
9219,693,5
462,036,55
9272,953,8
26 2,797,777Cannedbeef 46,183,196 336,675
55,284,102 401,363 46,903,826 386,957
57,503,942 518,111
56,543,027 524,719
82,073,149 760,818
80,414,524 824,249
Processedfish
172,699,293
1,258,978
172,522,970
1,252,517
376,164,230
3,103,355
190,190,131 1,713,613
209,905,162
1,947,920
229,813,934
2,130,375
235,039,254 2,409,152
COOKISLANDS NZD$
2,000 2,001 2,002 2,003 2,004 2,005 2,006 2,007Chickenand fowls 1,799,744 758,160 2,250,576
1,046,360 2,140,188
1,246,788 2,048,676 1,361,345 2,395,563
1,688,560 2,521,376
1,638,768 2,604,251 1,918,005
Wheat 968 408 35,215 16,373 108 63 12,584 8,362 1,164 820 8,443 5,488 7,816 5,756Rice 247,725 104,357 261,710 121,677 0 307,368 204,246 350,446 247,019 356,816 231,913 317,945 234,163Flour 792,366 333,792 832,599 387,100 903,456 526,317 628,973 417,953 838,019 590,694 881,649 573,028 576,713 424,743Cannedbeef 1,728,949 728,337 1,648,410 766,395 1,750,160
1,019,573 1,440,421 957,160 2,070,814
1,459,655 1,718,911
1,117,206 1,353,608 996,919
Processedfish 631,867 266,180 416,205 193,506 517,210 301,306 371,322 246,743 494,473 348,539 526,078 341,924 467,228 344,109
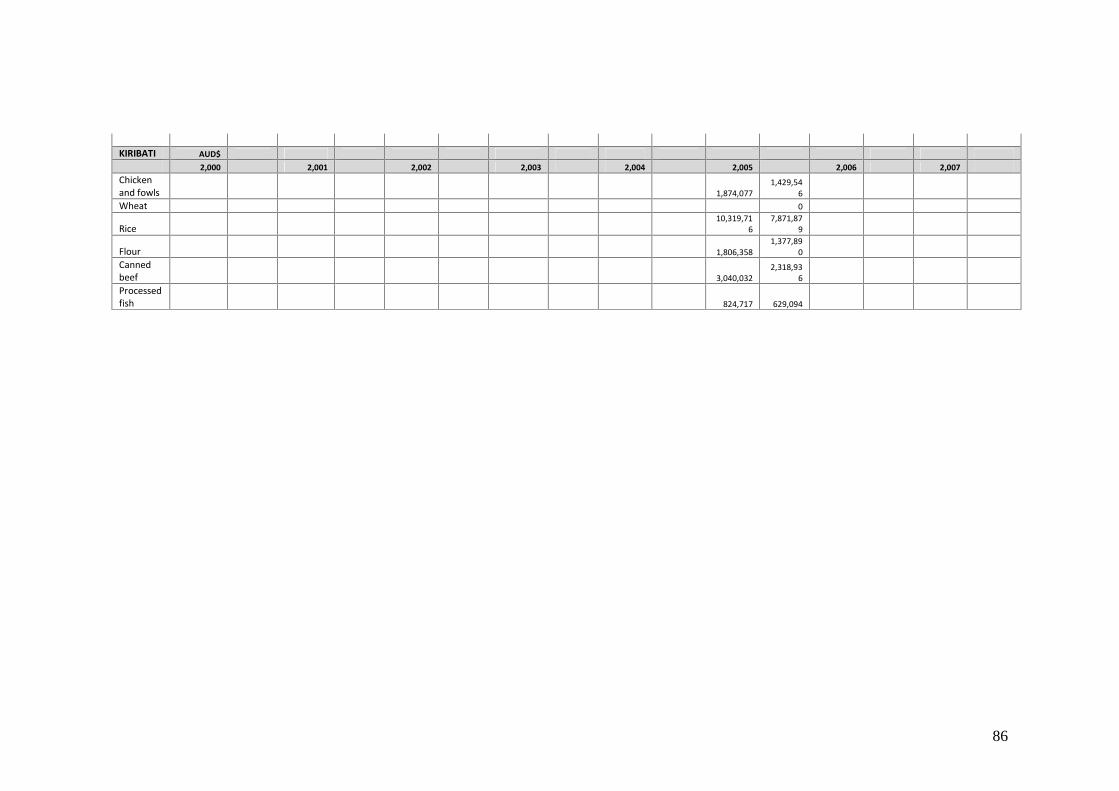
86
KIRIBATI AUD$2,000 2,001 2,002 2,003 2,004 2,005 2,006 2,007
Chickenand fowls 1,874,077
1,429,546
Wheat 0
Rice10,319,71
67,871,87
9
Flour 1,806,3581,377,89
0Cannedbeef 3,040,032
2,318,936
Processedfish 824,717 629,094
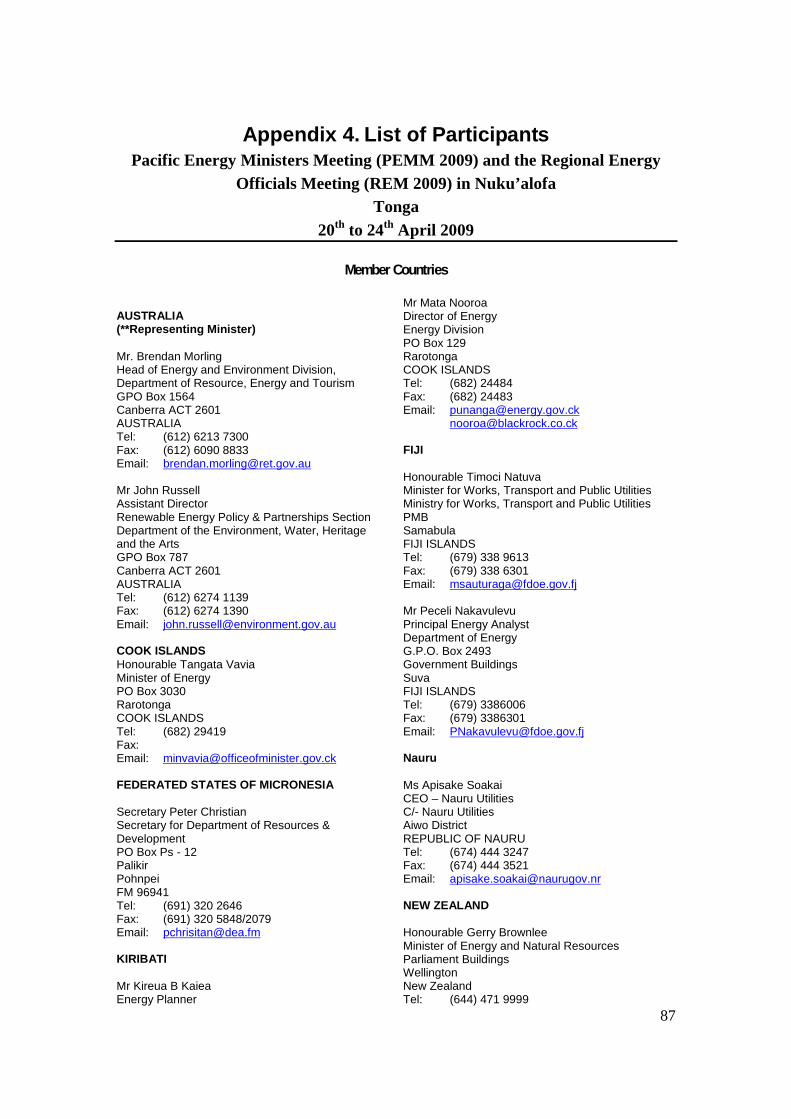
87
Appendix 4. List of ParticipantsPacific Energy Ministers Meeting (PEMM 2009) and the Regional Energy
Officials Meeting (REM 2009) in Nuku’alofaTonga
20th to 24th April 2009
Member Countries
AUSTRALIA(**Representing Minister)
Mr. Brendan MorlingHead of Energy and Environment Division,Department of Resource, Energy and TourismGPO Box 1564Canberra ACT 2601AUSTRALIATel: (612) 6213 7300Fax: (612) 6090 8833Email: [email protected]
Mr John RussellAssistant DirectorRenewable Energy Policy & Partnerships SectionDepartment of the Environment, Water, Heritageand the ArtsGPO Box 787Canberra ACT 2601AUSTRALIATel: (612) 6274 1139Fax: (612) 6274 1390Email: [email protected]
COOK ISLANDSHonourable Tangata VaviaMinister of EnergyPO Box 3030RarotongaCOOK ISLANDSTel: (682) 29419Fax:Email: [email protected]
FEDERATED STATES OF MICRONESIA
Secretary Peter ChristianSecretary for Department of Resources &DevelopmentPO Box Ps - 12PalikirPohnpeiFM 96941Tel: (691) 320 2646Fax: (691) 320 5848/2079Email: [email protected]
KIRIBATI
Mr Kireua B KaieaEnergy Planner
Mr Mata NooroaDirector of EnergyEnergy DivisionPO Box 129RarotongaCOOK ISLANDSTel: (682) 24484Fax: (682) 24483Email: [email protected]
FIJI
Honourable Timoci NatuvaMinister for Works, Transport and Public UtilitiesMinistry for Works, Transport and Public UtilitiesPMBSamabulaFIJI ISLANDSTel: (679) 338 9613Fax: (679) 338 6301Email: [email protected]
Mr Peceli NakavulevuPrincipal Energy AnalystDepartment of EnergyG.P.O. Box 2493Government BuildingsSuvaFIJI ISLANDSTel: (679) 3386006Fax: (679) 3386301Email: [email protected]
Nauru
Ms Apisake SoakaiCEO – Nauru UtilitiesC/- Nauru UtilitiesAiwo DistrictREPUBLIC OF NAURUTel: (674) 444 3247Fax: (674) 444 3521Email: [email protected]
NEW ZEALAND
Honourable Gerry BrownleeMinister of Energy and Natural ResourcesParliament BuildingsWellingtonNew ZealandTel: (644) 471 9999
88
Ministry of Works & EnergyP O Box 498BetioTarawaREPUBLIC OF KIRIBATITel: (686) 25 046Fax: (686) 20 172Email: [email protected]
NAURU
Honourable Frederick PitcherMinister of Commerce, Industry & EnvironmentMinistry for Commerce, Industry & EnvironmentGovernment MinistriesYaren District
REPUBLIC OF NAURU
Tel: (674) 444 3133 ext. 212Fax: (674) 444 3199Email: [email protected]
Mr Russ J KunSecretary for Ministry Commerce, Industry &EnvironmentGovernment MinistriesYaren DistrictREPUBLIC OF NAURUTel: (674) 444 3133 xtn 212Fax: (674) 444 3199Email: [email protected]
NIUE
Honourable Togia SioneholoMinister for Bulk FuelsFale FonoGovernment of NiueAlofiNIUETel: (683) 4200Fax: (683) 4206Email: [email protected]
Ms Josie TamatePolicy AdvisorPremiers DepartmentMinistry for Bulk FuelsGovernment of NiueAlofiNIUETel: (683) 4364Fax: (683) 4206Email: [email protected]
Fax: (644) 471 2551Email: [email protected]
Dr Peter CrabtreeDirector Energy and Communications BranchMinistry of Economic DevelopmentPO Box 1473WellingtonNEW ZEALANDTel: (644) 76 2618Fax: (644) 499 0969Email: [email protected]
Mr Mark RamsdenDeputy DirectorPacific GroupNZAIDPrivate Bag 18901WellingtonNew ZealandTel: (644) 439 8000Fax: (644) 439 8813Email: [email protected]
PAPUA NEW GUINEA
Mr Vore VeveActing Deputy SecretaryDepartment of Petroleum and EnergyPO Box 494Waigani, NCDPAPUA NEW GUINEA
Tel: (675) 325 3233Fax: (675) 325 1678Email: [email protected]
Mr Idau KopiA/Assistant DirectorEnergy DivisionPO Box 494Waigani, NCDPAPUA NEW GUINEATel: (675) 325 3233Fax: (675) 325 1678Email: [email protected]
REPUBLIC OF MARSHALL ISLANDS
(**Representing the Minister)Ms Angeline AbrahamNational Energy PlannerMinistry of Resources & DevelopmentP O Box 1727MajuroMARSHALL ISLANDS 96900Tel: (692) 625 3206Fax: (692) 625 7471Email: [email protected]
89
PALAUHonourable Jackson R. NgiraingasMinister of Public Infrastructure, Industry andCommerceMinistry for Public Infrastructure, Industry &CommercePO Box 1471KororPALAU 96940Tel: (680) 767 2111/ 4343Fax: (680) 767 3207Email: [email protected]
Mr Charles UongSpecial Assistant to the MinisterMinistry for Public Infrastructure, Industry andCommercePO Box 1471KororPalau 96940Tel: (680) 767 2111 / 4343Fax: (680) 767 3207Email: [email protected]
Mr Nick WardropEnergy AdviserMinistry of Resources & DevelopmentP O Box 1727MajuroMARSHALL ISLANDS 96900Tel: (692) 625 3206
61 7 418254275Fax: (692) 625 7471Email: [email protected]
Ms Yuen Kayo Yamaguchi – KottonMinistry of FinanceSenior EU Desk OfficerPO Box DMajuroMARSHALL ISLANDS 96900Tel: (692) 625 8835Fax: (692) 625 3607Email: [email protected]
SAMOA
Honourable Niko Lee HangMinister of FinanceMinistry of FinancePrivate Mail BagGovernment of SamoaApiaSAMOA (WESTERN)Tel: (685) 25210Fax: (685) 25357Email: [email protected]
Ms Hinauri PetanaCEOMinistry for FinancePrivate Mail BagGovernment of SamoaApiaSAMOA (WESTERN)
Mr Thomas Kijiner JnrPermanent SecretaryMinistry of Resources and DevelopmentP O Box 1727MAJUROMARSHALL ISLANDS 96900Tel: (692) 625 3206Fax: (692) 625 7471Email: [email protected]
SOLOMON ISLANDS
Honourable Edward HuniehuMinister of Mines, Energy and Rural ElectrificationMinistry of Mines, Energy and Rural ElectrificationPO Box G37HoniaraSOLOMON ISLANDSTel: (677) 21521Fax: (677) 25811Email: [email protected]
Mr John KorinihonaDirector of EnergyMinistry of Mines, Energy and Rural ElectrificationP O Box G37HoniaraSOLOMON ISLANDSTel: (677) 21 522Fax: (677) 25 811Email: [email protected] Tione BugotuPermanent SecretaryMinistry of Mines, Energy and Rural ElectrificationPO Box G37HoniaraSOLOMON ISLANDS
Tel: (677) 21 522Fax: (677) 25 811Email: [email protected]
Mr Toswell KauaMinistry of Mines, Energy and Rural ElectrificationPO Box G37HoniaraSOLOMON ISLANDSTel: (677) 21 522 / 21 525Fax: (677) 25 811Email: [email protected]
Ms Emeline VeikosoEnergy Planner, EPUMinistry of Lands, Surveys & Natural ResourcesP O Box 5Nuku’alofaKINGDOM of TONGATel: (676) 23 611Fax: (676) 23 216Email: [email protected]
Honourable Kausea NatanoMinister of Public Utilities and IndustriesMinistry for Public Utilities and IndustriesPrivate Mail Bag
90
Tel: (685) 34332Fax: (685) 21312Email: [email protected]
TONGA
Lord TuitaMinistry of Lands, Surveys & Natural ResourcesP O Box 5Nuku’alofaKINGDOM of TONGATel: (676) 20615Fax: (676) 23 216Email:
Hon Lisiate AkoloMinistry for Labour, Commerce & IndustriesP O Box 5Nuku’alofaKINGDOM of TONGATel: (676) 20615Fax: (676) 23 216Email:
Mr Sean TorbitDeputy Head of MissionNZ High Commission to TongaNuku'alofaTonga (NZ)Tel: (676) 23 122Fax:Email: [email protected]
Dr Sione Nailasikau HalatuituiaSecretary for Lands, Surveys & Natural ResourcesMinistry of Lands, Surveys & Natural ResourcesP O Box 5Nuku’alofaKINGDOM of TONGATel: (676) 23 611Fax: (676) 23 216Email: [email protected] Asipeli PalakiDeputy CEOMinistry of Lands, Surveys & Natural ResourcesP O Box 5Nuku’alofaKINGDOM of TONGATel: (676) 23 611Fax: (676) 23 216Email: [email protected]
VANUATU
Honourable Raphael WorworMinister for Lands, Geology, Mines, WaterResources, Energy & EnvironmentPMB 9007Port VilaVANUATUTel: (678) 23105Fax:
VaiakuFunafutiTel: (688) 20615Fax: (688) 20207Email: [email protected]
Mr Paulson PanapaSecretary - Public Utilities and IndustriesMinistry for Public Utilities and IndustriesPrivate Mail BagFunafutiTUVALUTel: (688) 20 060Fax: (688) 20 207Email: [email protected] Nielu MeisakeAssistant Energy PlannerMinistry for Public Utilities and IndustriesPrivate Mail BagFunafutiTUVALUTel: (688) 20 056Fax: (688) 20 207Email: [email protected]
AUSAID
Mr Brian DawsonClimate Change and Energy AdvisorAusAIDGPO Box 887Canberra ACT 2601AUSTRALIATel: (612) 6206 4819Fax: (612) 6206 4720Email: [email protected]
Mr Paul WrightProgram ManagerInfrastructure Pacific BranchAusAIDGPO Box 887Canberra ACT 2601AUSTRALIA
Tel: (612) 6206 4346Fax: (612) 6206 4720Email: [email protected]
Asian Development Bank
Mr Anthony MaxwellEnergy SpeclialistAsian Development Bank6 ADB AvenueMandaluyong City 1550Metro ManilaPHILIPPINES
Tel: (632) 632-6391Fax: (632) 636 2446Email: [email protected]
91
Mr Moli JanjeaSenior Energy OfficerEnergy UnitPrivate Mail Bag 9067Rue Winston ChurchillPort VilaVANUATUTel: [678] 25201Fax: [678] 23586Email: [email protected]
DEVELOPING PARTNERS
ARGO ENVIORNMENT LTD
Mr Luke GowingDirectorArgo Environment LtdPO Box 105774Auckland 1143NEW ZEALANDTel: 64 9 376 0631Fax: 64 21 323310Email: [email protected]
Mr Garry VenusDirectorArgo Environment LtdPO Box 105774Auckland 1143NEW ZEALANDTel: 64 9 376 0631Fax: 64 21 741410Email: [email protected]
Ms Allison WoodruffYoung Professional (Economics)Asian Developmet Bank6 ADB AvenueMandaluyong City 1550Metro ManilaPHILIPPINESTel: (632) 632-6207Fax: (632) 636 2444Email: [email protected]
Technical Centre for Agricultural and RuralCooperation (CTA)
Dr Hansjoerg NeunDirectorTechnical Centre for Agricultural and RuralCooperation (CTA)Postbus 3806700 AJ WageningenTHE NETHERLANDSTel: 31 (0) 317467131Fax: 31 (0) 317 460067Email: [email protected]
Mr Jiwan AcharyaClimate Change SpecialistEnergy, Transport, and Water DivisionRegional and Sustainable Development DepartmentAsian Development Bank6 ADB AvenueMandaluyong City 1550Metro ManilaPHILIPPINESTel: (632) 632-6207Fax: (632) 636 2444Email: [email protected]: (612) 6295 1533Fax: (612) 6239 6751Email: [email protected]
European Investment Bank
Mr Nigel HallEuropean Investment BankTechnical AdviserAurora Place88 Philip StreetSydneyNSW 2000AUSTRALIATel: 61 282 110530Fax: 61 282 110538Email: [email protected]
The Foundation for DevelopmentMr Craig WilsonExecutive DirectorThe Foundation for Development Cooperation137 Melbourne StSouth BrisbaneQueensland 4101AUSTRALIATel: (61 7) 3217 2924Fax: (61 7) 3846 0342Email: [email protected]
International Union for the Conservation ofNature (IUCN)
Ms Andrea AthanasSenior Programme OfficerEnergy, Ecosystems and LivelihoodsBusiness and BiodiversityThe World Conservation Union (IUCN)28 Rue de MauverneyGland 1196SwitzerlandTel: (41) 22 999 0213Fax: (41) 22 999 0002Email: [email protected]
REEEP
Mr Mark FogartyChair of REEEPSouth East Asia PacificSuite 201, Level 218 Kavanagh StreetSouthbank VIC 3006AUSTRALIA
92
Delegation of the European Commission for thePacific
Mr Lenaic GeorgelinHead of InfrastructureDelegation of the European Commission for thePacific4th Floor, Development Bank CentrePrivate Mail Bag GPOSUVAFIJI ISLANDSTel: (679) 331 3633Fax: (679) 330 0370Email: [email protected]
Embassy of Austria
Mr Lukas Wolfgang StrohmayerGovernment of AustriaMinister – CounsellorEmbassy of AustriaP O Box 3375ManukaCanberraACT 2603AUSTRALIA
Mr Taholo KamiDirectorIUCN Regional Office for OceaniaPMB5 Ma'afu StreetSuvaFIJI ISLANDSTel: (679) 331 9084Fax: (679) 3100 128Email: [email protected]
Mr Anare MatakivitiProject ManagerIUCN Regional Office for OceaniaPMBSuvaFIJI ISLANDSTel: (679) 331 9084Fax: (679) 3100 128Email: [email protected] Salote SauturagaIUCNPMB5 Ma'afu StreetSuvaFIJI ISLANDSTel: (679) 331 9084Fax: (679) 3100 128Email: [email protected]
IT Power
Mr Anthony DerrickManaging DirectorIT POWER LTDThe Warren, Bramshill RoadRg27 0pr Hook Eversley, HantsUnited KingdomTel: 44 12 56392700
Tel: (613) 9929 4100Fax: (613) 9929 4101
Ms Eva OberenderRegional Manager – South East Asia PacificREEEPSuite 201, Level 218 Kavanagh StreetSouthbank VIC 3006AUSTRALIATel: (613) 9929 4100Fax: (613) 9929 4101Email: [email protected]
Ms Maaike GöbelManager – South East Asia PacificREEEPSuite 201, Level 218 Kavanagh StreetSouthbank VIC 3006AUSTRALIATel: (613) 9929 4100Fax: (613) 9929 4101Email: [email protected]
Ms Amy KeanAdvisorREEEPSuite 201, Level 218 Kavanagh StreetSouthbank VIC 3006AUSTRALIATel: (613) 9929 4100Fax: (613) 9929 4101Email: [email protected]
Email: [email protected]
Mr Frederic AsselineSenior Energy SpecialistWorld Bank1618 St, NWWashington DC 20433
Tel: 61(0) 2 9223 7777Fax: 61 (0) 2 9223 9903Email: [email protected]
Mr Tendai GreganEnergy SpecialistSustainable Development DepartmentEast Asia and the Pacific Region (EASNS)World BankLevel 19, 14 Martin PlaceSydney NSW 2000AUSTRALIATel: 61(0) 2 9223 7777Fax: 61 (0) 2 9223 9903Email: [email protected]
Mr Charles FeinsteinSD Leader for Timor- LestePapua New Guinea and the Pacific Isl.Sustainable Development DepartmentEast Asia and the Pacific Region (EASNS)
93
Fax: 44 12 56392700Email: [email protected]
Mr Mike AllenAdvisorREEEPSuite 201, Level 218 Kavanagh StreetSouthbank VIC 3006AUSTRALIATel: (613) 9929 4100Fax: (613) 9929 4101Email: [email protected]
UNDP
Mr Thomas Lynge JensenEnvironment & Energy Policy SpecialistUNDP Pacific CentrePrivate Mail BagSuvaFIJI ISLANDSTel: (679) 330 0399Fax: (679) 330 1976Email: [email protected] Sebastian HermannAssociate Expert Renewable EnergyRenewable andRural Energy UnitEnergy and Climate Change BranchProgramme Development and TechnicalCooperation DivisionUNIDOVienna International CentreP O Box 3001400ViennaAUSTRIATel: 43 1 26026 4817Fax: 43 1 26026 6803Email: [email protected]
World Bank
Ms Wendy HughesSenior Energy SpecialistSustainable Development DepartmentEast Asia and the Pacific Region (EASNS)World BankLevel 19, 14 Martin PlaceSydney NSW 2000AUSTRALIATel: 61(0) 2 9223 7777Fax: 61 (0) 2 9223 9903Email: [email protected]
TECHNICAL PRESENTERS
FIJI
Mr Peter JohnstonConsultantPO Box 4206SamabulaSuvaFIJI ISLANDS
World BankLevel 19, 14 Martin PlaceSydney NSW 2000AUSTRALIATel: 61(0) 2 9235 6531Fax: 61 (0) 2 9223 9903Email: [email protected]
Mr Marin SwalesConsultant - Power EngineerSustainable Development DepartmentEast Asia and the Pacific Region (EASNS)World BankLevel 19, 14 Martin PlaceSydney NSW 2000AUSTRALIATel: 61(0) 2 9223 7777Fax: 61 (0) 2 9223 9903Email: [email protected]
TECHNICAL PRESENTERS
FIJI
Mr Peter JohnstonConsultantPO Box 4206SamabulaSuvaFIJI ISLANDSTel: (679) 337 0861Fax:Email: [email protected]
THE FOUNDATION FOR DEVELOPMENTCOOPERATION
Mr Jack WhelanThe Foundation for Development Cooperation137 Melbourne StreetSouth BrisbaneQueensland 4101AUSTRALIATel: (617) 3217 2924Fax: (617) 3846 0342Email: [email protected]
FIJI ELECTRICITY AUTHORITY
Mr Hasmukh PatelCEOFiji Electricity AuthorityPMBSuvaFIJI ISLANDSTel: (679) 3224310Fax: (679) 3311074Email: [email protected]
KIRIBATI SOLAR ENERGY COMPANY LIMITED
Mr Terubentau AkuraCEOKiribati Solar Energy Company LimitedPO Box 493
94
Tel: (679) 337 0861Fax:Email: [email protected]
THE FOUNDATION FOR DEVELOPMENTCOOPERATION
Mr Jack WhelanThe Foundation for Development Cooperation137 Melbourne StreetSouth BrisbaneQueensland 4101AUSTRALIATel: (617) 3217 2924Fax: (617) 3846 0342Email: [email protected]
KIRIBATI SOLAR ENERGY COMPANY LIMITED
Mr Terubentau AkuraCEOKiribati Solar Energy Company LimitedPO Box 493BetioTarawaKIRIBATITel: (686) 2605Email: [email protected]
UNELCO
Mr John ChanielBoard MemberUNELCOPO Box 25Port VilaVANUATUTel: (678) 23883Fax: (678) 25011Email: [email protected]
OBSERVERS
Mr Lester BemandProject Manager / EngineerBemand Consultanting PTY LTD28 Renown AveOatleyNSW 2223AUSTRALIATel: 61 2 95807948Fax: 61 2 95807948Email: [email protected]
Mr Keith R ChapmanBioenergy Food SecurityConsultant to FAO - SAP8 Fort StreetBuderim 4556QueenslandAUSTRALIATel: 61 7 54456430Fax: 61 7 54456430Email: [email protected]
BetioTarawaKIRIBATITel: (686) 2605Email: [email protected]
NAURU UTILITIES AUTHORITY
Ms Silvie DageagoNauru Utilities AuthorityAIWO DistrictNAURU ISLANDTel: (674) 444 3794Fax: (674)Email: [email protected] – MINISTRY OF FINANCE
Mrs Silia Kilepoa-UalesiEnergy CoordinatorMinistry FinanceCentral Bank BuildingBeach RoadApiaSAMOA
Tel: (685) 34 341 / 34333Fax: (685) 21 312Email: [email protected]
SOLOMON ISLANDS – WILLIES ELECTRICAL
Mr David IroManager - Willies ElectricalPO Box R169HoniaraSOLOMIN ISLANDSTel: (677) 30508Fax: (677) 30477Email: [email protected]
SOCIÉTÉ DE RECHERCHE DU PACIFIQUE
Ms Barbara VlaeminckSRP DirectorSociété de Recherche du PacifiqueImmeuble Le Surcouf1 Rue Frédéric SurleauBP5363 - 98853 Nouméa CedexNOUVELLE-CALÉDONIETel: (687) 28 2195Fax: (687) 28 9896Email: [email protected]
Mr. Tau'aika 'Uta'atu (Heiss Fonohema)for CommanderTonga Defence Services
Mr. Laki PifeletiChief Education OfficerMinistry of Education, Women Affair's & Culture
Mr. David Robert WrightActing CEO & Chairman of the BoardTonga Power Ltd
95
Ms. 'Akanesi PaungaDeputy Director & Head of Women Affair's DivisionMinistry of Education, Women Affair's & Culture
Mr Sione TaumoepeauDirector of WorksMinistry of Works
Mr. Paula TaufaSales & Marketing ManagerBP Southwet Pacific Ltd
Ms. Sepiuta MoalaAuditorAudit Department
RIF CONSULTANTS
Ms Catherine BennetMr Russell HowarthMr Rewi Edwin (Ed) Pittman
COUNCIL OF REGIONAL ORGANISATIONS OFTHE PACIFIC (CROP)
PACIFIC ISLANDS FORUM SECRETARIAT
Mr Tuiloma Neroni SladeSecretary GeneralPacific Islands Forum SecretariatPMBSuvaFIJI ISLANDSTel: (679) 331 2600Fax:Email: [email protected]
Mr Edward (Ed) VrkicExecutive Officer – Pacific PlanPacific Islands Forum SecretariatPMBSuvaFIJI ISLANDSTel: (679)Fax: (679)Email:
PACIFIC POWER ASSOCIATION
Mr Tony NeilExecutive DirectorPacific Power AssociationPMBSuvaFIJI ISLANDSTel: (679) 330 6022Fax: (679) 330 2038Email: [email protected] for the Pacific Community
Mr Jimmy RodgersDirector General Tel: (679) 323 2845Fax: (679) 323 1511Email: [email protected]
Mr Roland LeongRefining & MarketingManager – Marketing & OperationsPO Box 140Nuku’alofaKINGDOM OF TONGATel: (676) 23377/23797Fax: (676) 23899Email: [email protected]
Honourable 'Akau'olaRenewable Energy AdvisorPMO Advisory Unit
Ms Meleane TaueliTonga Police
Mr Vailala MatotoSecretary for FisheriesFisheries DepartmentNuku'alofaPhone: 23 730Email: [email protected]
Mr Garaio D GafiyeManager - Energy ProgrammeATCDI UnitechPMB Lae
Mr Albert (Al) BingerAdvisor to Executive DirectorCaribbean Community Climate Change CentreBelmopanBelizeCentral AmericaTel: (501) 522 1104/
1094Fax: (501) 822 1365Email: [email protected]
Secretariat of the Pacific Community (SPC)
BP D5, 98848 Noumea Cedex95 Promenade Roger Laroque, Anse VataNEW-CALEDONIATel: (687) 262000Fax: (687) 263818Email: [email protected]
Mr Tim MartynEconomistSecretariat of the Pacific Community (SPC)Private Mail BagSuvaFIJI ISLANDSTel: (679) 337 0733Fax: (679) 337 0021Email: [email protected]
SPREP
Mr Kosi LatuActing DirectorSPREPPO Box 240Apia
96
Dr Ajal KumarLecturerFaculty of Science, Technology and EnvironmentUniversity of the South PacificLaucala CampusSuvaFIJI ISALNDSTel: (679) 32 32147Fax: (679) 323 1511Email: [email protected]
SOPAC SECRETARIAT
Secretariat of the Pacific Applied GeoscienceCommissionPrivate Mail Bag GPOSuvaFIJI ISLANDSTel: (679) 3381 377Fax: (679) 3370 040Email: [email protected]: www.sopac.org
Ms Cristelle PrattDirectorEmail: [email protected]
Mr Paul FairbairnManager Community Lifelines ProgrammeEmail: [email protected]
Mr Rupeni MarioSenior Energy AdvisorEmail: [email protected]
Ms Arieta GonelevuSenior Project OfficerEmail: [email protected]
Ms Lala BukarauSenior Advisor – Technial EditorEmail: [email protected]
Mr Sakaio ManoaAdviser ICTEmail: [email protected]
SAMOATel: (685) 21929Fax: (685) 20231Email: [email protected]
Mr Solomone FifitaManager – PIGGAREPSPREPPO Box 240ApiaSAMOATel: (685) 21929Fax: (685) 20231Email: [email protected]
University of the South Pacific
Dr Kifle KahsaiAssociate DeanFaculty of Science, Technology and EnvironmentUniversity of the South PacificLaucala CampusSuvaFIJI ISALNDS
Mrs Koin EtuatiEnergy Project OfficerEmail: [email protected]
Ms Pooja PalPA – Community Lifelines ProgrammeEmail: [email protected]
Ms Atishma LalEnergy Support OfficerEmail: [email protected]
97
Appendix 4. List of Persons Met
SOPAC Secretariat
Secretariat of the Pacific Applied GeoscienceCommission (SOPAC)Private Mail Bag GPOSuvaFIJI ISLANDSTel: (679) 3381 377Fax: (679) 3370 040Email: [email protected]: www.sopac.org
Ms Cristelle PrattDirectorEmail: [email protected]
Mr Paul FairbairnManager Community Lifelines ProgrammeEmail: [email protected]
Mr Rupeni MarioSenior Energy AdvisorEmail: [email protected]
Ms Arieta GonelevuSenior Project OfficerEmail: [email protected]
Ms Pooja PalPA – Community Lifelines ProgrammeEmail: [email protected]
Mr Ivan KrishnaProject Officer-EnergyCommunity Lifelines [email protected]
University of the South PacificDr Kifle KahsaiAssociate DeanFaculty of Science, Technology and EnvironmentUniversity of the South PacificLaucala CampusSuvaFIJI ISALNDS
Dr Ajal KumarLecturerFaculty of Science, Technology and EnvironmentUniversity of the South PacificLaucala CampusSuvaFIJI ISALNDSTel: (679) 32 32147Fax: (679) 323 1511Email: [email protected]
UNELCO
Mr John ChanielBoard Member
SPREP
Mr Kosi LatuActing DirectorSPREPPO Box 240ApiaSAMOATel: (685) 21929Fax: (685) 20231Email: [email protected]
Mr Solomone FifitaManager – PIGGAREPSPREPPO Box 240ApiaSAMOATel: (685) 21929Fax: (685) 20231Email: [email protected]
Mr Taito NakalevuRegional Project ManagerUNDP/SPREPPO Box 240ApiaSAMOATel: (685) 21929Fax: (685) 20231Email: [email protected]
Mr Albert (Al) BingerAdvisor to Executive DirectorCaribbean Community Climate Change CentreBelmopanBelizeCentral AmericaTel: (501) 522 1104/
1094Fax: (501) 822 1365Email: [email protected]
Secretariat of the Pacific Community (SPC)BP D5, 98848 Noumea Cedex95 Promenade Roger Laroque, Anse VataNEW-CALEDONIATel: (687) 262000Fax: (687) 263818Email: [email protected]
Mr Tim MartynEconomistSecretariat of the Pacific Community (SPC)Private Mail BagSuvaFIJI ISLANDSTel: (679) 337 0733Fax: (679) 337 0021Email: [email protected]
SAMOA – MINISTRY OF FINANCE
98
UNELCOPO Box 25Port VilaVANUATUTel: (678) 23883Fax: (678) 25011Email: [email protected]
Mr Peter JohnstonConsultantPO Box 4206SamabulaSuvaFIJI ISLANDSTel: (679) 337 0861Fax:Email: [email protected]
THE FOUNDATION FOR DEVELOPMENTCOOPERATION
Mr Jack WhelanThe Foundation for Development Cooperation137 Melbourne StreetSouth BrisbaneQueensland 4101AUSTRALIATel: (617) 3217 2924Fax: (617) 3846 0342Email: [email protected]
FIJIMr. Peceli NakavulevuDept of Energy Ministry of Works and EnergyPO Box 2493Govt. BuildingsSuvaFIJI ISLANDSTel: (679) 3386006Fax: (679) 3386677Email: [email protected]
Mr Tony NeilExecutive DirectorPacific Power AssociationPMBSuvaFIJI ISLANDSTel: (679) 330 6022Fax: (679) 330 2038Email: [email protected]
Mr Taholo KamiDirectorIUCN Regional Office for OceaniaPMB5 Ma'afu StreetSuvaFIJI ISLANDSTel: (679) 331 9084Fax: (679) 3100 128Email: [email protected]
Mr Anare MatakivitiProject ManagerIUCN Regional Office for Oceania
Mrs Silia Kilepoa-UalesiEnergy CoordinatorMinistry FinanceCentral Bank BuildingBeach RoadApiaSAMOATel: (685) 34 341 / 34333Fax: (685) 21 312Email: [email protected]
IT Power
Mr Anthony DerrickManaging DirectorIT POWER LTDThe Warren, Bramshill RoadRg27 0pr Hook Eversley, HantsUnited KingdomTel: 44 12 56392700Fax: 44 12 56392700Email: [email protected]
REEPMr Mike AllenAdvisorREEEPSuite 201, Level 218 Kavanagh StreetSouthbank VIC 3006AUSTRALIATel: (613) 9929 4100Fax: (613) 9929 4101Email: [email protected]
Mr Thomas Lynge JensenEnvironment & Energy Policy SpecialistUNDP Pacific CentrePrivate Mail BagSuvaFIJI ISLANDSTel: (679) 330 0399Fax: (679) 330 1976Email: [email protected]
UNIDO
Mr Sebastian HermannAssociate Expert Renewable EnergyRenewable and Rural Energy UnitEnergy and Climate Change BranchProgramme Development and TechnicalCooperation DivisionUNIDOVienna International CentreP O Box 3001400ViennaAUSTRIATel: 43 1 26026 4817Fax: 43 1 26026 6803Email: [email protected]
World Bank
99
PMB5 Ma'afu StreetSuvaFIJI ISLANDSTel: (679) 331 9084Fax: (679) 3100 128Email: [email protected]
Ms Salote SauturagaIUCNPMB5 Ma'afu StreetSuvaFIJI ISLANDSTel: (679) 331 9084Fax: (679) 3100 128Email: [email protected]
Dr Richard BeyerPerm. SecretaryMinistry of Primary IndustriesTakayawa TowerPMB Raiwaga SuvaFijiTel: 679-3301611Fax:679- 3310679Email: [email protected] Foundation for Development
Mr Craig WilsonExecutive DirectorThe Foundation for Development Cooperation137 Melbourne StSouth BrisbaneQueensland 4101AUSTRALIATel: (61 7) 3217 2924Fax: (61 7) 3846 0342Email: [email protected]
VANUATU
Mr Moli JanjeaSenior Energy OfficerEnergy UnitPrivate Mail Bag 9067Rue Winston ChurchillPort VilaVANUATUTel: [678] 25201Fax: [678] 23586Email: [email protected]
Solomon IslandsMr Toswell KauaMinistry of Mines, Energy and Rural ElectrificationPO Box G37HoniaraSOLOMON ISLANDSTel: (677) 21 522 / 21 525Fax: (677) 25 811Email: [email protected]
Marshall Islands
Mr Nick Wardrop
Ms Wendy HughesSenior Energy SpecialistSustainable Development DepartmentEast Asia and the Pacific Region (EASNS)World BankLevel 19, 14 Martin PlaceSydney NSW 2000AUSTRALIATel: 61(0) 2 9223 7777Fax: 61 (0) 2 9223 9903Email: [email protected]
Kingdom of TongaMr Asipeli PalakiDeputy CEOMinistry of Lands, Surveys & Natural ResourcesP O Box 5Nuku’alofaKingdom Of TongaTel: (676) 23 611Fax: (676) 23 216Email: [email protected]
Ms Emeline VeikosoEnergy Planner, EPUMinistry of Lands, Surveys & Natural ResourcesP O Box 5Nuku’alofaKINGDOM of TONGATel: (676) 23 611Fax: (676) 23 216Email: [email protected]
Asian Development Bank
Mr Anthony MaxwellEnergy SpeclialistAsian Development Bank6 ADB AvenueMandaluyong City 1550Metro ManilaPHILIPPINESTel: (632) 632-6391Fax: (632) 636 2446Email: [email protected]
AusAID and AustraliaMr Brian DawsonClimate Change and Energy AdvisorAusAIDGPO Box 887Canberra ACT 2601AUSTRALIATel: (612) 6206 4819Fax: (612) 6206 4720Email: [email protected]
Mr Paul WrightProgram ManagerInfrastructure Pacific BranchAusAIDGPO Box 887Canberra ACT 2601AUSTRALIA
100
Energy AdviserMinistry of Resources & DevelopmentP O Box 1727MajuroMARSHALL ISLANDS 96900Tel: (692) 625 3206
61 7 418254275Fax: (692) 625 7471Email: [email protected]
Ms Yuen Kayo Yamaguchi – KottonMinistry of FinanceSenior EU Desk OfficerPO Box MajuroMARSHALL ISLANDS 96900Tel: (692) 625 8835Fax: (692) 625 3607Email: [email protected]
Republic Of Marshall Islands
(**Representing the Minister)Ms Angeline AbrahamNational Energy PlannerMinistry of Resources & DevelopmentP O Box 1727MajuroMARSHALL ISLANDS 96900Tel: (692) 625 3206Fax: (692) 625 7471Email: [email protected]
Mr Thomas Kijiner JnrPermanent SecretaryMinistry of Resources and DevelopmentP O Box 1727MAJUROMARSHALL ISLANDS 96900Tel: (692) 625 3206Fax: (692) 625 7471Email: [email protected]
Ms. Yuen Kayo Yamaguchii KottonTA to NAO-EU OfficerMinistry of FinanceMajuroMarshall Islands. 96960.Tel: 692-6258835/5413Fax: 692-6253607Email: [email protected]
SamoaMr. Mua’Ausa Joseph Siegfried WalterGeneral ManagerElectric Power CorporationLevel 3 John Williams Bldg.Tamaligi.ApiaSamoaTel: 685-26286Fax: 685 23748Email: [email protected]@samoa.ws
Mr. Wairarapa Young
Tel: (612) 6206 4346Fax: (612) 6206 4720Email: [email protected]
Mr John RussellAssistant DirectorRenewable Energy Policy & Partnerships SectionDepartment of the Environment, Water, Heritageand the ArtsGPO Box 787 Canberra ACT 2601AUSTRALIATel: (612) 6274 1139Fax: (612) 6274 1390Email: [email protected]
South Pacific Commission
Mr Tim MartynEconomistSecretariat of the Pacific Community (SPC)Private Mail BagSuvaFIJI ISLANDSTel: (679) 337 0733Fax: (679) 337 0021Email: [email protected]
Dr. Lex ThomsonFACT Team LeaderAgri-Forestry Export Production SpecialistSecretariat of the Pacific Community (SPC)Private Mail BagSuvaFIJI ISLANDSTel: 679-337 0733Fax: 679-3370021Email: [email protected]
Papua New Guinea
Mr. Garaio GafiyeRes. EngineerPNG Univ of TechnologyPMB, Lae.Morobe ProvincePapua New guineaTel: 675-473 4778Fax: 675-473 4303Email: [email protected] SamoaTel: 685-65408Fax: 685-685 2378Email: [email protected]
VanuatuMinistry of Agriculture Quarantine Forestry andFisheries Port Vila:
Ruben MarkwardDirector of Agriculture
James WasiDept of Ag [email protected]
Ms.Annick Stevens
101
Renewable Energy OfficerElectric Power CorporationLevel 3 John Williams Bldg.Tamaligi.
Mr Taito Ulaitino Dr Faale TumaaliiChief Executive OfficerScientific Research Organisation of SamoaPO box 6597Apia Post Office, Apia. Samoa.Tel: 685-20664Fax:685 20352Email: [email protected]
FAO –SAP SamoaPrivate Mail BagApia Samoa.Tel: +685 22127Fax+ 685 21126
Vili FavaoSub Regional FAO Representative for the PacificEmail: [email protected]
Dirk SchulzEmail: [email protected]
Aru MatiasEmail: [email protected]
Mat PureaEmail: [email protected]
Stephen Rogers: Consultant to FAOEmail: [email protected] PoonythEmail: [email protected]
Mere SalesaEmail: [email protected]
PAPUA NEW GUINEA
Dept of Agriculture and LivestockPort Moresby.
Mr Brown KonabeDirector of Food Security Programme and FoodSecurity BranchKonedobuPort [email protected]
Mr. Ian OnagaDirector of Science and Technology BranchKonedobuPort Moresby
Dr Ruth TuriaDirector Forest Policy PlanningNational Forest ServiceNational Capital District Port [email protected]
Mr. Goodwill Amos
Food Security Officer
Julie BeierleinTech Assistant –Food Security
Vincent LebotAgric Research (Root Crops)[email protected]
Rexon ViraSen. Forestry Officer Planning
Ms. Sapai-Moana MatarikiSen. Trade and Marketing OfficerDept of Trade and IndustryPort [email protected]
Ministry of Lands, Geology, Mines, Energy and RuralWater Supply Port Vila:
George ShemDept of Lands-Land Use Planning
Ms Josiana JacksonGIS Section Chief/ITC UnitLands and [email protected]
Moli JanjeaEnergy Officer
Jesse BenjaminRural Electrification Unit
Trinison TariHead of Environmental Unit
Erickson SammyRural Water Supply Officer
Willie KarieResources DepartmentSocometra Vanuatu Ltd.UNELCOPort [email protected]
Francois PyTechnical DepartmentSocometra Vanuatu Ltd.UNELCOPort [email protected]
John ChanielBoard MemberUNELCOPort [email protected]
Nicholas MonvoisinManagement TeamTeouma Prawns/Coconut OilPort [email protected]
102
Manager Forest Planning and Coordinator Forestand Climate ChangeNational Forest ServiceNational Capital District Port [email protected]
Mr Alan LariAssistant DirectorEngineering Services BranchEnergy DivisionDept of Petroleum and EnergyNational Capital District Port MoresbyPh: 675-3253233
Mr Vove VeveActing SecretaryDept of Petroleum and EnergyNational Capital District Port Moresby
Mr Brenden TrawenDept of Environment and ConservationSomare Foundation Building Port Moresby
Mt Gerard NateraManager Spatial Systems and DataDept of Environment and ConservationSomare Foundation Building Port [email protected]
Professor PalMrs Rosa KambouNARI PNG.
Mr Pepi KimasSec. Dept of Lands andThe DirectorWaigami. Port Moresby.
Mr Nick SuvuloActing National StatisticianWaigami. Port [email protected]
Mr Alan AkuSen. Projects OfficerKokonas Indastri KoporesenNat Capital District Port [email protected]
Mr. Ian OrrellManaging DirectorOilPalm Research Association Inc.Dami Research StationKimbe West New Britain [email protected]
Mr.Jeong LimCEOChangae Cassava Biofuel ProjectPort Moresby
Mr Matthew KanuaProgram Manager-AgriculturePNG Sustainable Development ProjectNCD Port Moresby
Solomon Islands
Mr Harry BrockProject ManagerGuadalcanal Plains Palm Oil Ltd.,Email: [email protected]
Mr Grant VinningAus AID Community Sector ProgramMarketing SpecialistTom Yu [email protected]
Mr Owen HughesAgriculture Livelihoods Program ManagerAusAID Community Sector ProgramTom Yu BldgHoniaraPh: [email protected]
Mr Trevor ClarkCocoa Rehabilitation Program CoordinatorAusAID Community Sector ProgramTom Yu BldgHoniaraPh: +677-96565
Ross AndrewarthaTeam LeaderAusAIDForestry Management Project [email protected]
John VollrathDirector ManagerSolomon Tropical [email protected]: +677-38553
Aileen CroghanFirst SecretaryDept CooperationAus AIDAustralian High [email protected]: + 677-21561
Mr. Paul GreenerRural Development AdviserDept CooperationAus AIDAustralian High CommissionHoniara
Mr Martin SamManager Distribution/Chief EngineerRanadi Head [email protected]: + 677-30533
103
Mr Ted SitapaiPNG Sustainable Development ProjectNCD Port Moresby
Mr Sev MasoAdvisor –Power EngineeringProgram Manager-AgriculturePNG Sustainable Development ProjectNCD Port [email protected]
Mr. Raymond YauiabMr. Daniel Paita and TeamOffice of Climate Change and EnvironmentalSustainabilityPort [email protected]
Mr Phil ShermanRemote Sensing UnitScience 2 BuildingUPNGPort Moresby
Mr. Tony Nakuk andMs. Myamya KyiPolicy and Statistics SectionCommerce and IndustryDept of Foreign Affairs and Trade.Port Moresby.
Mr Alfred MaesuliaUnder SecretaryMinistry of Agriculture and [email protected]: + 677-24570
Mr Kennet BulehiteEnergy DivisionMinistry of Mines, Energy and Rural [email protected]
Mr David RamuCommodity Export Marketing AuthorityHoniara
Mr Jimmy IkinaHeadNational GIS UnitNational Land CentreMinistry of LandsHoniara
Mr John HarunariDirector of Extension and TrainingMinistry of Agriculture and [email protected]
Mr. Jimi SaeleaDirector of ResearchMinistry of Agriculture and LivestockHoniara
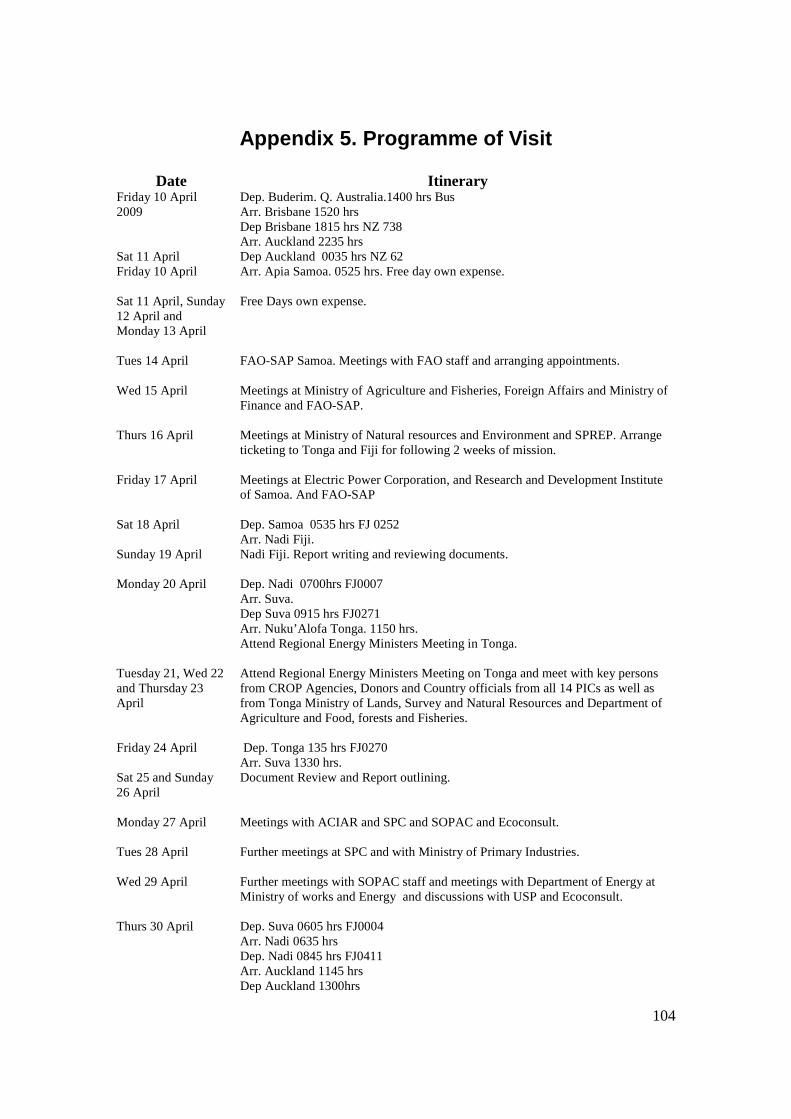
104
Appendix 5. Programme of Visit
Date ItineraryFriday 10 April2009
Sat 11 AprilFriday 10 April
Sat 11 April, Sunday12 April andMonday 13 April
Tues 14 April
Wed 15 April
Thurs 16 April
Friday 17 April
Sat 18 April
Sunday 19 April
Monday 20 April
Tuesday 21, Wed 22and Thursday 23April
Friday 24 April
Sat 25 and Sunday26 April
Monday 27 April
Tues 28 April
Wed 29 April
Thurs 30 April
Dep. Buderim. Q. Australia.1400 hrs BusArr. Brisbane 1520 hrsDep Brisbane 1815 hrs NZ 738Arr. Auckland 2235 hrsDep Auckland 0035 hrs NZ 62Arr. Apia Samoa. 0525 hrs. Free day own expense.
Free Days own expense.
FAO-SAP Samoa. Meetings with FAO staff and arranging appointments.
Meetings at Ministry of Agriculture and Fisheries, Foreign Affairs and Ministry ofFinance and FAO-SAP.
Meetings at Ministry of Natural resources and Environment and SPREP. Arrangeticketing to Tonga and Fiji for following 2 weeks of mission.
Meetings at Electric Power Corporation, and Research and Development Instituteof Samoa. And FAO-SAP
Dep. Samoa 0535 hrs FJ 0252Arr. Nadi Fiji.Nadi Fiji. Report writing and reviewing documents.
Dep. Nadi 0700hrs FJ0007Arr. Suva.Dep Suva 0915 hrs FJ0271Arr. Nuku’Alofa Tonga. 1150 hrs.Attend Regional Energy Ministers Meeting in Tonga.
Attend Regional Energy Ministers Meeting on Tonga and meet with key personsfrom CROP Agencies, Donors and Country officials from all 14 PICs as well asfrom Tonga Ministry of Lands, Survey and Natural Resources and Department ofAgriculture and Food, forests and Fisheries.
Dep. Tonga 135 hrs FJ0270Arr. Suva 1330 hrs.Document Review and Report outlining.
Meetings with ACIAR and SPC and SOPAC and Ecoconsult.
Further meetings at SPC and with Ministry of Primary Industries.
Further meetings with SOPAC staff and meetings with Department of Energy atMinistry of works and Energy and discussions with USP and Ecoconsult.
Dep. Suva 0605 hrs FJ0004Arr. Nadi 0635 hrsDep. Nadi 0845 hrs FJ0411Arr. Auckland 1145 hrsDep Auckland 1300hrs
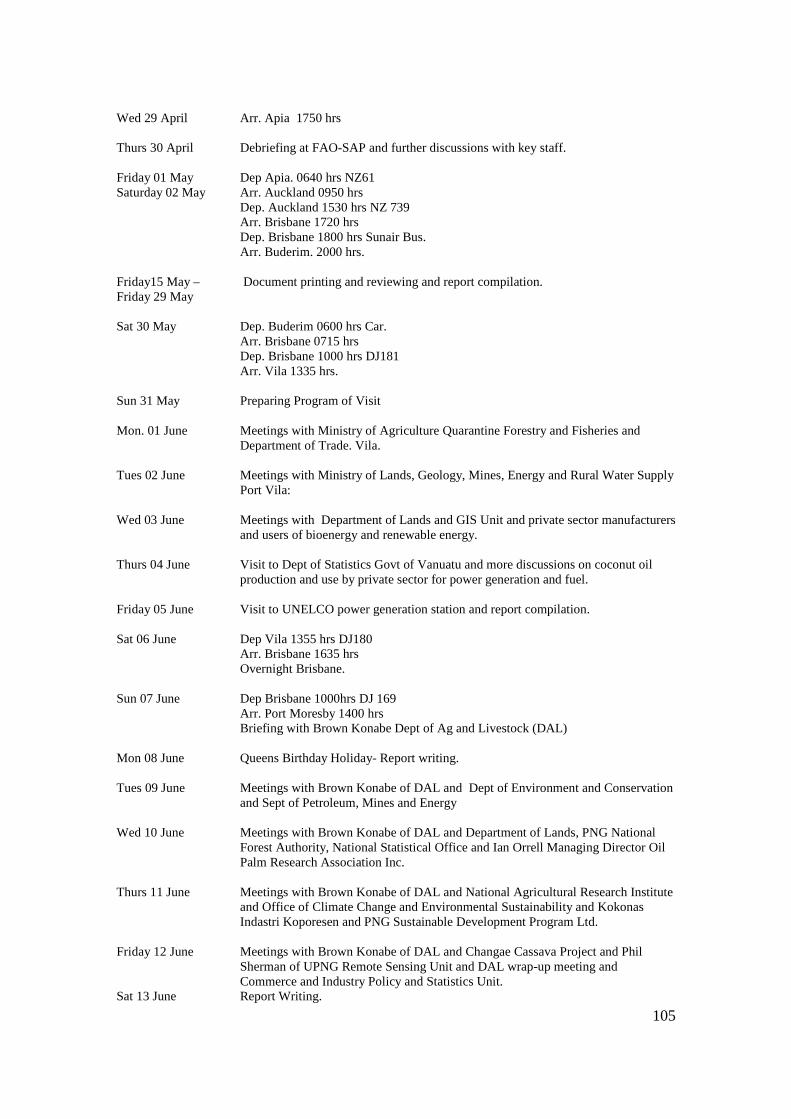
105
Wed 29 April
Thurs 30 April
Friday 01 MaySaturday 02 May
Friday15 May –Friday 29 May
Sat 30 May
Sun 31 May
Mon. 01 June
Tues 02 June
Wed 03 June
Thurs 04 June
Friday 05 June
Sat 06 June
Sun 07 June
Mon 08 June
Tues 09 June
Wed 10 June
Thurs 11 June
Friday 12 June
Sat 13 June
Arr. Apia 1750 hrs
Debriefing at FAO-SAP and further discussions with key staff.
Dep Apia. 0640 hrs NZ61Arr. Auckland 0950 hrsDep. Auckland 1530 hrs NZ 739Arr. Brisbane 1720 hrsDep. Brisbane 1800 hrs Sunair Bus.Arr. Buderim. 2000 hrs.
Document printing and reviewing and report compilation.
Dep. Buderim 0600 hrs Car.Arr. Brisbane 0715 hrsDep. Brisbane 1000 hrs DJ181Arr. Vila 1335 hrs.
Preparing Program of Visit
Meetings with Ministry of Agriculture Quarantine Forestry and Fisheries andDepartment of Trade. Vila.
Meetings with Ministry of Lands, Geology, Mines, Energy and Rural Water SupplyPort Vila:
Meetings with Department of Lands and GIS Unit and private sector manufacturersand users of bioenergy and renewable energy.
Visit to Dept of Statistics Govt of Vanuatu and more discussions on coconut oilproduction and use by private sector for power generation and fuel.
Visit to UNELCO power generation station and report compilation.
Dep Vila 1355 hrs DJ180Arr. Brisbane 1635 hrsOvernight Brisbane.
Dep Brisbane 1000hrs DJ 169Arr. Port Moresby 1400 hrsBriefing with Brown Konabe Dept of Ag and Livestock (DAL)
Queens Birthday Holiday- Report writing.
Meetings with Brown Konabe of DAL and Dept of Environment and Conservationand Sept of Petroleum, Mines and Energy
Meetings with Brown Konabe of DAL and Department of Lands, PNG NationalForest Authority, National Statistical Office and Ian Orrell Managing Director OilPalm Research Association Inc.
Meetings with Brown Konabe of DAL and National Agricultural Research Instituteand Office of Climate Change and Environmental Sustainability and KokonasIndastri Koporesen and PNG Sustainable Development Program Ltd.
Meetings with Brown Konabe of DAL and Changae Cassava Project and PhilSherman of UPNG Remote Sensing Unit and DAL wrap-up meeting andCommerce and Industry Policy and Statistics Unit.Report Writing.
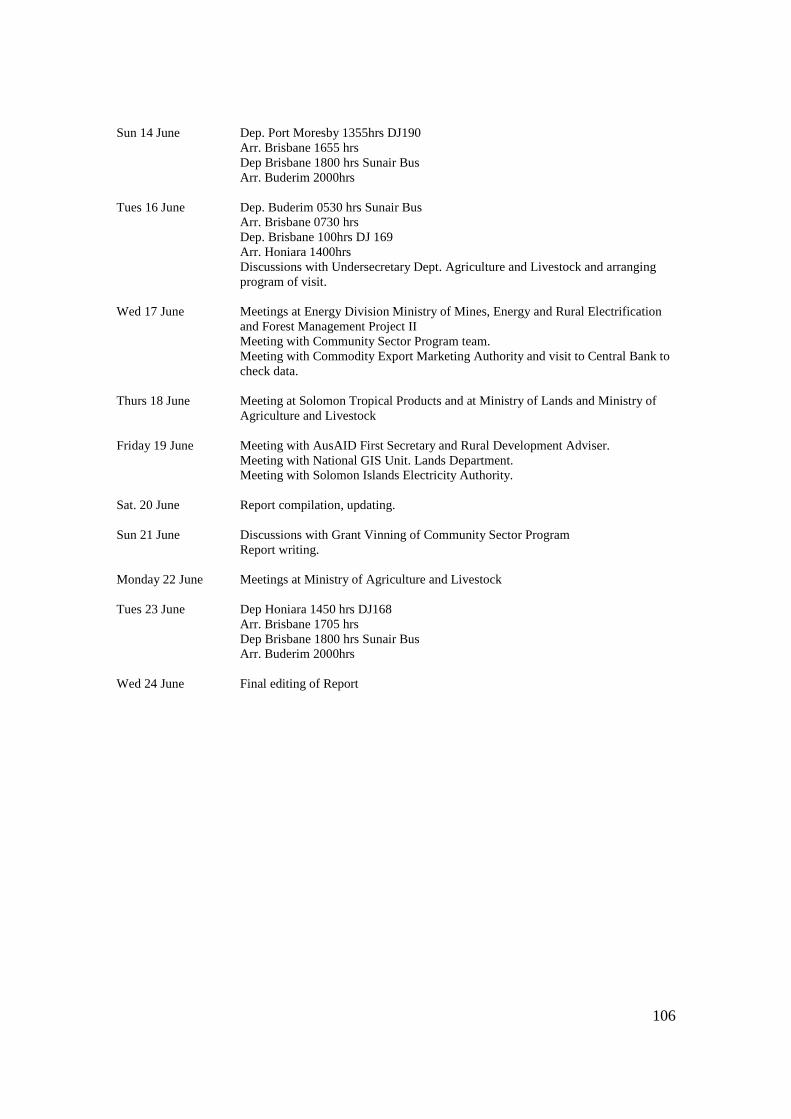
106
Sun 14 June
Tues 16 June
Wed 17 June
Thurs 18 June
Friday 19 June
Sat. 20 June
Sun 21 June
Monday 22 June
Tues 23 June
Wed 24 June
Dep. Port Moresby 1355hrs DJ190Arr. Brisbane 1655 hrsDep Brisbane 1800 hrs Sunair BusArr. Buderim 2000hrs
Dep. Buderim 0530 hrs Sunair BusArr. Brisbane 0730 hrsDep. Brisbane 100hrs DJ 169Arr. Honiara 1400hrsDiscussions with Undersecretary Dept. Agriculture and Livestock and arrangingprogram of visit.
Meetings at Energy Division Ministry of Mines, Energy and Rural Electrificationand Forest Management Project IIMeeting with Community Sector Program team.Meeting with Commodity Export Marketing Authority and visit to Central Bank tocheck data.
Meeting at Solomon Tropical Products and at Ministry of Lands and Ministry ofAgriculture and Livestock
Meeting with AusAID First Secretary and Rural Development Adviser.Meeting with National GIS Unit. Lands Department.Meeting with Solomon Islands Electricity Authority.
Report compilation, updating.
Discussions with Grant Vinning of Community Sector ProgramReport writing.
Meetings at Ministry of Agriculture and Livestock
Dep Honiara 1450 hrs DJ168Arr. Brisbane 1705 hrsDep Brisbane 1800 hrs Sunair BusArr. Buderim 2000hrs
Final editing of Report