RAJAS THAN - National Institute of Educational Planning and ...
246
RAJAS THAN · . : DIRECTORATE Of ECONOMICS &·STATi.STICS, . _.. . ·, .I> .
-
Upload
khangminh22 -
Category
Documents
-
view
4 -
download
0
Transcript of RAJAS THAN - National Institute of Educational Planning and ...
RAJAS THAN · . : DIRECTORATE Of ECONOMICS & ·STATi.STICS, ~JASTHAN, J~IP.UR . _..
. ~ ·,
.I> .
BASIC STATISTICS RAJAS THAN
1999
DIRECTORATE OF ECONOMICS & STATISTICS, RAJASTHAN, JAIPUR
Price : 110/-
Printed at:
Raj. Rajya Sahakari Mudranalaya Ltd., Jaipur
Phone:751352, 751417

PREFACE
The Publication "BASIC STATISTICS-1999" provides important information on different sectors of the state's economy in the form of tables.
The present issue includes information relating to various socioeconomic and development activities as provided by different Central and State Government Departments. The data presented in the publication relates to the calendar year 1998 or the Financial/Agriculture/Cooperative year ·1997-98 except where otherwise indicated.
The offic~rs and staff of the Co-ordination Unit of this Directorate have done a comma.ndable job in bringing out this publication.
I am sure that the present issue of the publication, like it's previous issues, would be usefui to planners, policy makers and research scholars in understanding the socio-economic changes, in all dimensions, taking place in the state.
Any suggestion from users regarding improvement in coverage and presentation of the publication would be highly appreciated.
JAIPUR March,2000
~ -n·'Vl I.--,
---------------( N.L. KHINCHI) Director,
Economics & Statistics, Rajasthan, Jaipur.
OFFICERS AND OFFICIALS
ASSOCIATED WITH
THIS PUBLICATION
Joint Director
Shri D.K. Jain
De_p_-,P-v Director
..r.::.l1·1 B.S. J at
Assistant Director
Shri R.N. Meena
Statistical Assistants
Shri Jagdeep Purohit Smt. Sudha Mathur Smt. Santosh Jain
Computor
Shri Shrawan Gupta
(a)
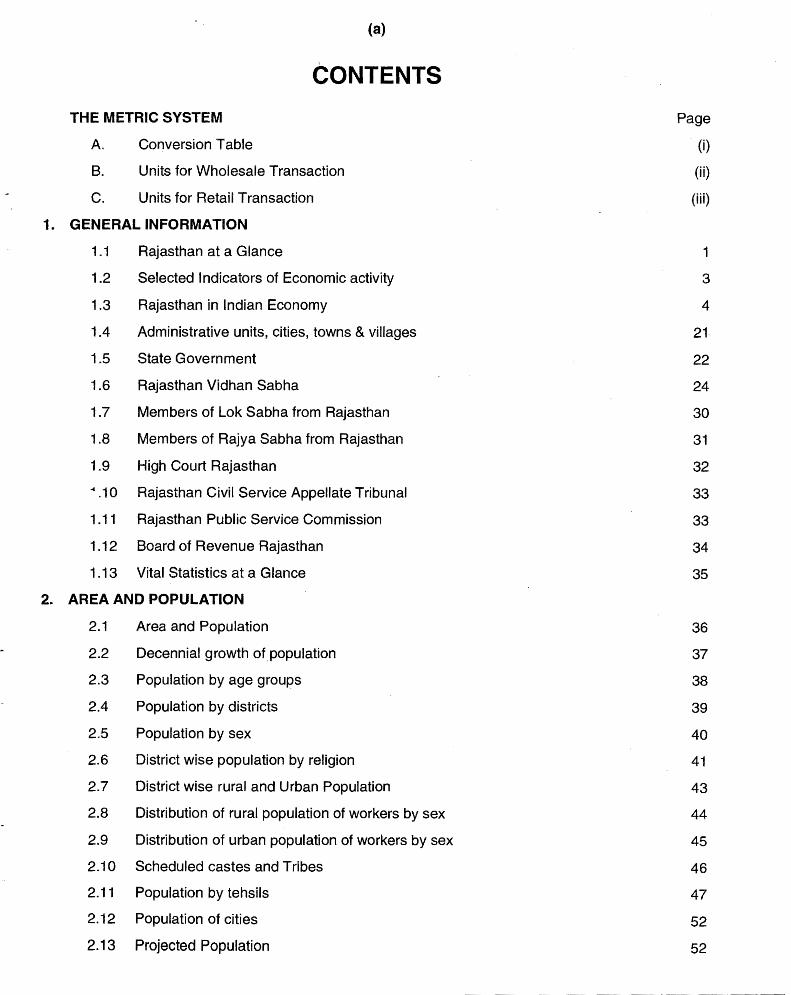
CONTENTS
THE METRIC SYSTEM Page
A. Conversion Table (i)
B. Units for Wholesale Transaction (ii)
C. Units for Retail Transaction (iii)
1. GENERAL INFORMATION
1.1 Rajasthan at a Glance 1
1.2 Selected Indicators of Economic activity 3
1.3 Rajasthan in Indian Economy 4
1.4 Administrative units, cities, towns & villages 21
1.5 State Government 22
1.6 Rajasthan Vidhan Sabha 24
1.7 Members of Lok Sabha from Rajasthan 30
1.8 Members of Rajya Sabha from Rajasthan 31
1.9 High Court Rajasthan 32
.... 10 Rajasthan Civil Service Appellate Tribunal 33
1.11 Rajasthan Public Service Commission 33
1.12 Board of Revenue Rajasthan 34
1.13 Vital Statistics at a Glance 35
2. AREA AND POPULATION
2.1 Area and Population 36
2.2 Decennial growth of population 37
2.3 Population by age groups 38
2.4 Population by districts 39
2.5 Population by sex 40
2.6 District wise population by religion 41
2.7 District wise rural and Urban Population 43
2.8 Distribution of rural population of workers by sex 44
2.9 Distribution of urban population of workers by sex 45
2.10 Scheduled castes and Tribes 46
2.11 Population by tehsils 47
2.12 Population of cities 52
2.13 Projected Population 52
-------~-
(b)
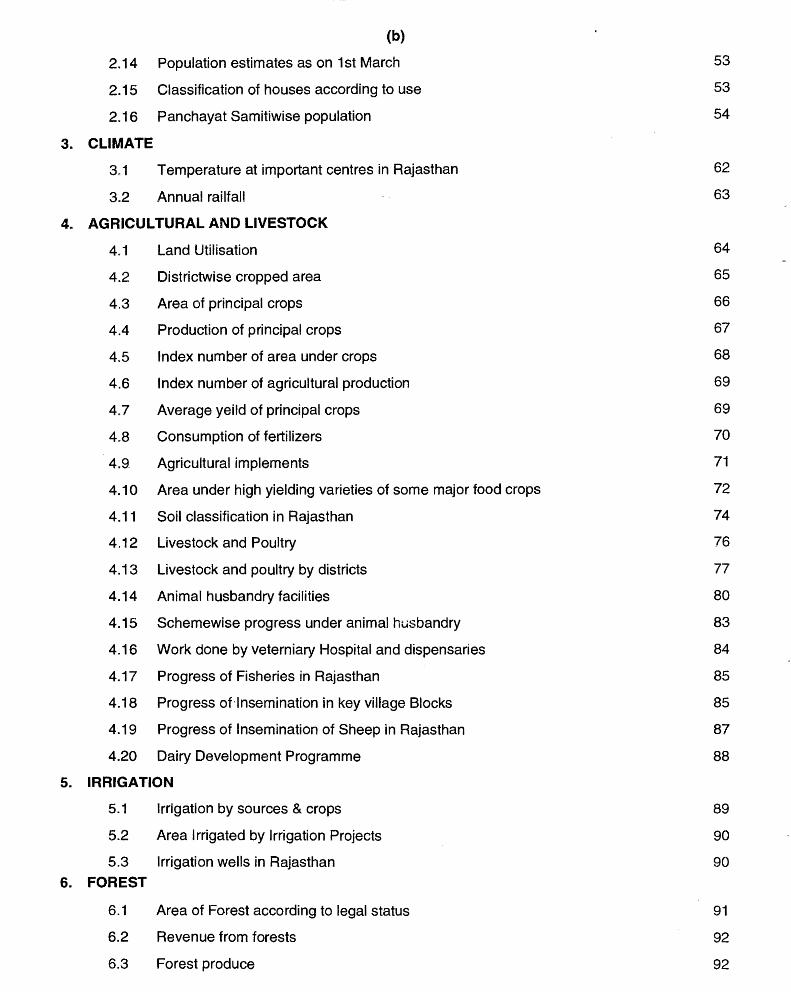
2.14 Population estimates as on 1st March 53
2.15 Classification of houses according to use 53
2.16 Panchayat Samitiwise population 54
3. CLIMATE
3.1 Temperature at important centres in Rajasthan 62
3.2 Annual railfall 63
4. AGRICULTURAL AND LIVESTOCK
4.1 Land Utilisation 64
4.2 Districtwise cropped area 65
4.3 Area of principal crops 66
4.4 Production of principal crops 67
4.5 Index number of area under crops 68
4.6 Index number of agricultural production 69
4.7 Average yeild of principal crops 69
4.8 Consumption of fertilizers 70
4.9 Agricultural implements 71
4.10 Area under high yielding varieties of some major food crops 72
4.11 Soil classification in Rajasthan 74
4.12 Livestock and Poultry 76
4.13 Livestock and poultry by districts 77
4.14 Animal husbandry facilities 80
4.15 Schemewise progress under animal husbandry 83
4.16 Work done by veterniary Hospital and dispensaries 84
4.17 Progress of Fisheries in Rajasthan 85
4.18 Progress of-Insemination in key village Blocks 85
4.19 Progress of Insemination of Sheep in Rajasthan 87
4.20 Dairy Development Programme 88
5. IRRIGATION
5.1 Irrigation by sources & crops 89
5.2 Area Irrigated by Irrigation Projects 90
5.3 Irrigation wells in Rajasthan 90 6. FOREST
6.1 Area of Forest according to legal status 91
6.2 Revenue from forests 92
6.3 Forest produce 92
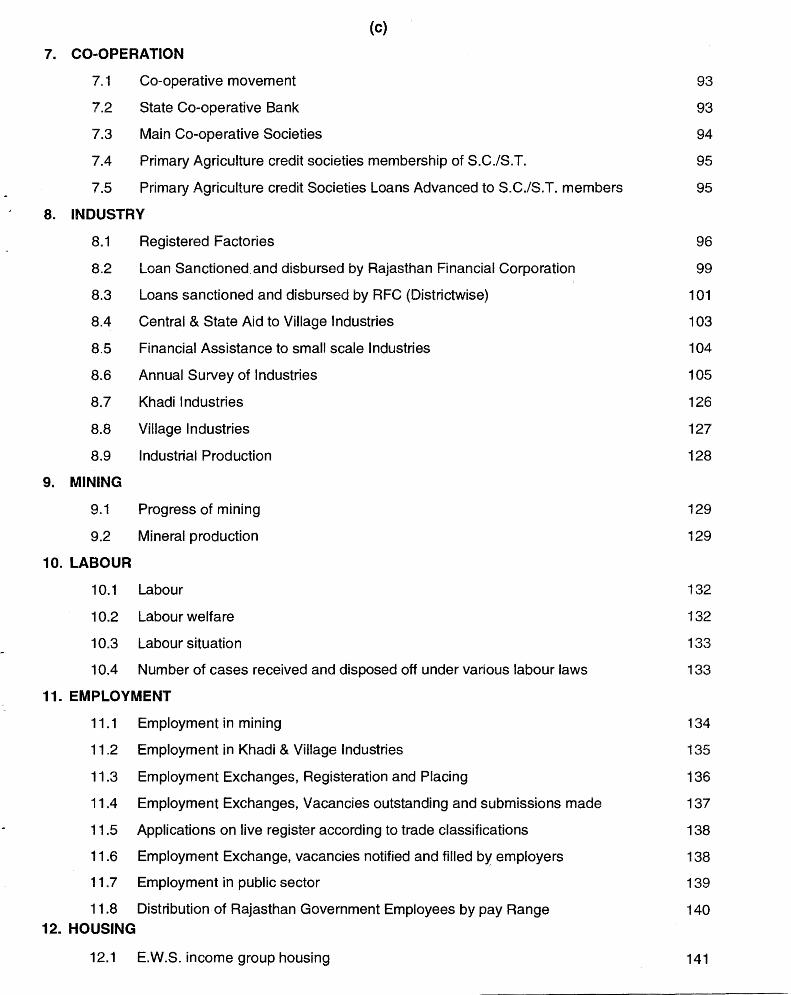
(c)
7. CO-OPERATION
7.1
7.2
7.3
7.4
7.5
Co-operative movement
State Co-operative Bank
Main Co-operative Societies
Primary Agriculture credit societies membership of S.C./S.T.
Primary Agriculture credit Societies Loans Advanced to S.C./S.T. members
8. INDUSTRY
9.
8.1
8.2
8.3
8.4
8.5
8.6
8.7
8.8
8.9
MINING
9.1
9.2
Registered Factories
Loan Sanctioned.and disbursed by Rajasthan Financial Corporation
Loans sanctioned and disbursed by RFC (Districtwise)
Central & State Aid to Village Industries
Financial Assistance to small scale Industries
Annual Survey of Industries
Khadi Industries
Village Industries
Industrial Production
Progress of mining
Mineral production
10. LABOUR
10.1 Labour
10.2 Labour welfare
10.3 Labour situation
10.4 Number of cases received and disposed off under various labour laws
11. EMPLOYMENT
11.1 Employment in mining
11 .2 Employment in Khadi & Village Industries
11.3 Employment Exchanges, Registeration and Placing
11.4 Employment Exchanges, Vacancies outstanding and submissions made
11.5 Applications on live register according to trade classifications
11 .6 Employment Exchange, vacancies notified and filled by employers
11. 7 Employment in public sector
11.8 Distribution of Rajasthan Government Employees by pay Range 12. HOUSING
12.1 E.W.S. income group housing
93
93
94
95
95
96
99
101
103
104
105
126
127
128
129
129
132
132
133
133
134
135
136
137
138
138
139
140
141
(d)
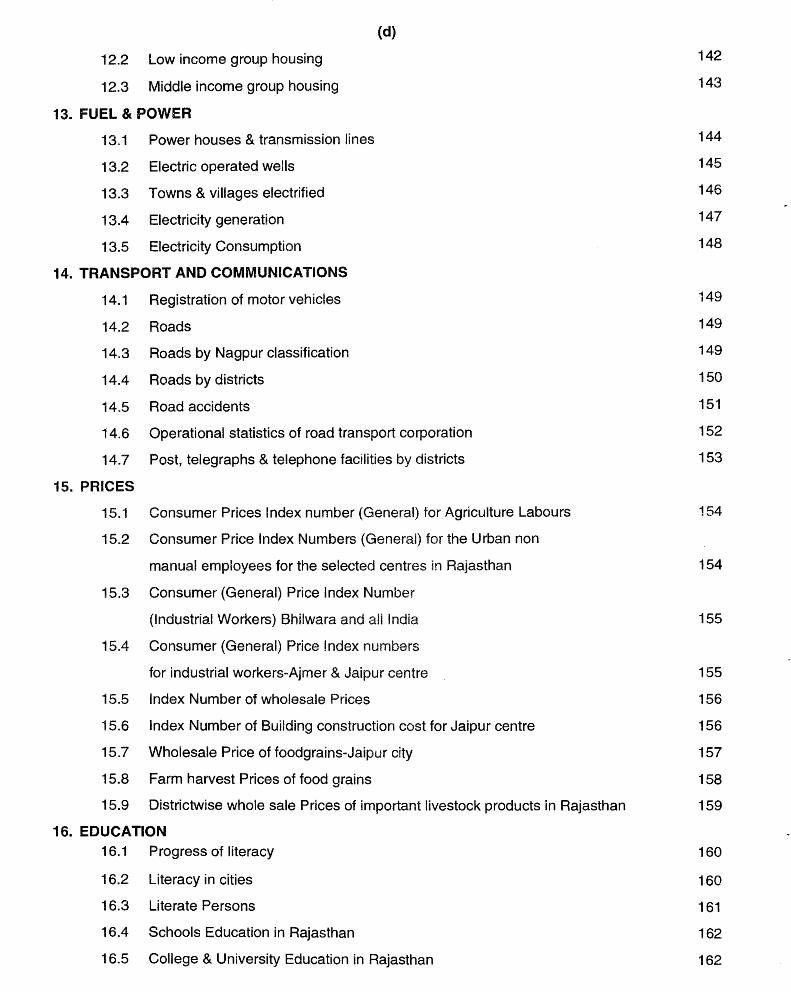
12.2 Low income group housing
12.3 Middle income group housing
13. FUEL & POWER
13.1 Power houses & transmission lines
13.2 Electric operated wells
13.3 Towns & villages electrified
13.4 Electricity generation
13.5 Electricity Consumption
14. TRANSPORT AND COMMUNICATIONS
14.1 Registration of motor vehicles
14.2 Roads
14.3 Roads by Nagpur classification
14.4 Roads by districts
14.5 Road accidents
14.6 Operational statistics of road transport corporation
14.7 Post, telegraphs & telephone facilities by districts
15. PRICES
15.1 Consumer Prices Index number (General) for .Agriculture Labours
15.2 Consumer Price Index Numbers (General) for the Urban non
manual employees for the selected centres in Rajasthan
15.3 Consumer (General) Price Index Number
(Industrial Workers) Bhilwara and all India
15.4 Consumer (General) Price Index numbers
for industrial workers-Ajmer & Jaipur centre
15.5 Index Number of wholesale Prices
15.6 Index Number of Building construction cost for Jaipur centre
15. 7 Wholesale Price of foodgrains-Jaipur city
15.8 Farm harvest Prices of food grains
15.9 Districtwise whole sale Prices of important livestock products in Rajasthan
16. EDUCATION 16.1 Progress of literacy
16.2 Literacy in cities
16.3 Literate Persons
16.4 Schools Education in Rajasthan
16.5 College & University Education in Rajasthan
142
143
144
145
146
147
148
149
149
149
150
151
152
153
154
154
155
155
156
156
157
158
159
160
160
161
162
162
(e)
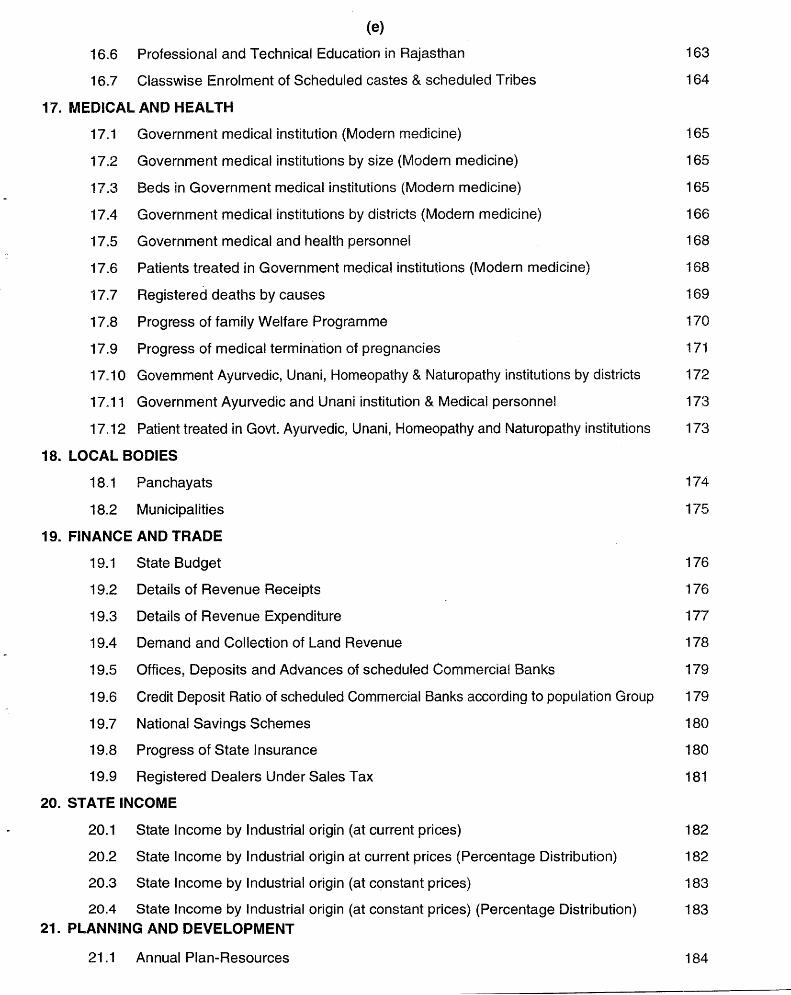
16.6 Professional and Technical Education in Rajasthan
16.7 Classwise Enrolment of Scheduled castes & scheduled Tribes
17. MEDICAL AND HEALTH
17 .1 Government medical institution (Modern medicine)
17.2 Government medical institutions by size (Modern medicine)
17.3 Beds in Government medical institutions (Modern medicine)
17.4 Government medical institutions by districts (Modern medicine)
17 .5 Government medical and health personnel
17.6 Patients treated in Government medical institutions (Modern medicine)
17. 7 Registered deaths by causes
17 .8 Progress of family Welfare Programme
17 .9 Progress of medical termination of pregnancies
163
164
165
165
165
166
168
168
169
170
171
17.1 O Government Ayurvedic, Unani, Homeopathy & Naturopathy institutions by districts 172
17.11 Government Ayurvedic and Unani institution & Medical personnel 173
17.12 Patient treated in Govt. Ayurvedic, Unani, Homeopathy and Naturopathy institutions 173
18. LOCAL BODIES
18.1 Panchayats 174
18.2 Municipalities 175
19. FINANCE AND TRADE
19 .1 State Budget 176
19.2 Details of Revenue Receipts 176
19.3 Details of Revenue Expenditure 177
19.4 Demand and Collection of Land Revenue 178
19.5 Offices, Deposits and Advances of scheduled Commercial Banks 179
19.6 Credit Deposit Ratio of scheduled Commercial Banks according to population Group 179
19.7 National Savings Schemes 180
19.8 Progress of State Insurance 180
19.9 Registered Dealers Under Sales Tax 181
20. STATE INCOME
20.1 State Income by Industrial origin (at current prices) 182
20.2 State Income by Industrial origin at current prices (Percentage Distribution) 182
20.3 State Income by Industrial origin (at cqnstant prices) 183
20.4 State Income by Industrial origin (at constant prices) (Percentage Distribution) 183 21. PLANNING AND DEVELOPMENT
21.1 Annual Plan-Resources 184
(f)
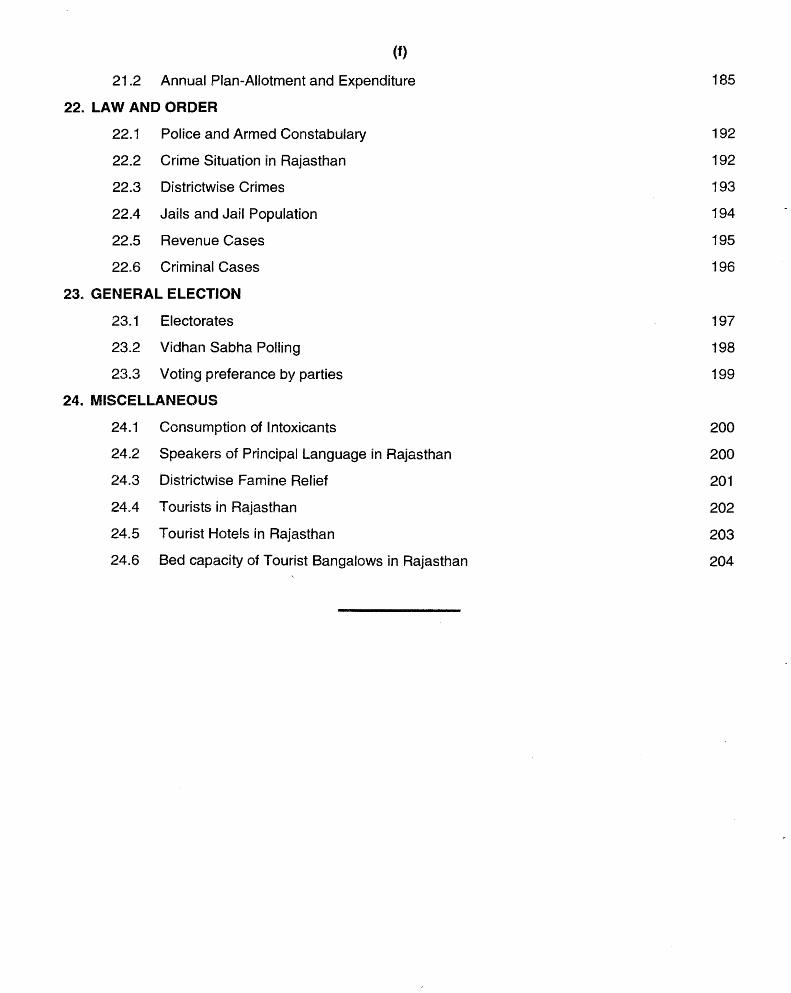
21.2 Annual Plan-Allotment and Expenditure
22. LAW AND ORDER
22.1 Police and Armed Constabulary
22.2 Crime Situation in Rajasthan
22.3 Districtwise Crimes
22.4 Jails and Jail Population
22.5 Revenue Cases
22.6 Criminal Cases
23. GENERAL ELECTION
23.1 Electorates
23.2 Vidhan Sabha Polling
23.3 Voting preferance by parties
24. MISCELLANEOUS
24.1
24.2
24.3
24.4
24.5
24.6
Consumption of Intoxicants
Speakers of Principal Language in Rajasthan
Districtwise Famine Relief
Tourists in Ra_jasthan
Tourist Hotels in Rajasthan
Bed capacity of Tourist Bangalows in Rajasthan
185
192
192
193
194
195
196
197
198
199
200
200
201
202
203
204
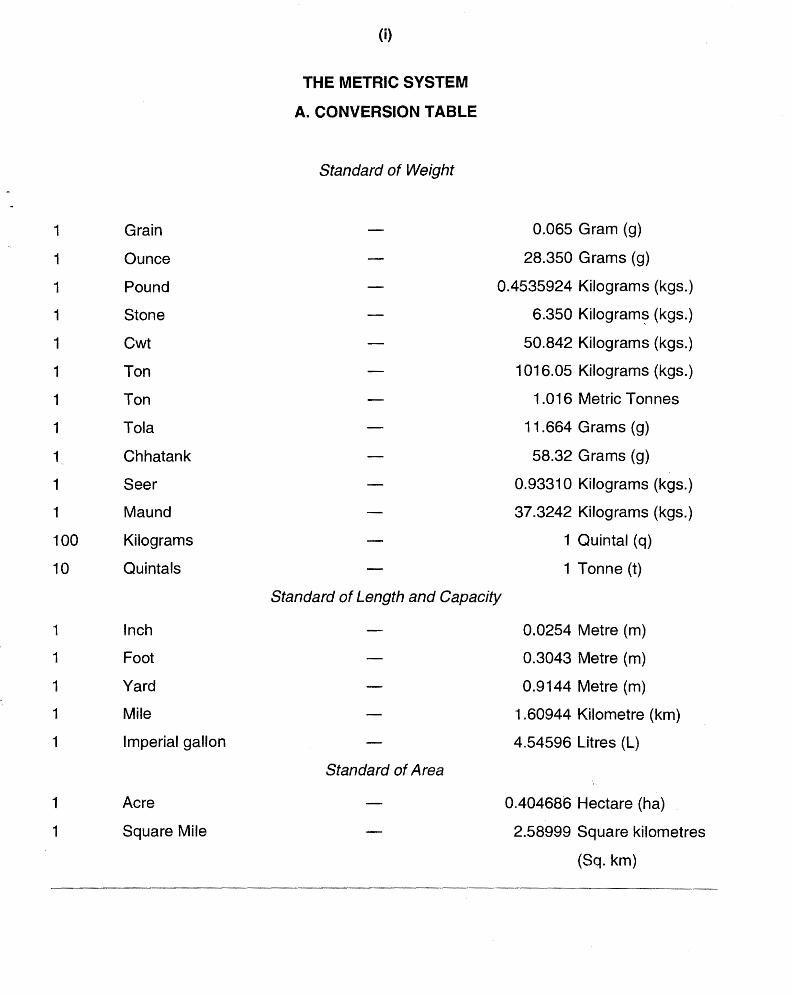
1 Grain
1 Ounce
1 Pound
1 Stone
1 Cwt
1 Ton
1 Ton
1 Tola
1 Chhatank
1 Seer
1 Maund
100 Kilograms
10 Quinta ls
1 Inch
1 Foot
1 Yard
1 Mile
1 Imperial gallon
1 Acre
1 Square Mile
(i)
THE METRIC SYSTEM
A. CONVERSION TABLE
Standard of Weight
0.065 Gram (g)
28.350 Grams (g)
0.4535924 Kilograms (kgs.)
6.350 Kilogram~ (kgs.)
50.842 Kilograms (kgs.)
1016.05 Kilograms (kgs.)
1.016 Metric Tonnes
11.664 Grams (g)
58.32 Grams (g)
0.93310 Kilograms (kgs.)
37.3242 Kilograms (kgs.)
1 Quintal ( q)
1 Tonne (t)
Standard of Length and Capacity
0.0254 Metre (m)
0.3043 Metre (m)
0.9144 Metre (m)
1.60944 Kilometre (km)
4.54596 Litres (L)
Standard of Area
0.404686 Hectare (ha)
2.58999 Square kilometres
(Sq. km)
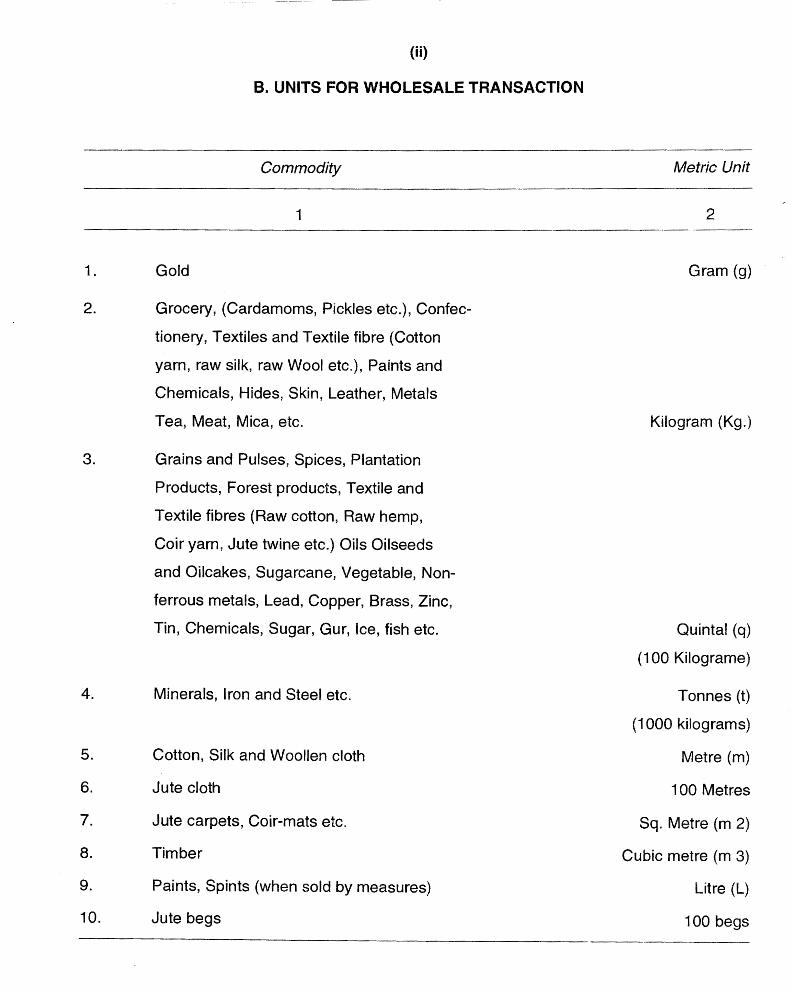
(ii)
B. UNITS FOR WHOLESALE TRANSACTION
Commodity Metric Unit
1 2
1. Gold Gram (g)
2. Grocery, (Cardamoms, Pickles etc.), Contee-
tionery, Textiles and Textile fibre (Cotton
yarn, raw silk, raw Wool etc.), Paints and
Chemicals, Hides, Skin, Leather, Metals
Tea, Meat, Mica, etc. Kilogram (Kg.)
3. Grains and Pulses, Spices, Plantation
Products, Forest products, Textile and
Textile fibres (Raw cotton, Raw hemp,
Coir yarn, Jute twine etc.) Oils Oilseeds
and Oilcakes, Sugarcane, Vegetable, Non-
ferrous metals, Lead, Copper, Brass, Zinc,
Tin, Chemicals, Sugar, Gur, Ice, fish etc. Quintal (q)
(100 Kilograme)
4. Minerals, Iron and Steel etc. Tonnes (t)
(1000 kilograms)
5. Cotton, Silk and Woollen cloth Metre (m)
6. Jute cloth 100 Metres
7. Jute carpets, Coir-mats etc. Sq. Metre (m 2)
8. Timber Cubic metre (m 3)
9. Paints, Spints (when sold by measures) Litre (L)
10. Jute begs 100 begs
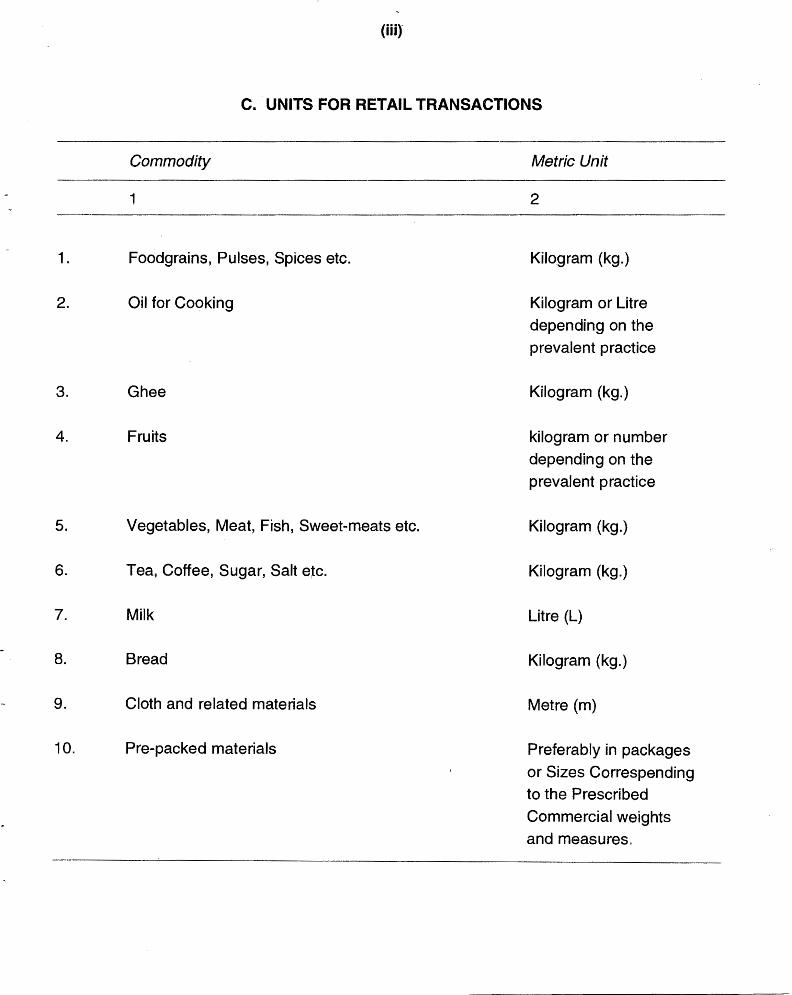
(iii)"
C. UNITS FOR RETAIL TRANSACTIONS
Commodity Metric Unit
1 2
1. Foodgrains, Pulses, Spices etc. Kilogram (kg.)
2. Oil for Cooking Kilogram or Litre depending on the prevalent practice
3. Ghee Kilogram (kg.)
4. Fruits kilogram or number
depending on the prevalent practice
5. Vegetables, Meat, Fish, Sweet-meats etc. Kilogram (kg.)
6. Tea, Coffee, Sugar, Salt etc. Kilogram (kg.)
7. Milk Litre (L)
8. Bread Kilogram (kg.)
9. Cloth and related materials Metre (m)
10. Pre-packed materials Preferably in packages
or Sizes Correspending to the Prescribed Commercial weights
and measures"
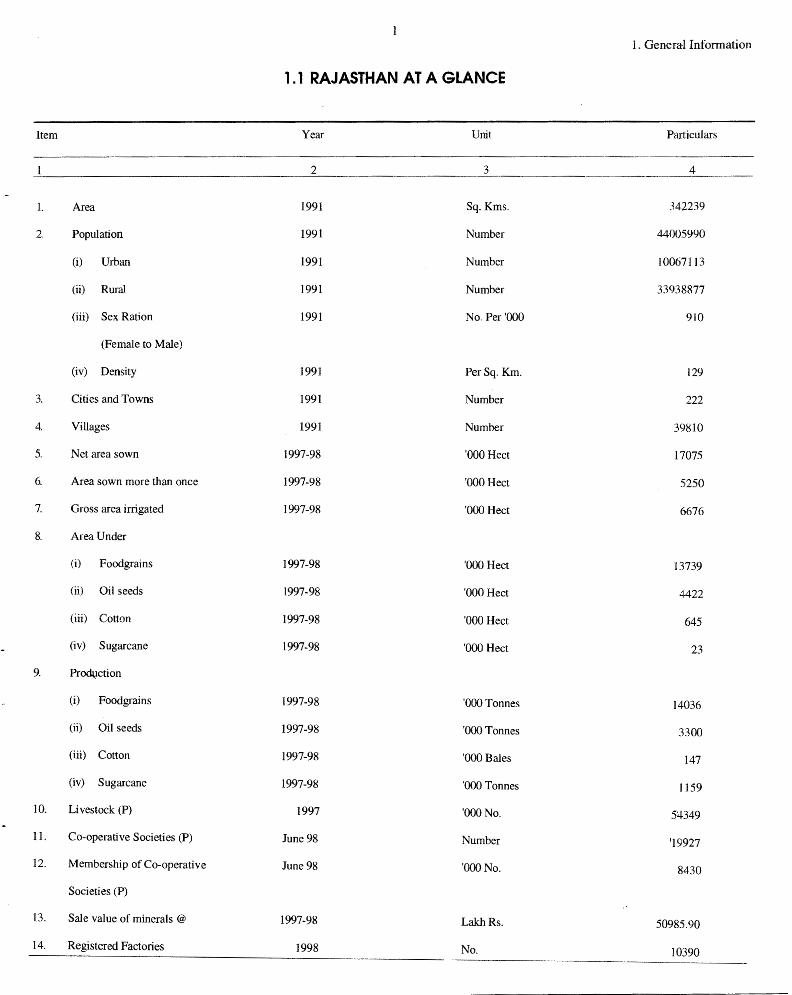
1. General Information
1.1 RAJASTHAN AT A GLANCE
Item Year Unit Particulars
2 3 4
1. Area 1991 Sq. Kms. 342239
2. Population 1991 Number 44005990
(i) Urban 1991 Number 10067113
(ii) Rural 1991 Number 33938877
(iii) Sex Ration 1991 No. Per '000 910
(Female to Male)
(iv) Density 1991 Per Sq. Km. 129
3. Cities and Towns 1991 Number 222
4. Villages 1991 Number 39810
5. Net area sown 1997-98 '000 Hect 17075
6. Area sown more than once 1997-98 '000 Hect 5250
7. Gross area irrigated 1997-98 '000 Hect 6676
8. Area Under
(i) Food grains 1997-98 '000 Hect 13739
(ii) Oil seeds 1997-98 '000 Hect 4422
(iii) Cotton 1997-98 '000 Hect 645
(iv) Sugarcane 1997-98 '000 Hect 23
9. Pro~ction
(i) Foodgrains 1997-98 'OOOTonnes 14036
(ii) Oil seeds 1997-98 'OOOTonnes 3300
(iii) Cotton 1997-98 '000 Bales 147
(iv) Sugarcane 1997-98 'OOOTonnes 1159
10. Livestock (P) 1997 'OOONo. 5"l349
11. Co-operative Societies (P) June 98 Number '19927
12. Membership of Co-operative June 98 'OOONo. 8430
Societies (P)
13. Sale value of minerals @ 1997-98 Lakh Rs. 50985.90
14. Registered Factories 1998 No. 10390
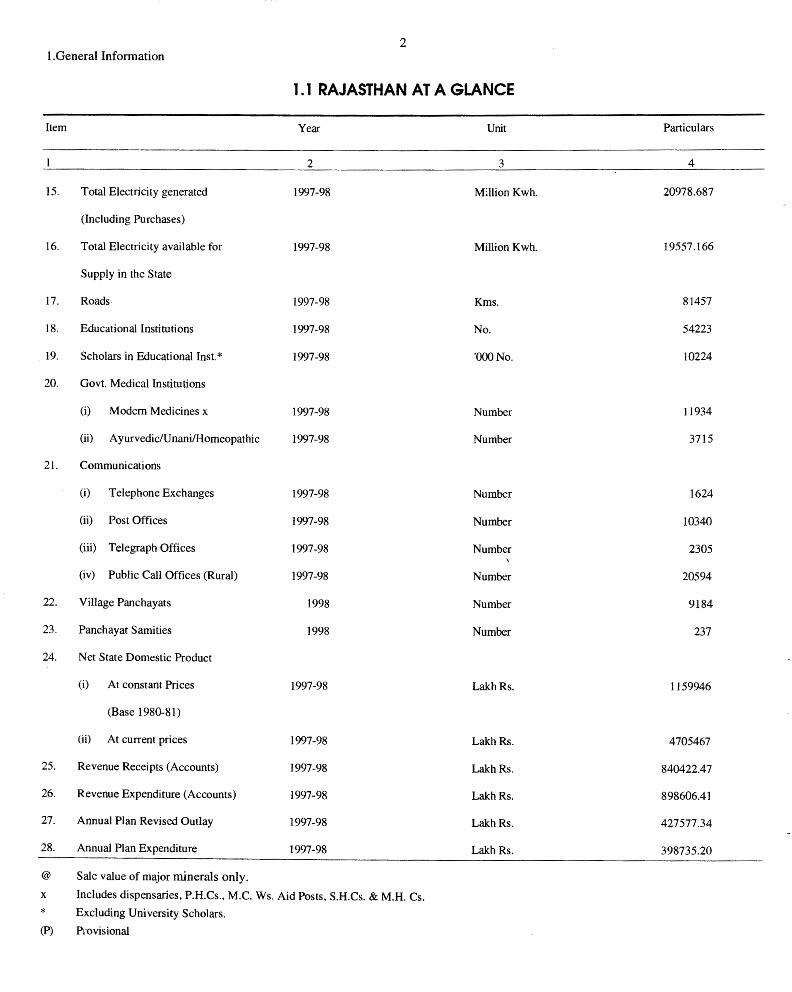
2 I .General Information
1.1 RAJASTHAN AT A GLANCE
Item Year Unit Particulars
2 3 4
15. Total Electricity generated 1997-98 Million K wh. 20978.687
(Including Purchases)
16. Total Electricity available for 1997-98 Million K wh. 19557.166
Supply in the State
17. Roads 1997-98 Kms. 81457
18. Educational Institutions 1997-98 No. 54223
19. Scholars in Educational Inst.* 1997-98 'OOONo. 10224
20. Govt. Medical Institutions
(i) Modem Medicines x 1997-98 Number 11934
(ii) Ayurvedic/Unani/Homeopathic 1997-98 Number 3715
21. Communications
(i) Telephone Exchanges 1997-98 Number 1624
(ii) Post Offices 1997-98 Number 10340
(iii) Telegraph Offices 1997-98 Number 2305
(iv) Public Call Offices (Rural) 1997-98 Number 20594
22. Village Panchayats 1998 Number 9184
23. Panchayat Samities 1998 Number 237
24. Net State Domestic Product
(i) At constant Prices 1997-98 LakhRs. 1159946
(Base 1980-81)
(ii) At current prices 1997-98 Lakh Rs. 4705467
25. Revenue Receipts (Accounts) 1997-98 Lakh Rs. 840422.47
26. Revenue Expenditure (Accounts) 1997-98 LakhRs. 898606.41
27. Annual Plan Revised Outlay 1997-98 Lakh Rs. 427577.34
28. Annual Plan Expenditure 1997-98 Lakh Rs. 398735.20
@ Sale value of major minerals only.
x Includes dispensaries, P.H.Cs., M.C. Ws. Aid Posts, S.H.Cs. & M.H. Cs.
* Excluding University Scholars.
(P) Provisional
-3 I. General Information
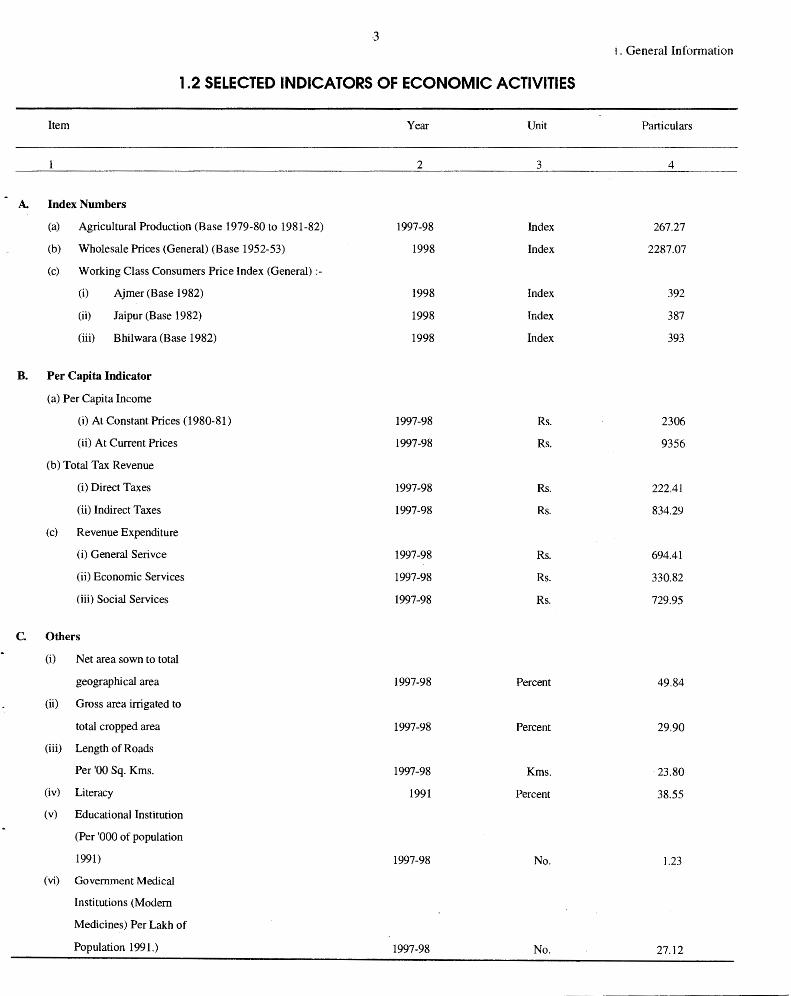
1.2 SELECTED INDICATORS OF ECONOMIC ACTIVITIES
Item Year Unit Particulars
2 3 4
A. Index Numbers
(a) Agricultural Production (Base 1979-80 to 1981-82) 1997-98 Index 267.27
(b) Wholesale Prices (General) (Base 1952-53) 1998 Index 2287.07
(c) Working Class Consumers Price Index (General):-
(i) Ajmer (Base 1982) 1998 Index 392
(ii) Jaipur (Base 1982) 1998 Index 387
(iii) Bhilwara (Base 1982) 1998 Index 393
B. Per Capita Indicator
(a) Per Capita Income
(i) At Constant Prices (1980-81) 1997-98 Rs. 2306
(ii) At Current Prices 1997-98 Rs. 9356
(b) Total Tax Revenue
(i) Direct Taxes 1997-98 Rs. 222.41
(ii) Indirect Taxes 1997-98 Rs. 834.29
(c) Revenue Expenditure
(i) General Serivce 1997-98 Rs. 694.41
(ii) Economic Services 1997-98 Rs. 330.82
(iii) Social Services 1997-98 Rs. 729.95
c. Others
(i) Net area sown to total
geographical area 1997-98 Percent 49.84
(ii) Gross area irrigated to
total cropped area 1997-98 Percent 29.90
(iii) Length of Roads
Per '00 Sq. Kms. 1997-98 Kms. 23.80
(iv) Literacy 1991 Percent 38.55
(v) Educational Institution
(Per '000 of population
1991) 1997-98 No. 1.23
(vi) Government Medical
Institutions (Modem
Medicines) Per Lakh of
Population 1991.) 1997-98 No. 27.12
-4 I .General Information
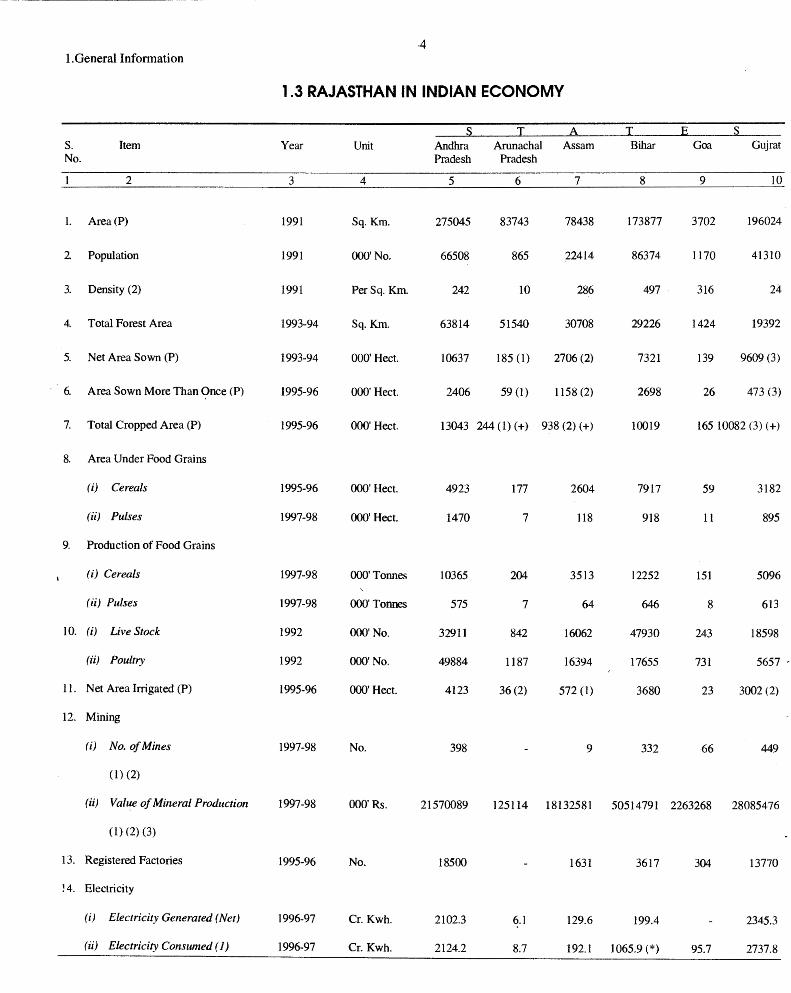
1.3 RAJASTHAN IN INDIAN ECONOMY
s T A T E s S. Item Year Unit Andhra Arunachal Assam Bihar Goa Gujrat No. Pradesh Pradesh
2 3 4 5 6 7 8 9 10
1. Area(P) 1991 Sq.Km. 275045 83743 78438 173877 3702 196024
2 Population 1991 OOO'No. 66508 865 _22414 86374 1170 41310
3. Density (2) 1991 Per Sq. Km. 242 IO 286 497 316 24
4. Total Forest Area 1993-94 Sq.Km. 63814 51540 30708 29226 1424 19392
5. Net Area Sown (P) 1993-94 000' Hect. 10637 185 (1) 2706 (2) 7321 139 9609 (3)
6. Area Sown More Than Once (P) 1995-96 000' Hect. 2406 59 (1) 1158 (2) 2698 26 473 (3)
7. Total Cropped Area (P) 1995-96 000' Hect. 13043 244 (1) (+) 938 (2)(+) 10019 165 10082 (3) (+)
8. Area Under Food Grains
(i) Cereals 1995-96 000' Hect. 4923 177 2604 7917 59 3182
(ii) Pulses 1997-98 000' Hect. 1470 7 118 918 11 895
9. Production of Food Grains
(i) Cereals 1997-98 OOO'Tonnes 10365 204 3513 12252 151 5096
(ii) Pulses 1997-98 000' Tonnes 575 7 64 646 8 613
10. (i) Live Stock 1992 000' No. 32911 842 16062 47930 243 18598
(ii) Poultry 1992 000' No. 49884 1187 16394 17655 731 5657 .
11. Net Area Irrigated (P) 1995-96 000' Hect. 4123 36 (2) 572 (1) 3680 23 3002 (2)
12. Mining
(i) No. of Mines 1997-98 No. 398 9 332 66 449
(1)(2)
(ii) Value of Mineral Production 1997-98 000' Rs. 21570089 125114 18132581 50514791 2263268 28085476
(1) (2) (3)
13. Registered Factories 1995-96 No. 18500 1631 3617 304 13770
14. Electricity
(i) Electricity Generated (Net) 1996-97 Cr. Kwh. 2102.3 6.1 129.6 199.4 2345.3
(ii) Electricity Consumed (I) 1996-97 Cr. Kwh. 2124.2 8.7 192.1 1065.9 (*) 95.7 2737.8
5 I , General Information
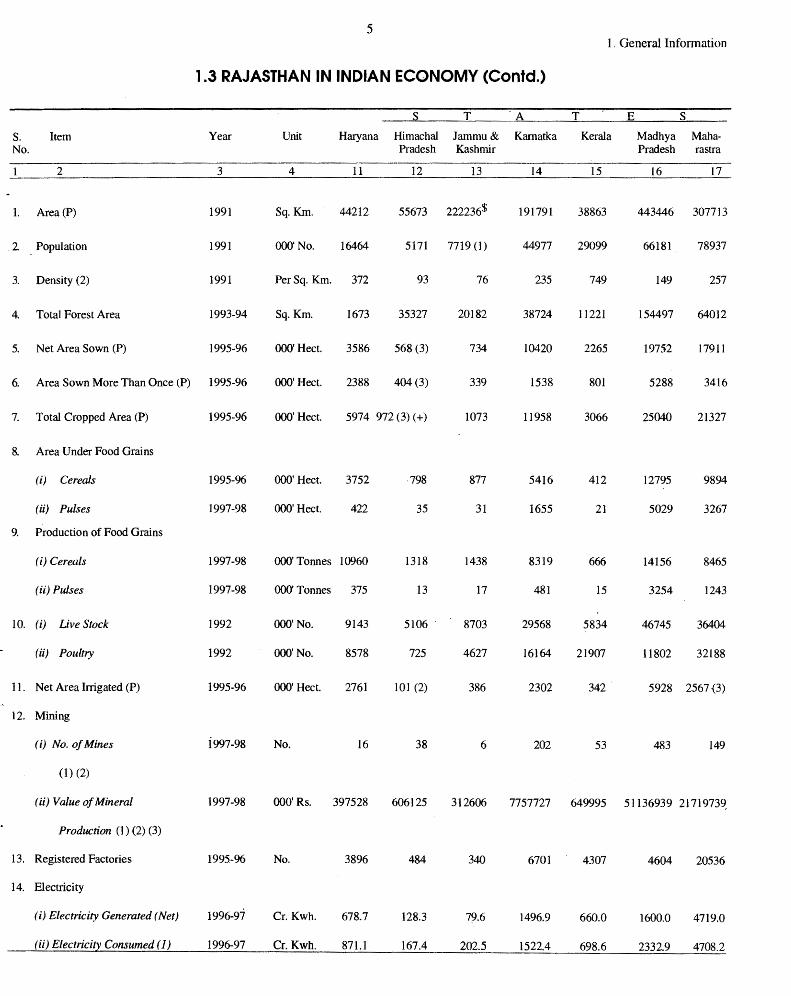
1.3 RAJASTHAN IN INDIAN ECONOMY (Contd.)
s T A T E s s. Item Year Unit Haryana Himachal Jammu& Kamatka Kerala Madhya Maha-No. Pradesh Kashmir Pradesh rastra
2 3 4 11 12 13 14 15 16 17
1. Area (P) 1991 Sq.Km. 44212 55673 222236$ 191791 38863 443446 307713
2 Population 1991 OOO'No. 16464 5171 7719(1) 44977 29099 66181 78937
3. Density (2) 1991 Per Sq. Km. 372 93 76 235 749 149 257
4. Total Forest Area 1993-94 Sq.Km. 1673 35327 20182 38724 11221 154497 64012
5. Net Area Sown (P) 1995-96 000' Hect. 3586 568 (3) 734 10420 2265 19752 17911
6. Area Sown More Than Once (P) 1995-96 000' Hect. 2388 404 (3) 339 1538 801 5288 3416
7. Total Cropped Area (P) 1995-96 000' Hect. 5974 972 (3)(+) 1073 11958 3066 25040 21327
8. Area Under Food Grains
(i) Cereals 1995-96 000' Hect. 3752 798 877 5416 412 12795 9894
(ii) Pulses 1997-98 OOO'Hect. 422 35 31 1655 21 5029 3267
9. Production of Food Grains
(i) Cereals 1997-98 000' Tonnes 10960 1318 1438 8319 666 14156 8465
(ii) Pulses 1997-98 OOO'Tonnes 375 13 17 481 15 3254 1243
10. (i) Live Stock 1992 000' No. 9143 5106 . 8703 29568 5834 46745 36404
(ii) Poultry 1992 000' No. 8578 725 4627 16164 21907 11802 32188
11. Net Area Irrigated (P) 1995-96 000' Hect. 2761 101 (2) 386 2302 342 5928 2567 {3)
12. Mining
( i) No. of Mines i997-98 No. 16 38 6 202 53 483 149
(1) (2)
(ii) Value of Mineral 1997-98 000' Rs. 397528 606125 312606 7757727 649995 51136939 2171973~
Production (1) (2) (3)
13. Registered Factories 1995-96 No. 3896 484 340 6701 4307 4604 20536
14. Electricity
(i) Electricity Generated (Net) 1996-97 Cr. Kwh. 678.7 128.3 79.6 1496.9 660.0 1600.0 4719.0
(ii) Electrici!l_ Consumed (I) 1996-97 Cr. Kwh. 871.1 167.4 202.5 1522.4 698.6 2332.9 4708.2
6 I .General Information
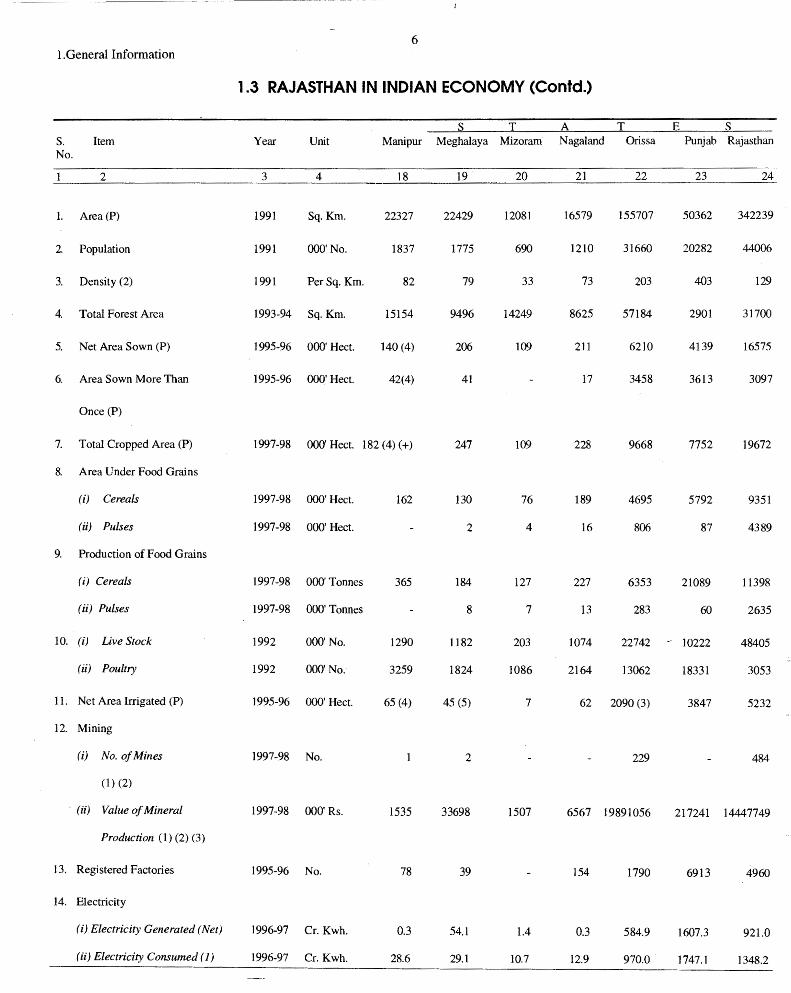
1.3 RAJASTHAN IN INDIAN ECONOMY (Contd.)
s T A T E s S. Item Year Unit Manipur Meghalaya Mizoram Nagaland Orissa Punjab Rajasthan No.
2 3 4 18 19 20 21 22 23 24
1. Area (P) 1991 Sq.Km. 22327 22429 12081 16579 155707 50362 342239
2 Population 1991 000' No. 1837 1775 690 1210 31660 20282 44006
3. Density (2) 1991 Per Sq. Km. 82 79 33 73 203 403 129
4. Total Forest Area 1993-94 Sq.Km. 15154 9496 14249 8625 57184 2901 31700
5. Net Area Sown (P) 1995-96 000' Hect. 140 (4) 206 109 211 6210 4139 16575
6. Area Sown More Than 1995-96 000' Hect. 42(4) 41 17 3458 3613 3097
Once (P)
7. Total Cropped Area (P) 1997-98 000' Hect. 182 (4) (+) 247 109 228 9668 7752 19672
8. Area Under Food Grains
(i) Cereals 1997-98 000' Hect. 162 130 76 189 4695 5792 9351
(ii) Pulses 1997-98 000' Hect. 2 4 16 806 87 4389
9. Production of Food Grains
(i) Cereals 1997-98 000' Tonnes 365 184 127 227 6353 21089 11398
(ii) Pulses 1997-98 000' Tonnes 8 7 13 283 60 2635
10. (i) Live Stock 1992 000' No. 1290 1182 203 1074 22742 ~ 10222 48405
(ii) Poultry 1992 000' No. 3259 1824 1086 2164 13062 18331 3053
11. Net Area Irrigated (P) 1995-96 000' Hect. 65 (4) 45 (5) 7 62 2090 (3) 3847 5232
12. Mining
(i) No. of Mines 1997-98 No. 2 229 484
(1) (2)
. (ii) Value of Mineral 1997-98 000' Rs. 1535 33698 1507 6567 19891056 217241 14447749
Production (l) (2) (3)
13. Registered Factories 1995-96 No. 78 39 154 1790 6913 4960
14. Electricity
(i) Electricity Generated (Net) 1996-97 Cr. Kwh. 0.3 54.1 1.4 0.3 584.9 1607.3 921.0
(ii) Electricity Consumed ( 1) 1996-97 Cr. Kwh. 28.6 29.1 10.7 12.9 970.0 1747.1 1348.2
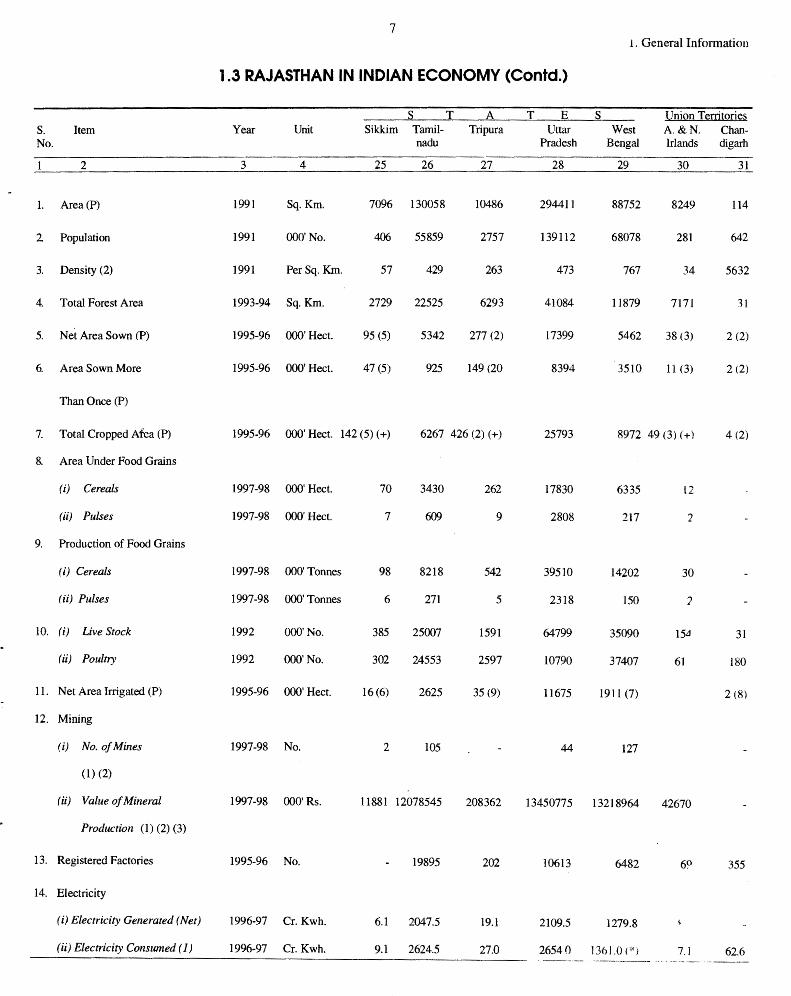
7 1. General Information
1.3 RAJASTHAN IN INDIAN ECONOMY (Contd.)
s T A T E s Union Territories s. Item Year Unit Sikkim Tamil- Tripura Uttar West A&N. Chan-No. nadu Pradesh Bengal lrlands digarh
2 3 4 25 26 27 28 29 30 31
1. Area (P) 1991 Sq.Km. 7096 130058 10486 294411 88752 8249 114
2 Population 1991 OOO'No. 406 55859 2757 139112 68078 281 642
3. Density (2) 1991 Per Sq. Km. 57 429 263 473 767 34 5632
4. Total Forest Area 1993-94 Sq.Km. 2729 22525 6293 41084 11879 7171 31
5. Net Area Sown (P) 1995-96 000' Hect. 95 (5) 5342 277 (2) 17399 5462 38 (3) 2 (2)
6. Area Sown More 1995-96 000' Hect. 47 (5) 925 149(20 8394 3510 11 (3) 2 (2)
Than Once (P)
7. Total Cropped Afea (P) 1995-96 000' Hect. 142 (5) (+) 6267 426 (2) ( +) 25793 8972 49 (3)(+) 4 (2)
8. Area Under Food Grains
(i) Cereals 1997-98 000' Hect. 70 3430 262 17830 6335 12
(ii) Pulses 1997-98 000' Hect. 7 6()<) 9 2808 217 2
9. Production of Food Grains
(i) Cereals 1997-98 OOO'Tonnes 98 8218 542 39510 14202 30
(ii) Pulses 1997-98 OOO'Tonnes 6 271 5 2318 150 '}
10. (i) Live Stock 1992 000' No. 385 25007 1591 64799 35090 l5A 31
(ii) Poultry 1992 000' No. 302 24553 2597 10790 37407 61 180
11. Net Area Irrigated (P) 1995-96 000' Hect. 16 (6) 2625 35 (9) 11675 1911 (7) 2 (8)
12. Mining
(i) No. of Mines 1997-98 No. 2 105 44 127
(1) (2)
(ii) Value of Mineral 1997-98 000' Rs. 11881 12078545 208362 13450775 13218964 42670
Production (1) (2) (3)
13. Registered Factories 1995-96 No. 19895 202 10613 6482 6~ 355
14. Electricity
(i) Electricity Generated (Net) 1996-97 Cr. Kwh. 6.1 2047.5 19.1 2109.5 1279.8
(ii) Electricity Consumed (1) 1996-97 Cr. Kwh. 9.1 2624.5 27.0 2654 () 1361.()( *) 7.1 62.6 ·--·------- -- ···-·--··---·--------·
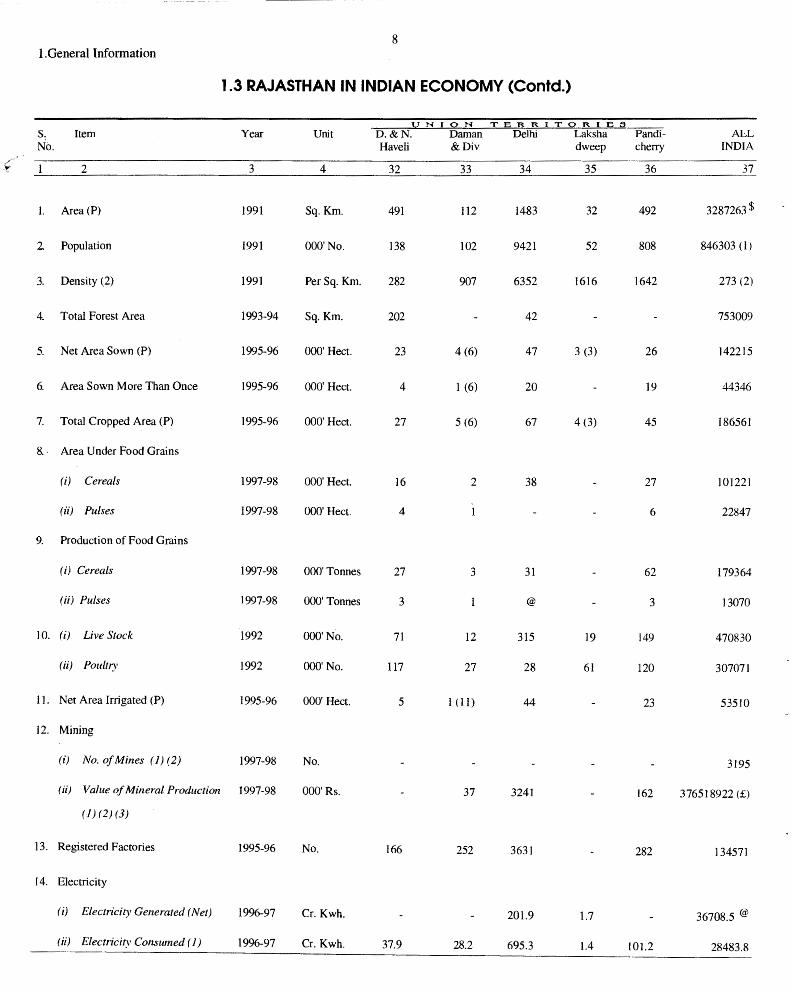
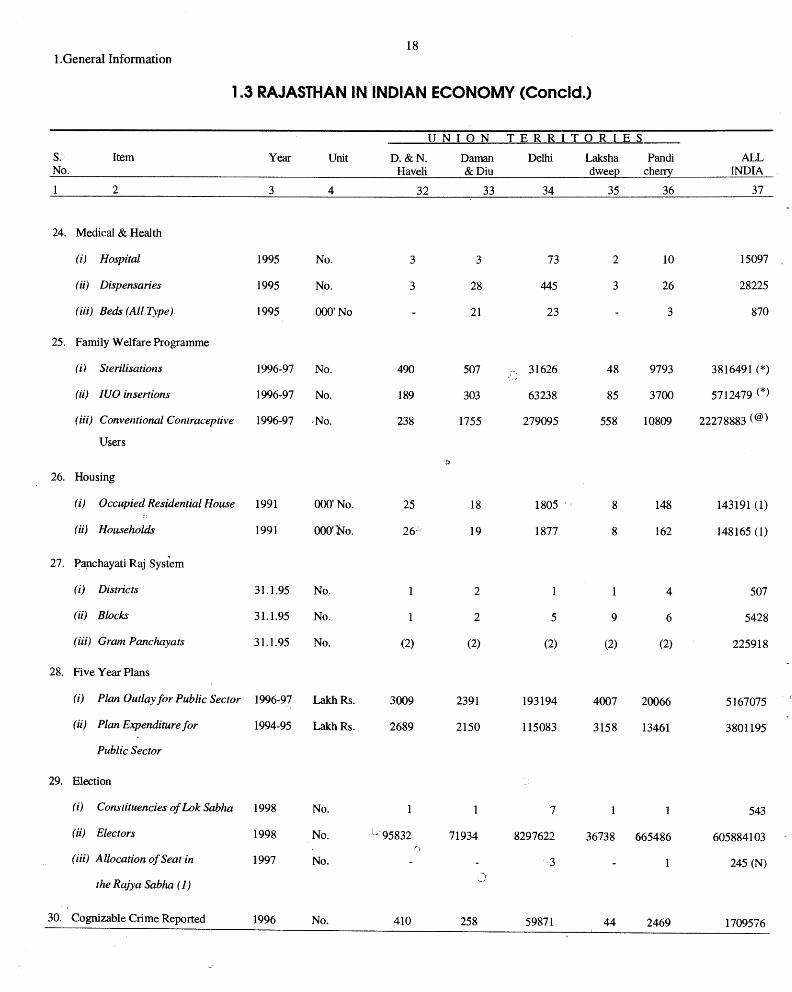
8 I .General Information
1.3 RAJASTHAN IN INDIAN ECONOMY (Contd.)
!,LNIQN T:BRRITQRIBS s. Item Year Unit D.&N. Daman Delhi Laksha Pandi- ALL No. Haveli &Div dweep cherry INDIA
2 3 4 32 33 34 35 36 37
I. Area (P) 1991 Sq.Km. 491 112 1483 32 492 3287263$
2 Population 1991 OOO'No. 138 102 9421 52 808 846303 (1)
3. Density (2) 1991 Per Sq. Km. 282 907 6352 1616 1642 273 (2)
4. Total Forest Area 1993-94 Sq.Km. 202 42 753009
5. Net Area Sown (P) 1995-96 000' Hect. 23 4 (6) 47 3 (3) 26 142215
6. Area Sown More Than Once 1995-96 000' Hect. 4 1 (6) 20 19 44346
7. Total Cropped Area (P) 1995-96 000' Hect. 27 5 (6) 67 4 (3) 45 186561
8.' Area Under Food Grains
(i) Cereals 1997-98 000' Hect. 16 2 38 27 101221
(ii) Pulses 1997-98 000' Hect. 4 6 22847
9. Production of Food Grains
(i) Cereals 1997-98 000' Tonnes 27 3 31 62 179364
(ii) Pulses 1997-98 000' Tonnes 3 @ 3 13070
10. (i) Live Stock 1992 OOO'No. 71 12 315 19 149 470830
(ii) Poultry 1992 000' No. 117 27 28 61 120 307071
11. Net Area Irrigated (P) 1995-96 000' Hect. 5 1 (11) 44 23 53510
12. Mining
(i) No. of Mines (1) (2) 1997-98 No. 3195
(ii) Value of Mineral Production 1997-98 000' Rs. 37 3241 162 376518922 (£)
(1)(2)(3)
13. Registered Factories 1995-96 No. J66 252 3631 282 134571
14. Electricity
(i) Electricity Generated (Net) 1996-97 Cr. Kwh. 201.9 1.7 36708.5@
(ii) Electricity Consumed ( 1) 1996-97 Cr. Kwh. 37.9 28.2 695.3 1.4 101.2 28483.8
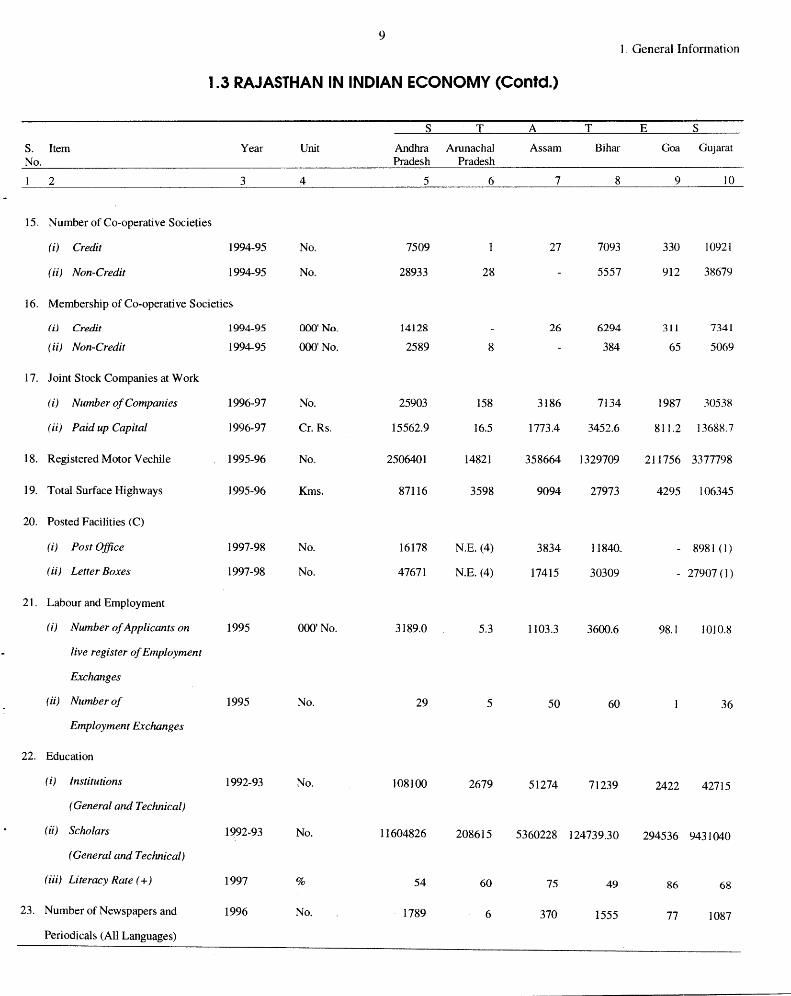
9 I, General Information
1.3 RAJASTHAN IN INDIAN ECONOMY (Contd.)
s T A T E s S. Item Year Unit Andhra Arunachal Assam Bihar Goa Gujarat No. Pradesh Pradesh
2 3 4 5 6 7 8 9 10
15. Number of Co-operative Societies
(i) Credit 1994-95 No. 7509 27 7093 330 10921
(ii) Non-Credit 1994-95 No. 28933 28 5557 912 38679
16. Membership of Co-operative Societies
(ij Credit 1994-95 000' No_ 14128 26 6294 311 7341
(ii) Non-Credit 1994-95 000' No. 2589 8 384 65 5069
17. Joint Stock Companies at Work
(i) Number of Companies 1996-97 No. 25903 158 3186 7134 1987 30538
(ii) Paid up Capital 1996-97 Cr. Rs. 15562.9 16.5 1773.4 3452.6 811.2 13688.7
18. Registered Motor Vechile 1995-96 No. 2506401 14821 358664 1329709 211756 3377798
19. Total Surface Highways 1995-96 Kms. 87116 3598 9094 27973 4295 106345
20. Posted Facilities (C)
(i) Post Office 1997-98 No. 16178 N.E. (4) 3834 11840. - 8981 (I)
(ii) Letter Boxes 1997-98 No. 47671 N.E. (4) 17415 30309 - 27907 (])
21. Labour and Employment
(i) Number of Applicants on 1995 000' No. 3189.0 5.3 1103.3 3600.6 98.1 1010.8
live register of Employment
Exchanges
(ii) Number of 1995 No. 29 5 50 60 36
Employment Exchanges
22. Education
(i) Institutions 1992-93 No. 108100 2679 51274 71239 2422 42715
(General and Technical)
(ii) Scholars 1992-93 No. 11604826 208615 5360228 124739.30 294536 9431040
(General and Technical)
(iii) Literacy Rate ( +) 1997 % 54 60 75 49 86 68
23. Number of Newspapers and 1996 No. 1789 6 370 1555 77 1087
Periodicals (All Languages)

10 I .General Information
1.3 RAJASTHAN IN INDIAN ECONOMY (Contd.)
s T A T E s s. Item Year Unit Haryana Himachal Jammu& Kamataka Kerala Madhya Maha No. Pradesh Kashmir Pradesh rashtra
2 3 4 11 12 13 14 15 16 17
15. Number of Co-operative Societies
(i) Credit 1994-95 No. 2967 2455 5 6713 2628 92 36602
(ii) Non-Credit 1994-95 No. 10996 1363 16282 6931 20 98111
16. Membership of Co-operative Societies
(i) Credit 1994-95 000' No. 2364 960 81 8644 12907 1530 24342
(ii) Non-Credit 1994-95 000' No. 1028 159 4601 11559 208 10880
17. Joint Stock Companies at Work
(i) Number of Companies 1996-97 No. 4538 1566 1329 19847 9379 10843 96922
(ii) Paid up Capital 1996-97 Cr. Rs. 1188.7 838.3 138.2 7599.5 2697.0 4126.7 35501.2
18. Registered Motor Vechile 1995-96 No. 954563 119037 195125 2249890 1170241 2309608 4032565
19. Total Surface Highways 1995-96 Kms. 22568 13305 6738 81216 36005 82070 245588
20. Posted Facilities (C)
(i) Post Office 1997-98 No. 2621 2756 1620 9838 5052 (2) 11282 12609 (3)
(ii) Letter Boxes 1997-98 No. 9468 7304 3612 29615 1998 (2) 48696 47563 (3)
21. Labour and Employment
(i) Number of Applicants on 1995 000' No. 632.5 468.9 119.0 1394.4 3635.4 2193.2 3227.3
live register of Employment
Exchanges
(ii) Number of 1995 No. 92 13 14 33 67 56 36
Employment Exchanges
22. Education
(i) Institutions 1992-93 No. 9478 9940 13730 52351 12789 103956 77799
(General and Technical)'
(ii) Scholars 1992-93 No. 3172258 1265551 1353524 9638485 6014748 13089330 17671288
(General and Technical)
(iii) Lite racy Rate ( +) 1997 % 65 77 59 58 93 56 74
23. Number of Newspapers and 1996 No. 780 126 311 1926 1510 3003 3979
Periodicals (All Languages)
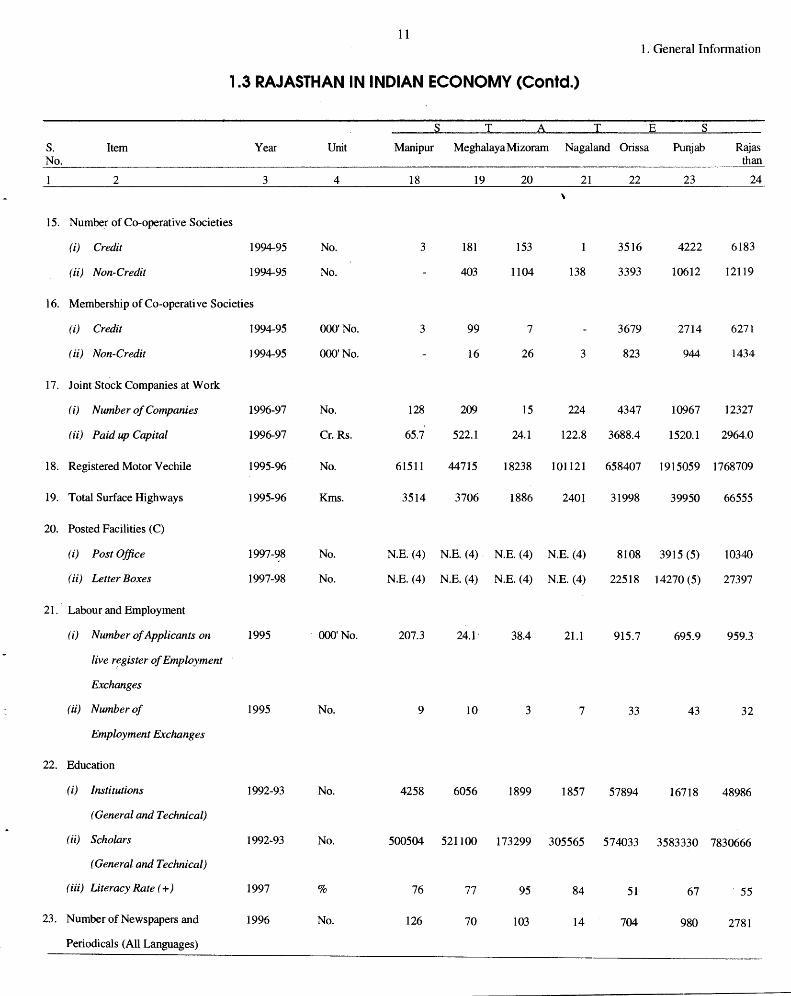
11 1. General Infonnation
1.3 RAJASTHAN IN INDIAN ECONOMY (Contd.)
s T A T E s S. Item Year Unit Manipur Meghalaya Mizoram Nagaland Orissa Punjab Rajas No. than
2 3 4 18 19 20 21 22 23 24
\
15. Number of Co-operative Societies
(i) Credit 1994-95 No. 3 181 153 3516 4222 6183
(ii) Non-Credit 1994-95 No. 403 1104 138 3393 10612 12119
16. Membership of Co-operative Societies
(i) Credit 1994-95 OOO'No. 3 99 7 3679 2714 6271
(ii) Non-Credit 1994-95 OOO'No. 16 26 3 823 944 1434
17. Joint Stock Companies at Work
(i) Number of Companies 1996-97 No. 128 209 15 224 4347 10967 12327
(ii) Paid up Capital 1996-97 Cr. Rs. 65.7 522.1 24.1 122.8 3688.4 1520.1 2964.0
18. Registered Motor Vechile 1995-96 No. 61511 44715 18238 101121 658407 1915059 1768709
19. Total Surface Highways 1995-96 Kms. 3514 3706 1886 2401 31998 39950 66555
20. Posted Facilities (C)
(i) Post Office 1997-98 No. N.E. (4) N.E. (4) N.E. (4) N.E. (4) 8108 3915 (5) 10340
(ii) Letter Boxes 1997-98 No. N.E. (4) N.E. (4) N.E. (4) N.E. (4) 22518 14270 (5) 27397
21. Labour and Employment
(i) Number of Applicants on 1995 OOO'No. 207.3 24.1· 38.4 21.1 915.7 695.9 959.3
live r~gister of Employment
Exchanges
(ii) Number of 1995 No. 9 10 3 7 33 43 32
Employment Exchanges
22. Education
(i) Institutions 1992-93 No. 4258 6056 1899 1857 57894 16718 48986
(General and Technical)
(ii) Scholars 1992-93 No. 500504 521100 173299 305565 574033 3583330 7830666
(General and Technical)
(iii) Literacy Rate ( +) 1997 % 76 77 95 84 51 67 . 55
23. Number of Newspapers and 1996 No. 126 70 103 14 704 980 2781
Periodicals (All Languages)
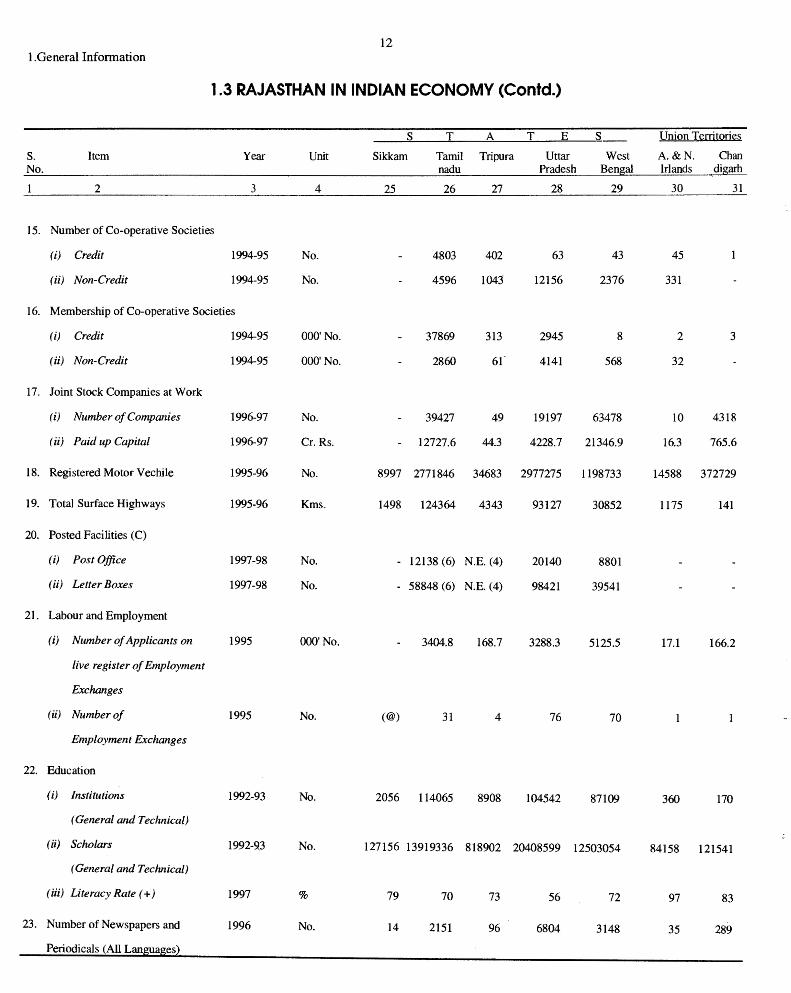
12 I .General Information
1.3 RAJASTHAN IN INDIAN ECONOMY (Contd.)
s T A T E s Union Territories
s. Item Year Unit Sikkam Tamil Tripura Uttar West A.&N. Chan No. nadu Pradesh Bengal lrlands digarh
2 3 4 25 26 27 28 29 30 31
15. Number of Co-operative Societies
(i) Credit 1994-95 No. 4803 402 63 43 45
(ii) Non-Credit 1994-95 No. 4596 1043 12156 2376 331
16. Membership of Co-operative Societies
(i) Credit 1994-95 OOO'No. 37869 313 2945 8 2 3
(ii) Non-Credit 1994-95 OOO'No. 2860 61' 4141 568 32
17. Joint Stock Companies at Work
(i) Number of Companies 1996-97 No. 39427 49 19197 63478 10 4318
(ii) Paid up Capital 1996-97 Cr. Rs. 12727.6 44.3 4228.7 21346.9 16.3 765.6
18. Registered Motor Vechile 1995-96 No. 8997 2771846 34683 2977275 1198733 14588 372729
19. Total Surface Highways 1995-96 Kms. 1498 124364 4343 93127 30852 1175 141
20. Posted Facilities (C)
(i) Post Office 1997-98 No. - 12138 (6) N.E. (4) 20140 8801
(ii) Letter Boxes 1997-98 No. - 58848 (6) N.E. (4) 98421 39541
21. Labour and Employment
(i) Number of Applicants on 1995 OOO'No. 3404.8 168.7 3288.3 5125.5 17.l 166.2
live register of Employment
Exchanges
(ii) Number of 1995 No. (@) 31 4 76 70
Employment Exchanges
22. Education
(i) Institutions 1992-93 No. 2056 114065 8908 104542 87109 360 170
(General and Technical)
(ii) Scholars 1992-93 No. 127156 13919336 818902 20408599 12503054 84158 121541
(General and Technical)
(iii) Literacy Rate ( +) 1997 % 79 70 73 56 72 97 83
23. Number of Newspapers and 1996 No. 14 2151 96 6804 3148 35 289
Periodicals (All Lan~ases)
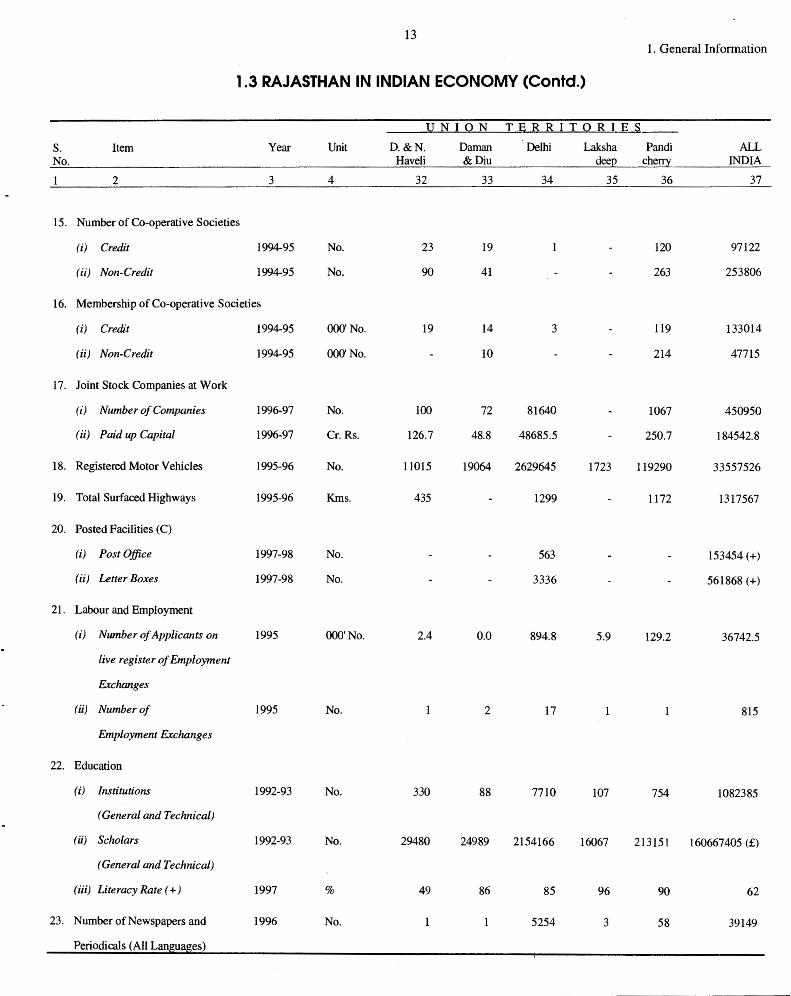
13 1. General Information
1.3 RAJASTHAN IN INDIAN ECONOMY (Contd.)
:UNION TERRITQRIES
S. Item Year Unit D.&N. Daman Delhi Laksha Pan di ALL No. Haveli &Diu deeQ cherry INDIA
2 3 4 32 33 34 35 36 37
15. Number of Co-operative Societies
(i) Credit 1994-95 No. 23 19 120 97122
(ii) Non-Credit 1994-95 No. 90 41 263 253806
16. Membership of Co-operative Societies
(i) Credit 1994-95 000' No. 19 14 3 119 133014
(ii) Non-Credit 1994-95 OOO'No. 10 214 47715
17. Joint Stock Companies at Work
(i) Number of Companies 1996-97 No. 100 72 81640 1067 450950
(ii) Paid up Capital 1996-97 Cr. Rs. 126.7 48.8 48685.5 250.7 184542.8
18. Registered Motor Vehicles 1995-96 No. 11015 19064 2629645 1723 119290 33557526
19. Total Surf aced Highways 1995-96 Kms. 435 1299 1172 1317567
20. Posted Facilities (C)
(i) Post Office 1997-98 No. 563 153454 (+)
(ii) Letter Boxes 1997-98 No. 3336 561868 (+)
21. Labour and Employment
(i) Number of Applicants on 1995 OOO'No. 2.4 0.0 894.8 5.9 129.2 36742.5
live register of Employment
Exchanges
(ii) Number of 1995 No. 2 17 815
Employment Exchanges
22. Education
(i) Institutions 1992-93 No. 330 88 7710 107 754 1082385
(General and Technical)
(ii) Scholars 1992-93 No. 29480 24989 2154166 16067 213151 160667405 (£)
(General and Technical)
(iii) Literacy Rate ( +) 1997 % 49 86 85 96 90 62
23. Number of Newspapers and 1996 No. 5254 3 58 39149
Periodicals (All Languages)
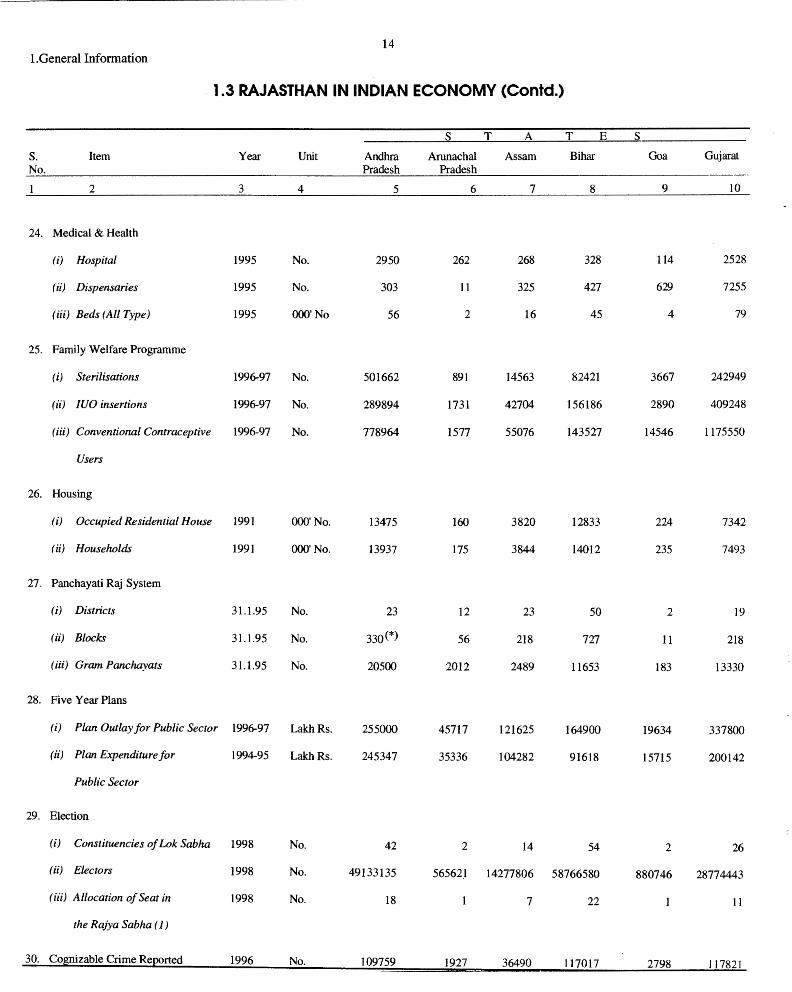
14 I.General Information
1.3 RAJASTHAN IN INDIAN ECONOMY (Contd.)
s T A T E s s. Item Year Unit Andhra Arunachal Assam Bihar Goa Gujarat No. Pradesh Pradesh
2 3 4 5 6 7 8 9 10
24. Medical & Health
(i) Hospital 1995 No. 2950 262 268 328 114 2528
(ii) Dispensaries 1995 No. 303 11 325 427 629 7255
(iii) Beds (All Type) 1995 000' No 56 2 16 45 4 79
25. Family Welfare Programme
(i) Sterilisations 1996-97 No. 501662 891 14563 82421 3667 242949
(ii) IUO insertions 1996-97 No. 289894 1731 42704 156186 2890 409248
(iii) Conventional Contraceptive 1996-97 No. 778964 1577 55076 143527 14546 1175550
Users
26. Housing
(i) Occupied Residential House 1991 OOO'No. 13475 160 3820 12833 224 7342
(ii) Households 1991 000' No. 13937 175 3844 14012 235 7493
27. Panchayati Raj System
(i) Districts 31.1.95 No. 23 12 23 50 2 19
(ii) Blocks 31.1.95 No. 330(*) 56 218 727 11 218
(iii) Gram Panchayats 31.1.95 No. 20500 2012 2489 11653 183 13330
28. Five Year Plans
(i) Plan Outlay for Public Sector 1996-97 LakhRs. 255000 45717 121625 164900 19634 337800
(ii) Plan Expenditure for 1994-95 LakhRs. 245347 35336 104282 91618 15715 200142
Public Sector
29. Election
(i) Constituencies of Lok Sabha 1998 No. 42 2 14 54 2 26
(ii) Electors 1998 No. 49133135 56562J 14277806 58766580 880746 28774443
(iii) A /location of Seat in 1998 No. 18 7 22 11
the Rajya Sabha ( 1)
30. Co~nizable Crime ReEorted 1996 No. 109759 1927 36490 117017 2798 117821
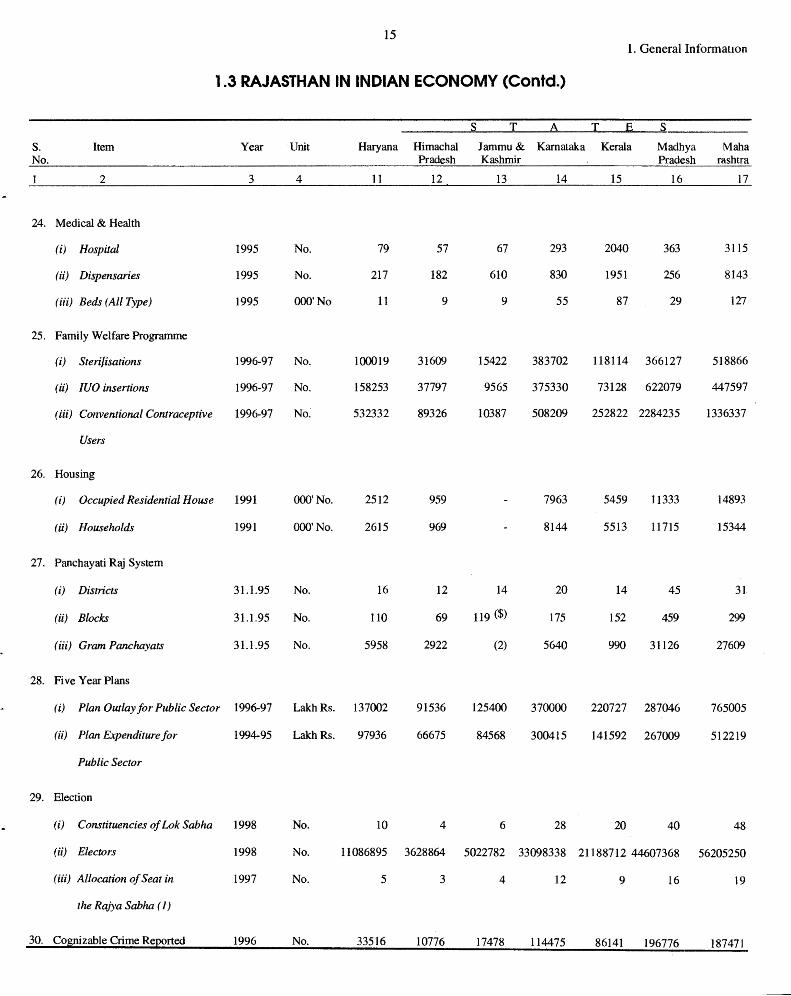
15 1. General Informauon
1.3 RAJASTHAN IN INDIAN ECONOMY (Contd.)
s T A T E s s. Item Year Unit Haryana Himachal Jammu& Karnataka Kerala Madhya Maha No. Pradesh Kashmir Pradesh rashtra
2 3 4 11 12 13 14 15 16 17
24. Medical & Health
(i) Hospital 1995 No. 79 57 67 293 2040 363 3115
(ii) Dispensaries 1995 No. 217 182 610 830 1951 256 8143
(iii) Beds (All Type) 1995 OOO'No 11 9 9 55 87 29 127
25. Family Welfare Programme
(i) Sterilisations 1996-97 No. 100019 31609 15422 383702 118114 366127 518866
(ii) IUO insertions 1996-97 No. 158253 37797 9565 375330 73128 622079 447597
(iii) Conventional Contraceptive 1996-97 No. 532332 89326 10387 508209 252822 2284235 1336337
Users
26. Housing
(i) Occupied Residential House 1991 OOO'No. 2512 959 7963 5459 11333 14893
(ii) Households 1991 OOO'No. 2615 969 8144 5513 11715 15344
27. Panchayati Raj System
(i) Districts 31.1.95 No. 16 12 14 20 14 45 31
(ii) Blocks 31.1.95 No. 110 69 119 ($) 175 152 459 299
(iii) Gram Panchayats 31.1.95 No. 5958 2922 (2) 5640 990 31126 27609
28. Five Year Plans
(i) Plan Outlay for Public Sector 1996-97 Laich Rs. 137002 91536 125400 370000 220727 287046 765005
(ii) Plan Expenditure for 1994-95 Laich Rs. 97936 66675 84568 300415 141592 267009 512219
Public Sector
29. Election
(i) Constituencies of Lok Sabha 1998 No. 10 4 6 28 20 40 48
(ii) Electors 1998 No. 11086895 3628864 5022782 33098338 21188712 44607368 56205250
(iii) Allocation of Seat in 1997 No. 5 3 4 12 9 16 19
the Rajya Sabha. (I)
30. Co&nizable Crime ReEorted 1996 No. 33516 10776 17478 114475 86141 196776 187471
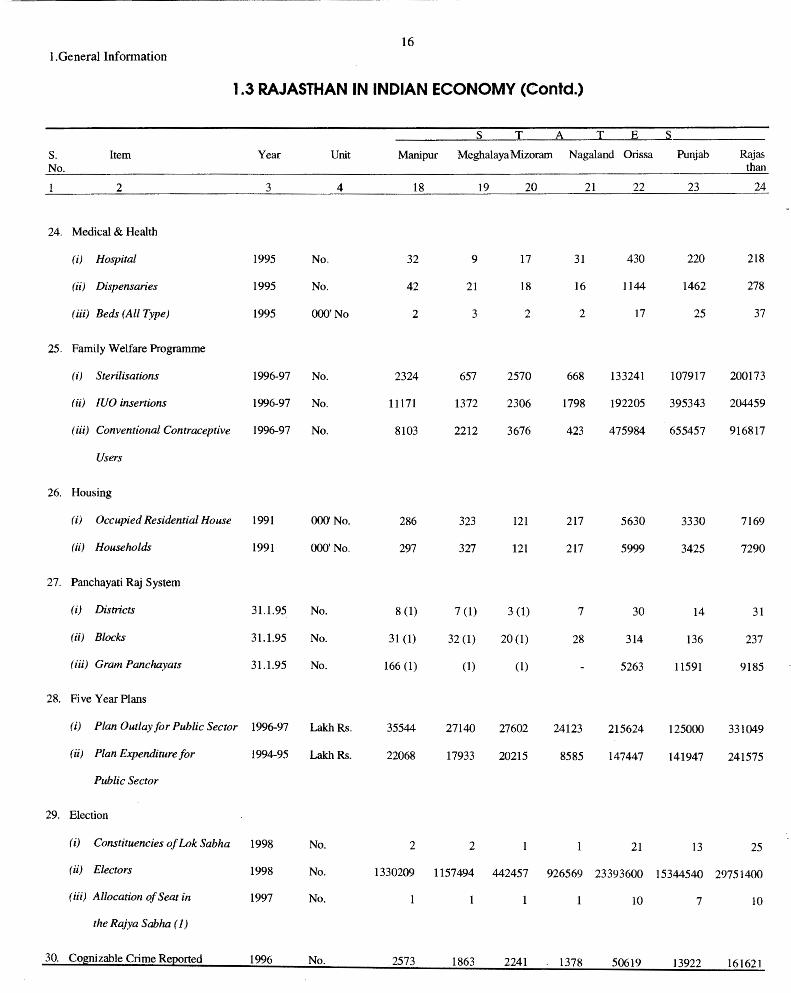
16 I .General Information
1.3 RAJASTHAN IN INDIAN ECONOMY (Contd.)
s T A T E s s. Item Year Unit Manipur Meghalaya Mizoram Nagaland Orissa Punjab Rajas No. than
2 3 4 18 19 20 21 22 23 24
24. Medical & Health
(i) Hospital 1995 No. 32 9 17 31 430 220 218
(ii) Dispensaries 1995 No. 42 21 18 16 1144 1462 278
(iii) Beds (All Type) 1995 000' No 2 3 2 2 17 25 37
25. Family Welfare Programme
(i) Sterilisations 1996-97 No. 2324 657 2570 668 133241 107917 200173
(ii) IUO insertions 1996-97 No. 11171 1372 2306 1798 192205 395343 204459
(iii) Conventional Contraceptive 1996-97 No. 8103 2212 3676 423 475984 655457 916817
Users
26. Housing
(i) Occupied Residential House 1991 000' No. 286 323 121 217 5630 3330 7169
(ii) Households 1991 000' No. 297 327 121 217 5999 3425 7290
27. Panchayati Raj System
(i) Districts 31.1.95 No. 8 (1) 7 (1) 3 (1) 7 30 14 31
(ii) Blocks 31.1.95 No. 31 (1) 32 (1) 20(1) 28 314 136 237
(iii) Gram Panchayats 31.1.95 No. 166 (1) (1) (1) 5263 11591 9185
28. Five Year Plans
(i) Plan Outlay for Public Sector 1996-97 Laich Rs. 35544 27140 27602 24123 215624 125000 331049
(ii) Plan Expenditure for 1994-95 Laich Rs. 22068 17933 20215 8585 147447 141947 241575
Public Sector
29. Election
(i) Constituencies of Lok Sabha 1998 No. 2 2 21 13 25
(ii) Electors 1998 No. 1330209 1157494 442457 926569 23393600 15344540 29751400
(iii) Allocation of Seat in 1997 No. 10 7 10
the Rajya Sabha (I)
30. Co~izable Crime ReEorted 1996 No. 2573 1863 2241 1378 50619 13922 161621
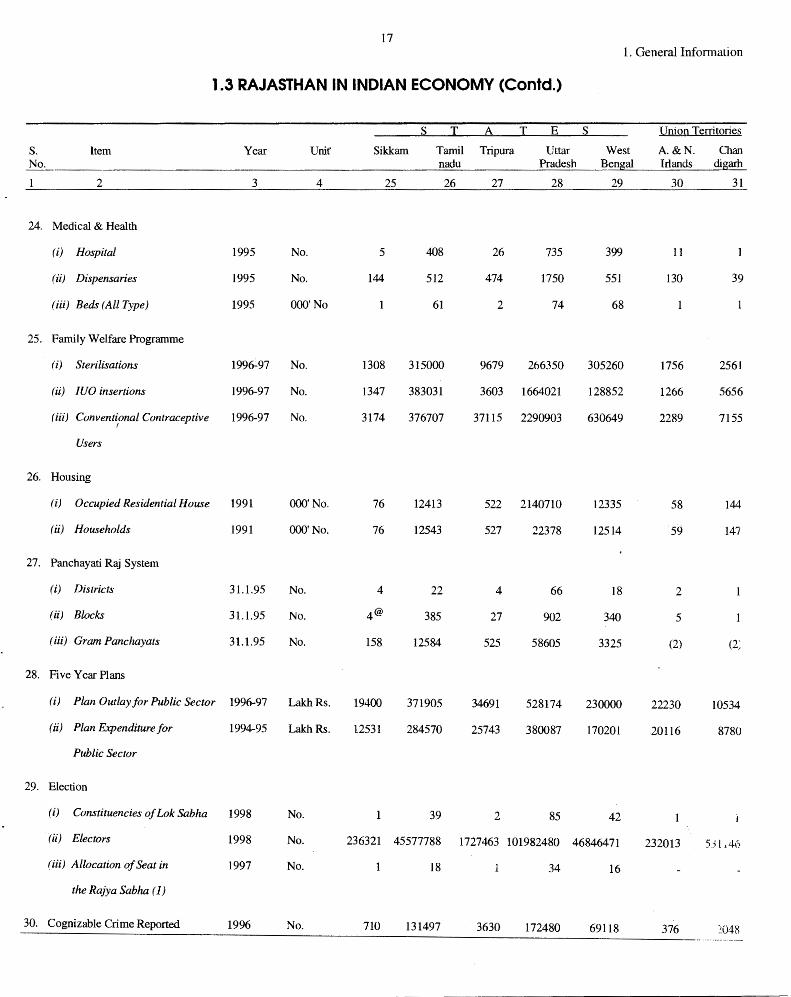
17 l. General Information
1.3 RAJASTHAN IN INDIAN ECONOMY (Contd.)
s T A T E s Union Territories
s. Item Year Unit" Sikkam Tamil Tripura Uttar West A.&N. Chan No. nadu Pradesh Bengal Irlancls digarh
2 3 4 25 26 27 28 29 30 31
24. Medical & Health
(i) Hospital 1995 No. 5 408 26 735 399 11
(ii) Dispensaries 1995 No. 144 512 474 1750 551 130 39
(iii) Beds (All Type) 1995 000' No 61 2 74 68
25. Family Welfare Programme
(i) Sterilisations 1996~97 No. 1308 315000 9679 266350 305260 1756 2561
(ii) /UO insertions 1996-97 No. 1347 383031 3603 1664021 128852 1266 5656
(iii) Conventional Contraceptive 1996-97 No. 3174 376707 37115 2290903 630649 2289 7155 I
Users
26. Housing
(i) Occupied Residential House 1991 000' No. 76 12413 522 2140710 12335 58 144
(ii) Households 1991 OOO'No. 76 12543 527 22378 12514 59 147
27. Panchayati Raj System
(i) Districts 31.1.95 No. 4 22 4 66 18 2
(ii) Blocks 31.1.95 No. 4@ 385 27 902 340 5
(iii) Gram Panchayats 31.1.95 No. 158 12584 525 58605 3325 (2) (2~
28. Five Year Plans
(i) Plan Outlay for Public Sector 1996-97 Laich Rs. 19400 371905 34691 528174 230000 22230 10534
(ii) Plan Expenditure for 1994-95 Lakh Rs. 12531 284570 25743 380087 170201 20116 8780
Public Sector
29. Election
(i) Constituencies of Lok Sabha 1998 No. 39 2 85 42
(ii) Electors 1998 No. 236321 45577788 1727463 101982480 46846471 232013 531,40
(iii) Allocation of Seat in 1997 No. 18 34 16
the Rajya Sabha ( 1)
30. Cognizable Crime Reported 1996 No. 710 131497 3630 172480 69118 376 '?048 .. ·-··---·-·---
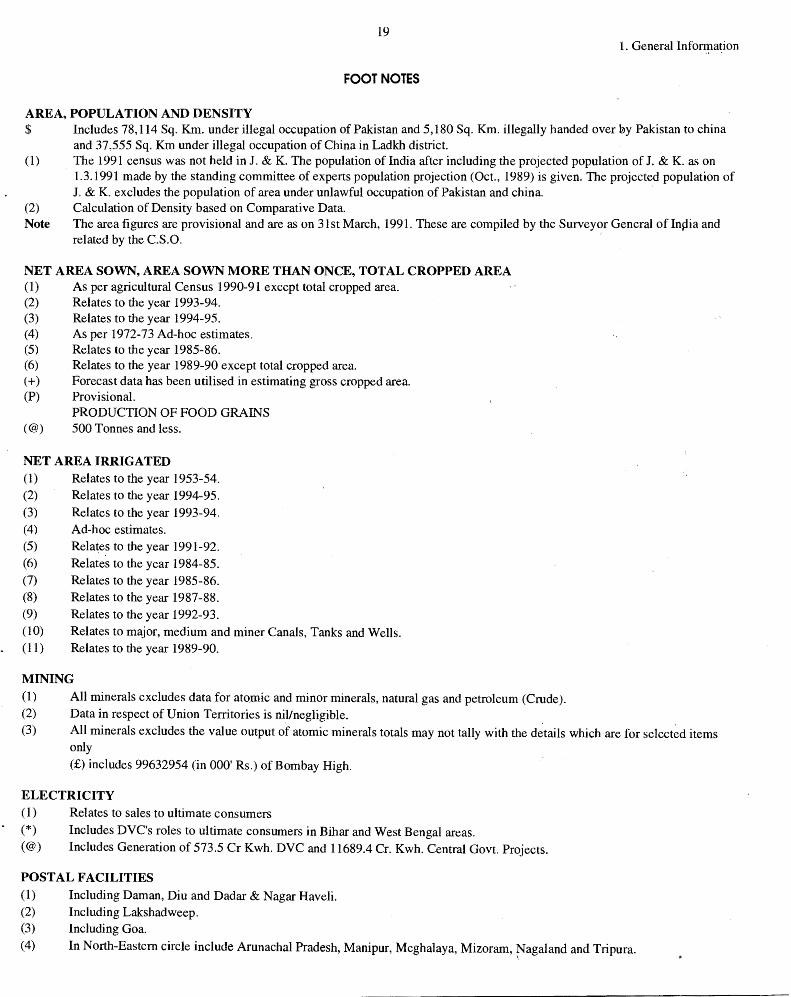
19 1. General Information
FOOTNOTES
AREA, POPULATION AND DENSITY $ Includes 78,114 Sq. Km. under illegal occupation of Pakistan and 5,180 Sq. Km. illegally handed over by Pakistan to china
and 37 ,555 Sq. Km under illegal occupation of China in Ladkh district. (1) The 1991 census was not held in J. & K. The population oflndia after including the projected population of J. & K. as on
1.3.1991 made by the standing committee of experts population projection (Oct., 1989) is given. The projected population of J. & K. excludes the population of area under unlawful occupation of Pakistan and china. ·
(2) Calculation of Density based on Comparative Data. Note The area figures are provisional and are as on 31st March, 1991. These are compiled by the Surveyor General of Inpia and
related by the C.S.0.
NET AREA SOWN, AREA SOWN MORE THAN ONCE, TOTAL CROPPED AREA (1) As per agricultural Census 1990-91 except total cropped area. (2) Relates to the year 1993-94. (3) Relates to the year 1994-95. (4) As per 1972-73 Ad-hoc estimates. (5) Relates to the year 1985-86. (6) Relates to the year 1989-90 except total cropped area. ( +) Forecast data has been utilised in estimating gross cropped area. (P) Provisional.
PRODUCTION OF FOOD GRAINS (@) 500 Tonnes and less.
NET AREA IRRIGATED (1) Relates to the year 1953-54. (2) Relates to the year 1994-95. (3) Relates to the year 1993-94. ( 4) Ad-hoc estimates. (5) Relates to the year 1991-92. (6) Relates to the year 1984-85. (7) Relates to the year 1985-86. (8) Relates to the year 1987-88. (9) Relates to the year 1992-93.
(10) Relates to major, medium and miner Canals, Tanks and Wells. (11) Relates to the year 1989-90.
MINING
(1) All minerals excludes data for atomic and minor minerals, natural gas and petroleum (Crude). (2) Data in respect of Union Territories is nil/negligible.
(3) All minerals excludes the value output of atomic minerals totals may not tally with the d~tails which are for select~d items only
(£)includes 99632954 (in 000' Rs.) of Bombay High.
ELECTRICITY
(1) Relates to sales to ultimate consumers
(*) Includes DVC's roles to ultimate consumers in Bihar and West Bengal areas. (@) Includes Generation of 573.5 Cr Kwh. DVC and 11689.4 Cr. Kwh. Central Govt. Projects.
POSTAL FACILITIES
(1) Including Daman, Diu and Dadar & Nagar Haveli. (2) Including Lakshadweep. (3) Including Goa.
(4) In North-Eastern circle include Arunachal Pradesh, Manipur, Meghalaya, Mizoram, Nagaland and Tripura. \
20 I.General Information
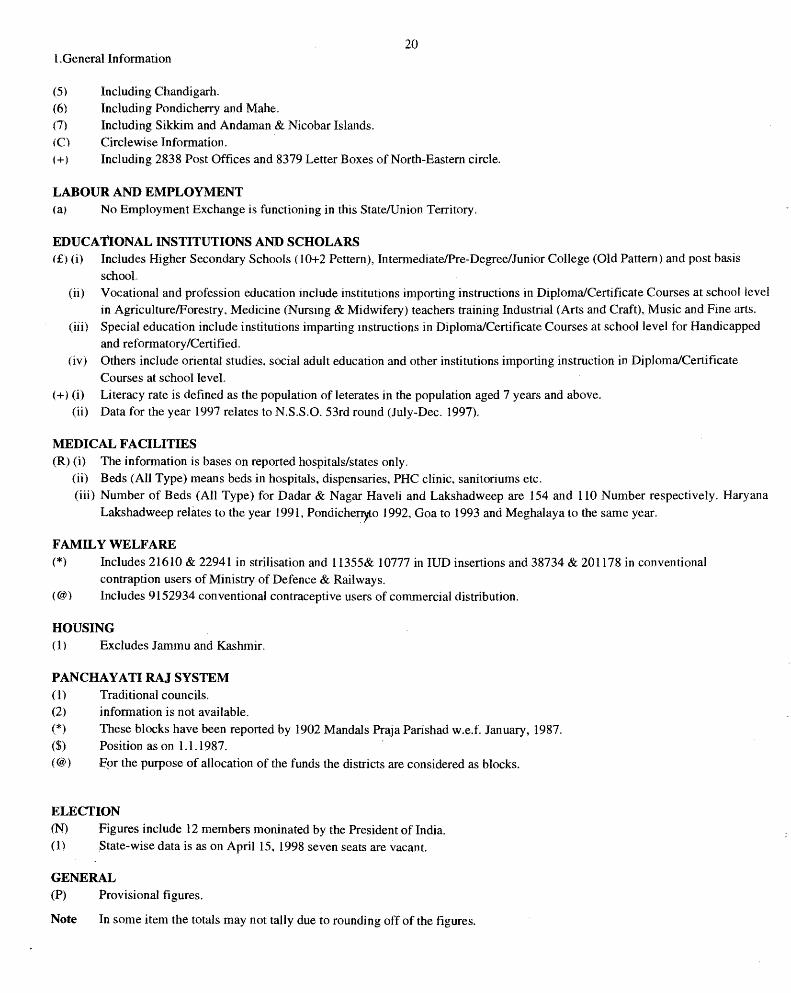
(5) Including Chandigarh. (6) Including Pondicherry and Mahe. (7) Including Sikkim and Andaman & Nicobar Islands. (C) Circlewise Information. (+) Including 2838 Post Offices and 8379 Letter Boxes of North-Eastern circle.
LABOUR AND EMPLOYMENT (a) No Employment Exchange is functioning in this State/Union Territory.
EDUCATIONAL INSTITUTIONS AND SCHOLARS (£) (i) Includes Higher Secondary Schools ( 10+2 Pettern), Intermediate/Pre-Degree/Junior College (Old Pattern) and post basis
school.. (ii) Vocational and profession education include institutions importing instructions in Diploma/Certificate Courses at school level
in Agriculture/Forestry, Medicine (Nursing & Midwifery) teachers training Industrial (Arts and Craft), Music and Fine arts. (iii) Special education include institutions imparting mstructions in Diploma/Certificate Courses at school level for Handicapped
and reformatory/Certified. (iv) Others include orientaJ studies, social adult education and other institutions importing instruction in Diploma/Certificate
Courses at school level. ( +) (i) Literacy rate is defined as the population of leterates in the population aged 7 years and above.
(ii) Data for the year 1997 relates to N.S.S.O. 53rd round (July-Dec. 1997).
MEDICAL FACILITIES (R) (i) The information is bases on reported hospitals/states only.
(ii) Beds (All Type) means beds in hospitals, dispensaries, PHC clinic, sanitoriums etc. (iii) Number of Beds (All Type) for Dadar & Nagar Haveli and Lakshadweep are 154 and 110 Number respectively. Haryana
Lakshadweep relates to the year 1991, Pondicherl)lo 1992, Goa to 1993 and Meghalaya to the same year.
FAMILY WELFARE (*) Includes 21610 & 22941 in strilisation and 11355& 10777 in IUD insertions and 38734 & 201178 in conventional
contraption users of Ministry of Defence & Railways. (@) Includes 9152934 conventional contraceptive users of commercial distribution.
HOUSING (1) Excludes Jammu and Kashmir,
PANCHAYATIRAJSYSTEM ( 1) Traditional councils. (2) information is not available.
(*) These blocks have been repotted by 1902 Mandals Praja Parishad w.e.f. January, 1987. ($) Position as on 1.1.1987.
(@) F'~Jr the purpose of allocation of the funds the districts are considered as blocks.
ELECTION <N) Figures include 12 members moninated by the President of India. (1) $tate-wise data is as on April 15. 1998 seven seats are vacant.
GENERAL (P) Provisional figures.
Note In some item the totals may not tally due to rounding off of the figures.
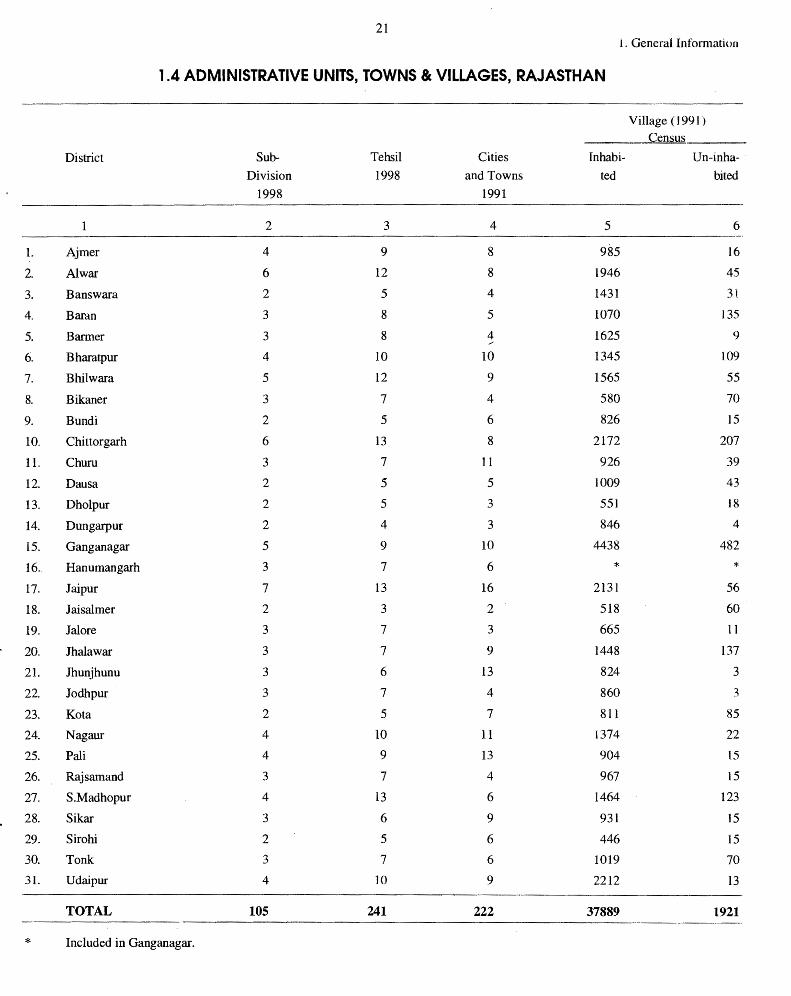
21 l . General Information
1.4 ADMINISTRATIVE UNITS, TOWNS & VILLAGES, RAJASTHAN
Village ( J 991)
Census
District Sub- Tehsil Cities Inhabi- Un-inha-
Division 1998 and Towns ted bited
1998 1991
1 2 3 4 5 6
1. Ajmer 4 9 8 985 16
2. Al war 6 12 8 1946 45
3. Banswara 2 5 4 1431 3l
4. Baran 3 8 5 1070 135
5. Barmer 3 8 4 1625 9 /
6. Bharatpur 4 10 10 1345 109
7. Bhilwara 5 12 9 1565 55
8. Bikaner 3 7 4 580 70
9. Bundi 2 5 6 826 15
10. Chittorgarh 6 13 8 2172 207
11. Churu 3 7 11 926 39
12. Dausa 2 5 5 1009 43
13. Dholpur 2 5 3 551 18
14. Dungarpur 2 4 3 846 4
15. Gang an agar 5 9 10 4438 482
16. Hanumangarh 3 7 6 * * 17. Jaipur 7 13 16 2131 56
18. Jaisalmer 2 3 2 518 60
19. Jal ore 3 7 3 665 11
20. Jhalawar 3 7 9 1448 137
21. Jhunjhunu 3 6 13 824 3
22. Jodhpur 3 7 4 860 3
23. Ko ta 2 5 7 811 85
24. Nagaur 4 10 11 1374 22
25. Pali 4 9 13 904 15
26. Rajsamand 3 7 4 967 15
27. S.Madhopur 4 13 6 1464 123
28. Sikar 3 6 9 931 15
29. Sirohi 2 5 6 446 15
30. Tonk 3 7 6 1019 70
31. Udaipur 4 10 9 2212 13
TOTAL 105 241 222 37889 1921
* Included in Ganganagar.
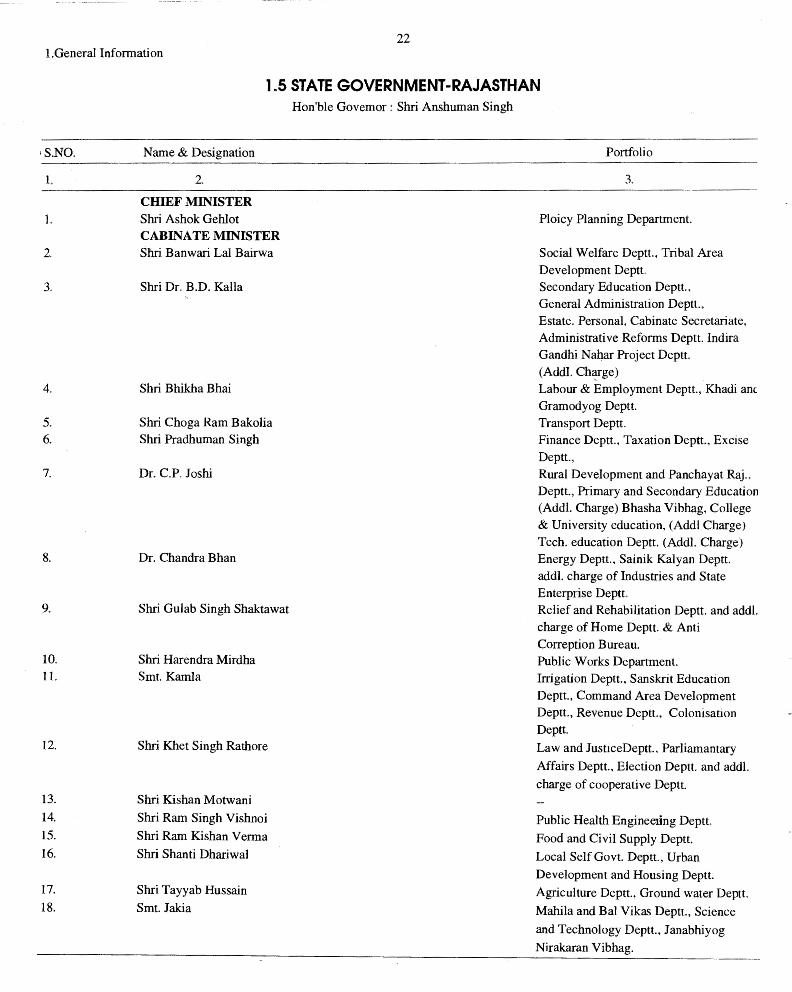
22 I.General Information
1.5 STATE GOVERNMENT-RAJASTHAN
1 S.NO.
L
L
2,
3.
5.
6.
7.
8.
9.
10.
11.
12.
13.
14.
15.
16.
17.
18.
Name & Designation
2.
CHIEF MINISTER Shri Ashok Gehlot
CABINATE MINISTER Sfui Banwari Lal Bairwa
Shri DL B.D. Kalla
Shri Bhikha Bhai
Shri Choga Ram Bakolia
Shri Pradhuman Singh
Dr. C.P. Joshi
Dr. Chandra Bhan
Shri Guiab Singh Shaktawat
Shri Harendra Mirdha
Smt. Kamla
Shri Khet Singh Rathore
Shri Kishan Motwani
Shri Ram Singh Vishnoi
Shri Ram Kishan Verma
Shri Shanti Dhariwal
Shri Tayyab Hussain
Smt. Jakia
Hon'ble Governor : Shri Anshuman Singh
Portfolio
Ploicy Planning Department.
Social Welfare Deptt., Tribal Area
Development Deptt.
Secondary Education Deptt.,
General Administration Deptt..
Estate. Personal, Cabinate Secretariate,
Administrative Reforms Deptt. Indira
Gandhi Nahar Project DeptL
(Addl. Ch~ge)
Labour & Employment Deptt., Khadi anc
Gramodyog Deptt.
Transport Deptt.
Finance Deptt., Taxation Deptt., Excise
Deptt.,
Rural Development and Panchayat Raj ..
Deptt., Primary and Secondary Education
(Addl. Charge) Bhasha Vibhag, College
& University education, (Addi Charge)
Tech. education Deptt. (Addl. Charge)
Energy Deptt., Sainik Kalyan Deptt.
addl. charge of Industries and State
Enterprise Deptt
Relief and Rehabilitation Deptt. and addl.
charge of Home Deptt. & Anti
Correption Bureau.
Public Works Department.
Irrigation Deptt., Sanskrit Education
Deptt., Command Area Development
Deptt., Revenue Deptt., Colonisation
Deptt.
Law and JusticeDeptt., Parliamantary
Affairs Deptt., Election Deptt. and addl.
charge of cooperative Deptt.
Public Health Engineeiing Deptt.
Food and Civil Supply Deptt.
Local Self Govt. Deptt., Urban
Development and Housing Deptt.
Agriculture Deptt., Ground water Deptt.
Mahila and Bal Vikas Deptt., Science
and Technology Deptt., Janabhiyog
Nirakaran Vibhag.
1.
1.
2.
3.
4.
5.
6.
7.
8.
9.
10.
11.
12.
13.
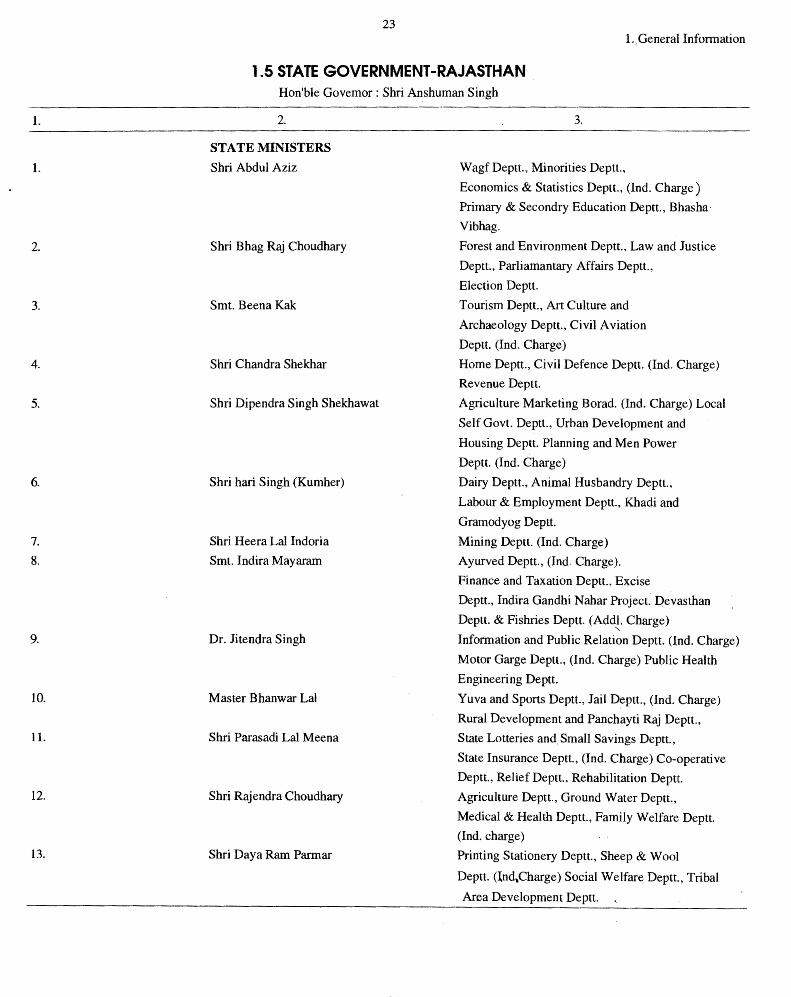
23 1.,General Information
1.5 STATE GOVERNMENT-RAJASTHAN Hon'ble Governor : Shri Anshuman Singh
2.
STATE MINISTERS
Shri Abdul Aziz
Shri Bhag Raj Choudhary
Smt. Beena Kak
Shri Chandra Shekhar
Shri Dipendra Singh Shekhawat
Shri hari Singh (Kumher)
Shri Heera Lal Indoria
Smt. Indira Mayaram
Dr. Jitendra Singh
Master Bhanwar Lal
Shri Parasadi Lal Meena
Shri Rajendra Choudhary
Shri Daya Ram Parmar
3.
Wagf Deptt., Minorities Deptt.,
Economics & Statistics Deptt., (Ind. Charge)
Primary & Secondry Education Deptt., Bhasha
Vibhag.
Forest and Environment Deptt., Law and Justice
Deptt., Parliamantary Affairs Deptt.,
Election Deptt.
Tourism Deptt., Art Culture and
Archaeology Deptt., Civil Aviation
Deptt. (Ind. Charge)
Home Deptt., Civil Defence Deptt. (Ind. Charge)
Revenue Deptt.
Agriculture Marketing Borad. (Ind. Charge) Local
Self Govt. Deptt., Urban Development and
Housing Deptt. Planning and Men Power
Deptt. (Ind. Charge)
Dairy Deptt., Animal Husbandry Deptt.,
Labour & Employment Deptt., Khadi and
Gramodyog Deptt.
Mining Deptt. (Ind. Charge)
Ayurved Deptt., (Ind. Charge).
Finance and Taxation Deptt., Excise
Deptt., Indira Gandhi Nahar Project. Oevasthan
Deptt. & Fishries Deptt. (Addl. Charge) " Information and Public Relation Deptt. (Ind. Charge)
Motor Garge Deptt., (Ind. Charge) Public Health
Engineering Deptt.
Yuva and Sports Deptt., Jail Deptt., (Ind. Charge)
Rural Development and Panchayti Raj Deptt.,
State Lotteries and. Small Savings Deptt.,
State Insurance Deptt., (Ind. Charge) Co-operative
Deptt., Relief Deptt., Rehabilitation Deptt.
Agriculture Deptt., Ground Water Deptt.,
Medical & Health Deptt., Family Welfare Deptt.
(Ind. charge)
Printing Stationery Deptt., Sheep & Wool
Deptt. (lnd,Charge) Social Welfare Deptt., Tribal
Area Development Deptt.
24 I .General Information
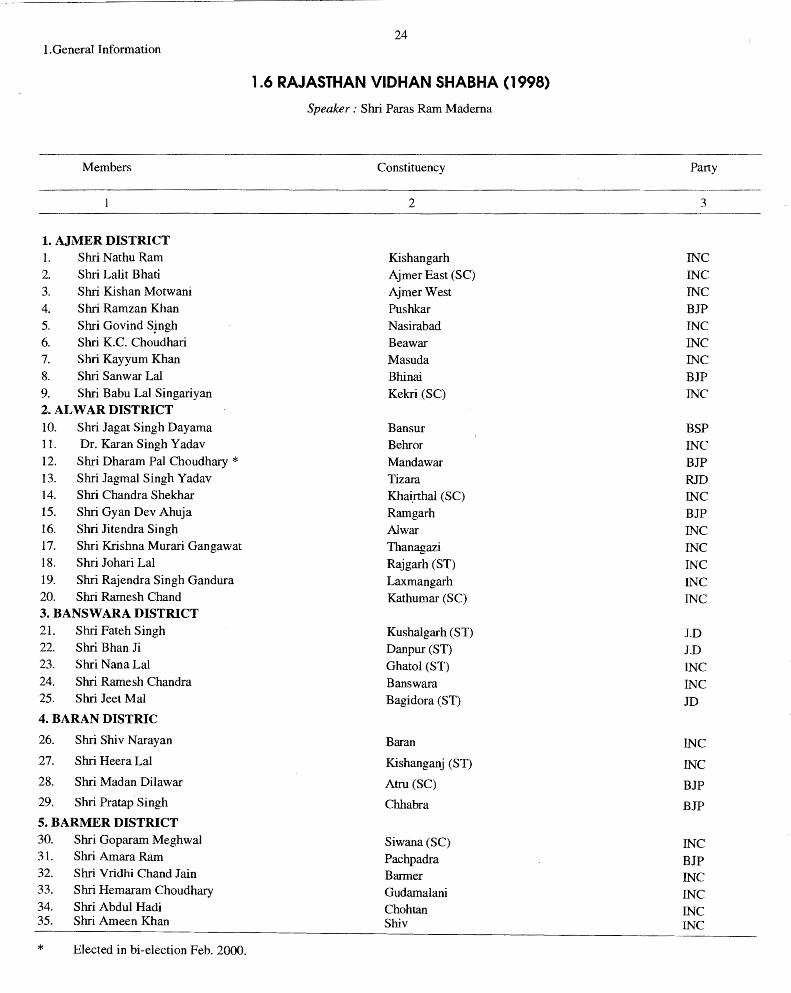
1.6 RAJASTHAN VIDHAN SHABHA (1998)
Speaker: Shri Paras Ram Maderna
Members Constituency Party
2 3
1. AJMER DISTRICT 1. Shri Nathu Ram Kishangarh INC
2. Shri Lalit Bhati Ajmer East (SC) INC 3. Shri Kishan Motwani AjmerWest INC 4. Shri Ramzan Khan Pushkar BJP 5. Shri Govind Sjngh Nasirabad INC 6. Shri K.C. Choudhari Bea war INC 7. Shri Kayyum Khan Masuda INC 8. Shri Sanwar Lal Bhinai BJP 9. Shri Babu Lal Singariyan Kekri (SC) INC 2. AL WAR DISTRICT 10. Shri Jagat Singh Dayama Bansur BSP 11. Dr. Karan Singh Y adav Behror INC 12. Shri Dharam Pal Choudhary* Manda war BJP 13. Shri Jagmal Singh Y adav Tizara RID 14. Shri Chandra Shekhar Khai.rthal (SC) INC 15. Shri Gyan Dev Ahuja Ramgarh BJP 16. Shri Jitendra Singh Al war INC 17. Shri Krishna Murari Gangawat Thanagazi INC 18. Shri Johari Lal Rajgarh (ST) INC 19. Shri Rajendra Singh Gandura Laxmangarh INC 20. Shri Ramesh Chand Kathumar (SC) INC 3. BANSW ARA DISTRICT 21. Shri Fateh Singh Kushalgarh (ST) J.D 22. Shri Bhan Ji Danpur(ST) J.D 23. Shri Nana Lal Ghatol (ST) INC 24. Shri Ramesh Chandra Banswara INC 25. Shri Jeet Mal Bagidora (ST) JD
4. BARAN DISTRIC
26. Shri Shiv Narayan Baran INC
27. Shri Heera Lal Kishanganj (ST) INC 28. Shri Madan Dilawar Atru (SC) BJP 29. Shri Pratap Singh Chhabra BJP 5. BARMER DISTRICT 30. Shri Goparam Meghwal Siwana (SC) INC 31. Shri Amara Ram Pachpadra BJP 32. Shri Vridhi Chand Jain Barmer INC 33. Shri Hemaram Choudhary Gudamalani INC 34. Shri Abdul Hadi Chohtan INC 35. Shri Ameen Khan Shiv INC
* Elected in bi-election Feb. 2000.
25 1. General Information
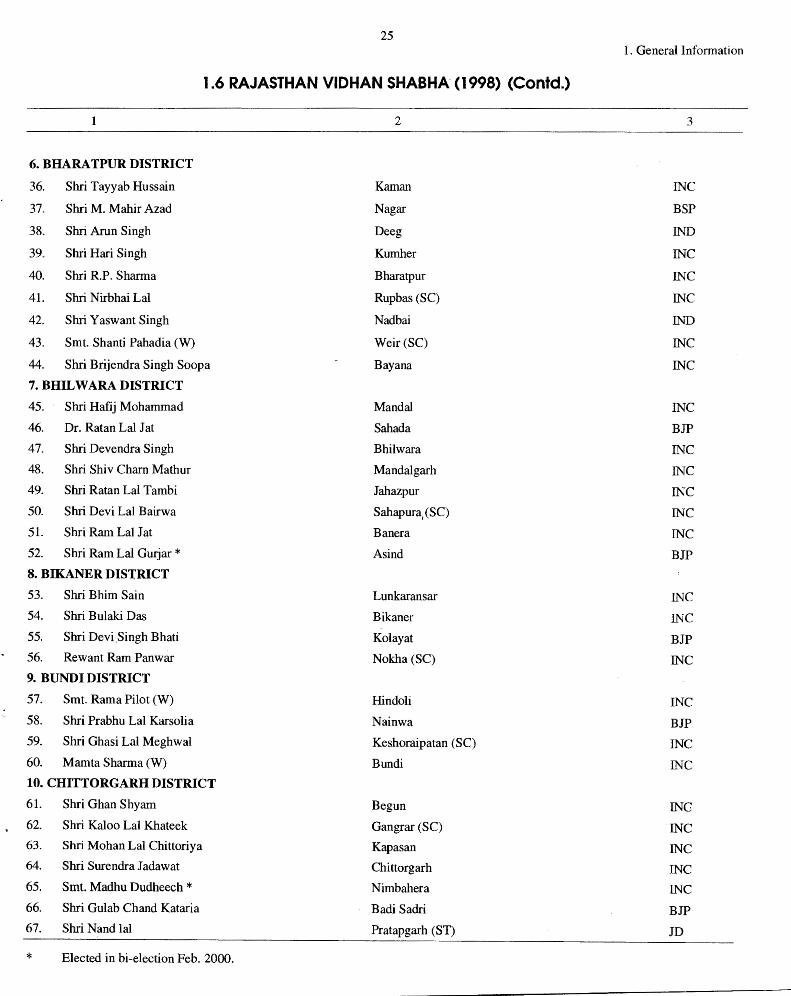
1.6 RAJASTHAN VIDHAN SHABHA (1998) (Contd.)
2 3
6. BHARATPUR DISTRICT
36. Shri Tayyab Hussain Kaman INC
37. Shri M. Mahir Azad Nagar BSP
38o Shri Arun Singh Deeg IND
39. Shri Hari Singh Kumher INC
40. Shri RP. Sharma Bharatpur INC
41. Shri Nirbhai Lal Rupbas (SC) INC
42. Shri Y aswant Singh Nadbai IND
43. Smt. Shanti Pahadia (W) Weir (SC) INC
44. Shri Brijendra Singh Soopa Bayana INC
7. BHILWARA DISTRICT
45. Shri Hafij Mohammad Mand al INC
46. Dr. Ratan Lal Jat Sahada BJP
47. Shri Devendra Singh Bhilwara INC
48. Shri Shiv Cham Mathur Mandalgarh ThrC
49. Shri Ratan Lal Tambi Jahazpur INC
50. Shri Devi Lal Bairwa Sahapura, (SC) INC
51. Shri Ram Lal Jat Banera INC
52. Shri Ram Lal Gurjar * Asind BJP
8. BIKANER DISTRICT
53. Shri Bhim Sain Lunkaransar INC
54. Shri Bulaki Das Bikaner INC
55. Shri Devi .Singh Bhati Kolayat BJP
56. Rewant Ram Panwar Nokha (SC) INC
9. BUNDI DISTRICT
57. Smt. Rama Pilot (W) Hindoli INC
58. Shri Prabhu Lal Karsolia Nainwa BJP
59. Shri Ghasi Lal Meghwal Keshoraipatan (SC) INC
60. Mamta Sharma (W) Bundi INC
10. CHITTORGARH DISTRICT
61. Shri Ghan Shyam Begun INC
62. Shri Kaloo Lal Khateek Gangrar (SC) INC 63. Shri Mohan Lal Chittoriya Kapasan INC 64. Shri Surendra Jadawat Chittorgarh INC
65. Smt. Madhu Dudheech * Nimbahera INC
66. Shri Guiab Chand Kataria Badi Sadri BJP
67. Shri Nand lal Pratapgarh (ST) JD
* Elected in bi-election Feb. 2000.
26 1. General Information
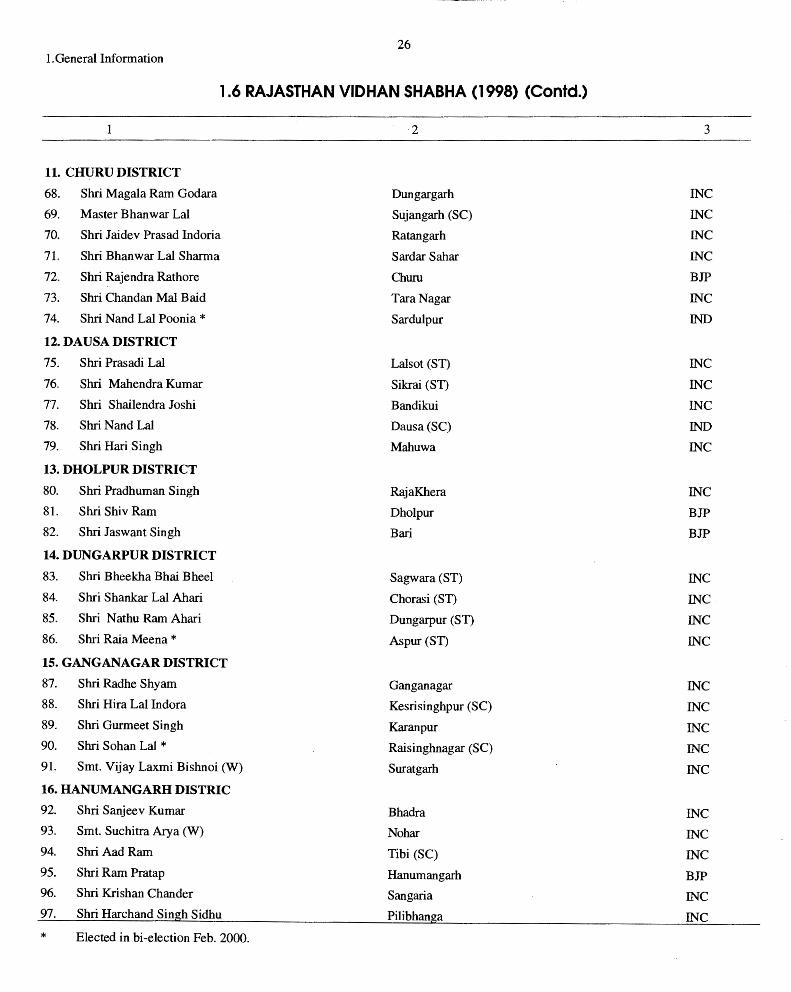
1.6 RAJASTHAN VIDHAN SHABHA (1998) (Contd.)
2 3
11. CHURU DISTRICT
68. Shri Magala Ram Godara Dungargarh INC
69. Master Bhanwar Lal Sujangarh (SC) INC
70. Shri Jaidev Prasad Indoria Ratangarh INC
71. Shri Bhanwar Lal Sharma Sardar Sahar INC
72. Shri Rajendra Rathore Churu BJP
73. Shri Chandan Mal Baid TaraNagar INC
74. Shri Nand Lal Poonia * Sardulpur IND
12. DAUSA DISTRICT
75. Shri Prasadi Lal Lalsot (ST) INC
76. Shri Mahendra Kumar Sikrai (ST) INC
77. Shri Shailendra Joshi Bandikui INC
78. Shri Nand Lal Dausa(SC) IND
79. Shri Hari Singh Mahuwa INC
13. DHOLPUR DISTRICT
80. Shri Pradhuman Singh RajaKhera INC
81. Shri Shiv Ram Dholpur BJP
82. Shri Jaswant Singh Bari BJP
14. DUNGARPUR DISTRICT
83. Shri Bheekha Bhai Bheel Sagwara (ST) INC
84. Shri Shankar Lal Ahari Chorasi (ST) INC
85. Shri N athu Ram Ahari Dungarpur (ST) INC
86. Shri Raia Meena * Aspur (ST) INC
15. GANGANAGAR DISTRICT
87. Shri Radhe Shyam Ganganagar INC
88. Shri Hira Lal Indora Kesrisinghpur (SC) INC
89. Shri Gurmeet Singh Karanpur INC
90. Shri Sohan Lal * Raisinghnagar (SC) INC
91. Smt. Vijay Laxmi Bishnoi (W) Suratgarh INC
16. HANUMANGARH DISTRIC
92. Shri Sanjeev Kumar Bhadra INC 93. Smt. Suchitra Arya (W) Nohar INC 94. Shri AadRam Tibi (SC) INC 95. Shri Ram Pratap Hanumangarh BJP 96. Shri Krishan Chander Sangaria INC 97. Shri Harchand Singh Sidhu Pilibhanga INC
* Elected in bi-election Feb. 2000.
27 1. General Information
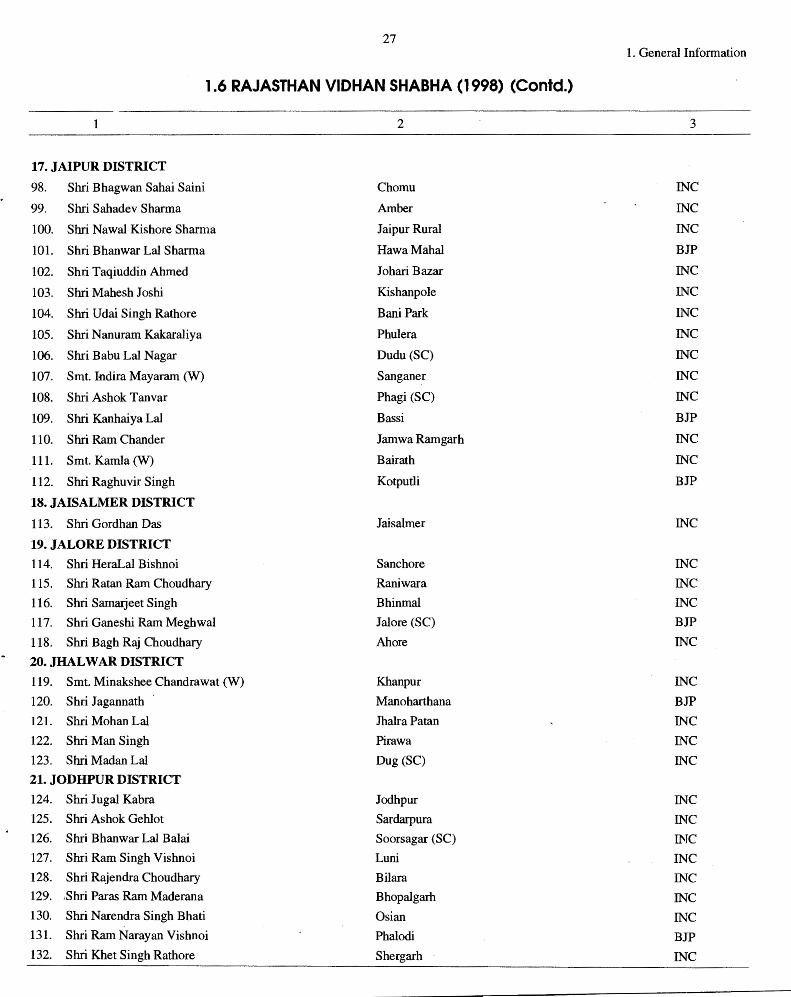
1.6 RAJASTHAN VIDHAN SHABHA (1998) (Contd.)
2 3
17. JAIPUR DISTRICT
98. Shri Bhagwan Sahai Saini Chomu INC
99. Shri Sahadev Sharma Amber INC
100. Shri Nawal Kishore Sharma Jaipur Rural INC
101. Shri Bhanwar Lal Sharma HawaMahal BJP
102. Shri Taqiuddin Ahmed Johari Bazar INC
103. Shri Mahesh Joshi Kishanpole INC
104. Shri Udai Singh Rathore Bani Park INC
105. Shri Nanuram Kakaraliya Phulera INC
106. Shri Babu Lal Nagar Dudu (SC) INC
107. Smt. Indira Mayaram (W) Sanganer INC
108. Shri Ashok Tanvar Phagi (SC) INC
109. Shri Kanhaiya Lal Bassi BJP
llO. Shri Ram Chander Jamwa Ramgarh INC
ll 1. Smt. Kamla (W) Bairath INC
ll2. Shri Raghuvir Singh Kotputli BJP
18. JAISALMER DISTRICT
ll3. Shri Gordhan Das Jaisalmer INC
19. JALORE DISTRICT
114. Shri HeraLal Bishnoi San chore INC
ll5. Shri Ratan Ram Choudhary Raniwara INC
ll6. Shri Samarjeet Singh Bhinmal INC
ll7. Shri Ganeshi Ram Meghwal Jalore (SC) BJP
ll8. Shri Bagh Raj Choudhary Ah ore INC
20. JHALW AR DISTRICT
ll9. Smt. Minakshee Chandrawat (W) Khanpur INC
120. Shri Jagannath Manoharthana BJP
121. Shri Mohan Lal Jhalra Patan INC
122. Shri Man Singh Pirawa INC
123. Shri Madan Lal Dug (SC) INC
21. JODHPUR DISTRICT
124. Shri Jugal Kabra Jodhpur INC
125. Shri Ashok Gehlot Sardarpura INC
126. Shri Bhanwar Lal Balai Soorsagar (SC) INC
127. Shri Ram Singh Vishnoi Luni INC
128. Shri Rajendra Choudhary Bilara ThrC 129. ,Shri Paras Ram Maderana Bhopalgarh INC 130. Shri Narendra Singh Bhati Osian INC 131. Shri Ram Narayan Vishnoi Phalodi BJP 132. Shri Khet Singh Rathore Shergarh INC
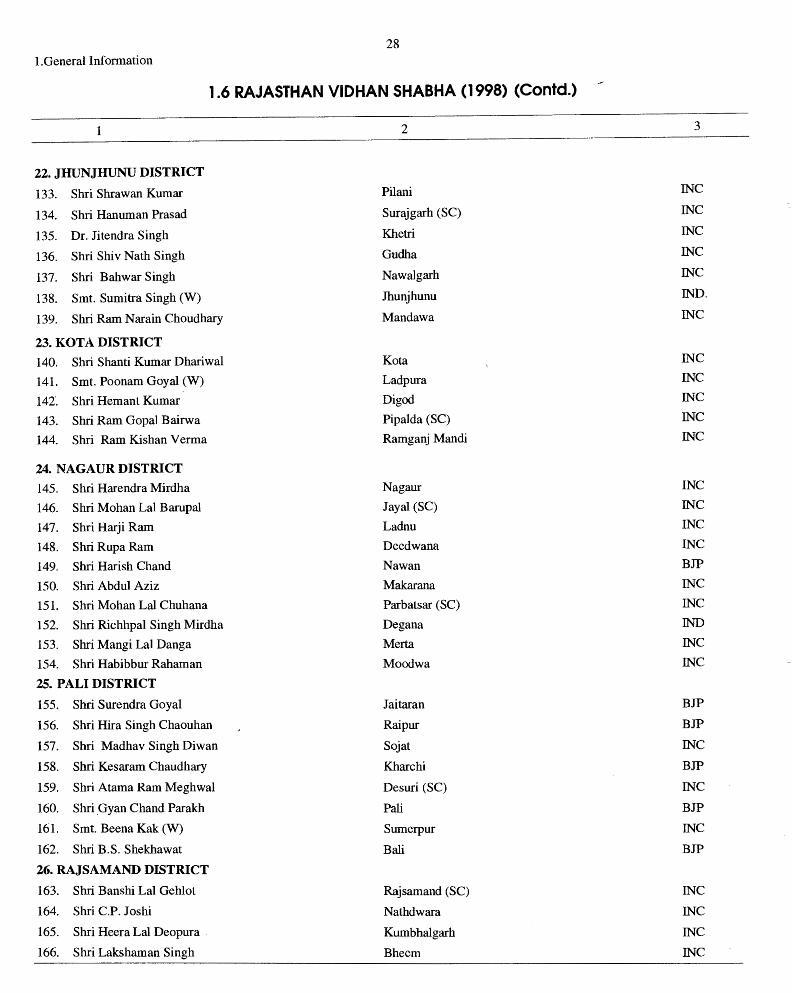
28 I .General Information
1.6 RAJASTHAN VIDHAN SHABHA (1998) (Contd.)
1
22. JHUNJHUNU DISTRICT
133. Shri Shrawan Kumar
134. Shri Hanuman Prasad
135. Dr. Jitendra Singh
136. Shri Shiv Nath Singh
137. Shri Bahwar Singh
138. Smt. Sumitra Singh (W)
139. Shri Ram Narain Choudhary
23. KOTA DISTRICT
140. Shri Shanti Kumar Dhariwal
141. Smt. Poonam Goyal (W)
142'. Shri Hemant Kumar
143. Shri Ram Gopal Bairwa
144. Shri Ram Kishan Verma
24. NAGAUR DISTRICT
145. Shri Harendra Mirdha
146. Shri Mohan Lal Barupal
147. Shri Harji Ram
148. Shri Rupa Ram
149. Shri Harish Chand
150. Shri Abdul Aziz
151. Shri Mohan Lal Chuhana
152. Shri Richhpal Singh Mirdha
153. Shri Mangi Lal Danga
154. Shri Habibbur Rahaman
25. PALI DISTRICT
155. Shri Surendra Goyal
156. Shri Hira Singh Chaouhan
157. Shri Madhav Singh Diwan
158. Shri Kesaram Chaudhary
159. Shri Atama Ram Meghwal
160. Shri _Gyan Chand Parakh
161. Smt. Beena Kak (W)
162. Shri B.S. Shekhawat
26. RAJSAMAND DISTRICT
163. Shri Banshi Lal Gehlot
164. Shri C.P. Joshi
165. Shri Heera Lal Deopura
166. Shri Lakshaman Singh
2
Pilani
Surajgarh (SC)
Khetri
Gudha
Nawalgarh
Jhunjhunu
Mandawa
Kota
Ladpura
Di god
Pipalda (SC)
Ramganj Mandi
Nagaur
Jayal (SC)
Ladnu
Deedwana
Nawan
Makarana
Parbatsar (SC)
Degana
Merta
Moodwa
Jaitaran
Raipur
Sojat
Khare hi
Desuri (SC)
Pali
Sumerpur
Bali
Rajsamand (SC)
Nathdwara
Kumbhalgarh
Bheem
3
INC
INC
INC
INC
INC
IND.
INC
INC
INC
INC
INC
INC
INC
INC
INC
INC
BJP
INC
INC
IND
INC
INC
BJP
BJP
INC
BJP
INC
BJP
INC
BJP
INC
INC
INC
INC
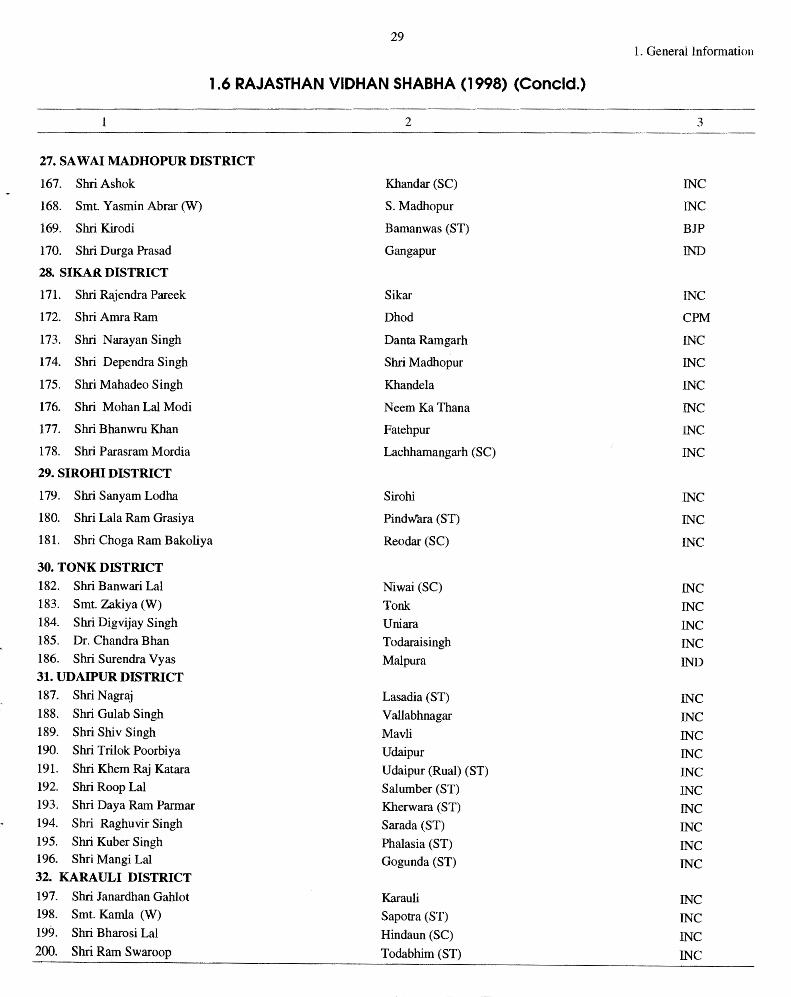
29 1. General Information
1.6 RAJASTHAN VIDHAN SHABHA (1998) (Concld.)
2 3
27. SA WAI MADHOPUR DISTRICT
167. Shri Ashok Khandar (SC) INC
168. Smt. Yasmin Abrar (W) S. Madhopur INC
169. Shri Kirodi Bamanwas (ST) BJP
170. Shri Durga Prasad Gangapur IND
28. SIKAR. DISTRICT
171. Shri Rajendra Pareek Sikar INC
172. Shri Amra Ram Dhod CPM
173. Shri Narayan Singh Danta Ramgarh INC
174. Shri Dependra Singh Shri Madhopur INC
175. Shri Mahadeo Singh Khandela INC
176. Shri Mohan Lal Modi Neem Ka Thana INC
177. Shri Bhanwru Khan Fatehpur INC
178. Shri Parasram Mordia Lachhamangarh (SC) INC
29. SIROHI DISTRICT
179. Shri Sanyam Lodha Sirohi INC
180. Shri Lala Ram Grasiya Pindwara (ST) INC
181. Shri Choga Ram Bakoliya Reodar (SC) INC
30. TONK DISTRICT 182. Shri Banwari Lal Niwai (SC) INC 183. Smt. Zakiya (W) Tonk INC 184. Shri Digvijay Singh Uniara INC 185. Dr. Chandra Bhan Todaraisingh INC 186. Shri Surendra Vyas Malpura IND 31. UDAIPUR DISTRICT 187. Shri Nagraj Lasadia (ST) INC 188. Shri Gulab Singh V allabhnagar INC 189. Shri Shiv Singh Mavli INC 190. Shri Trilok Poorbiya Udaipur INC 191. Shri Khem Raj Katara Udaipur (Rual) (ST) INC 192. Shri Roop Lal Salumber (ST) INC 193. Shri Daya Ram Parmar Kherwara (ST) INC 194. Shri Raghuvir Singh Sarada (ST) INC 195. Shri Kuber Singh Phalasia (ST) INC 196. Shri Mangi Lal Gogunda (ST) INC 32. KARAULI DISTRICT
197. Shri Janardhan Gahlot Karauli INC 198. Smt. Kamla (W) Sapotra (ST) INC 199. Shri Bharosi Lal Hindaun (SC) INC 200. Shri Ram Swaroop Todabhim (ST) INC
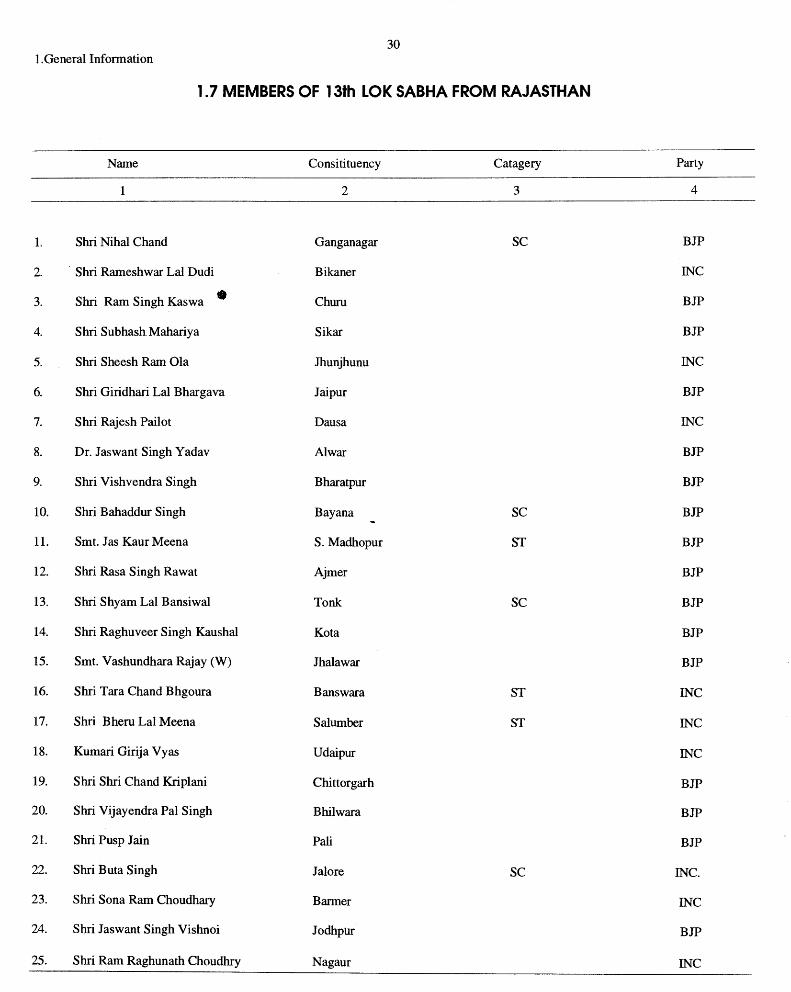
30 I.General Information
1.7 MEMBERS OF 13th LOK SABHA FROM RAJASTHAN
Name Consi ti tu ency Catagery Party
1 2 3 4
L Shri Nihal Chand Ganganagar SC BJP
2. · Shri Rameshwar Lal Dudi Bikaner INC
3. Shri Ram Singh Kaswa • Churn BJP
4. Shri Subhash.Mahariya Sikar BJP
5. Shri Sheesh Ram Ola Jhunjhunu INC
6. Shri Giridhari Lal Bhargava Jaipur BJP
7. Shri Rajesh Pailot Dausa INC
8. Dr. Jaswant Singh Y adav Al war BJP
9. Shri Vishvendra Singh Bharatpur BJP
10. Shri Bahaddur Singh Bayana SC BJP
11. Smt. Jas Kaur Meena S. Madhopur ST BJP
12. Shri Rasa Singh Rawat Ajmer BJP
13. Shri Shyam Lal Bansiwal Tonk SC BJP
14. Shri Raghuveer Singh Kaushal Ko ta BJP
15. Smt. Vashundhara Rajay (W) Jhalawar BJP
16. Shri Tara Chand Bhgoura Banswara ST INC
17. Shri B heru Lal Meena Sal umber ST INC
18. Kumari Girija Vyas Udaipur INC
19. Shri Shri Chand Kriplani Chittorgarh BJP
20. Shri Vijayendra Pal Singh Bhilwara BJP
21. Shri Pusp Jain Pali BJP
22. Shri B uta Singh Jalore SC INC.
23. Shri Sona Ram Choudhary Barmer INC
24. Shri Jaswant Singh Vishnoi Jodhpur BJP
25. Shri Ram Raghunath Choudhry Nagaur INC
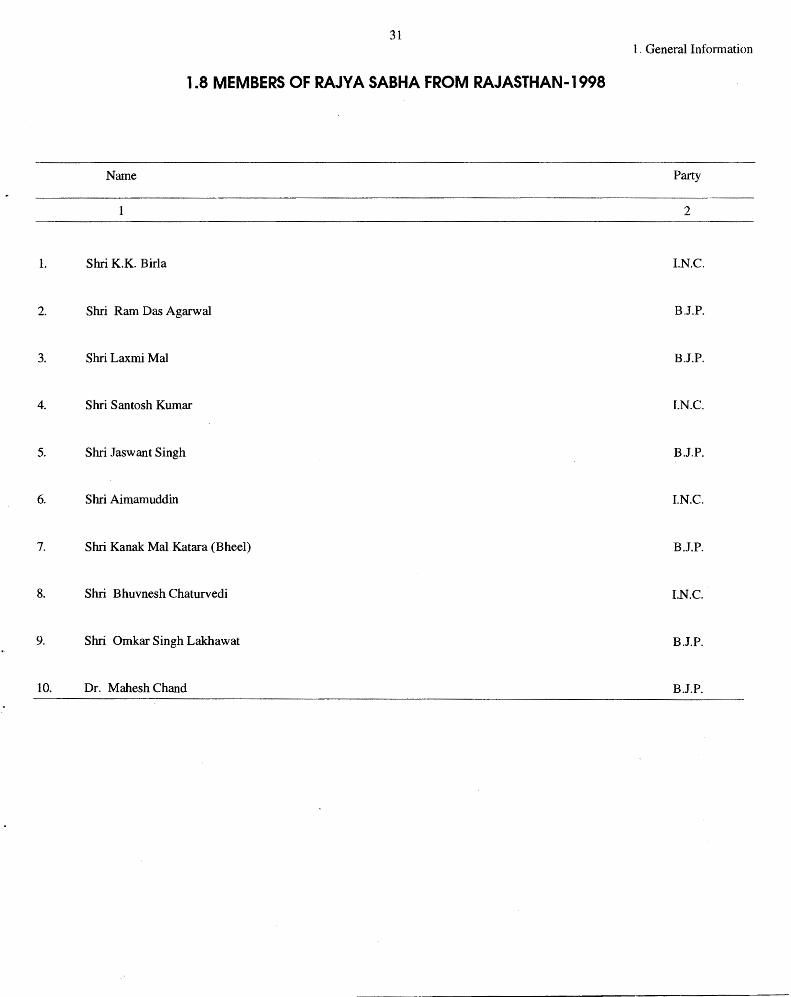
31 1. General lnfom1ation
1.8 MEMBERS OF RAJVA SABHA FROM RAJASTHAN-1998
Name Party
2
1. Shri K.K. Birla I.N.C.
2. Shri Ram Das Agarwal BJ.P.
3. Shri Laxmi Mal B.J.P.
4. Shri Santosh Kumar I.N.C.
5. Shri Jaswant Singh BJ.P.
6. Shri Aimamuddin I.N.C.
7. Shri Kanak Mal Katara (Bheel) B..J.P.
8. Shri Bhuvnesh Chaturvedi I.N.C.
9. Shri Omkar Singh Lakhawat B.J.P.
10. Dr. Mahesh Chand B.J.P.
I.General Information
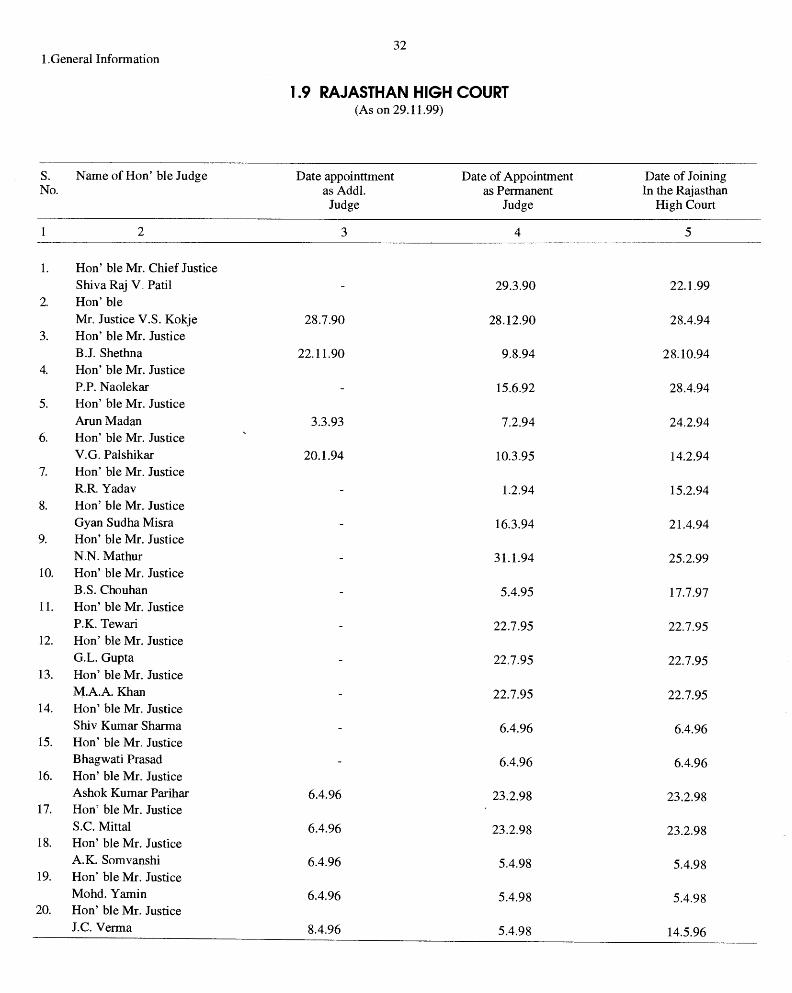
s. Name of Hon' hie Judge No.
2
1. Hon' hle Mr. Chief Justice Shiva Raj V. Patil
2. Hon' hie
Mr. Justice V.S. Kokje 3. Hon' hie Mr. Justice
B.J. Shethna 4. Hon' hle Mr. Justice
P.P. Naolekar 5. Hon' hle Mr. Justice
Arnn Madan 6. Hon' hie Mr. Justice
V.G. Palshikar 7. Hon' hie Mr. Justice
R.R. Yadav 8. Hon' hie Mr. Justice
Gyan Sudha Misra 9. Hon' hie Mr. Justice
N.N. Mathur 10. Hon' hie Mr. Justice
B.S. Chouhan 11. Hon' hie Mr. Justice
P.K. Tewari 12. Hon' hie Mr. Justice
G.L. Gupta 13. Hon' hie Mr. Justice
M.A.A. Khan 14. Hon' hie Mr. Justice
Shiv Kumar Sharma 15. Hon' hie Mr. Justice
Bhagwati Prasad 16. Hon' hie Mr. Justice
Ashok Kumar Parihar 17. Hon' hie Mr. Justice
S.C. Mittal 18. Hon' hie Mr. Justice
A.K. Somvanshi 19. Hon' hie Mr. Justice
Mohd. Yamin 20. Hon' hie Mr. Justice
J.C. Verma
32
1.9 RAJASTHAN HIGH COURT (As on 29.11.99)
Date appointtment Date of Appointment as Addi. as Permanent Judge Judge
3 4
29.3.90
28.7.90 28.12.90
22.11.90 9.8.94
15.6.92
3.3.93 7.2.94
20.1.94 10.3.95
1.2.94
16.3.94
31.1.94
5.4.95
22.7.95
22.7.95
22.7.95
6.4.96
6.4.96
6.4.96 23.2.98
6.4.96 23.2.98
6.4.96 5.4.98
6.4.96 5.4.98
8.4.96 5.4.98
Date of Joining In the Rajasthan
High Court
5
22.1.99
28.4.94
28.10.94
28.4.94
24.2.94
14.2.94
15.2.94
21.4.94
25.2.99
17.7.97
22.7.95
22.7.95
22.7.95
6.4.96
6.4.96
23.2.98
23.2.98
5.4.98
5.4.98
14.5.96

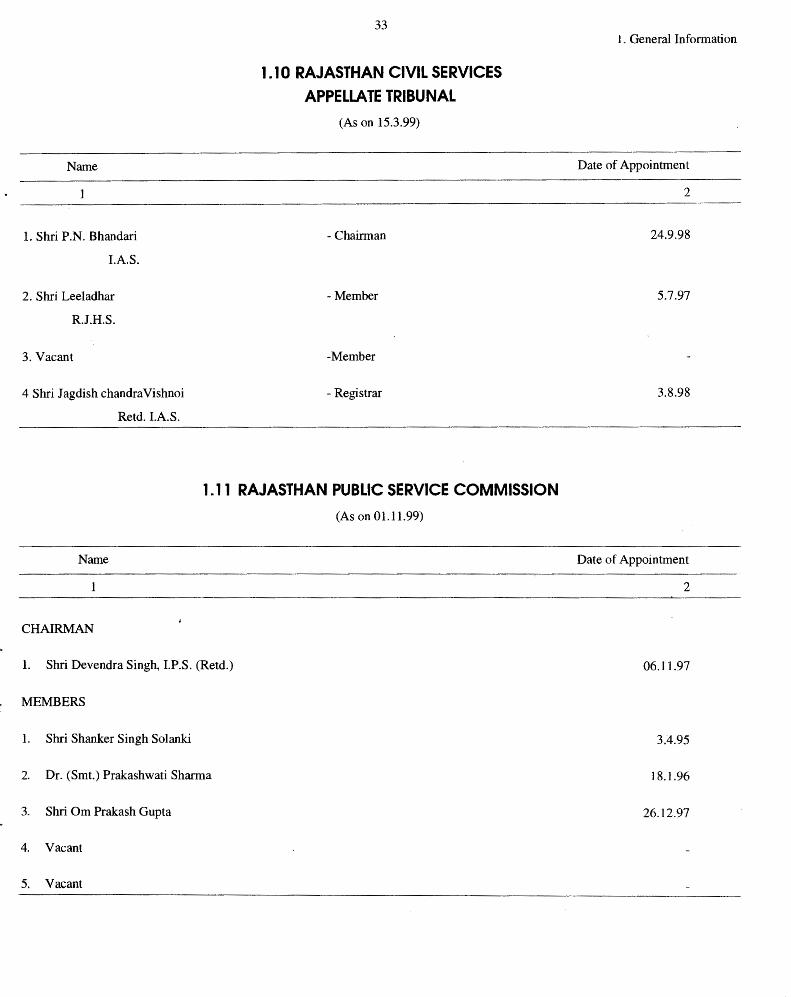
Name
1
1. Shri P.N. Bhandari
l.A.S.
2. Shri Leeladhar
R.J.H.S.
3. Vacant
4 Shri J agdish chandra Vishnoi
Retd. l.A.S.
33
1.10 RAJASTHAN CIVIL SERVICES APPELLATE TRIBUNAL
(As on 15.3.99)
- Chairman
-Member
-Member
- Registrar
1.11 RAJASTHAN PUBLIC SERVICE COMMISSION
(As on 01.11.99)
Name
CHAIRMAN
1. Shri Devendra Singh, I.P.S. (Retd.)
MEMBERS
1. Shri Shanker Singh Solanki
2. Dr. (Smt.) Prakashwati Sharma
3. Shri Om Prakash Gupta
4. Vacant
5. Vacant
1. General Information
Date of Appointment
2
24.9.98
5.7.97
3.8.98
Date of Appointment
2
06.11.97
3.4.95
18.1.96
26.12.97
Name
1
1. Shri P.N. Bhandari
l.A.S.
2. Shri Leeladhar
R.J.H.S.
3. Vacant
4 Shri J agdish chandra Vishnoi
Retd. l.A.S.
33
1.10 RAJASTHAN CIVIL SERVICES APPELLATE TRIBUNAL
(As on 15.3.99)
- Chairman
-Member
-Member
- Registrar
1.11 RAJASTHAN PUBLIC SERVICE COMMISSION
(As on 01.11.99)
Name
CHAIRMAN
1. Shri Devendra Singh, I.P.S. (Retd.)
MEMBERS
1. Shri Shanker Singh Solanki
2. Dr. (Smt.) Prakashwati Sharma
3. Shri Om Prakash Gupta
4. Vacant
5. Vacant
1. General Information
Date of Appointment
2
24.9.98
5.7.97
3.8.98
Date of Appointment
2
06.11.97
3.4.95
18.1.96
26.12.97
I .General Information
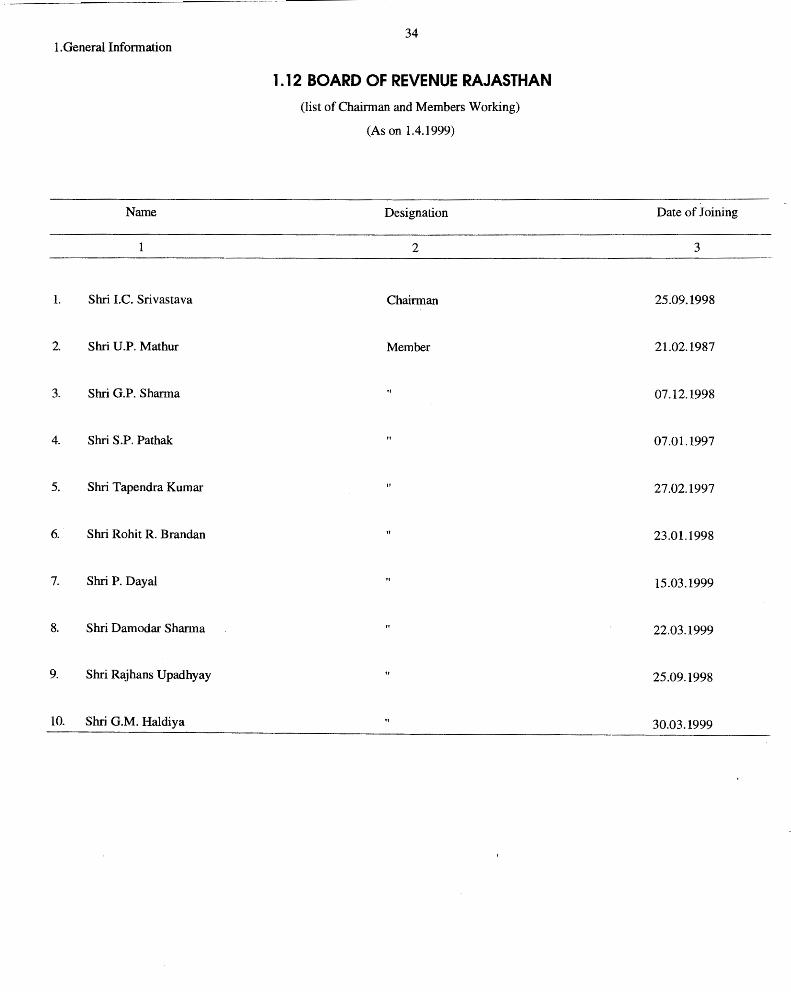
Name
I. Shri LC. Srivastava
2. Shri U.P. Mathur
3. Shri G.P. Sharma
4. Shri S.P. Pathak
5. Shri Tapendra Kumar
6. Shri Rohit R. Brandan
7. Shri P. Dayal
8. Shri Damodar Sharma
9. Shri Rajhans Upadhyay
10. Shri G.M. Haldiya
34
1.12 BOARD OF REVENUE RAJASTHAN
(list of Chairman and Members Working)
(As on 1.4.1999)
Designation
2
Chairman
Member
"
Date of Joining
3
25.09.1998
21.02.1987
07.12.1998
07.01.1997
27.02.1997
23.01.1998
15.03.1999
22.03.1999
25.09.1998
30.03.1999
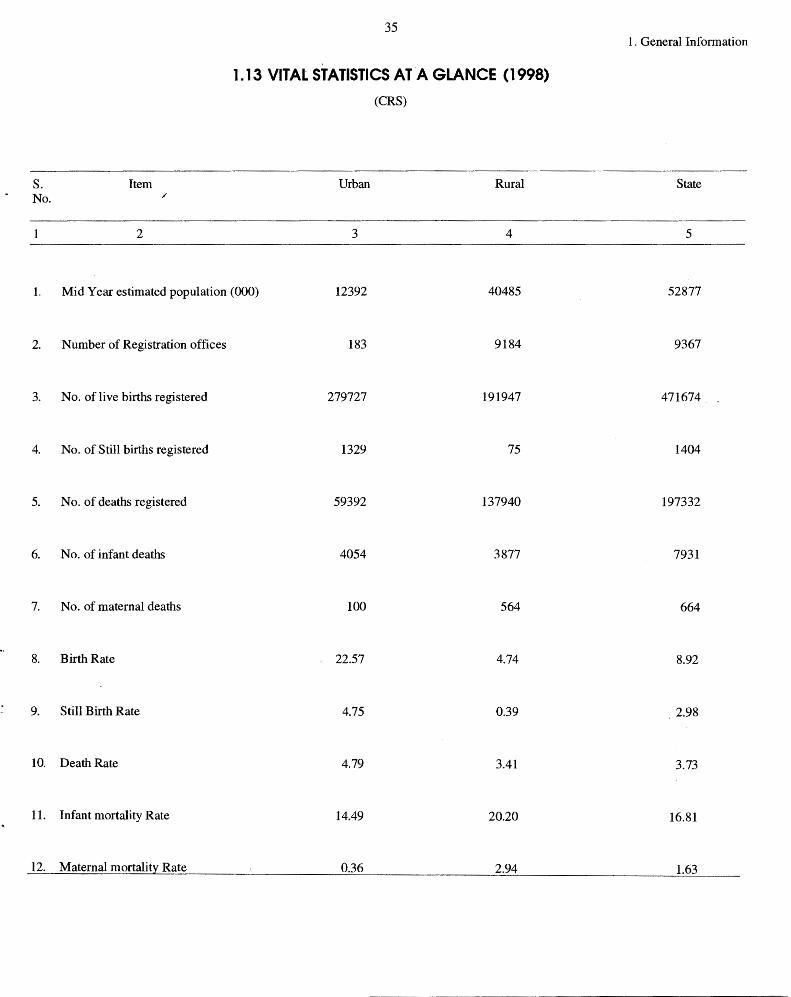
s. No.
Item
2
/
35
1.13 VITAL STATISTICS AT A GLANCE (1998)
(CRS)
Urban Rural
3 4
1. Mid Year estimated population (000) 12392 40485
2. Number of Registration offices 183 9184
3. No. of live births registered 279727 191947
4. No. of Still births registered 1329 75
5. No. of deaths registered 59392 137940
6. No. of infant deaths 4054 3877
7. No. of maternal deaths 100 564
8. Birth Rate 22.57 4.74
9. Still Birth Rate 4.75 0.39
10. Death Rate 4.79 3.41
11. Infant mortality Rate 14.49 20.20
12. Maternal mortality Rate 0.36 2.94
1. General Information
State
5
52877
9367
471674
1404
197332
7931
664
8.92
'2.98
3.73
16.81
1.63
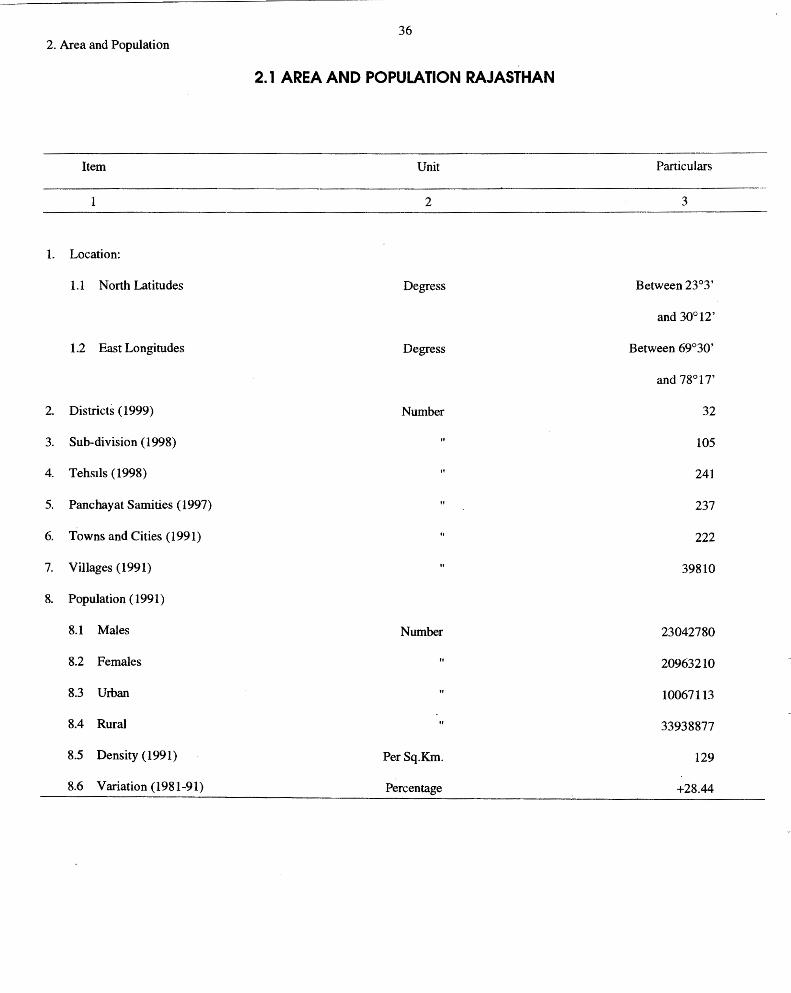
36 2. Area and Population
2.1 AREA AND POPULATION RAJASTHAN
Item Unit Particulars
2 3
1. Location:
1.1 North Latitudes Degress Between 23°3'
and 30°12'
1.2 East Longitudes Degress Between 69°30'
and 78°17'
2. Districts (1999) Number 32
3. Sub-division (1998) 105
4. Tehs1ls (1998) 241
5. Panchayat Samities (1997) 237
6. Towns and Cities (1991) 222
7. Villages ( 1991) 39810
8. Population (1991)
8.1 Males Number 23042780
8.2 Females 20963210
8.3 Urban 10067113
8.4 Rural 33938877
8.5 Density (1991) Per Sq.Km. 129
8.6 Variation (1981-91) Percentage +28.44
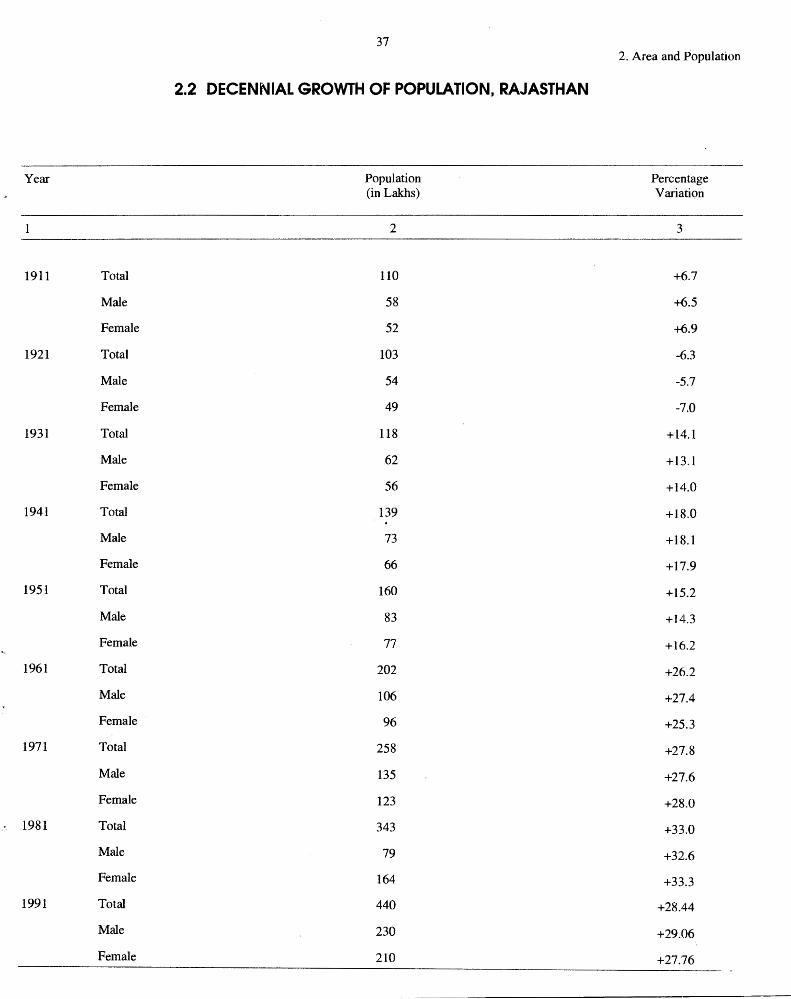
37 2. Area and Population
2.2 DECENNIAL GROWTH OF POPULATION, RAJASTHAN
Year Population Percentage (in Lakhs) Variati<;m
2 3
1911 Total 110 +6.7
Male 58 +6.5
Female 52 +6.9
1921 Total 103 -6.3
Male 54 -5.7
Female 49 -7.0
1931 Total 118 +14.1
Male 62 +13.l
Female 56 +14.0
1941 Total 139 +18.0
Male 73 +18.1
Female 66 +17.9
1951 Total 160 +15.2
Male 83 +14.3
Female 77 +16.2
1961 Total 202 +26.2
Male 106 +27.4
Female 96 +25.3
1971 Total 258 +27.8
Male 135 +27.6
Female 123 +28.0
1981 Total 343 +33.0
Male 79 +32.6
Female 164 +33.3
1991 Total 440 +28.44
Male 230 +29.06
Female 210 +27.76
2. Area and Population
Age M
2
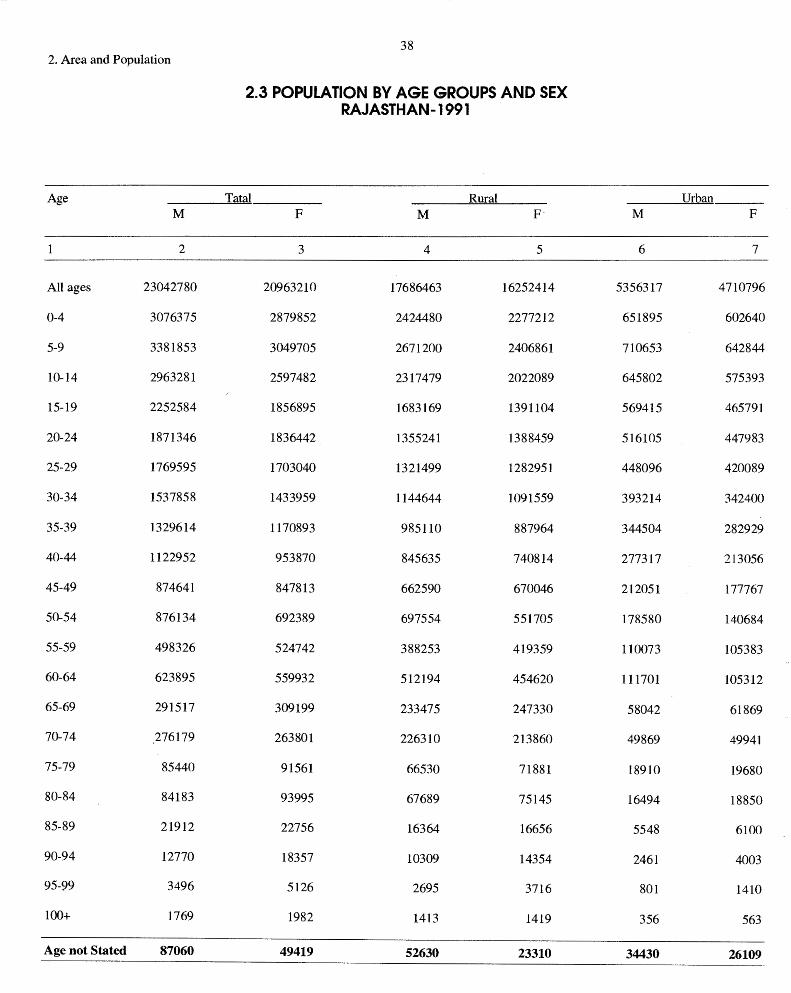
All ages 23042780
0-4 3076375
5-9 3381853
10-14 2963281
15-19 2252584
20-24 1871346
25-29 1769595
30-34 1537858
35-39 1329614
40-44 1122952
45-49 874641
50-54 876134
55-59 498326
60-64 623895
65-69 291517
70-74 276179
75-79 85440
80-84 84183
85-89 21912
90-94 12770
95-99 3496
100+ 1769
Age not Stated 87060
38
2.3 POPULATION BY AGE GROUPS AND SEX RAJASTHAN-1991
Tatal Rural F M F·
3 4 5
20963210 17686463 16252414
2879852 2424480 2277212
3049705 2671200 2406861
2597482 2317479 2022089
1856895 1683169 1391104
1836442 1355241 1388459
1703040 1321499 1282951
1433959 1144644 1091559
1170893 985110 887964
953870 845635 740814
847813 662590 670046
692389 697554 551705
524742 388253 419359
559932 512194 454620
309199 233475 247330
263801 226310 213860
91561 66530 71881
93995 67689 75145
22756 16364 16656
18357 10309 14354
5126 2695 3716
1982 1413 1419
49419 52630 23310
Urban M F
6 7
5356317 4710796
651895 602640
710653 642844
645802 575393
569415 465791
516105 447983
448096 420089
393214 342400
344504 282929
277317 213056
212051 177767
178580 140684
110073 105383
111701 105312
58042 61869
49869 49941
18910 19680
16494 18850
5548 6100
2461 4003
801 1410
356 563
34430 26109
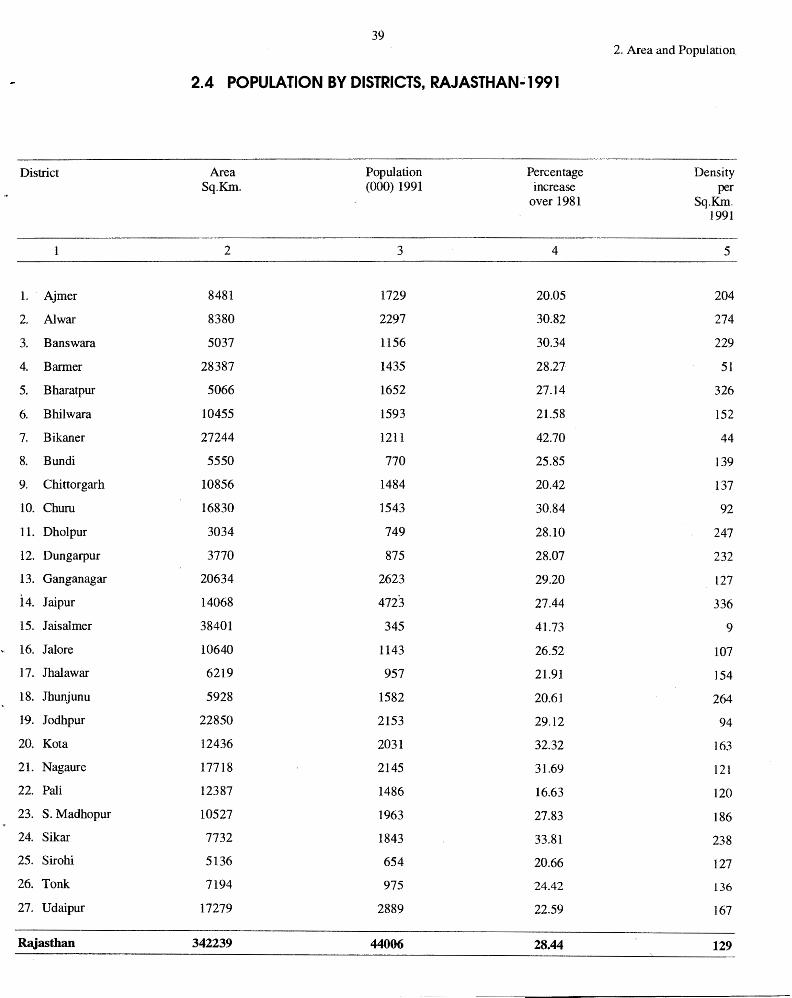
39 2. Area and Population
2.4 POPULATION BY DISTRICTS, RAJASTHAN-1991
District Area Population Percentage Density Sq.Km. (000) 1991 increase per
over 1981 Sq.Km. 1991
2 3 4 5
1. Ajmer 8481 1729 20.05 204
2. Al war 8380 2297 30.82 274
3. Banswara 5037 1156 30.34 229
4. Barmer 28387 1435 28.27 51
5. Bharatpur 5066 1652 27.14 326
6. Bhilwara 10455 1593 21.58 152
7. Bikaner 27244 1211 42.70 44
8. Bundi 5550 770 25.85 139
9. Chittorgarh 10856 1484 20.42 137
10. Chum 16830 1543 30.84 92
11. Dholpur 3034 749 28.10 247
12. Dungarpur 3770 875 28.07 232
13. Gang an agar 20634 2623 29.20 127
l4. Jaipur 14068 4723 27.44 336
15. Jaisalmer 38401 345 41.73 9
16. Jalore 10640 1143 26.52 107
17. Jhalawar 6219 957 21.91 154
18. Jhunjunu 5928 1582 20.61 264
19. Jodhpur 22850 2153 29.12 94
20. Ko ta 12436 2031 32.32 163
21. Nagaure 17718 2145 31.69 121
22. Pali 12387 1486 16.63 120
23. S. Madhopur 10527 1963 27.83 186
24. Sikar 7732 1843 33.81 238
25. Sirohi 5136 654 20.66 127
26. Tonk 7194 975 24.42 136
27. Udaipur 17279 2889 22.59 167
Rajas than 342239 44006 28.44 129
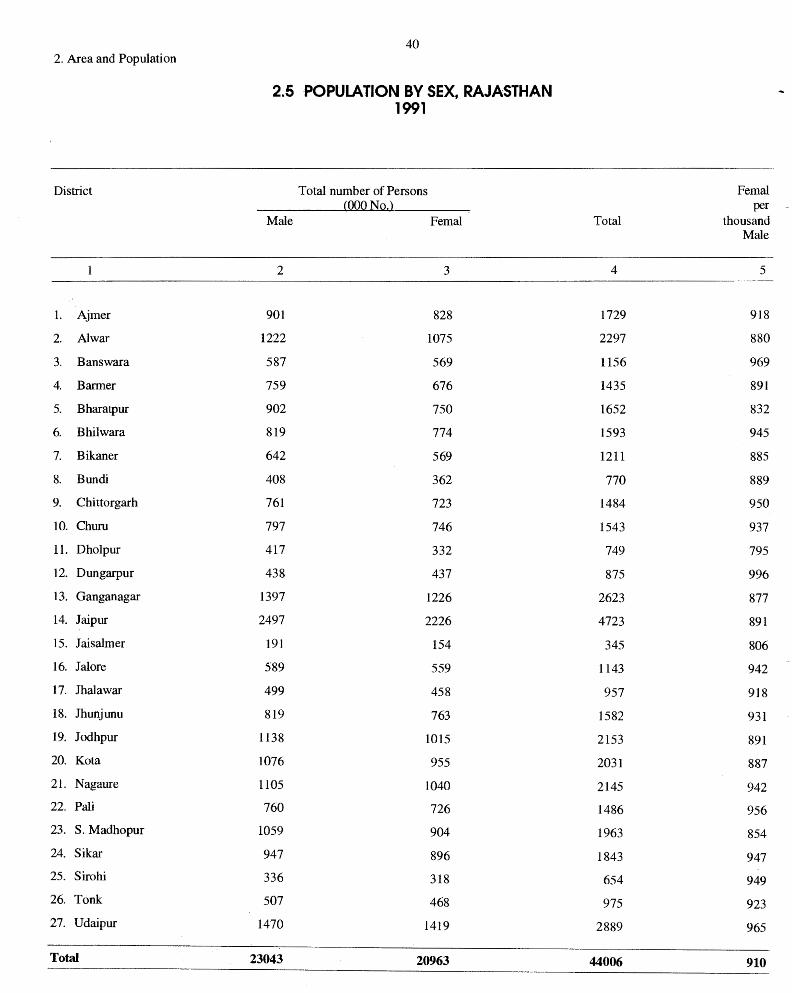
2. Area and Population
District
I. Ajmer
2. Al war
3. Banswara
4. Barmer
5. Bharatpur
6. Bhilwara
7. Bikaner
8. Bundi
9. Chittorgarh
10. Churn
11. Dholpur
12. Dungarpur
13. Ganganagar
14. Jaipur
15. Jaisalmer
16. Jalore
17. Jhalawar
18. Jhunjunu
19. Jodhpur
20. Ko ta
21. Nagaure
22. Pali
23. S.Madhopur
24. Sikar
25. Sirohi
26. Tonk
27. Udaipur
Total
40
2.5 POPULATION BY SEX, RAJASTHAN 1991
Total number of Persons (000 No.)
Male Femal
2 3
901 828
1222 1075
587 569
759 676
902 750
819 774
642 569
408 362
761 723
797 746
417 332
438 437
1397 1226
2497 2226
191 154
589 559
499 458
819 763
1138 1015
1076 955
1105 1040
760 726
1059 904
947 896
336 318
507 468
1470 1419
23043 20963
Femal per -
Total thousand Male
4 5
1729 918
2297 880
1156 969
1435 891
1652 832
1593 945
1211 885
770 889
1484 950
1543 937
749 795
875 996
2623 877
4723 891
345 806
1143 942
957 918
1582 931
2153 891
2031 887
2145 942
1486 956
1963 854
1843 947
654 949
975 923
2889 965
44006 910

s. District No.
2
1. Ajmer
2. Al war
3. Banswara
4. Barmer
5. Bharatpur
6. Bhilwara
7. Bikaner
8. Bundi
9. Chittorgarh
10. churu
11. Dholpur
12. Dungarpur
13. Ganganagar
14. Jaipur
15. Jaisalmer
16. Jalore
17. Jhalawar
18. Jhunjunu
19. Jodhpur
20. Ko ta
21. Nagaure
22. Pali
23. S. Madhopur
24. Sikar
25. Sirohi
26. Tonk
27. Udaipur
Rajasthan
41
2.6 DISTRICT WISE POPULATION BY RELIGION RAJASTHAN 1991
Total Hindus Muslims Population
3 4 5
1729207 1500241 170621
2296580 1982837 255436
1155600 1093974 35324
1435222 1235894 163708
1651584 1439675 182829
1593128 1478164 84253
1211140 1044015 126710
770284 707689 43920
1484190 1372547 77856
1543211 1359941 163406
749479 699948 45696
874549 835806 24820
2622777 2000064 101048
4722551 4~65535 381214
344517 259009 83104
1142563 1071310 41606
956971 882333 63431
1582421 1427271 152701
2153483 1895845 224731
2030831 1805719 191453
2144810 1867744 259632
1486432 1369408 85979
1963246 1803141 145456
1842914 1627004 210025
654029 620124 19258
975006 856745 97680
2889301 2699116 93442
44005990 39201099 3525339
2. Area and Population
(Number)
Sikhs
6
5863
44460
361
298
21520
934
12589
8211
1567
282
1003
78
515895
12141
719
48
601
722
4323
11583
197
1117
844
161
487
332
2838
649174
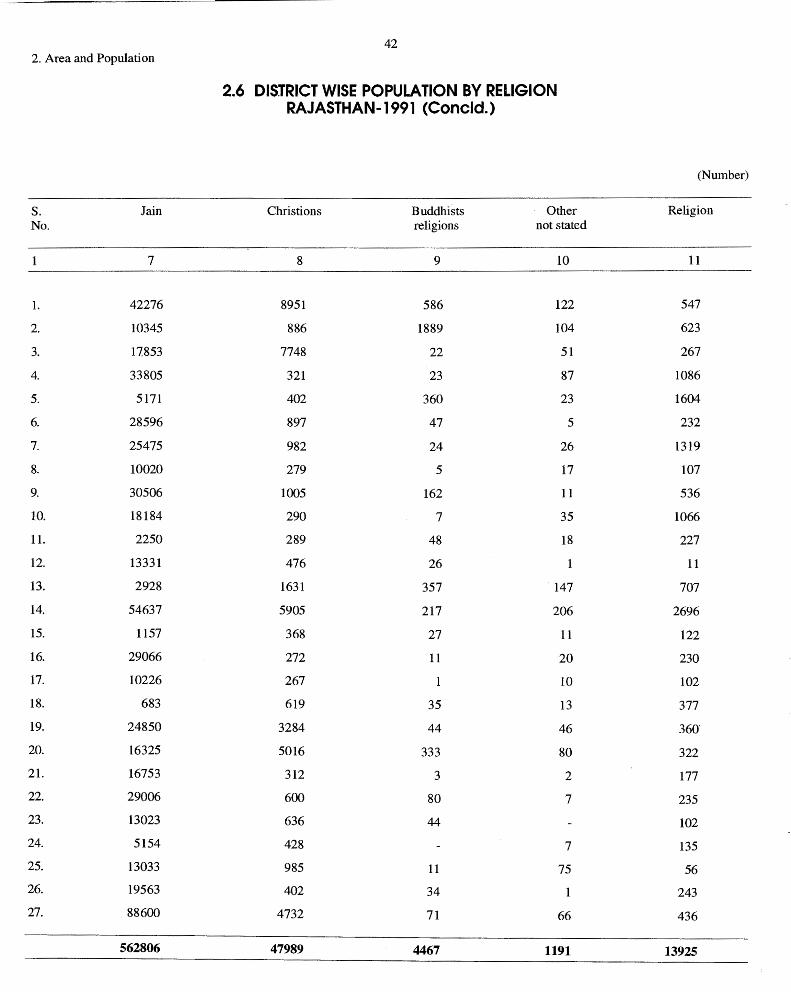
2. Area and Population
s. Jain No.
7
1. 42276
2. 10345
3. 17853
4. 33805
5. 5171
6. 28596
7. 25475
8. 10020
9. 30506
10. 18184
11. 2250
12. 13331
13. 2928
14. 54637
15. 1157
16. 29066
17. 10226
18. 683
19. 24850
20. 16325
21. 16753
22. 29006
23. 13023
24. 5154
25. 13033
26. 19563
27. 88600
562806
42
2.6 DISJRICT WISE POPULATION BY RELIGION RAJASTHAN-1991 (Concld.)
Christions Buddhists Other religions not stated
8 9 10
8951 586 122
886 1889 104
7748 22 51
321 23 87
402 360 23
897 47 5
982 24 26
279 5 17
1005 162 11
290 7 35
289 48 18
476 26
1631 357 147
5905 217 206
368 27 11
272 11 20
267 10
619 35 13
3284 44 46
5016 333 80
312 3 2
600 80 7
636 44
428 7
985 11 75
402 34
4732 71 66
47989 4467 1191
(Number)
Religion
11
547
623
267
1086
1604
232
1319
107
536
1066
227
11
707
2696
122
230
102
377
360'
322
177
235
102
135
56
243
436
13925
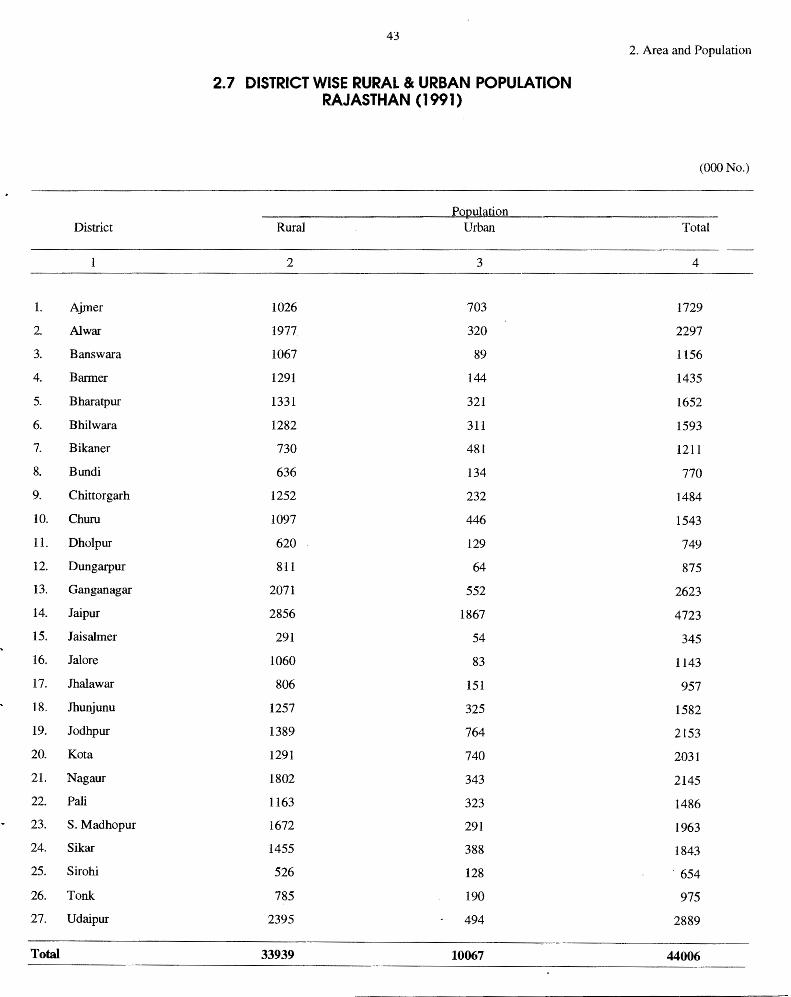
District
1. Ajmer
2. Al war
3. Banswara
4. Barmer
5. Bharatpur
6. Bhilwara
7. Bikaner
8. Bundi
9. Chittorgarh
10. Churn
11. Dholpur
12. Dungarpur
13. Ganganagar
14. Jaipur
15. Jaisalmer
16. Jalore
17. Jhalawar
lK Jhunjunu
19. Jodhpur
20. Ko ta
21. Nagaur
22. Pali
23. S.Madhopur
24. Sikar
25. Sirohi
26. Tonk
27. Udaipur
Total
43
2.7 DISTRICT WISE RURAL & URBAN POPULATION RAJASTHAN ( 1991)
Population Rural Urban
2 3
1026 703
1977 320
1067 89
1291 144
1331 321
1282 311
730 481
636 134
1252 232
1097 446
620 129
811 64
2071 552
2856 1867
291 54
1060 83
806 151
1257 325
1389 764
1291 740
1802 343
1163 323
1672 291
1455 388
526 128
785 190
2395 494
33939 10067
2. Area and Population
(000 No.)
Total
4
1729
2297
1156
1435
1652
1593
1211
770
1484
1543
749
875
2623
4723
345
1143
957
1582
2153
2031
2145
1486
1963
1843
. 654
975
2889
44006
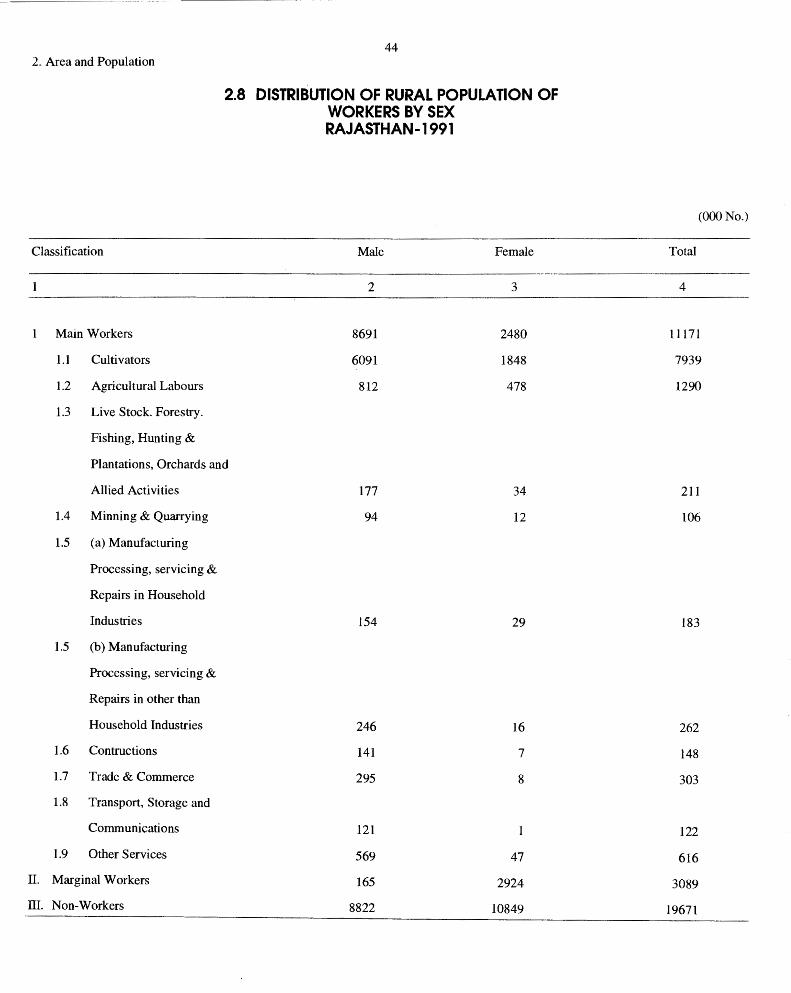
2.. Area and Population
Classification
Main Workers
1.1 Cultivators
1.2 Agricultural Labours
1.3 Live Stock. Forestry.
Fishing, Hunting &
44
2.8 DISTRIBUTION OF RURAL POPULATION OF WORKERS BY SEX RAJASTHAN-1991
Male Female
2 3
8691 2480
6091 1848
812 478
Plantations, Orchards and
Allied Activities 177 34
1.4 Minning & Quarrying 94 12
1.5 (a) Manufacturing
Processing, servicing &
Repairs in Household
Industries 154 29
1.5 (b) Manufacturing
Processing, servicing &
Repairs in other than
Household Industries 246 16
1.6 Contructions 141 7
1.7 Trade & Commerce 295 8
1.8 Transport, Storage and
Communications 121
1.9 Other Services 569 47
II. Marginal Workers 165 2924
III. Non-Workers 8822 10849
(000 No.)
Total
4
11171
7939
1290
211
106
183
262
148
303
122
616
3089
19671
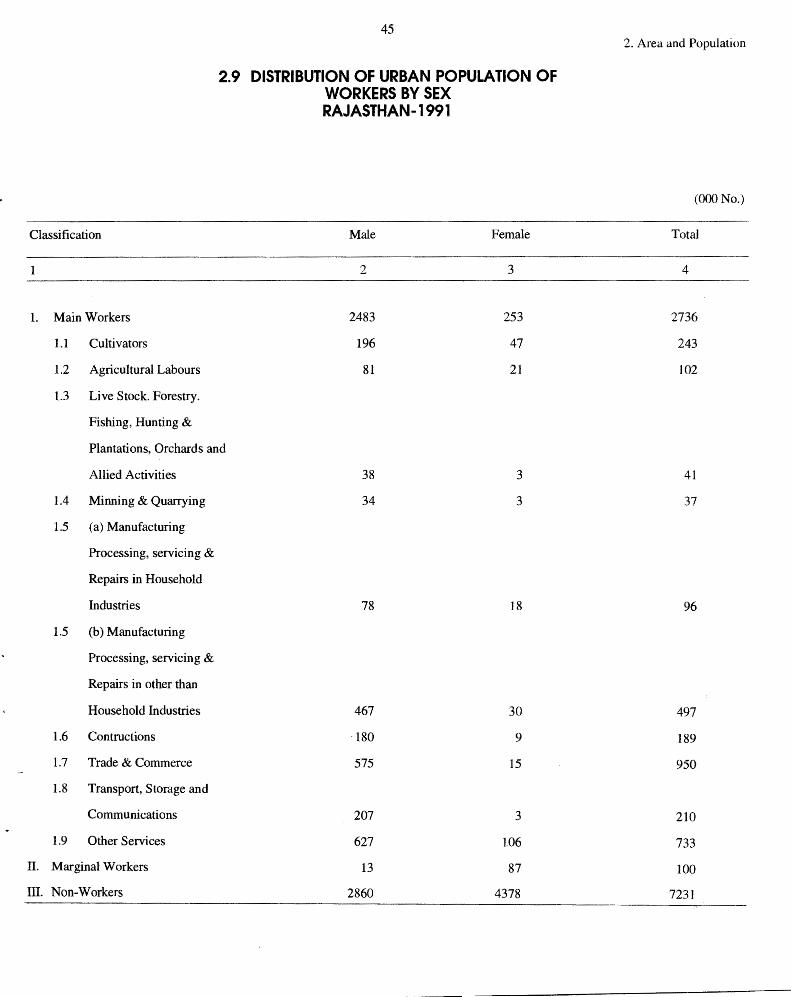
Classification
1. Main Workers
1.1 Cul ti vat ors
1.2 Agricultural Labours
1.3 Live Stock. Forestry.
Fishing, Hunting &
45
2.9 DISTRIBUTION OF URBAN POPULATION OF WORKERS BY SEX RAJASTHAN-1991
Male Female
2 3
2483 253
196 47
81 21
Plantations, Orchards and
Allied Activities 38 3
1.4 Minning & Quarrying 34 3
1.5 (a) Manufacturing
Processing, servicing &
Repairs in Household
Industries 78 18
1.5 (b) Manufacturing
Processing, servicing &
Repairs in other than
Household Industries 467 30
1.6 Contructions 180 9
1.7 Trade & Commerce 575 15
1.8 Transport, Storage and
Communications 207 3
1.9 Other Services 627 1.06
n. Marginal Workers 13 87
III. Non-Workers 2860 4378
2. Area and Population
(000 No.)
Total
4
2736
243
102
41
37
96
497
189
950
2W
733
100
7231
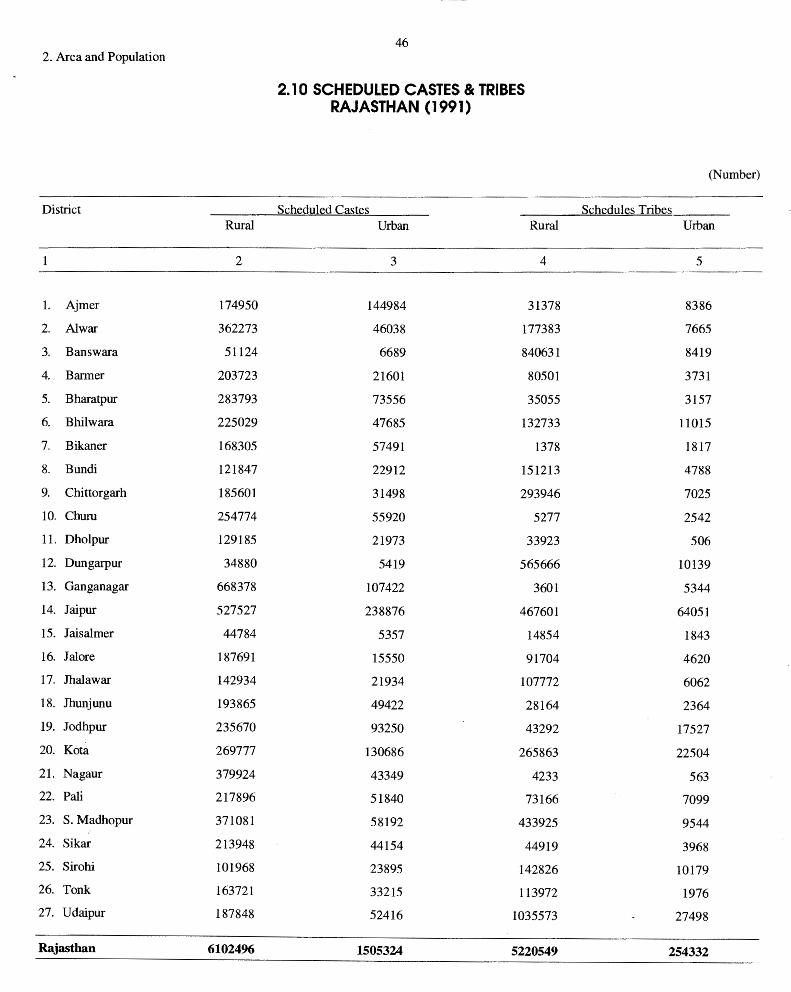
2. Area and Population
District Rural
2
1. Ajmer 174950
2. Al war 362273
3. Banswara 51124
4. Barmer 203723
5. Bharatpur 283793
6. Bhilwara 225029
7. Bikaner 168305
8. Bundi 121847
9. Chittorgarh 185601
10. Chum 254774
11. Dholpur 129185
12. Dungarpur 34880
13. Ganganagar 668378
14. Jaipur 527527
15. Jaisalmer 44784
16. Jalore 187691
17. Jhalawar 142934
18. Jhunjunu 193865
19. Jodhpur 235670
20. Ko ta 269777
21. Nagaur 379924
22. Pali 217896
23. S.Madhopur 371081
24. Sikar 213948
25. Sirohi 101968
26. Tonk 163721
27. Udaipur 187848
Rajasthan 6102496
46
2.10 SCHEDULED CASTES & TRIBES RAJASTHAN ( 1991)
Scheduled Castes Urban Rural
3 4
144984 31378
46038 177383
6689 840631
21601 80501
73556 35055
47685 132733
57491 1378
22912 151213
31498 293946
55920 5277
21973 33923
5419 565666
107422 3601
238876 467601
5357 14854
15550 91704
21934 107772
49422 28164
93250 43292
130686 265863
43349 4233
51840 73166
58192 433925
44154 44919
23895 142826
33215 113972
52416 1035573
1505324 5220549
(Number)
Schedules Tribes Urban
5
8386
7665
8419
3731
3157
11015
1817
4788
7025
2542
506
10139
5344
64051
1843
4620
6062
2364
17527
22504
563
7099
9544
3968
10179
1976
27498
254332
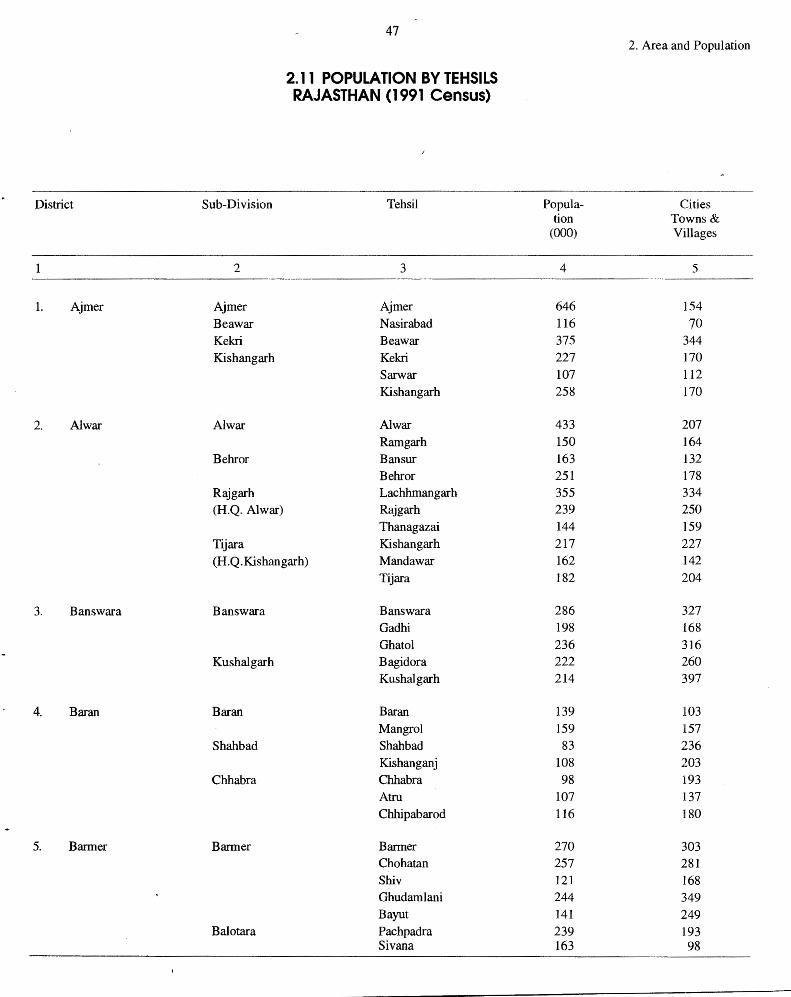
District
1. Ajmer
2. Al war
3. Banswara
4. Baran
5. Barmer
Sub-Division
2
Ajmer Bea war Kekri Kishangarh
Al war
Behror
Rajgarh (H.Q. Alwar)
Tijara
47
2.11 POPULATION BY TEHSILS RAJASTHAN (1991 Census)
Tehsil
3
Ajmer Nasirabad Bea war Kekri Sarwar Kishangarh
Al war Ramgarh Bansur Behror Lachhmangarh Rajgarh Thanagazai Kishangarh
(H.Q.Kishangarh) Manda war Tijara
Banswara Banswara Gadhi Ghatol
Kushalgarh Bagidora Kushalgarh
Baran Baran Mangrol
Shahbad Shah bad Kishanganj
Chhabra Chhabra Atru Chhipabarod
Barmer Barmer Chohatan Shiv Ghudamlani Bayut
Balotara Pachpadra Sivana
2. Area and Population
Popula- Cities ti on Towns &
(000) Villages
4 5
646 154 116 70 375 344 227 170 107 112 258 170
433 207 150 164 163 132 251 178 355 334 239 250 144 159 217 227 162 142 182 204
286 327 198 168 236 316 222 260 214 397
139 103 159 157 83 236
108 203 98 193
107 137 116 180
270 303 257 281 121 168 244 349 141 249 239 193 163 98

48 2. Area and Population
2.11 POPULATION BY TEHSILS RAJASTHAN (1991 Census) (Contd.)
2 3 4 5
6. Bharatpur Bayana Bayana 178 176 Rupbas 167 157 Weir 190 151
Bharatpur Bharatpur 290 177 Nadbai 145 117 Kumher 145 119
Deeg Deeg 160 133 Kaman 118 123 Nagar 150 174 Pahadi 108 136
7. Bhilwara Bhilwara Bhilwara 314 132 Mand al 164 163 Banera 88 85
Gulabpura Asind 167 204 Hurada 92 71
Mandalgarh Kotri 122 146 Mandalgarh 183 294
Shahpura Jhazpur 148 193 Shahpura 144 155
Gangapur Sahada 100 97 Raipur 71 90
8. Bikaner B ikaner (North) Bikaner 677 199 Lunkaransar 156 166
Bikaner (South) Magra (Kolayat) 133 206 Nokha 245 134
9. Bundi Bundi Bundi 279 266 Keshoraipatan 206 228
Nainwa Hindoli 151 174 Nainwa 134 179
10 Chittorgarh Begun Begun 195 462 Chittorgarh Chittorgarh 208 230
Gangrar 75 l28 Kap as an Kapasan 153 197
Rashmi 66 89 Nimbahera Badisadri 90 154
Bhadesar 89 168 Chhoti Sadari 100 152 Dung la 77 108 Nimbahera 152 171
Pratapgarh Pratpgarh 188 354 Arnod 91 174
11. Churu Churu Churu 215 104 Sadarsahar 243 185
Rajgarh Rajgarh 265 209 Taranagar 146 123
Ratangarh Dungargarh 170 97 Ratangarh 200 100 Sujangarh 304 158
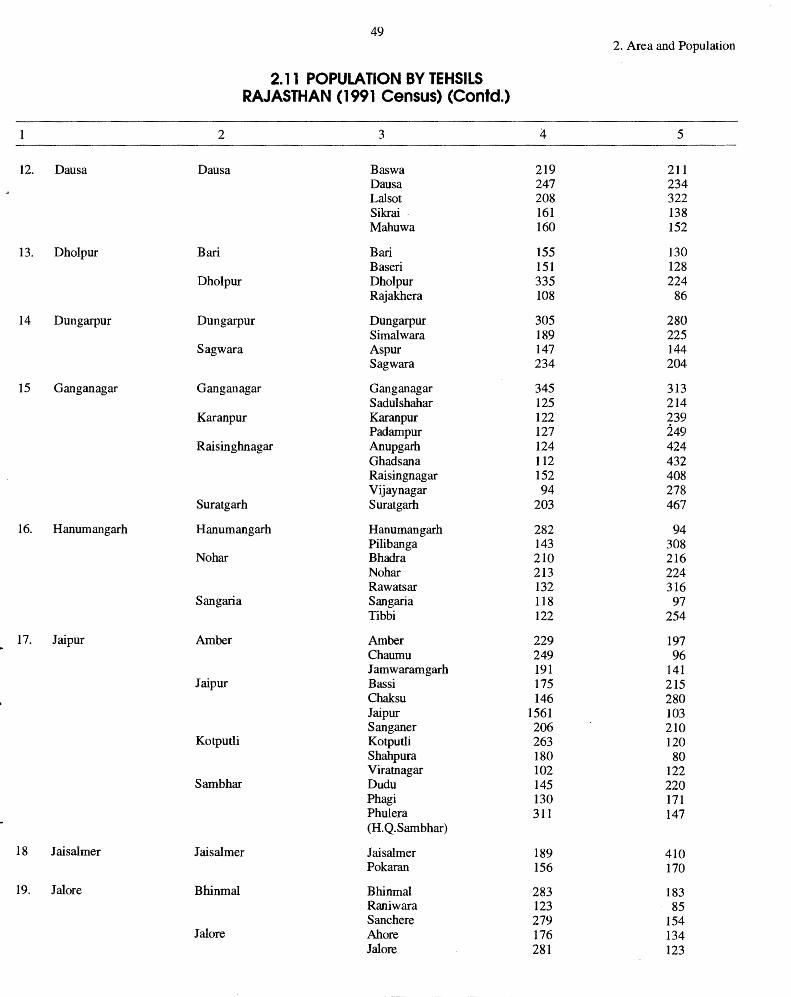
49 2. Area and Population
2.11 POPULATION BY TEHSILS RAJASTHAN (1991 Census) (Contd.)
2 3 4 5
12. Daus a Dausa Baswa 219 211 Dausa 247 234 Lal sot 208 322 Sikrai . 161 138 Mahuwa 160 152
13. Dholpur Bari Bari 155 130 Baseri 151 128
Dholpur Dholpur 335 224 · Rajakhera 108 86
14 Dungarpur Dungarpur Dungarpur 305 280 Simalwara 189 225
Sagwara Aspur 147 144 Sagwara 234 204
15 Ganganagar Ganganagar Ganganagar 345 313 Sadulshahar 125 214
Karanpur Karanpur 122 239 Padampur 127 249
Raisinghnagar Anupgarh 124 424 Ghadsana 112 432 Raisingnagar 152 408 Vijaynagar 94 278
Suratgarh Suratgarh 203 467
16. Hanumangarh Hanumangarh Hanumangarh 282 94 Pilibanga 143 308
Nohar Bhadra 210 216 Nohar 213 224 Rawatsar 132 316
Sangaria Sangaria 118 97 Tibbi 122 254
17. Jaipur Amber Amber 229 197 Chaumu 249 96 Jamwaramgarh 191 141
Jaipur Bassi 175 215 Chaksu 146 280 Jaipur 1561 103 Sanganer 206 210
Kotputli Kotputli 263 120 Shahpura 180 80 Viratnagar 102 122
Sambhar Dudu 145 220 Phagi 130 171 Phulera 311 147 (H.Q.Sambhar)
18 Jaisalmer Jaisalmer Jaisalmer 189 410 Pokaran 156 170
19. Jal ore Bhinmal Bhinmal 283 183 Raniwara 123 85 Sane here 279 154
Jal ore Ah ore 176 134 Jal ore 281 123
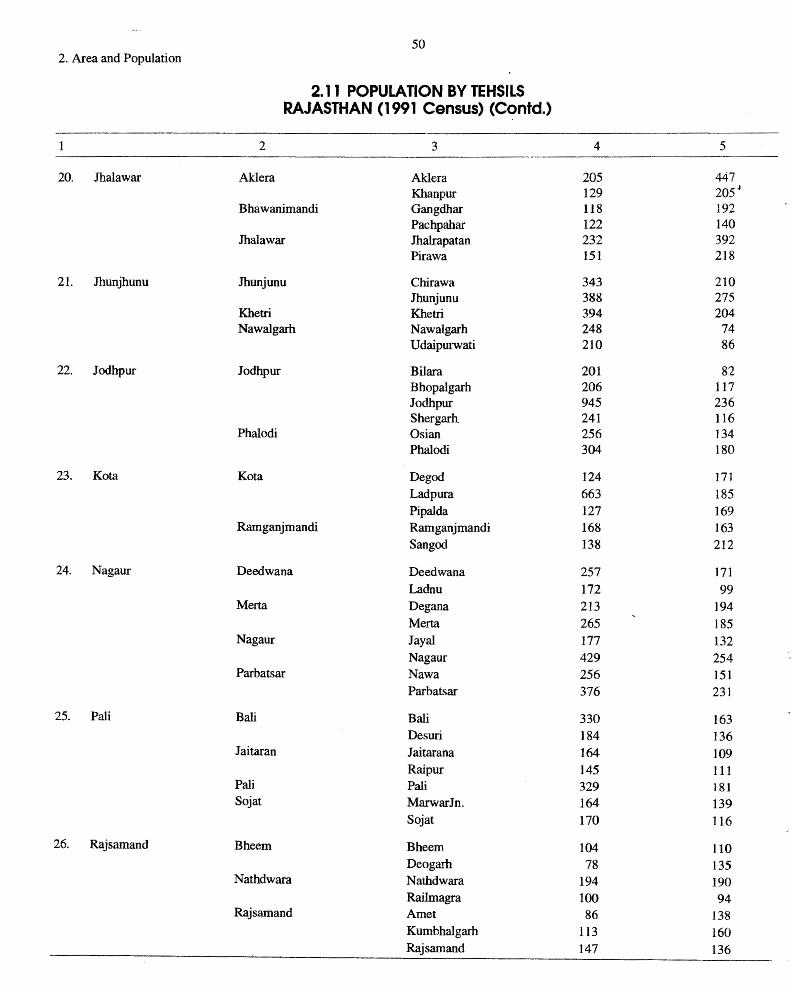
50 2. Area and Population
2.11 POPULATION BY TEHSILS RAJASTHAN (1991 Census) (Contd.)
2 3 4 5
20. Jhalawar Aklera Aklera 205 447 Khanpur 129 205J
Bhawanimandi Gangdhar 118 192 Pachpahar 122 140
Jhalawar Jhalrapatan 232 392 Pirawa 151 218
21. Jhunjhunu Jhunjunu Chirawa 343 210 Jhunjunu 388 275
Khetri Khetri 394 204 Nawalgarh Nawalgarh 248 74
Udaipurwati 210 86
22. Jodhpur Jodhpur Bilara 201 82 Bhopalgarh 206 117 Jodhpur 945 236 Shergarh 241 116
Phalodi Osian 256 134 Phalodi 304 180
23. Kota Kota De god 124 171
Ladpura 663 185 Pipalda 127 169
Ramganjmandi Ramganjmandi 168 163 San god 138 212
24. Nagaur Deedwana Deedwana 257 171 Ladnu 172 99
Merta Degana 213 194 Merta 265 185
Nagaur Jayal 177 132 Nagaur 429 254
Parbatsar Nawa 256 151 Parbatsar 376 231
25. Pali Bali Bali 330 163 Desuri 184 136
Jaitaran Jaitarana 164 109 Raipur 145 II I
Pali Pali 329 181 Sojat MarwarJn. 164 139
Sojat 170 116
26. Rajsamand Bheem Bheem 104 110 Deogarh 78 135
Nathdwara Nathdwara 194 190 Railmagra 100 94
Rajsamand Arnet 86 138 Kumbhalgarh 113 160 Rajsamand 147 136
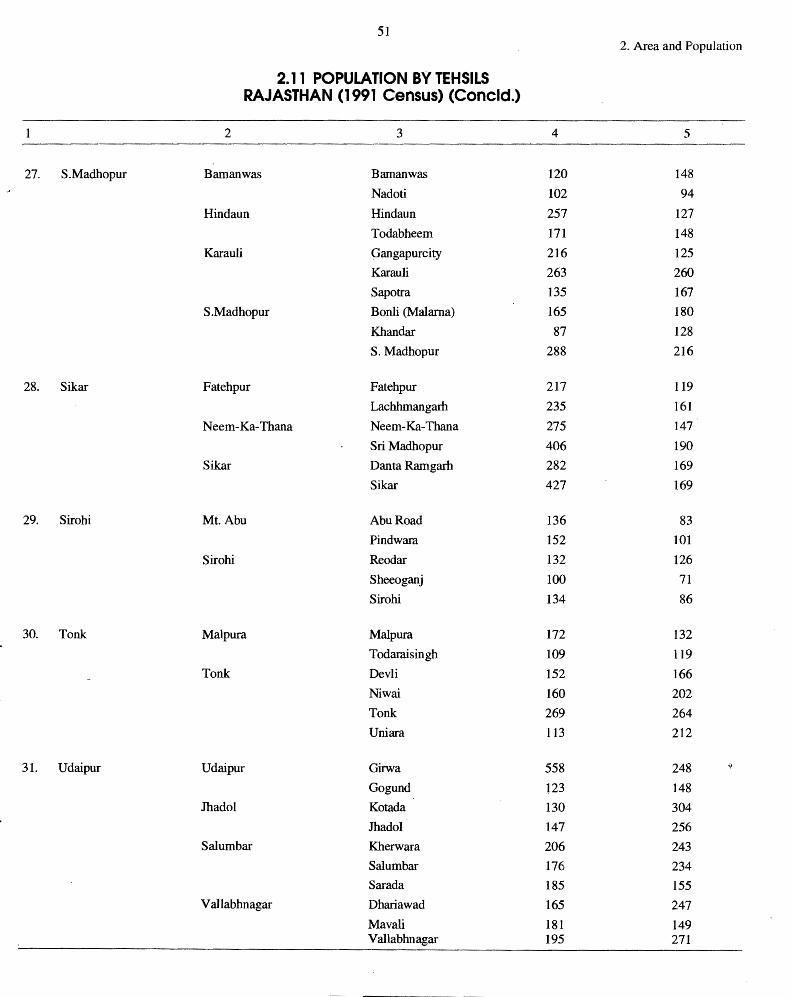
51 2. Area and Population
2.11 POPULATION BY TEHSILS RAJASTHAN (1991 Census) (Concld.)
2 3 4 5
27. S.Madhopur Bamanwas Bamanwas 120 148
Nadoti 102 94
Hindaun Hindaun 257 127
Todabheem 171 148 Karauli Gangapurcity 216 125
Karau Ii 263 260 Sapotra 135 167
S.Madhopur Bonli (Malama) 165 180
Khandar 87 128 S.Madhopur 288 216
28. Sikar Fatehpur Fatehpur 217 119
Lachhmangarh 235 161
Neem-Ka-Thana Neem-Ka-Thana 275 147
Sri Madhopur 406 190 Sikar Danta Ramgarh 282 169
Sikar 427 169
29. Sirohi Mt. Abu Abu Road 136 83 Pindwara 152 101
Sirohi Reodar 132 126 Sheeoganj 100 71 Sirohi 134 86
30. Tonk Malpura Malpura 172 132 Todaraisingh 109 119
Tonk Devli 152 166 Niwai 160 202 Tonk 269 264 Uniara 113 212
31. Udaipur Udaipur Girwa 558 248 Gogund 123 148
Jhadol Kotada 130 304 Jhadol 147 256
Salum bar Kherwara 206 243 Salum bar 176 234 Sarada 185 155
V allabhnagar Dhariawad 165 247 Mavali 181 149 V allabhnagar 195 271
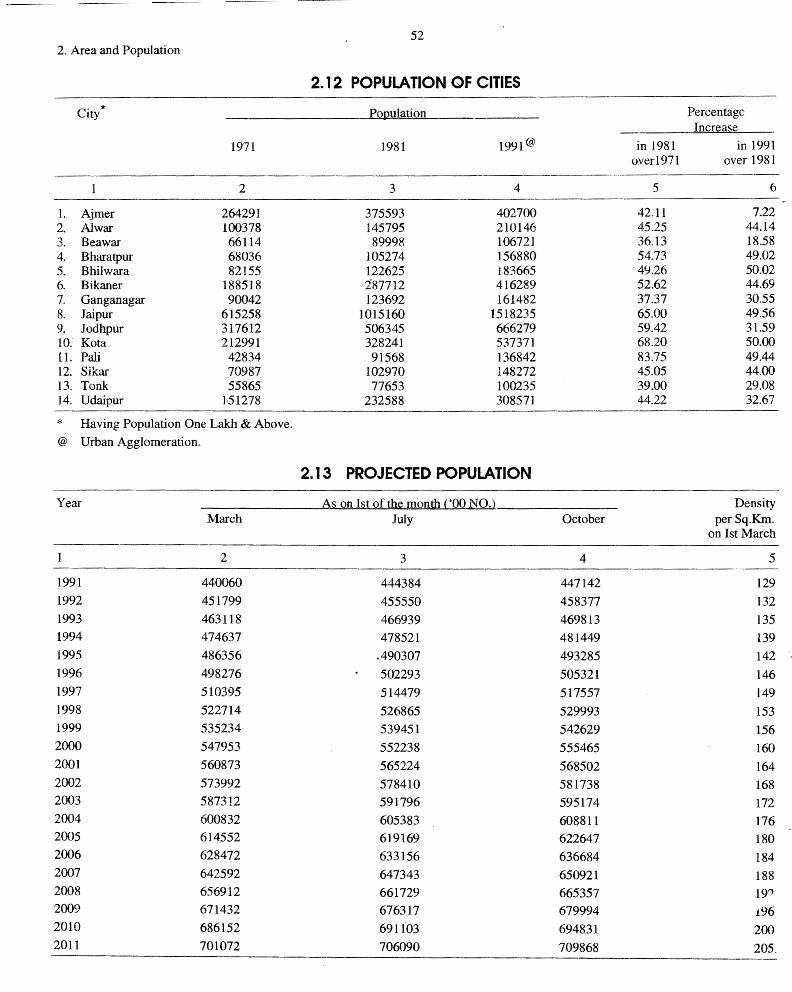
52 2. Area and Population
2.12 POPULATION OF CITIES
City* Ponulation Percentage Increase
1971 1981 1991@ in 1981 in 1991 over1971 over 1981
2 3 4 5 6
1. Ajmer 264291 375593 402700 42.11 7.22 2. Al war 100378 145795 210146 45.25 44.14 3. Bea war 66114 89998 106721 36.13 18.58 4. Bharatpur 68036 105274 156880 54.73 49.02 5. Bhilwara 82155 122625 183665 49.26 50.02 6. Bikaner 188518 287712 416289 52.62 44.69 7. Ganganagar 90042 123692 161482 37.37 30.55 8. Jaipur 615258 1015160 1518235 65.00 49.56 9. Jodhpur 317612 506345 666279 59.42 31.59 10: Kota 212991 328241 537371 68.20 50.00 11. Pali 42834 91568 136842 83.75 49.44 12. Sikar 70987 102970 148272 45.05 44.00 13. Tonk 55865 77653 100235 39.00 29.08 14. Udaipur 151278 232588 308571 44.22 32.67
* Having Population One Lakh & Above. @ Urban Agglomeration.
2.13 PROJECTED POPULATION
Year As on Ist of the month ('00 NO.) Density March July October per Sq.Km.
on Ist March
2 3 4 5
1991 440060 444384 447142 129 1992 451799 455550 458377 132 1993 463118 466939 469813 135 1994 474637 478521 481449 139 1995 486356 .490307 493285 142 1996 498276 502293 505321 146 1997 510395 514479 517557 149 1998 522714 526865 529993 153 1999 535234 539451 542629 156 2000 547953 552238 555465 160 2001 560873 565224 568502 164 2002 573992 578410 581738 168 2003 587312 591796 595174 172 2004 600832 605383 608811 176 2005 614552 619169 622647 180 2006 628472 633156 636684 184 2007 642592 647343 650921 188 2008 656912 661729 665357 19" 2009 671432 676317 679994 i.96 2010 686152 6911°03 694831 200 2011 701072 706090 709868 205.
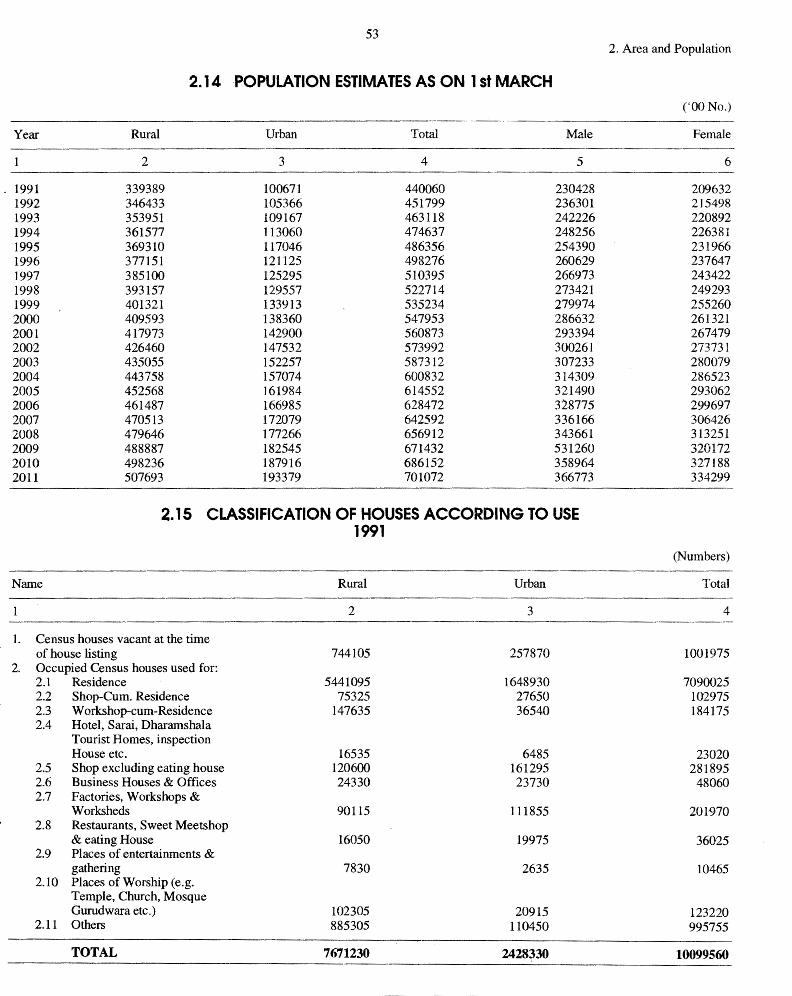
Year
1991 1992 1993 1994 1995 1996 1997 1998 1999 2000 2001 2002 2003 2004 2005 2006 2007 2008 2009 2010 2011
Rural
2
339389 346433 353951 361577 369310 377151 385100 393157 401321 409593 417973 426460 435055 443758 452568 461487 470513 479646 488887 498236 507693
53
2.14 POPULATION ESTIMATES AS ON 1st MARCH
Urban Total
3 4
100671 440060 105366 451799 109167 463118 113060 474637 117046 486356 121125 498276 125295 510395 129557 522714 133913 535234 138360 547953 142900 560873 147532 573992 152257 587312 157074 600832 161984 614552 166985 628472 172079 642592 177266 656912 182545 671432 187916 686152 193379 701072
Male
5
230428 236301 242226 248256 254390 260629 266973 273421 279974 286632 293394 300261 307233 314309 321490 328775 336166 343661 531260 358964 366773
2.15 CLASSIFICATION OF HOUSES ACCORDING TO USE 1991
Name
1. Census houses vacant at the time of house listing
2. Occupied Census houses used for: 2.1 Residence 2.2 Shop-Cum. Residence 2.3 Workshop-cum-Residence 2.4 Hotel, Sarai, Dharamshala
Tourist Homes, inspection House etc.
2.5 Shop excluding eating house 2.6 Business Houses & Offices 2. 7 Factories, Workshops &
Worksheds 2.8 Restaurants, Sweet Meetshop
& eating House 2.9 Places of entertainments &
gathering 2.10 Places of Worship (e.g.
Temple, Church, Mosque Gurudwara etc.)
2.11 Others
TOTAL
Rural
2
744105
5441095 75325
147635
16535 120600 24330
90115
16050
7830
102305 885305
7671230
Urban
3
257870
1648930 27650 36540
6485 161295 23730
111855
19975
2635
20915 110450
2428330
2. Area and Population
("00 No.)
Female
6
209632 215498 220892 226381 231966 237647 243422 249293 255260 261321 267479 273731 280079 286523 293062 299697 306426 313251 320172 327188 334299
(Numbers)
Total
4
1001975
7090025 102975 184175
23020 281895 48060
201970
36025
10465
123220 995755
10099560
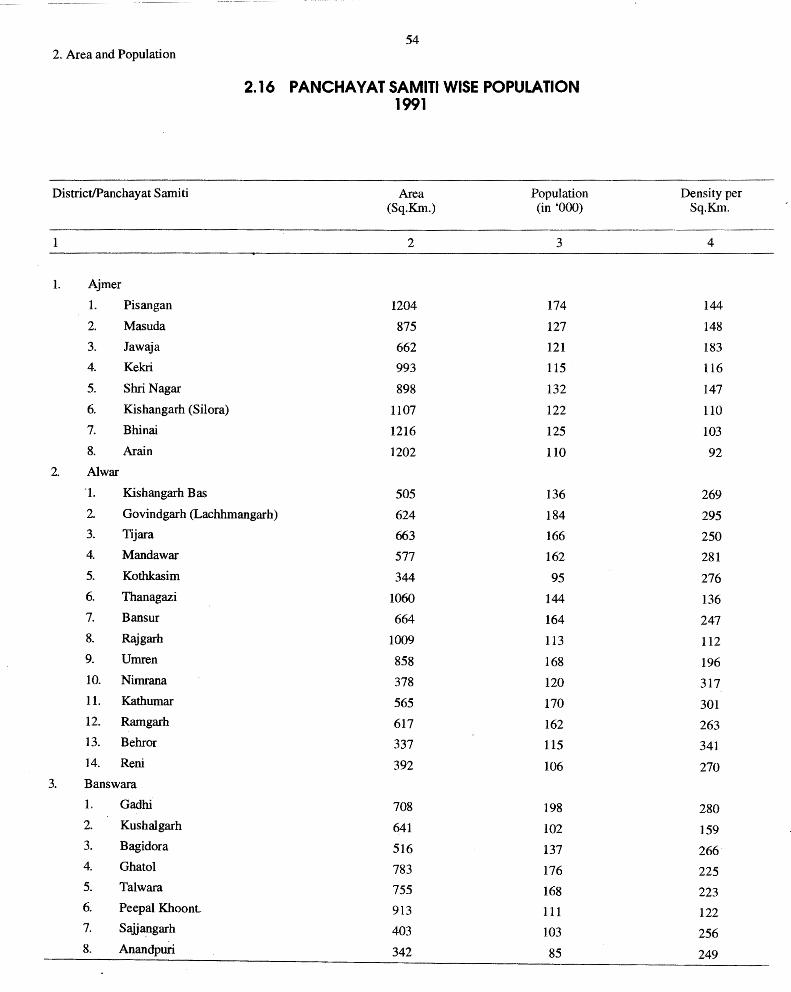
2. Area and Population
District/Panchayat Samiti
1. Ajmer
1. Pisangan
2. Masuda
3. Jawaja
4. Kekri
5. Shri Nagar
6. Kishangarh (Silora)
7. Bhinai
8. Arain
2. Al war
·1. Kishangarh Bas
54
2.16 PANCHAYAT SAMITI WISE POPULATION 1991
Area Population (Sq.Km.) (in '000)
2 3
l204 174
875 127
662 121
993 115
898 132
1107 122
1216 125
1202 110
505 136 2. Govindgarh (Lachhmangarh) 624 184 3. Tijara 663 166 4. Manda war 577 162 5. Kothkasim 344 95 6. Thanagazi 1060 144 7. Bansur 664 164 8. Rajgarh 1009 113 9. Umren 858 168 10. Nimrana 378 120 11. Kathumar 565 170 12. Ramgarh 617 162 13. Behror 337 115 14. Reni 392 106
3. Banswara
1. Gadhi 708 198 2. Kushalgarh 641 102 3. Bagidora 516 137 4. Ghatol 783 176 5. Talwara 755 168 6. Peepal Khoont- 913 111 7. Sajj~garh 403 103 8. Anandpuri 342 85
Density per Sq.Km.
4
144
148
183
116
147
110
103
92
269
295
250
281
276
136
247
112
196
317
301
263
341
270
280
159
266
225
223
122
256
249

55 2. Area and Population
2.16 PANCHAYAT SAMITI WISE POPULATION (Contd.) 1991
2 3 4
4. Barmer
1. Siwana 2019 163 81
2. Sheo 6616 122 18
3. Pachpadra (Balotra) 3485 192 55
4. Gudhamanali (Dhorimanna) 2668 181 68
5. Barmer 3813 171 44.
6. Sindhari 3116 168 54
7. Bai too 3228 152 47
8. Chohtan 3266 171 52
5. Bharatpur
1. Nagar Pahari (Nagar) 622 182 293
2. Nadbai 432 128 296
3. Roop bas 539 167 310
4. Kumher 440 129 293
5. Weir 576 161 280
6. Kaman 557 154 276
7. Bayana 800 152 190
8. Se war 470 142 302
9. Deeg 490 126 257
6. Bhilwara
1. Mandalgarh 1406 166 118
2. Mandal 1115 147 127
3. Shahpura 1127 121 107
4. Jahazpur 1033 133 129
5. Kotri 950 122 128
6. Asind 1110 156 141
7. Hurda 617 73 118
8. Raipur 515 71 138
9. Suwana 832 130 1:56
10. Sahada 633 85 134
11. Baneda 677 88 130
7. Bikaner
1. Nokha 3768 209 55 2. Kolayat 7319 .:133 18 3. Bikaner 8948 248 28 4. Lunkaransar 6214 156 25
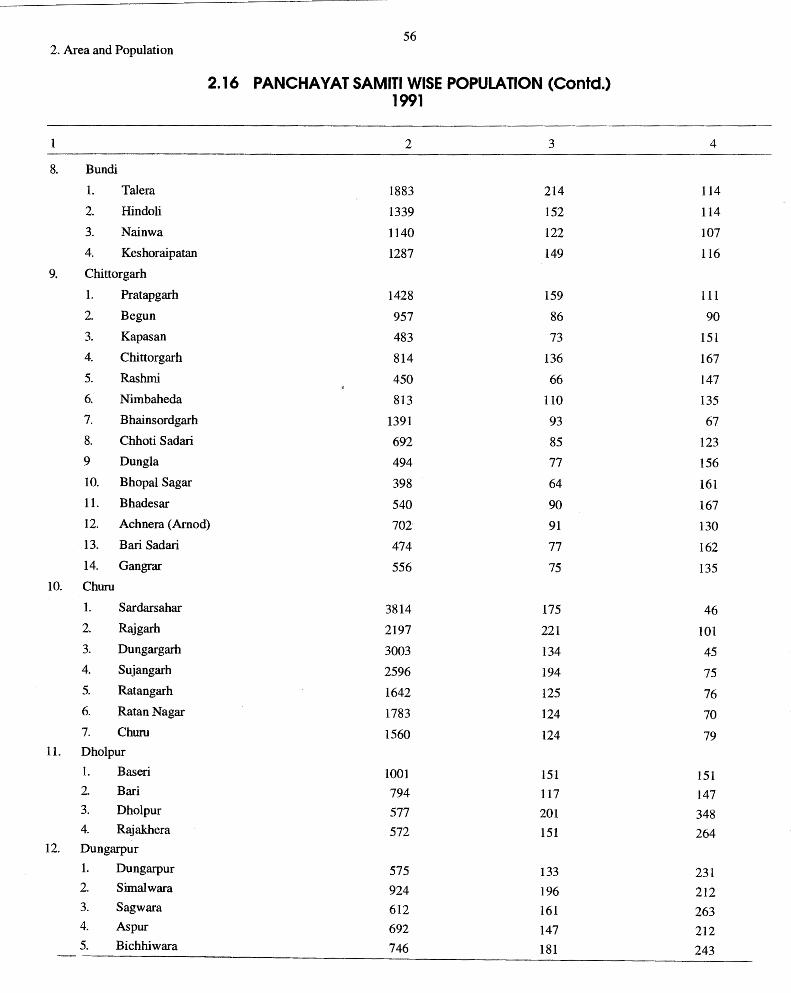
56 2. Area and Population
2.16 PANCHAYAT SAMITI WISE POPULATION (Contd.) 1991
2 3 4
8. Bundi
1. Talera 1883 214 114
2. Hindoli 1339 152 114
3. Nainwa 1140 122 107
4. Keshoraipatan 1287 149 116
9. Chittorgarh
1. Pratapgarh 1428 159 111
2. Begun 957 86 90
3. Ka pas an 483 73 151
4. Chittorgarh 814 136 167
5. Rashmi 450 66 147
6. Nimbaheda 813 110 135
7. Bhainsordgarh 1391 93 67
8. Chhoti Sadari 692 85 123
9 Dungla 494 77 156
10. Bhopal Sagar 398 64 161
11. Bhadesar 540 90 167
12. Achnera (Amod) 702· 91 130
13. Bari Sadari 474 77 162
14. Gangrar 556 75 135
10. Chum
1. Sardarsahar 3814 175 46
2. Rajgarh 2197 221 101 3. Dungargarh 3003 134 45 4. Sujangarh 2596 194 75 5. Ratangarh 1642 125 76 6. Ratan Nagar 1783 124 70 7. Chum 1560 124 79
11. Dholpur
1. Baseri 1001 151 151 2. Bari 794 117 147 3. Dholpur 577 201 348 4. Rajak:hera 572 151 264
12. Dungarpur
1. Dungarpur 575 133 231 2. Simalwara 924 196 212 3. Sagwara 612 161 263 4. Aspur 692 147 212 5. Bichhiwara 746 181 243
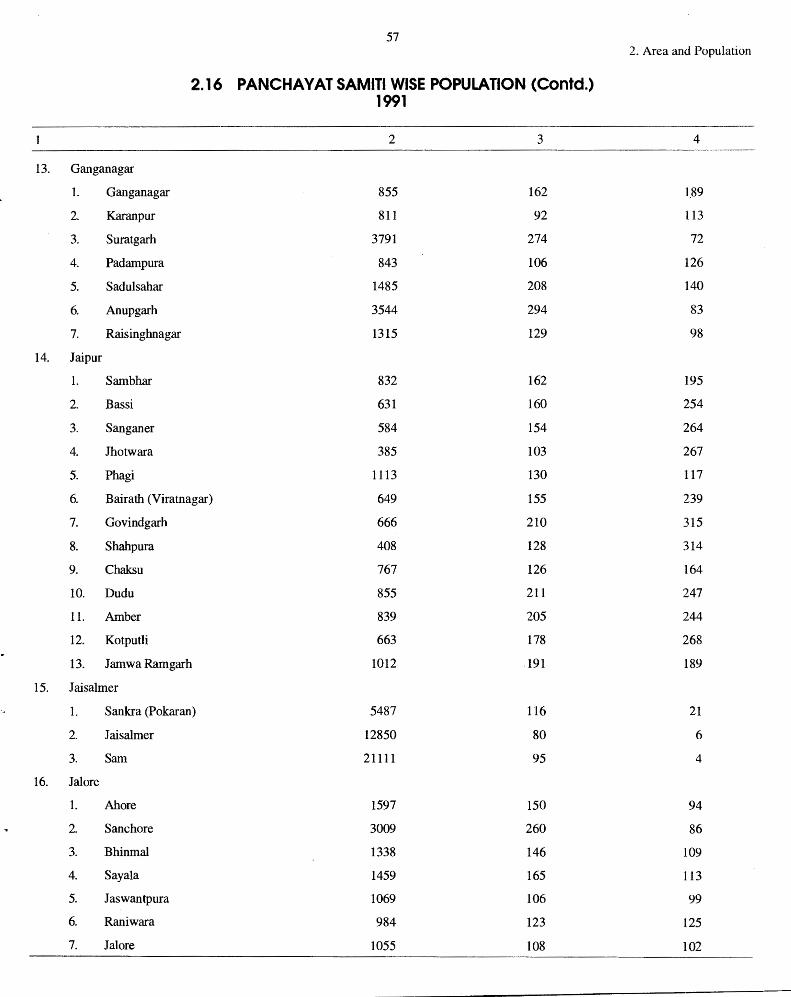
57 2. Area and Population
2.16 PANCHAYAT SAMITI WISE POPULATION (Contd.) 1991
2 3 4 -·-·--
13. Ganganagar
1. Ganganagar 855 162 1.89
2. Karanpur 811 92 113
3. Suratgarh 3791 274 72
4. Padampura 843 106 126
5. Sadulsahar 1485 208 140
6. Anupgarh 3544 294 83
7. Raisinghnagar 1315 129 98
14. Jaipur
1. Sambhar 832 162 195
2. Bassi 631 160 254
3. Sanganer 584 154 264
4. Jhotwara 385 103 267
5. Phagi 1113 130 117
6. Bairath (Viratnagar) 649 155 239
7. Govindgarh 666 210 315
8. Shahpura 408 128 314
9. Chaksu 767 126 164
10. Du du 855 211 247
11. Amber 839 205 244
12. Kotputli 663 178 268
13. Jamwa Ramgarh 1012 191 189
15. Jaisalmer
I. Sankra (Pokaran) 5487 116 21
2. Jaisalmer 12850 80 6
3. Sam 21111 95 4
16. Jalore
1. Ah ore 1597 150 94
2. Sanchore 3009 260 86
3. Bhinmal 1338 146 109
4. Sayala 1459 165 113
5. Jaswantpura 1069 106 99
6. Raniwara 984 123 125
7. Jal ore 1055 108 102
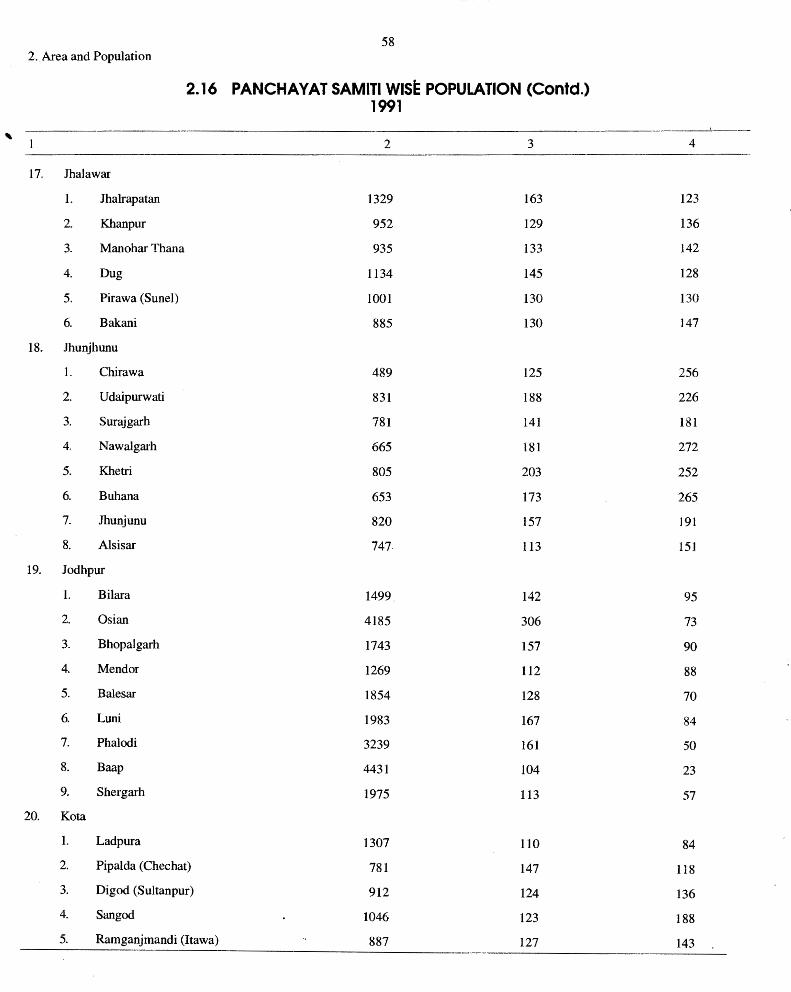
---~---~---------------~-----
58 2 .. Area and Population
2.16 PANCHAVAT SAMITI WISE POPULATION (Contd.) 1991
' 2 3 4
17. Jhalawar
1. Jhalrapatan 1329 163 123
2. Khanpur 952 129 136
3. Manohar Thana 935 133 142
4. Dug 1134 145 128
5. Pirawa (Sunel) 1001 130 130
6. Bakani 885 130 147
18. Jhunjhunu
1. Chirawa 489 125 256
2. Udaipurwati 831 188 226
3. Surajgarh 781 141 181
4. Nawalgarh 665 181 272
5. Khetri 805 203 252
6. Buhana 653 173 265
7. Jhunjunu 820 157 191
8. Alsisar 747 113 151
19. Jodhpur
1. Bilara 1499 142 95
2. Osian 4185 306 73
3. Bhopalgarh 1743 157 90
4. Mend or 1269 112 88
5. Balesar 1854 128 70
6. Luni 1983 167 84
7. Phalodi 3239 161 50
8. Baap 4431 104 23
9. Shergarh 1975 113 57
20. Ko ta
1. Ladpura 1307 110 84
2. Pipalda (Chechat) 781 147 118
3. Digod (Sultanpur) 912 124 136
4. Sangod 1046 123 188
5. Ramganjmandi (Itawa) 887 127 143
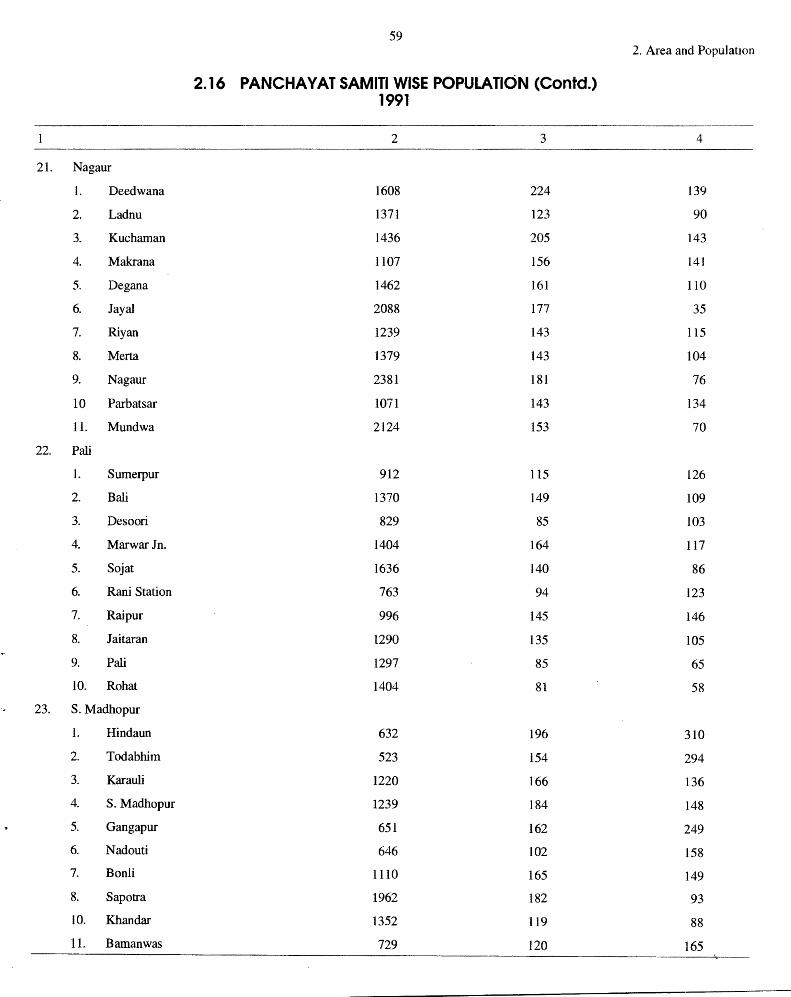
59 2. Area and Populat10n
2.16 PANCHAYAT SAMITI WISE POPULATION (Contd.) 1991
2 3 4
21. Nagaur
1. Deedwana 1608 224 139
2. Ladnu 1371 123 90
3. Kucha.man 1436 205 143
4. Makrana 1107 156 141
5. Degana 1462 161 110
6. Jay al 2088 177 35
7. Riyan 1239 143 115
8. Merta 1379 143 104
9. Nagaur 2381 181 76
10 Parbatsar 1071 143 134
11. Mundwa 2124 153 70
22. Pali
1. Sumerpur 912 115 126
2. Bali 1370 149 109
3. Desoori 829 85 103
4. Marwar Jn. 1404 164 117
5. Sojat 1636 140 86
6. Rani Station 763 94 123
7. Raipur 996 145 146
8. Jaitaran 1290 135 105
9. Pali 1297 85 65
10. Ro hat 1404 81 58
23. S. Madhopur
1. Hindaun 632 196 310
2. Todabhim 523 154 294
3. Karauli 1220 166 136
4. S. Madhopur 1239 184 148
5. Gangapur 651 162 249
6. Nadouti 646 102 158
7. Bonli 1110 165 149
8. Sapotra 1962 182 93
10. Khandar 1352 119 88
11. Bamanwas 729 120 165
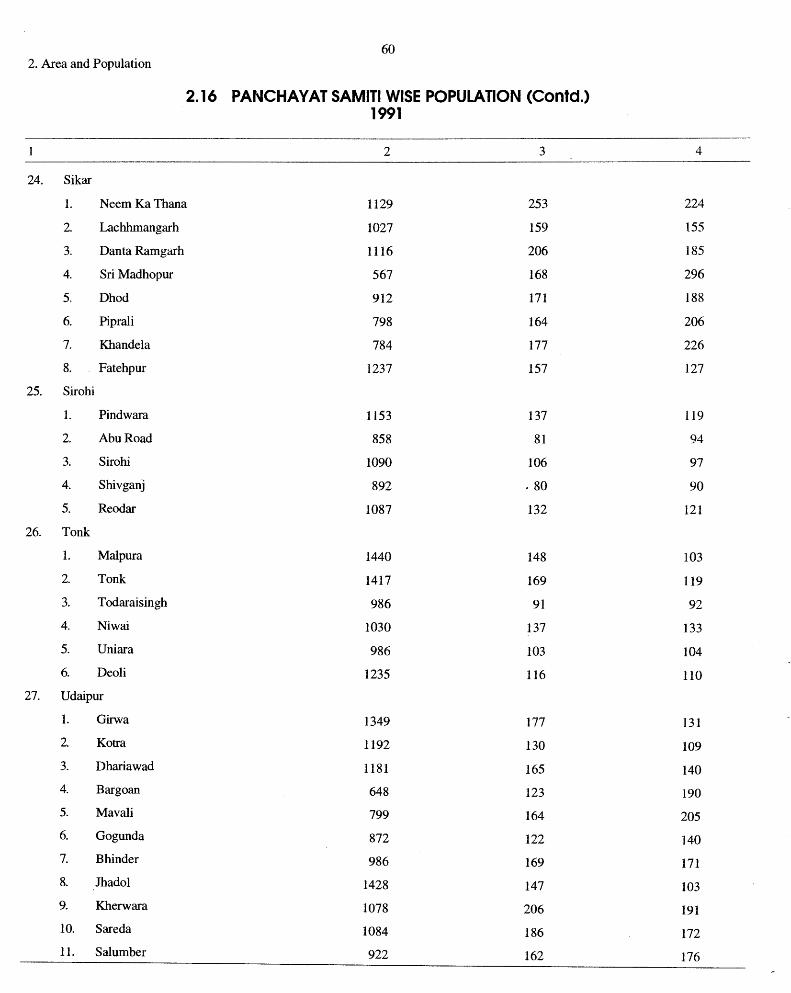
60 2. Area and Population
2.16 PANCHAVAT SAMITI WISE POPULATION (Contd.) 1991
2 3 4
24. Sikar
1. Neem Ka Thana 1129 253 224
2. Lachhmangarh 1027 159 155
3. Danta Ramgarh 1116 206 185
4. Sri Madhopur 567 168 296
5. Dhod 912 171 188
6. Piprali 798 164 206
7. Khan de la 784 177 226
8. Fatehpur 1237 157 127
25. Sirohi
1. Pindwara 1153 137 119
2. Abu Road 858 81 94
3. Sirohi 1090 106 97
4. Shivganj 892 . 80 90
5. Reodar 1087 132 121
26. Tonk
1. Malpura 1440 148 103
2. Tonk 1417 169 119
3. Todaraisingh 986 91 92
4. Niwai 1030 137 133
5. Uniara 986 103 104
6. Deoli 1235 116 110
27. Udaipur
1. Girwa 1349 177 131
2. Kotra 1192 130 109
3. Dhariawad 1181 165 140
4. Bargoan 648 123 190
5. Mavali 799 164 205
6. Gogunda 872 122 140
7. Bhinder 986 169 171
8. Jhadol 1428 147 103
9. Kherwara 1078 206 191
10. Sareda 1084 186 172
11. Sal umber 922 162 176
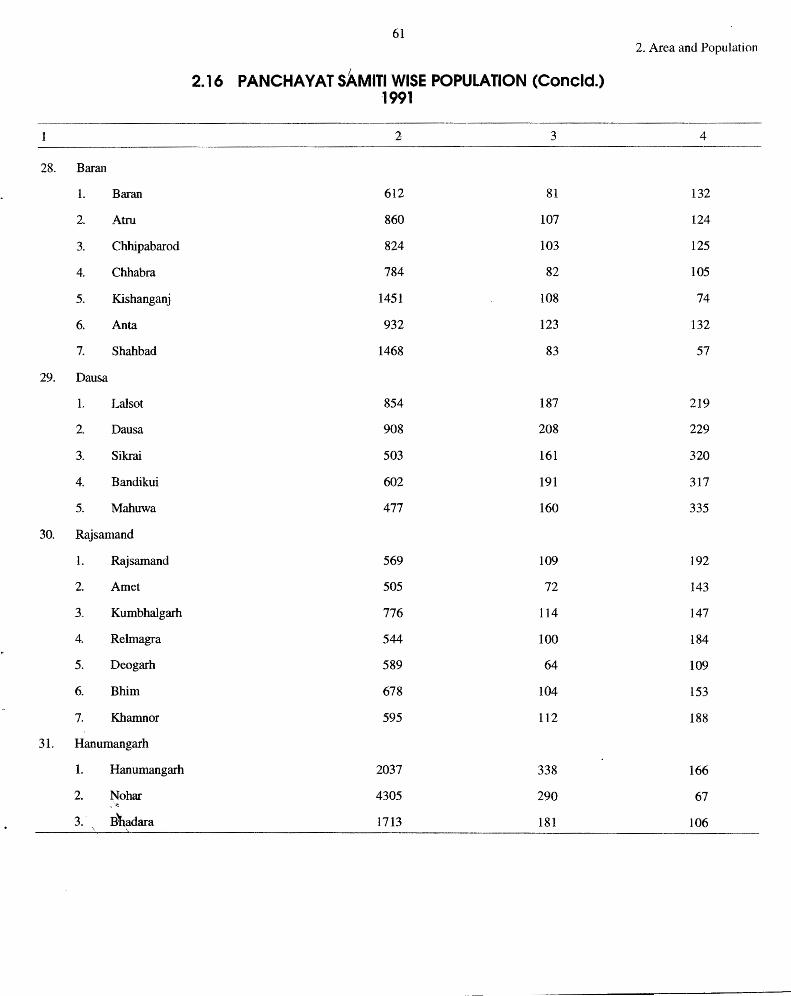
61 2. Area and Population
2.16 PANCHAYAT SAMITI WISE POPULATION (Concld.) 1991
2 3 4
28. Baran
1. Baran 612 81 132
2. Atru 860 107 124
3. Chhipabarod 824 103 125
4. Chhabra 784 82 105
5. Kishanganj 1451 108 74
6. An ta 932 123 132
7. Shah bad 1468 83 57
29. Dausa
L Lal sot 854 187 219
2. Dausa 908 208 229
3. Sikrai 503 161 320
4. Bandikui 602 191 317
5. Mahuwa 477 160 335
30. Rajsamand
1. Rajsamand 569 109 192
2. Arnet 505 72 143
3. Kumbhalgarh 776 114 147
4. Relmagra 544 100 184
5. Deogarh 589 64 109
6. Bhim 678 104 153
7. Khamnor 595 112 188
31. Hanumangarh
1. Hanumangarh 2037 338 166
2. Nohar 4305 290 67 ~ ~
3. Bhadara 1713 181 106
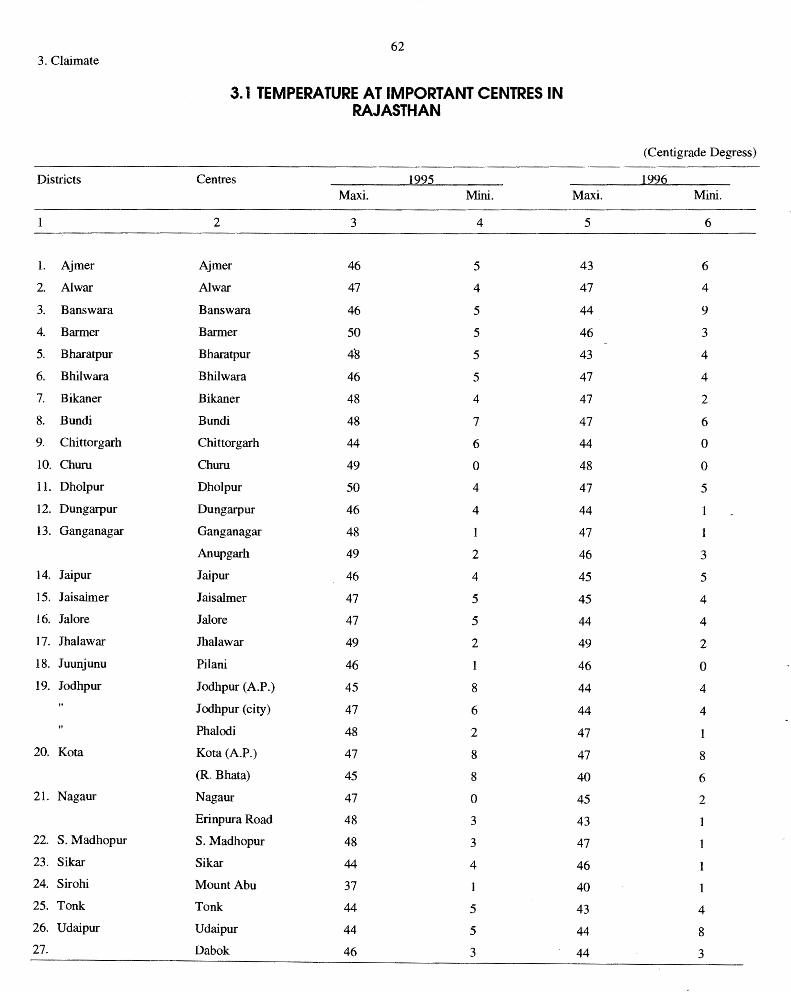
62 3. Claimate
3.1 TEMPERATURE AT IMPORTANT CENTRES IN RAJASTHAN
(Centigrade Degress)
Districts Centres 1295 1996 Maxi. Mini. Maxi. Mini.
1 2 3 4 5 6
1. Ajmer Ajmer 46 5 43 6
2. Al war Al war 47 4 47 4
3. Banswara Banswara 46 5 44 9
4. Barmer Barmer 50 5 46 3
5. Bharatpur Bharatpur 4'8 5 43 4
6. Bhilwara Bhilwara 46 5 47 4
7. Bikaner Bikaner 48 4 47 2
8. Bundi Bundi 48 7 47 6
9. Chittorgarh Chittorgarh 44 6 44 0
10. Chum Chum 49 0 48 0
11. Dholpur Dholpur 50 4 47 5
12. Dungarpur Dungarpur 46 4 44
13. Ganganagar Ganganagar 48 1 47
Anupgarh 49 2 46 3
14. Jaipur Jaipur 46 4 45 5
15. Jaisalmer Jaisalmer 47 5 45 4
16. Jal ore Jalore 47 5 44 4
17. Jhalawar Jhalawar 49 2 49 2
18. Juunjunu Pilani 46 1 46 0 19. Jodhpur Jodhpur (A.P.) 45 8 44 4
Jodhpur (city) 47 6 44 4
Phalodi 48 2 47 1
20. Ko ta Kota (A.P.) 47 8 47 8
(R. Bhata) 45 8 40 6
21. Nagaur Nagaur 47 0 45 2
Erinpura Road 48 3 43
22. S. Madhopur S.Madhopur 48 3 47
23. Sikar Sikar 44 4 46
24. Sirohi Mount Abu 37 40
25. Tonk Tonk 44 5 43 4
26. Udaipur Udaipur 44 5 44 8
27. Dabok 46 3 44 3
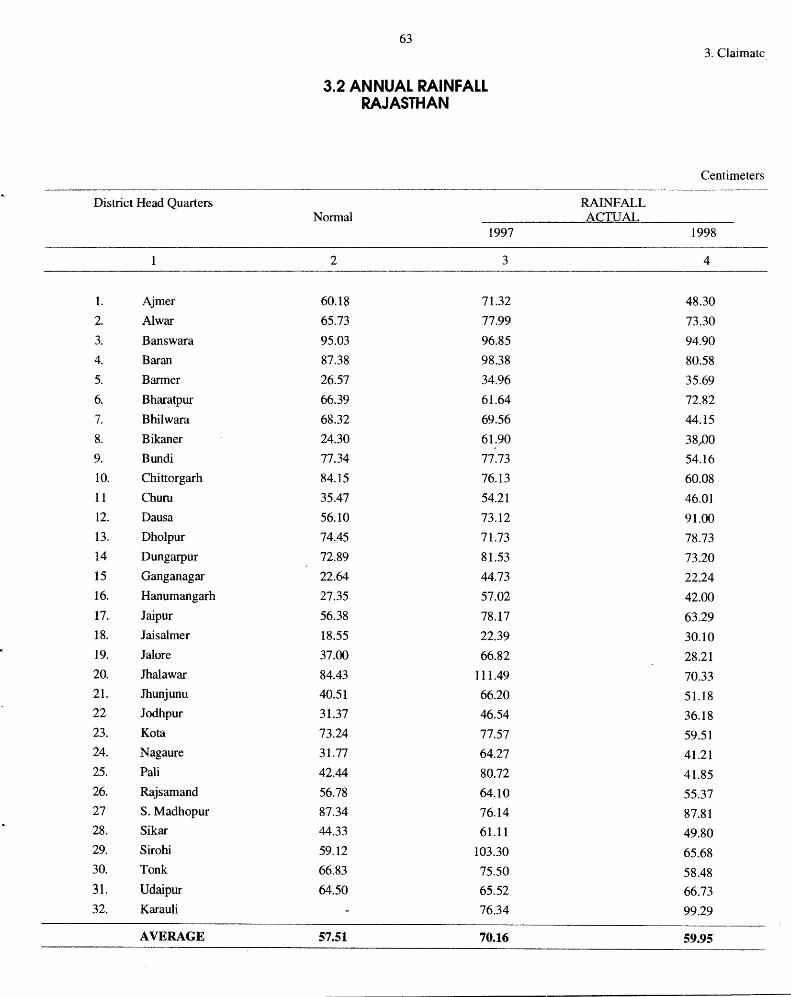
District Head Quarters
I. Ajmer
2. Al war
3. Banswara
4. Baran
5. Barmer
6. Bharatpur
7. Bhilwara
8. Bikaner
9. Bundi
10. Chittorgarh
11 Chum
12. Dausa
13. Dholpur
14 Dungarpur
15 Ganganagar
16. Hanumangarh
17. Jaipur
18. Jaisalmer
19. Jal ore
20. Jhalawar
21. Jhunjunu
22 Jodhpur
23. Ko ta
24. Nagaure
25. Pali
26. Rajsamand
27 S.Madhopur
28. Sikar
29. Sirohi
30. Tonk
31. Udaipur
32. Karauli
AVERAGE
63
3.2 ANNUAL RAINFALL RAJASTHAN
Normal 1997
2 3
60.18 71.32
65.73 77.99
95.03 96.85
87.38 98.38
26.57 34.96
66.39 61.64
68.32 69.56
24.30 61.90
77.34 77.73
84.15 76.13
35.47 54.21
56.10 73.12
74.45 71.73
72.89 81.53
22.64 44.73
27.35 57.02
56.38 78.17
18.55 22.39
37.00 66.82
84.43 111.49
40.51 66.20
31.37 46.54
73.24 77.57
31.77 64.27
42.44 80.72
56.78 64.10
87.34 76.14
44.33 61.11
59.12 103.30
66.83 75.50
64.50 65.52
76.34
57.51 70.16
3. Claimate
Centimeters
RAINFALL ACTUAL
1998
4
48.30
73.30
94.90
80.58
35.69
72.82
44.15
38j)O
54.16
60.08
46.01
91.00
78.73
73.20
22.24
42.00
63.29
30.10
28.21
70.33
51.18
36.18
59.51
41.21
41.85
55.37
87.81
49.80
65.68
58.48
66.73
99.29
59.95
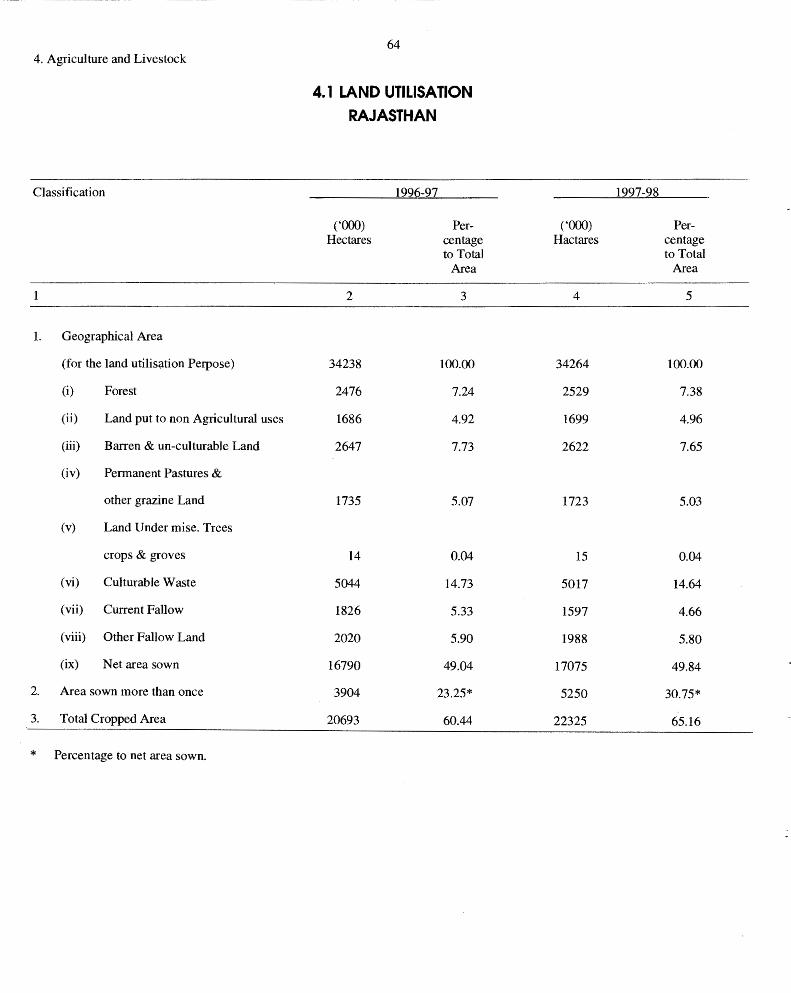
40 Agriculture and Livestock
Classification
1
1. Geographical Area
(for the land utilis(;ltion Perpose)
(i) Forest
(ii) Land put to non Agricultural uses
(iii) Barren & un-culturable Land
(iv) Permanent Pastures &
other grazine Land
(v) Land Under mise. Trees
crops & groves
(vi) Culturable Waste
(vii) Current Fallow
(viii) Other Fallow Land
(ix) Net area sown
2. Area sown more than once
3. Total Cropped Area
* Percentage to net area sown.
64
4.1 LAND UTILISATION RAJASTHAN
1996-97
('000) Per-Hectares centage
to Total Area
2 3
34238 100.00
2476 7.24
1686 4.92
2647 7.73
1735 5.07
14 0.04
5044 14.73
1826 5.33
2020 5.90
16790 49.04
3904 23.25*
20693 60.44
1997-98
('000) Per-Hactares centage
to Total Area
4 5
34264 100.00
2529 7.38
1699 4.96
2622 7.65
1723 5.03
15 0.04
5017 14.64
1597 4.66
1988 5.80
17075 49.84
5250 30.75*
22325 65.16
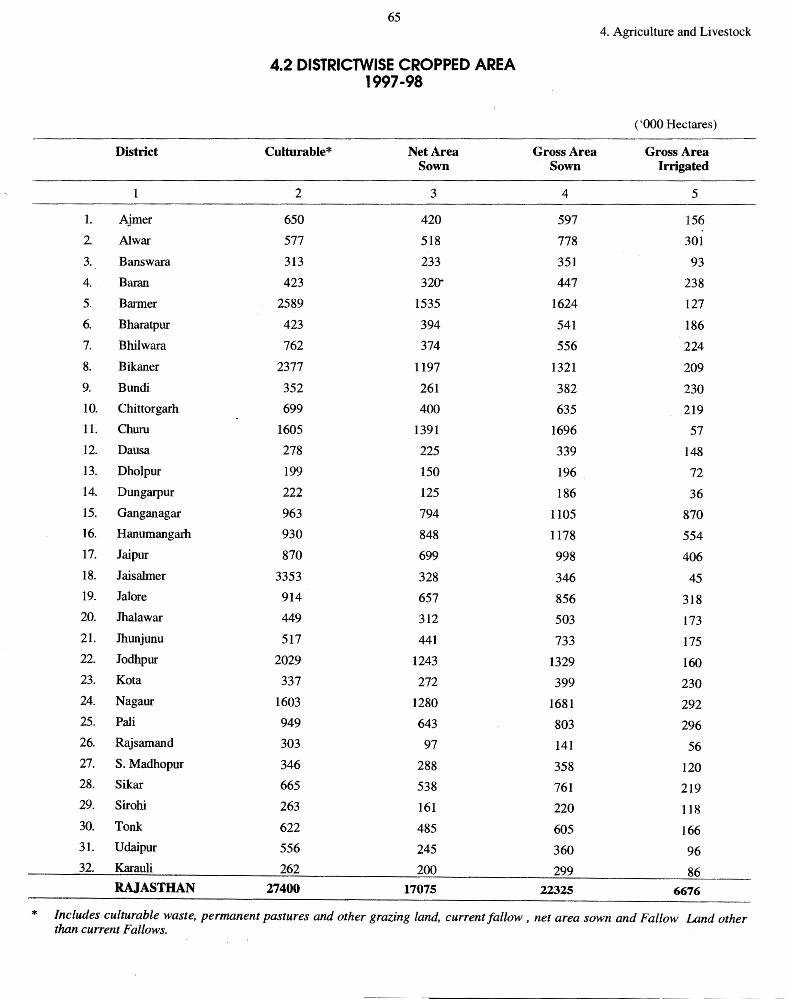
65 4. Agriculture and Livestock
4.2 DISTRICTWISE CROPPED AREA 1997-98
( '000 Hectares)
District Culturable* NetArea Gross Area Gross Area Sown Sown Irrigated
2 3 4 5
1. Ajmer 650 420 597 156
2 Alwar 577 518 778 301
3. Banswara 313 233 351 93
4. Baran 423 320- 447 238
5. Banner 2589 1535 1624 127
6. Bharatpur 423 394 541 186
7. Bhilwara 762 374 556 224
8. Bikaner 2377 1197 1321 209 9. Bundi 352 261 382 230 10. Chittorgarh 699 400 635 219 11. Chum 1605 1391 1696 57 12. Dausa 278 225 339 148 13. Dholpur 199 150 196 72
14. Dungarpur 222 125 186 36 15. Ganganagar 963 794 1105 870 16. Hanumangarh 930 848 1178 554 17. Jaipur 870 699 998 406 18. Jaisalmer 3353 328 346 45 19. Jalore 914 657 856 318 20. Jhalawar 449 312 503 173 21. Jhunjunu 517 441 733 175 22. Jodhpur 2029 1243 1329 160 23. Kot a 337 272 399 230 24. Nagaur 1603 1280 1681 292 25. Pali 949 643 803 296 26. Rajsamand 303 97 141 56 27. S. Madhopur 346 288 358 120 28. Sikar 665 538 761 219 29. Sirohi 263 161 220 118
30. Tonk 622 485 605 166 31. Udaipur 556 245 360 96 32. Karauli 262 200 299 86
RAJASTHAN 27400 17075 22325 6676
* Includes culturable waste, permanent pastures and other grazing land, current fallow, net area sown and Fallow Land other than current Fallows.
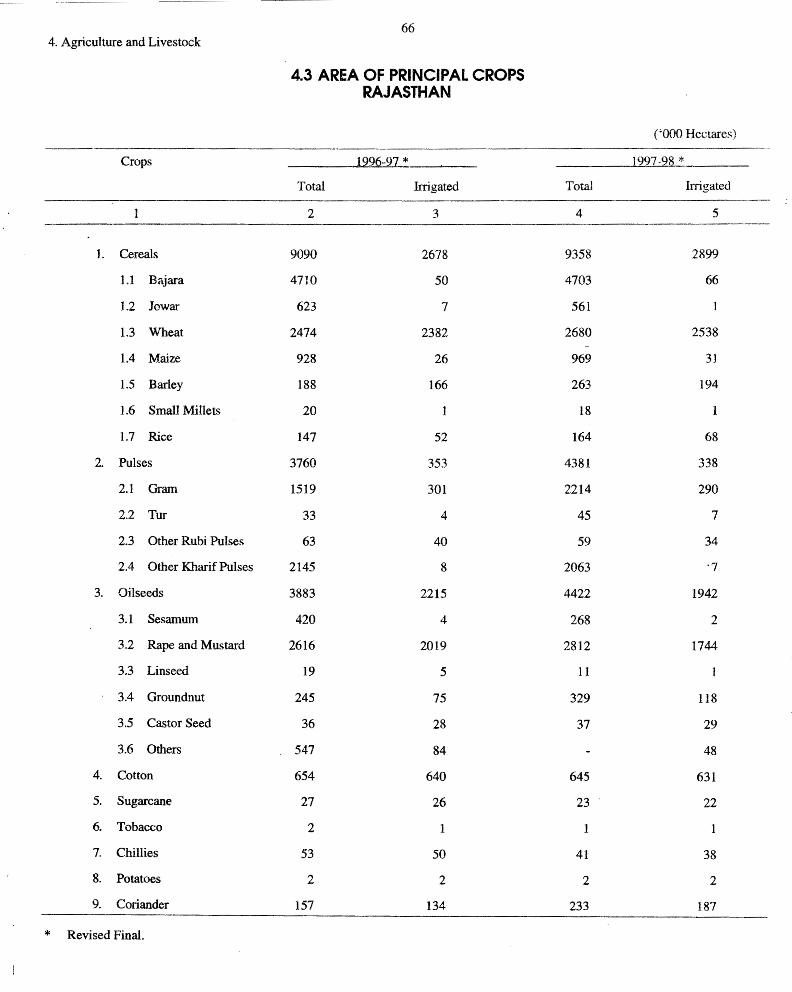
-~-
66 4. Agriculture and Livestock
4.3 AREA OF PRINCIPAL CROPS RAJASTHAN
('000 Hectares)
Crops 1226-97 * 1997-98 * Total Irrigated Total Irrigated
2 3 4 5
L Cereals 9090 2678 9358 2899
1.1 Bajara 4710 50 4703 66
1.2 Jo war 623 7 561
1.3 Wheat 2474 2382 2680 2538
1.4 Maize 928 26 969 31
1.5 Barley 188 166 263 194
1.6 Small Millets 20 18
1.7 Rice 147 52 164 68
2. Pulses 3760 353 4381 338
2.1 Gram 1519 301 2214 290
2.2 Tur 33 4 45 7
2.3 Other Rubi Pulses 63 40 59 34
2.4 Other Kharif Pulses 2145 8 2063 ·7
3. Oilseeds 3883 2215 4422 1942
3.1 Sesamum 420 4 268 2
3.2 Rape and Mustard 2616 2019 2812 1744
3.3 Linseed 19 5 11
3.4 Groundnut 245 75 329 118
3.5 Castor Seed 36 28 37 29
3.6 Others 547 84 48
4. Cotton 654 640 645 631
5. Sugarcane 27 26 23 22
6. Tobacco 2 1
7. Chillies 53 50 41 38
8. Potatoes 2 2 2 2
9. Coriander 157 134 233 187
* Revised Final.
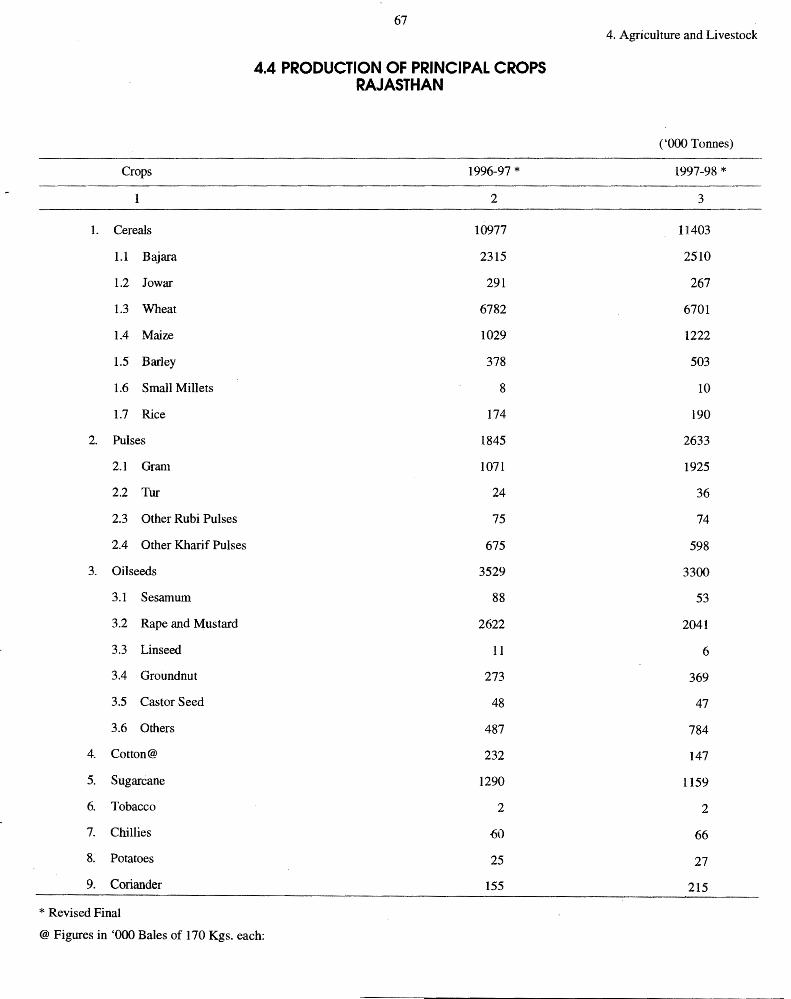
Crops
1
1. Cereals
1.1 Bajara
1.2 Jowar
1.3 Wheat
1.4 Maize
1.5 Barley
1.6 Small Millets
1.7 Rice
2. Pulses
2.1 Gram
2.2 Tur
2.3 Other Rubi Pulses
2.4 Other Kharif Pulses
3. Oilseeds
3.1 Sesamum
3.2 Rape and Mustard
3.3 Linseed
3.4 Groundnut
3.5 Castor Seed
3.6 Others
4. Cotton@
5. Sugarcane
6. Tobacco
7. Chillies
8. Potatoes
9. Coriander
* Revised Final
67
4.4 PRODUCTION OF PRINCIPAL CROPS RAJASTHAN
1996-97 *
2
10977
2315
291
6782
1029
378
8
174
1845
1071
24
75
675
3529
88
2622
11
273
48
487
232
1290
2
·60
25
155
@ Figures in '000 Bales of 170 Kgs. each:
4. Agriculture and Livestock
( '000 Tonnes)
1997-98 *
3
11403
2510
267
6701
1222
503
10
190
2633
1925
36
74
598
3300
53
2041
6
369
47
784
147
1159
2
66
27
215
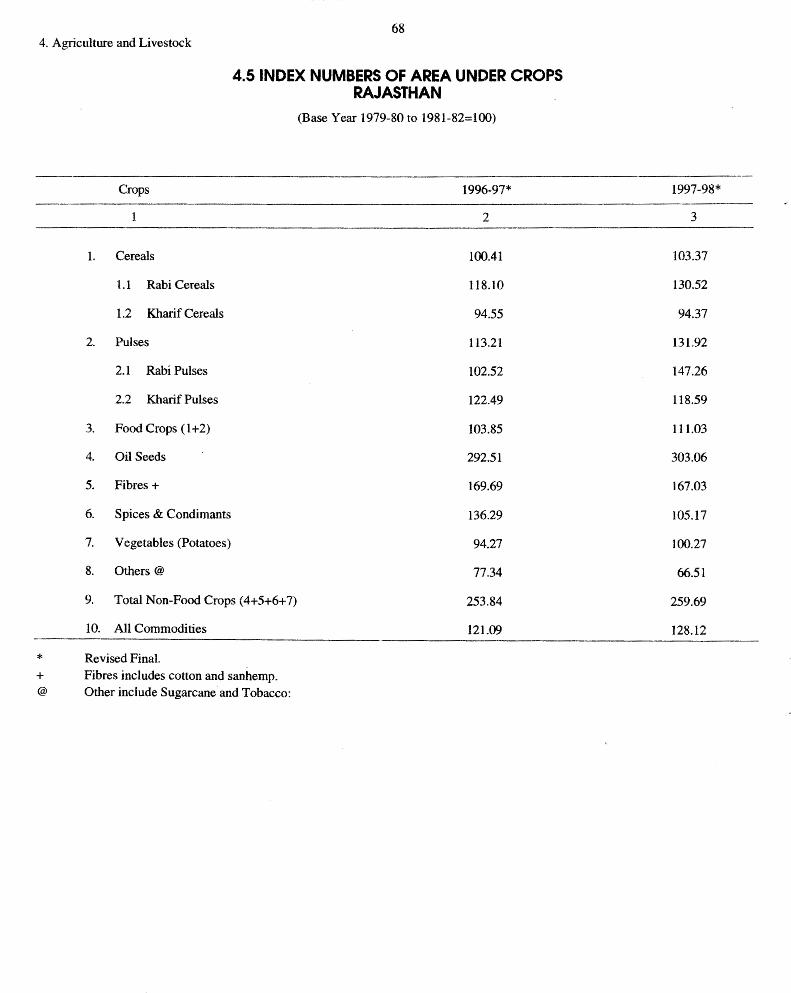
68 4. Agriculture and Livestock
* + @
4.5 INDEX NUMBERS OF AREA UNDER CROPS RAJASTHAN
(Base Year 1979-80 to 1981-82=100)
Crops 1996-97*
2
1. Cereals 100.41
1.1 Rabi Cereals 118.10
1.2 Kharif Cereals 94.55
2. Pulses 113.21
2.1 Rabi Pulses 102.52
2.2 Kharif Pulses 122.49
3. Food Crops (1+2) 103.85
4. Oil Seeds 292.51
5. Fibres+ 169.69
6. Spices & Condimants 136.29
7. Vegetables (Potatoes) 94.27
8. Others@ 77.34
9. Total Non-Food Crops (4+5+6+ 7) 253.84
10. All Commodities 121.09
Revised Final. Fibres includes cotton and sanhemp. Other include Sugarcane and Tobacco:
1997-98*
3
103.37
130.52
94.37
131.92
147.26
118.59
111.03
303.06
167.03
105.17
100.27
66.51
259.69
128.12
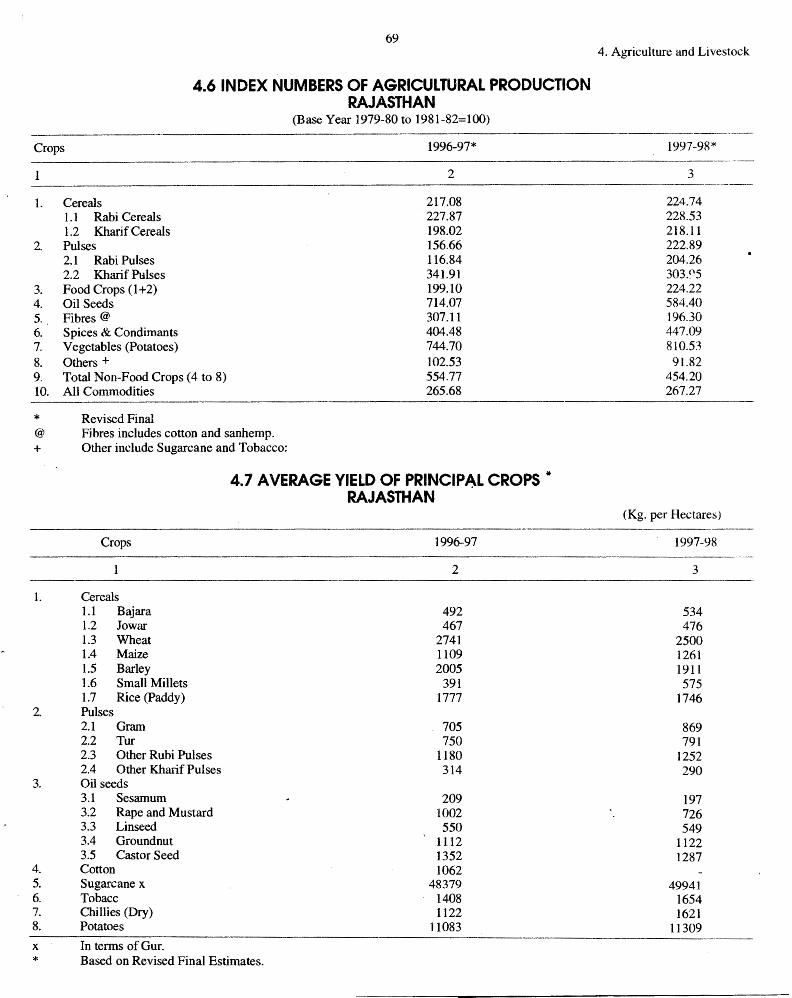
69
4.6 INDEX NUMBERS OF AGRICULTURAL PRODUCTION RAJASTHAN
Crops
1.
2.
3. 4. 5.
Cereals 1.1 Rabi Cereals 1.2 Kharif Cereals Pulses 2.1 Rabi Pulses 2.2 Kharif Pelses Food Crops (1+2) Oil Seeds Fibres@
6. Spices & Condimants 7. Vegetables (Potatoes) 8. Others+ 9. Total Non-Food Crops (4 to 8) 10. All Commodities
* Revised Final @ Fibres includes cotton and sanhemp. + Other include Sugarcane and Tobacco:
(Base Year 1979-80 to 1981-82=100)
1996-97*
2
217.08 227.87 198.02 156.66 116.84 341.91 199.10 714.07 307.11 404.48 744.70 102.53 554.77 265.68
4.7 AVERAGE YIELD OF PRINCIPAL CROPS* RAJASTHAN
Crops 1996-97
2
1. Cereals 1.1 Bajara 492 1.2 Jowar 467 1.3 Wheat 2741 1.4 Maize 1109 1.5 Barley 2005 1.6 Small Millets 391 1.7 Rice (Paddy) 1777
2. Pulses 2.1 Gram 705 2.2 Tur 750 2.3 Other Rubi Pulses 1180 2.4 Other Kharif Pulses 314
3. Oil seeds 3.1 Sesamum 209 3.2 Rape and Mustard 1002 3.3 Linseed 550 3.4 Groundnut 1112 3.5 Castor Seed 1352
4. Cotton 1062 5. Sugarcane x 48379 6. Tobacc 1408 7. Chillies (Dry) 1122 8. Potatoes 11083
x In terms of Gur. * Based on Revised Final Estimates.
4. Agriculture and Livestock
1997-98*
3
224.74 228.53 218.11 222.89 204.26 303."5 224.22 584.40 196.30 447.09 810.5:~
91.82 454.20 267.27
(Kg. per Hectares)
1997-98
3
534 476
2500 1261 1911 575
1746
869 791
1252 290
197 726 549
1122 1287
49941 1654 1621
11309

70 4. Agriculture and Livestock
4.8 CONSUMPTION OF FERTILIZERS
(In M. Tonnes)
Nitrogenous (N) Phosuhatic ') Pottsic (K)
District 1996-97 1997-98 1996-97 1997-98 1996-97 1997-98
2 3 4 5 6 7
1. Ajmer 9303 8708 3585 5075 190 91
2. Al war 25350 27018 5222 6272 519 376
3. Banswara 16339 19689 1973 2588 88 101
4. Baran 26072 30714 9125 12462 272 235
5. Banner 2488 2599 580 521 14 9
6. Bharatpur 25963 24759 6063 7375 321 202
7. Bhilwara 20129 21652 6629 8183 204 82
8. Bikaner 4510 15913 720 2353 26 103
9. Bundi 22062 25132 6453 8365 354 299
10. Chittorgarh 32874 29784 8546 11219 562 214
11. Churn 663 1378 93 155
12. Dausa 17789 15846 4977 6293 240 190
13. Dholpur 9115 11200 1200 1820 174 140
14. Dungarpur 4296 4418 618 671 9
15. Ganganagar 84599 78780 15993 18061 636 590
16. Jaipur 21257 22767 7220 7964 536 r 713
17. Jaisalmer 1103 1247 381 288 42 6 18. Jalore 10564 12950 2195 2794 123 49 19. Jhaiawar 18427 21270 7031 13121 141 104
20. Jhunjunu 5625 4904 883 845 3 21. Jodhpur 11998 13858 5729 6992 804 647 22. Kota 37822 44980 14223 17463 551 516 23. Nagaur 14190 16083 6199 7502 278 124 24. P'aii 15216 19718 7668 9072 266 153 25. Rajsamand 3456 3597 680 2028 24 IO 26. S.Madhopur 27293 33350 6464 10807 181 93 27. Sikar 7591 7187 1803 2427 32 62 28. Sirohi 6066 8671 1090 1424 171 23 29. Tonk 11038 12895 3925 5840 127 75 30. Udaipur 12983 13903 2449 4415 96 24 31. Hanumangarh 39988 36876 7248 5680 369 281
RAJASTHAN 546169 591847 146965 190072 7344 5518
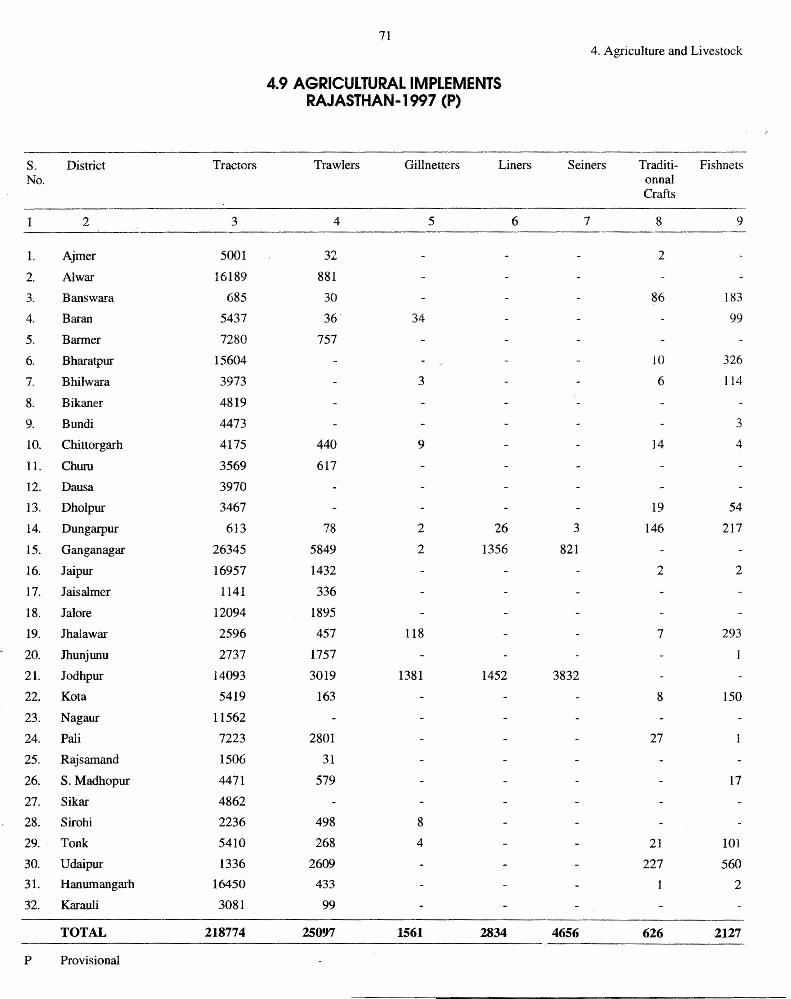
S. District Tractors No.
1 2 3
1. Ajmer 5001
2. Al war 16189
3. Banswara 685
4. Baran 5437
5. Banner 7280
6. Bharatpur 15604
7. Bhilwara 3973
8. Bikaner 4819
9. Bundi 4473
10. Chittorgarh 4175
11. Churu 3569
12. Dausa 3970
13. Dholpur 3467
14. Dungarpur 613
15. Ganganagar 26345
16. Jaipur 16957
17. Jaisalmer 1141
18. Jal ore 12094
19. Jhalawar 2596
20. Jhunjunu 2737
21. Jodhpur 14093
22. Kota 5419
23. Nagaur 11562
24. Pali 7223
25. Rajsamand 1506
26. S. Madhopur 4471
27. Sikar 4862
28. Sirohi 2236
29. Tonk 5410
30. Udaipur 1336
31. Hanumangarh 16450
32. Karauli 3081
TOTAL 218774
p Provisional
71
4.9 AGRICULTURAL IMPLEMENTS RAJASTHAN-1997 (P)
Trawlers Gillnetters Liners
4 5 6
32
881
30
36 34
757
3
440 9
617
78 2 26
5849 2 1356
1432
336
1895
457 118
1757
3019 1381 1452
163
2801
31
579
498 8
268 4
2609
433
99
25097 1561 2834
4. Agriculture and Livestock
Seiners Traditi- Fishnets onnal Crafts
7 8 9
2
86 183
99
10 326
6 114
3
14 4
19 54
3 146 217
821 t"I 2 £,
7 293
3832
8 150
27
17
21 101
227 560
2
4656 626 2127
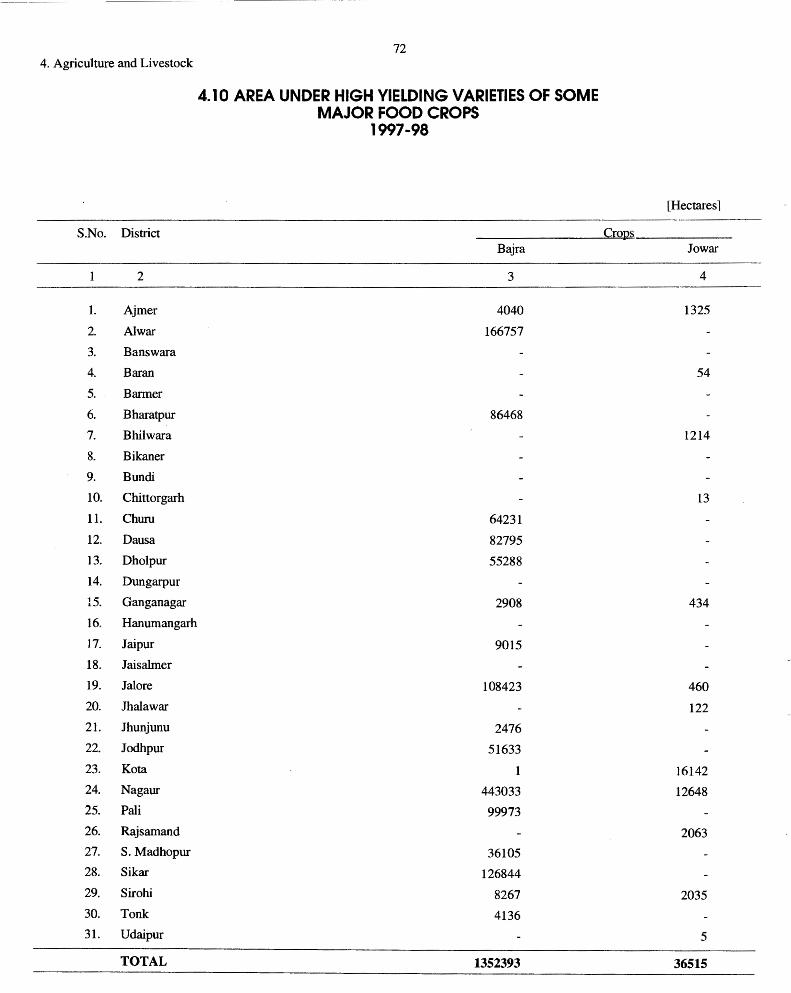
4. Agriculture and Livestock
S.No. District
2
I. Ajmer
2. Al war
3. Banswara
4. Baran
5. Barmer
6. Bharatpur
7. Bhilwara
8. Bikaner
9. Bundi
10. Chittorgarh
11. Churn
12. Dausa
13. Dholpur
14. Dungarpur
15. Ganganagar
16. Hanumangarh
17. Jaipur
18. Jaisalmer
19. Jalore
20. Jhalawar
21. Jhunjunu
22. Jodhpur
23. Ko ta
24. Nagaur
25. Pali
26. Rajsamand
27. S.Madhopur
28. Sikar
29. Sirohi
30. Tonk
31. Udaipur
TOTAL
72
4.10 AREA UNDER HIGH YIELDING VARIETIES OF SOME MAJOR FOOD CROPS
1997-98
Bajra
3
4040
166757
86468
64231
82795
55288
2908
9015
108423
2476
51633
1
443033
99973
36105
126844
8267
4136
1352393
[Hectares]
Crops Jo war
4
1325
54
1214
13
434
460
122
16142
12648
2063
2035
5
36515
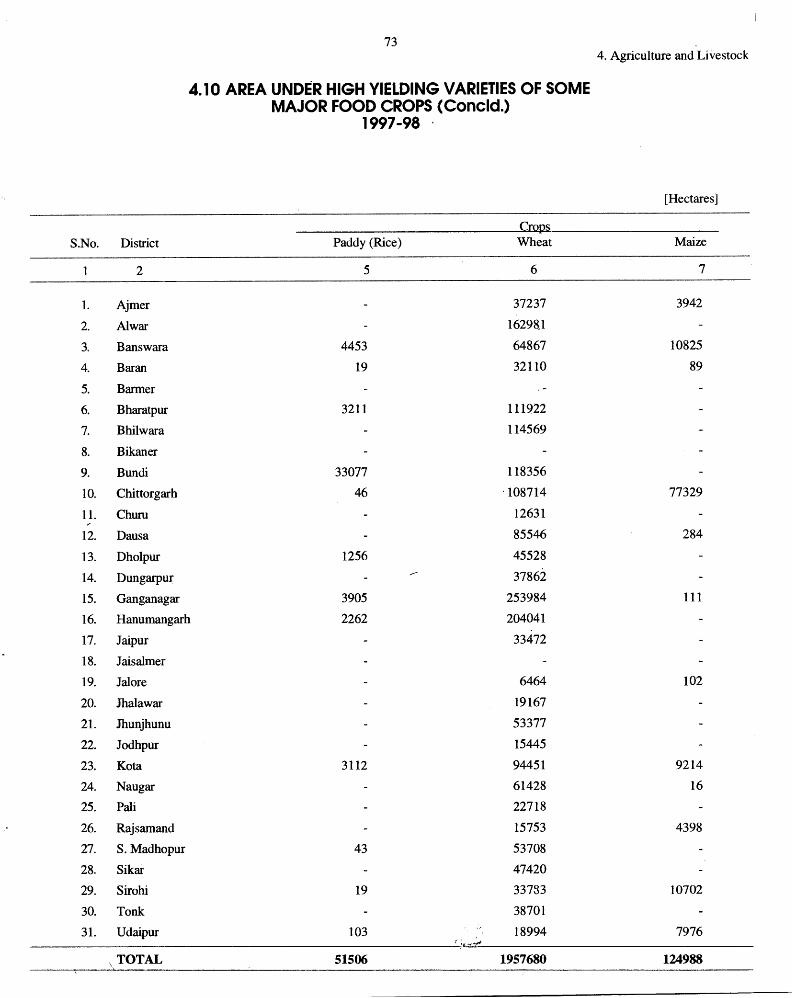
S.No.
1
1.
2.
3.
4.
5.
6.
7.
8.
9.
10.
11.
12.
13.
14.
15.
16.
17.
18.
19.
20.
21.
22.
23.
24.
25.
26.
27.
28.
29.
30.
31.
District
2
Ajmer
Al war
Banswara
Baran
Barmer
Bharatpur
Bhilwara
Bikaner
Bundi
Chittorgarh
Chum
Dausa
Dholpur
Dungarpur
Ganganagar
73
4.10 AREA UNDER HIGH YIELDING VARIETIES OF SOME MAJOR FOOD CROPS (Concld.)
1997-98 .
Cmps Paddy (Rice) Wheat
5 6
37237
16298.1
4453 64867
19 32110
3211 111922
114569
33077 118356
46 '108714
12631
85546
1256 45528
37862
3905 253984
Hanumangarh 2262 204041
Jaipur 33472
Jaisalmer
Jalore 6464
Jhalawar 19167
Jhunjhunu 53377
Jodhpur 15445
Ko ta 3112 94451
Naugar 61428
Pali 22718
Rajsamand 15753
S.Madhopur 43 53708
Sikar 47420
Sirohi 19 33733
Tonk 38701
Udaipur 103 18994 !;,~~~
\TOTAL 51506 1957680
4. Agriculture and Livestock
[Hectares]
Maize
7
3942
10825
89
77329
284
111
102
9214
16
4398
10702
7976
124988
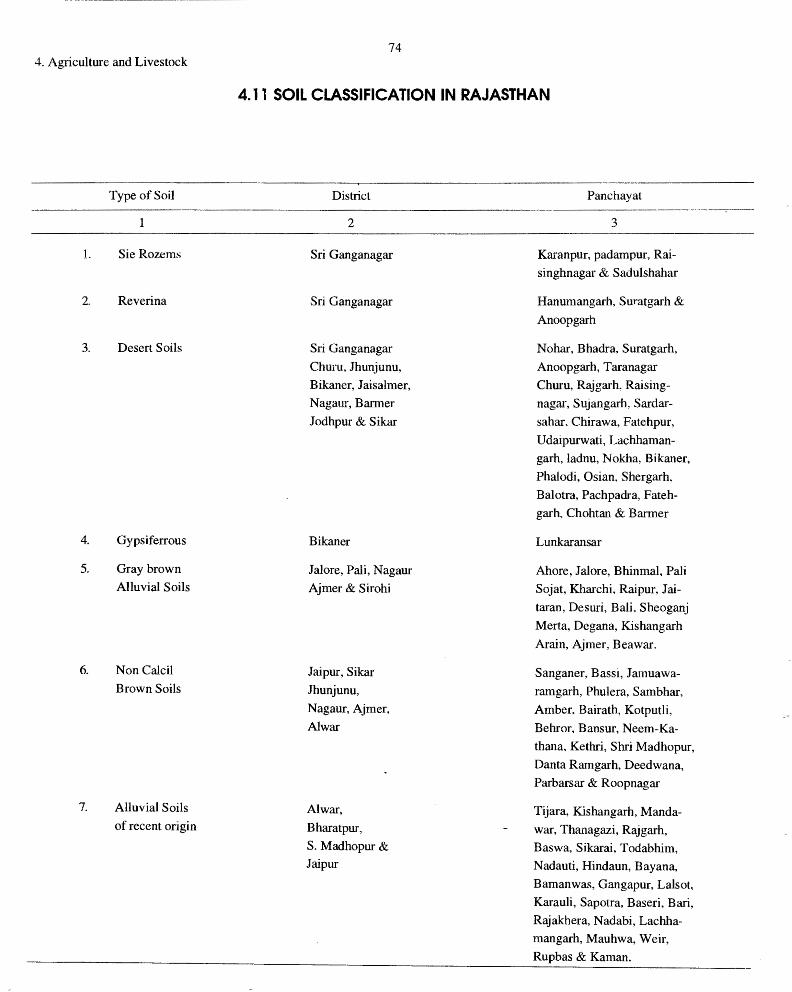
74 4. Agriculture and Livestock
4.11 SOIL CLASSIFICATION IN RAJASTHAN
Type of Soil District Panchayat
2 3
1. Sie Rozems Sri Ganganagar Karanpur, padampur, Rai-
singhnagar & Sadulshahar
2. Reverina Sri Ganganagar Hanumangarh, Suratgarh &
Anoopgarh
3. Desert Soils Sri Ganganagar Nohar, Bhadra, Suratgarh,
Churn, Jhunjunu, Anoopgarh, Taranagar
Bikaner, Jaisalmer, Churu, Rajgarh, Raising-
Nagaur, Barmer nagar, Sujangarh, Sardar-
Jodhpur & Sikar sahar, Chirawa, Fatehpur,
Udaipurwati, Lachhaman-garh, ladnu, Nokha, Bikaner,
Phalodi, Osian. Shergarh,
Balotra, Pachpadra, Fateh-
garb, Chohtan & Barmer
4. Gypsiferrous Bikaner Lunkaransar
5. Gray brown Jalore, Pali, Nagaur Ahore, Jalore, Bhinmal, Pali Alluvial Soils Ajmer & Sirohi Sojat, Kharchi, Raipur, Jai-
taran, Desuri, Bali, Sheoganj
Merta, Degana, Kishangarh
Arain, Ajmer, Beawar.
6. Non Calcil Jaipur, Sikar Sanganer, Bassi, Jamuawa-Brown Soils Jhunjunu, ramgarh, Phulera, Sambhar,
Nagaur, Ajmer, Amber. Bairath, Kotputli, Al war Behror, Bansur, Neem-Ka-
thana, Kethri, Shri Madhopur,
Danta Ramgarh, Deedwana,
Parbarsar & Roopnagar
7. Alluvial Soils Al war, Tijara, Kishangarh, Manda-of recent origin Bharatpur, war, Thanagazi, Rajgarh,
S. Madhopur & Baswa, Sikarai, Todabhim, Jaipur Nadauti, Hindaun, Bayana,
Bamanwas, Gangapur, Lalsot,
Karauli, Sapotra, Baseri, Bari,
Rajakhera, Nadabi, Lachha-
mangarh, Mauhwa, Weir,
Rupbas & Kaman.
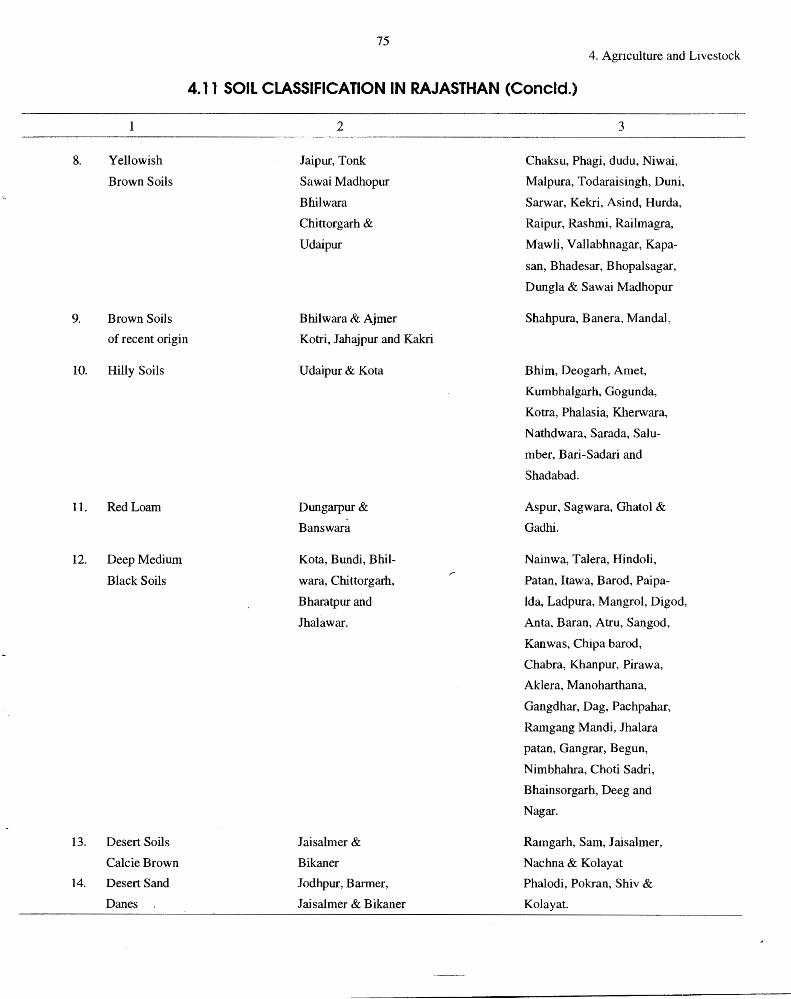
75 4. Agriculture and Livestock
4.11 SOIL CLASSIFICATION IN RAJASTHAN (Concld.)
8.
9.
Yellowish
Brown Soils
Brown Soils
of recent origin
10. Hilly Soils
11. Red Loam
12. Deep Medium
Black Soils
13. Desert Soils
Calcie Brown
14. Desert Sand
Danes
2
Jaipur, Tonk
Sawai Madhopur
Bhilwara
Chittorgarh &
Udaipur
Bhilwara & Ajmer
Kotri, Jahajpur and Kakri
Udaipur & Kota
Dungarpur&
Banswara
Kota, Bundi, Bhil
wara, Chittorgarh,
Bharatpur and
Jhalawar.
Jaisalmer &
Bikaner
Jodhpur, Barmer,
Jaisalmer & Bikaner
3
Chaksu, Phagi, dudu, Niwai,
Malpura, Todaraisingh, Duni,
Sarwar, Kekri, Asind, Hurda,
Raipur, Rashmi, Railmagra,
Mawli, Vallabhnagar, Kapa
san, Bhadesar, Bhopalsagar,
Dungla & Sawai Madhopur
Shahpura, Banera, Mandal,
Bhim, Deogarh, Arnet,
Kumbhalgarh, Gogunda,
Kotra, Phalasia, Kherwara,
Nathdwara, Sarada, Salu
mber, Bari-Sadari and
Shadabad.
Aspur, Sagwara, Ghatol &
Gadhi.
Nainwa, Talera, Hindoli,
Patan, ltawa, Barod, Paipa
lda, Ladpura, Mangrol, Digod,
Anta, Baran, Atru, Sangod,
Kanwas, Chipa barod,
Chabra, Khanpur, Pirawa,
Aklera, Manoharthana,
Gangdhar, Dag, Pachpahar,
Ram.gang Mandi, Jhalara
patan, Gangrar, Begun,
Nimbhahra, Choti Sadri,
Bhainsorgarh, Deeg and
Nagar.
Ramgarh, Sam, J aisalmer,
Nachna & Kolayat
Phalodi, Pokran, Shiv &
Kolayat.
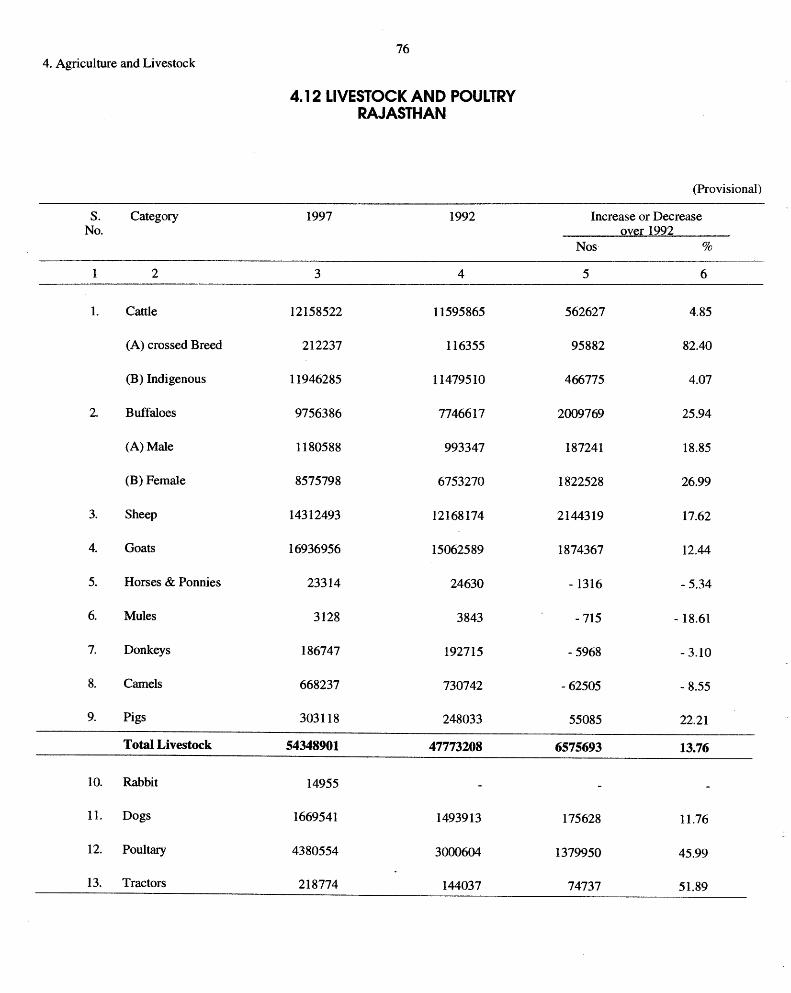
4. Agriculture and Livestock
s. Category No.
1 2
1. Cattle
(A) crossed Breed
(B) Indigenous
2. Buffaloes
(A) Male
(B) Female
3. Sheep
4. Goats
5. Horses & Ponnies
6. Mules
7. Donkeys
8. Camels
9. Pigs
Total Livestock
10. Rabbit
11. Dogs
12. Poultary
13. Tractors
76
4.12 LIVESTOCK AND POULTRY RAJASTHAN
1997 1992
3 4
12158522 11595865
212237 116355
11946285 11479510
9756386 7746617
1180588 993347
8575798 6753270
14312493 12168174
16936956 15062589
23314 24630
3128 3843
186747 192715
668237 730742
303118 248033
54348901 47773208
14955
1669541 1493913
4380554 3000604
218774 144037
(Provisional)
Increase or Decrease over 1992
Nos %
5 6
562627 4.85
95882 82.40
466775 4.07
2009769 25.94
187241 18.85
1822528 26.99
2144319 17.62
1874367 12.44
- 1316 - 5.34
- 715 - 18.61
-5968 -3.10
-62505 - 8.55
55085 22.21
6575693 13.76
175628 11.76
1379950 45.99
74737 51.89
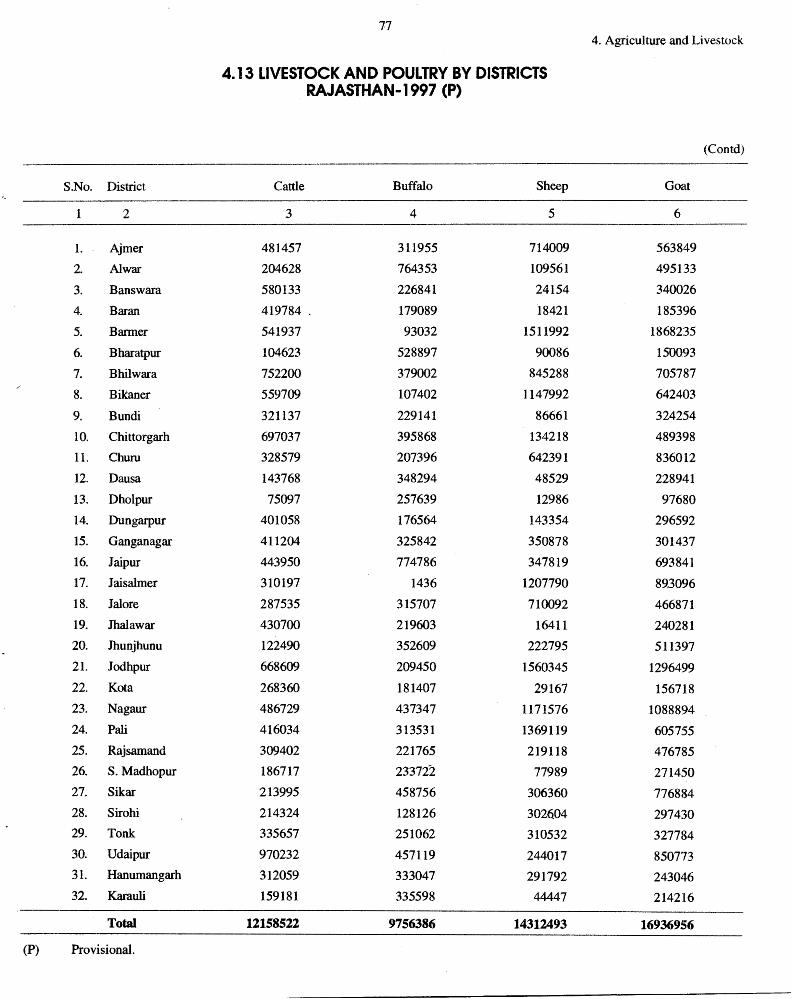
S.No. District
2
1. Ajmer
2. Al war
3. Banswara
4. Baran
5. Barmer
6. Bharatpur
7. Bhilwara
8. Bikaner
9. Bundi
10. Chittorgarh
11. Chum
12. Dausa
13. Dholpur
14. Dungarpur
15. Ganganagar
16. Jaipur
17. Jaisalmer
18. Jalore
19. Jhalawar
20. Jhunjhunu
21. Jodhpur
22. Kota
23. Nagaur
24. Pali
25. Rajsamand
26. S.Madhopur
27. Sikar
28. Sirohi
29. Tonk
30. Udaipur
31. Hanumangarh
32. Karauli
Total
(P) Provisional.
77
4.13 LIVESTOCK AND POULTRY BY DISTRICTS RAJASTHAN-1997 (P)
Cattle Buffalo Sheep
.3 4 5
481457 311955 714009
204628 764353 109561
580133 226841 24154
419784 . 179089 18421
541937 93032 1511992
104623 528897 90086
752200 379002 845288
559709 107402 1147992
321137 229141 86661
697037 395868 134218
328579 207396 642391
143768 348294 48529
75097 257639 12986
401058 176564 143354
411204 325842 350878
443950 774786 347819
310197 1436 1207790
287535 315707 710092
430700 219603 16411
122490 352609 222795
668609 209450 1560345
268360 181407 29167
486729 437347 1171576
416034 313531 1369119
309402 221765 219118
186717 23'3722 77989
213995 458756 306360
214324 128126 302604 335657 251062 310532
970232 457119 244017
312059 333047 291792 159181 335598 44447
12158522 9756386 14312493
4. Agriculture and Livestock
(Contd)
Goat
6
563849
495133
340026
185396
1868235
150093
705787
642403
324254
489398
836012
228941
97680
296592
301437
693841
89.3096
466871
240281
511397
1296499
156718
1088894
605755
476785
271450
776884
297430
327784
850773
243046
214216
16936956
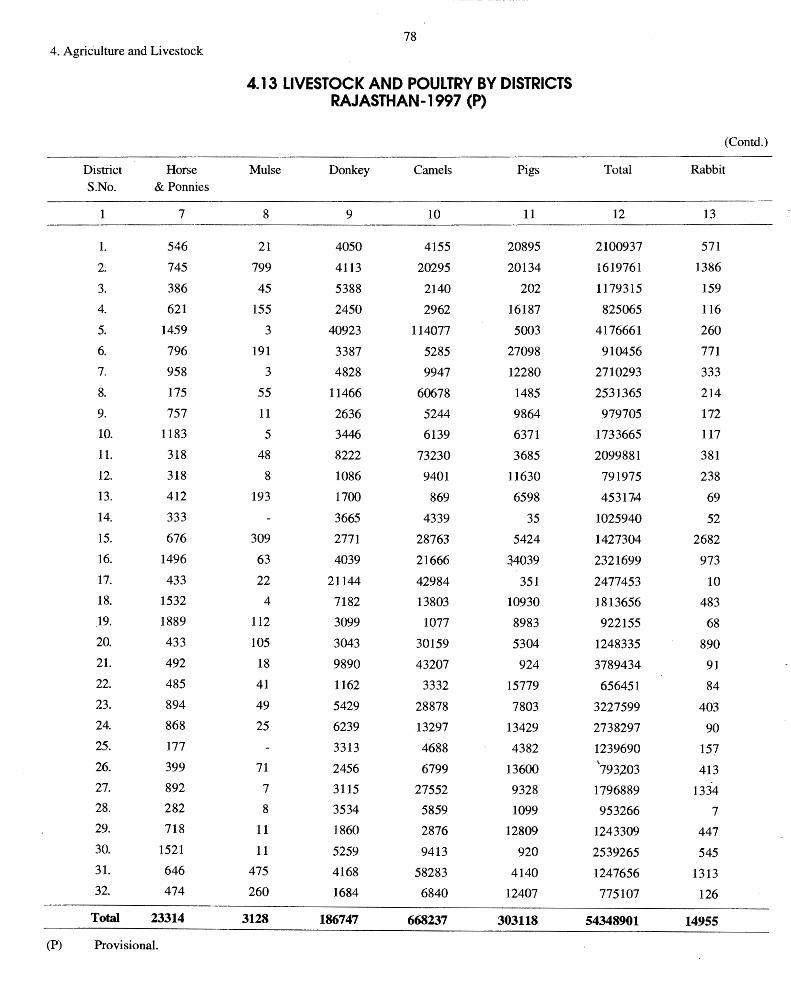
78 4. Agriculture and Livestock
4.13 LIVESTOCK AND POULTRY BY DISTRICTS RAJASTHAN-1997 (P)
(Contd.)
District Horse Muise Donkey Camels Pigs Total Rabbit S.No. & Ponnies
7 8 9 10 11 12 13
1. 546 21 4050 4155 20895 2100937 571
2. 745 799 4113 20295 20134 1619761 1386
3. 386 45 5388 2140 202 1179315 159
4. 621 155 2450 2962 16187 825065 116
5. 1459 3 40923 114077 5003 4176661 260
6. 796 191 3387 5285 27098 910456 771
7. 958 3 4828 9947 12280 2710293 333
8. 175 55 11466 60678 1485 2531365 214
9. 757 11 2636 5244 9864 979705 172
10. 1183 5 3446 6139 6371 1733665 117
11. 318 48 8222 73230 3685 2099881 381
12. 318 8 1086 9401 11630 791975 238
13. 412 193 1700 869 6598 453174 69 14. 333 3665 4339 35 1025940 52 15. 676 309 2771 28763 5424 1427304 2682 16. 1496 63 4039 21666 3.4039 2321699 973
17. 433 22 21144 42984 351 2477453 10 18. 1532 4 7182 13803 10930 1813656 483 19. 1889 112 3099 1077 8983 922155 68 20. 433 105 3043 30159 5304 1248335 890 21. 492 18 9890 43207 924 3789434 91 22. 485 41 1162 3332 15779 656451 84 23. 894 49 5429 28878 7803 3227599 403 24. 868 25 6239 13297 13429 2738297 90 25. 177 3313 4688 4382 1239690 157 26. 399 71 2456 6799 13600
~
793203 413 27. 892 7 3115 27552 9328 1796889 1334 28. 282 8 3534 5859 1099 953266 7 29. 718 11 1860 2876 12809 1243309 447 30. 1521 11 5259 9413 920 2539265 545 31. 646 475 4168 58283 4140 1247656 1313 32. 474 260 1684 6840 12407 775107 126
Total 23314 3128 186747 668237 303118 54348901 14955
(P) Provisional.
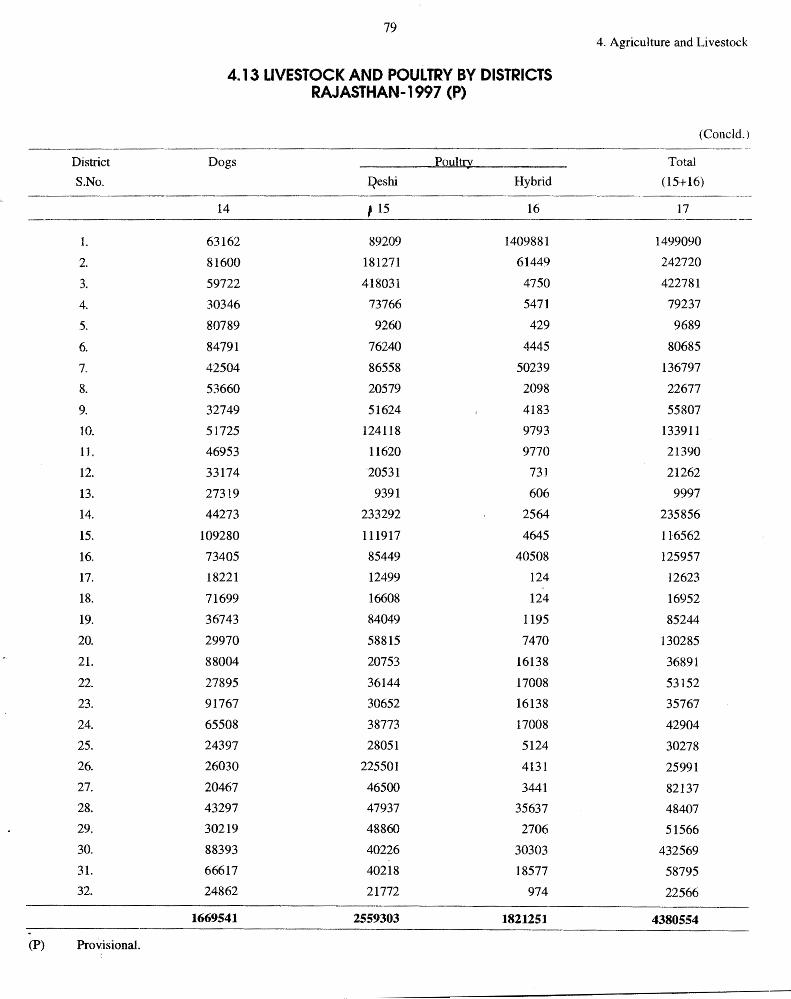
79 4. Agriculture and Livestock
4.13 LIVESTOCK AND POULTRY BY DISTRICTS RAJASTHAN-1997 (P)
(Concld.)
District Dogs Poul~ Total
S.No. Qeshi Hybrid (15+ 16)
14 f15 16 17
L 63162 89209 1409881 1499090
2. 81600 181271 61449 242720
3. 59722 418031 4750 422781
4. 30346 73766 5471 79237
5. 80789 9260 429 9689
6. 84791 76240 4445 80685
7. 42504 86558 50239 136797
8. 53660 20579 2098 22677
9. 32749 51624 4183 55807
10. 51725 124118 9793 133911
1 J. 46953 11620 9770 21390
12. 33174 20531 731 21262
13. 27319 9391 606 9997
14. 44273 233292 2564 235856
15. 109280 111917 4645 116562
16. 73405 85449 40508 125957
17. 18221 12499 124 12623
18. 71699 16608 124 16952
19. 36743 84049 1195 85244
20. 29970 58815 7470 130285
21. 88004 20753 16138 36891
22. 27895 36144 17008 53152
23. 91767 30652 16138 35767
24. 65508 38773 17008 42904
25. 24397 28051 5124 30278
26. 26030 225501 4131 25991 27. 20467 46500 3441 82137 28. 43297 47937 35637 48407
29. 30219 48860 2706 51566
30. 88393 40226 30303 432569
31. 66617 40218 18577 58795 32. 24862 21772 974 22566
1669541 2559303 1821251 4380554
(P) ProY.isional. i
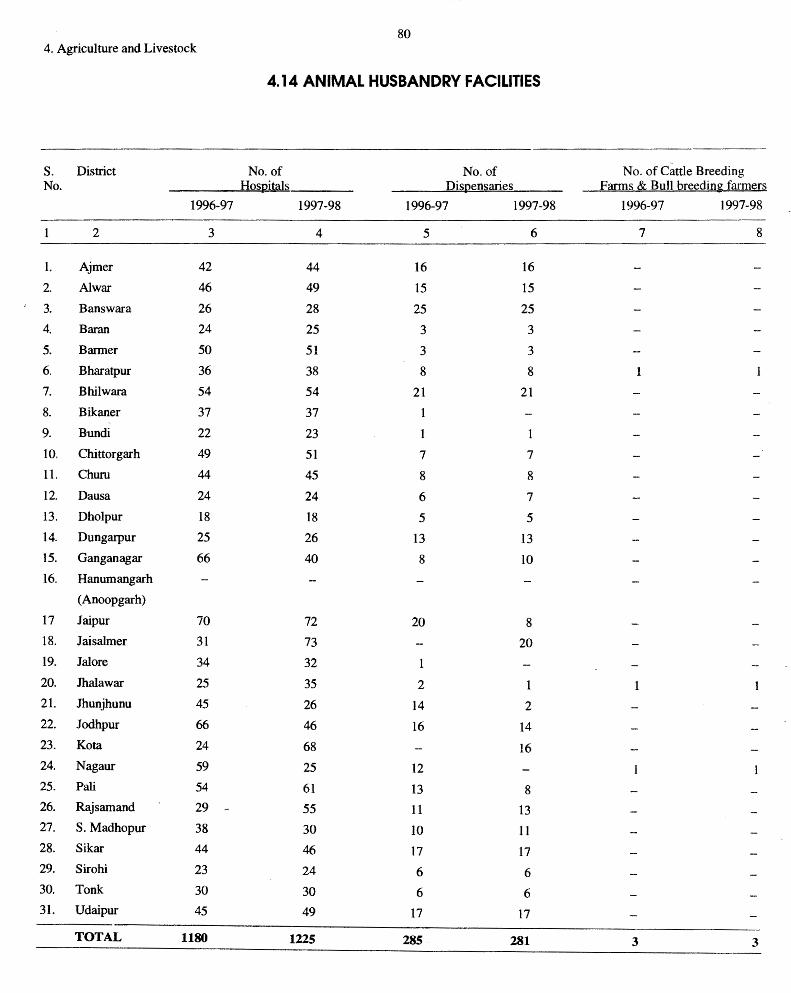
80 4. Agriculture and Livestock
4.14 ANIMAL HUSBANDRY FACILITIES
S. District No.of No.of No. of C~ttle Breeding No. Hos12itals Dispensaries Farms & Bull breeding farmers
1996-97 1997-98 1996-97 1997-98 1996-97 1997-98
1 2 3 4 5 6 7 8
1. Ajmer 42 44 16 16
2. Al war 46 49 15 15
3. Banswara 26 28 25 25
4. Baran 24 25 3 3
5. Barmer 50 51 3 3
6. Bharatpur 36 38 8 8 7. Bhilwara 54 54 21 21
8. Bikaner 37 37 1
9. Bundi 22 23 1 1
10. Chittorgarh 49 51 7 7 11. Churn 44 45 8 8 12. Dausa 24 24 6 7 13. Dholpur 18 18 5 5 14. Dungarpur 25 26 13 13 15. Ganganagar 66 40 8 10
16. Hanumangarh
(Anoopgarh)
17 Jaipur 70 72 20 8 18. Jaisalmer 31 73 20
19. Jalore 34 32 1 20. Jhalawar 25 35 2 1 1 21. Jhunjhunu 45 26 14 2 22. Jodhpur 66 46 16 14 23. Ko ta 24 68 16 24. Nagaur 59 25 12 25. Pali 54 61 13 8 26. Rajsamand 29 - 55 11 13 27. S. Madhopur 38 30 10 11 28. Sikar 44 46 17 17 29. Sirohi 23 24 6 6 30. Tonk 30 30 6 6 31. Udaipur 45 49 17 17
TOTAL 1180 1225 285 281 3 3
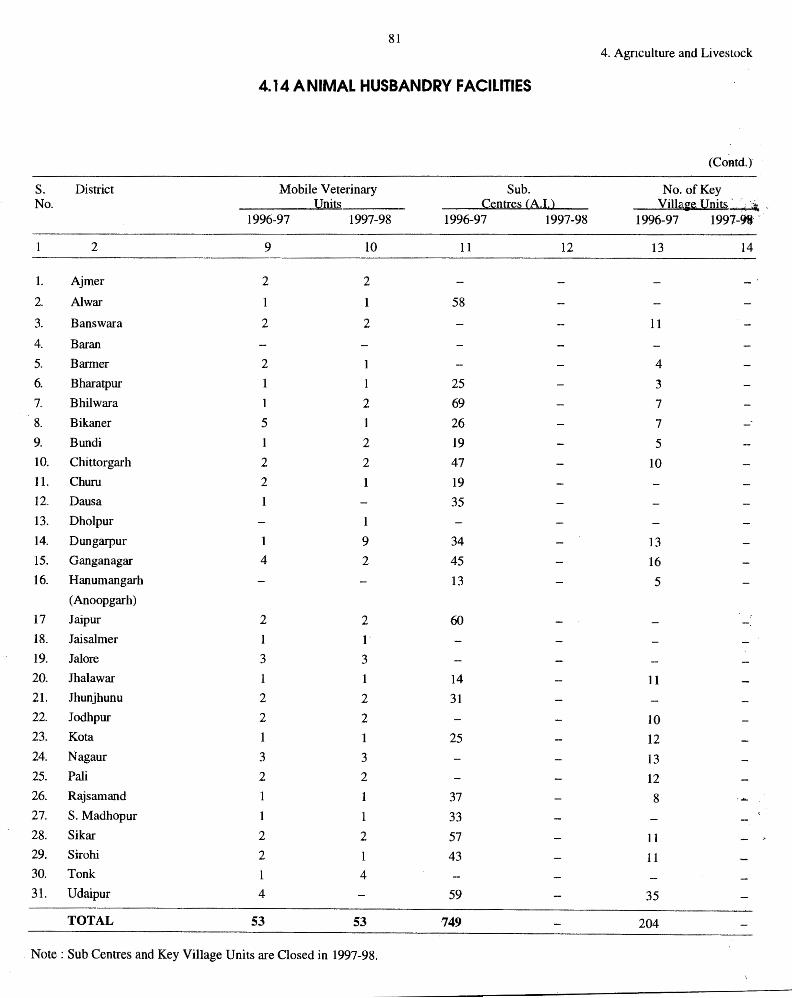
81 4. Agriculture and Livestock
4.14 ANIMAL HUSBANDRY FACILITIES
(Contd.)
s. District Mobile Veterinary Sub. No. of Key No. J.,Init~ C~ntr~~ (A.I.} Vill~it~ J..Init~~ ,
1996-97 1997-98 1996-97 1997-98 1996-97 1997-98·'
2 9 10 11 12 13 14
1. Ajmer 2 2 -2. Al war 1 58
3. Banswara 2 2 11
4. Baran
5. Barmer 2 1 4
6. Bharatpur 1 1 25 3
7. Bhilwara 1 2 69 7
8. Bikaner 5 1 26 7 --9. Bundi 2 19 5
IO. Chittorgarh 2 2 47 10
11. Chum 2 19
12. Dausa 35
13. Dholpur 1
14. Dungarpur 9 34 13
15. Gang an agar 4 2 45 16
16. Hanumangarh 13 5
(Anoopgarh)
17 Jaipur 2 2 60 -18. Jaisalmer 1 1·
19. Jalore 3 3
20. Jhalawar 1 14 11
21. Jhunjhunu 2 2 31
22. Jodhpur 2 2 10 23. Kota 1 1 25 12
24. Nagaur 3 3 13 25. Pali 2 2 12 26. Rajsamand 37 8
27. S.Madhopur 1 33
28. Sikar 2 2 57 11 29. Sirohi 2 43 11 30. Tonk 4
31. Udaipur 4 59 35
TOTAL 53 53 749 204
Note: Sub Centres and Key Village Units are Closed in 1997-98.
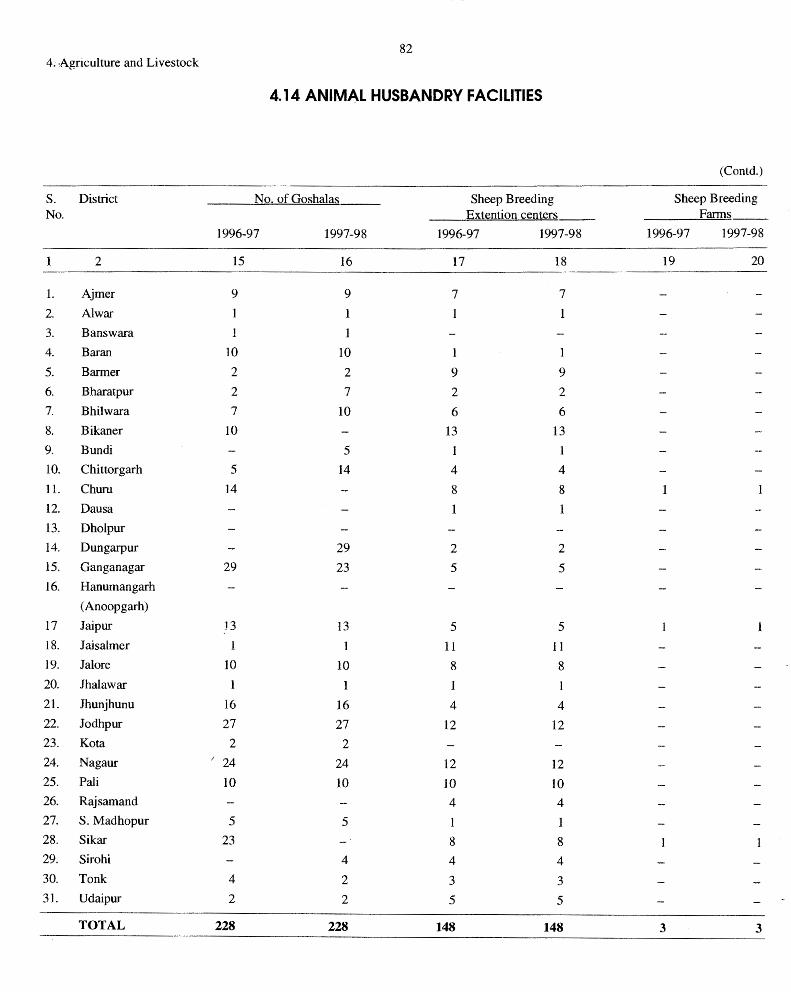
82 4. Agriculture and Livestock
4.14 ANIMAL HUSBANDRY FACILITIES
(Contd.)
S. District No. of Goshalas Sheep Breeding Sheep Breeding No. Extention centers Farms
1996-97 1997-98 1996-97 1997-98 1996-97 1997-98
2 15 16 17 18 19 20
1. Ajmer 9 9 7 7
2. Al war
3. Banswara l
4. Baran 10 10 1 1
5. Barmer 2 2 9 9
6. Bharatpur 2 7 2 2
7. Bhilwara 7 10 6 6
8. Bikaner 10 13 13
9. Bundi 5
10. Chittorgarh 5 14 4 4
11. Chum 14 8 8
12. Dausa
13. Dholpur
14. Dungarpur 29 2 ,.., ""
15. Ganganagar 29 23 5 5
16. Hanumangarh
(Anoopgarh)
17 Jaipur J3 13 5 5
18. Jaisalmer 1 1 11 11
19. Jal ore 10 10 8 8
20. Jhalawar 1
21. Jhunjhunu 16 16 4 4
22. Jodhpur 27 27 12 12
23. Ko ta 2 2
24. Nagaur ( 24 24 12 12
25. Pali 10 10 10 10 26. Rajsamand 4 4
27. S. Madhopur 5 5 1 1 28. Sikar 23 8 8 29. Sirohi 4 4 4
30. Tonk 4 2 3 3 31. Udaipur 2 2 5 5
TOTAL 228 228 148 148 3 3
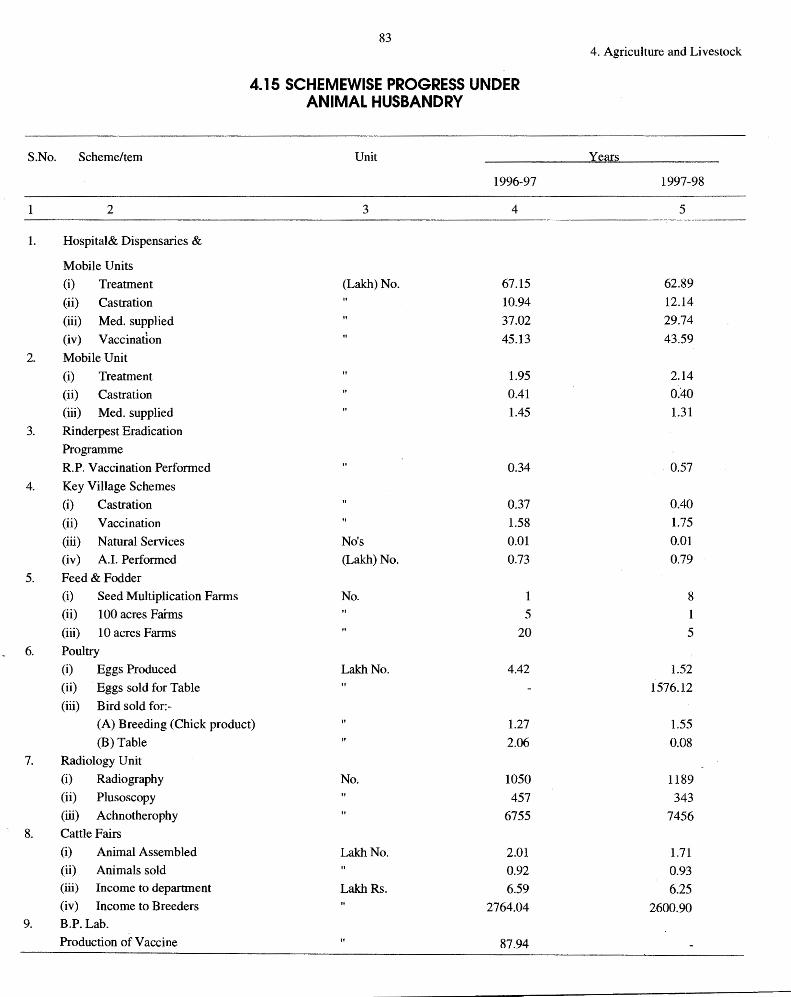
S.No.
1.
2.
3.
4.
5.
6.
7.
8.
9.
Scheme/tern
2
Hospital& Dispensaries &
Mobile Units
(i) Treatment
(ii) Castration
(iii) Med. supplied
(iv) Vaccination
Mobile Unit
(i) Treatment
(ii) Castration
(iii) Med. supplied
Rinderpest Eradication
Programme
R.P. Vaccination Performed
Key Village Schemes
(i) Castration
(ii) Vaccination
(iii) Natural Services
(iv) A.I. Performed
Feed & Fodder
(i) Seed Multiplication Farms
(ii) 100 acres Fai-ms
(iii) 10 acres Farms
Poultry
(i) Eggs Produced
(ii) Eggs sold for Table
(iii) Bird sold for:-
83
4.15 SCHEMEWISE PROGRESS UNDER ANIMAL HUSBANDRY
Unit
1996-97
3 4
(Lakh) No. 67.15
10.94
37.02
45.13
1.95
0.41
1.45
0.34
0.37
1.58
No's 0.01
(Lakh) No. 0.73
No. 1
5
20
LakhNo. 4.42
(A) Breeding (Chick product) 1.27
(B) Table 2.06
Radiology Unit
(i) Radiography No. 1050
(ii) Plusoscopy 457
(iii) Achnotherophy 6755
Cattle Fairs
(i) Animal Assembled LakhNo. 2.01 (ii) Animals sold 0.92 (iii) Income to department LakhRs. 6.59 (iv) Income to Breeders 2764.04 B.P. Lab.
Production of Vaccine 87.94
4. Agriculture and Livestock
Years
1997-98
5
62.89
12.14
29.74
43.59
2.14
0.40
1.31
0.57
0.40
1.75
0.01
0.79
8
1
5
1.52
1576.12
1.55
0.08
1189
343
7456
1.71
0.93
6.25 2600.90
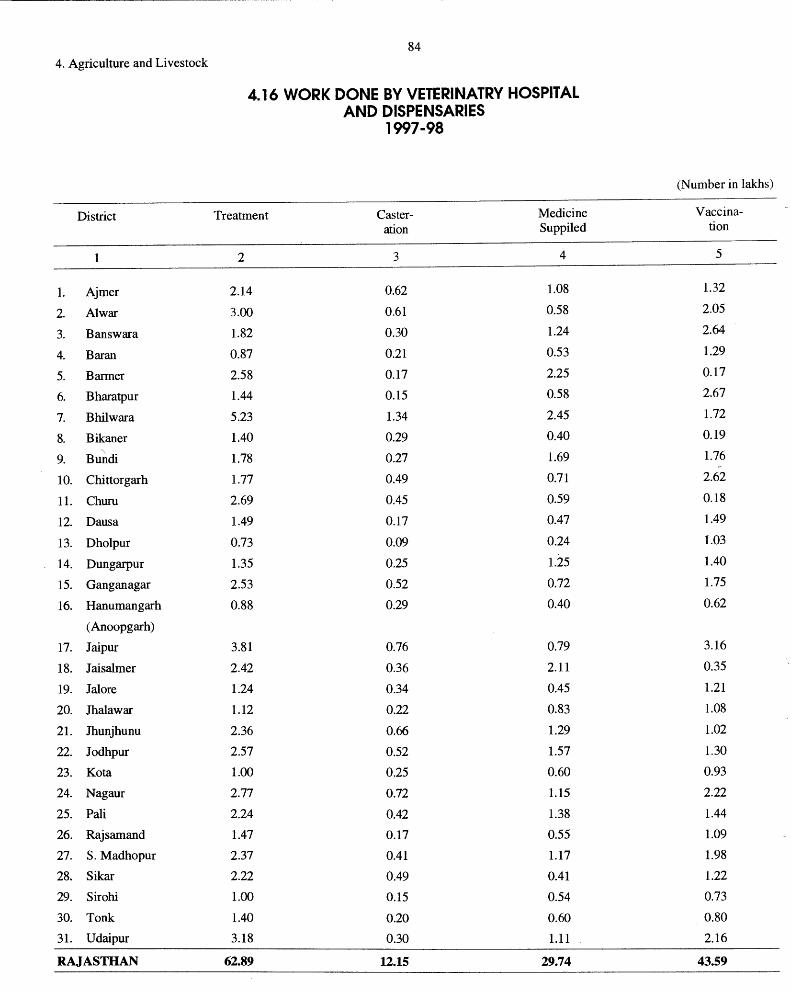
4. Agriculture and Livestock
District
1
1. Ajmer
2. Al war
3. Banswara
4. Baran
5. Barmer
6. Bharatpur
7. Bhilwara
8. Bikaner ' 9. Bundi
10. Chittorgarh
11. Chum
12. Dausa
13. Dholpur
14. Dungarpur
15. Gang an agar
16. Hanumangarh
(Anoopgarh)
17. Jaipur
18. Jaisalmer
19. Jalore
20. Jhalawar
21. Jhunjhunu
22. Jodhpur
23. Ko ta
24. Nagaur
25. Pali
26. Rajsamand
27. S.Madhopur
28. Sikar
29. Sirohi
30. Tonk
31. Udaipur
RAJASTHAN
84
4.16 WORK DONE BY VETERINATRY HOSPITAL AND DISPENSARIES
1997-98
Treatment Caster- Medicine ation Suppiled
2 3 4
2.14 0.62 1.08
3.00 0.61 0.58
1.82 0.30 1.24
0.87 0.21 0.53
2.58 0.17 2.25
1.44 0.15 0.58
5.23 1.34 2.45
1.40 0.29 0.40
1.78 0.27 1.69
1.77 0.49 0.71
2.69 0.45 0.59
1.49 0.17 0.47
0.73 0.09 0.24
1.35 0.25 1.25
2.53 0.52 0.72
0.88 0.29 0.40
3.81 0.76 0.79
2.42 0.36 2.11
1.24 0.34 0.45
1.12 0.22 0.83
2.36 0.66 1.29
2.57 0.52 1.57
1.00 0.25 0.60
2.77 0.72 1.15
2.24 0.42 1.38
1.47 0.17 0.55
2.37 0.41 1.17
2.22 0.49 0.41
1.00 0.15 0.54
1.40 0.20 0.60
3.18 0.30 1.11
62.89 12.15 29.74
(Number in lakhs)
Vaccina-ti on
5
1.32
2.05
2.64
1.29
0.17
2.67
1.72
0.19
1.76
2.62
0.18
1.49
1.03
1.40
1.75
0.62
3.16
0.35
1.21
1.08
1.02
1.30
0.93
2.22
1.44
1.09
1.98
1.22
0.73
0.80
2.16
43.59
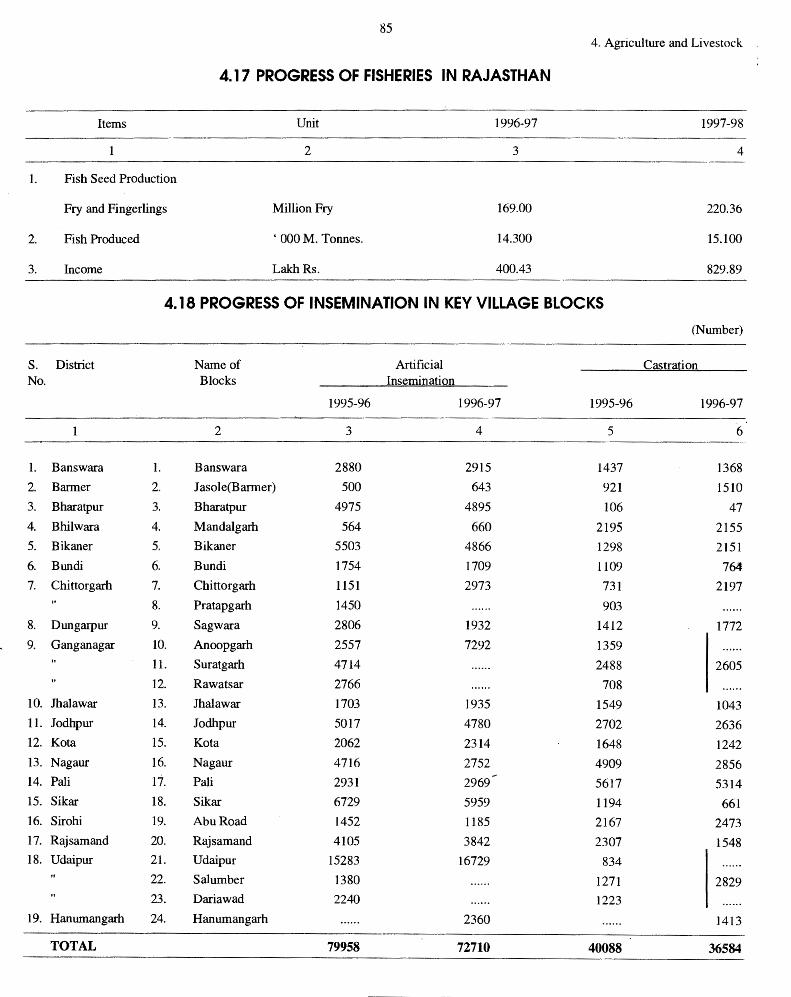
85 4. Agriculture and Livestock
4.17 PROGRESS OF FISHERIES IN RAJASTHAN
Items Unit 1996-97 1997-98
2 3 4
1. Fish Seed Production
Fry and Fingerlings Million Fry 169.00 220.36
2. Fish Produced ' 000 M. Tonnes. 14.300 15.100
3. Income LakhRs. 400.43 829.89
4.18 PROGRESS OF INSEMINATION IN KEY VILLAGE BLOCKS
(Number)
s. District Name of Artificial Castration No. Blocks Insemination
1995-96 1996-97 1995-96 1996-97
1 2 3 4 5 6
1. Banswara 1. Banswara 2880 2915 1437 1368
2. Barmer 2. Jasole(Barmer) 500 643 921 1510
3. Bharatpur 3. Bharatpur 4975 4895 106 47
4. Bhilwara 4. Mandalgarh 564 660 2195 2155
5. Bikaner 5. Bikaner 5503 4866 1298 2151
6. Bundi 6. Bundi 1754 1709 1109 764
7. Chittorgarh 7. Chittorgarh 1151 2973 731 2197
8. Pratapgarh 1450 903
8. Dungarpur 9. Sagwara 2806 1932 1412 1772
9. Ganganagar 10. Anoopgarh 2557 7292 1359
11. Suratgarh 4714 2488 2605
12. Raw a tsar 2766 708
10. Jhalawar 13. Jhalawar 1703 1935 1549 1043 11. Jodhpur 14. Jodhpur 5017 4780 2702 2636 12. Ko ta 15. Ko ta 2062 2314 1648 1242
13. Nagaur 16. Nagaur 4716 2752 4909 2856 14. Pali 17. Pali 2931 2969 5617 5314 15. Sikar 18. Sikar 6729 5959 1194 661 16. Sirohi 19. Abu Road 1452 1185 2167 2473 17. Rajsamand 20. Rajsamand 4105 3842 2307 1548 18. Udaipur 21. Udaipur 15283 16729 834
22. Salumber 1380 1271 2829 23. Daria wad 2240 1223
19. Hanumangarh 24. Hanumangarh 2360 1413
TOTAL 79958 72710 40088 36584
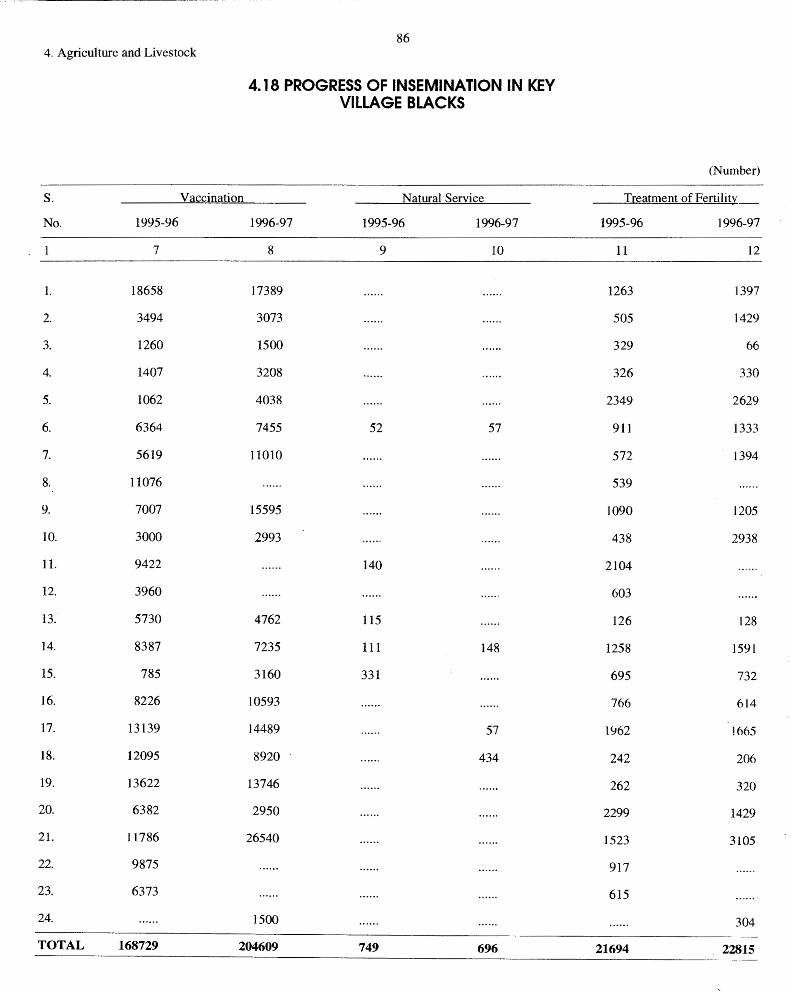
86 4. Agriculture and Livestock
S.
No. 1995-96
7
1. 18658
2. 3494
3. 1260
4. 1407
5. 1062
6. 6364
7. 5619
8. 11076
9. 7007
10. 3000
11. 9422
12. 3960
13. 5730
14. 8387
15. 785
16. 8226
17. 13139
18. 12095
19. 13622
20. 6382
21. 11786
22. 9875
23. 6373
24.
TOTAL 168729
Vaccination
4.18 PROGRESS OF INSEMINATION IN KEV VILLAGE BLACKS
Natural Service
1996-97 1995-96 1996-97
8 9 10
17389
3073
1500
3208
4038
7455 52 57
11010
15595
2993
140
4762 115
7235 111 148
3160 331
10593
14489 57
8920 434
13746
2950
26540
1500
204609 749 696
(Number)
Treatment of Fertilit~
1995-96 1996-97
11 12
1263 1397
505 1429
329 66
326 330
2349 2629
911 1333
572 1394
539
1090 1205
438 2938
2104
603
126 128
1258 1591
695 732
766 614
1962 1665
242 206
262 320
2299 1429
1523 3105
917
615
304
21694 22815
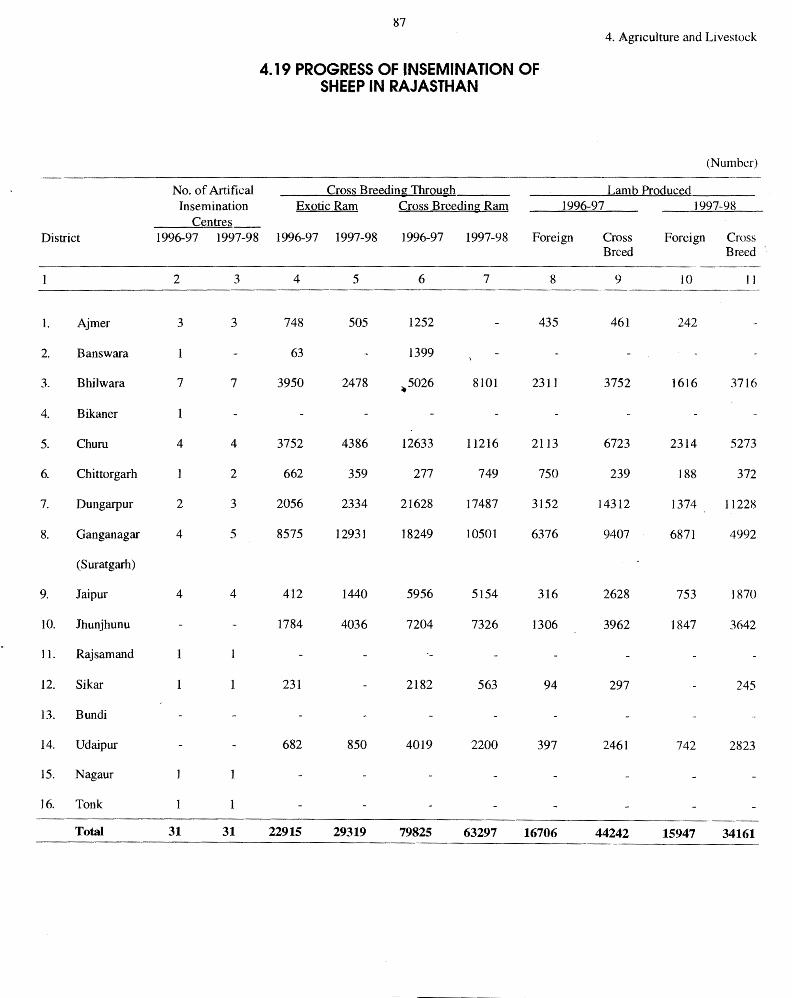
No. of Artifical Insemination
Centres District 1996-97 1997-98
2 3
1. Ajmer 3 3
2. Banswara
3. Bhilwara 7 7
4. Bikaner
5. Churu 4 4
6. Chittorgarh 2
7. Dungarpur 2 3
8. Ganganagar 4 5
(Suratgarh)
9. Jaipur 4 4
10. Jhunjhunu
11. Rajsamand
12. Sikar
13. Bundi
14. Udaipur
15. Nagaur
16. Tonk
Total 31 31
87
4.19 PROGRESS OF INSEMINATION OF SHEEP IN RAJASTHAN
Cross Breeding ThrQugh Exotic Ram Cross Breeding Ram
4. Agriculture and Livestock
(Number)
Lamb Produced. 1996-97 1997-98
1996-97 1997-98 1996-97 1997-98 Foreign Cross Foreign Cross Breed Breed
4 5 6 7 8 9 IO 11
748 505 1252 435 461 242
63 1399
3950 2478 ._5026 8101 2311 3752 1616 3716
3752 4386 12633 11216 2113 6723 2314 5273
662 359 277 749 750 239 188 372
2056 2334 21628 17487 3152 14312 1374 11228
8575 12931 18249 10501 6376 9407 6871 4992
412 1440 5956 5154 316 2628 753 1870
1784 4036 7204 7326 1306 3962 1847 3642
231 2182 563 94 297 245
682 850 4019 2200 397 2461 742 2823
22915 29319 79825 63297 16706 44242 15947 34161
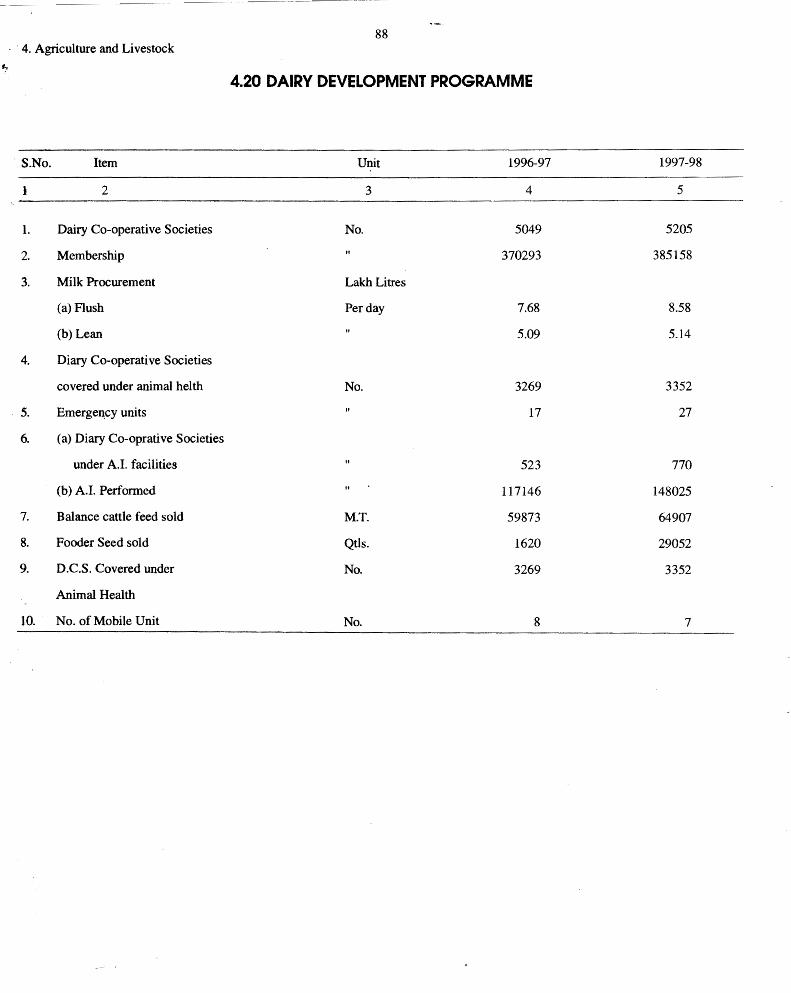
88 · 4. Agriculture and Livestock
4.20 DAIRY DEVELOPMENT PROGRAMME
. S.No. Item Unit 1996-97 1997-98
} 2 3 4 5
1. Dairy Co-operative Societies No. 5049 5205
2. Membership II 370293 385158
3. Milk Procurement Lakh Litres
(a) Flush Per day 7.68 8.58
(b) Lean 5.09 5.14
4. Diary Co-operative Societies
covered under animal helth No. 3269 3352
. 5. Emerge~cy units 17 27
6. (a) Diary Co-oprative Societies
under A.I. facilities 523 770
(b) A.I. Performed 117146 148025
7. Balance cattle feed sold M.T. 59873 64907
8. Fooder Seed sold Qtls. 1620 29052
9. D.C.S. Covered under No. 3269 3352
Animal Health
10. No. of Mobile Unit No. 8 7
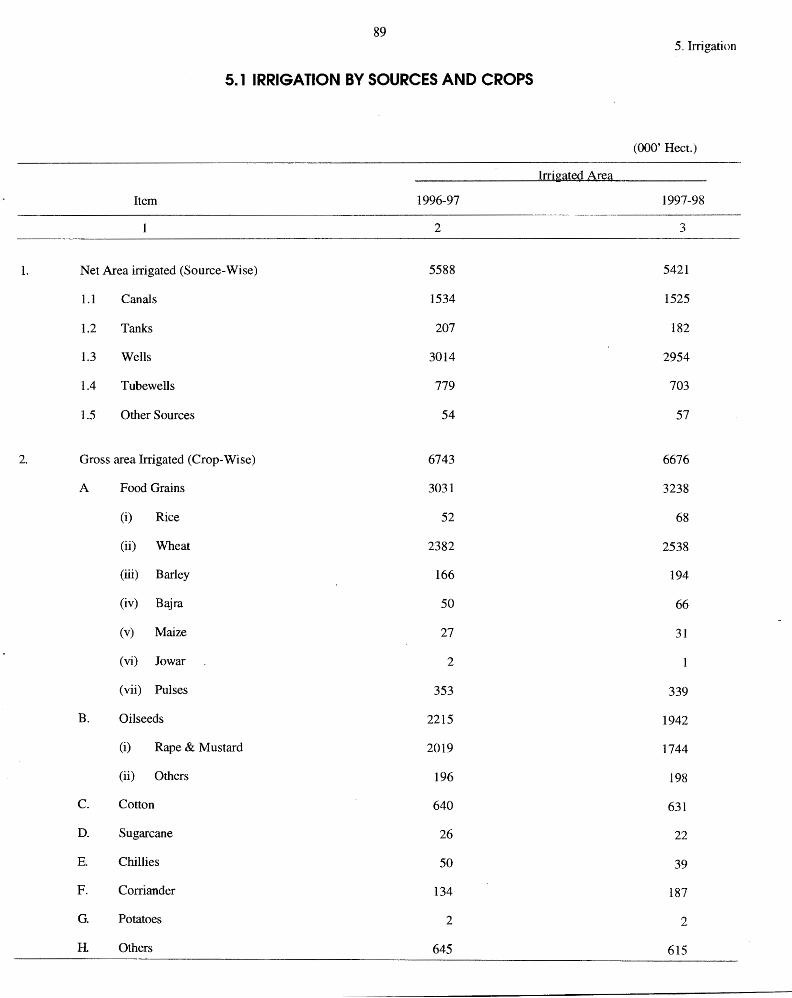
89 5 .. Irrigation
5.1 IRRIGATION BY SOURCES AND CROPS
(000' Hect.)
Irrigated Area
Item 1996-97 1997-98
2 3
1. Net Area irrigated (Source-Wise) 5588 5421
1.1 Canals 1534 1525
1.2 Tanks 207 182
1.3 Wells 3014 2954
1.4 Tubewells 779 703
1.5 Other Sources 54 57
2. Gross area Irrigated (Crop-Wise) 6743 6676
A Food Grains 3031 3238
(i) Rice 52 68
(ii) Wheat 2382 2538
(iii) Barley 166 194
(iv) Bajra 50 66
(v) Maize 27 31
(vi) Jo war 2
(vii) Pulses 353 339
B. Oilseeds 2215 1942
(i) Rape & Mustard 2019 1744
(ii) Others 196 198
c. Cotton 640 631
D. Sugarcane 26 22
E. Chillies 50 39
F. Corriander 134 187
G. Potatoes 2 2
H Others 645 615
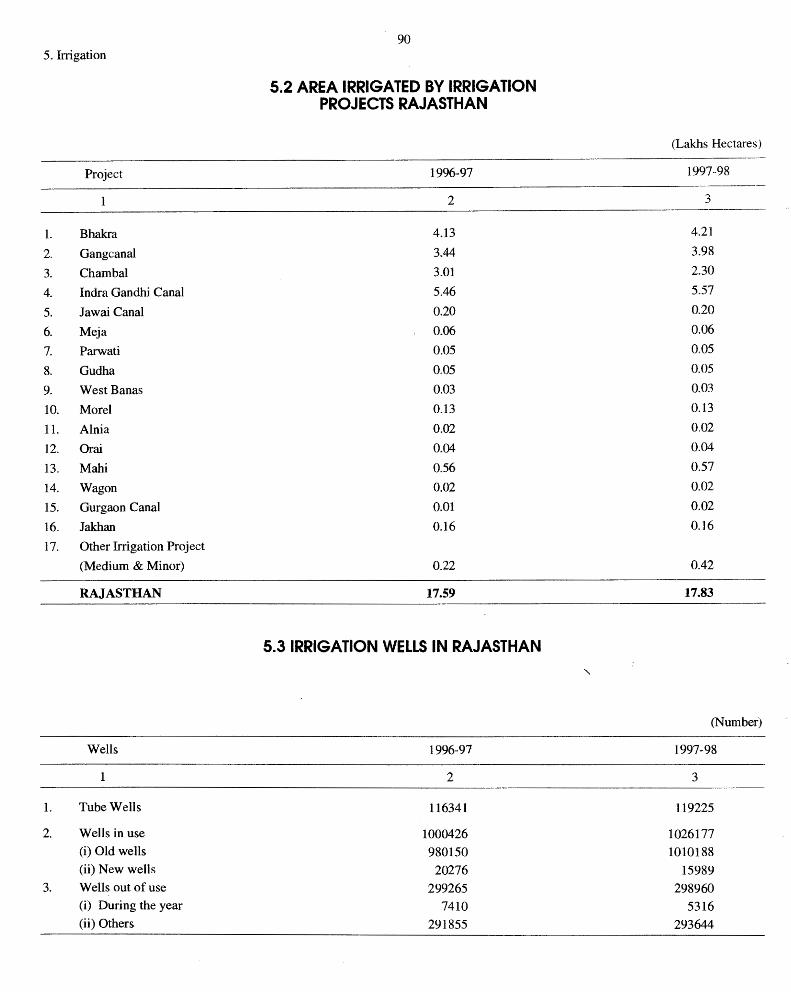
5. Irrigation
Project
1. Bhakra
2. Gangcanal
3. Chambal
4. Indra Gandhi Canal
5. Jawai Canal
6. Meja
7. Parwati
8. Gudha
9. West Banas
10. Morel
11. Alnia
12. Orai
13. Mahi
14. Wagon
15. Gurgaon Canal
16. Jakhan
17. Other Irrigation Project
(Medium & Minor)
RAJASTHAN
Wells
1
1. Tube Wells
2. Wells in use
(i) Old wells
(ii) New wells
3. Wells out of use
(i) During the year
(ii) Others
90
5.2 AREA IRRIGATED BY IRRIGATION PROJECTS RAJASTHAN
1996-97
2
4.13
3.44
3.01
5.46
0.20
0.06
0.05
0.05
0.03
0.13
0.02
0.04
0.56
0.02
0.01
0.16
0.22
17.59
5.3 IRRIGATION WELLS IN RAJASTHAN
1996-97
2
116341
1000426
980150
20276
299265
7410
291855
(Lakhs Hectares)
1997-98
3
4.21
3.98
2.30
5.57
0.20
0.06
0.05
0.05
0.03
0.13
0.02
0.04
0.57
0.02
0.02
0.16
0.42
17.83
(Number)
1997-98
3
119225
1026177
1010188
15989
298960
5316
293644
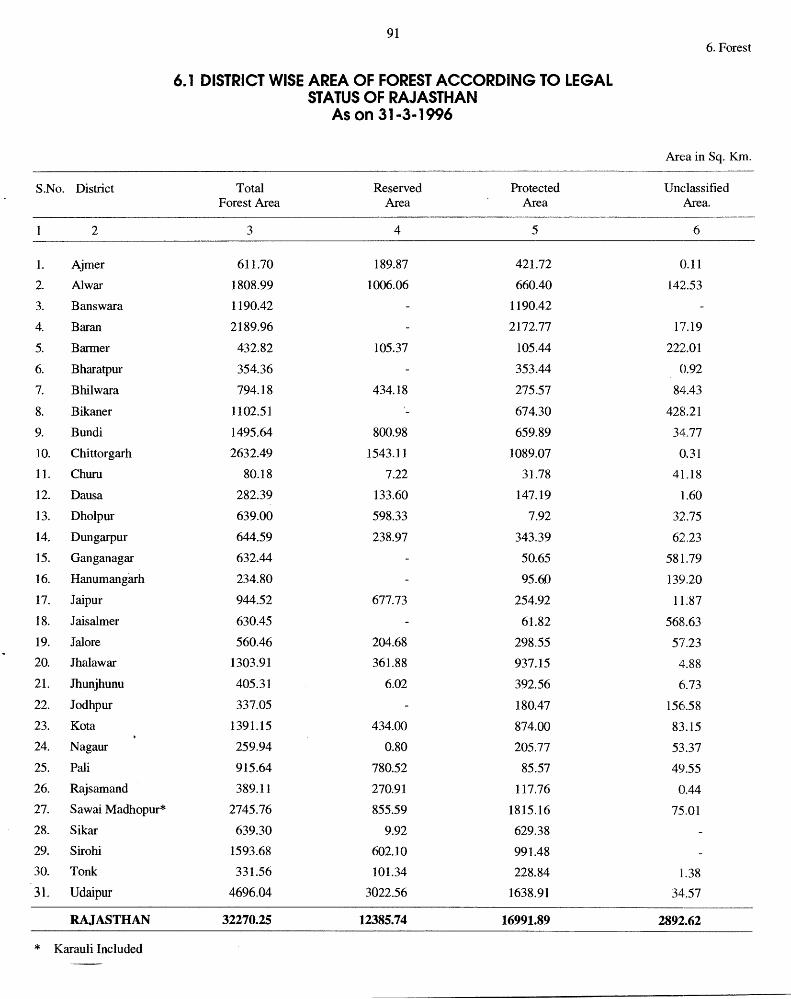
91 6. Forest
6.1 DISTRICT WISE AREA OF FOREST ACCORDING TO LEGAL STATUS OF RAJASTHAN
As on 31-3-1996
Area in Sq. Km.
S.No. District Total Reserved Protected Unclassified Forest Area Area Area Area.
2 3 4 5 6
1. Ajmer 611.70 189.87 421.72 0.11
2. Al war 1808.99 1006.06 660.40 142.53
3. Banswara 1190.42 1190.42
4. Baran 2189.96 2172.77 17.19
5. Barmer 432.82 105.37 105.44 222.01
6. Bharatpur 354.36 353.44 0.92
7. Bhilwara 794.18 434.18 275.57 84.43
8. Bikaner 1102.51 674.30 428.21
9. Bundi 1495.64 800.98 659.89 34.77
10. Chittorgarh 2632.49 1543.11 1089.07 0.31
11. Chum 80.18 7.22 31.78 41.18
12. Dausa 282.39 133.60 147.19 1.60
13. Dholpur 639.00 598.33 7.92 32.75
14. Dungarpur 644.59 238.97 343.39 62.23
15. Ganganagar 632.44 50.65 581.79
16. Hanumangarh 234.80 95.60 139.20
17. Jaipur 944.52 677.73 254.92 11 :87
18. Jaisalmer 630.45 61.82 568.63
19. Jalore 560.46 204.68 298.55 57.23
20. Jhalawar 1303.91 361.88 937.15 4.88
21. Jhunjhunu 405.31 6.02 392.56 6.73
22. Jodhpur 337.05 180.47 156.58
23. Ko ta 1391.15 434.00 874.00 83.15
24. Nagaur 259.94 0.80 205.77 53.37
25. Pali 915.64 780.52 85.57 49.55
26. Rajsamand 389.11 270.91 117.76 0.44
27. Sawai Madhopur* 2745.76 855.59 1815.16 75.01
28. Sikar 639.30 9.92 629.38
29. Sirohi 1593.68 602.10 991.48
30. Tonk 331.56 101.34 228.84 l.38
31. Udaipur 4696.04 3022.56 1638.91 34.57
RAJASTHAN 32270.25 12385.74 16991.89 2892.62
* Karauli Included
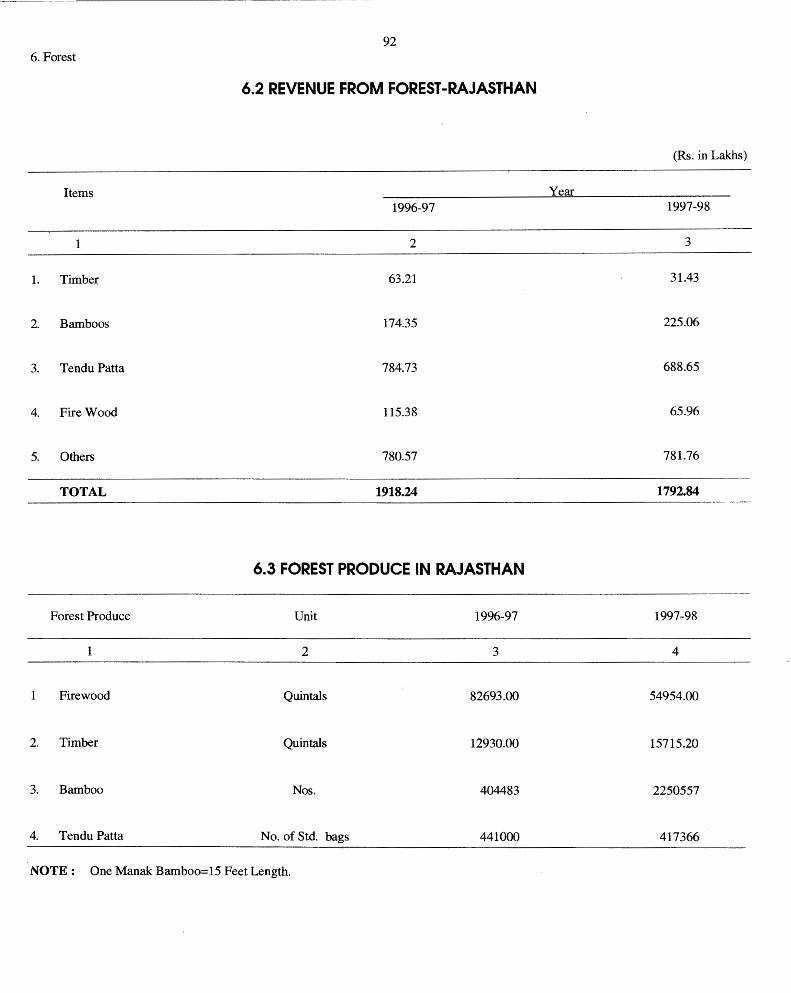
92 6. Forest
6.2 REVENUE FROM FOREST-RAJASTHAN
(Rs. in Lakhs)
Items Year 1996-97 1997-98
2 3
1. Timber 63.21 31.43
2. Bamboos 174.35 225.06
3. Tendu Patta 784.73 688.65
4. Fire Wood 115.38 65.96
5. Others 780.57 781.76
TOTAL 1918.24 1792.84
6.3 FOREST PRODUCE IN RAJASTHAN
Forest Produce Unit 1996-97 1997-98
2 3 4
Firewood Quintals 82693.00 54954.00
2. Timber Quintals 12930.00 15715.20
3. Bamboo Nos. 404483 2250557
4. Tendu Patta No. of Std. bags 441000 417366
NOTE : One Manak Bamboo=15 Feet Length.

93 7 .. Co-operation
7.1 CO-OPERATIVE MOVEMENT RAJASTHAN
Item Unit At the Year ending (June) 1997 1998
1 2 3 4
1. Co-operative societies Number 19970 19927
2. Membership 8294334 8430293
3. Share Capital LakhRs. 51196.23 59263.70
4. Working Capital 581268.80 646783.53
*5. Credit Societies
5 .1 Loans Advanced 154463.02 127721.69
5 .2 Recoveries made 131148.86 102299.37
5.3 Loans outstanding 130142.16 155364.32
6. Non-credit societies
6.1 Purchases 199884.99 219412.30
6.2 Sales 227599.00 238226.76
* To Avoid the duplication of data, data relating to Loan have been taken from primary level.
7.2 STATE CO-OPERATIVE BANK RAJASTHAN
At the Y Qfil'. Qnding (JuneJ S.No. Item Unit 1997 1998
1 2 3 4 5
. 1. Membership Number 79 79
(i) Govt: 1 1
(ii) Societies " 64 64
(iii) Nominal 14 14
2 Share Capital
(i) Govt. Rs. inLakh 164.00 164.00
(ii) Other/Societies 2118.33 2282.53
3. Deposits 35148.34 47123.64
4. Reserves 6850.41 8344.34
5. Own Funds 9132.74 10790.87
6. Borrowings 35260.62 .37381.71
7. Working Capital 83883.66 100954.68
8. Loans Advances 55334.19 58889.92
9. Loans Recoveries % 84.88 81.32
10. Loans outstanding Rs. inLakh 53036.75 58136.73
11. Profit during the year 378.28 489.81
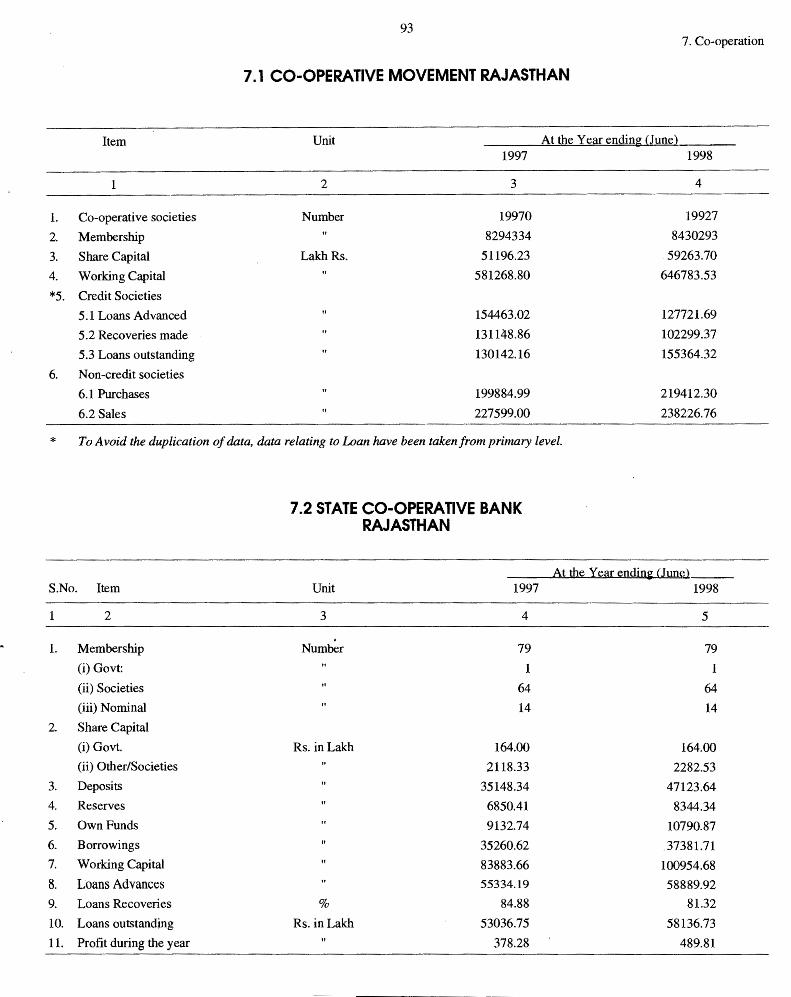
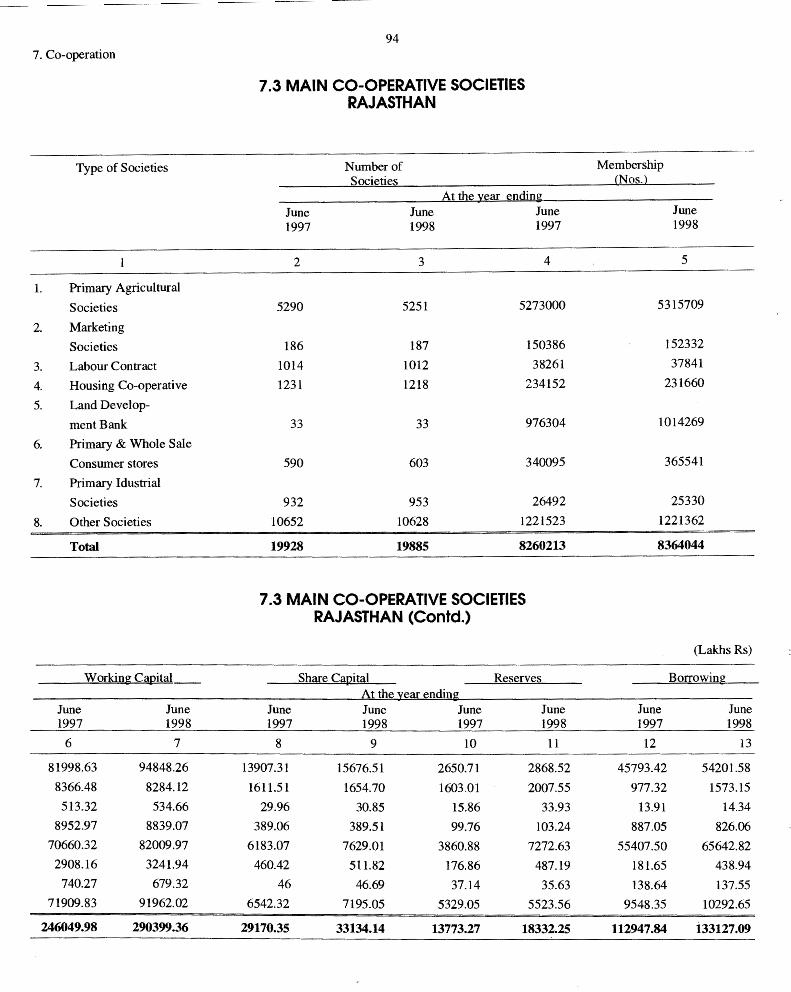
7. Co-operation
Type of Societies
I. Primary Agricultural
Societies
2. Marketing
Societies
3. Labour Contract
4. Housing Co-operative
5. Land Develop-
mentBank
6. Primary & Whole Sale
Consumer stores
7. Primary Idustrial
Societies
8. Other Societies
Total
Working Canital
June June 1997 1998
6 7
81998.63 94848.26
8366.48 8284.12
513.32 534.66
8952.97 8839.07
70660.32 82009.97
2908.16 3241.94
740.27 679.32
71909.83 91962.02
246049.98 290399.36
94
7.3 MAIN CO-OPERATIVE SOCIETIES RAJASTHAN
Number of Societies
At the ~ear ending June June June 1997 1998 1997
2 3 4
5290 5251 5273000
186 187 150386
1014 1012 38261
1231 1218 234152
33 33 976304
590 603 340095
932 953 26492
10652 10628 1221523
19928 19885 8260213
7.3 MAIN CO-OPERATIVE SOCIETIES RAJASTHAN (Contd.)
Share Ca12ital Reserves At the ~ear ending
June June June June 1997 1998 1997 1998
8 9 10 11
13907.31 15676.51 2650.71 2868.52
1611.51 1654.70 1603.01 2007.55
29.96 30.85 15.86 33.93
389.06 389.51 99.76 103.24
6183.07 7629.01 3860.88 7272.63
460.42 511.82 176.86 487.19
46 46.69 37.14 35.63
6542.32 7195.05 5329.05 5523.56
29170.35 33134.14 13773.27 18332.25
Membership (Nos.}
June 1998
5
5315709
152332
37841
231660
1014269
365541
25330
1221362
8364044
(Lakhs Rs)
Borrowing
June June 1997 1998
12 13
45793.42 54201.58
977.32 1573.15
13.91 14.34
887.05 826.06
55407.50 65642.82
181.65 438.94
138.64 137.55
9548.35 10292.65
112947.84 i33127.09

Items
1. Membership
2. Borrowing Members
3. Members indebted at the
end of the year
4. Members defaulting at the
end of the year
Items
1. Loans Advanced
(a) Short Term
(b) Medium Term
2. Loans Recovered
(a) Short Term
(b) Medium Term
3. Loans Outstanding
(a) Short term
(b) Medium Term
4. Loans Over Due
(a) Short Term
(b) Medium Term
95
7~4 PRIMARY AGRICULTURE CREDIT SOCIETIES MEMBERSHIP OF S.C./S.T.
Scheduled Castes 1997 1998 1997
2 3 4
1143207 107\742 816870
210094 235002 162251
308951 324128 226739
223757 100963 112148
7.5 PRIMARY AGRICULTURE CREDIT SOCIETIES LOAN ADVANCED TO S.C./S.T. MEMBERS
Scheduled Cas~s
1997 1998 1997
2 3 4
7997.94 11371.77 4772.40
NA NA NA
NA NA NA
7858.23 10429.95 3951.11
NA NA NA
NA NA NA
8737.74 9820.73 6324.51
NA NA NA
NA NA NA
3145.44 4021.35 2488.87
NA NA NA
NA NA NA
7. Co-operation
(Number)
Scheduled Tribes 1998
5
502984
136539
188282
69159
(Amount in Lacs)
Scheduled Tribes
1998
5
6003.37
NA
NA
6128.05
NA
NA
6234.39
NA
NA
2359.82
NA
NA
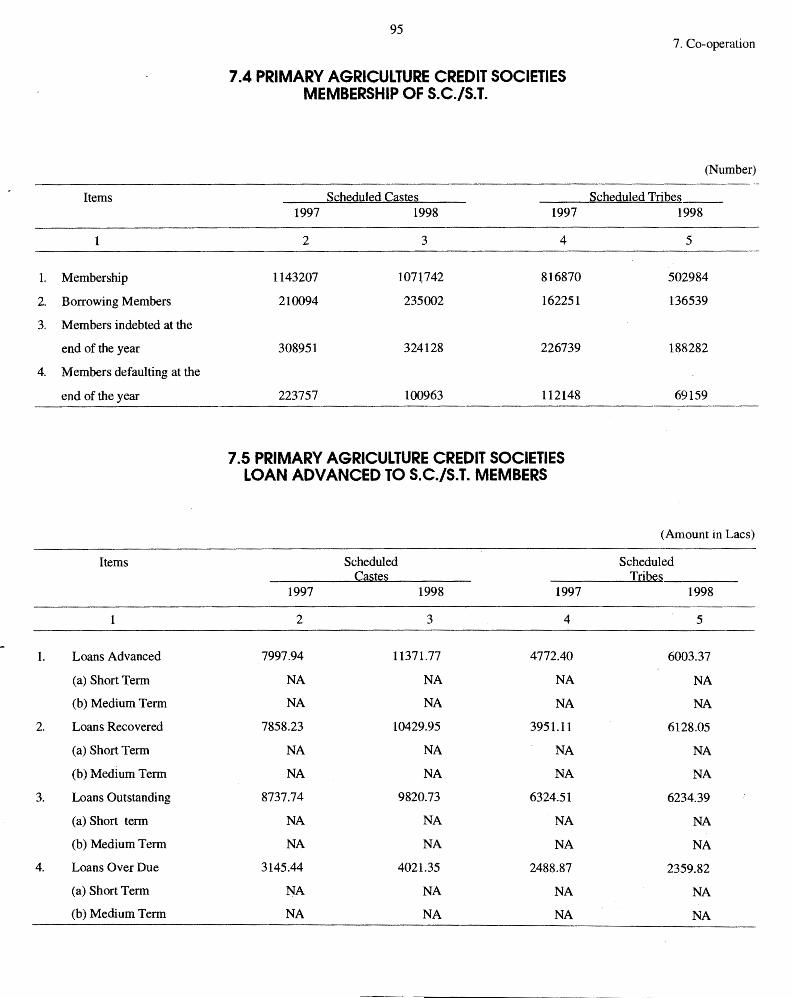
Items
1. Membership
2. Borrowing Members
3. Members indebted at the
end of the year
4. Members defaulting at the
end of the year
Items
1. Loans Advanced
(a) Short Term
(b) Medium Term
2. Loans Recovered
(a) Short Term
(b) Medium Term
3. Loans Outstanding
(a) Short term
(b) Medium Term
4. Loans Over Due
(a) Short Term
(b) Medium Term
95
7~4 PRIMARY AGRICULTURE CREDIT SOCIETIES MEMBERSHIP OF S.C./S.T.
Scheduled Castes 1997 1998 1997
2 3 4
1143207 107\742 816870
210094 235002 162251
308951 324128 226739
223757 100963 112148
7.5 PRIMARY AGRICULTURE CREDIT SOCIETIES LOAN ADVANCED TO S.C./S.T. MEMBERS
Scheduled Cas~s
1997 1998 1997
2 3 4
7997.94 11371.77 4772.40
NA NA NA
NA NA NA
7858.23 10429.95 3951.11
NA NA NA
NA NA NA
8737.74 9820.73 6324.51
NA NA NA
NA NA NA
3145.44 4021.35 2488.87
NA NA NA
NA NA NA
7. Co-operation
(Number)
Scheduled Tribes 1998
5
502984
136539
188282
69159
(Amount in Lacs)
Scheduled Tribes
1998
5
6003.37
NA
NA
6128.05
NA
NA
6234.39
NA
NA
2359.82
NA
NA
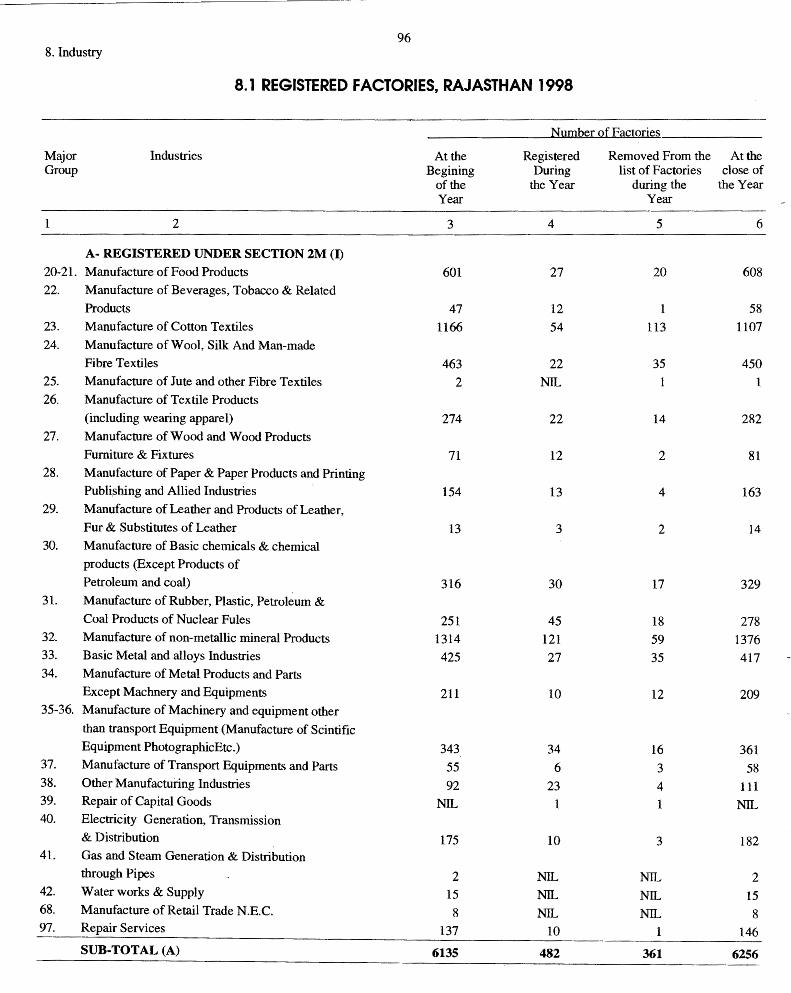
96 8. Industry
8.1 REGISTERED FACTORIES, RAJASTHAN 1998
Number of Factories
Major Industries Atthe Registered Removed From the Atthe Group Begining During list of Factories close of
of the the Year during the the Year Year Year
1 2 3 4 5 6
A- REGISTERED UNDER SECTION 2M (I)
20-21. Manufacture of Food Products 601 27 20 608 22. Manufacture of Beverages, Tobacco & Related
Products 47 12 1 58 23. Manufacture of Cotton Textiles 1166 54 113 1107 24. Manufacture of Wool, Silk And Man-made
Fibre Textiles 463 22 35 450 25. Manufacture of Jute and other Fibre Textiles 2 NIL 1 26. Manufacture of Textile Products
(including wearing apparel) 274 22 14 282 27. Manufacture of Wood and Wood Products
Furniture & Fixtures 71 12 2 81 28. Manufacture of Paper & Paper Products and Printing
Publi.shing and Allied Industries 154 13 4 163 29. Manufacture of Leather and Products of Leather,
Fur & Substitutes of Leather 13 3 2 14 30. Manufacture of Basic chemicals & chemical
products (Except Products of
Petroleum and coal) 316 30 17 329 31. Manufacture of Rubber, Plastic, Petroleum &
Coal Products of Nuclear Pules 251 45 18 278 32. Manufacture of non-metallic mineral Products 1314 121 59 1376 33. Basic Metal and alloys Industries 425 27 35 417 34. Manufacture of Metal Products and Parts
Except Machnery and Equipments 211 10 12 209 35-36. Manufacture of Machinery and equipment other
than transport Equipment (Manufacture of Scintific Equipment PhotographicEtc.) 343 34 16 361
37. Manufacture of Transport Equipments and Parts 55 6 3 58 38. Other Manufacturing Industries 92 23 4 111 39. Repair of Capital Goods NIL 1 1 NIL 40. Electricity Generation, Transmission
& Distribution 175 10 3 182 41. Gas and Steam Generation & Distribution
through Pipes 2 NIL NIL 2 42. Water works & Supply 15 NIL NIL 15 68. Manufacture of Retail Trade N.E.C. 8 NIL NIL 8 97. Repair Services 137 10 1 146
SUB-TOTAL (A) 6135 482 361 6256
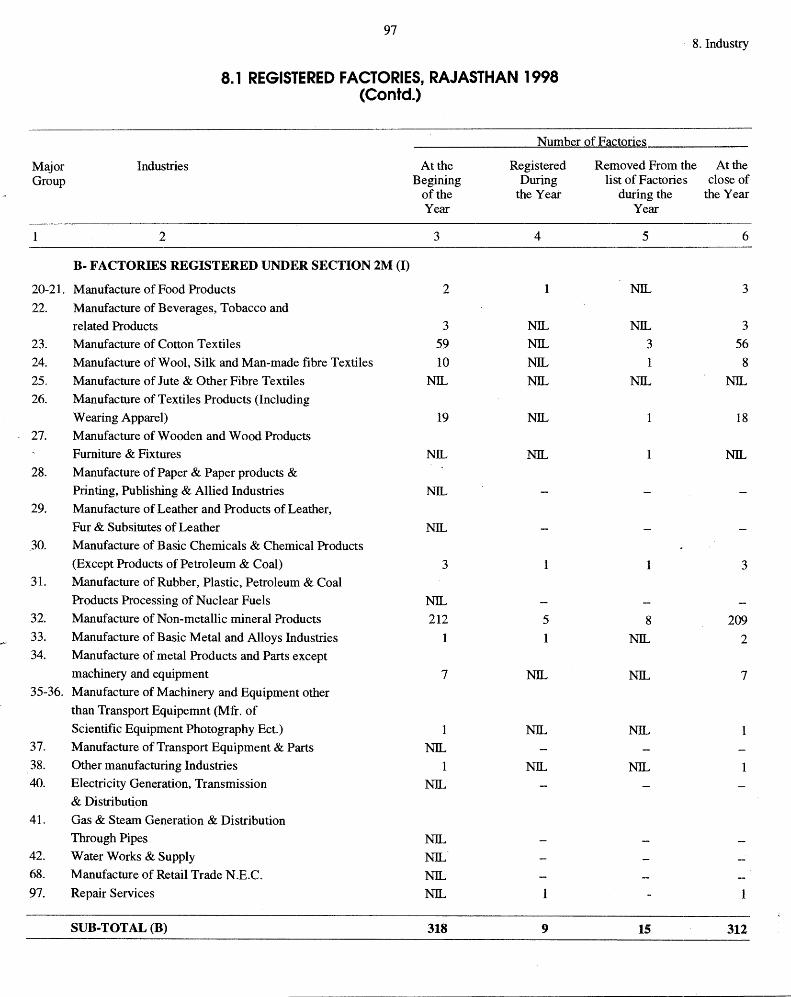
97 8. Industry
8.1 REGISTERED FACTORIES, RAJASTHAN 1998 (Contd.)
Number of Factorie~
Major Industries Atthe Registered Removed From the At the Group Begining During list of Factories close of
of the the Year during the the Year Year Year
2 3 4 5 6
B- FACTORIES REGISTERED UNDER SECTION 2M (I)
20-21. Manufacture of Food Products 2 1 NIL 3
22. Manufacture of Beverages, Tobacco and
related Products 3 NIL NIL 3
23. Manufacture of Cotton Textiles 59 NIL 3 56
24. Manufacture of Wool, Silk and Man-made fibre Textiles 10 NIL 8
25. Manufacture of Jute & Other Fibre Textiles NIL NIL NIL NIL 26. Manufacture of Textiles Products (Including
Wearing Apparel) 19 NIL 1 18
27. Manufacture of Wooden and Wood Products
Furniture & Fixtures NIL NIL 1 NIL
28. Manufacture of Paper & Paper products &
Printing, Publishing & Allied Industries NIL 29. Manufacture of Leather and Products of Leather,
Fur & Subsitutes of Leather NIL
30. Manufacture of Basic Chemicals & Chemical Products
(Except Products of Petroleum & Coal) 3 3 31. Manufacture of Rubber, Plastic, Petroleum & Coal
Products Processing of Nuclear Fuels NIL 32. Manufacture of Non-metallic mineral Products 212 5 8 209 33. Manufacture of Basic Metal and Alloys Industries 1 1 NIL 2 34. Manufacture of metal Products and Parts except
machinery and equipment 7 NIL NIL 7 35-36. Manufacture of Machinery and Equipment other
than Transport Equipemnt (Mfr. of
Scientific Equipment Photography Ect.) 1 NIL NIL 37. Manufacture of Transport Equipment & Parts NIL 38. Other manufacturing Industries 1 NIL NIL 1 40. Electricity Generation, Transmission NIL
& Distribution
41. Gas & Steam Generation & Distribution
Through Pipes NIL 42. Water Works & Supply NIL 68. Manufacture of Retail Trade N .E.C. NIL 97. Repair Services NIL 1
SUB-TOTAL (B) 318 9 15 312
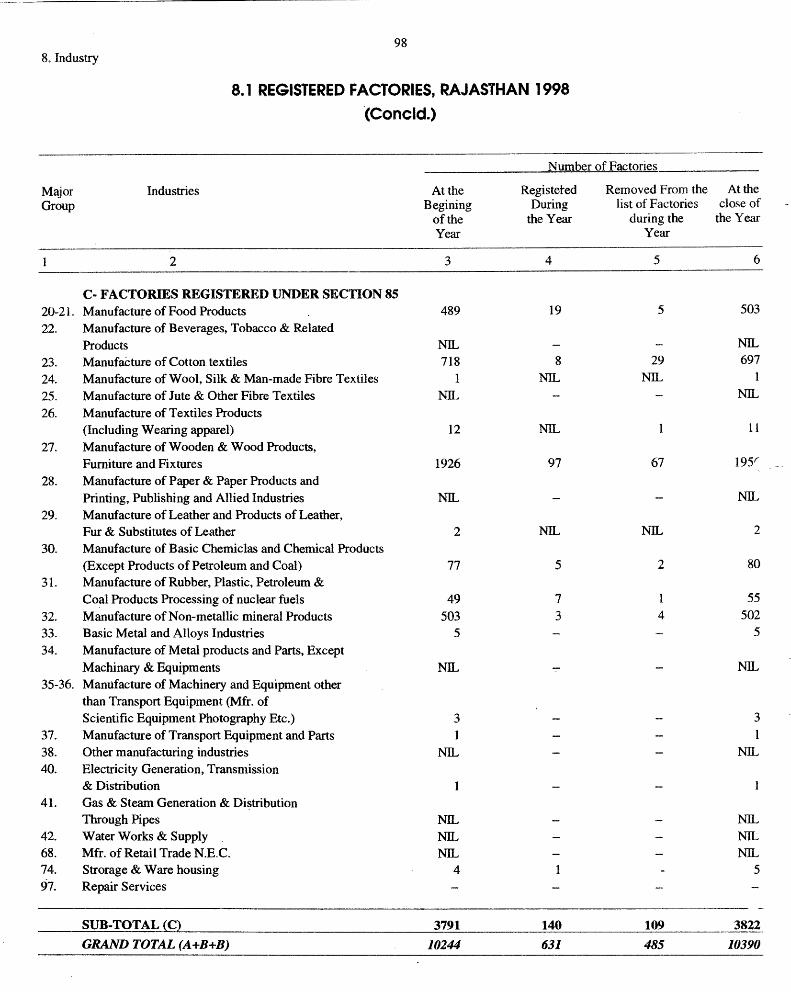
98 8. Industry
8.1 REGISTERED FACTORIES, RAJASTHAN 1998 '(Concld.)
Number of Factories
Major Industries At the Registered Removed From the At the Group Begining During list of Factories close of
of the the Year during the the Year Year Year
2 3 4 5 6
C- FACTORIES REGISTERED UNDER SECTION 85
20-21. Manufacture of Food Products 489 19 5 503
22. Manufacture of Beverages, Tobacco & Related
Products NIL NIL
23. Manufadure of Cotton textiles 718 8 29 697
24. Manufacture of Wool, Silk & Man-made Fibre Textiles 1 NIL NIL I
25. Manufacture of Jute & Other Fibre Textiles NIL NIL
26. Manufacture of Textiles Products (Including Wearing apparel) 12 NlL 11
27. Manufacture of Wooden & Wood Products,
Furniture and Fixtures 1926 97 67 1951'
28. Manufacture of Paper & Paper Products and
Printing, Publishing and Allied Industries NIL NIL
29. Manufacture of Leather and Products of Leather, Fur & Substitutes of Leather 2 NIL NlL 2
30. Manufacture of Basic Chemiclas and Chemical Products (Except Products of Petroleum and Coal) 77 5 2 80
31. Manufacture of Rubber, Plastic, Petroleum & Coal Products Processing of nuclear fuels 49 7 1 55
32. Manufacture of Non-metallic mineral Products 503 3 4 502
33. Basic Metal and Alloys Industries 5 5
34. Manufacture of Metal products and Parts, Except
Machinary & Equipments NIL NIL 35-36. Manufacture of Machinery and Equipment other
than Transport Equipment (Mfr. of Scientific Equipment Photography Etc.) 3 3
37. Manufacture of Transport Equipment and Parts 1 38. Other manufacturing industries NIL NIL 40. Electricity Generation, Transmission
& Distribution 1 41. Gas & Steam Generation & Distribution
Through Pipes NIL NIL 42. Water Works & Supply NIL NIL 68. Mfr. of Retail Trade N.E.C. NIL NIL 74. Strorage & Ware housing 4 1 5 97. Repair Services
SUB-TOTAL {q 3791 140 109 3822
GRAND TOTAL (A+B+B) 10244 631 485 10390
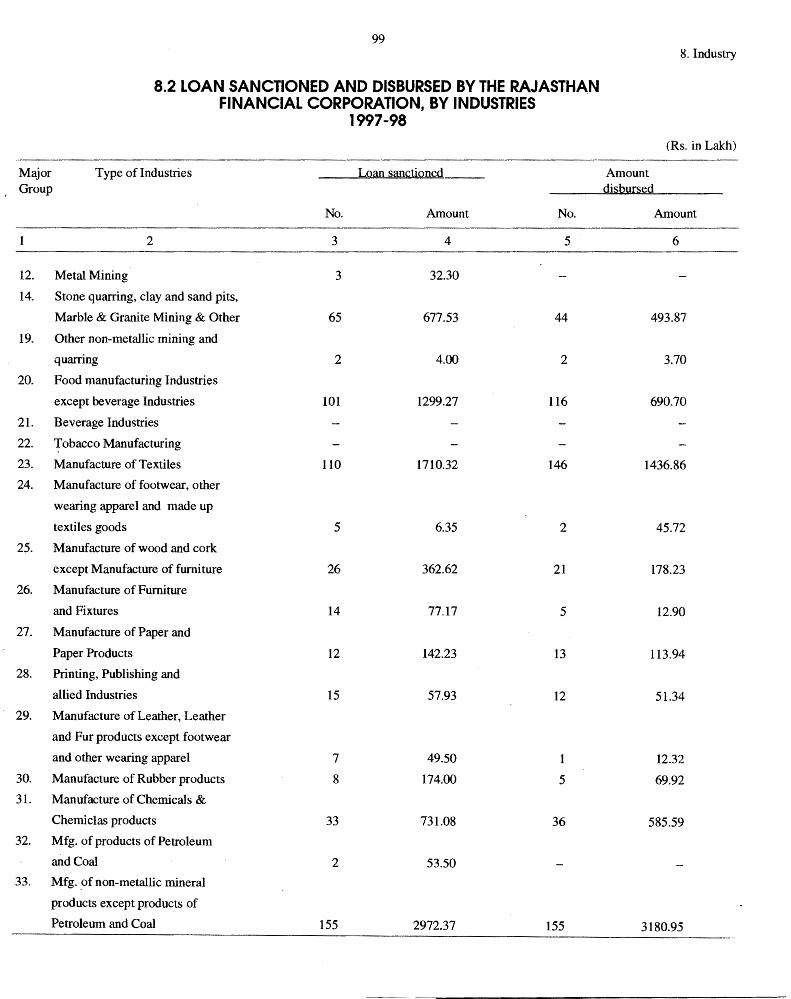
99 8. Industry
8.2 LOAN SANCTIONED AND DISBURSED BY THE RAJASTHAN FINANCIAL CORPORATION, BY INDUSTRIES
1997-98 (Rs. in Lakh)
Major Type of Industries LQan sanctioned Amount Group di~.bur~~d
No. Amount No. Amount
2 3 4 5 6
12. Metal Mining 3 32.30
14. Stone quarring, clay and sand pits,
Marble & Granite Mining & Other 65 677.53 44 493.87
19. Other non-metallic mining and
quarring 2 4.00 2 3.70
20. Food manufacturing Industries
except beverage Industries 101 1299.27 116 690.70
2L Beverage Industries
22. ~obacco Manufacturing
23. Manufacture of Textiles 110 1710.32 146 1436.86
24. Manufacture of footwear, other
wearing apparel and made up
textiles goods 5 6.35 2 45.72
25. Manufacture of wood and cork
except Manufacture of furniture 26 362.62 21 178.23
26. Manufacture of Furniture
and Fixtures 14 77.17 5 12.90
27. Manufacture of Paper and
Paper Products 12 142.23 13 113.94
28. Printing, Publishing and
allied Industries 15 57.93 12 51.34
29. Manufacture of Leather, Leather
and Fur products except footwear
and other wearing apparel 7 49.50 1 12.32
30. Manufacture of Rubber products 8 174.00 5 69.92
31. Manufacture of Chemicals &
Chemiclas products 33 731.08 36 585.59
32. Mfg. of products of Petroleum
and Coal 2 53.50
33. Mfg. ~f non-metallic mineral
products except products of
Petroleum and Coal 155 2972.37 155 3180.95
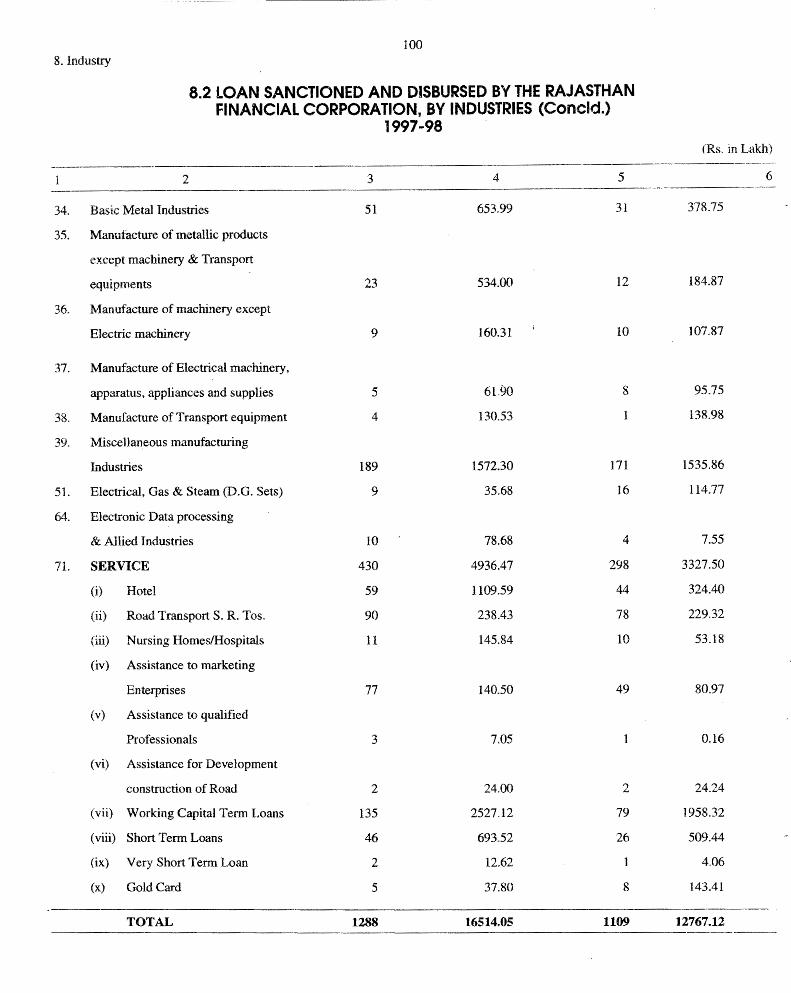
100 8. Industry
8.2 LOAN SANCTIONED AND DISBURSED BY THE RAJASTHAN FINANCIAL CORPORATION, BY INDUSTRIES (Concld.)
1997-98 (Rs. in Lakh)
2 3 4 5 6
34. Basic Metal Industries 51 653.99 31 378.75
35. Manufacture of metallic products
except machinery & Transport
equipments 23 534.00 12 184.87
36. Manufacture of machinery except
EJectric machinery 9 160.31 10 107.87
37. Manufacture of Electrical machinery,
apparatus, appliances and supplies 5 6L90 8 95.75
38. Manufacture of Transport equipment 4 130.53 138.98
39. Miscellaneous manufacturing
Industries 189 1572.30 171 1535.86
51. Electrical, Gas & Steam (D.G. Sets) 9 35.68 16 114.77
64. Electronic Data processing
& Allied Industries 10 78.68 4 7.55
71. SERVICE 430 4936.47 298 3327.50
(i) Hotel 59 1109.59 44 324.40
(ii) Road Transport S. R. Tos. 90 238.43 78 229.32
(iii) Nursing Homes/Hospitals 11 145.84 10 53.18
(iv) Assistance to marketing
Enterprises 77 140.50 49 80.97
(v) Assistance to qualified
Professionals 3 7.05 0.16
(vi) Assistance for Development
construction of Road 2 24.00 2 24.24
(vii) Working Capital Term Loans 135 2527.12 79 1958.32
(viii) Short Term Loans 46 693.52 26 509.44
(ix) Very Short Term Loan 2 12.62 4.06
(x) Gold Card 5 37.80 8 143.41
TOTAL 1288 16514.05 1109 12767.12
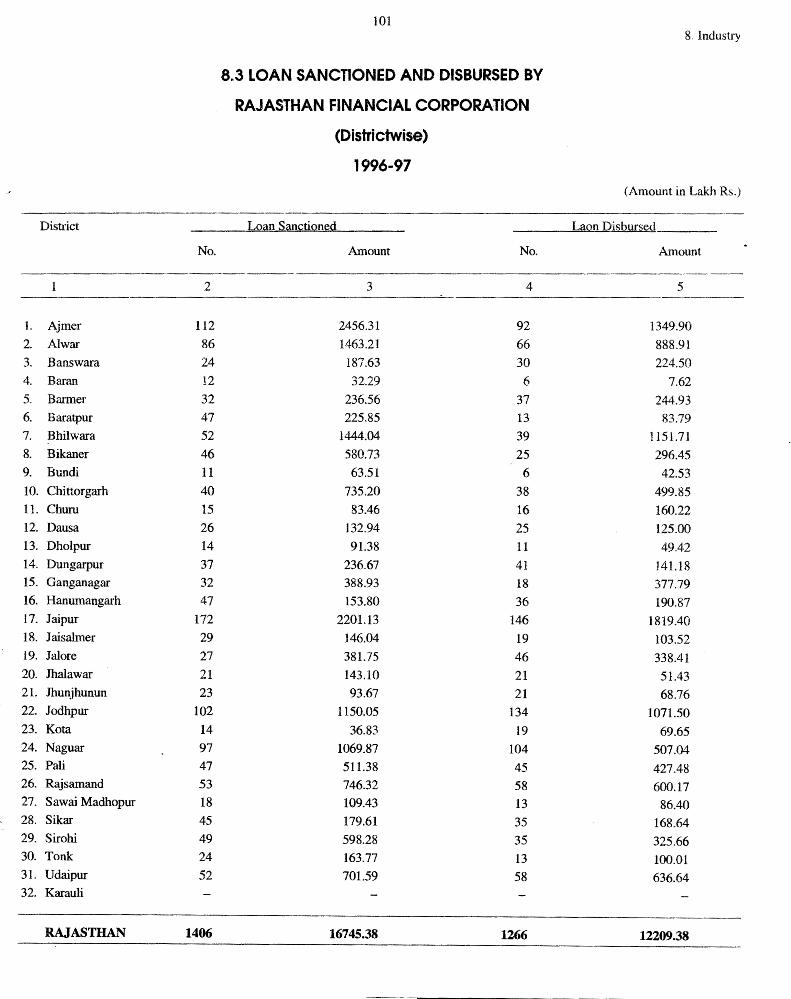
101 8 .. Industry
8.3 LOAN SANCTIONED AND DISBURSED BY
RAJASTHAN FINANCIAL CORPORATION
(Districtwise)
1996-97
(Amount in Lakh Rs.)
District LQan San~tiQned LaQn Disbyrsed
No. Amount No. Amount
-----2 3 4 5
1. Ajmer 112 2456.31 92 1349.90
'"' Al war 86 1463.21 66 888.91 L..
3. Banswara 24 187.63 30 224.50
4. Baran 12 32.29 6 7.62
5 .. Barmer 32 236.56 37 244.93
6. Baratpur 47 225.85 13 83.79
7. Bhilwara 52 1444.04 39 1151.71
8. Bikaner 46 580.73 25 296.45
9. Bundi 11 63.51 6 42.53
10. Chittorgarh 40 735.20 38 499.85
11. Churu 15 83.46 16 160.22
12. Dausa 26 132.94 25 125.00
13. Dholpur 14 91.38 11 49.42 14. Dungarpur 37 236.67 41 141.18 15. Ganganagar 32 388.93 18 377.79 16. Hanumangarh 47 153.80 36 190.87 l7. Jaipur 172 2201.13 146 1819.40 18. Jaisalmer 29 146.04 19 103.52 19. Jalore 27 381.75 46 338.41 20. Jhalawar 21 143.10 21 51.43 21. Jhunjhunun 23 93.67 21 68.76 22. Jodhpur 102 1150.05 134 1071.50 23. Ko ta 14 36.83 19 69.65 24. Naguar 97 1069.87 104 507.04 25. Pali 47 511.38 45 427.48 26. Rajsamand 53 746.32 58 600.17 27. Sawai Madhopur 18 109.43 13 86.40 28. Sikar 45 179.61 35 168.64 29. Sirohi 49 598.28 35 325.66 30. Tonk 24 163.77 13 100.01 31. Udaipur 52 701.59 58 636.64 32. Karauli
RAJASTHAN 1406 16745.38 1266 12209.38
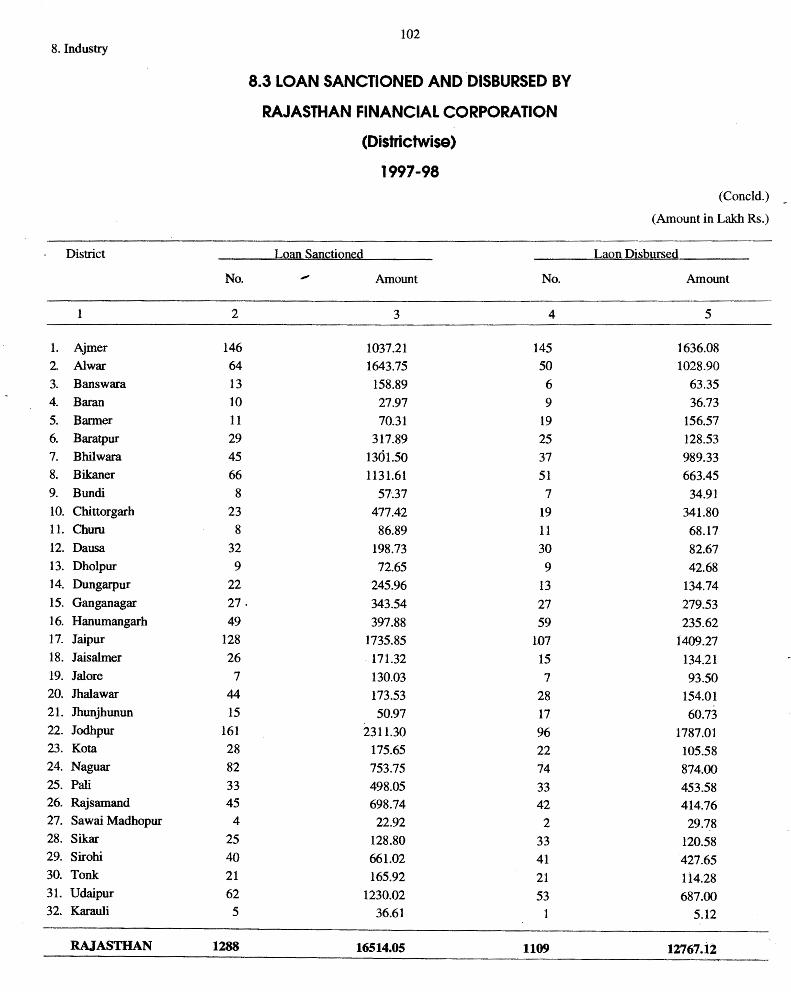
102 8. Industry
8.3 LOAN SANCTIONED AND DISBURSED BY
RAJASTHAN FINANCIAL CORPORATION
(Districtwise)
1997-98 (Concld.)
(Amount in Lakh Rs.)
District Lmm SanQtiQn~d Laon Disbursed
No. - Amount No. Amount
1 2 3 4 5
1. Ajmer 146 1037.21 145 1636.08
2. Al war 64 1643.75 50 1028.90
3. Banswara 13 158.89 6 63.35
4. Baran 10 27.97 9 36.73
5. Barmer 11 70.31 19 156.57
6. Baratpur 29 317.89 25 128.53
7. Bhilwara 45 1301.50 37 989.33 8. Bikaner 66 1131.61 51 663.45 9. Bundi 8 57-.37 7 34.91 I 0. Chittorgarh 23 477.42 19 341.80 11. Churu 8 86.89 11 68.17 12. Dausa 32 198.73 30 82.67 13. Dholpur 9 72.65 9 42.68 14. Dungarpur 22 245.96 13 134.74 15. Ganganagar 27. 343.54 27 279.53 16. Hanumangarh 49 397.88 59 235.62 17. Jaipur 128 1735.85 1.07 1409.27 18. Jaisalmer 26 171.32 15 134.21 19. Jalore 7 130.03 7 93.50 20. Jhalawar 44 173.53 28 154.01 21. Jhunjhunun 15 50.97 17 60.73 22. Jodhpur 161 2311.30 96 1787.01 23. Kota 28 175.65 22 105.58 24. Naguar 82 753.75 74 874.00 25. Pali 33 498.05 33 453.58 26. Rajsamand 45 698.74 42 414.76 27. Sawai Madhopur 4 22.92 2 29.78 28. Sikar 25 128.80 33 120.58 29. Sirohi 40 661.02 41 427.65 30. Tonk 21 165.92 21 114.28 31. Udaipur 62 1230.02 53 687.00 32. Karauli 5 36.61 1 5.12
RAJASTHAN 1288 16514.05 1109 12767.12
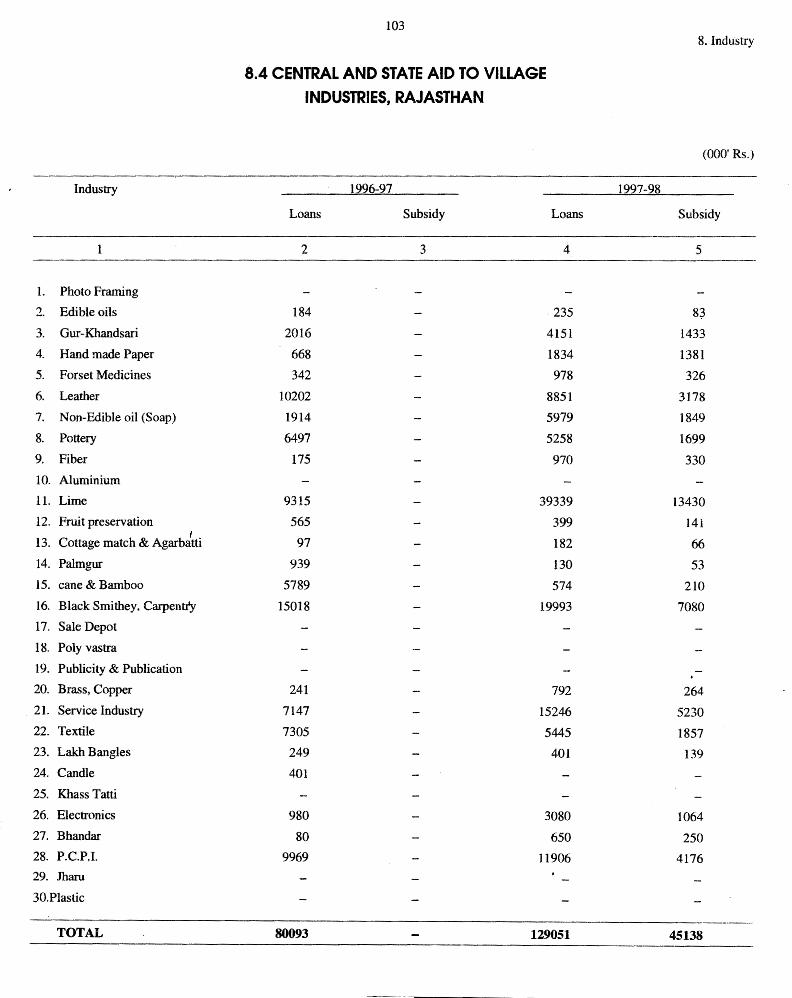
Industry
1. Photo Framing
2. Edible oils
3. Gur-Khandsari
4. Hand made Paper
5. Forset Medicines
6. Leather
7. Non-Edible oil (Soap)
8. Pottery
9. Fiber
10. Aluminium
11. Lime
12. Fruit preservation
13. Cottage match & Agarb~tti 14. Palmgur
15. cane & Bamboo
16. Black Smithey, Carpentty
17. Sale Depot
18. Poly vastra
19. Publicity & Publication
20. Brass, Copper
21. Service Industry
22. Textile
23. Lakh Bangles
24. Candle
25. Khass Tatti
26. Electronics
27. Bhandar
28. P.C.P.I.
29. Jharu
30.Plastic
TOTAL
103
8.4 CENTRAL AND STATE AID TO VILLAGE INDUSTRIES, RAJASTHAN
1996-97
Loans Subsidy Loans
2 3 4
184 235
2016 4151
668 1834
342 978
10202 8851
1914 5979
6497 5258
175 970
9315 39339
565 399
97 182
939 130
5789 574
15018 19993
241 792
7147 15246
7305 5445
249 401
401
980 3080
80 650
9969 11906
80093 129051
8. Industry
(000' Rs.)
1297-98
Subsidy
5
8~
1433
1381
326
3178
1849
1699
330
13430
141
66
53
210
7080
264
5230
1857
139
1064
250
4176
45138
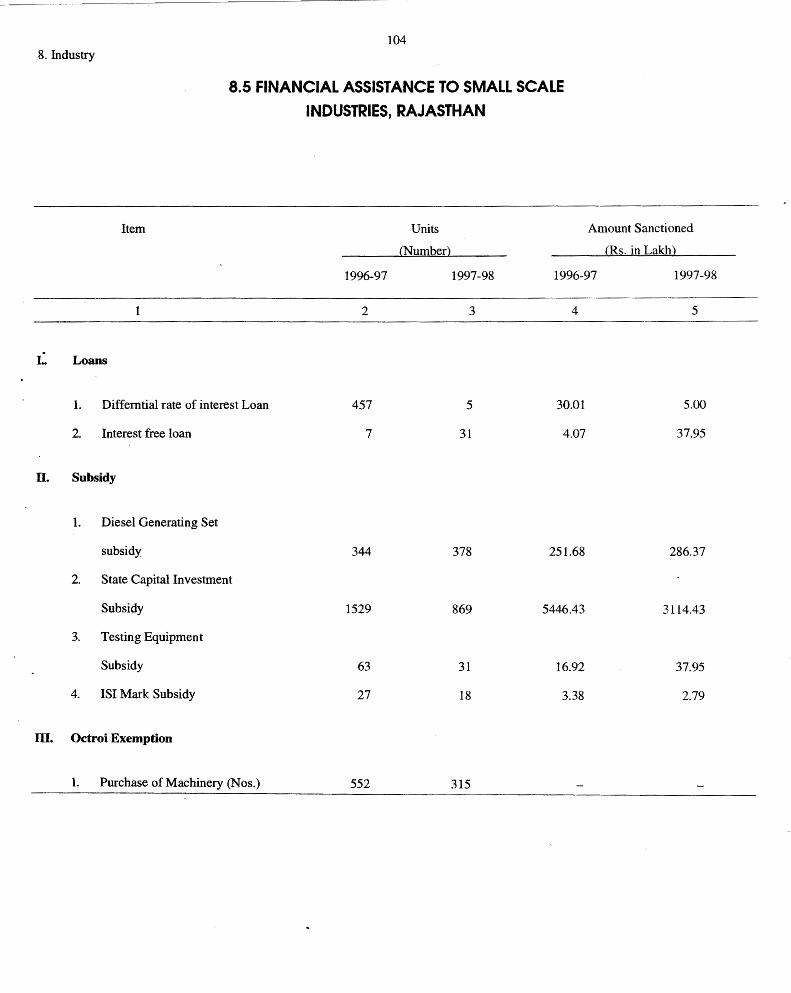
8. Industry
Item
104
8.5 FINANCIAL ASSISTANCE TO SMALL SCALE INDUSTRIES, RAJASTHAN
Units
(Number)
Amount Sanctioned
CRs. in Lakh)
1996-97 1997-98 1996-97 1997-98
2 3 4 5
1: Loans
1. Diff emtial rate of interest Loan 457 5 30.01 5.00
2. Interest free loan 7 31 4.07 37.95
II. Subsidy
1. Diesel Generating Set
subsidy 344 378 251.68 286.37
2. State Capital Investment
Subsidy 1529 869 5446.43 3114.43
3. Testing Equipment
Subsidy 63 31 16.92 37.95
4. ISi Mark Subsidy 27 18 3.38 2.79
m. Octroi Exemption
1. Purchase of Machinery (Nos.) 552 315
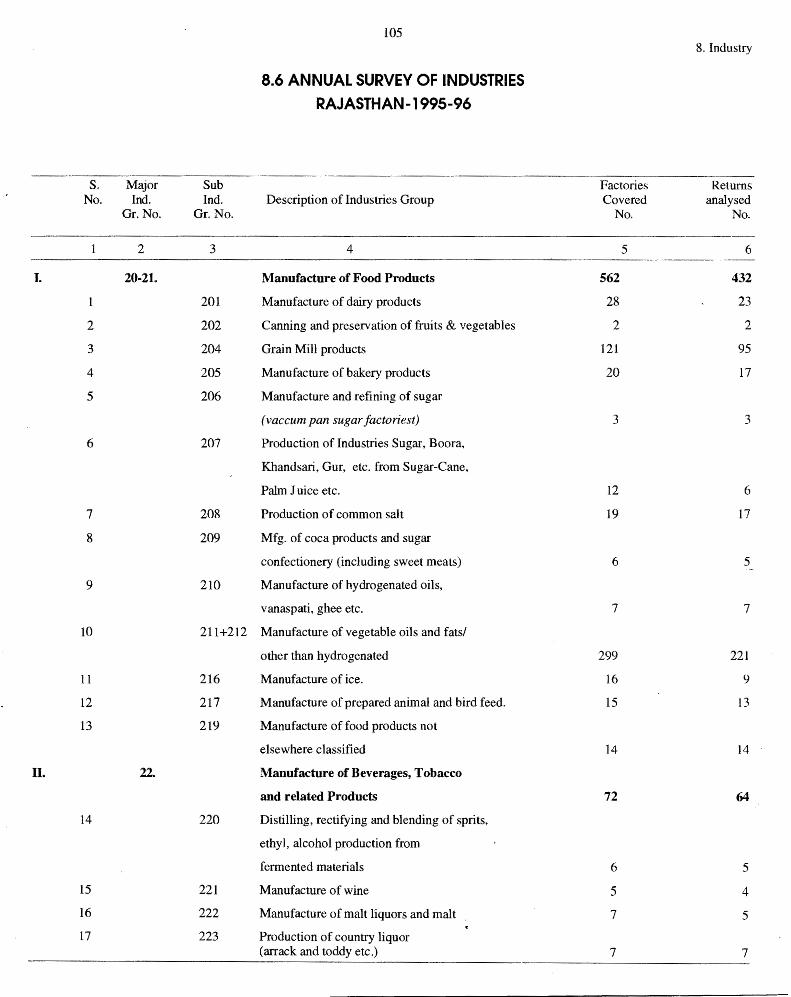
s. Major Sub No. Ind. Ind.
Gr.No. Gr.No.
2 3
L 20-21.
201
2 202
3 204
4 205
5 206
6 207
7 208
8 209
9 210
IO 211+212
11 216
12 217
13 219
II. 22.
14 220
15 221
16 222
17 223
105
8.6 ANNUAL SURVEY OF INDUSTRIES RAJASTHAN-1995-96
Description of Industries Group
4
Manufacture of Food Products
Manufacture of dairy products
Canning and preservation of fruits & vegetables
Grain Mill products
Manufacture of bakery products
Manufacture and refining of sugar
(vaccum pan sugar factoriest)
Production of Industries Sugar, Boora,
Khandsari, Gur, etc. from Sugar-Cane,
Palm Juice etc.
Production of common salt
Mfg. of coca products and sugar
confectionery (including sweet meats)
Manufacture of hydrogenated oils,
vanaspati, ghee etc.
Manufacture of vegetable oils and fats/
other than hydrogenated
Manufacture of ice.
Manufacture of prepared animal and bird feed.
Manufacture of food products not
elsewhere classified
Manufacture of Beverages, Tobacco
and related Products
Distilling, rectifying and blending of sprits,
ethyl, alcohol production from
fermented materials
Manufacture of wine
Manufacture of malt liquors and malt
Production of country liquor (arrack and toddy etc.)
8. Industry
Factories Returns Covered analysed
No. No.
5 6
562 432
28 23
2 2
121 95
20 17
3 3
12 6
19 17
6 5
7 7
299 221
16 9
15 13
14 14
72 64
6 5
5 4
7 5
7 7
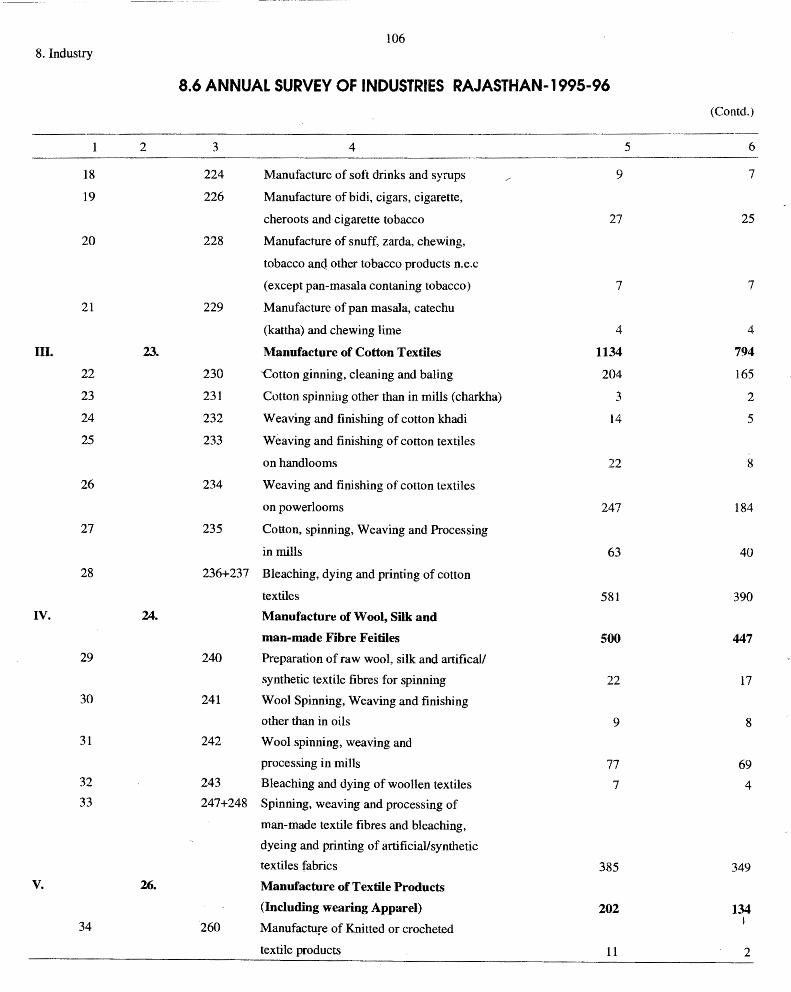
106 8. Industry
8.6 ANNUAL SURVEY OF INDUSTRIES RAJASTHAN-1995-96 (Contd.)
2 3 4 5 6
18 224 Manufacture of soft drinks and syrups 9 7
19 226 Manufacture of bidi, cigars, cigarette,
cheroots and cigarette tobacco 27 25
20 228 Manufacture of snuff, zarda, chewing,
tobacco anq other tobacco products n.e.c
(except pan-masala contaning tobacco) 7 7
21 229 Manufacture of pan masala, catechu
(kattha) and chewing lime 4 4
III. 23. Manufacture of Cotton Textiles 1134 794
22 230 -Cotton ginning, cleaning and baling 204 165
23 231 Cotton spinning other than in mills ( charkha) 3 2
24 232 Weaving and finishing of cotton khadi 14 5
25 233 Weaving and finishing of cotton textiles
on handlooms 22 8
26 234 Weaving and finishing of cotton textiles
on powerlooms 247 184
27 235 Cotton, spinning, Weaving and Processing
in mills 63 40
28 236+237 Bleaching, dying and printing of cotton
textiles 581 390
IV. 24. Manufacture of Wool, Silk and
man-made Fibre Feitiles 500 447
29 240 Preparation of raw wool, silk and artifical/
synthetic textile fibres for spinning 22 17
30 241 Wool Spinning, Weaving and finishing
other than in oils 9 8
31 242 Wool spinning, weaving and
processing in mills 77 69
32 243 Bleaching and dying of woollen textiles 7 4 33 247+248 Spinning, weaving and processing of
man-made textile fibres and bleaching,
dyeing and printing of artificial/synthetic
textiles fabrics 385 349
v. 26. Manufacture of Textile Products
(Including wearing Apparel) 202 134
34 260 Manufacture of Knitted or crocheted I
textile products 11 2
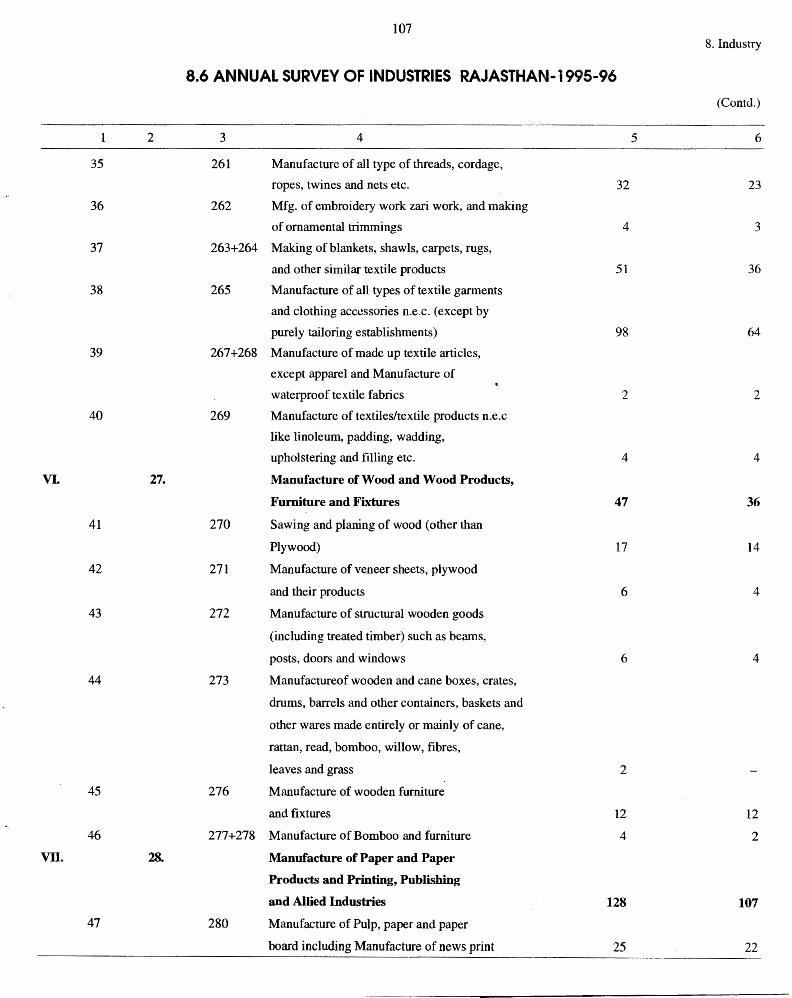
107 8. Industry
8.6 ANNUAL SURVEY OF INDUSTRIES RAJASTHAN-1995-96
(Contd.)
2 3 4 5 6
35 261 Manufacture of all type of threads, cordage,
ropes, twines and nets etc. 32 23
36 262 Mfg. of embroidery work zari work, and making
of ornamental trimmings 4 3
37 263+264 Making of blankets, shawls, carpets, rugs,
and other similar textile products 51 36
38 265 Manufacture of all types of textile garments
and clothing accessories n.e.c. (except by
purely tailoring establishments) 98 64
39 267+268 Manufacture of made up textile articles,
except apparel and Manufacture of
waterproof textile fabrics 2 2
40 269 Manufacture of textiles/textile products n.e.c
like linoleum, padding, wadding,
upholstering and filling etc. 4 4
VI. 27. Manufacture of Wood and Wood Products,
Furniture and Fixtures 47 36
41 270 Sawing and planing of wood (other than
Plywood) 17 14
42 271 Manufacture of veneer sheets, plywood
and their products 6 4
43 272 Manufacture of structural wooden goods
(including treated timber) such as beams,
posts, doors and windows 6 4
44 273 Manufactureof wooden and cane boxes, crates,
drums, barrels and other containers, baskets and
other wares made entirely or mainly of cane,
rattan, read, bomboo, willow, fibres,
leaves and grass 2
45 276 Manufacture of wooden furniture
and fixtures 12 12
46 277+278 Manufacture of Bomboo and furniture 4 2
vn. 28. Manufacture of Paper and Paper
Products and Printing, Publishing
and Allied Industries 128 107
47 280 Manufacture of Pulp, paper and paper
board including Manufacture of news print 25 22
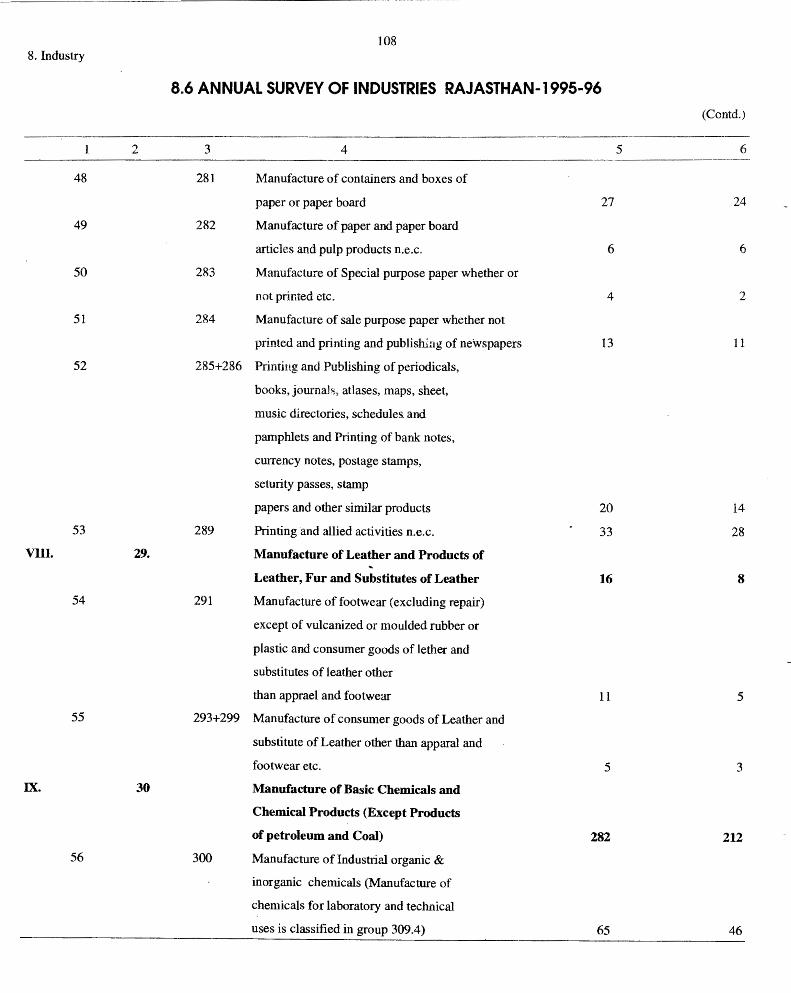
108 8. Industry
8.6 ANNUAL SURVEY OF INDUSTRIES RAJASTHAN-1995-96 (Contd.)
2 3 4 5 6
48 281 Manufacture of containers and boxes of
paper or paper board 27 24
49 282 Manufacture of paper and paper board
articles and pulp products n.e.c. 6 6
50 283 Manufacture of Special purpose paper whether or
not primed etc. 4 2
51 284 Manufacture of sale purpose paper whether not
printed and printing and publishlng of newspapers 13 11
52 285+286 Printing and Publishing of periodicals,
books, journals. atlases, maps, sheet,
music directories, schedules. and
pamphlets and Printing of bank notes,
currency notes, postage stamps,
seturity passes, stamp
papers and other similar products 20 14
53 289 Printing and allied activities n.e.c. 33 28
VIII. 29. Manufacture of Leather and Products of
Leather, Fur and Substitutes of Leather 16 8
54 291 Manufacture of footwear (excluding repair)
except of vulcanized or moulded rubber or
plastic and consumer goods of !ether and
substitutes of leather other
than apprael and footwear 11 5
55 293+299 Manufacture of consumer goods of Leather and
substitute of Leather other than apparal and
footwear etc. 5 3
IX. 30 Manufacture of Basic Chemicals and
Chemical Products (Except Products
of petroleum and Coal) 282 212
56 300 Manufacture of Industrial organic &
inorganic chemicals (Manufacture of
chemicals for laboratory and technical
uses is classified in group 309.4) 65 46
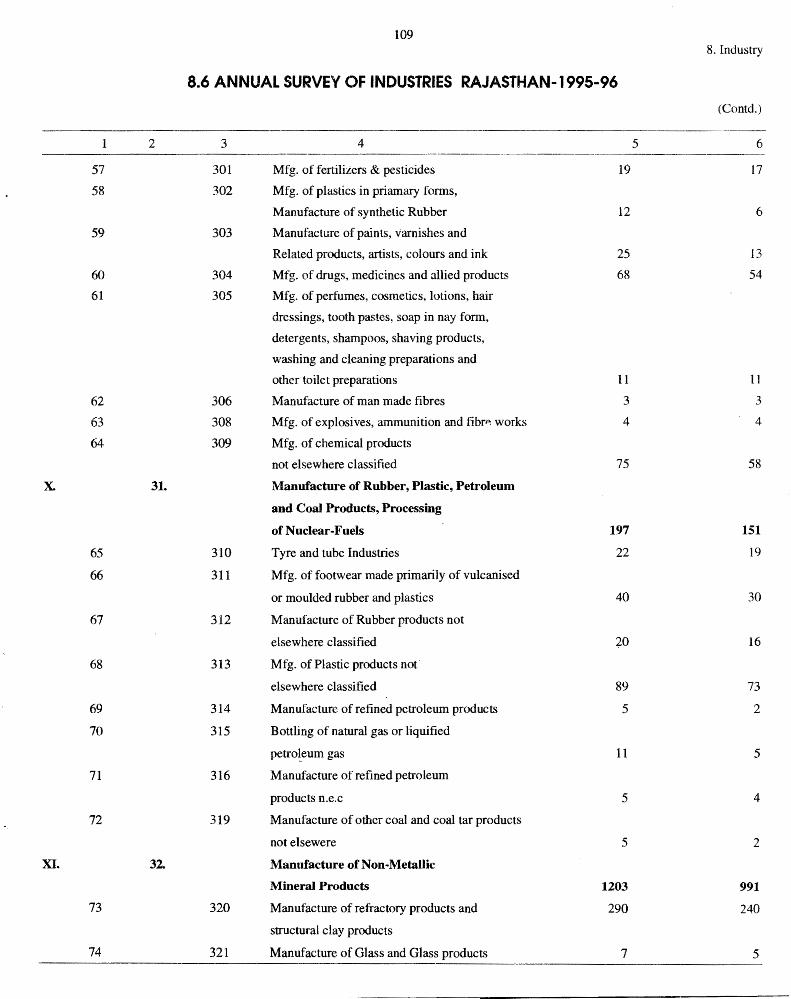
109 8. Industry
8.6 ANNUAL SURVEY OF INDUSTRIES RAJASTHAN-1995-96
(Contd.)
2 3 4 5 6 --------------------------
57 301 Mfg. of fertilizers & pesticides 19 17
58 302 Mfg. of plastics in priamary forms,
Manufacture of synthetic Rubber 12 6
59 303 Manufacture of paints, varnishes and
Related products, artists, colours and ink 25 13
60 304 Mfg. of drugs, medicines and allied products 68 54
61 305 Mfg. of perfumes, cosmetics, lotions, hair
dressings, tooth pastes, soap in nay form,
detergents, shampoos, shaving products,
washing and cleaning preparations and
other toilet preparations 11 11
62 306 Manufacture of man made fibres 3 3
63 308 Mfg. of explosives, ammunition and fibrP. works 4 4
64 309 Mfg. of chemical products
not elsewhere classified 75 58
:x. 31. Manufacture of Rubber, Plastic, Petroleum
and Coal Products, Processing
of Nuclear-Fuels 197 151
65 310 Tyre and tube Industries 22 19
66 311 Mfg. of footwear made primarily of vulcanised
or moulded rubber and plastics 40 30
67 312 Manufacture of Rubber products not
elsewhere classified 4,0 16
68 313 Mfg. of Plastic products not·
elsewhere classified 89 73
69 314 Manufacture of refined petroleum products 5 2
70 315 Bottling of natural gas or liquified
petro~eum gas 11 5
71 316 Manufacture of refined petroleum
products n.e.c 5 4
72 319 Manufacture of other coal and coal tar products
not elsewere 5 2
XI. 32. Manufacture of Non-Metallic
Mineral Products 1203 991
73 320 Manufacture of refractory products and 290 240
structural clay products
74 321 Manufacture of Glass and Glass products 7 5
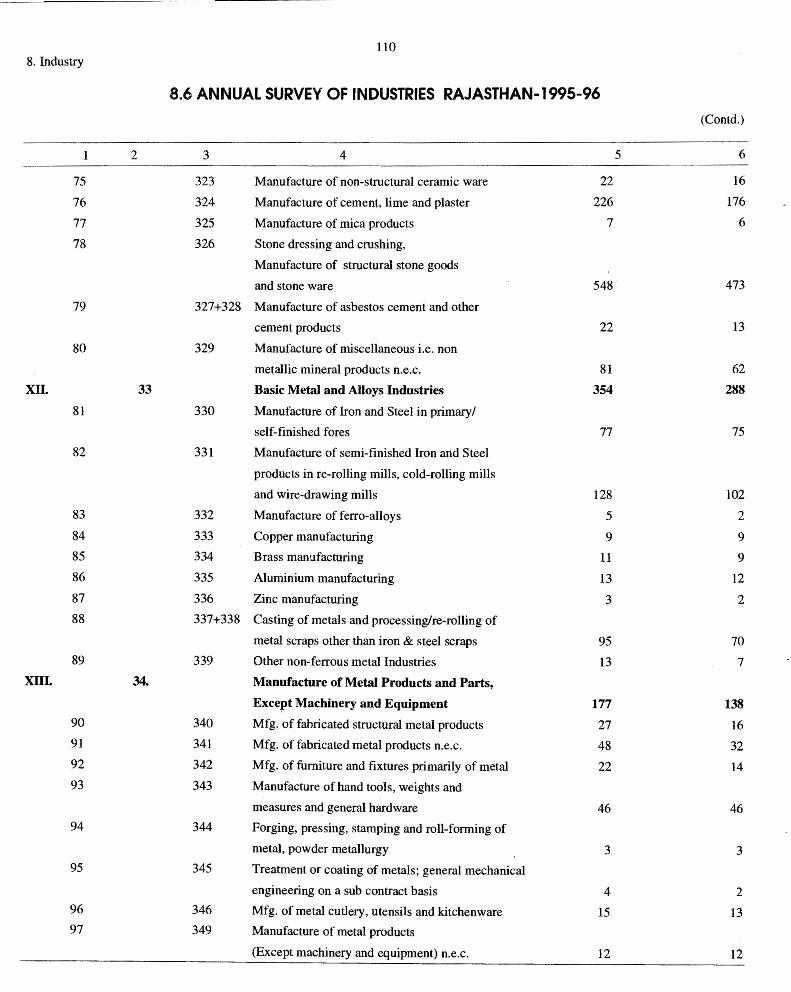
110 8, Industry
8.6 ANNUAL SURVEY OF INDUSTRIES RAJASTHAN-1995-96 (Contd.)
2 3 4 5 6
75 323 Manufacture of non-structural ceramic ware 22 16
76 324 Manufacture of cement, lime and plaster 226 176
77 325 Manufacture of mica products 7 6
78 326 Stone dressing and crushing,
Manufacture of structural stone goods
and stone ware 548 473
79 327+328 Manufacture of asbestos cement and other
cement products 22 13
80 329 Manufacture of miscellaneous i.e. non
metallic mineral products n.e.c. 81 62
XII. 33 Basic Metal and Alloys Industries 354 288
81 330 Manufacture of Iron and Steel in primary/
self-finished fores 77 75
82 331 Manufacture of semi-finished Iron and Steel
products in re-rolling mills, cold-rolling mills
and wire-drawing mills 128 102
83 332 Manufacture of ferro-alloys 5 2
84 333 Copper manufacturing 9 9 85 334 Brass manufacturing 11 9 86 335 Aluminium manufacturing 13 12
87 336 Zinc manufacturing 3 2 88 337+338 Casting of metals and processing/re-rolling of
metal scraps other than iron & steel scraps 95 70 89 339 Other non-ferrous metal Industries 13 7
XIII. 34. Manufacture of Metal Products and Parts,
Except Machinery and Equipment 177 138
90 340 Mfg. of fabricated structural metal products 27 16 91 341 Mfg. of fabricated metal products n.e.c. 48 32 92 342 Mfg. of furniture and fixtures primarily of metal 22 14 93 343 Manufacture of hand tools, weights and
measures and general hardware 46 46 94 344 Forging, pressing, stamping and roll-forming of
metal, powder metallurgy 3 3 95 345 Treatment or coating of metals; general mechanical
engineering on a sub contract basis 4 2 96 346 Mfg. of metal cutlery, utensils and kitchenware 15 13 97 349 Manufacture of metal products
(Except machinery and equipment) n.e.c. 12 12
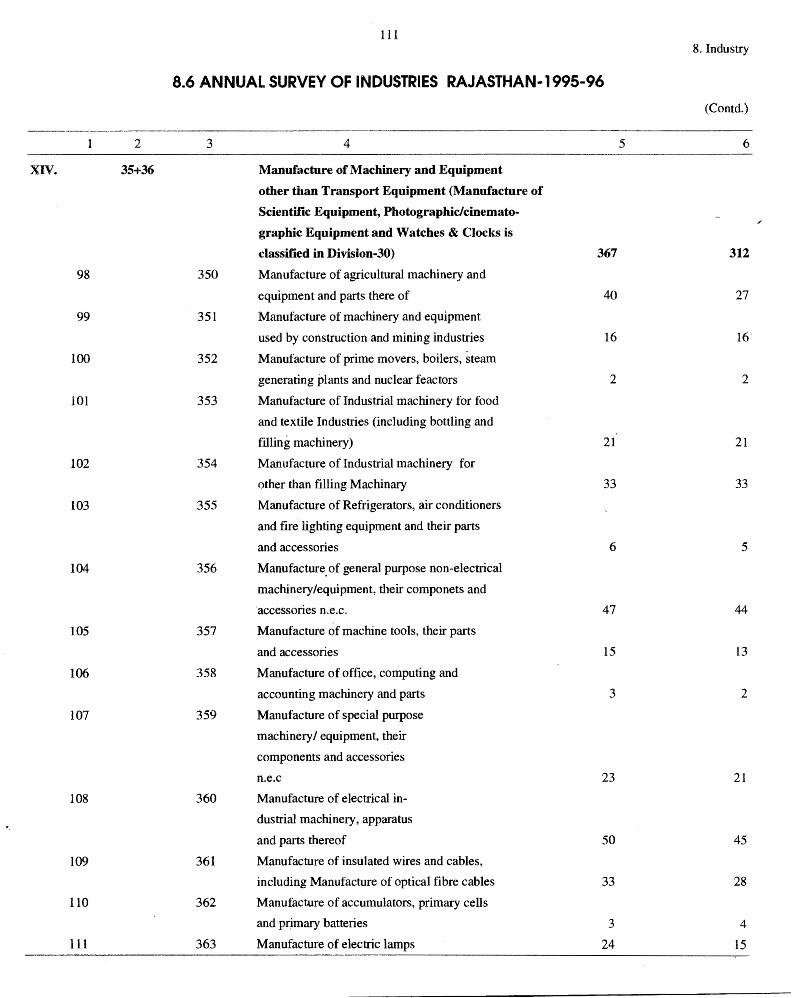
111 8. Industry
8.6 ANNUAL SURVEY OF INDUSTRIES RAJASTHAN-1995-96
(Contd.)
2 3 4 5 6
XIV. 35+36 Manufacture of Machinery and Equipment
other than Transport Equipment (Manufacture of
Scientific Equipment, Photographic/cinemato-
graphic Equipment and Watches & Clocks is
classified in Division-30) 367 312
98 350 Manufacture of agricultural machinery and
equipment and parts there of 40 27
99 351 Manufacture of machinery and equipment
used by construction and mining industries 16 16"
100 352 Manufacture of prime movers, boilers, steam
generating plants and nuclear feactors 2 2
101 353 Manufacture of Industrial machinery for food
and textile Industries (including bottling and
filling machinery) 21 21
102 354 Manufacture of Industrial machinery for
other than filling Machinary 33 33
103 355 Manufacture of Refrigerators, air conditioners
and fire lighting equipment and their parts
and accessories 6 5
104 356 Manufacture. of general purpose non-electrical
machinery/equipment, their componets and
accessories n.e.c. 47 44
105 357 Manufacture of machine tools, their parts
and accessories 15 13
106 358 Manufacture of office, computing and
accounting machinery and parts 3 2
107 359 Manufacture of special purpose
machinery/ equipment, their
components and accessories
n.e.c 23 21
108 360 Manufacture of electrical in-
dustrial machinery, apparatus
and parts thereof 50 45
109 361 Manufacture of insulated wires and cables,
including Manufacture of optical fibre cables 33 28
110 362 Manufacture of accumulators, primary cells
and primary batteries 3 4
111 363 Manufacture of electric lamps 24 15
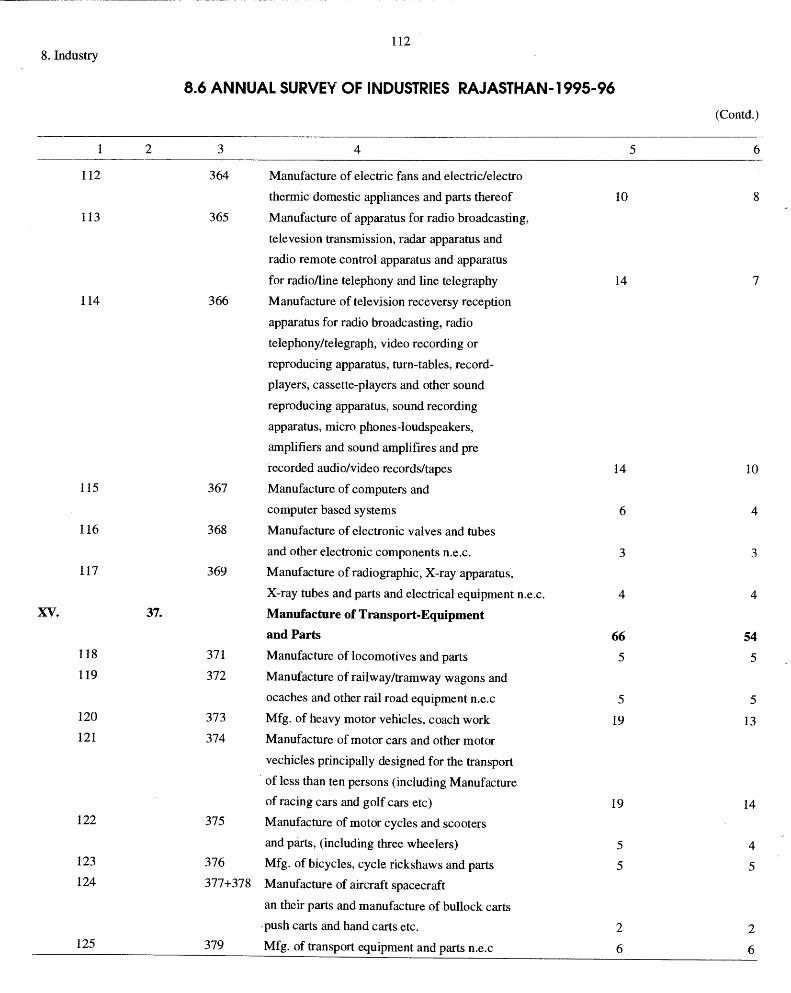
112 8. Industry
8.6 ANNUAL SURVEY OF INDUSTRIES RAJASTHAN-1995-96
(Contd.)
2 3 4 5 6
112 364 Manufacture of electric fans and electric/electro
thermic domestic appliances and parts thereof 10 8
113 365 Manufacture of apparatus for radio broadcasting,
televesion transmission, radar apparatus and
radio remote control apparatus and apparatus
for radio/line telephony and line telegraphy 14 7
114 366 Manufacture of television receversy reception
apparatus for radio broadcasting, radio
telephony/telegraph, video recording or
reproducing apparatus, tum-tables, record-
players, cassette-players and other sound
reproducing apparatus, sound recording
apparatus, micro phones-loudspeakers,
amplifiers and sound amplifires and pre
recorded audio/video records/tapes 14 10
115 367 Manufacture of computers and
computer based systems 6 4
116 368 Manufacture of electronic valves and tubes
and other electronic components n.e.c. 3 3 117 369 Manufacture of radiographic, X-ray apparatus,
X-ray tubes and parts and electrical equipment n.e.c. 4 4
xv. 37. Manufacture of Transport-Equipment
and Parts 66 54 118 371 Manufacture of locomotives and parts 5 5 119 372 Manufacture of railway/tramway wagons and
ocaches and other rail road equipment n.e.c 5 5 120 373 Mfg. of heavy motor vehicles, coach work 19 13 121 374 Manufacture of motor cars and other motor
vechicles principally designed for the transport
of less than ten persons (including Manufacture
of racing cars and golf cars etc) 19 14 122 375 Manufacture of motor cycles and scooters
and parts, (including three wheelers) 5 4 123 376 Mfg. of bicycles, cycle rickshaws and parts 5 5 124 377+378 Manufacture of aircraft spacecraft
an their parts and manufacture of bullock carts
-push carts and hand carts etc. 2 2 125 379 Mfg. of transport equipment and parts n.e.c 6 6
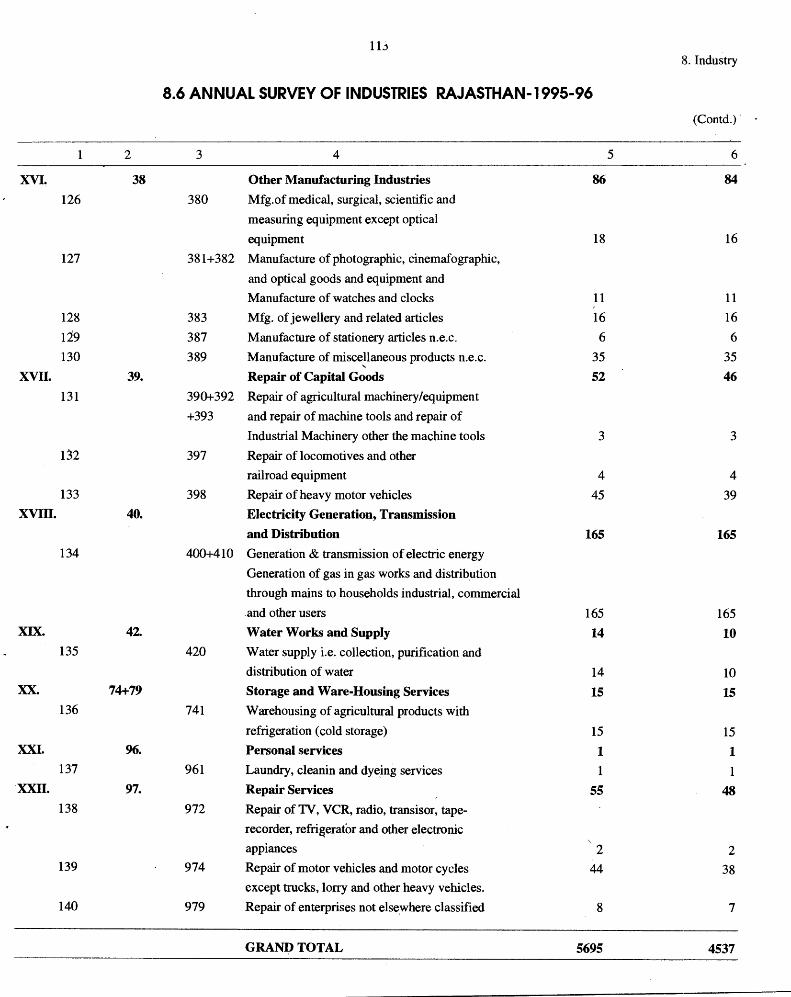
11.; 8. Industry
8.6 ANNUAL SURVEY OF INDUSTRIES RAJASTHAN-1995-96 (Contd.)·
1 2 3 4 5 6
XVI. 38 Other Manufacturing Industries 86 84
126 380 Mfg.of medical, surgical, scientific and
measuring equipment except optical
equipment 18 16 127 381+382 Manufacture of photographic, cinemafographic,
and optical goods and equipment and
Manufacture of watches and clocks 11 11
128 383 Mfg. of jewellery and related articles 16 16
129 387 Manufacture of stationery articles n.e.c. 6 6
130 389 Manufacture of misce!laneous products n.e.c. 35 35 XVII. 39. Repair of Capital Goods 52 46
131 390+392 Repair of agricultural machinery/equipment
+393 and repair of machine tools and repair of
Industrial Machinery other the machine tools 3 3 132 397 Repair of locomotives and other
railroad equipment 4 4 133 398 Repair of heavy motor vehicles 45 39
XVIII. 40. Electricity Generation, Transmission
and Distribution 165 165 134 400+410 Generation & transmission of electric energy
Generation of gas in gas works and distribution
through mains to households industrial, commercial
.and other users 165 165 XIX. 42. Water Works and Supply 14 10
135 420 Water supply i.e. collection, purification and
distribution of water 14 10 xx. 74+79 Storage and Ware-Housing Services 15 15
136 741 Warehousing of agricultural products with
refrigeration (cold storage) 15 15 XXI. 96. Personal services 1 1
137 961 Laundry, cleanin and dye_ing services 1 1 ·XXII. 97. Repair Services 55 48
138 972 Repair of TV, VCR, radio, transisor, tape-
recorder, refri~erafor and other electronic
appiances 2 2 139 974 Repair of motor vehicles and motor cycles 44 38
except trucks, lorry and other heavy vehicles.
140 979 Repair of enterprises not else:where classified 8 7
GRAND TOTAL 5695 4537
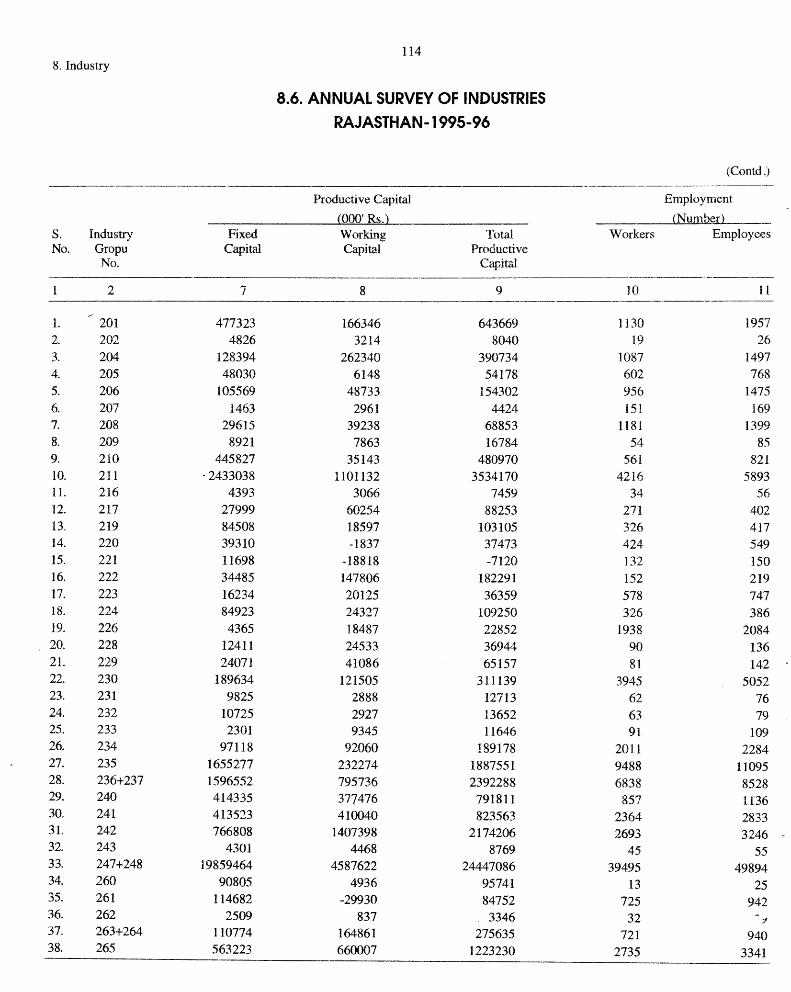
114 8. Industry
8.6. ANNUAL SURVEY OF INDUSTRIES RAJASTHAN-1995-96
(Contd.) --------------
Productive Capita] Employment
(000' Rs.) <Numbru ____ s. Industry Fixed Working Total Workers Employees No. Gropu Capital Capital Productive
No. Capital ------·-
2 7 8 9 10 11 ------------------
1. 201 477323 166346 643669 1130 1957 2. 202 4826 3214 8040 19 26
3. 204 128394 262340 390734 1087 1497 4. 205 48030 6148 54178 602 768 5. 206 105569 48733 154302 956 1475 6. 207 1463 2961 4424 151 169 7. 208 29615 39238 68853 1181 1399 8. 209 8921 7863 16784 54 85 9. 210 445827 35143 480970 561 821 10. 211 ·2433038 1101132 3534170 4216 5893 11. 216 4393 3066 7459 34 56
12. 217 27999 60254 88253 271 402 n 219 84508 18597 103105 326 417 14. 220 39310 -1837 37473 424 549 15. 221 11698 -18818 -7120 132 150 16. 222 34485 147806 182291 152 219 17. 223 16234 20125 36359 578 747 18. 224 84923 24327 109250 326 386 19. 226 4365 18487 22852 1938 2084 20. 228 12411 24533 36944 90 136 21. 229 24071 41086 65157 81 142 22. 230 189634 121505 311139 3945 5052 23. 231 9825 2888 12713 62 76 24. 232 10725 2927 13652 63 79 25. 233 2301 9345 11646 91 109 26. 234 97118 92060 189178 2011 2284 27. 235 1655277 232274 1887551 9488 11095 28. 236+237 1596552 795736 2392288 6838 8528 29. 240 414335 377476 791811 857 1 r36 30. 241 413523 410040 823563 2364 2833 31. 242 766808 1407398 2174206 2693 3246 -32. 243 4301 4468 8769 45 55 33. 247+248 19859464 4587622 24447086 39495 49894 34. 260 90805 4936 95741 13 25 35. 261 114682 -29930 84752 725 942 36. 262 2509 837 3346 32 :,I
37. 263+264 110774 164861 275635 721 940 38. 265 563223 660007 1223230 2735 3341
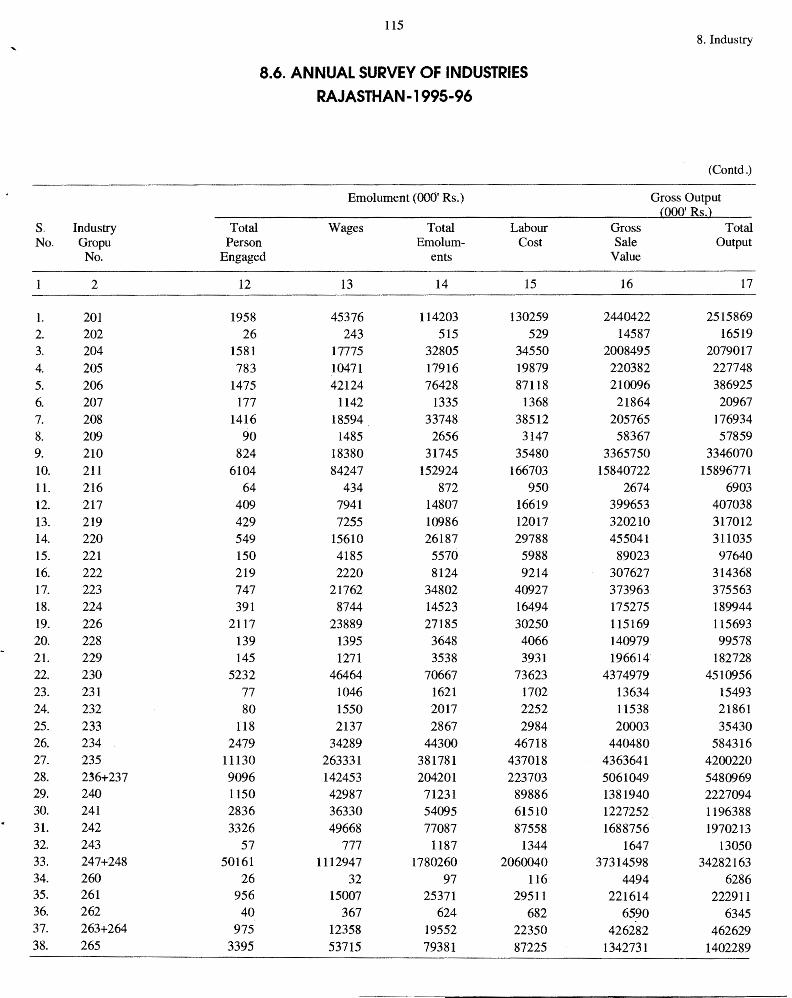
S. Industry No. Gropu
1. 2. 3. 4. 5. 6. 7. 8. 9.
10. 11. 12. 13. 14. 15. 16. 17. 18. 19. 20. 21. 22. 23. 24. 25. 26. 27. 28. 29. 30. 31. 32. 33. 34. 35. 36. 37. 38.
No.
2
201 202 204 205 206 207 208 209 210 211 216 217 219 220 221 222 223 224 226 228 229 230 231 232 233 234 235 236+237 240 241 242 243 247+248 260 261 262 263+264 265
115
8.6. ANNUAL SURVEY OF INDUSTRIES RAJASTHAN-1995-96
Total Person
Engaged
12
1958 26
1581 783
1475 177
1416 90
824 6104
64 409 429 549 150 219 747 391
2117 139 145
5232 77 80
118 2479
11130 9096 1150 2836 3326
57 50161
26 956 40
975 3395
Emolument (000' Rs.)
Wages
13
45376 243
17775 10471 42124
1142 18594.
1485 18380 84247
434 7941 7255
15610 4185 2220
21762 8744
23889 1395
1271 46464
1046 1550 2137
34289 263331 142453 42987 36330 49668
777 1112947
32 15007
367 12358 53715
Total Emolum-
en ts
14
114203 515
32805 17916 76428
1335 33748
2656 31745
152924 872
14807 10986 26187 5570 8124
34802 14523 27185 3648 3538
70667 1621 2017 2867
44300 381781 204201 71231 54095 77087
1187 1780260
97 25371
624 19552 79381
Labour Cost
15
130259 529
34550 19879 87118
1368 38512 3147
35480 166703
950 16619 12017 29788 5988 9214
40927 16494 30250 4066 3931
73623 1702 2252 2984
46718 437018 223703 89886 61510 87558
1344 2060040
116 29511
682 22350 87225
Gross Sale
Value
16
2440422 14587
2008495 220382 210096 21864
205765 58367
3365750 15840722
2674 399653 320210 455041
89023 307627 373963 175275 115169 140979 196614'
4374979 13634 11538 20003
440480 4363641 5061049 1381940 1227252 1688756
1647 37314598
4494 221614
6590 426282
1342731
8. Industry
(Contd.)
Gross Output 000' Rs.)
Total Output
17
2515869 16519
2079017 227748 386925 20967
176934 57859
3346070 15896771
6903 407038 317012 311035 97640
314368 375563 189944 115693 99578
182728 4510956
15493 21861 35430
584316 4200220 5480969 2227094 1196388 1970213
13050 34282163
6286 222911
6345 462629
1402289
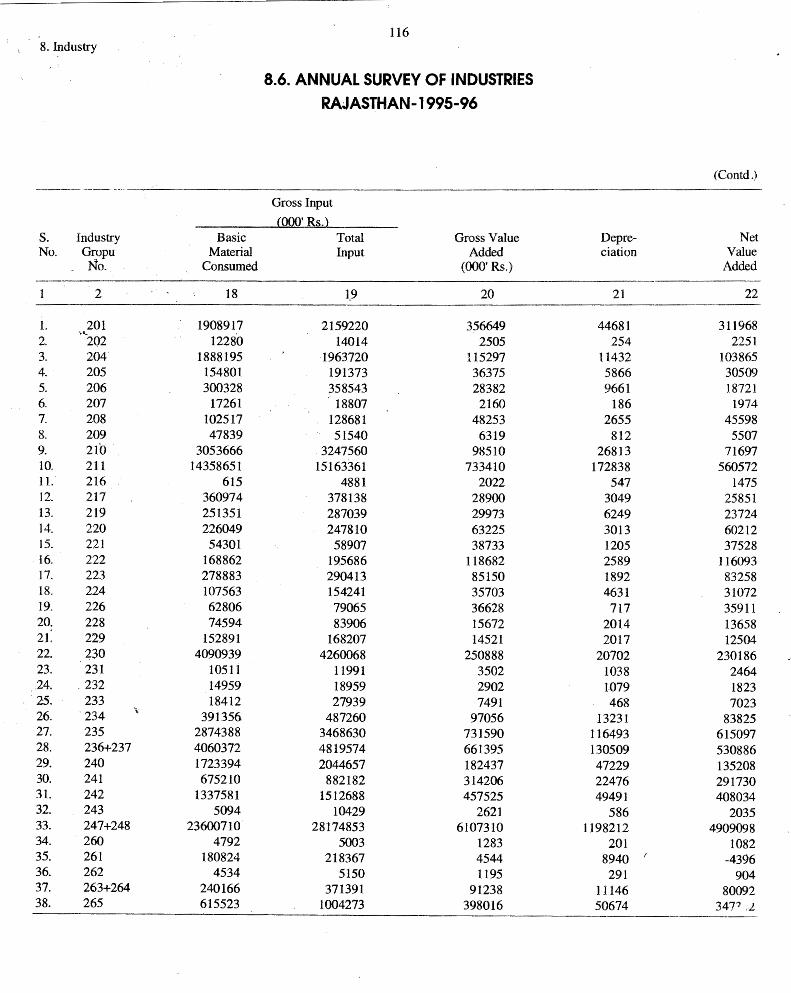
8. Industry
--- ---· --·-
S. Industry Basic No. Gr~pu Material
No. Consumed
2 18
1. 201 1908917 ';r• ...
12280 2. 202 3. 204 1888195 4. 205 154801 5. 206 300328 6. 207 17261 7. 208 102517 8. 209 47839 9. 210 3053666 m 211 14358651 11. 216 615 12. 217 360974 13. 219 251351 14. 220 226049 15. 221 54301 16. 222 168862 17. 223 278883 18. 224 107563 19. 226 62806 20. 228 74594 21. 229 152891 22. 230 4090939 23. 231 10511 24. 232 14959
. 25. 233 18412 26. . 234 '\
391356 27. 235 2874388 28. 236+237 4060372 29. 240 1723394 30. 241 675210 31. 242 1337581 32. 243 5094 33. 247+248 23600710 34. 260 4792 35. 261 180824 36. 262 4534 37. 263+264 240166 38. 265 615523
116
8.6. ANNUAL SURVEY OF INDUSTRIES RAJASTHAN-1995-96
Gross Input
(000' Rs.} Total Gross Value Input Added
(000' Rs.)
1.9 20
2159220 356649 14014 2505
1963720 115297 191373 36375 358543 28382
18807 2160 128681 48253 51540 6319
3247560 98510 15163361 733410
4881 2022 378138 28900 287039 29973 247810 63225 58907 38733
195686 118682 290413 85150 154241 35703 79065 36628 83906 15672
168207 14521 4260068 250888
11991 3502 18959 2902 27939 7491
487260 97056 3468630 731590 4819574 661395 2044657 182437 882182 314206
1512688 457525 10429 2621
28174853 6107310 5003 1283
218367 4544 5150 1195
371391 91238 1004273 398016
(Contd.)
Depre- Net ciation Value
Added
21 22
44681 311968 254 2251
11432 103865 5866 30509 9661 18721
186 1974 2655 45598 812 5507
26813 71697 172838 560572
547 1475 3049 25851 6249 23724 3013 60212 1205 37528 2589 116093 1892 83258 4631 31072 717 35911
2014 13658 2017 12504
20702 230186 1038 2464 1079 1823 468 7023
13231 83825 116493 615097 130509 530886 47229 135208 22476 291730 49491 408034
586 2035 1198212 4909098
201 1082 8940 ( -4396 291 904
11146 80092 50674 347" .L
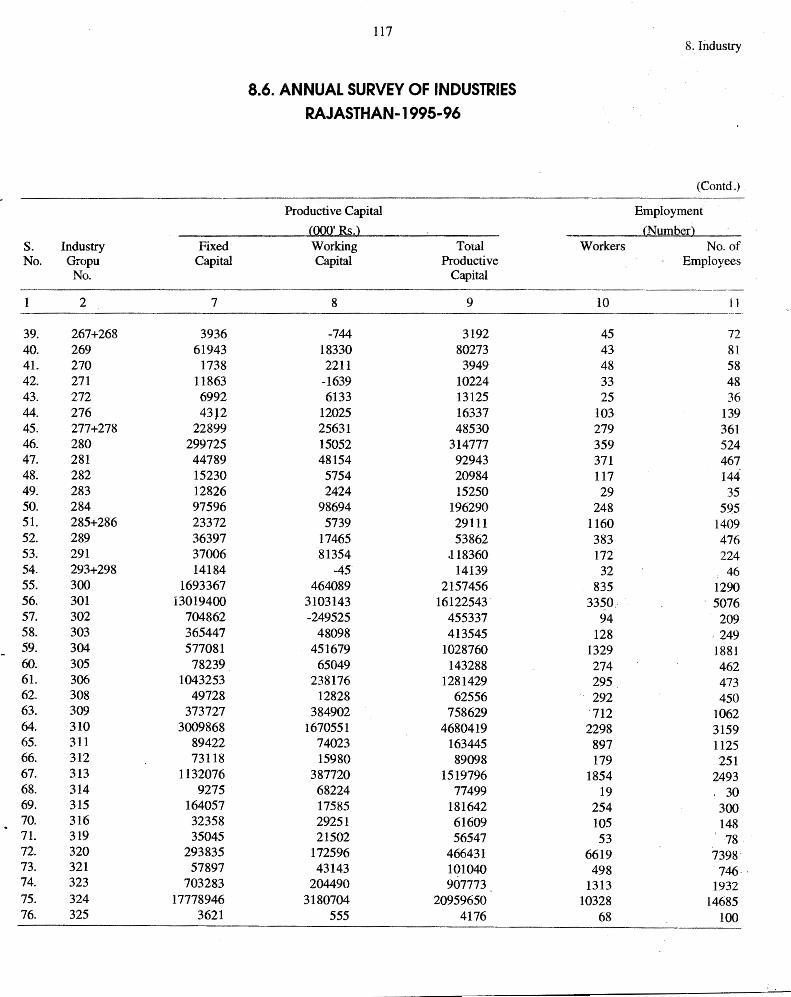
S. Industry Fixed No. Gropu Capital
No.
2 7
39. 267+268 3936 40. 269 61943 41. 270 1738 42. 271 11863 43. 272 6992 44. 276 43J2 45. 277+278 22899 46. 280 299725 47. 281 44789 48. 282 15230 49. 283 12826 50. 284 97596 51. 285+286 23372 52. 289 36397 53. 291 37006 54. 293+298 14184 55. 300 1693367 56. 301 13019400 57. 302 704862 58. 303 365447 59. 304 577081 60. 305 78239 61. 306 1043253 62. 308 49728 63. 309 373727 64. 310 3009868 65. 311 89422 66. 312 73118 67. 313 1132076 68. 314 9275 69. 315 164057 70. 316 32358 71. 319 35045 72. 320 293835 73. 321 57897 74. 323 703283 75. 324 17778946 76. 325 3621
117
8.6. ANNUAL SURVEY OF INDUSTRIES RAJASTHAN-1995-96
Productive Capital
(000' Rs.} Working Total Capital Productive
Capital
8 9
-744 3192 18330 80273 2211 3949
-1639 10224 6133 13125
12025 16337 25631 48530 15052 314777 48154 92943 5754 20984 2424 15250
98694 196290 5739 29111
17465 53862 81354 .118360
-45 14139 464089 2157456
3103143 16122543' -249525 455337
48098 413545 451679 1028760 65049 143288
238176 1281429 12828 62556
384902 758629 1670551 4680419
74023 163445 15980 89098
387720 1519796 68224 77499 17585 181642 29251 61609 21502 56547
172596 466431 43143 101040
204490 907773 3180704 20959650
555 4176
8 .. Industry
(Contd.)
Employment
(Number} Workers No.of
Employees
10 11
45 72 43 81 48 58 33 48 25 36
103 139 279 361 359 524 371 467 117 144 29 35
248 595 1160 1409 383 476 172 224 32 46
835 1290 33~0 .. ' 5076
94 209 128 249
1329 1881 274 462 295 473 292 450
·712 1062 2298 3159 897 1125 179 251
1854 2493 19 ' 30
254 300 105 148 53 ·78
6619 7398· 498 746
1313 1932 10328 14685
68 100
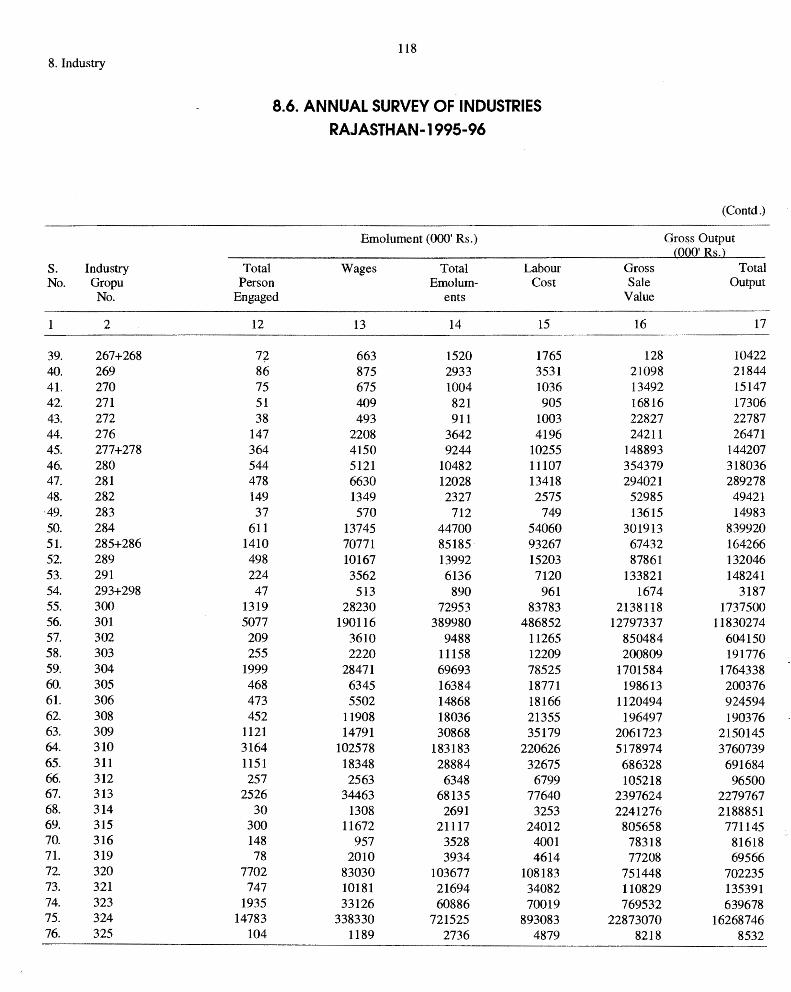
8. Industry
s. Industry No. Gropu
No.
2
39. 267+268 40. 269 41. 270 42. 271 43. 272 44. 276 45. 277+278 46. 280 47. 281 48. 282 '49. 283 50. 284 51. 285+286 52. 289 53. 291 54. 293+298 55. 300 56. 301 57. 302 58. 303 59. 304 60. 305 61. 306 62. 308 63. 309 64. 310 65. 311 66. 312 67. 313 68. 314 69. 315 70. 316 71. 319 72. 320 73. 321 74. 323 75. 324 76. 325
118
8.6. ANNUAL SURVEY OF INDUSTRIES RAJASTHAN-1995-96
Emolument (000' Rs.)
Total Wages Total Labour Person Emo I um- Cost
Engaged en ts
12 13 14 15
77 663 1520 1765 86 875 2933 3531 75 675 1004 1036 51 409 821 905 38 493 911 1003
147 2208 3642 4196 364 4150 9244 10255 544 5121 10482 11107 478 6630 12028 13418 149 1349 2327 2575 37 570 712 749
611 13745 44700 54060 1410 70771 85185 93267 498 10167 13992 15203 224 3562 6136 7120 47 513 890 961
1319 28230 72953 83783 5077 190116 389980 486852 209 3610 9488 11265 255 2220 11158 12209
1999 28471 69693 78525 468 6345 16384 18771 473 5502 14868 18166 452 11908 18036 21355
1121 14791 30868 35179 3164 102578 183183 220626 1151 18348 28884 32675 257 2563 6348 6799
2526 34463 68135 77640 30 1308 2691 3253
300 11672 21117 24012 148 957 3528 4001 78 2010 3934 4614
7702 83030 103677 108183 747 10181 21694 34082
1935 33126 60886 70019 14783 338330 721525 893083
104 1189 2736 4879
(Contd.)
Gross Output (000' Rs.}
Gross Total Sale Output
Value
16 17
128 10422 21098 21844 13492 15147 16816 17306 22827 22787 24211 26471
148893 144207 354379 318036 294021 289278 52985 49421 13615 14983
301913 839920 67432 164266 87861 132046
133821 148241 1674 3187
2138118 1737500 12797337 11830274
850484 604150 200809 191776
1701584 1764338 198613 200376
1120494 924594 196497 190376
2061723 2150145 5178974 3760739 686328 691684 105218 96500
2397624 2279767 2241276 2188851 805658 771145 78318 81618 77208 69566
751448 702235 110829 135391 769532 639678
22873070 16268746 8218 8532
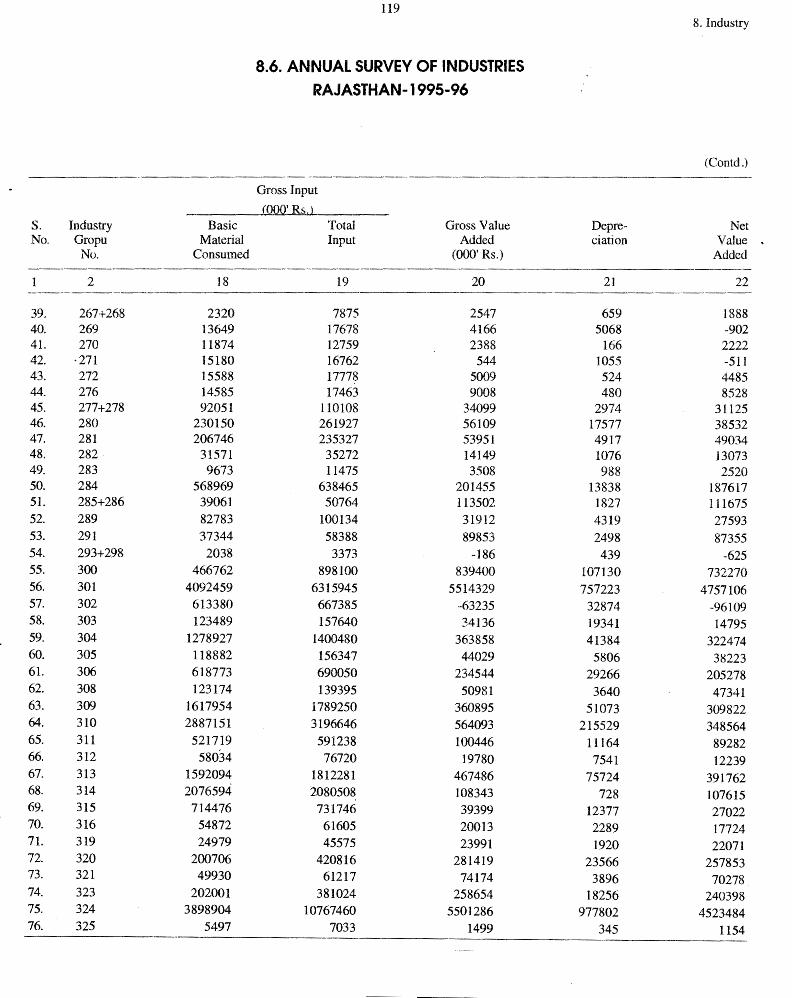
S. Industry Basic No. Gropu Material
No. Consumed
2 18
39. 267+268 2320 40. 269 13649 41. 270 11874 42. ·271 15180 43. 272 15588 44. 276 14585 45. 277+278 92051 46. 280 230150 47. 281 206746 48. 282 31571 49. 283 9673 50. 284 568969 51. 285+286 39061 52. 289 82783 53. 291 37344 54. 293+298 2038 55. 300 466762 56. 301 4092459 57. 302 613380 58. 303 123489 59. 304 1278927 60. 305 118882 61. 306 618773 62. 308 123174 63. 309 1617954 64. 310 2887151 65. 311 521719 66. 312 58034 67. 313 1592094 68. 314 2076594 69. 315 714476 70. 316 54872 71. 319 24979 72. 320 200706 73. 321 49930 74. 323 202001 75. 324 3898904 76. 325 5497
119
8.6. ANNUAL SURVEY OF INDUSTRIES RAJASTHAN-1995-96
Gross Input
<OQO' Rs.} Total Gross Value Input Added
(000' Rs.)
19 20
7875 2547 17678 4166 12759 2388 16762 544 17778 5009 17463 9008
110108 34099 261927 56109 235327 53951 35272 14149 11475 3508
638465 201455 50764 113502
100134 31912 58388 89853 3373 -186
898100 839400 6315945 5514329 667385 ·-63235 157640 34136
1400480 363858 156347 44029 690050 234544 139395 50981
1789250 360895 3196646 564093 591238 100446 76720 19780
1812281 467486 2080508 108343 731746 39399
61605 20013 45575 23991
420816 281419 61217 74174
381024 258654 10767460 5501286
7033 1499
8. Industry
(Contd.)
Depre- Net ciation Value
Added
21 22
659 1888 5068 -902
166 2222 1055 -511 524 4485 480 8528
2974 31125 17577 38532 4917 49034 1076 13073 988 2520
13838 187617 1827 111675 4319 27593 2498 87355 439 -625
107130 732270 757223 4757106 32874 -96109 19341 14795 41384 322474 5806 38223
29266 205278 3640 47341
51073 309822 215529 348564
11164 89282 7541 12239
75724 391762 728 107615
12377 27022 2289 17724 1920 22071
23566 257853 3896 70278
18256 240398 977802 4523484
345 1154
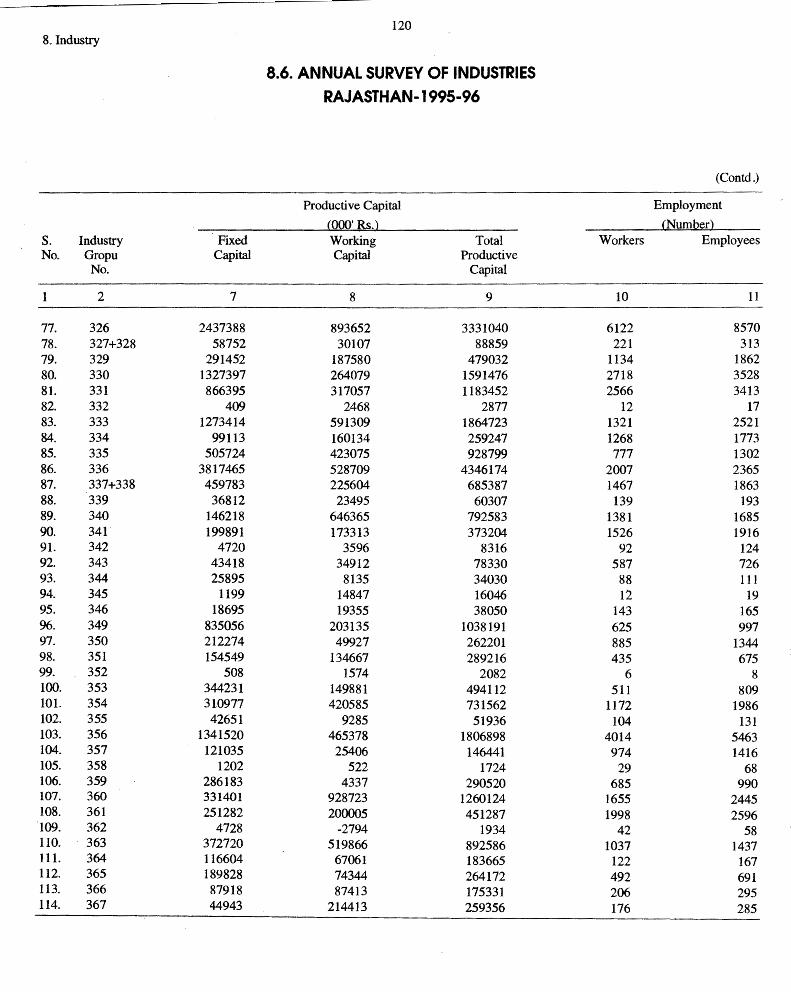
8. Industry
s. Industry Fixed No. Gropu Capital
No.
2 7
77. 326 2437388 78. 327+328 58752 79. 329 291452 80. 330 1327397 81. 331 866395 82. 332 409 83. 333 1273414 84. 334 99113 85. 335 505724 86. 336 3817465 87. 337+338 459783 88. 339 36812 89. 340 146218 90. 341 199891 91. 342 4720 92. 343 43418 93. 344 25895 94. 345 1199 95. 346 18695 96. 349 835056 97. 350 212274 98. 351 154549 99. 352 508 100. 353 344231 101. 354 310977 102. 355 42651 103. 356 1341520 104. 357 121035 105. 358 1202 106. 359 286183 107. 360 331401 108. 361 251282 '109. 362 4728 110. ' 363 372720 Ill. 364 116604 112. 365 189828 113. 366 87918 114. 367 44943
120
8.6. ANNUAL SURVEY OF INDUSTRIES RAJASTHAN-1995-96
Productive Capital
(000' Rs.) Working Total Capital Productive
Capital
8 9
893652 3331040 30107 88859
187580 479032 264079 1591476 317057 1183452
2468 2877 591309 1864723 160134 259247 423075 928799 528709 4346174 225604 685387 23495 60307
646365 792583 173313 373204
3596 8316 34912 78330
8135 34030 14847 16046 19355 38050
203135 1038191 49927 262201
134667 289216 1574 2082
149881 494112 420585 731562
9285 51936 465378 1806898 25406 146441
522 1724 4337 290520
928723 1260124 200005 451287
-2794 1934 519866 892586
67061 183665 74344 264172 87413 175331
214413 259356
(Contd.)
Employment
(Number) Workers Employees
10 11
6122 8570 221 313
1134 1862 2718 3528 2566 3413
12 17 1321 2521 1268 1773 777 1302
2007 2365 1467 1863 139 193
1381 1685 1526 1916
92 124 587 726
88 111 12 19
143 165 625 997 885 1344 435 675
6 8 511 809
1172 1986 104 131
4014 5463 974 1416
29 68 685 990
1655 2445 1998 2596
42 58 1037 1437 122 167 492 691 206 295 176 285
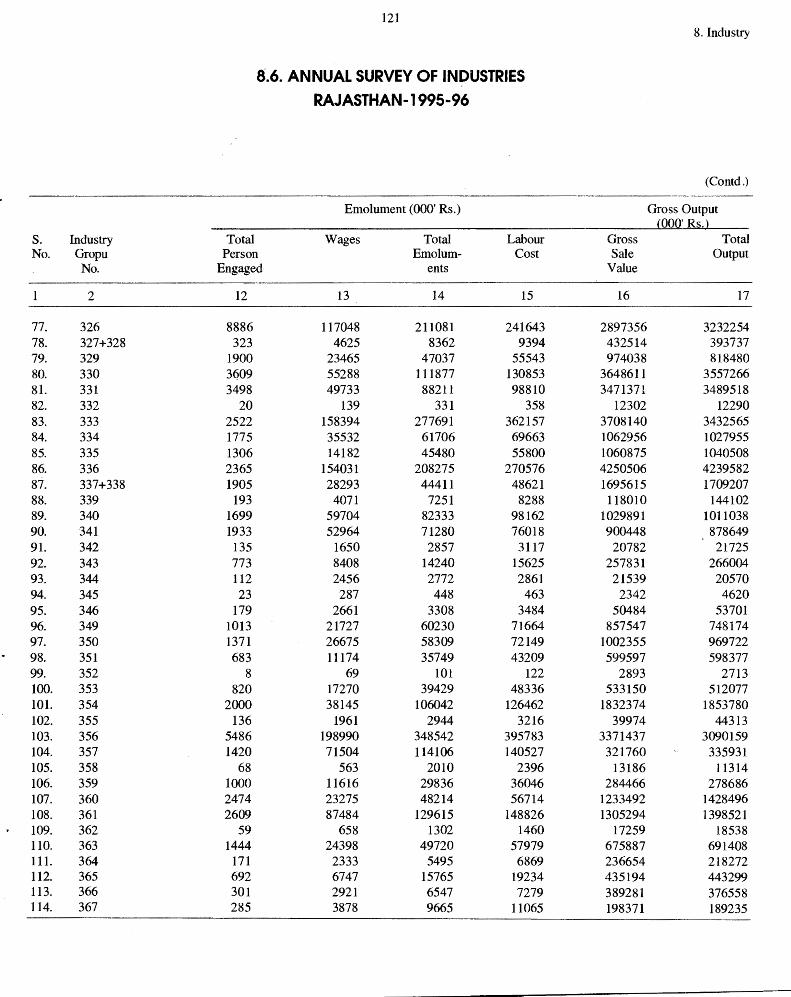
s. Industry No. Gropu
No.
2
77. 326 78. 327+328 79. 329 80. 330 81. 331 82. 332 83. 333 84. 334 85. 335 86. 336 87. 337+338 88. 339 89. 340 90. 341 91. 342 92. 343 93. 344 94. 345 95. 346 96. 349 97. 350 98. 351 99. 352 100. 353 101. 354 102. 355 103. 356 104. 357 105. 358 106. 359 107. 360 108. 361 109. 362 110. 363 111. 364 112. 365 113. 366 114. 367
121
8.6. ANNUAL SURVEY OF INDUSTRIES RAJASTHAN-1995-96
Emolument (000' Rs.)
Total Wages Total Labour Person Emo I um- Cost
Engaged en ts
12 13 14 15
8886 117048 211081 241643 323 4625 8362 9394
1900 23465 47037 55543 3q09 55288 111877 130853 3498 49733 88211 98810
20 139 331 358 2522 158394 277691 362157 1775 35532 61706 69663 1306 14182 45480 55800 2365 154031 208275 270576 1905 28293 44411 48621
193 4071 7251 8288 1699 59704 82333 98162 1933 52964 71280 76018 135 1650 2857 3117 773 8408 14240 15625 112 2456 2772 2861 23 287 448 463
179 2661 3308 3484 1013 21727 60230 71664 1371 26675 58309 72149 683 11174 35749 43209
8 69 101 122 820 17270 39429 48336
2000 38145 106042 126462 136 1961 2944 3216
5486 198990 348542 395783 1420 71504 114106 140527
68 563 2010 2396 1000 11616 29836 36046 2474 23275 48214 56714 2609 87484 129615 148826
59 658 1302 1460 1444 24398 49720 57979
171 2333 5495 6869 692 6747 15765 19234 301 2921 6547 7279 285 3878 9665 11065
8. Industry
(Contd.)
Gross Output 000' Rs.}
Gross Total Sale Output
Value
16 17
2897356 3232254 432514 393737 974038 818480
3648611 3557266 3471371 3489518
12302 12290 3708140 3432565 1062956 1027955 1060875 1040508 4250506 4239582 1695615 1709207 118010 144102
1029891 1011038 900448 878649 20782 21725
257831 266004 21539 20570 2342 4620
50484 53701 857547 748174
1002355 969722 599597 598377
2893 2713 533150 512077
1832374 1853780 39974 44313
3371437 3090159 321760 335931
13186 11314 284466 278686
1233492 1428496 1305294 1398521
17259 18538 675887 691408 236654 218272 435194 443299 389281 376558 198371 189235
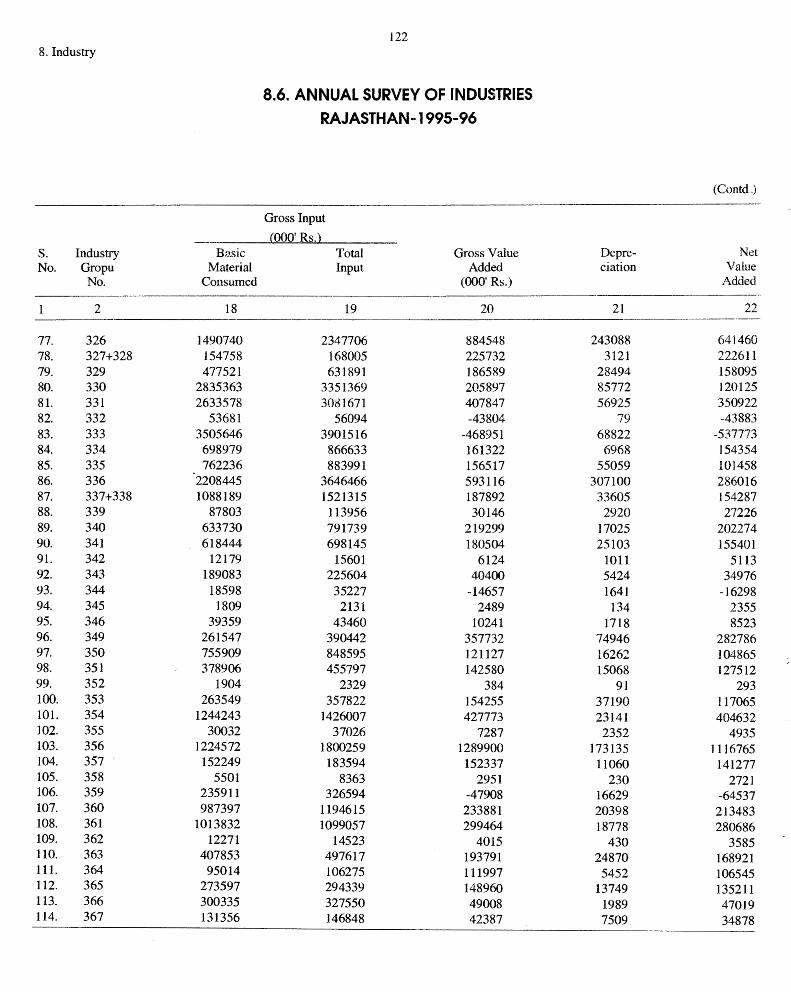
8. Industry
s. Industry Basic No. Gropu Material
No. Consumed
2 18
77. 326 1490740 78. 327+328 154758 79. 329 477521 80. 330 2835363 81. 331 2633578 82. 332 53681 83. 333 3505646 84. 334 698979 85. 335 762236 86. 336 2208445 87. 337+338 1088189 88. 339 87803 89. 340 633730 90. 341 618444 91. 342 12179 92. 343 189083 93. 344 18598 94. 345 1809 95. 346 39359 96. 349 261547 97. 350 755909 98. 351 378906 99. 352 1904 100. 353 263549 101. 354 1244243 102. 355 30032 103. 356 1224572 104. 357 152249 105. 358 5501 106. 359 235911 107. 360 987397 108. 361 1013832 109. 362 12271 110. 363 407853 111. 364 95014 112. 365 273597 113. 366 300335 114. 367 131356
122
8.6. ANNUAL SURVEY OF INDUSTRIES RAJASTHAN-1995-96
Gross Input
(000' Rs.) Total Gross Value Input Added
(000' Rs.)
19 20
2347706 884548 168005 225732 631891 186589
3351369 205897 3081671 407847
56094 -43804 3901516 -468951 866633 161322 883991 156517
3646466 593116 1521315 187892
113956 30146 79l739 219299 698145 180504
15601 6124 225604 40400 35227 -14657
2131 2489 43460 10241
390442 357732 848595 121127 455797 142580
2329 384 357822 154255
1426007 427773 37026 7287
1800259 1289900 183594 152337
8363 2951 326594 -47908
1194615 233881 1099057 299464
14523 4015 497617 193791 106275 111997 294339 148960 327550 49008 146848 42387
(Contd.)
De pre- Net ciation Value
Added
21 22
243088 641460 3121 222611
28494 158095 85772 120125 56925 350922
79 -43883 68822 -537773 6968 154354
55059 101458 307100 286016 33605 154287 2920 27226
17025 202274 25103 155401
1011 5113 5424 34976 1641 -16298 134 2355
1718 8523 74946 282786 16262 104865 15068 127512
91 293 37190 117065 23141 404632 2352 4935
173135 1116765 11060 141277
230 2721 16629 -64537 20398 213483 18778 280686
430 3585 24870 168921 5452 106545
13749 135211 1989 47019 7509 34878
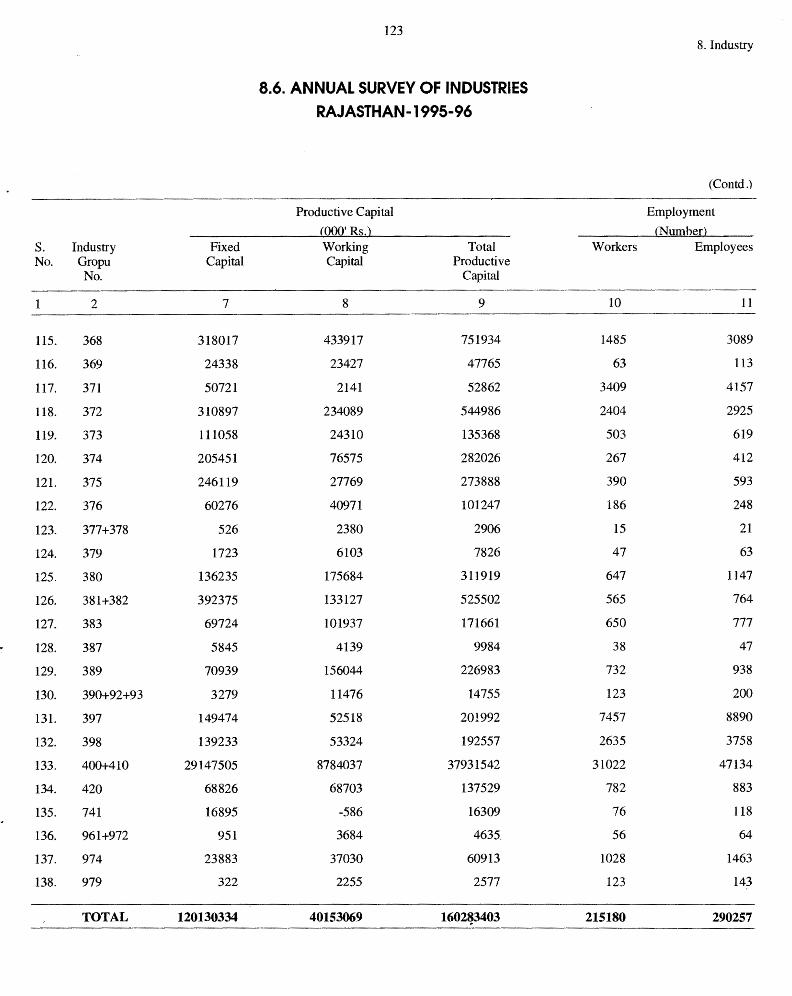
s. Industry Fixed No. Gropu Capital
No.
1 2 7
115. 368 318017
116. 369 24338
117. 371 50721
118. 372 310897
119. 373 111058
120. 374 205451
121. 375 246119
122. 376 60276
123. 377+378 526
124. 379 1723
125. 380 136235
126. 381+382 392375
127. 383 69724
128. 387 5845
129. 389 70939
130. 390+92+93 3279
131. 397 149474
132. 398 139233
133. 400+410 29147505
134. 420 68826
135. 741 16895
136. 961+972 951
137. 974 23883
138. 979 322
TOTAL 120130334
123
8.6. ANNUAL SURVEY OF INDUSTRIES RAJASTHAN-1995-96
Productive Capital (000' Rs.) Working Total Capital Productive
Capital
8 9
433917 751934
23427 47765
2141 52862
234089 544986
24310 135368
76575 282026
27769 273888
40971 101247
2380 2906
6103 7826
175684 311919
133127 525502
101937 171661
4139 9984
156044 226983
11476 14755
52518 201992
53324 192557
8784037 37931542
68703 137529
-586 16309
3684 4635
37030 60913
2255 2577
40153069 1602~403
8. Industry
(Contd.)
Employment (Number}
Workers Employees
10 11
1485 3089
63 113
3409 4157
2404 2925
503 619
267 412
390 593
186 248
15 21
47 63
647 1147
565 764
650 777
38 47
732 938
123 200
7457 8890
2635 3758
31022 47134
782 883
76 118
56 64
1028 1463
123 143
215180 290257
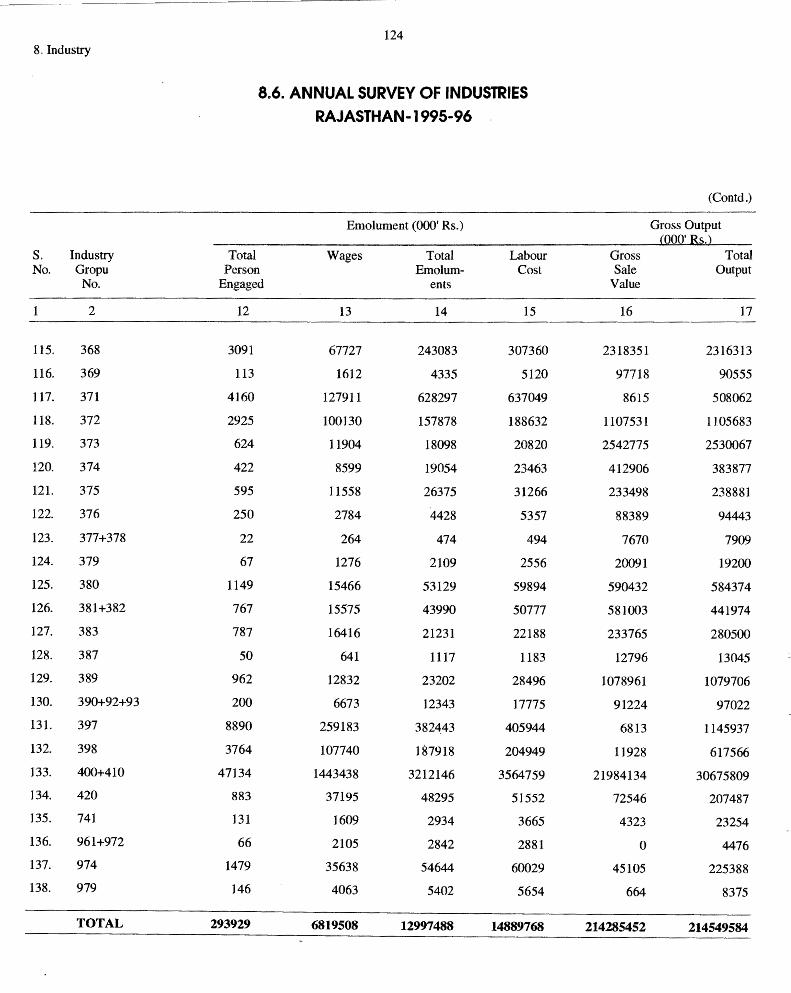
8. Industry
s. Industry No. Gropu
No.
1 2
ll5. 368
116. 369
117. 371
118. 372
119. 373
120. 374
121. 375
122. 376
123. 377+378
124. 379
125. 380
126. 381+382
127. 383
128. 387
129. 389
130. 390+92+93
131. 397
132. 398
133. 400+410
134. 420
135. 741
136. 961+972
137. 974
138. 979
TOTAL
124
8.6. ANNUAL SURVEY OF INDUSTRIES RAJASTHAN-1995-96
Emolument (000' Rs.)
Total Wages Total Labour Person Emolum- Cost
Engaged en ts
12 13 14 15
3091 67727 243083 307360
113 1612 4335 5120
4160 127911 628297 637049
2925 100130 157878 188632
624 11904 18098 20820
422 8599 19054 23463
595 11558 26375 31266
250 2784 4428 5357
22 264 474 494
67 1276 2109 2556
1149 15466 53129 59894
767 15575 43990 50777
787 16416 21231 22188
50 641 1117 1183
962 12832 23202 28496
200 6673 12343 17775
8890 259183 382443 405944
3764 107740 187918 204949
47134 1443438 3212146 3564759
883 37195 48295 51552
131 1609 2934 3665
66 2105 2842 2881
1479 35638 54644 60029
146 4063 5402 5654
293929 6819508 12997488 14889768
(Contd.)
Gross Output (000' Rs.}
Gross Total Sale Output
Value
16 17
2318351 2316313
97718 90555
8615 508062
1107531 1105683
2542775 2530067
412906 383877
233498 238881
88389 94443
7670 7909
20091 19200
590432 584374
581003 441974
233765 280500
12796 13045
1078961 1079706
91224 97022
6813 1145937
11928 617566
21984134 30675809
72546 207487
4323 23254
0 4476
45105 225388
664 8375
214285452 214549584

s. Industry Basic No. Gropu Material
No. Consumed
2 18
115. 368 1810132
116. 369 72916
117. 371 232499
118. 372 664436
119. 373 1367695
120. 374 267243
121. 375 81452
122. 376 54373
123. 377+378 6510
124. 379 13122
125. 380 256784
126. 381+382 232095
127. 383 165456
128. 387 8477
129. 389 607592
130. 390+92+93 77764
131. 397 665524
132. 398 321526
133. 400+410 13304712
134. 420 28117
135. 741 2534
136. 961+972 557
137. 974 113704
138. 979 1297
TOTAL 131789084
125
8.6. ANNUAL SURVEY OF INDUSTRIES RAJASTHAN-1995-96
Gross Input
(000' Rs.) Total Gross Value Input Added
(000' Rs.)
19 20
2086569 229744
84743 5812
265696 242366
799066 306617
1398142 1131925
308888 74989
140611 98270
64708 29735
6915 994
15249 3951
342646 241728
296966 145008
185469 95031
10027 3018
707107 372599
81621 15401
725484 420453
508241 109325
20321001 10354808
220482 -12995
15980 7274
1059 3417
211391 13997
2298 6077
167313066 47236518
8. Industry
(Concld.)
Depre- Net ciation Value
Added
21 22
35648 194096
1256 4556
33675 208691
61810 244807
6407 1125518
10997 63992
14514 83756
2362 27373
93 901
327 3624
14156 227572
18280 126728
7190 87841
511 2507
8950 363649
509 14892
15756 404697
5476 103849
2251200 8103608
9434 -22429
1744 5530
90 3327
3761 10236
65 6012
8344665 38891853
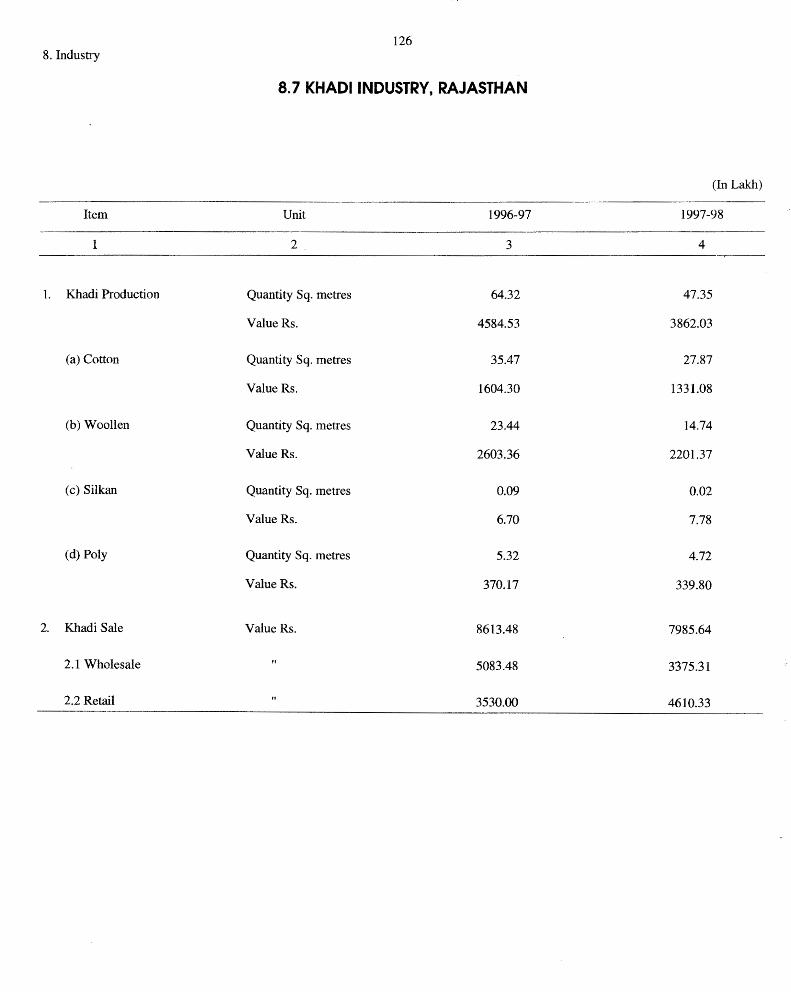
126 8. Industry
8.7 KHADI INDUSTRY, RAJASTHAN
(In Lakh)
Item Unit 1996-97 1997-98
2 3 4
1. Khadi Production Quantity Sq. metres 64.32 47.35
Value Rs. 4584.53 3862.03
(a) Cotton Quantity Sq. metres 35.47 27.87
Value Rs. 1604.30 1331.08
(b) Woollen Quantity Sq. metres 23.44 14.74
Value Rs. 2603.36 2201.37
(c) Silkan Quantity Sq. metres 0.09 0.02
Value Rs. 6.70 7.78
(d) Poly Quantity Sq. metres 5.32 4.72
Value Rs. 370.17 339.80
2. Khadi Sale Value Rs. 8613.48 7985.64
2.1 Wholesale 5083.48 3375.31
2.2 Retail 3530.00 4610.33
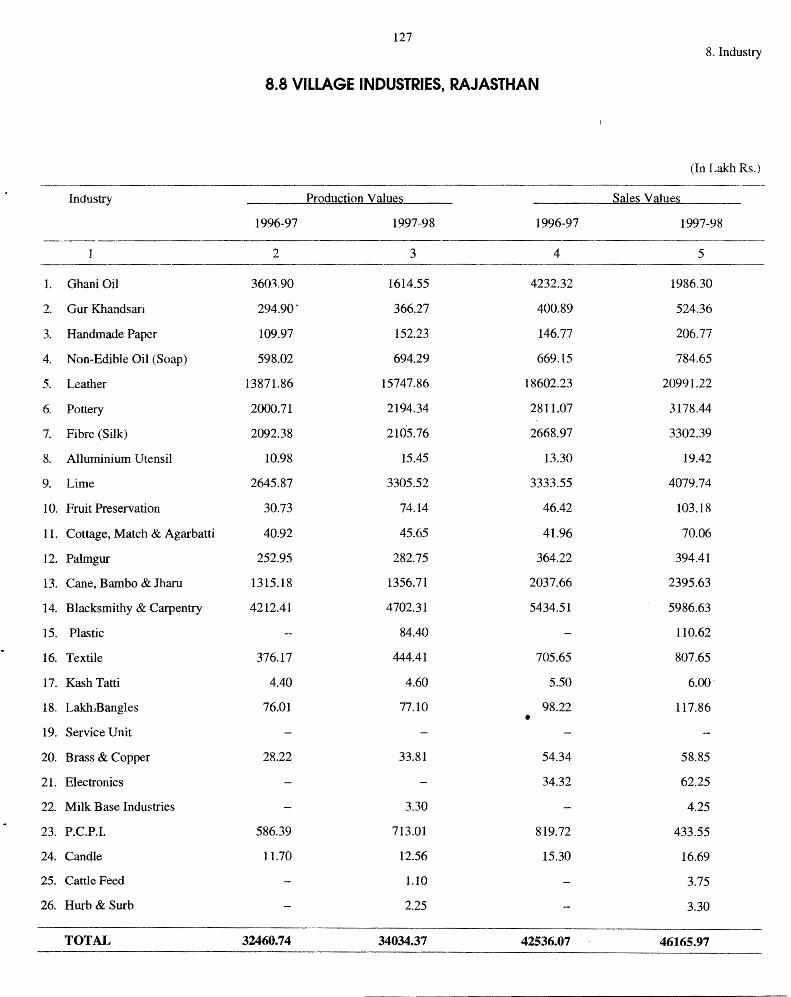
127 8. Industry
8.8 VILLAGE INDUSTRIES, RAJASTHAN
(In Lakh Rs.)
Industry PrQduction Values Sales Values
1996-97 1997--98 1996-97 1997-98 -------·
2 3 4 5
1. Ghani Oil 360:190 1614.55 4232.32 1986.30
2. Gur Khandsari 294.90' 366.27 400.89 524.36
3. Handmade Paper 109.97 152.23 146.77 206.77
4. Non-Edible Oil (Soap) 598.02 694.29 669.15 784.65
5. Leather 13871.86 15747.86 18602.23 20991.22
6. Pottery 2000.71 2194.34 2811.07 3178.44
7. Fibre (Silk) 2092.38 2105.76 2668.97 3302.39
8. Alluminium Utensil 10.98 15.45 13.30 19.42
9. Lime 2645.87 3305.52 3333.55 4079.74
10. Fruit Preservation 30.73 74.14 46.42 103.18
11. Cottage, Match & Agarbatti 40.92 45.65 41.96 70.06
12. Palmgur 252.95 282.75 364.22 394.41
13. Cane, Bambo & Jharu 1315.18 1356.71 2037.66 2395.63
14. Blacksmithy & Carpentry 4212.41 4702.31 5434.51 5986.63
15. Plastic 84.40 110.62
16. Textile 376.17 444.41 705.65 807.65
17. Kash Tatti 4.40 4.60 5.50 6.00·
18. Lakh,Bangles 76.01 77.10 98.22 117.86 •
19. Service Unit
20. Brass & Copper 28.22 33.81 54.34 58.85
21. Electronics 34.32 62.25
22. Milk Base Industries 3.30 4.25
23. P.C.P.I. 586.39 713.01 819.72 433.55
24. Candle 11.70 12.56 15.30 16.69
25. Cattle Feed 1.10 3.75
26. Hurb & Surb 2.25 3.30
TOTAL 32460.74 34034.37 42536.07 46165.97
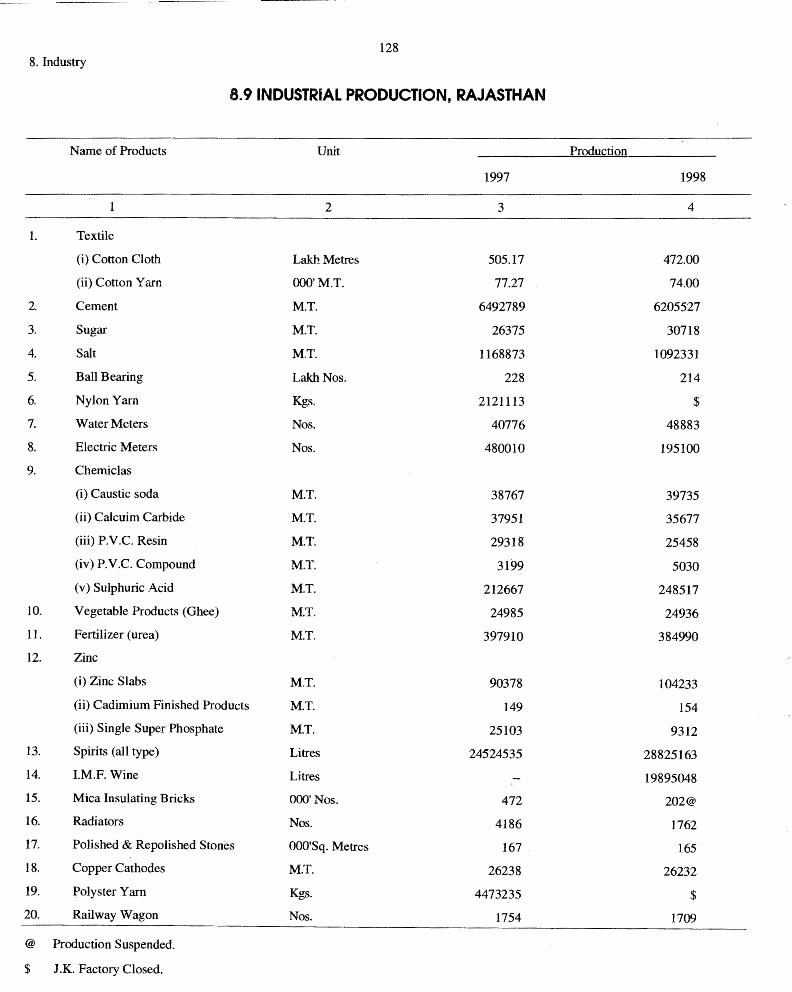
128 8. Industry
8.9 INDUSTRiAL PRODUCTION, RAJASTHAN
Name of Products Unit Production
1997 1998
2 3 4
1. Textile
(i) Cotton Cloth Lak:hMetres 505.17 472.00
(ii) Cotton Yarn OOO'M.T. 77.27 74.00
2. Cement M.T. 6492789 6205527
3. Sugar M.T. 26375 30718
4. Salt M.T. 1168873 1092331
5. Ball Bearing LakhNos. 228 214
6. Nylon Yarn Kgs. 2121113 $
7. Water Meters Nos. 40776 48883
8. Electric Meters Nos. 480010 195100
9. Chemiclas
(i) Caustic soda M.T. 38767 39735
(ii) Calcuim Carbide M.T. 37951 35677
(iii) P.V.C. Resin M.T. 29318 25458
(iv) P.V.C. Compound M.T. 3199 5030
(v) Sulphuric Acid M.T. 212667 248517
10. Vegetable Products (Ghee) M.T. 24985 24936
11. Fertilizer (urea) M.T. 397910 384990
12. Zinc
(i) Zinc Slabs M.T. 90378 104233
(ii) Cadimium Finished Products M.T. 149 154
(iii) Single Super Phosphate M.T. 25103 9312 13. Spirits (all type) Litres 24524535 28825163 14. I.M.E Wine Litres 19895048 15. Mica Insulating Bricks OOO'Nos. 472 202@ 16. Radiators Nos. 4186 1762 17. Polished & Repolished Stones OOO'Sq. Metres 167 165 18. Copper Cathodes M.T. 26238 26232 19. Polyster Yarn Kgs. 4473235 $
20. Railway Wagon Nos. 1754 1709
@ Production Suspended.
$ J.K. Factory Closed.
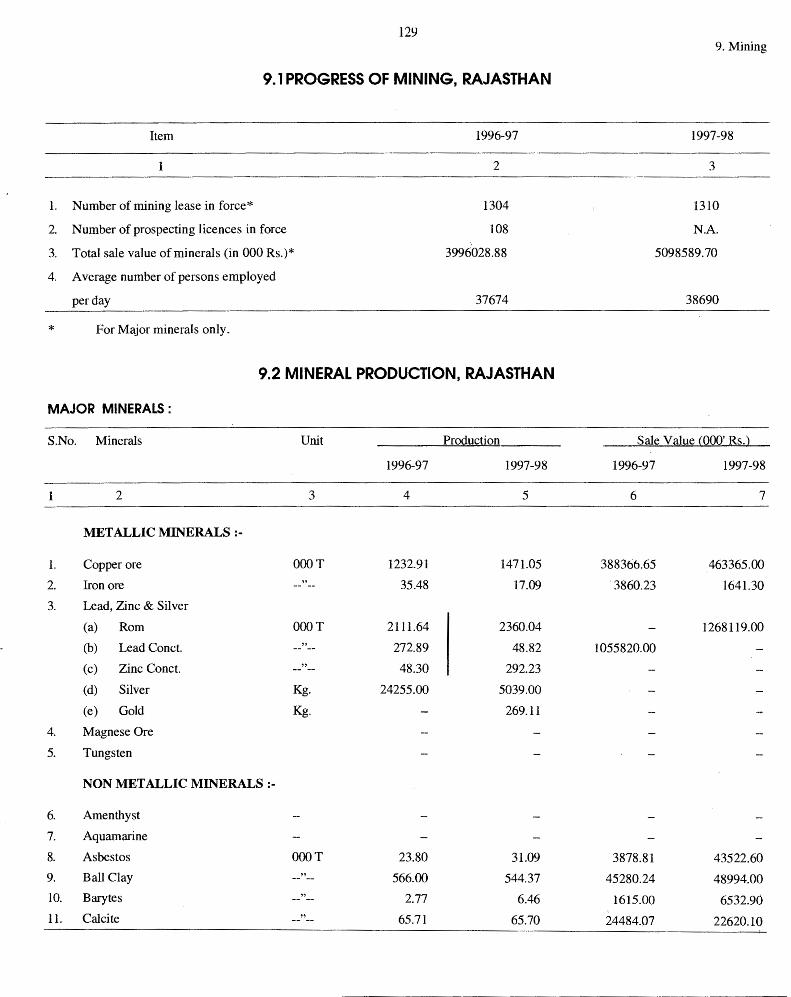
129
9.1 PROGRESS OF MINING, RAJASTHAN
Item
1. Number of mining lease in force*
2. Number of prospecting licences in force
3. Total sale value of minerals (in 000 Rs.)*
4. Average number of persons employed
per day
* For Major minerals only.
1996-97
2
1304
108 I
3996028.88
37674
9.2 MINERAL PRODUCTION, RAJASTHAN
MAJOR MINERALS :
S.No. Minerals Unit Production
1996-97 1997-98
2 3 4 5
METALLIC MINERALS:-
1. Copper ore OOOT 1232.91 1471.05
2. Iron ore ,,
35.48 17.09
3. Lead, Zinc & Silver
(a) Rom OOOT 2111.64 2360.04
(b) Lead Conct. " 272.89 48.82
(c) Zinc Conct. " 48.30 292.23
(d) Silver Kg. 24255.00 5039.00
(e) Gold Kg. 269.11
4. Magnese Ore
5. Tungsten
NON METALLIC MINERALS:-
6. Amenthyst
7. Aquamarine
8. Asbestos OOOT 23.80 31.09
9. Ball Clay " 566.00 544.37
10. Barytes ,,
2.77 6.46
11. Calcite " 65.71 65.70
9. Mining
1997-98
3
1310
N.A.
5098589.70
38690
Sale Value (000' Rs.)
1996-97 1997-98
6 7
388366.65 463365.00
. 3860.23 1641.30
1268119.00
1055820.00
3878.81 43522.60
45280.24 48994.00
1615.00 6532.90
24484.07 22620.10
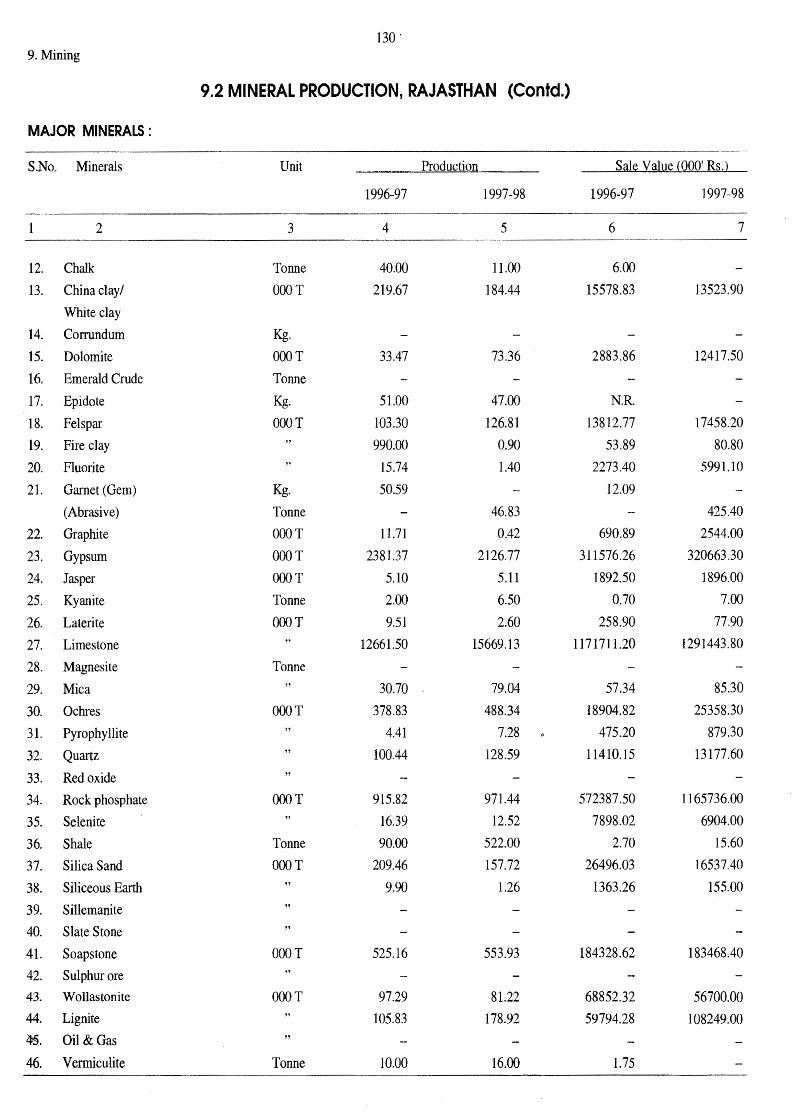
130. 9. Mining
9.2 MINERAL PRODUCTION, RAJASTHAN (Contd.)
MAJOR MINERALS :
S.No. Minerals Unit Production Sale Value (000' Rs.}
1996-97 1997-98 1996-97 1997-98
' 1 2 3 4 5 6 7
12. Chalk Tonne 40.00 11.00 6.00
13. China clay/ OOOT 219.67 184.44 15578.83 13523.90
White clay
14. Corrundum Kg.
15. Dolomite OOOT 33.47 73.36 2883.86 12417.50
16. Emerald Crude Tonne
17. Epidote Kg. 51.00 47.00 N.R.
18. Felspar OOOT 103.30 126.81 13812.77 17458.20
19. Fire clay 990.00 0.90 53.89 80.80
20. Fluorite " 15.74 1.40 2273.40 5991.10
21. Garnet (Gem) Kg. 50.59 12.09
(Abrasive) Tonne 46.83 425.40
22. Graphite OOOT 11.71 0.42 690.89 2544.00
23. Gypsum OOOT 2381.37 2126.77 311576.26 320663.30
24. Jasper OOOT 5.10 5.11 1892.50 1896.00
25. Kyanite Tonne 2.00 6.50 0.70 7.00
26. Laterite OOOT 9.51 2.60 258.90 77.90
27. Limestone 12661.50 15669.13 1171711.20 1291443.80
28. Magnesite Tonne
29. Mica " 30.70 79.04 57.34 85.30
30. Ochres OOOT 378.83 488.34 18904.82 25358.30
31. Pyrophyllite 4.41 7.28 475.20 879.30
32. Quartz 100.44 128.59 11410.15 13177.60
33. Red oxide "
34. Rock phosphate OOOT 915.82 971.44 572387.50 1165736.00
35. Selenite 16.39 12.52 7898.02 6904.00
36. Shale Tonne 90.00 522.00 2.70 15.60
37. Silica Sand OOOT 209.46 157.72 26496.03 16537.40
38. Siliceous Earth " 9.90 1.26 1363.26 155.00
39. Sillemanite
40. Slate Stone "
41. Soapstone OOOT 525.16 553.93 184328.62 183468.40
42. Sulphur ore
43. Wollastonite OOOT 97.29 81.22 68852.32 56700.00
44. Lignite 105.83 178.92 59794.28 108249.00
4§. Oil & Gas
46. Vermiculite Tonne 10.00 16.00 1.75
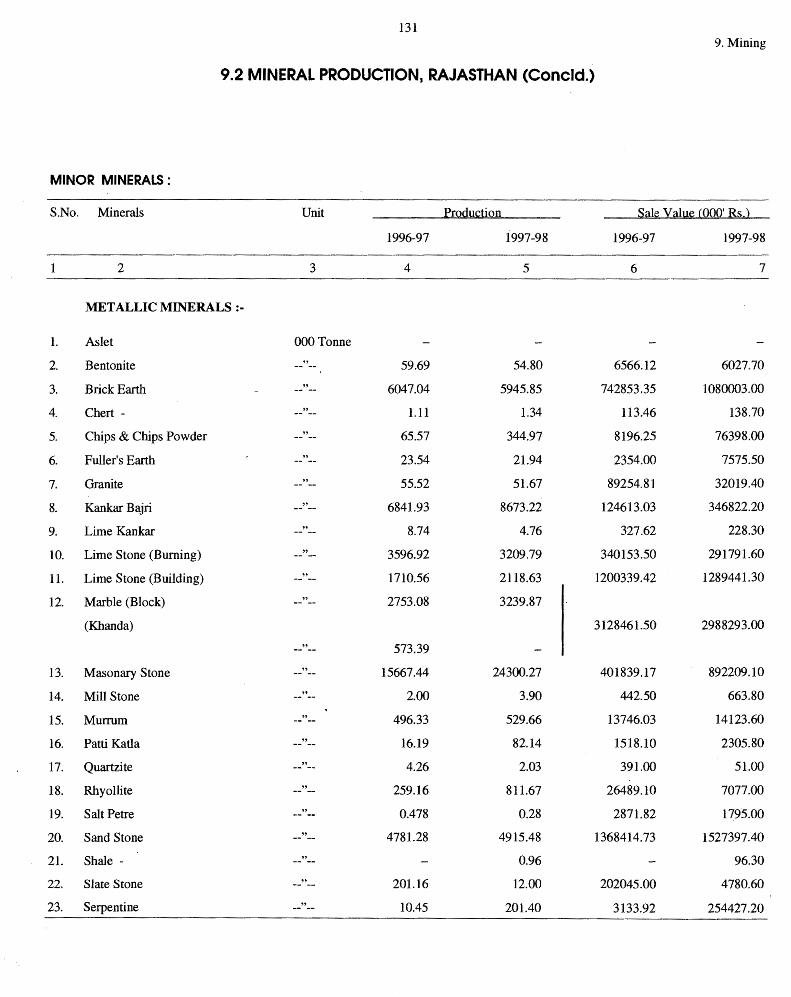
131 9. Mining
9.2 MINERAL PRODUCTION, RAJASTHAN (Concld.)
MINOR MINERALS :
S.No. Minerals Unit PrQdu~tiQn Sal~ Vah!~ (QOO' R~ l
1996-97 1997-98 1996-97 1997-98
2 3 4 5 6 7
METALLIC MINERALS :-
1. As let 000 Tonne
2. Bentonite " 59.69 54.80 6566.12 6027,70
3. Brick Earth " 6047.04 5945.85 742853.35 1080003.00
4. Chert - " 1.11 1.34 113.46 138.70
5. Chips & Chips Powder " 65.57 344.97 8196.25 76398.00
6. Fuller's Earth " 23.54 21.94 2354.00 7575.50
7. Granite " 55.52 51.67 89254.81 32019.40
8. Kankar Bajri " 6841.93 8673.22 124613.03 346822.20
9. Lime Kankar " 8.74 4.76 327.62 228.30
10. Lime Stone (Burning) " 3596.92 3209.79 340153.50 291791.60
11. Lime Stone (Building) " 1710.56 2118.63 1200339.42 1289441.30
12. Marble (Block) " 2753.08 3239.87
(Khanda) 3128461.50 2988293.00
" 573.39
13. Masonary Stone " 15667.44 24300.27 401839.17 892209.10
14. Mill Stone " 2.00 3.90 442.50 663.80
15. Murrum " 496.33 529.66 13746.03 14123.60
16. Patti Katla " 16.19 82.14 1518.10 2305.80
17. Quartzite " 4.26 2.03 391.00 51.00
18. Rhyollite " 259.16 811.67 26489.10 7077.00
19. Salt Petre " 0.478 0.28 2871.82 1795.00
20. Sand Stone " 4781.28 4915.48 1368414.73 1527397.40
21. Shale - " 0.96 96.30
22. Slate Stone " 201.16 12.00 202045.00 4780.60
23. Serpentine " 10.45 201.40 3133.92 254427.20

10. Labour
Item
1. Trade Unions
1.1 Registered at the end of the year
1.2 Membership
2. Industrial disputes
2.1 Strikes & Lockouts
2.2 Workers Involved
2.3 mandays lost
3. Accidents occurred+
3.1 Fatal
3.2 Non-Fatal
4. Worken's Compensation
4.1 Cases Decided
4.2 Amount Paid ('000 Rs.)
5. Employees Provident Fund Scheme
5.1 Factories/Establishment Covered
5.2 Subscribers
5.3 Contribution From the Subscribers (Lakh Rs.)
6. Employees's State Insurance Scheme
6.1 Factories/Establishment covered
6.2 W orkerns insured
132
10.1 LABOUR
+ Information relates to the Calender Year 1997 to 1998.
* Provisional
1996-97
2
3254
542833
45
23349
828007
60
2698
787
36493
7838
656592
17433.31
6130
278400
10.2 LABOUR WELFARE, RAJASTHAN
Item 1996-97
1 2
1. labour welfare centres working 10
2. Adults educated 102
3. Children educated 116
4. Radio sets installed 17
5. Reading rooms working 12
6. Libraries functioning 10
7. First aid medical box provided
8. labourers benefitted 200
9. Children benefitted 116
(Number)
1997-98
3
3441
602961
34*
22006*
1114000*
68
1609
778
53459
8643
685366
20528.09
6277
311650
(Number)
1997-98
3
10
442
464
17
12
10
1261
668
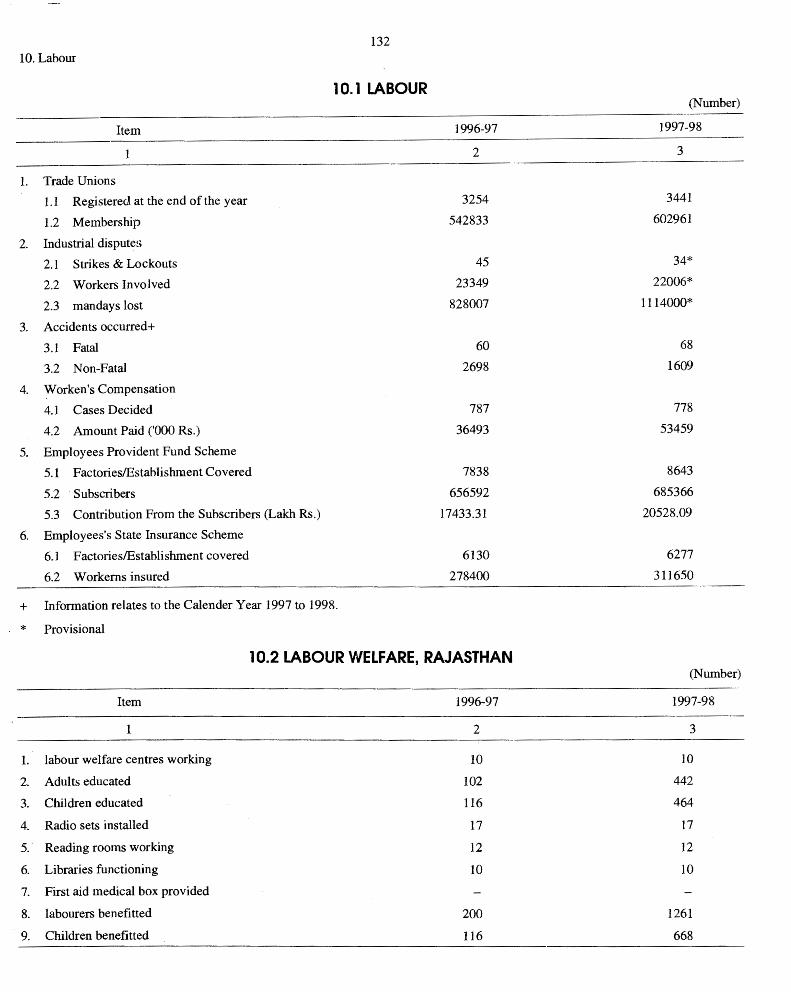
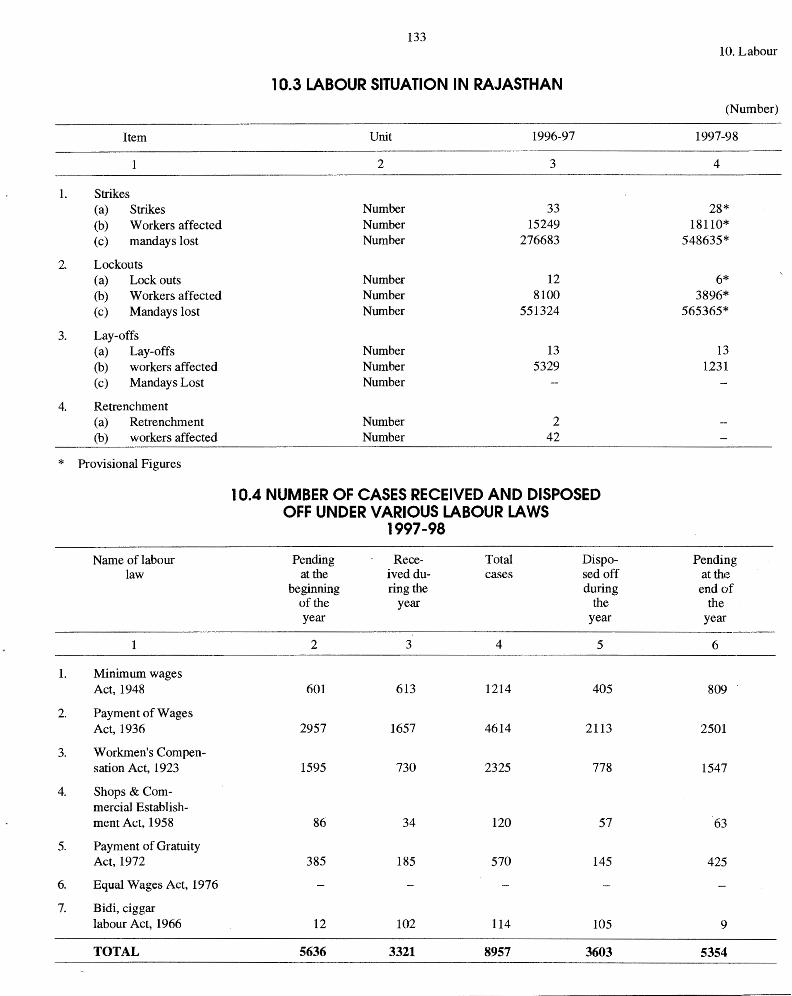
133 10. Labour
10.3 LABOUR SITUATION IN RAJASTHAN (Number)
Item Unit 1996-97 1997-98
2 3 4
1. Strikes (a) Strikes Number 33 28* (b) Workers affected Number 15249 18110* (c) mandays lost Number 276683 548635*
2. Lockouts (a) Lock outs Number 12 6* (b) Workers affected Number 8100 3896* (c) Mandays lost Number 551324 565365*
3. Lay-offs (a) Lay-offs Number 13 13 (b) workers affected Number 5329 1.231 (c) Mandays Lost Number
4. Retrenchment (a) Retrenchment Number 2 (b) workers affected Number 42
* Provisional Figures
10.4 NUMBER OF CASES RECEIVED AND DISPOSED OFF UNDER VARIOUS LABOUR LAWS
1997-98
Name of labour Pending Rece- Total Dis po- Pending law at the ived du- cases sed off at th1e
beginning ring the during end of of the year the the year year year
2 3 4 5 6
1. Minimum wages Act, 1948 601 613 1214 405 809
2. Payment of Wages Act, 1936 2957 1657 4614 2113 2501
3. Workmen's Compen-sation Act, 1923 1595 730 2325 778 1547
4. Shops &Com-mercial Establish-ment Act, 1958 86 34 120 57 63
5. Payment of Gratuity Act, 1972 385 185 570 145 425
6. Equal Wages Act, 1976
7. Bidi, ciggar labour Act, 1966 12 102 114 105 9
TOTAL 5636 3321 8957 3603 5354
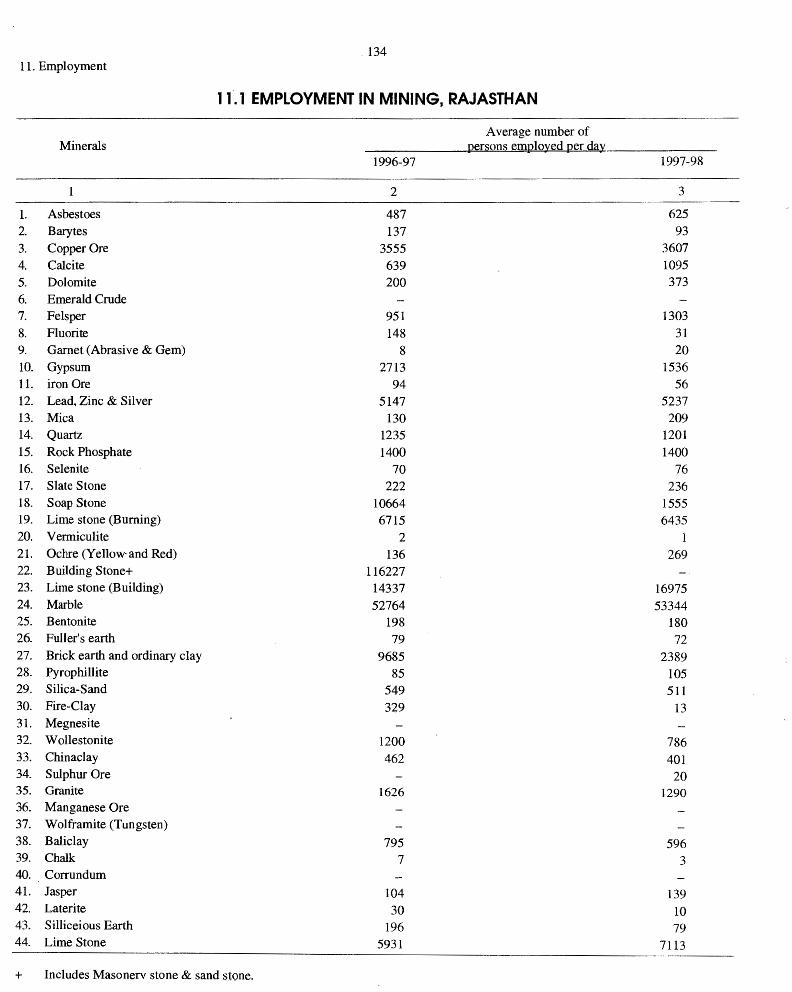
134 11. Employment
11. l EMPLOYMENT IN MINING, RAJASTHAN
Average number of Minerals per~ons emplo~ed per da~
1996-97 1997-98
2 3
1. As bes toes 487 625 2. Barytes 137 93 3. Copper Ore 3555 3607 4. Calcite 639 1095 5. Dolomite 200 373
6. Emerald Crude 7. Fels per 951 1303 8. Fluorite 148 31 9. Gamet (Abrasive & Gem) 8 20 10. Gypsum 2713 1536 11. iron Ore 94 56 12. Lead, Zinc & Silver 5147 5237 13. Mica 130 209 14. Quartz 1235 1201 15. Rock Phosphate 1400 1400 16. Selenite 70 76 17. Slate Stone 222 236 18. Soap Stone 10664 1555 19. Lime stone (Burning) 6715 6435 20. Vermiculite 2 1 21. Ochre (Yellow and Red) 136 269 22. Building Stone+ 116227 23. Lime stone (Building) 14337 16975 24. Marble 52764 53344 25. Bentonite 198 180 26. Fuller's earth 79 72 27. Brick earth and ordinary clay 9685 2389 28. Pyrophillite 85 105 29. Silica-Sand 549 511 30. Fire-Clay 329 13 31. Megnesite 32. W ollestonite 1200 786 33. Chinaclay 462 401 34. Sulphur Ore 20 35. Granite 1626 1290 36. Manganese Ore 37. Wolframite (Tungsten) 38. Baliclay 795 596 39. Chalk 7 3 40. Corrundum 41. Jasper 104 139 42. Laterite 30 10 43. Silliceious Earth 196 79 44. Lime Stone 5931 7113
+ Includes Masonerv stone & sand stone.
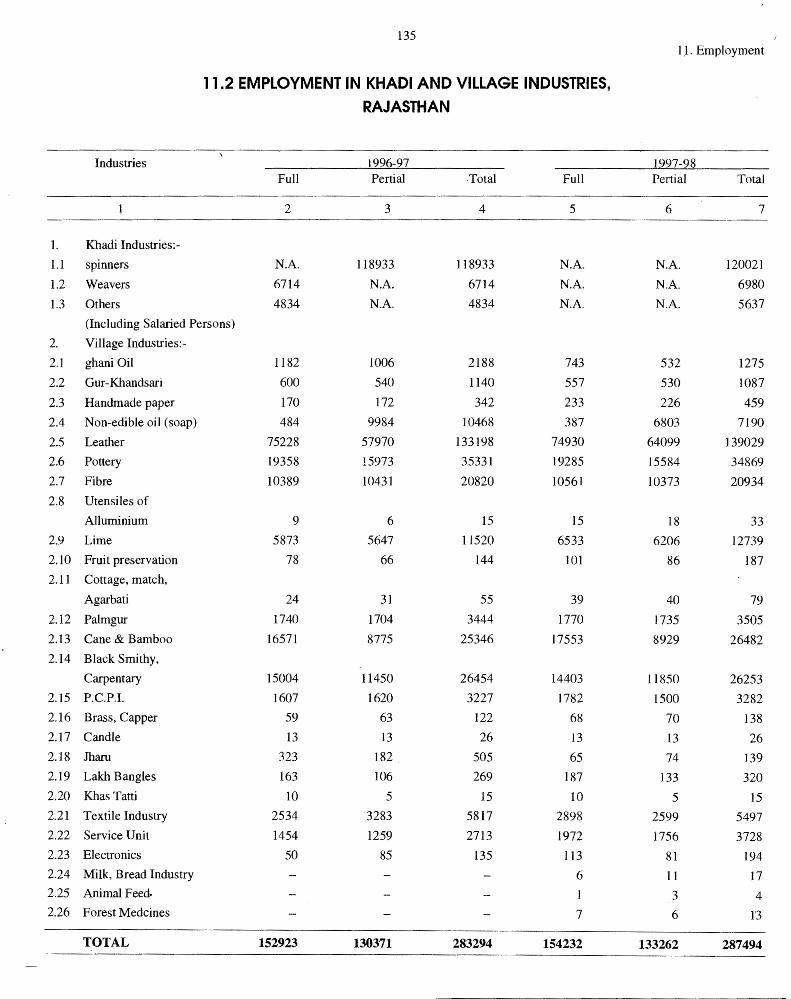
1.
1.1
1.2
1.3
2. 2.1
2.2
2.3
2.4
2.5 2.6
2.7
2.8
2.9
2.10
2.11
2.12
2.13 2.14
2.15 2.16
2.17
2.18
2.19
2.20
2.21
2.22 2.23 2.24 2.25 2.26
Industries
Khadi Industries:-
spinners
Weavers
Others
135
11.2 EMPLOYMENT IN KHADI AND VILLAGE INDUSTRIES, RAJASTHAN
1996-97 Full Pertial Total Full
2 3 4 5
N.A. 118933 118933 N.A.
6714 N.A. 6714 N.A.
4834 N.A. 4834 N.A.
(Including Salaried Persons)
Village Industries:-
ghani Oil 1182 1006 2188 743
Gur-Khandsari 600 540 1140 557
Handmade paper 170 172 342 233
Non-edible oil (soap) 484 9984 10468 387
Leather 75228 57970 133198 74930
Pottery 19358 15973 35331 19285
Fibre 10389 10431 20820 10561 Utensiles of
Alluminium 9 6 15 15 Lime 5873 5647 11520 6533 Fruit preservation 78 66 144 101 Cottage, match,
Agarbati 24 31 55 39
Palmgur 1740 1704 3444 1770 Cane & Bamboo 16571 8775 25346 17553 Black Smithy,
Carpentary 15004 11450 26454 14403 P.C.P.I. 1607 1620 3227 1782 Brass, Capper 59 63 122 68 Candle 13 13 26 13 Jharu 323 182 505 65 Lakh Bangles 163 106 269 187 Khas Tatti 10 5 15 10
Textile Industry 2534 3283 5817 2898 Service Unit 1454 1259 2713 1972 Electronics 50 85 135 113 Milk, Bread Industry 6 Animal Feed.
Forest Medcines 7
TOTAL 152923 130371 283294 154232
U. Employment
1997-98 Pertial Total
6 7
N.A. 120021
N.A. 6980 N.A. 5637
532 1275
530 1087
226 459
6803 7190
64099 139029 15584 34869
10373 20934
18 33 6206 12739
86 187
40 79
1735 3505
8929 26482
11850 26253 1500 3282
70 138
13 26
74 139 133 320
5 15 2599 5497 1756 3728
81 194 11 17 3 4 6 1'3
133262 287494
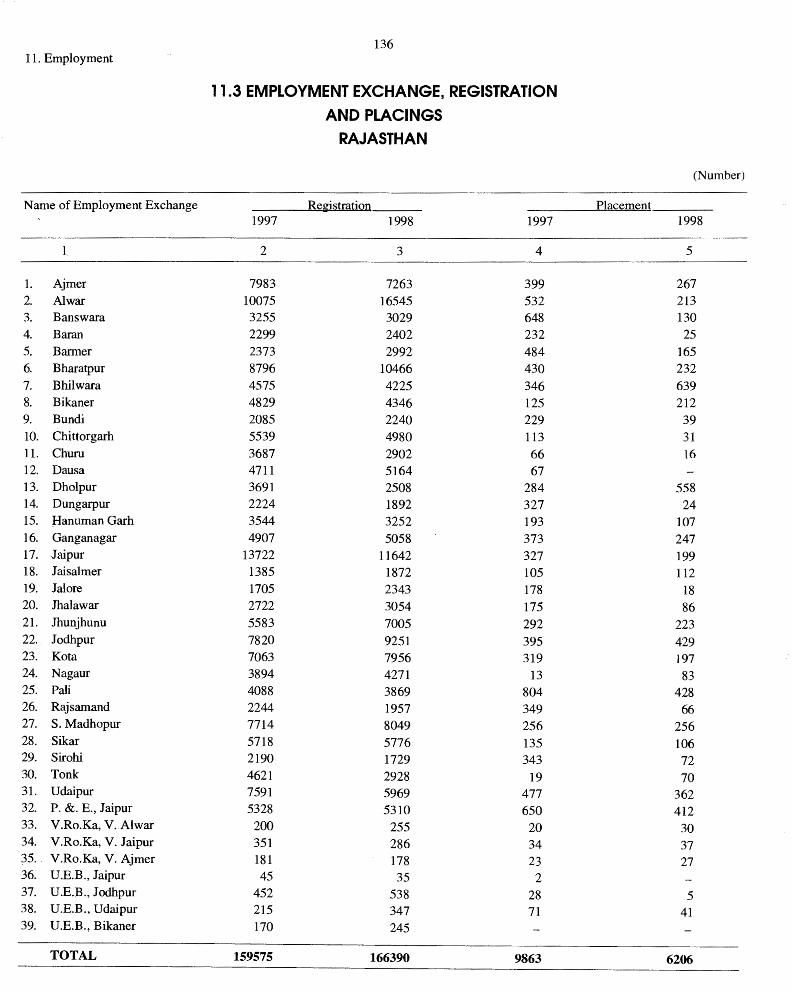
136 I I. Employment
11.3 EMPLOYMENT EXCHANGE, REGISTRATION
AND PLACINGS RAJASTHAN
(Number)
Name of Employment Exchange Registration Placement 1997 1998 1997 1998
2 3 4 5
I. Ajmer 7983 7263 399 267 2. Al war 10075 16545 532 213 3. Banswara 3255 3029 648 130 4. Baran 2299 2402 232 25 5. Barmer 2373 2992 484 165 6. Bharatpur 8796 10466 430 232 7. Bhilwara 4575 4225 346 639 8. Bikaner 4829 4346 125 212 9. Bundi 2085 2240 229 39 10. Chittorgarh 5539 4980 113 31 11. Churn 3687 2902 66 16 12. Dausa 4711 5164 67 13. Dholpur 3691 2508 284 558 14. Dungarpur 2224 1892 327 24 15. Hanuman Garh 3544 3252 193 107 16. Ganganagar 4907 5058 373 247 17. .Jaipur 13722 11642 327 199 18. Jaisalmer 1385 1872 105 112 19. Jal ore 1705 2343 178 18 20. Jhalawar 2722 3054 175 86 21. Jhunjhunu 5583 7005 292 223 22. Jodhpur 7820 9251 395 429 23. Ko ta 7063 7956 319 197 24. Nagaur 3894 4271 13 83 25. Pali 4088 3869 804 428 26. Rajsamand 2244 1957 349 66 27. S.Madhopur 7714 8049 256 256 28. Sikar 5718 5776 135 106 29. Sirohi 2190 1729 343 72 30. Tonk 4621 2928 19 70 31. Udaipur 7591 5969 477 362 32. P. &. E., Jaipur 5328 5310 650 412 33. V.Ro.Ka, V.Alwar 200 255 20 30 34. V.Ro.Ka, V. Jaipur 351 286 34 37 35. V.Ro.Ka, V. Ajmer 181 178 23 27 36. U.E.B., Jaipur 45 35 2 37. U.E.B., Jodhpur 452 538 28 5 38. U.E.B., Udaipur 215 347 71 41 39. U.E.B., Bikaner 170 245
TOTAL 159575 166390 9863 6206
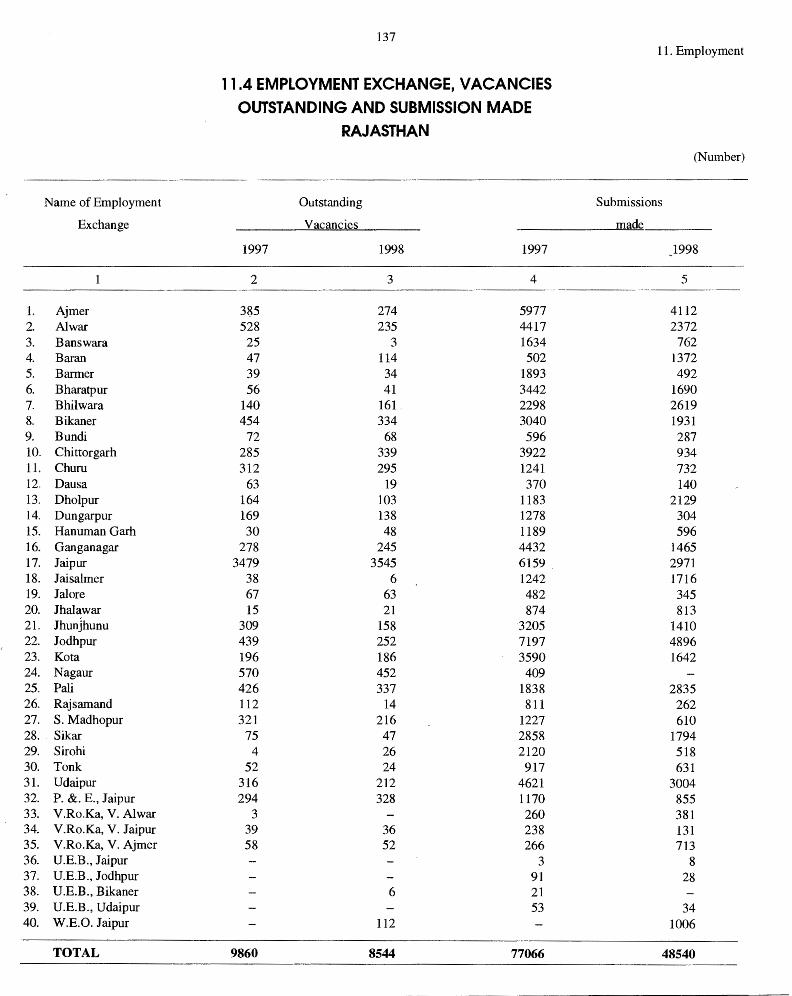
137 11. Employment
11.4 EMPLOYMENT EXCHANGE, VACANCIES OUTSTANDING AND SUBMISSION MADE
RAJASTHAN
(Number)
Name of Employment Outstanding Submissions
Exchange Vacancies made
1997 1998 1997 1998 -
2 3 4 5
1. Ajmer 3$5 274 5977 4112 2. Al war 528 235 4417 2372 3. Banswara 25 3 1634 762 4. Baran 47 114 502 1372 5. Barmer 39 34 1893 492 6. Bharatpur 56 41 3442 1690 7. Bhilwara 140 161. 2298 2619 8. Bikaner 454 334 3040 1931 9. Bundi 72 68 596 287 10. Chittorgarh 285 339 3922 934 11. Churn 312 295 1241 732 12. Dausa 63 19 370 140 13. Dholpur 164 103 1183 2129 14. Dungarpur 169 138 1278 304 15. Hanuman Garh 30 48 1189 596 16. Ganganagar 278 245 4432 1465 17. Jaipur 3479 3545 6159 2971 18. Jaisalmer 38 6 1242 1716 19. Jalore 67 63 482 345 20. Jhalawar 15 21 874 813 21. Jhunjhunu 309 158 3205 1410 22. Jodhpur 439 252 7197 4896 23. Ko ta 196 186 3590 1642 24. Nagaur 570 452 409 25. Pali 426 337 1838 2835 26. Rajsamand 112 14 811 262 27. S. Madhopur 321 216 1227 610 28. Sikar 75 47 2858 1794 29. Sirohi 4 26 2120 518 30. Tonk 52 24 917 631 31. Udaipur 316 212 4621 3004 32. P. &. E., Jaipur 294 328 1170 855 33. V.Ro.Ka, V. Alwar 3 260 381 34. V.Ro.Ka, V. Jaipur 39 36 238 131 35. V.Ro.Ka, V. Ajmer 58 52 266 713 36. U.E.B., Jaipur 3 8 37. U.E.B., Jodhpur 91 28 38. U.E.B., Bikaner 6 21 39. U.E.B., Udaipur 53 34 40. W.E.0. Jaipur 112 1006
TOTAL 9860 8544 77066 48540

138 11. Employment
11.5 APPLICATIONS ON LIVE REGISTER ACCORDING TO TRADE CLASSIFICATION
RAJASTHAN
Particulars
1. Commercial, Technical & others Related
2. Administrative & Managerial
3. Clerks & Similar other works
4. Salesman
5. Agriculture, Fishers, Honters etc.
6. Service Class Persons
7. Production Related & Transport and Communications
(including Railways) Artists, Lawyers. and news workers
8. Unclassified workers
TOTAt,
1997
2
122567
358
4834
17
15036
1051
28724
711766
884353
11.6 EMPLOYMENT EXCHANGE, VACANCIES NOTIFIED
Employer
1. Central Government
2. State Government
3. Quasi-Government and Local Bodies
4. N on-Goyemment
TOTAL
AND FILLED BY EMPLOYERS RAJ AST HAN
Vacancies Notified
1997 1998
2 3
1983 1016
4477 2946
3417 1365
3552 3995
13429 9322
1997
4
1094
5044
2650
894
9682
(Number)
1998
3
132400
364
4677
19
14889
1114
30066
721444
904973
(Number)
Vacancies Filled
1998
5
835
2799
899
1492
6025
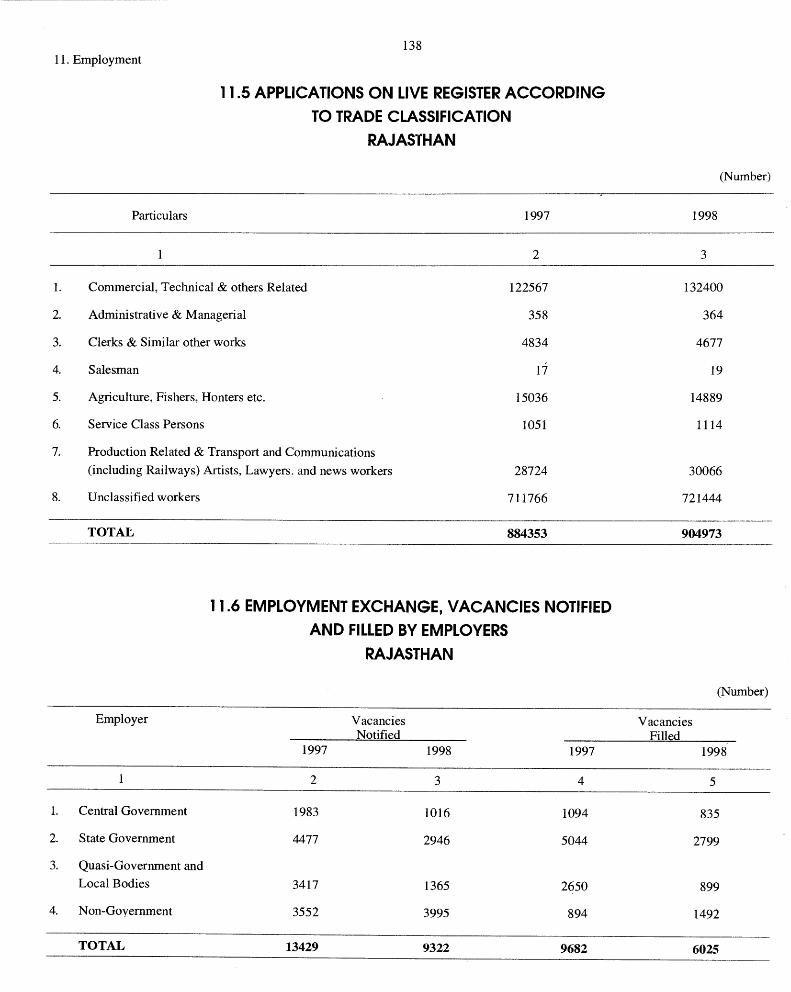

139 11. Employment
11.7 EMPLOYMENT IN PUBLIC SECTOR (INDUSTRIES AND SERVICES)
RAJASTHAN
(Number)
Establishment as on 31 December Total Estimated
1997 1998 Emplo):'.ment Branch/Industry Addre- Res po- Addre- Res po 1997 1998
ssed nded ssed nded
2 3 4 5 6 7
RAJASTHAN 12685 11310 12871 11741 1013474 1016535
A. Classification by Branches
1. Central Govt. 535 456 532 468 168761 166563
2. State Govt. 7676 6914 7844 7164 524428 530144
3. Quasi Govt. 3985 3515 4004 3679 192849 193180
4. Local Bodies 489 425 491 430 127446 126648
B. Classified by Industries.
0. Agri., Live Stock,
Fishing etc. 432 394 412 376 22022 21191
1. Mining & Quarrying 84 74 84 78 20038 19637
2. & 3. Manufacturing 115 108 113 107 27587 26729
4. Electricity, Water
Gas and Sanitary
Services 1163 977 1192 1013 78674 79052
5. Construction 810 713 819 722 42829 43593
6. Trade and Commerce 279 . 254 281 258 6139 6143
7. Transport, Storage
and Communication 248 210 246 220 163200 162182
8. Services 2307 2046 2322 2177 54318 55223
9. Community, social and 7247 6534 7402 6790 598667 602685
personal service

11. Employment
Monthly Pay Ranges
1. Below Rs. 800/-
2. 800-900
3. 900-1000
4. 1000-1200
5. 1200-1500
6. 1500-1800
7. 1800-2000
8. 2000-2200
9. 2200-2500
10. 2500-2700
11. 2700-3000
12. 3000-3500
13. 3500-4000
14. 4000-above
TOTAL
140
11.8 DISTRIBUTION OF RAJASTHAN GOVERNMENT EMPLOYEES BY PAY RANGE
Non-gazetted- Gazetted Total Employees Employees Employees (No.) as on (No.) as on (No.) as on
31.3.96 31.3.96 31.3.96
2 3 4
30941 30941
42041 42041
51879 51879
50779 50779
90210 90210
69625 420 70045
39779 244 40023
28871 8692 37563
23328 10147 33475
5958 8180 14138
2448 5768 8216
5195 5195
3075 3075
3303 3303
435859 45024 480883
* Weighted Average Monthly Pay.
Average Monthly·
Empluments As on
31.3.96 (Rs.)
5
1692
2268
3110
3831
4039
4419
5131
5818
6265
7125
7940
8575
9603
16619
4332* -
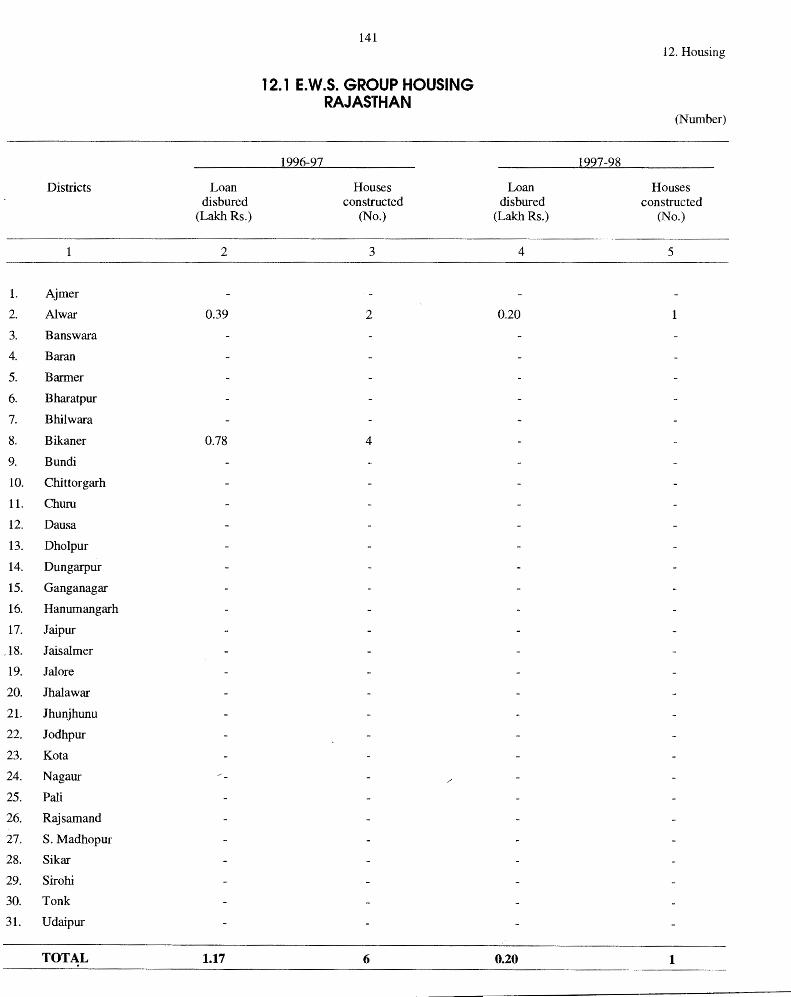
141 12. Housing
12.1 E.W.S. GROUP HOUSING RAJASTHAN
(Number)
1996-97 1997-98
Districts Loan Houses Loan Houses disbured constructed disbured constructed
(Lakh Rs.) (No.) (Lakh Rs.) (No.)
2 3 4 5
1. Ajmer
2. Al war 0.39 2 0.20
3. Banswara
4. Baran
5. Barmer
6. Bharatpur
7. Bhilwara
8. Bikaner 0.78 4
9. Bundi
10. Chittorgarh
11. Chum
12. Dausa
13. Dholpur
14. Dungarpur
15. Ganganagar
16. Hanumangarh
17. Jaipur
.18. Jaisalmer
19. Jal ore
20. Jhalawar
21. Jhunjhunu
22. Jodhpur
23. Ko ta
24. Nagaur
25. Pali
26. Rajsamand
27. S.Madhopur
28. Sikar
29. Sirohi
30. Tonk
31. Udaipur
TOTAL 1.17 6 0.20 1

142 12. Housing
12.2 LOW INCOME GROUP HOUSING RAJASTHAN
(Number)
1996-97 1997-98
District Loan Houses Loan Houses disbured constructed disbured constructed
(Lakh Rs.) (No.) (Lakh Rs.) (No.)
2 3 4 5
1. Ajmer 0.84 2 1.26 3
2. Al war 0.63 2 1.04 1
3. Banswara 2.IO IO
4. Baran
5. Barmer 1.56 12 0.74 2
6. Bharatpur 2.84 12 1.46 IO
7. Bhilwara 1.22 2 0.25 2
8. Bikaner 24.00 14.68 64
9. Bundi 2.16 14 0.98 7
IO. Chittorgarh 1.18
11. Churu
12. Dausa
13. Dholpur 0.25
14. Dungarpur 0.22 1
15. Ganganagar 1.76 4 0.77 6
16. Hanumangarh
17. Jaipur 0.42 2
18. Jaisalmer 5.00 8
19. Jal ore
20. Jhalawar
21. Jhunjhunu 1.68 4 0.42 2
22. Jodhpur 0.21
23. Ko ta
24. Nagaur 20.41 50 1.55 22
25. Pali 5.04 12 Z,.94 7 26. Rajsamand
27. S.Madhopur 1.18 4
28. Sikar
29. Sirohi
30. Tonk 0.18
31. Udaipur 3
TOTAL 69.38 131 31.43 144
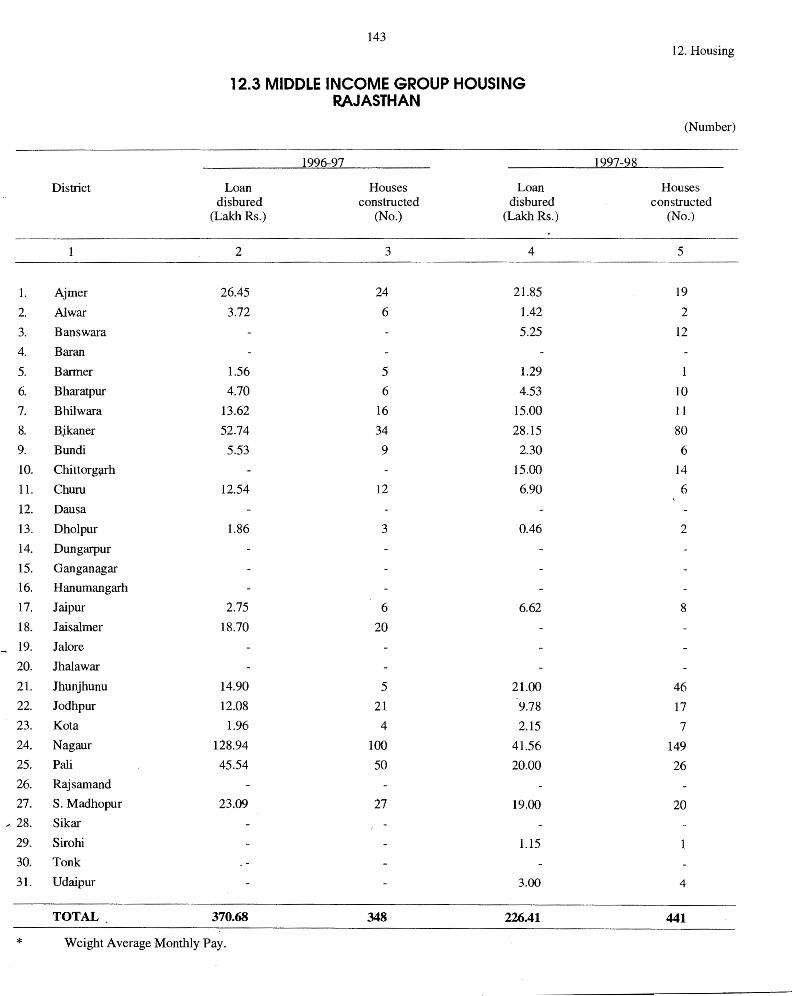
143 12. Housing
12.3 MIDDLE INCOME GROUP HOUSING RAJASTHAN
(Number)
1996-97 1997-98
District Loan Houses Loan Houses disbured constructed disbured constructed
(Lakh Rs.) (No.) (Lakh Rs.) (No.)
2 3 4 5
1. Ajmer 26.45 24 21.85 19
2. Al war 3.72 6 1.42 2
3. Banswara 5.25 12
4. Baran
5. Barmer 1.56 5 1.29 I
6. Bharatpur 4.70 6 4.53 10
7. Bhilwara 13.62 16 15.00 1 I
8. Bjkaner 52.74 34 28.15 80
9. Bundi 5.53 9 2.30 6
10. ChittorgSlrh 15.00 14
11. Chum 12.54 12 6.90 6
12. Dausa
13. Dholpur 1.86 3 0.46 2
14. Dungarpur
15. Ganganagar
16. Hanumangarh
17. Jaipur 2.75 6 6.62 8
18. Jaisalmer 18.70 20
19. Jal ore
20. Jhalawar
21. Jhunjhunu 14.90 5 21.00 46
22. Jodhpur 12.08 21 9.78 17
23. Kota 1.96 4 2.15 7
24. Nagaur 128.94 100 41.56 149
25. Pali 45.54 50 20.00 26
26. Rajsamand
27. S.Madhopur 23.09 27 19.00 20
... 28. Sikar
29. Sirohi 1.15
30. Tonk
31. Udaipur 3.00 4
TOTAL 370.68 348 226.41 441
* Weight Average Monthly Pay.
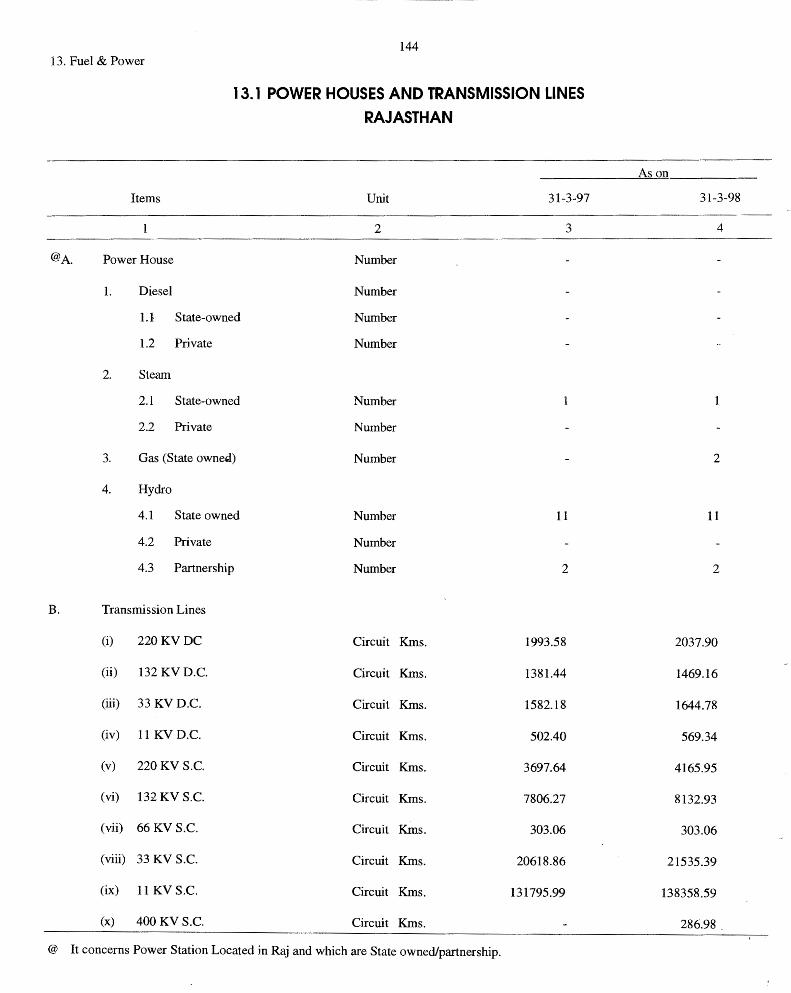
144 13. Fuel & Power
13. 1 POWER HOUSES AND TRANSMISSION LINES RAJASTHAN
Items Unit 31-3-97
2 3
@A. Power House Number
1. Diesel Number
u State-owned Number
1.2 Private Number
2. Steam
2.1 State-owned Number
2.2 Private Number
3. Gas (State owne'1) Number
4. Hydro
4.1 State owned Number 11
4.2 Private Number
4.3 Partnership Number 2
B. Transmission Lines
(i) 220KVDC Circuit Kms. 1993.58
(ii) 132 KVD.C. Circuit Kms. 1381.44
(iii) 33 KVD.C. Circuit Kms. 1582.18
(iv) 11 KVD.C. Circuit Kms. 502.40
(v) 220 KV S.C. Circuit Kms. 3697.64
(vi) 132KV S.C. Circuit Kms. 7806.27
(vii) 66 KV S.C. Circuit Kms. 303.06
(viii) 33 KV S.C. Circuit Kms. 20618.86
(ix) 11 KV S.C. Circuit Kms. 131795.99
(x) 400 KV S.C. Circuit Kms.
@ It concerns Power Station Located in Raj and which are State owned/partnership.
As on
31-3-98
4
2
11
2
2037.90
1469.16
1644.78
569.34
4165.95
8132.93
303.06
21535.39
138358.59
286.98.
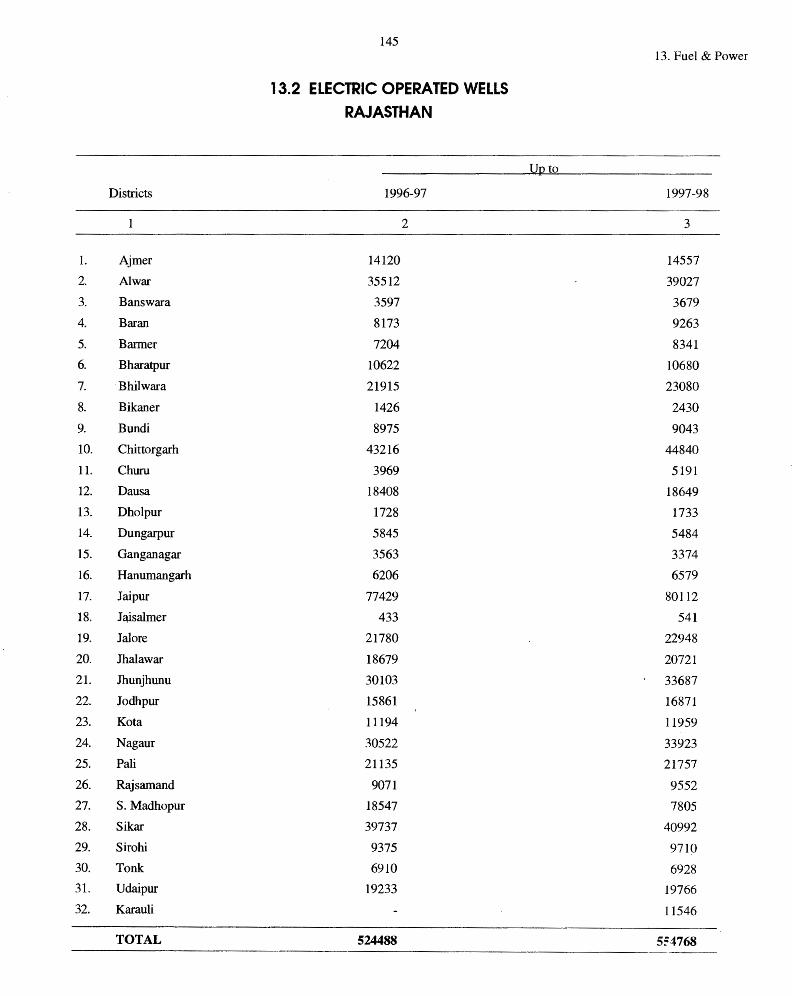
Districts
1. Ajmer
2. Al war
3. Banswara
4. Baran
5. Barmer
6. Bharatpur
7. Bhilwara
8. Bikaner
9. Bundi
10. Chittorgarh
11. Chum
12. Dausa
13. Dholpur
14. Dungarpur
15. Ganganagar
16. Hanumangarh
17. Jaipur
18. J~salmer
19. Jal ore
20. Jhalawar
21. Jhunjhunu
22. Jodhpur
23. Ko ta
24. Nagaur
25. Pali
26. Rajsamand
27. S. Madhopur
28. Sikar
29. Sirohi
30. Tonk
31. Udaipur
32. Karauli
TOTAL
145
13.2 ELECTRIC OPERATED WELLS RAJASTHAN
1996-97
2
14120
35512
3597
8173
7204
10622
21915
1426
8975
43216
3969
18408
1728
5845
3563
6206
77429
433
21780
18679
30103
15861
11194
30522
21135
9071
18547
39737
9375
6910
19233
524488
13. Fuel & Power
U to
1997-98
3
14557
39027
3679
9263
8341
10680
23080
2430
9043
44840
5191
18649
1733
5484
3374
6579
80112
541
22948
20721
33687
16871
11959
33923
21757
9552
7805
40992
9710
6928
19766
11546
5::4768
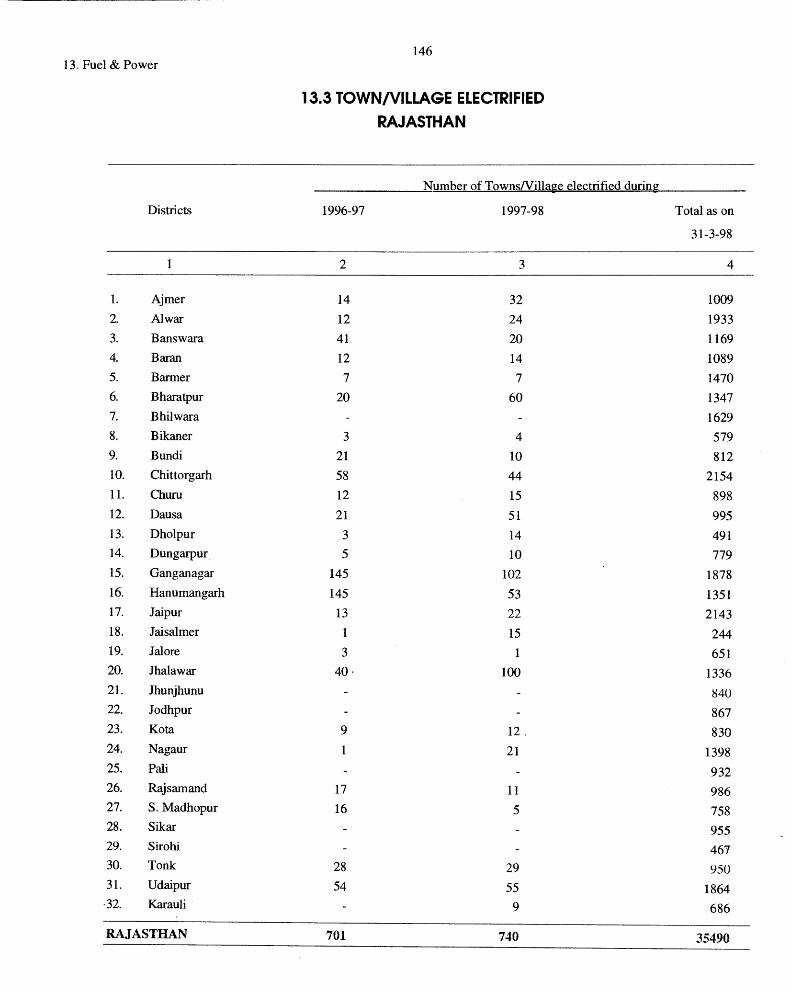
13. Fuel & Power
Districts
1. Ajmer
2. Al war
3. Banswara
4. Baran
5. Barmer
6. Bharatpur
7. Bhilwara
8. Bikaner
9. Bundi
10. Chittorgarh
11. Churu
12. Dausa
13. Dholpur
14. Dungarpur
15. Ganganagar
16. Hanumangarh
17. Jaipur
18. Jaisalmer
19. Jalore
20. Jhalawar
21. Jhunjhunu
22. Jodhpur
23. Ko ta
24. Nagaur
25. Pali
26. Rajsamand
27. S.Madhopur
28. Sikar
29. Sirohi
30. Tonk
31. Udaipur
·32. Karauli
RAJASTHAN
146
13.3 TOWNNILLAGE ELECTRIFIED RAJASTHAN
Number of TownsNillage electrified during
1996-97 1997-98
2 3
14 32
12 24
41. 20
12 14
7 7
20 60
3 4
21 10
58 44
12 15
21 51
3 14
5 10
145 102
145 53
13 22
1 15
3 1
40. 100
9 12.
21
17 11
16 5
28 29 54 55
9
701 740
Total as on
31-3-98
4
1009
1933
1169
1089
1470
1347
1629
579
812
2154
898
995
491
779
1878
1351
2143
244
651
1336
840
867
830
1398
932
986
758
955
461
950
1864
686
35490
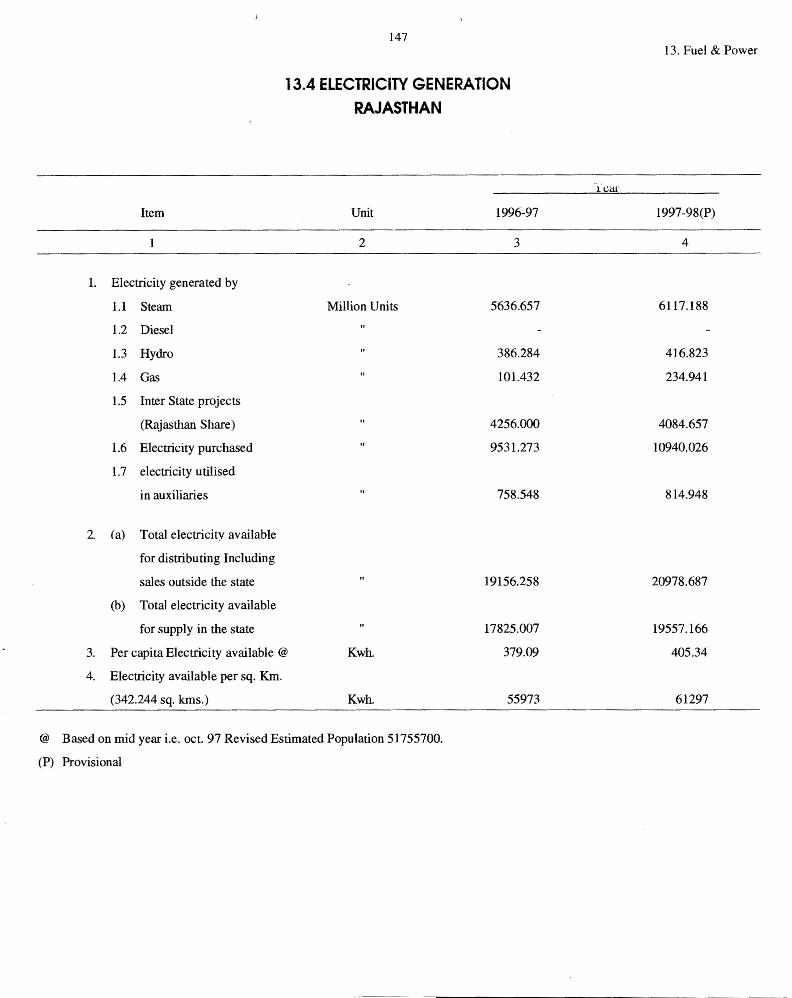
@
(P)
Item
1. Electricity generated by
1.1 Steam
1.2 Diesel
1.3 Hydro
1.4 Gas
1.5 Inter State projects
(Rajasthan Share)
1.6 Electricity purchased
1.7 electricity utilised
in auxiliaries
2. (a) Total electricity available
for distributing Including
sales outside the state
(b) Total electricity available
for supply in the state
147
13.4 ELECTRICITY GENERATION RAJASTHAN
Unit 1996-97
2 3
Million Units 5636.657
386.284
101.432
4256.000
9531.273
758.548
19156.258
" 17825.007
3. Per capita Electricity available @ Kwh. 379.09
4. Electricity available per sq. Km.
(342.244 sq. kms.) Kwh. 55973
Based on mid year i.e. oct. 97 Revised Estimated Population 51755700.
Provisional
13. Fuel & Power
"i ~al
1997-98(P)
4
6117.188
416.823
234.941
4084.657
10940.026
814.948
20978.687
19557.166
405.34
61297
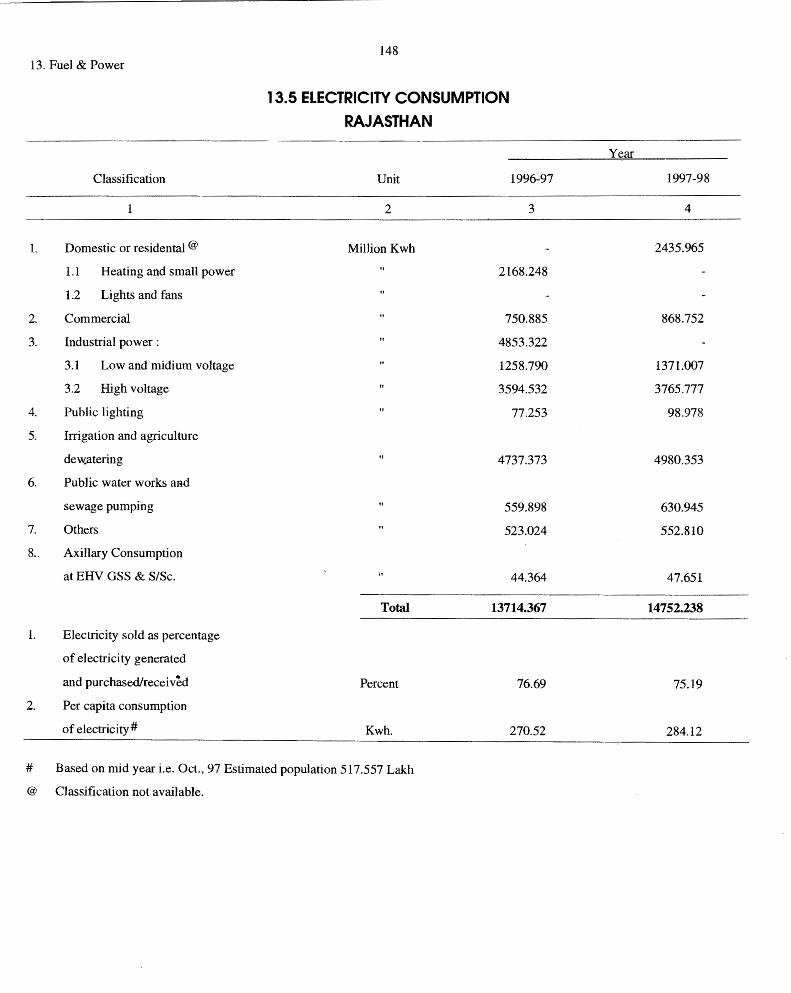
148 13. Fuel & Power
13.5 ELECTRICITY CONSUMPTION
RAJASTHAN
Year
Classification Unit 1996-97 1997-98
2 3 4
1. Domestic or residental @ Million Kwh 2435.965
1.1 Heating and small power 2168.248
1.2 Lights and fans
2. Commercial 750.885 868.752
3. Industrial power: 4853.322
3.1 Low and-midium voltage 1258.790 1371.007
3.2 High voltage 3594.532 3765.777
4. Public lighting 77.253 98.978
5. Irrigation and agriculture
de~atering 4737.373 4980.353
6. Public water works aRd
sewage pumping 559.898 630.945
7. Others 523.024 552.810
8 .. Axillary Consumption
at EHV GSS & S!Sc. 44.364 47.651
Total 13714.367 14752.238
1. Electricity sold as percentage
of electricity generated
and purchased/received Percent 76.69 75.19
2. Per capita consumption
of electricity# Kwh. 270.52 284.12
# Based on mid year i.e. Oct., 97 Estimated population 517.557 Lakh
@ Classification not available.

Type of Vehicles
1. Motorised Rickshaws
149
14.1 REGISTRATION OF MOTOR VEHICLES RAJASTHAN
1996-97
• 2
2. Auto/Motorised Cycle & Scooters 90
1325605 3. Tempo
(i) Goods vehicle (ii) Passenger vehicle
4. Auto Rickshaws 5. Car/Station Wagons 6. Jeep 7. Tractors 8. Trail ors 9. Taxis 10. Buses/Mini Buses 11. Trucks 12. Others
I.
2. 3. 4. 5.
TOTAL
Type
Painted (B.T.) Metalled (W.B.M.) Graveiled Fair weather and dressed up tracks National highways
TOTAL
* Maintined by P.W.D.
2422 5231
29206 91965 74688
248375 46233 14476 36-1-43
1048~,q I
2888
1985532
14.2 ROAOS* RAJASTHAN
1996-97
2
5)419 5388
11139 155
2846
74947
14.3 ROAD BY NAGPUR CLASSIFICATION RAJASTHAN
Classification 1996-97
2
1. National Highways 2846 2. State Highways 10047 3. Major district roads 5820 4. Other district roads 12684 5: village roads 43550
TOTAL 74947
14. Transport & Communication
(Number)
1997-98
3
90 1472889
2882 5527
31971 101768 85410
276100 48155 15593 40239
116213 2962
2199799
(Kilometres)
1997-98
3
62173 5797
10421 102
2964
81457
(Kilometres)
1997-98
3
2964 10039 5760
12792 46938
78493
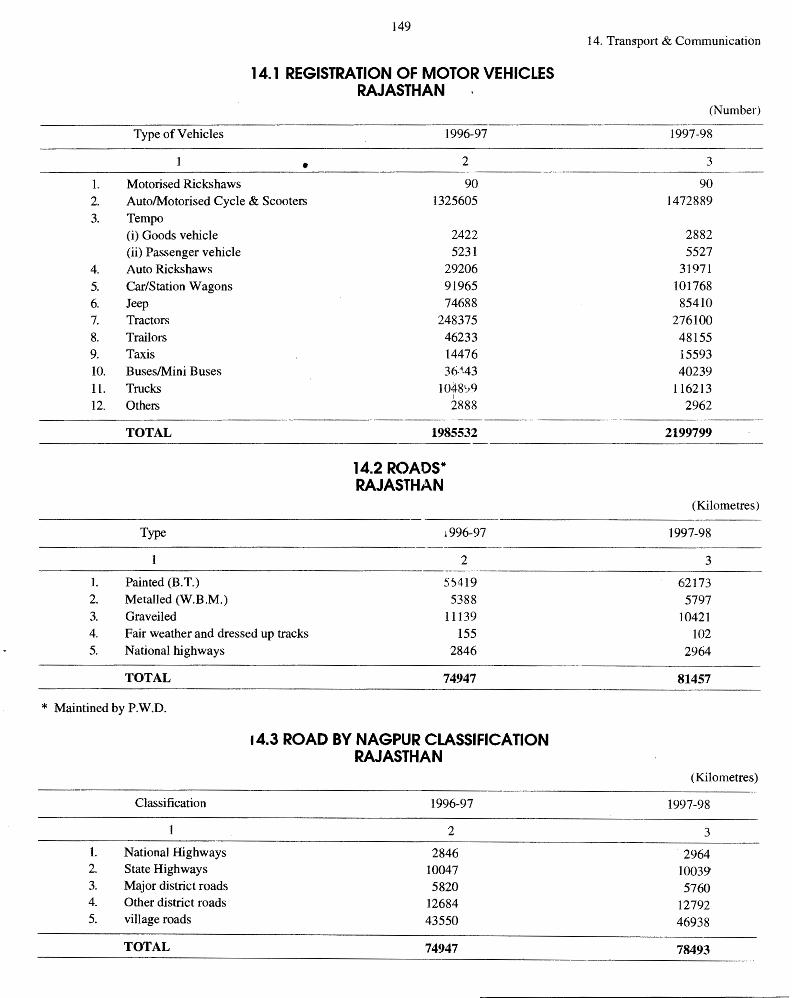
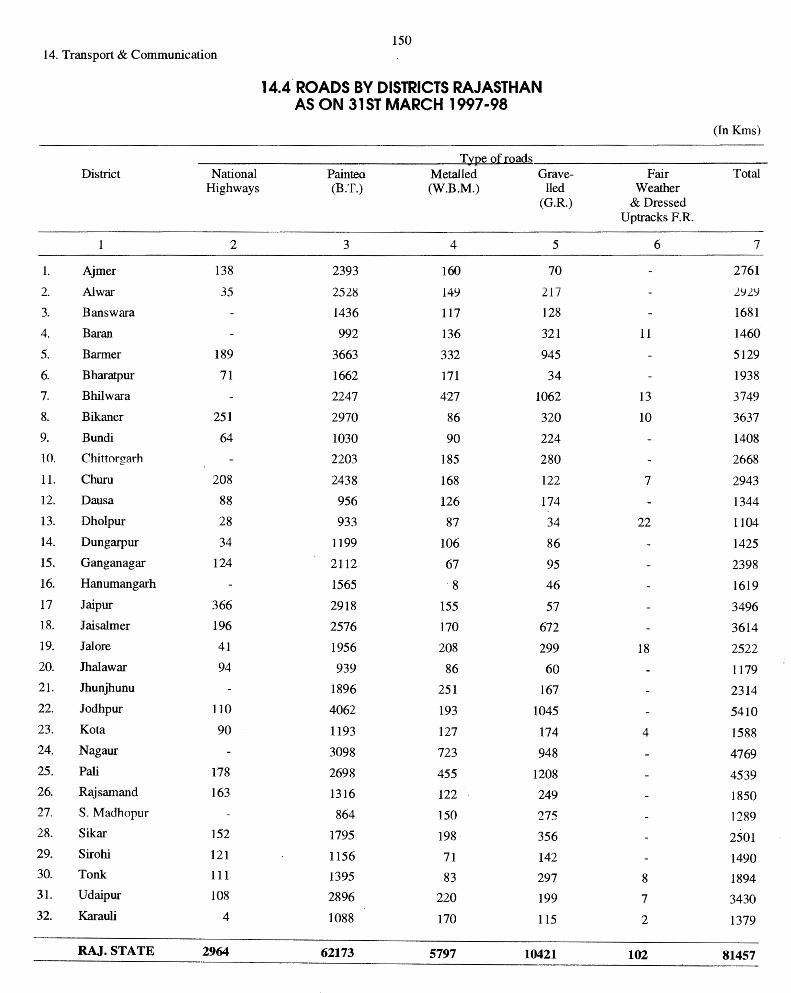
150 14. Transport & Communication
14.4 ROADS BY DISTRICTS RAJASTHAN AS ON 31 ST MARCH 1997 -98
(In Kms)
T:xpe of roads District National Painteo Metalled Grave- Fair Total
Highways (B.T.) (W.B.M.) lled Weather (G.R.) & Dressed
Uptracks F.R.
2 3 4 5 6 7
1. Ajmer 138 2393 160 70 2761
2. Al war 35 2528 149 217 2929
3. Banswara 1436 117 128 1681
4. Baran 992 136 321 11 1460
5. Barmer 189 3663 332 945 5129
6. Bharatpur 71 1662 171 34 1938
7. Bhilwara 2247 427 1062 13 3749
8. Bikaner 251 2970 86 320 IO 3637
9. Bundi 64 1030 90 224 1408
10. Chittorgarh 2203 185 280 2668
11. Churu 208 2438 168 122 7 2943 12. Dausa 88 956 126 174 1344 13. Dholpur 28 933 87 34 22 1104 14. Dungarpur 34 1199 106 86 1425 15. Ganganagar 124 2112 67 95 2398 16. Hanumangarh 1565 ·8 46 1619 17 Jaipur 366 2918 155 57 3496 18. Jaisalmer 196 2576 170 672 3614 19. Jal ore 41 1956 208 299 18 2522 20. Jhalawar 94 939 86 60 1179 21. Jhunjhunu 1896 251 167 2314 22. Jodhpur 110 4062 193 1045 5410 23. Ko ta 90 1193 127 174 4 1588 24. Nagaur 3098 723 948 4769 25. Pali 178 2698 455 1208 4539 26. Rajsamand 163 1316 122 249 1850 27. S. Madhopur 864 150 275 1289 28. Sikar 152 1795 198 356 2501 29. Sirohi 121 1156 71 142 1490 30. Tonk 111 1395 83 297 8 1894 31. Udaipur 108 2896 220 199 7 3430 32. Karauli 4 1088 170 115 2 1379
RAJ.STATE 2964 62173 5797 10421 102 81457
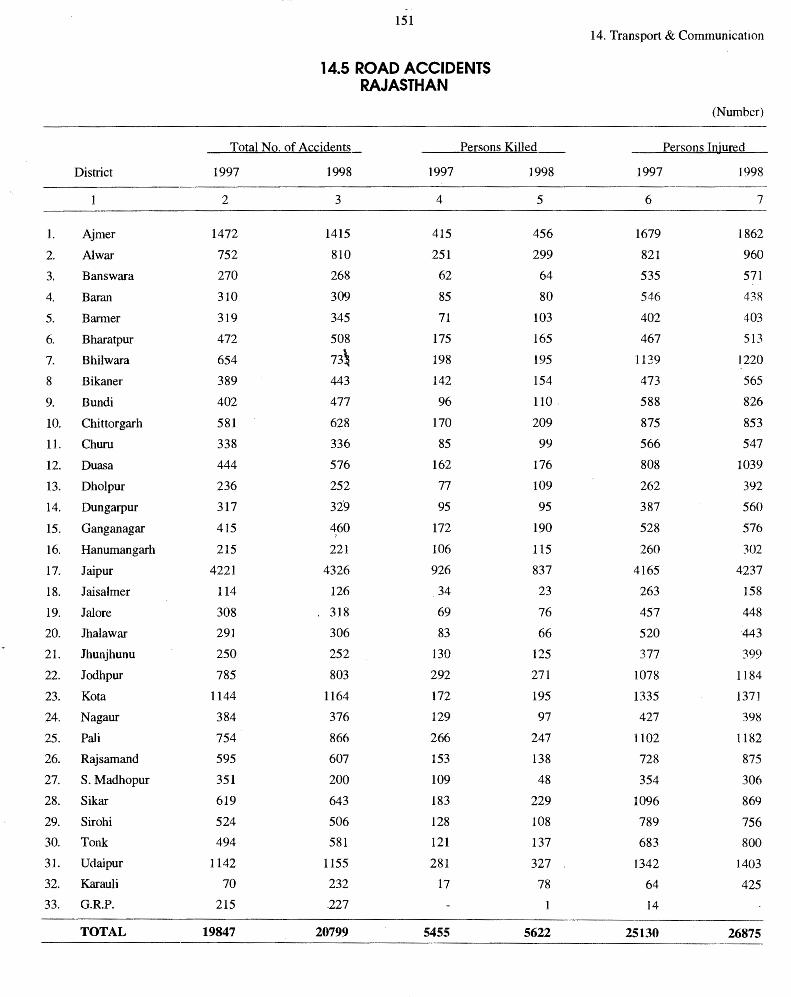
151 14. Transport & Communication
14.5 ROAD ACCIDENTS RAJASTHAN
(Number)
Total No. of Accidents Persons Killed Persons Injured
District 1997 1998 1997 1998 1997 1998
2 3 4 5 6 7
1. Ajmer 1472 1415 415 456 1679 1862
2. Al war 752 810 251 299 821 960
3. Banswara 270 268 62 64 535 571
4. Baran 310 309 85 80 546 438
5. Barmer 319 345 71 103 402 403
6. Bharatpur 472 508 175 165 467 513
7. Bhilwara 654 73, 198 195 1139 1220
8 Bikaner 389 443 142 154 473 565
9. Bundi 402 477 96 110 588 826
10. Chittorgarh 581 628 170 209 875 853
11. Churu 338 336 85 99 566 547
12. Du as a 444 576 162 176 808 1039
13. Dholpur 236 252 77 109 262 392
14. Dungarpur 317 329 95 95 387 560
15. Ganganagar 415 460 172 190 528 576
16. Hanumangarh 215 221 106 115 260 302
17. Jaipur 4221 4326 926 837 4165 4237
18. Jaisalmer 114 126 34 23 263 158
19. Jalore 308 318 69 76 457 448
20. Jhalawar 291 306 83 66 520 443
21. Jhunjhunu 250 252 130 125 377 399
22. Jodhpur 785 803 292 271 1078 1184
23. Ko ta 1144 1164 172 195 1335 1371
24. Nagaur 384 376 129 97 427 398
25. Pali 754 866 266 247 1102 1182
26. Rajsamand 595 607 153 138 728 875
27. S. Madhopur 351 200 109 48 354 306
28. Sikar 619 643 183 229 1096 869
29. Sirohi 524 506 128 108 789 756
30. Tonk 494 581 121 137 683 800
31. Udaipur 1142 1155 281 327 1342 1403
32. Karauli 70 232 17 78 64 425 33. G.R.P. 215 .227 14
TOTAL 19847 20799 5455 5622 25130 26875
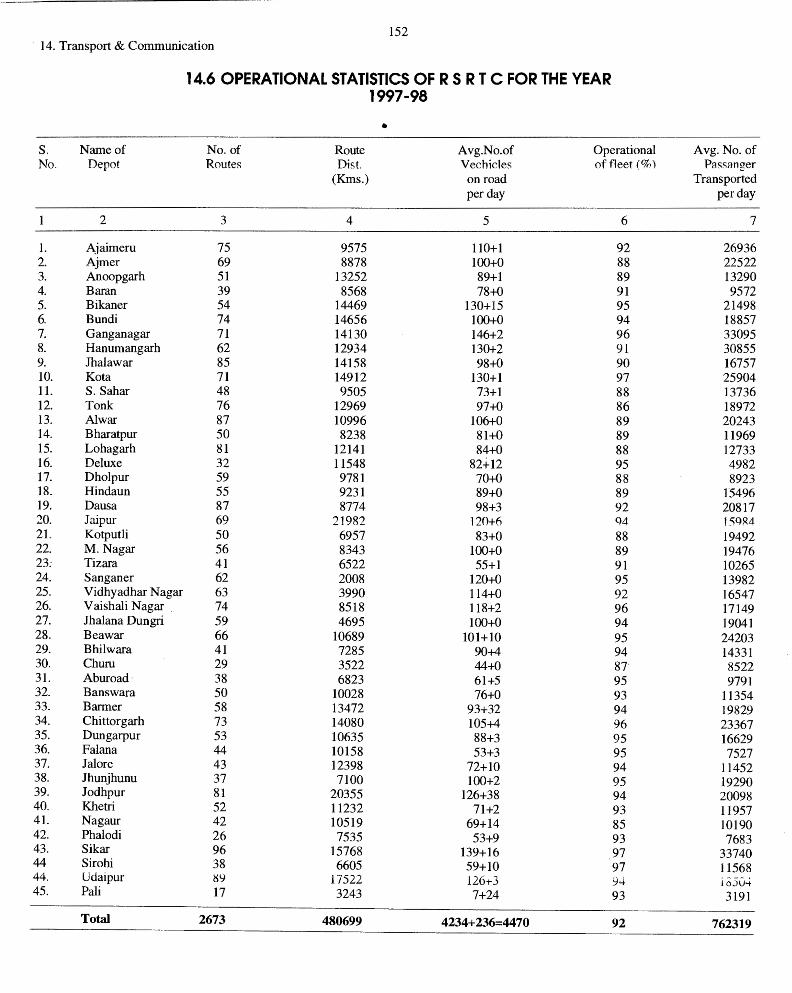
152 14. Transport & Communication
14.6 OPERATIONAL STATISTICS OF RS RT C FOR THE YEAR 1997-98
• S. Name of No. of Route Avg.No.of Operational Avg. No. of No. Depot Routes Dist. Vechicles of fleet(%) Passt=1nger
(Kms.) on road Transported per day per day
2 3 4 5 6 7
1. Ajaimeru 75 9575 110+1 92 26936 2. Ajmer 69 8878 100+0 88 22522 3. Anoopgarh 51 13252 89+1 89 13290 4. Baran 39 8568 78+0 91 9572 5. Bikaner 54 14469 130+15 95 21498 6. Bundi 74 14656 100+0 94 18857 7. Ganganagar 71 14130 146+2 96 33095 8. Hanumangarh 62 12934 130+2 91 30855 9. Jhalawar 85 14158 98+0 90 16757 10. Ko ta 71 14912 130+1 97 25904 11. S. Sahar 48 9505 73+1 88 13736 12. Tonk 76 12969 97+0 86 18972 13. Al war 87 10996 106+0 89 20243 14. Bharatpur 50 8238 81+0 89 11969 15. Lohagarh 81 12141 84+0 88 12733 16. Deluxe 32 11548 82-i-12 95 4982 17. Dholpur 59 9781 70+0 88 8923 18. Hindaun 55 9231 89+0 89 15496 19. Dausa 87 8774 98+3 92 20817 20. Jaipur 69 21982 120+6 94 159~4
21. Kotputli 50 6957 83+0 88 19492 22. M. Nagar 56 8343 100+0 89 19476 23: Tizara 41 6522 55+1 91 10265 24. Sanganer 62 2008 120+0 95 13982 25. Vidhyadhar N agar 63 3990 114+0 92 16547 26. V aishali N agar 74 8518 118+2 96 17149 27. Jhalana Dungri 59 4695 100+0 94 19041 28. Bea war 66 10689 101+10 95 24203 29. Bhilwara 41 7285 90+4 94 14331 30. Churn 29 3522 44+0 87' 8522 31. Aburoad· 38 6823 61+5 95 9791 32. Banswara 50 10028 76+0 93 11354 33. Barmer 58 13472 93+32 94 19829 34. Chittorgarh 73 14080 105+4 96 23367 35. Dungarpur 53 10635 88+3 95 16629 36. Falana 44 10158 53+3 95 7527 37. Jalore 43 12398 72+10 94 11452 38. Jhunjhunu 37 7100 100+2 95 19290 39. Jodhpur 81 20355 126+38 94 20098 40. Khetri 52 11232 71+2 93 11957 41. Nagaur 42 10519 69+14 85 10190 42. Phalodi 26 7535 53+9 93 7683 43. Sikar 96 15768 139+16 97 33740 44 Sirohi 38 6605 59+10 97 11568 44. Udaipur 89 17522 126+3 94 10.50.+ 45. Pali 17 3243 7+24 93 3191
Total 2673 480699 4234+236=4470 92 762319
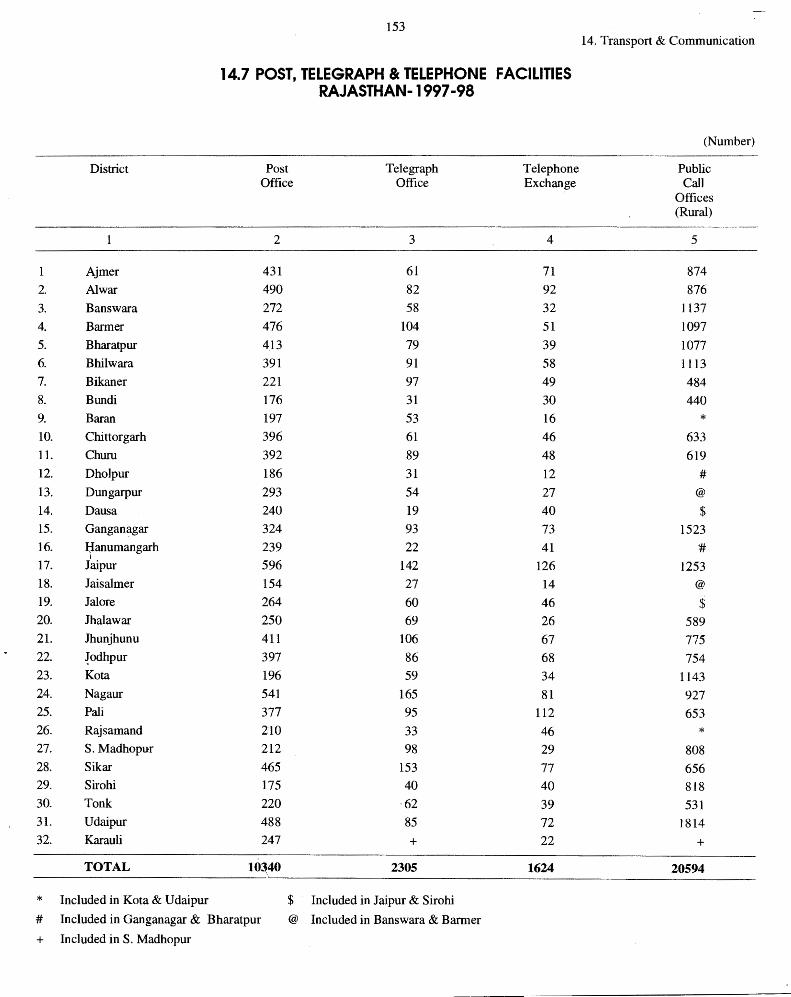
153 14. Transport & Communication
14.7 POST, TELEGRAPH & TELEPHONE FACILITIES RAJASTHAN-1997-98
(Number)
District Post Telegraph Telephone Public Office Office Exchange Call
Offices (Rural)
2 3 4 5
1 Ajmer 431 61 71 874
2. Al war 490 82 92 876
3. Banswara 272 58 32 1137
4. Barmer 476 104 51 1097
5. Bharatpur 413 79 39 1077 6. Bhilwara 391 91 58 1113
7. Bikaner 221 97 49 484 8. Bundi 176 31 30 440
9. Baran 197 53 16 * 10. Chittorgarh 396 61 46 633
11. Churn 392 89 48 619
12. Dholpur 186 31 12 #
13. Dungarpur 293 54 27 @
14. Dausa 240 19 40 $ 15. Ganganagar 324 93 73 1523 16. I;lanumangarh 239 22 41 '#
I
17. Jaipur 596 142 126 1253 18. Jaisalmer 154 27 14 @
19. Jalore 264 60 46 $ 20. Jhalawar 250 69 26 589 21. Jhunjhunu 411 106 67 775 22. ~odhpur 397 86 68 754 23. Ko ta 196 59 34 1143 24. Nagaur 541 165 81 927 25. Pali 377 95 112 653 26. Rajsamand 210 33 46 * 27. S.Madhopur 212 98 29 808 28. Sikar 465 153 77 656 29. Sirohi 175 40 40 818
30. Tonk 220 ·62 39 531 31. Udaipur 488 85 72 1814
32. Karau Ii 247 + 22 +
TOTAL 10~40 2305 1624 20594
* Included in Kota & Udaipur $ Included in Jaipur & Sirohi
# Included in Ganganagar & Bharatpur @ Included in Banswara & Banner
+ Included in S. Madhopur

15. Prices
Year/Months
1993-94 1994-95 1995-96 1995-96 1996-97 1997-98 July August September October November December January February March April May June
154
15.1 CONSUMER PRICE INDEX NUMBERS (GENERAL) FOR AGRICULTURE LABOURS
1997
1998
(Base Agriculture Year 1986-87=100)
Rajasthan
2
1235 1413 1431 1431 1603 269 267 270 266 264 262 266 272 274 271 269 269 272
General Index
Note: Base Year for 1993-94 to 1996-97 is 1960-61=100
15.2 CONSUMER PRICE INDEX NUMBERS (GENERAL) ' FOR THE URBAN NON-MANUAL EMPLOYEES FOR THE
SELECTED CENTRES OF RAJASTHAN
(Base Year 1984-85= 100)
Centres Year/Months Ajmer Jaipur Jodhpur
~ 3 4
1994 260 238 230 1995 285 257 250 1996 309 285 271 1997 330 310 291 1998 362 342 324 January 1998 350 330 307 February 350 329 307 March 346 330 308 April 352 330 313 May 349 331 314 June 359 333 321 July 363 346 330 August 368 346 340 September 372 352 341 October 378 362 342 November 386 362 343 December 375 355 335
All India
3
1147 1282 1409 1409 1530 269 261 262 263 263 262 265 274 273 272 273 276 282
All India
5
231 254 276 297 330 313 313 312 316 320 326 336 337 340 347 350 345
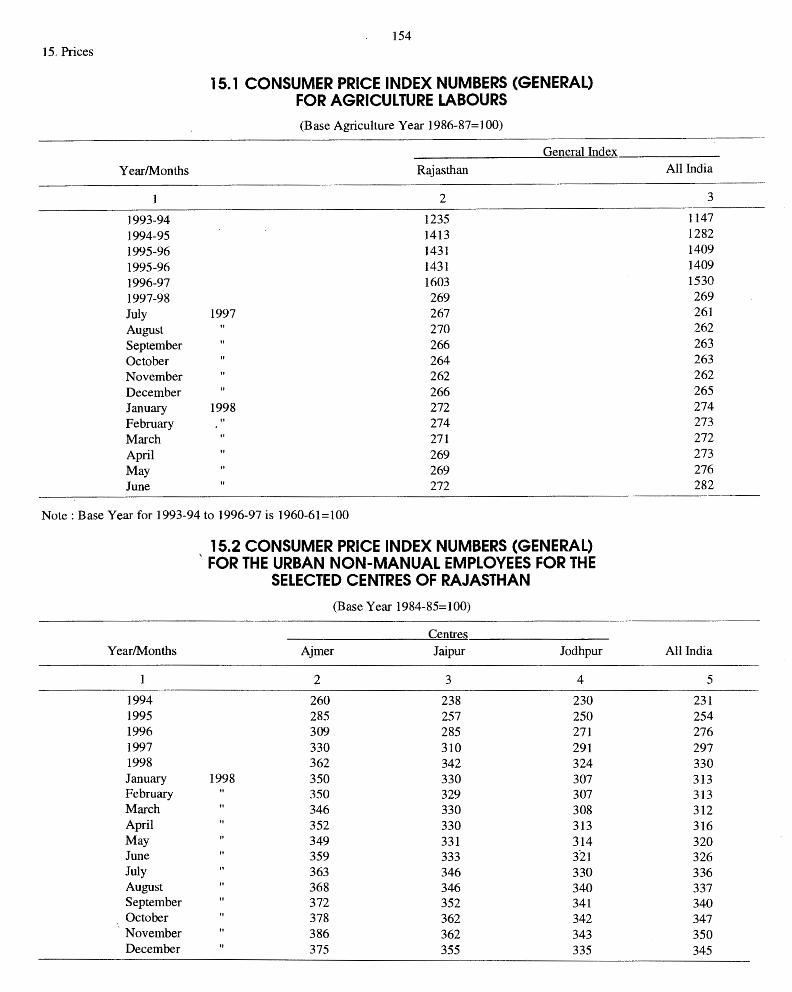
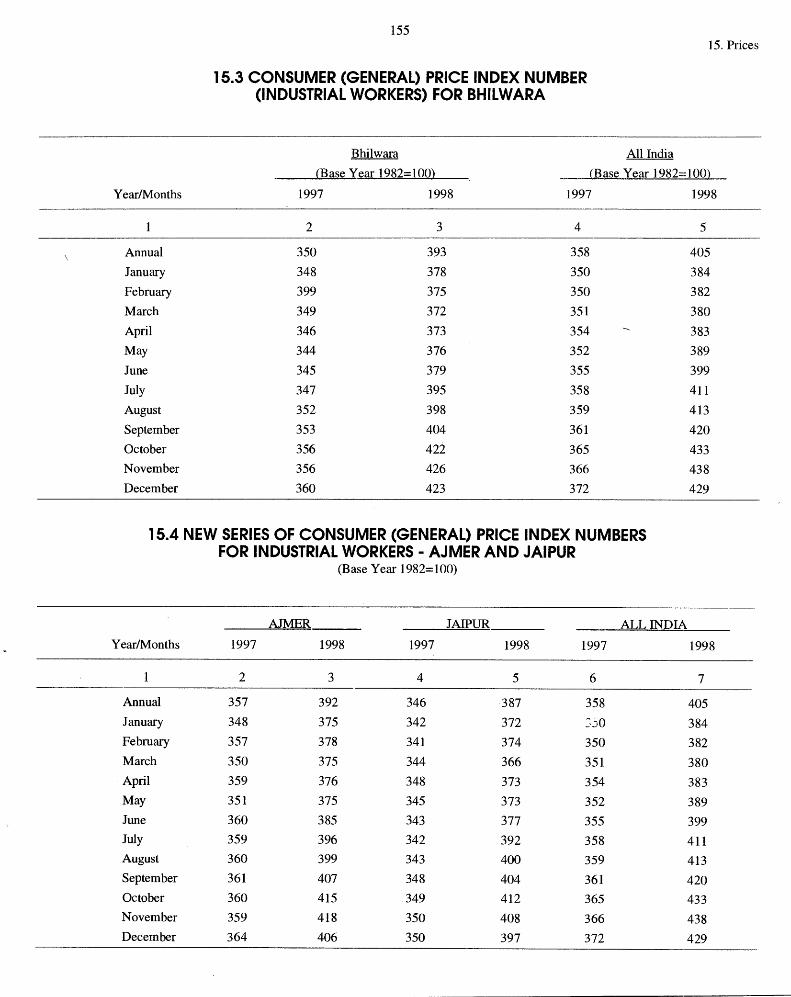
155
15.3 CONSUMER (GENERAL) PRICE INDEX NUMBER (INDUSTRIAL WORKERS) FOR BHILWARA
Bhilwara
15. Prices
All India (Base Year 1982=100) (Base Year 1982= 100}
Year/Months
Annual January
February March
April May June
July August
September October November
December
1997
2
350 348 399 349
346 344
345 347
352
353 356 356
360
1998 1997
3 4
393 358 378 350 375 350 372 351
373 354 376 352
379 355 395 358 398 359 404 361 422 365 426 366 423 372
15.4 NEW SERIES OF CONSUMER (GENERAL) PRICE INDEX NUMBERS FOR INDUSTRIAL WORKERS - AJMER AND JAIPUR
(Base Year 1982=100)
AJMER JAIPUR ALL INDIA Year/Months 1997 1998 1997 1998 1997
2 3 4 5 6
Annual 357 392 346 387 358 January 348 375 342 372 :::jO
February 357 378 341 374 350 March 350 375 344 366 351 April 359 376 348 373 354 May 351 375 345 373 352 June 360 385 343 377 355 July 359 396 342 392 358 August 360 399 343 400 359 September 361 407 348 404 361 October 360 415 .349 412 365 November 359 418 350 408 366 December 364 406 350 397 372
1998
5
405
384 382
380
383 389 399 411 413
420
433 438 429
1998
7
405
384 382 380
383 389 399 411 413 420 433
438 429

156 15. Prices
15.5 INDEX NUMBER OF WHOLE-SALE PRICES RAJASTHAN
(Base Year 1952-53=100)
Months/ Food Industrial Fuel Manufa- General Year Group Raw Power Cture
Meterial (Group) (Group) (Group)
• 1 2 3 4 5 6
Average Index No. 1998 2249.20 2146.19 4206.09 2158.73 2287.07
January 98 2302.11 2054.30 4174.80 2130.67 2314.17
February 98 2254.48 2062.48 4174.80 2137.23 2280.91.
March 98 · 2244.63 2074.31 4174.80 2140.25 2274.96
April 98 2163.37 2080.10 4167.32 2143.78 2216.15
May98 2151.65 2115.89 4167.53 2148.05 2210.60
June 98 2182.38 2180.94 4228.17 2155.79 2240,49
July 98 2207.76 2184.29 4228.17 2162.75 2260.52
August 98 2234.74 2166.08 4232.40 2162.89 2279.28
September 98 2261.79 2166.60 4231.27 2165.92 2299.63
October98 2318.47 2202.06 4231.27 2180.79 2346.02
November98 2323.52 2231.84 4231.27 2185.93 2352.51
December98 2345.48 2275.38 4231.27 2190.69 2369.66
15.6 INDEX NUMBERS OF BUILDING CONSTRUCTION COST FOR JAIPUR CENTRE
(Base Year 1971=100)
INDEX Year/Quarter Building Labour General
Meterial
1 2 3 4
1994 838.08 1203.36 980.39
1995 920.00 1258.84 1052.02
1996 1076.30 1370.62 1190.97
1997 1189.99 1574.35 1329.22
1998 1233.42 1747.34 1433.64
March-98 1225.66 1665.37 1396.97
June- 98 1231.22 1665.37 1400.37
September- 98 1236.11 1829.30 1467.22
December- 98 1240.67 1829.30 1470.00
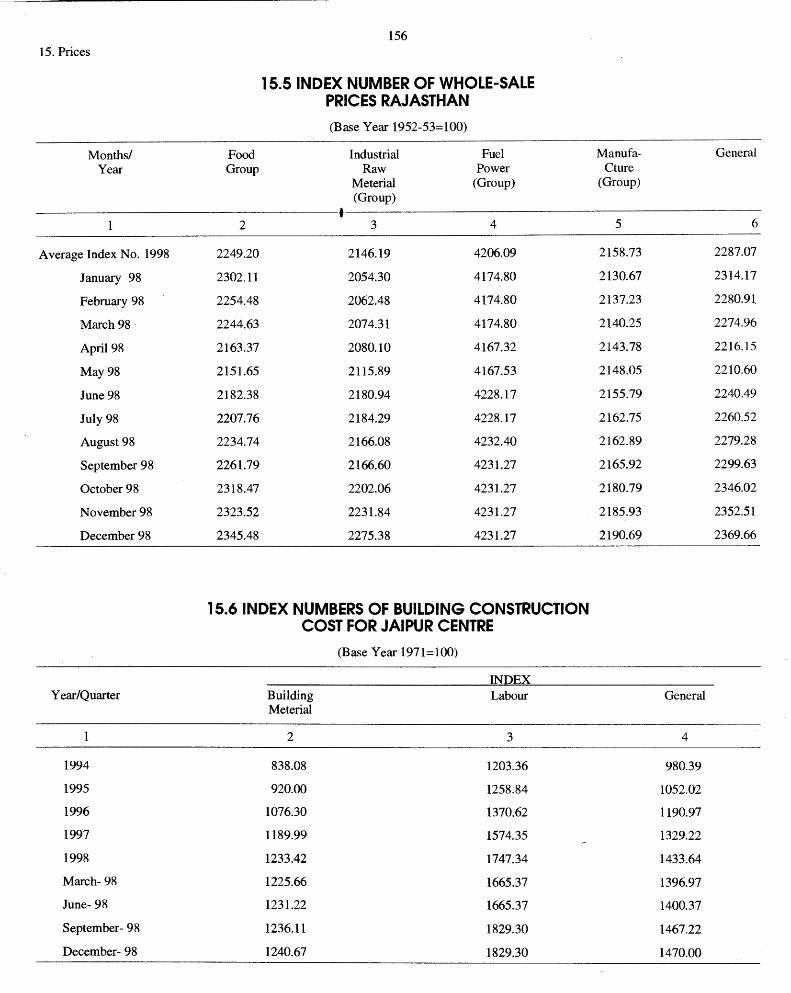
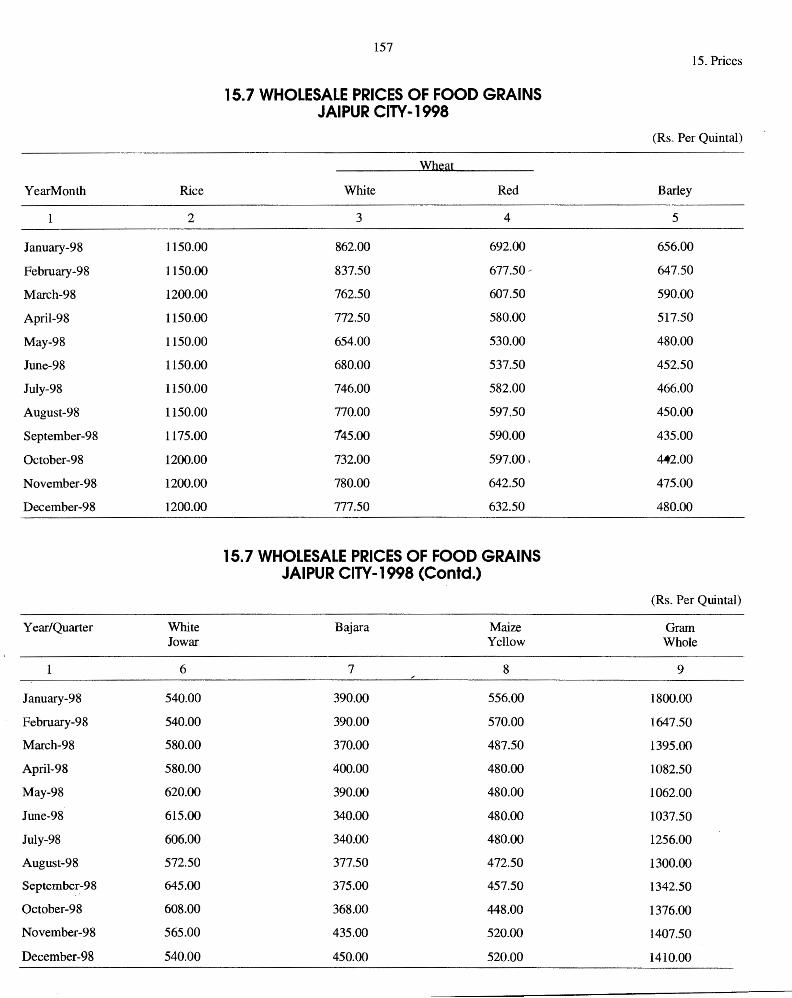
157 15. Prices
15.7 WHOLESALE PRICES OF FOOD GRAINS JAIPUR CITV-1998
(Rs. Per Quintal)
Wheat
YearMonth Rice White Red Barley
2 3 4 5
January-98 1150.00 862.00 692.00 656.00
February-98 1150.00 837.50 677.50~ 647.50
March-98 1200.00 762.50 607.50 590.00
April-98 1150.00 772.50 580.00 517.50
May-98 1150.00 654.00 530.00 480.00
June-98 1150.00 680.00 537.50 452.50
July-98 1150.00 746.00 582.00 466.00
August-98 1150.00 770.00 597.50 450.00
September-98 1175.00 145.00 590.00 435.00
October-98 1200.00 732.00 597.00 I ~2.00
November-98 1200.00 780.00 642.50 475.00
December-98 1200.00 777.50 632.50 480.00
15.7 WHOLESALE PRICES OF FOOD GRAINS JAIPUR CITV-1998 (Contd.)
(Rs. Per Quintal)
Year/Quarter White Bajara Maize Gram Jo war Yellow Whole
6 7 8 9
January-98 540.00 390.00 556.00 1800.00
February-98 540.00 390.00 570.00 1647.50
March-98 580.00 370.00 487.50 1395.00
April-98 580.00 400.00 480.00 1082.50
May-98 620.00 390.00 480.00 1062.00
June-98 615.00 340.00 480.00 1037.50
July-98 606.00 340.00 480.00 1256.00
August-98 572.50 377.50 472.50 1300.00
September~98 645.00 375.00 457.50 1342.50
October-98 608.00 368.00 448.00 1376.00
November-98 565.00 435.00 520.00 1407.50
December-98 540.00 450.00 520.00 1410.00
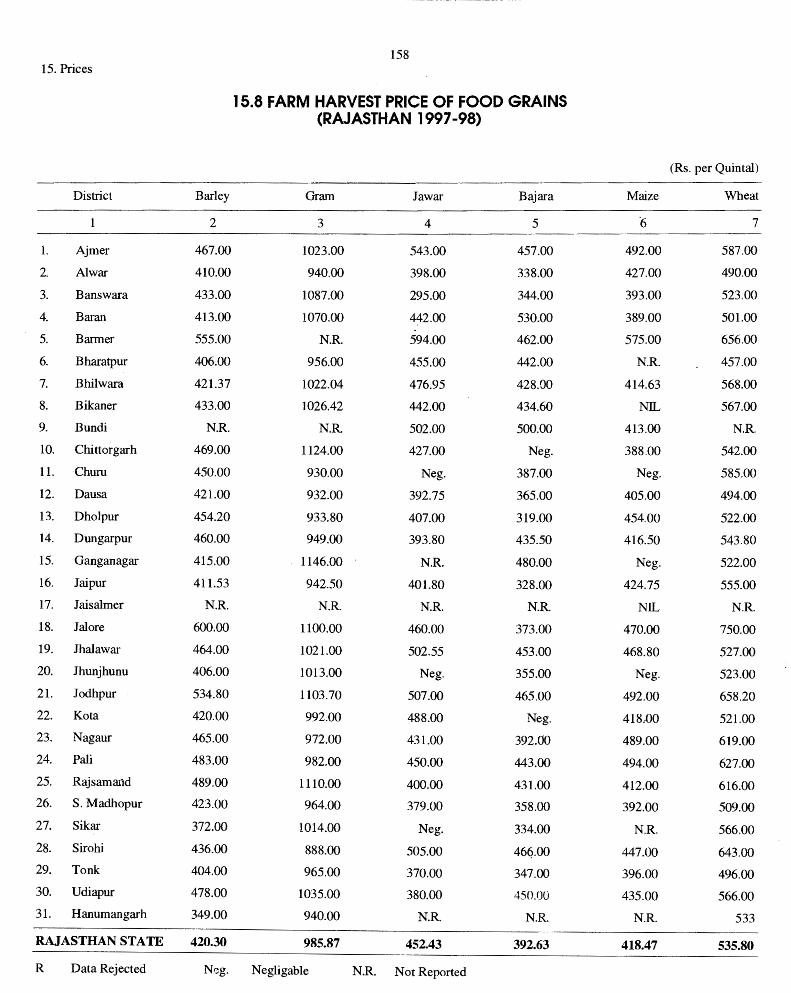
158 15. Prices
15.8 FARM HARVEST PRICE OF FOOD GRAINS (RAJASTHAN 1997-98)
(Rs. per Quintal)
District Barley Gram Jawar Bajara Maize Wheat
2 3 4 5 6 7
1. Ajmer 467.00 1023.00 543.00 457.00 492.00 587.00
2. Al war 410.00 940.00 398.00 338.00 427.00 490.00
3. Banswara 433.00 1087.00 295.00 344.00 393.00 523.00
4. Baran 413.00 1070.00 442.00 530.00 389.00 501.00
5. Barmer 555.00 N.R 594.00 462.00 575.00 656.00
6. Bharatpur 406.00 956.00 455.00 442.00 N.R. 457.00
7. Bhilwara 421.37 1022.04 476.95 428.00 414.63 568.00
8. Bikaner 433.00 1026.42 442.00 434.60 NIL 567.00
9. Bundi N.R. N.R. 502.00 500.00 413.00 N.R.
10. Chittorgarh 469.00 1124.00 427.00 Neg. 388.00 542.00
11. Churu 450.00 930.00 Neg. 387.00 Neg. 585.00
12. Dausa 421.00 932.00 392.75 365.00 405.00 494.00
13. Dholpur 454.20 933.80 407.00 319.00 454.00 522.00
14. Dungarpur 460.00 949.00 393.80 435.50 416.50 543.80
15. Ganganagar 415.00 1146.00 N.R. 480.00 Neg. 522.00
16. Jaipur 411.53 942.50 401.80 328.00 424.75 555.00
17. Jaisalmer N.R. N.R. N.R. N.R. NIL N.R.
18. Jalore 600.00 1100.00 460.00 373.00 470.00 750.00
19. Jhalawar 464.00 1021.00 502.55 453.00 468.80 527.00
20. Jhunjhunu 406.00 1013.00 Neg. 355.00 Neg. 523.00
21. Jodhpur 534.80 1103.70 507.00 465.00 492.00 658.20
22. Ko ta 420.00 992.00 488.00 Neg. 418 . .00 521.00
23. Nagaur 465.00 972.00 431.00 392.00 489.00 619.00
24. Pali 483.00 982.00 450.00 443.00 494.00 627.00
25. Rajsamand 489.00 1110.00 400.00 431.00 412.00 616.00
26. S.Madhopur 423.00 964.00 379.00 358.00 392.00 509.00
27. Sikar 372.00 1014.00 Neg. 334.00 N.R. 566.00
28. Sirohi 436.00 888.00 505.00 46(?.00 447.00 643.00
29. Tonk 404.00 965.00 370.00 347.00 396.00 496.00
30. Udiapur 478.00 1035.00 380.00 450.00 435.00 566.00
31. Hanumangarh 349.00 940.00 N.R. N.R. N.R. 533
RAJASTHAN STATE 420.30 985.87 452.43 392.63 418.47 535.80
R Data Rejected N~g. Negligable N.R. Not Reported
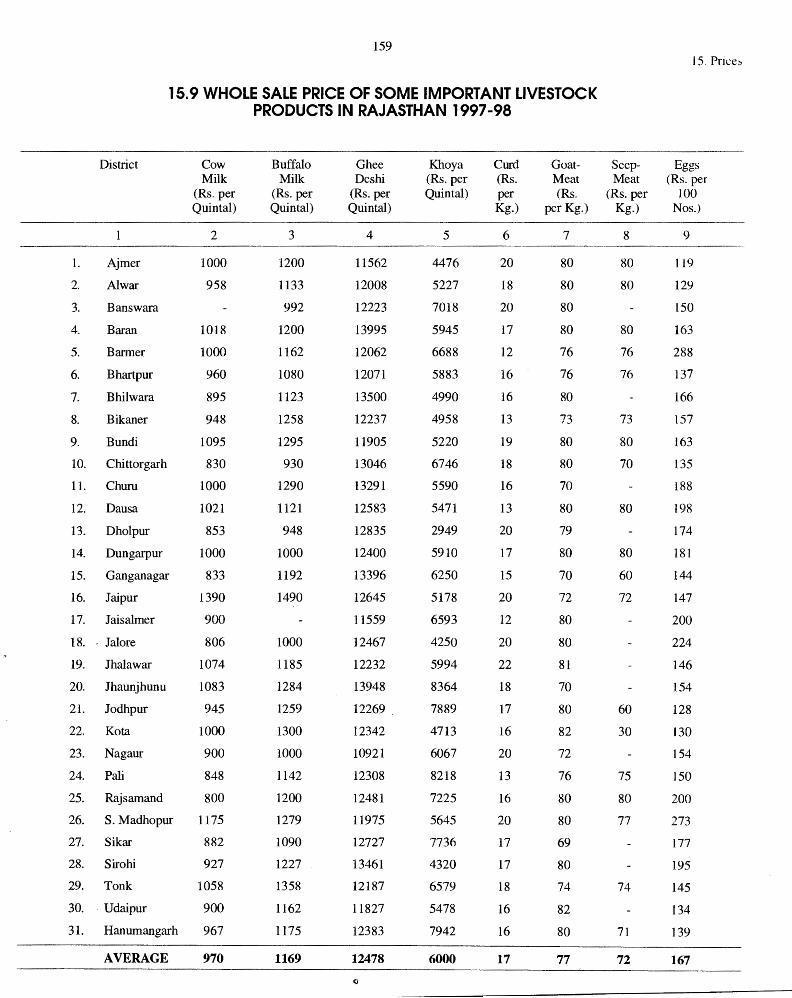
159
15.9 WHOLE SALE PRICE OF SOME IMPORTANT LIVESTOCK PRODUCTS IN RAJASTHAN 1997-98
1.
2.
3.
4.
5.
6.
7.
District
Ajmer
Al war
Banswara
Baran
Barmer
Bhartpur
Bhilwara
8. Bikaner
9. Bundi
10. Chittorgarh
11. Churu
12. Dausa
13. Dholpur
14. Dungarpur
15. Ganganagar
16. Jaipur
1 7. Jaisalmer
18. " Jalore
19. Jhalawar
Cow Milk
(Rs. per Quintal)
2
1000
958
1018
1000
960
895
948
1095
830
1000
1021
853
1000
833
1390
900
806
1074
20. Jhaunjhunu 1083
21. Jodhpur 945
22. Kota 1000
23. Nagaur 900
24. Pali 848
25. Rajsamand 800
26. S. Madhopur 117 5
27. Sikar
28. Sirohi
29. Tonk
30. Udaipur
31. Hanumangarh
AVERAGE
882
927
1058
900
967
970
Buffalo Milk
(Rs. per Quintal)
3
1200
1133
992
1200
1162
1080
1123
1258
1295
930
1290
1121
948
1000
1192
1490 I
1000
1185
1284
1259
1300
1000
1142
1200
1279
1090
1227
1358
1162
1175
1169
Ghee Des hi
(Rs. per Quintal)
4
11562
12008
12223
13995
12062
12071
13500
12237
11905
13046
13291
12583
12835
12400
13396
12645
11559
12467
12232
13948
12269 .
12342
10921
12308
12481
11975
12727
13461
12187
11827
12383
12478
Kho ya (Rs. per Quintal)
5
4476
5227
7018
5945
6688
5883
4990
4958
5220
6746
5590
5471
2949
5910
6250
5178
6593
4250
5994
8364
7889
4713
6067
8218
7225
5645
7736
4320
6579
5478
7942
6000
Curd (Rs. per Kg.)
6
20
18
20
17
12
16
16
13
19
18
16
13
20
17
15
20
12
20
22
18
17
16
20
13
16
20
17
17
18
16
16
17
GoatMeat (Rs.
per Kg.)
7
80
80
80
80
76
76
80
73
80
80
70
80
79
80
70
72
80
80
81
70
80
82
72
76
80
80
69
80
74
82
80
77
SeepMeat
(Rs. per Kg.)
8
80
80
80
76
76
73
80
70
80
80
60
72
60
30
75
80
77
74
71
72
15. Pm:e~
Eggs (Rs. per
100 Nos.)
9
119
129
150
163
288
137
166
157
163
135
188
198
174
181
144
147
200
224
146
154
128
130
154
150
200
273
177
195
145
134
139
167

160 16. Education
16.1 PROGRESS OF LITERACY IN RAJASTHAN
Year Percentage of Literac.)'.'. of resuective Pouulation
Person Male Female
2 3 4
1921 4.22 7.33 0.59
1931 4.65 8.15 0.72
1941 5.51 9.36 1.14
1951 8.95 14.44 3.00
1961 15.21 23.71 5.84
1971 19.07 28.74 8.40
1981 24.38 36.30 11.42
1991* 38.55 54.99 20.44
* Age 7 and Above
16.2 LITERACY IN CITIES- RAJASTHAN
City* Percentage of literacy to persons
1981 1991
2 3
1. Ajmer 60.47 67.63
2. Al war 58.14 62.45
3. Be war 62.98
4. Bharatpur 51.14 54.91
5. Bhilwara 48.03 53.39
6. Bikaner 52.35 56.94
7. Ganganagar 55.89 58.70
8. Jaipur 54.64 57.95
9. Jodhpur 51.90 56A4
10. Ko ta 56.07 60.15
11. Pali 49.32
12. Sikar 39.09 44.48
13. Tonk 40.92
14. Udiapur 62.41 66.24
* Cities having Population above one Lakh.
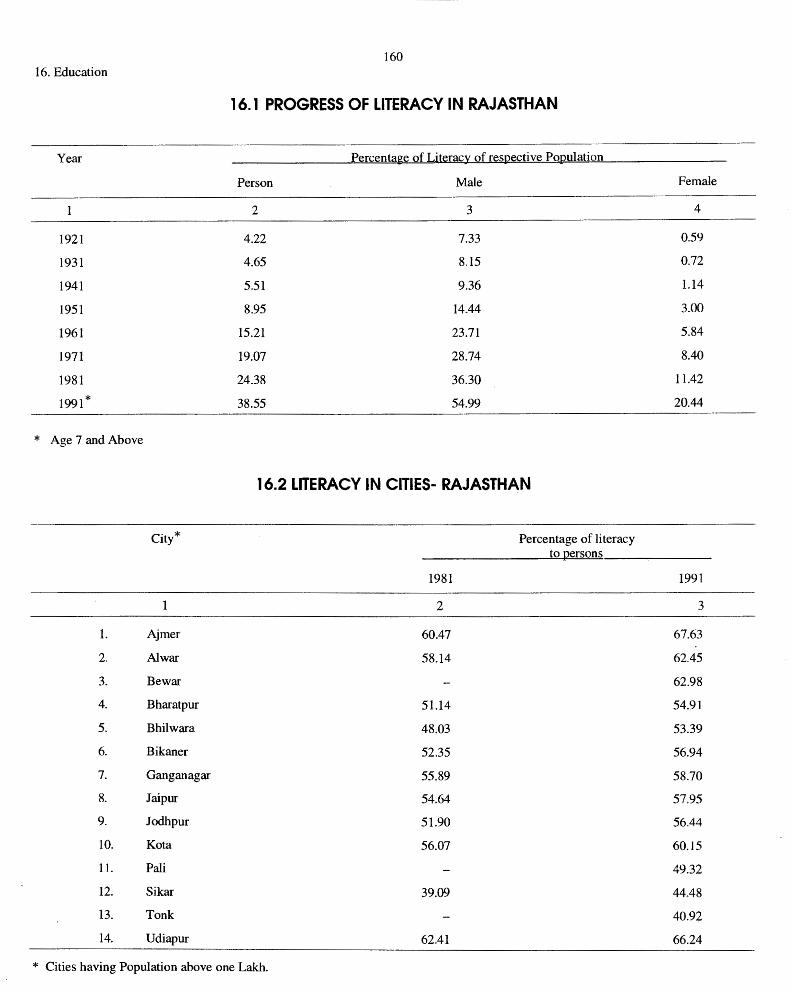
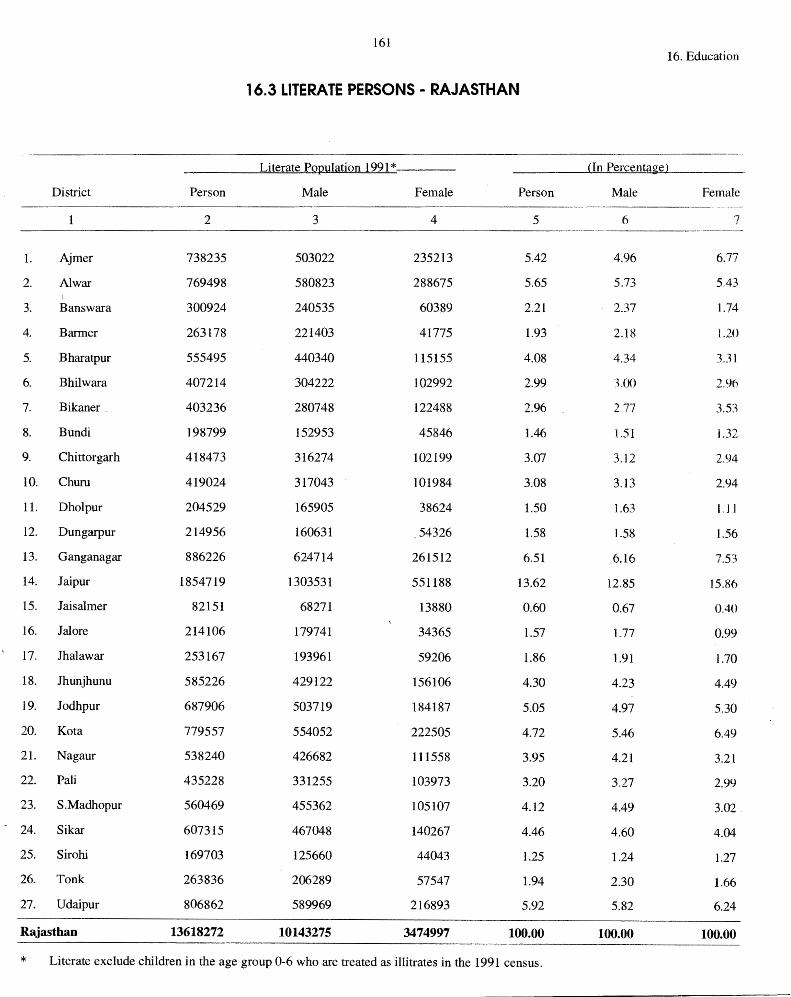
161 16. Education
16.3 LITERATE PERSONS - RAJASTHAN
Literate Population 1991 * (In Percentage)
District Person Male Female Person Male Female
2 3 4 5 6 7
1. Ajmer 738235 503022 235213 5.42 4.96 6.77
2. Al war 769498 580823 288675 5.65 5.73 5A3 I
3. Banswara 300924 240535 60389 2.21 2.37 1.74
4. Barmer 263178 221403 41775 1.93 2.18 1.20
5. Bharatpur 555495 440340 115155 4.08 4.34 3.31
6. Bhilwara 407214 304222 102992 2.99 3.00 2 .. 96
7. Bikaner. 403236 280748 122488 2.96 2.77 3.53
8. Bundi 198799 152953 45846 1.46 1.51 l.32
9. Chi ttorgarh 418473 316274 102199 3.07 3.12 2.94
IO. Churn 419024 317043 101984 3.08 3.13 2.94
11. Dholpur 204529 165905 38624 1.50 1.63 I.I I
12. Dungarpur 214956 160631 54326 1.58 1.58 1.56
13. Ganganagar 886226 624714 261512 6.51 6.16 7.53
14. Jaipur 1854719 1303531 551188 13.62 12.85 15.86
15. Jaisalmer 82151 68271 13880 0.60 0.67 0.40
16. Jal ore 214106 179741 34365 1.57 1.77 0.99
17. Jhalawar 253167 193961 59206 1.86 1.91 1.70
18. Jhunjhunu 585226 429122 156106 4.30 4.23 4.49
19. Jodhpur 687906 503719 184187 5.05 4.97 5.30
20. Ko ta 779557 554052 222505 4.72 5.46 6.49
21. Nagaur 538240 426682 111558 3.95 4.21 3.21
22. Pali 435228 331255 103973 3.20 3.27 2.99
23. S.Madhopur 560469 455362 105107 4.12 4.49 3.02' ~
24. Sikar 607315 467048 140267 4.46 4.60 4.04
25. Sirohi 169703 125660 44043 1.25 1.24 1.27
26. Tonk 263836 206289 57547 1.94 2.30 1.66
27. Udaipur 806862 589969 216893 5.92 5.82 6.24
Rajasthan 13618272 10143275 3474997 100.00 100.00 100.00
* Literate exclude children in the age group 0-6 who are treated as illitrates in the 1991 census.

162 16. Education
16.4 SCHOOL EDUCATION IN RAJASTHAN
A-Institution 1996-97
2
1. Higer Secondary & Secondary 4996
2. Upper Primary 13283
3. Primary & Pre Primary 33584
TOTAL 51863
B-Scholars 1996-97
Boys Girls Boys
2 3 4
1. Higher Sec. & Secondary 1558502 647335 1651190
2. Upper Primary 2182460 1168179 2277226
3. Primary & Pre Primary 2430117 1502043 2474866
TOTAL 6171079 3317557 6409282
C-Teachers Male Female Male
1. Higher Sec. & Secondary 60763 24027 65134
2. Upper Primary 73348 25038 79256
3. Primary & Pre Primary 68134 28365 69723
TOTAL 202245 77430 214113
16.5 COLLEGE & UNIVERSITY EDUCATION IN RAJASTHAN
Insitutions
A- Institutions
1. University & Deemed University
2. Colleges
B-Scholars*
1.
2.
Boys
Girls
C-Teachers
1.
2.
Male
Female
* Execluding University' Scholars & Teachers.
1996-97
2
220
8
212
170793
118245
52548
5265
3206
2059
1997-98
(Number)
1997-98
3
5347
14634
33839
53820
Girls
5
710554
1272872
1630230
3613656
Female
25709
27960
28328
81997
(Number)
1997-98
3
245
8
237
187971
127756
60215
3850
3475
2375
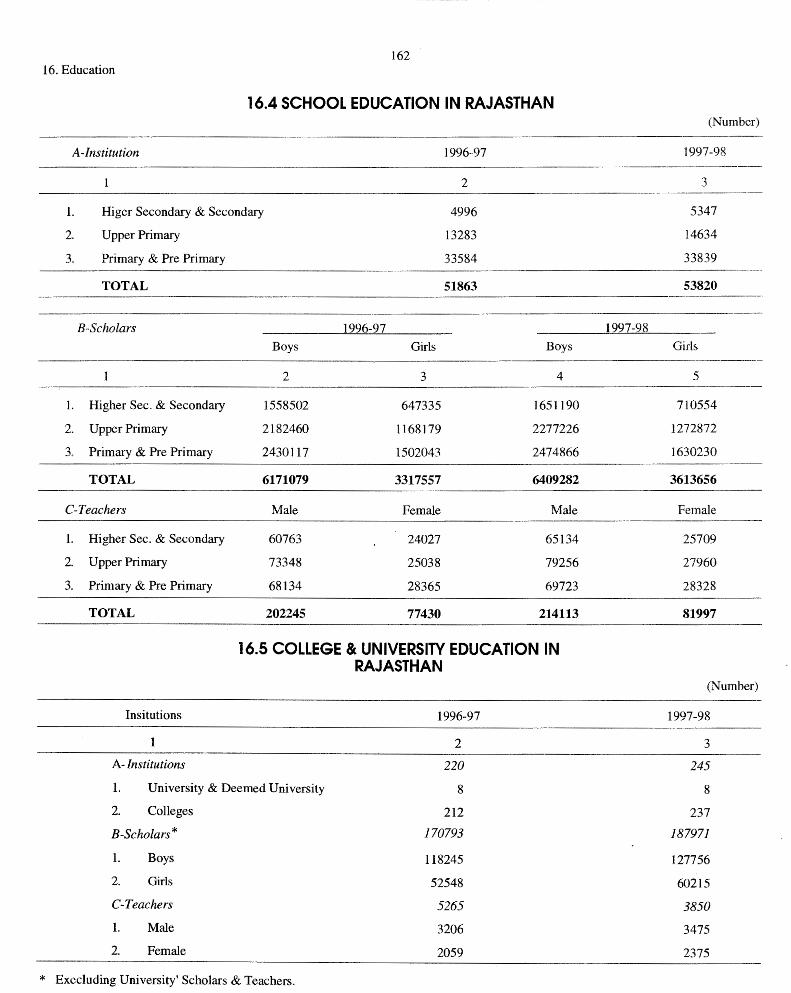
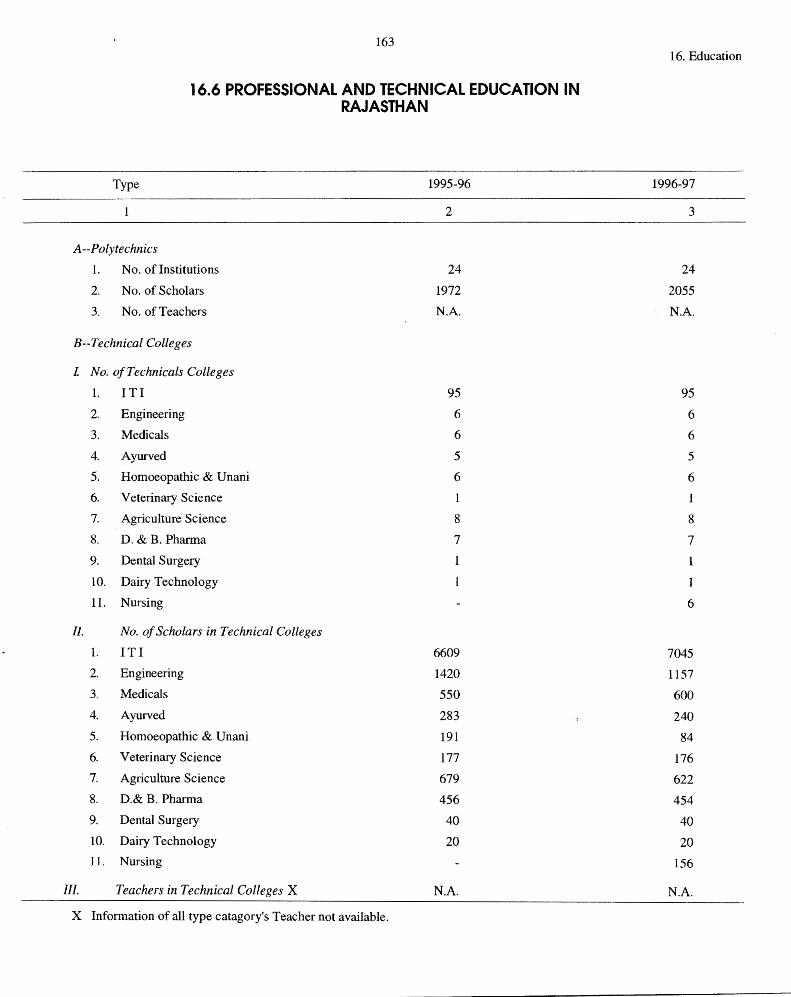
163
16.6 PROFESSIONAL AND TECHNICAL EDUCATION IN RAJASTHAN
Type 1995-96
2
A--Polytechnics
1. No. of Institutions 24
2. No. of Scholars 1972
3. No. of Teachers N.A.
B--Technical Colleges
1 No. of Technicals Colleges
1. ITI 95
2. Engineering 6
3. Medicals 6
4. Ayurved 5
5. Homoeopathic & Unani 6
6. Veterinary Science 1
7. Agriculture Science 8
8. D. & B. Pharma 7
9. Dental Surgery 1
10. Dairy Technology
11. Nursing
//. No. of Scholars in Technical Colleges
1. ITI 6609
2. Engineering 1420
3. Medicals 550
4. Ayurved 283
5. Homoeopathic & Unani 191
6. Veterinary Science 177
7. Agriculture Science 679
8. D.& B. Pharma 456
9. Denta] Surgery 40
10. Dairy Technology 20
11. Nursing
Ill. Teachers in Technical Colleges X N.A.
x Information of all type catagory's Teacher not available.
16. Education
1996-97
3
24
2055
N.A.
95
6
6
5
6
l
8
7
6
7045
1157
600
240
84
176
622
454
40
20
156
N.A.
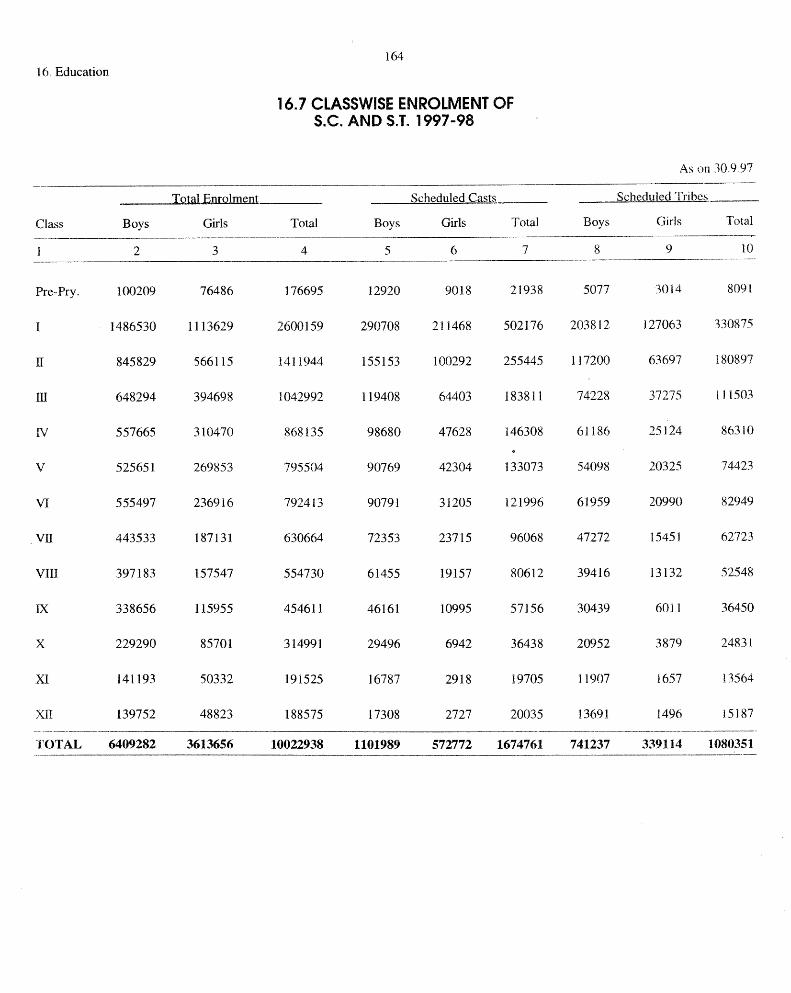
164 16. Education
16.7 CLASSWISE ENROLMENT OF S.C. AND S.T. 1997-98
As on 30.9 . .97 --·--~----
Total Enrolment Scheduled Casts Scheduled Tribes
Class Boys Girls Total Boys Girls Total Boys Girls Total ____________ ,,_.
2 3 4 5 6 7 8 9 10 ------·----------·
Pre-Pry. 100209 76486 176695 12920 9018 21938 5077 3014 8091
1486530 1113629 2600159 290708 211468 502176 203812 127063 330875
II 845829 566115 1411944 155153 100292 255445 117200 63697 180897
ill 648294 394698 1042992 119408 64403 183811 74228 37275 111503
IV 557665 310470 868135 98680 47628 146308 61186 25124 86310
v 525651 269853 795504 90769 42304 133073 54098 20325 74423
VI 555497 236916 792413 90791 31205 121996 61959 20990 82949
VII 443533 187131 630664 72353 23715 96068 47272 15451 62723
vrn 397183 157547 554730 61455 19157 80612 39416 13132 52548
IX 338656 115955 454611 46161 10995 57156 30439 6011 36450
.x 229290 85701 314991 29496 6942 36438 20952 3879 24831
XI 141193 50332 191525 16787 2918 19705 11907 1657 13564
XII 139752 48823 188575 17308 2727 20035 13691 1496 15187 -- ---··--··--- . -----------·-------------------
TOTAL 6409282 3613656 10022938 1101989 572772 1674761 741237 339114 1080351 ------------------------

165 17. Medical and Public Health
Item
L Hospitals 2. Primary Health Centres 3. Dispensaries 4. M.C.W .. Centres 5. Aid posts 6. Subsidiary Health Centres
& Mini Health Centres 7. Beds
(a) In Govt. Medical Instutions (b) In Other Medical Instutions
17 .1 GOVT. MEDICAL INSTITUTION (MODERN MEDICINE) RAJASTHAN
Urban
1996-97 1997-98
2 3
205 205 20
278 268 92 92 13 13
20801 20801
N.A. N.A.
1996-97
4
14 1616
26
9400
16141
N.A.
17.2 GOVERNMENT MEDICAL INSTITUTIONS BY SIZE (MODERN MEDICINE) RAJASTHAN
Hispital Beds
Primary Health
Dispensaries Aid Posts
Rural
(Number)
1997-98
5
14 1646
26
9650
16141
N.A.
Subsidary Health Centres & M.C.W
Centres
1996-97 1997-98 1996-97 1997-98 1996-97 1997-98 1996-97 1997-98 1996-97 1997-98
Below 10 10-19 20-49 50-99
100-149 150-299
300&Above
Total
1. 2. 3. 4. 5.
2 3
29 80 51 12 28 19
219
19 83 57 12 29 19
219
4
1414 20
165 15 2
1616
5 6 7 8 -----.. --···--·--·--·
1436 27 26 18
169 21
2
1646 27 26 1
17 .3 BEDS IN GOVERNMENT MEDICAL INSTUTUTIONS (MODERN MEDICINE) RAJASTHAN
Categories
Hospitals Dispensaries M. C. W. Centres P.H.C. Aid Post
TOTAL
1996-97
2
21187 140 719
14894 2
36942
In Patient Beds
9
1
l-0 l 1
91 91 13 u 3 3
107 107
(Number'!
1997-98
21387 140 719
15238 2
37486
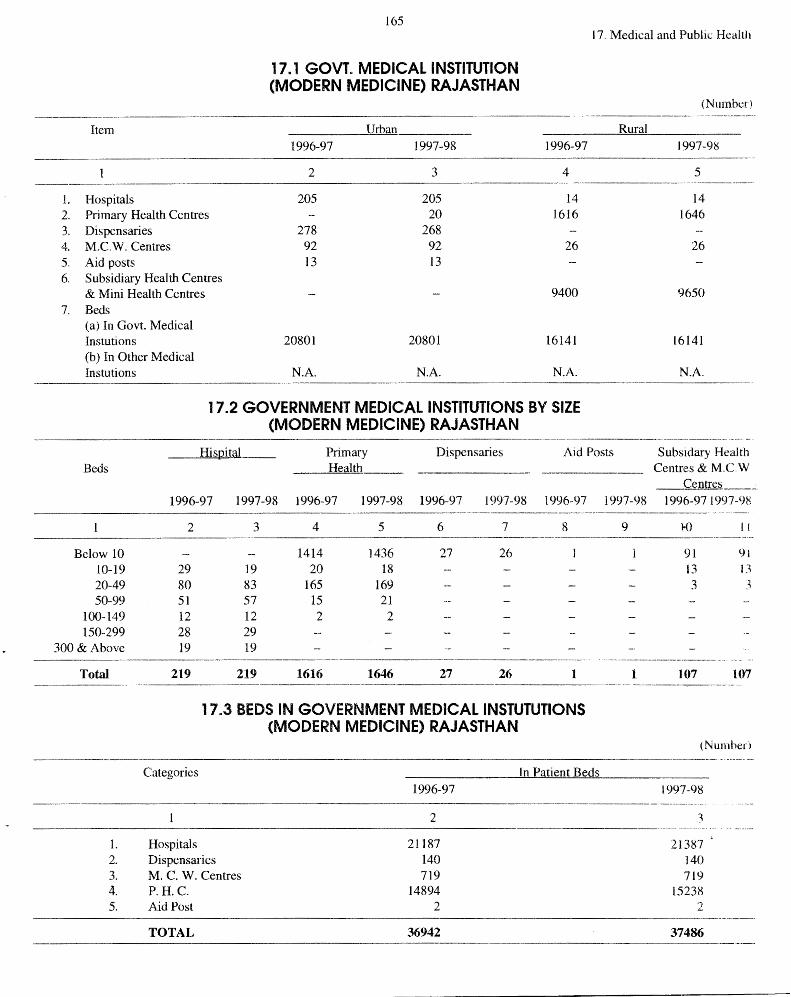
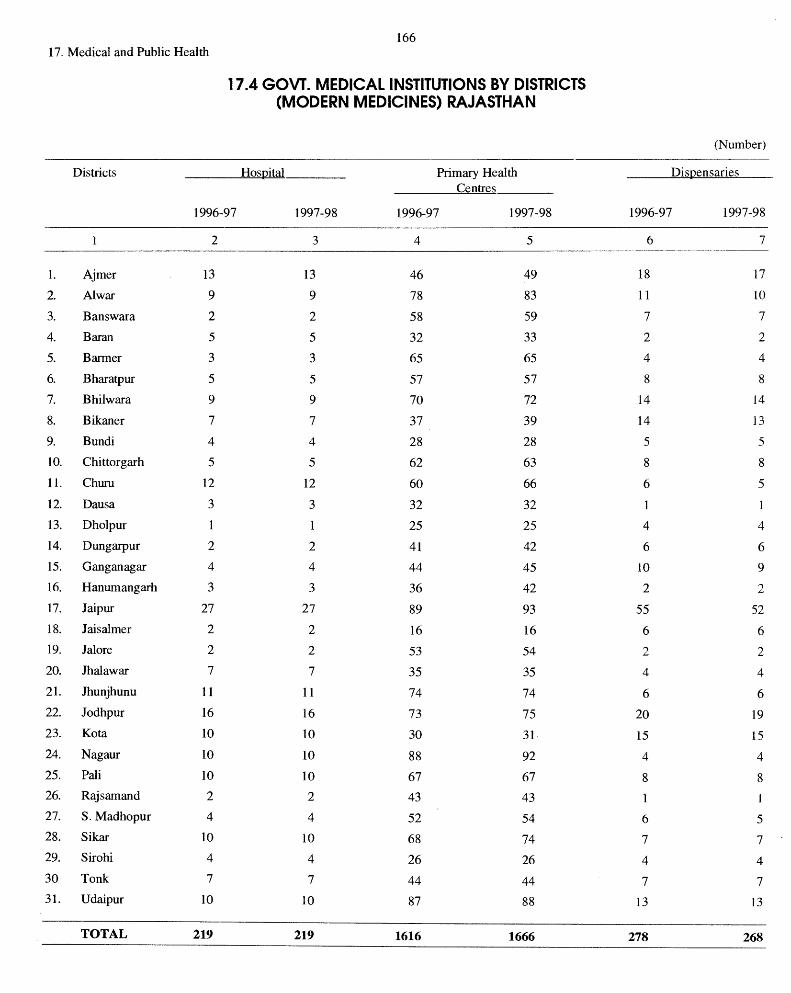
------- - --- -
166 17. Medical and Public Health
17 .4 GOVT. MEDICAL INSTITUTIONS BY DISTRICTS (MODERN MEDICINES) RAJASTHAN
(Number)
Districts Hos:gital Primary Health Dis12ensaries Centres
1996-97 1997-98 1996-97 1997-98 1996-97 1997-98
2 3 4 5 6 7
1. Ajmer 13 13 46 49 18 17
2. Al war 9 9 78 83 11 10
3. Banswara 2 2 58 59 7 7
4. Baran 5 5 32 33 2 2
5. Barmer 3 3 65 65 4 4
6. Bharatpur 5 5 57 57 8 8
7. Bhilwara 9 9 70 72 14 14
8. Bikaner 7 7 37 39 14 13
9. Bundi 4 4 28 28 5 5
10. Chittorgarh 5 5 62 63 8 8
11. Churu 12 12 60 66 6 5
12. Dausa 3 3 32 32 1 1
13. Dholpur 1 1 25 25 4 4
14. Dungarpur 2 2 41 42 6 6
15. Ganganagar 4 4 44 45 10 9
16. Hanumangarh 3 3 36 42 2 2
17. Jaipur 27 27 89 93 55 52
18. Jaisalmer 2 2 16 16 6 6
19. Jalore 2 2 53 54 ,, 2 ,:..,
20. Jhalawar 7 7 35 35 4 4
21. Jhunjhunu 11 11 74 74 6 6
22. Jodhpur 16 16 73 75 20 19
23. Ko ta 10 10 30 31 · 15 15
24. Nagaur 10 10 88 92 4 4
25. Pali 10 10 67 67 8 8
26. Rajsamand 2 2 43 43 1
27. S.Madhopur 4 4 52 54 6 5 28. Sikar 10 10 68 74 7 7
29. Sirohi 4 4 26 26 4 4
30 Tonk 7 7 44 44 7 7
31. Udaipur 10 10 87 88 13 13
TOTAL 219 219 1616 1666 278 268
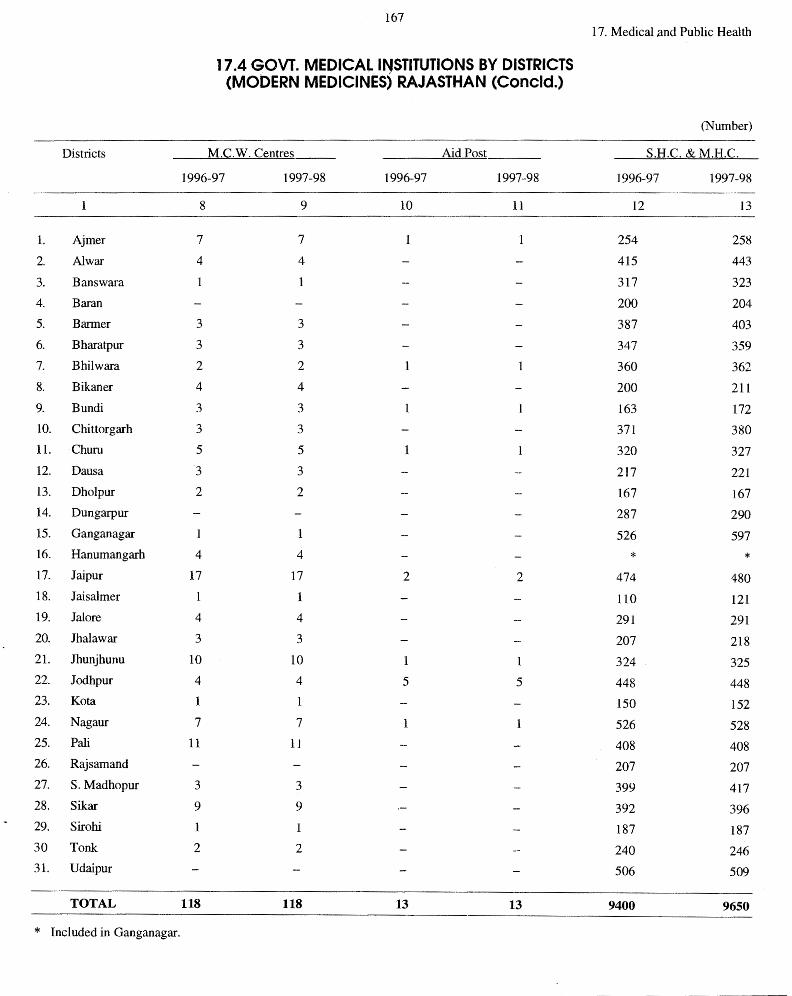
167 1 7. Medical .and Public Health
17 .4 GOVT. MEDICAL INSTITUTIONS BY DISTRICTS (MODERN MEDICINES) RAJASTHAN (Concld.)
(Number)
Districts M.C.W. Centres Aid Post S.H.C. & M.H.C.
1996-97 1997-98 1996-97 1997-98 1996-97 1997-98
1 8 9 10 11 12 13
1. Ajmer 7 7 254 258
2. Al war 4 4 415 443
3. Banswara 1 1 317 323
4. Baran 200 204
5. Barmer 3 3 387 403
6. Bharatpur 3 3 347 359
7. Bhilwara 2 2 1 360 362
8. Bikaner 4 4 200 211
9. Bundi 3 3 163 172
10. Chittorgarh 3 3 371 380
11. Churn 5 5 1 320 327
12. Dausa J 3 217 221
13. Dholpur 2 2 167 167
14. Dungarpur 287 290
15. Ganganagar 1 1 526 597
16. Hanumangarh 4 4 * * 17. Jaipur 17 17 2 2 474 480
18. Jaisalmer 1 1 110 121
19. Jalore 4 4 291 291
20. Jhalawar 3 3 207 218
21. Jhunjhunu 10 10 1 324 325
22. Jodhpur 4 4 5 5 448 448 23. Ko ta 1 1 150 152
24. Nagaur 7 7 1 1 526 528
25. Pali 11 11 408 408 26. Rajsamand 207 207
27. S. Madhopur 3 3 399 417
28. Sikar 9 9 392 396 29. Sirohi 1 1 187 187
30 Tonk 2 2 240 246 31. Udaipur 506 509
TOTAL 118 118 13 13 9400 9650
* Included in Ganganagar.

168 17. Medical and PubJic Health
l. 2. 3. 4. 5.
6. 7.
8. 9. 10. 11.
12.
13. 14. 15. 16.
17.5 .GOVT MEDICAL HEALTH PERSONNEL (Modern Medicine)
Item
Senior Specialist
Junior Specialist
Senior Medical Officer
c. A. s Nurse Grade-I (Male & Female)
Nurse Grade-II (Male & Female)
A. N. M. (Midwives)
Multipurpose Workers (Male) Health Inspectors
Woman Health Visitors
Senior Lab Technicians/Lab Tecnicians
X-ray Technicians/Rediographer/
Assitt. Radiographer
Sanitary Inspectors Food Inspectors Sector Supervisor (Male)
Others
TOTAL
RAJASTHAN
Sanctioned Strenght
1996-97
2
234 1284 897
3431 1751 8258
11271 4542
237 1308 2017
453 1095
34 928
37740
17.6 PATIENTS TREATED IN GOVT. MEDICAL INSTITUTIONS (Modern Medicine)
Year
1984 1985 1986 1987 1988 1989 1990 1991 1992 1993 1994 1995 1996
RAJASTHAN
Patients Treated
Indoor
2
796477 852322 832243 929281
1100702 1085310 1218825 1302780 1294651 1303850 1638537 1710614 1832445
(Number)
1997-98
3
234 1325 891
3560 1751 8258
11278 4106
237 1308 2325
453 669
34 920
79
37446
(Number)
Outdoor
'3
26705066 26967658 27257138 28478465 3037285
29456686 31328171 31573169 33062140 33234469 38641097 39176755 39692018
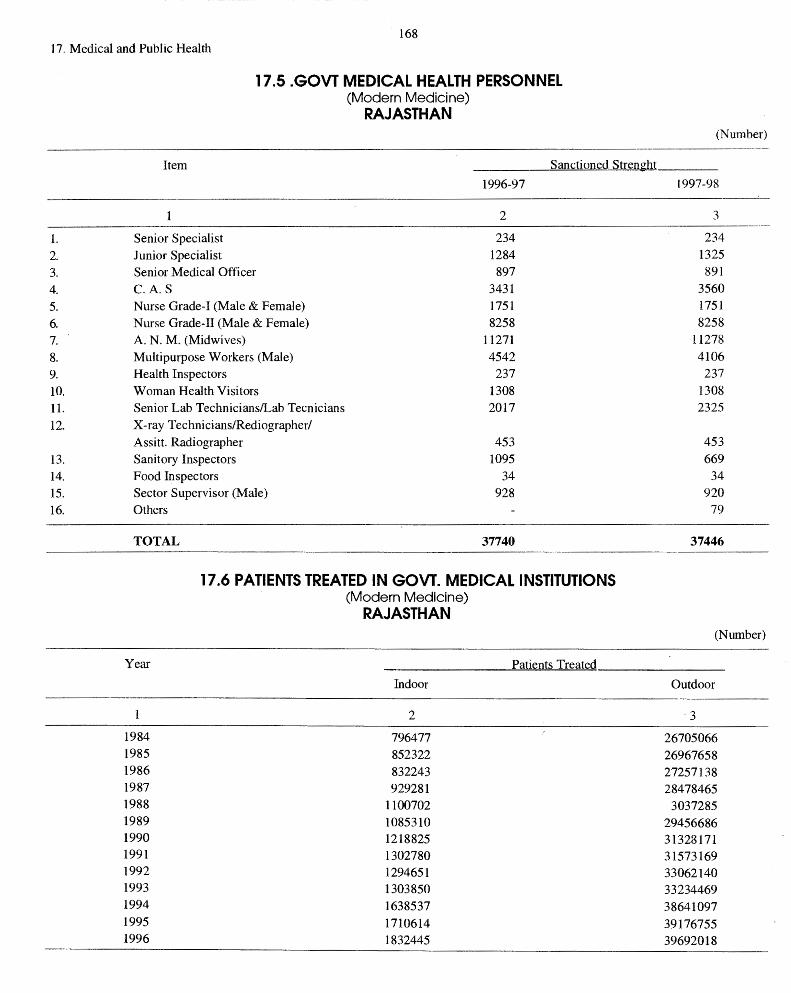

169 17. Medical and Public Health
17.7 REGISTERED DEATHS BY CAUSE, RAJASTHAN 1998
Cause of Death Death
Urban Rural Total
2 3 4
L Cholera 428 1731 2159 2. Typhoid and Para Typhoid 702 3694 4396 3. Food Poisoning 177 376 553 4. Dysentary, Diarrhorea, Gestroenterities 841 4303 5144
5. Tuberculosis 2055 5773 7828 6. Leprosy 111 179 290 7. Diptheria 309 123 432 8. Whooping Cough 265 428 693 9. Tetanus 697 623 1320 10. Acute Polinyelities 126 270 396 11. Measeles 267 739 1006 12. Rabies 106 194 300 13. Malaria 942 4005 4947 14. Cancer 1347 2534 3881 15. Diabetsmallitus 633 1056 1689 16. Anaemia 433 1918 2351 17. Meningities 578 130 708 l& Ischaemic Heart Diseases· 5198 6823 12021 19. Pneumonia 948 1840 2788 20. Influenza 360 985 1345 21. Bronchits & Asthma 2001 7282 9283 22. Jaundice 643 1550 2193 23. Chomic liver diseases & Cerrhosis 642 656 1298 24. Ulcer of stomach and Duodenum 630 1856 2486 25. Apdenidci ties 249 574 823 26. Diseases of Urinary system 330 776 1106 27. Abortion 59 258 317 28. Haemarrhage of Preganancy & Child birth 133 926 1059 29. Certain conditions orginatian in the Perinatal period 552 411 963 30. Cerebrovascular Disease (Paralysis) 747 2198 2945 31. Old age 15361 53257 68618 32. Other Unspecified disease 17397 23918 41315 E33. Snake and other Poisonous Insect's bite 169 820 989 E34. Accidental cased by fire, fire & flames 580 512 1092 E35. Accidental Falls 358 587 945 E36. Accidental Poisoning 280 434 714 E 37. Transport Accidents 1201 1574 2775 E 38. Other Unspecified accidents 1044 2102 3146 E39. Sucide and self inficted injuries 327 346 673 E40. Homicide and injury purpaosely inficted
by other person 166 179 345
TOTAL 59392 137940 197332
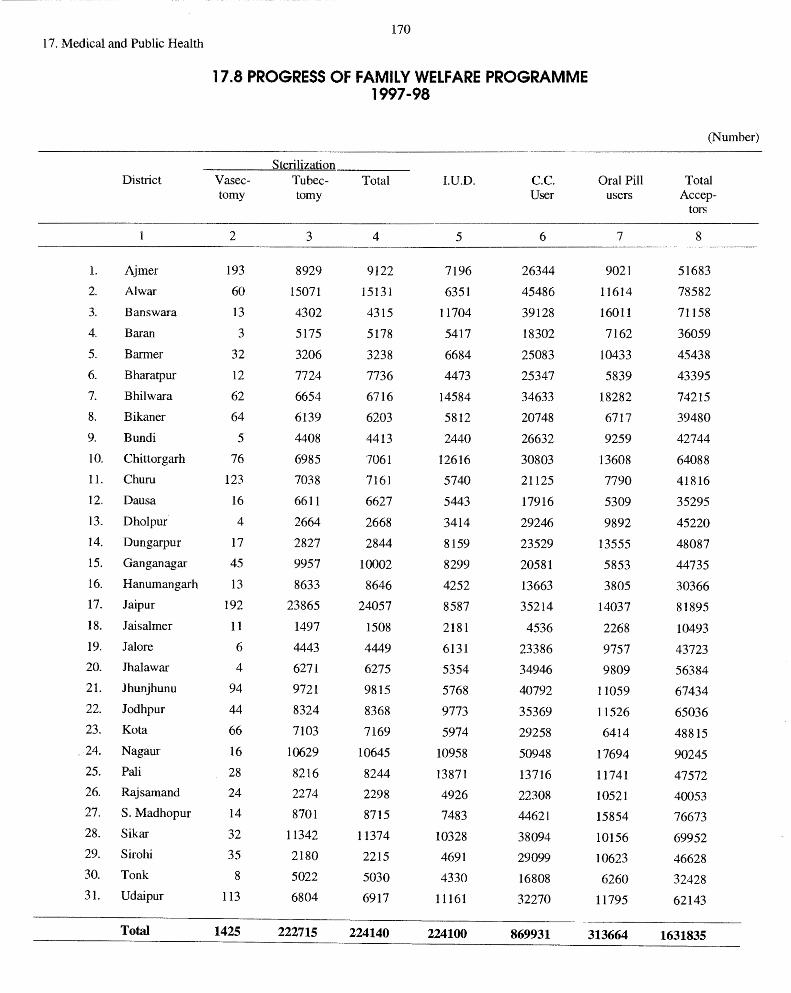
170 17. Medical and Public Health
17 .8 PROGRESS OF FAMILY WELFARE PROGRAMME 1997-98
(Number)
Sterilization District Vasec- Tu bee- Total I.U.D. c.c. Oral Pill Total
tomy tomy User users Accep-tors
2 3 4 5 6 7 8
1. Ajmer 193 8929 9122 7196 26344 9021 51683
2. Al war 60 15071 15131 6351 45486 11614 78582
3. Banswara 13 4302 4315 11704 39128 16011 71158
4. Baran 3 5175 5178 5417 18302 7162 36059
5. Barmer 32 3206 3238 6684 25083 10433 45438
6. Bharatpur 12 7724 7736 4473 25347 5839 43395
7. Bhilwara 62 6654 6716 14584 34633 18282 74215 8. Bikaner 64 6139 6203 5812 20748 6717 39480
9. Bundi 5 4408 4413 2440 26632 9259 42744
m Chittorgarh 76 6985 7061 12616 30803 13608 64088 11. Churn 123 7038 7161 5740 21125 7790 41816 12. Dausa 16 6611 6627 5443 17916 5309 35295 13. Dholpur 4 2664 2668 3414 29246 9892 45220 14. Dungarpur 17 2827 2844 8159 23529 13555 48087 15. Ganganagar 45 9957 10002 8299 20581 5853 44735 16. Hanumangarh 13 8633 8646 4252 13663 3805 30366 17. Jaipur 192 23865 24057 8587 35214 14037 81895 18. Jaisalmer 11 1497 1508 2181 4536 2268 10493 19. Jalore 6 4443 4449 6131 23386 9757 43723 20. Jhalawar 4 6271 6275 5354 34946 9809 56384 21. Jhunjhunu 94 9721 9815 5768 40792 11059 67434 22. Jodhpur 44 8324 8368 9773 35369 11526 65036 23. Ko ta 66 7103 7169 5974 29258 6414 48815
. 24. Nagaur 16 10629 10645 10958 50948 17694 90245 25. Pali 28 8216 8244 13871 13716 11741 47572 26. Rajsamand 24 2274 2298 4926 22308 10521 40053 27. S.Madhopur 14 8701 8715 7483 44621 15854 76673 28. Sikar 32 11342 11374 10328 38094 10156 69952 29. Sirohi 35 2180 2215 4691 29099 10623 46628 30. Tonk 8 5022 5030 4330 16808 6260 32428 31. Udaipur 113 6804 6917 11161 32270 11795 62143
Total 1425 222715 224140 224100 869931 313664 1631835
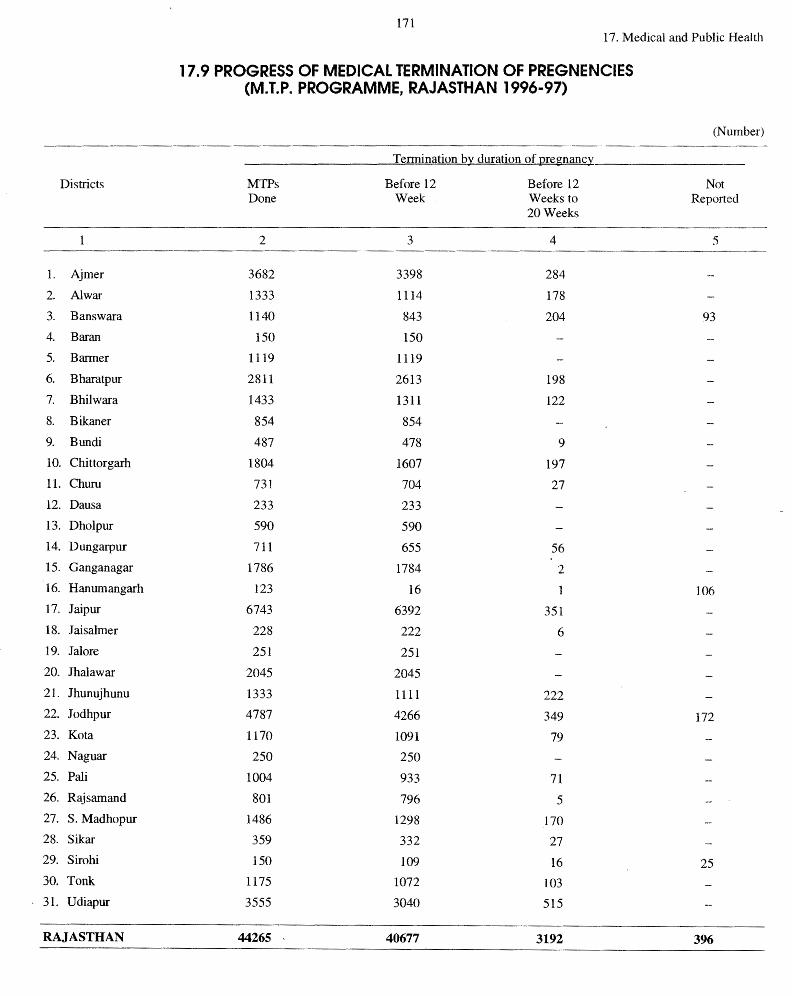
171 17. Medical and Public Health
17.9 PROGRESS OF MEDICAL TERMINATION OF PREGNENCIES (M.T.P. PROGRAMME, RAJASTHAN 1996-97)
(Number)
Termination by: duration of pregnancy:
Districts MTPs Before 12 Before 12 Not Done Week Weeks to Reported
20Weeks
2 3 4 5
1. Ajmer 3682 3398 284
2. Al war 1333 1114 178
3. Banswara 1140 843 204 93
4. Baran 150 150
5. Barmer 1119 1119
6. Bharatpur 2811 2613 198
7. Bhilwara 1433 1311 122
8. Bikaner 854 854
9. Bundi 487 478 9
10. Chittorgarh 1804 1607 197
11. Churn 731 704 27
12. Dausa 233 233
13. Dholpur 590 590
14. Dungarpur 711 655 56
15. Ganganagar 1786 1784 2 I
16. Hanumangarh 123 16 106
17. Jaipur 6743 6392 351
18. Jaisalmer 228 222 6
19. Jal ore 251 251
20. Jhalawar 2045 2045
21. Jhunujhunu 1333 1111 222
22. Jodhpur 4787 4266 349 172
23. Ko ta 1170 1091 79
24. Naguar 250 250
25. Pali 1004 933 71
26. Rajsamand 801 796 5 27. S. Madhopur 1486 1298 170
28. Sikar 359 332 27
29. Sirohi 150 109 16 25
30. Tonk 1175 1072 103
31. Udiapur 3555 3040 515
RAJAS THAN 44265 40677 3192 396
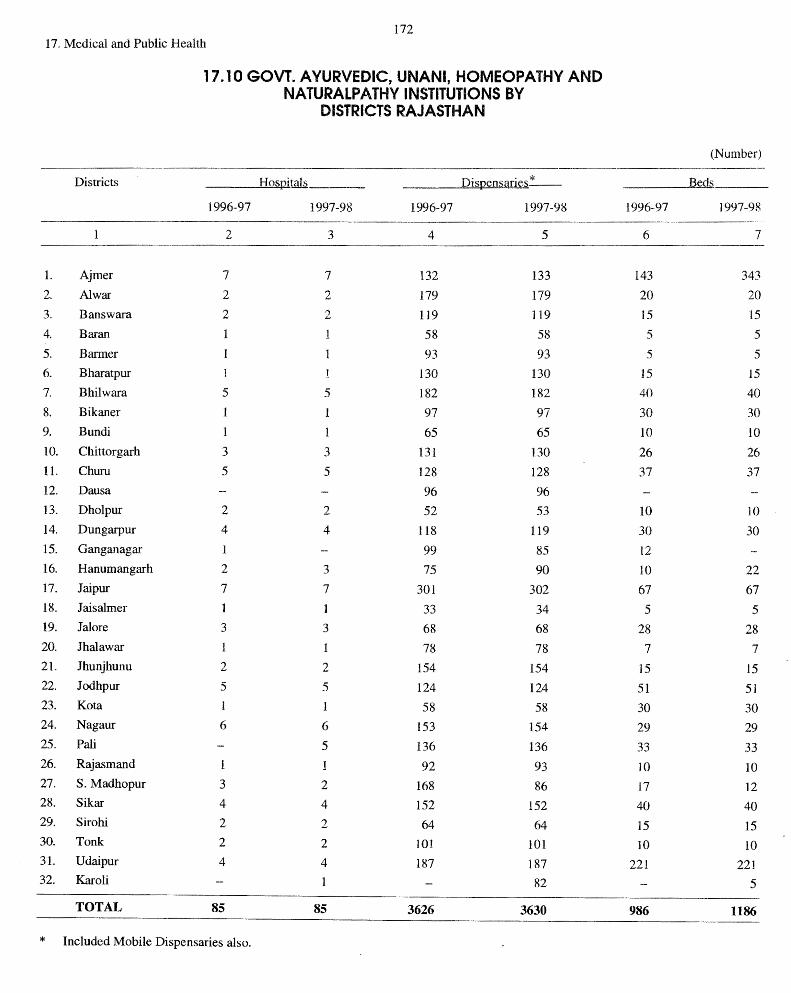
172 17. Medical and Public Health
17.10 GOVT. AYURVEDIC, UNANI, HOMEOPATHY AND NATURALPATHY INSTITUTIONS BY
DISTRICTS RAJASTHAN
(Number)
Districts Hos12itals Dis12ensaries * Beds
1996-97 1997-98 1996-97 1997-98 1996-97 1997-98
2 3 4 5 6 7
1. Ajmer 7 7 132 133 143 343
2. Al war 2 2 179 179 20 20
3. Banswara 2 2 119 119 15 15
4. Baran 58 58 5 5
5. Barmer 93 93 5 5
6. Bharatpur 1 130 130 15 15
7. Bhilwara 5 5 182 182 40 40
8. Bikaner l 97 97 30 30
9. Bundi 1 1 65 65 10 10
10. Chittorgarh 3 3 131 130 26 26
11. Churn 5 5 128 128 37 37
12. Dausa 96 96
13. Dholpur 2 2 52 53 10 10
14. Dungarpur 4 4 118 119 30 30
15. Ganganagar l 99 85 12
16. Hanumangarh 2 3 75 90 10 22
17. Jaipur 7 7 301 302 67 67
18. Jaisalmer 1 1 33 34 5 5 19. Jal ore 3 3 68 68 28 28
20. Jhalawar 1 1 78 78 7 7 21. Jhunjhunu 2 2 154 154 15 15 22. Jodhpur 5 5 124 124 51 51 23. Ko ta l 1 58 58 30 30 24. Nagaur 6 6 153 154 29 29 25. Pali 5 136 136 33 33 26. Rajasmand 1 92 93 IO 10 27. S.Madhopur 3 2 168 86 17 12 28. Sikar 4 4 152 152 40 40 29. Sirohi 2 2 64 64 15 15 30. Tonk 2 2 101 101 10 10 31. Udaipur 4 4 187 187 221 221 32. Karo Ii 82 5
TOTAL 85 85 3626 3630 986 1186
* Included Mobile Dispensaries also.

L
2.
3.
4.
5.
173
17 .11 GOVT. A YURVEDIC, HOMEOPATHIC AND NATURALPATHY & UNANI INSTITUTIONS
MEDICAL PERSONNEL, RAJASTHAN
Head 1996-97
2
Ayurvedic and Unani Hositals 85
Ayurvedic and Unani Dispensaries 3626
Beds 986
Medical Personnel
(i) Vaidya/Haleim/Doctors (Momeopatic) 3924
(ii) Compounders and Nurses 3912
Ayurvedic Mobile Dispensaries 5 ~~~~~~· ~~~~~~~~~-
17. Medical and Public Health
(Number)
1997-98
3
85
3623
l 186
3929
3917
7
17.12 PATIENT TREATED IN GOVT. AYURVEDIC, UNANI, HOMEOPATHIC AND NATURALPATHY INSTITUTIONS,
RAJASTHAN
(Number)
Patients Treated
Years Indoor Outdoor Total
2 3 4
1991-92 5705 23152504 23158209
1992-93 6390 20460016 20466406
1993-94 10027 18649805 18659832
1994-95 5660 19581137 19586797
1995-96 4768 16116128 16120896
1996-97 4473 17479806 17484279
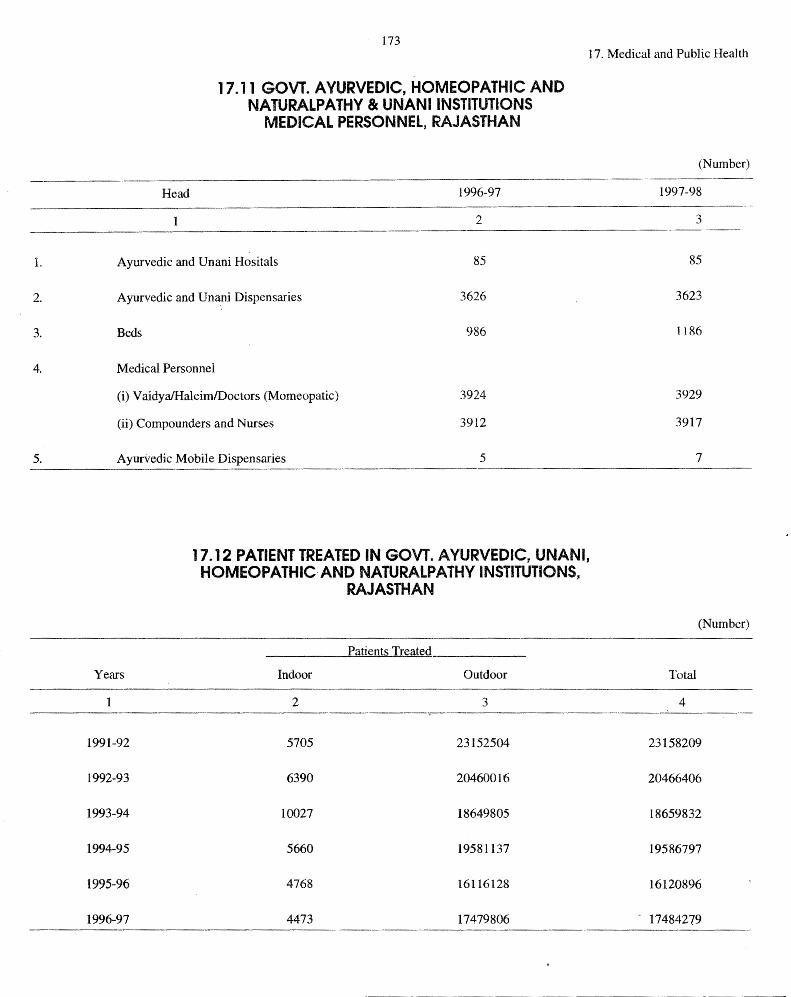
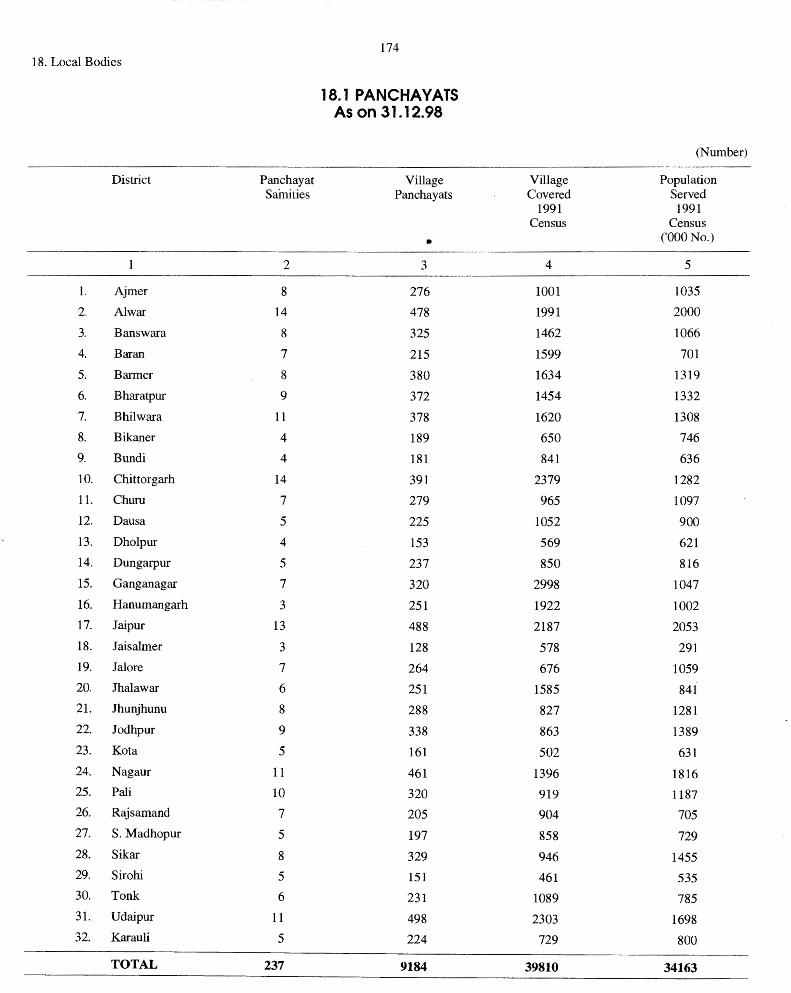
174 18. Local Bodies
18.1 PANCHAYATS As on 31.12.98
(Number)
District Panchayat Village Village Population Saini ties Panchayats Covered Served
1991 1991 Census Census
• ('000 No.)
2 3 4 5
L Ajmer 8 276 1001 1035
2, Al war 14 478 1991 2000
3. Banswara 8 325 1462 1066
4. Baran 7 215 1599 701
5. Barmer 8 380 1634 1319
6. Bharatpur 9 372 1454 1332
7. Bhilwara 11 378 1620 1308
8. Bikaner 4 189 650 746
9. Bundi 4 181 841 636
10. Chittorgarh 14 391 2379 1282
11. Churn 7 279 965 1097
12, Dausa 5 225 1052 900
13. Dholpur 4 153 569 621
14. Dungarpur 5 237 850 816
15. Ganganagar 7 320 2998 1047
16. Hanumangarh 3 251 1922 1002
17. Jaipur 13 488 2187 2053
18. Jaisalmer 3 128 578 291
19. Jal ore 7 264 676 1059
20. Jhalawar 6 251 1585 841
21. Jhunjhunu 8 288 827 1281
22. Jodhpur 9 338 863 1389
23. Ko ta 5 161 502 631
24. Nagaur 11 461 1396 1816 25. Pali 10 320 919 1187 26. Rajsamand 7 205 904 705
27. S.Madhopur 5 197 858 729
28. Sikar 8 329 946 1455 29. Sirohi 5 151 461 535 30. Tonk 6 231 1089 785 31. Udaipur 11 498 2303 1698 32. Karau Ii 5 224 729 800
TOTAL 237 9184 39810 34163
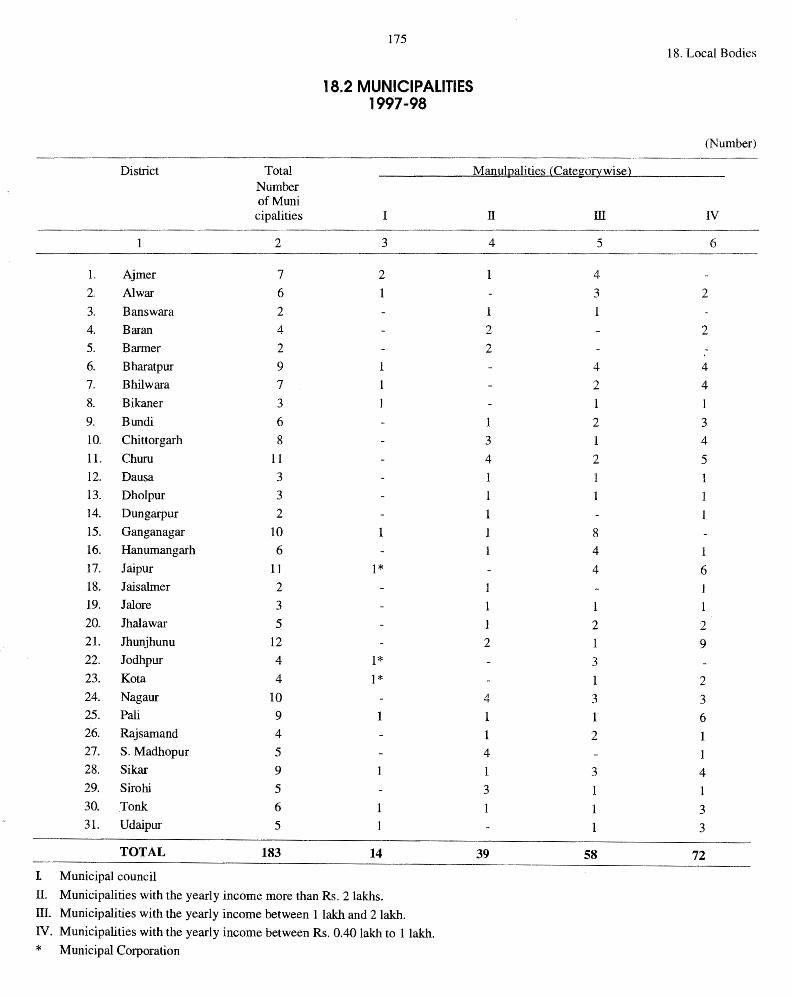
175 18. Local Bodies
18.2 MUNICIPALITIES 1997-98
(Number)
District Total Manulpalities (Category wise} Number of Muni
cipalities I II III IV
2 3 4 5 6
1. Ajmer 7 2 4
2. Al war 6 1 3 2 3. Banswara 2
4. Baran 4 2 2 5. Barmer 2 2 -
6. Bharatpur 9 4 4
7. Bhilwara 7 2 4
8. Bikaner 3
9. Bundi 6 1 2 3
10. Chittorgarh 8 3 1 4
11. Churn 11 4 2 5 12. Dausa 3 1 13. Dholpur 3 l 14. Dungarpur 2
15. Ganganagar IO 8 16. Hanumangarh 6 4 1 17. Jaipur 11 1* 4 6 18. Jaisalmer 2
19. Jalore 3
20. Jhalawar 5 2 2 21. Jhunjhunu 12 2 9 22. Jodhpur 4 1* 3 23. Kota 4 1* 1 2 24. Nagaur IO 4 3 3 25. Pali 9 1 6 26. Rajsamand 4 2 27. S.Madhopur 5 4 1 28. Sikar 9 1 3 4 29. Sirohi 5 3 30. Tonk 6 3 31. Udaipur 5 3
TOTAL 183 14 39 58 72
I Municipal council
II. Municipalities with the yearly income more than Rs. 2 lakhs.
III. Municipalities with the yearly income between 1 lakh and 2 lakh.
IV. Municipalities with the yearly income between Rs. 0.40 lakh to l lakh.
* Municipal Corporation

19. Finance & Trade
Year
1989-90 1990-91 1991-92 1992-93 1993-94 1994-95 1995-96 1996-97 1997-98 1998-99
Accounts
R.E.
Revenue Receipts
2
266759.91 364788.63 412876.26 488746.98 559692.41 632172.57 762986.94 755972.16 840422.47 883810.09
176
19.1 STATE BUDGET RAJASTHAN
Revenue Expenditure
3
269762.79 347994.45 408022.98 499696.60 589760.84 674647.91 833155.62 842567.02 898606.41
1177155.37
19.2 DETAILS OF REVENUE RECEIPTS RAJASTHAN
Head of Account
1 Total Tax Revenue 1. Direct Taxes:
(i) Shares in Central Taxes+ (ii) Land Revenue and Tax on
Agriculture Income (iii) Stamps & Registration Fee (iv) Taxes on immovable property
2. Indirect Taxes: (i) Share in Union Excise (ii) State Excise (iii) Sels Tax (iv) Taxes on Vehicles (v) Taxes on goods & passengers (vi) Other taxes & Dutiesx
II. Non Tax Revenue 1. Interest Receipts, dividends and Profits 2. General Services* 3. Social & Community services% 4. Economic Services @
5. Grants-in-aid
+ Includes Taxes on income, Estate duty.
1996-97 Accounts
2
488960.37 109773.33 75126.24
3774.01 27625.67
3247.41 379187.04 101458.00 78456.43
139965.60 27694.40
0.03 11692.97
267011.79 63108.83 24756.96 11156.27 37089.59
130900.14
x Include Electricity duties, entertainment tax and tax on Commercial crops.
1997-98 Accounts
3
541930.96 114065.40 75046.22
4476.94 31227.16
3315.08 427865.56 105827.00 92278.93
182653.66 34719.96
0.10 12385.91
298491.51 60674.18 22352.82 14182.42 39032.76
162249.33
* Includes Administrative Services, Public Works Pension, Stationery and Printings Etc.
(Lakh Rs.)
Surplus(+) Defictt (-)
4
(-) 3002.88 (+) 16794.18
(+) 485328 (-) 10949.62 (-) 30068.43 (-) 42475.37 (-) 70186.68 (-) 86594.86 (-) 58183.94
(-) 293345.28
(Lakh Rupees)
1998-99 RE
4
601939.12 123633.70 80478.00
3655.70 37500.00 2000.00
478305.42 115949.00 103000.00 210000.00
36225.00 0.12
13131.30 281870.97
69016.30 17419.58 16699.39 41098.13
137637.57
% Includes Medical, Housing Urban Development Information & Publicity, Labour, employment, Social Security and Welfare Education Arts and culture, Public Health, Sanitation and Water Supply.
@ Includes Co-operation Agriculture, Food, Animal Husbandry Fisheries and Roads, Minor Irrigation, Forest, industries, Mines. Irrigation and Multipurpose River Projects.
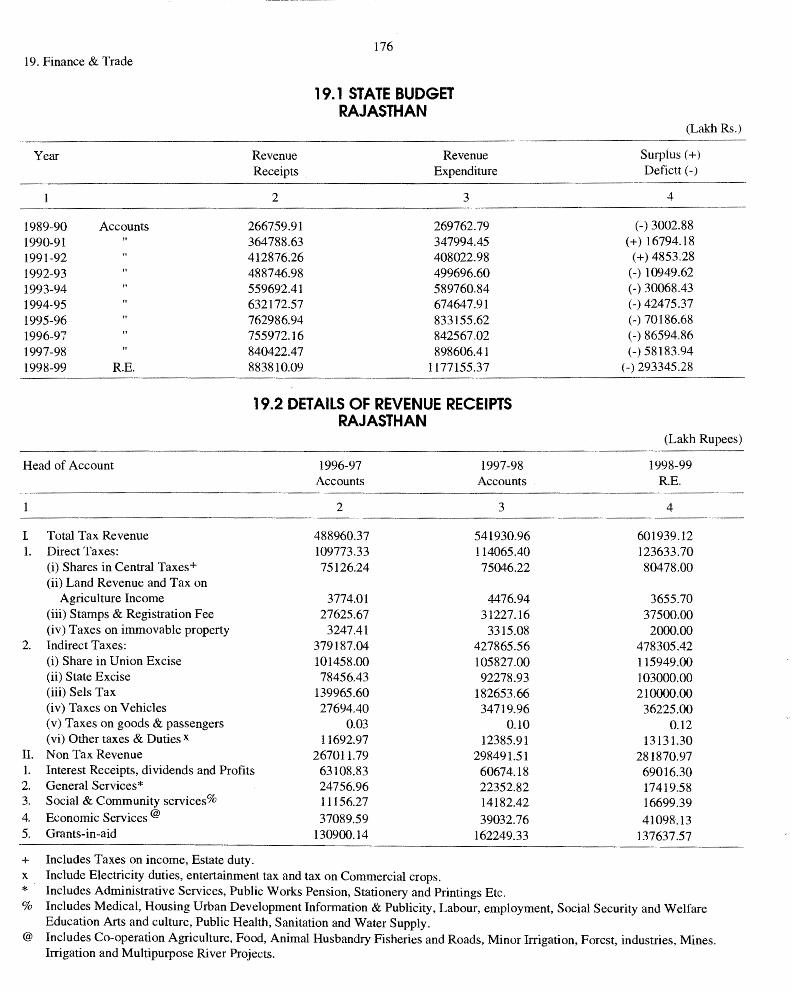
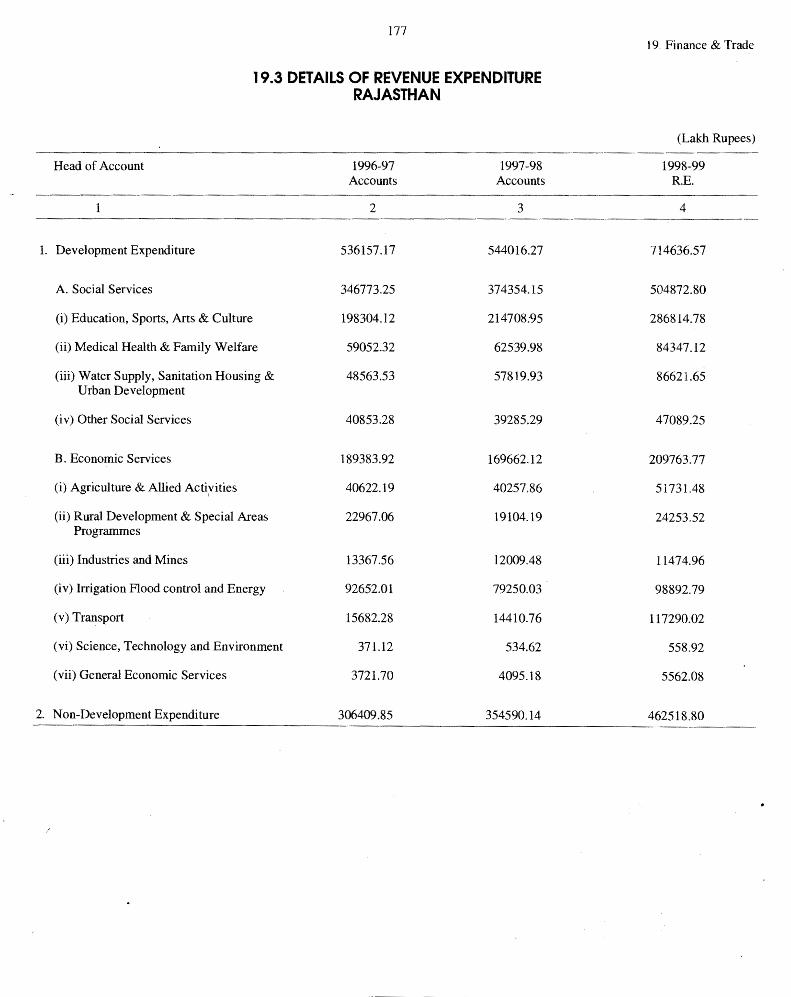
177 19 .. Finance & Trade
19.3 DETAILS OF REVENUE EXPENDITURE RAJASTHAN
(Lakh Rupees)
Head of Account 1996-97 1997-98 1998-99 Accounts Accounts RE.
2 3 4
1. Development Expenditure 536157.17 544016.27 714636.57
A. Social Services 346773.25 374354.15 504872.80
(i) Education, Sports, Arts & Culture 198304.12 214708:95 286814.78
(ii) Medical Health & Family Welfare 59052.32 62539.98 84347.12
(iii) Water Supply, Sanitation Housing & 48563.53 57819.93 86621.65 Urban Development
(iv) Other Social Services 40853.28 39285.29 47089.25
B. Economic Services 189383.92 169662.12 209763.77
(i) Agriculture & Allied Actiyities 40622.19 40257.86 51731.48
(ii) Rural Development & Special Areas 22967.06 19104.19 24253.52 Programmes
(iii) Industries and Mines 13367.56 12009.48 11474.96
(iv) Irrigation Flood control and Energy 92652.01 79250.03 98892.79
( v) Transport 15682.28 14410.76 117290.02
(vi) Science, Technology and Environment 371.12 534.62 558.92
(vii) General Economic Services 3721.70 4095.18 5562.08
2. Non-Development Expenditure 306409.85 354590.14 462518.80
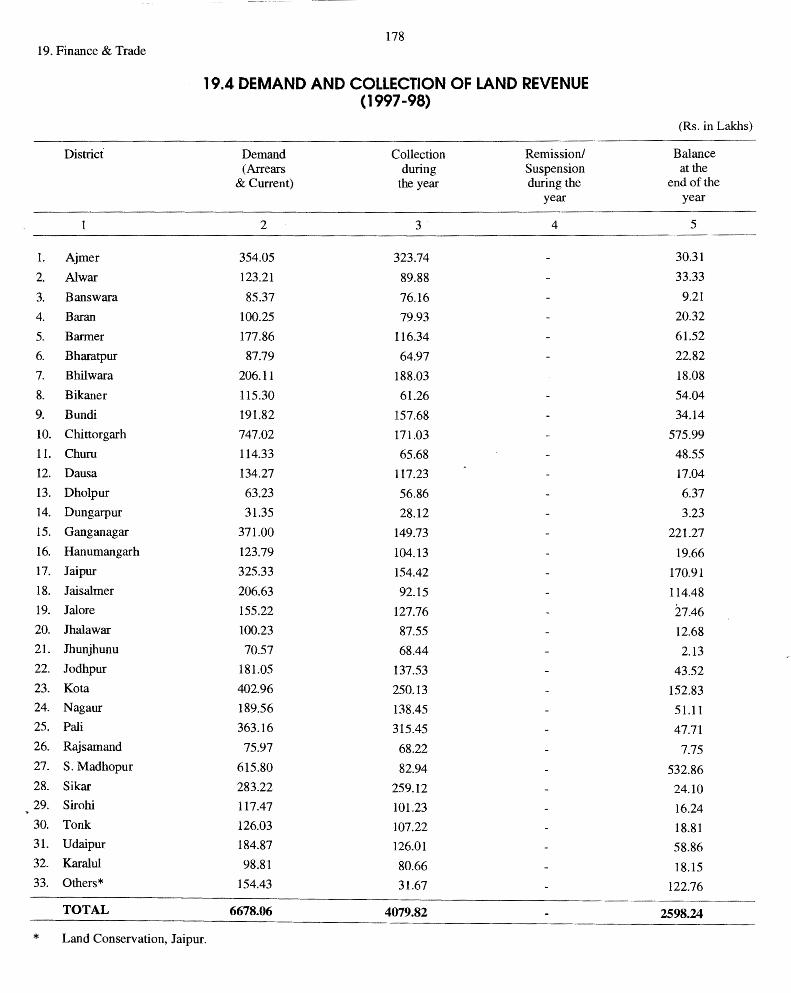
178 19. Finance & Trade
19.4 DEMAND AND COLLECTION OF LAND REVENUE (1997-98)
(Rs. in Lakhs)
District Demand Collection Remission/ Balance (Arrears during Suspension at the
& Current) the year during the end of the year year
2 3 4 5
1. Ajmer 354.05 323.74 30.31
2. Al war 123.21 89.88 33.33
3. Banswara 85.37 76.16 9.21
4. Baran 100.25 79.93 20.32
5. Barmer 177.86 116.34 61.52
6. Bharatpur 87.79 64.97 22.82
7. Bhilwara 206.11 188.03 18.08
8. Bikaner 115.30 61.26 54.04
9. Bundi 191.82 157.68 34.14
10. Chittorgarh 747.02 171.03 575.99
11. Churu 114.33 65.68 48.55
12. Dausa 134.27 117.23 17.04
13. Dholpur 63.23 56.86 6.37
14. Dungarpur 31.35 28.12 3.23
15. Ganganagar 371.00 149.73 221.27
16. Hanumangarh 123.79 104.13 19.66
17. Jaipur 325.33 154.42 170.91
18. Jaisalmer 206.63 92.15 114.48 19. Jalore 155.22 127.76 27.46 20. Jhalawar 100.23 87.55 12.68 21. Jhunjhunu 70.57 68.44 2.13 22. Jodhpur 181.05 137.53 43.52 23. Ko ta 402.96 250.13 152.83 24. Nagaur 189.56 138.45 51.11 25. Pali 363.16 315.45 47.71 26. Rajsamand 75.97 68.22 7.75 27. S.Madhopur 615.80 82.94 532.86 28. Sikar 283.22 259.12 24.10 29. Sirohi 117.47 101.23 16.24 30. Tonk 126.03 107.22 18.81 31. Udaipur 184.87 126.01 58.86 32. Karalul 98.81 80.66 18.15 33. Others* 154.43 31.67 122.76
TOTAL 6678.06 4079.82 2598.24
* Land Conservation, Jaipur.
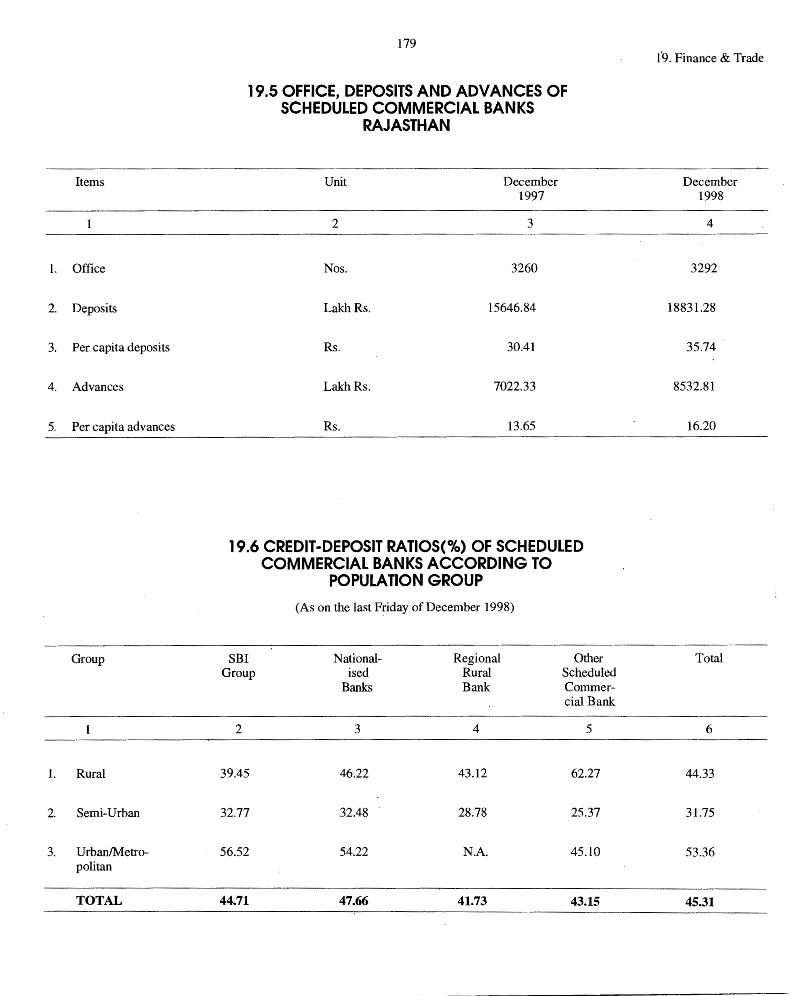
Items
1. Office
2. Deposits
3. Per capita deposits
4. Advances
5. Per capita advances
Group
1. Rural
2. Semi-Urban
3. Urban/Metro-politan
TOTAL
179
19.5 OFFICE, DEPOSITS AND ADVANCES OF SCHEDULED COMMERCIAL BANKS
RAJASTHAN
Unit December 1997
2 3
Nos. 3260
LakhRs. 15646.84
Rs. 30.41
LakhRs. 7022.33
Rs. 13.65
19.6 CREDIT-DEPOSIT RATIOS(C>fo) OF SCHEDULED COMMERCIAL BANKS ACCORDING TO
POPULATION GROUP
(As on the last Friday of December 1998)
SBI National- Regional Other Group ised Rural Scheduled
Banks Bank Commer-cial Bank
2 3 4 5
39.45 46.22 43.12 62.27
32.77 32.48 28.78 25.37
56.52 54.22 N.A. 45.10
44.71 47.66 41.73 43.15
1'9. Finance & Trade
December 1998
4
3292
18831.28
35.74
8532.81
16.20
Total
6
44.33
31.75
53.36
45.31

180 19. Finance & Trade
19.7 NATIONAL SAVING SCHEMES RAJASTHAN
(Rs. in lakh)
Schemes Gross Sale Discharges/ Net Sale Withdrawals
1996-97 1997-98 19~6-97 1997-98 1996-97 1997-98
2 3 4 5 6 7
1. National Saving Certificates VIII 23357.31 19937.51 4906.38 6078.95 18450.93 13858.56
2. Post Office Saving Bank 34913.01 43259.02 27171.86 39213.45 7741.15 4045.57
3. Cummulativetime Deposit 71.81 21.07 50.74
4. Post Office time Deposit 6950.63 12538.54 7113.02 7425.68 162.39 5112.86
5. Recurring Deposit(P.O.R.D.) 41297.75 53150.71 30603.75 36664.51 10694.00 16486.20
6. N.S.S. 268.82 482.40 3055.18 3790.84 2786.36 (-) 3308.44
7. Post Office Monthly Income Scheme 6198.77 14516.94 2921.91 2038.94 3276.86 12478.00
8. Indira Vikas Patra 17438.01 25402.03 19489.03 7262.97 2051.02 18139.06
9. Kisan Vikas Patra 32972.83 55608.26 12623.39 20032.97 20349.44 35575.29
10. Discharge of Old Certificates 284.72 252.47 ("'.) 284.72 (-) 252.47
11. P.P.F. Ale 8018.63 17557.19 2420.75 3518.05 5597.88 14039.14
12. Deposits Scheme for Retiring
Govt. Employees 9467.94 1589.71 7878.23
13. Transfer Enteries 252.41 (-) 1105.62 853.21
TOTAL 180703.10 242452.60 111095.15 126278.83 69607.95 116173.77
19.8 PROGRESS OF STATE INSURANCE RAJASTHAN
Items Unit 1996-97 1997-98
2 3 4
1. Policies in Force at the end of the year Number 585393 601261
2. Sum assured by the end of the year Crore Rs. 1183.14 1274.80
3. Premium recovered during the year Crore Rs. 66.85 68;00
4. Claims paid during the year:-
4.1 By Death-
(i) Cases Number 2137 1690
(ii) Amount Crore Rs. 10.43 10.80
4.2 By maturity
(i) Cases Number 11863 10633
(ii) Amount Crore Rs. 33.18 33.24
4.3 By surrender
(i) Cases Number 1116 1098 (ii) Amount Crore Rs. 1.16 1.66
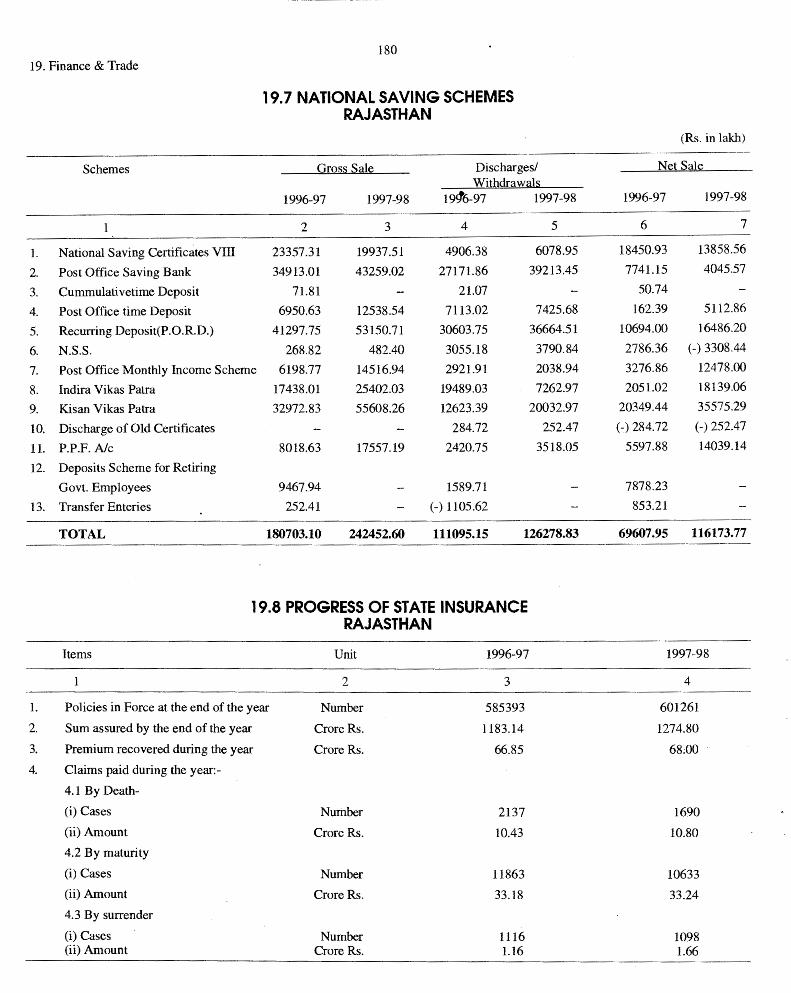
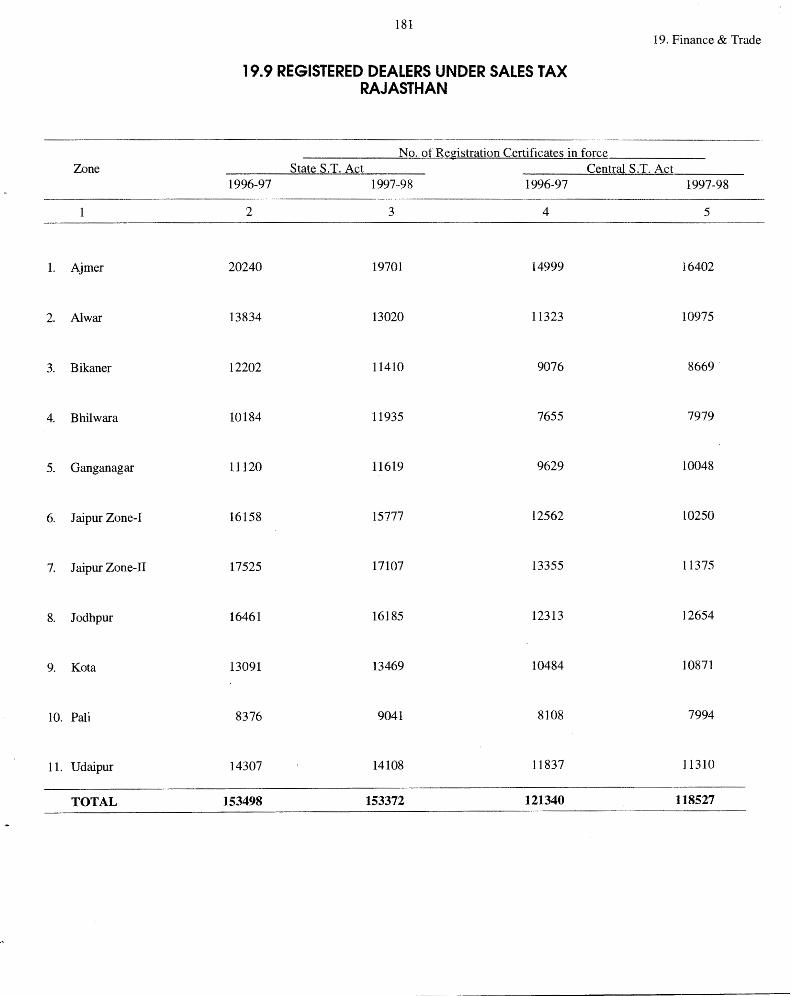
Zone
1. Ajmer
2. Al war
3. Bikaner
4. Bhilwara
5. Ganganagar
6. Jaipur Zone-I
7. Jaipur Zone-II
8. Jodhpur
9. Kota
10. Pali
11. Udaipur
TOTAL
181
19.9 REGISTERED DEALERS UNDER SALES TAX RAJASTHAN
19. Finance & Trade
No. of Registration Certificates in force State S.T. Act Central S.T. Act
1996-97 1997-98 1996-97 1997-98
2 3 4 5
20240 19701 14999 16402
13834 13020 11323 10975
12202 11410 9076 8669-
10184 11935 7655 7979
11120 11619 9629 10048
16158 15777 12562 L0250
17525 17107 13355 L 1375
16461 16185 12313 12654
13091 13469 10484 10871
8376 9041 8108 7994
14307 14108 11837 11310
153498 153372 121340 118527

182 20. State Income
(+)
(*)
1. 2. 3. 4. 5. 6. 7. 8. 9. 10. 11. 12. 13. 14.
15. 16.
20.1 STATE INCOME BY INDUSTRIAL ORIGN AT CURRENT PRICES
Sector 1996-97 (+)
2
Agriculture (including A.H.) 1897913 Forestry 63833 Fisheries 4939 Mining 68871 Manufacturing (Regd.) 246705 Manufacturing (Unregd.) 128565 Construction 266744 Electricity, Gas, water supply 117200 Railway 65810 Other Transport & Storage 66741 Communication 38013 Trade, Hotels, Restaurants 771245 Banking and Insurance 166543 Real Estate and Ownership of Dwelling 83803 Business Services Publice Administration 155520 Other Services 288258
Net State Domestic Product at Factor Cost 4430703
Per Capital Income (Rs.) 8974
Provisional Estimates.
Quick Estimates.
1. 2. 3. 4. 5. 6. 7. 8. 9. 10. 11. 12. 13. 14.
15. 16.
20.2 STATE INCOME BY INDUSTRIAL ORIGN AT CURRENT PRICES
(Percentage Distribution)
Sector 1996-97
2
Agriculture (including A.H.) 42.84 Forestry 1.44 Fisheries 0.11 Mining 1.55 Manufacturing (Regd.) 5.57 Manufacturing (Unregd.) 2.90 Construction 6.02 Electricity, Gas, water supply 2.65 Railway 1.49 Other Transport & Storage 1.51 Communication 0.86 Trade, Hotels, Restaurants 17.41 Banking and Insurance 3.76 Real Estate and Ownership of Dwelling 1.89 Business Services Publice Administration 3.51 Other Services 6.51
Net State Domestic Product at Factor Cost 100.00
(Lakh Rs.)
1997-98 (*)
3
1936314 70451 5262
90584 246080 126705 302666 149200 75333 79065 46562
792815 191477 92508
169440 331005
4705467
9356
1997-98
3
41.15 1.50 0.11 1.93 5.23 2.69 6.43 3.17 1.60 1.68 0.99
16.85 4.07 1.97
3.60 7.03
100.00
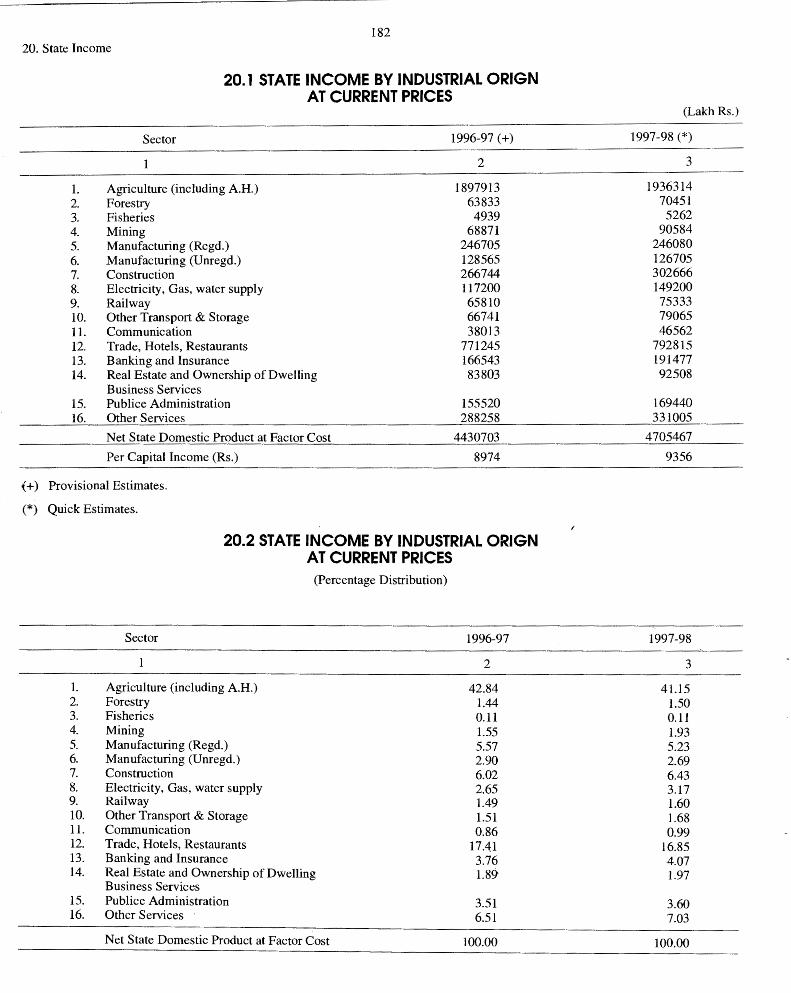

(+)
(*)
1. 2. 3 .. 4. 5. 6. 7. 8. 9. 10. 11. 12. 13. 14.
15. 16.
183
20.3 STATE INCOME BY INDUSTRIAL ORIGN AT CONSTANT PRICES
Sector 1996-97 (+)
2
Agriculture (including A.H.) 496207 Forestry 16306 Fisheries 839 Mining 20922 Manufacturing (Regd.) 81509 Manufacturing (U nregd.) 47298 Construction 61801 Electricity, Gas, water supply 24913 Railway 5208 Other Transport & Storage 12841 Communication 8250 Trade, Hotels, Restaurants 153001 Banking and Insurance 61048 Real Estate and Ownership of Dwelling 34225 Business Services Publice Administration 37418 Other Services 68906
Net State Domestic Product 1130692
Per Capital Income (Rs.) 2290
Provisional Estimates.
Quick Estimates.
1. 2. 3. 4. 5. 6. 7. 8. 9. 10. 11. 12. 13. 14.
15. 16.
20.4 STATE INCOME BY INDUSTRIAL ORIGN AT CONSTANT PRICES
(Percentage Distribution)
Sector 1996-97
2
Agriculture (including A.H.) 43.89 Forestry 1.44 Fisheries 0.07 Mining 1.85 Manufacturing (Regd.) 7.21 Manufacturing (U nregd.) 4.18 Construction 5.47 Electricity, Gas, water supply 2.20 Railway 0.46 Other Transport & Storage 1.14 Communication 0.73 Trade, Hotels, Restaurants 13.53 Banking and Insurance 5.40 Real Estate and Ownership of Dwelling 3.03 Business· Services Publice Administration 3.31 Other Services 6.09
Net State Domestic Product at Factor Cost 100.00
20. State Income
(Lakh Rs.)
1997-98 (*)
3
503516 16681
886 26785 79982 47679 62817 28829
5230 13634 9826
150292 68017 35554
37485 72733
1159946
2306
1997-98
3
43.41 1.44 0.08 2.31 6.90 4.11 5.42 2.49 0.45 1.18 0.85
12.96 5.86 3.07
3.23 6.27
100.00
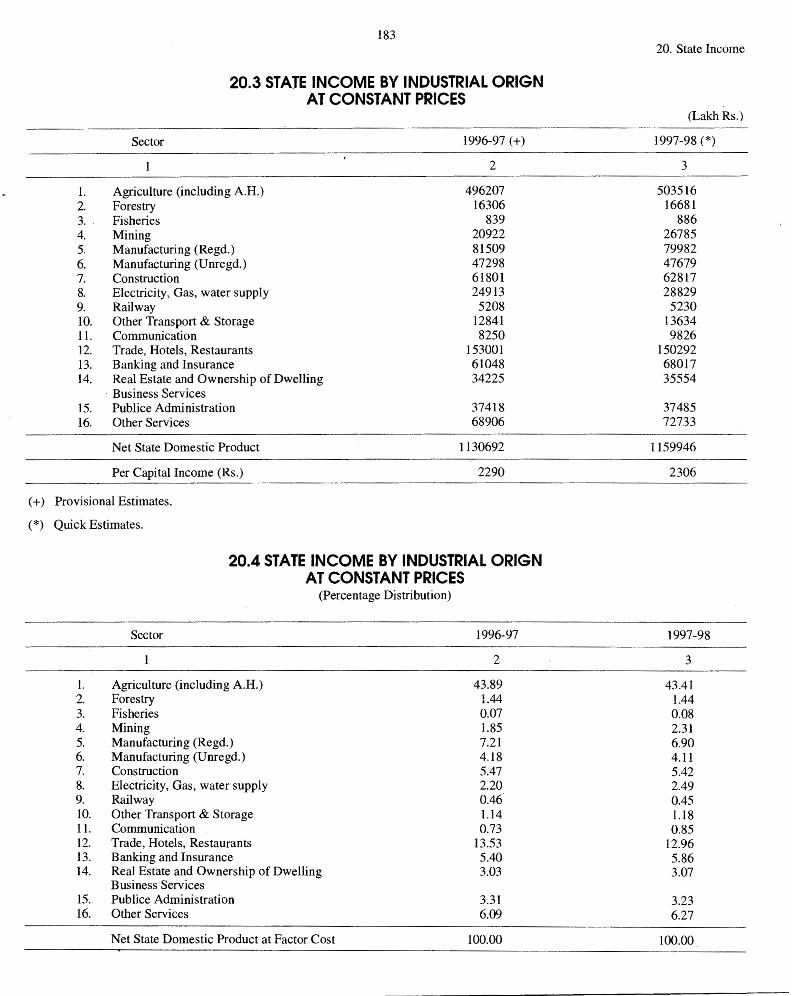
(+)
(*)
1. 2. 3 .. 4. 5. 6. 7. 8. 9. 10. 11. 12. 13. 14.
15. 16.
183
20.3 STATE INCOME BY INDUSTRIAL ORIGN AT CONSTANT PRICES
Sector 1996-97 (+)
2
Agriculture (including A.H.) 496207 Forestry 16306 Fisheries 839 Mining 20922 Manufacturing (Regd.) 81509 Manufacturing (U nregd.) 47298 Construction 61801 Electricity, Gas, water supply 24913 Railway 5208 Other Transport & Storage 12841 Communication 8250 Trade, Hotels, Restaurants 153001 Banking and Insurance 61048 Real Estate and Ownership of Dwelling 34225 Business Services Publice Administration 37418 Other Services 68906
Net State Domestic Product 1130692
Per Capital Income (Rs.) 2290
Provisional Estimates.
Quick Estimates.
1. 2. 3. 4. 5. 6. 7. 8. 9. 10. 11. 12. 13. 14.
15. 16.
20.4 STATE INCOME BY INDUSTRIAL ORIGN AT CONSTANT PRICES
(Percentage Distribution)
Sector 1996-97
2
Agriculture (including A.H.) 43.89 Forestry 1.44 Fisheries 0.07 Mining 1.85 Manufacturing (Regd.) 7.21 Manufacturing (U nregd.) 4.18 Construction 5.47 Electricity, Gas, water supply 2.20 Railway 0.46 Other Transport & Storage 1.14 Communication 0.73 Trade, Hotels, Restaurants 13.53 Banking and Insurance 5.40 Real Estate and Ownership of Dwelling 3.03 Business· Services Publice Administration 3.31 Other Services 6.09
Net State Domestic Product at Factor Cost 100.00
20. State Income
(Lakh Rs.)
1997-98 (*)
3
503516 16681
886 26785 79982 47679 62817 28829
5230 13634 9826
150292 68017 35554
37485 72733
1159946
2306
1997-98
3
43.41 1.44 0.08 2.31 6.90 4.11 5.42 2.49 0.45 1.18 0.85
12.96 5.86 3.07
3.23 6.27
100.00
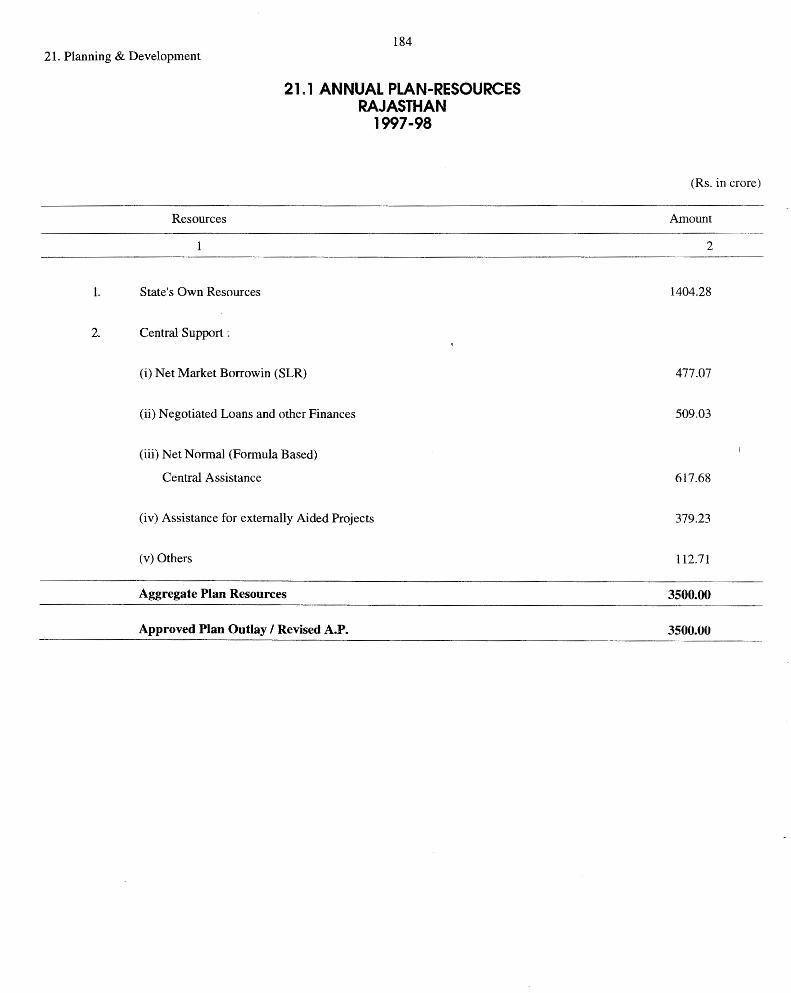
184 21. Planning & Development
1.
2.
21. 1 ANNUAL PLAN-RESOURCES RAJASTHAN
1997-98
Resources
State's Own Resources
Central Support :
(i) Net Market Borrowin (SLR)
(ii) Negotiated Loans and other Finances
(iii) Net Normal (Formula Based)
Central Assistance
(iv) Assistance for externally Aided Projects
(v) Others
Aggregate Plan Resources
Approved Plan Outlay I Revised A.P.
(Rs. in crore)
Amount
2
1404.28
477.07
509.03
617.68
379.23
112.71
3500.00
3500.00
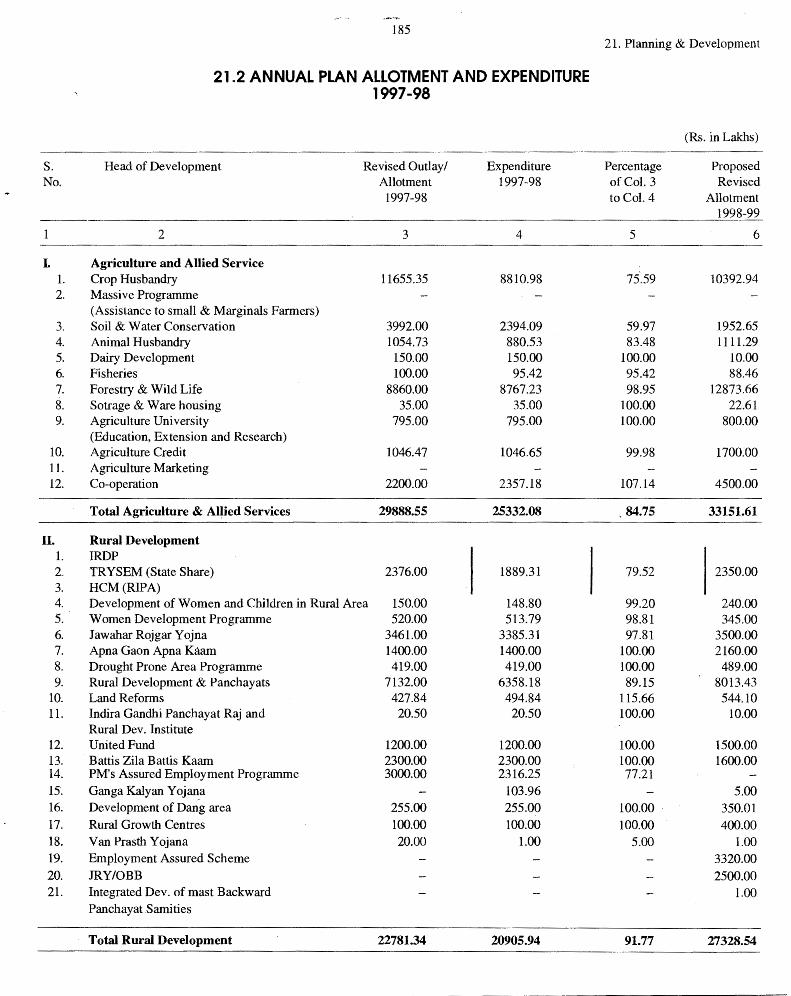
185 2 L Planning & Development
21.2 ANNUAL PLAN ALLOTMENT AND EXPENDITURE 1997-98
(Rs. in Lakhs)
S. Head of Development Revised Outlay/ Expenditure Percentage Proposed No. Allotment 1997-98 of Col. 3 Revised
1997-98 to Col. 4 Allotment 1998-99
2 3 4 5 6
L Agriculture and Allied Service 1. Crop Husbandry 11655.35 8810.98 75',59 10392.94 2. Massive Programme
(Assistance to small & Marginals Farmers) 3. Soil & Water Conservation 3992.00 2394.09 59.97 1952.65 4. Animal Husbandry 1054.73 880.53 83.48 1111.29 5. Dairy Development 150.00 150.00 100.00 10.00 6. Fisheries 100.00 95.42 95.42 88.46 7. Forestry & Wild Life 8860.00 8767.23 98.95 12873.66 8. Sotrage & Ware housing 35.00 35.00 100.00 22.61 9. Agriculture University 795.00 795.00 100.00 800.00
(Education, Extension and Research) 10. Agriculture Credit 1046.47 1046.65 99.98 1700.00 11. Agriculture Marketing 12. Co-operation 2200.00 2357.18 107.14 4500.00
Total Agriculture & Al~ied Services 29888.55 25332.08 84.75 33151.61
11. Rural Development 1. IRDP 2. TRYSEM (State Share) 2376.00 1889.31 79.52 2350.00 3. HCM(RIPA) 4. Development of Women and Children in Rural Area 150.00 148.80 99.20 240.00 5. Women Development Programme 520.00 513.79 98.81 345.00 6. Jawahar Rojgar Yojna 3461.00 3385.31 97.81 3500.00 7. Apna Gaon Apna Kaam 1400.00 1400.00 100.00 2160.00 8. Drought Prone Area Programme 419.00 419.00 100.00 489.00 9. Rural Development & Panchayats 7132.00 6358.18 89.15 8013.43
10. Land Reforms 427.84 494.84 115.66 544.10 11. Indira Gandhi Panchayat Raj and 20.50 20.50 100.00 10.00
Rural Dev. Institute 12. United Fund 1200.00 1200.00 100.00 1500.00 13. Battis Zila Battis Kaam 2300.00 2300.00 100.00 1600.00 14. PM's Assured Employment Programme 3000.00 2316.25 77.21 15. Ganga Kalyan Y oj~a 103.96 5.00 16. Development of Dang area 255.00 255.00 100.00 . 350.01 17. Rural Growth Centres 100.00 100.00 100.00 400.00 18. Van Prasth Y ojana 20.00 1.00 5.00 1.00 19. Employment Assured Scheme 3320.00 20. JRY/OBB 2500.00 21. Integrated Dev. of mast Backward 1.00
Panchayat Sarni ties
Total Rural Development 22781.34 20905.94 91.77 27328.54
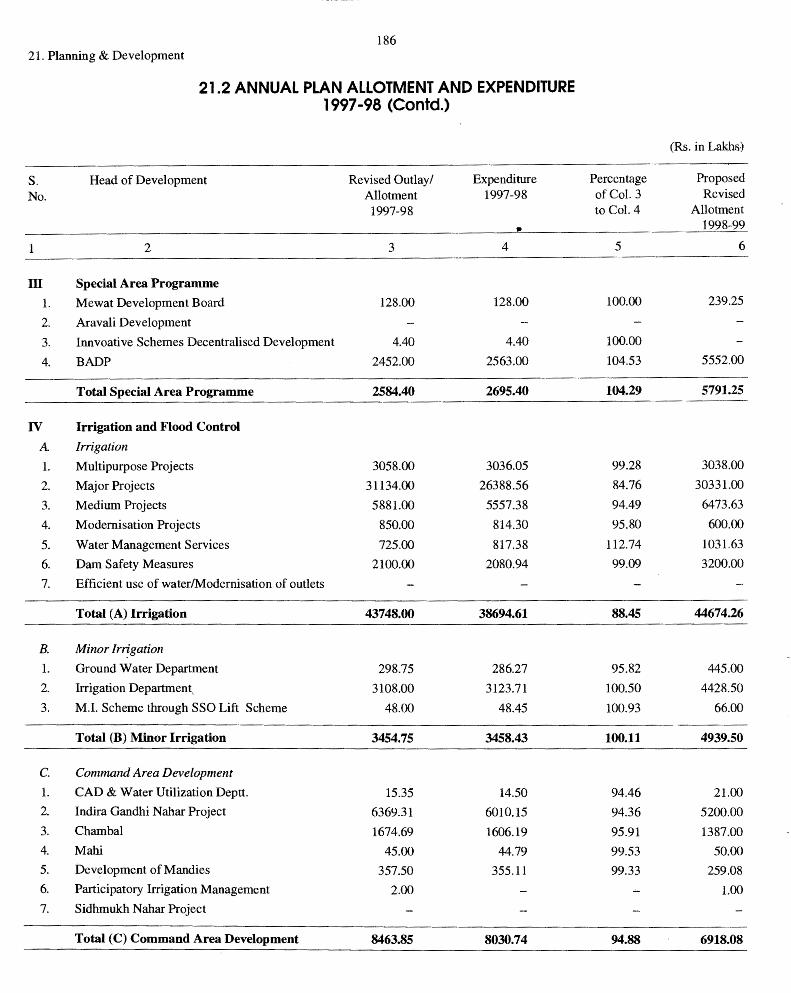
---------
186 21. Planning & Development
21.2 ANNUAL PLAN ALLOTMENT AND EXPENDITURE 1997-98 (Contd.)
(Rs. in Lakhs)
S. Head of Development Revised Outlay/ Expenditure Percentage Proposed
No. Allotment 1997-98 of Col. 3 Revised 1997-98 to Col. 4 Allotment
• 1998-99
2 3 4 5 6
m Special Area Programme
1. Mewat Development Board 128.00 128.00 100.00 239.25
2. Aravali Development
3. Innvoative Schemes Decentralised Development 4.40 4.40 100.00
4. BADP 2452.00 2563.00 104.53 5552.00
Total Special Area Programme 2584.40 2695.40 104.29 5791.25
IV Irrigation and Flood Control
A Irrigation
1. Multipurpose Projects 3058.00 3036.05 99.28 3038.00
2. Major Projects 31134.00 26388.56 84.76 30331.00
3. Medium Projects 5881.00 5557.38 94.49 6473.63
4. Modernisation Projects 850.00 814.30 95.80 600.00
5. Water Management Services 725.00 817.38 112.74 1031.63
6. Dam Safety Measures 2100.00 2080.94 99.09 3200.00
7. Efficient use of water/Modernisation of outlets
Total (A) Irrigation 43748.00 38694.61 88.45 44674.26
B. Minor lrr!gation
1. Ground Water Department 298.75 286.27 95.82 445.00
2. Irrigation Department, 3108.00 3123.71 100.50 4428.50
3. M.I. Scheme through SSO Lift Scheme 48.00 48.45 100.93 66.00
Total (B) Minor Irrigation 3454.75 3458.43 100.11 4939.50
c. Command Area Development
1. CAD & Water Utilization Deptt. 15.35 14.50 94.46 21.00
2. Indira Gandhi Nahar Project 6369.31 6010.15 94.36 5200.00
3. Chambal 1674.69 1606.19 95.91 1387.00
4. Mahi 45.00 44.79 99.53 50.00
5. Development of Mandies 357.50 355.11 99.33 259.08
6. Participatory Irrigation Management 2.00 1.00
7. Sidhmukh Nahar Project
Total (C) Command Area Development 8463.85 8030.74 94.88 6918.08
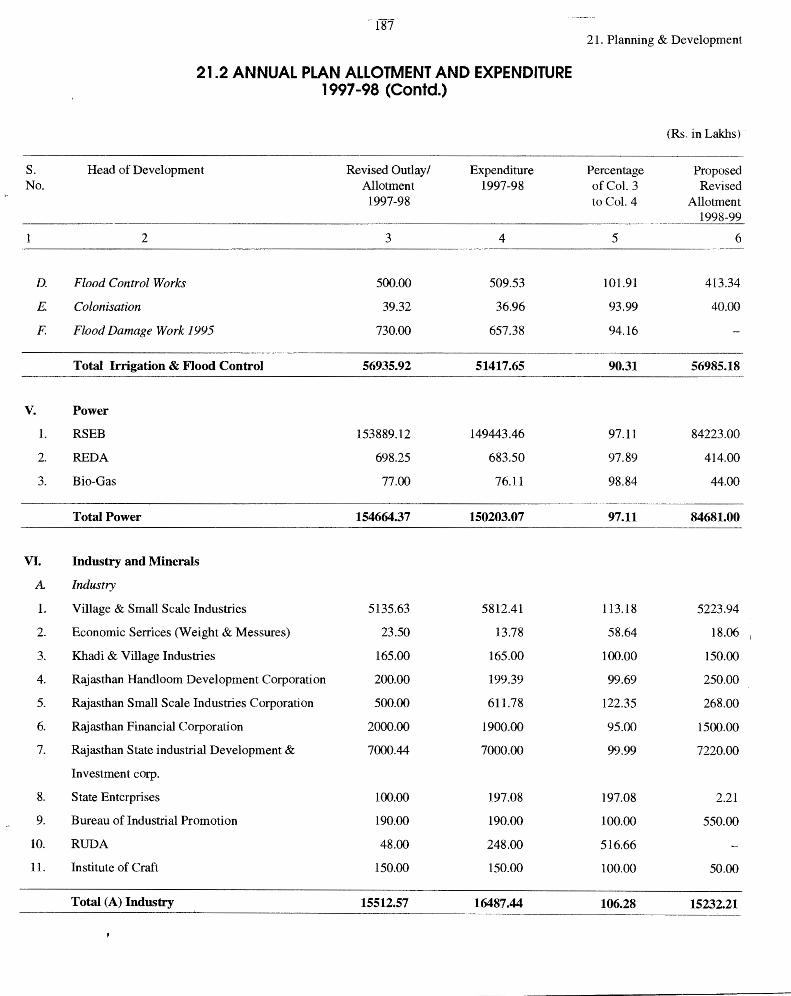
- f87 21. Planning & Development
21.2 ANNUAL PLAN ALLOTMENT AND EXPENDITURE 1997-98 (Contd.)
(Rs. in Lakhs)
S. Head of Development Revised Outlay I Expenditure Percentage Proposed No. Allotment 1997-98 of Col. 3 Revised
1997-98 to Col. 4 Allotment 1998-99
2 3 4 5 6
D. Flood Control Works 500.00 509.53 101.91 41334
E Colonisation 39.32 36.96 93.99 40.00
F. Flood Damage Work 1995 730.00 657.38 94.16
Total Irrigation & Flood Control 56935.92 51417.65 90.31 56985.18
v. Power
1. RSEB 153889.12 149443.46 97.11 84223.00
2. REDA 698.25 683.50 97.89 414.00
3. Bio-Gas 77.00 76.11 98.84 44.00
Total Power 154664.37 150203.07 97.11 84681.00
VI. Industry and Minerals
A Industry
1. Village & Small Scale Industries 5135.63 5812.41 113.18 5223.94
2. Economic Serrices (Weight & Messures) 23.50 13.78 58.64 18.06
3. Khadi & Village Industries 165.00 165.00 100.00 150.00
4. Rajasthan Handloom Development Corporation 200.00 199.39 99.69 250.00
5. Rajasthan Small Scale Industries Corporation 500.00 611.78 122.35 268.00
6. Rajasthan Financial Corporation 2000.00 1900.00 95.00 1500.00
7. Rajasthan State industrial Development & 7000.44 7000.00 99.99 7220.00
Investment corp.
8. State Enterprises 100.00 197.08 197.08 2.21
9. Bureau of Industrial Promotion 190.00 190.00 100.00 550.00
10. RUDA 48.00 248.00 516.66
11. Institute of Craft 150.00 150.00 100.00 50.00
Total (A) Industry 15512.57 16487.44 106.28 15232.21
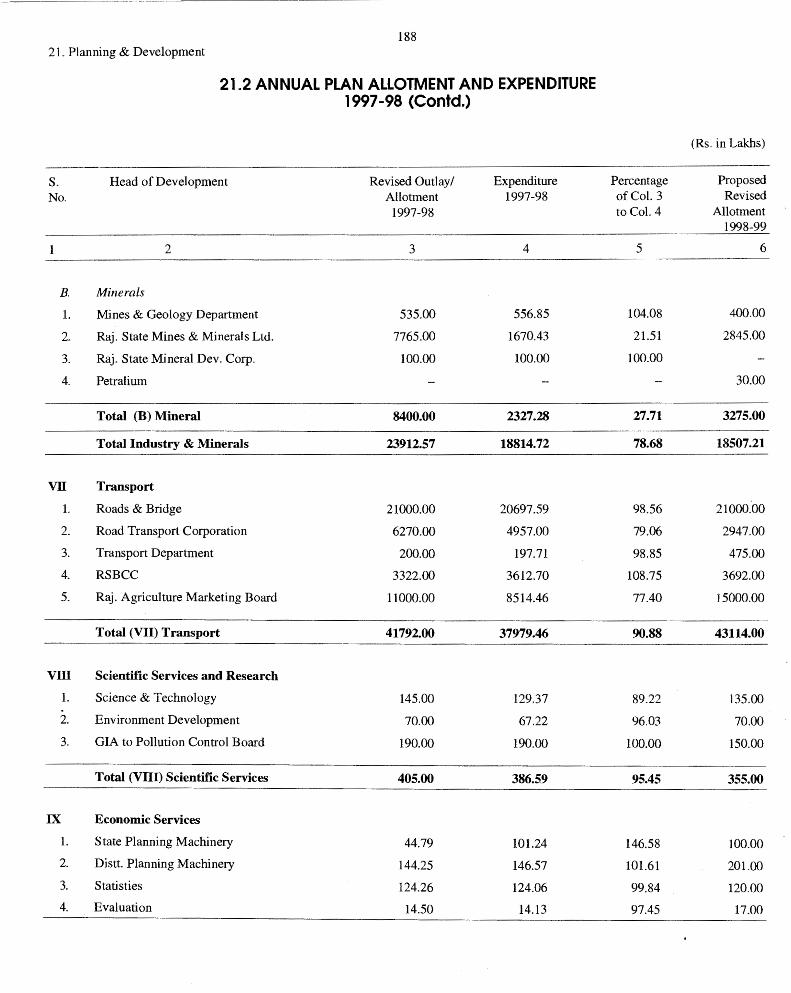
188 21. Planning & Development
21.2 ANNUAL PLAN ALLOTMENT AND EXPENDITURE 1997-98 (Contd.)
(Rs. in Lakhs)
s. Head of Development Revised Outlay/ Expenditure Percentage Proposed No. Allotment 1997-98 of Col. 3 Revised
1997-98 to Col. 4 Allotment 1998-99
2 3 4 5 6
B. Minerals
1. Mines & Geology Department 535.00 556.85 104.08 400.00
2. Raj. State Mines & Minerals Ltd. 7765.00 1670.43 21.51 2845.00
3. Raj. State Mineral Dev. Corp. 100.00 100.00 100.00
4. Petralium 30.00
Total {B) Mineral 8400.00 2327.28 27.71 3275.00
Total Industry & Minerals 23912.57 18814.72 78.68 18507.21
VII Transport
1. Roads & Bridge 21000.00 20697.59 98.56 21000.00
2. Road Transport Corporation 6270.00 4957.00 79.06 2947.00
3. Transport Department 200.00 197.71 98.85 475.00
4. RSBCC 3322.00 3612.70 108.75 3692.00
5. Raj. Agriculture Marketing Board 11000.00 8514.46 77.40 15000.00
Total {VII) Transport 41792.00 37979.46 90.88 43114.00
vm Scientific Services and Research
1. Science & Technology 145.00 129.37 89.22 135.00
2. Environment Development 70.00 67.22 96.03 70.00
3. GIA to Pollution Control Board 190.00 190.00 100.00 150.00
Total {VIII) Scientific Services 405.00 386.59 95.45 355.00
IX Economic Services
1. State Planning Machinery 44.79 101.24 146.58 100.00
2. Distt. Planning Machinery 144.25 146.57 101.61 201.00
3. Statisties 124.26 124.06 99.84 120.00
4. Evaluation 14.50 14.13 97.45 17.00
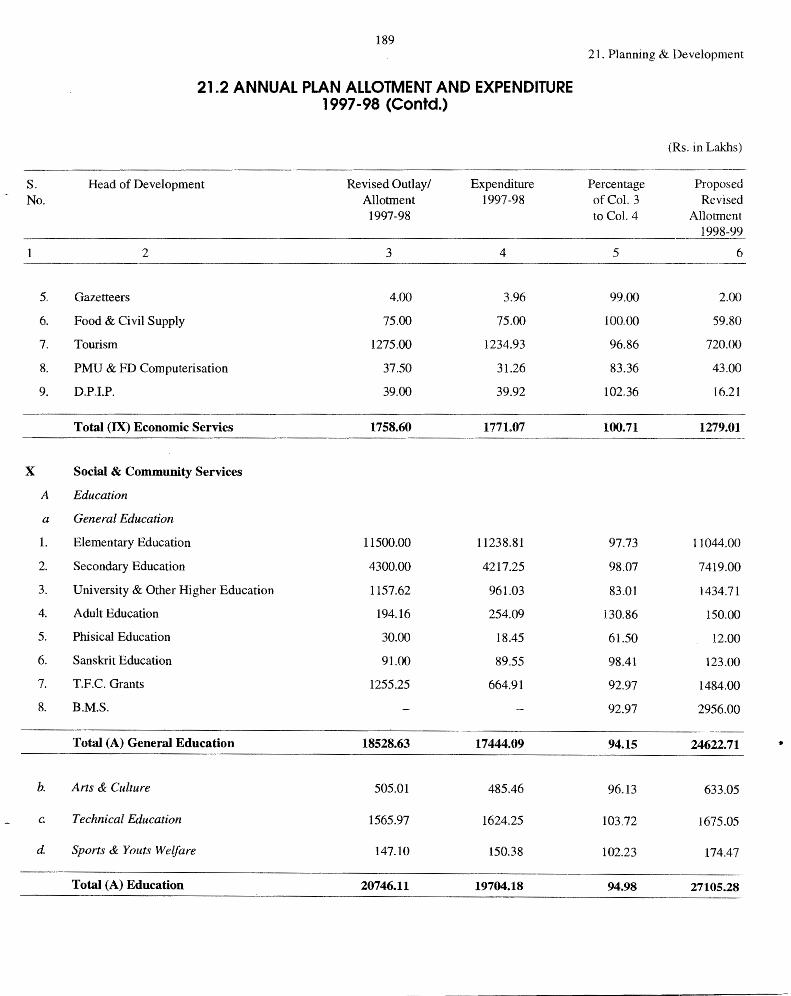
189 21. Planning & Development
21.2 ANNUAL PLAN ALLOTMENT AND EXPENDITURE 1997-98 (Contd.)
(Rs. in Lakhs)
s. Head of Development Revised Outlay/ Expenditure Percentage Proposed No. Allotment 1997-98 of Col. 3 Revised
1997-98 to Col. 4 Allotment 1998-99
-
2 3 4 5 6
5. Gazetteers 4.00 3.96 99.00 2.00
6. Food & Civil Supply 75.00 75.00 100.00 59.80
7. Tourism 1275.00 1234.93 96.86 720.00
8. PMU & FD Computerisation 37.50 31.26 83.36 43.00
9. D.PJ.P. 39.00 39.92 102.36 16.21
Total (IX) Economic Servies 1758.60 1771.07 100.71 1279.01
x Social & Community Services
A Education
a General Education
1. Elementary Education 11500.00 11238.81 97.73 11044.00
2. Secondary Education 4300.00 4217.25 98.07 7419.00
3. University & Other Higher Education 1157.62 961.03 83.01 1434.71
4. Adult Education 194.16 254.09 130.86 150.00
5. Phisical Education 30.00 18.45 61.50 12.00
6. Sanskrit Education 91.00 89.55 98.41 123.00
7. T.F.C. Grants 1255.25 664.91 92.97 1484.00
8. B.M.S. 92.97 2956.00
Total (A) General Education 18528.63 17444.09 94.15 24622.71 •
b. Arts & Culture 505.01 485.46 96.13 633.05
c. Technical Education 1565.97 1624.25 103.72 1675.05
d Sports & Youts Welfare 147.10 150.38 102.23 174.47
Total (A) Education 20746.11 19704.18 94.98 27105.28
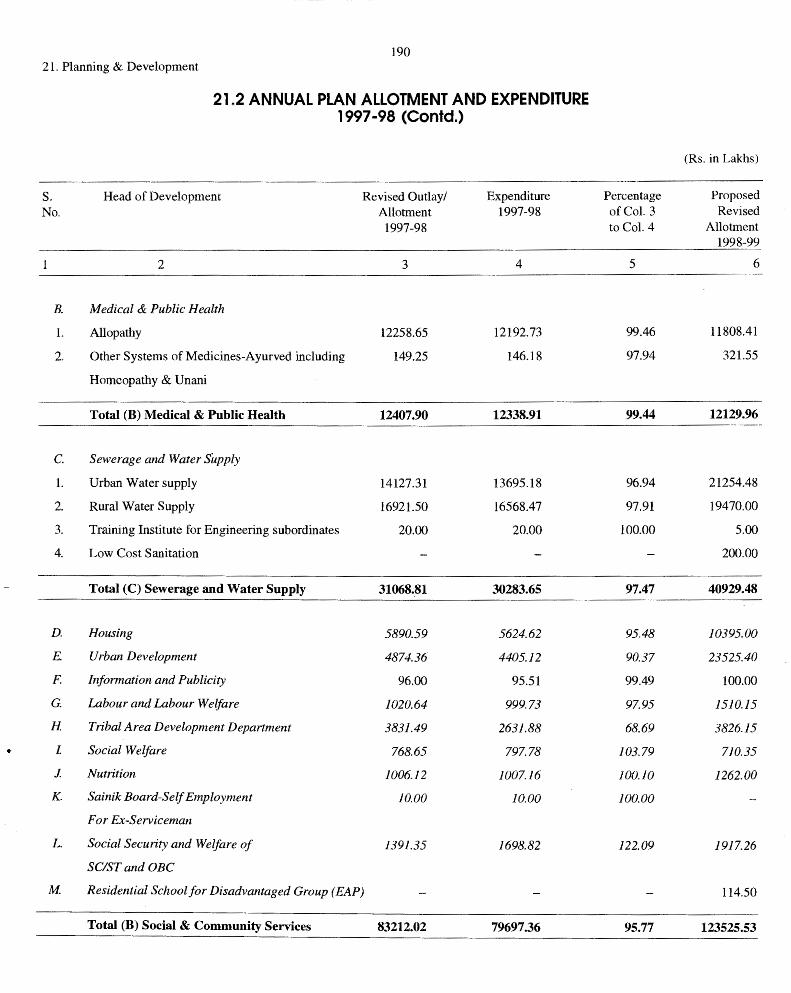
190 21. Planning & Development
21.2 ANNUAL PLAN ALLOTMENT AND EXPENDITURE 1997-98 (Contd.)
(Rs. in Lakhs)
S. Head of Development Revised Outlay/ Expenditure Percentage Proposed No. Allotment 1997-98 ofCoL 3 Revised
1997-98 to Col. 4 Allotment 1998-99
2 3 4 5 6
B. Medical & Public Health
1. Allopathy 12258.65 12192.73 99.46 11808.41
2. Other Systems of Medicines-Ayurved including 149.25 146.18 97.94 321.55
Homeopathy & Unani
Total (B) Medical & Public Health 12407.90 12338.91 99.44 12129.96
c. Sewerage and Water Supply
1. Urban Water supply 14127.31 13695.18 96.94 21254.48
2. Rural Water Supply 16921.50 16568.47 97.91 19470.00
3. Training Institute for Engineering subordinates 20.00 20.00 100.00 5.00
4. Low Cost Sanitation 200.00
Total (C) Sewerage and Water Supply 31068.81 30283.65 97.47 40929.48
D. Housing 5890.59 5624.62 95.48 10395.00
E Urban Development 4874.36 4405.12 90.37 23525.40
F. lnf ormation and Publicity 96.00 95.51 99.49 100.00
G. Labour and Labour Welfare 1020.64 999.73 97.95 1510.15
H Tribal Area Development Department 3831.49 2631.88 68.69 3826.15
• l Social Welfare 768.65 797.78 103.79 710.35
J. Nutrition 1006.12 1007.16 JOO.JO 1262.00
K. Sainik Board-Self Employment 10.00 10.00 100.00
For Ex-Serviceman
L. Social Security and Welfare of 1391.35 1698.82 122.09 1917.26
SC/ST and OBC
M Residential School for Disadvantaged Group (EAP) 114.50
Total (B) Social & Community Services 83212.02 79697.36 95.77 123525.53
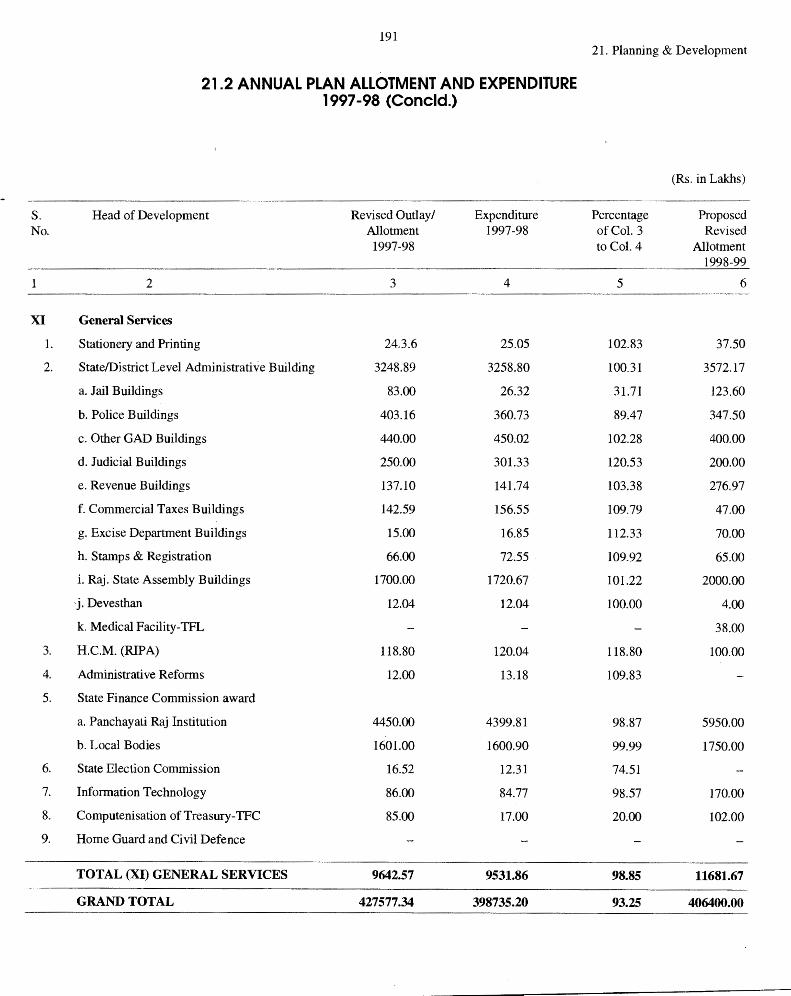
S. No.
XI
I.
2.
3.
4.
5.
6.
7.
8.
9.
191
21.2 ANNUAL PLAN ALLOTMENT AND EXPENDITURE 1997-98 (Concld.)
Head of Development Revised Outlay/ Expenditure Allotment 1997-98
1997-98
2 3 4
General Services
Stationery and Printing 24.3.6 25.05
State/District Level Administrative Building 3248.89 3258.80
a. Jail Buildings 83.00 26.32
b. Police Buildings 403.16 360.73
c. Other GAD Buildings 440.00 450.02
d. Judicial Buildings 250.00 301.33
e. Revenue Buildings 137.10 141.74
f. Commercial Taxes Buildings 142.59 156.55
g. Excise Department Buildings 15.00 16.85
h. Stamps & Registration 66.00 72.55
i. Raj. State Assembly Buildings 1700.00 1720.67
j. Devesthan 12.04 12.04
k. Medical Facility-TFL
H.C.M. (RIPA) 118.80 120.04
Administrative Reforms 12.00 13.18
State Finance Commission award
a. Panchayati Raj Institution 4450.00 4399.81
b. Local Bodies 1601.00 1600.90
State Election Commission 16.52 12.31
Information Technology 86.00 84.77
Computenisation of Treasury-TFC 85.00 17.00
Home Guard and Civil Defence
TOTAL (XI) GENERAL SERVICES 9642.57 9531.86
GRAND TOTAL 427577.34 398735.20
21. Planning & Development
(Rs. in Lakhs)
Percentage Proposed of Col. 3 Revised to Col. 4 Allotment
1998-99
5 6
102.83 37.50
100.31 3572.17
31.71 123.60
89.47 347.50
102.28 400.00
120.53 200.00
103.38 276.97
109.79 47.00
112.33 70.00
109.92 65.00
101.22 2000.00
100.00 4.00
38.00
118.80 100.00
109.83
98.87 5950.00
99.99 1750.00
74.51
98.57 170.00
20.00 102.00
98.85 11681.67
93.25 406400.00
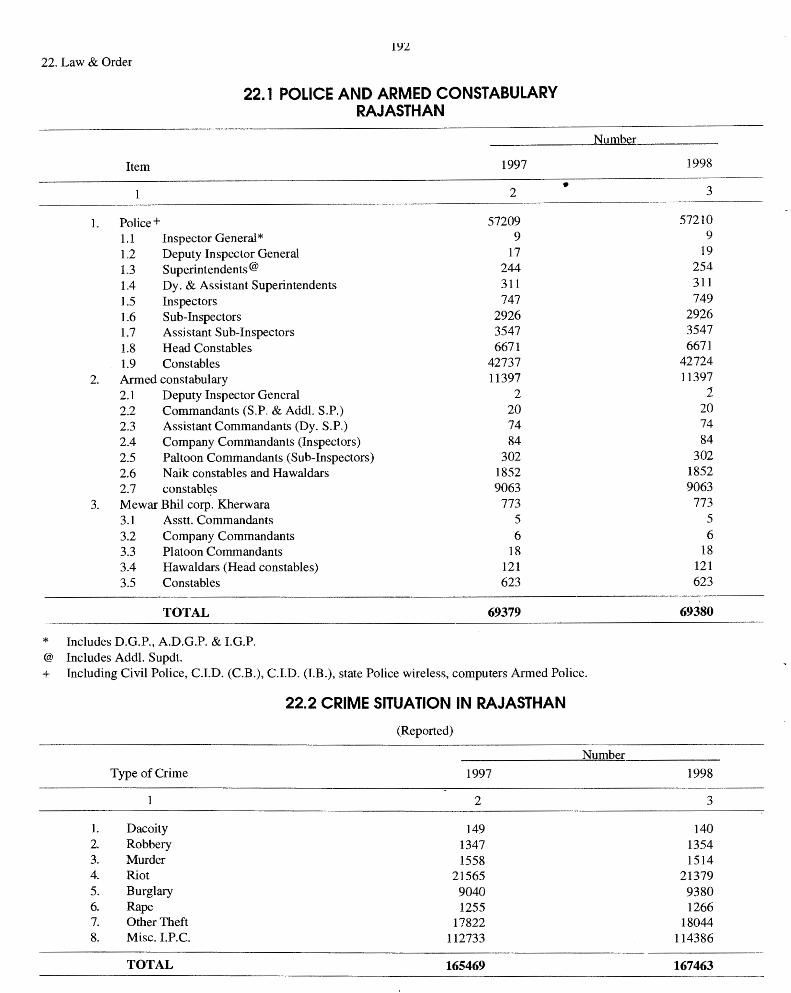
19:2
220 Law & Order
22.1 POLICE AND ARMED CONSTABULARY RAJASTHAN
L
Item
Police+ 1.1 L2 1.3 L4 1.5 1.6 1.7 1.8
Inspector General* Deputy Inspector General Superintendents@ Dy 0 & Assistant Superintendents Inspectors Sub-Inspectors Assistant Sub-Inspectors Head Constables
1.9 Constables 2. Armed constabulary
2.1 Deputy Inspector General 2.2 Commandants (S.P. & Addi. S.P.) 2.3 Assistant Commandants (Dy. S.P.) 2.4 Company Commandants (Inspectors) 2.5 Paltoon Commandants (Sub-Inspectors) 2.6 Naik constables and Hawaldars 2. 7 constabl~s
3. Mewar Bhil corp. Kherwara 3.1 Asstt. Commandants 3.2 Company Commandants 3.3 Platoon Commandants 3.4 Hawaldars (Head constables) 3.5 Constables
TOTAL
* Includes D.G.P., A.D.G.P. & LG.Po @ Includes Addi. Supdt.
1997
2
57209 9
17 244 311 747
2926 3547 6671
42737 11397
2 20 74 84
302 1852 9063
773 5 6
18 121 623
69379
Number
•
+ Including Civil Police, C.I.D. (C.B.), C.I.D. (LB.), state Police wireless, computers Armed Police.
Type of Crime
1. Dacoity 2. Robbery 3. Murder 4. Riot 5. Burglary 6. Rape 7. Other Theft 8. Misc. I.P.C.
TOTAL
22.2 CRIME SITUATION IN RAJASTHAN
(Reported)
1997
2
149 1347 1558
21565 9040 1255
17822 112733
165469
Number
1998
3
57210 9
19 254 311 749
2926 3547 6671
42724 11397
2 20 74 84
302 1852 9063
773 5 6
18 121 623
69380
1998
3
140 1354 1514
21379 9380 1266
18044 114386
167463
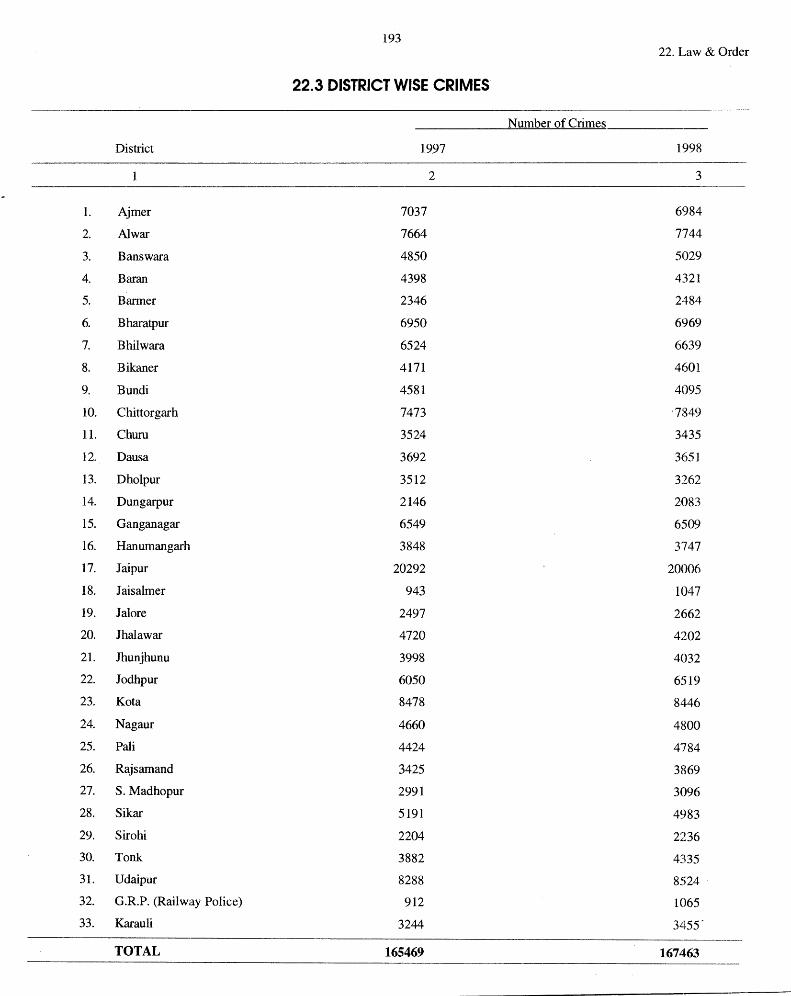
193 22. Law & Order
22.3 DISTRICT WISE CRIMES
Number of Crimes
District 1997 1998
2 3
1. Ajmer 7037 6984
2. Al war 7664 7744
3. Banswara 4850 5029
4. Baran 4398 4321
5. Barmer 2346 2484
6. Bharatpur 6950 6969
7. Bhilwara 6524 6639
8. Bikaner 4171 4601
9. Bundi 4581 4095
10. Chittorgarh 7473 ·7849
11. Churn 3524 3435
12. Dausa 3692 3651
13. Dholpur 3512 3262
14. Dungarpur 2146 2083
15. Ganganagar 6549 6509
16. Hanumangarh 3848 3747
17. Jaipur 20292 20006
18. Jaisalmer 943 1047
19. Jal ore 2497 2662
20. Jhalawar 4720 4202
21. Jhunjhunu 3998 4032
22. Jodhpur 6050 6519
23. Kota 8478 8446
24. Nagaur 4660 4800
25. Pali 4424 4784
26. Rajsamand 3425 3869
27. S. Madhopur 2991 3096
28. Sikar 5191 4983
29. Sirohi 2204 2236
30. Tonk 3882 4335
31. Udaipur 8288 8524 .
32. G.R.P. (Railway Police) 912 1065
33. Karau Ii 3244 3455·
TOTAL 165469 167463
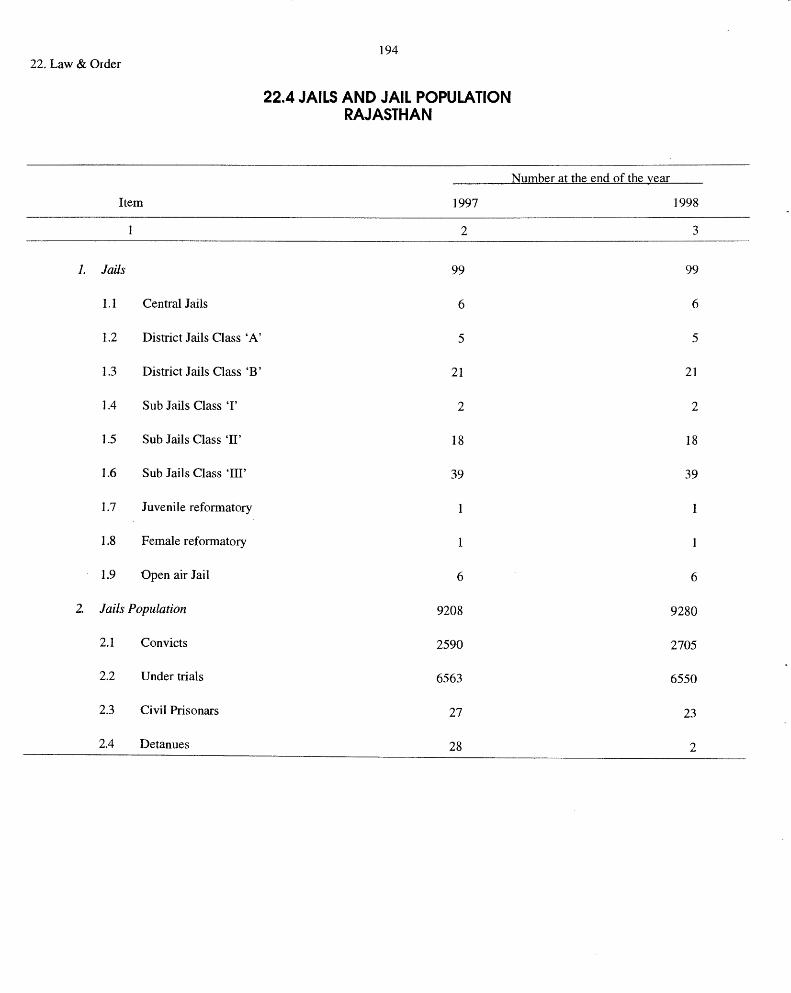
22. Law & Order
Item
1. Jails
1.1 Central Jails
1.2 District Jails Class 'A'
1.3 District Jails Class 'B'
1.4 Sub Jails Class 'I'
1.5 Sub Jails Class 'II'
1.6 Sub Jails Class 'III'
1.7 Juvenile reformatory
1.8 Female reformatory
1.9 Open air Jail
2. Jails Population
2.1 Convicts
2.2 Under trials
2.3 Civil Prisonars
2.4 Detanues
194
22.4 JAILS AND JAIL POPULATION RAJASTHAN
1997
2
99
6
5
21
2
18
39
6
9208
2590
6563
27
28
Number at the end of the year
1998
3
99
6
5
21
2
18
39
6
9280
2705
6550
23
2
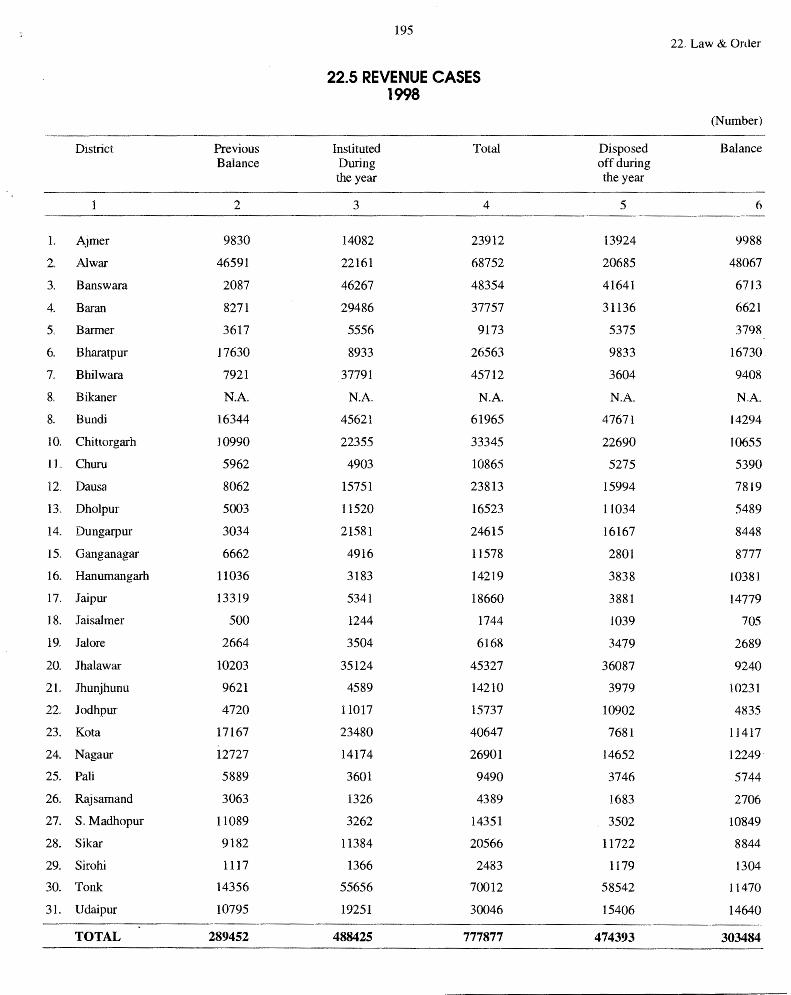
195 22. Law & Order
22.5 REVENUE CASES 1998
(Number)
District Previous Instituted Total Disposed Balance Balance During off during
the year the year
2 3 4 5 6
L ;\jmer 9830 14082 23912 13924 9988
2. Al war 46591 22161 68752 20685 48067
3. Banswara 2087 46267 48354 41641 6713
4. Baran 8271 29486 37757 31136 6621
5. Barmer 3617 5556 9173 5375 3798
6. Bharatpur 17630 8933 26563 9833 16730.
7. Bhilwara 7921 37791 45712 3604 9408
R Bikaner N.A. N.A. N.A. N.A. NA
8. Bundi 16344 45621 61965 47671 14294
m Chittorgarh 10990 22355 33345 22690 10655
lL Churu 5962 4903 1086.5 5275 5390
12. Dausa 8062 15751 23813 15994 7819
13. Dholpur 5003 11520 16523 11034 5489
14. Dungarpur 3034 21581 24615 16167 8448
15 .. Ganganagar 6662 4916 11578 2801 8777
16. Hanumangarh 11036 3183 14219 3838 10381
17. Jaipur 13319 5341 18660 3881 14779
18. Jaisalmer 500 1244 1744 1039 705
19. Jal ore 2664 3504 6168 3479 2689
20. Jhalawar 10203 35124 45327 36087 9240
2L Jhunjhunu 9621 4589 14210 3979 10231
22. Jodhpur 4720 11017 15737 10902 4835
23. Ko ta 17167 23480 40647 7681 11417
24. Nagaur 12727 14174 26901 14652 12249·
25. Pali 5889 3601 9490 3746 5744
26. Rajsamand 3063 1326 4389 1683 2706
27. S. Madhopur 11089 3262 14351 3502 10849
28. Sikar 9182 11384 20566 11722 8844
29. Sirohi 1117 1366 2483 1179 1304
30. Tonk 14356 55656 70012 58542 11470
31. Udaipur 10795 19251 30046 15406 14640
TOTAL 289452 488425 777877 474393 303484
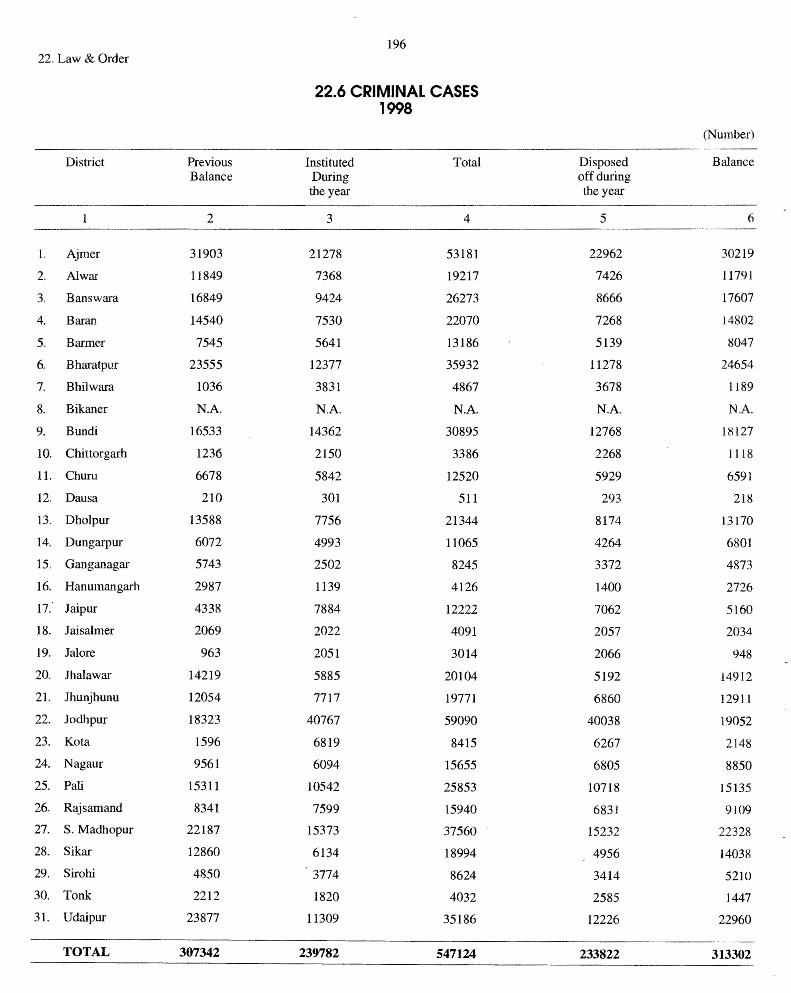
196 22. Law & Order
22.6 CRIMINAL CASES 1998
(Number)
District Previous Instituted Total Disposed Balance Balance During off during
the year the year
2 3 4 5 6
L Ajmer 31903 21278 53181 22962 30219
2. Al war 11849 7368 19217 7426 11791
3. Banswara 16849 9424 26273 8666 17607
4. Baran 14540 7530 22070 7268 14802
5. Barmer 7545 5641 13186 5139 8047
6. Bharatpur 23555 12377 35932 11278 24654
7. Bhilwara 1036 3831 4867 3678 1189
8. Bikaner N.A. N.A. N.A. N.A. N.A.
9. Bundi 16533 14362 30895 12768 18127
10. Chittorgarh 1236 2150 3386 2268 1118
11. Churn 6678 5842 12520 5929 6591
12. Dausa 210 301 511 293 218
13. Dholpur 13588 7756 21344 8174 13170
14. Dungarpur 6072 4993 11065 4264 6801
15. Ganganagar 5743 2502 8245 3372 4873
16. Hanumangarh 2987 1139 4126 1400 2726
17. Jaipur 4338 7884 12222 7062 5160
18. Jaisalmer 2069 2022 4091 2057 2034
19. Jalore 963 2051 3014 2066 948
20. Jhalawar 14219 5885 20104 5192 14912
21. Jhunjhunu 12054 7717 19771 6860 12911
22. Jodhpur 18323 40767 59090 40038 19052
23. Ko ta 1596 6819 8415 6267 2148
24. Nagaur 9561 6094 15655 6805 8850
25. Pali 15311 10542 25853 10718 15135
26. Rajsamand 8341 7599 15940 6831 9109
27. S. Madhopur 22187 15373 37560 15232 22328 28. Sikar 12860 6134 18994 4956 14038 29. Sirohi 4850 3774 8624 3414 5210 30. Tonk 2212 1820 4032 2585 1447 31. Udaipur 23877 11309 35186 12226 22960
TOTAL 307342 239782 547124 233822 313302
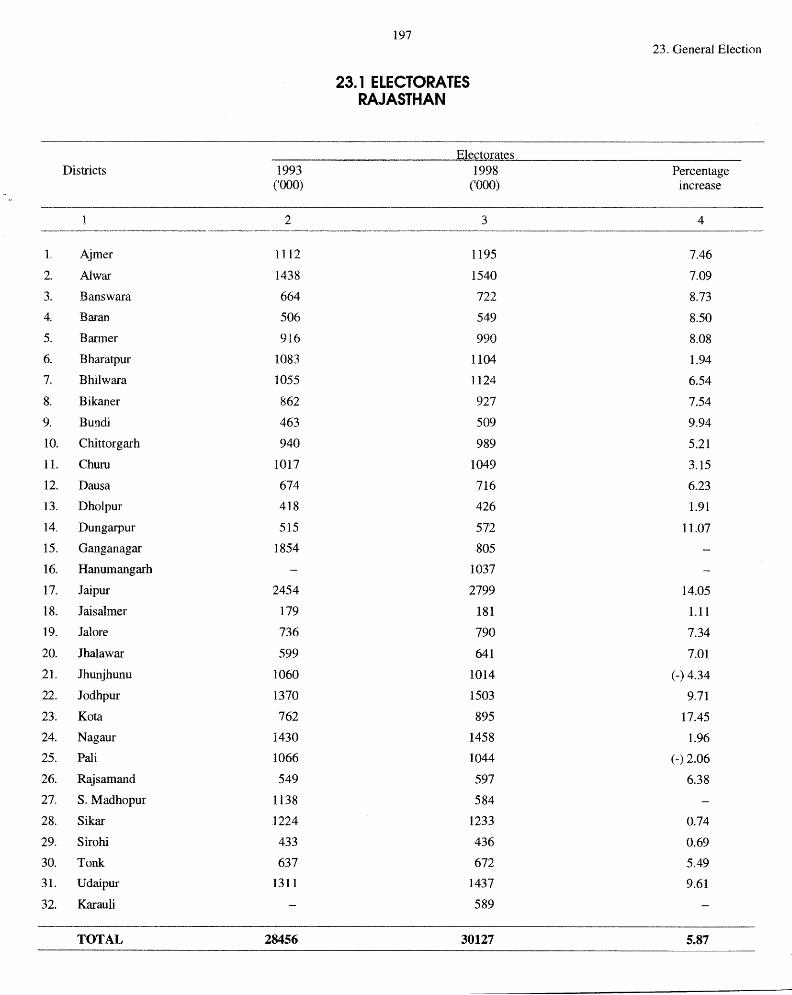
Districts 1993 ('000)
2
L Ajmer 1112
2. Al war 1438
3. Banswara 664
4. Baran 506
5. Barmer 916
6. Bharatpur 1083
7. Bhilwara 1055
8. Bikaner 862
9. Bundi 463
10. Chittorgarh 940
11. Churu 1017
12. Dausa 674
13. Dholpur 418
14, Dungarpur 515
15. Ganganagar 1854
16. Hanumangarh
17. Jaipur 2454
18. Jaisalmer 179
19. Jal ore 736
20. Jhalawar 599
21. Jhunjhunu 1060
22. Jodhpur 1370
23. Ko ta 762
24. Nagaur 1430
25. Pali 1066
26. Rajsamand 549
27, S. Madhopur 1138
28. Sikar 1224
29. Sirohi 433
30. Tonk 637
31. Udaipur 1311
32. Karau Ii
TOTAL 28456
197
23.1 ELECTORATES RAJASTHAN
Electorates 1998
('000)
3
1195
1540
722
549
990
1104
1124
927
509
989
1049
716
426
572
805
1037
2799
181
790
641
1014
1503
895
1458
1044
597
584
1233
436
672
1437
589
30127
23. General Election
Percentage increase
4
7.46
7.09
8.73
8.50
8.08
1.94
6.54
7.54
9.94
5.21
3.15
6.23
l.91
11.07
14.05
1.11
7.34
7.01
(-)4.34
9.71
17.45
1.96
(-) 2.06
6.38
0.74
0.69
5.49
9.61
5.87
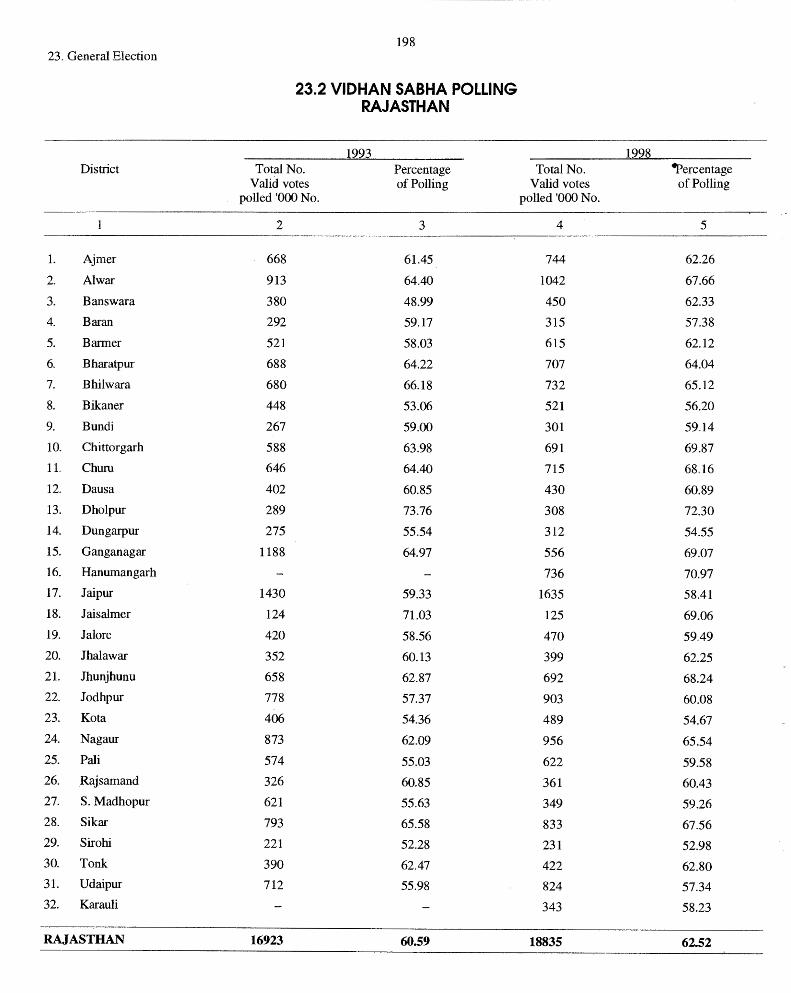
-----------
198 23. General Election
23.2 VIDHAN SABHA POLLING RAJASTHAN
1993 1998 District Total No. Percentage Total No. ~ercentage
Valid votes of Polling Valid votes of Polling polled '000 No. polled '000 No.
2 3 4 5
1. Ajmer 668 61.45 744 62.26
2. Al war 913 64.40 1042 67.66
3. Banswara 380 48.99 450 62.33
4. Baran 292 59.17 315 57.38
5. Barmer 521 58.03 615 62.12
6. Bharatpur 688 64.22 707 64.04
7. Bhilwara 680 66.18 732 65.12
K Bikaner 448 53.06 521 56.20
9. Bundi 267 59.00 301 59J4
10. Chittorgarh 588 63.98 691 69.87
11. Churn 646 64.40 715 68.16
12. Daus a 402 60.85 430 60.89
13. Dholpur 289 73.76 308 72.30
14. Dungarpur 275 55.54 312 54.55
15. Ganganagar 1188 64.97 556 69.07
16. Hanumangarh 736 70.97
17. Jaipur 1430 59.33 1635 58.41
18. Jaisalmer 124 71.03 125 69.06
19. Jalore 420 58.56 470 59.49
20. Jhalawar 352 60.13 399 62.25
21. Jhunjhunu 658 62.87 692 68.24
22. Jodhpur 778 57.37 903 60.08
23. Kota 406 54.36 489 54.67
24. Nagaur 873 62.09 956 65.54
25. Pali 574 55.03 622 59.58
26. Rajsamand 326 60.85 361 60.43
27. S.Madhopur 621 55.63 349 59.26
28. Sikar 793 65.58 833 67.56 29. Sirohi 221 52.28 231 52.98 30. Tonk 390 62.47 422 62.80 31. Udaipur 712 55.98 824 57.34 32. Karauli 343 58.23
RAJASTHAN 16923 60.59 18835 62.52
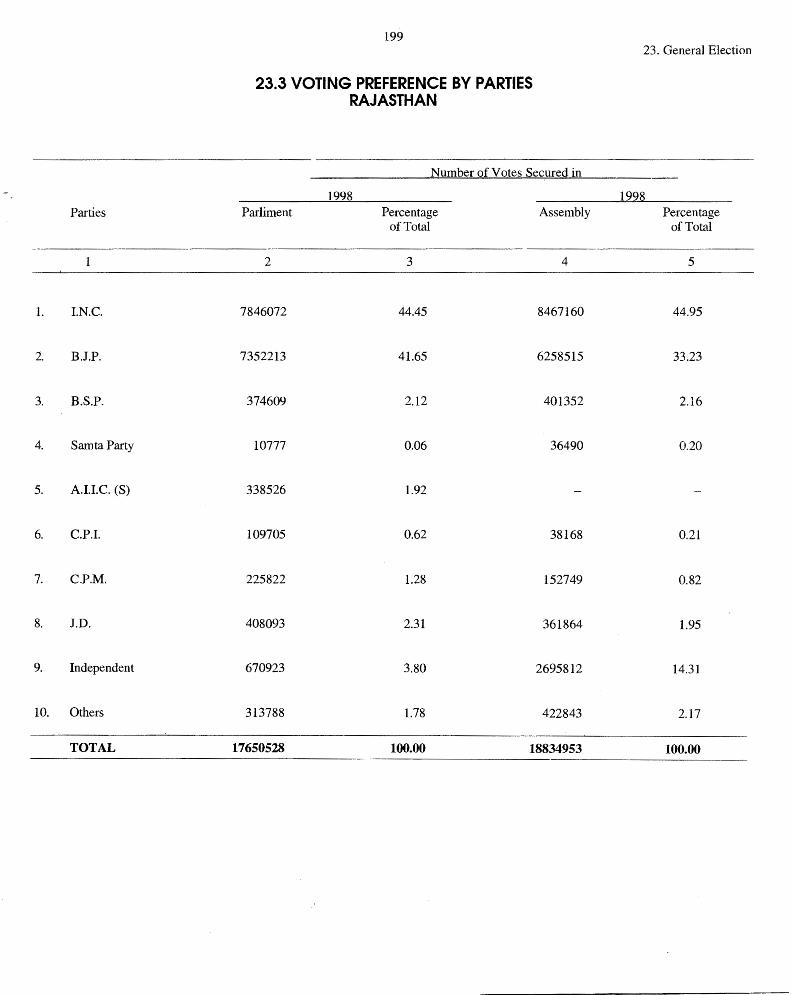
Parties
1. I.N.C.
2. B.J.P.
3. B.S.P.
4. Samta Party
5. A.I.LC. (S)
6. C.P.I.
7. C.P.M.
8. J.D.
9. Independent
10. Others
TOTAL
199
23.3 VOTING PREFERENCE BY PARTIES RAJASTHAN
Number of Votes Secured in
1998 Parliment Percentage Assembly
of Total
2 3 4
7846072 44.45 8467160
7352213 41.65 6258515
374609 2.12 401352
10777 0.06 36490
338526 1.92
109705 0.62 38168
225822 1.28 152749
408093 2.31 361864
670923 3.80 2695812
313788 1.78 422843
17650528 100.00 18834953
23. General Election
1998 Percentage
of Total
5
44.95
33.23
2.16
0.20
0.21
0.82
1.95
14.31
2.17
100.00

24. Miscellaneous
Item
A. Shops 1. Country Liquor 2. Indian Made Foreign Liquor 3. Hamp Drugs
B. Consumption 1. Foreign Liquor
1.1 Imported spirit & wine 1.2 Indian made spirit &
Liquor (I.M.F.L.) 1.3 Indian made beer
2. Country Liquor 3. Opium 4. Bhang 5. Lanced Poppy Heads
200
24. 1 CONSUMPTION OF INTOXICANTS
Unit
2
Number
(B.L.)
(Lakh B.L.)
Kilogram Lakh Kilogram
1996-97
3
4272 1019
989
1665.50
247.26 269.63
1013.33 16.434
0.50 · 15.41
24.2 SPEAKERS OF PRINCIPAL LANGUAGES IN RAJASTHAN-1991
Language
All Language Assamese Bengali Gujarati Hindi@
Kannada Kashmiri Konkani
Malayalam Manipuri Marathi Nepali Oriya Punjabi Sanskrit Sindhi Tamil Telugu Urdu Other than Schedule VIII
(According to Schedule VIII)
Speakers
2
44005990 2135
28133 50367
39410968 3101 1005
126 26450
1 18142
6769 10494
834243 433
336523 12461 7332
953497 2303810
1997-98
4
4747
962 966
5780
289.69 252.37
883.82 16.434
0.50 15.41
Percentage of Total
3
100.00
Neg .. 0.06 0.11
89.56 Neg. Neg. Neg.
0.06 Neg. 0.04
0.02 0.02 1.90 Neg. 0.76
0.03 0.02 2.17 5.24
@ HINDI INCLUDES--Awadhi, Bagi, Banjari, Bhojpuri, Brij Bhasha, Bundeli, Chhattisgarhi, Dundhari, Garhwali, Gojri, Harauti, Haryanvi, Kangri, Khariboli, Kumauni, Labani, Magadhi, Maithili, Malvi, Marwari, Mewati, Mewari, Nimadi. Pahari, Rajasthani, Sadan.
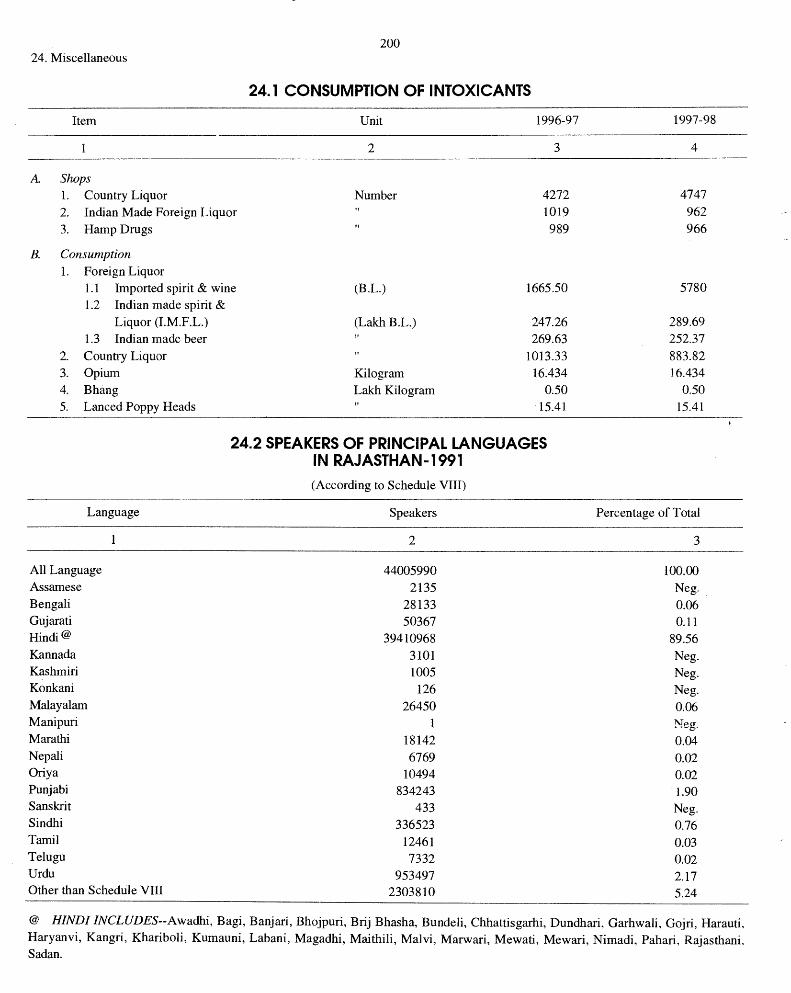
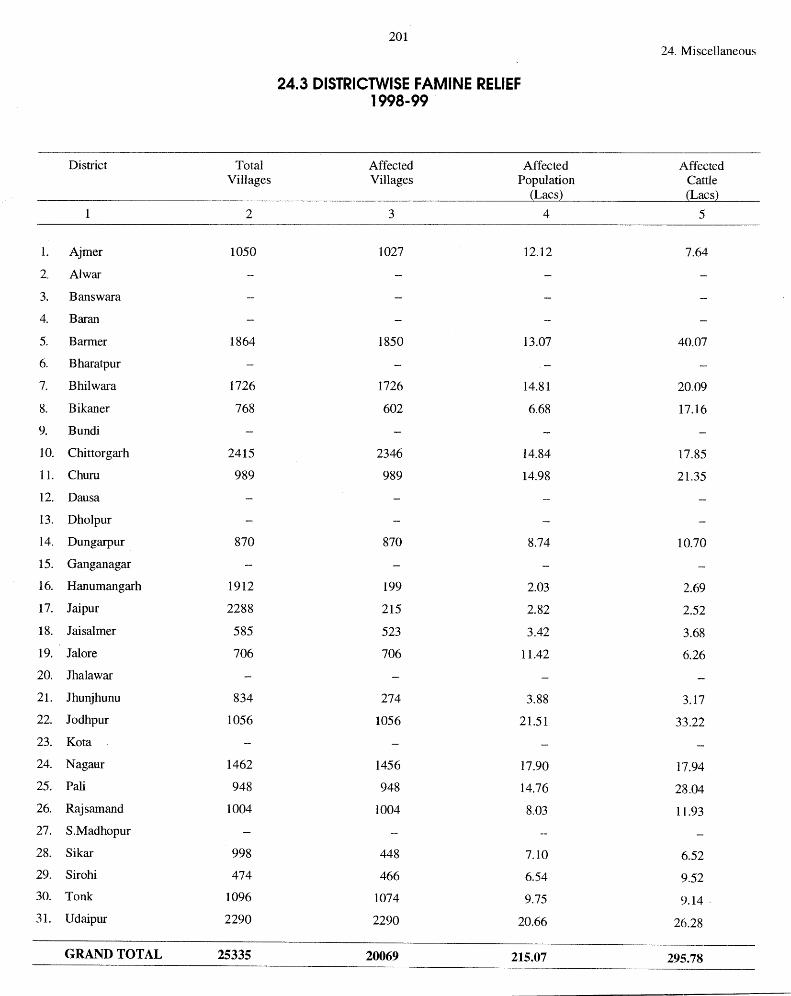
District Total Villages
1 2
1. Ajmer 1050
2. Al war
3. Banswara
4. Baran
5. Barmer 1864
6. Bharatpur
7. Bhilwara 1726
8. Bikaner 768
9. Bundi
10. Chittorgarh 2415
11. Churu 989
12. Dausa
13. Dholpur
14. Dungarpur 870
15. Ganganagar
16. Hanumangarh 1912
17. Jaipur 2288
18. Jaisalmer 585
19. Jalore 706
20. Jhalawar
21. Jhunjhunu 834
22. Jodhpur 1056
23. Ko ta
24. Nagaur 1462
25. Pali 948
26. Rajsamand 1004
27. S.Madhopur
28. Sikar 998
29. Sirohi 474
30. Tonk 1096
31. Udaipur 2290
GRAND TOTAL 25335
201
24.3 DISTRICTWISE FAMINE RELIEF 1998-99
Affected Affected Villages Population
Lacs
3 4
1027 12.12
1850 13.07
1726 14.81
602 6.68
2346 14.84
989 14.98
870 8.74
199 2.03
215 2.82
523 3.42
706 11.42
274 3.88
1056 21.51
1456 17.90
948 14.76
1004 8.03
448 7.10
466 6.54
1074 9.75
2290 20.66
20069 215.07
24. Miscellaneous
Affected Cattle Lacs
5
7.64
40.07
20.09
17.16
17.85
21.35
10.70
2.69
2.52
3.68
6.26
.3.17
33.22
17.94
28.04
11.93
6.52
9.52
9.14'
26.28
295.78
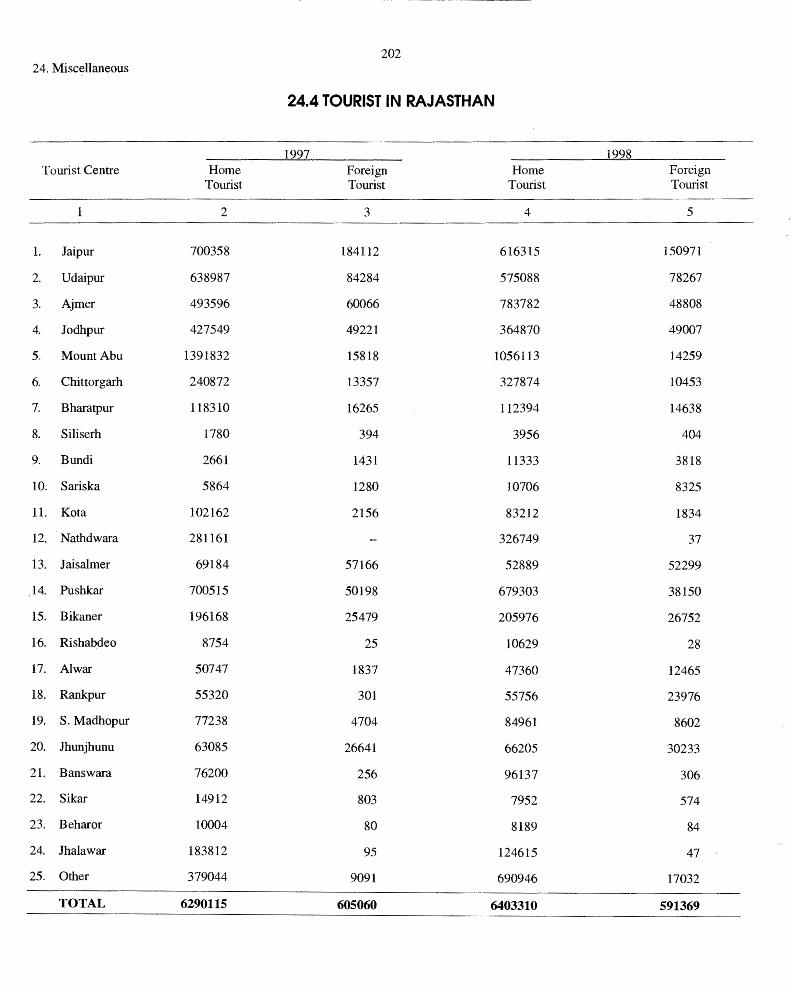
202 24. Miscellaneous
24.4 TOURIST IN RAJASTHAN
1997 1998 Tourist Centre Home Foreign Home Foreign
Tourist Tourist Tourist Tourist
1 2 3 4 5
1. Jaipur 700358 184112 616315 150971
2. Udaipur 638987 84284 575088 78267
3. Ajmer 493596 60066 783782 48808
4. Jodhpur 427549 49221 364870 49007
5. Mount Abu 1391832 15818 1056113 14259
6. Chittorgarh 240872 13357 327874 10453
7. Bharatpur 118310 16265 112394 14638
8. Siliserh 1780 394 3956 404
9. Bundi 2661 1431 11333 3818
10. Sariska 5864 1280 10706 8325
11. Ko ta 102162 2156 83212 1834
12. Nathdwara 281161 326749 37
13. Jaisalmer 69184 57166 52889 52299
,14. Pushkar 700515 50198 679303 38150
15. Bikaner 196168 25479 205976 26752
16. Rishabdeo 8754 25 10629 28
17. Al war 50747 1837 47360 12465
18. Rankpur 55320 301 55756 23976
19. S.Madhopur 77238 4704 84961 8602
20. Jhunjhunu 63085 26641 66205 30233
21. Banswara 76200 256 96137 306
22. Sikar 14912 803 7952 574
23. Beharor 10004 80 8189 84
24. Jhalawar 183812 95 124615 47
25. Other 379044 9091 690946 17032
TOTAL 6290115 605060 6403310 591369

203 24. Misce1laneous
24.5 TOURIST HOTELS IN RAJASTHAN 1997-98
NQ. of Hotels Name of Tourist General Haritage Tourist Reception
Centre Information Centre
2 3 4
1. Ajmer 33 2
2. Al war 35
3. Amber
4. Banswara 18
5. Bikaner 33 4
6. Bharatpur 27 1
7. Bundi 9
8. Chittorgarh 21
9. Jaipur 150 7 4
10. Jaisalmer 83 2
11. Jodhpur 51 2
12. Jhalawar 8
13. Jhunjhunu 20 4
14. Ko ta 50
15. Mount Abu 102 3
16. Nathdwara 2
17. Nagaur
18. Pushkar 20
19. Pali 2
20. Ranakpur 5
21. Sariska 2 ,I
22. S.Madhopur 20
23. Sikar 11 1-
24. Udaipur 139 4 2
TOTAL 841 32 24
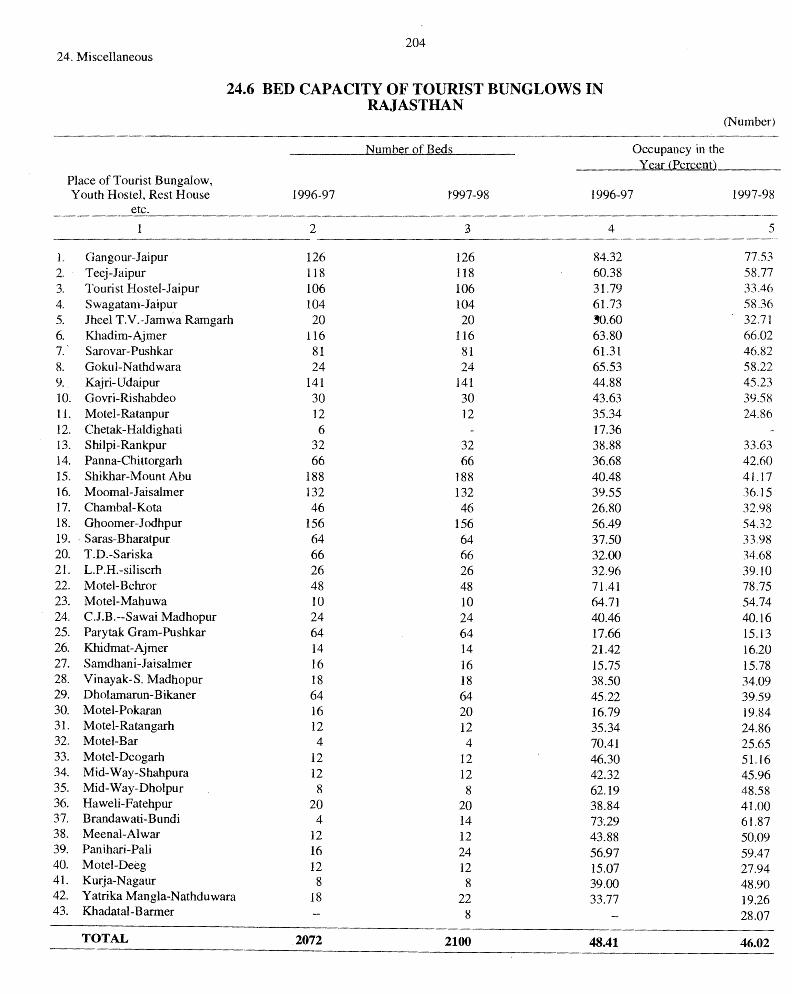
204 24. Miscellaneous
24.6 BED CAPACITY OF TOURIST BUNGLOWS IN RAJASTHAN
(Number)
Number of Beds Occupancy in the Year (Percent}
Place of Tourist Bungalow, Youth Hostel, Rest House 1996-97 t997-98 1996-97 1997-98
etc.
2 3 4 5
1. Gangour-Jaipur 126 126 84.32 77.53 2. Teej-Jaipur 118 118 60.38 58.77 3. Tourist Hostel-Jaipur 106 106 31.79 33.46 4. Swagatam-Jaipur 104 104 61.73 58.36 5. Jheel TV.-Jamwa Ramgarh 20 20 ,0.60 32.71 6. Khadim-Ajmer 116 116 63.80 66.02 7.' Sarovar-Pushkar 81 81 61.31 46.82 8. Gokul-Nathdwara 24 24 65.53 58.22 9. Kajri-Udaipur 141 141 44.88 45.23 10. Govri-Rishabdeo 30 30 43.63 39.58 11. Motel-Ratanpur 12 12 35.34 24.86 12. Chetak-Haldighati 6 17.36 13. Shilpi-Rankpur 32 32 38.88 33.63 14. Panna-Chittorgarh 66 66 36.68 42.60 15. Shikhar-Mount Abu 188 188 40.48 41.17 16. Moomal-Jaisalmer 132 132 39.55 36.15 17. Chambal-Kota 46 46 26.80 32.98 18. Ghoomer-J odhpur 156 156 56.49 54.32 19. · Saras-Bharatpur 64 64 37.50 33.98 20. T.D.-Sariska 66 66 32.00 34.68 21. L.P.H.-siliserh 26 26 32.96 39.IO 22. Motel-Behror 48 48 71.41 78.75 23. Motel-Mahuwa 10 10 64.71 54.74 24. C.J.B.--Sawai Madhopur 24 24 40.46 40.16 25. Parytak Gram-Pushkar 64 64 17.66 15.13 26. Khidmat-Ajmer 14 14 21.42 16.20 27. Samdhani-J aisalmer 16 16 15.75 15.78 28. Vinayak-S. Madhopur 18 18 38.50 34.09 29. Dholamarun-Bikaner 64 64 45.22 39.59 30. Motel-Pokaran 16 20 16.79 19.84 31. Motel-Ratangarh 12 12 35.34 24.86 32. Motel-Bar 4 4 70.41 25.65 33. Motel-Deogarh 12 12 46.30 51.16 34. Mid-W ay-Shahpura 12 12 42.32 45.96 35. Mid-Way-Dholpur 8 8 62.19 48.58 36. Haweli-Fatehpur 20 20 38.84 41.00 37. Brandawati-B undi 4 14 73'.29 61.87 38. Meenal-Alwar 12 12 43.88 50.09 39. Panihari-Pali 16 24 56.97 59.47 40. Motel-Deeg 12 12 15.07 27.94 41. Kurja-Nagaur 8 8 39.00 48.90 42. Yatrika Mangla-Nathduwara 18 22 33.77 19.26 43. Khadatal-Barmer 8 28.07
TOTAL 2072 2100 48.41 46.02